宏碁掠夺者猎户座3000台式电脑与酷睿i7-12700F和RTX 3070的审查中
")
宏碁的掠夺者系列已经存在多年,主要针对游戏玩家。笔记本电脑和台式电脑都有各种带有这一称号的型号。在目前的捕食者猎户座3000中,制造商不仅更新了产品,而且与老一代产品相比采用了新的外壳。
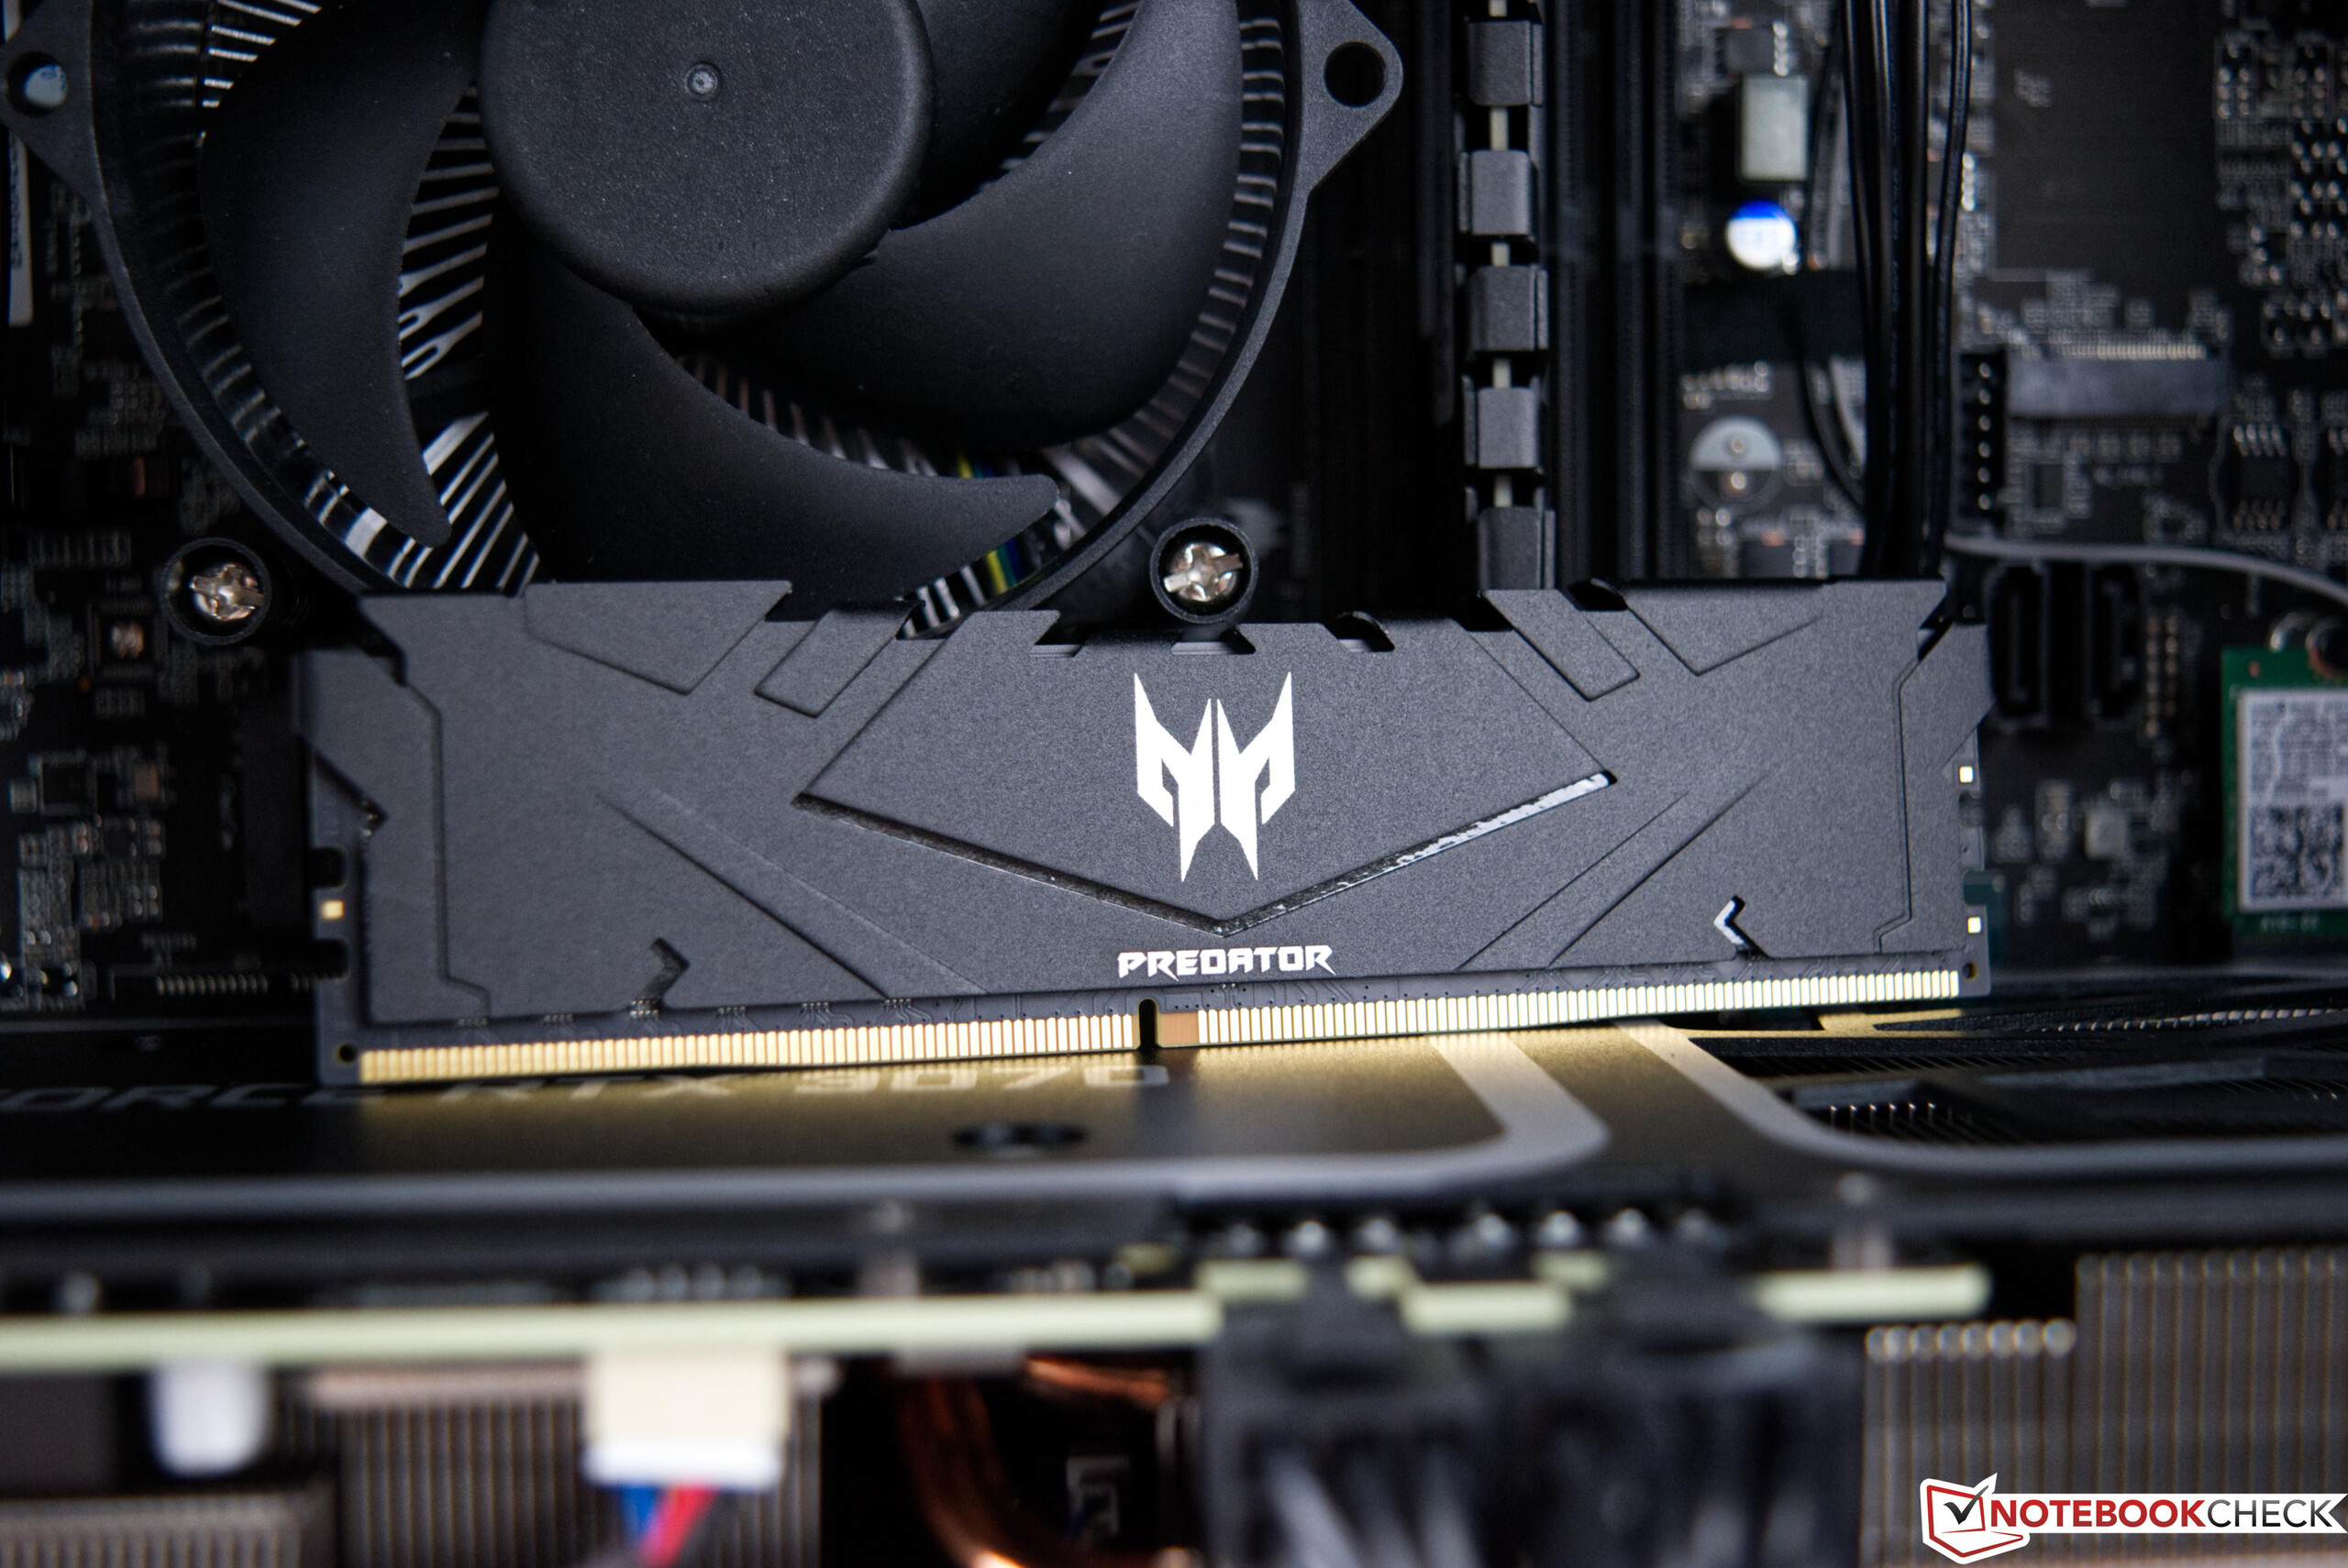
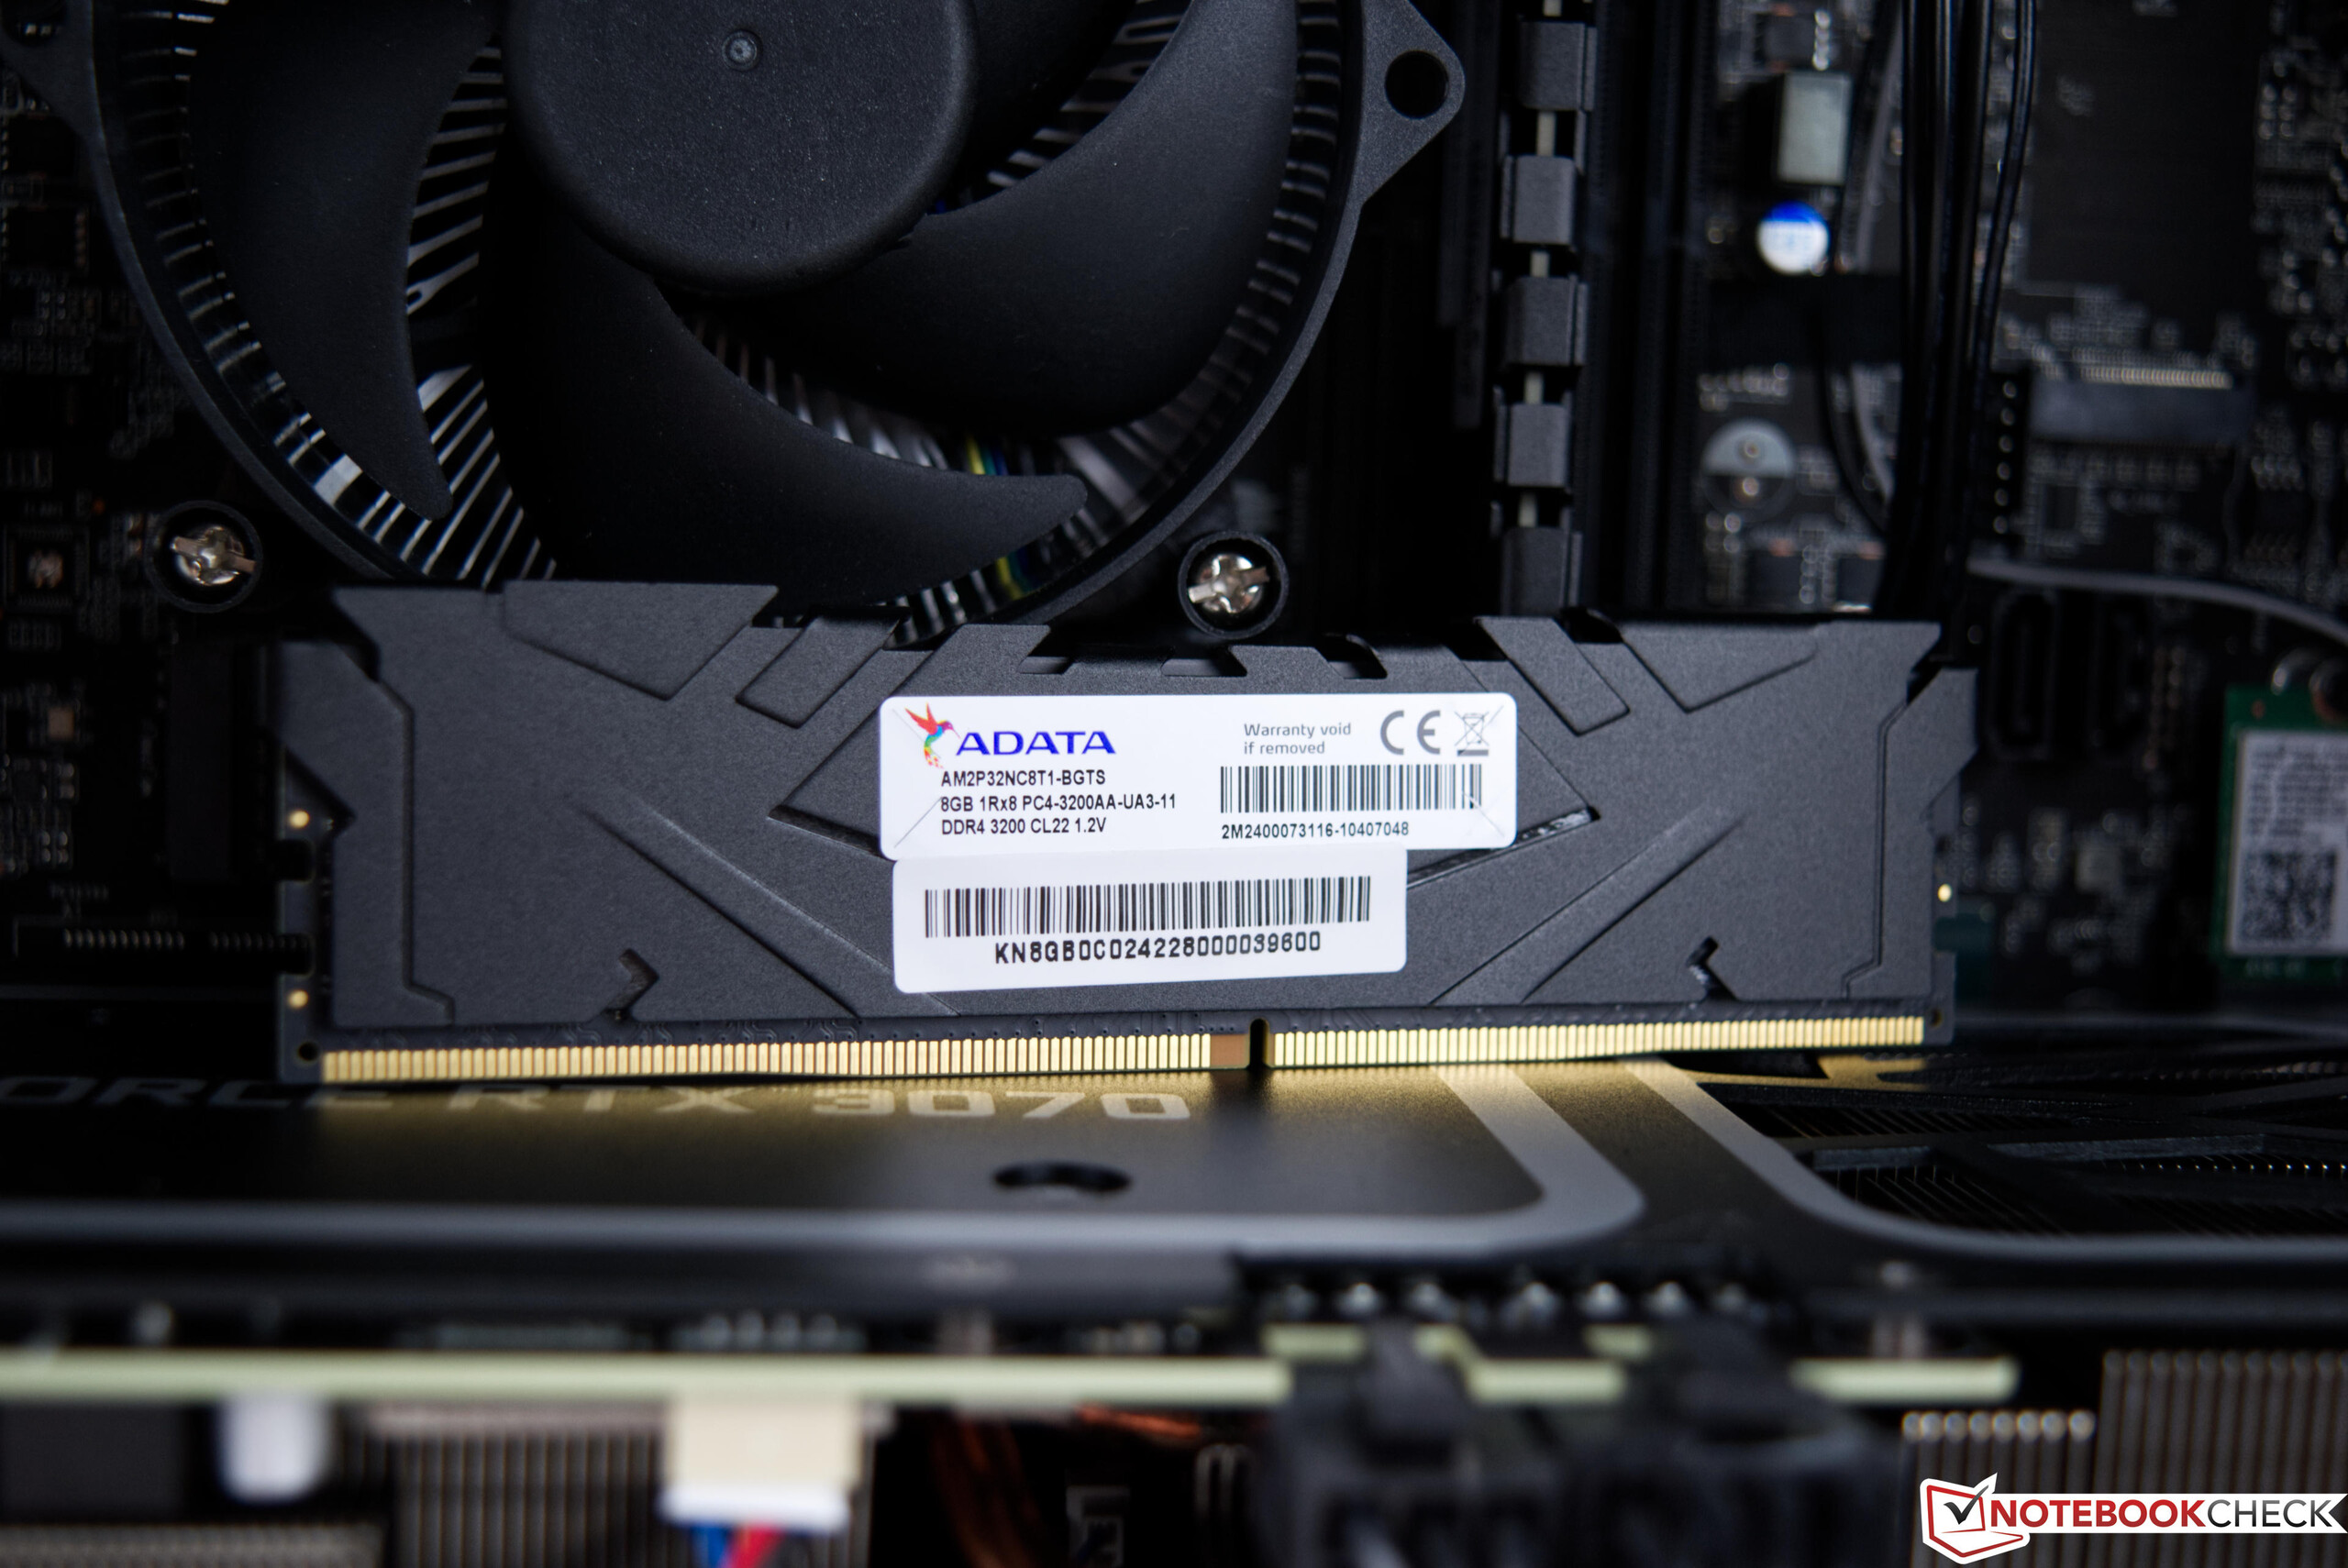
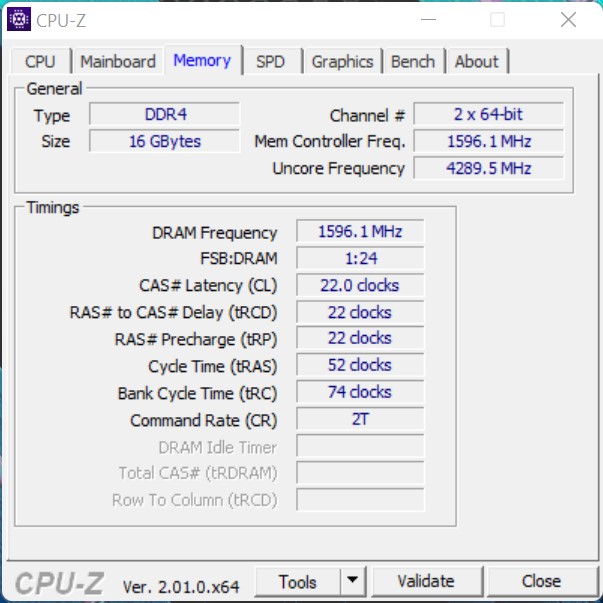
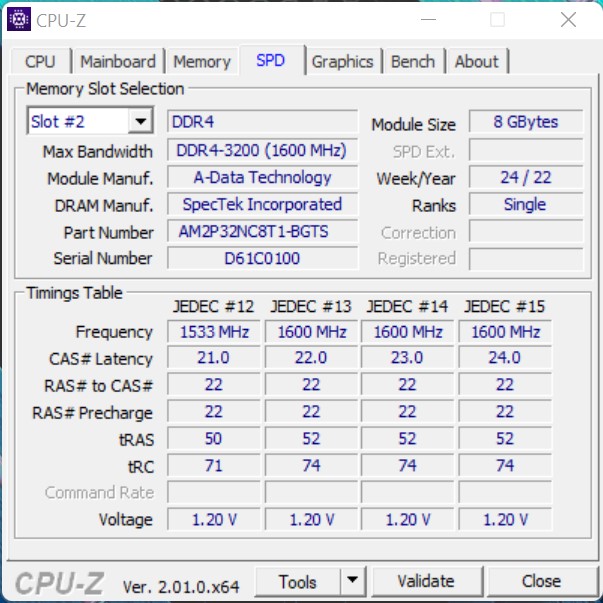
英特尔酷睿i7-12700或英特尔酷睿i7-12700F总是作为一个基础(英特尔酷睿i7-12700F在我们的样本中)。然而,在GPU配置方面有不同的型号,尽管GeForce RTX 3070是这个系列中的顶级型号。当涉及到工作内存时,总是使用DDR4内存。尽管如此,你可以根据你的预算在16GB或32GB之间选择。这同样适用于存储,在我们的系统中,宏碁在当前的捕食者猎户座3000中提供的1TB是最低的。
潜在的竞争对手比较
Rating | Date | Model | Weight | Height | Price |
|---|---|---|---|---|---|
v7 (old) | 09 / 2022 | Acer Predator Orion 3000 PO3-640 i7-12700F, GeForce RTX 3070 | 7.4 kg | 377 mm | |
v (old) | 12 / 2021 | Intel Beast Canyon NUC i9-11900KB, GeForce RTX 3060 | 189 mm | ||
v (old) | Zotac Magnus One (ECM73070C) i7-10700, GeForce RTX 3070 | ||||
v (old) | 05 / 2022 | Zotac ZBOX Magnus EN173070C i7-11800H, GeForce RTX 3070 Laptop GPU | 1.8 kg | 62.2 mm | |
v (old) | 04 / 2022 | Intel Dragon Canyon NUC - RTX 3060 i9-12900, GeForce RTX 3060 | 189 mm | ||
v (old) | Zotac MEK Mini (RTX 2070 Super) i7-9700, GeForce RTX 2070 Super (Desktop) |
Acer Predator Orion 3000 PO3-640的详细信息

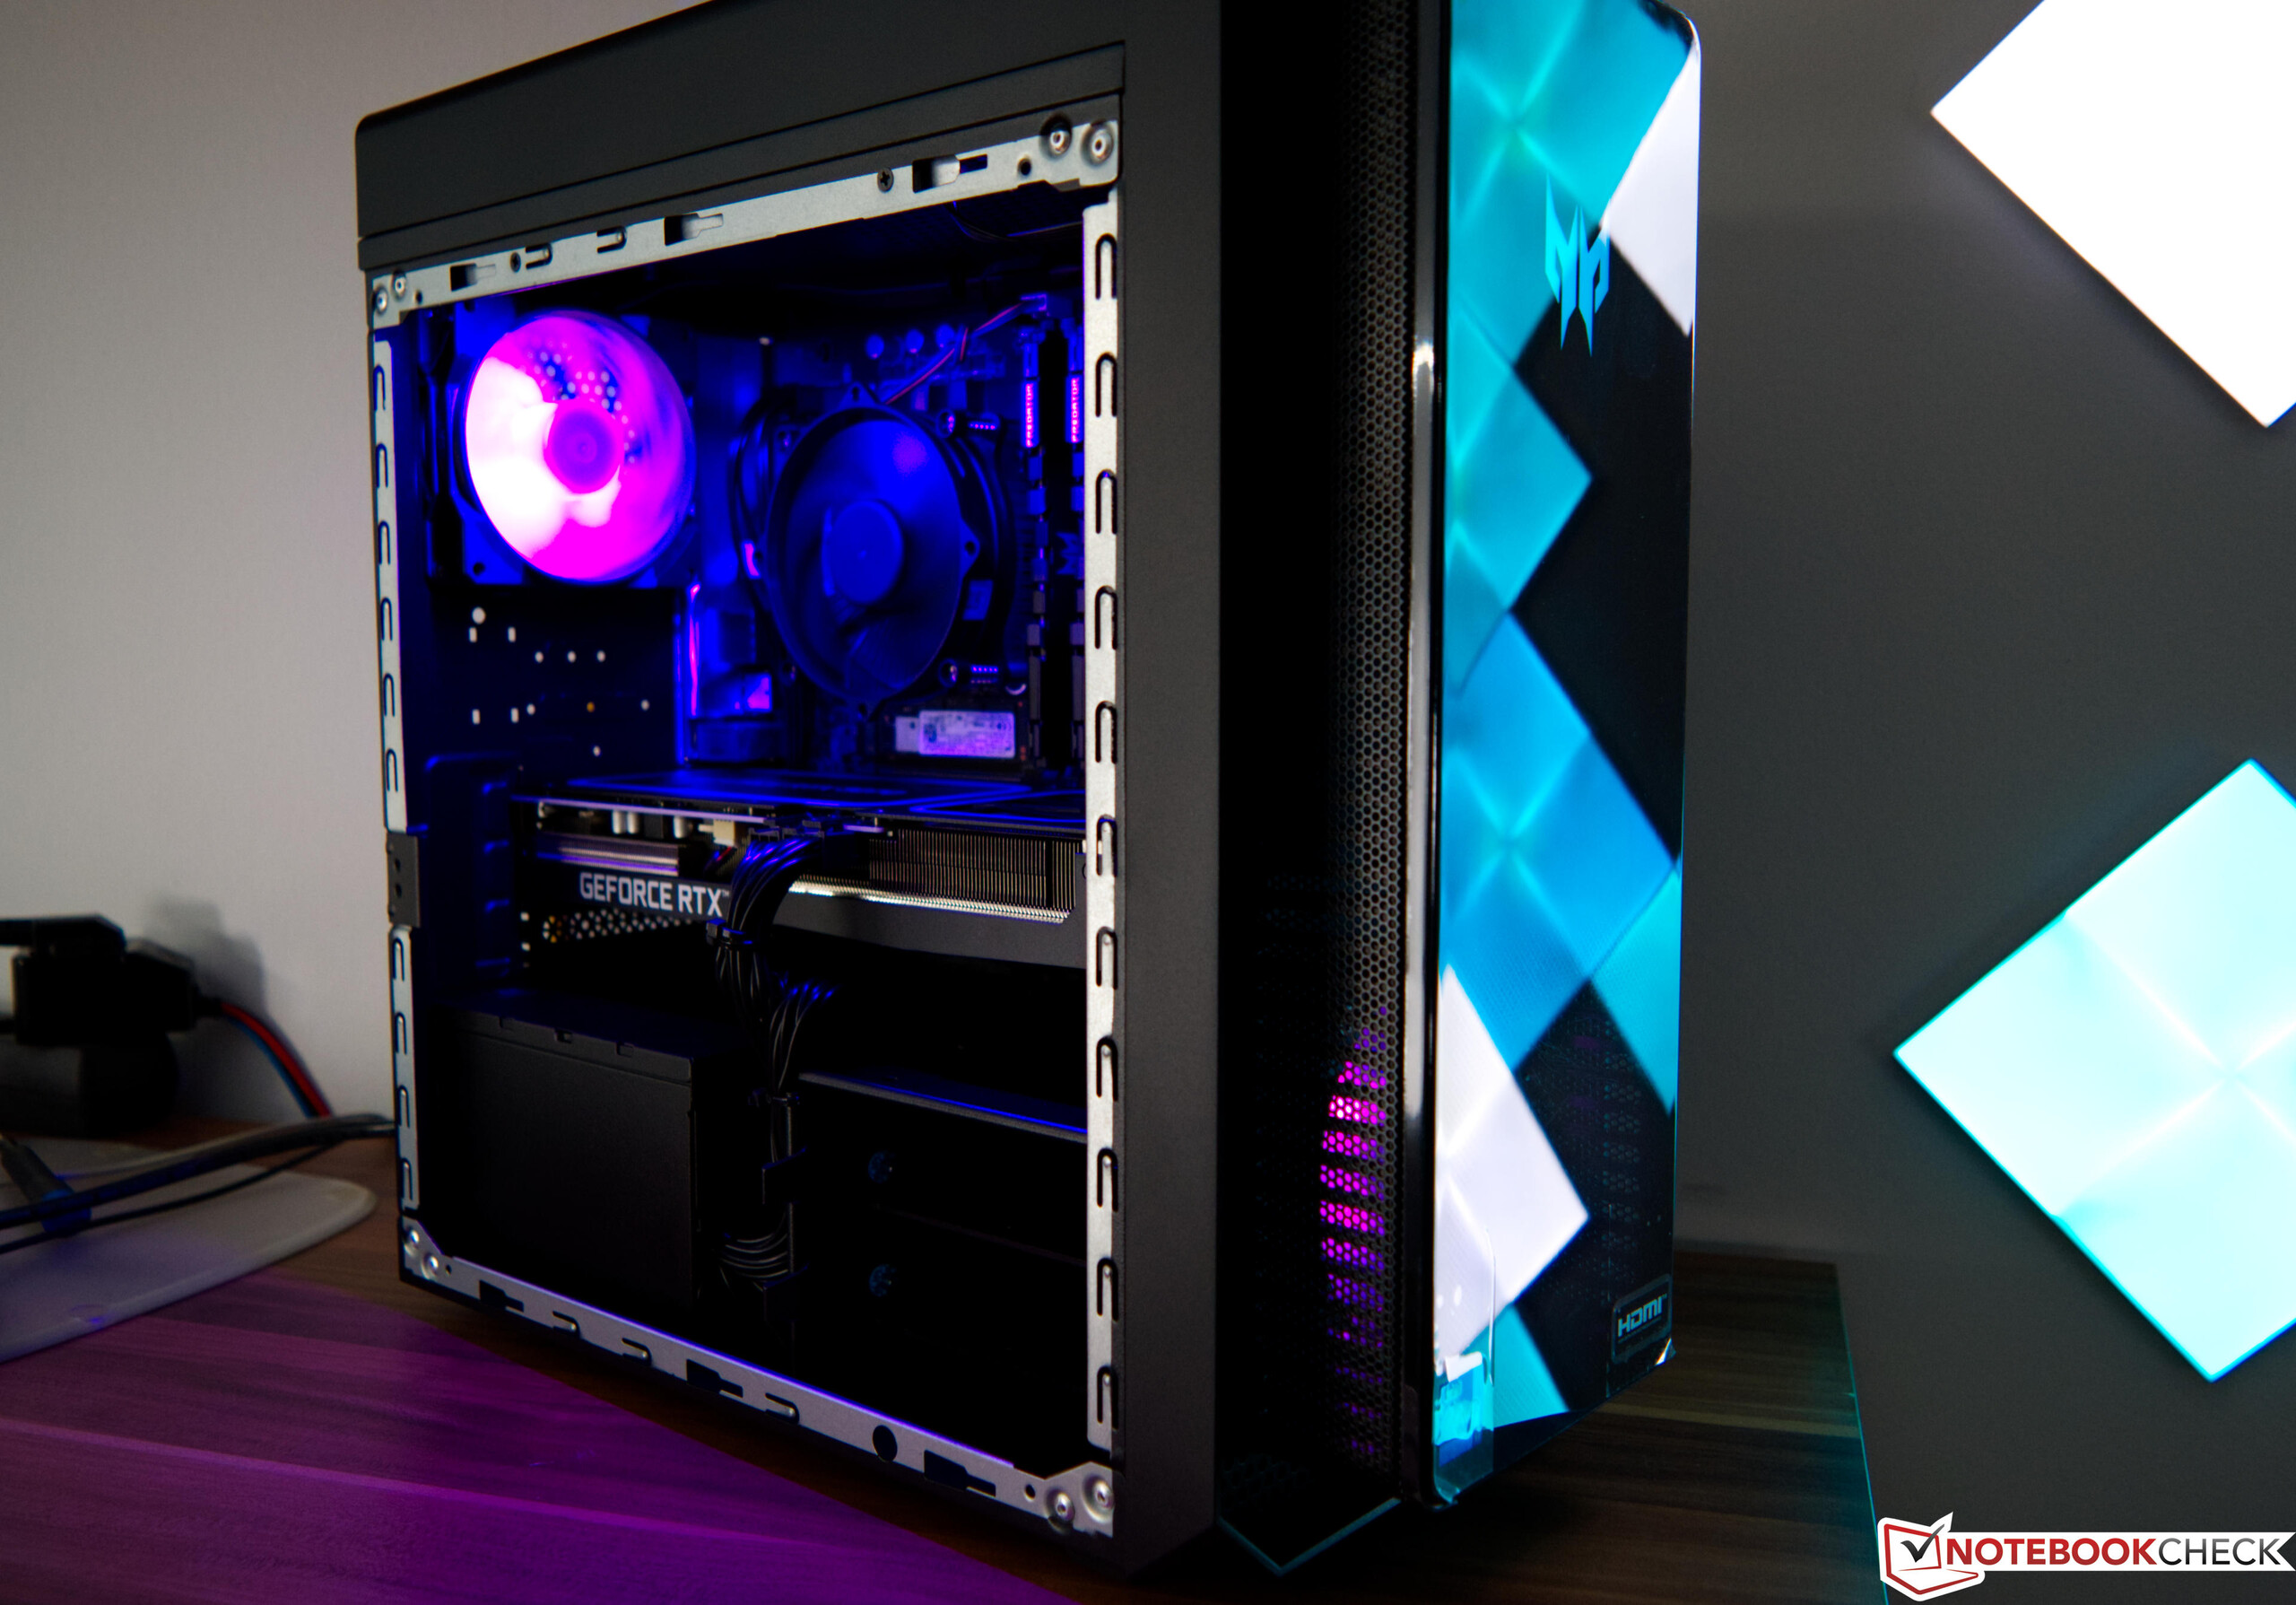

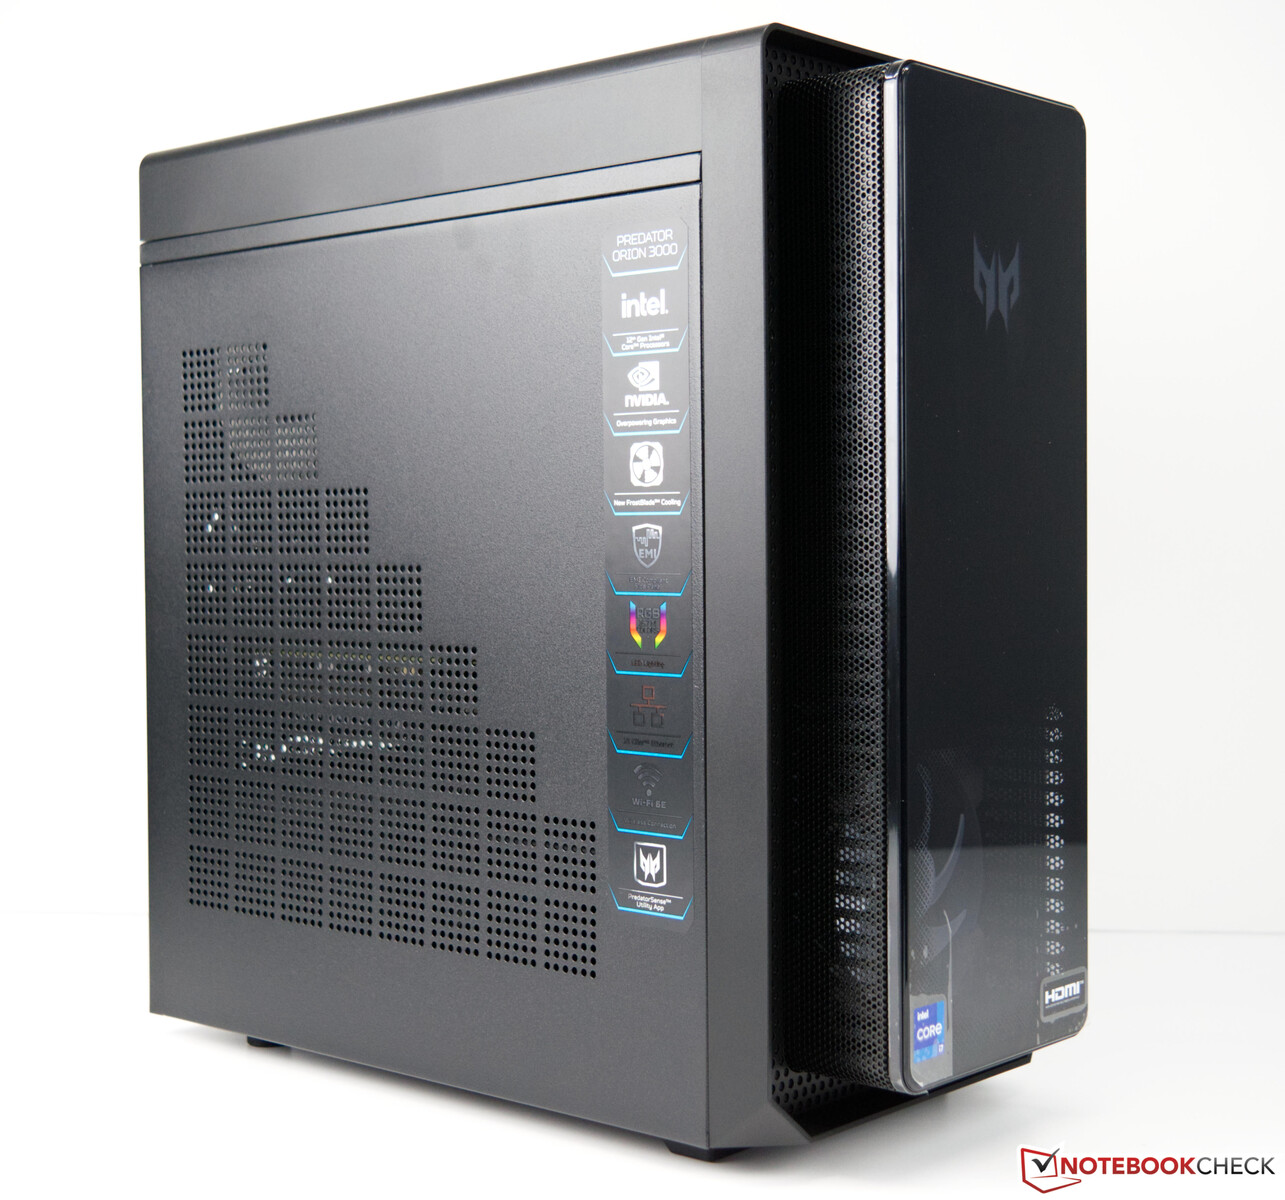
案例
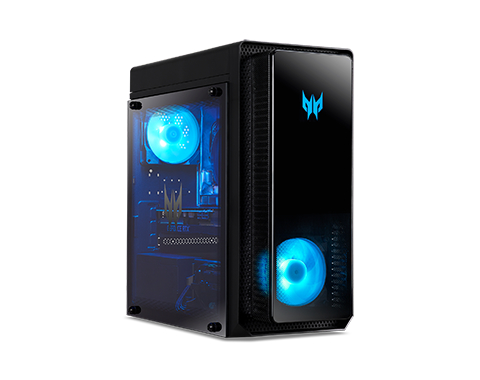
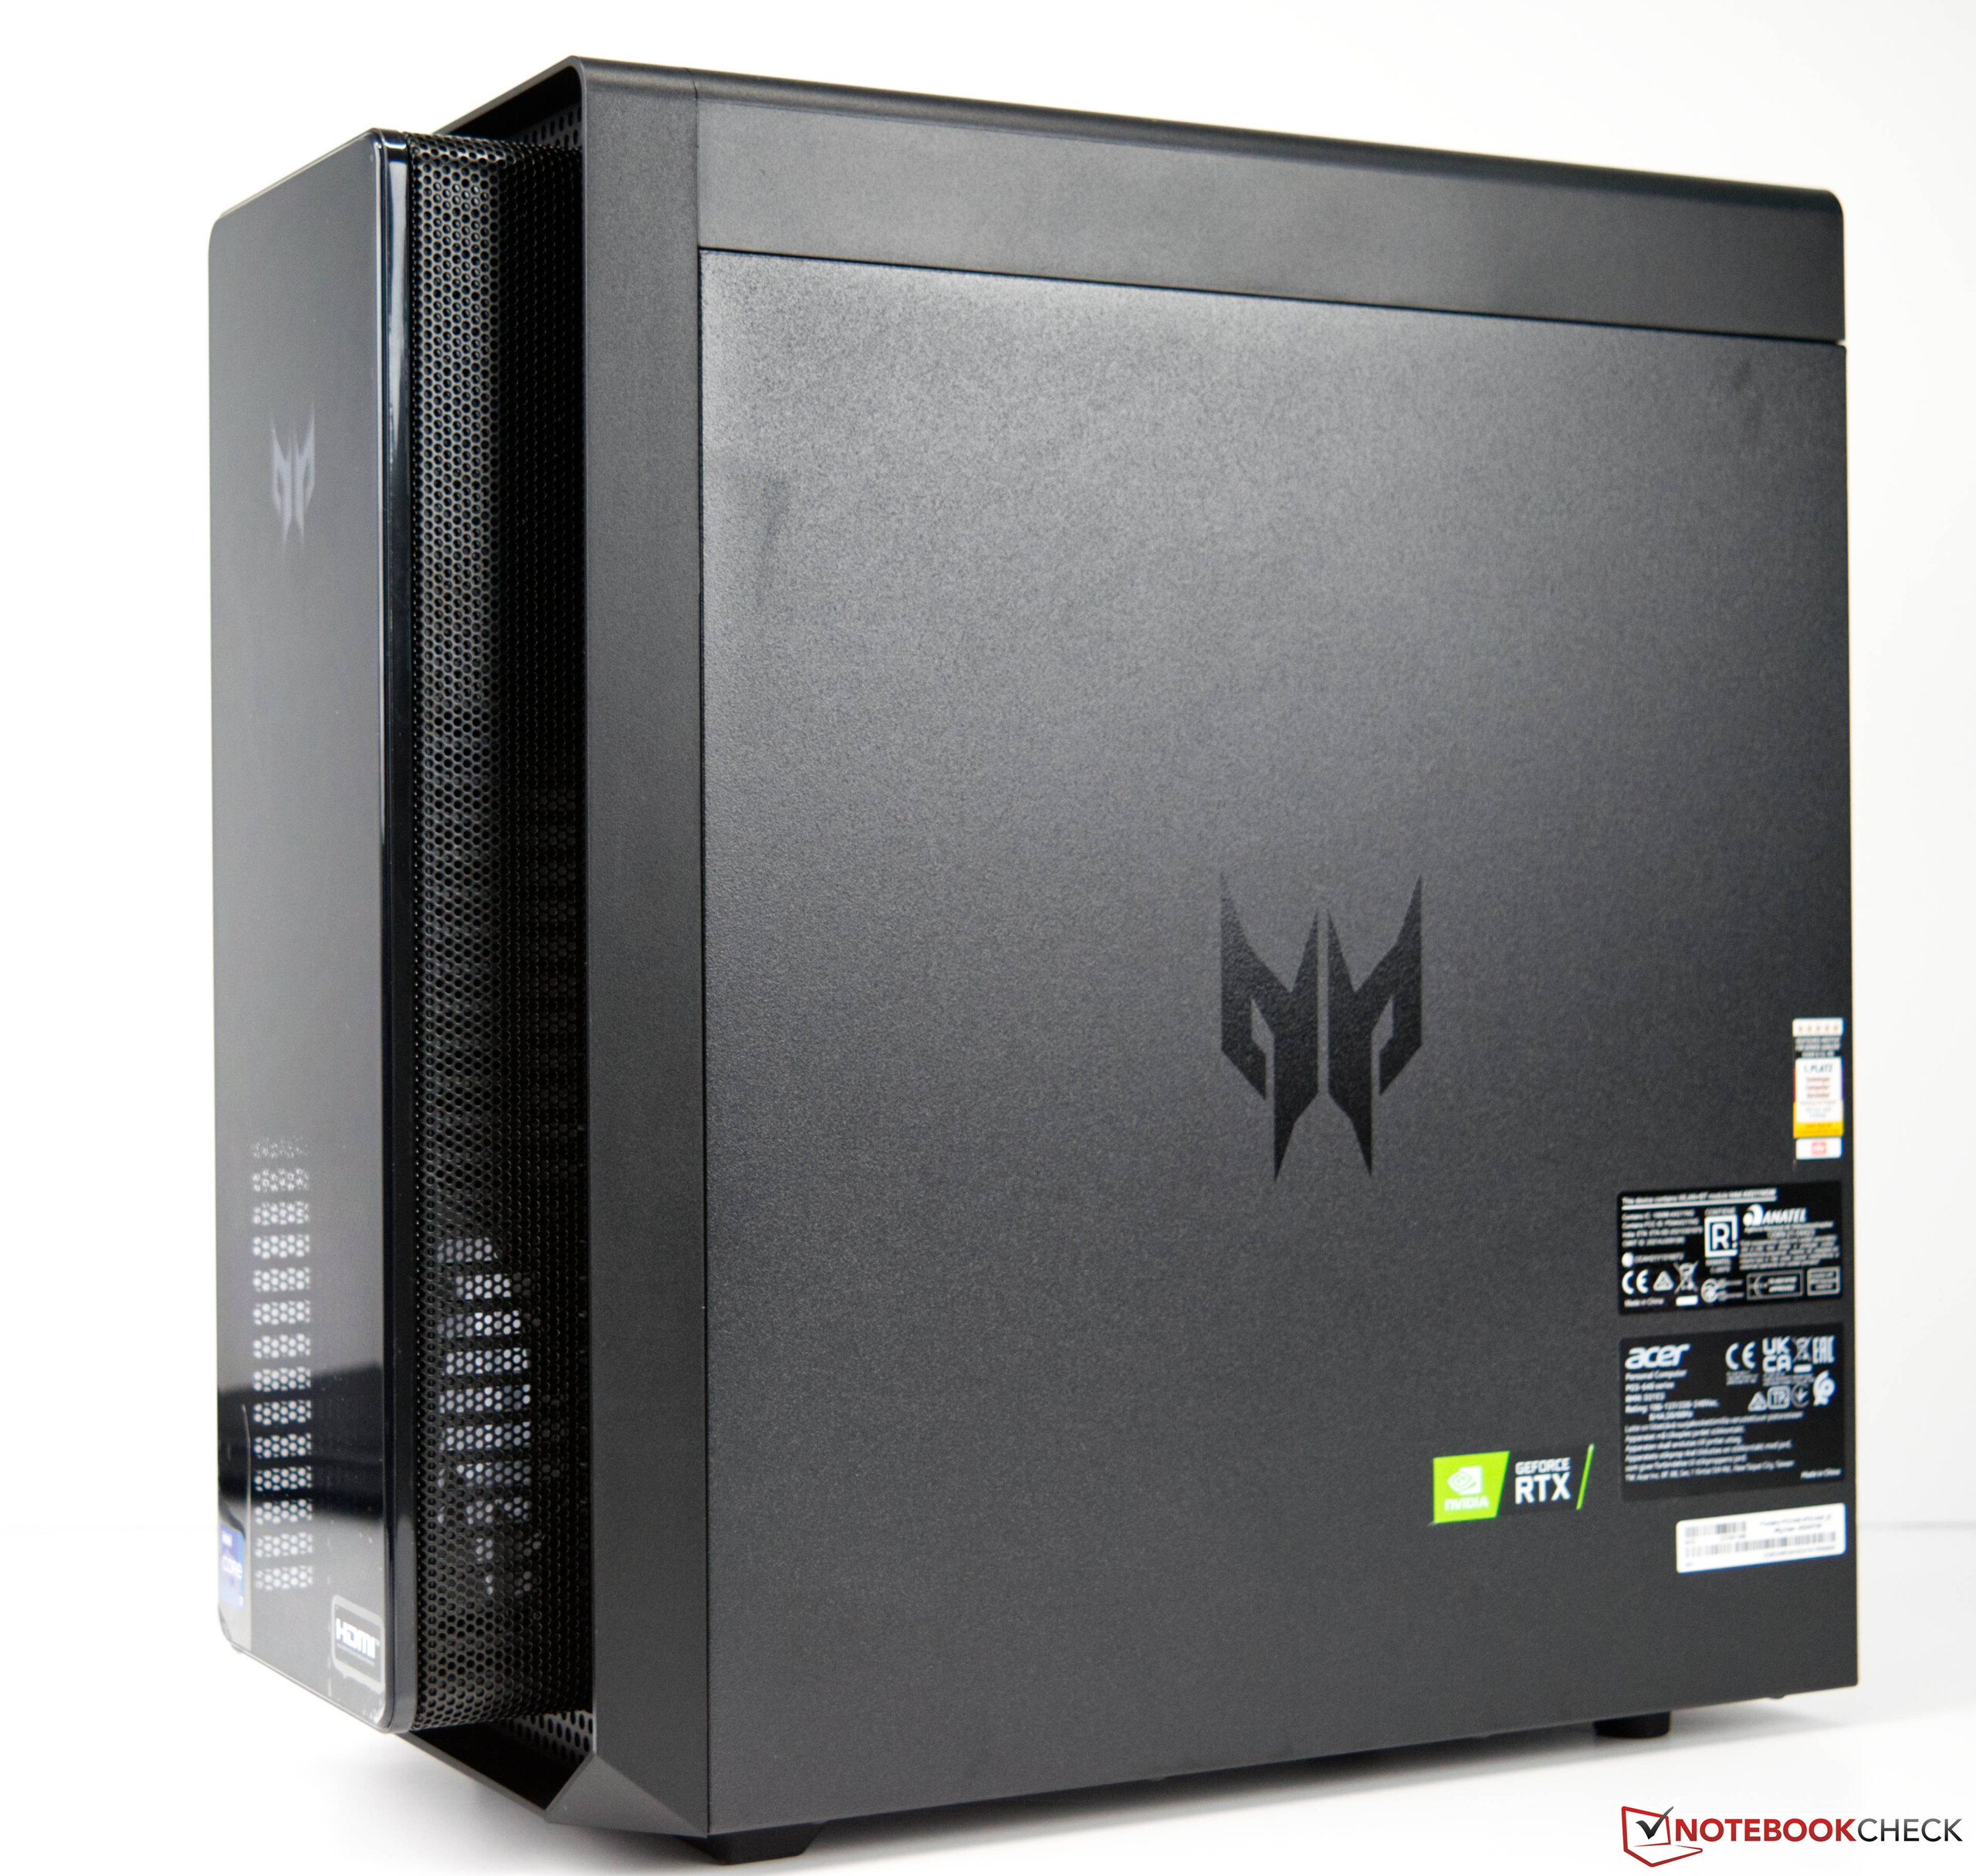
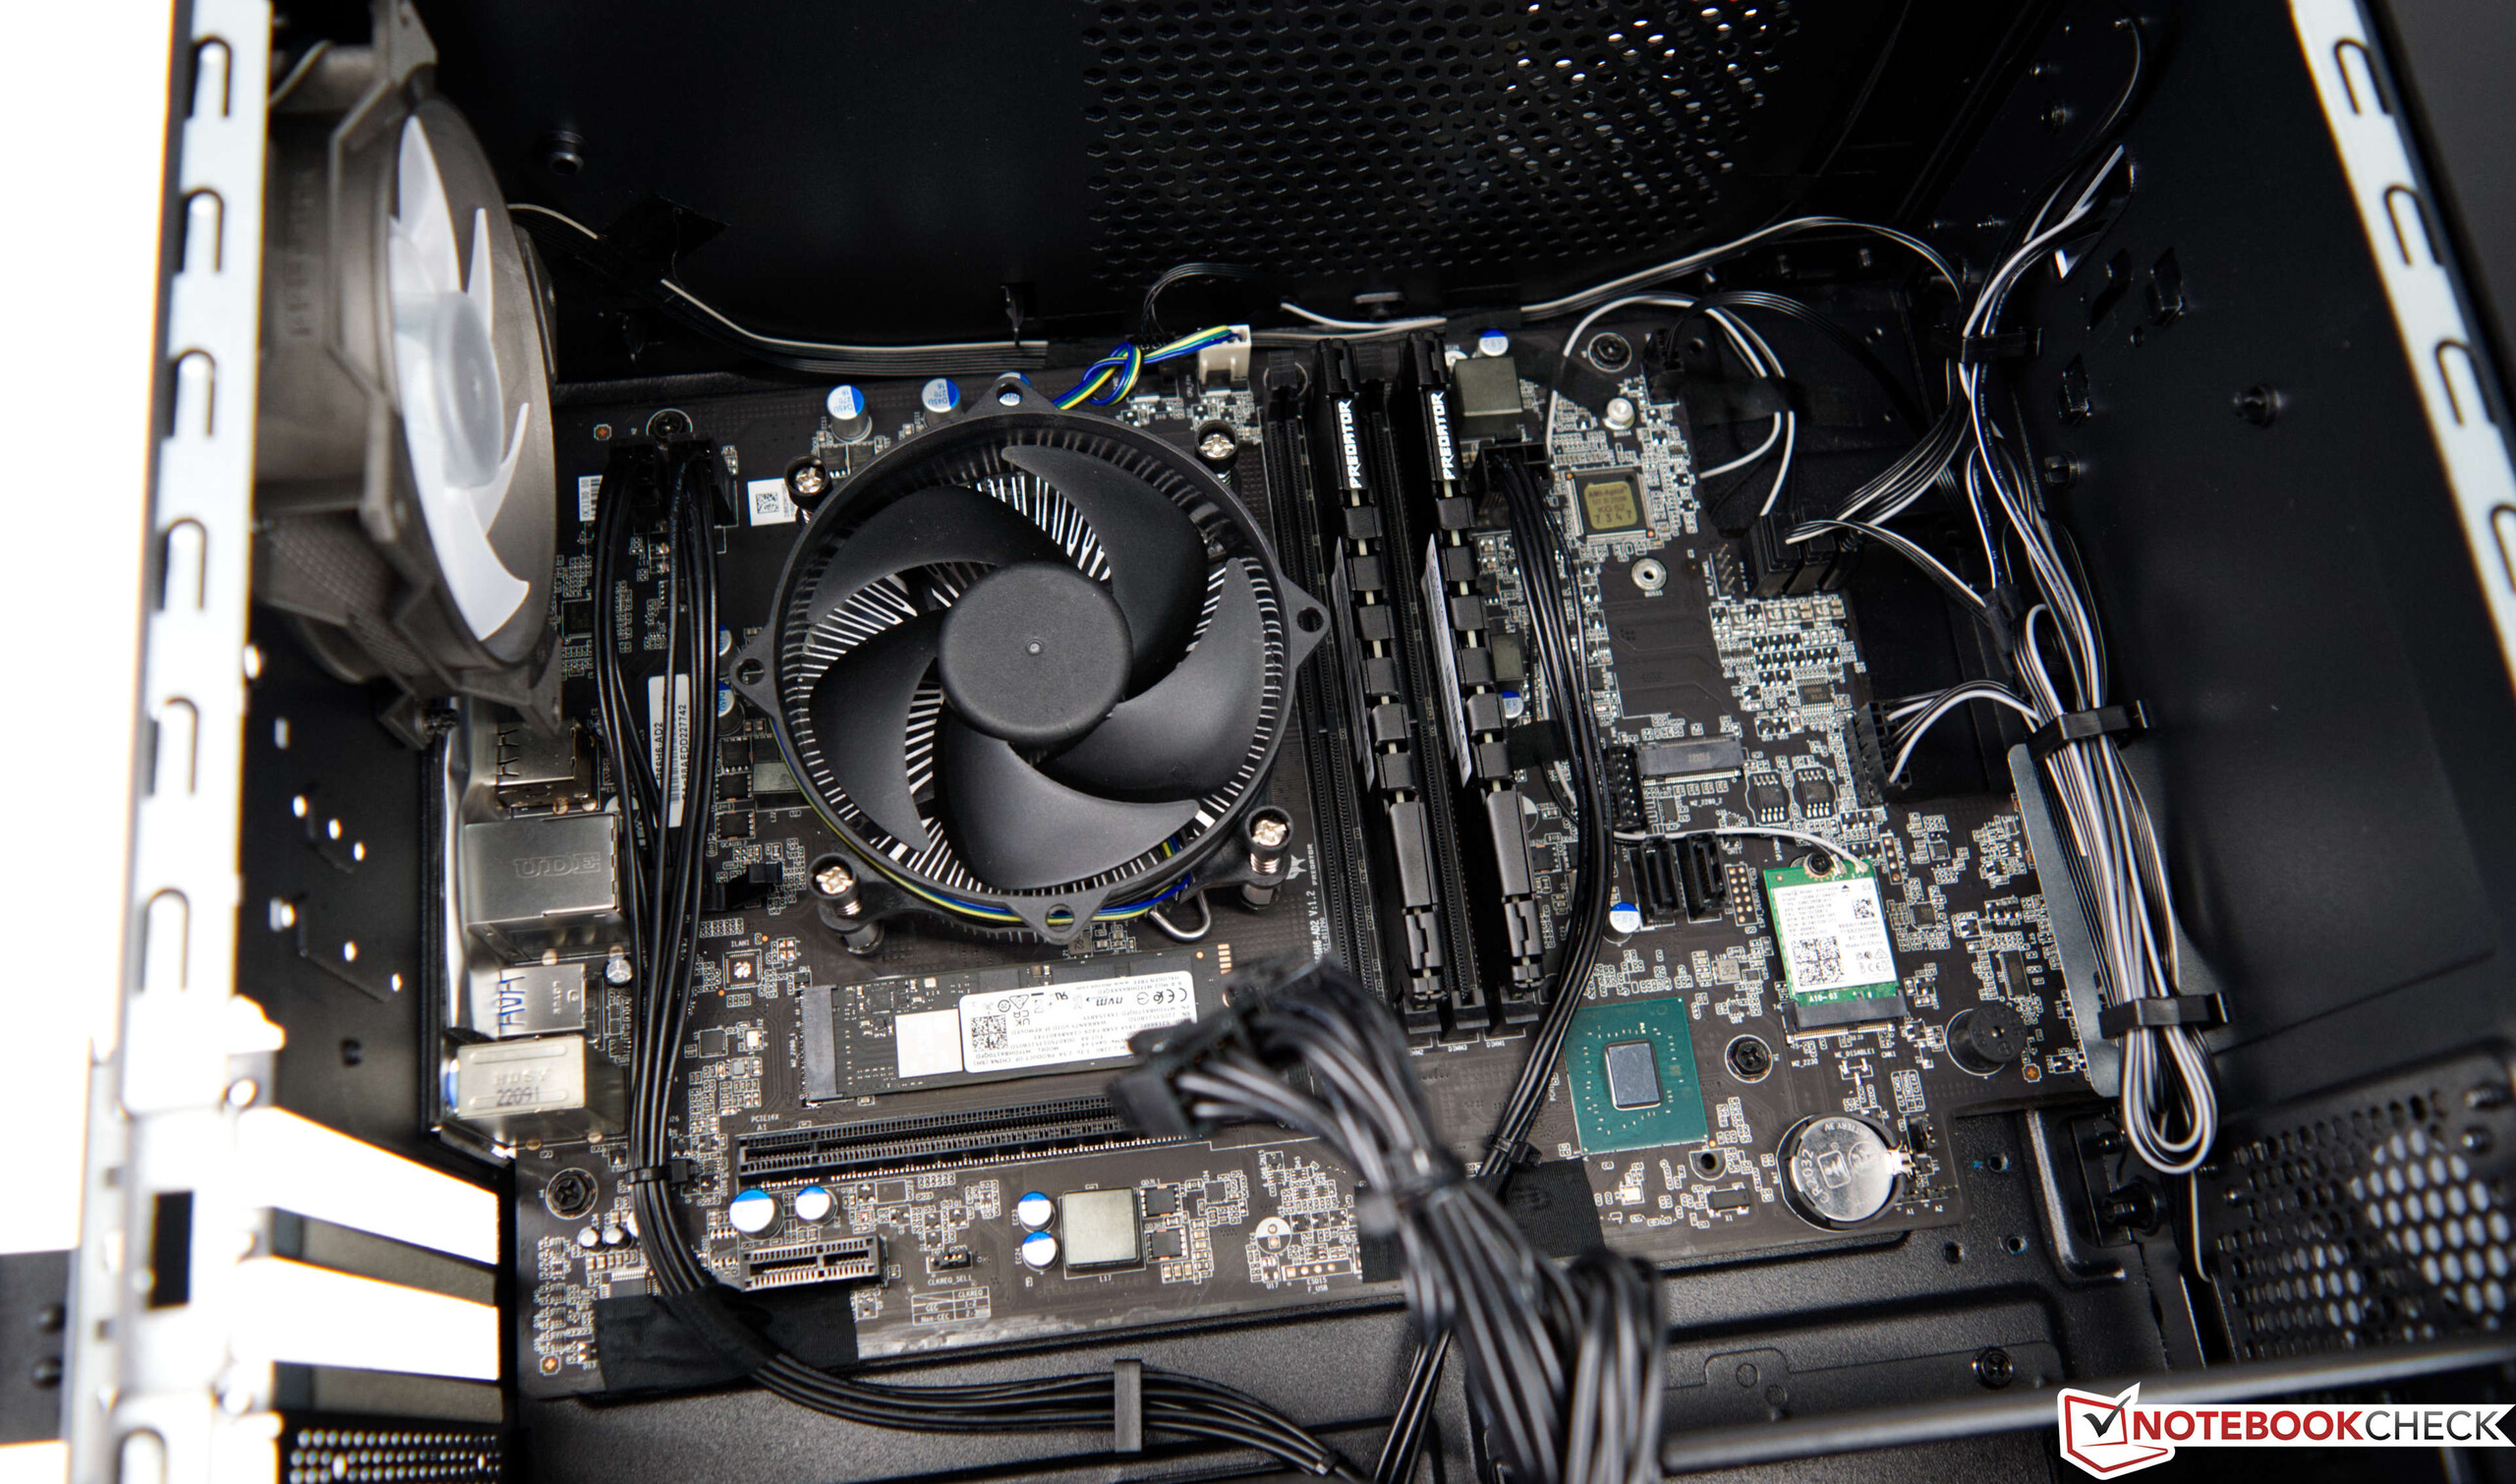
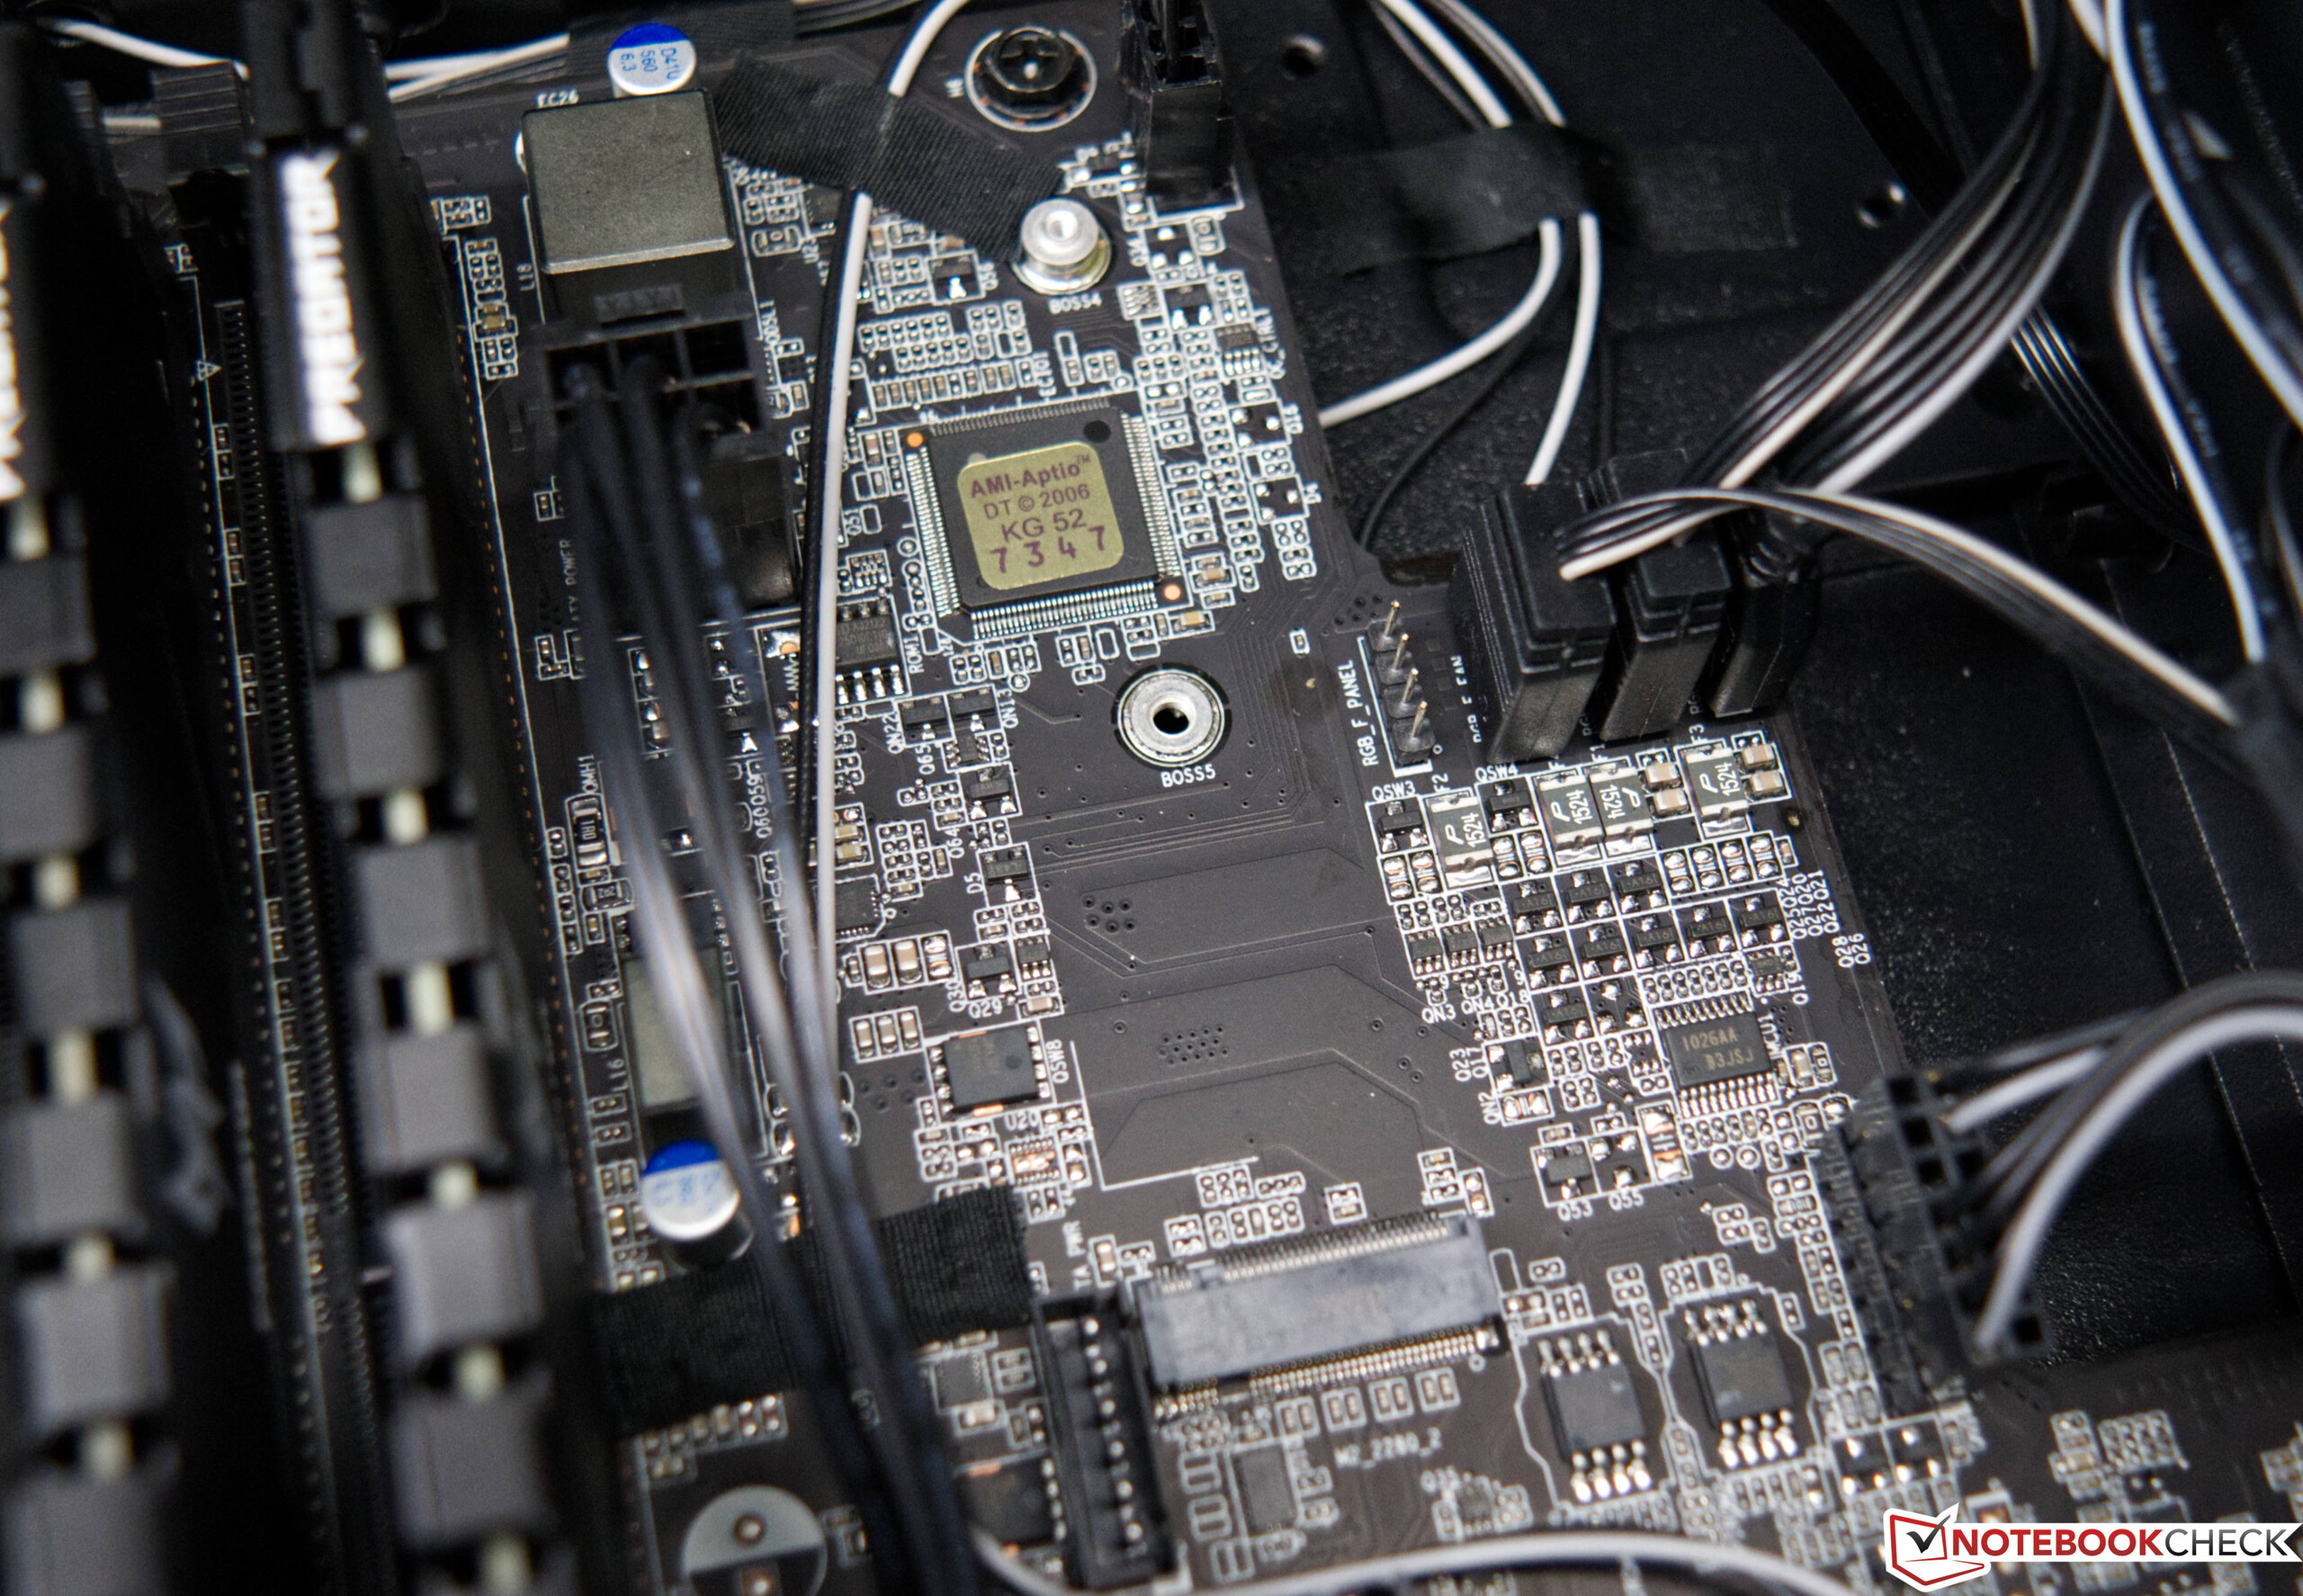
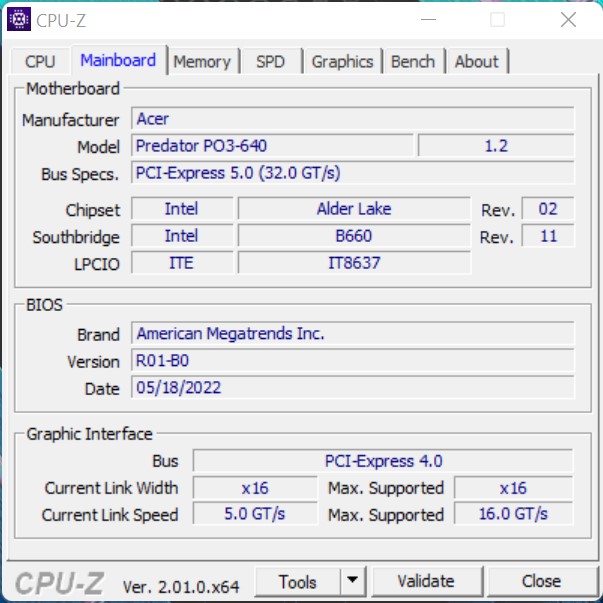
宏碁掠夺者猎户座3000 PO3-640的机箱乍一看像一个标准的ATX机箱。然而,制造商在这里偏离了标准,因为前面的连接器直接位于主板上,没有通过电缆连接到主板上。有了这样的结构,更换主板几乎是不可能的。然而,其他制造商也走类似的路子,将专有主板安装在专有机箱中。这款机箱制造得很好,尽管外观确实是一个品味问题。交付范围还包括一个带有观察窗的侧板,以更好地展示安装的组件。然而,由于空气流通已经非常有限,我们在测试中避免使用这个别致的侧板。至少金属盖板提供了几个孔来吸纳新鲜空气。
装备
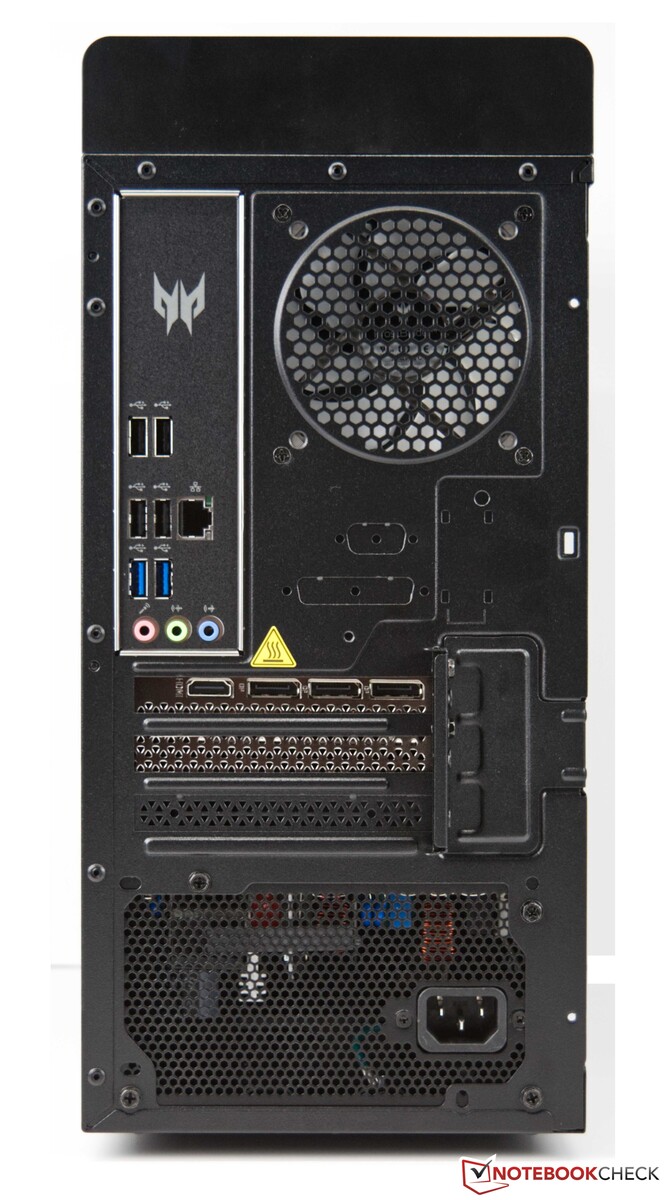
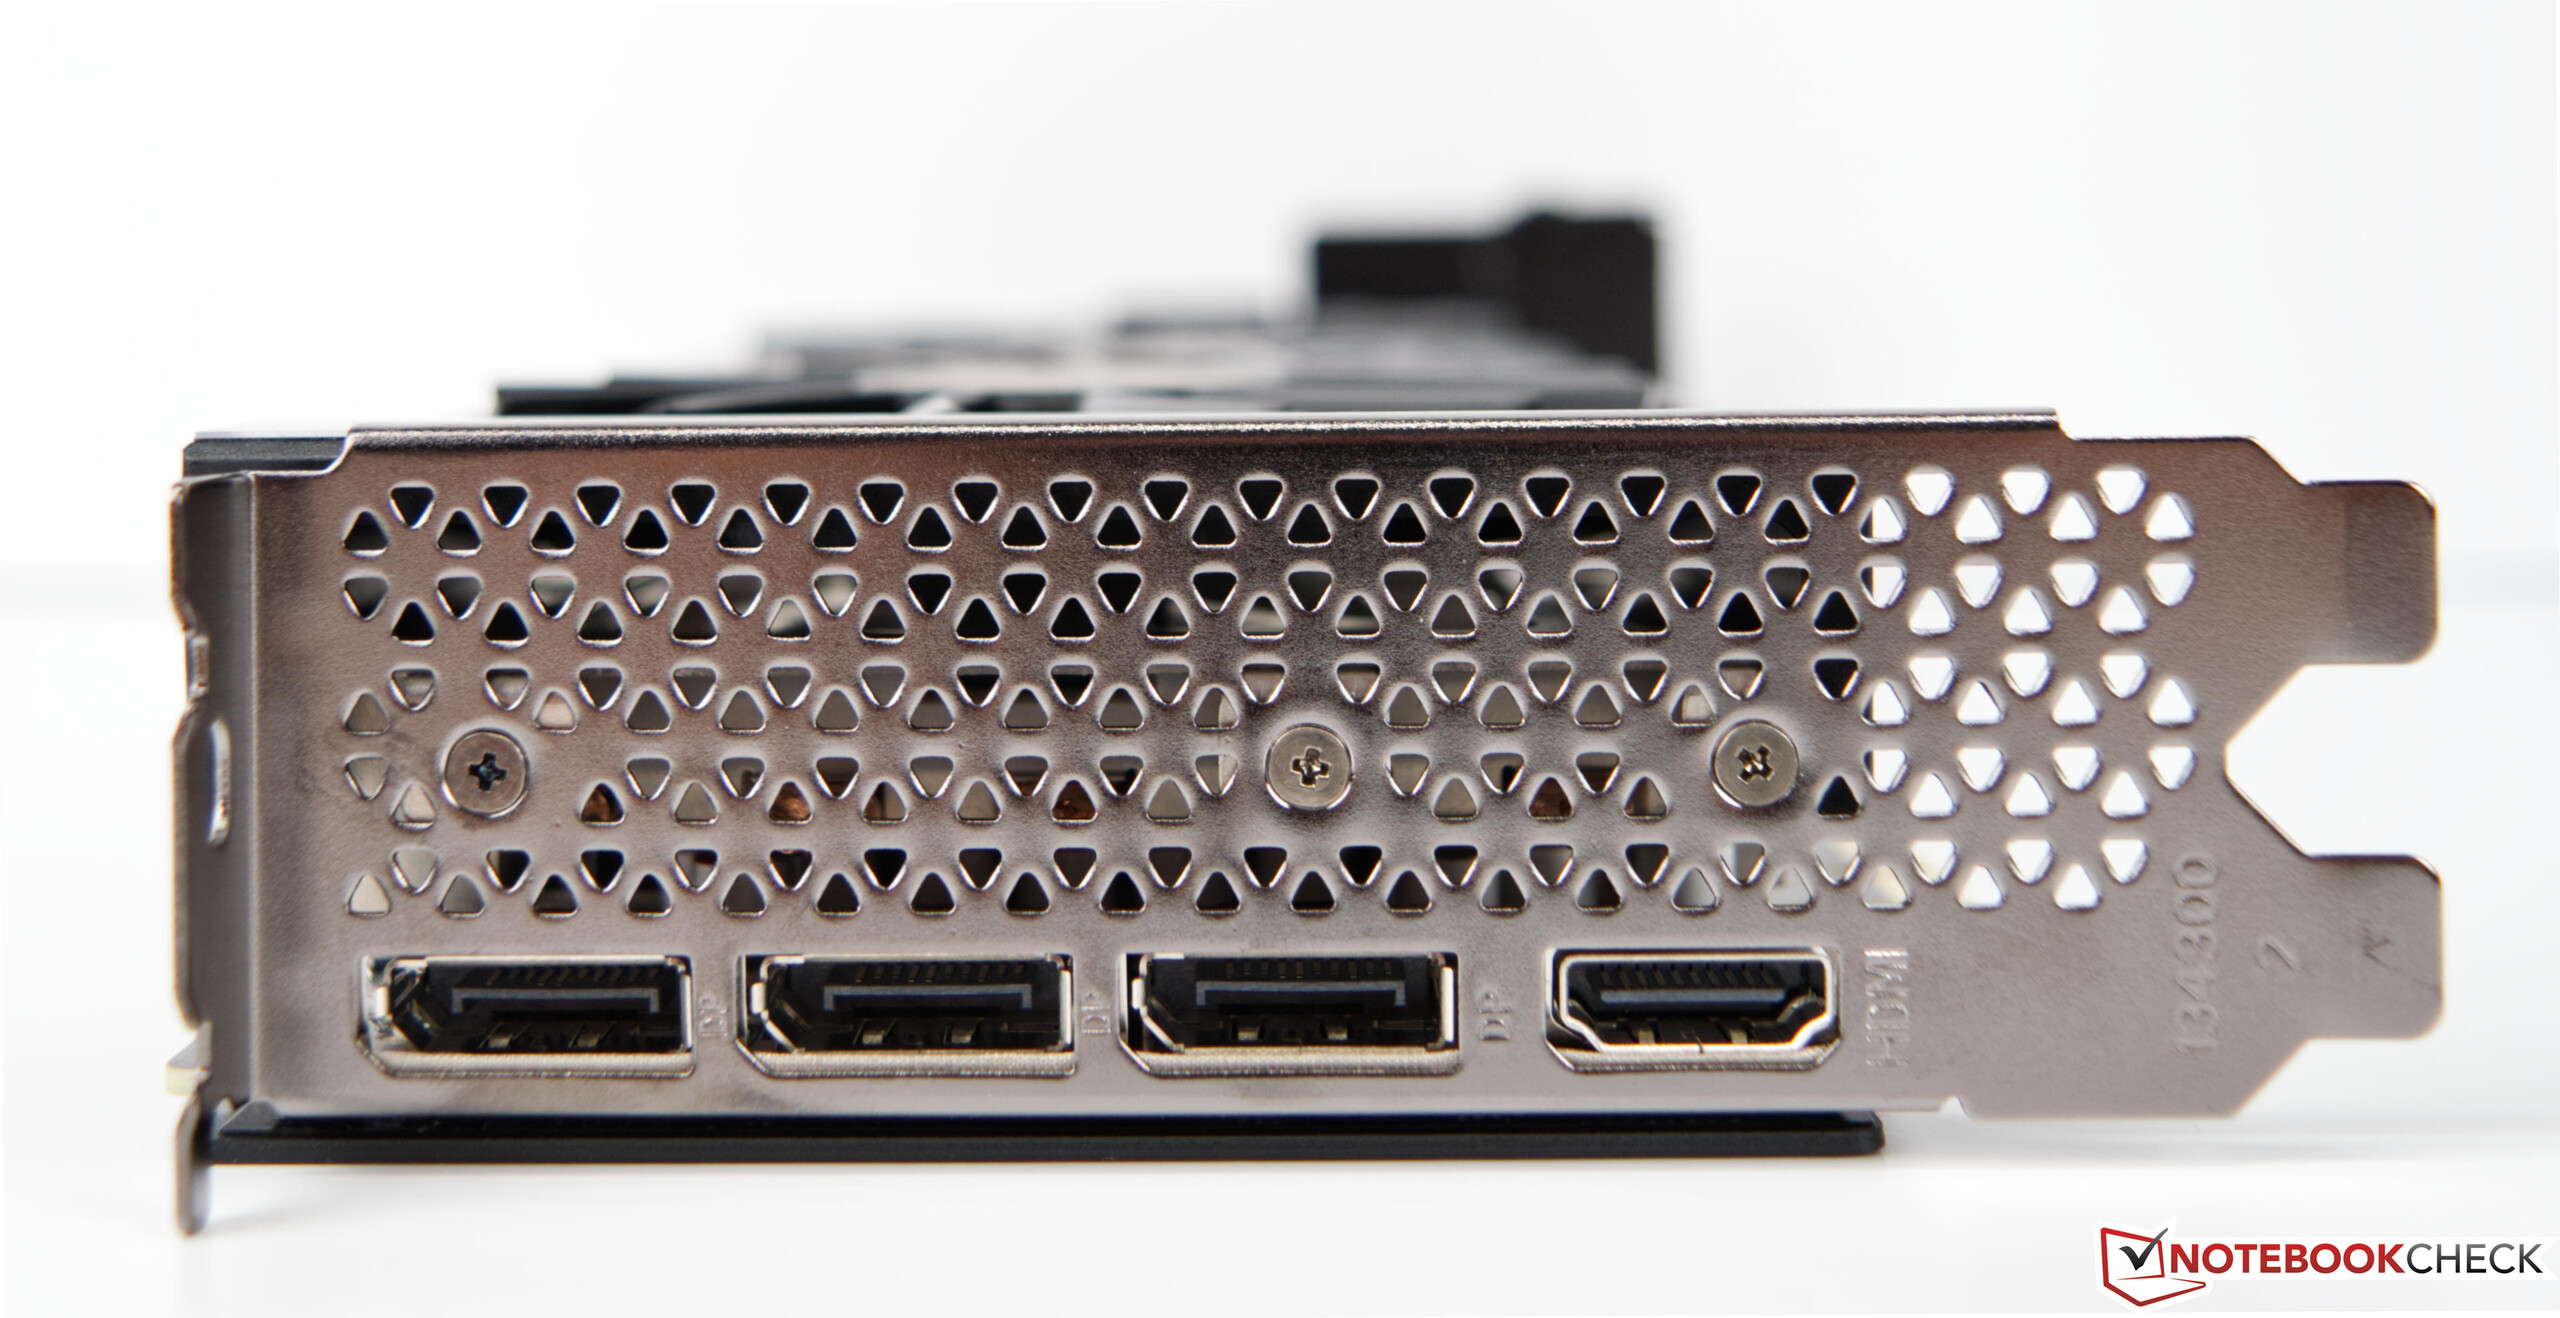
在接口选择方面没有太多可批评的地方。总共有8个USB端口,分为7个TypeA和1个Type-C。GPU提供3x DisplayPort和HDMI作为标准。然而,只有千兆网卡作为网络接口。我们希望这里有一个更快的2.5G或5G局域网端口。你还必须做的是没有SD卡读卡器。端口的分布对于一个设备级别来说是典型的。因此,大多数接口都在背面,这并不令人惊讶。然而,由于机箱的构造,前面的USB端口有点难以到达。
沟通
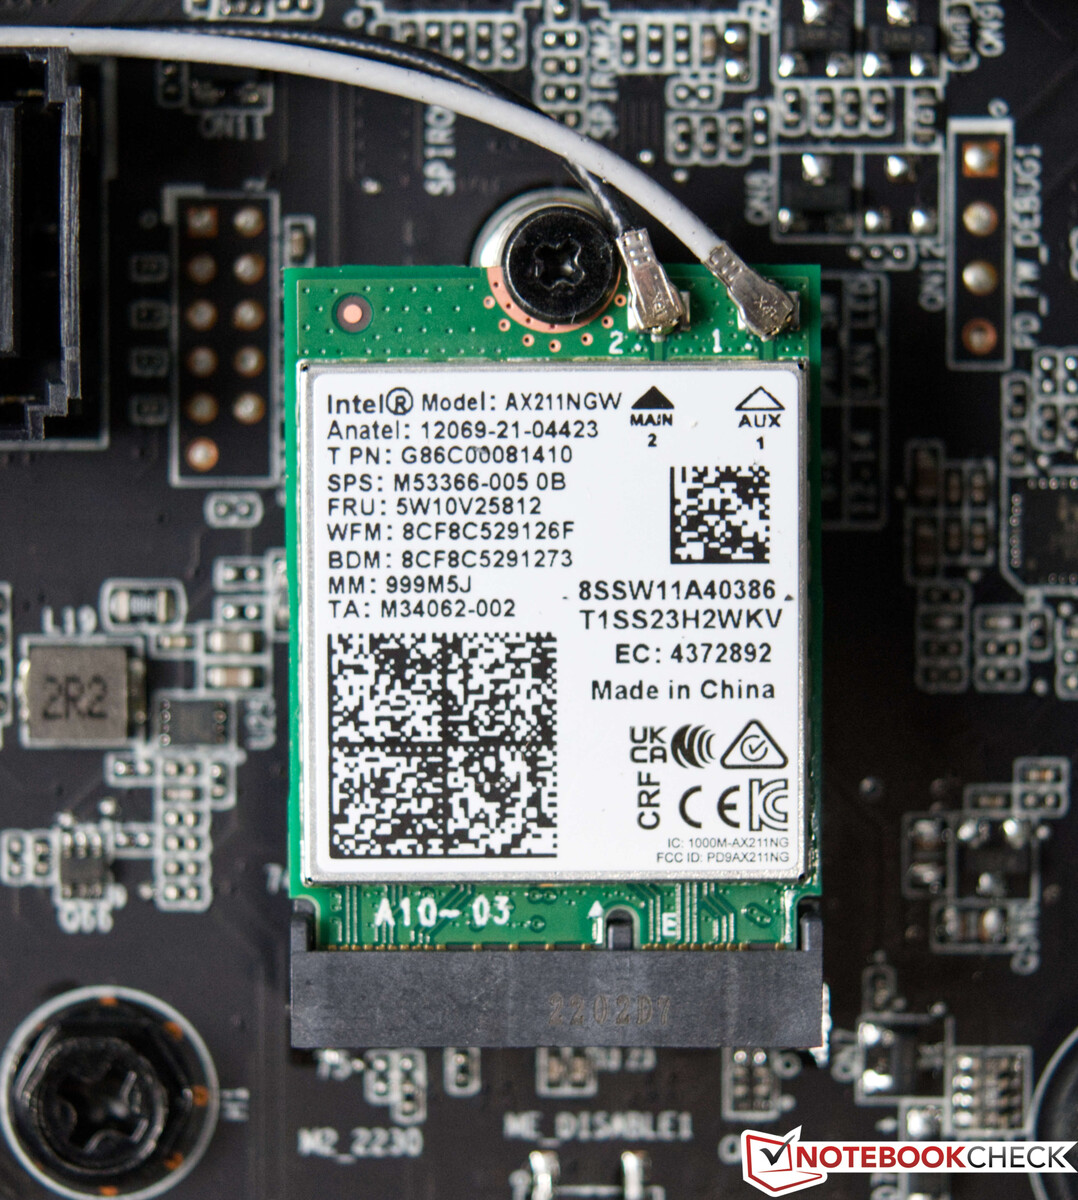
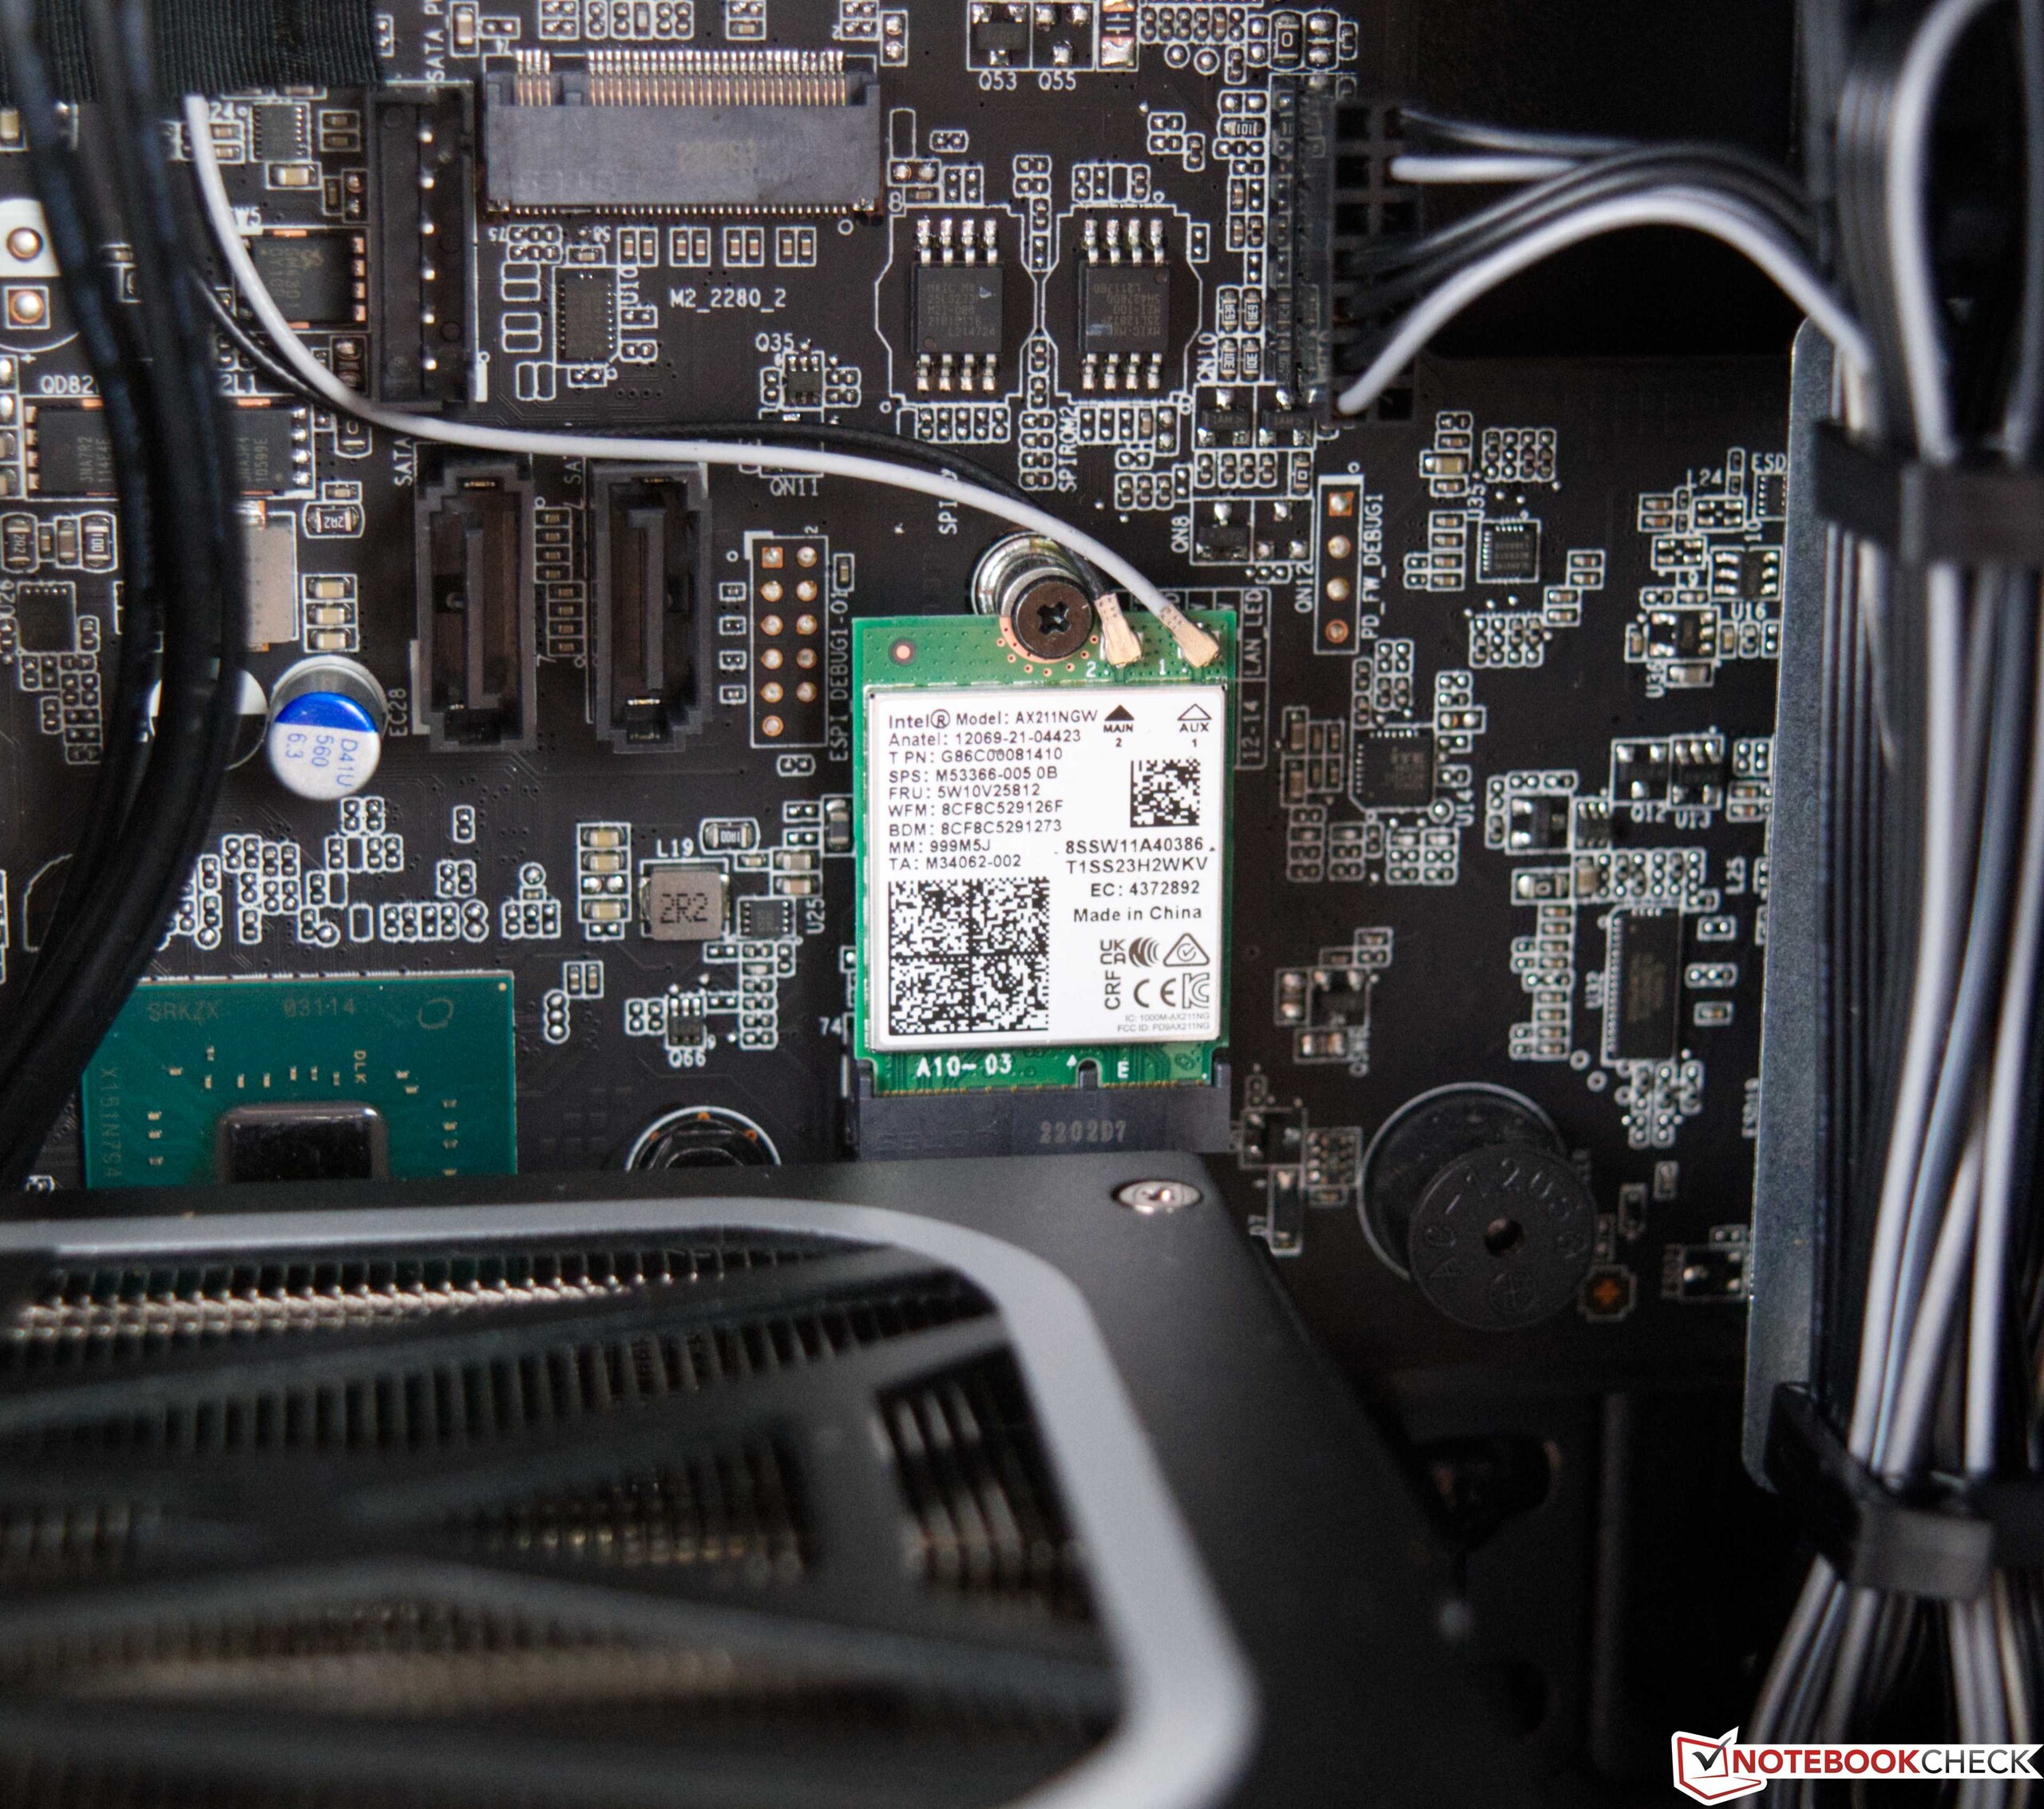
宏碁还为Predator配备了一个英特尔Wi-Fi 6E AX211模块。它作为一个M.2插卡直接位于主板上,提供相对较好的传输速率。然而,英特尔Wi-Fi 6E AX211在数据接收方面的表现无法跟上良好的传输速率。比较设备在这里部分地提供了更好的速率。然而,日常测试表明,你也可以很好地管理所安装的WLAN模块。我们在使用无线连接方面没有任何问题。作为替代方案,用户可以使用一个依靠杀手锏E2600芯片的RJ45端口。不幸的是,这只能提供最大的1GBit/s。
辅料
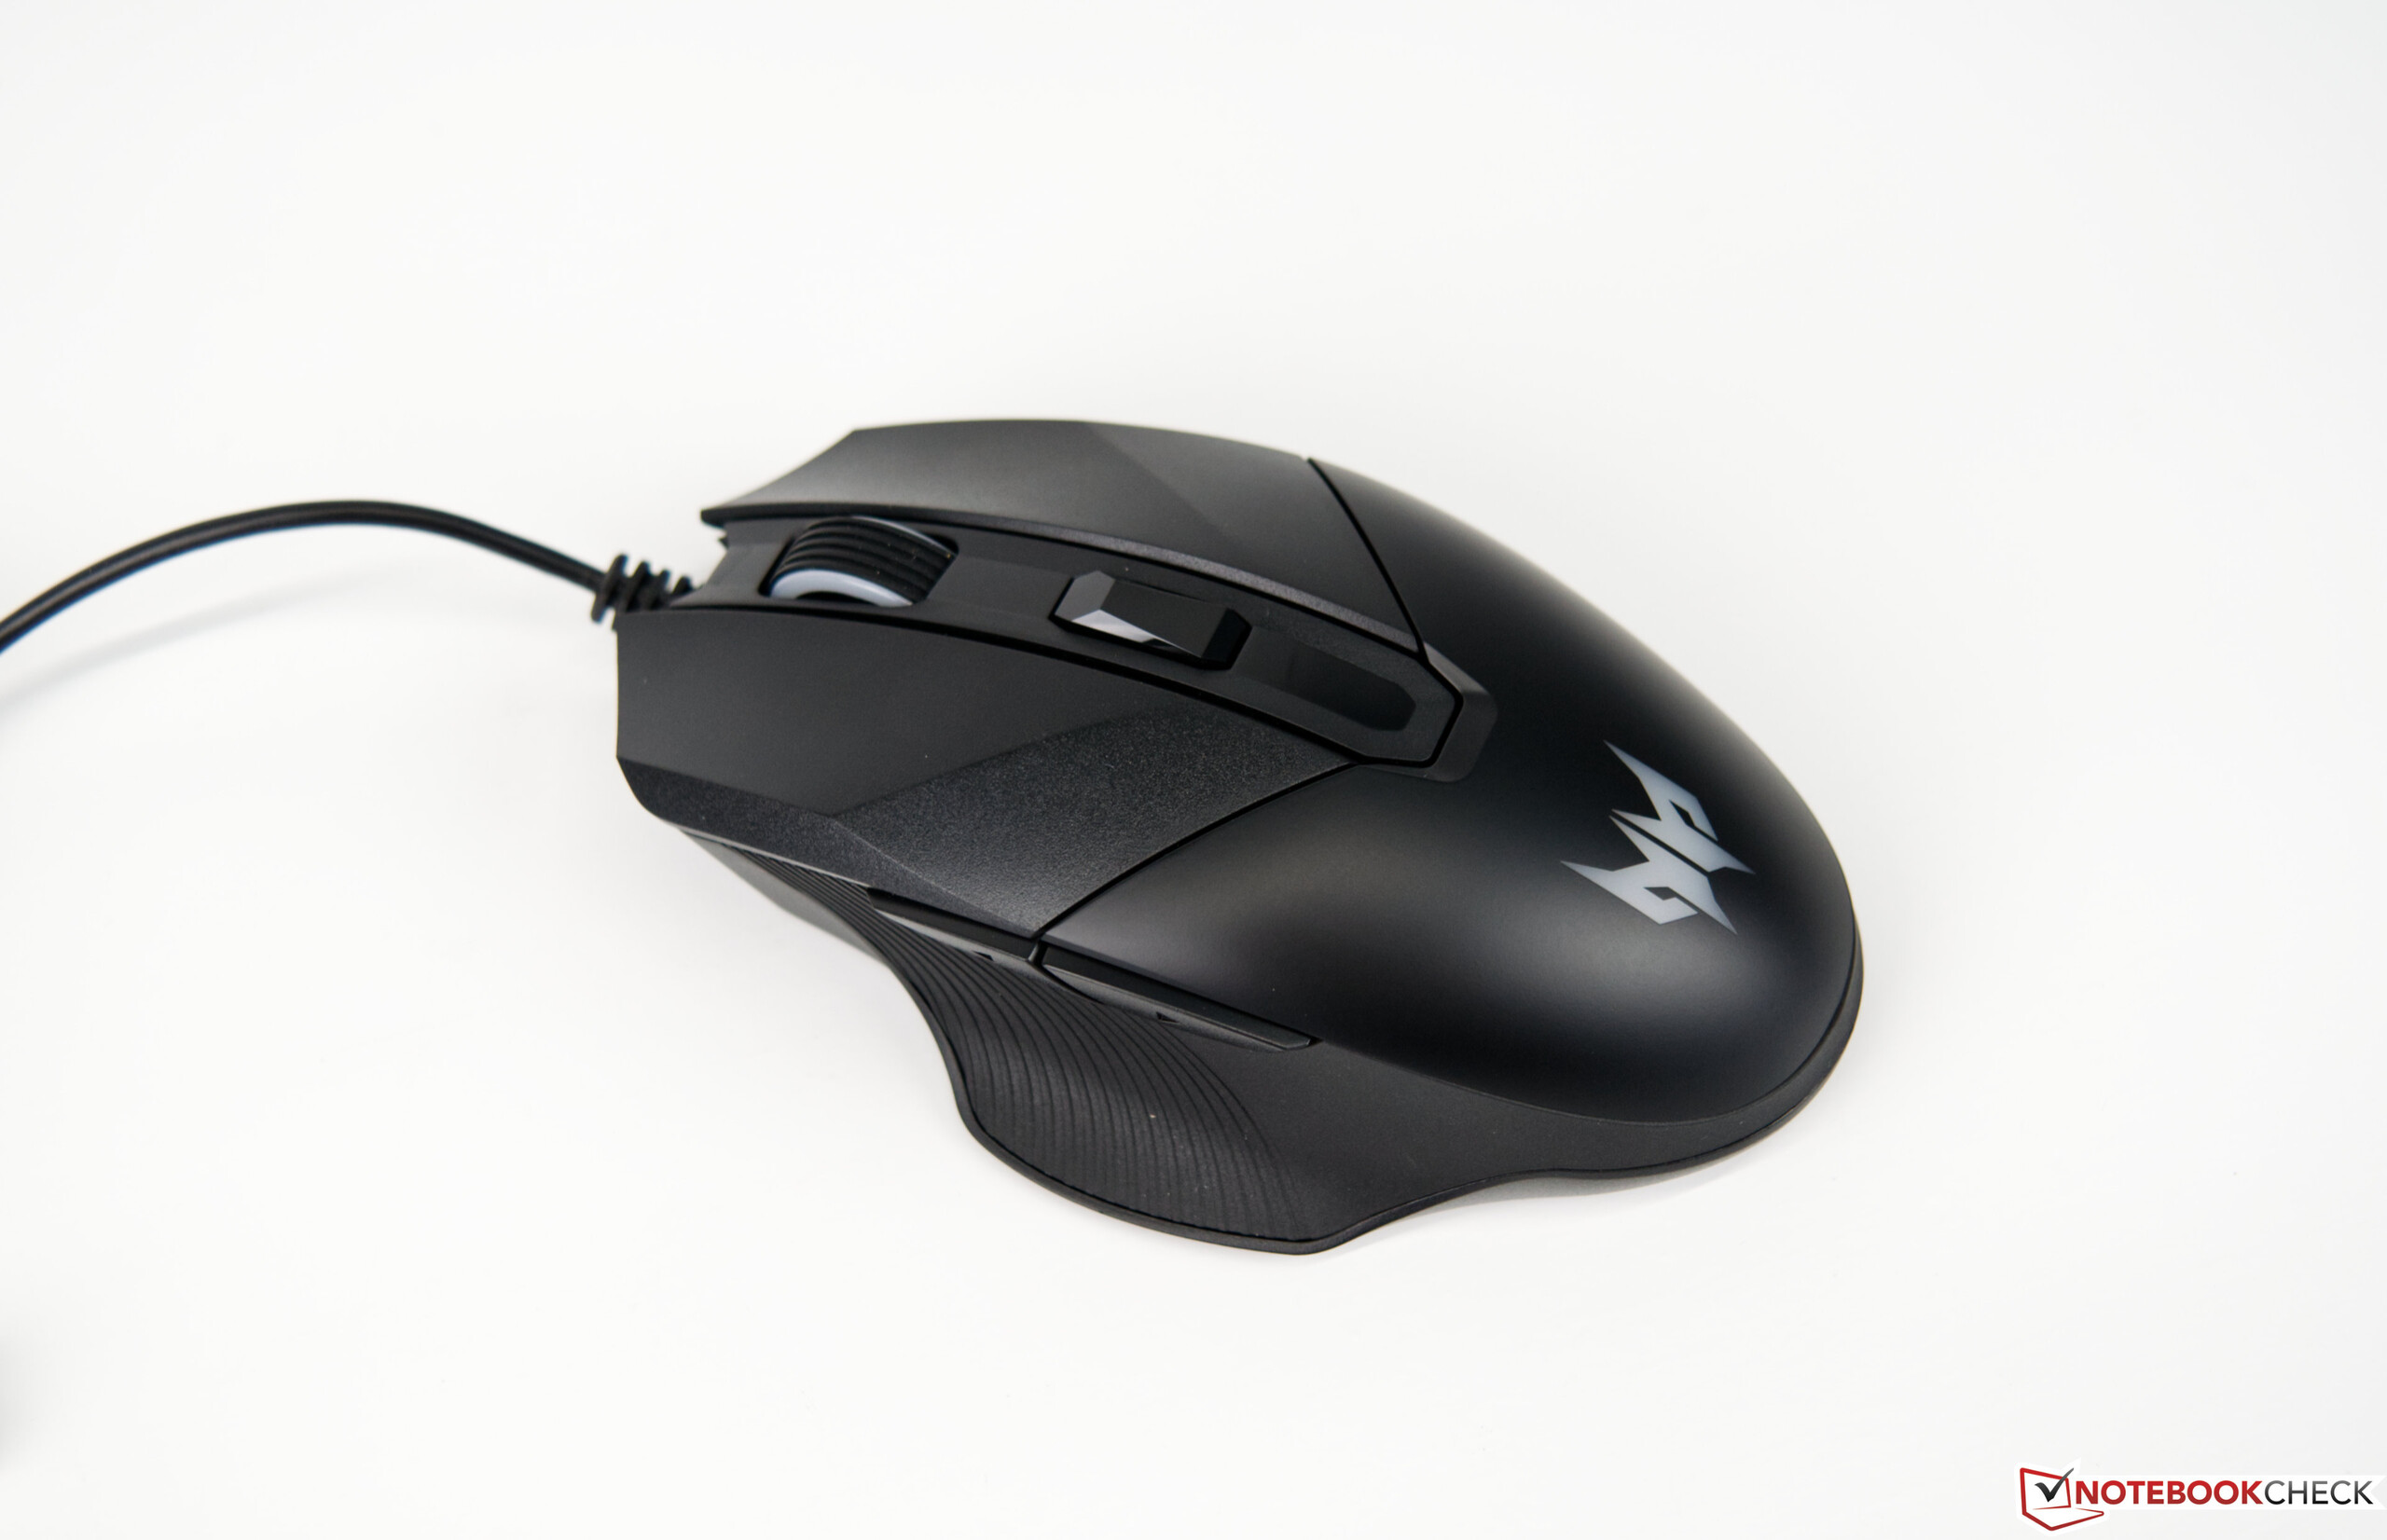
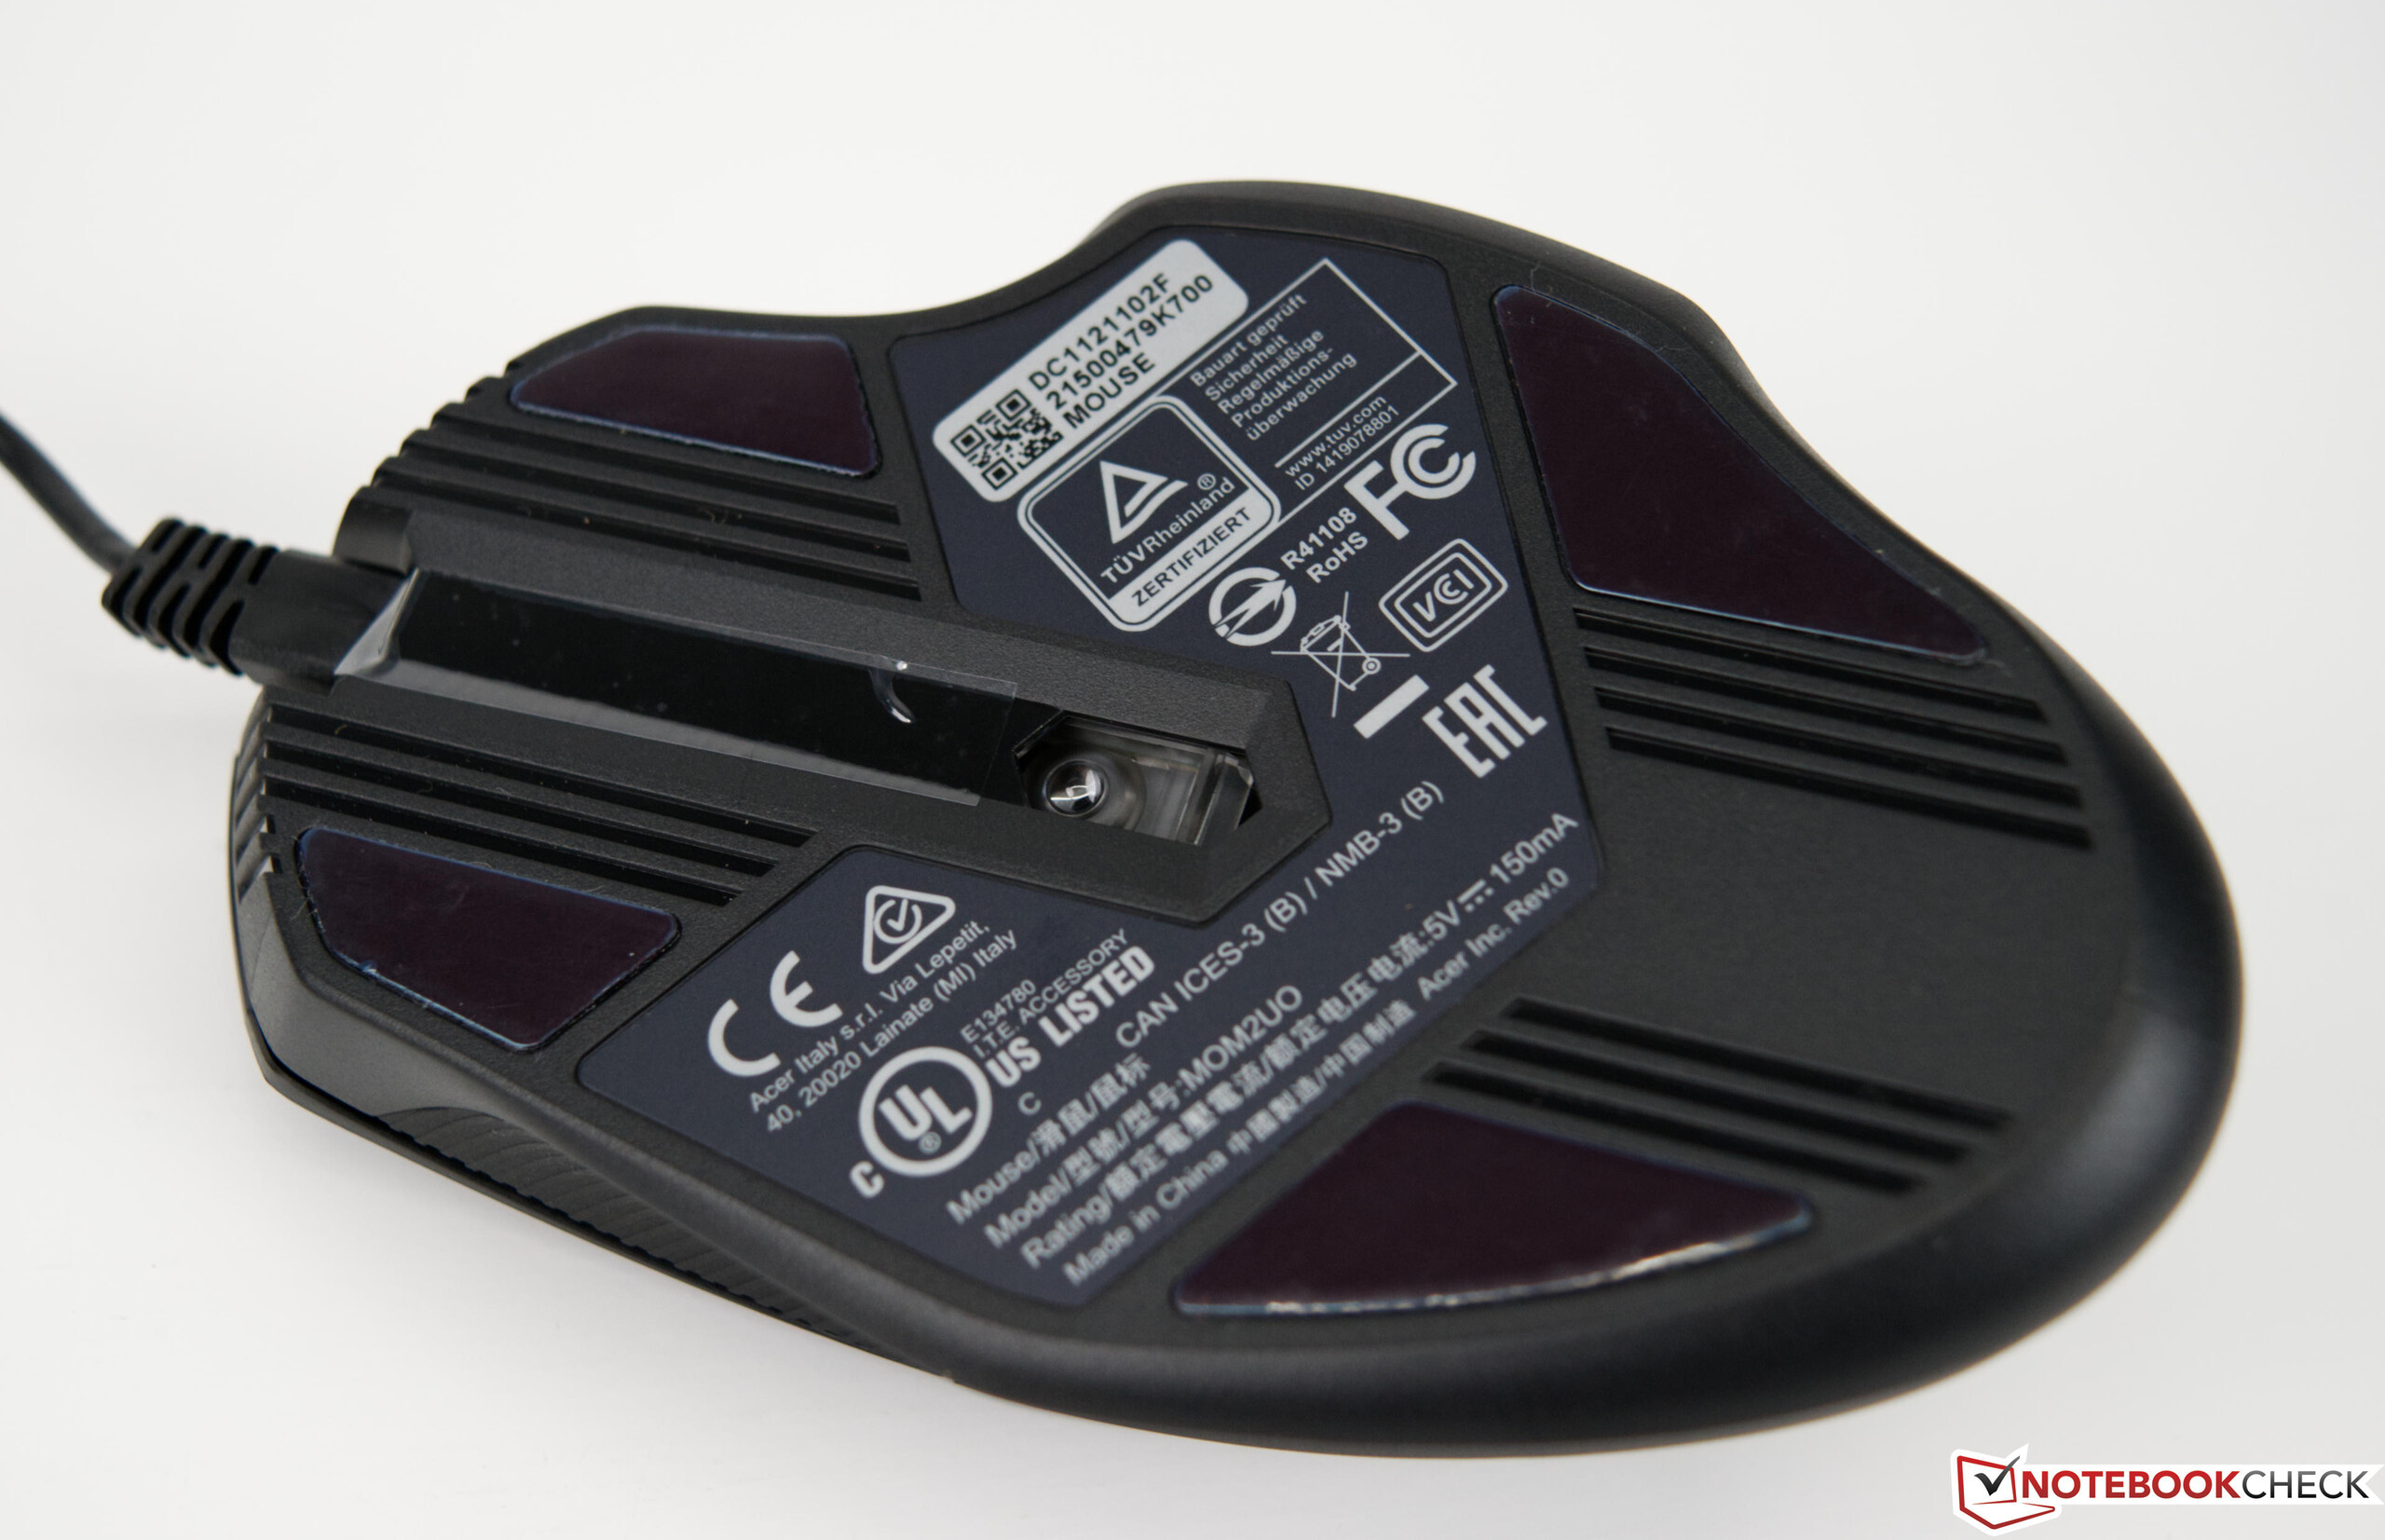
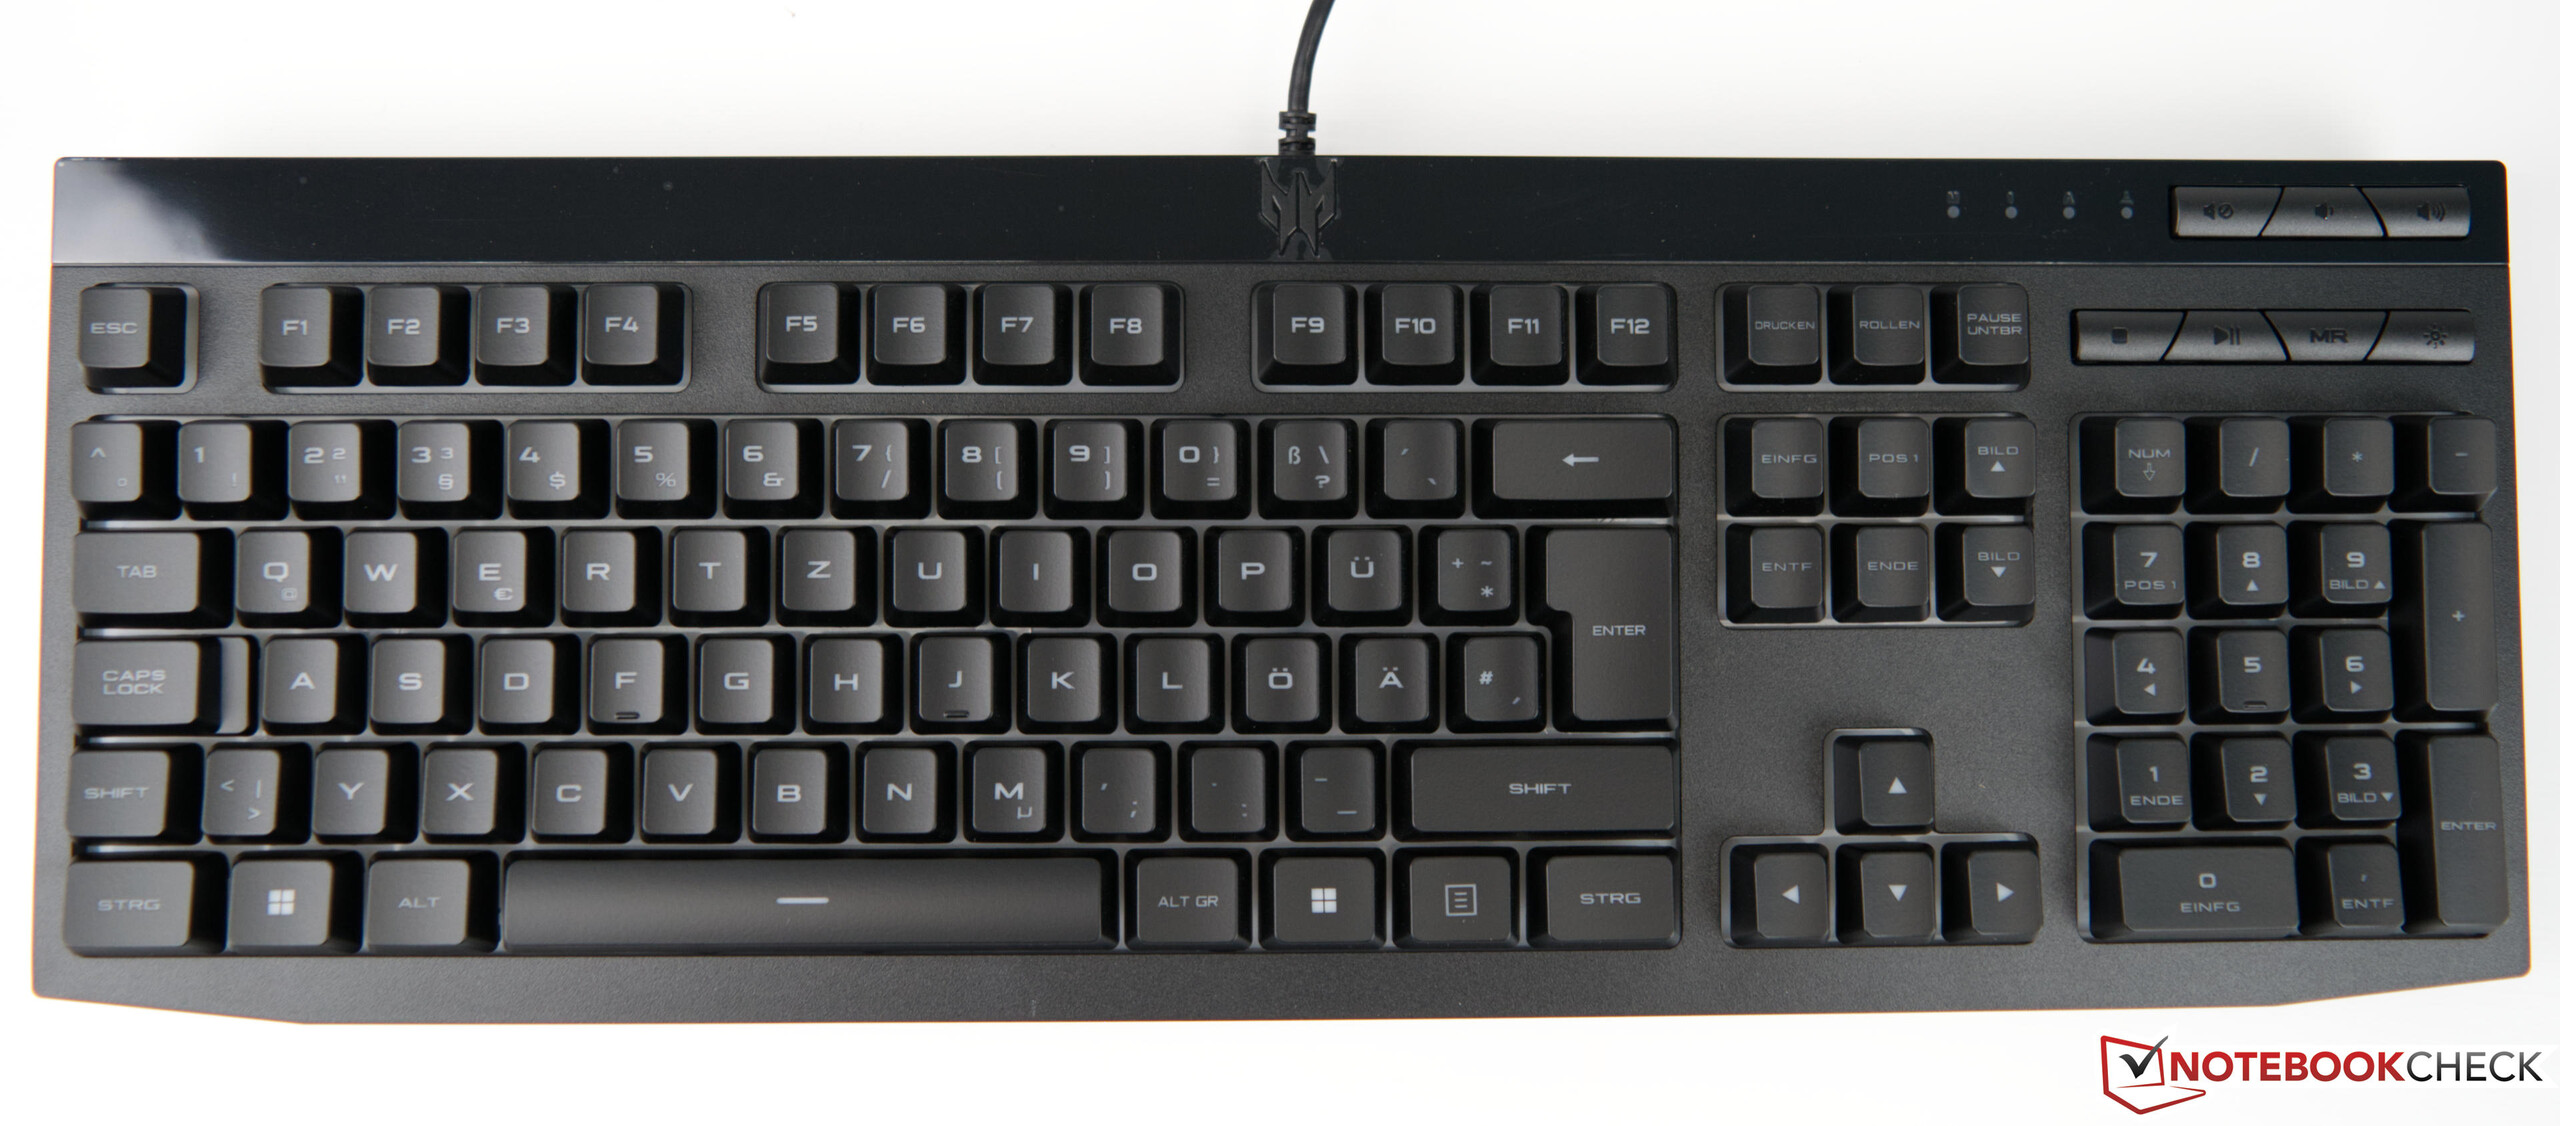
如果你购买宏碁捕食者猎户座3000,你还会得到一个光学匹配的键盘和一个游戏鼠标,它也是捕食者风格的。因此,你一开始就做好了准备,硬件提供了一个连贯的整体印象。该塔楼还可以通过可选的侧板进行升级,包括一个观察窗。这样可以更好地展示内置的RGB照明。
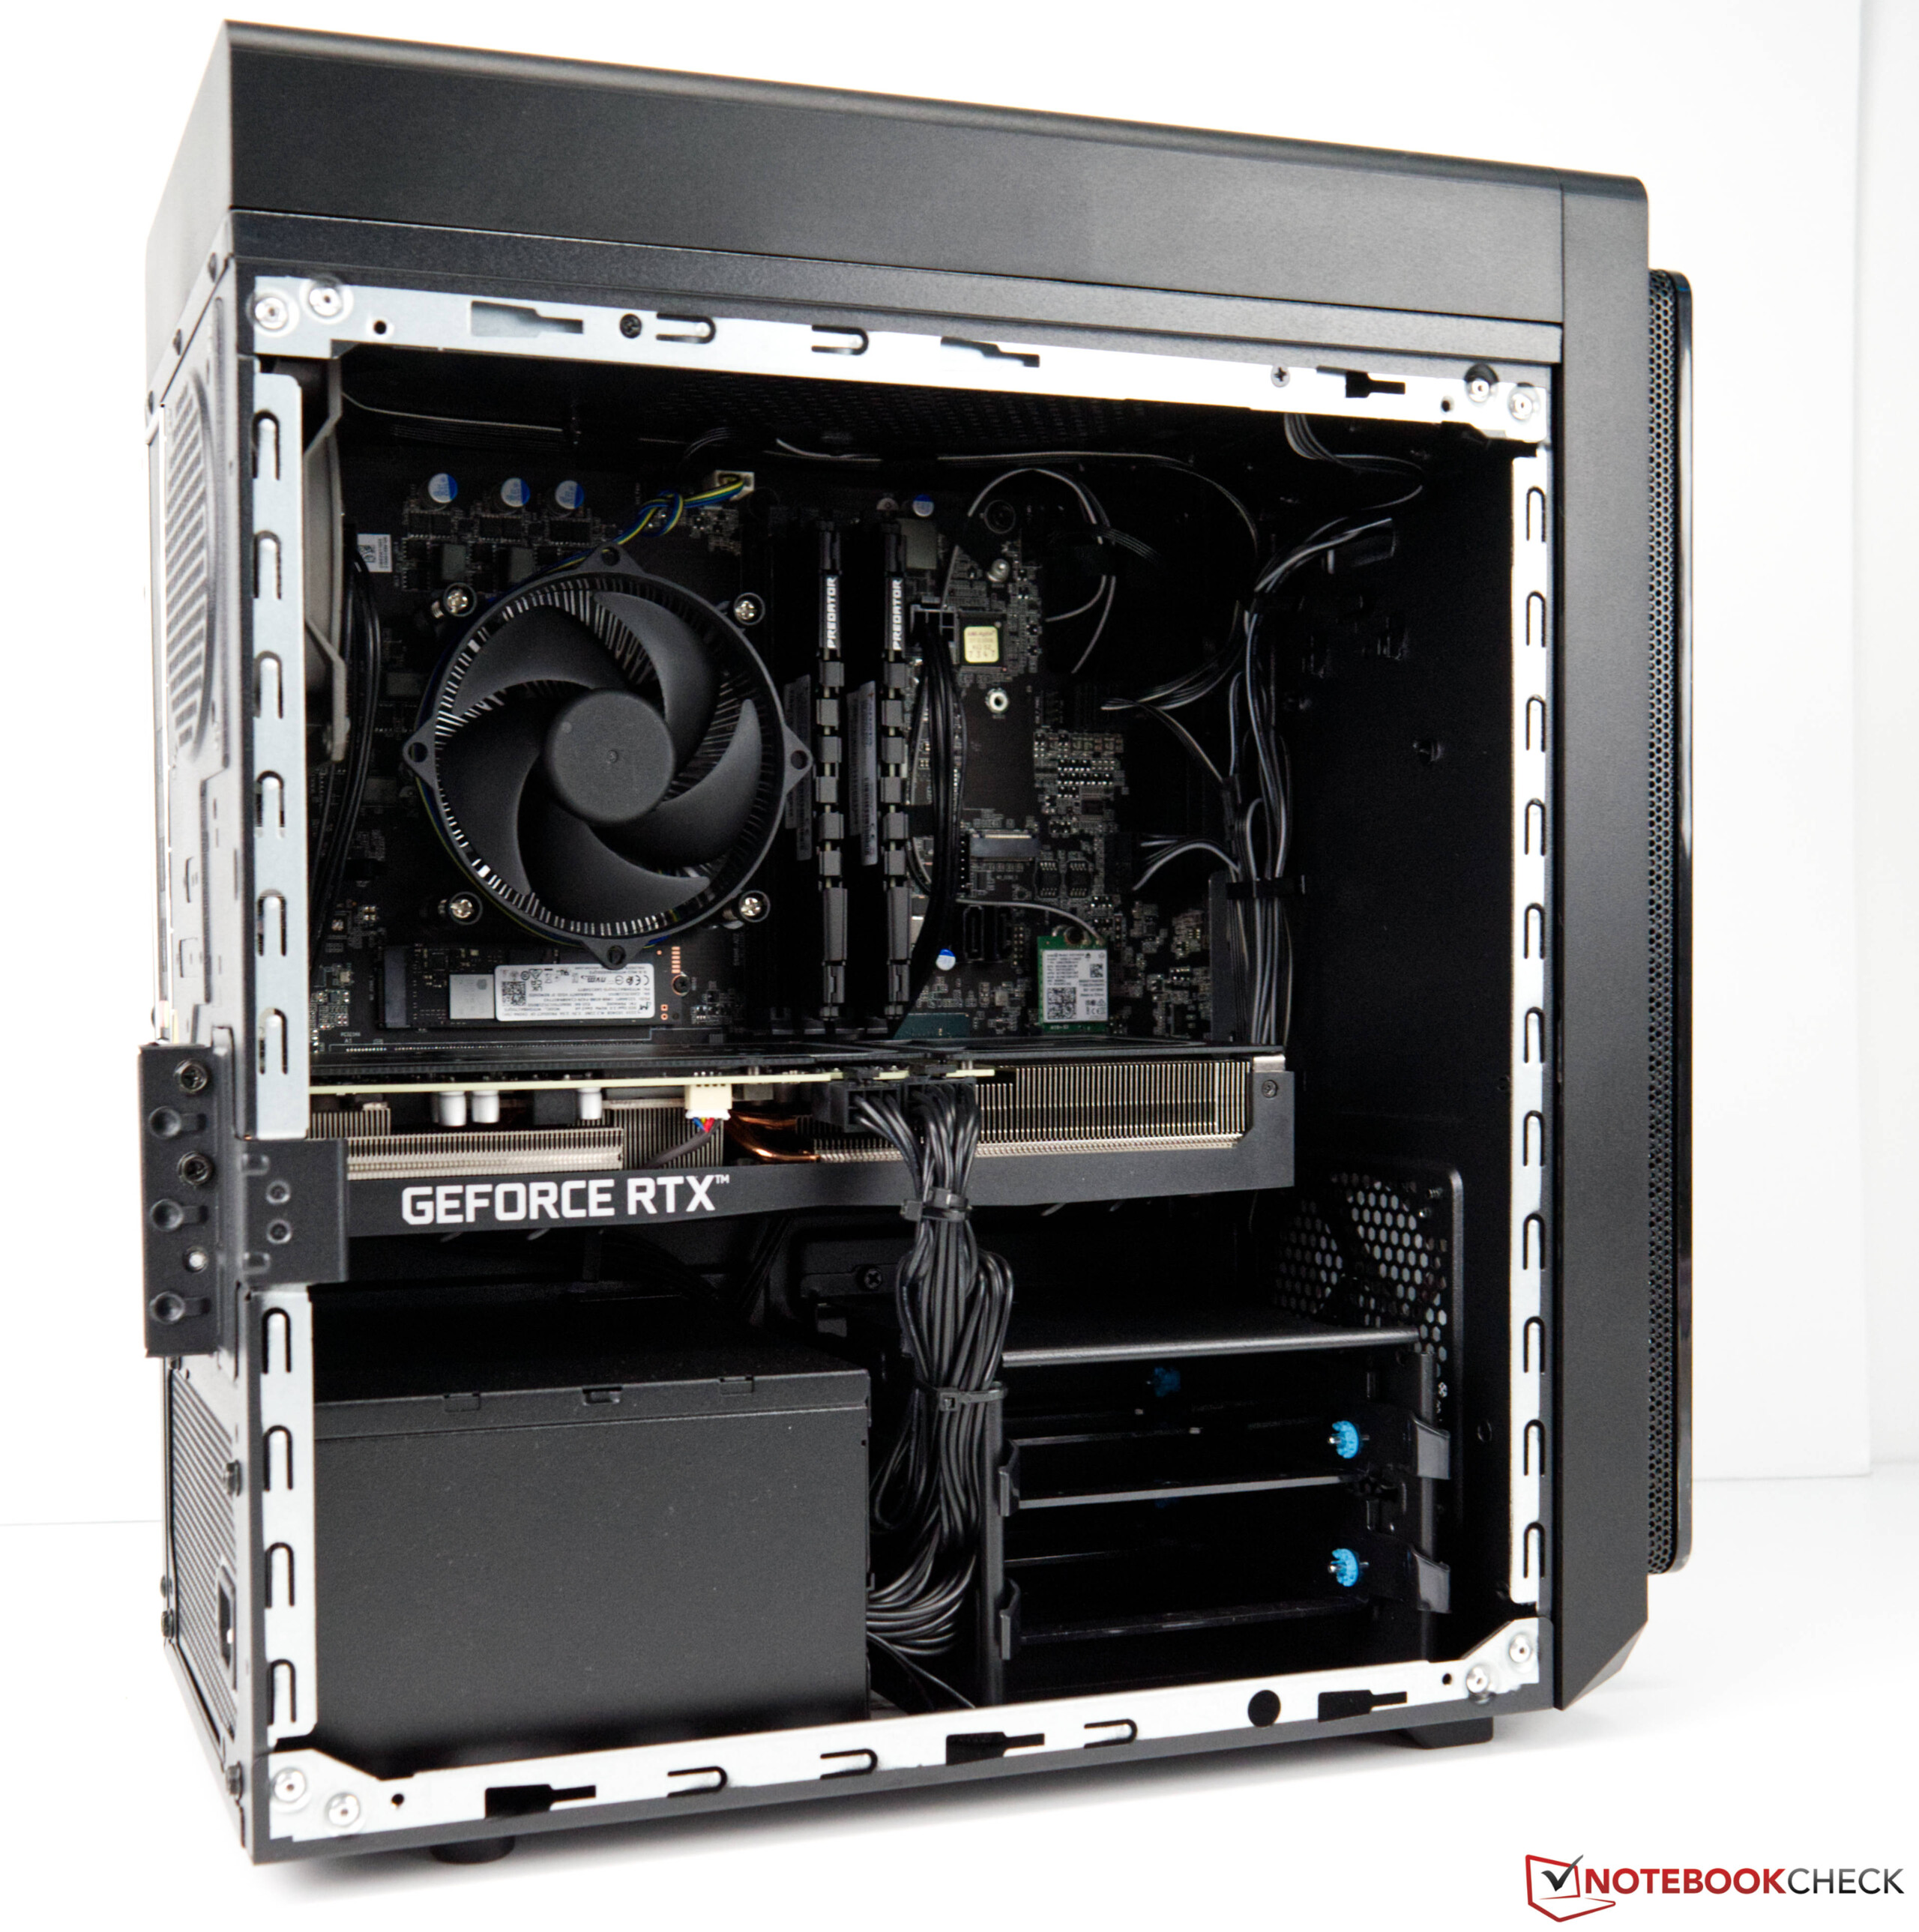
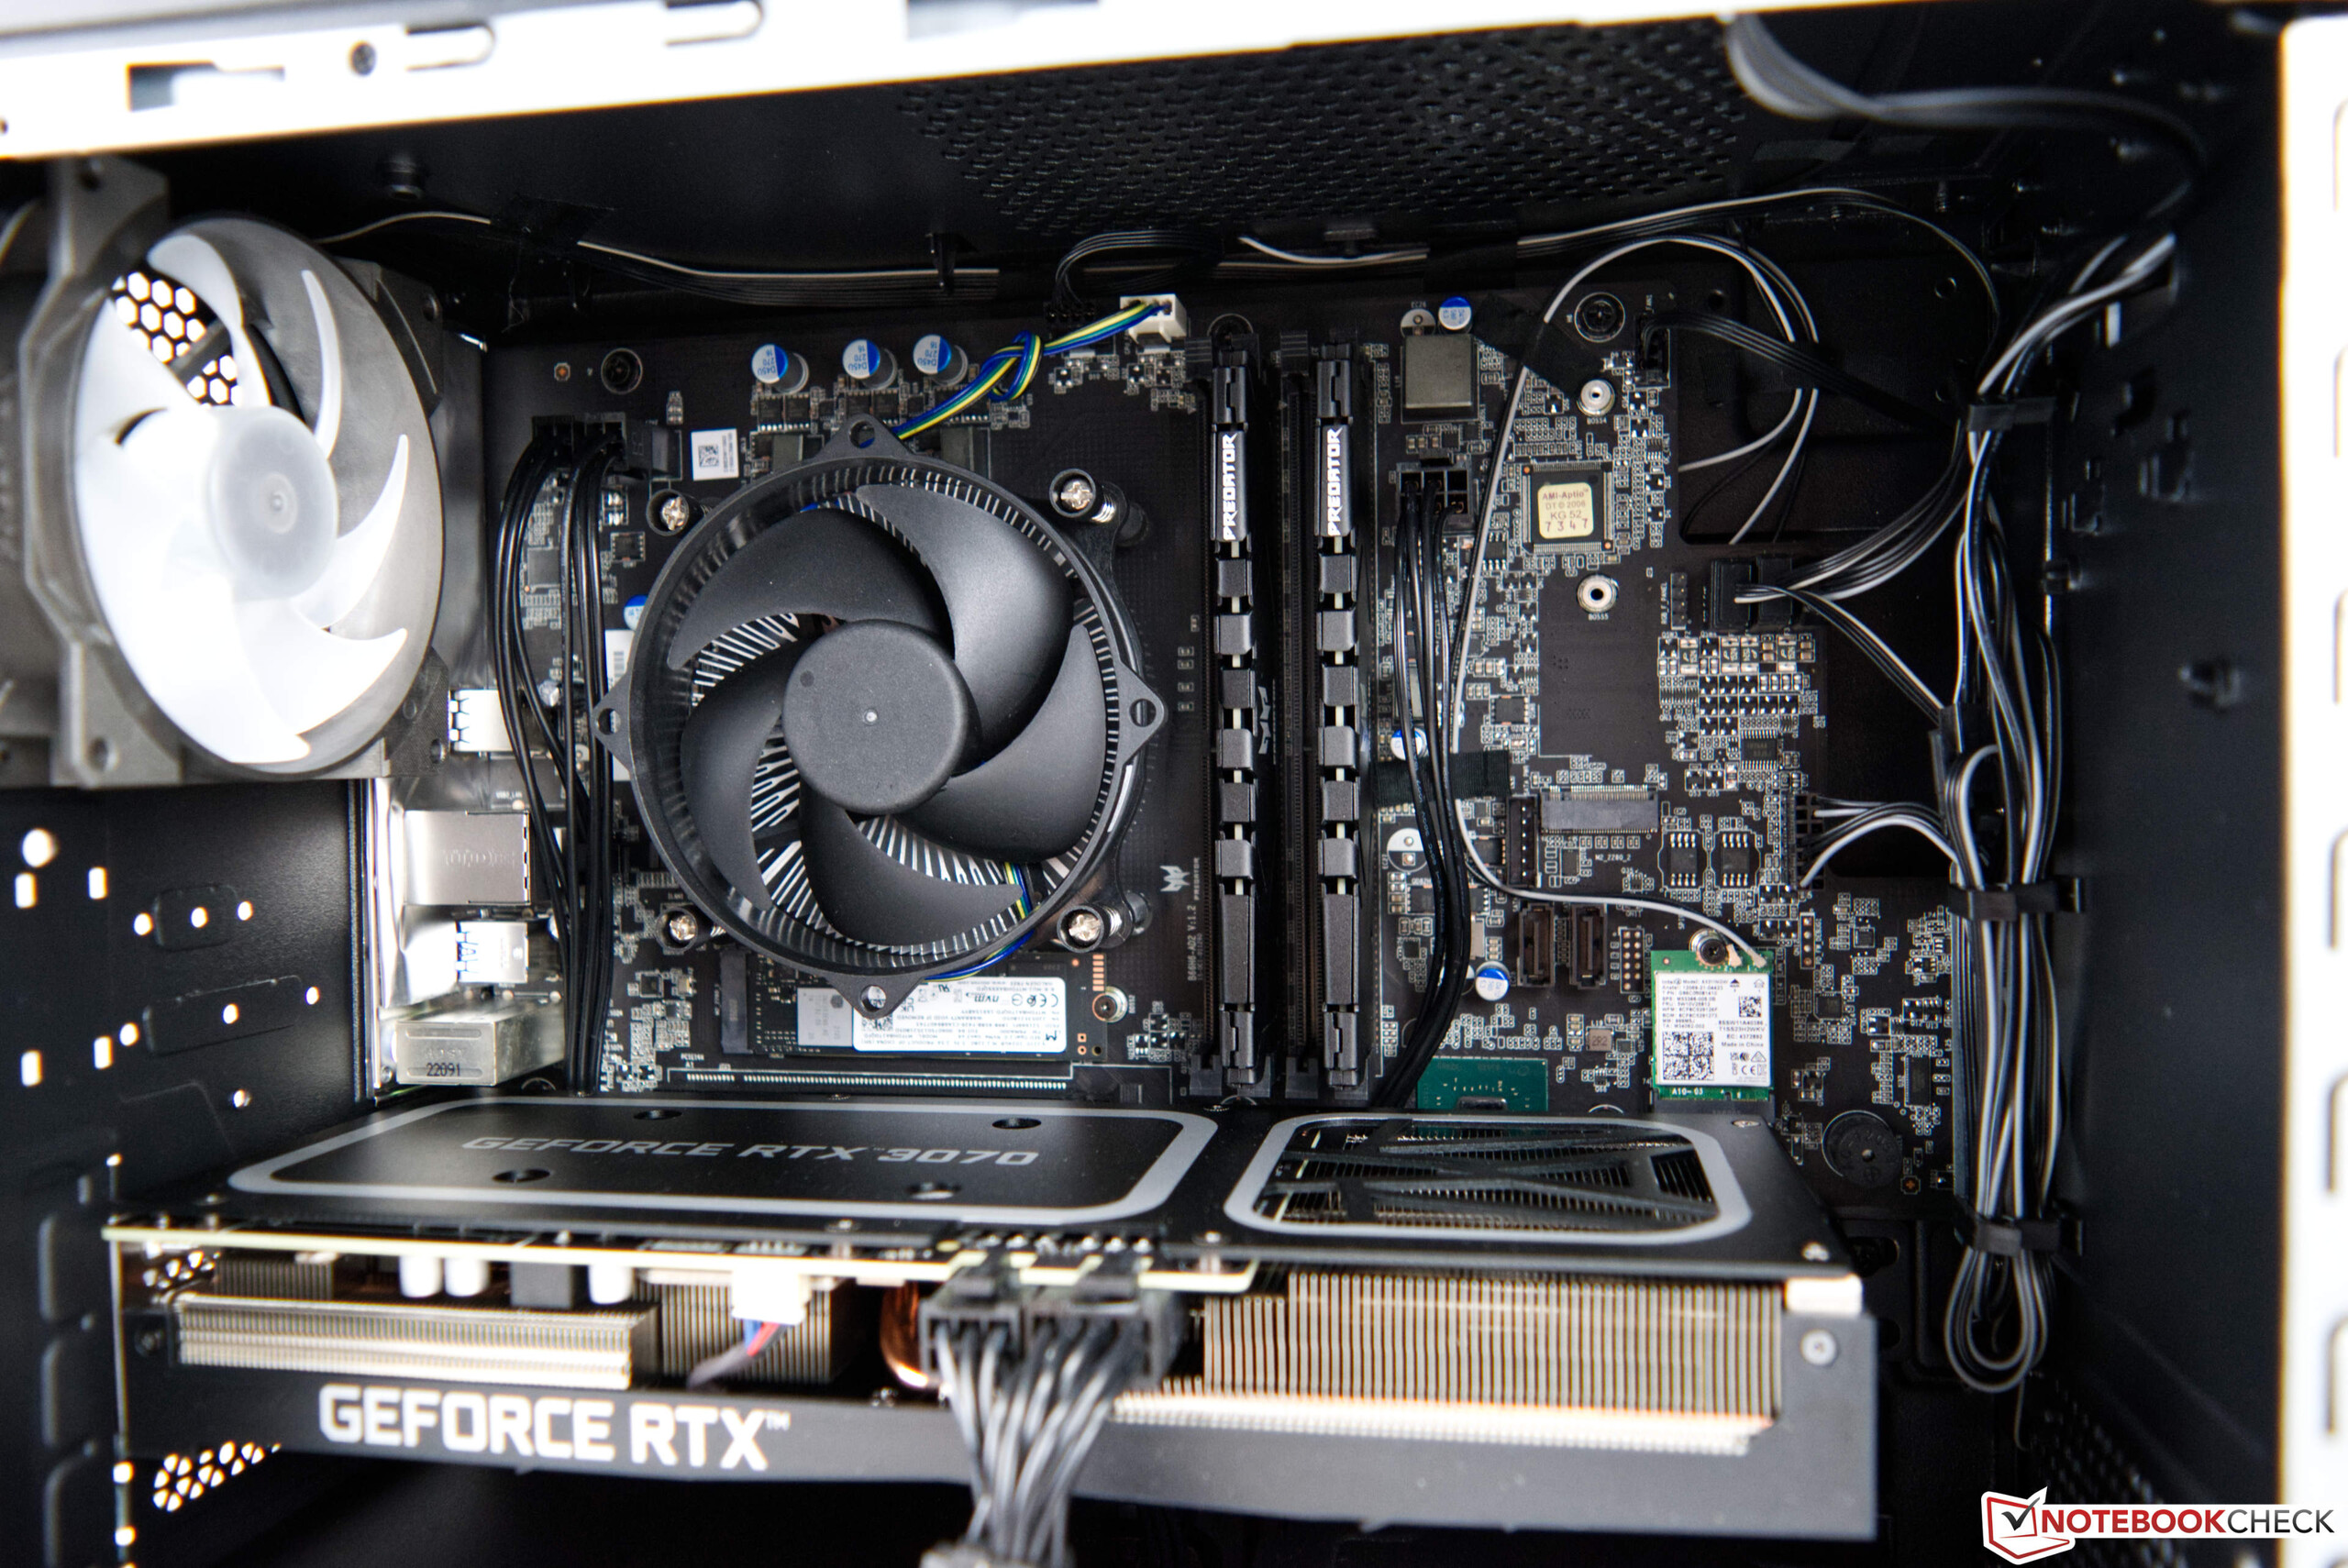
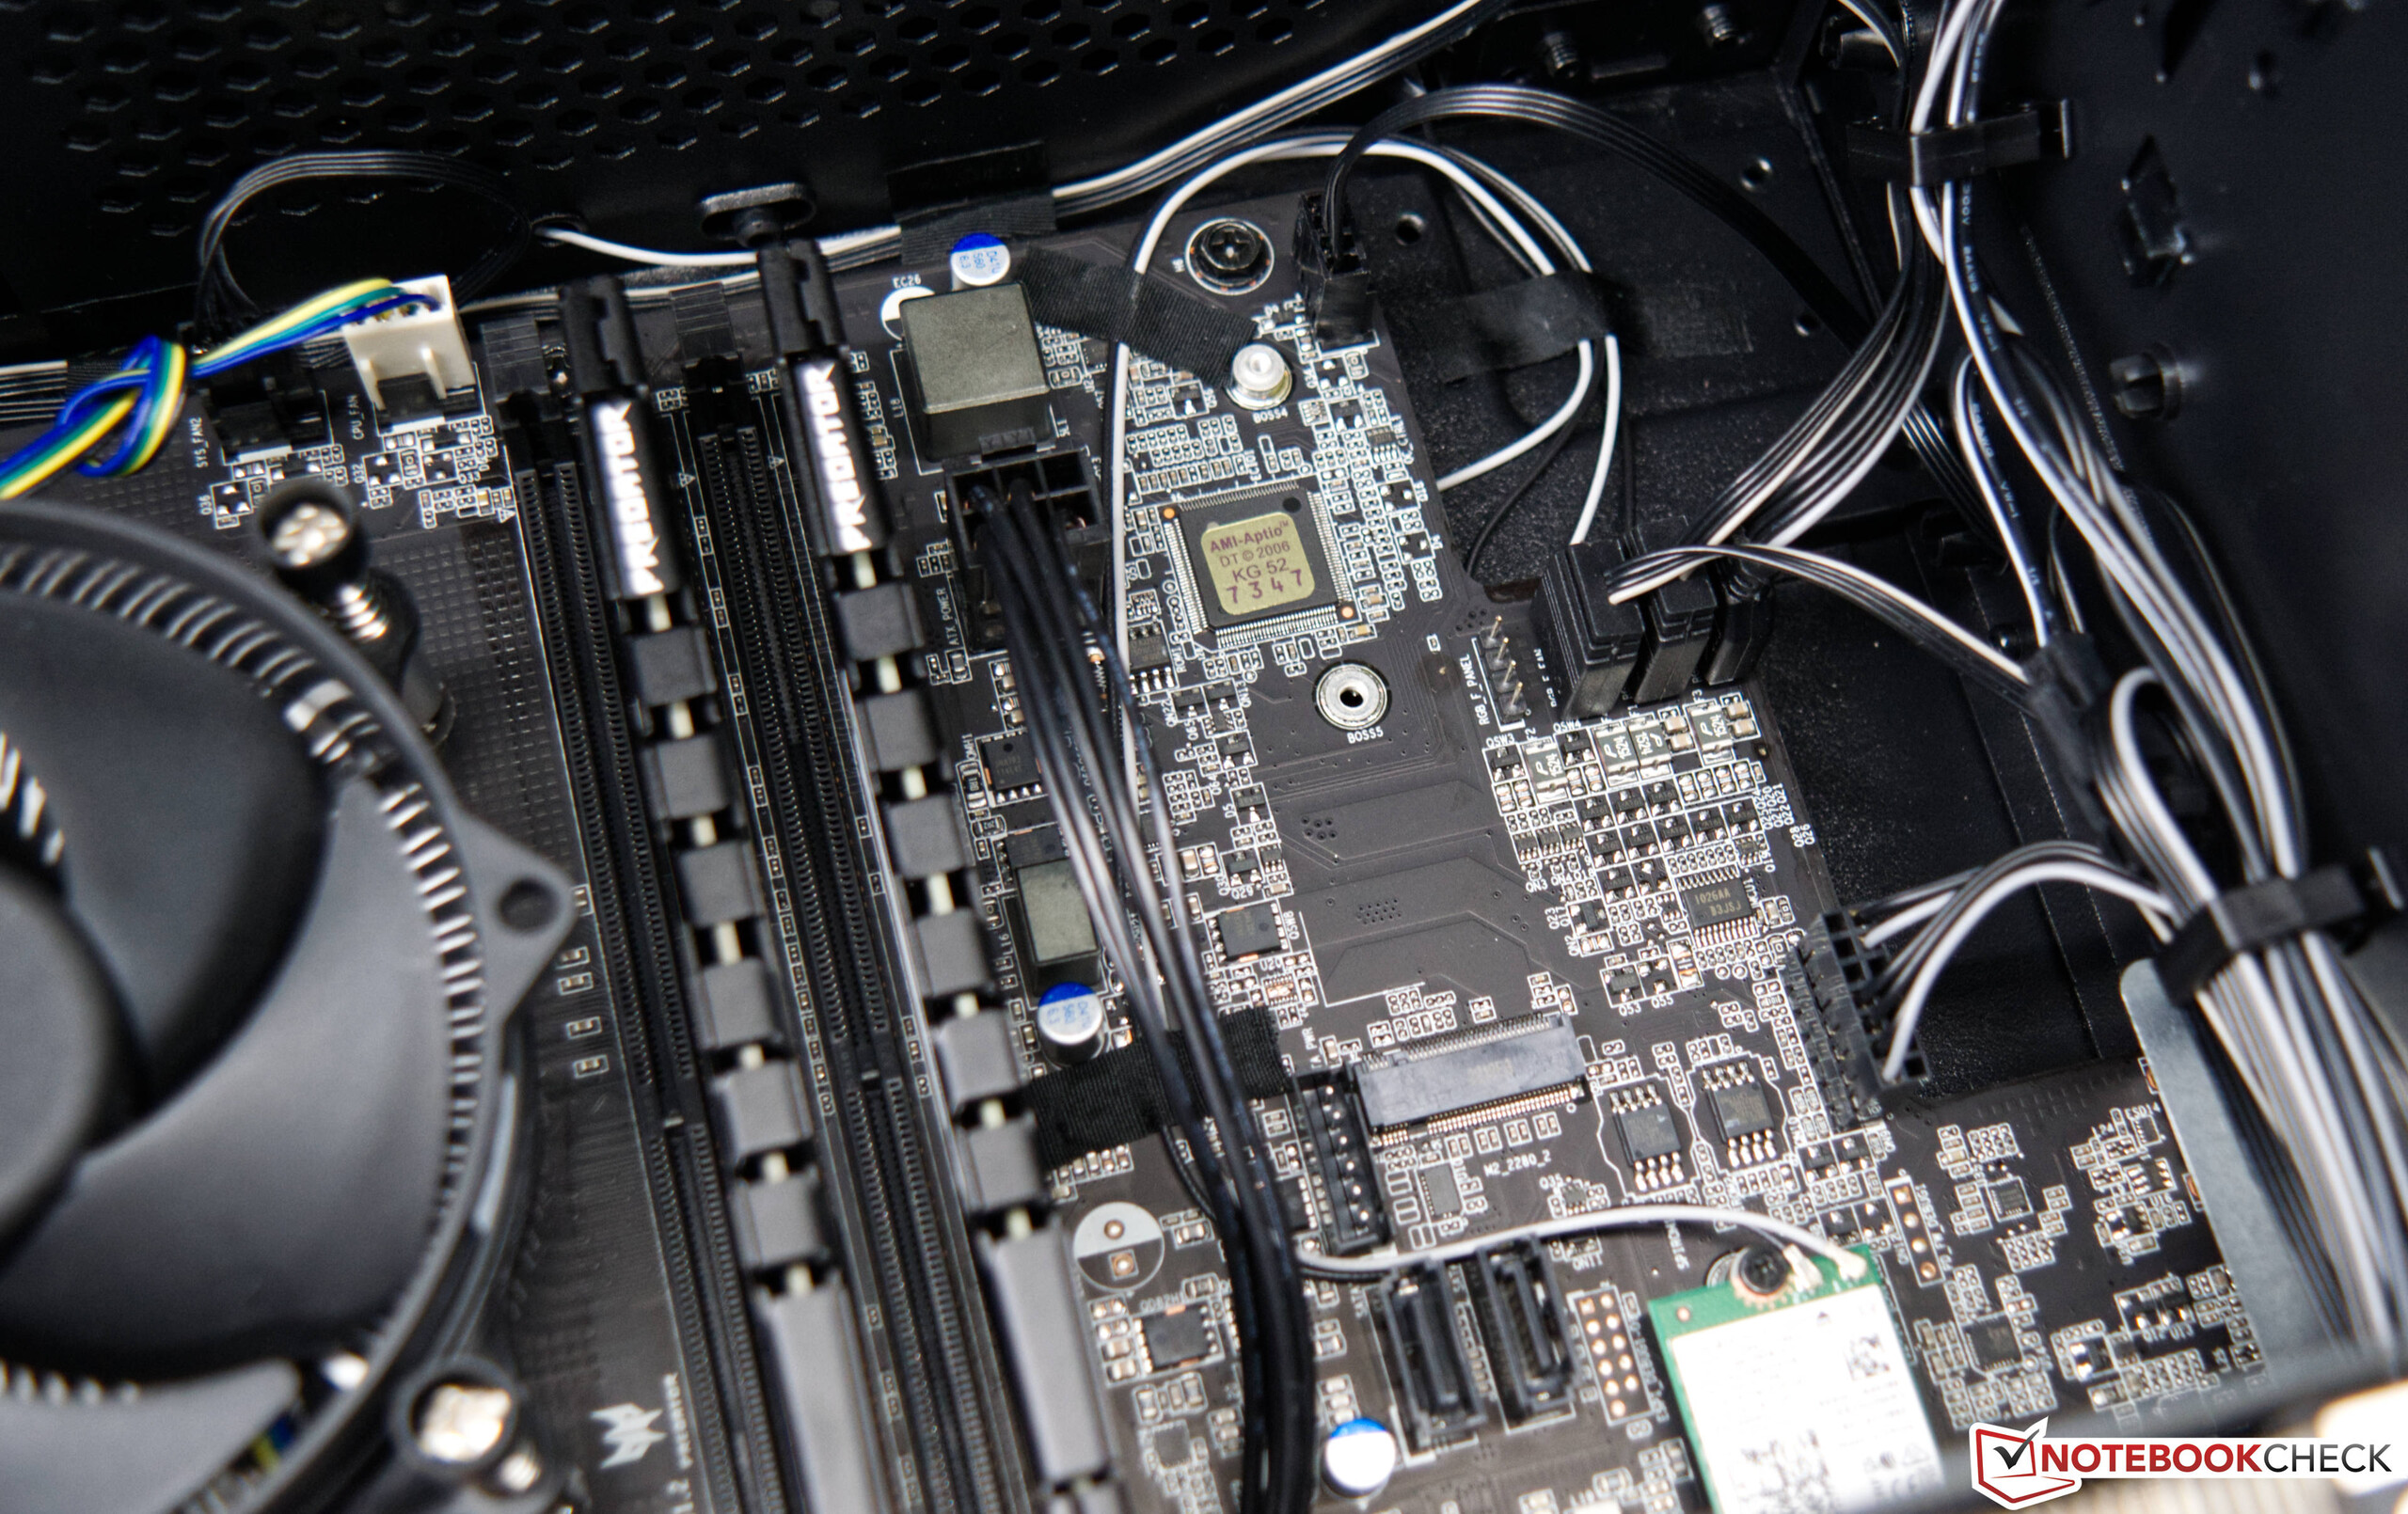
维护
对于宏碁掠夺者猎户座3000来说,维护并不是一个大问题。侧板用两颗螺丝固定,可以很容易地拆除。内部组件很容易接近。例如,可以用第二个M.2模块扩展大容量存储。另外,最多可以容纳两个传统的3.5英寸硬盘驱动器。
性能 - 刹车的酷睿i7-12700F
宏碁的捕食者猎户座3000的当前版本总是配备了一个节俭的65瓦CPU。因此,最强的模型配备了 英特尔酷睿i7-12700F.这提供了非常好的性能,并且由于具有E-核和P-核的混合架构,总是能够为各自的应用程序提供最佳速度。在更便宜的配置中,你也可以得到配备英特尔酷睿i5-12400的Predator Orion 3000。这也提供了一个良好的游戏性能,但必须做的是没有E-cores。作为一个图形卡,你至少可以得到一个 GeForce RTX 3060这是为1080p游戏设计的。更多性能可通过 GeForce RTX 3070还可以进行1440p游戏。
测试条件
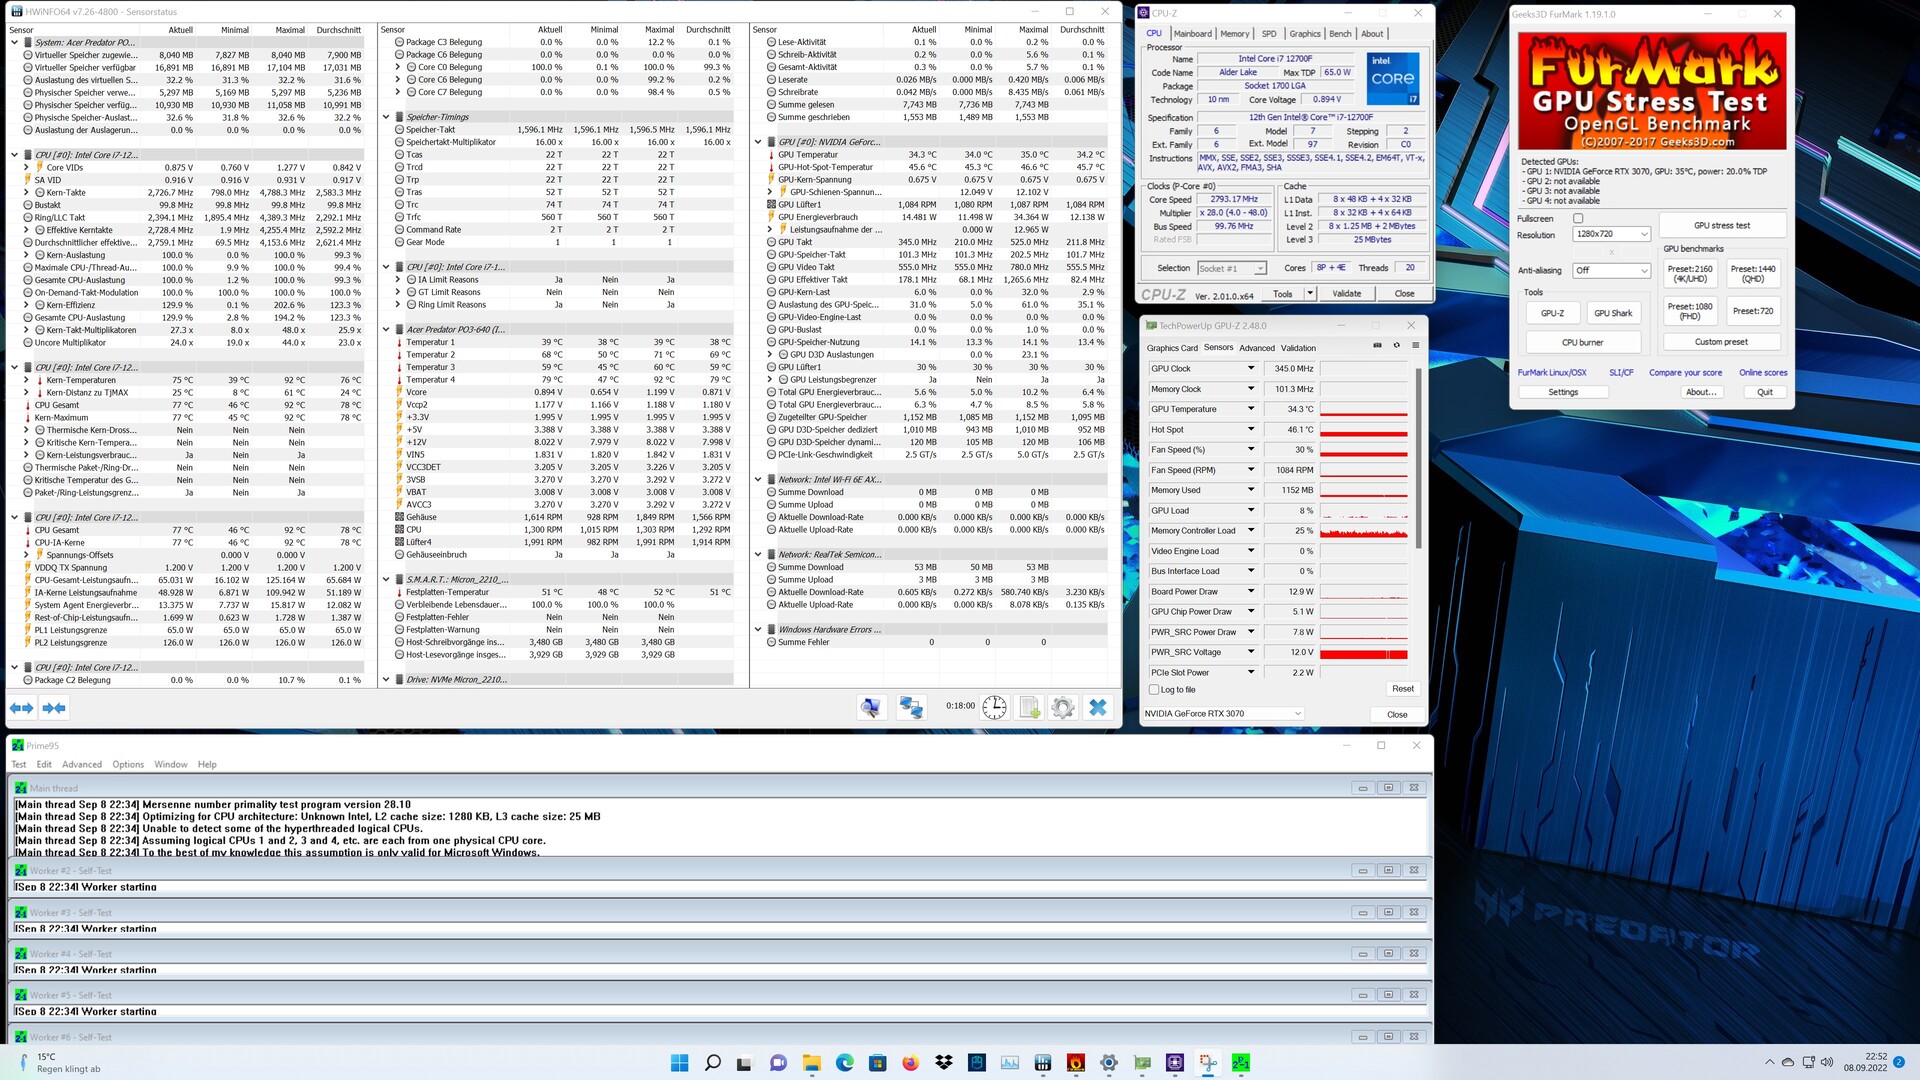
我们以能量曲线的最大性能
进行了所有测试。我们也没有使用机箱内的透明侧板。风扇速度也可以通过Predator Sense
工具进行配置。我们保持自动设置,以实现噪音和性能之间的良好折衷。
处理器
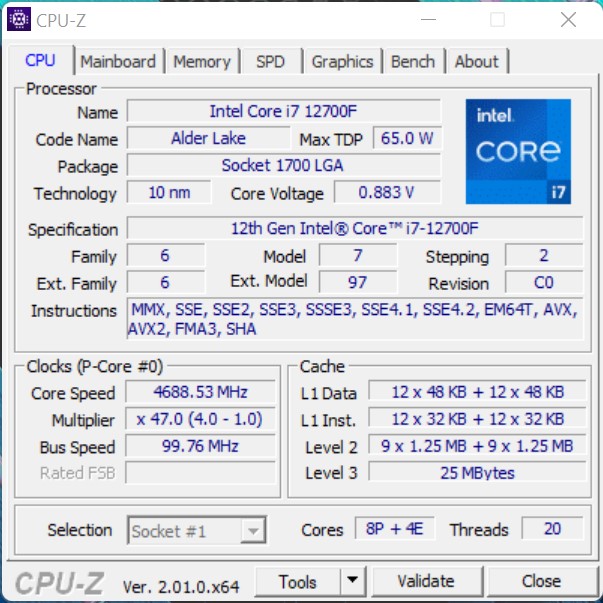
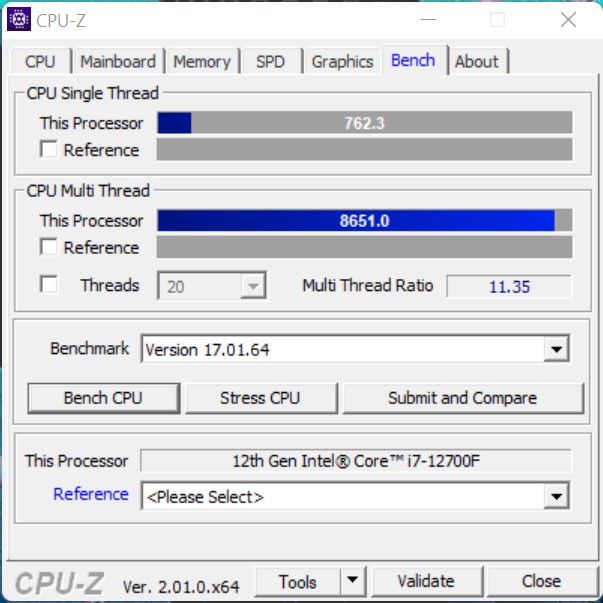
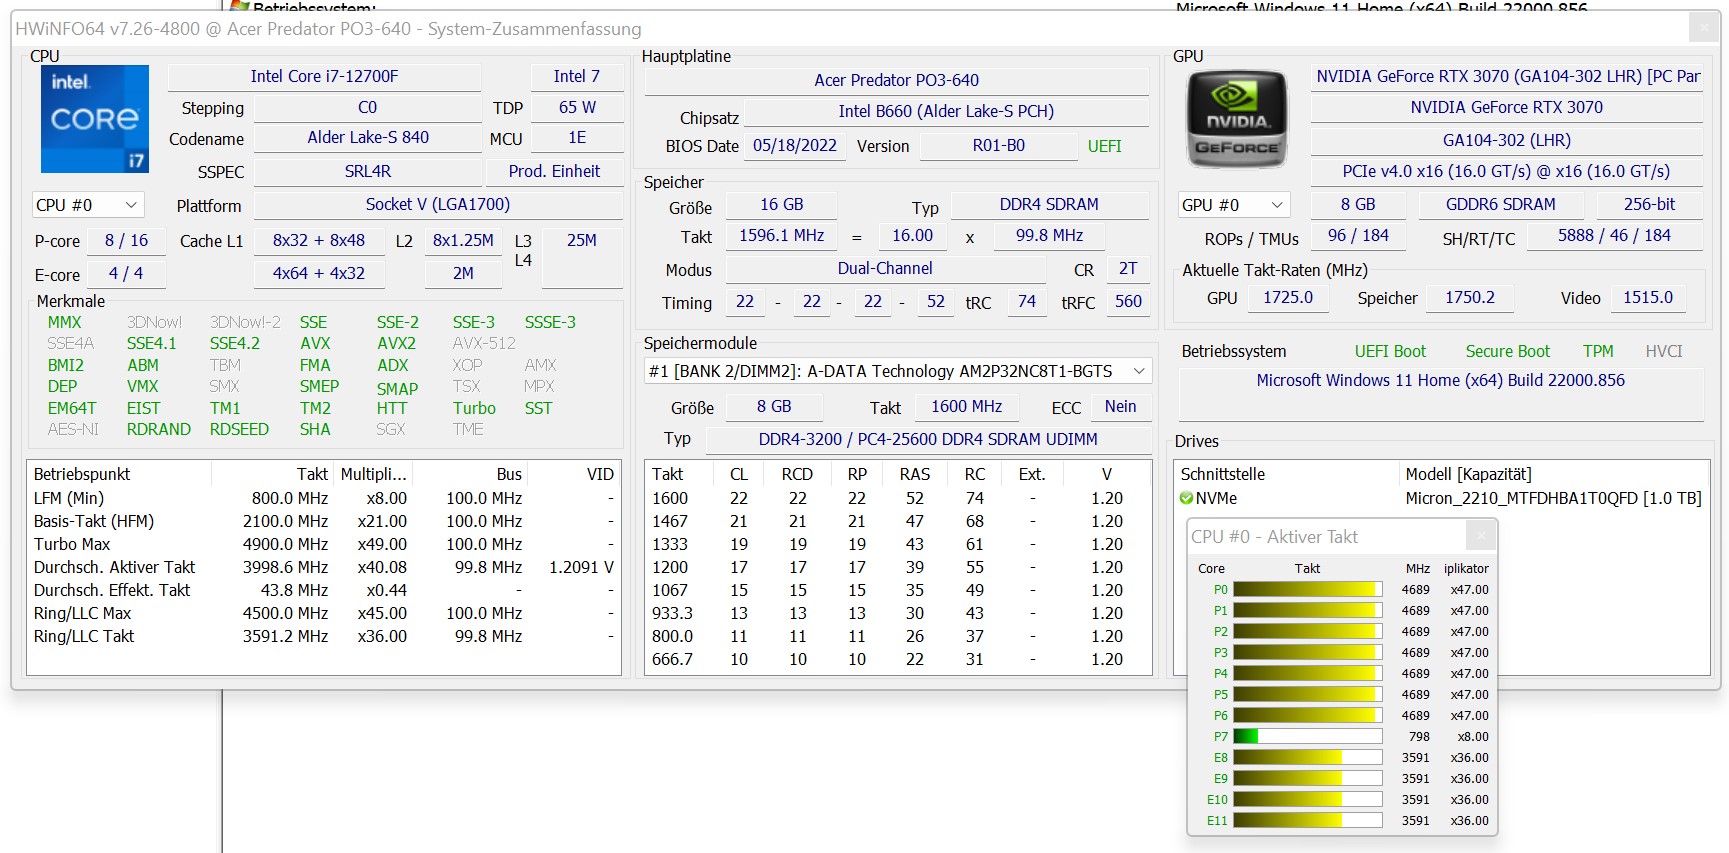
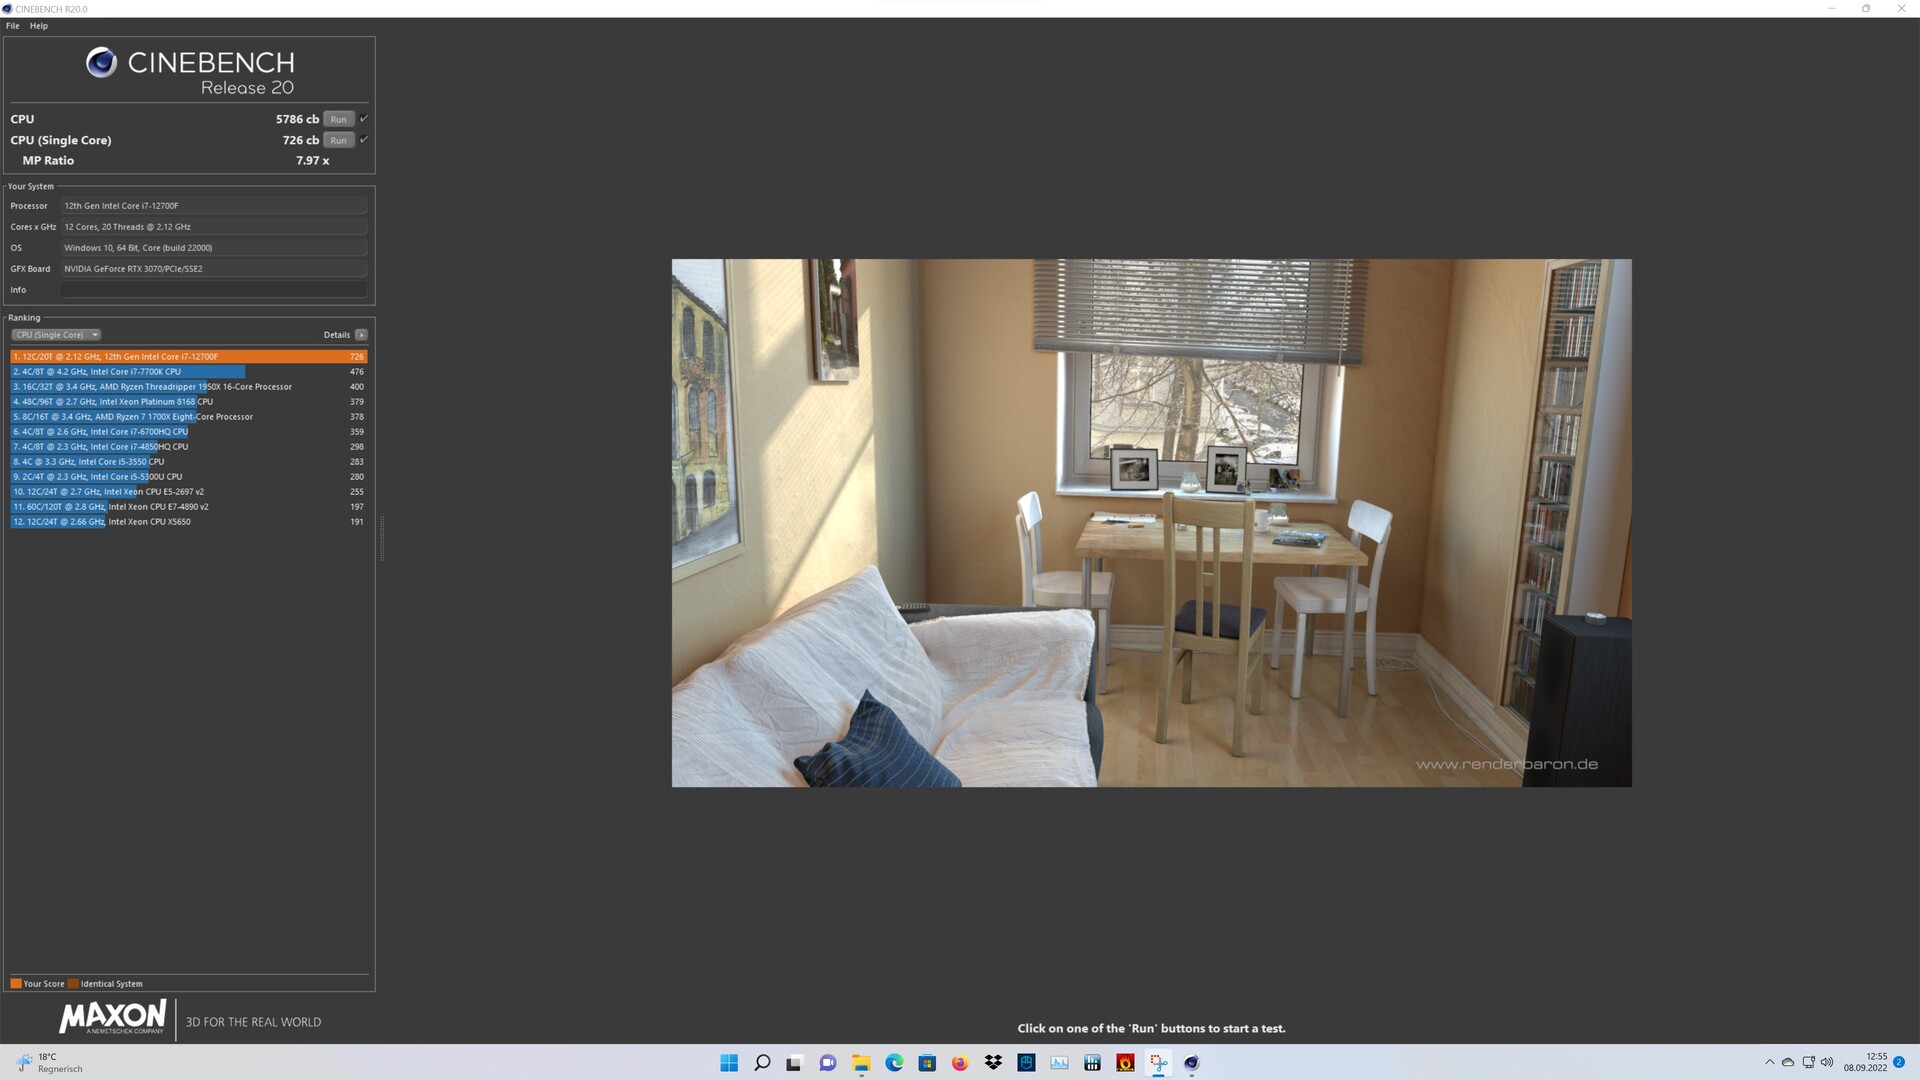
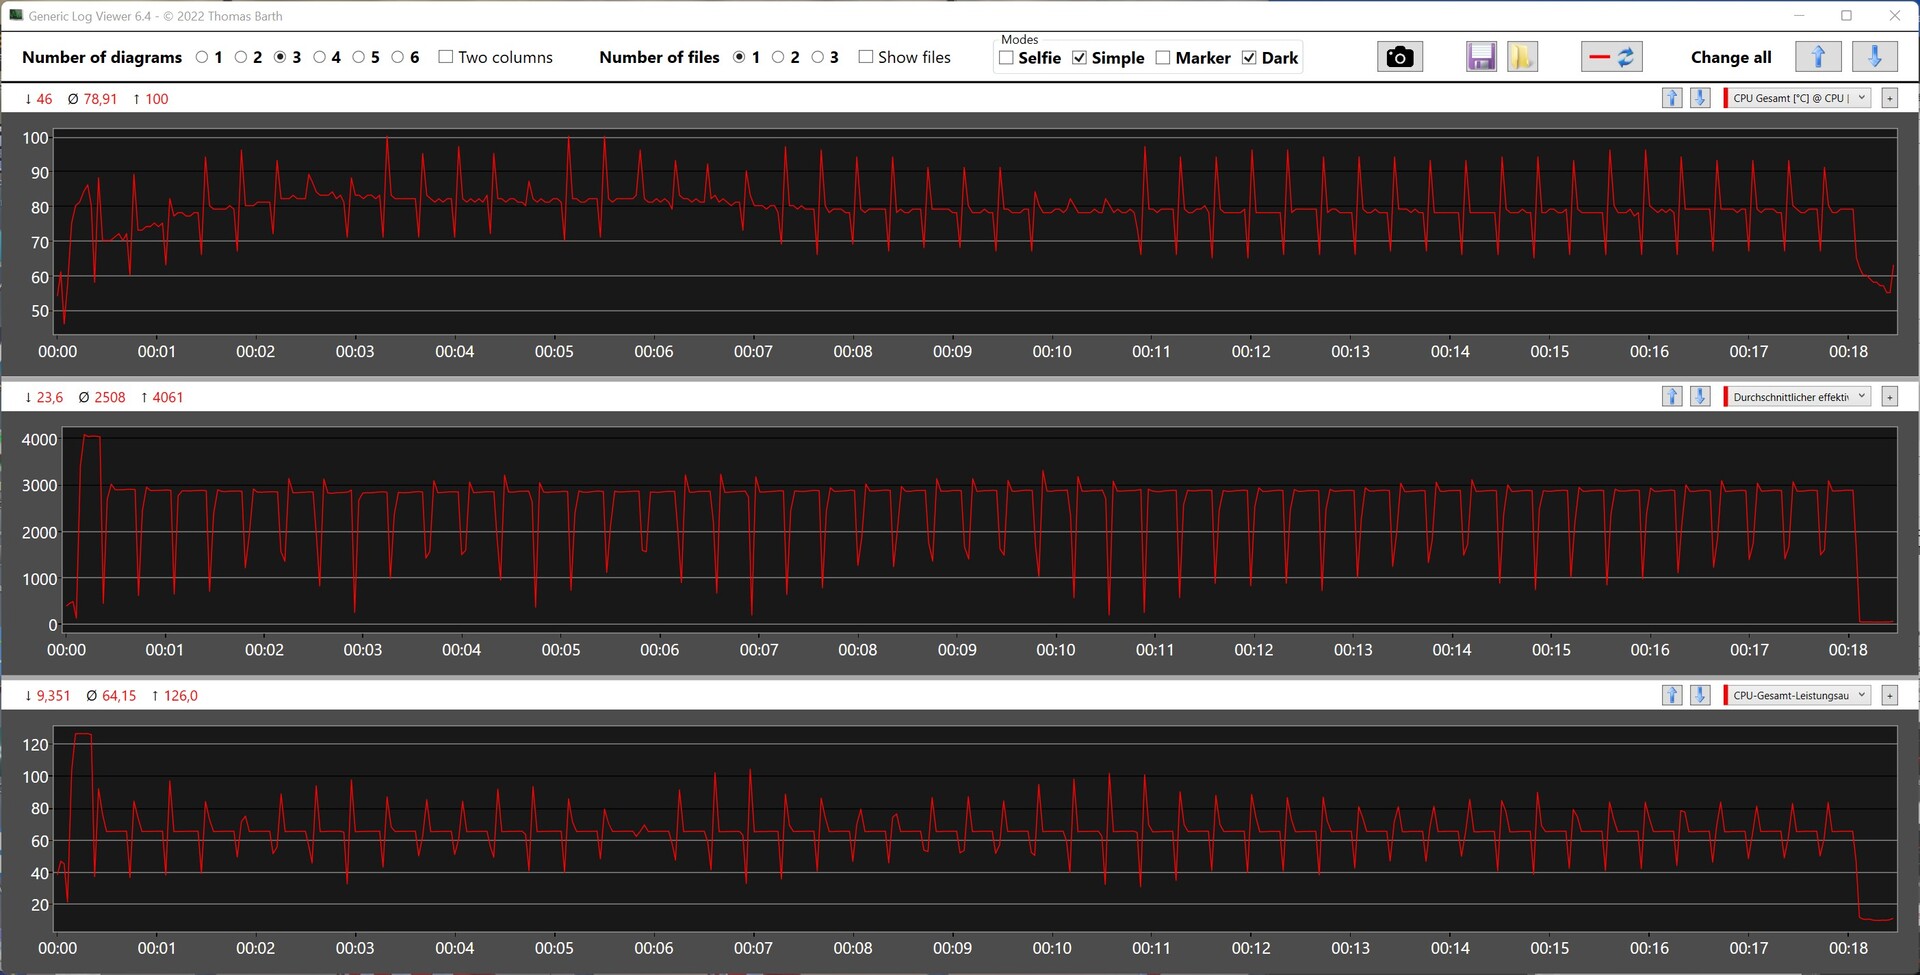
有了 英特尔酷睿i7-12700F在这次审查中,捕食者猎户座3000配备了宏碁为该PC提供的最快型号。这个65瓦的SoC提供了8个P-cores和4个E-cores,它们一起可以同时处理多达20个线程。然而,宏碁在谈到最大功率时多少限制了英特尔酷睿i7-12700F,因为这个型号的PL2通常为180瓦。另一方面,宏碁将这里的最大功耗限制在126瓦,最长时间为28秒。与其他对比设备相比,宏碁捕食者猎户座3000仍能取得不错的成绩。尽管如此,制造商为了获得更好的整体结果而放弃了性能。
对于进一步的比较和基准,我们参考了我们的CPU比较表.
| Performance rating - Percent | |
| Intel Dragon Canyon NUC - RTX 3060 | |
| Intel Core i5-12600K | |
| Acer Predator Orion 3000 PO3-640 | |
| Intel Beast Canyon NUC | |
| Asus ExpertCenter D9 SFF | |
| Zotac ZBOX Magnus EN173070C | |
| Zotac Magnus One (ECM73070C) -2! | |
| Zotac MEK Mini (RTX 2070 Super) | |
| Cinebench R15 | |
| CPU Single 64Bit | |
| Intel Core i5-12600K | |
| Acer Predator Orion 3000 PO3-640 | |
| Intel Dragon Canyon NUC - RTX 3060 | |
| Intel Beast Canyon NUC | |
| Asus ExpertCenter D9 SFF | |
| Zotac ZBOX Magnus EN173070C | |
| Zotac MEK Mini (RTX 2070 Super) | |
| Zotac Magnus One (ECM73070C) | |
| CPU Multi 64Bit | |
| Intel Dragon Canyon NUC - RTX 3060 | |
| Acer Predator Orion 3000 PO3-640 | |
| Intel Core i5-12600K | |
| Intel Beast Canyon NUC | |
| Asus ExpertCenter D9 SFF | |
| Zotac ZBOX Magnus EN173070C | |
| Zotac Magnus One (ECM73070C) | |
| Zotac MEK Mini (RTX 2070 Super) | |
| Cinebench R20 | |
| CPU (Single Core) | |
| Intel Core i5-12600K | |
| Acer Predator Orion 3000 PO3-640 | |
| Intel Dragon Canyon NUC - RTX 3060 | |
| Intel Beast Canyon NUC | |
| Asus ExpertCenter D9 SFF | |
| Zotac ZBOX Magnus EN173070C | |
| Zotac MEK Mini (RTX 2070 Super) | |
| CPU (Multi Core) | |
| Intel Dragon Canyon NUC - RTX 3060 | |
| Intel Core i5-12600K | |
| Acer Predator Orion 3000 PO3-640 | |
| Intel Beast Canyon NUC | |
| Asus ExpertCenter D9 SFF | |
| Zotac ZBOX Magnus EN173070C | |
| Zotac MEK Mini (RTX 2070 Super) | |
| Cinebench R11.5 | |
| CPU Single 64Bit | |
| Intel Core i5-12600K | |
| Acer Predator Orion 3000 PO3-640 | |
| Intel Dragon Canyon NUC - RTX 3060 | |
| Intel Beast Canyon NUC | |
| Asus ExpertCenter D9 SFF | |
| Zotac ZBOX Magnus EN173070C | |
| Zotac Magnus One (ECM73070C) | |
| Zotac MEK Mini (RTX 2070 Super) | |
| CPU Multi 64Bit | |
| Intel Dragon Canyon NUC - RTX 3060 | |
| Acer Predator Orion 3000 PO3-640 | |
| Intel Core i5-12600K | |
| Intel Beast Canyon NUC | |
| Asus ExpertCenter D9 SFF | |
| Zotac ZBOX Magnus EN173070C | |
| Zotac Magnus One (ECM73070C) | |
| Zotac MEK Mini (RTX 2070 Super) | |
| Cinebench R10 | |
| Rendering Single CPUs 64Bit | |
| Intel Core i5-12600K | |
| Acer Predator Orion 3000 PO3-640 | |
| Intel Dragon Canyon NUC - RTX 3060 | |
| Asus ExpertCenter D9 SFF | |
| Intel Beast Canyon NUC | |
| Zotac ZBOX Magnus EN173070C | |
| Zotac Magnus One (ECM73070C) | |
| Zotac MEK Mini (RTX 2070 Super) | |
| Rendering Multiple CPUs 64Bit | |
| Intel Dragon Canyon NUC - RTX 3060 | |
| Acer Predator Orion 3000 PO3-640 | |
| Intel Core i5-12600K | |
| Asus ExpertCenter D9 SFF | |
| Intel Beast Canyon NUC | |
| Zotac ZBOX Magnus EN173070C | |
| Zotac Magnus One (ECM73070C) | |
| Zotac MEK Mini (RTX 2070 Super) | |
| Blender - v2.79 BMW27 CPU | |
| Zotac MEK Mini (RTX 2070 Super) | |
| Zotac Magnus One (ECM73070C) | |
| Asus ExpertCenter D9 SFF | |
| Zotac ZBOX Magnus EN173070C | |
| Intel Beast Canyon NUC | |
| Intel Dragon Canyon NUC - RTX 3060 | |
| Acer Predator Orion 3000 PO3-640 | |
| Intel Core i5-12600K | |
| wPrime 2.10 | |
| 32m | |
| Zotac MEK Mini (RTX 2070 Super) | |
| Intel Core i5-12600K | |
| Asus ExpertCenter D9 SFF | |
| Zotac ZBOX Magnus EN173070C | |
| Intel Beast Canyon NUC | |
| Zotac Magnus One (ECM73070C) | |
| Acer Predator Orion 3000 PO3-640 | |
| Intel Dragon Canyon NUC - RTX 3060 | |
| 1024m | |
| Intel Dragon Canyon NUC - RTX 3060 | |
| Intel Core i5-12600K | |
| Zotac MEK Mini (RTX 2070 Super) | |
| Acer Predator Orion 3000 PO3-640 | |
| Zotac ZBOX Magnus EN173070C | |
| Zotac Magnus One (ECM73070C) | |
| Asus ExpertCenter D9 SFF | |
| Intel Beast Canyon NUC | |
| X264 HD Benchmark 4.0 | |
| Pass 1 | |
| Intel Core i5-12600K | |
| Intel Dragon Canyon NUC - RTX 3060 | |
| Acer Predator Orion 3000 PO3-640 | |
| Intel Beast Canyon NUC | |
| Asus ExpertCenter D9 SFF | |
| Zotac MEK Mini (RTX 2070 Super) | |
| Zotac ZBOX Magnus EN173070C | |
| Zotac Magnus One (ECM73070C) | |
| Pass 2 | |
| Intel Core i5-12600K | |
| Intel Dragon Canyon NUC - RTX 3060 | |
| Acer Predator Orion 3000 PO3-640 | |
| Intel Beast Canyon NUC | |
| Zotac ZBOX Magnus EN173070C | |
| Asus ExpertCenter D9 SFF | |
| Zotac Magnus One (ECM73070C) | |
| Zotac MEK Mini (RTX 2070 Super) | |
| WinRAR - Result | |
| Intel Dragon Canyon NUC - RTX 3060 | |
| Intel Beast Canyon NUC | |
| Acer Predator Orion 3000 PO3-640 | |
| Zotac ZBOX Magnus EN173070C | |
| Zotac MEK Mini (RTX 2070 Super) | |
| Zotac Magnus One (ECM73070C) | |
| Intel Core i5-12600K | |
| Asus ExpertCenter D9 SFF | |
| TrueCrypt | |
| AES Mean 100MB | |
| Intel Dragon Canyon NUC - RTX 3060 | |
| Intel Core i5-12600K | |
| Asus ExpertCenter D9 SFF | |
| Intel Beast Canyon NUC | |
| Zotac Magnus One (ECM73070C) | |
| Zotac ZBOX Magnus EN173070C | |
| Zotac MEK Mini (RTX 2070 Super) | |
| Acer Predator Orion 3000 PO3-640 | |
| Twofish Mean 100MB | |
| Intel Dragon Canyon NUC - RTX 3060 | |
| Acer Predator Orion 3000 PO3-640 | |
| Intel Core i5-12600K | |
| Zotac Magnus One (ECM73070C) | |
| Asus ExpertCenter D9 SFF | |
| Intel Beast Canyon NUC | |
| Zotac ZBOX Magnus EN173070C | |
| Zotac MEK Mini (RTX 2070 Super) | |
| Serpent Mean 100MB | |
| Intel Dragon Canyon NUC - RTX 3060 | |
| Acer Predator Orion 3000 PO3-640 | |
| Intel Core i5-12600K | |
| Zotac Magnus One (ECM73070C) | |
| Intel Beast Canyon NUC | |
| Asus ExpertCenter D9 SFF | |
| Zotac ZBOX Magnus EN173070C | |
| Zotac MEK Mini (RTX 2070 Super) | |
| Geekbench 5.5 | |
| Multi-Core | |
| Intel Core i5-12600K | |
| Acer Predator Orion 3000 PO3-640 | |
| Asus ExpertCenter D9 SFF | |
| Intel Beast Canyon NUC | |
| Intel Dragon Canyon NUC - RTX 3060 | |
| Zotac ZBOX Magnus EN173070C | |
| Zotac Magnus One (ECM73070C) | |
| Zotac MEK Mini (RTX 2070 Super) | |
| Single-Core | |
| Intel Core i5-12600K | |
| Asus ExpertCenter D9 SFF | |
| Intel Beast Canyon NUC | |
| Intel Dragon Canyon NUC - RTX 3060 | |
| Acer Predator Orion 3000 PO3-640 | |
| Zotac ZBOX Magnus EN173070C | |
| Zotac MEK Mini (RTX 2070 Super) | |
| Zotac Magnus One (ECM73070C) | |
| Geekbench 5.0 | |
| 5.0 Multi-Core | |
| Intel Core i5-12600K | |
| Acer Predator Orion 3000 PO3-640 | |
| Asus ExpertCenter D9 SFF | |
| Intel Beast Canyon NUC | |
| Intel Dragon Canyon NUC - RTX 3060 | |
| Zotac Magnus One (ECM73070C) | |
| Zotac ZBOX Magnus EN173070C | |
| Zotac MEK Mini (RTX 2070 Super) | |
| 5.0 Single-Core | |
| Intel Core i5-12600K | |
| Asus ExpertCenter D9 SFF | |
| Intel Beast Canyon NUC | |
| Intel Dragon Canyon NUC - RTX 3060 | |
| Zotac ZBOX Magnus EN173070C | |
| Acer Predator Orion 3000 PO3-640 | |
| Zotac Magnus One (ECM73070C) | |
| Zotac MEK Mini (RTX 2070 Super) | |
| Geekbench 4.4 | |
| 64 Bit Single-Core Score | |
| Intel Core i5-12600K | |
| Asus ExpertCenter D9 SFF | |
| Intel Beast Canyon NUC | |
| Intel Dragon Canyon NUC - RTX 3060 | |
| Zotac ZBOX Magnus EN173070C | |
| Acer Predator Orion 3000 PO3-640 | |
| Zotac MEK Mini (RTX 2070 Super) | |
| Zotac Magnus One (ECM73070C) | |
| 64 Bit Multi-Core Score | |
| Intel Core i5-12600K | |
| Acer Predator Orion 3000 PO3-640 | |
| Asus ExpertCenter D9 SFF | |
| Intel Beast Canyon NUC | |
| Intel Dragon Canyon NUC - RTX 3060 | |
| Zotac ZBOX Magnus EN173070C | |
| Zotac Magnus One (ECM73070C) | |
| Zotac MEK Mini (RTX 2070 Super) | |
| 3DMark 11 - 1280x720 Performance Physics | |
| Intel Core i5-12600K | |
| Intel Dragon Canyon NUC - RTX 3060 | |
| Acer Predator Orion 3000 PO3-640 | |
| Asus ExpertCenter D9 SFF | |
| Intel Beast Canyon NUC | |
| Zotac ZBOX Magnus EN173070C | |
| Zotac Magnus One (ECM73070C) | |
| Zotac MEK Mini (RTX 2070 Super) | |
| 7-Zip 18.03 | |
| 7z b 4 | |
| Intel Core i5-12600K | |
| Acer Predator Orion 3000 PO3-640 | |
| Intel Beast Canyon NUC | |
| Intel Dragon Canyon NUC - RTX 3060 | |
| Zotac ZBOX Magnus EN173070C | |
| Asus ExpertCenter D9 SFF | |
| Zotac Magnus One (ECM73070C) | |
| Zotac MEK Mini (RTX 2070 Super) | |
| 7z b 4 -mmt1 | |
| Acer Predator Orion 3000 PO3-640 | |
| Intel Beast Canyon NUC | |
| Intel Dragon Canyon NUC - RTX 3060 | |
| Intel Core i5-12600K | |
| Asus ExpertCenter D9 SFF | |
| Zotac ZBOX Magnus EN173070C | |
| Zotac Magnus One (ECM73070C) | |
| Zotac MEK Mini (RTX 2070 Super) | |
| HWBOT x265 Benchmark v2.2 - 4k Preset | |
| Intel Core i5-12600K | |
| Acer Predator Orion 3000 PO3-640 | |
| Intel Beast Canyon NUC | |
| Intel Dragon Canyon NUC - RTX 3060 | |
| Zotac ZBOX Magnus EN173070C | |
| Asus ExpertCenter D9 SFF | |
| Zotac Magnus One (ECM73070C) | |
| Zotac MEK Mini (RTX 2070 Super) | |
| R Benchmark 2.5 - Overall mean | |
| Zotac MEK Mini (RTX 2070 Super) | |
| Zotac Magnus One (ECM73070C) | |
| Zotac ZBOX Magnus EN173070C | |
| Intel Beast Canyon NUC | |
| Intel Dragon Canyon NUC - RTX 3060 | |
| Asus ExpertCenter D9 SFF | |
| Intel Core i5-12600K | |
| Acer Predator Orion 3000 PO3-640 | |
| LibreOffice - 20 Documents To PDF | |
| Intel Core i5-12600K | |
| Zotac Magnus One (ECM73070C) | |
| Acer Predator Orion 3000 PO3-640 | |
| Zotac MEK Mini (RTX 2070 Super) | |
| Zotac ZBOX Magnus EN173070C | |
| Intel Beast Canyon NUC | |
| Intel Dragon Canyon NUC - RTX 3060 | |
| Asus ExpertCenter D9 SFF | |
| WebXPRT 3 - Overall | |
| Intel Core i5-12600K | |
| Acer Predator Orion 3000 PO3-640 | |
| Intel Beast Canyon NUC | |
| Intel Dragon Canyon NUC - RTX 3060 | |
| Zotac ZBOX Magnus EN173070C | |
| Asus ExpertCenter D9 SFF | |
| Zotac Magnus One (ECM73070C) | |
| Zotac MEK Mini (RTX 2070 Super) | |
| Mozilla Kraken 1.1 - Total | |
| Zotac MEK Mini (RTX 2070 Super) | |
| Zotac Magnus One (ECM73070C) | |
| Zotac ZBOX Magnus EN173070C | |
| Intel Beast Canyon NUC | |
| Intel Dragon Canyon NUC - RTX 3060 | |
| Asus ExpertCenter D9 SFF | |
| Acer Predator Orion 3000 PO3-640 | |
| Intel Core i5-12600K | |
| 3DMark | |
| 3840x2160 Fire Strike Ultra Physics | |
| Intel Dragon Canyon NUC - RTX 3060 | |
| Acer Predator Orion 3000 PO3-640 | |
| Intel Core i5-12600K | |
| Asus ExpertCenter D9 SFF | |
| Intel Beast Canyon NUC | |
| Zotac ZBOX Magnus EN173070C | |
| Zotac Magnus One (ECM73070C) | |
| Zotac MEK Mini (RTX 2070 Super) | |
| 1920x1080 Fire Strike Physics | |
| Intel Dragon Canyon NUC - RTX 3060 | |
| Acer Predator Orion 3000 PO3-640 | |
| Intel Core i5-12600K | |
| Asus ExpertCenter D9 SFF | |
| Intel Beast Canyon NUC | |
| Zotac ZBOX Magnus EN173070C | |
| Zotac Magnus One (ECM73070C) | |
| Zotac MEK Mini (RTX 2070 Super) | |
| 2560x1440 Time Spy CPU | |
| Intel Dragon Canyon NUC - RTX 3060 | |
| Intel Core i5-12600K | |
| Acer Predator Orion 3000 PO3-640 | |
| Asus ExpertCenter D9 SFF | |
| Intel Beast Canyon NUC | |
| Zotac ZBOX Magnus EN173070C | |
| Zotac Magnus One (ECM73070C) | |
| Zotac MEK Mini (RTX 2070 Super) | |
* ... smaller is better
AIDA64: FP32 Ray-Trace | FPU Julia | CPU SHA3 | CPU Queen | FPU SinJulia | FPU Mandel | CPU AES | CPU ZLib | FP64 Ray-Trace | CPU PhotoWorxx
| Performance rating | |
| Average of class Desktop | |
| Intel Beast Canyon NUC | |
| Intel Dragon Canyon NUC - RTX 3060 | |
| Zotac ZBOX Magnus EN173070C | |
| Asus ExpertCenter D9 SFF | |
| Intel Core i5-12600K | |
| Acer Predator Orion 3000 PO3-640 | |
| Zotac MEK Mini (RTX 2070 Super) | |
| AIDA64 / FP32 Ray-Trace | |
| Average of class Desktop (12248 - 84577, n=21, last 2 years) | |
| Acer Predator Orion 3000 PO3-640 | |
| Intel Beast Canyon NUC | |
| Intel Dragon Canyon NUC - RTX 3060 | |
| Zotac ZBOX Magnus EN173070C | |
| Asus ExpertCenter D9 SFF | |
| Zotac MEK Mini (RTX 2070 Super) | |
| Intel Core i5-12600K | |
| AIDA64 / FPU Julia | |
| Average of class Desktop (65152 - 246125, n=21, last 2 years) | |
| Acer Predator Orion 3000 PO3-640 | |
| Intel Beast Canyon NUC | |
| Intel Dragon Canyon NUC - RTX 3060 | |
| Zotac ZBOX Magnus EN173070C | |
| Asus ExpertCenter D9 SFF | |
| Zotac MEK Mini (RTX 2070 Super) | |
| Intel Core i5-12600K | |
| AIDA64 / CPU SHA3 | |
| Average of class Desktop (2982 - 10804, n=21, last 2 years) | |
| Intel Beast Canyon NUC | |
| Intel Dragon Canyon NUC - RTX 3060 | |
| Zotac ZBOX Magnus EN173070C | |
| Asus ExpertCenter D9 SFF | |
| Intel Core i5-12600K | |
| Acer Predator Orion 3000 PO3-640 | |
| Zotac MEK Mini (RTX 2070 Super) | |
| AIDA64 / CPU Queen | |
| Average of class Desktop (76512 - 187912, n=18, last 2 years) | |
| Acer Predator Orion 3000 PO3-640 | |
| Intel Beast Canyon NUC | |
| Intel Dragon Canyon NUC - RTX 3060 | |
| Asus ExpertCenter D9 SFF | |
| Zotac ZBOX Magnus EN173070C | |
| Intel Core i5-12600K | |
| Zotac MEK Mini (RTX 2070 Super) | |
| AIDA64 / FPU SinJulia | |
| Average of class Desktop (6443 - 35251, n=21, last 2 years) | |
| Acer Predator Orion 3000 PO3-640 | |
| Intel Beast Canyon NUC | |
| Intel Dragon Canyon NUC - RTX 3060 | |
| Intel Core i5-12600K | |
| Zotac ZBOX Magnus EN173070C | |
| Asus ExpertCenter D9 SFF | |
| Zotac MEK Mini (RTX 2070 Super) | |
| AIDA64 / FPU Mandel | |
| Average of class Desktop (31697 - 129745, n=21, last 2 years) | |
| Intel Beast Canyon NUC | |
| Intel Dragon Canyon NUC - RTX 3060 | |
| Acer Predator Orion 3000 PO3-640 | |
| Zotac ZBOX Magnus EN173070C | |
| Asus ExpertCenter D9 SFF | |
| Zotac MEK Mini (RTX 2070 Super) | |
| Intel Core i5-12600K | |
| AIDA64 / CPU AES | |
| Average of class Desktop (57777 - 513073, n=21, last 2 years) | |
| Intel Beast Canyon NUC | |
| Intel Dragon Canyon NUC - RTX 3060 | |
| Zotac ZBOX Magnus EN173070C | |
| Asus ExpertCenter D9 SFF | |
| Intel Core i5-12600K | |
| Zotac MEK Mini (RTX 2070 Super) | |
| Acer Predator Orion 3000 PO3-640 | |
| AIDA64 / CPU ZLib | |
| Average of class Desktop (887 - 2674, n=21, last 2 years) | |
| Intel Core i5-12600K | |
| Acer Predator Orion 3000 PO3-640 | |
| Intel Beast Canyon NUC | |
| Intel Dragon Canyon NUC - RTX 3060 | |
| Zotac ZBOX Magnus EN173070C | |
| Asus ExpertCenter D9 SFF | |
| Zotac MEK Mini (RTX 2070 Super) | |
| AIDA64 / FP64 Ray-Trace | |
| Average of class Desktop (6471 - 44013, n=21, last 2 years) | |
| Acer Predator Orion 3000 PO3-640 | |
| Intel Beast Canyon NUC | |
| Intel Dragon Canyon NUC - RTX 3060 | |
| Zotac ZBOX Magnus EN173070C | |
| Asus ExpertCenter D9 SFF | |
| Zotac MEK Mini (RTX 2070 Super) | |
| Intel Core i5-12600K | |
| AIDA64 / CPU PhotoWorxx | |
| Intel Core i5-12600K | |
| Average of class Desktop (38071 - 63949, n=21, last 2 years) | |
| Acer Predator Orion 3000 PO3-640 | |
| Asus ExpertCenter D9 SFF | |
| Zotac ZBOX Magnus EN173070C | |
| Intel Beast Canyon NUC | |
| Intel Dragon Canyon NUC - RTX 3060 | |
| Zotac MEK Mini (RTX 2070 Super) | |
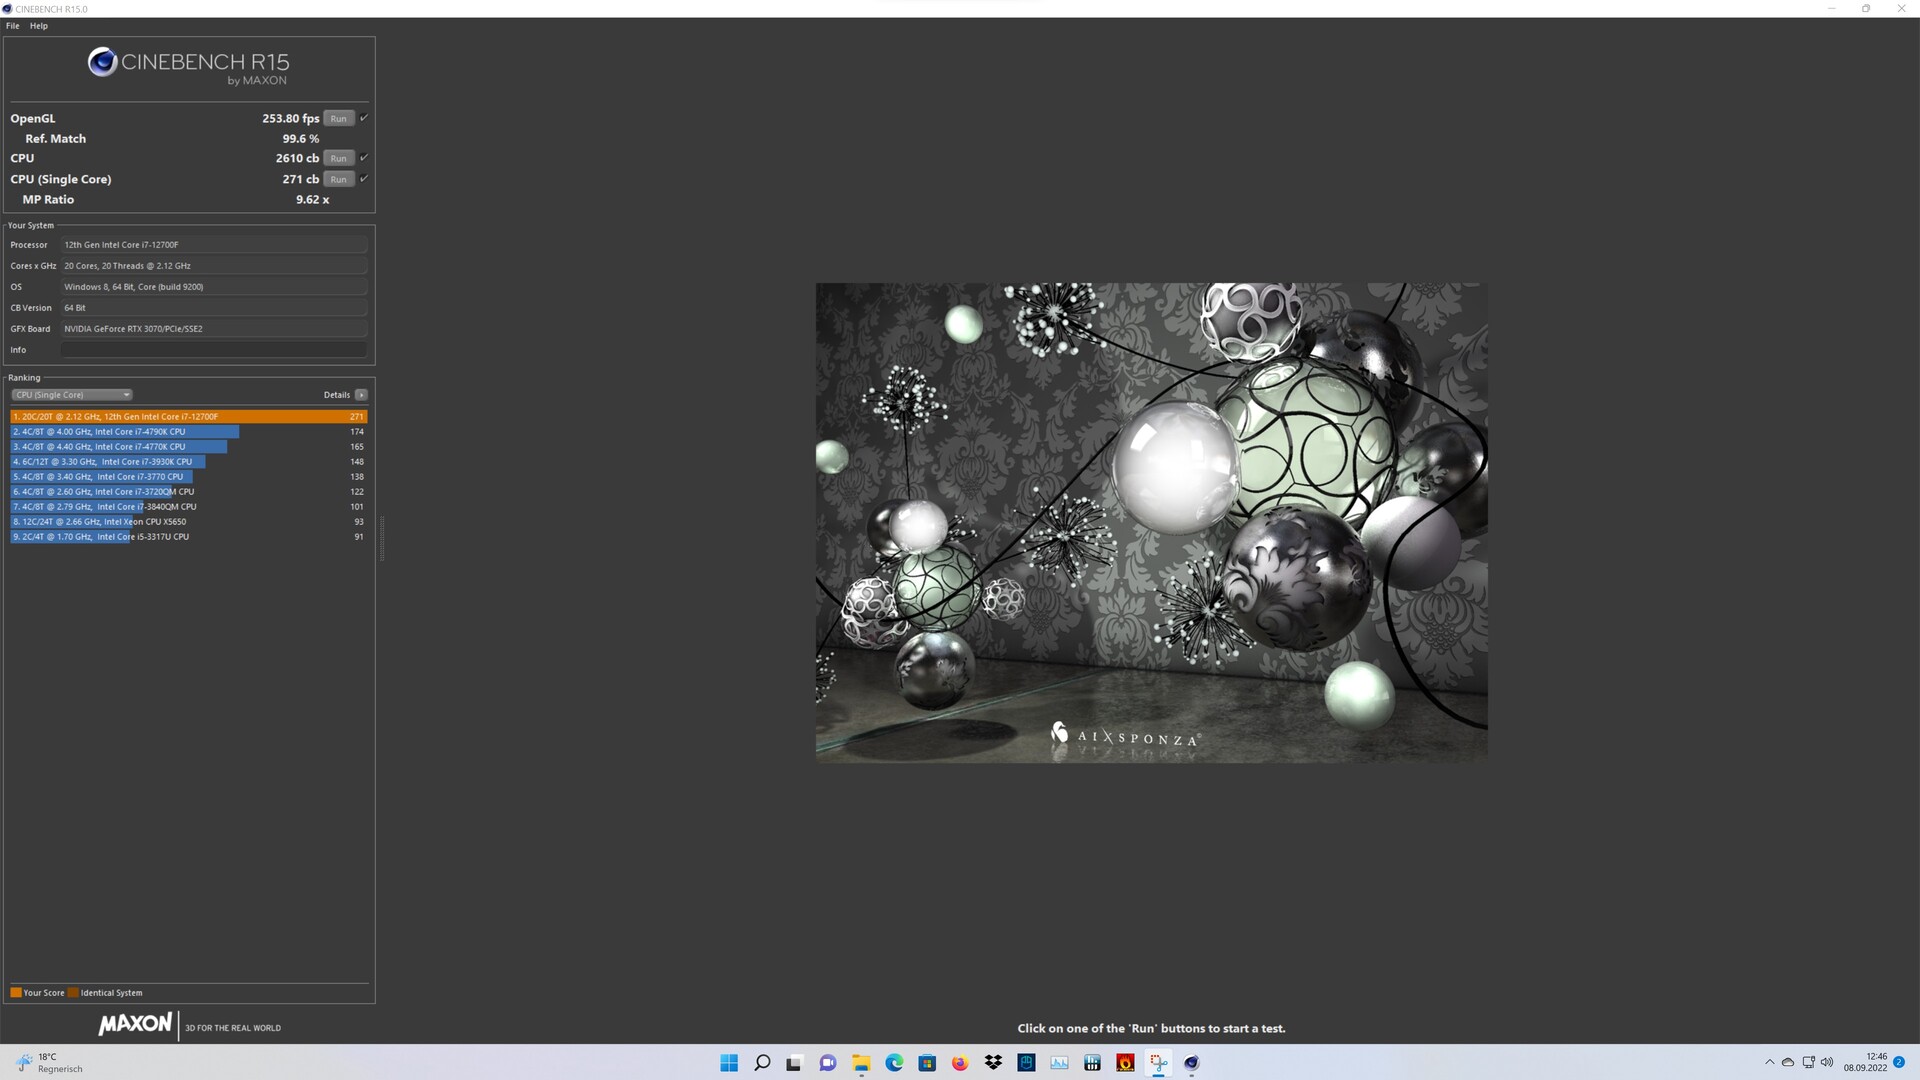
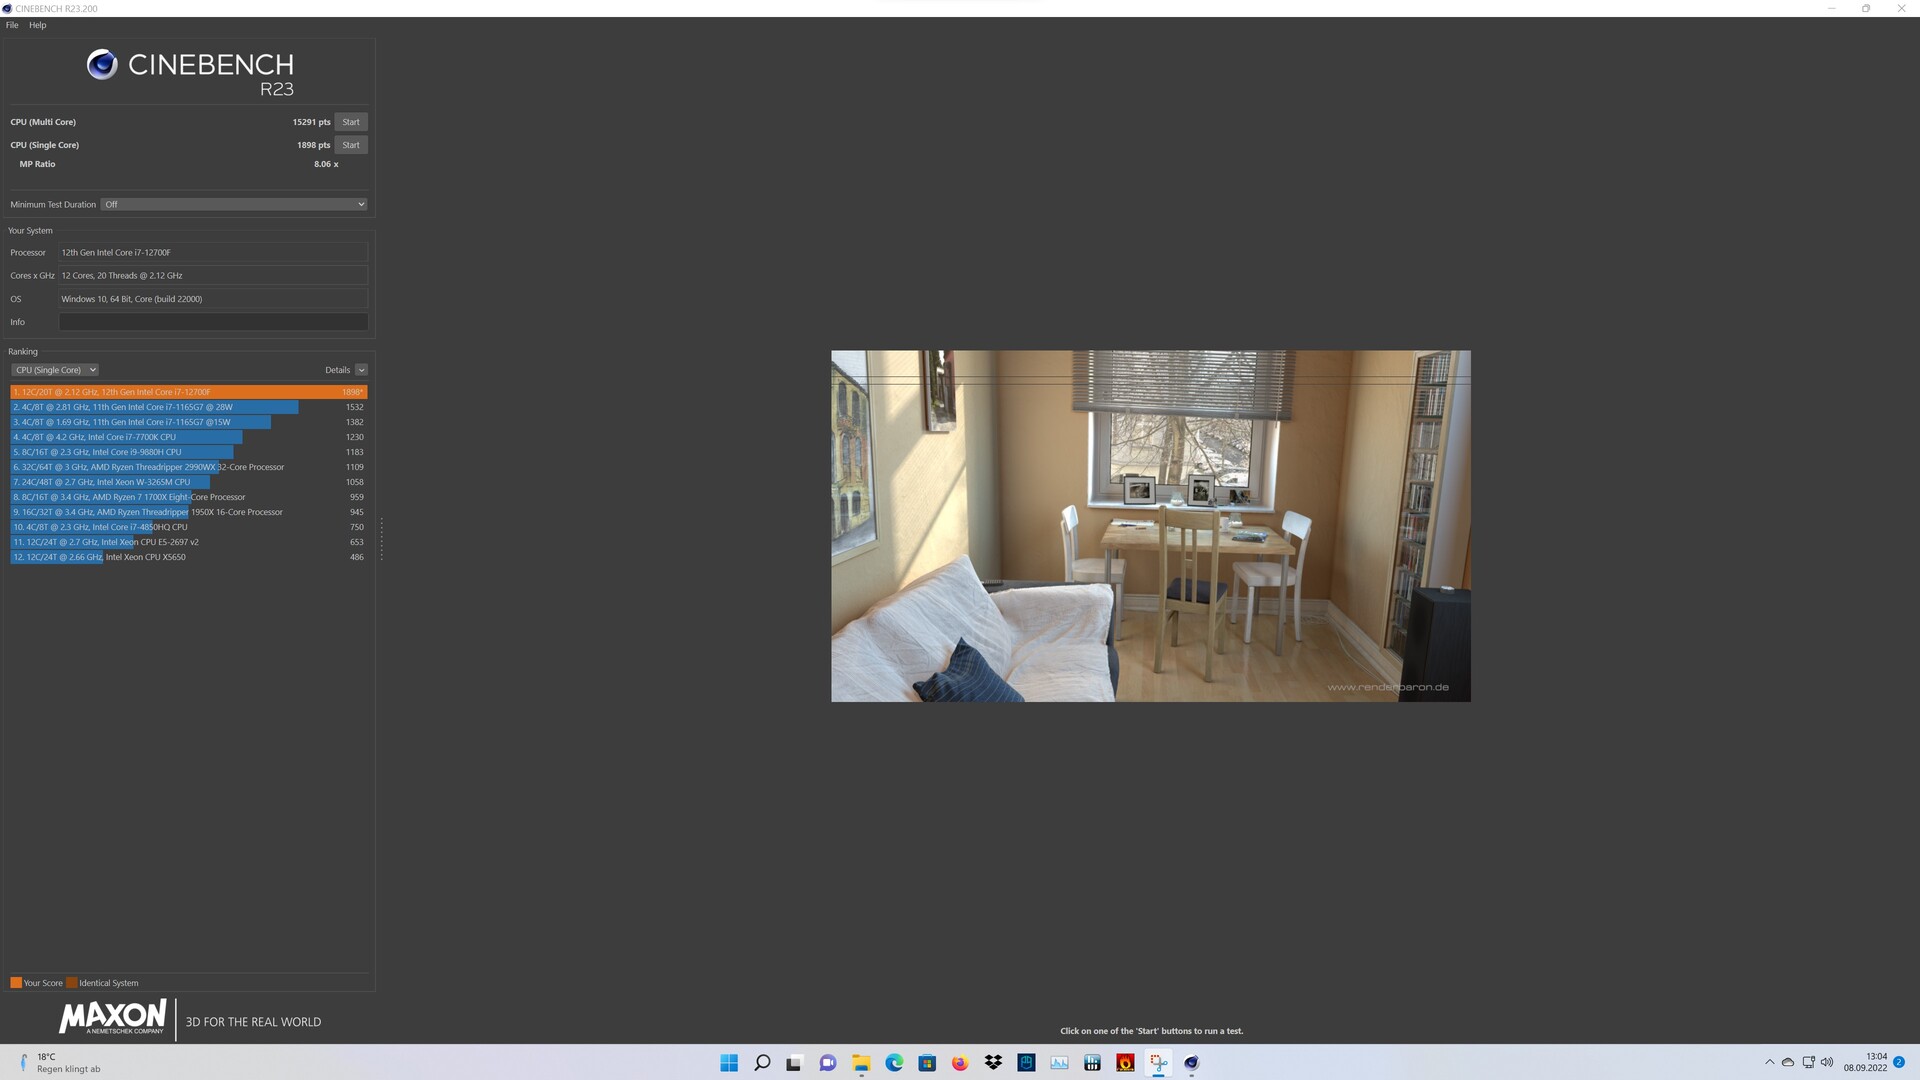
宏碁Predator Orion 3000在Cinebench R15多循环中的表现
在Cinebench R15的连续循环中,我们对内置冷却系统的效率有了初步的了解。在第一次运行后,性能急剧下降,因为增加的PL2只能在第一次运行时比在以后的运行中维持更长的时间。测试期间记录的CPU指标很好地表明了这一点。
系统性能
事实上,系统性能基准没有永久调用全部性能,这显然适合宏碁掠夺者猎户座3000。结果很好,只比英特尔龙峡谷NUC的差几个百分点。 英特尔Dragon Canyon NUC与 英特尔酷睿i9-12900.在测试中,与这里的对比设备相比,工作内存的表现相当好,尽管用更快的内存和更低的延迟可以实现更多一点的性能。
| Performance rating - Percent | |
| Intel Dragon Canyon NUC - RTX 3060, Intel Core i9-12900 | |
| Acer Predator Orion 3000 PO3-640, Intel Core i7-12700F | |
| Intel Beast Canyon NUC, Intel Core i9-11900KB | |
| Zotac ZBOX Magnus EN173070C, Intel Core i7-11800H | |
| Zotac Magnus One (ECM73070C), Intel Core i7-10700 | |
| Zotac MEK Mini (RTX 2070 Super), Intel Core i7-9700 | |
| PCMark 10 | |
| Score | |
| Intel Dragon Canyon NUC - RTX 3060, Intel Core i9-12900 | |
| Acer Predator Orion 3000 PO3-640, Intel Core i7-12700F | |
| Intel Beast Canyon NUC, Intel Core i9-11900KB | |
| Zotac ZBOX Magnus EN173070C, Intel Core i7-11800H | |
| Zotac Magnus One (ECM73070C), Intel Core i7-10700 | |
| Zotac MEK Mini (RTX 2070 Super), Intel Core i7-9700 | |
| Essentials | |
| Intel Dragon Canyon NUC - RTX 3060, Intel Core i9-12900 | |
| Intel Beast Canyon NUC, Intel Core i9-11900KB | |
| Acer Predator Orion 3000 PO3-640, Intel Core i7-12700F | |
| Zotac ZBOX Magnus EN173070C, Intel Core i7-11800H | |
| Zotac Magnus One (ECM73070C), Intel Core i7-10700 | |
| Zotac MEK Mini (RTX 2070 Super), Intel Core i7-9700 | |
| Productivity | |
| Intel Dragon Canyon NUC - RTX 3060, Intel Core i9-12900 | |
| Acer Predator Orion 3000 PO3-640, Intel Core i7-12700F | |
| Intel Beast Canyon NUC, Intel Core i9-11900KB | |
| Zotac ZBOX Magnus EN173070C, Intel Core i7-11800H | |
| Zotac MEK Mini (RTX 2070 Super), Intel Core i7-9700 | |
| Zotac Magnus One (ECM73070C), Intel Core i7-10700 | |
| AIDA64 / Memory Copy | |
| Average of class Desktop (54743 - 98416, n=21, last 2 years) | |
| Acer Predator Orion 3000 PO3-640 | |
| Average Intel Core i7-12700F (n=1) | |
| Intel Beast Canyon NUC | |
| Intel Dragon Canyon NUC - RTX 3060 | |
| Zotac ZBOX Magnus EN173070C | |
| Zotac MEK Mini (RTX 2070 Super) | |
| AIDA64 / Memory Read | |
| Average of class Desktop (58375 - 110448, n=21, last 2 years) | |
| Zotac ZBOX Magnus EN173070C | |
| Acer Predator Orion 3000 PO3-640 | |
| Average Intel Core i7-12700F (n=1) | |
| Intel Beast Canyon NUC | |
| Intel Dragon Canyon NUC - RTX 3060 | |
| Zotac MEK Mini (RTX 2070 Super) | |
| AIDA64 / Memory Write | |
| Average of class Desktop (60635 - 93889, n=21, last 2 years) | |
| Zotac ZBOX Magnus EN173070C | |
| Intel Beast Canyon NUC | |
| Intel Dragon Canyon NUC - RTX 3060 | |
| Acer Predator Orion 3000 PO3-640 | |
| Average Intel Core i7-12700F (n=1) | |
| Zotac MEK Mini (RTX 2070 Super) | |
| AIDA64 / Memory Latency | |
| Average of class Desktop (68.5 - 168, n=21, last 2 years) | |
| Intel Beast Canyon NUC | |
| Intel Dragon Canyon NUC - RTX 3060 | |
| Zotac ZBOX Magnus EN173070C | |
| Acer Predator Orion 3000 PO3-640 | |
| Average Intel Core i7-12700F (n=1) | |
| Zotac MEK Mini (RTX 2070 Super) | |
* ... smaller is better
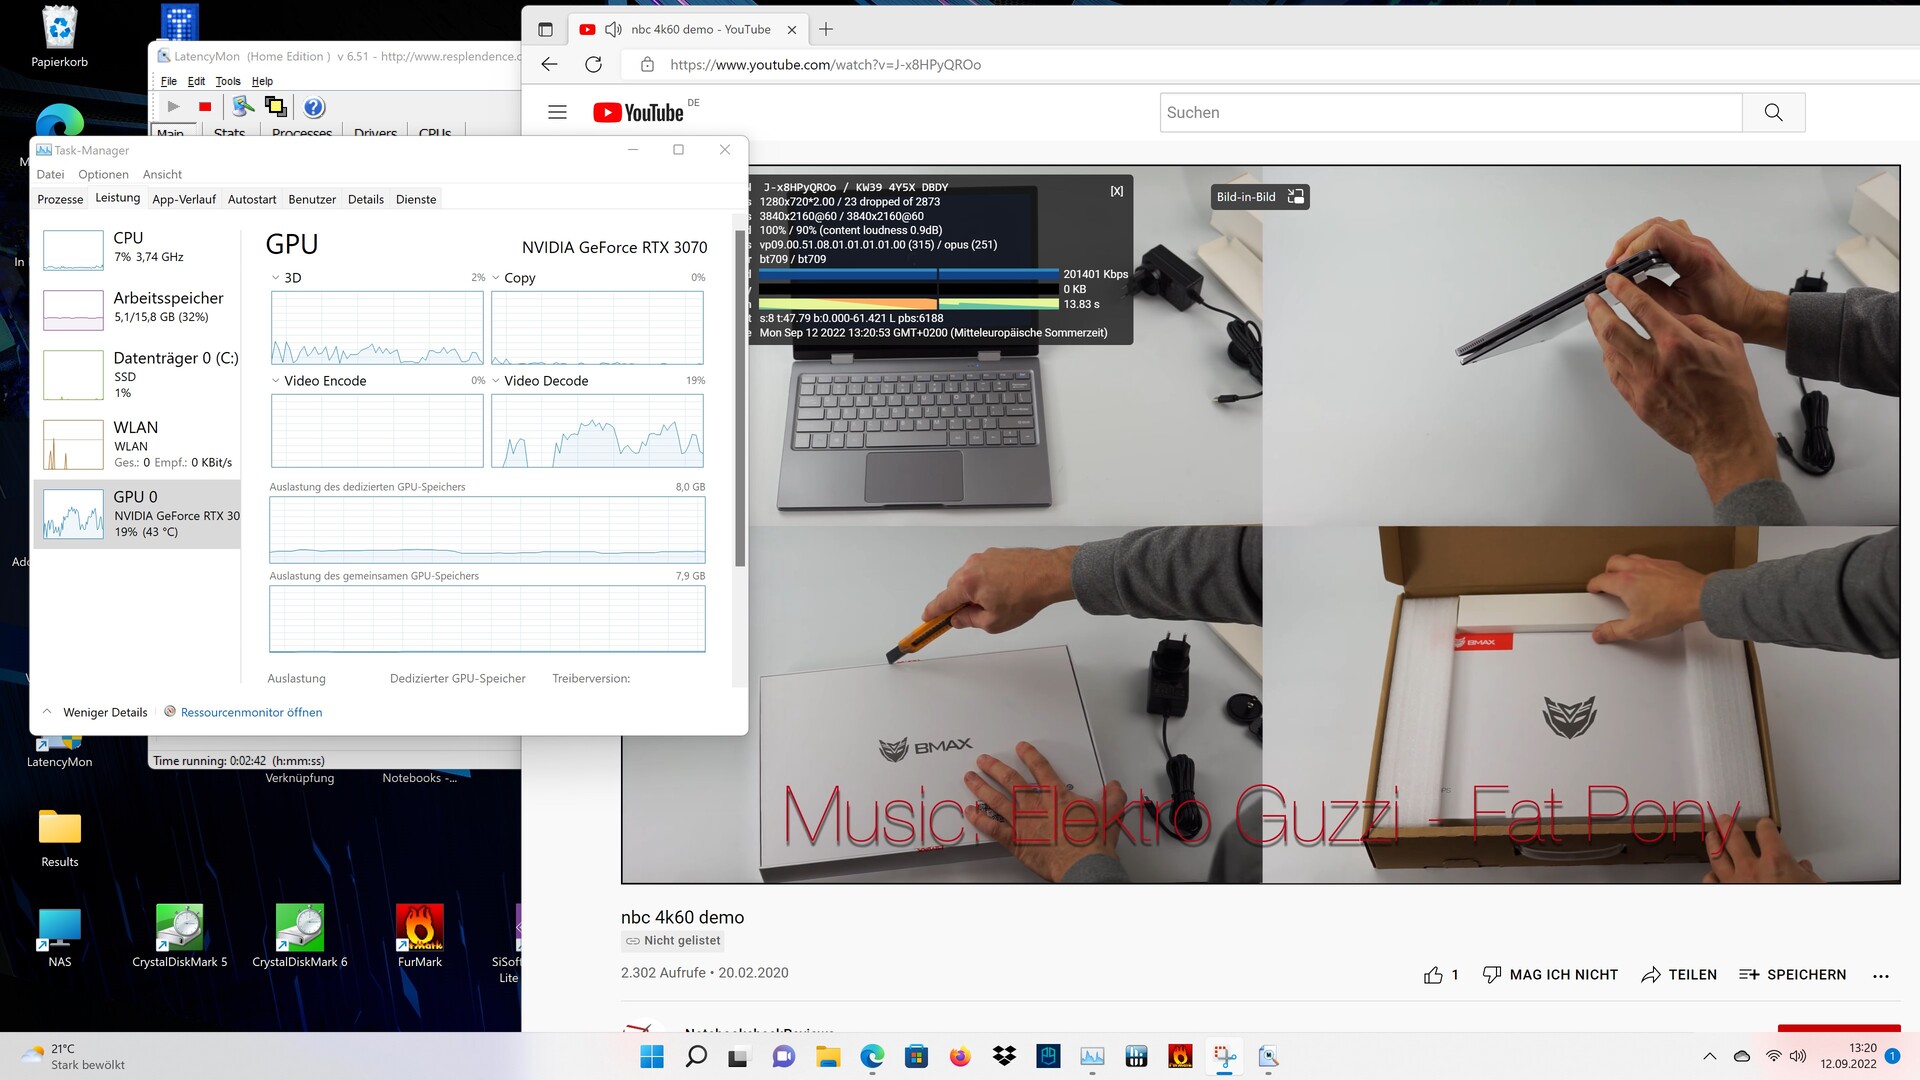
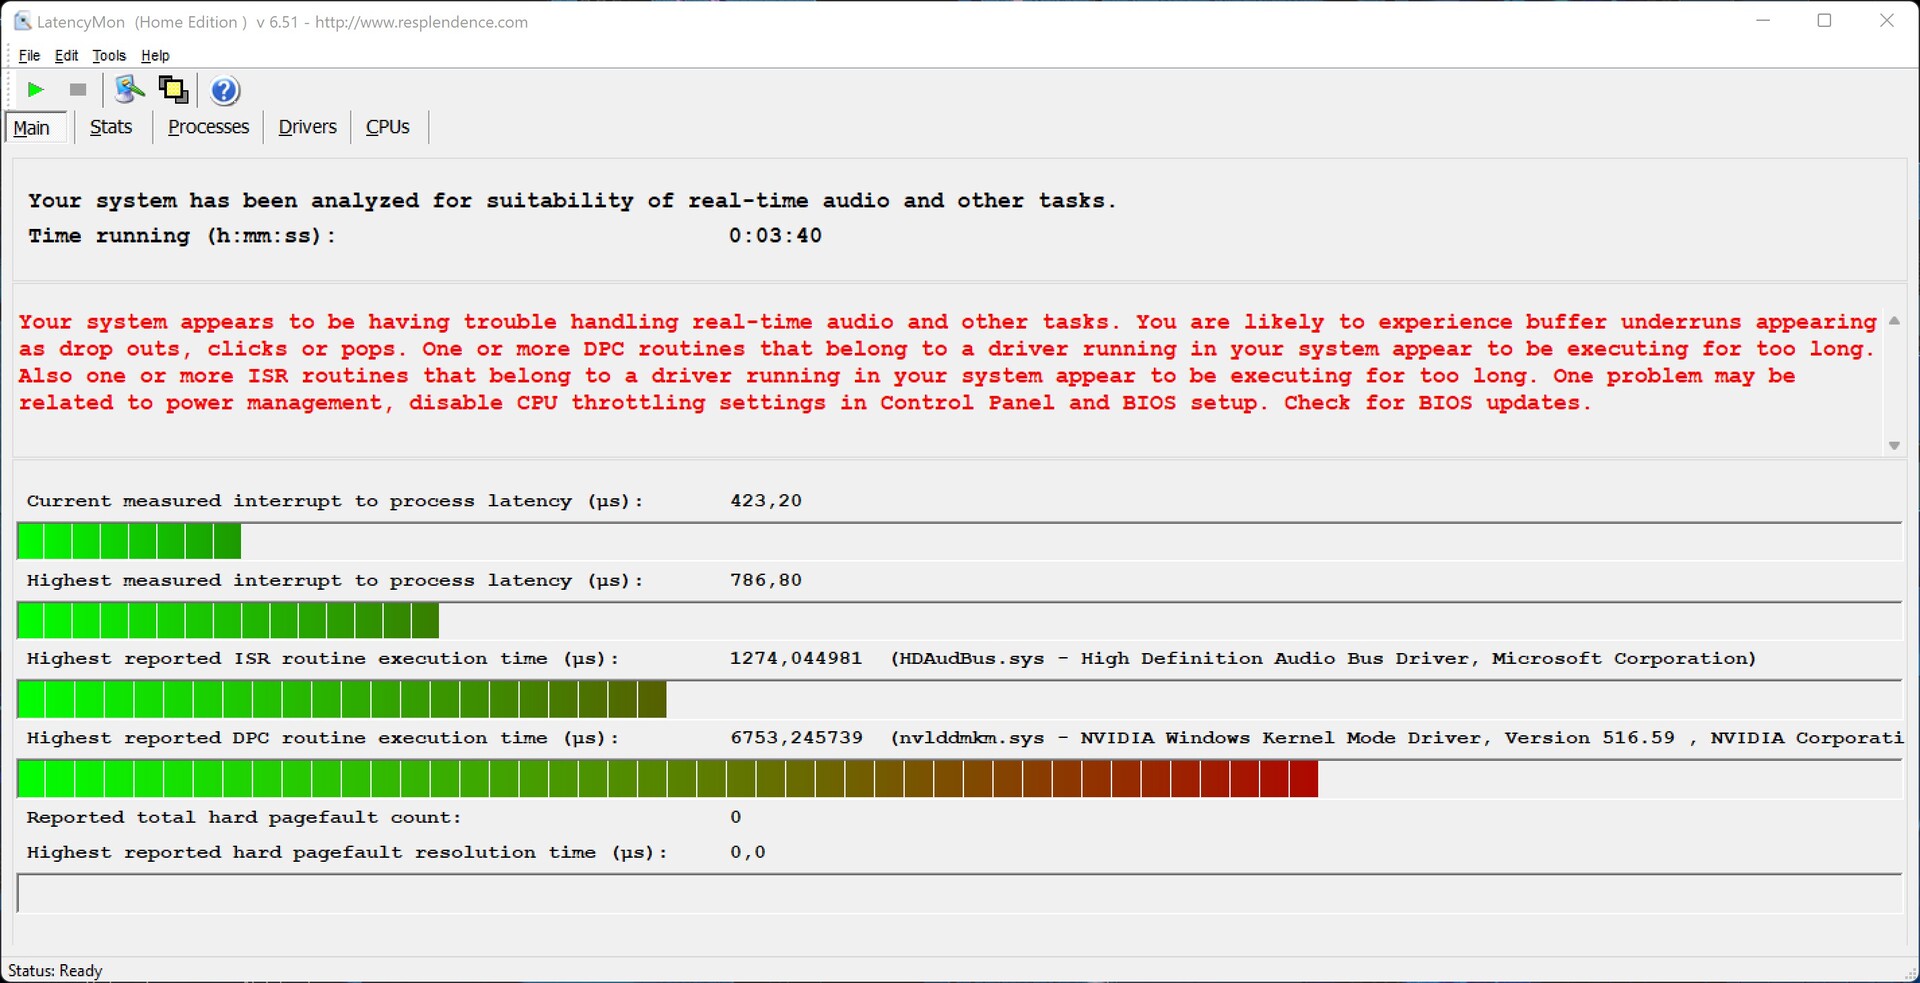
DPC延迟
LatencyMon已经报告了在Edge中打开多个标签时的延迟问题。驱动程序在这里似乎还没有被优化。
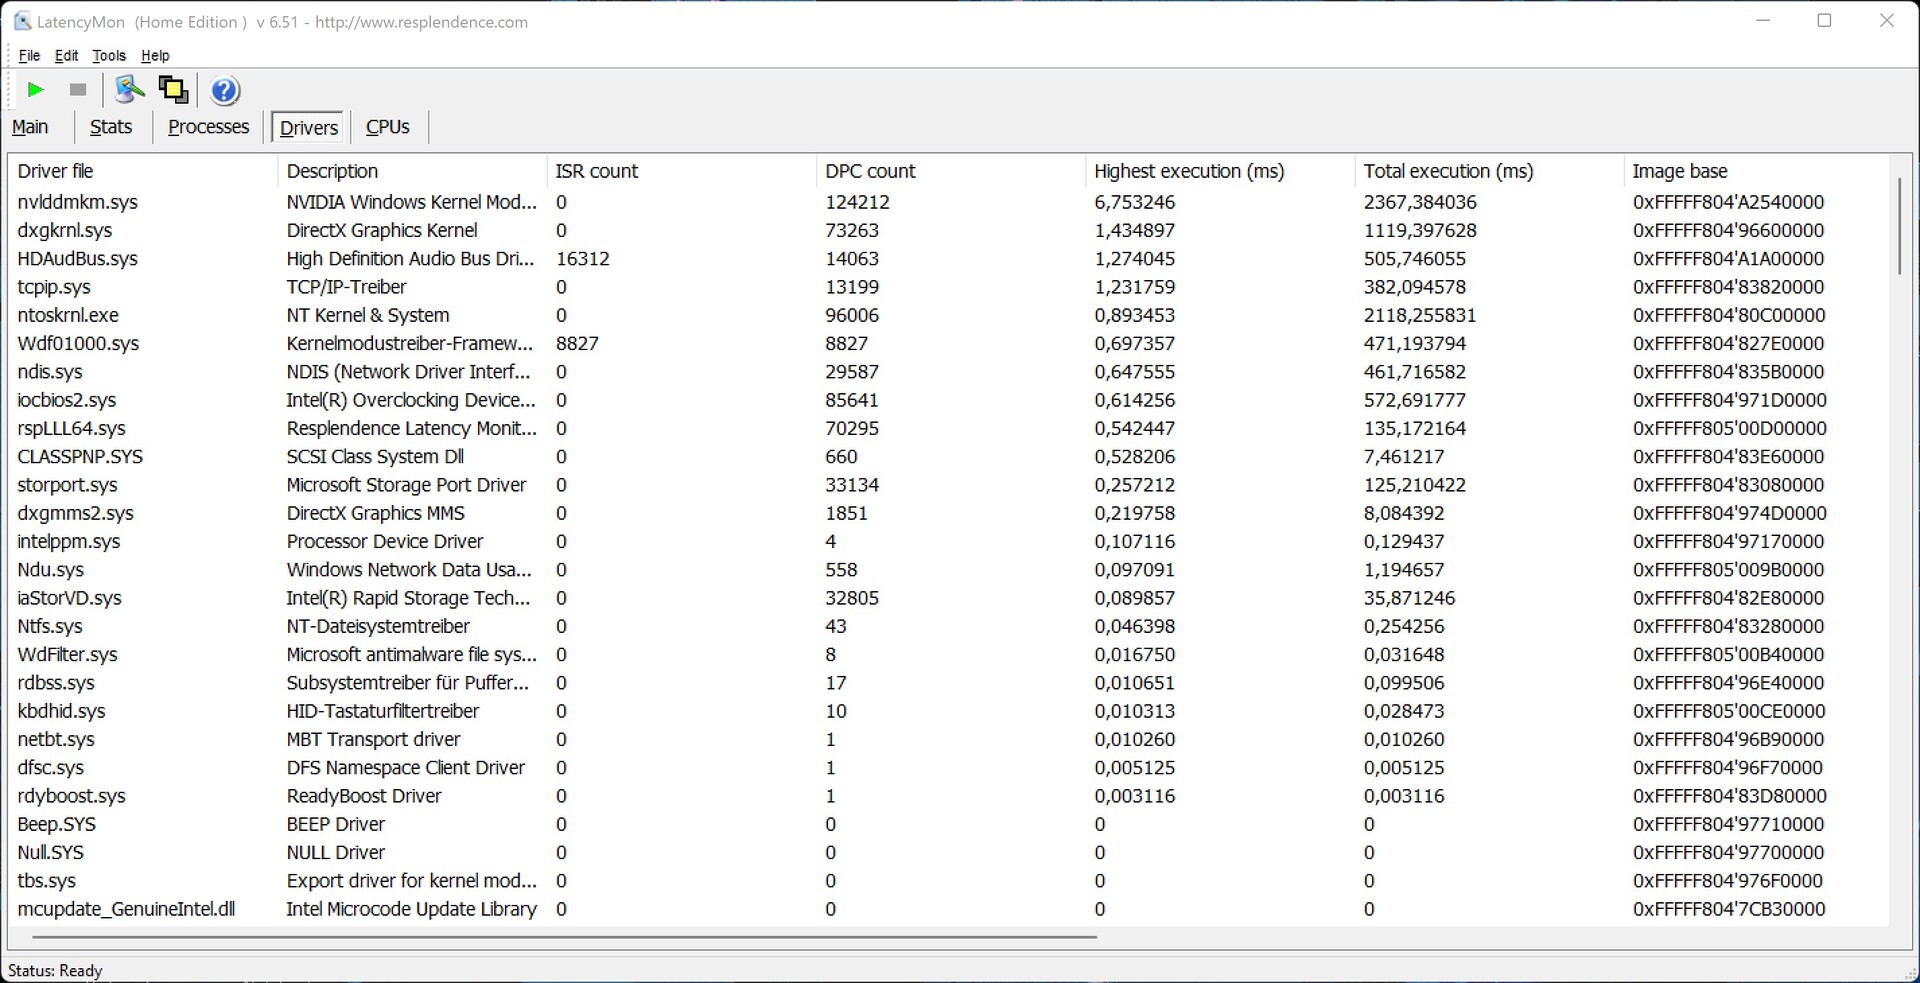
| DPC Latencies / LatencyMon - interrupt to process latency (max), Web, Youtube, Prime95 | |
| Acer Predator Orion 3000 PO3-640, Intel Core i7-12700F | |
| Minisforum EliteMini B550, AMD Ryzen 7 5700G | |
| Asus ExpertCenter D9 SFF, Intel Core i7-11700 | |
| Zotac ZBOX Magnus EN173070C, Intel Core i7-11800H | |
| Minisforum EliteMini HX90, AMD Ryzen 9 5900HX | |
* ... smaller is better
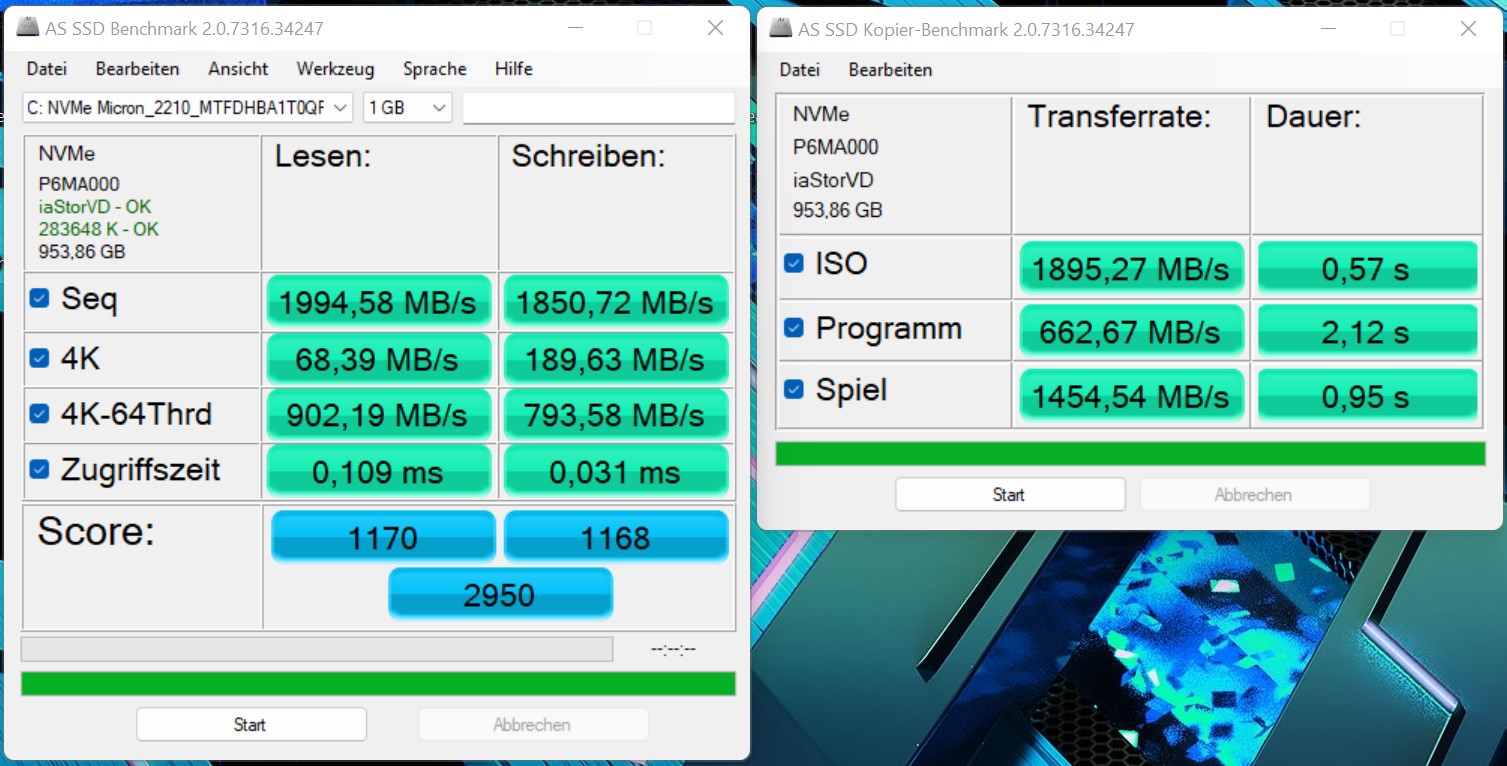
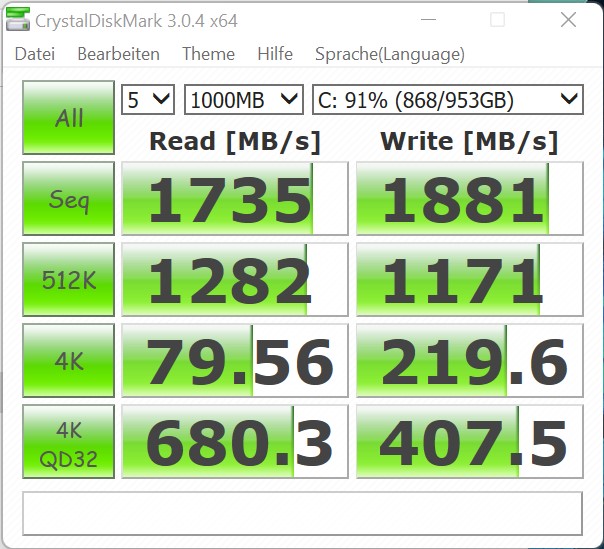
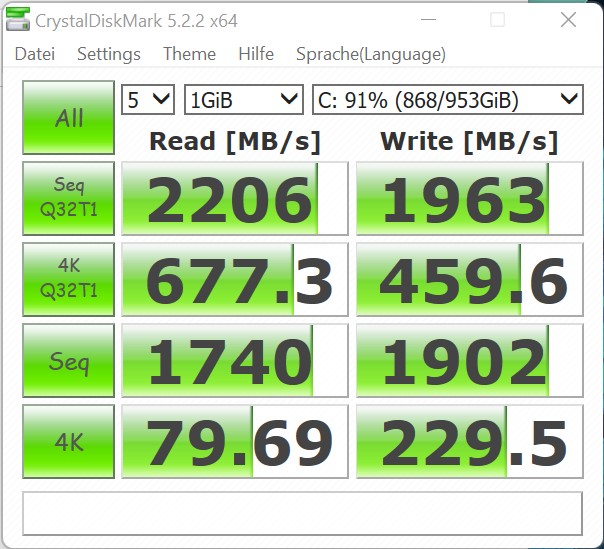
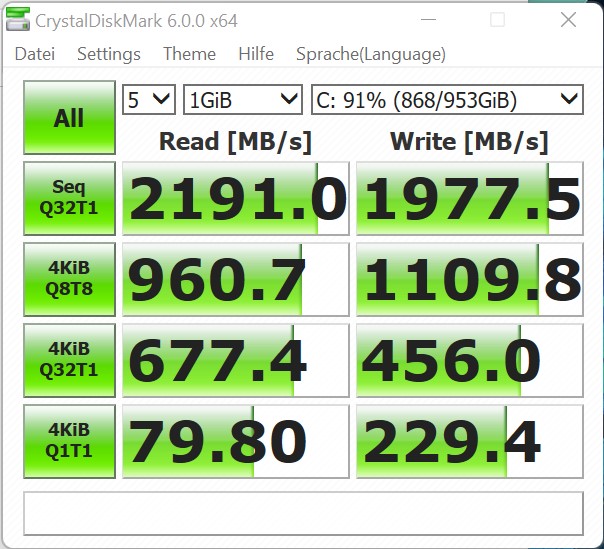
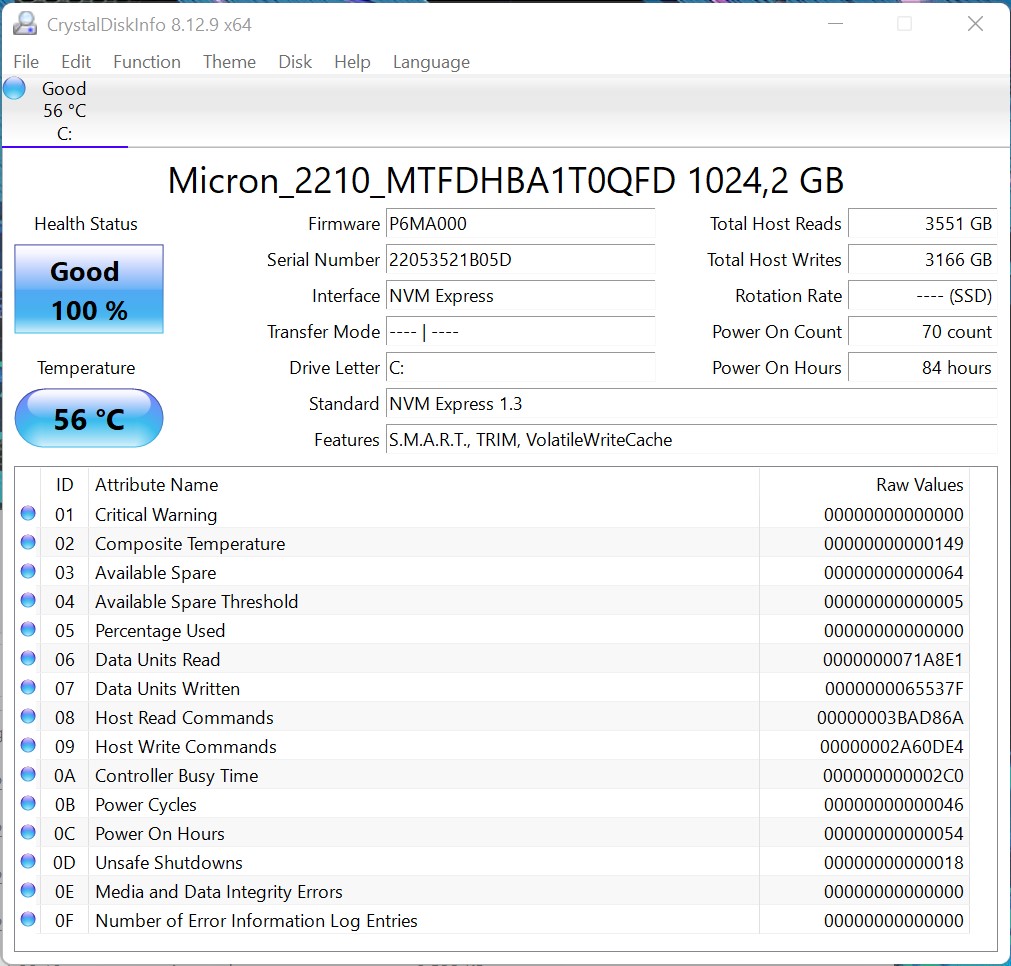
大容量存储
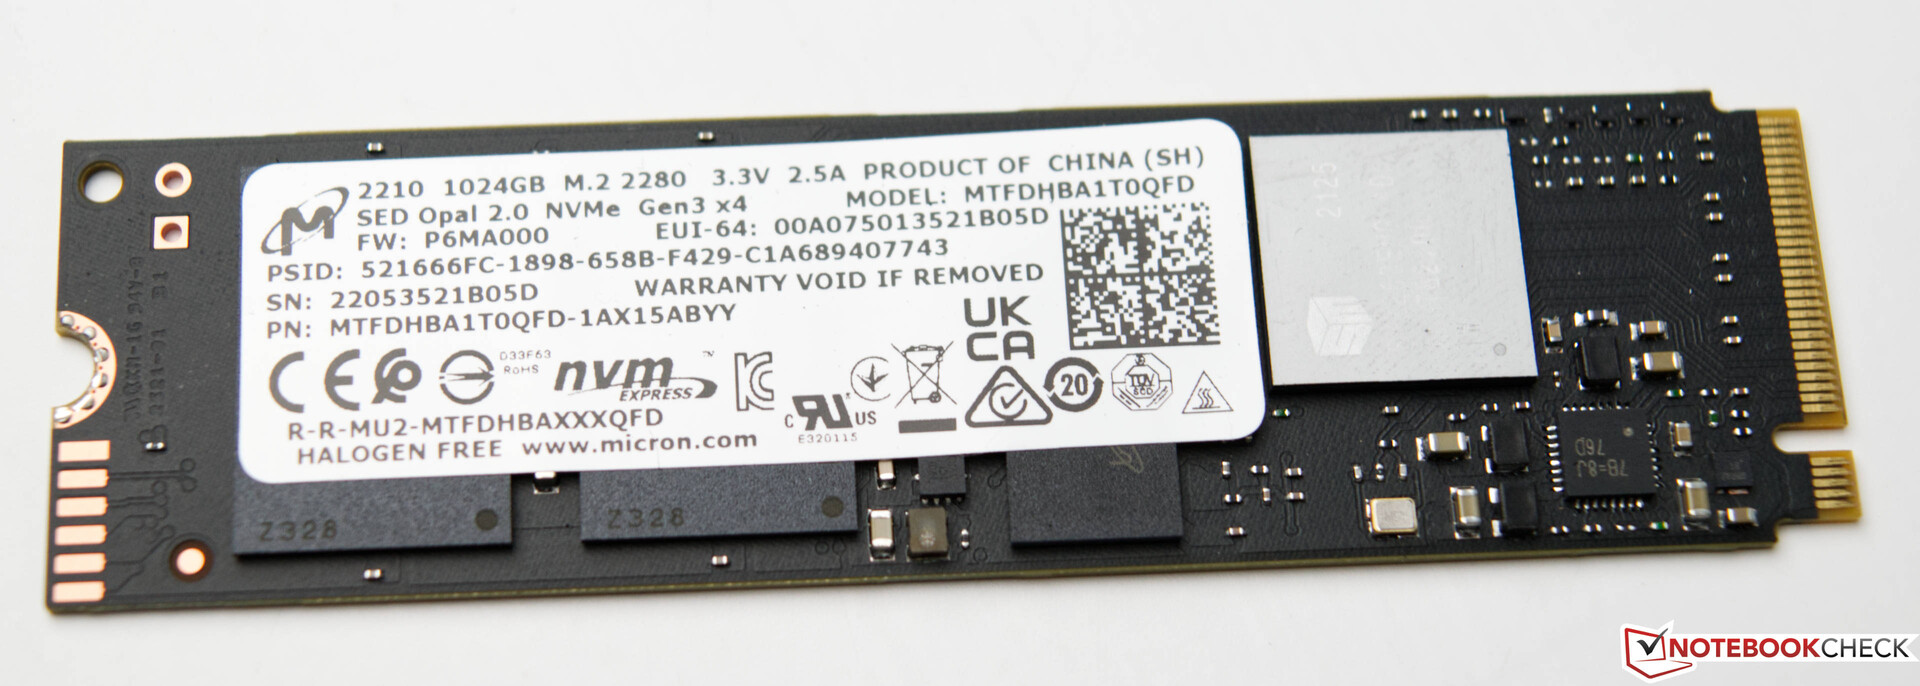
我们的测试样品配备了美光公司的1TB固态硬盘。M.2模块提供了良好的传输率,尽管最高值不能完全跟上比较设备。然而,这在日常使用中很难注意到。例如,4K读取率有更大的影响,这在宏碁掠夺者猎户座3000中表现得非常好。在我们看来,1TB的存储容量是足够的,对于游戏设备来说不应该更小。宏碁掠夺者猎户座3000的大容量存储可以相对容易地扩展。主板上可以安装第二个M.2模块。此外,机箱内还有空间容纳两个3.5英寸的硬盘驱动器。所有必要的连接线都包括在该设备中
关于进一步的比较和基准,请参考我们的比较图表.

| Drive Performance rating - Percent | |
| Average of class Desktop | |
| Intel Beast Canyon NUC | |
| Intel Dragon Canyon NUC - RTX 3060 -11! | |
| Acer Predator Orion 3000 PO3-640 | |
| Zotac ZBOX Magnus EN173070C | |
| Average Micron 2210 MTFDHBA1T0QFD | |
| Zotac Magnus One (ECM73070C) | |
| Zotac MEK Mini (RTX 2070 Super) | |
* ... smaller is better
Disk Throttling: DiskSpd Read Loop, Queue Depth 8
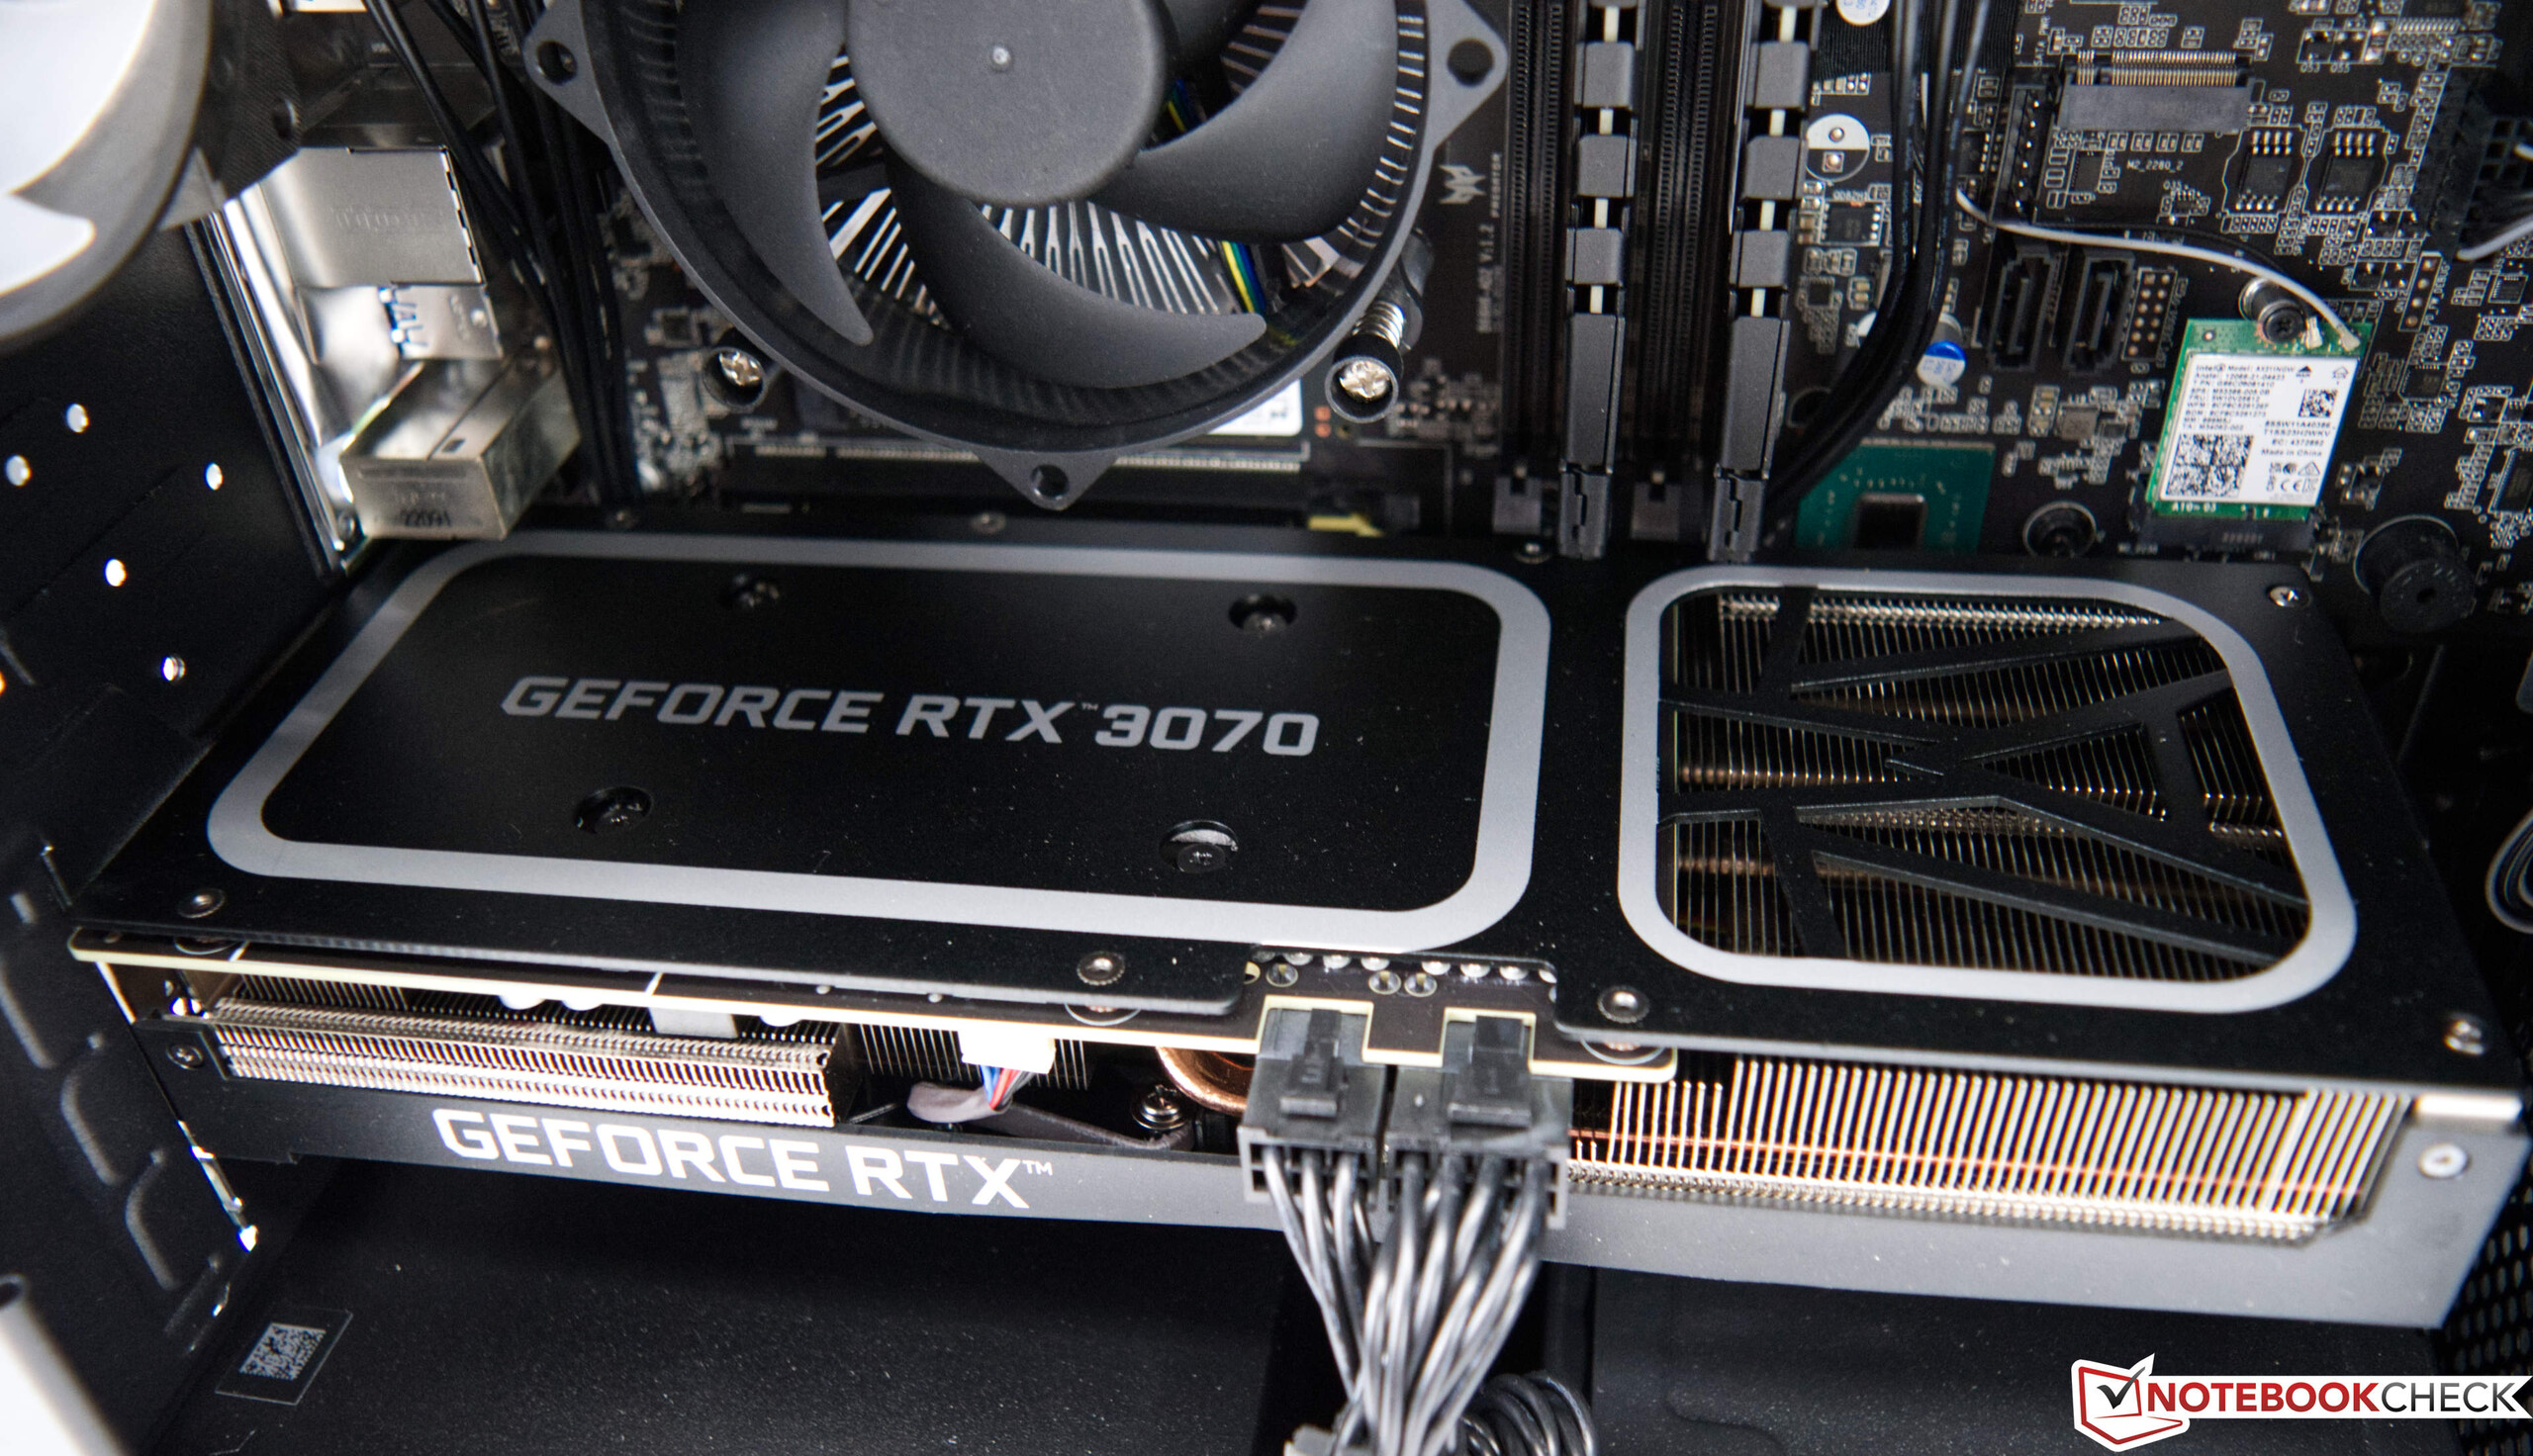
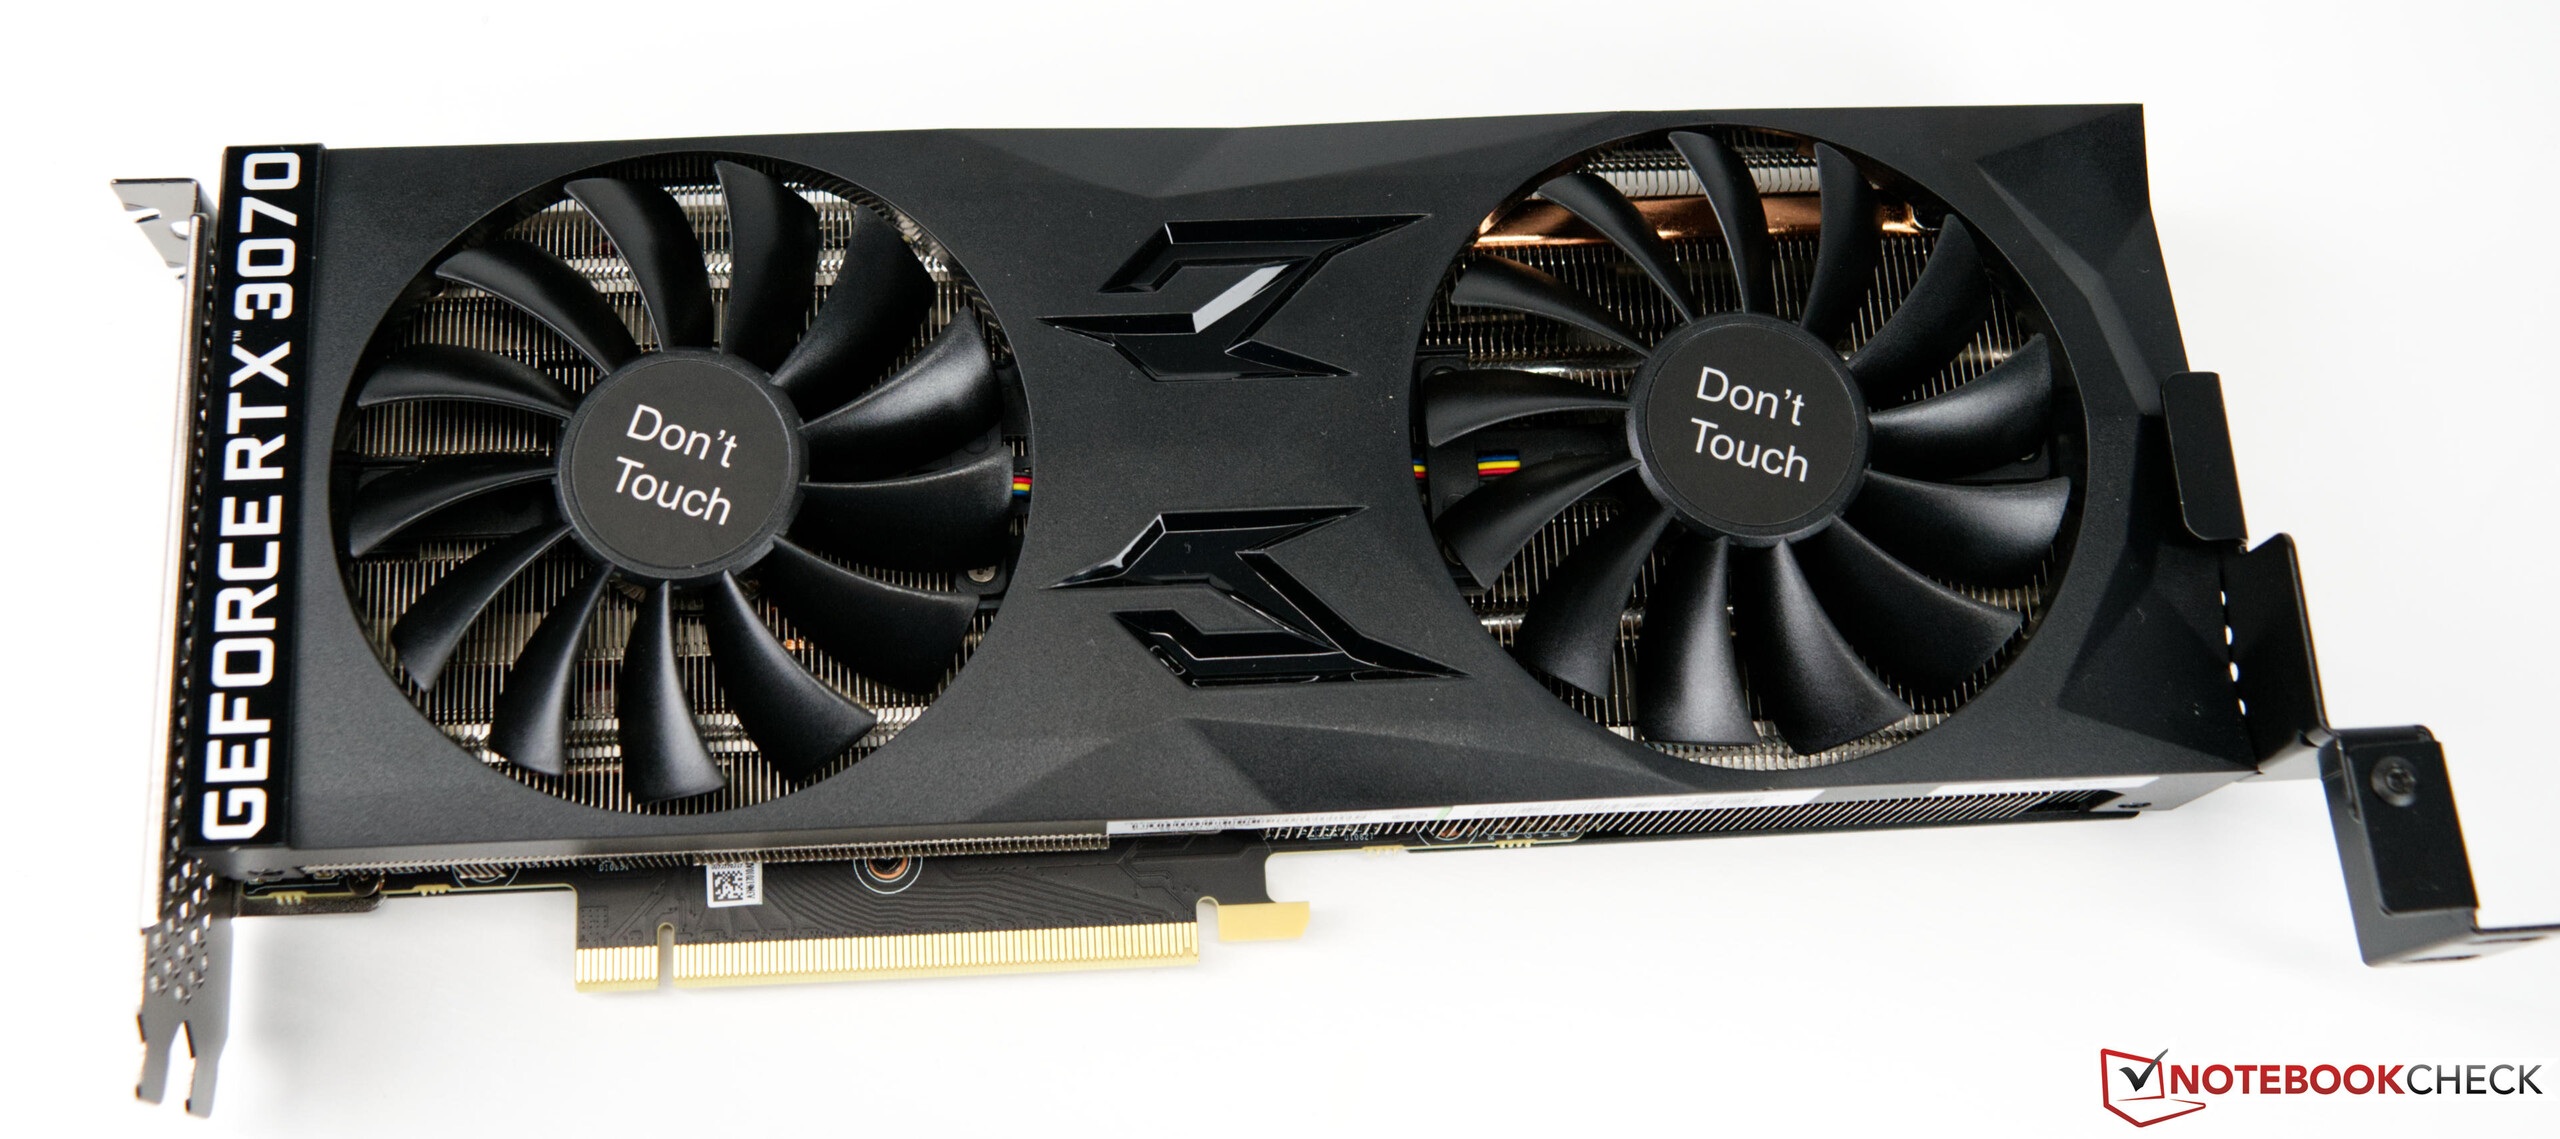
图形卡
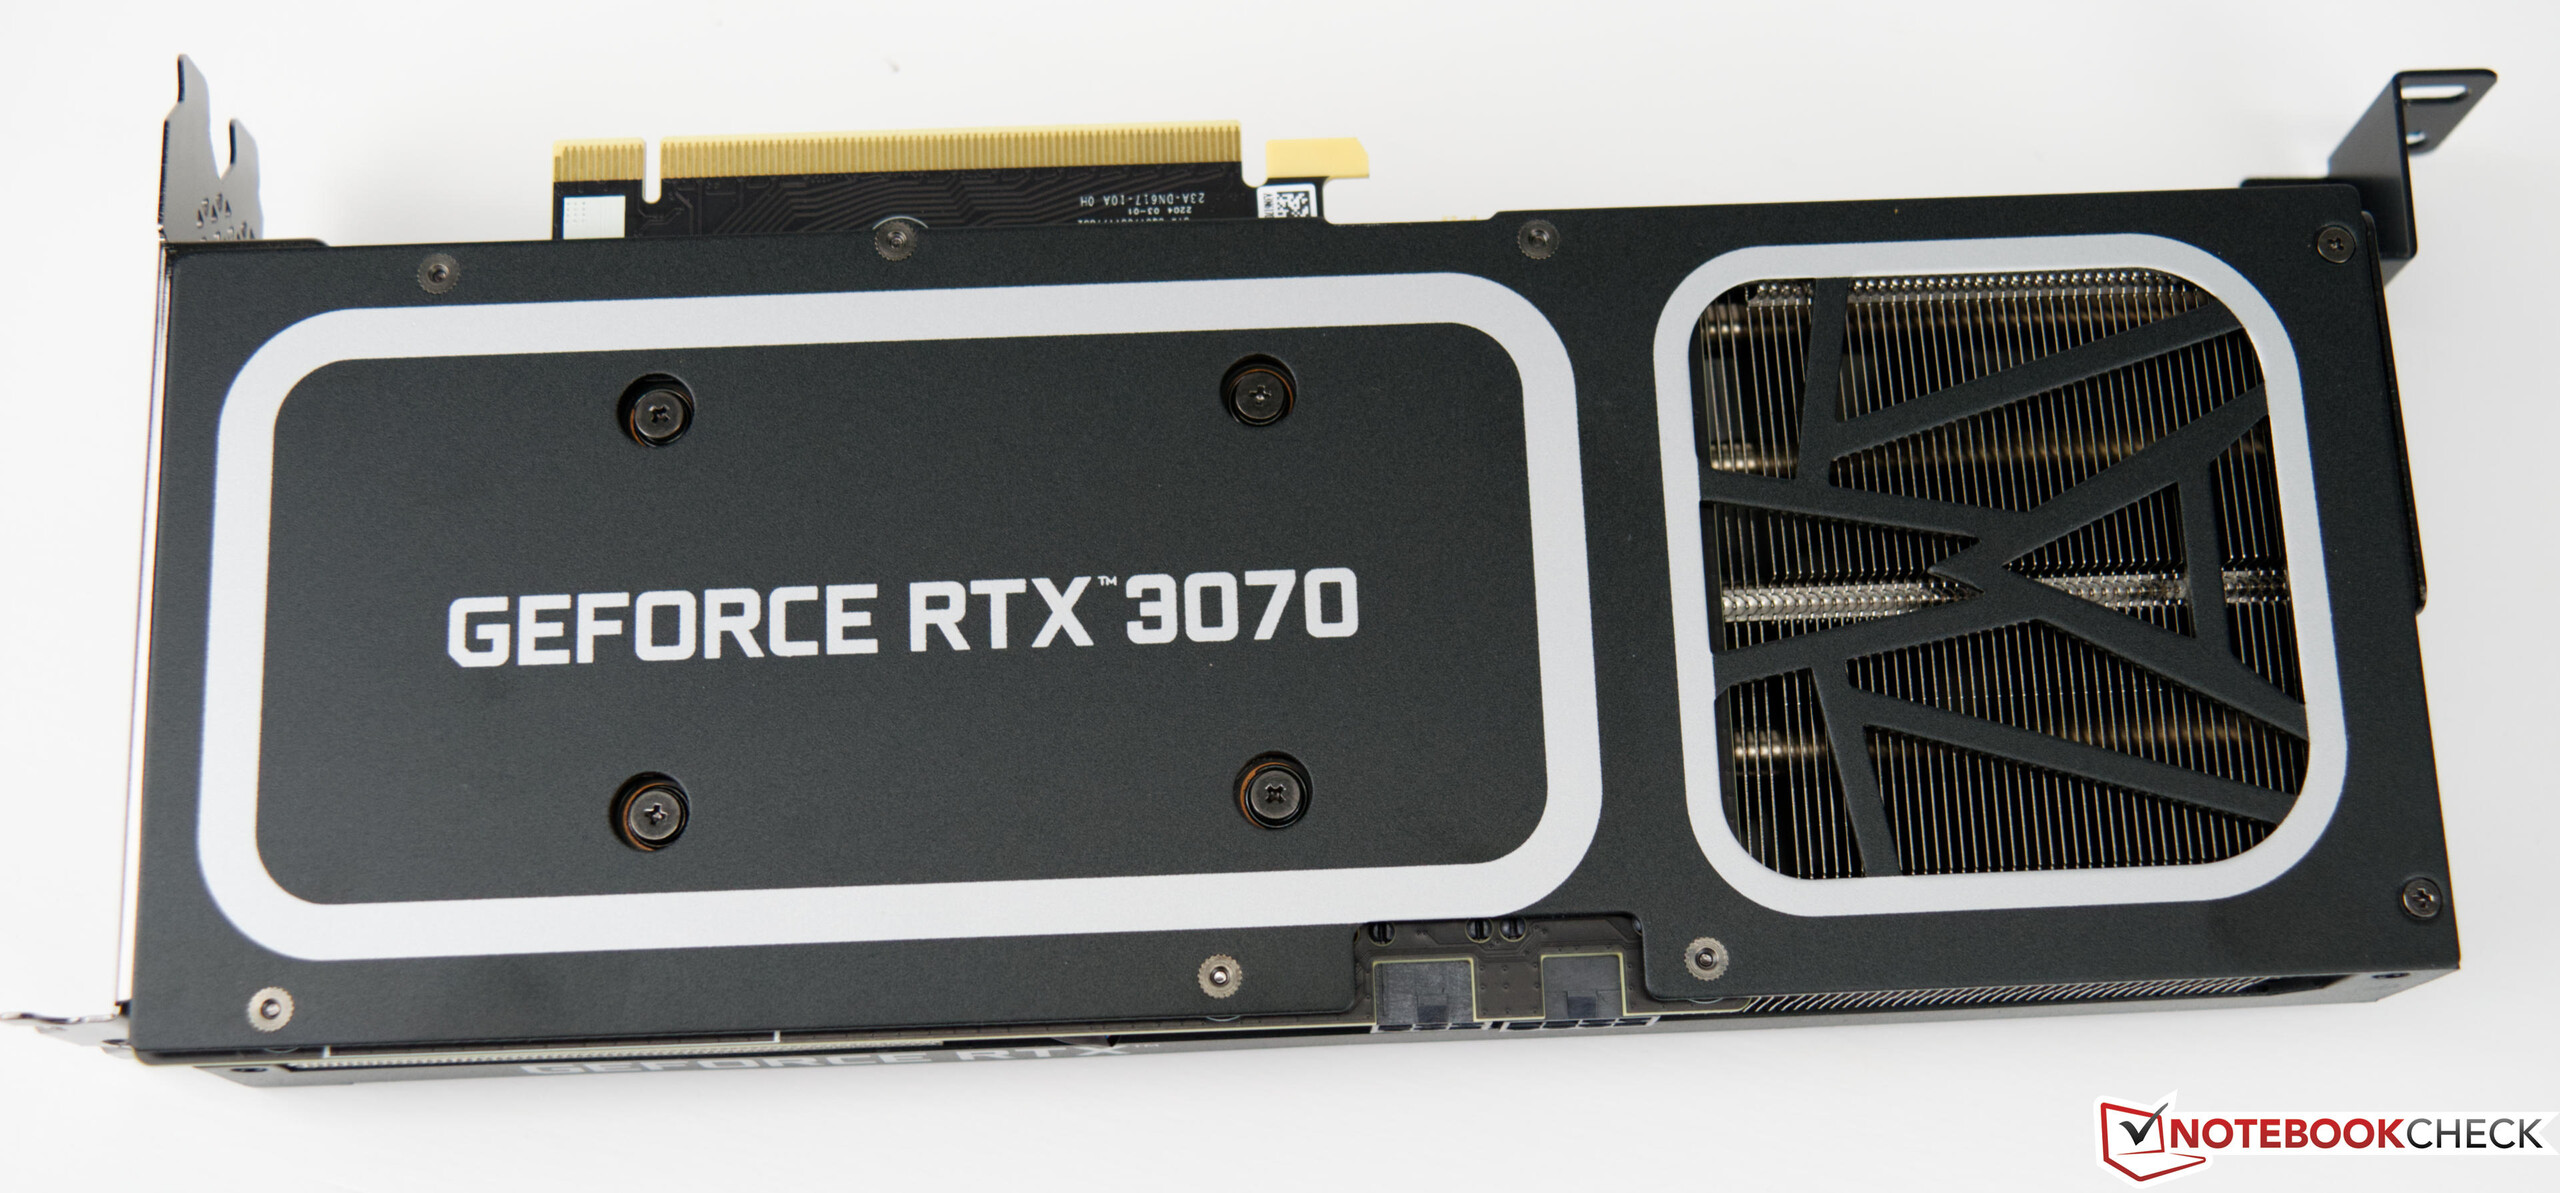
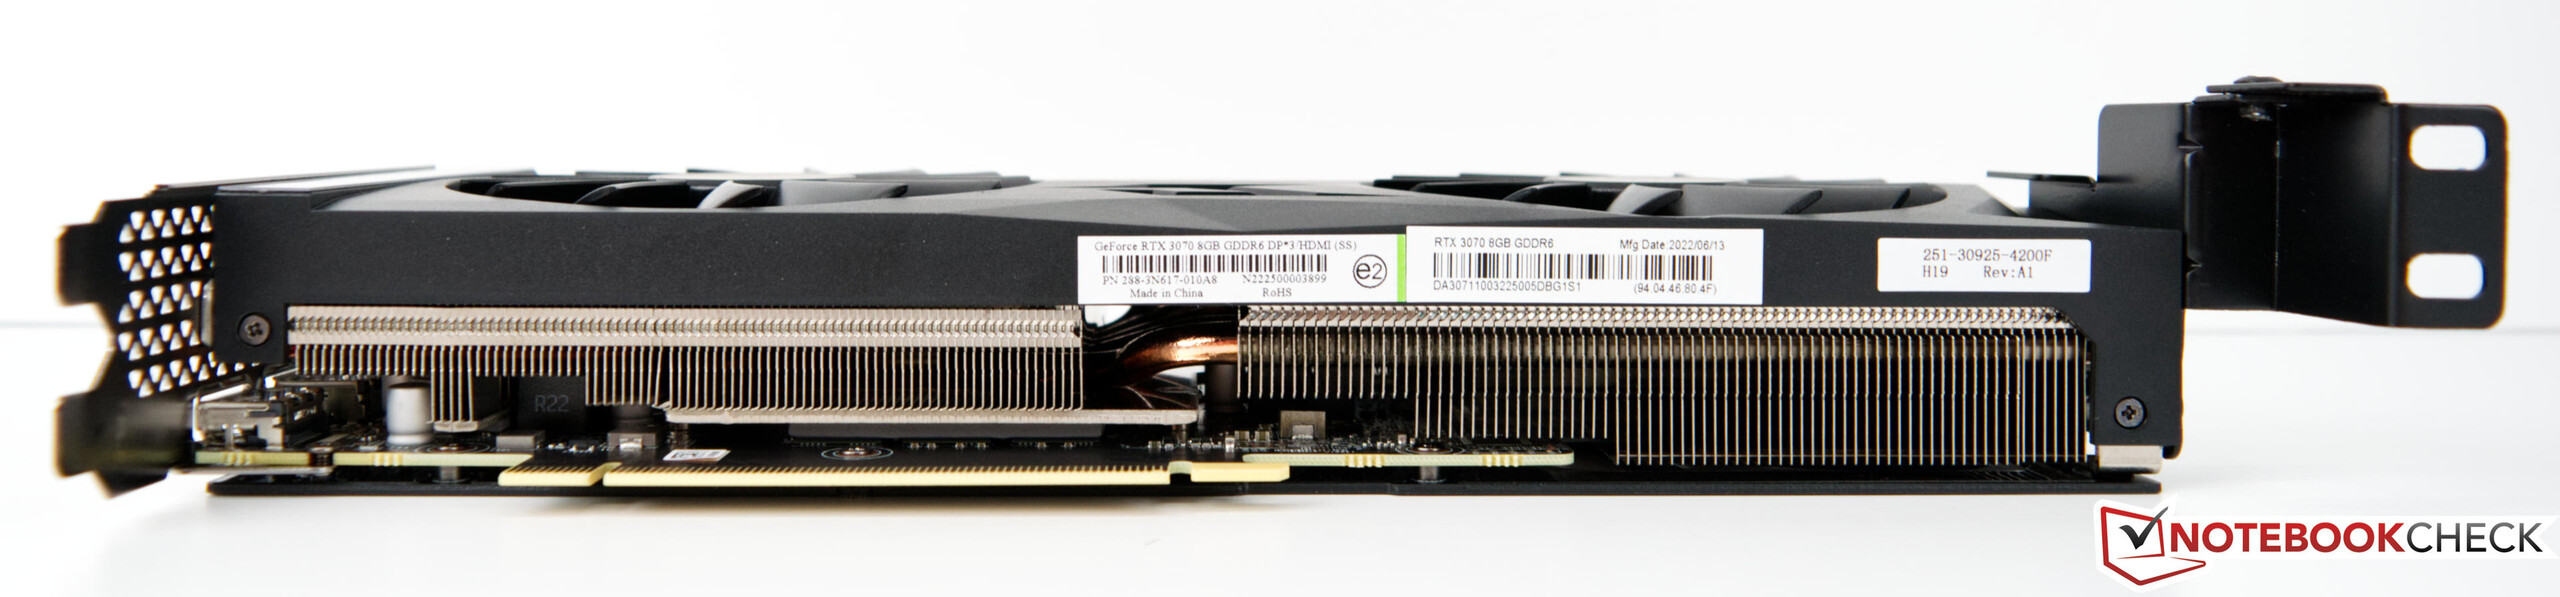
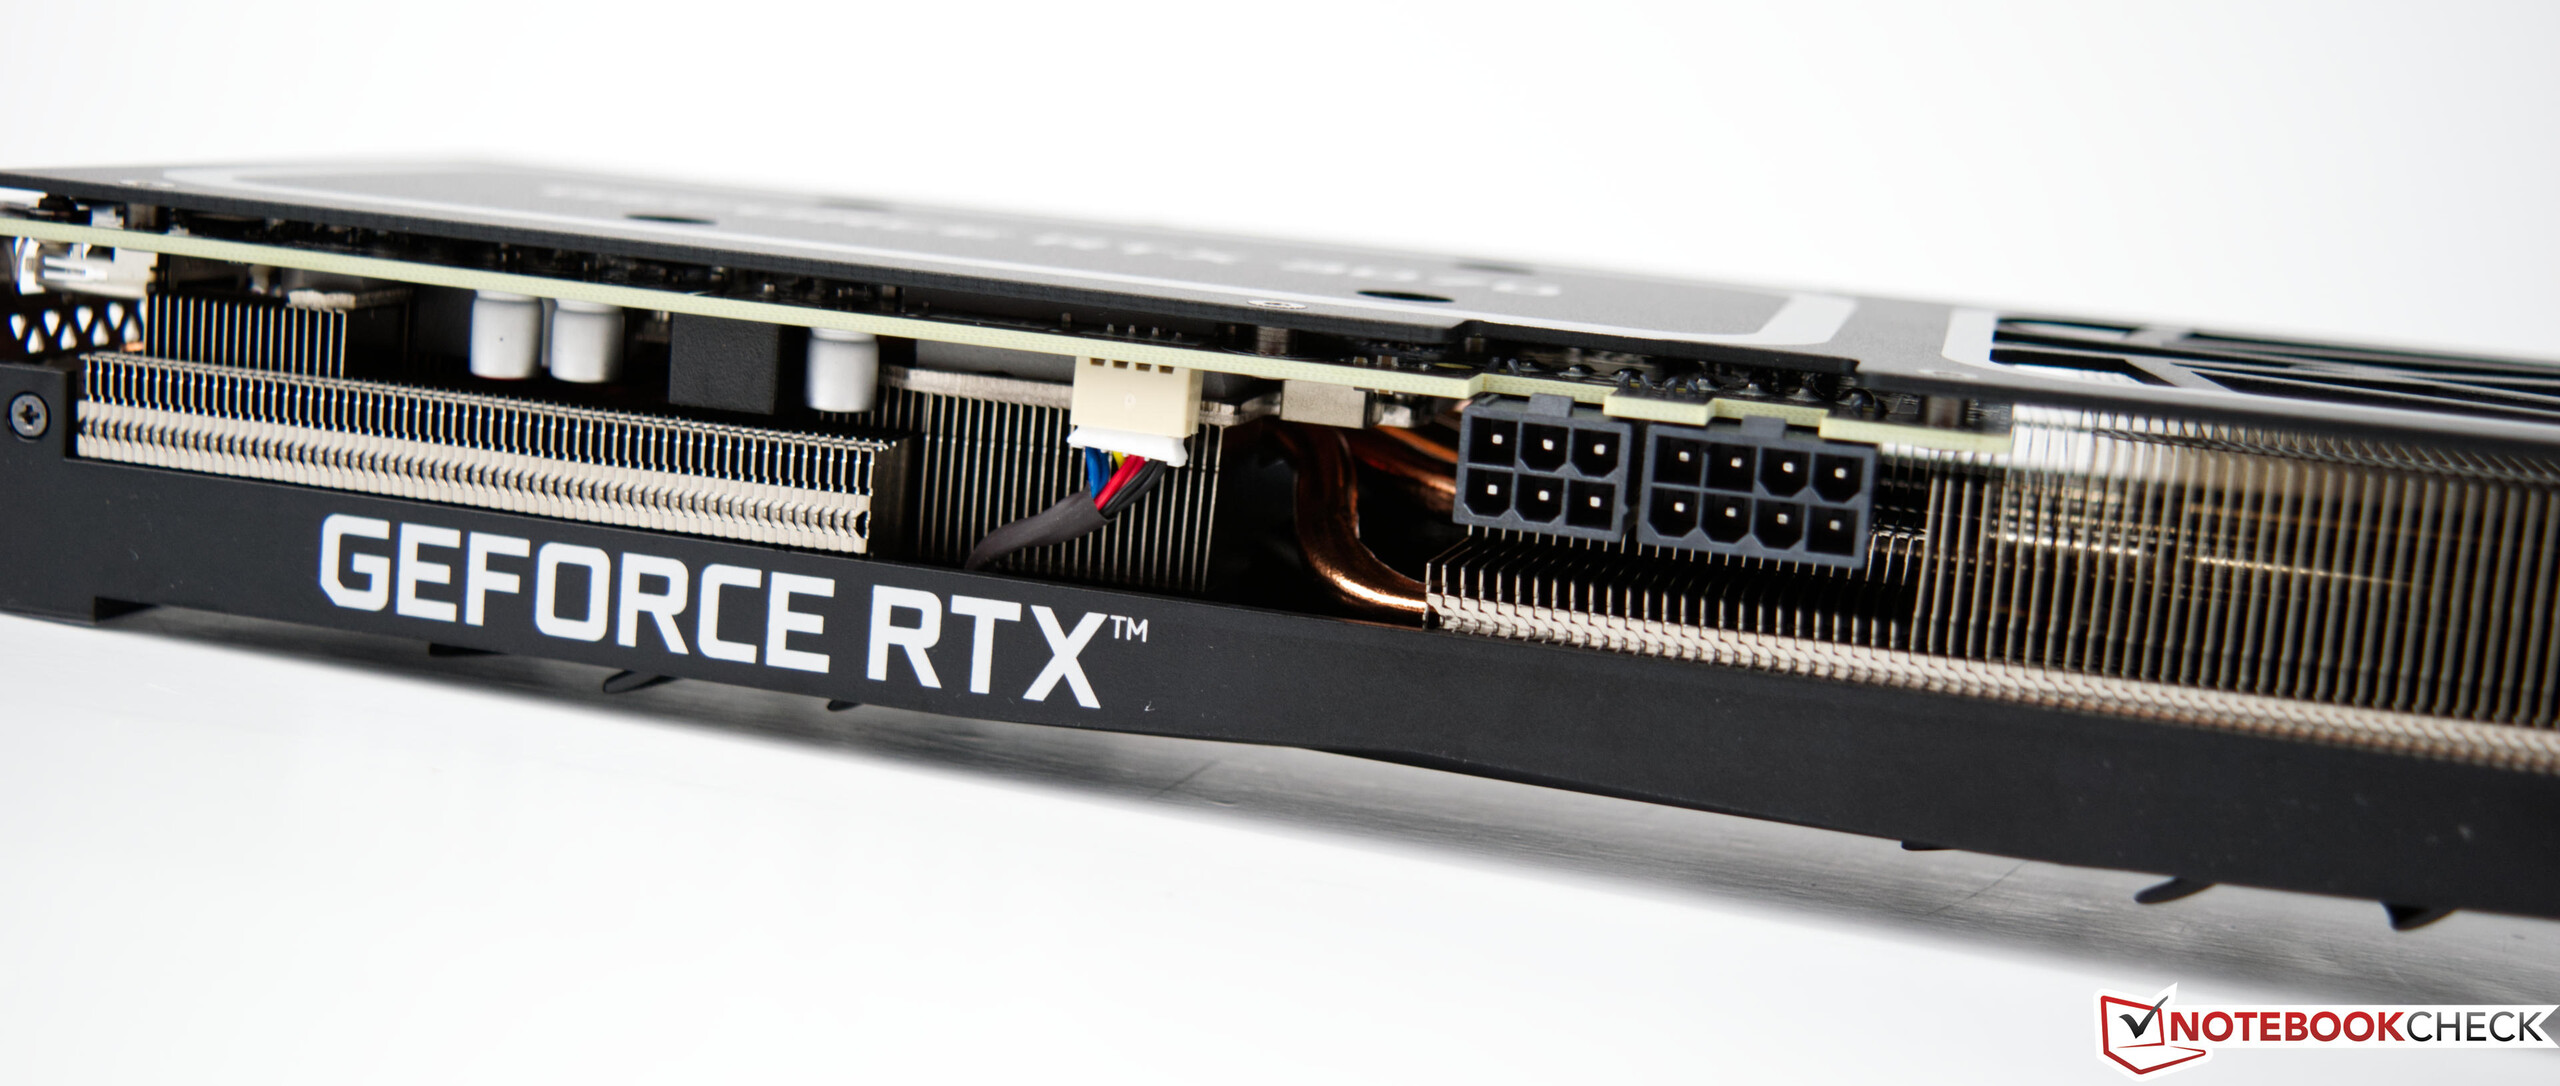
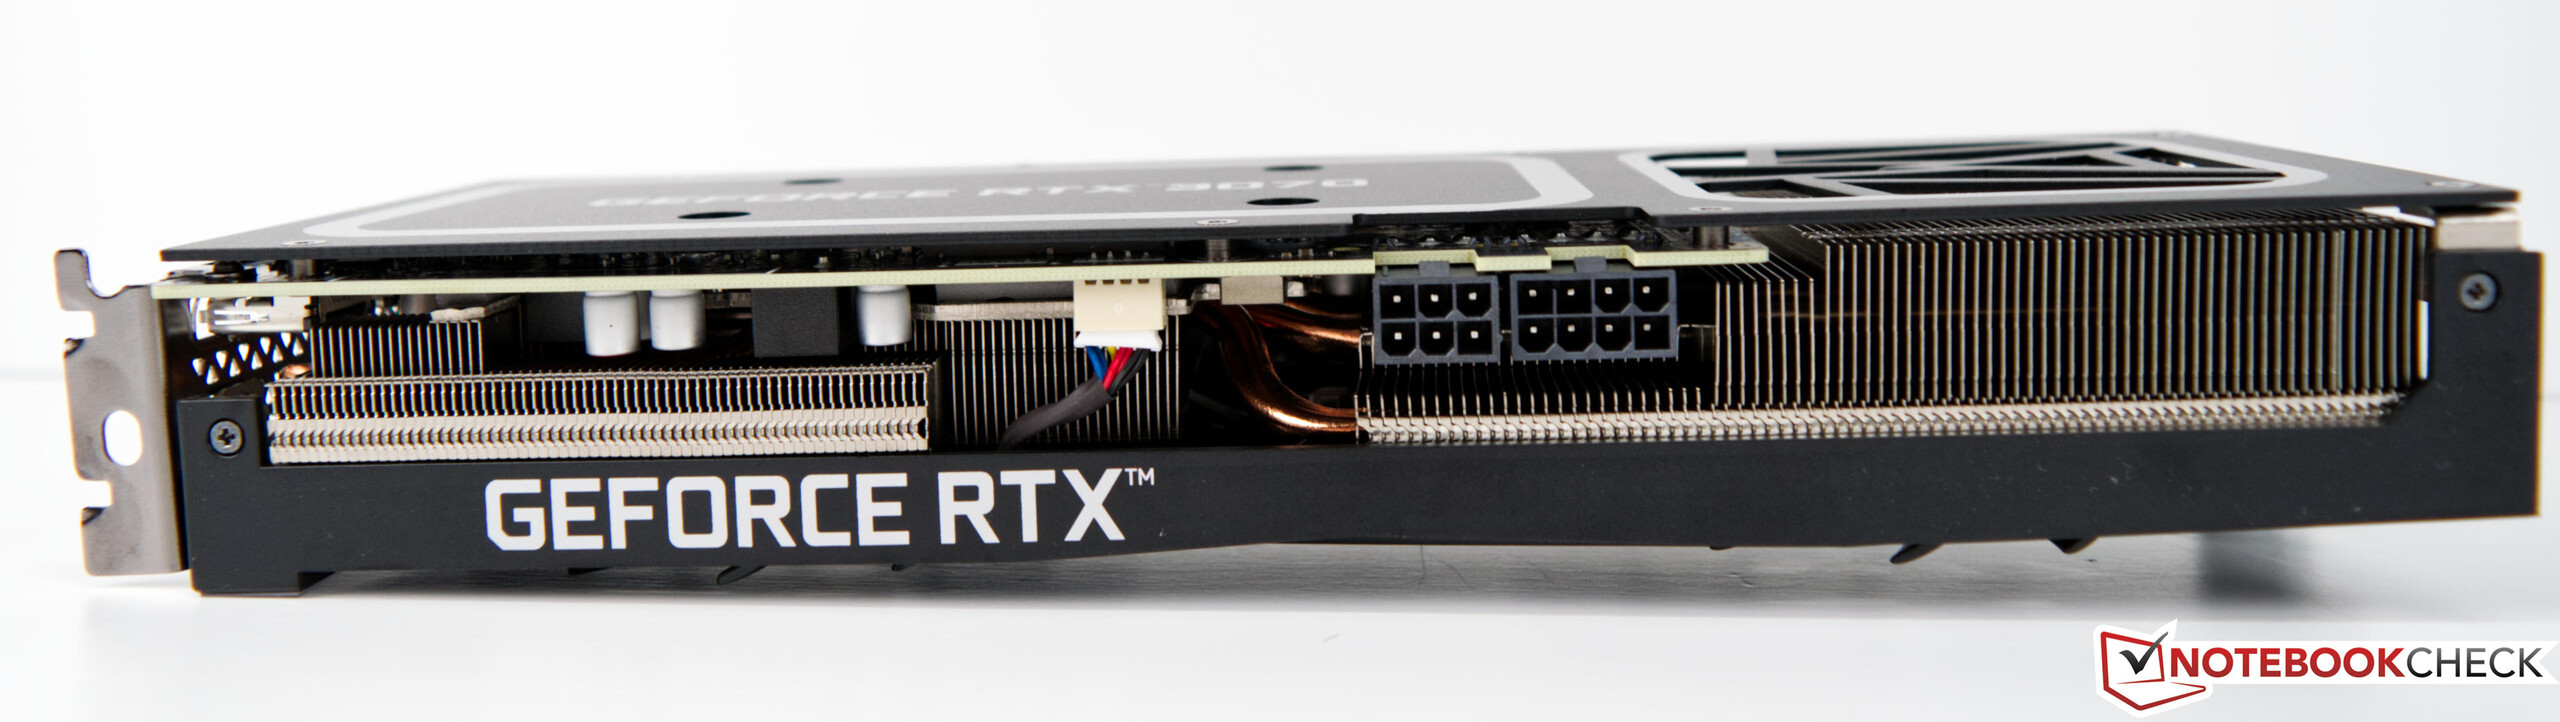
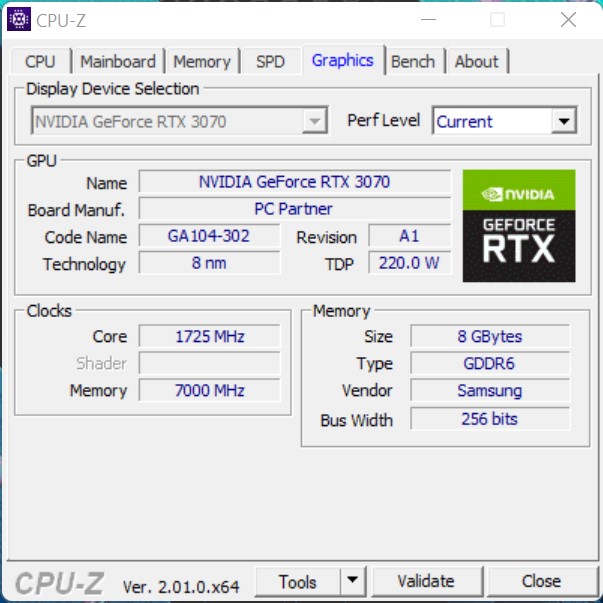
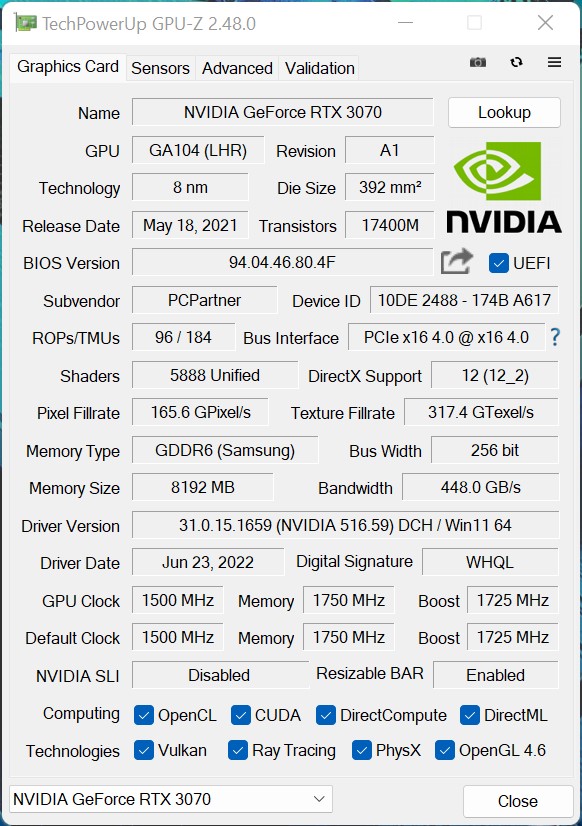
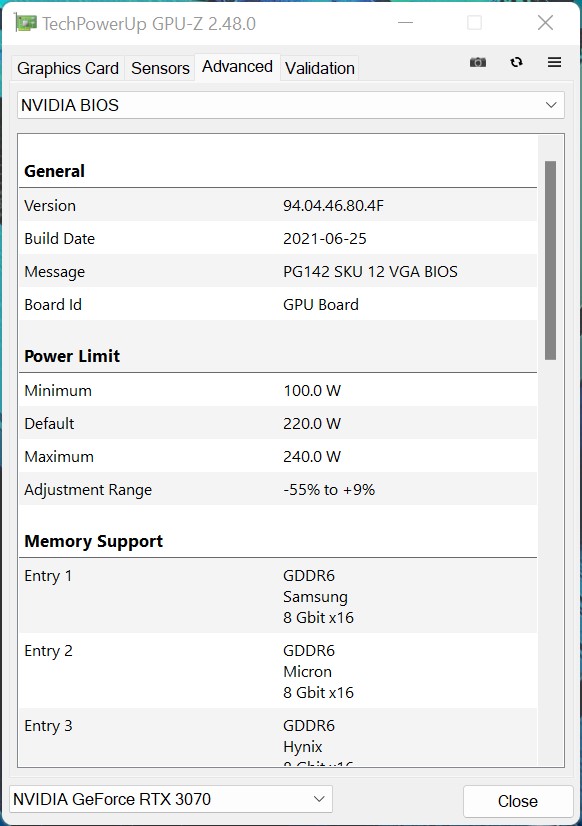
随着 NvidiaGeForce RTX 3070我们有宏碁掠夺者猎户座3000在测试中的最强配置。考虑到有些节制的CPU性能,合成测试中的3D性能变得非常好。GeForce RTX 3070的未知模型完全按照Nvidia给出的规格工作。这意味着GPU时钟为1,500 MHz,在Boost中指定为1,750 MHz。至于VRAM,RTX 3070通常有8GB的GDDR6,安装模型的总功耗为220瓦。与之相比 Zotac Magnus One宏碁掠夺者猎户座3000由于有更好的CPU,可以占上风。
NvidiaGeForce RTX 3070的更多基准测试可以在这里找到这里
| 3DMark Performance rating - Percent | |
| Acer Predator Orion 3000 PO3-640 | |
| MSI GeForce RTX 3070 Ventus 3X | |
| Zotac Magnus One (ECM73070C) | |
| Zotac ZBOX Magnus EN173070C | |
| Zotac MEK Mini (RTX 2070 Super) | |
| Intel Dragon Canyon NUC - RTX 3060 | |
| Intel Beast Canyon NUC | |
| 3DMark 11 - 1280x720 Performance GPU | |
| Acer Predator Orion 3000 PO3-640 | |
| MSI GeForce RTX 3070 Ventus 3X | |
| Zotac Magnus One (ECM73070C) | |
| Zotac ZBOX Magnus EN173070C | |
| Zotac MEK Mini (RTX 2070 Super) | |
| Intel Dragon Canyon NUC - RTX 3060 | |
| Intel Beast Canyon NUC | |
| 3DMark | |
| 1280x720 Cloud Gate Standard Graphics | |
| Acer Predator Orion 3000 PO3-640 | |
| Zotac Magnus One (ECM73070C) | |
| Zotac ZBOX Magnus EN173070C | |
| MSI GeForce RTX 3070 Ventus 3X | |
| Intel Beast Canyon NUC | |
| Zotac MEK Mini (RTX 2070 Super) | |
| Intel Dragon Canyon NUC - RTX 3060 | |
| 1920x1080 Fire Strike Graphics | |
| Acer Predator Orion 3000 PO3-640 | |
| MSI GeForce RTX 3070 Ventus 3X | |
| Zotac Magnus One (ECM73070C) | |
| Zotac ZBOX Magnus EN173070C | |
| Zotac MEK Mini (RTX 2070 Super) | |
| Intel Dragon Canyon NUC - RTX 3060 | |
| Intel Beast Canyon NUC | |
| 2560x1440 Time Spy Graphics | |
| MSI GeForce RTX 3070 Ventus 3X | |
| Acer Predator Orion 3000 PO3-640 | |
| Zotac Magnus One (ECM73070C) | |
| Zotac ZBOX Magnus EN173070C | |
| Zotac MEK Mini (RTX 2070 Super) | |
| Intel Dragon Canyon NUC - RTX 3060 | |
| Intel Beast Canyon NUC | |
| Fire Strike Extreme Graphics | |
| Acer Predator Orion 3000 PO3-640 | |
| MSI GeForce RTX 3070 Ventus 3X | |
| Zotac Magnus One (ECM73070C) | |
| Zotac ZBOX Magnus EN173070C | |
| Zotac MEK Mini (RTX 2070 Super) | |
| Intel Dragon Canyon NUC - RTX 3060 | |
| Intel Beast Canyon NUC | |
| Performance rating - Percent | |
| Acer Predator Orion 3000 PO3-640 | |
| Zotac Magnus One (ECM73070C) | |
| Zotac ZBOX Magnus EN173070C | |
| Intel Dragon Canyon NUC - RTX 3060 | |
| Intel Beast Canyon NUC | |
| Unigine Heaven 4.0 | |
| Extreme Preset OpenGL | |
| Acer Predator Orion 3000 PO3-640 | |
| Zotac Magnus One (ECM73070C) | |
| Zotac ZBOX Magnus EN173070C | |
| Intel Dragon Canyon NUC - RTX 3060 | |
| Intel Beast Canyon NUC | |
| Extreme Preset DX11 | |
| Acer Predator Orion 3000 PO3-640 | |
| Zotac Magnus One (ECM73070C) | |
| Zotac ZBOX Magnus EN173070C | |
| Intel Dragon Canyon NUC - RTX 3060 | |
| Intel Beast Canyon NUC | |
| Unigine Valley 1.0 | |
| 1920x1080 Extreme HD DirectX AA:x8 | |
| Acer Predator Orion 3000 PO3-640 | |
| Zotac Magnus One (ECM73070C) | |
| Zotac ZBOX Magnus EN173070C | |
| Intel Dragon Canyon NUC - RTX 3060 | |
| Intel Beast Canyon NUC | |
| 1920x1080 Extreme HD Preset OpenGL AA:x8 | |
| Acer Predator Orion 3000 PO3-640 | |
| Zotac Magnus One (ECM73070C) | |
| Zotac ZBOX Magnus EN173070C | |
| Intel Dragon Canyon NUC - RTX 3060 | |
| Intel Beast Canyon NUC | |
| Unigine Superposition | |
| 1920x1080 1080p High | |
| Acer Predator Orion 3000 PO3-640 | |
| Zotac Magnus One (ECM73070C) | |
| Zotac ZBOX Magnus EN173070C | |
| Intel Beast Canyon NUC | |
| Intel Dragon Canyon NUC - RTX 3060 | |
| 1920x1080 1080p Extreme | |
| Acer Predator Orion 3000 PO3-640 | |
| Zotac Magnus One (ECM73070C) | |
| Zotac ZBOX Magnus EN173070C | |
| Intel Dragon Canyon NUC - RTX 3060 | |
| Intel Beast Canyon NUC | |
| 3840x2160 4k Optimized | |
| Acer Predator Orion 3000 PO3-640 | |
| Zotac Magnus One (ECM73070C) | |
| Zotac ZBOX Magnus EN173070C | |
| Intel Beast Canyon NUC | |
| Intel Dragon Canyon NUC - RTX 3060 | |
| 3DMark 05 Standard | 58568 points | |
| 3DMark 06 Standard Score | 59134 points | |
| 3DMark Vantage P Result | 91011 points | |
| 3DMark 11 Performance | 36421 points | |
| 3DMark Ice Storm Standard Score | 237580 points | |
| 3DMark Cloud Gate Standard Score | 59231 points | |
| 3DMark Fire Strike Score | 25739 points | |
| 3DMark Fire Strike Extreme Score | 15841 points | |
| 3DMark Time Spy Score | 12665 points | |
Help | ||
游戏性能
宏碁掠夺者猎户座3000在游戏测试中很好地受益于Alder Lake处理器。这提供了非常高的每时钟性能(IPC,每周期指令),这导致了游戏时的体面提升。尽管有TDP的限制,但Predator Orion 3000可以很好地实现这一点,因为游戏往往不总是需要全部的CPU功率。再加上NvidiaGeForce RTX 3070,即使是最新的游戏也可以毫无问题地进行。你应该把自己限制在1440p的最大分辨率,尽管GeForce RTX 3070也可以在2160p的分辨率下掌握许多游戏。对于所有测试的游戏与其他型号相比的性能概述,我们参考了我们的 GPU游戏列表.
| GTA V | |
| 1920x1080 Highest AA:4xMSAA + FX AF:16x | |
| KFA2 GeForce RTX 3080 SG | |
| Acer Predator Orion 3000 PO3-640 | |
| Average NVIDIA GeForce RTX 3070 (91.1 - 122.4, n=5) | |
| Zotac ZBOX Magnus EN173070C | |
| Intel Beast Canyon NUC | |
| Intel Dragon Canyon NUC - RTX 3060 | |
| Zotac Magnus One (ECM73070C) | |
| 1920x1080 High/On (Advanced Graphics Off) AA:2xMSAA + FX AF:8x | |
| KFA2 GeForce RTX 3080 SG | |
| Acer Predator Orion 3000 PO3-640 | |
| Intel Beast Canyon NUC | |
| Intel Dragon Canyon NUC - RTX 3060 | |
| Average NVIDIA GeForce RTX 3070 (157 - 177.7, n=5) | |
| Zotac ZBOX Magnus EN173070C | |
| Zotac Magnus One (ECM73070C) | |
| The Witcher 3 | |
| 1920x1080 High Graphics & Postprocessing (Nvidia HairWorks Off) | |
| KFA2 GeForce RTX 3080 SG | |
| Acer Predator Orion 3000 PO3-640 | |
| Zotac Magnus One (ECM73070C) | |
| Average NVIDIA GeForce RTX 3070 (100 - 264, n=8) | |
| Zotac ZBOX Magnus EN173070C | |
| Intel Dragon Canyon NUC - RTX 3060 | |
| Zotac MEK Mini (RTX 2070 Super) | |
| 1920x1080 Ultra Graphics & Postprocessing (HBAO+) | |
| KFA2 GeForce RTX 3080 SG | |
| Acer Predator Orion 3000 PO3-640 | |
| Zotac Magnus One (ECM73070C) | |
| Average NVIDIA GeForce RTX 3070 (52.8 - 132.2, n=7) | |
| Zotac ZBOX Magnus EN173070C | |
| Zotac MEK Mini (RTX 2070 Super) | |
| Intel Dragon Canyon NUC - RTX 3060 | |
| Far Cry 5 | |
| 1920x1080 Ultra Preset AA:T | |
| KFA2 GeForce RTX 3080 SG | |
| Acer Predator Orion 3000 PO3-640 | |
| Average NVIDIA GeForce RTX 3070 (117 - 143, n=5) | |
| Intel Dragon Canyon NUC - RTX 3060 | |
| Intel Beast Canyon NUC | |
| Zotac ZBOX Magnus EN173070C | |
| Zotac Magnus One (ECM73070C) | |
| Zotac MEK Mini (RTX 2070 Super) | |
| 2560x1440 Ultra Preset AA:T | |
| KFA2 GeForce RTX 3080 SG | |
| Acer Predator Orion 3000 PO3-640 | |
| Average NVIDIA GeForce RTX 3070 (112 - 130, n=5) | |
| Zotac Magnus One (ECM73070C) | |
| Zotac ZBOX Magnus EN173070C | |
| Intel Beast Canyon NUC | |
| Intel Dragon Canyon NUC - RTX 3060 | |
| Zotac MEK Mini (RTX 2070 Super) | |
| Far Cry New Dawn | |
| 2560x1440 Ultra Preset | |
| KFA2 GeForce RTX 3080 SG | |
| Acer Predator Orion 3000 PO3-640 | |
| Average NVIDIA GeForce RTX 3070 (92 - 113, n=4) | |
| Zotac Magnus One (ECM73070C) | |
| Intel Dragon Canyon NUC - RTX 3060 | |
| Zotac ZBOX Magnus EN173070C | |
| Intel Beast Canyon NUC | |
| Zotac MEK Mini (RTX 2070 Super) | |
| 1920x1080 Ultra Preset | |
| Acer Predator Orion 3000 PO3-640 | |
| KFA2 GeForce RTX 3080 SG | |
| Intel Dragon Canyon NUC - RTX 3060 | |
| Average NVIDIA GeForce RTX 3070 (95 - 121, n=4) | |
| Intel Beast Canyon NUC | |
| Zotac ZBOX Magnus EN173070C | |
| Zotac Magnus One (ECM73070C) | |
| Zotac MEK Mini (RTX 2070 Super) | |
| Strange Brigade | |
| 2560x1440 ultra AA:ultra AF:16 | |
| KFA2 GeForce RTX 3080 SG | |
| Acer Predator Orion 3000 PO3-640 | |
| Average NVIDIA GeForce RTX 3070 (165 - 181.1, n=5) | |
| Zotac Magnus One (ECM73070C) | |
| Zotac ZBOX Magnus EN173070C | |
| Intel Beast Canyon NUC | |
| Intel Dragon Canyon NUC - RTX 3060 | |
| 1920x1080 ultra AA:ultra AF:16 | |
| KFA2 GeForce RTX 3080 SG | |
| Acer Predator Orion 3000 PO3-640 | |
| Average NVIDIA GeForce RTX 3070 (222 - 245, n=5) | |
| Zotac Magnus One (ECM73070C) | |
| Zotac ZBOX Magnus EN173070C | |
| Intel Beast Canyon NUC | |
| Intel Dragon Canyon NUC - RTX 3060 | |
| Borderlands 3 | |
| 2560x1440 Badass Overall Quality (DX11) | |
| KFA2 GeForce RTX 3080 SG | |
| Acer Predator Orion 3000 PO3-640 | |
| Average NVIDIA GeForce RTX 3070 (75.1 - 82.9, n=5) | |
| Zotac Magnus One (ECM73070C) | |
| Intel Beast Canyon NUC | |
| Zotac ZBOX Magnus EN173070C | |
| Intel Dragon Canyon NUC - RTX 3060 | |
| Zotac MEK Mini (RTX 2070 Super) | |
| 1920x1080 Badass Overall Quality (DX11) | |
| KFA2 GeForce RTX 3080 SG | |
| Acer Predator Orion 3000 PO3-640 | |
| Average NVIDIA GeForce RTX 3070 (95.3 - 108.9, n=5) | |
| Intel Beast Canyon NUC | |
| Zotac Magnus One (ECM73070C) | |
| Intel Dragon Canyon NUC - RTX 3060 | |
| Zotac ZBOX Magnus EN173070C | |
| Zotac MEK Mini (RTX 2070 Super) | |
| Metro Exodus | |
| 1920x1080 Ultra Quality AF:16x | |
| KFA2 GeForce RTX 3080 SG | |
| Acer Predator Orion 3000 PO3-640 | |
| Average NVIDIA GeForce RTX 3070 (91.3 - 97.7, n=5) | |
| Zotac Magnus One (ECM73070C) | |
| Zotac ZBOX Magnus EN173070C | |
| Zotac MEK Mini (RTX 2070 Super) | |
| Intel Dragon Canyon NUC - RTX 3060 | |
| Intel Beast Canyon NUC | |
| 2560x1440 Ultra Quality AF:16x | |
| KFA2 GeForce RTX 3080 SG | |
| Acer Predator Orion 3000 PO3-640 | |
| Zotac Magnus One (ECM73070C) | |
| Average NVIDIA GeForce RTX 3070 (74.4 - 78.3, n=5) | |
| Zotac ZBOX Magnus EN173070C | |
| Zotac MEK Mini (RTX 2070 Super) | |
| Intel Dragon Canyon NUC - RTX 3060 | |
| Intel Beast Canyon NUC | |
| low | med. | high | ultra | QHD | 4K | |
|---|---|---|---|---|---|---|
| GTA V (2015) | 184.7 | 181.6 | 177.7 | 122.4 | 113.1 | 125.9 |
| The Witcher 3 (2015) | 507 | 408 | 264 | 132.2 | 93.9 | |
| Dota 2 Reborn (2015) | 146.5 | 133.9 | 129.3 | 121.4 | 122.7 | |
| Rise of the Tomb Raider (2016) | 376 | 266 | 182.9 | 153.7 | 76.7 | |
| Final Fantasy XV Benchmark (2018) | 195.8 | 172.3 | 129.7 | 99.3 | 58.2 | |
| X-Plane 11.11 (2018) | 150.6 | 137.4 | 111.3 | 98.4 | ||
| Far Cry 5 (2018) | 179 | 159 | 151 | 141 | 125 | 72 |
| Strange Brigade (2018) | 466 | 328 | 268 | 233 | 173.2 | 98.7 |
| Shadow of the Tomb Raider (2018) | 194.8 | 173.8 | 166.8 | 157.1 | 114.8 | 62.6 |
| Far Cry New Dawn (2019) | 162 | 140 | 135 | 121 | 113 | 74 |
| Metro Exodus (2019) | 224 | 156.8 | 121.9 | 97.7 | 78.3 | 49.7 |
| Anno 1800 (2019) | 167.5 | 164.1 | 130.8 | 74.7 | 69.3 | 41.8 |
| Control (2019) | 240 | 167.7 | 124.9 | 81.3 | 40.6 | |
| Borderlands 3 (2019) | 171.5 | 144.7 | 127.9 | 108.9 | 82.9 | 46.3 |
| F1 2020 (2020) | 351 | 302 | 288 | 215 | 162.2 | 92.7 |
| Watch Dogs Legion (2020) | 125 | 123 | 109 | 89 | 67 | 37 |
| Dirt 5 (2020) | 248.1 | 191.8 | 157 | 122.1 | 99 | 65.3 |
| F1 2021 (2021) | 407 | 361 | 304 | 158 | 118 | 67.3 |
| New World (2021) | 166.9 | 139.5 | 128.3 | 117.5 | 95 | 48.9 |
| Far Cry 6 (2021) | 154.9 | 138.3 | 121.1 | 114.2 | 95.9 | 26.4 |
| Forza Horizon 5 (2021) | 247 | 171 | 160 | 115 | 100 | 73 |
| God of War (2022) | 142.3 | 140.5 | 117.8 | 83.5 | 69.3 | 49.8 |
| GRID Legends (2022) | 249 | 224 | 198 | 151 | 127 | 84 |
| Cyberpunk 2077 1.6 (2022) | 146.7 | 145.1 | 136 | 90.3 | 60.6 | 29 |
| Tiny Tina's Wonderlands (2022) | 248 | 204 | 145.8 | 113.9 | 80.7 | 44.4 |
| F1 22 (2022) | 258 | 249 | 228 | 81 | 52 | 25 |
排放--冷却系统较弱
噪声排放
Acer Predator Orion 3000的冷却系统由前面的一个风扇和后面的一个风扇组成,前者负责吸入新鲜空气,后者负责将热空气输送到机箱外。从理论上讲,这听起来很不错,但在实践中,事实证明这并不是最佳选择。宏碁限制捕食者猎户座3000的处理器的最大功耗不是没有原因的。然而,尽管CPU冷却器很小,但这台电脑在测试中并不显眼,空闲时只有31.6分贝(A)。该系统在负载下也比较安静,在压力测试中达到约38 dB(A)。然而,如果我们让风扇全速运转(通过Predator Sense游戏模式),我们的测量设备显示为54分贝(A)。
Noise level
| Idle |
| 31.5 / 31.6 / 31.6 dB(A) |
| Load |
| 32.7 / 38.1 dB(A) |
 | ||
30 dB silent 40 dB(A) audible 50 dB(A) loud |
||
min: | ||
| Acer Predator Orion 3000 PO3-640 i7-12700F, GeForce RTX 3070 | Zotac Magnus One (ECM73070C) i7-10700, GeForce RTX 3070 | Zotac ZBOX Magnus EN173070C i7-11800H, GeForce RTX 3070 Laptop GPU | Intel Dragon Canyon NUC - RTX 3060 i9-12900, GeForce RTX 3060 | |
|---|---|---|---|---|
| Noise | -18% | -10% | -2% | |
| off / environment * (dB) | 29.8 | 30 -1% | 30.7 -3% | 30.2 -1% |
| Idle Minimum * (dB) | 31.5 | 33.58 -7% | 32.7 -4% | 30.2 4% |
| Idle Average * (dB) | 31.6 | 32.8 -4% | 30.4 4% | |
| Idle Maximum * (dB) | 31.6 | 32.8 -4% | 30.8 3% | |
| Load Average * (dB) | 32.7 | 44.25 -35% | 41.7 -28% | |
| Load Maximum * (dB) | 38.1 | 48.72 -28% | 45.4 -19% | 45.1 -18% |
* ... smaller is better
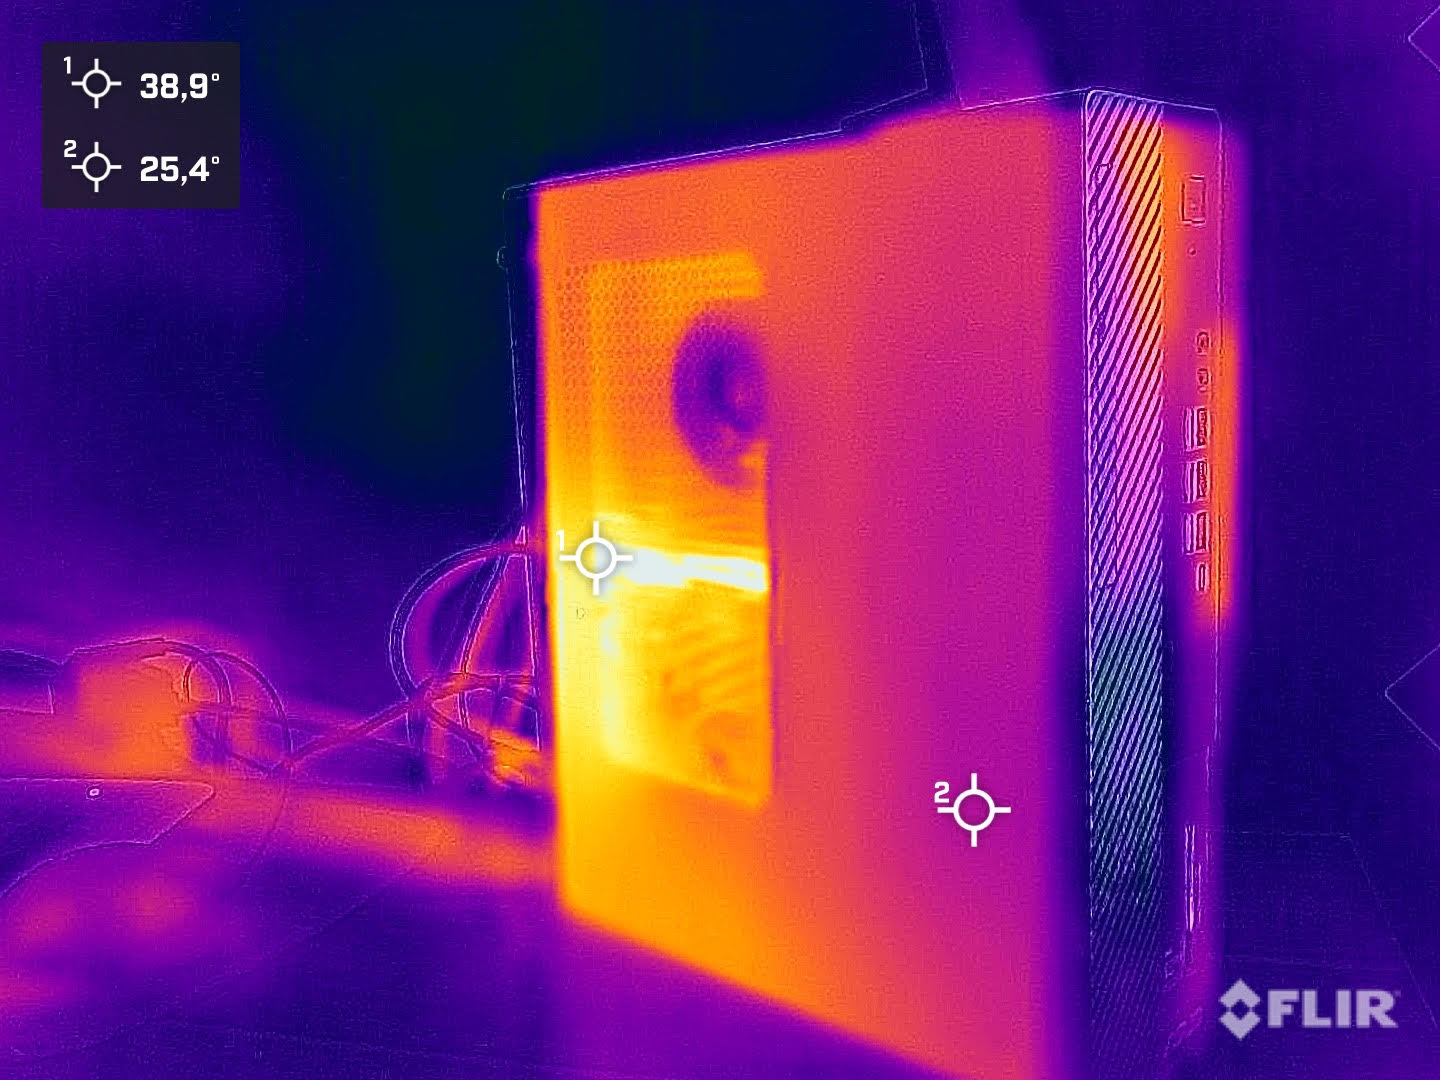
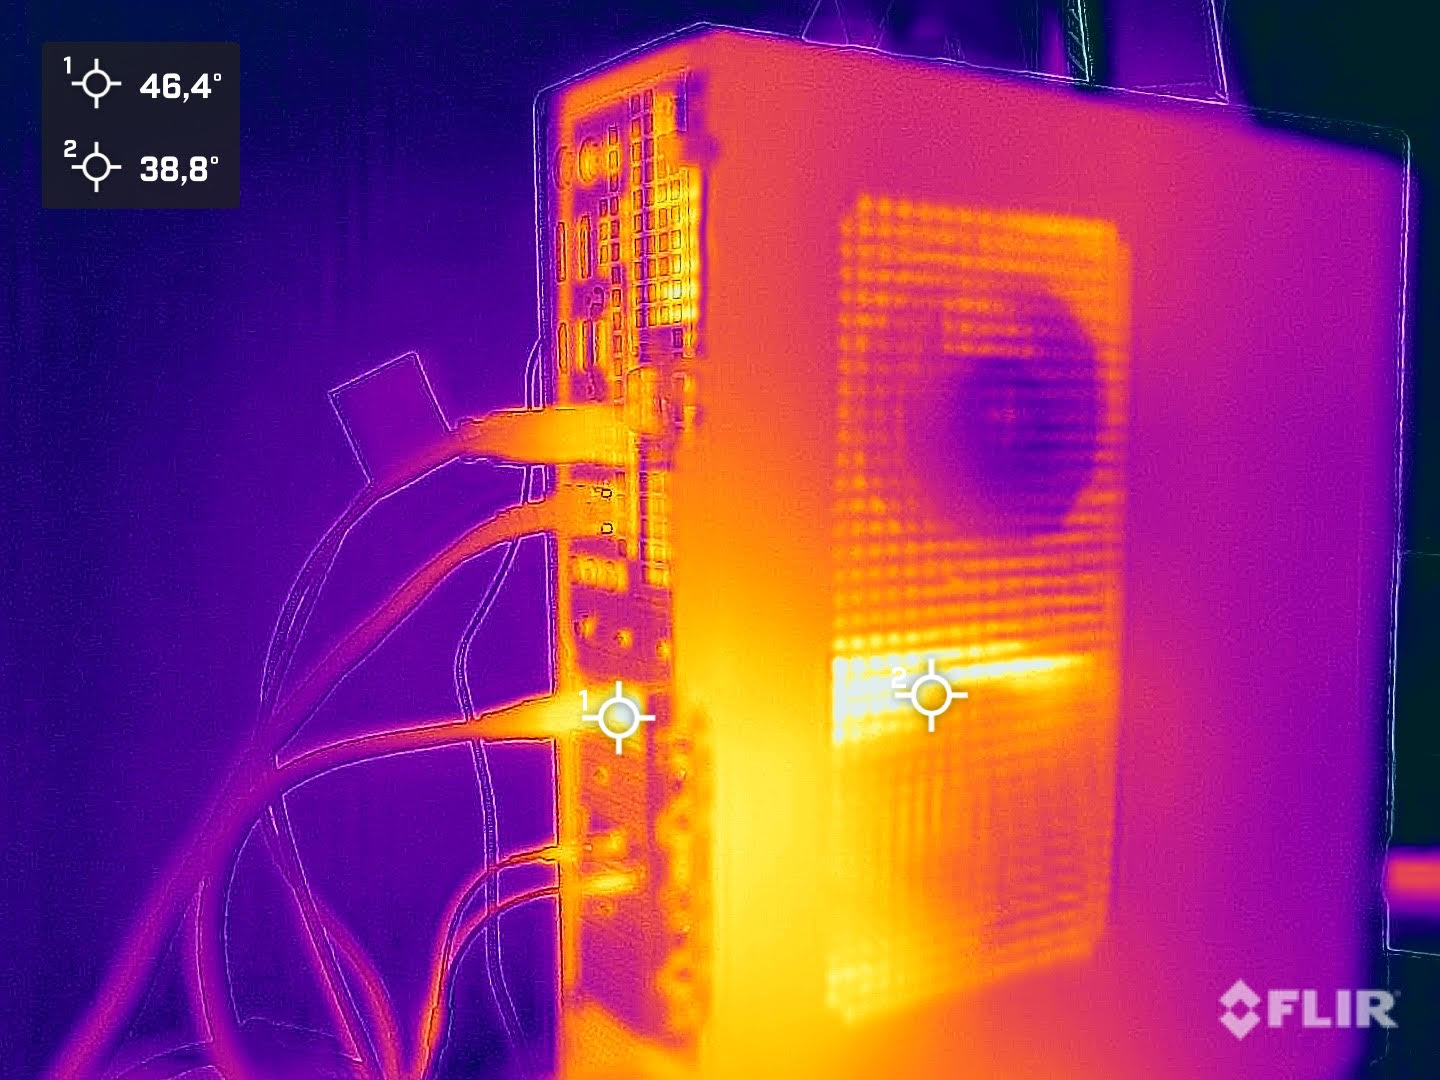
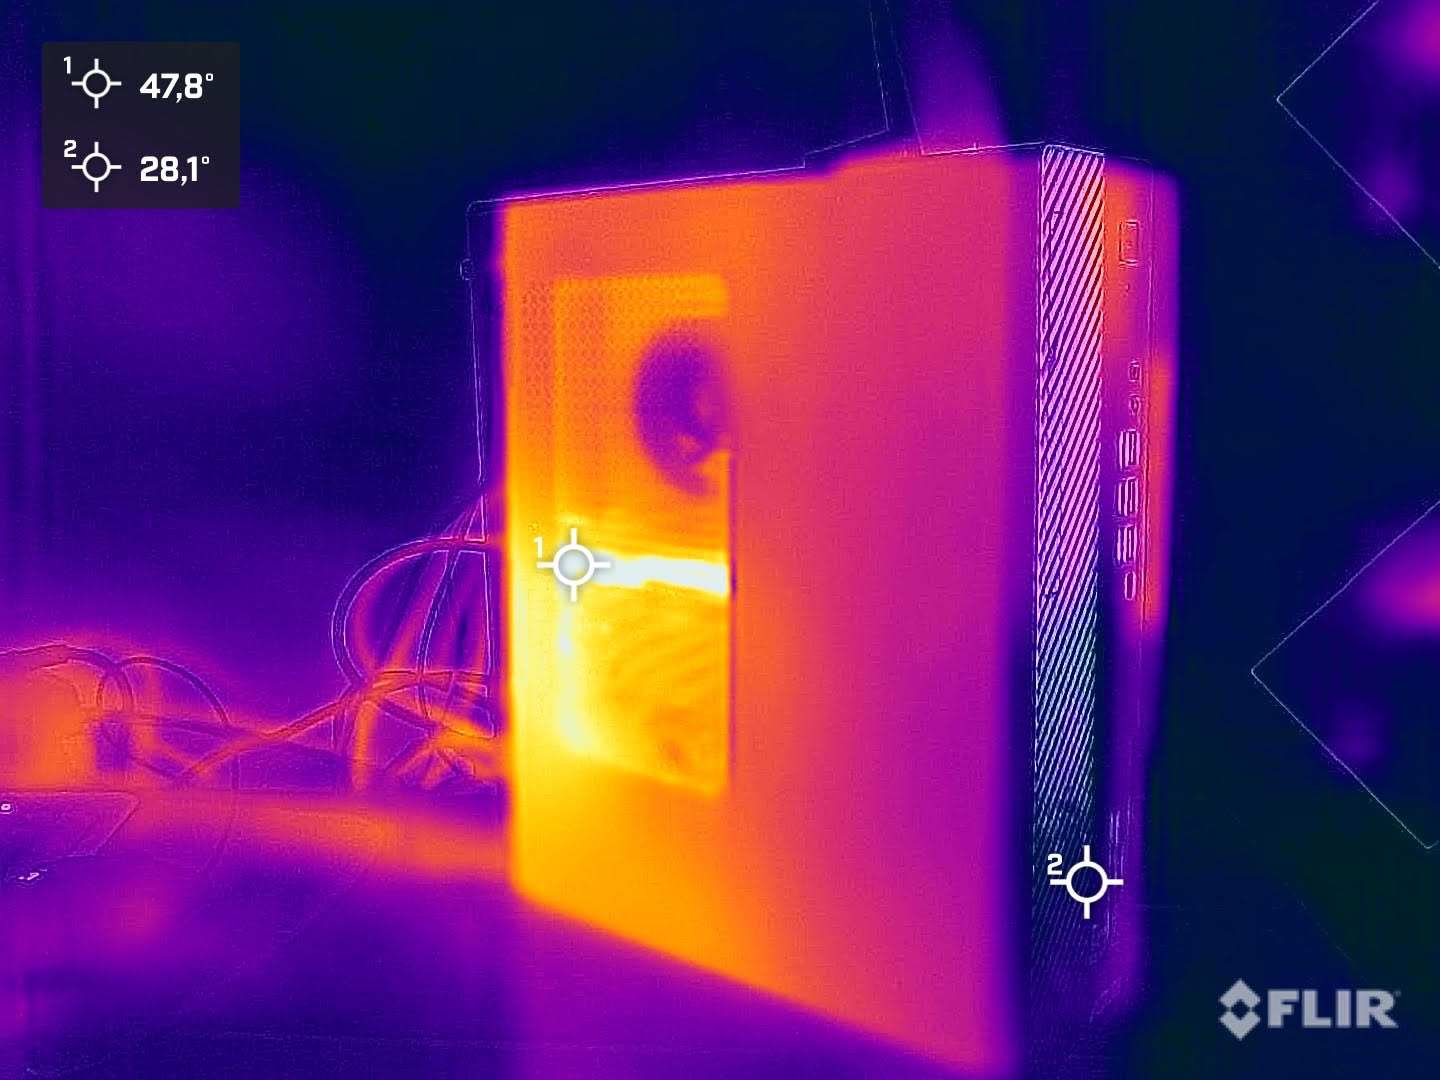
温度
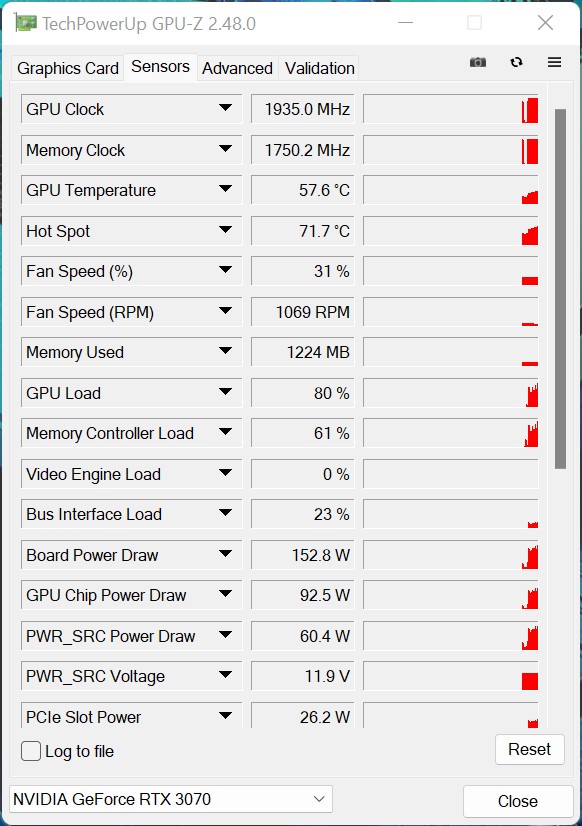
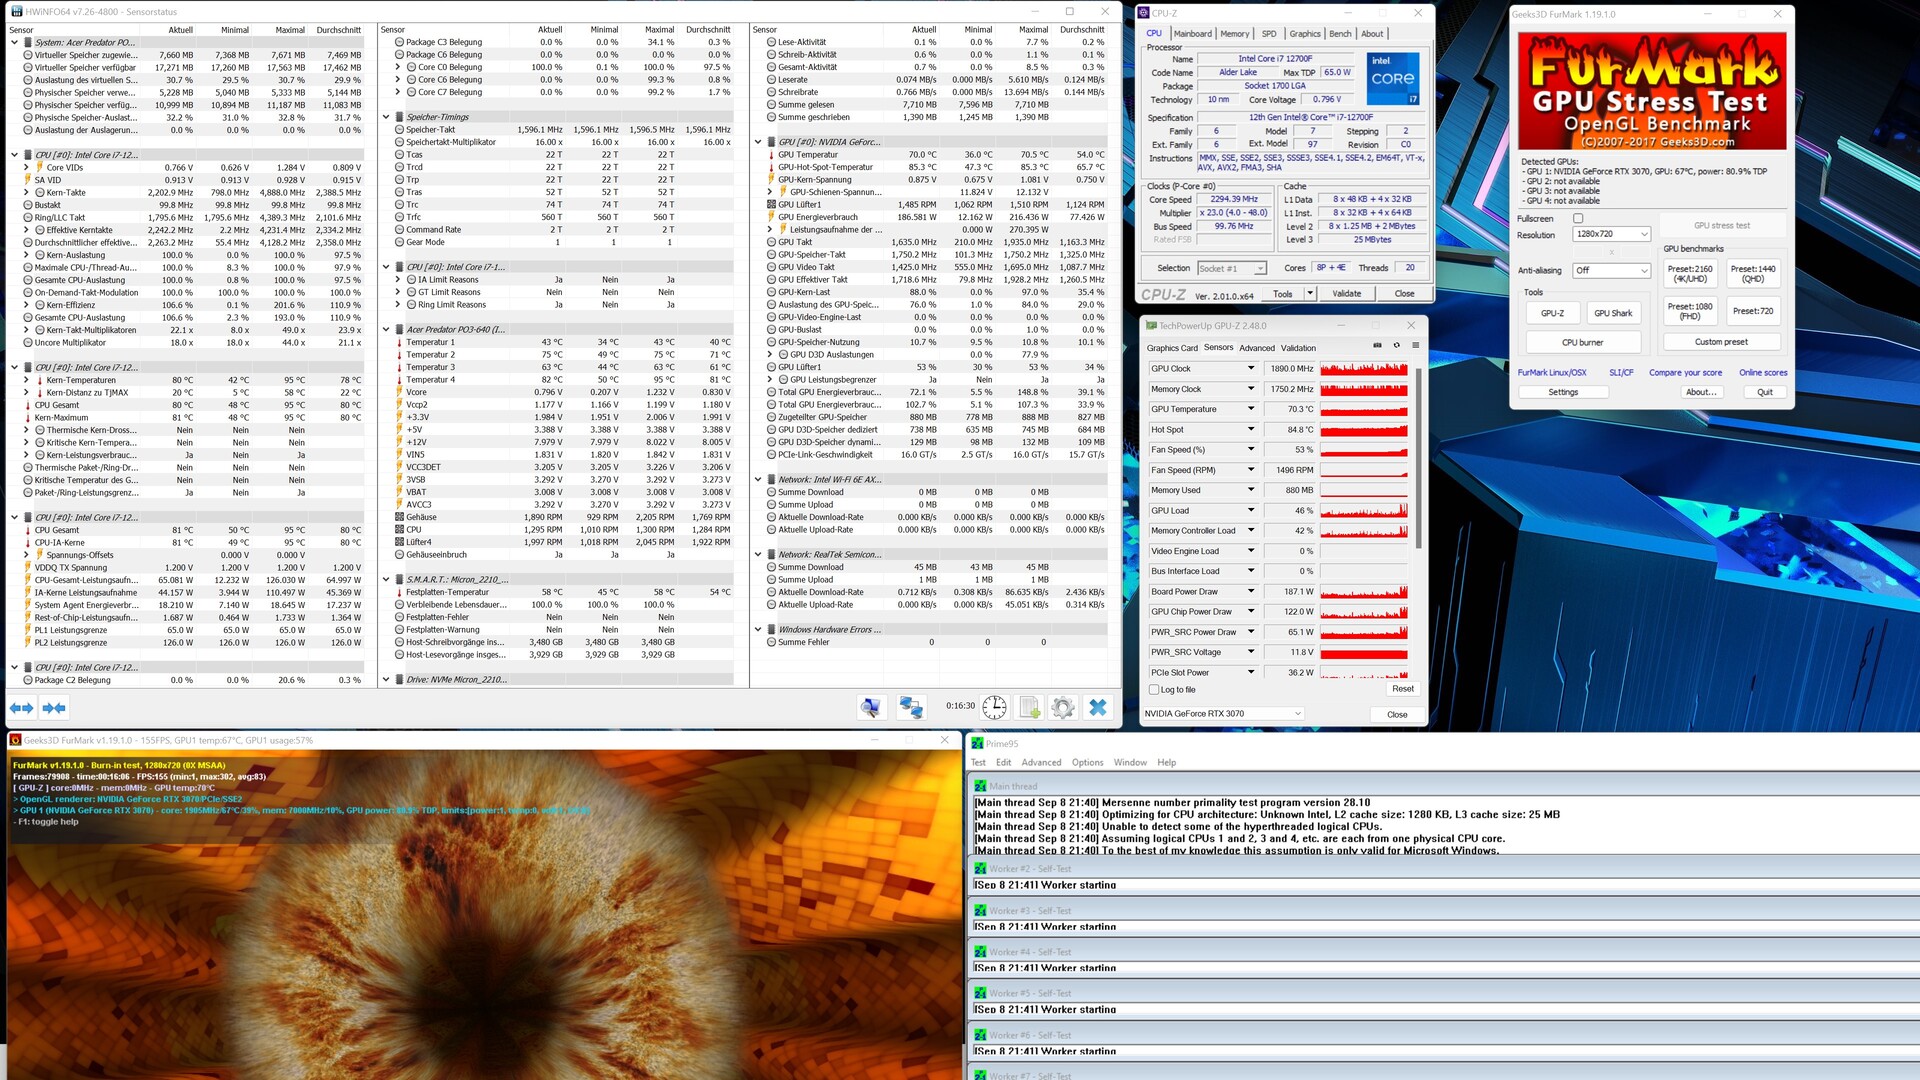
宏碁捕食者猎户座3000的机箱在负载下有点发热,但这并不是什么问题。另一方面,背面的单个风扇将非常热的空气从机箱中铲出。在这里,向顶部增加一个散热装置会更加有效。我们注意到处理器在负载下的最高值为98℃。这表明宏碁已经达到了所安装的冷却系统的极限,即使是 英特尔酷睿i7-12700F仍有储备。尽管如此,Predator Orion 3000仍然可以在测试中提供良好的性能。GPU的最高温度要低得多,为70.5℃。
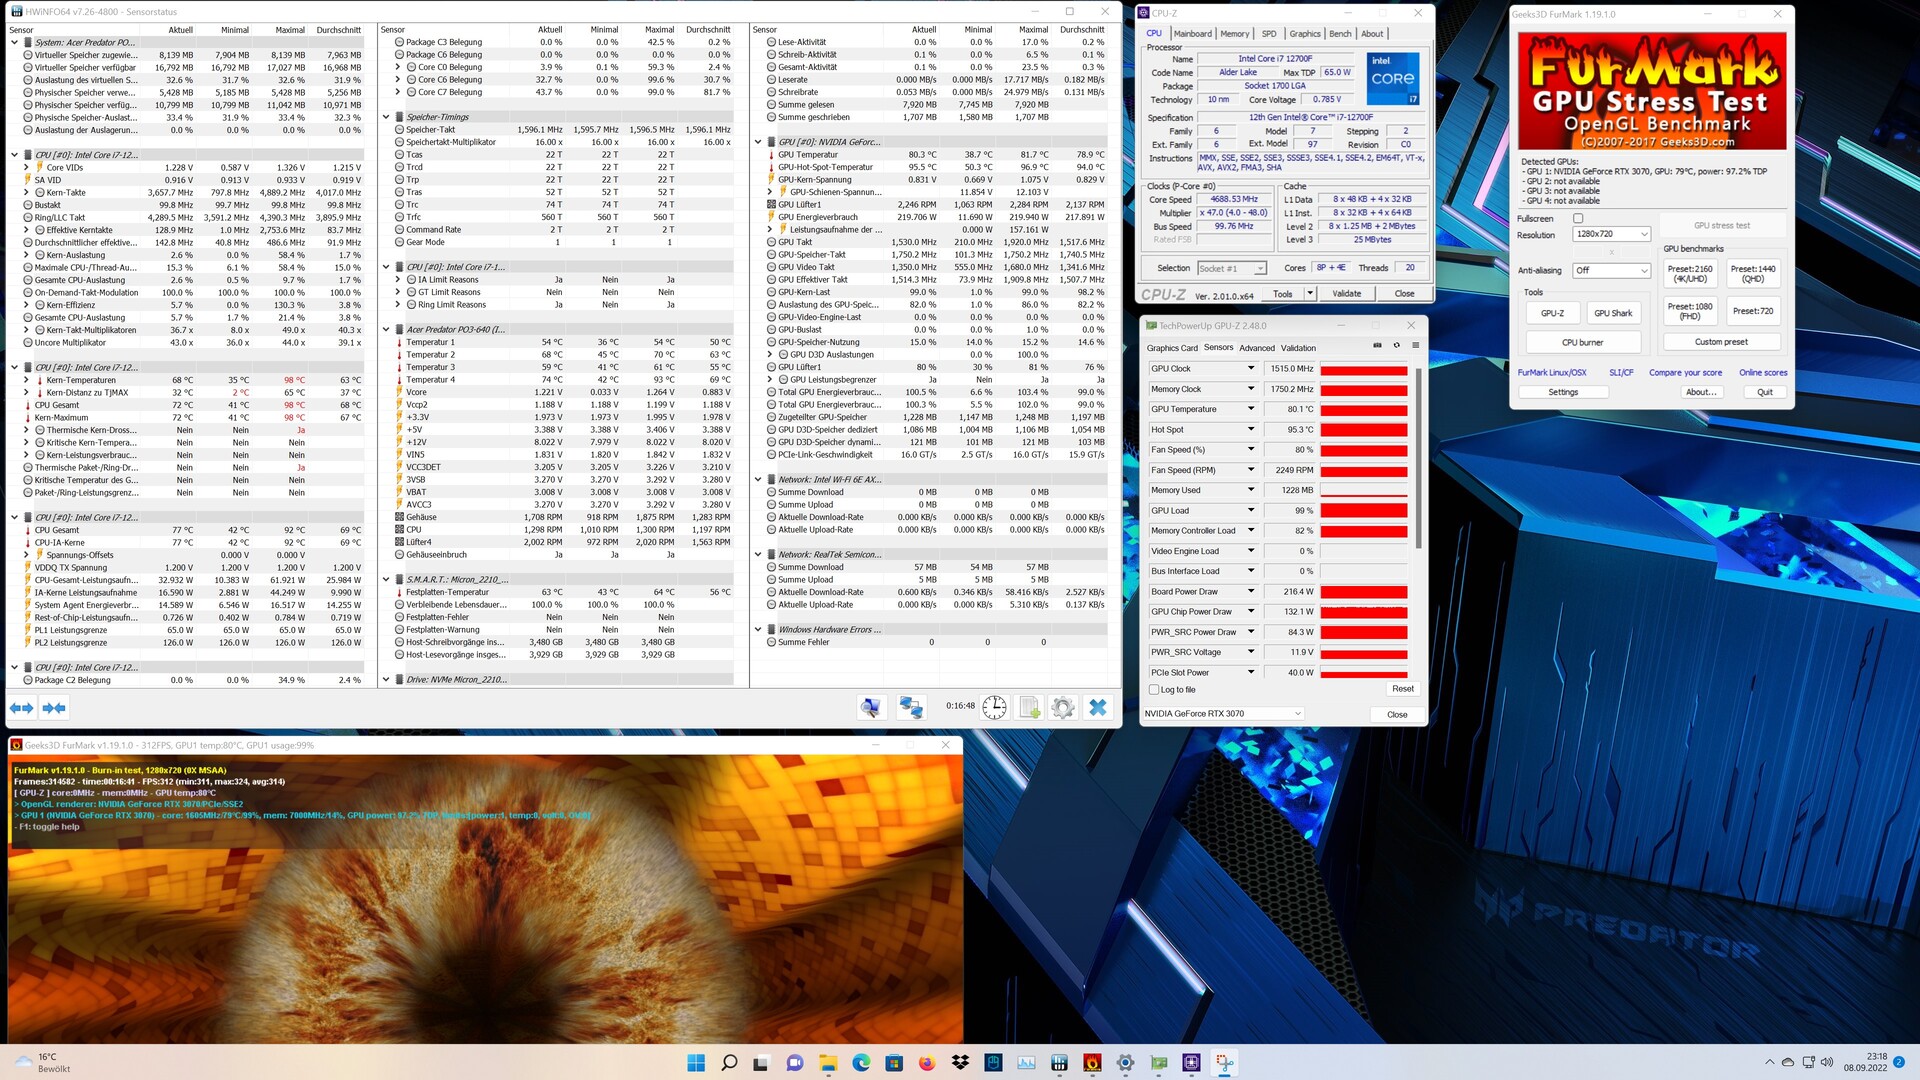
能源消耗
宏碁掠夺者猎户座3000在空转和低负荷时出奇地节俭。我们的仪表只显示不到30瓦的功率。在压力测试中,它的功率短时间内高达361瓦,尽管平均只有186瓦。这是由于PL2的原因,它最多只允许28秒。在游戏过程中,该系统的功耗平均为338瓦。我们记录的短期峰值高达364瓦。安装了一个500瓦的ATX电源,可以应付硬件要求。
| Off / Standby | |
| Idle | |
| Load |
|
Key:
min: | |
| Acer Predator Orion 3000 PO3-640 i7-12700F, GeForce RTX 3070 | Zotac ZBOX Magnus EN173070C i7-11800H, GeForce RTX 3070 Laptop GPU | Average NVIDIA GeForce RTX 3070 | Average of class Desktop | |
|---|---|---|---|---|
| Power Consumption | -27% | -93% | -4% | |
| Idle Minimum * (Watt) | 24.6 | 31.3 -27% | 56 ? -128% | 17.9 ? 27% |
| Idle Average * (Watt) | 24.6 | 35.1 -43% | 58.5 ? -138% | 37.2 ? -51% |
| Idle Maximum * (Watt) | 29.6 | 41.6 -41% | 70.5 ? -138% | 41.3 ? -40% |
| Load Average * (Watt) | 124.6 | 214 -72% | 122.1 ? 2% | 96.7 ? 22% |
| Witcher 3 ultra * (Watt) | 338.1 | 193.5 43% | ||
| Load Maximum * (Watt) | 186.1 | 231 -24% | 305 ? -64% | 141.6 ? 24% |
* ... smaller is better
Power Consumption with external Monitor
Pros
Cons
结论--快速的游戏PC,但冷却效果不佳
宏碁掠夺者猎户座3000是一款紧凑型游戏PC,基于英特尔当前的CPU一代。这款 英特尔酷睿i7-12700F提供了非常好的性能,尽管有PL2的限制,但速度足以满足当前游戏的需求。如果有更好的冷却效果,这里可以实现更多。随着 NvidiaGeForce RTX 3070,你会得到一个符合Nvidia规格的传统模型。然而,该模型表现良好,在目前的游戏中实现了1440p分辨率的流畅帧率。其余的配置相当标准,有1TB SSD和16GB DDR4内存。在这里使用更快的DDR5内存将是面向未来的。
为了增强宏碁捕食者猎户座3000的外观,左侧的面板可以替换为带有观察窗的侧板。这也是交货范围的一部分。还有一个键盘和一个鼠标,它接上了宏碁捕食者的外观,从而提供了一个连贯的整体画面
由于英特尔酷睿i7-12700F和NvidiaGeForce RTX 3070,宏碁捕食者猎户座3000提供了作为游戏PC的良好基础。不幸的是,冷却系统不得不接受一些妥协。
最大的批评点是处理器的散热太小。然而,令人惊讶的是,宏碁掠夺者猎户座3000的声音并不令人难以忍受。制造商可能没有在自动模式下以更高的温度为代价提高速度。自我调整的风扇曲线可以提供负载下稍好的温度。然而,负载下的低噪音排放也是过去的事了。
价格和可用性
Acer Predator Orion 3000可直接从Acer,在我们的测试配置中,价格为2200欧元。.目前,你也可以在Computer Universe获得该设备,价格仅为1,900欧元。.
Acer Predator Orion 3000 PO3-640
- 09/13/2022 v7 (old)
Sebastian Bade
Price comparison
