Notebookcheck Logo

惠普ZBook Firefly 14 G9笔记本评测--移动工作站更新后性能更强

BIOS更新提高了性能。 在我们对ZBook Firefly 14 G9进行审查后,惠普发布了更新,以提高性能。然而,不久之后又发布了进一步的更新,其中CPU的性能又有一定程度的下降。因此,我们再次审查了这款紧凑型工作站的性能。
Alder Lake Business Laptop / Notebook Thunderbolt Ultrabook Workstation

在我们 目前的HP ZBook Firefly 14 G9的原始审查与令人失望的性能率,制造商改进的性能与更新。然而,进一步的更新包括BIOS版本01.04.10再次使CPU的性能恶化了一些。这意味着我们在测试时要做很多额外的工作,这种情况对客户来说也是有问题的,因为你永远不知道下一次更新后的性能会如何变化。

在下面的文章中,我们将重点讨论更新对CPU和GPU性能的影响,以及性能提高如何影响负载下的表面温度和风扇行为。所有其他信息可以在 我们对ZBook Firefly 14 G9的原始评论.

HP ZBook Firefly 14 G9-6B8A2EA
Processor
Intel Core i7-1265U 10 x 1.3 - 4.8 GHz, 51 W PL2 / Short Burst, 33 W PL1 / Sustained, Alder Lake-U
Graphics adapter
NVIDIA T550 Laptop GPU - 4 GB VRAM, Memory: 1500 MHz, 30 W TDP, GDDR6, 527.37, Optimus
Memory
32 GB 
, DDR5-4800, Dual-Channel, 2 Slots, max. 64 GB
Display
14.00 inch 16:10, 1920 x 1200 pixel 162 PPI, CMN1435, IPS, glossy: no, 60 Hz
Mainboard
Intel Alder Lake-P PCH
Storage
Micron 3400 1TB MTFDKBA1T0TFH, 1024 GB 
, 885 GB free
Soundcard
Intel Alder Lake-P PCH - cAVS (Audio, Voice, Speech)
Connections
2 USB 3.0 / 3.1 Gen1, 2 USB 4.0 40 Gbps, 2 Thunderbolt, USB-C Power Delivery (PD), 1 HDMI, 2 DisplayPort, 1 Kensington Lock, Audio Connections: 3.5-mm-Stereo, 1 Fingerprint Reader, Brightness Sensor
Networking
Intel Wi-Fi 6E AX211 (a/b/g/h/n = Wi-Fi 4/ac = Wi-Fi 5/ax = Wi-Fi 6/ Wi-Fi 6E 6 GHz), Bluetooth 5.2
Size
height x width x depth (in mm): 19.9 x 315.6 x 224.3
Battery
51 Wh, 4240 mAh Lithium-Polymer
Operating System
Microsoft Windows 11 Pro
Camera
Webcam: 5 MP IR with Shutter
Primary Camera: 5 MPix
Additional features
Speakers: Stereo, Keyboard: Chiclet, Keyboard Light: yes, 65W PSU, 36 Months Warranty
Weight
1.517 kg, Power Supply: 311 g
Price
2200 Euro
Note: The manufacturer may use components from different suppliers including display panels, drives or memory sticks with similar specifications.


性能 - CPU和GPU现在更快

在我们最初对ZBook Firefly 14 G9的审查中(还有更大的 ZBook Firefly 16 G9我们对组件的低功率限制感到惊讶,因为 酷睿i7-1265U只允许消耗12瓦,在25瓦的短峰值后,和 Nvidia T550只有20瓦。当然,这对性能产生了巨大的影响,惠普也对结果感到惊讶,这 导致了制造商的一些更新。

现在允许显卡消耗30瓦而不是20瓦,处理器的功率限制提高到33/51瓦。这些数值也达到了,但惠普通过进一步的更新,又将性能降到了最低。理论上,33/51瓦的数值仍然有效,但该数值已不再稳定。

处理器 - 酷睿i7-1265U

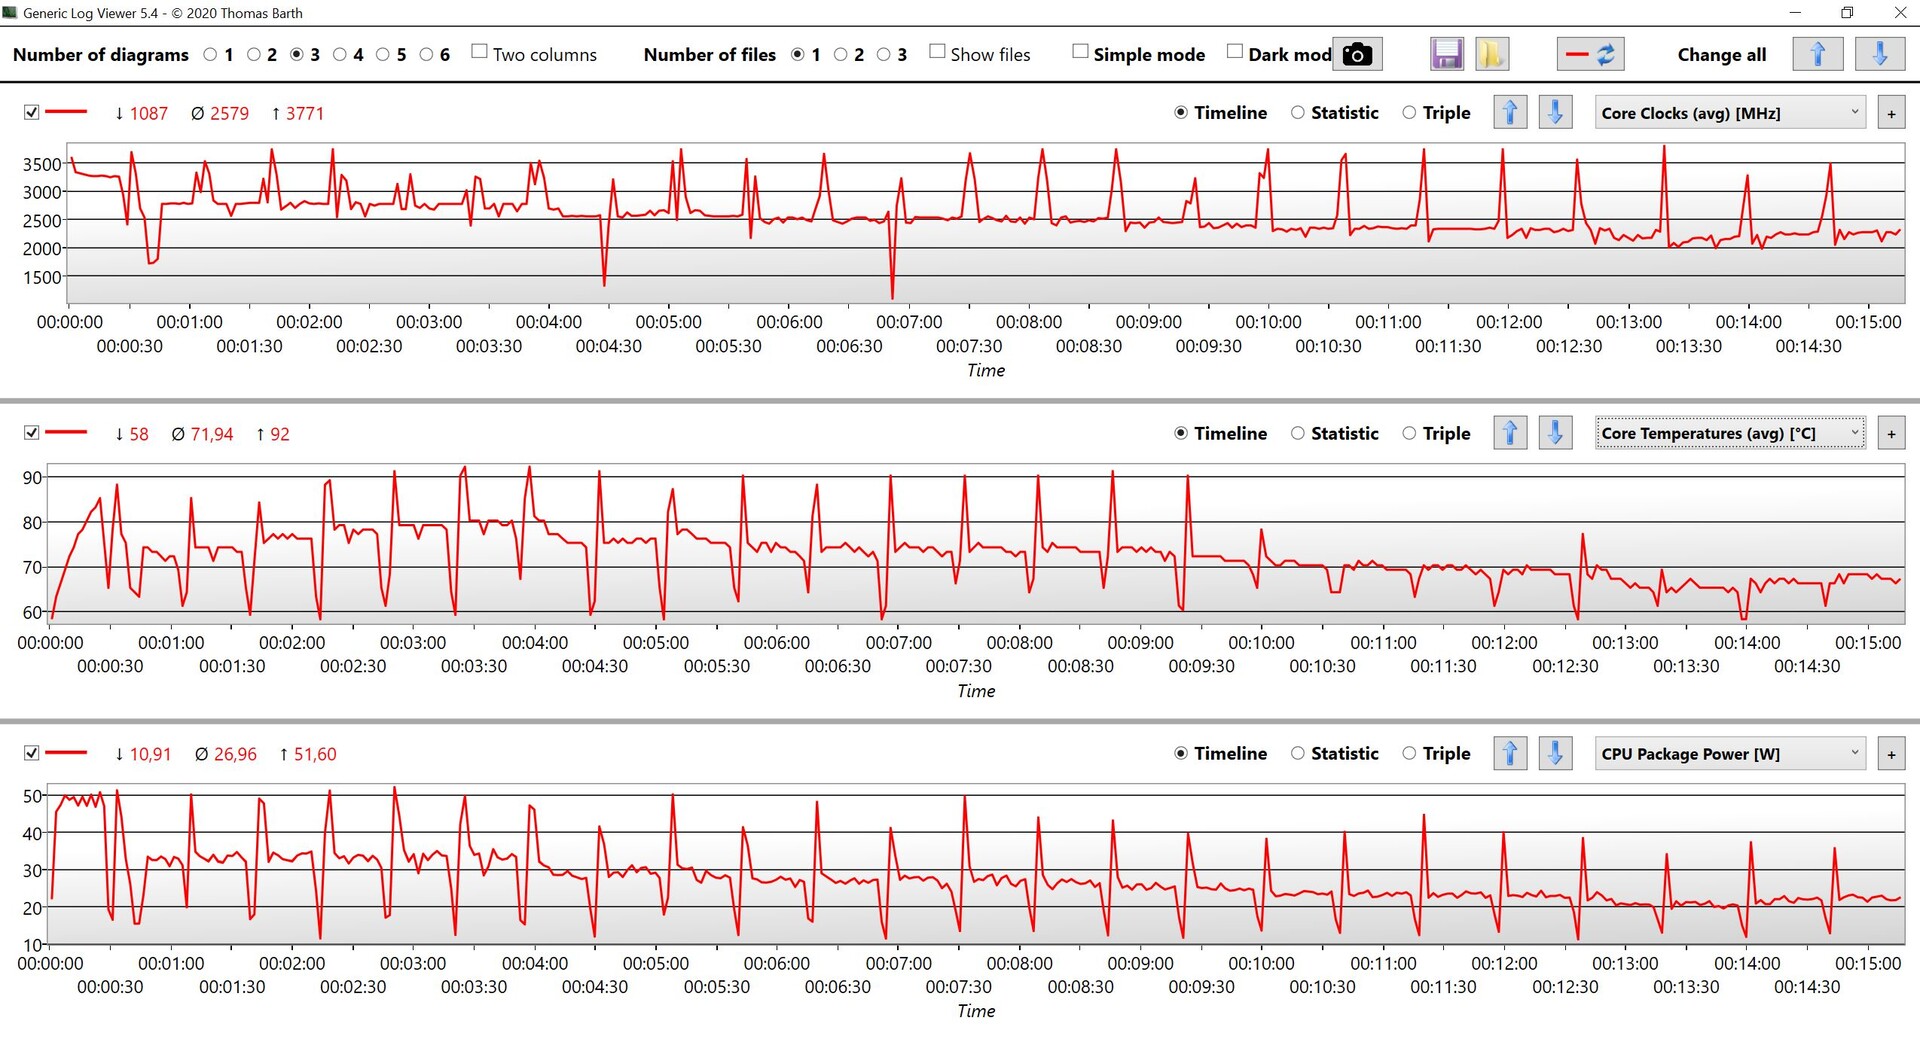
由于功率限制的增加, 酷睿i7-1265U在ZBook中,现在比旧的设置更有竞争力,特别是在短期负载下,现在也比旧型号有明显优势。由于提高了功率限制,萤火虫14现在还可以获得性能核心的全部单核功率,就酷睿i7-1265U而言,在4.6-4.7GHz时需要约21瓦的能量。然而,情况看起来并不怎么好,因为在多核负载期间,时钟会波动,我们希望这里有一个稳定的水平。不得不说的是,高功率限制很快就会导致非常高的芯片温度,而冷却系统必须首先应对这一问题。仅仅 因为英特尔允许U系列CPU的最大功耗为51瓦,将限制设置得更高并不总是合理的

Cinebench R15 Multi loop

08517025534042551059568076585093510201105119012751360144515301615Tooltip
HP ZBook Firefly 14 G9-6B8A2EA Intel Core i7-1265U: Ø1242 (1060.05-1543.33)
HP ZBook Firefly 14 G9-6B8A2EA Intel Core i7-1265U: Ø676 (667.96-706.38)
HP ZBook Firefly 14 G8 2C9Q2EA Intel Core i7-1165G7: Ø710 (671.68-843.29)
HP EliteBook 865 G9 AMD Ryzen 7 PRO 6850U: Ø1606 (1590.77-1665.14)
CPU数据 Cinebench R15多循环

同时,必须明确地说,目前的AMD CPU,如 Ryzen 7 Pro 6850U中的 HP EliteBook 865 G9在25瓦的多核负载下,提供了更稳定和更好的结果。英特尔在单核模式下的性能核心方面有优势,但它也需要更多的电力。

在电池模式下,处理器在多核测试的前10秒允许消耗30瓦,然后降至15瓦。在单核模式下是17瓦,后来只有15瓦,所以这里也没有完整的性能。进一步的CPU基准测试可在 我们的技术部分.

CPU Performance Rating: Percent
Cinebench R23: Multi Core | Single Core
Cinebench R20: CPU (Multi Core) | CPU (Single Core)
Cinebench R15: CPU Multi 64Bit | CPU Single 64Bit
Blender: v2.79 BMW27 CPU
7-Zip 18.03: 7z b 4 | 7z b 4 -mmt1
Geekbench 5.4: Multi-Core | Single-Core
HWBOT x265 Benchmark v2.2: 4k Preset
LibreOffice : 20 Documents To PDF
R Benchmark 2.5: Overall mean
CPU Performance Rating
Dell Precision 5000 5470
Intel Core i9-12900H
84.2 pt ∼84%
Apple MacBook Pro 14 2021 M1 Pro Entry -8!
Apple M1 Pro 8-Core
79.8 pt ∼80%
Average of class Workstation
 
78.8 pt ∼79%
HP ZBook Firefly 14 G9-6B8A2EA
Intel Core i7-1265U
69 pt ∼69%
HP EliteBook 865 G9
AMD Ryzen 7 PRO 6850U
68 pt ∼68%
Average Intel Core i7-1265U
 
61.5 pt ∼62%
Lenovo ThinkPad P14s Gen2-20VX000GGE
Intel Core i7-1185G7
52.4 pt ∼52%
HP ZBook Firefly 14 G8 2C9Q2EA -2!
Intel Core i7-1165G7
48.3 pt ∼48%
HP ZBook Firefly 14 G9-6B8A2EA
Intel Core i7-1265U
48 pt ∼48%
Cinebench R23 / Multi Core
Dell Precision 5000 5470
Intel Core i9-12900H
13077 (12213.6min - 13076.7max) Points ∼100% +50%
Average of class Workstation
  (4332 - 20351, n=28, last 2 years)
12612 Points ∼96% +44%
HP EliteBook 865 G9
AMD Ryzen 7 PRO 6850U
10047 Points ∼77% +15%
Apple MacBook Pro 14 2021 M1 Pro Entry
Apple M1 Pro 8-Core
9581 Points ∼73% +10%
HP ZBook Firefly 14 G9-6B8A2EA
Intel Core i7-1265U
8740 Points ∼67%
Average Intel Core i7-1265U
  (4332 - 9219, n=10)
7486 Points ∼57% -14%
Lenovo ThinkPad P14s Gen2-20VX000GGE
Intel Core i7-1185G7
5876 Points ∼45% -33%
HP ZBook Firefly 14 G9-6B8A2EA
Intel Core i7-1265U
4332 Points ∼33% -50%
Cinebench R23 / Single Core
Dell Precision 5000 5470
Intel Core i9-12900H
1777 Points ∼100% +3%
HP ZBook Firefly 14 G9-6B8A2EA
Intel Core i7-1265U
1726 Points ∼97%
Average Intel Core i7-1265U
  (1144 - 1820, n=10)
1595 Points ∼90% -8%
Average of class Workstation
  (1144 - 1885, n=27, last 2 years)
1590 Points ∼89% -8%
Apple MacBook Pro 14 2021 M1 Pro Entry
Apple M1 Pro 8-Core
1531 Points ∼86% -11%
Lenovo ThinkPad P14s Gen2-20VX000GGE
Intel Core i7-1185G7
1493 Points ∼84% -13%
HP ZBook Firefly 14 G9-6B8A2EA
Intel Core i7-1265U
1415 Points ∼80% -18%
HP EliteBook 865 G9
AMD Ryzen 7 PRO 6850U
1409 Points ∼79% -18%
Cinebench R20 / CPU (Multi Core)
Average of class Workstation
  (1669 - 7971, n=29, last 2 years)
4775 Points ∼100% +43%
Dell Precision 5000 5470
Intel Core i9-12900H
4594 Points ∼96% +37%
HP EliteBook 865 G9
AMD Ryzen 7 PRO 6850U
3886 Points ∼81% +16%
HP ZBook Firefly 14 G9-6B8A2EA
Intel Core i7-1265U
3344 Points ∼70%
Average Intel Core i7-1265U
  (1669 - 3584, n=10)
2884 Points ∼60% -14%
Lenovo ThinkPad P14s Gen2-20VX000GGE
Intel Core i7-1185G7
2269 Points ∼48% -32%
HP ZBook Firefly 14 G8 2C9Q2EA
Intel Core i7-1165G7
2036 Points ∼43% -39%
HP ZBook Firefly 14 G9-6B8A2EA
Intel Core i7-1265U
1681 Points ∼35% -50%
Cinebench R20 / CPU (Single Core)
Dell Precision 5000 5470
Intel Core i9-12900H
685 Points ∼100% +3%
HP ZBook Firefly 14 G9-6B8A2EA
Intel Core i7-1265U
665 Points ∼97%
Average of class Workstation
  (528 - 727, n=29, last 2 years)
622 Points ∼91% -6%
Average Intel Core i7-1265U
  (528 - 701, n=10)
619 Points ∼90% -7%
HP EliteBook 865 G9
AMD Ryzen 7 PRO 6850U
587 Points ∼86% -12%
HP ZBook Firefly 14 G8 2C9Q2EA
Intel Core i7-1165G7
581 Points ∼85% -13%
Lenovo ThinkPad P14s Gen2-20VX000GGE
Intel Core i7-1185G7
529 Points ∼77% -20%
HP ZBook Firefly 14 G9-6B8A2EA
Intel Core i7-1265U
528 Points ∼77% -21%
Cinebench R15 / CPU Multi 64Bit
Dell Precision 5000 5470
Intel Core i9-12900H
2313 (1355.47min - 2312.54max) Points ∼100% +50%
Average of class Workstation
  (706 - 3520, n=29, last 2 years)
2031 Points ∼88% +32%
HP EliteBook 865 G9
AMD Ryzen 7 PRO 6850U
1665 (1590.77min - 1665.14max) Points ∼72% +8%
HP ZBook Firefly 14 G9-6B8A2EA
Intel Core i7-1265U
1543 (1060.05min - 1543.33max) Points ∼67%
Apple MacBook Pro 14 2021 M1 Pro Entry
Apple M1 Pro 8-Core
1320 (1307min - 1320max) Points ∼57% -14%
Average Intel Core i7-1265U
  (706 - 1572, n=10)
1244 Points ∼54% -19%
Lenovo ThinkPad P14s Gen2-20VX000GGE
Intel Core i7-1185G7
902 (538.67min - 901.88max) Points ∼39% -42%
HP ZBook Firefly 14 G8 2C9Q2EA
Intel Core i7-1165G7
843 (671.68min - 843.29max) Points ∼36% -45%
HP ZBook Firefly 14 G9-6B8A2EA
Intel Core i7-1265U
706 (667.96min - 706.38max) Points ∼31% -54%
Cinebench R15 / CPU Single 64Bit
HP ZBook Firefly 14 G9-6B8A2EA
Intel Core i7-1265U
252 Points ∼100%
Dell Precision 5000 5470
Intel Core i9-12900H
248 Points ∼98% -2%
Average of class Workstation
  (166.2 - 274, n=28, last 2 years)
238 Points ∼94% -6%
HP EliteBook 865 G9
AMD Ryzen 7 PRO 6850U
232 Points ∼92% -8%
Average Intel Core i7-1265U
  (165.3 - 260, n=10)
230 Points ∼91% -9%
HP ZBook Firefly 14 G8 2C9Q2EA
Intel Core i7-1165G7
225 Points ∼89% -11%
HP ZBook Firefly 14 G9-6B8A2EA
Intel Core i7-1265U
215 Points ∼85% -15%
Lenovo ThinkPad P14s Gen2-20VX000GGE
Intel Core i7-1185G7
213 Points ∼85% -15%
Apple MacBook Pro 14 2021 M1 Pro Entry
Apple M1 Pro 8-Core
210 Points ∼83% -17%
Blender / v2.79 BMW27 CPU
HP ZBook Firefly 14 G9-6B8A2EA
Intel Core i7-1265U
667 Seconds * ∼100% -55%
Lenovo ThinkPad P14s Gen2-20VX000GGE
Intel Core i7-1185G7
630 Seconds * ∼94% -47%
HP ZBook Firefly 14 G8 2C9Q2EA
Intel Core i7-1165G7
580 Seconds * ∼87% -35%
Average Intel Core i7-1265U
  (364 - 684, n=10)
466 Seconds * ∼70% -8%
HP ZBook Firefly 14 G9-6B8A2EA
Intel Core i7-1265U
430 Seconds * ∼64%
HP EliteBook 865 G9
AMD Ryzen 7 PRO 6850U
303 Seconds * ∼45% +30%
Average of class Workstation
  (160 - 684, n=27, last 2 years)
287 Seconds * ∼43% +33%
Dell Precision 5000 5470
Intel Core i9-12900H
248 Seconds * ∼37% +42%
7-Zip 18.03 / 7z b 4
Dell Precision 5000 5470
Intel Core i9-12900H
51968 MIPS ∼100% +50%
Average of class Workstation
  (20087 - 80204, n=28, last 2 years)
51104 MIPS ∼98% +47%
HP EliteBook 865 G9
AMD Ryzen 7 PRO 6850U
44011 MIPS ∼85% +27%
HP ZBook Firefly 14 G9-6B8A2EA
Intel Core i7-1265U
34692 MIPS ∼67%
Average Intel Core i7-1265U
  (20087 - 38715, n=10)
32344 MIPS ∼62% -7%
HP ZBook Firefly 14 G8 2C9Q2EA
Intel Core i7-1165G7
22854 MIPS ∼44% -34%
HP ZBook Firefly 14 G9-6B8A2EA
Intel Core i7-1265U
21897 MIPS ∼42% -37%
Lenovo ThinkPad P14s Gen2-20VX000GGE
Intel Core i7-1185G7
21244 MIPS ∼41% -39%
7-Zip 18.03 / 7z b 4 -mmt1
HP ZBook Firefly 14 G9-6B8A2EA
Intel Core i7-1265U
5617 MIPS ∼100%
Average of class Workstation
  (4777 - 6197, n=28, last 2 years)
5607 MIPS ∼100% 0%
HP EliteBook 865 G9
AMD Ryzen 7 PRO 6850U
5542 MIPS ∼99% -1%
Lenovo ThinkPad P14s Gen2-20VX000GGE
Intel Core i7-1185G7
5507 MIPS ∼98% -2%
Dell Precision 5000 5470
Intel Core i9-12900H
5505 MIPS ∼98% -2%
HP ZBook Firefly 14 G8 2C9Q2EA
Intel Core i7-1165G7
5352 MIPS ∼95% -5%
Average Intel Core i7-1265U
  (4614 - 5617, n=10)
5198 MIPS ∼93% -7%
HP ZBook Firefly 14 G9-6B8A2EA
Intel Core i7-1265U
4777 MIPS ∼85% -15%
Geekbench 5.4 / Multi-Core
Dell Precision 5000 5470
Intel Core i9-12900H
12252 Points ∼100% +41%
Apple MacBook Pro 14 2021 M1 Pro Entry
Apple M1 Pro 8-Core
9942 Points ∼81% +15%
Average of class Workstation
  (5022 - 15483, n=26, last 2 years)
9646 Points ∼79% +11%
HP ZBook Firefly 14 G9-6B8A2EA
Intel Core i7-1265U
8679 Points ∼71%
Average Intel Core i7-1265U
  (5022 - 8981, n=10)
7709 Points ∼63% -11%
HP EliteBook 865 G9
AMD Ryzen 7 PRO 6850U
7044 Points ∼57% -19%
HP ZBook Firefly 14 G9-6B8A2EA
Intel Core i7-1265U
5718 Points ∼47% -34%
Lenovo ThinkPad P14s Gen2-20VX000GGE
Intel Core i7-1185G7
5692 Points ∼46% -34%
HP ZBook Firefly 14 G8 2C9Q2EA
Intel Core i7-1165G7
4999 Points ∼41% -42%
Geekbench 5.4 / Single-Core
HP ZBook Firefly 14 G9-6B8A2EA
Intel Core i7-1265U
1806 Points ∼100% +5%
Dell Precision 5000 5470
Intel Core i9-12900H
1805 Points ∼100% +5%
Apple MacBook Pro 14 2021 M1 Pro Entry
Apple M1 Pro 8-Core
1769 Points ∼98% +3%
HP ZBook Firefly 14 G9-6B8A2EA
Intel Core i7-1265U
1721 Points ∼95%
Average Intel Core i7-1265U
  (1429 - 1806, n=10)
1697 Points ∼94% -1%
Average of class Workstation
  (1448 - 1924, n=26, last 2 years)
1677 Points ∼93% -3%
Lenovo ThinkPad P14s Gen2-20VX000GGE
Intel Core i7-1185G7
1626 Points ∼90% -6%
HP ZBook Firefly 14 G8 2C9Q2EA
Intel Core i7-1165G7
1551 Points ∼86% -10%
HP EliteBook 865 G9
AMD Ryzen 7 PRO 6850U
1433 Points ∼79% -17%
HWBOT x265 Benchmark v2.2 / 4k Preset
Average of class Workstation
  (5.09 - 23.5, n=28, last 2 years)
14.3 fps ∼100% +50%
Dell Precision 5000 5470
Intel Core i9-12900H
13.4 fps ∼94% +40%
HP EliteBook 865 G9
AMD Ryzen 7 PRO 6850U
11.7 fps ∼82% +22%
HP ZBook Firefly 14 G9-6B8A2EA
Intel Core i7-1265U
9.56 fps ∼67%
Average Intel Core i7-1265U
  (5.09 - 10.6, n=10)
8.57 fps ∼60% -10%
Lenovo ThinkPad P14s Gen2-20VX000GGE
Intel Core i7-1185G7
7.18 fps ∼50% -25%
HP ZBook Firefly 14 G8 2C9Q2EA
Intel Core i7-1165G7
6.7 fps ∼47% -30%
HP ZBook Firefly 14 G9-6B8A2EA
Intel Core i7-1265U
5.43 fps ∼38% -43%
LibreOffice / 20 Documents To PDF
HP EliteBook 865 G9
AMD Ryzen 7 PRO 6850U
53.1 s * ∼100% -21%
HP ZBook Firefly 14 G8 2C9Q2EA
Intel Core i7-1165G7
52.8 s * ∼99% -20%
Average Intel Core i7-1265U
  (44 - 61.6, n=10)
49.9 s * ∼94% -13%
Average of class Workstation
  (23 - 95.2, n=28, last 2 years)
48.2 s * ∼91% -10%
HP ZBook Firefly 14 G9-6B8A2EA
Intel Core i7-1265U
46.5 s * ∼88% -6%
Dell Precision 5000 5470
Intel Core i9-12900H
45.8 s * ∼86% -4%
HP ZBook Firefly 14 G9-6B8A2EA
Intel Core i7-1265U
44 s * ∼83%
Lenovo ThinkPad P14s Gen2-20VX000GGE
Intel Core i7-1185G7
41.3 s * ∼78% +6%
R Benchmark 2.5 / Overall mean
HP ZBook Firefly 14 G8 2C9Q2EA
Intel Core i7-1165G7
0.567 sec * ∼100% -18%
Lenovo ThinkPad P14s Gen2-20VX000GGE
Intel Core i7-1185G7
0.55 sec * ∼97% -15%
HP ZBook Firefly 14 G9-6B8A2EA
Intel Core i7-1265U
0.525 sec * ∼93% -10%
Average of class Workstation
  (0.4416 - 0.615, n=28, last 2 years)
0.521 sec * ∼92% -9%
HP EliteBook 865 G9
AMD Ryzen 7 PRO 6850U
0.519 sec * ∼92% -8%
Average Intel Core i7-1265U
  (0.4666 - 0.578, n=10)
0.507 sec * ∼89% -6%
HP ZBook Firefly 14 G9-6B8A2EA
Intel Core i7-1265U
0.4787 sec * ∼84%
Dell Precision 5000 5470
Intel Core i9-12900H
0.4771 sec * ∼84% -0%

* ... smaller is better

Cinebench R15 CPU Multi 64Bit
1543 Points
Cinebench R15 OpenGL 64Bit
205 fps
Cinebench R15 Ref. Match 64Bit
99.6 %
Cinebench R15 CPU Single 64Bit
252 Points
Help
Performance Rating
Average of class Workstation
 
89.5 pt ∼90%
Dell Precision 5000 5470
Intel Core i9-12900H, RTX A1000 Laptop GPU
84.6 pt ∼85%
HP EliteBook 865 G9
AMD Ryzen 7 PRO 6850U, Radeon 680M
83.9 pt ∼84%
HP ZBook Firefly 14 G9-6B8A2EA
Intel Core i7-1265U, T550 Laptop GPU
60 pt ∼60%
HP ZBook Firefly 14 G8 2C9Q2EA
Intel Core i7-1165G7, T500 Laptop GPU
53.2 pt ∼53%
Average Intel Core i7-1265U
 
53.2 pt ∼53%
HP ZBook Firefly 14 G9-6B8A2EA
Intel Core i7-1265U, T550 Laptop GPU
39.1 pt ∼39%
AIDA64 / FP32 Ray-Trace
Average of class Workstation
  (2619 - 18395, n=22, last 2 years)
13202 KRay/s ∼100% +82%
Dell Precision 5000 5470
Intel Core i9-12900H, RTX A1000 Laptop GPU
12918 KRay/s ∼98% +78%
HP EliteBook 865 G9
AMD Ryzen 7 PRO 6850U, Radeon 680M
11668 KRay/s ∼88% +61%
HP ZBook Firefly 14 G9-6B8A2EA
Intel Core i7-1265U, T550 Laptop GPU
7249 KRay/s ∼55%
HP ZBook Firefly 14 G8 2C9Q2EA
Intel Core i7-1165G7, T500 Laptop GPU
6909 KRay/s ∼52% -5%
Average Intel Core i7-1265U
  (2619 - 8178, n=10)
6278 KRay/s ∼48% -13%
HP ZBook Firefly 14 G9-6B8A2EA
Intel Core i7-1265U, T550 Laptop GPU
4277 KRay/s ∼32% -41%
AIDA64 / FPU Julia
HP EliteBook 865 G9
AMD Ryzen 7 PRO 6850U, Radeon 680M
73770 Points ∼100% +97%
Dell Precision 5000 5470
Intel Core i9-12900H, RTX A1000 Laptop GPU
65170 Points ∼88% +74%
Average of class Workstation
  (12909 - 93999, n=22, last 2 years)
65042 Points ∼88% +73%
HP ZBook Firefly 14 G9-6B8A2EA
Intel Core i7-1265U, T550 Laptop GPU
37511 Points ∼51%
Average Intel Core i7-1265U
  (12909 - 41649, n=10)
32723 Points ∼44% -13%
HP ZBook Firefly 14 G8 2C9Q2EA
Intel Core i7-1165G7, T500 Laptop GPU
29814 Points ∼40% -21%
HP ZBook Firefly 14 G9-6B8A2EA
Intel Core i7-1265U, T550 Laptop GPU
22111 Points ∼30% -41%
AIDA64 / CPU SHA3
Average of class Workstation
  (824 - 4254, n=22, last 2 years)
3258 MB/s ∼100% +66%
Dell Precision 5000 5470
Intel Core i9-12900H, RTX A1000 Laptop GPU
2950 MB/s ∼91% +50%
HP EliteBook 865 G9
AMD Ryzen 7 PRO 6850U, Radeon 680M
2475 MB/s ∼76% +26%
HP ZBook Firefly 14 G9-6B8A2EA
Intel Core i7-1265U, T550 Laptop GPU
1961 MB/s ∼60%
HP ZBook Firefly 14 G8 2C9Q2EA
Intel Core i7-1165G7, T500 Laptop GPU
1921 MB/s ∼59% -2%
Average Intel Core i7-1265U
  (824 - 2183, n=10)
1731 MB/s ∼53% -12%
HP ZBook Firefly 14 G9-6B8A2EA
Intel Core i7-1265U, T550 Laptop GPU
1143 MB/s ∼35% -42%
AIDA64 / CPU Queen
Dell Precision 5000 5470
Intel Core i9-12900H, RTX A1000 Laptop GPU
109214 Points ∼100% +64%
Average of class Workstation
  (26716 - 109214, n=22, last 2 years)
90586 Points ∼83% +36%
HP EliteBook 865 G9
AMD Ryzen 7 PRO 6850U, Radeon 680M
87176 Points ∼80% +31%
HP ZBook Firefly 14 G9-6B8A2EA
Intel Core i7-1265U, T550 Laptop GPU
67065 Points ∼61% 0%
HP ZBook Firefly 14 G9-6B8A2EA
Intel Core i7-1265U, T550 Laptop GPU
66757 Points ∼61%
Average Intel Core i7-1265U
  (63615 - 67065, n=10)
65614 Points ∼60% -2%
HP ZBook Firefly 14 G8 2C9Q2EA
Intel Core i7-1165G7, T500 Laptop GPU
49352 Points ∼45% -26%
AIDA64 / FPU SinJulia
HP EliteBook 865 G9
AMD Ryzen 7 PRO 6850U, Radeon 680M
11123 Points ∼100% +133%
Average of class Workstation
  (3105 - 12364, n=22, last 2 years)
9345 Points ∼84% +96%
Dell Precision 5000 5470
Intel Core i9-12900H, RTX A1000 Laptop GPU
8599 Points ∼77% +80%
HP ZBook Firefly 14 G9-6B8A2EA
Intel Core i7-1265U, T550 Laptop GPU
4779 Points ∼43%
HP ZBook Firefly 14 G8 2C9Q2EA
Intel Core i7-1165G7, T500 Laptop GPU
4749 Points ∼43% -1%
Average Intel Core i7-1265U
  (3105 - 5135, n=10)
4331 Points ∼39% -9%
HP ZBook Firefly 14 G9-6B8A2EA
Intel Core i7-1265U, T550 Laptop GPU
3289 Points ∼30% -31%
AIDA64 / FPU Mandel
HP EliteBook 865 G9
AMD Ryzen 7 PRO 6850U, Radeon 680M
40693 Points ∼100% +119%
Average of class Workstation
  (6967 - 51299, n=22, last 2 years)
34581 Points ∼85% +86%
Dell Precision 5000 5470
Intel Core i9-12900H, RTX A1000 Laptop GPU
31638 Points ∼78% +70%
HP ZBook Firefly 14 G9-6B8A2EA
Intel Core i7-1265U, T550 Laptop GPU
18622 Points ∼46%
HP ZBook Firefly 14 G8 2C9Q2EA
Intel Core i7-1165G7, T500 Laptop GPU
17895 Points ∼44% -4%
Average Intel Core i7-1265U
  (6967 - 20804, n=10)
16054 Points ∼39% -14%
HP ZBook Firefly 14 G9-6B8A2EA
Intel Core i7-1265U, T550 Laptop GPU
10541 Points ∼26% -43%
AIDA64 / CPU AES
Average of class Workstation
  (19489 - 132156, n=22, last 2 years)
73885 MB/s ∼100% +93%
HP ZBook Firefly 14 G8 2C9Q2EA
Intel Core i7-1165G7, T500 Laptop GPU
67771 MB/s ∼92% +77%
HP EliteBook 865 G9
AMD Ryzen 7 PRO 6850U, Radeon 680M
50118 MB/s ∼68% +31%
HP ZBook Firefly 14 G9-6B8A2EA
Intel Core i7-1265U, T550 Laptop GPU
38355 MB/s ∼52%
Dell Precision 5000 5470
Intel Core i9-12900H, RTX A1000 Laptop GPU
34721 MB/s ∼47% -9%
Average Intel Core i7-1265U
  (19489 - 42966, n=10)
34526 MB/s ∼47% -10%
HP ZBook Firefly 14 G9-6B8A2EA
Intel Core i7-1265U, T550 Laptop GPU
24543 MB/s ∼33% -36%
AIDA64 / CPU ZLib
HP EliteBook 865 G9
AMD Ryzen 7 PRO 6850U, Radeon 680M
655 MB/s ∼100% +14%
Average of class Workstation
  (314 - 1217, n=29, last 2 years)
598 MB/s ∼91% +4%
HP ZBook Firefly 14 G9-6B8A2EA
Intel Core i7-1265U, T550 Laptop GPU
574 MB/s ∼88%
Average Intel Core i7-1265U
  (314 - 632, n=10)
514 MB/s ∼78% -10%
Dell Precision 5000 5470
Intel Core i9-12900H, RTX A1000 Laptop GPU
449 MB/s ∼69% -22%
HP ZBook Firefly 14 G8 2C9Q2EA
Intel Core i7-1165G7, T500 Laptop GPU
379 MB/s ∼58% -34%
HP ZBook Firefly 14 G9-6B8A2EA
Intel Core i7-1265U, T550 Laptop GPU
341 MB/s ∼52% -41%
AIDA64 / FP64 Ray-Trace
Average of class Workstation
  (1473 - 9925, n=22, last 2 years)
7189 KRay/s ∼100% +84%
Dell Precision 5000 5470
Intel Core i9-12900H, RTX A1000 Laptop GPU
7085 KRay/s ∼99% +82%
HP EliteBook 865 G9
AMD Ryzen 7 PRO 6850U, Radeon 680M
6091 KRay/s ∼85% +56%
HP ZBook Firefly 14 G9-6B8A2EA
Intel Core i7-1265U, T550 Laptop GPU
3902 KRay/s ∼54%
HP ZBook Firefly 14 G8 2C9Q2EA
Intel Core i7-1165G7, T500 Laptop GPU
3724 KRay/s ∼52% -5%
Average Intel Core i7-1265U
  (1473 - 4376, n=10)
3339 KRay/s ∼46% -14%
HP ZBook Firefly 14 G9-6B8A2EA
Intel Core i7-1265U, T550 Laptop GPU
2262 KRay/s ∼31% -42%
AIDA64 / CPU PhotoWorxx
Dell Precision 5000 5470
Intel Core i9-12900H, RTX A1000 Laptop GPU
46123 MPixel/s ∼100% +11%
HP ZBook Firefly 14 G9-6B8A2EA
Intel Core i7-1265U, T550 Laptop GPU
41462 MPixel/s ∼90%
Average Intel Core i7-1265U
  (20213 - 47031, n=10)
35509 MPixel/s ∼77% -14%
Average of class Workstation
  (11898 - 46123, n=22, last 2 years)
29261 MPixel/s ∼63% -29%
HP ZBook Firefly 14 G9-6B8A2EA
Intel Core i7-1265U, T550 Laptop GPU
27493 MPixel/s ∼60% -34%
HP ZBook Firefly 14 G8 2C9Q2EA
Intel Core i7-1165G7, T500 Laptop GPU
21725 MPixel/s ∼47% -48%
HP EliteBook 865 G9
AMD Ryzen 7 PRO 6850U, Radeon 680M
19707 MPixel/s ∼43% -52%

系统性能

从主观上讲,你不会注意到在日常情况下更高的性能,但现在在合成基准PCMark 10中,性能提高了13%。

PCMark 10 / Score
Dell Precision 5000 5470
RTX A1000 Laptop GPU, i9-12900H, Samsung PM9A1 MZVL21T0HCLR
6870 Points ∼100% +11%
Average of class Workstation
  (4960 - 7246, n=28, last 2 years)
6410 Points ∼93% +4%
HP ZBook Firefly 14 G9-6B8A2EA
T550 Laptop GPU, i7-1265U, Micron 3400 1TB MTFDKBA1T0TFH
6181 Points ∼90%
HP EliteBook 865 G9
Radeon 680M, R7 PRO 6850U, Samsung PM991 MZVLQ512HBLU
5873 Points ∼85% -5%
Average Intel Core i7-1265U, NVIDIA T550 Laptop GPU
  (5488 - 6181, n=3)
5768 Points ∼84% -7%
Lenovo ThinkPad P14s Gen2-20VX000GGE
T500 Laptop GPU, i7-1185G7, Toshiba XG6 KXG6AZNV1T02
5634 Points ∼82% -9%
HP ZBook Firefly 14 G9-6B8A2EA
T550 Laptop GPU, i7-1265U, Micron 3400 1TB MTFDKBA1T0TFH
5488 Points ∼80% -11%
HP ZBook Firefly 14 G8 2C9Q2EA
T500 Laptop GPU, i7-1165G7, Toshiba XG6 KXG60ZNV1T02
5282 Points ∼77% -15%
PCMark 10 / Essentials
Dell Precision 5000 5470
RTX A1000 Laptop GPU, i9-12900H, Samsung PM9A1 MZVL21T0HCLR
10876 Points ∼100% +9%
Average Intel Core i7-1265U, NVIDIA T550 Laptop GPU
  (9960 - 10250, n=3)
10068 Points ∼93% +1%
Average of class Workstation
  (8472 - 11465, n=28, last 2 years)
10036 Points ∼92% +1%
HP ZBook Firefly 14 G9-6B8A2EA
T550 Laptop GPU, i7-1265U, Micron 3400 1TB MTFDKBA1T0TFH
9994 Points ∼92% 0%
HP ZBook Firefly 14 G9-6B8A2EA
T550 Laptop GPU, i7-1265U, Micron 3400 1TB MTFDKBA1T0TFH
9960 Points ∼92%
Lenovo ThinkPad P14s Gen2-20VX000GGE
T500 Laptop GPU, i7-1185G7, Toshiba XG6 KXG6AZNV1T02
9609 Points ∼88% -4%
HP EliteBook 865 G9
Radeon 680M, R7 PRO 6850U, Samsung PM991 MZVLQ512HBLU
9289 Points ∼85% -7%
HP ZBook Firefly 14 G8 2C9Q2EA
T500 Laptop GPU, i7-1165G7, Toshiba XG6 KXG60ZNV1T02
8765 Points ∼81% -12%
PCMark 10 / Productivity
HP ZBook Firefly 14 G9-6B8A2EA
T550 Laptop GPU, i7-1265U, Micron 3400 1TB MTFDKBA1T0TFH
9474 Points ∼100%
Lenovo ThinkPad P14s Gen2-20VX000GGE
T500 Laptop GPU, i7-1185G7, Toshiba XG6 KXG6AZNV1T02
8982 Points ∼95% -5%
Average Intel Core i7-1265U, NVIDIA T550 Laptop GPU
  (8315 - 9474, n=3)
8784 Points ∼93% -7%
Average of class Workstation
  (7693 - 10374, n=28, last 2 years)
8683 Points ∼92% -8%
HP EliteBook 865 G9
Radeon 680M, R7 PRO 6850U, Samsung PM991 MZVLQ512HBLU
8587 Points ∼91% -9%
Dell Precision 5000 5470
RTX A1000 Laptop GPU, i9-12900H, Samsung PM9A1 MZVL21T0HCLR
8522 Points ∼90% -10%
HP ZBook Firefly 14 G8 2C9Q2EA
T500 Laptop GPU, i7-1165G7, Toshiba XG6 KXG60ZNV1T02
8337 Points ∼88% -12%
HP ZBook Firefly 14 G9-6B8A2EA
T550 Laptop GPU, i7-1265U, Micron 3400 1TB MTFDKBA1T0TFH
8315 Points ∼88% -12%
PCMark 10 / Digital Content Creation
Dell Precision 5000 5470
RTX A1000 Laptop GPU, i9-12900H, Samsung PM9A1 MZVL21T0HCLR
9494 Points ∼100% +40%
Average of class Workstation
  (5081 - 10241, n=28, last 2 years)
8304 Points ∼87% +22%
HP EliteBook 865 G9
Radeon 680M, R7 PRO 6850U, Samsung PM991 MZVLQ512HBLU
6894 Points ∼73% +1%
HP ZBook Firefly 14 G9-6B8A2EA
T550 Laptop GPU, i7-1265U, Micron 3400 1TB MTFDKBA1T0TFH
6793 Points ∼72%
Average Intel Core i7-1265U, NVIDIA T550 Laptop GPU
  (5399 - 6793, n=3)
5907 Points ∼62% -13%
Lenovo ThinkPad P14s Gen2-20VX000GGE
T500 Laptop GPU, i7-1185G7, Toshiba XG6 KXG6AZNV1T02
5625 Points ∼59% -17%
HP ZBook Firefly 14 G8 2C9Q2EA
T500 Laptop GPU, i7-1165G7, Toshiba XG6 KXG60ZNV1T02
5476 Points ∼58% -19%
HP ZBook Firefly 14 G9-6B8A2EA
T550 Laptop GPU, i7-1265U, Micron 3400 1TB MTFDKBA1T0TFH
5399 Points ∼57% -21%
CrossMark / Overall
Dell Precision 5000 5470
RTX A1000 Laptop GPU, i9-12900H, Samsung PM9A1 MZVL21T0HCLR
1801 Points ∼100% +13%
Average of class Workstation
  (1154 - 1962, n=20, last 2 years)
1631 Points ∼91% +3%
HP ZBook Firefly 14 G9-6B8A2EA
T550 Laptop GPU, i7-1265U, Micron 3400 1TB MTFDKBA1T0TFH
1617 Points ∼90% +2%
Average Intel Core i7-1265U, NVIDIA T550 Laptop GPU
  (1591 - 1623, n=3)
1610 Points ∼89% +1%
HP ZBook Firefly 14 G9-6B8A2EA
T550 Laptop GPU, i7-1265U, Micron 3400 1TB MTFDKBA1T0TFH
1591 Points ∼88%
Apple MacBook Pro 14 2021 M1 Pro Entry
M1 Pro 14-Core GPU, M1 Pro 8-Core, Apple SSD AP0512
1490 Points ∼83% -6%
HP EliteBook 865 G9
Radeon 680M, R7 PRO 6850U, Samsung PM991 MZVLQ512HBLU
1329 Points ∼74% -16%
CrossMark / Productivity
Dell Precision 5000 5470
RTX A1000 Laptop GPU, i9-12900H, Samsung PM9A1 MZVL21T0HCLR
1679 Points ∼100% +8%
HP ZBook Firefly 14 G9-6B8A2EA
T550 Laptop GPU, i7-1265U, Micron 3400 1TB MTFDKBA1T0TFH
1582 Points ∼94% +2%
Average of class Workstation
  (1188 - 1836, n=20, last 2 years)
1578 Points ∼94% +2%
Average Intel Core i7-1265U, NVIDIA T550 Laptop GPU
  (1553 - 1592, n=3)
1576 Points ∼94% +1%
HP ZBook Firefly 14 G9-6B8A2EA
T550 Laptop GPU, i7-1265U, Micron 3400 1TB MTFDKBA1T0TFH
1553 Points ∼92%
HP EliteBook 865 G9
Radeon 680M, R7 PRO 6850U, Samsung PM991 MZVLQ512HBLU
1373 Points ∼82% -12%
Apple MacBook Pro 14 2021 M1 Pro Entry
M1 Pro 14-Core GPU, M1 Pro 8-Core, Apple SSD AP0512
1305 Points ∼78% -16%
CrossMark / Creativity
Dell Precision 5000 5470
RTX A1000 Laptop GPU, i9-12900H, Samsung PM9A1 MZVL21T0HCLR
2060 Points ∼100% +20%
Apple MacBook Pro 14 2021 M1 Pro Entry
M1 Pro 14-Core GPU, M1 Pro 8-Core, Apple SSD AP0512
1915 Points ∼93% +11%
Average of class Workstation
  (1180 - 2192, n=20, last 2 years)
1778 Points ∼86% +3%
HP ZBook Firefly 14 G9-6B8A2EA
T550 Laptop GPU, i7-1265U, Micron 3400 1TB MTFDKBA1T0TFH
1744 Points ∼85% +1%
Average Intel Core i7-1265U, NVIDIA T550 Laptop GPU
  (1723 - 1751, n=3)
1739 Points ∼84% +1%
HP ZBook Firefly 14 G9-6B8A2EA
T550 Laptop GPU, i7-1265U, Micron 3400 1TB MTFDKBA1T0TFH
1723 Points ∼84%
HP EliteBook 865 G9
Radeon 680M, R7 PRO 6850U, Samsung PM991 MZVLQ512HBLU
1363 Points ∼66% -21%
CrossMark / Responsiveness
Dell Precision 5000 5470
RTX A1000 Laptop GPU, i9-12900H, Samsung PM9A1 MZVL21T0HCLR
1488 Points ∼100% +11%
Average of class Workstation
  (990 - 1865, n=20, last 2 years)
1398 Points ∼94% +4%
HP ZBook Firefly 14 G9-6B8A2EA
T550 Laptop GPU, i7-1265U, Micron 3400 1TB MTFDKBA1T0TFH
1376 Points ∼92% +2%
Average Intel Core i7-1265U, NVIDIA T550 Laptop GPU
  (1344 - 1376, n=3)
1362 Points ∼92% +1%
HP ZBook Firefly 14 G9-6B8A2EA
T550 Laptop GPU, i7-1265U, Micron 3400 1TB MTFDKBA1T0TFH
1344 Points ∼90%
HP EliteBook 865 G9
Radeon 680M, R7 PRO 6850U, Samsung PM991 MZVLQ512HBLU
1118 Points ∼75% -17%
Apple MacBook Pro 14 2021 M1 Pro Entry
M1 Pro 14-Core GPU, M1 Pro 8-Core, Apple SSD AP0512
1044 Points ∼70% -22%
PCMark 10 Score
6181 points
Help

图形卡

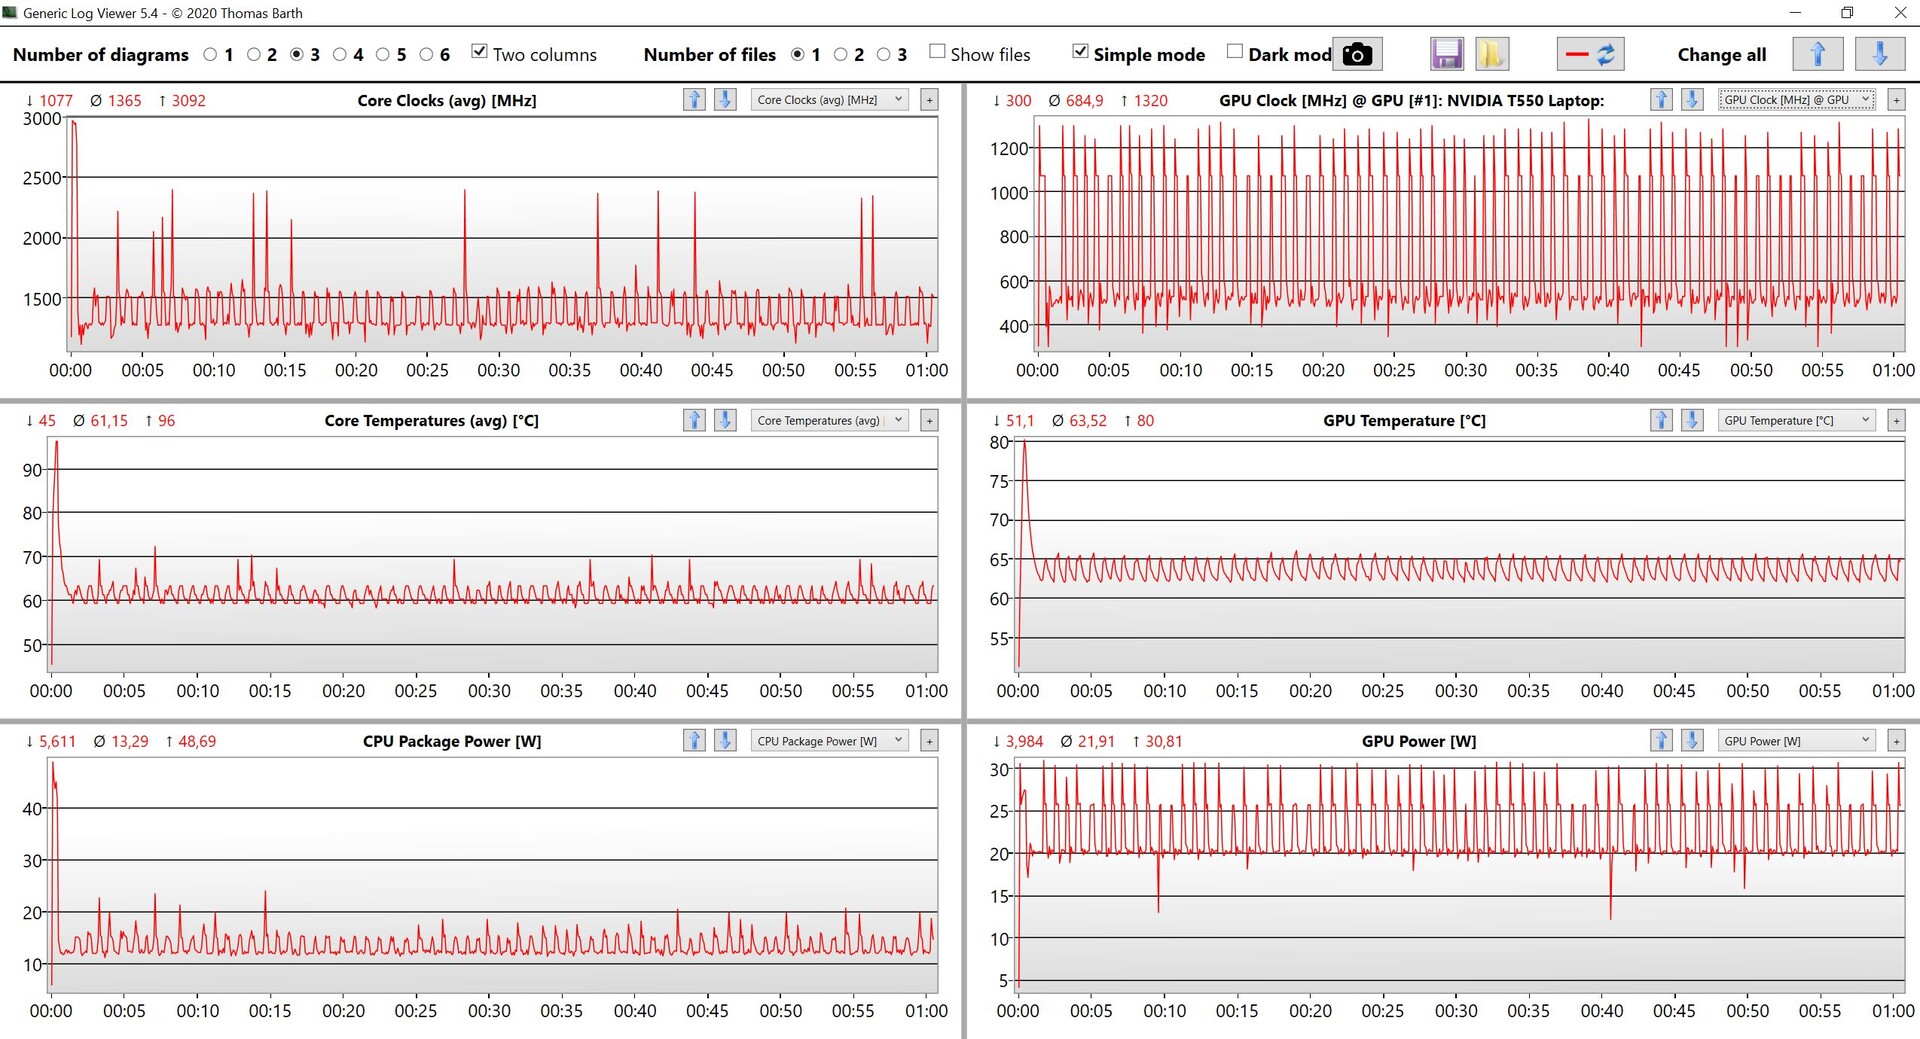
更新之后,Nvidia的T550专用GPU Nvidia的专用T550 GPU现在允许消耗30瓦而不是20瓦,在GPU基准测试中,优势为10-20%。因此,现在也有一个明显的优势比旧的 Nvidia T500.然而,在最新的更新之后,性能也确实不完全稳定,结果也降低了几个百分点,例如,3DMarkTime Spy 压力测试也只是没有通过。

更高的性能在游戏基准测试中也很明显,因为我们看到在这里也比我们的原始测试有10-20%的优势,这取决于标题和设置。

在电池模式下,GPU被限制在20瓦,所以ZBook在这里又落到了以前的水平。更多的GPU基准测试被列在这里.

3DMark
1920x1080 Fire Strike Graphics
Average of class Workstation
  (4081 - 29610, n=29, last 2 years)
14831 Points ∼100% +165%
Dell Precision 5000 5470
NVIDIA RTX A1000 Laptop GPU, Intel Core i9-12900H
10914 Points ∼74% +95%
HP ZBook Firefly 14 G9-6B8A2EA
NVIDIA T550 Laptop GPU, Intel Core i7-1265U
5593 Points ∼38%
Average NVIDIA T550 Laptop GPU
  (4816 - 5593, n=3)
5100 Points ∼34% -9%
HP ZBook Firefly 14 G9-6B8A2EA
NVIDIA T550 Laptop GPU, Intel Core i7-1265U
4816 Points ∼32% -14%
HP ZBook Firefly 14 G8 2C9Q2EA
NVIDIA T500 Laptop GPU, Intel Core i7-1165G7
4635 Points ∼31% -17%
HP EliteBook 865 G9
AMD Radeon 680M, AMD Ryzen 7 PRO 6850U
4015 Points ∼27% -28%
Lenovo ThinkPad P14s Gen2-20VX000GGE
NVIDIA T500 Laptop GPU, Intel Core i7-1185G7
3814 Points ∼26% -32%
2560x1440 Time Spy Graphics
Average of class Workstation
  (1284 - 11580, n=29, last 2 years)
5563 Points ∼100% +147%
Dell Precision 5000 5470
NVIDIA RTX A1000 Laptop GPU, Intel Core i9-12900H
4101 Points ∼74% +82%
HP ZBook Firefly 14 G9-6B8A2EA
NVIDIA T550 Laptop GPU, Intel Core i7-1265U
2252 Points ∼40%
Average NVIDIA T550 Laptop GPU
  (1882 - 2252, n=3)
2021 Points ∼36% -10%
HP ZBook Firefly 14 G8 2C9Q2EA
NVIDIA T500 Laptop GPU, Intel Core i7-1165G7
1939 Points ∼35% -14%
HP ZBook Firefly 14 G9-6B8A2EA
NVIDIA T550 Laptop GPU, Intel Core i7-1265U
1882 Points ∼34% -16%
Lenovo ThinkPad P14s Gen2-20VX000GGE
NVIDIA T500 Laptop GPU, Intel Core i7-1185G7
1636 Points ∼29% -27%
HP EliteBook 865 G9
AMD Radeon 680M, AMD Ryzen 7 PRO 6850U
1399 Points ∼25% -38%
Geekbench 5.4 - OpenCL Score
Average of class Workstation
  (16095 - 151795, n=25, last 2 years)
69936 Points ∼100% +91%
Dell Precision 5000 5470
NVIDIA RTX A1000 Laptop GPU, Intel Core i9-12900H
52380 Points ∼75% +43%
HP ZBook Firefly 14 G9-6B8A2EA
NVIDIA T550 Laptop GPU, Intel Core i7-1265U
36536 Points ∼52%
Apple MacBook Pro 14 2021 M1 Pro Entry
Apple M1 Pro 14-Core GPU, Apple M1 Pro 8-Core
35173 Points ∼50% -4%
Average NVIDIA T550 Laptop GPU
  (32530 - 36536, n=3)
34129 Points ∼49% -7%
HP ZBook Firefly 14 G9-6B8A2EA
NVIDIA T550 Laptop GPU, Intel Core i7-1265U
32530 Points ∼47% -11%
HP ZBook Firefly 14 G8 2C9Q2EA
NVIDIA T500 Laptop GPU, Intel Core i7-1165G7
30811 Points ∼44% -16%
Lenovo ThinkPad P14s Gen2-20VX000GGE
NVIDIA T500 Laptop GPU, Intel Core i7-1185G7
30428 Points ∼44% -17%
HP EliteBook 865 G9
AMD Radeon 680M, AMD Ryzen 7 PRO 6850U
21874 Points ∼31% -40%
SPECviewperf 13
Solidworks (sw-04)
Dell Precision 5000 5470
NVIDIA RTX A1000 Laptop GPU, Intel Core i9-12900H
134.89 fps ∼100% +28%
Average of class Workstation
  (63.3 - 207, n=28, last 2 years)
133.3 fps ∼99% +26%
HP ZBook Firefly 14 G9-6B8A2EA
NVIDIA T550 Laptop GPU, Intel Core i7-1265U
105.68 fps ∼78%
Average NVIDIA T550 Laptop GPU
  (95 - 105.7, n=3)
98.8 fps ∼73% -7%
HP ZBook Firefly 14 G9-6B8A2EA
NVIDIA T550 Laptop GPU, Intel Core i7-1265U
95 fps ∼70% -10%
HP ZBook Firefly 14 G8 2C9Q2EA
NVIDIA T500 Laptop GPU, Intel Core i7-1165G7
83.8 fps ∼62% -21%
Lenovo ThinkPad P14s Gen2-20VX000GGE
NVIDIA T500 Laptop GPU, Intel Core i7-1185G7
64.9 fps ∼48% -39%
Siemens NX (snx-03)
Average of class Workstation
  (17.4 - 413, n=28, last 2 years)
186.4 fps ∼100% +70%
Dell Precision 5000 5470
NVIDIA RTX A1000 Laptop GPU, Intel Core i9-12900H
185.06 fps ∼99% +69%
HP ZBook Firefly 14 G9-6B8A2EA
NVIDIA T550 Laptop GPU, Intel Core i7-1265U
109.67 fps ∼59%
Average NVIDIA T550 Laptop GPU
  (95.8 - 109.7, n=3)
101.7 fps ∼55% -7%
HP ZBook Firefly 14 G9-6B8A2EA
NVIDIA T550 Laptop GPU, Intel Core i7-1265U
95.8 fps ∼51% -13%
HP ZBook Firefly 14 G8 2C9Q2EA
NVIDIA T500 Laptop GPU, Intel Core i7-1165G7
82.7 fps ∼44% -25%
Lenovo ThinkPad P14s Gen2-20VX000GGE
NVIDIA T500 Laptop GPU, Intel Core i7-1185G7
72.2 fps ∼39% -34%
Showcase (showcase-02)
Average of class Workstation
  (19 - 142.9, n=28, last 2 years)
71.2 fps ∼100% +154%
Dell Precision 5000 5470
NVIDIA RTX A1000 Laptop GPU, Intel Core i9-12900H
57.85 fps ∼81% +106%
HP ZBook Firefly 14 G9-6B8A2EA
NVIDIA T550 Laptop GPU, Intel Core i7-1265U
28.06 fps ∼39%
Average NVIDIA T550 Laptop GPU
  (24.8 - 28.1, n=3)
26.1 fps ∼37% -7%
HP ZBook Firefly 14 G9-6B8A2EA
NVIDIA T550 Laptop GPU, Intel Core i7-1265U
24.8 fps ∼35% -12%
HP ZBook Firefly 14 G8 2C9Q2EA
NVIDIA T500 Laptop GPU, Intel Core i7-1165G7
16.01 fps ∼22% -43%
Medical (medical-02)
Average of class Workstation
  (18.6 - 140, n=28, last 2 years)
70.3 fps ∼100% +73%
Dell Precision 5000 5470
NVIDIA RTX A1000 Laptop GPU, Intel Core i9-12900H
62.13 fps ∼88% +53%
HP ZBook Firefly 14 G9-6B8A2EA
NVIDIA T550 Laptop GPU, Intel Core i7-1265U
40.74 fps ∼58%
Average NVIDIA T550 Laptop GPU
  (34.5 - 40.7, n=3)
37.1 fps ∼53% -9%
HP ZBook Firefly 14 G9-6B8A2EA
NVIDIA T550 Laptop GPU, Intel Core i7-1265U
34.5 fps ∼49% -15%
HP ZBook Firefly 14 G8 2C9Q2EA
NVIDIA T500 Laptop GPU, Intel Core i7-1165G7
31.08 fps ∼44% -24%
Lenovo ThinkPad P14s Gen2-20VX000GGE
NVIDIA T500 Laptop GPU, Intel Core i7-1185G7
24.84 fps ∼35% -39%
Maya (maya-05)
Average of class Workstation
  (49.5 - 363, n=28, last 2 years)
173.6 fps ∼100% +98%
Dell Precision 5000 5470
NVIDIA RTX A1000 Laptop GPU, Intel Core i9-12900H
161.74 fps ∼93% +85%
HP ZBook Firefly 14 G9-6B8A2EA
NVIDIA T550 Laptop GPU, Intel Core i7-1265U
87.57 fps ∼50%
Average NVIDIA T550 Laptop GPU
  (77.5 - 87.6, n=3)
82 fps ∼47% -6%
HP ZBook Firefly 14 G9-6B8A2EA
NVIDIA T550 Laptop GPU, Intel Core i7-1265U
77.5 fps ∼45% -11%
HP ZBook Firefly 14 G8 2C9Q2EA
NVIDIA T500 Laptop GPU, Intel Core i7-1165G7
53.5 fps ∼31% -39%
Lenovo ThinkPad P14s Gen2-20VX000GGE
NVIDIA T500 Laptop GPU, Intel Core i7-1185G7
48.47 fps ∼28% -45%
Energy (energy-02)
Average of class Workstation
  (7.71 - 74.3, n=28, last 2 years)
31.2 fps ∼100% +133%
Dell Precision 5000 5470
NVIDIA RTX A1000 Laptop GPU, Intel Core i9-12900H
25.13 fps ∼81% +88%
HP ZBook Firefly 14 G9-6B8A2EA
NVIDIA T550 Laptop GPU, Intel Core i7-1265U
13.37 fps ∼43%
Average NVIDIA T550 Laptop GPU
  (11.7 - 13.4, n=3)
12.4 fps ∼40% -7%
HP ZBook Firefly 14 G9-6B8A2EA
NVIDIA T550 Laptop GPU, Intel Core i7-1265U
11.7 fps ∼38% -12%
HP ZBook Firefly 14 G8 2C9Q2EA
NVIDIA T500 Laptop GPU, Intel Core i7-1165G7
8.82 fps ∼28% -34%
Lenovo ThinkPad P14s Gen2-20VX000GGE
NVIDIA T500 Laptop GPU, Intel Core i7-1185G7
8.57 fps ∼27% -36%
Creo (creo-02)
Average of class Workstation
  (45.5 - 331, n=27, last 2 years)
163.9 fps ∼100% +81%
Dell Precision 5000 5470
NVIDIA RTX A1000 Laptop GPU, Intel Core i9-12900H
155.73 fps ∼95% +72%
HP ZBook Firefly 14 G9-6B8A2EA
NVIDIA T550 Laptop GPU, Intel Core i7-1265U
90.66 fps ∼55%
Average NVIDIA T550 Laptop GPU
  (82.4 - 90.7, n=3)
86.2 fps ∼53% -5%
HP ZBook Firefly 14 G9-6B8A2EA
NVIDIA T550 Laptop GPU, Intel Core i7-1265U
82.4 fps ∼50% -9%
HP ZBook Firefly 14 G8 2C9Q2EA
NVIDIA T500 Laptop GPU, Intel Core i7-1165G7
61.3 fps ∼37% -32%
Lenovo ThinkPad P14s Gen2-20VX000GGE
NVIDIA T500 Laptop GPU, Intel Core i7-1185G7
55.8 fps ∼34% -38%
Catia (catia-05)
Average of class Workstation
  (49.9 - 369, n=28, last 2 years)
191.6 fps ∼100% +62%
Dell Precision 5000 5470
NVIDIA RTX A1000 Laptop GPU, Intel Core i9-12900H
184.4 fps ∼96% +56%
HP ZBook Firefly 14 G9-6B8A2EA
NVIDIA T550 Laptop GPU, Intel Core i7-1265U
118.22 fps ∼62%
Average NVIDIA T550 Laptop GPU
  (104 - 118.2, n=3)
110.4 fps ∼58% -7%
HP ZBook Firefly 14 G9-6B8A2EA
NVIDIA T550 Laptop GPU, Intel Core i7-1265U
104 fps ∼54% -12%
HP ZBook Firefly 14 G8 2C9Q2EA
NVIDIA T500 Laptop GPU, Intel Core i7-1165G7
92.7 fps ∼48% -22%
Lenovo ThinkPad P14s Gen2-20VX000GGE
NVIDIA T500 Laptop GPU, Intel Core i7-1185G7
81.9 fps ∼43% -31%
3ds Max (3dsmax-06)
Average of class Workstation
  (46.8 - 241, n=27, last 2 years)
133.6 fps ∼100% +101%
Dell Precision 5000 5470
NVIDIA RTX A1000 Laptop GPU, Intel Core i9-12900H
123.69 fps ∼93% +86%
HP ZBook Firefly 14 G9-6B8A2EA
NVIDIA T550 Laptop GPU, Intel Core i7-1265U
66.38 fps ∼50%
Average NVIDIA T550 Laptop GPU
  (61.6 - 66.4, n=3)
63.7 fps ∼48% -4%
HP ZBook Firefly 14 G9-6B8A2EA
NVIDIA T550 Laptop GPU, Intel Core i7-1265U
61.6 fps ∼46% -7%
HP ZBook Firefly 14 G8 2C9Q2EA
NVIDIA T500 Laptop GPU, Intel Core i7-1165G7
52.6 fps ∼39% -21%
Lenovo ThinkPad P14s Gen2-20VX000GGE
NVIDIA T500 Laptop GPU, Intel Core i7-1185G7
45.15 fps ∼34% -32%
SPECviewperf 2020 v1
1920x1080 Solidworks (solidworks-05)
Average of class Workstation
  (23.2 - 258, n=28, last 2 years)
124.5 fps ∼100% +103%
Dell Precision 5000 5470
NVIDIA RTX A1000 Laptop GPU, Intel Core i9-12900H
108.5 fps ∼87% +77%
HP ZBook Firefly 14 G9-6B8A2EA
NVIDIA T550 Laptop GPU, Intel Core i7-1265U
61.38 fps ∼49%
Average NVIDIA T550 Laptop GPU
  (46.3 - 61.4, n=3)
54 fps ∼43% -12%
HP ZBook Firefly 14 G9-6B8A2EA
NVIDIA T550 Laptop GPU, Intel Core i7-1265U
46.3 fps ∼37% -25%
Lenovo ThinkPad P14s Gen2-20VX000GGE
NVIDIA T500 Laptop GPU, Intel Core i7-1185G7
37.82 fps ∼30% -38%
1920x1080 Siemens NX (snx-04)
Average of class Workstation
  (17 - 411, n=28, last 2 years)
194.1 fps ∼100% +69%
Dell Precision 5000 5470
NVIDIA RTX A1000 Laptop GPU, Intel Core i9-12900H
174.1 fps ∼90% +52%
HP ZBook Firefly 14 G9-6B8A2EA
NVIDIA T550 Laptop GPU, Intel Core i7-1265U
114.82 fps ∼59%
Average NVIDIA T550 Laptop GPU
  (84 - 114.8, n=3)
99.4 fps ∼51% -13%
HP ZBook Firefly 14 G9-6B8A2EA
NVIDIA T550 Laptop GPU, Intel Core i7-1265U
84 fps ∼43% -27%
Lenovo ThinkPad P14s Gen2-20VX000GGE
NVIDIA T500 Laptop GPU, Intel Core i7-1185G7
66.2 fps ∼34% -42%
1920x1080 Medical (medical-03)
Average of class Workstation
  (8 - 68.3, n=28, last 2 years)
34.3 fps ∼100% +92%
Dell Precision 5000 5470
NVIDIA RTX A1000 Laptop GPU, Intel Core i9-12900H
30.29 fps ∼88% +70%
HP ZBook Firefly 14 G9-6B8A2EA
NVIDIA T550 Laptop GPU, Intel Core i7-1265U
17.87 fps ∼52%
Average NVIDIA T550 Laptop GPU
  (13.5 - 17.9, n=3)
15.6 fps ∼45% -13%
HP ZBook Firefly 14 G9-6B8A2EA
NVIDIA T550 Laptop GPU, Intel Core i7-1265U
13.5 fps ∼39% -24%
Lenovo ThinkPad P14s Gen2-20VX000GGE
NVIDIA T500 Laptop GPU, Intel Core i7-1185G7
10.73 fps ∼31% -40%
1920x1080 Maya (maya-06)
Average of class Workstation
  (46.8 - 404, n=28, last 2 years)
201 fps ∼100% +83%
Dell Precision 5000 5470
NVIDIA RTX A1000 Laptop GPU, Intel Core i9-12900H
189.59 fps ∼94% +73%
HP ZBook Firefly 14 G9-6B8A2EA
NVIDIA T550 Laptop GPU, Intel Core i7-1265U
109.68 fps ∼55%
Average NVIDIA T550 Laptop GPU
  (86.9 - 109.7, n=3)
98.2 fps ∼49% -10%
HP ZBook Firefly 14 G9-6B8A2EA
NVIDIA T550 Laptop GPU, Intel Core i7-1265U
86.9 fps ∼43% -21%
Lenovo ThinkPad P14s Gen2-20VX000GGE
NVIDIA T500 Laptop GPU, Intel Core i7-1185G7
59.3 fps ∼30% -46%
1920x1080 Energy (energy-03)
Average of class Workstation
  (6.72 - 71.6, n=28, last 2 years)
32.9 fps ∼100% +143%
Dell Precision 5000 5470
NVIDIA RTX A1000 Laptop GPU, Intel Core i9-12900H
23.77 fps ∼72% +75%
HP ZBook Firefly 14 G9-6B8A2EA
NVIDIA T550 Laptop GPU, Intel Core i7-1265U
13.56 fps ∼41%
Average NVIDIA T550 Laptop GPU
  (10.6 - 13.6, n=3)
12.1 fps ∼37% -11%
HP ZBook Firefly 14 G9-6B8A2EA
NVIDIA T550 Laptop GPU, Intel Core i7-1265U
10.6 fps ∼32% -22%
Lenovo ThinkPad P14s Gen2-20VX000GGE
NVIDIA T500 Laptop GPU, Intel Core i7-1185G7
8.62 fps ∼26% -36%
1920x1080 Creo (creo-03)
Average of class Workstation
  (27.4 - 165.1, n=28, last 2 years)
93.4 fps ∼100% +104%
Dell Precision 5000 5470
NVIDIA RTX A1000 Laptop GPU, Intel Core i9-12900H
87.16 fps ∼93% +91%
Average NVIDIA T550 Laptop GPU
  (44.5 - 48.5, n=3)
46.2 fps ∼49% +1%
HP ZBook Firefly 14 G9-6B8A2EA
NVIDIA T550 Laptop GPU, Intel Core i7-1265U
45.73 fps ∼49%
HP ZBook Firefly 14 G9-6B8A2EA
NVIDIA T550 Laptop GPU, Intel Core i7-1265U
44.5 fps ∼48% -3%
Lenovo ThinkPad P14s Gen2-20VX000GGE
NVIDIA T500 Laptop GPU, Intel Core i7-1185G7
32.72 fps ∼35% -28%
1920x1080 CATIA (catia-06)
Average of class Workstation
  (13.8 - 109.8, n=28, last 2 years)
58.4 fps ∼100% +97%
Dell Precision 5000 5470
NVIDIA RTX A1000 Laptop GPU, Intel Core i9-12900H
47.4 fps ∼81% +60%
HP ZBook Firefly 14 G9-6B8A2EA
NVIDIA T550 Laptop GPU, Intel Core i7-1265U
29.58 fps ∼51%
Average NVIDIA T550 Laptop GPU
  (22.4 - 29.6, n=3)
25.6 fps ∼44% -13%
HP ZBook Firefly 14 G9-6B8A2EA
NVIDIA T550 Laptop GPU, Intel Core i7-1265U
22.4 fps ∼38% -24%
Lenovo ThinkPad P14s Gen2-20VX000GGE
NVIDIA T500 Laptop GPU, Intel Core i7-1185G7
16.48 fps ∼28% -44%
1920x1080 3ds Max (3dsmax-07)
Average of class Workstation
  (17.5 - 144.6, n=28, last 2 years)
69.5 fps ∼100% +117%
Dell Precision 5000 5470
NVIDIA RTX A1000 Laptop GPU, Intel Core i9-12900H
54.35 fps ∼78% +70%
HP ZBook Firefly 14 G9-6B8A2EA
NVIDIA T550 Laptop GPU, Intel Core i7-1265U
32.03 fps ∼46%
Average NVIDIA T550 Laptop GPU
  (28.3 - 32, n=3)
30 fps ∼43% -6%
HP ZBook Firefly 14 G9-6B8A2EA
NVIDIA T550 Laptop GPU, Intel Core i7-1265U
28.3 fps ∼41% -12%
Lenovo ThinkPad P14s Gen2-20VX000GGE
NVIDIA T500 Laptop GPU, Intel Core i7-1185G7
19.56 fps ∼28% -39%
Blender / v3.3 Classroom HIP/AMD
HP EliteBook 865 G9
AMD Radeon 680M, AMD Ryzen 7 PRO 6850U
555 Seconds * ∼100%
Average of class Workstation
  (330 - 474, n=3, last 2 years)
379 Seconds * ∼68%
Blender / v3.3 Classroom OPTIX/RTX
HP ZBook Firefly 14 G9-6B8A2EA
NVIDIA T550 Laptop GPU, Intel Core i7-1265U
265 Seconds * ∼100% -4%
Average NVIDIA T550 Laptop GPU
  (256 - 269, n=3)
263 Seconds * ∼99% -3%
HP ZBook Firefly 14 G9-6B8A2EA
NVIDIA T550 Laptop GPU, Intel Core i7-1265U
256 Seconds * ∼97%
Average of class Workstation
  (21 - 269, n=14, last 2 years)
91.2 Seconds * ∼34% +64%
Dell Precision 5000 5470
NVIDIA RTX A1000 Laptop GPU, Intel Core i9-12900H
61 Seconds * ∼23% +76%
Blender / v3.3 Classroom CUDA
HP ZBook Firefly 14 G9-6B8A2EA
NVIDIA T550 Laptop GPU, Intel Core i7-1265U
283 Seconds * ∼100% -2%
Average NVIDIA T550 Laptop GPU
  (278 - 285, n=3)
282 Seconds * ∼100% -1%
HP ZBook Firefly 14 G9-6B8A2EA
NVIDIA T550 Laptop GPU, Intel Core i7-1265U
278 Seconds * ∼98%
Average of class Workstation
  (35 - 285, n=14, last 2 years)
121.4 Seconds * ∼43% +56%
Dell Precision 5000 5470
NVIDIA RTX A1000 Laptop GPU, Intel Core i9-12900H
112 Seconds * ∼40% +60%
Blender / v3.3 Classroom CPU
HP ZBook Firefly 14 G9-6B8A2EA
NVIDIA T550 Laptop GPU, Intel Core i7-1265U
1202 Seconds * ∼100% -65%
Average NVIDIA T550 Laptop GPU
  (728 - 1326, n=3)
1085 Seconds * ∼90% -49%
HP ZBook Firefly 14 G9-6B8A2EA
NVIDIA T550 Laptop GPU, Intel Core i7-1265U
728 Seconds * ∼61%
HP EliteBook 865 G9
AMD Radeon 680M, AMD Ryzen 7 PRO 6850U
516 Seconds * ∼43% +29%
Average of class Workstation
  (273 - 1326, n=15, last 2 years)
506 Seconds * ∼42% +30%
Dell Precision 5000 5470
NVIDIA RTX A1000 Laptop GPU, Intel Core i9-12900H
448 Seconds * ∼37% +38%

* ... smaller is better

Performance Rating - Percent
Average of class Workstation
 
98.1 pt ∼98%
Dell Precision 5000 5470
Intel Core i9-12900H, NVIDIA RTX A1000 Laptop GPU
86.2 pt ∼86%
HP ZBook Firefly 14 G9-6B8A2EA
Intel Core i7-1265U, NVIDIA T550 Laptop GPU
51.7 pt ∼52%
HP ZBook Firefly 14 G8 2C9Q2EA -2!
Intel Core i7-1165G7, NVIDIA T500 Laptop GPU
50.3 pt ∼50%
HP ZBook Firefly 14 G9-6B8A2EA
Intel Core i7-1265U, NVIDIA T550 Laptop GPU
48.7 pt ∼49%
Lenovo ThinkPad P14s Gen2-20VX000GGE
Intel Core i7-1185G7, NVIDIA T500 Laptop GPU
36.4 pt ∼36%
HP EliteBook 865 G9
AMD Ryzen 7 PRO 6850U, AMD Radeon 680M
27.7 pt ∼28%
The Witcher 3 - 1920x1080 Ultra Graphics & Postprocessing (HBAO+)
Average of class Workstation
  (11.4 - 110.4, n=29, last 2 years)
54.7 fps ∼100% +136%
Dell Precision 5000 5470
Intel Core i9-12900H, NVIDIA RTX A1000 Laptop GPU
42.7 (40min) fps ∼78% +84%
HP ZBook Firefly 14 G9-6B8A2EA
Intel Core i7-1265U, NVIDIA T550 Laptop GPU
23.2 (20min, 21P1) fps ∼42%
HP ZBook Firefly 14 G8 2C9Q2EA
Intel Core i7-1165G7, NVIDIA T500 Laptop GPU
21.9 fps ∼40% -6%
HP ZBook Firefly 14 G9-6B8A2EA
Intel Core i7-1265U, NVIDIA T550 Laptop GPU
19.6 (18min, 18P1) fps ∼36% -16%
Lenovo ThinkPad P14s Gen2-20VX000GGE
Intel Core i7-1185G7, NVIDIA T500 Laptop GPU
17 fps ∼31% -27%
HP EliteBook 865 G9
AMD Ryzen 7 PRO 6850U, AMD Radeon 680M
14.3 (12min, 13P1) fps ∼26% -38%
GTA V - 1920x1080 Highest Settings possible AA:4xMSAA + FX AF:16x
Average of class Workstation
  (13.3 - 124.4, n=26, last 2 years)
66.1 fps ∼100% +123%
Dell Precision 5000 5470
Intel Core i9-12900H, NVIDIA RTX A1000 Laptop GPU
58.9 (9.57min, 38.5P1) fps ∼89% +99%
HP ZBook Firefly 14 G9-6B8A2EA
Intel Core i7-1265U, NVIDIA T550 Laptop GPU
29.6 (14.9min, 17.9P1) fps ∼45%
HP ZBook Firefly 14 G9-6B8A2EA
Intel Core i7-1265U, NVIDIA T550 Laptop GPU
29 (5.96min, 18.9P1) fps ∼44% -2%
Lenovo ThinkPad P14s Gen2-20VX000GGE
Intel Core i7-1185G7, NVIDIA T500 Laptop GPU
19 (8.26min, 11.4P1) fps ∼29% -36%
HP EliteBook 865 G9
AMD Ryzen 7 PRO 6850U, AMD Radeon 680M
11.3 (1.23min, 7.87P1) fps ∼17% -62%
Final Fantasy XV Benchmark - 1920x1080 High Quality
Average of class Workstation
  (12.3 - 113.1, n=28, last 2 years)
55.3 fps ∼100% +149%
Dell Precision 5000 5470
Intel Core i9-12900H, NVIDIA RTX A1000 Laptop GPU
43 fps ∼78% +94%
HP ZBook Firefly 14 G9-6B8A2EA
Intel Core i7-1265U, NVIDIA T550 Laptop GPU
22.2 fps ∼40%
HP ZBook Firefly 14 G9-6B8A2EA
Intel Core i7-1265U, NVIDIA T550 Laptop GPU
22 fps ∼40% -1%
HP ZBook Firefly 14 G8 2C9Q2EA
Intel Core i7-1165G7, NVIDIA T500 Laptop GPU
16.7 fps ∼30% -25%
Lenovo ThinkPad P14s Gen2-20VX000GGE
Intel Core i7-1185G7, NVIDIA T500 Laptop GPU
16.7 fps ∼30% -25%
HP EliteBook 865 G9
AMD Ryzen 7 PRO 6850U, AMD Radeon 680M
14.8 fps ∼27% -33%
Strange Brigade - 1920x1080 ultra AA:ultra AF:16
Average of class Workstation
  (24.5 - 197.7, n=26, last 2 years)
97.2 fps ∼100% +156%
Dell Precision 5000 5470
Intel Core i9-12900H, NVIDIA RTX A1000 Laptop GPU
72.8 (53.2min, 56.3P1) fps ∼75% +92%
HP ZBook Firefly 14 G9-6B8A2EA
Intel Core i7-1265U, NVIDIA T550 Laptop GPU
38 fps ∼39%
HP ZBook Firefly 14 G9-6B8A2EA
Intel Core i7-1265U, NVIDIA T550 Laptop GPU
33.2 (26.1min, 27.1P1) fps ∼34% -13%
Lenovo ThinkPad P14s Gen2-20VX000GGE
Intel Core i7-1185G7, NVIDIA T500 Laptop GPU
24.5 (19.1min, 20.9P1) fps ∼25% -36%
HP EliteBook 865 G9
AMD Ryzen 7 PRO 6850U, AMD Radeon 680M
22 (14min, 15.9P1) fps ∼23% -42%
Dota 2 Reborn - 1920x1080 ultra (3/3) best looking
Dell Precision 5000 5470
Intel Core i9-12900H, NVIDIA RTX A1000 Laptop GPU
132.1 (114.8min) fps ∼100% +41%
Average of class Workstation
  (55.6 - 158, n=28, last 2 years)
117.2 fps ∼89% +25%
HP ZBook Firefly 14 G9-6B8A2EA
Intel Core i7-1265U, NVIDIA T550 Laptop GPU
93.4 (82min) fps ∼71%
HP ZBook Firefly 14 G9-6B8A2EA
Intel Core i7-1265U, NVIDIA T550 Laptop GPU
84 (72.5min) fps ∼64% -10%
HP ZBook Firefly 14 G8 2C9Q2EA
Intel Core i7-1165G7, NVIDIA T500 Laptop GPU
77.8 (68.4min) fps ∼59% -17%
Lenovo ThinkPad P14s Gen2-20VX000GGE
Intel Core i7-1185G7, NVIDIA T500 Laptop GPU
71.4 (60.6min) fps ∼54% -24%
HP EliteBook 865 G9
AMD Ryzen 7 PRO 6850U, AMD Radeon 680M
48 (42.4min) fps ∼36% -49%
X-Plane 11.11 - 1920x1080 high (fps_test=3)
Average of class Workstation
  (31.7 - 112.5, n=29, last 2 years)
78.3 fps ∼100% +37%
Dell Precision 5000 5470
Intel Core i9-12900H, NVIDIA RTX A1000 Laptop GPU
76.3 fps ∼97% +34%
HP ZBook Firefly 14 G9-6B8A2EA
Intel Core i7-1265U, NVIDIA T550 Laptop GPU
58.8 fps ∼75% +3%
HP ZBook Firefly 14 G9-6B8A2EA
Intel Core i7-1265U, NVIDIA T550 Laptop GPU
57 fps ∼73%
HP ZBook Firefly 14 G8 2C9Q2EA
Intel Core i7-1165G7, NVIDIA T500 Laptop GPU
56.4 fps ∼72% -1%
Lenovo ThinkPad P14s Gen2-20VX000GGE
Intel Core i7-1185G7, NVIDIA T500 Laptop GPU
38.6 fps ∼49% -32%
HP EliteBook 865 G9
AMD Ryzen 7 PRO 6850U, AMD Radeon 680M
29.3 fps ∼37% -49%

Witcher 3 FPS chart

0510152025Tooltip
HP ZBook Firefly 14 G9-6B8A2EA i7-1265U, T550 Laptop GPU: Ø23.2 (20-25)
HP ZBook Firefly 14 G9-6B8A2EA i7-1265U, T550 Laptop GPU: Ø19.6 (18-21)
low med. high ultra
GTA V (2015) 127.2 120.6 63.9 29.6
The Witcher 3 (2015) 139 78 43 23.2
Dota 2 Reborn (2015) 126 110.1 101.2 93.4
Final Fantasy XV Benchmark (2018) 65.7 30.5 22.2
X-Plane 11.11 (2018) 77.4 65.4 57
Strange Brigade (2018) 139 56 44 38
F1 2021 (2021) 156.6 75.4 59.9 36.8
F1 22 (2022) 69.9 63 44.6 33.4

排放--ZBook现在有了更活跃的风扇

更新后,风扇的声音变得有点大,而且更活跃。高功率限制是造成这种情况的原因,因为在短时间的负载高峰期已经达到了高的芯片温度。因此,在日常使用中,风扇开始工作的情况可能会更频繁。我们在纯CPU负载(单核和多核)下测得33分贝(A),一旦显卡也处于负载状态,就会超过40分贝(A)。

Noise Level

Idle
23.6 / 23.6 / 23.6 dB(A)
Load
42.5 / 42.5 dB(A)
  red to green bar
 
 
30 dB
silent
40 dB(A)
audible
50 dB(A)
loud
 
min: dark, med: mid, max: light   Earthworks M23R, Arta (15 cm distance)   environment noise: 23.6 dB(A)
dB(A) 0102030405060708090Deep BassMiddle BassHigh BassLower RangeMidsHigher MidsLower HighsMid HighsUpper HighsSuper Highs2032.832.831.329.529.62529.831.528.630.826.93124.725.323.323.223.34030.42829.230.930.55026.723.925.125.224.86323.622.723.922.122.48020.123.224.319.218.610018.821.421.118.922.61252020.521.717.918.816017.419.92016.216.12001922.321.816.818.725018.922.523.116.617.731518.923.22415.117.440018.324.62512.116.15001925.927.510.316.763020.526.627.610.516.780020.528.929.29.318.1100021.728.728.89.418.7125021.129.130.59.320.3160022.328.731.29.919.5200021.729.130.210.118.1250022.530.53310.219.4315020.829.431.910.817400021.630.33211.218.6500020.529.331.111.616.2630018.428.33111.813.9800014.425.127.912.912.31000013.2