微星造物主Z17笔记本电脑回顾。创作人和游戏者在4000欧元左右能得到什么?

新的Creator Z17继承了Creator 17(2020)的脚步。 创造者17(2020)但其设计已被完全修改。我们在回顾Creator Z16P时已经领略了新的设计。 回顾Creator Z16P的时候,我们已经领略到了新的设计,这是这个昂贵的工作站的16英寸版本,主要针对创意者。
其特点是 酷睿i9-12900H和一个 RTX 3070 Ti,造物主Z17当然也会吸引游戏玩家。但是,高昂的价格、薄薄的金属机箱、反光的2.2K触摸屏,更不用说,一个无法满功率运行的显卡,意味着该设备更针对那些从事创造性工作的人。
在我们看来,Z17正在与具有类似硬件的多媒体或游戏笔记本电脑竞争,例如Razer Blade 17 。除了Razer,我们还不得不将Aorus 17X XES 和戴尔XPS 17 (不幸的是只提供了RTX 3060 )列入我们的比较。而且,由于微星的16英寸机型对我们来说是可用的,它也将成为比较的一部分。最后,我们将看一下两年前的前辈,看看有什么变化。
潜在的竞争对手比较
Rating | Date | Model | Weight | Height | Size | Resolution | Price |
|---|---|---|---|---|---|---|---|
| 83.8 % v7 (old) | 09 / 2022 | MSI Creator Z17 A12UGST-054 i9-12900H, GeForce RTX 3070 Ti Laptop GPU | 2.5 kg | 19 mm | 17.00" | 2560x1600 | |
| 82.5 % v7 (old) | 11 / 2020 | MSI Creator 17 A10SGS i7-10875H, GeForce RTX 2080 Super Max-Q | 2.4 kg | 20 mm | 17.30" | 3840x2160 | |
| 83.7 % v7 (old) | 06 / 2022 | MSI Creator Z16P B12UHST i9-12900H, GeForce RTX 3080 Ti Laptop GPU | 2.4 kg | 20.4 mm | 16.00" | 2560x1600 | |
| 90.1 % v7 (old) | 05 / 2022 | Razer Blade 17 (i7-12800H, RTX 3070 Ti) i7-12800H, GeForce RTX 3070 Ti Laptop GPU | 2.8 kg | 19.9 mm | 17.30" | 2560x1440 | |
| 83.7 % v7 (old) | 08 / 2022 | Aorus 17X XES i9-12900HX, GeForce RTX 3070 Ti Laptop GPU | 2.7 kg | 30 mm | 17.30" | 1920x1080 | |
| 88.8 % v7 (old) | 06 / 2022 | Dell XPS 17 9720 RTX 3060 i7-12700H, GeForce RTX 3060 Laptop GPU | 2.5 kg | 19.5 mm | 17.00" | 3840x2400 |
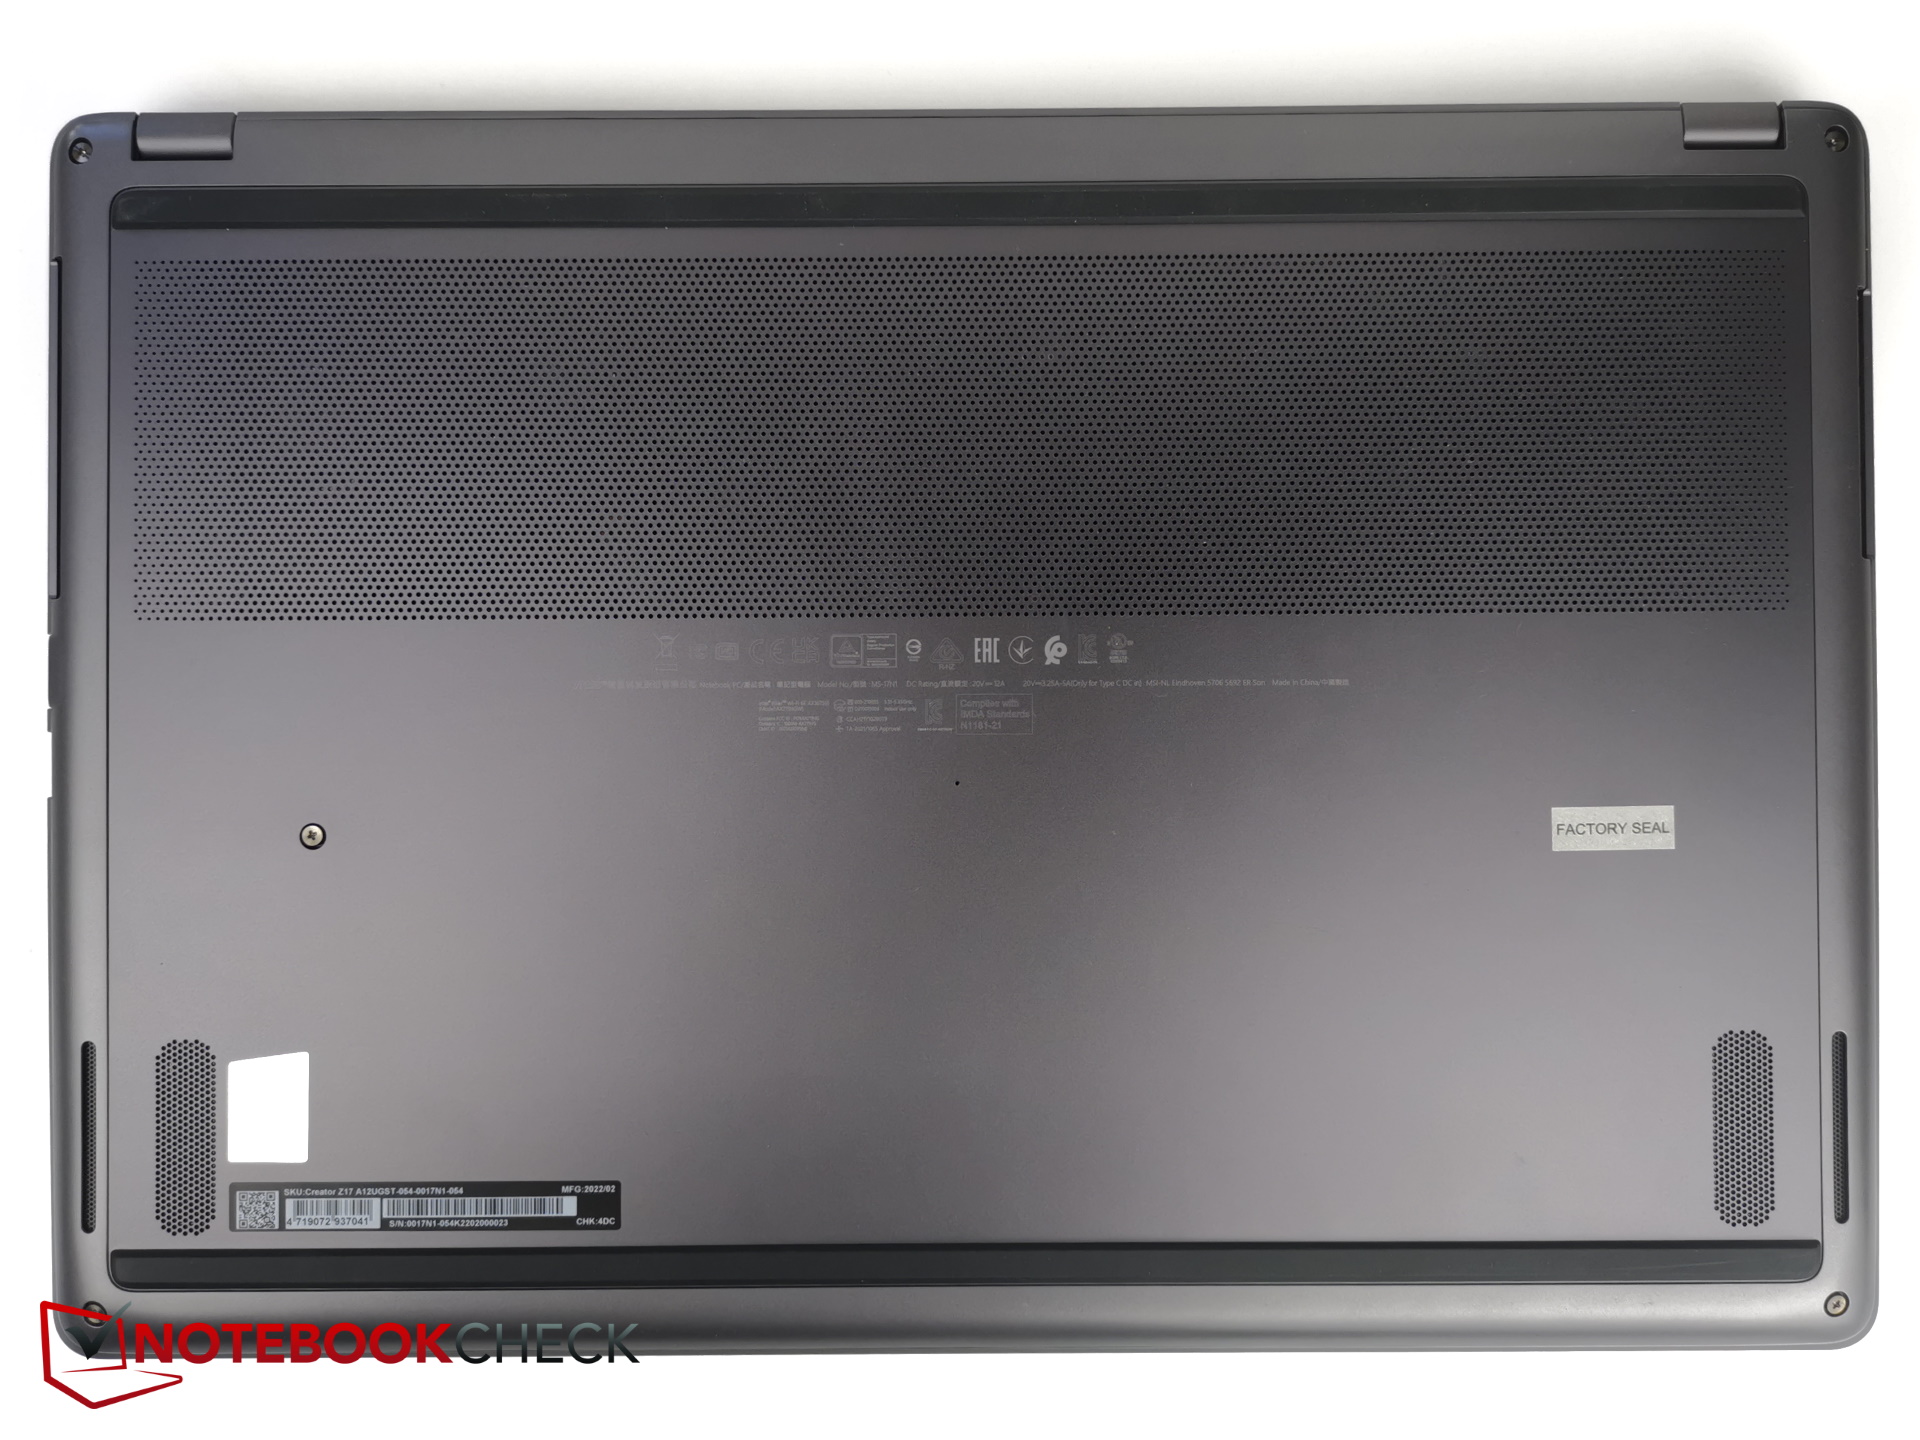
底座 - 超薄、坚固,由金属制成
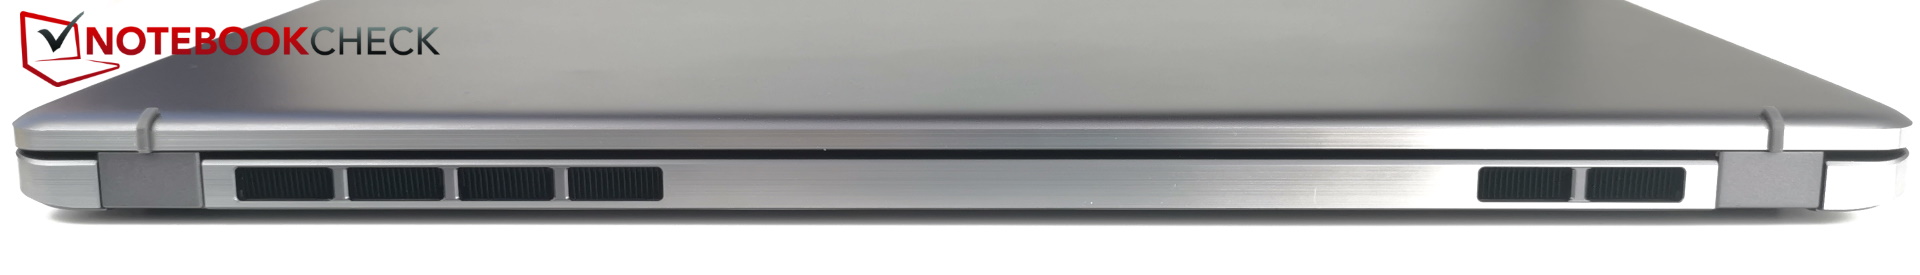
机箱只有19毫米(0.75英寸)薄,似乎几乎完全由金属制成。这使得该设备非常坚固。因此,它在扭曲时几乎没有表现出任何弯曲,只发出非常轻微的吱吱声,特别是在右侧的端口周围。即使是可以打开到180度的显示屏盖子,也有令人愉快的抗扭性。
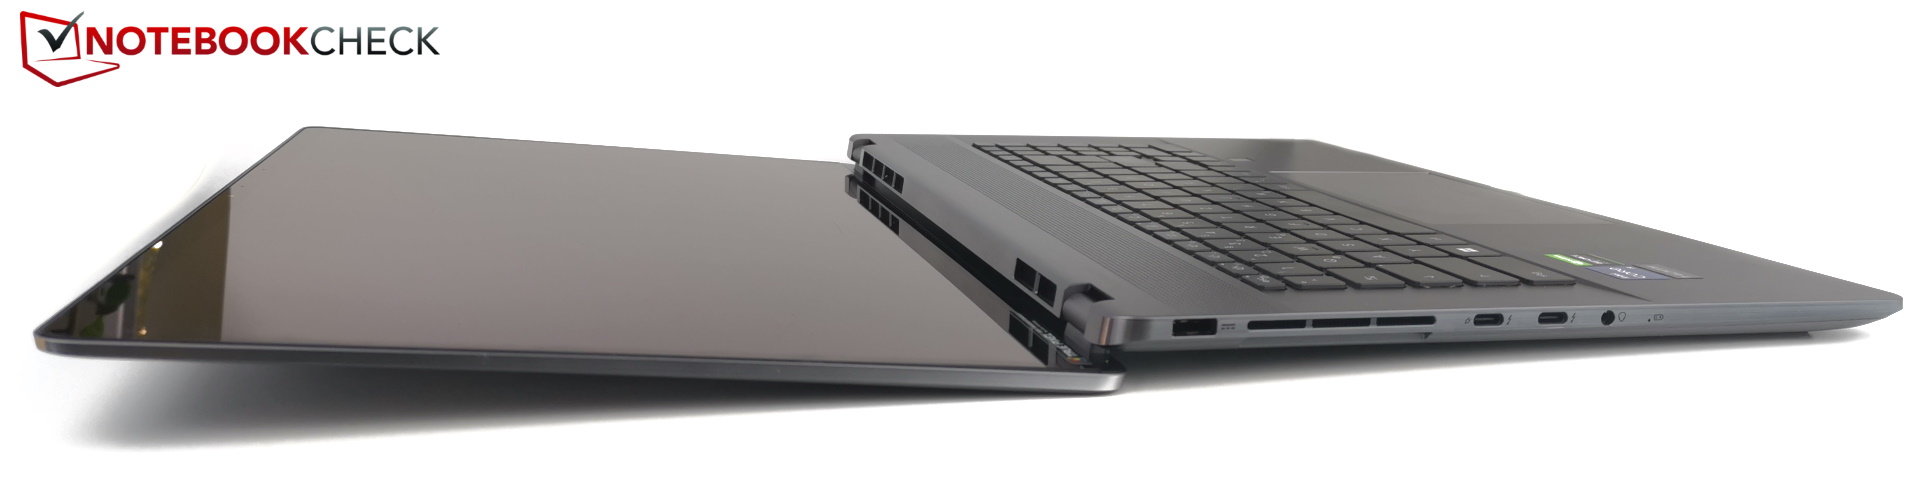
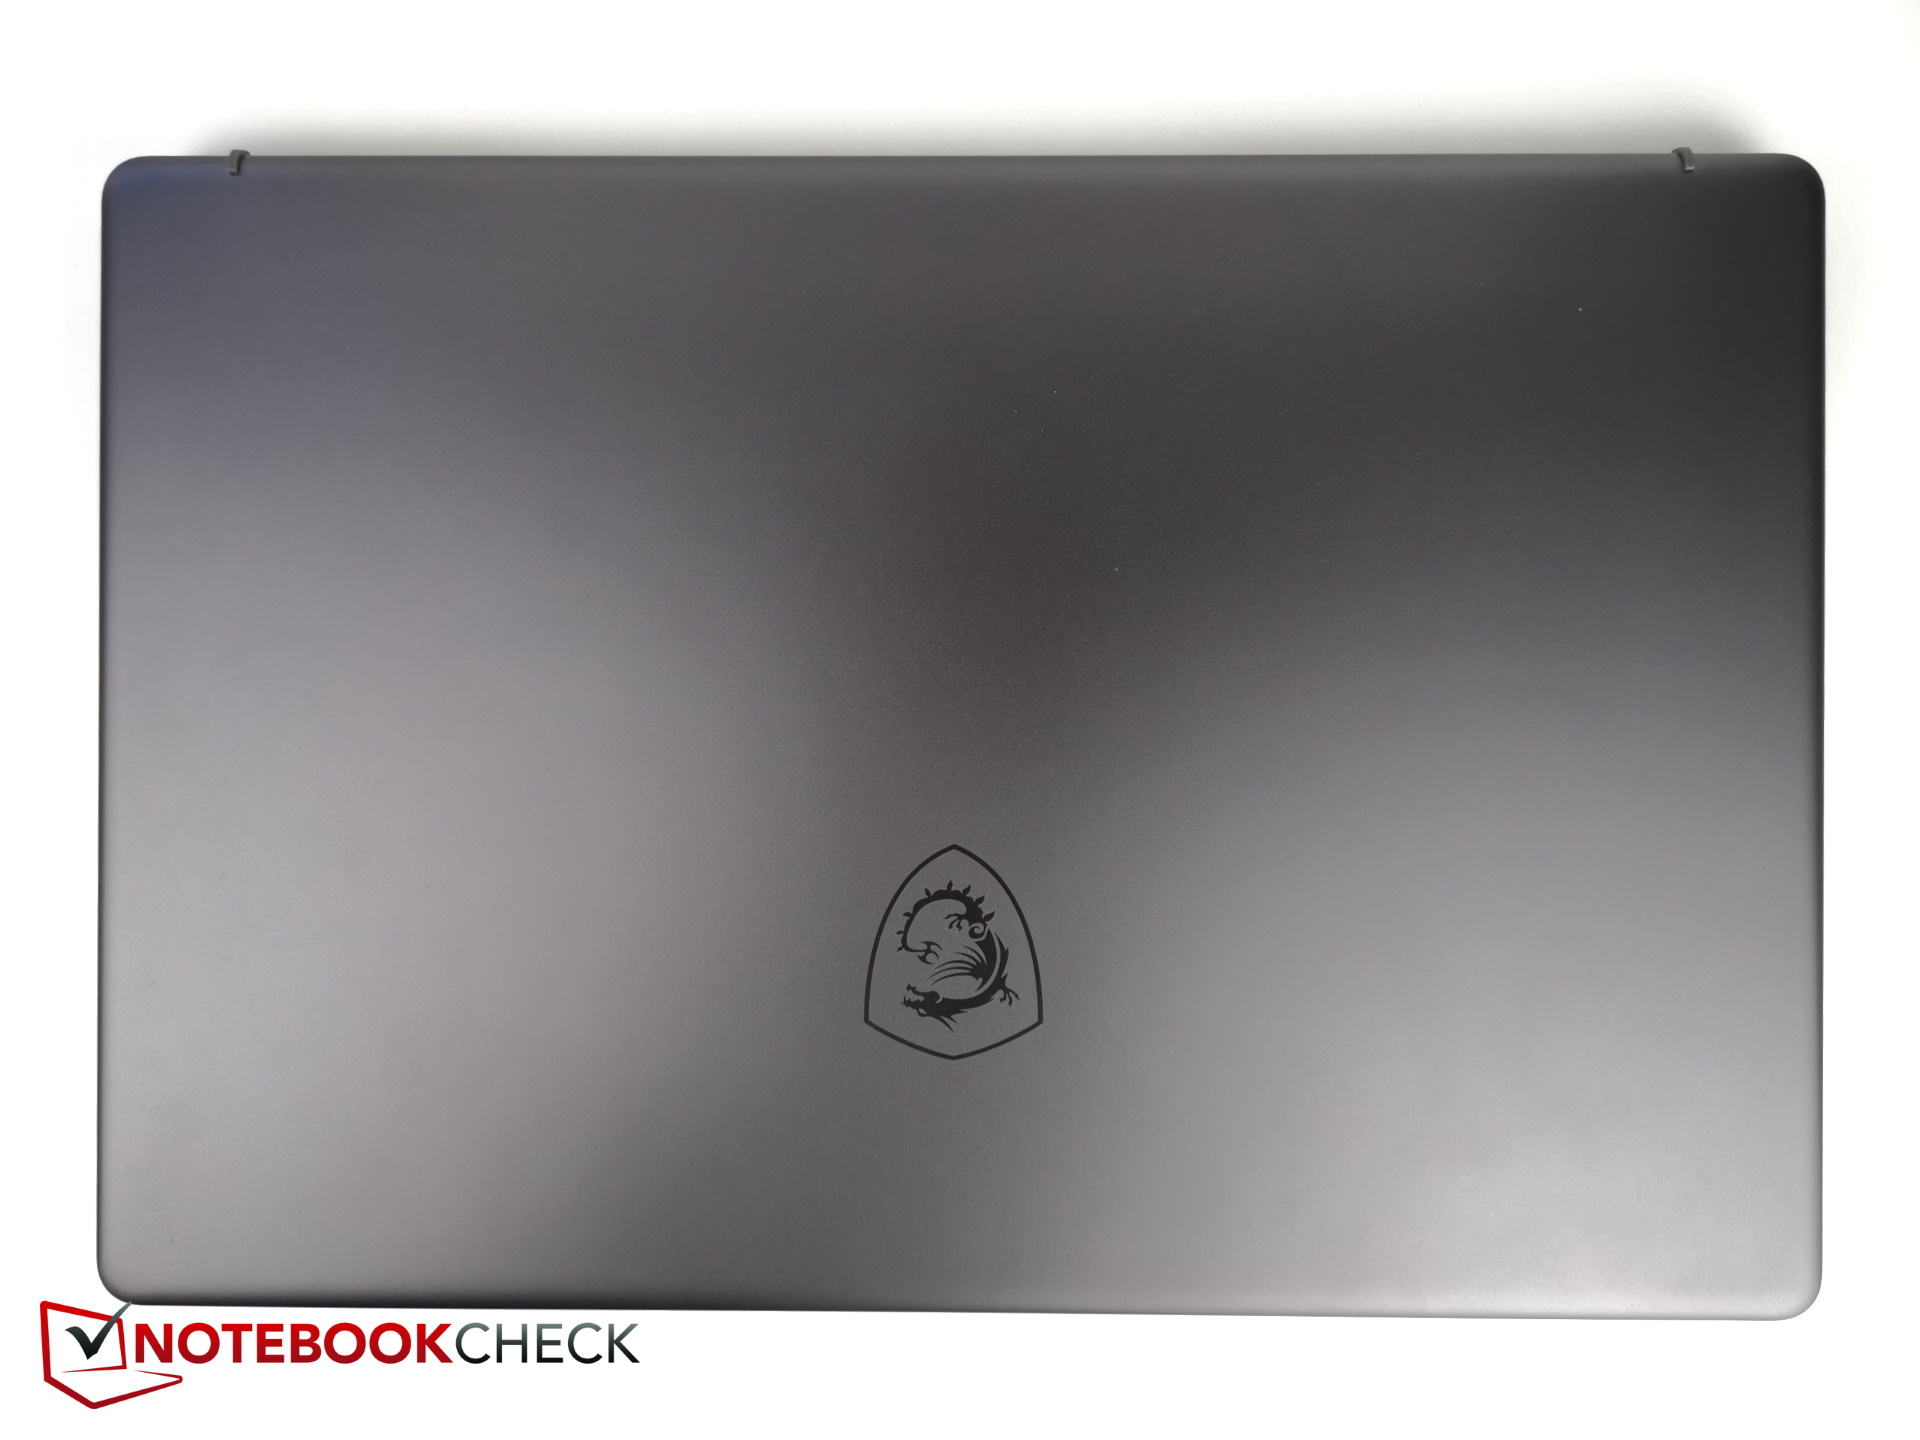
深灰色的金属设计简洁而时尚。几乎所有的边缘和角落都是圆形的。到处都有通风口,但两侧的通风口非常小,相当不显眼。
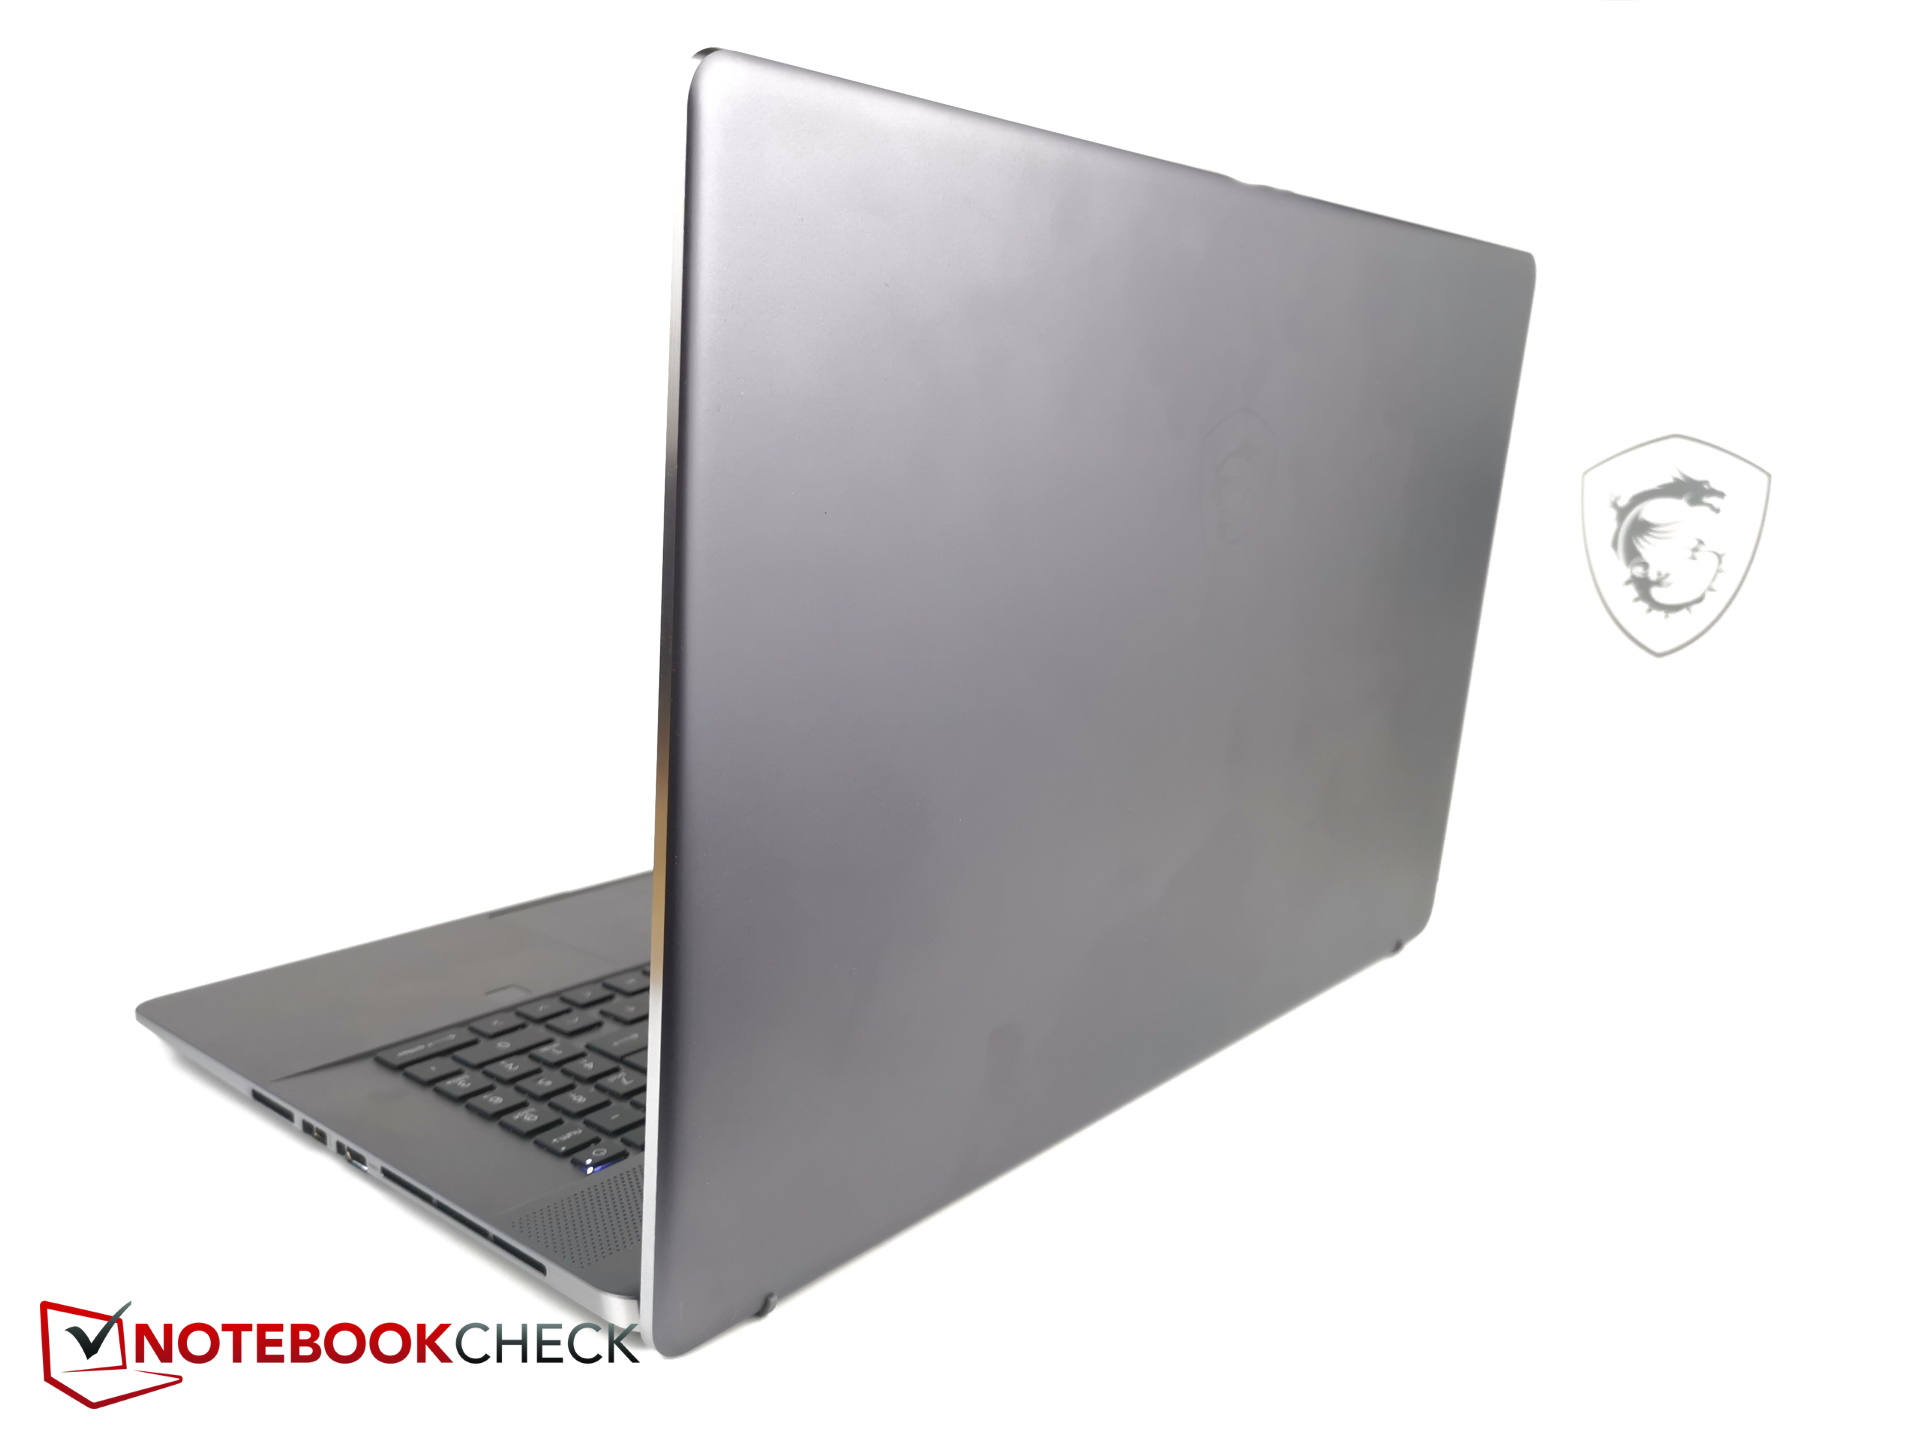
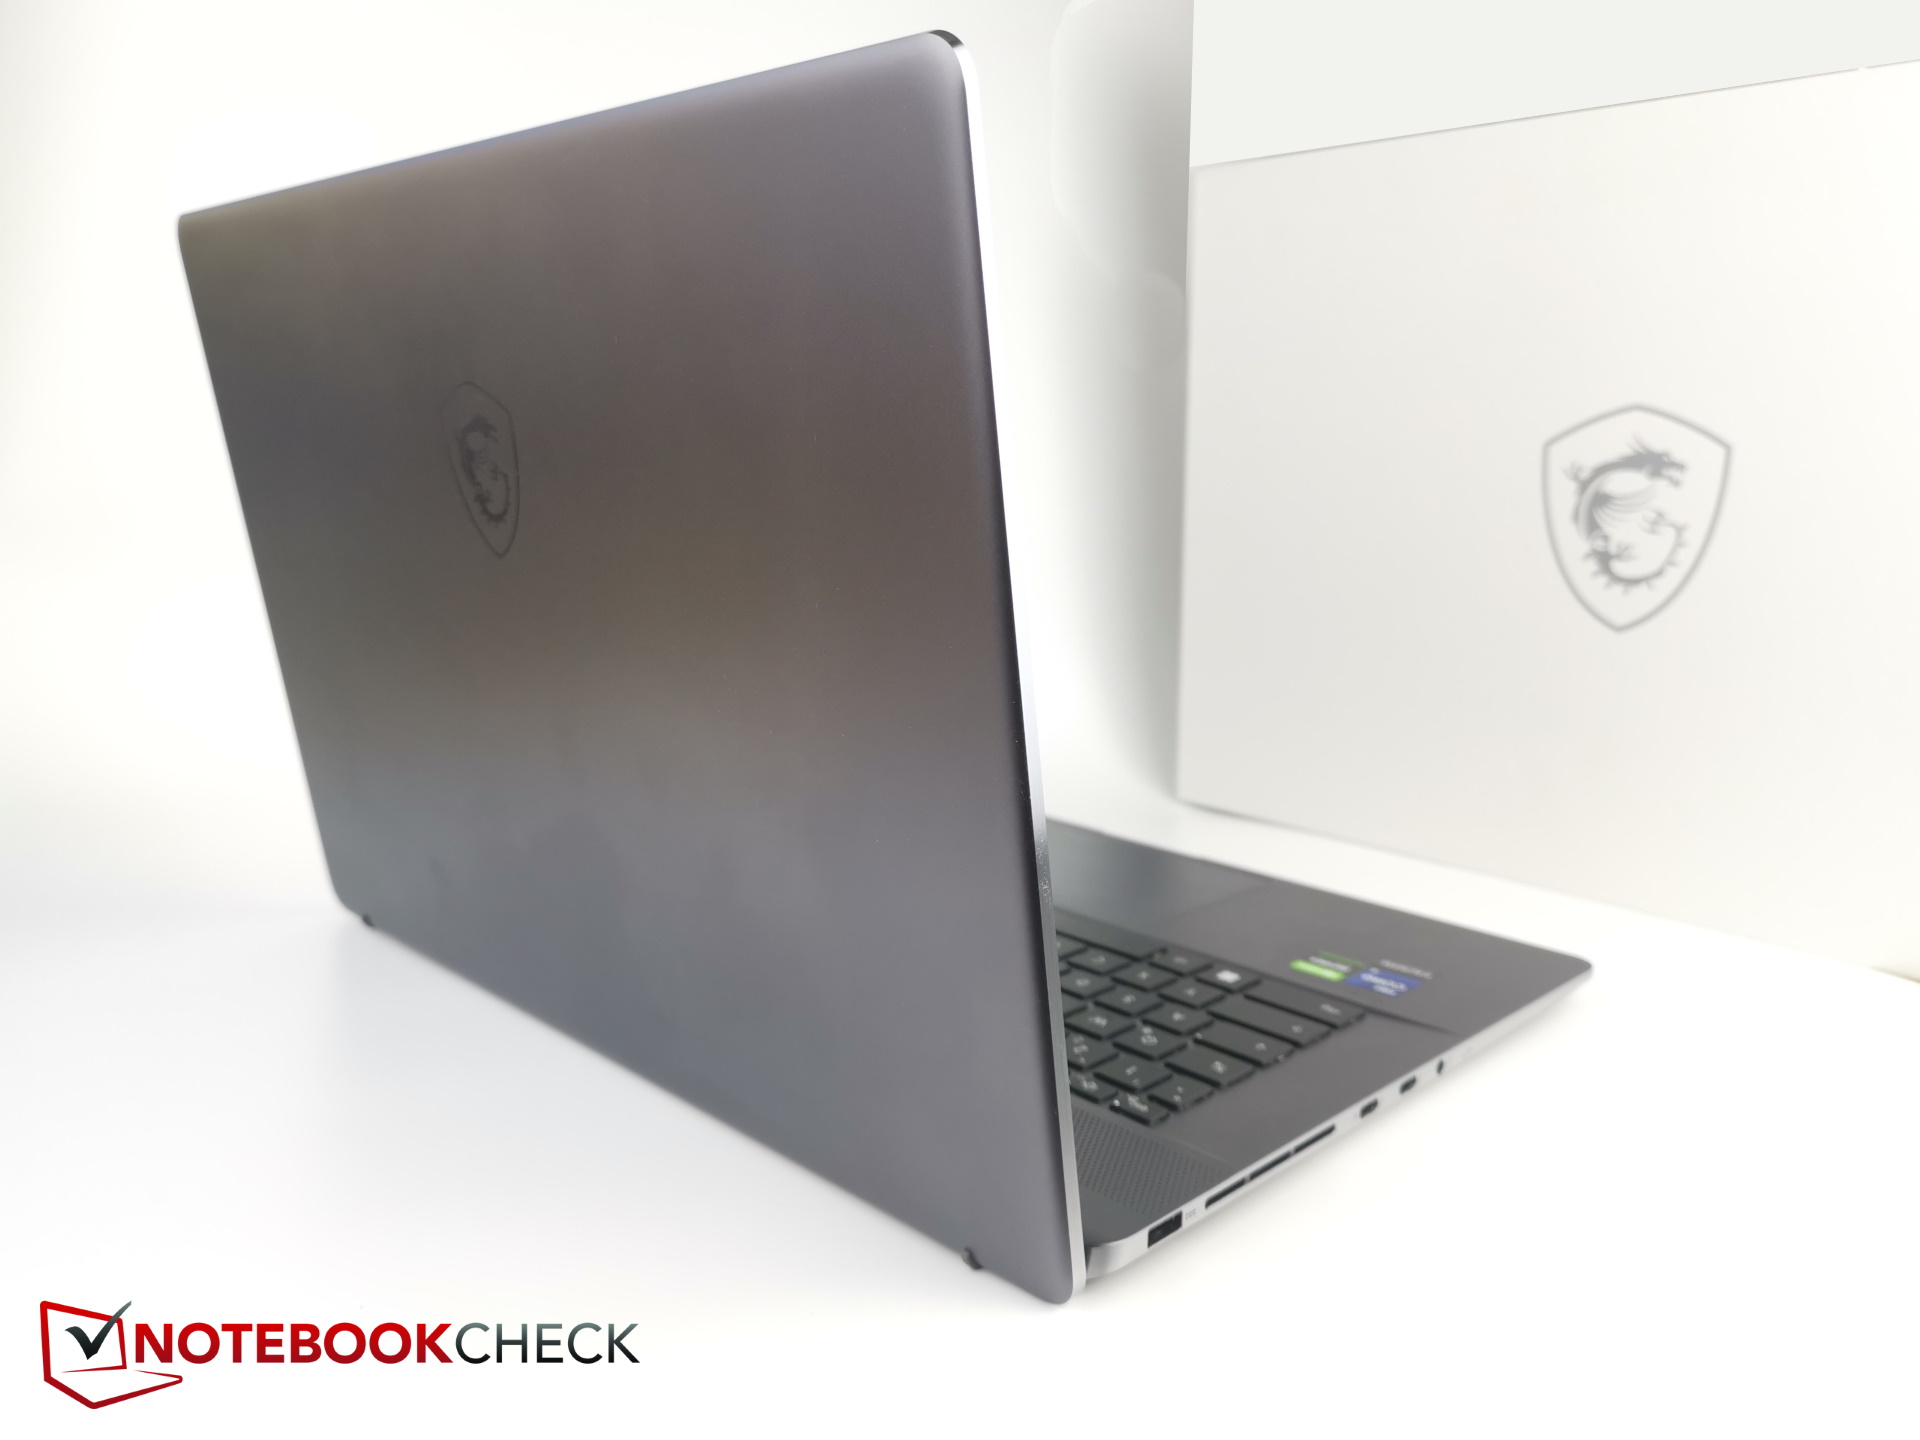
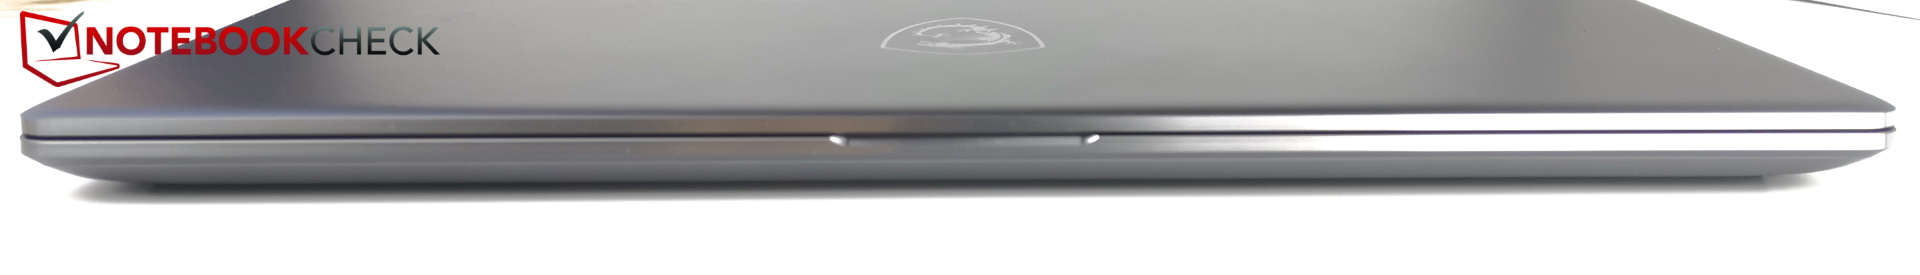
Z17比它的前辈更紧凑一些,特别是在宽度上。它的厚度只有19毫米(0.75英寸)。即使是非常薄的Razer Blade也有大约1毫米(0.04英寸)的厚度,无法与Creator的苗条程度相比。
Creator Z17的重量约为2.5公斤(5.5磅),也比Blade 17轻约300克(0.66磅)。总体而言,该设备是我们比较中最薄的,也是最小的17英寸笔记本电脑之一。
特点 - 薄型微星工作站
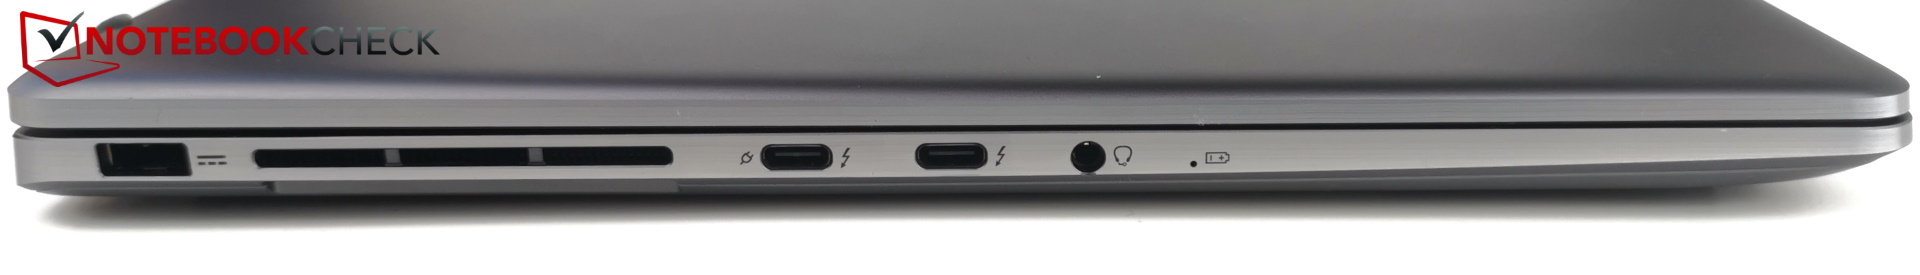
对于一个17英寸的设备来说,端口的选择是相当细的。总共有三个USB端口,一个耳机插孔,一个HDMI输出和一个SD读卡器。Z17甚至没有一个以太网端口,也没有一个Kensington锁插槽。你将需要购买一个可选的USB适配器来实现以太网连接。
积极的一面是,两个USB-C端口支持Thunderbolt 4。不幸的是,这也意味着该设备上只有一个USB-A端口可用。因此,对于创作者来说,使用集线器进行工作几乎是必不可少的。
尽管端口的选择不多,但它们的排列方式却不太理想--至少在右侧。HDMI输出和USB-A端口,所有的东西,都位于非常近的地方,几乎肯定会相互干扰。
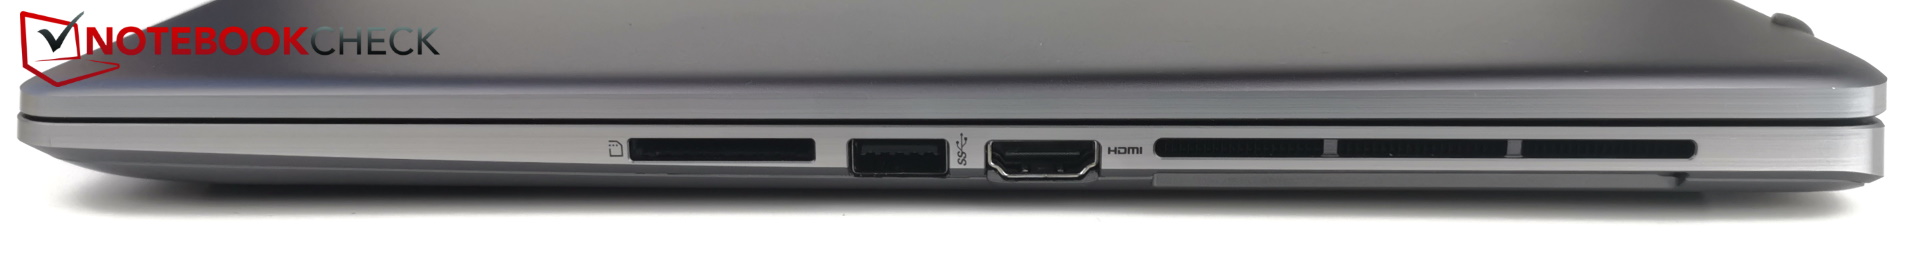
SD卡阅读器
当你把SD卡插入读卡器时,它并没有被锁定,而只是坐在那里,大约一半的卡都伸出来了。用我们的参考SD卡(AV PRO microSD 128 GB V60)实现的传输率是相当温和的。你应该能够从这个价格的笔记本电脑中期待更多。例如,Razer Blade的速度是它的两倍,而XPS 17在这个部门甚至更快。
| SD Card Reader | |
| average JPG Copy Test (av. of 3 runs) | |
| Dell XPS 17 9720 RTX 3060 (Toshiba Exceria Pro SDXC 64 GB UHS-II) | |
| Razer Blade 17 (i7-12800H, RTX 3070 Ti) | |
| Average of class Multimedia (23 - 531, n=37, last 2 years) | |
| MSI Creator Z17 A12UGST-054 (AV Pro SD microSD 128 GB V60) | |
| MSI Creator Z16P B12UHST (AV PRO microSD 128 GB V60) | |
| maximum AS SSD Seq Read Test (1GB) | |
| Dell XPS 17 9720 RTX 3060 (Toshiba Exceria Pro SDXC 64 GB UHS-II) | |
| Average of class Multimedia (37.3 - 1455, n=36, last 2 years) | |
| Razer Blade 17 (i7-12800H, RTX 3070 Ti) | |
| MSI Creator Z17 A12UGST-054 (AV Pro SD microSD 128 GB V60) | |
连接性
如前所述,Z17上缺少一个以太网端口。没有适配器,即使在家里,你也只能使用无线连接。但微星至少包括一个支持Wi-Fi 6E的杀手级无线模块。
传输速率很好而且很快,特别是在使用6GHz频段时。在两次测试中,每一次的传输速率都有一个小的下滑。
网络摄像头
微星包括一个带有红外传感器和面部识别的全高清网络摄像头。图像质量很好,但颜色偏差往往有点偏红。


安全问题
创造者Z17有一个指纹传感器。此外,它的摄像头配备了一个红外传感器,并支持使用面部识别登录。
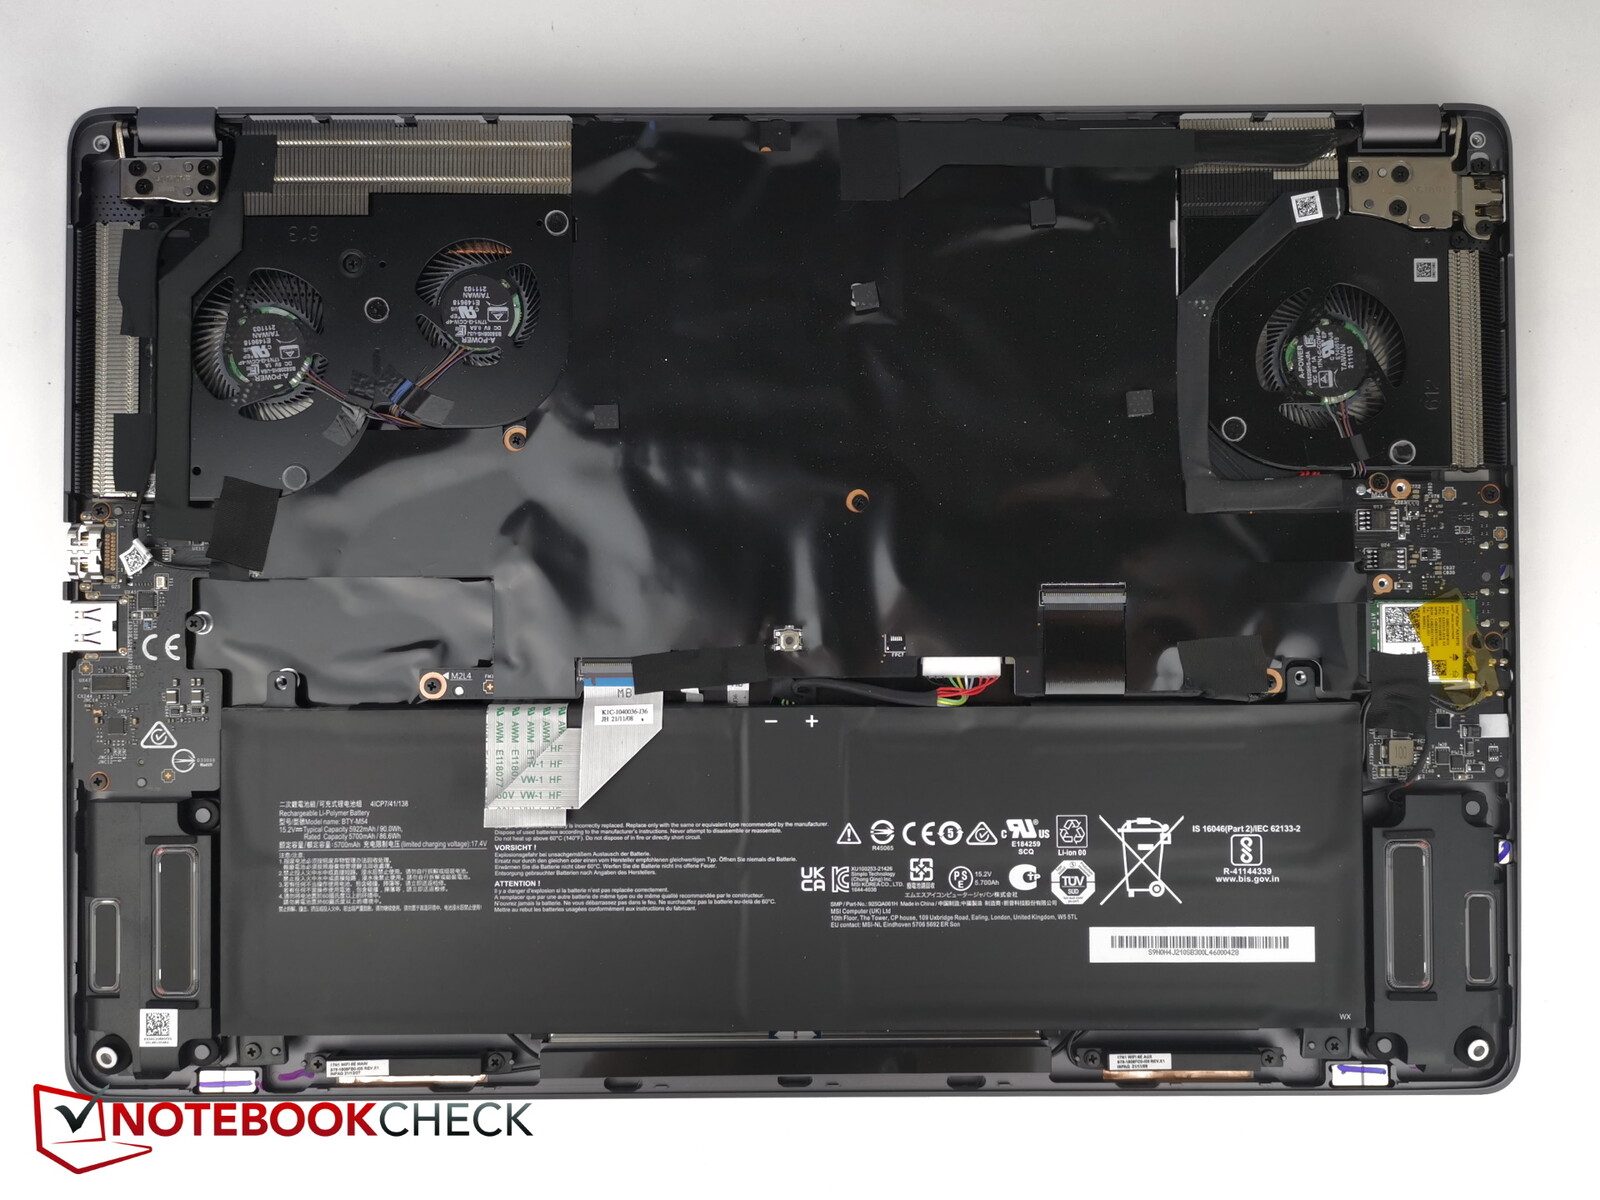
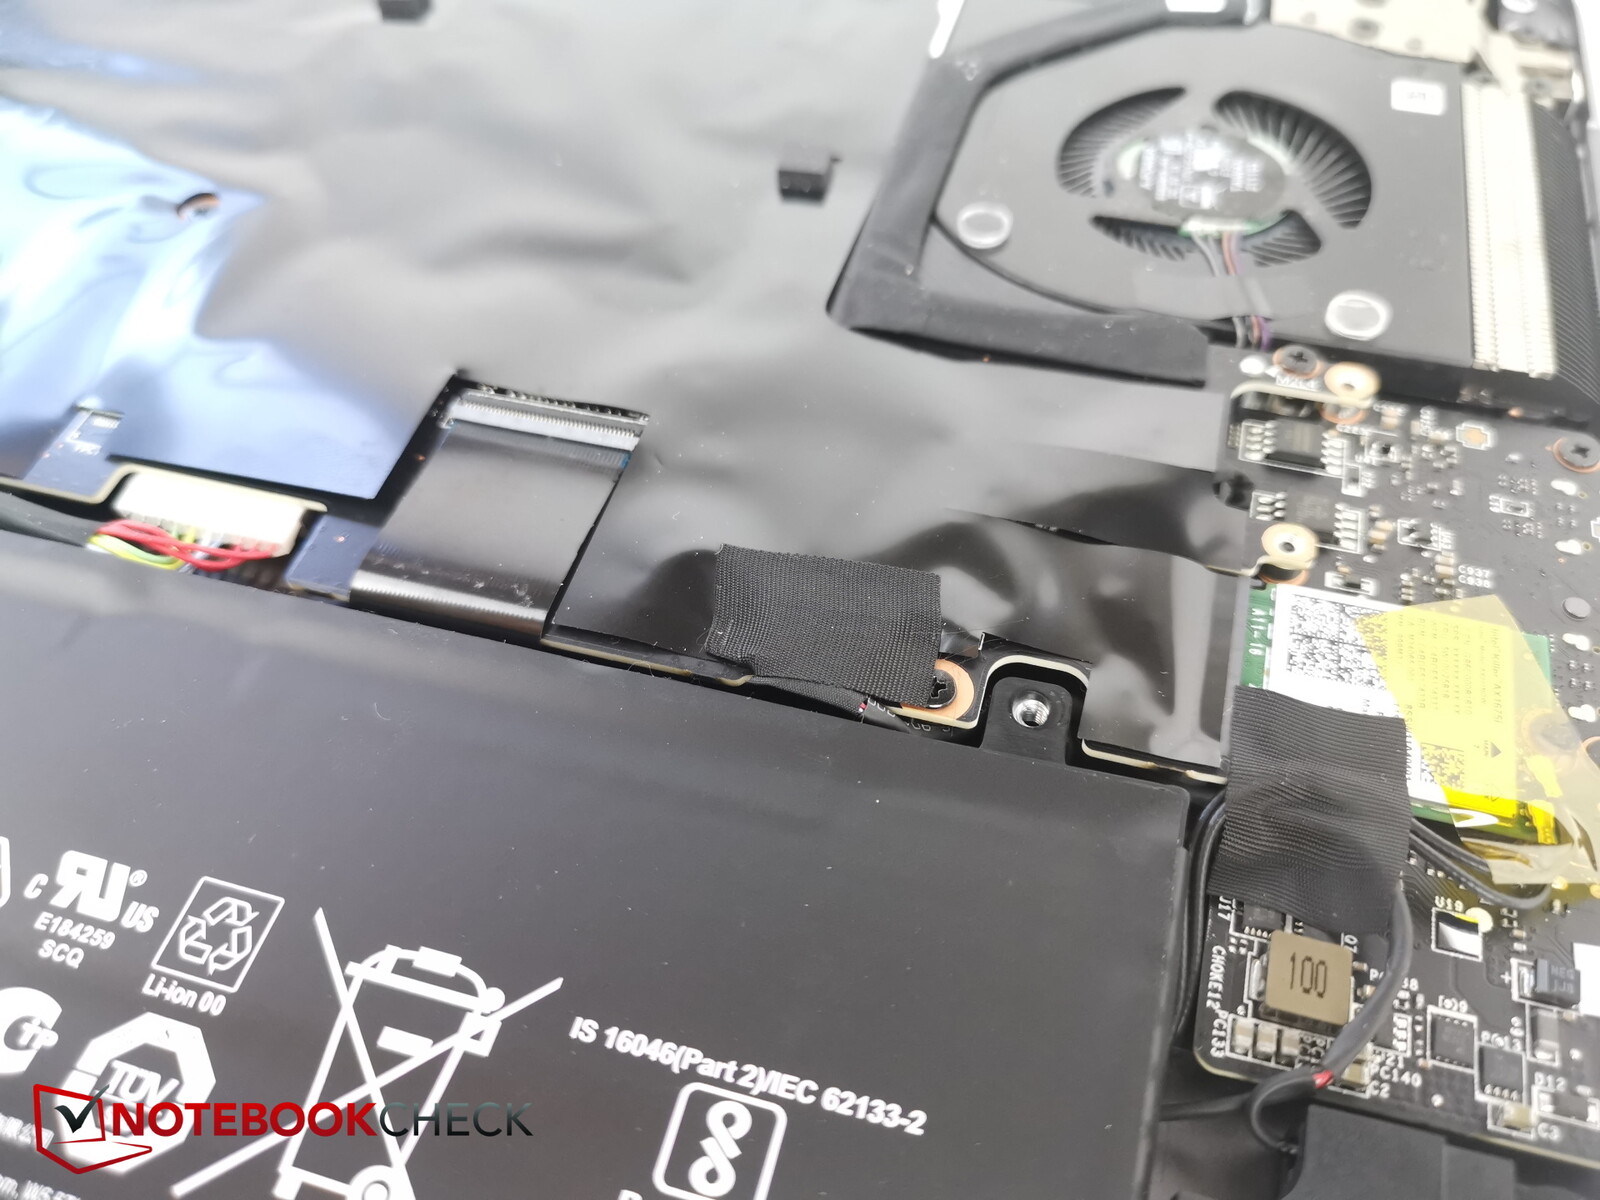
维护
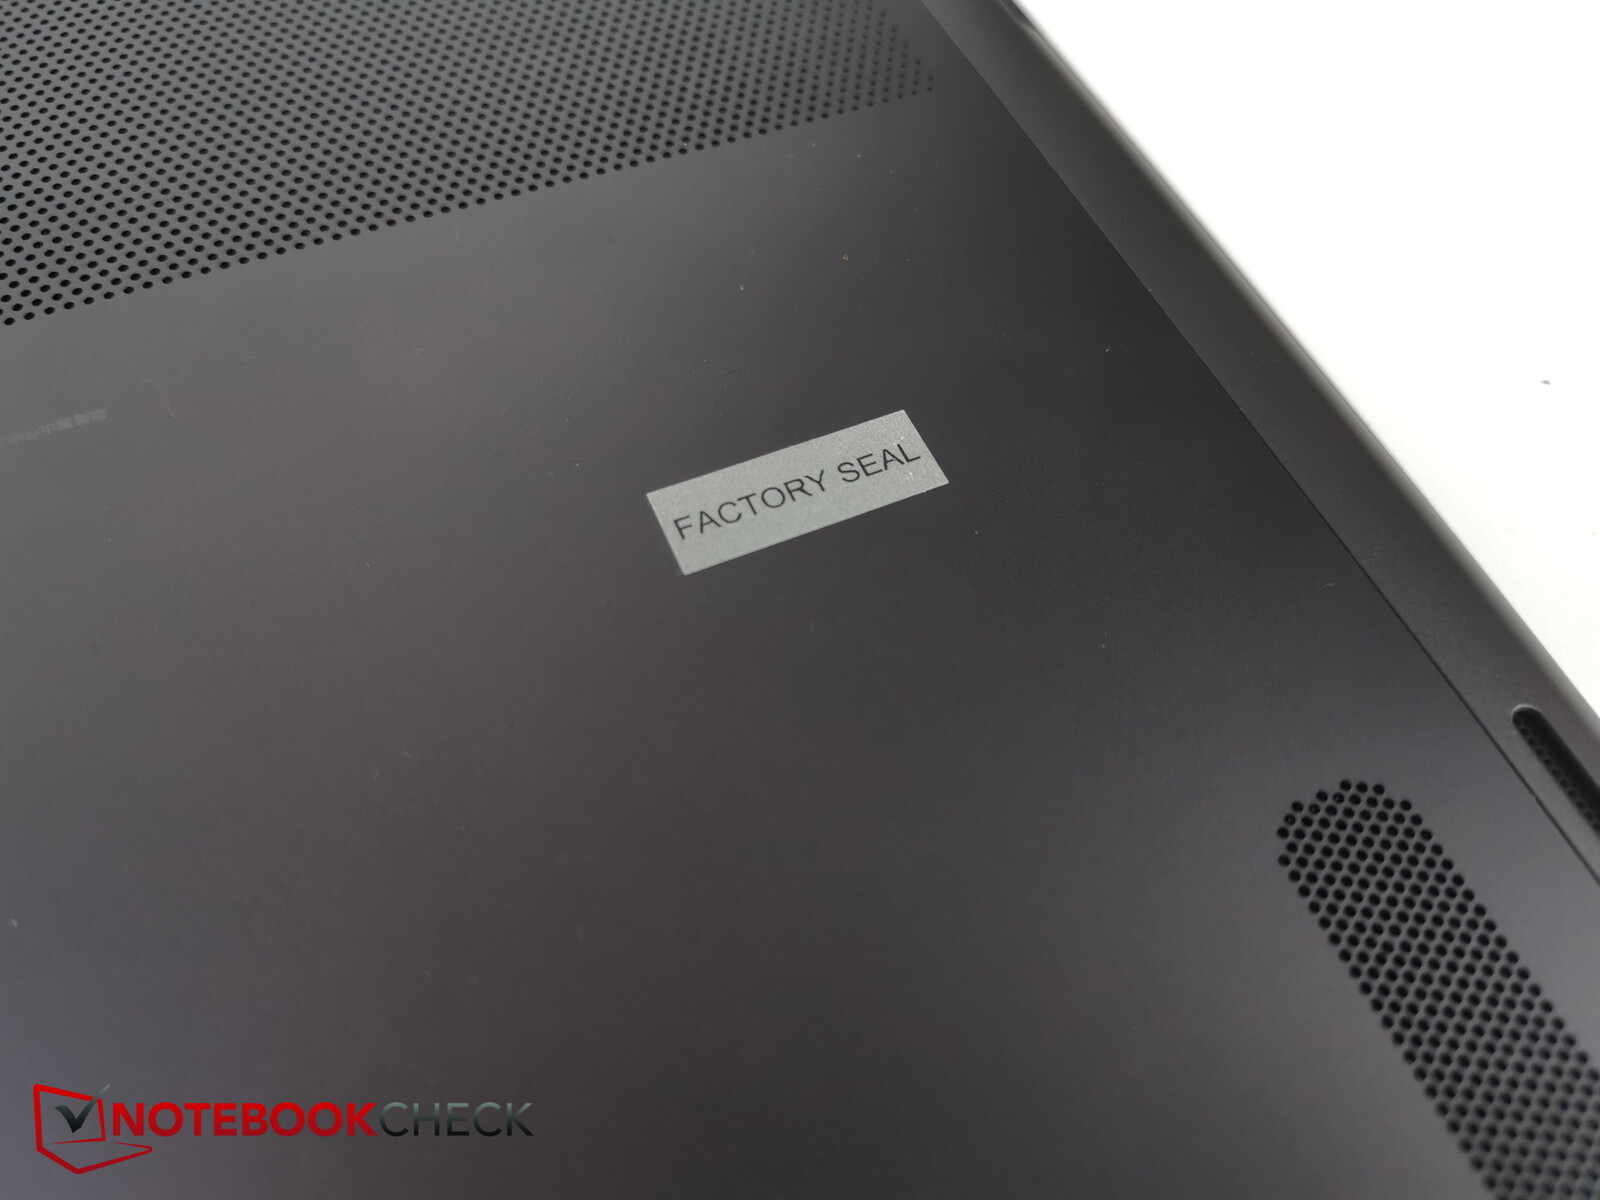
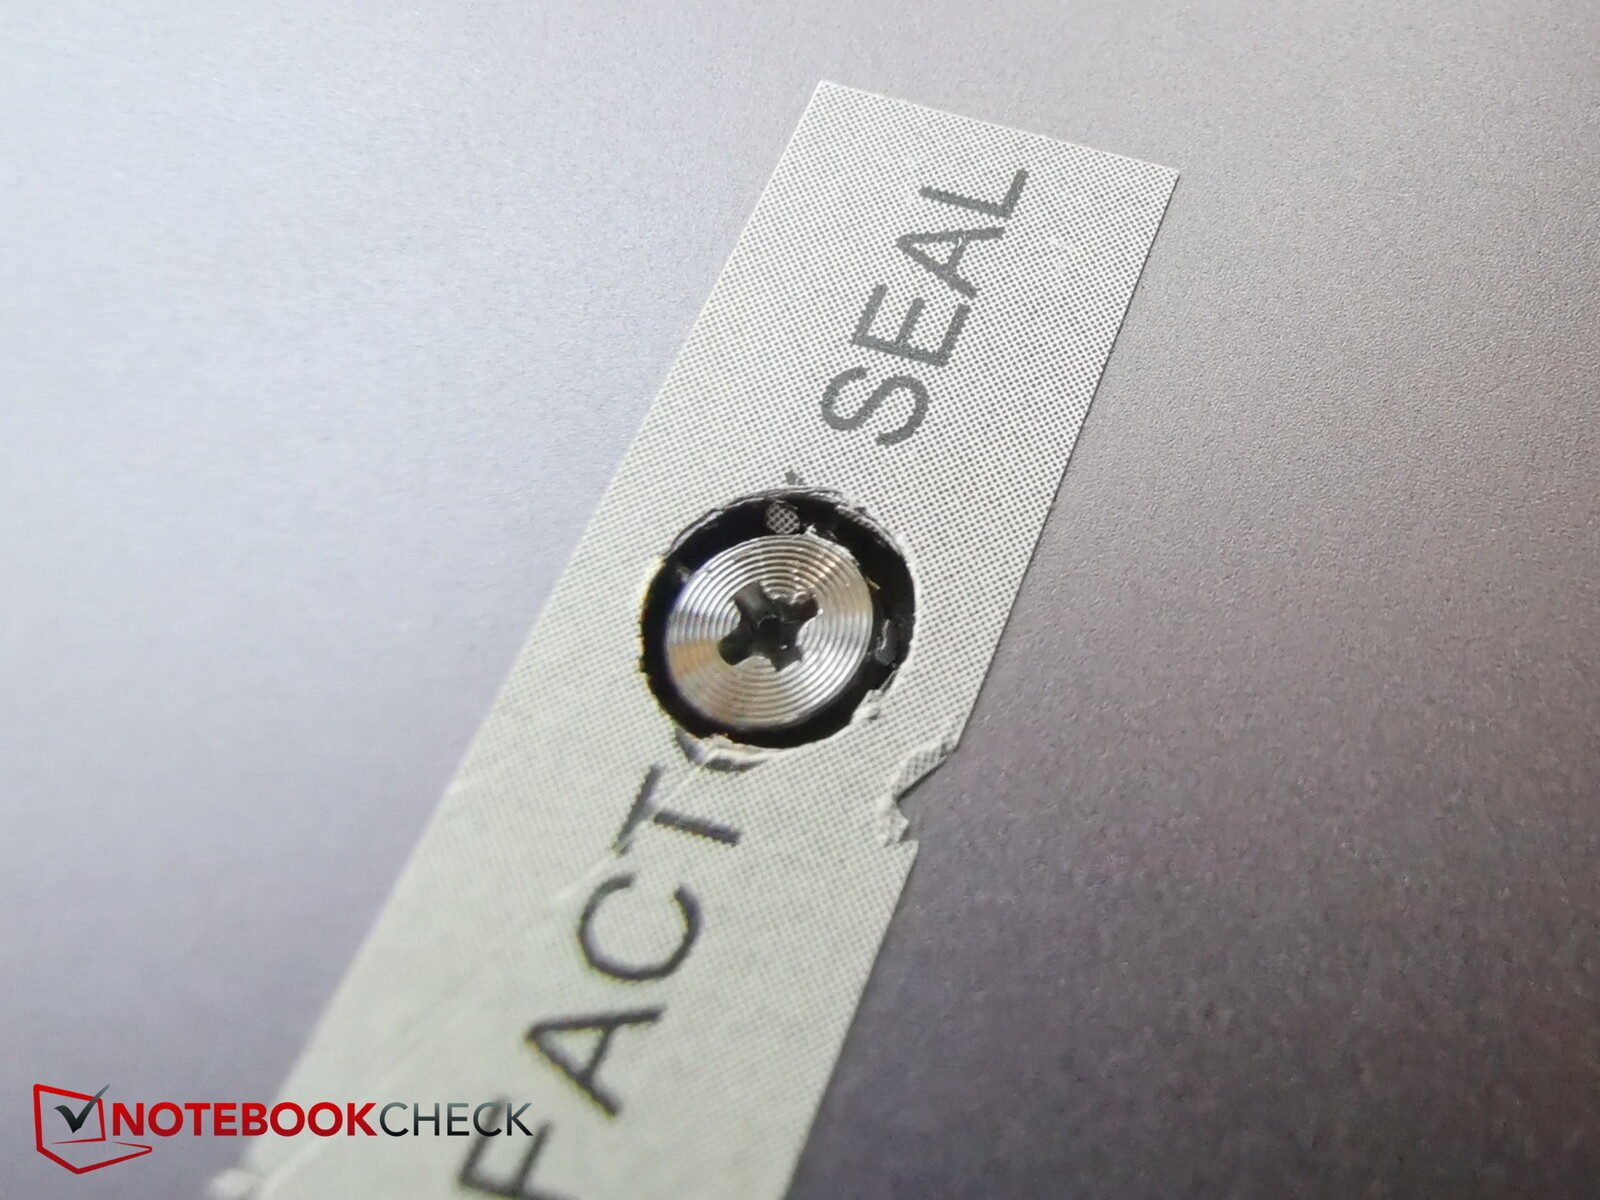
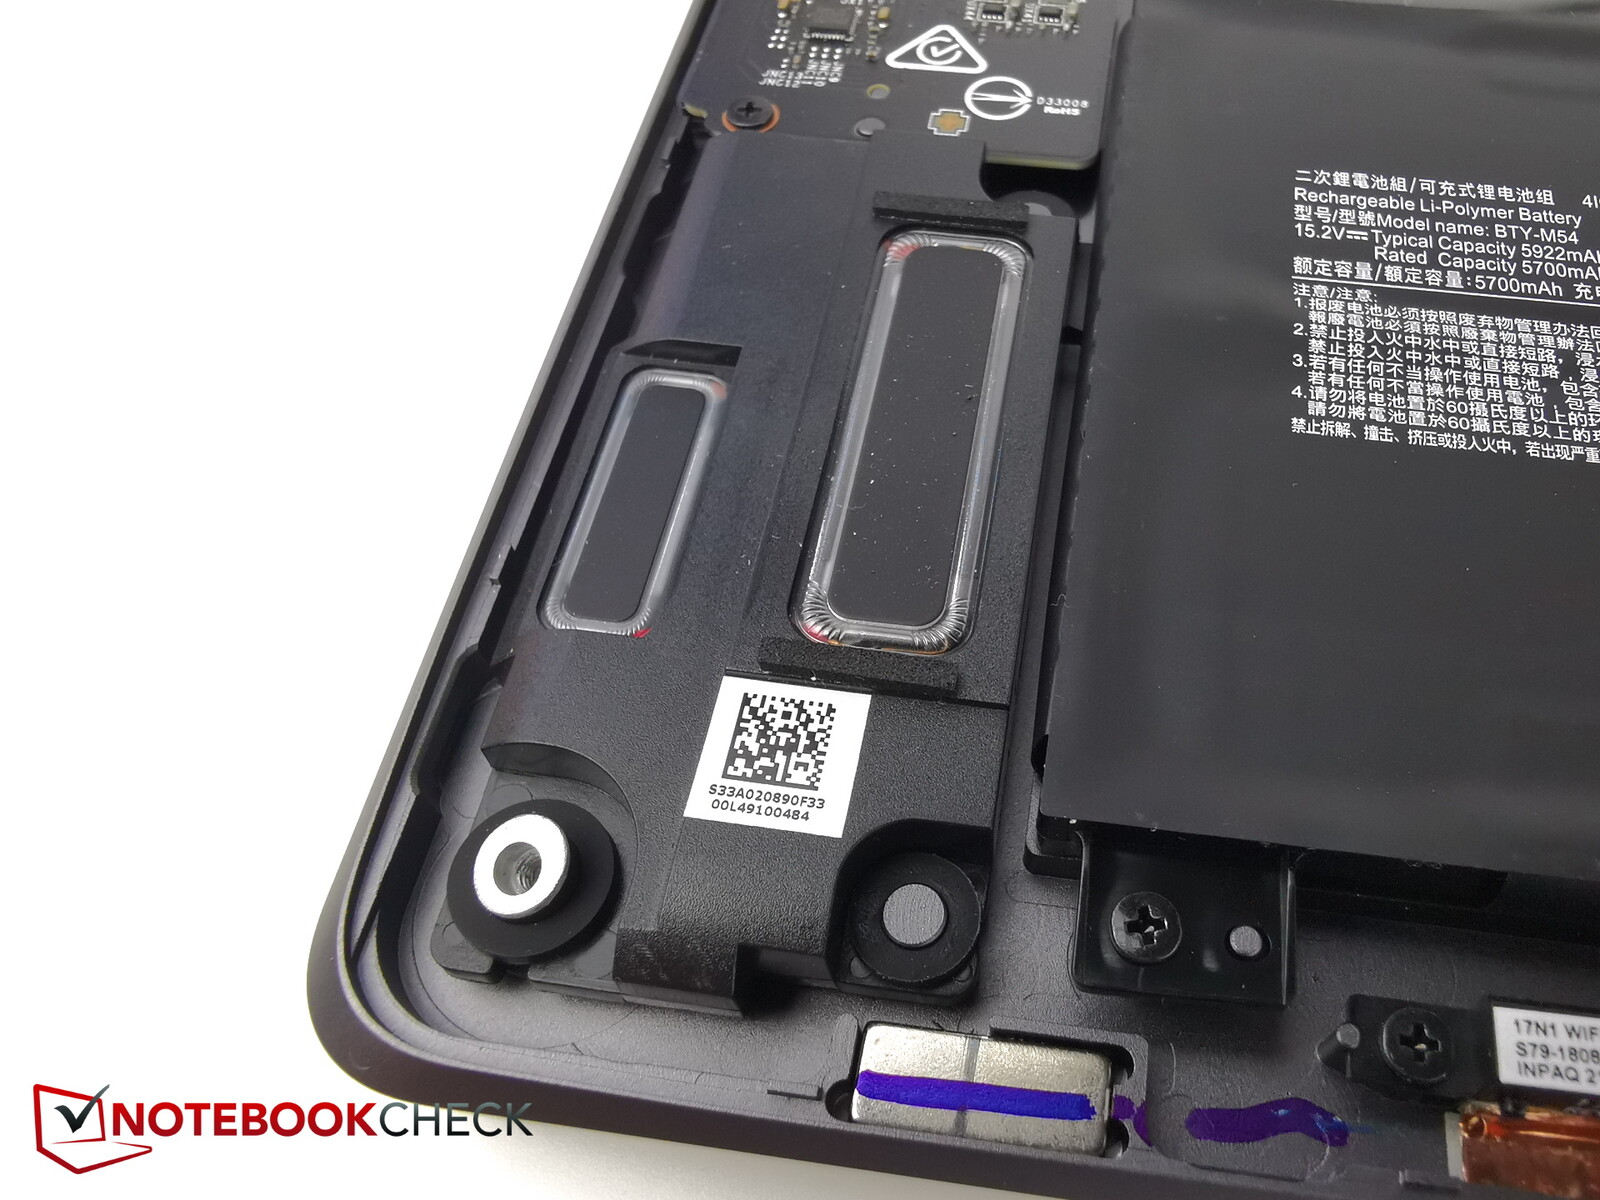
底部面板只用六颗菲利普斯螺钉固定在那里。不幸的是,其中一颗螺丝上有一张工厂密封贴纸。损坏贴纸可能会影响未来任何保修要求的有效性。你将首先需要一个工具来撬开面板。之后,可以快速而毫不费力地拆下面板。
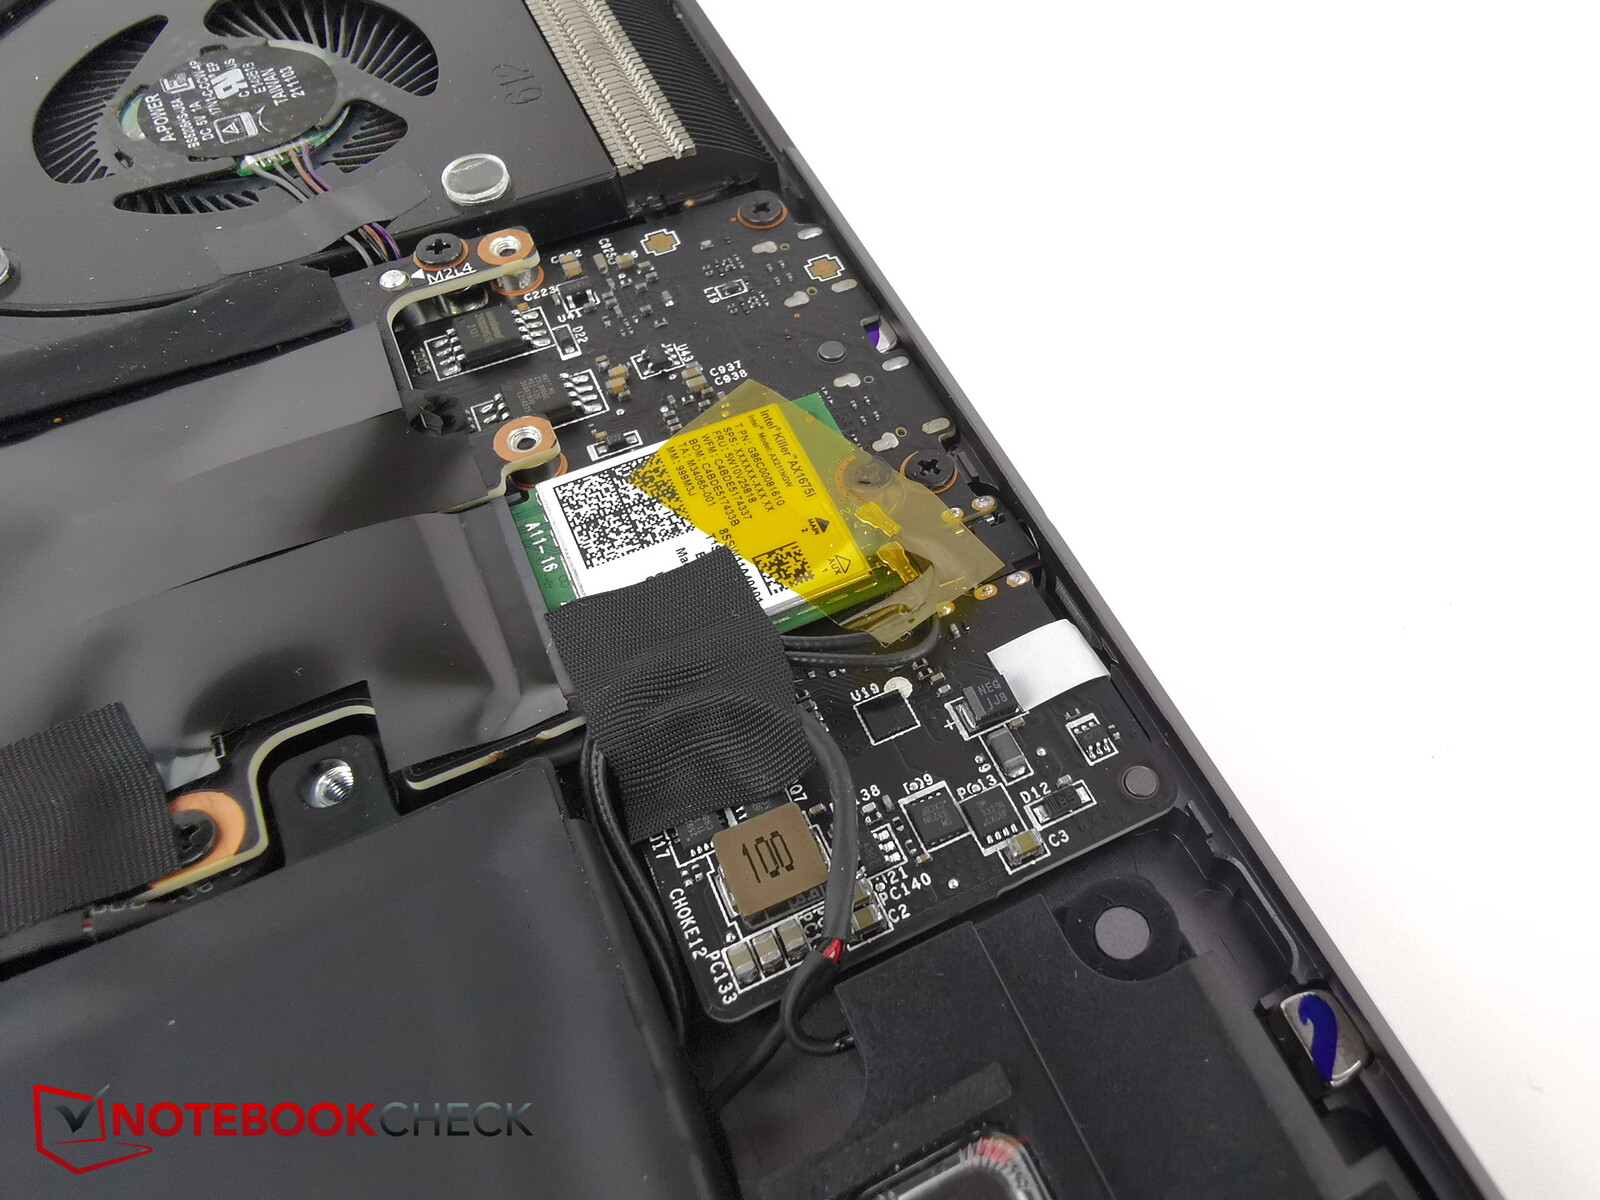
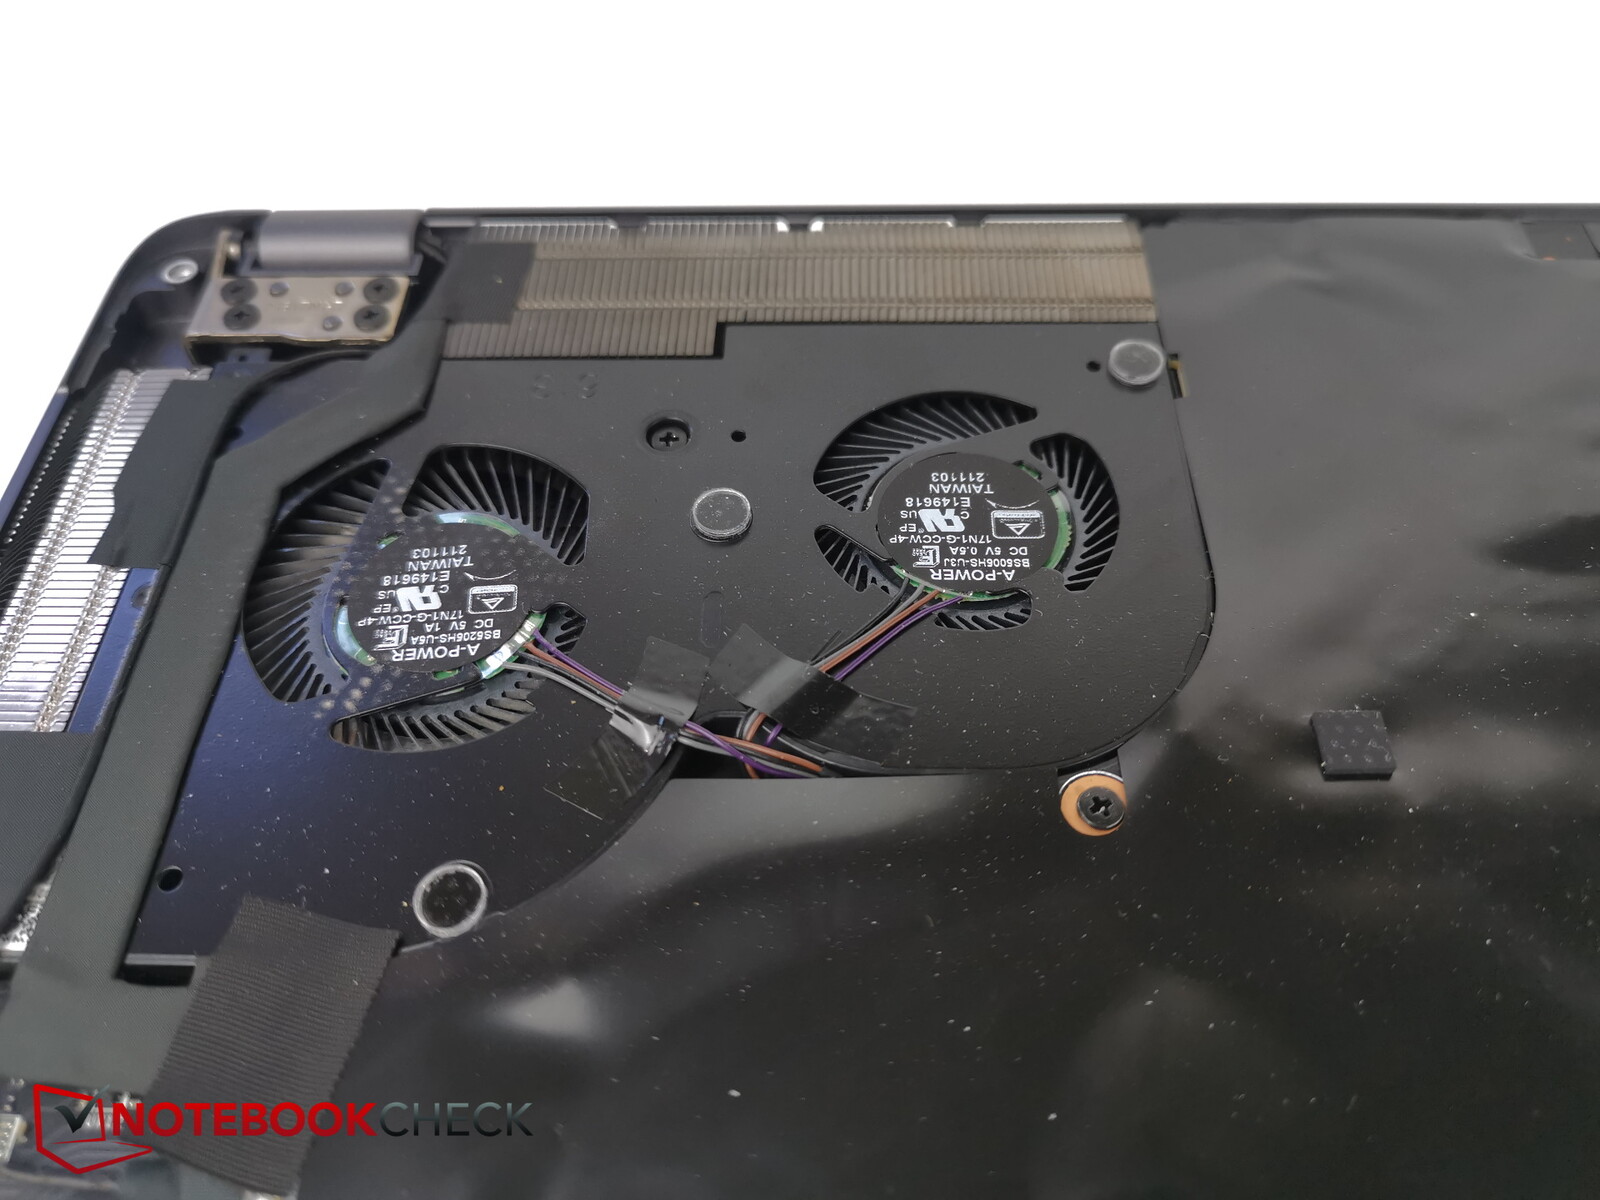
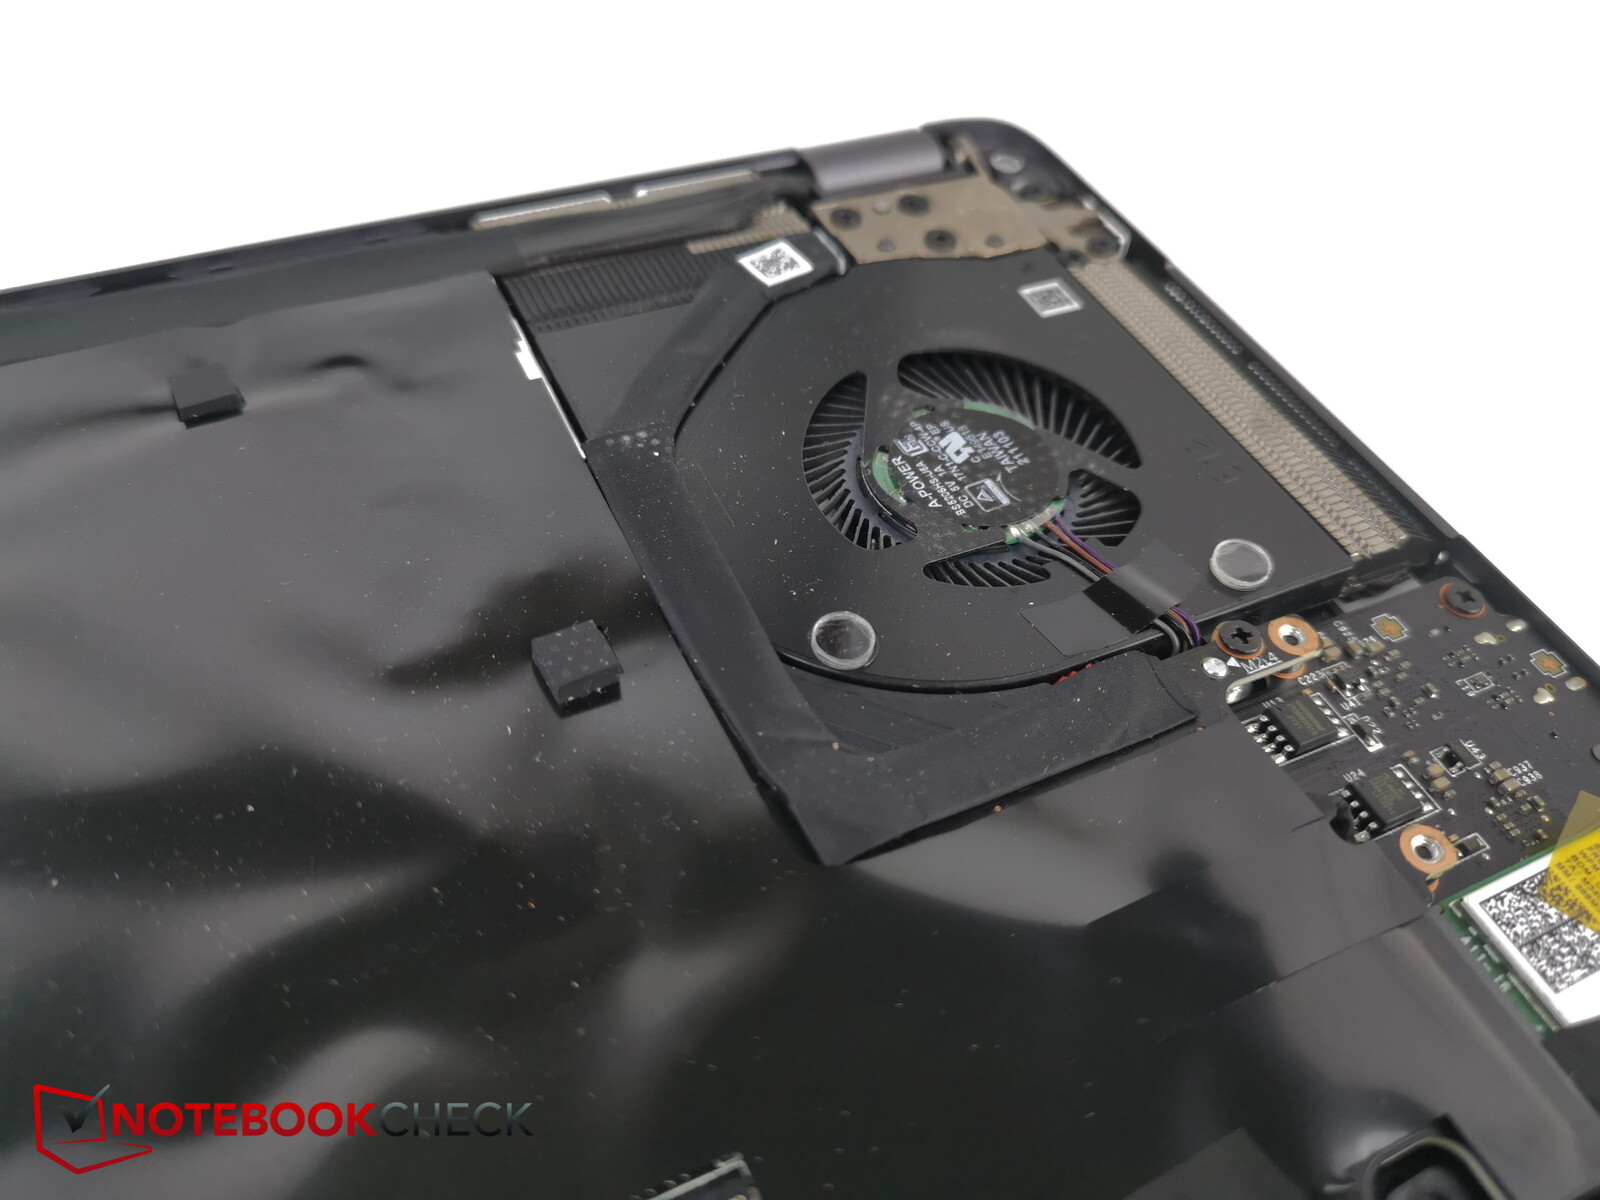
Z17的内部结构相当难以维修和升级,因为几乎所有部件都被一大张黑膜覆盖。只有Wi-Fi模块和风扇可以立即进入。即使在偷看了薄膜的四角后,我们也无法找到内存和固态硬盘的位置。这张膜已经被粘上了,在不损坏任何东西的情况下,它是无法被移除的。
配件和保修
尽管该设备的价格不菲,但盒子里没有任何附件。如果能有一个USB到以太网的适配器,至少也是不错的。
在德国,微星为笔记本电脑提供两年的保修期,包括提货和退货服务。在美国,保修期为一年。
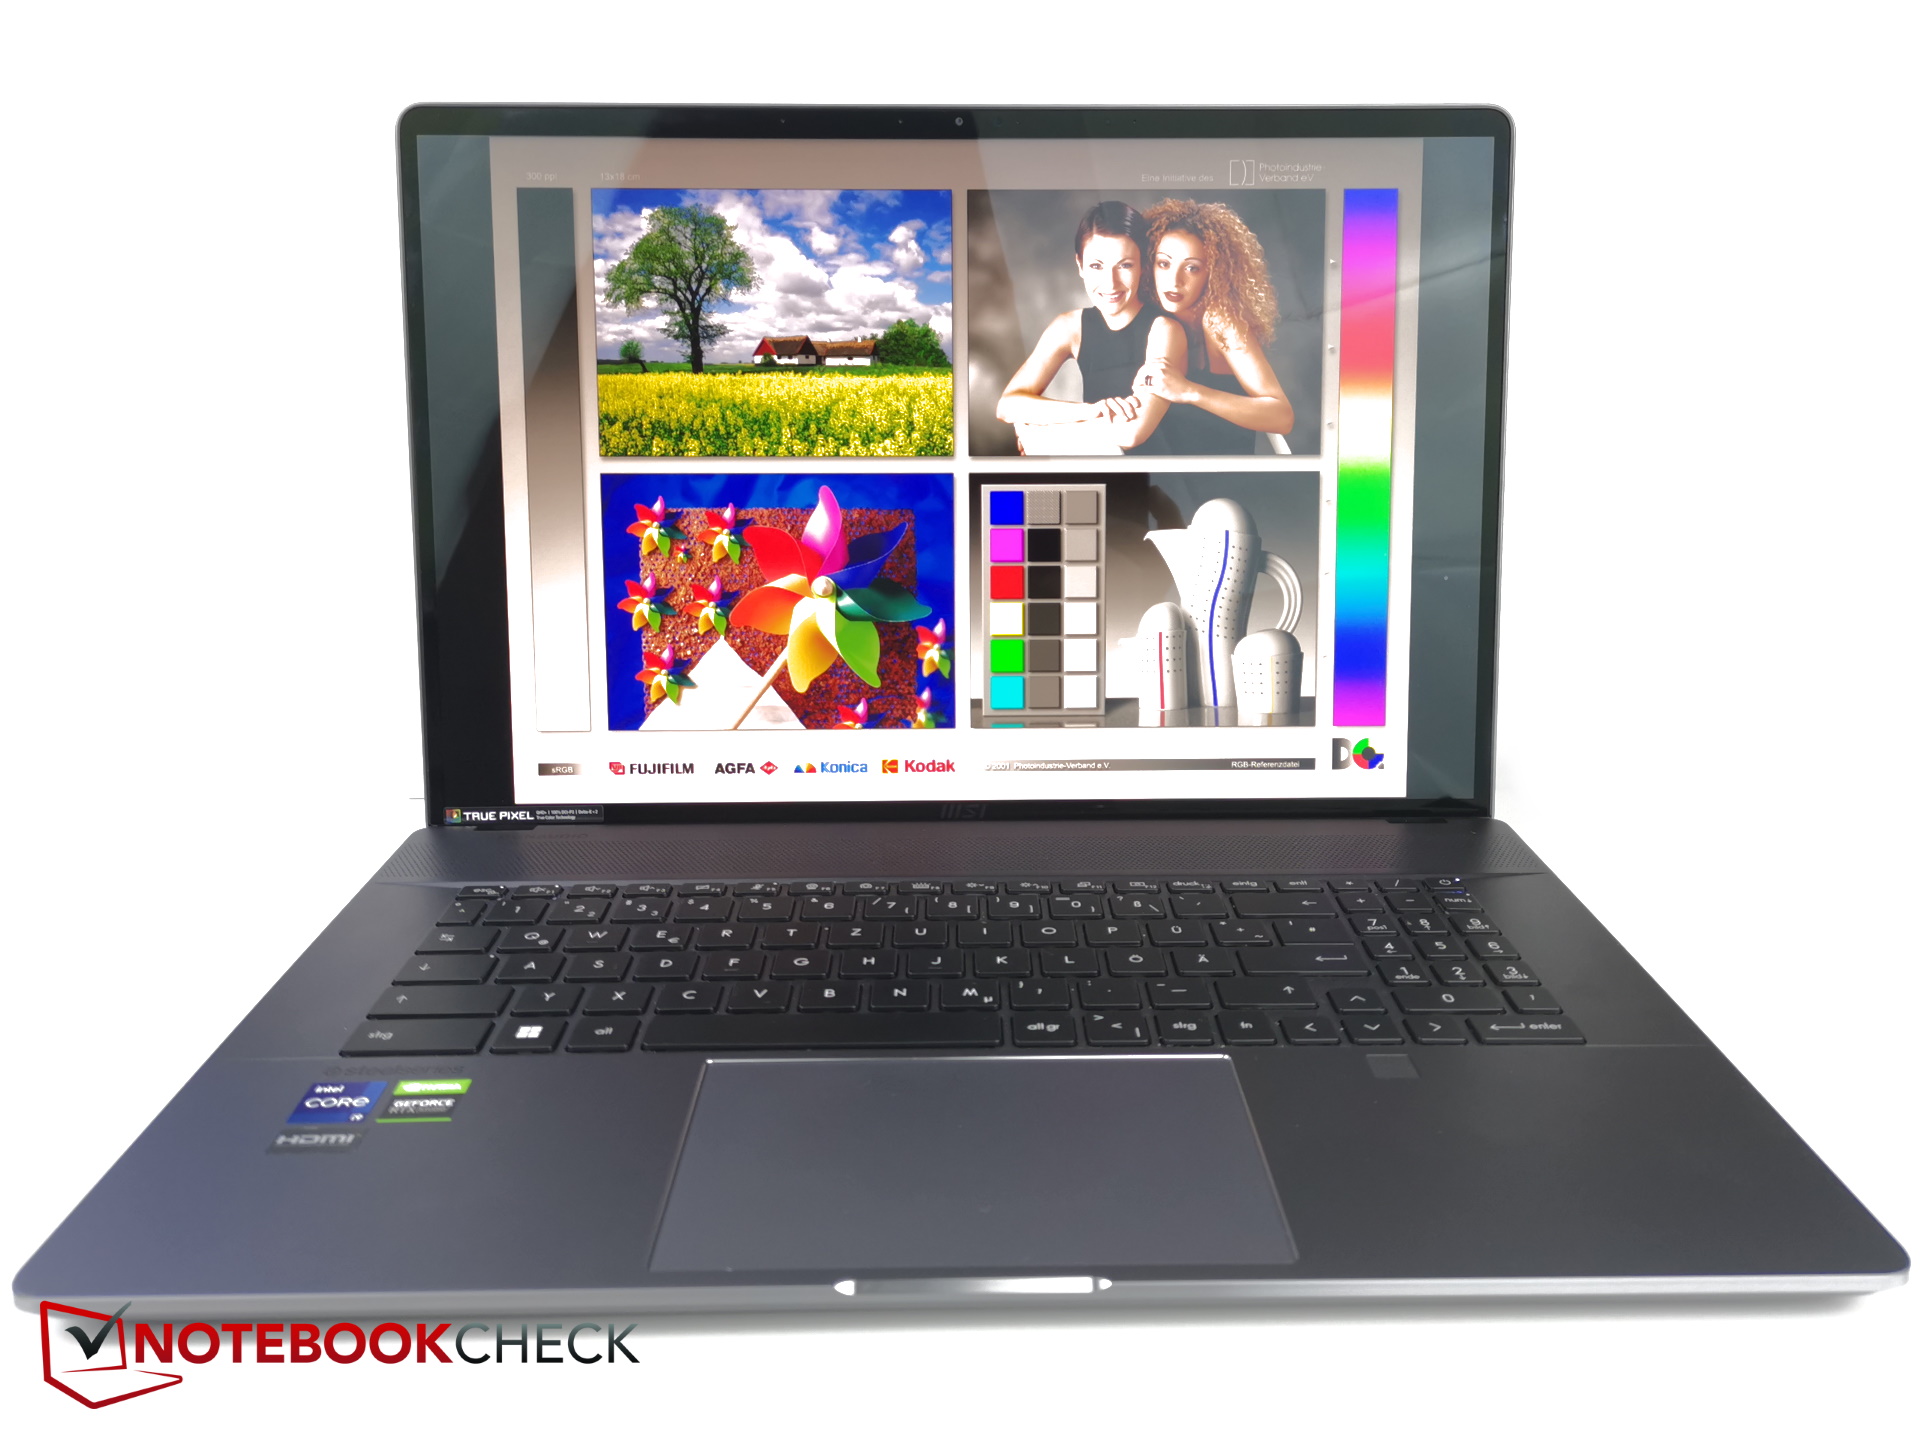
Input devices - Solid options for creators
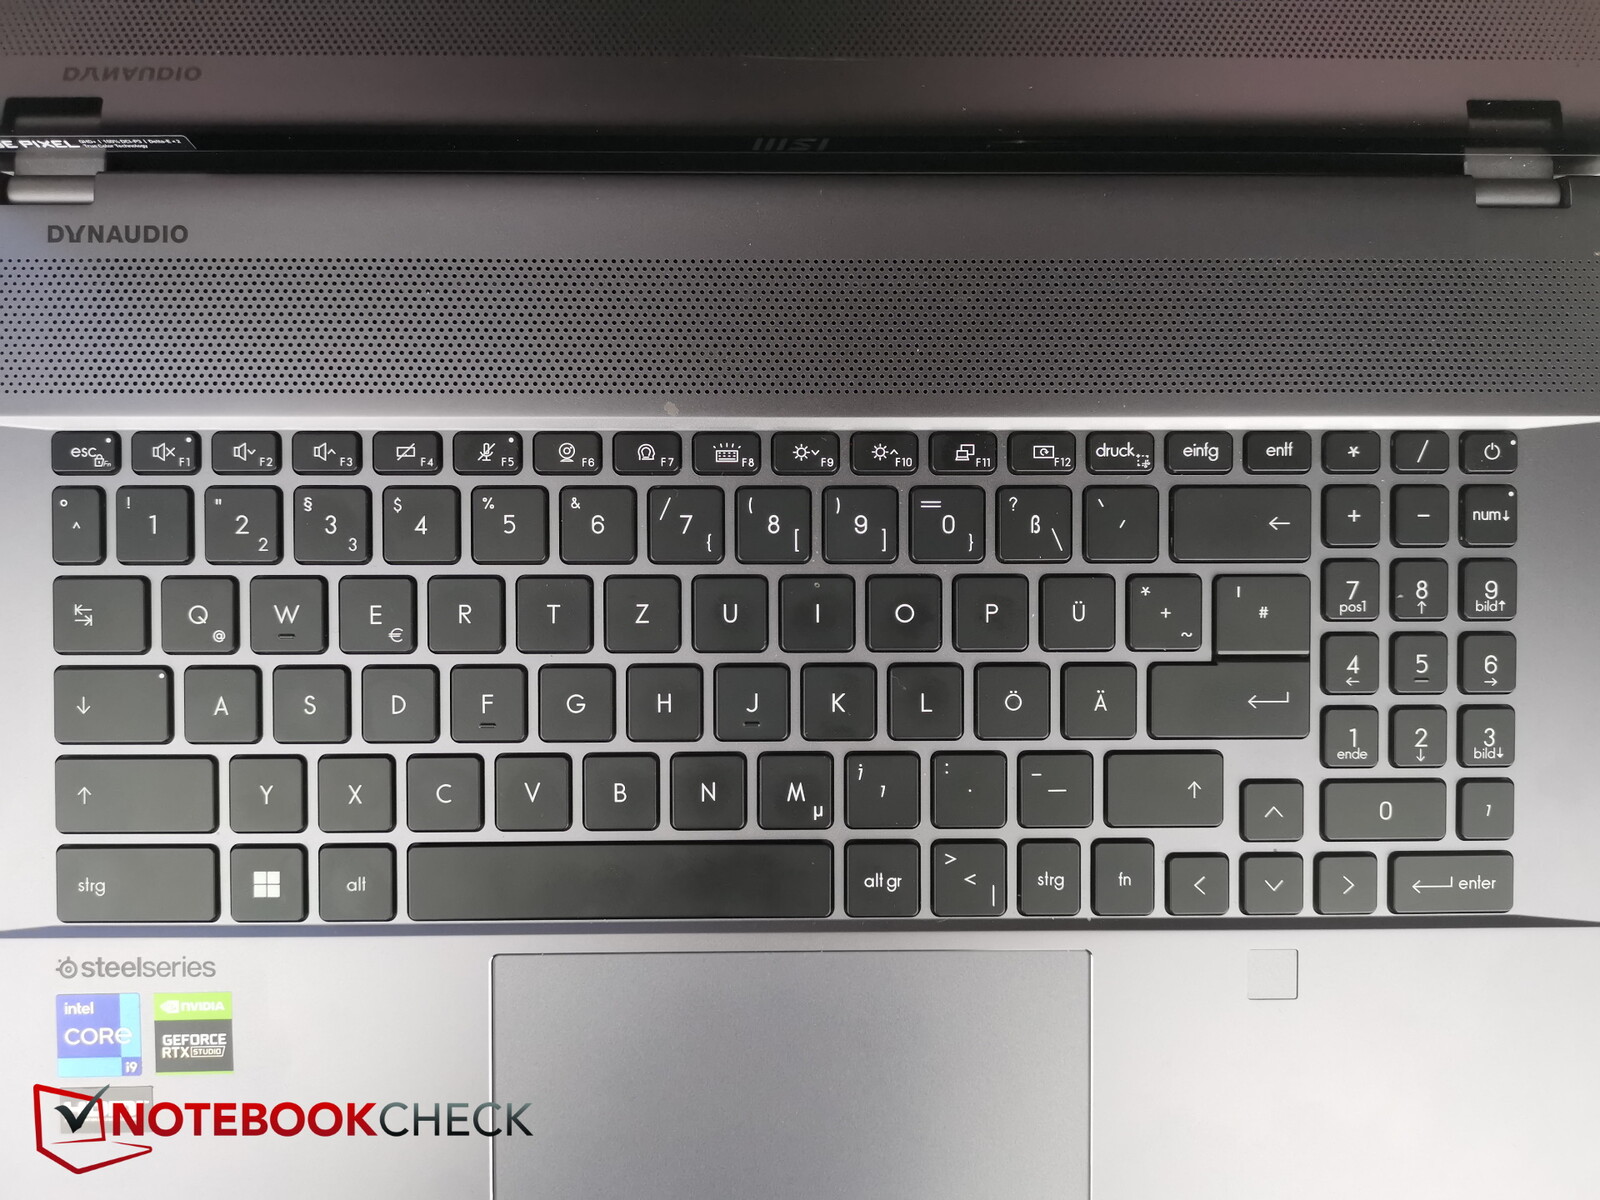
键盘
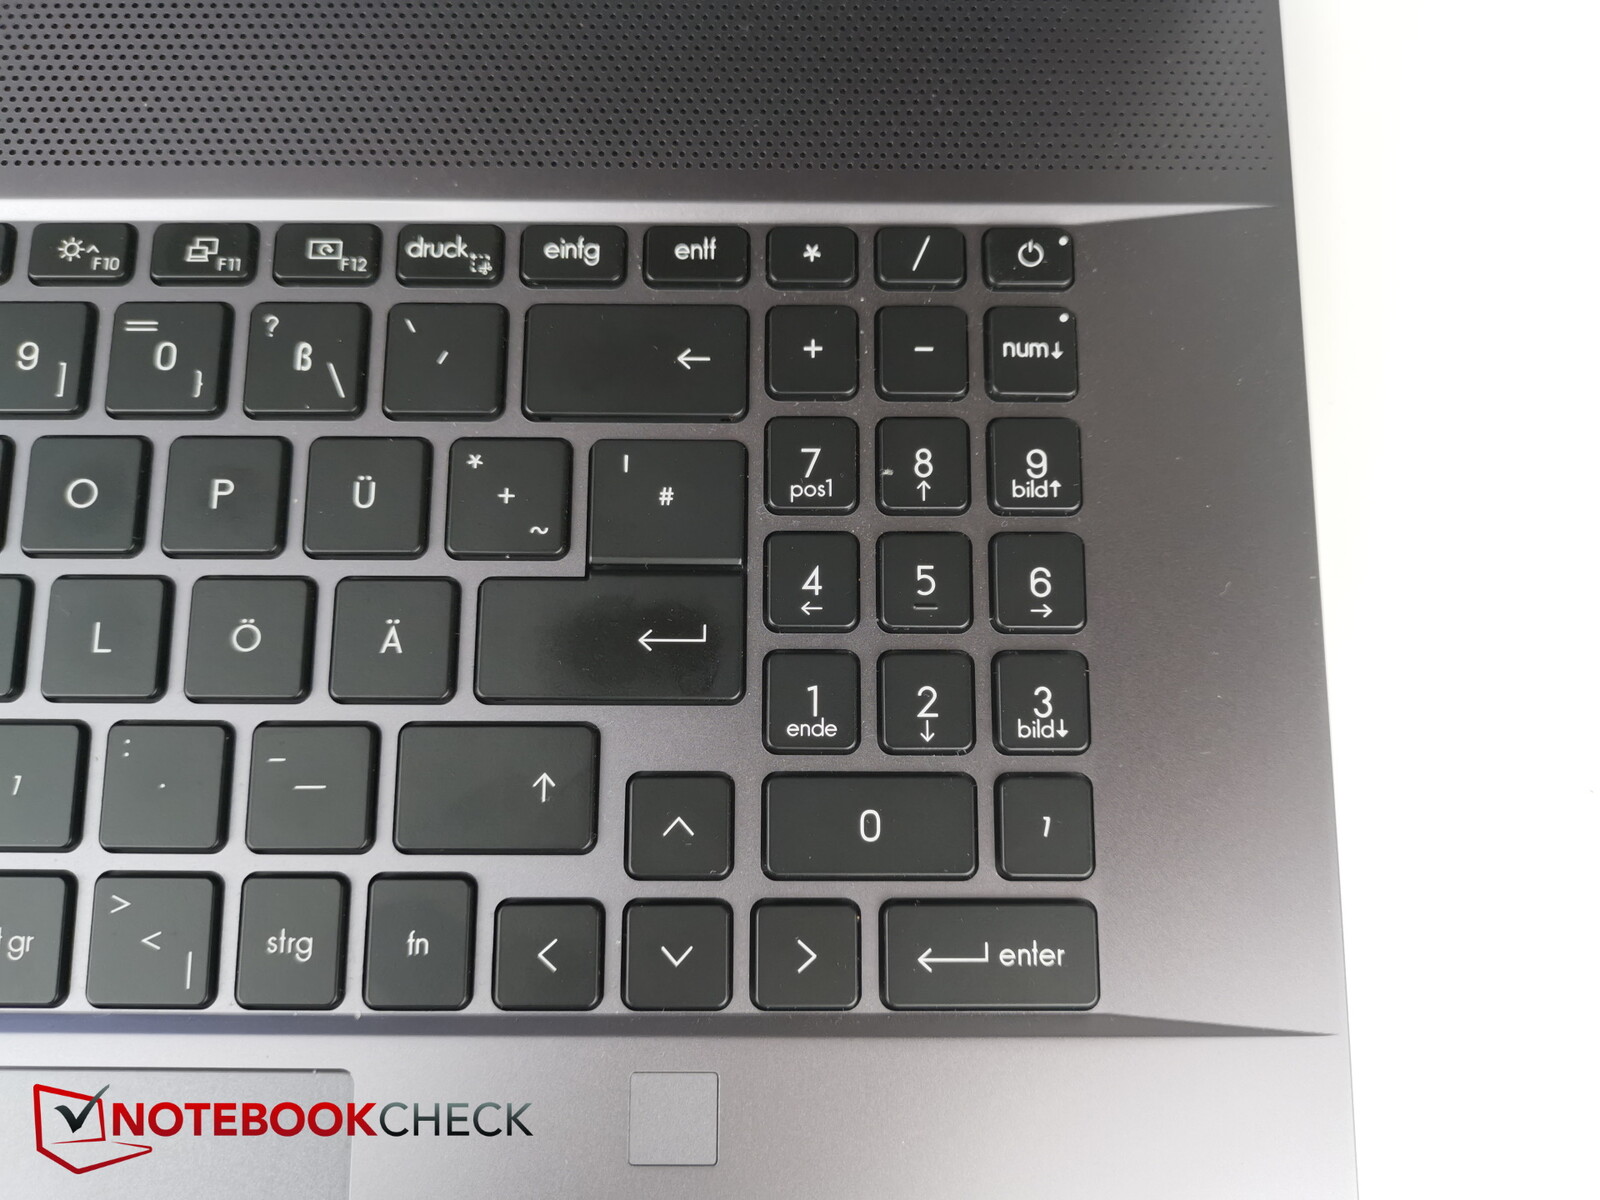
虽然这是一台17英寸的笔记本电脑,但它并没有利用整个键盘的宽度。虽然普通按键足够大,而且间隔很好,但右边的数字键盘看起来太小,而且挤在一起。然而,按键上的字体在整个过程中是清晰可见和可读的。
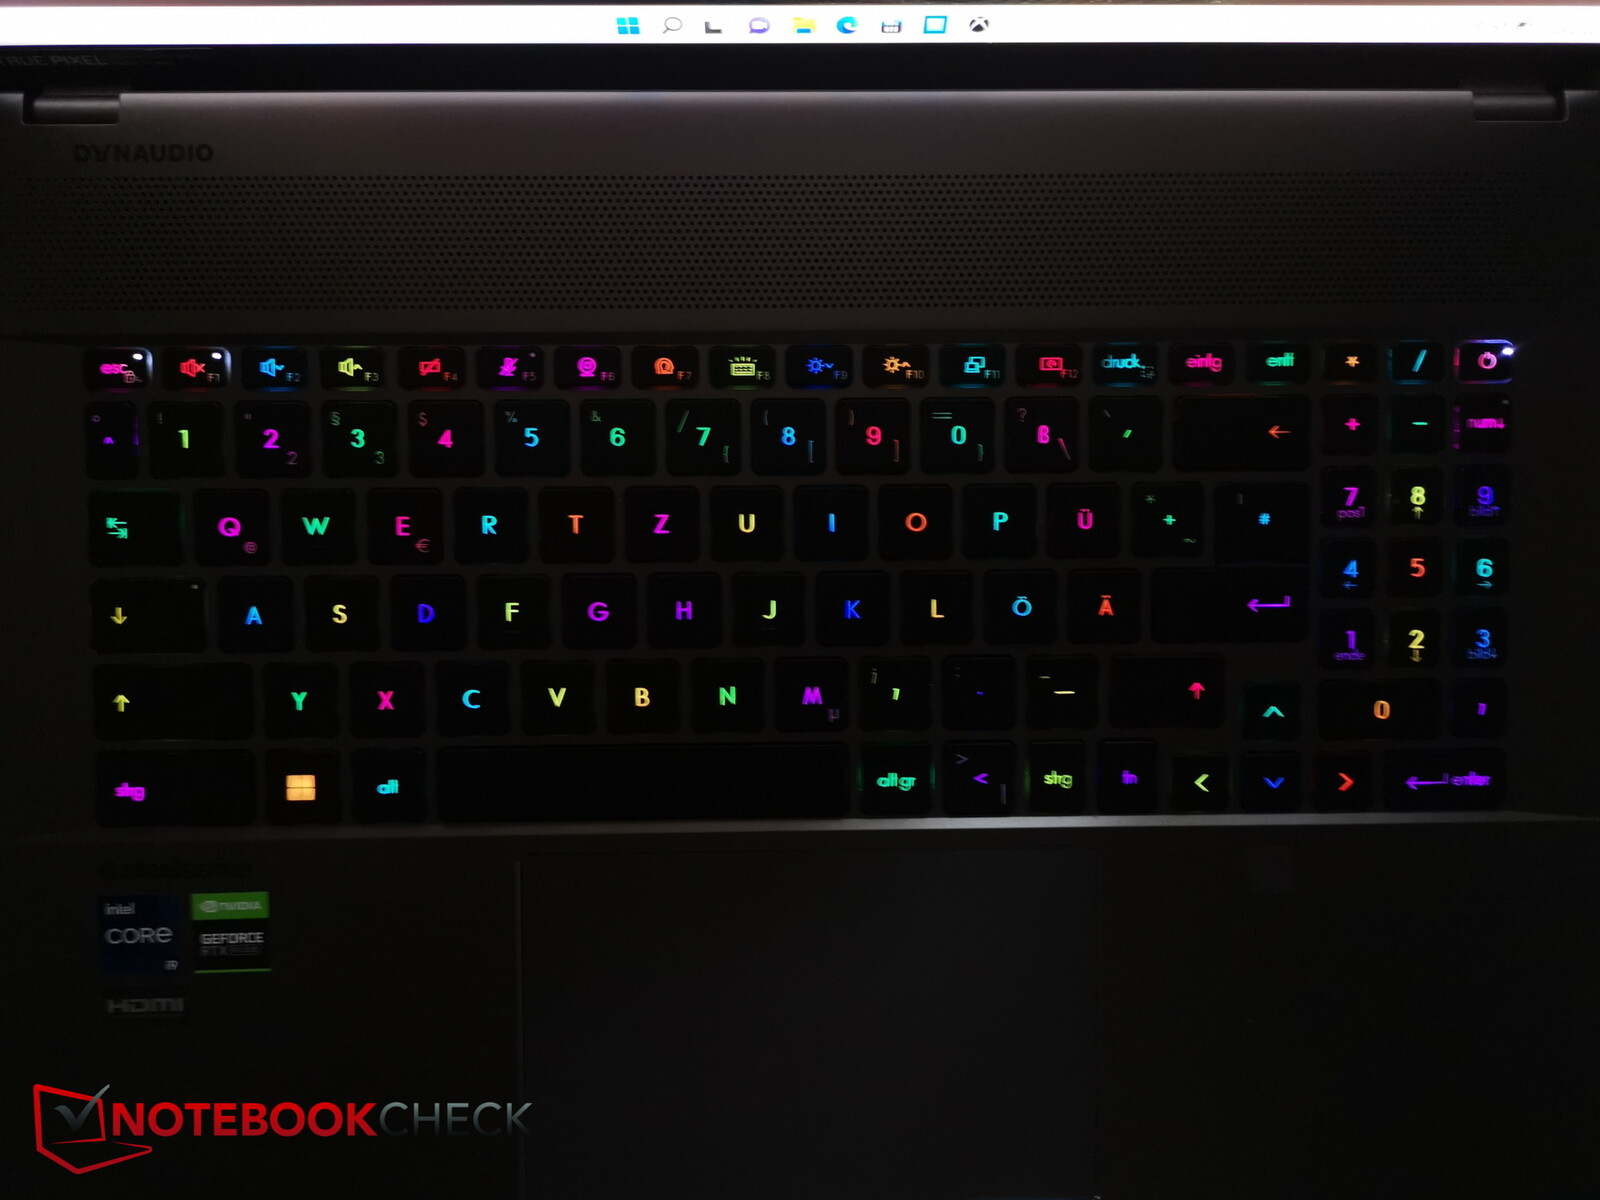
方向键也同样非常小。右边的Ctrl键和狭窄的Fn键也是如此(与大多数键盘不同的是,Fn键只在右边出现)。
这些键本身的键程很短,但提供了清晰的反馈,可以快速打字。当你打字的时候,键盘的中心没有任何明显的弯曲--一切都感觉很硬。
键盘有独立的RGB照明,可在低光环境下使用。有四个亮度级别可供选择,当然也可以关闭照明。
触摸板
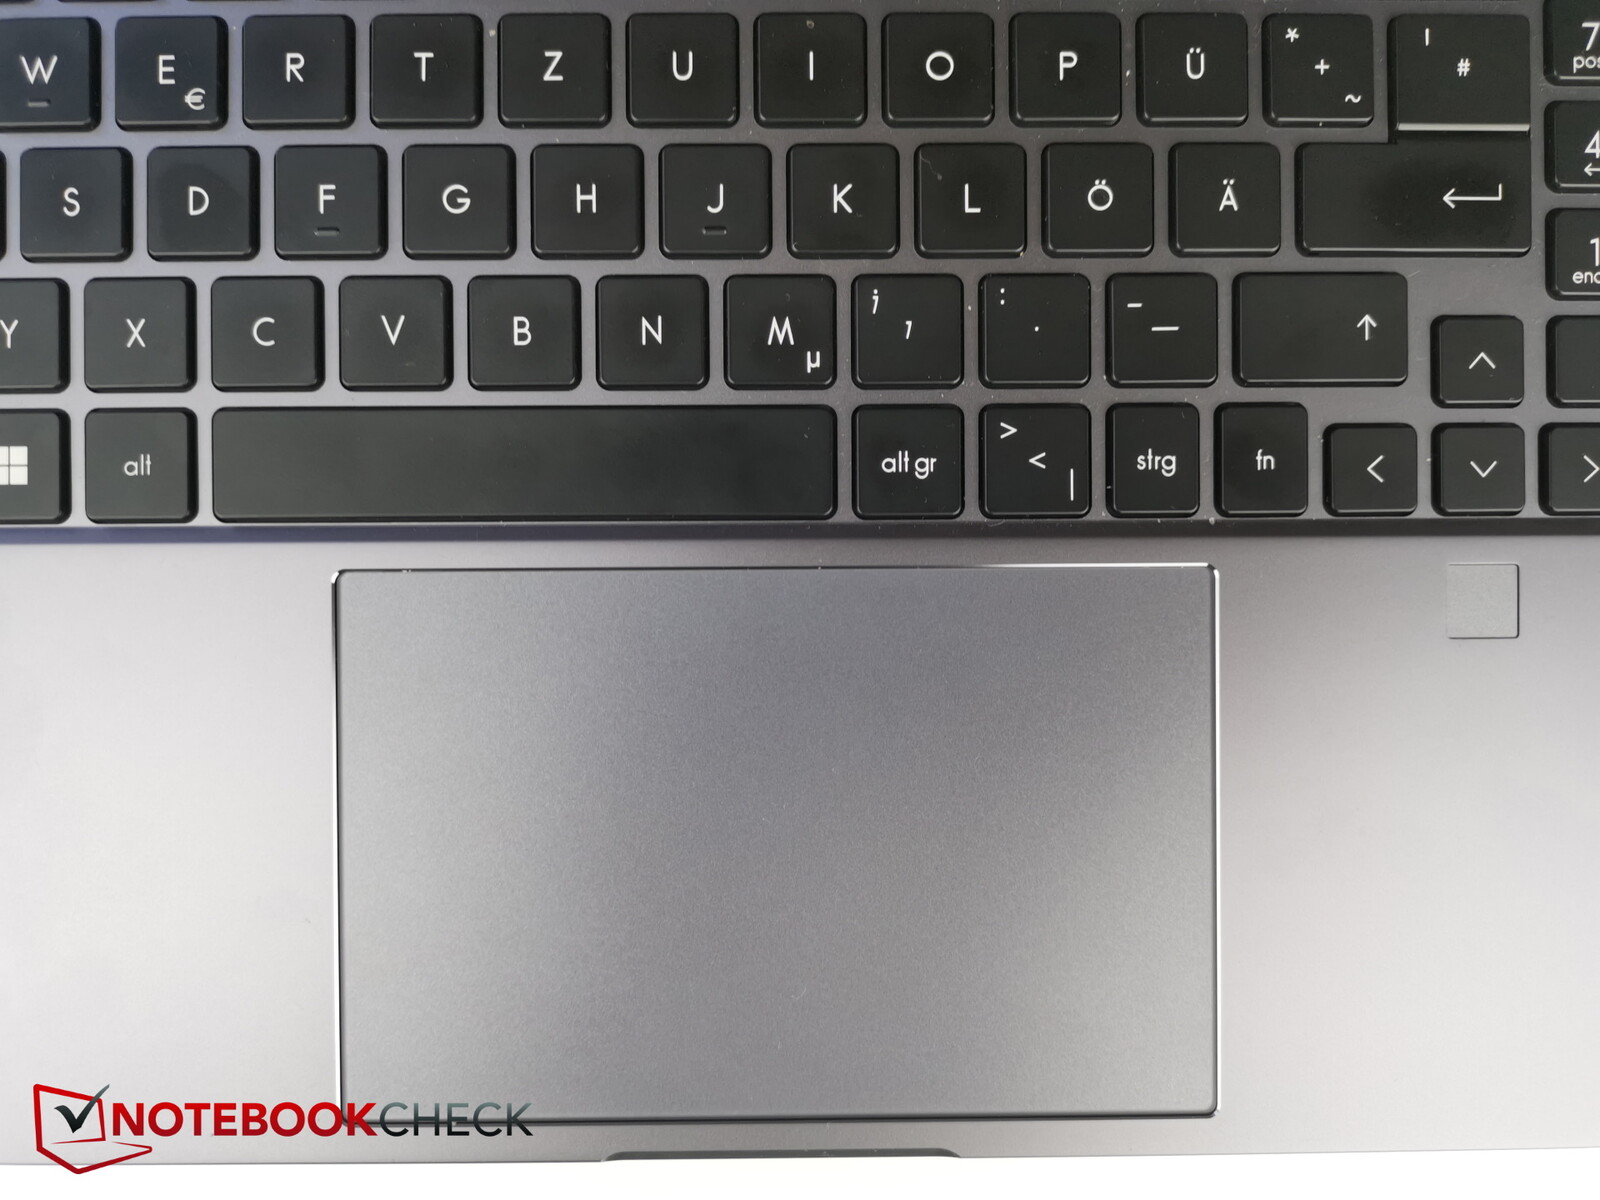
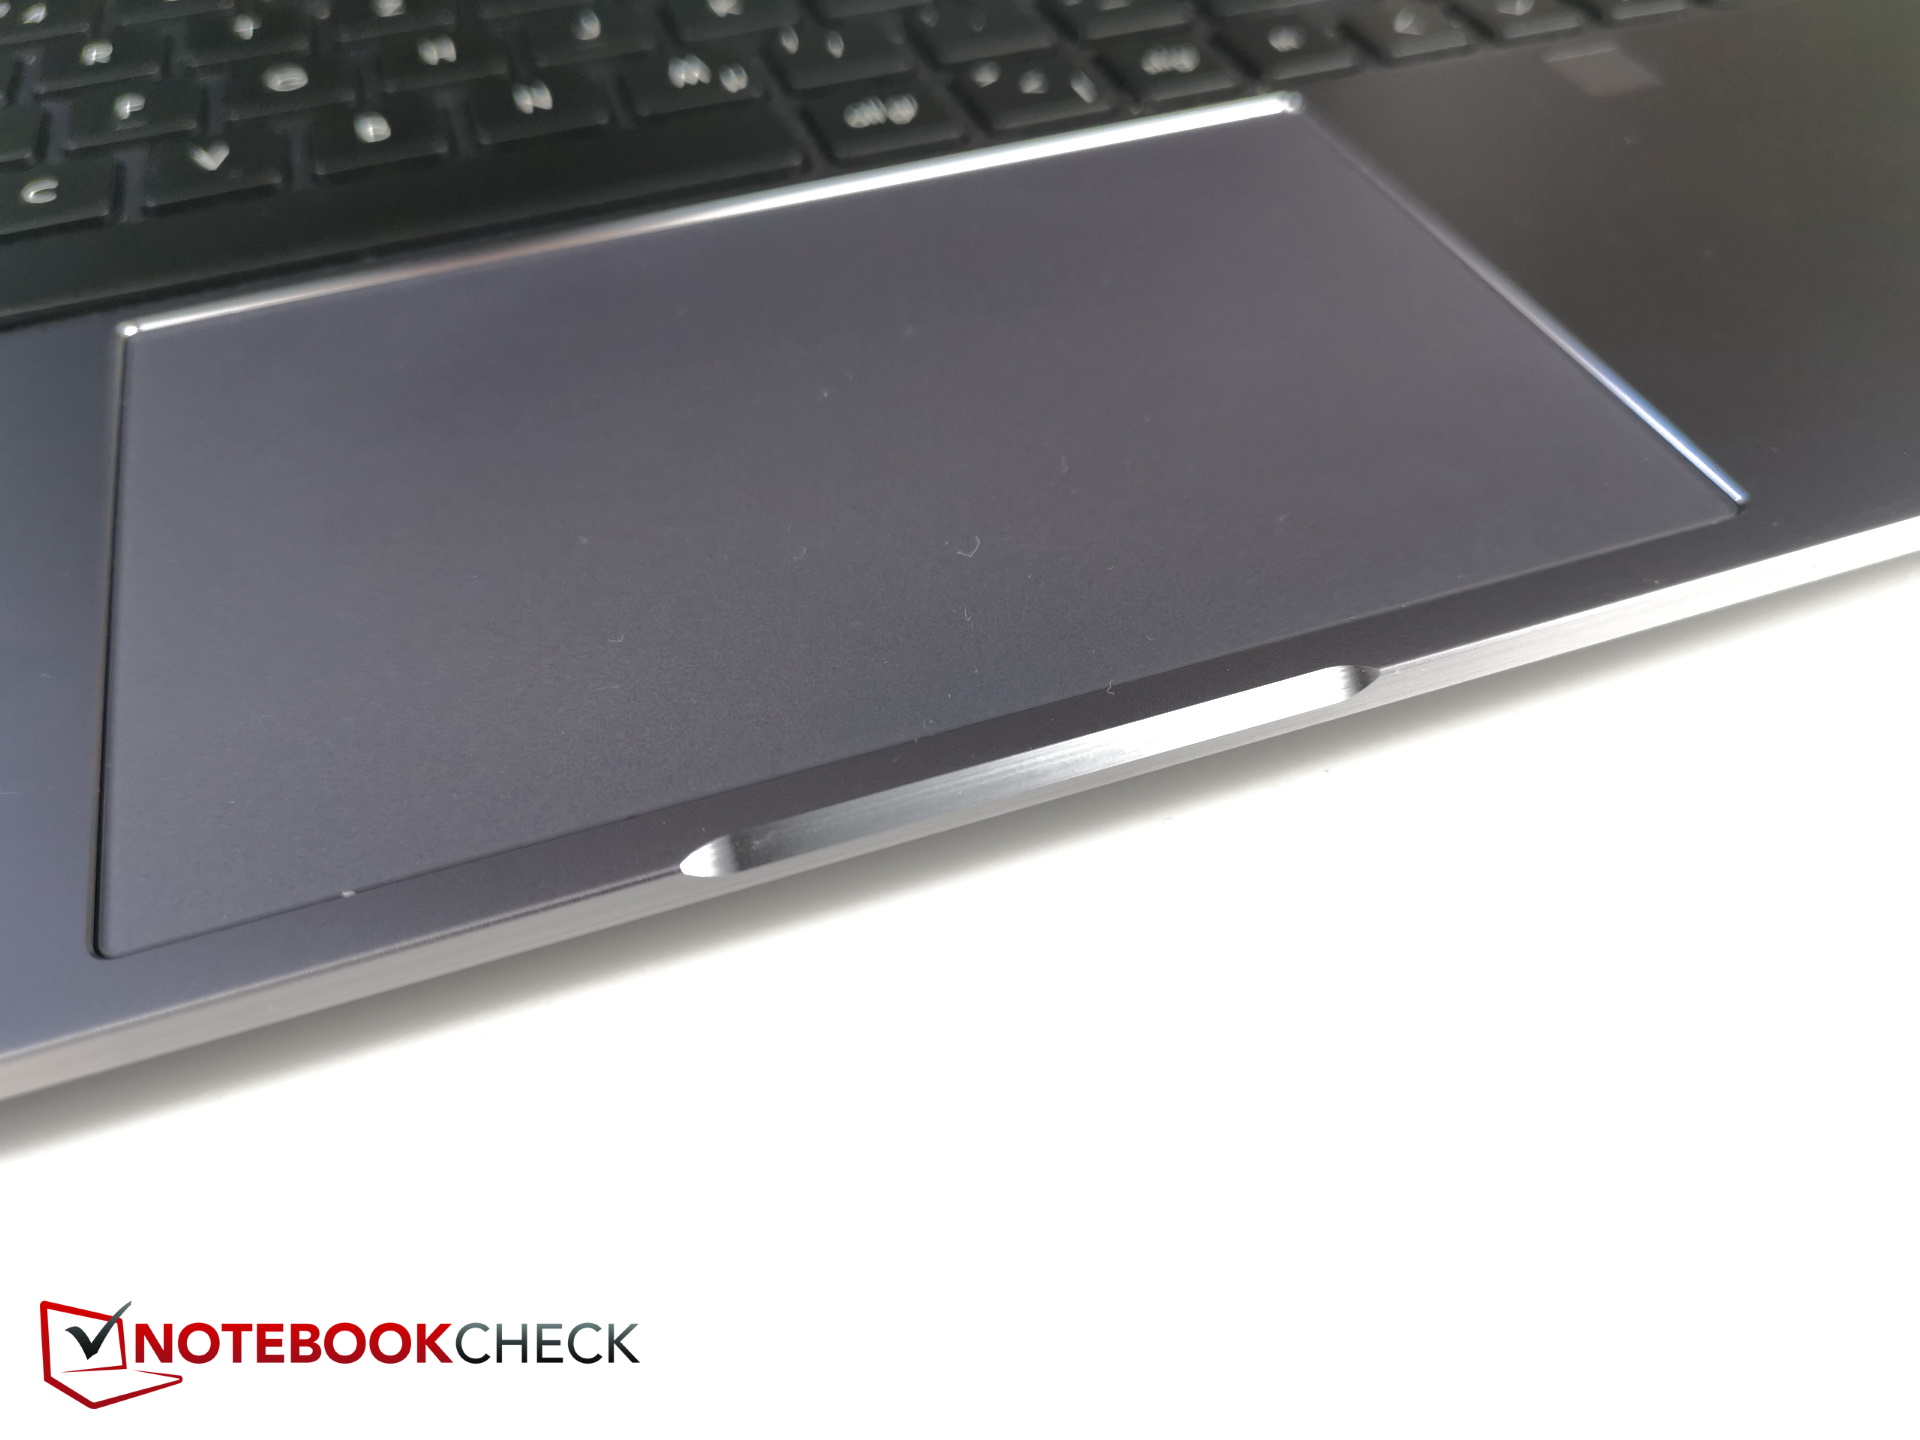
你会注意到触摸板的第一件事是它有多大的空间(约13.1 x 8.2厘米,或5.16 x 3.23英寸)。表面非常光滑,即使你的手指非常缓慢地滑过,也完全没有抓地力的感觉。
集成的按钮有一个明显的压力点。按键所需的力道恰到好处,或者说比必要时略高。触摸板发出的点击声非常合理。
触摸屏
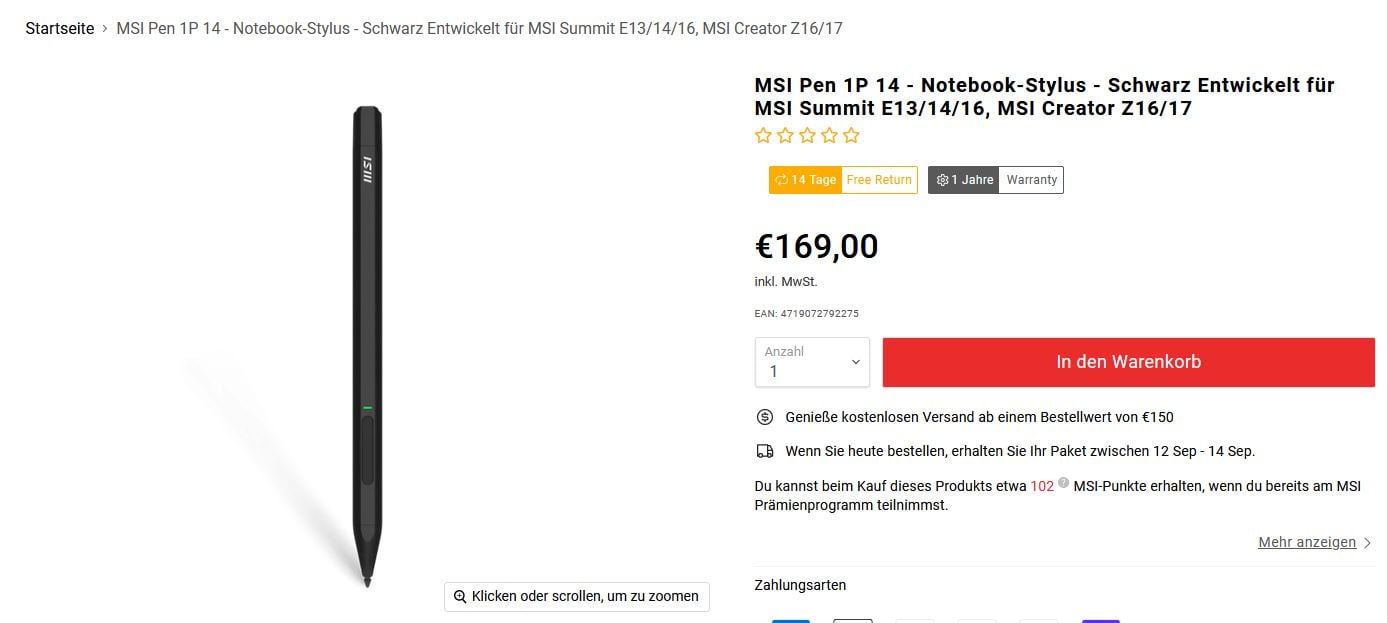
触摸输入被注册,没有任何明显的延迟,导致触摸屏真的很容易使用。微星造物主Z17也支持笔输入,但令人遗憾的是,尽管产品价格很高,但并不包括一支手写笔。就其本身而言,微星笔的价格高达169欧元(亚马逊网站为99美元)。用手指使用触摸屏,往往会留下难看的痕迹。
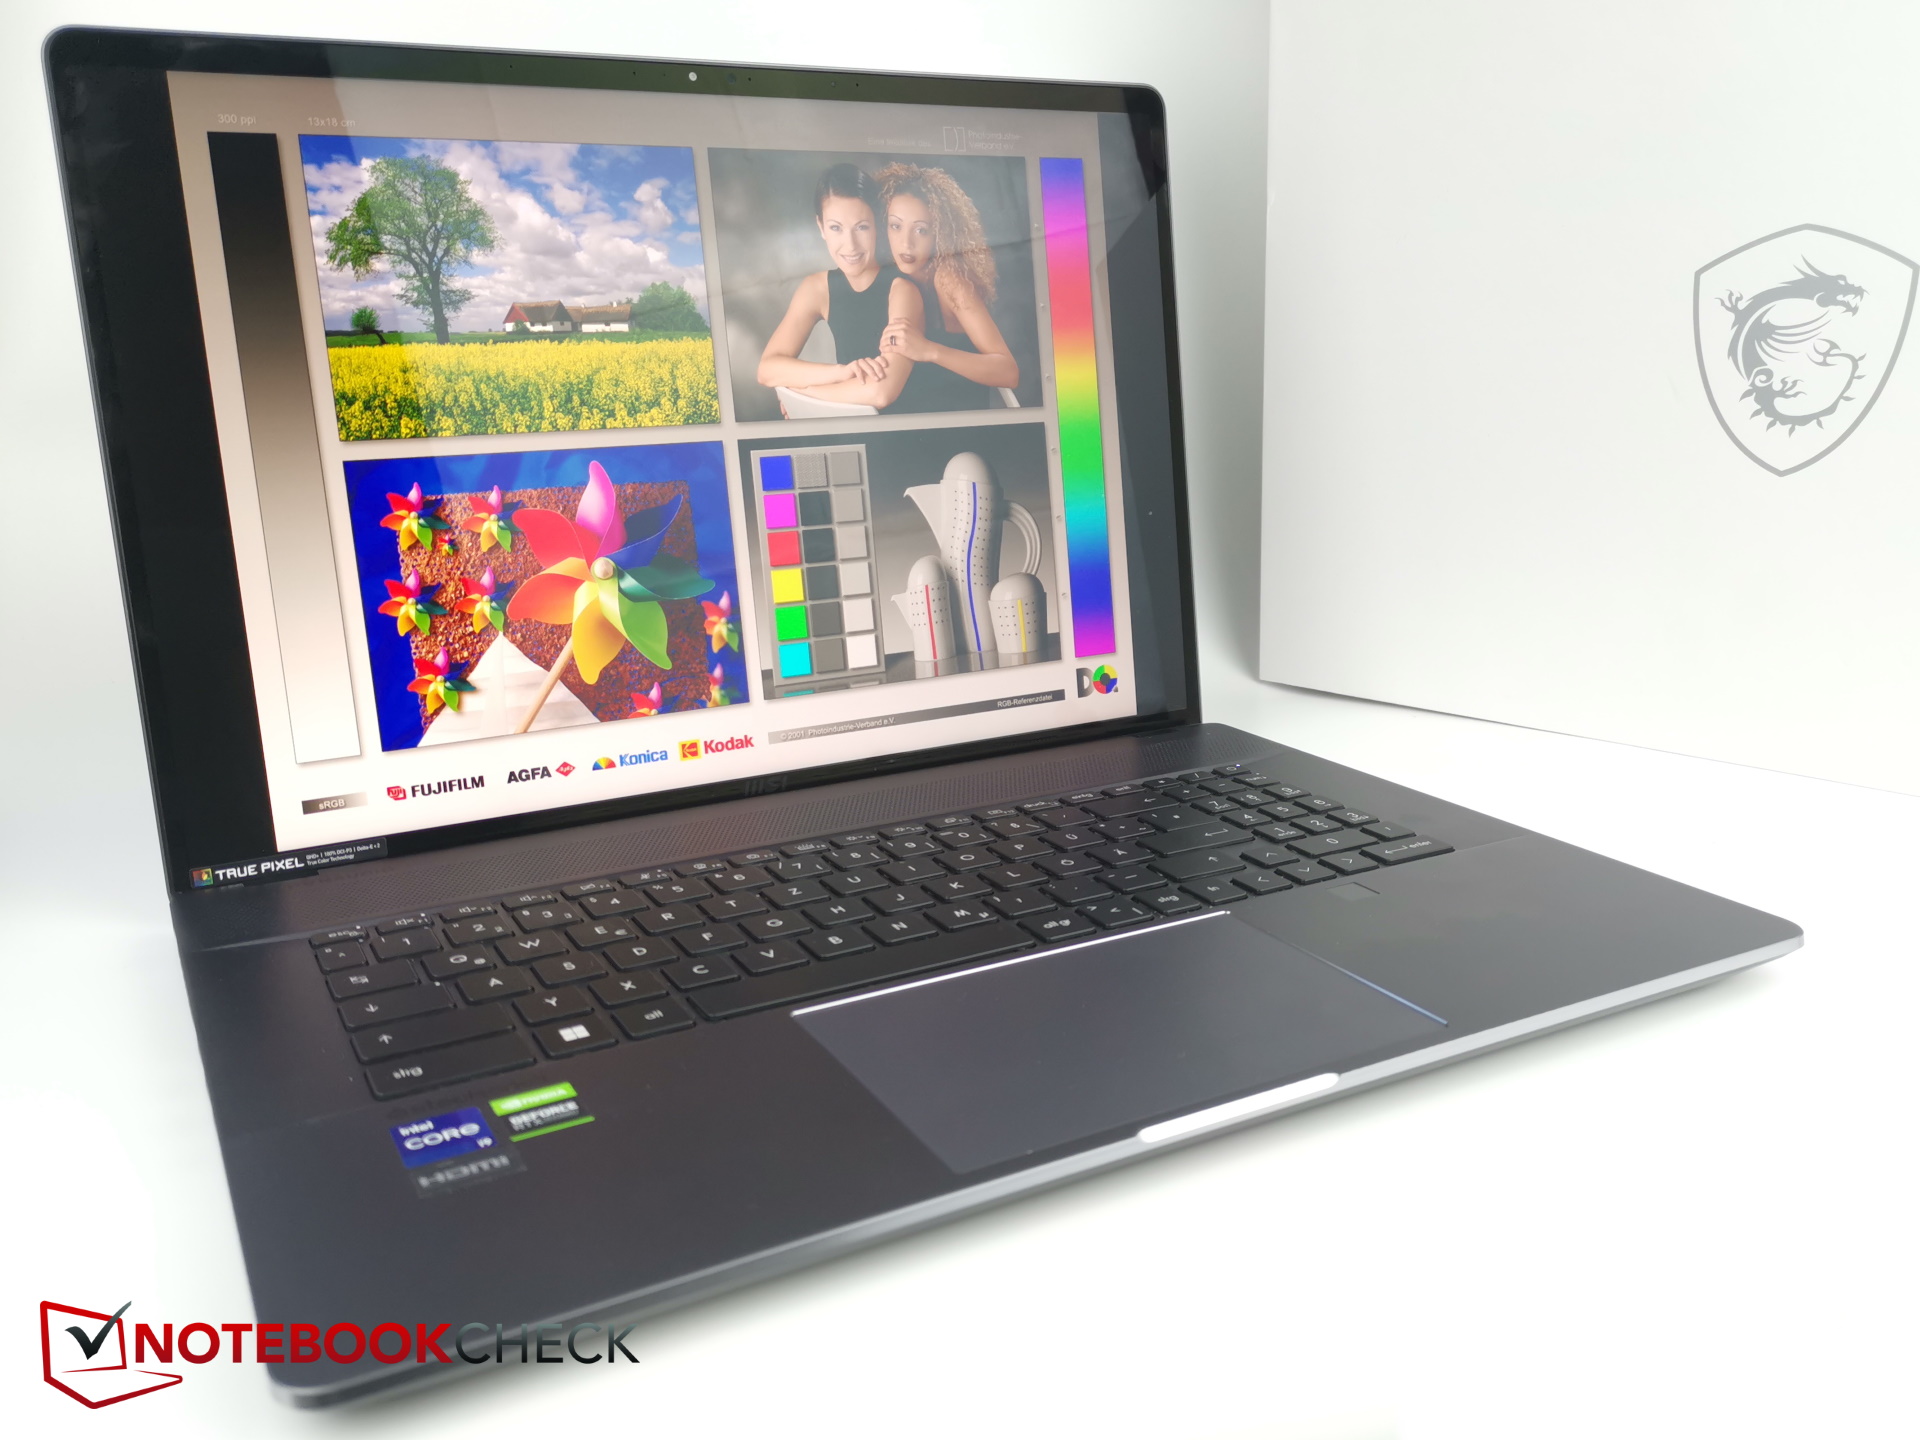
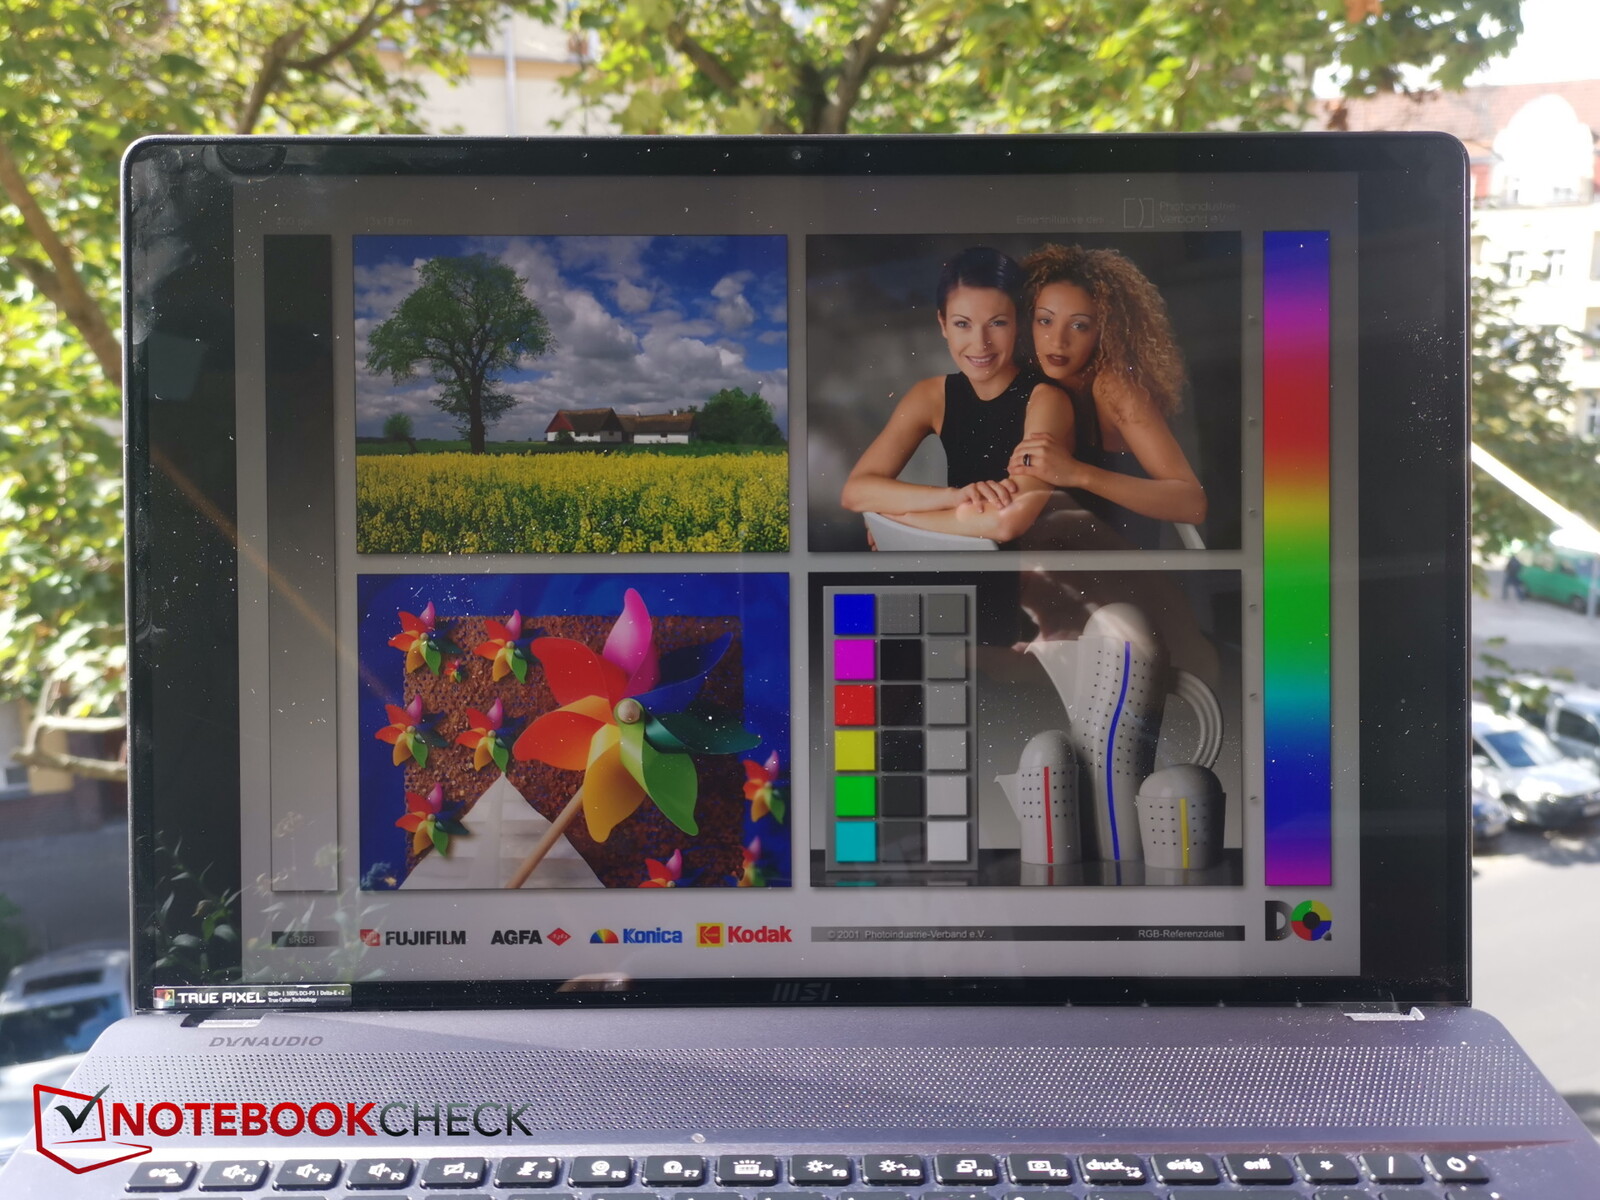
显示屏 - 光滑的触摸屏,全显示P3

微星公司为这台笔记本电脑选择了一个有光泽的17英寸触摸屏。它是一个165赫兹的IPS面板,分辨率为2,560 x 1,600(即16:10的长宽比)。
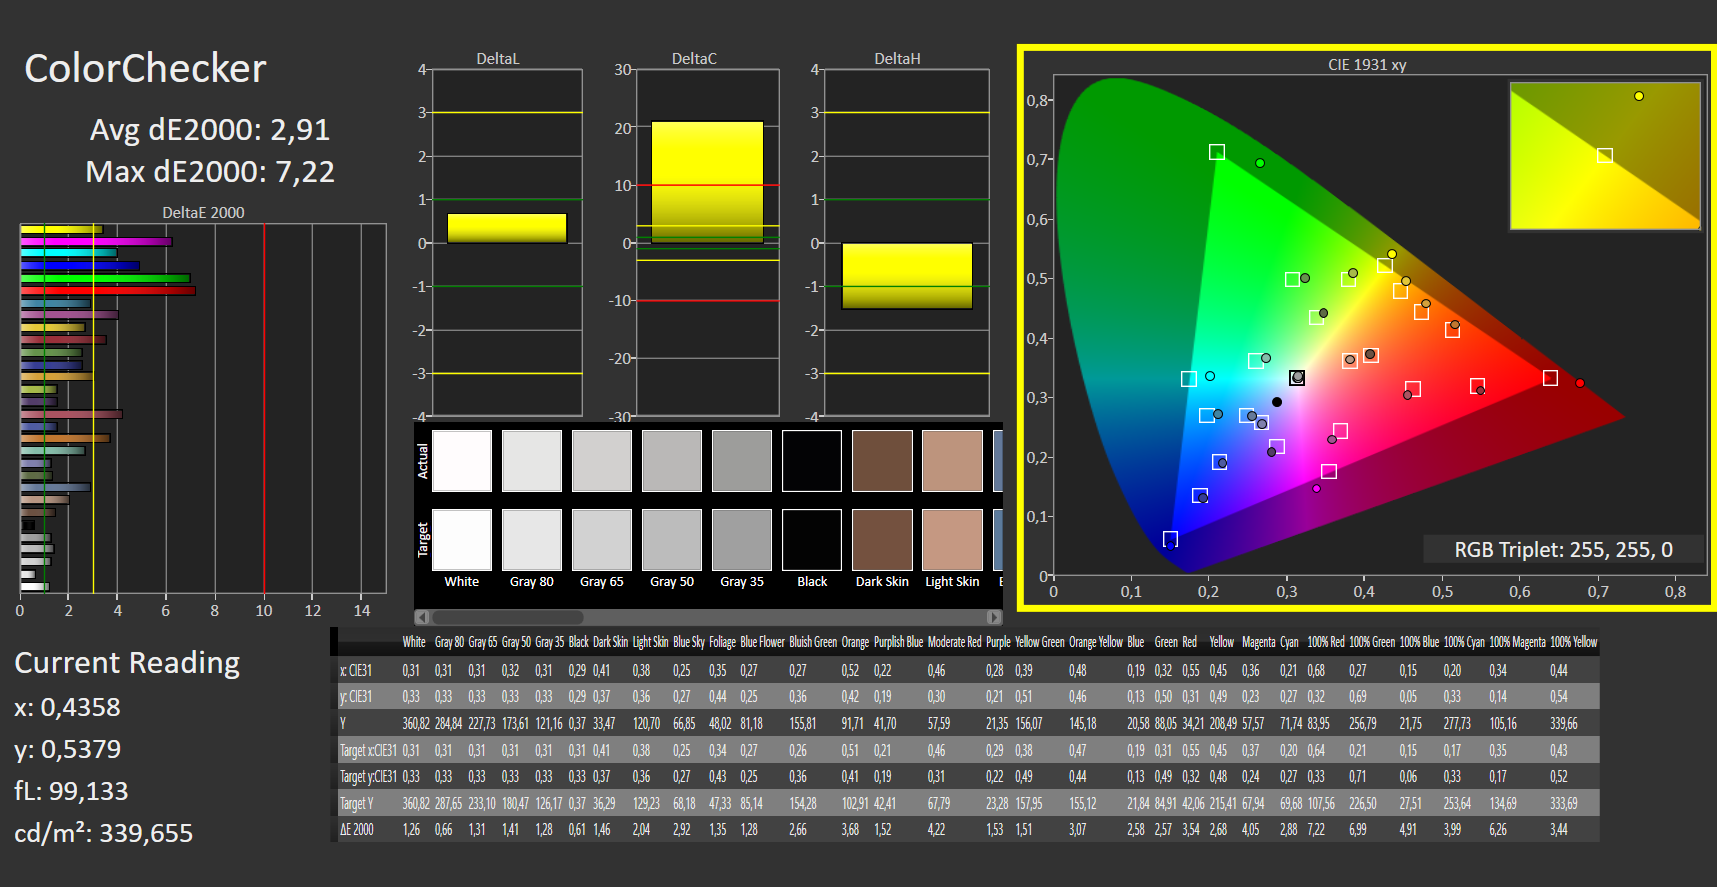
该显示屏能够提供相当高的400尼特的峰值亮度。而且它也被认为是相当均匀的照明,亮度分布为88%。就我们测量的数值而言,黑度和对比度略微令人失望。然而,根据我们的主观印象,由于光泽的表面,色彩显得非常活泼。
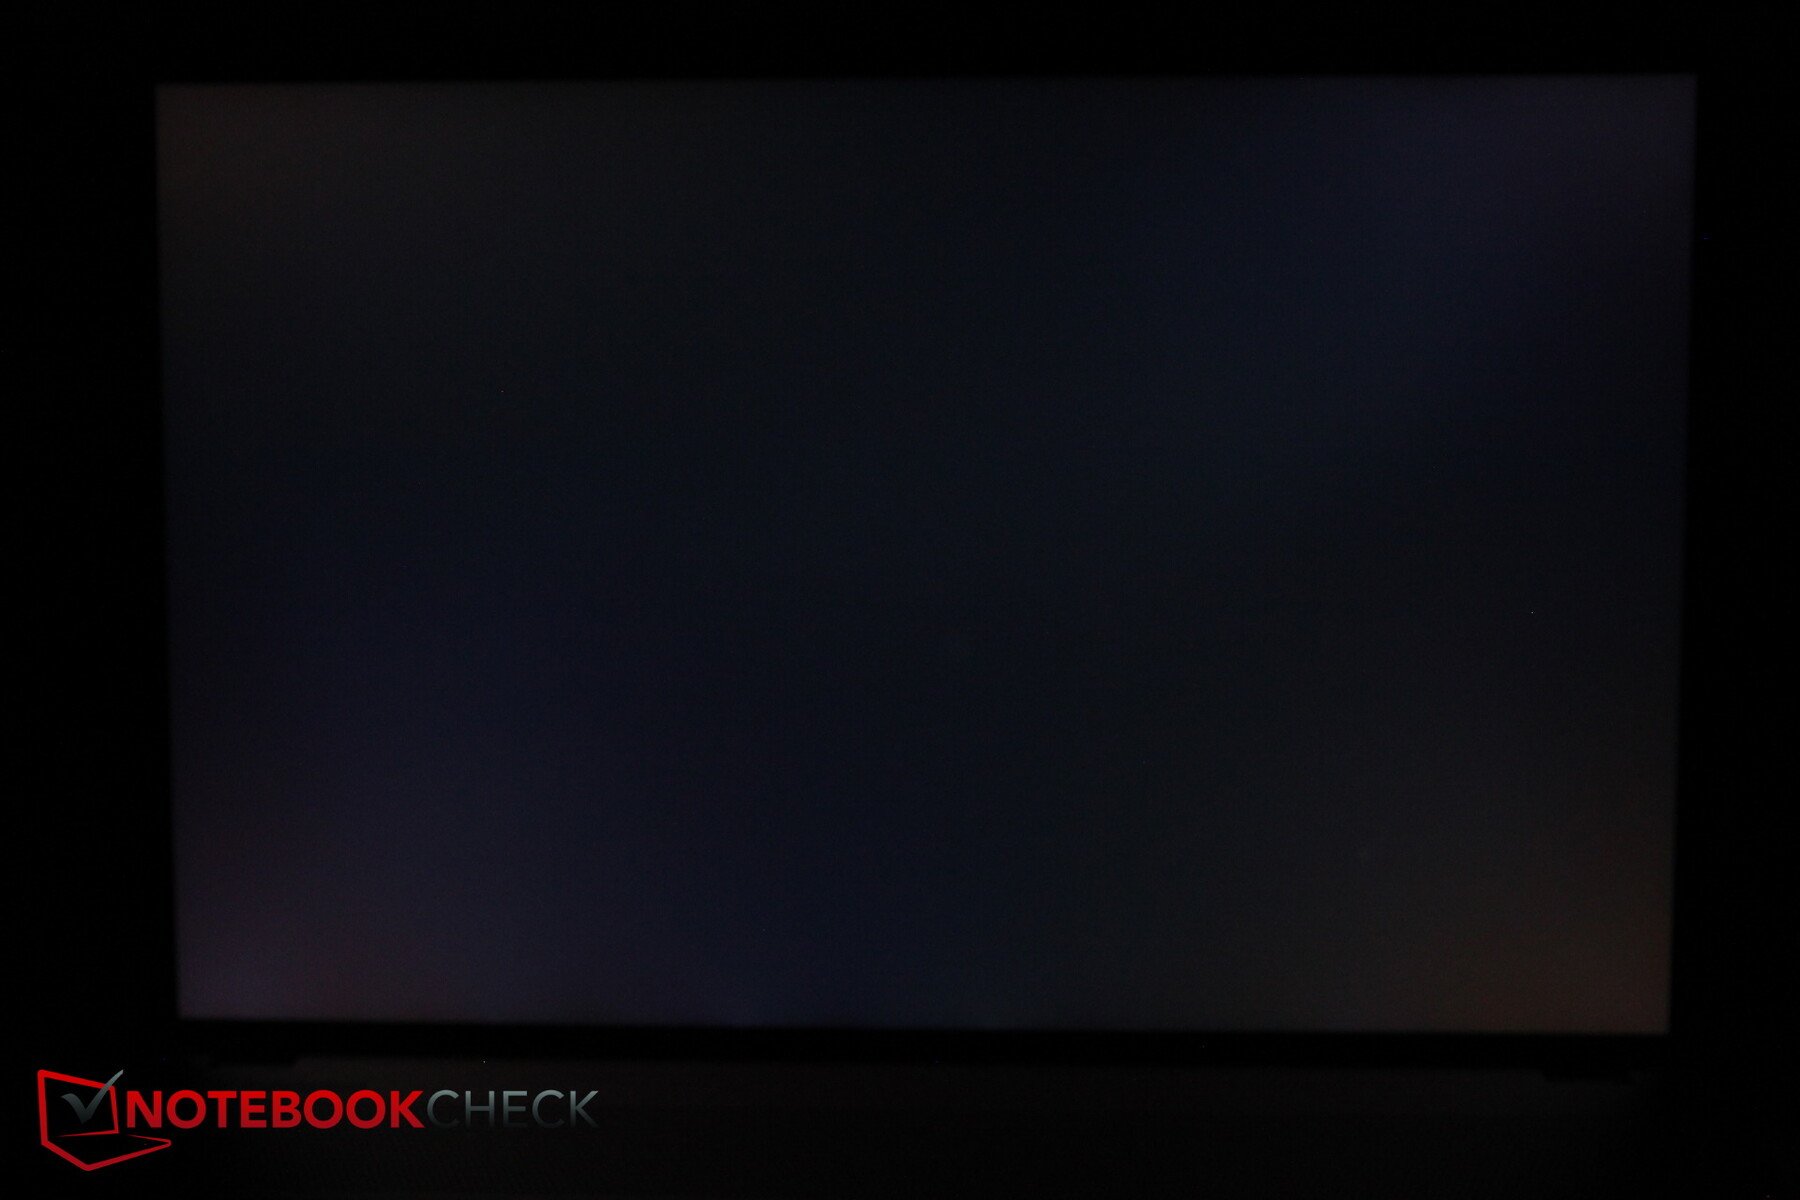
游戏玩家也会对极快的响应时间感到高兴。在非常黑暗的环境中,屏幕出血只在屏幕的下边缘有轻微的可见性。
| |||||||||||||||||||||||||
Brightness Distribution: 88 %
Center on Battery: 444 cd/m²
Contrast: 634:1 (Black: 0.7 cd/m²)
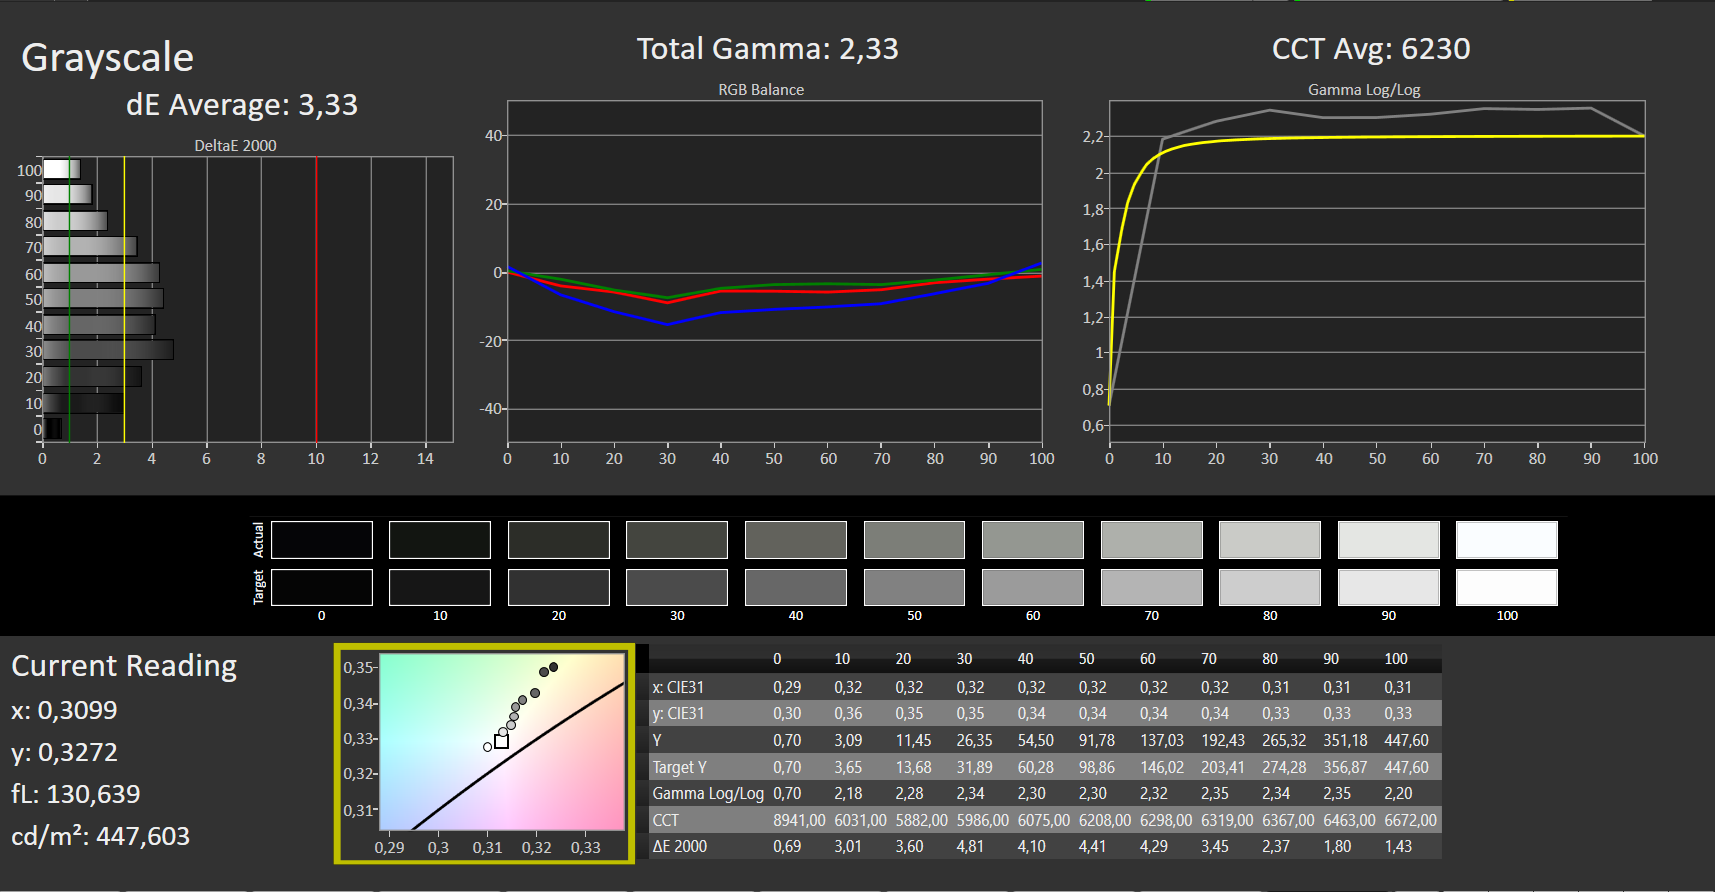
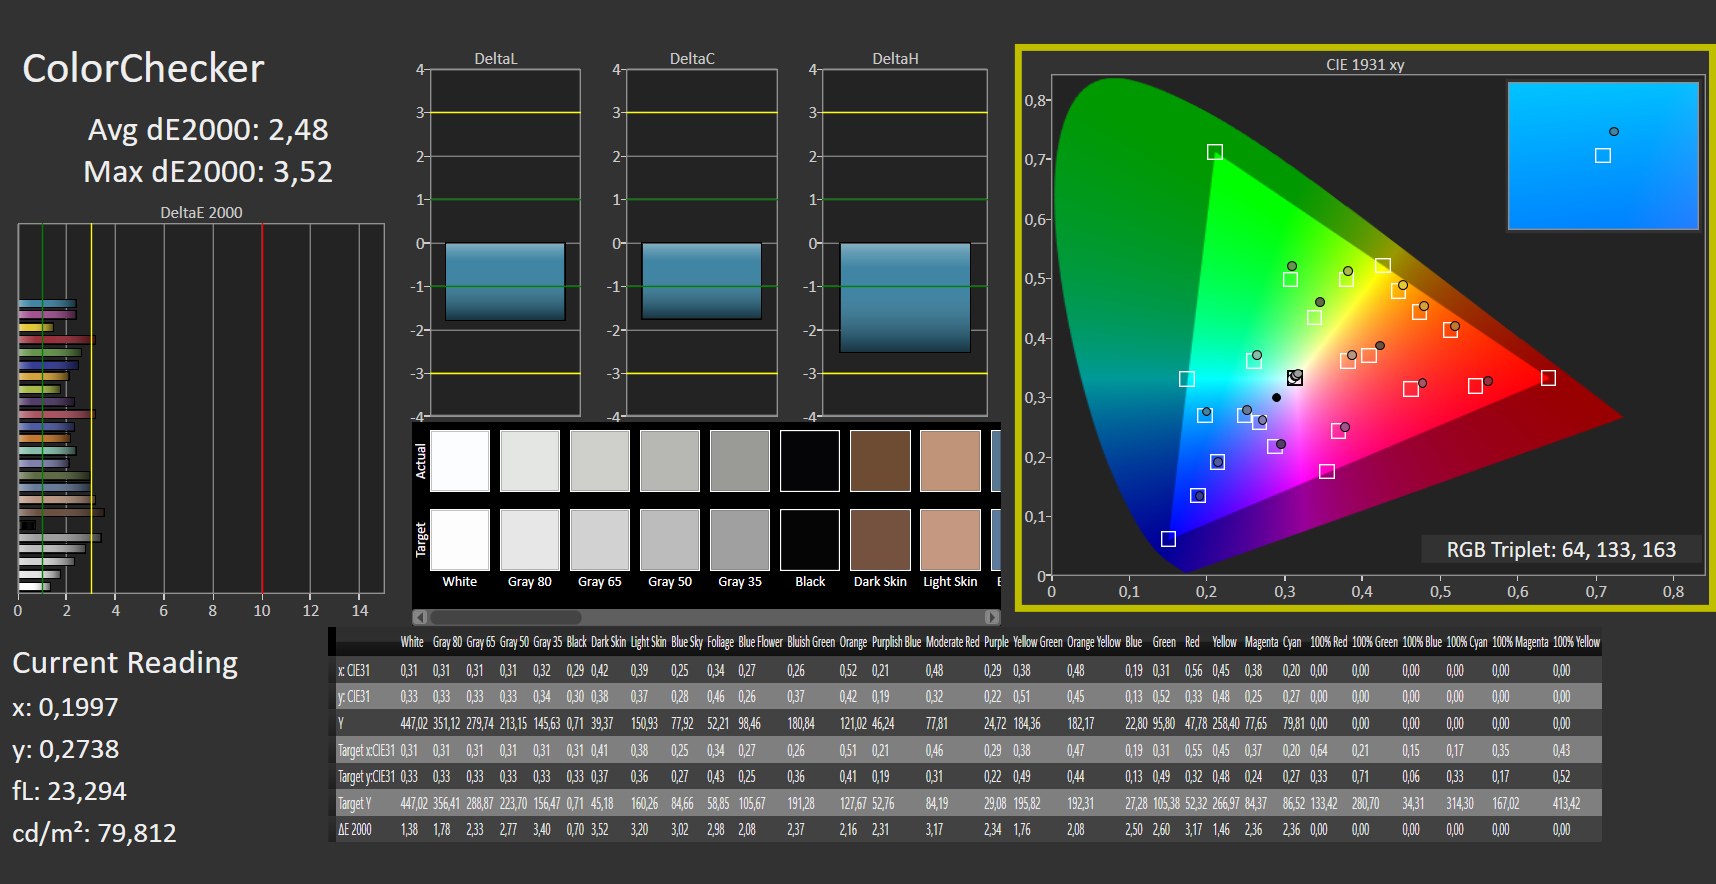
ΔE ColorChecker Calman: 2.48 | ∀{0.5-29.43 Ø4.71}
calibrated: 2.91
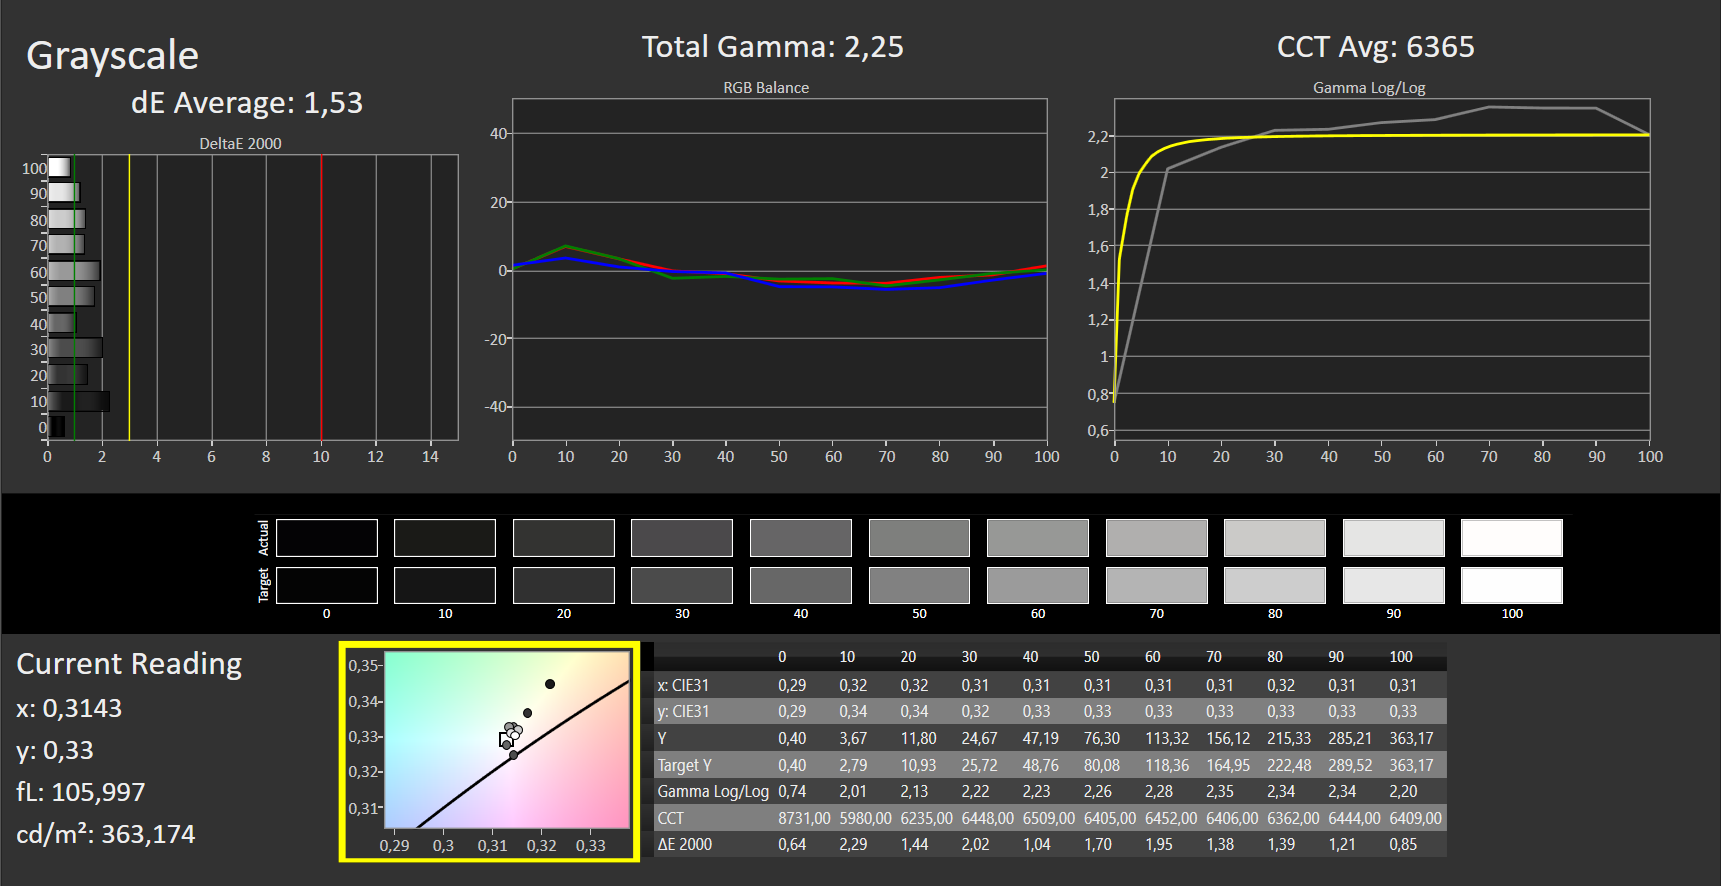
ΔE Greyscale Calman: 3.33 | ∀{0.09-98 Ø4.96}
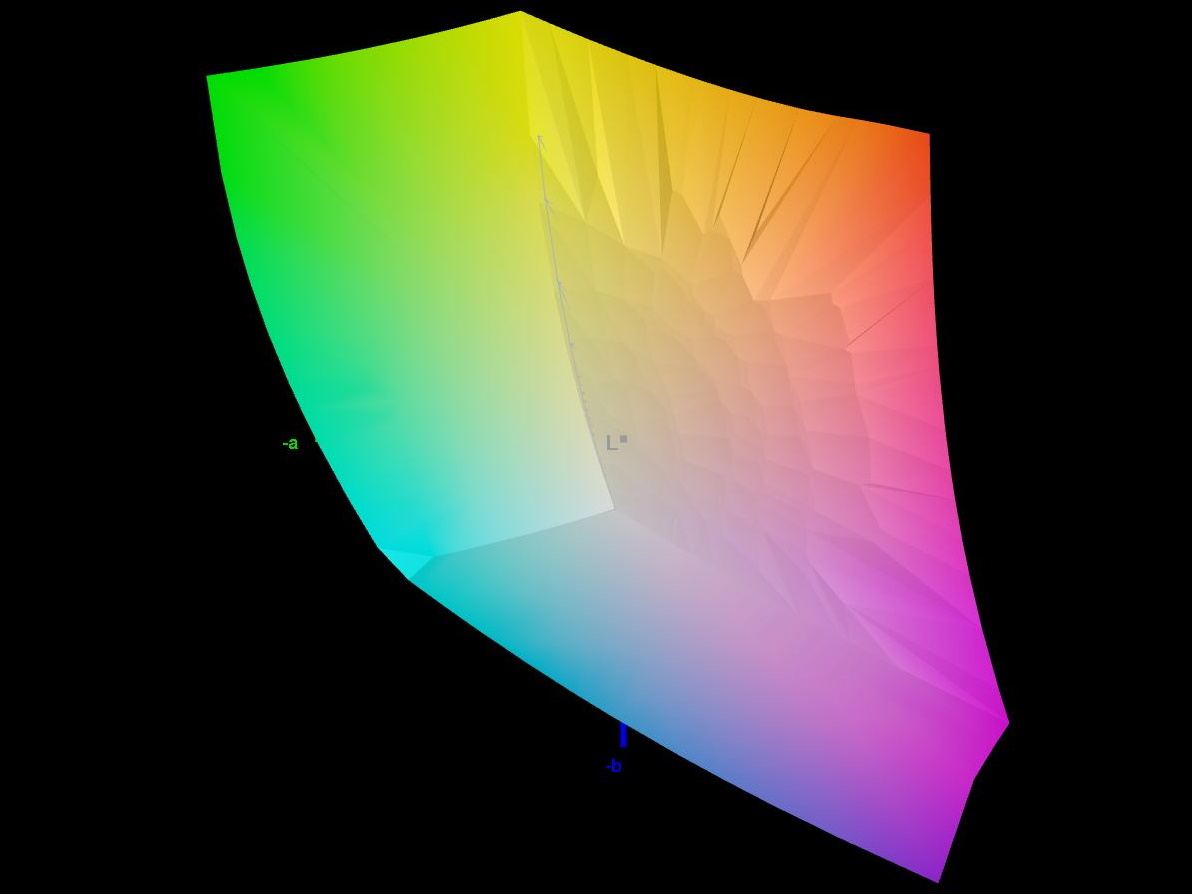
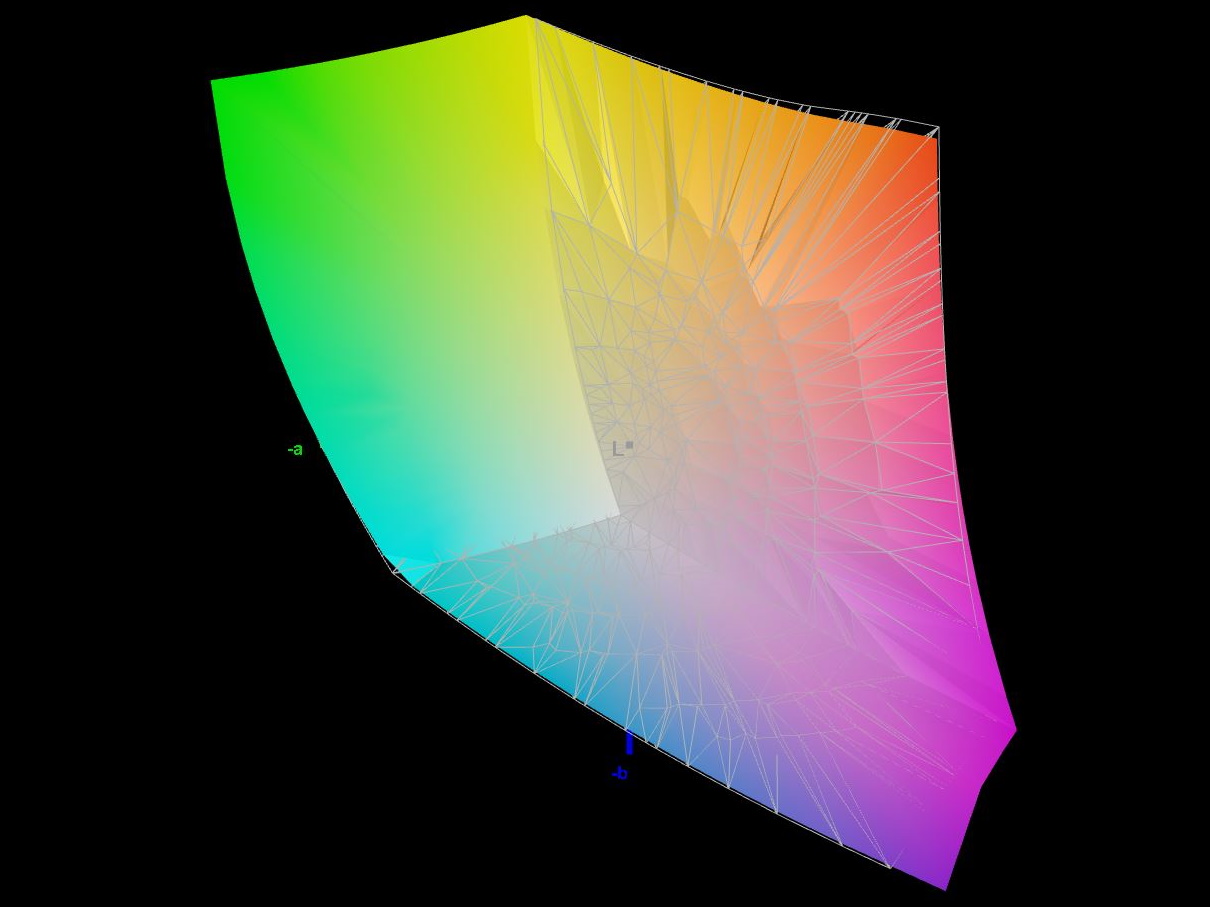
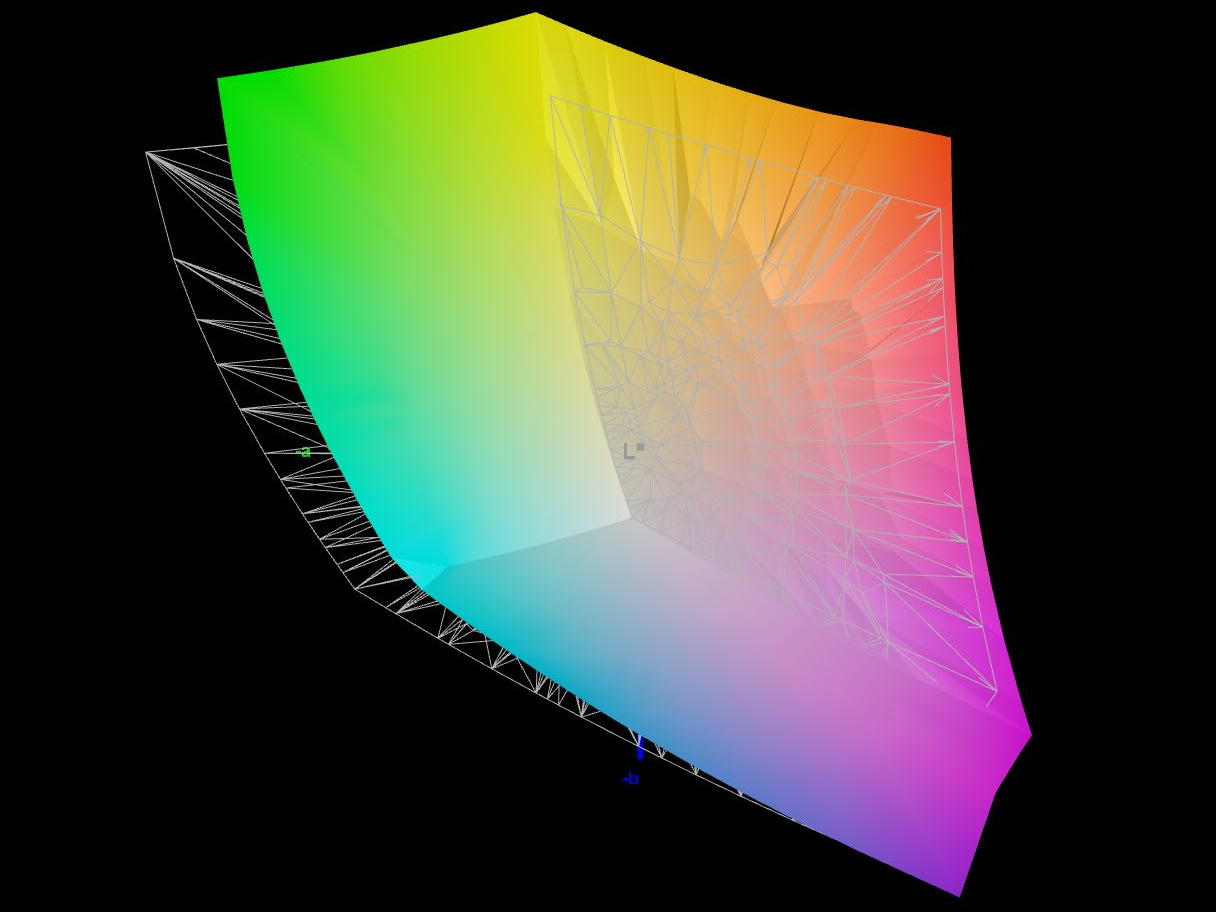
86.4% AdobeRGB 1998 (Argyll 3D)
99.9% sRGB (Argyll 3D)
98.9% Display P3 (Argyll 3D)
Gamma: 2.33
CCT: 6230 K
| MSI Creator Z17 A12UGST-054 AUO3C9B (B170QAN01.0), IPS, 2560x1600, 17" | MSI Creator 17 A10SGS B173ZAN05.0 (AUO278E), Mini-LED IPS-Level, 3840x2160, 17.3" | MSI Creator Z16P B12UHST AUOD298, IPS True Pixel (~100% DCI-P3), 2560x1600, 16" | Razer Blade 17 (i7-12800H, RTX 3070 Ti) BOE CQ NE173QHM-NZ1 (BOE09F9), IPS, 2560x1440, 17.3" | Aorus 17X XES Sharp SHP1563, IPS, 1920x1080, 17.3" | Dell XPS 17 9720 RTX 3060 Sharp LQ170R1, IPS, 3840x2400, 17" | |
|---|---|---|---|---|---|---|
| Display | -7% | -0% | -1% | -15% | -2% | |
| Display P3 Coverage (%) | 98.9 | 82 -17% | 97.6 -1% | 97.9 -1% | 70.1 -29% | 92.9 -6% |
| sRGB Coverage (%) | 99.9 | 97.5 -2% | 99.9 0% | 99.9 0% | 99.9 0% | 100 0% |
| AdobeRGB 1998 Coverage (%) | 86.4 | 84 -3% | 86.8 0% | 85.5 -1% | 71.9 -17% | 85.3 -1% |
| Response Times | -76% | -23% | -81% | 27% | -485% | |
| Response Time Grey 50% / Grey 80% * (ms) | 11 ? | 12.9 ? -17% | 15.2 ? -38% | 3.4 ? 69% | 51.2 ? -365% | |
| Response Time Black / White * (ms) | 5 ? | 8.8 ? -76% | 6.4 ? -28% | 11.2 ? -124% | 5.8 ? -16% | 35.2 ? -604% |
| PWM Frequency (Hz) | 26600 ? | |||||
| Screen | 26% | 16% | -28% | -28% | -34% | |
| Brightness middle (cd/m²) | 444 | 996 124% | 428 -4% | 341 -23% | 278 -37% | 512.7 15% |
| Brightness (cd/m²) | 415 | 952 129% | 394 -5% | 308 -26% | 273 -34% | 463 12% |
| Brightness Distribution (%) | 88 | 93 6% | 86 -2% | 82 -7% | 79 -10% | 85 -3% |
| Black Level * (cd/m²) | 0.7 | 0.68 3% | 0.42 40% | 0.45 36% | 0.26 63% | 0.32 54% |
| Contrast (:1) | 634 | 1465 131% | 1019 61% | 758 20% | 1069 69% | 1602 153% |
| Colorchecker dE 2000 * | 2.48 | 4.21 -70% | 1.67 33% | 4.16 -68% | 3.96 -60% | 5.98 -141% |
| Colorchecker dE 2000 max. * | 3.52 | 6.79 -93% | 5.71 -62% | 8.14 -131% | 10.78 -206% | 12.09 -243% |
| Colorchecker dE 2000 calibrated * | 2.91 | 2.03 30% | 0.71 76% | 3 -3% | 1.07 63% | |
| Greyscale dE 2000 * | 3.33 | 4.1 -23% | 3.1 7% | 5.09 -53% | 6.8 -104% | 7.2 -116% |
| Gamma | 2.33 94% | 2.207 100% | 2.195 100% | 2.48 89% | 2.224 99% | 2.54 87% |
| CCT | 6230 104% | 7491 87% | 6498 100% | 6884 94% | 7651 85% | 6914 94% |
| Color Space (Percent of AdobeRGB 1998) (%) | 84 | |||||
| Color Space (Percent of sRGB) (%) | 97 | |||||
| Total Average (Program / Settings) | -19% /
11% | -2% /
7% | -37% /
-30% | -5% /
-18% | -174% /
-96% |
* ... smaller is better
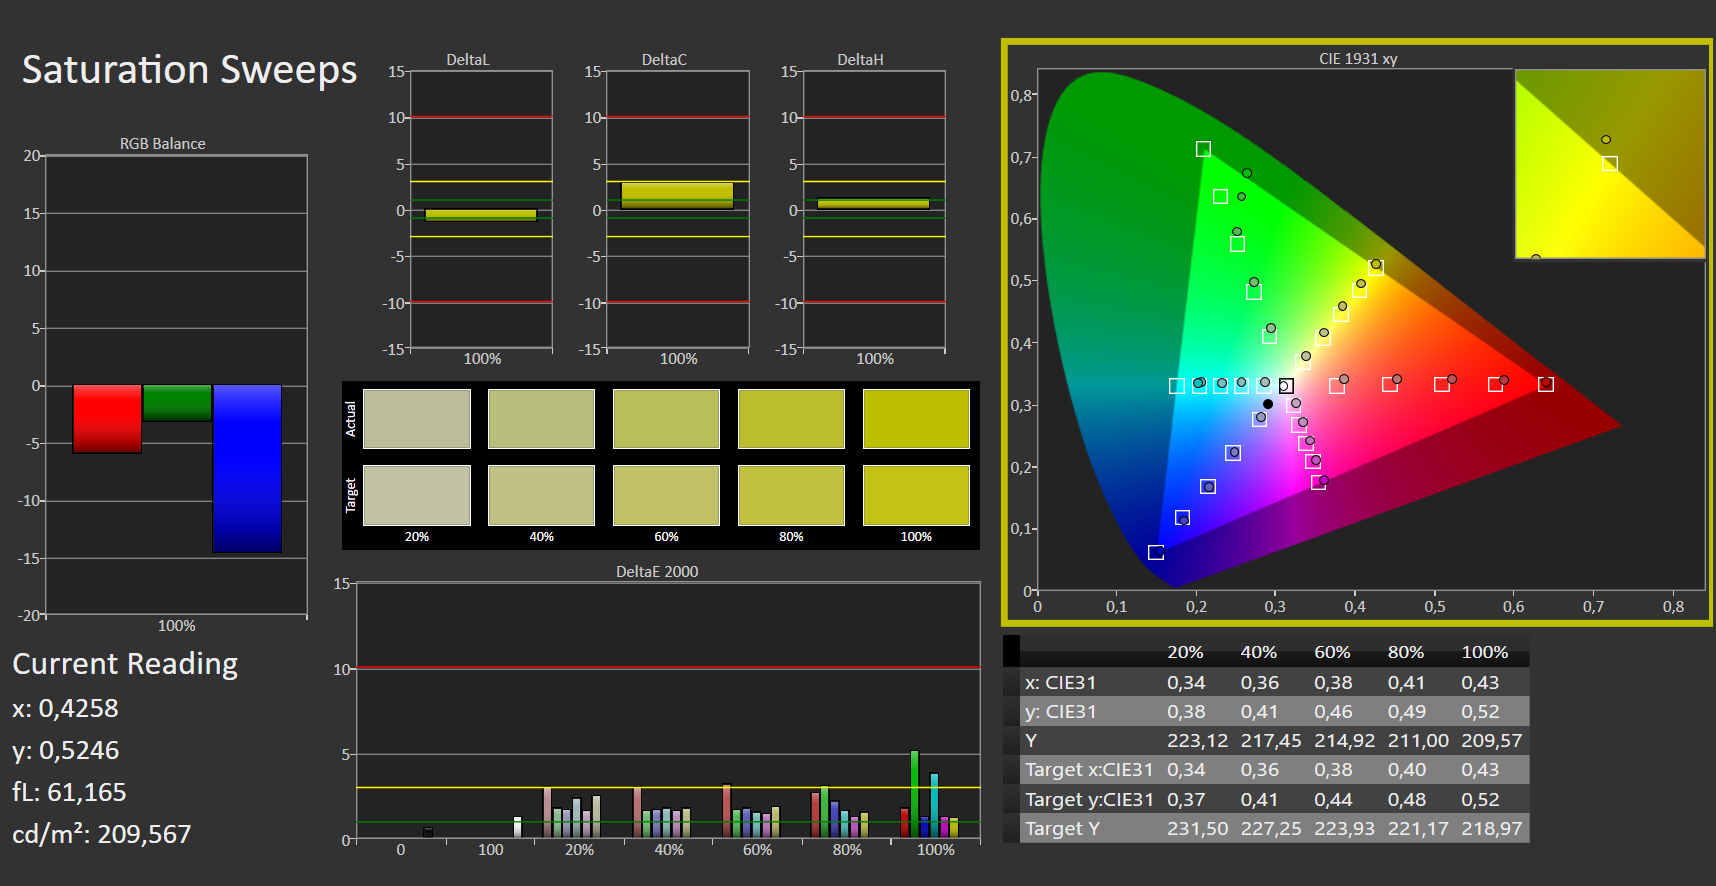
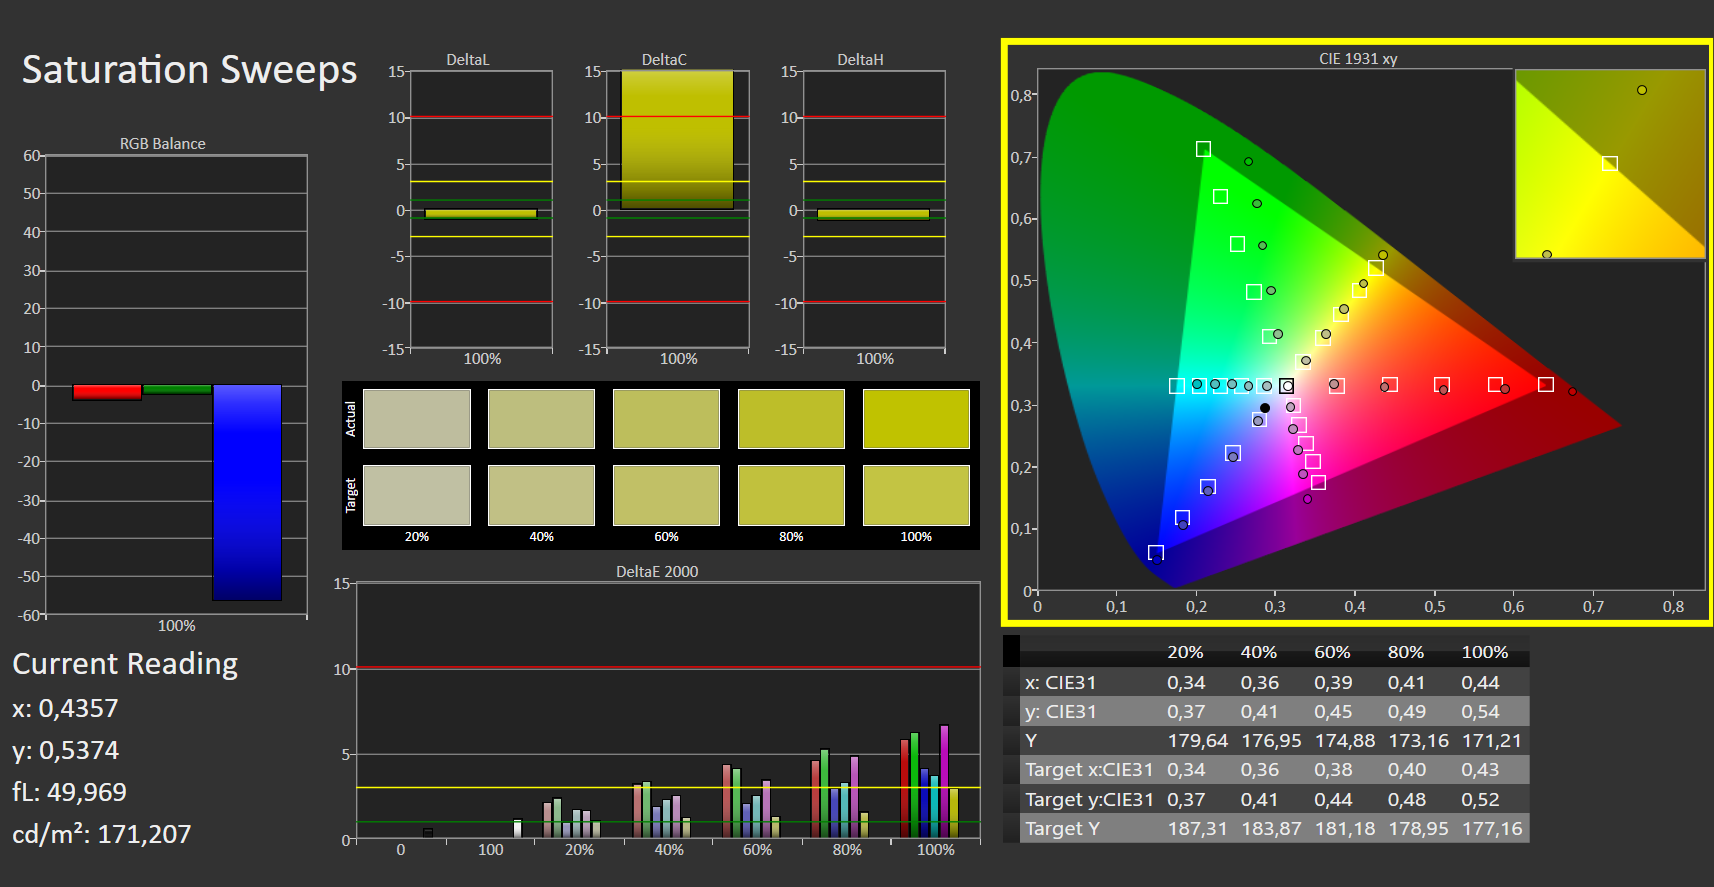
对创意者来说是个好消息:该显示器完全覆盖了Display P3和sRGB,甚至能够覆盖86%的AdobeRGB色彩空间。
显示器在开箱时就已经被很好地校准了。颜色和灰度的Delta E值在2到3之间。手动校准并没有进一步改善结果。
Display Response Times
| ↔ Response Time Black to White | ||
|---|---|---|
| 5 ms ... rise ↗ and fall ↘ combined | ↗ 2 ms rise |  |
| ↘ 3 ms fall | ||
| The screen shows very fast response rates in our tests and should be very well suited for fast-paced gaming. In comparison, all tested devices range from 0.1 (minimum) to 240 (maximum) ms. » 18 % of all devices are better. This means that the measured response time is better than the average of all tested devices (19.8 ms). | ||
| ↔ Response Time 50% Grey to 80% Grey | ||
| 11 ms ... rise ↗ and fall ↘ combined | ↗ 5 ms rise |  |
| ↘ 6 ms fall | ||
| The screen shows good response rates in our tests, but may be too slow for competitive gamers. In comparison, all tested devices range from 0.165 (minimum) to 636 (maximum) ms. » 25 % of all devices are better. This means that the measured response time is better than the average of all tested devices (31 ms). | ||
Screen Flickering / PWM (Pulse-Width Modulation)
| Screen flickering / PWM not detected |    | ||
In comparison: 52 % of all tested devices do not use PWM to dim the display. If PWM was detected, an average of 7754 (minimum: 5 - maximum: 343500) Hz was measured. | |||
光滑的表面使笔记本电脑在户外使用时明显更加困难。它的缺点只是部分地被屏幕的相当高的亮度所缓解了。如果你打算在外面工作,你可能应该找一个阴凉的地方。
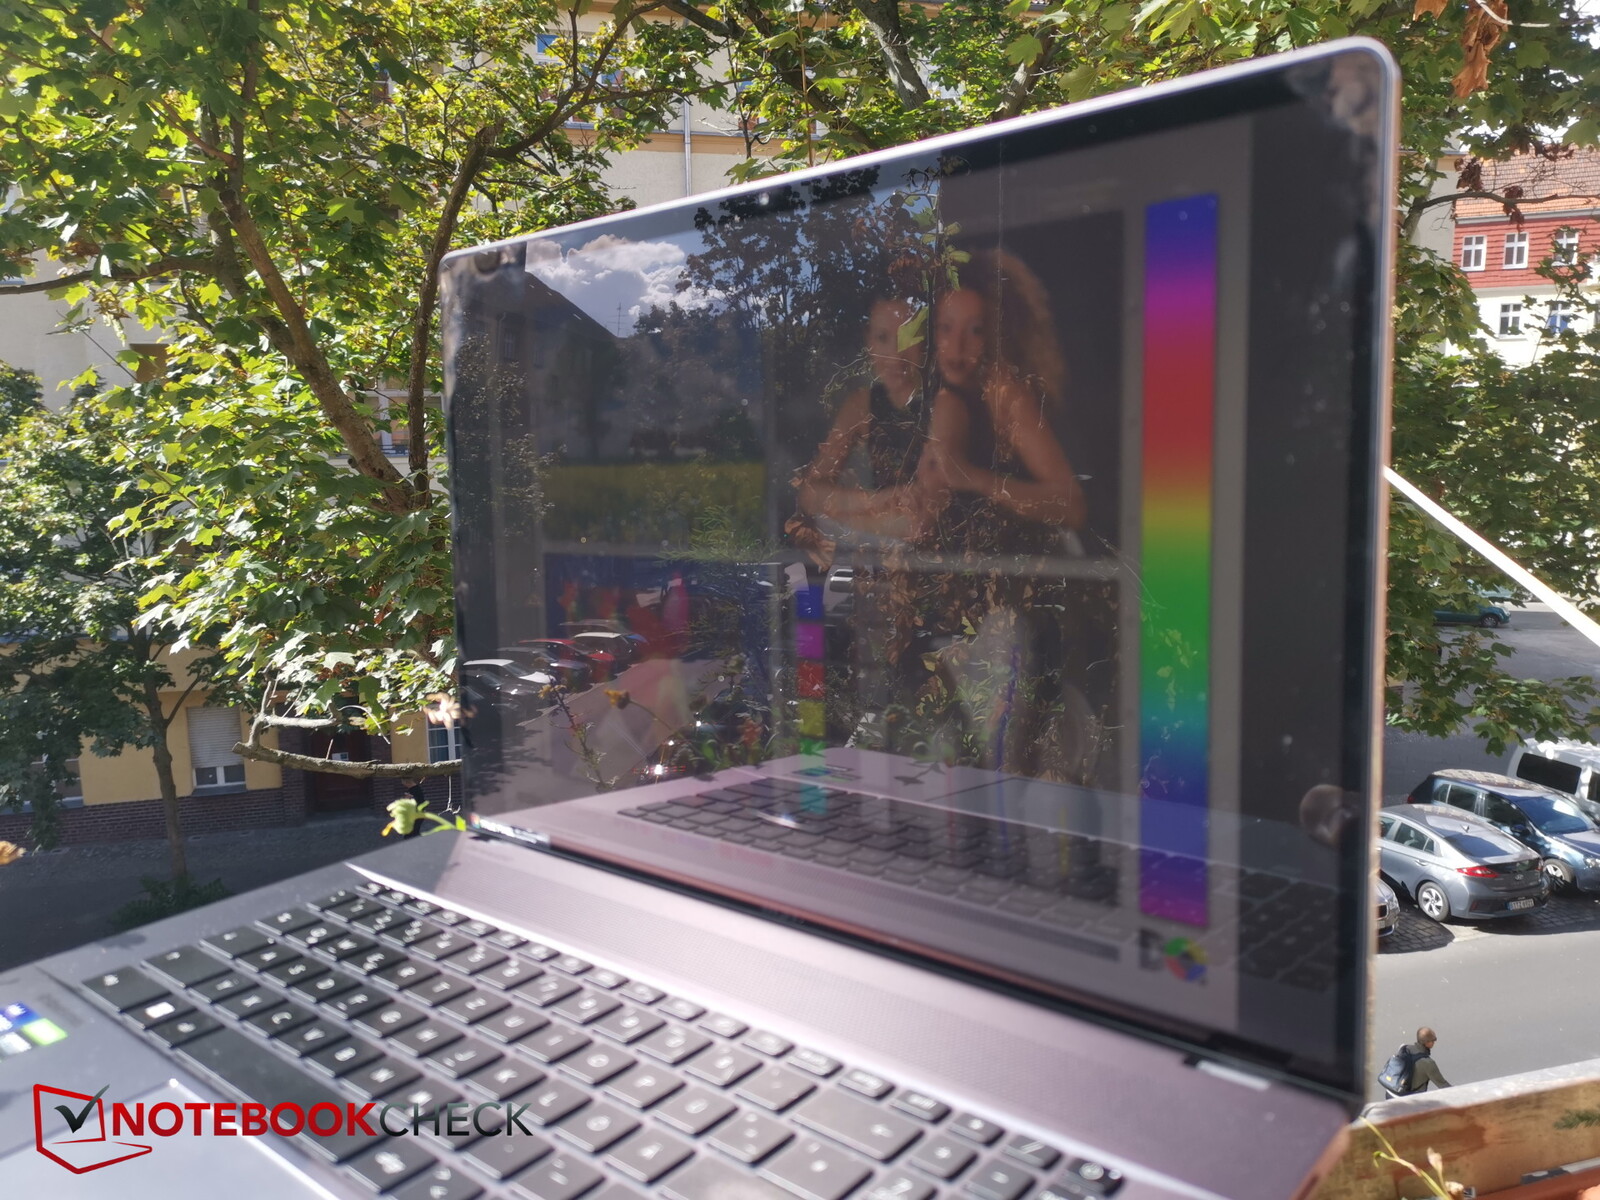
该显示屏具有相当宽的视角。亮度和对比度只有在从极端角度观看屏幕时才开始下降。

性能 - 纤细的底盘使Z17的性能大打折扣
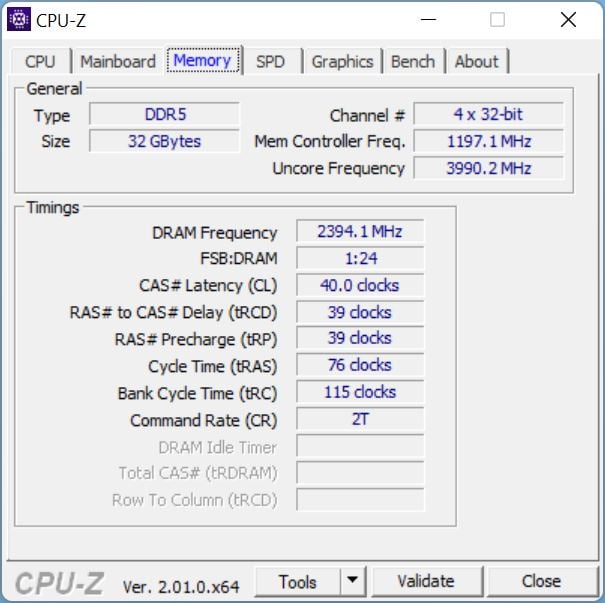
结合强大的 酷睿i9-12900H和 RTX 3070 Ti应该让游戏玩家和内容创作者都感到兴奋。特别是伟大的触摸屏,是会吸引内容创作者的东西。这款笔记本电脑还拥有慷慨的32GB内存,这对创意项目来说是恰到好处的数量。
Z17有三种配置。除了审查配置外,还有一个带有RTX 3080和2TB的SSD存储,以及最高规格的型号,它配备了一个 RTX 3080 Ti,64GB内存和2TB的SSD存储。这三种型号都使用相同的CPU和显示屏。
测试条件
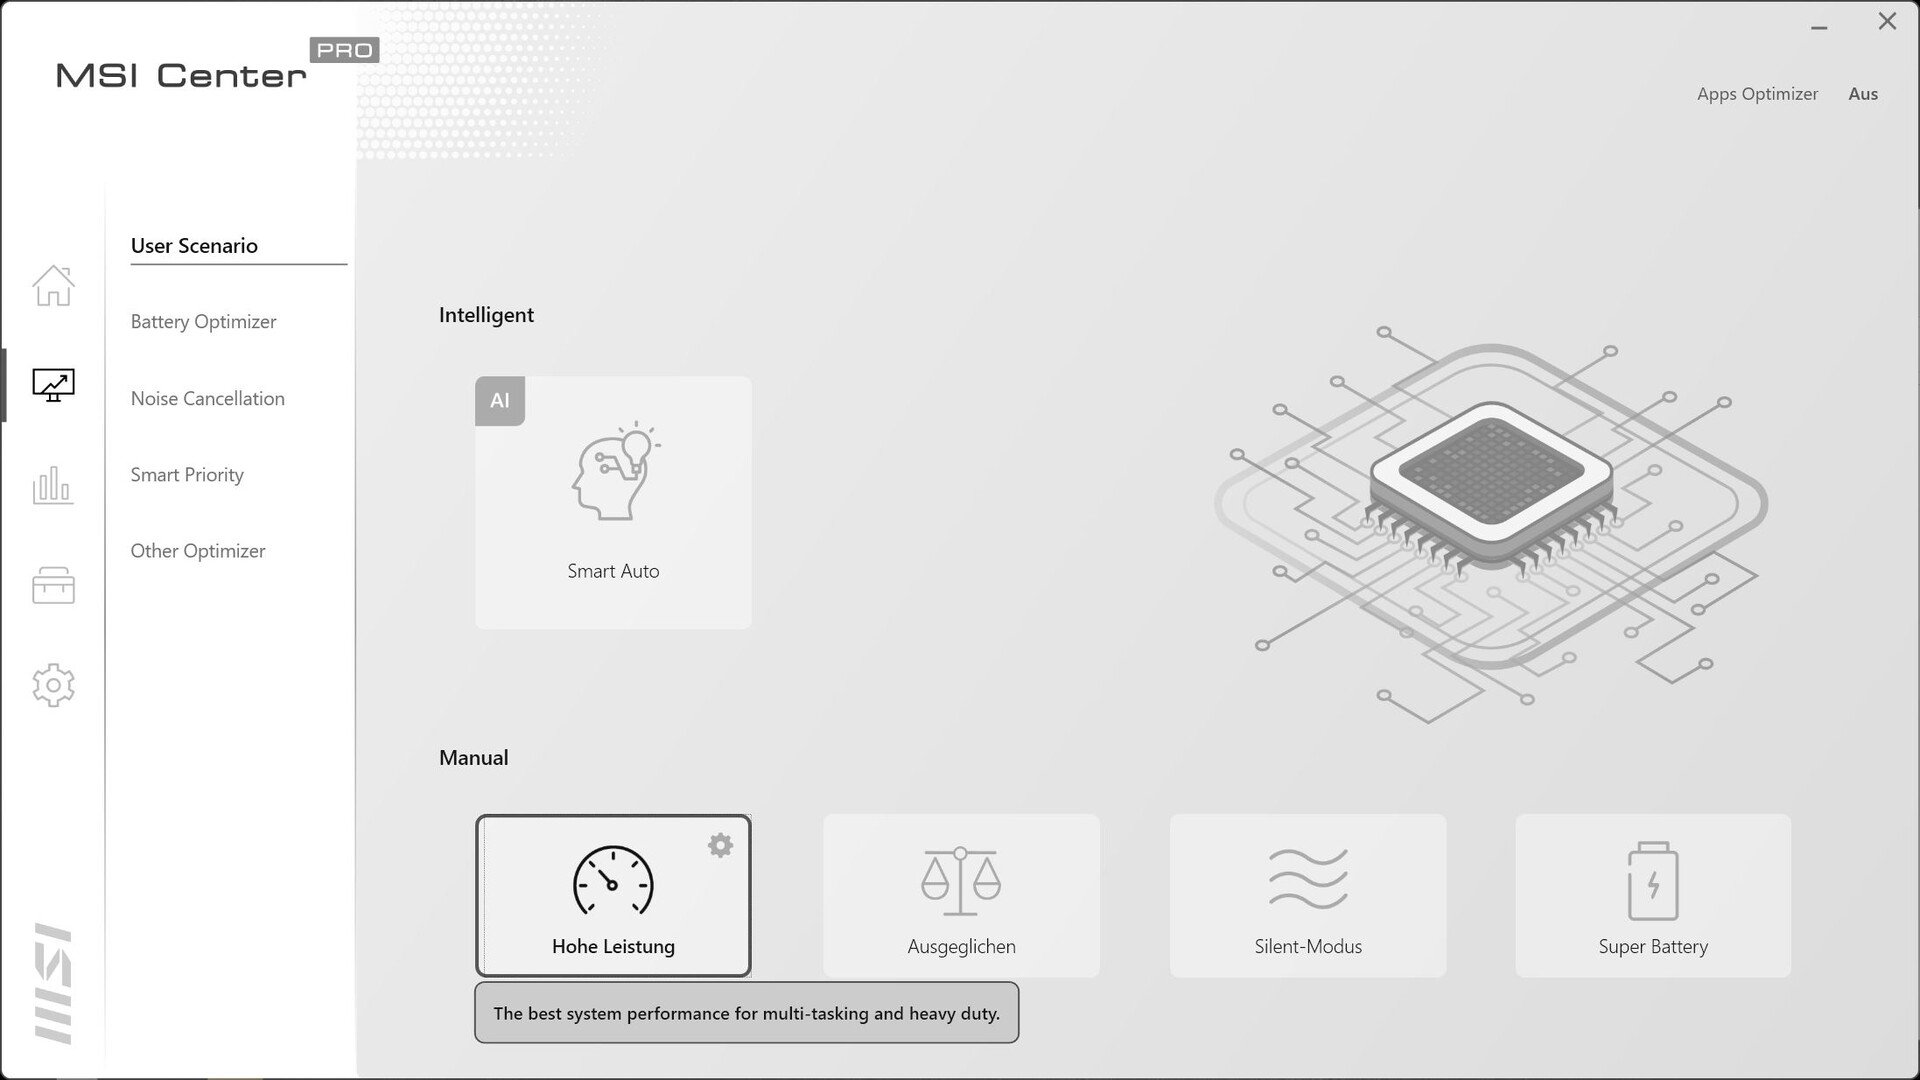
这台笔记本电脑配备了微星中心专业版--制造商自己的软件,可以让你定制各种系统设置。除了电池测试,其他所有的基准测试都是在笔记本电脑的高性能模式下进行的,以便获得尽可能好的结果。在你启动笔记本电脑后,软件需要一段时间来启动。
处理器
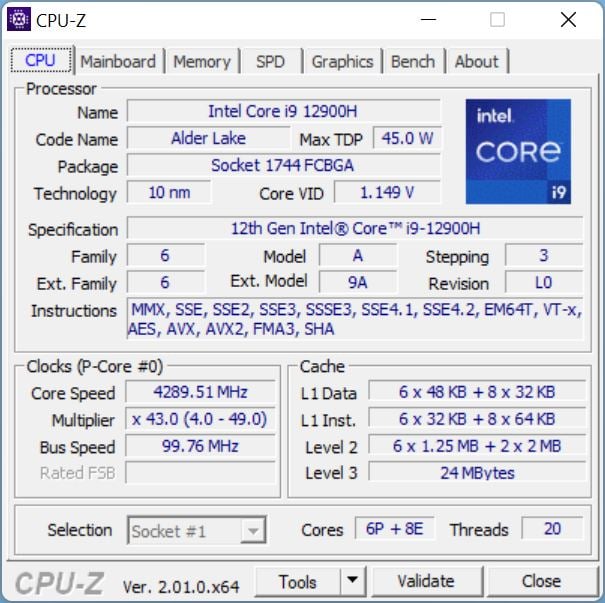
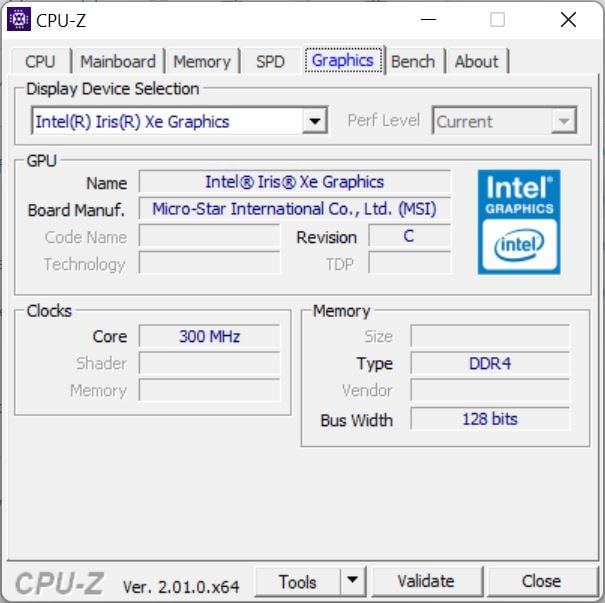
有了 英特尔酷睿i9-12900H微星将当前最快的Alder Lake处理器之一放在Z17中。这对于一个具有如此纤细外形的设备来说是相当不寻常的。总共有14个核心(20个线程;6个P-cores和8个E-cores),时钟速度从1.8到5GHz不等。该处理器支持vPro的全部 "企业 "功能集(管理功能)。所有96个EU都在集成的Xe图形上活动。
在Cinebench循环测试中,竞争对手完全被Z17超越了,至少在持续的CPU性能方面。尽管如此,这些笔记本电脑也没有安装顶级的CPU。这款 酷睿i7-12800H中的 刀片17能够在开始时超过Z17的i9-12900H。但Z17仍然有更好的持续性能。
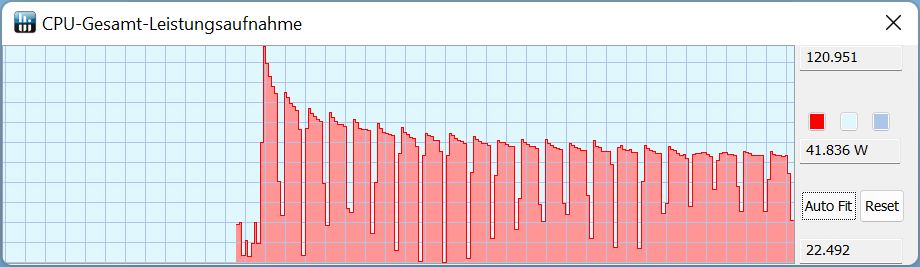
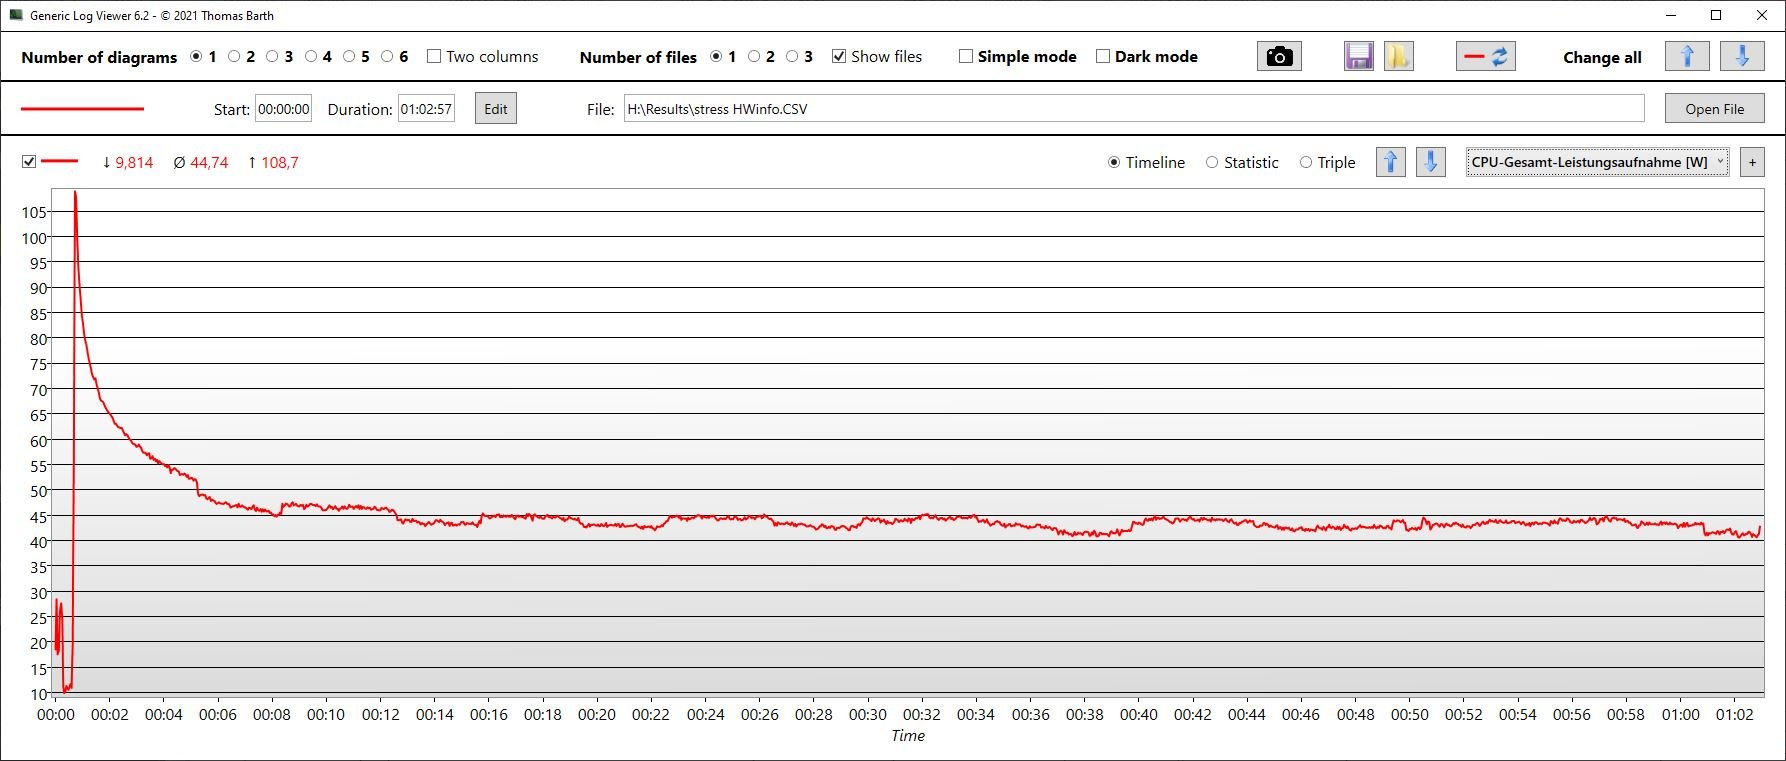
你可以从右边的截图中看出CPU的表现。在第一次运行时,TDP只达到120瓦;然后随着时间的推移,功耗开始逐渐下降。在每次运行中,TDP也略有下降。
总的来说,Z17在性能上的下降明显没有Razer Blade的i7处理器那么严重。 Razer Blade的i7在最初的几次运行后,Z17表现出的性能下降明显没有Razer Blade的i7那么严重。有趣的是,Z16P中同样的i9处理器一直快了约10%至15%,尽管该笔记本的外形尺寸较小。这意味着Z17中的i9根本没有发挥其全部潜力。因此,与竞争对手相比,非常小的性能提升并不能证明使用耗电的酷睿i9处理器是合理的。单线程性能在某种程度上低于预期的 i9-12900H.
根据Cinebench R15的测量,在电池上运行时,笔记本电脑的CPU性能损失了大约25%。CPU只达到了50瓦的TDP。
Cinebench R15 Multi Sustained Load
Cinebench R23: Multi Core | Single Core
Cinebench R20: CPU (Multi Core) | CPU (Single Core)
Cinebench R15: CPU Multi 64Bit | CPU Single 64Bit
Blender: v2.79 BMW27 CPU
7-Zip 18.03: 7z b 4 | 7z b 4 -mmt1
Geekbench 5.5: Multi-Core | Single-Core
HWBOT x265 Benchmark v2.2: 4k Preset
LibreOffice : 20 Documents To PDF
R Benchmark 2.5: Overall mean
| CPU Performance rating | |
| Aorus 17X XES | |
| MSI Creator Z16P B12UHST | |
| MSI Creator Z17 A12UGST-054 | |
| Average of class Multimedia | |
| Dell XPS 17 9720 RTX 3060 | |
| Razer Blade 17 (i7-12800H, RTX 3070 Ti) | |
| Average Intel Core i9-12900H | |
| MSI Creator 17 A10SGS -2! | |
| Cinebench R23 / Multi Core | |
| MSI Creator Z16P B12UHST | |
| Aorus 17X XES | |
| Dell XPS 17 9720 RTX 3060 | |
| Average of class Multimedia (4861 - 33362, n=74, last 2 years) | |
| MSI Creator Z17 A12UGST-054 | |
| Razer Blade 17 (i7-12800H, RTX 3070 Ti) | |
| Average Intel Core i9-12900H (7359 - 19648, n=28) | |
| Cinebench R23 / Single Core | |
| Average of class Multimedia (1128 - 2459, n=66, last 2 years) | |
| Aorus 17X XES | |
| MSI Creator Z16P B12UHST | |
| MSI Creator Z17 A12UGST-054 | |
| Average Intel Core i9-12900H (1634 - 1930, n=28) | |
| Razer Blade 17 (i7-12800H, RTX 3070 Ti) | |
| Dell XPS 17 9720 RTX 3060 | |
| Cinebench R20 / CPU (Multi Core) | |
| Aorus 17X XES | |
| MSI Creator Z16P B12UHST | |
| Dell XPS 17 9720 RTX 3060 | |
| Average of class Multimedia (1887 - 12912, n=57, last 2 years) | |
| MSI Creator Z17 A12UGST-054 | |
| Average Intel Core i9-12900H (2681 - 7471, n=28) | |
| Razer Blade 17 (i7-12800H, RTX 3070 Ti) | |
| MSI Creator 17 A10SGS | |
| Cinebench R20 / CPU (Single Core) | |
| Aorus 17X XES | |
| MSI Creator Z16P B12UHST | |
| Average of class Multimedia (425 - 853, n=57, last 2 years) | |
| MSI Creator Z17 A12UGST-054 | |
| Razer Blade 17 (i7-12800H, RTX 3070 Ti) | |
| Average Intel Core i9-12900H (624 - 738, n=28) | |
| Dell XPS 17 9720 RTX 3060 | |
| MSI Creator 17 A10SGS | |
| Cinebench R15 / CPU Multi 64Bit | |
| MSI Creator Z16P B12UHST | |
| Aorus 17X XES | |
| Razer Blade 17 (i7-12800H, RTX 3070 Ti) | |
| MSI Creator Z17 A12UGST-054 | |
| Average of class Multimedia (856 - 5224, n=61, last 2 years) | |
| Average Intel Core i9-12900H (1395 - 3077, n=28) | |
| Dell XPS 17 9720 RTX 3060 | |
| MSI Creator 17 A10SGS | |
| Cinebench R15 / CPU Single 64Bit | |
| Average of class Multimedia (184.8 - 326, n=59, last 2 years) | |
| Aorus 17X XES | |
| MSI Creator Z16P B12UHST | |
| Razer Blade 17 (i7-12800H, RTX 3070 Ti) | |
| Average Intel Core i9-12900H (235 - 277, n=29) | |
| MSI Creator Z17 A12UGST-054 | |
| Dell XPS 17 9720 RTX 3060 | |
| MSI Creator 17 A10SGS | |
| Blender / v2.79 BMW27 CPU | |
| MSI Creator 17 A10SGS | |
| Average of class Multimedia (100 - 557, n=58, last 2 years) | |
| Average Intel Core i9-12900H (160 - 451, n=28) | |
| Razer Blade 17 (i7-12800H, RTX 3070 Ti) | |
| Dell XPS 17 9720 RTX 3060 | |
| MSI Creator Z17 A12UGST-054 | |
| Aorus 17X XES | |
| MSI Creator Z16P B12UHST | |
| 7-Zip 18.03 / 7z b 4 | |
| MSI Creator Z16P B12UHST | |
| Dell XPS 17 9720 RTX 3060 | |
| Aorus 17X XES | |
| MSI Creator Z17 A12UGST-054 | |
| Razer Blade 17 (i7-12800H, RTX 3070 Ti) | |
| Average Intel Core i9-12900H (34684 - 76677, n=28) | |
| Average of class Multimedia (26062 - 130368, n=55, last 2 years) | |
| MSI Creator 17 A10SGS | |
| 7-Zip 18.03 / 7z b 4 -mmt1 | |
| Aorus 17X XES | |
| MSI Creator Z16P B12UHST | |
| Average of class Multimedia (3666 - 7545, n=56, last 2 years) | |
| MSI Creator Z17 A12UGST-054 | |
| Average Intel Core i9-12900H (5302 - 6289, n=28) | |
| Razer Blade 17 (i7-12800H, RTX 3070 Ti) | |
| Dell XPS 17 9720 RTX 3060 | |
| MSI Creator 17 A10SGS | |
| Geekbench 5.5 / Multi-Core | |
| Aorus 17X XES | |
| MSI Creator Z16P B12UHST | |
| MSI Creator Z17 A12UGST-054 | |
| Average of class Multimedia (4652 - 20422, n=56, last 2 years) | |
| Razer Blade 17 (i7-12800H, RTX 3070 Ti) | |
| Dell XPS 17 9720 RTX 3060 | |
| Average Intel Core i9-12900H (8519 - 14376, n=31) | |
| MSI Creator 17 A10SGS | |
| Geekbench 5.5 / Single-Core | |
| Average of class Multimedia (805 - 2974, n=56, last 2 years) | |
| Aorus 17X XES | |
| MSI Creator Z16P B12UHST | |
| MSI Creator Z17 A12UGST-054 | |
| Average Intel Core i9-12900H (1631 - 1897, n=31) | |
| Razer Blade 17 (i7-12800H, RTX 3070 Ti) | |
| Dell XPS 17 9720 RTX 3060 | |
| MSI Creator 17 A10SGS | |
| HWBOT x265 Benchmark v2.2 / 4k Preset | |
| Aorus 17X XES | |
| MSI Creator Z16P B12UHST | |
| Average of class Multimedia (5.26 - 36.1, n=56, last 2 years) | |
| MSI Creator Z17 A12UGST-054 | |
| Average Intel Core i9-12900H (8.05 - 22.5, n=28) | |
| Razer Blade 17 (i7-12800H, RTX 3070 Ti) | |
| Dell XPS 17 9720 RTX 3060 | |
| MSI Creator 17 A10SGS | |
| LibreOffice / 20 Documents To PDF | |
| MSI Creator 17 A10SGS | |
| Average of class Multimedia (23.9 - 146.7, n=57, last 2 years) | |
| Average Intel Core i9-12900H (36.8 - 59.8, n=28) | |
| Dell XPS 17 9720 RTX 3060 | |
| Razer Blade 17 (i7-12800H, RTX 3070 Ti) | |
| MSI Creator Z17 A12UGST-054 | |
| MSI Creator Z16P B12UHST | |
| Aorus 17X XES | |
| R Benchmark 2.5 / Overall mean | |
| MSI Creator 17 A10SGS | |
| Average of class Multimedia (0.3604 - 0.947, n=56, last 2 years) | |
| Dell XPS 17 9720 RTX 3060 | |
| Razer Blade 17 (i7-12800H, RTX 3070 Ti) | |
| Average Intel Core i9-12900H (0.4218 - 0.506, n=28) | |
| MSI Creator Z17 A12UGST-054 | |
| MSI Creator Z16P B12UHST | |
| Aorus 17X XES | |
* ... smaller is better
AIDA64: FP32 Ray-Trace | FPU Julia | CPU SHA3 | CPU Queen | FPU SinJulia | FPU Mandel | CPU AES | CPU ZLib | FP64 Ray-Trace | CPU PhotoWorxx
| Performance rating | |
| Aorus 17X XES | |
| Average of class Multimedia | |
| Average Intel Core i9-12900H | |
| MSI Creator Z16P B12UHST | |
| MSI Creator Z17 A12UGST-054 | |
| Dell XPS 17 9720 RTX 3060 | |
| Razer Blade 17 (i7-12800H, RTX 3070 Ti) | |
| MSI Creator 17 A10SGS | |
| AIDA64 / FP32 Ray-Trace | |
| Average of class Multimedia (2214 - 50388, n=53, last 2 years) | |
| Aorus 17X XES | |
| Average Intel Core i9-12900H (4074 - 18289, n=29) | |
| MSI Creator 17 A10SGS | |
| MSI Creator Z16P B12UHST | |
| MSI Creator Z17 A12UGST-054 | |
| Razer Blade 17 (i7-12800H, RTX 3070 Ti) | |
| Dell XPS 17 9720 RTX 3060 | |
| AIDA64 / FPU Julia | |
| Average of class Multimedia (12867 - 201874, n=54, last 2 years) | |
| Aorus 17X XES | |
| Average Intel Core i9-12900H (22307 - 93236, n=29) | |
| MSI Creator 17 A10SGS | |
| MSI Creator Z16P B12UHST | |
| MSI Creator Z17 A12UGST-054 | |
| Razer Blade 17 (i7-12800H, RTX 3070 Ti) | |
| Dell XPS 17 9720 RTX 3060 | |
| AIDA64 / CPU SHA3 | |
| Average of class Multimedia (626 - 8623, n=54, last 2 years) | |
| Aorus 17X XES | |
| Average Intel Core i9-12900H (1378 - 4215, n=29) | |
| MSI Creator Z16P B12UHST | |
| MSI Creator Z17 A12UGST-054 | |
| Razer Blade 17 (i7-12800H, RTX 3070 Ti) | |
| Dell XPS 17 9720 RTX 3060 | |
| MSI Creator 17 A10SGS | |
| AIDA64 / CPU Queen | |
| MSI Creator Z16P B12UHST | |
| MSI Creator Z17 A12UGST-054 | |
| Aorus 17X XES | |
| Average Intel Core i9-12900H (78172 - 111241, n=28) | |
| Dell XPS 17 9720 RTX 3060 | |
| Razer Blade 17 (i7-12800H, RTX 3070 Ti) | |
| MSI Creator 17 A10SGS | |
| Average of class Multimedia (13483 - 181505, n=41, last 2 years) | |
| AIDA64 / FPU SinJulia | |
| Aorus 17X XES | |
| MSI Creator Z16P B12UHST | |
| Razer Blade 17 (i7-12800H, RTX 3070 Ti) | |
| MSI Creator Z17 A12UGST-054 | |
| Average Intel Core i9-12900H (5709 - 10410, n=29) | |
| Dell XPS 17 9720 RTX 3060 | |
| Average of class Multimedia (886 - 28794, n=54, last 2 years) | |
| MSI Creator 17 A10SGS | |
| AIDA64 / FPU Mandel | |
| Average of class Multimedia (6395 - 105740, n=53, last 2 years) | |
| Aorus 17X XES | |
| Average Intel Core i9-12900H (11257 - 45581, n=29) | |
| MSI Creator 17 A10SGS | |
| MSI Creator Z16P B12UHST | |
| MSI Creator Z17 A12UGST-054 | |
| Razer Blade 17 (i7-12800H, RTX 3070 Ti) | |
| Dell XPS 17 9720 RTX 3060 | |
| AIDA64 / CPU AES | |
| Aorus 17X XES | |
| MSI Creator Z16P B12UHST | |
| MSI Creator Z17 A12UGST-054 | |
| Average Intel Core i9-12900H (31935 - 151546, n=29) | |
| Dell XPS 17 9720 RTX 3060 | |
| Average of class Multimedia (8171 - 126790, n=54, last 2 years) | |
| Razer Blade 17 (i7-12800H, RTX 3070 Ti) | |
| MSI Creator 17 A10SGS | |
| AIDA64 / CPU ZLib | |
| MSI Creator Z16P B12UHST | |
| Razer Blade 17 (i7-12800H, RTX 3070 Ti) | |
| Aorus 17X XES | |
| Average of class Multimedia (143.8 - 2022, n=54, last 2 years) | |
| MSI Creator Z17 A12UGST-054 | |
| Average Intel Core i9-12900H (449 - 1193, n=29) | |
| Dell XPS 17 9720 RTX 3060 | |
| MSI Creator 17 A10SGS | |
| AIDA64 / FP64 Ray-Trace | |
| Average of class Multimedia (1014 - 26875, n=54, last 2 years) | |
| Aorus 17X XES | |
| Average Intel Core i9-12900H (2235 - 10511, n=29) | |
| MSI Creator Z16P B12UHST | |
| MSI Creator 17 A10SGS | |
| MSI Creator Z17 A12UGST-054 | |
| Dell XPS 17 9720 RTX 3060 | |
| Razer Blade 17 (i7-12800H, RTX 3070 Ti) | |
| AIDA64 / CPU PhotoWorxx | |
| Average of class Multimedia (8187 - 88154, n=54, last 2 years) | |
| Dell XPS 17 9720 RTX 3060 | |
| Aorus 17X XES | |
| MSI Creator Z16P B12UHST | |
| MSI Creator Z17 A12UGST-054 | |
| Average Intel Core i9-12900H (20960 - 48269, n=30) | |
| Razer Blade 17 (i7-12800H, RTX 3070 Ti) | |
| MSI Creator 17 A10SGS | |
系统性能
令人惊讶的是,Z17在PCMark 10中的表现略低于平均水平。重复测试并没有产生任何改进的结果。其他具有相同CPU/GPU组合的笔记本电脑平均表现好8%。
尽管如此,根据我们对Z17的经验,它在日常工作中运行平稳,没有问题。

CrossMark: Overall | Productivity | Creativity | Responsiveness
| PCMark 10 / Score | |
| MSI Creator Z16P B12UHST | |
| Aorus 17X XES | |
| Average of class Multimedia (4325 - 10386, n=52, last 2 years) | |
| Average Intel Core i9-12900H, NVIDIA GeForce RTX 3070 Ti Laptop GPU (7087 - 8072, n=6) | |
| Dell XPS 17 9720 RTX 3060 | |
| Razer Blade 17 (i7-12800H, RTX 3070 Ti) | |
| MSI Creator Z17 A12UGST-054 | |
| MSI Creator 17 A10SGS | |
| PCMark 10 / Essentials | |
| MSI Creator Z16P B12UHST | |
| Average Intel Core i9-12900H, NVIDIA GeForce RTX 3070 Ti Laptop GPU (10266 - 11663, n=6) | |
| Dell XPS 17 9720 RTX 3060 | |
| Aorus 17X XES | |
| Average of class Multimedia (8025 - 11664, n=51, last 2 years) | |
| MSI Creator Z17 A12UGST-054 | |
| Razer Blade 17 (i7-12800H, RTX 3070 Ti) | |
| MSI Creator 17 A10SGS | |
| PCMark 10 / Productivity | |
| Average of class Multimedia (7323 - 18233, n=51, last 2 years) | |
| MSI Creator Z16P B12UHST | |
| Aorus 17X XES | |
| Average Intel Core i9-12900H, NVIDIA GeForce RTX 3070 Ti Laptop GPU (9402 - 10742, n=6) | |
| MSI Creator Z17 A12UGST-054 | |
| Dell XPS 17 9720 RTX 3060 | |
| Razer Blade 17 (i7-12800H, RTX 3070 Ti) | |
| MSI Creator 17 A10SGS | |
| PCMark 10 / Digital Content Creation | |
| Aorus 17X XES | |
| MSI Creator Z16P B12UHST | |
| Average Intel Core i9-12900H, NVIDIA GeForce RTX 3070 Ti Laptop GPU (10009 - 12541, n=6) | |
| Razer Blade 17 (i7-12800H, RTX 3070 Ti) | |
| Average of class Multimedia (3651 - 16240, n=51, last 2 years) | |
| Dell XPS 17 9720 RTX 3060 | |
| MSI Creator Z17 A12UGST-054 | |
| MSI Creator 17 A10SGS | |
| CrossMark / Overall | |
| Aorus 17X XES | |
| MSI Creator Z17 A12UGST-054 | |
| Dell XPS 17 9720 RTX 3060 | |
| Average of class Multimedia (866 - 2728, n=60, last 2 years) | |
| Average Intel Core i9-12900H, NVIDIA GeForce RTX 3070 Ti Laptop GPU (1664 - 2044, n=6) | |
| Razer Blade 17 (i7-12800H, RTX 3070 Ti) | |
| CrossMark / Productivity | |
| Aorus 17X XES | |
| MSI Creator Z17 A12UGST-054 | |
| Average Intel Core i9-12900H, NVIDIA GeForce RTX 3070 Ti Laptop GPU (1591 - 1968, n=6) | |
| Average of class Multimedia (931 - 2489, n=60, last 2 years) | |
| Dell XPS 17 9720 RTX 3060 | |
| Razer Blade 17 (i7-12800H, RTX 3070 Ti) | |
| CrossMark / Creativity | |
| Aorus 17X XES | |
| Average of class Multimedia (907 - 3465, n=60, last 2 years) | |
| MSI Creator Z17 A12UGST-054 | |
| Dell XPS 17 9720 RTX 3060 | |
| Average Intel Core i9-12900H, NVIDIA GeForce RTX 3070 Ti Laptop GPU (1797 - 2148, n=6) | |
| Razer Blade 17 (i7-12800H, RTX 3070 Ti) | |
| CrossMark / Responsiveness | |
| Aorus 17X XES | |
| MSI Creator Z17 A12UGST-054 | |
| Average Intel Core i9-12900H, NVIDIA GeForce RTX 3070 Ti Laptop GPU (1514 - 2069, n=6) | |
| Dell XPS 17 9720 RTX 3060 | |
| Razer Blade 17 (i7-12800H, RTX 3070 Ti) | |
| Average of class Multimedia (605 - 2024, n=60, last 2 years) | |
| PCMark 10 Score | 7087 points | |
Help | ||
| AIDA64 / Memory Copy | |
| Average of class Multimedia (11299 - 132135, n=54, last 2 years) | |
| MSI Creator Z16P B12UHST | |
| Dell XPS 17 9720 RTX 3060 | |
| Aorus 17X XES | |
| MSI Creator Z17 A12UGST-054 | |
| Average Intel Core i9-12900H (34438 - 74264, n=29) | |
| Razer Blade 17 (i7-12800H, RTX 3070 Ti) | |
| MSI Creator 17 A10SGS | |
| AIDA64 / Memory Read | |
| Average of class Multimedia (11624 - 174586, n=54, last 2 years) | |
| Aorus 17X XES | |
| Dell XPS 17 9720 RTX 3060 | |
| MSI Creator Z16P B12UHST | |
| MSI Creator Z17 A12UGST-054 | |
| Average Intel Core i9-12900H (36365 - 74642, n=29) | |
| Razer Blade 17 (i7-12800H, RTX 3070 Ti) | |
| MSI Creator 17 A10SGS | |
| AIDA64 / Memory Write | |
| Average of class Multimedia (11755 - 134998, n=54, last 2 years) | |
| MSI Creator Z16P B12UHST | |
| MSI Creator Z17 A12UGST-054 | |
| Dell XPS 17 9720 RTX 3060 | |
| Aorus 17X XES | |
| Average Intel Core i9-12900H (32276 - 67858, n=29) | |
| Razer Blade 17 (i7-12800H, RTX 3070 Ti) | |
| MSI Creator 17 A10SGS | |
| AIDA64 / Memory Latency | |
| Average of class Multimedia (7 - 535, n=53, last 2 years) | |
| MSI Creator Z16P B12UHST | |
| MSI Creator Z17 A12UGST-054 | |
| Dell XPS 17 9720 RTX 3060 | |
| Aorus 17X XES | |
| Average Intel Core i9-12900H (74.7 - 118.1, n=28) | |
| MSI Creator 17 A10SGS | |
| Razer Blade 17 (i7-12800H, RTX 3070 Ti) | |
* ... smaller is better
DPC延时
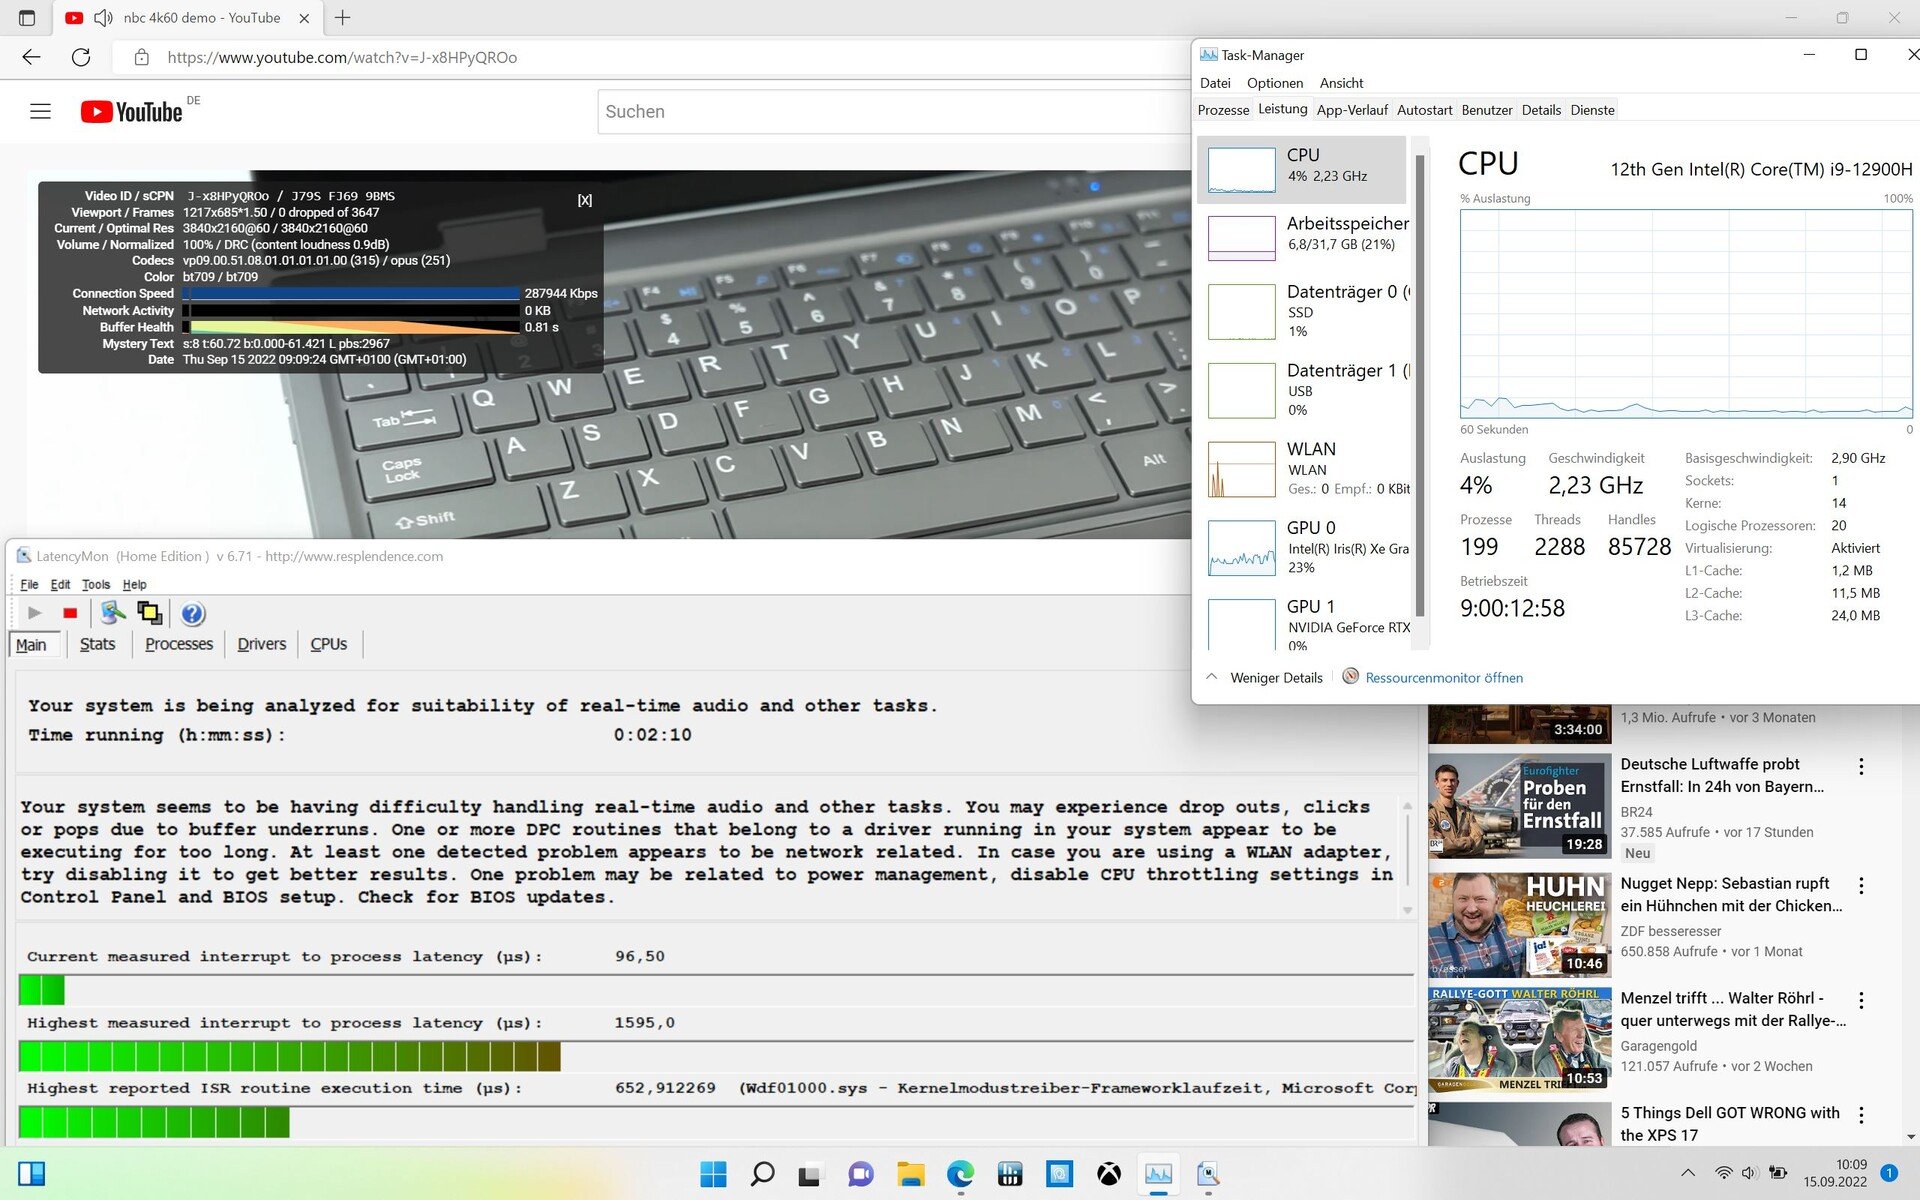
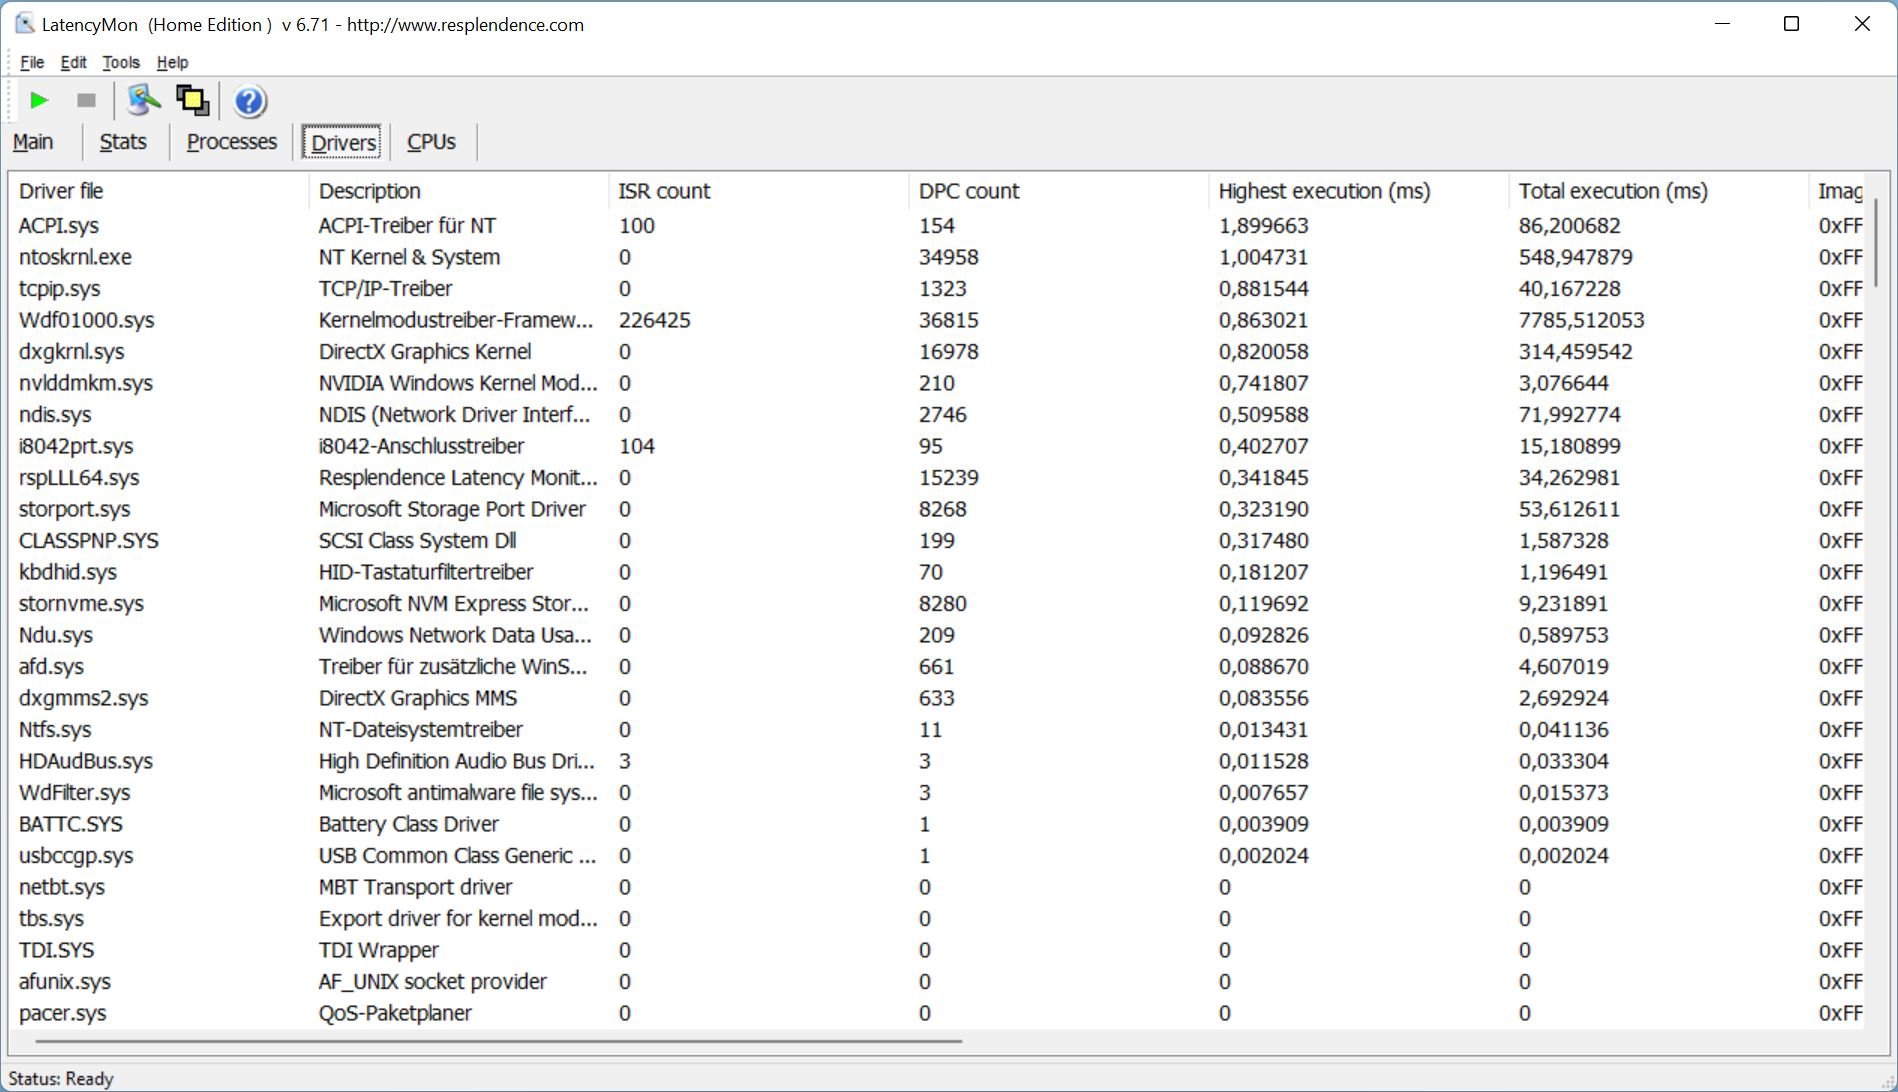
当浏览器被打开时,LatencyMon没有检测到任何问题。然而,当同时打开几个标签来显示我们的主页时,情况就不是这样了。对于一个创作者的笔记本电脑来说,延迟是令人失望的高。
尽管如此,我们的4K 60FPS YouTube视频的播放很流畅,没有导致任何丢帧。
在我们的审查中,我们在启动笔记本后出现了一次蓝屏错误。希望制造商能通过BIOS更新迅速解决这些问题。

| DPC Latencies / LatencyMon - interrupt to process latency (max), Web, Youtube, Prime95 | |
| MSI Creator Z17 A12UGST-054 | |
| Aorus 17X XES | |
| MSI Creator 17 A10SGS | |
| Razer Blade 17 (i7-12800H, RTX 3070 Ti) | |
| MSI Creator Z16P B12UHST | |
| Dell XPS 17 9720 RTX 3060 | |
* ... smaller is better
大容量存储
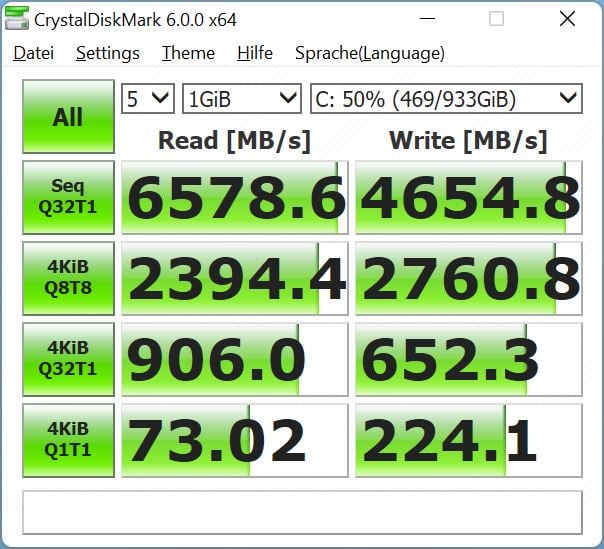
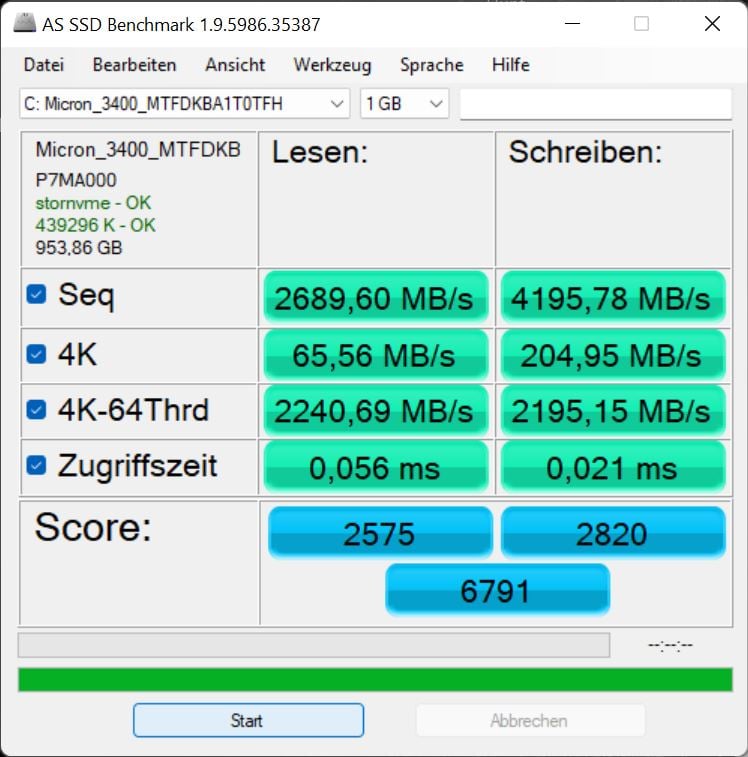
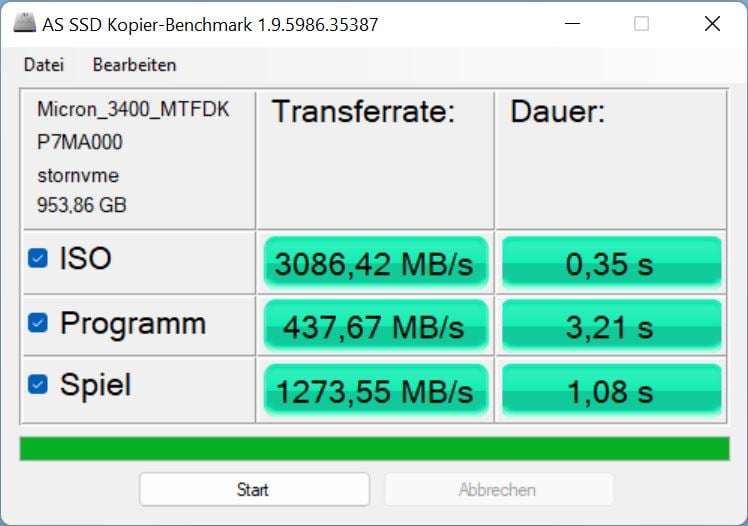
在我们的模型上,微星安装了一个容量为1TB的美光3400 SSD。该PCIe 4驱动器在我们的SSD比较表上排名第63位.制造商声称,它的最大读取速度为6600MB/s--我们的测量结果绝对可以证明这一点。该硬盘还具有非常稳定的持续性能。
尽管如此,三星PM9A1驱动器在 Razer Blade 17和微星自己的 Z16P要快一点,Aorus中的技嘉固态硬盘也是如此。但这种微小的差异很难解释Z17相当差的系统性能。

* ... smaller is better
Sustained Read Performance: DiskSpd Read Loop, Queue Depth 8
图形卡
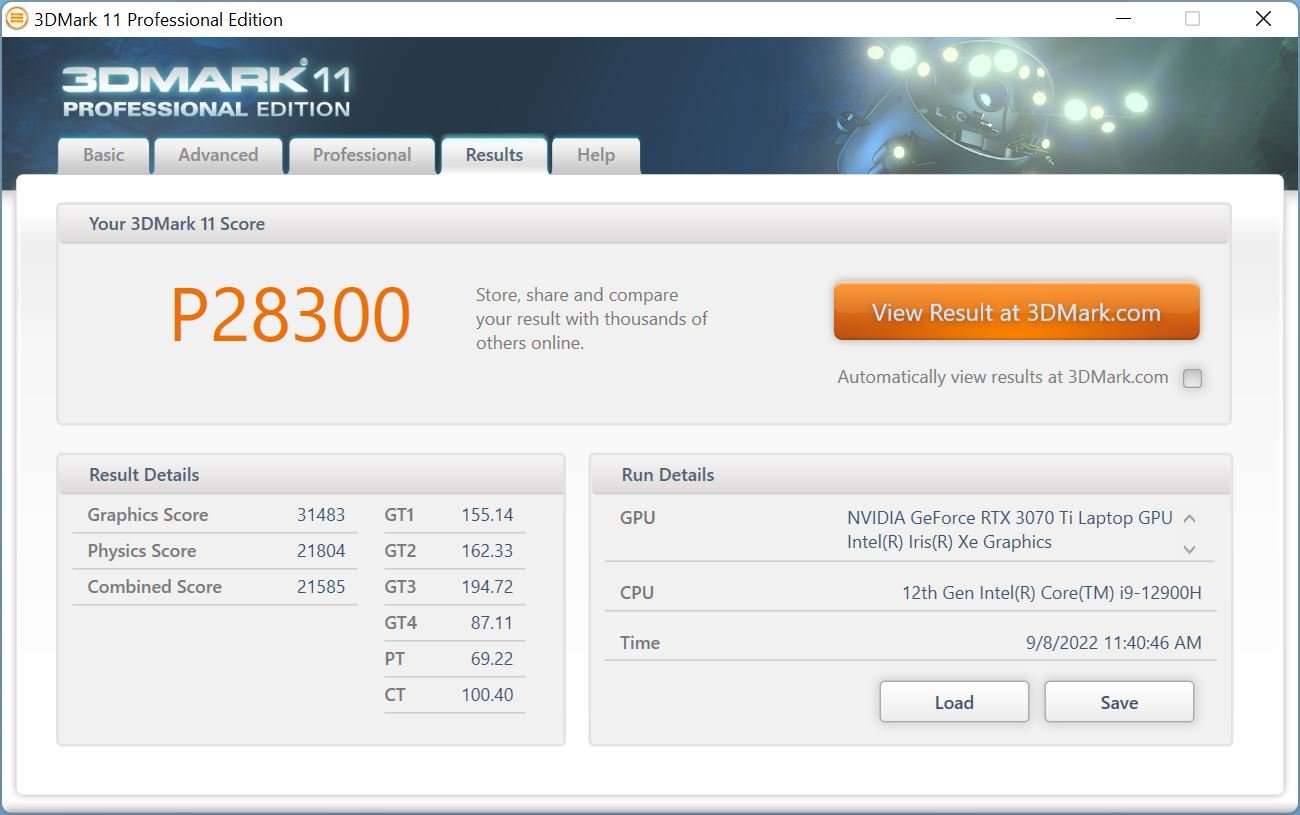
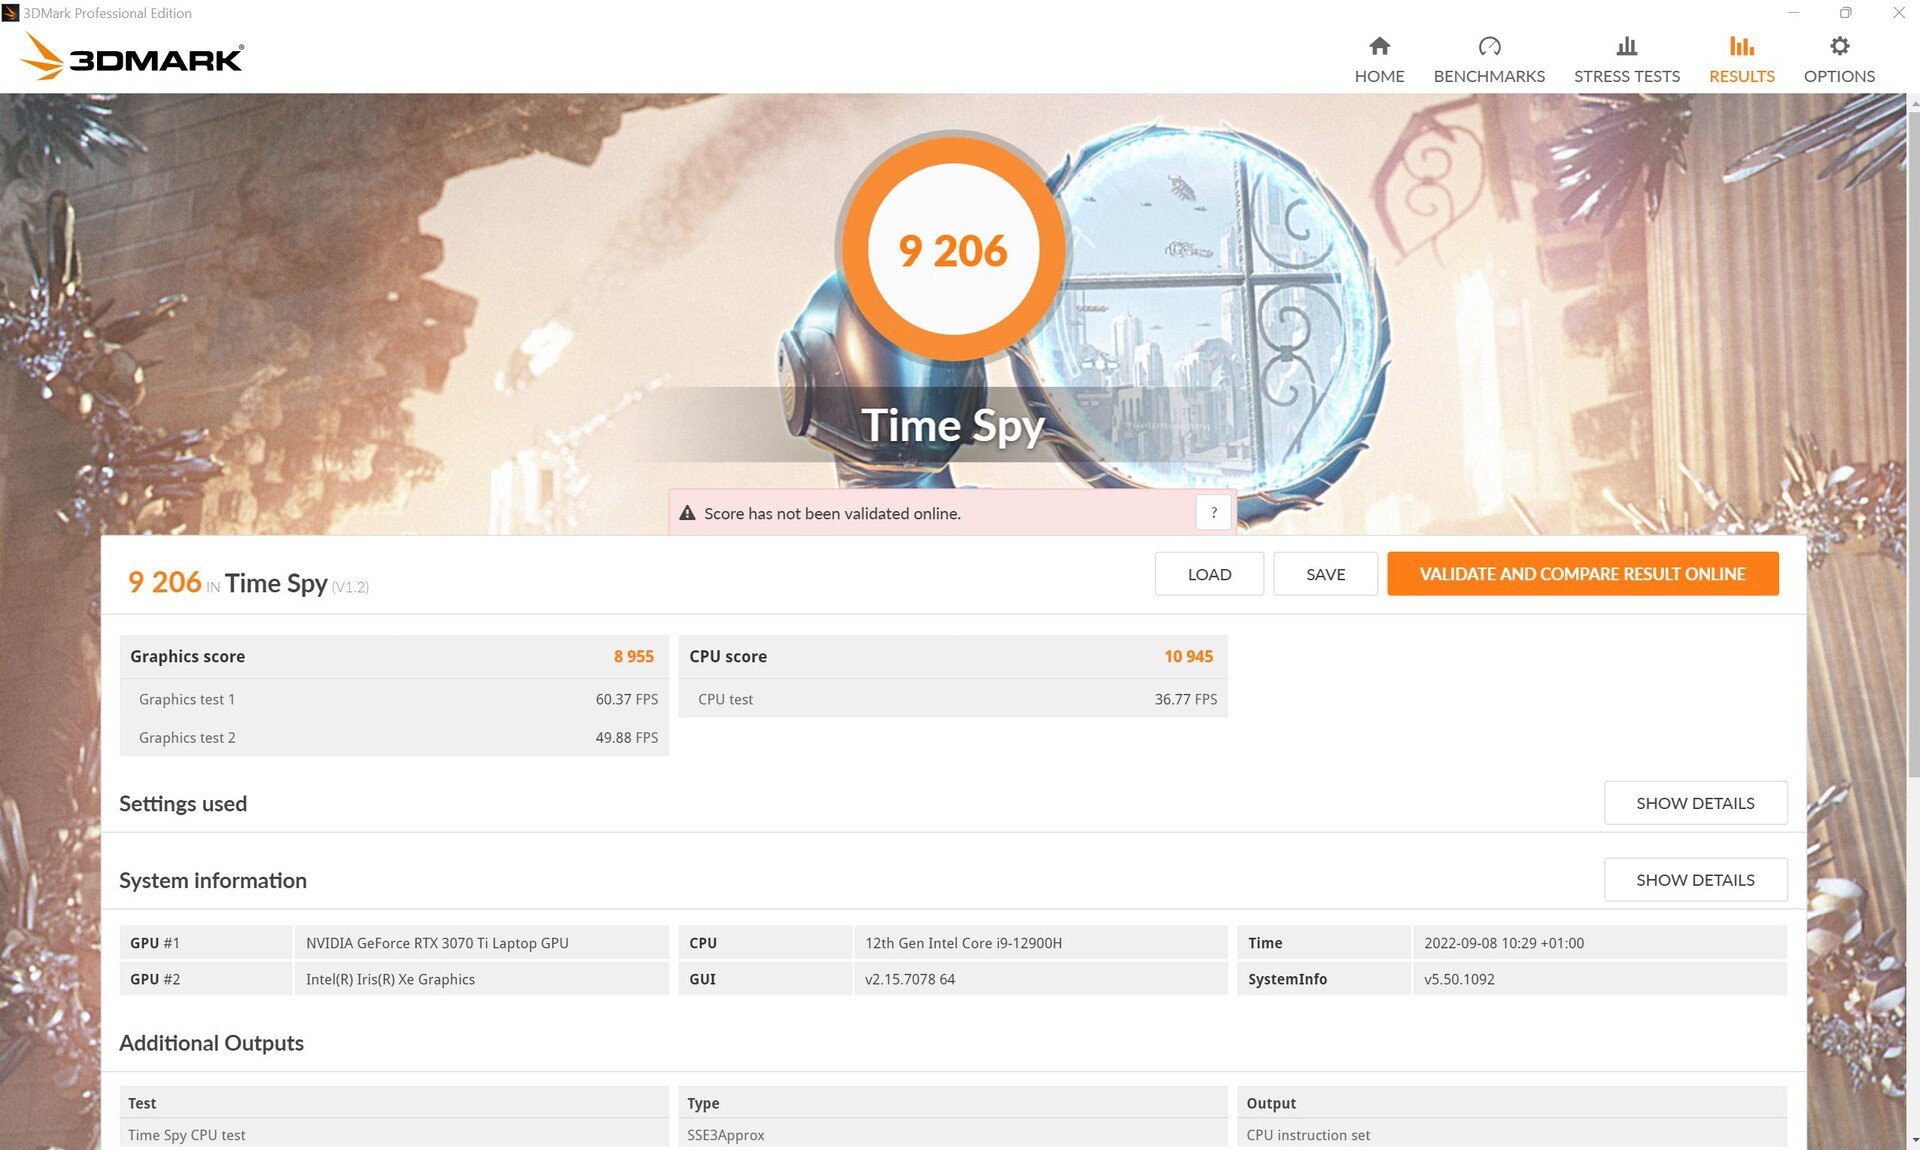
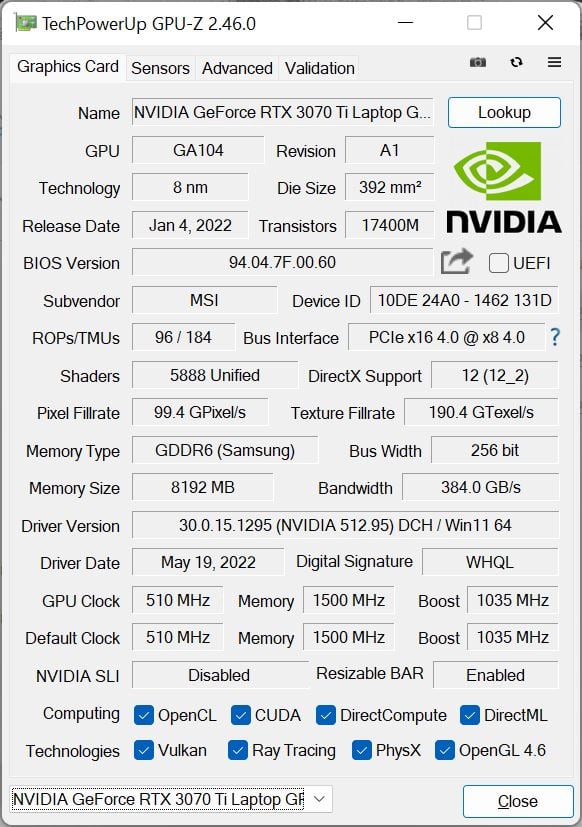
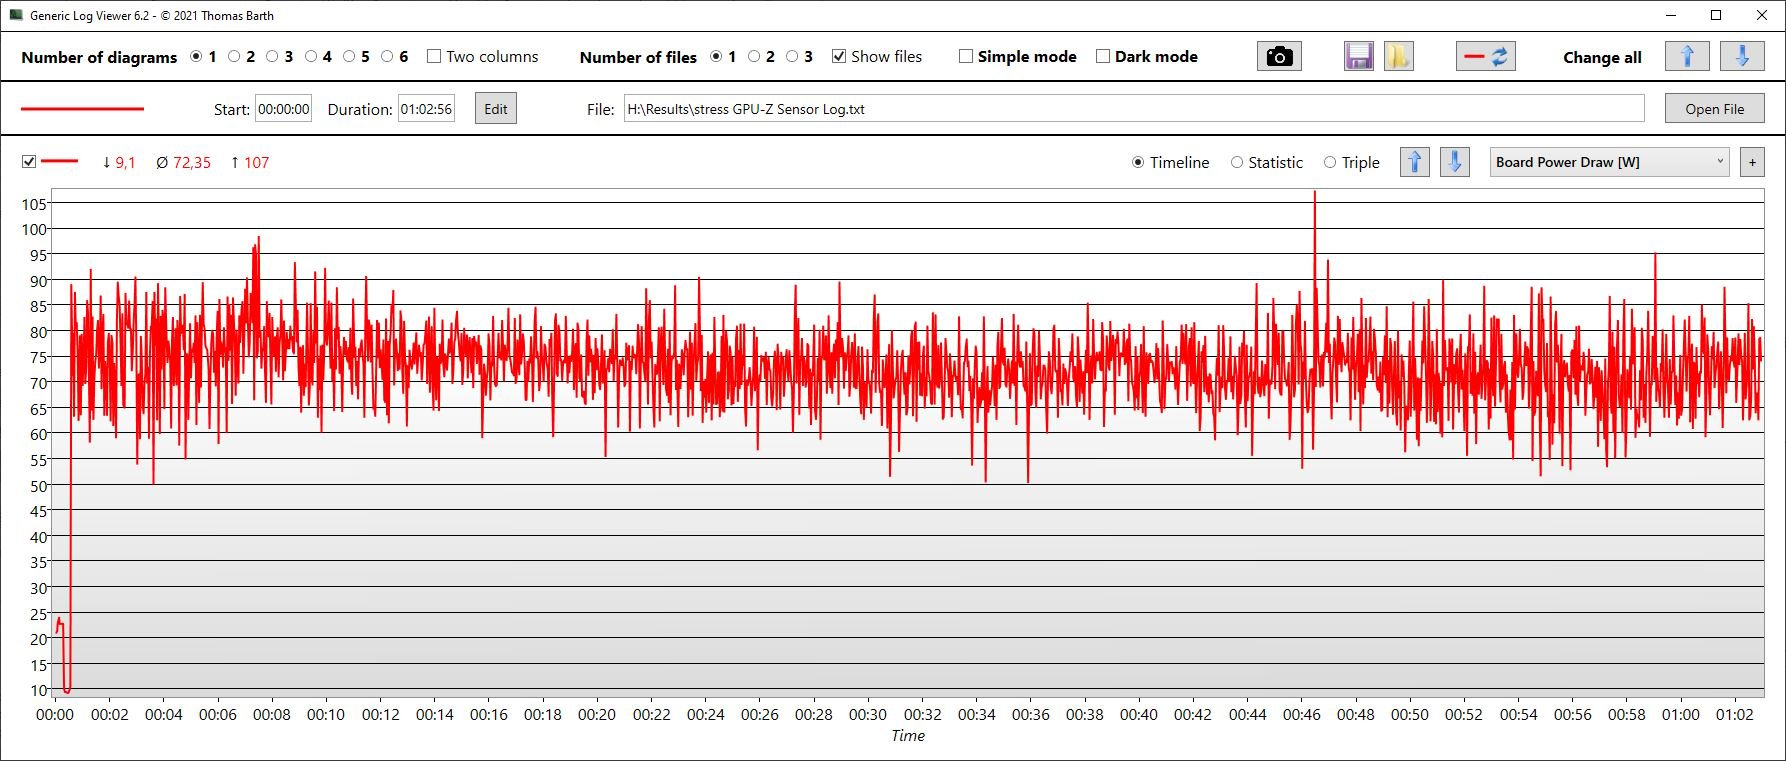
Z17的特点是 GeForce RTX 3070 Ti有8GB的视频内存。理论上,这是一个非常强大的显卡,但它在薄薄的Z17中只能获得90瓦的功率(包括动态提升)。作为比较,Z17中的GPU 刀锋17有150瓦的功率可供支配。
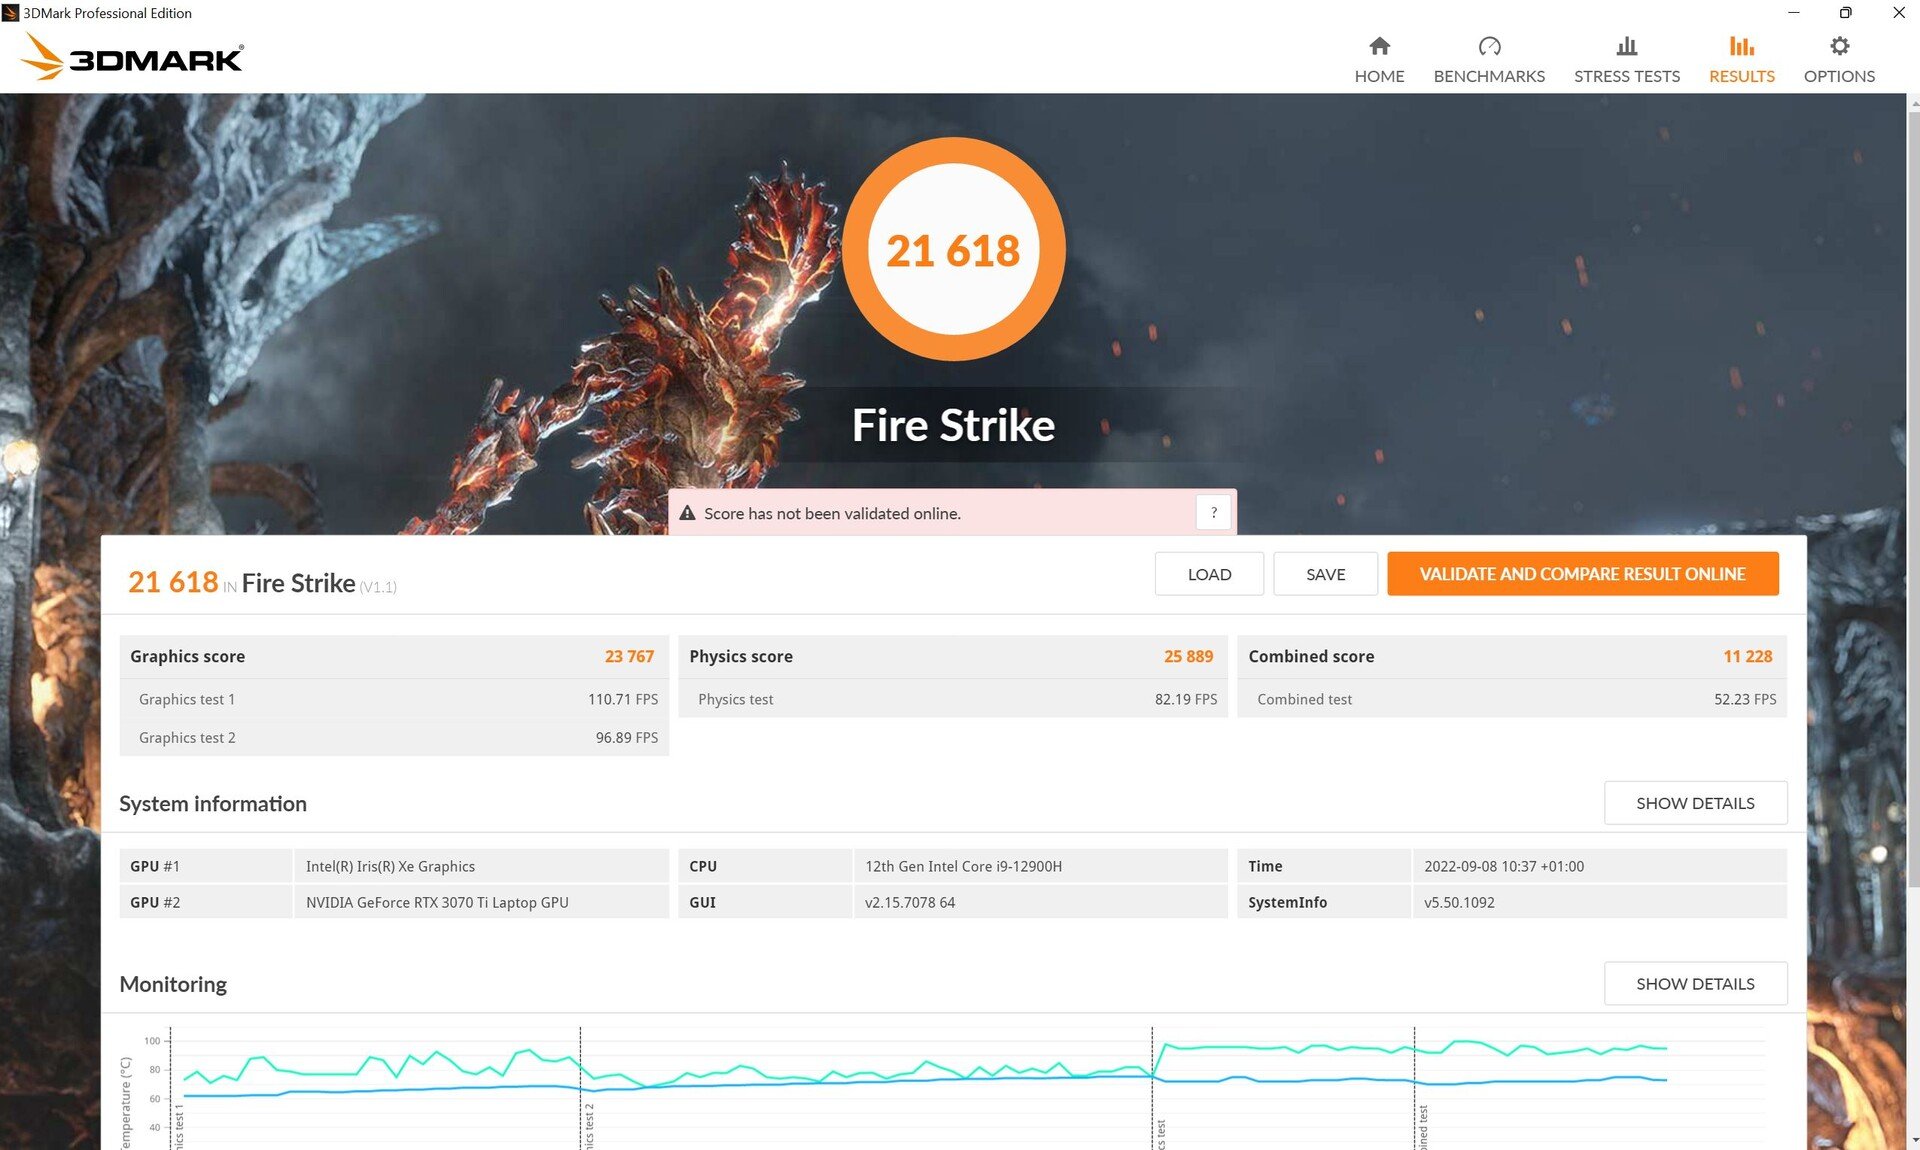
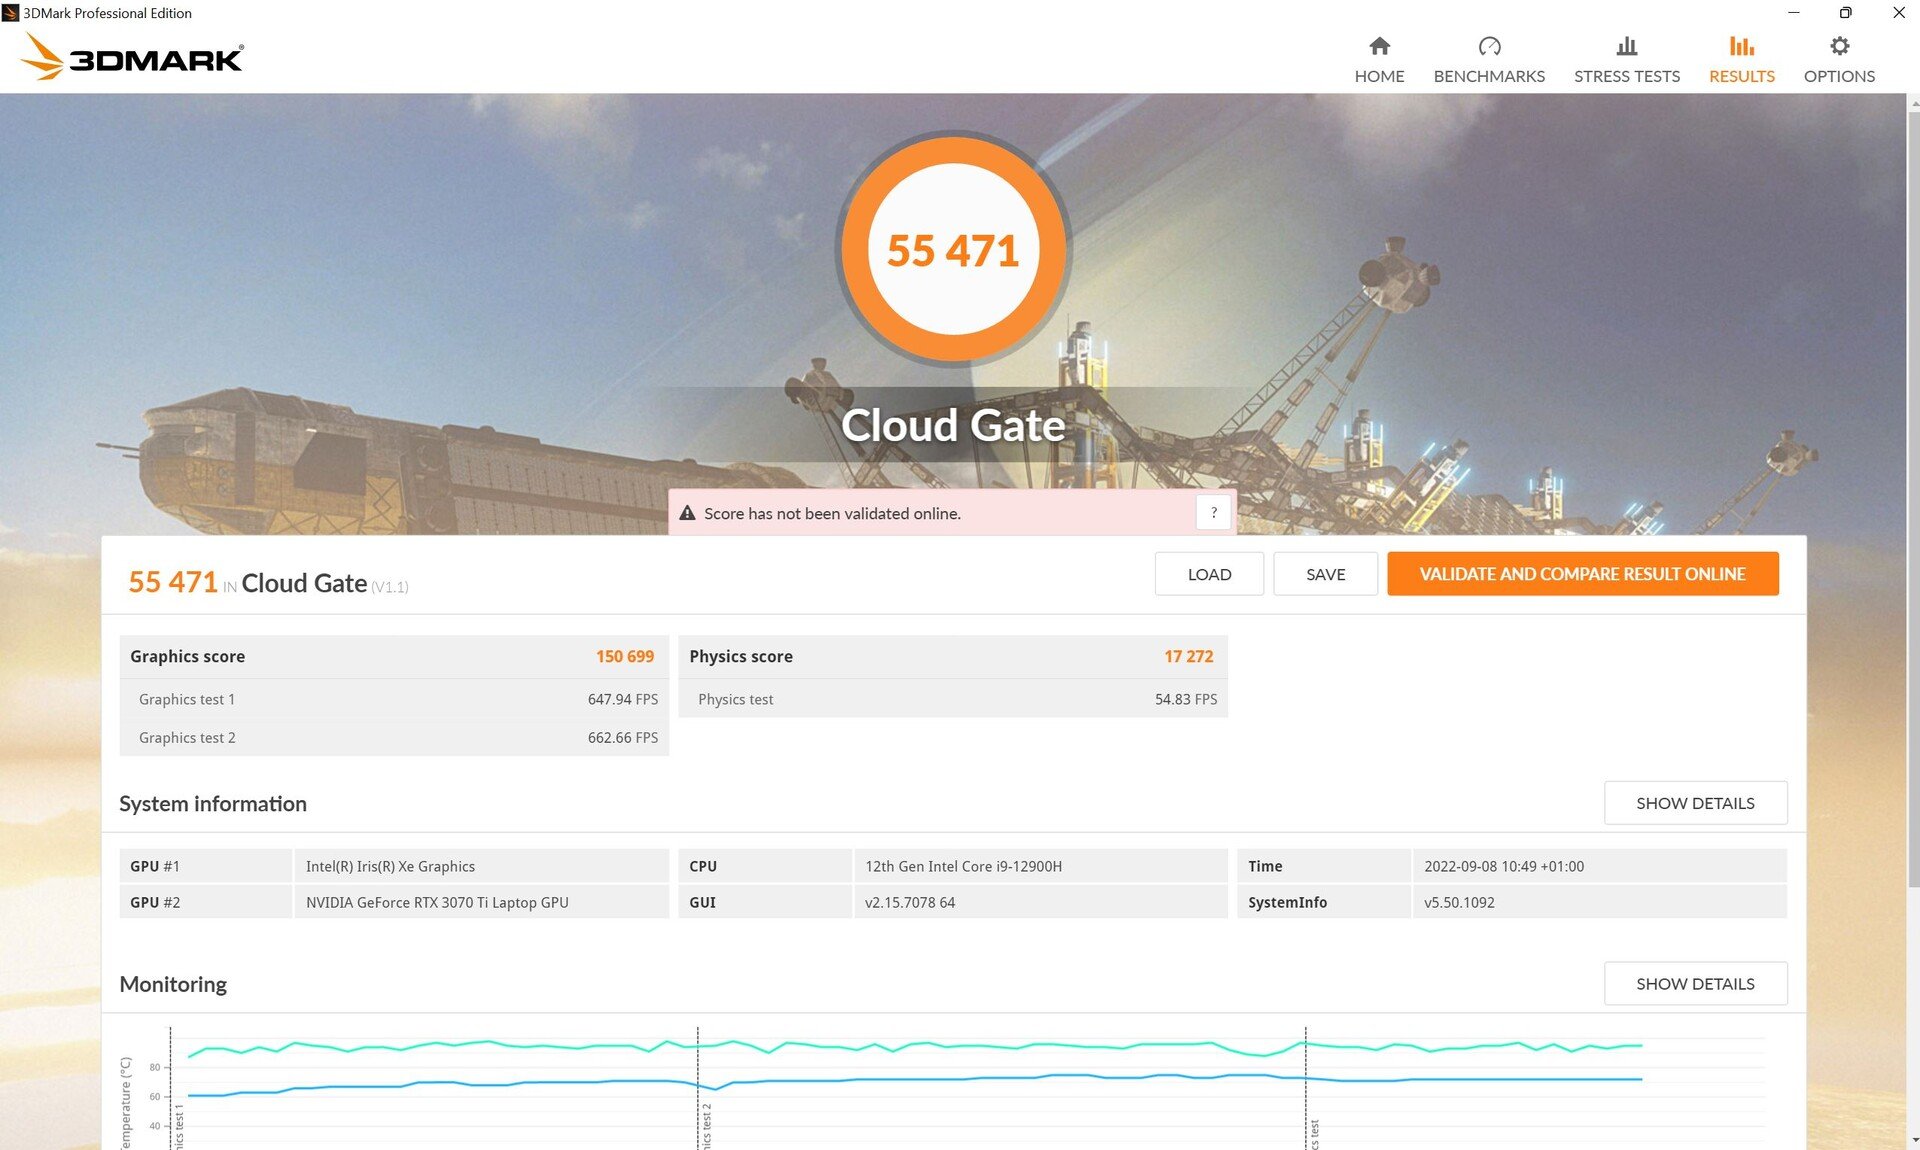
因此,Creator Z17在合成3DMark基准测试中的表现比所有具有相同GPU的笔记本电脑的平均水平至少低5%。
在电池上运行时,该笔记本在3DMark 11中损失了约45%的GPU性能。
| 3DMark 11 Performance | 28300 points | |
| 3DMark Cloud Gate Standard Score | 55471 points | |
| 3DMark Fire Strike Score | 21618 points | |
| 3DMark Time Spy Score | 9206 points | |
Help | ||
| Blender | |
| v3.3 Classroom OPTIX/RTX | |
| Average of class Multimedia (12 - 105, n=22, last 2 years) | |
| Aorus 17X XES | |
| v3.3 Classroom CUDA | |
| Average of class Multimedia (20 - 186, n=22, last 2 years) | |
| Aorus 17X XES | |
| v3.3 Classroom CPU | |
| Average of class Multimedia (134.5 - 1042, n=62, last 2 years) | |
| Aorus 17X XES | |
* ... smaller is better
游戏性能
在《远征5号》中的出色表现似乎或多或少是个例外。总体而言,额定功率为90瓦的 RTX 3070 Ti表现至少比平均水平低5%到10%。与之相比 刀锋17,性能差异可高达20%,这取决于所使用的游戏和设置。这就是说,在大多数游戏中,差异要小得多。
| The Witcher 3 | |
| 1920x1080 High Graphics & Postprocessing (Nvidia HairWorks Off) | |
| Average NVIDIA GeForce RTX 3070 Ti Laptop GPU (139.7 - 226, n=27) | |
| Razer Blade 17 (i7-12800H, RTX 3070 Ti) | |
| MSI Creator Z17 A12UGST-054 | |
| Aorus 17X XES | |
| MSI Creator Z16P B12UHST | |
| MSI Creator 17 A10SGS | |
| Dell XPS 17 9720 RTX 3060 | |
| Average of class Multimedia (22 - 224, n=7, last 2 years) | |
| 1920x1080 Ultra Graphics & Postprocessing (HBAO+) | |
| Razer Blade 17 (i7-12800H, RTX 3070 Ti) | |
| Average NVIDIA GeForce RTX 3070 Ti Laptop GPU (76.8 - 124.1, n=39) | |
| Aorus 17X XES | |
| MSI Creator Z17 A12UGST-054 | |
| MSI Creator 17 A10SGS | |
| MSI Creator Z16P B12UHST | |
| Dell XPS 17 9720 RTX 3060 | |
| Average of class Multimedia (11 - 121, n=7, last 2 years) | |
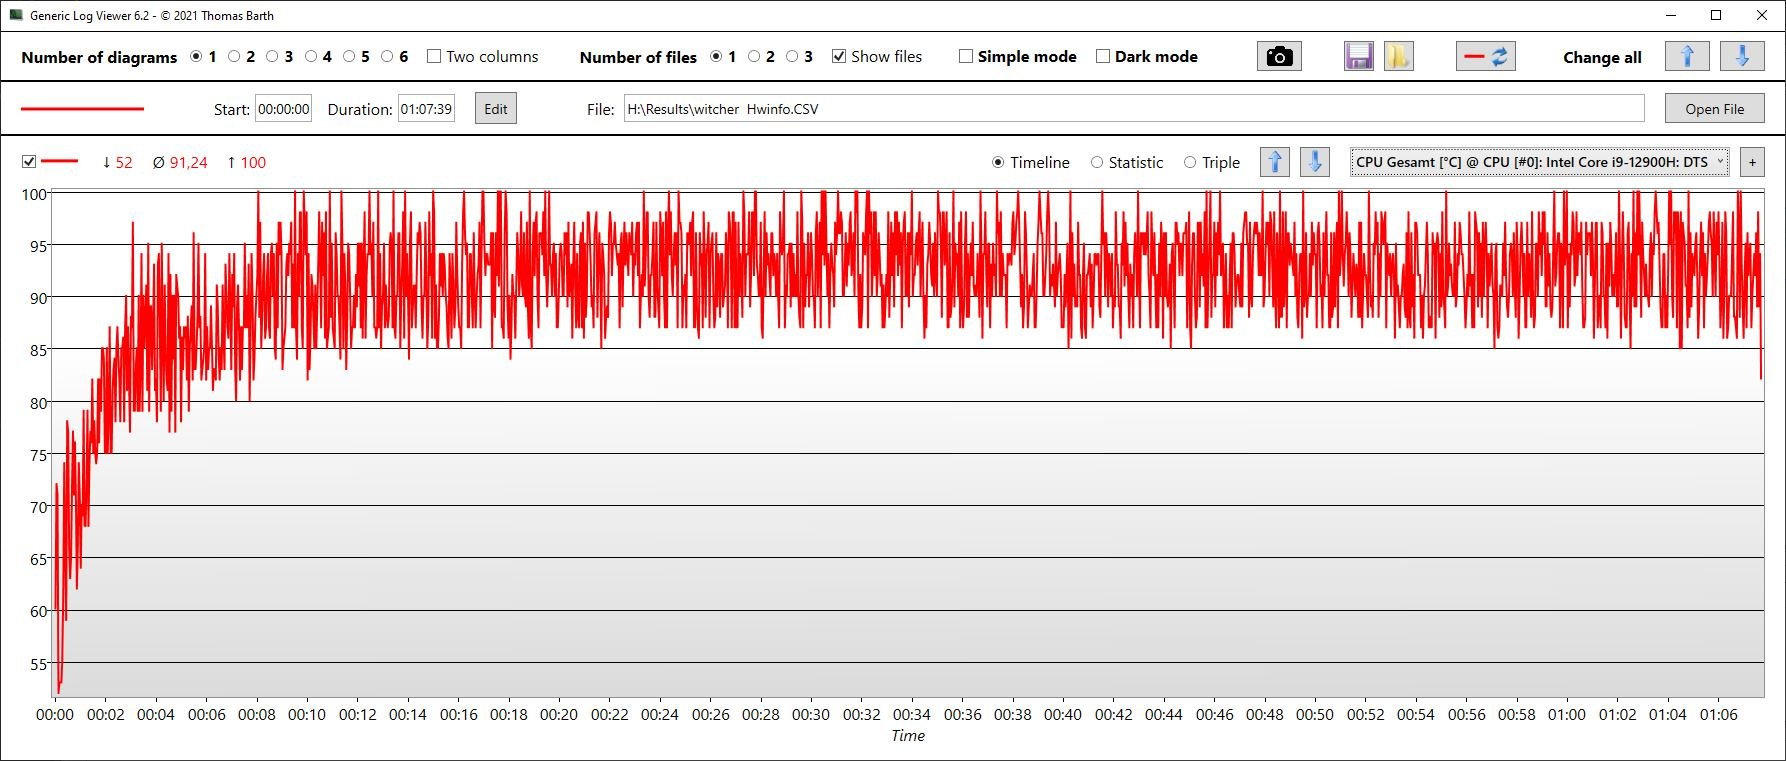
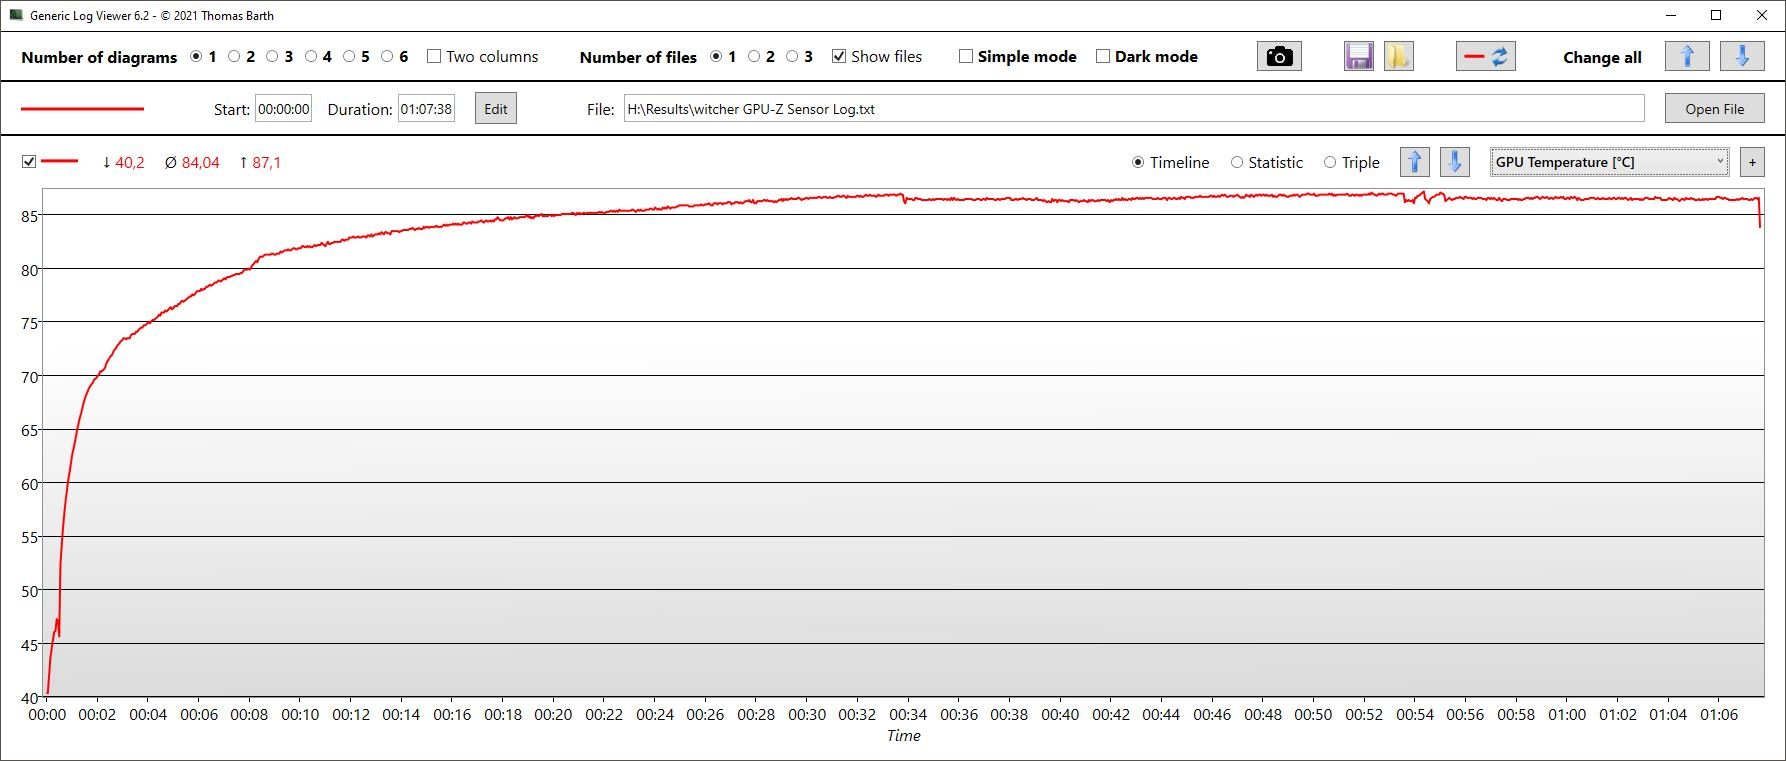
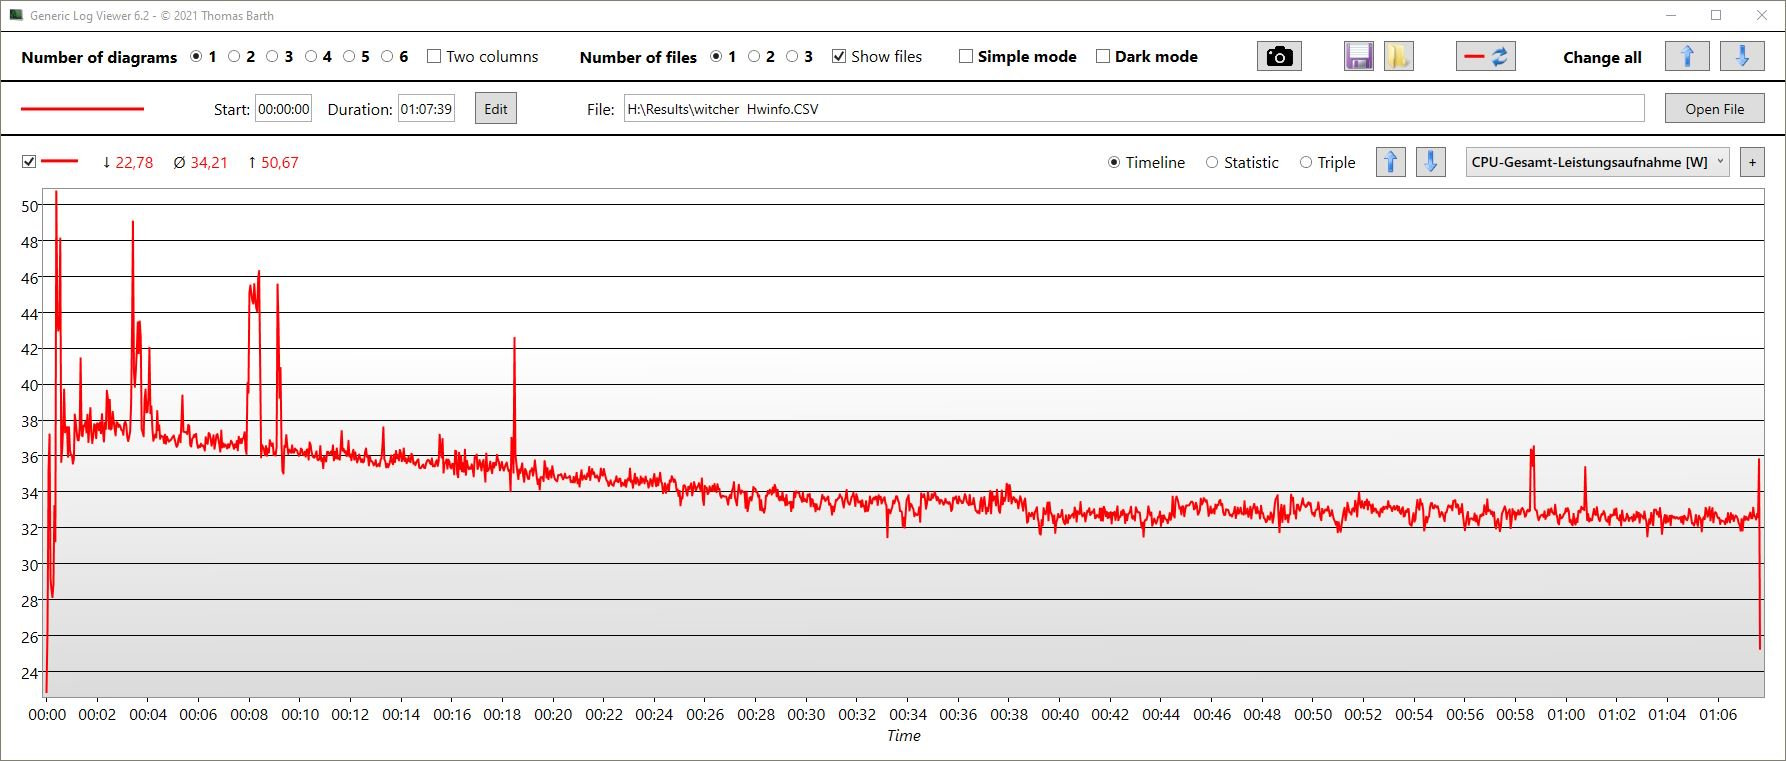
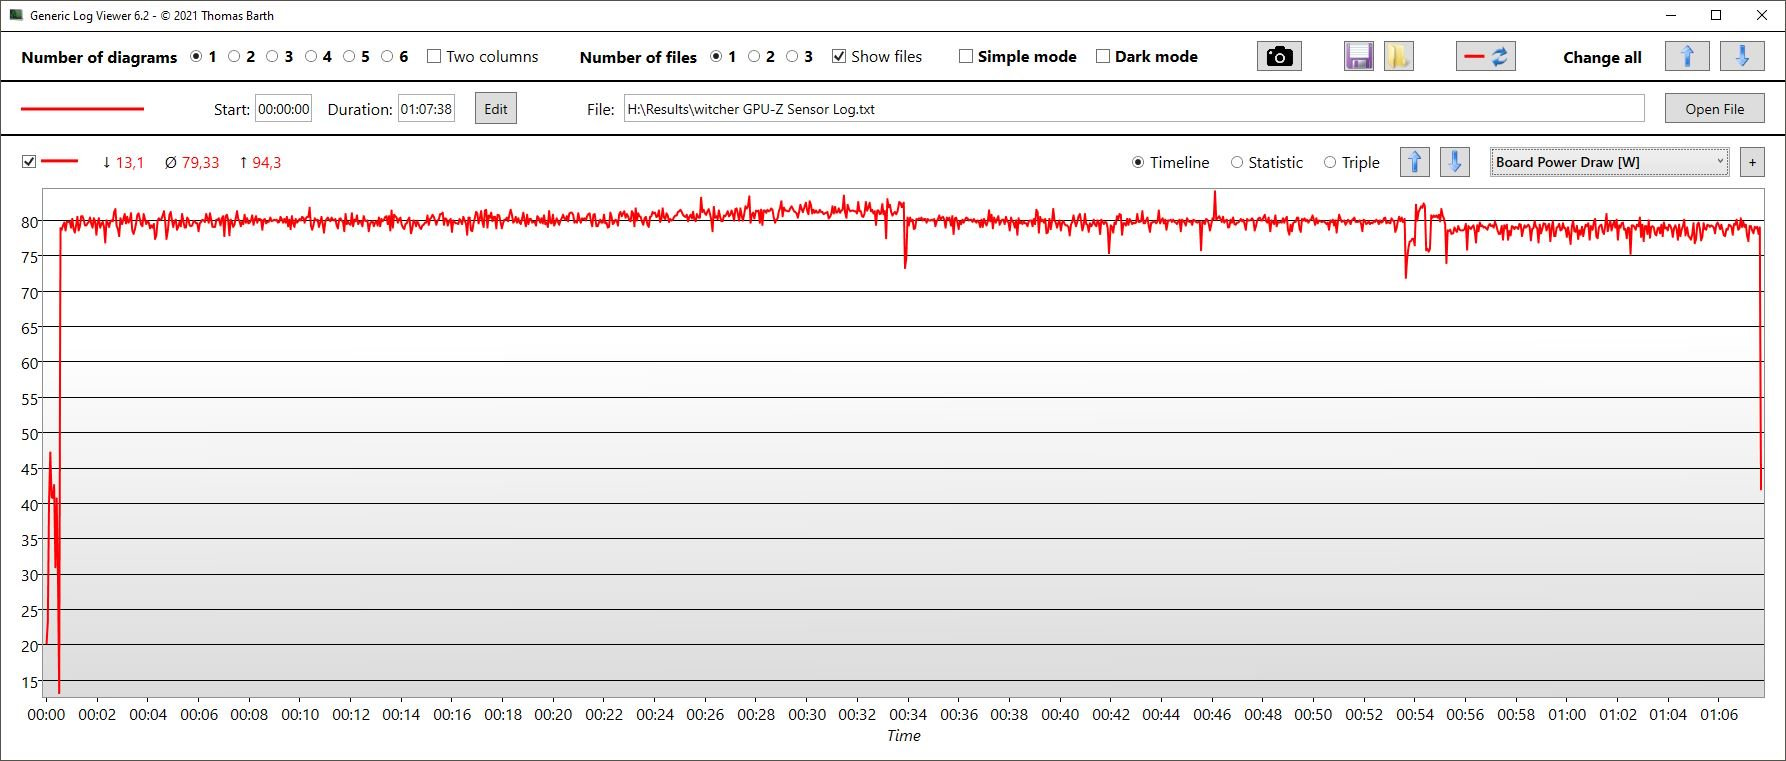
在Witcher 3 循环测试期间,性能在一小时内下降。从开始到结束,帧率下降了整整18%,这是相当多的。这可能是由于高温使Z17无法持续提供其峰值性能。
CPU时钟速度在2.5和3.3GHz之间波动(取决于核心),CPU温度平均为91℃(196℉)。在测试期间,整体功耗从50瓦下降到34瓦。
同时,GPU时钟速度短暂达到1.6GHz,然后下降到只有1.1GHz。内存时钟速度保持不变。GPU温度约为84°C(183°F),但也有热点达到99°C(210°F)。GPU总共消耗了大约79瓦特的功率。
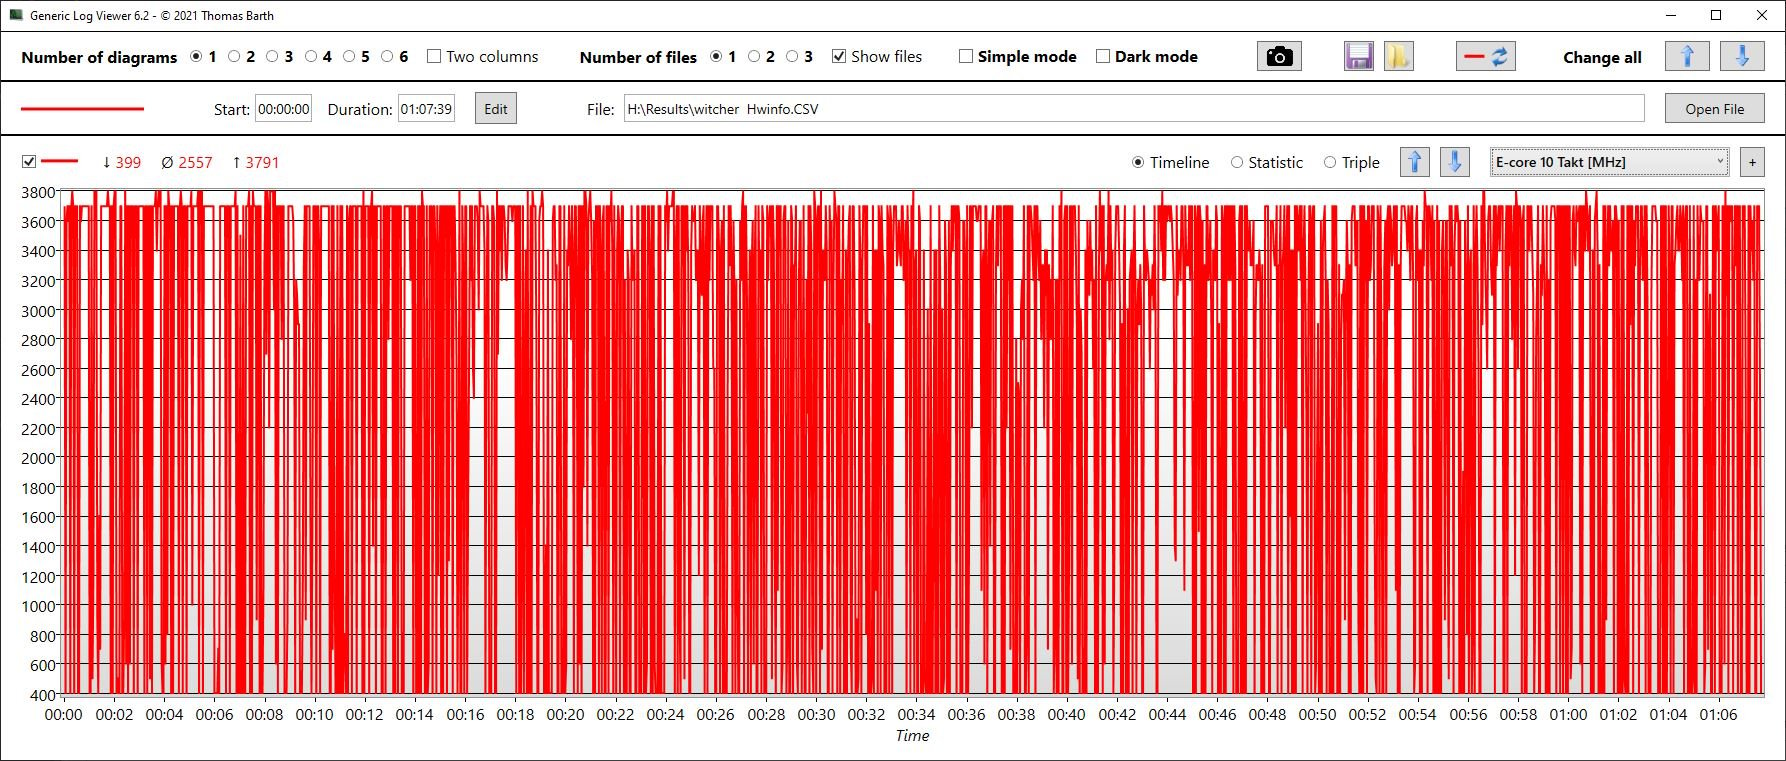
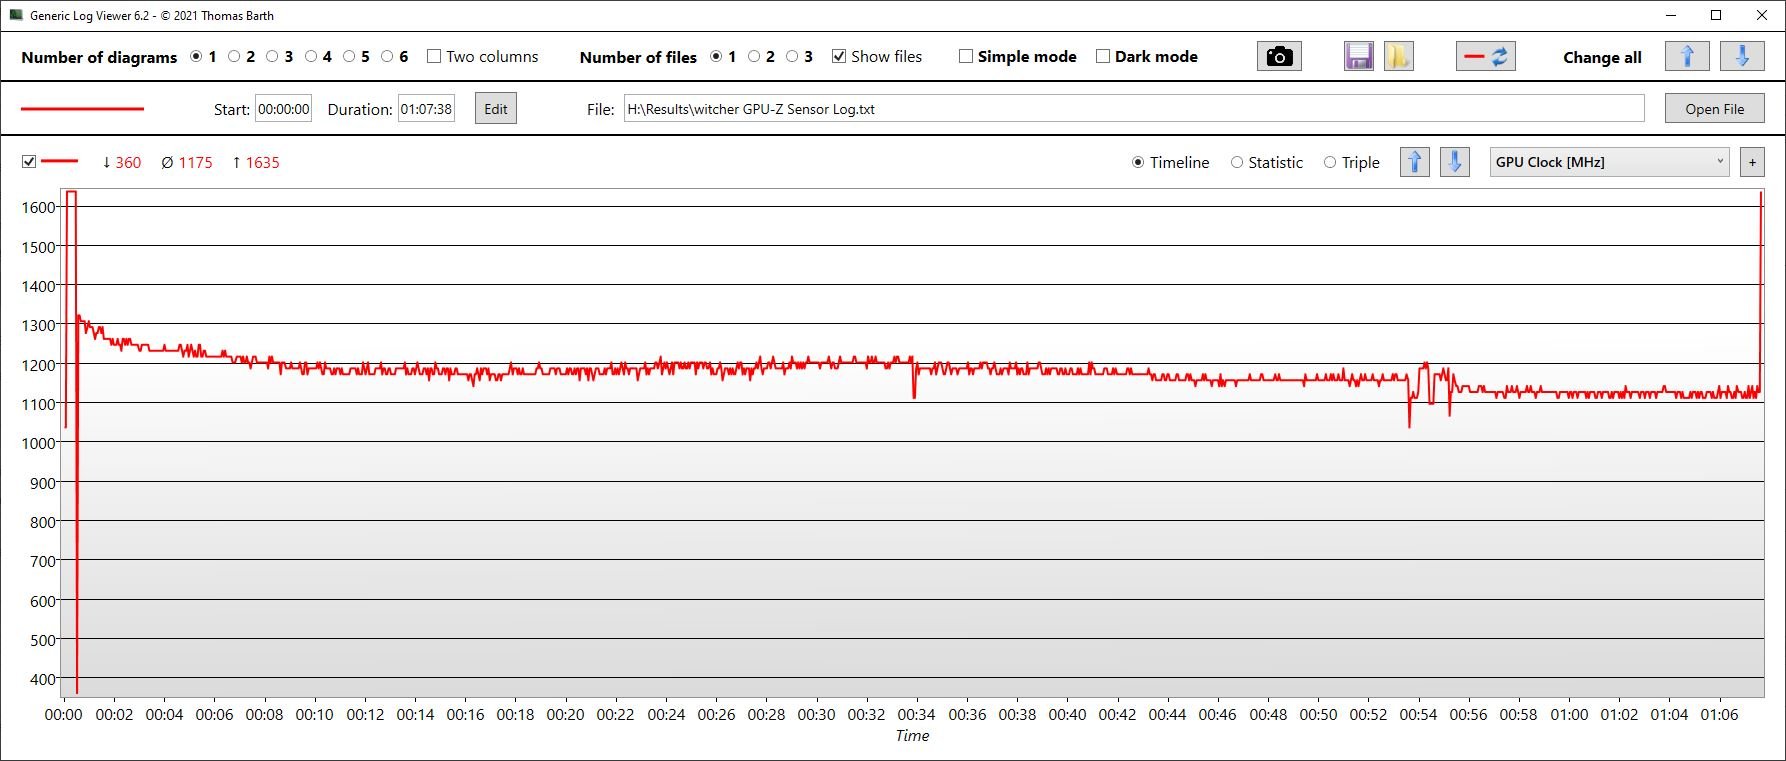
Witcher 3, FPS graph
| low | med. | high | ultra | QHD | |
|---|---|---|---|---|---|
| GTA V (2015) | 118.7 | 90.7 | |||
| The Witcher 3 (2015) | 307 | 289.4 | 165.6 | 90.5 | |
| Dota 2 Reborn (2015) | 191.9 | 177.5 | 168.3 | 158.5 | |
| Final Fantasy XV Benchmark (2018) | 186.6 | 117.9 | 85.4 | 62.5 | |
| X-Plane 11.11 (2018) | 152.5 | 135.3 | 107.6 | ||
| Far Cry 5 (2018) | 187 | 145 | 137 | 124 | 93 |
| Strange Brigade (2018) | 160.6 | 119.8 | |||
| Dying Light 2 (2022) | 100 | 81 | 67.2 | 46.7 |
排放--造物主Z17很热,声音很大
噪声排放
Z17的风扇几乎从未停止运行,因此,即使在空闲状态下,这款纤薄的笔记本电脑也比其竞争对手更吵。微星中心专业版的 "静音 "模式几乎是个笑话。激活它之后,你很可能会徒劳地等待风扇在某个时刻停止转动。
不幸的是,当设备处于负载状态时,噪音情况仍然存在。只有更厚、性能更强的Aorus在压力下的声音略微大一些。为了进一步说明这一点, Razer Blade 17至少和Z17一样快,在负载下比Z17安静10%到30%。
Noise level
| Idle |
| 31.8 / 31.8 / 31.8 dB(A) |
| Load |
| 53.9 / 54.9 dB(A) |
 | ||
30 dB silent 40 dB(A) audible 50 dB(A) loud |
||
min: | ||
| MSI Creator Z17 A12UGST-054 GeForce RTX 3070 Ti Laptop GPU, i9-12900H, Micron 3400 1TB MTFDKBA1T0TFH | MSI Creator 17 A10SGS GeForce RTX 2080 Super Max-Q, i7-10875H, Samsung SSD PM981 MZVLB2T0HMLB | MSI Creator Z16P B12UHST GeForce RTX 3080 Ti Laptop GPU, i9-12900H, Samsung PM9A1 MZVL22T0HBLB | Razer Blade 17 (i7-12800H, RTX 3070 Ti) GeForce RTX 3070 Ti Laptop GPU, i7-12800H, Samsung PM9A1 MZVL21T0HCLR | Aorus 17X XES GeForce RTX 3070 Ti Laptop GPU, i9-12900HX, Gigabyte AG470S1TB-SI B10 | Dell XPS 17 9720 RTX 3060 GeForce RTX 3060 Laptop GPU, i7-12700H, Samsung PM9A1 MZVL21T0HCLR | |
|---|---|---|---|---|---|---|
| Noise | -1% | 12% | 21% | -1% | 18% | |
| off / environment * (dB) | 26 | 30 -15% | 26 -0% | 23 12% | 26 -0% | 23.8 8% |
| Idle Minimum * (dB) | 31.8 | 32 -1% | 27 15% | 23 28% | 28 12% | 24.1 24% |
| Idle Average * (dB) | 31.8 | 33 -4% | 29 9% | 23 28% | 32 -1% | 24.1 24% |
| Idle Maximum * (dB) | 31.8 | 40 -26% | 31 3% | 23 28% | 38 -19% | 24.1 24% |
| Load Average * (dB) | 53.9 | 47 13% | 43 20% | 36.92 32% | 53 2% | 43.2 20% |
| Witcher 3 ultra * (dB) | 53.9 | 46 15% | 43 20% | 50 7% | 54 -0% | 48 11% |
| Load Maximum * (dB) | 54.9 | 48 13% | 46 16% | 50 9% | 55 -0% | 48 13% |
* ... smaller is better
温度
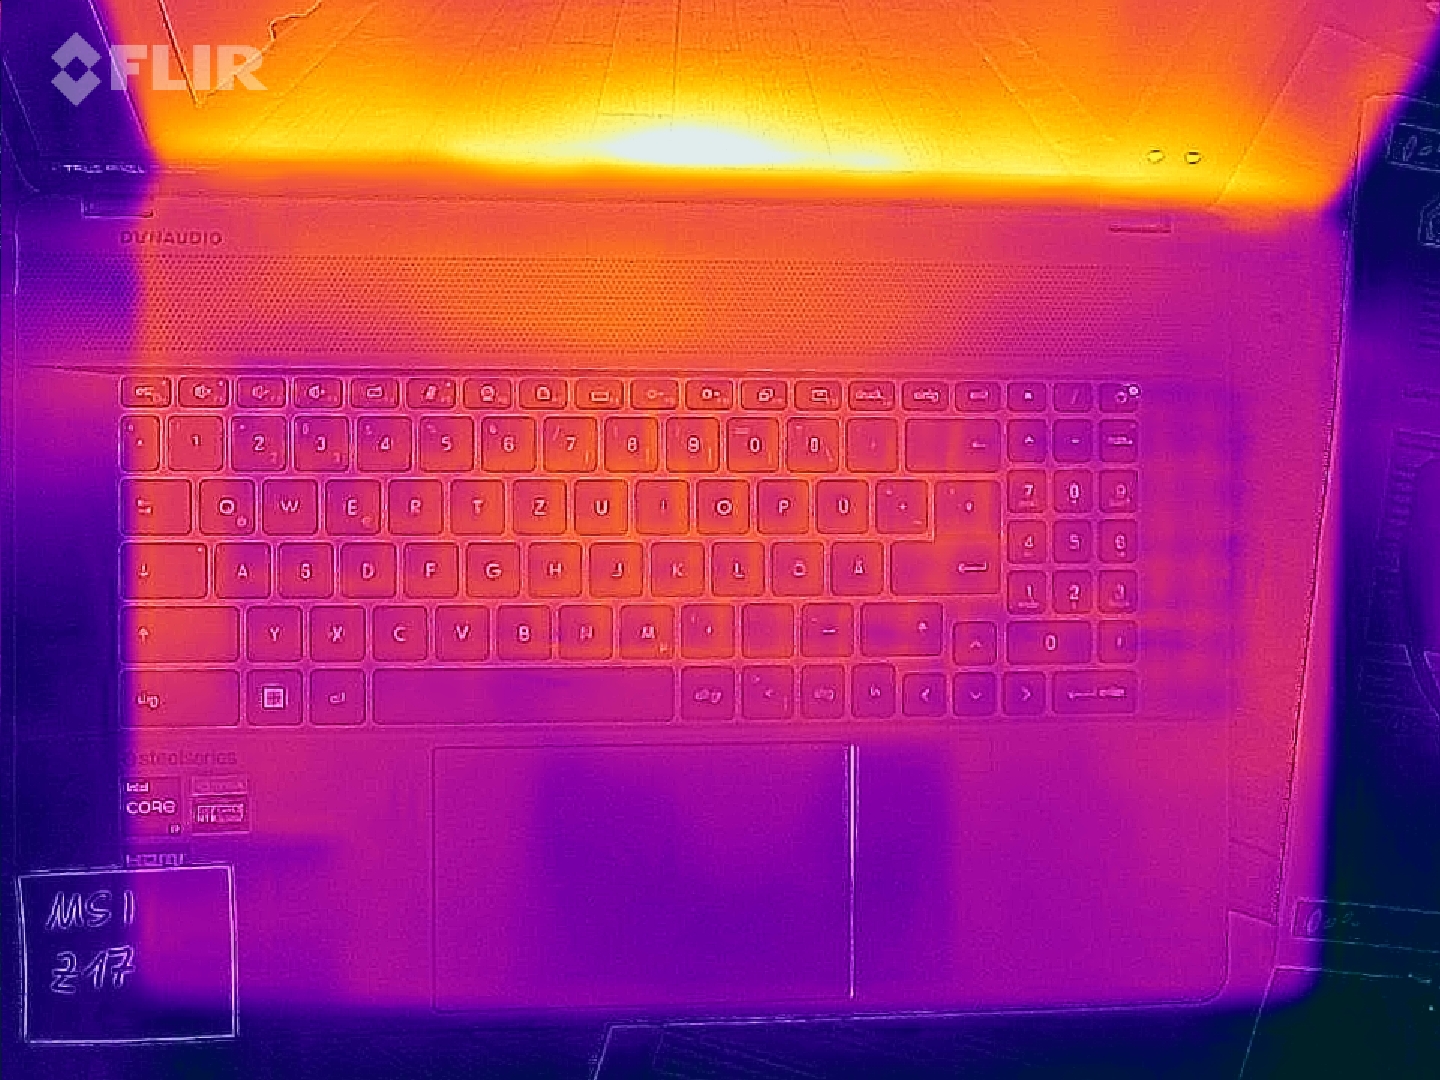
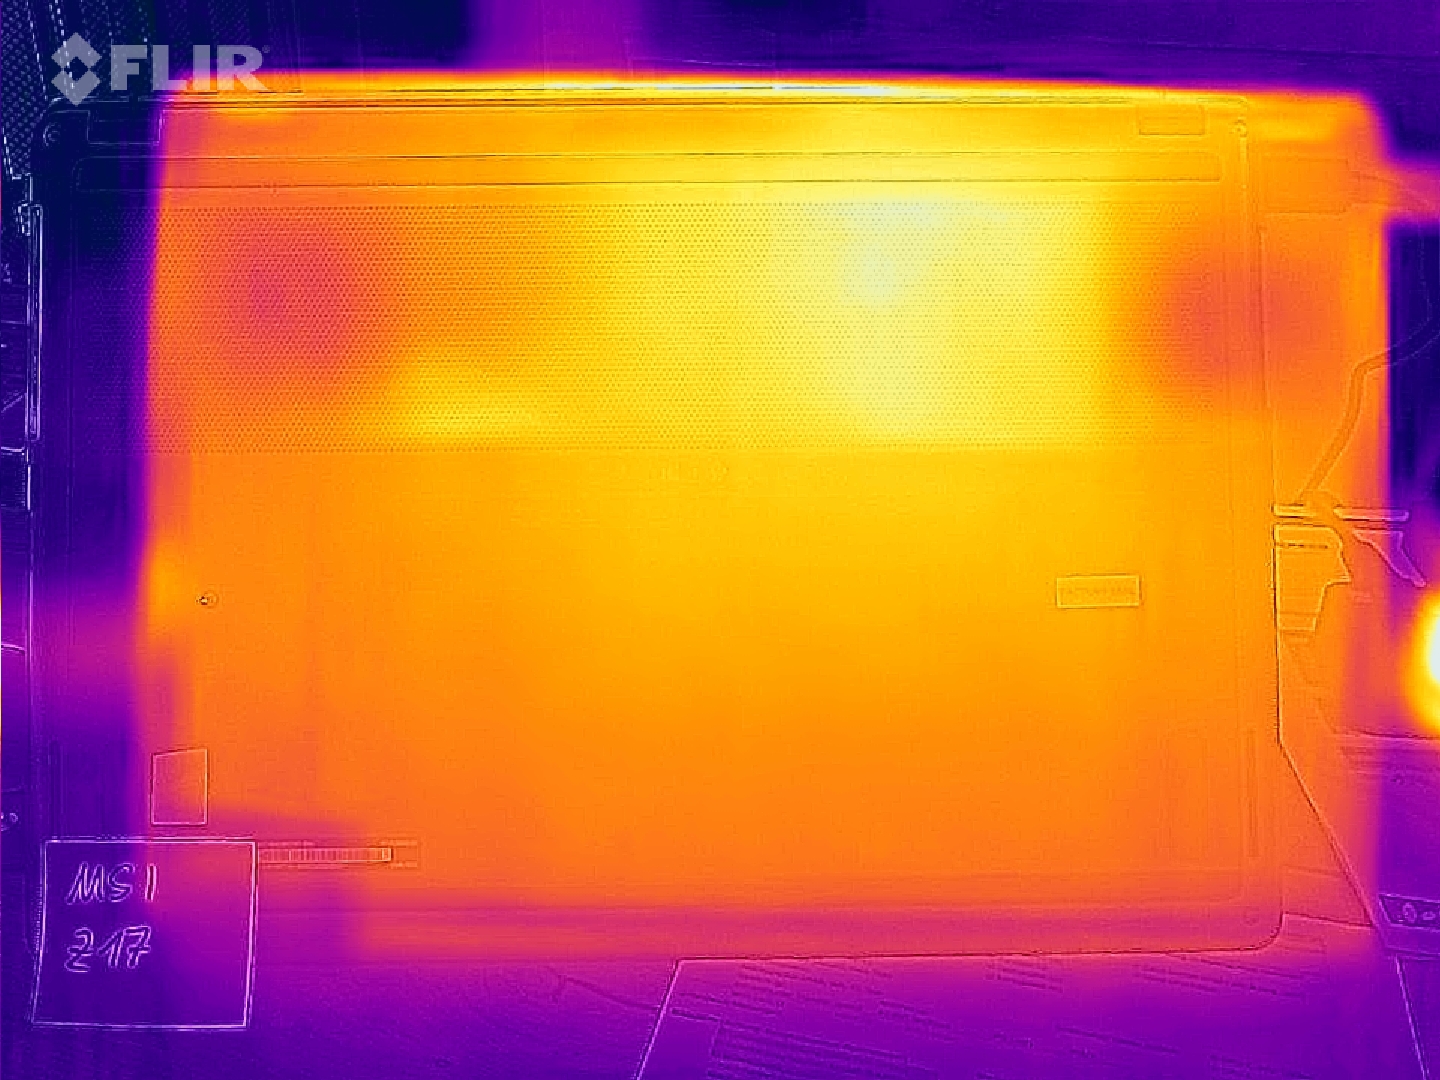
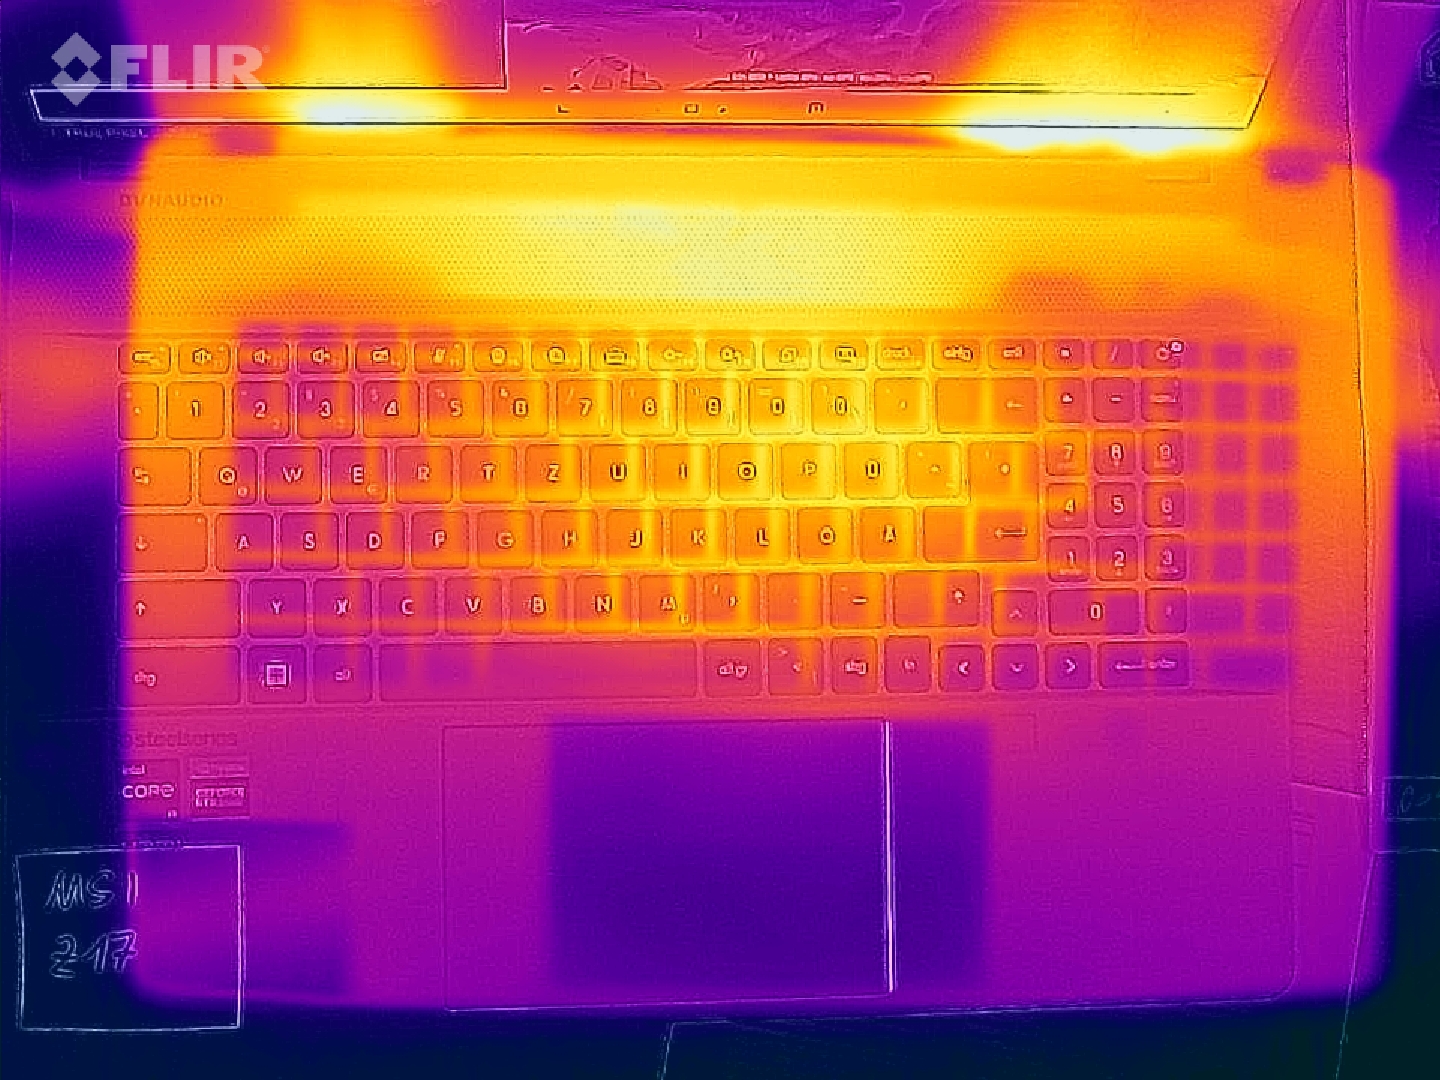
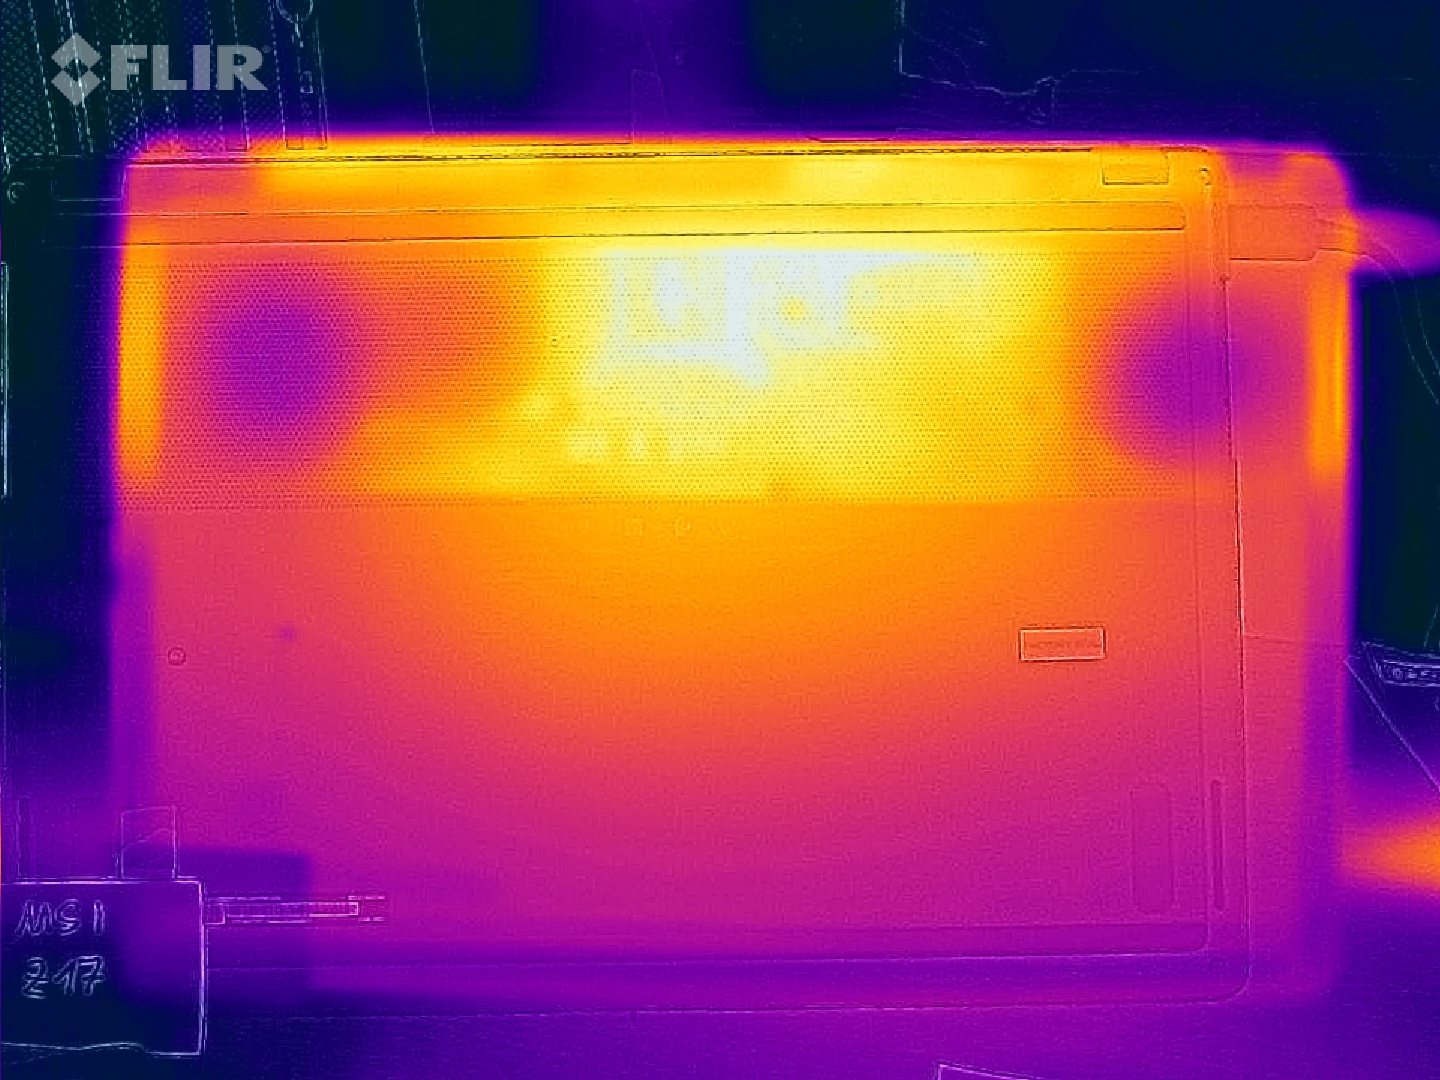
你会误以为响亮的风扇至少可以保持机箱的温度。在负载(压力测试)下,底部面板中间(靠近显示屏)出现了温度高达68°C(154°F)的热点。其他公司的竞争产品在负载和游戏过程中都至少有10°C(50°F)的温度。
在压力测试期间,即使是掌托也接近40°C (104°F),当笔记本电脑运行时达到36°C (97°F)Witcher 3 。这些也同样是对比组内的最高值。
(-) The maximum temperature on the upper side is 63.9 °C / 147 F, compared to the average of 36.8 °C / 98 F, ranging from 21 to 71 °C for the class Multimedia.
(-) The bottom heats up to a maximum of 68 °C / 154 F, compared to the average of 39.1 °C / 102 F
(+) In idle usage, the average temperature for the upper side is 27 °C / 81 F, compared to the device average of 31.3 °C / 88 F.
(-) Playing The Witcher 3, the average temperature for the upper side is 44.6 °C / 112 F, compared to the device average of 31.3 °C / 88 F.
(-) The palmrests and touchpad can get very hot to the touch with a maximum of 40 °C / 104 F.
(-) The average temperature of the palmrest area of similar devices was 28.7 °C / 83.7 F (-11.3 °C / -20.3 F).
| MSI Creator Z17 A12UGST-054 Intel Core i9-12900H, NVIDIA GeForce RTX 3070 Ti Laptop GPU | MSI Creator 17 A10SGS Intel Core i7-10875H, NVIDIA GeForce RTX 2080 Super Max-Q | MSI Creator Z16P B12UHST Intel Core i9-12900H, NVIDIA GeForce RTX 3080 Ti Laptop GPU | Razer Blade 17 (i7-12800H, RTX 3070 Ti) Intel Core i7-12800H, NVIDIA GeForce RTX 3070 Ti Laptop GPU | Aorus 17X XES Intel Core i9-12900HX, NVIDIA GeForce RTX 3070 Ti Laptop GPU | Dell XPS 17 9720 RTX 3060 Intel Core i7-12700H, NVIDIA GeForce RTX 3060 Laptop GPU | |
|---|---|---|---|---|---|---|
| Heat | 1% | -1% | 11% | -8% | 5% | |
| Maximum Upper Side * (°C) | 63.9 | 52 19% | 67 -5% | 43 33% | 54 15% | 51.8 19% |
| Maximum Bottom * (°C) | 68 | 59 13% | 69 -1% | 44 35% | 58 15% | 44.2 35% |
| Idle Upper Side * (°C) | 28.3 | 34 -20% | 29 -2% | 32 -13% | 37 -31% | 34.8 -23% |
| Idle Bottom * (°C) | 30.2 | 33 -9% | 29 4% | 34 -13% | 39 -29% | 33.2 -10% |
* ... smaller is better
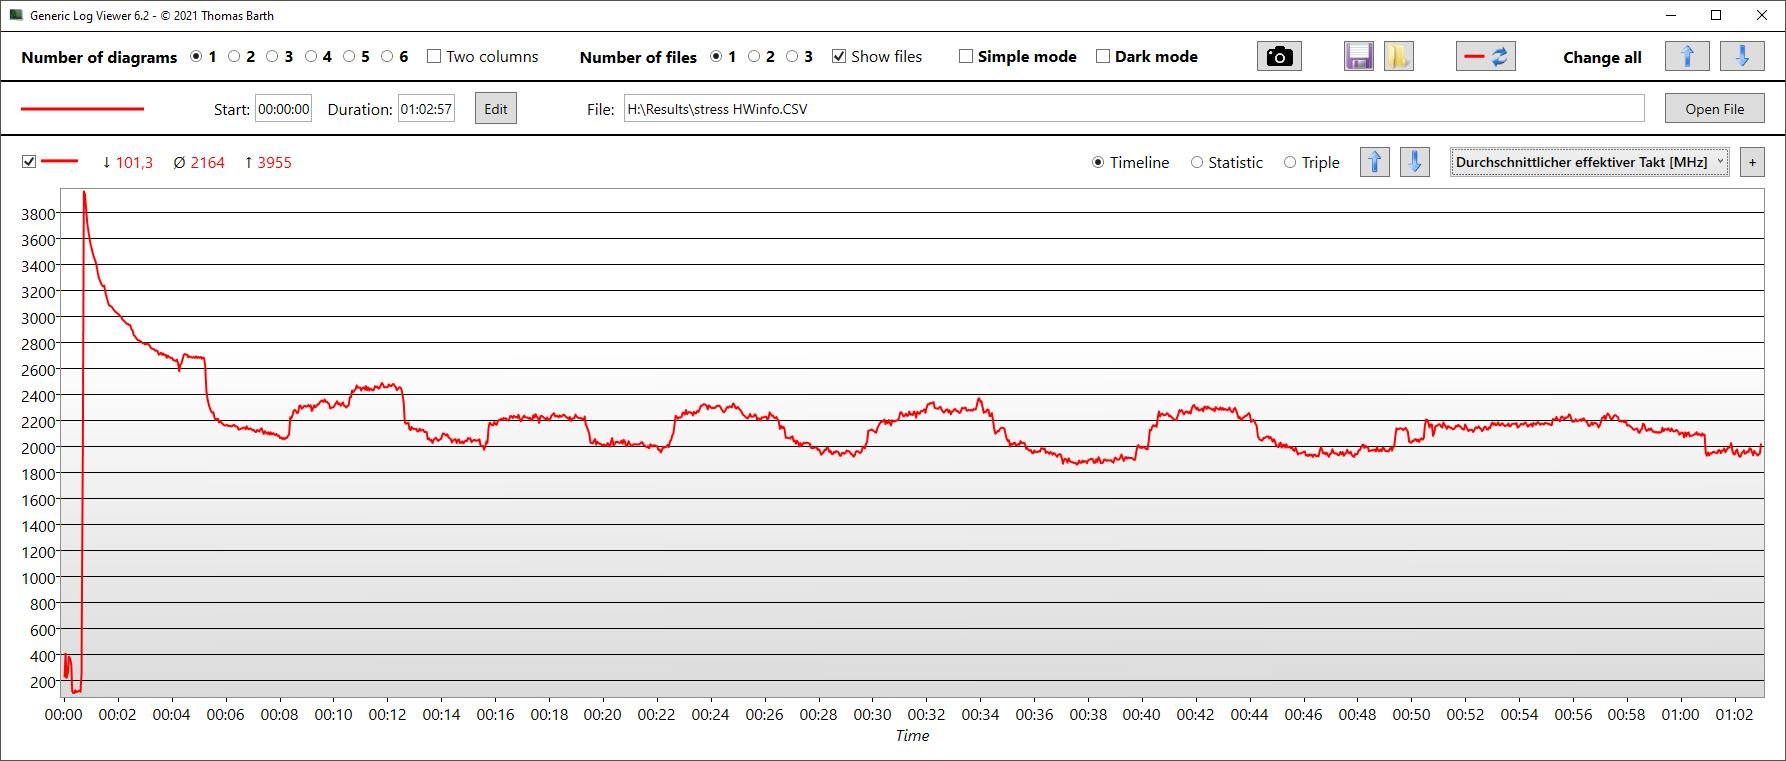
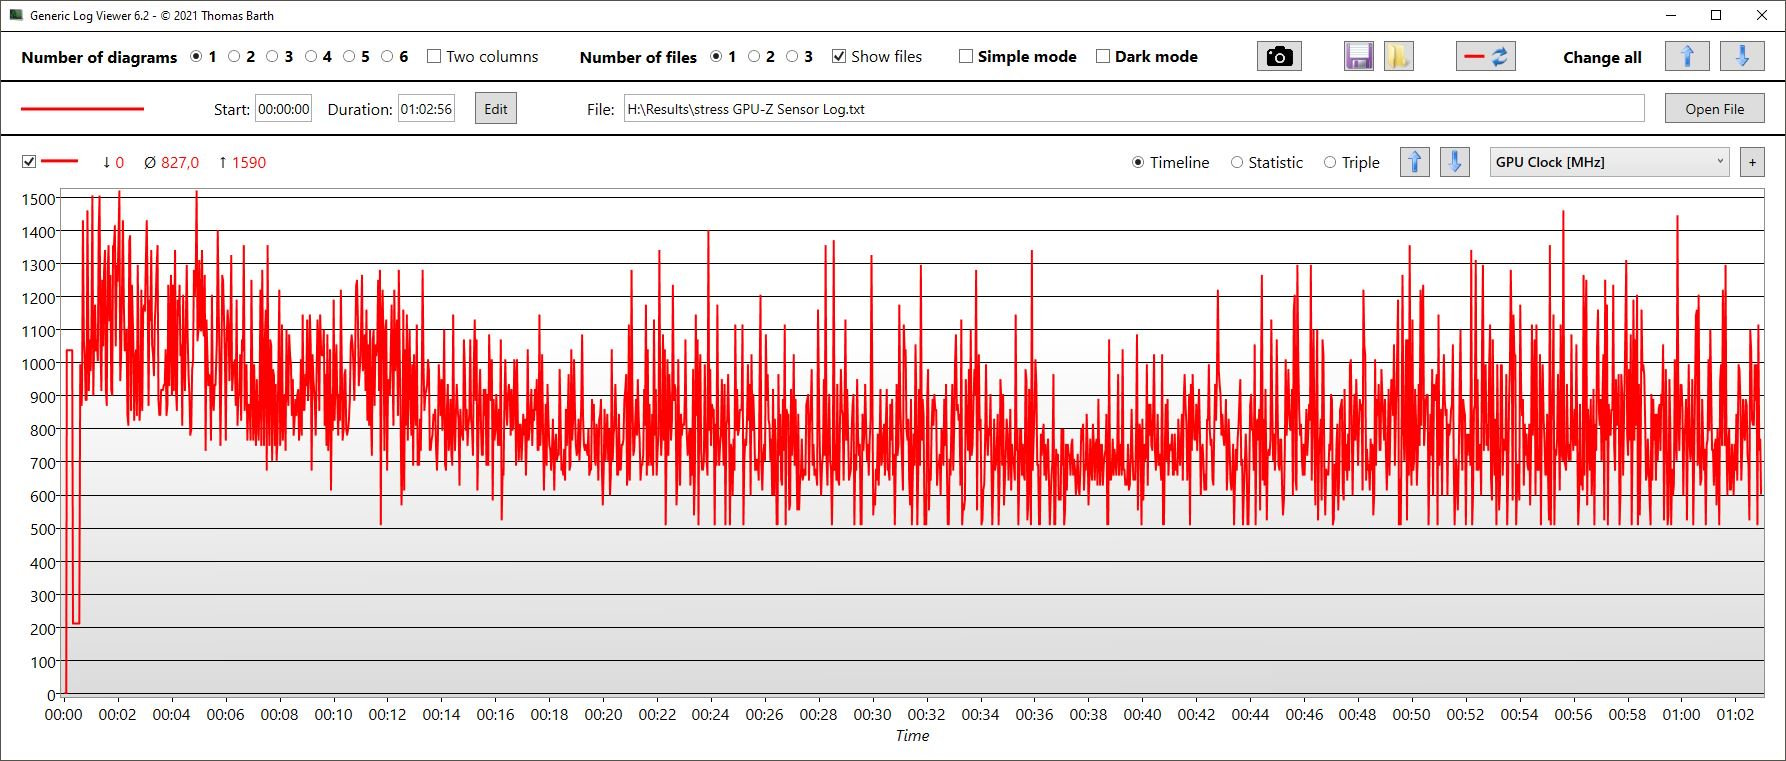
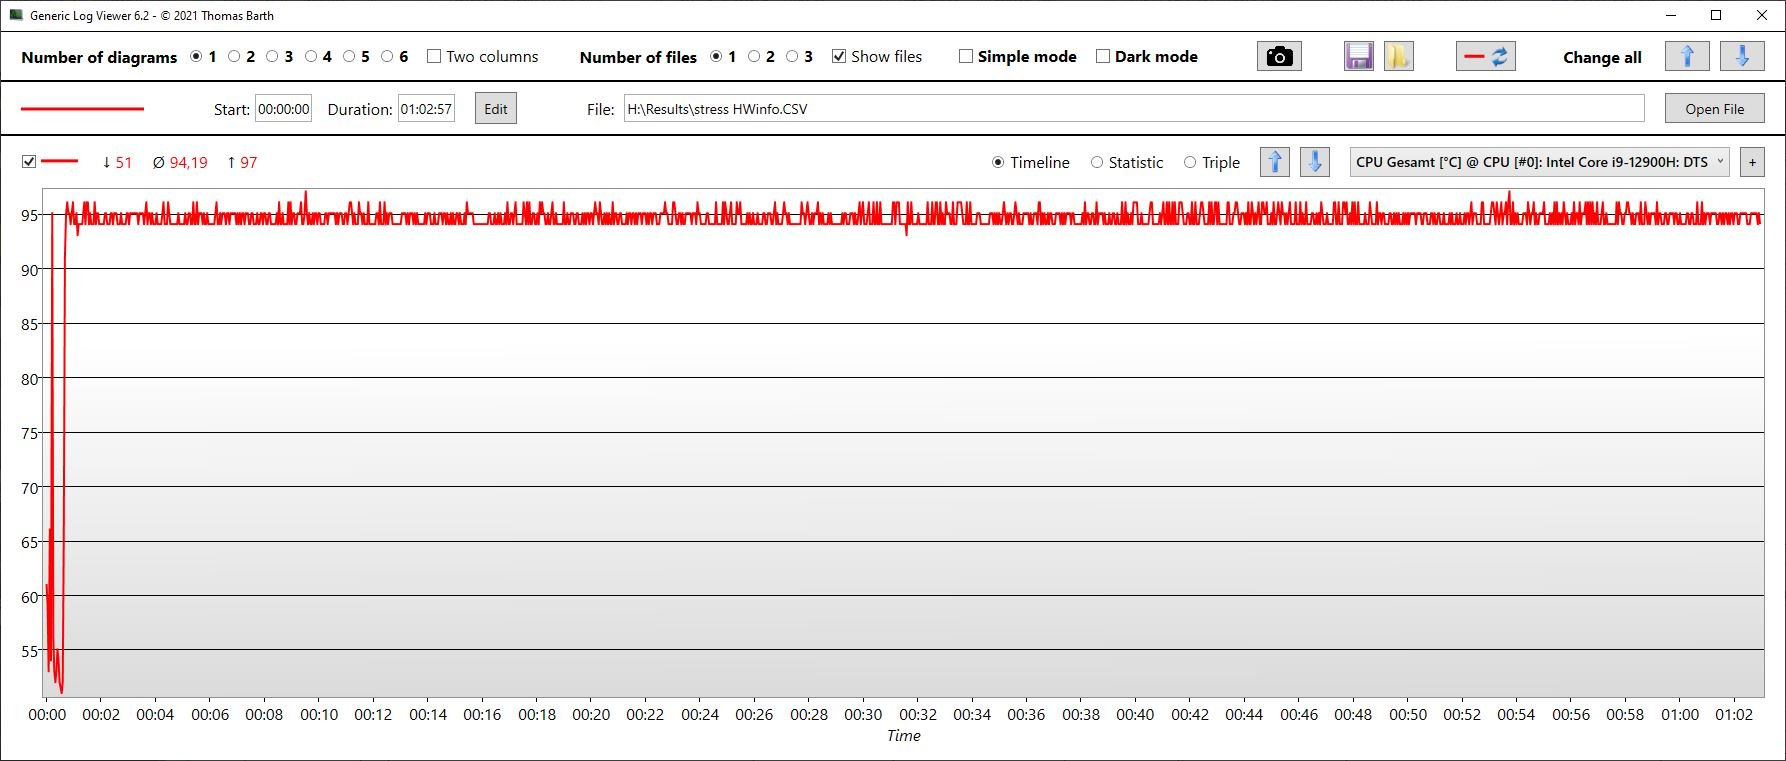
压力测试
在我们一小时的压力测试开始时,CPU的时钟速度非常短暂地接近4GHz。然后由于温度过高而迅速下降,最后稳定在2.1到2.2GHz左右。核心达到了它们的温度极限,平均运行温度为94℃(201℃)。
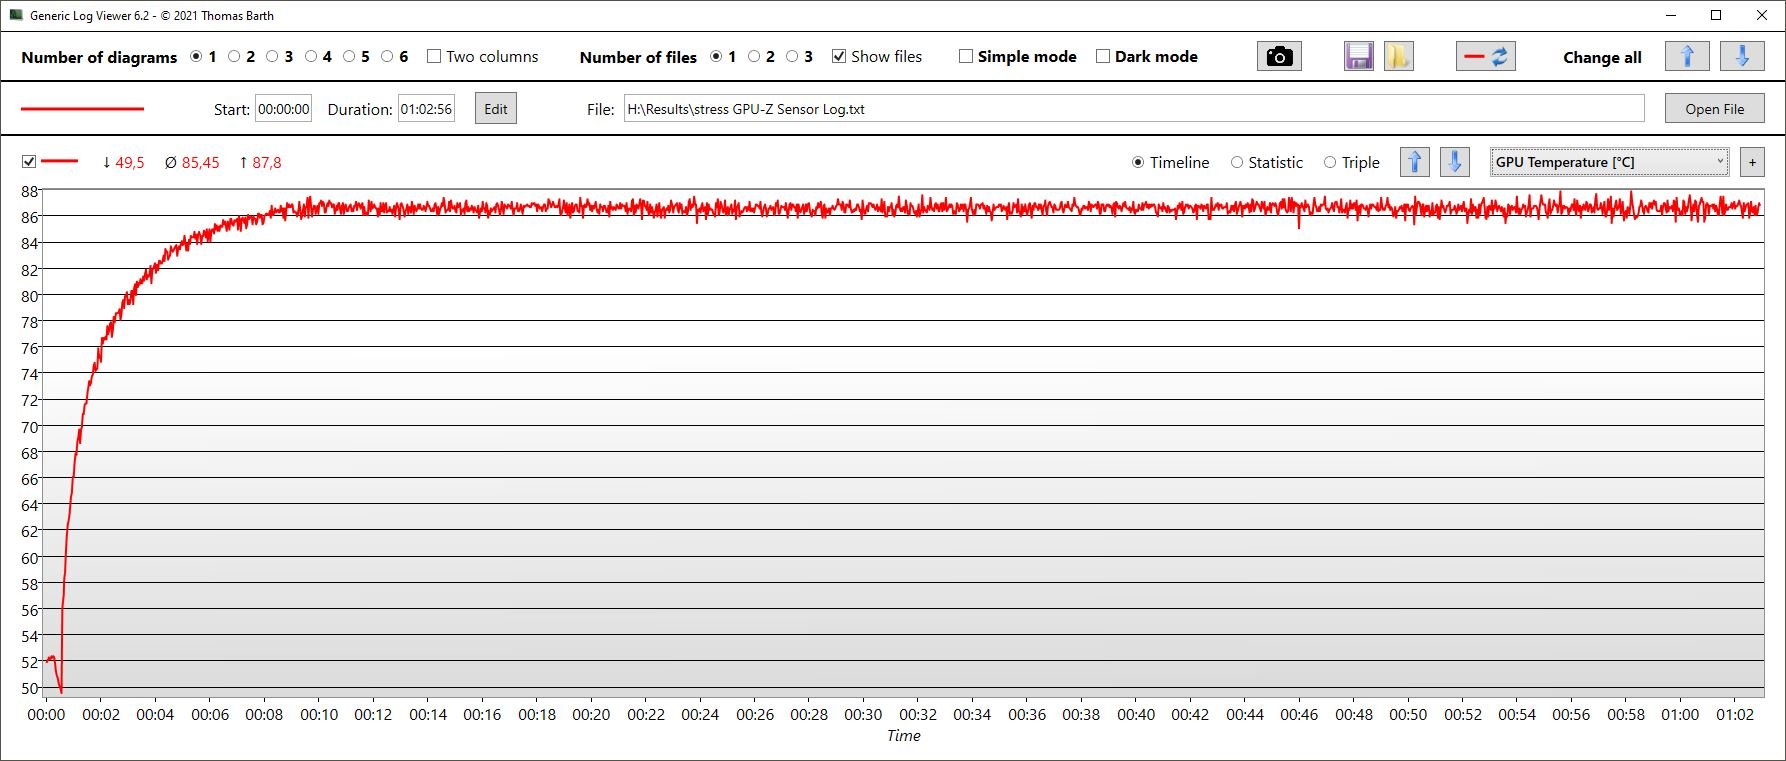
同时,GPU时钟速度在500 MHz和1.4 GHz之间急剧波动,平均为827 MHz,相当低。GPU保持在85°C(185°F)的恒定温度,消耗了大约72瓦的功率。
发言人
尽管两路立体声扬声器可以变得很响,但它们几乎没有任何低音可言。我们对立体声扬声器的期望更高。只有一个耳机插孔可用于连接模拟播放设备。
MSI Creator Z17 A12UGST-054 audio analysis
(+) | speakers can play relatively loud (84.8 dB)
Bass 100 - 315 Hz
(-) | nearly no bass - on average 29.6% lower than median
(±) | linearity of bass is average (12.8% delta to prev. frequency)
Mids 400 - 2000 Hz
(+) | balanced mids - only 2.4% away from median
(±) | linearity of mids is average (8.9% delta to prev. frequency)
Highs 2 - 16 kHz
(±) | higher highs - on average 6.8% higher than median
(+) | highs are linear (6.5% delta to prev. frequency)
Overall 100 - 16.000 Hz
(±) | linearity of overall sound is average (20.9% difference to median)
Compared to same class
» 71% of all tested devices in this class were better, 8% similar, 21% worse
» The best had a delta of 5%, average was 17%, worst was 45%
Compared to all devices tested
» 57% of all tested devices were better, 8% similar, 35% worse
» The best had a delta of 4%, average was 23%, worst was 134%
Apple MacBook Pro 16 2021 M1 Pro audio analysis
(+) | speakers can play relatively loud (84.7 dB)
Bass 100 - 315 Hz
(+) | good bass - only 3.8% away from median
(+) | bass is linear (5.2% delta to prev. frequency)
Mids 400 - 2000 Hz
(+) | balanced mids - only 1.3% away from median
(+) | mids are linear (2.1% delta to prev. frequency)
Highs 2 - 16 kHz
(+) | balanced highs - only 1.9% away from median
(+) | highs are linear (2.7% delta to prev. frequency)
Overall 100 - 16.000 Hz
(+) | overall sound is linear (4.6% difference to median)
Compared to same class
» 0% of all tested devices in this class were better, 0% similar, 100% worse
» The best had a delta of 5%, average was 17%, worst was 45%
Compared to all devices tested
» 0% of all tested devices were better, 0% similar, 100% worse
» The best had a delta of 4%, average was 23%, worst was 134%
电源管理 - 工作站符合预期
消耗功率
与性能一样,负载下的耗电量也是合理的。相比较而言, Razer Blade 17在游戏过程中或在最大负载下运行时,耗电量明显更大。Aorus的情况也是如此。
相比之下,Z17的耗电情况很不寻常--它是竞争对手的两倍。因为 创造者Z16P闲置时的功耗只有Z17的一半,尽管它有一个更强大的GPU,我们相信有一个过程导致RTX GPU被激活。
我们测量了220瓦的峰值功率使用。240瓦的充电器(约16.4 x 7.5 x 2.5厘米,或6.5 x 3.0 x 1.0英寸)处理这种水平的电力使用应该没有问题。
| Off / Standby | |
| Idle | |
| Load |
|
Key:
min: | |
| MSI Creator Z17 A12UGST-054 i9-12900H, GeForce RTX 3070 Ti Laptop GPU, Micron 3400 1TB MTFDKBA1T0TFH, IPS, 2560x1600, 17" | MSI Creator 17 A10SGS i7-10875H, GeForce RTX 2080 Super Max-Q, Samsung SSD PM981 MZVLB2T0HMLB, Mini-LED IPS-Level, 3840x2160, 17.3" | MSI Creator Z16P B12UHST i9-12900H, GeForce RTX 3080 Ti Laptop GPU, Samsung PM9A1 MZVL22T0HBLB, IPS True Pixel (~100% DCI-P3), 2560x1600, 16" | Razer Blade 17 (i7-12800H, RTX 3070 Ti) i7-12800H, GeForce RTX 3070 Ti Laptop GPU, Samsung PM9A1 MZVL21T0HCLR, IPS, 2560x1440, 17.3" | Aorus 17X XES i9-12900HX, GeForce RTX 3070 Ti Laptop GPU, Gigabyte AG470S1TB-SI B10, IPS, 1920x1080, 17.3" | Dell XPS 17 9720 RTX 3060 i7-12700H, GeForce RTX 3060 Laptop GPU, Samsung PM9A1 MZVL21T0HCLR, IPS, 3840x2400, 17" | Average NVIDIA GeForce RTX 3070 Ti Laptop GPU | Average of class Multimedia | |
|---|---|---|---|---|---|---|---|---|
| Power Consumption | 18% | 33% | 21% | 3% | 45% | 31% | 67% | |
| Idle Minimum * (Watt) | 34.6 | 15 57% | 11 68% | 14.4 58% | 18 48% | 5.9 83% | 14.2 ? 59% | 5.66 ? 84% |
| Idle Average * (Watt) | 43 | 20 53% | 17 60% | 20 53% | 28 35% | 15.8 63% | 19.9 ? 54% | 10.2 ? 76% |
| Idle Maximum * (Watt) | 44.9 | 42 6% | 26 42% | 21.5 52% | 36 20% | 26.7 41% | 26.2 ? 42% | 12.5 ? 72% |
| Load Average * (Watt) | 145 | 150 -3% | 124 14% | 119 18% | 153 -6% | 117.4 19% | 125.8 ? 13% | 65.2 ? 55% |
| Witcher 3 ultra * (Watt) | 152.4 | 170 -12% | 133.5 12% | 218 -43% | 221 -45% | 114.8 25% | ||
| Load Maximum * (Watt) | 220 | 210 5% | 212 4% | 248 -13% | 290 -32% | 136.6 38% | 248 ? -13% | 113.5 ? 48% |
* ... smaller is better
Power consumption Witcher 3 / stress test
Power consumption with external monitor
电池寿命
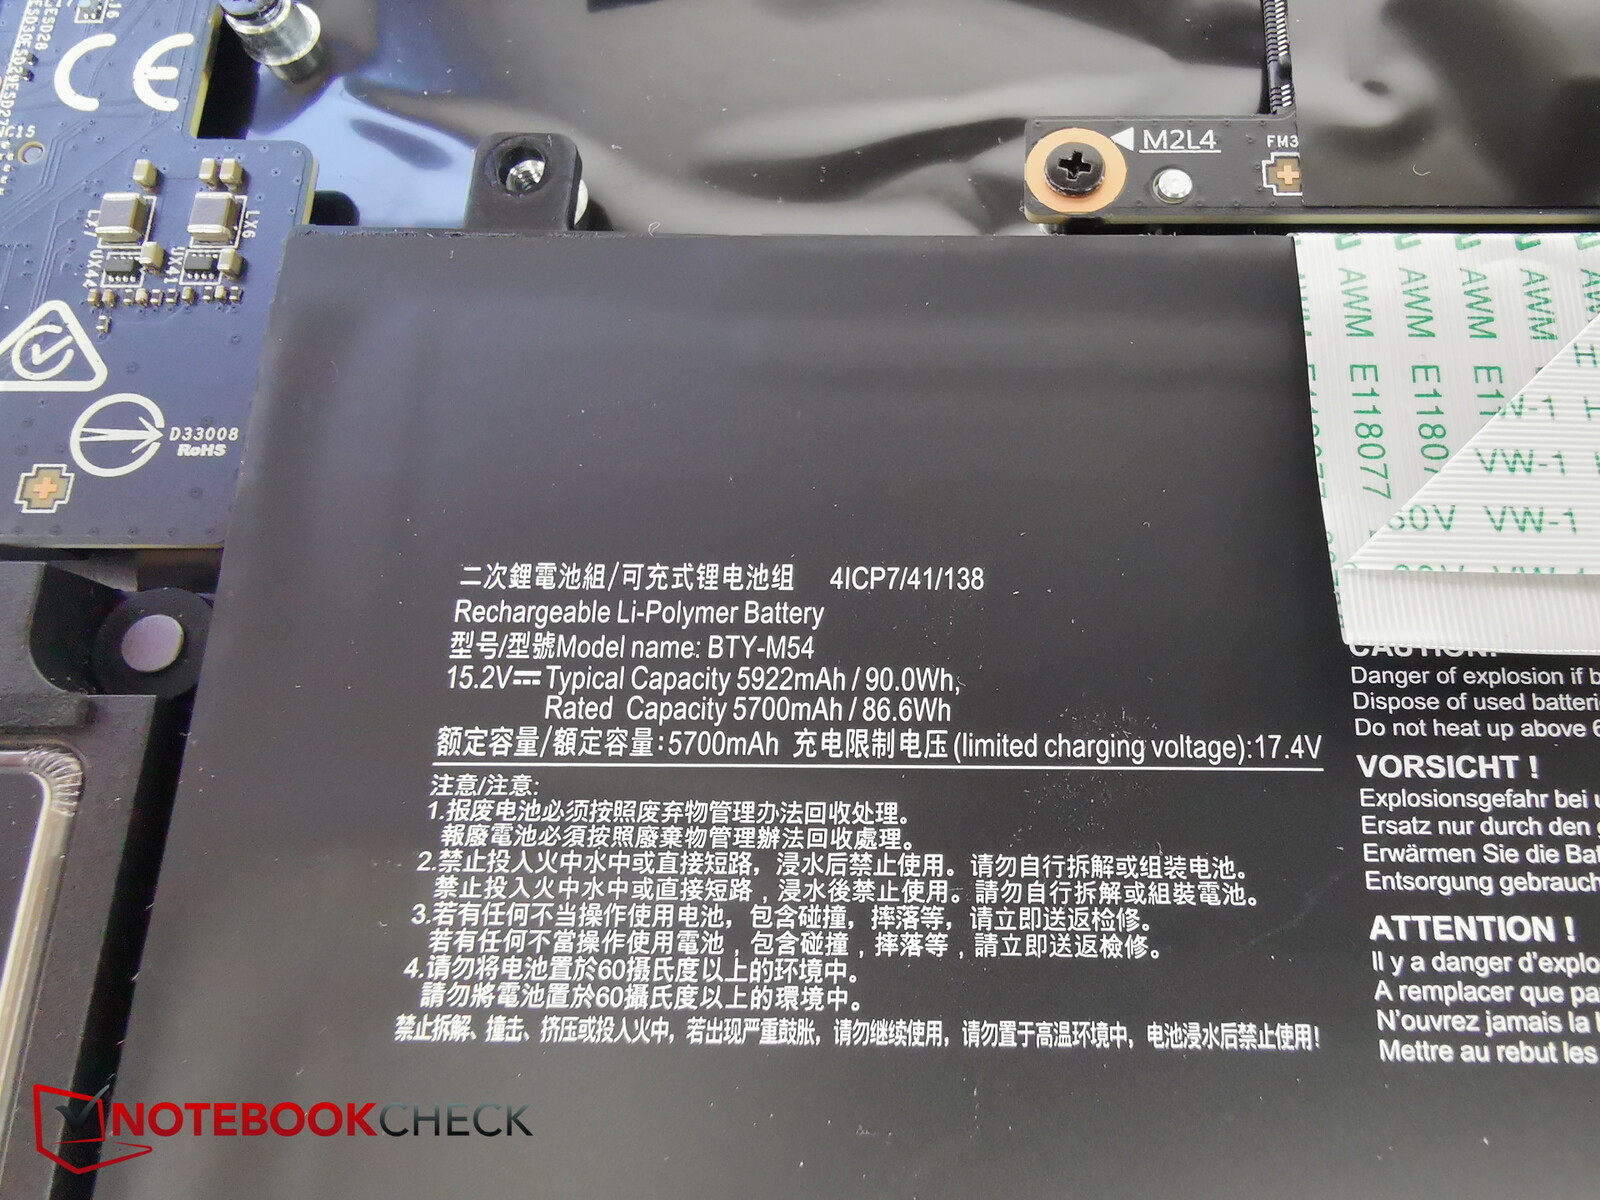
造物主Z17在拔掉电源时由90Wh的电池供电,这与比较中的其他笔记本电脑相当。由此产生的电池寿命在比较中的设备中处于较高的水平。尽管电池略小,但 雷蛇刀片17能够在一次充电中持续几乎相同的时间。为了最大限度地利用笔记本电脑的电池,将显示器的刷新率降低到60赫兹是至关重要的。在Z17上,当设备被拔掉时,这几乎是自动发生的。
Z17在浏览网页时将持续4.5到5.5小时(取决于屏幕亮度)。视频播放时的电池寿命也在同一范围内。
| MSI Creator Z17 A12UGST-054 i9-12900H, GeForce RTX 3070 Ti Laptop GPU, 90 Wh | MSI Creator 17 A10SGS i7-10875H, GeForce RTX 2080 Super Max-Q, 82 Wh | MSI Creator Z16P B12UHST i9-12900H, GeForce RTX 3080 Ti Laptop GPU, 90 Wh | Razer Blade 17 (i7-12800H, RTX 3070 Ti) i7-12800H, GeForce RTX 3070 Ti Laptop GPU, 82 Wh | Aorus 17X XES i9-12900HX, GeForce RTX 3070 Ti Laptop GPU, 99 Wh | Dell XPS 17 9720 RTX 3060 i7-12700H, GeForce RTX 3060 Laptop GPU, 97 Wh | Average of class Multimedia | |
|---|---|---|---|---|---|---|---|
| Battery runtime | -35% | -18% | -7% | -29% | 2% | 103% | |
| H.264 (h) | 5.5 | 5.8 5% | 4.9 -11% | 3.8 -31% | 17.1 ? 211% | ||
| WiFi v1.3 (h) | 5.5 | 4.4 -20% | 5.2 -5% | 5.9 7% | 4.4 -20% | 8.7 58% | 12.2 ? 122% |
| Load (h) | 2.2 | 1.1 -50% | 1 -55% | 1.8 -18% | 1.4 -36% | 1 -55% | 1.664 ? -24% |
| Reader / Idle (h) | 7.2 | 24.9 ? |
Pros
Cons
结论 - 微星工作站令人瞠目结舌的4,000欧元
乍一看,微星造物主Z17似乎是一款非常适合创意者的工作笔记本电脑。其高昂的价格不仅归功于其强大的硬件,而且还归功于其坚固的金属底盘,特别薄的外形尺寸,伟大的触摸屏等等。
诚然,我们为Z17设定了相对较高的标准,但它在整体上仍然让我们失望。这主要是由于该设备产生了大量的热量和噪音:尽管有三个风扇,但冷却系统对薄型机箱来说并不理想。这意味着Z17比其竞争对手更热、更吵,甚至在3D应用中的表现更差,因为 RTX 3070 Ti只有90瓦的功率供其使用。鉴于已经很高的温度,不可能增加瓦特数。
如果它比竞争对手运行得更安静、更凉爽,我们可以忽略工作用笔记本电脑有些低于平均水平的性能。然而,Z17的情况恰恰相反。
造物主Z17有一个梦幻般的尺寸,伟大的触摸屏,以及良好的配合和完成,但它被这样一个事实所破坏,即冷却解决方案似乎略微不堪重负,导致性能随着时间的推移而下降。
优秀的 Razer Blade 17是Z17的一个伟大的替代品。它和Z17一样薄,一样高级,但更安静,更冷,甚至能够提供更稳定的性能。微星自己的 创造者Z16P在一些方面也比Z17做得更好,比如噪音水平。
价格和可用性
Z17的价格应该超过4,000欧元(3,875美元),考虑到现有的替代品,我们认为这太贵了。然而,具有类似规格的型号现在可以在Amazon.com售价为3,049美元。
MSI Creator Z17 A12UGST-054
- 09/20/2022 v7 (old)
Christian Hintze
Price comparison

