戴尔XPS 13 Plus笔记本电脑评测。基本配置是最佳选择吗?

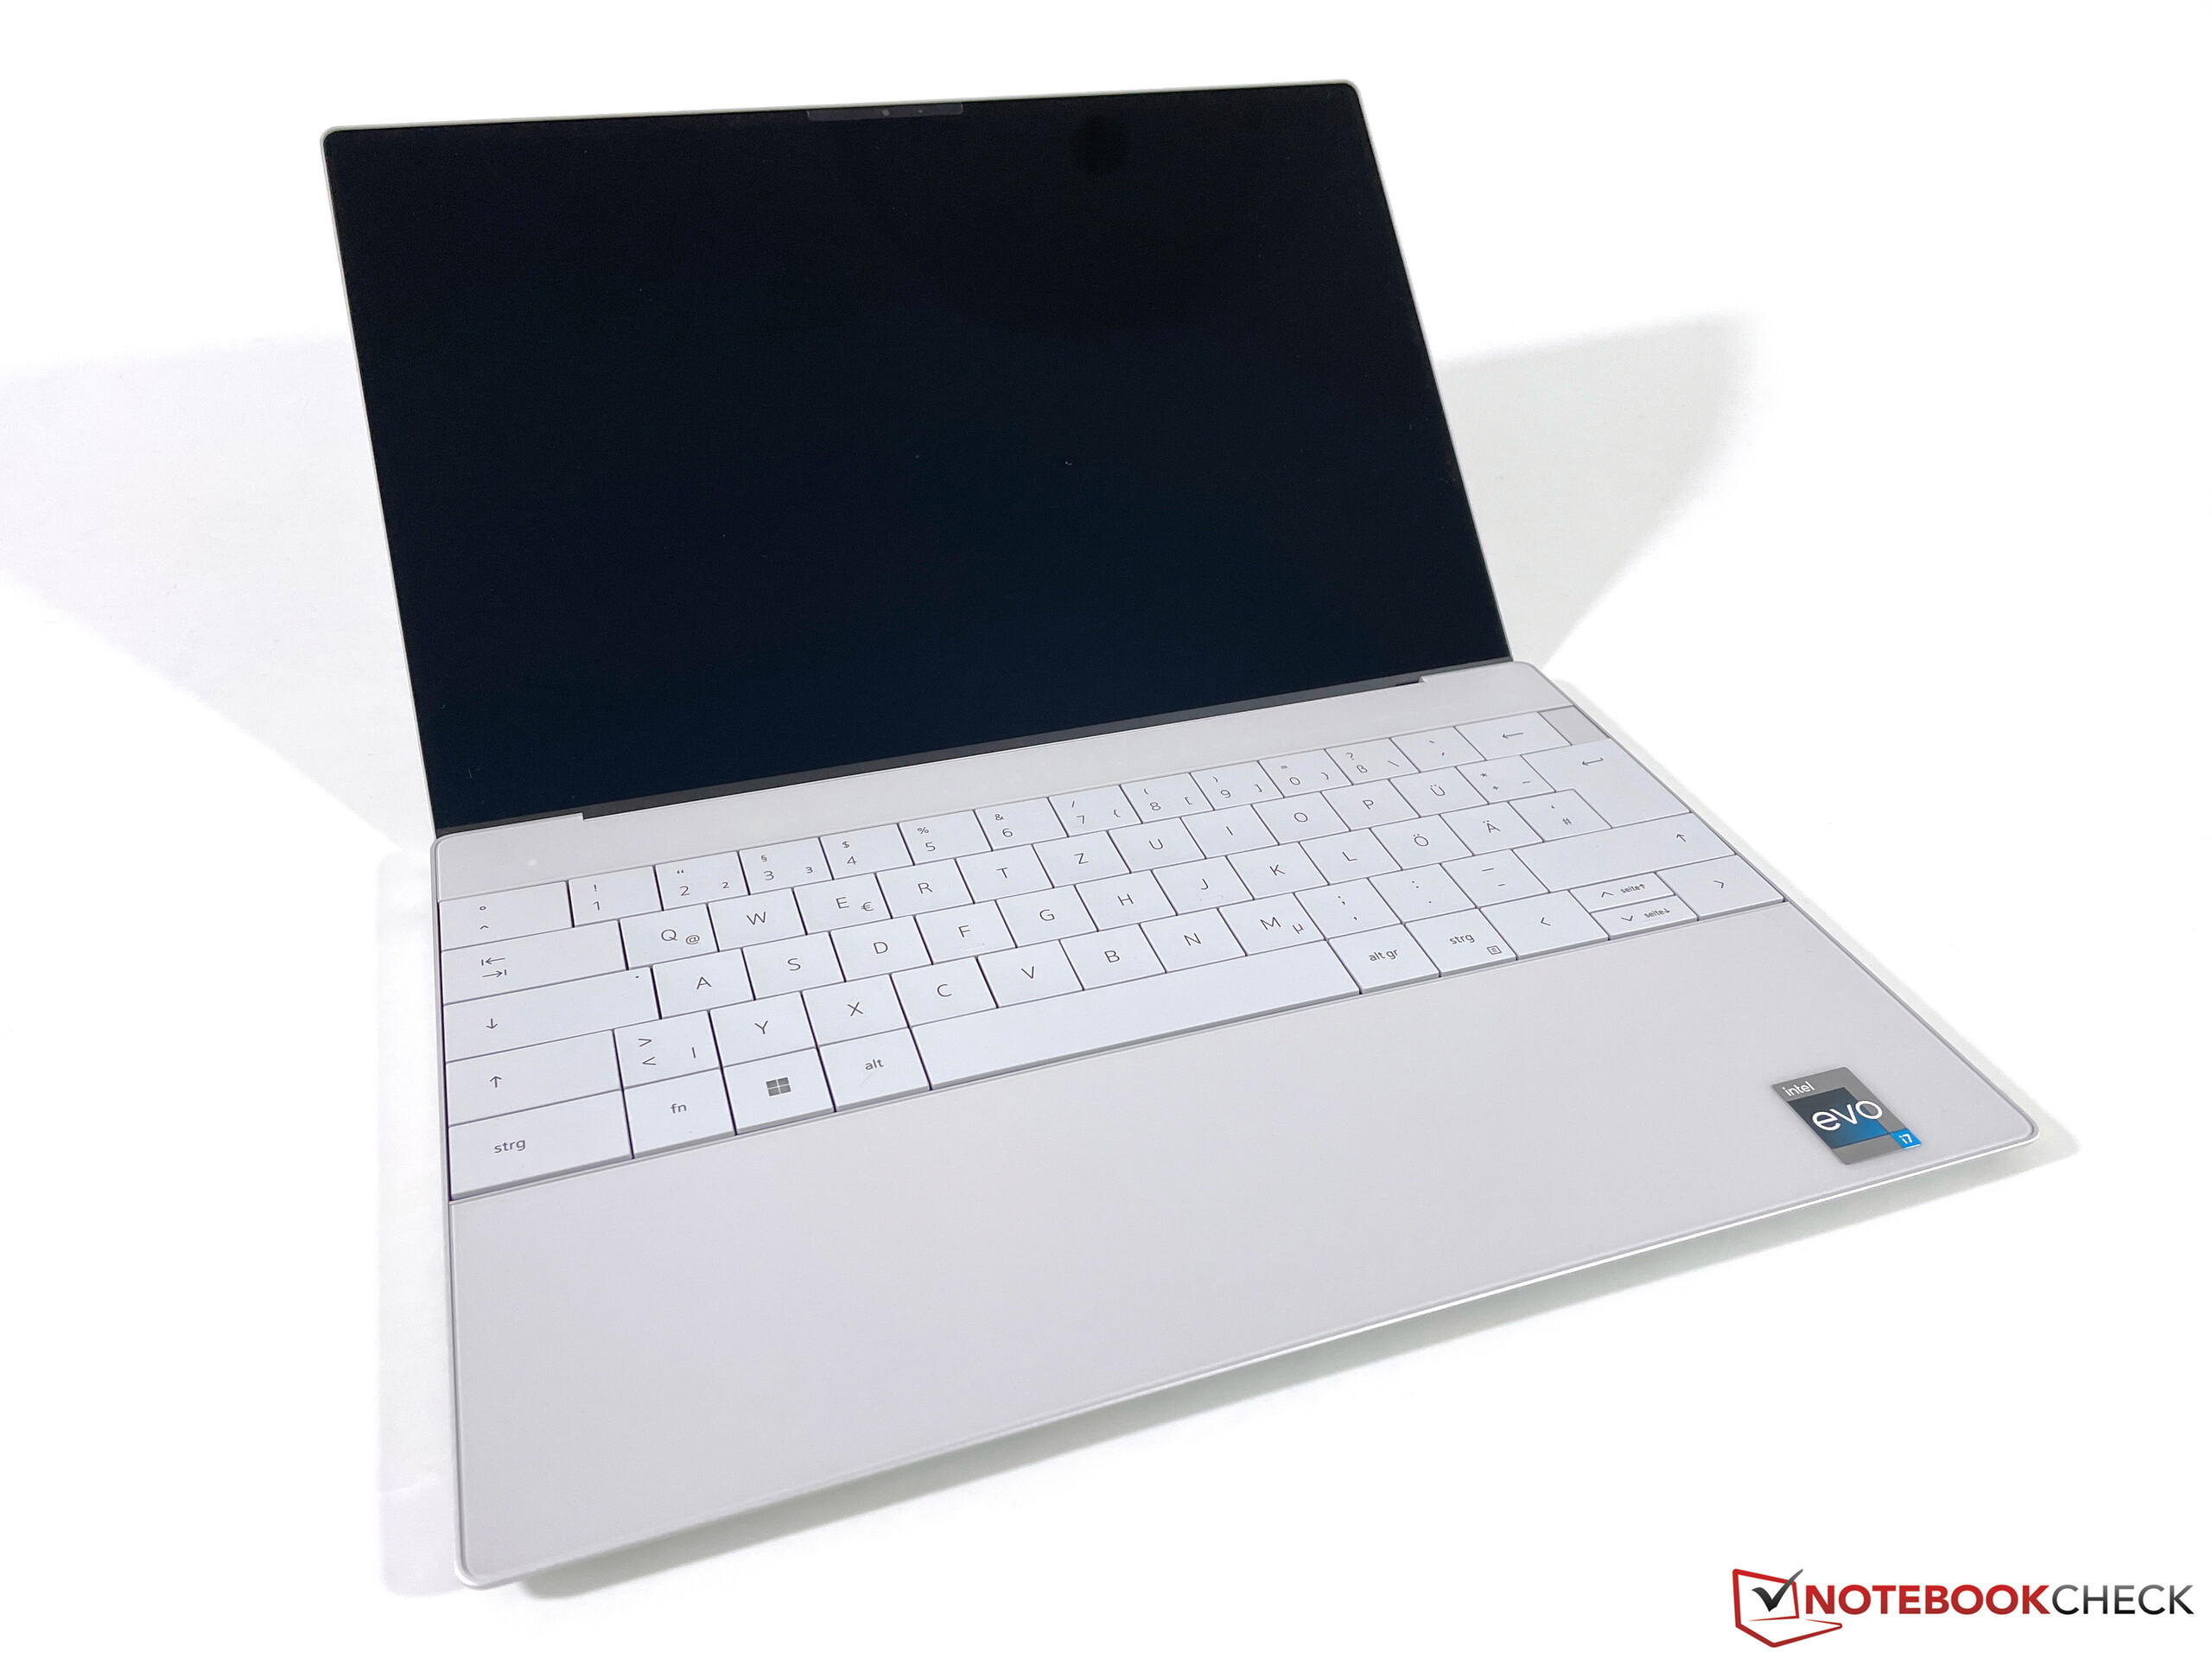
我们对XPS爱不释手。继"到目前为止最快的XPS 13"之后,我们现在又有了入门级的Plus机型,配备了Core i5-1240P,全高清面板和512GB美光SSD。进入对性能要求较高的XPS世界的入门级产品目前价格为1350欧元(约合1385美元)。
作为一个提醒。从今年起,戴尔提供的紧凑型XPS 13有两个版本。普通版"普通 "XPS 13配备英特尔Alder Lake CPU的U系列,以及XPS 13 Plus配有更强大的Alder Lake P芯片。我们已经对这两个版本进行了评测,并得出结论,性能上的差异是巨大的。这不仅适用于CPU和iGPU,而且也适用于存储设备。
在这次审查更新中,我们将提出以下问题。酷睿i7的额外成本是否值得?与Alder Lake U型号(i5)的性能差异是什么?考虑到Alder Lake U的运行时间是Alder Lake P的两倍,那么电池寿命如何?
和以前一样,有一些竞争对手在我们的评测中获得了更好的总体分数。首先是Apple MacBook Air 2020 M1入门和 华硕Zenbook S 13 OLED,这两个产品往往比入门级的XPS 13 Plus i5更便宜。
更多戴尔XPS 13笔记本电脑由Notebookcheck审查。
XPS 13 Plus 9320 i7-1260P(4K, Alder Lake P 2022)
XPS 13 9315 i5-1230U(全高清, Alder Lake U 2022)
XPS 13 9310 Core i7(全高清,Tiger Lake 2021)
在这次更新中,我们不会去讨论做工、端口配置、输入设备或扬声器;相反,请参考我们对XPS 13 Plus 9320 i7-1260P(4K, Alder Lake P 2022)。
潜在的竞争对手比较
Rating | Date | Model | Weight | Height | Size | Resolution | Price |
|---|---|---|---|---|---|---|---|
| 86.1 % v7 (old) | 08 / 2022 | Dell XPS 13 Plus 9320 i5-1240p i5-1240P, Iris Xe G7 80EUs | 1.2 kg | 15.3 mm | 13.40" | 1920x1200 | |
| 91.1 % v7 (old) | 12 / 2020 | Apple MacBook Air 2020 M1 Entry M1, M1 7-Core GPU | 1.3 kg | 16.1 mm | 13.30" | 2560x1600 | |
| 90.1 % v7 (old) | 07 / 2022 | Asus Zenbook S 13 OLED R7 6800U, Radeon 680M | 1.1 kg | 14.9 mm | 13.30" | 2880x1800 | |
| 89.8 % v7 (old) | 02 / 2021 | Lenovo ThinkPad X1 Nano-20UN002UGE i7-1160G7, Iris Xe G7 96EUs | 946 g | 16 mm | 13.00" | 2160x1350 | |
| 88.8 % v7 (old) | 02 / 2022 | Huawei MateBook 13s i5 11300H i5-11300H, Iris Xe G7 80EUs | 1.3 kg | 16.5 mm | 13.40" | 2520x1680 | |
| 86.9 % v7 (old) | 07 / 2022 | Dell XPS 13 Plus 9320 4K i7-1260P, Iris Xe G7 96EUs | 1.2 kg | 15.3 mm | 13.40" | 3840x2400 |
连接性--仅对XPS Plus进行SSD升级
沟通
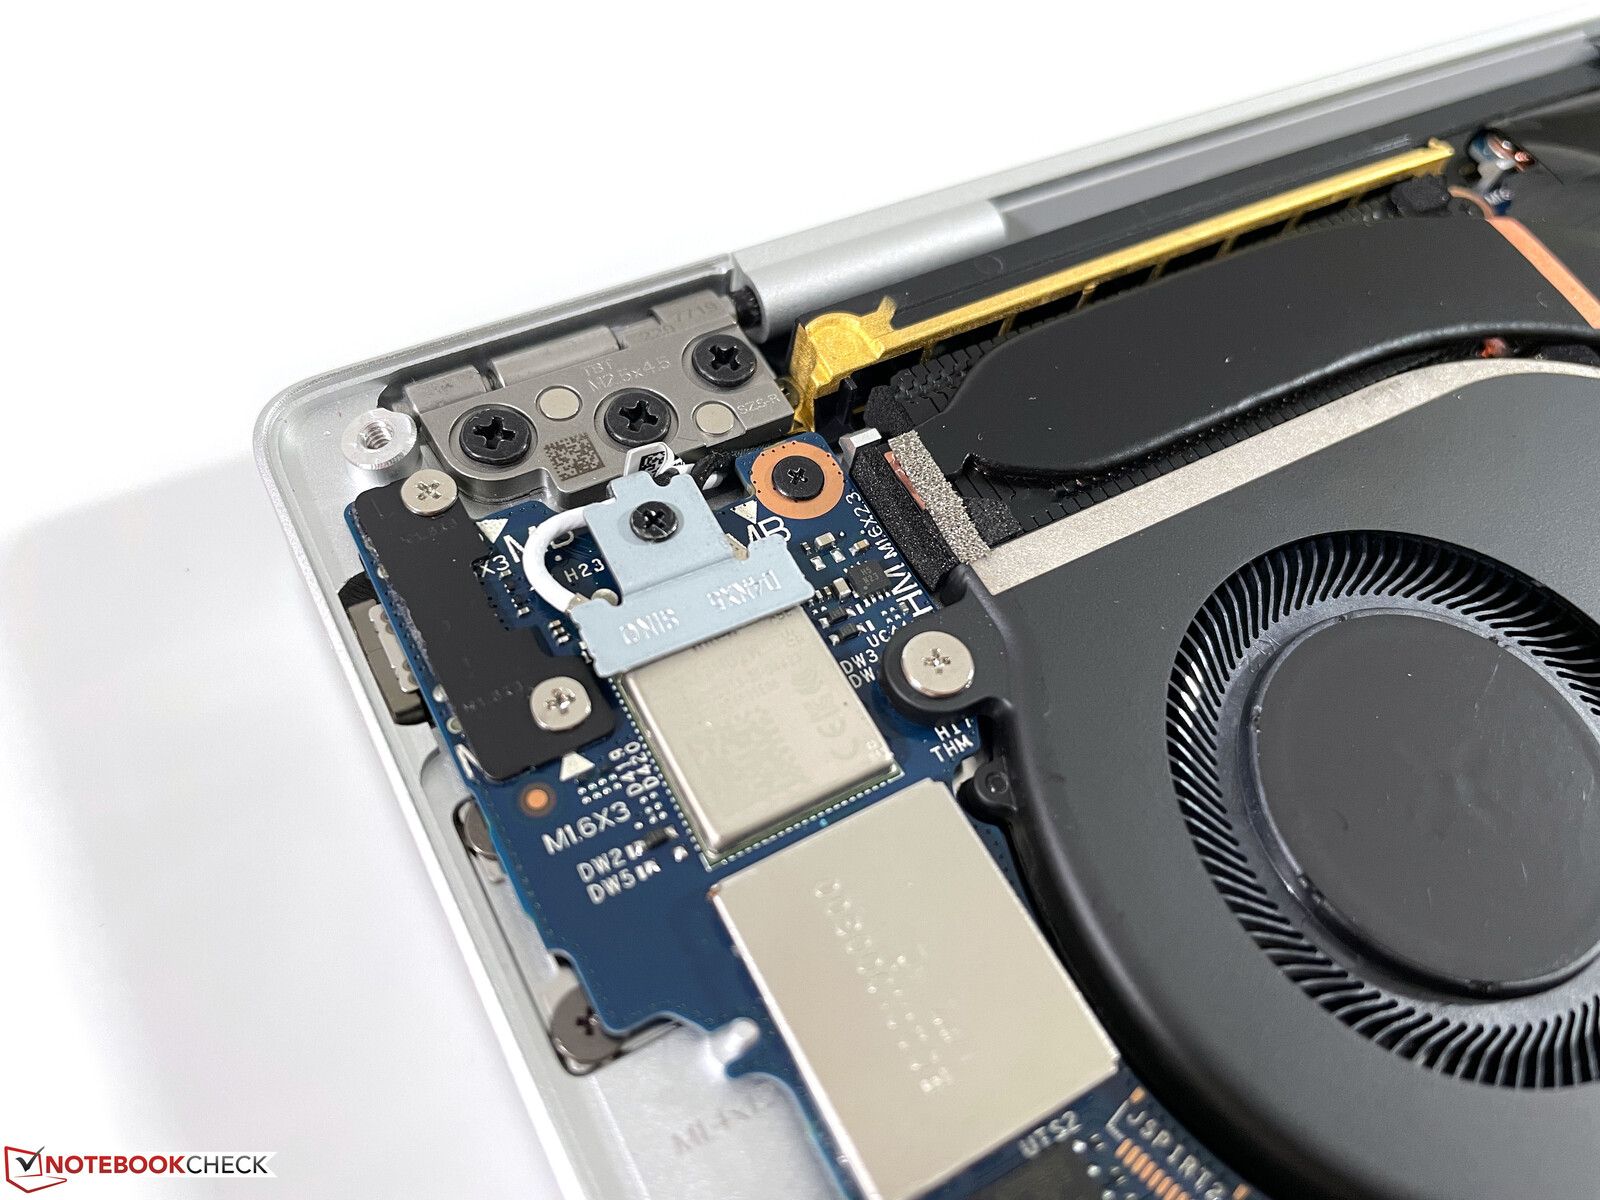
我们能够用这个评测单元连接到我们的路由器提供的Wi-Fi 6E网络。这在Plus的4K/i7版本中是不可能的。
网络摄像头


维护
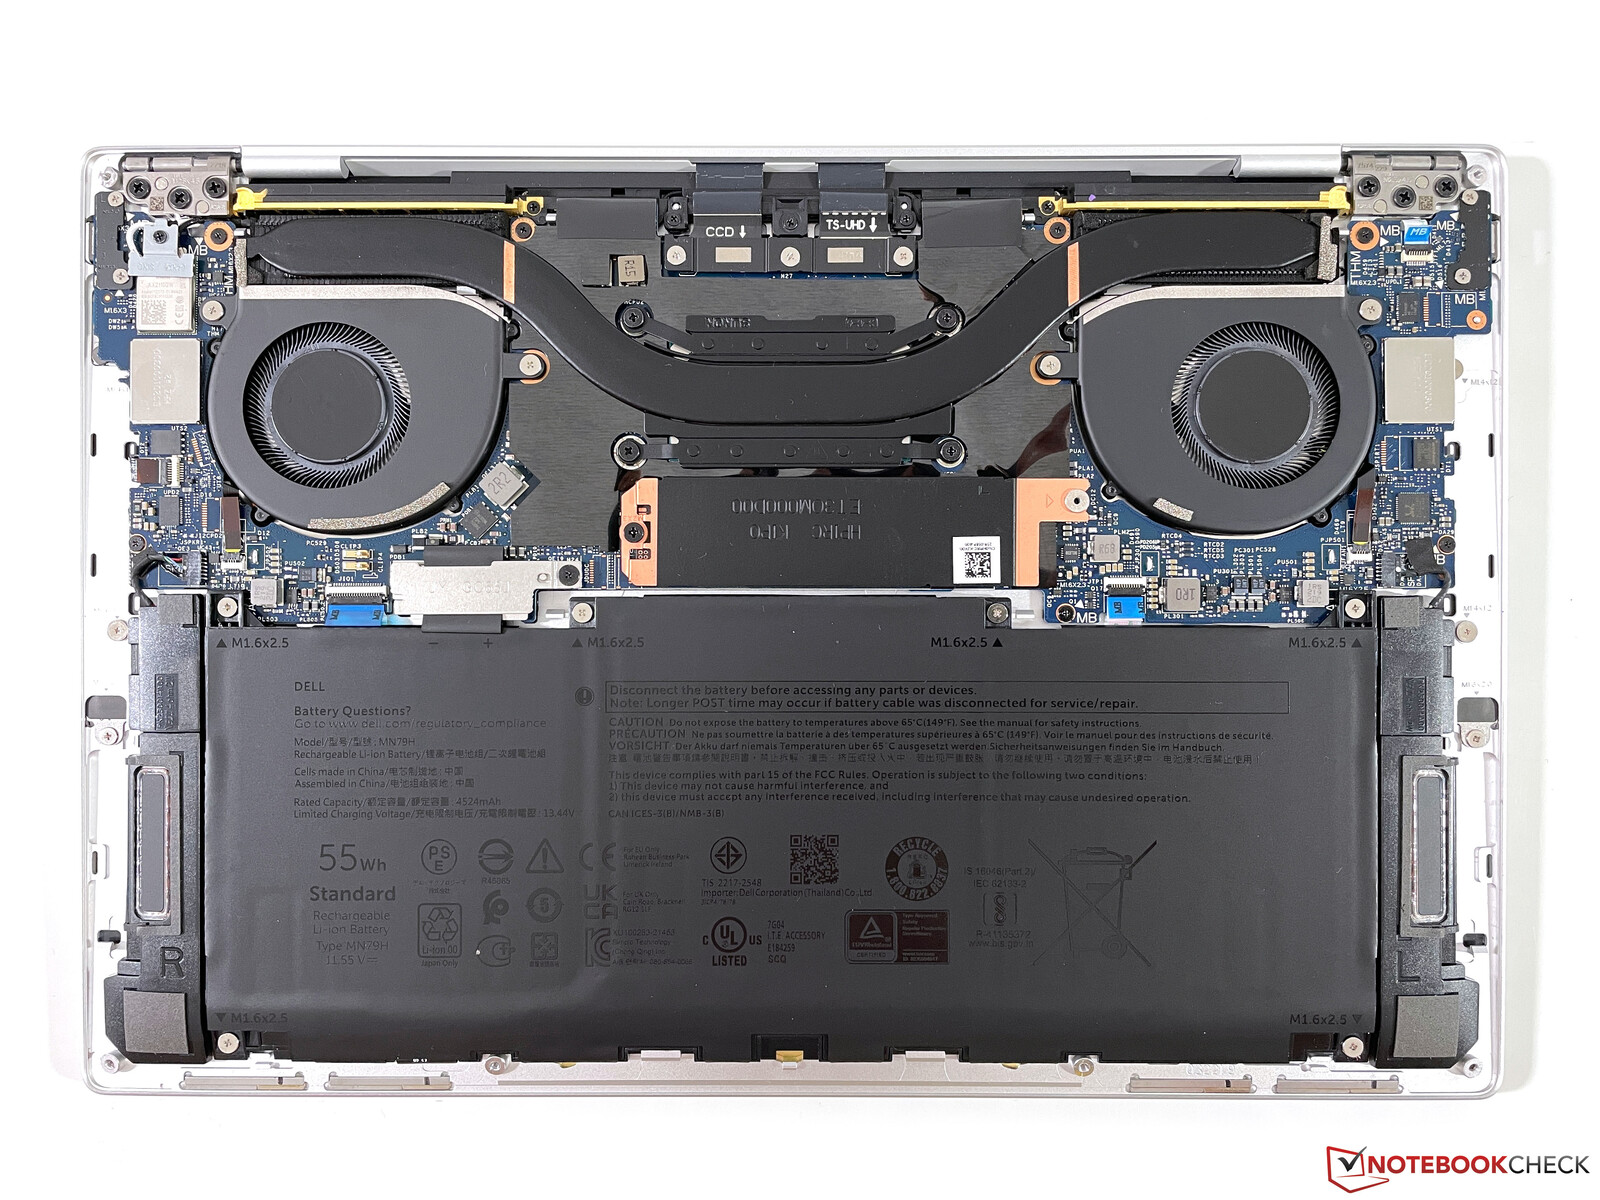
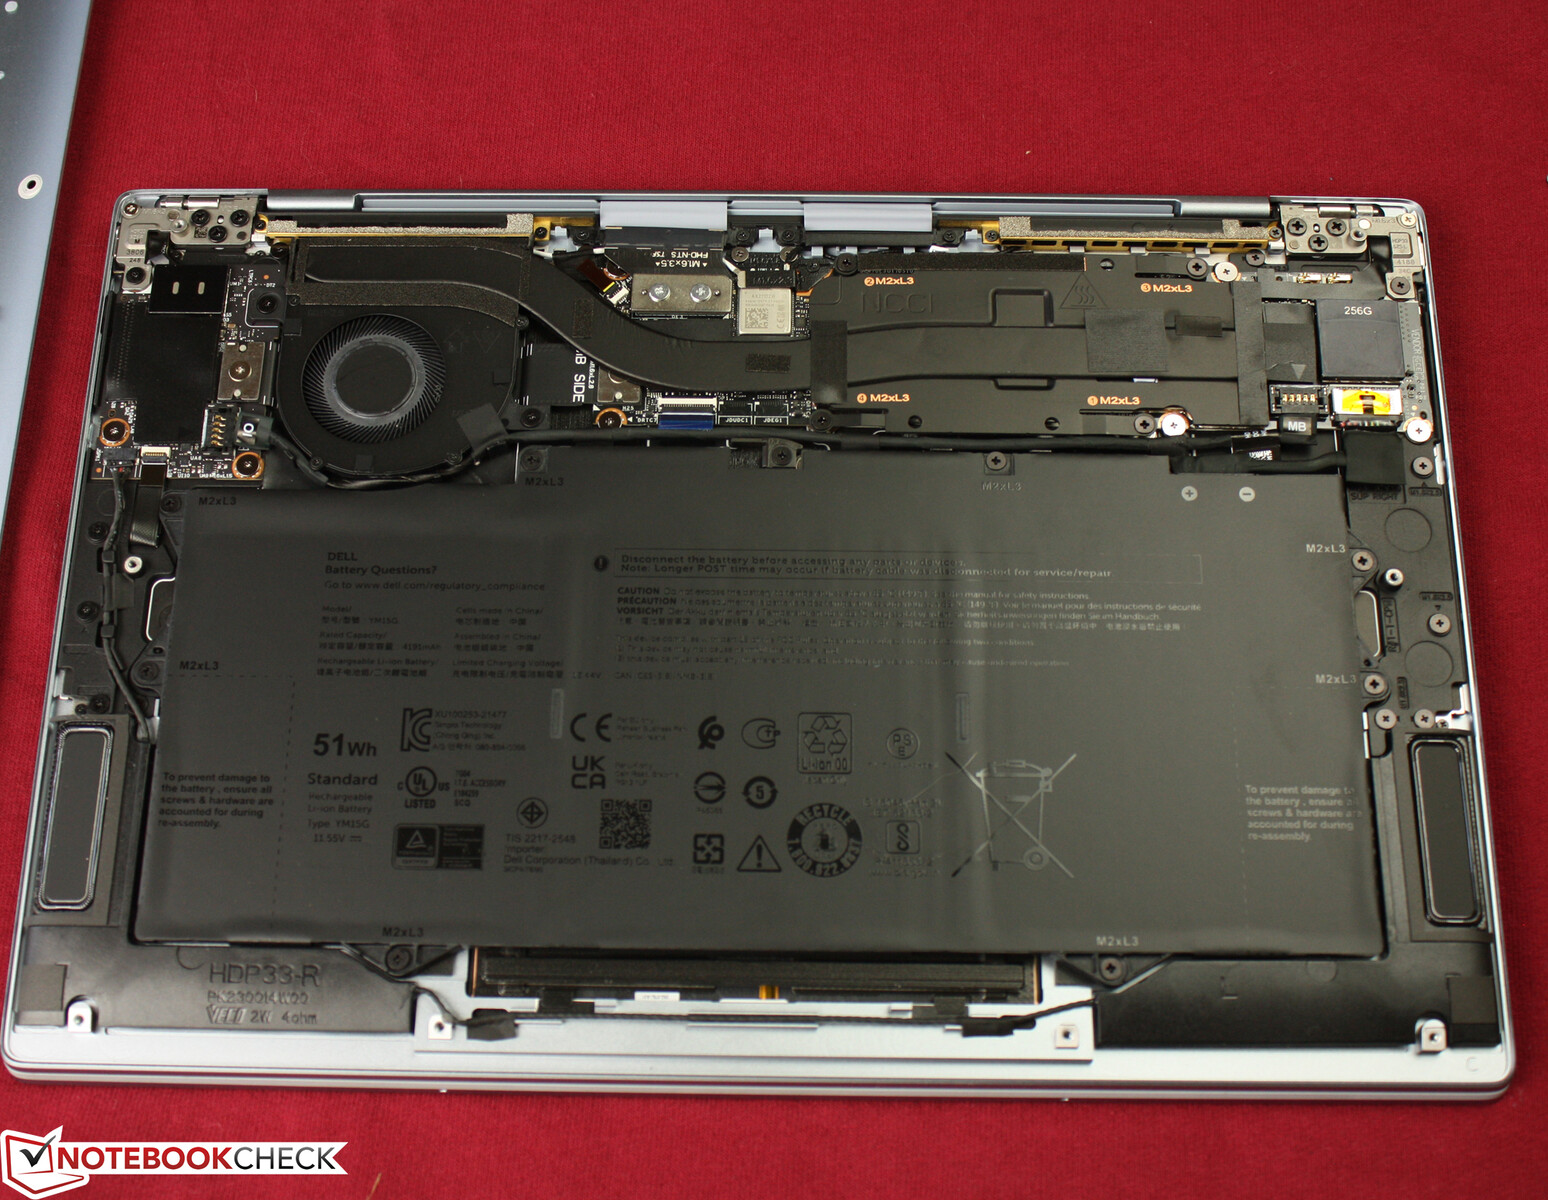
底盖用六颗Torx螺丝(T5)固定,很容易拆卸。内部布局井然有序,但用户只能清洁风扇或更换M.2 SSD。
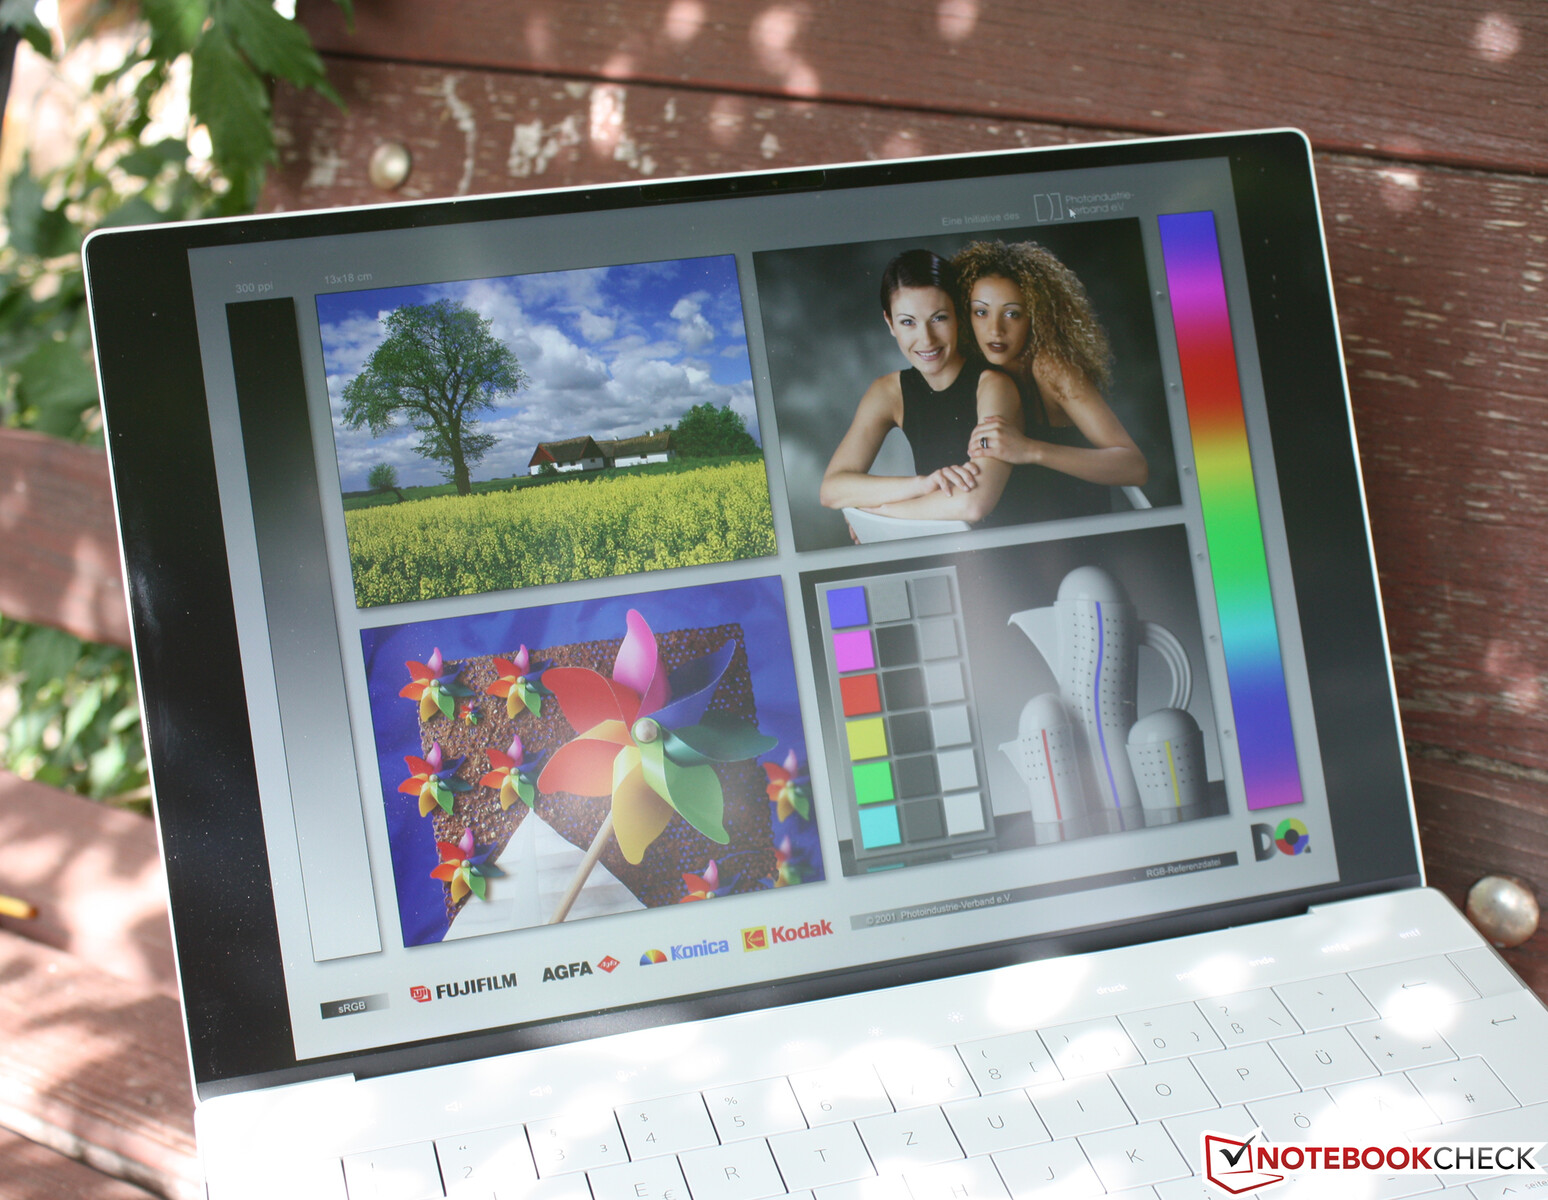
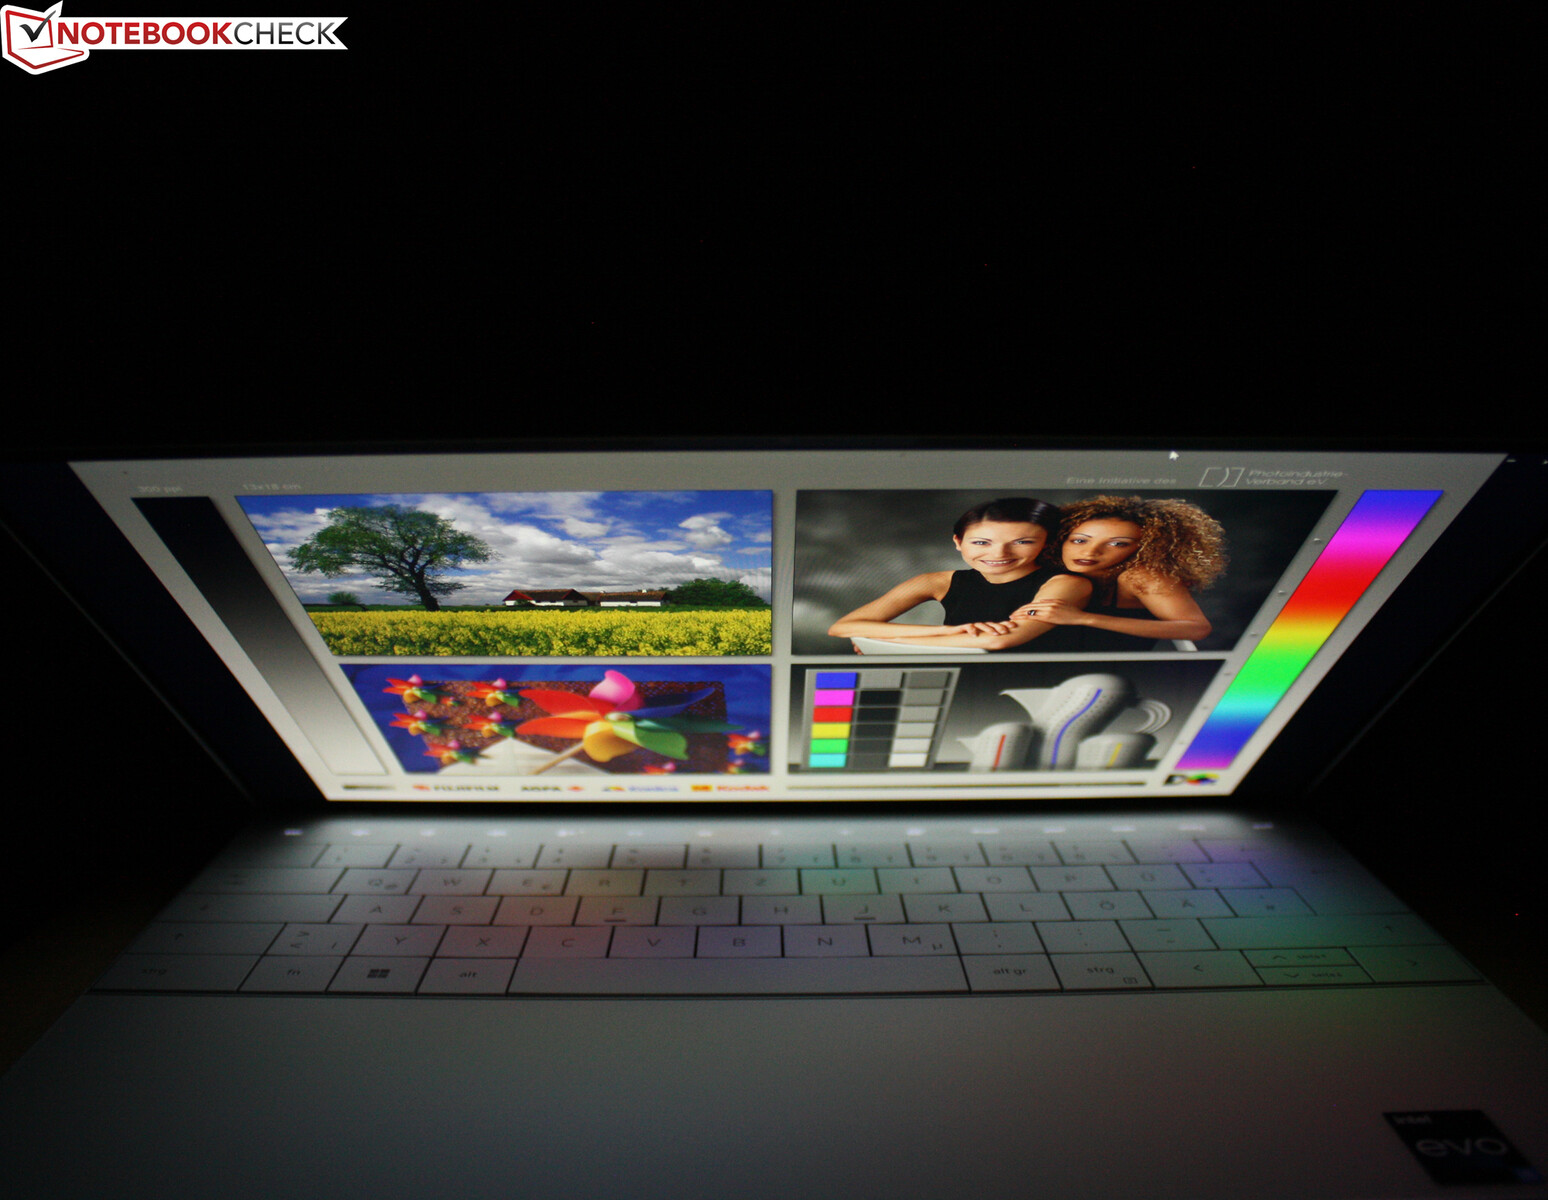
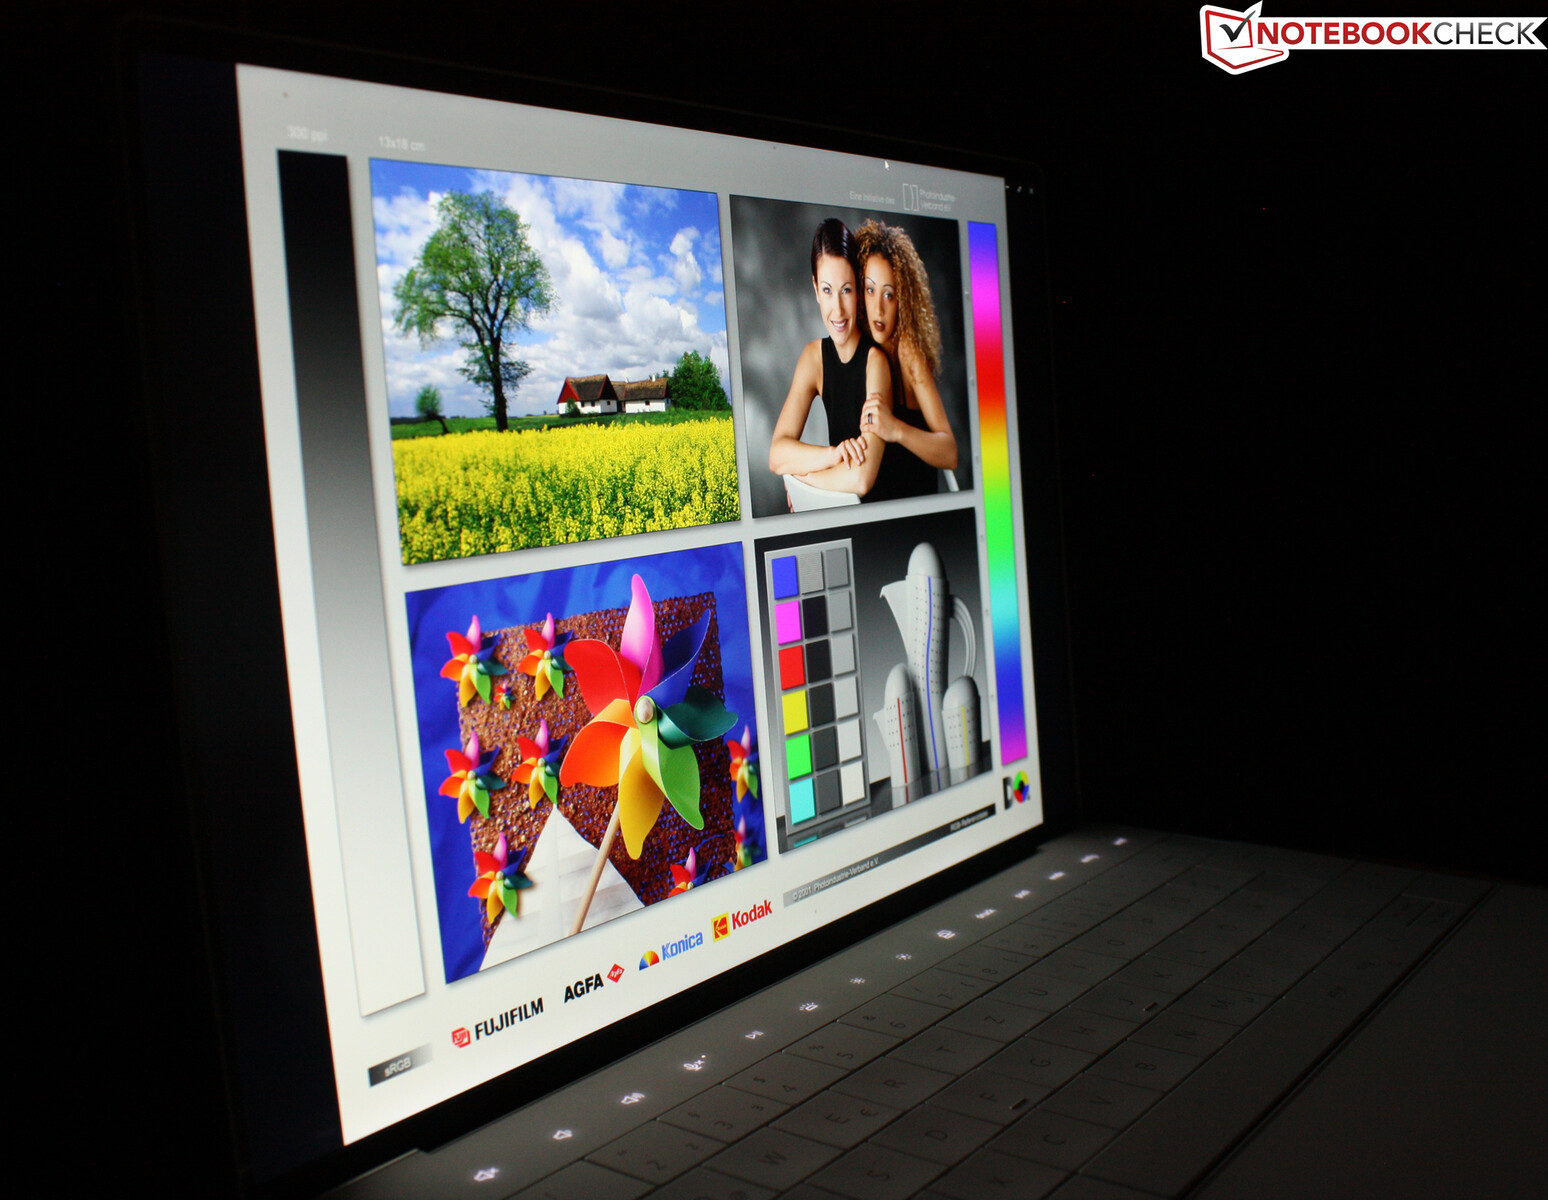
显示屏 - 戴尔次笔记本的明亮面板
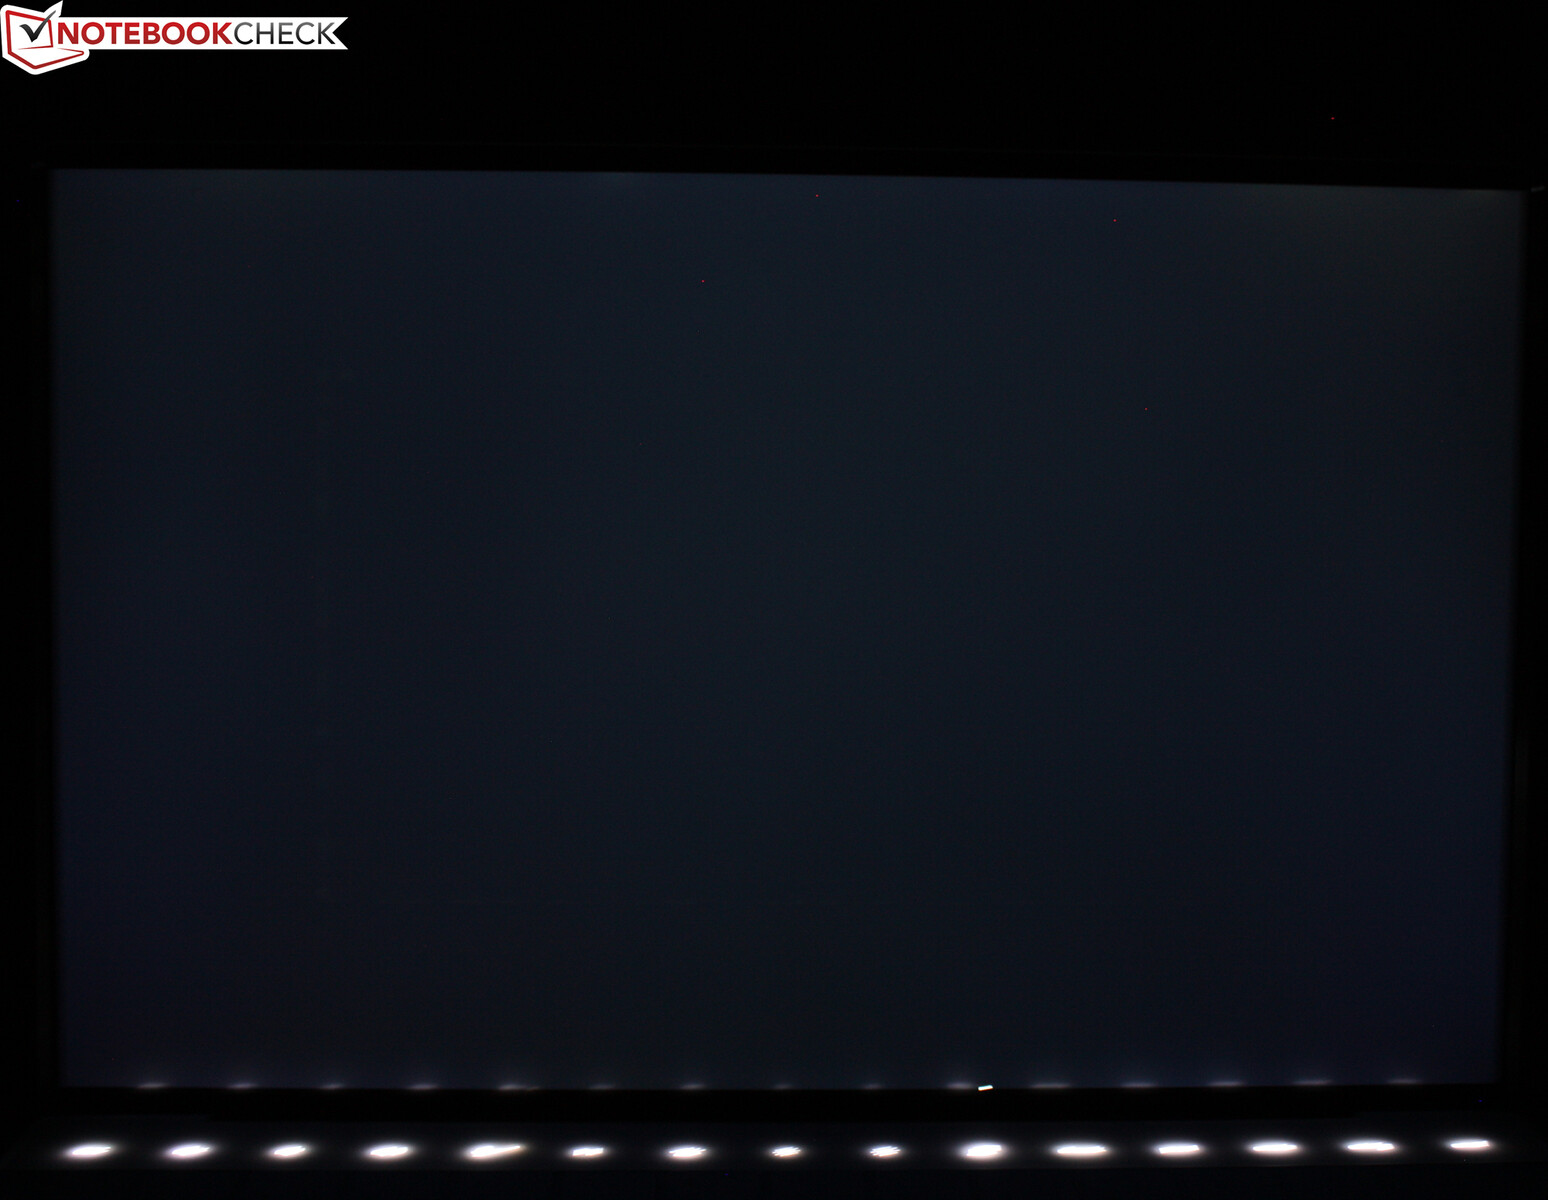
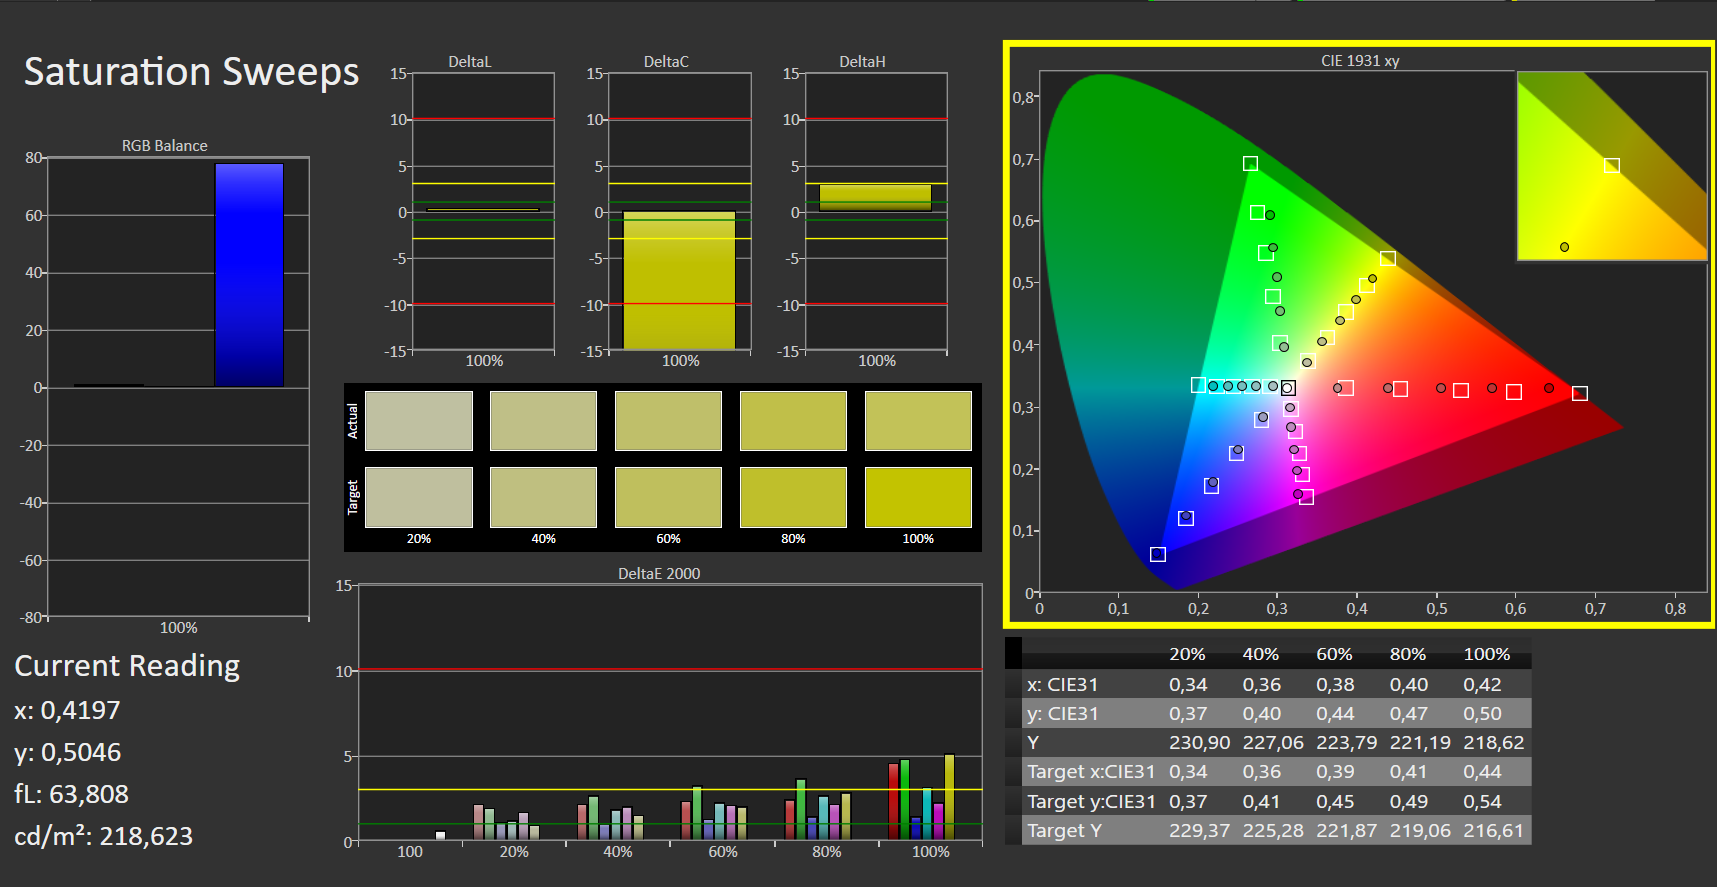
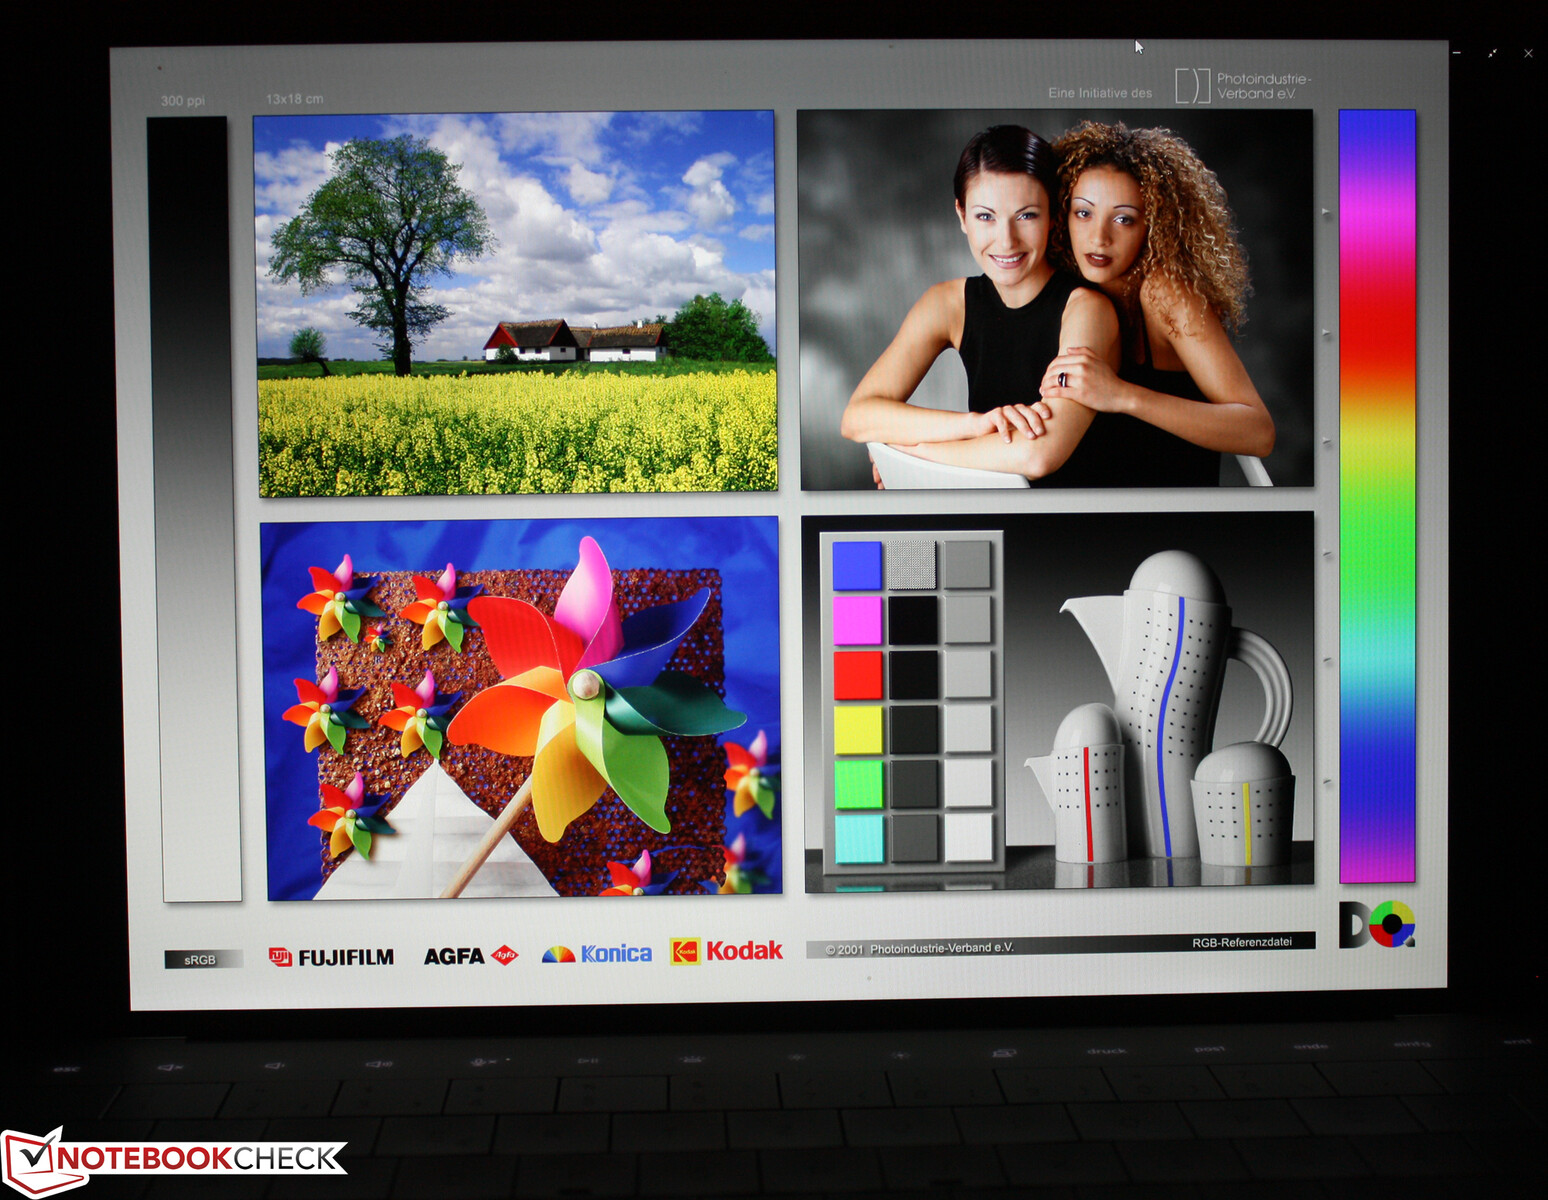
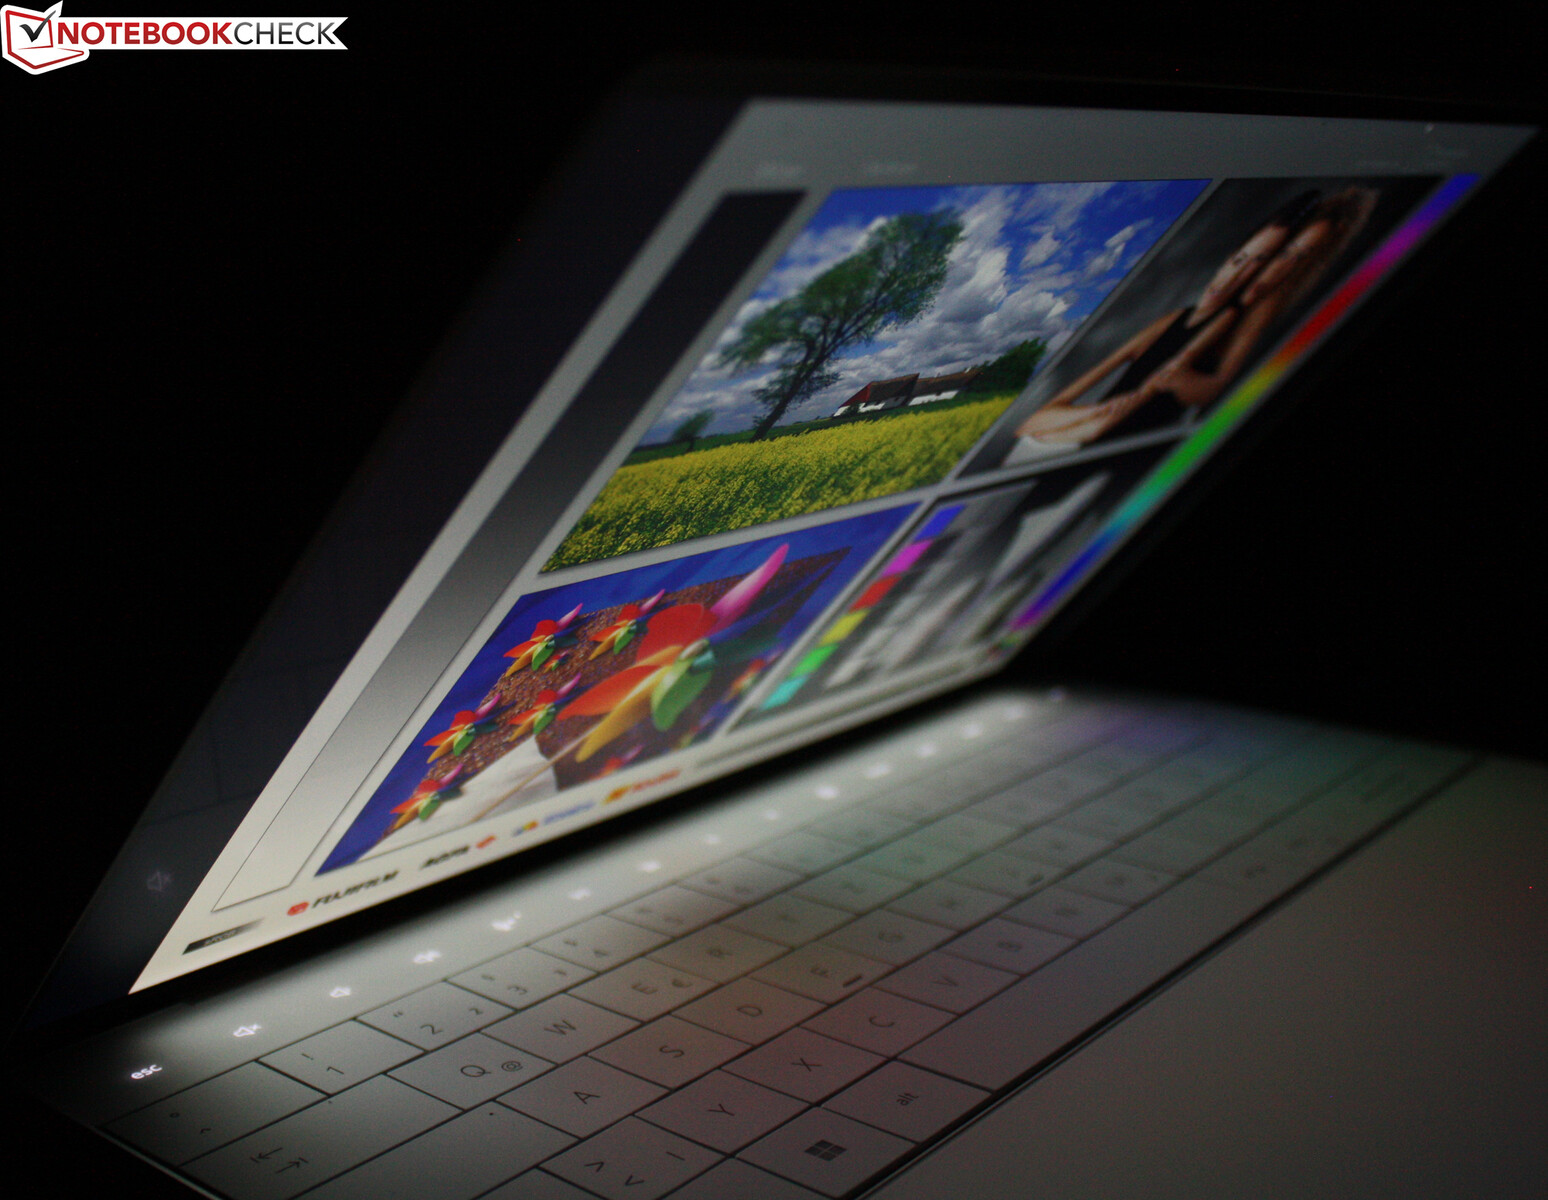
我们的XPS Plus 9320拥有最基本的面板变体,来自夏普的1,920x1,200像素的LQ134N1。它与 XPS 9315入门级型号因此,从对比度到亮度再到色彩空间的所有参数都非常相似。在使用黑色背景和全亮度的情况下,屏幕出血在左上角略微可见。亮度很高,为460 cd/m²(平均),我们发现制造商的500 cd/m²规格是真实的(最大498 cd/m²)。
4K面板在加长版的i7(夏普LQ134R1)在我们的测量中具有相同的亮度,即473 cd/m²(平均),但它的对比度更高。1,764:1而不是940:1;这是支持4K面板的一个论据。Plus版本有一个替代的OLED面板,但我们还没有机会审查它。
电池供电时亮度略有下降,下降了78cd/m²(中心:420cd/m²)。XPS 13 Plus没有使用PWM来降低亮度水平。三张屏幕截图显示了100%、50%和0%亮度下的同质线。
| |||||||||||||||||||||||||
Brightness Distribution: 85 %
Center on Battery: 420 cd/m²
Contrast: 940:1 (Black: 0.53 cd/m²)
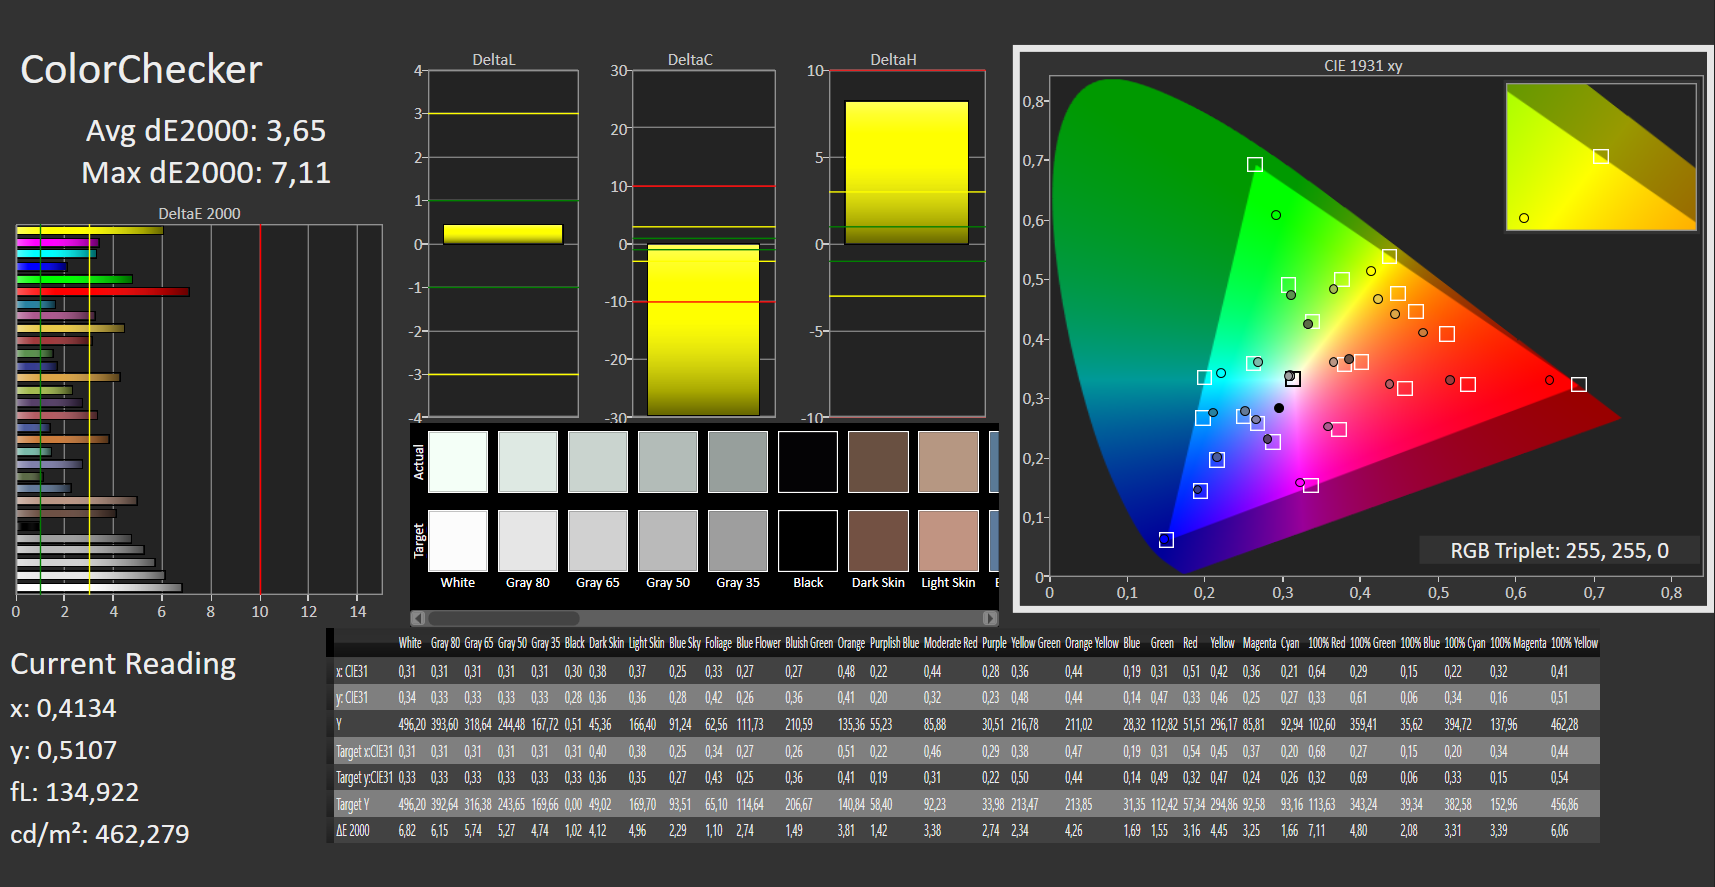
ΔE ColorChecker Calman: 3.65 | ∀{0.5-29.43 Ø4.72}
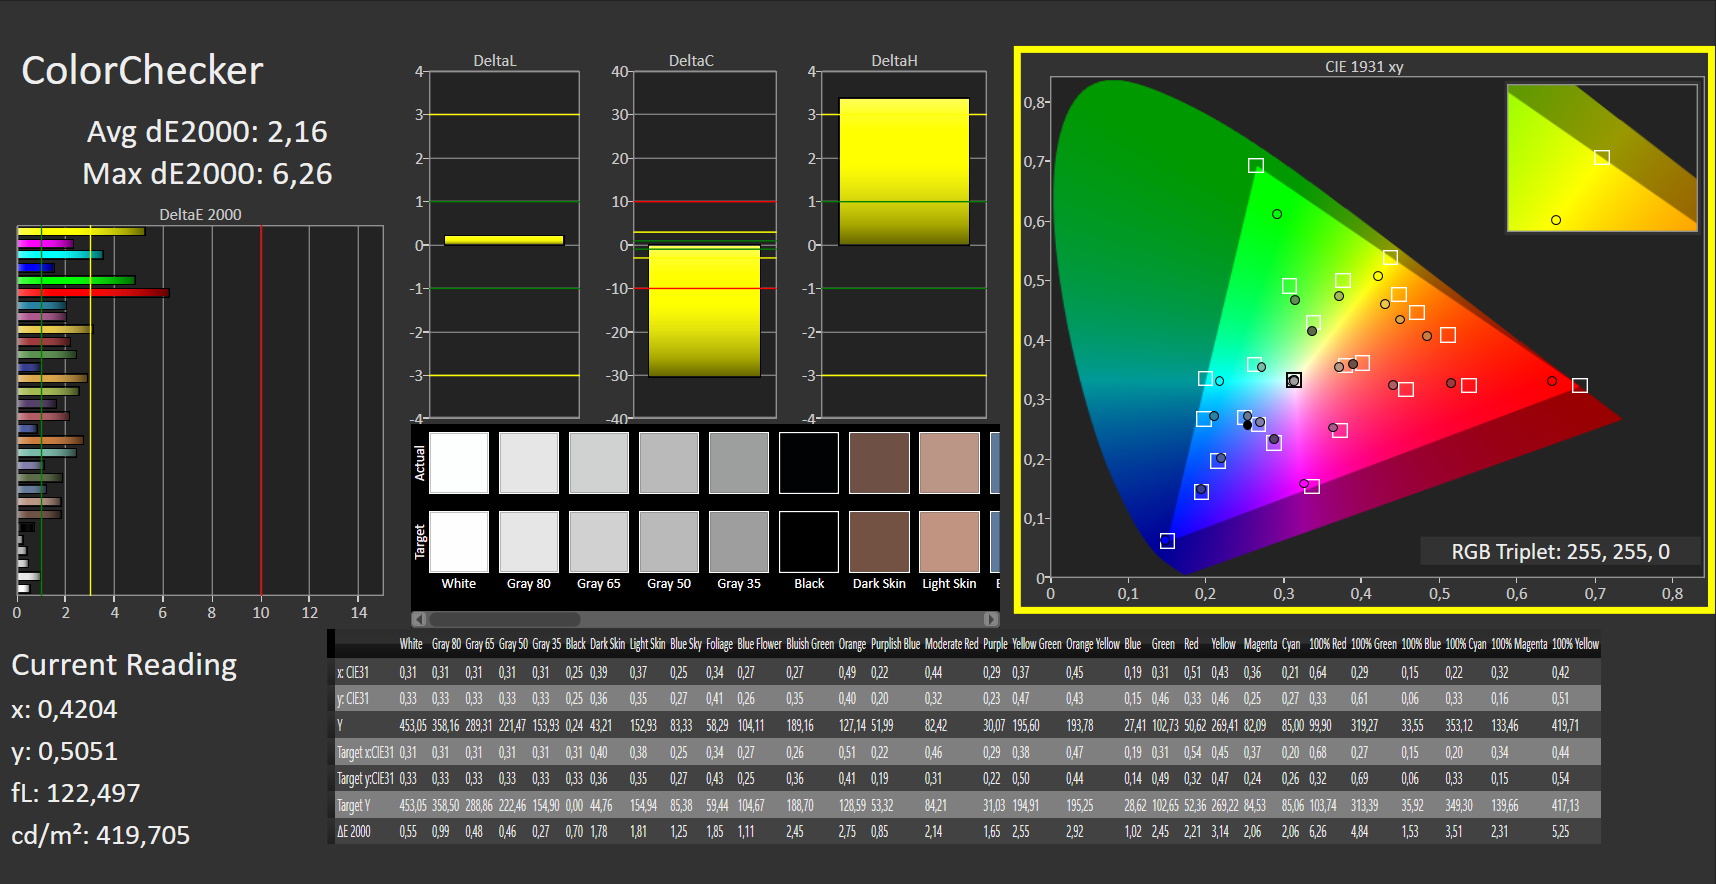
calibrated: 2.16
ΔE Greyscale Calman: 4.25 | ∀{0.09-98 Ø4.97}
71% AdobeRGB 1998 (Argyll 3D)
99% sRGB (Argyll 3D)
69% Display P3 (Argyll 3D)
Gamma: 2.45
CCT: 6690 K
| Dell XPS 13 Plus 9320 i5-1240p Sharp SHP1548 LQ134N1, IPS, 1920x1200, 13.4" | Dell XPS 13 9315, i5-1230U Sharp SHP1548 LQ134N1, IPS, 1920x1200, 13.4" | Dell XPS 13 Plus 9320 4K LQ134R1, IPS, 3840x2400, 13.4" | Apple MacBook Air 2020 M1 Entry IPS, 2560x1600, 13.3" | Asus Zenbook S 13 OLED SDC4172, OLED, 2880x1800, 13.3" | Lenovo ThinkPad X1 Nano-20UN002UGE MND007ZA1-2, IPS, 2160x1350, 13" | Huawei MateBook 13s i5 11300H TL134GDXP02-0, LTPS, 2520x1680, 13.4" | |
|---|---|---|---|---|---|---|---|
| Display | 0% | 6% | 22% | 28% | 1% | -6% | |
| Display P3 Coverage (%) | 69 | 69 0% | 76.5 11% | 98.6 43% | 99.8 45% | 70.4 2% | 65.2 -6% |
| sRGB Coverage (%) | 99 | 100 1% | 100 1% | 100 1% | 100 1% | 99.9 1% | 92 -7% |
| AdobeRGB 1998 Coverage (%) | 71 | 71 0% | 76 7% | 85.9 21% | 97.8 38% | 72 1% | 67.5 -5% |
| Response Times | 3% | 5% | 4% | 94% | -19% | -5% | |
| Response Time Grey 50% / Grey 80% * (ms) | 45 ? | 40 ? 11% | 38.9 ? 14% | 31 ? 31% | 2.1 ? 95% | 46.8 ? -4% | 44.8 ? -0% |
| Response Time Black / White * (ms) | 21 ? | 22 ? -5% | 21.9 ? -4% | 26.1 ? -24% | 1.68 ? 92% | 28 ? -33% | 22.8 ? -9% |
| PWM Frequency (Hz) | 118000 ? | 240.4 ? | 9804 ? | ||||
| Screen | 10% | 28% | 30% | 215% | 39% | 35% | |
| Brightness middle (cd/m²) | 498 | 466 -6% | 494 -1% | 417 -16% | 336 -33% | 460 -8% | 468 -6% |
| Brightness (cd/m²) | 460 | 442 -4% | 474 3% | 395 -14% | 338 -27% | 434 -6% | 450 -2% |
| Brightness Distribution (%) | 85 | 89 5% | 89 5% | 91 7% | 99 16% | 92 8% | 92 8% |
| Black Level * (cd/m²) | 0.53 | 0.4 25% | 0.28 47% | 0.39 26% | 0.02 96% | 0.27 49% | 0.23 57% |
| Contrast (:1) | 940 | 1165 24% | 1764 88% | 1069 14% | 16800 1687% | 1704 81% | 2035 116% |
| Colorchecker dE 2000 * | 3.65 | 3.03 17% | 3.1 15% | 1.12 69% | 1.8 51% | 1.1 70% | 2 45% |
| Colorchecker dE 2000 max. * | 7.11 | 6.68 6% | 4.2 41% | 2.71 62% | 3.8 47% | 4.5 37% | 5.5 23% |
| Colorchecker dE 2000 calibrated * | 2.16 | 2.34 -8% | 1.5 31% | 0.77 64% | 1.8 17% | 1 54% | 1.5 31% |
| Greyscale dE 2000 * | 4.25 | 3.12 27% | 3.2 25% | 1.7 60% | 0.9 79% | 1.6 62% | 2.6 39% |
| Gamma | 2.45 90% | 2.41 91% | 2.41 91% | 2207 0% | 2.22 99% | 2.2 100% | 2.17 101% |
| CCT | 6690 97% | 6418 101% | 6189 105% | 6870 95% | 6580 99% | 6475 100% | 6511 100% |
| Color Space (Percent of AdobeRGB 1998) (%) | 65.7 | ||||||
| Color Space (Percent of sRGB) (%) | 99.9 | ||||||
| Total Average (Program / Settings) | 4% /
7% | 13% /
20% | 19% /
25% | 112% /
157% | 7% /
22% | 8% /
20% |
* ... smaller is better
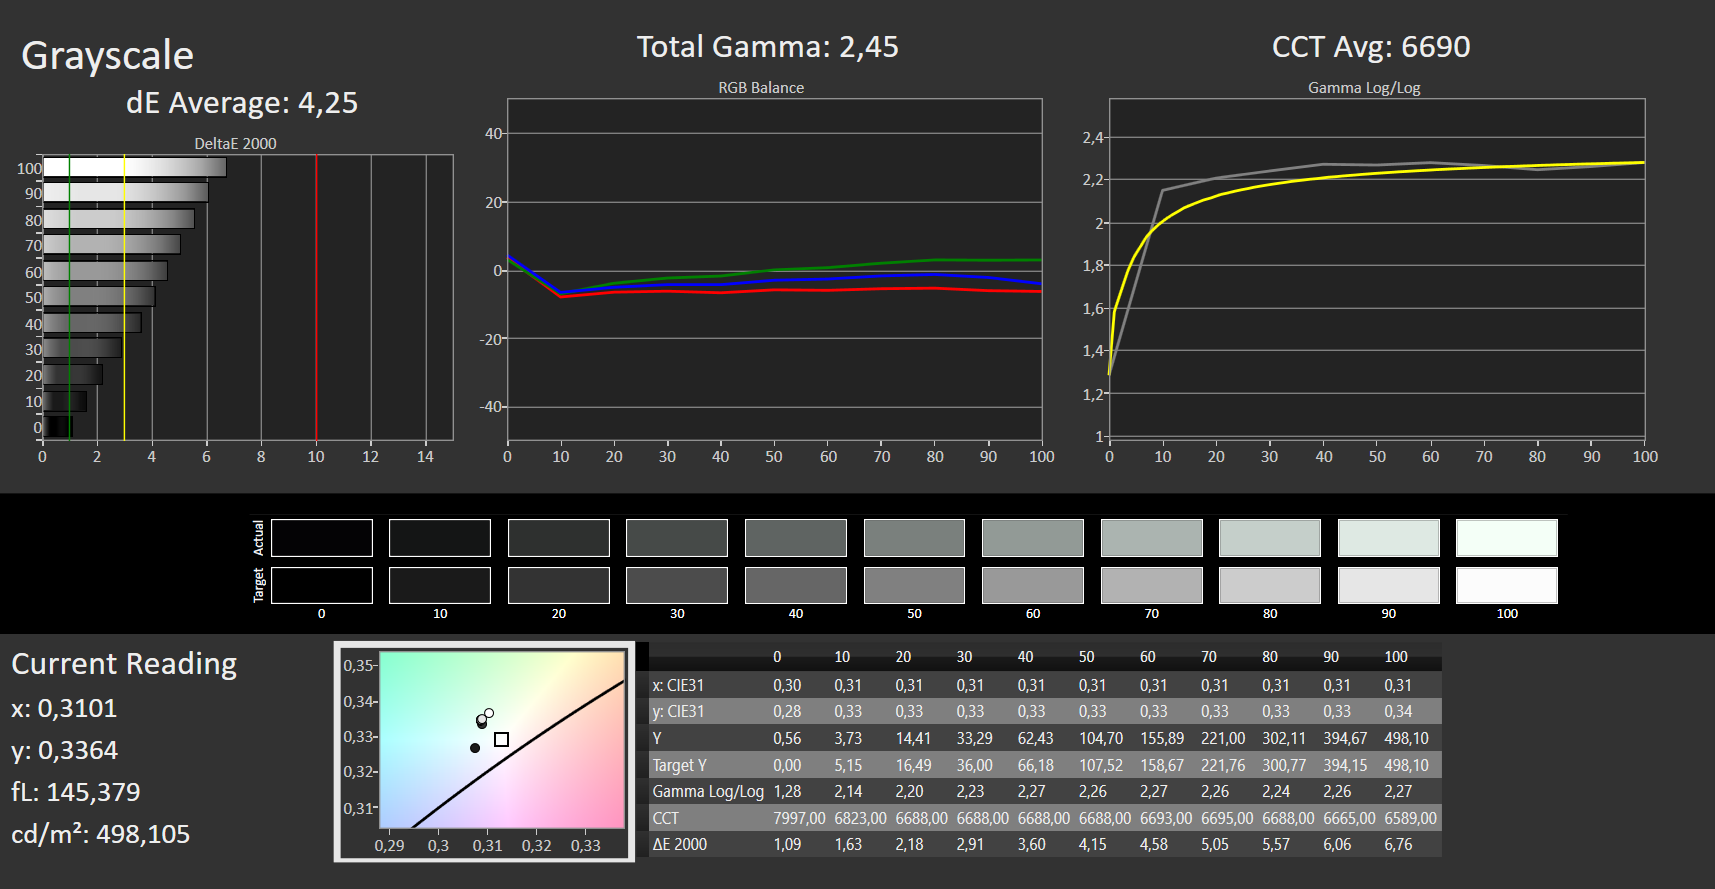
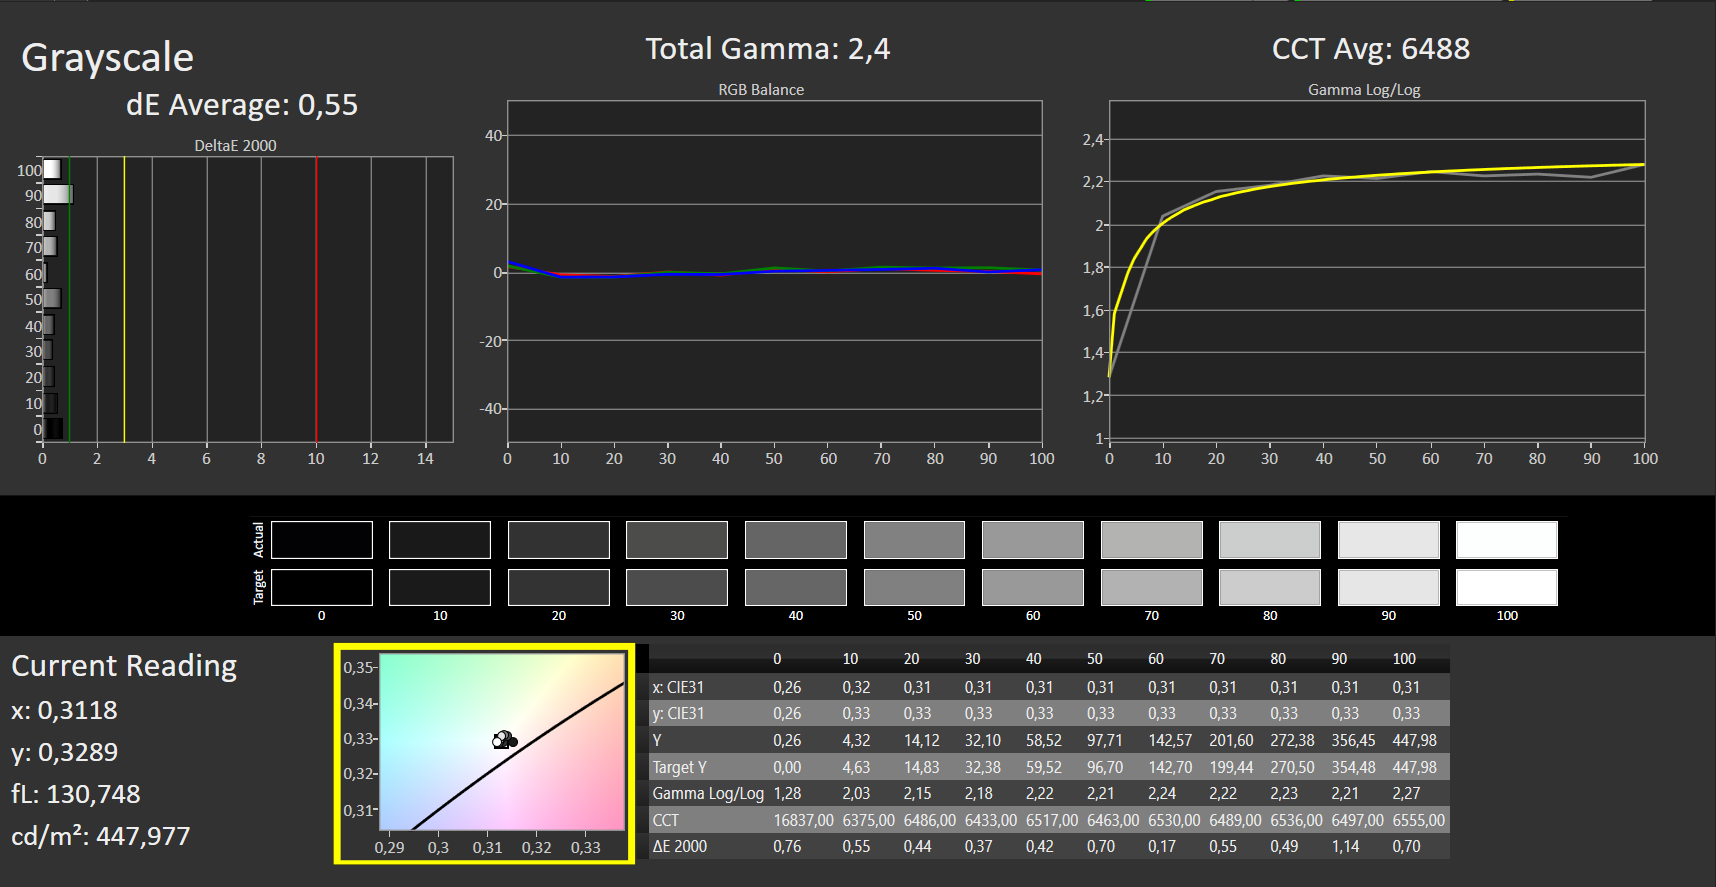
在使用专业的CalMAN软件(X-Rite i1 Pro 2)进行分析时,我们注意到两件事。100%的sRGB都被覆盖。此外,灰度的Delta E值超过4.0,色彩的Delta E值略低于4。这使得校准非常值得推荐,因为它消除了灰色的轻微色彩影响。进行校准的努力得到了低于0.5的优秀Delta E的回报。如果你有相同的显示器配置(夏普LQ134N1),你可以通过使用上面方框中提供的颜色配置文件来增强你的戴尔笔记本电脑。

Display Response Times
| ↔ Response Time Black to White | ||
|---|---|---|
| 21 ms ... rise ↗ and fall ↘ combined | ↗ 8 ms rise |  |
| ↘ 13 ms fall | ||
| The screen shows good response rates in our tests, but may be too slow for competitive gamers. In comparison, all tested devices range from 0.1 (minimum) to 240 (maximum) ms. » 47 % of all devices are better. This means that the measured response time is similar to the average of all tested devices (19.8 ms). | ||
| ↔ Response Time 50% Grey to 80% Grey | ||
| 45 ms ... rise ↗ and fall ↘ combined | ↗ 20 ms rise |  |
| ↘ 25 ms fall | ||
| The screen shows slow response rates in our tests and will be unsatisfactory for gamers. In comparison, all tested devices range from 0.165 (minimum) to 636 (maximum) ms. » 77 % of all devices are better. This means that the measured response time is worse than the average of all tested devices (31 ms). | ||
Screen Flickering / PWM (Pulse-Width Modulation)
| Screen flickering / PWM not detected | ≤ 100 % brightness setting |    | |
In comparison: 52 % of all tested devices do not use PWM to dim the display. If PWM was detected, an average of 7763 (minimum: 5 - maximum: 343500) Hz was measured. | |||
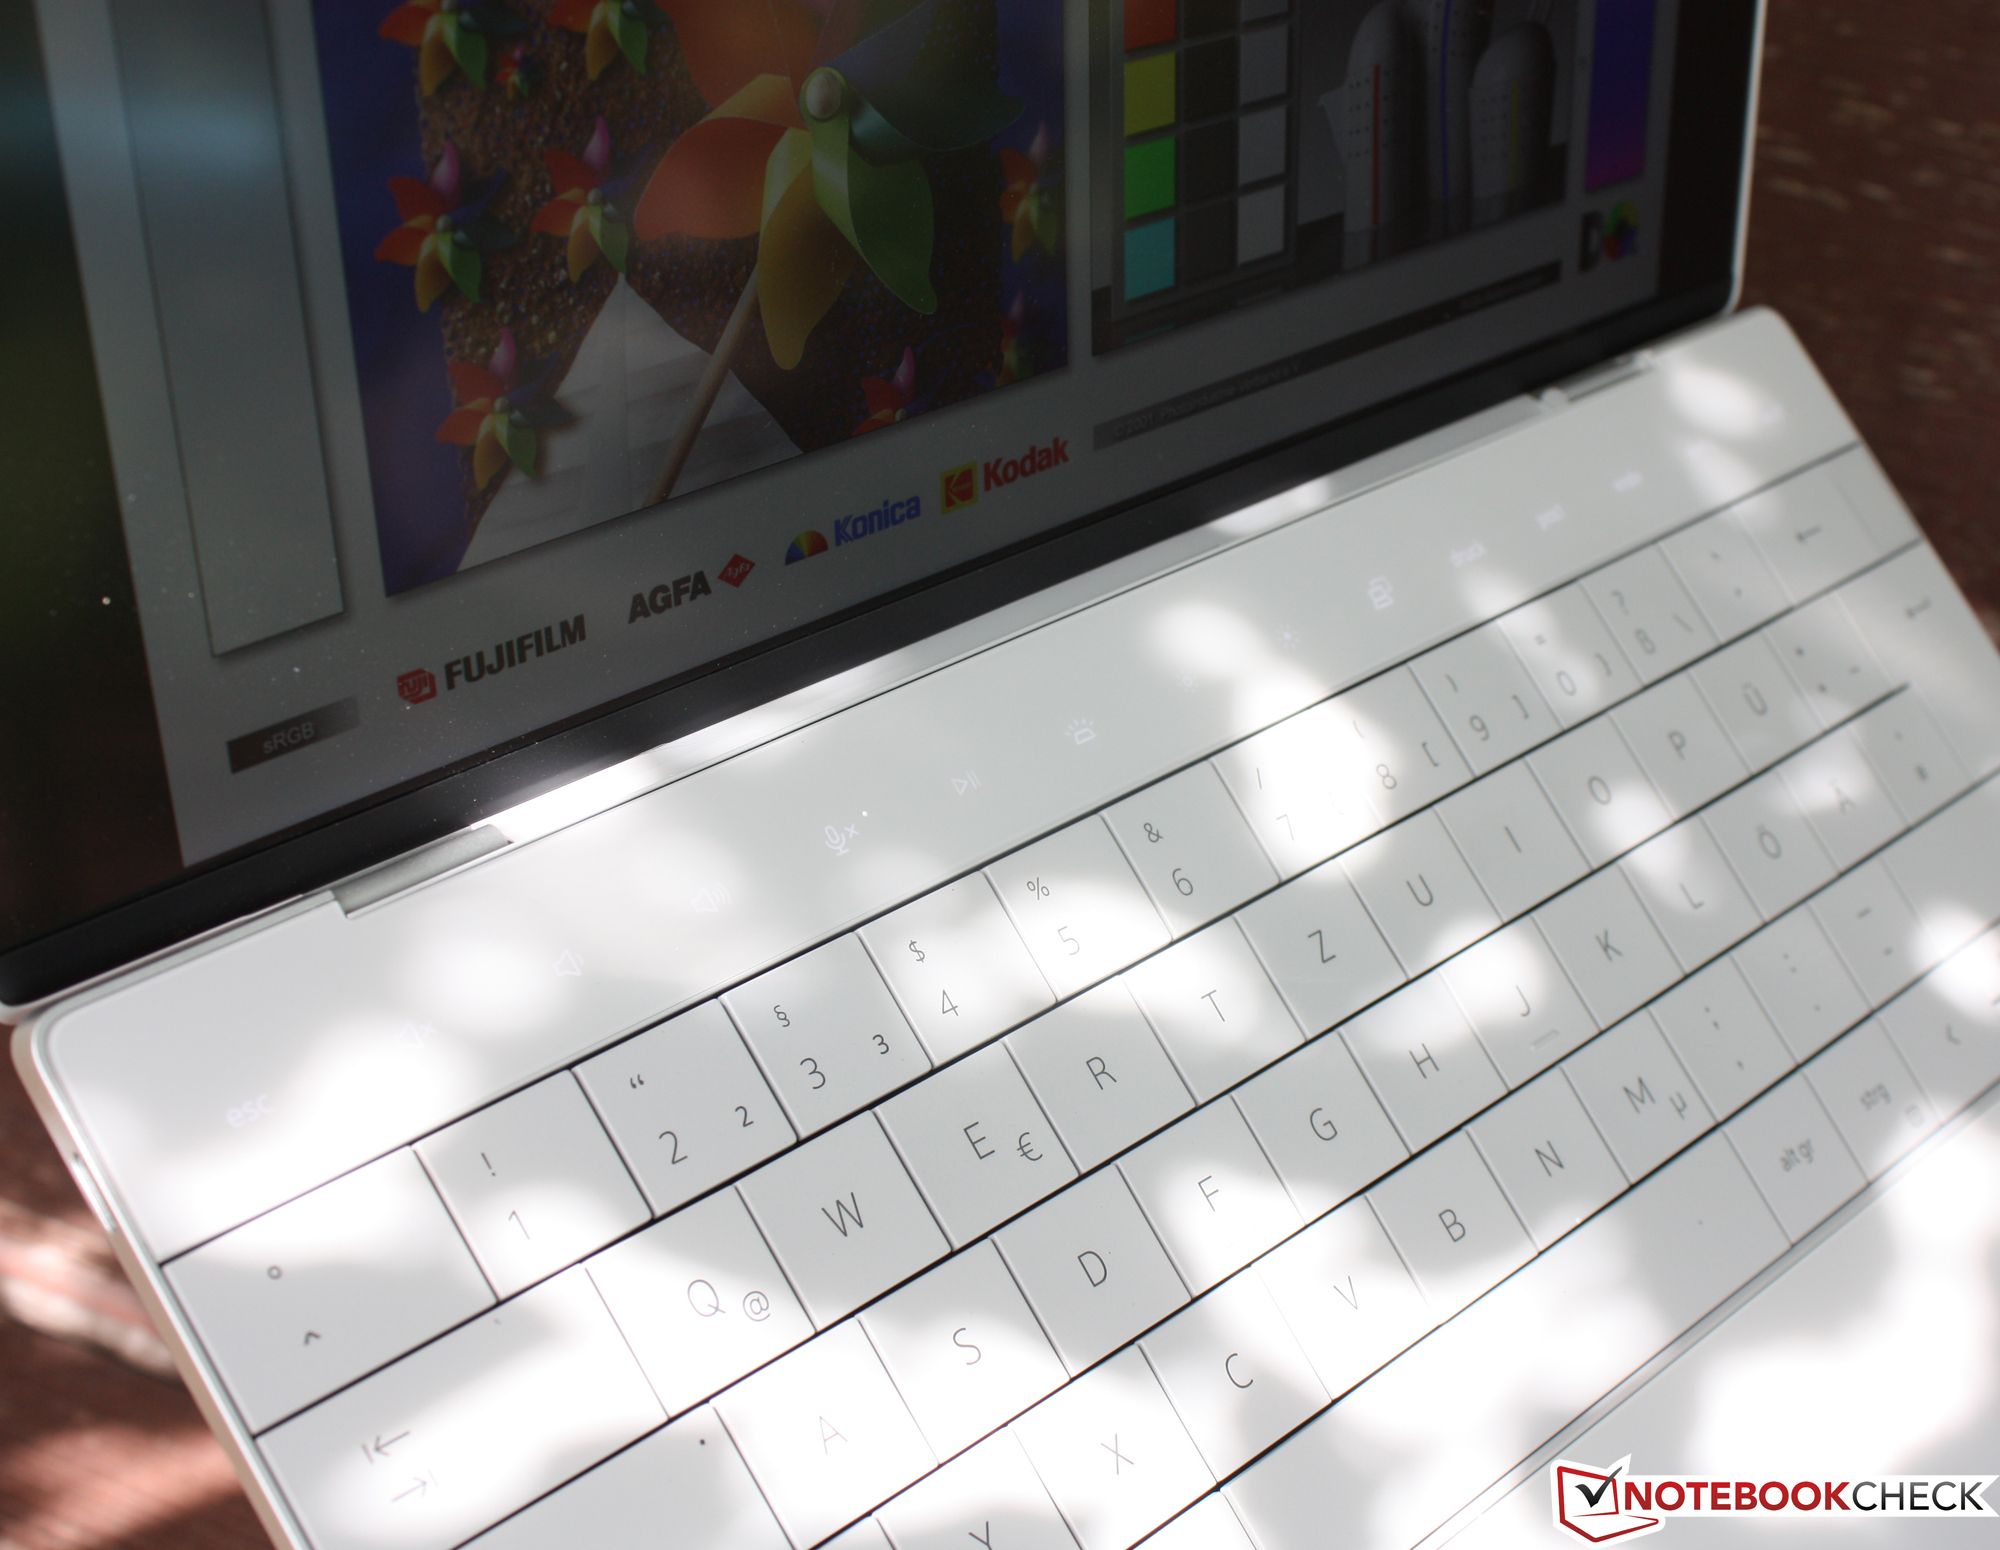
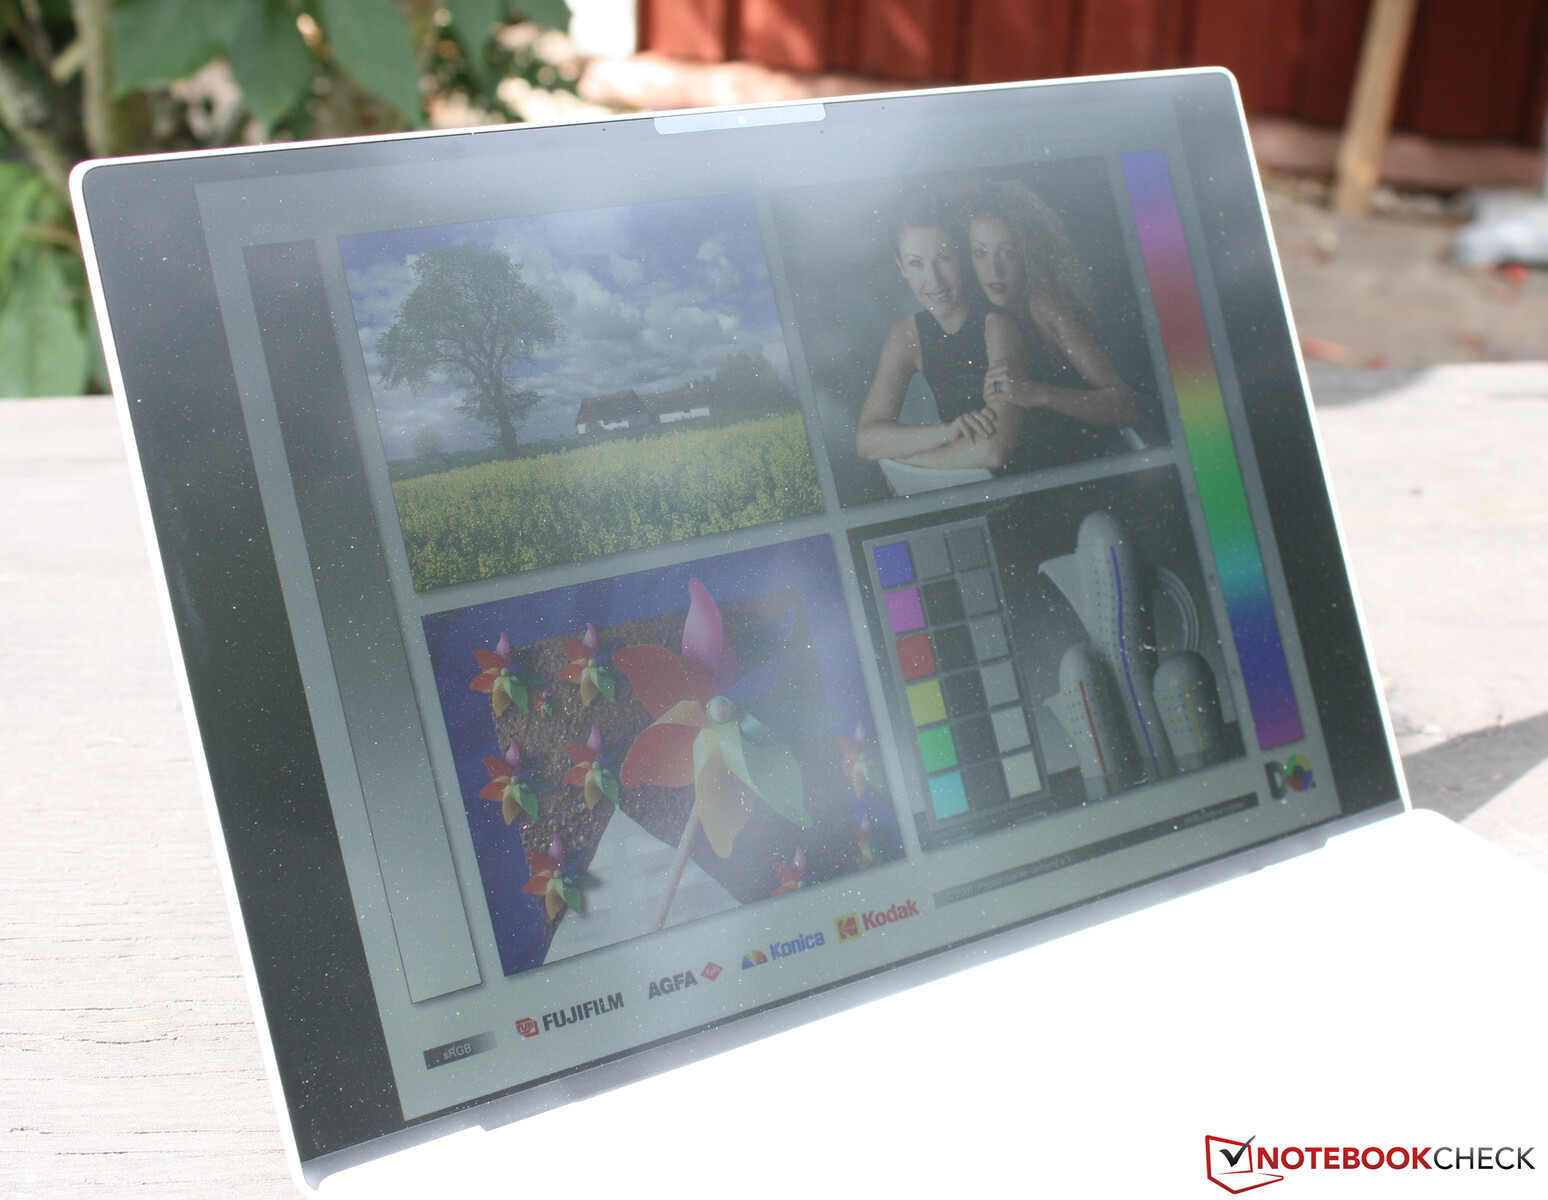
抗反射的全高清面板在阳光下以其400尼特的亮度发挥作用,但在阳光下难以避免暗淡的反射。
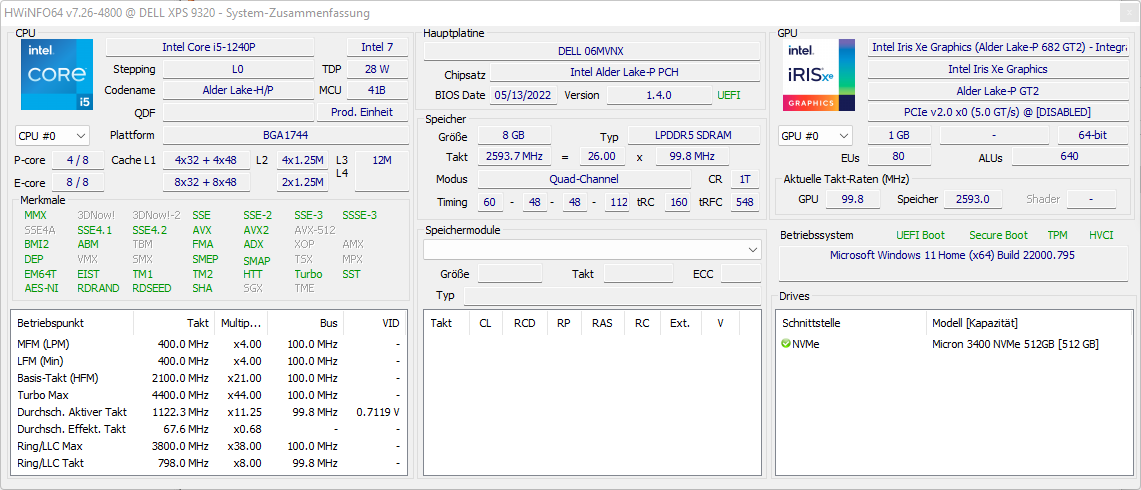
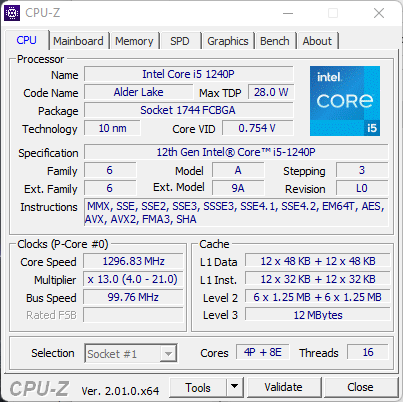
性能 - 英特尔i5的持续功率较小
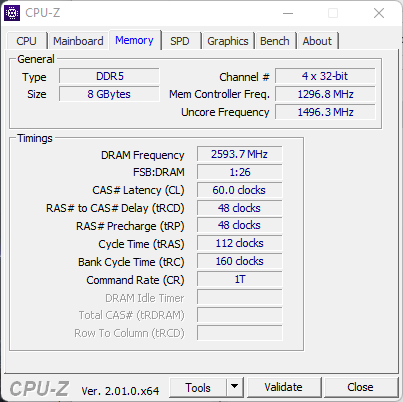
XPS 13 Plus专门配备了Alder Lake P处理器,即配备了酷睿i5-1240P和酷睿i7-1260P(每种情况下有4个性能核心和8个效率核心),或者使用有两个额外性能核心的Core i7-1280P。用户可以选择8、16或32GB的内存(LPDDR5-5200);32GB的内存只适用于与i7 CPU之一的组合。我们的测试设备必须管理8GB的LPDDR5内存;内存是集成的,但以双通道模式连接。一个来自美光的512GB M.2固态硬盘完善了该套装。固态硬盘是插槽式的。
测试条件
戴尔在预装的电源管理器中提供了四种不同的性能配置文件(优化、安静、超性能和冷却),但我们不会再看冷却配置文件。我们使用超性能模式进行了以下基准测试和测量。有了两个风扇,XPS 13 Plus的冷却性能对于一个紧凑型设备来说是相当不错的。在日常使用和短期峰值负载期间,即使在这种模式下,该设备也经常保持沉默。在CPU最大负荷下,两个风扇的声音有点大,但性能也是不错的回报。理论上,该处理器在所有三种模式下可消耗64瓦,但只有超性能模式能够从Cinebench R15开始保持PL1的性能限制(59瓦)。
处理器
凭借其4个性能和8个效率核心的特点。酷睿i5-1240P在性能方面名列前茅,我们的CPU性能评级如下。1260P位居榜首,其次是 Ryzen 7 6800U.P核的运行速度高达4.4GHz,但这只是在单核负载下实现的。这正是在日常使用中仍然很重要的那种负载,这就是为什么看一下单核结果是可取的。Alder Lake P芯片在这里稍微领先(Cinebench),其次是AMD 6800U再次领先。不过,根据基准测试的不同,也有急剧偏离的情况,如Apple M1在Blender测试中的表现。
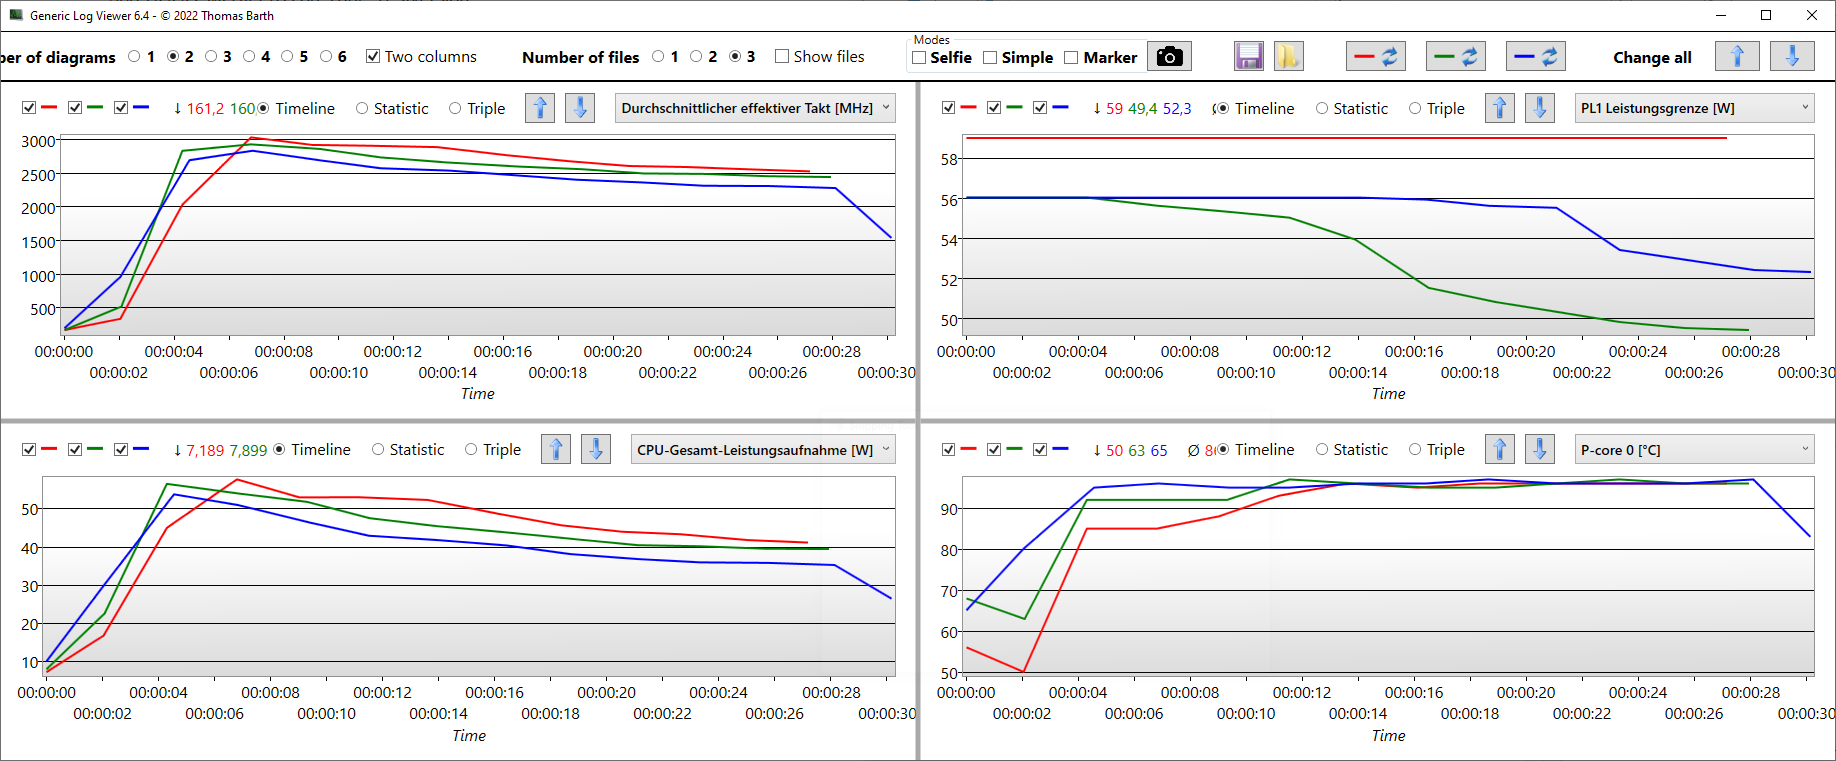
我们在三种性能模式下运行Cinebench R15 Multi基准测试。在超性能(红色)下,允许有59瓦的PL1,3.0GHz的时钟速率也是最高的。优化模式将PL1降低到56瓦,安静模式也是如此。然而,时钟速度在安静模式下仅5秒后就开始逐渐节流,这就是为什么PL1随后下降到略低于50瓦(PL2:48瓦),而时钟速度相应下降到2.5GHz。
在Cinebench R15多重循环中,时钟速度增加到3.0 GHz,然后下降到2.5 GHz,同时总功耗也下降。由于P核已经加热到95℃(约203°F),在R15循环的所有后续运行中,时钟速度不断降低,这就是为什么分数也会下降。在大约20次运行后,分数不再是1591分,而是只有1213分。这是一个24%的损失。的i5-1230U在 入门级的XPS落后了500分左右。事实再次证明,AMD的竞争是稳固的,无法将其从宝座上击落。华硕华硕Zenbook S13 OLED在R15排行榜上领先。
Cinebench的多循环再一次证实了Alder Lake处理器的弱点。起初,多核性能几乎与目前的AMD Ryzen 7 6800U,后者的功耗明显更低,最大为30瓦。随后,XPS 13 Plus中的i5/i7定格在34瓦,但它的性能低于ZenBook S 13中的6800U。禅书S 1325瓦的性能。
Cinebench R15 Multi endurance test
Cinebench R15: CPU Single 64Bit | CPU Multi 64Bit
Cinebench R20: CPU (Multi Core) | CPU (Single Core)
Cinebench R23: Multi Core | Single Core
Blender: v2.79 BMW27 CPU
7-Zip 18.03: 7z b 4 | 7z b 4 -mmt1
LibreOffice : 20 Documents To PDF
R Benchmark 2.5: Overall mean
HWBOT x265 Benchmark v2.2: 4k Preset
| CPU Performance rating | |
| Average of class Subnotebook | |
| Dell XPS 13 Plus 9320 4K | |
| Asus Zenbook S 13 OLED | |
| Dell XPS 13 Plus 9320 i5-1240p | |
| Average Intel Core i5-1240P | |
| Apple MacBook Air 2020 M1 Entry -1! | |
| Huawei MateBook 13s i5 11300H | |
| Lenovo ThinkPad X1 Nano-20UN002UGE -1! | |
| Cinebench R15 / CPU Single 64Bit | |
| Average of class Subnotebook (72.4 - 322, n=56, last 2 years) | |
| Dell XPS 13 Plus 9320 4K | |
| Asus Zenbook S 13 OLED | |
| Dell XPS 13 Plus 9320 i5-1240p | |
| Apple MacBook Air 2020 M1 Entry | |
| Lenovo ThinkPad X1 Nano-20UN002UGE | |
| Huawei MateBook 13s i5 11300H | |
| Average Intel Core i5-1240P (91.8 - 243, n=18) | |
| Cinebench R15 / CPU Multi 64Bit | |
| Average of class Subnotebook (327 - 3345, n=56, last 2 years) | |
| Asus Zenbook S 13 OLED | |
| Dell XPS 13 Plus 9320 4K | |
| Dell XPS 13 Plus 9320 4K | |
| Dell XPS 13 Plus 9320 i5-1240p | |
| Average Intel Core i5-1240P (407 - 2007, n=19) | |
| Apple MacBook Air 2020 M1 Entry | |
| Huawei MateBook 13s i5 11300H | |
| Huawei MateBook 13s i5 11300H | |
| Lenovo ThinkPad X1 Nano-20UN002UGE | |
| Cinebench R20 / CPU (Multi Core) | |
| Average of class Subnotebook (579 - 8541, n=56, last 2 years) | |
| Asus Zenbook S 13 OLED | |
| Dell XPS 13 Plus 9320 4K | |
| Dell XPS 13 Plus 9320 i5-1240p | |
| Average Intel Core i5-1240P (763 - 4456, n=16) | |
| Huawei MateBook 13s i5 11300H | |
| Apple MacBook Air 2020 M1 Entry | |
| Lenovo ThinkPad X1 Nano-20UN002UGE | |
| Cinebench R20 / CPU (Single Core) | |
| Average of class Subnotebook (128 - 832, n=56, last 2 years) | |
| Dell XPS 13 Plus 9320 4K | |
| Dell XPS 13 Plus 9320 i5-1240p | |
| Asus Zenbook S 13 OLED | |
| Average Intel Core i5-1240P (251 - 653, n=16) | |
| Lenovo ThinkPad X1 Nano-20UN002UGE | |
| Huawei MateBook 13s i5 11300H | |
| Apple MacBook Air 2020 M1 Entry | |
| Cinebench R23 / Multi Core | |
| Average of class Subnotebook (1555 - 21812, n=59, last 2 years) | |
| Asus Zenbook S 13 OLED | |
| Dell XPS 13 Plus 9320 4K | |
| Dell XPS 13 Plus 9320 i5-1240p | |
| Average Intel Core i5-1240P (277 - 11556, n=20) | |
| Apple MacBook Air 2020 M1 Entry | |
| Lenovo ThinkPad X1 Nano-20UN002UGE | |
| Huawei MateBook 13s i5 11300H | |
| Cinebench R23 / Single Core | |
| Average of class Subnotebook (358 - 2213, n=60, last 2 years) | |
| Dell XPS 13 Plus 9320 4K | |
| Dell XPS 13 Plus 9320 i5-1240p | |
| Apple MacBook Air 2020 M1 Entry | |
| Asus Zenbook S 13 OLED | |
| Average Intel Core i5-1240P (640 - 1689, n=18) | |
| Huawei MateBook 13s i5 11300H | |
| Blender / v2.79 BMW27 CPU | |
| Apple MacBook Air 2020 M1 Entry | |
| Lenovo ThinkPad X1 Nano-20UN002UGE | |
| Huawei MateBook 13s i5 11300H | |
| Average Intel Core i5-1240P (285 - 1926, n=16) | |
| Average of class Subnotebook (159 - 2271, n=57, last 2 years) | |
| Dell XPS 13 Plus 9320 i5-1240p | |
| Dell XPS 13 Plus 9320 4K | |
| Asus Zenbook S 13 OLED | |
| 7-Zip 18.03 / 7z b 4 | |
| Asus Zenbook S 13 OLED | |
| Average of class Subnotebook (11668 - 77867, n=56, last 2 years) | |
| Dell XPS 13 Plus 9320 4K | |
| Dell XPS 13 Plus 9320 i5-1240p | |
| Apple MacBook Air 2020 M1 Entry | |
| Average Intel Core i5-1240P (7254 - 47002, n=16) | |
| Huawei MateBook 13s i5 11300H | |
| Lenovo ThinkPad X1 Nano-20UN002UGE | |
| 7-Zip 18.03 / 7z b 4 -mmt1 | |
| Average of class Subnotebook (2643 - 6699, n=58, last 2 years) | |
| Apple MacBook Air 2020 M1 Entry | |
| Asus Zenbook S 13 OLED | |
| Dell XPS 13 Plus 9320 4K | |
| Huawei MateBook 13s i5 11300H | |
| Dell XPS 13 Plus 9320 i5-1240p | |
| Lenovo ThinkPad X1 Nano-20UN002UGE | |
| Average Intel Core i5-1240P (2197 - 5320, n=16) | |
| LibreOffice / 20 Documents To PDF | |
| Dell XPS 13 Plus 9320 i5-1240p | |
| Average Intel Core i5-1240P (46.4 - 120.5, n=16) | |
| Average of class Subnotebook (39.9 - 220, n=55, last 2 years) | |
| Asus Zenbook S 13 OLED | |
| Lenovo ThinkPad X1 Nano-20UN002UGE | |
| Huawei MateBook 13s i5 11300H | |
| Dell XPS 13 Plus 9320 4K | |
| Apple MacBook Air 2020 M1 Entry | |
| R Benchmark 2.5 / Overall mean | |
| Apple MacBook Air 2020 M1 Entry | |
| Lenovo ThinkPad X1 Nano-20UN002UGE | |
| Huawei MateBook 13s i5 11300H | |
| Average Intel Core i5-1240P (0.4987 - 1.236, n=16) | |
| Asus Zenbook S 13 OLED | |
| Average of class Subnotebook (0.4024 - 1.456, n=57, last 2 years) | |
| Dell XPS 13 Plus 9320 i5-1240p | |
| Dell XPS 13 Plus 9320 4K | |
| HWBOT x265 Benchmark v2.2 / 4k Preset | |
| Average of class Subnotebook (0.97 - 25.1, n=56, last 2 years) | |
| Asus Zenbook S 13 OLED | |
| Dell XPS 13 Plus 9320 4K | |
| Dell XPS 13 Plus 9320 i5-1240p | |
| Average Intel Core i5-1240P (1.99 - 12.9, n=16) | |
| Huawei MateBook 13s i5 11300H | |
| Lenovo ThinkPad X1 Nano-20UN002UGE | |
* ... smaller is better
AIDA64: FP32 Ray-Trace | FPU Julia | CPU SHA3 | CPU Queen | FPU SinJulia | FPU Mandel | CPU AES | CPU ZLib | FP64 Ray-Trace | CPU PhotoWorxx
| Performance rating | |
| Asus Zenbook S 13 OLED | |
| Average of class Subnotebook | |
| Huawei MateBook 13s i5 11300H | |
| Dell XPS 13 Plus 9320 4K | |
| Dell XPS 13 Plus 9320 i5-1240p | |
| Average Intel Core i5-1240P | |
| Lenovo ThinkPad X1 Nano-20UN002UGE | |
| AIDA64 / FP32 Ray-Trace | |
| Average of class Subnotebook (1135 - 32888, n=57, last 2 years) | |
| Asus Zenbook S 13 OLED | |
| Huawei MateBook 13s i5 11300H | |
| Lenovo ThinkPad X1 Nano-20UN002UGE | |
| Average Intel Core i5-1240P (2405 - 9694, n=16) | |
| Dell XPS 13 Plus 9320 4K | |
| Dell XPS 13 Plus 9320 i5-1240p | |
| AIDA64 / FPU Julia | |
| Asus Zenbook S 13 OLED | |
| Average of class Subnotebook (5218 - 123315, n=57, last 2 years) | |
| Huawei MateBook 13s i5 11300H | |
| Average Intel Core i5-1240P (7407 - 49934, n=16) | |
| Lenovo ThinkPad X1 Nano-20UN002UGE | |
| Dell XPS 13 Plus 9320 4K | |
| Dell XPS 13 Plus 9320 i5-1240p | |
| AIDA64 / CPU SHA3 | |
| Average of class Subnotebook (444 - 5287, n=57, last 2 years) | |
| Asus Zenbook S 13 OLED | |
| Huawei MateBook 13s i5 11300H | |
| Lenovo ThinkPad X1 Nano-20UN002UGE | |
| Dell XPS 13 Plus 9320 4K | |
| Dell XPS 13 Plus 9320 i5-1240p | |
| Average Intel Core i5-1240P (415 - 2462, n=16) | |
| AIDA64 / CPU Queen | |
| Asus Zenbook S 13 OLED | |
| Dell XPS 13 Plus 9320 4K | |
| Dell XPS 13 Plus 9320 i5-1240p | |
| Average Intel Core i5-1240P (29405 - 76736, n=16) | |
| Average of class Subnotebook (10579 - 95002, n=49, last 2 years) | |
| Huawei MateBook 13s i5 11300H | |
| Lenovo ThinkPad X1 Nano-20UN002UGE | |
| AIDA64 / FPU SinJulia | |
| Asus Zenbook S 13 OLED | |
| Average of class Subnotebook (744 - 18418, n=57, last 2 years) | |
| Dell XPS 13 Plus 9320 4K | |
| Dell XPS 13 Plus 9320 i5-1240p | |
| Average Intel Core i5-1240P (2135 - 6540, n=16) | |
| Huawei MateBook 13s i5 11300H | |
| Lenovo ThinkPad X1 Nano-20UN002UGE | |
| AIDA64 / FPU Mandel | |
| Asus Zenbook S 13 OLED | |
| Average of class Subnotebook (3341 - 65433, n=57, last 2 years) | |
| Huawei MateBook 13s i5 11300H | |
| Lenovo ThinkPad X1 Nano-20UN002UGE | |
| Average Intel Core i5-1240P (5113 - 23992, n=16) | |
| Dell XPS 13 Plus 9320 i5-1240p | |
| Dell XPS 13 Plus 9320 4K | |
| AIDA64 / CPU AES | |
| Asus Zenbook S 13 OLED | |
| Huawei MateBook 13s i5 11300H | |
| Lenovo ThinkPad X1 Nano-20UN002UGE | |
| Average of class Subnotebook (638 - 96917, n=57, last 2 years) | |
| Average Intel Core i5-1240P (8849 - 90370, n=16) | |
| Dell XPS 13 Plus 9320 i5-1240p | |
| Dell XPS 13 Plus 9320 4K | |
| AIDA64 / CPU ZLib | |
| Average of class Subnotebook (164.9 - 1379, n=57, last 2 years) | |
| Dell XPS 13 Plus 9320 4K | |
| Dell XPS 13 Plus 9320 i5-1240p | |
| Asus Zenbook S 13 OLED | |
| Average Intel Core i5-1240P (101.6 - 812, n=16) | |
| Huawei MateBook 13s i5 11300H | |
| Lenovo ThinkPad X1 Nano-20UN002UGE | |
| AIDA64 / FP64 Ray-Trace | |
| Average of class Subnotebook (610 - 17495, n=57, last 2 years) | |
| Asus Zenbook S 13 OLED | |
| Huawei MateBook 13s i5 11300H | |
| Lenovo ThinkPad X1 Nano-20UN002UGE | |
| Average Intel Core i5-1240P (1154 - 5258, n=16) | |
| Dell XPS 13 Plus 9320 4K | |
| Dell XPS 13 Plus 9320 i5-1240p | |
| AIDA64 / CPU PhotoWorxx | |
| Average of class Subnotebook (6569 - 85600, n=57, last 2 years) | |
| Dell XPS 13 Plus 9320 4K | |
| Dell XPS 13 Plus 9320 i5-1240p | |
| Lenovo ThinkPad X1 Nano-20UN002UGE | |
| Huawei MateBook 13s i5 11300H | |
| Average Intel Core i5-1240P (11873 - 43661, n=16) | |
| Asus Zenbook S 13 OLED | |
系统性能
实际上,XPS 13 Plus是一台反应灵敏的电脑,但它在PC Mark 10中排名靠后。为什么会这样呢?原因是Essentials中的低分,这可能是由缓慢的美光固态硬盘造成的--很快就会有更多的讨论。配备三星固态硬盘(1TB)的4K Plus在次要评分中赢得了相当多的分数。在任何情况下,没有XPS Plus可以从华硕Zenbook S 13 OLED中夺得领先优势。 华硕Zenbook S 13 OLED.
CrossMark: Overall | Productivity | Creativity | Responsiveness
| PCMark 10 / Score | |
| Average of class Subnotebook (4920 - 9939, n=44, last 2 years) | |
| Asus Zenbook S 13 OLED | |
| Dell XPS 13 Plus 9320 4K | |
| Average Intel Core i5-1240P, Intel Iris Xe Graphics G7 80EUs (4881 - 5345, n=11) | |
| Huawei MateBook 13s i5 11300H | |
| Dell XPS 13 Plus 9320 i5-1240p | |
| Dell XPS 13 9315, i5-1230U | |
| Lenovo ThinkPad X1 Nano-20UN002UGE | |
| PCMark 10 / Essentials | |
| Asus Zenbook S 13 OLED | |
| Dell XPS 13 Plus 9320 4K | |
| Average of class Subnotebook (8552 - 11646, n=44, last 2 years) | |
| Average Intel Core i5-1240P, Intel Iris Xe Graphics G7 80EUs (8890 - 10652, n=11) | |
| Dell XPS 13 9315, i5-1230U | |
| Huawei MateBook 13s i5 11300H | |
| Lenovo ThinkPad X1 Nano-20UN002UGE | |
| Dell XPS 13 Plus 9320 i5-1240p | |
| PCMark 10 / Productivity | |
| Average of class Subnotebook (5435 - 16606, n=44, last 2 years) | |
| Asus Zenbook S 13 OLED | |
| Dell XPS 13 Plus 9320 4K | |
| Dell XPS 13 Plus 9320 i5-1240p | |
| Average Intel Core i5-1240P, Intel Iris Xe Graphics G7 80EUs (6118 - 7058, n=11) | |
| Dell XPS 13 9315, i5-1230U | |
| Huawei MateBook 13s i5 11300H | |
| Lenovo ThinkPad X1 Nano-20UN002UGE | |
| PCMark 10 / Digital Content Creation | |
| Average of class Subnotebook (5722 - 13779, n=44, last 2 years) | |
| Asus Zenbook S 13 OLED | |
| Dell XPS 13 Plus 9320 4K | |
| Average Intel Core i5-1240P, Intel Iris Xe Graphics G7 80EUs (5169 - 6213, n=11) | |
| Dell XPS 13 Plus 9320 i5-1240p | |
| Huawei MateBook 13s i5 11300H | |
| Lenovo ThinkPad X1 Nano-20UN002UGE | |
| Dell XPS 13 9315, i5-1230U | |
| CrossMark / Overall | |
| Dell XPS 13 Plus 9320 4K | |
| Average of class Subnotebook (365 - 2356, n=59, last 2 years) | |
| Average Intel Core i5-1240P, Intel Iris Xe Graphics G7 80EUs (1392 - 1553, n=7) | |
| Asus Zenbook S 13 OLED | |
| Dell XPS 13 Plus 9320 i5-1240p | |
| Apple MacBook Air 2020 M1 Entry | |
| Huawei MateBook 13s i5 11300H | |
| Dell XPS 13 9315, i5-1230U | |
| CrossMark / Productivity | |
| Dell XPS 13 Plus 9320 4K | |
| Average of class Subnotebook (364 - 2277, n=59, last 2 years) | |
| Asus Zenbook S 13 OLED | |
| Average Intel Core i5-1240P, Intel Iris Xe Graphics G7 80EUs (1393 - 1524, n=7) | |
| Huawei MateBook 13s i5 11300H | |
| Dell XPS 13 Plus 9320 i5-1240p | |
| Dell XPS 13 9315, i5-1230U | |
| Apple MacBook Air 2020 M1 Entry | |
| CrossMark / Creativity | |
| Dell XPS 13 Plus 9320 4K | |
| Average of class Subnotebook (372 - 2743, n=59, last 2 years) | |
| Dell XPS 13 Plus 9320 i5-1240p | |
| Apple MacBook Air 2020 M1 Entry | |
| Average Intel Core i5-1240P, Intel Iris Xe Graphics G7 80EUs (1426 - 1647, n=7) | |
| Asus Zenbook S 13 OLED | |
| Dell XPS 13 9315, i5-1230U | |
| Huawei MateBook 13s i5 11300H | |
| CrossMark / Responsiveness | |
| Huawei MateBook 13s i5 11300H | |
| Dell XPS 13 Plus 9320 4K | |
| Average Intel Core i5-1240P, Intel Iris Xe Graphics G7 80EUs (1267 - 1545, n=7) | |
| Average of class Subnotebook (312 - 1854, n=59, last 2 years) | |
| Dell XPS 13 Plus 9320 i5-1240p | |
| Asus Zenbook S 13 OLED | |
| Dell XPS 13 9315, i5-1230U | |
| Apple MacBook Air 2020 M1 Entry | |
| PCMark 10 Score | 4903 points | |
Help | ||
| AIDA64 / Memory Copy | |
| Average of class Subnotebook (14554 - 131023, n=57, last 2 years) | |
| Dell XPS 13 Plus 9320 i5-1240p | |
| Average Intel Core i5-1240P (23312 - 70537, n=16) | |
| AIDA64 / Memory Read | |
| Average of class Subnotebook (15948 - 127174, n=57, last 2 years) | |
| Dell XPS 13 Plus 9320 i5-1240p | |
| Average Intel Core i5-1240P (18989 - 70553, n=16) | |
| AIDA64 / Memory Write | |
| Average of class Subnotebook (15709 - 135141, n=57, last 2 years) | |
| Dell XPS 13 Plus 9320 i5-1240p | |
| Average Intel Core i5-1240P (23454 - 62496, n=16) | |
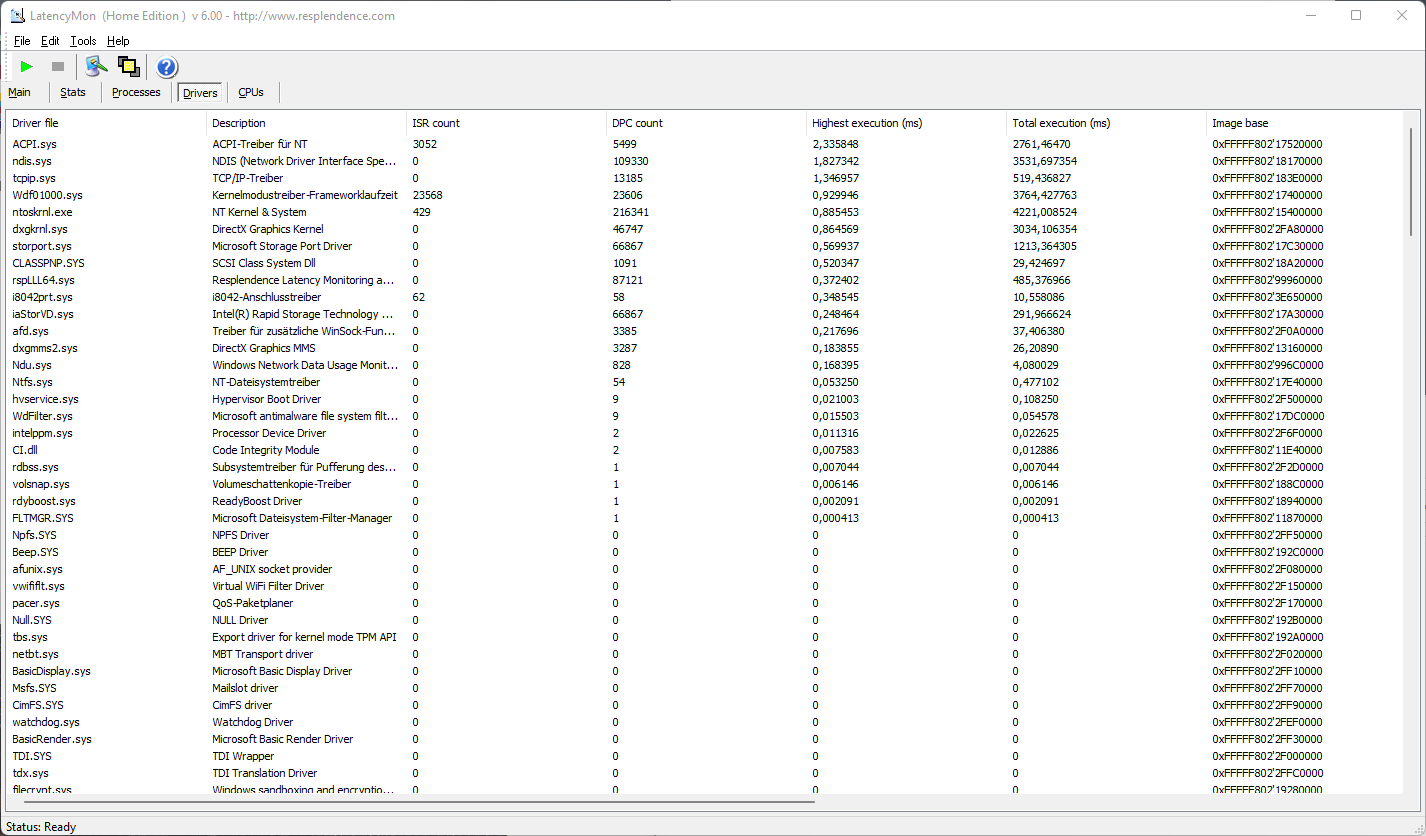
DPC延迟
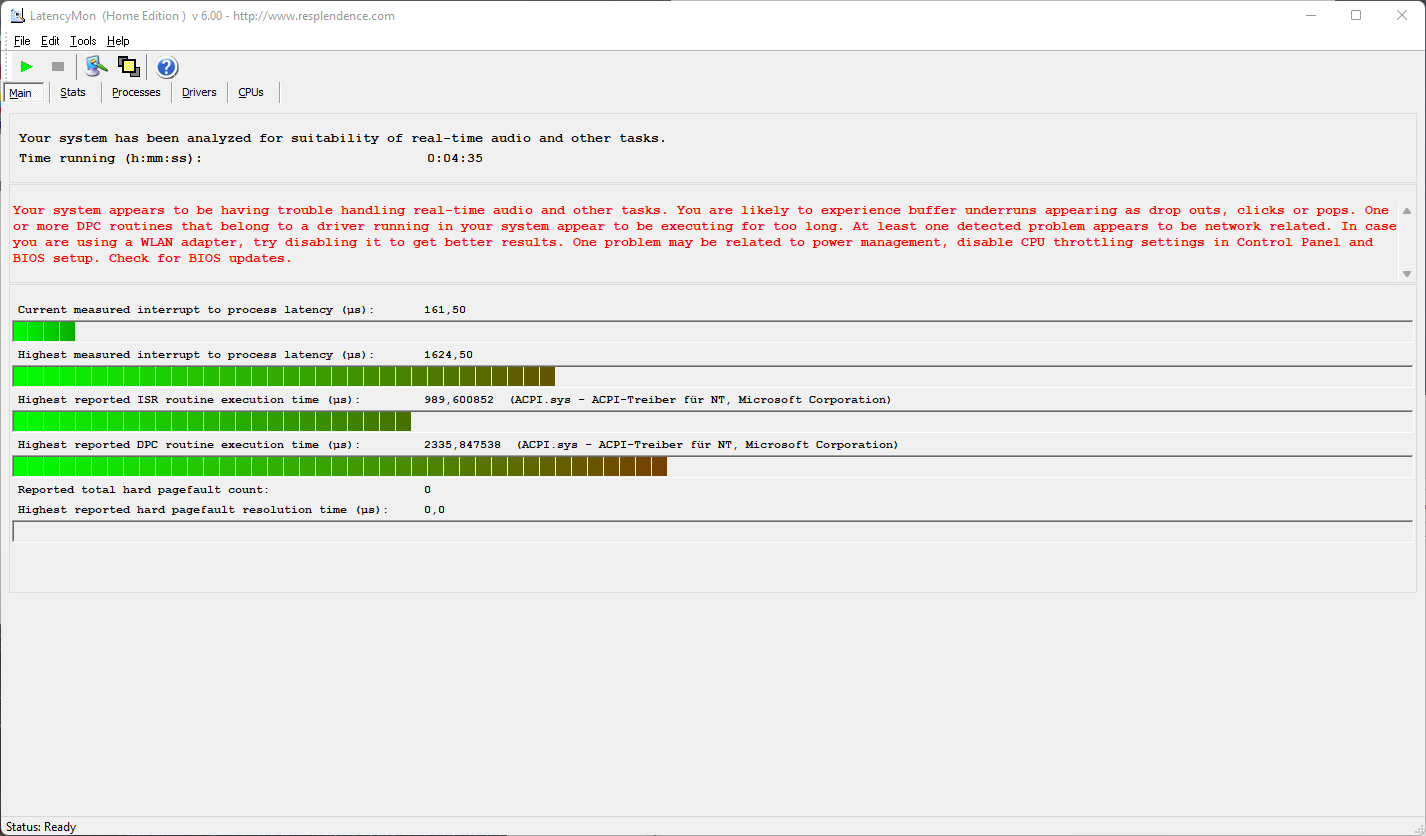
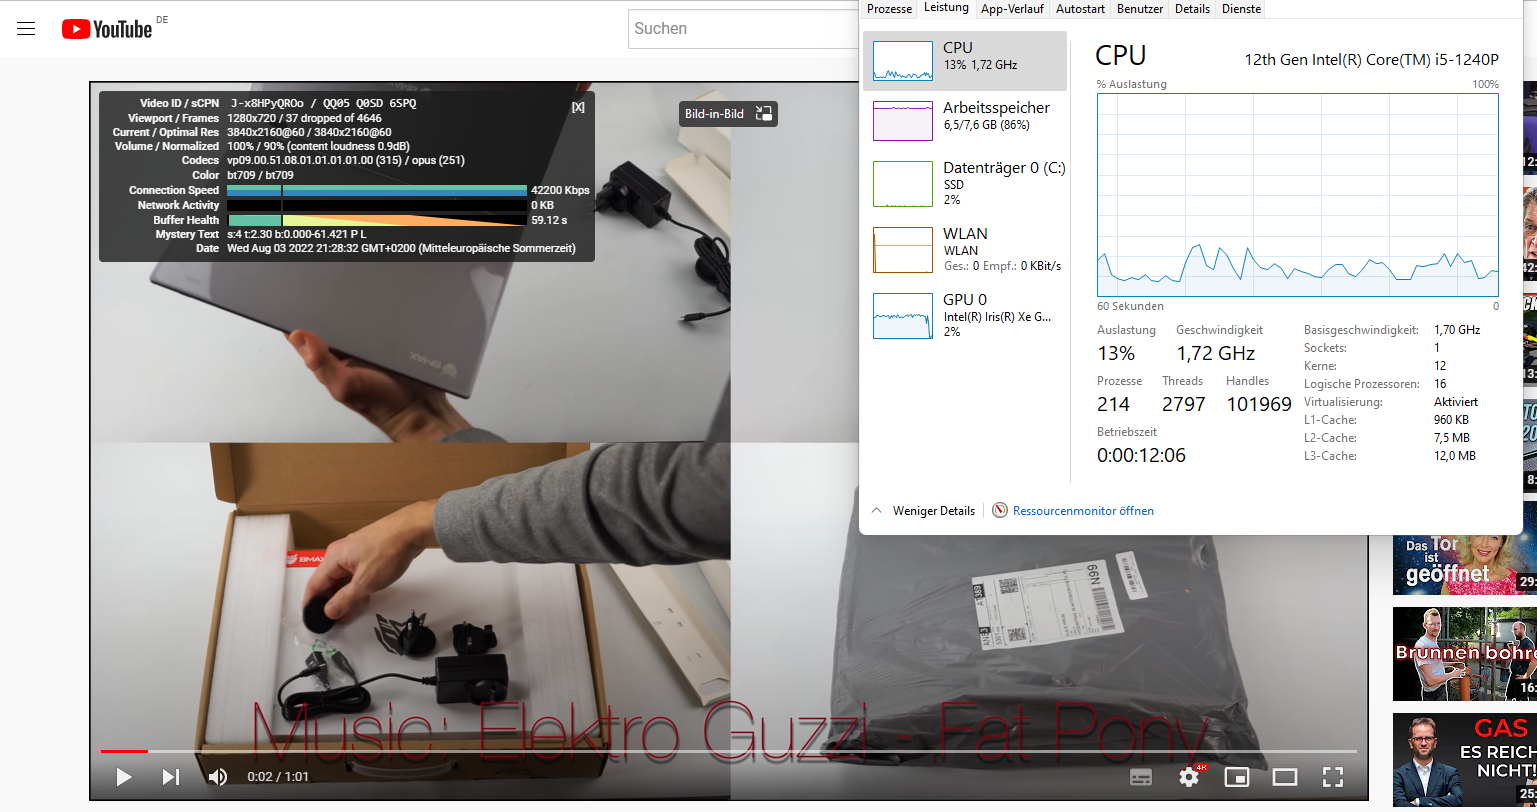
我们的标准化延迟测试(网页浏览、4K YouTube、CPU负载)发现了问题;ACPI驱动造成了问题。这也是XPS 13 Plus i7/4K的情况。因此,在目前的BIOS版本/驱动程序设置下,XPS 13 Plus只适合在有限范围内使用实时音频应用程序。
| DPC Latencies / LatencyMon - interrupt to process latency (max), Web, Youtube, Prime95 | |
| Dell XPS 13 Plus 9320 i5-1240p | |
| Lenovo ThinkPad X1 Nano-20UN002UGE | |
| Huawei MateBook 13s i5 11300H | |
| Dell XPS 13 Plus 9320 4K | |
| Asus Zenbook S 13 OLED | |
* ... smaller is better
储存
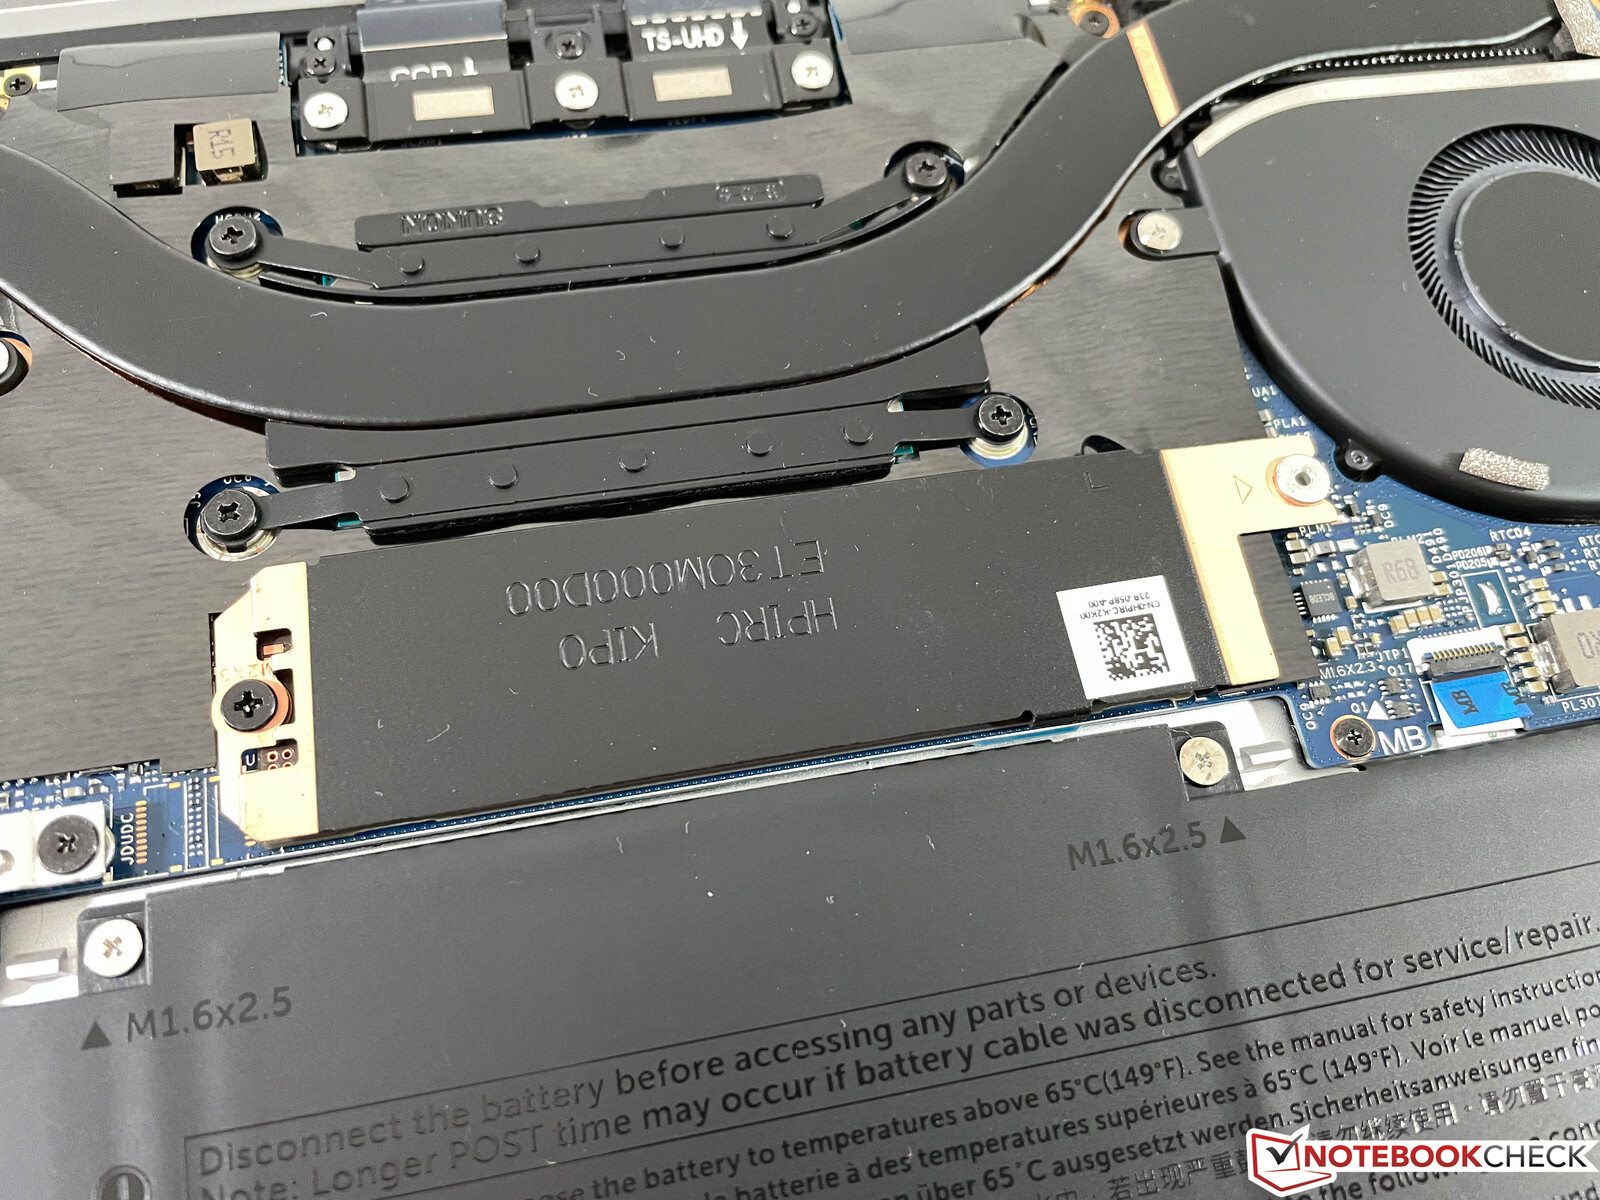
512GB美光3400固态硬盘是作为M.2设备连接的。作为提醒,XPS 13 Plus使用M.2插槽,这使得以后可以升级SSD。普通的XPS 13使用焊接的板载芯片。在512GB中,约有312GB在第一次启动后可供用户使用。
美光3400在测试中排在最后。竞争中的Phison和三星芯片--但也在XPS 13 Plus(i7 + 1 TB)--只是速度更快。因此,并不是每台XPS Plus都有可能拥有最好的硬件。配备1TB三星固态硬盘的4K XPS 9320表现得更好。
关于其他的比较和基准,请参考我们的 硬盘/SSD基准测试文章.

* ... smaller is better
Continuous load read: DiskSpd Read Loop, Queue Depth 8
图形卡
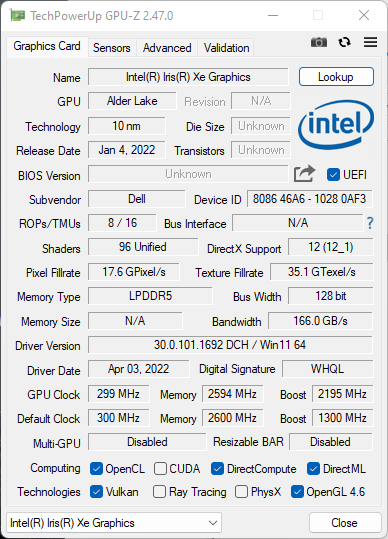
的Iris Xe Graphics G7在Tiger Lake 处理器中使用的80EUs是一个老熟人;它也在Alder Lake CPU中使用。总体而言,根据混合的3DMark结果,图形性能一般。同样的iGPU在XPS 13 9305中显示了更好的结果。 XPS 13 9305.
| 3DMark Performance rating - Percent | |
| Average of class Subnotebook | |
| Asus Zenbook S 13 OLED -1! | |
| Dell XPS 13 Plus 9320 4K | |
| Dell XPS 13 9305 Core i5 FHD -1! | |
| Lenovo ThinkPad X1 Nano-20UN002UGE -1! | |
| Huawei MateBook 13s i5 11300H | |
| Average Intel Iris Xe Graphics G7 80EUs | |
| Dell XPS 13 Plus 9320 i5-1240p | |
| Dell XPS 13 9315, i5-1230U | |
| 3DMark 11 - 1280x720 Performance GPU | |
| Average of class Subnotebook (995 - 18489, n=54, last 2 years) | |
| Asus Zenbook S 13 OLED | |
| Dell XPS 13 Plus 9320 4K | |
| Dell XPS 13 9305 Core i5 FHD | |
| Huawei MateBook 13s i5 11300H | |
| Lenovo ThinkPad X1 Nano-20UN002UGE | |
| Average Intel Iris Xe Graphics G7 80EUs (2246 - 6579, n=112) | |
| Dell XPS 13 Plus 9320 i5-1240p | |
| Dell XPS 13 9315, i5-1230U | |
| 3DMark 11 Performance | 5500 points | |
| 3DMark Cloud Gate Standard Score | 10751 points | |
| 3DMark Fire Strike Score | 3722 points | |
| 3DMark Time Spy Score | 1290 points | |
Help | ||
游戏性能
然而,Iris Xe在这里相当强大,尽管你通常最多被限制在中度或高度的细节,甚至在简单的标题中。然而,Radeon 680MRadeon 680MiGPU要快得多,包括在游戏基准测试中。芯片Iris Xe Graphics G7是日常多媒体使用的一个不错的选择,因为即使是高分辨率的视频也不是问题。图形性能只是在电池电量上略有下降。进一步的GPU基准测试见 可在此获得.
| The Witcher 3 | |
| 1366x768 Medium Graphics & Postprocessing | |
| Average of class Subnotebook (71 - 115, n=8, last 2 years) | |
| Dell XPS 13 Plus 9320 4K | |
| Huawei MateBook 13s i5 11300H | |
| Dell XPS 13 Plus 9320 i5-1240p | |
| Dell XPS 13 9305 Core i5 FHD | |
| Dell XPS 13 9315, i5-1230U | |
| Lenovo ThinkPad X1 Nano-20UN002UGE | |
| Average Intel Iris Xe Graphics G7 80EUs (21.8 - 56.9, n=103) | |
| 1920x1080 High Graphics & Postprocessing (Nvidia HairWorks Off) | |
| Average of class Subnotebook (25.6 - 64, n=13, last 2 years) | |
| Asus Zenbook S 13 OLED | |
| Dell XPS 13 Plus 9320 4K | |
| Dell XPS 13 Plus 9320 i5-1240p | |
| Huawei MateBook 13s i5 11300H | |
| Lenovo ThinkPad X1 Nano-20UN002UGE | |
| Dell XPS 13 9315, i5-1230U | |
| Average Intel Iris Xe Graphics G7 80EUs (9.3 - 33.5, n=101) | |
| Dell XPS 13 9305 Core i5 FHD | |
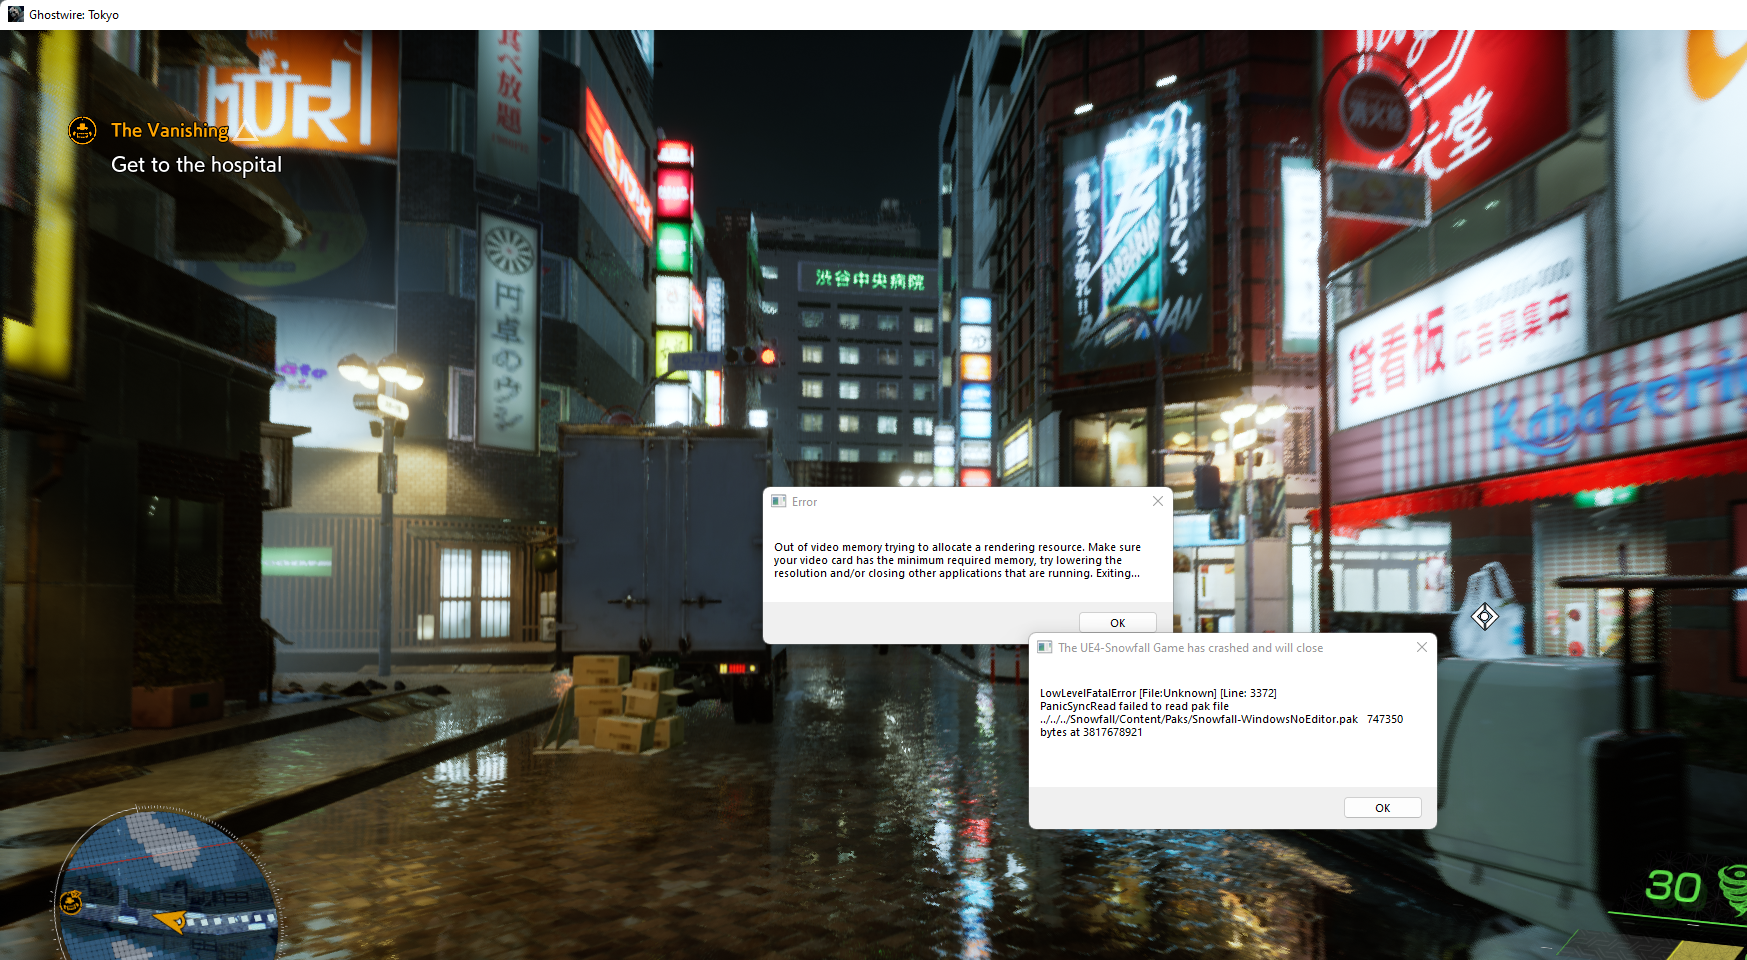
| Ghostwire Tokyo - 1280x720 Lowest Settings | |
| Dell XPS 13 Plus 9320 i5-1240p | |
| Average Intel Iris Xe Graphics G7 80EUs (n=1) | |
| Strange Brigade | |
| 1280x720 lowest AF:1 | |
| Average of class Subnotebook (85 - 335, n=49, last 2 years) | |
| Asus Zenbook S 13 OLED | |
| Dell XPS 13 Plus 9320 4K | |
| Huawei MateBook 13s i5 11300H | |
| Dell XPS 13 9305 Core i5 FHD | |
| Average Intel Iris Xe Graphics G7 80EUs (22.7 - 98.7, n=84) | |
| Dell XPS 13 Plus 9320 i5-1240p | |
| Dell XPS 13 9315, i5-1230U | |
| 1920x1080 medium AA:medium AF:4 | |
| Average of class Subnotebook (29.8 - 137.5, n=49, last 2 years) | |
| Asus Zenbook S 13 OLED | |
| Dell XPS 13 Plus 9320 4K | |
| Huawei MateBook 13s i5 11300H | |
| Dell XPS 13 Plus 9320 i5-1240p | |
| Dell XPS 13 9305 Core i5 FHD | |
| Average Intel Iris Xe Graphics G7 80EUs (6 - 48.8, n=86) | |
| Dell XPS 13 9315, i5-1230U | |
| Final Fantasy XV Benchmark | |
| 1280x720 Lite Quality | |
| Average of class Subnotebook (21.4 - 129.8, n=54, last 2 years) | |
| Asus Zenbook S 13 OLED | |
| Dell XPS 13 Plus 9320 4K | |
| Huawei MateBook 13s i5 11300H | |
| Dell XPS 13 Plus 9320 i5-1240p | |
| Dell XPS 13 9305 Core i5 FHD | |
| Average Intel Iris Xe Graphics G7 80EUs (8.32 - 45.6, n=107) | |
| Dell XPS 13 9315, i5-1230U | |
| 1920x1080 Standard Quality | |
| Average of class Subnotebook (15.1 - 75.2, n=53, last 2 years) | |
| Asus Zenbook S 13 OLED | |
| Dell XPS 13 Plus 9320 4K | |
| Huawei MateBook 13s i5 11300H | |
| Dell XPS 13 9305 Core i5 FHD | |
| Dell XPS 13 Plus 9320 i5-1240p | |
| Average Intel Iris Xe Graphics G7 80EUs (4.47 - 25.4, n=100) | |
| Dell XPS 13 9315, i5-1230U | |
| Dota 2 Reborn - 1920x1080 ultra (3/3) best looking | |
| Average of class Subnotebook (13 - 97, n=60, last 2 years) | |
| Dell XPS 13 Plus 9320 i5-1240p | |
| Asus Zenbook S 13 OLED | |
| Dell XPS 13 Plus 9320 4K | |
| Huawei MateBook 13s i5 11300H | |
| Dell XPS 13 9305 Core i5 FHD | |
| Average Intel Iris Xe Graphics G7 80EUs (7.8 - 66.1, n=114) | |
| Lenovo ThinkPad X1 Nano-20UN002UGE | |
Witcher 3在全高清和高设置下运行流畅。我们使用全高清下的Ultra设置来测试iGPU在负载下的稳定性。虽然在这种情况下,22-23FPS不再是可玩的,但它仍然是恒定的,这表明功率输出是稳定的。GPU的时钟频率保持在1,300 MHz。
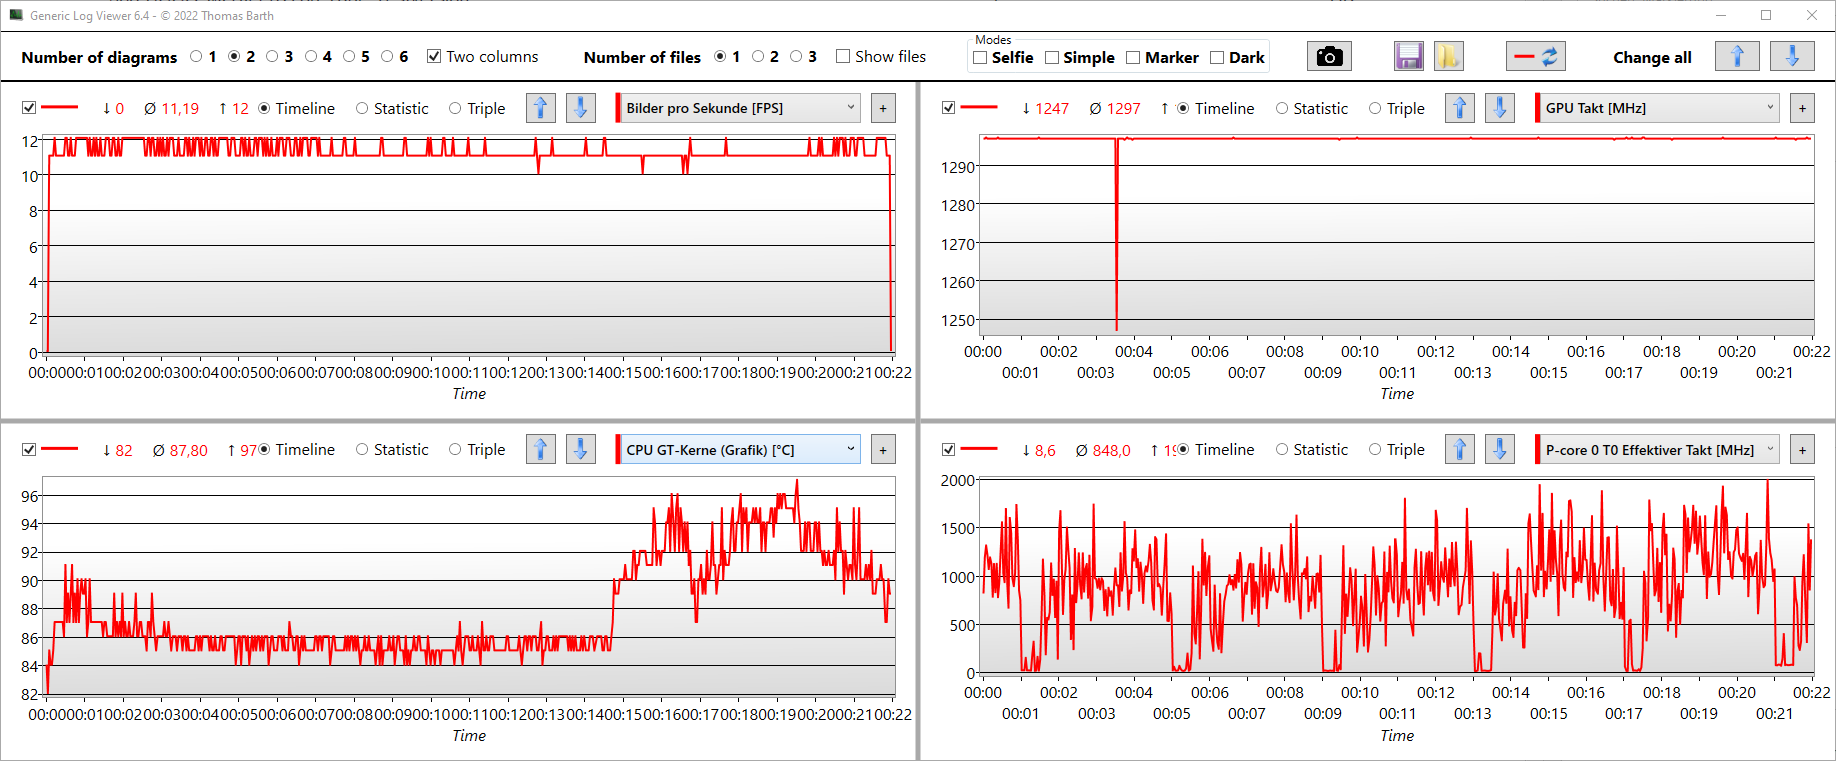
The Witcher 3 FPS diagram
| low | med. | high | ultra | |
|---|---|---|---|---|
| GTA V (2015) | 91 | 32 | ||
| The Witcher 3 (2015) | 75.5 | 48.1 | 31.9 | 13.1 |
| Dota 2 Reborn (2015) | 134.4 | 119.5 | 70.9 | 66.1 |
| Final Fantasy XV Benchmark (2018) | 36.3 | 19.7 | 11.7 | |
| X-Plane 11.11 (2018) | 28.5 | 23.7 | 28.8 | |
| Far Cry 5 (2018) | 61 | 28 | ||
| Strange Brigade (2018) | 67.7 | 30.7 | 24.4 | |
| Ghostwire Tokyo (2022) |
排放--比阿尔德湖U的声音更大
噪声排放
在执行要求不高的任务时,XPS 13 Plus中的两个风扇通常是停用的,或者最多在最低水平运行。这只有在绝对安静的情况下才能听到。风扇开启的频率或多或少取决于电源模式,其中超性能导致它们运行最频繁。然而,即使在这种模式下,它们在空闲使用时也会再次关闭。当使用优化模式时,这台13英寸笔记本电脑非常安静,它甚至可以被带入对噪音敏感的环境。
在优化模式和超性能模式下,事情在负载下变得更响,这是由于高功率限制造成的。在压力测试和CPU高负荷下,我们测量到最大47 dB(A)。这很明显,但没有令人不快的频率。如果你需要笔记本不那么吵,你可以使用安静模式,即使在高负荷下也只产生最大38分贝(A)。
如果你在寻找安静,你不一定需要Alder Lake U。XPS 13 9315的最大噪音水平只有40 dB(A)。这里的决定性因素是使用相应的静音电源模式。
Noise level
| Idle |
| 26.2 / 26.2 / 26.2 dB(A) |
| Load |
| 38.4 / 47.1 dB(A) |
 | ||
30 dB silent 40 dB(A) audible 50 dB(A) loud |
||
min: | ||
| Dell XPS 13 Plus 9320 i5-1240p Iris Xe G7 80EUs, i5-1240P, Micron 3400 MTFDKBA512TFH 512GB | Asus Zenbook S 13 OLED Radeon 680M, R7 6800U, Samsung PM9A1 MZVL21T0HCLR | Lenovo ThinkPad X1 Nano-20UN002UGE Iris Xe G7 96EUs, i7-1160G7, WDC PC SN530 SDBPNPZ-512G | Huawei MateBook 13s i5 11300H Iris Xe G7 80EUs, i5-11300H, Phison Electronics PS5012 | Dell XPS 13 Plus 9320 4K Iris Xe G7 96EUs, i7-1260P, Samsung PM9A1 MZVL21T0HCLR | Dell XPS 13 9315, i5-1230U Iris Xe G7 80EUs, i5-1230U, Micron 3460 256 GB Soldered | |
|---|---|---|---|---|---|---|
| Noise | 10% | 3% | 6% | 4% | 2% | |
| off / environment * (dB) | 26 | 24 8% | 24.9 4% | 24.5 6% | 24.4 6% | 26 -0% |
| Idle Minimum * (dB) | 26.2 | 24 8% | 24.9 5% | 24.5 6% | 24.4 7% | 26 1% |
| Idle Average * (dB) | 26.2 | 24 8% | 26.3 -0% | 24.5 6% | 24.4 7% | 26 1% |
| Idle Maximum * (dB) | 26.2 | 24 8% | 31.8 -21% | 28 -7% | 25.5 3% | 27.5 -5% |
| Load Average * (dB) | 38.4 | 33.1 14% | 34.3 11% | 35.9 7% | 40.4 -5% | 39.5 -3% |
| Load Maximum * (dB) | 47.1 | 41.7 11% | 37.5 20% | 38.6 18% | 45.5 3% | 39.6 16% |
| Witcher 3 ultra * (dB) | 40.2 | 34.3 | 35.9 | 45.5 | 39.6 |
* ... smaller is better
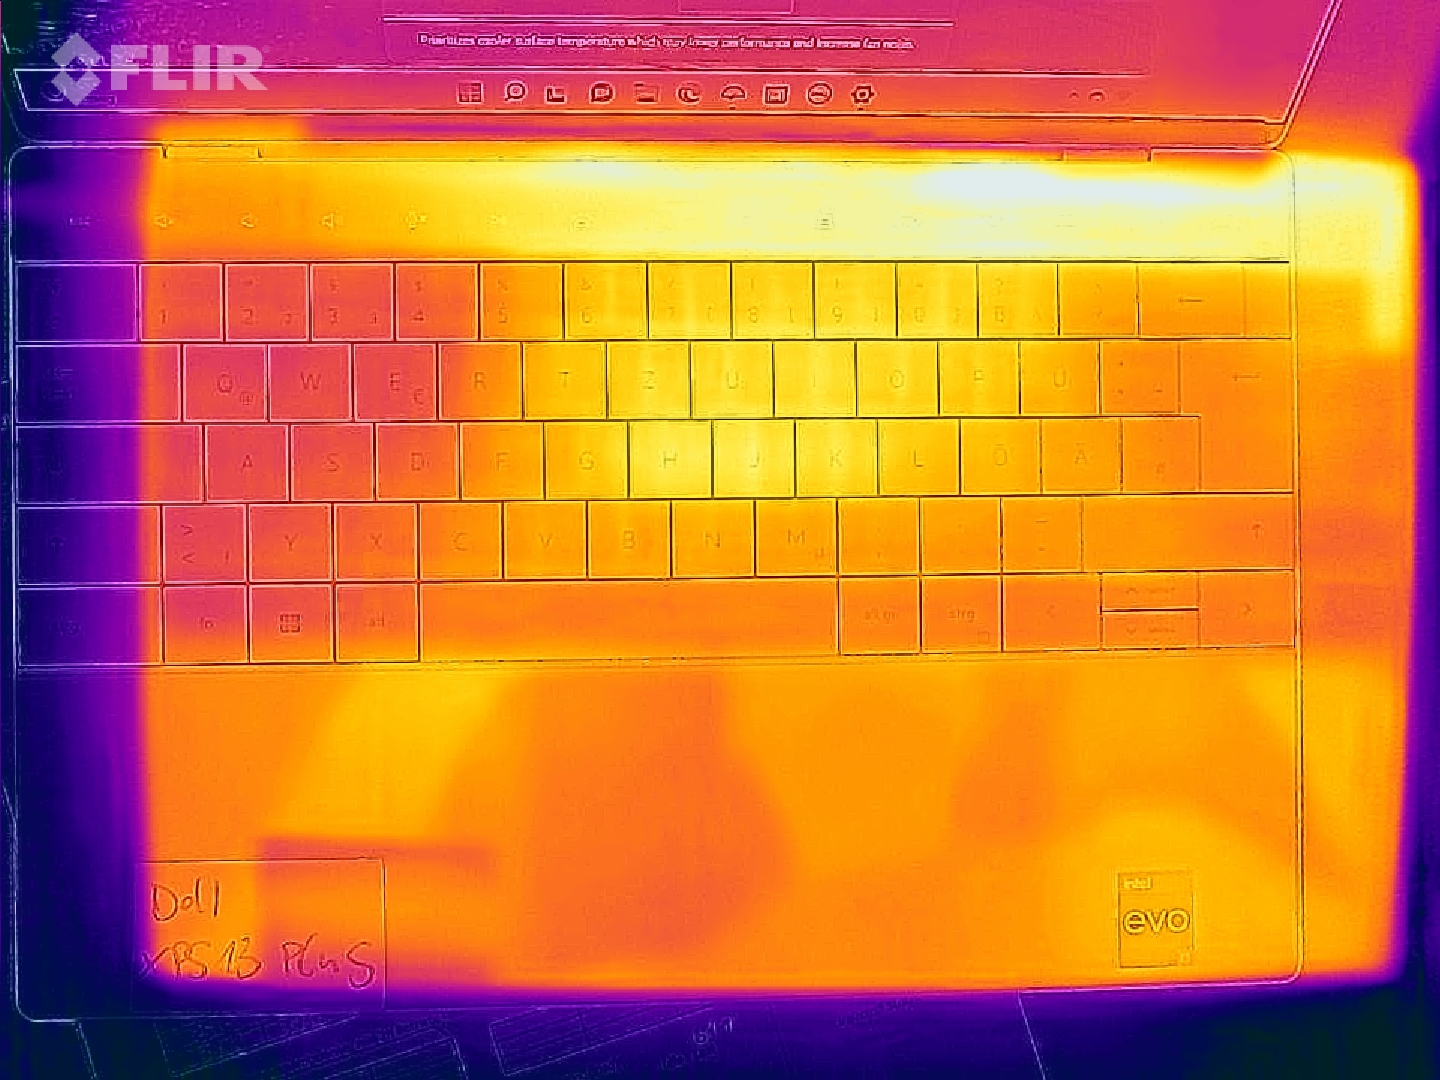
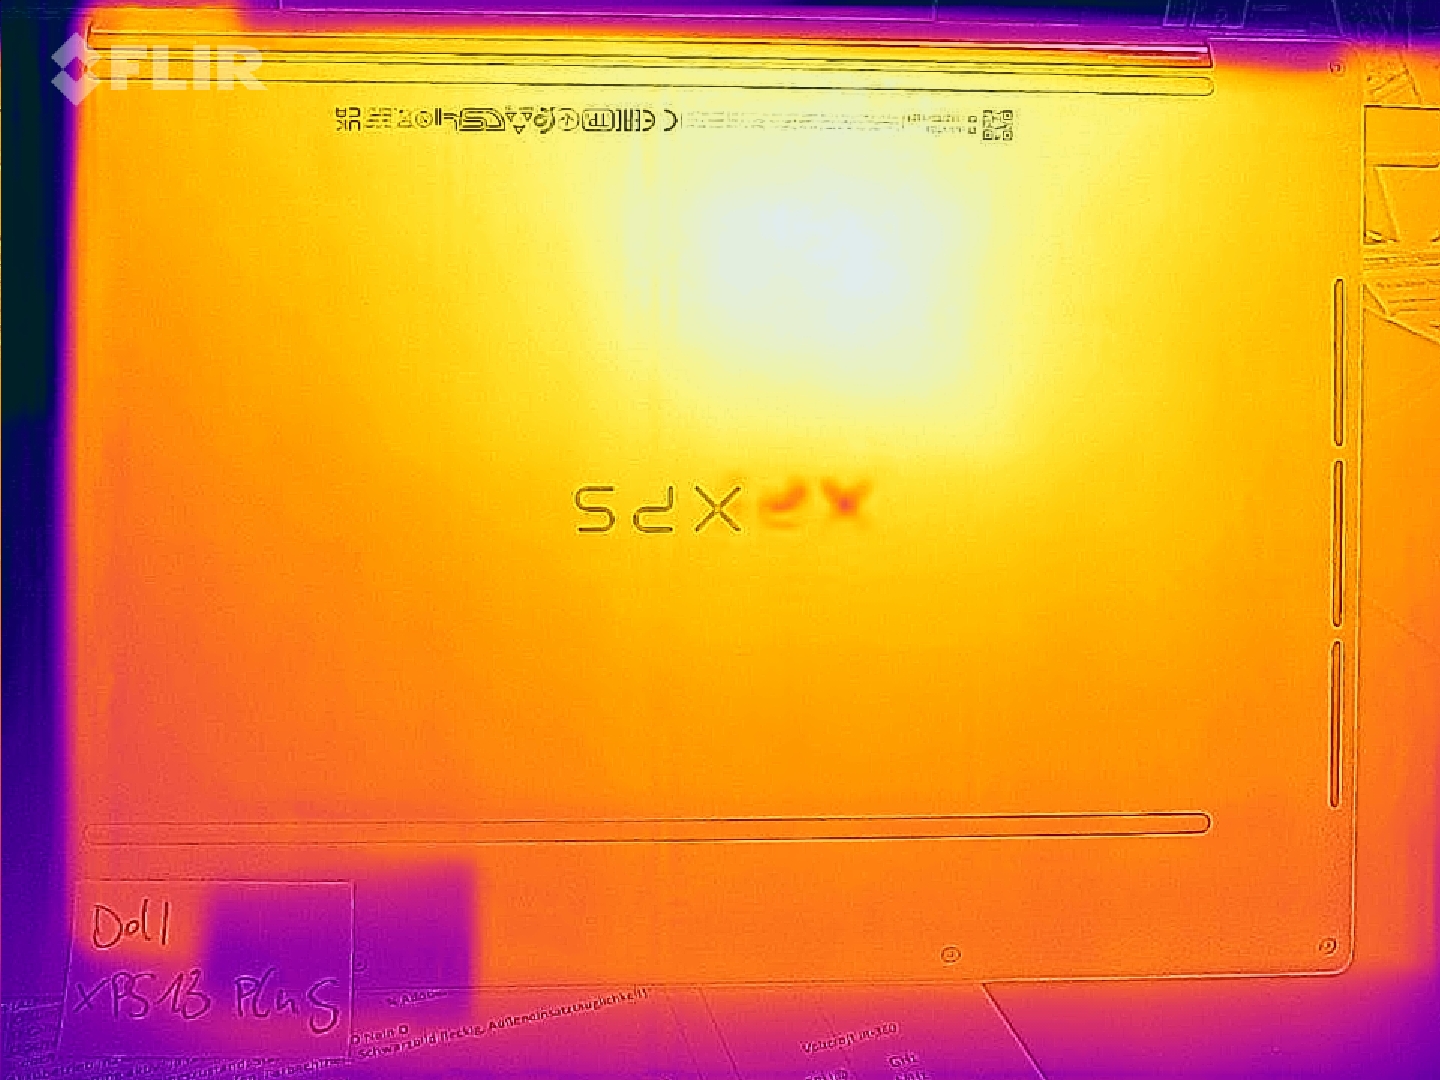
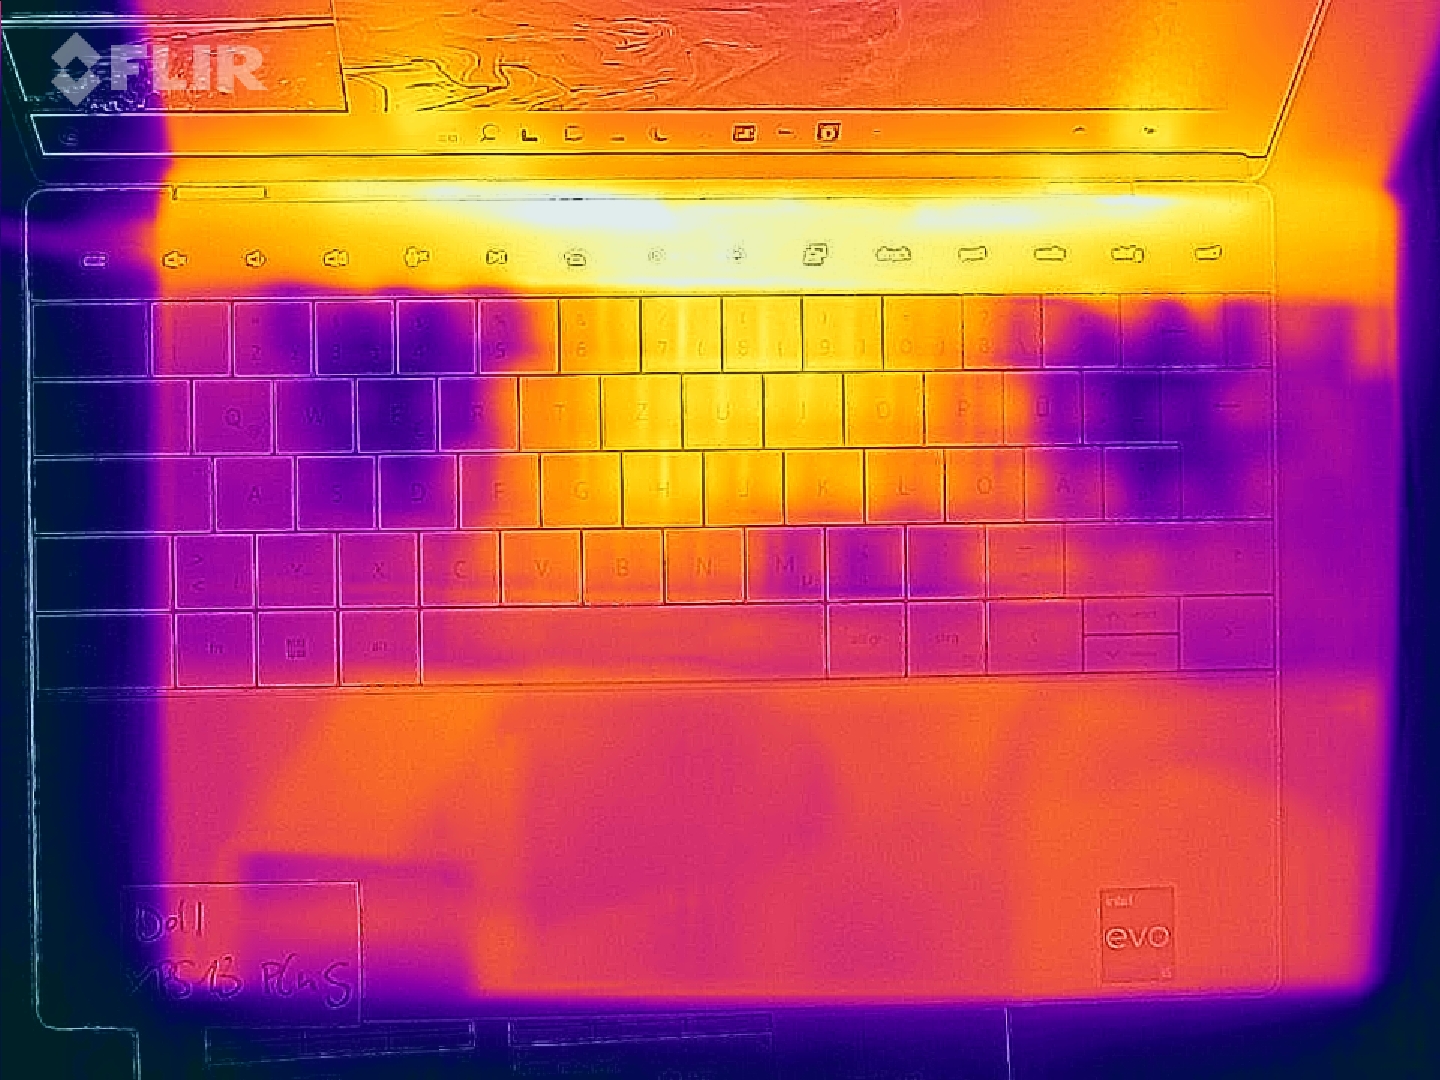
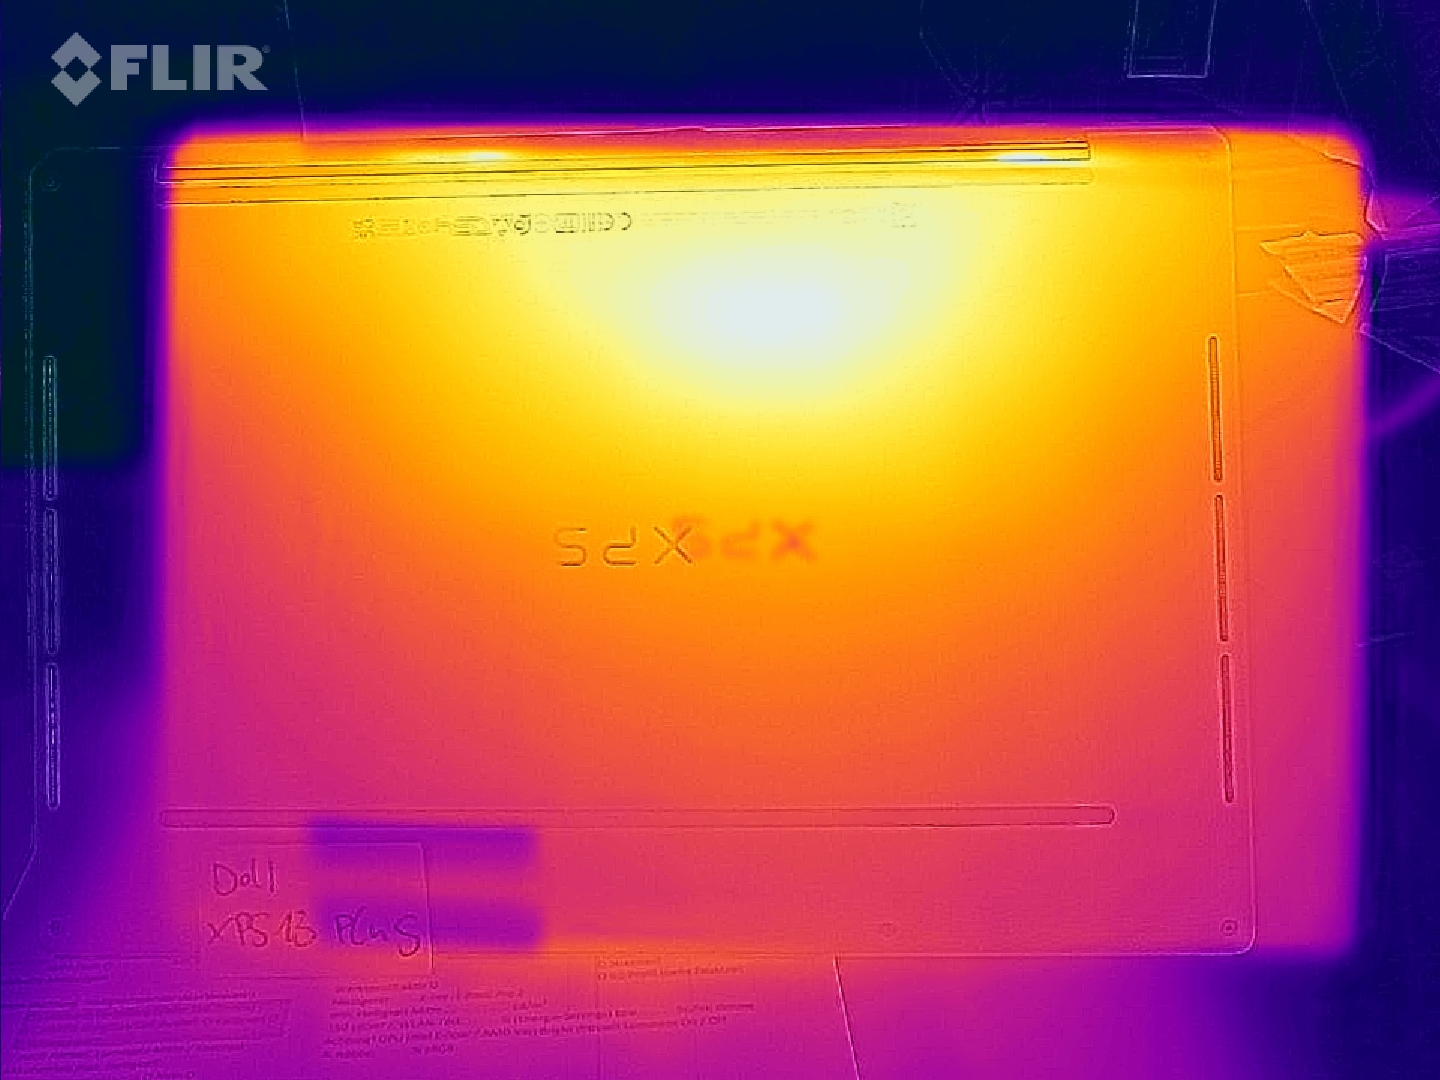
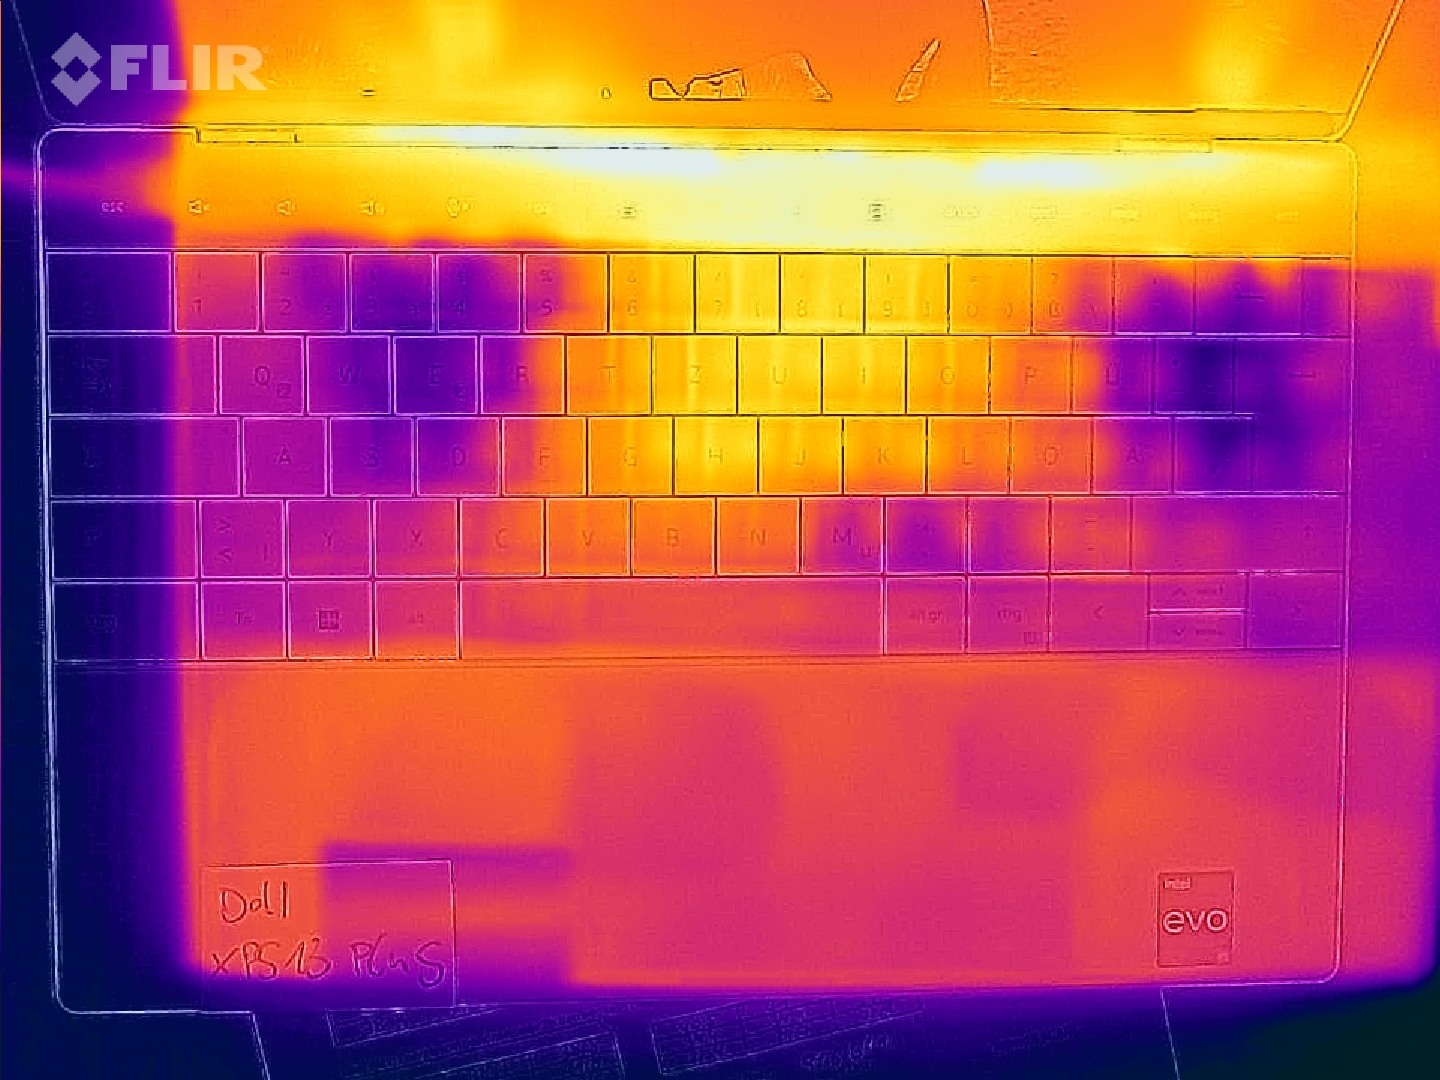
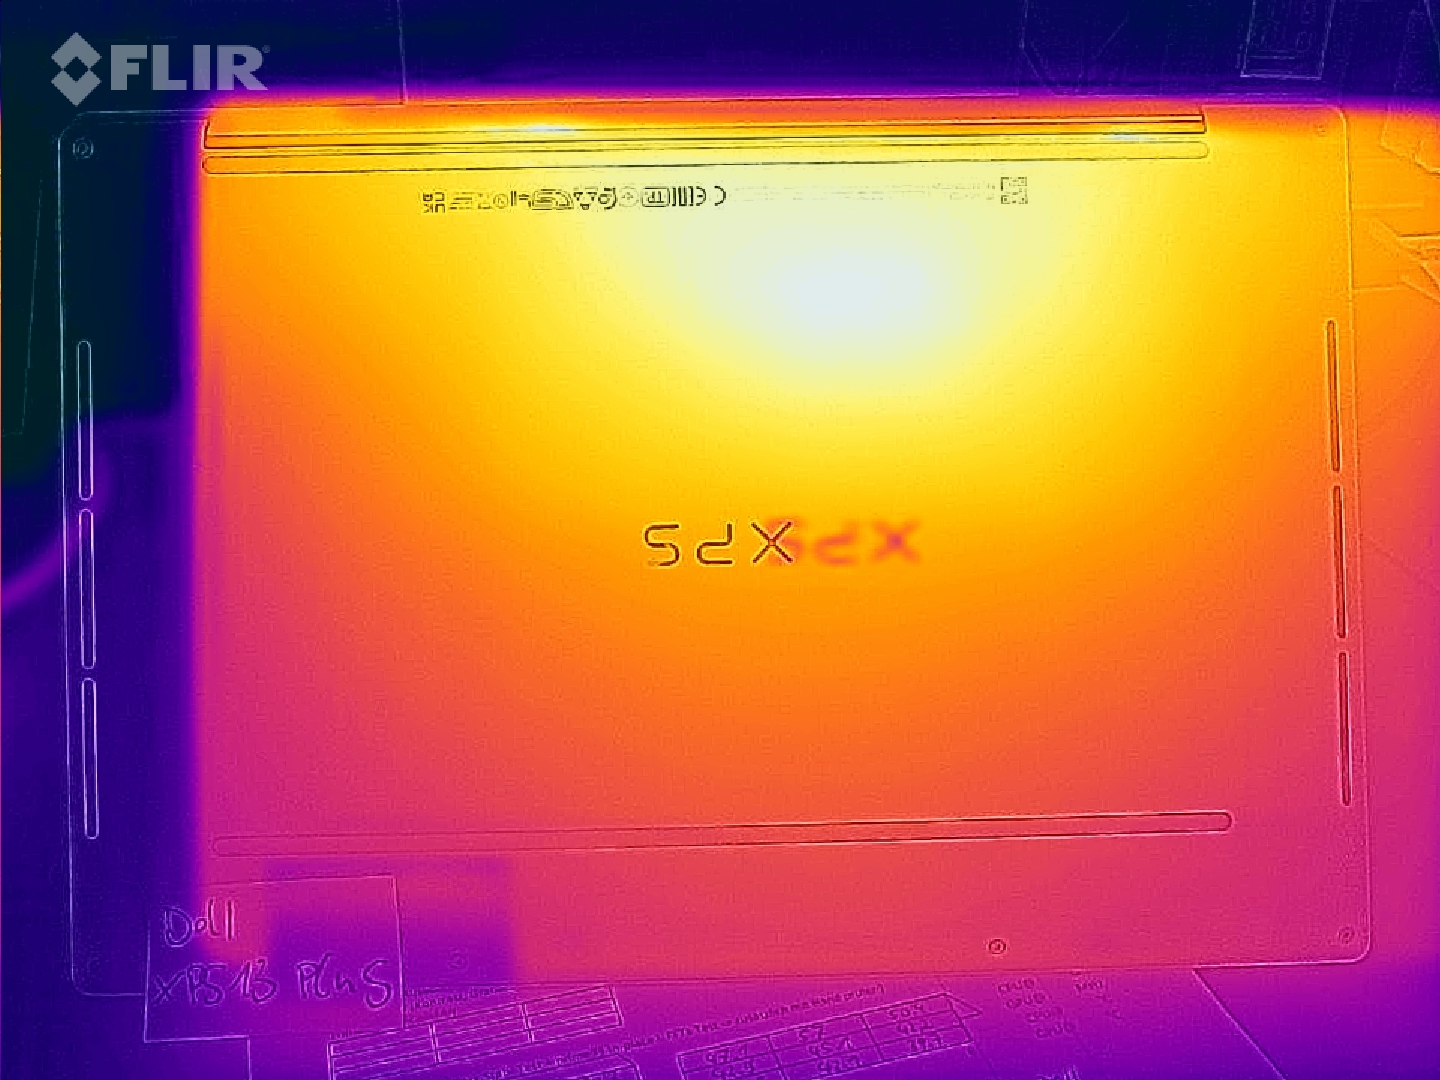
温度
该箱子在日常使用中保持着宜人的温度。在外出时,13英寸的机箱可以放在腿上,没有任何问题。然而,底部和上部的键盘区域,特别是在沉重的、连续的负载或游戏时发热。底部在某些时候达到接近57℃(约135°F)。我们认为一个平坦的表面对空气流通是可取的。
紧凑的60瓦电源适配器变得非常热,达到61°C(约142°F)。
(-) The maximum temperature on the upper side is 47.6 °C / 118 F, compared to the average of 35.9 °C / 97 F, ranging from 21.4 to 59 °C for the class Subnotebook.
(-) The bottom heats up to a maximum of 57 °C / 135 F, compared to the average of 39.2 °C / 103 F
(±) In idle usage, the average temperature for the upper side is 34.2 °C / 94 F, compared to the device average of 30.8 °C / 87 F.
(-) Playing The Witcher 3, the average temperature for the upper side is 39.3 °C / 103 F, compared to the device average of 30.8 °C / 87 F.
(±) The palmrests and touchpad can get very hot to the touch with a maximum of 39.8 °C / 103.6 F.
(-) The average temperature of the palmrest area of similar devices was 28.2 °C / 82.8 F (-11.6 °C / -20.8 F).
| Dell XPS 13 Plus 9320 i5-1240p Intel Core i5-1240P, Intel Iris Xe Graphics G7 80EUs | Apple MacBook Air 2020 M1 Entry Apple M1, Apple M1 7-Core GPU | Asus Zenbook S 13 OLED AMD Ryzen 7 6800U, AMD Radeon 680M | Lenovo ThinkPad X1 Nano-20UN002UGE Intel Core i7-1160G7, Intel Iris Xe Graphics G7 96EUs | Huawei MateBook 13s i5 11300H Intel Core i5-11300H, Intel Iris Xe Graphics G7 80EUs | Dell XPS 13 Plus 9320 4K Intel Core i7-1260P, Intel Iris Xe Graphics G7 96EUs | Dell XPS 13 9315, i5-1230U Intel Core i5-1230U, Intel Iris Xe Graphics G7 80EUs | |
|---|---|---|---|---|---|---|---|
| Heat | 24% | 16% | 26% | 25% | 21% | 14% | |
| Maximum Upper Side * (°C) | 47.6 | 44 8% | 47.9 -1% | 42.2 11% | 42.8 10% | 41.1 14% | 42.3 11% |
| Maximum Bottom * (°C) | 57 | 44 23% | 56.1 2% | 47.5 17% | 46.9 18% | 48.8 14% | 44.9 21% |
| Idle Upper Side * (°C) | 38.8 | 27 30% | 26.8 31% | 24.3 37% | 25.2 35% | 28 28% | 32.5 16% |
| Idle Bottom * (°C) | 41 | 27 34% | 27.3 33% | 25.3 38% | 26 37% | 29.3 29% | 38.2 7% |
* ... smaller is better
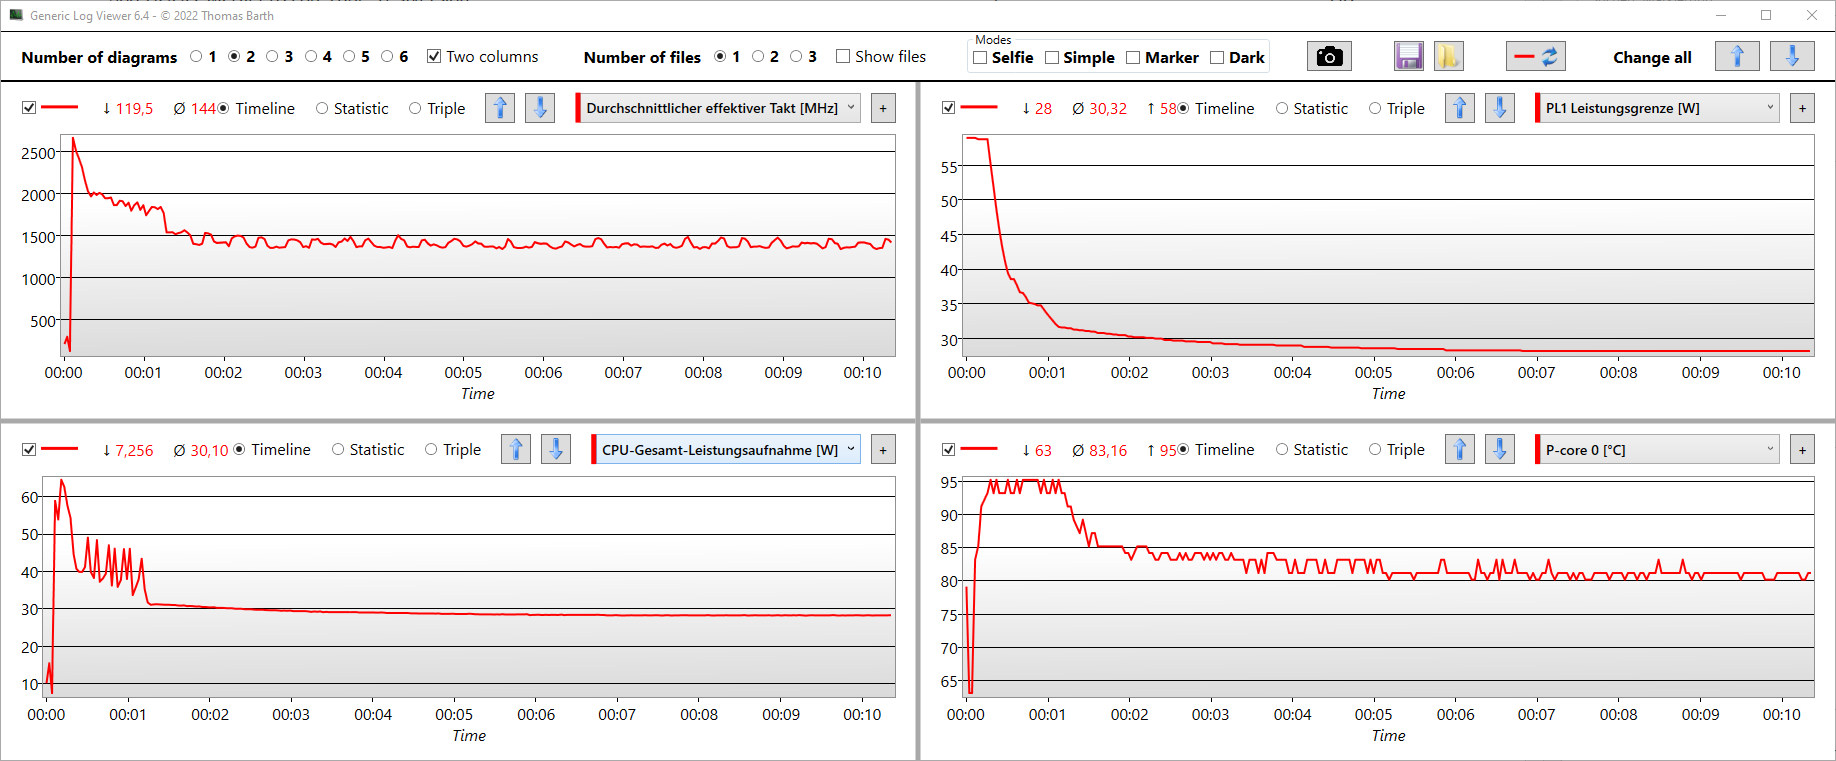
压力测试
在压力测试中,该处理器的消耗量稳定在30瓦。在此之前,几秒钟内可以达到60瓦左右,但随后在第一分钟内下降到40至30瓦之间。这种节流是由P核达到95℃(约203°F)触发的。在压力测试之后,性能并没有受到影响。
Dell XPS 13 Plus 9320 i5-1240p audio analysis
(+) | speakers can play relatively loud (84.36 dB)
Bass 100 - 315 Hz
(±) | reduced bass - on average 13.7% lower than median
(±) | linearity of bass is average (9.4% delta to prev. frequency)
Mids 400 - 2000 Hz
(+) | balanced mids - only 2.4% away from median
(+) | mids are linear (4.9% delta to prev. frequency)
Highs 2 - 16 kHz
(±) | higher highs - on average 6.2% higher than median
(+) | highs are linear (3.3% delta to prev. frequency)
Overall 100 - 16.000 Hz
(+) | overall sound is linear (13.8% difference to median)
Compared to same class
» 25% of all tested devices in this class were better, 6% similar, 69% worse
» The best had a delta of 5%, average was 18%, worst was 53%
Compared to all devices tested
» 15% of all tested devices were better, 4% similar, 81% worse
» The best had a delta of 4%, average was 23%, worst was 134%
Asus Zenbook S 13 OLED audio analysis
(±) | speaker loudness is average but good (76.5 dB)
Bass 100 - 315 Hz
(±) | reduced bass - on average 12.6% lower than median
(±) | linearity of bass is average (11.1% delta to prev. frequency)
Mids 400 - 2000 Hz
(±) | higher mids - on average 5.8% higher than median
(+) | mids are linear (4.7% delta to prev. frequency)
Highs 2 - 16 kHz
(+) | balanced highs - only 2.6% away from median
(+) | highs are linear (5.3% delta to prev. frequency)
Overall 100 - 16.000 Hz
(+) | overall sound is linear (14.7% difference to median)
Compared to same class
» 31% of all tested devices in this class were better, 5% similar, 64% worse
» The best had a delta of 5%, average was 18%, worst was 53%
Compared to all devices tested
» 19% of all tested devices were better, 4% similar, 77% worse
» The best had a delta of 4%, average was 23%, worst was 134%
能源管理
能源消耗
我们用Prime95和FurMark(超性能)进行了压力测试。系统被允许在一分钟内使用63瓦特,之后时钟频率慢慢降低;随着时间的推移(1:00至3:00),功耗从56瓦特下降到49瓦特。
60瓦的电源适配器过载会对充电时间产生影响。在压力测试期间,电池的充电速度非常慢;能量在这里得到了配给。之前耗尽的电池在一个小时后只充到18%。这使得在给设备施加压力的同时,也很难给电池充电。
许多采用Alder Lake P CPU的紧凑型笔记本电脑都有这个问题。然而,由于这种情况总是只发生在很短的时间内,所以在实践中影响很小。电池也不会耗尽。这款 采用Alder Lake U的经济型XPS 13型号也没有这个问题,尽管它的电源适配器很小,只有45瓦。尽管在这种情况下,压力测试也能达到47瓦,但也只是几秒钟的时间。此后,系统只需要持续的26瓦,不再需要40到45瓦。显示TheWitcher 3/压力测试期间的能耗的图表呈现了与节能的Alder Lake U XPS的对比。
| Off / Standby | |
| Idle | |
| Load |
|
Key:
min: | |
| Dell XPS 13 Plus 9320 i5-1240p i5-1240P, Iris Xe G7 80EUs, Micron 3400 MTFDKBA512TFH 512GB, IPS, 1920x1200, 13.4" | Apple MacBook Air 2020 M1 Entry M1, M1 7-Core GPU, Apple SSD AP0256Q, IPS, 2560x1600, 13.3" | Asus Zenbook S 13 OLED R7 6800U, Radeon 680M, Samsung PM9A1 MZVL21T0HCLR, OLED, 2880x1800, 13.3" | Lenovo ThinkPad X1 Nano-20UN002UGE i7-1160G7, Iris Xe G7 96EUs, WDC PC SN530 SDBPNPZ-512G, IPS, 2160x1350, 13" | Huawei MateBook 13s i5 11300H i5-11300H, Iris Xe G7 80EUs, Phison Electronics PS5012, LTPS, 2520x1680, 13.4" | Dell XPS 13 Plus 9320 4K i7-1260P, Iris Xe G7 96EUs, Samsung PM9A1 MZVL21T0HCLR, IPS, 3840x2400, 13.4" | Dell XPS 13 9315, i5-1230U i5-1230U, Iris Xe G7 80EUs, Micron 3460 256 GB Soldered, IPS, 1920x1200, 13.4" | Average Intel Iris Xe Graphics G7 80EUs | Average of class Subnotebook | |
|---|---|---|---|---|---|---|---|---|---|
| Power Consumption | 56% | 22% | 40% | 23% | 2% | 47% | 30% | 32% | |
| Idle Minimum * (Watt) | 10 | 1.9 81% | 4.8 52% | 3.3 67% | 4.2 58% | 7 30% | 3.6 64% | 4.49 ? 55% | 3.78 ? 62% |
| Idle Average * (Watt) | 12.3 | 6.4 48% | 8.7 29% | 5.7 54% | 8.1 34% | 11 11% | 6.8 45% | 7.4 ? 40% | 6.57 ? 47% |
| Idle Maximum * (Watt) | 15.5 | 7 55% | 10.1 35% | 9.1 41% | 9 42% | 11.4 26% | 6.8 56% | 9.26 ? 40% | 7.94 ? 49% |
| Load Average * (Watt) | 43 | 25 42% | 45.6 -6% | 29.6 31% | 41.7 3% | 59.7 -39% | 24 44% | 36.6 ? 15% | 41.9 ? 3% |
| Witcher 3 ultra * (Watt) | 43.1 | 42.4 2% | 27.7 36% | 40.1 7% | 49.4 -15% | 23.6 45% | |||
| Load Maximum * (Watt) | 62.8 | 30.3 52% | 49.5 21% | 55.1 12% | 68 -8% | 63 -0% | 47 25% | 61.7 ? 2% | 64.4 ? -3% |
* ... smaller is better
Energy consumption during The Witcher 3 / Stress test
Energy consumption with an external monitor
电池寿命
戴尔将Plus版本的电池容量增加到55Wh,但电池寿命仍然比全高清9305的前辈短。 全高清9305的前辈由于耗电量增加。后者可以持续554分钟,但现在只有480分钟。XPS 13 Plus以这8小时落后于竞争对手。的MacBook Air 2020 M1入门翻了一番,甚至强大的华硕Zenbook S 13 OLED也能多持续一个多小时(550分钟)。戴尔的电池寿命冠军只在XPS 13 9315采用Alder Lake U。
在全亮度下,电池运行时间明显减少。使用的不是150 cd/m²,而是420 cd/m²,这导致了6小时。分别为59瓦和48瓦的高功率限制,反映在96分钟的短负荷运行时间上(Battery Eater Classic)。在这种情况下,146分钟的华硕Zenbook S 13 OLED显示, R7 6800U的性能差不多,处理能量的效率更高--但它也有一个更强大的67瓦特电池。
55瓦时的电池需要1:30小时才能充电到80%。需要2:40小时才能达到100%。
| Dell XPS 13 Plus 9320 i5-1240p i5-1240P, Iris Xe G7 80EUs, 55 Wh | Apple MacBook Air 2020 M1 Entry M1, M1 7-Core GPU, 49.9 Wh | Asus Zenbook S 13 OLED R7 6800U, Radeon 680M, 67 Wh | Lenovo ThinkPad X1 Nano-20UN002UGE i7-1160G7, Iris Xe G7 96EUs, 48.2 Wh | Huawei MateBook 13s i5 11300H i5-11300H, Iris Xe G7 80EUs, 60 Wh | Dell XPS 13 Plus 9320 4K i7-1260P, Iris Xe G7 96EUs, 55 Wh | Dell XPS 13 9315, i5-1230U i5-1230U, Iris Xe G7 80EUs, 51 Wh | Dell XPS 13 9305 Core i5 FHD i5-1135G7, Iris Xe G7 80EUs, 52 Wh | Average of class Subnotebook | |
|---|---|---|---|---|---|---|---|---|---|
| Battery runtime | 100% | 33% | 12% | 9% | -17% | 74% | 48% | 49% | |
| WiFi v1.3 (h) | 8 | 16 100% | 9.2 15% | 9.9 24% | 9.4 18% | 6.9 -14% | 14.8 85% | 9.2 15% | 14 ? 75% |
| Load (h) | 1.6 | 2.4 50% | 1.6 0% | 1.6 0% | 1.3 -19% | 2.6 63% | 2.9 81% | 1.969 ? 23% | |
| H.264 (h) | 15.2 | 15.4 | 11 | 11 | 15.4 ? | ||||
| Reader / Idle (h) | 25.4 | 28.6 ? |
Pros
Cons
结论 - i7和1TB三星固态硬盘是性能的最佳选择。
哪一款是适合我的XPS 13?如果你正在寻找副笔记本形式的尖端性能,你将不可避免地倾向于XPS 13 Plus形式的Alder Lake P变体。
选择Core i7-1260P ,根据基准测试,性能会有10%的增长。这适用于纯处理能力,但也适用于系统性能。此外,与酷睿i5相比,酷睿i7在连续负载下提供了18%的提升,酷睿i5在Cinebench循环中的节流更为明显。
系统性能(PCMarks)得益于酷睿i7测试系统中快速的1TB三星固态硬盘,而戴尔为i5 Plus型号配备了较慢的512GB美光驱动器。然而,在固态硬盘制造商的问题上,客户没有发言权。一兆字节的固态硬盘的额外成本,即 酷睿i7-1260P和16GB内存的额外费用是300欧元(约307美元)。这听起来很公平。
UHD+触摸屏能使天平倾斜吗?可能不会,因为除了更高的分辨率和更好的对比度外,它不涵盖P3色彩空间,这对专业用途可能很重要。此外,它可以与任何处理器一起订购,包括酷睿i5。
简而言之,酷睿i7与三星的1TB固态硬盘相结合,正是适合性能极客的戴尔产品。
但是,XPS 13 Plus是否具有良好的性价比?想从13英寸笔记本电脑中榨取最佳性能的用户(PCMark、R15循环和CPU测试)--而且价格诱人--可能想看看 华硕Zenbook S 13 OLED它预计将以1300欧元(约合人民币1332元)起售。它配备了P3色彩空间,512GB固态硬盘(三星),16GB内存,当然还有一个3.5毫米组合音频插孔。该 Zenbook S 13 OLED获得了90%的评分。缺乏Thunderbolt 4端口可能是最大的缺点。
紧随其后,获得更高的评价--尽管处理能力稍差--的是 Apple MacBook Air 2020 M1入门.尽管是被动冷却,但它提供了足够的性能,同时在这个过程中更有效率,但显示屏不支持HDR。我们还审查了新的 MacBook Air 2022 M2,这是一款配备Apple M2处理器的入门级版本。
价格和可用性
戴尔XPS 13 Plus 9320的配置为酷睿i5-1240p,512GB固态硬盘,8GB内存和全高清显示屏,目前可以在戴尔的网上商店找到售价1299美元。戴尔还让你根据自己的需要定制设备。
Dell XPS 13 Plus 9320 i5-1240p
- 08/10/2022 v7 (old)
Sebastian Jentsch
Price comparison

