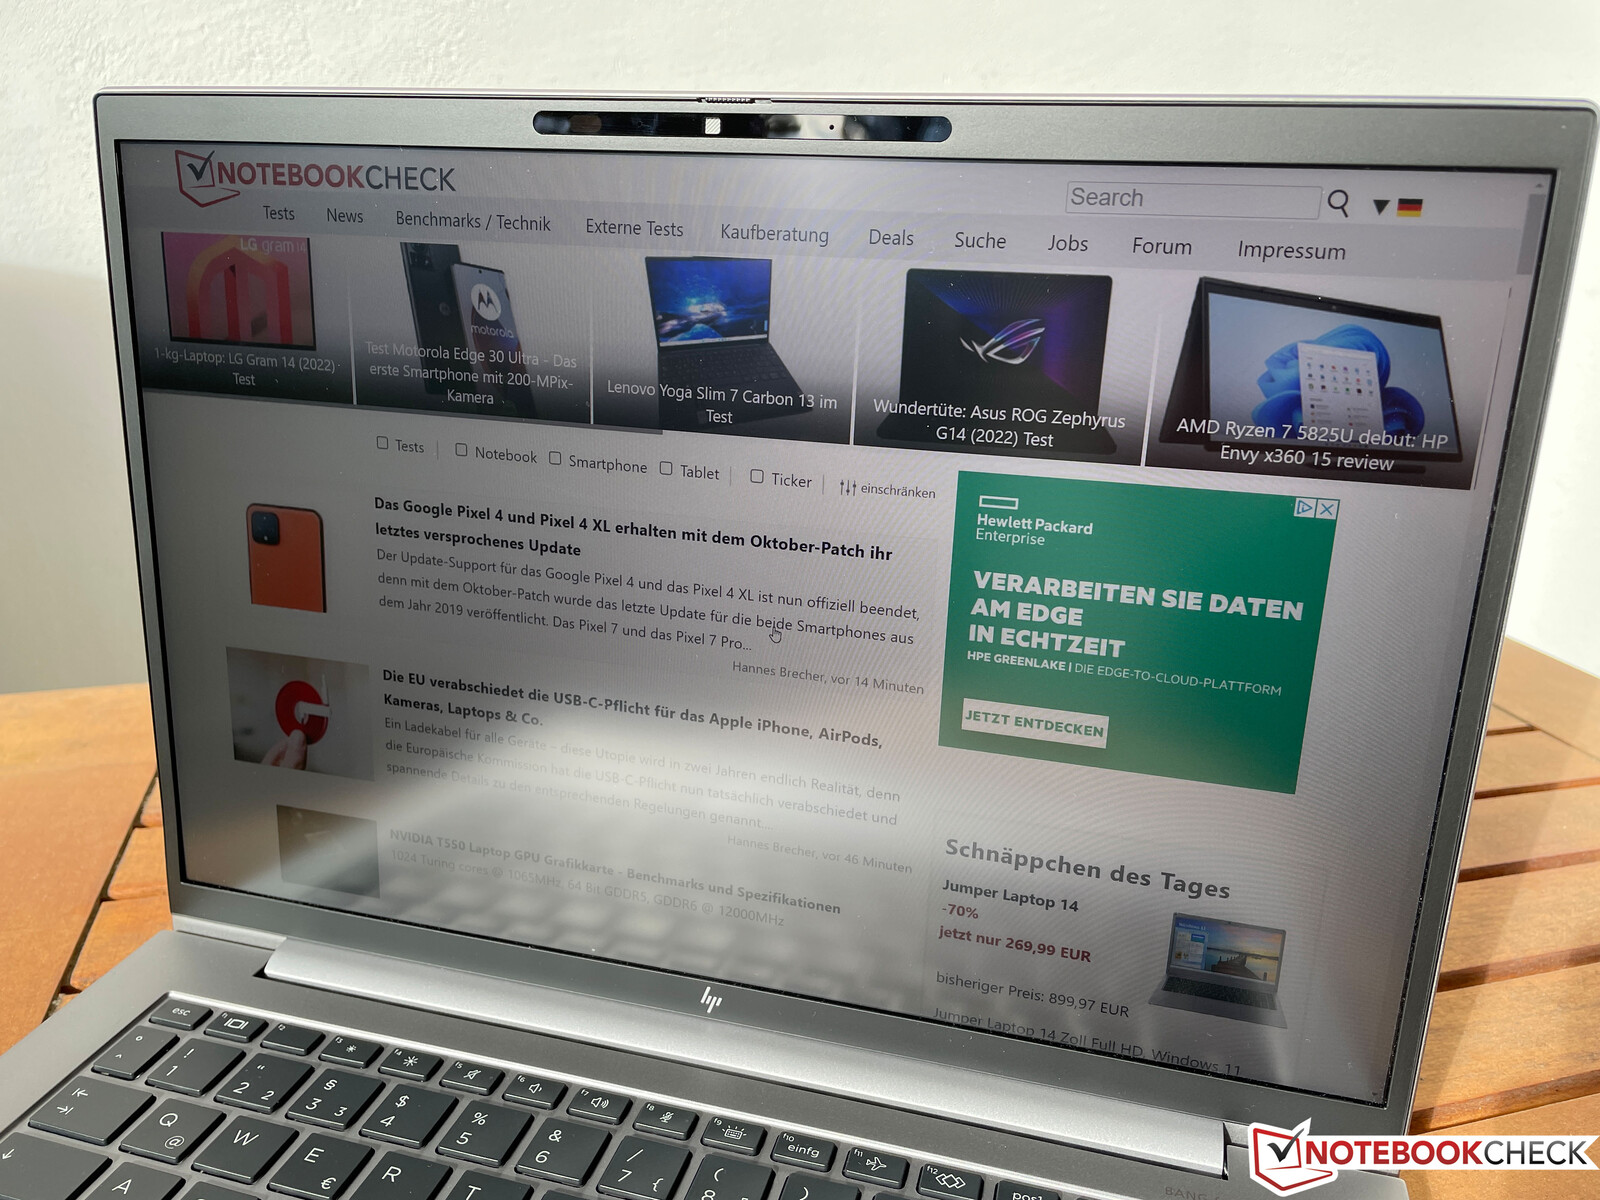
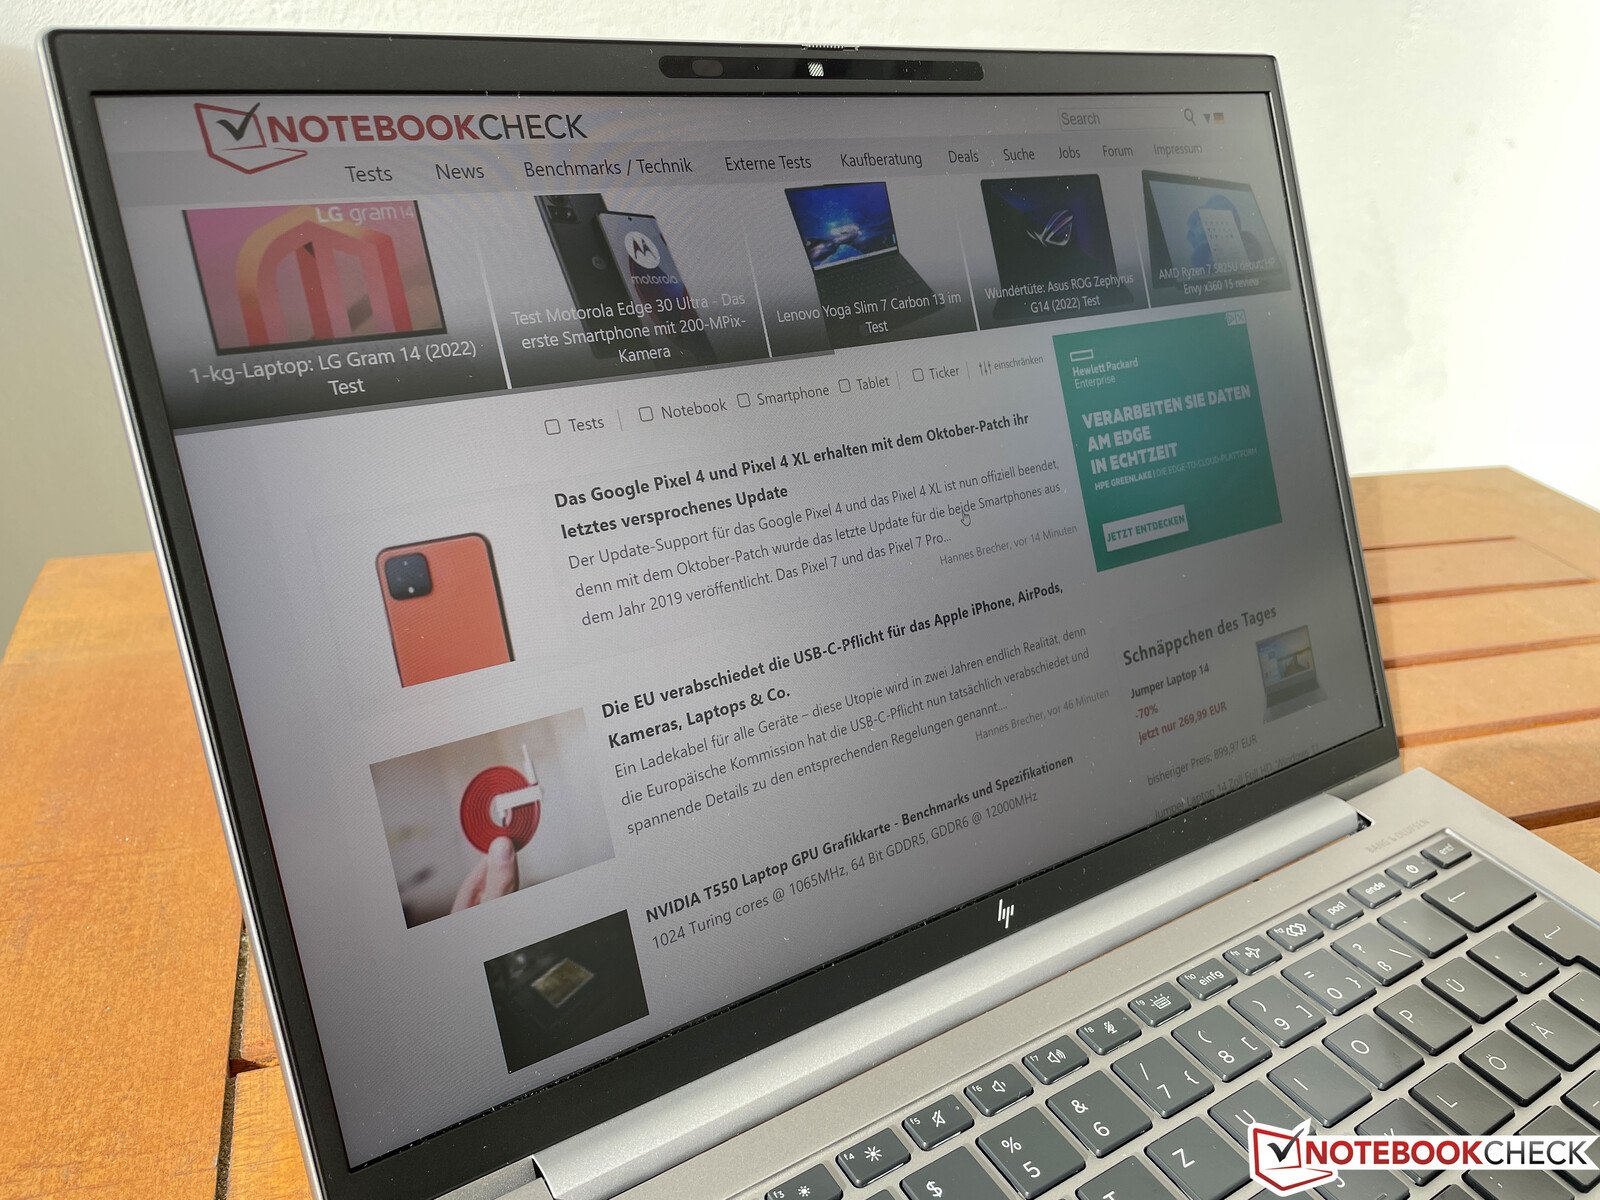
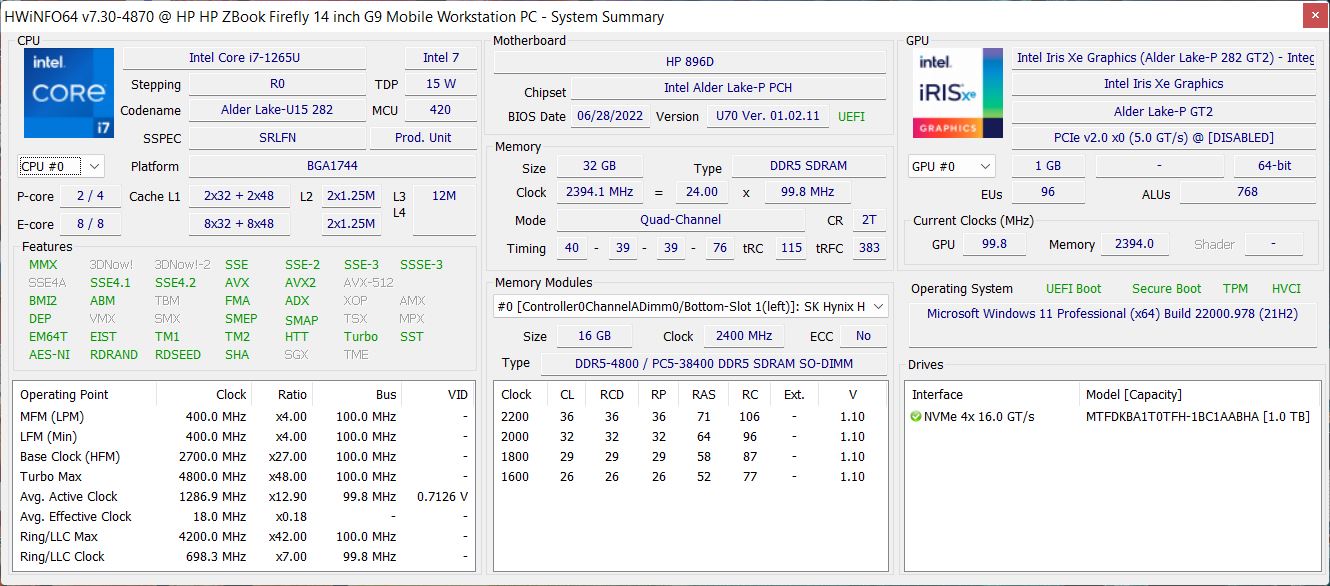
惠普ZBook Firefly 14 G9笔记本电脑的审查。英特尔Alder Lake-U降低了这款移动工作站的速度
我们最近审查了较大的 ZBook Firefly 16 G9现在我们来看看惠普的14英寸显示屏的移动工作站。与其较大的表弟相似,ZBook Firefly 14 G9也配备了当前的英特尔Alder Lake处理器,以及一个专门的 Nvidia T550专业GPU,因此针对的是入门级专业领域。
我们的配置,代号为6B8A2EA,使用的是酷睿i7-1265U,Nvidia T550,32GB内存,1TB SSD,以及16:10格式的哑光全高清面板。这一配置目前的售价约为2100欧元(约合2075美元)。
潜在的竞争对手比较
Rating | Date | Model | Weight | Height | Size | Resolution | Price |
|---|---|---|---|---|---|---|---|
| 83.6 % v7 (old) | 10 / 2022 | HP ZBook Firefly 14 G9-6B8A2EA i7-1265U, T550 Laptop GPU | 1.5 kg | 19.9 mm | 14.00" | 1920x1200 | |
| 87.6 % v7 (old) | 09 / 2022 | Dell Precision 5000 5470 i9-12900H, RTX A1000 Laptop GPU | 1.6 kg | 18.95 mm | 14.00" | 2560x1600 | |
| 85.1 % v7 (old) | 06 / 2021 | Lenovo ThinkPad P14s Gen2-20VX000GGE i7-1185G7, T500 Laptop GPU | 1.5 kg | 18 mm | 14.00" | 1920x1080 | |
| 89 % v7 (old) | 03 / 2022 | Microsoft Surface Laptop Studio i7 RTX 3050 Ti i7-11370H, GeForce RTX 3050 Ti Laptop GPU | 1.8 kg | 19 mm | 14.40" | 2400x1600 | |
| 92.7 % v7 (old) | 11 / 2021 | Apple MacBook Pro 14 2021 M1 Pro Entry M1 Pro 8-Core, M1 Pro 14-Core GPU | 1.6 kg | 15.5 mm | 14.20" | 3024x1964 |
案件和设备
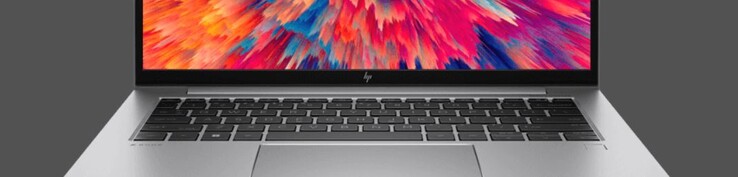
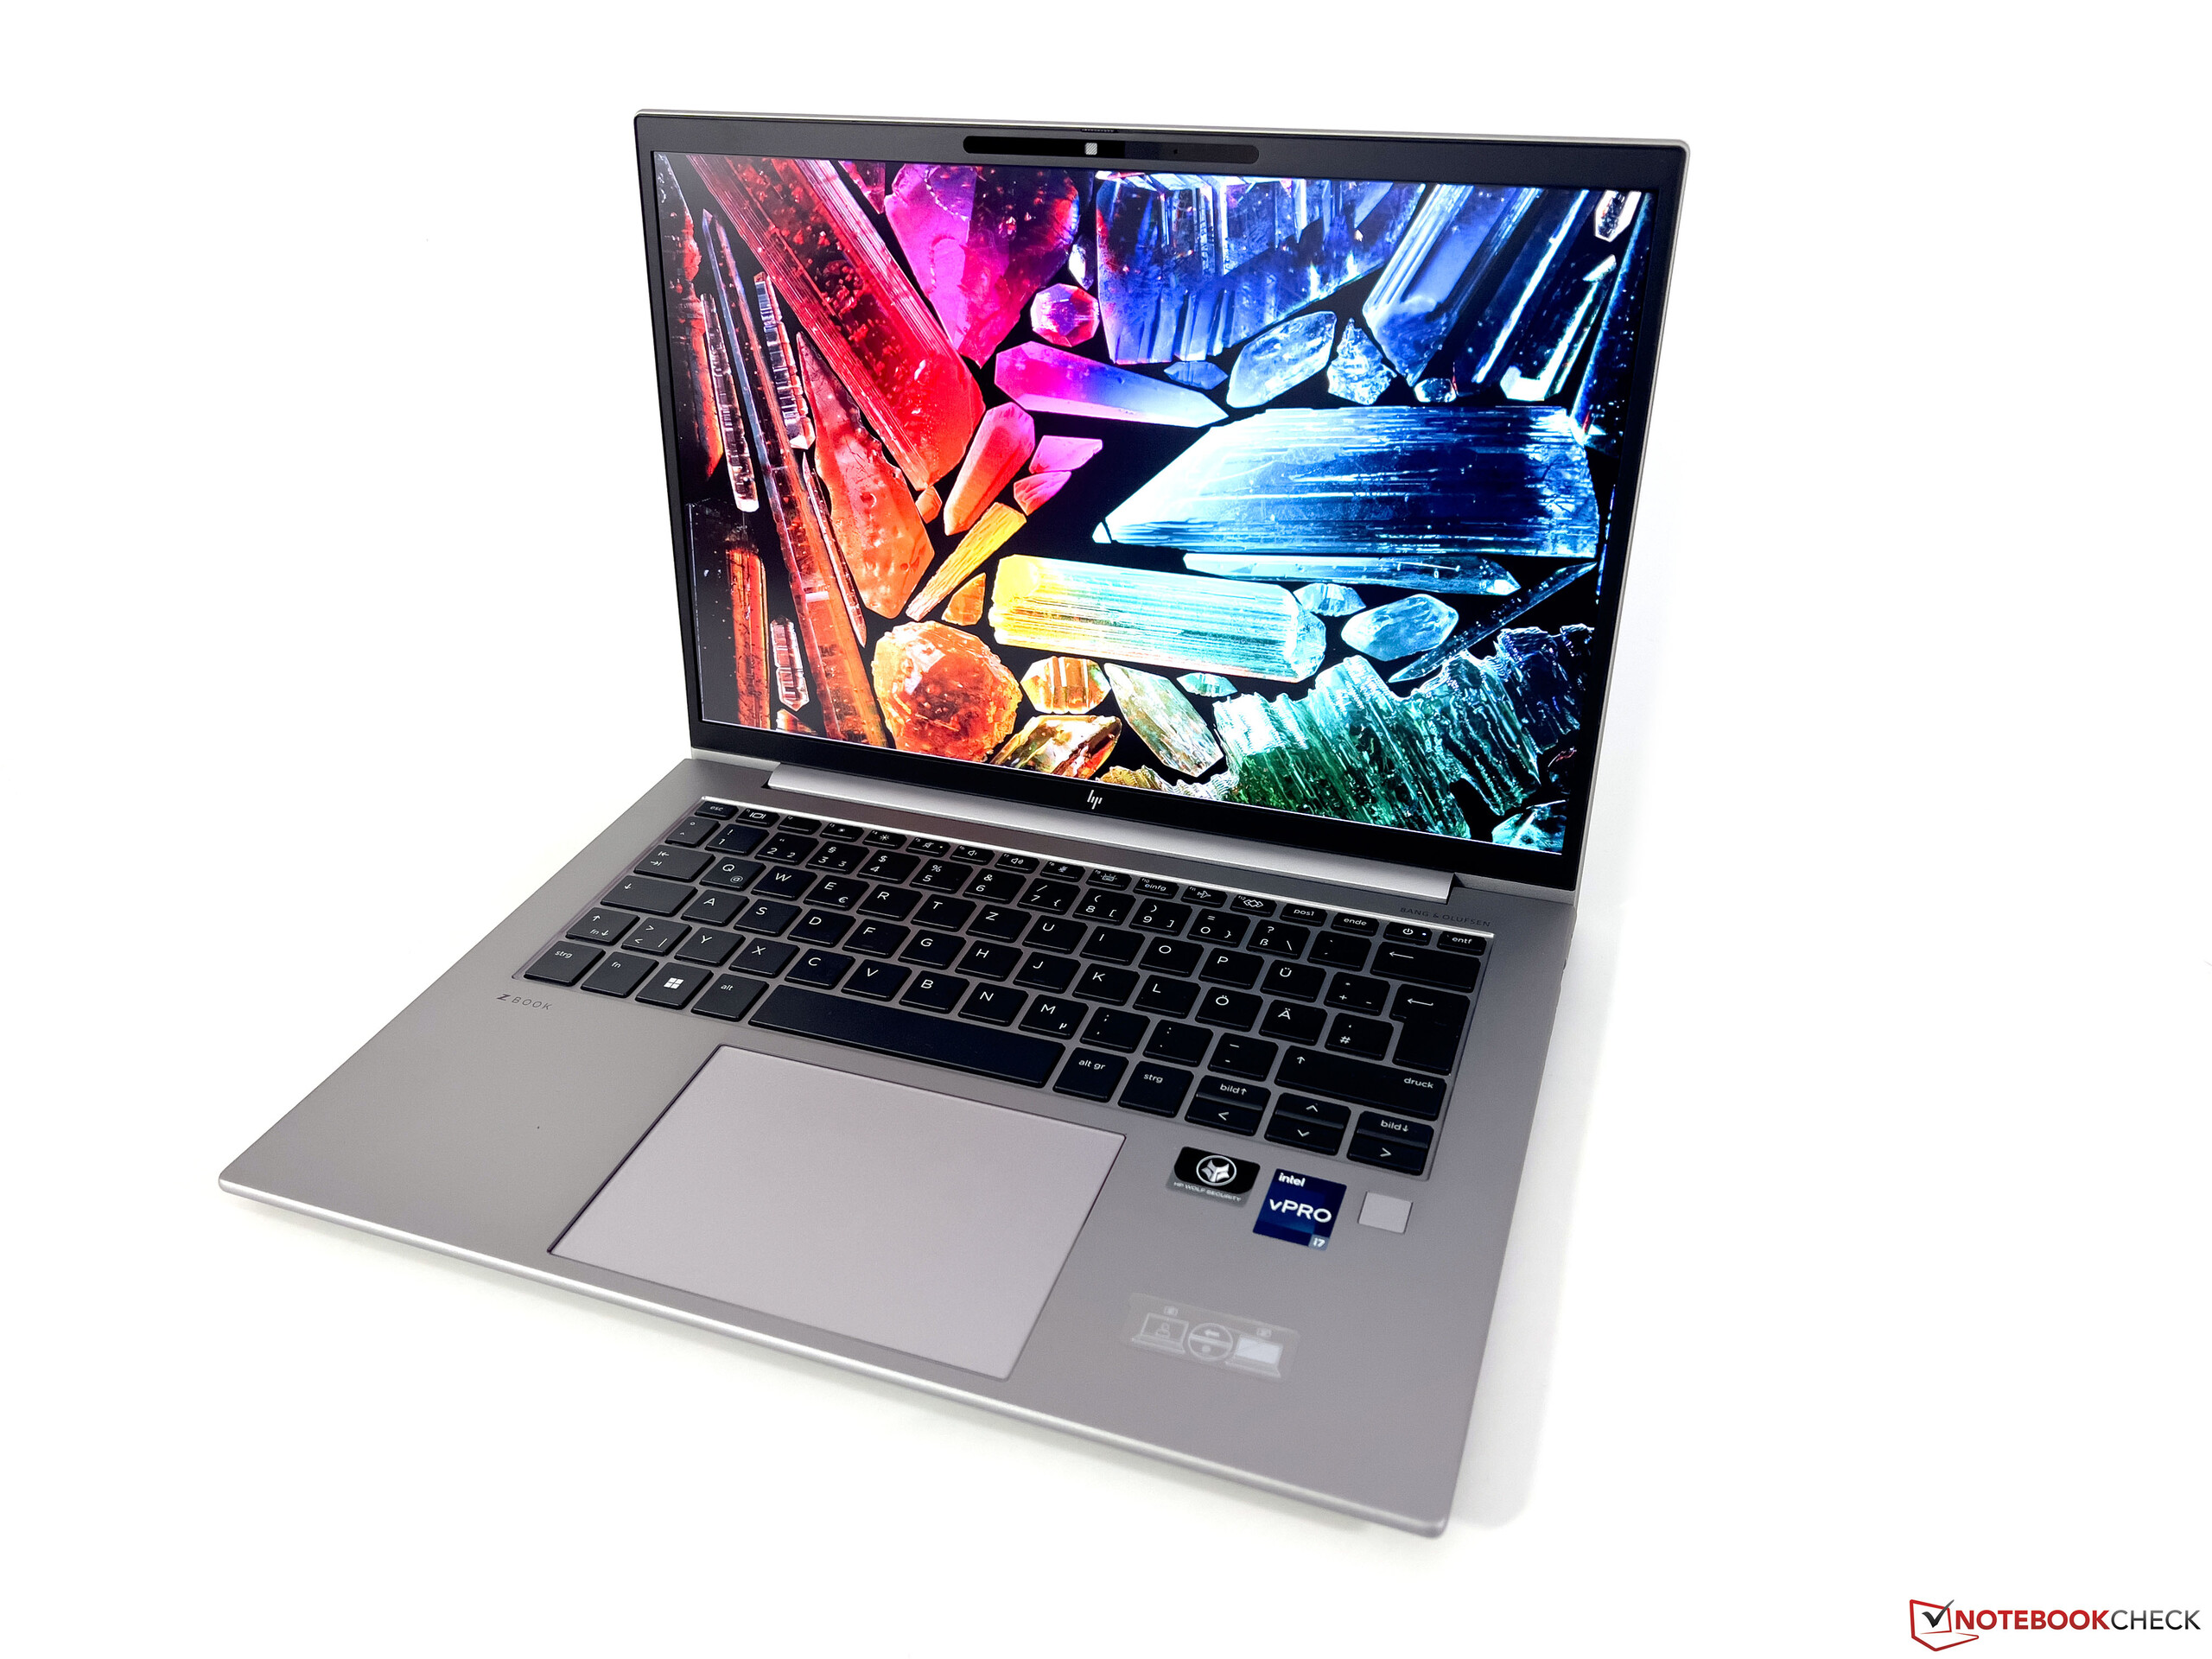
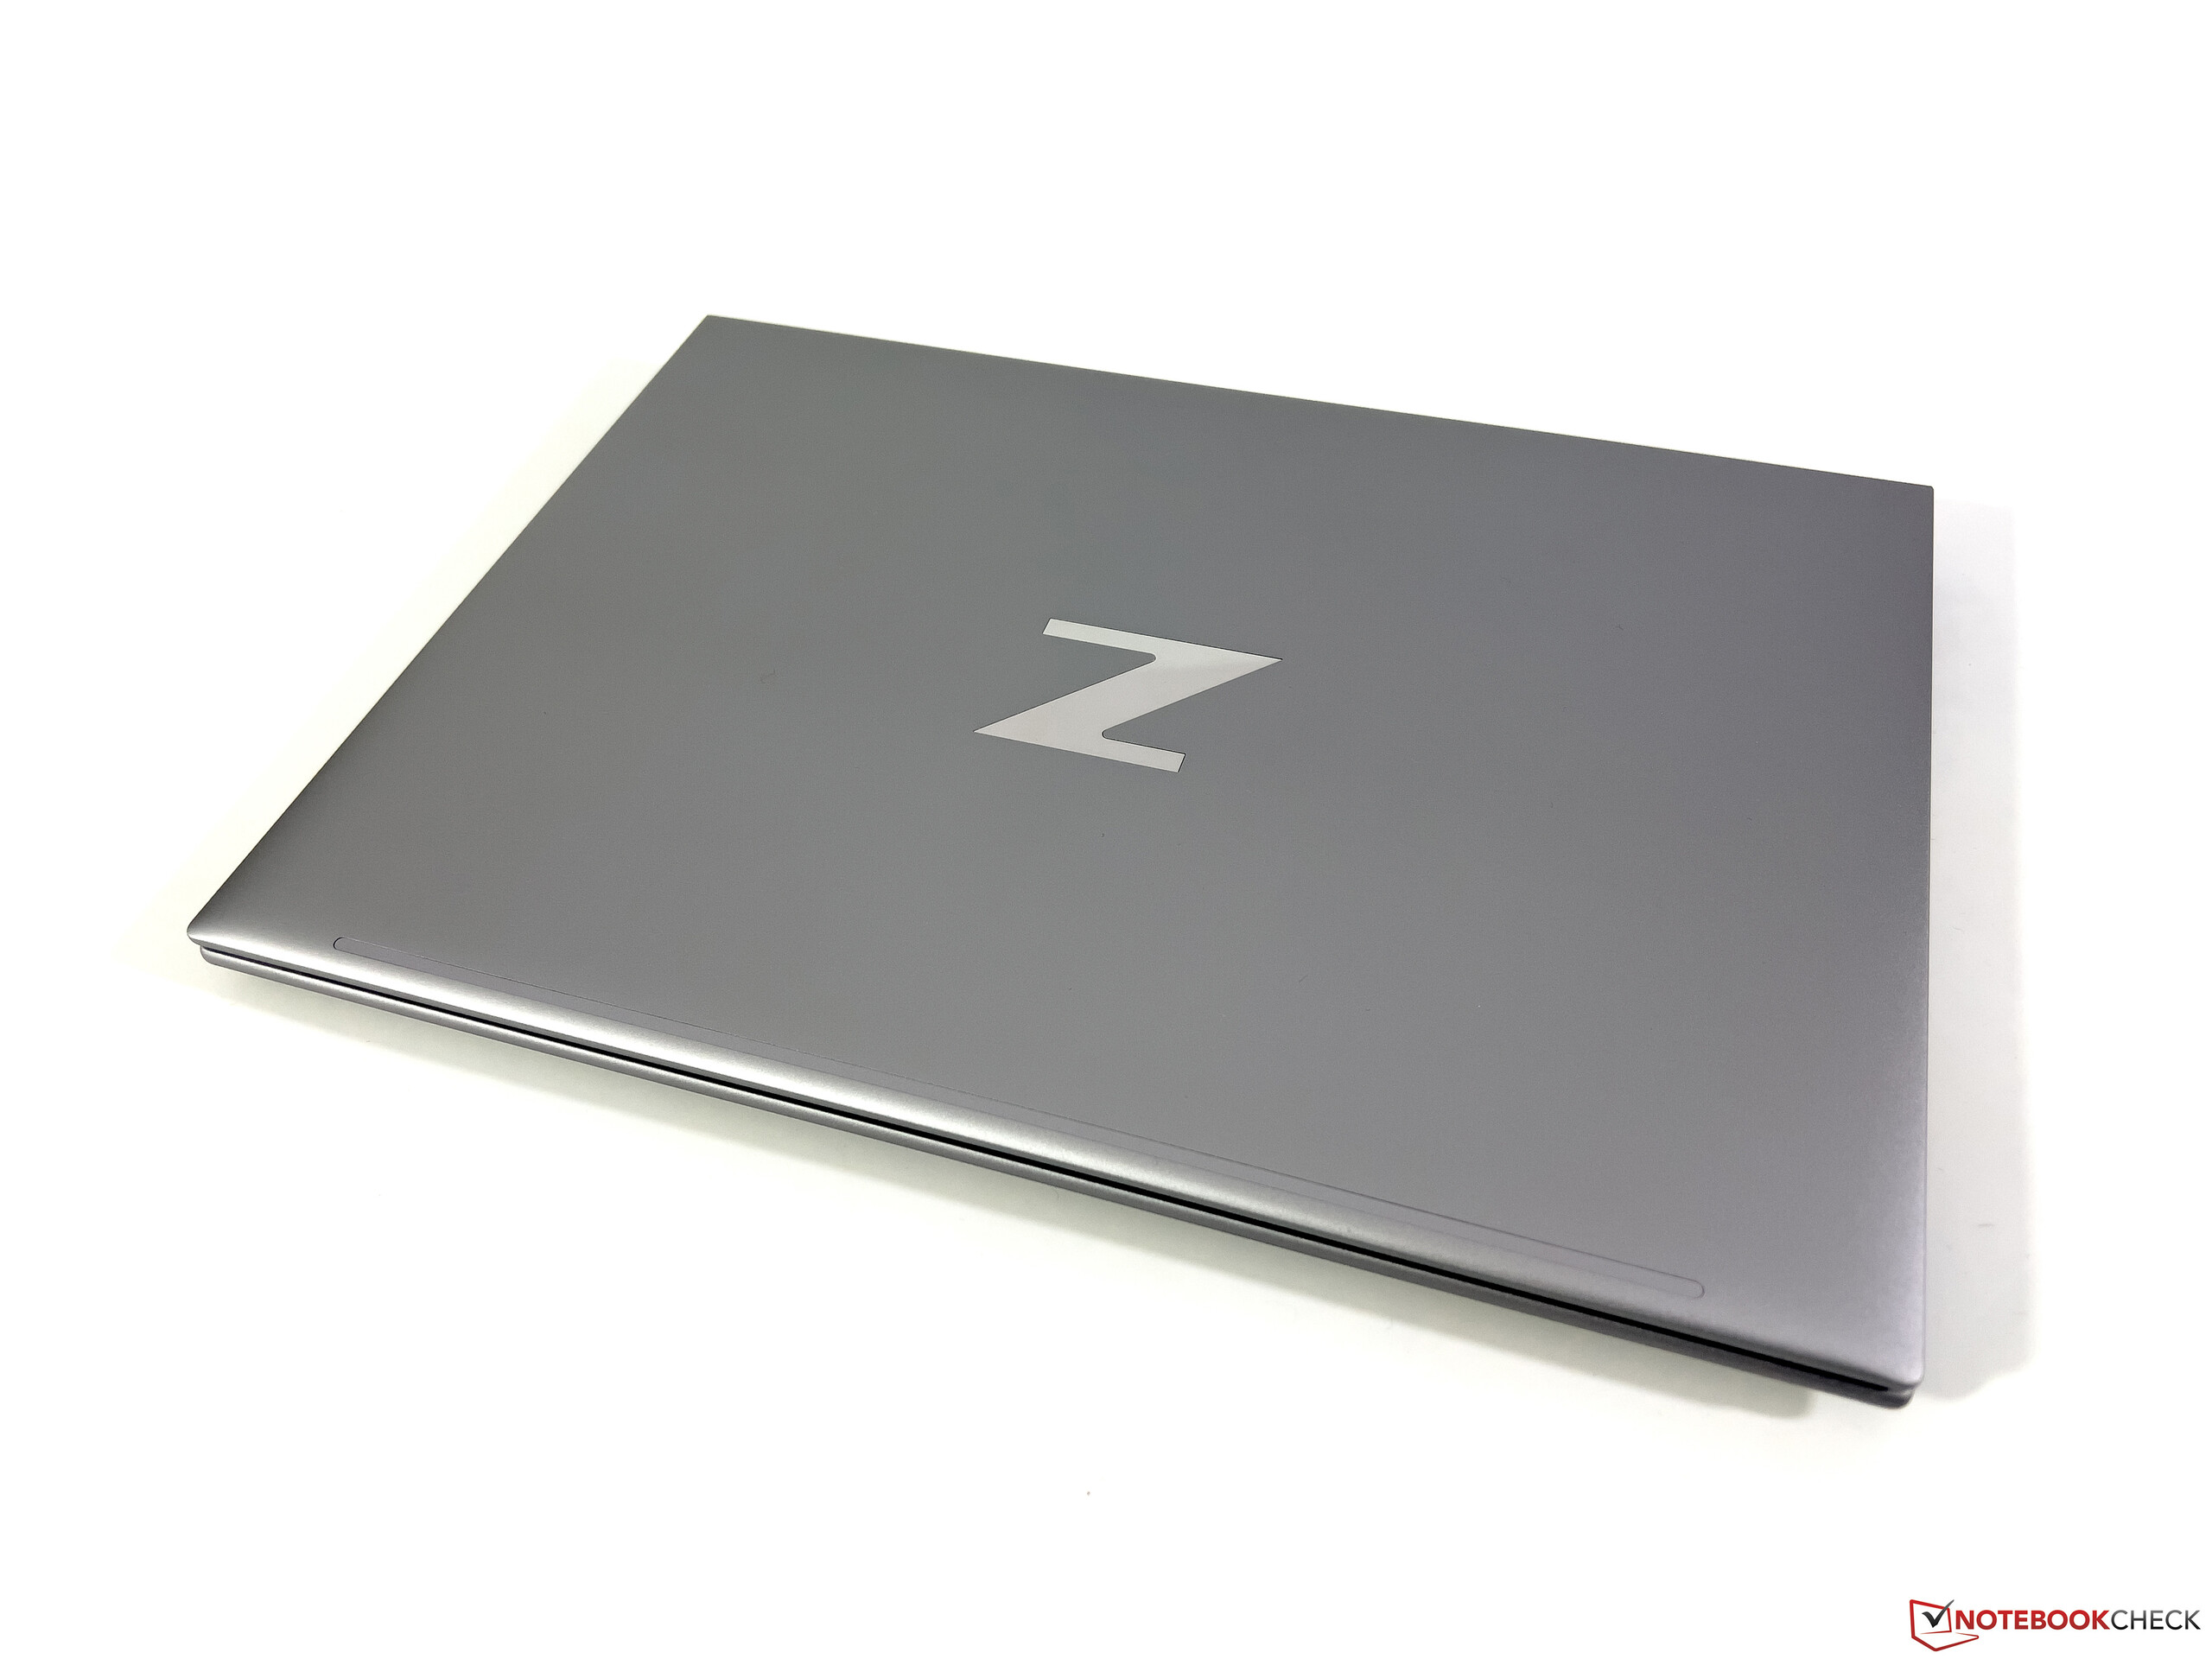
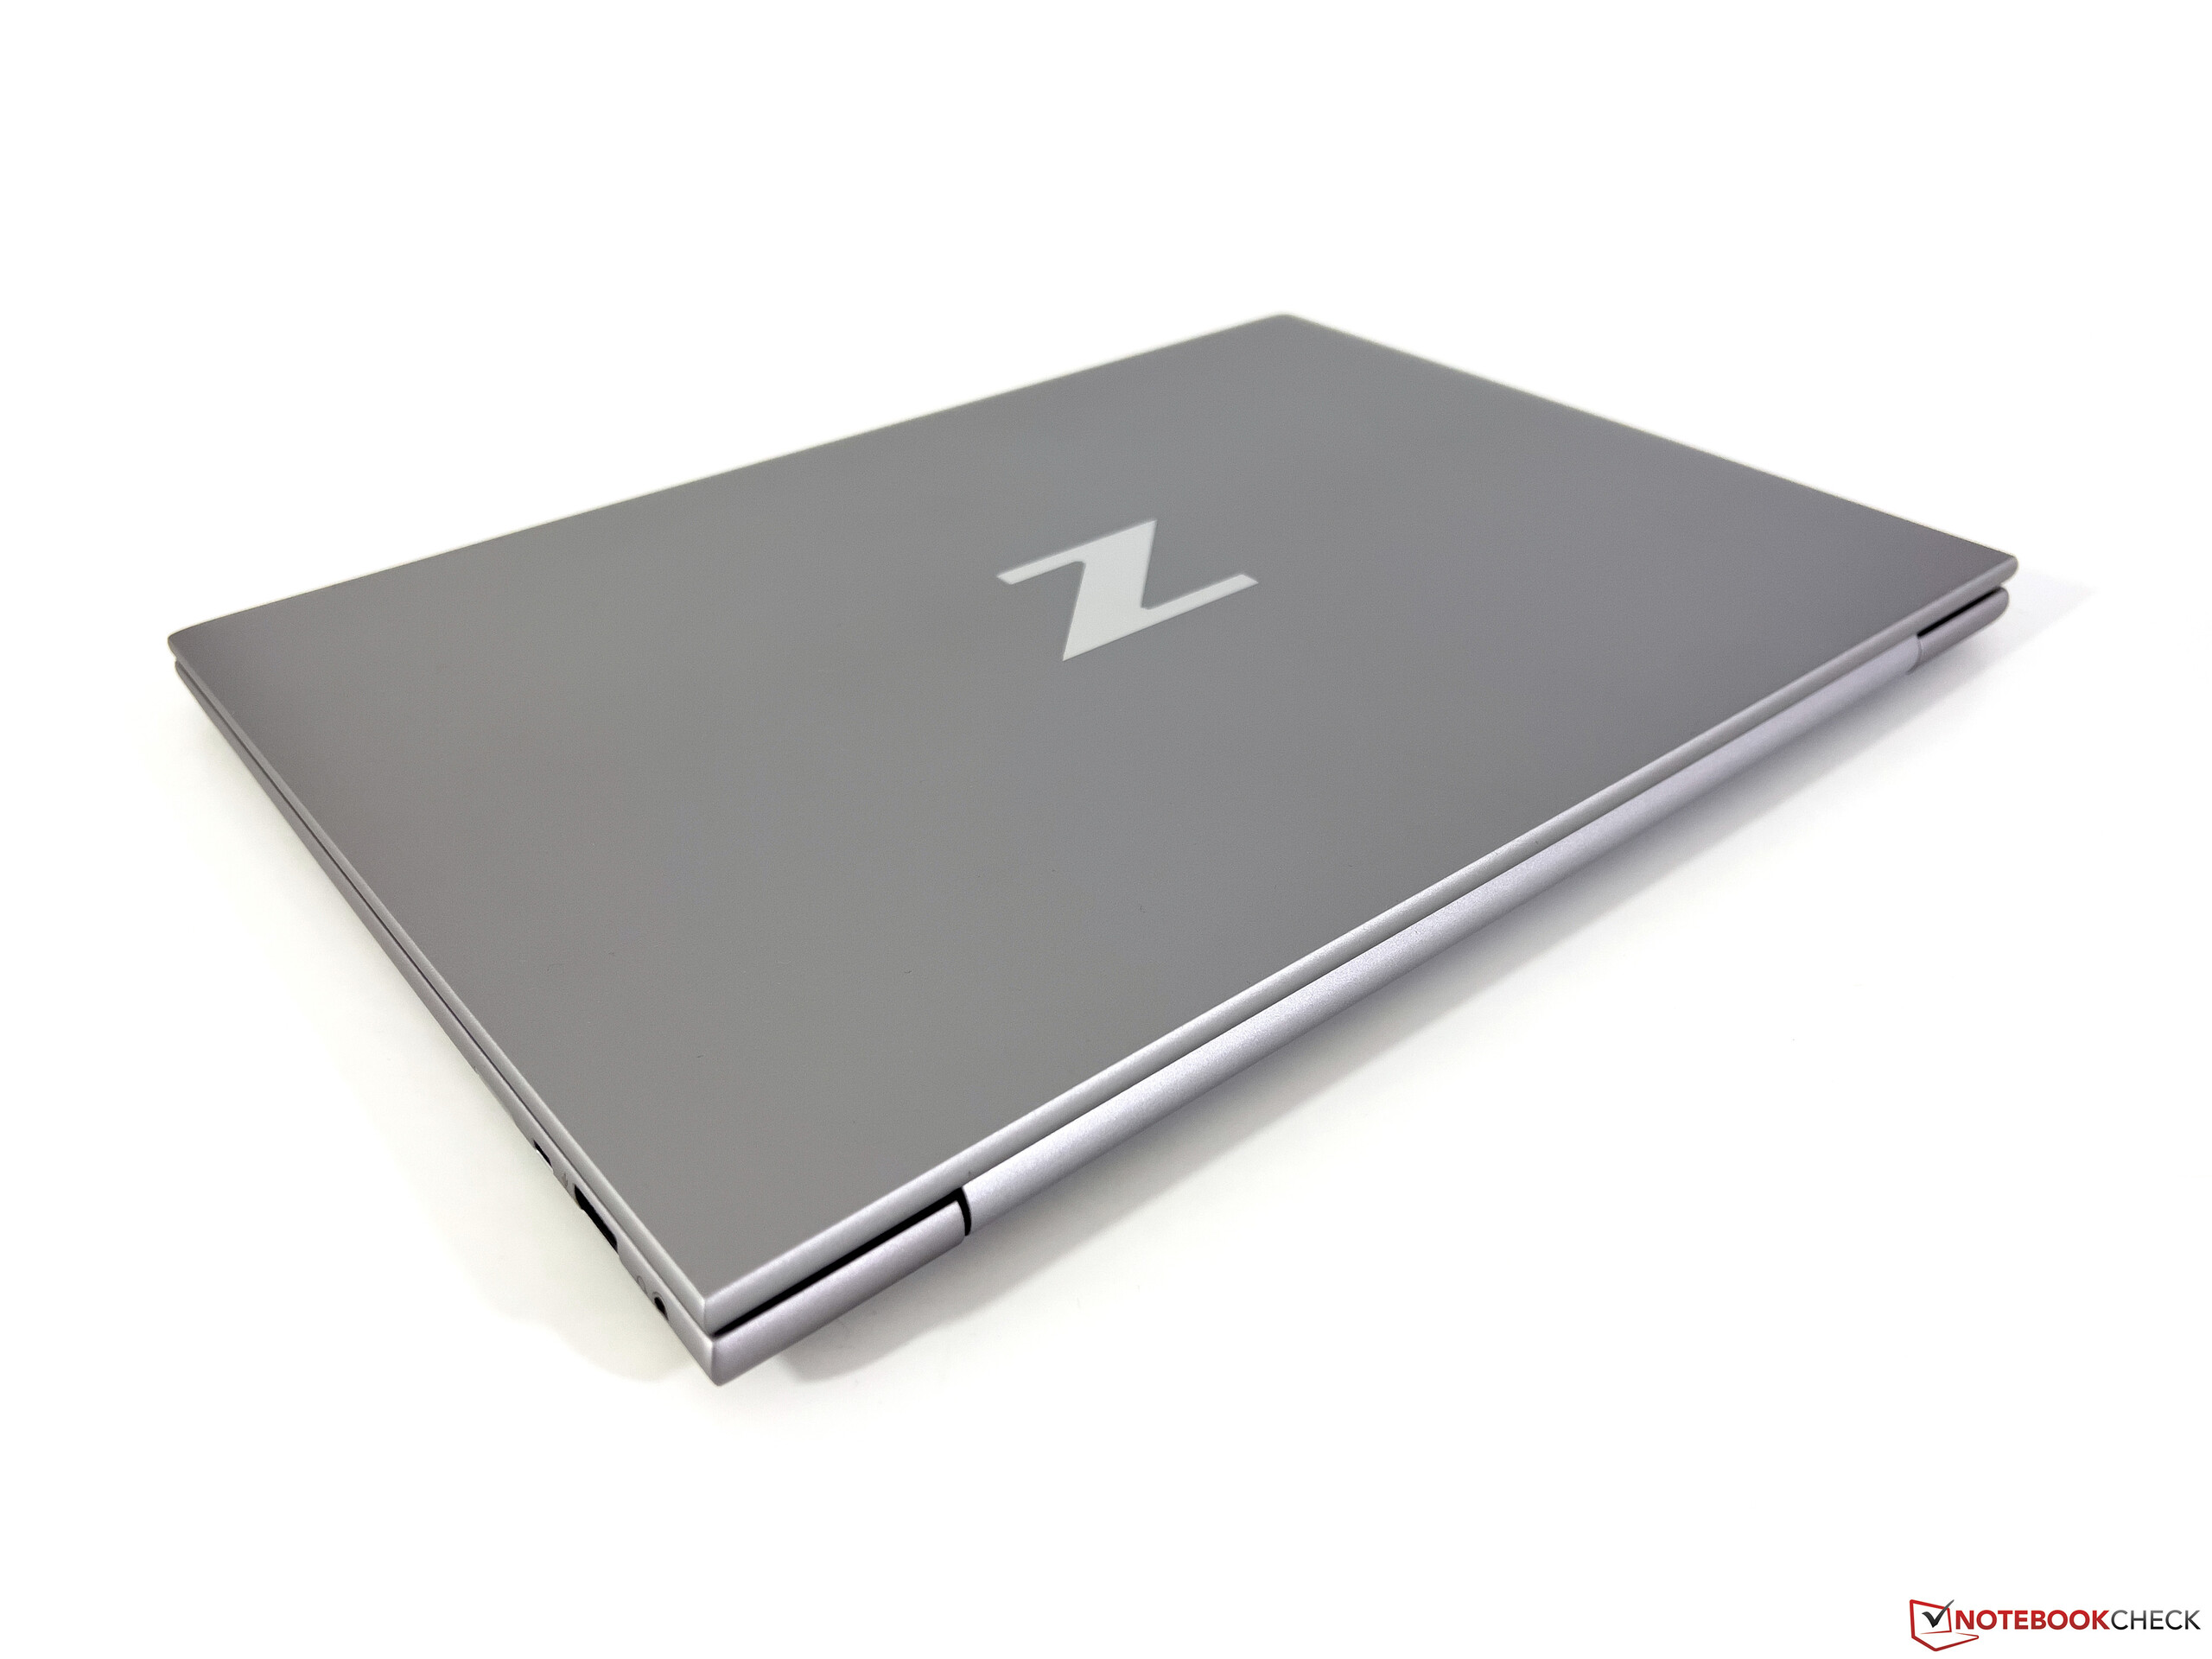
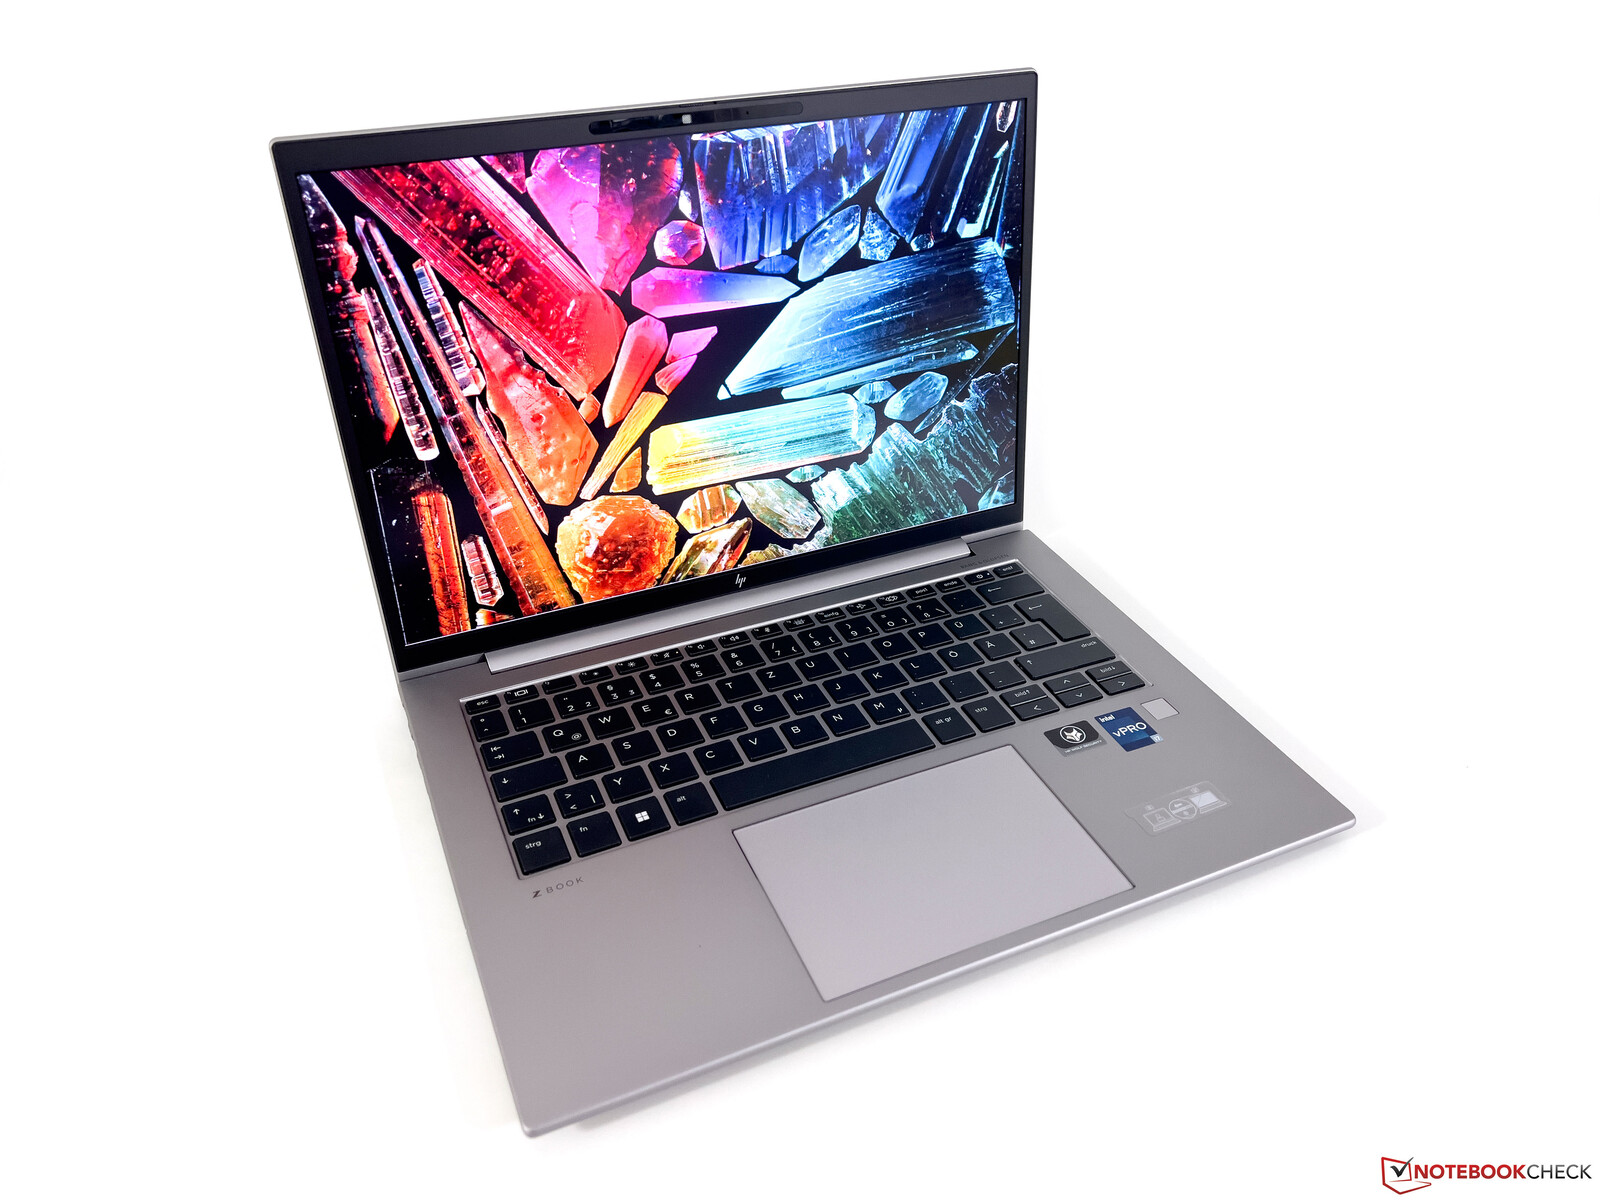
惠普ZBook Firefly G9采用了与该公司常规商务机型相同的机箱,如EliteBook 840 G9或845 G9。 845 G9,但在这个移动工作站中,银色似乎略显暗淡。铝制机箱给人留下高质量的印象,也非常稳定。我们没有遇到任何问题,比如屏幕边框松动(见EliteBook 845 G9的评论)。 对EliteBook 845 G9的评论).由于16:10的显示屏和狭窄的屏幕边缘,这款紧凑的14英寸笔记本看起来相当现代,但在专业环境中,其相当克制的设计并不突出。最大打开角度约为170度,铰链调节良好。可以毫无问题地用一只手打开盖子,同时几乎完全防止了摇晃。
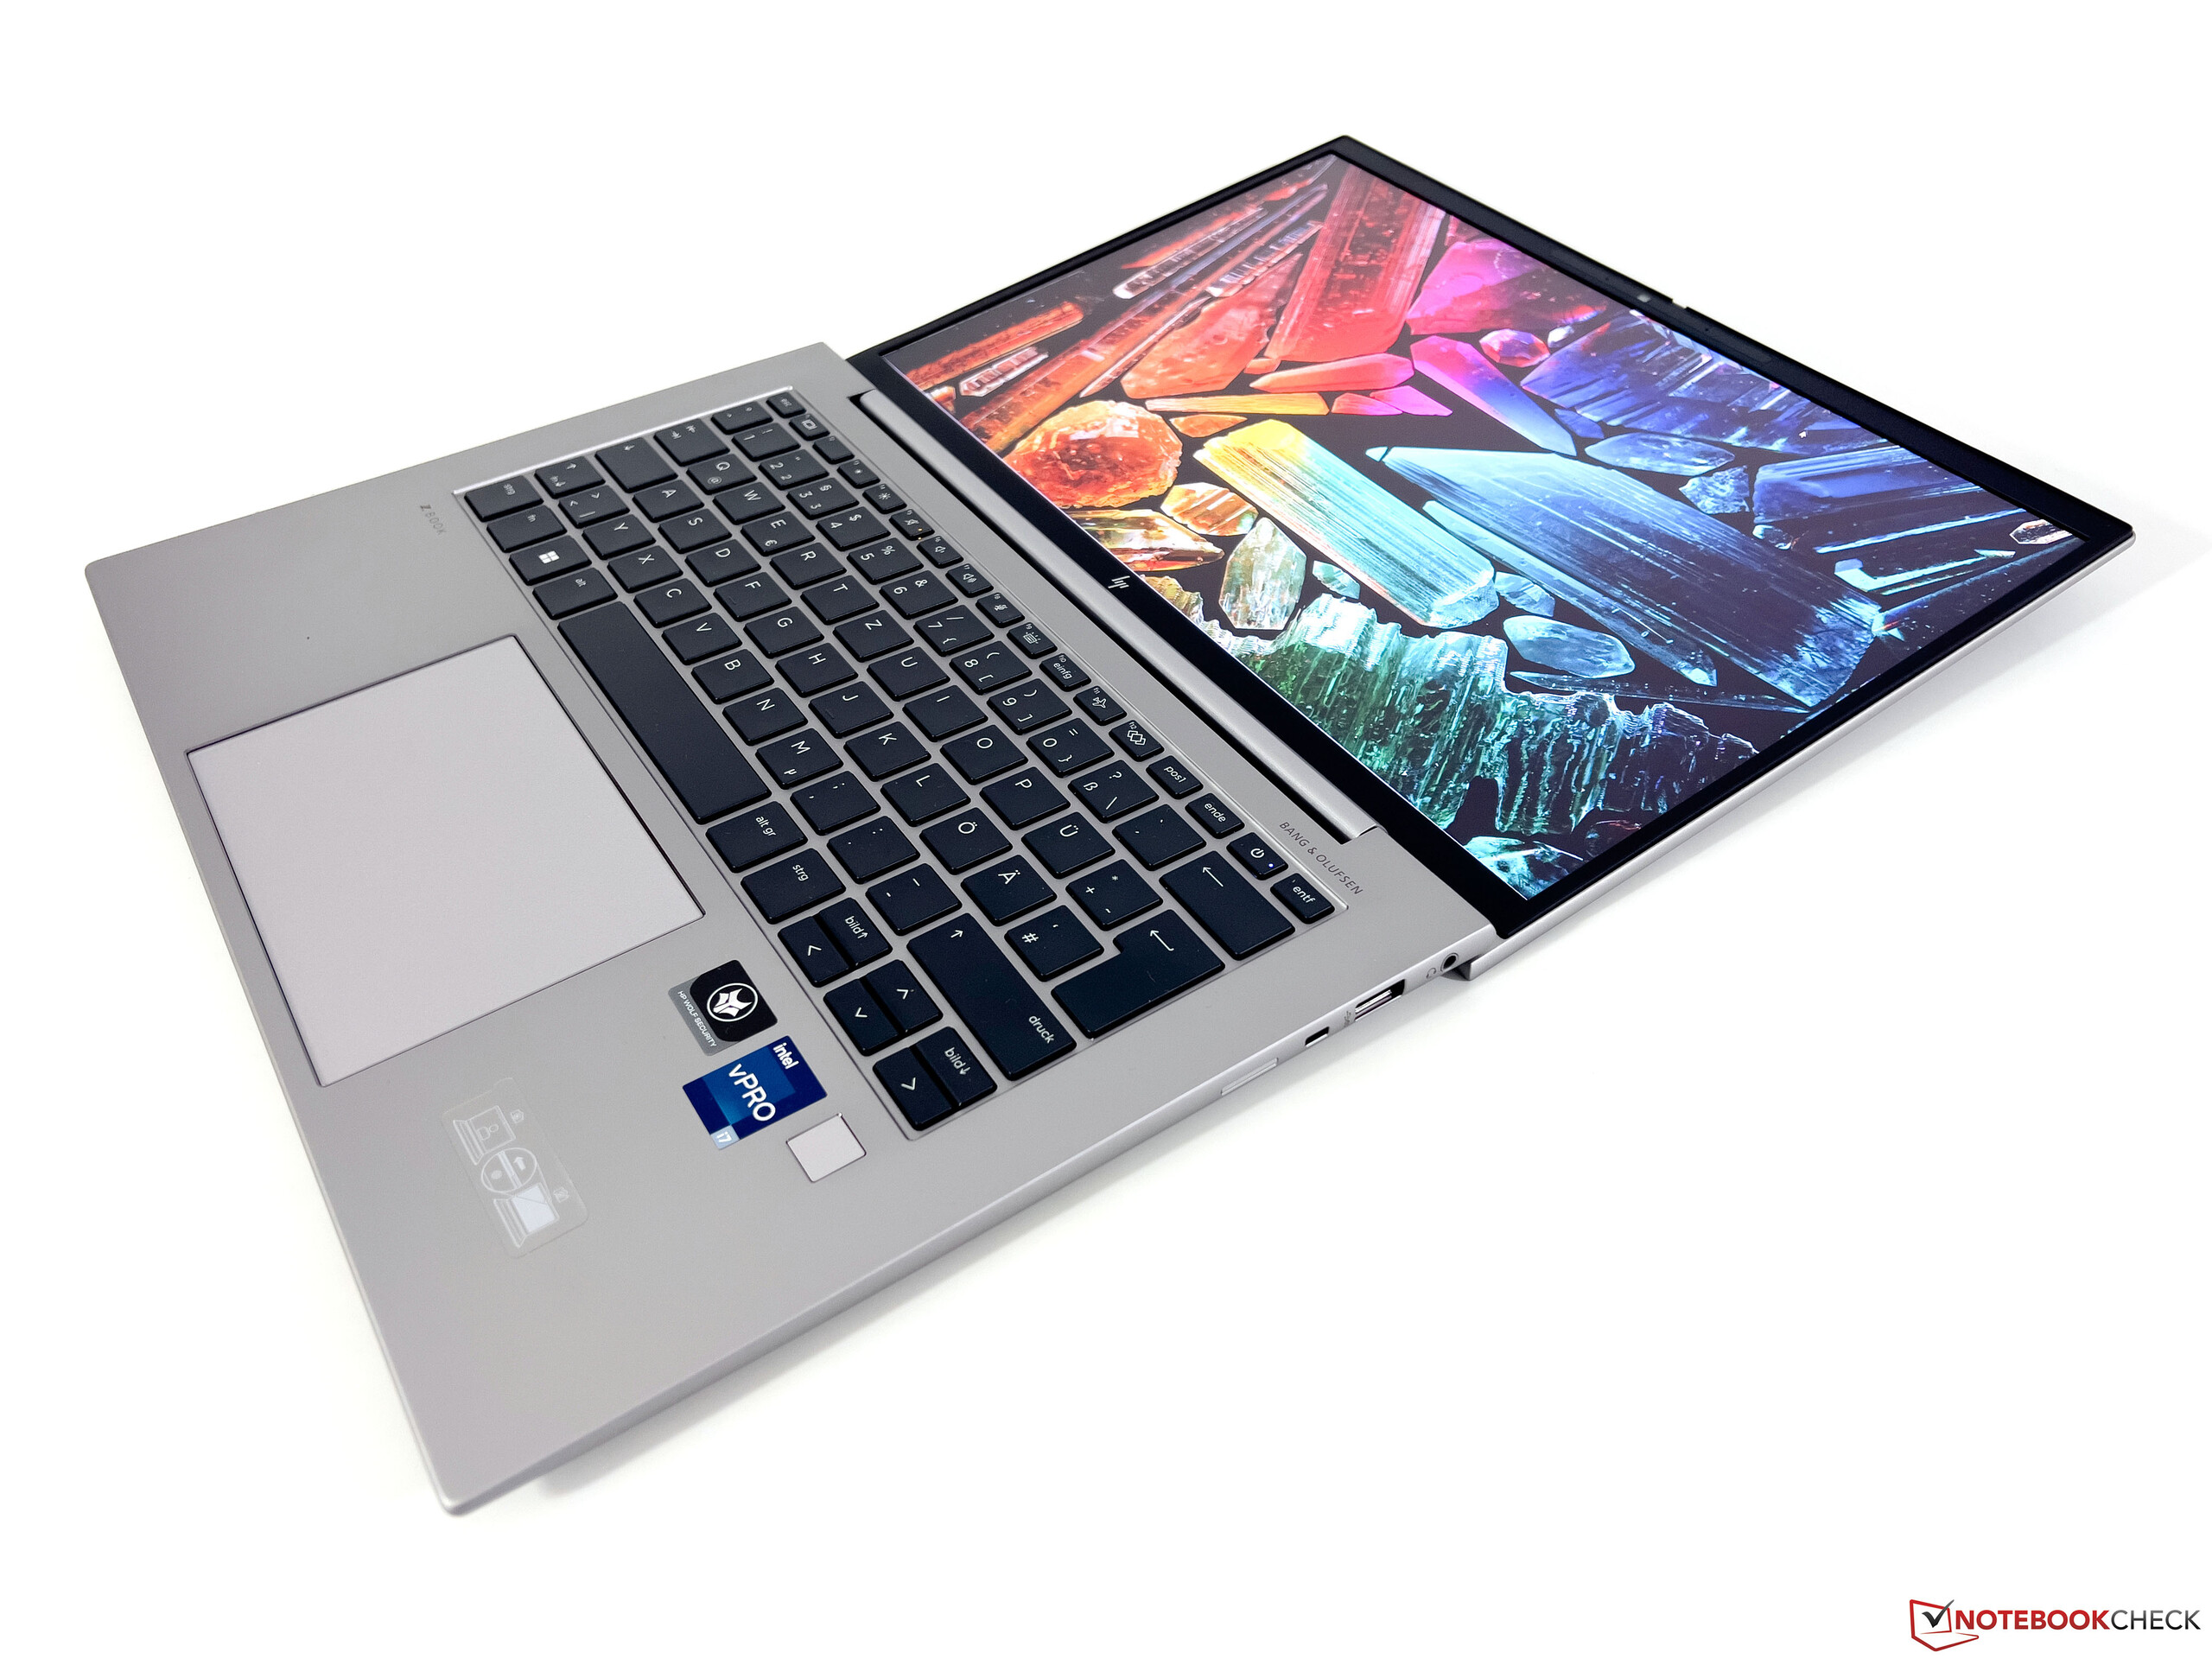
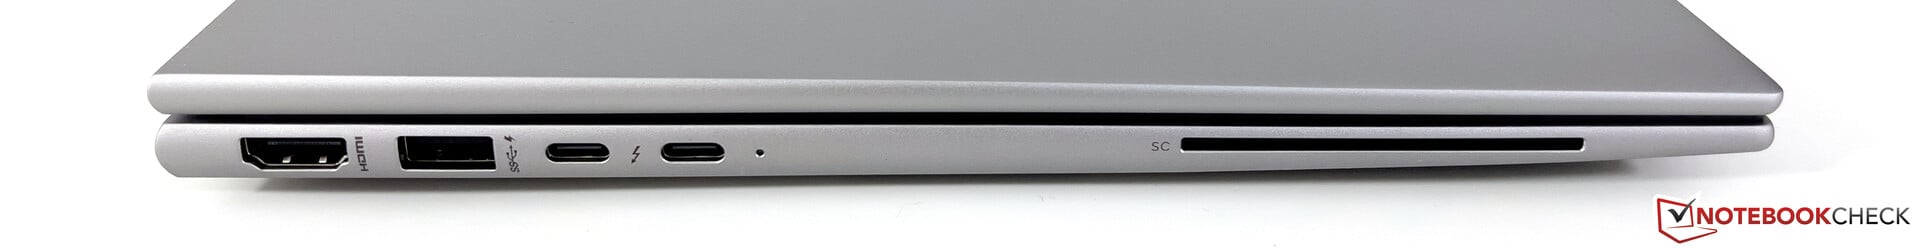
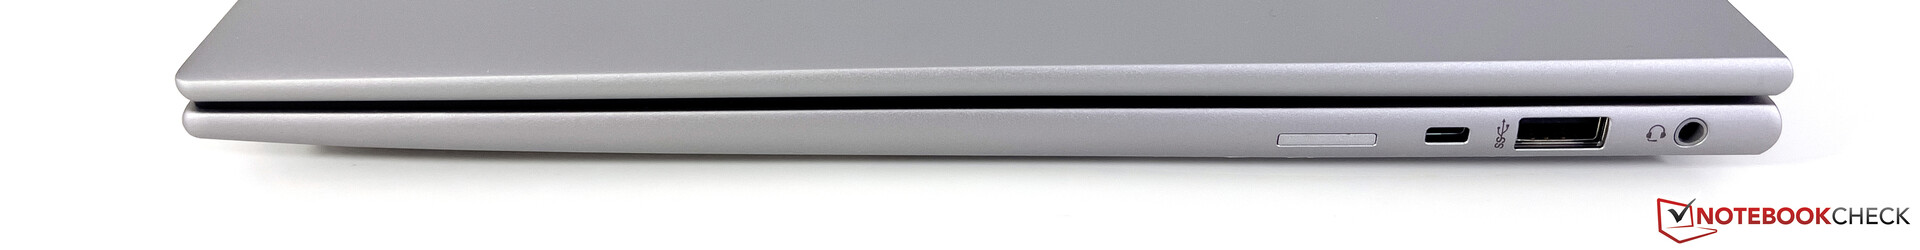
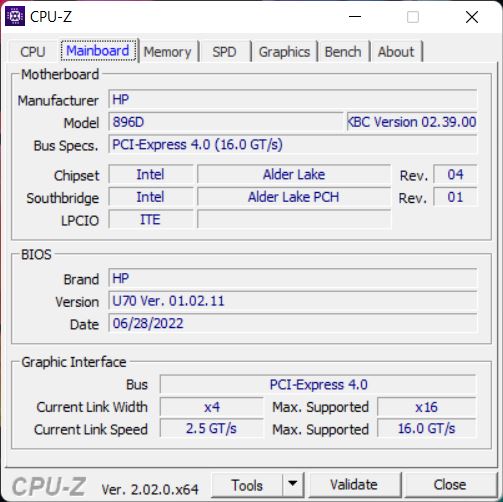
ZBook提供了所有重要的端口,包括两个支持Thunderbolt 4的USB-C端口,这也使电源或连接到一个扩展坞。除了一个成熟的HDMI输出,还有一个智能卡读卡器和一个WWAN型号(可选择5G)的nano-SIM卡的插槽。不过,WWAN模块不能升级。惠普使用英特尔的现代AX211 WLAN模块,它支持Wi-Fi 6E标准。在测试中,我们能够连接到来自华硕的参考路由器的6GHz网络,没有任何问题,传输速率也非常好。不包括一个以太网端口和一个读卡器。
除了红外摄像头外,惠普还安装了一个机械光圈的500万像素网络摄像头,它只能记录最大2560×1440像素(3.7MP)的图片。视频可以在每秒30帧的情况下以最大1440p的速度记录。这款相机给人留下了良好的印象,在图像清晰度以及色彩保真度方面可以从通常的720p或1080p模块中脱颖而出。


维护
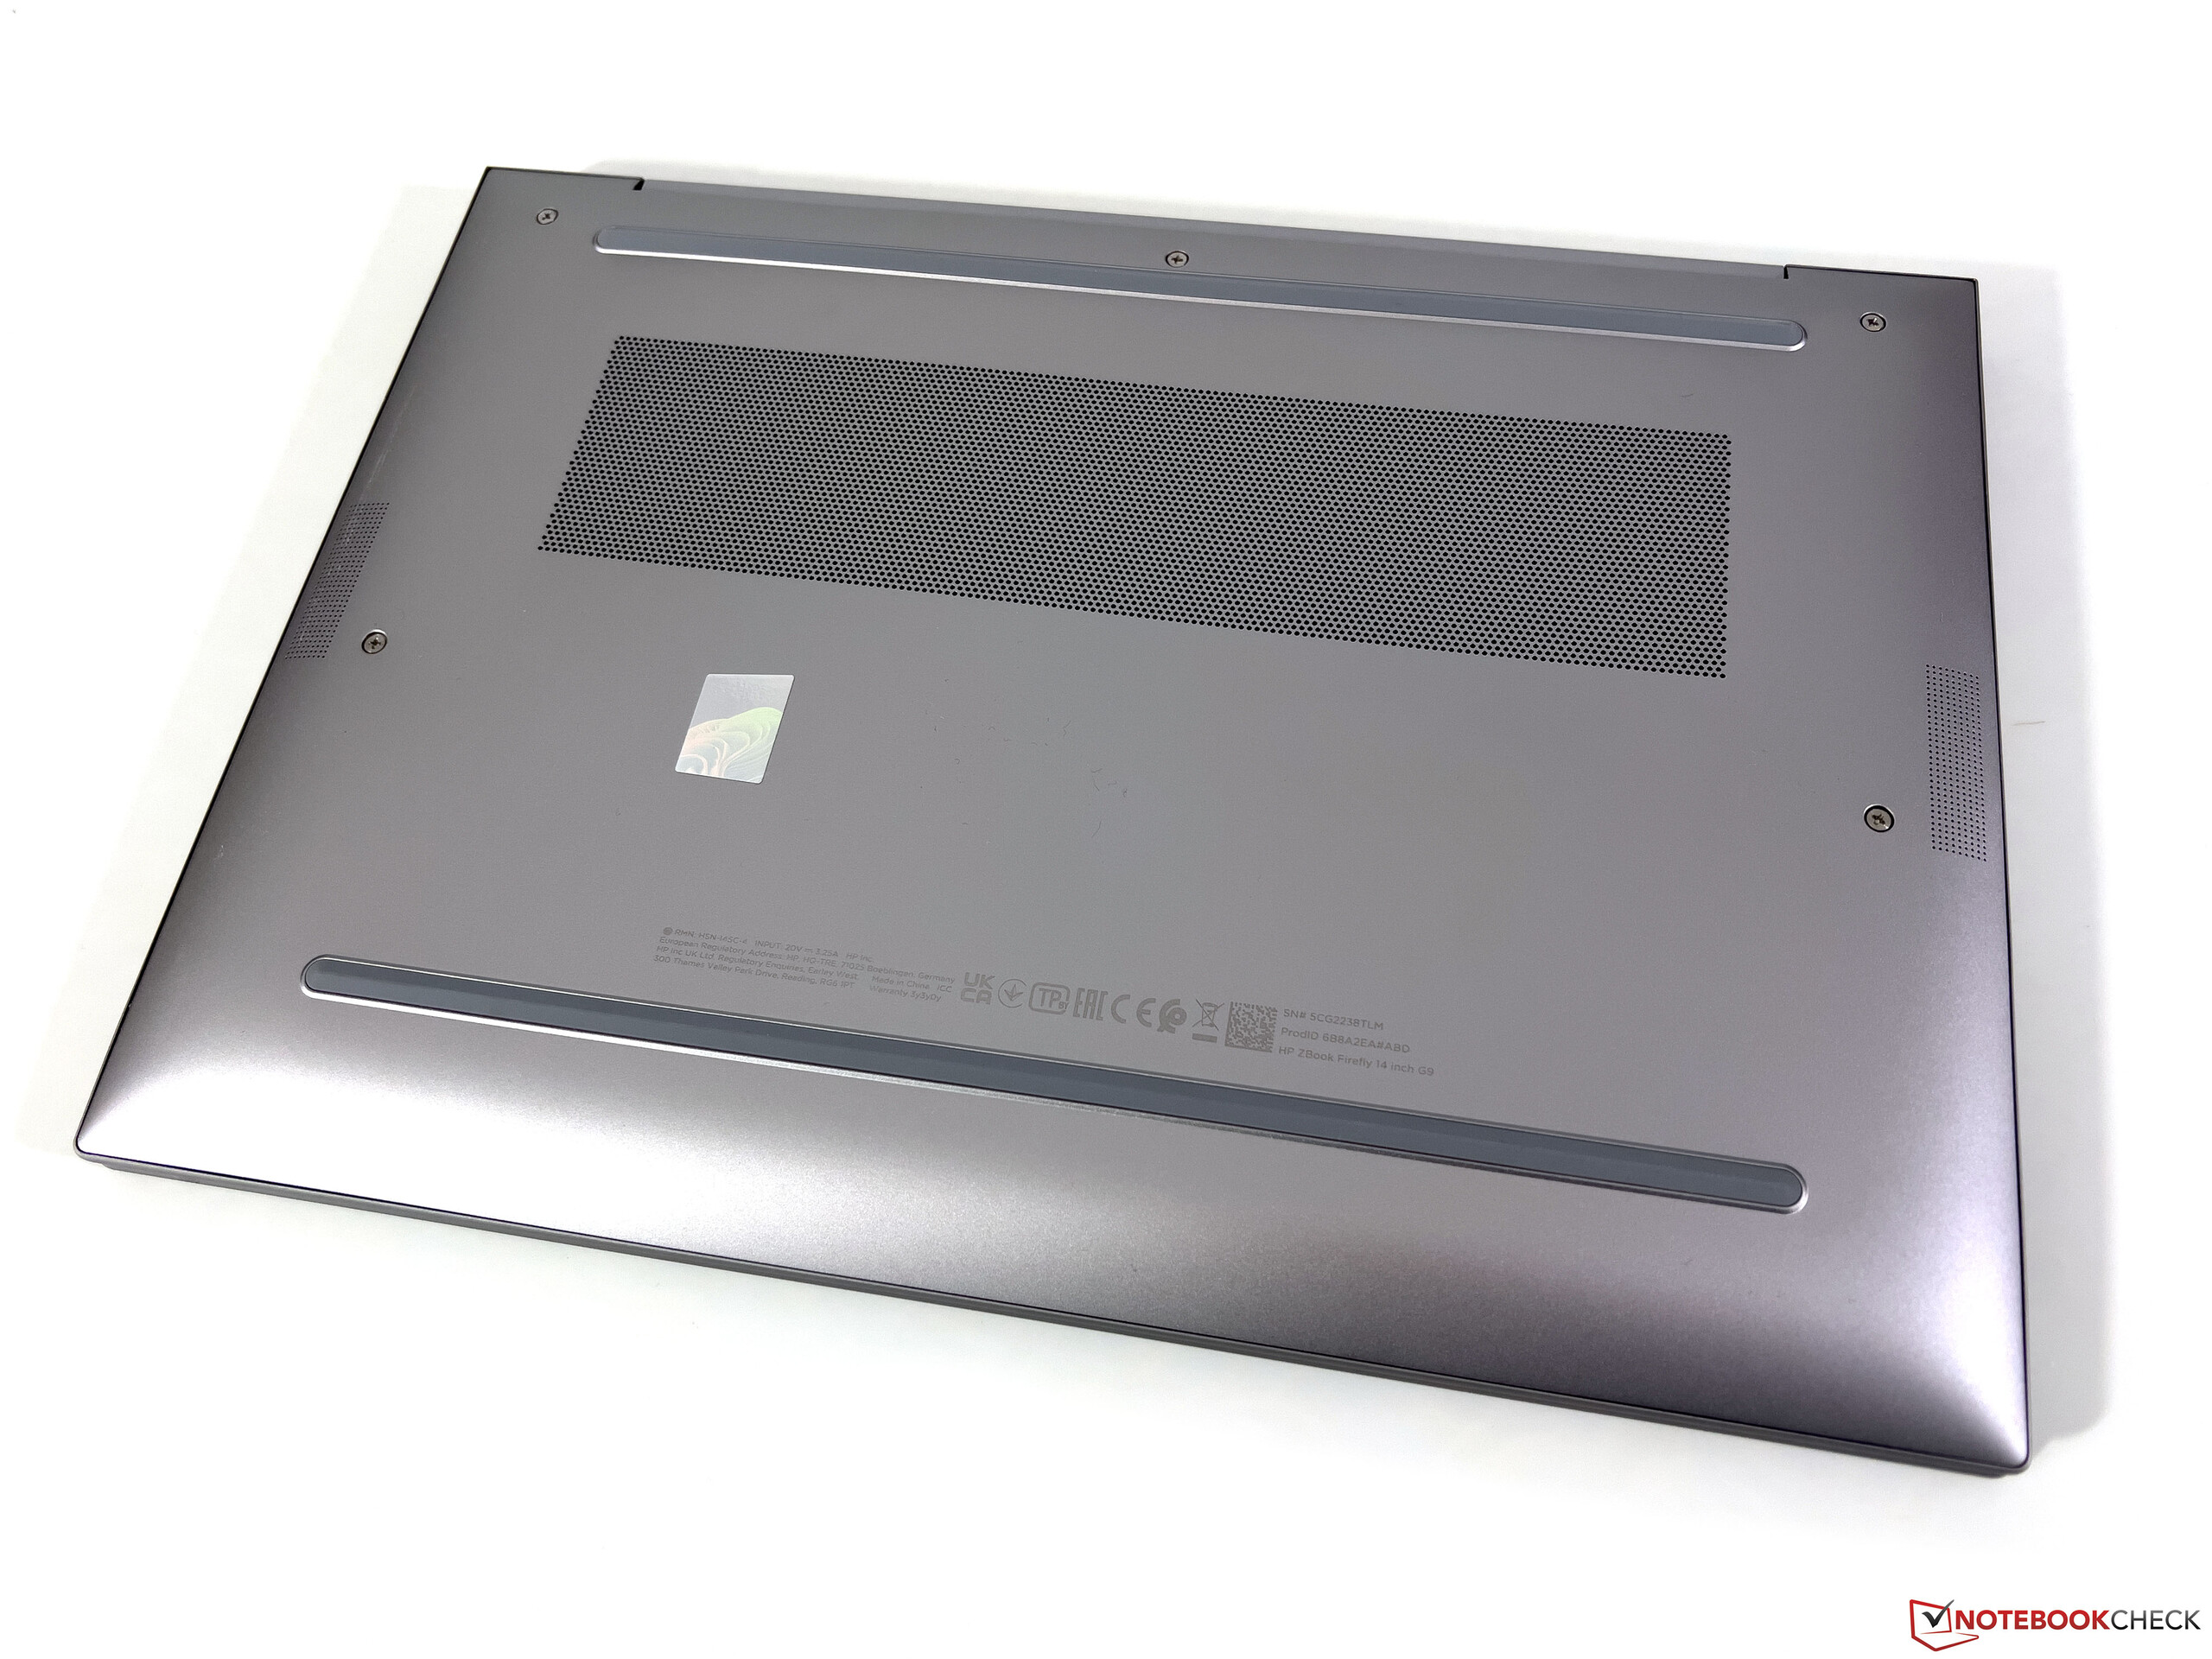
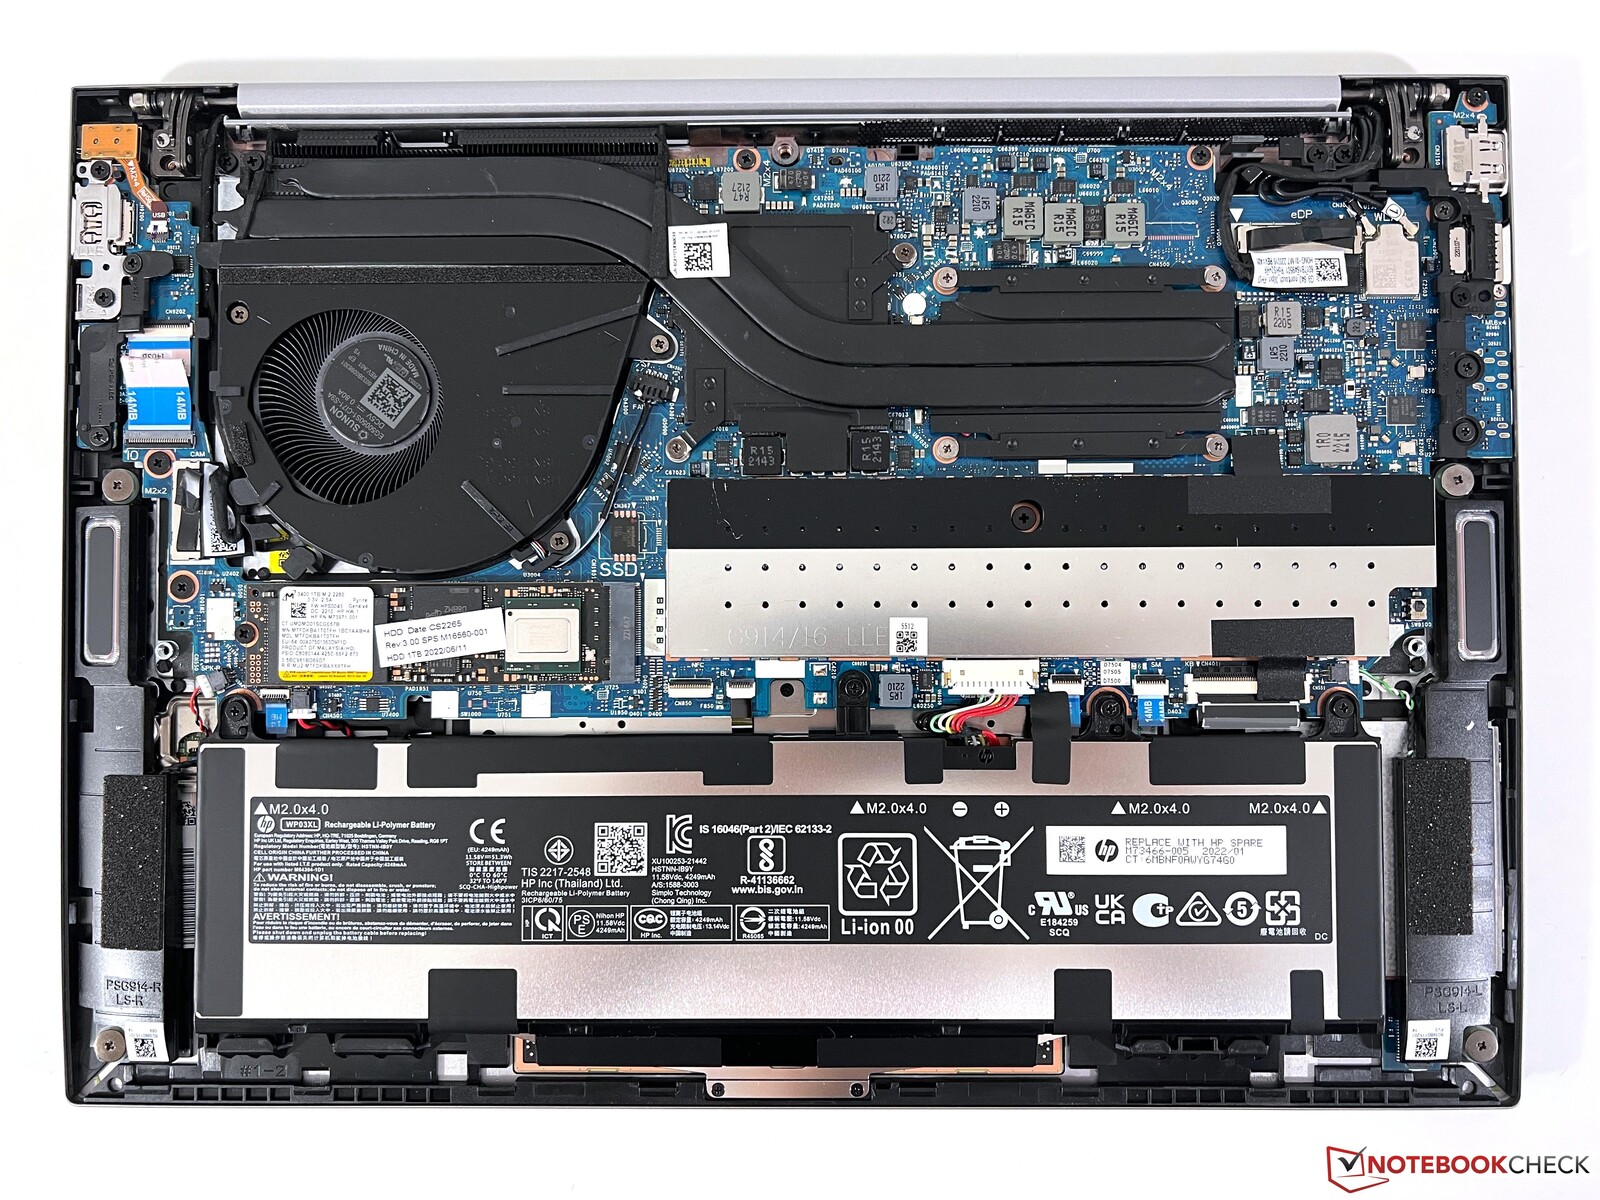
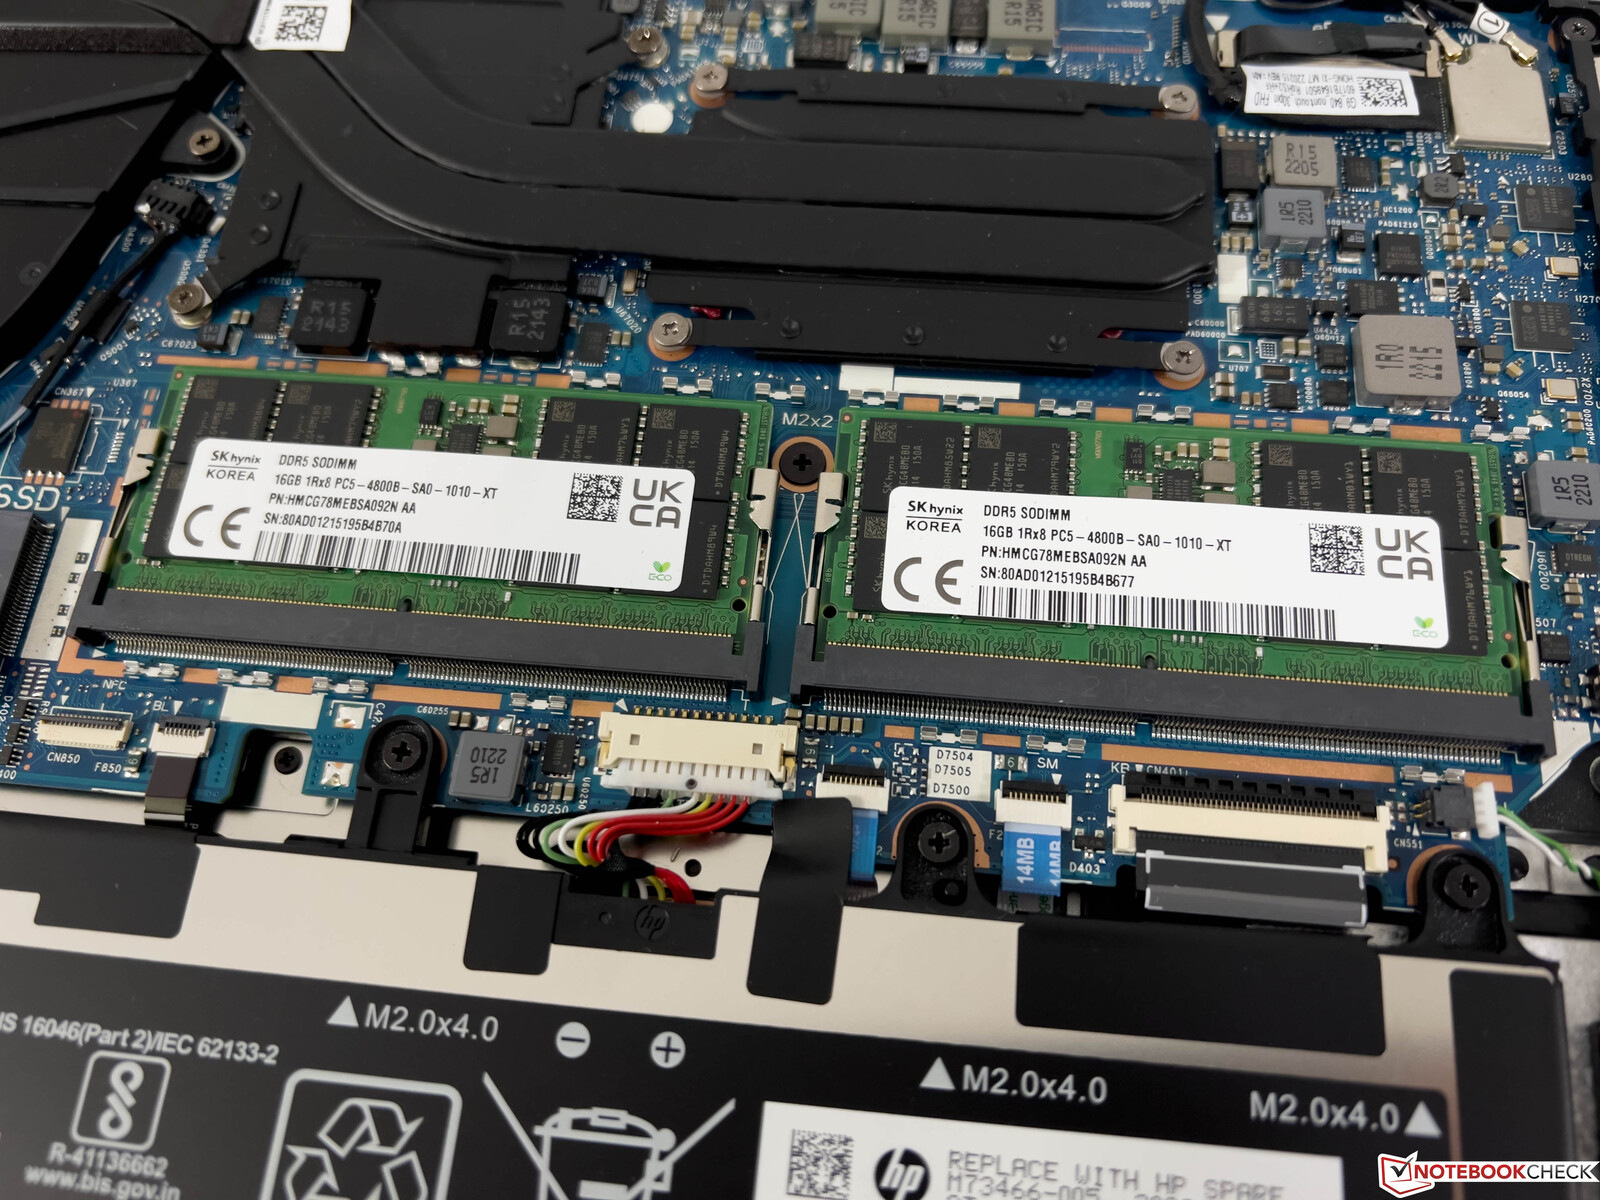
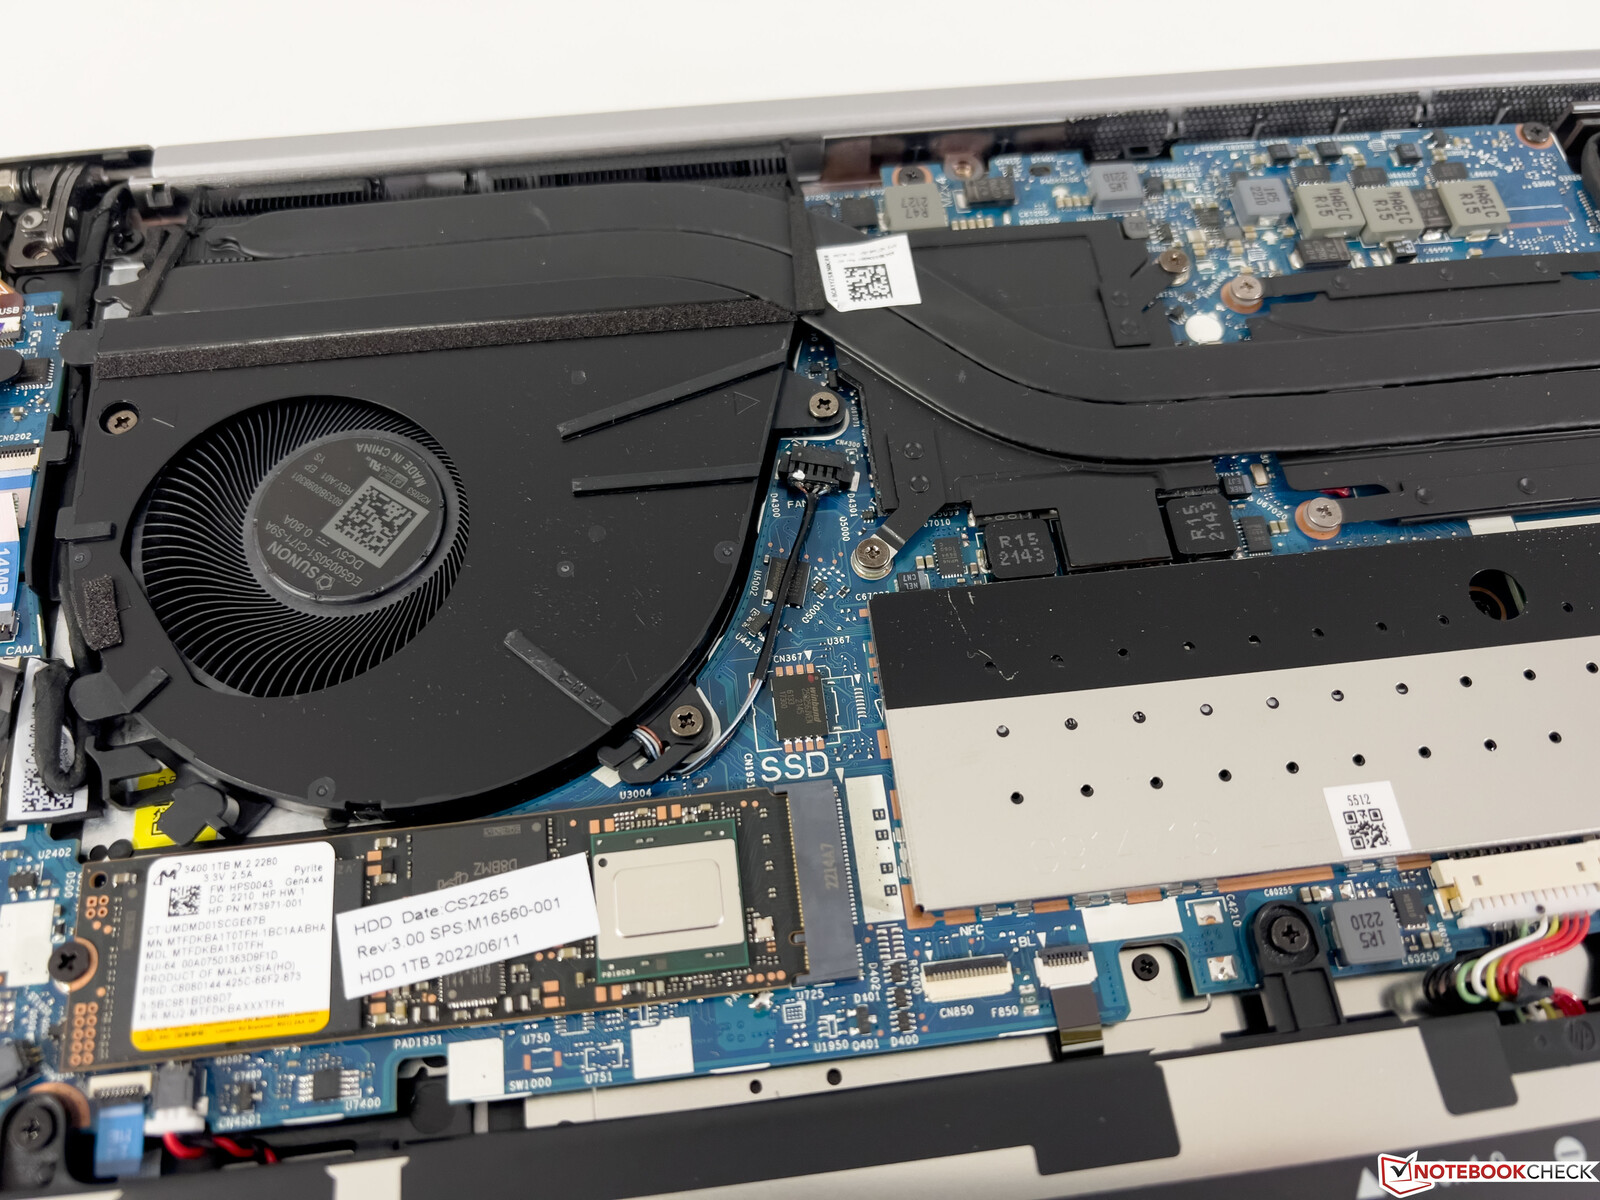
底部的机箱盖是用传统的飞利浦螺丝固定的(它们只是松动,并不能完全拧开),可以很容易地拆下来。在里面,你可以接触到风扇、带螺丝的电池、M.2-2280插槽以及两个SO-DIMM插槽,它们位于另外一个盖子下面。然而,WLAN模块被焊接在主板上。
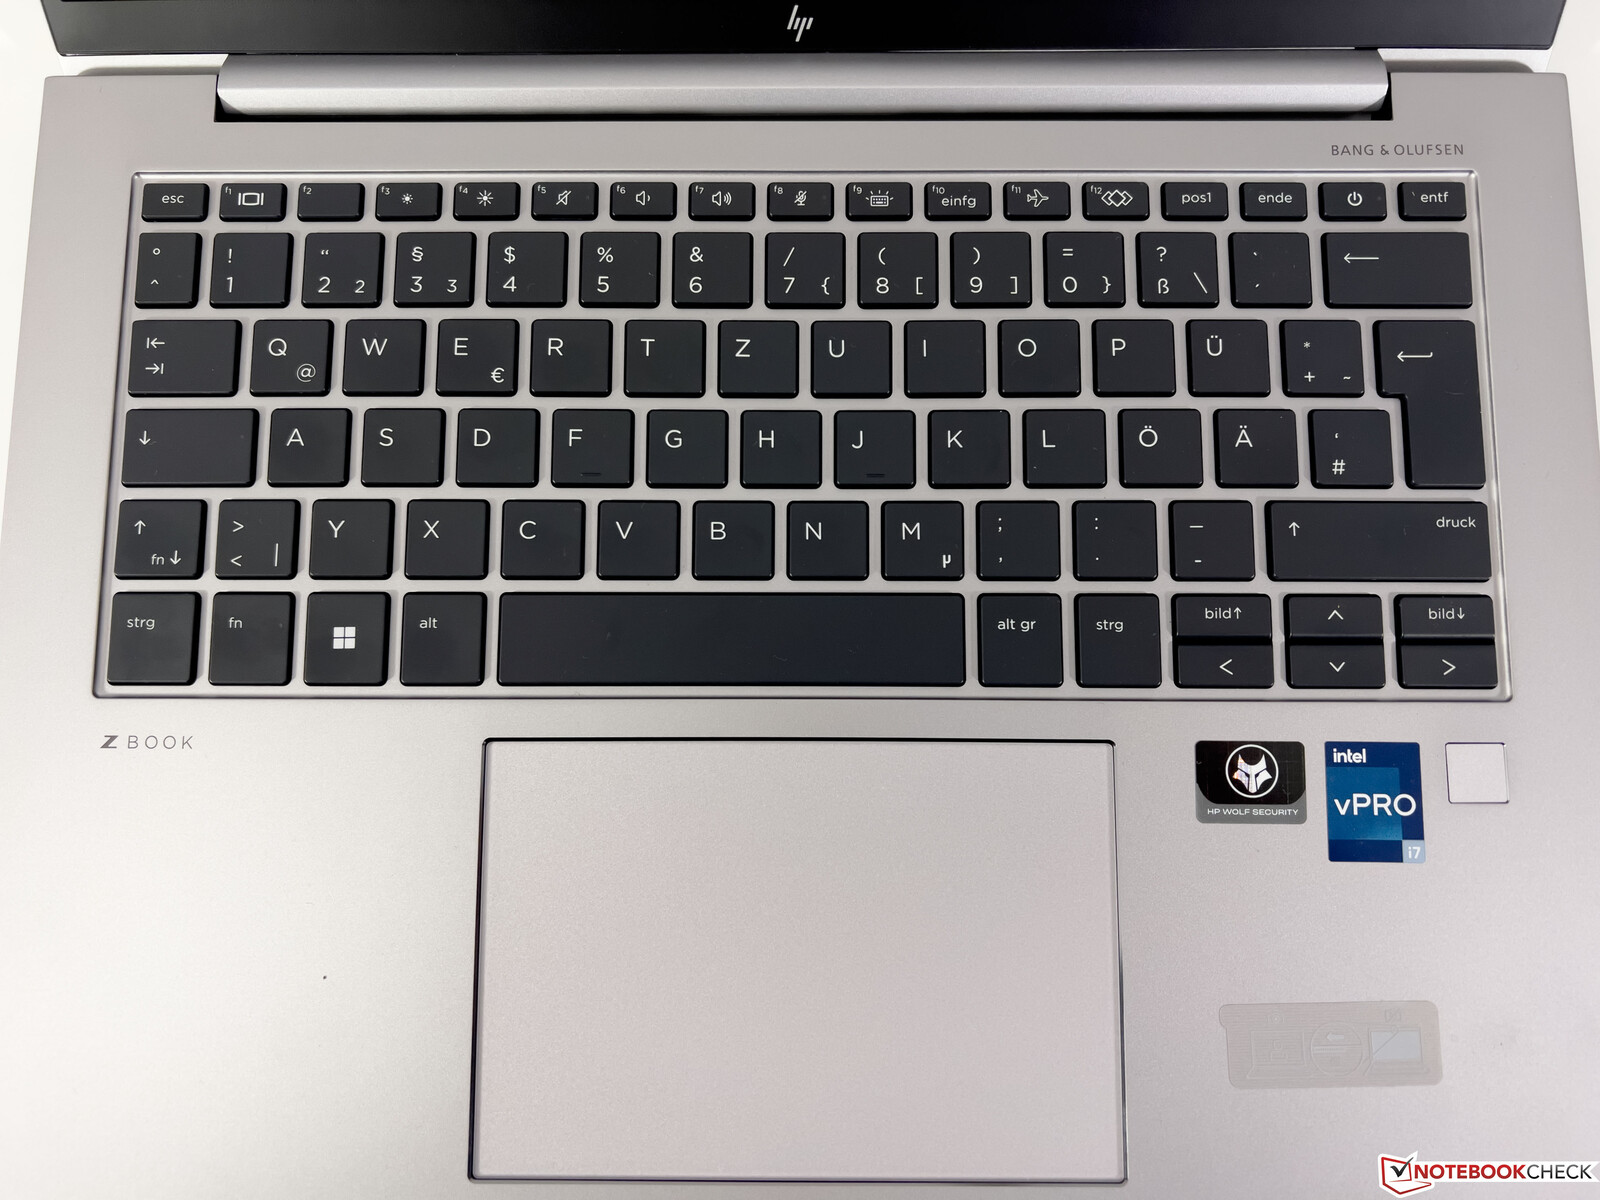
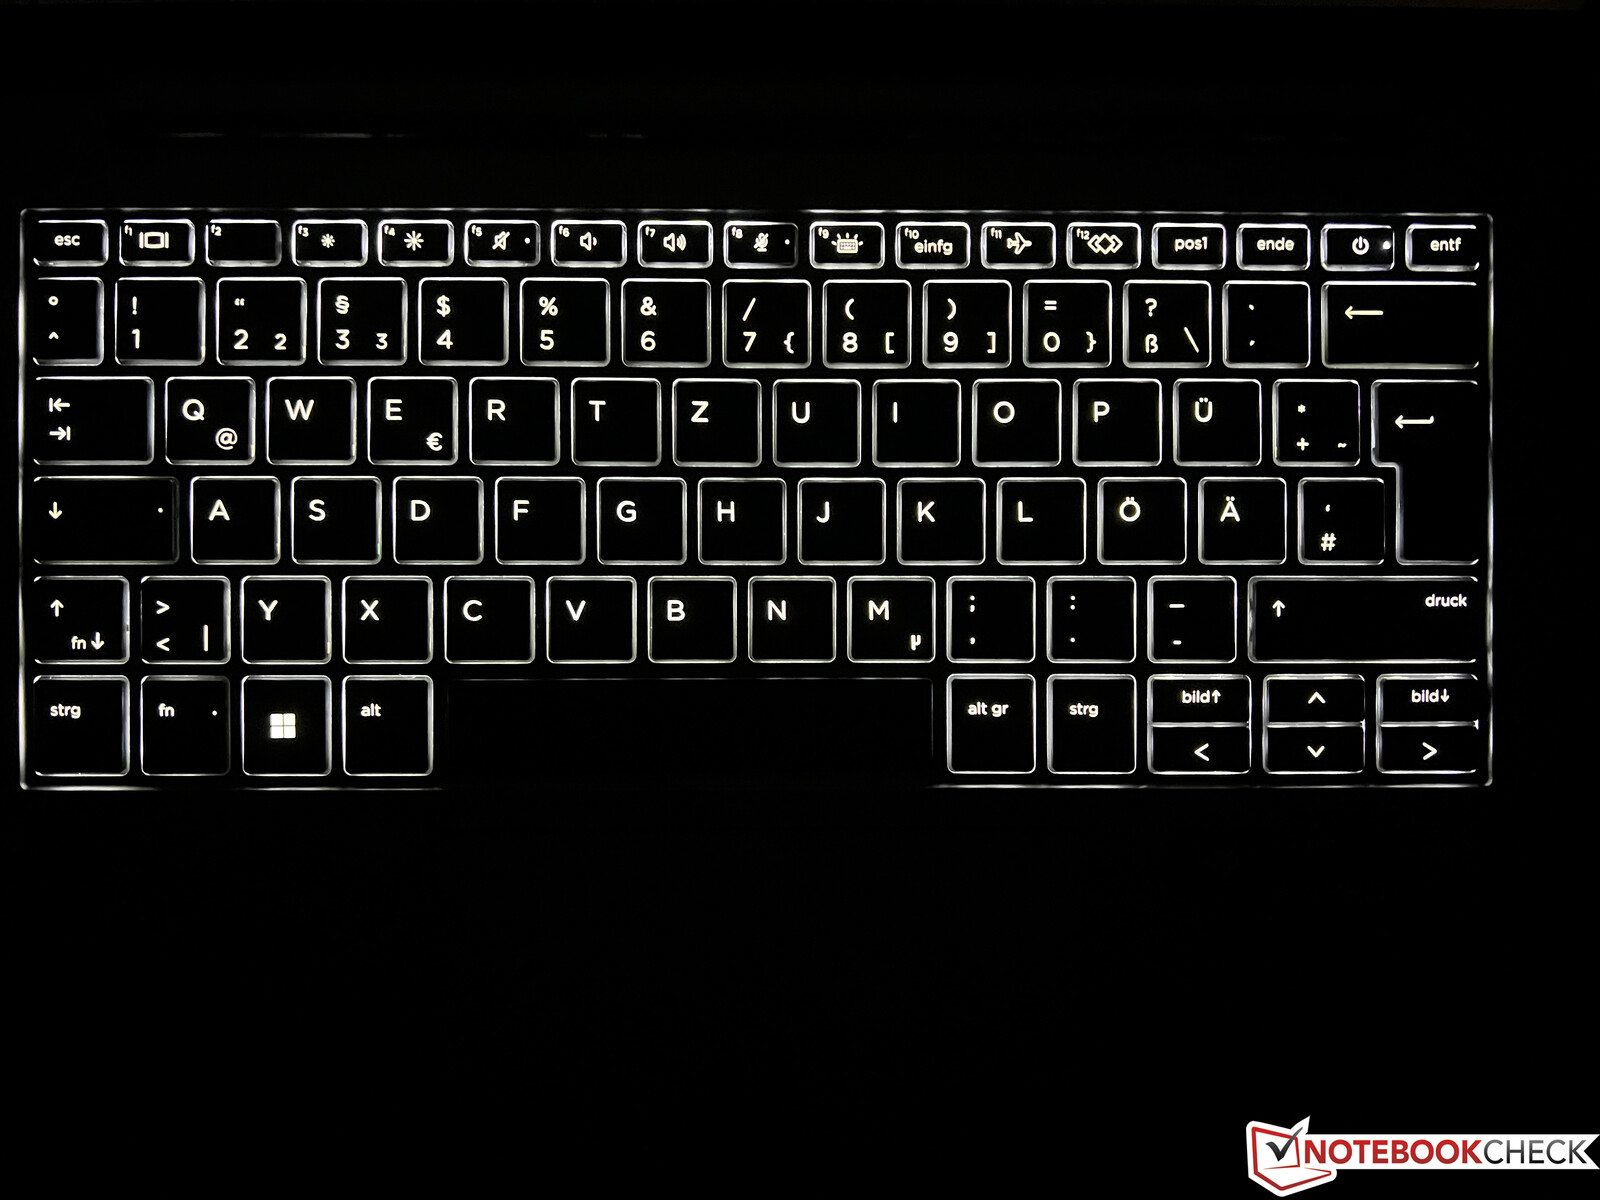
输入设备。带有非常好的键盘的Zbook
背光键盘提供了一个牢固的压力点,整体上有非常舒适的打字体验,使ZBook适合书写很长的文本。电源键集成在键盘的右上方,有可能会意外地撞到这个键。此外,方向键也非常小。指纹扫描仪位于键盘下方的右侧。
大型点击板(12 x 8厘米)具有良好的滑动性能,在日常使用中效果很好。键盘的下部可以被按下,这时会有令人愉快的丰富而安静的点击声--就像它应该有的那样。
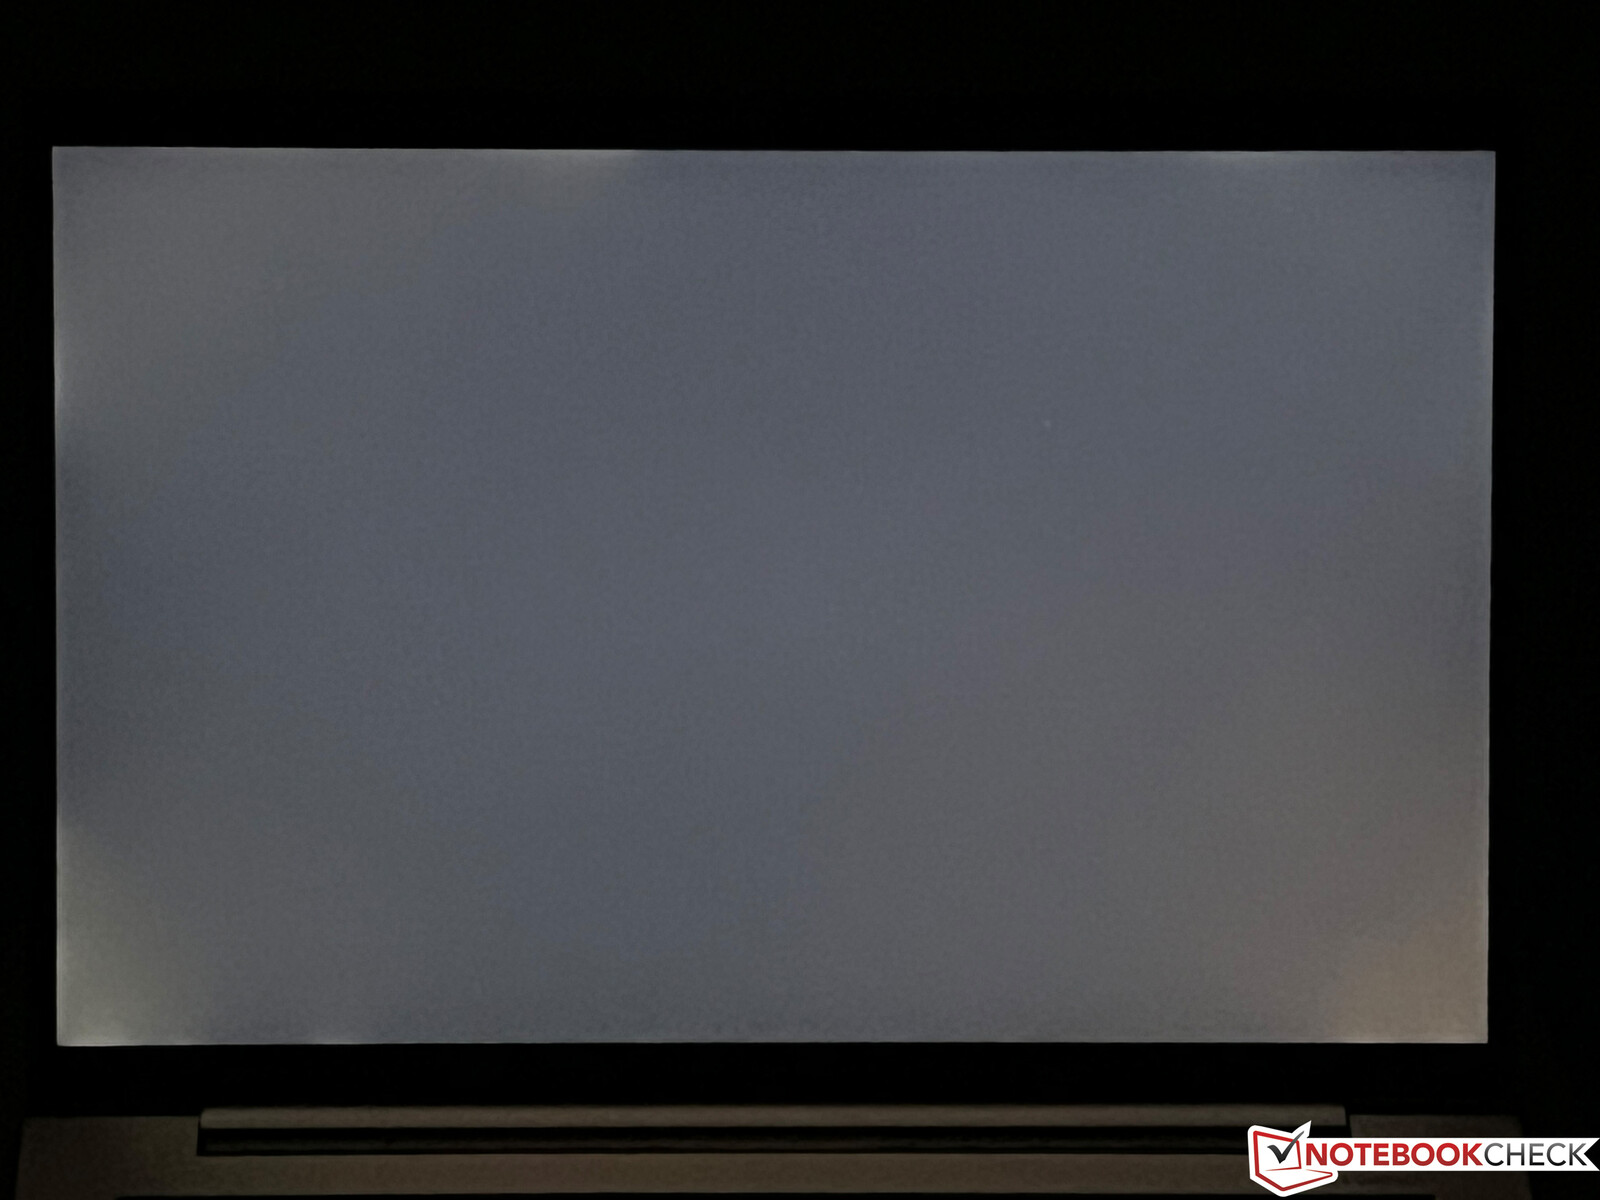
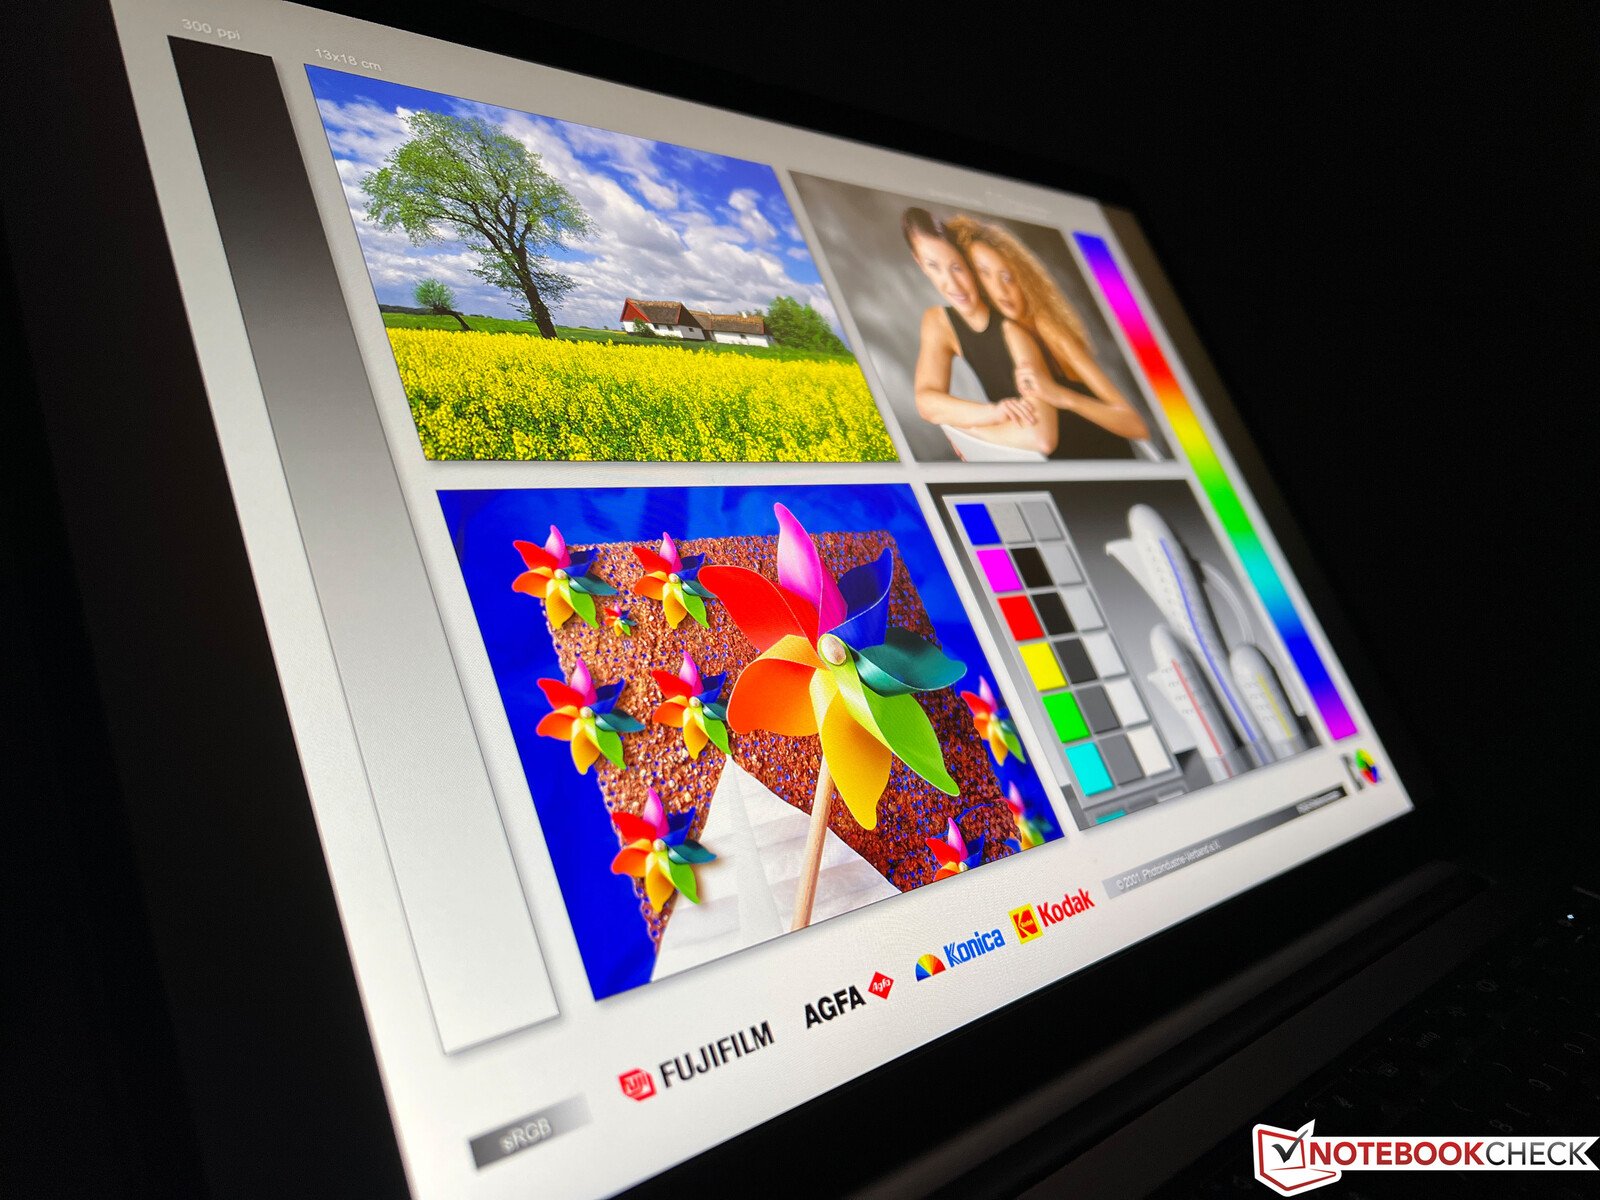
显示屏。ZBook采用哑光IPS面板
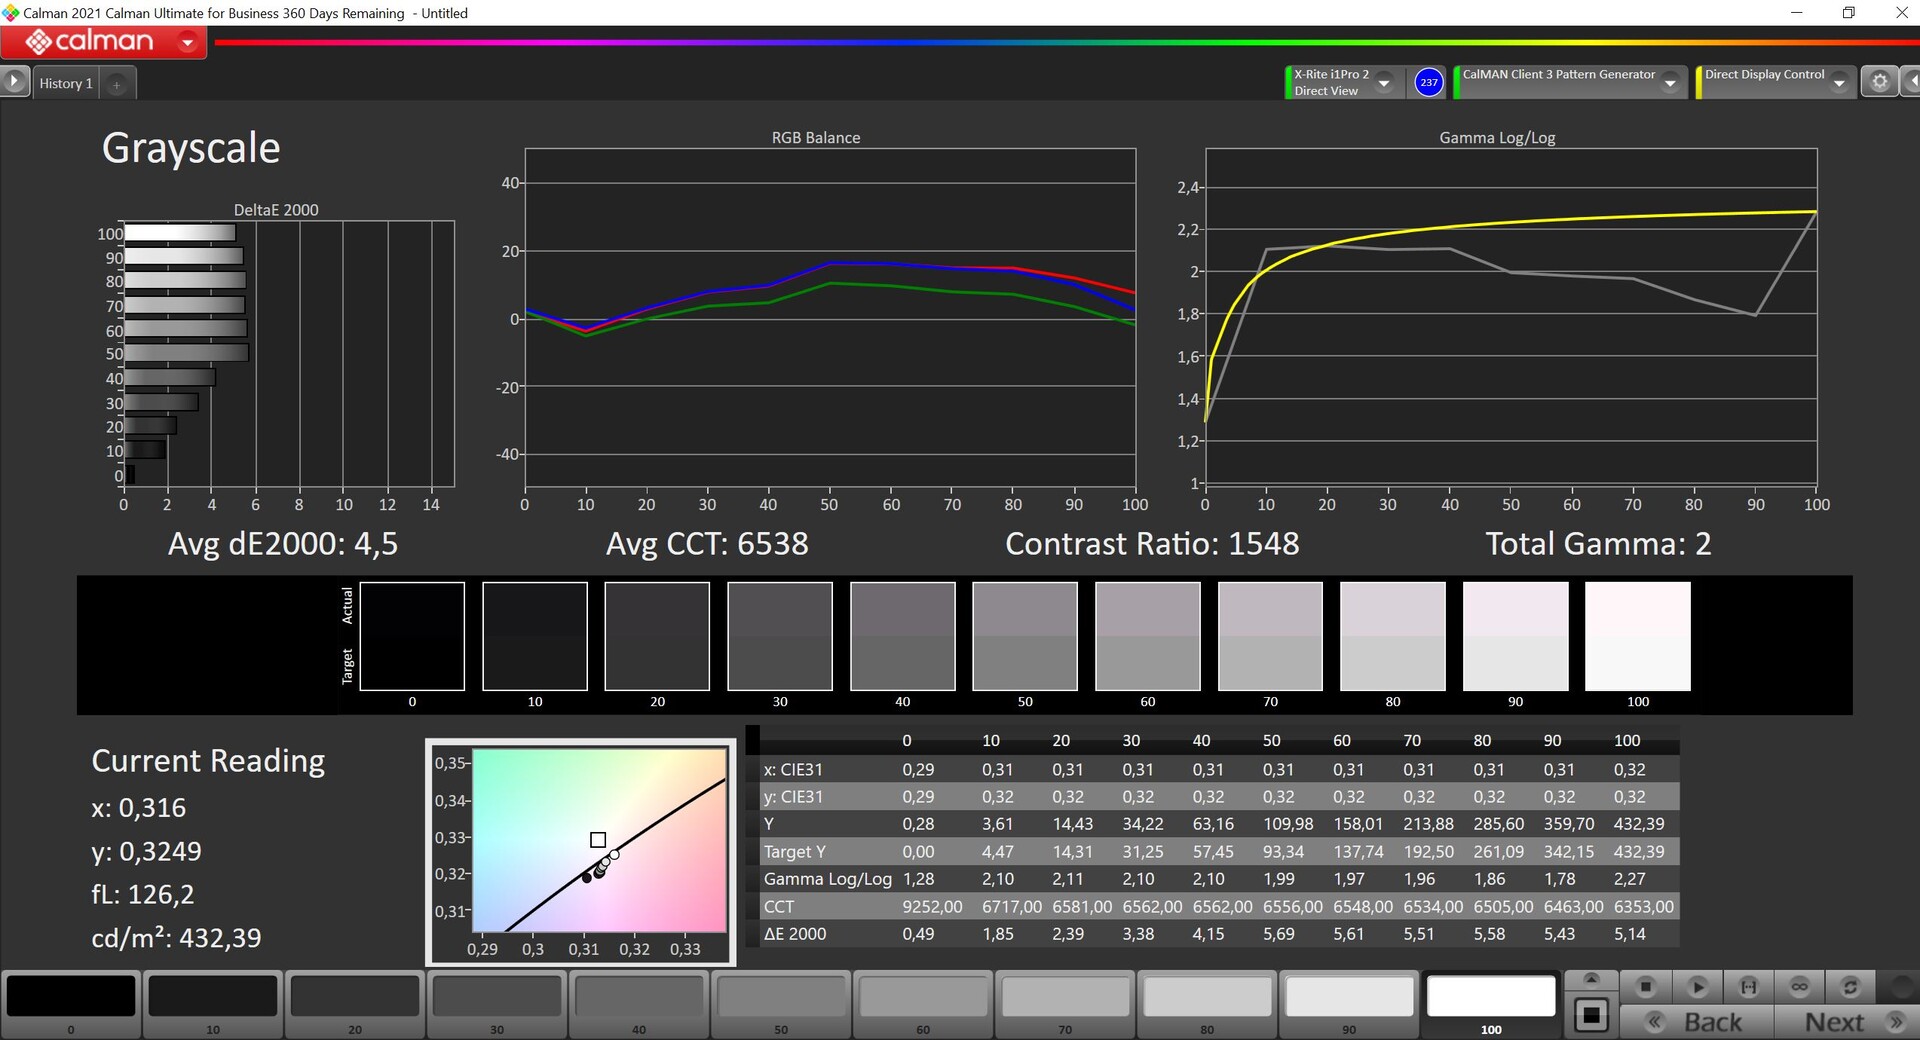
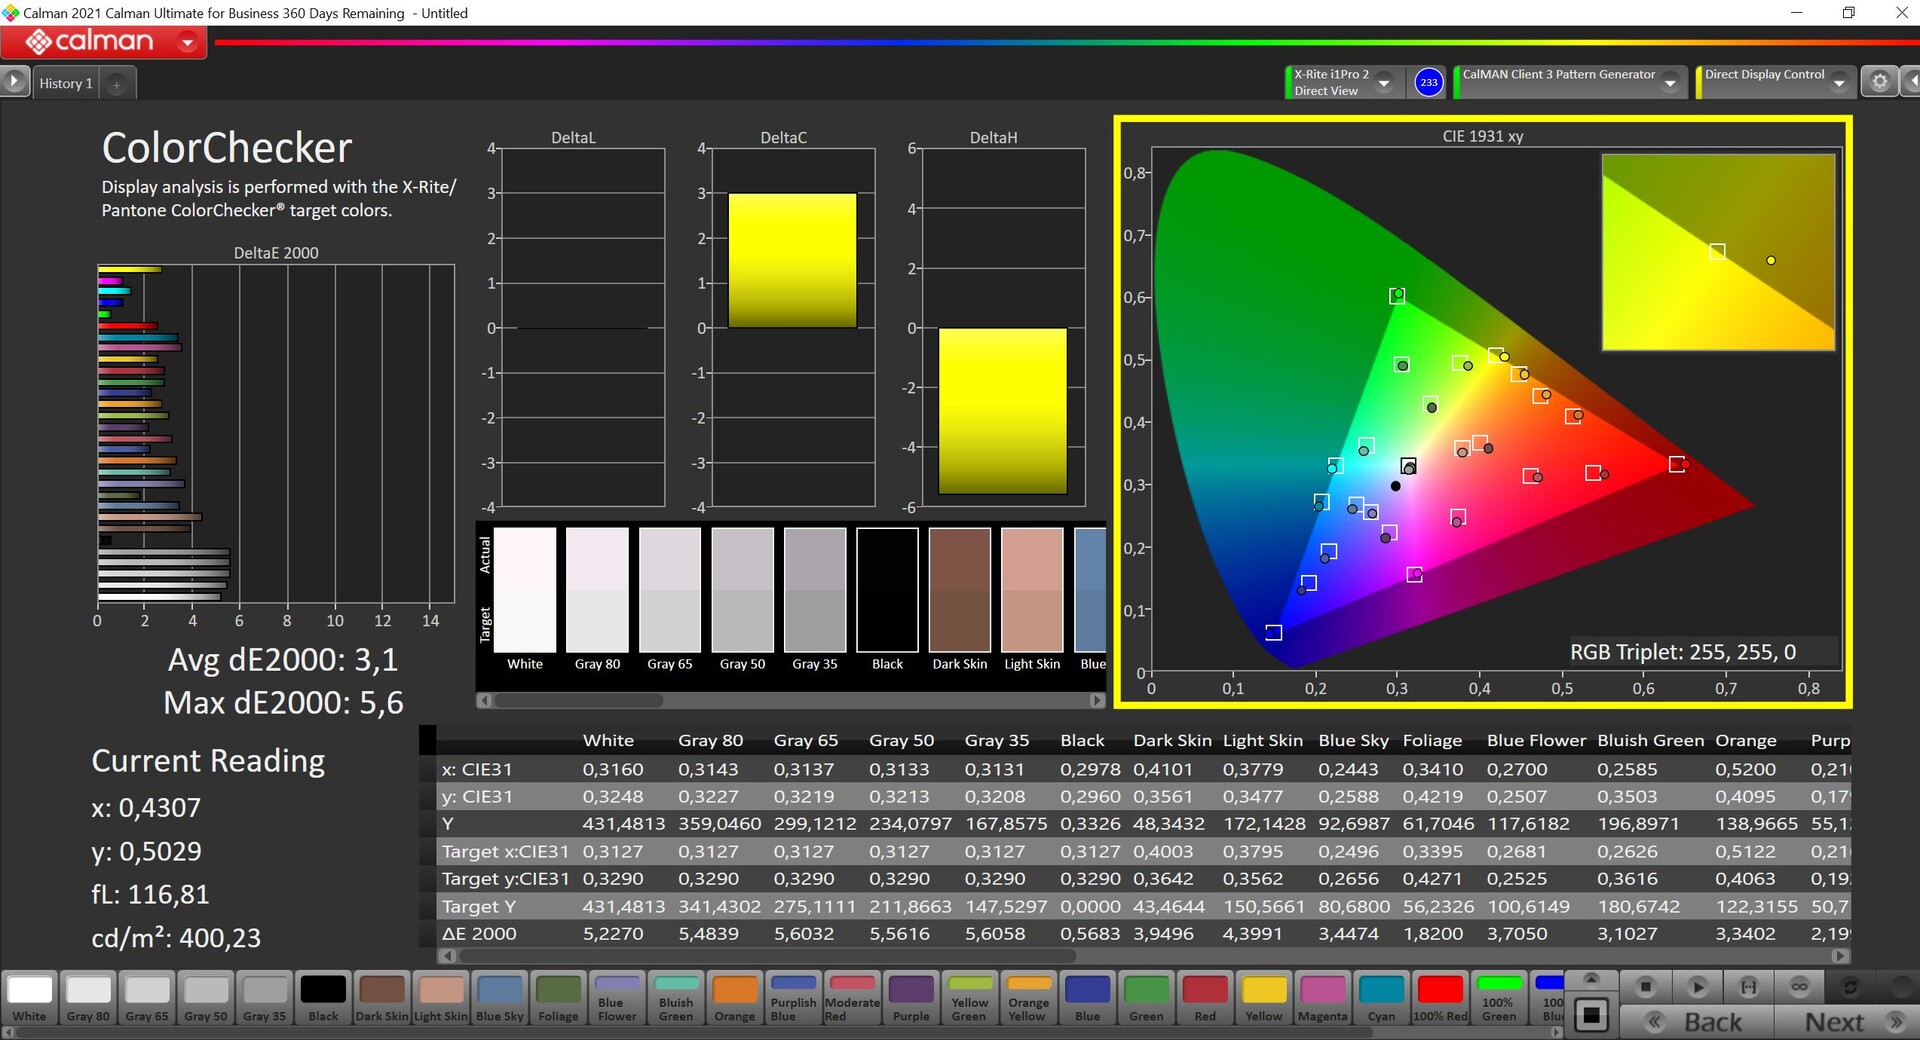
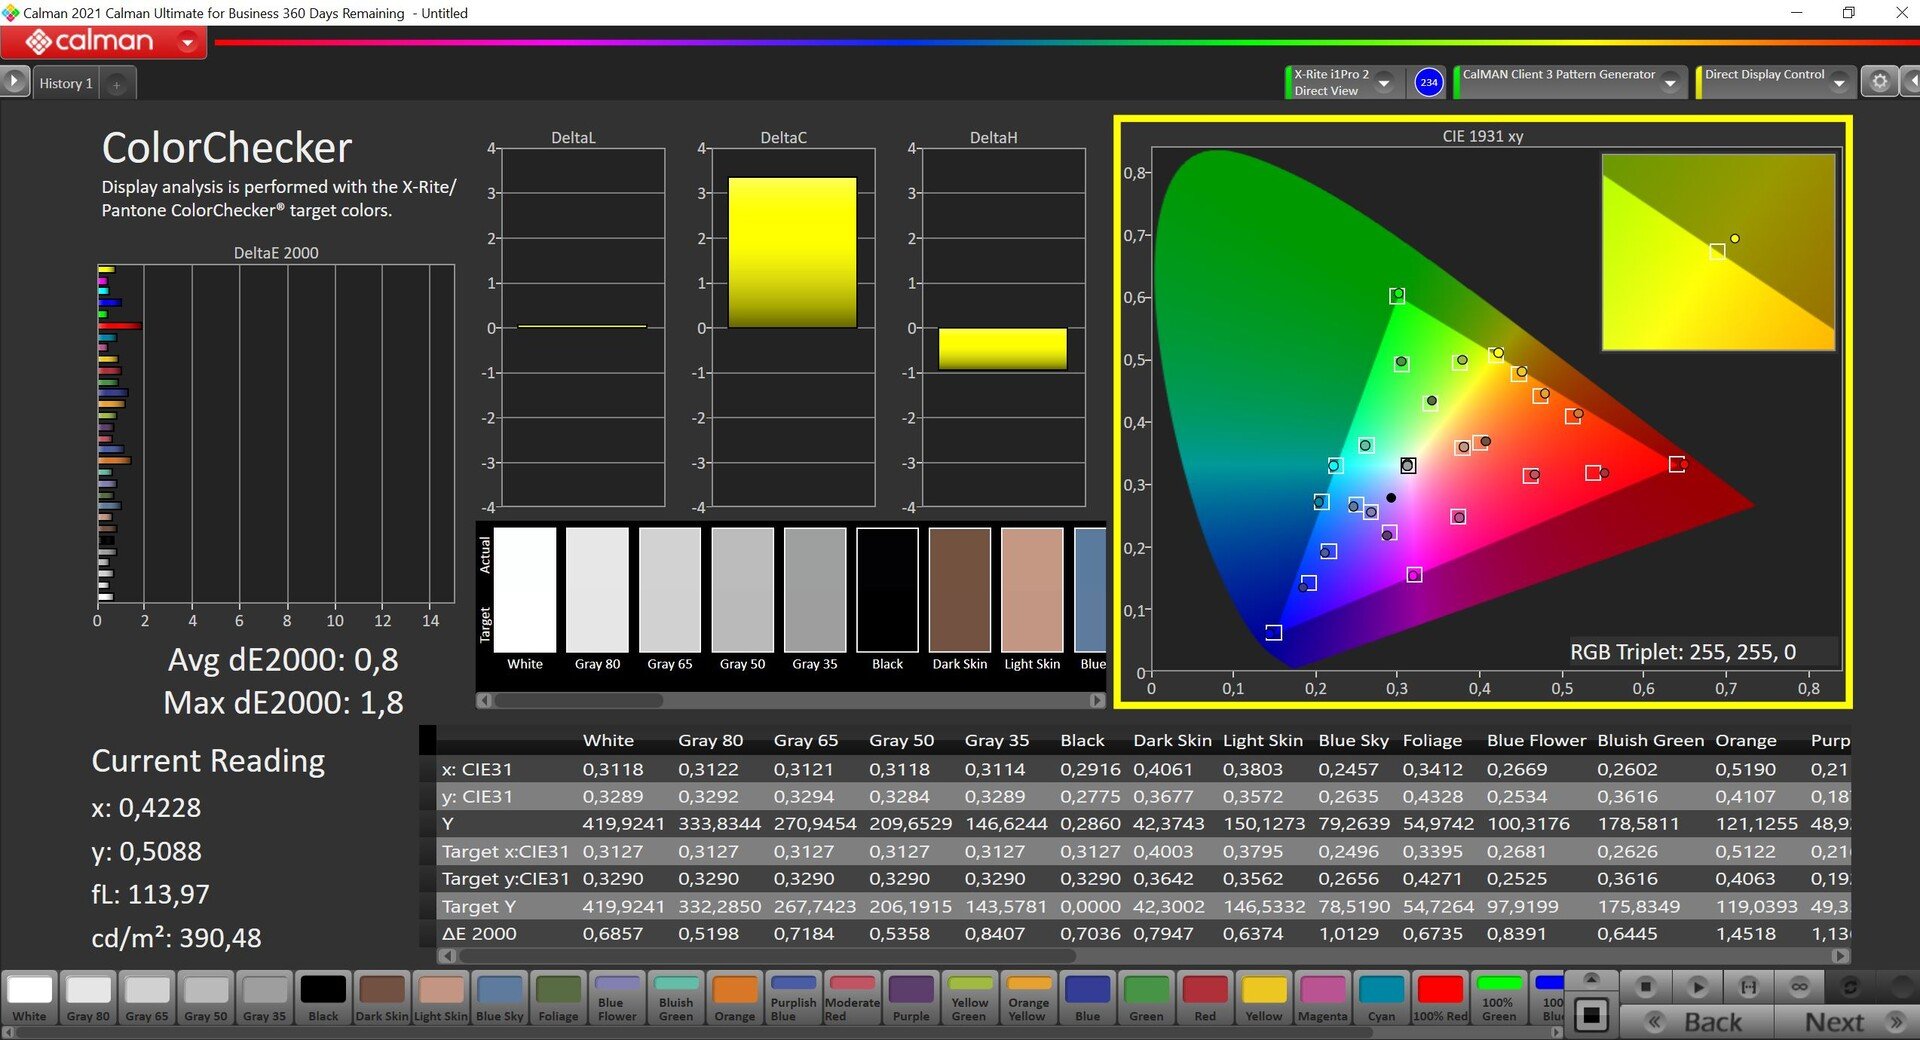
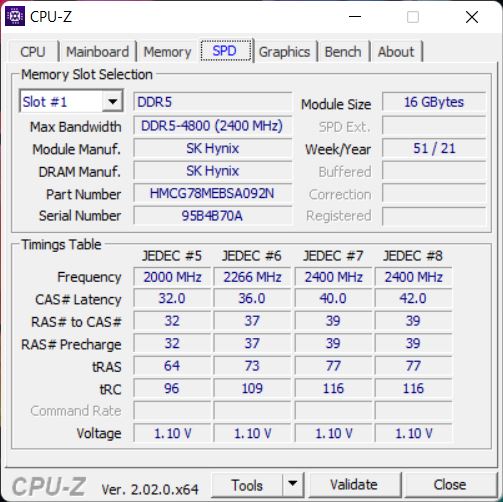
惠普为ZBook Firefly 14 G9提供了总共四种不同的16:10面板选择,所有这些都是基于IPS技术的,并具有哑光表面。然而,如果可能的话,应该避免使用亮度为250cd/m²、带有触摸屏的标准型号。内置隐私过滤器的SureView面板也有一些缺点,正如我们在对 EliteBook 845 G9.我们的测试设备安装的是分辨率为1920 x 1200像素(100% sRGB)的400尼特面板,但也可以选择覆盖P3色彩空间、分辨率为2660 x 1600像素和120赫兹的DreamColor面板。
从主观上讲,该面板提供了出色的画质,因为尽管有磨砂涂层,但即使是明亮的表面也不会出现颗粒感。平均亮度超过400cd/m²,对比度也很高。我们没有注意到任何PWM的闪烁,视角的稳定性非常好。只有在最大亮度下,我们才注意到在黑暗背景下的下边缘有轻微的光晕。
| |||||||||||||||||||||||||
Brightness Distribution: 91 %
Center on Battery: 431 cd/m²
Contrast: 1543:1 (Black: 0.28 cd/m²)
ΔE ColorChecker Calman: 3.1 | ∀{0.5-29.43 Ø4.71}
calibrated: 0.8
ΔE Greyscale Calman: 4.5 | ∀{0.09-98 Ø4.96}
71.1% AdobeRGB 1998 (Argyll 3D)
99.9% sRGB (Argyll 3D)
69.6% Display P3 (Argyll 3D)
Gamma: 2
CCT: 6528 K
| HP ZBook Firefly 14 G9-6B8A2EA CMN1435, IPS, 1920x1200, 14" | Dell Precision 5000 5470 AU Optronics B140QAN, IPS, 2560x1600, 14" | Lenovo ThinkPad P14s Gen2-20VX000GGE B140HAN05.7, IPS, 1920x1080, 14" | Microsoft Surface Laptop Studio i7 RTX 3050 Ti LQ144P1JX01, IPS, 2400x1600, 14.4" | Apple MacBook Pro 14 2021 M1 Pro Entry Mini-LED, 3024x1964, 14.2" | HP ZBook Firefly 14 G8 2C9Q2EA AU Optronics AUO068B, IPS, 1920x1080, 14" | |
|---|---|---|---|---|---|---|
| Display | 8% | -5% | 9% | 43% | 0% | |
| Display P3 Coverage (%) | 69.6 | 79.3 14% | 65.4 -6% | 80.6 16% | 99.3 43% | 70 1% |
| sRGB Coverage (%) | 99.9 | 100 0% | 96.6 -3% | 99.9 0% | 99.5 0% | |
| AdobeRGB 1998 Coverage (%) | 71.1 | 78.7 11% | 66.5 -6% | 78.5 10% | 71.4 0% | |
| Response Times | -9% | -15% | 2% | -29% | -13% | |
| Response Time Grey 50% / Grey 80% * (ms) | 56.3 ? | 52.4 ? 7% | 58.8 ? -4% | 58.4 ? -4% | 58.4 ? -4% | 64.4 ? -14% |
| Response Time Black / White * (ms) | 26.2 ? | 32.4 ? -24% | 32.8 ? -25% | 24 ? 8% | 40.4 ? -54% | 29.2 ? -11% |
| PWM Frequency (Hz) | 5000 ? | 14880 | ||||
| Screen | 10% | -9% | 24% | 428% | 3% | |
| Brightness middle (cd/m²) | 432 | 537 24% | 350 -19% | 497 15% | 489 13% | 461 7% |
| Brightness (cd/m²) | 407 | 518 27% | 348 -14% | 491 21% | 479 18% | 439 8% |
| Brightness Distribution (%) | 91 | 94 3% | 94 3% | 92 1% | 94 3% | 89 -2% |
| Black Level * (cd/m²) | 0.28 | 0.33 -18% | 0.14 50% | 0.29 -4% | 0.01 96% | 0.24 14% |
| Contrast (:1) | 1543 | 1627 5% | 2500 62% | 1714 11% | 48900 3069% | 1921 24% |
| Colorchecker dE 2000 * | 3.1 | 2.97 4% | 4.3 -39% | 1.2 61% | 0.8 74% | 2.6 16% |
| Colorchecker dE 2000 max. * | 5.6 | 5.33 5% | 6.7 -20% | 2.8 50% | 1.3 77% | 5.8 -4% |
| Colorchecker dE 2000 calibrated * | 0.8 | 0.88 -10% | 1.5 -88% | 0.8 -0% | 1.1 -38% | |
| Greyscale dE 2000 * | 4.5 | 2.4 47% | 5.3 -18% | 1.9 58% | 1.1 76% | 4.4 2% |
| Gamma | 2 110% | 2.06 107% | 2.42 91% | 2.14 103% | 2.24 98% | 2.29 96% |
| CCT | 6528 100% | 6668 97% | 7631 85% | 6821 95% | 6478 100% | |
| Color Space (Percent of AdobeRGB 1998) (%) | 61.1 | 65.2 | ||||
| Color Space (Percent of sRGB) (%) | 96.4 | 99.4 | ||||
| Total Average (Program / Settings) | 3% /
7% | -10% /
-9% | 12% /
17% | 147% /
310% | -3% /
0% |
* ... smaller is better
我们用专业的CalMAN软件进行的分析显示,在交货状态下,有轻微的偏蓝/偏红,与sRGB参考色空间相比,许多颜色也略高于DeltaE 2000的3的偏差。只要你不编辑图片,这对日常使用来说是完全足够的。
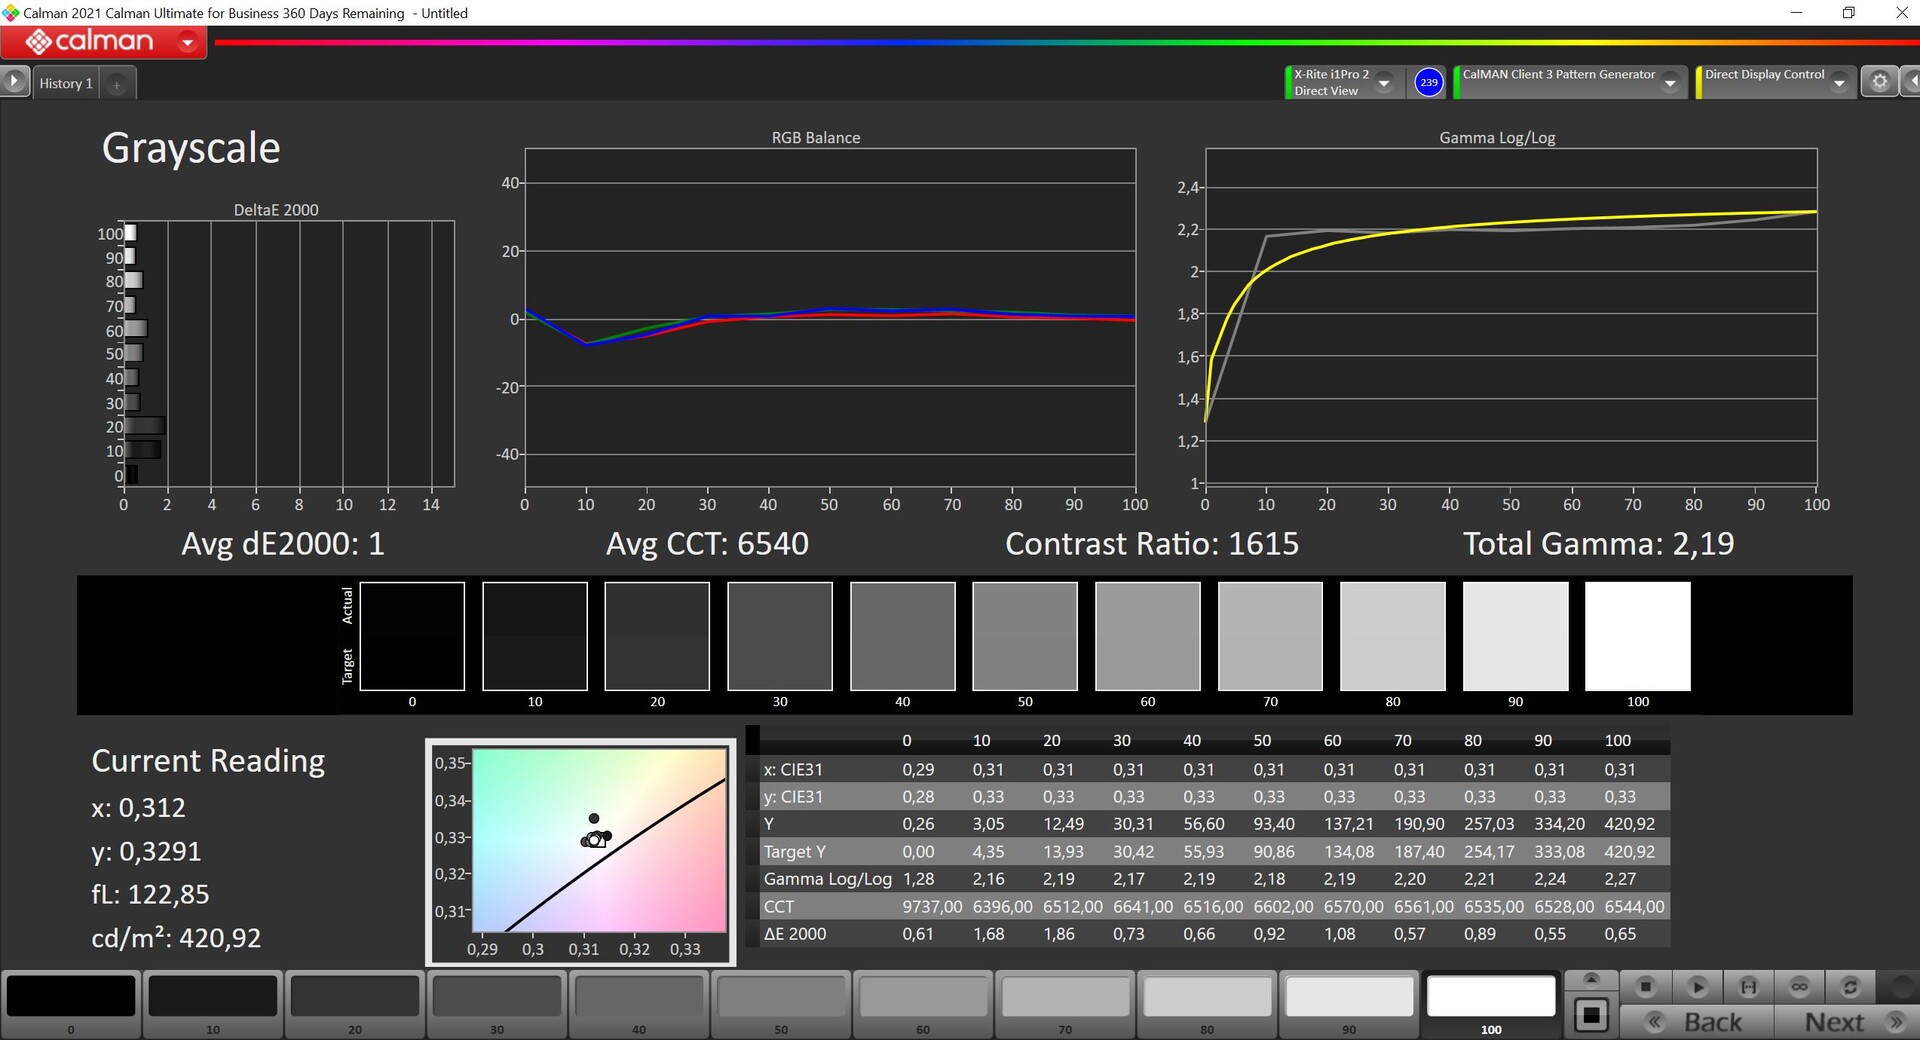
然而,我们自己的校准显示了该面板的潜力有多大。我们能够完全消除偏色,颜色的平均偏差下降到只有0.8(最大1.8),这是一个很好的表现。

Display Response Times
| ↔ Response Time Black to White | ||
|---|---|---|
| 26.2 ms ... rise ↗ and fall ↘ combined | ↗ 9.7 ms rise | 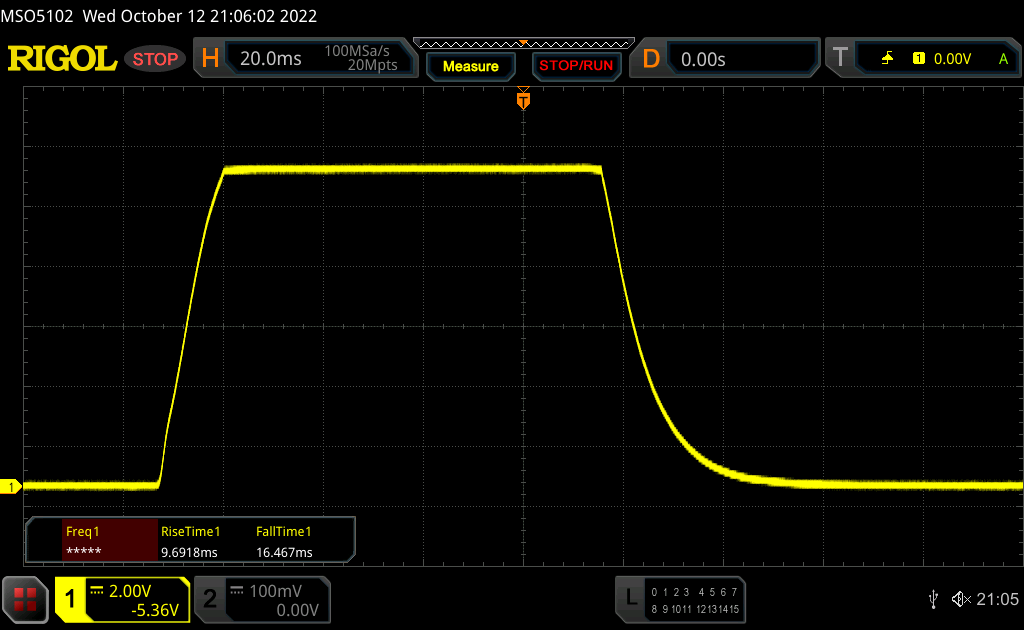 |
| ↘ 16.5 ms fall | ||
| The screen shows relatively slow response rates in our tests and may be too slow for gamers. In comparison, all tested devices range from 0.1 (minimum) to 240 (maximum) ms. » 66 % of all devices are better. This means that the measured response time is worse than the average of all tested devices (19.8 ms). | ||
| ↔ Response Time 50% Grey to 80% Grey | ||
| 56.3 ms ... rise ↗ and fall ↘ combined | ↗ 25 ms rise | 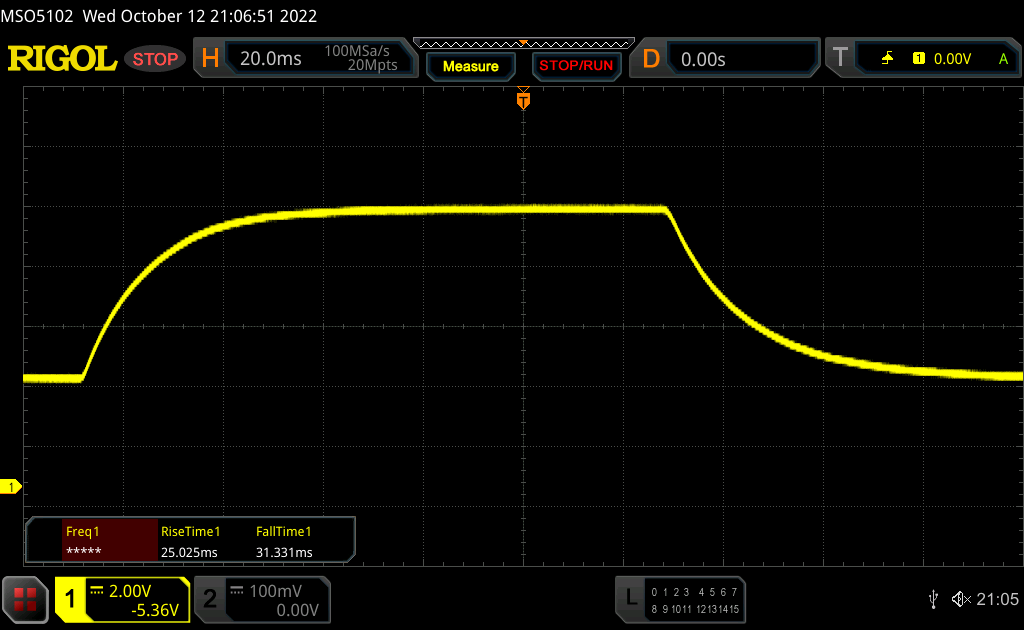 |
| ↘ 31.3 ms fall | ||
| The screen shows slow response rates in our tests and will be unsatisfactory for gamers. In comparison, all tested devices range from 0.165 (minimum) to 636 (maximum) ms. » 93 % of all devices are better. This means that the measured response time is worse than the average of all tested devices (31 ms). | ||
Screen Flickering / PWM (Pulse-Width Modulation)
| Screen flickering / PWM not detected | 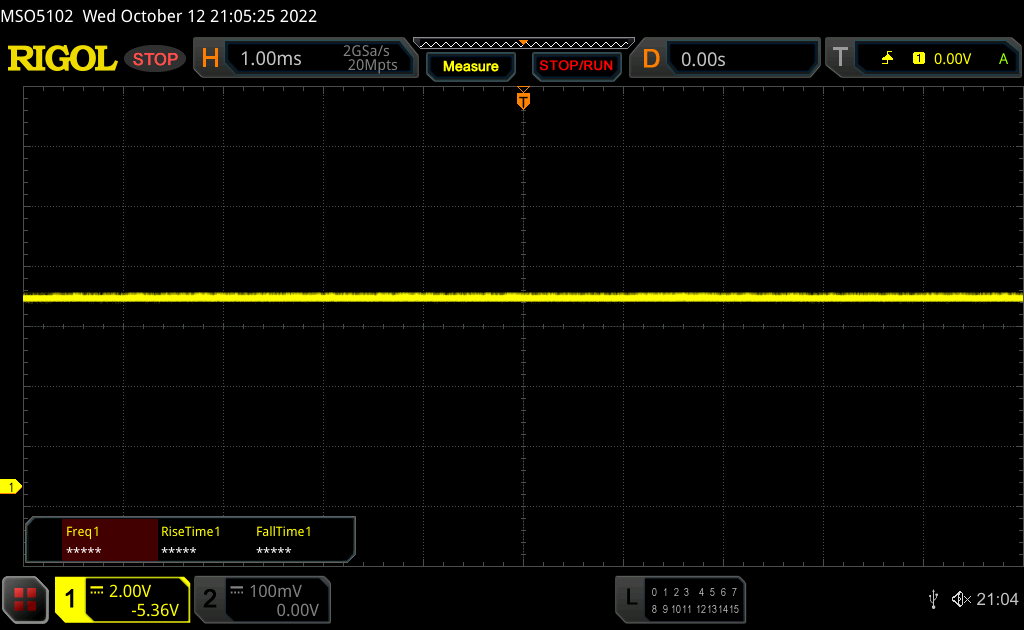 | ||
In comparison: 52 % of all tested devices do not use PWM to dim the display. If PWM was detected, an average of 7754 (minimum: 5 - maximum: 343500) Hz was measured. | |||
哑光显示屏在户外的表现非常好。在阳光直射下,该面板只能稍微亮一点。
业绩:12 W Alder Lake-U
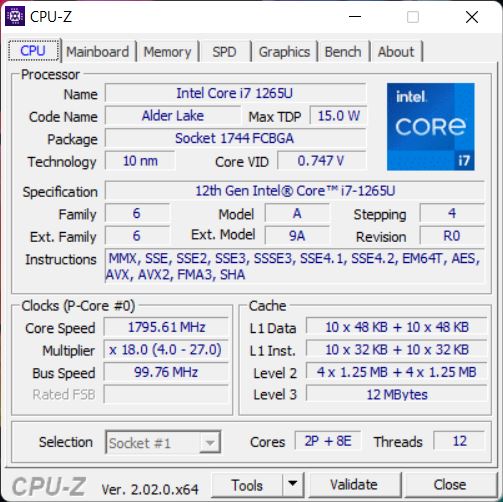
处理器。英特尔酷睿i7-1265U
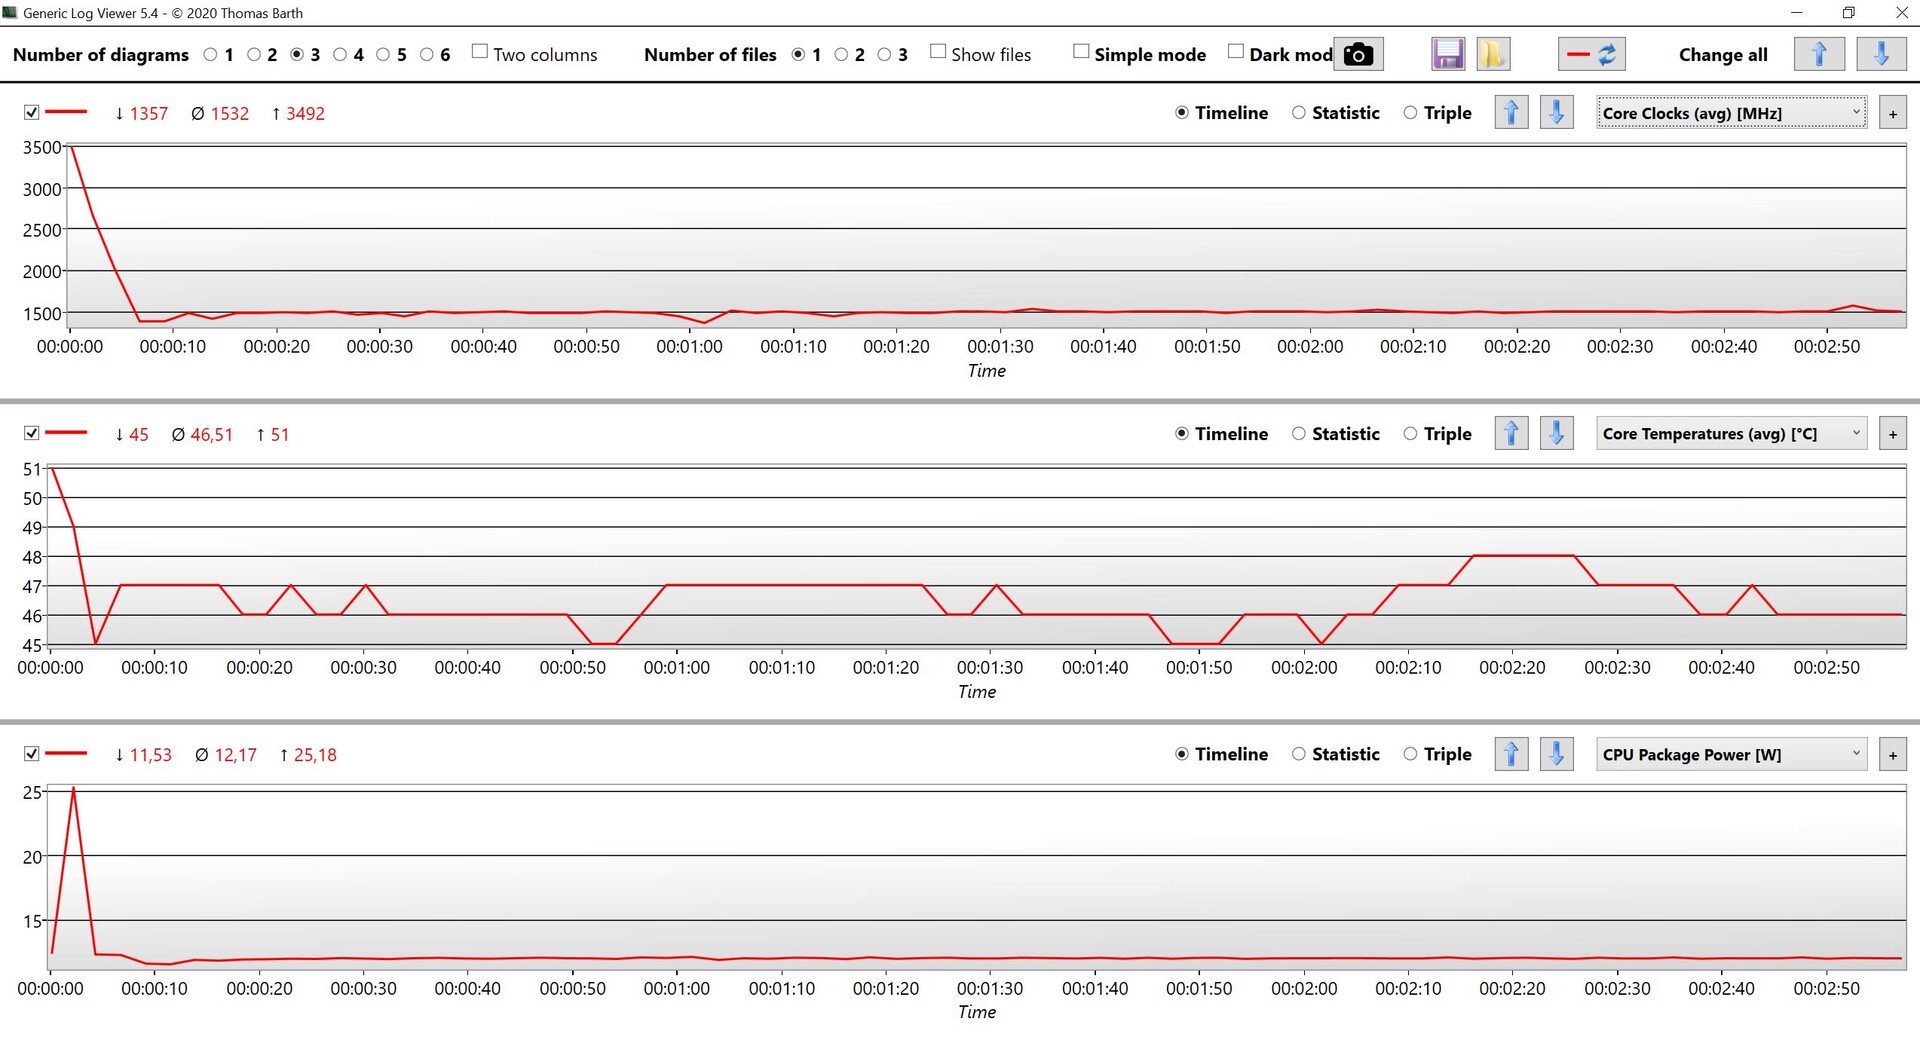
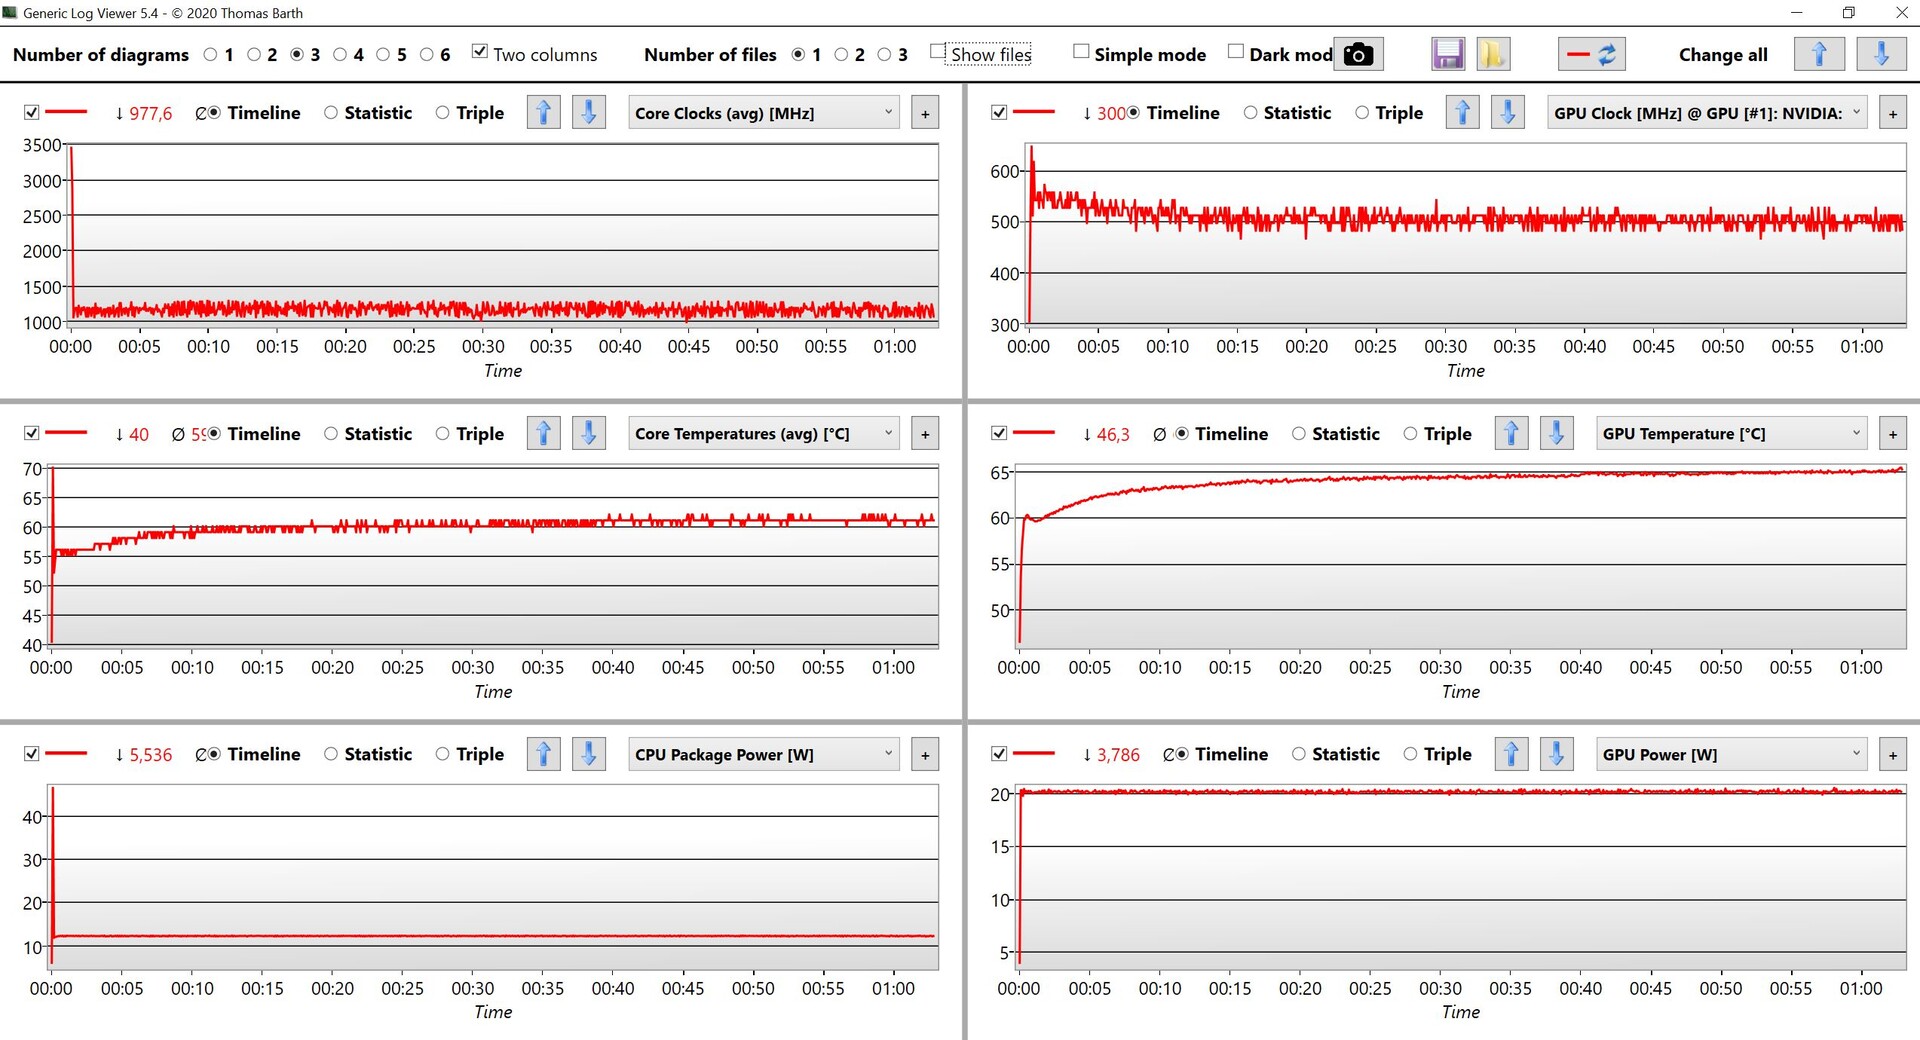
Core i7-1265U 是目前的Alder Lake芯片(第12代),有两个快速性能和八个效率核心。理论上性能潜力也很高,但ZBook Firefly 14 G9中的芯片被非常低的12W功率限制所拖累,几秒钟后就启动了。 这对于简单的任务来说是足够的,但是如果把所有的CPU基准测试放在一起,整体性能甚至比Tiger Lake Core i7-1165G7 前代机型。
我们还在较大的 萤火虫16 G9也遇到了类似的问题,因此正在与制造商联系。对于一个移动工作站来说,其性能绝对是令人失望的。作为比较,正常的商业变体 EliteBook 845 G9与 AMD Ryzen 9 Pro 6950HS提供约三倍的多核性能。
更多CPU基准测试可在 我们的技术部分.
Cinebench R15 multi-core loop
Cinebench R23: Multi Core | Single Core
Cinebench R20: CPU (Multi Core) | CPU (Single Core)
Cinebench R15: CPU Multi 64Bit | CPU Single 64Bit
Blender: v2.79 BMW27 CPU
7-Zip 18.03: 7z b 4 | 7z b 4 -mmt1
Geekbench 5.5: Multi-Core | Single-Core
HWBOT x265 Benchmark v2.2: 4k Preset
LibreOffice : 20 Documents To PDF
R Benchmark 2.5: Overall mean
| CPU Performance rating | |
| Average of class Workstation | |
| Dell Precision 5000 5470 | |
| Apple MacBook Pro 14 2021 M1 Pro Entry -8! | |
| HP EliteBook 845 G9 6F6H6EA | |
| Average Intel Core i7-1265U | |
| Microsoft Surface Laptop Studio i7 RTX 3050 Ti | |
| Lenovo ThinkPad P14s Gen2-20VX000GGE | |
| HP ZBook Firefly 14 G8 2C9Q2EA -2! | |
| HP ZBook Firefly 14 G9-6B8A2EA | |
| HP ZBook Firefly 16 G9-6B897EA | |
| Cinebench R23 / Multi Core | |
| Average of class Workstation (14621 - 38520, n=23, last 2 years) | |
| Dell Precision 5000 5470 | |
| HP EliteBook 845 G9 6F6H6EA | |
| Apple MacBook Pro 14 2021 M1 Pro Entry | |
| Average Intel Core i7-1265U (4332 - 9219, n=10) | |
| Microsoft Surface Laptop Studio i7 RTX 3050 Ti | |
| Lenovo ThinkPad P14s Gen2-20VX000GGE | |
| HP ZBook Firefly 16 G9-6B897EA | |
| HP ZBook Firefly 14 G9-6B8A2EA | |
| Cinebench R23 / Single Core | |
| Average of class Workstation (1712 - 2228, n=23, last 2 years) | |
| Dell Precision 5000 5470 | |
| Average Intel Core i7-1265U (1144 - 1820, n=10) | |
| Apple MacBook Pro 14 2021 M1 Pro Entry | |
| HP EliteBook 845 G9 6F6H6EA | |
| Microsoft Surface Laptop Studio i7 RTX 3050 Ti | |
| Lenovo ThinkPad P14s Gen2-20VX000GGE | |
| HP ZBook Firefly 14 G9-6B8A2EA | |
| HP ZBook Firefly 16 G9-6B897EA | |
| Cinebench R20 / CPU (Multi Core) | |
| Average of class Workstation (5760 - 15043, n=23, last 2 years) | |
| Dell Precision 5000 5470 | |
| HP EliteBook 845 G9 6F6H6EA | |
| Average Intel Core i7-1265U (1669 - 3584, n=10) | |
| Microsoft Surface Laptop Studio i7 RTX 3050 Ti | |
| Lenovo ThinkPad P14s Gen2-20VX000GGE | |
| HP ZBook Firefly 14 G8 2C9Q2EA | |
| HP ZBook Firefly 14 G9-6B8A2EA | |
| HP ZBook Firefly 16 G9-6B897EA | |
| Cinebench R20 / CPU (Single Core) | |
| Average of class Workstation (671 - 857, n=23, last 2 years) | |
| Dell Precision 5000 5470 | |
| Average Intel Core i7-1265U (528 - 701, n=10) | |
| HP EliteBook 845 G9 6F6H6EA | |
| HP ZBook Firefly 14 G8 2C9Q2EA | |
| Microsoft Surface Laptop Studio i7 RTX 3050 Ti | |
| HP ZBook Firefly 16 G9-6B897EA | |
| Lenovo ThinkPad P14s Gen2-20VX000GGE | |
| HP ZBook Firefly 14 G9-6B8A2EA | |
| Cinebench R15 / CPU Multi 64Bit | |
| Average of class Workstation (2489 - 5810, n=23, last 2 years) | |
| Dell Precision 5000 5470 | |
| HP EliteBook 845 G9 6F6H6EA | |
| Apple MacBook Pro 14 2021 M1 Pro Entry | |
| Average Intel Core i7-1265U (706 - 1572, n=10) | |
| Microsoft Surface Laptop Studio i7 RTX 3050 Ti | |
| Lenovo ThinkPad P14s Gen2-20VX000GGE | |
| HP ZBook Firefly 14 G8 2C9Q2EA | |
| HP ZBook Firefly 16 G9-6B897EA | |
| HP ZBook Firefly 14 G9-6B8A2EA | |
| Cinebench R15 / CPU Single 64Bit | |
| Average of class Workstation (191.4 - 328, n=23, last 2 years) | |
| Dell Precision 5000 5470 | |
| HP EliteBook 845 G9 6F6H6EA | |
| Average Intel Core i7-1265U (165.3 - 260, n=10) | |
| HP ZBook Firefly 14 G8 2C9Q2EA | |
| Microsoft Surface Laptop Studio i7 RTX 3050 Ti | |
| HP ZBook Firefly 14 G9-6B8A2EA | |
| Lenovo ThinkPad P14s Gen2-20VX000GGE | |
| Apple MacBook Pro 14 2021 M1 Pro Entry | |
| HP ZBook Firefly 16 G9-6B897EA | |
| Blender / v2.79 BMW27 CPU | |
| HP ZBook Firefly 16 G9-6B897EA | |
| HP ZBook Firefly 14 G9-6B8A2EA | |
| Lenovo ThinkPad P14s Gen2-20VX000GGE | |
| HP ZBook Firefly 14 G8 2C9Q2EA | |
| Microsoft Surface Laptop Studio i7 RTX 3050 Ti | |
| Average Intel Core i7-1265U (364 - 684, n=10) | |
| HP EliteBook 845 G9 6F6H6EA | |
| Dell Precision 5000 5470 | |
| Average of class Workstation (91 - 222, n=23, last 2 years) | |
| 7-Zip 18.03 / 7z b 4 | |
| Average of class Workstation (60489 - 116969, n=23, last 2 years) | |
| Dell Precision 5000 5470 | |
| HP EliteBook 845 G9 6F6H6EA | |
| Average Intel Core i7-1265U (20087 - 38715, n=10) | |
| Microsoft Surface Laptop Studio i7 RTX 3050 Ti | |
| HP ZBook Firefly 14 G8 2C9Q2EA | |
| HP ZBook Firefly 14 G9-6B8A2EA | |
| Lenovo ThinkPad P14s Gen2-20VX000GGE | |
| HP ZBook Firefly 16 G9-6B897EA | |
| 7-Zip 18.03 / 7z b 4 -mmt1 | |
| Average of class Workstation (5126 - 6960, n=23, last 2 years) | |
| HP EliteBook 845 G9 6F6H6EA | |
| Lenovo ThinkPad P14s Gen2-20VX000GGE | |
| Dell Precision 5000 5470 | |
| HP ZBook Firefly 14 G8 2C9Q2EA | |
| Average Intel Core i7-1265U (4614 - 5617, n=10) | |
| Microsoft Surface Laptop Studio i7 RTX 3050 Ti | |
| HP ZBook Firefly 16 G9-6B897EA | |
| HP ZBook Firefly 14 G9-6B8A2EA | |
| Geekbench 5.5 / Multi-Core | |
| Average of class Workstation (11542 - 25554, n=23, last 2 years) | |
| Dell Precision 5000 5470 | |
| Apple MacBook Pro 14 2021 M1 Pro Entry | |
| Average Intel Core i7-1265U (5022 - 8981, n=10) | |
| HP EliteBook 845 G9 6F6H6EA | |
| HP ZBook Firefly 14 G9-6B8A2EA | |
| Microsoft Surface Laptop Studio i7 RTX 3050 Ti | |
| Lenovo ThinkPad P14s Gen2-20VX000GGE | |
| HP ZBook Firefly 16 G9-6B897EA | |
| HP ZBook Firefly 14 G8 2C9Q2EA | |
| Geekbench 5.5 / Single-Core | |
| Average of class Workstation (1783 - 2183, n=23, last 2 years) | |
| HP ZBook Firefly 14 G9-6B8A2EA | |
| Dell Precision 5000 5470 | |
| HP ZBook Firefly 16 G9-6B897EA | |
| Apple MacBook Pro 14 2021 M1 Pro Entry | |
| Average Intel Core i7-1265U (1429 - 1806, n=10) | |
| Lenovo ThinkPad P14s Gen2-20VX000GGE | |
| HP ZBook Firefly 14 G8 2C9Q2EA | |
| Microsoft Surface Laptop Studio i7 RTX 3050 Ti | |
| HP EliteBook 845 G9 6F6H6EA | |
| HWBOT x265 Benchmark v2.2 / 4k Preset | |
| Average of class Workstation (17.8 - 40.5, n=23, last 2 years) | |
| Dell Precision 5000 5470 | |
| HP EliteBook 845 G9 6F6H6EA | |
| Average Intel Core i7-1265U (5.09 - 10.6, n=10) | |
| Microsoft Surface Laptop Studio i7 RTX 3050 Ti | |
| Lenovo ThinkPad P14s Gen2-20VX000GGE | |
| HP ZBook Firefly 14 G8 2C9Q2EA | |
| HP ZBook Firefly 14 G9-6B8A2EA | |
| HP ZBook Firefly 16 G9-6B897EA | |
| LibreOffice / 20 Documents To PDF | |
| HP EliteBook 845 G9 6F6H6EA | |
| Microsoft Surface Laptop Studio i7 RTX 3050 Ti | |
| HP ZBook Firefly 14 G8 2C9Q2EA | |
| HP ZBook Firefly 16 G9-6B897EA | |
| Average Intel Core i7-1265U (44 - 61.6, n=10) | |
| Average of class Workstation (37.1 - 74.7, n=23, last 2 years) | |
| HP ZBook Firefly 14 G9-6B8A2EA | |
| Dell Precision 5000 5470 | |
| Lenovo ThinkPad P14s Gen2-20VX000GGE | |
| R Benchmark 2.5 / Overall mean | |
| Microsoft Surface Laptop Studio i7 RTX 3050 Ti | |
| HP ZBook Firefly 14 G8 2C9Q2EA | |
| Lenovo ThinkPad P14s Gen2-20VX000GGE | |
| HP ZBook Firefly 16 G9-6B897EA | |
| HP ZBook Firefly 14 G9-6B8A2EA | |
| HP EliteBook 845 G9 6F6H6EA | |
| Average Intel Core i7-1265U (0.4666 - 0.578, n=10) | |
| Dell Precision 5000 5470 | |
| Average of class Workstation (0.3825 - 0.603, n=23, last 2 years) | |
* ... smaller is better
AIDA64: FP32 Ray-Trace | FPU Julia | CPU SHA3 | CPU Queen | FPU SinJulia | FPU Mandel | CPU AES | CPU ZLib | FP64 Ray-Trace | CPU PhotoWorxx
| Performance rating | |
| Average of class Workstation | |
| HP EliteBook 845 G9 6F6H6EA | |
| Dell Precision 5000 5470 | |
| Microsoft Surface Laptop Studio i7 RTX 3050 Ti | |
| Average Intel Core i7-1265U | |
| HP ZBook Firefly 14 G8 2C9Q2EA | |
| HP ZBook Firefly 14 G9-6B8A2EA | |
| HP ZBook Firefly 16 G9-6B897EA | |
| AIDA64 / FP32 Ray-Trace | |
| Average of class Workstation (16730 - 61611, n=23, last 2 years) | |
| HP EliteBook 845 G9 6F6H6EA | |
| Dell Precision 5000 5470 | |
| Microsoft Surface Laptop Studio i7 RTX 3050 Ti | |
| HP ZBook Firefly 14 G8 2C9Q2EA | |
| Average Intel Core i7-1265U (2619 - 8178, n=10) | |
| HP ZBook Firefly 14 G9-6B8A2EA | |
| HP ZBook Firefly 16 G9-6B897EA | |
| AIDA64 / FPU Julia | |
| Average of class Workstation (89597 - 186971, n=23, last 2 years) | |
| HP EliteBook 845 G9 6F6H6EA | |
| Dell Precision 5000 5470 | |
| Average Intel Core i7-1265U (12909 - 41649, n=10) | |
| Microsoft Surface Laptop Studio i7 RTX 3050 Ti | |
| HP ZBook Firefly 14 G8 2C9Q2EA | |
| HP ZBook Firefly 14 G9-6B8A2EA | |
| HP ZBook Firefly 16 G9-6B897EA | |
| AIDA64 / CPU SHA3 | |
| Average of class Workstation (4178 - 8975, n=23, last 2 years) | |
| HP EliteBook 845 G9 6F6H6EA | |
| Dell Precision 5000 5470 | |
| Microsoft Surface Laptop Studio i7 RTX 3050 Ti | |
| HP ZBook Firefly 14 G8 2C9Q2EA | |
| Average Intel Core i7-1265U (824 - 2183, n=10) | |
| HP ZBook Firefly 14 G9-6B8A2EA | |
| HP ZBook Firefly 16 G9-6B897EA | |
| AIDA64 / CPU Queen | |
| Dell Precision 5000 5470 | |
| Average of class Workstation (60778 - 144411, n=23, last 2 years) | |
| HP EliteBook 845 G9 6F6H6EA | |
| HP ZBook Firefly 14 G9-6B8A2EA | |
| Average Intel Core i7-1265U (63615 - 67065, n=10) | |
| HP ZBook Firefly 16 G9-6B897EA | |
| HP ZBook Firefly 14 G8 2C9Q2EA | |
| Microsoft Surface Laptop Studio i7 RTX 3050 Ti | |
| AIDA64 / FPU SinJulia | |
| Average of class Workstation (8165 - 29343, n=23, last 2 years) | |
| HP EliteBook 845 G9 6F6H6EA | |
| Dell Precision 5000 5470 | |
| HP ZBook Firefly 14 G8 2C9Q2EA | |
| Microsoft Surface Laptop Studio i7 RTX 3050 Ti | |
| Average Intel Core i7-1265U (3105 - 5135, n=10) | |
| HP ZBook Firefly 14 G9-6B8A2EA | |
| HP ZBook Firefly 16 G9-6B897EA | |
| AIDA64 / FPU Mandel | |
| Average of class Workstation (44497 - 98153, n=23, last 2 years) | |
| HP EliteBook 845 G9 6F6H6EA | |
| Dell Precision 5000 5470 | |
| Microsoft Surface Laptop Studio i7 RTX 3050 Ti | |
| HP ZBook Firefly 14 G8 2C9Q2EA | |
| Average Intel Core i7-1265U (6967 - 20804, n=10) | |
| HP ZBook Firefly 14 G9-6B8A2EA | |
| HP ZBook Firefly 16 G9-6B897EA | |
| AIDA64 / CPU AES | |
| Average of class Workstation (73133 - 187841, n=23, last 2 years) | |
| HP ZBook Firefly 14 G8 2C9Q2EA | |
| HP EliteBook 845 G9 6F6H6EA | |
| Microsoft Surface Laptop Studio i7 RTX 3050 Ti | |
| Dell Precision 5000 5470 | |
| Average Intel Core i7-1265U (19489 - 42966, n=10) | |
| HP ZBook Firefly 14 G9-6B8A2EA | |
| HP ZBook Firefly 16 G9-6B897EA | |
| AIDA64 / CPU ZLib | |
| Average of class Workstation (929 - 2148, n=23, last 2 years) | |
| HP EliteBook 845 G9 6F6H6EA | |
| Average Intel Core i7-1265U (314 - 632, n=10) | |
| Dell Precision 5000 5470 | |
| HP ZBook Firefly 14 G8 2C9Q2EA | |
| HP ZBook Firefly 14 G9-6B8A2EA | |
| Microsoft Surface Laptop Studio i7 RTX 3050 Ti | |
| HP ZBook Firefly 16 G9-6B897EA | |
| AIDA64 / FP64 Ray-Trace | |
| Average of class Workstation (8545 - 32891, n=23, last 2 years) | |
| Dell Precision 5000 5470 | |
| HP EliteBook 845 G9 6F6H6EA | |
| Microsoft Surface Laptop Studio i7 RTX 3050 Ti | |
| HP ZBook Firefly 14 G8 2C9Q2EA | |
| Average Intel Core i7-1265U (1473 - 4376, n=10) | |
| HP ZBook Firefly 14 G9-6B8A2EA | |
| HP ZBook Firefly 16 G9-6B897EA | |
| AIDA64 / CPU PhotoWorxx | |
| Average of class Workstation (37151 - 93684, n=23, last 2 years) | |
| Dell Precision 5000 5470 | |
| Microsoft Surface Laptop Studio i7 RTX 3050 Ti | |
| Average Intel Core i7-1265U (20213 - 47031, n=10) | |
| HP ZBook Firefly 14 G9-6B8A2EA | |
| HP ZBook Firefly 14 G8 2C9Q2EA | |
| HP ZBook Firefly 16 G9-6B897EA | |
| HP EliteBook 845 G9 6F6H6EA | |
系统性能
尽管CPU性能相对较低,但主观的系统性能非常好,这也可以归功于快速的PCIe 4.0固态硬盘。我们在测试中也没有发现任何问题。
CrossMark: Overall | Productivity | Creativity | Responsiveness
| PCMark 10 / Score | |
| Average of class Workstation (6563 - 10409, n=19, last 2 years) | |
| Dell Precision 5000 5470 | |
| HP EliteBook 845 G9 6F6H6EA | |
| Average Intel Core i7-1265U, NVIDIA T550 Laptop GPU (5488 - 6181, n=3) | |
| Lenovo ThinkPad P14s Gen2-20VX000GGE | |
| HP ZBook Firefly 16 G9-6B897EA | |
| Microsoft Surface Laptop Studio i7 RTX 3050 Ti | |
| HP ZBook Firefly 14 G9-6B8A2EA | |
| HP ZBook Firefly 14 G8 2C9Q2EA | |
| PCMark 10 / Essentials | |
| Dell Precision 5000 5470 | |
| Average of class Workstation (9622 - 11157, n=19, last 2 years) | |
| HP ZBook Firefly 16 G9-6B897EA | |
| Average Intel Core i7-1265U, NVIDIA T550 Laptop GPU (9960 - 10250, n=3) | |
| HP ZBook Firefly 14 G9-6B8A2EA | |
| Lenovo ThinkPad P14s Gen2-20VX000GGE | |
| HP EliteBook 845 G9 6F6H6EA | |
| HP ZBook Firefly 14 G8 2C9Q2EA | |
| Microsoft Surface Laptop Studio i7 RTX 3050 Ti | |
| PCMark 10 / Productivity | |
| Average of class Workstation (8789 - 20616, n=19, last 2 years) | |
| Lenovo ThinkPad P14s Gen2-20VX000GGE | |
| Average Intel Core i7-1265U, NVIDIA T550 Laptop GPU (8315 - 9474, n=3) | |
| HP ZBook Firefly 16 G9-6B897EA | |
| Dell Precision 5000 5470 | |
| Microsoft Surface Laptop Studio i7 RTX 3050 Ti | |
| HP ZBook Firefly 14 G8 2C9Q2EA | |
| HP ZBook Firefly 14 G9-6B8A2EA | |
| HP EliteBook 845 G9 6F6H6EA | |
| PCMark 10 / Digital Content Creation | |
| Average of class Workstation (8108 - 15631, n=19, last 2 years) | |
| Dell Precision 5000 5470 | |
| HP EliteBook 845 G9 6F6H6EA | |
| Microsoft Surface Laptop Studio i7 RTX 3050 Ti | |
| Average Intel Core i7-1265U, NVIDIA T550 Laptop GPU (5399 - 6793, n=3) | |
| Lenovo ThinkPad P14s Gen2-20VX000GGE | |
| HP ZBook Firefly 16 G9-6B897EA | |
| HP ZBook Firefly 14 G8 2C9Q2EA | |
| HP ZBook Firefly 14 G9-6B8A2EA | |
| CrossMark / Overall | |
| Average of class Workstation (1307 - 2267, n=22, last 2 years) | |
| Dell Precision 5000 5470 | |
| HP ZBook Firefly 16 G9-6B897EA | |
| HP ZBook Firefly 14 G9-6B8A2EA | |
| Average Intel Core i7-1265U, NVIDIA T550 Laptop GPU (1591 - 1623, n=3) | |
| Apple MacBook Pro 14 2021 M1 Pro Entry | |
| Microsoft Surface Laptop Studio i7 RTX 3050 Ti | |
| HP EliteBook 845 G9 6F6H6EA | |
| CrossMark / Productivity | |
| Average of class Workstation (1130 - 2122, n=22, last 2 years) | |
| Dell Precision 5000 5470 | |
| HP ZBook Firefly 16 G9-6B897EA | |
| HP ZBook Firefly 14 G9-6B8A2EA | |
| Average Intel Core i7-1265U, NVIDIA T550 Laptop GPU (1553 - 1592, n=3) | |
| Microsoft Surface Laptop Studio i7 RTX 3050 Ti | |
| HP EliteBook 845 G9 6F6H6EA | |
| Apple MacBook Pro 14 2021 M1 Pro Entry | |
| CrossMark / Creativity | |
| Average of class Workstation (1657 - 2725, n=22, last 2 years) | |
| Dell Precision 5000 5470 | |
| Apple MacBook Pro 14 2021 M1 Pro Entry | |
| HP ZBook Firefly 16 G9-6B897EA | |
| HP ZBook Firefly 14 G9-6B8A2EA | |
| Average Intel Core i7-1265U, NVIDIA T550 Laptop GPU (1723 - 1751, n=3) | |
| Microsoft Surface Laptop Studio i7 RTX 3050 Ti | |
| HP EliteBook 845 G9 6F6H6EA | |
| CrossMark / Responsiveness | |
| Average of class Workstation (993 - 2096, n=22, last 2 years) | |
| Dell Precision 5000 5470 | |
| HP ZBook Firefly 14 G9-6B8A2EA | |
| HP ZBook Firefly 16 G9-6B897EA | |
| Average Intel Core i7-1265U, NVIDIA T550 Laptop GPU (1344 - 1376, n=3) | |
| Microsoft Surface Laptop Studio i7 RTX 3050 Ti | |
| HP EliteBook 845 G9 6F6H6EA | |
| Apple MacBook Pro 14 2021 M1 Pro Entry | |
| PCMark 10 Score | 5488 points | |
Help | ||
| AIDA64 / Memory Copy | |
| Average of class Workstation (56003 - 164795, n=23, last 2 years) | |
| Dell Precision 5000 5470 | |
| Average Intel Core i7-1265U (40212 - 72204, n=10) | |
| Microsoft Surface Laptop Studio i7 RTX 3050 Ti | |
| HP ZBook Firefly 14 G9-6B8A2EA | |
| HP ZBook Firefly 14 G8 2C9Q2EA | |
| AIDA64 / Memory Read | |
| Average of class Workstation (55795 - 121563, n=23, last 2 years) | |
| Dell Precision 5000 5470 | |
| HP ZBook Firefly 14 G9-6B8A2EA | |
| Average Intel Core i7-1265U (41808 - 69493, n=10) | |
| Microsoft Surface Laptop Studio i7 RTX 3050 Ti | |
| HP ZBook Firefly 14 G8 2C9Q2EA | |
| AIDA64 / Memory Write | |
| Average of class Workstation (55663 - 214520, n=23, last 2 years) | |
| Dell Precision 5000 5470 | |
| HP ZBook Firefly 14 G9-6B8A2EA | |
| Microsoft Surface Laptop Studio i7 RTX 3050 Ti | |
| Average Intel Core i7-1265U (41382 - 76027, n=10) | |
| HP ZBook Firefly 14 G8 2C9Q2EA | |
| AIDA64 / Memory Latency | |
| Average of class Workstation (84.5 - 165.2, n=23, last 2 years) | |
| Dell Precision 5000 5470 | |
| Microsoft Surface Laptop Studio i7 RTX 3050 Ti | |
| Average Intel Core i7-1265U (74.6 - 112.4, n=10) | |
| HP ZBook Firefly 14 G9-6B8A2EA | |
| HP ZBook Firefly 14 G8 2C9Q2EA | |
* ... smaller is better
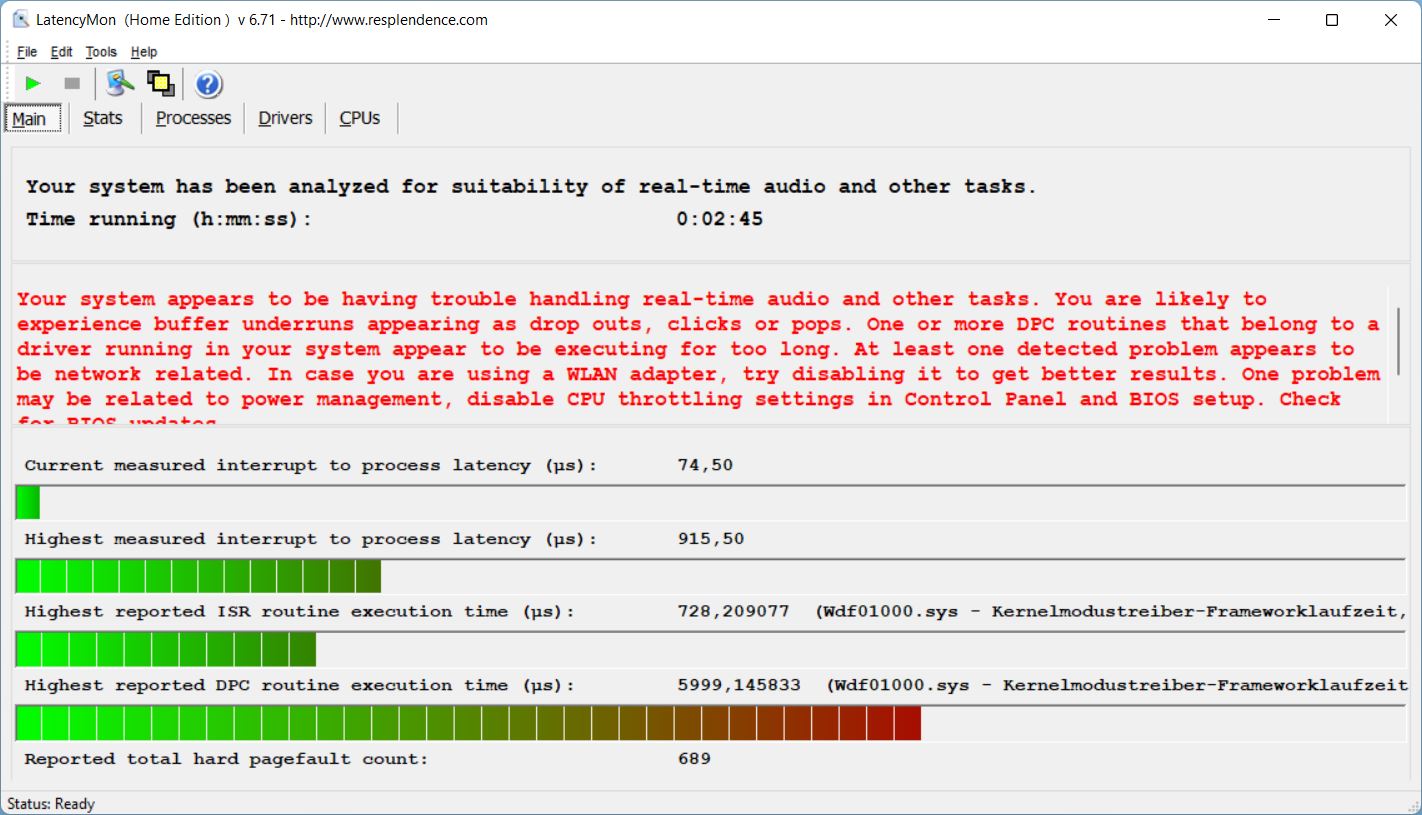
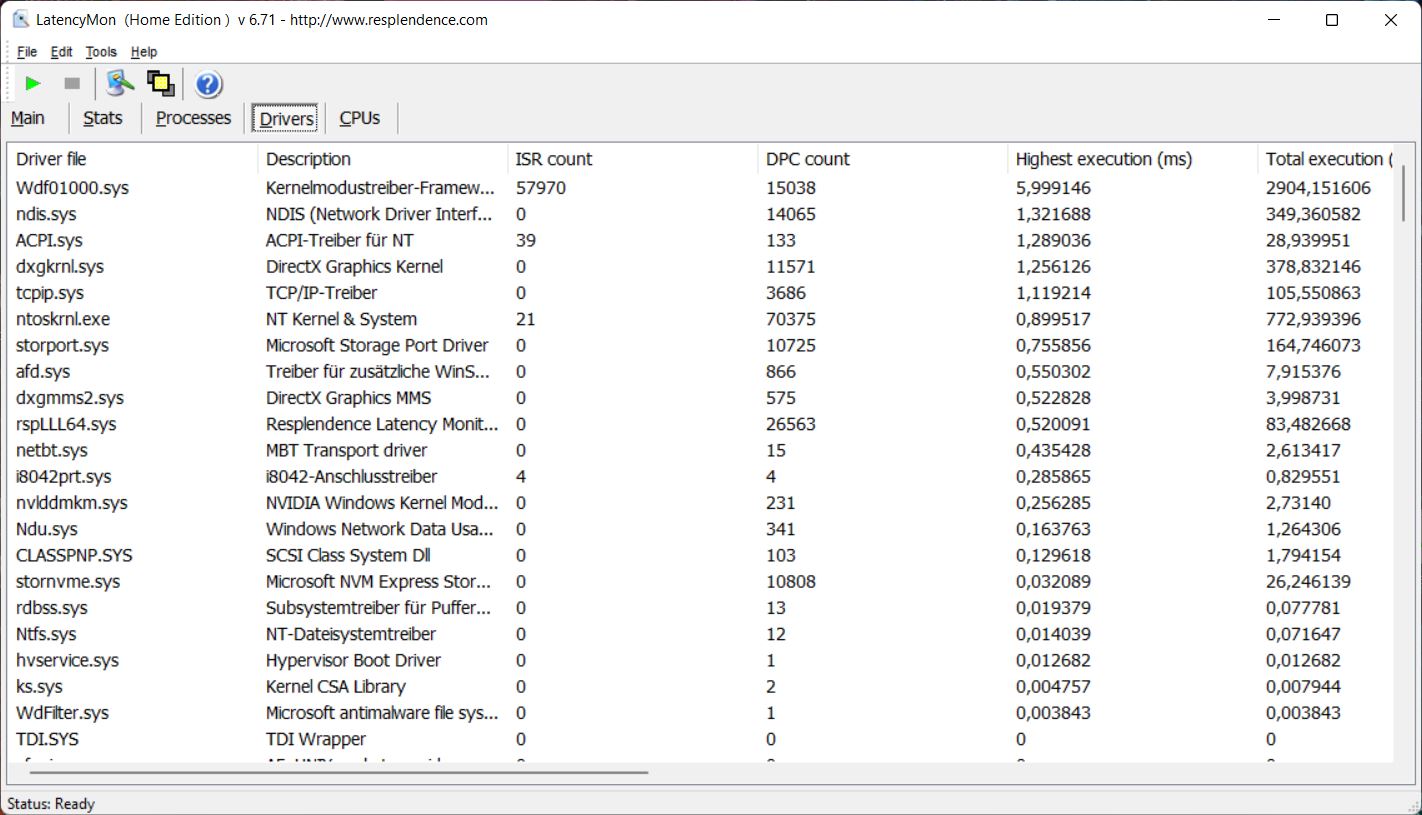
DPC延时
有了手头的BIOS版本,ZBook在我们的延迟测试中显示出局限性,因此并不理想地适合实时音频应用。
| DPC Latencies / LatencyMon - interrupt to process latency (max), Web, Youtube, Prime95 | |
| HP ZBook Firefly 14 G8 2C9Q2EA | |
| Dell Precision 5000 5470 | |
| HP EliteBook 845 G9 6F6H6EA | |
| Lenovo ThinkPad P14s Gen2-20VX000GGE | |
| HP ZBook Firefly 16 G9-6B897EA | |
| HP ZBook Firefly 14 G9-6B8A2EA | |
| Microsoft Surface Laptop Studio i7 RTX 3050 Ti | |
* ... smaller is better
大容量存储
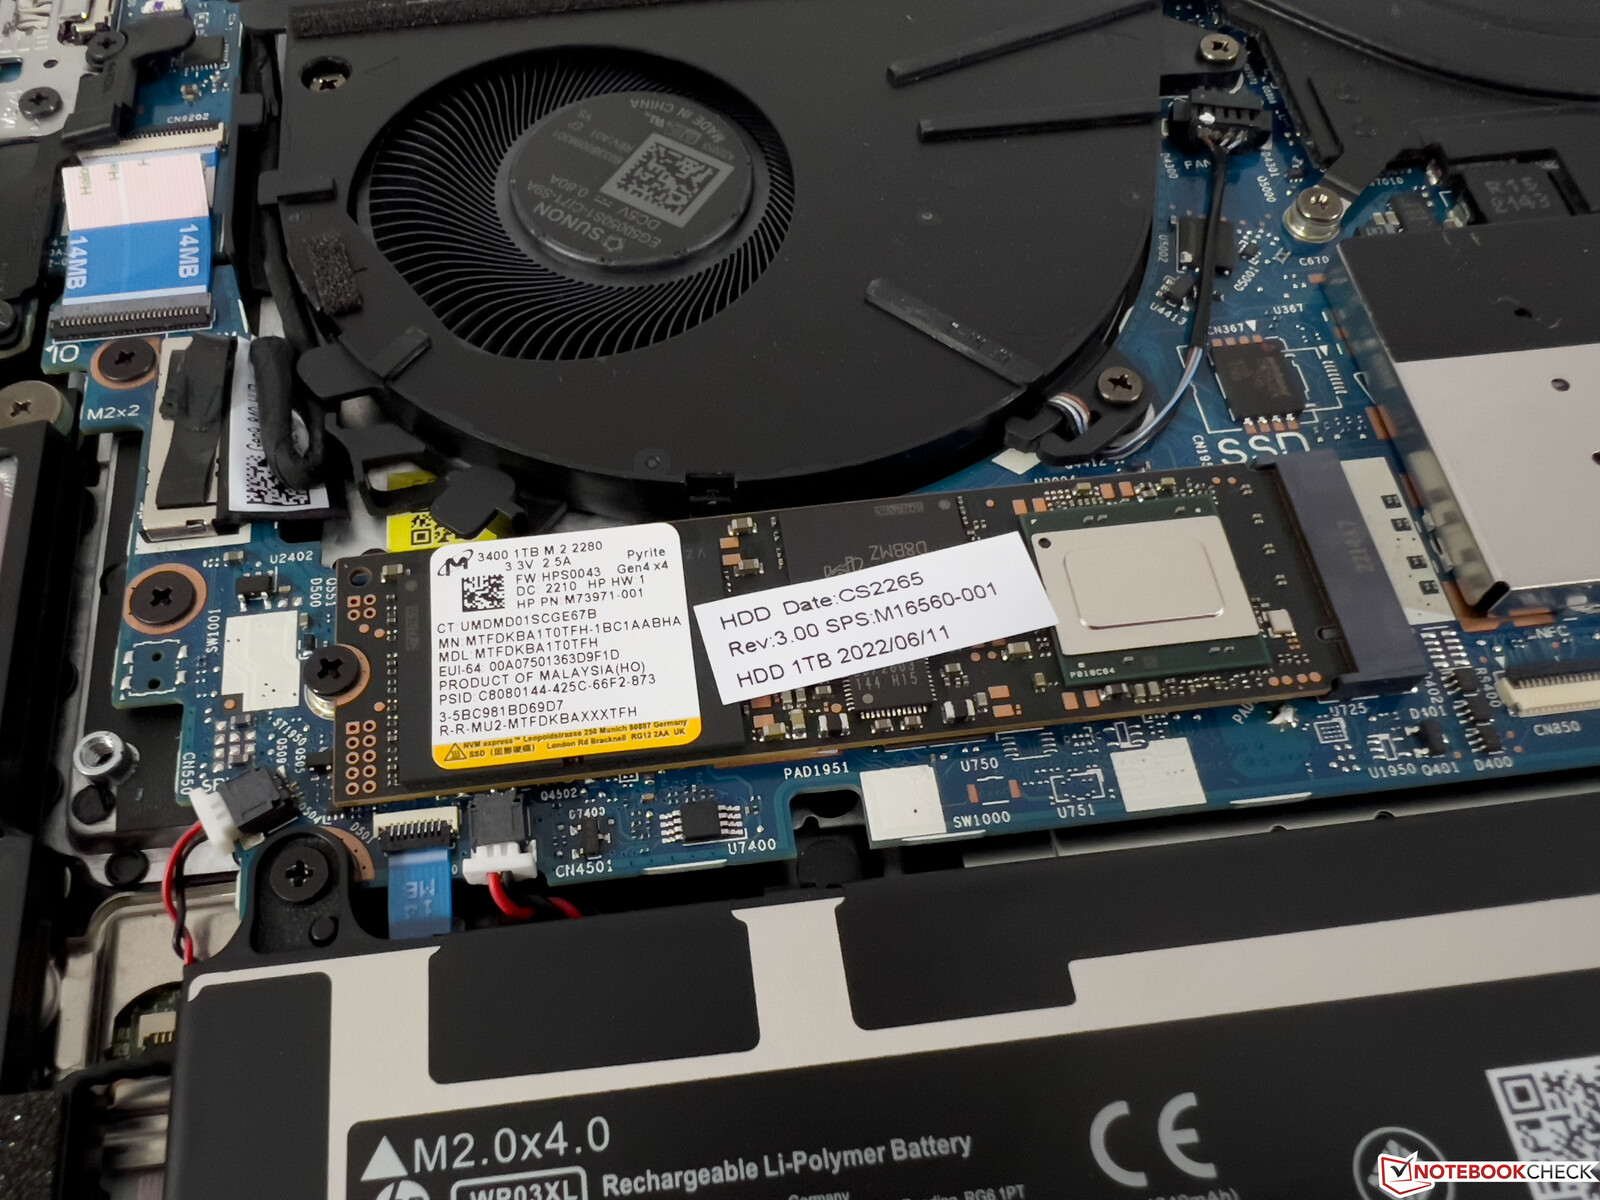
惠普安装了一个快速的PCIe 4.0 Micron 3400固态硬盘,存储容量为1TB,其中885GB在第一次启动后仍可使用。超过6GB/s的传输率是很好的,但在永久负载期间,由于温度过高,几分钟后会出现性能波动。
更多的SSD基准测试可在这里.

* ... smaller is better
Dauerleistung Lesen: DiskSpd Read Loop, Queue Depth 8
图形卡
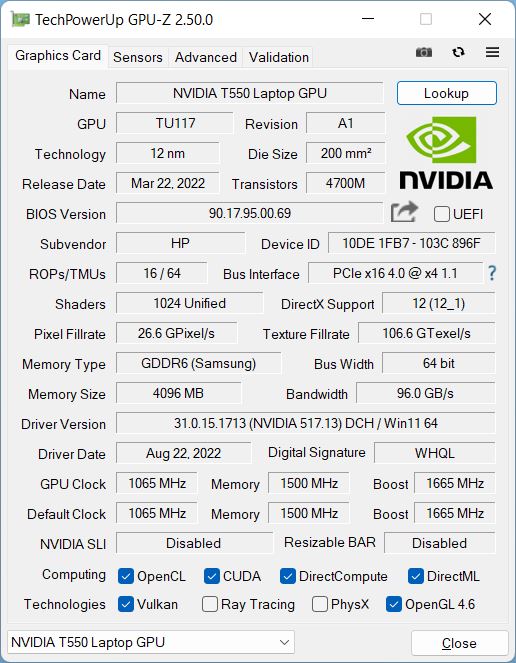
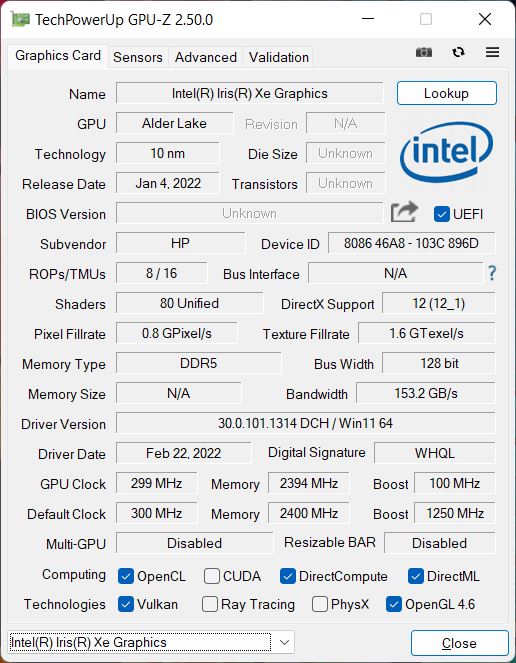
与较大的 萤火虫16 G9的情况,专用的 Nvidia T550在TGP只有20W的情况下运行,这是Nvidia规定的最低值(20-60W)。由于它是一个专业的GPU,你会得到优化的驱动程序,包括专业应用程序的认证。因此,尽管是入门级的分类,该GPU仍然是有意义的。
就纯粹的性能而言,新的T550有点令人失望,只是略微领先于 T500 GPU在旧的 ZBook Firefly 14 G8.在永久负载和电池模式下,性能保持稳定。
更多的GPU基准测试可以在 我们的技术部分.
游戏性能也处于入门级范围,但至少现代休闲游戏通常可以在减少细节的情况下合理地玩,只要要求不是太高。
3DMark: 1280x720 Cloud Gate Standard Graphics | 1920x1080 Fire Strike Graphics | 2560x1440 Time Spy Graphics | Wild Life Extreme Unlimited | Wild Life Extreme
| 3DMark Performance rating | |
| Average of class Workstation -1! | |
| Apple MacBook Pro 14 2021 M1 Pro Entry -3! | |
| Microsoft Surface Laptop Studio i7 RTX 3050 Ti | |
| Dell Precision 5000 5470 -2! | |
| HP ZBook Firefly 16 G9-6B897EA | |
| Average NVIDIA T550 Laptop GPU | |
| HP ZBook Firefly 14 G9-6B8A2EA | |
| HP ZBook Firefly 14 G8 2C9Q2EA -2! | |
| HP EliteBook 845 G9 6F6H6EA -2! | |
| Lenovo ThinkPad P14s Gen2-20VX000GGE -2! | |
| 3DMark / Cloud Gate Standard Graphics | |
| Average of class Workstation (58392 - 152418, n=14, last 2 years) | |
| Dell Precision 5000 5470 | |
| Microsoft Surface Laptop Studio i7 RTX 3050 Ti | |
| HP ZBook Firefly 16 G9-6B897EA | |
| Average NVIDIA T550 Laptop GPU (32743 - 33694, n=2) | |
| HP ZBook Firefly 14 G9-6B8A2EA | |
| HP EliteBook 845 G9 6F6H6EA | |
| HP ZBook Firefly 14 G8 2C9Q2EA | |
| Lenovo ThinkPad P14s Gen2-20VX000GGE | |
| 3DMark / Fire Strike Graphics | |
| Average of class Workstation (8293 - 52560, n=23, last 2 years) | |
| Microsoft Surface Laptop Studio i7 RTX 3050 Ti | |
| Dell Precision 5000 5470 | |
| Average NVIDIA T550 Laptop GPU (4816 - 5593, n=3) | |
| HP ZBook Firefly 16 G9-6B897EA | |
| HP ZBook Firefly 14 G9-6B8A2EA | |
| HP ZBook Firefly 14 G8 2C9Q2EA | |
| Lenovo ThinkPad P14s Gen2-20VX000GGE | |
| HP EliteBook 845 G9 6F6H6EA | |
| 3DMark / Time Spy Graphics | |
| Average of class Workstation (2725 - 24806, n=23, last 2 years) | |
| Microsoft Surface Laptop Studio i7 RTX 3050 Ti | |
| Dell Precision 5000 5470 | |
| Average NVIDIA T550 Laptop GPU (1882 - 2252, n=3) | |
| HP ZBook Firefly 14 G8 2C9Q2EA | |
| HP ZBook Firefly 16 G9-6B897EA | |
| HP ZBook Firefly 14 G9-6B8A2EA | |
| Lenovo ThinkPad P14s Gen2-20VX000GGE | |
| HP EliteBook 845 G9 6F6H6EA | |
| 3DMark / Wild Life Extreme Unlimited | |
| Microsoft Surface Laptop Studio i7 RTX 3050 Ti | |
| Apple MacBook Pro 14 2021 M1 Pro Entry | |
| HP ZBook Firefly 16 G9-6B897EA | |
| Average NVIDIA T550 Laptop GPU (3530 - 3649, n=2) | |
| HP ZBook Firefly 14 G9-6B8A2EA | |
| 3DMark / Wild Life Extreme | |
| Average of class Workstation (5189 - 30182, n=10, last 2 years) | |
| Microsoft Surface Laptop Studio i7 RTX 3050 Ti | |
| Apple MacBook Pro 14 2021 M1 Pro Entry | |
| HP ZBook Firefly 16 G9-6B897EA | |
| Average NVIDIA T550 Laptop GPU (3617 - 3739, n=2) | |
| HP ZBook Firefly 14 G9-6B8A2EA | |
| 3DMark Cloud Gate Standard Score | 17829 points | |
| 3DMark Fire Strike Score | 4559 points | |
| 3DMark Time Spy Score | 2031 points | |
Help | ||
* ... smaller is better
The Witcher 3 FPS chart
| low | med. | high | ultra | |
|---|---|---|---|---|
| GTA V (2015) | 116 | 117.2 | 61.6 | 29 |
| The Witcher 3 (2015) | 121 | 73 | 39 | 19.6 |
| Dota 2 Reborn (2015) | 113.3 | 103.8 | 92.3 | 84 |
| Final Fantasy XV Benchmark (2018) | 60.2 | 30.5 | 22 | |
| X-Plane 11.11 (2018) | 68.1 | 64.1 | 58.8 | |
| Strange Brigade (2018) | 126.1 | 47.7 | 38.7 | 33.2 |
| F1 2021 (2021) | 152.7 | 70.7 | 56.5 | 36.1 |
| F1 22 (2022) | 66.4 | 59.9 | 41.4 | 29.5 |
排放和能源
噪声排放
在日常使用中,只要不使用专用的GPU,ZBook Firefly 14 G9就能保持非常安静的状态,因此,处理器的低性能在风扇的行为上得到了积极的注意。即使在CPU满负荷的情况下,风扇的啸叫声也低于30dB(A),因此在正常环境下几乎听不到。
当T550也处于工作状态时,风扇很快就会达到~40dB(A)。我们无法检测到任何其他电子噪音。
Noise level
| Idle |
| 24.3 / 24.3 / 24.3 dB(A) |
| Load |
| 35.6 / 41 dB(A) |
 | ||
30 dB silent 40 dB(A) audible 50 dB(A) loud |
||
min: | ||
| HP ZBook Firefly 14 G9-6B8A2EA T550 Laptop GPU, i7-1265U, Micron 3400 1TB MTFDKBA1T0TFH | Dell Precision 5000 5470 RTX A1000 Laptop GPU, i9-12900H, Samsung PM9A1 MZVL21T0HCLR | Lenovo ThinkPad P14s Gen2-20VX000GGE T500 Laptop GPU, i7-1185G7, Toshiba XG6 KXG6AZNV1T02 | Microsoft Surface Laptop Studio i7 RTX 3050 Ti GeForce RTX 3050 Ti Laptop GPU, i7-11370H, SK Hynix PC711 1TB HFS001TDE9X084N | Apple MacBook Pro 14 2021 M1 Pro Entry M1 Pro 14-Core GPU, M1 Pro 8-Core, Apple SSD AP0512 | HP ZBook Firefly 14 G8 2C9Q2EA T500 Laptop GPU, i7-1165G7, Toshiba XG6 KXG60ZNV1T02 | HP EliteBook 845 G9 6F6H6EA Radeon 680M, R9 PRO 6950HS, WDC PC SN810 1TB | HP ZBook Firefly 16 G9-6B897EA T550 Laptop GPU, i7-1265U, Samsung PM9A1 MZVL21T0HCLR | |
|---|---|---|---|---|---|---|---|---|
| Noise | -10% | -1% | -4% | 3% | -10% | -6% | -1% | |
| off / environment * (dB) | 24.3 | 23 5% | 24.6 -1% | 24.7 -2% | 24.8 -2% | 28.7 -18% | 25.5 -5% | 23.8 2% |
| Idle Minimum * (dB) | 24.3 | 23.3 4% | 24.6 -1% | 24.7 -2% | 24.8 -2% | 28.7 -18% | 25.5 -5% | 23.8 2% |
| Idle Average * (dB) | 24.3 | 23.3 4% | 24.6 -1% | 24.7 -2% | 24.8 -2% | 28.7 -18% | 25.5 -5% | 23.8 2% |
| Idle Maximum * (dB) | 24.3 | 23.3 4% | 24.6 -1% | 24.7 -2% | 24.8 -2% | 28.7 -18% | 25.5 -5% | 23.8 2% |
| Load Average * (dB) | 35.6 | 48.5 -36% | 38.9 -9% | 33.2 7% | 27.8 22% | 34 4% | 38.1 -7% | 39.4 -11% |
| Witcher 3 ultra * (dB) | 38.2 | 48.6 -27% | 44.5 -16% | 27.8 27% | 40.1 -5% | 40.5 -6% | ||
| Load Maximum * (dB) | 41 | 50.4 -23% | 38.9 5% | 46.7 -14% | 49.5 -21% | 40.1 2% | 44 -7% | 41.4 -1% |
* ... smaller is better
温度
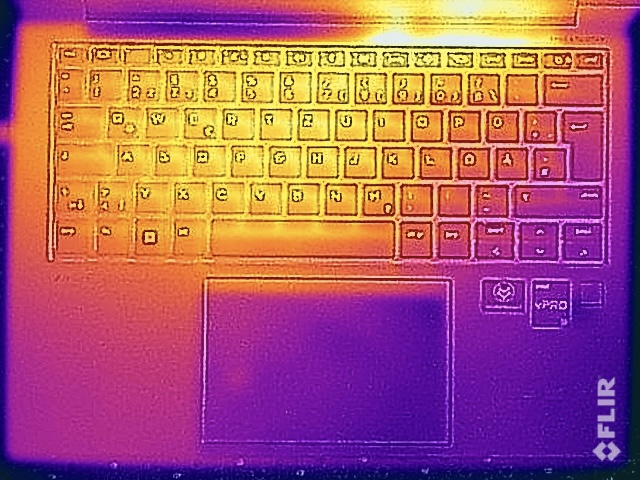
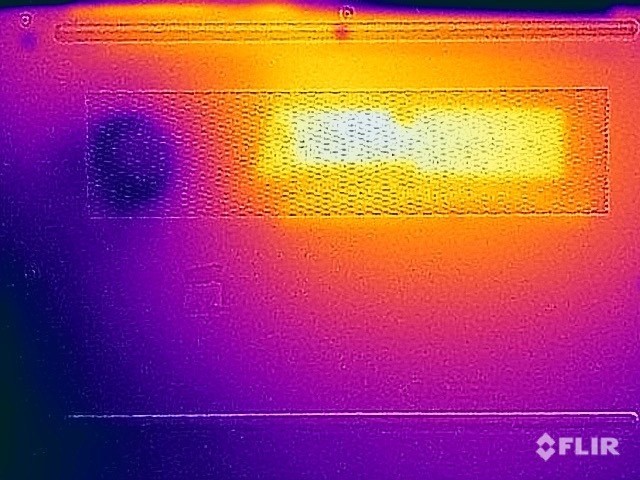
ZBook Firefly 14 G9在正常使用中没有任何温度问题,表面保持令人愉快的冷却。在满负荷的情况下(尤其是在有活动的GPU的情况下),温度不会变得很严重,但尽管性能相对较低,底面的一些位置超过47℃。
然后,通常的行为发生在压力测试中。CPU立即稳定在12W,而GPU保持稳定在20W。
(±) The maximum temperature on the upper side is 41.2 °C / 106 F, compared to the average of 38.2 °C / 101 F, ranging from 22.2 to 69.8 °C for the class Workstation.
(-) The bottom heats up to a maximum of 47.9 °C / 118 F, compared to the average of 41.1 °C / 106 F
(+) In idle usage, the average temperature for the upper side is 25.8 °C / 78 F, compared to the device average of 32 °C / 90 F.
(±) Playing The Witcher 3, the average temperature for the upper side is 32.7 °C / 91 F, compared to the device average of 32 °C / 90 F.
(+) The palmrests and touchpad are reaching skin temperature as a maximum (32.1 °C / 89.8 F) and are therefore not hot.
(-) The average temperature of the palmrest area of similar devices was 27.8 °C / 82 F (-4.3 °C / -7.8 F).
| HP ZBook Firefly 14 G9-6B8A2EA Intel Core i7-1265U, NVIDIA T550 Laptop GPU | Dell Precision 5000 5470 Intel Core i9-12900H, NVIDIA RTX A1000 Laptop GPU | Lenovo ThinkPad P14s Gen2-20VX000GGE Intel Core i7-1185G7, NVIDIA T500 Laptop GPU | Microsoft Surface Laptop Studio i7 RTX 3050 Ti Intel Core i7-11370H, NVIDIA GeForce RTX 3050 Ti Laptop GPU | Apple MacBook Pro 14 2021 M1 Pro Entry Apple M1 Pro 8-Core, Apple M1 Pro 14-Core GPU | HP ZBook Firefly 14 G8 2C9Q2EA Intel Core i7-1165G7, NVIDIA T500 Laptop GPU | HP EliteBook 845 G9 6F6H6EA AMD Ryzen 9 PRO 6950HS, AMD Radeon 680M | |
|---|---|---|---|---|---|---|---|
| Heat | -8% | -12% | 11% | 5% | 3% | -13% | |
| Maximum Upper Side * (°C) | 41.2 | 41.8 -1% | 52.4 -27% | 42.3 -3% | 46.8 -14% | 42.6 -3% | 49.4 -20% |
| Maximum Bottom * (°C) | 47.9 | 36 25% | 63.7 -33% | 38.2 20% | 40.9 15% | 49.4 -3% | 48 -0% |
| Idle Upper Side * (°C) | 26.5 | 34.6 -31% | 24.6 7% | 23.4 12% | 24.2 9% | 24.2 9% | 30.8 -16% |
| Idle Bottom * (°C) | 27 | 33.6 -24% | 26 4% | 23.5 13% | 24.2 10% | 24.6 9% | 31.4 -16% |
* ... smaller is better
扩音器
两个立体声扬声器提供了体面的声音--只是低音很弱,因此声音看起来不是很有力。然而,这些扬声器非常适用于会议和语音再现。
HP ZBook Firefly 14 G9-6B8A2EA audio analysis
(+) | speakers can play relatively loud (84.5 dB)
Bass 100 - 315 Hz
(-) | nearly no bass - on average 19.6% lower than median
(±) | linearity of bass is average (13% delta to prev. frequency)
Mids 400 - 2000 Hz
(+) | balanced mids - only 2.5% away from median
(+) | mids are linear (3.5% delta to prev. frequency)
Highs 2 - 16 kHz
(+) | balanced highs - only 1.9% away from median
(+) | highs are linear (3.2% delta to prev. frequency)
Overall 100 - 16.000 Hz
(+) | overall sound is linear (12.7% difference to median)
Compared to same class
» 21% of all tested devices in this class were better, 4% similar, 74% worse
» The best had a delta of 7%, average was 17%, worst was 35%
Compared to all devices tested
» 12% of all tested devices were better, 3% similar, 86% worse
» The best had a delta of 4%, average was 23%, worst was 134%
Apple MacBook Pro 14 2021 M1 Pro Entry audio analysis
(+) | speakers can play relatively loud (84.9 dB)
Bass 100 - 315 Hz
(+) | good bass - only 4.3% away from median
(+) | bass is linear (5.9% delta to prev. frequency)
Mids 400 - 2000 Hz
(+) | balanced mids - only 1.1% away from median
(+) | mids are linear (1.9% delta to prev. frequency)
Highs 2 - 16 kHz
(+) | balanced highs - only 2.9% away from median
(+) | highs are linear (3% delta to prev. frequency)
Overall 100 - 16.000 Hz
(+) | overall sound is linear (5.6% difference to median)
Compared to same class
» 2% of all tested devices in this class were better, 1% similar, 97% worse
» The best had a delta of 5%, average was 17%, worst was 45%
Compared to all devices tested
» 0% of all tested devices were better, 0% similar, 100% worse
» The best had a delta of 4%, average was 23%, worst was 134%
能源消耗
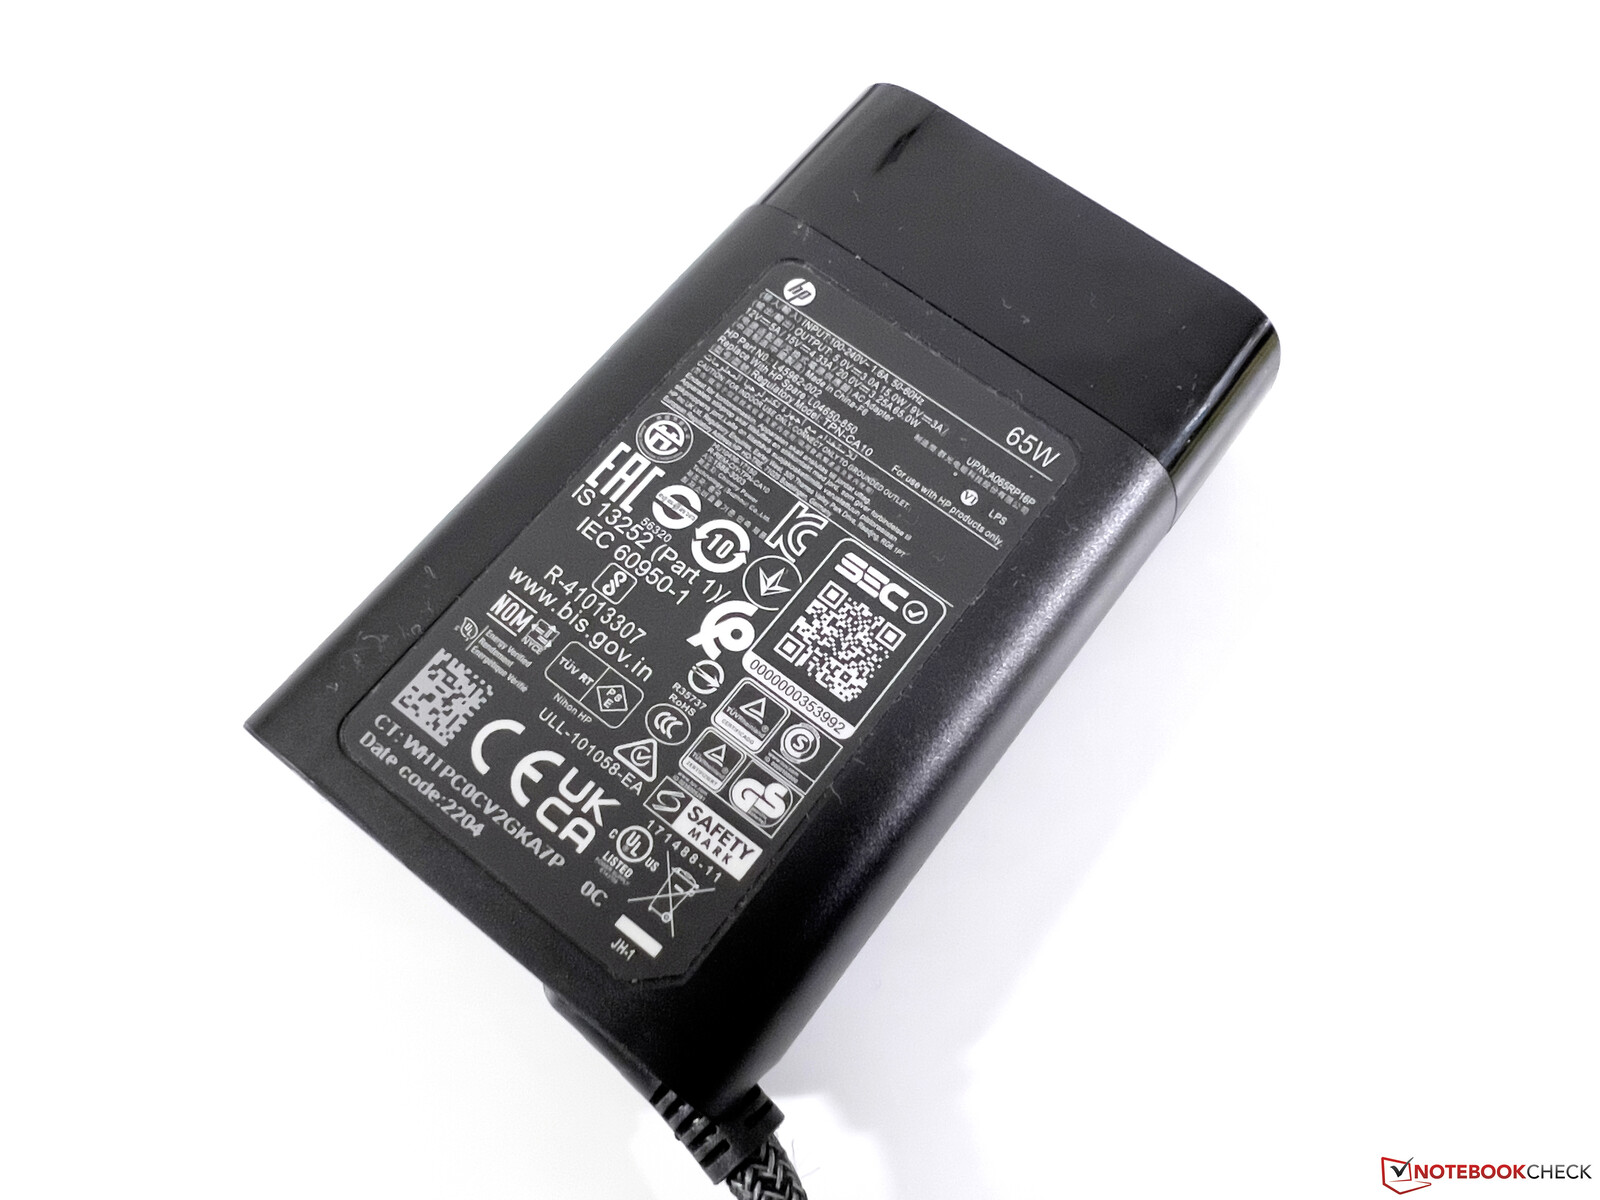
总的来说,ZBook Firefly 14 G9是一台非常高效的笔记本电脑,尽管在负载下低性能的影响是明显的。在压力测试中,它在很短的时间内达到68W,但消耗量立即稳定在~45W,并保持在这个水平。因此,附带的65W电源是足够的。
| Off / Standby | |
| Idle | |
| Load |
|
Key:
min: | |
Power consumption - The Witcher 3 / Stress test
Power consumption - External monitor
电池寿命
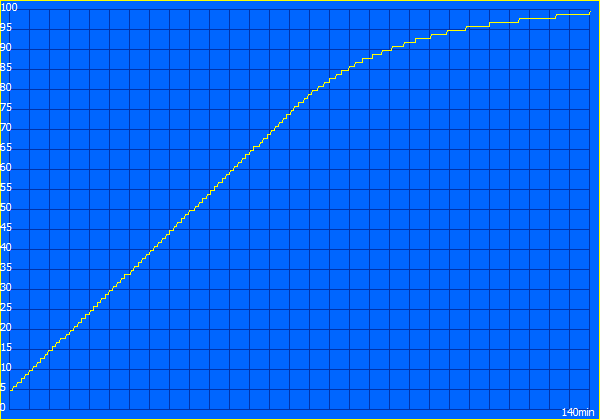
使用51瓦时电池,ZBook Firefly 14 G9在我们的WLAN测试中,在150cd/m²(相当于最大亮度的63%)下,提供了近9个小时的体面运行时间;在全屏亮度下,约7.5小时。然而,除了Surface Studio之外,竞争对手提供了更多的耐力--甚至是旧的 ZBook Firefly 14 G8持续时间也更长。
当设备开启时,充满电需要140分钟,72分钟后可获得80%的电量。没有快速充电功能。
| HP ZBook Firefly 14 G9-6B8A2EA i7-1265U, T550 Laptop GPU, 51 Wh | Dell Precision 5000 5470 i9-12900H, RTX A1000 Laptop GPU, 72 Wh | Lenovo ThinkPad P14s Gen2-20VX000GGE i7-1185G7, T500 Laptop GPU, 50 Wh | Microsoft Surface Laptop Studio i7 RTX 3050 Ti i7-11370H, GeForce RTX 3050 Ti Laptop GPU, 58 Wh | Apple MacBook Pro 14 2021 M1 Pro Entry M1 Pro 8-Core, M1 Pro 14-Core GPU, 69.9 Wh | HP ZBook Firefly 14 G8 2C9Q2EA i7-1165G7, T500 Laptop GPU, 53 Wh | HP EliteBook 845 G9 6F6H6EA R9 PRO 6950HS, Radeon 680M, 51 Wh | Average of class Workstation | |
|---|---|---|---|---|---|---|---|---|
| Battery runtime | ||||||||
| WiFi v1.3 (h) | 8.8 | 9.6 9% | 9.2 5% | 8 -9% | 13.6 55% | 12.8 45% | 9.3 6% | 8.55 ? -3% |
Pros
Cons
结论:ZBook Firefly 14太慢了
我们对ZBook Firefly 14 G9的结论基本上与较大的 萤火虫16 G9因为它在许多方面都是一个好的笔记本。像外壳、显示屏、设备和输入设备等方面都很有说服力,但性能是移动工作站的重点。
特别是处理器,不符合这一要求,新的萤火虫14 G9也比其前辈的Tiger Lake 处理器要慢。专用的 Nvidia T550显卡对专业应用来说是有意义的,但它也是最慢的版本,TGP只有20W。
惠普ZBook Firefly 14 G9在许多方面可以说服人,但对于移动工作站来说,性能实在太低。
如果你需要更多的CPU功率,你应该看看正常的商业变体 HP EliteBook 845 G9它配备了AMD的35W处理器,同时避免了SureView面板。
注:我们目前正在与惠普就CPU性能低的问题进行联系,一旦收到新的信息,我们将相应地更新文章。
价格和可用性
ZBook Firefly 14 G9可以直接在惠普公司配置。直接。另外,我们的测试配置也可以在网上商店买到,如Cyberport,价格约为2,100欧元(约2,075美元)。.
HP ZBook Firefly 14 G9-6B8A2EA
- 10/19/2022 v7 (old)
Andreas Osthoff
Price comparison
