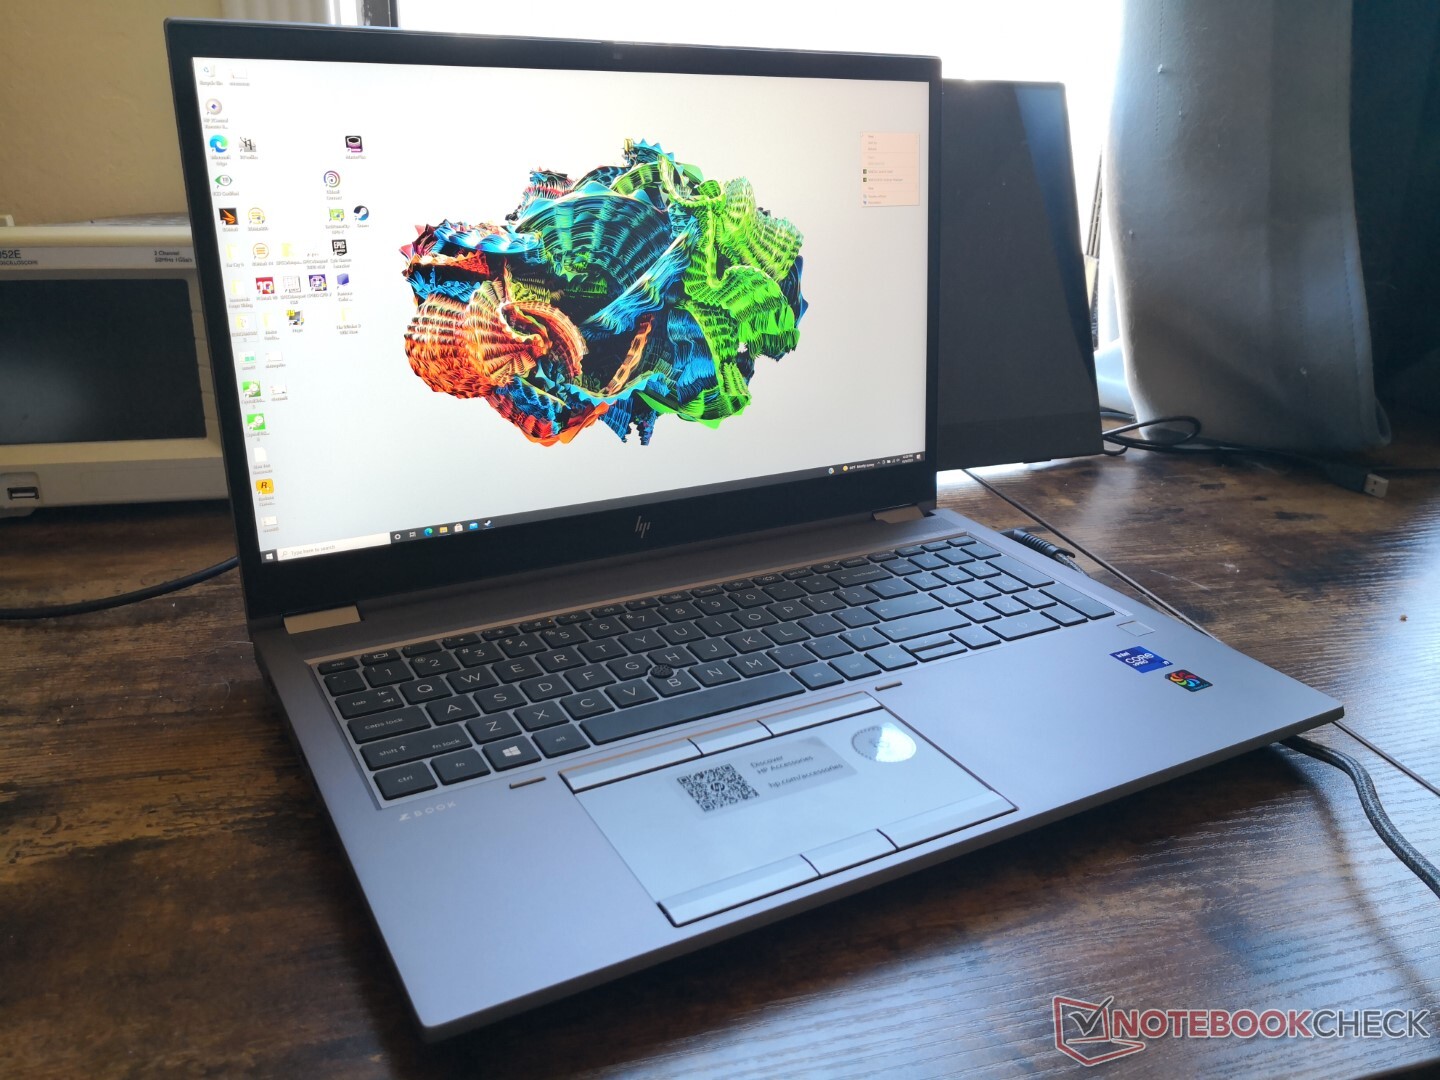
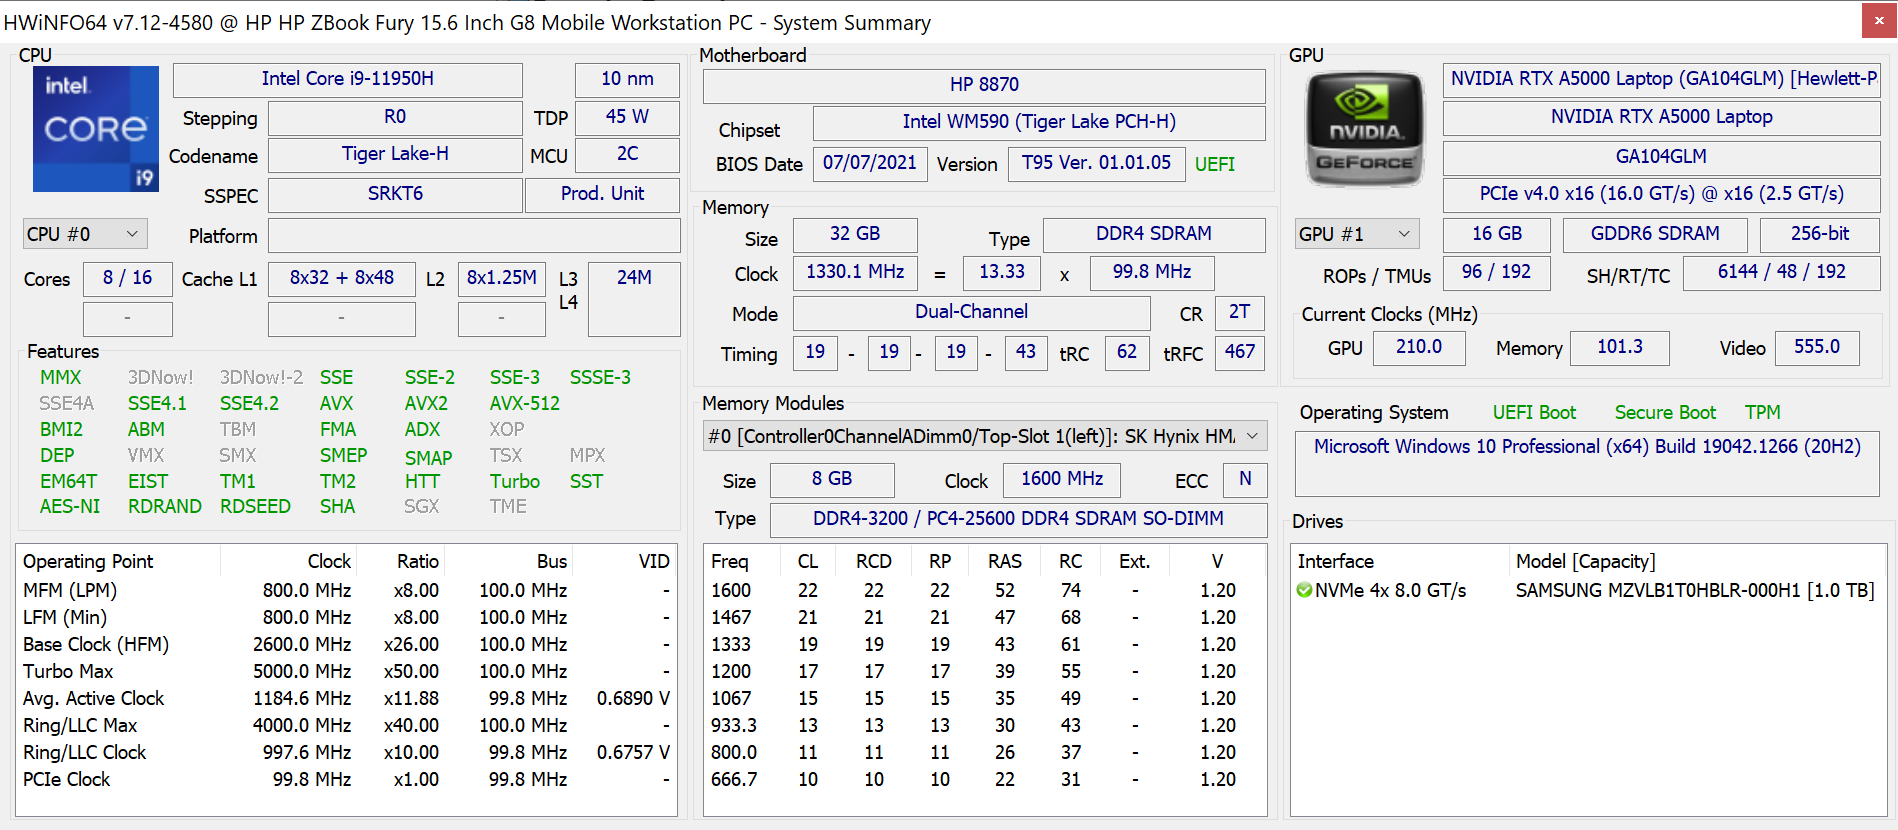
惠普ZBook Fury 15 G8工作站回顾。Quadro RTX A5000是一头野兽
虽然ZBook Fury 15 G7代表了对ZBook Fury 15 G6的大规模改造,但最新的ZBook Fury 15 G8整体上是一个相对较小的更新。较新的型号配备了Tiger Lake-H CPU和Nvidia Ampere GPU,以取代去年的Comet Lake-H和Nvidia Turing选项。它的显示屏也从4K 60 Hz升级到4K 120 Hz,成为极少数拥有这种面板选项的15英寸笔记本电脑之一。
SKU的范围从带集成显卡的酷睿i5-11500H CPU和45%的NTSC 1080p显示屏(约2000美元)到带Quadro RTX A5000显卡和4K UHD 100% DCI-P3光面触摸屏的Xeon W-11955M vPro CPU,价格超过6000美元。我们的测试装置是一个高端配置,配备酷睿i9-11950H、RTX A5000和4K120亚光显示屏,价格约为5000美元。
这一领域的竞争者包括其他传统的15.6英寸工作站,如 戴尔Precision 7550,联想ThinkPad P15第二代,以及 富士通Celsius系列.我们建议查看我们现有的关于 ZBook Fury 15 G7了解更多关于机箱及其功能的信息,因为Fury 15 G8采用了相同的骨架。
更多惠普评论。
potential competitors in comparison
Rating | Date | Model | Weight | Height | Size | Resolution | Price |
|---|---|---|---|---|---|---|---|
| 90.3 % v7 (old) | 10 / 2021 | HP ZBook Fury 15 G8 i9-11950H, RTX A5000 Laptop GPU | 2.5 kg | 25.9 mm | 15.60" | 3840x2160 | |
| 90.2 % v7 (old) | 06 / 2021 | HP ZBook Fury 15 G7 W-10885M, Quadro RTX 5000 Max-Q | 2.4 kg | 25.9 mm | 15.60" | 3840x2160 | |
| 88.3 % v7 (old) | 10 / 2021 | Dell Precision 5000 5560 i7-11850H, RTX A2000 Laptop GPU | 2 kg | 18 mm | 15.60" | 3840x2400 | |
| 87.8 % v7 (old) | 08 / 2021 | HP ZBook Studio 15 G8 i9-11950H, GeForce RTX 3070 Laptop GPU | 1.9 kg | 18 mm | 15.60" | 3840x2160 | |
| 85.3 % v7 (old) | Lenovo ThinkPad P15s Gen2-20W6000GGE i7-1165G7, T500 Laptop GPU | 1.9 kg | 19.1 mm | 15.60" | 3840x2160 | ||
| 82.7 % v7 (old) | 12 / 2020 | HP ZBook Firefly 15 G7 i7-10610U, Quadro P520 | 1.8 kg | 19.2 mm | 15.60" | 3840x2160 |
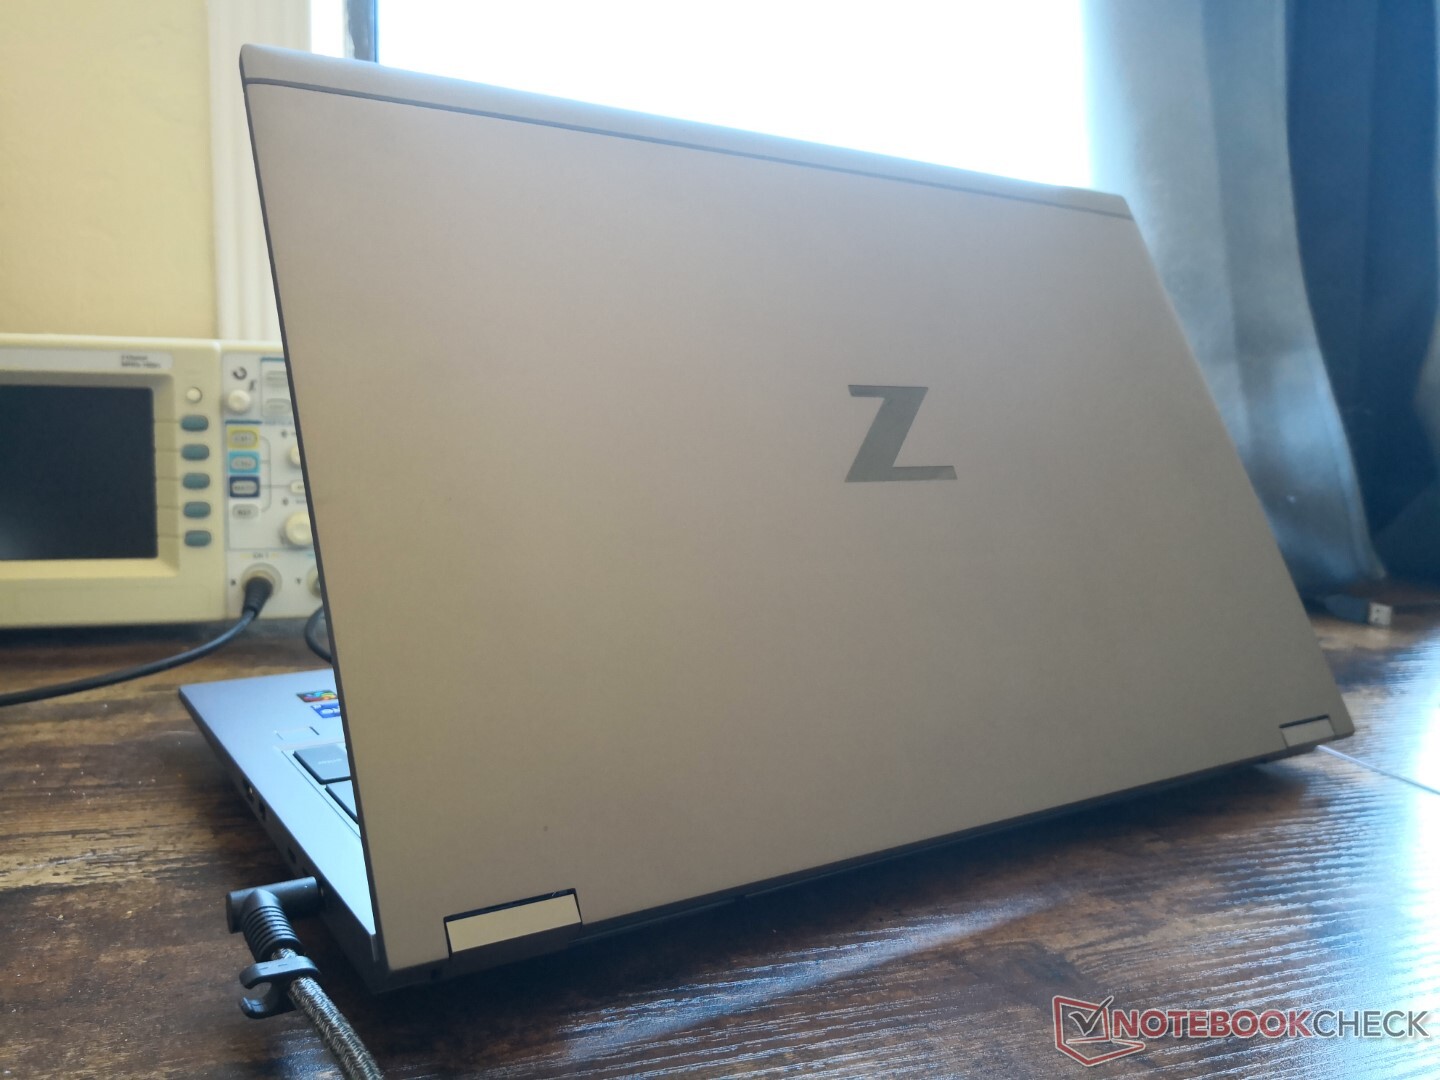
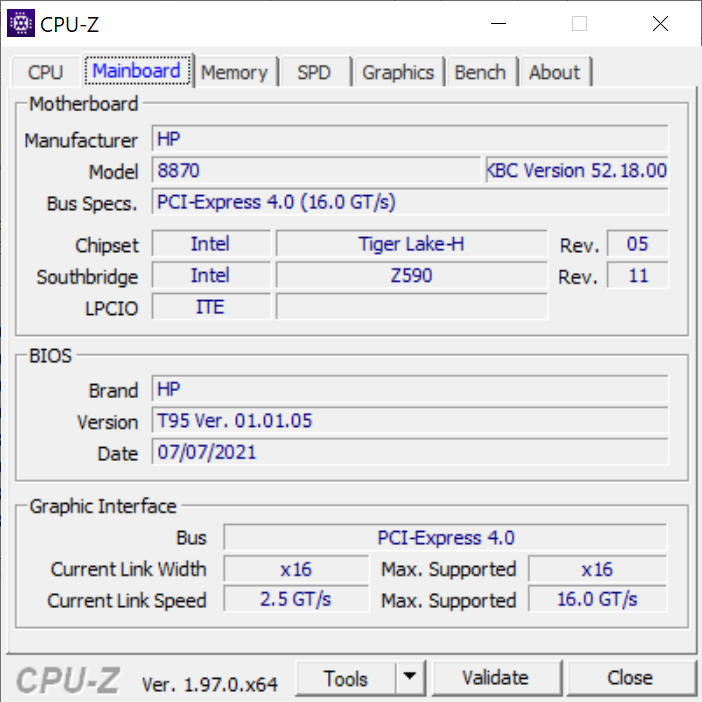
外壳 - 与ZBook Fury 15 G7相同
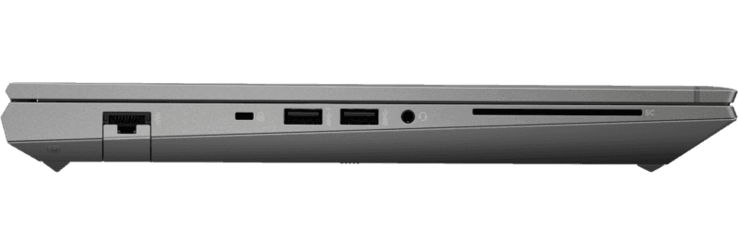
连接性
Fury 15 G7支持Thunderbolt 4,而不是 "只有 "Thunderbolt 3。除此以外,这些端口与去年相比仍然是相同的。
SD卡阅读器
| SD Card Reader | |
| average JPG Copy Test (av. of 3 runs) | |
| Dell Precision 5000 5560 (AV Pro V60) | |
| HP ZBook Fury 15 G7 (Toshiba Exceria Pro SDXC 64 GB UHS-II) | |
| HP ZBook Fury 15 G8 (AV Pro V60) | |
| HP ZBook Studio 15 G8 (AV Pro V60) | |
| Lenovo ThinkPad P15s Gen2-20W6000GGE (AV Pro V60) | |
| maximum AS SSD Seq Read Test (1GB) | |
| HP ZBook Fury 15 G7 (Toshiba Exceria Pro SDXC 64 GB UHS-II) | |
| Dell Precision 5000 5560 (AV Pro V60) | |
| Lenovo ThinkPad P15s Gen2-20W6000GGE (AV Pro V60) | |
| HP ZBook Studio 15 G8 (AV Pro V60) | |
| HP ZBook Fury 15 G8 (AV Pro V60) | |
沟通
| Networking | |
| iperf3 transmit AX12 | |
| HP ZBook Studio 15 G8 | |
| Lenovo ThinkPad P15s Gen2-20W6000GGE | |
| HP ZBook Fury 15 G8 | |
| HP ZBook Firefly 15 G7 | |
| Dell Precision 5000 5560 | |
| HP ZBook Fury 15 G7 | |
| iperf3 receive AX12 | |
| Lenovo ThinkPad P15s Gen2-20W6000GGE | |
| Dell Precision 5000 5560 | |
| HP ZBook Studio 15 G8 | |
| HP ZBook Fury 15 G8 | |
| HP ZBook Firefly 15 G7 | |
| HP ZBook Fury 15 G7 | |
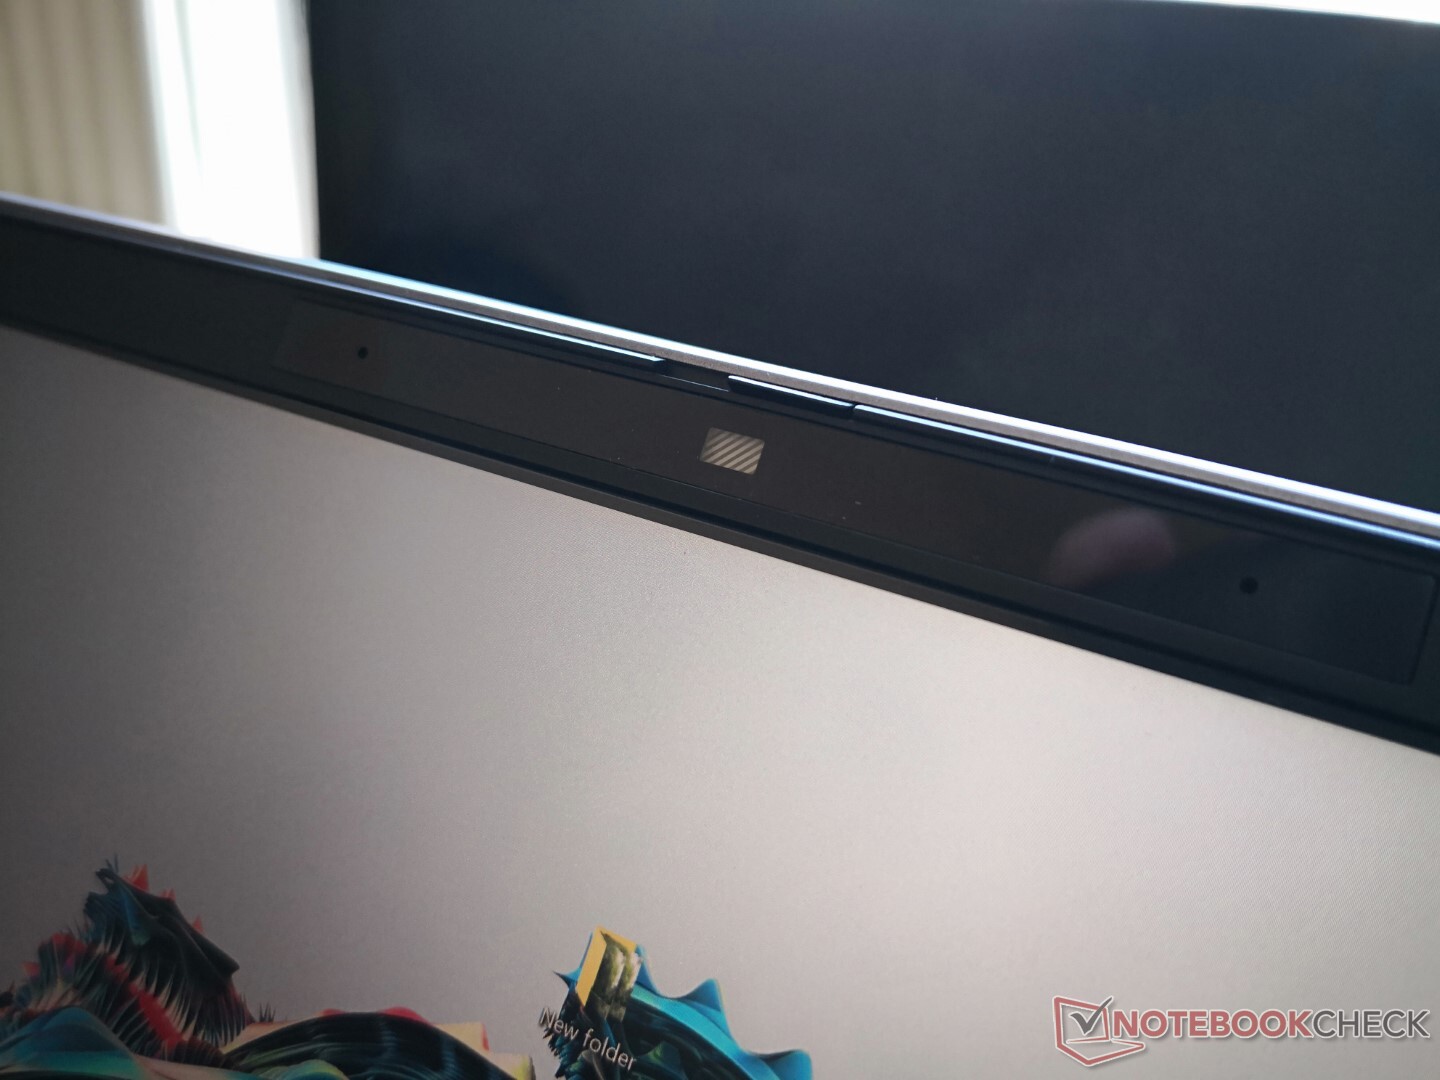
网络摄像头 - 静态720p
相机质量仍然很差,只有720p。一些制造商如 雷蛇 已经将他们的集成网络摄像头从720p升级到1080p。


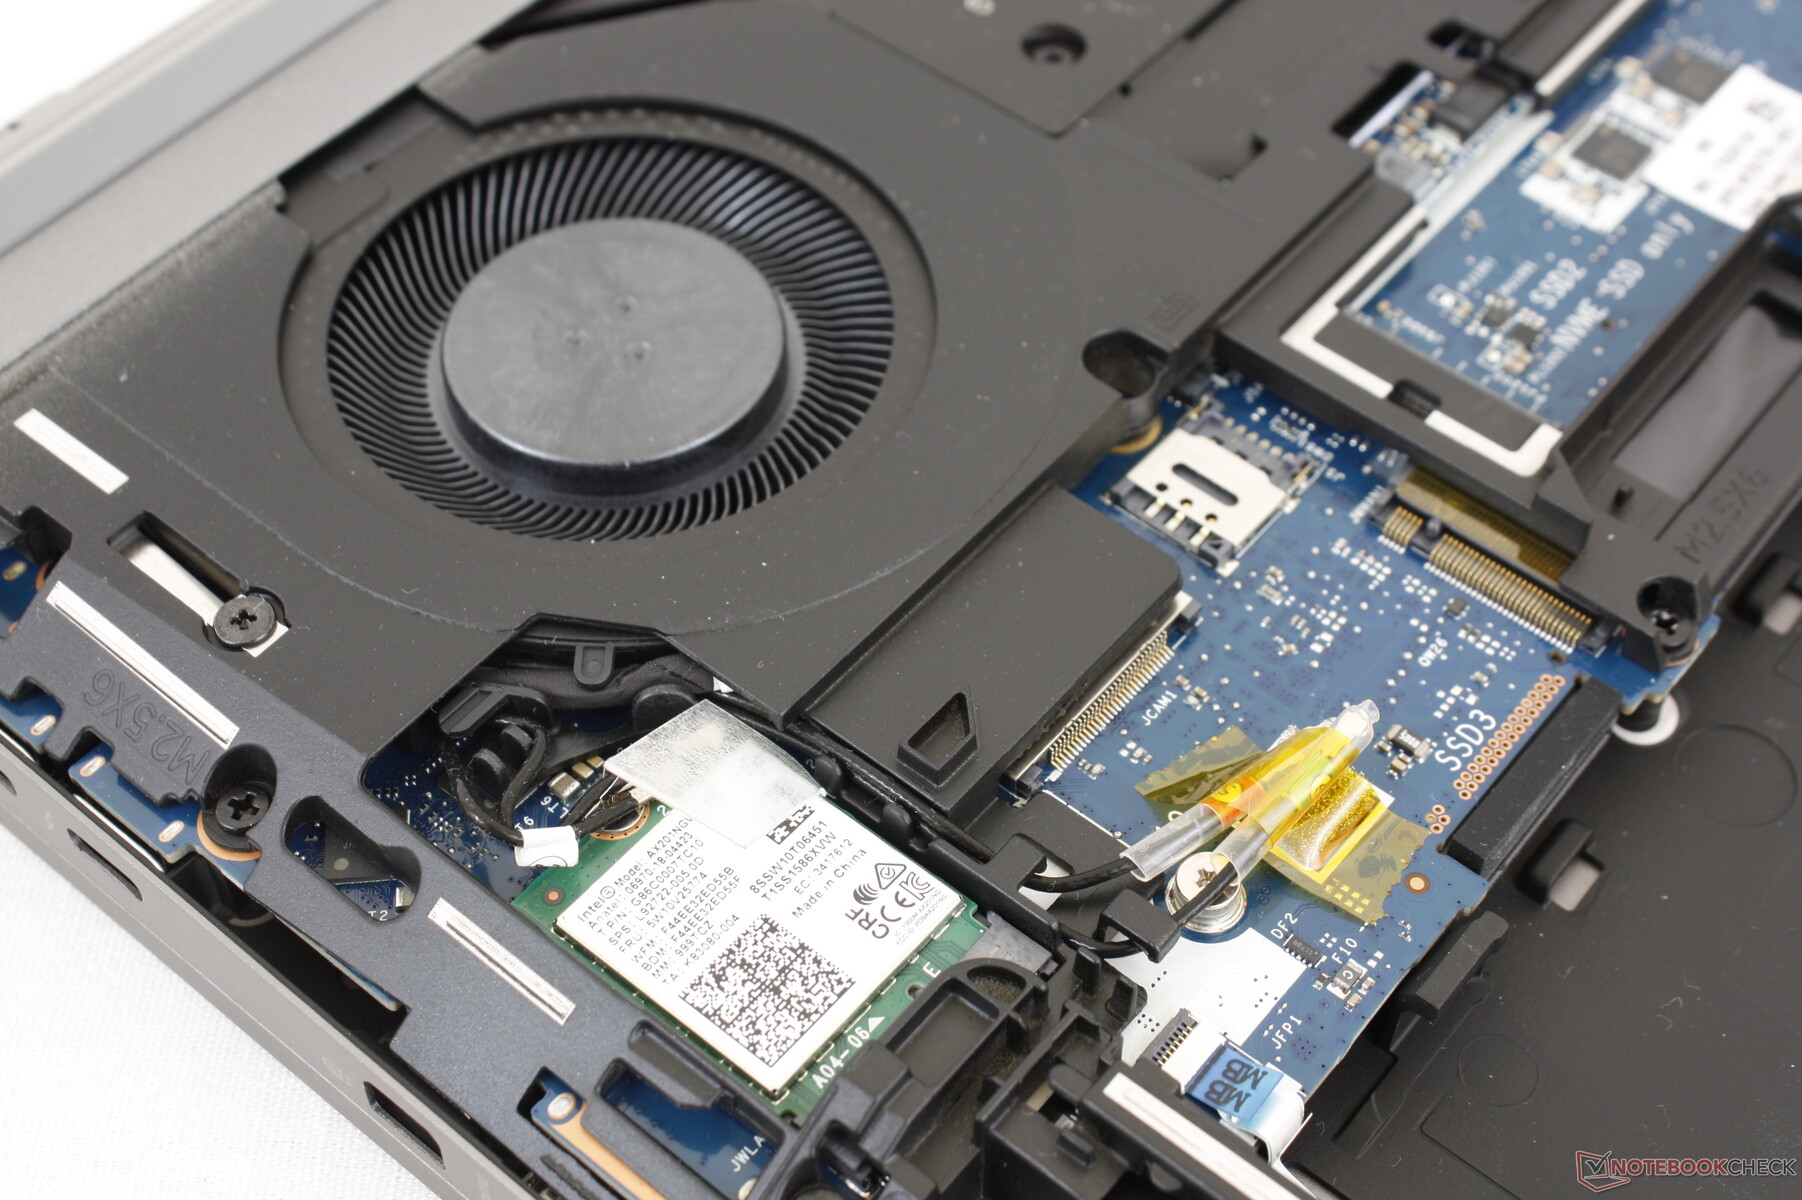
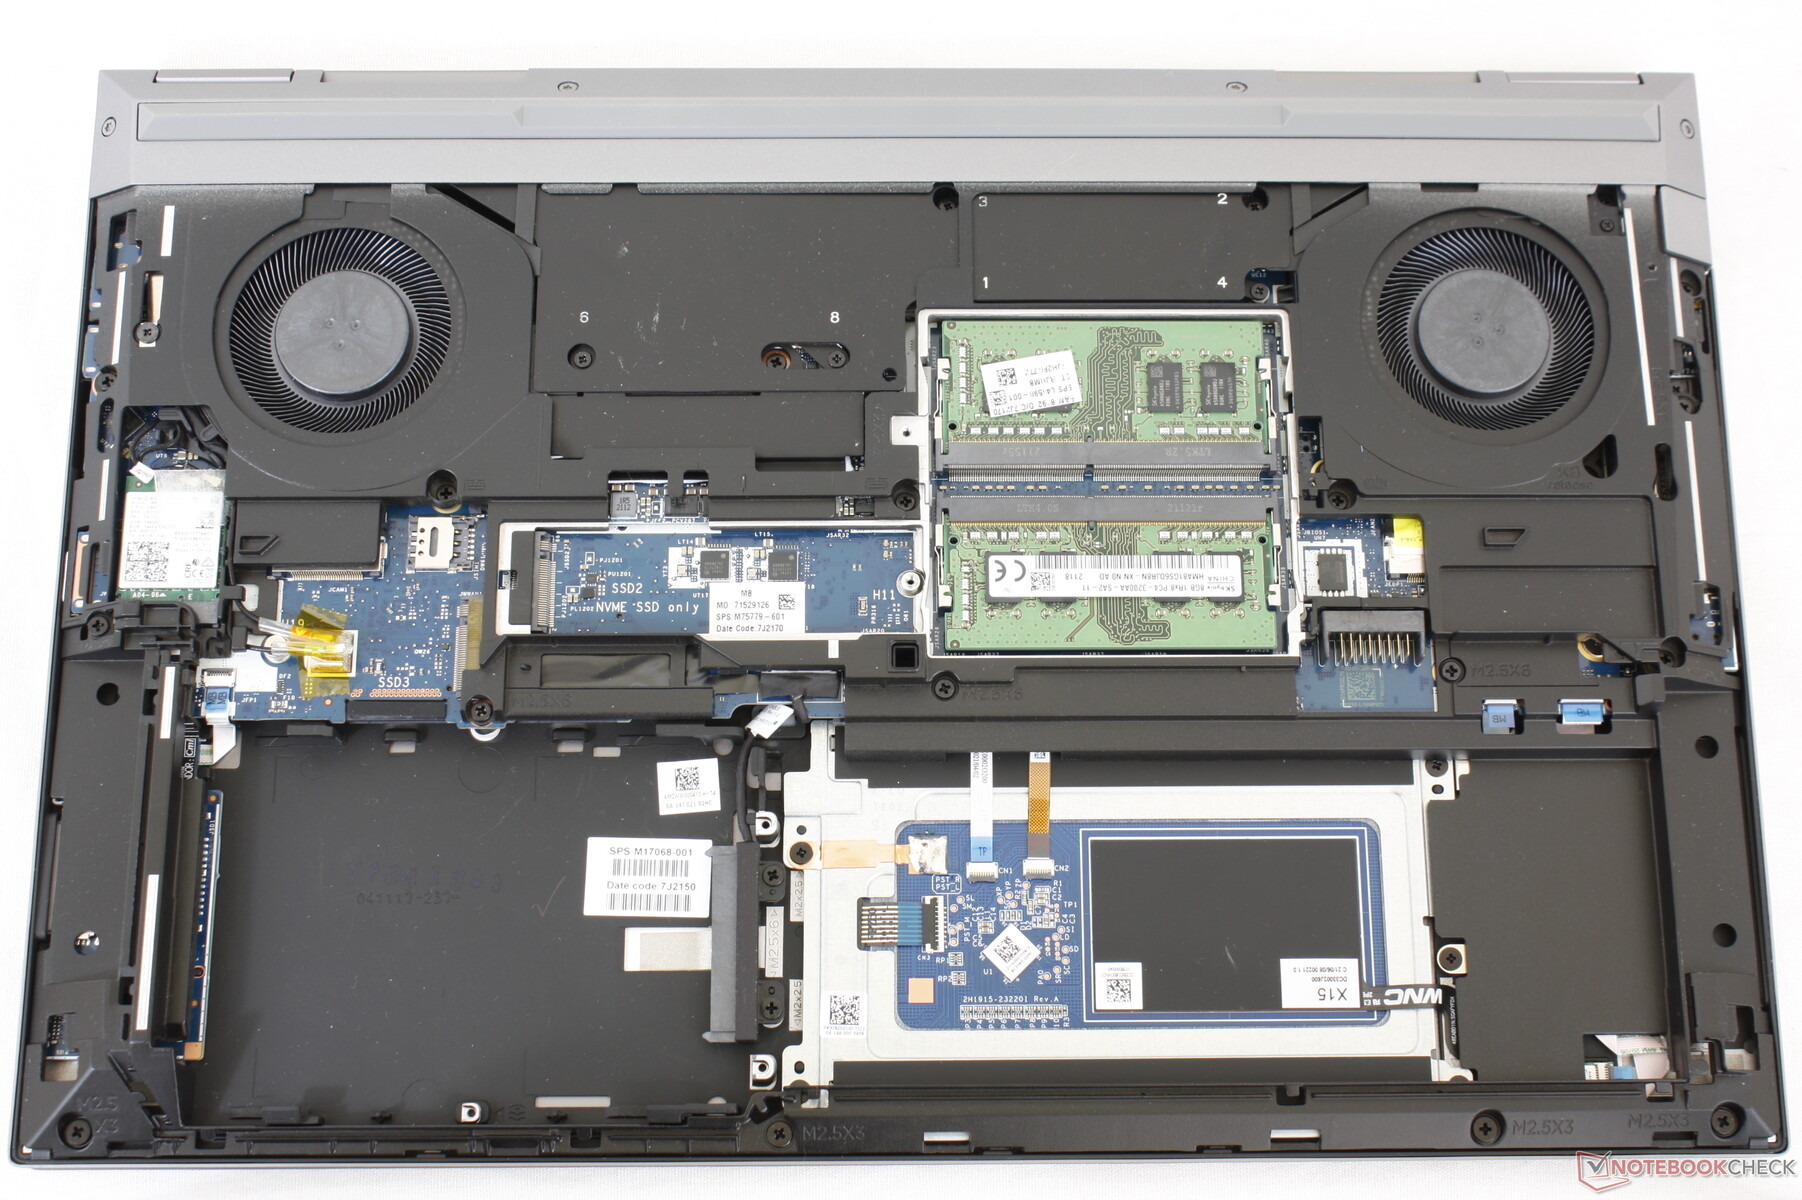
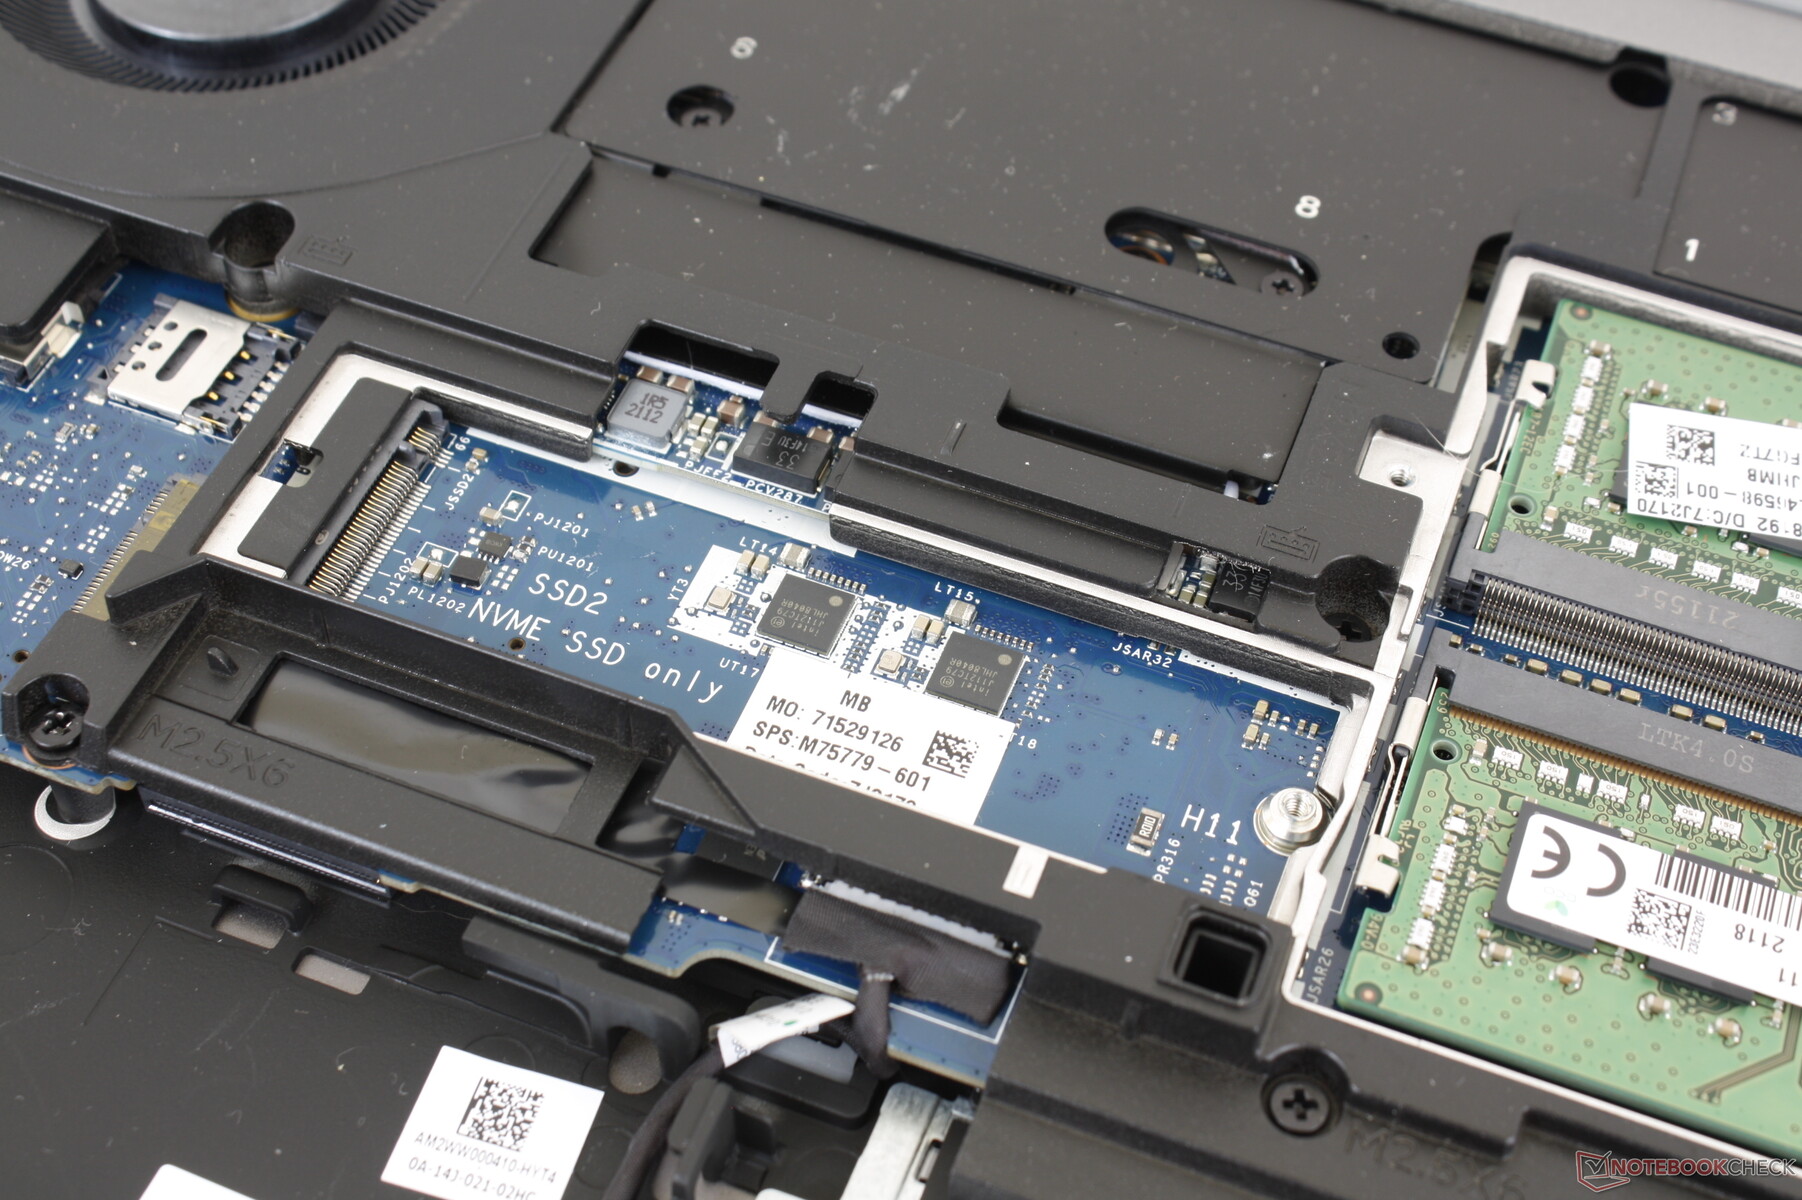
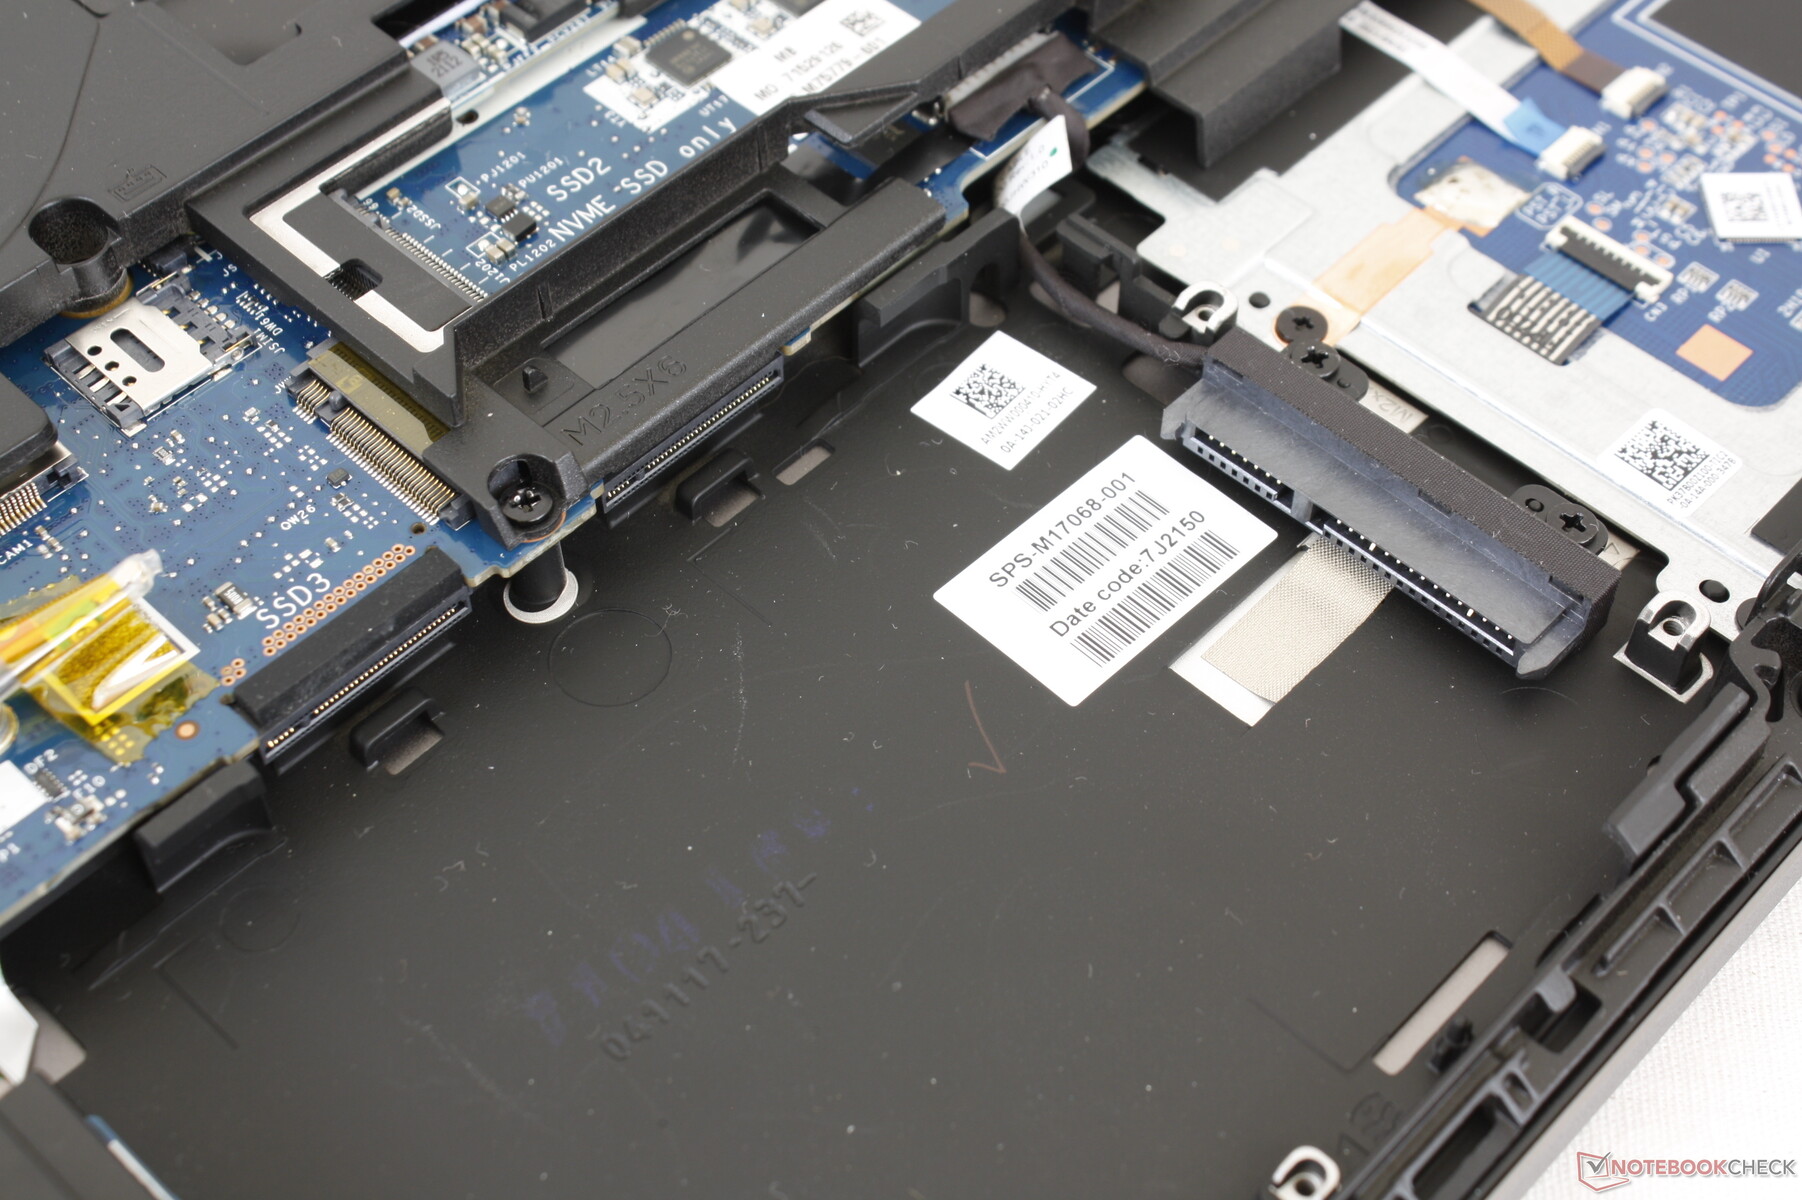
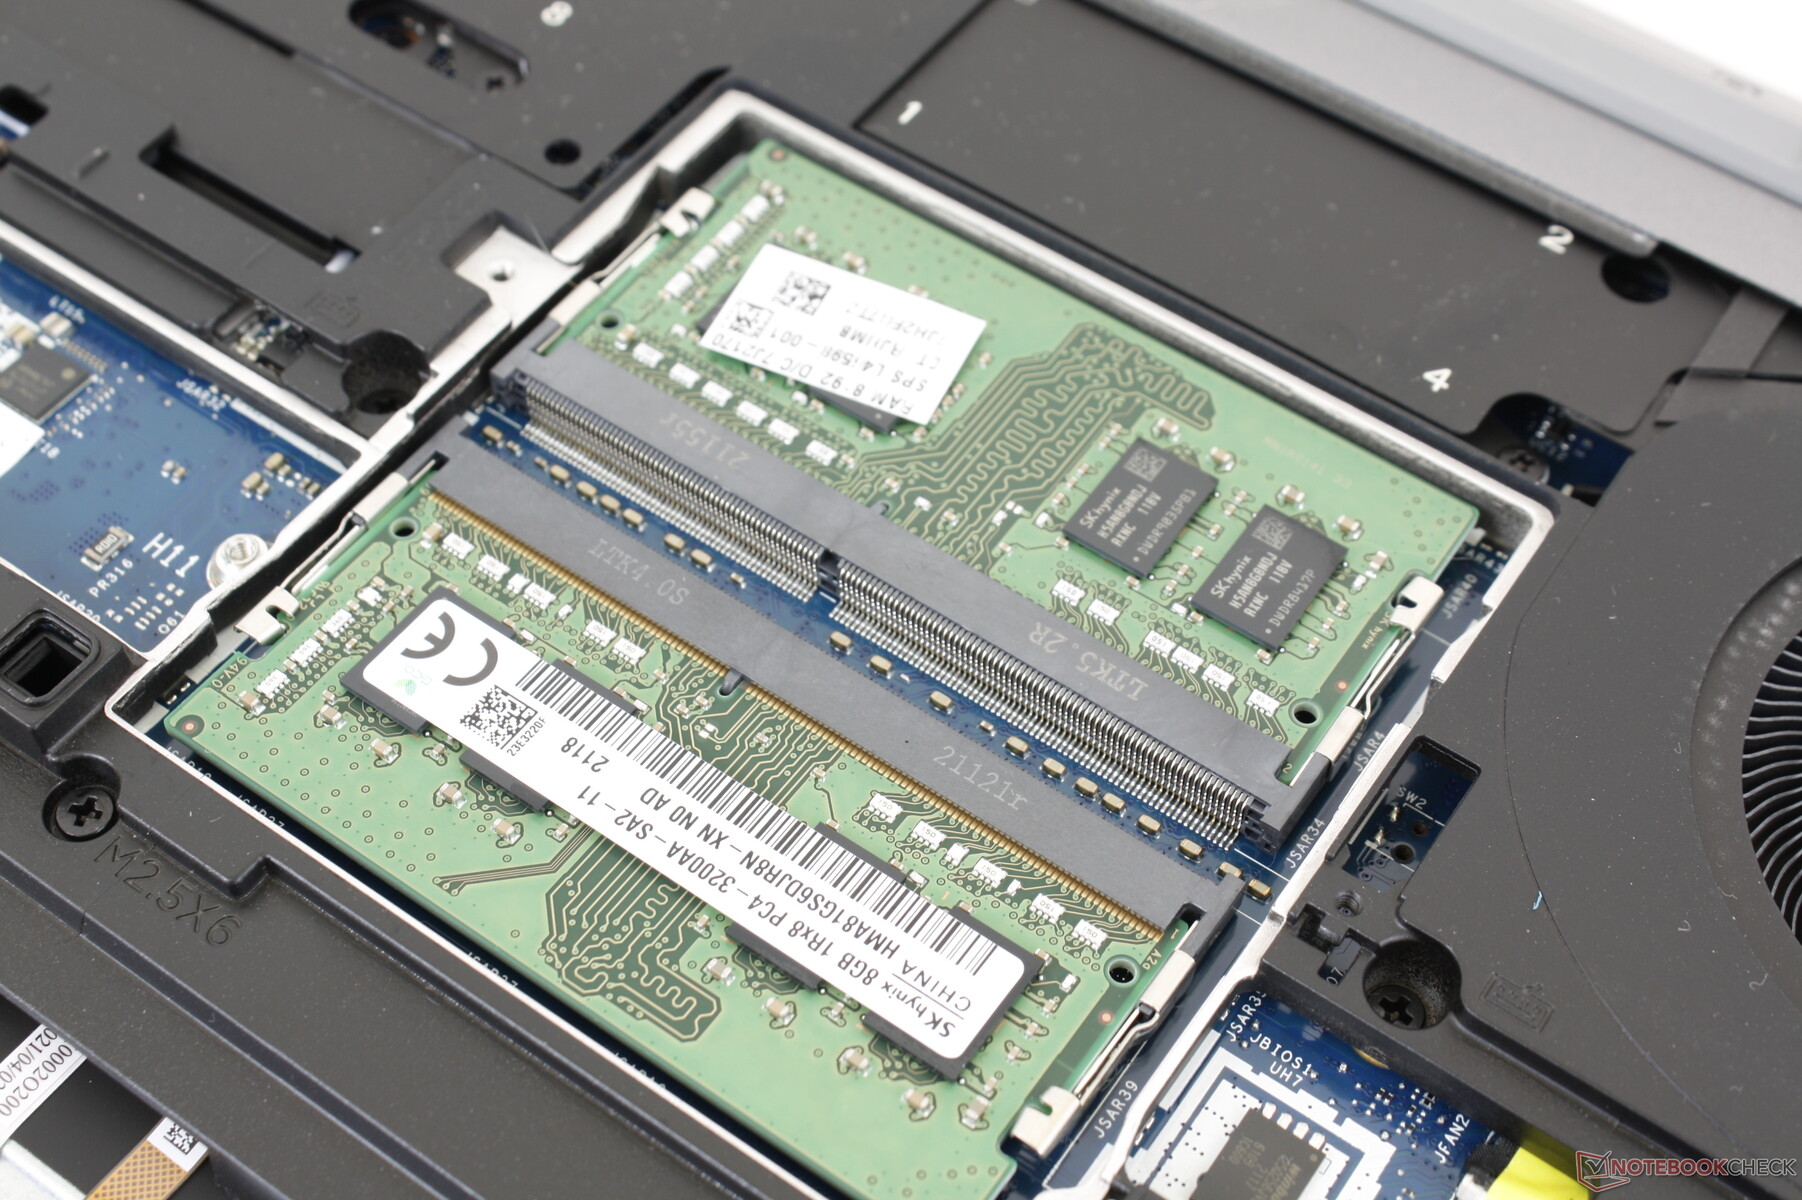
维护 - 准备好螺丝刀
底部面板很容易滑落--不需要工具或螺丝刀。然而,一旦进入内部,大多数组件都在金属板下面,需要用飞利浦螺丝刀来拆卸。额外的内存和存储组件在主板的另一侧,因此它们不那么容易接近。
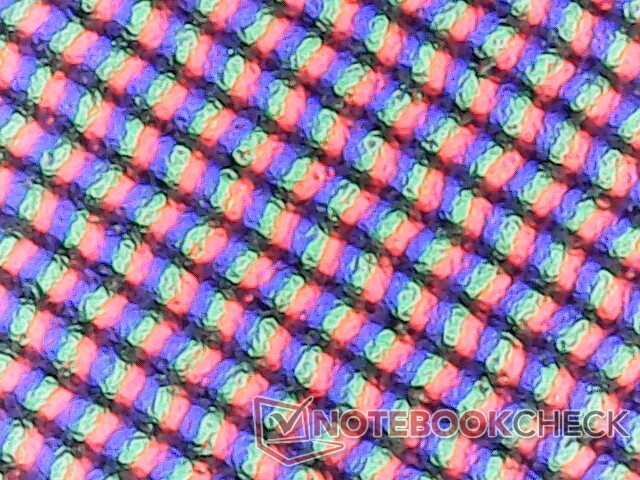
显示--120赫兹使一切变得不同
Fury 15 G8的新4K 120赫兹面板比Fury 15 G7的4K 60赫兹面板有了明显的改进,尽管具有相同的高原始分辨率和宽广的色彩覆盖。除了从60赫兹到120赫兹的明显好处外,较新的面板提供了快得多的黑白和灰度响应时间,几乎是4倍,特别是在处理快速移动的图形时,不容易出现明显的重影。亮度和对比度仍然很高,分别为~600:1和>1000:1。
也许4K面板最大的缺点是,由于哑光覆盖,它有一点颗粒感,所以尽管有很高的PPI,文本和图像看起来并不那么清晰。惠普提供了光面选项来克服这个具体的缺点。
| |||||||||||||||||||||||||
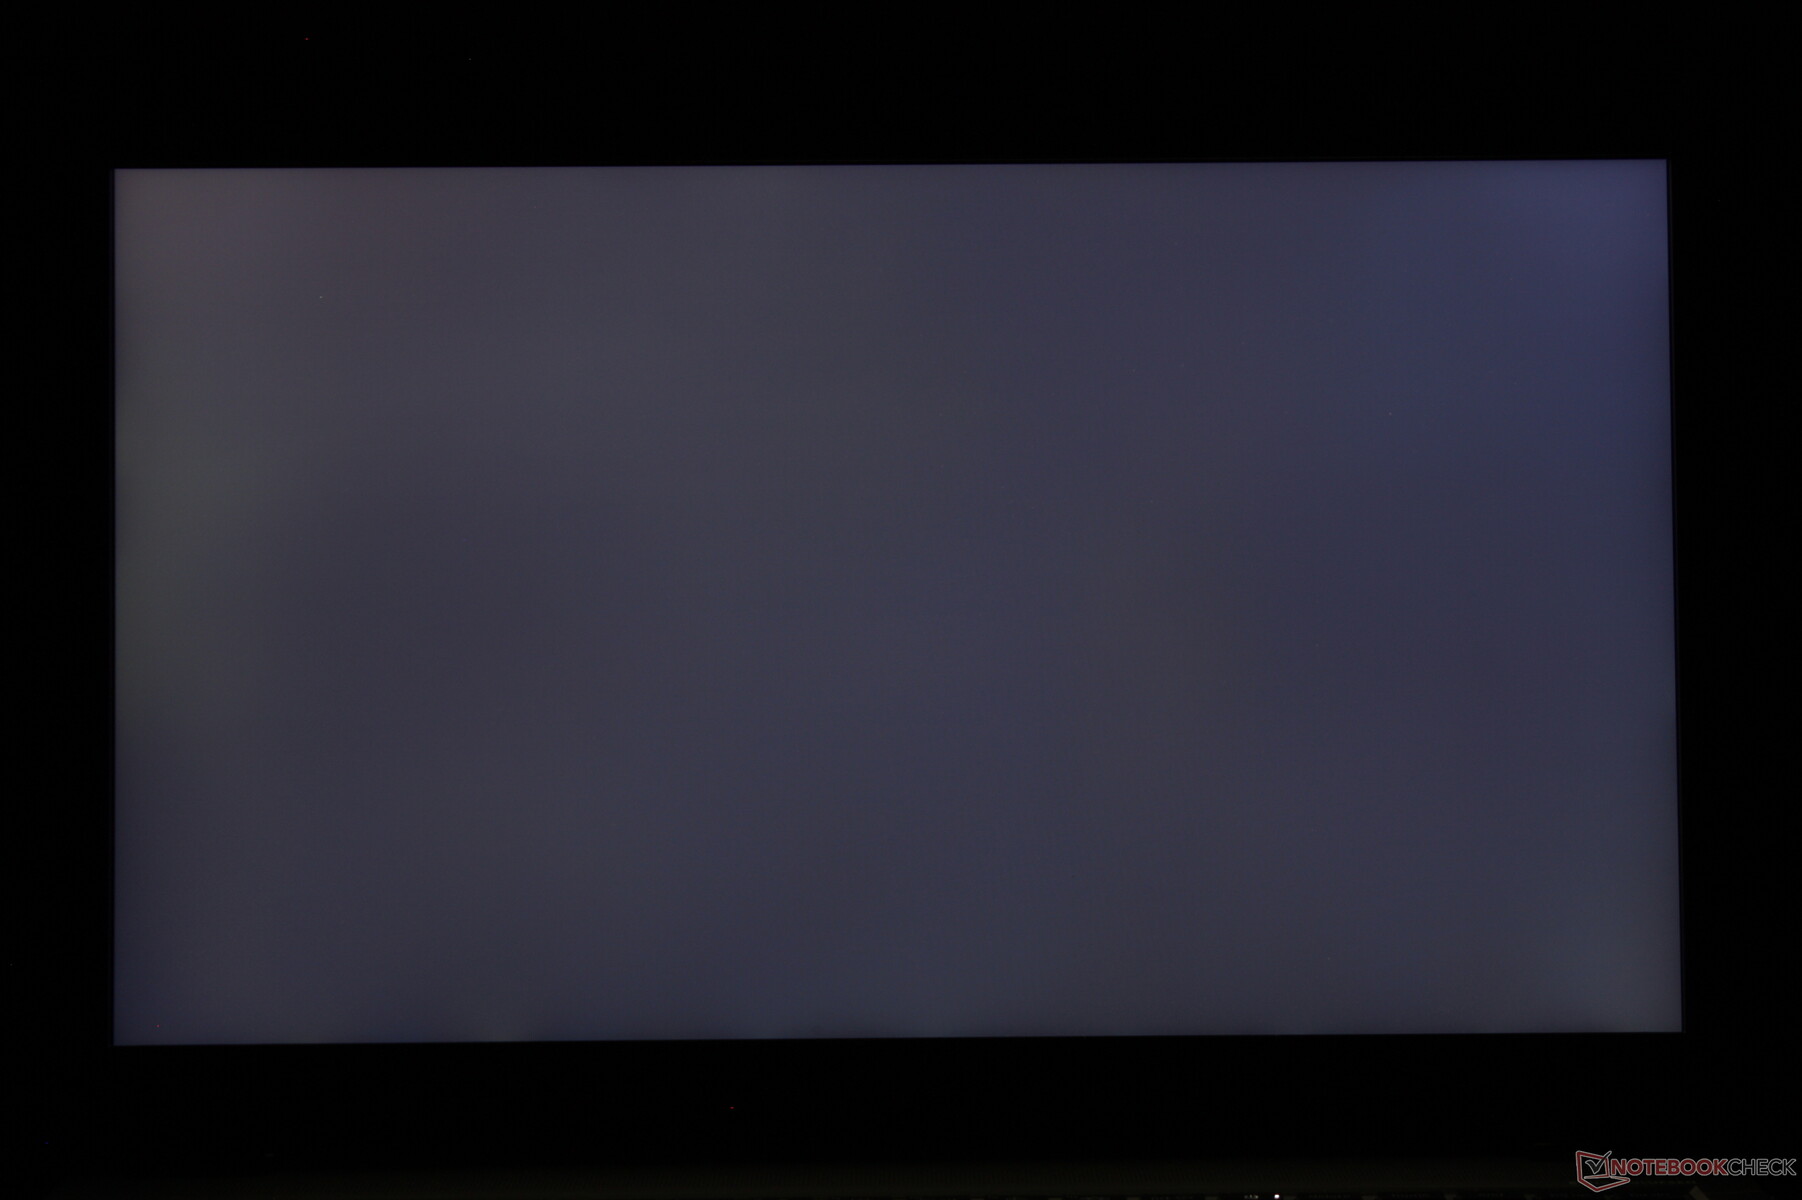
Brightness Distribution: 87 %
Center on Battery: 626 cd/m²
Contrast: 1079:1 (Black: 0.58 cd/m²)
ΔE ColorChecker Calman: 5.41 | ∀{0.5-29.43 Ø4.71}
calibrated: 0.6
ΔE Greyscale Calman: 6.2 | ∀{0.09-98 Ø4.96}
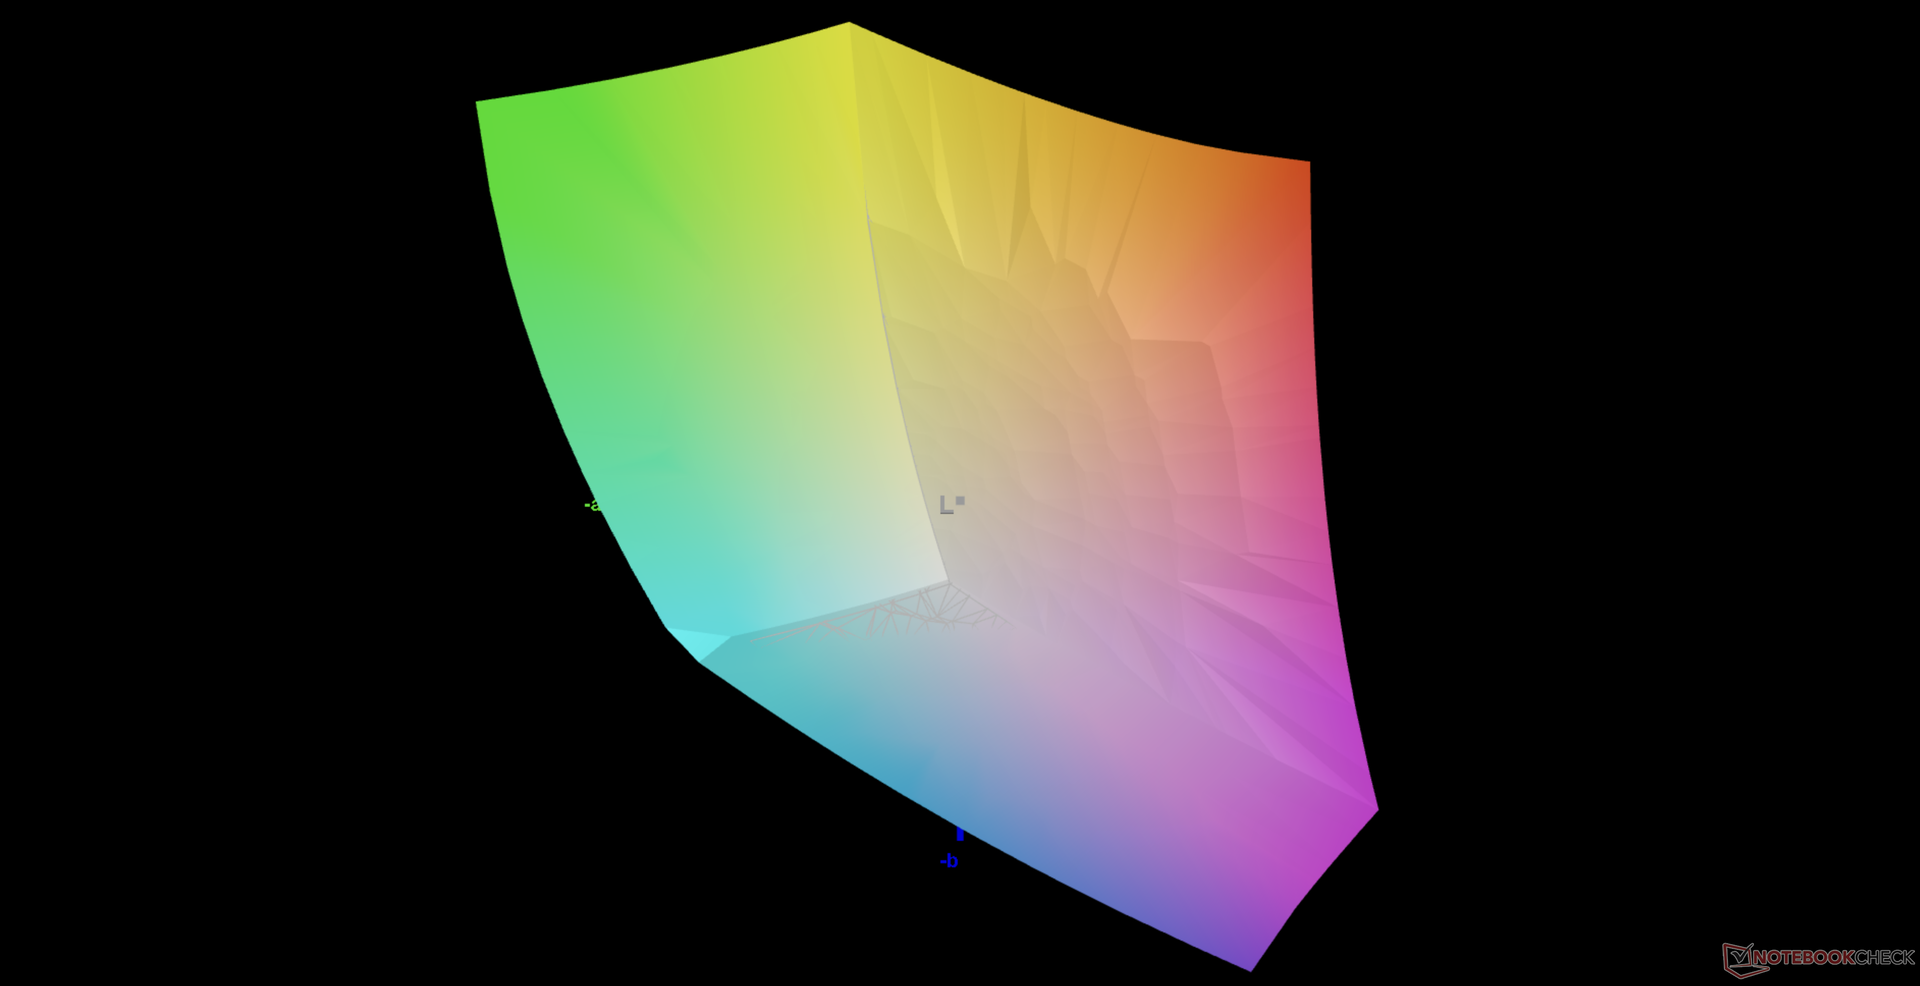
87.3% AdobeRGB 1998 (Argyll 3D)
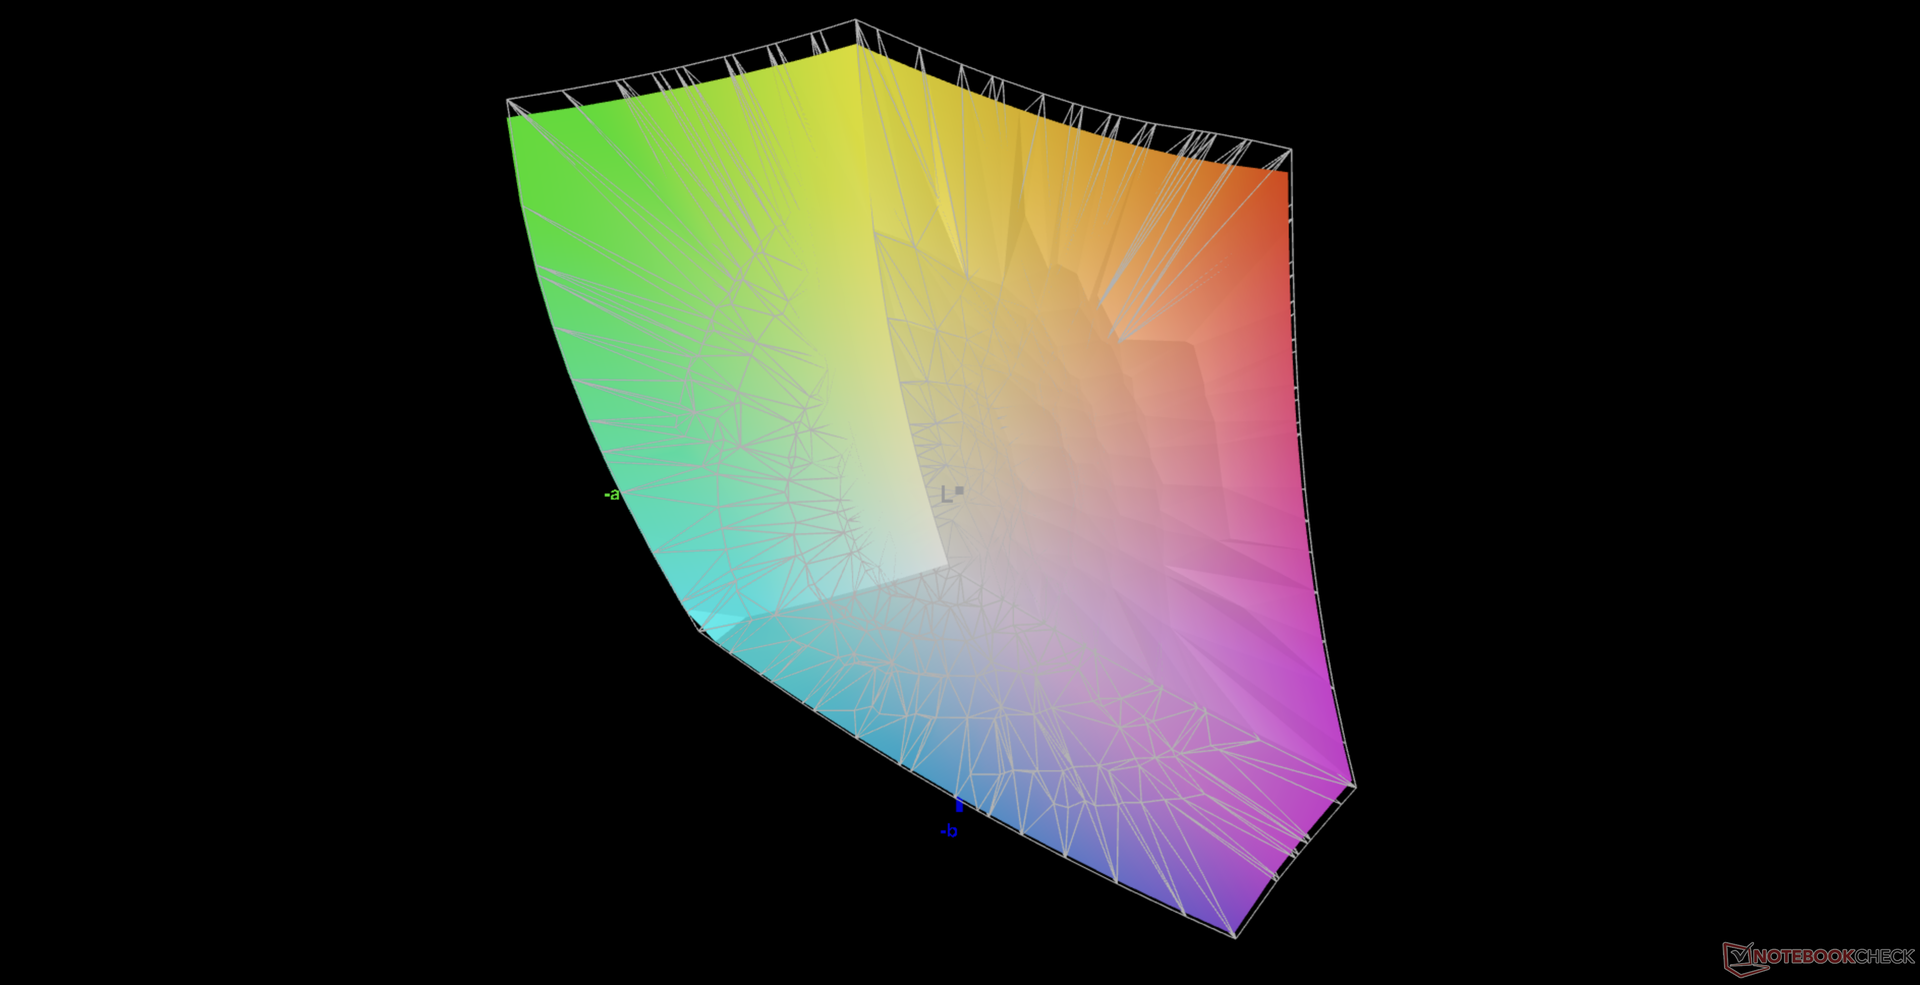
100% sRGB (Argyll 3D)
95.9% Display P3 (Argyll 3D)
Gamma: 2.66
CCT: 6101 K
| HP ZBook Fury 15 G8 BOE0969, IPS, 15.6", 3840x2160 | HP ZBook Fury 15 G7 LG Philips LGD0661, IPS, 15.6", 3840x2160 | Dell Precision 5000 5560 Sharp LQ156R1, IPS, 15.6", 3840x2400 | HP ZBook Studio 15 G8 SDC4145, OLED, 15.6", 3840x2160 | Lenovo ThinkPad P15s Gen2-20W6000GGE MNF601EA1-1, IPS LED, 15.6", 3840x2160 | HP ZBook Firefly 15 G7 LGD064F, IPS LED, 15.6", 3840x2160 | |
|---|---|---|---|---|---|---|
| Display | -1% | 5% | 4% | -0% | -17% | |
| Display P3 Coverage (%) | 95.9 | 95.6 0% | 94.9 -1% | 99.9 4% | 84.5 -12% | 68.8 -28% |
| sRGB Coverage (%) | 100 | 99.8 0% | 100 0% | 100 0% | 98.7 -1% | 97.7 -2% |
| AdobeRGB 1998 Coverage (%) | 87.3 | 84.5 -3% | 100 15% | 95.3 9% | 97.8 12% | 69.8 -20% |
| Response Times | -253% | -198% | 81% | -141% | -189% | |
| Response Time Grey 50% / Grey 80% * (ms) | 14.8 ? | 56 ? -278% | 47.2 ? -219% | 2.4 ? 84% | 40 ? -170% | 44 ? -197% |
| Response Time Black / White * (ms) | 11 ? | 36 ? -227% | 30.4 ? -176% | 2.4 ? 78% | 23.2 ? -111% | 30.8 ? -180% |
| PWM Frequency (Hz) | 240.4 ? | |||||
| Screen | -29% | 7% | -58% | 35% | 5% | |
| Brightness middle (cd/m²) | 626 | 672.8 7% | 501.5 -20% | 379.6 -39% | 604 -4% | 381 -39% |
| Brightness (cd/m²) | 589 | 674 14% | 467 -21% | 380 -35% | 609 3% | 382 -35% |
| Brightness Distribution (%) | 87 | 89 2% | 83 -5% | 95 9% | 91 5% | 92 6% |
| Black Level * (cd/m²) | 0.58 | 0.5 14% | 0.44 24% | 0.34 41% | 0.21 64% | |
| Contrast (:1) | 1079 | 1346 25% | 1140 6% | 1776 65% | 1814 68% | |
| Colorchecker dE 2000 * | 5.41 | 3.48 36% | 4.73 13% | 5.15 5% | 0.9 83% | 3 45% |
| Colorchecker dE 2000 max. * | 9.05 | 9.44 -4% | 8.45 7% | 7.79 14% | 2.6 71% | 5.2 43% |
| Colorchecker dE 2000 calibrated * | 0.6 | 3.03 -405% | 0.51 15% | 3.1 -417% | 0.8 -33% | 1.5 -150% |
| Greyscale dE 2000 * | 6.2 | 3.1 50% | 3.6 42% | 2.6 58% | 1.1 82% | 3.5 44% |
| Gamma | 2.66 83% | 2.04 108% | 2.08 106% | 1.99 111% | 2.15 102% | 2.26 97% |
| CCT | 6101 107% | 6380 102% | 6447 101% | 6166 105% | 6656 98% | 7254 90% |
| Color Space (Percent of AdobeRGB 1998) (%) | 75.2 | 84.5 | 64.3 | |||
| Color Space (Percent of sRGB) (%) | 100 | 98.6 | 97.5 | |||
| Total Average (Program / Settings) | -94% /
-55% | -62% /
-23% | 9% /
-19% | -35% /
2% | -67% /
-27% |
* ... smaller is better
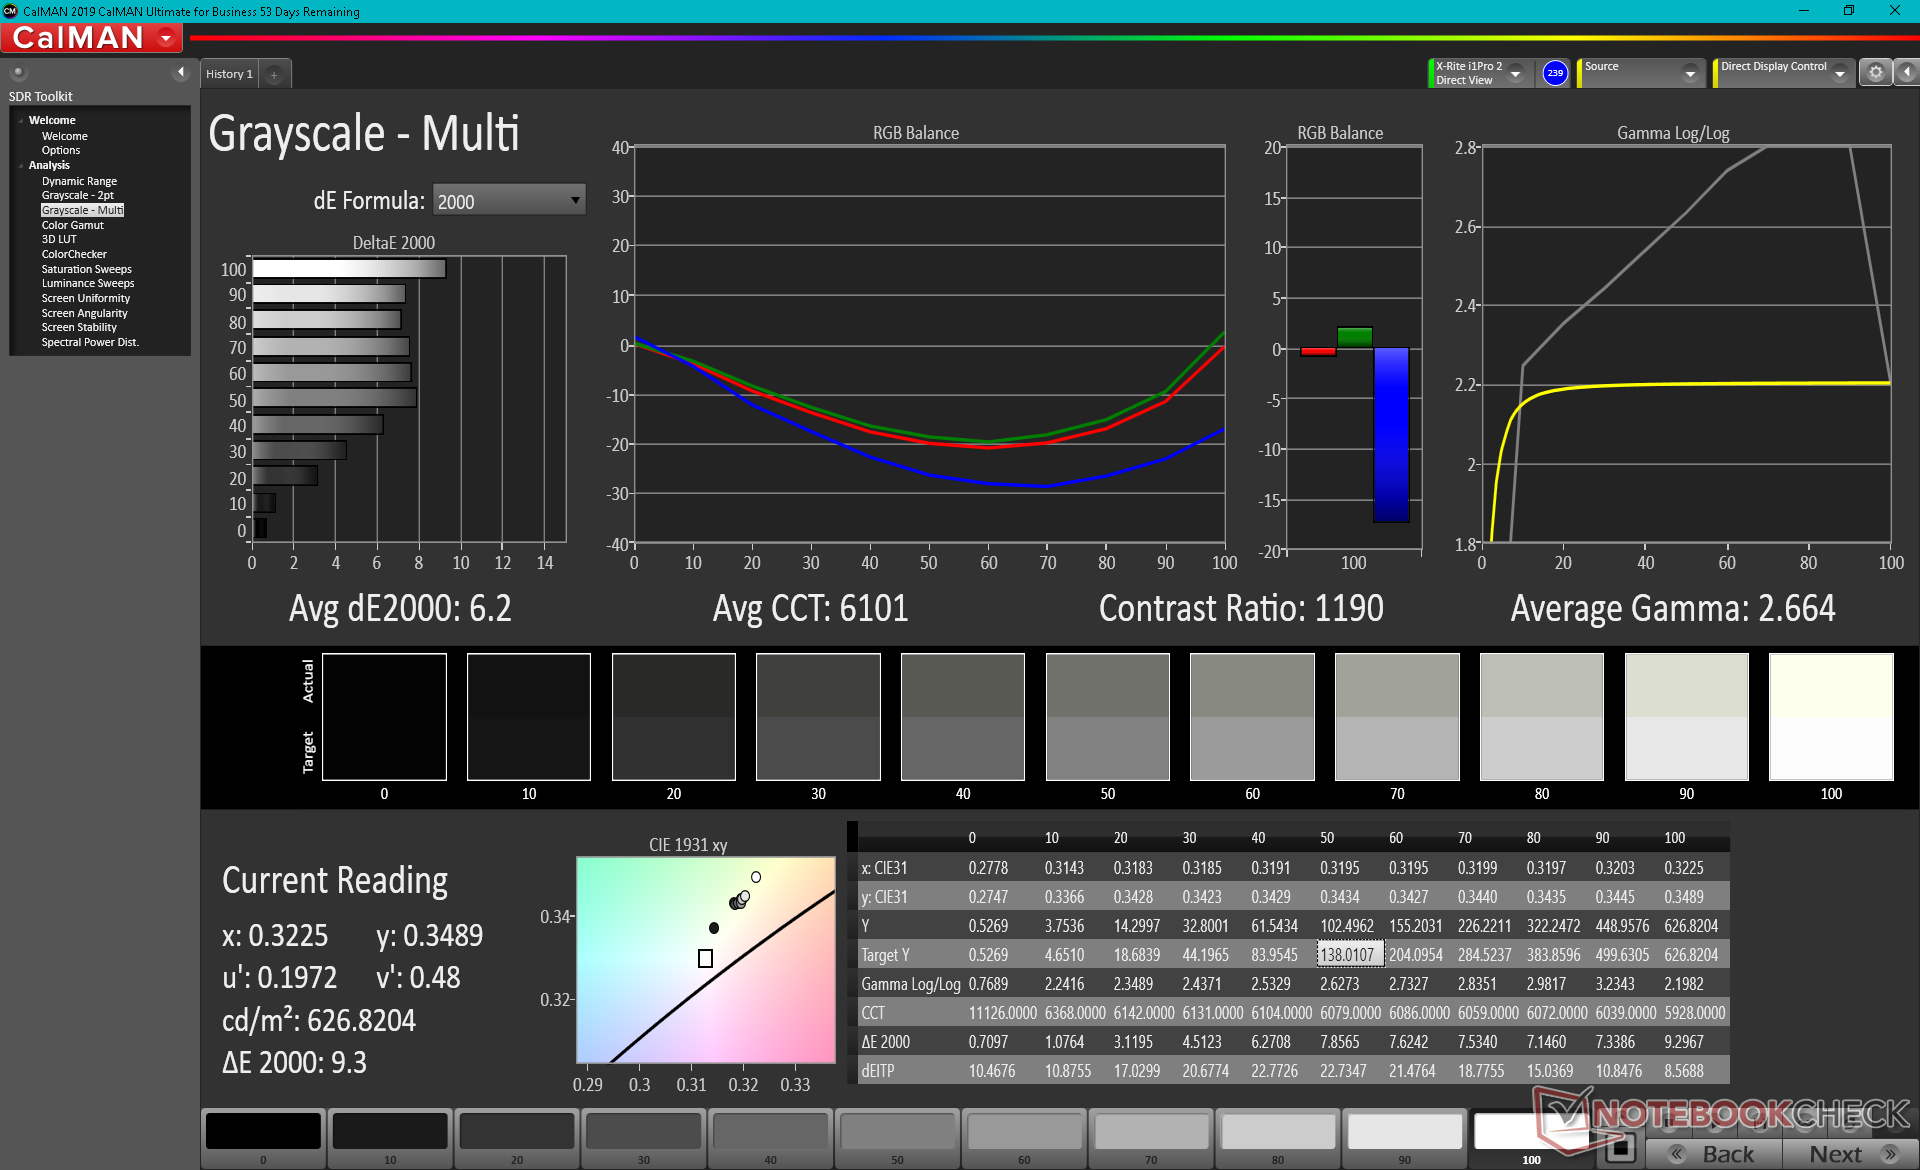
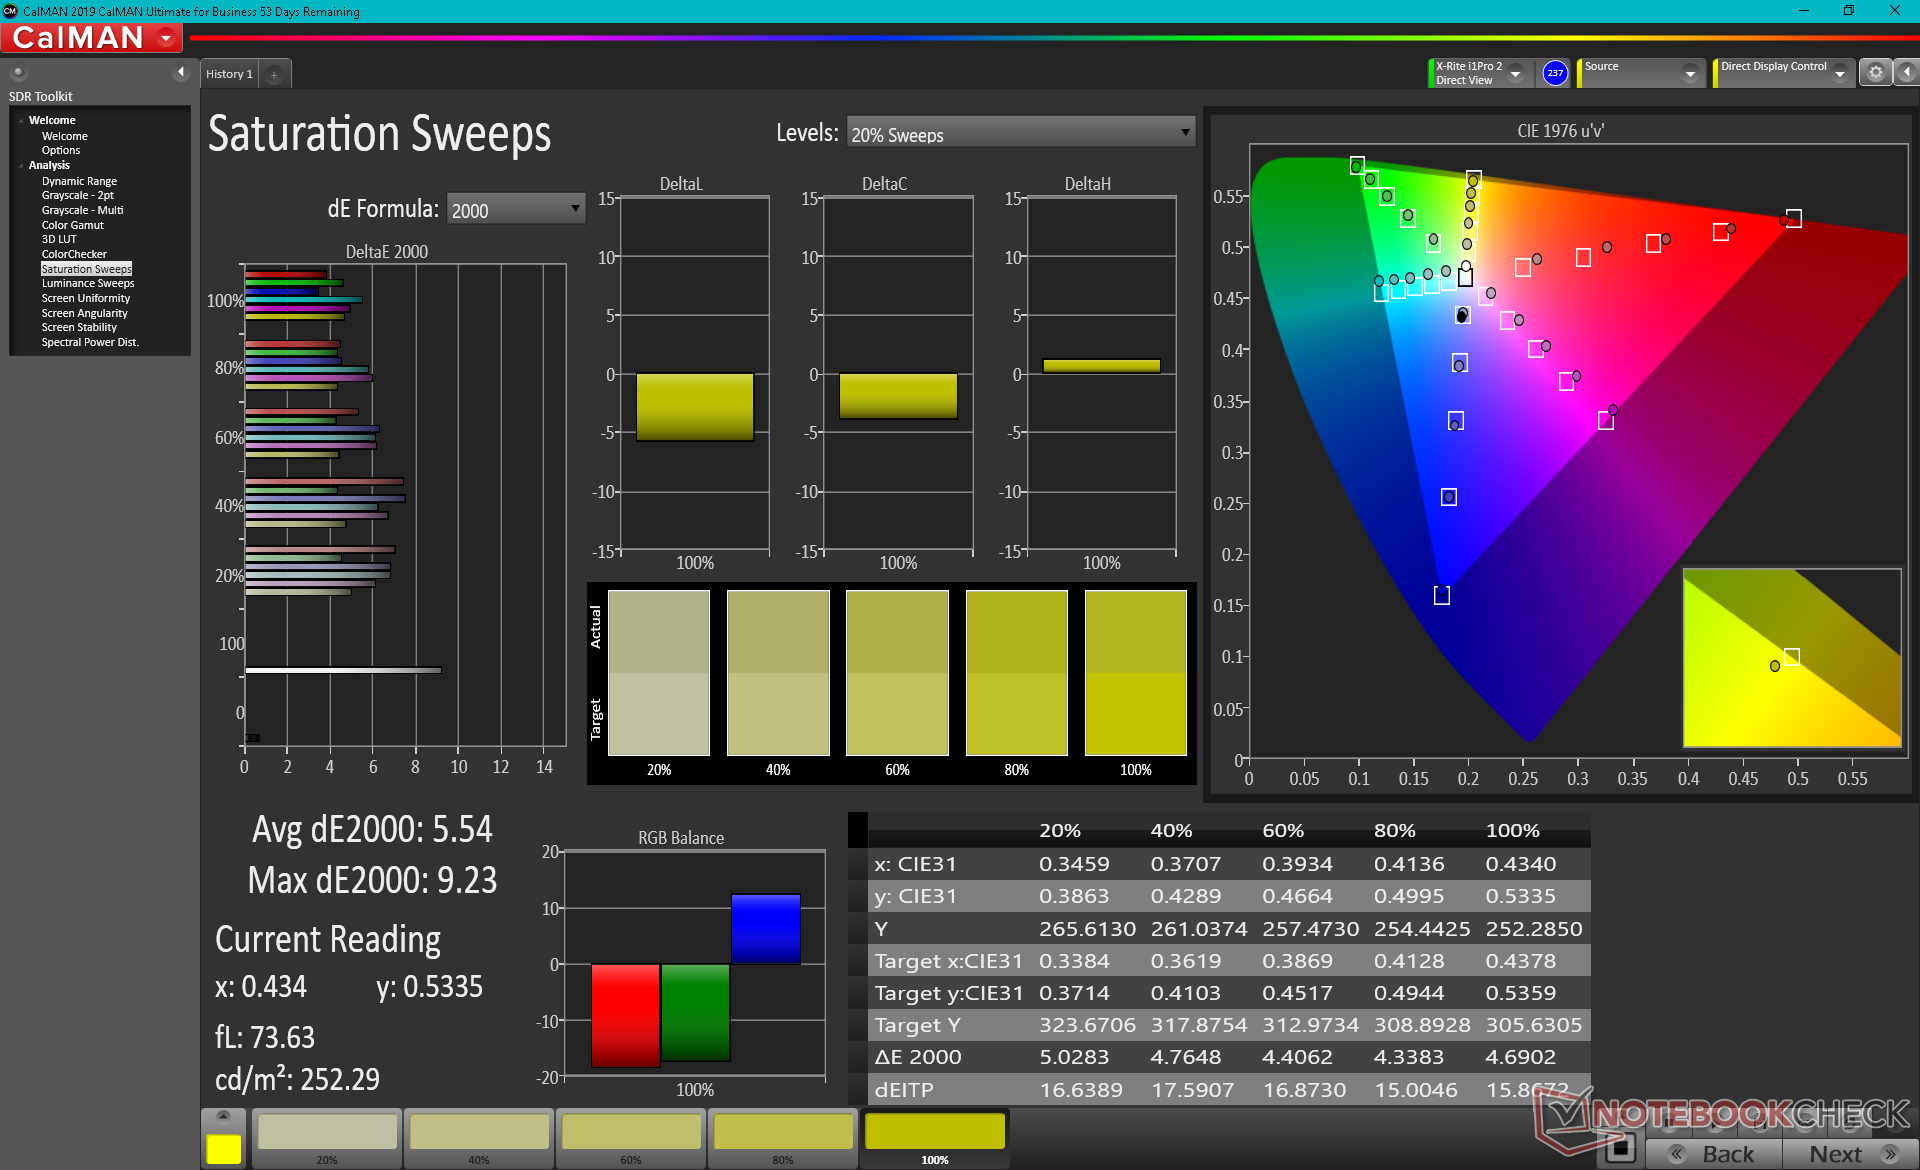
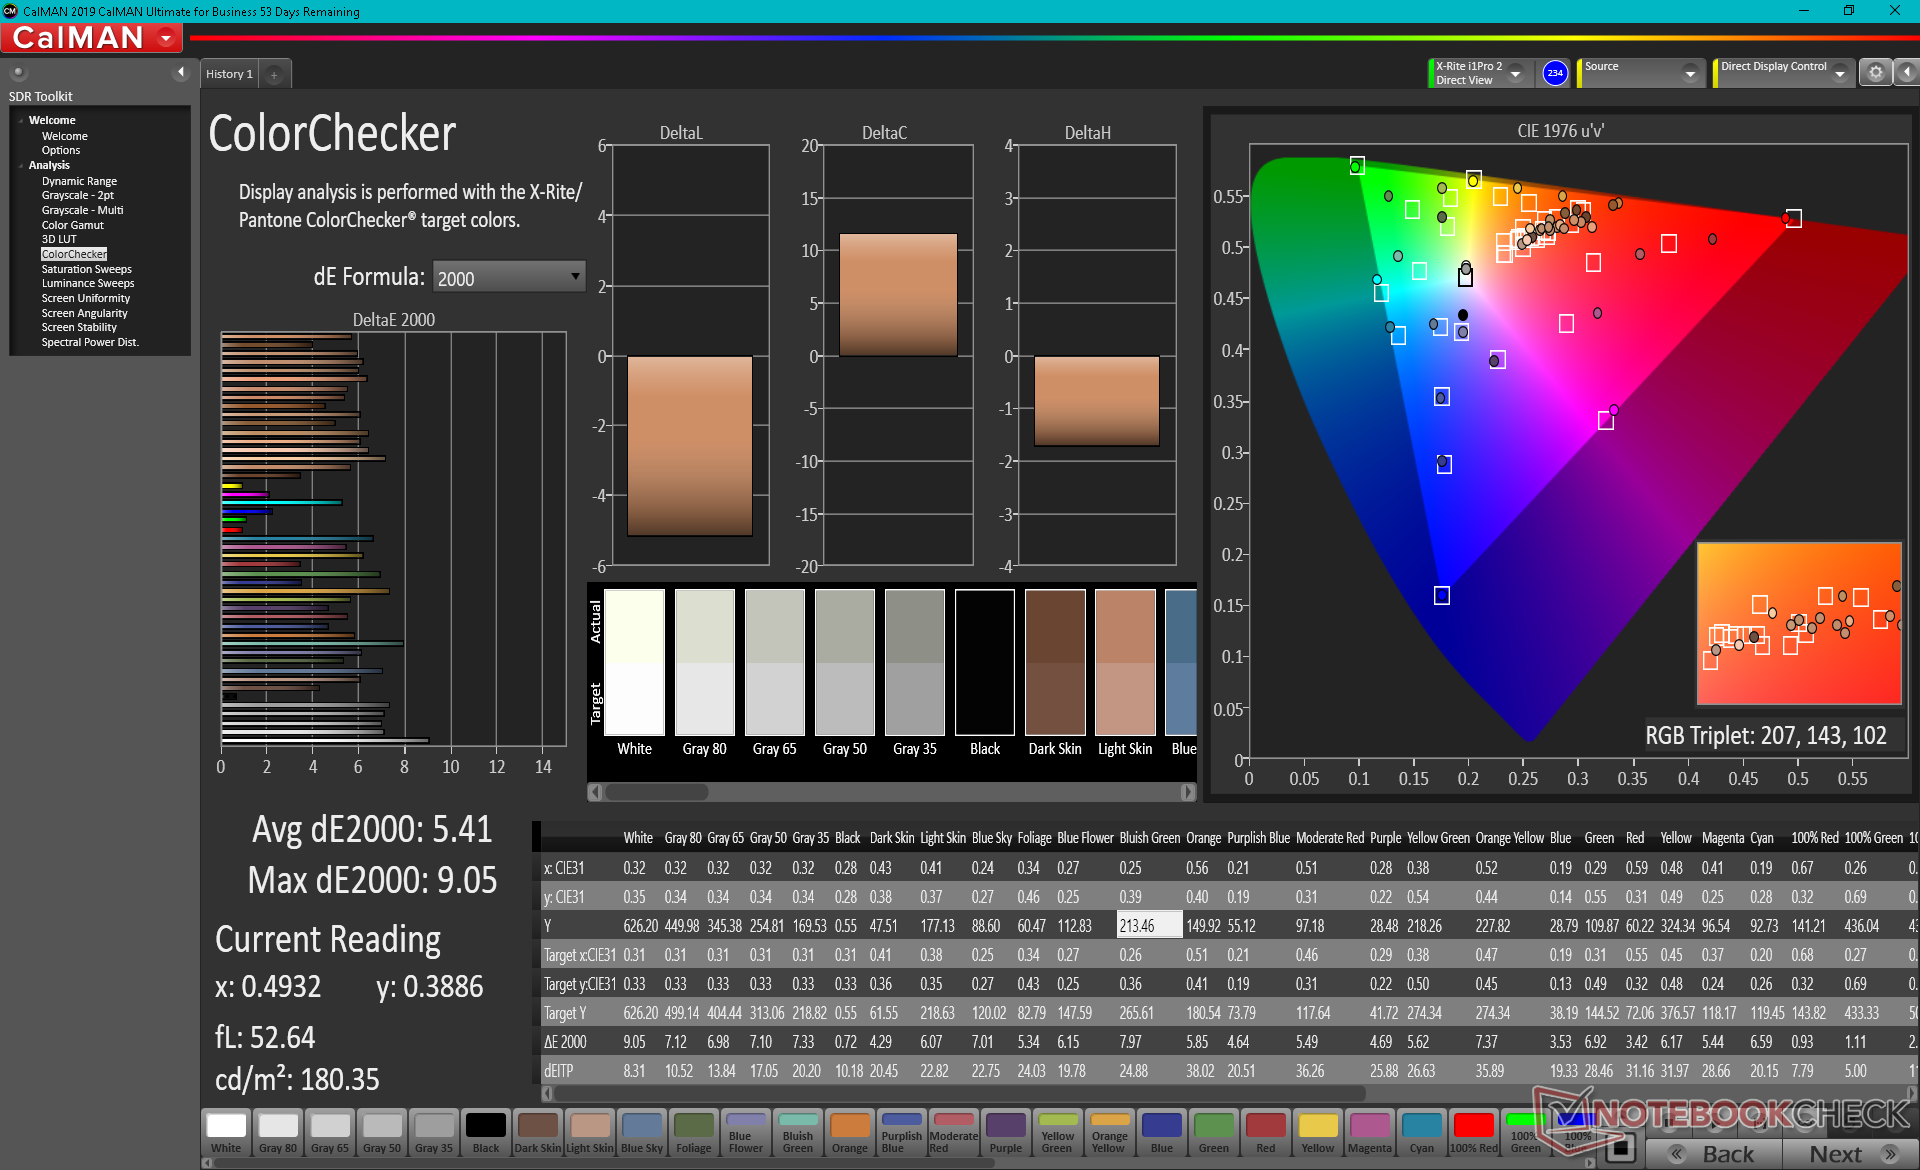
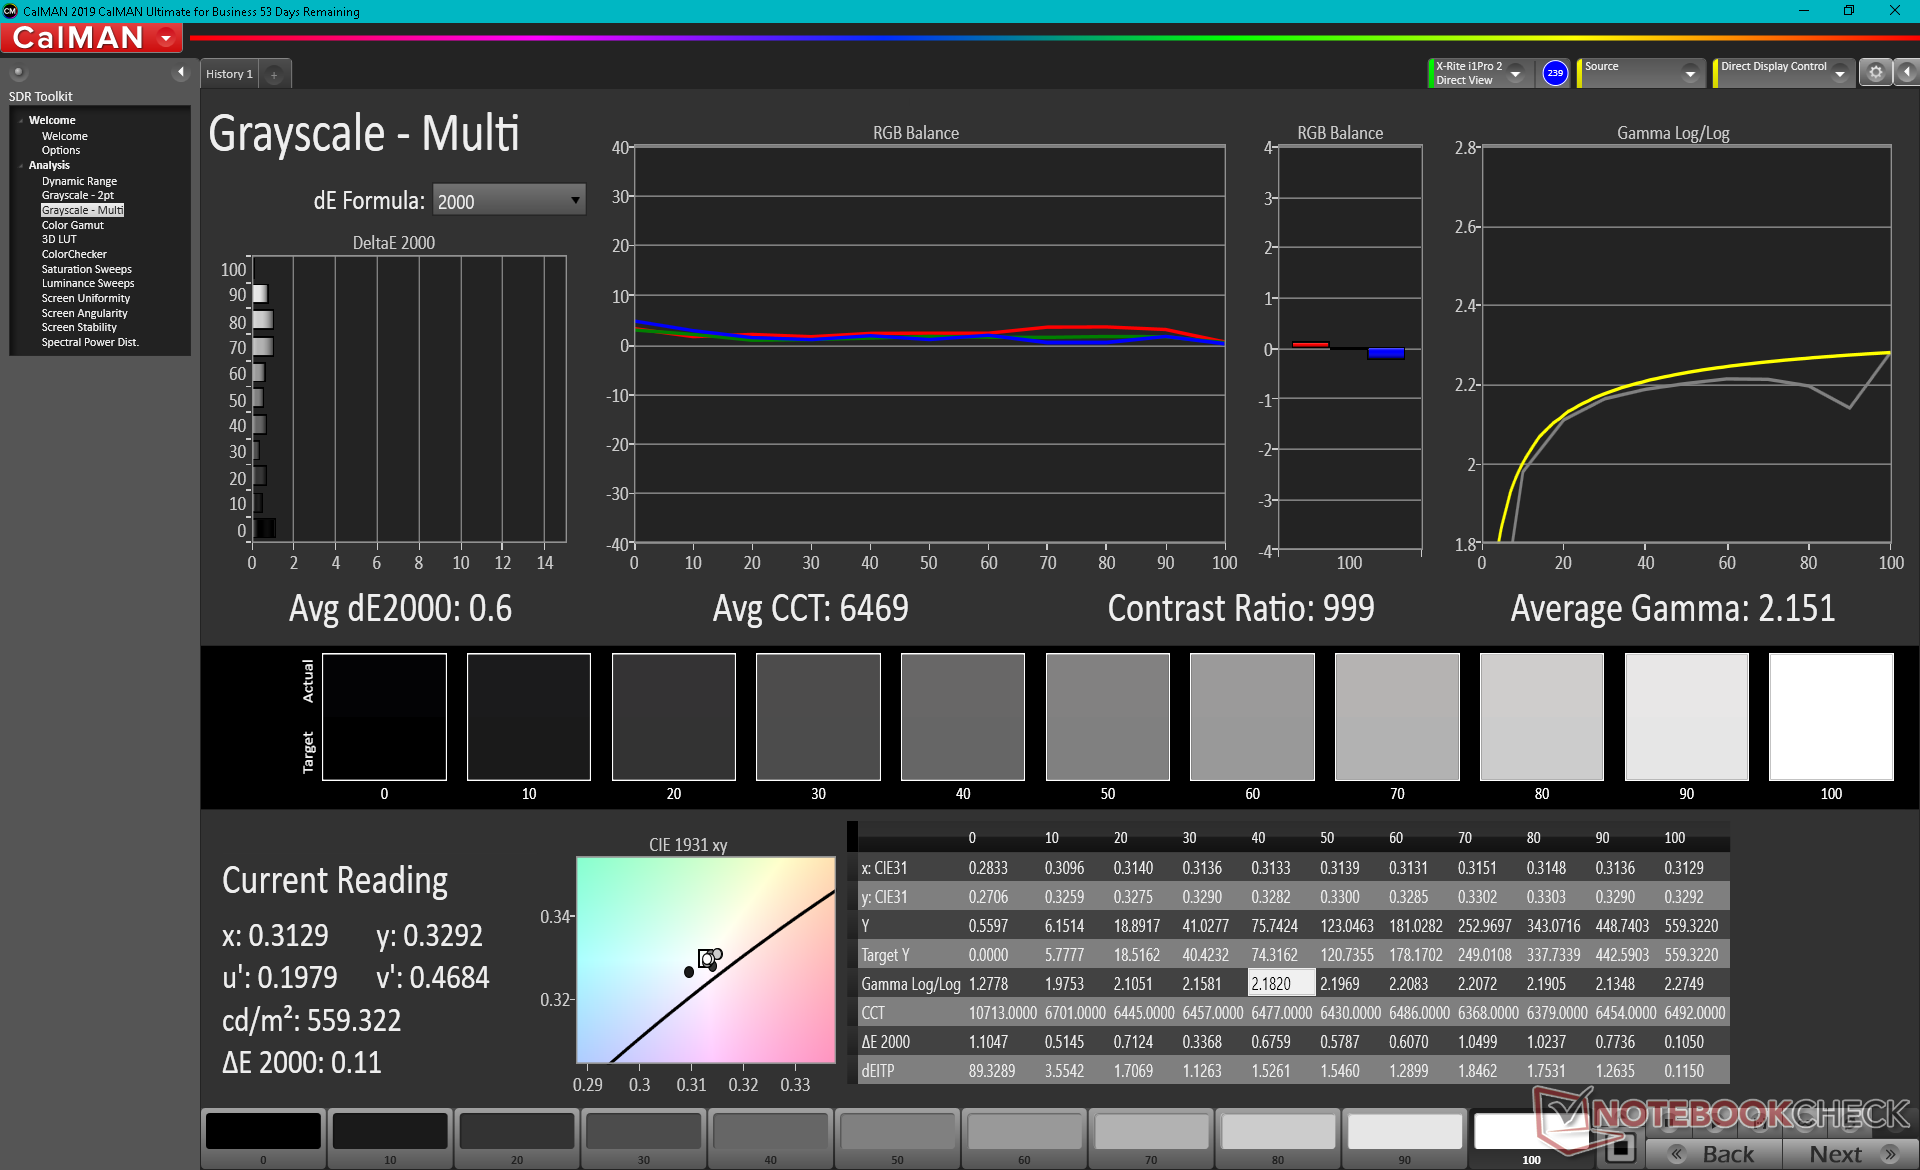
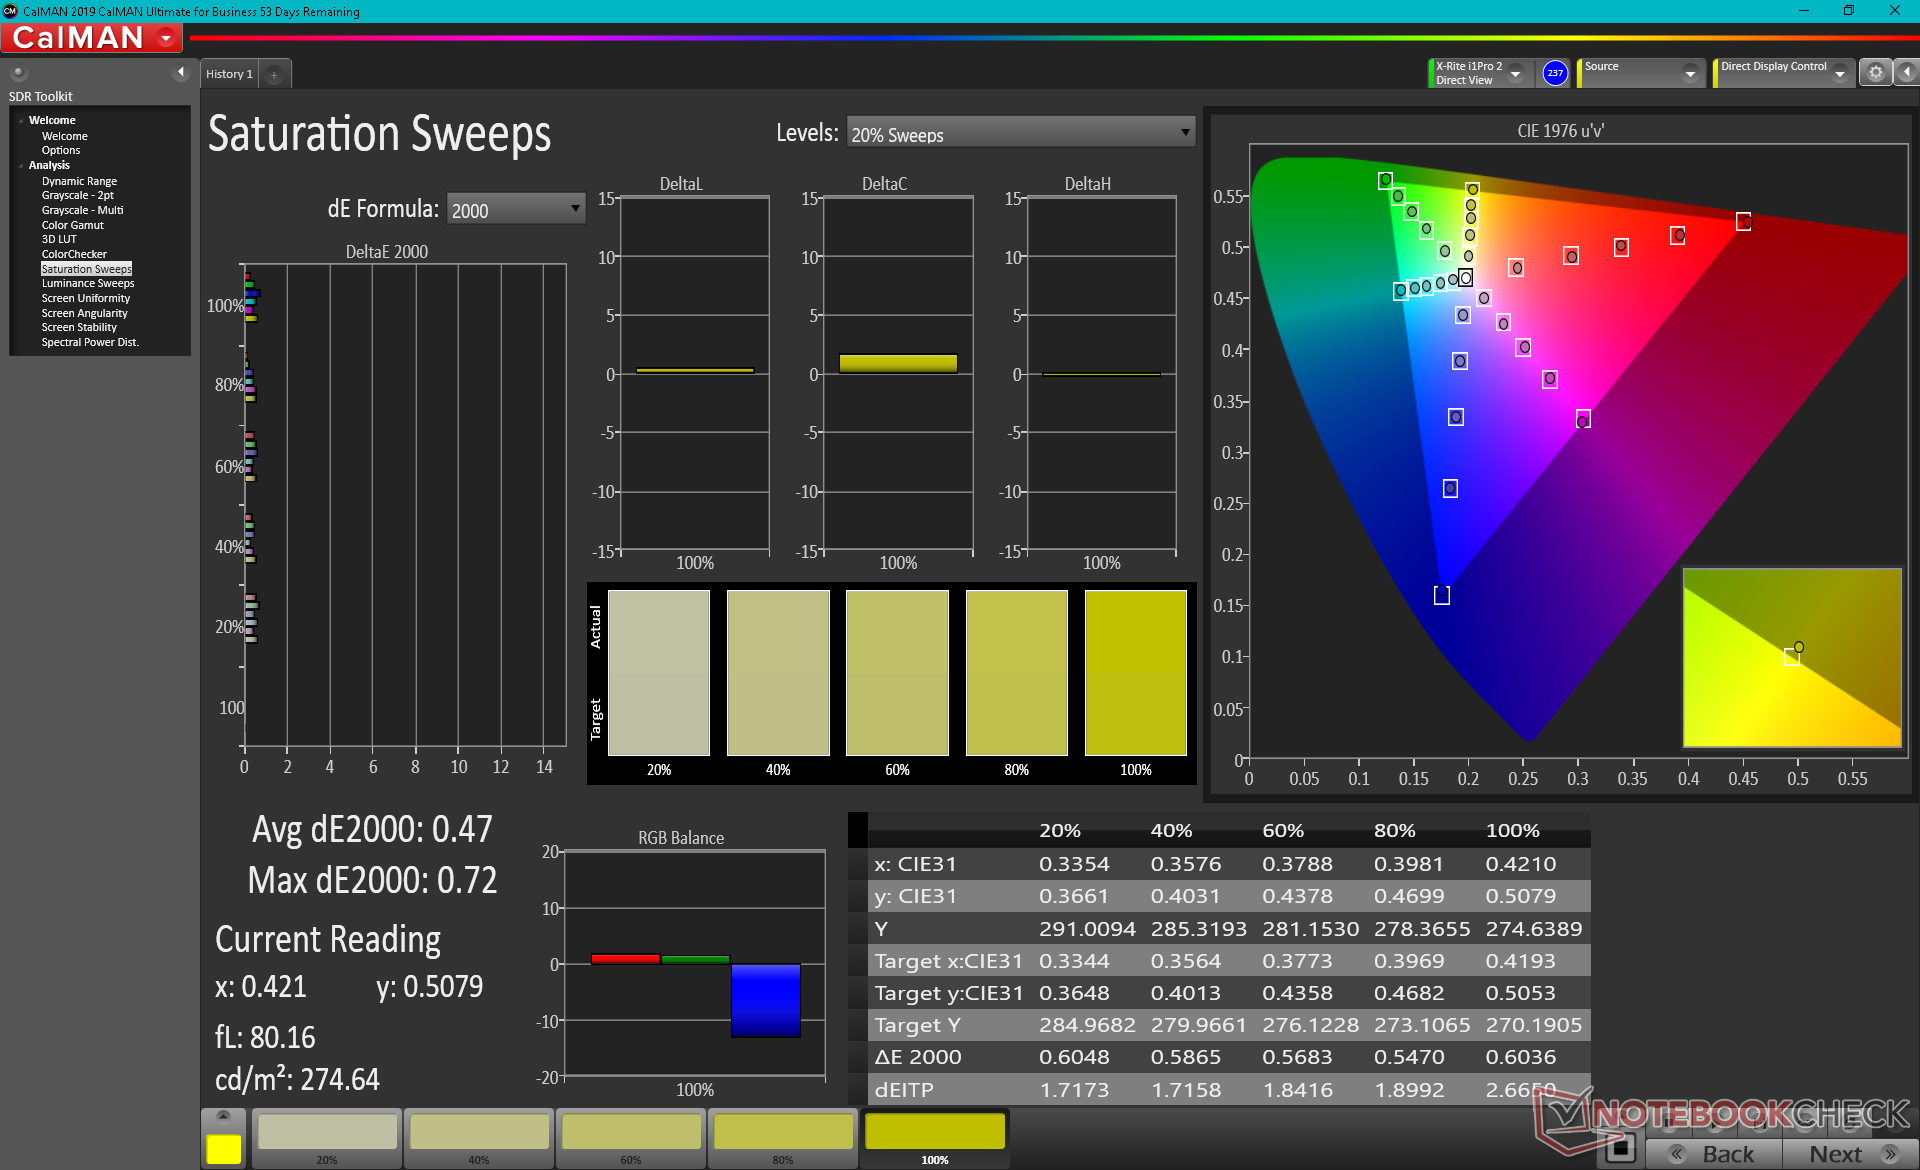
我们的X-Rite色度计显示,DCI-P3覆盖率为96%,而惠普声称的覆盖率为100%。将宽广的色彩与极快的响应时间结合起来,你就有了一个4K面板,它在专业图形编辑和游戏应用方面都非常好。
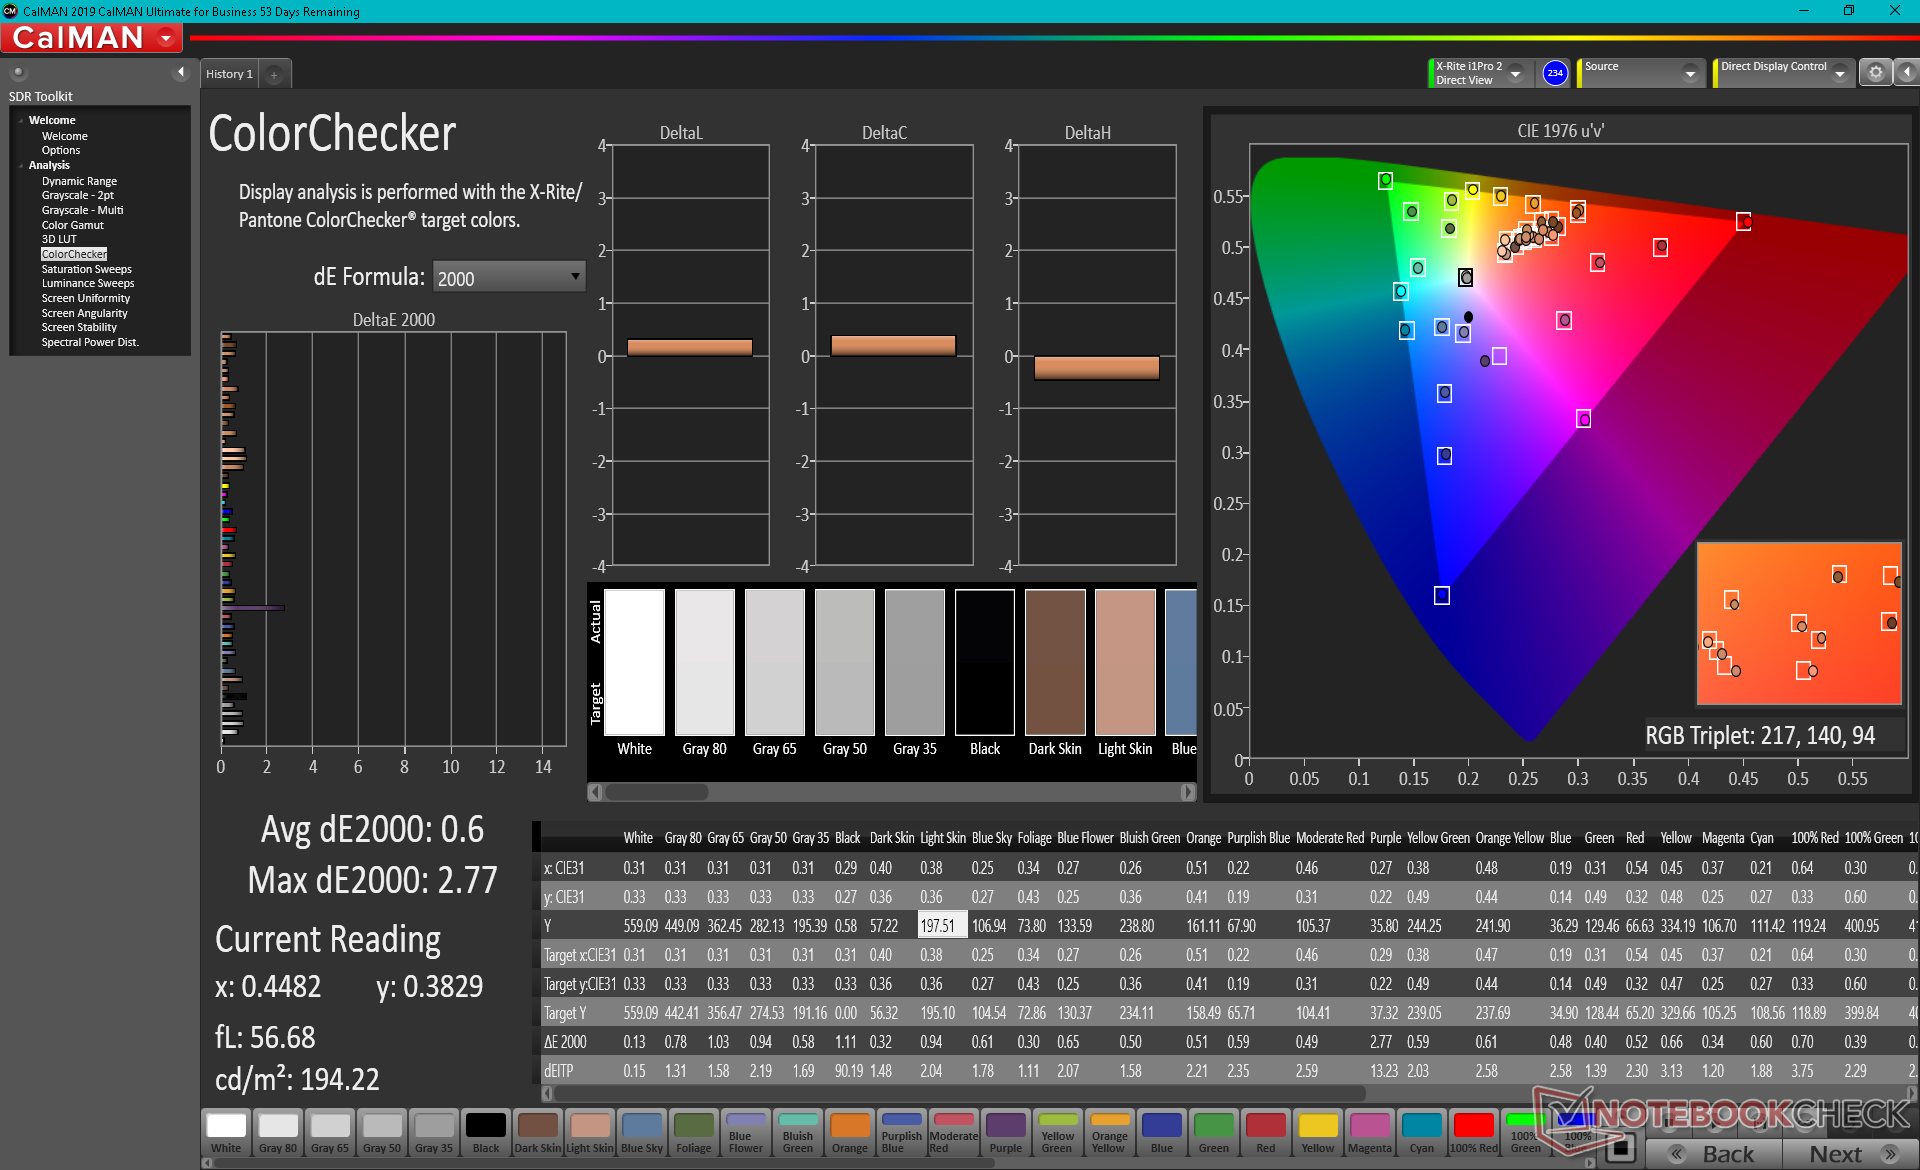
该显示器可以根据DCI-P3标准进行更好的开箱校准。开箱后的平均灰度和色彩deltaE值分别为6.2和5.41,色温为6100,过于偏暖。用X-Rite色度计自行校准面板可以解决这些缺点。
Display Response Times
| ↔ Response Time Black to White | ||
|---|---|---|
| 11 ms ... rise ↗ and fall ↘ combined | ↗ 7.6 ms rise | 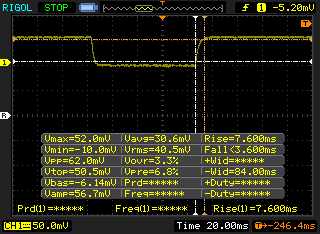 |
| ↘ 3.4 ms fall | ||
| The screen shows good response rates in our tests, but may be too slow for competitive gamers. In comparison, all tested devices range from 0.1 (minimum) to 240 (maximum) ms. » 30 % of all devices are better. This means that the measured response time is better than the average of all tested devices (19.8 ms). | ||
| ↔ Response Time 50% Grey to 80% Grey | ||
| 14.8 ms ... rise ↗ and fall ↘ combined | ↗ 7.6 ms rise | 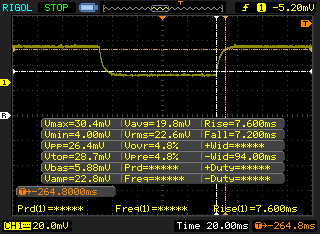 |
| ↘ 7.2 ms fall | ||
| The screen shows good response rates in our tests, but may be too slow for competitive gamers. In comparison, all tested devices range from 0.165 (minimum) to 636 (maximum) ms. » 29 % of all devices are better. This means that the measured response time is better than the average of all tested devices (31 ms). | ||
Screen Flickering / PWM (Pulse-Width Modulation)
| Screen flickering / PWM not detected | 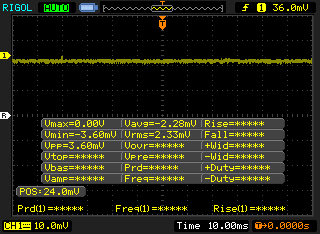 | ||
In comparison: 52 % of all tested devices do not use PWM to dim the display. If PWM was detected, an average of 7757 (minimum: 5 - maximum: 343500) Hz was measured. | |||
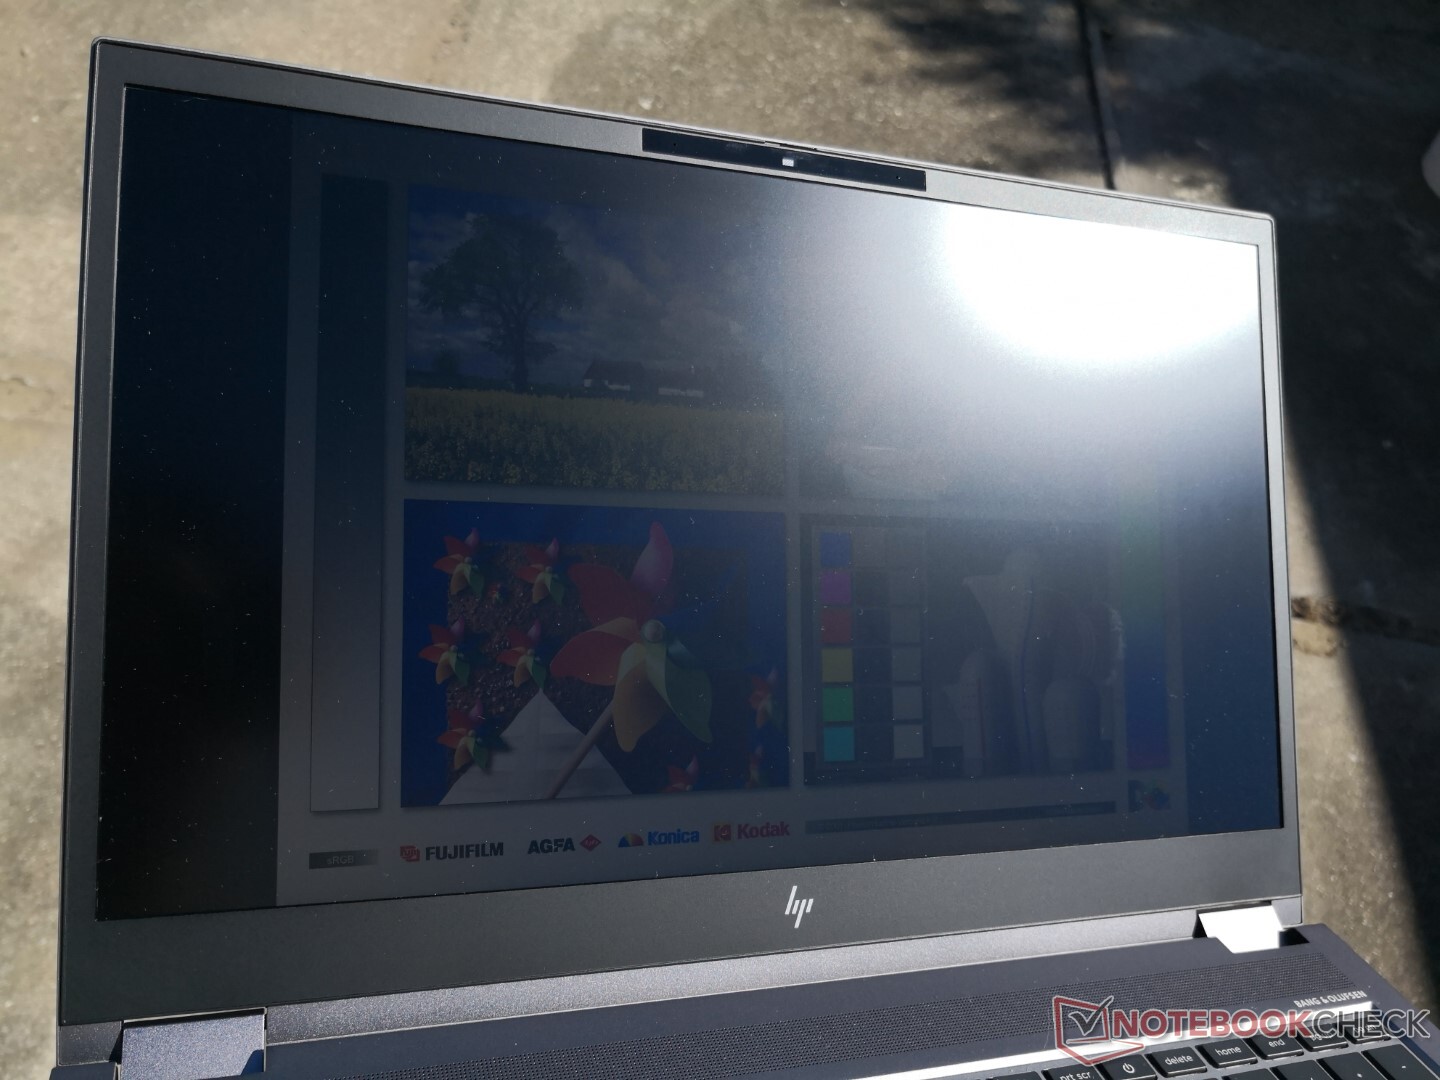
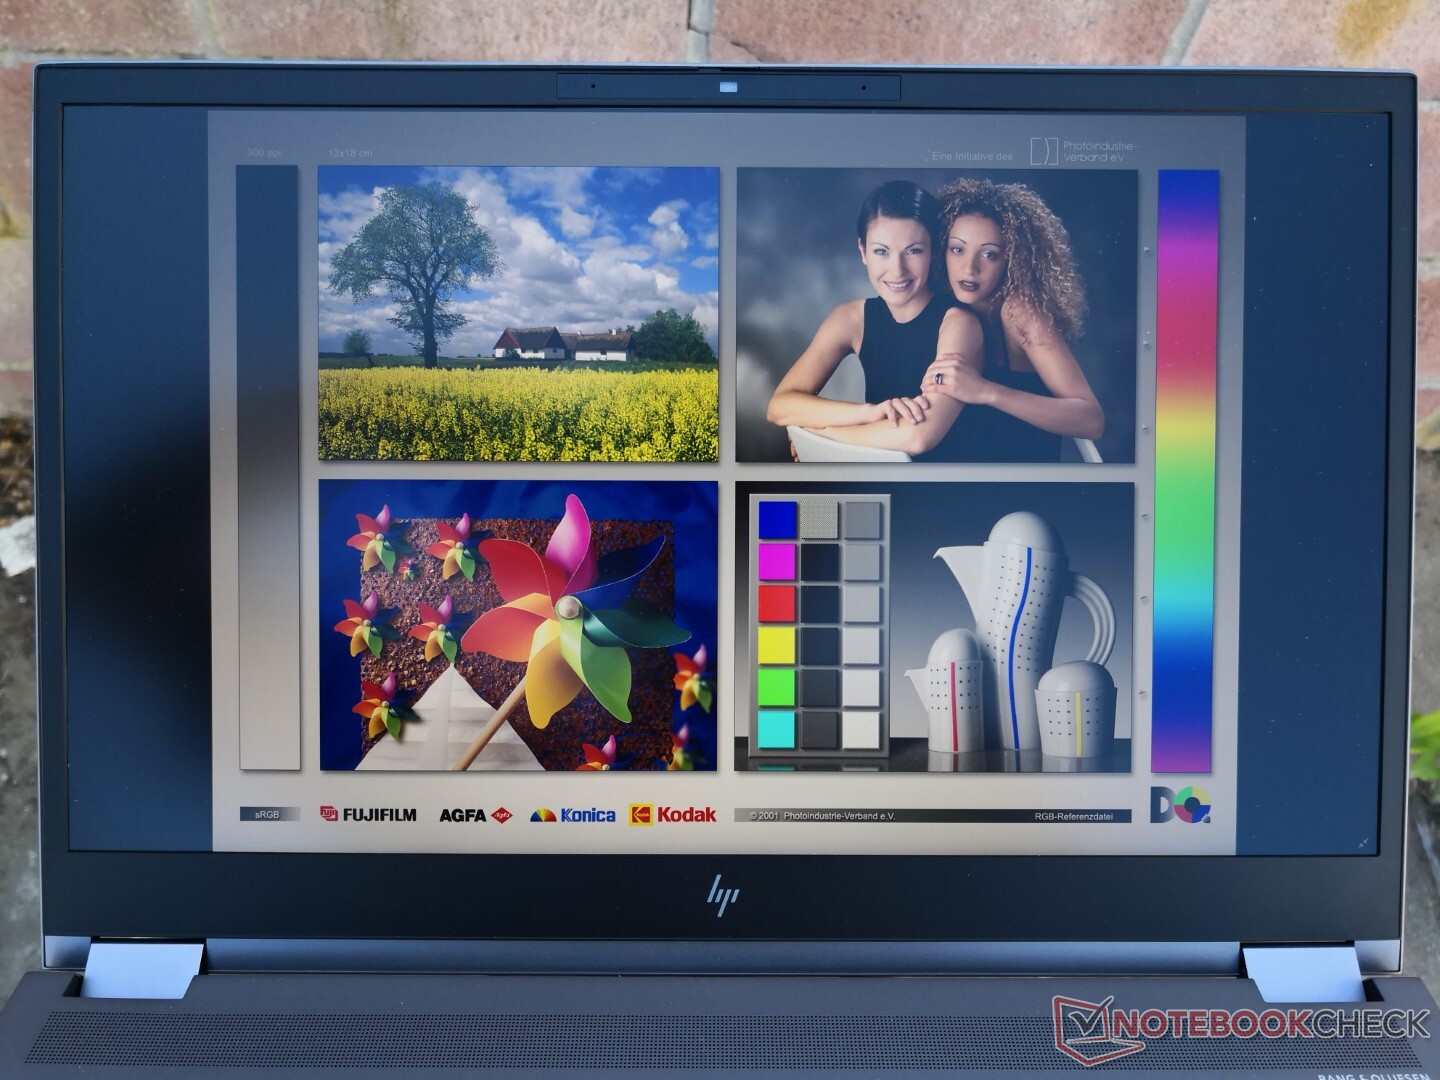
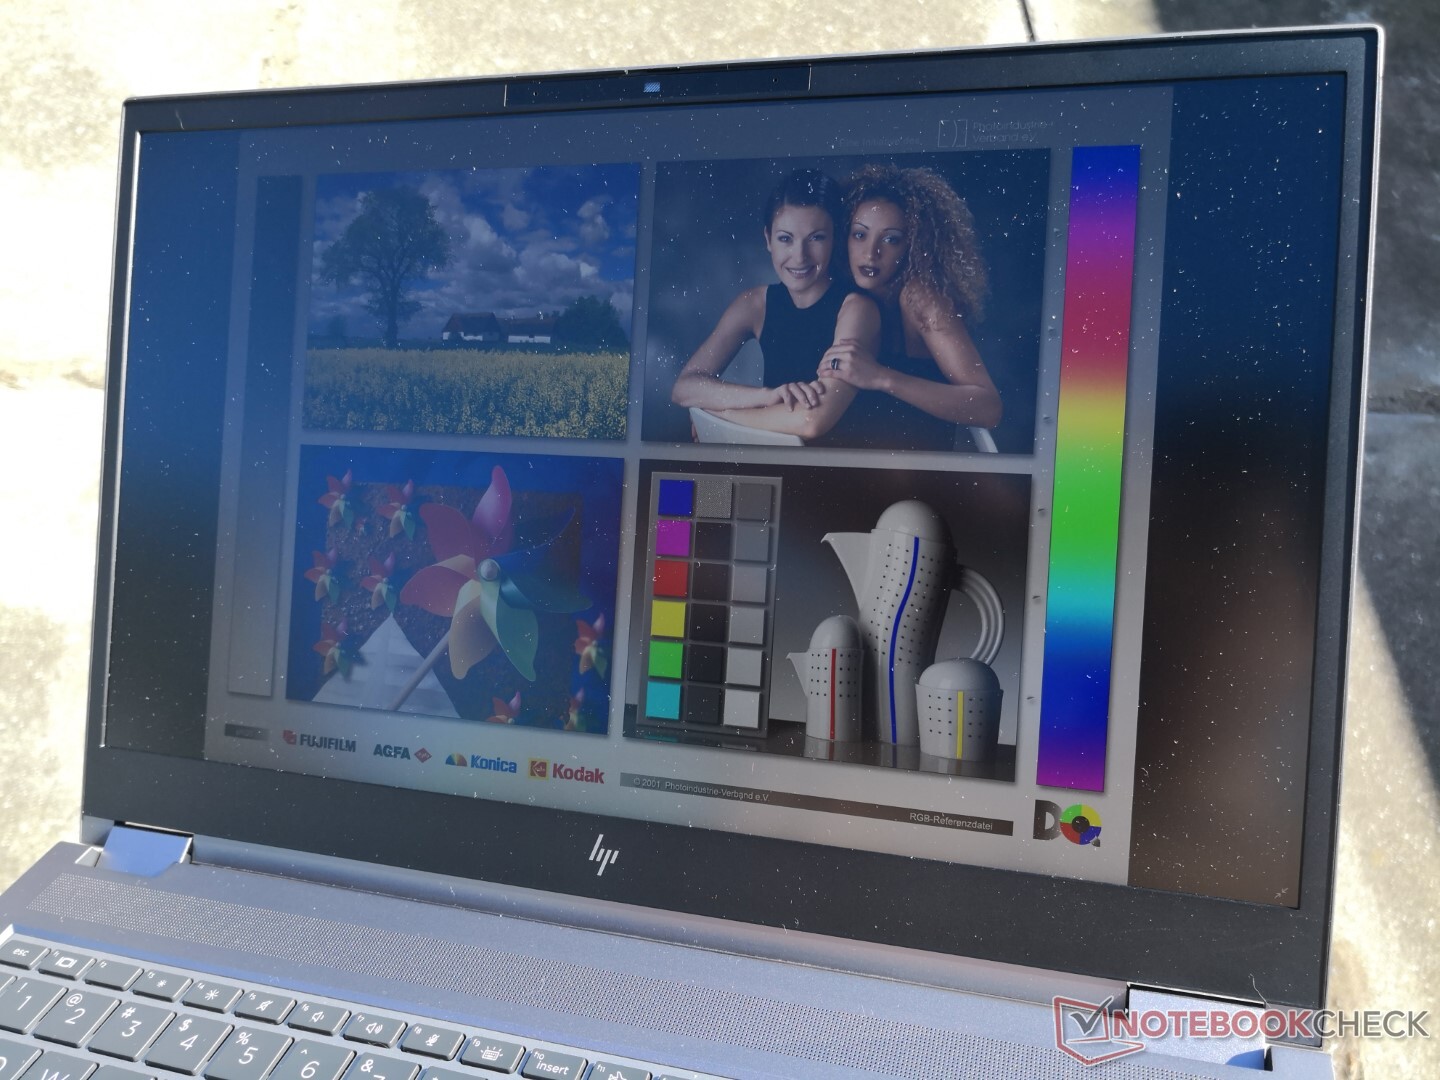
由于采用了超亮的600 nit背光,户外能见度比许多其他工作站要好。甚至惠普自己的ZBook Studio 15 G8或 萤火虫15 G7在其各自的最大亮度设置下也不接近400尼特。尽管如此,你仍然希望适当地缩放字体,并在阴暗处工作,以最大限度地提高可读性。

性能 - 英特尔第11代产品
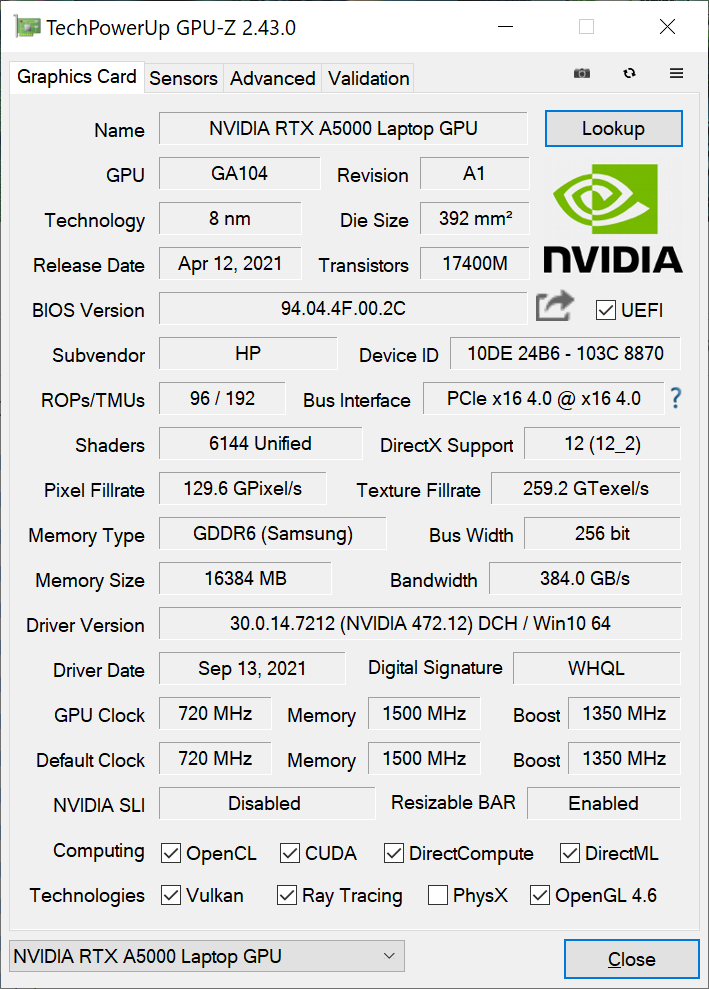
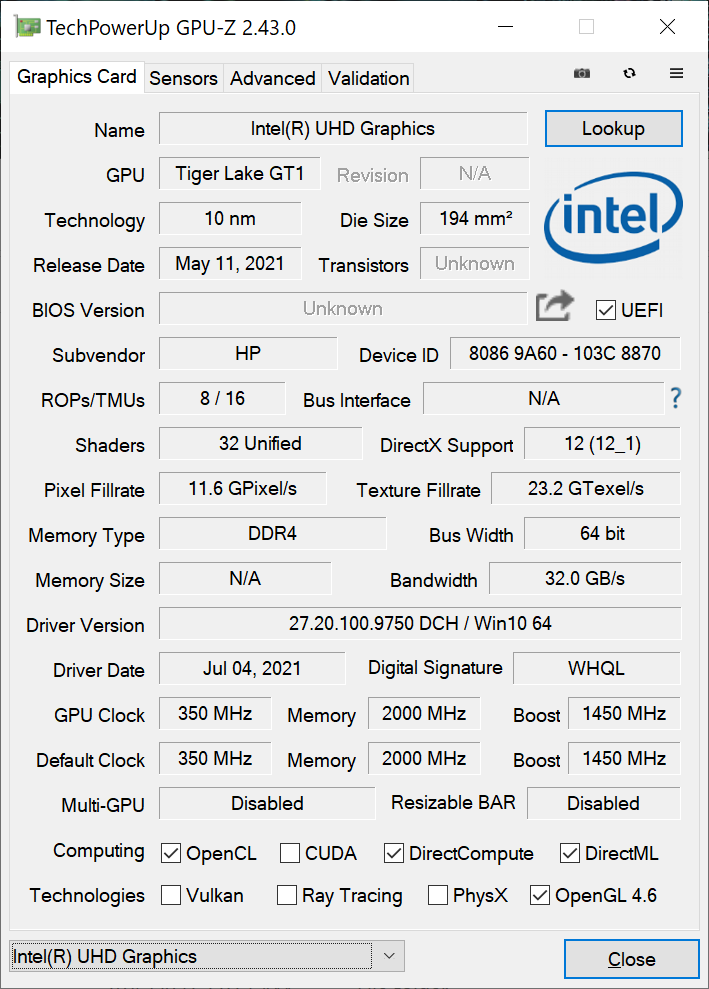
CPU选项涵盖了Tiger Lake-H CPU和Nvidia T1200和RTX A系列GPU,直至RTX A5000。Xeon甚至Radeon Pro W6600M选项也可用于非常广泛的可配置选项。特别是更高端的选项是你在任何笔记本电脑上可以找到的一些最快的移动工作站级处理器。
支持可调整栏和动态提升2.0,而高级优化和WhisperMode 2.0则不支持。不幸的是,也没有手动图形开关。
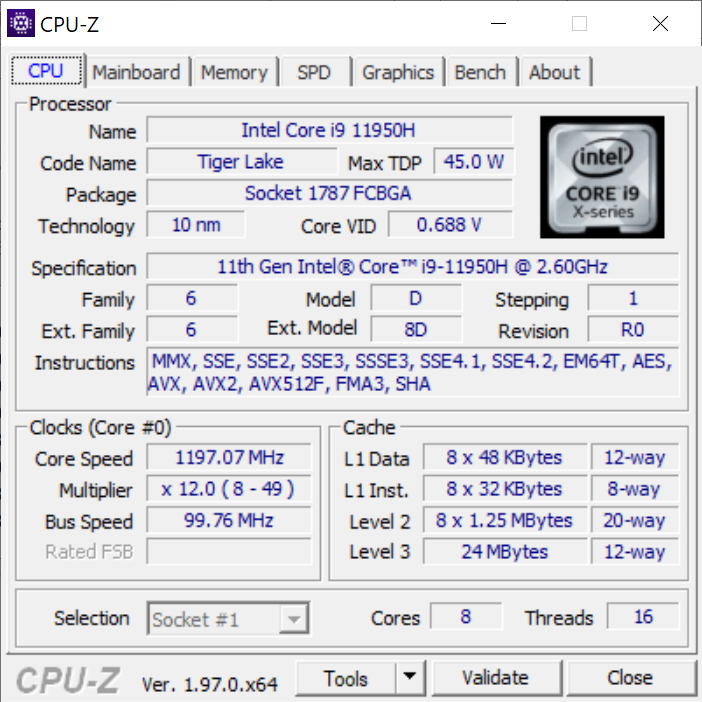
处理器
多线程CPU的性能比起其他的CPU还差几个百分点。 酷睿i9-11900H在竞争性的 微星WS66这是可以预期的,因为它整合了vPro功能。 酷睿i9-11950H单线程性能,然而,仍然是优秀的,与非vPro对应的性能相当。整体多线程性能比Xeon W-10885M高约15%。 Xeon W-10885M当然,没有对ECC内存的任何支持。
Cinebench R15 Multi Loop
Cinebench R23: Multi Core | Single Core
Cinebench R15: CPU Multi 64Bit | CPU Single 64Bit
Blender: v2.79 BMW27 CPU
7-Zip 18.03: 7z b 4 -mmt1 | 7z b 4
Geekbench 5.5: Single-Core | Multi-Core
HWBOT x265 Benchmark v2.2: 4k Preset
LibreOffice : 20 Documents To PDF
R Benchmark 2.5: Overall mean
| Cinebench R20 / CPU (Multi Core) | |
| Lenovo Legion 5 15ACH-82JU00C6GE-FL | |
| MSI GS76 Stealth 11UH | |
| Average Intel Core i9-11950H (4471 - 5000, n=4) | |
| HP ZBook Fury 15 G8 | |
| Lenovo ThinkPad P15 G2-20YQ001JGE | |
| HP ZBook Fury 15 G7 | |
| HP ZBook Fury 15 G7 | |
| Dell Precision 5000 5560 | |
| Acer Nitro 5 AN515-45-R05E | |
| Acer Nitro 5 AN515-45-R05E | |
| Gigabyte Aero 15 OLED XC | |
| Dell Precision 5550 P91F | |
| Cinebench R20 / CPU (Single Core) | |
| Average Intel Core i9-11950H (610 - 632, n=4) | |
| HP ZBook Fury 15 G8 | |
| MSI GS76 Stealth 11UH | |
| Dell Precision 5000 5560 | |
| Lenovo ThinkPad P15 G2-20YQ001JGE | |
| Lenovo Legion 5 15ACH-82JU00C6GE-FL | |
| Acer Nitro 5 AN515-45-R05E | |
| Acer Nitro 5 AN515-45-R05E | |
| HP ZBook Fury 15 G7 | |
| HP ZBook Fury 15 G7 | |
| Dell Precision 5550 P91F | |
| Gigabyte Aero 15 OLED XC | |
| Cinebench R23 / Multi Core | |
| Lenovo Legion 5 15ACH-82JU00C6GE-FL | |
| MSI GS76 Stealth 11UH | |
| Average Intel Core i9-11950H (12048 - 13113, n=4) | |
| HP ZBook Fury 15 G8 | |
| Lenovo ThinkPad P15 G2-20YQ001JGE | |
| Dell Precision 5000 5560 | |
| Gigabyte Aero 15 OLED XC | |
| HP ZBook Fury 15 G7 | |
| Cinebench R23 / Single Core | |
| HP ZBook Fury 15 G8 | |
| Average Intel Core i9-11950H (1569 - 1633, n=4) | |
| MSI GS76 Stealth 11UH | |
| Dell Precision 5000 5560 | |
| Lenovo ThinkPad P15 G2-20YQ001JGE | |
| Lenovo Legion 5 15ACH-82JU00C6GE-FL | |
| HP ZBook Fury 15 G7 | |
| Gigabyte Aero 15 OLED XC | |
| Cinebench R15 / CPU Multi 64Bit | |
| MSI GS76 Stealth 11UH | |
| Lenovo Legion 5 15ACH-82JU00C6GE-FL | |
| Average Intel Core i9-11950H (1827 - 2130, n=5) | |
| Lenovo ThinkPad P15 G2-20YQ001JGE | |
| HP ZBook Fury 15 G8 | |
| Gigabyte Aero 15 OLED XC | |
| HP ZBook Fury 15 G7 | |
| HP ZBook Fury 15 G7 | |
| Acer Nitro 5 AN515-45-R05E | |
| Dell Precision 5000 5560 | |
| Dell Precision 5550 P91F | |
| Cinebench R15 / CPU Single 64Bit | |
| Average Intel Core i9-11950H (236 - 249, n=4) | |
| HP ZBook Fury 15 G8 | |
| MSI GS76 Stealth 11UH | |
| Dell Precision 5000 5560 | |
| Lenovo ThinkPad P15 G2-20YQ001JGE | |
| Lenovo Legion 5 15ACH-82JU00C6GE-FL | |
| Acer Nitro 5 AN515-45-R05E | |
| HP ZBook Fury 15 G7 | |
| HP ZBook Fury 15 G7 | |
| Dell Precision 5550 P91F | |
| Gigabyte Aero 15 OLED XC | |
| Blender / v2.79 BMW27 CPU | |
| HP ZBook Fury 15 G7 | |
| Dell Precision 5550 P91F | |
| Acer Nitro 5 AN515-45-R05E | |
| Dell Precision 5000 5560 | |
| Gigabyte Aero 15 OLED XC | |
| Lenovo ThinkPad P15 G2-20YQ001JGE | |
| HP ZBook Fury 15 G8 | |
| Average Intel Core i9-11950H (244 - 261, n=3) | |
| MSI GS76 Stealth 11UH | |
| Lenovo Legion 5 15ACH-82JU00C6GE-FL | |
| 7-Zip 18.03 / 7z b 4 -mmt1 | |
| Average Intel Core i9-11950H (5755 - 5919, n=3) | |
| HP ZBook Fury 15 G8 | |
| Dell Precision 5000 5560 | |
| HP ZBook Fury 15 G7 | |
| MSI GS76 Stealth 11UH | |
| Lenovo ThinkPad P15 G2-20YQ001JGE | |
| Lenovo Legion 5 15ACH-82JU00C6GE-FL | |
| Dell Precision 5550 P91F | |
| Gigabyte Aero 15 OLED XC | |
| Acer Nitro 5 AN515-45-R05E | |
| 7-Zip 18.03 / 7z b 4 | |
| Lenovo Legion 5 15ACH-82JU00C6GE-FL | |
| MSI GS76 Stealth 11UH | |
| Average Intel Core i9-11950H (50050 - 51402, n=3) | |
| HP ZBook Fury 15 G8 | |
| Lenovo ThinkPad P15 G2-20YQ001JGE | |
| Dell Precision 5000 5560 | |
| Gigabyte Aero 15 OLED XC | |
| Acer Nitro 5 AN515-45-R05E | |
| Dell Precision 5550 P91F | |
| HP ZBook Fury 15 G7 | |
| Geekbench 5.5 / Single-Core | |
| Average Intel Core i9-11950H (1623 - 1702, n=3) | |
| MSI GS76 Stealth 11UH | |
| Lenovo ThinkPad P15 G2-20YQ001JGE | |
| Lenovo Legion 5 15ACH-82JU00C6GE-FL | |
| Acer Nitro 5 AN515-45-R05E | |
| HP ZBook Fury 15 G7 | |
| Dell Precision 5550 P91F | |
| Gigabyte Aero 15 OLED XC | |
| Geekbench 5.5 / Multi-Core | |
| MSI GS76 Stealth 11UH | |
| Lenovo ThinkPad P15 G2-20YQ001JGE | |
| Dell Precision 5550 P91F | |
| Average Intel Core i9-11950H (7286 - 8152, n=3) | |
| Gigabyte Aero 15 OLED XC | |
| Lenovo Legion 5 15ACH-82JU00C6GE-FL | |
| HP ZBook Fury 15 G7 | |
| Acer Nitro 5 AN515-45-R05E | |
| HWBOT x265 Benchmark v2.2 / 4k Preset | |
| Lenovo Legion 5 15ACH-82JU00C6GE-FL | |
| MSI GS76 Stealth 11UH | |
| HP ZBook Fury 15 G8 | |
| Average Intel Core i9-11950H (13.8 - 14.5, n=4) | |
| Lenovo ThinkPad P15 G2-20YQ001JGE | |
| Dell Precision 5000 5560 | |
| Gigabyte Aero 15 OLED XC | |
| Acer Nitro 5 AN515-45-R05E | |
| Dell Precision 5550 P91F | |
| HP ZBook Fury 15 G7 | |
| LibreOffice / 20 Documents To PDF | |
| Lenovo Legion 5 15ACH-82JU00C6GE-FL | |
| Gigabyte Aero 15 OLED XC | |
| HP ZBook Fury 15 G7 | |
| Acer Nitro 5 AN515-45-R05E | |
| HP ZBook Fury 15 G8 | |
| MSI GS76 Stealth 11UH | |
| Lenovo ThinkPad P15 G2-20YQ001JGE | |
| Average Intel Core i9-11950H (38.6 - 53.2, n=4) | |
| Dell Precision 5000 5560 | |
| Dell Precision 5550 P91F | |
| R Benchmark 2.5 / Overall mean | |
| Dell Precision 5550 P91F | |
| Gigabyte Aero 15 OLED XC | |
| Lenovo ThinkPad P15 G2-20YQ001JGE | |
| HP ZBook Fury 15 G7 | |
| HP ZBook Fury 15 G8 | |
| Dell Precision 5000 5560 | |
| Acer Nitro 5 AN515-45-R05E | |
| Average Intel Core i9-11950H (0.521 - 0.551, n=4) | |
| Lenovo Legion 5 15ACH-82JU00C6GE-FL | |
| MSI GS76 Stealth 11UH | |
* ... smaller is better
系统性能
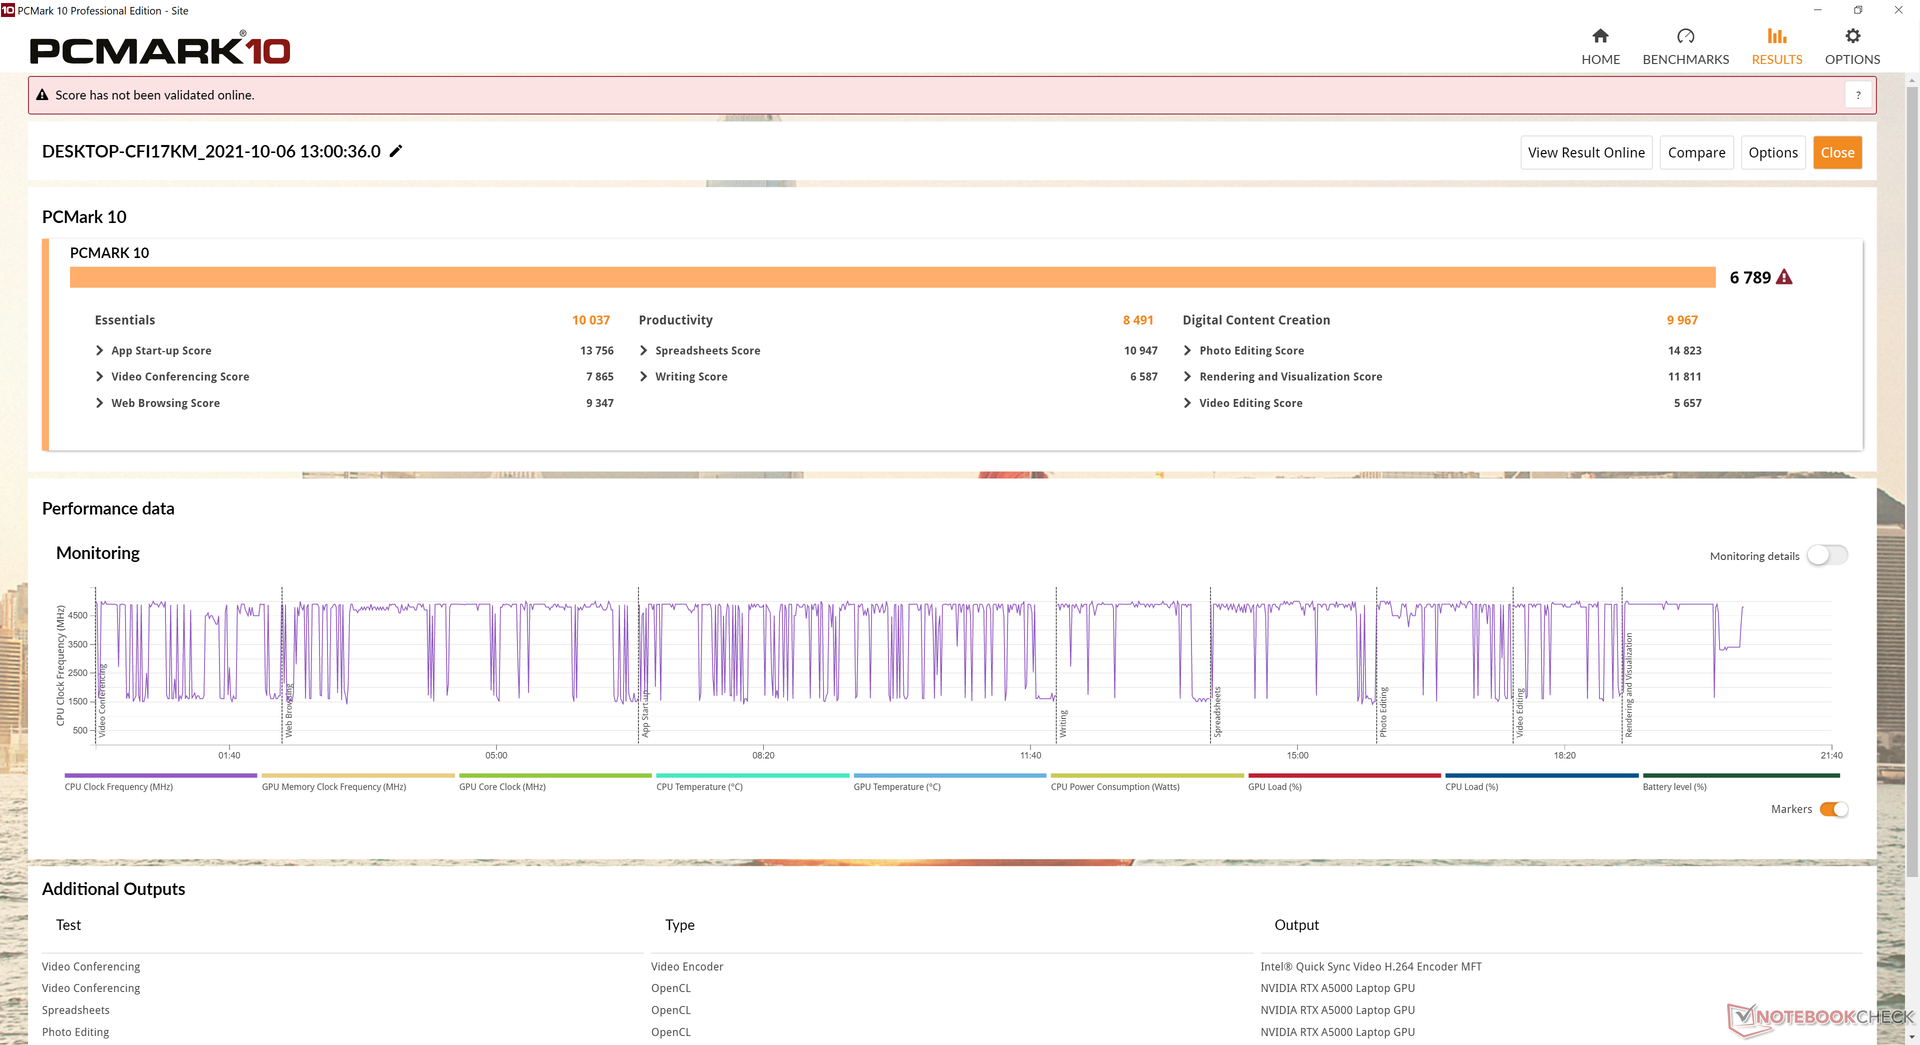
PCMark分数一直高于我们在Fury 15 G7上记录的分数,同时与我们在配备RTX 3070显卡的厚道工作室15 G8上记录的分数几乎相同。
| PCMark 10 / Score | |
| HP ZBook Fury 15 G8 | |
| Average Intel Core i9-11950H, NVIDIA RTX A5000 Laptop GPU (n=1) | |
| HP ZBook Studio 15 G8 | |
| Dell Precision 5000 5560 | |
| HP ZBook Fury 15 G7 | |
| Lenovo ThinkPad P15s Gen2-20W6000GGE | |
| HP ZBook Firefly 15 G7 | |
| PCMark 10 / Essentials | |
| Dell Precision 5000 5560 | |
| HP ZBook Fury 15 G8 | |
| Average Intel Core i9-11950H, NVIDIA RTX A5000 Laptop GPU (n=1) | |
| HP ZBook Studio 15 G8 | |
| Lenovo ThinkPad P15s Gen2-20W6000GGE | |
| HP ZBook Fury 15 G7 | |
| HP ZBook Firefly 15 G7 | |
| PCMark 10 / Productivity | |
| Lenovo ThinkPad P15s Gen2-20W6000GGE | |
| Dell Precision 5000 5560 | |
| HP ZBook Fury 15 G8 | |
| Average Intel Core i9-11950H, NVIDIA RTX A5000 Laptop GPU (n=1) | |
| HP ZBook Studio 15 G8 | |
| HP ZBook Fury 15 G7 | |
| HP ZBook Firefly 15 G7 | |
| PCMark 10 / Digital Content Creation | |
| HP ZBook Fury 15 G8 | |
| Average Intel Core i9-11950H, NVIDIA RTX A5000 Laptop GPU (n=1) | |
| HP ZBook Studio 15 G8 | |
| Dell Precision 5000 5560 | |
| HP ZBook Fury 15 G7 | |
| Lenovo ThinkPad P15s Gen2-20W6000GGE | |
| HP ZBook Firefly 15 G7 | |
| PCMark 10 Score | 6789 points | |
Help | ||
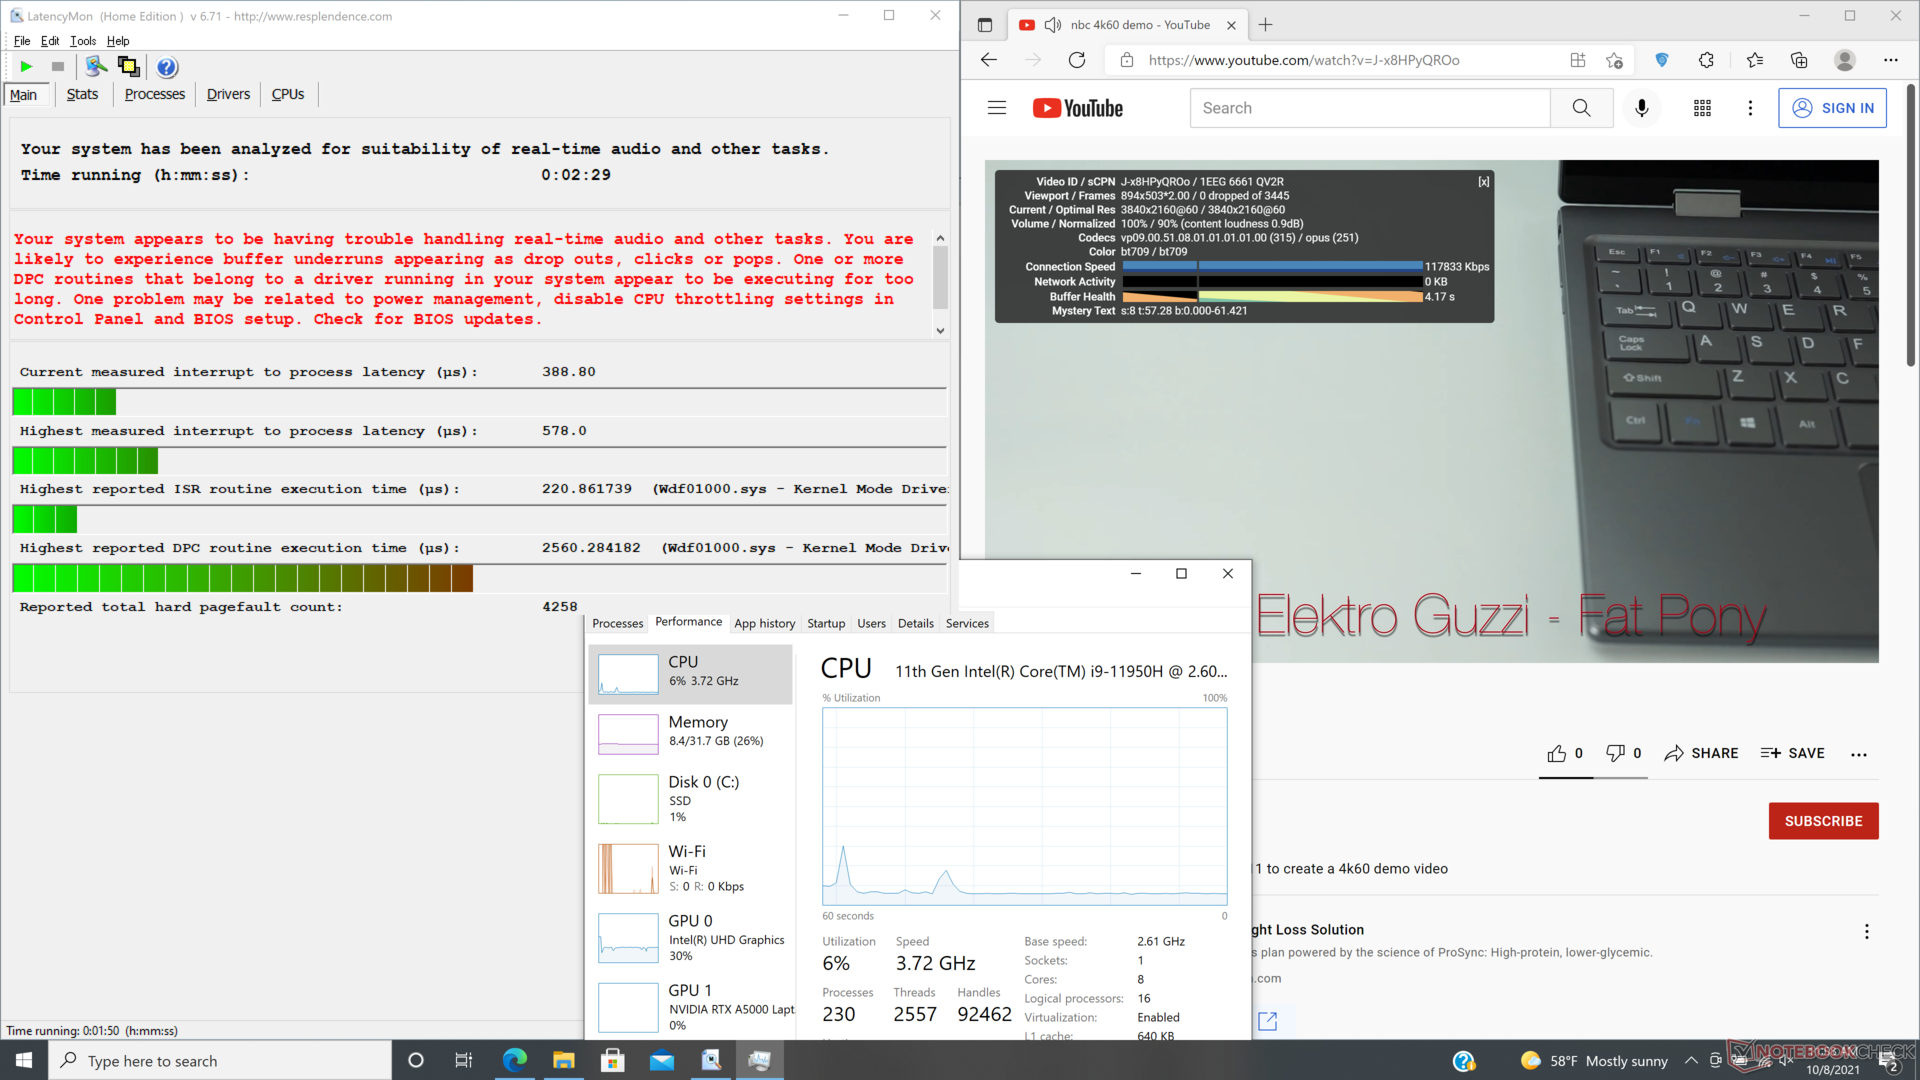
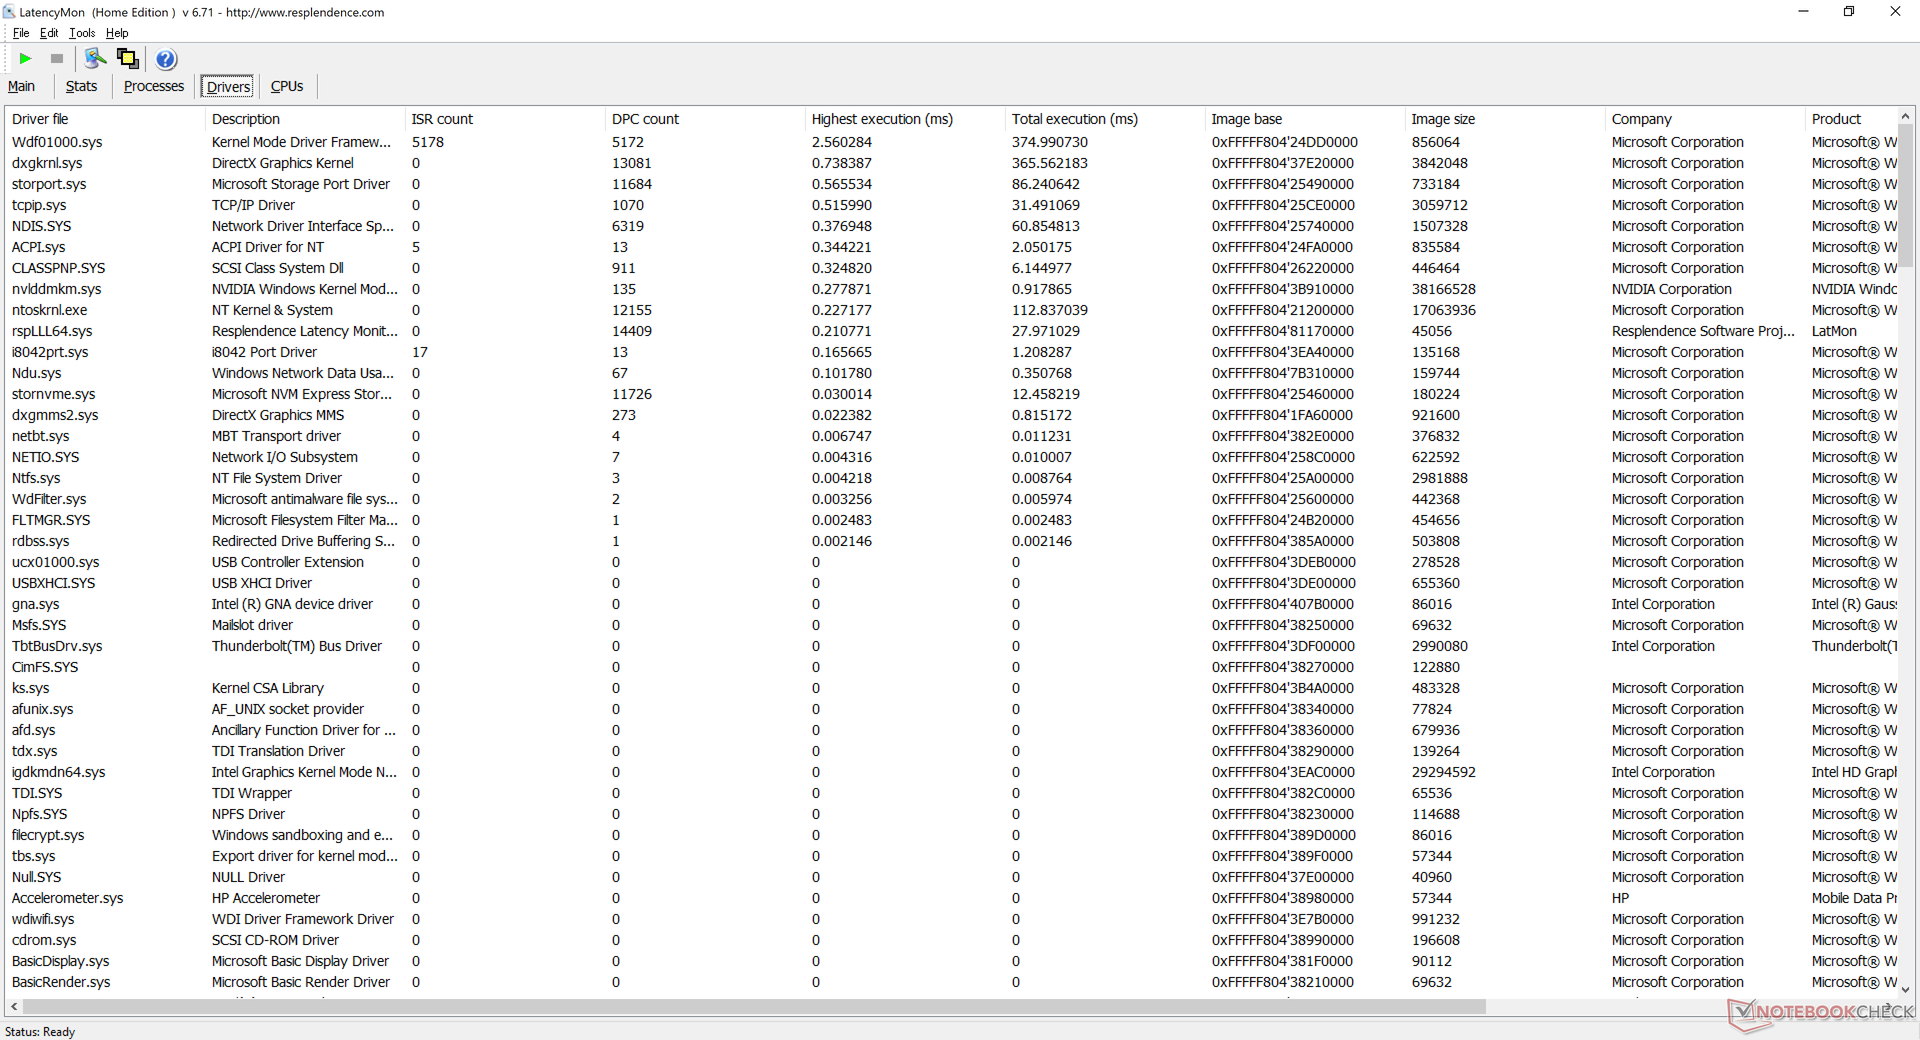
DPC延时
LatencyMon显示,在我们的主页上打开多个浏览器标签或运行Prime95压力时,没有出现重大的延迟中断。然而,DPC常规时间,会像我们在去年的Fury 15 G7上观察到的那样飙升。在60FPS下的4K视频播放是顺畅的,没有掉帧。
| DPC Latencies / LatencyMon - interrupt to process latency (max), Web, Youtube, Prime95 | |
| Lenovo ThinkPad P15s Gen2-20W6000GGE | |
| HP ZBook Firefly 15 G7 | |
| HP ZBook Fury 15 G7 | |
| HP ZBook Studio 15 G8 | |
| Dell Precision 5000 5560 | |
| HP ZBook Fury 15 G8 | |
* ... smaller is better
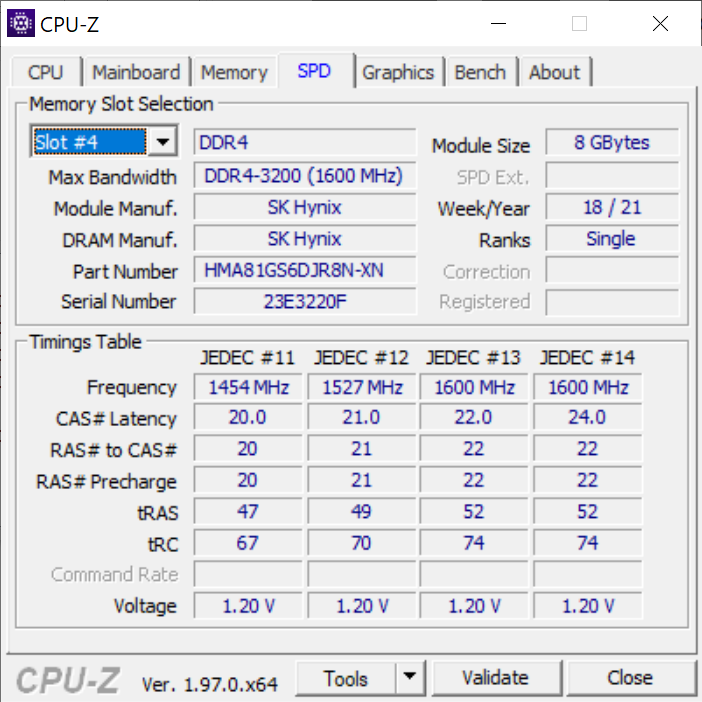
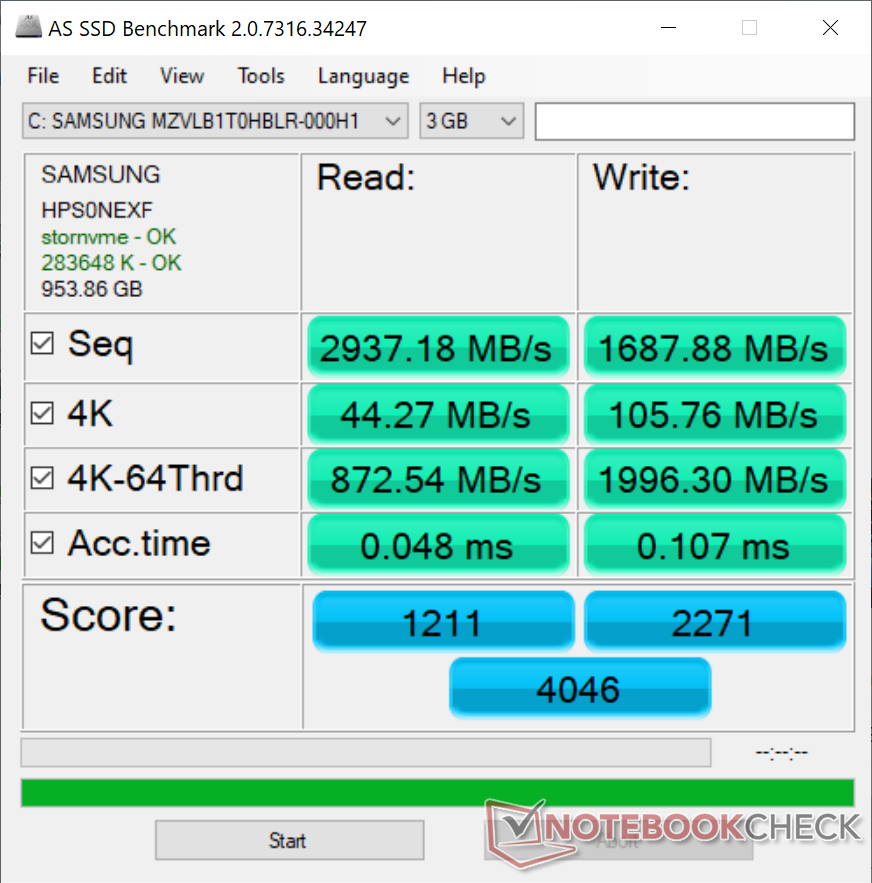
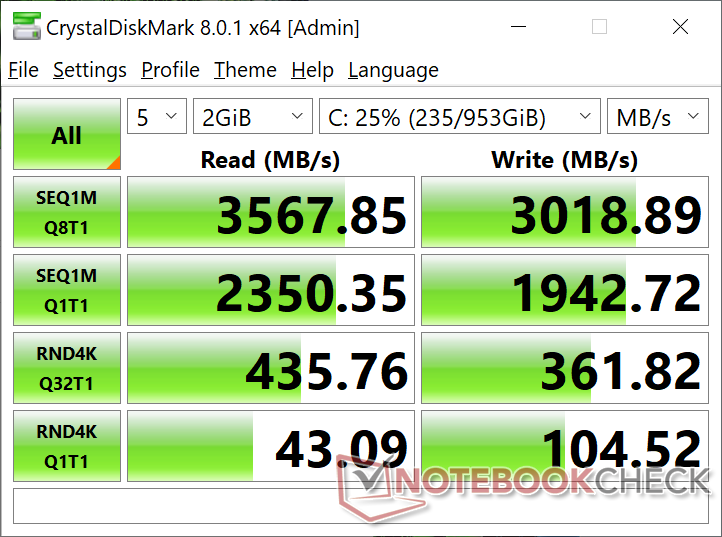
存储设备--有很多选择
我们的设备可以支持多达四个内部存储驱动器(2个M.2 2280,1个M.2 2242,1个2.5英寸SATA III)。有趣的是,惠普没有提供任何PCIe4选项,因为目前所有的SKU都配备了PCIe3固态硬盘,比如我们熟悉的 三星PM981a.我们已经联系了惠普,试图确认是否支持PCIe4 NVMe速度,我们将相应地更新这个页面。
| HP ZBook Fury 15 G8 Samsung PM981a MZVLB1T0HBLR | HP ZBook Fury 15 G7 Samsung PM981a MZVLB1T0HBLR | Dell Precision 5000 5560 Samsung PM9A1 MZVL22T0HBLB | HP ZBook Studio 15 G8 Samsung PM981a MZVLB2T0HALB | Lenovo ThinkPad P15s Gen2-20W6000GGE WDC PC SN720 SDAQNTW-1T00 | HP ZBook Firefly 15 G7 Toshiba XG6 KXG60ZNV1T02 | |
|---|---|---|---|---|---|---|
| AS SSD | 24% | 93% | 104% | 19% | -1% | |
| Seq Read (MB/s) | 2937 | 2127 -28% | 5169 76% | 2953 1% | 2796 -5% | 2666 -9% |
| Seq Write (MB/s) | 1688 | 1296 -23% | 1986 18% | 1691 0% | 2525 50% | 1257 -26% |
| 4K Read (MB/s) | 44.27 | 54.8 24% | 78 76% | 43.98 -1% | 50.9 15% | 48.04 9% |
| 4K Write (MB/s) | 105.8 | 110.8 5% | 214.6 103% | 105.4 0% | 211.9 100% | 137.5 30% |
| 4K-64 Read (MB/s) | 873 | 1420 63% | 1232 41% | 1065 22% | 1505 72% | 977 12% |
| 4K-64 Write (MB/s) | 1996 | 2012 1% | 2719 36% | 1957 -2% | 949 -52% | 1142 -43% |
| Access Time Read * (ms) | 0.048 | 0.046 4% | 0.024 50% | 0.04 17% | 0.081 -69% | 0.053 -10% |
| Access Time Write * (ms) | 0.107 | 0.099 7% | 0.059 45% | 0.105 2% | 0.019 82% | 0.03 72% |
| Score Read (Points) | 1211 | 1687 39% | 1827 51% | 1404 16% | 1835 52% | 1292 7% |
| Score Write (Points) | 2271 | 2253 -1% | 3133 38% | 2232 -2% | 1413 -38% | 1406 -38% |
| Score Total (Points) | 4046 | 4770 18% | 5753 42% | 4297 6% | 4177 3% | 3297 -19% |
| Copy ISO MB/s (MB/s) | 901 | 2779 208% | 3201 255% | 2474 175% | ||
| Copy Program MB/s (MB/s) | 118.7 | 123.3 4% | 415.8 250% | 1074 805% | ||
| Copy Game MB/s (MB/s) | 372 | 440.8 18% | 1212 226% | 1929 419% | ||
| CrystalDiskMark 5.2 / 6 | 10% | 54% | 7% | 31% | 7% | |
| Write 4K (MB/s) | 96.3 | 114.1 18% | 172.4 79% | 110.5 15% | 237.6 147% | 133.1 38% |
| Read 4K (MB/s) | 51.5 | 57.2 11% | 78.8 53% | 51.8 1% | 54.7 6% | 51.6 0% |
| Write Seq (MB/s) | 1942 | 2580 33% | 2991 54% | 2071 7% | 2603 34% | 1986 2% |
| Read Seq (MB/s) | 2504 | 2527 1% | 3351 34% | 2505 0% | 1889 -25% | 2208 -12% |
| Write 4K Q32T1 (MB/s) | 346.6 | 480.2 39% | 459.2 32% | 429.8 24% | 505 46% | 462.3 33% |
| Read 4K Q32T1 (MB/s) | 408 | 387.6 -5% | 484.3 19% | 418.3 3% | 606 49% | 400.2 -2% |
| Write Seq Q32T1 (MB/s) | 3019 | 2996 -1% | 4761 58% | 3060 1% | 2795 -7% | 3074 2% |
| Read Seq Q32T1 (MB/s) | 3514 | 2853 -19% | 7071 101% | 3539 1% | 3448 -2% | 3268 -7% |
| Total Average (Program / Settings) | 17% /
19% | 74% /
79% | 56% /
69% | 25% /
24% | 3% /
2% |
* ... smaller is better

Disk Throttling: DiskSpd Read Loop, Queue Depth 8
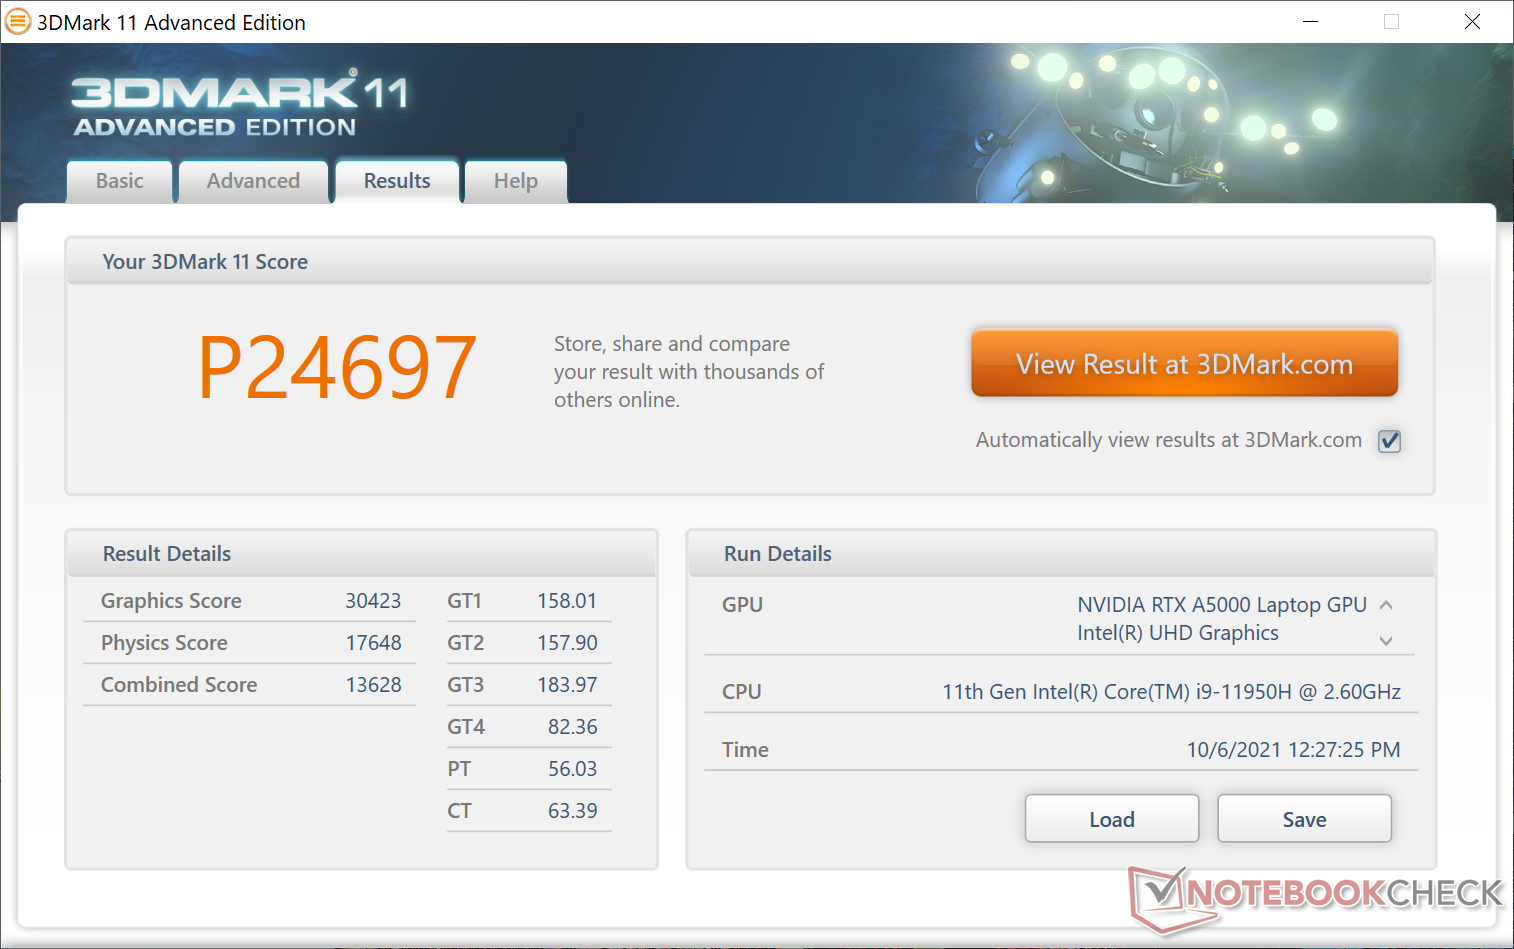
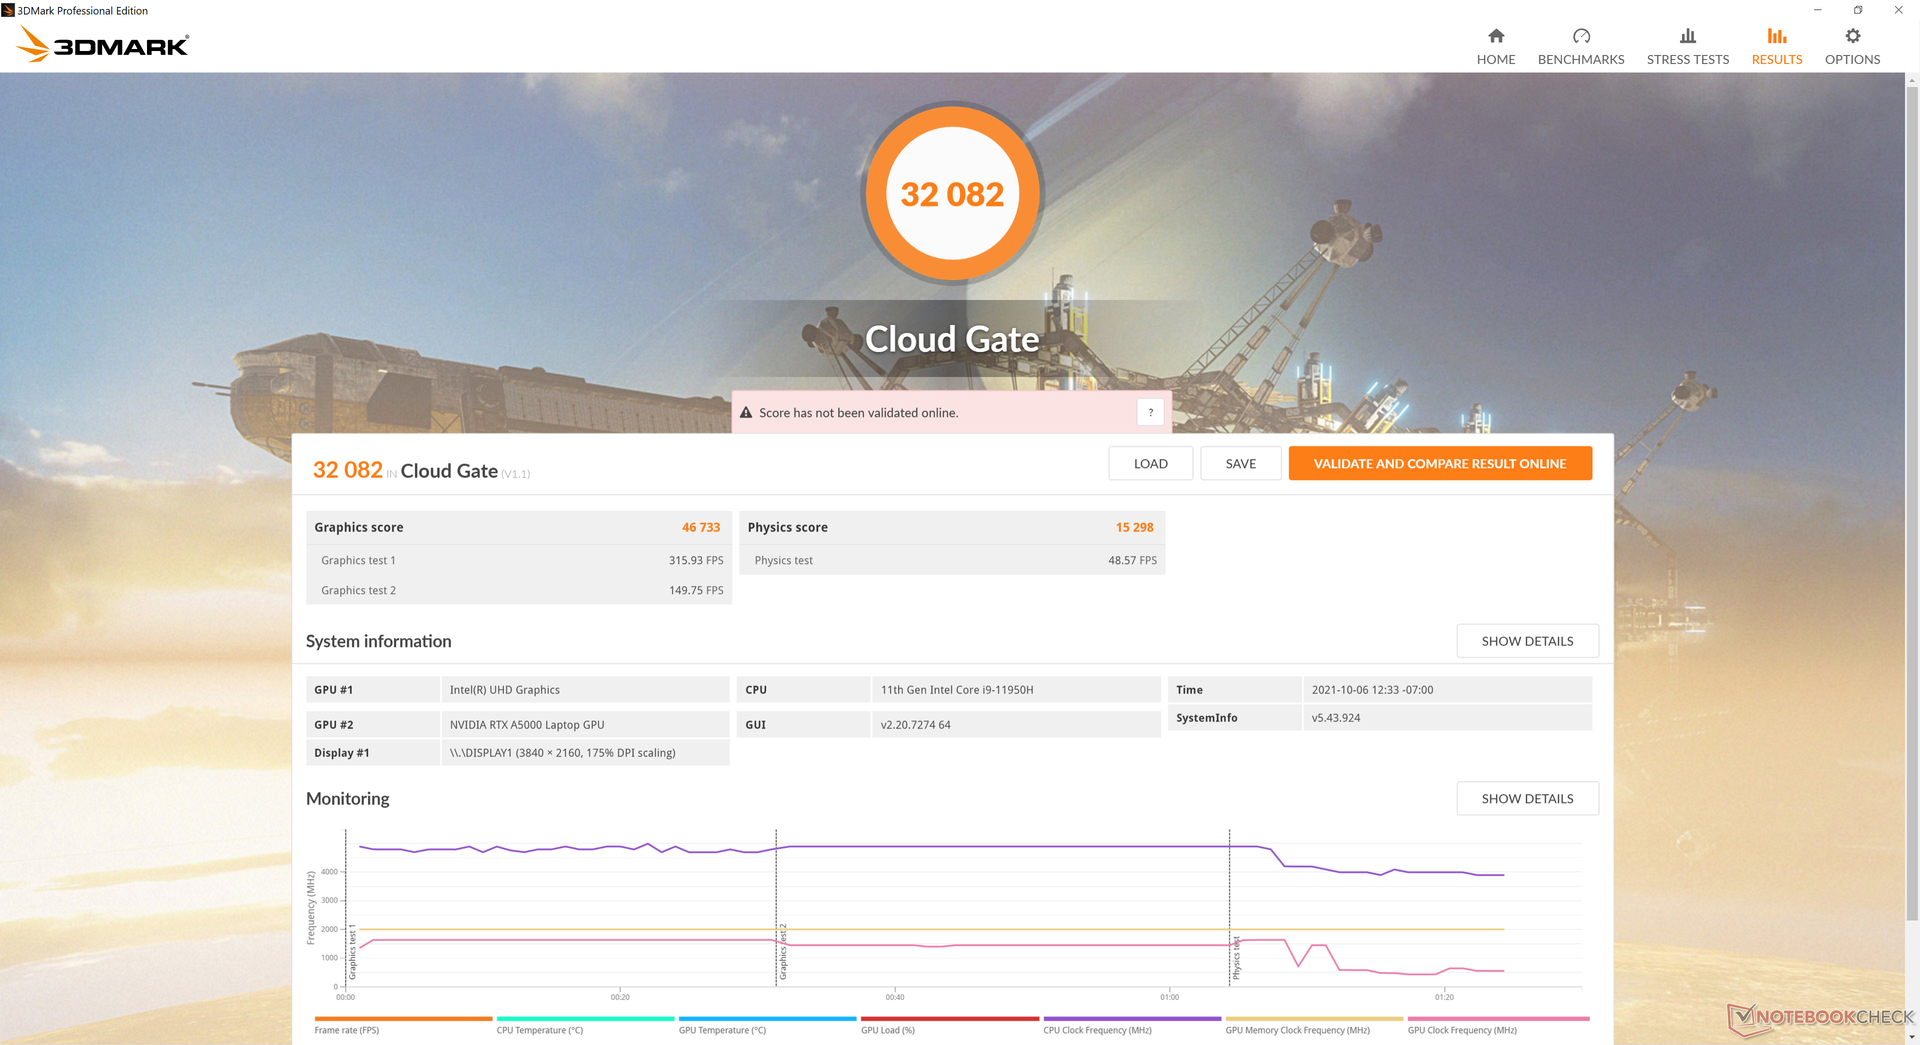
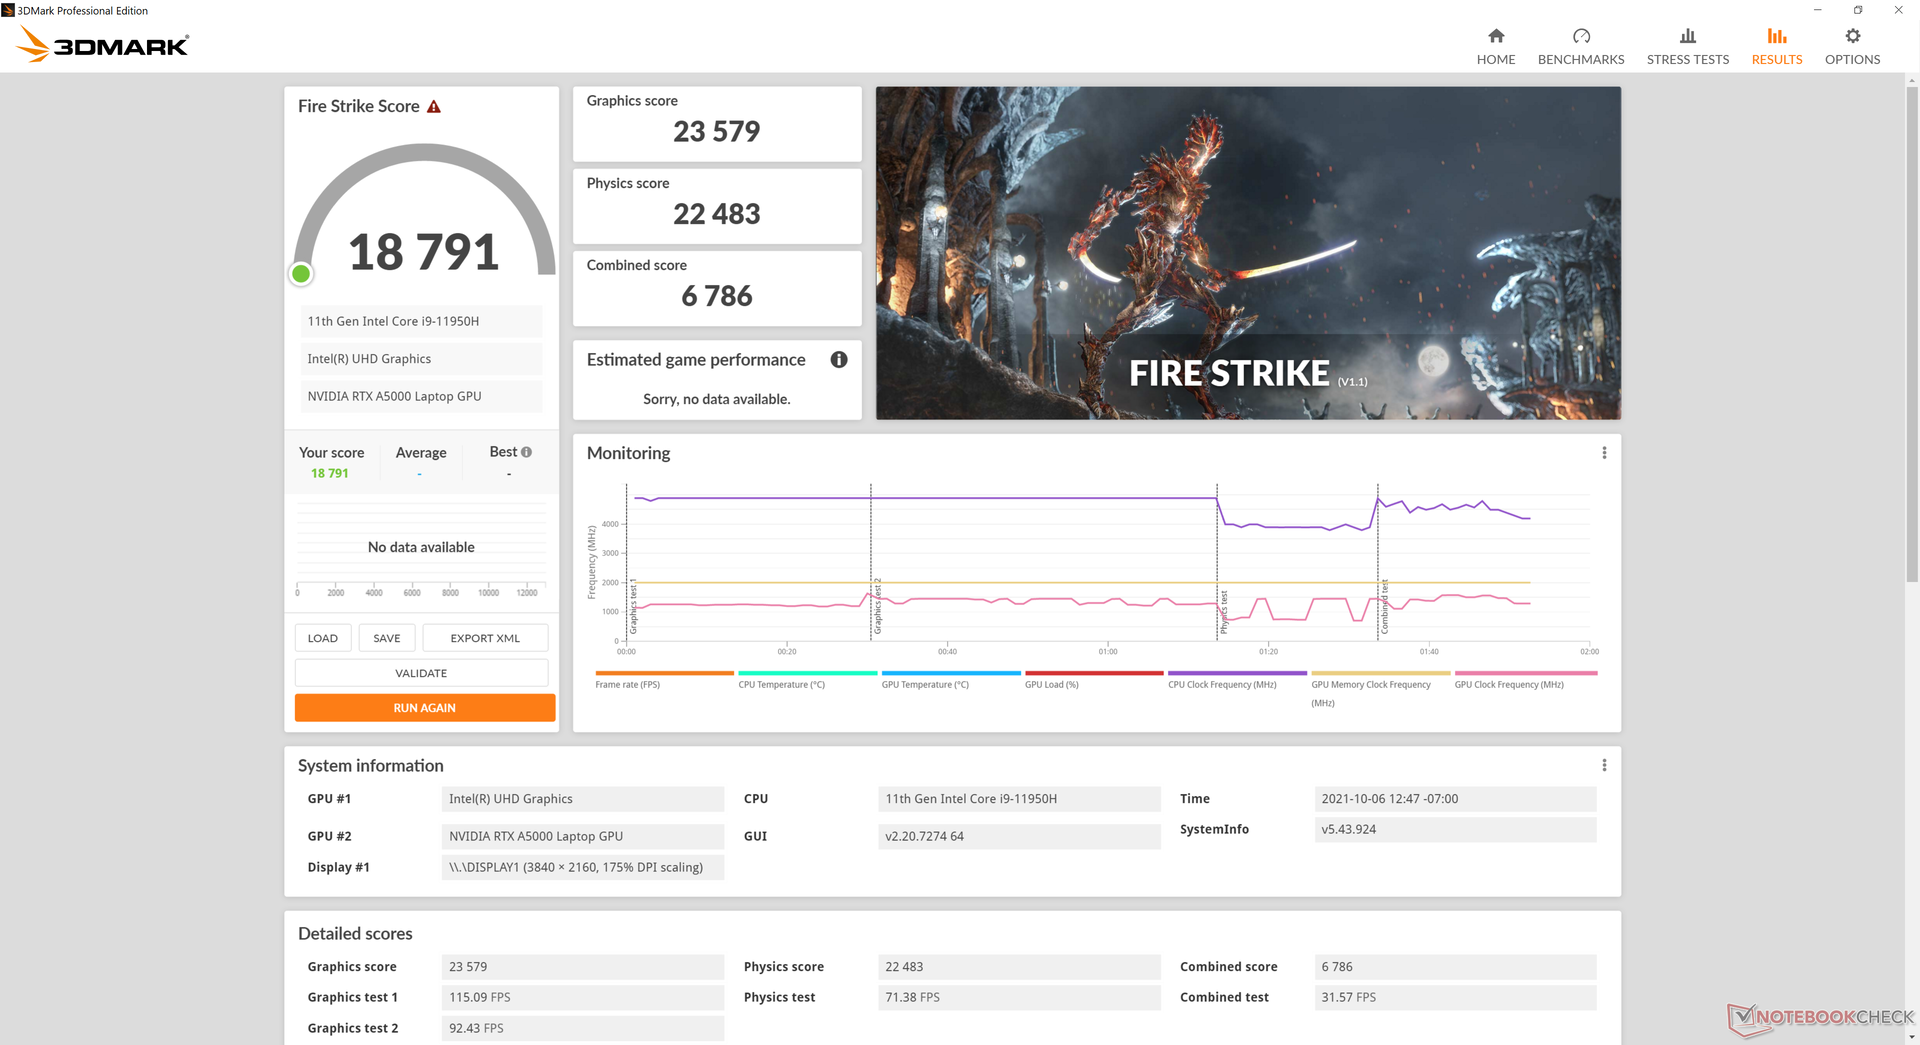
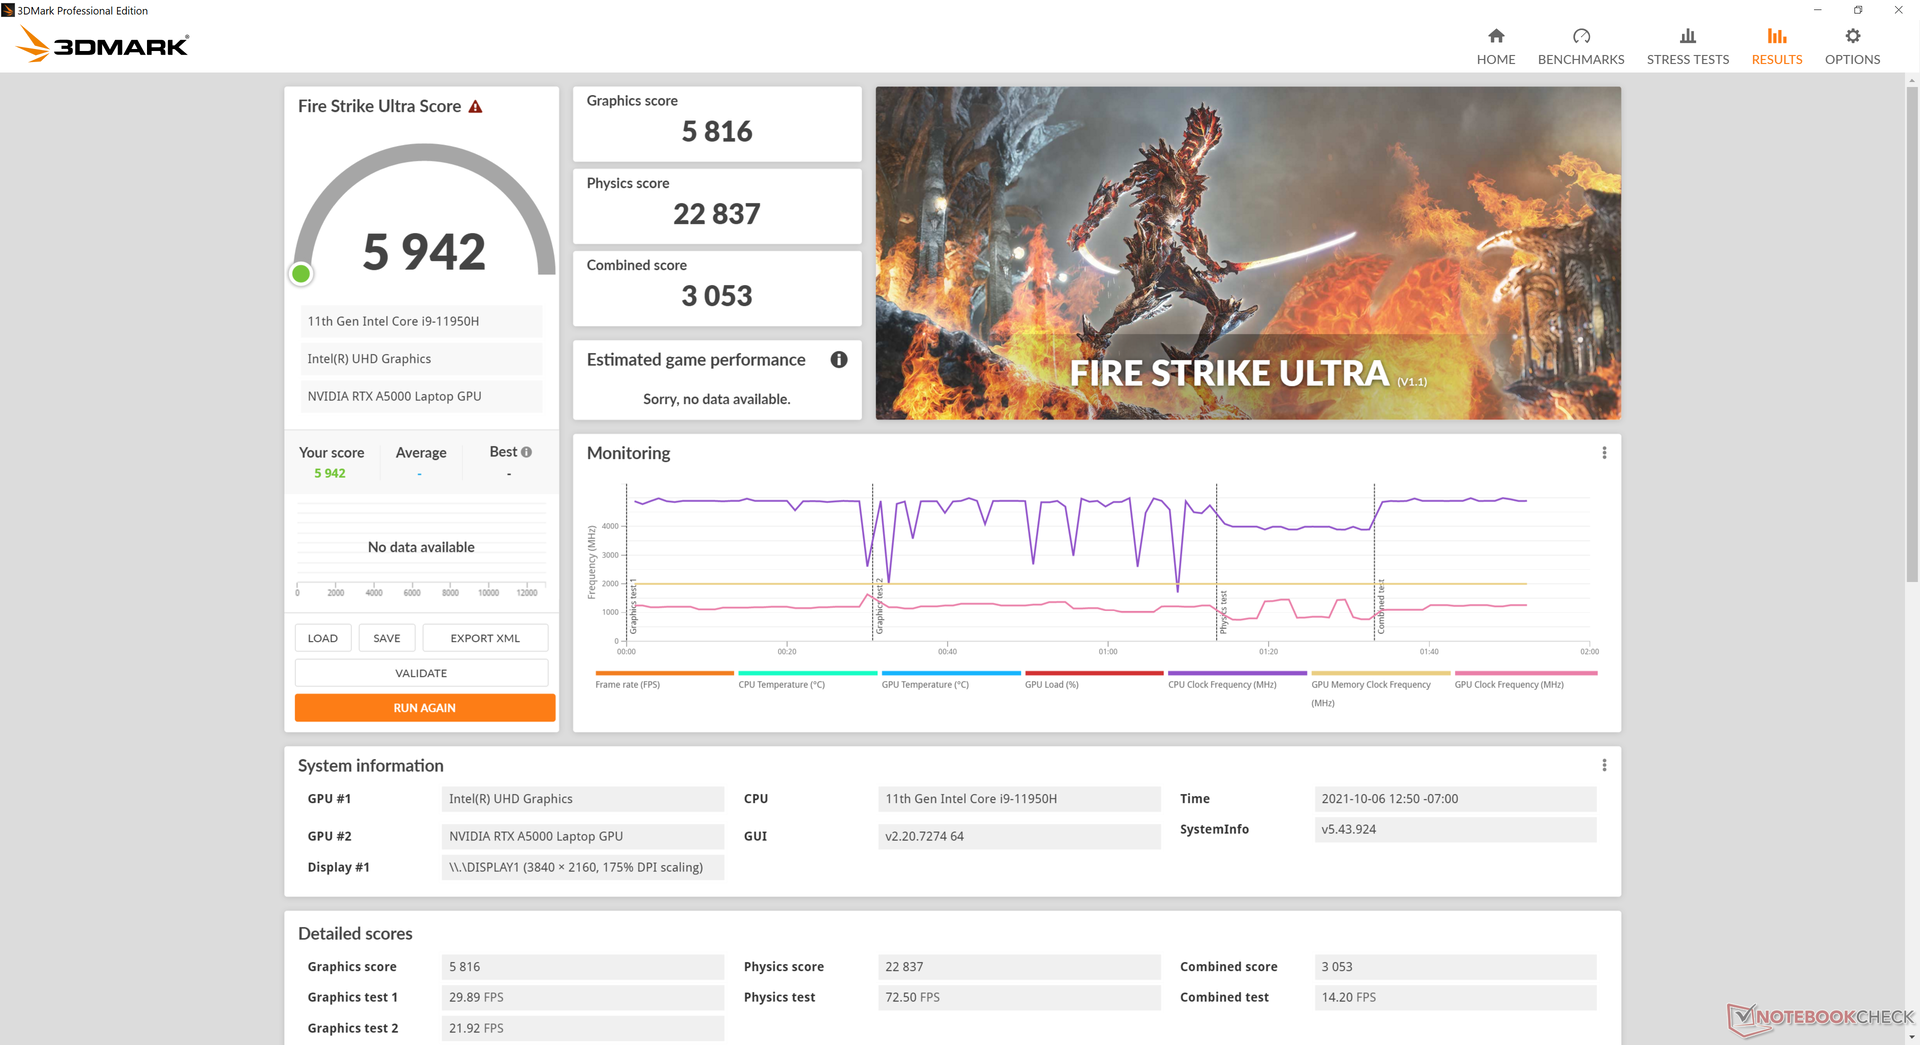
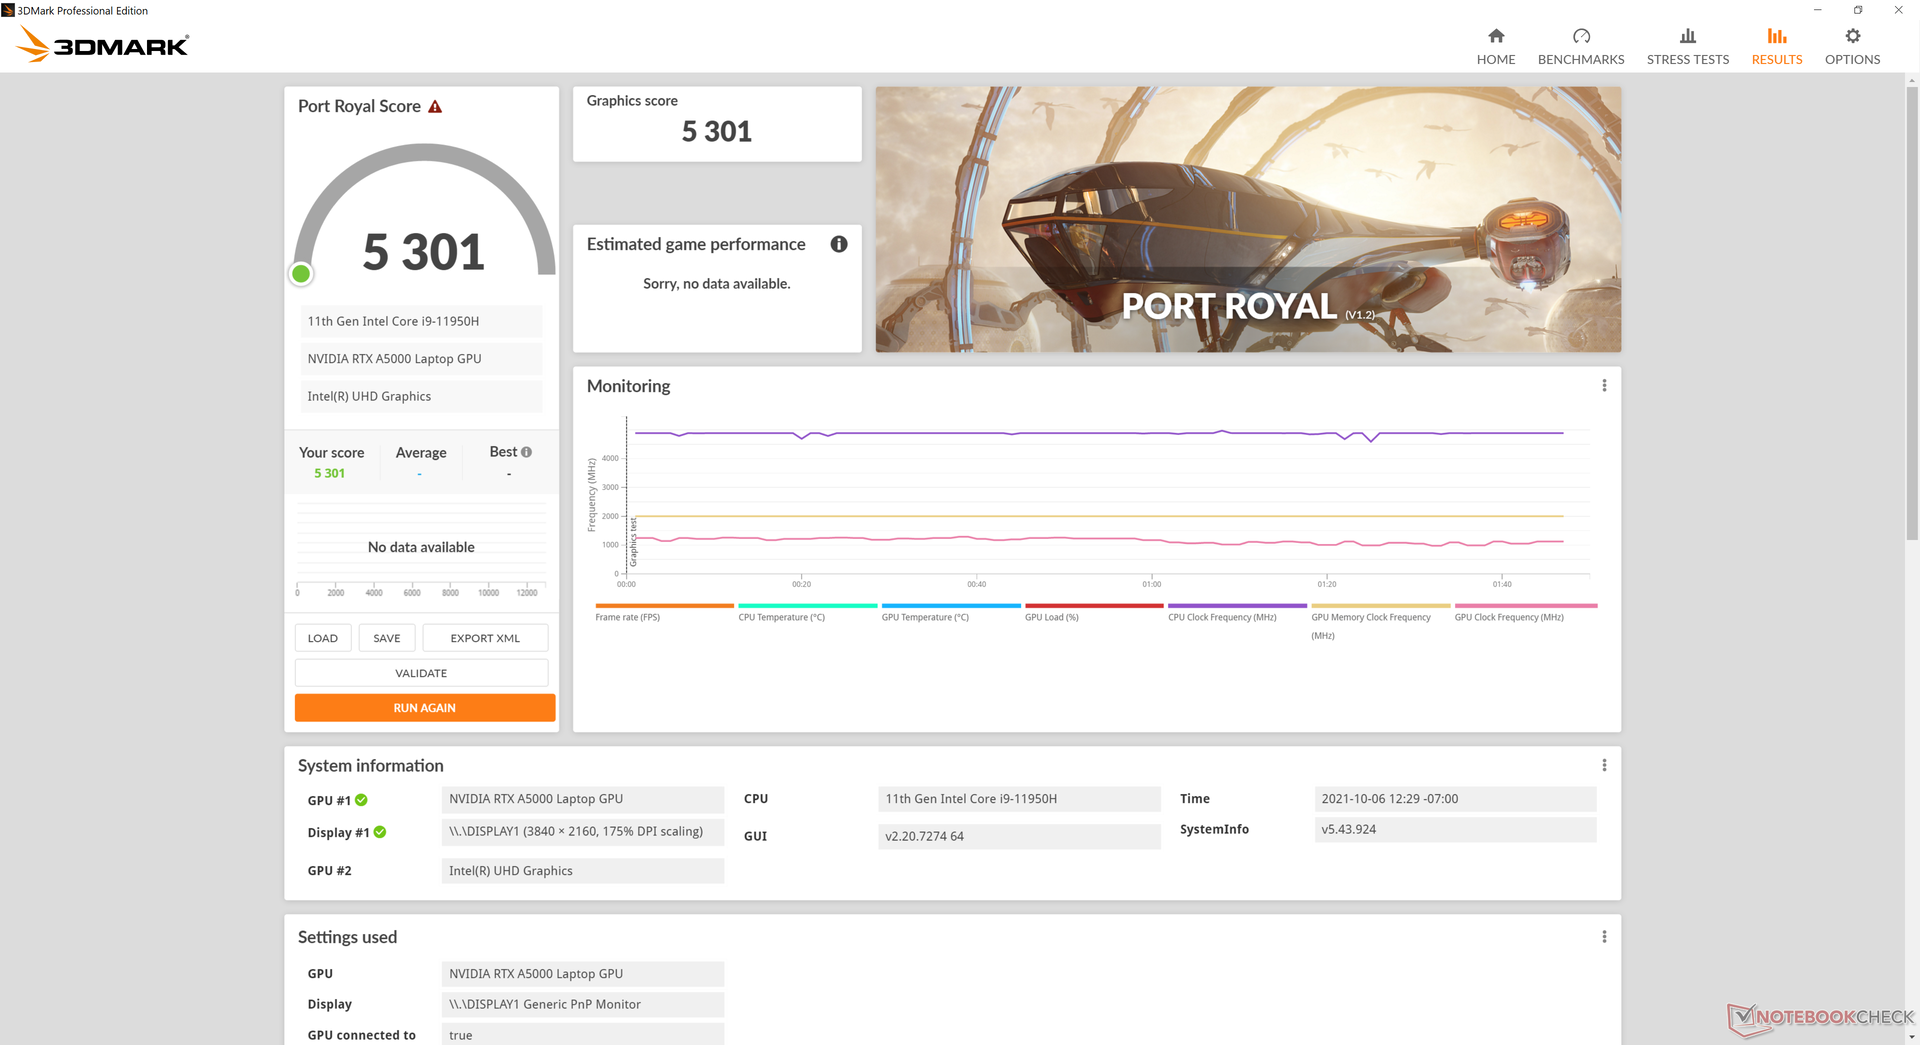
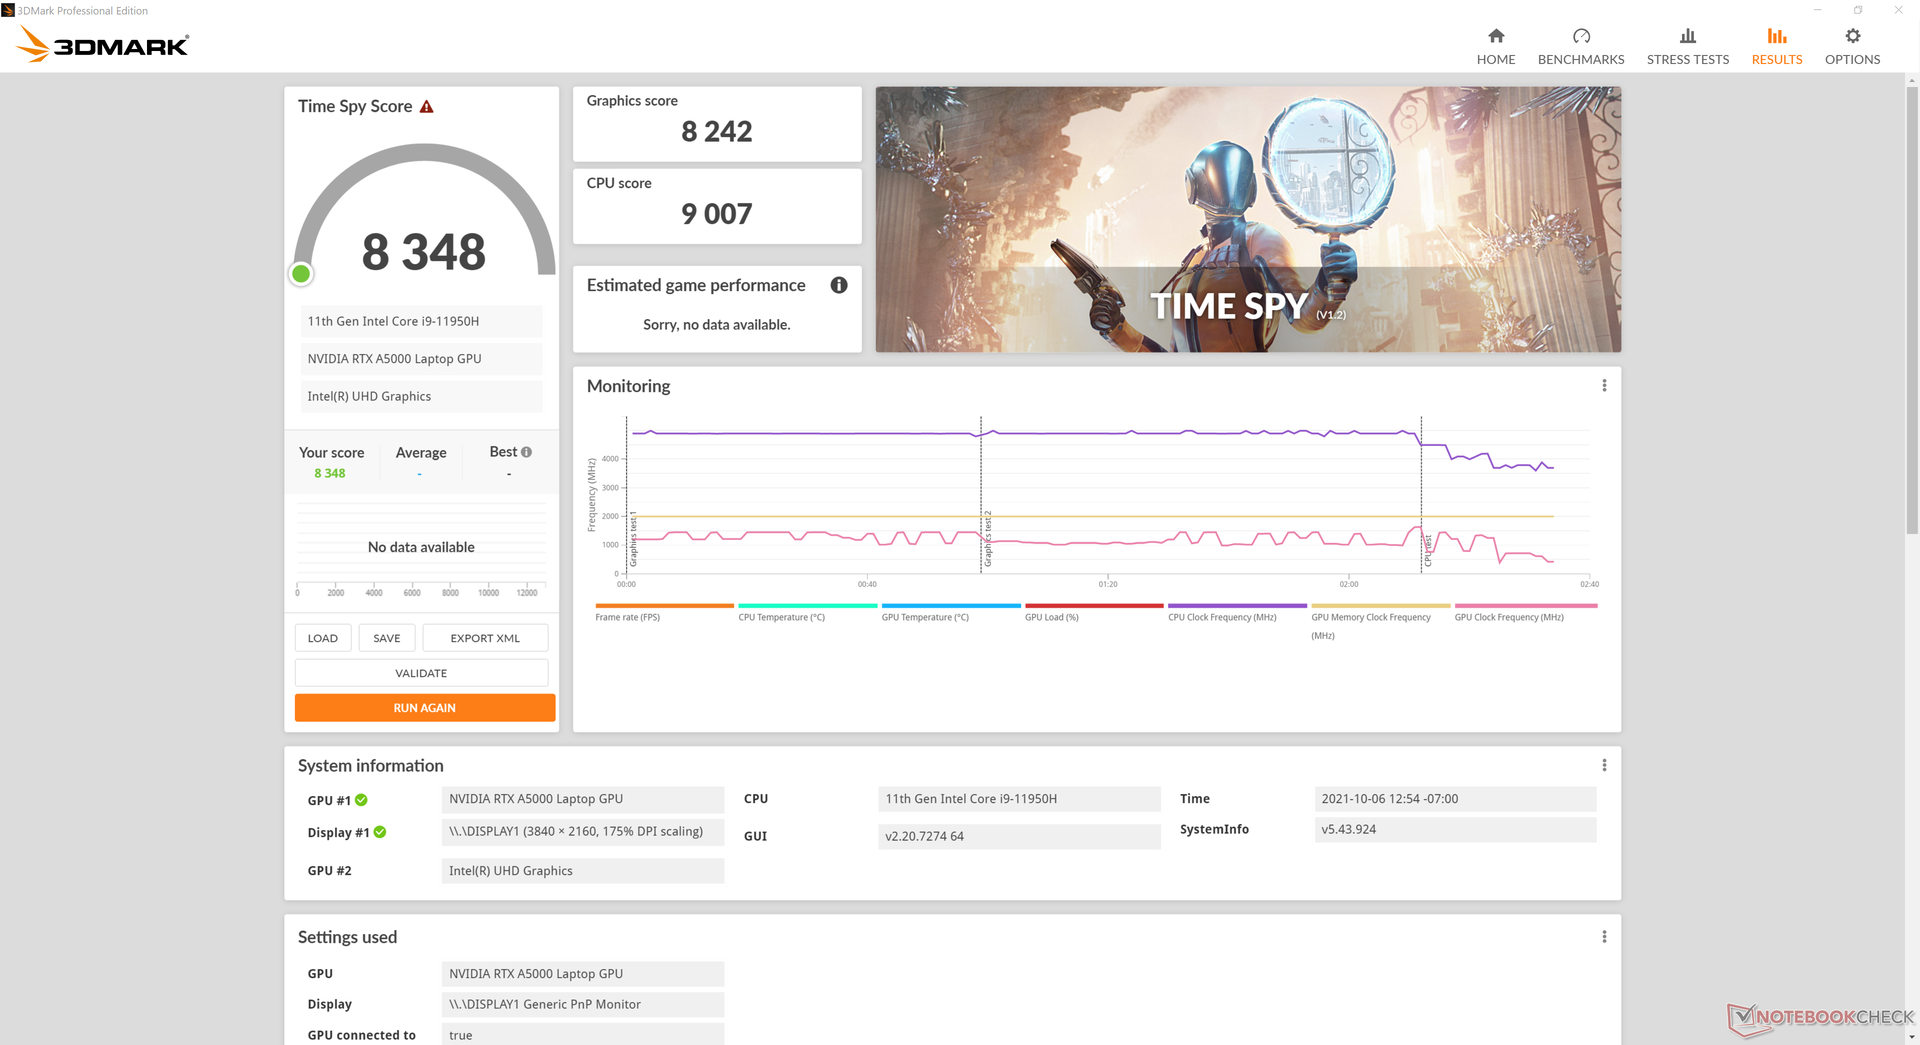
GPU性能--Quadro RTX A5000功能强大
原始图形性能介于 移动GeForce RTX 3060和 移动RTX 3070比Quadro RTX 5000 Max-Q快约10%至20%。 Quadro RTX 5000 Max-Q在老款Fury 15 G7中。SpecViewPerf中的某些子基准测试甚至可以看到40%到50%的改进。
虽然没有针对游戏进行优化,但该系统绝对可以在QHD分辨率下通过最苛刻的标题。整体游戏性能在大多数情况下与移动GeForce RTX 3060相似。
| 3DMark | |
| 1920x1080 Fire Strike Graphics | |
| Average NVIDIA RTX A5000 Laptop GPU (23579 - 29610, n=3) | |
| MSI GS76 Stealth 11UH | |
| Gigabyte Aero 15 OLED XC | |
| HP ZBook Fury 15 G8 | |
| Lenovo Legion 5 15ACH-82JU00C6GE-FL | |
| HP ZBook Studio 15 G8 | |
| Lenovo ThinkPad P15 G2-20YQ001JGE | |
| HP ZBook Fury 15 G7 | |
| Dell Precision 5000 5560 | |
| Acer Nitro 5 AN515-45-R05E | |
| Dell Precision 5550 P91F | |
| Lenovo ThinkPad P15s Gen2-20W6000GGE | |
| HP ZBook Firefly 15 G7 | |
| Apple MacBook 12 (Early 2016) 1.1 GHz | |
| 2560x1440 Time Spy Graphics | |
| Average NVIDIA RTX A5000 Laptop GPU (8242 - 11580, n=3) | |
| MSI GS76 Stealth 11UH | |
| Gigabyte Aero 15 OLED XC | |
| Lenovo Legion 5 15ACH-82JU00C6GE-FL | |
| HP ZBook Fury 15 G8 | |
| HP ZBook Studio 15 G8 | |
| Lenovo ThinkPad P15 G2-20YQ001JGE | |
| HP ZBook Fury 15 G7 | |
| Dell Precision 5000 5560 | |
| Acer Nitro 5 AN515-45-R05E | |
| Dell Precision 5550 P91F | |
| Lenovo ThinkPad P15s Gen2-20W6000GGE | |
| HP ZBook Firefly 15 G7 | |
| 2560x1440 Port Royal Graphics | |
| Average NVIDIA RTX A5000 Laptop GPU (5301 - 7194, n=2) | |
| HP ZBook Fury 15 G8 | |
| HP ZBook Studio 15 G8 | |
| Dell Precision 5000 5560 | |
| 3DMark 11 Performance | 24697 points | |
| 3DMark Cloud Gate Standard Score | 32082 points | |
| 3DMark Fire Strike Score | 18791 points | |
| 3DMark Time Spy Score | 8348 points | |
Help | ||
Witcher 3 FPS Chart
| low | med. | high | ultra | QHD | 4K | |
|---|---|---|---|---|---|---|
| GTA V (2015) | 175 | 169 | 131 | 76.1 | 70.4 | 75.5 |
| The Witcher 3 (2015) | 335.1 | 227.4 | 149.5 | 81.7 | 57.5 | |
| Dota 2 Reborn (2015) | 164 | 148 | 140 | 131 | 95 | |
| Final Fantasy XV Benchmark (2018) | 155 | 110 | 81.1 | 62.6 | 35.4 | |
| X-Plane 11.11 (2018) | 108 | 90.8 | 76.5 | 48.6 | ||
| Far Cry 5 (2018) | 137 | 93 | 90 | 85 | 79 | 44 |
| Strange Brigade (2018) | 337 | 195 | 165 | 147 | 108 | 64 |
| Shadow of the Tomb Raider (2018) | 128 | 109 | 106 | 94 | 71 | 38 |
| Far Cry New Dawn (2019) | 105 | 85 | 78 | 71 | 62 | 43 |
| Metro Exodus (2019) | 154 | 94.8 | 74.5 | 59.8 | 46.3 | 28.5 |
| Borderlands 3 (2019) | 159.6 | 121.6 | 85.9 | 67.1 | 46.8 | 25.6 |
| Gears Tactics (2020) | 145.8 | 181.2 | 120.3 | 94.7 | 66.6 | 34.9 |
| Horizon Zero Dawn (2020) | 133 | 109 | 101 | 91 | 73 | 40 |
| Watch Dogs Legion (2020) | 69 | 64 | 60 | 45 | 43 | 26 |
| Dirt 5 (2020) | 178.1 | 115.2 | 91.7 | 74.8 | 59.5 | 39 |
| Assassin´s Creed Valhalla (2020) | 113 | 76 | 64 | 55 | 44 | 29 |
| Immortals Fenyx Rising (2020) | 123 | 90 | 84 | 80 | 59 | 38 |
| Hitman 3 (2021) | 206.6 | 147.3 | 138.1 | 125.8 | 87.1 | 47.1 |
| F1 2021 (2021) | 164 | 136 | 122 | 85 | 59 | 38 |
Emissions
系统噪音
Fury 15 G8的两个50毫米风扇在引入压力负荷时往往比Fury 15 G7更快地提高转速。例如,在运行3DMark 06的第一个基准场景时,我们能够记录到37.8 dB(A)的高分贝,而旧型号上只有31.7 dB(A)。总的来说,风扇噪音仍然比ZBook Studio 15 G8安静,但比速度较慢的ZBook Firefly 15 G7响得多。
| HP ZBook Fury 15 G8 RTX A5000 Laptop GPU, i9-11950H, Samsung PM981a MZVLB1T0HBLR | HP ZBook Fury 15 G7 Quadro RTX 5000 Max-Q, W-10885M, Samsung PM981a MZVLB1T0HBLR | Dell Precision 5000 5560 RTX A2000 Laptop GPU, i7-11850H, Samsung PM9A1 MZVL22T0HBLB | HP ZBook Studio 15 G8 GeForce RTX 3070 Laptop GPU, i9-11950H, Samsung PM981a MZVLB2T0HALB | Lenovo ThinkPad P15s Gen2-20W6000GGE T500 Laptop GPU, i7-1165G7, WDC PC SN720 SDAQNTW-1T00 | HP ZBook Firefly 15 G7 Quadro P520, i7-10610U, Toshiba XG6 KXG60ZNV1T02 | |
|---|---|---|---|---|---|---|
| Noise | -5% | 8% | -6% | 2% | -3% | |
| off / environment * (dB) | 24.1 | 26.4 -10% | 23.4 3% | 23.5 2% | 24.3 -1% | 29.3 -22% |
| Idle Minimum * (dB) | 24.1 | 26.4 -10% | 23.6 2% | 25.3 -5% | 25.5 -6% | 29.3 -22% |
| Idle Average * (dB) | 24.1 | 26.4 -10% | 23.6 2% | 25.3 -5% | 25.5 -6% | 29.3 -22% |
| Idle Maximum * (dB) | 24.8 | 26.4 -6% | 23.6 5% | 25.3 -2% | 25.5 -3% | 30 -21% |
| Load Average * (dB) | 37.8 | 31.7 16% | 25.8 32% | 41.2 -9% | 35.65 6% | 32.8 13% |
| Witcher 3 ultra * (dB) | 44.2 | 47 -6% | 40.1 9% | 49.4 -12% | 32.8 26% | |
| Load Maximum * (dB) | 44.2 | 47 -6% | 41.4 6% | 49.4 -12% | 35.65 19% | 32.8 26% |
* ... smaller is better
Noise level
| Idle |
| 24.1 / 24.1 / 24.8 dB(A) |
| Load |
| 37.8 / 44.2 dB(A) |
 | ||
30 dB silent 40 dB(A) audible 50 dB(A) loud |
||
min: | ||
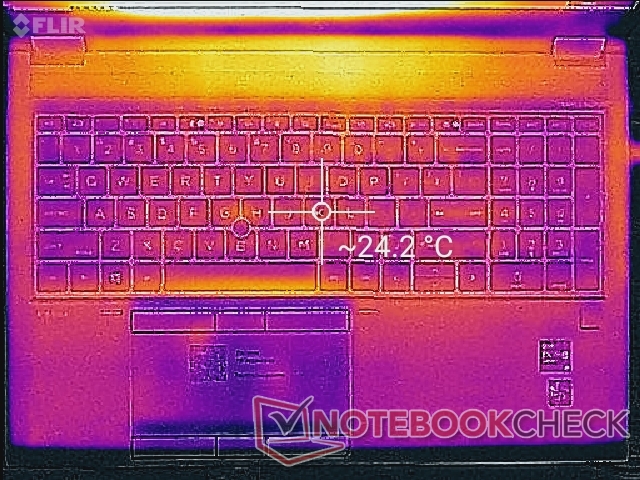
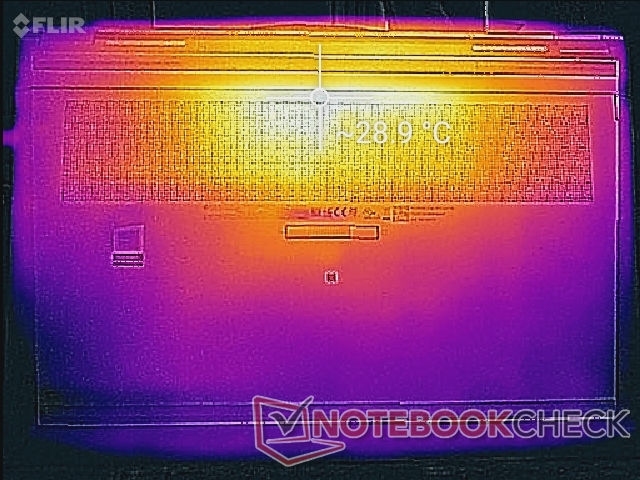
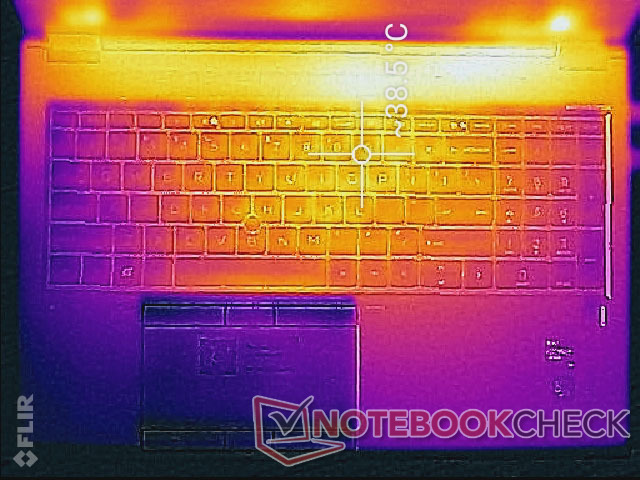
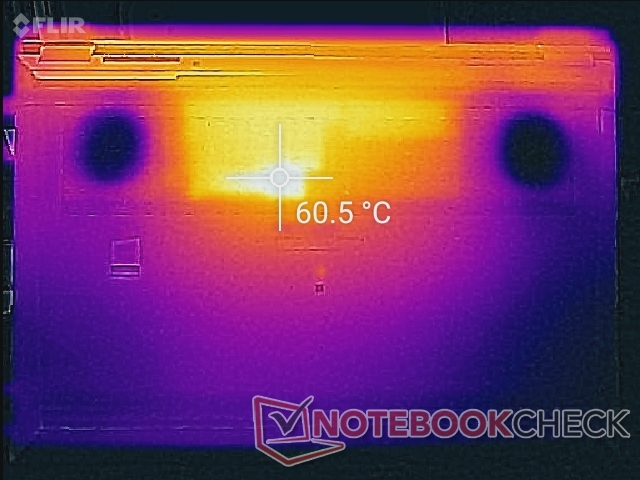
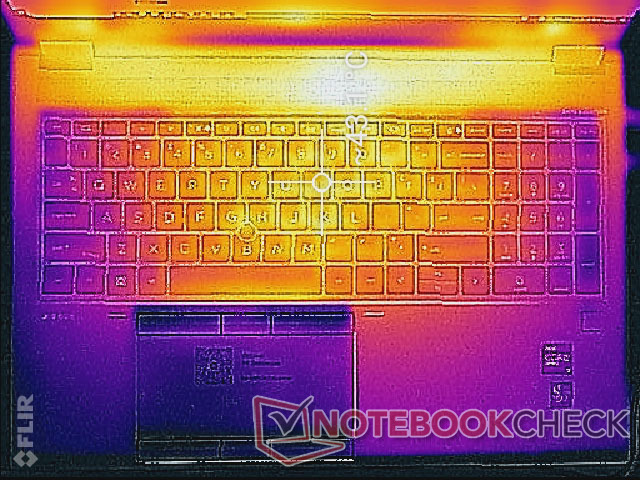
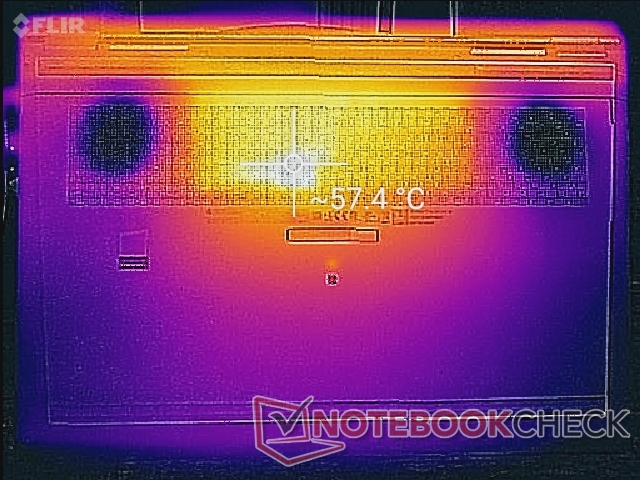
温度 - 汽化室冷却
顶部和底部的表面温度可分别达到43℃和60℃,而顶部和底部的温度为49℃至53℃。 Precision 7550当长时间运行高要求的负载时。换句话说,惠普的顶部温度较低,代价是底部温度较高,而戴尔的底部温度较低,代价是键盘按键较热。
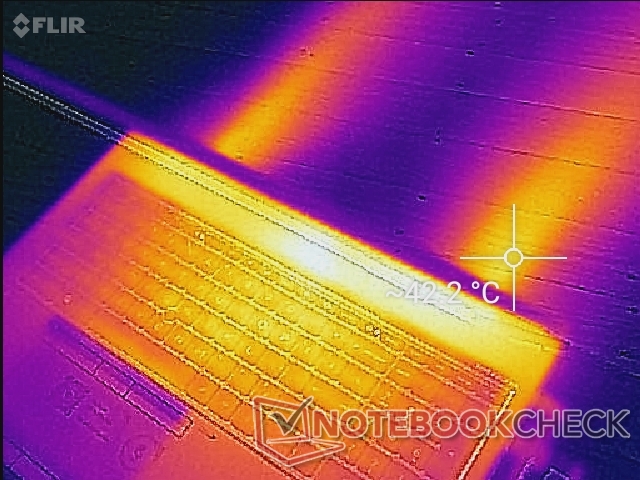
(-) The maximum temperature on the upper side is 45.6 °C / 114 F, compared to the average of 38.2 °C / 101 F, ranging from 22.2 to 69.8 °C for the class Workstation.
(-) The bottom heats up to a maximum of 57.6 °C / 136 F, compared to the average of 41.1 °C / 106 F
(+) In idle usage, the average temperature for the upper side is 24.4 °C / 76 F, compared to the device average of 32 °C / 90 F.
(±) Playing The Witcher 3, the average temperature for the upper side is 34 °C / 93 F, compared to the device average of 32 °C / 90 F.
(+) The palmrests and touchpad are reaching skin temperature as a maximum (33 °C / 91.4 F) and are therefore not hot.
(-) The average temperature of the palmrest area of similar devices was 27.8 °C / 82 F (-5.2 °C / -9.4 F).
压力测试
当使用Prime95时,CPU会在最初的几秒钟内提升到3.6GHz,直到达到96℃的核心温度,然后时钟频率会稳定在3.0至3.5GHz的范围内,同时保持96℃。结果与我们在戴尔Precision 7550和旧版Fury 15 G7上观察到的结果相似,表明这些高性能工作站优先考虑CPU性能,即使这意味着整体核心温度更高。
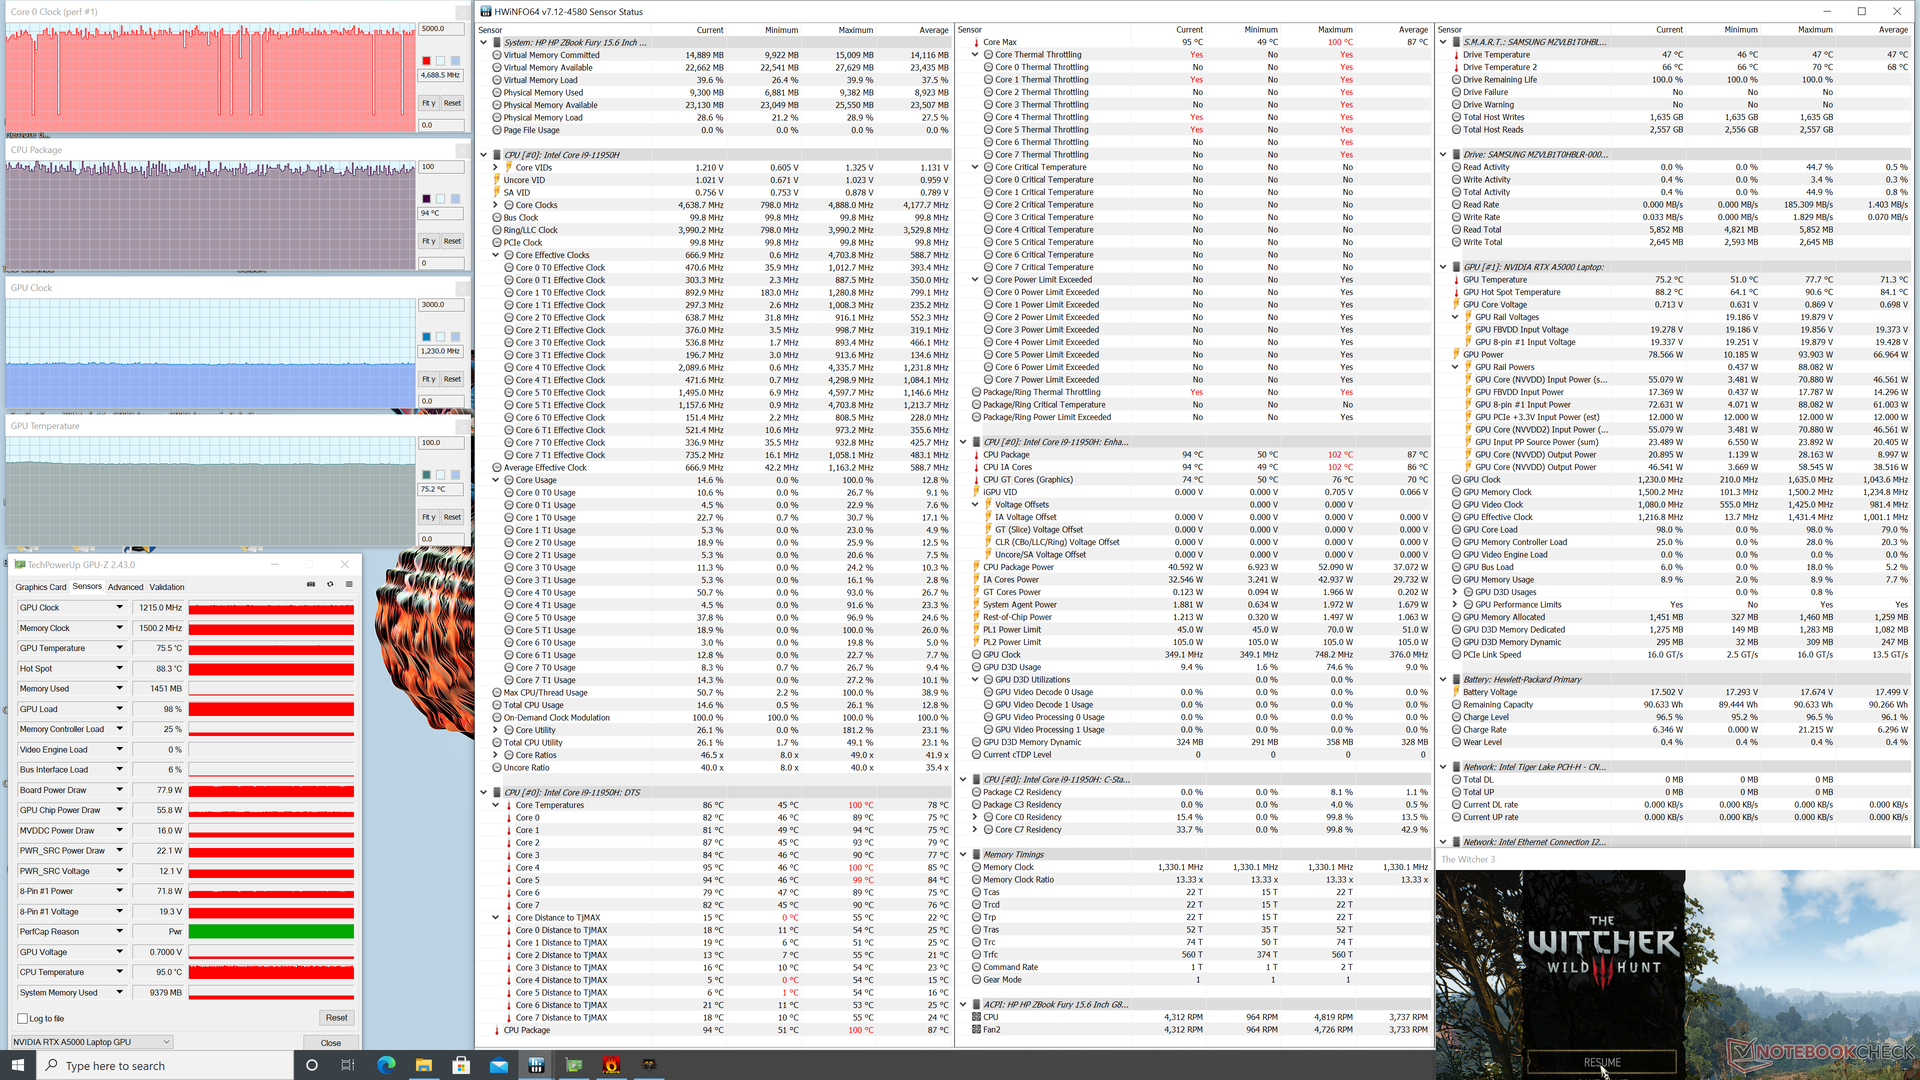
当运行Witcher 3 ,CPU和GPU温度将分别稳定在94℃和75℃,而Fury 15 G7的温度为85℃和70℃。因此,性能的逐年提升带来了轻微的温度上升。我们的Precision 7550的处理器在运行相同的游戏时,将稳定在10至20摄氏度的较低温度,幅度相对较大。
在运行游戏负载时,GPU板的功耗将稳定在78W,而其TGP目标为90W。我们能够达到93W的功耗,尽管只是在测试开始时的一小段时间内。
用电池运行会限制性能。在电池供电的情况下,3DMarkFire Strike 测试将返回物理和图形分数,分别为17779和6244分,而在主电源供电时则为22483和 23579分。
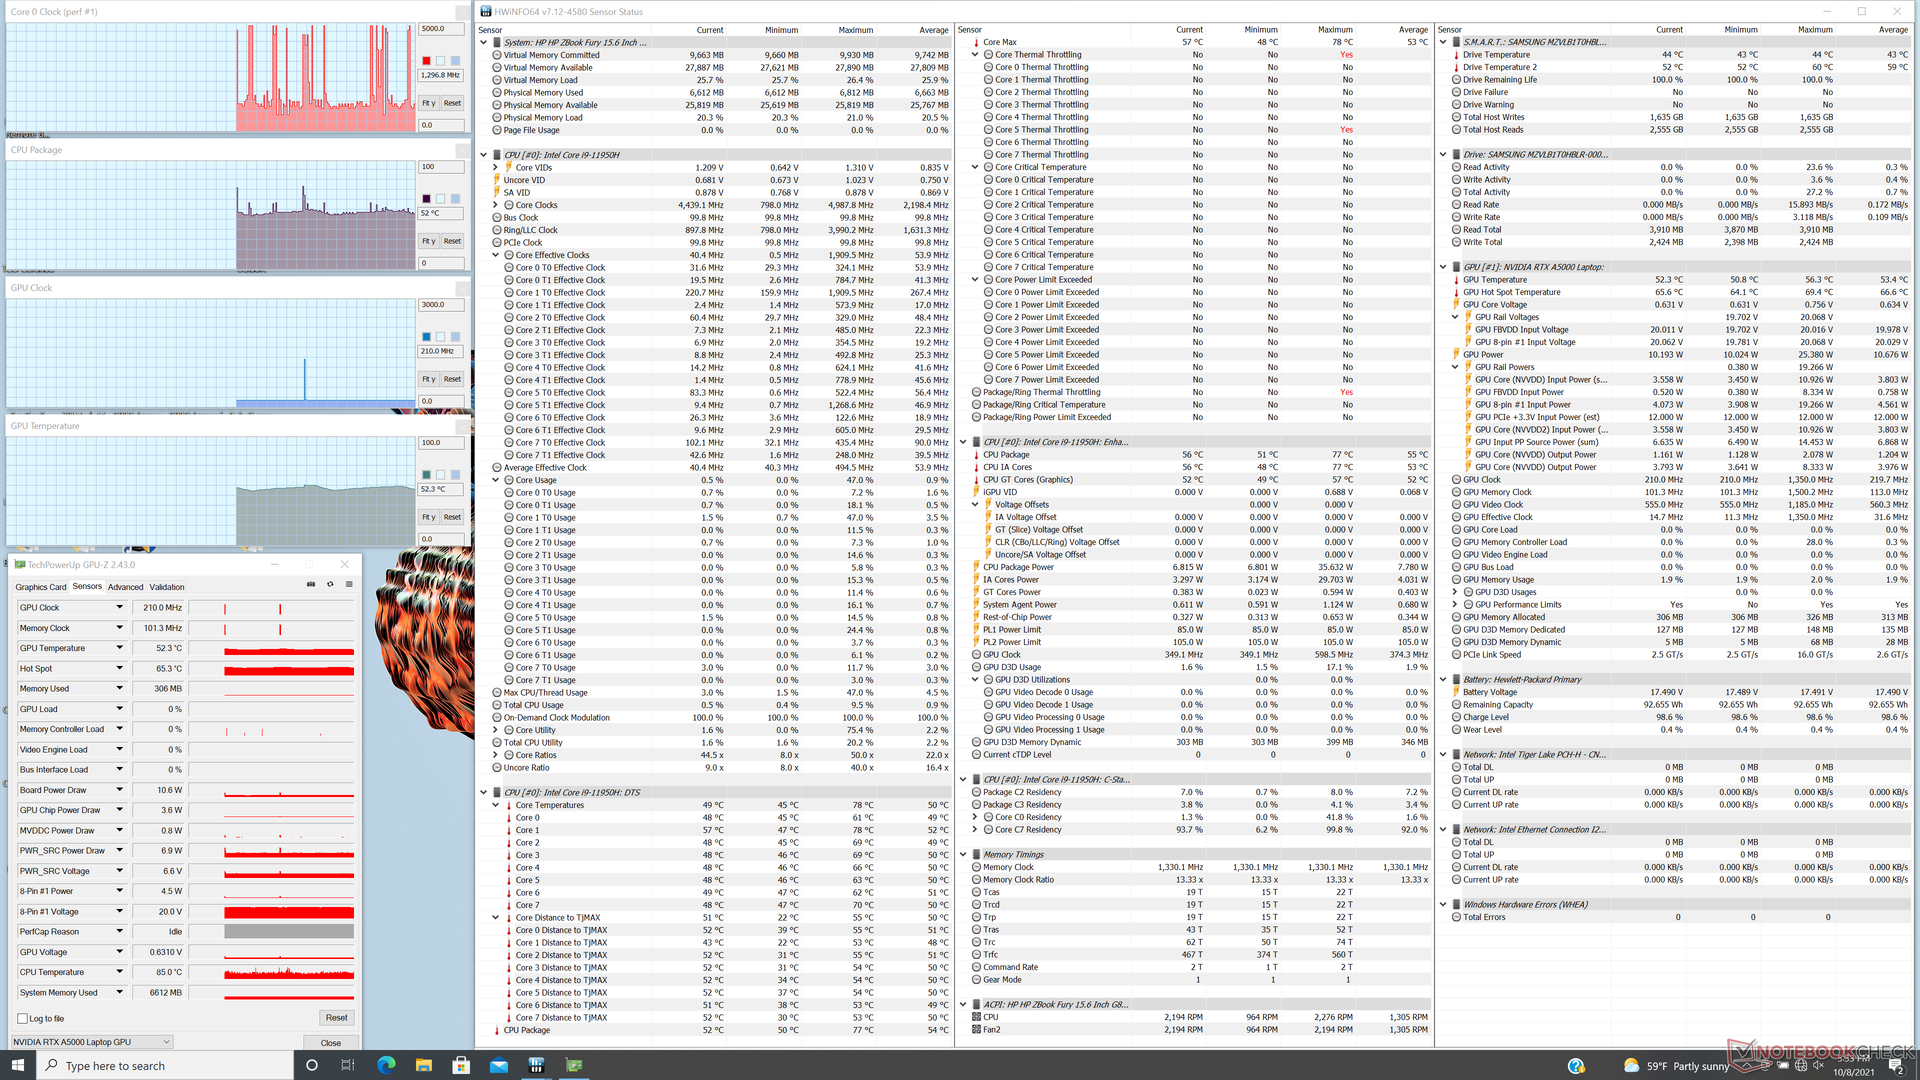
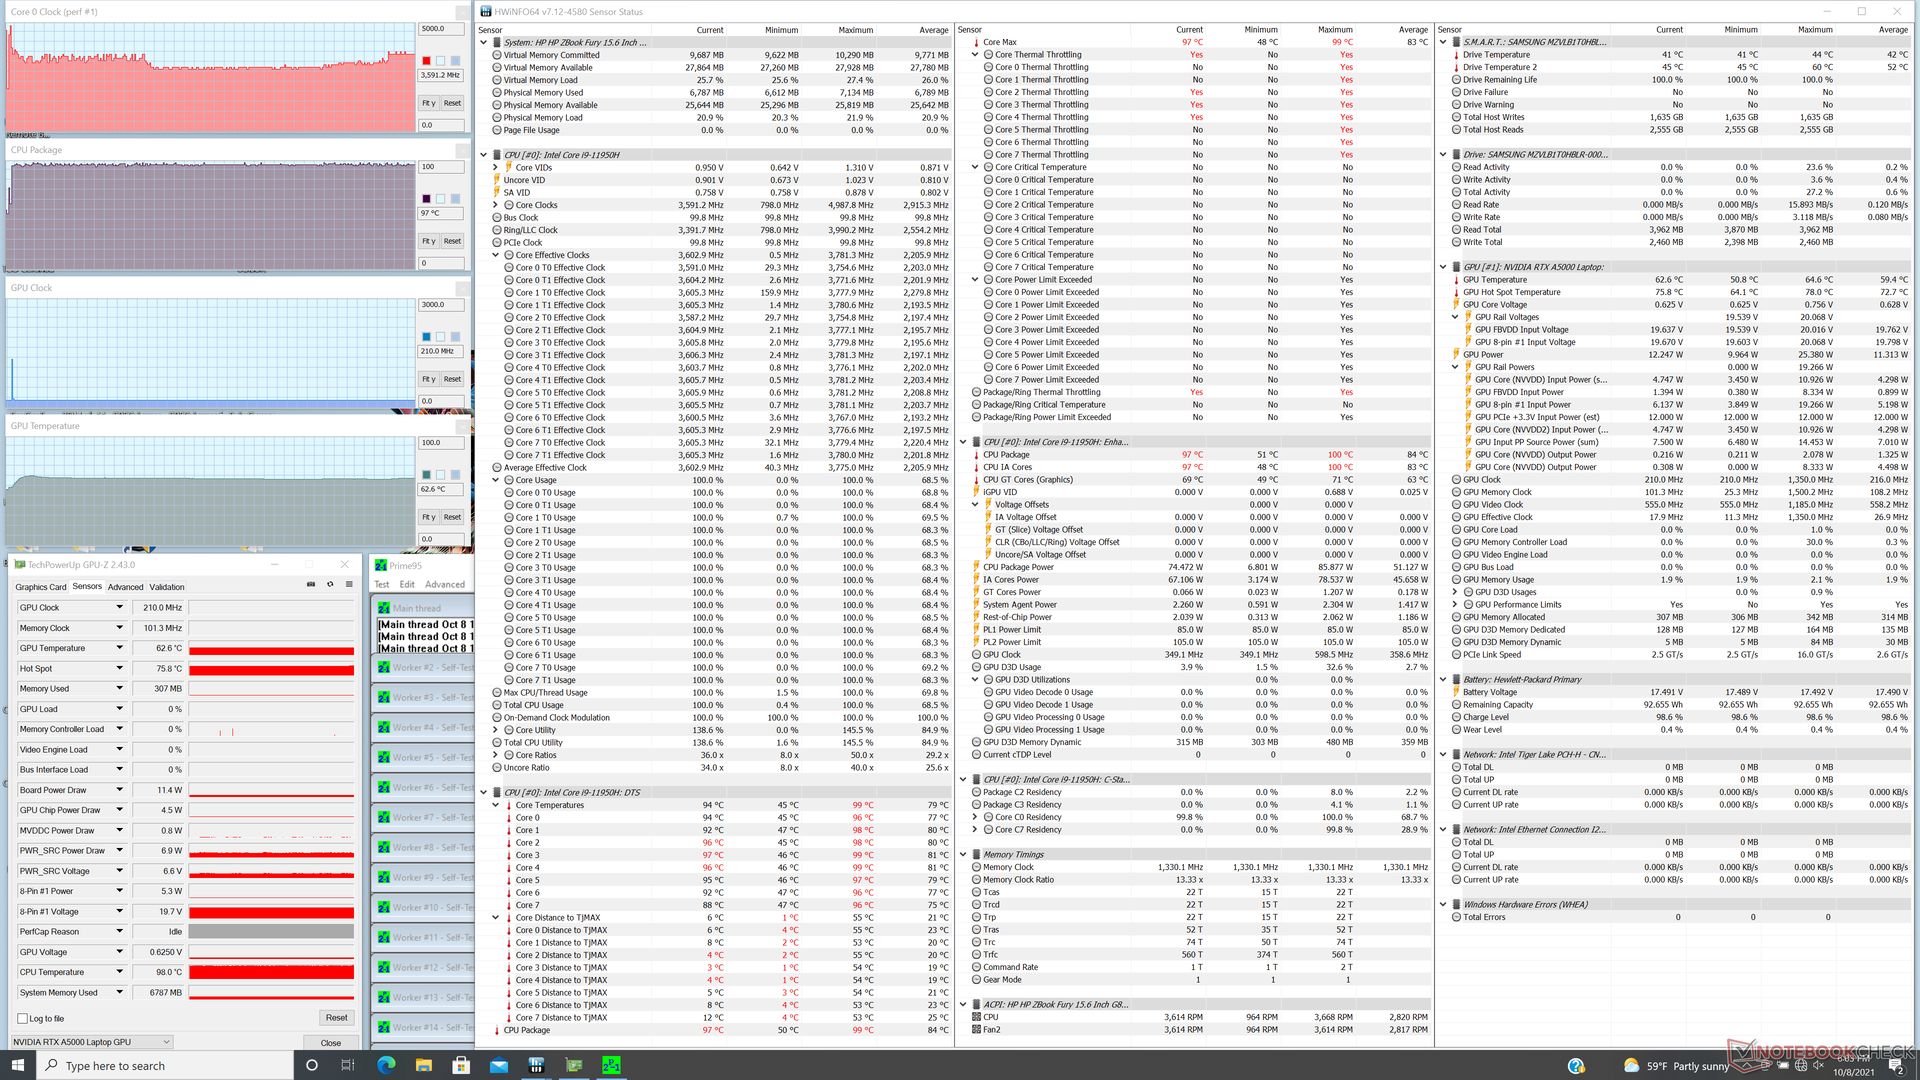
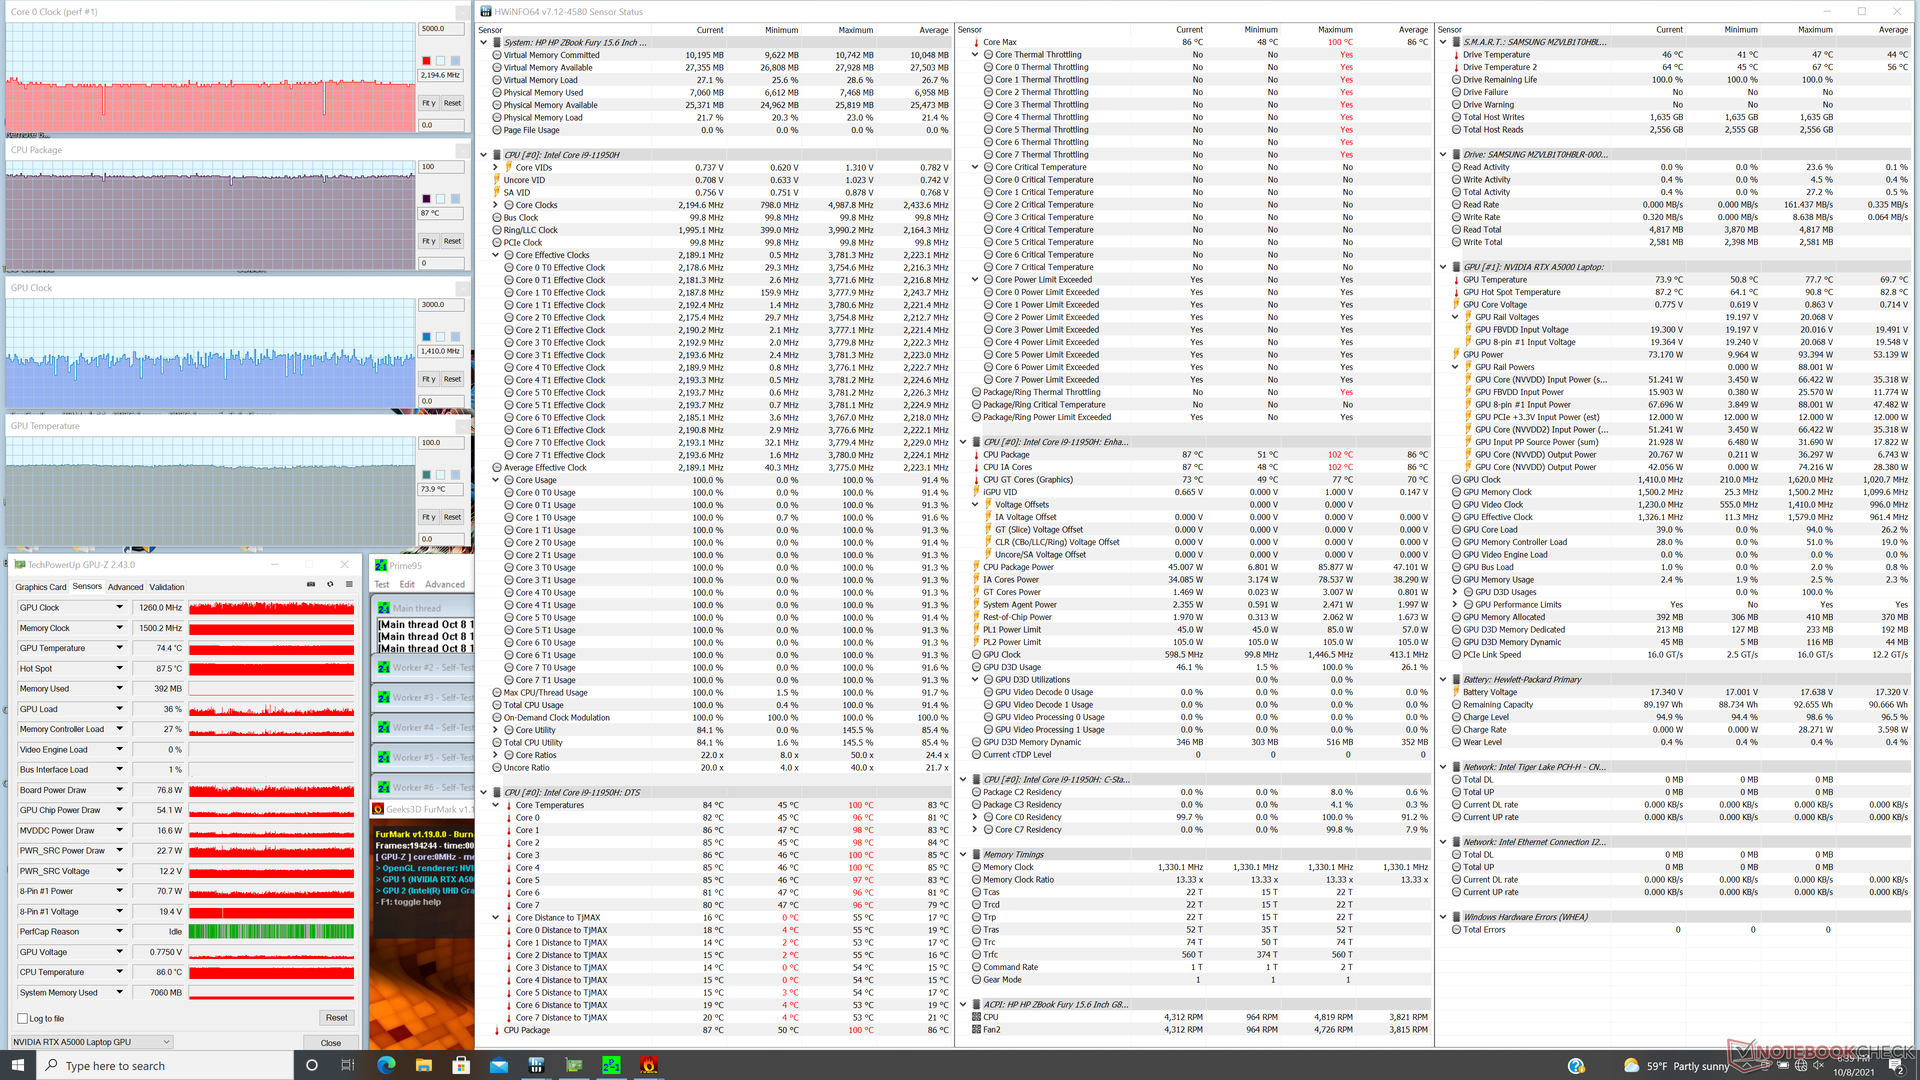
| CPU时钟(GHz) | GPU时钟(MHz) | CPU平均温度(℃) | GPU平均温度(℃) | |
| 系统空闲 | -- | -- | 52 | 52 |
| Prime95压力 | 3.0 - 3.5 | -- | 97 | 63 |
| Prime95 + FurMark压力 | 2.2 | ~1260 | 87 | 74 |
| Witcher 3 Stress | ~4.7 | 1215 | ~94 | 75 |
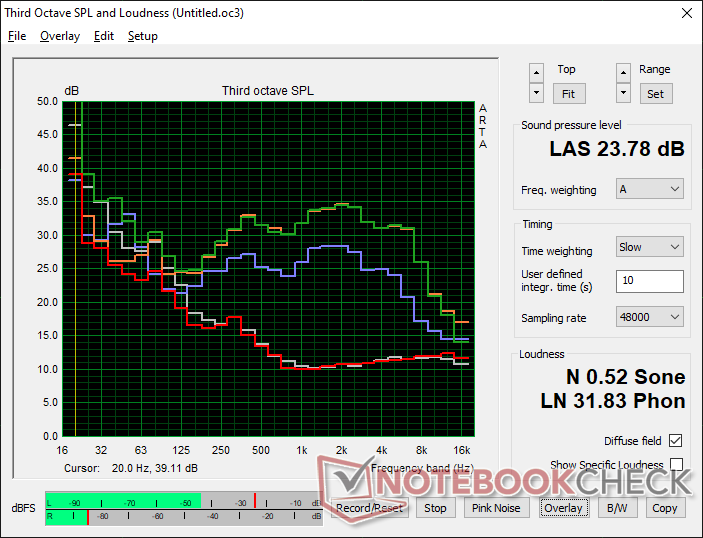
发言人

HP ZBook Fury 15 G8 audio analysis
(±) | speaker loudness is average but good (79.8 dB)
Bass 100 - 315 Hz
(±) | reduced bass - on average 10.6% lower than median
(±) | linearity of bass is average (8.8% delta to prev. frequency)
Mids 400 - 2000 Hz
(+) | balanced mids - only 3.9% away from median
(+) | mids are linear (4.8% delta to prev. frequency)
Highs 2 - 16 kHz
(+) | balanced highs - only 2.9% away from median
(+) | highs are linear (5.3% delta to prev. frequency)
Overall 100 - 16.000 Hz
(+) | overall sound is linear (11.9% difference to median)
Compared to same class
» 17% of all tested devices in this class were better, 4% similar, 79% worse
» The best had a delta of 7%, average was 17%, worst was 35%
Compared to all devices tested
» 9% of all tested devices were better, 2% similar, 89% worse
» The best had a delta of 4%, average was 23%, worst was 134%
Apple MacBook 12 (Early 2016) 1.1 GHz audio analysis
(+) | speakers can play relatively loud (83.6 dB)
Bass 100 - 315 Hz
(±) | reduced bass - on average 11.3% lower than median
(±) | linearity of bass is average (14.2% delta to prev. frequency)
Mids 400 - 2000 Hz
(+) | balanced mids - only 2.4% away from median
(+) | mids are linear (5.5% delta to prev. frequency)
Highs 2 - 16 kHz
(+) | balanced highs - only 2% away from median
(+) | highs are linear (4.5% delta to prev. frequency)
Overall 100 - 16.000 Hz
(+) | overall sound is linear (10.2% difference to median)
Compared to same class
» 7% of all tested devices in this class were better, 2% similar, 90% worse
» The best had a delta of 5%, average was 18%, worst was 53%
Compared to all devices tested
» 5% of all tested devices were better, 1% similar, 94% worse
» The best had a delta of 4%, average was 23%, worst was 134%
Energy Management
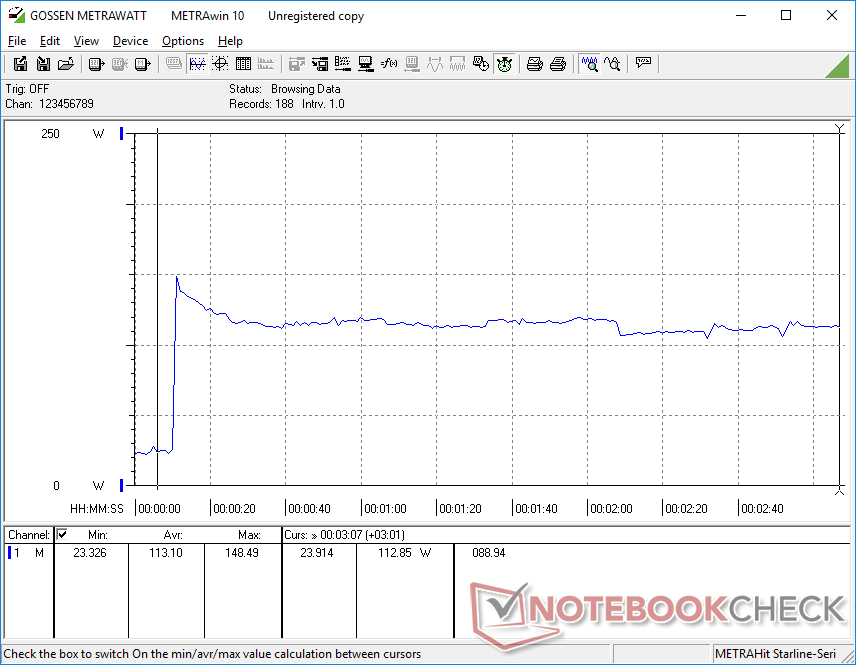
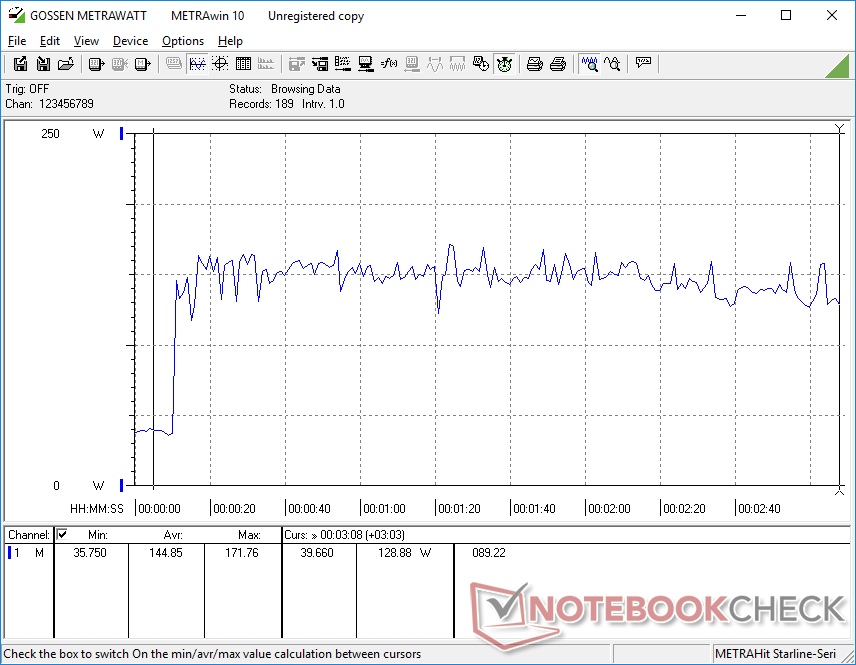
耗电量--高耗能显示器
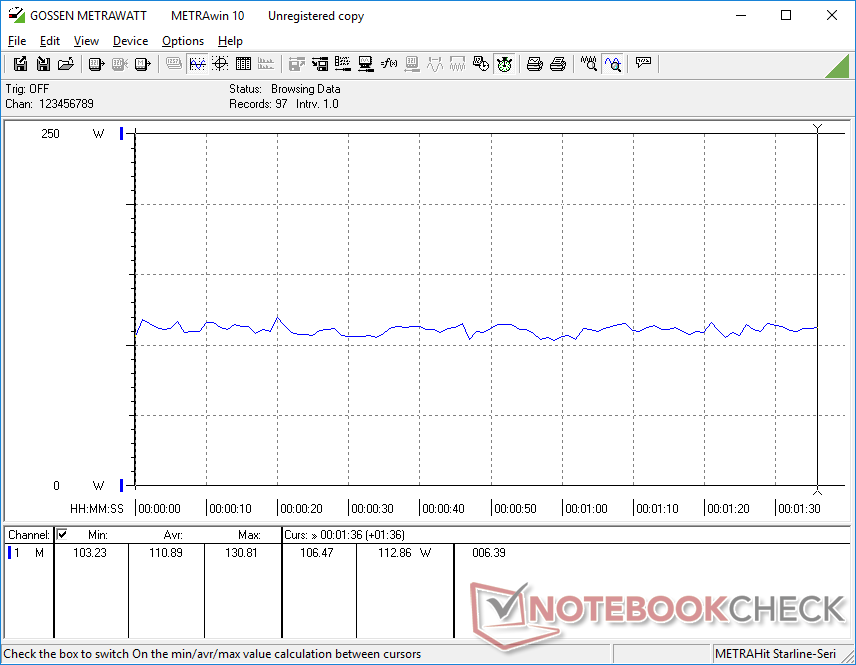
该系统比其直接的Fury 15 G7前辈的功耗略高,尤其是在低处理负荷下。我们的设备会在8瓦至20瓦的稍高范围内安顿下来,而旧型号的功率为4瓦至14瓦。否则,在运行高要求的负载时,两款机型的功耗非常接近。
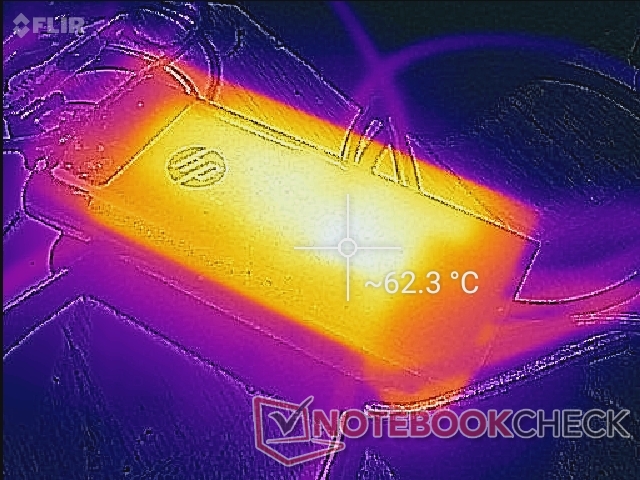
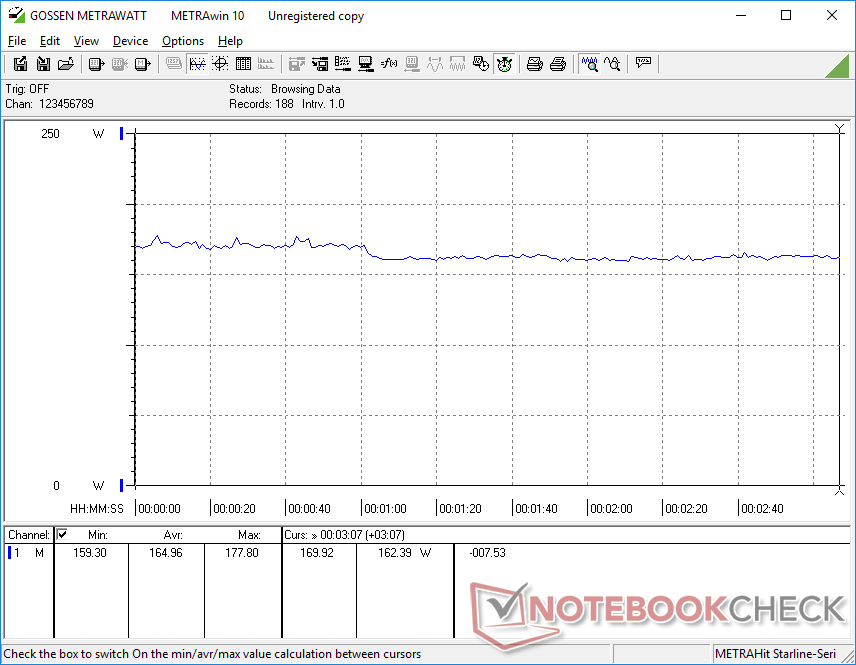
运行极端负载(Prime95+FurMark)会导致中等大小(约15.2 x 7.2 x 2.4厘米)的200瓦交流适配器的功耗飙升至172瓦。即使在运行高负荷时,系统也会继续充电,尽管速度较慢。
从最低亮度设置跳到最高亮度设置会多消耗约11W,而由于我们的惠普的超亮面板,在大多数超极本上的消耗量约为一半。
| Off / Standby | |
| Idle | |
| Load |
|
Key:
min: | |
| HP ZBook Fury 15 G8 i9-11950H, RTX A5000 Laptop GPU, Samsung PM981a MZVLB1T0HBLR, IPS, 3840x2160, 15.6" | HP ZBook Fury 15 G7 W-10885M, Quadro RTX 5000 Max-Q, Samsung PM981a MZVLB1T0HBLR, IPS, 3840x2160, 15.6" | Dell Precision 5000 5560 i7-11850H, RTX A2000 Laptop GPU, Samsung PM9A1 MZVL22T0HBLB, IPS, 3840x2400, 15.6" | HP ZBook Studio 15 G8 i9-11950H, GeForce RTX 3070 Laptop GPU, Samsung PM981a MZVLB2T0HALB, OLED, 3840x2160, 15.6" | Lenovo ThinkPad P15s Gen2-20W6000GGE i7-1165G7, T500 Laptop GPU, WDC PC SN720 SDAQNTW-1T00, IPS LED, 3840x2160, 15.6" | HP ZBook Firefly 15 G7 i7-10610U, Quadro P520, Toshiba XG6 KXG60ZNV1T02, IPS LED, 3840x2160, 15.6" | |
|---|---|---|---|---|---|---|
| Power Consumption | 11% | 22% | -10% | 49% | 59% | |
| Idle Minimum * (Watt) | 8.3 | 4.6 45% | 6.2 25% | 11 -33% | 5.8 30% | 3.5 58% |
| Idle Average * (Watt) | 19.9 | 13.6 32% | 13.9 30% | 18.8 6% | 13.3 33% | 6.7 66% |
| Idle Maximum * (Watt) | 21.8 | 21.5 1% | 23.8 -9% | 31.7 -45% | 15.6 28% | 9.6 56% |
| Load Average * (Watt) | 110.9 | 113.1 -2% | 95.7 14% | 105.2 5% | 43.2 61% | 60 46% |
| Witcher 3 ultra * (Watt) | 165 | 157.5 5% | 87 47% | 148 10% | 37.1 78% | 49.3 70% |
| Load Maximum * (Watt) | 171.8 | 199 -16% | 132.6 23% | 171.8 -0% | 67.3 61% | 68.6 60% |
* ... smaller is better
Power Consumption Witcher 3 / Stresstest
电池寿命
与Fury 15 G7相比,Fury 15 G8的WLAN运行时间短了几个小时,即使设置为相同的平衡配置文件、显示亮度和集成图形设置。我们怀疑更高的原生刷新率或潜在的自动背景活动可能是造成电池寿命明显缩短的部分原因。
从空电到满电大约需要90分钟。只要功率输出足够高,大多数USB-C充电器也能在该系统上工作。
| HP ZBook Fury 15 G8 i9-11950H, RTX A5000 Laptop GPU, 94 Wh | HP ZBook Fury 15 G7 W-10885M, Quadro RTX 5000 Max-Q, 94 Wh | Dell Precision 5000 5560 i7-11850H, RTX A2000 Laptop GPU, 86 Wh | HP ZBook Studio 15 G8 i9-11950H, GeForce RTX 3070 Laptop GPU, 83 Wh | Lenovo ThinkPad P15s Gen2-20W6000GGE i7-1165G7, T500 Laptop GPU, 57 Wh | HP ZBook Firefly 15 G7 i7-10610U, Quadro P520, 53 Wh | |
|---|---|---|---|---|---|---|
| Battery runtime | 39% | 2% | 0% | 24% | 47% | |
| WiFi v1.3 (h) | 6.2 | 8.6 39% | 6.3 2% | 6.2 0% | 7.7 24% | 9.1 47% |
| Reader / Idle (h) | 13.2 | 12 | 12.9 | |||
| Load (h) | 1.3 | 1.8 | 1.8 | 1.9 | 2 |
Pros
Cons
结论 -- 愤怒的表现
ZBook Fury 15 G8从我们已经熟悉的Fury 15 G7机箱中榨取了更多性能。用户将看到最新一代CPU和GPU带来的边际到中等程度的收益,同时保持相同的AC适配器和物理特性。从Fury 15 G6到Fury 15 G7的跳跃对该系列来说已经很重要了,指望Fury 15 G8进行全面自上而下的重新设计是不现实的。如果性能提升与他们的工作负荷有关,电力用户可能想考虑Fury 15 G8。否则,Fury 15 G7可以用更少的钱提供基本相同的体验。
新的120赫兹4K面板选项值得称赞,也许比处理器的升级更值得称赞,因为更平滑的运动和减少的重影更明显。这绝对是我们希望在ZBook系列之外的更多笔记本电脑上看到的面板。
总的来说,Fury 15系列仍然是工作站的一个优秀替代品,如 MSI WS66, 雷蛇刀片工作室, ZBook Firefly, 或 联想ThinkPad P1这些产品牺牲了功能和选项,只是为了更薄和更时尚的外观。
价格和可用性
截至目前,ZBook Fury 15 G8还没有通过第三方零售商广泛销售。至少有一个SKU可以在Walmart上找到。,但用户应该直接从惠普购买https://www.hp.com/us-en/shop/pdp/hp-zbook-fury-15-g8-mobile-workstation-customizable-46q15av-mb以获得更多可配置的选项。
HP ZBook Fury 15 G8
- 10/13/2021 v7 (old)
Allen Ngo
Price comparison

