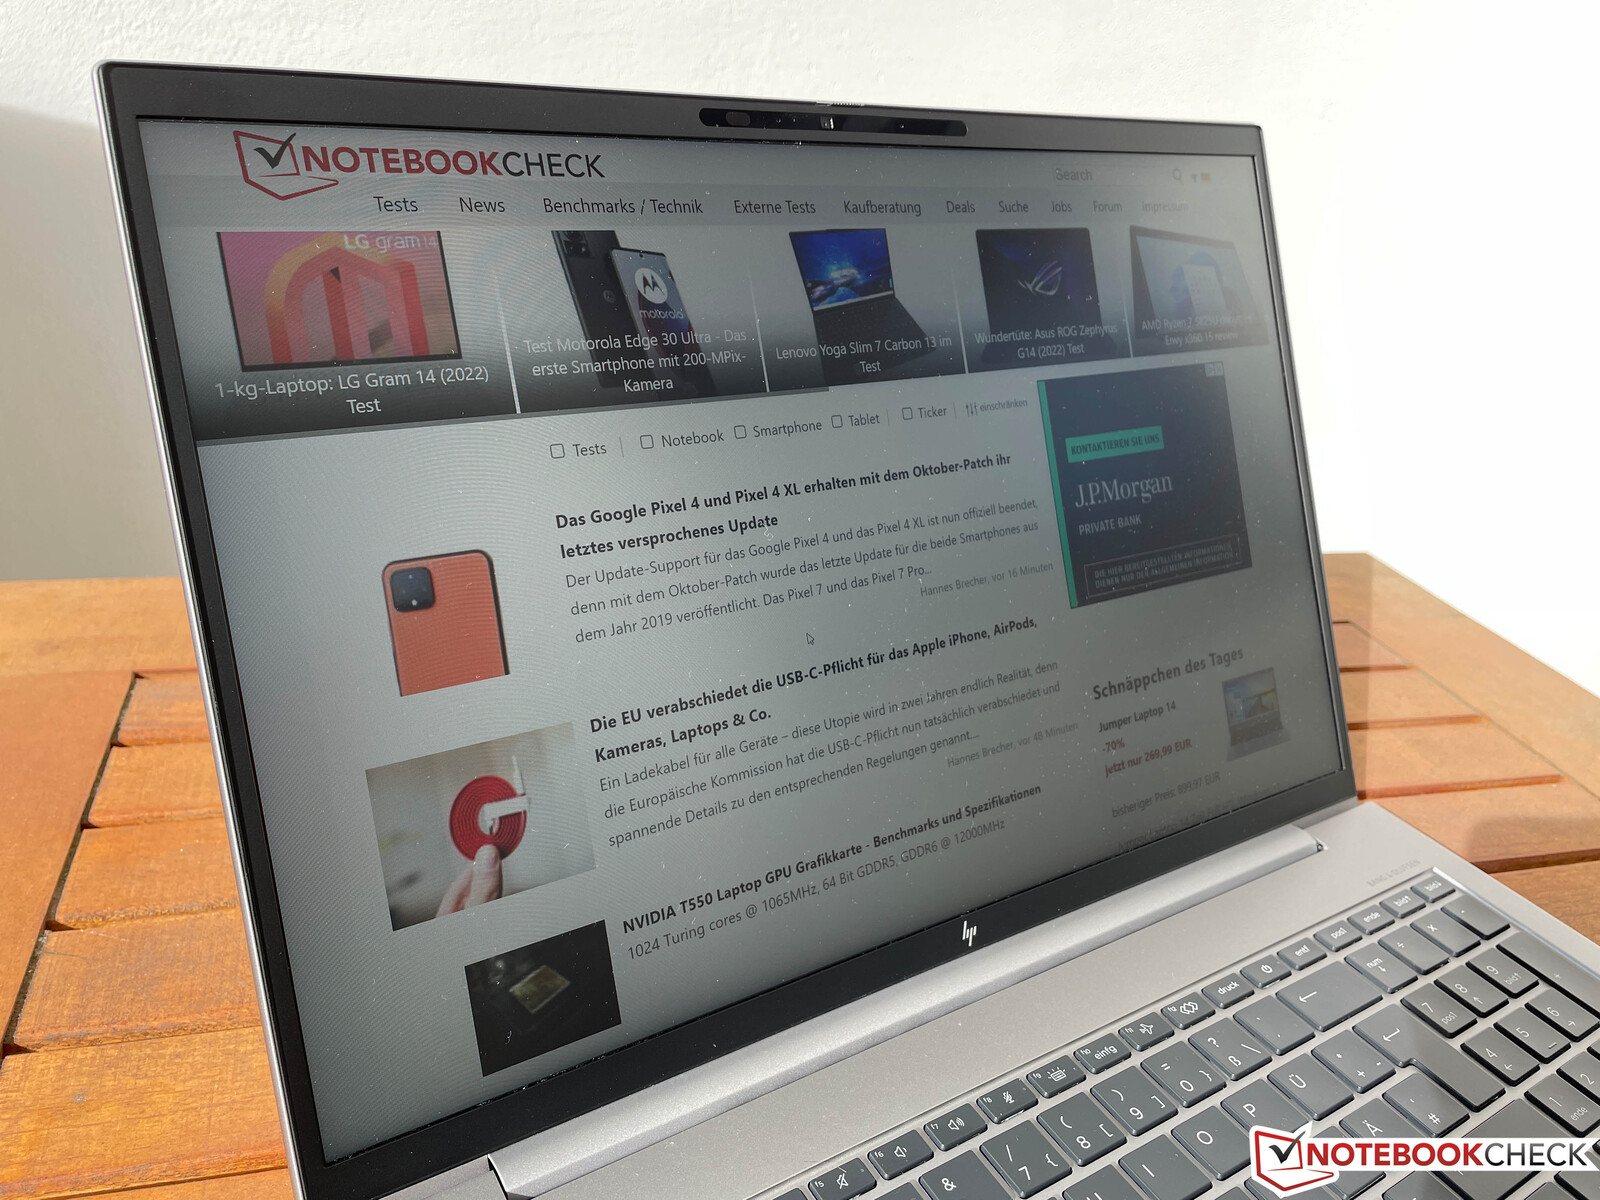
惠普ZBook Firefly 16 G9笔记本电脑评测--移动工作站,性能不尽如人意
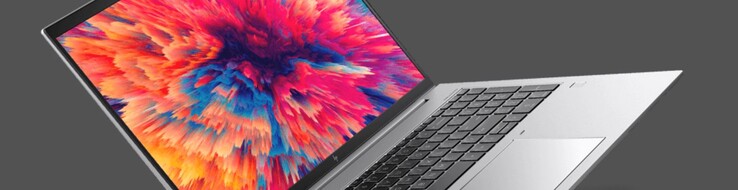
惠普的ZBook Firefly系列多年来一直由配备入门级专业GPU的超薄工作站组成,尽管只有14英寸和15英寸的外形尺寸。今年的萤火虫16 G9配备了更大的16英寸显示屏,与较小的型号一样,被惠普称为第九代。铝制外壳包含一个来自英特尔的新Alder Lake-U处理器和一个来自Nvidia的专业级T550 GPU。此外,这款笔记本电脑配备了32GB内存,1TB固态硬盘,以及16:10长宽比(1920 x 1200像素)的哑光IPS显示屏,目前售价约为3000美元。
潜在的竞争对手比较
Rating | Date | Model | Weight | Height | Size | Resolution | Price |
|---|---|---|---|---|---|---|---|
| 82.9 % v7 (old) | 10 / 2022 | HP ZBook Firefly 16 G9-6B897EA i7-1265U, T550 Laptop GPU | 2 kg | 19.2 mm | 16.00" | 1920x1200 | |
| 89.3 % v7 (old) | 02 / 2022 | Lenovo ThinkPad P1 G4-20Y4Z9DVUS i7-11800H, T1200 Laptop GPU | 1.8 kg | 17.7 mm | 16.00" | 2560x1600 | |
| 88.3 % v7 (old) | 10 / 2021 | Dell Precision 5000 5560 i7-11850H, RTX A2000 Laptop GPU | 2 kg | 18 mm | 15.60" | 3840x2400 | |
| 85.3 % v7 (old) | Lenovo ThinkPad P15s Gen2-20W6000GGE i7-1165G7, T500 Laptop GPU | 1.9 kg | 19.1 mm | 15.60" | 3840x2160 | ||
| 83.8 % v7 (old) | HP ZBook Firefly 15 G8 2C9R7EA i7-1165G7, T500 Laptop GPU | 1.8 kg | 19.2 mm | 15.60" | 1920x1080 | ||
| 93.2 % v7 (old) | 11 / 2021 | Apple MacBook Pro 16 2021 M1 Pro M1 Pro, M1 Pro 16-Core GPU | 2.2 kg | 16.8 mm | 16.20" | 3456x2234 |
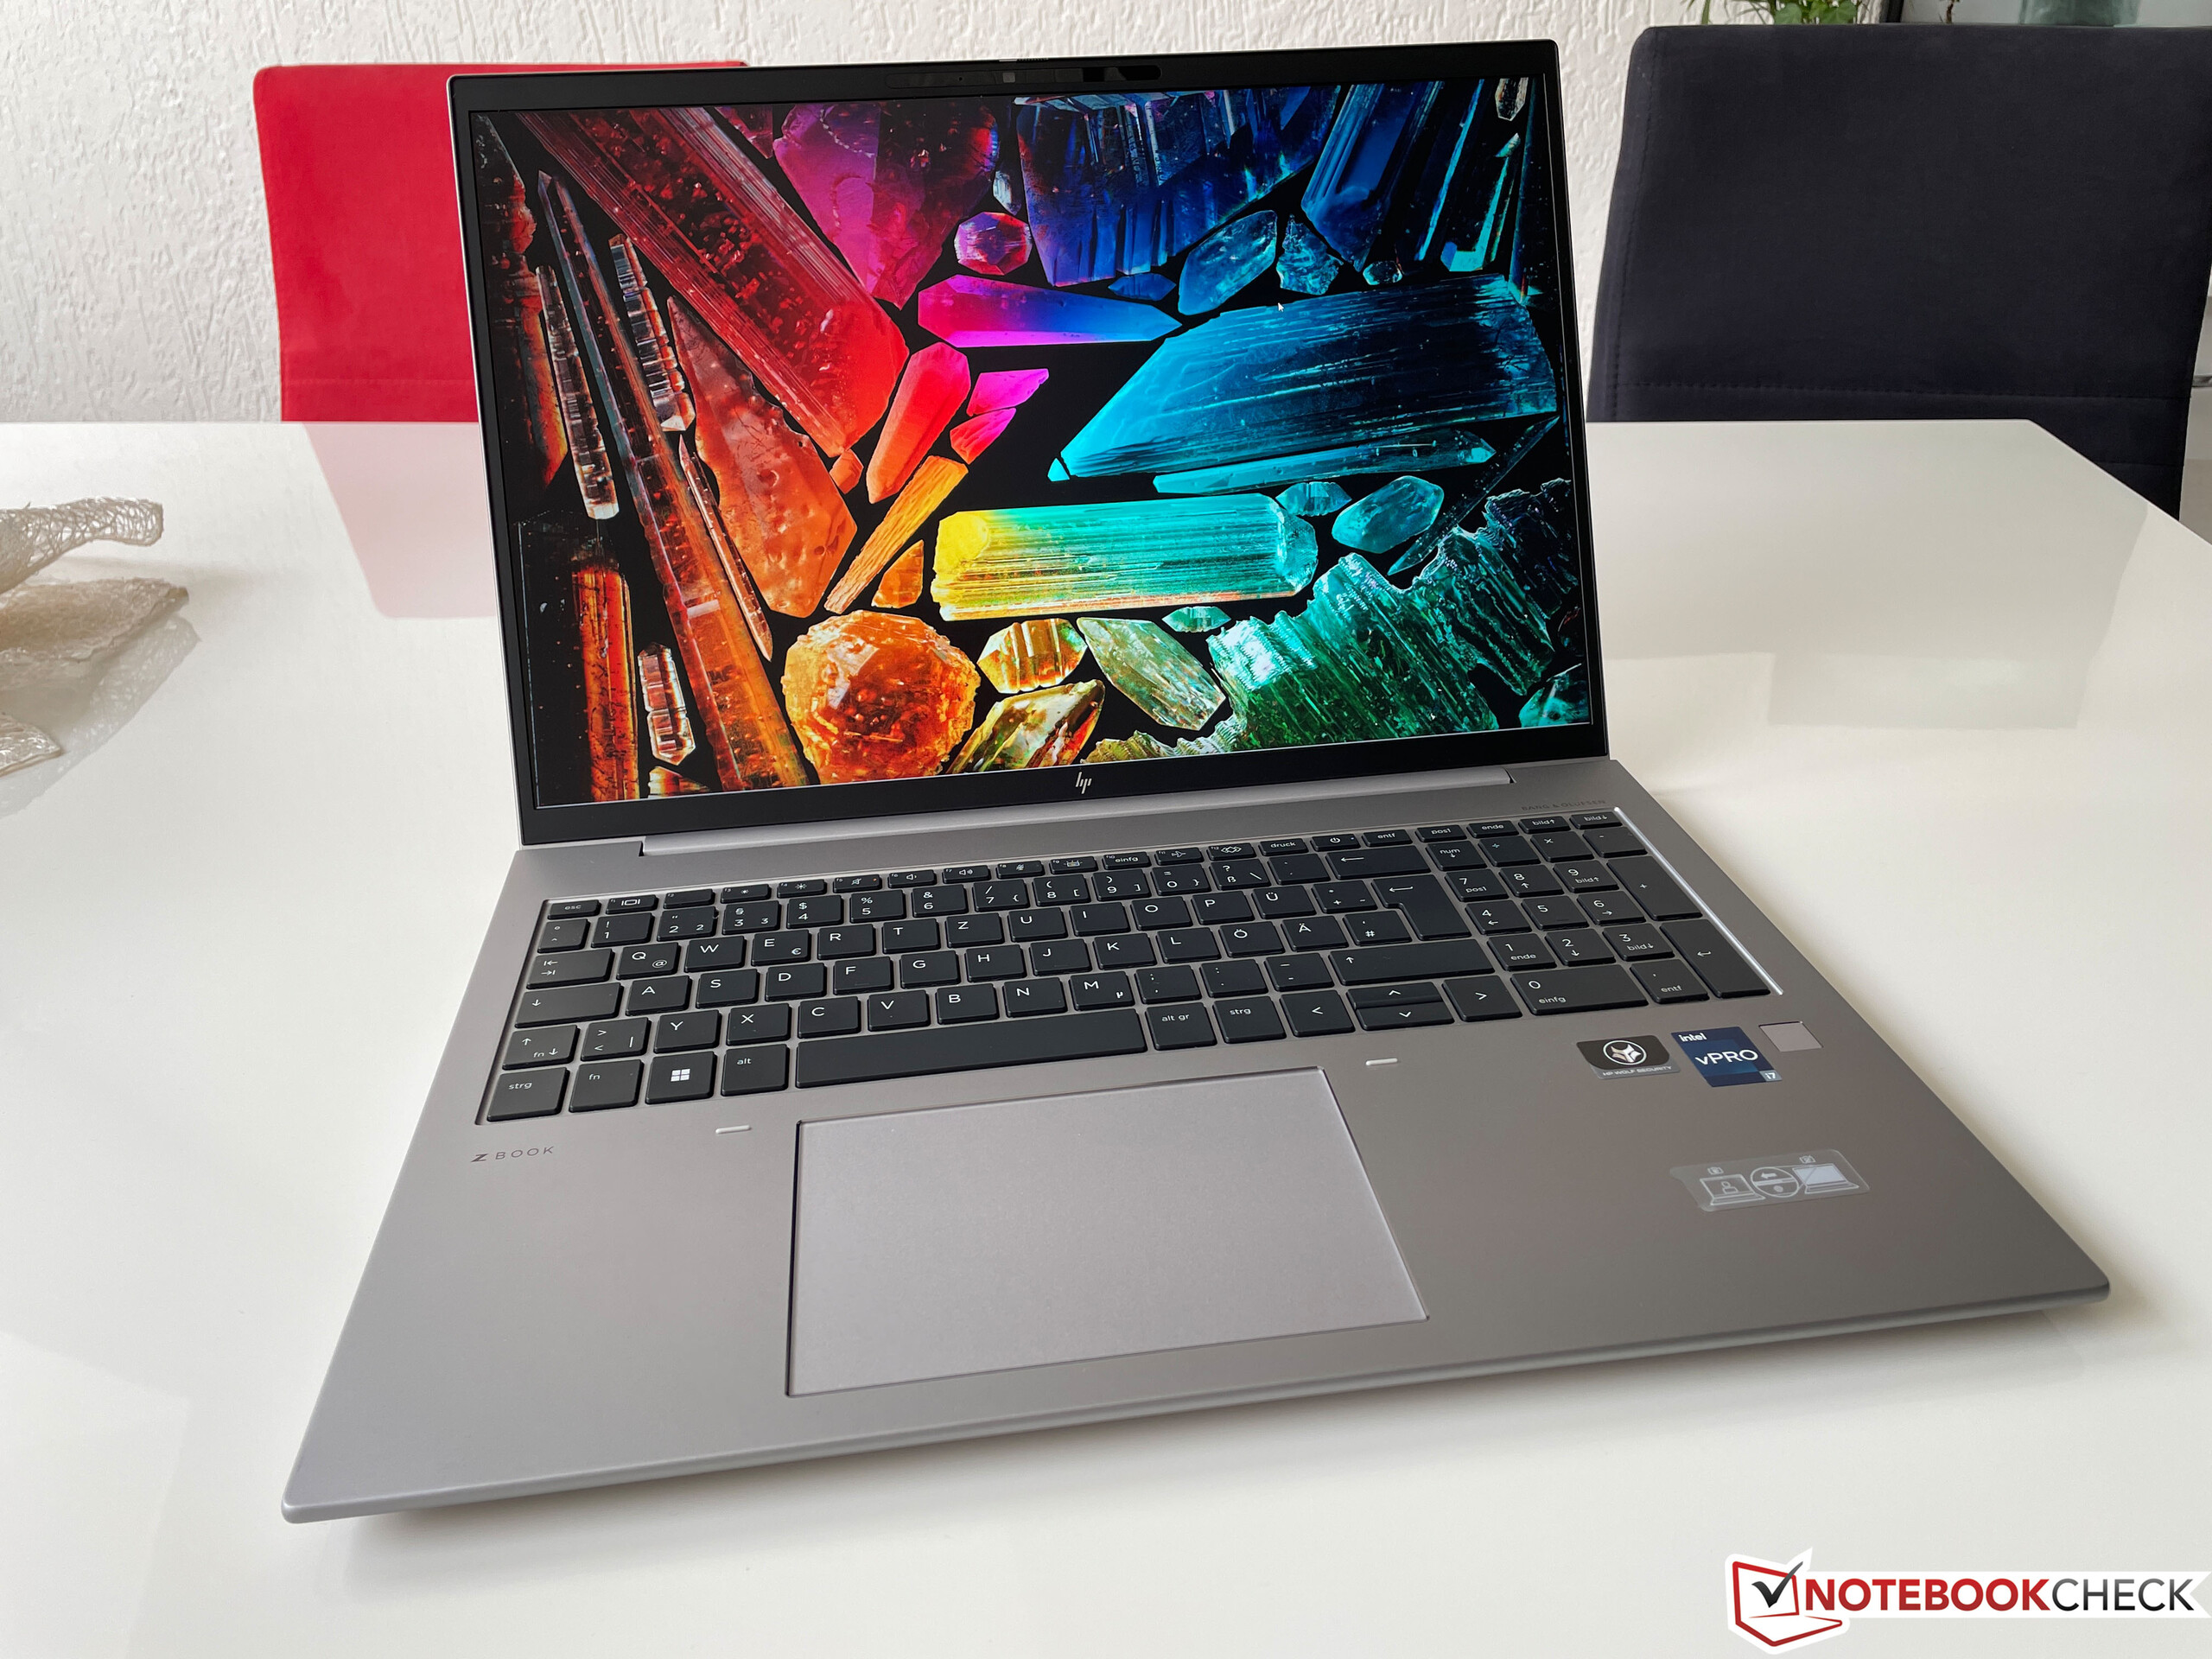
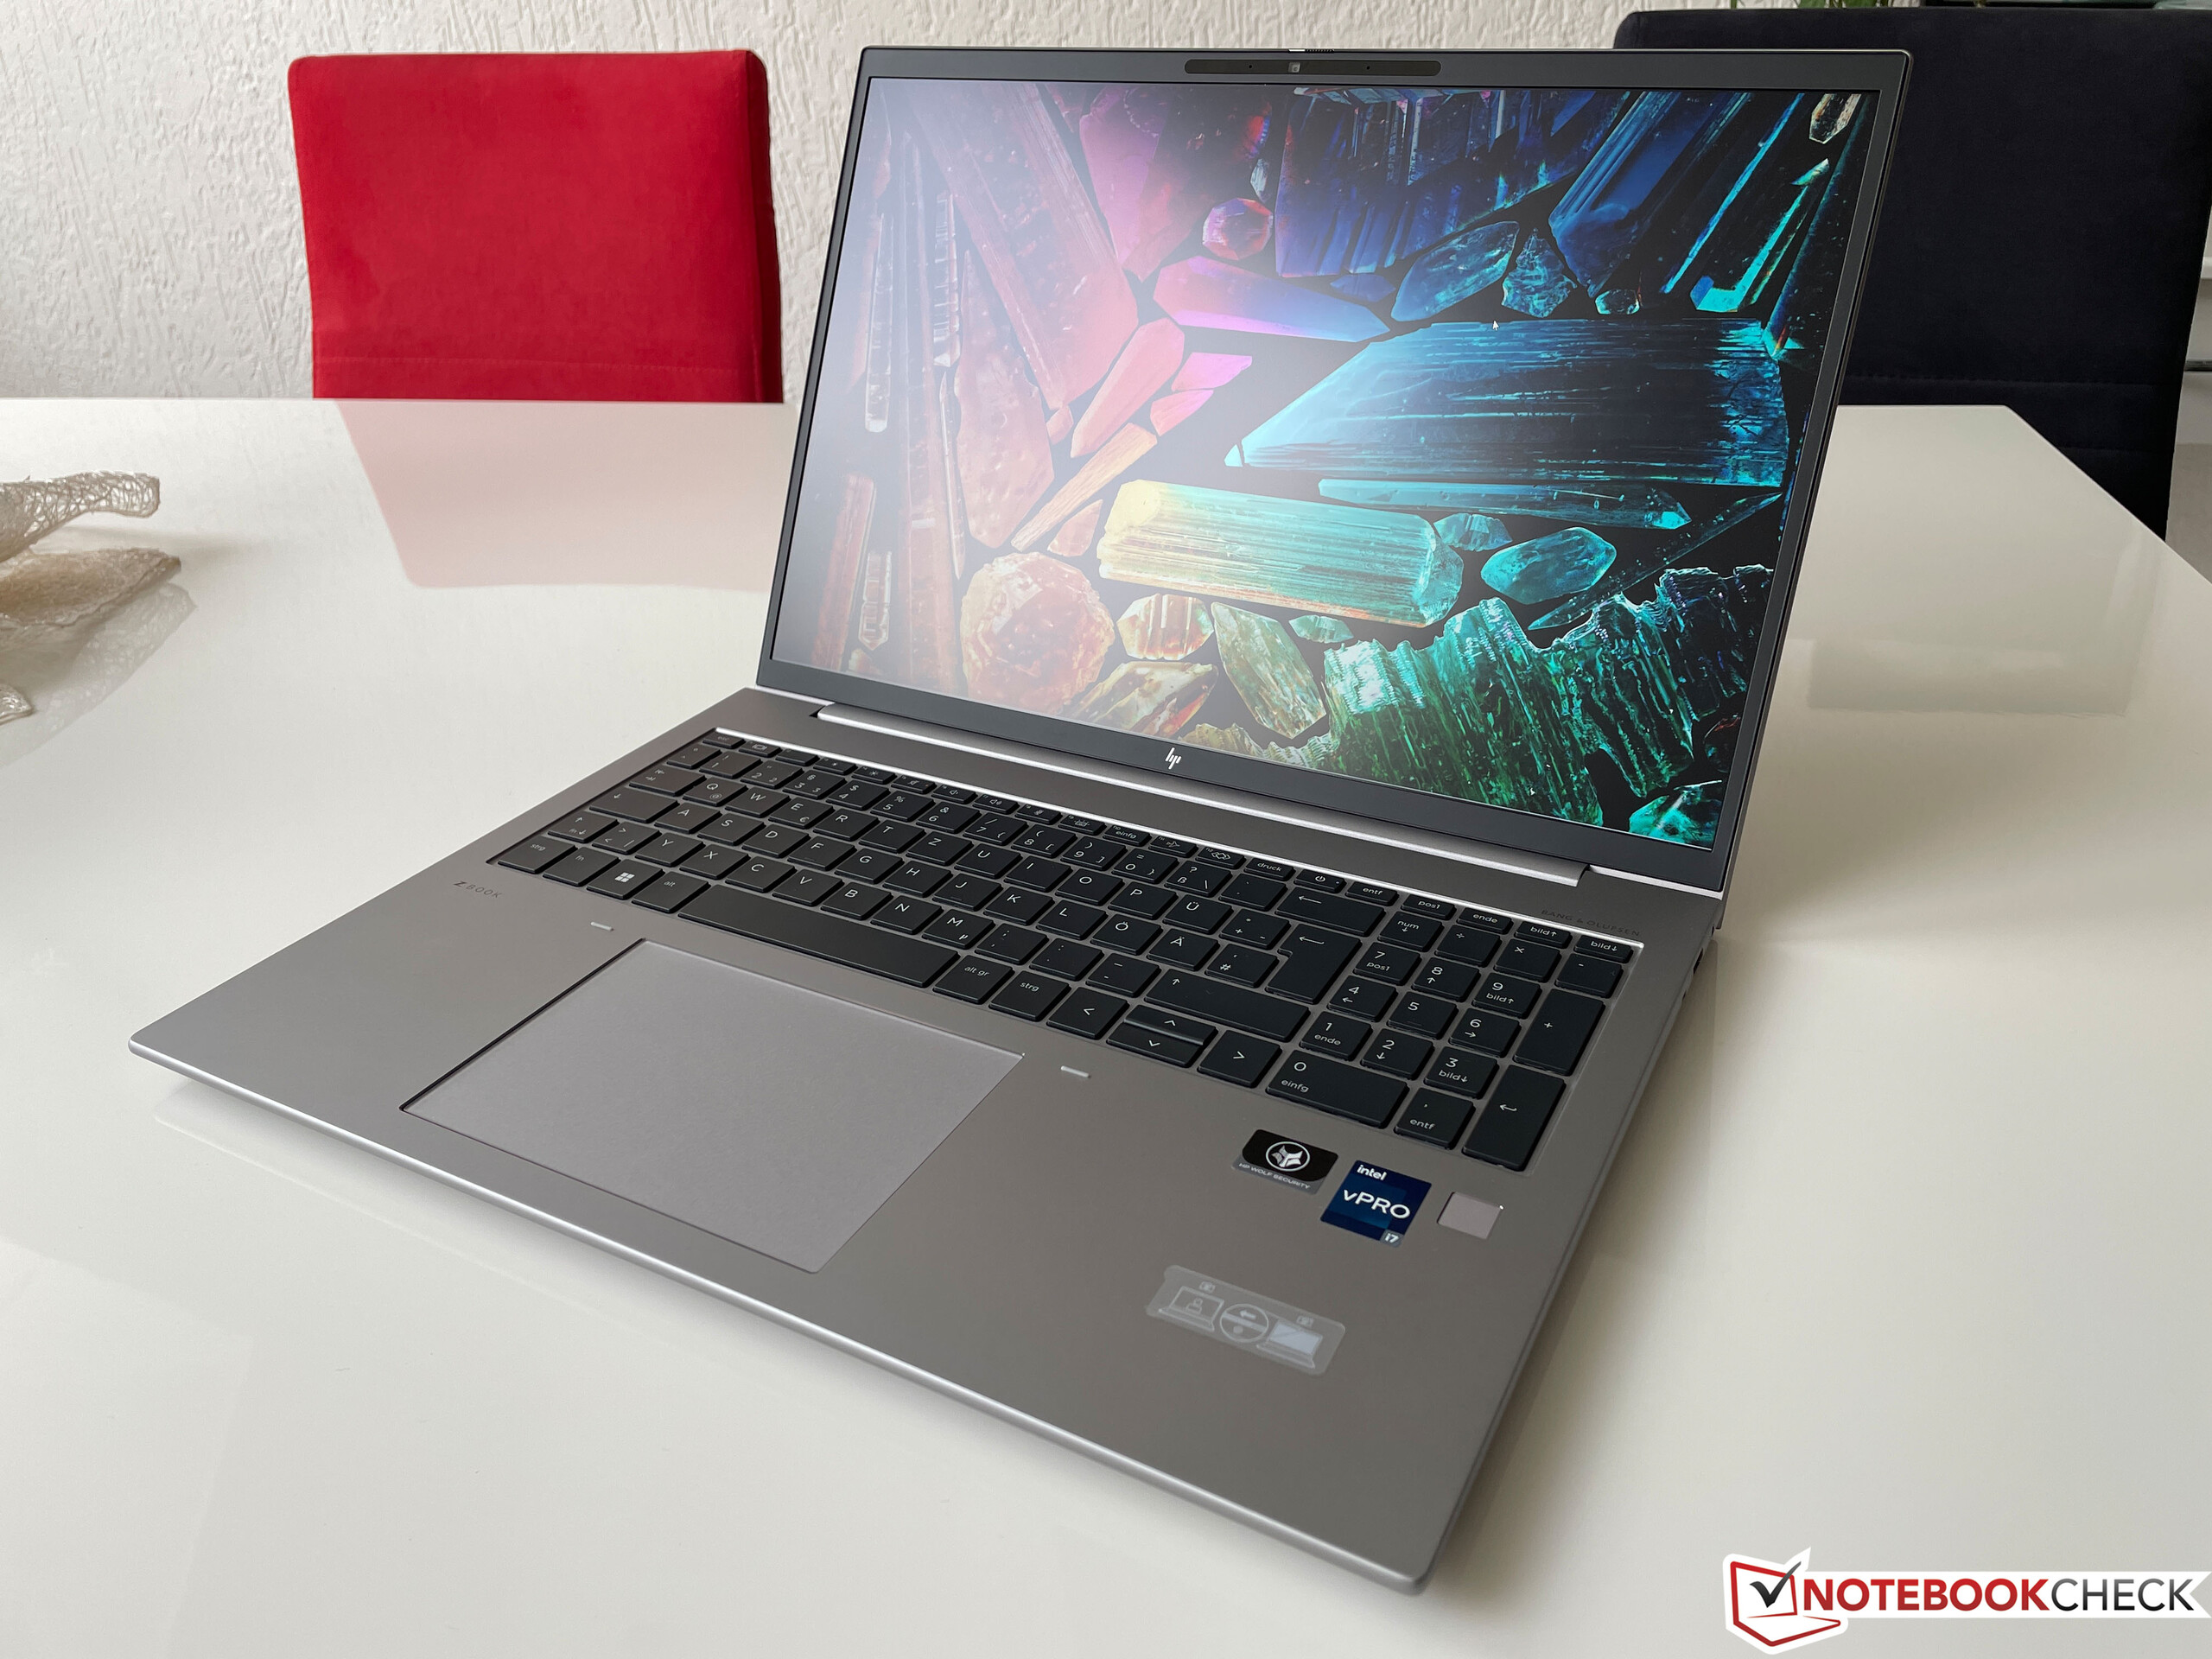
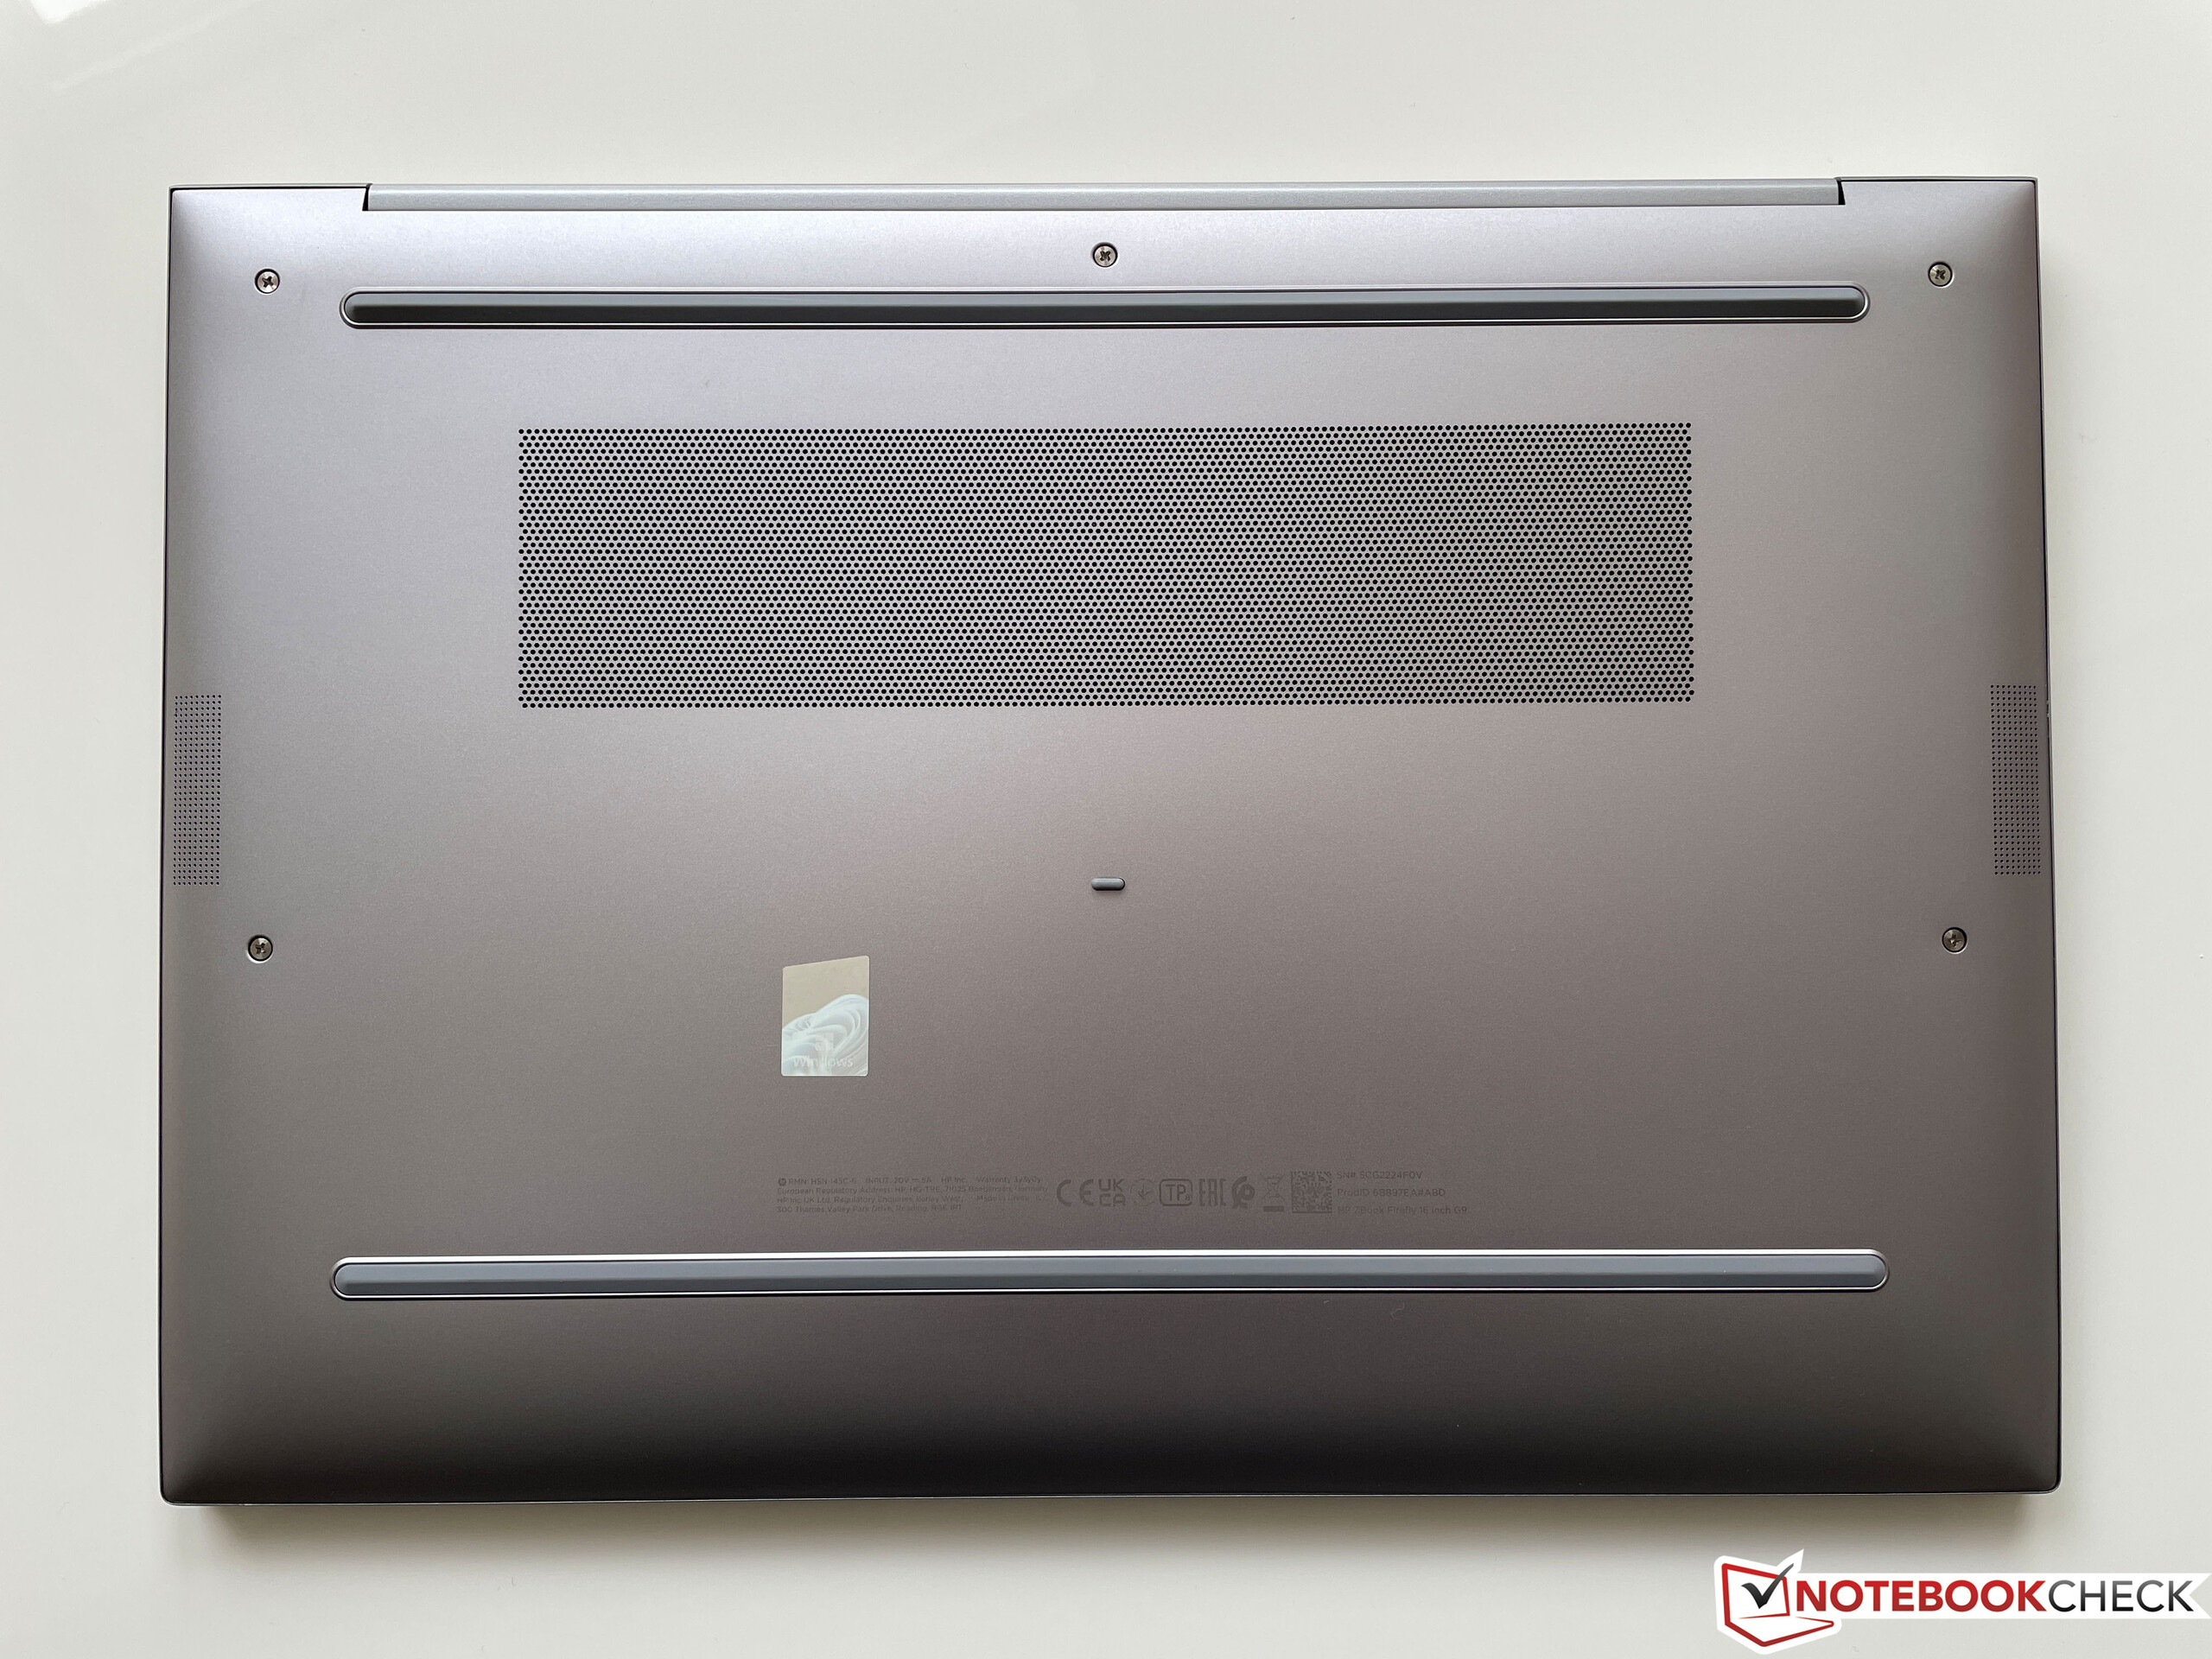
外壳--惠普采用了优质的铝制外壳
与去年的 G8机型的,惠普在较新的萤火虫G9(这包括16英寸和14英寸机型)上使用了更多圆润的设计元素,具有良好的触觉效果。它没有提供大的惊喜,完全由铝组成的银色机箱给人以非常高级的印象。底部单元对来自角落的扭曲有极强的抵抗力,在压力下几乎不屈服。机盖延续了这一趋势,对扭曲的敏感度极低,即使在背面集中施压的情况下,显示屏也不会出现扭曲。同时,铰链略微太松。虽然显示器可以很容易地用一只手打开,但铰链并不能完全防止摇晃或显示器在小角度关闭。显示器可以打开到180度的最大角度。
ZBook Firefly在视觉上相当微妙,因为盖子上光亮的Z标志、黑色键盘和黑色显示屏边框是唯一明显的对比元素。各个侧面的边框都相当窄,设备整体看起来非常现代。
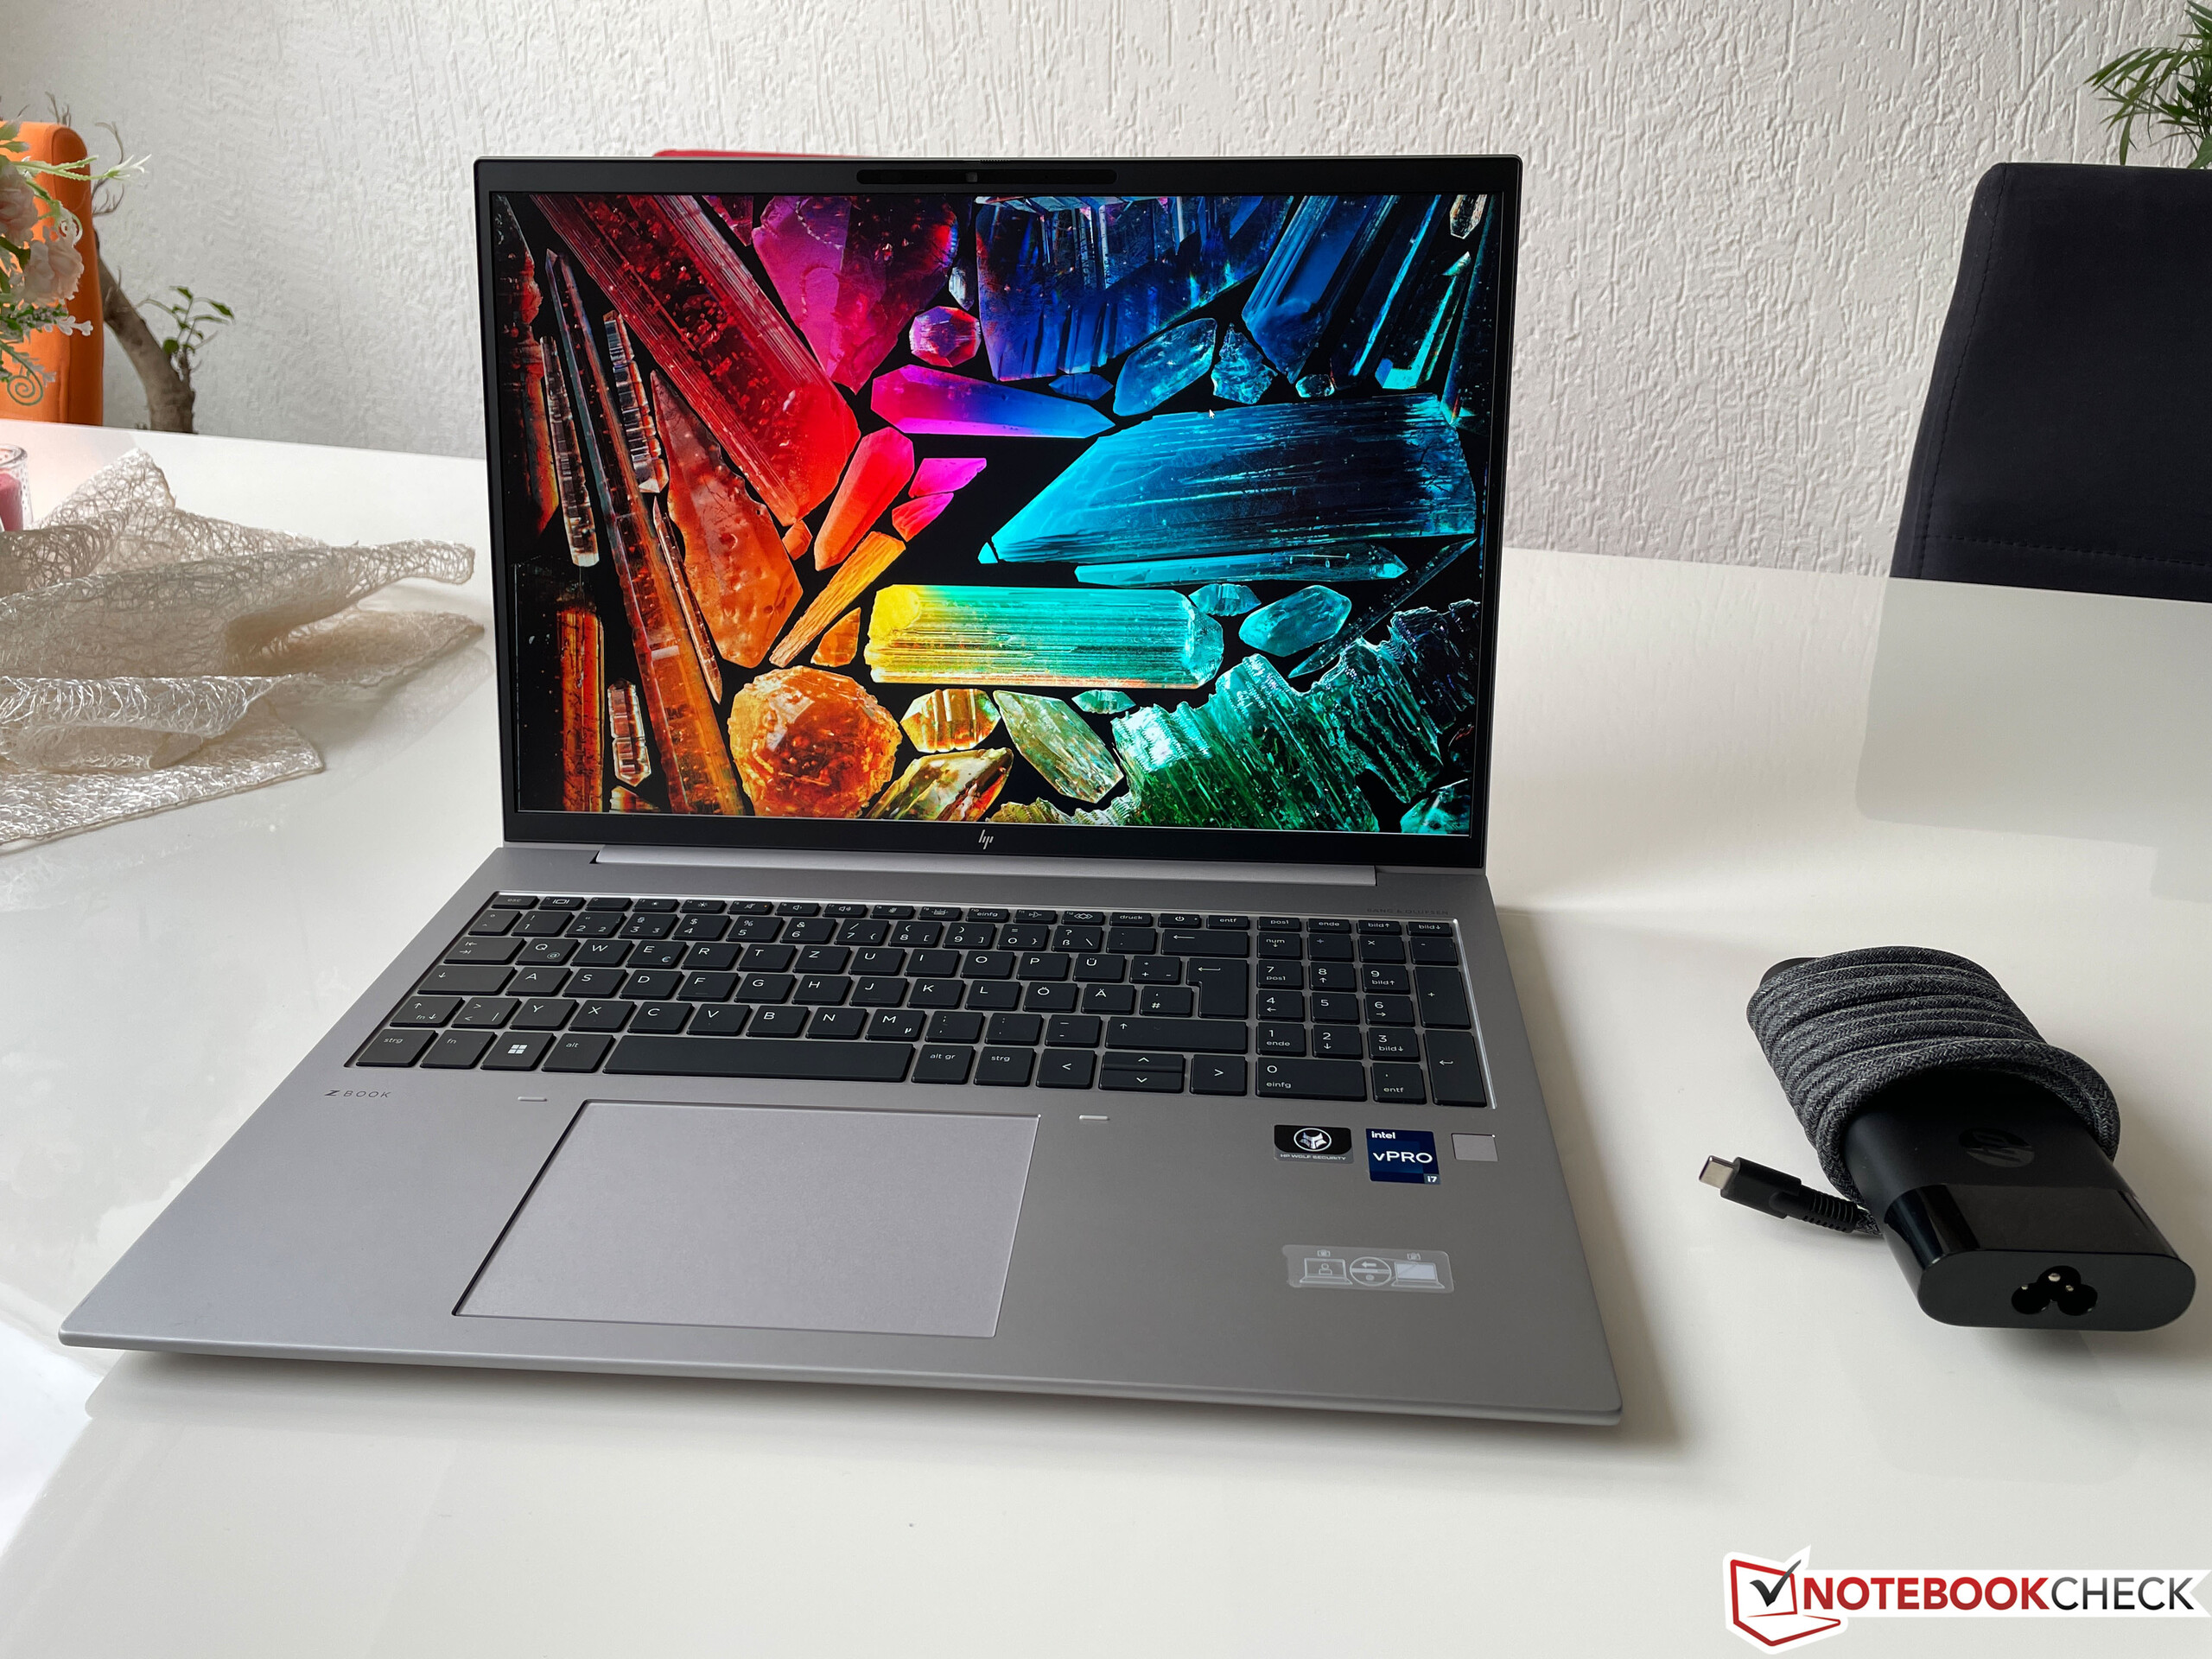
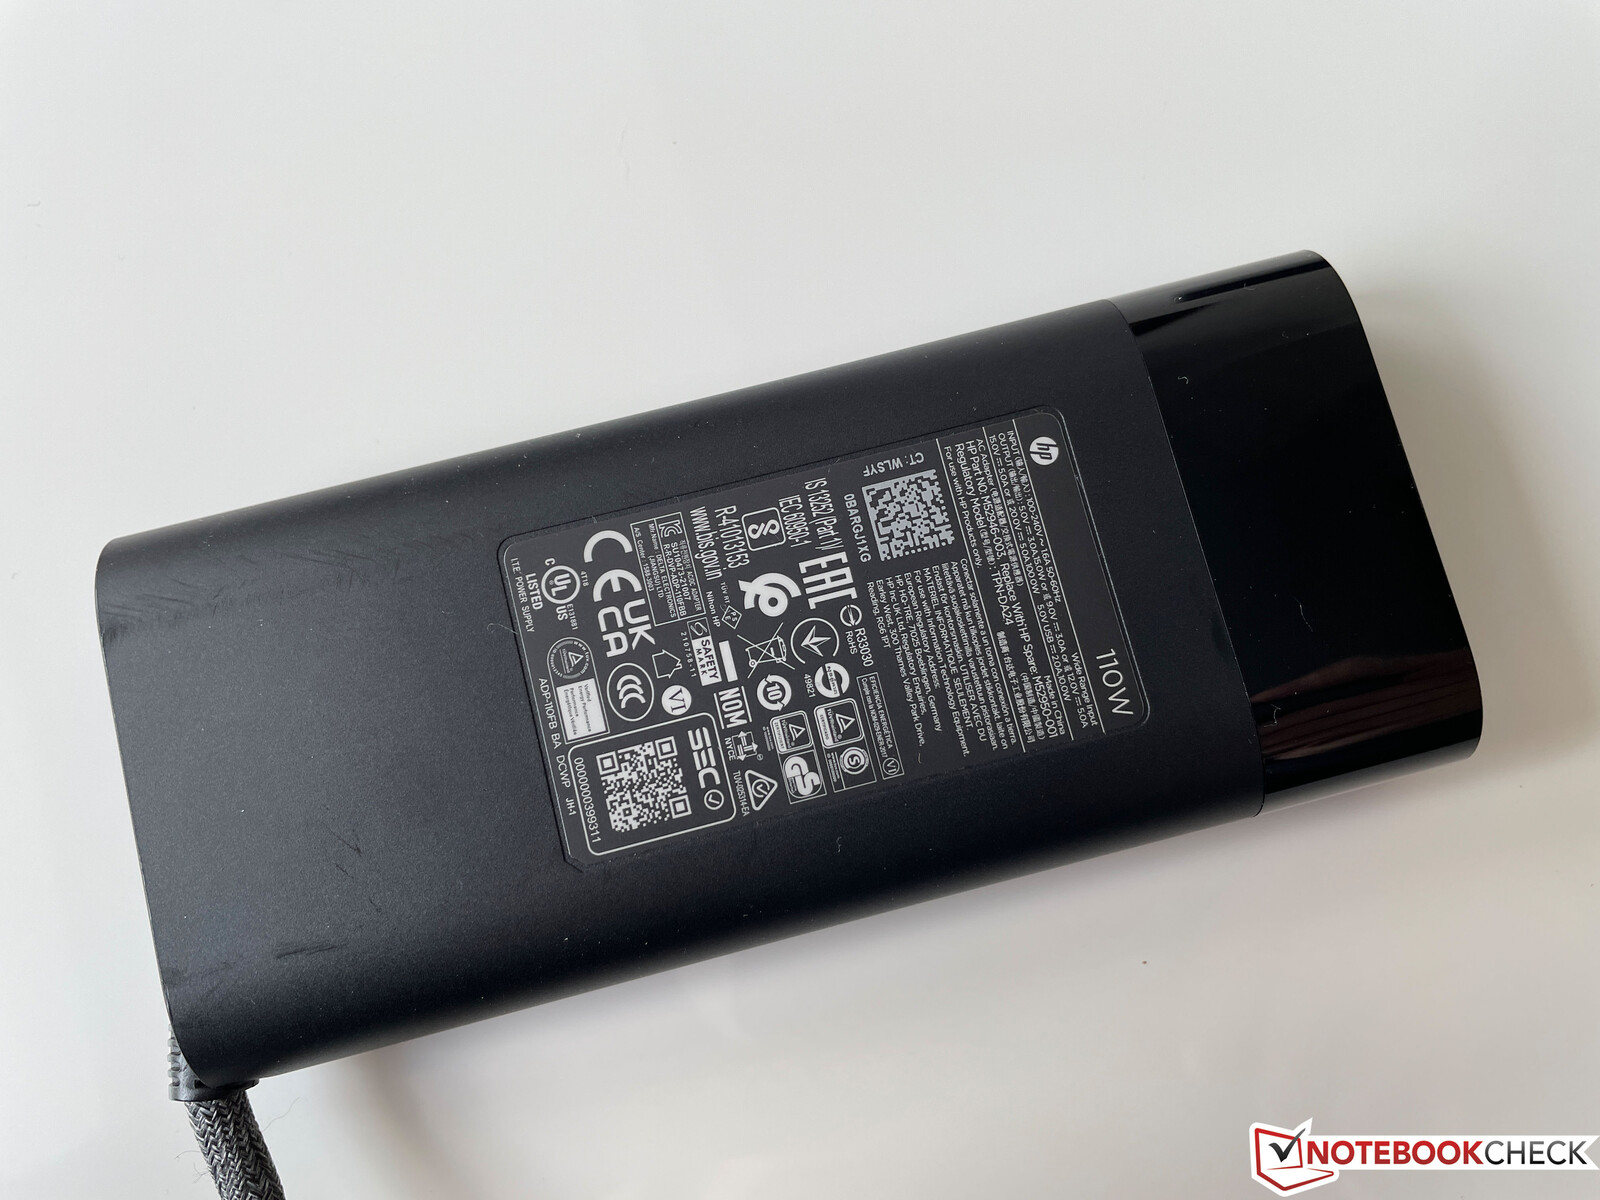
萤火虫16 G9对于一个16英寸的机型来说是比较紧凑的,只比老款的萤火虫15 G8略宽。 ZBook Firefly 15 G8.它的重量接近2公斤(约4.4磅),而110瓦的充电器又接近500克(约1.1磅)。
连接性 - 带有雷电4和Wi-Fi 6E的Firefly
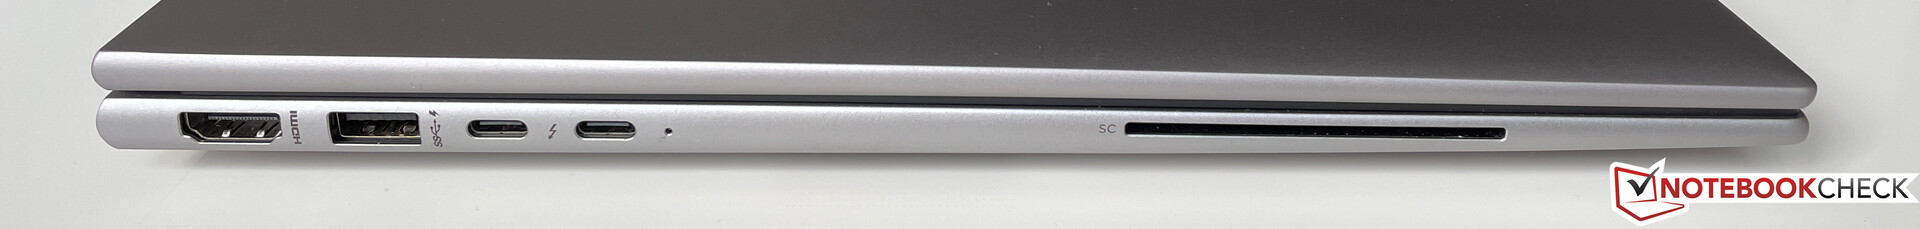
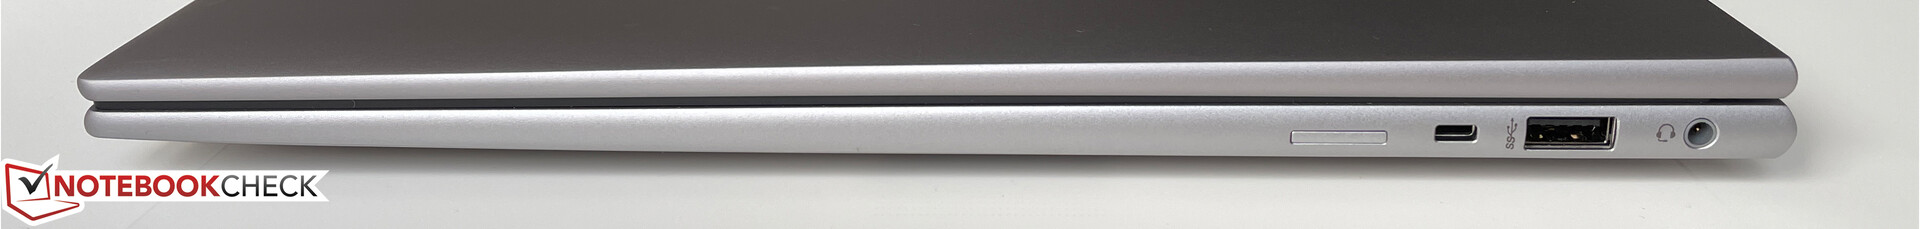
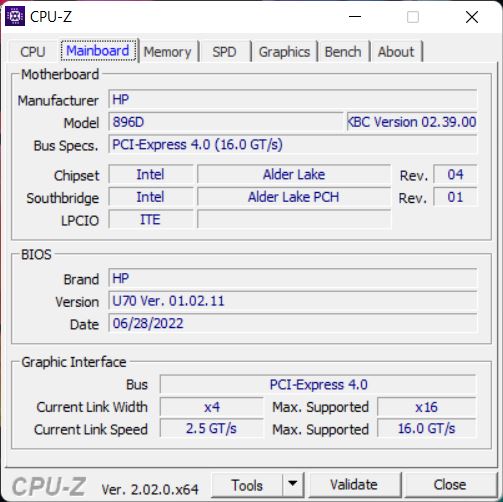
大多数端口都位于机箱左侧,除了两个USB Type-C端口外,还有一个普通的USB Type-A端口、HDMI输出和一个智能卡读卡器。凭借板载的Thunderbolt 4,ZBook符合当前的标准,尽管该工作站没有以太网端口(可以通过USB-C适配器添加)。
沟通
ZBook Firefly可以配置--但不是加装--一个可选的LTE甚至5G模块。英特尔的现代AX211E模块处理无线通信,支持所有最新的Wi-Fi标准以及蓝牙5.2。在我们的测试中,与我们的华硕参考路由器的6-GHz网络的连接没有任何问题,而且传输速率一直很好。
网络摄像头
数据表上的网络摄像头规格有些令人困惑,因为惠普提到了一个500万像素的红外摄像头。虽然我们无法对红外摄像头(用于通过Windows Hello进行面部识别)的分辨率做出任何陈述,但主摄像头捕捉的照片高达370万像素(2560 x 1440像素)。与老式网络摄像头相比,更高的分辨率的优势是非常明显的,尽管颜色精度没有什么可写的。


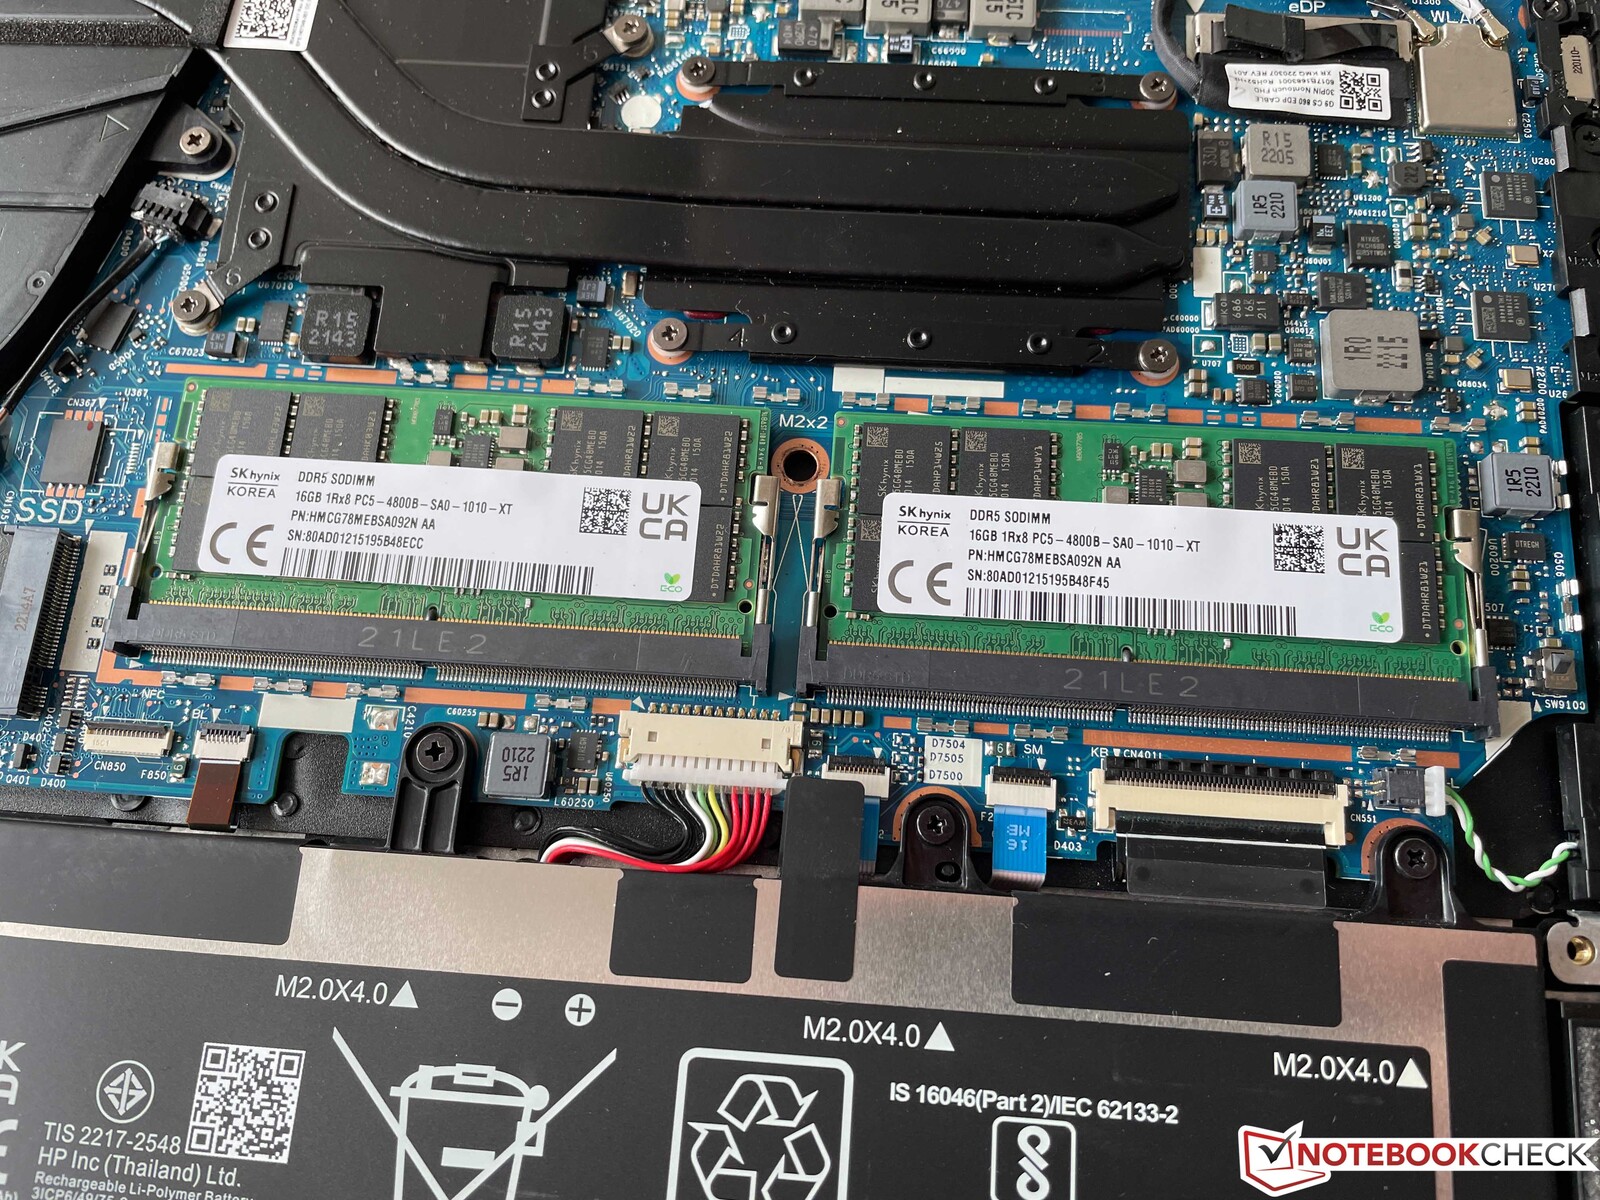
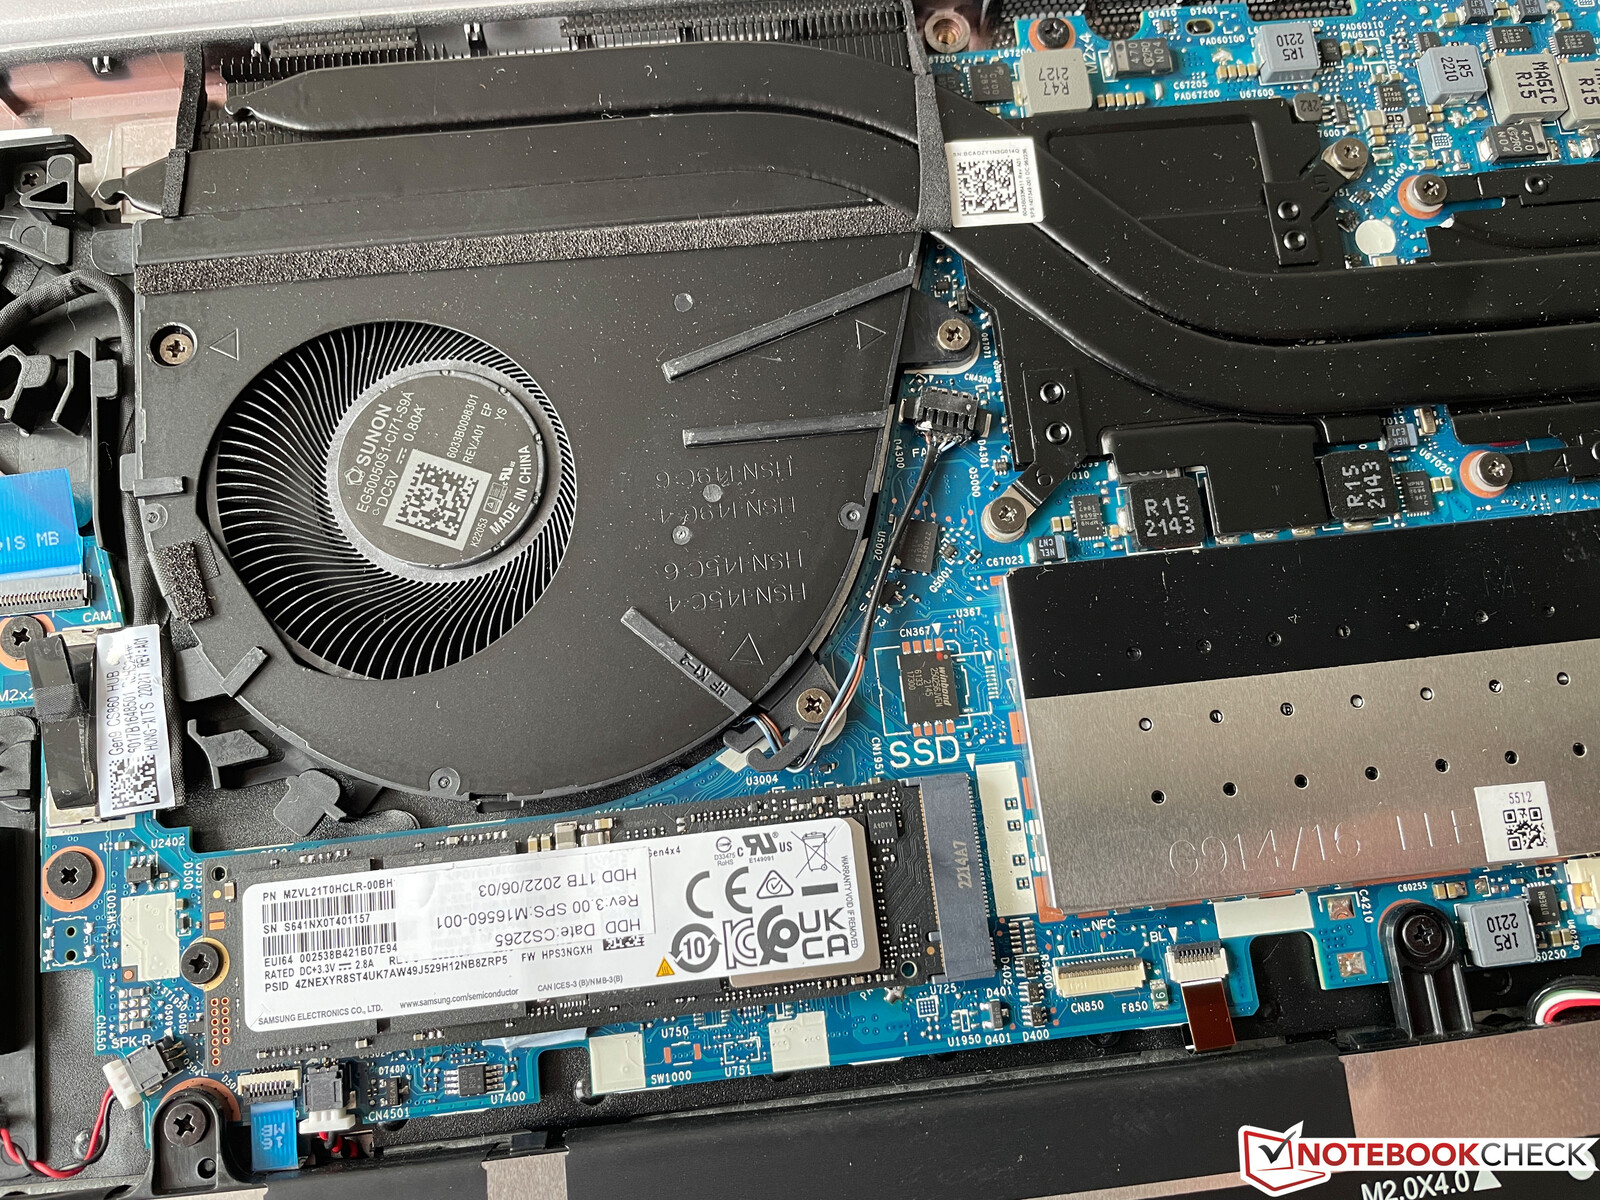
维护
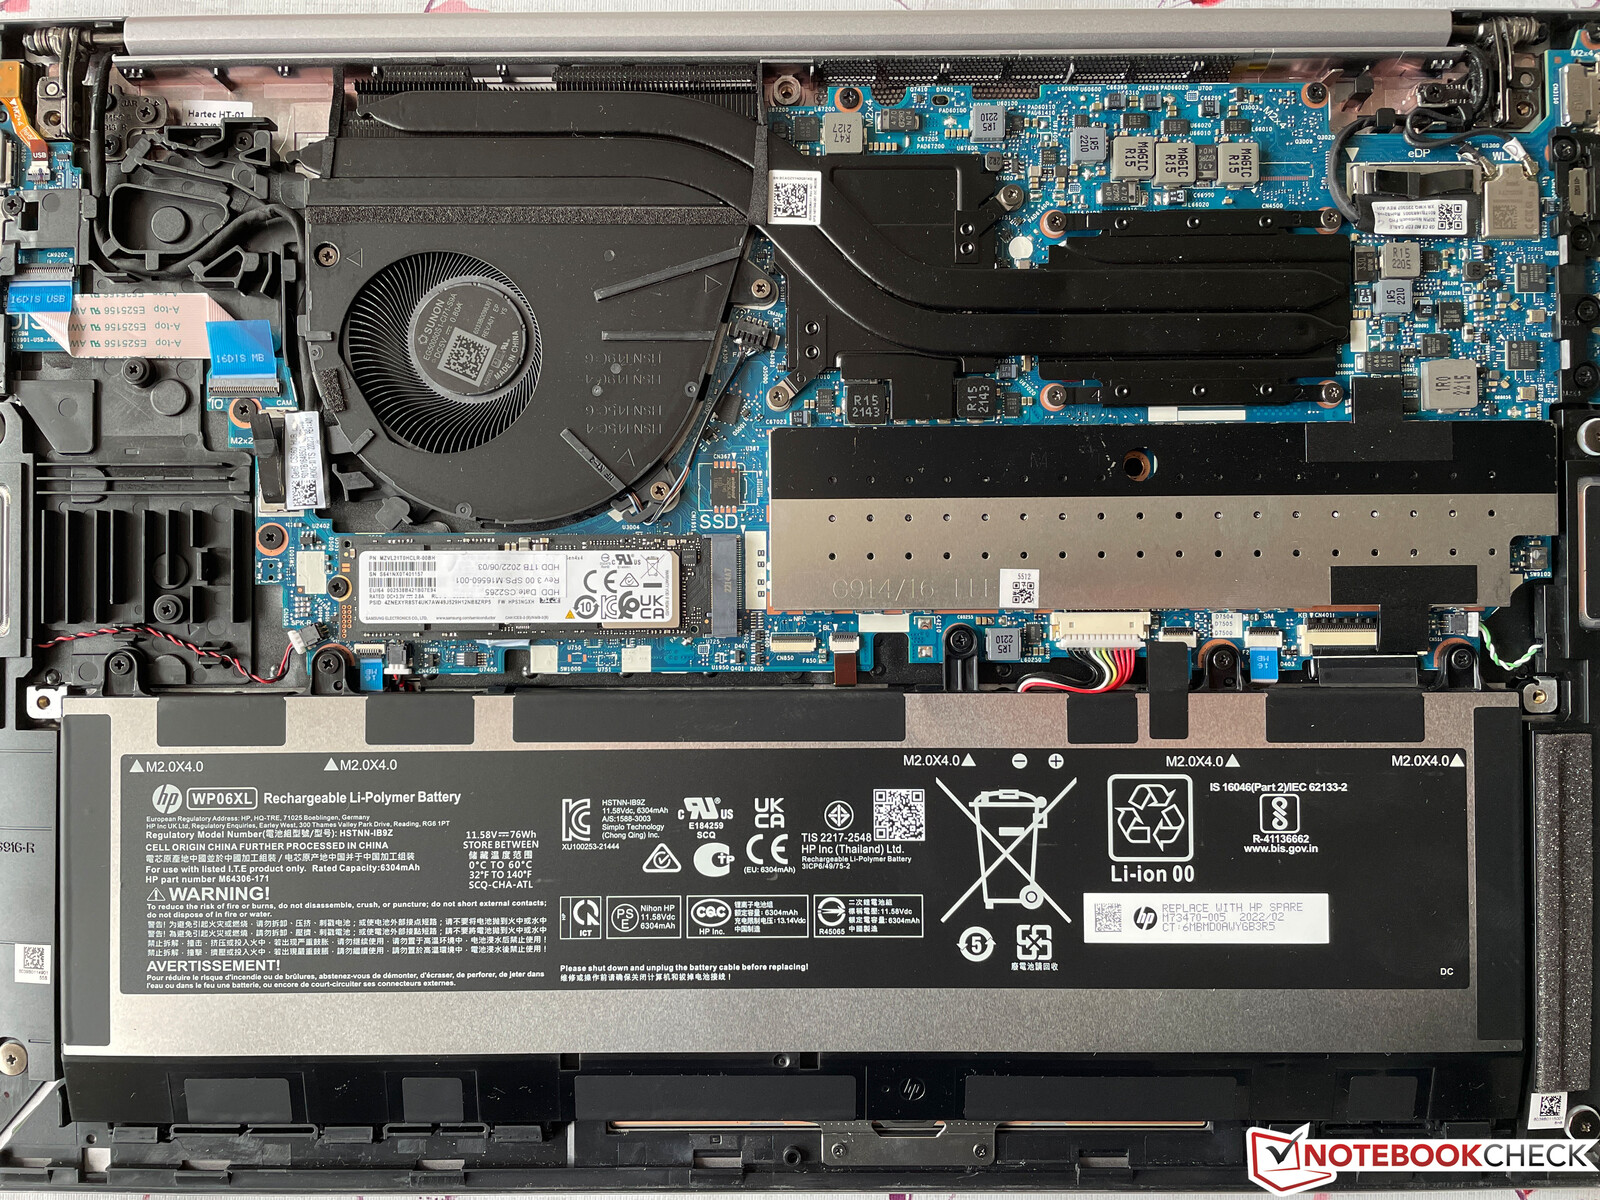
底板可以很容易地拆除,因为专门使用了标准的飞利浦头螺钉(只能松开,不能用力拆除)。在内部,用户可以接触到电池、风扇、M.2-2280固态硬盘和两个SODIMM模块,它们隐藏在一个额外的盖子下面。Wi-Fi模块不能被升级。
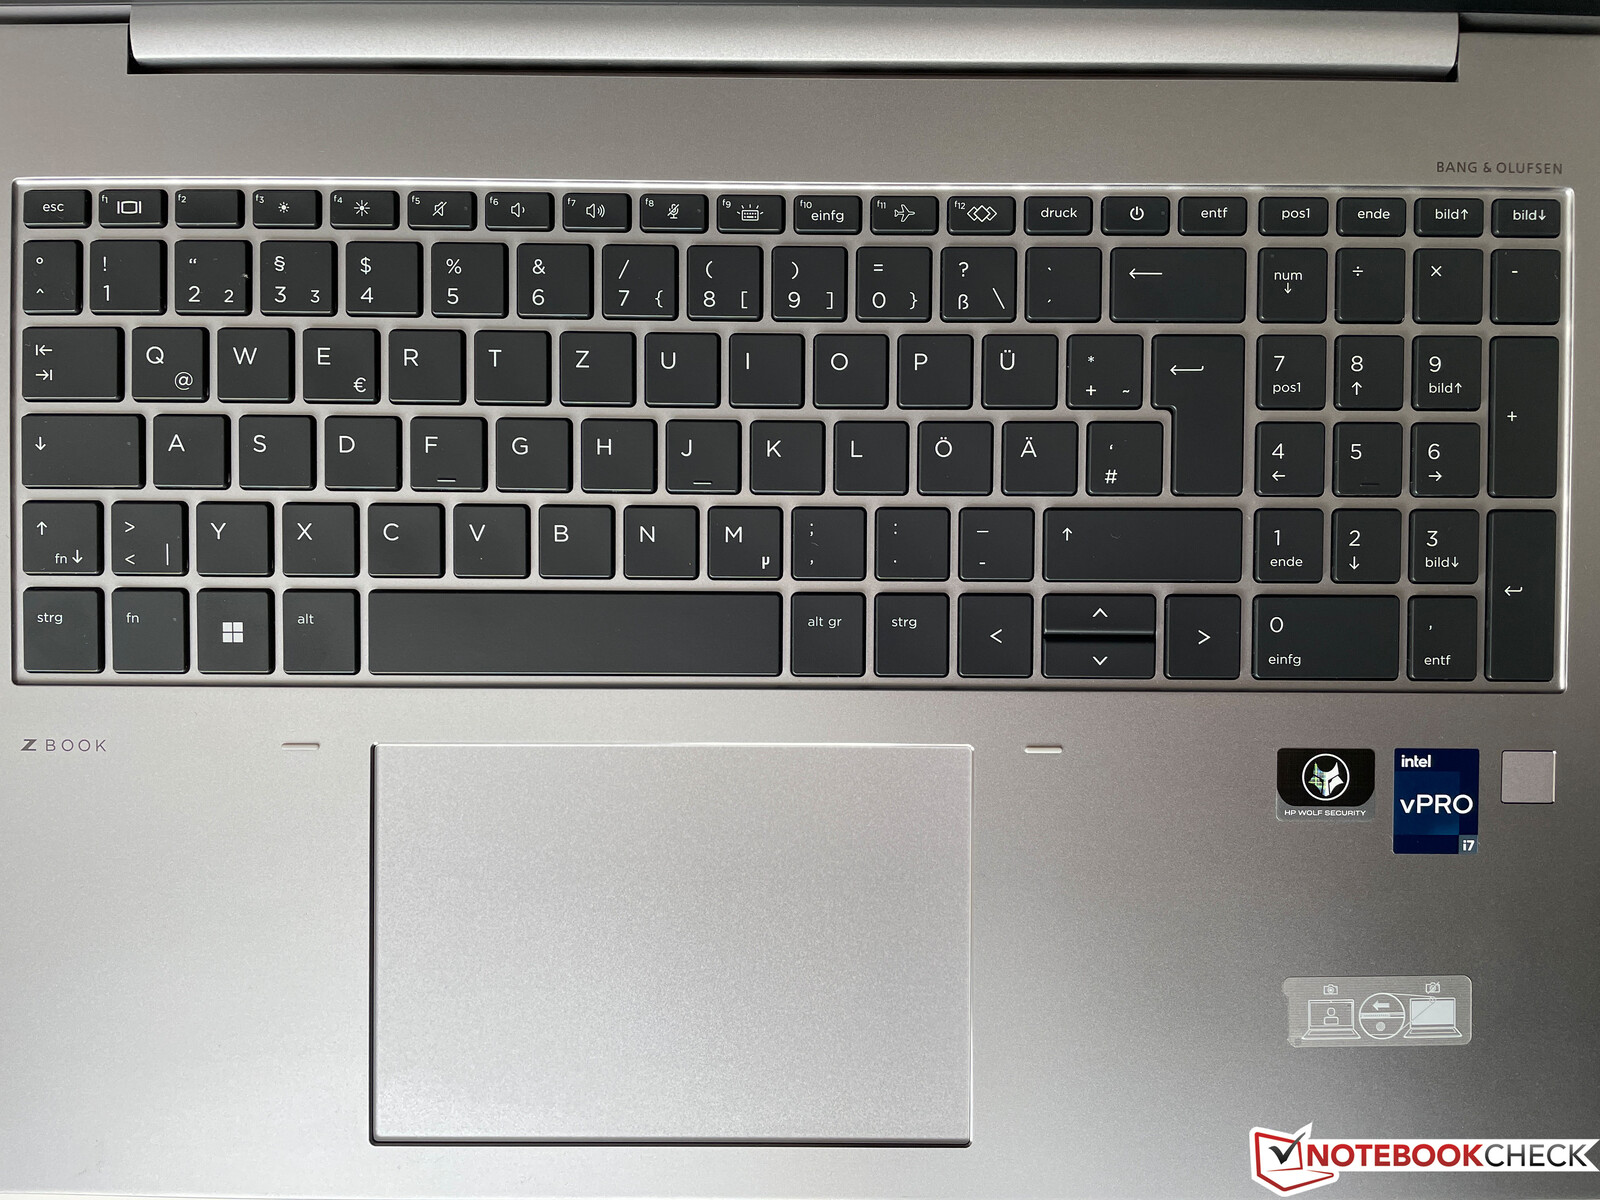
输入设备--拥有出色键盘的ZBook
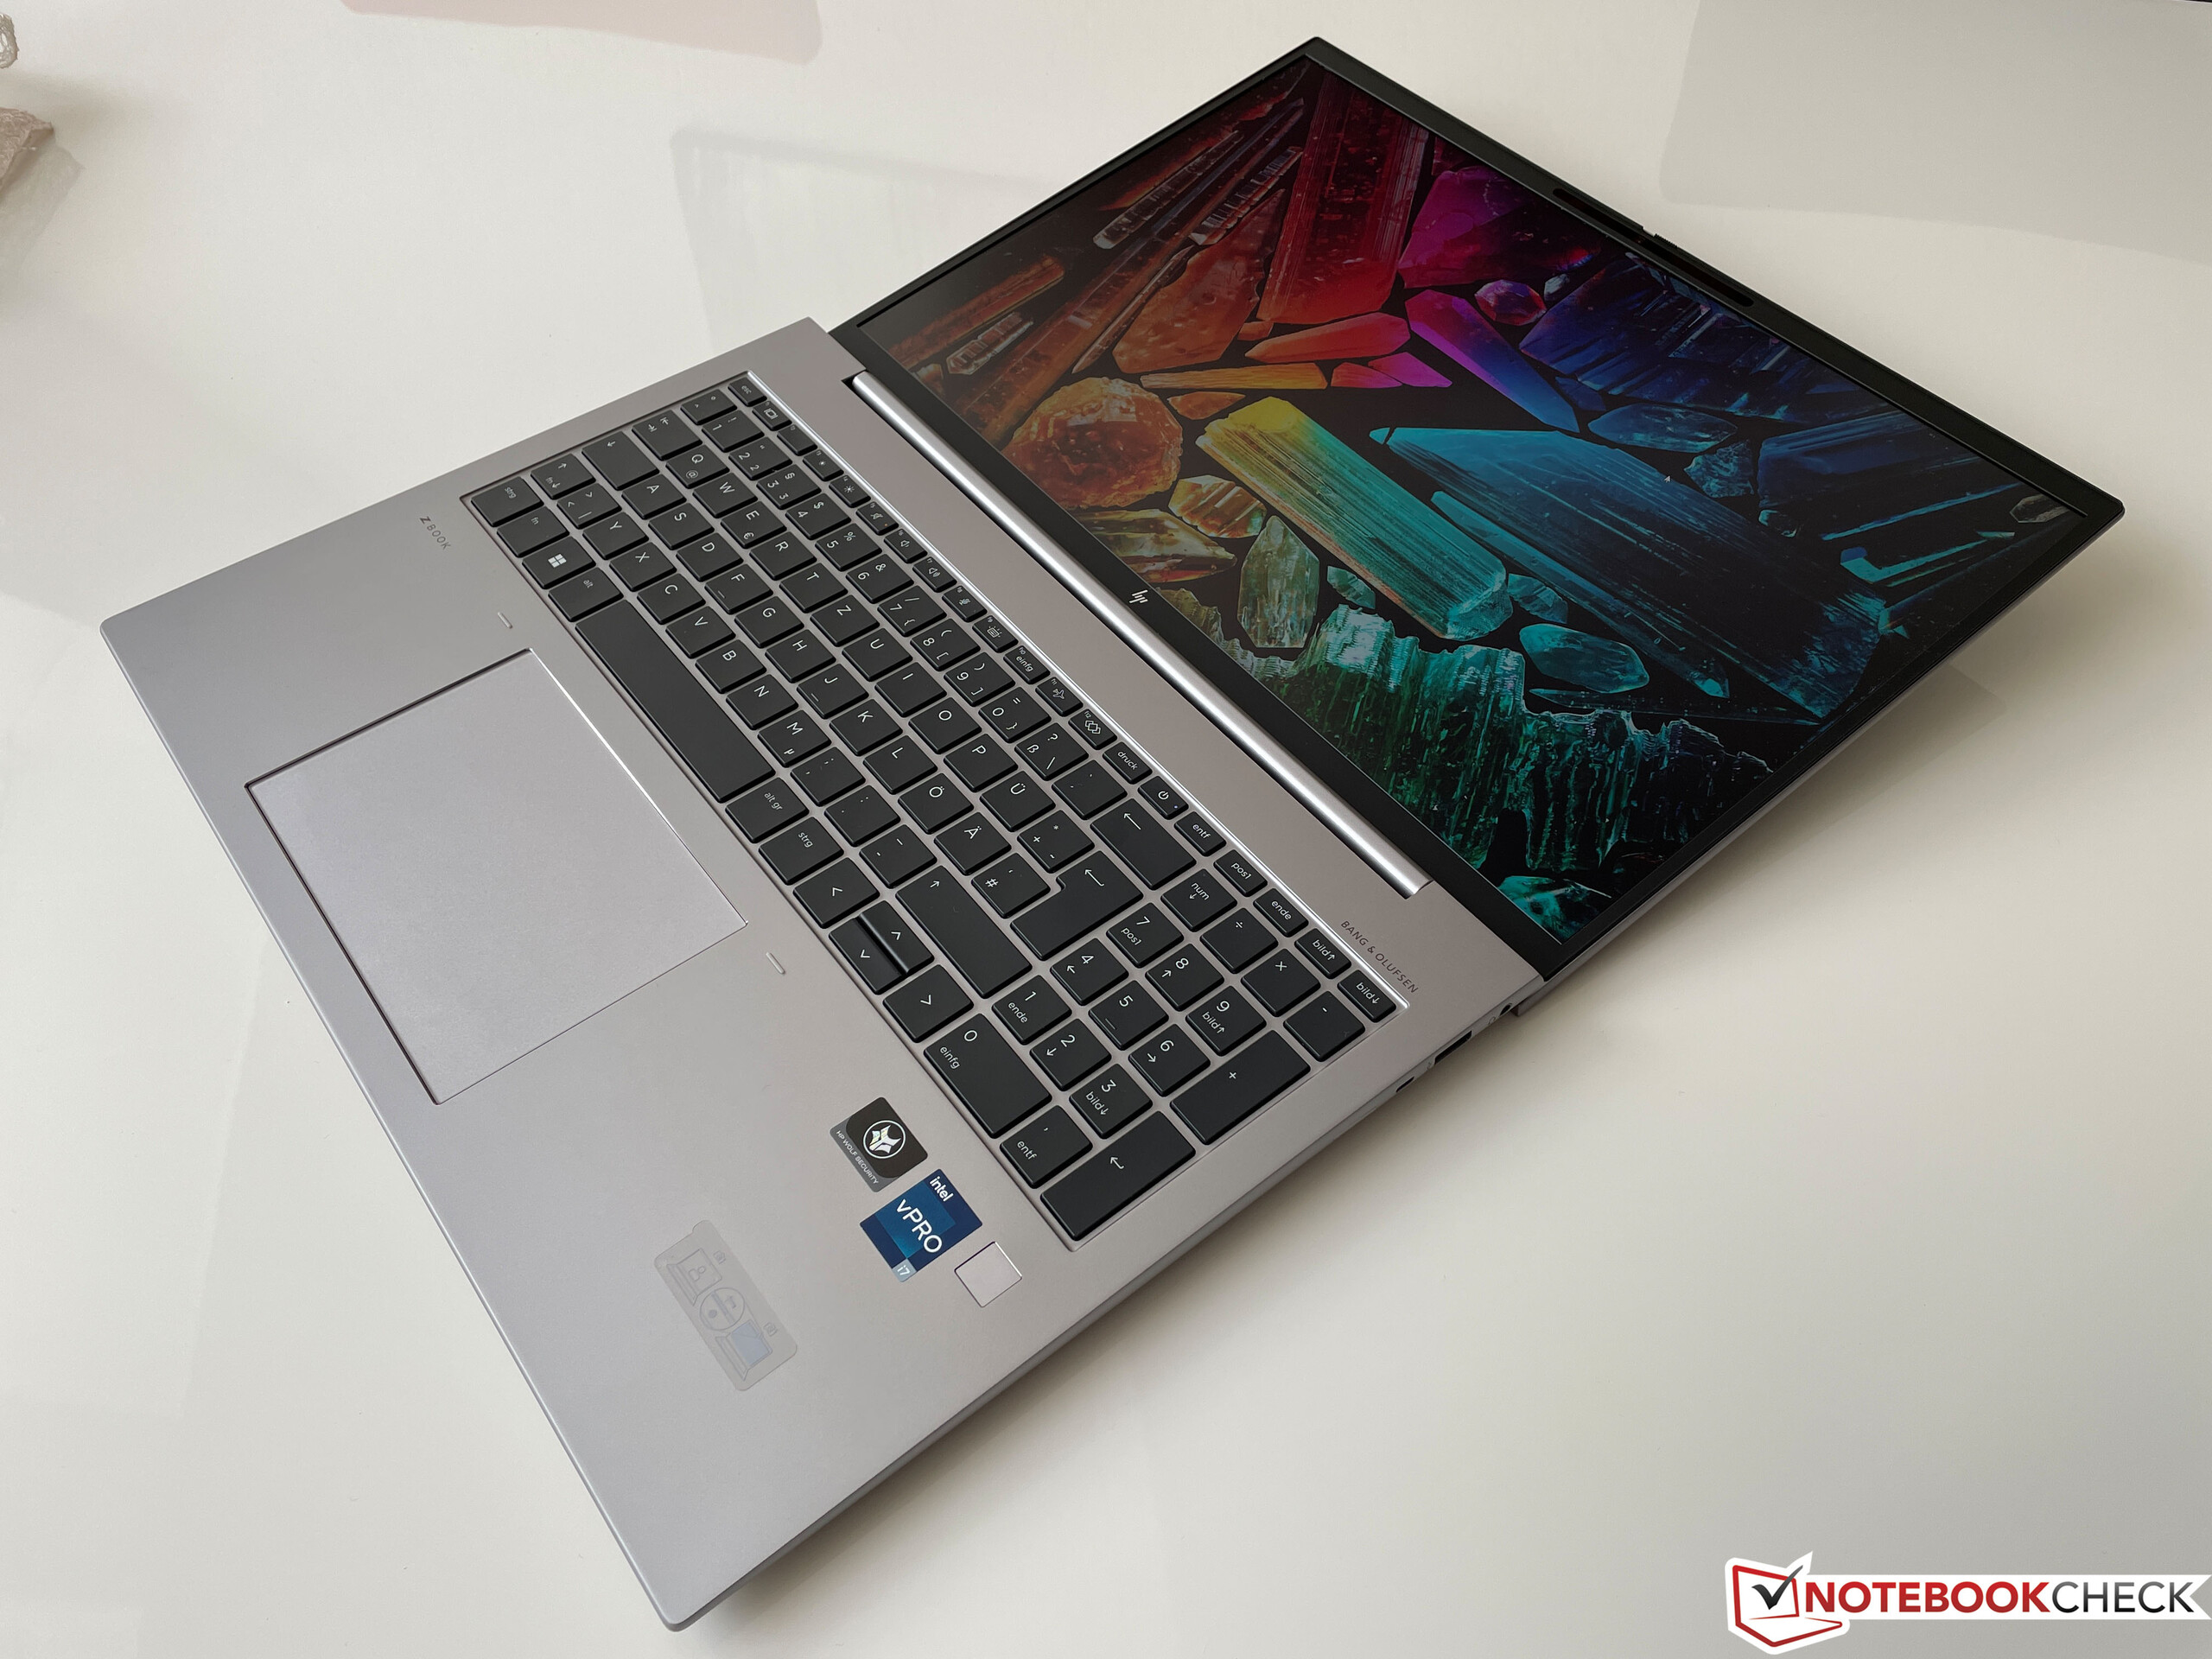
惠普使用的键盘有一个数字键盘,有两个亮度设置的白色背光,还有防泼水功能。我们对该键盘总体上非常满意,而且由于惠普没有反复减少键程,键盘的主观感觉甚至比目前的联想ThinkPad机型更好。不过,由于反馈相当牢固,你对键盘的印象可能会因个人喜好而改变。电源键集成在键盘上,这一点不太理想,而且在键盘右下方有一个指纹扫描仪。
由于惠普省略了键盘中央的跟踪点,因此,大型点击板是默认情况下唯一可用的鼠标输入方法。它略微向左移动,尺寸为12.8 x 8.7厘米(约5.04 x 3.43英寸),即使对于需要四个手指的手势也足够大。光滑的表面提供了良好的滑行性能,光标控制是完美无缺的。点击可以在垫子的底部触发,听起来很有深度。
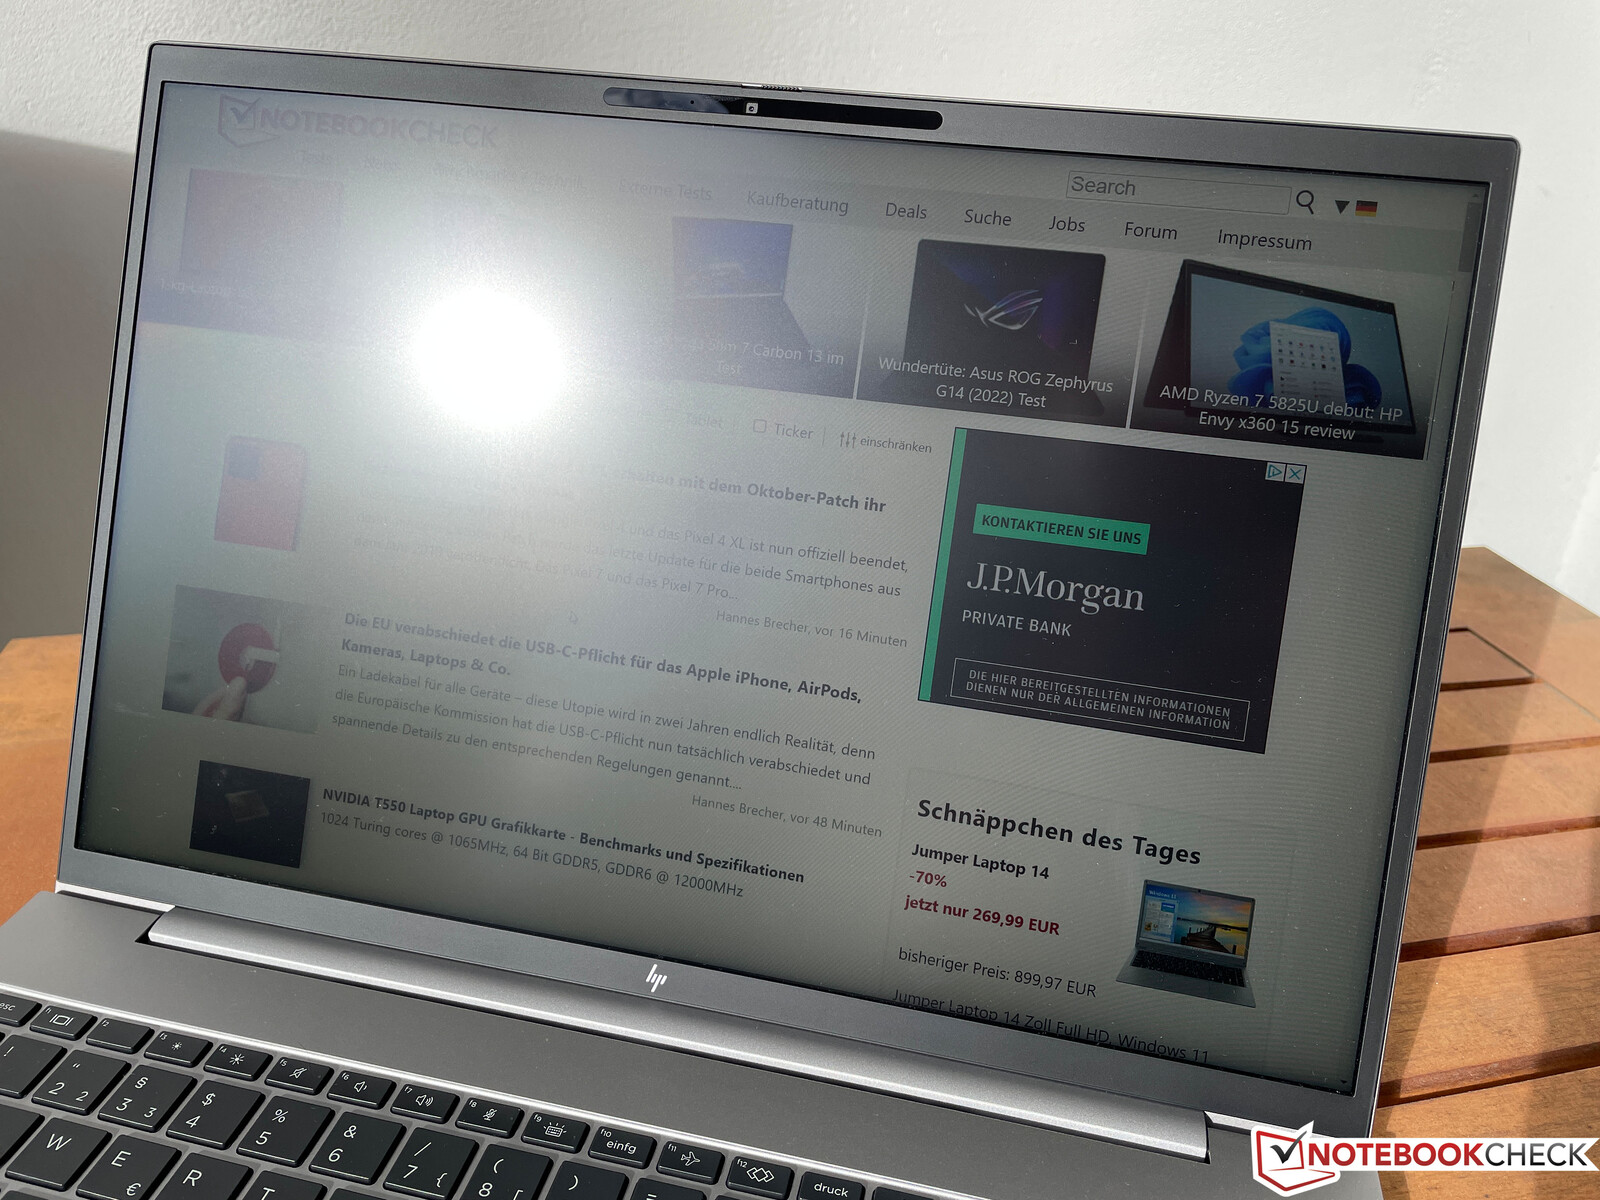
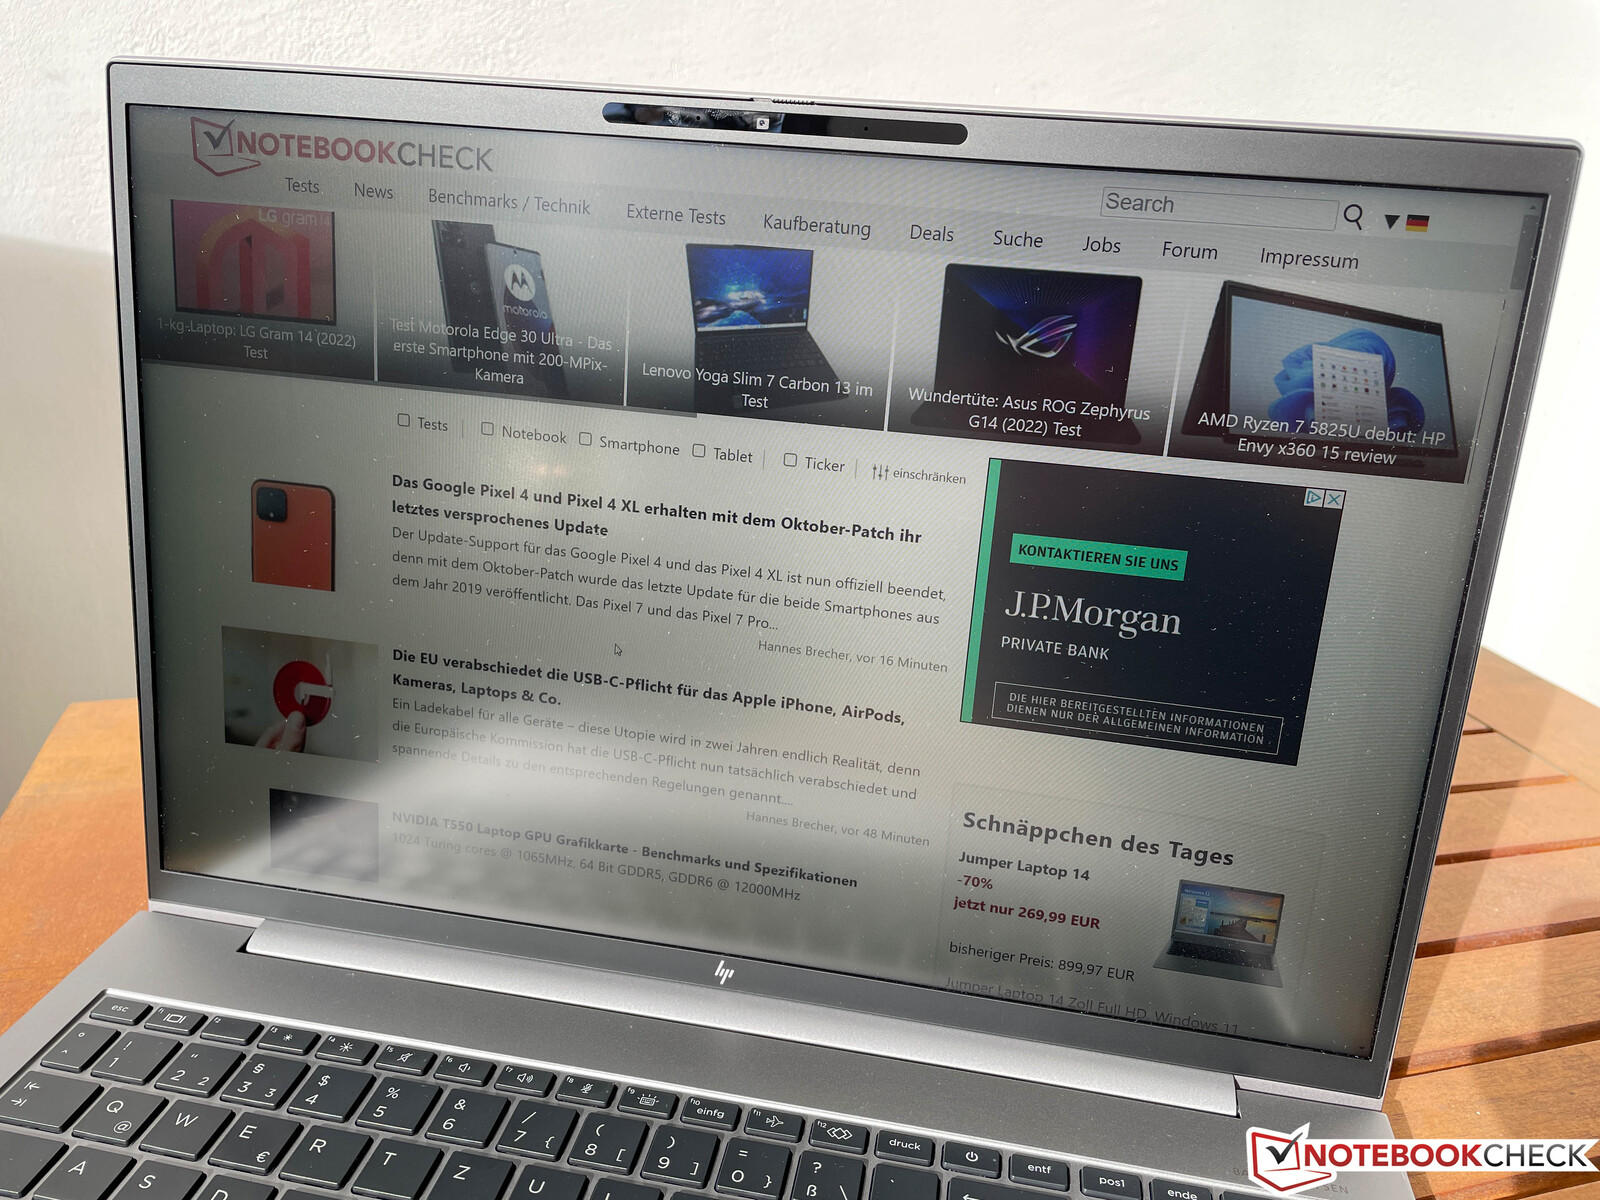
显示屏--惠普使用的是哑光16:10面板
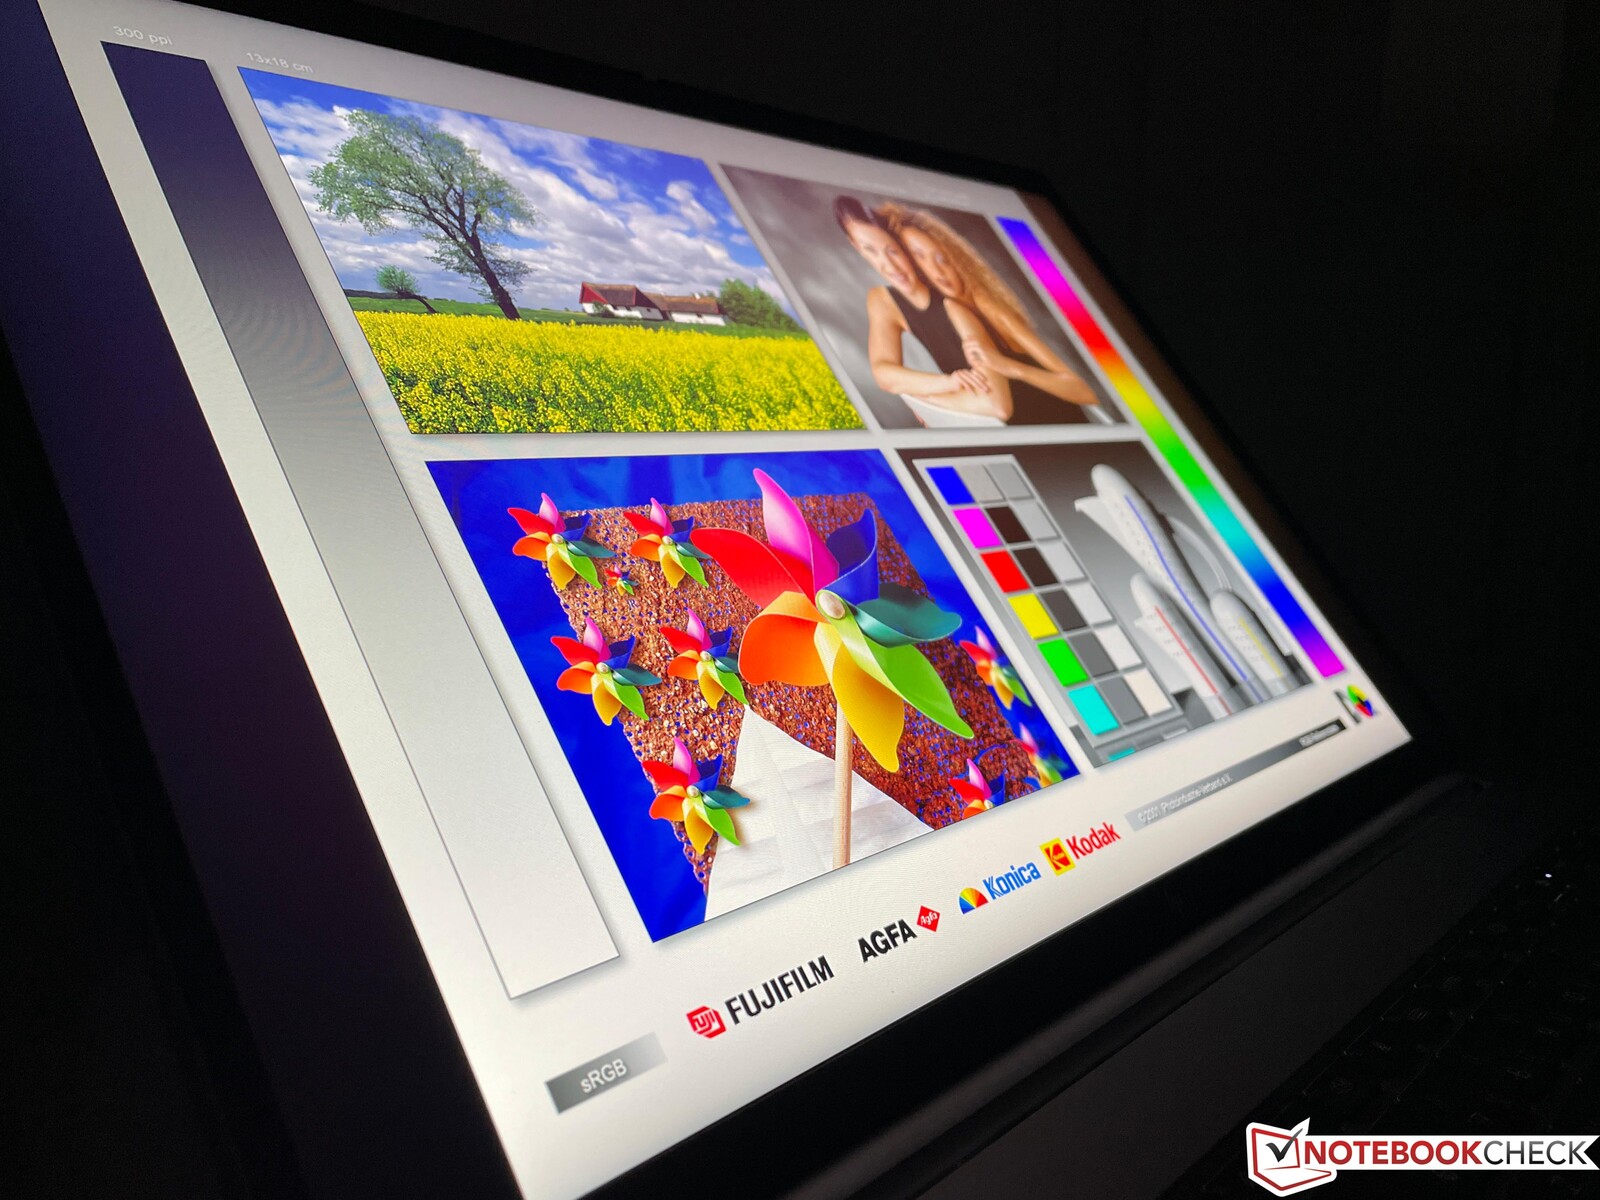
ZBook Firefly 16 G9专门使用雾面IPS面板,原始分辨率为1920 x 1200像素。没有更高的分辨率或扩展的色彩空间覆盖率的显示选项可用。两个标准选项(45%的NTSC色彩空间覆盖率)应该被跳过,因为它们被指定为一个低的最大亮度,只有250尼特。
- WUXGA(1920 x 1200),250尼特,哑光,IPS,45% NTSC
- WUXGA (1920 x 1200), 250尼特, 哑光, IPS, 45 % NTSC, 触摸屏
- WUXGA (1920 x 1200), 400尼特, 哑光, IPS, 100 % sRGB
- WUXGA (1920 x 1200), 1000尼特SureView, 哑光, IPS, 100 % sRGB
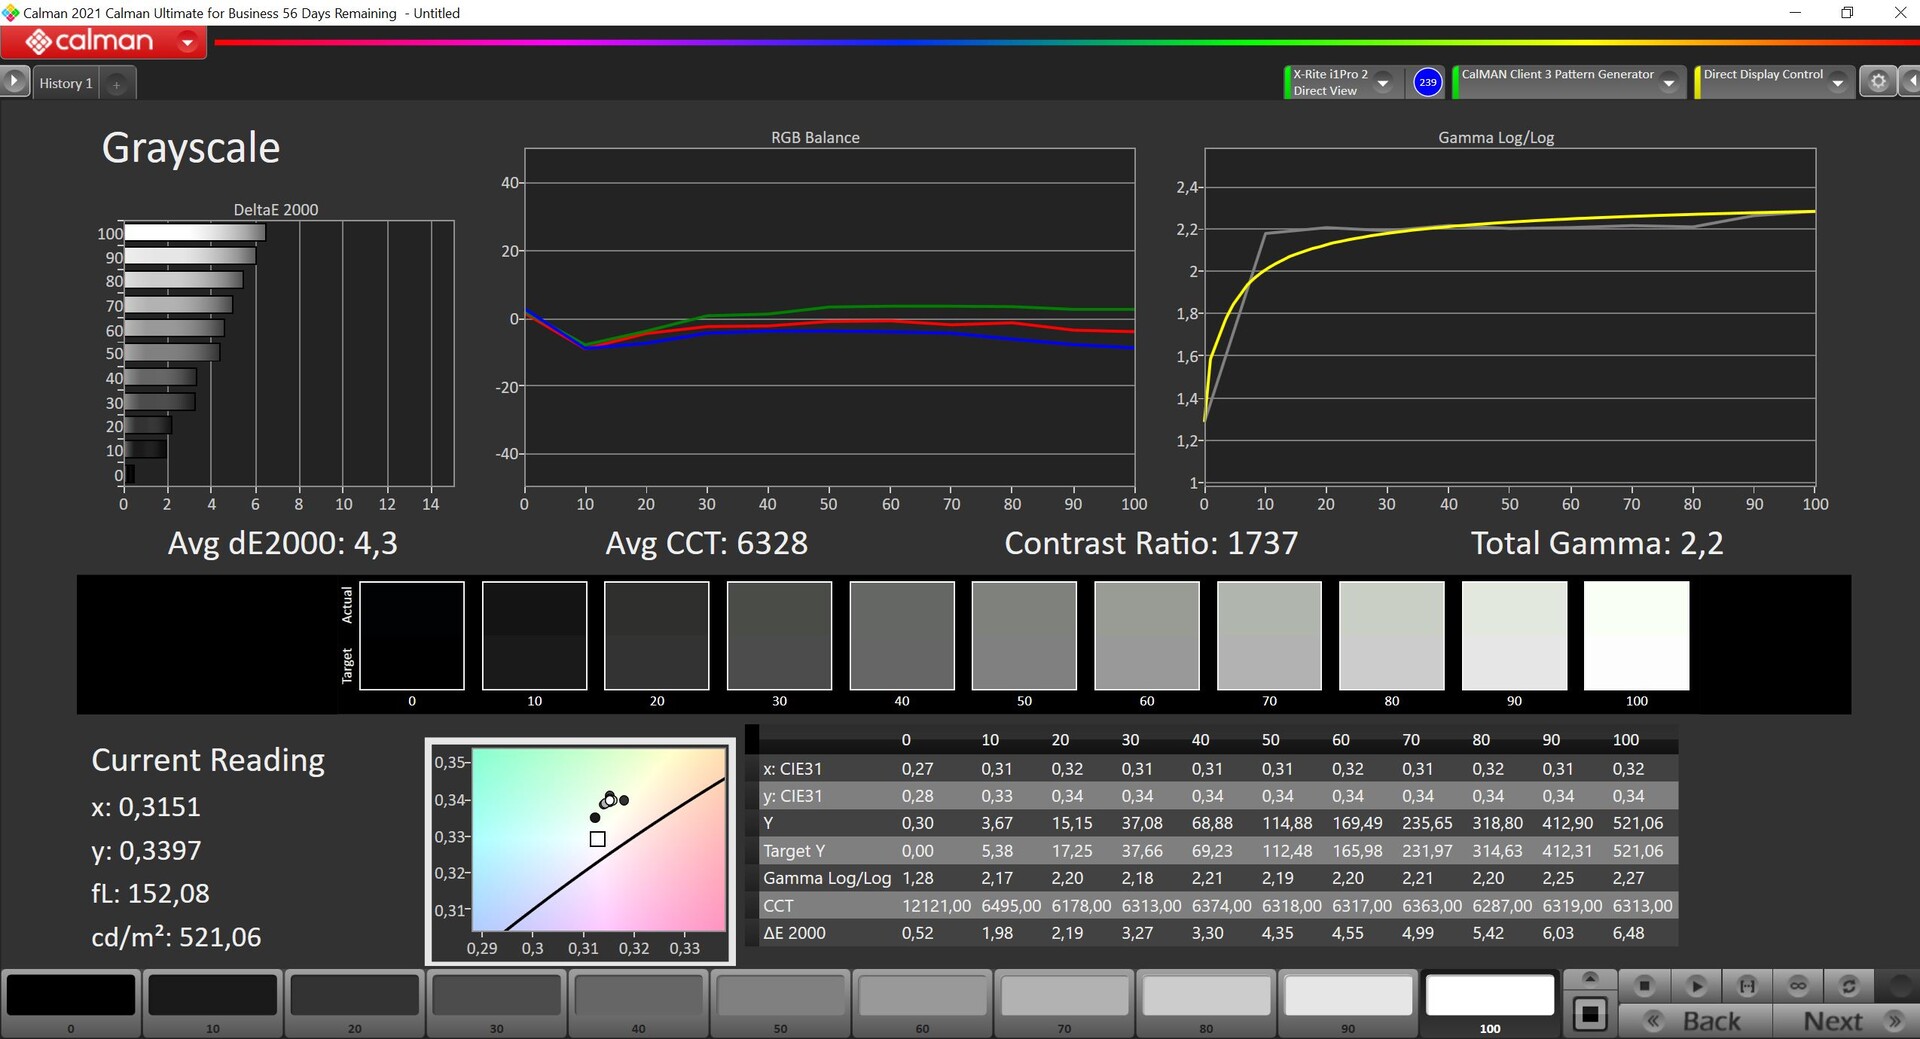
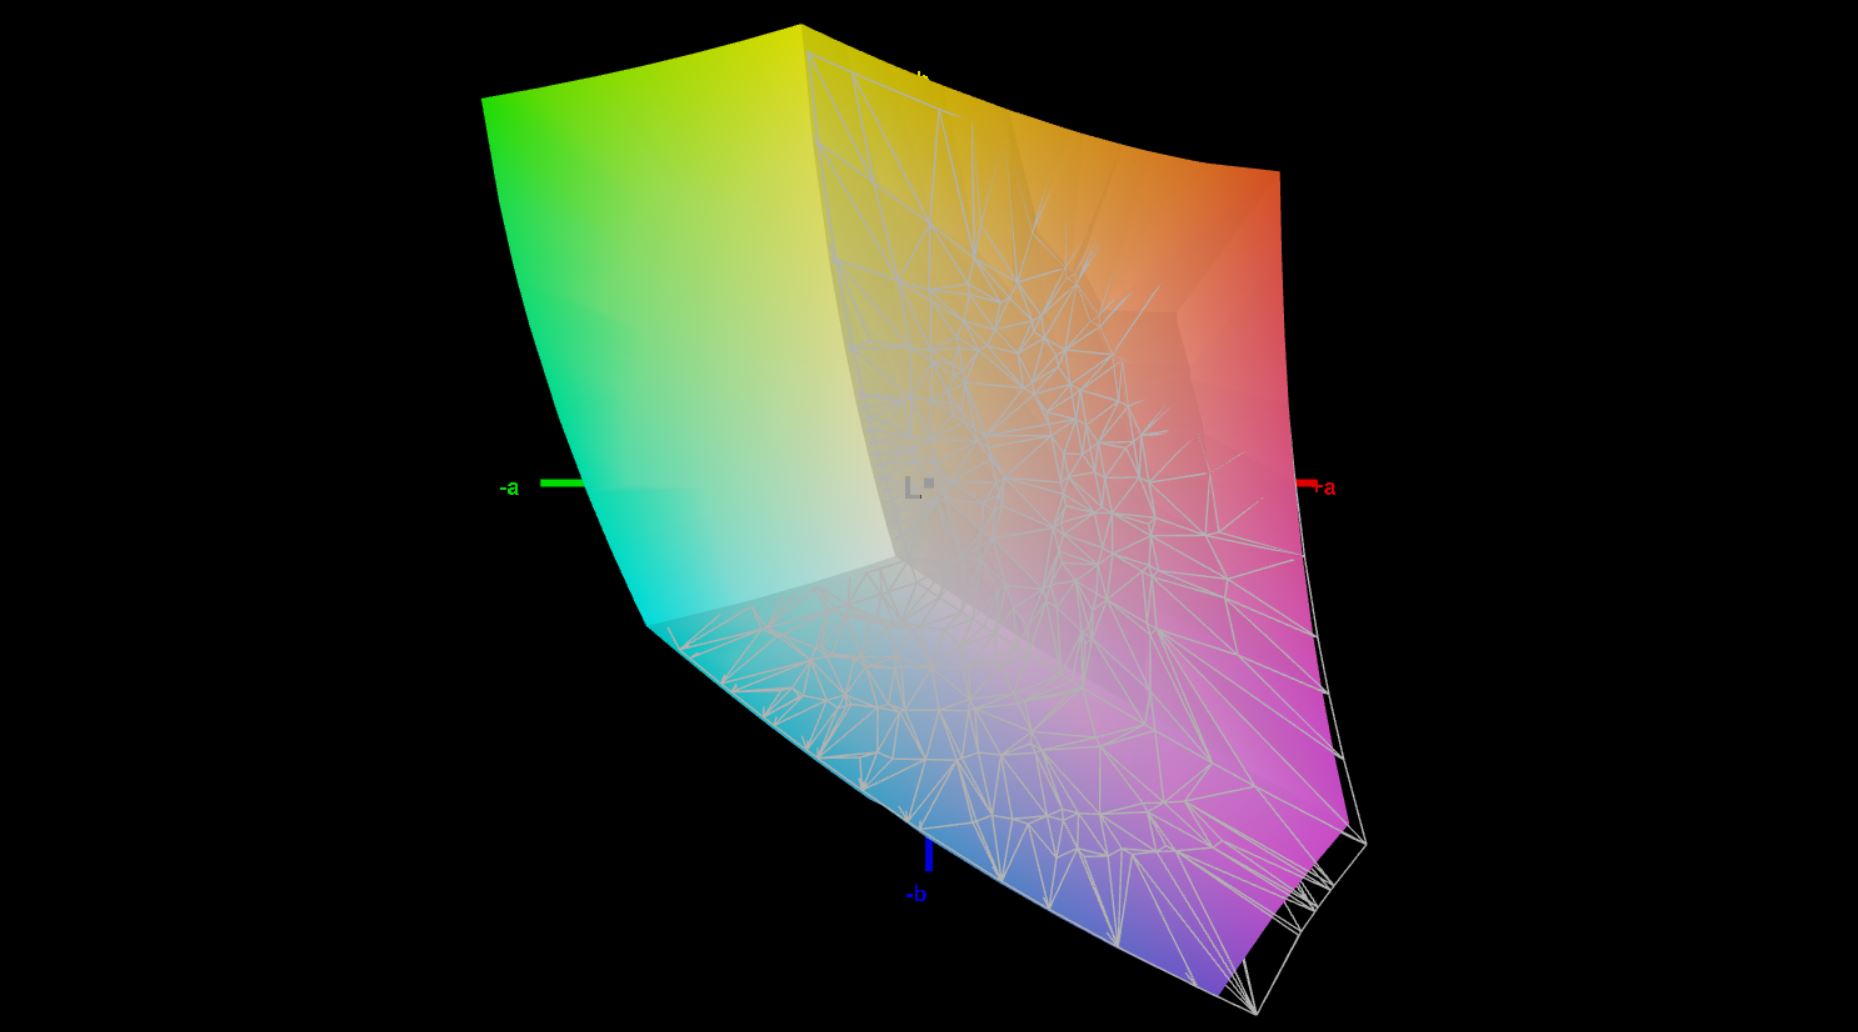
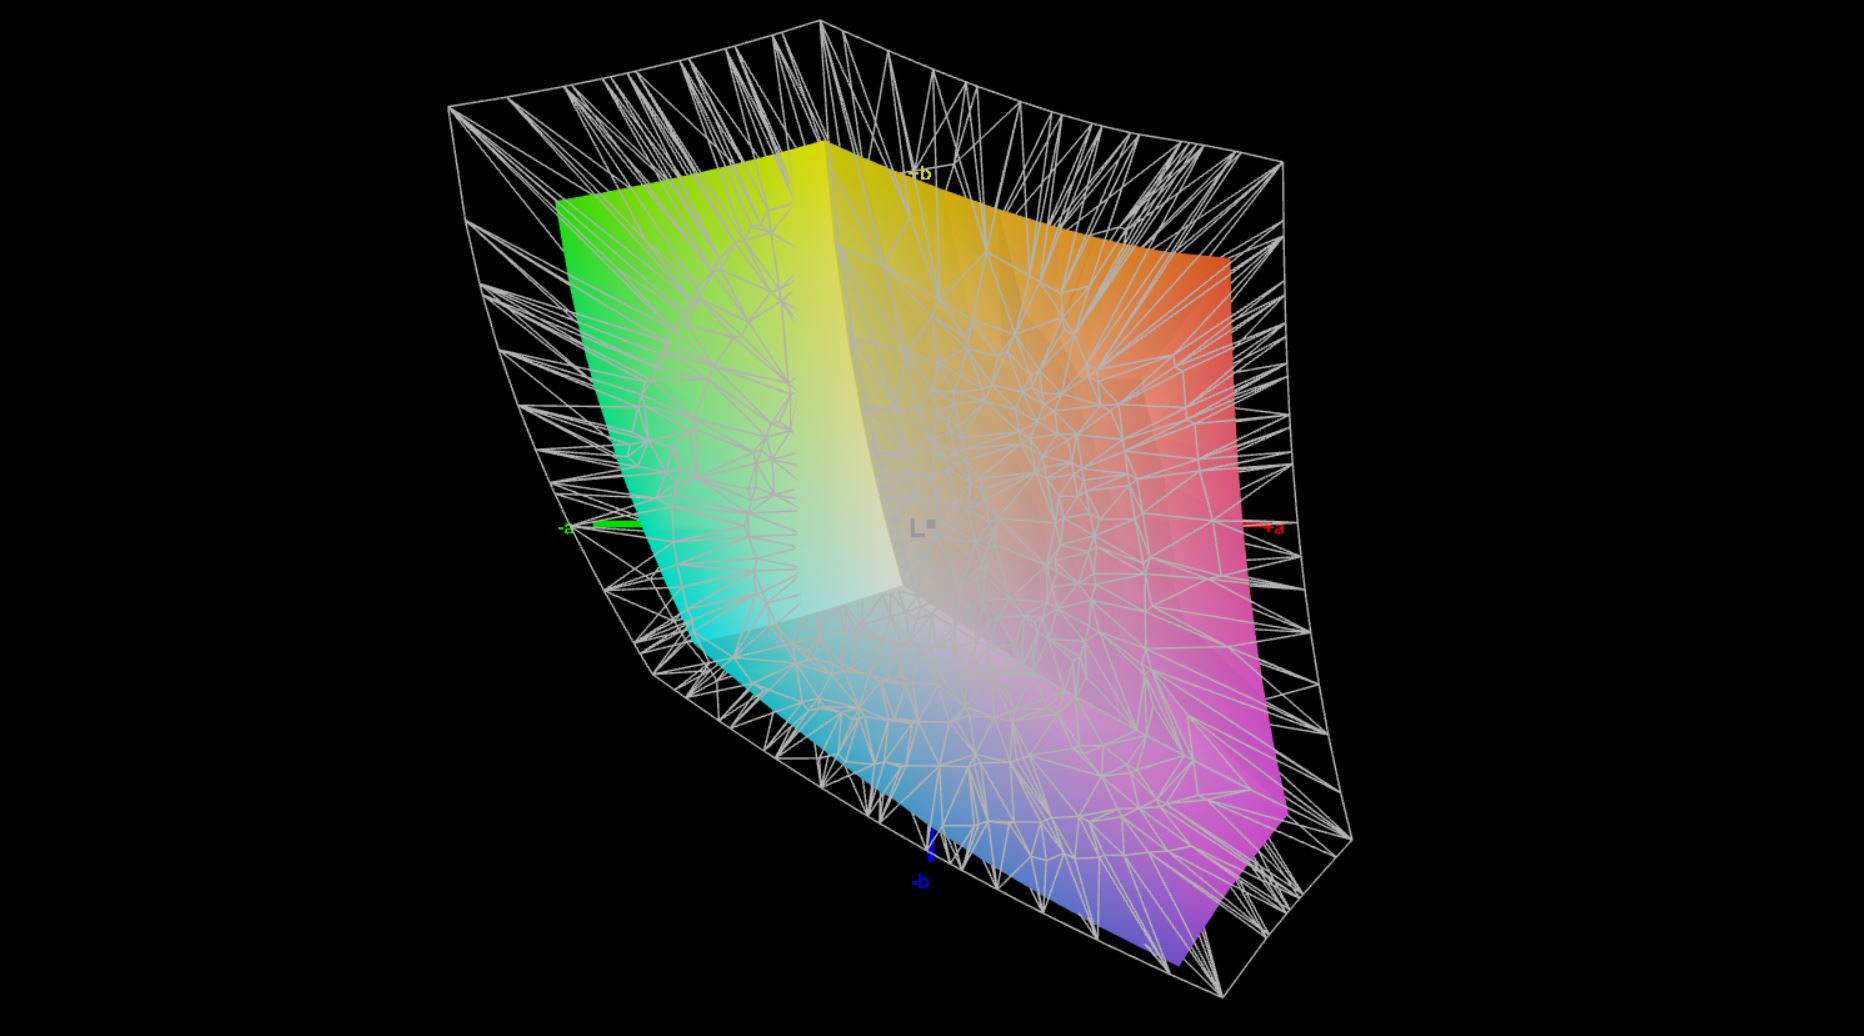
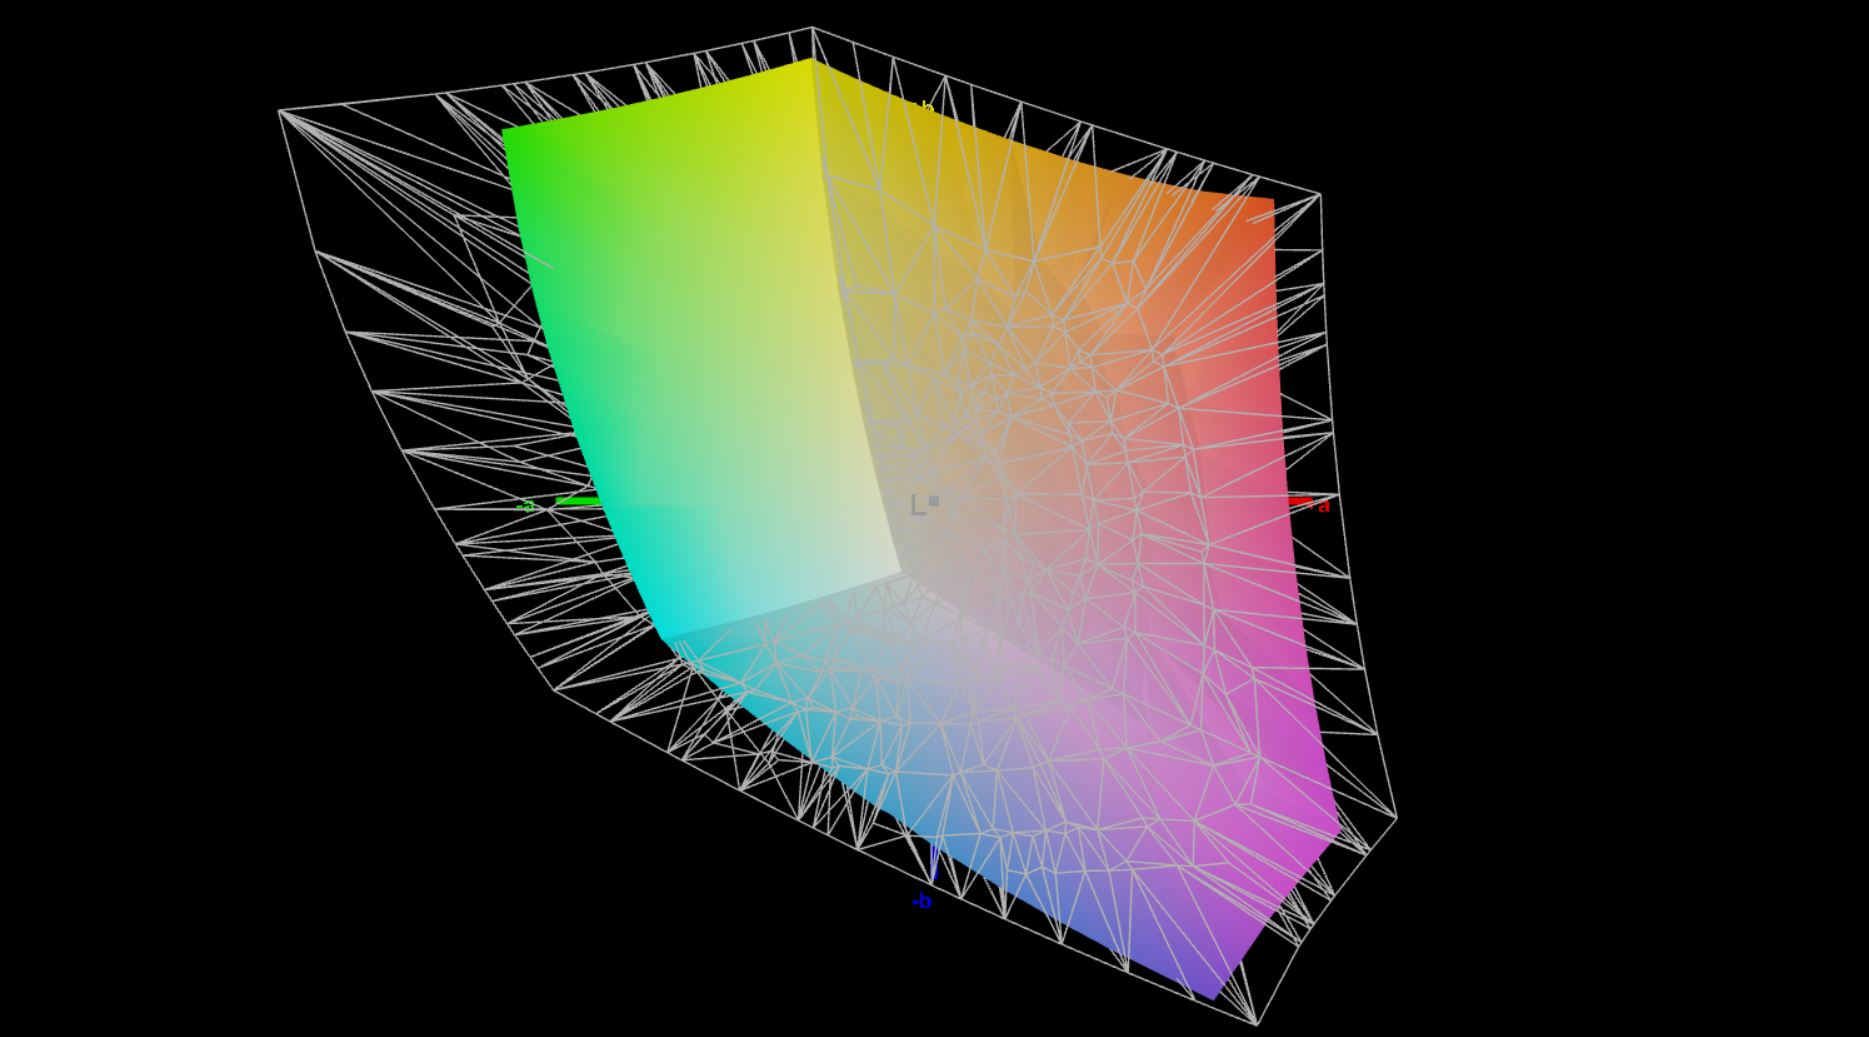
正如我们已经看到的 许多次正如我们以前多次看到的那样,可选的SureView显示屏并非没有弱点,这使得具有400尼特和全sRGB色彩空间覆盖的面板(这也是我们的测试配置所使用的)成为在亮度和图像质量之间取得良好平衡的最佳选择。我们对京东方的测试样本感到惊喜,它大大超过了它的规格,平均接近500尼特。同时,它的黑色值为0.31尼特,很好,导致了~1700:1的优秀对比度。
从主观上讲,图像看起来很好,尽管有磨砂层,但即使是较亮的区域也不会出现颗粒感。尽管是FHD分辨率,但屏幕为生产力提供了足够程度的清晰度。然而,响应时间有点慢,而且有轻微但明显的重影,例如在移动光标时。即使在最大亮度下,我们也没有观察到严重的背光渗漏,也没有PWM闪烁。
| |||||||||||||||||||||||||
Brightness Distribution: 93 %
Center on Battery: 524 cd/m²
Contrast: 1697:1 (Black: 0.31 cd/m²)
ΔE ColorChecker Calman: 3.6 | ∀{0.5-29.43 Ø4.71}
calibrated: 2.6
ΔE Greyscale Calman: 5.5 | ∀{0.09-98 Ø4.96}
70% AdobeRGB 1998 (Argyll 3D)
96.1% sRGB (Argyll 3D)
68.1% Display P3 (Argyll 3D)
Gamma: 2.02
CCT: 6527 K
| HP ZBook Firefly 16 G9-6B897EA BOE0A02, IPS, 1920x1200, 16" | Lenovo ThinkPad P1 G4-20Y4Z9DVUS NE160QDM-N63, IPS, 2560x1600, 16" | Dell Precision 5000 5560 Sharp LQ156R1, IPS, 3840x2400, 15.6" | Lenovo ThinkPad P15s Gen2-20W6000GGE MNF601EA1-1, IPS LED, 3840x2160, 15.6" | HP ZBook Firefly 15 G8 2C9R7EA LGD069B, IPS, 1920x1080, 15.6" | Apple MacBook Pro 16 2021 M1 Pro Liquid Retina XDR, Mini-LED, 3456x2234, 16.2" | |
|---|---|---|---|---|---|---|
| Display | 6% | 29% | 22% | 1% | 25% | |
| Display P3 Coverage (%) | 68.1 | 72.7 7% | 94.9 39% | 84.5 24% | 68.6 1% | 99.1 46% |
| sRGB Coverage (%) | 96.1 | 99.3 3% | 100 4% | 98.7 3% | 98.5 2% | 100 4% |
| AdobeRGB 1998 Coverage (%) | 70 | 74.7 7% | 100 43% | 97.8 40% | 70 0% | 88 26% |
| Response Times | 8% | -23% | 3% | -35% | -176% | |
| Response Time Grey 50% / Grey 80% * (ms) | 52.8 ? | 40.8 23% | 47.2 ? 11% | 40 ? 24% | 56 ? -6% | 42.8 ? 19% |
| Response Time Black / White * (ms) | 19.5 ? | 20.8 -7% | 30.4 ? -56% | 23.2 ? -19% | 32 ? -64% | 91.6 ? -370% |
| PWM Frequency (Hz) | 14880 | |||||
| Screen | 9% | -5% | 35% | -3% | 211% | |
| Brightness middle (cd/m²) | 526 | 441 -16% | 501.5 -5% | 604 15% | 397 -25% | 514 -2% |
| Brightness (cd/m²) | 499 | 420 -16% | 467 -6% | 609 22% | 402 -19% | 497 0% |
| Brightness Distribution (%) | 93 | 90 -3% | 83 -11% | 91 -2% | 84 -10% | 95 2% |
| Black Level * (cd/m²) | 0.31 | 0.27 13% | 0.44 -42% | 0.34 -10% | 0.13 58% | 0.02 94% |
| Contrast (:1) | 1697 | 1633 -4% | 1140 -33% | 1776 5% | 3054 80% | 25700 1414% |
| Colorchecker dE 2000 * | 3.6 | 2.6 28% | 4.73 -31% | 0.9 75% | 5.9 -64% | 1.4 61% |
| Colorchecker dE 2000 max. * | 6.6 | 6 9% | 8.45 -28% | 2.6 61% | 9.4 -42% | 2.8 58% |
| Colorchecker dE 2000 calibrated * | 2.6 | 1.2 54% | 0.51 80% | 0.8 69% | 1.1 58% | |
| Greyscale dE 2000 * | 5.5 | 4.5 18% | 3.6 35% | 1.1 80% | 8.8 -60% | 2.3 58% |
| Gamma | 2.02 109% | 2.18 101% | 2.08 106% | 2.15 102% | 2.47 89% | 2.27 97% |
| CCT | 6527 100% | 6623 98% | 6447 101% | 6656 98% | 6416 101% | 6792 96% |
| Color Space (Percent of AdobeRGB 1998) (%) | 84.5 | 63.7 | ||||
| Color Space (Percent of sRGB) (%) | 98.6 | 98.5 | ||||
| Total Average (Program / Settings) | 8% /
8% | 0% /
0% | 20% /
28% | -12% /
-7% | 20% /
108% |
* ... smaller is better
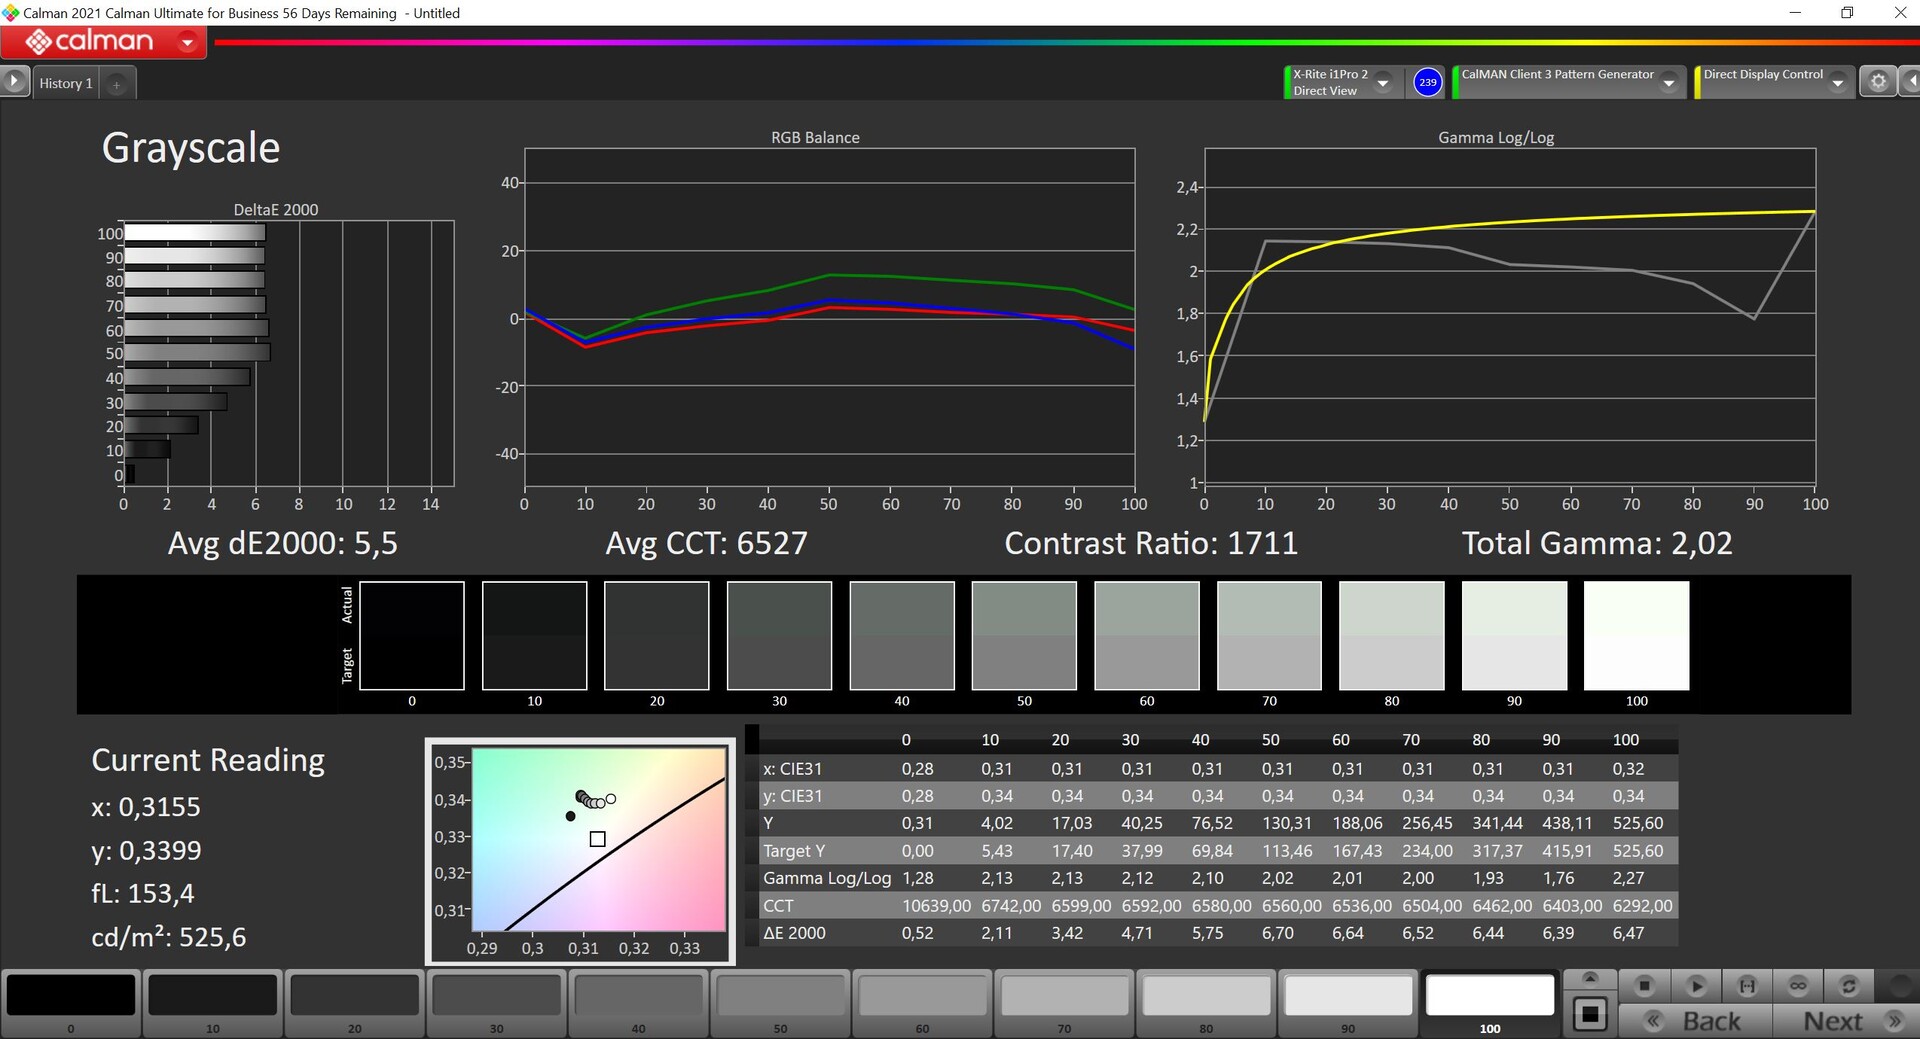
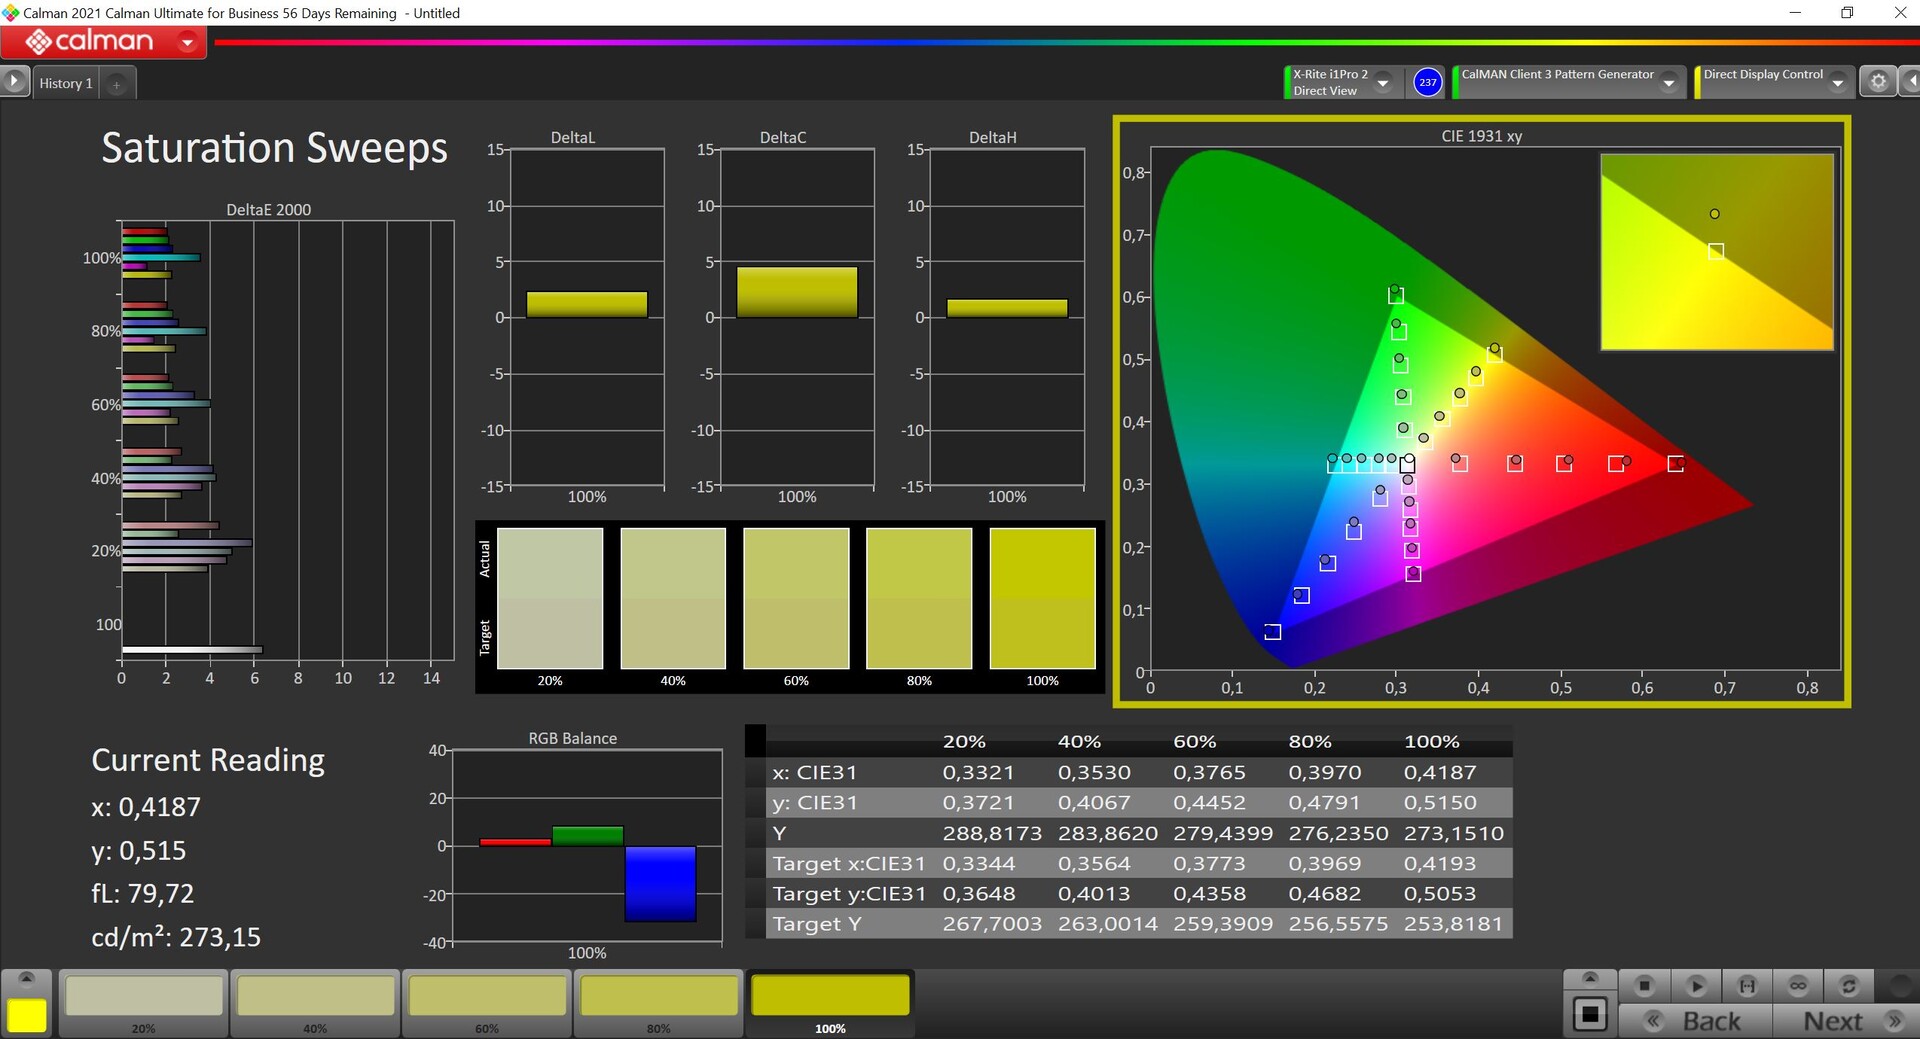
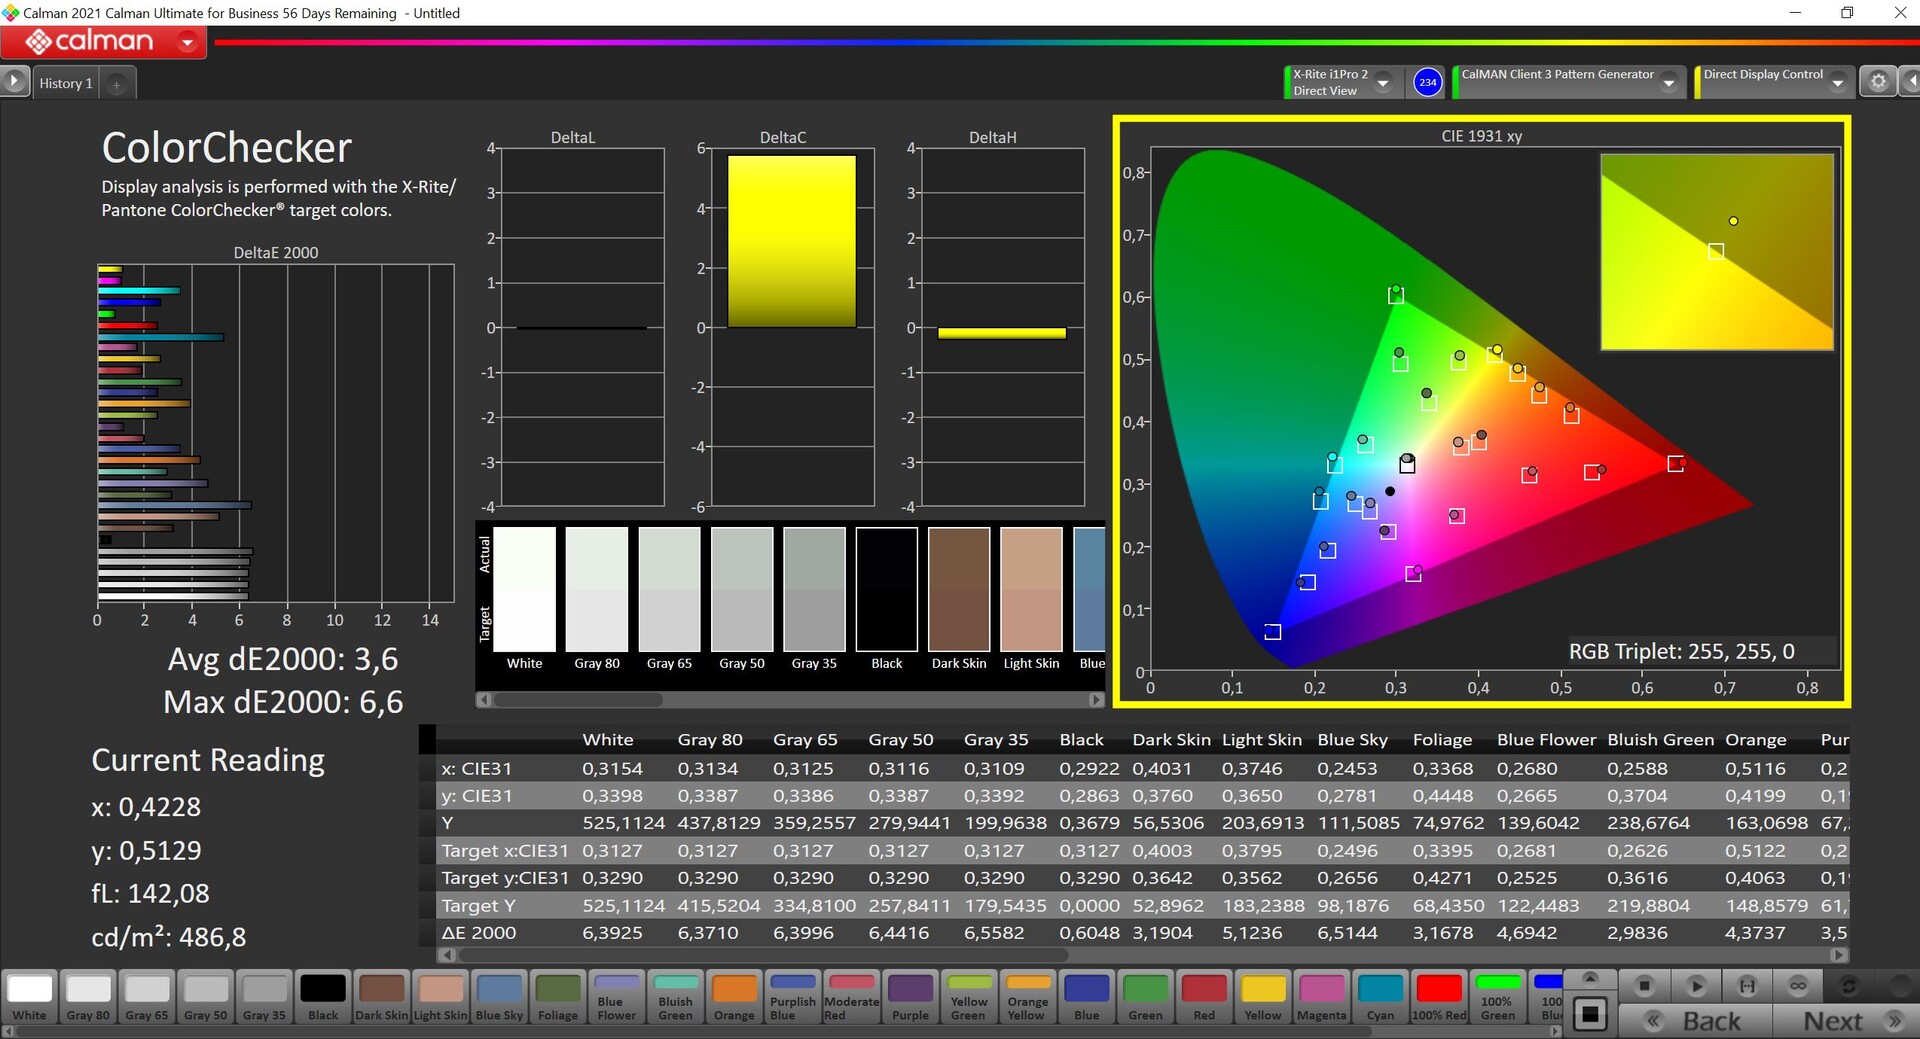
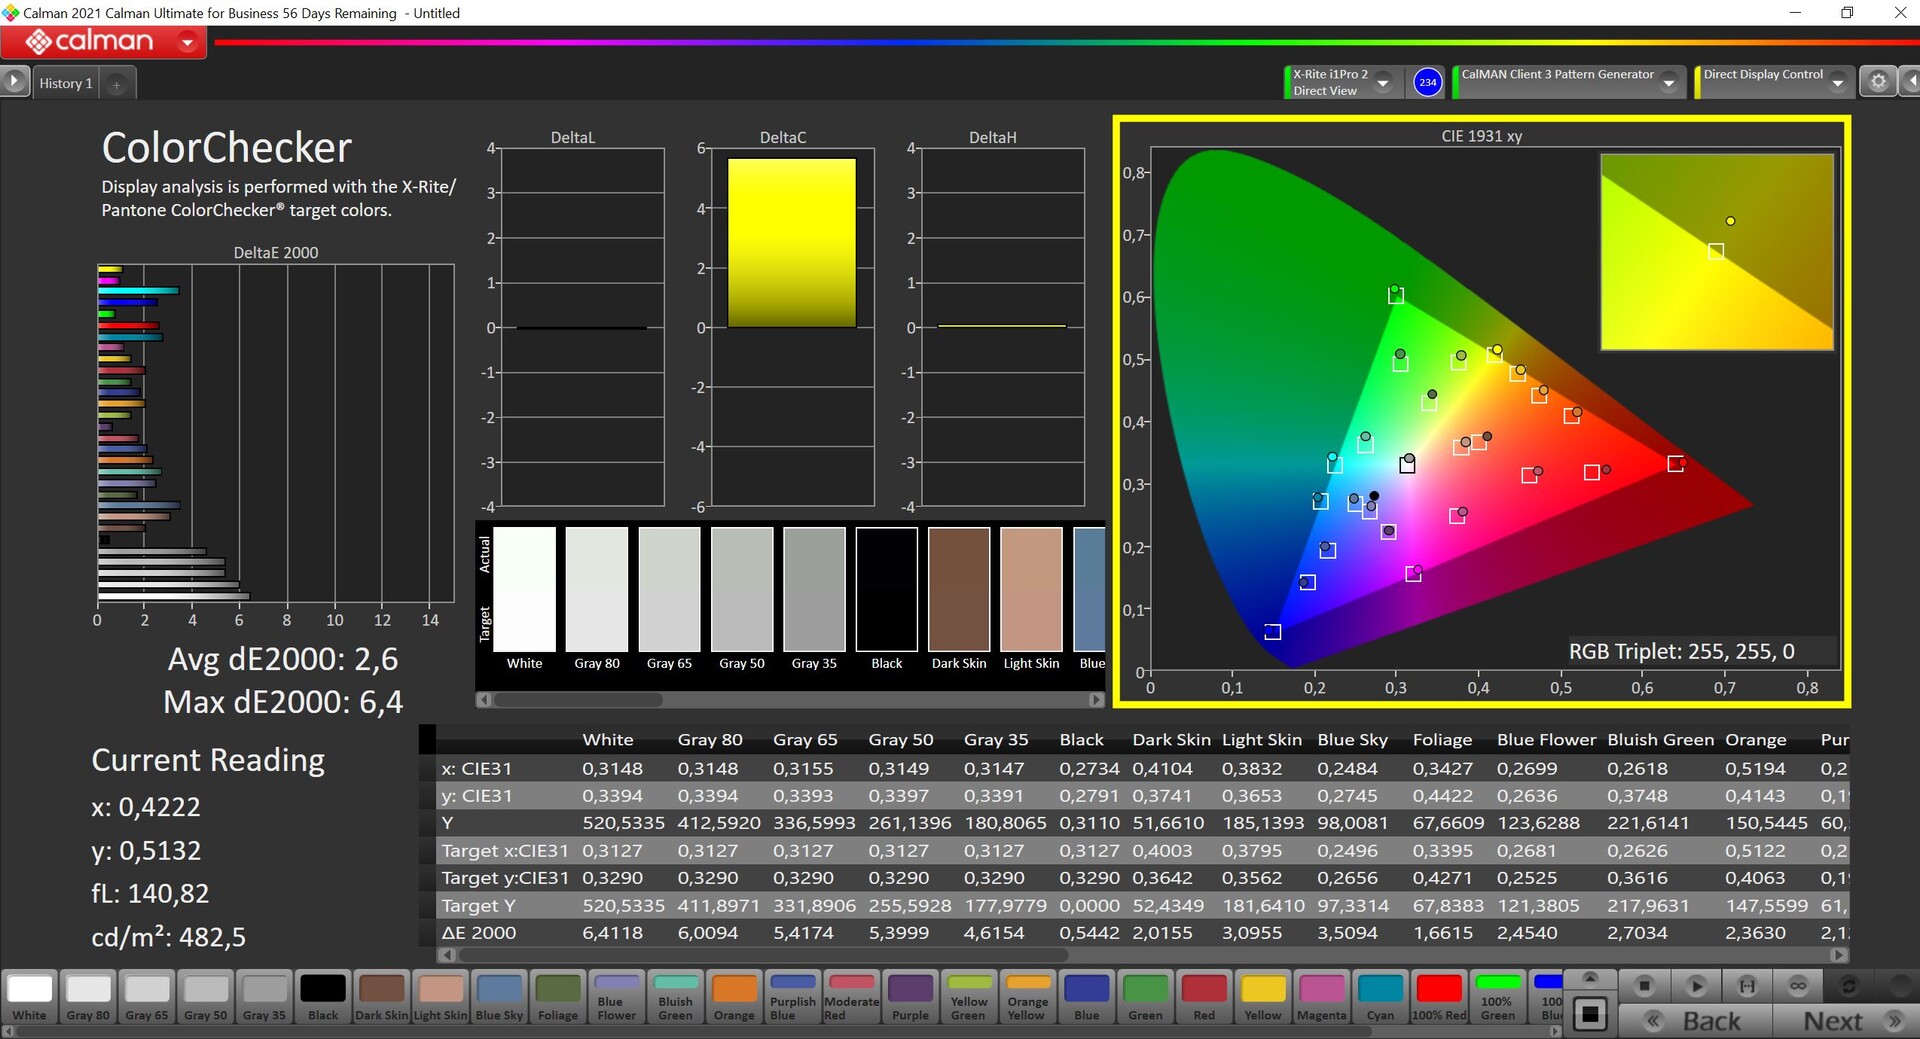
在我们的专业CalMAN分析中(X-Rite i1 Pro 2),我们观察到一个微弱的绿色色调和平均灰度,以及相对于sRGB参考色彩空间超过3的色彩偏差。校准显示器后,绿色色调不再是一个问题,大多数颜色的色彩精度都落入了理想范围。由于接近完整的sRGB色彩空间的覆盖,照片编辑是一个真正的可能性。
Display Response Times
| ↔ Response Time Black to White | ||
|---|---|---|
| 19.5 ms ... rise ↗ and fall ↘ combined | ↗ 6 ms rise | 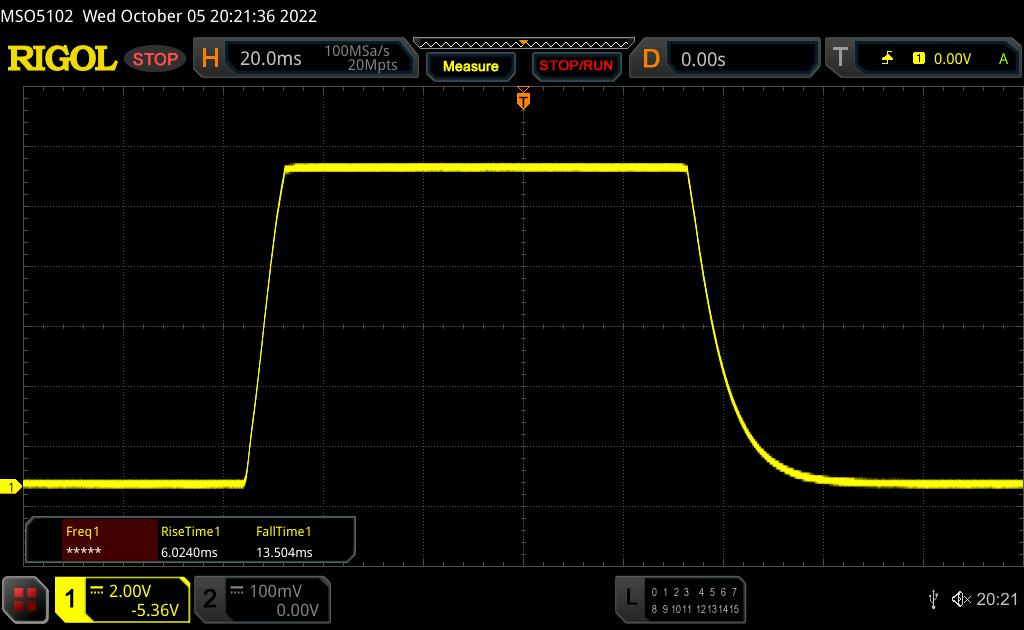 |
| ↘ 13.5 ms fall | ||
| The screen shows good response rates in our tests, but may be too slow for competitive gamers. In comparison, all tested devices range from 0.1 (minimum) to 240 (maximum) ms. » 43 % of all devices are better. This means that the measured response time is similar to the average of all tested devices (19.8 ms). | ||
| ↔ Response Time 50% Grey to 80% Grey | ||
| 52.8 ms ... rise ↗ and fall ↘ combined | ↗ 22.9 ms rise | 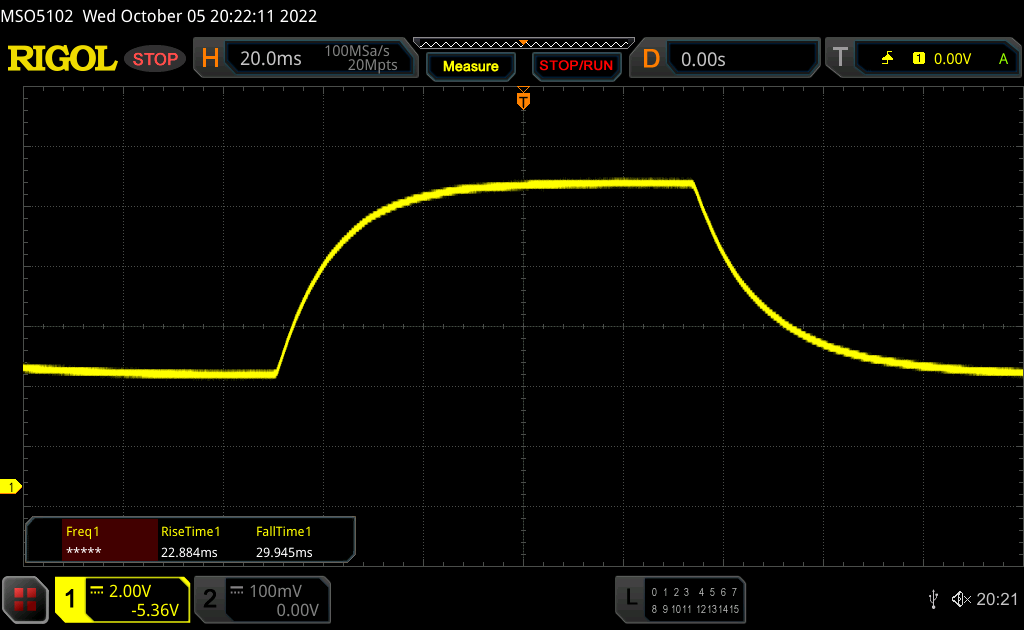 |
| ↘ 29.9 ms fall | ||
| The screen shows slow response rates in our tests and will be unsatisfactory for gamers. In comparison, all tested devices range from 0.165 (minimum) to 636 (maximum) ms. » 89 % of all devices are better. This means that the measured response time is worse than the average of all tested devices (31 ms). | ||
Screen Flickering / PWM (Pulse-Width Modulation)
| Screen flickering / PWM not detected | 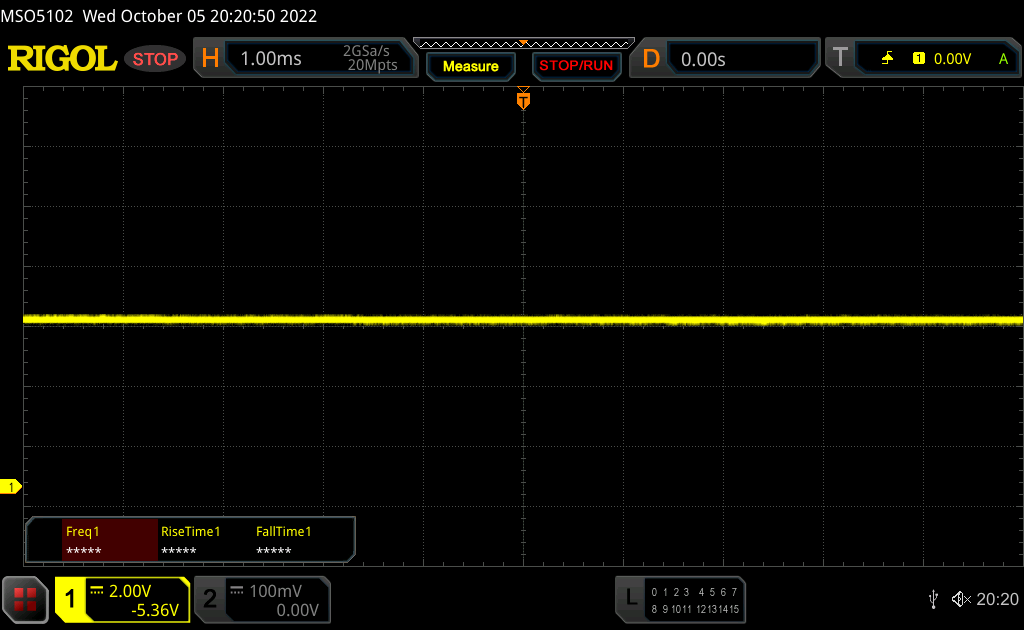 | ||
In comparison: 52 % of all tested devices do not use PWM to dim the display. If PWM was detected, an average of 7757 (minimum: 5 - maximum: 343500) Hz was measured. | |||
ZBook Firefly 16 G9很适合在户外使用,其磨砂面板和高最大亮度非常有用。只要阳光不直接照射到屏幕上,即使是晴天也不应该成为问题。
性能 - Alder Lake-U和Nvidia T550
测试条件
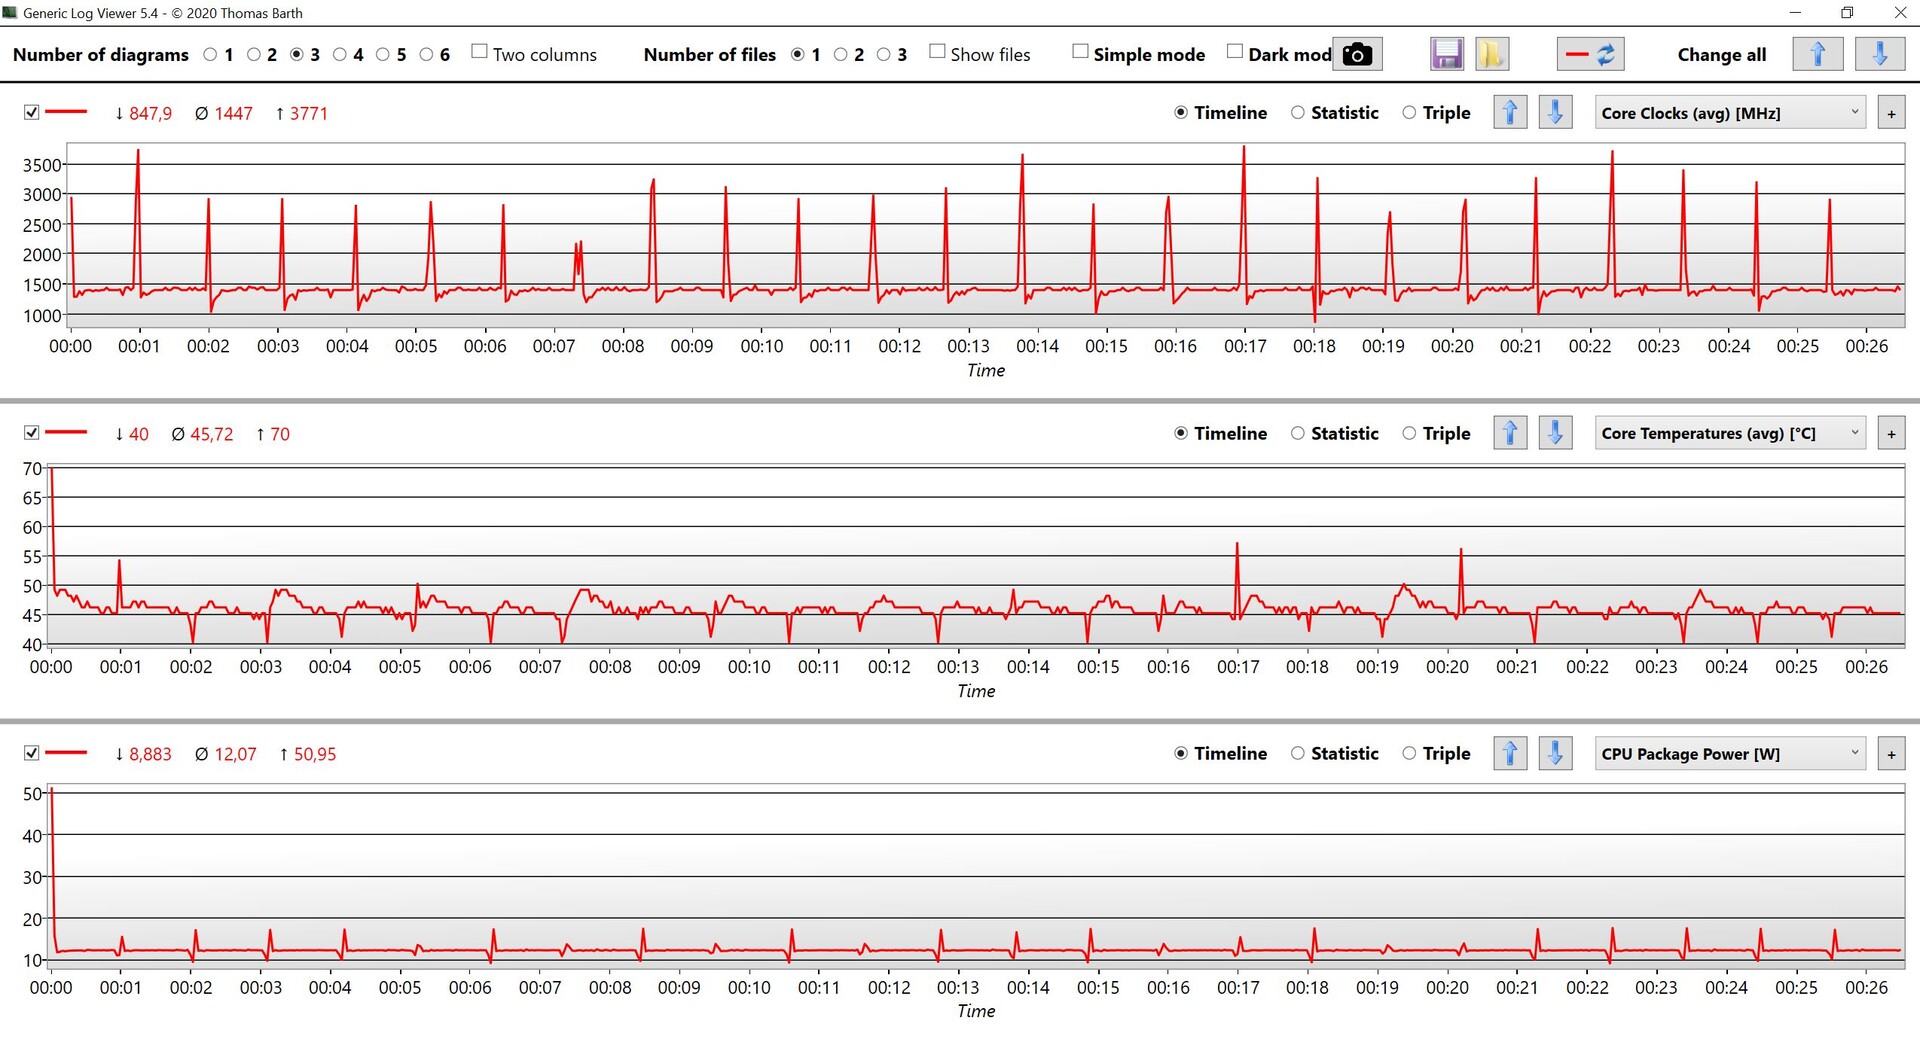
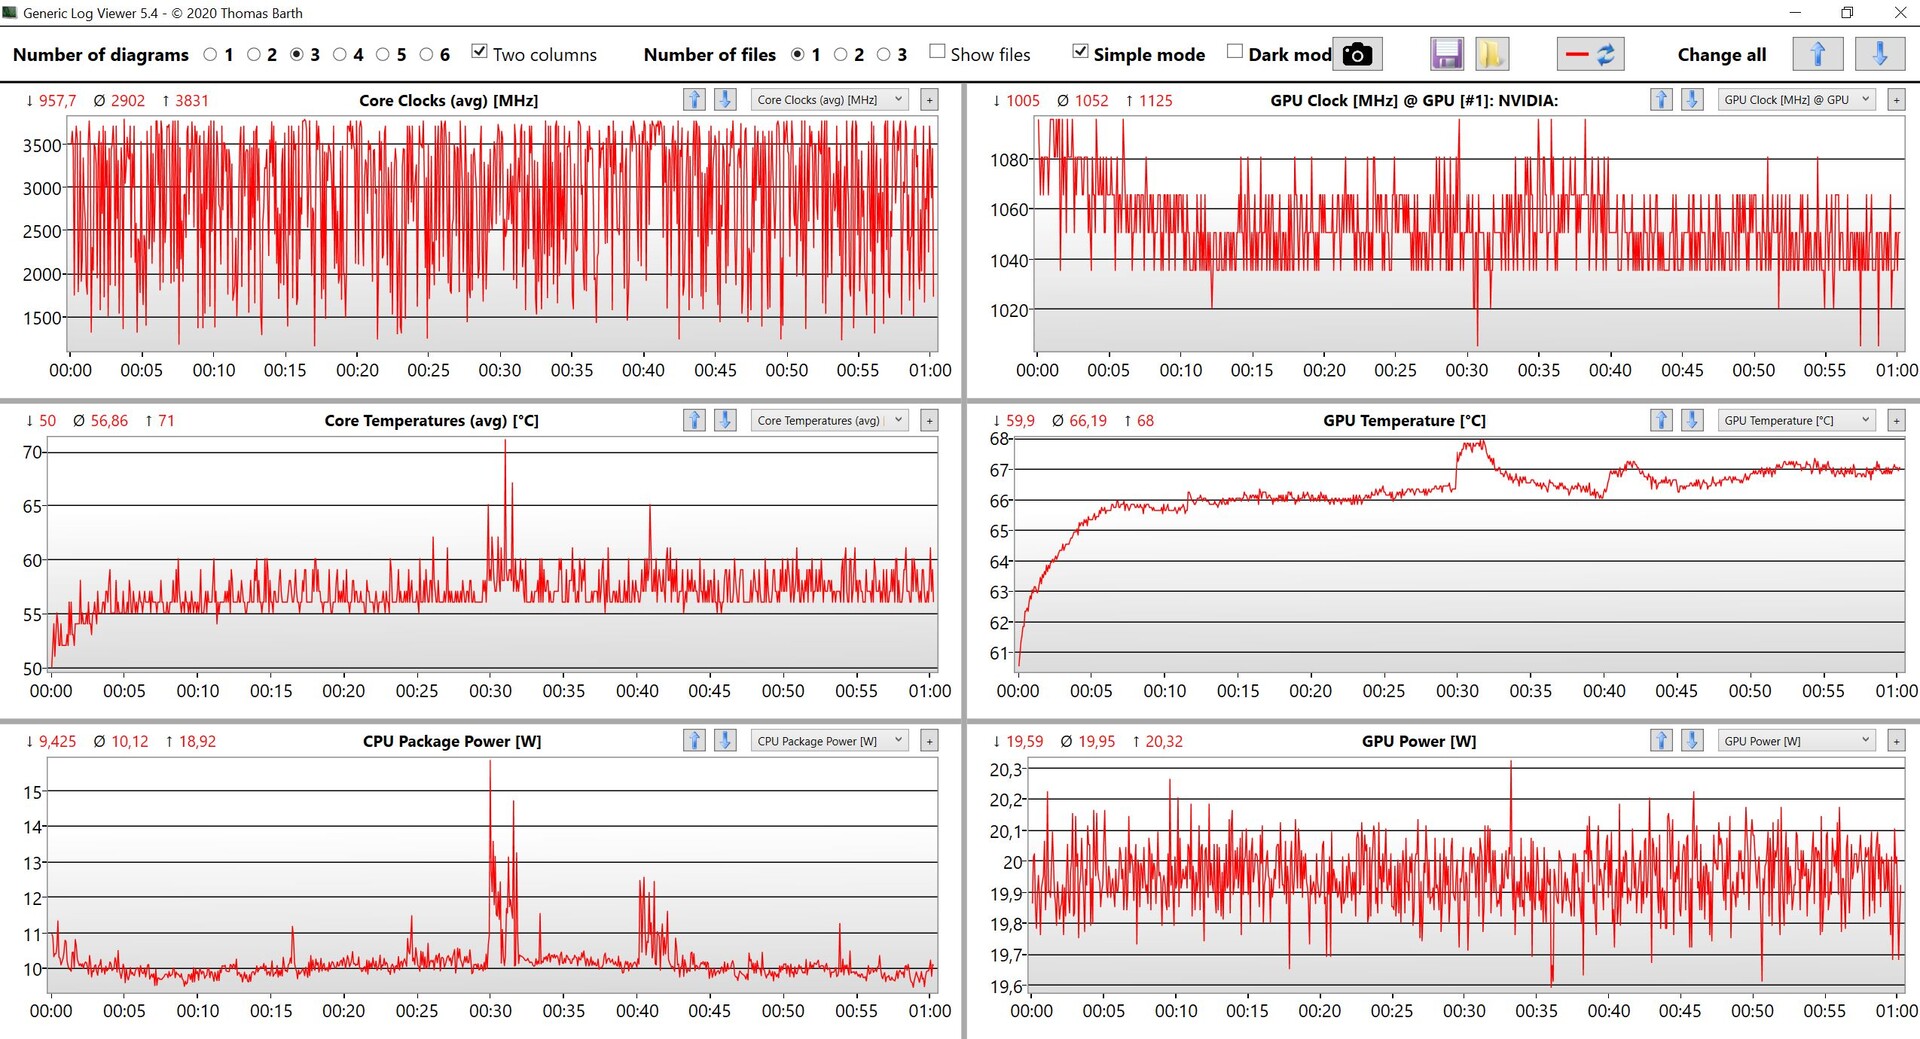
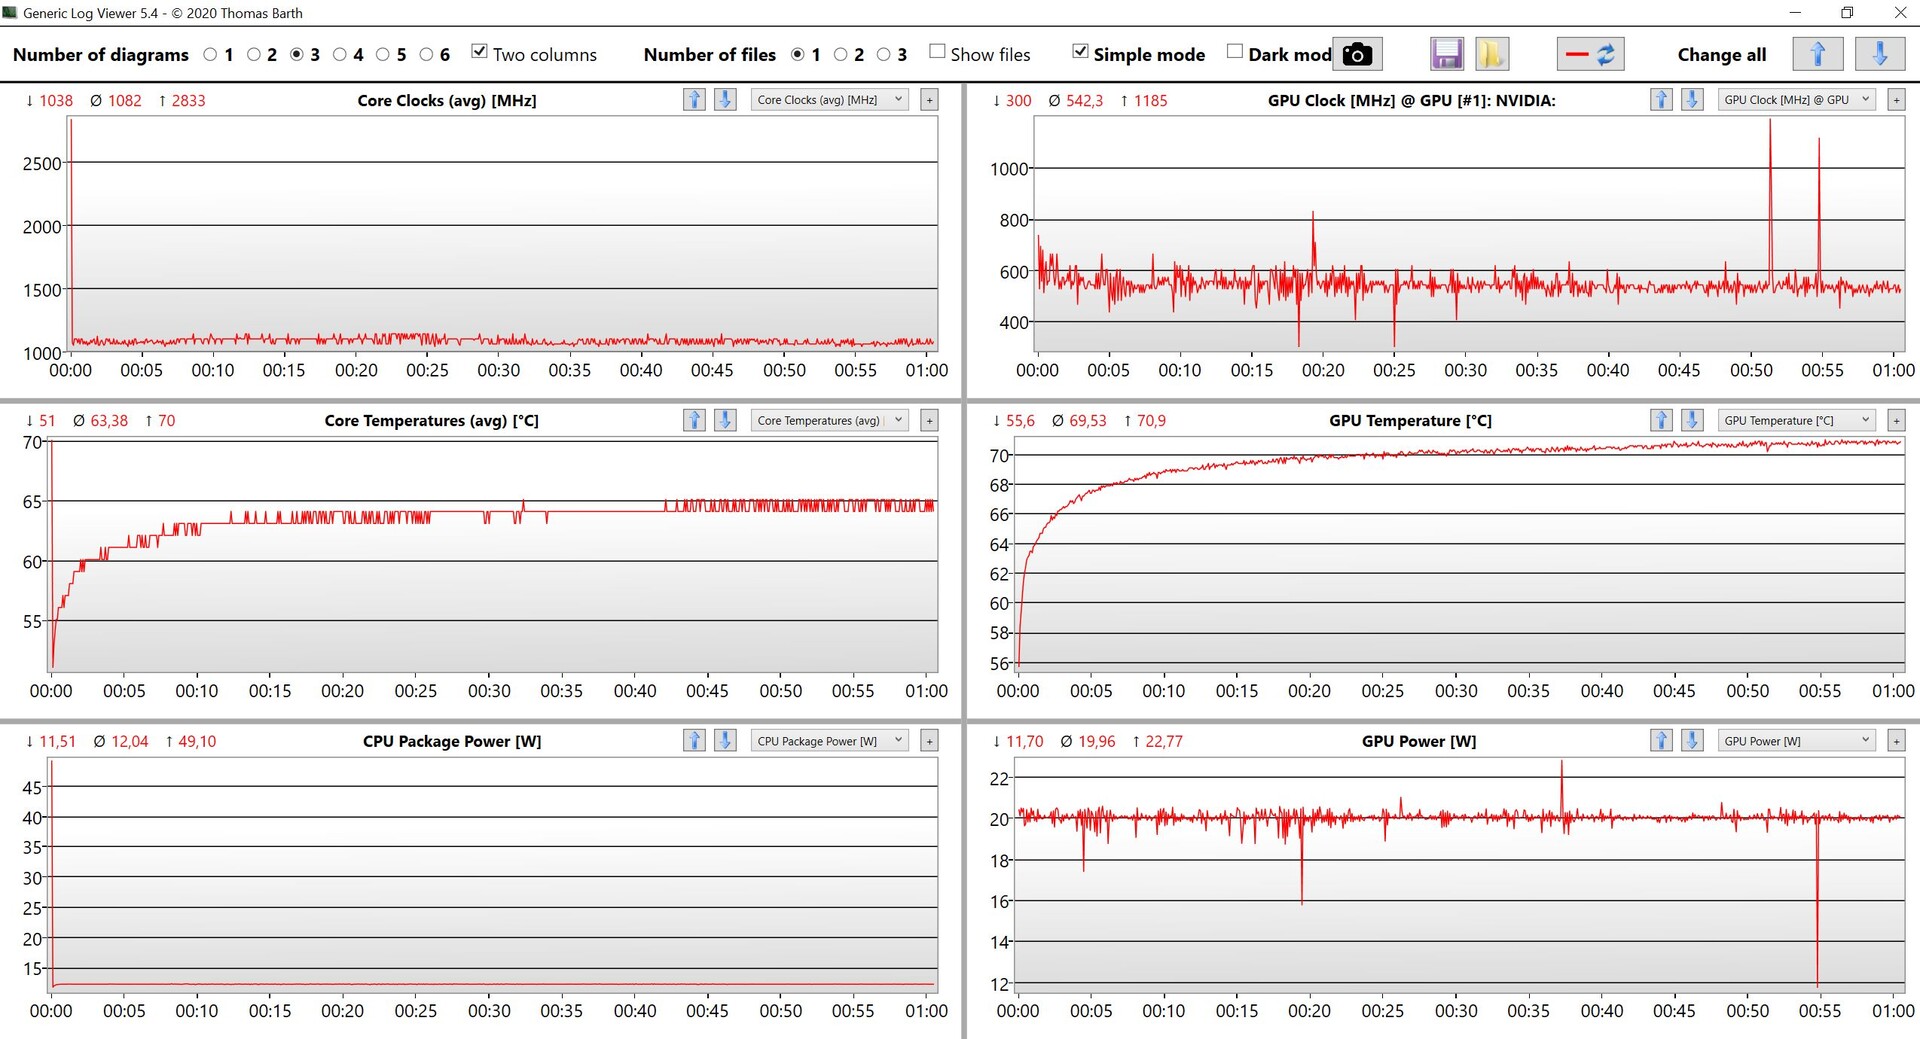
除了默认的Windows性能设置外,没有任何电源配置文件。我们非常惊讶地看到,在短时间内的功率限制为51瓦,在连续压力下为12瓦,非常低。最重要的是,高Turbo Boost只在大约一秒钟内可用。我们检查了所有设置(包括BIOS),并安装了所有可用的更新,但限制不会改变。同样,显卡的20瓦限制代表了这个芯片的绝对最低值。由于我们在14英寸版本上观察到类似的行为,我们的测试设备似乎不太可能有问题。即使冷却解决方案在CPU/GPU综合压力下达到了极限,我们也找不到CPU在纯粹的CPU负载下如此严重节流的理由。根据数据表,Alder Lake-P芯片,如 酷睿i5-1240P或 酷睿i7-1260P也可以使用,尽管我们目前无法确定它们的功率限制是否更合理。
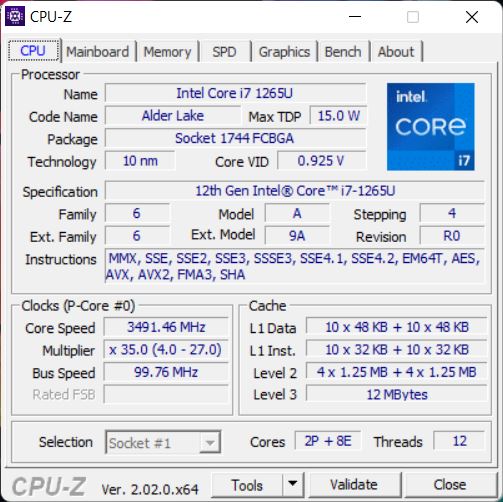
处理器
从名义上看, 英特尔酷睿i7-1265U是一个拥有两个性能和八个效率核心的快速处理器。然而,由于其TDP被大量限制在仅12瓦,其性能非常糟糕,甚至在单核基准测试中也出现了节流现象。虽然目前英特尔GPU的实际性能可以根据制造商设定的TDP而有很大的不同,但我们从来没有见过这么低的结果,甚至老式的Firefly 15 G8也是如此。 酷睿i7-1165G7甚至老式的Firefly 15 G8也比我们的ZBook Firefly 16 G9更胜一筹。虽然在单核基准测试中赤字不大,使得在日常使用中性能不佳不那么明显,但多核基准测试结果使这个移动工作站或多或少成为最慢的笔记本电脑之一。令我们惊讶的是,在电池模式下的性能更差,功率限制仅为30/10瓦。更多基准测试可在 这里.
Cinebench R15 Multi Loop
Cinebench R23: Multi Core | Single Core
Cinebench R20: CPU (Multi Core) | CPU (Single Core)
Cinebench R15: CPU Multi 64Bit | CPU Single 64Bit
Blender: v2.79 BMW27 CPU
7-Zip 18.03: 7z b 4 | 7z b 4 -mmt1
Geekbench 5.5: Multi-Core | Single-Core
HWBOT x265 Benchmark v2.2: 4k Preset
LibreOffice : 20 Documents To PDF
R Benchmark 2.5: Overall mean
| CPU Performance rating | |
| Average of class Workstation | |
| Apple MacBook Pro 16 2021 M1 Pro -5! | |
| Lenovo ThinkPad P1 G4-20Y4Z9DVUS | |
| Dell Precision 5000 5560 -2! | |
| Average Intel Core i7-1265U | |
| Lenovo ThinkPad P15s Gen2-20W6000GGE | |
| HP ZBook Firefly 15 G8 2C9R7EA -2! | |
| HP ZBook Firefly 16 G9-6B897EA | |
| Cinebench R23 / Multi Core | |
| Average of class Workstation (14621 - 38520, n=23, last 2 years) | |
| Lenovo ThinkPad P1 G4-20Y4Z9DVUS | |
| Apple MacBook Pro 16 2021 M1 Pro | |
| Dell Precision 5000 5560 | |
| Average Intel Core i7-1265U (4332 - 9219, n=10) | |
| Lenovo ThinkPad P15s Gen2-20W6000GGE | |
| HP ZBook Firefly 16 G9-6B897EA | |
| Cinebench R23 / Single Core | |
| Average of class Workstation (1712 - 2228, n=23, last 2 years) | |
| Average Intel Core i7-1265U (1144 - 1820, n=10) | |
| Apple MacBook Pro 16 2021 M1 Pro | |
| Dell Precision 5000 5560 | |
| Lenovo ThinkPad P1 G4-20Y4Z9DVUS | |
| Lenovo ThinkPad P15s Gen2-20W6000GGE | |
| HP ZBook Firefly 16 G9-6B897EA | |
| Cinebench R20 / CPU (Multi Core) | |
| Average of class Workstation (5760 - 15043, n=23, last 2 years) | |
| Lenovo ThinkPad P1 G4-20Y4Z9DVUS | |
| Dell Precision 5000 5560 | |
| Average Intel Core i7-1265U (1669 - 3584, n=10) | |
| Apple MacBook Pro 16 2021 M1 Pro | |
| HP ZBook Firefly 15 G8 2C9R7EA | |
| Lenovo ThinkPad P15s Gen2-20W6000GGE | |
| HP ZBook Firefly 16 G9-6B897EA | |
| Cinebench R20 / CPU (Single Core) | |
| Average of class Workstation (671 - 857, n=23, last 2 years) | |
| Average Intel Core i7-1265U (528 - 701, n=10) | |
| HP ZBook Firefly 15 G8 2C9R7EA | |
| Lenovo ThinkPad P1 G4-20Y4Z9DVUS | |
| Dell Precision 5000 5560 | |
| Lenovo ThinkPad P15s Gen2-20W6000GGE | |
| HP ZBook Firefly 16 G9-6B897EA | |
| Apple MacBook Pro 16 2021 M1 Pro | |
| Cinebench R15 / CPU Multi 64Bit | |
| Average of class Workstation (2489 - 5810, n=23, last 2 years) | |
| Lenovo ThinkPad P1 G4-20Y4Z9DVUS | |
| Apple MacBook Pro 16 2021 M1 Pro | |
| Dell Precision 5000 5560 | |
| Average Intel Core i7-1265U (706 - 1572, n=10) | |
| Lenovo ThinkPad P15s Gen2-20W6000GGE | |
| HP ZBook Firefly 15 G8 2C9R7EA | |
| HP ZBook Firefly 16 G9-6B897EA | |
| Cinebench R15 / CPU Single 64Bit | |
| Average of class Workstation (191.4 - 328, n=23, last 2 years) | |
| Dell Precision 5000 5560 | |
| Lenovo ThinkPad P1 G4-20Y4Z9DVUS | |
| Average Intel Core i7-1265U (165.3 - 260, n=10) | |
| HP ZBook Firefly 15 G8 2C9R7EA | |
| Lenovo ThinkPad P15s Gen2-20W6000GGE | |
| Apple MacBook Pro 16 2021 M1 Pro | |
| HP ZBook Firefly 16 G9-6B897EA | |
| Blender / v2.79 BMW27 CPU | |
| HP ZBook Firefly 16 G9-6B897EA | |
| HP ZBook Firefly 15 G8 2C9R7EA | |
| Lenovo ThinkPad P15s Gen2-20W6000GGE | |
| Average Intel Core i7-1265U (364 - 684, n=10) | |
| Dell Precision 5000 5560 | |
| Lenovo ThinkPad P1 G4-20Y4Z9DVUS | |
| Apple MacBook Pro 16 2021 M1 Pro | |
| Average of class Workstation (91 - 222, n=23, last 2 years) | |
| 7-Zip 18.03 / 7z b 4 | |
| Average of class Workstation (60489 - 116969, n=23, last 2 years) | |
| Lenovo ThinkPad P1 G4-20Y4Z9DVUS | |
| Dell Precision 5000 5560 | |
| Average Intel Core i7-1265U (20087 - 38715, n=10) | |
| HP ZBook Firefly 15 G8 2C9R7EA | |
| Lenovo ThinkPad P15s Gen2-20W6000GGE | |
| HP ZBook Firefly 16 G9-6B897EA | |
| 7-Zip 18.03 / 7z b 4 -mmt1 | |
| Average of class Workstation (5126 - 6960, n=23, last 2 years) | |
| Dell Precision 5000 5560 | |
| Lenovo ThinkPad P1 G4-20Y4Z9DVUS | |
| HP ZBook Firefly 15 G8 2C9R7EA | |
| Lenovo ThinkPad P15s Gen2-20W6000GGE | |
| Average Intel Core i7-1265U (4614 - 5617, n=10) | |
| HP ZBook Firefly 16 G9-6B897EA | |
| Geekbench 5.5 / Multi-Core | |
| Average of class Workstation (11542 - 25554, n=23, last 2 years) | |
| Apple MacBook Pro 16 2021 M1 Pro | |
| Lenovo ThinkPad P1 G4-20Y4Z9DVUS | |
| Average Intel Core i7-1265U (5022 - 8981, n=10) | |
| Lenovo ThinkPad P15s Gen2-20W6000GGE | |
| HP ZBook Firefly 16 G9-6B897EA | |
| HP ZBook Firefly 15 G8 2C9R7EA | |
| Geekbench 5.5 / Single-Core | |
| Average of class Workstation (1783 - 2183, n=23, last 2 years) | |
| HP ZBook Firefly 16 G9-6B897EA | |
| Apple MacBook Pro 16 2021 M1 Pro | |
| Average Intel Core i7-1265U (1429 - 1806, n=10) | |
| Lenovo ThinkPad P1 G4-20Y4Z9DVUS | |
| HP ZBook Firefly 15 G8 2C9R7EA | |
| Lenovo ThinkPad P15s Gen2-20W6000GGE | |
| HWBOT x265 Benchmark v2.2 / 4k Preset | |
| Average of class Workstation (17.8 - 40.5, n=23, last 2 years) | |
| Lenovo ThinkPad P1 G4-20Y4Z9DVUS | |
| Dell Precision 5000 5560 | |
| Average Intel Core i7-1265U (5.09 - 10.6, n=10) | |
| Lenovo ThinkPad P15s Gen2-20W6000GGE | |
| HP ZBook Firefly 15 G8 2C9R7EA | |
| HP ZBook Firefly 16 G9-6B897EA | |
| LibreOffice / 20 Documents To PDF | |
| HP ZBook Firefly 16 G9-6B897EA | |
| Lenovo ThinkPad P1 G4-20Y4Z9DVUS | |
| Average Intel Core i7-1265U (44 - 61.6, n=10) | |
| Dell Precision 5000 5560 | |
| Average of class Workstation (37.1 - 74.7, n=23, last 2 years) | |
| Lenovo ThinkPad P15s Gen2-20W6000GGE | |
| HP ZBook Firefly 15 G8 2C9R7EA | |
| R Benchmark 2.5 / Overall mean | |
| HP ZBook Firefly 15 G8 2C9R7EA | |
| Lenovo ThinkPad P15s Gen2-20W6000GGE | |
| Lenovo ThinkPad P1 G4-20Y4Z9DVUS | |
| HP ZBook Firefly 16 G9-6B897EA | |
| Dell Precision 5000 5560 | |
| Average Intel Core i7-1265U (0.4666 - 0.578, n=10) | |
| Average of class Workstation (0.3825 - 0.603, n=23, last 2 years) | |
* ... smaller is better
AIDA64: FP32 Ray-Trace | FPU Julia | CPU SHA3 | CPU Queen | FPU SinJulia | FPU Mandel | CPU AES | CPU ZLib | FP64 Ray-Trace | CPU PhotoWorxx
| Performance rating | |
| Average of class Workstation | |
| Lenovo ThinkPad P1 G4-20Y4Z9DVUS | |
| Lenovo ThinkPad P15s Gen2-20W6000GGE | |
| Average Intel Core i7-1265U | |
| HP ZBook Firefly 15 G8 2C9R7EA | |
| HP ZBook Firefly 16 G9-6B897EA | |
| AIDA64 / FP32 Ray-Trace | |
| Average of class Workstation (16730 - 61611, n=23, last 2 years) | |
| Lenovo ThinkPad P1 G4-20Y4Z9DVUS | |
| Lenovo ThinkPad P15s Gen2-20W6000GGE | |
| HP ZBook Firefly 15 G8 2C9R7EA | |
| Average Intel Core i7-1265U (2619 - 8178, n=10) | |
| HP ZBook Firefly 16 G9-6B897EA | |
| AIDA64 / FPU Julia | |
| Average of class Workstation (89597 - 186971, n=23, last 2 years) | |
| Lenovo ThinkPad P1 G4-20Y4Z9DVUS | |
| Average Intel Core i7-1265U (12909 - 41649, n=10) | |
| Lenovo ThinkPad P15s Gen2-20W6000GGE | |
| HP ZBook Firefly 15 G8 2C9R7EA | |
| HP ZBook Firefly 16 G9-6B897EA | |
| AIDA64 / CPU SHA3 | |
| Average of class Workstation (4178 - 8975, n=23, last 2 years) | |
| Lenovo ThinkPad P1 G4-20Y4Z9DVUS | |
| Lenovo ThinkPad P15s Gen2-20W6000GGE | |
| HP ZBook Firefly 15 G8 2C9R7EA | |
| Average Intel Core i7-1265U (824 - 2183, n=10) | |
| HP ZBook Firefly 16 G9-6B897EA | |
| AIDA64 / CPU Queen | |
| Average of class Workstation (60778 - 144411, n=23, last 2 years) | |
| Lenovo ThinkPad P1 G4-20Y4Z9DVUS | |
| Average Intel Core i7-1265U (63615 - 67065, n=10) | |
| HP ZBook Firefly 16 G9-6B897EA | |
| Lenovo ThinkPad P15s Gen2-20W6000GGE | |
| HP ZBook Firefly 15 G8 2C9R7EA | |
| AIDA64 / FPU SinJulia | |
| Average of class Workstation (8165 - 29343, n=23, last 2 years) | |
| Lenovo ThinkPad P1 G4-20Y4Z9DVUS | |
| Lenovo ThinkPad P15s Gen2-20W6000GGE | |
| HP ZBook Firefly 15 G8 2C9R7EA | |
| Average Intel Core i7-1265U (3105 - 5135, n=10) | |
| HP ZBook Firefly 16 G9-6B897EA | |
| AIDA64 / FPU Mandel | |
| Average of class Workstation (44497 - 98153, n=23, last 2 years) | |
| Lenovo ThinkPad P1 G4-20Y4Z9DVUS | |
| Lenovo ThinkPad P15s Gen2-20W6000GGE | |
| HP ZBook Firefly 15 G8 2C9R7EA | |
| Average Intel Core i7-1265U (6967 - 20804, n=10) | |
| HP ZBook Firefly 16 G9-6B897EA | |
| AIDA64 / CPU AES | |
| Average of class Workstation (73133 - 187841, n=23, last 2 years) | |
| Lenovo ThinkPad P1 G4-20Y4Z9DVUS | |
| Lenovo ThinkPad P15s Gen2-20W6000GGE | |
| HP ZBook Firefly 15 G8 2C9R7EA | |
| Average Intel Core i7-1265U (19489 - 42966, n=10) | |
| HP ZBook Firefly 16 G9-6B897EA | |
| AIDA64 / CPU ZLib | |
| Average of class Workstation (929 - 2148, n=23, last 2 years) | |
| Lenovo ThinkPad P1 G4-20Y4Z9DVUS | |
| Average Intel Core i7-1265U (314 - 632, n=10) | |
| Lenovo ThinkPad P15s Gen2-20W6000GGE | |
| HP ZBook Firefly 15 G8 2C9R7EA | |
| HP ZBook Firefly 16 G9-6B897EA | |
| AIDA64 / FP64 Ray-Trace | |
| Average of class Workstation (8545 - 32891, n=23, last 2 years) | |
| Lenovo ThinkPad P1 G4-20Y4Z9DVUS | |
| Lenovo ThinkPad P15s Gen2-20W6000GGE | |
| HP ZBook Firefly 15 G8 2C9R7EA | |
| Average Intel Core i7-1265U (1473 - 4376, n=10) | |
| HP ZBook Firefly 16 G9-6B897EA | |
| AIDA64 / CPU PhotoWorxx | |
| Average of class Workstation (37151 - 93684, n=23, last 2 years) | |
| Average Intel Core i7-1265U (20213 - 47031, n=10) | |
| Lenovo ThinkPad P15s Gen2-20W6000GGE | |
| HP ZBook Firefly 16 G9-6B897EA | |
| HP ZBook Firefly 15 G8 2C9R7EA | |
| Lenovo ThinkPad P1 G4-20Y4Z9DVUS | |
系统性能
从主观上讲,日常使用中的性能非常好,从合成基准测试中可以看出CPU性能不佳,这当然可以部分归功于快速的PCIe-4.0 SSD。也就是说,用户在给系统施加压力时,例如通过多任务处理,会很快遇到限制。缓慢的CPU性能也意味着该系统肯定不是面向未来的。
CrossMark: Overall | Productivity | Creativity | Responsiveness
| PCMark 10 / Score | |
| Average of class Workstation (6563 - 10409, n=19, last 2 years) | |
| Dell Precision 5000 5560 | |
| Lenovo ThinkPad P1 G4-20Y4Z9DVUS | |
| Average Intel Core i7-1265U, NVIDIA T550 Laptop GPU (5488 - 6181, n=3) | |
| HP ZBook Firefly 16 G9-6B897EA | |
| HP ZBook Firefly 15 G8 2C9R7EA | |
| Lenovo ThinkPad P15s Gen2-20W6000GGE | |
| PCMark 10 / Essentials | |
| Dell Precision 5000 5560 | |
| Average of class Workstation (9622 - 11157, n=19, last 2 years) | |
| HP ZBook Firefly 16 G9-6B897EA | |
| Average Intel Core i7-1265U, NVIDIA T550 Laptop GPU (9960 - 10250, n=3) | |
| Lenovo ThinkPad P1 G4-20Y4Z9DVUS | |
| Lenovo ThinkPad P15s Gen2-20W6000GGE | |
| HP ZBook Firefly 15 G8 2C9R7EA | |
| PCMark 10 / Productivity | |
| Average of class Workstation (8789 - 20616, n=19, last 2 years) | |
| Lenovo ThinkPad P15s Gen2-20W6000GGE | |
| Dell Precision 5000 5560 | |
| HP ZBook Firefly 15 G8 2C9R7EA | |
| Average Intel Core i7-1265U, NVIDIA T550 Laptop GPU (8315 - 9474, n=3) | |
| HP ZBook Firefly 16 G9-6B897EA | |
| Lenovo ThinkPad P1 G4-20Y4Z9DVUS | |
| PCMark 10 / Digital Content Creation | |
| Average of class Workstation (8108 - 15631, n=19, last 2 years) | |
| Dell Precision 5000 5560 | |
| Lenovo ThinkPad P1 G4-20Y4Z9DVUS | |
| Average Intel Core i7-1265U, NVIDIA T550 Laptop GPU (5399 - 6793, n=3) | |
| HP ZBook Firefly 15 G8 2C9R7EA | |
| HP ZBook Firefly 16 G9-6B897EA | |
| Lenovo ThinkPad P15s Gen2-20W6000GGE | |
| CrossMark / Overall | |
| Average of class Workstation (1307 - 2267, n=22, last 2 years) | |
| HP ZBook Firefly 16 G9-6B897EA | |
| Average Intel Core i7-1265U, NVIDIA T550 Laptop GPU (1591 - 1623, n=3) | |
| Apple MacBook Pro 16 2021 M1 Pro | |
| Lenovo ThinkPad P1 G4-20Y4Z9DVUS | |
| CrossMark / Productivity | |
| Average of class Workstation (1130 - 2122, n=22, last 2 years) | |
| HP ZBook Firefly 16 G9-6B897EA | |
| Average Intel Core i7-1265U, NVIDIA T550 Laptop GPU (1553 - 1592, n=3) | |
| Lenovo ThinkPad P1 G4-20Y4Z9DVUS | |
| Apple MacBook Pro 16 2021 M1 Pro | |
| CrossMark / Creativity | |
| Average of class Workstation (1657 - 2725, n=22, last 2 years) | |
| Apple MacBook Pro 16 2021 M1 Pro | |
| HP ZBook Firefly 16 G9-6B897EA | |
| Average Intel Core i7-1265U, NVIDIA T550 Laptop GPU (1723 - 1751, n=3) | |
| Lenovo ThinkPad P1 G4-20Y4Z9DVUS | |
| CrossMark / Responsiveness | |
| Average of class Workstation (993 - 2096, n=22, last 2 years) | |
| HP ZBook Firefly 16 G9-6B897EA | |
| Average Intel Core i7-1265U, NVIDIA T550 Laptop GPU (1344 - 1376, n=3) | |
| Lenovo ThinkPad P1 G4-20Y4Z9DVUS | |
| Apple MacBook Pro 16 2021 M1 Pro | |
| PCMark 10 Score | 5634 points | |
Help | ||
| AIDA64 / Memory Copy | |
| Average of class Workstation (56003 - 164795, n=23, last 2 years) | |
| Average Intel Core i7-1265U (40212 - 72204, n=10) | |
| HP ZBook Firefly 16 G9-6B897EA | |
| Lenovo ThinkPad P15s Gen2-20W6000GGE | |
| Lenovo ThinkPad P1 G4-20Y4Z9DVUS | |
| HP ZBook Firefly 15 G8 2C9R7EA | |
| AIDA64 / Memory Read | |
| Average of class Workstation (55795 - 121563, n=23, last 2 years) | |
| Average Intel Core i7-1265U (41808 - 69493, n=10) | |
| HP ZBook Firefly 16 G9-6B897EA | |
| Lenovo ThinkPad P15s Gen2-20W6000GGE | |
| Lenovo ThinkPad P1 G4-20Y4Z9DVUS | |
| HP ZBook Firefly 15 G8 2C9R7EA | |
| AIDA64 / Memory Write | |
| Average of class Workstation (55663 - 214520, n=23, last 2 years) | |
| HP ZBook Firefly 16 G9-6B897EA | |
| Average Intel Core i7-1265U (41382 - 76027, n=10) | |
| Lenovo ThinkPad P15s Gen2-20W6000GGE | |
| Lenovo ThinkPad P1 G4-20Y4Z9DVUS | |
| HP ZBook Firefly 15 G8 2C9R7EA | |
| AIDA64 / Memory Latency | |
| Average of class Workstation (84.5 - 165.2, n=23, last 2 years) | |
| Average Intel Core i7-1265U (74.6 - 112.4, n=10) | |
| HP ZBook Firefly 16 G9-6B897EA | |
| Lenovo ThinkPad P1 G4-20Y4Z9DVUS | |
| Lenovo ThinkPad P15s Gen2-20W6000GGE | |
| HP ZBook Firefly 15 G8 2C9R7EA | |
* ... smaller is better
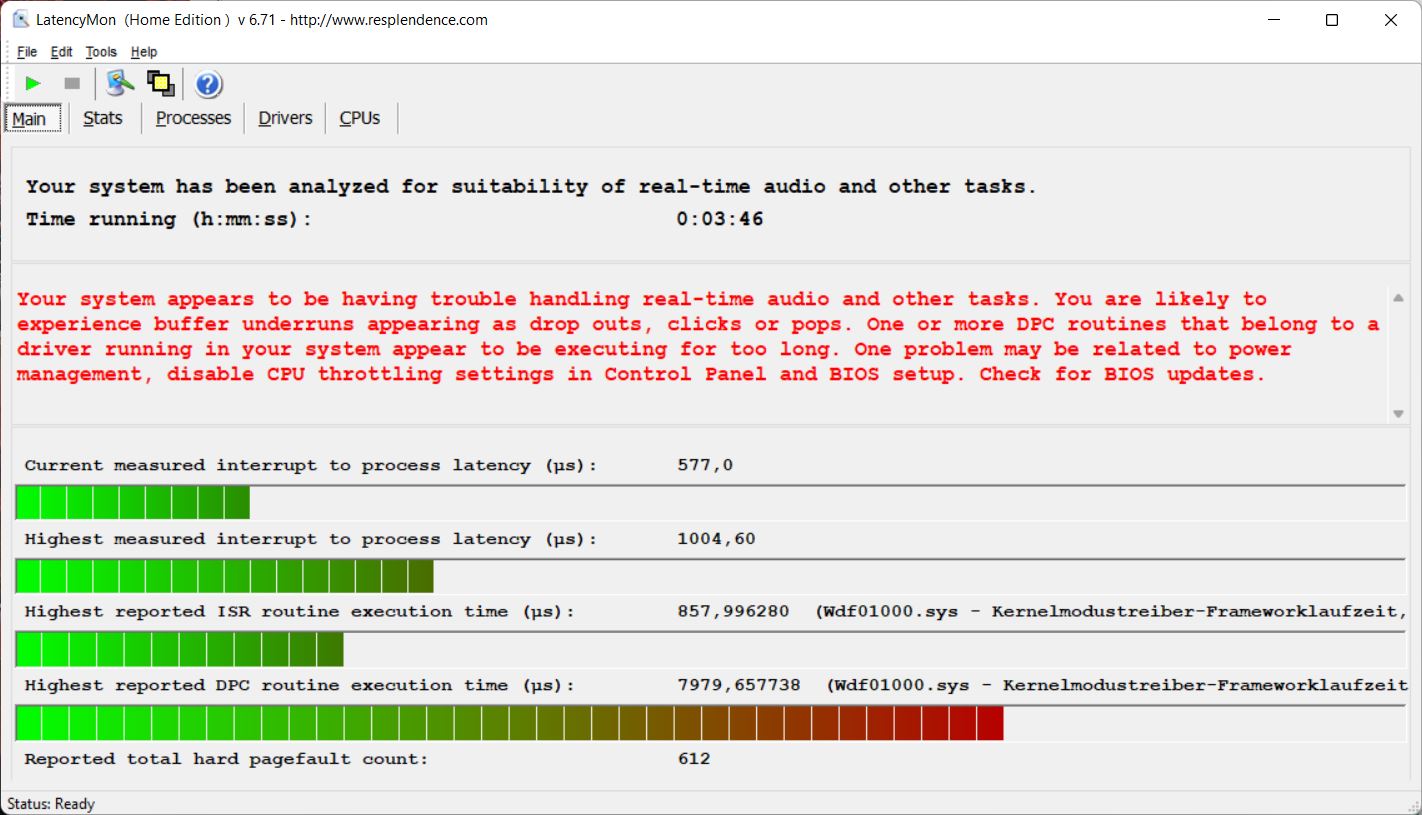
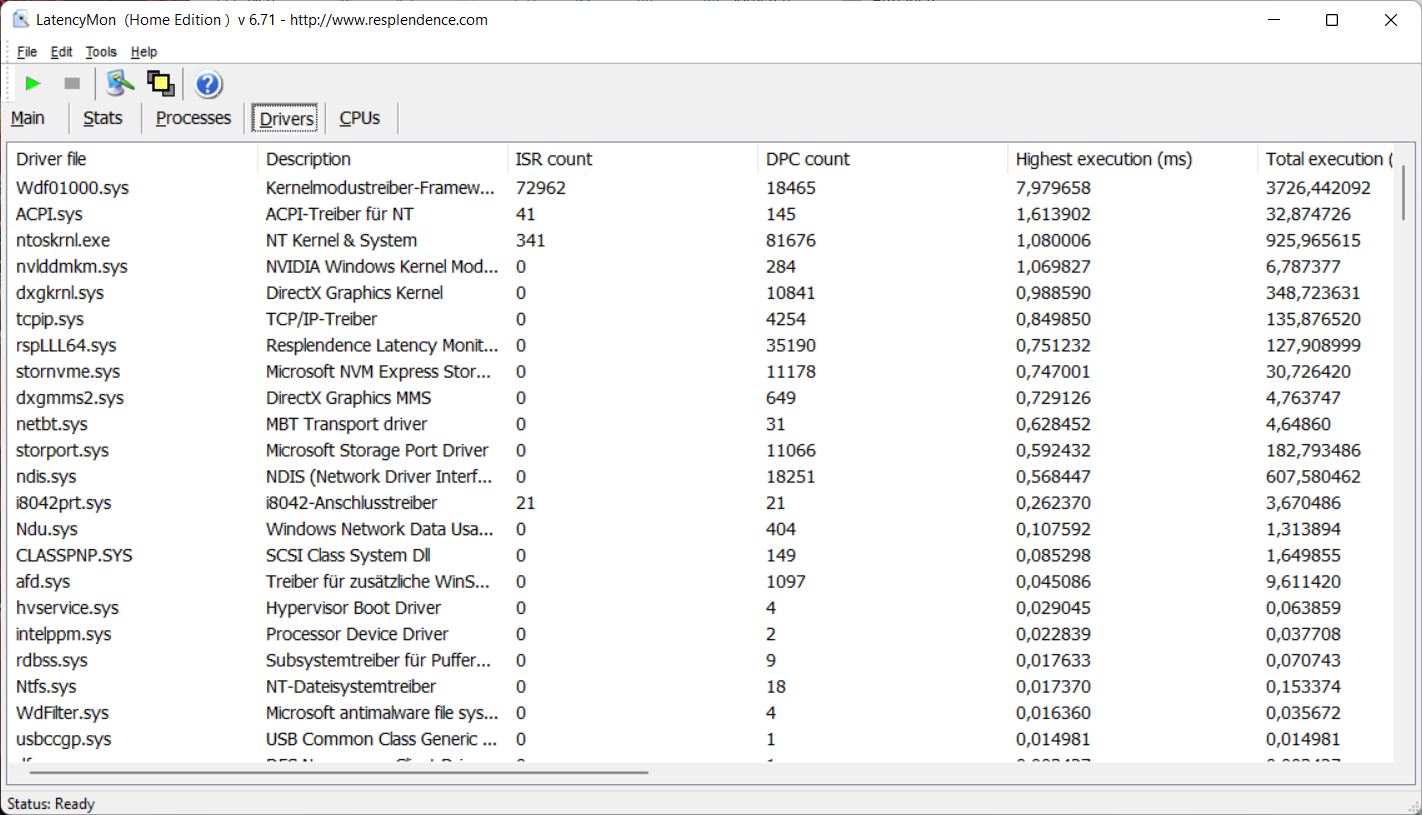
DPC延时
在测试时采用最新的BIOS版本,我们的测试设备在进行标准化的Wi-Fi测试(浏览网页、观看4K YouTube视频、CPU压力)时,DPC延迟略有增加,使ZBook成为使用实时音频软件的次优选择。
| DPC Latencies / LatencyMon - interrupt to process latency (max), Web, Youtube, Prime95 | |
| Lenovo ThinkPad P15s Gen2-20W6000GGE | |
| Lenovo ThinkPad P1 G4-20Y4Z9DVUS | |
| HP ZBook Firefly 15 G8 2C9R7EA | |
| HP ZBook Firefly 16 G9-6B897EA | |
| Dell Precision 5000 5560 | |
* ... smaller is better
存储解决方案
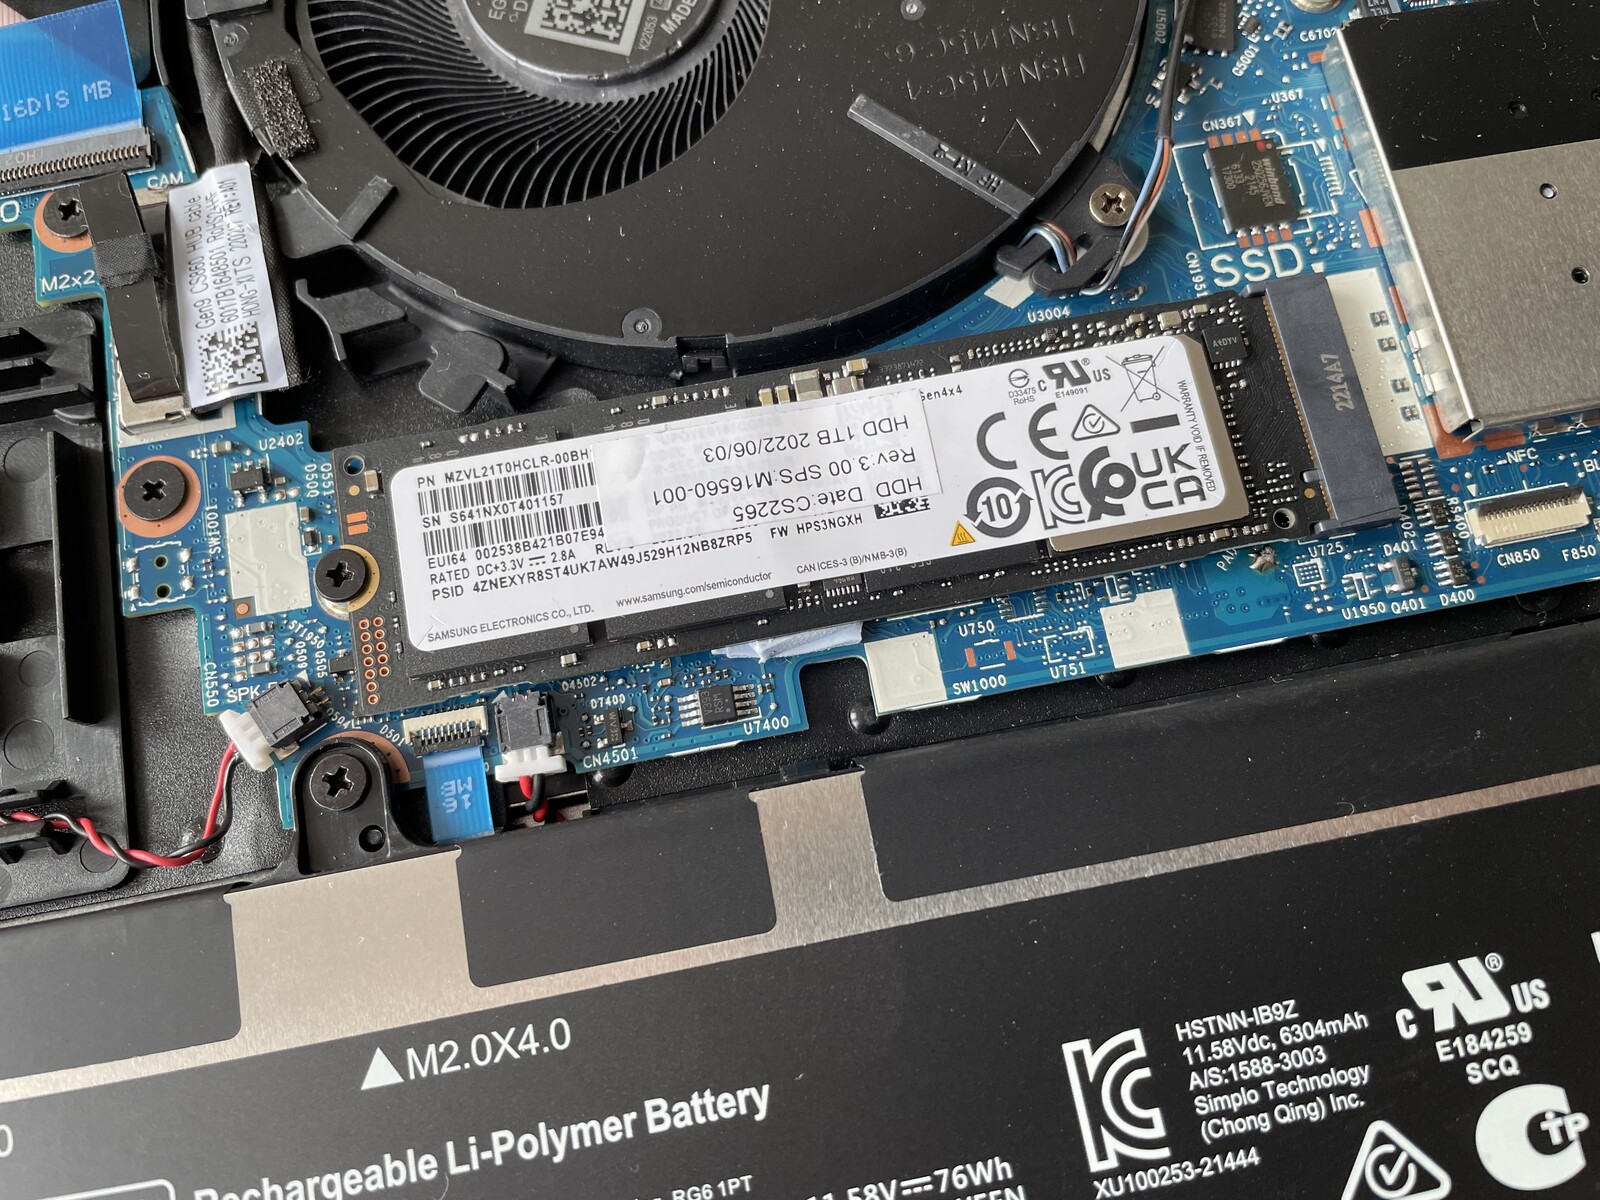
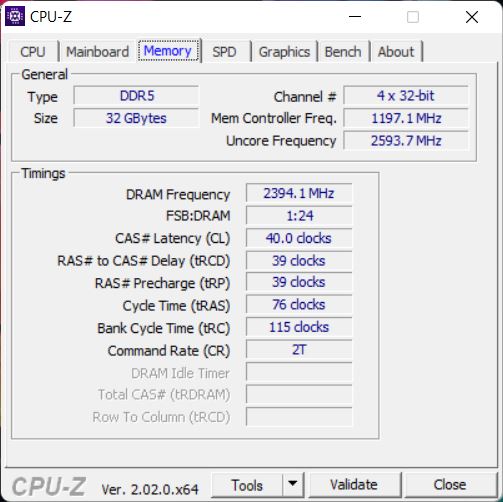
ZBook Firefly 16 G9配备了一个快速的PCIe-4.0插槽,在我们的测试样品中,有一个1TB的三星M.2-2280固态硬盘。PM9A1是目前最快的固态硬盘之一,我们测得的传输速率非常好。尽管固态硬盘没有冷却器,但在持续的压力下,其性能明显没有下降。在这里,机箱内的定位当然也是一个因素。出厂时,用户可以使用890GB。更多的SSD基准测试可以在 在这里找到.

| Drive Performance rating - Percent | |
| Average of class Workstation | |
| Average Samsung PM9A1 MZVL21T0HCLR | |
| Dell Precision 5000 5560 | |
| Lenovo ThinkPad P1 G4-20Y4Z9DVUS | |
| HP ZBook Firefly 16 G9-6B897EA | |
| Lenovo ThinkPad P15s Gen2-20W6000GGE | |
| HP ZBook Firefly 15 G8 2C9R7EA | |
* ... smaller is better
Disk Throttling: DiskSpd Read Loop, Queue Depth 8
GPU性能
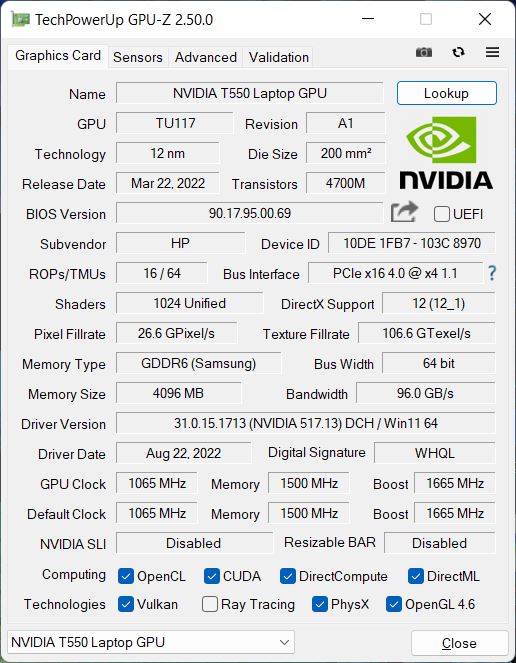
新的 锐达T550与旧的T500相比,是一个小的升级。 T500仍然基于TU-117芯片,该芯片也被用于 GeForce MX550& MX450.换句话说,这在很大程度上是一款入门级显卡,尤其是惠普将其TGP设定为仅有20瓦(本来可以达到60瓦)。根据不同的使用情况,专业驱动程序赋予了GPU一些合法性。
我们的合成3DMark基准测试的性能结果是令人失望的,因为老款的T500在 萤火虫15 G8稍微快一些,而我们在35瓦的TGP下测试的消费类芯片MX550的性能明显更好。至少在专业的SPECViewperf基准测试中,T550确保了对旧版T500的小幅领先。
即使在连续负载和电池模式下,GPU性能也始终保持在这个普遍较低的水平。更多的GPU基准测试可以在我们的 基准测试列表.
| 3DMark 11 - 1280x720 Performance GPU | |
| Average of class Workstation (12535 - 69594, n=23, last 2 years) | |
| Dell Precision 5000 5560 | |
| Lenovo ThinkPad P1 G4-20Y4Z9DVUS | |
| Lenovo ThinkPad T14 G3-21CF004NGE | |
| Lenovo IdeaCentre AIO 3 24IAP7 | |
| HP ZBook Firefly 15 G8 2C9R7EA | |
| Average NVIDIA T550 Laptop GPU (7432 - 8701, n=2) | |
| HP ZBook Firefly 16 G9-6B897EA | |
| HP EliteBook 845 G9 6F6H6EA | |
| Lenovo ThinkPad P15s Gen2-20W6000GGE | |
| 3DMark | |
| 1920x1080 Fire Strike Graphics | |
| Average of class Workstation (8293 - 52560, n=23, last 2 years) | |
| Dell Precision 5000 5560 | |
| Lenovo ThinkPad P1 G4-20Y4Z9DVUS | |
| Lenovo ThinkPad T14 G3-21CF004NGE | |
| Lenovo IdeaCentre AIO 3 24IAP7 | |
| HP ZBook Firefly 15 G8 2C9R7EA | |
| Average NVIDIA T550 Laptop GPU (4816 - 5593, n=3) | |
| HP ZBook Firefly 16 G9-6B897EA | |
| HP EliteBook 845 G9 6F6H6EA | |
| Lenovo ThinkPad P15s Gen2-20W6000GGE | |
| 2560x1440 Time Spy Graphics | |
| Average of class Workstation (2725 - 24806, n=23, last 2 years) | |
| Dell Precision 5000 5560 | |
| Lenovo ThinkPad P1 G4-20Y4Z9DVUS | |
| Lenovo IdeaCentre AIO 3 24IAP7 | |
| Lenovo ThinkPad T14 G3-21CF004NGE | |
| HP ZBook Firefly 15 G8 2C9R7EA | |
| Average NVIDIA T550 Laptop GPU (1882 - 2252, n=3) | |
| HP ZBook Firefly 16 G9-6B897EA | |
| Lenovo ThinkPad P15s Gen2-20W6000GGE | |
| HP EliteBook 845 G9 6F6H6EA | |
| Wild Life Extreme Unlimited | |
| Apple MacBook Pro 16 2021 M1 Pro | |
| Lenovo IdeaCentre AIO 3 24IAP7 | |
| HP ZBook Firefly 16 G9-6B897EA | |
| Average NVIDIA T550 Laptop GPU (3530 - 3649, n=2) | |
| Lenovo ThinkPad T14 G3-21CF004NGE | |
| Geekbench 5.5 - OpenCL Score | |
| Average of class Workstation (33651 - 272866, n=23, last 2 years) | |
| Lenovo ThinkPad P1 G4-20Y4Z9DVUS | |
| Lenovo IdeaCentre AIO 3 24IAP7 | |
| Apple MacBook Pro 16 2021 M1 Pro | |
| Average NVIDIA T550 Laptop GPU (32530 - 36536, n=3) | |
| HP ZBook Firefly 16 G9-6B897EA | |
| Lenovo ThinkPad T14 G3-21CF004NGE | |
| HP ZBook Firefly 15 G8 2C9R7EA | |
| Lenovo ThinkPad P15s Gen2-20W6000GGE | |
| HP EliteBook 845 G9 6F6H6EA | |
| GFXBench | |
| 2560x1440 Aztec Ruins High Tier Offscreen | |
| Apple MacBook Pro 16 2021 M1 Pro | |
| Average of class Workstation (60.6 - 224, n=6, last 2 years) | |
| Lenovo IdeaCentre AIO 3 24IAP7 | |
| HP ZBook Firefly 16 G9-6B897EA | |
| Average NVIDIA T550 Laptop GPU (n=1) | |
| 1920x1080 Aztec Ruins Normal Tier Offscreen | |
| Apple MacBook Pro 16 2021 M1 Pro | |
| Average of class Workstation (152.8 - 583, n=6, last 2 years) | |
| Lenovo IdeaCentre AIO 3 24IAP7 | |
| HP ZBook Firefly 16 G9-6B897EA | |
| Average NVIDIA T550 Laptop GPU (n=1) | |
| 1920x1080 Car Chase Offscreen | |
| Apple MacBook Pro 16 2021 M1 Pro | |
| Average of class Workstation (157.3 - 526, n=6, last 2 years) | |
| Lenovo IdeaCentre AIO 3 24IAP7 | |
| HP ZBook Firefly 16 G9-6B897EA | |
| Average NVIDIA T550 Laptop GPU (n=1) | |
| 3DMark 06 Standard Score | 31003 points | |
| 3DMark Vantage P Result | 25155 points | |
| 3DMark 11 Performance | 7405 points | |
| 3DMark Cloud Gate Standard Score | 17399 points | |
| 3DMark Fire Strike Score | 4581 points | |
| 3DMark Time Spy Score | 2066 points | |
Help | ||
| Blender | |
| v3.3 Classroom HIP/AMD | |
| Lenovo Legion 5 Pro 16 ARH7H-82RG0047GE | |
| Lenovo ThinkPad T14 G3-21CF004NGE | |
| v3.3 Classroom OPTIX/RTX | |
| HP ZBook Firefly 16 G9-6B897EA | |
| Dell Precision 5000 5470 | |
| Asus VivoBook Pro 16X OLED N7600PC-L2026X | |
| Lenovo Legion 5 Pro 16 ARH7H-82RG0047GE | |
| Average of class Workstation (10 - 43, n=17, last 2 years) | |
| v3.3 Classroom CUDA | |
| HP ZBook Firefly 16 G9-6B897EA | |
| Dell Precision 5000 5470 | |
| Asus VivoBook Pro 16X OLED N7600PC-L2026X | |
| Lenovo Legion 5 Pro 16 ARH7H-82RG0047GE | |
| Average of class Workstation (16 - 74, n=17, last 2 years) | |
| v3.3 Classroom CPU | |
| HP ZBook Firefly 16 G9-6B897EA | |
| Asus VivoBook Pro 16X OLED N7600PC-L2026X | |
| Lenovo ThinkPad T14 G3-21CF004NGE | |
| Lenovo Legion 5 Pro 16 ARH7H-82RG0047GE | |
| Dell Precision 5000 5470 | |
| Average of class Workstation (148 - 364, n=23, last 2 years) | |
* ... smaller is better
SPECviewperf 13: Solidworks (sw-04) | Siemens NX (snx-03) | Showcase (showcase-02) | Medical (medical-02) | Maya (maya-05) | Energy (energy-02) | Creo (creo-02) | Catia (catia-05) | 3ds Max (3dsmax-06)
| SPECviewperf 2020 / Solidworks (solidworks-05) | |
| Dell Precision 5000 5560 | |
| Lenovo ThinkPad P1 G4-20Y4Z9DVUS | |
| HP ZBook Firefly 16 G9-6B897EA | |
| HP ZBook Firefly 15 G8 2C9R7EA | |
| Lenovo ThinkPad P15s Gen2-20W6000GGE | |
| SPECviewperf 2020 / Siemens NX (snx-04) | |
| Dell Precision 5000 5560 | |
| Lenovo ThinkPad P1 G4-20Y4Z9DVUS | |
| HP ZBook Firefly 16 G9-6B897EA | |
| HP ZBook Firefly 15 G8 2C9R7EA | |
| Lenovo ThinkPad P15s Gen2-20W6000GGE | |
| SPECviewperf 2020 / Medical (medical-03) | |
| Dell Precision 5000 5560 | |
| Lenovo ThinkPad P1 G4-20Y4Z9DVUS | |
| HP ZBook Firefly 16 G9-6B897EA | |
| HP ZBook Firefly 15 G8 2C9R7EA | |
| Lenovo ThinkPad P15s Gen2-20W6000GGE | |
| SPECviewperf 2020 / Maya (maya-06) | |
| Dell Precision 5000 5560 | |
| Lenovo ThinkPad P1 G4-20Y4Z9DVUS | |
| HP ZBook Firefly 16 G9-6B897EA | |
| HP ZBook Firefly 15 G8 2C9R7EA | |
| Lenovo ThinkPad P15s Gen2-20W6000GGE | |
| SPECviewperf 2020 / Energy (energy-03) | |
| Dell Precision 5000 5560 | |
| Lenovo ThinkPad P1 G4-20Y4Z9DVUS | |
| HP ZBook Firefly 16 G9-6B897EA | |
| HP ZBook Firefly 15 G8 2C9R7EA | |
| Lenovo ThinkPad P15s Gen2-20W6000GGE | |
| SPECviewperf 2020 / Creo (creo-03) | |
| Dell Precision 5000 5560 | |
| Lenovo ThinkPad P1 G4-20Y4Z9DVUS | |
| HP ZBook Firefly 16 G9-6B897EA | |
| HP ZBook Firefly 15 G8 2C9R7EA | |
| Lenovo ThinkPad P15s Gen2-20W6000GGE | |
| SPECviewperf 2020 / CATIA (catia-06) | |
| Dell Precision 5000 5560 | |
| Lenovo ThinkPad P1 G4-20Y4Z9DVUS | |
| HP ZBook Firefly 16 G9-6B897EA | |
| HP ZBook Firefly 15 G8 2C9R7EA | |
| Lenovo ThinkPad P15s Gen2-20W6000GGE | |
| SPECviewperf 2020 / 3ds Max (3dsmax-07) | |
| Dell Precision 5000 5560 | |
| Lenovo ThinkPad P1 G4-20Y4Z9DVUS | |
| HP ZBook Firefly 16 G9-6B897EA | |
| HP ZBook Firefly 15 G8 2C9R7EA | |
| Lenovo ThinkPad P15s Gen2-20W6000GGE | |
| SPECviewperf 13 / Solidworks (sw-04) | |
| Dell Precision 5000 5560 | |
| Lenovo ThinkPad P1 G4-20Y4Z9DVUS | |
| HP ZBook Firefly 16 G9-6B897EA | |
| HP ZBook Firefly 15 G8 2C9R7EA | |
| Lenovo ThinkPad P15s Gen2-20W6000GGE | |
| SPECviewperf 13 / Siemens NX (snx-03) | |
| Dell Precision 5000 5560 | |
| Lenovo ThinkPad P1 G4-20Y4Z9DVUS | |
| HP ZBook Firefly 16 G9-6B897EA | |
| HP ZBook Firefly 15 G8 2C9R7EA | |
| Lenovo ThinkPad P15s Gen2-20W6000GGE | |
| SPECviewperf 13 / Showcase (showcase-02) | |
| Dell Precision 5000 5560 | |
| Lenovo ThinkPad P1 G4-20Y4Z9DVUS | |
| HP ZBook Firefly 16 G9-6B897EA | |
| HP ZBook Firefly 15 G8 2C9R7EA | |
| Lenovo ThinkPad P15s Gen2-20W6000GGE | |
| SPECviewperf 13 / Medical (medical-02) | |
| Dell Precision 5000 5560 | |
| Lenovo ThinkPad P1 G4-20Y4Z9DVUS | |
| HP ZBook Firefly 16 G9-6B897EA | |
| HP ZBook Firefly 15 G8 2C9R7EA | |
| Lenovo ThinkPad P15s Gen2-20W6000GGE | |
| SPECviewperf 13 / Maya (maya-05) | |
| Dell Precision 5000 5560 | |
| Lenovo ThinkPad P1 G4-20Y4Z9DVUS | |
| HP ZBook Firefly 16 G9-6B897EA | |
| HP ZBook Firefly 15 G8 2C9R7EA | |
| Lenovo ThinkPad P15s Gen2-20W6000GGE | |
| SPECviewperf 13 / Energy (energy-02) | |
| Dell Precision 5000 5560 | |
| Lenovo ThinkPad P1 G4-20Y4Z9DVUS | |
| HP ZBook Firefly 15 G8 2C9R7EA | |
| HP ZBook Firefly 16 G9-6B897EA | |
| Lenovo ThinkPad P15s Gen2-20W6000GGE | |
| SPECviewperf 13 / Creo (creo-02) | |
| Dell Precision 5000 5560 | |
| Lenovo ThinkPad P1 G4-20Y4Z9DVUS | |
| HP ZBook Firefly 16 G9-6B897EA | |
| HP ZBook Firefly 15 G8 2C9R7EA | |
| Lenovo ThinkPad P15s Gen2-20W6000GGE | |
| SPECviewperf 13 / Catia (catia-05) | |
| Dell Precision 5000 5560 | |
| Lenovo ThinkPad P1 G4-20Y4Z9DVUS | |
| HP ZBook Firefly 16 G9-6B897EA | |
| HP ZBook Firefly 15 G8 2C9R7EA | |
| Lenovo ThinkPad P15s Gen2-20W6000GGE | |
| SPECviewperf 13 / 3ds Max (3dsmax-06) | |
| Dell Precision 5000 5560 | |
| Lenovo ThinkPad P1 G4-20Y4Z9DVUS | |
| HP ZBook Firefly 16 G9-6B897EA | |
| HP ZBook Firefly 15 G8 2C9R7EA | |
| Lenovo ThinkPad P15s Gen2-20W6000GGE | |
游戏性能
尽管 芯片自然在某种程度上适合游戏,但由于CPU速度较慢,性能受到影响,T550的速度几乎没有超过集成的 Radeon 680M的集成Radeon 680M ThinkPad T14 G3比如说。只要有关标题的要求不高,中高设置在大多数情况下应该还是可以的。
| The Witcher 3 | |
| 1920x1080 High Graphics & Postprocessing (Nvidia HairWorks Off) | |
| Average of class Workstation (n=1last 2 years) | |
| Dell Precision 5000 5560 | |
| Lenovo ThinkPad P1 G4-20Y4Z9DVUS | |
| Lenovo ThinkPad T14 G3-21CF004NGE | |
| Average NVIDIA T550 Laptop GPU (39 - 43, n=3) | |
| HP ZBook Firefly 16 G9-6B897EA | |
| Lenovo ThinkPad P15s Gen2-20W6000GGE | |
| 1920x1080 Ultra Graphics & Postprocessing (HBAO+) | |
| Average of class Workstation (n=1last 2 years) | |
| Dell Precision 5000 5560 | |
| Lenovo ThinkPad P1 G4-20Y4Z9DVUS | |
| Lenovo ThinkPad T14 G3-21CF004NGE | |
| HP ZBook Firefly 15 G8 2C9R7EA | |
| Average NVIDIA T550 Laptop GPU (19.6 - 23.2, n=3) | |
| HP ZBook Firefly 16 G9-6B897EA | |
| Lenovo ThinkPad P15s Gen2-20W6000GGE | |
| GTA V | |
| 1920x1080 High/On (Advanced Graphics Off) AA:2xMSAA + FX AF:8x | |
| Average of class Workstation (44.4 - 179.4, n=21, last 2 years) | |
| Dell Precision 5000 5560 | |
| Lenovo ThinkPad T14 G3-21CF004NGE | |
| Average NVIDIA T550 Laptop GPU (61.5 - 63.9, n=3) | |
| HP ZBook Firefly 16 G9-6B897EA | |
| Lenovo ThinkPad P15s Gen2-20W6000GGE | |
| 1920x1080 Highest AA:4xMSAA + FX AF:16x | |
| Average of class Workstation (18.1 - 156.1, n=23, last 2 years) | |
| Dell Precision 5000 5560 | |
| Average NVIDIA T550 Laptop GPU (29 - 29.6, n=3) | |
| HP ZBook Firefly 16 G9-6B897EA | |
| Lenovo ThinkPad P15s Gen2-20W6000GGE | |
| Lenovo ThinkPad T14 G3-21CF004NGE | |
| Final Fantasy XV Benchmark | |
| 1920x1080 Standard Quality | |
| Average of class Workstation (38.2 - 232, n=23, last 2 years) | |
| Dell Precision 5000 5560 | |
| Lenovo ThinkPad P1 G4-20Y4Z9DVUS | |
| Lenovo ThinkPad T14 G3-21CF004NGE | |
| HP ZBook Firefly 16 G9-6B897EA | |
| Average NVIDIA T550 Laptop GPU (30.5 - 31.2, n=3) | |
| Lenovo ThinkPad P15s Gen2-20W6000GGE | |
| 1920x1080 High Quality | |
| Average of class Workstation (26.4 - 197.6, n=23, last 2 years) | |
| Dell Precision 5000 5560 | |
| Lenovo ThinkPad P1 G4-20Y4Z9DVUS | |
| Lenovo ThinkPad T14 G3-21CF004NGE | |
| HP ZBook Firefly 16 G9-6B897EA | |
| Average NVIDIA T550 Laptop GPU (22 - 22.3, n=3) | |
| Lenovo ThinkPad P15s Gen2-20W6000GGE | |
| F1 2021 | |
| 1920x1080 High Preset AA:T AF:16x | |
| Dell Precision 5000 5560 | |
| HP ZBook Firefly 16 G9-6B897EA | |
| Average NVIDIA T550 Laptop GPU (56.5 - 59.9, n=3) | |
| Lenovo ThinkPad T14 G3-21CF004NGE | |
| 1920x1080 Ultra High Preset + Raytracing AA:T AF:16x | |
| Dell Precision 5000 5560 | |
| HP ZBook Firefly 16 G9-6B897EA | |
| Average NVIDIA T550 Laptop GPU (36.1 - 37, n=3) | |
| Lenovo ThinkPad T14 G3-21CF004NGE | |
| Far Cry 5 | |
| 1920x1080 High Preset AA:T | |
| Average of class Workstation (39 - 138, n=9, last 2 years) | |
| Dell Precision 5000 5560 | |
| HP ZBook Firefly 16 G9-6B897EA | |
| Average NVIDIA T550 Laptop GPU (n=1) | |
| Lenovo ThinkPad T14 G3-21CF004NGE | |
| HP ZBook Firefly 15 G8 2C9R7EA | |
| 1920x1080 Ultra Preset AA:T | |
| Average of class Workstation (37 - 128, n=9, last 2 years) | |
| Dell Precision 5000 5560 | |
| HP ZBook Firefly 16 G9-6B897EA | |
| Average NVIDIA T550 Laptop GPU (n=1) | |
| Lenovo ThinkPad T14 G3-21CF004NGE | |
| HP ZBook Firefly 15 G8 2C9R7EA | |
| Dota 2 Reborn | |
| 1920x1080 high (2/3) | |
| Average of class Workstation (52.1 - 199.8, n=23, last 2 years) | |
| Dell Precision 5000 5560 | |
| Lenovo ThinkPad P1 G4-20Y4Z9DVUS | |
| HP ZBook Firefly 15 G8 2C9R7EA | |
| Average NVIDIA T550 Laptop GPU (92.1 - 101.2, n=3) | |
| HP ZBook Firefly 16 G9-6B897EA | |
| Lenovo ThinkPad P15s Gen2-20W6000GGE | |
| Lenovo ThinkPad T14 G3-21CF004NGE | |
| 1920x1080 ultra (3/3) best looking | |
| Average of class Workstation (50.7 - 178.4, n=23, last 2 years) | |
| Dell Precision 5000 5560 | |
| Lenovo ThinkPad P1 G4-20Y4Z9DVUS | |
| HP ZBook Firefly 15 G8 2C9R7EA | |
| Average NVIDIA T550 Laptop GPU (84 - 93.4, n=3) | |
| HP ZBook Firefly 16 G9-6B897EA | |
| Lenovo ThinkPad P15s Gen2-20W6000GGE | |
| Lenovo ThinkPad T14 G3-21CF004NGE | |
Witcher 3 FPS Graph
| low | med. | high | ultra | |
|---|---|---|---|---|
| GTA V (2015) | 106.2 | 103.3 | 61.5 | 29.2 |
| The Witcher 3 (2015) | 123 | 75 | 40 | 19.9 |
| Dota 2 Reborn (2015) | 111.4 | 100.3 | 92.1 | 85.2 |
| Final Fantasy XV Benchmark (2018) | 60.7 | 31.2 | 22.3 | |
| X-Plane 11.11 (2018) | 65.5 | 59.4 | 55.5 | |
| Far Cry 5 (2018) | 75 | 41 | 38 | 35 |
| Strange Brigade (2018) | 128 | 51 | 42 | 36 |
| F1 2021 (2021) | 151.1 | 74.4 | 59.5 | 37 |
| F1 22 (2022) | 69.6 | 62 | 43.3 | 31 |
排放与能源
系统噪音
两个主要部件性能不佳的一个可能原因可以在机箱内部看到。只有一个风扇。低性能的一个明显好处是安静的风扇,它在低负荷下总是空转,在CPU满负荷下几乎看不出来,只有29 dB(A)。当专用GPU进入画面时,事情变得更加嘈杂,大约为40-41 dB(A)。这使ZBook与明显更快的 戴尔Precision 5560同时使它的噪音明显高于例如 MacBook Pro 16或前代的 ZBook Firefly 15 G8萤火虫15 G8,后者提供了更好的性能。我们没有注意到任何电子噪音或线圈啸叫。
Noise level
| Idle |
| 23.8 / 23.8 / 23.8 dB(A) |
| Load |
| 39.4 / 41.4 dB(A) |
 | ||
30 dB silent 40 dB(A) audible 50 dB(A) loud |
||
min: | ||
| HP ZBook Firefly 16 G9-6B897EA T550 Laptop GPU, i7-1265U, Samsung PM9A1 MZVL21T0HCLR | Lenovo ThinkPad P1 G4-20Y4Z9DVUS T1200 Laptop GPU, i7-11800H, Samsung PM9A1 MZVL2512HCJQ | Dell Precision 5000 5560 RTX A2000 Laptop GPU, i7-11850H, Samsung PM9A1 MZVL22T0HBLB | Lenovo ThinkPad P15s Gen2-20W6000GGE T500 Laptop GPU, i7-1165G7, WDC PC SN720 SDAQNTW-1T00 | HP ZBook Firefly 15 G8 2C9R7EA T500 Laptop GPU, i7-1165G7, Toshiba XG6 KXG60ZNV1T02 | Apple MacBook Pro 16 2021 M1 Pro M1 Pro 16-Core GPU, M1 Pro, Apple SSD AP1024R | |
|---|---|---|---|---|---|---|
| Noise | -9% | 6% | 0% | 3% | 5% | |
| off / environment * (dB) | 23.8 | 24.3 -2% | 23.4 2% | 24.3 -2% | 24.1 -1% | 24.7 -4% |
| Idle Minimum * (dB) | 23.8 | 24.3 -2% | 23.6 1% | 25.5 -7% | 24.1 -1% | 24.7 -4% |
| Idle Average * (dB) | 23.8 | 24.3 -2% | 23.6 1% | 25.5 -7% | 24.1 -1% | 24.7 -4% |
| Idle Maximum * (dB) | 23.8 | 26.6 -12% | 23.6 1% | 25.5 -7% | 27.1 -14% | 24.7 -4% |
| Load Average * (dB) | 39.4 | 46.8 -19% | 25.8 35% | 35.65 10% | 32.8 17% | 26.1 34% |
| Witcher 3 ultra * (dB) | 40.5 | 46.8 -16% | 40.1 1% | 36.1 11% | ||
| Load Maximum * (dB) | 41.4 | 46.8 -13% | 41.4 -0% | 35.65 14% | 36.1 13% | 37.4 10% |
* ... smaller is better
温度
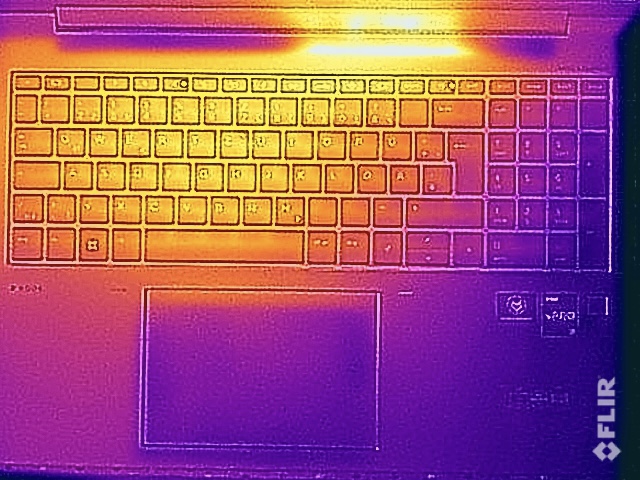
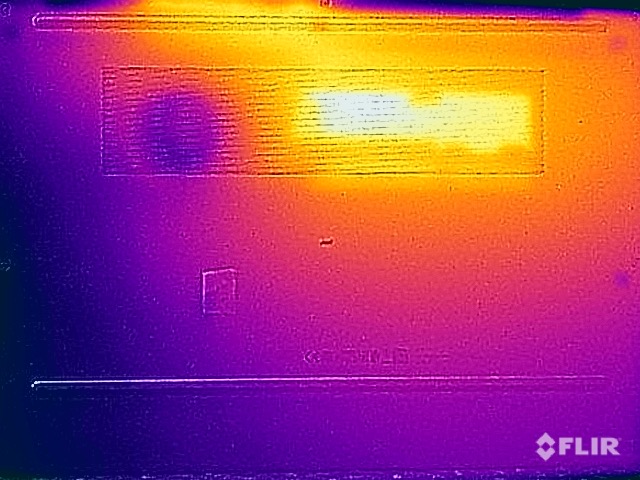
用户受益于CPU的低能耗,特别是在日常使用中,当专用的GPU空转时,金属表面只有温热,适合在膝上舒适使用。然而,给GPU施加压力会导致温度明显升高。虽然底部的48℃(118.4°F)远非关键,但考虑到性能不佳(系统总功率只有32瓦),它是相当温暖的。在压力测试期间,处理器几乎立即下降到12瓦,而GPU保持在20瓦的稳定水平。
(±) The maximum temperature on the upper side is 42.1 °C / 108 F, compared to the average of 38.2 °C / 101 F, ranging from 22.2 to 69.8 °C for the class Workstation.
(-) The bottom heats up to a maximum of 48 °C / 118 F, compared to the average of 41.1 °C / 106 F
(+) In idle usage, the average temperature for the upper side is 27.4 °C / 81 F, compared to the device average of 32 °C / 90 F.
(±) Playing The Witcher 3, the average temperature for the upper side is 33.6 °C / 92 F, compared to the device average of 32 °C / 90 F.
(+) The palmrests and touchpad are cooler than skin temperature with a maximum of 30.9 °C / 87.6 F and are therefore cool to the touch.
(-) The average temperature of the palmrest area of similar devices was 27.8 °C / 82 F (-3.1 °C / -5.6 F).
| HP ZBook Firefly 16 G9-6B897EA Intel Core i7-1265U, NVIDIA T550 Laptop GPU | Lenovo ThinkPad P1 G4-20Y4Z9DVUS Intel Core i7-11800H, NVIDIA T1200 Laptop GPU | Dell Precision 5000 5560 Intel Core i7-11850H, NVIDIA RTX A2000 Laptop GPU | Lenovo ThinkPad P15s Gen2-20W6000GGE Intel Core i7-1165G7, NVIDIA T500 Laptop GPU | HP ZBook Firefly 15 G8 2C9R7EA Intel Core i7-1165G7, NVIDIA T500 Laptop GPU | Apple MacBook Pro 16 2021 M1 Pro Apple M1 Pro, Apple M1 Pro 16-Core GPU | |
|---|---|---|---|---|---|---|
| Heat | -1% | -7% | -0% | 13% | 17% | |
| Maximum Upper Side * (°C) | 42.1 | 49.9 -19% | 48.2 -14% | 42.8 -2% | 41.2 2% | 41 3% |
| Maximum Bottom * (°C) | 48 | 56.7 -18% | 42.6 11% | 59.1 -23% | 47.2 2% | 39 19% |
| Idle Upper Side * (°C) | 29.9 | 25.5 15% | 34.8 -16% | 26.4 12% | 23.7 21% | 24 20% |
| Idle Bottom * (°C) | 32.9 | 26.2 20% | 35.2 -7% | 28.9 12% | 23.9 27% | 24 27% |
* ... smaller is better
发言人
两个下射式立体声扬声器位于键盘左右两侧的中间部分。虽然声音没有MacBook Pro 16上的好。 MacBook Pro 16的声音,但它总体上仍然很好,具有非常宽敞和饱满的特点。特别是在低音方面,仍有改进的余地。
HP ZBook Firefly 16 G9-6B897EA audio analysis
(+) | speakers can play relatively loud (83 dB)
Bass 100 - 315 Hz
(-) | nearly no bass - on average 17.5% lower than median
(±) | linearity of bass is average (12.1% delta to prev. frequency)
Mids 400 - 2000 Hz
(+) | balanced mids - only 2.7% away from median
(+) | mids are linear (3.8% delta to prev. frequency)
Highs 2 - 16 kHz
(+) | balanced highs - only 3% away from median
(+) | highs are linear (5.3% delta to prev. frequency)
Overall 100 - 16.000 Hz
(+) | overall sound is linear (13.3% difference to median)
Compared to same class
» 25% of all tested devices in this class were better, 4% similar, 71% worse
» The best had a delta of 7%, average was 17%, worst was 35%
Compared to all devices tested
» 14% of all tested devices were better, 3% similar, 83% worse
» The best had a delta of 4%, average was 23%, worst was 134%
Apple MacBook Pro 16 2021 M1 Pro audio analysis
(+) | speakers can play relatively loud (84.7 dB)
Bass 100 - 315 Hz
(+) | good bass - only 3.8% away from median
(+) | bass is linear (5.2% delta to prev. frequency)
Mids 400 - 2000 Hz
(+) | balanced mids - only 1.3% away from median
(+) | mids are linear (2.1% delta to prev. frequency)
Highs 2 - 16 kHz
(+) | balanced highs - only 1.9% away from median
(+) | highs are linear (2.7% delta to prev. frequency)
Overall 100 - 16.000 Hz
(+) | overall sound is linear (4.6% difference to median)
Compared to same class
» 0% of all tested devices in this class were better, 0% similar, 100% worse
» The best had a delta of 5%, average was 17%, worst was 45%
Compared to all devices tested
» 0% of all tested devices were better, 0% similar, 100% worse
» The best had a delta of 4%, average was 23%, worst was 134%
能源消耗
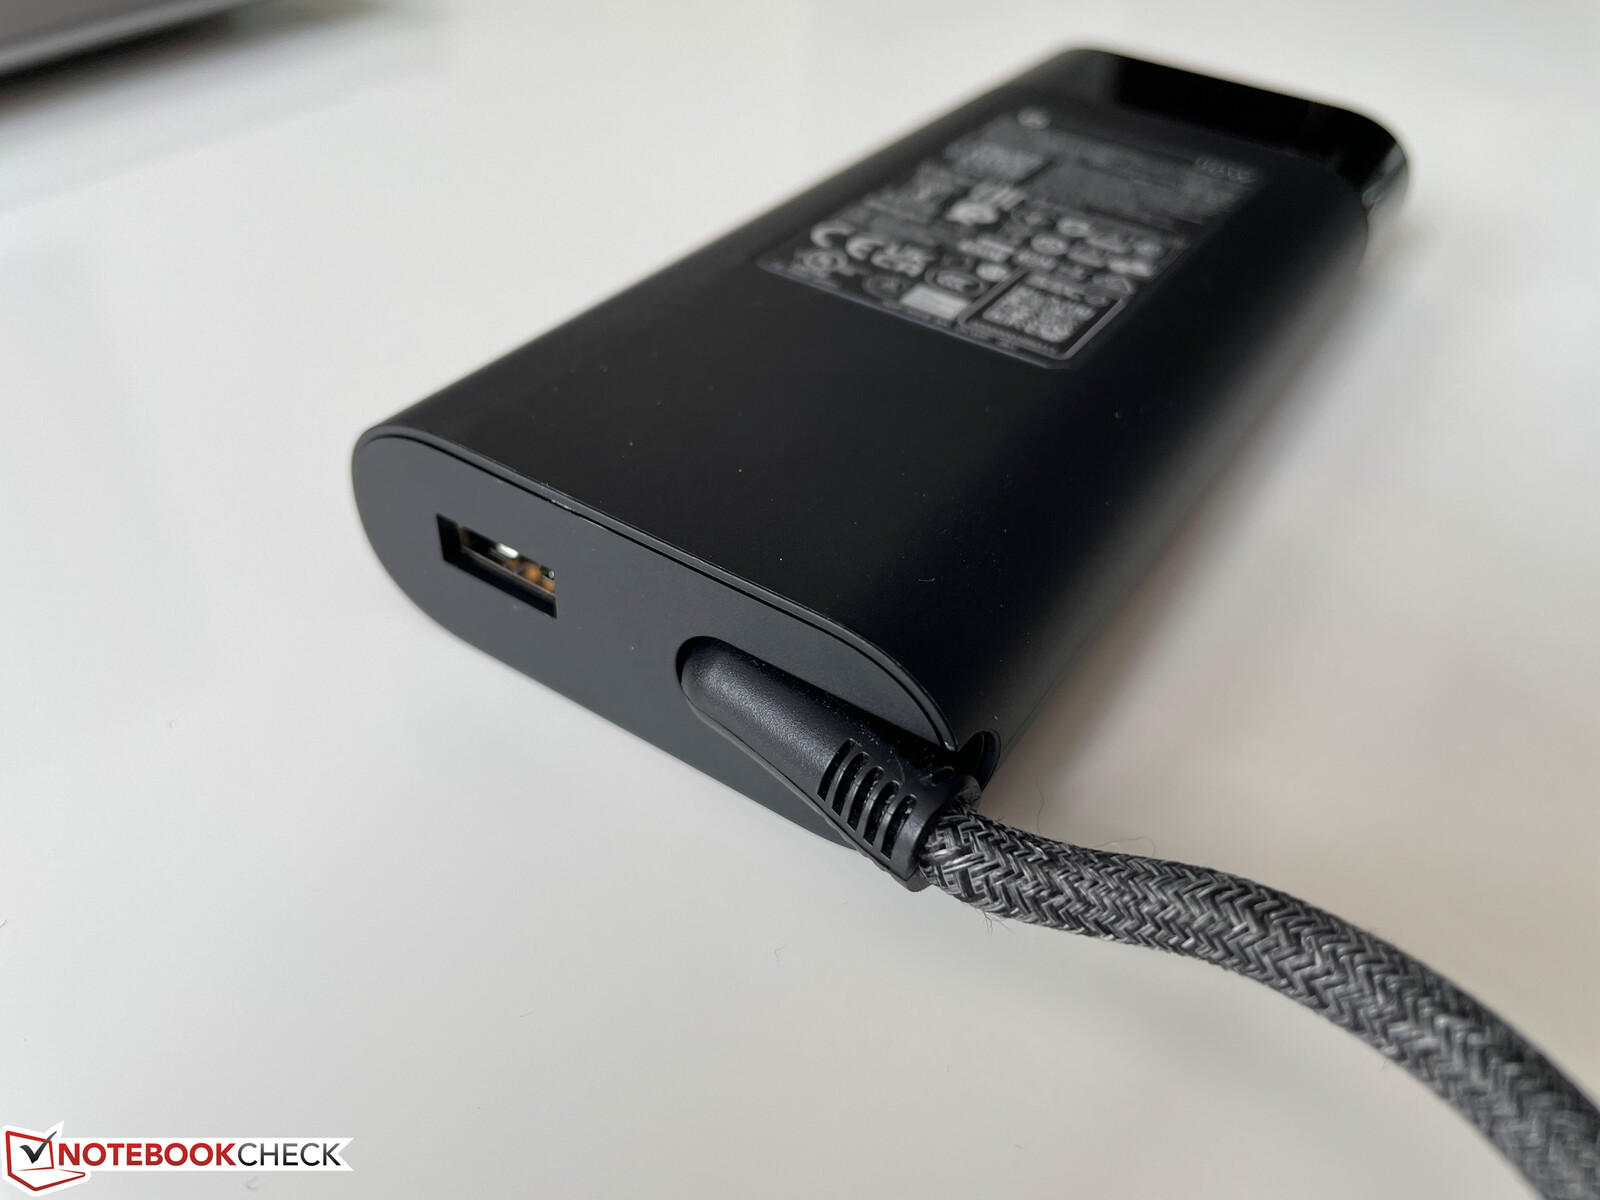
在空闲测试中,ZBook Firefly 16 G9呈现为一个非常节能的笔记本电脑,拥有一个明亮但经济的FHD面板。虽然该设备在负载下也非常经济,但这是以牺牲性能为代价的。在压力测试中,我们偶尔会测量到略高于90瓦的功率,但该数值随后迅速下降并稳定在47瓦。一个65瓦的充电器已经足够了。110-W型号通过USB-C的额定功率为100瓦,通过额外的USB-A端口的额定功率为10瓦。
| HP ZBook Firefly 16 G9-6B897EA T550 Laptop GPU, i7-1265U, Samsung PM9A1 MZVL21T0HCLR | Lenovo ThinkPad P1 G4-20Y4Z9DVUS T1200 Laptop GPU, i7-11800H, Samsung PM9A1 MZVL2512HCJQ | Dell Precision 5000 5560 RTX A2000 Laptop GPU, i7-11850H, Samsung PM9A1 MZVL22T0HBLB | Lenovo ThinkPad P15s Gen2-20W6000GGE T500 Laptop GPU, i7-1165G7, WDC PC SN720 SDAQNTW-1T00 | HP ZBook Firefly 15 G8 2C9R7EA T500 Laptop GPU, i7-1165G7, Toshiba XG6 KXG60ZNV1T02 | Apple MacBook Pro 16 2021 M1 Pro M1 Pro 16-Core GPU, M1 Pro, Apple SSD AP1024R | |
|---|---|---|---|---|---|---|
| Power Consumption | -93% | -86% | -19% | 6% | -37% | |
| Idle Minimum * (Watt) | 4.5 | 9.9 -120% | 6.2 -38% | 5.8 -29% | 3.3 27% | 5 -11% |
| Idle Average * (Watt) | 8 | 13.9 -74% | 13.9 -74% | 13.3 -66% | 5.6 30% | 15.1 -89% |
| Idle Maximum * (Watt) | 8.7 | 14.6 -68% | 23.8 -174% | 15.6 -79% | 8.7 -0% | 15.5 -78% |
| Load Average * (Watt) | 48.3 | 95 -97% | 95.7 -98% | 43.2 11% | 64.4 -33% | 54 -12% |
| Witcher 3 ultra * (Watt) | 45.3 | 98.9 -118% | 87 -92% | 37.1 18% | 53 -17% | |
| Load Maximum * (Watt) | 94.7 | 170.8 -80% | 132.6 -40% | 67.3 29% | 69 27% | 90 5% |
* ... smaller is better
| Off / Standby | |
| Idle | |
| Load |
|
Key:
min: | |
Energy Consumption Witcher 3 / Stress Test
Energy Consumption external Monitor
电池寿命
由于大电池(76Wh)和低耗电,电池寿命非常好。在我们的Wi-Fi测试中,该系统在最大亮度下持续了近10个小时,在调整亮度为150尼特(在我们的测试设备中,亮度为57%)的情况下,持续了令人印象深刻的13个小时,而视频测试则运行了18个小时以上。这些结果使ZBook在这一类别中成为强大的竞争对手,甚至是MacBook Pro 16的竞争者。 MacBook Pro 16.在最大压力下,电池仍能持续两小时,这又是由于性能低下造成的。在设备运行时完全充电只需要90分钟,仅30分钟后就可以达到50%的电量。
| HP ZBook Firefly 16 G9-6B897EA i7-1265U, T550 Laptop GPU, 76 Wh | Lenovo ThinkPad P1 G4-20Y4Z9DVUS i7-11800H, T1200 Laptop GPU, 90 Wh | Dell Precision 5000 5560 i7-11850H, RTX A2000 Laptop GPU, 86 Wh | Lenovo ThinkPad P15s Gen2-20W6000GGE i7-1165G7, T500 Laptop GPU, 57 Wh | HP ZBook Firefly 15 G8 2C9R7EA i7-1165G7, T500 Laptop GPU, 56 Wh | Apple MacBook Pro 16 2021 M1 Pro M1 Pro, M1 Pro 16-Core GPU, 99.6 Wh | Average of class Workstation | |
|---|---|---|---|---|---|---|---|
| Battery runtime | -32% | -31% | -31% | -7% | 13% | -36% | |
| H.264 (h) | 18.4 | 9.9 -46% | 15.3 -17% | 17.5 -5% | 10.1 ? -45% | ||
| WiFi v1.3 (h) | 13 | 8.8 -32% | 6.3 -52% | 7.7 -41% | 10.5 -19% | 16.9 30% | 8.55 ? -34% |
| Load (h) | 2 | 1.8 -10% | 1.9 -5% | 2.3 15% | 1.441 ? -28% |
Pros
Cons
结论--移动工作站比去年的型号更慢

良好、稳定的性能应该是移动工作站的首要任务。尽管ZBook Firefly机型是采用入门级组件的超薄工作站,但处理器的极低功率限制清楚地表明,惠普已经错过了这个目标。我们对当前一代Alder Lake-U处理器在一秒钟后只需运行12瓦的功率感到目瞪口呆,尤其是在16英寸的大机箱中。在这里,任何13英寸的子笔记本都能提供(好得多)的性能。
的性能 Nvidia T550GPU的性能同样令人失望,因为它只在20瓦的条件下运行--这是这种GPU的最低值。因此,图形性能只是稍微好一点,在某些情况下甚至比老款的ZBook Firefly 15 G8更差。 ZBook Firefly 15 G8配备Nvidia T500。这是在错误方向上迈出的一步。尽管性能缓慢,但我们测量到负载下的表面温度很高,表明冷却性能不佳。
笔记本电脑的其他方面几乎不值得一提,因为Firefly 16 G9未能实现其作为工作站的主要目的。安静的风扇和较长的电池寿命对改变这一事实没有什么作用。这是一个遗憾,因为优质的机箱、出色的键盘和哑光屏幕本来是一个好产品的坚实基础。
尽管惠普ZBook Firefly 16 G9显示出作为一个坚实的入门级移动工作站的潜力,但糟糕的CPU和平庸的GPU性能使其失去了预期的使用案例的资格。虽然它不一定是一台糟糕的笔记本电脑,但CPU的性能即使按照消费级标准也显得过时了。
虽然我们还没有对竞争对手的工作站进行审查,但由于处理器性能不佳,我们建议不要购买惠普的工作站。我们将努力获得另一个测试模型,该模型采用Alder Lake-P处理器,希望整体上有更好的CPU性能特征。
价格和可用性
我们的测试配置可从各种在线零售商或HP的在线商店获得,价格约为3000美元。直接提供,价格约为3000美元。
HP ZBook Firefly 16 G9-6B897EA
- 10/07/2022 v7 (old)
Andreas Osthoff
Price comparison

