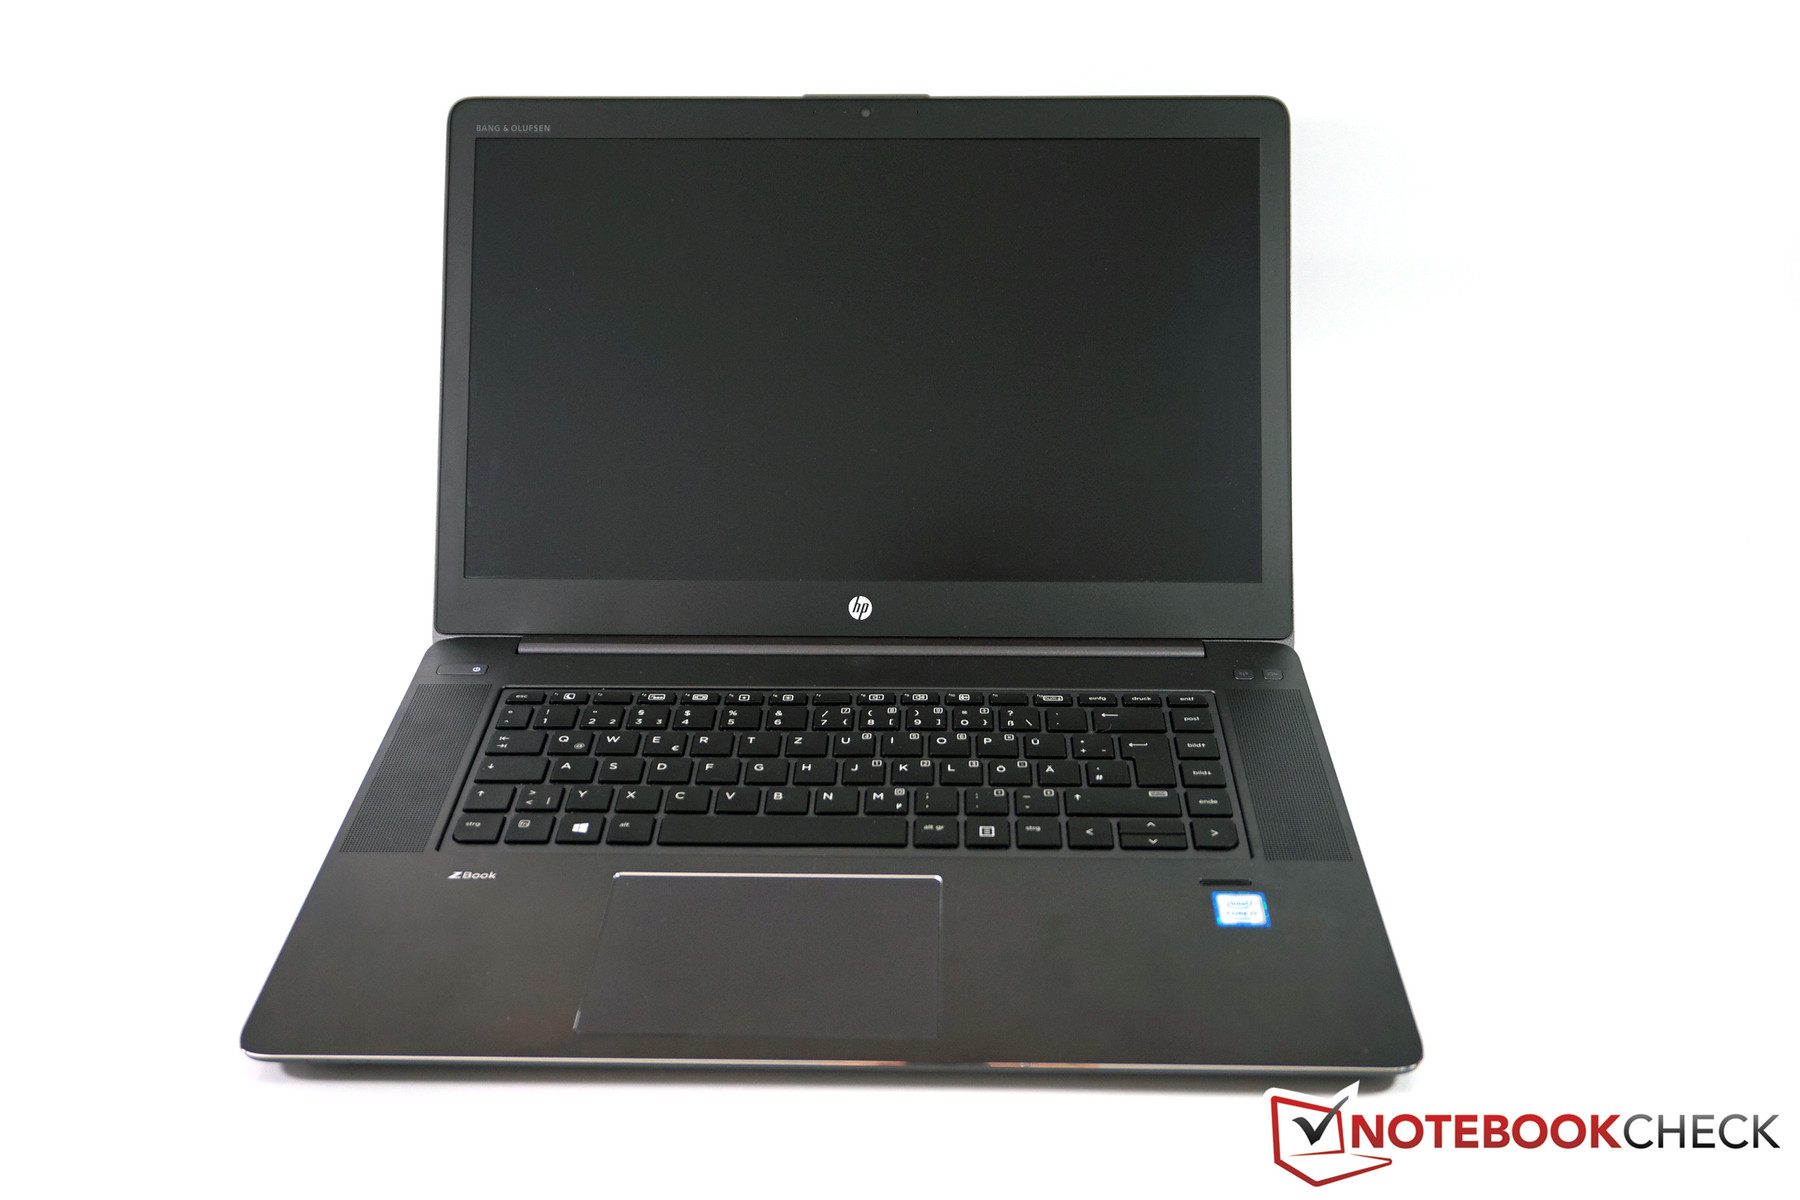
惠普 ZBook Studio G3 工作站简短评测
| |||||||||||||||||||||||||
Brightness Distribution: 86 %
Center on Battery: 307 cd/m²
Contrast: 1069:1 (Black: 0.29 cd/m²)
ΔE ColorChecker Calman: 5.9 | ∀{0.5-29.43 Ø4.71}
ΔE Greyscale Calman: 5.5 | ∀{0.09-98 Ø4.96}
99.9% sRGB (Calman 2D)
99% sRGB (Argyll 1.6.3 3D)
85% AdobeRGB 1998 (Argyll 1.6.3 3D)
98% AdobeRGB 1998 (Argyll 3D)
98.9% sRGB (Argyll 3D)
86% Display P3 (Argyll 3D)
Gamma: 2.09
CCT: 5980 K
| HP ZBook Studio G3 15.6", 3840x2160, IPS | Dell Precision 5510 15.6", 3840x2160, IGZO LED | MSI WS60-6QJE316H11 15.6", 3840x2160, IPS | Lenovo ThinkPad P50 15.6", 1920x1080, IPS | Lenovo ThinkPad P50s-20FKS00400 15.5", 2880x1620, IPS | HP ZBook 15 G3 15.6", 1920x1080, UWVA-IPS | HP ZBook 15u G3 15.6", 1920x1080, TN LED | Apple MacBook Pro Retina 15 inch 2015-05 15.4", 2880x1800, IPS-Panel | |
|---|---|---|---|---|---|---|---|---|
| Display | 2% | -31% | -51% | -24% | -18% | -34% | -24% | |
| Display P3 Coverage (%) | 86 | 88.4 3% | 55.1 -36% | 39.13 -54% | 63.7 -26% | 66.8 -22% | 53.2 -38% | 61.4 -29% |
| sRGB Coverage (%) | 98.9 | 100 1% | 83 -16% | 58.5 -41% | 87.6 -11% | 95.5 -3% | 80.1 -19% | 90.8 -8% |
| AdobeRGB 1998 Coverage (%) | 98 | 99.5 2% | 56.9 -42% | 40.45 -59% | 63.8 -35% | 69 -30% | 54.9 -44% | 62.9 -36% |
| Response Times | -38% | 10% | -9% | -5% | -38% | -26% | ||
| Response Time Grey 50% / Grey 80% * (ms) | 44 ? | 56.4 ? -28% | 34 ? 23% | 46 ? -5% | 38 ? 14% | 54 ? -23% | 45.6 ? -4% | |
| Response Time Black / White * (ms) | 23.2 ? | 34 ? -47% | 24 ? -3% | 26 ? -12% | 28.8 ? -24% | 35.6 ? -53% | 34.4 ? -48% | |
| PWM Frequency (Hz) | 200 ? | 1316 ? | 219 ? | 198 ? | 198.4 ? | |||
| Screen | 7% | -6% | -10% | -2% | -8% | -48% | 15% | |
| Brightness middle (cd/m²) | 310 | 391 26% | 237 -24% | 263 -15% | 319 3% | 306 -1% | 297.8 -4% | 341 10% |
| Brightness (cd/m²) | 299 | 361 21% | 208 -30% | 236 -21% | 290 -3% | 289 -3% | 284 -5% | 315 5% |
| Brightness Distribution (%) | 86 | 87 1% | 77 -10% | 78 -9% | 82 -5% | 85 -1% | 89 3% | 82 -5% |
| Black Level * (cd/m²) | 0.29 | 0.4 -38% | 0.26 10% | 0.34 -17% | 0.31 -7% | 0.34 -17% | 0.849 -193% | 0.34 -17% |
| Contrast (:1) | 1069 | 978 -9% | 912 -15% | 774 -28% | 1029 -4% | 900 -16% | 351 -67% | 1003 -6% |
| Colorchecker dE 2000 * | 5.9 | 4.85 18% | 4.42 25% | 2.35 60% | 4.8 19% | 5.1 14% | 8.68 -47% | 2.07 65% |
| Colorchecker dE 2000 max. * | 10.7 | 8.54 20% | 7.8 27% | 9.9 7% | 14.98 -40% | 3.27 69% | ||
| Greyscale dE 2000 * | 5.5 | 4.01 27% | 4.43 19% | 3.33 39% | 5.7 -4% | 7.4 -35% | 9.3 -69% | 1.9 65% |
| Gamma | 2.09 105% | 2.18 101% | 2.23 99% | 2.38 92% | 2.07 106% | 2.37 93% | 2.27 97% | 2.62 84% |
| CCT | 5980 109% | 7340 89% | 6133 106% | 6917 94% | 6260 104% | 7263 89% | 10585 61% | 6514 100% |
| Color Space (Percent of AdobeRGB 1998) (%) | 85 | 96 13% | 52.5 -38% | 37 -56% | 56.9 -33% | 63 -26% | 50.99 -40% | 58 -32% |
| Color Space (Percent of sRGB) (%) | 99 | 100 1% | 82.9 -16% | 58 -41% | 87.4 -12% | 95 -4% | 80.42 -19% | 91 -8% |
| Total Average (Program / Settings) | -10% /
-1% | -9% /
-9% | -23% /
-19% | -10% /
-7% | -21% /
-14% | -36% /
-42% | -5% /
6% |
* ... smaller is better
Display Response Times
| ↔ Response Time Black to White | ||
|---|---|---|
| 23.2 ms ... rise ↗ and fall ↘ combined | ↗ 6 ms rise | 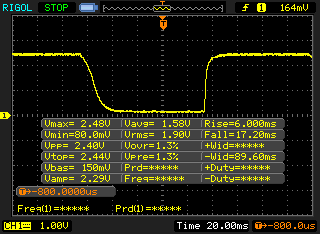 |
| ↘ 17.2 ms fall | ||
| The screen shows good response rates in our tests, but may be too slow for competitive gamers. In comparison, all tested devices range from 0.1 (minimum) to 240 (maximum) ms. » 53 % of all devices are better. This means that the measured response time is worse than the average of all tested devices (19.8 ms). | ||
| ↔ Response Time 50% Grey to 80% Grey | ||
| 44 ms ... rise ↗ and fall ↘ combined | ↗ 17 ms rise | 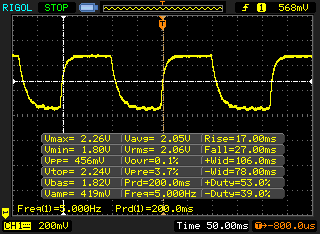 |
| ↘ 27 ms fall | ||
| The screen shows slow response rates in our tests and will be unsatisfactory for gamers. In comparison, all tested devices range from 0.165 (minimum) to 636 (maximum) ms. » 73 % of all devices are better. This means that the measured response time is worse than the average of all tested devices (31 ms). | ||
Screen Flickering / PWM (Pulse-Width Modulation)
| Screen flickering / PWM detected | 200 Hz | ≤ 55 % brightness setting | 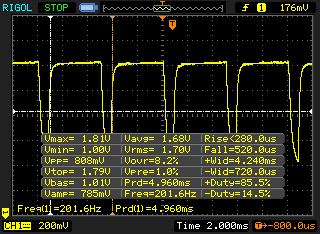 |
The display backlight flickers at 200 Hz (worst case, e.g., utilizing PWM) Flickering detected at a brightness setting of 55 % and below. There should be no flickering or PWM above this brightness setting. The frequency of 200 Hz is relatively low, so sensitive users will likely notice flickering and experience eyestrain at the stated brightness setting and below. In comparison: 52 % of all tested devices do not use PWM to dim the display. If PWM was detected, an average of 7754 (minimum: 5 - maximum: 343500) Hz was measured. | |||
| Cinebench R10 | |
| Rendering Multiple CPUs 32Bit | |
| HP ZBook 15 G3 | |
| Dell Precision 5510 | |
| HP ZBook Studio G3 | |
| MSI WS60-6QJE316H11 | |
| Apple MacBook Pro Retina 15 inch 2015-05 | |
| Lenovo ThinkPad P50 | |
| HP ZBook 15u G3 | |
| Lenovo ThinkPad P50s-20FKS00400 | |
| Rendering Single 32Bit | |
| MSI WS60-6QJE316H11 | |
| HP ZBook 15 G3 | |
| HP ZBook Studio G3 | |
| HP ZBook 15u G3 | |
| Dell Precision 5510 | |
| Apple MacBook Pro Retina 15 inch 2015-05 | |
| Lenovo ThinkPad P50s-20FKS00400 | |
| Lenovo ThinkPad P50 | |
| Rendering Multiple CPUs 64Bit | |
| HP ZBook 15 G3 | |
| Dell Precision 5510 | |
| HP ZBook Studio G3 | |
| Apple MacBook Pro Retina 15 inch 2015-05 | |
| MSI WS60-6QJE316H11 | |
| Lenovo ThinkPad P50 | |
| Lenovo ThinkPad P50s-20FKS00400 | |
| Rendering Single CPUs 64Bit | |
| MSI WS60-6QJE316H11 | |
| HP ZBook 15 G3 | |
| Apple MacBook Pro Retina 15 inch 2015-05 | |
| HP ZBook Studio G3 | |
| Dell Precision 5510 | |
| Lenovo ThinkPad P50s-20FKS00400 | |
| Lenovo ThinkPad P50 | |
| PCMark 8 | |
| Work Score Accelerated v2 | |
| HP ZBook 15 G3 | |
| Dell Precision 5510 | |
| HP ZBook 15u G3 | |
| Lenovo ThinkPad P50 | |
| Apple MacBook Pro Retina 15 inch 2015-05 | |
| HP ZBook Studio G3 | |
| MSI WS60-6QJE316H11 | |
| Lenovo ThinkPad P50s-20FKS00400 | |
| Creative Score Accelerated v2 | |
| Apple MacBook Pro Retina 15 inch 2015-05 | |
| HP ZBook 15u G3 | |
| Dell Precision 5510 | |
| HP ZBook 15 G3 | |
| HP ZBook Studio G3 | |
| Home Score Accelerated v2 | |
| Lenovo ThinkPad P50 | |
| HP ZBook 15u G3 | |
| HP ZBook 15 G3 | |
| Dell Precision 5510 | |
| Apple MacBook Pro Retina 15 inch 2015-05 | |
| HP ZBook Studio G3 | |
| MSI WS60-6QJE316H11 | |
| Lenovo ThinkPad P50s-20FKS00400 | |
| PCMark 7 - Score | |
| HP ZBook 15 G3 | |
| HP ZBook 15u G3 | |
| Apple MacBook Pro Retina 15 inch 2015-05 | |
| MSI WS60-6QJE316H11 | |
| HP ZBook Studio G3 | |
| Dell Precision 5510 | |
| Lenovo ThinkPad P50s-20FKS00400 | |
| Lenovo ThinkPad P50 | |
| PCMark 7 Score | 5336 points | |
| PCMark 8 Home Score Accelerated v2 | 3262 points | |
| PCMark 8 Creative Score Accelerated v2 | 4235 points | |
| PCMark 8 Work Score Accelerated v2 | 4301 points | |
Help | ||

| LuxMark v2.0 64Bit | |
| Room GPUs-only | |
| HP ZBook 15 G3 | |
| MSI WS60-6QJE316H11 | |
| HP ZBook Studio G3 | |
| Lenovo ThinkPad P50 | |
| Dell Precision 5510 | |
| Apple MacBook Pro Retina 15 inch 2015-05 | |
| Lenovo ThinkPad P50s-20FKS00400 | |
| Sala GPUs-only | |
| HP ZBook 15 G3 | |
| HP ZBook Studio G3 | |
| MSI WS60-6QJE316H11 | |
| Lenovo ThinkPad P50 | |
| HP ZBook 15u G3 | |
| Lenovo ThinkPad P50s-20FKS00400 | |
| Dell Precision 5510 | |
| Apple MacBook Pro Retina 15 inch 2015-05 | |
| SiSoft Sandra 2016 | |
| Image Processing | |
| HP ZBook 15 G3 | |
| HP ZBook Studio G3 | |
| MSI WS60-6QJE316H11 | |
| Lenovo ThinkPad P50 | |
| Dell Precision 5510 | |
| Lenovo ThinkPad P50s-20FKS00400 | |
| GP Cryptography (Higher Security AES256+SHA2-512) | |
| Lenovo ThinkPad P50 | |
| HP ZBook 15 G3 | |
| MSI WS60-6QJE316H11 | |
| HP ZBook Studio G3 | |
| Dell Precision 5510 | |
| Lenovo ThinkPad P50s-20FKS00400 | |
| GP Financial Analysis (FP High/Double Precision) | |
| HP ZBook 15 G3 | |
| Lenovo ThinkPad P50 | |
| MSI WS60-6QJE316H11 | |
| Dell Precision 5510 | |
| HP ZBook Studio G3 | |
| Lenovo ThinkPad P50s-20FKS00400 | |
| Unigine Heaven 3.0 | |
| 1920x1080 DX 11, Normal Tessellation, High Shaders AA:Off AF:Off | |
| MSI WS60-6QJE316H11 | |
| Lenovo ThinkPad P50 | |
| HP ZBook 15 G3 | |
| Dell Precision 5510 | |
| HP ZBook Studio G3 | |
| Lenovo ThinkPad P50s-20FKS00400 | |
| 1920x1080 OpenGL, Normal Tessellation, High Shaders AA:Off AF:Off | |
| HP ZBook 15 G3 | |
| HP ZBook Studio G3 | |
| Dell Precision 5510 | |
| MSI WS60-6QJE316H11 | |
| Lenovo ThinkPad P50 | |
| Lenovo ThinkPad P50s-20FKS00400 | |
| Unigine Valley 1.0 | |
| 1920x1080 Extreme HD DirectX AA:x8 | |
| Lenovo ThinkPad P50 | |
| HP ZBook 15 G3 | |
| MSI WS60-6QJE316H11 | |
| HP ZBook Studio G3 | |
| Dell Precision 5510 | |
| Lenovo ThinkPad P50s-20FKS00400 | |
| 1920x1080 Extreme HD Preset OpenGL AA:x8 | |
| HP ZBook 15 G3 | |
| HP ZBook Studio G3 | |
| Dell Precision 5510 | |
| MSI WS60-6QJE316H11 | |
| Lenovo ThinkPad P50 | |
| Lenovo ThinkPad P50s-20FKS00400 | |
| 3DMark | |
| 1920x1080 Fire Strike Score | |
| Asus G501VW-FY081T | |
| MSI WS60-6QJE316H11 | |
| HP ZBook 15 G3 | |
| Lenovo ThinkPad P50 | |
| Dell Precision 5510 | |
| HP ZBook Studio G3 | |
| Asus N752VX-GC131T | |
| Apple MacBook Pro Retina 15 inch 2015-05 | |
| HP ZBook 15u G3 | |
| Lenovo ThinkPad P50s-20FKS00400 | |
| 1920x1080 Fire Strike Graphics | |
| Asus G501VW-FY081T | |
| MSI WS60-6QJE316H11 | |
| Lenovo ThinkPad P50 | |
| HP ZBook 15 G3 | |
| Dell Precision 5510 | |
| HP ZBook Studio G3 | |
| Asus N752VX-GC131T | |
| Apple MacBook Pro Retina 15 inch 2015-05 | |
| Lenovo ThinkPad P50s-20FKS00400 | |
| HP ZBook 15u G3 | |
| 3DMark 06 Standard Score | 24393 points | |
| 3DMark 11 Performance | 4673 points | |
| 3DMark Ice Storm Standard Score | 42096 points | |
| 3DMark Cloud Gate Standard Score | 15717 points | |
| 3DMark Fire Strike Score | 3302 points | |
Help | ||
| low | med. | high | ultra | 4K | |
|---|---|---|---|---|---|
| BioShock Infinite (2013) | 176.7 | 115 | 100.1 | 37 | |
| The Witcher 3 (2015) | 59.4 | 36.5 | 20.8 | 10.8 | 7.7 |
| Rainbow Six Siege (2015) | 137.8 | 79.9 | 43.5 | 32 | 13.2 |
Noise level
| Idle |
| 30 / 30 / 30 dB(A) |
| Load |
| 51 / 52.8 dB(A) |
 | ||
30 dB silent 40 dB(A) audible 50 dB(A) loud |
||
min: | ||
| HP ZBook Studio G3 6820HQ, Quadro M1000M | Dell Precision 5510 E3-1505M v5, Quadro M1000M | MSI WS60-6QJE316H11 E3-1505M v5, Quadro M2000M | Lenovo ThinkPad P50 6820HQ, Quadro M2000M | Lenovo ThinkPad P50s-20FKS00400 6500U, Quadro M500M | HP ZBook 15 G3 E3-1505M v5, Quadro M2000M | HP ZBook 15u G3 6600U, FirePro W4190M | Apple MacBook Pro Retina 15 inch 2015-05 4870HQ, Radeon R9 M370X | |
|---|---|---|---|---|---|---|---|---|
| Noise | 6% | -10% | 10% | 11% | 3% | 9% | 7% | |
| off / environment * (dB) | 30 | 30 -0% | ||||||
| Idle Minimum * (dB) | 30 | 30 -0% | 37.2 -24% | 30 -0% | 30 -0% | 30 -0% | 29.8 1% | 28.9 4% |
| Idle Average * (dB) | 30 | 30 -0% | 37.2 -24% | 30 -0% | 30 -0% | 30 -0% | 29.8 1% | 28.9 4% |
| Idle Maximum * (dB) | 30 | 30 -0% | 37.2 -24% | 30 -0% | 30 -0% | 30 -0% | 29.8 1% | 28.9 4% |
| Load Average * (dB) | 51 | 42.08 17% | 42.1 17% | 34.5 32% | 33.5 34% | 45.3 11% | 39.5 23% | 46 10% |
| Load Maximum * (dB) | 52.8 | 46.78 11% | 50.7 4% | 42.1 20% | 41.9 21% | 49.7 6% | 43.2 18% | 46 13% |
* ... smaller is better
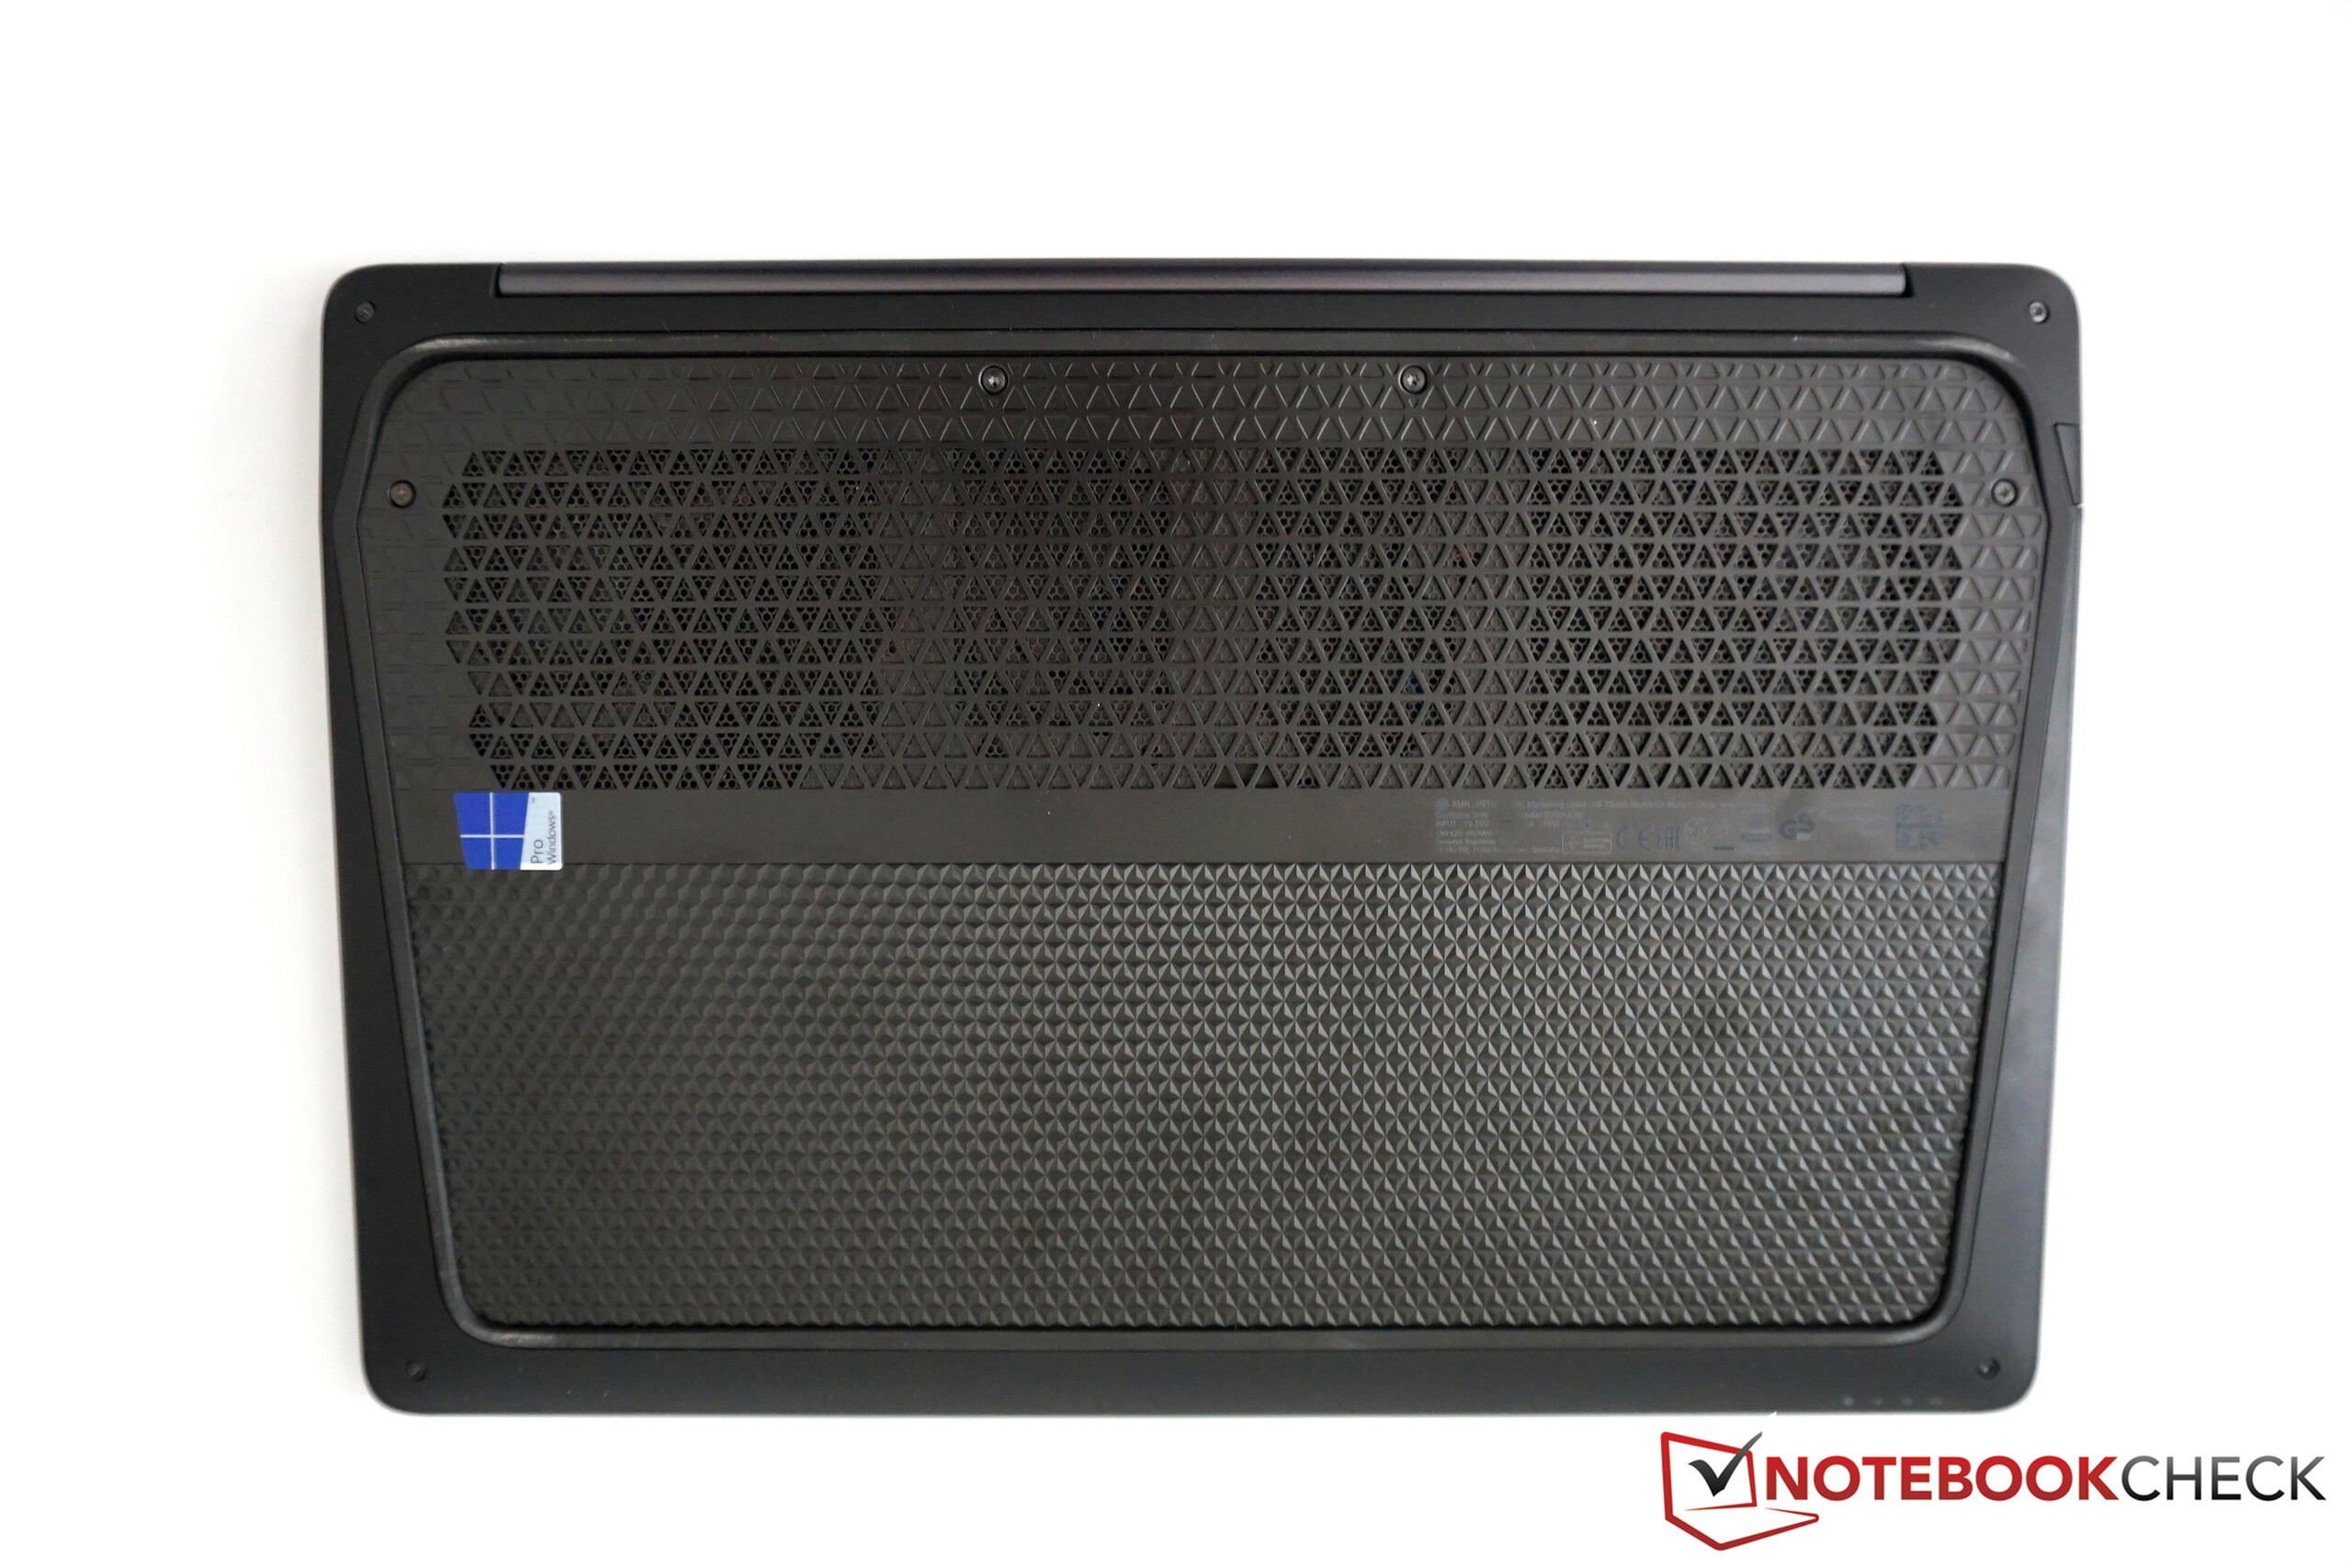
(-) The maximum temperature on the upper side is 69.8 °C / 158 F, compared to the average of 38.2 °C / 101 F, ranging from 22.2 to 69.8 °C for the class Workstation.
(-) The bottom heats up to a maximum of 77.3 °C / 171 F, compared to the average of 41.1 °C / 106 F
(+) In idle usage, the average temperature for the upper side is 30.1 °C / 86 F, compared to the device average of 32 °C / 90 F.
(±) The palmrests and touchpad can get very hot to the touch with a maximum of 38 °C / 100.4 F.
(-) The average temperature of the palmrest area of similar devices was 27.8 °C / 82 F (-10.2 °C / -18.4 F).
| HP ZBook Studio G3 6820HQ, Quadro M1000M | Dell Precision 5510 E3-1505M v5, Quadro M1000M | MSI WS60-6QJE316H11 E3-1505M v5, Quadro M2000M | Lenovo ThinkPad P50 6820HQ, Quadro M2000M | Lenovo ThinkPad P50s-20FKS00400 6500U, Quadro M500M | HP ZBook 15 G3 E3-1505M v5, Quadro M2000M | HP ZBook 15u G3 6600U, FirePro W4190M | Apple MacBook Pro Retina 15 inch 2015-05 4870HQ, Radeon R9 M370X | |
|---|---|---|---|---|---|---|---|---|
| Heat | 22% | 17% | 24% | 26% | 16% | 30% | 29% | |
| Maximum Upper Side * (°C) | 69.8 | 45.8 34% | 42.3 39% | 36.7 47% | 44.2 37% | 54.6 22% | 44.6 36% | 43.2 38% |
| Maximum Bottom * (°C) | 77.3 | 46.7 40% | 60.1 22% | 41.3 47% | 57.8 25% | 60.8 21% | 46 40% | 39 50% |
| Idle Upper Side * (°C) | 37.8 | 31.2 17% | 32.7 13% | 31.1 18% | 26.4 30% | 30.3 20% | 25.8 32% | 30 21% |
| Idle Bottom * (°C) | 31.4 | 31.9 -2% | 33.1 -5% | 36.2 -15% | 28.1 11% | 30.7 2% | 27.4 13% | 29.3 7% |
* ... smaller is better
| Off / Standby | |
| Idle | |
| Load |
|
Key:
min: | |
| HP ZBook Studio G3 64 Wh, 3840x2160 | Dell Precision 5510 56 Wh, 3840x2160 | MSI WS60-6QJE316H11 47 Wh, 3840x2160 | Lenovo ThinkPad P50 90 Wh, 1920x1080 | Lenovo ThinkPad P50s-20FKS00400 67 Wh, 2880x1620 | HP ZBook 15 G3 90 Wh, 1920x1080 | HP ZBook 15u G3 90 Wh, 1920x1080 | Apple MacBook Pro Retina 15 inch 2015-05 100 Wh, 2880x1800 | |
|---|---|---|---|---|---|---|---|---|
| Power Consumption | -5% | -71% | 25% | 43% | 11% | 42% | 16% | |
| Idle Minimum * (Watt) | 8.7 | 8.6 1% | 18.8 -116% | 5.6 36% | 4.3 51% | 5.7 34% | 4.3 51% | 6 31% |
| Idle Average * (Watt) | 14.2 | 16.2 -14% | 29.6 -108% | 8.6 39% | 9.7 32% | 12.2 14% | 7.9 44% | 12.8 10% |
| Idle Maximum * (Watt) | 14.4 | 16.7 -16% | 30.3 -110% | 9.3 35% | 10.2 29% | 12.6 12% | 11.5 20% | 13.3 8% |
| Load Average * (Watt) | 85.6 | 82.6 4% | 90.4 -6% | 89.5 -5% | 45.7 47% | 83.1 3% | 43.3 49% | 82.4 4% |
| Load Maximum * (Watt) | 129.7 | 131.8 -2% | 150.2 -16% | 105 19% | 55.8 57% | 138.2 -7% | 72.3 44% | 91.8 29% |
* ... smaller is better
| HP ZBook Studio G3 64 Wh | Dell Precision 5510 56 Wh | MSI WS60-6QJE316H11 47 Wh | Lenovo ThinkPad P50 90 Wh | Lenovo ThinkPad P50s-20FKS00400 67 Wh | HP ZBook 15 G3 90 Wh | HP ZBook 15u G3 90 Wh | Apple MacBook Pro Retina 15 inch 2015-05 100 Wh | |
|---|---|---|---|---|---|---|---|---|
| Battery runtime | 18% | -43% | 103% | 112% | 76% | 72% | 89% | |
| Reader / Idle (h) | 8.5 | 7.1 -16% | 2.7 -68% | 14.3 68% | 18.5 118% | 13.7 61% | 12.6 48% | 17.3 104% |
| H.264 (h) | 3.8 | 3.3 -13% | 2.4 -37% | 8.9 134% | 9 137% | 7.5 97% | 6.9 82% | |
| WiFi v1.3 (h) | 3.5 | 4.8 37% | 1.8 -49% | 8.3 137% | 6.8 94% | 6.4 83% | 5.2 49% | 7.2 106% |
| Load (h) | 1.1 | 1.8 64% | 0.9 -18% | 1.9 73% | 2.2 100% | 1.8 64% | 2.4 118% | 1.8 64% |
| WiFi (h) | 5 |
Pros
Cons
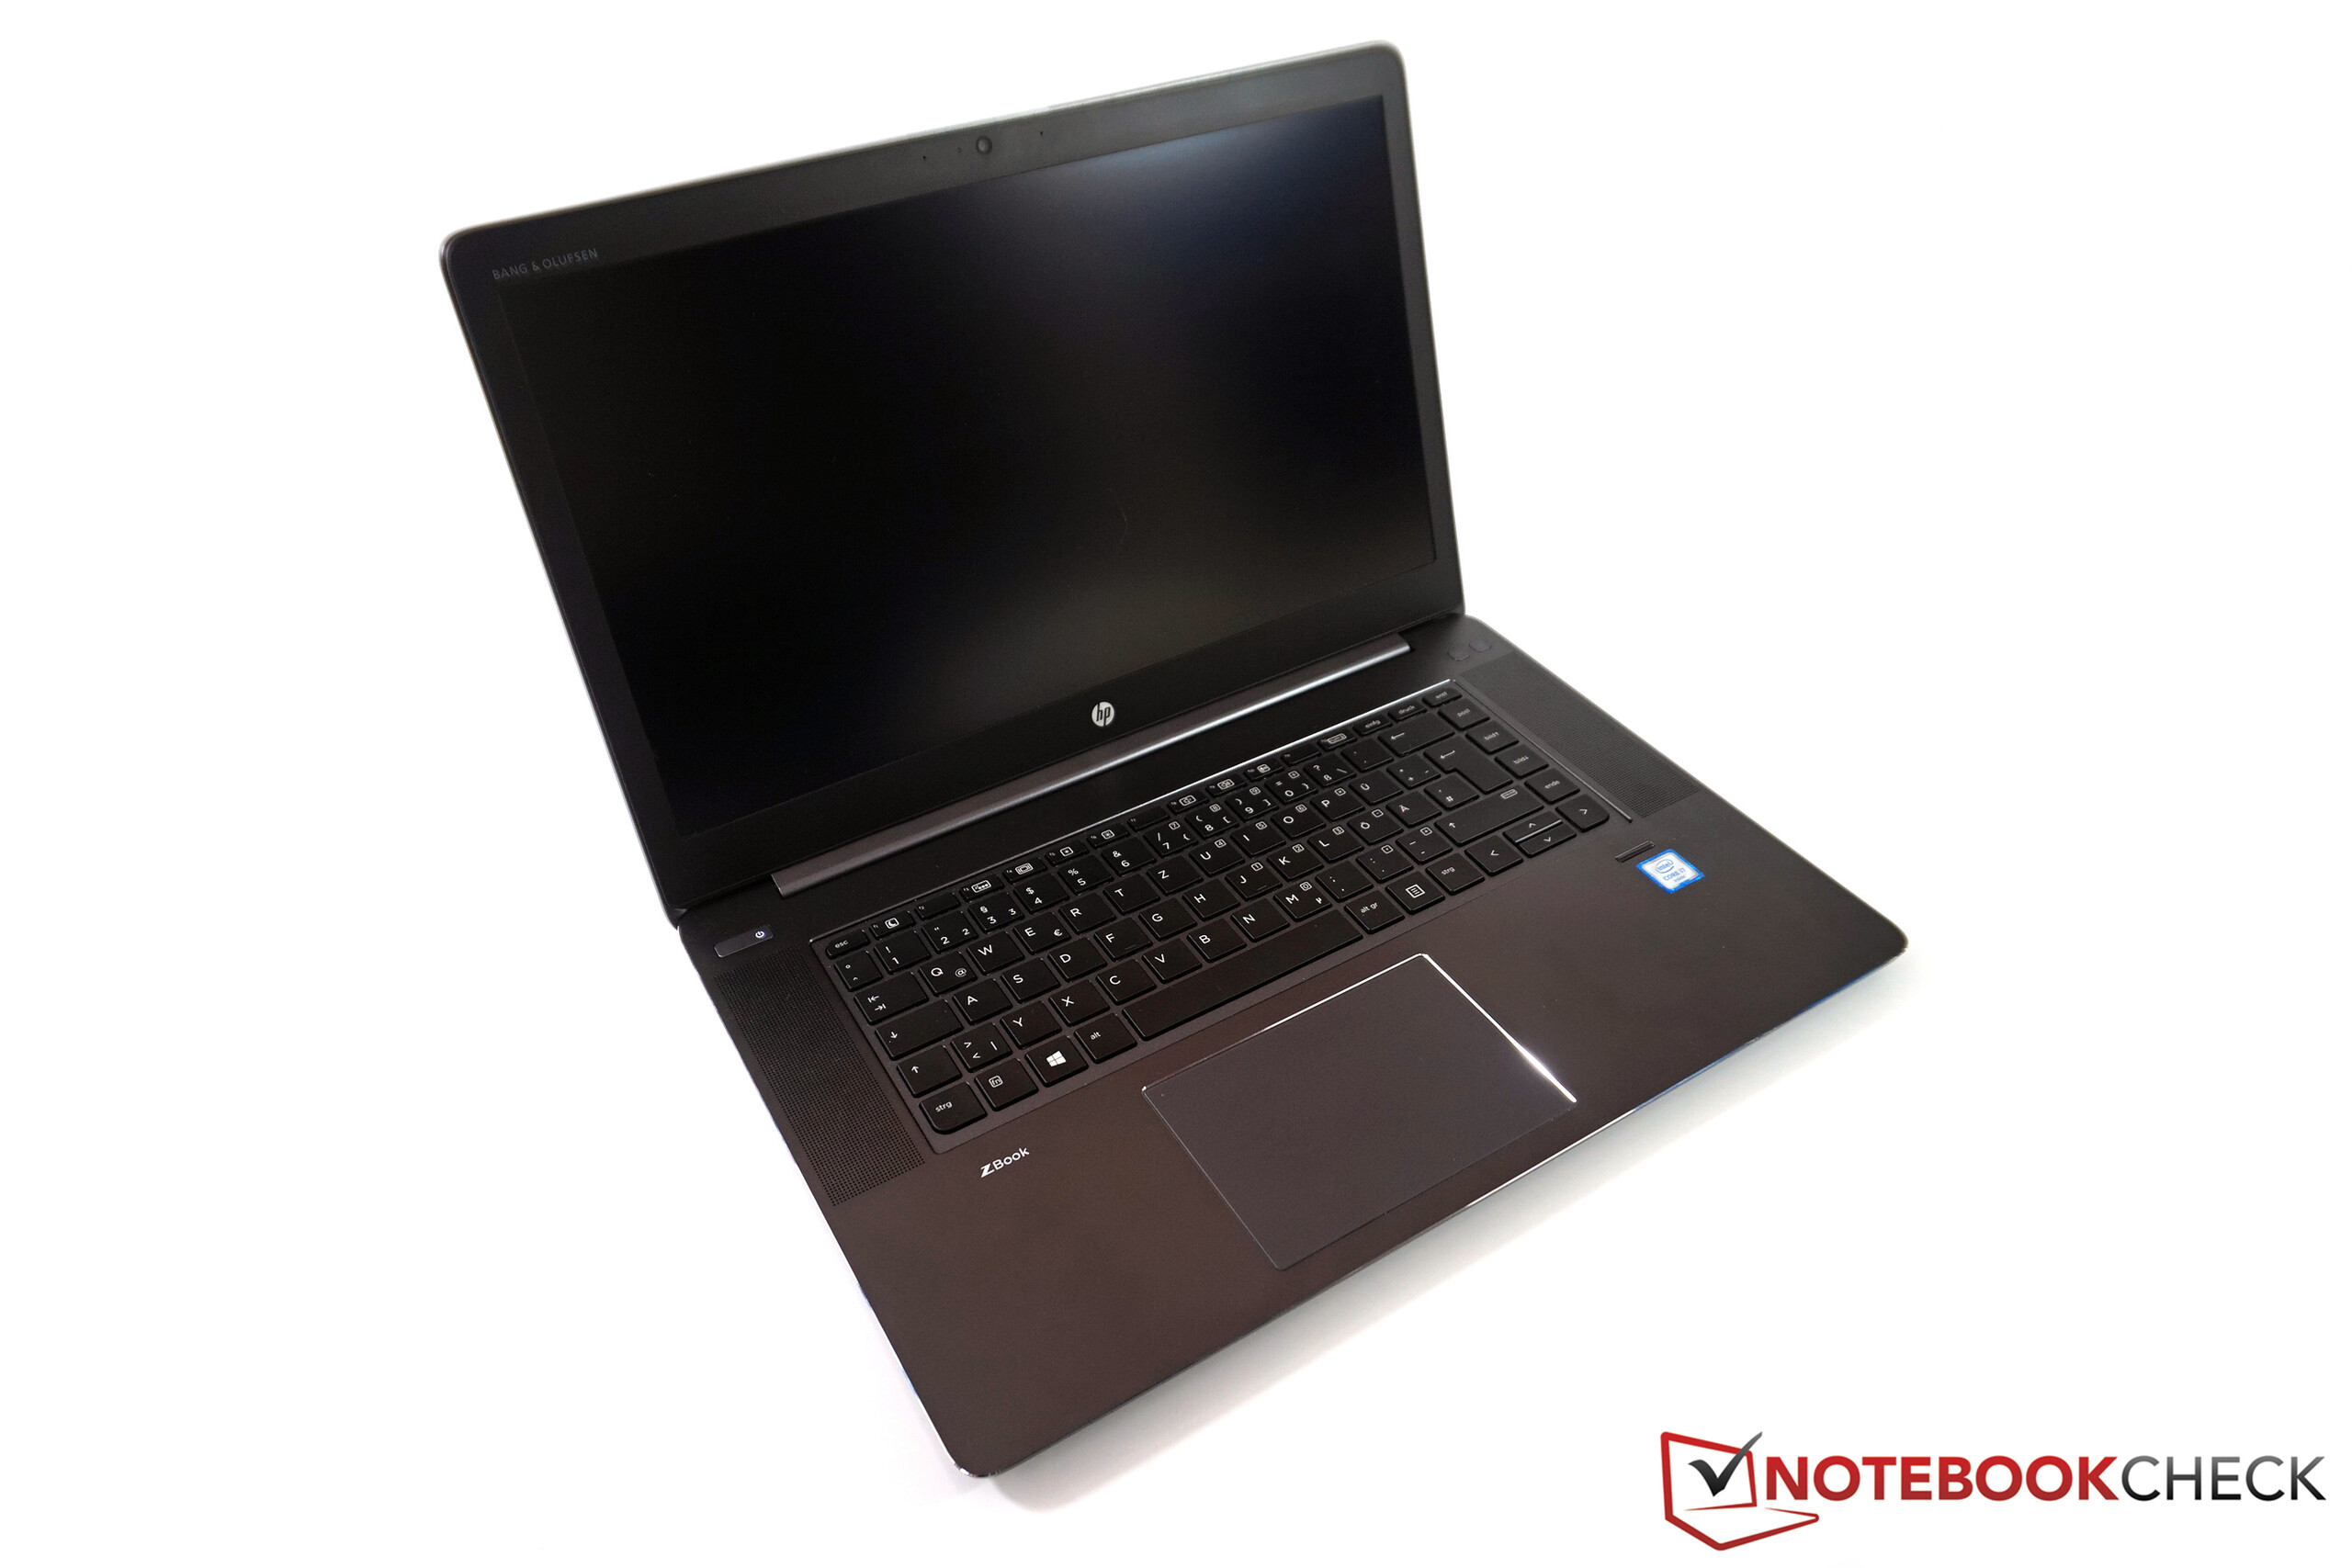
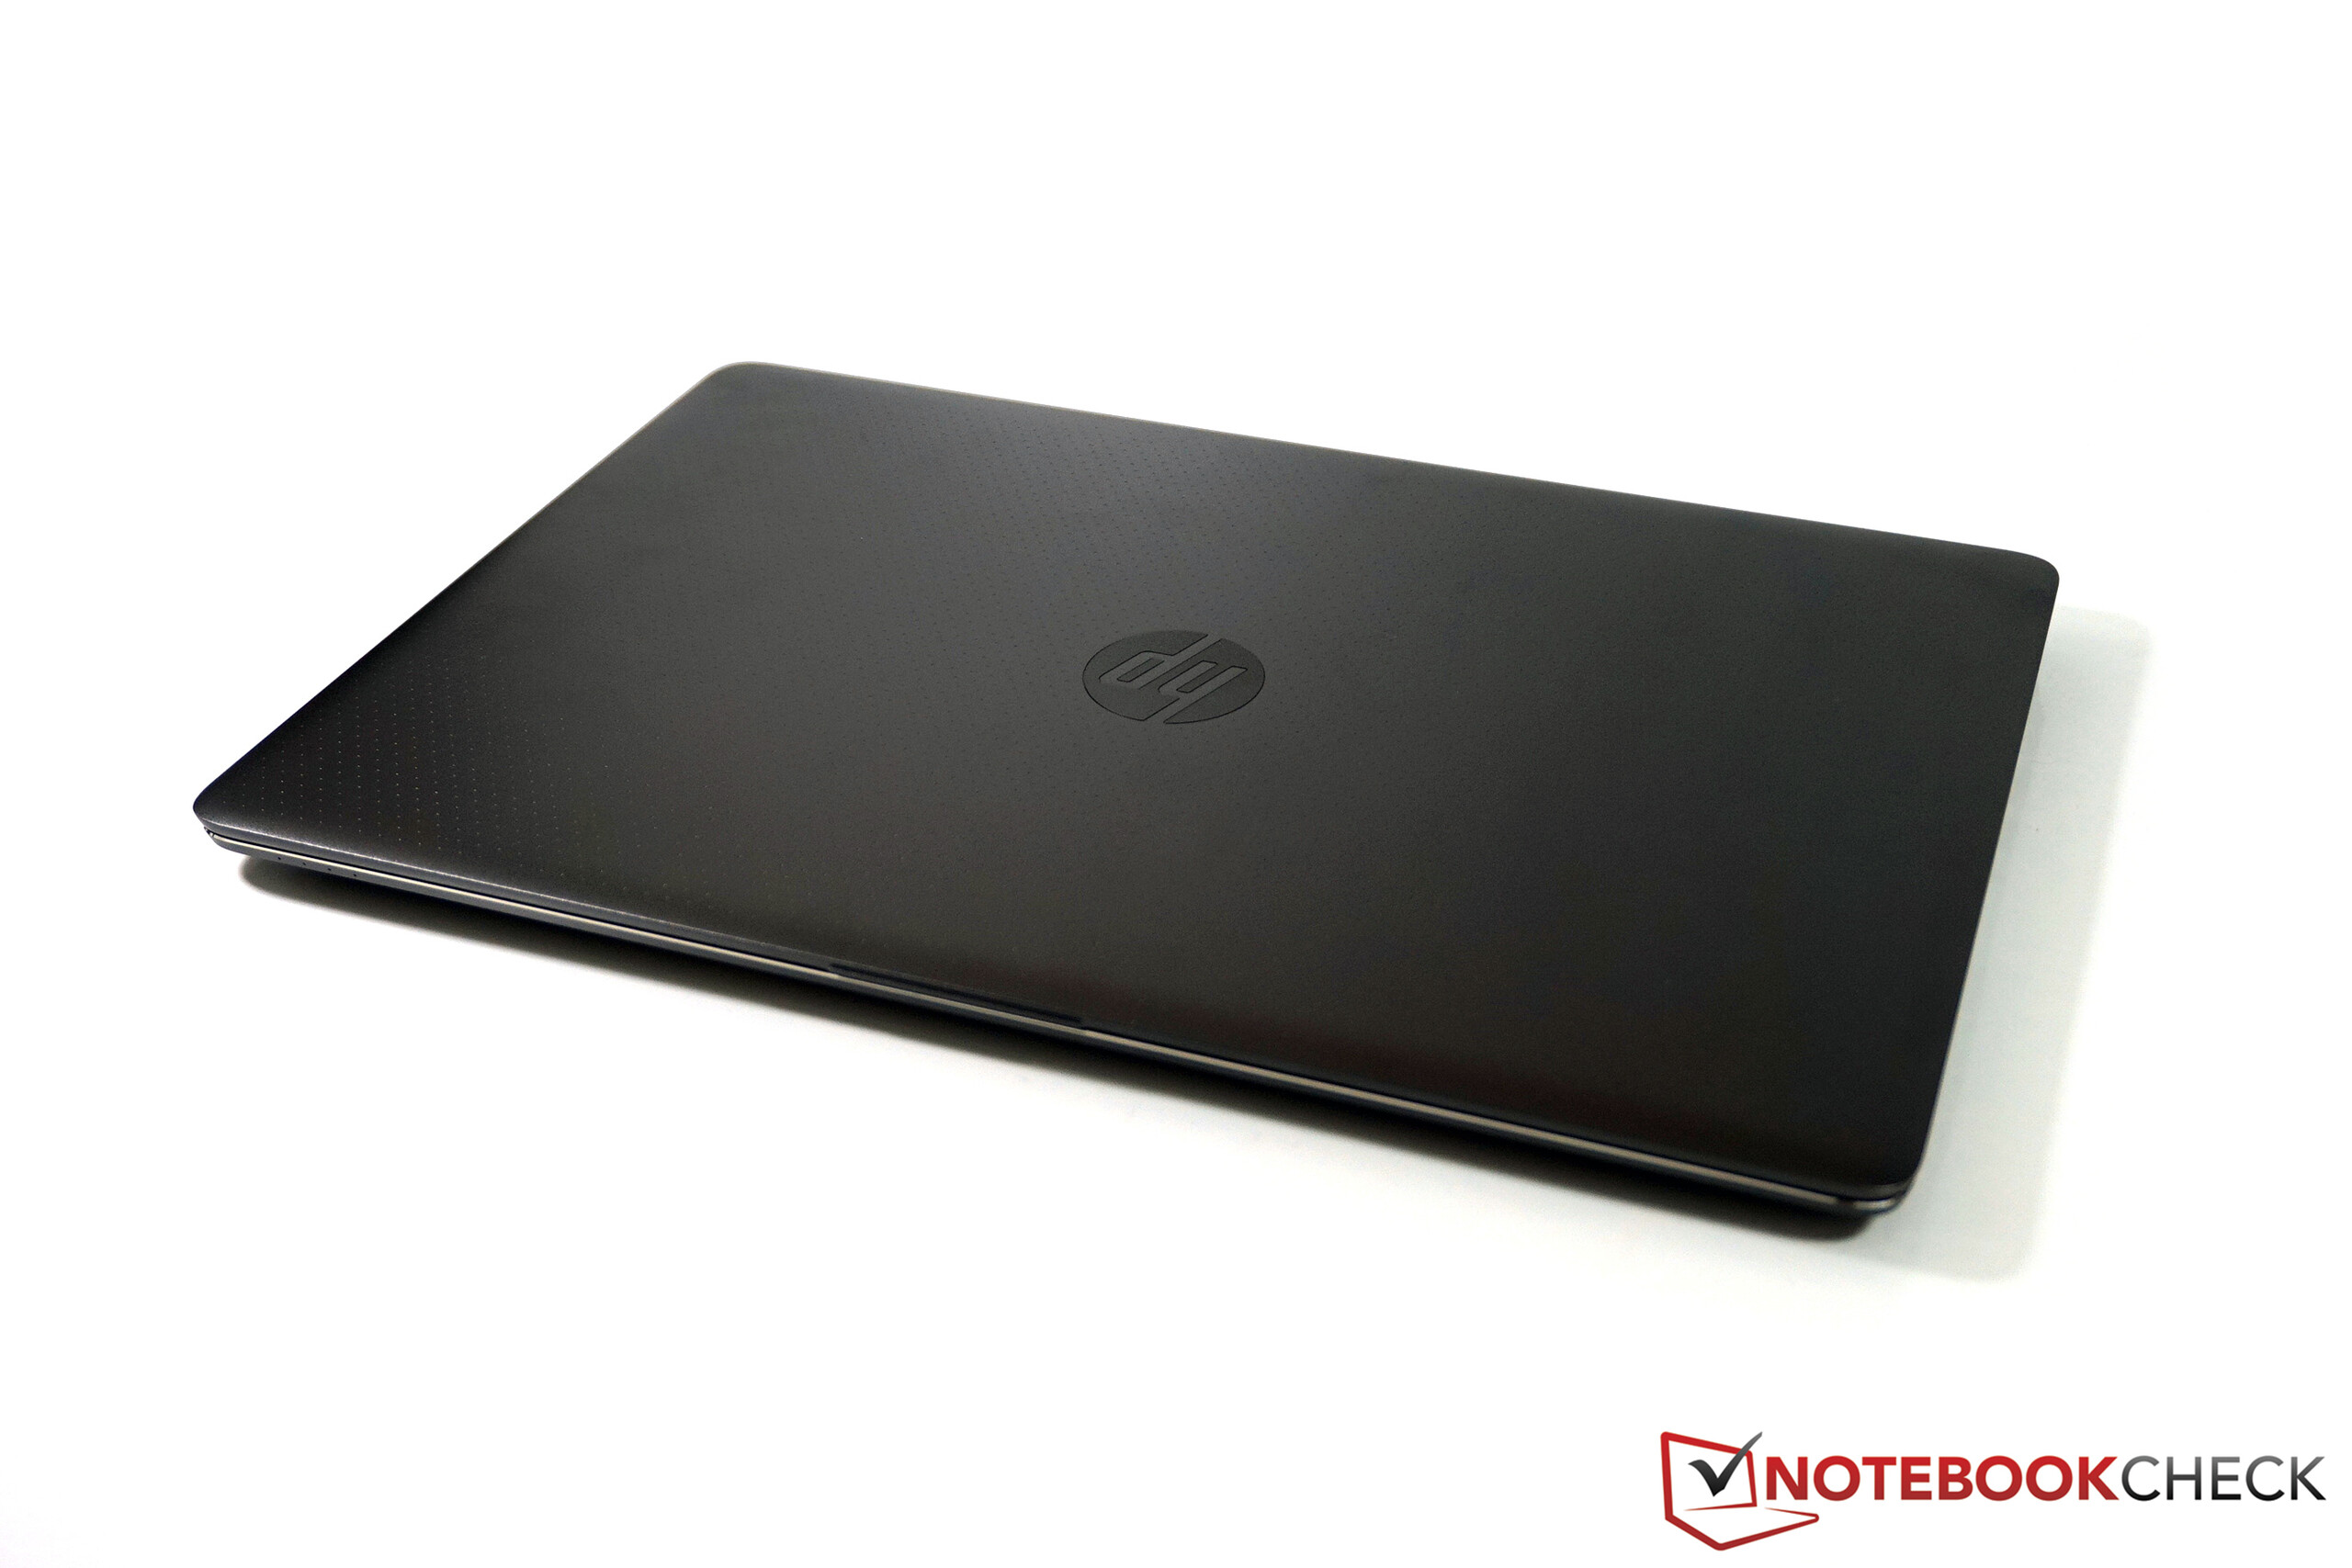
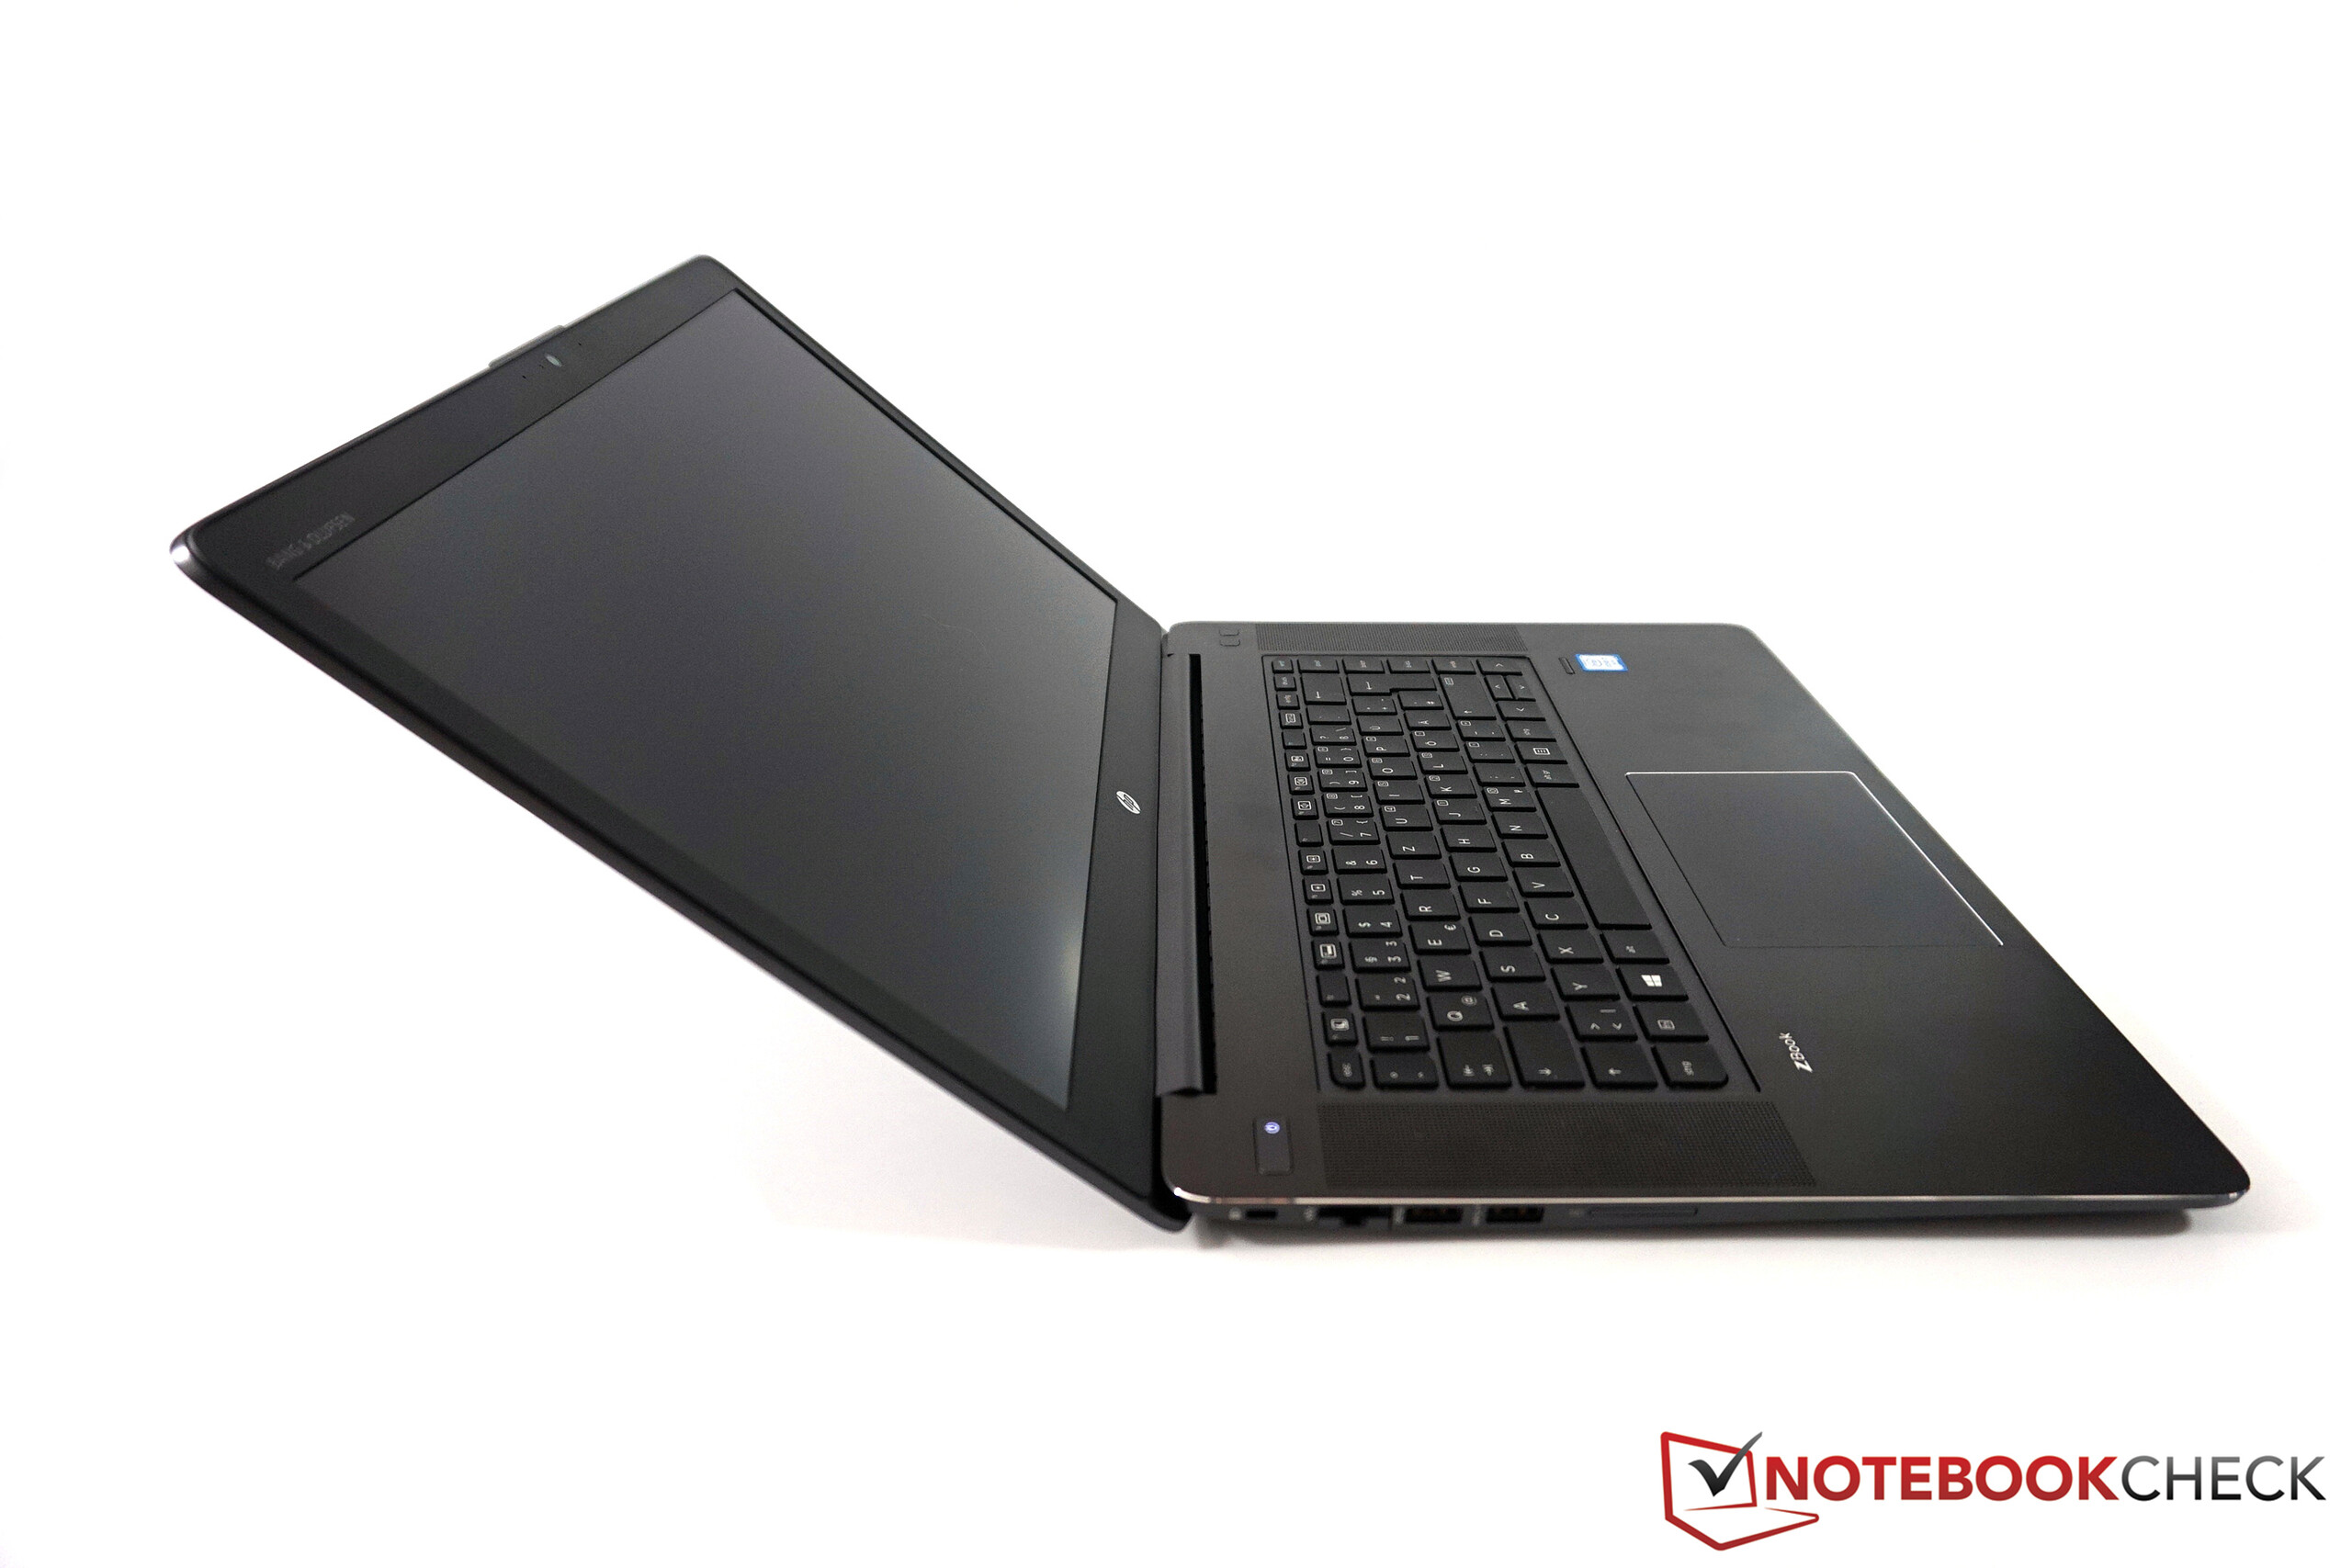
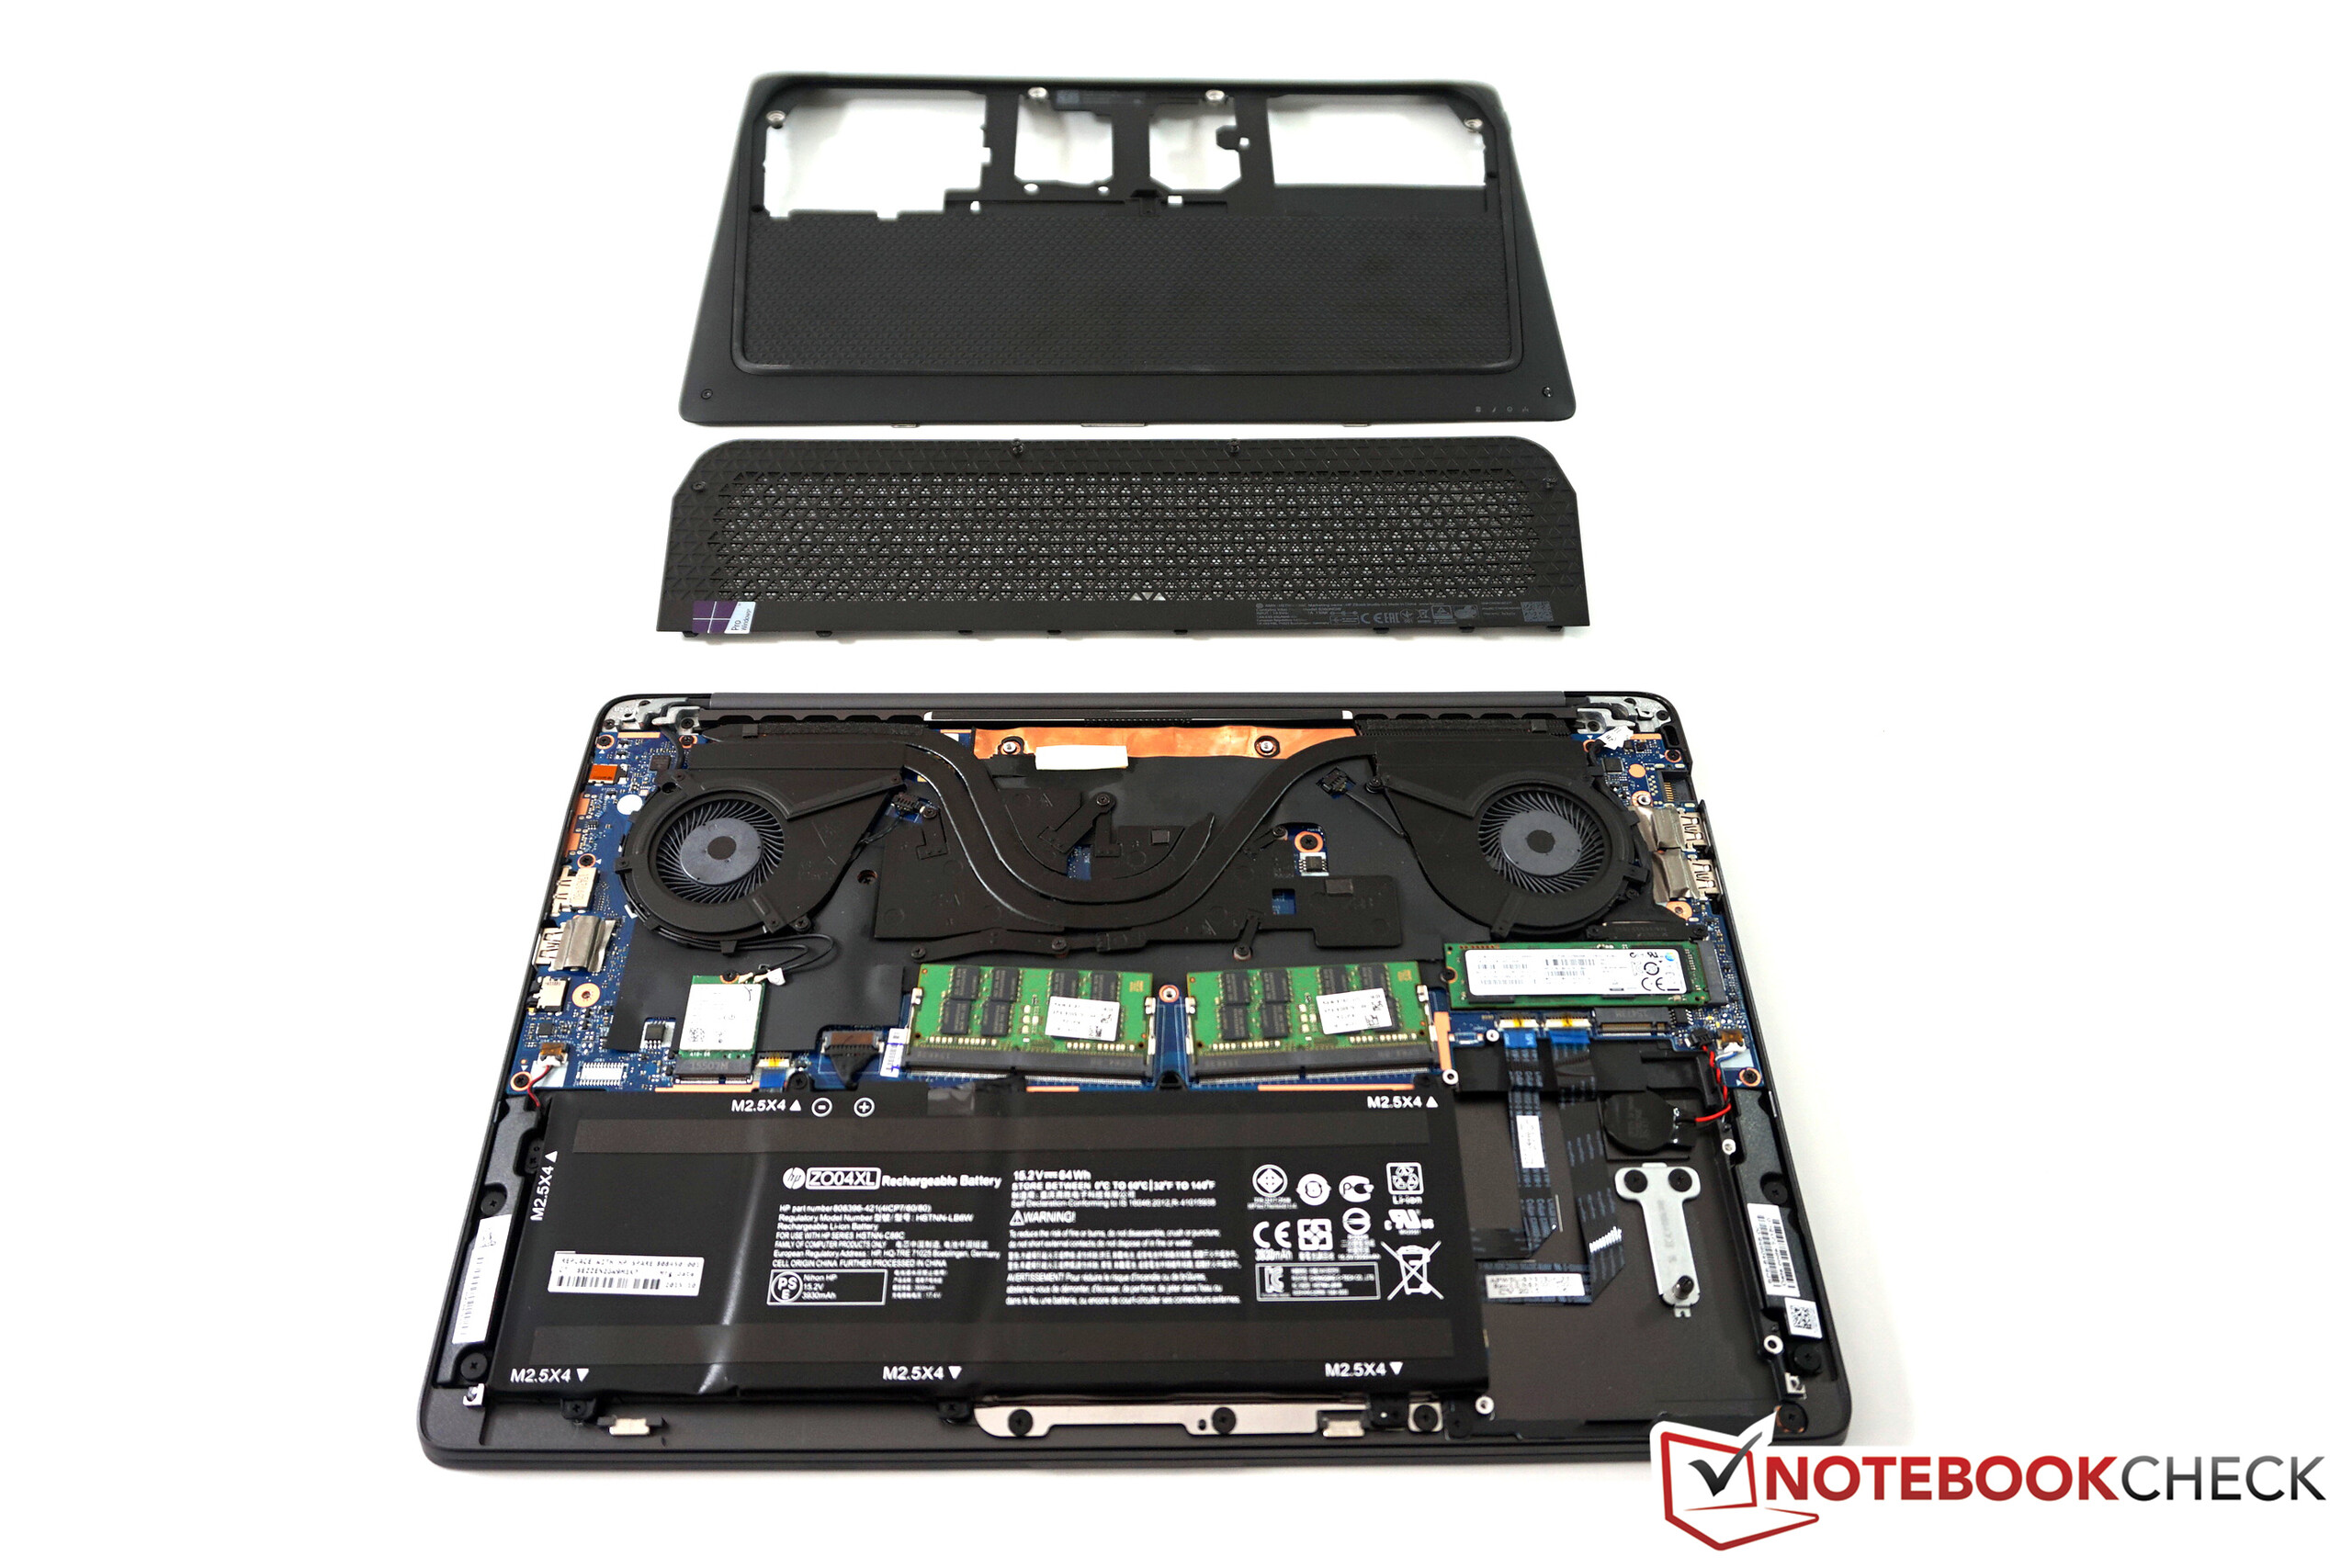
ZBook Studio G3对我们来说是个谜一样的存在。惠普的这台设备在许多方面都十分出色,不过在其他方面则让人大跌眼镜。遗憾的是,这台野心十足的工作站给我们的整体印象是负面的。这主要来自散热和电池续航的表现。在一般使用中,它的表面也可以达到烫手的温度,它的风扇也十分吵人,两个风扇单独控制,噪音非常大。而它不足四个小时的实际使用续航时间也很难适合移动使用。除此之外,它只有一些小问题如缺少对SmartCard和WWAN的支持。
ZBook Studio是个很有野心的计划。它在紧凑的机身中搭载了强劲的性能,不过作为回报的还有超高的温度和吵闹的风扇。这对于一台售价3800欧元(约27733人民币)的设备来说让人难以接受。
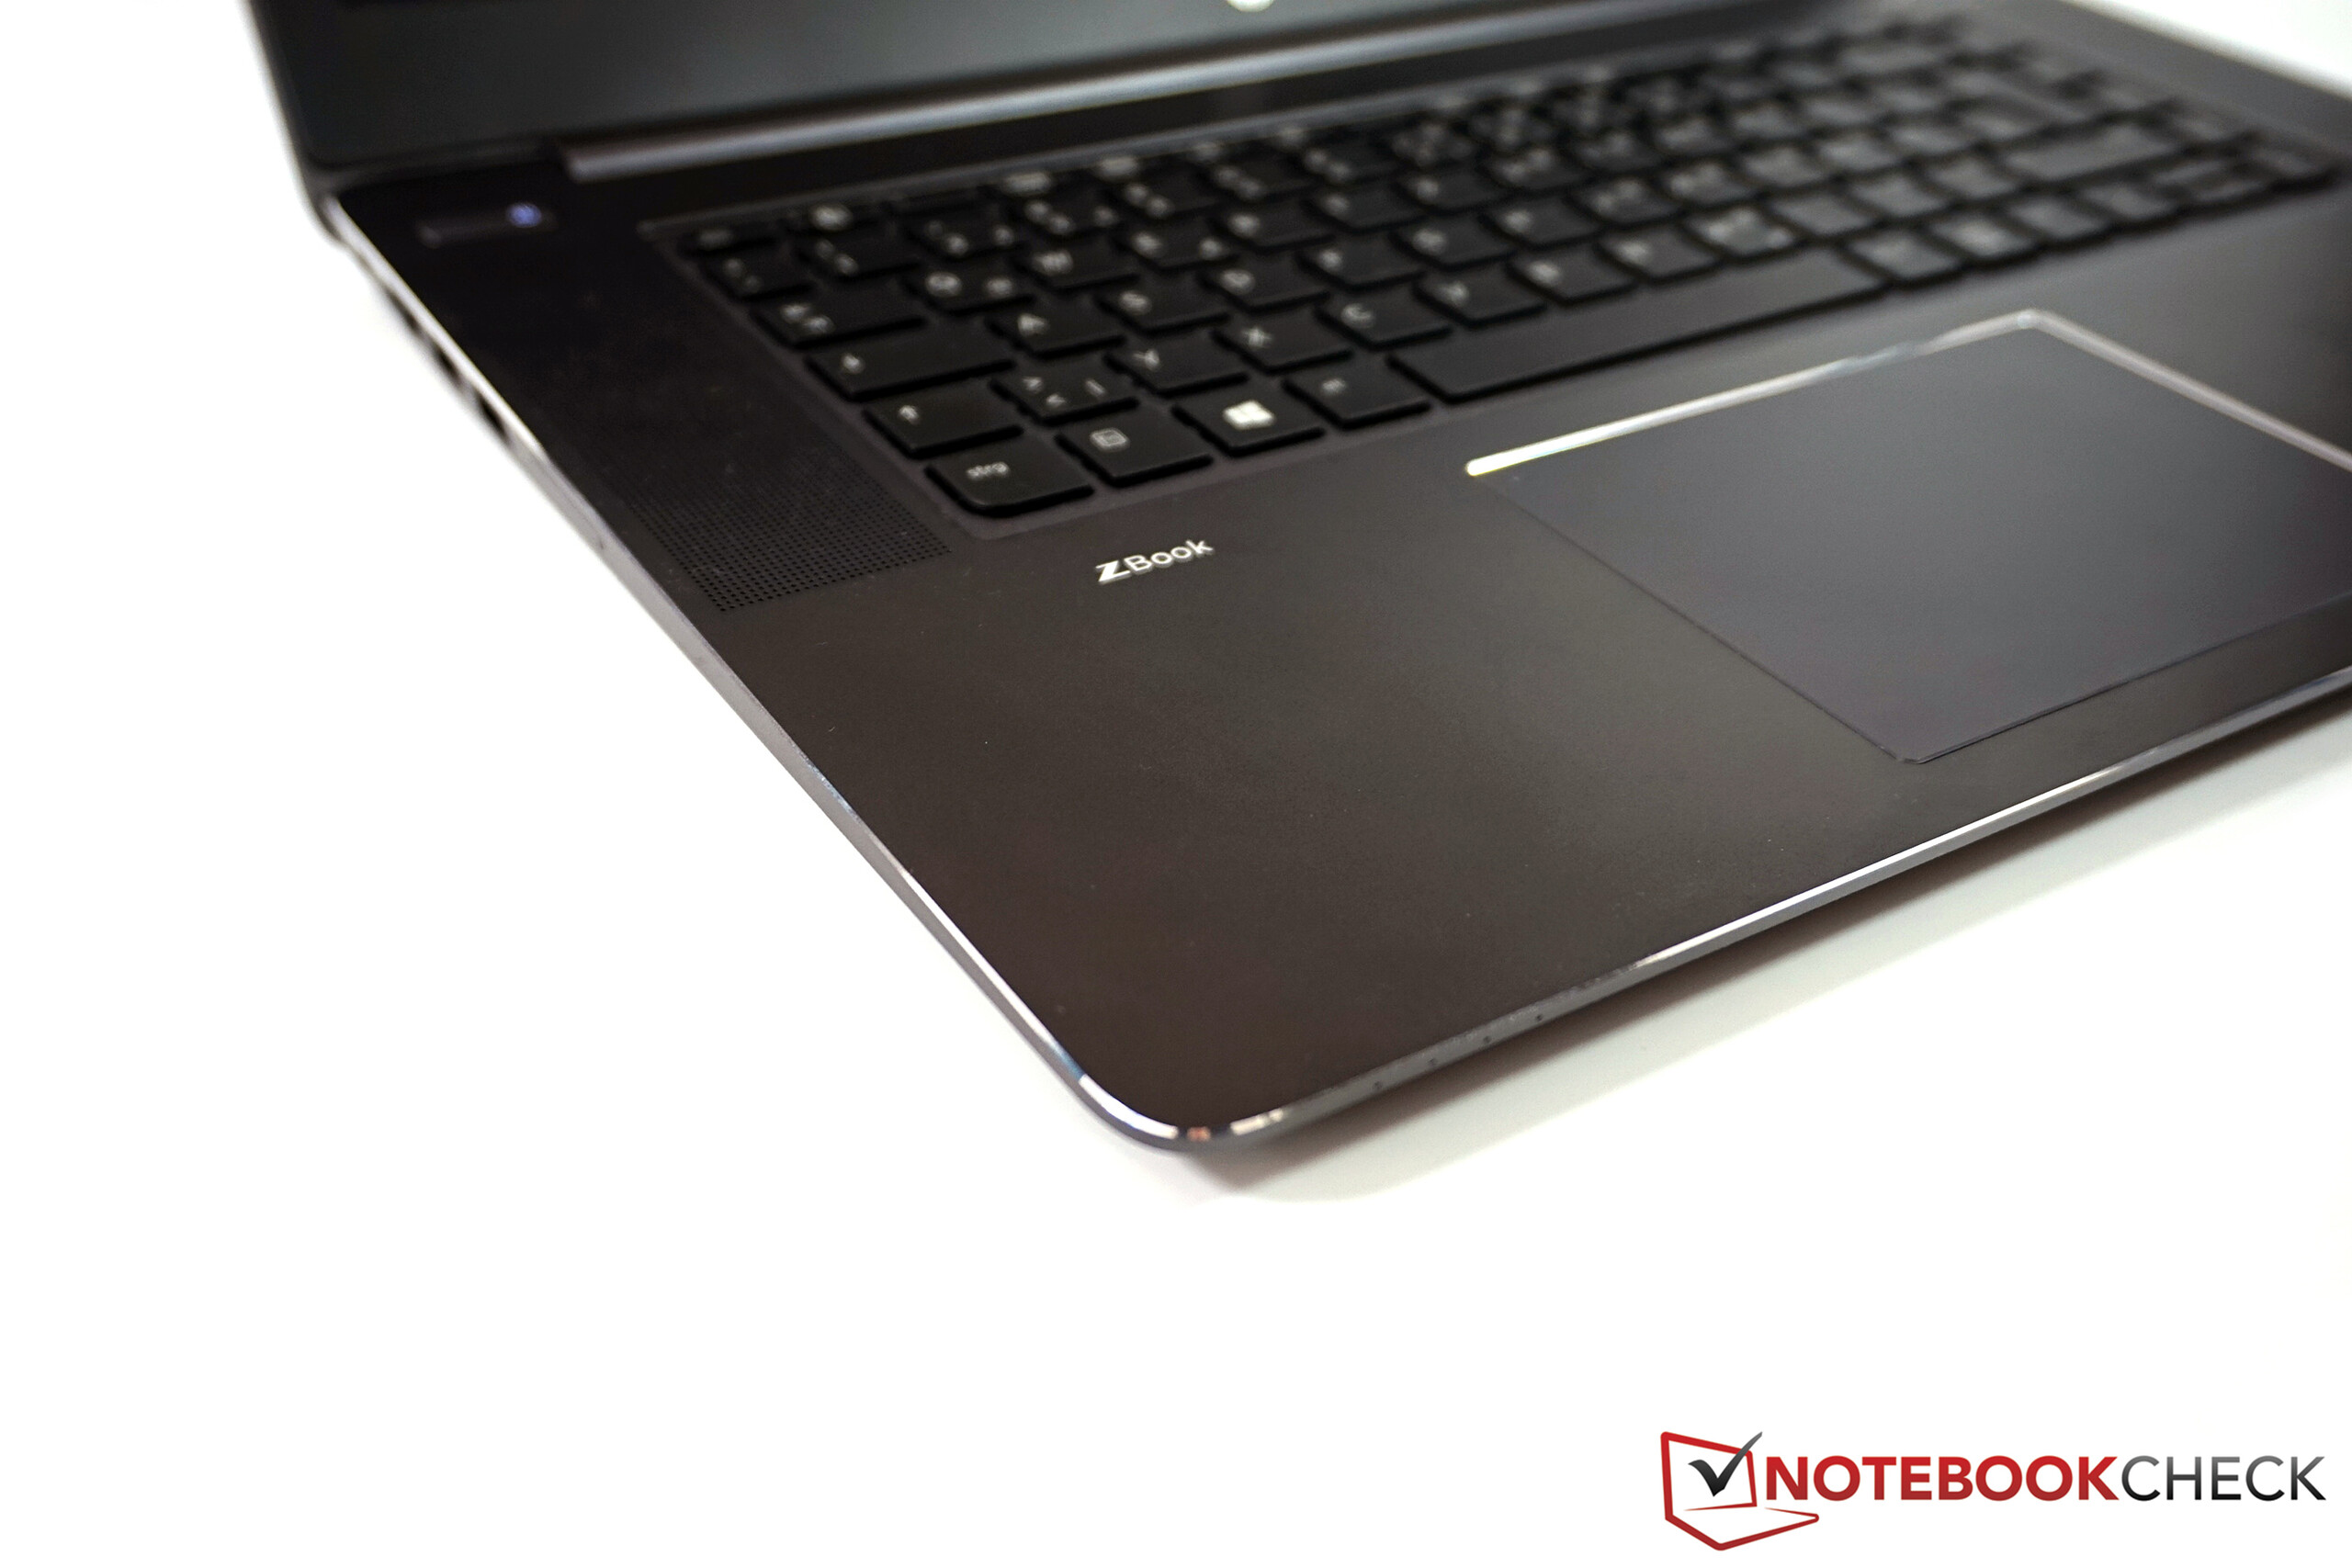
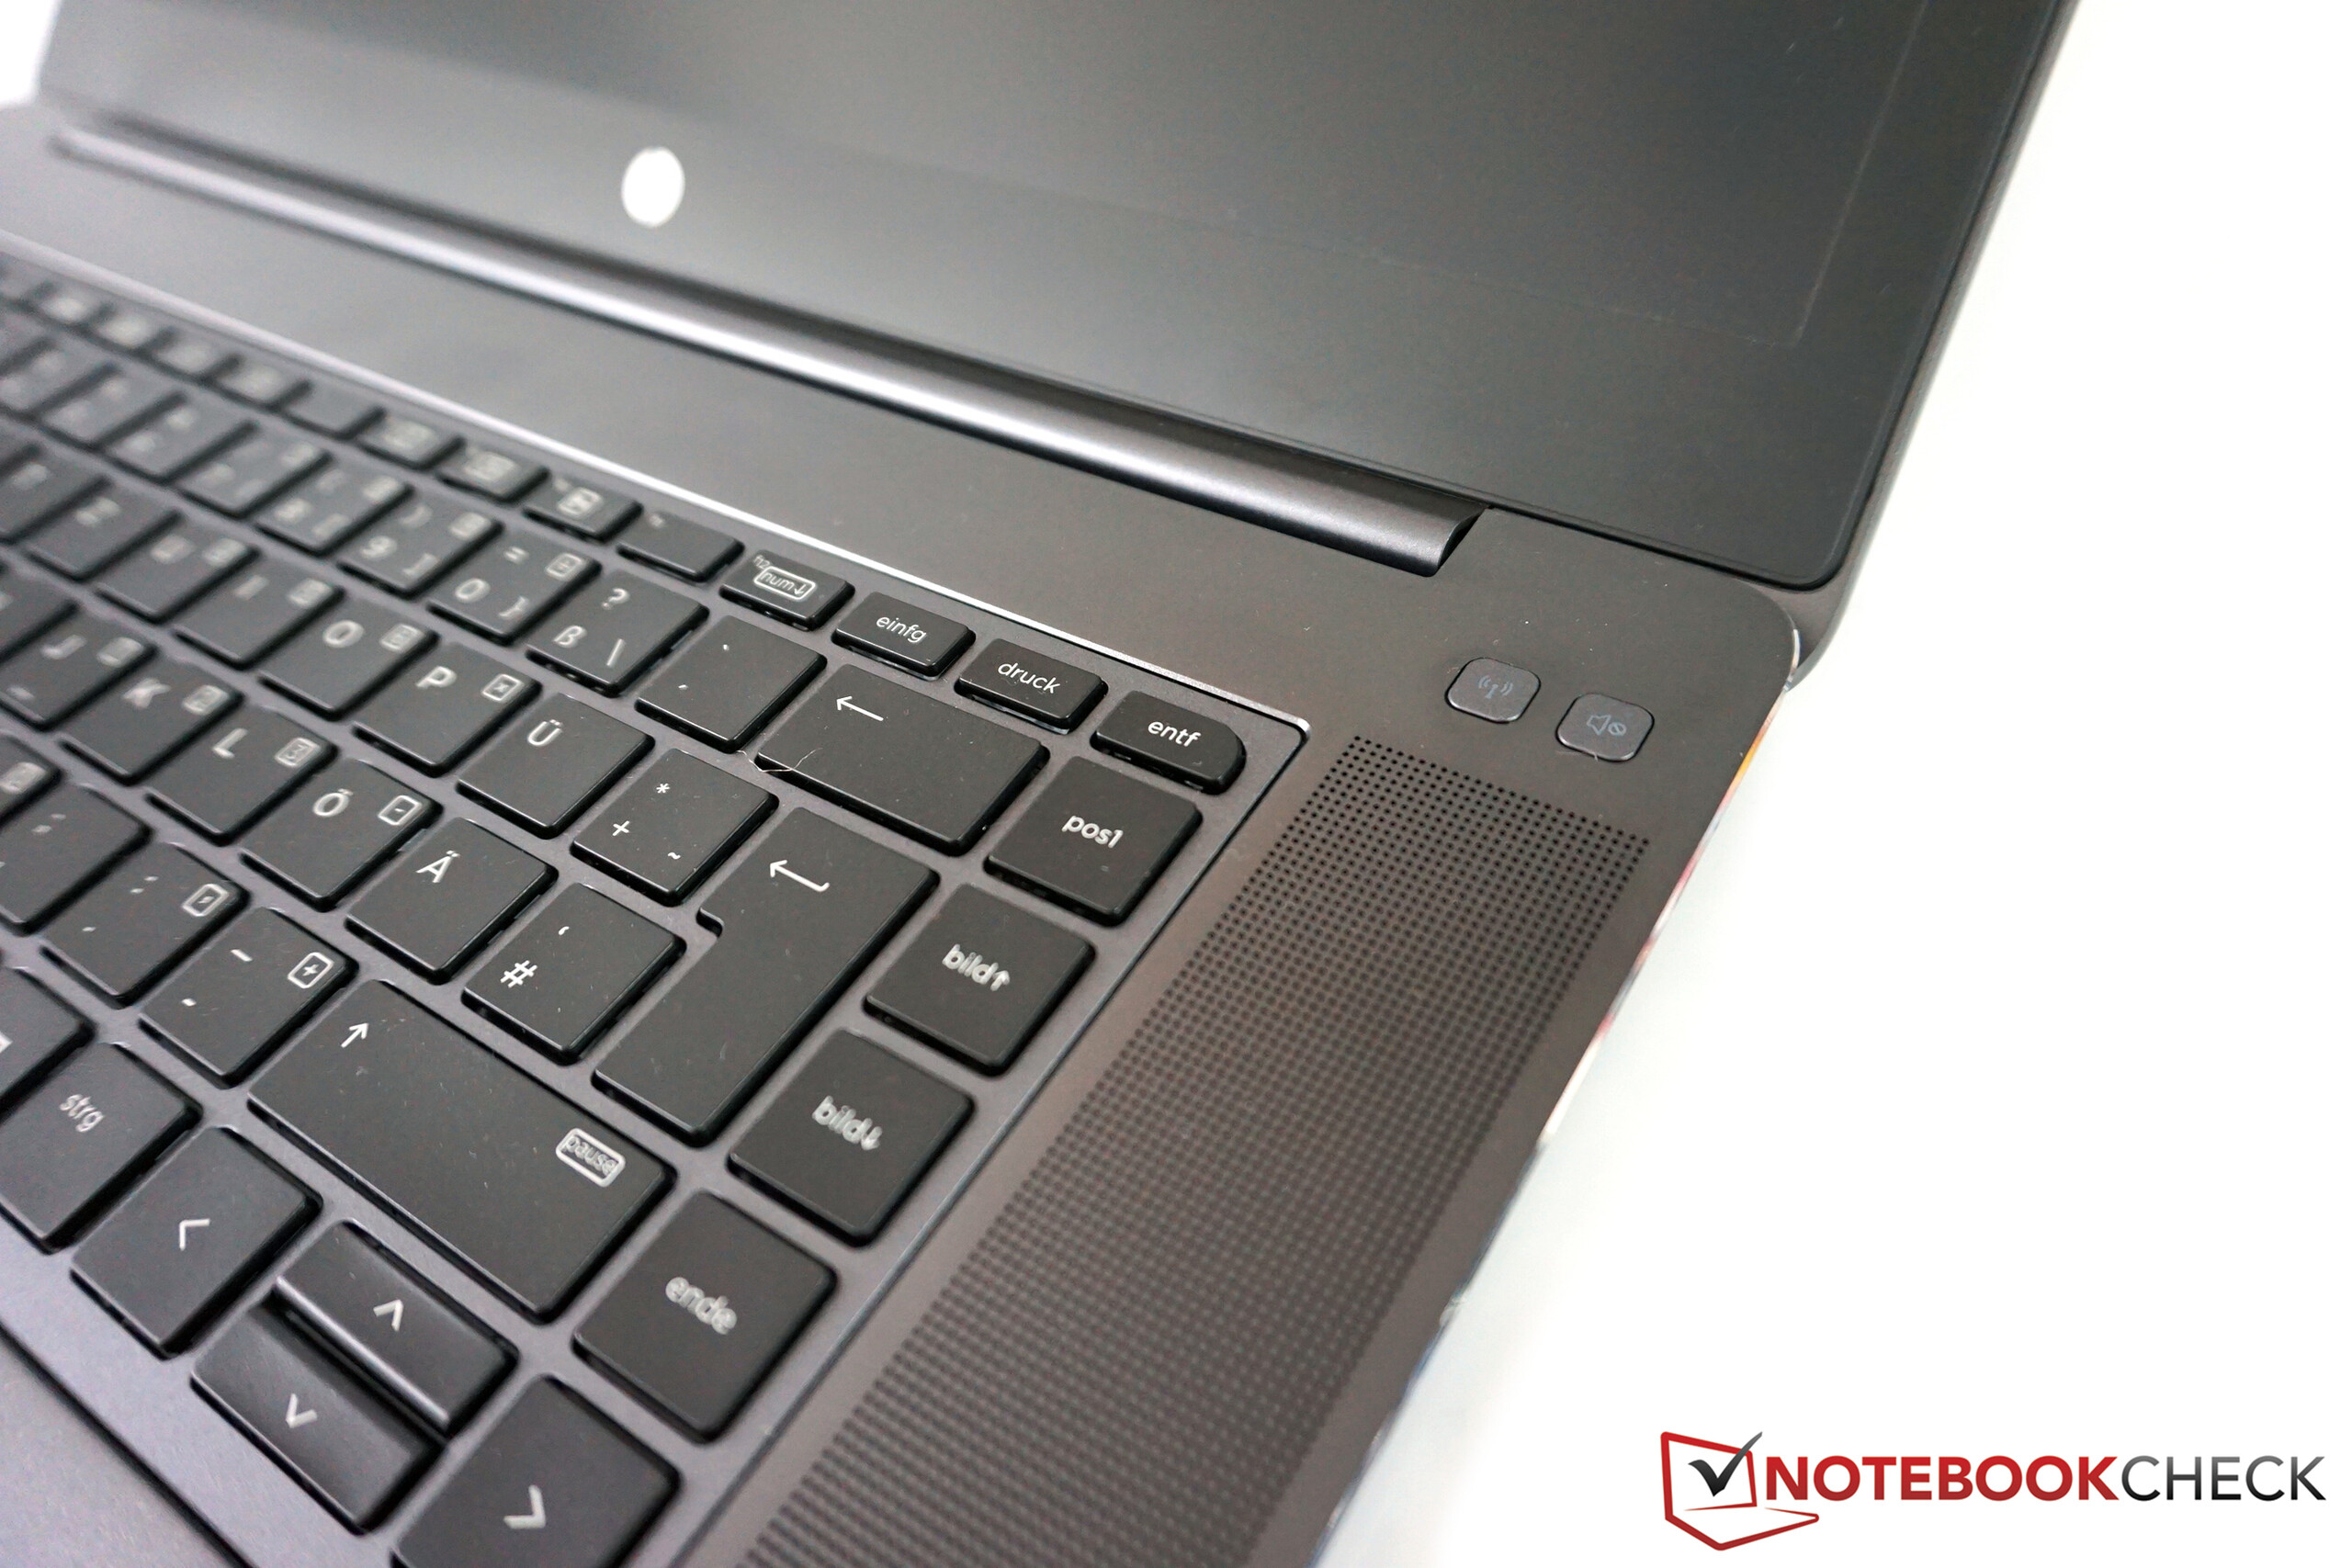
ZBook Studio实际上在很多方面也有亮点:在高品质机身中它采用了性能强劲的组件,搭配出色的4K屏幕和优秀的输入设备。我们认为它的缺点过于严重,对于这台测试机的高售价来说,让人难以接受。目前的BIOS更新没有解决问题,我们希望惠普至少可以通过更新改进风扇控制。目前尺寸更大的工作站设备在散热上表现更好,可以搭配性能更强的硬件。
注:本文是基于完整评测的缩减版本,阅读完整的英文评测,请点击这里。
HP ZBook Studio G3
- 05/19/2016 v5.1 (old)
Andreas Osthoff
Price comparison
