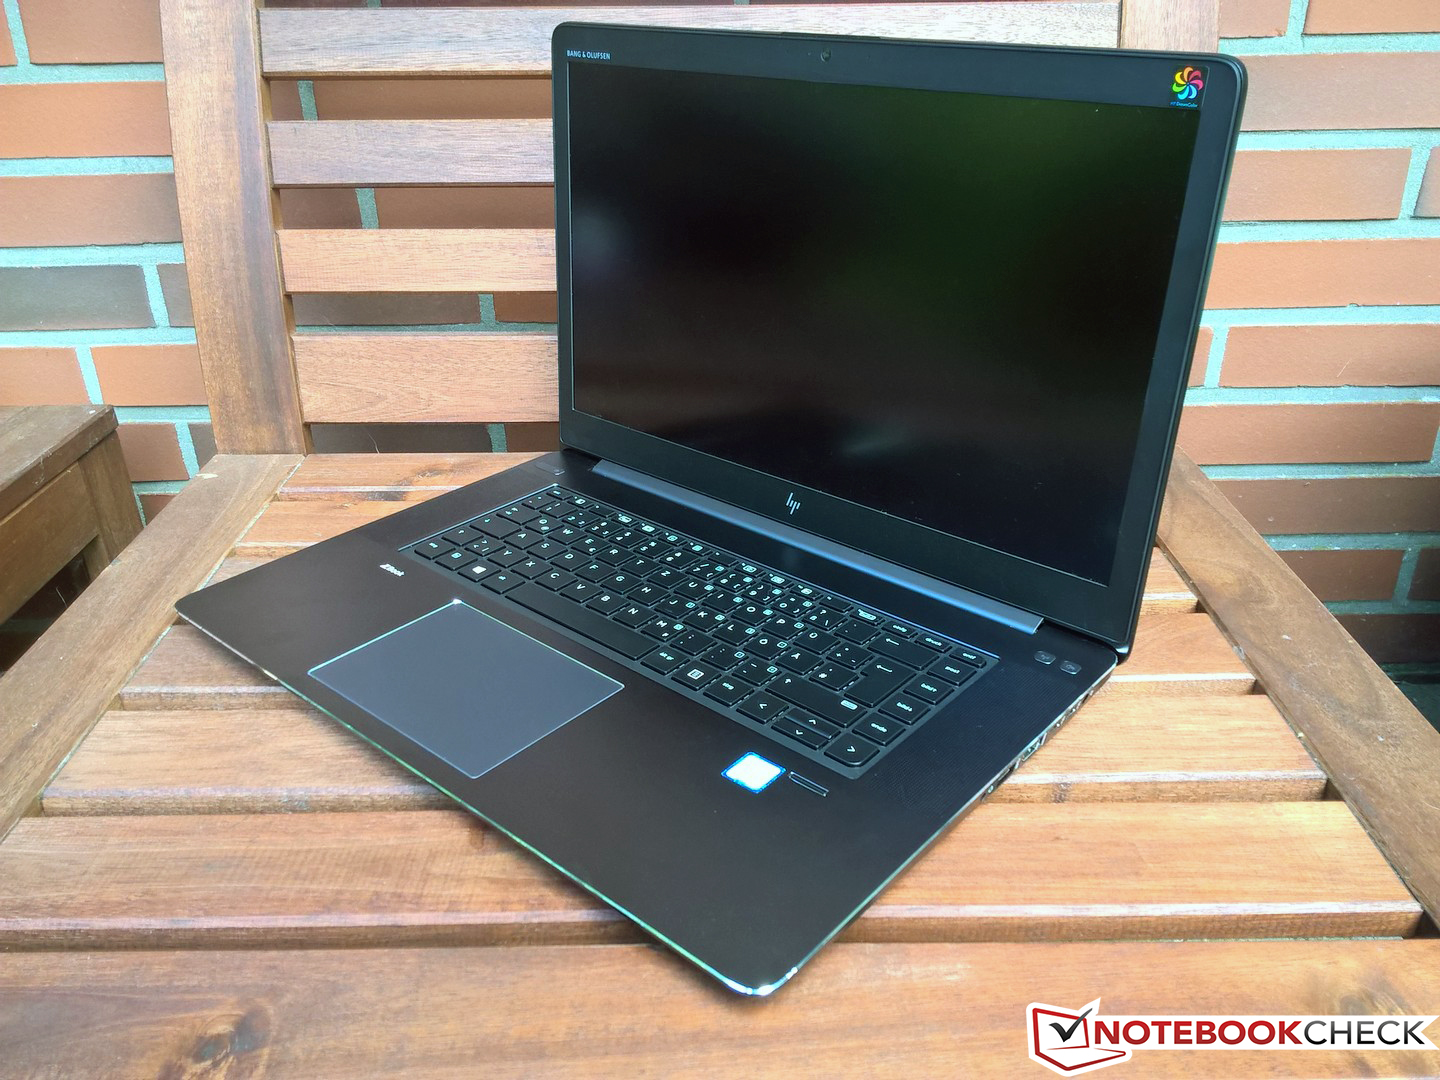
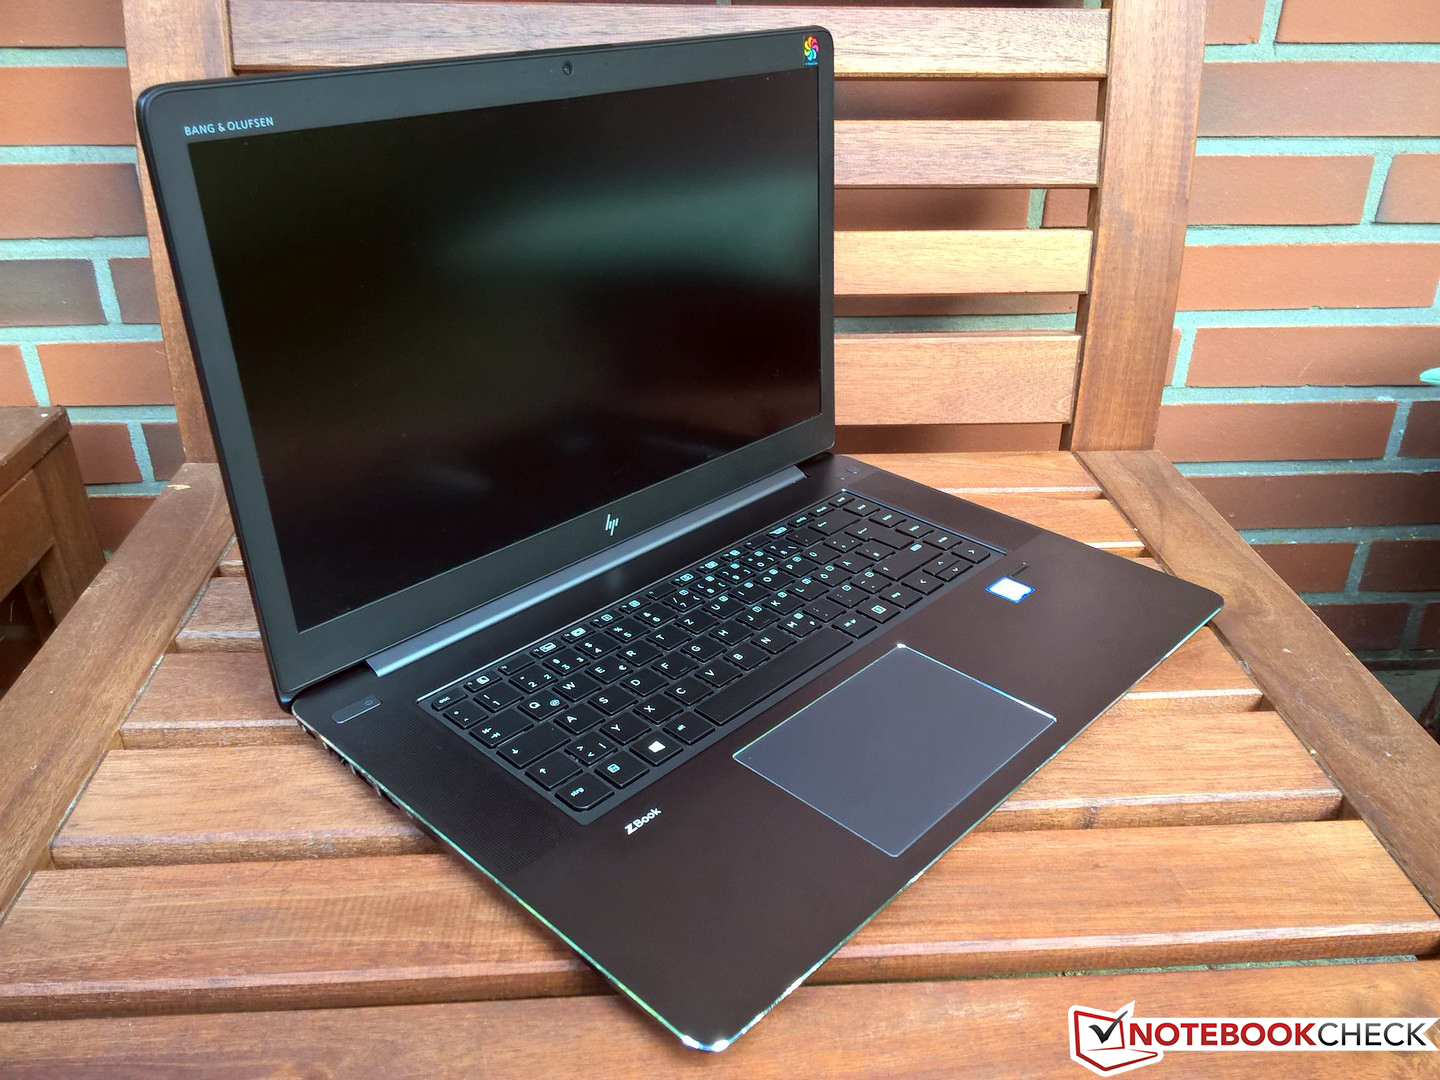
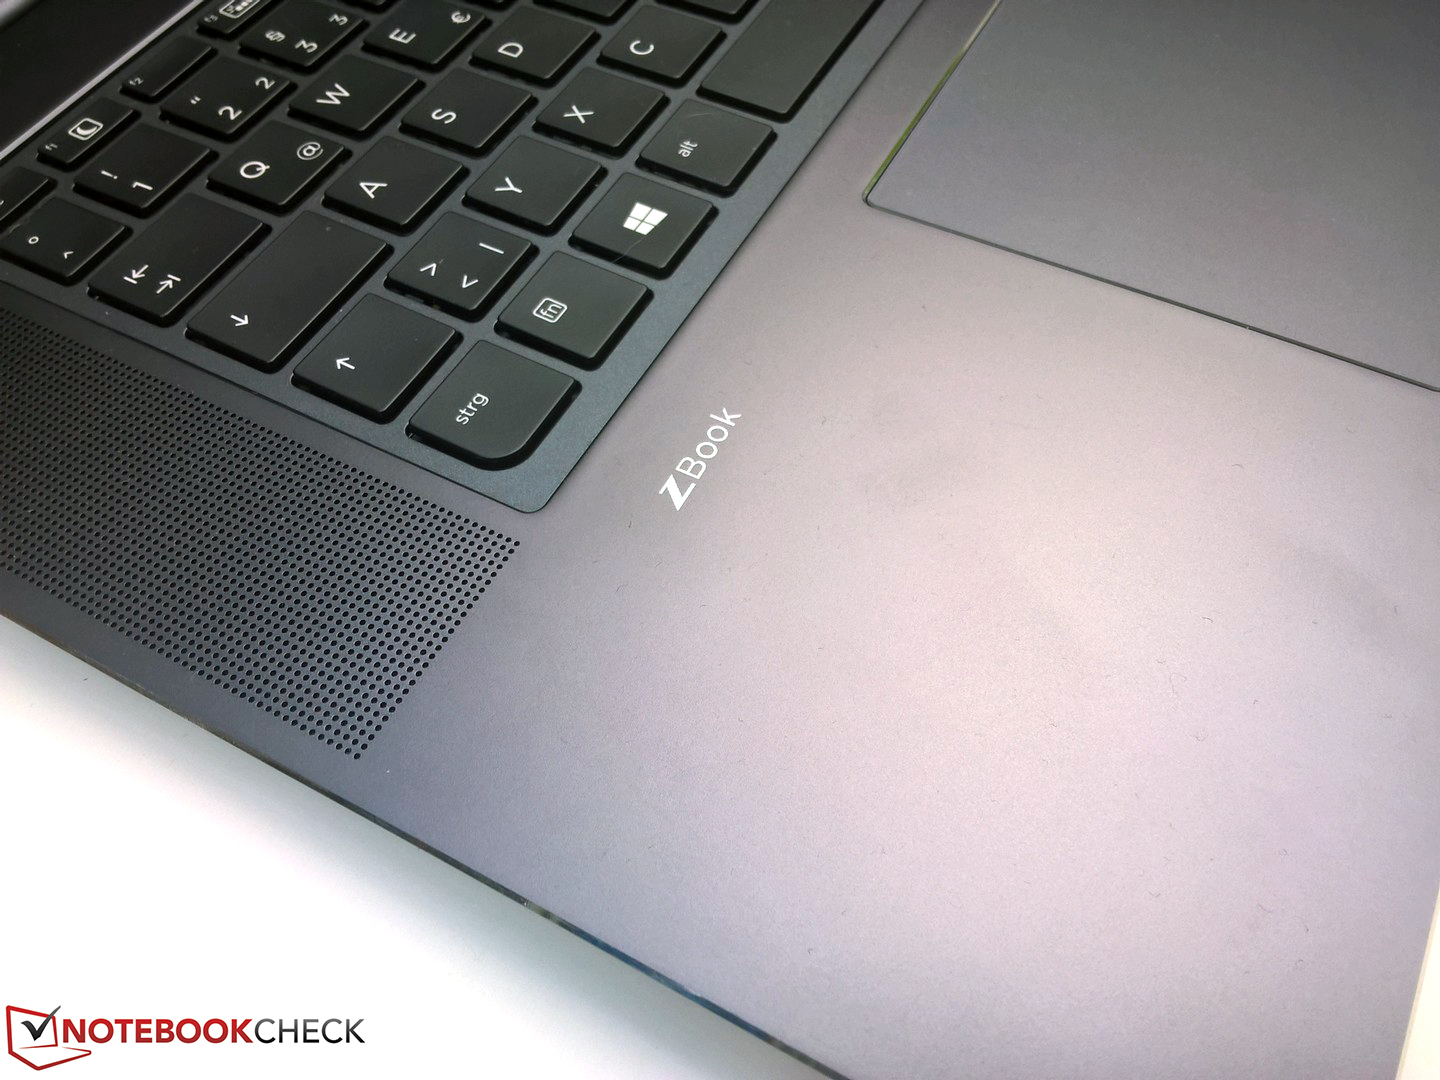
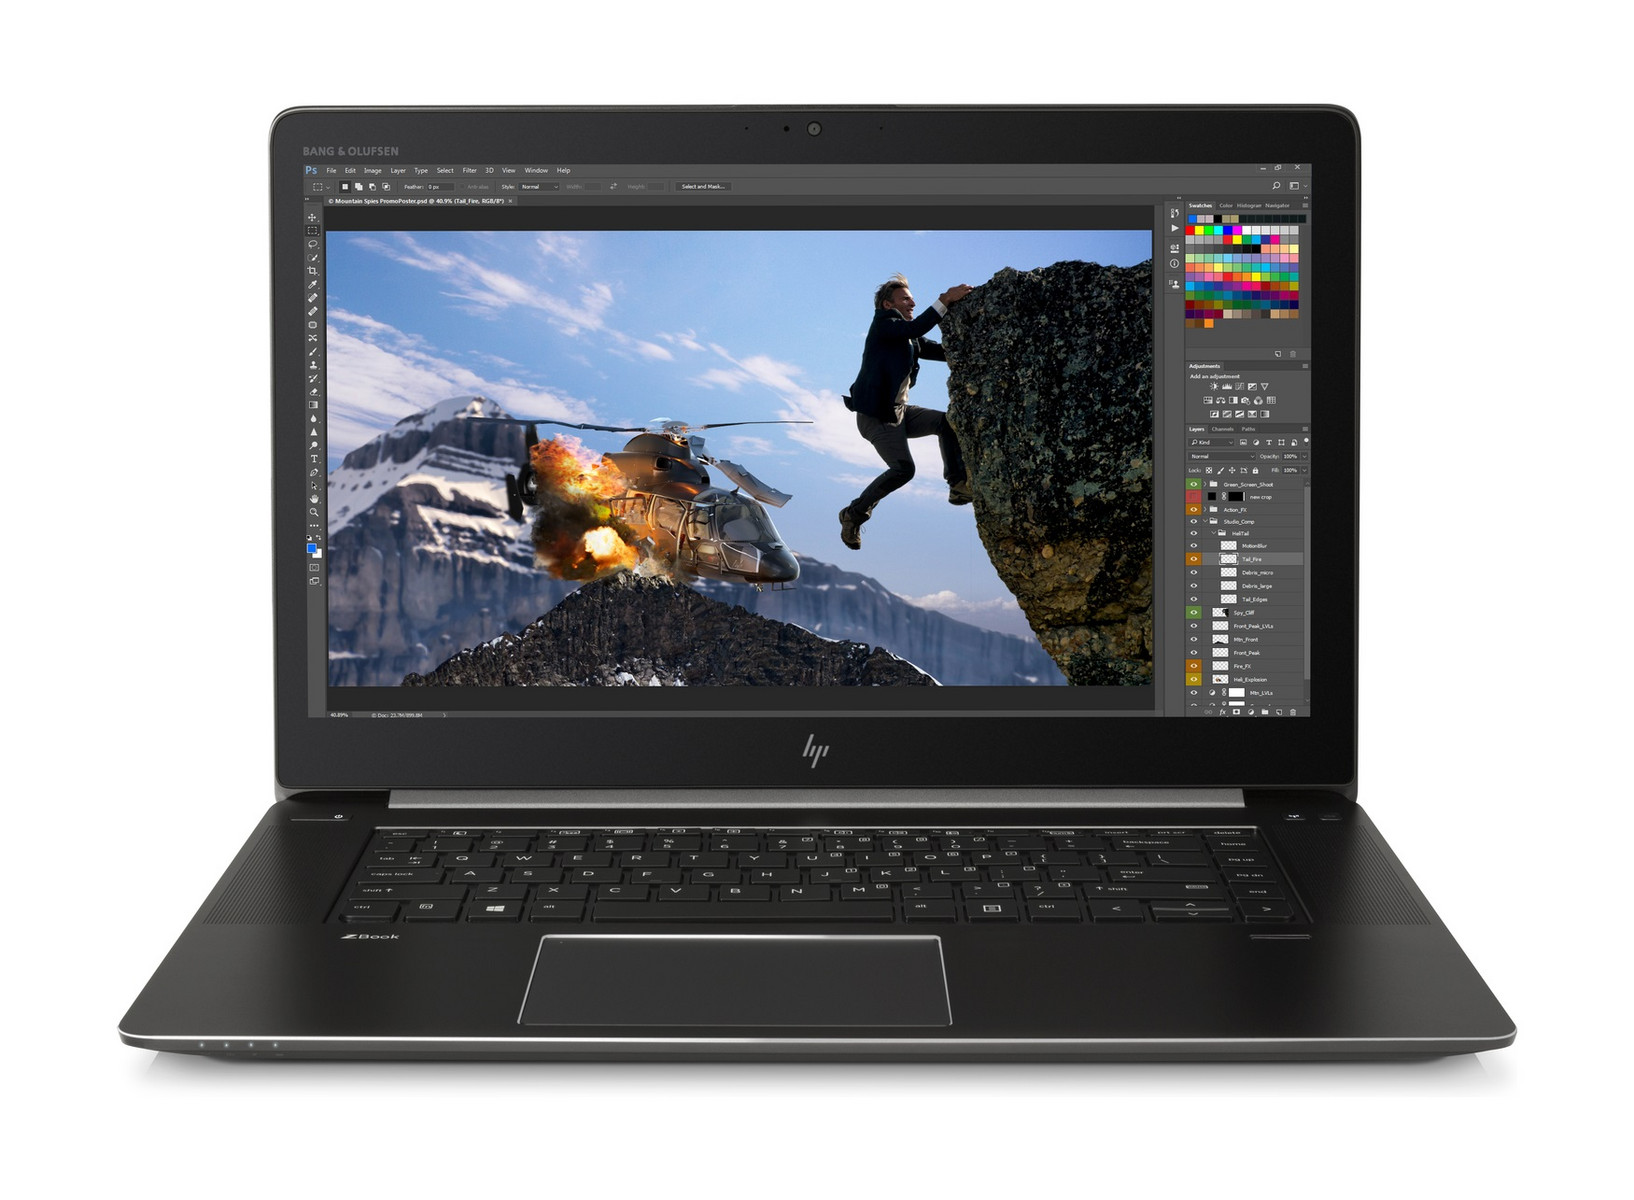
惠普ZBook Studio G4(Xeon,Quadro M1200,DreamColor)工作站简短评测
| SD Card Reader | |
| average JPG Copy Test (av. of 3 runs) | |
| HP ZBook Studio G4-Y6K17EA (Toshiba Exceria Pro SDXC 64 GB UHS-II) | |
| Dell Precision 5520 UHD (Toshiba Exceria Pro SDXC 64 GB UHS-II) | |
| Lenovo ThinkPad P51 20HH0016GE (Toshiba Exceria Pro SDXC 64 GB UHS-II) | |
| HP ZBook Studio G3 (Toshiba Exceria Pro SDXC 64 GB UHS-II) | |
| Lenovo ThinkPad P51s 20HB000SGE (Toshiba Exceria Pro SDXC 64 GB UHS-II) | |
| maximum AS SSD Seq Read Test (1GB) | |
| Dell Precision 5520 UHD (Toshiba Exceria Pro SDXC 64 GB UHS-II) | |
| Lenovo ThinkPad P51 20HH0016GE (Toshiba Exceria Pro SDXC 64 GB UHS-II) | |
| HP ZBook Studio G3 (Toshiba Exceria Pro SDXC 64 GB UHS-II) | |
| HP ZBook Studio G4-Y6K17EA (Toshiba Exceria Pro SDXC 64 GB UHS-II) | |
| Lenovo ThinkPad P51s 20HB000SGE (Toshiba Exceria Pro SDXC 64 GB UHS-II) | |
| Networking | |
| iperf3 transmit AX12 | |
| Lenovo ThinkPad P51s 20HB000SGE | |
| Lenovo ThinkPad P51 20HH0016GE | |
| Dell Precision 5520 UHD | |
| HP ZBook Studio G4-Y6K17EA | |
| iperf3 receive AX12 | |
| Lenovo ThinkPad P51s 20HB000SGE | |
| Lenovo ThinkPad P51 20HH0016GE | |
| HP ZBook Studio G4-Y6K17EA | |
| Dell Precision 5520 UHD | |
| |||||||||||||||||||||||||
Brightness Distribution: 78 %
Center on Battery: 324 cd/m²
Contrast: 1080:1 (Black: 0.3 cd/m²)
ΔE ColorChecker Calman: 1.6 | ∀{0.5-29.43 Ø4.71}
ΔE Greyscale Calman: 2.5 | ∀{0.09-98 Ø4.96}
98.9% sRGB (Argyll 1.6.3 3D)
85.7% AdobeRGB 1998 (Argyll 1.6.3 3D)
98% AdobeRGB 1998 (Argyll 3D)
98.9% sRGB (Argyll 3D)
82.6% Display P3 (Argyll 3D)
Gamma: 2.21
CCT: 6273 K
| HP ZBook Studio G4-Y6K17EA SHP1445, , 3840x2160, 15.6" | HP ZBook Studio G3 Sharp SPH1445, , 3840x2160, 15.6" | Dell Precision 5520 UHD SHP1476, , 3840x2160, 15.6" | Lenovo ThinkPad P51 20HH0016GE LEN40BD, B156ZAN02.1, , 3840x2160, 15.6" | Lenovo ThinkPad P51s 20HB000SGE BOE NV156QUM-N44, , 3840x2160, 15.6" | Apple MacBook Pro 15 2017 (2.9 GHz, 560) 2880x1800, 15.4" | |
|---|---|---|---|---|---|---|
| Display | 1% | -16% | 2% | -19% | ||
| Display P3 Coverage (%) | 82.6 | 86 4% | 67.4 -18% | 86.3 4% | 69.7 -16% | |
| sRGB Coverage (%) | 98.9 | 98.9 0% | 98.5 0% | 99.5 1% | 91.2 -8% | |
| AdobeRGB 1998 Coverage (%) | 98 | 98 0% | 68.9 -30% | 99.3 1% | 66.8 -32% | |
| Response Times | 13% | -36% | 13% | 16% | 6% | |
| Response Time Grey 50% / Grey 80% * (ms) | 44.8 ? | 44 ? 2% | 59.2 ? -32% | 40.8 ? 9% | 38.4 ? 14% | 42.4 ? 5% |
| Response Time Black / White * (ms) | 30 ? | 23.2 ? 23% | 41.6 ? -39% | 25.2 ? 16% | 24.8 ? 17% | 28 ? 7% |
| PWM Frequency (Hz) | 1497 ? | 200 ? | 980 ? | |||
| Screen | -53% | -21% | -11% | -30% | 18% | |
| Brightness middle (cd/m²) | 324 | 310 -4% | 372.4 15% | 317 -2% | 317 -2% | 534 65% |
| Brightness (cd/m²) | 338 | 299 -12% | 368 9% | 309 -9% | 290 -14% | 502 49% |
| Brightness Distribution (%) | 78 | 86 10% | 90 15% | 89 14% | 85 9% | 86 10% |
| Black Level * (cd/m²) | 0.3 | 0.29 3% | 0.48 -60% | 0.36 -20% | 0.32 -7% | 0.31 -3% |
| Contrast (:1) | 1080 | 1069 -1% | 776 -28% | 881 -18% | 991 -8% | 1723 60% |
| Colorchecker dE 2000 * | 1.6 | 5.9 -269% | 2.6 -63% | 2.7 -69% | 3.6 -125% | 1.8 -13% |
| Colorchecker dE 2000 max. * | 4.6 | 10.7 -133% | 5.6 -22% | 4.1 11% | 6.6 -43% | 3.8 17% |
| Greyscale dE 2000 * | 2.5 | 5.5 -120% | 3.7 -48% | 3 -20% | 4.2 -68% | 2.4 4% |
| Gamma | 2.21 100% | 2.09 105% | 2.14 103% | 2.27 97% | 2.24 98% | 2.27 97% |
| CCT | 6273 104% | 5980 109% | 7096 92% | 6077 107% | 6740 96% | 6563 99% |
| Color Space (Percent of AdobeRGB 1998) (%) | 85.7 | 85 -1% | 63 -26% | 87.6 2% | 59.5 -31% | 77.92 -9% |
| Color Space (Percent of sRGB) (%) | 98.9 | 99 0% | 99 0% | 99.5 1% | 91.1 -8% | 99.94 1% |
| Total Average (Program / Settings) | -13% /
-33% | -24% /
-22% | 1% /
-5% | -11% /
-21% | 12% /
16% |
* ... smaller is better
Screen Flickering / PWM (Pulse-Width Modulation)
| Screen flickering / PWM detected | 1497 Hz | ≤ 50 % brightness setting | 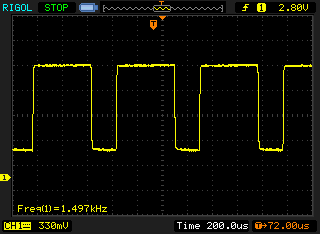 |
The display backlight flickers at 1497 Hz (worst case, e.g., utilizing PWM) Flickering detected at a brightness setting of 50 % and below. There should be no flickering or PWM above this brightness setting. The frequency of 1497 Hz is quite high, so most users sensitive to PWM should not notice any flickering. In comparison: 52 % of all tested devices do not use PWM to dim the display. If PWM was detected, an average of 7754 (minimum: 5 - maximum: 343500) Hz was measured. | |||
Display Response Times
| ↔ Response Time Black to White | ||
|---|---|---|
| 30 ms ... rise ↗ and fall ↘ combined | ↗ 17.2 ms rise | 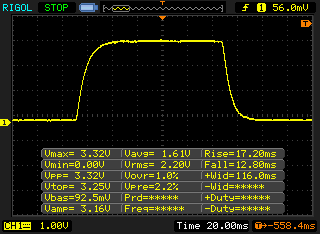 |
| ↘ 12.8 ms fall | ||
| The screen shows slow response rates in our tests and will be unsatisfactory for gamers. In comparison, all tested devices range from 0.1 (minimum) to 240 (maximum) ms. » 80 % of all devices are better. This means that the measured response time is worse than the average of all tested devices (19.8 ms). | ||
| ↔ Response Time 50% Grey to 80% Grey | ||
| 44.8 ms ... rise ↗ and fall ↘ combined | ↗ 22 ms rise | 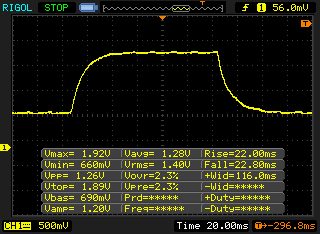 |
| ↘ 22.8 ms fall | ||
| The screen shows slow response rates in our tests and will be unsatisfactory for gamers. In comparison, all tested devices range from 0.165 (minimum) to 636 (maximum) ms. » 76 % of all devices are better. This means that the measured response time is worse than the average of all tested devices (31 ms). | ||

| Cinebench R15 | |
| CPU Single 64Bit | |
| Lenovo ThinkPad P51 20HH0016GE | |
| Dell Precision 5520 UHD | |
| HP ZBook Studio G4-Y6K17EA | |
| Lenovo ThinkPad P51s 20HB000SGE | |
| Apple MacBook Pro 15 2017 (2.9 GHz, 560) | |
| Acer Predator Helios 300 | |
| HP ZBook Studio G3 | |
| CPU Multi 64Bit | |
| Lenovo ThinkPad P51 20HH0016GE | |
| Apple MacBook Pro 15 2017 (2.9 GHz, 560) | |
| Apple MacBook Pro 15 2017 (2.9 GHz, 560) | |
| HP ZBook Studio G4-Y6K17EA | |
| Acer Predator Helios 300 | |
| HP ZBook Studio G3 | |
| Dell Precision 5520 UHD | |
| Lenovo ThinkPad P51s 20HB000SGE | |
| PCMark 8 | |
| Home Score Accelerated v2 | |
| HP ZBook Studio G4-Y6K17EA | |
| Apple MacBook Pro 15 2017 (2.9 GHz, 560) | |
| Lenovo ThinkPad P51 20HH0016GE | |
| Dell Precision 5520 UHD | |
| HP ZBook Studio G3 | |
| Lenovo ThinkPad P51s 20HB000SGE | |
| Work Score Accelerated v2 | |
| Apple MacBook Pro 15 2017 (2.9 GHz, 560) | |
| HP ZBook Studio G4-Y6K17EA | |
| HP ZBook Studio G3 | |
| Dell Precision 5520 UHD | |
| Lenovo ThinkPad P51 20HH0016GE | |
| Lenovo ThinkPad P51s 20HB000SGE | |
| Creative Score Accelerated v2 | |
| Lenovo ThinkPad P51 20HH0016GE | |
| HP ZBook Studio G4-Y6K17EA | |
| Dell Precision 5520 UHD | |
| Apple MacBook Pro 15 2017 (2.9 GHz, 560) | |
| Lenovo ThinkPad P51s 20HB000SGE | |
| HP ZBook Studio G3 | |
| PCMark 10 - Score | |
| Apple MacBook Pro 15 2017 (2.9 GHz, 560) | |
| HP ZBook Studio G4-Y6K17EA | |
| PCMark 8 Home Score Accelerated v2 | 4093 points | |
| PCMark 8 Creative Score Accelerated v2 | 5487 points | |
| PCMark 8 Work Score Accelerated v2 | 4408 points | |
| PCMark 10 Score | 4323 points | |
Help | ||
| HP ZBook Studio G4-Y6K17EA Samsung SM961 MZVKW512HMJP m.2 PCI-e | Dell Precision 5520 UHD Samsung SM961 MZVKW512HMJP m.2 PCI-e | Lenovo ThinkPad P51 20HH0016GE Samsung PM961 NVMe MZVLW512HMJP | Lenovo ThinkPad P51s 20HB000SGE Samsung SSD PM961 1TB M.2 PCIe 3.0 x4 NVMe (MZVLW1T0) | HP ZBook Studio G3 Samsung SM951 MZVPV512HDGL m.2 PCI-e | |
|---|---|---|---|---|---|
| AS SSD | 5% | -2% | -23% | -25% | |
| Score Total (Points) | 3693 | 3681 0% | 3424 -7% | 2771 -25% | 2367 -36% |
| Score Write (Points) | 1412 | 1379 -2% | 917 -35% | 1271 -10% | 470 -67% |
| Score Read (Points) | 1544 | 1554 1% | 1690 9% | 990 -36% | 1273 -18% |
| Access Time Write * (ms) | 0.026 | 0.023 12% | 0.025 4% | 0.027 -4% | 0.025 4% |
| Access Time Read * (ms) | 0.053 | 0.038 28% | 0.032 40% | 0.082 -55% | 0.046 13% |
| 4K-64 Write (MB/s) | 1108 | 1055 -5% | 623 -44% | 1018 -8% | 230.6 -79% |
| 4K-64 Read (MB/s) | 1213 | 1223 1% | 1372 13% | 792 -35% | 1050 -13% |
| 4K Write (MB/s) | 145.3 | 155.3 7% | 143.1 -2% | 130.8 -10% | 144.8 0% |
| 4K Read (MB/s) | 51.2 | 51.5 1% | 55.6 9% | 52.8 3% | 51.7 1% |
| Seq Write (MB/s) | 1588 | 1694 7% | 1506 -5% | 1217 -23% | 947 -40% |
| Seq Read (MB/s) | 2799 | 2799 0% | 2624 -6% | 1450 -48% | 1713 -39% |
* ... smaller is better

| 3DMark 11 - 1280x720 Performance GPU | |
| Lenovo ThinkPad P51 20HH0016GE | |
| HP ZBook Studio G4-Y6K17EA | |
| Apple MacBook Pro 15 2017 (2.9 GHz, 560) | |
| Lenovo ThinkPad P50 20ENV509PB | |
| Dell Precision 5520 UHD | |
| HP ZBook Studio G3 | |
| Dell Precision 3520 | |
| Lenovo ThinkPad P51s 20HB000SGE | |
| 3DMark - 1920x1080 Fire Strike Graphics | |
| Lenovo ThinkPad P51 20HH0016GE | |
| Lenovo ThinkPad P50 20ENV509PB | |
| Dell Precision 5520 UHD | |
| HP ZBook Studio G4-Y6K17EA | |
| Apple MacBook Pro 15 2017 (2.9 GHz, 560) | |
| HP ZBook Studio G3 | |
| Dell Precision 3520 | |
| Lenovo ThinkPad P51s 20HB000SGE | |
| Unigine Valley 1.0 | |
| 1920x1080 Extreme HD DirectX AA:x8 | |
| HP ZBook Studio G4-Y6K17EA | |
| Lenovo ThinkPad P51 20HH0016GE | |
| HP ZBook Studio G3 | |
| Apple MacBook Pro 15 2017 (2.9 GHz, 560) | |
| Dell Precision 3520 | |
| Lenovo ThinkPad P51s 20HB000SGE | |
| 1920x1080 Extreme HD Preset OpenGL AA:x8 | |
| Lenovo ThinkPad P51 20HH0016GE | |
| HP ZBook Studio G4-Y6K17EA | |
| HP ZBook Studio G3 | |
| Dell Precision 3520 | |
| Lenovo ThinkPad P51s 20HB000SGE | |
| Apple MacBook Pro 15 2017 (2.9 GHz, 560) | |
| 3DMark 11 Performance | 5516 points | |
| 3DMark Cloud Gate Standard Score | 17884 points | |
| 3DMark Fire Strike Score | 3878 points | |
Help | ||
| low | med. | high | ultra | 4K | |
|---|---|---|---|---|---|
| BioShock Infinite (2013) | 224.7 | 130.8 | 113.1 | 42.61 | |
| Thief (2014) | 93.3 | 58.9 | 50.1 | 26.2 | |
| The Witcher 3 (2015) | 73.6 | 45.9 | 26.3 | 13 | |
| Rise of the Tomb Raider (2016) | 88.1 | 49.15 | 28.36 | 23.92 | 9.88 |
Noise level
| Idle |
| 29.7 / 29.7 / 31.6 dB(A) |
| Load |
| 42.3 / 42.3 dB(A) |
 | ||
30 dB silent 40 dB(A) audible 50 dB(A) loud |
||
min: | ||
| HP ZBook Studio G4-Y6K17EA E3-1505M v6, Quadro M1200 | HP ZBook Studio G3 6820HQ, Quadro M1000M | Dell Precision 5520 UHD E3-1505M v6, Quadro M1200 | Apple MacBook Pro 15 2017 (2.9 GHz, 560) i7-7820HQ, Radeon Pro 560 | Lenovo ThinkPad P51 20HH0016GE E3-1505M v6, Quadro M2200 | Lenovo ThinkPad P51s 20HB000SGE i7-7600U, Quadro M520 | |
|---|---|---|---|---|---|---|
| Noise | -8% | -3% | 3% | 7% | 5% | |
| off / environment * (dB) | 29.4 | 30 -2% | 28.7 2% | 30.8 -5% | 29.6 -1% | 29.2 1% |
| Idle Minimum * (dB) | 29.7 | 30 -1% | 28.7 3% | 31 -4% | 29.6 -0% | 29.2 2% |
| Idle Average * (dB) | 29.7 | 30 -1% | 32.1 -8% | 31 -4% | 29.6 -0% | 29.2 2% |
| Idle Maximum * (dB) | 31.6 | 30 5% | 32.1 -2% | 31 2% | 29.6 6% | 31.1 2% |
| Load Average * (dB) | 42.3 | 51 -21% | 41.3 2% | 31.3 26% | 32.2 24% | 36.7 13% |
| Witcher 3 ultra * (dB) | 42.3 | 45.5 -8% | ||||
| Load Maximum * (dB) | 42.3 | 52.8 -25% | 45.5 -8% | 41.8 1% | 36.6 13% | 39.4 7% |
* ... smaller is better
(-) The maximum temperature on the upper side is 46.3 °C / 115 F, compared to the average of 38.2 °C / 101 F, ranging from 22.2 to 69.8 °C for the class Workstation.
(-) The bottom heats up to a maximum of 55.4 °C / 132 F, compared to the average of 41.1 °C / 106 F
(+) In idle usage, the average temperature for the upper side is 27.4 °C / 81 F, compared to the device average of 32 °C / 90 F.
(-) Playing The Witcher 3, the average temperature for the upper side is 41.5 °C / 107 F, compared to the device average of 32 °C / 90 F.
(±) The palmrests and touchpad can get very hot to the touch with a maximum of 37.7 °C / 99.9 F.
(-) The average temperature of the palmrest area of similar devices was 27.8 °C / 82 F (-9.9 °C / -17.9 F).
| Off / Standby | |
| Idle | |
| Load |
|
Key:
min: | |
| HP ZBook Studio G4-Y6K17EA E3-1505M v6, Quadro M1200, Samsung SM961 MZVKW512HMJP m.2 PCI-e, IPS, 3840x2160, 15.6" | Dell Precision 5520 UHD E3-1505M v6, Quadro M1200, Samsung SM961 MZVKW512HMJP m.2 PCI-e, IPS, 3840x2160, 15.6" | Apple MacBook Pro 15 2017 (2.9 GHz, 560) i7-7820HQ, Radeon Pro 560, , , 2880x1800, 15.4" | Lenovo ThinkPad P51 20HH0016GE E3-1505M v6, Quadro M2200, Samsung PM961 NVMe MZVLW512HMJP, IPS, 3840x2160, 15.6" | Lenovo ThinkPad P51s 20HB000SGE i7-7600U, Quadro M520, Samsung SSD PM961 1TB M.2 PCIe 3.0 x4 NVMe (MZVLW1T0), IPS, 3840x2160, 15.6" | HP ZBook Studio G3 6820HQ, Quadro M1000M, Samsung SM951 MZVPV512HDGL m.2 PCI-e, IPS, 3840x2160, 15.6" | |
|---|---|---|---|---|---|---|
| Power Consumption | 7% | 31% | 8% | 40% | 18% | |
| Idle Minimum * (Watt) | 12.6 | 8.9 29% | 3.7 71% | 8.6 32% | 5.8 54% | 8.7 31% |
| Idle Average * (Watt) | 17.1 | 13.6 20% | 16.2 5% | 15.9 7% | 10.4 39% | 14.2 17% |
| Idle Maximum * (Watt) | 19.3 | 14.1 27% | 18 7% | 22.1 -15% | 13.5 30% | 14.4 25% |
| Load Average * (Watt) | 88.3 | 100.3 -14% | 58.4 34% | 84.4 4% | 62.4 29% | 85.6 3% |
| Witcher 3 ultra * (Watt) | 74.8 | 100.2 -34% | ||||
| Load Maximum * (Watt) | 147.3 | 126.3 14% | 89.6 39% | 130.6 11% | 73.1 50% | 129.7 12% |
* ... smaller is better
| HP ZBook Studio G4-Y6K17EA E3-1505M v6, Quadro M1200, 64 Wh | Dell Precision 5520 UHD E3-1505M v6, Quadro M1200, 97 Wh | Apple MacBook Pro 15 2017 (2.9 GHz, 560) i7-7820HQ, Radeon Pro 560, Wh | Lenovo ThinkPad P51 20HH0016GE E3-1505M v6, Quadro M2200, 90 Wh | Lenovo ThinkPad P51s 20HB000SGE i7-7600U, Quadro M520, 104 Wh | HP ZBook Studio G3 6820HQ, Quadro M1000M, 64 Wh | |
|---|---|---|---|---|---|---|
| Battery runtime | 42% | 135% | 115% | 371% | 22% | |
| Reader / Idle (h) | 6.8 | 12.1 78% | 16.4 141% | 26.4 288% | 8.5 25% | |
| WiFi v1.3 (h) | 3.4 | 4.2 24% | 11.3 232% | 6.9 103% | 11.9 250% | 3.5 3% |
| Load (h) | 0.8 | 1 25% | 1.1 38% | 1.6 100% | 5.4 575% | 1.1 38% |
| H.264 (h) | 11.4 | 7.6 | 11.7 | 3.8 | ||
| Witcher 3 ultra (h) | 1.3 |
Pros
Cons
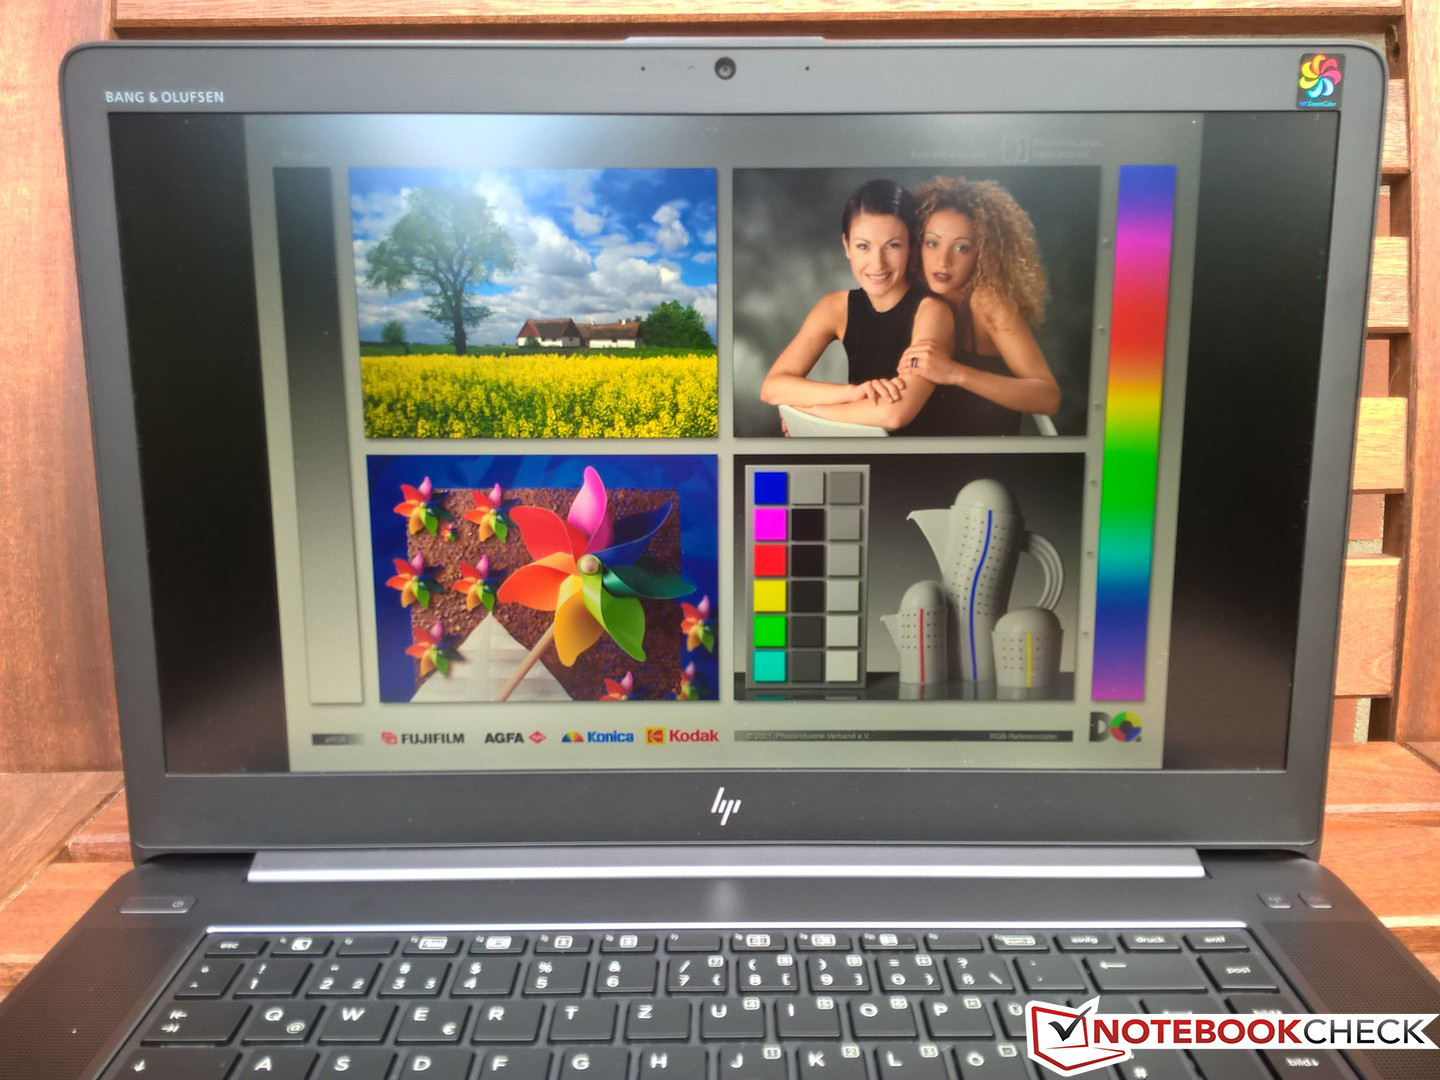
与惠普的其他移动工作站相似,ZBook Studio G4今年只做了微小的提升。然而,它的外壳已经足够的好了。可以说不是一个价格破坏者。除了一些组件的提升外,制造商还意识到了Studio G3体积过大、温度过高的问题。我们在上一代的Studio G3上体验到了极高的表面温度,而现在新款达到了其他超薄设备的水平。这种改进主要是通过性能限制来实现的,因为处理器会在默认情况下节流到35瓦。如果是在持续负载下工作,该值会进一步下降。因此,对比更为大众化的(同样更便宜)酷睿i7-7700HQ,移动版的Xeon处理器不是最好的选择。
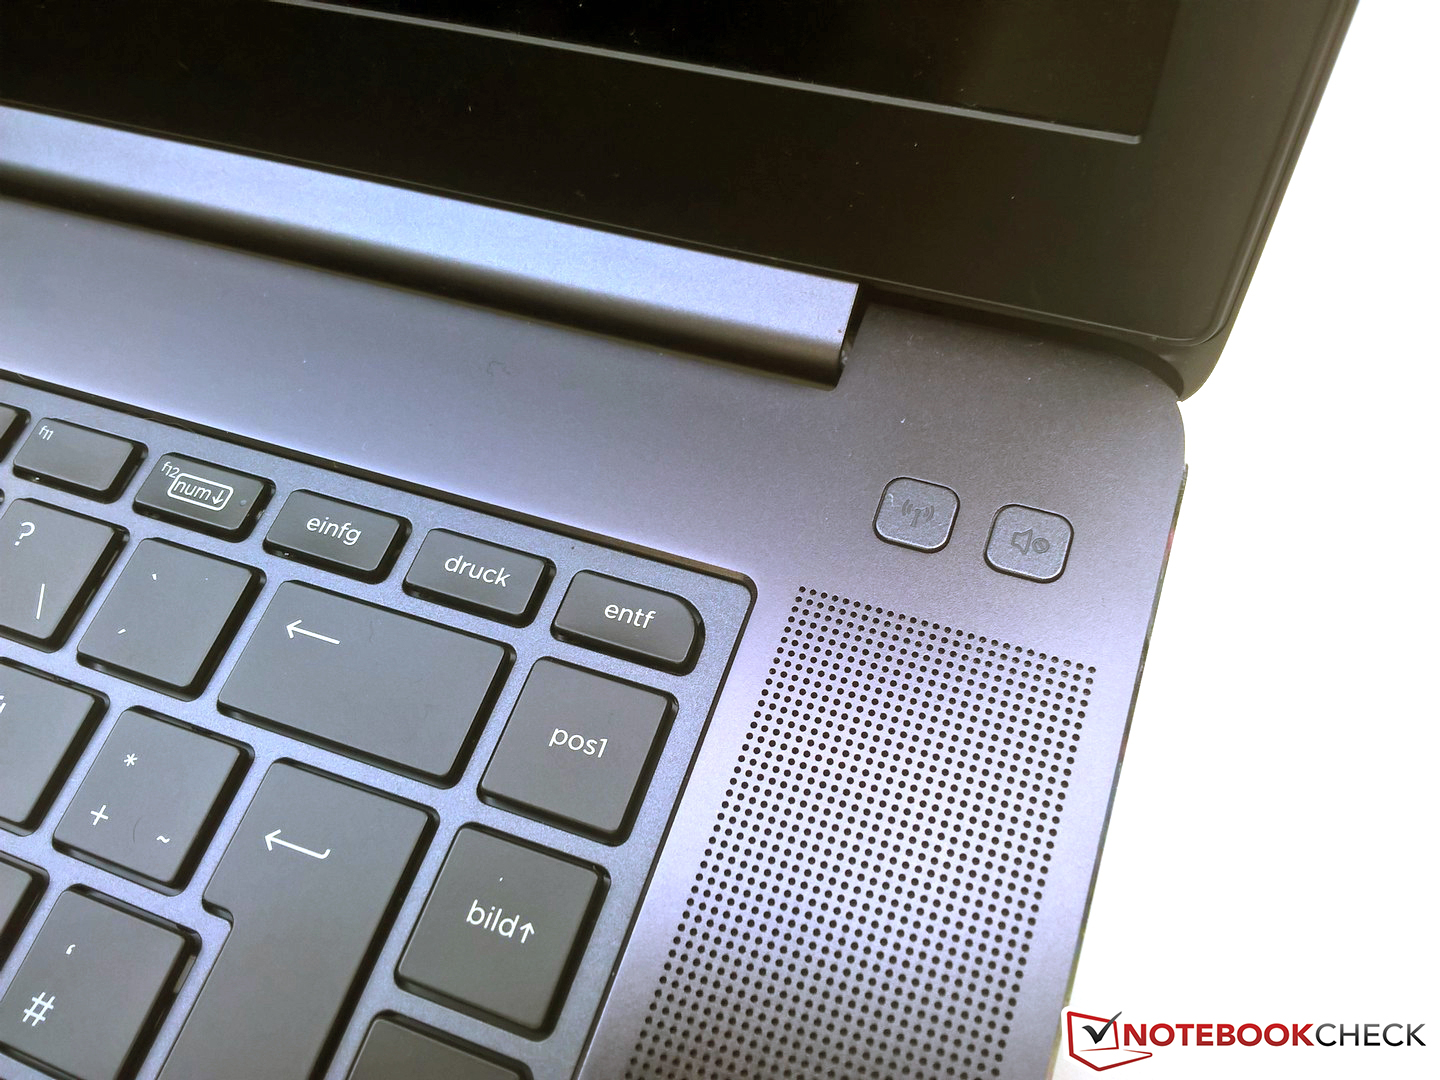
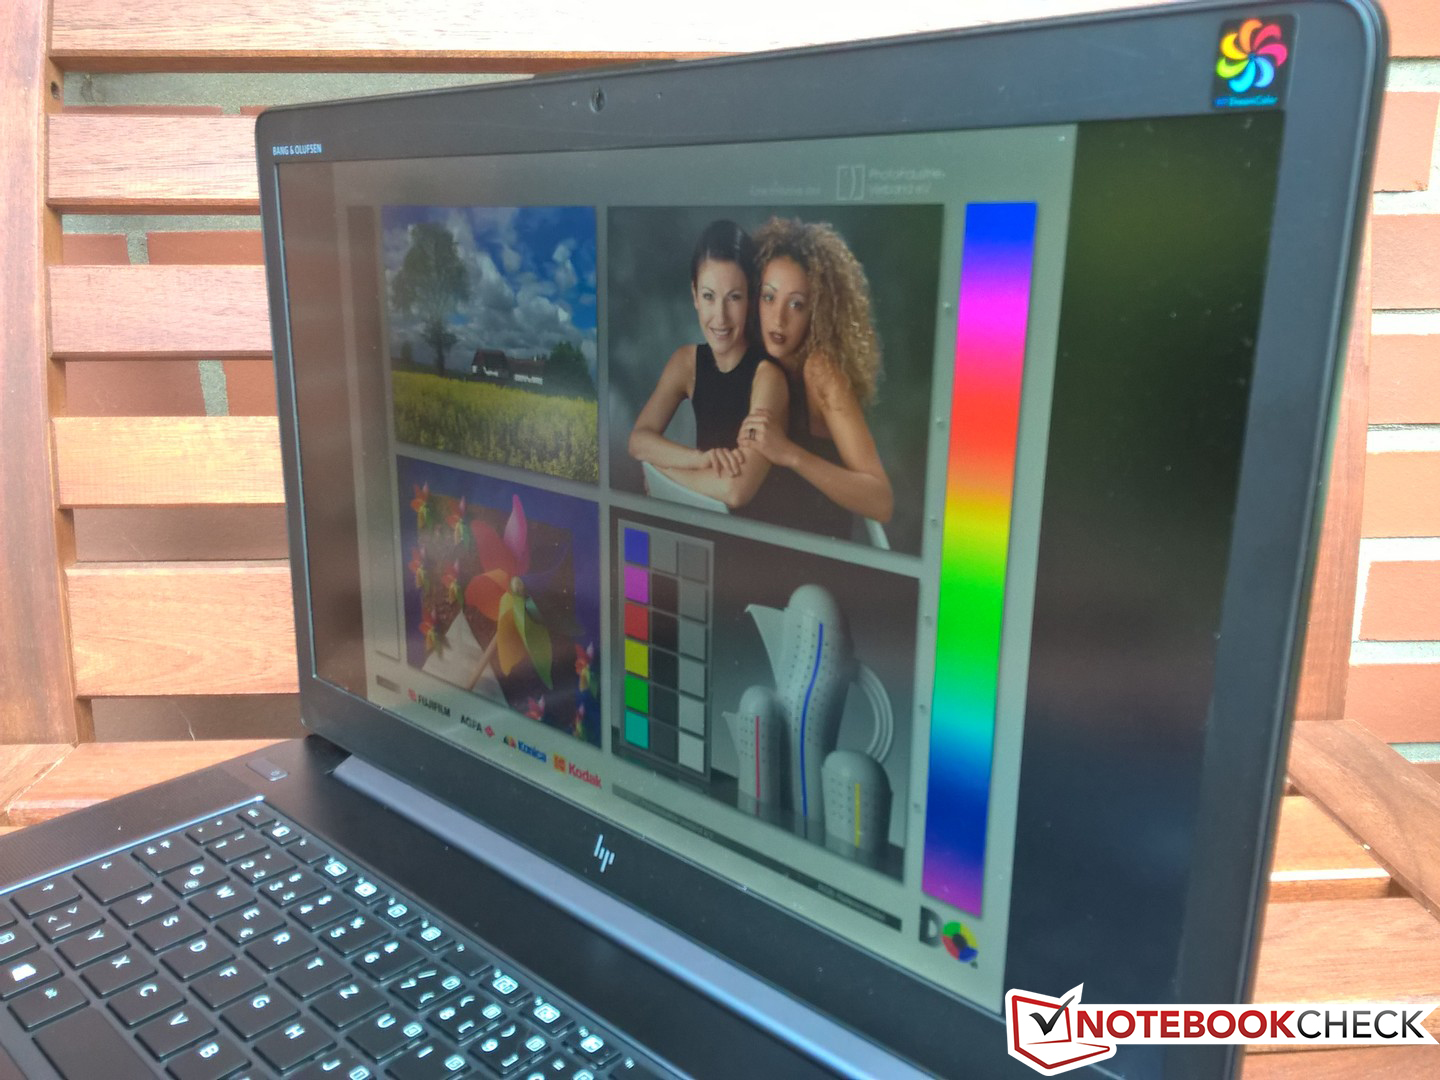
该机的风扇控制也得到改善,给我们留下了更好的印象。然而,DreamColor面板(它很优秀)不能满足我们所有要求。与常规UHD面板的唯一区别似乎是需要更多的额外软件,也会导致集成显卡的故障。这显然会增加功耗和影响续航时间。在WLAN测试中,仅仅3.5个小时的运行时间,对于移动设备来说不是很好。如果您不需要一个超薄机身,您可以选择更大更快的同类机——ZBook 15 G4。
HP ZBook Studio G4-Y6K17EA
- 10/19/2017 v6 (old)
Andreas Osthoff, Mike Wobker
Price comparison
