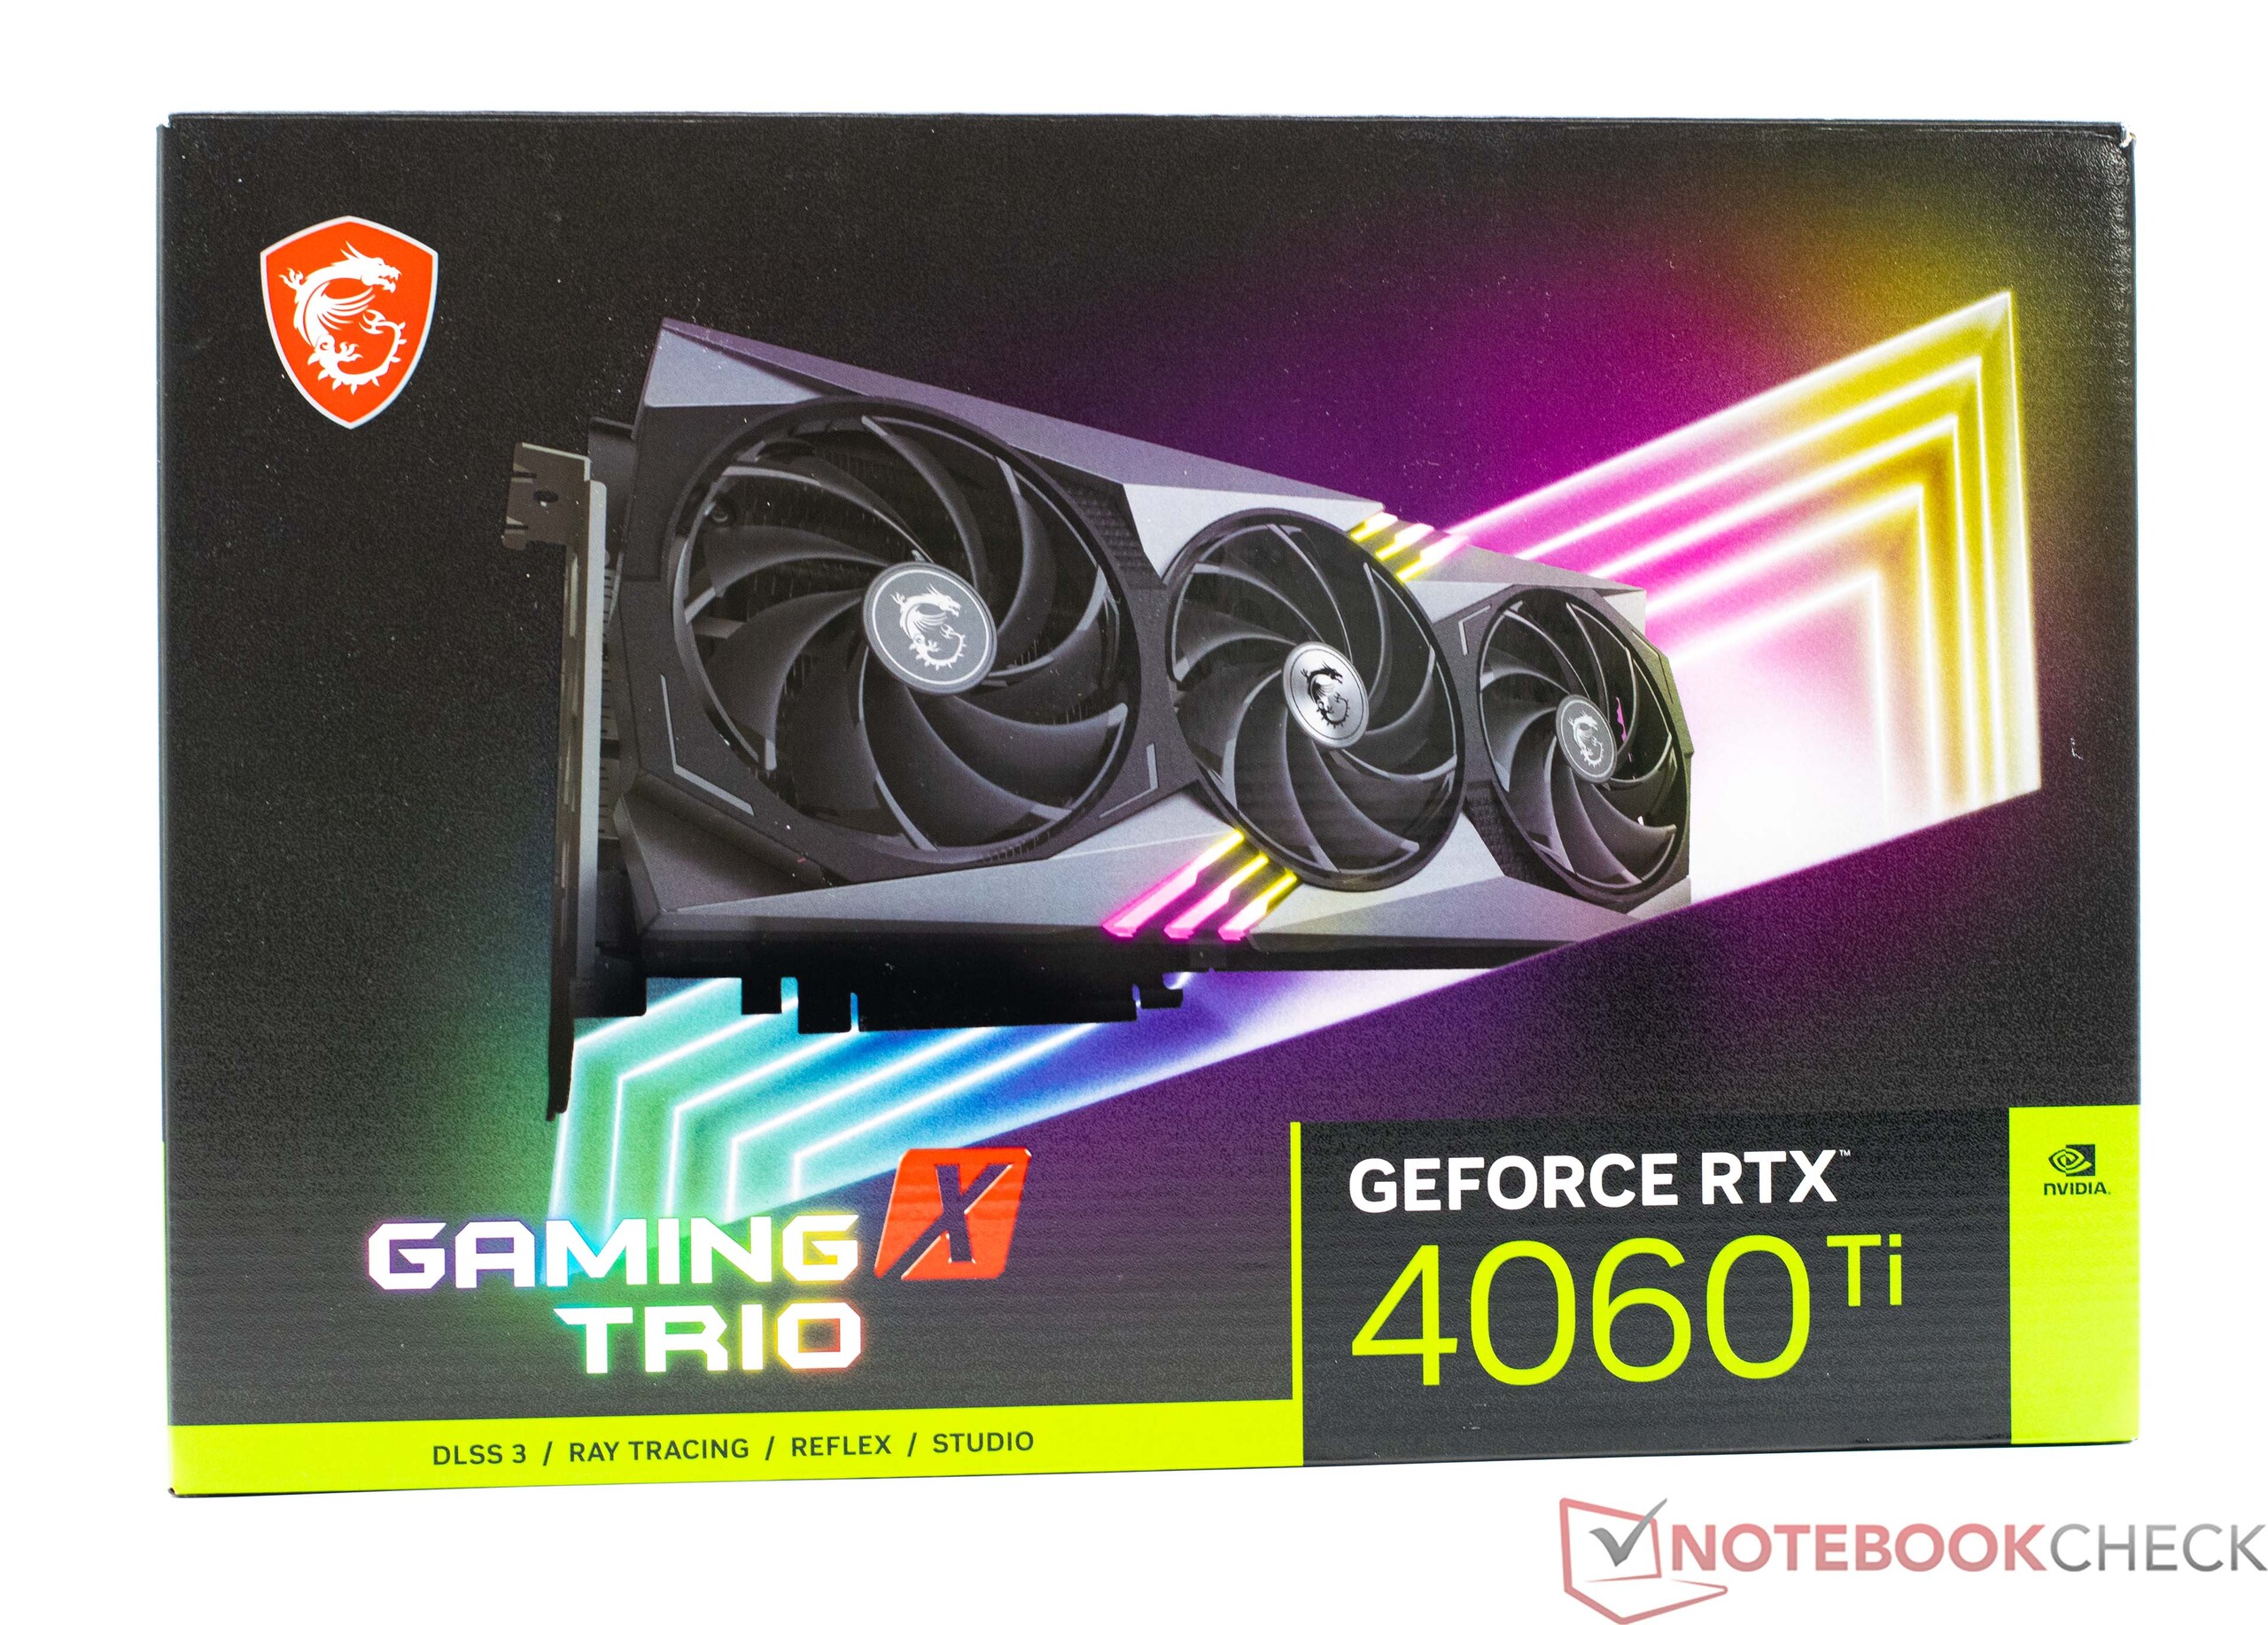
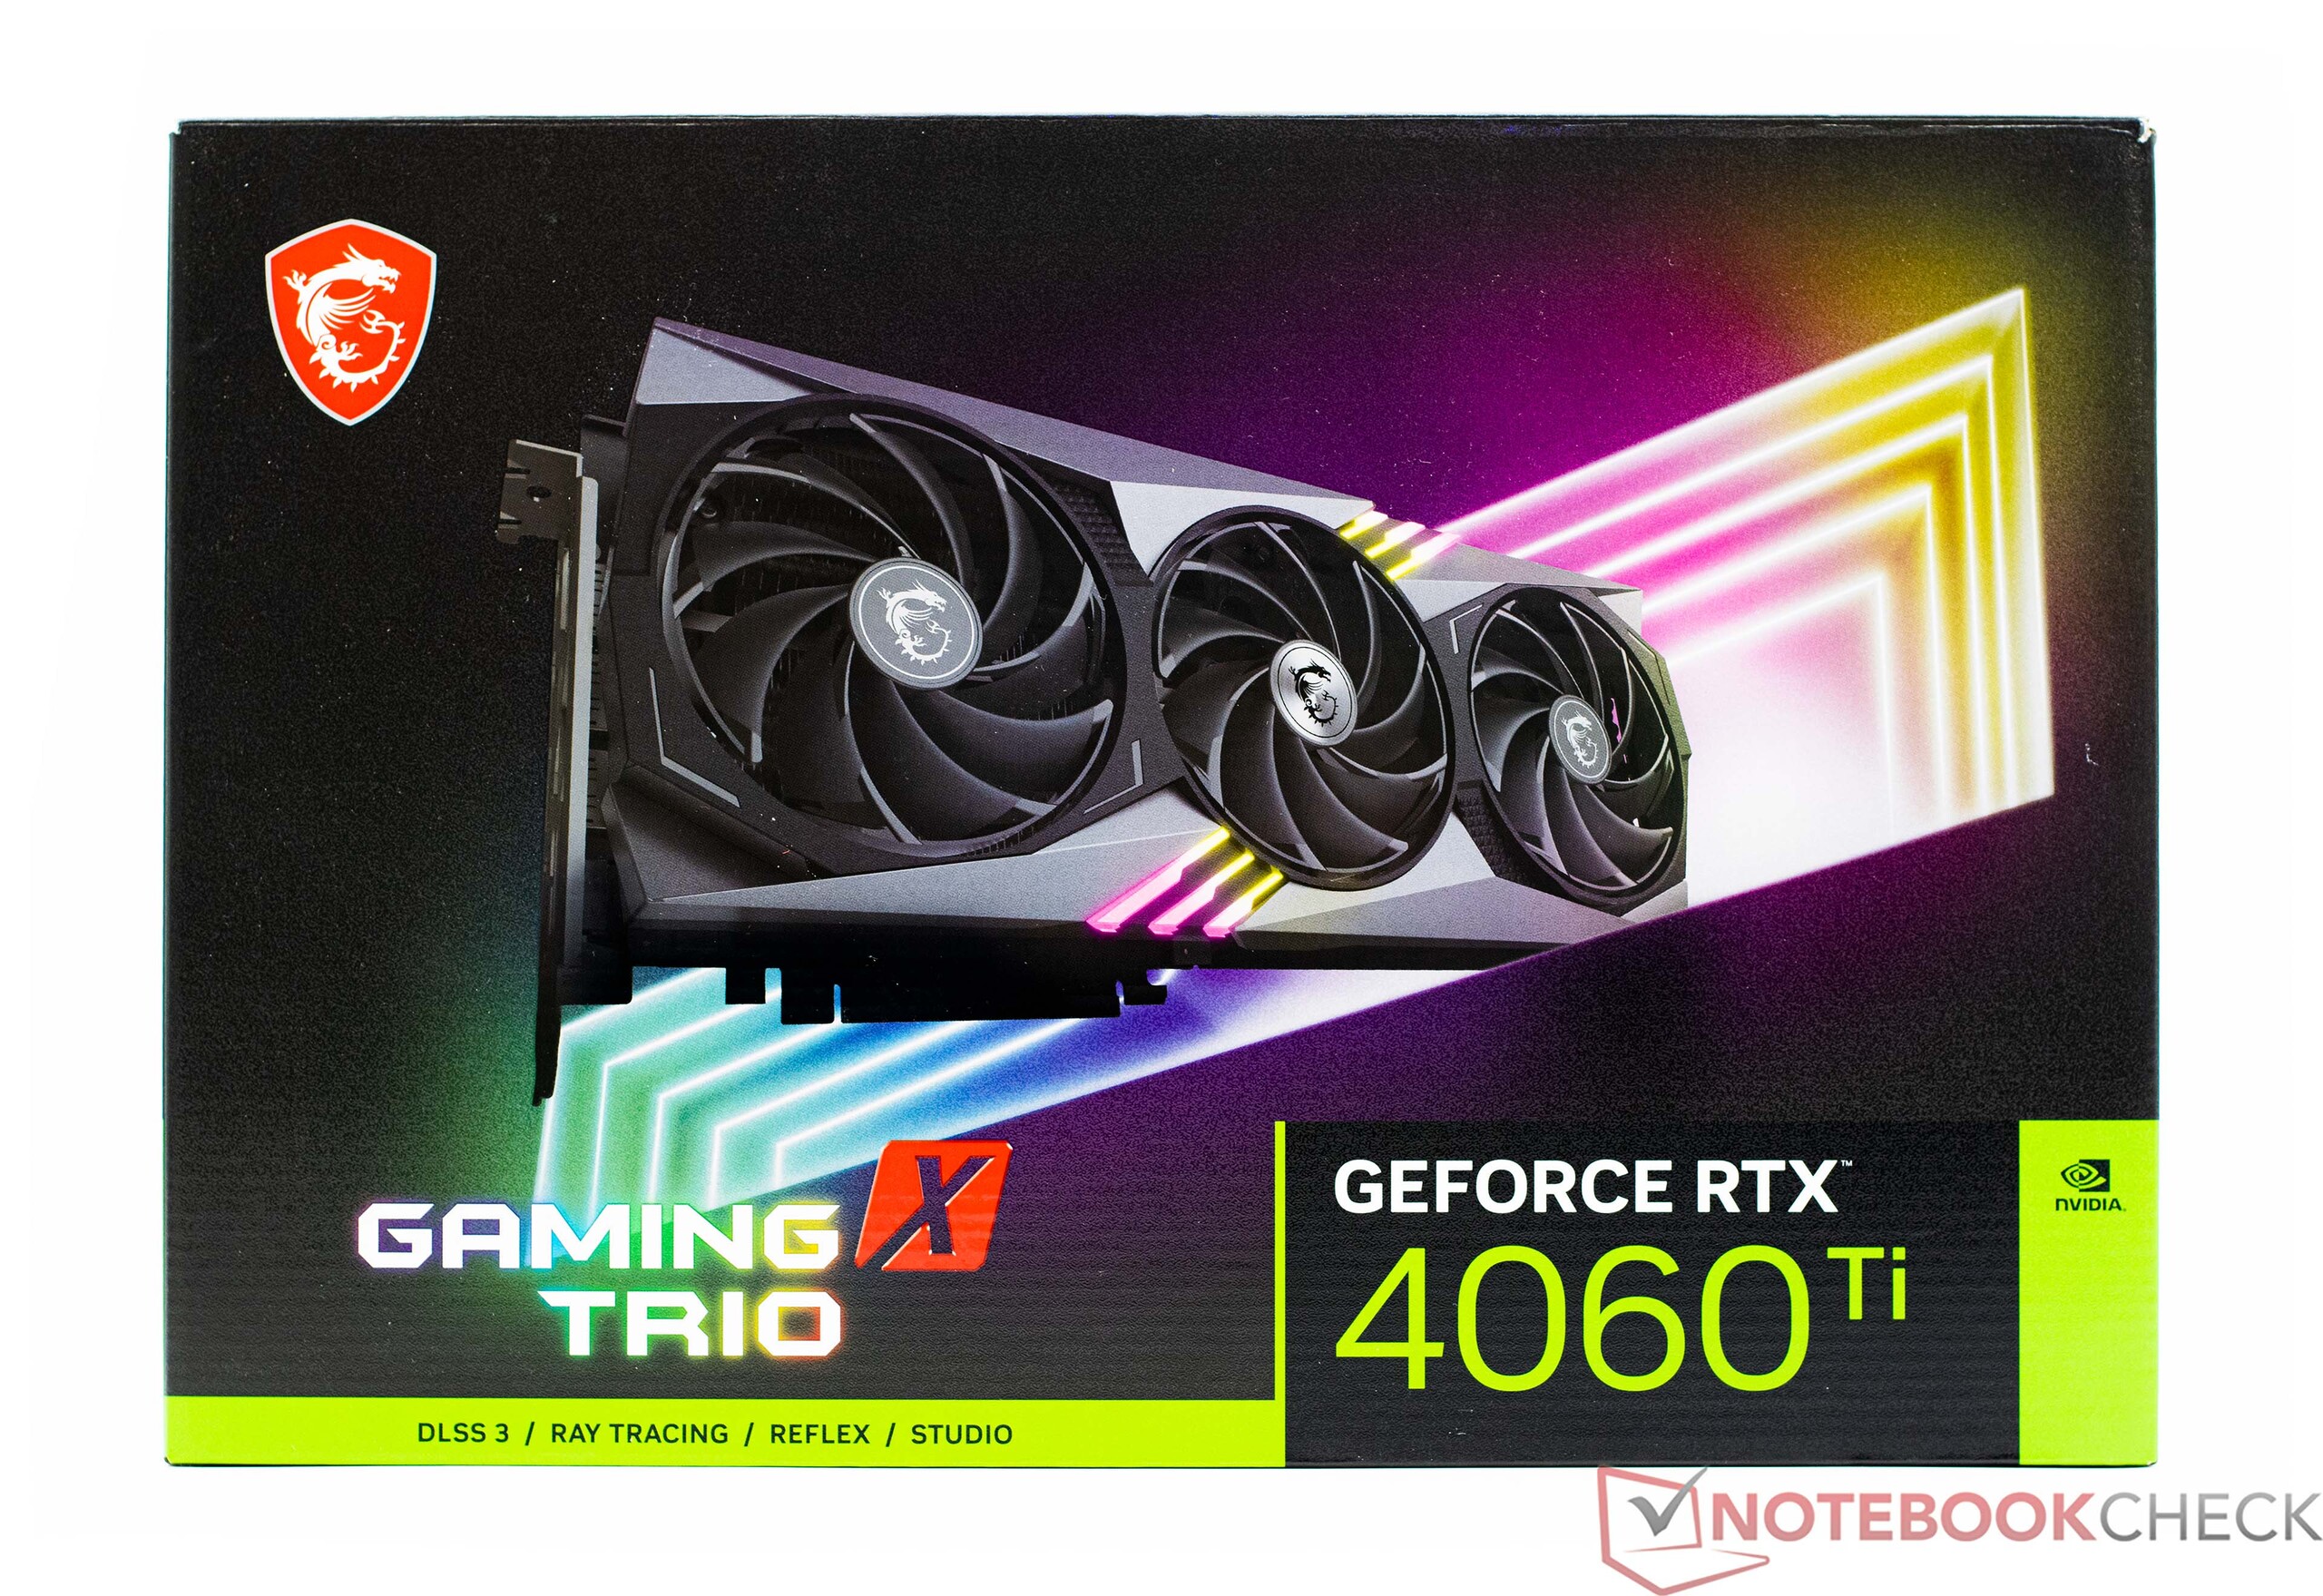
微星GeForce RTX 4060 Ti桌面显卡回顾: 比RTX4090更大的中端GPU

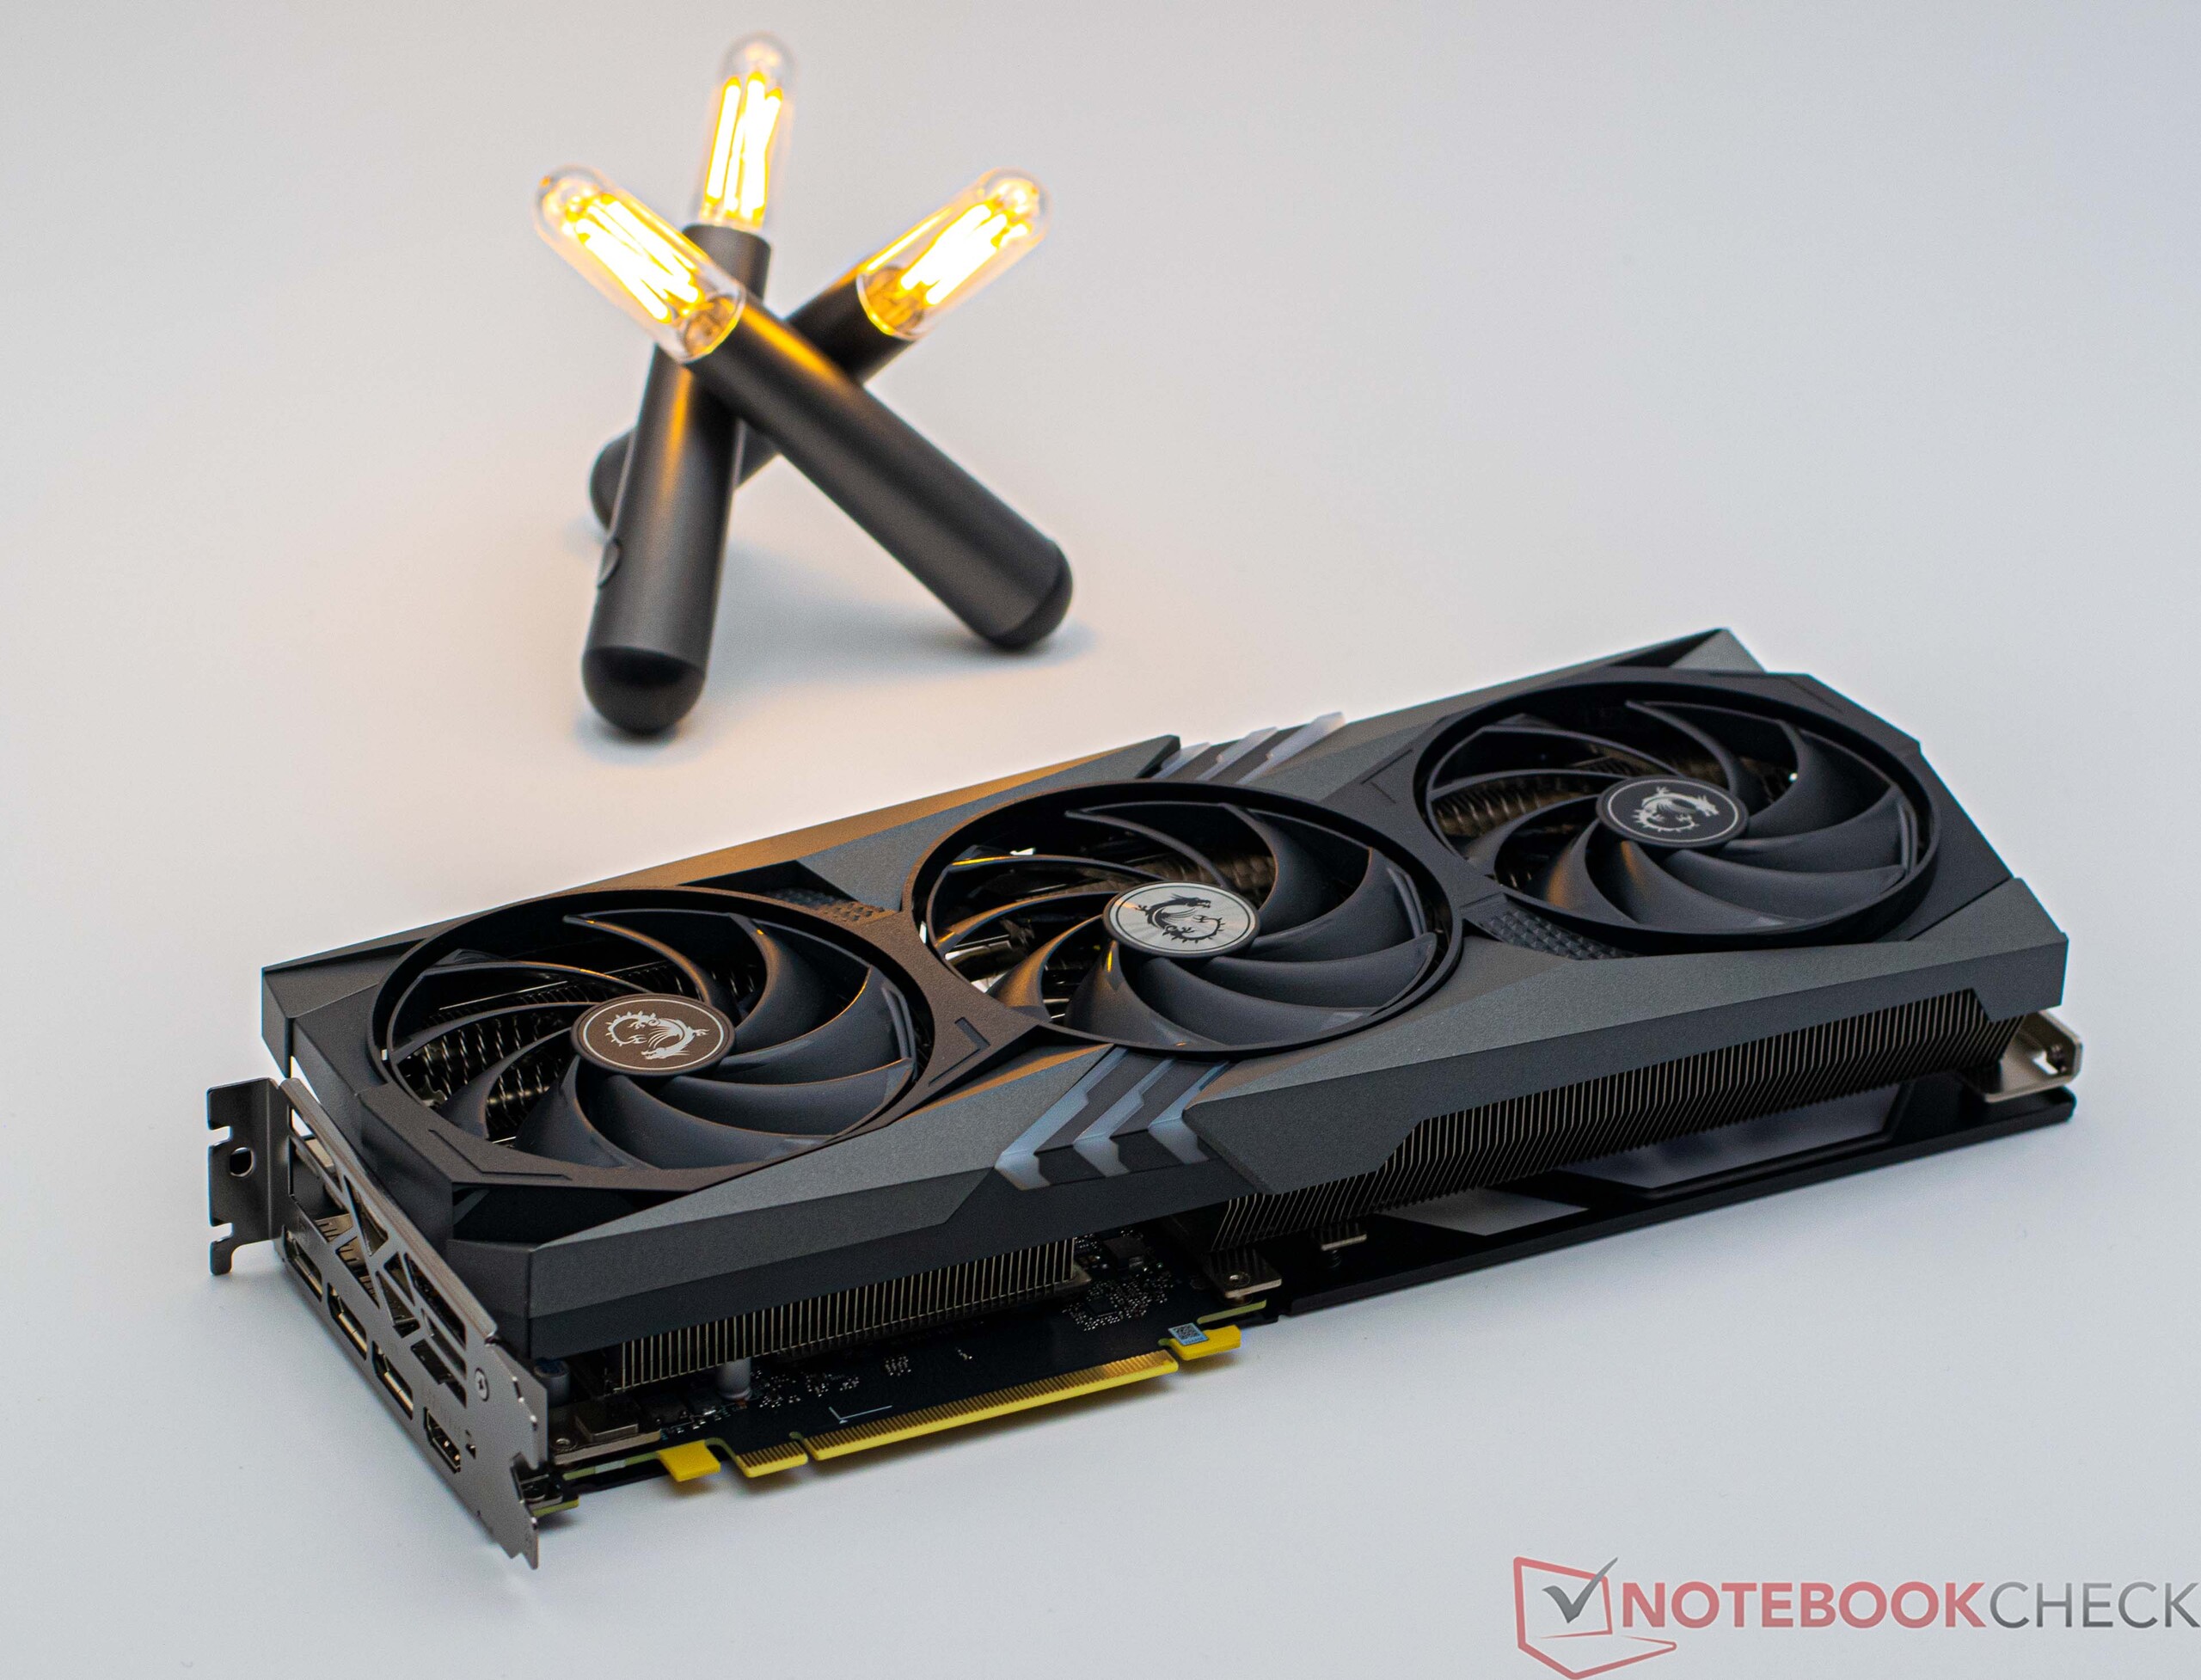
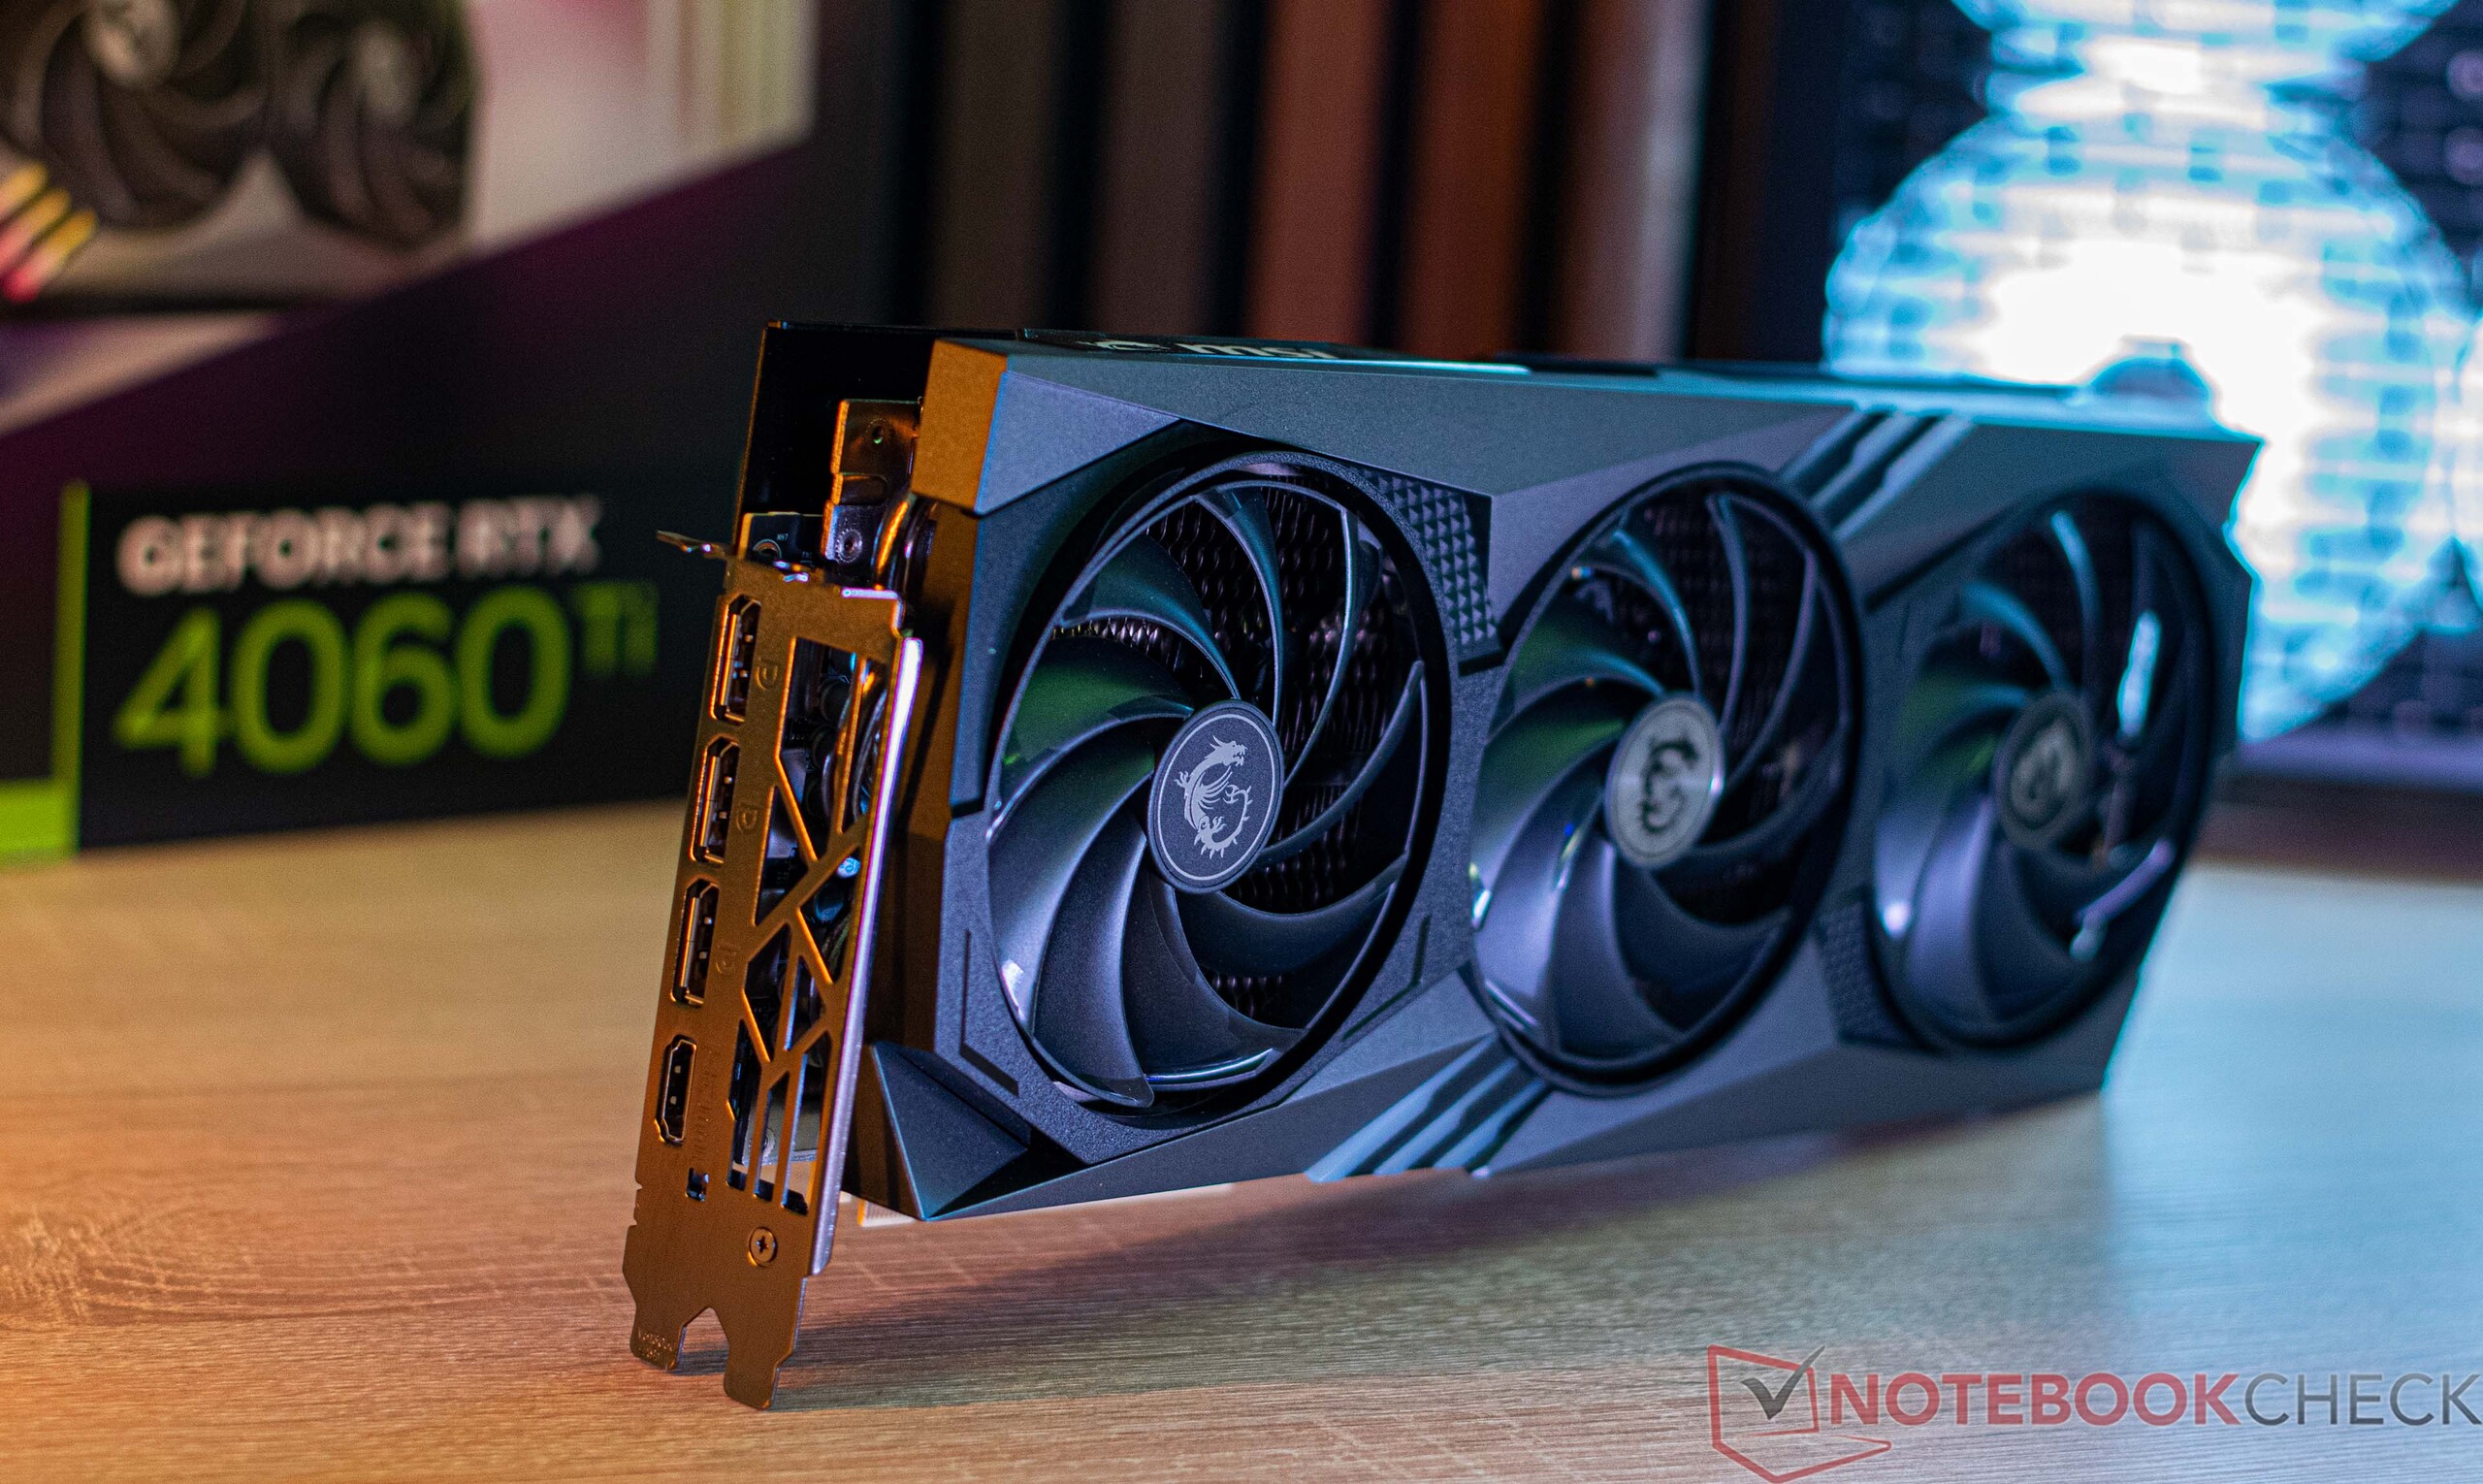
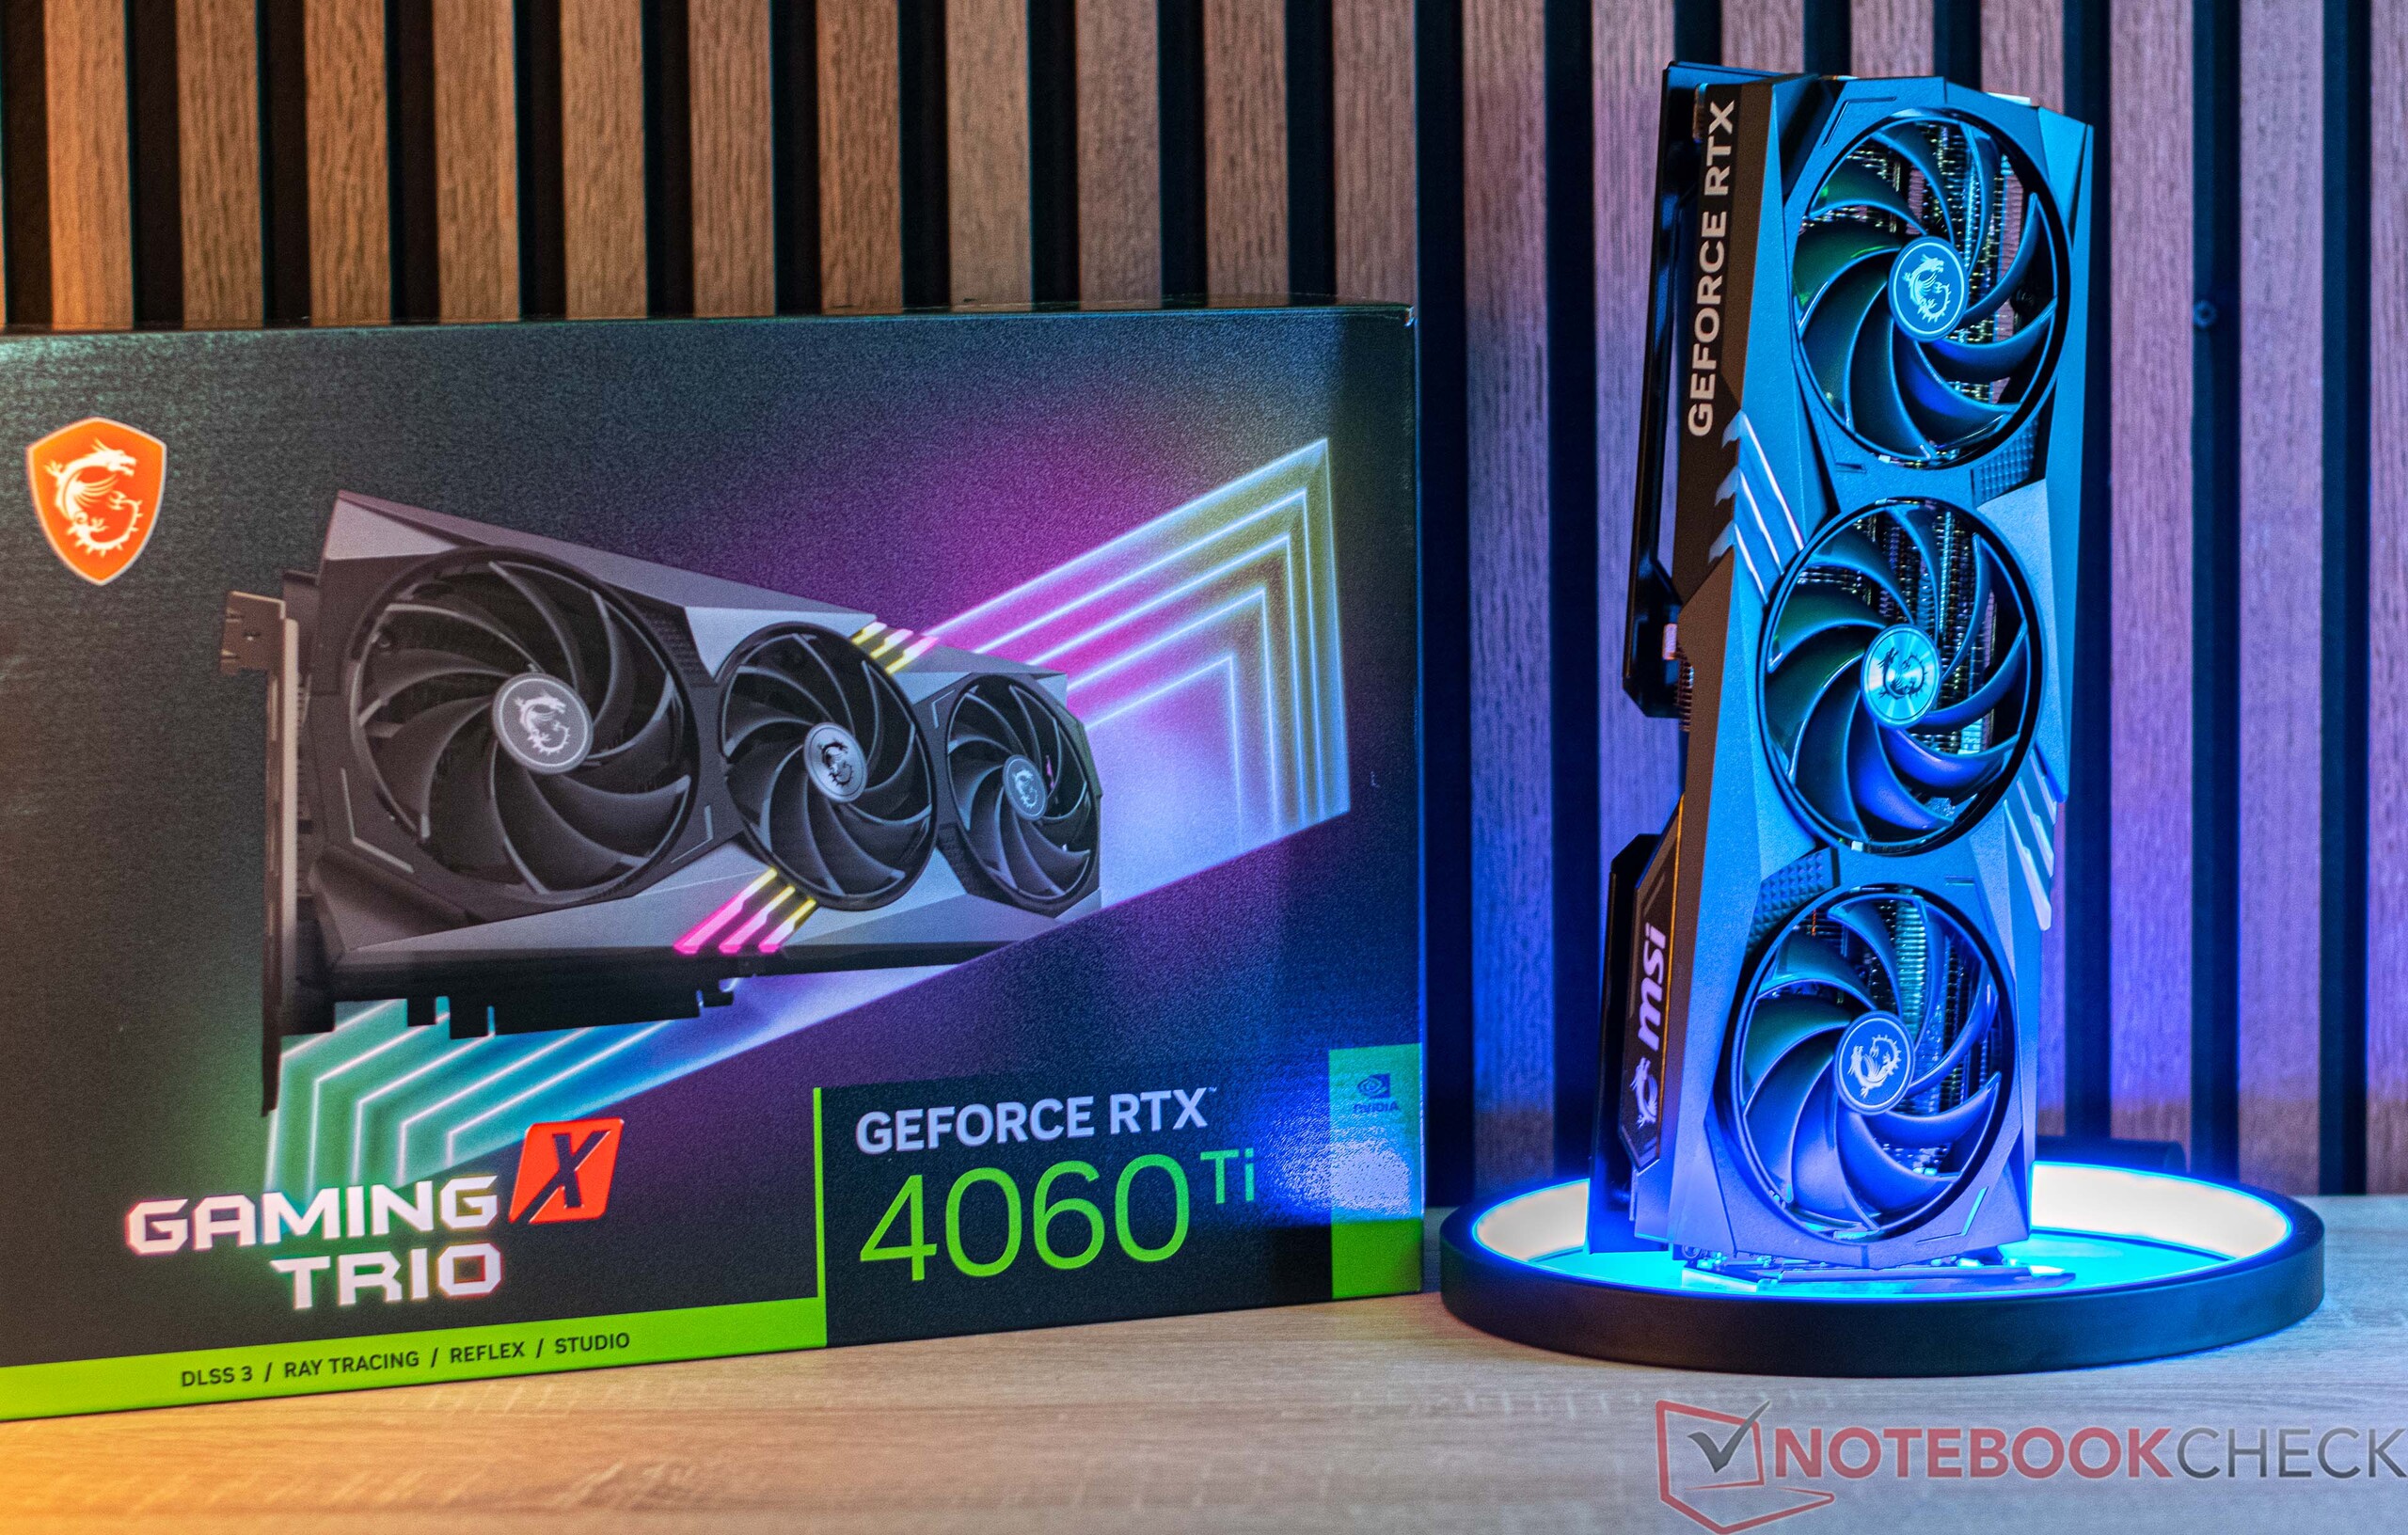
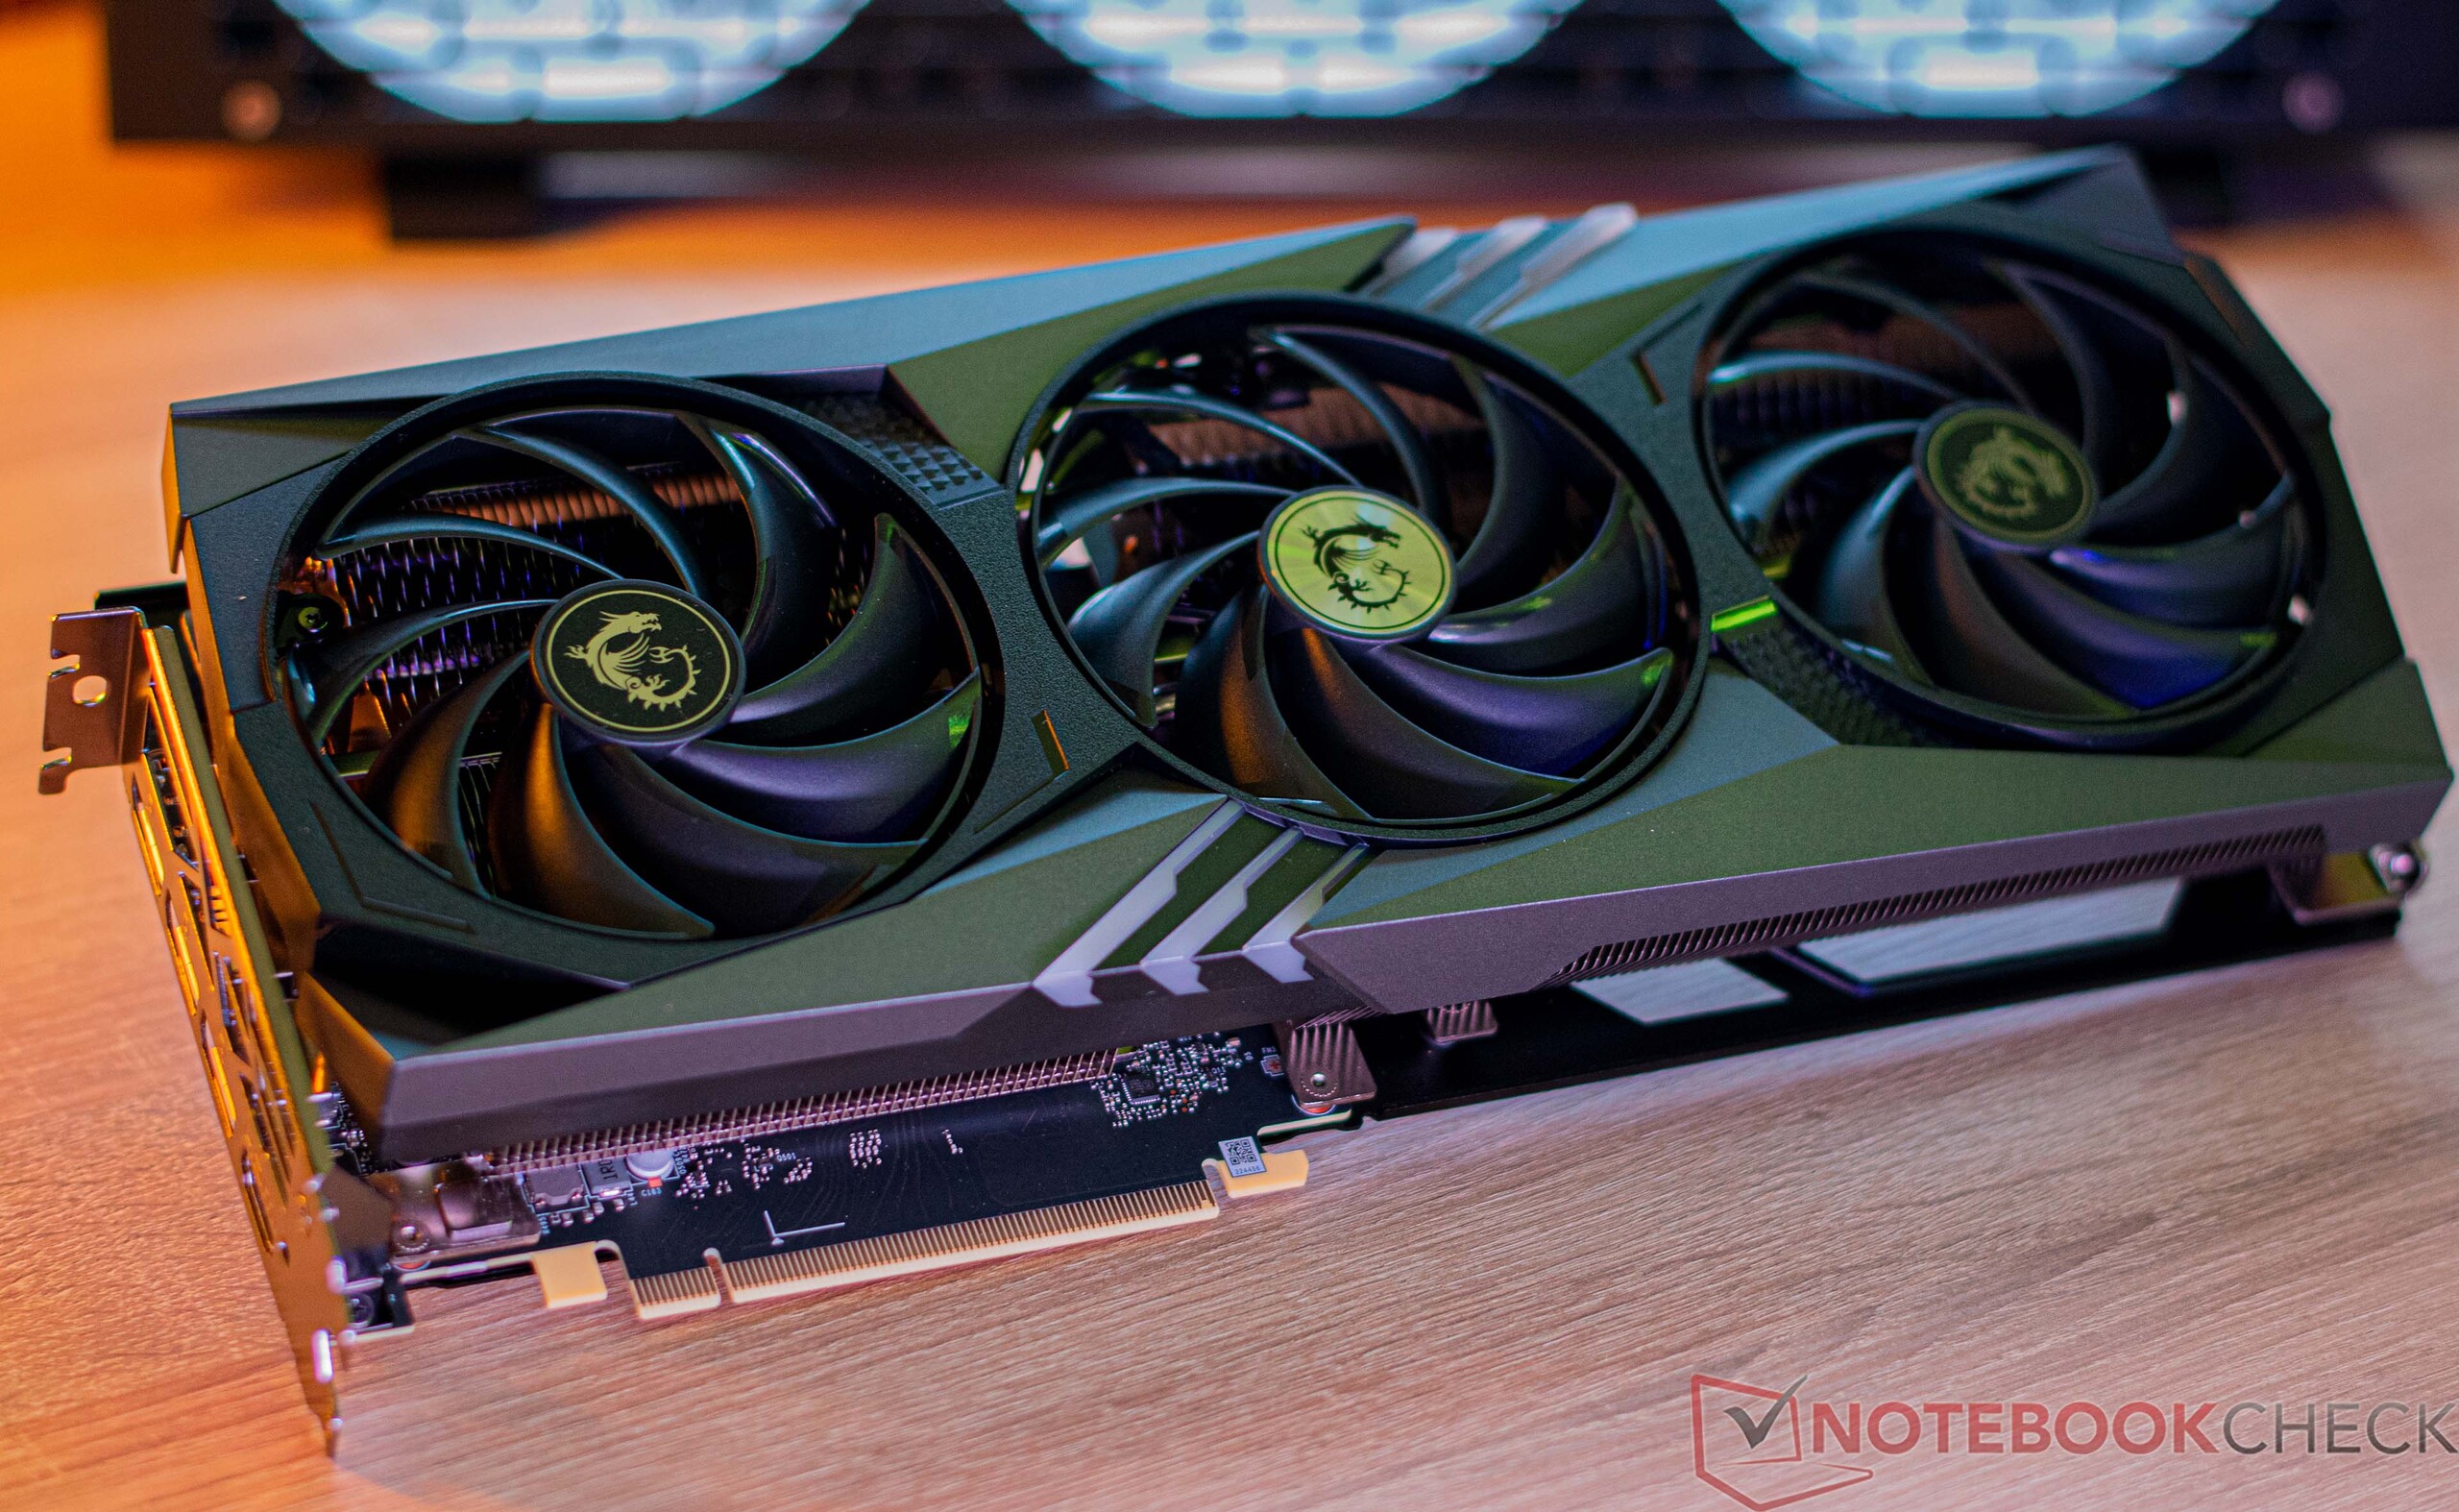
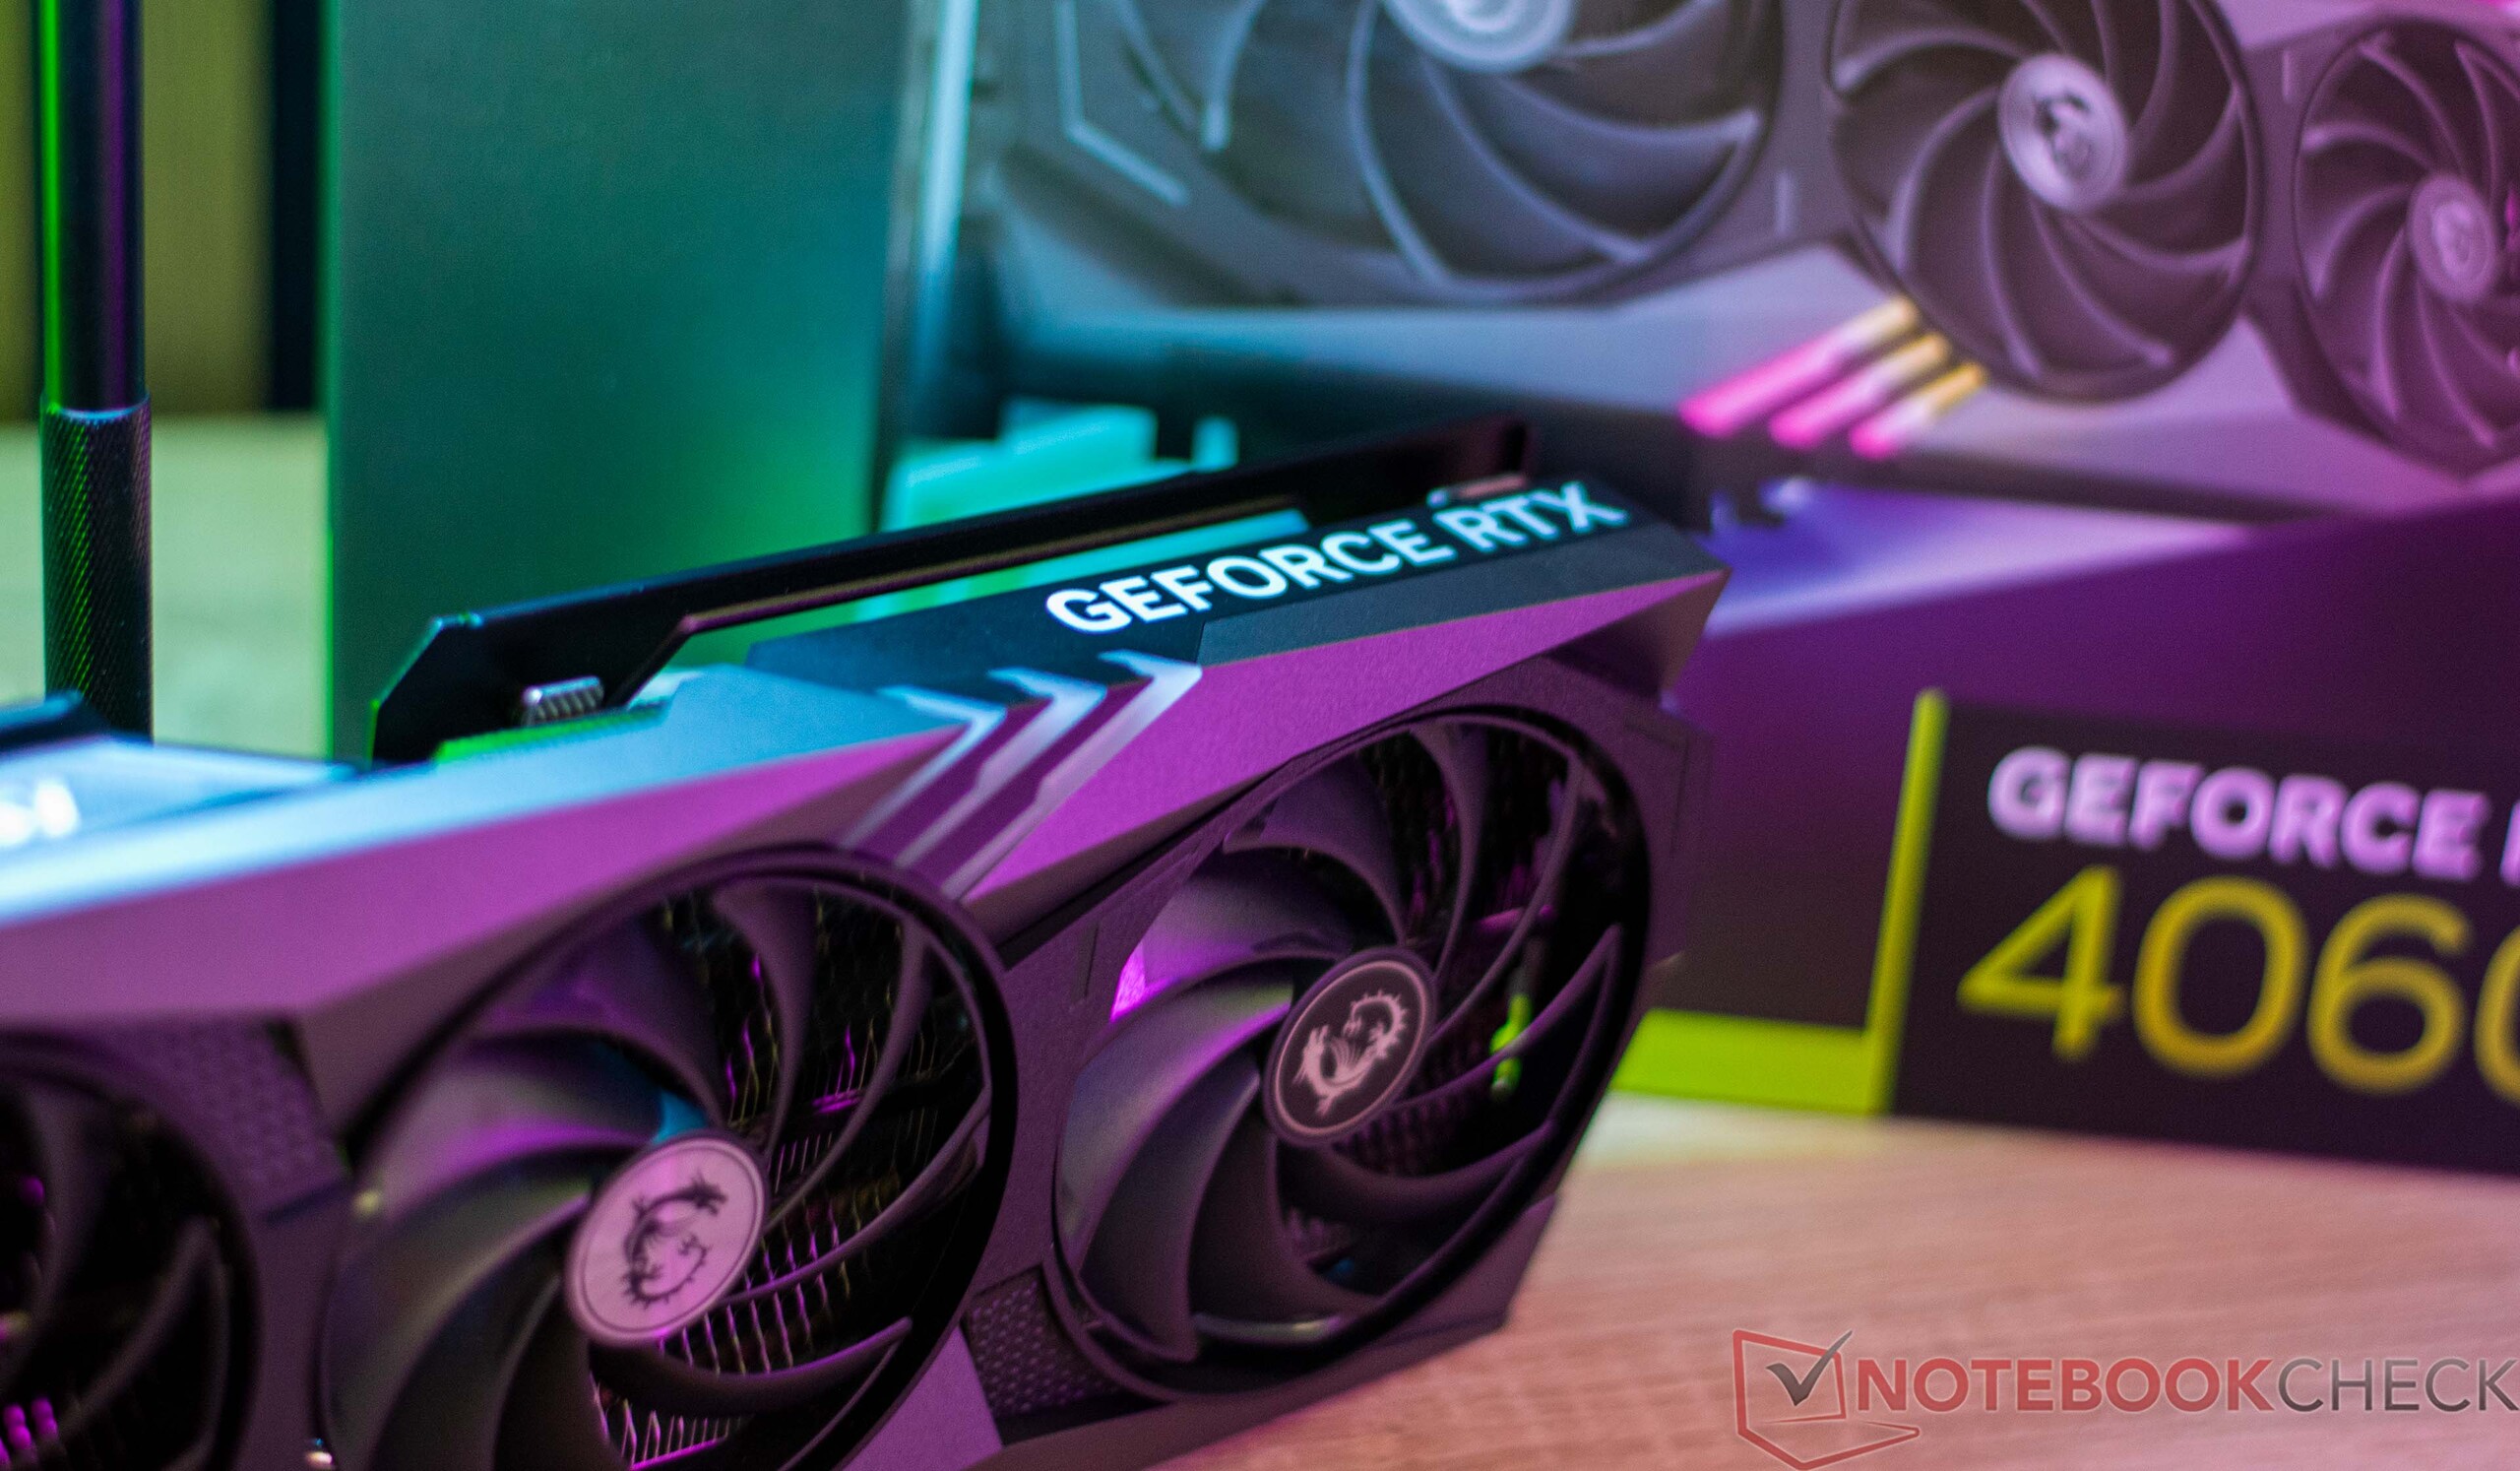
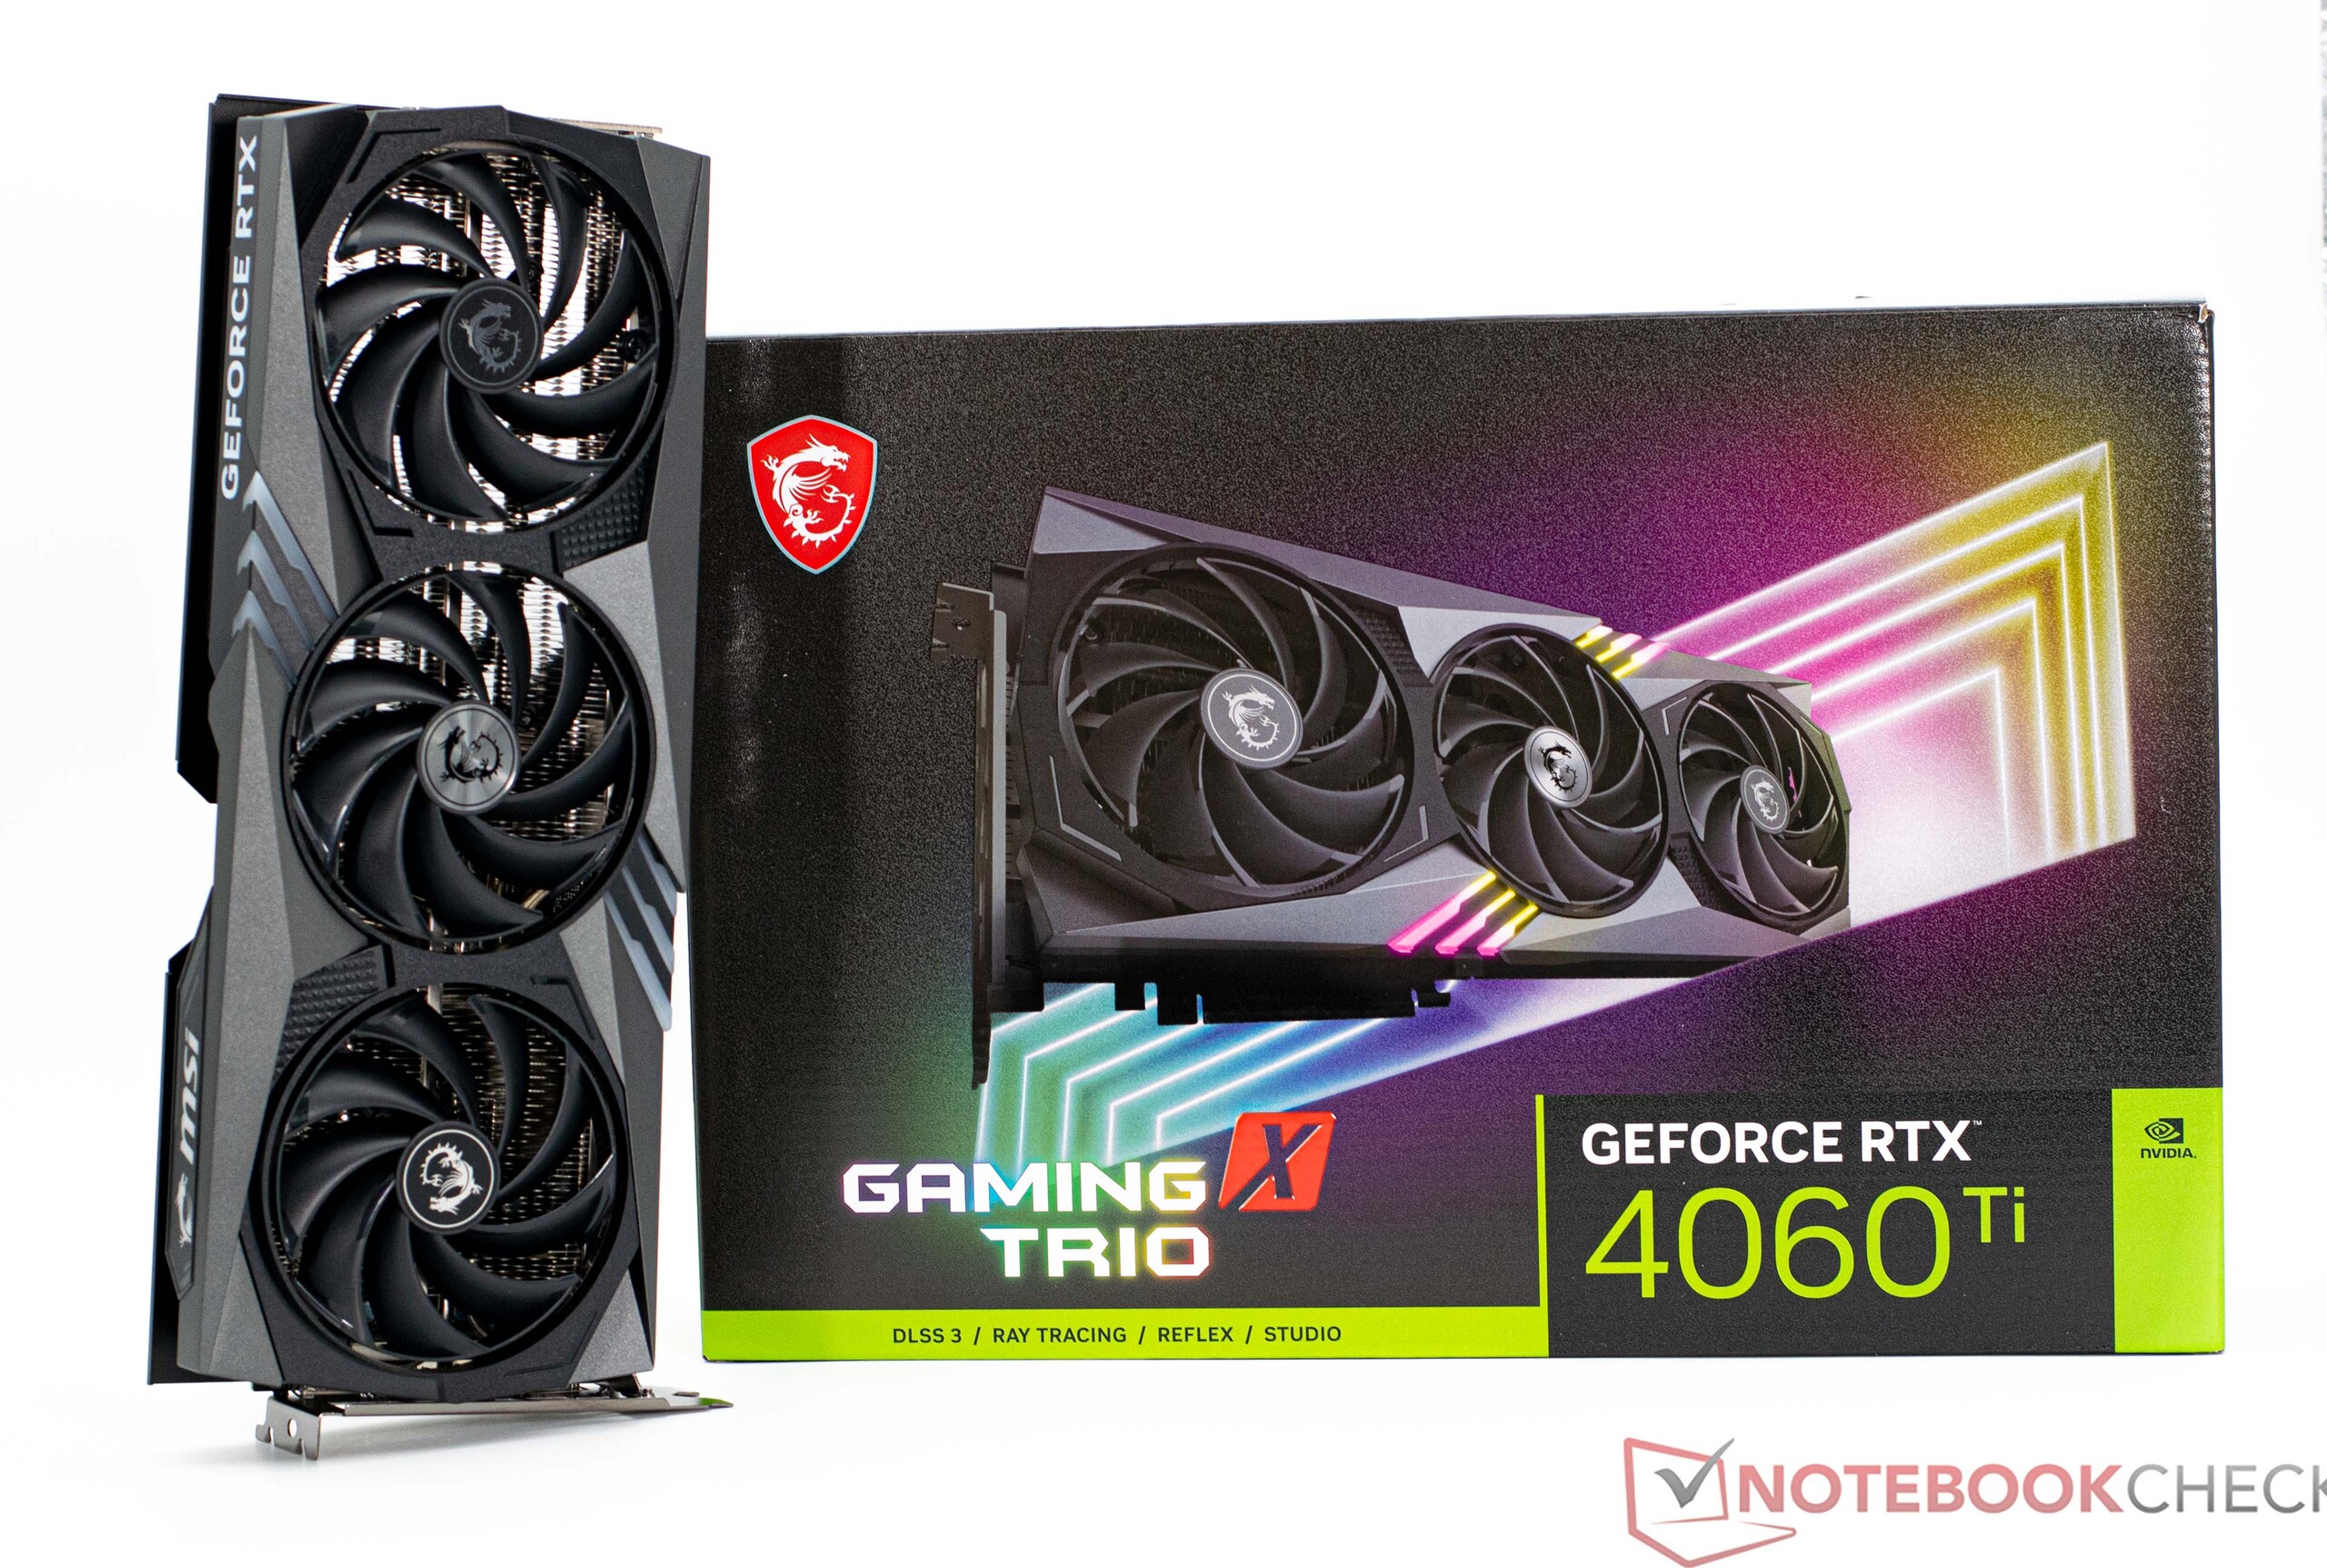
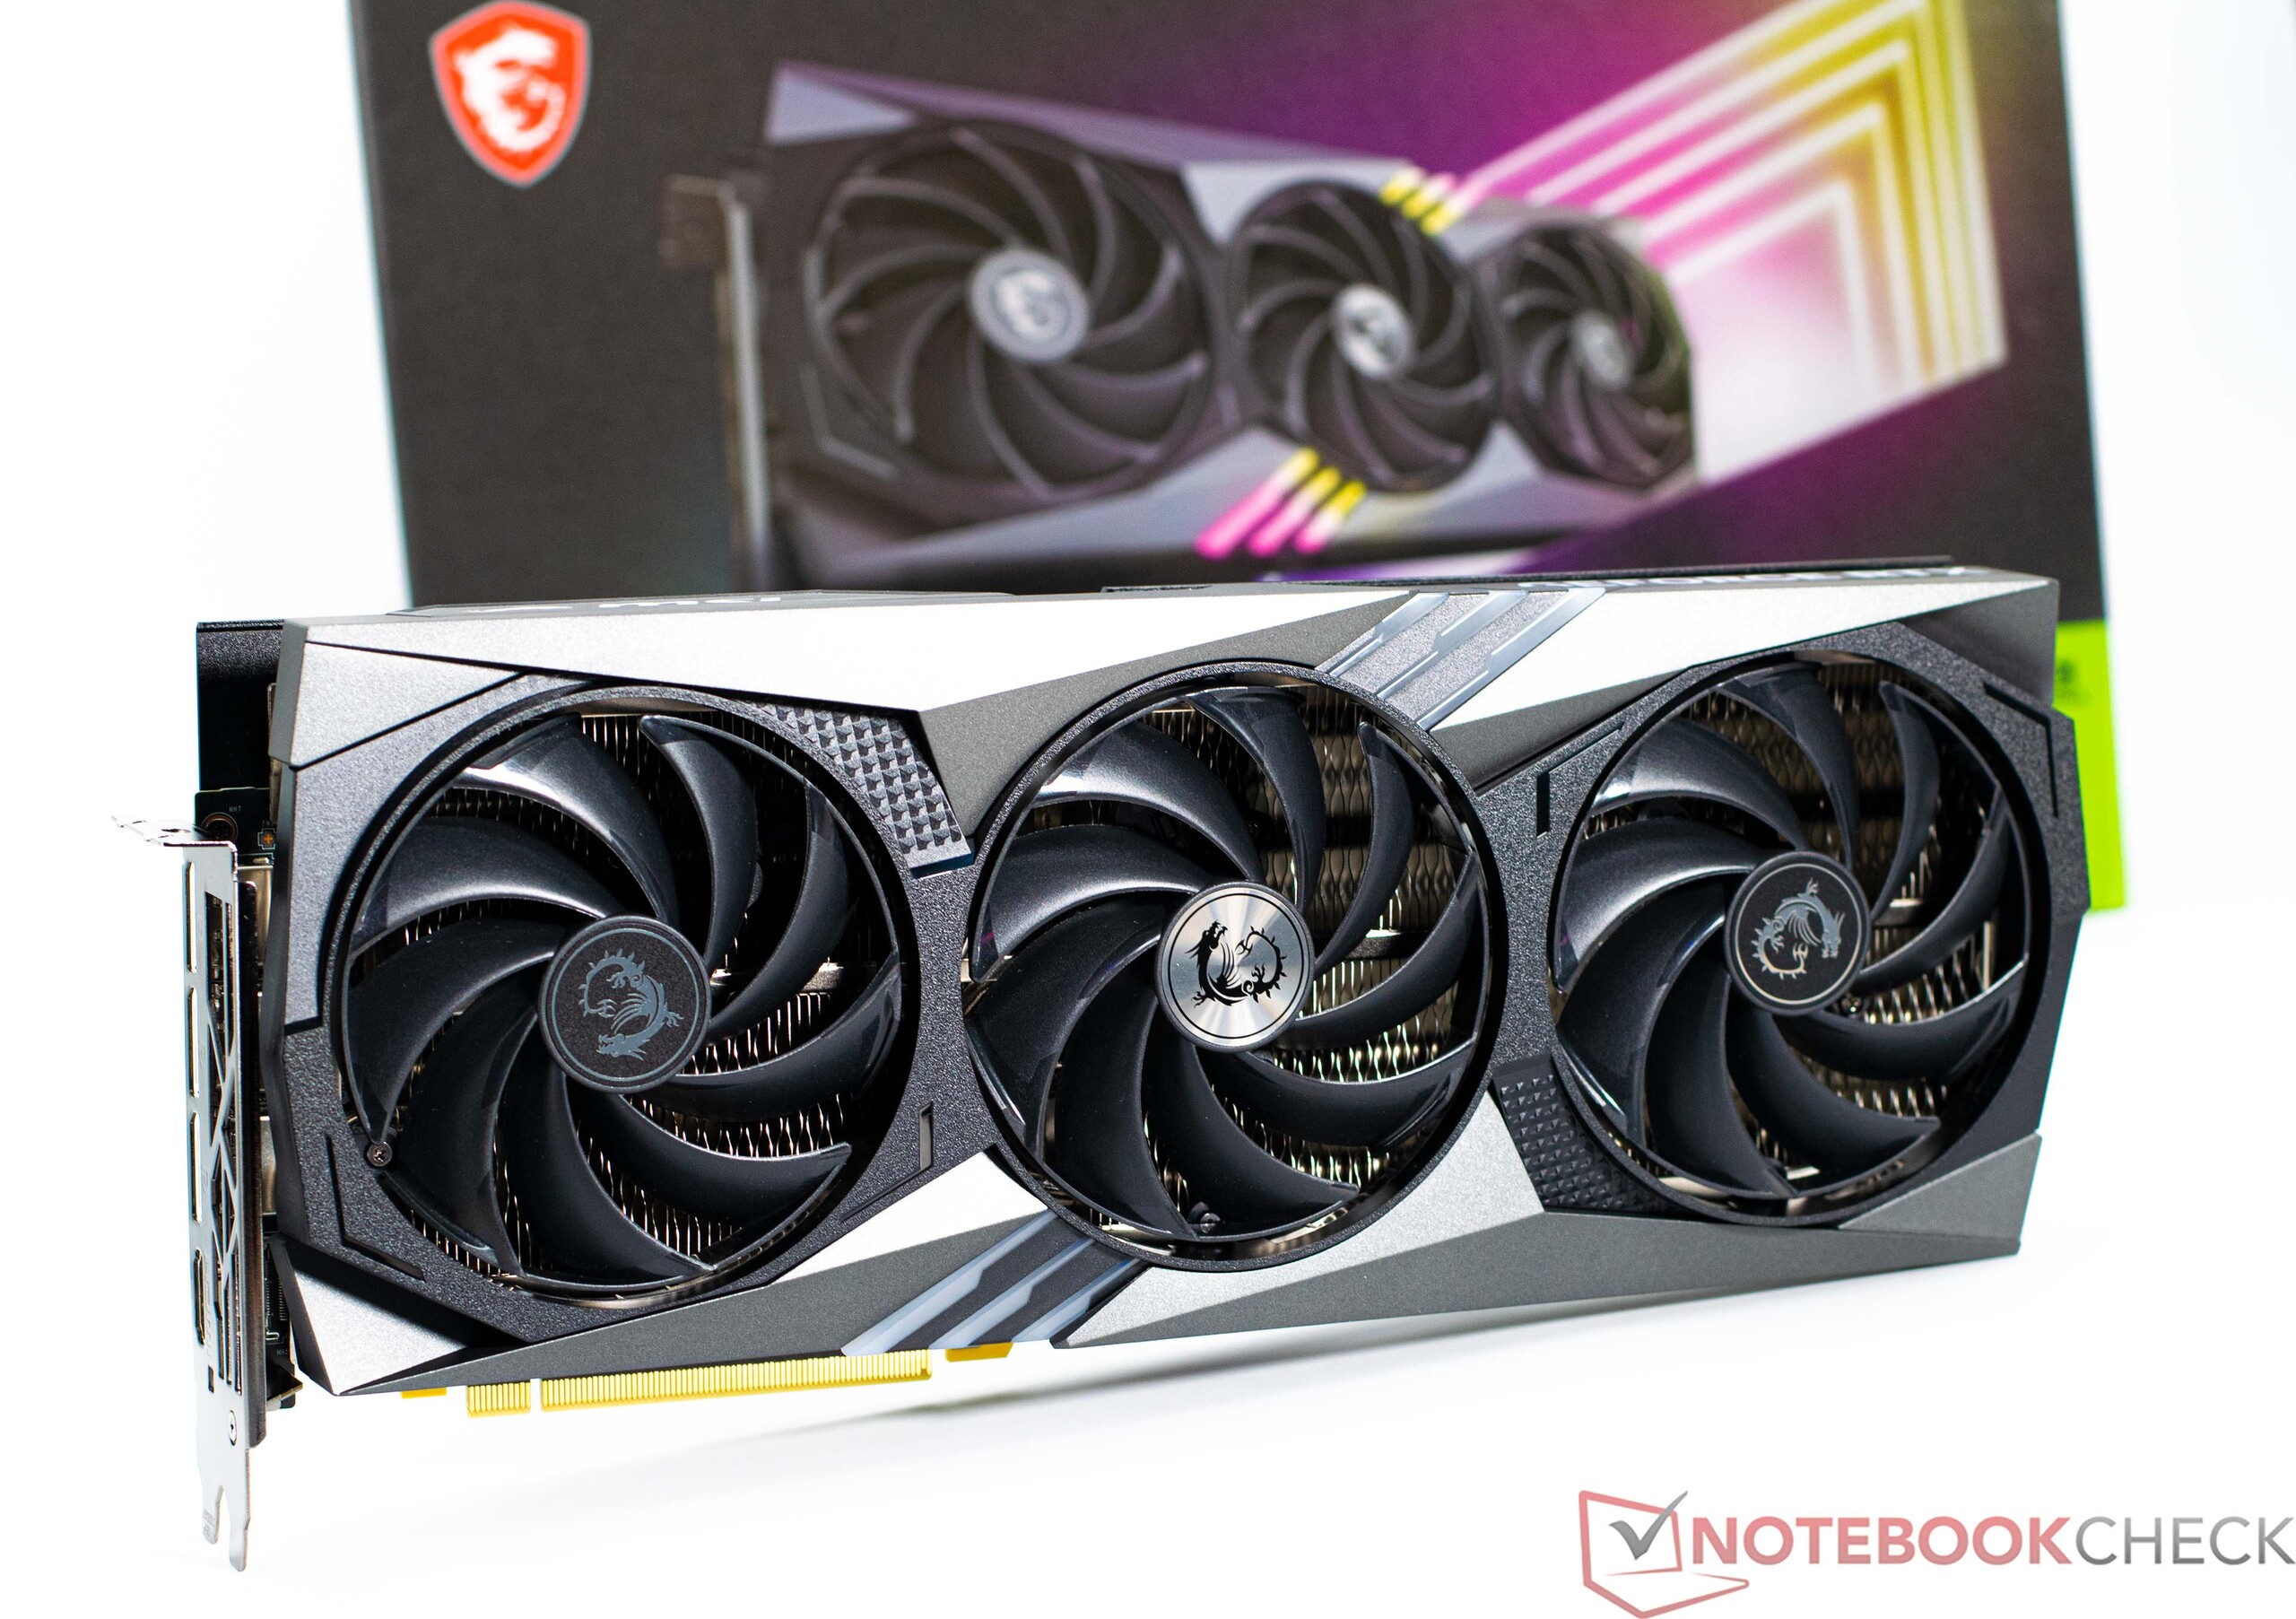
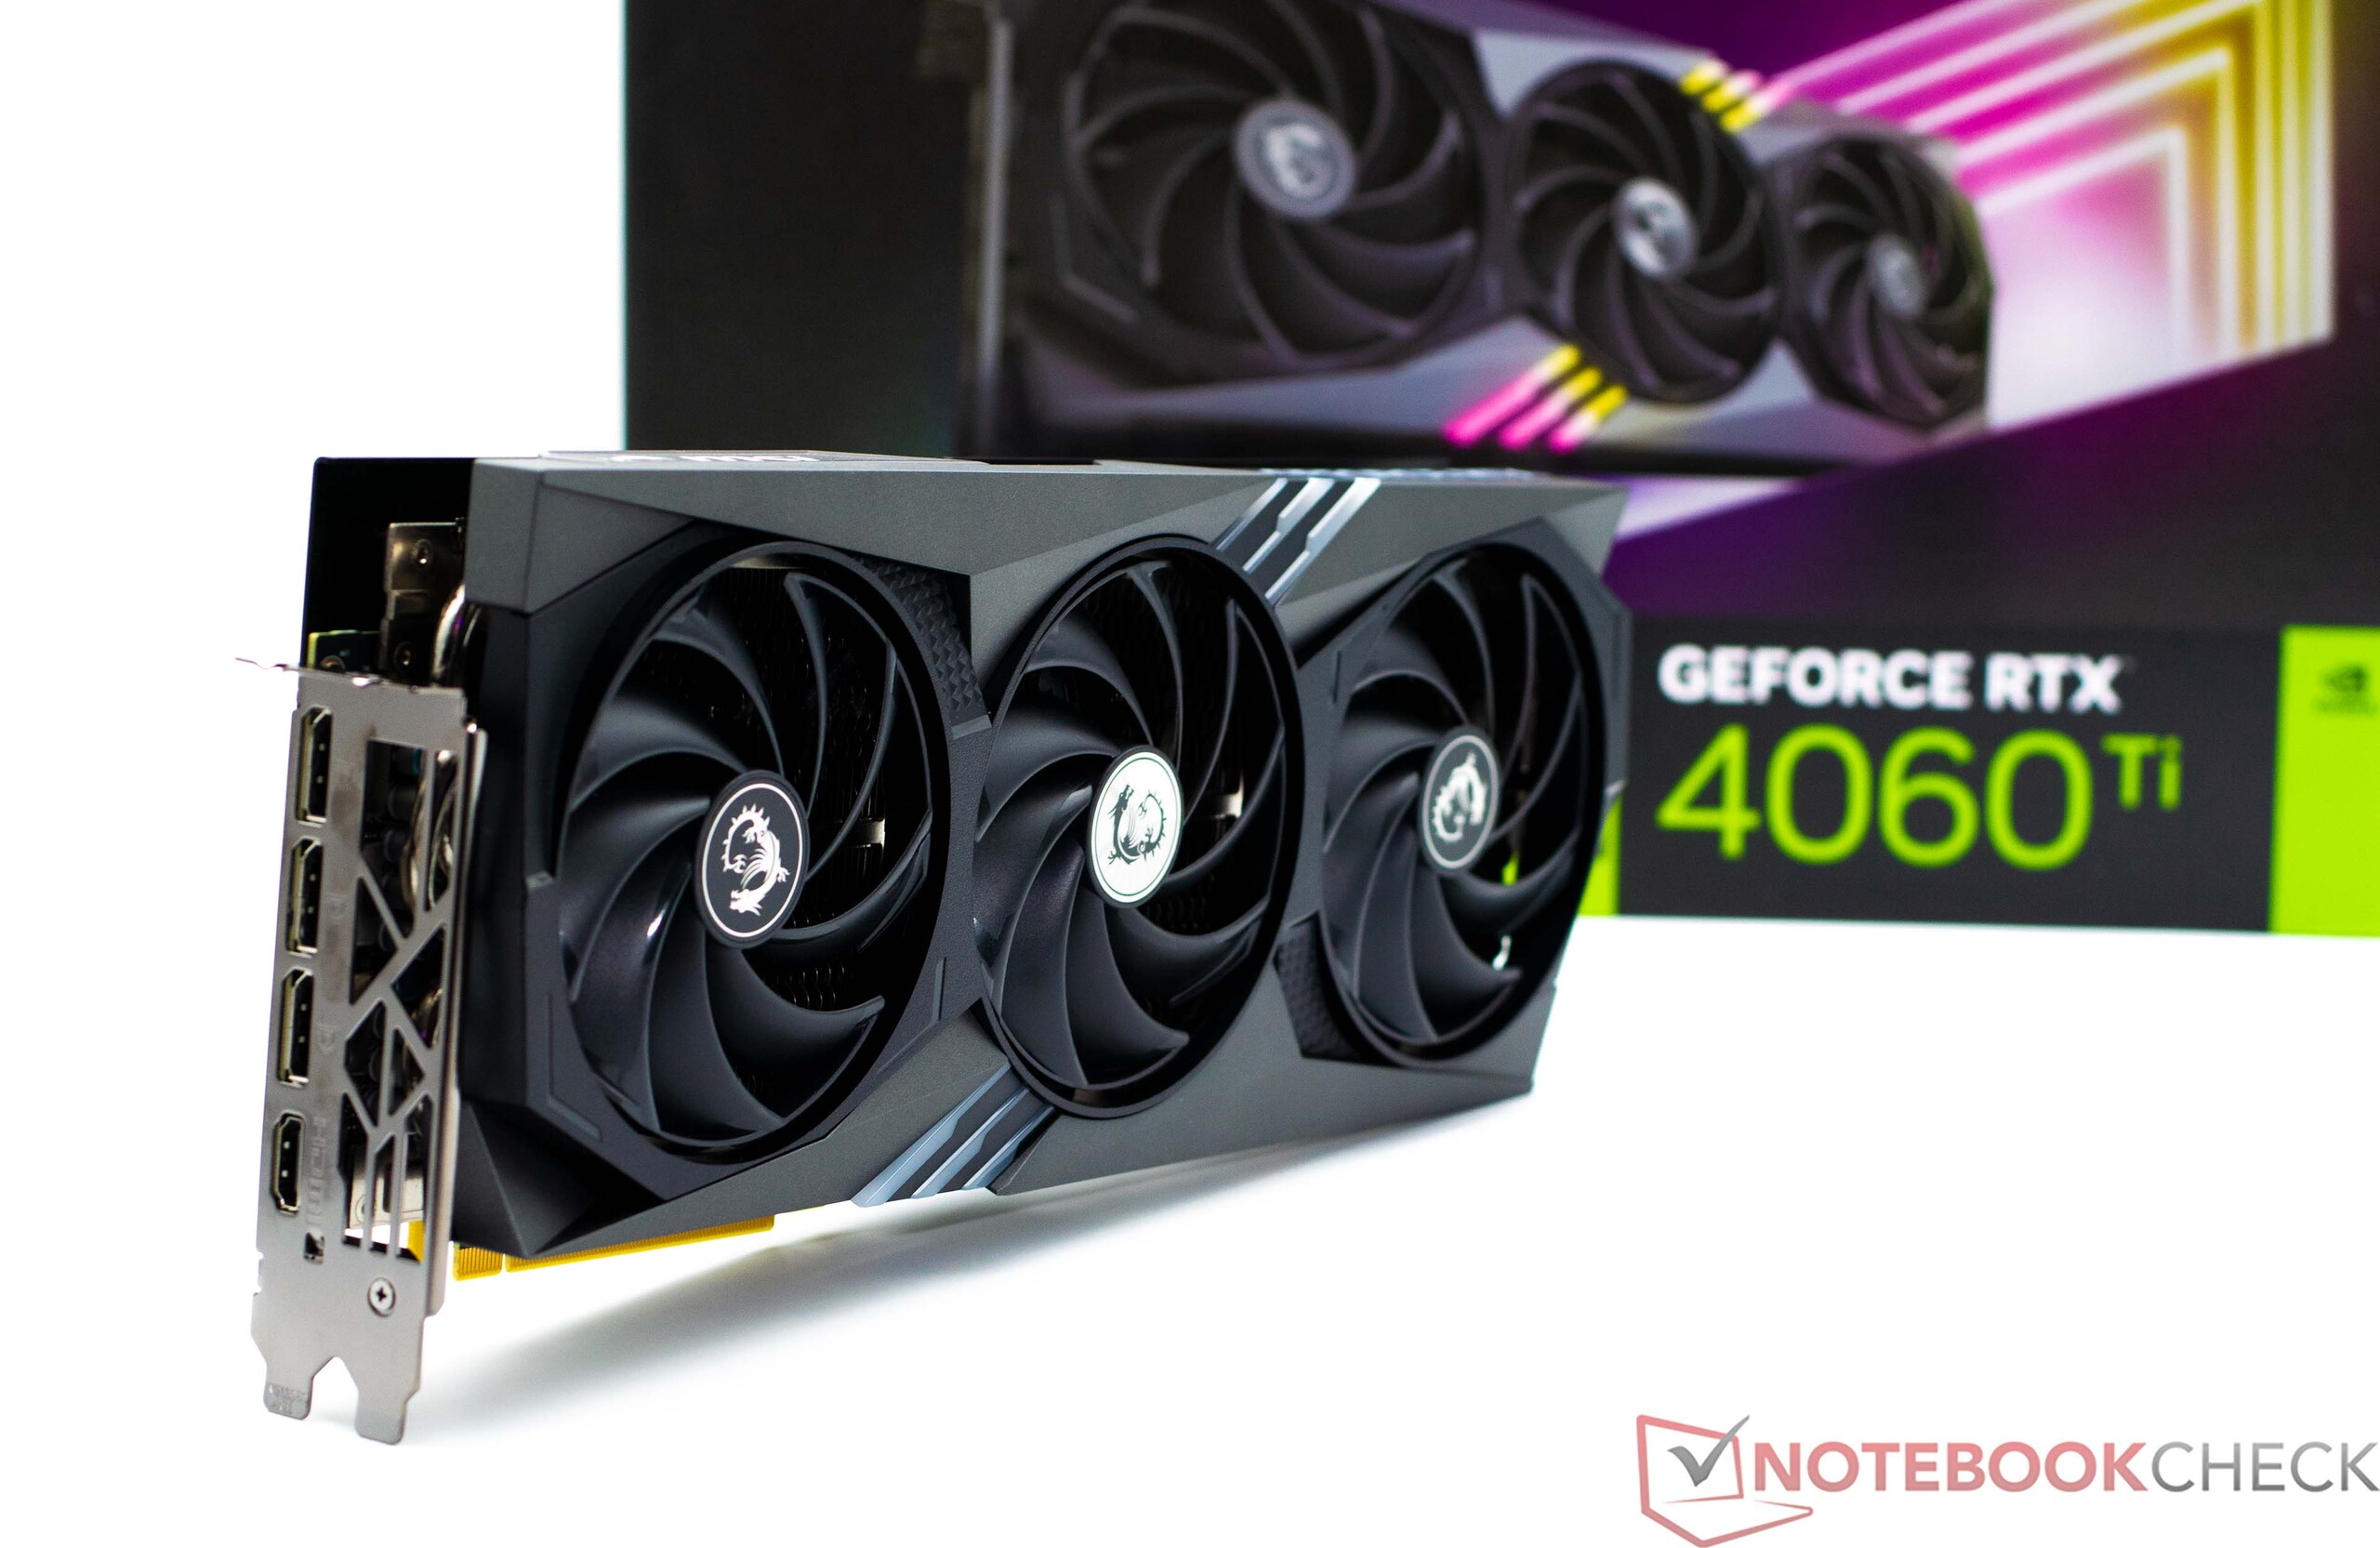
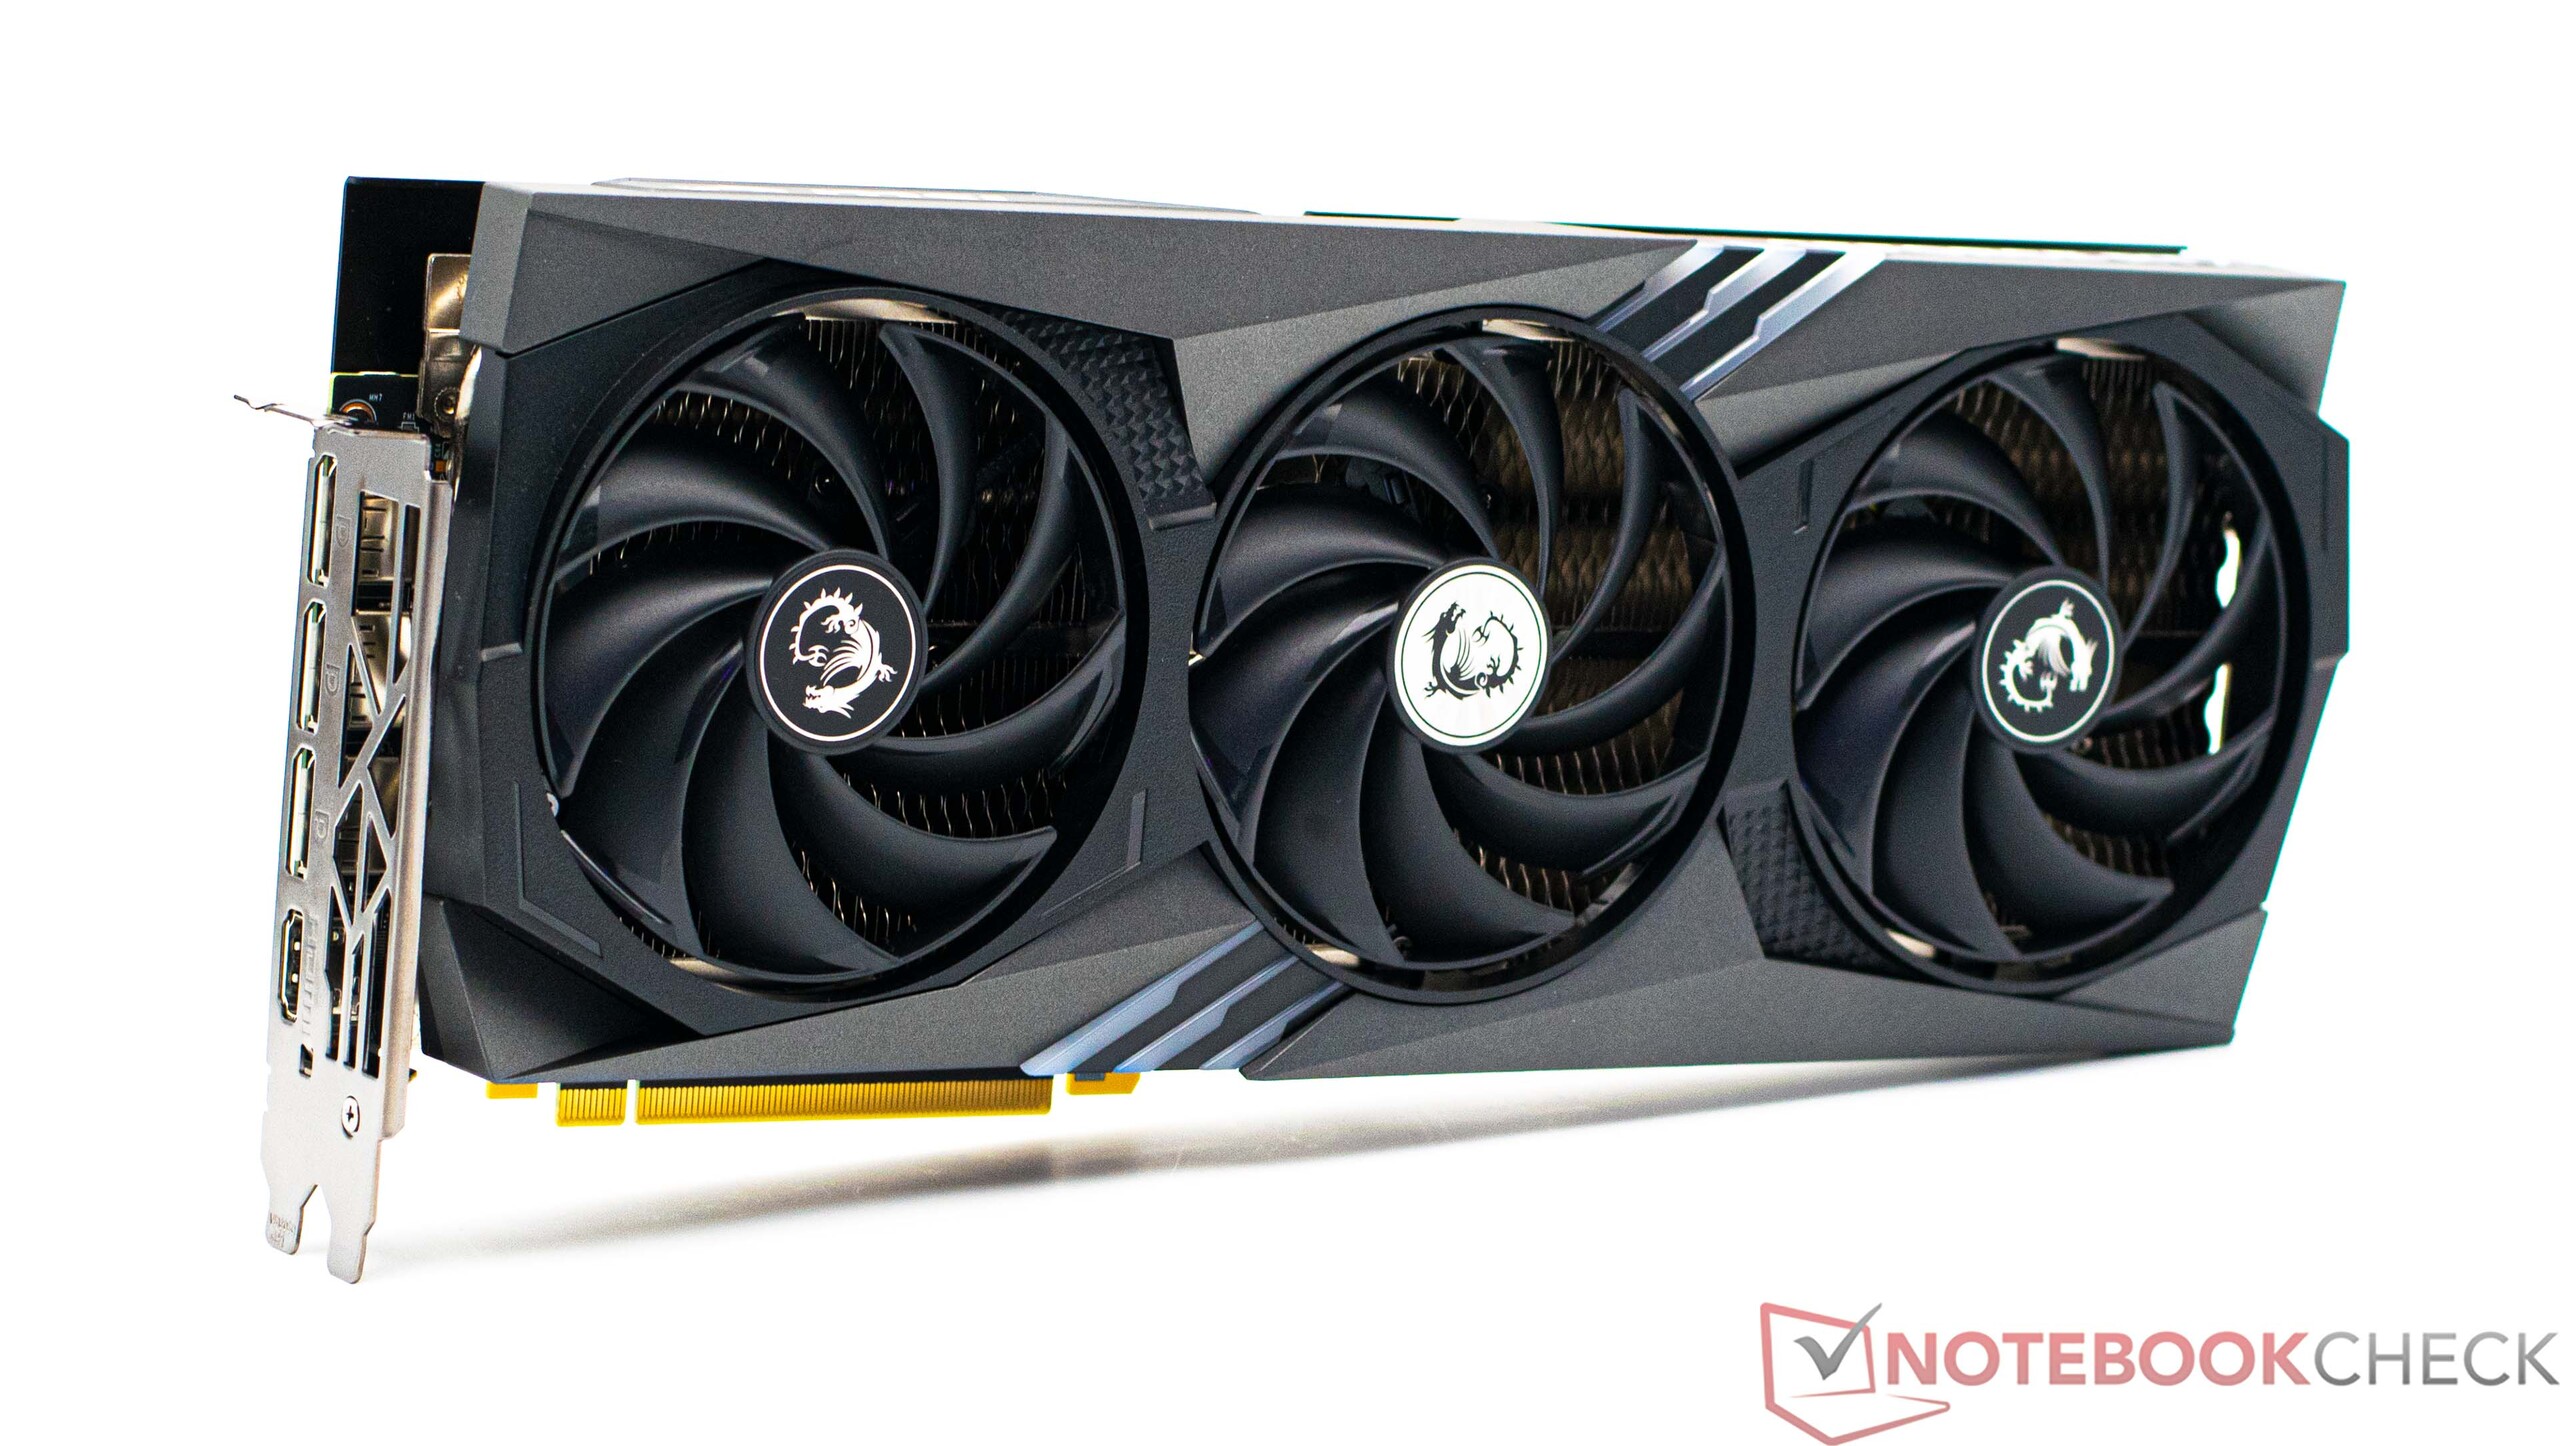
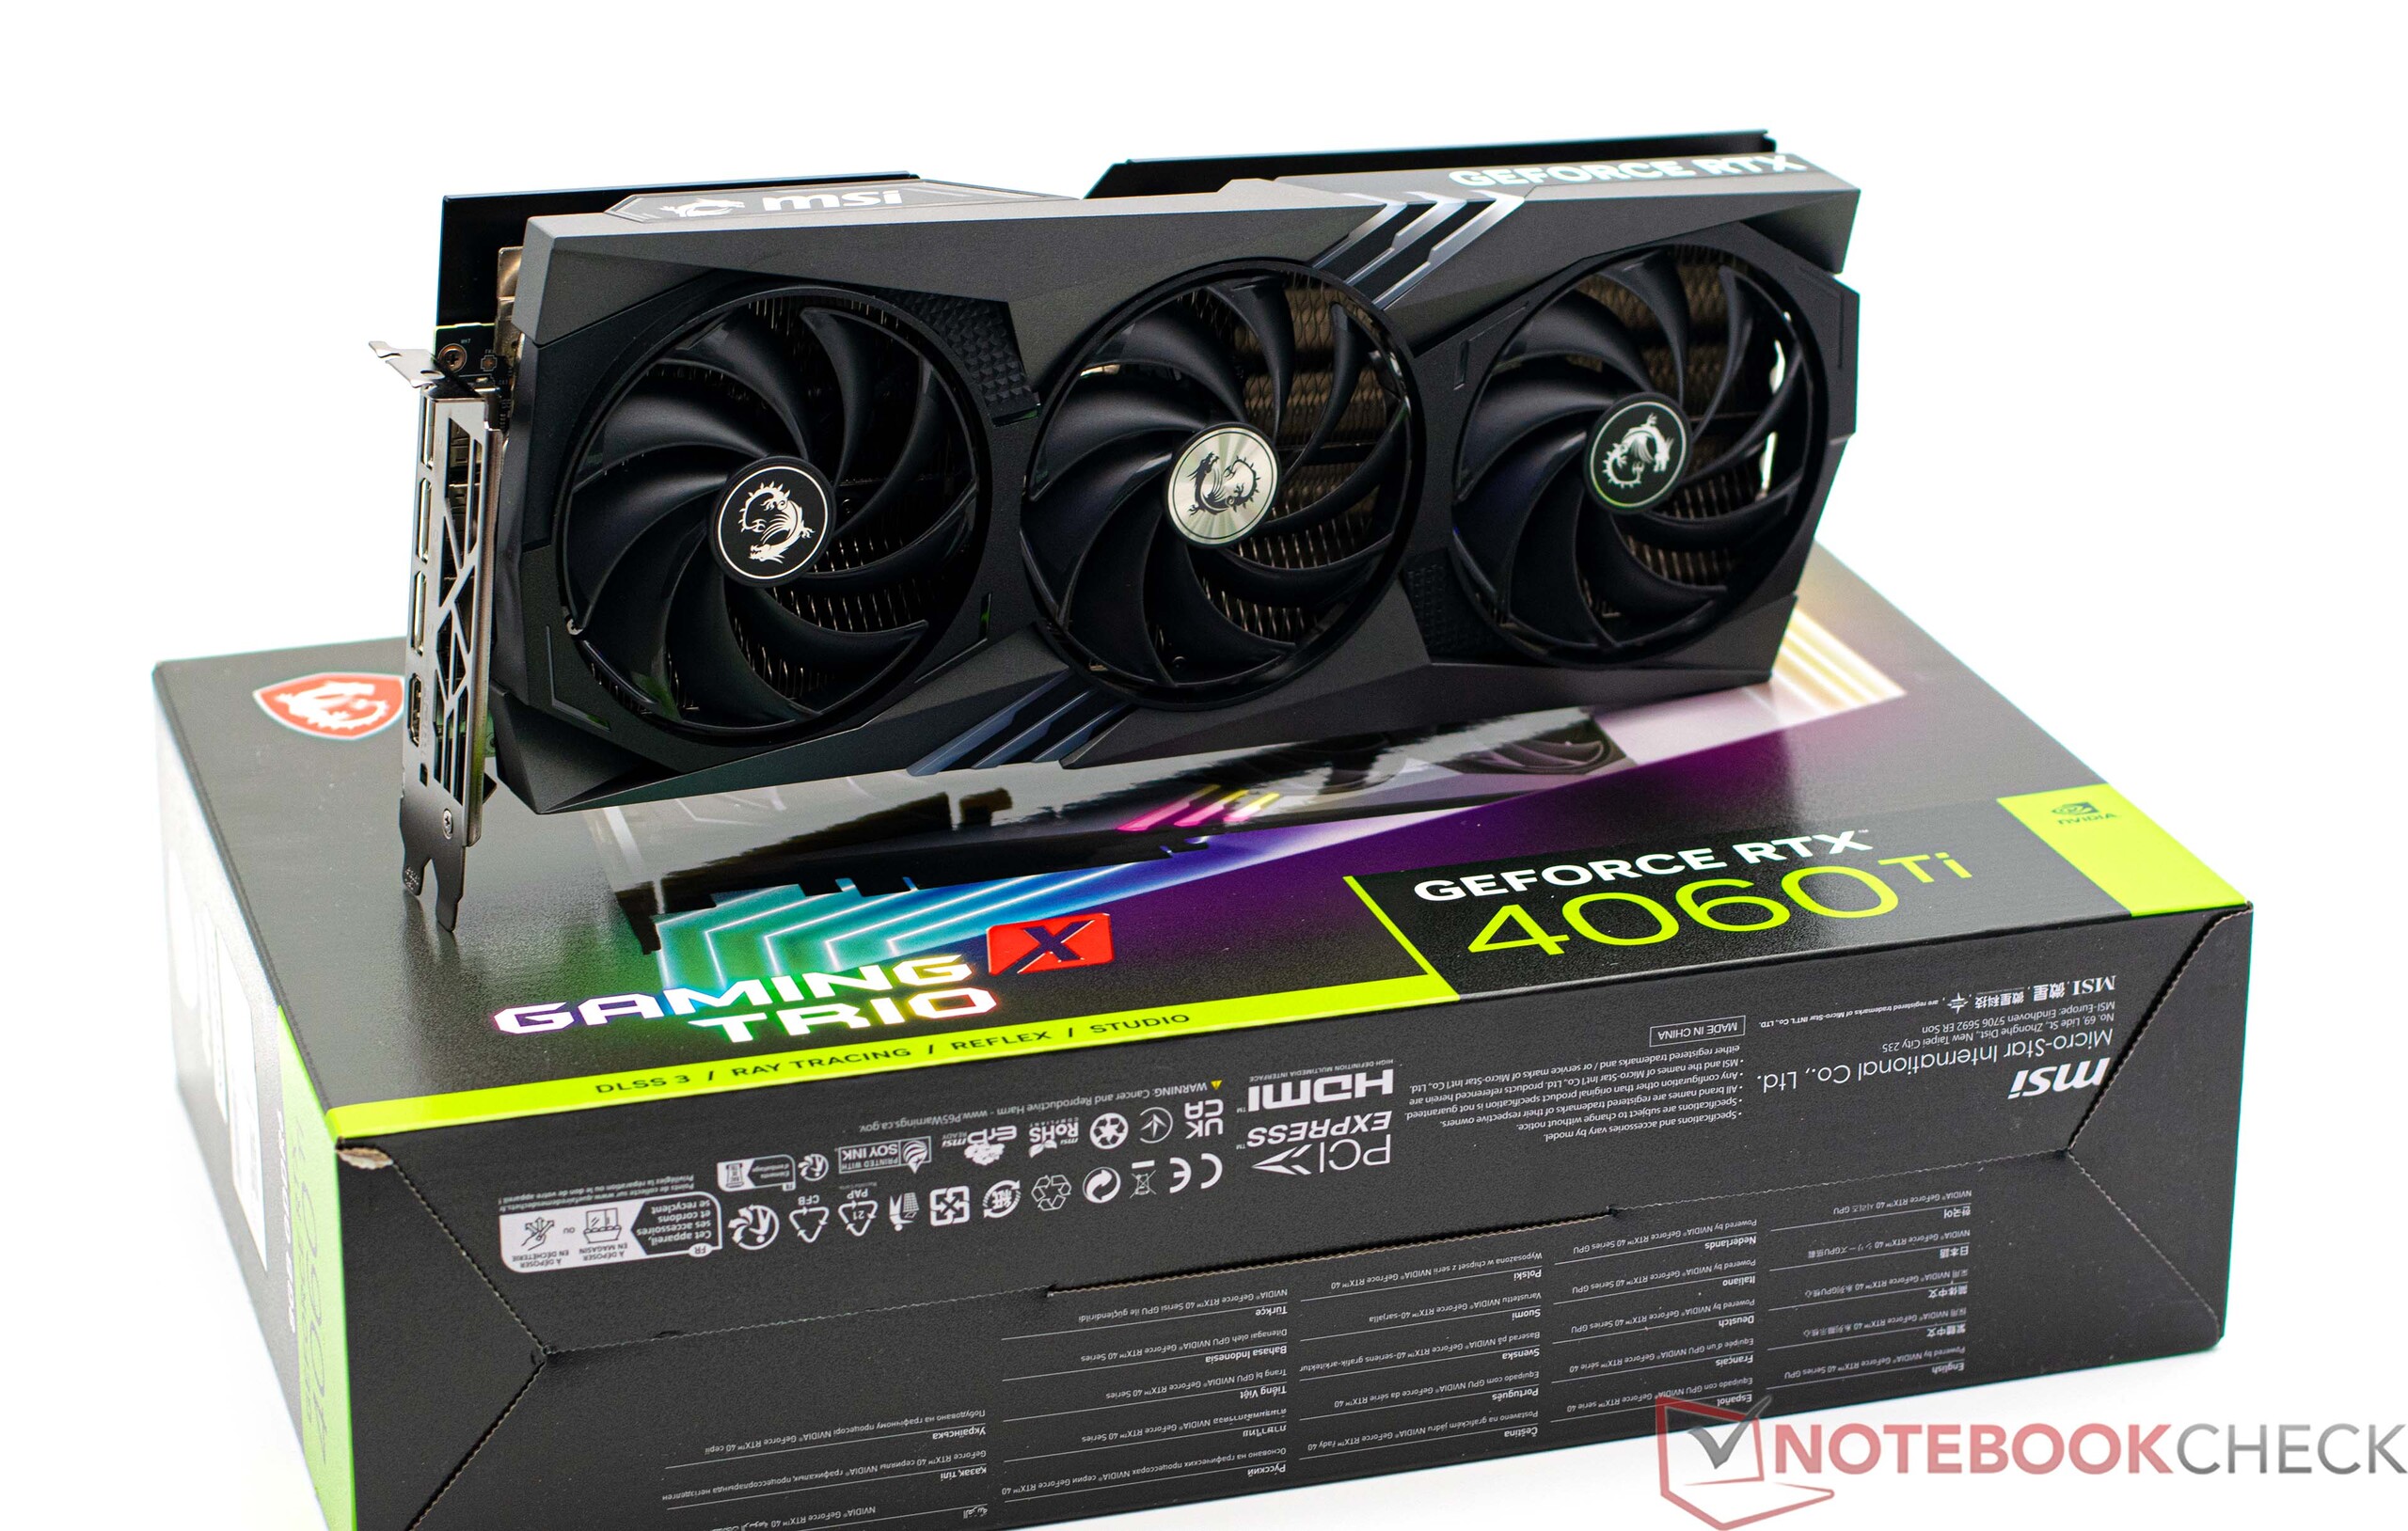
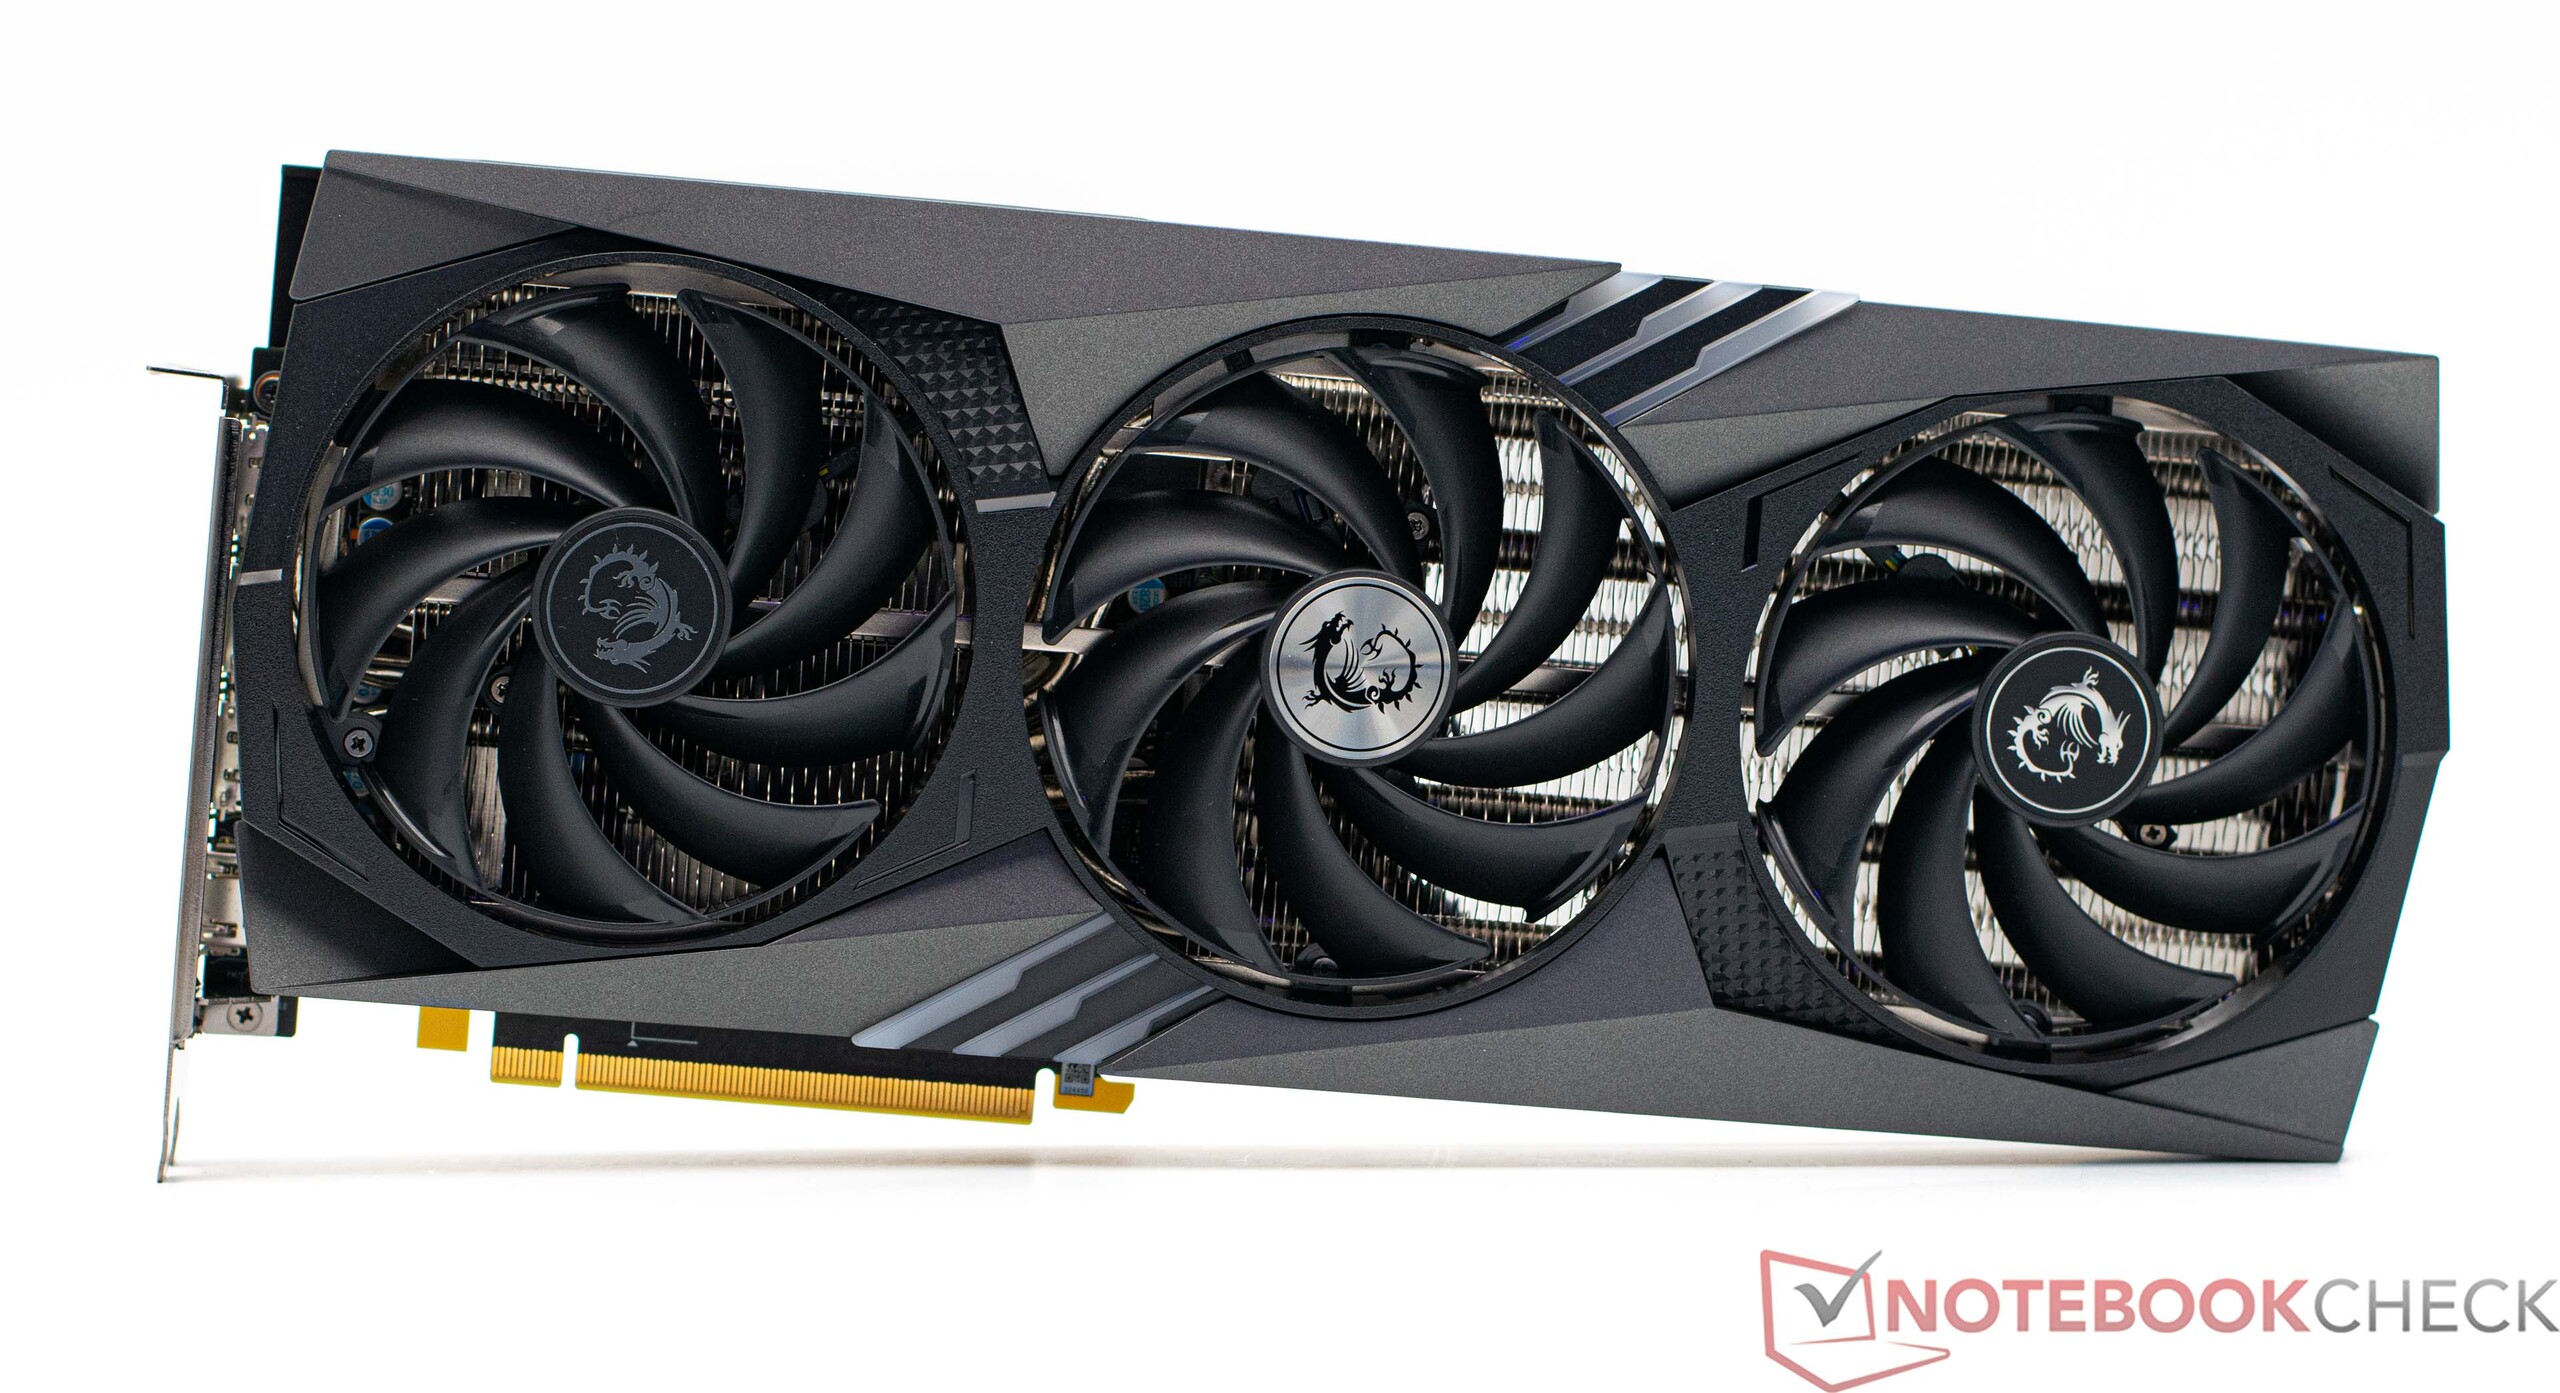
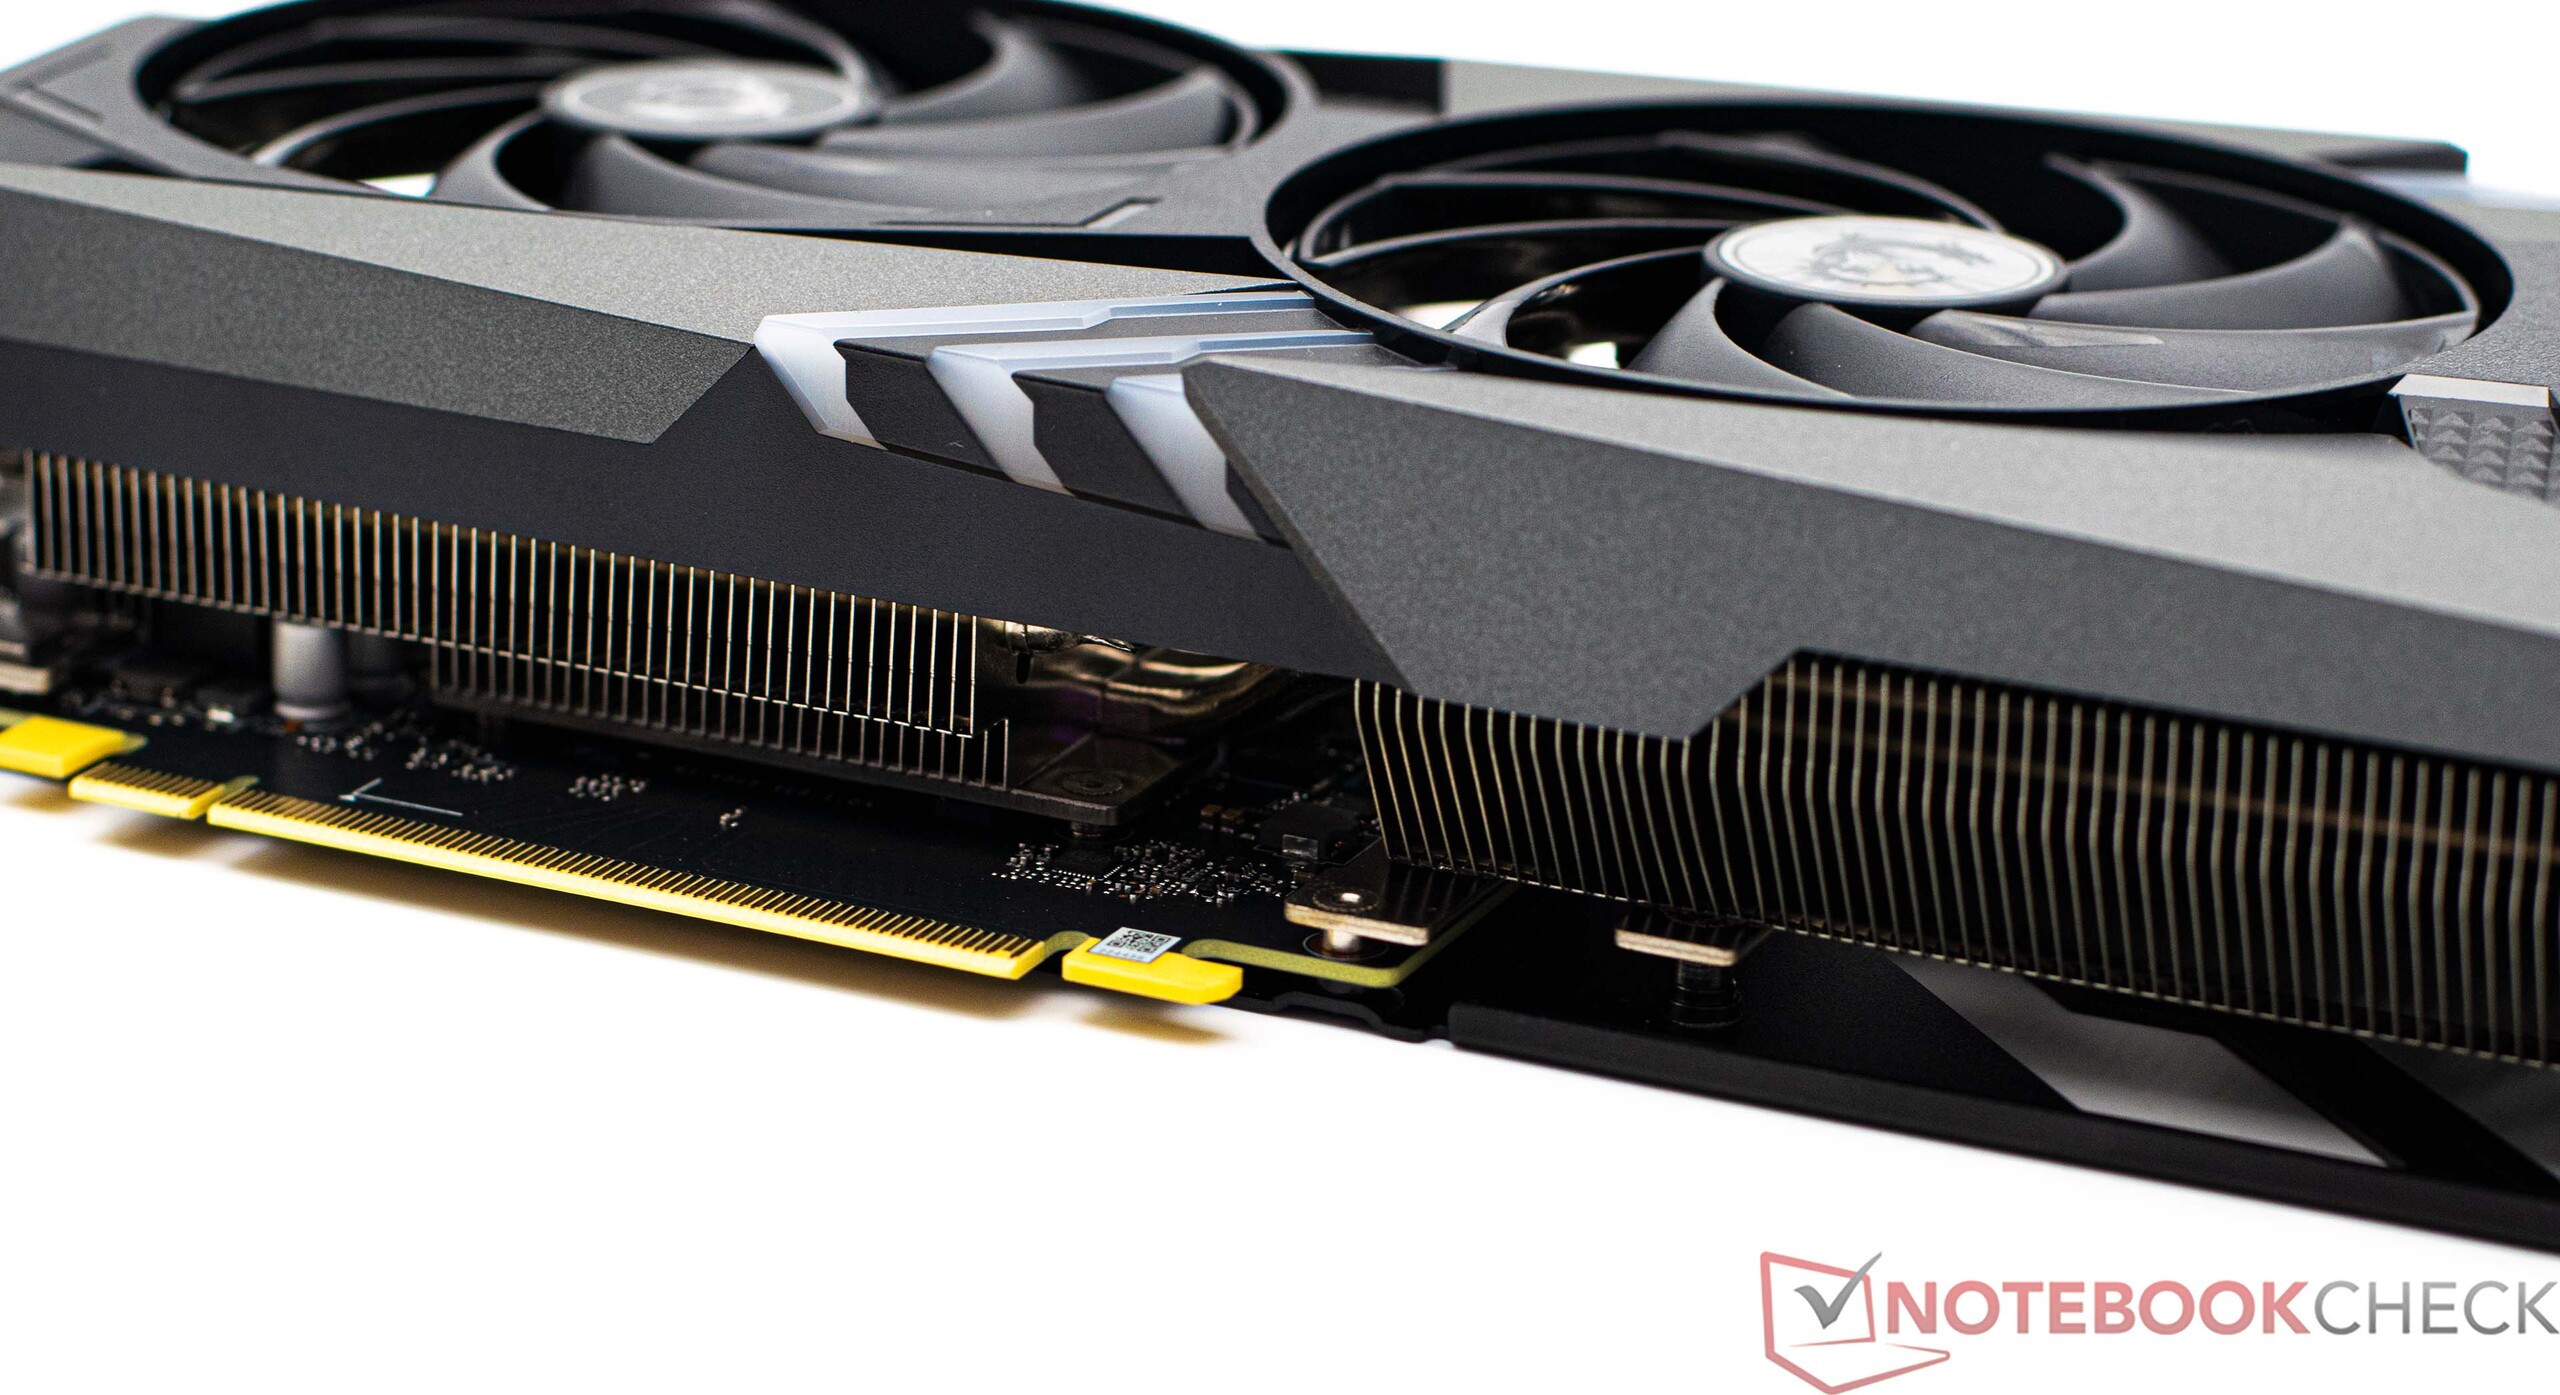
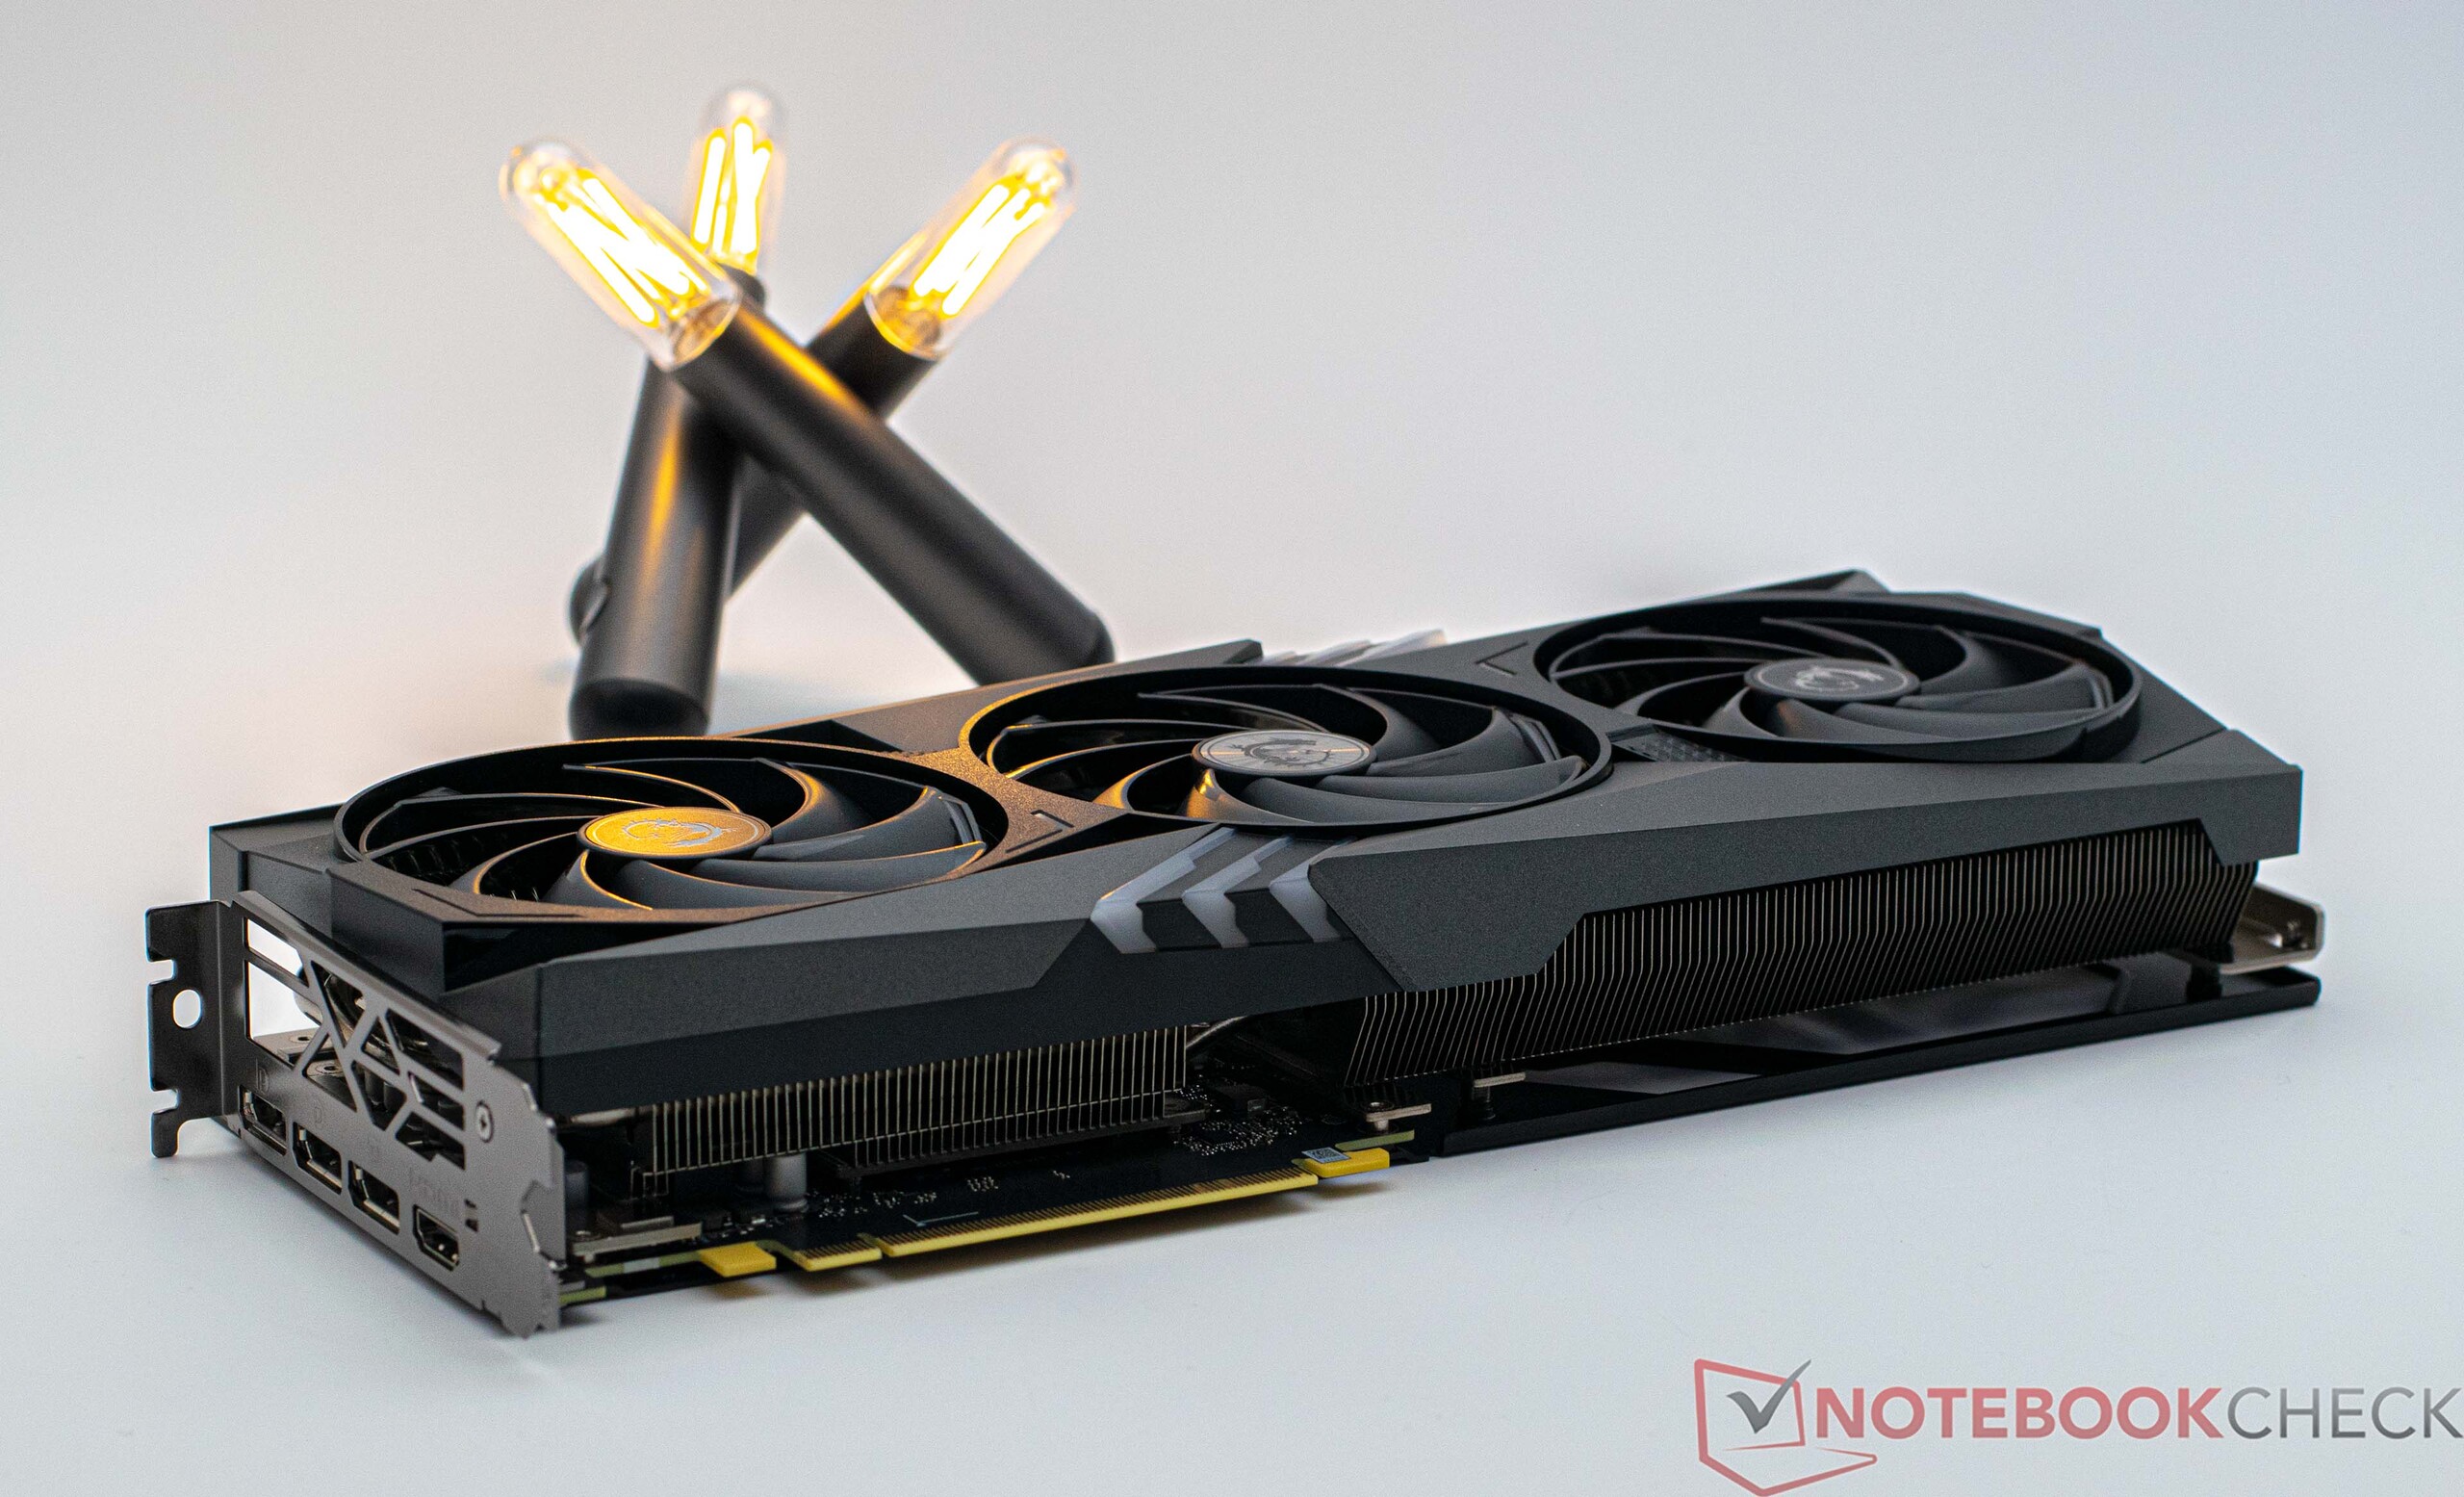
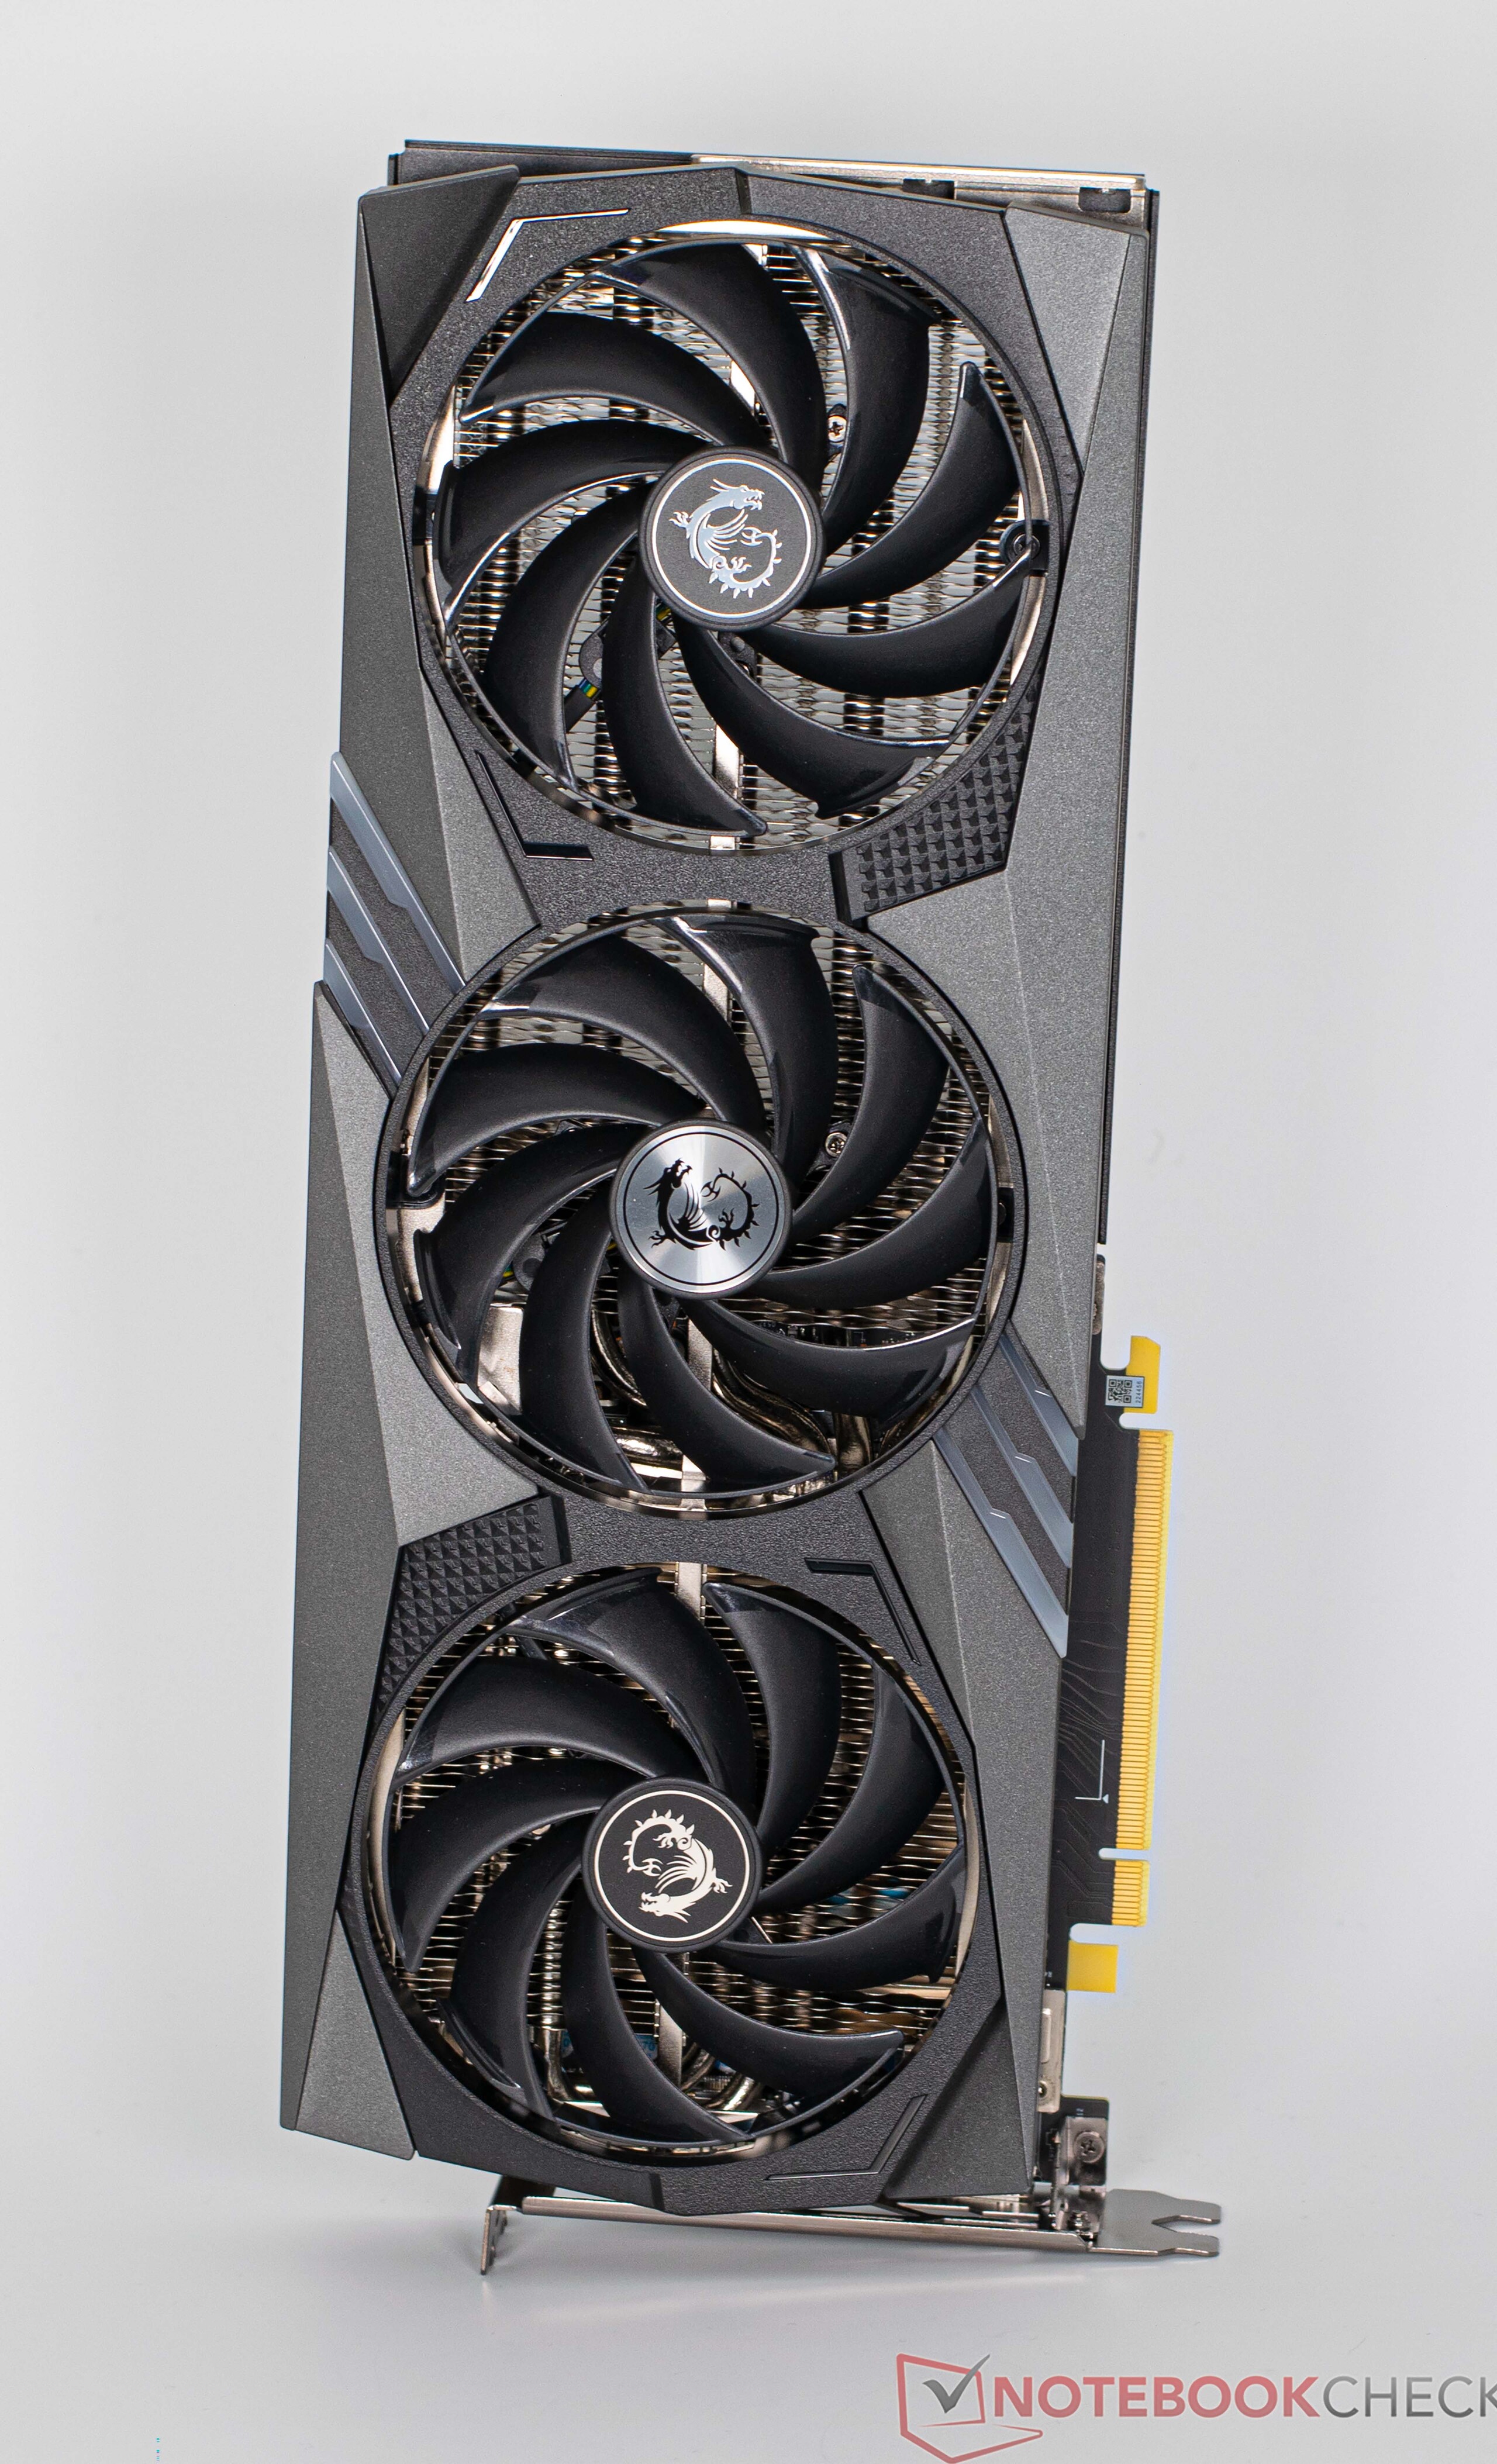
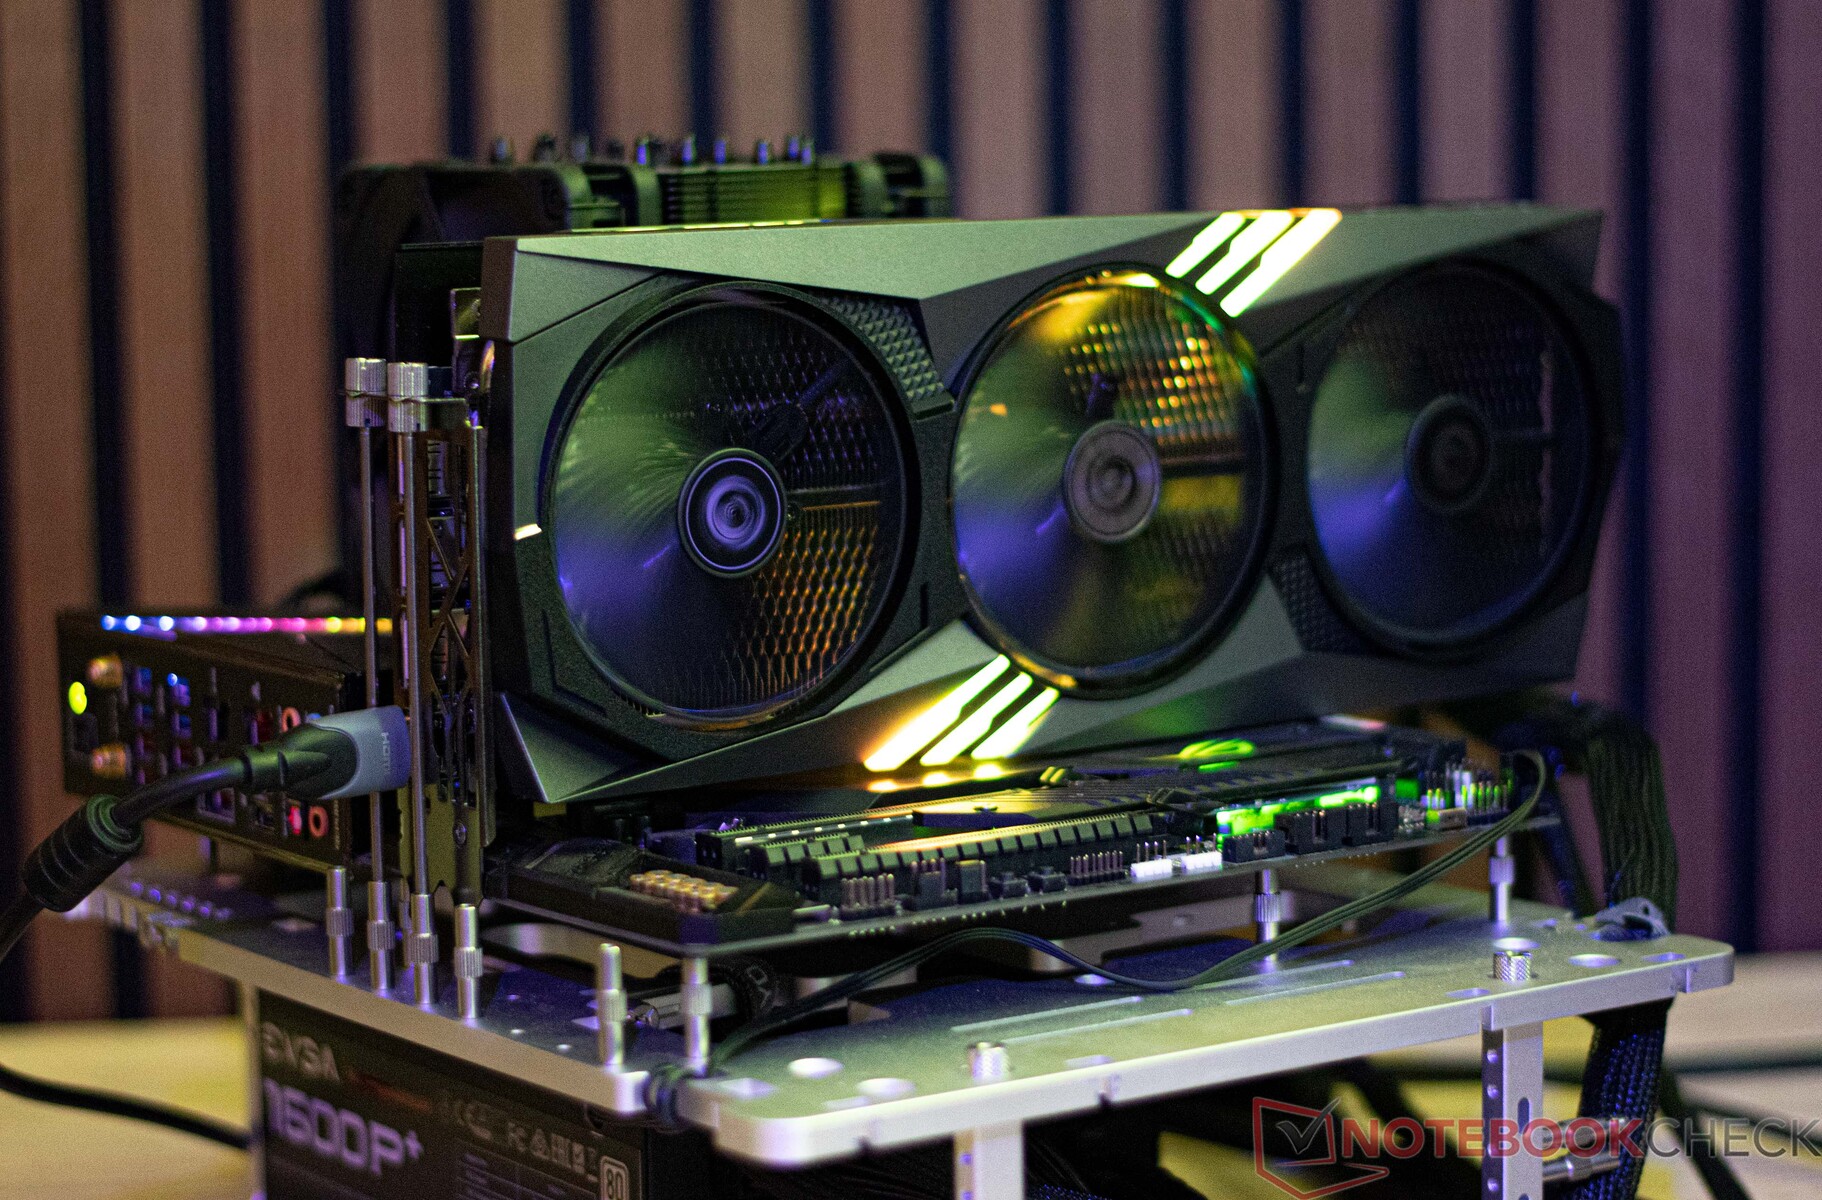
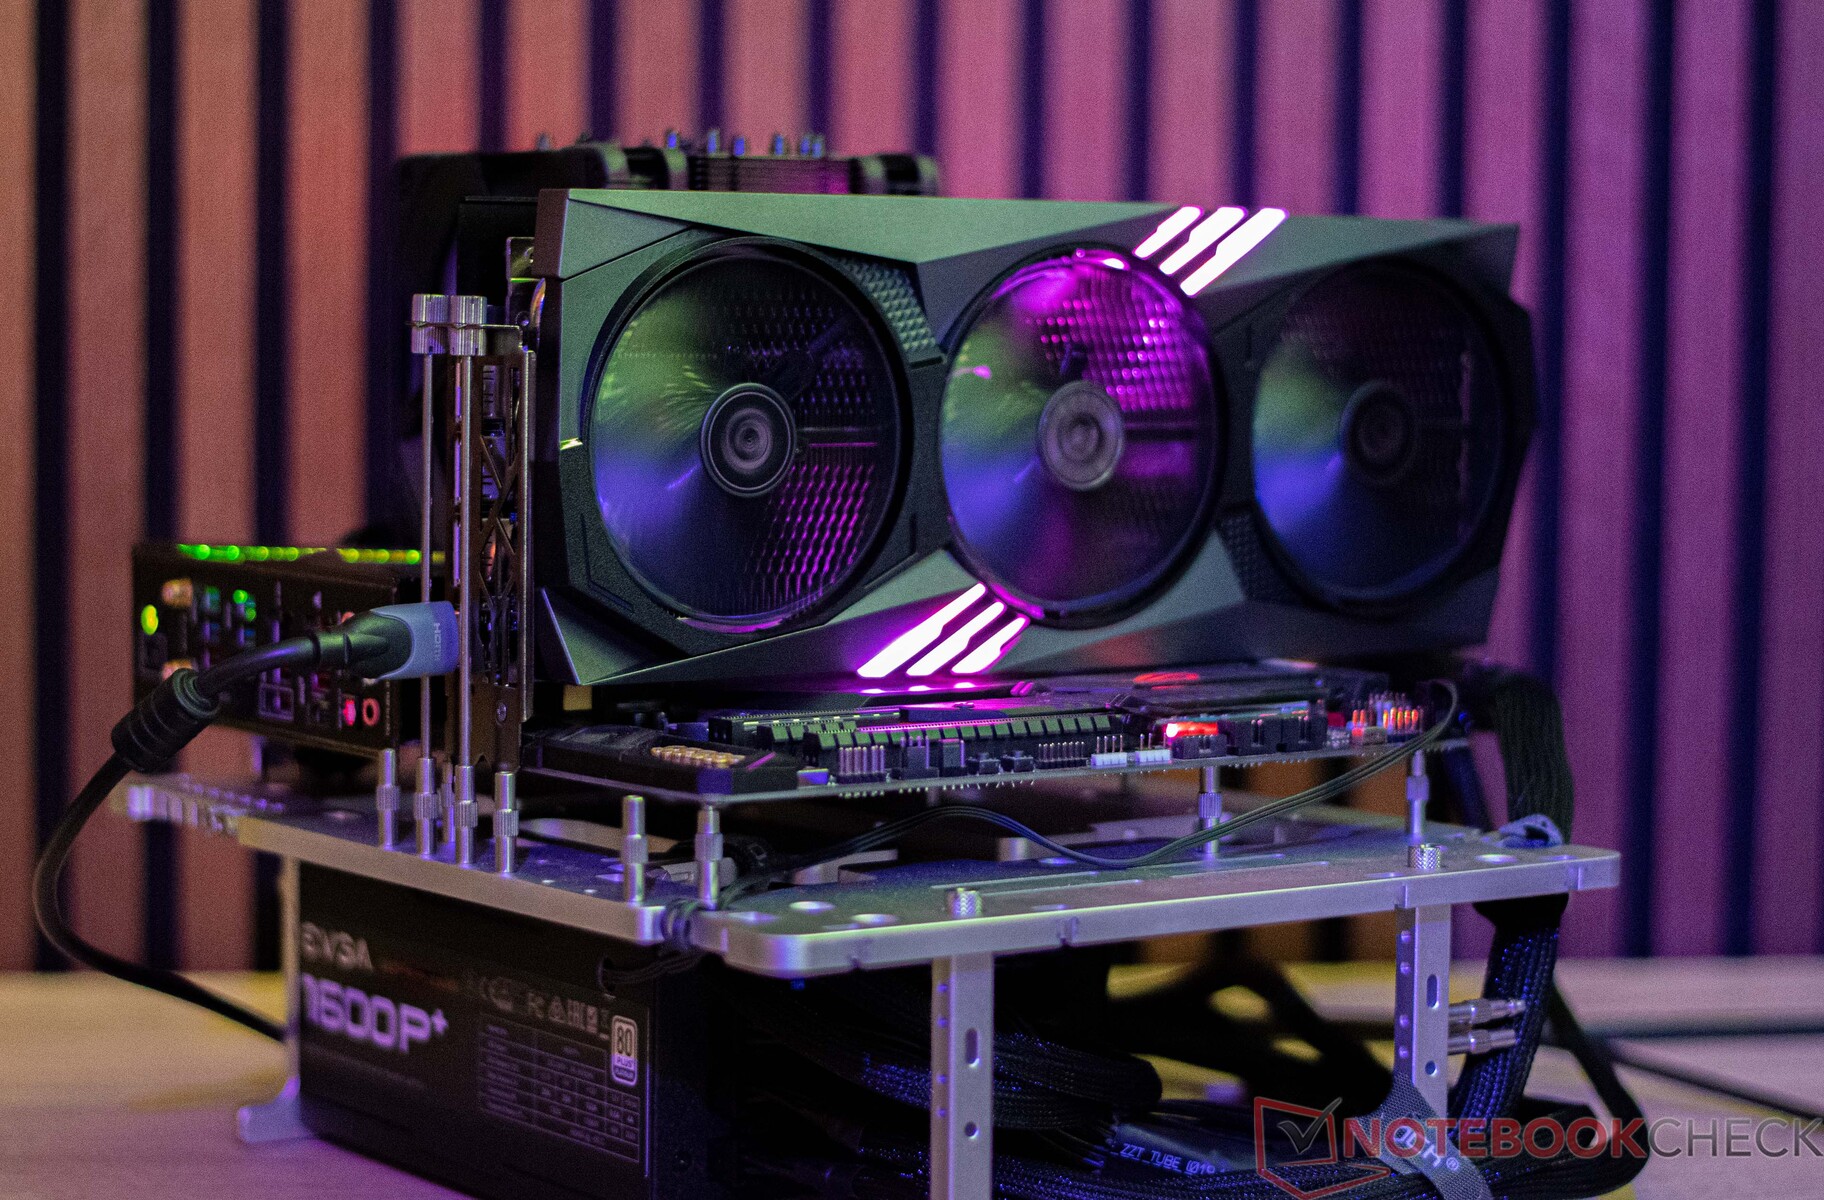
这一次,我们的测试样品GeForce RTX 4060 Ti是由微星制造的。准确地说,它是制造商的顶级型号,即Gaming X Trio版本。尽管它的功耗较低,只有160瓦,但内置的冷却系统非常大--这保证了非常安静的操作。它的尺寸实际上甚至比我们帕利特的GeForce RTX 4090还要长。在宽度上,微星GeForce RTX 4060 Ti占据了2.5个插槽,3个风扇为这个巨大的冷却装置提供新鲜空气。
Nvidia过去在中端卡的VRAM方面表现得有点小气,这已经不是什么秘密了。例如,NvidiaGeForce RTX 3060 Ti 只有8GB。现在,GeForce RTX 4060 Ti也只有8GB。然而,他们已经宣布了16GB的型号,它们应该很快就会进入市场。但是,一个大的VRAM有多重要?毕竟,GeForce RTX 4060 Ti只应该覆盖1080p的游戏。1,440p区域由采用RTX 4070芯片的型号覆盖,两个顶级型号RTX 4080和RTX 4090则负责UHD游戏。
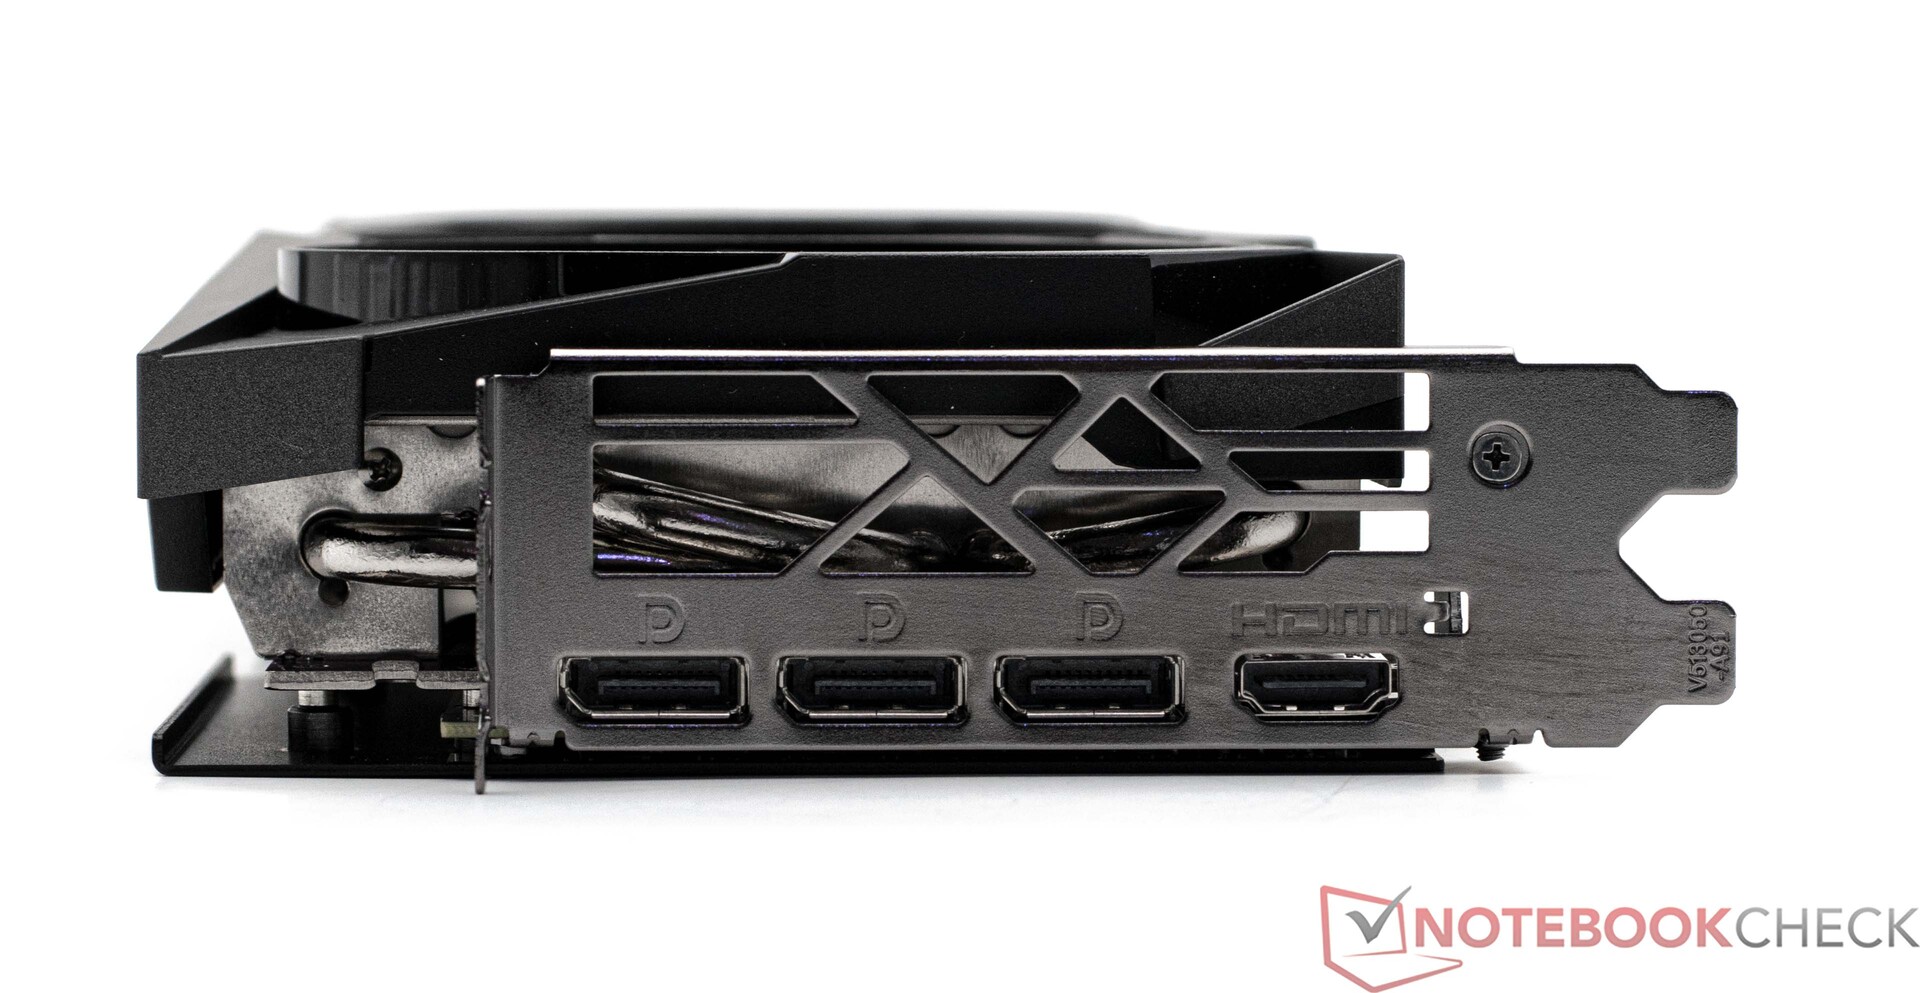
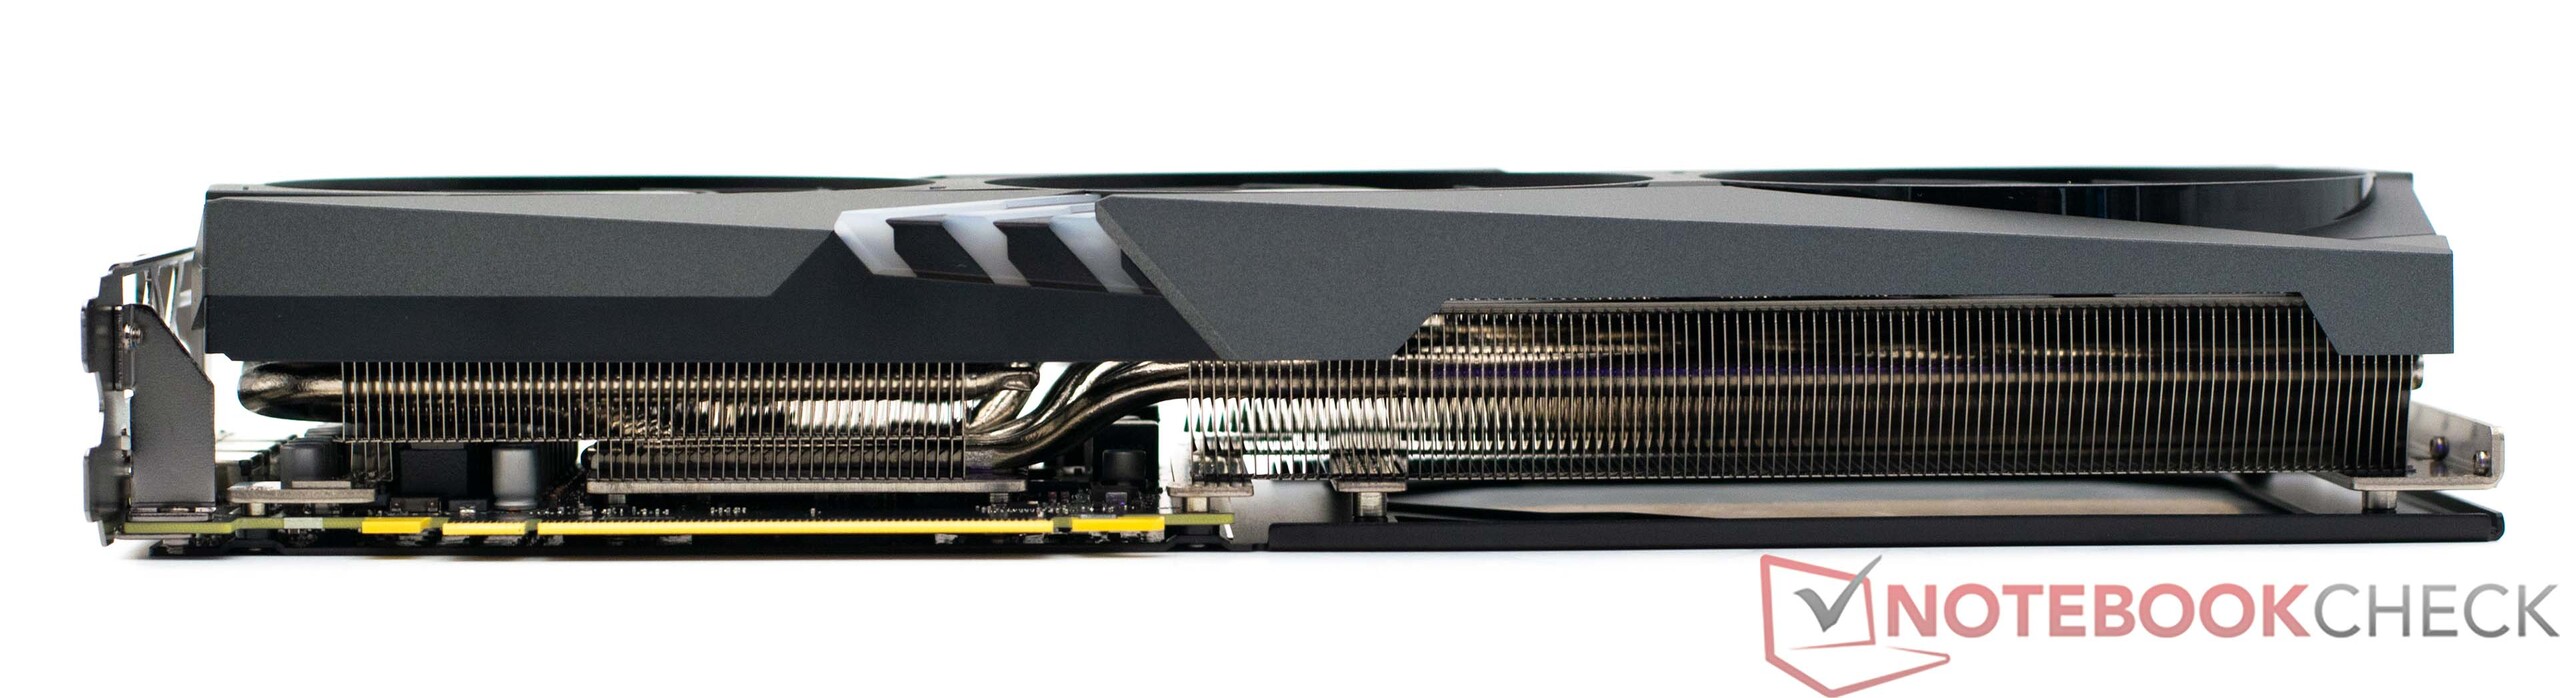
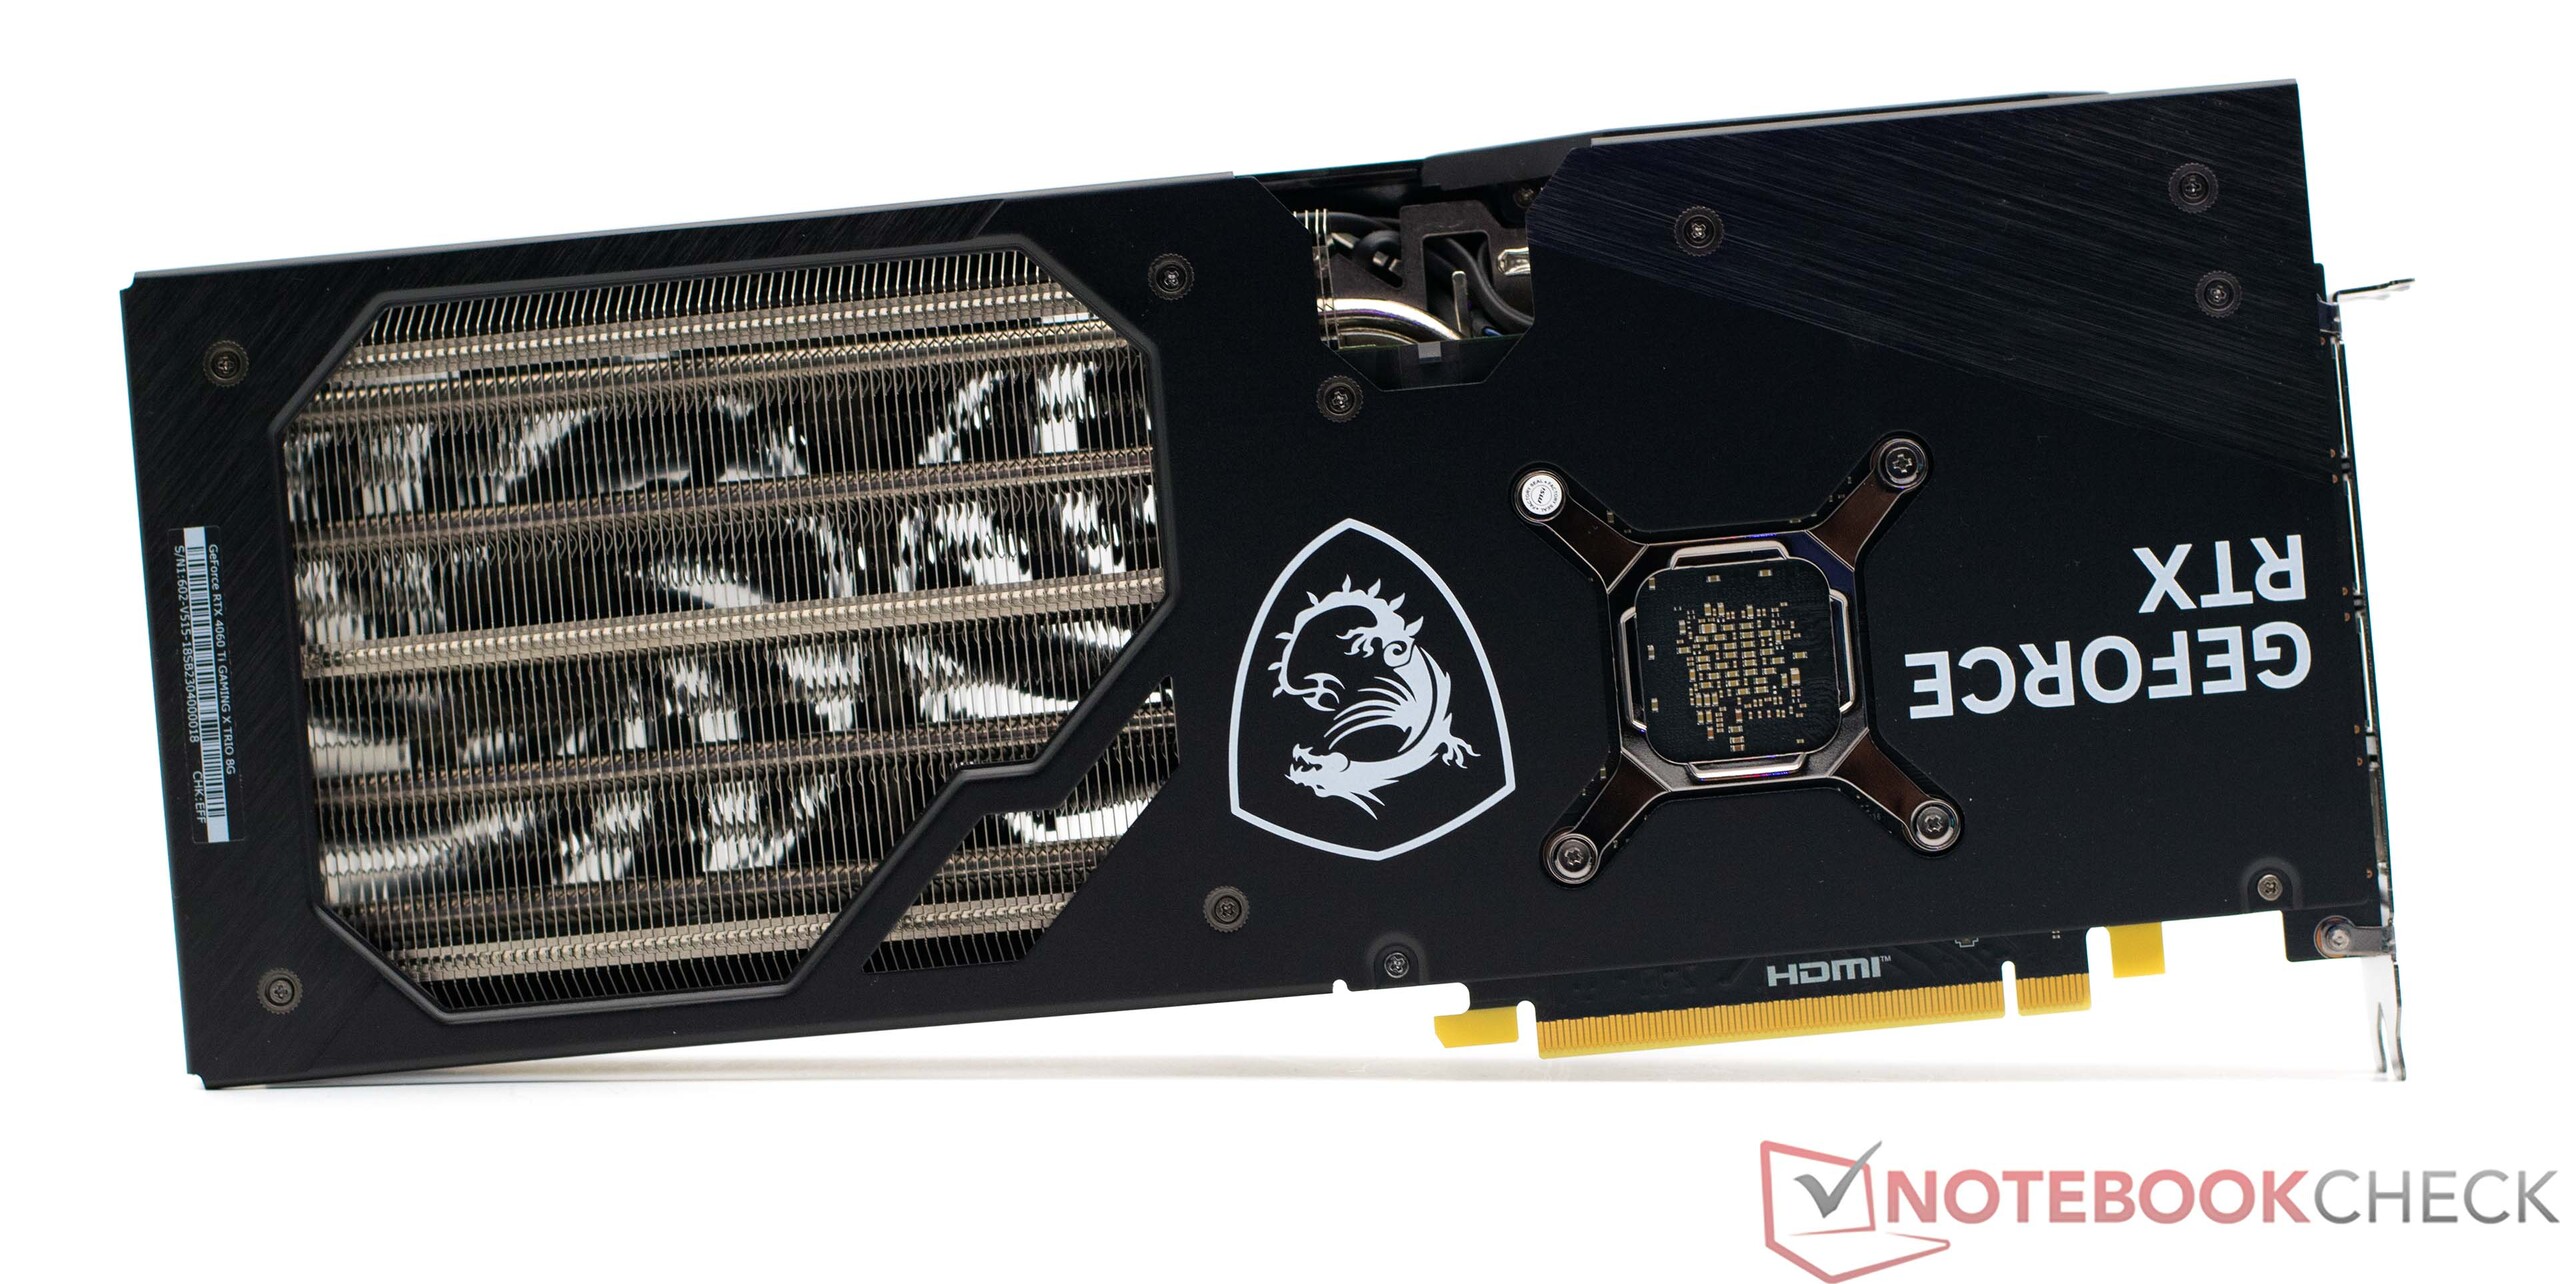
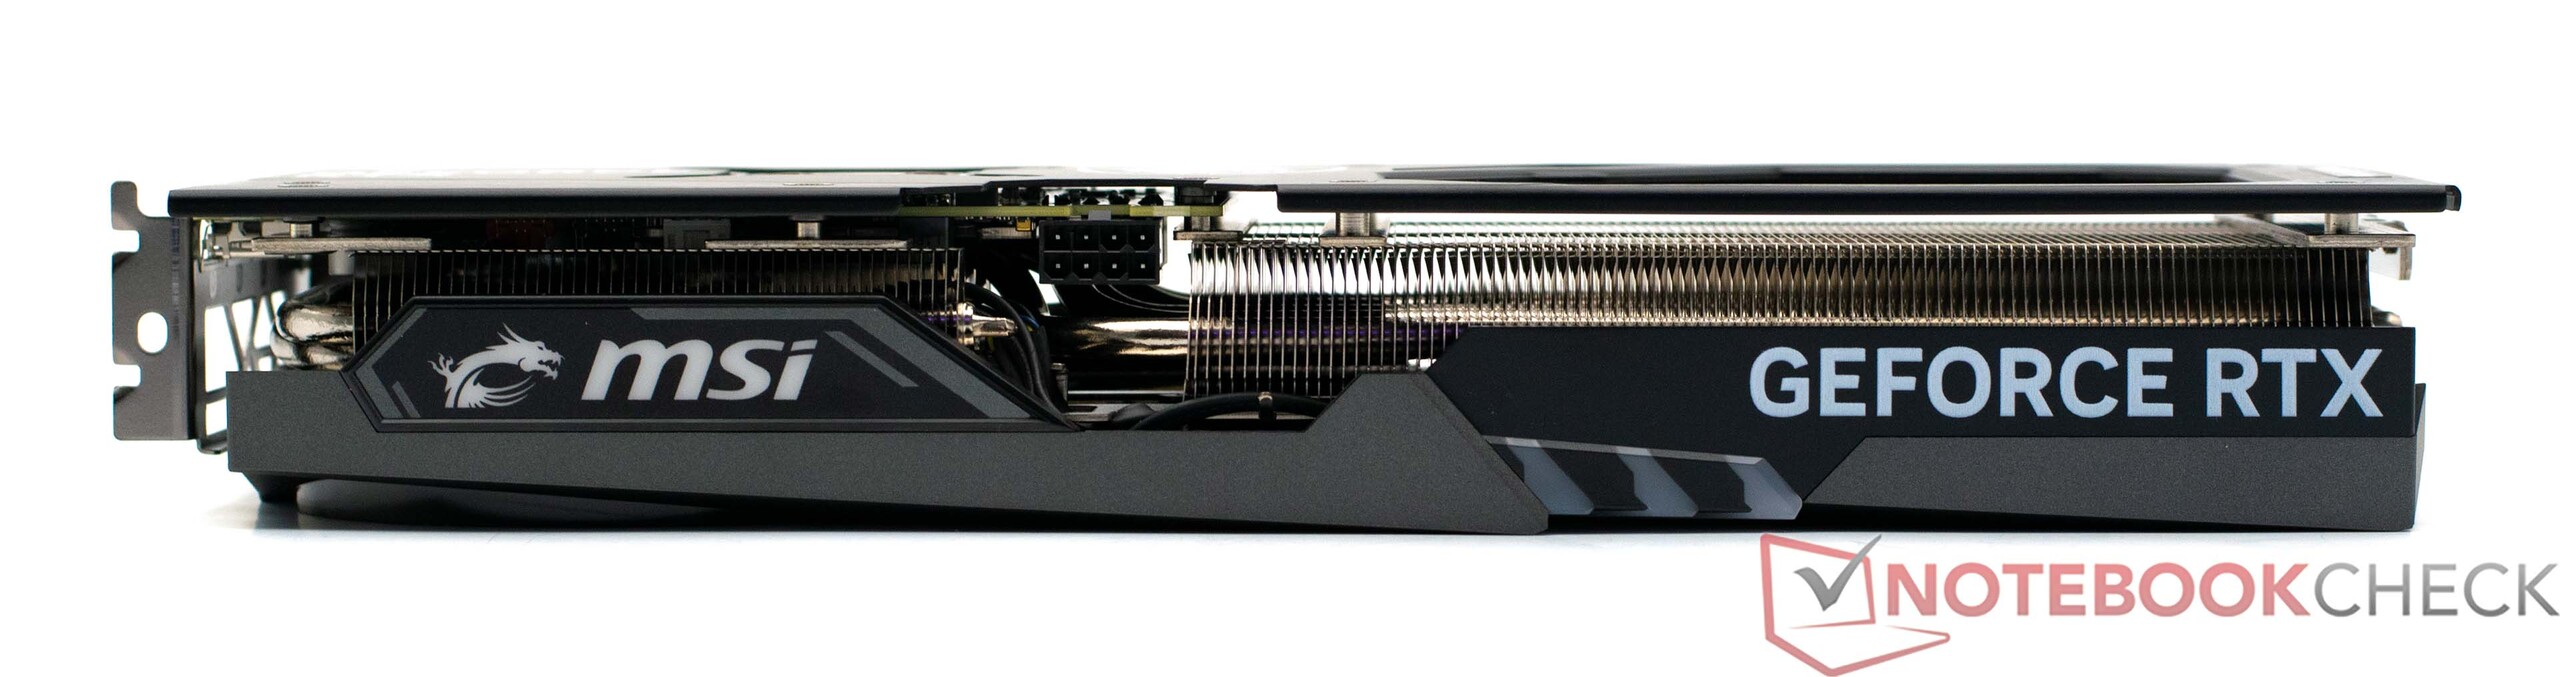
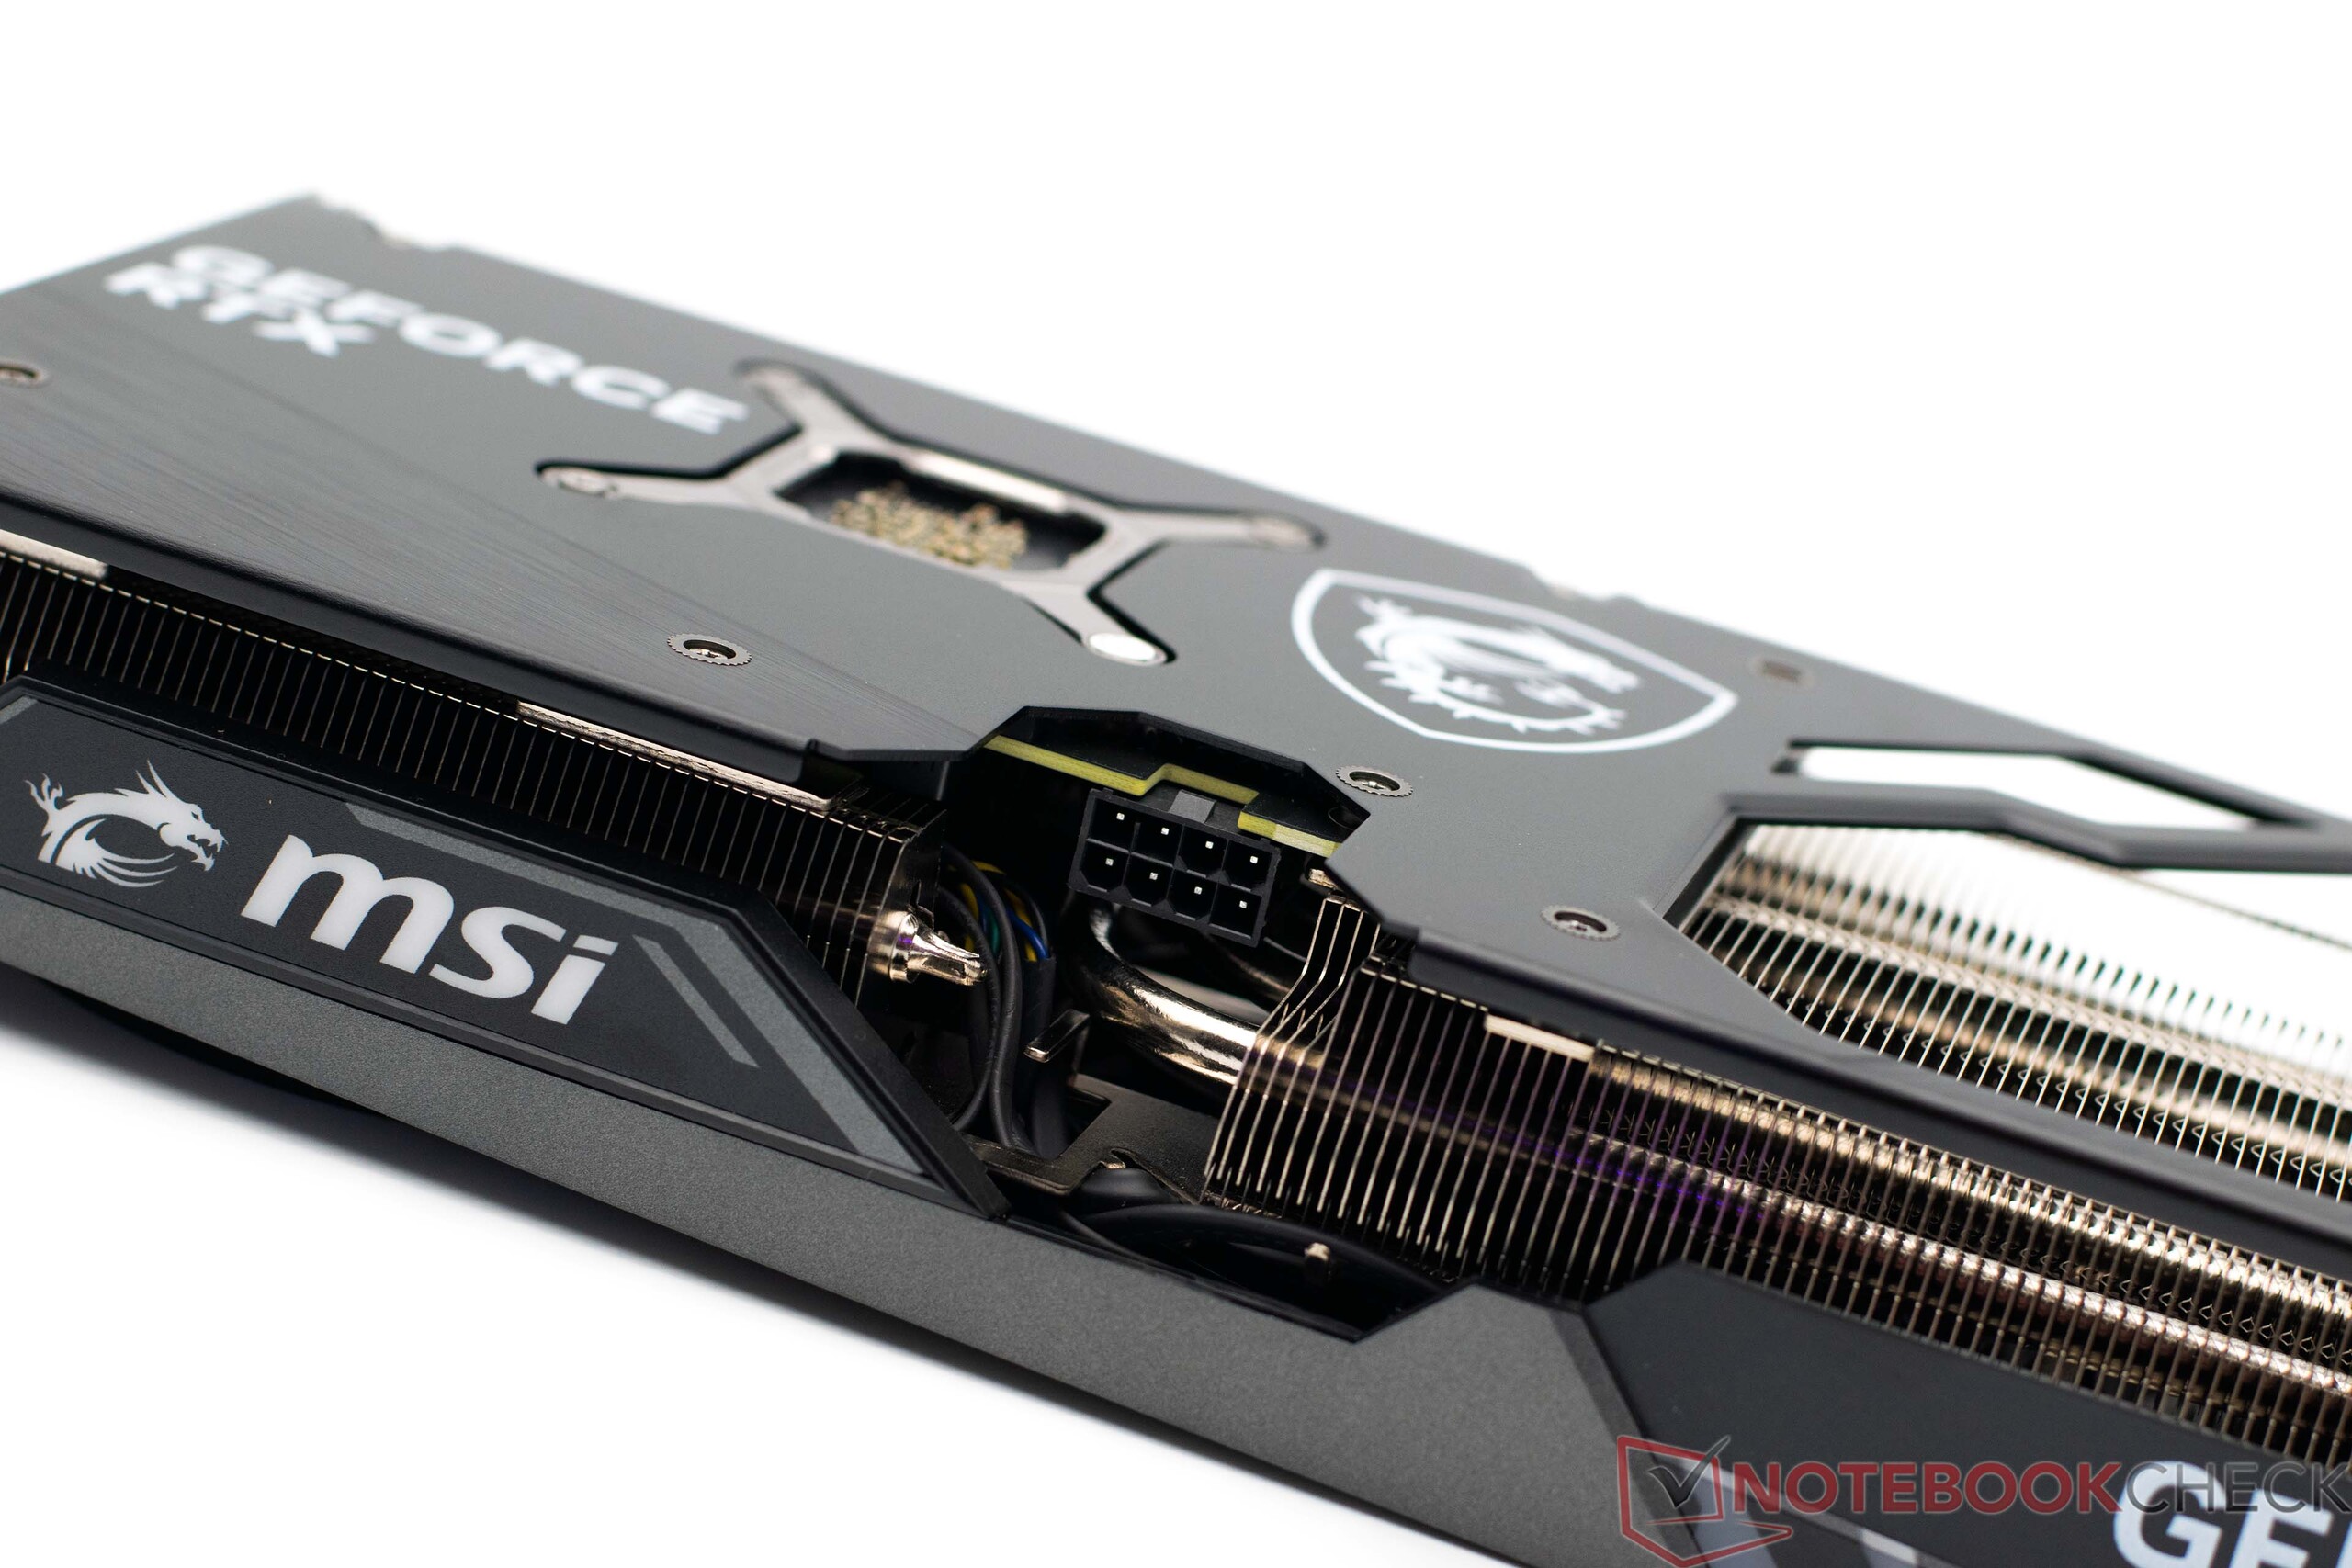
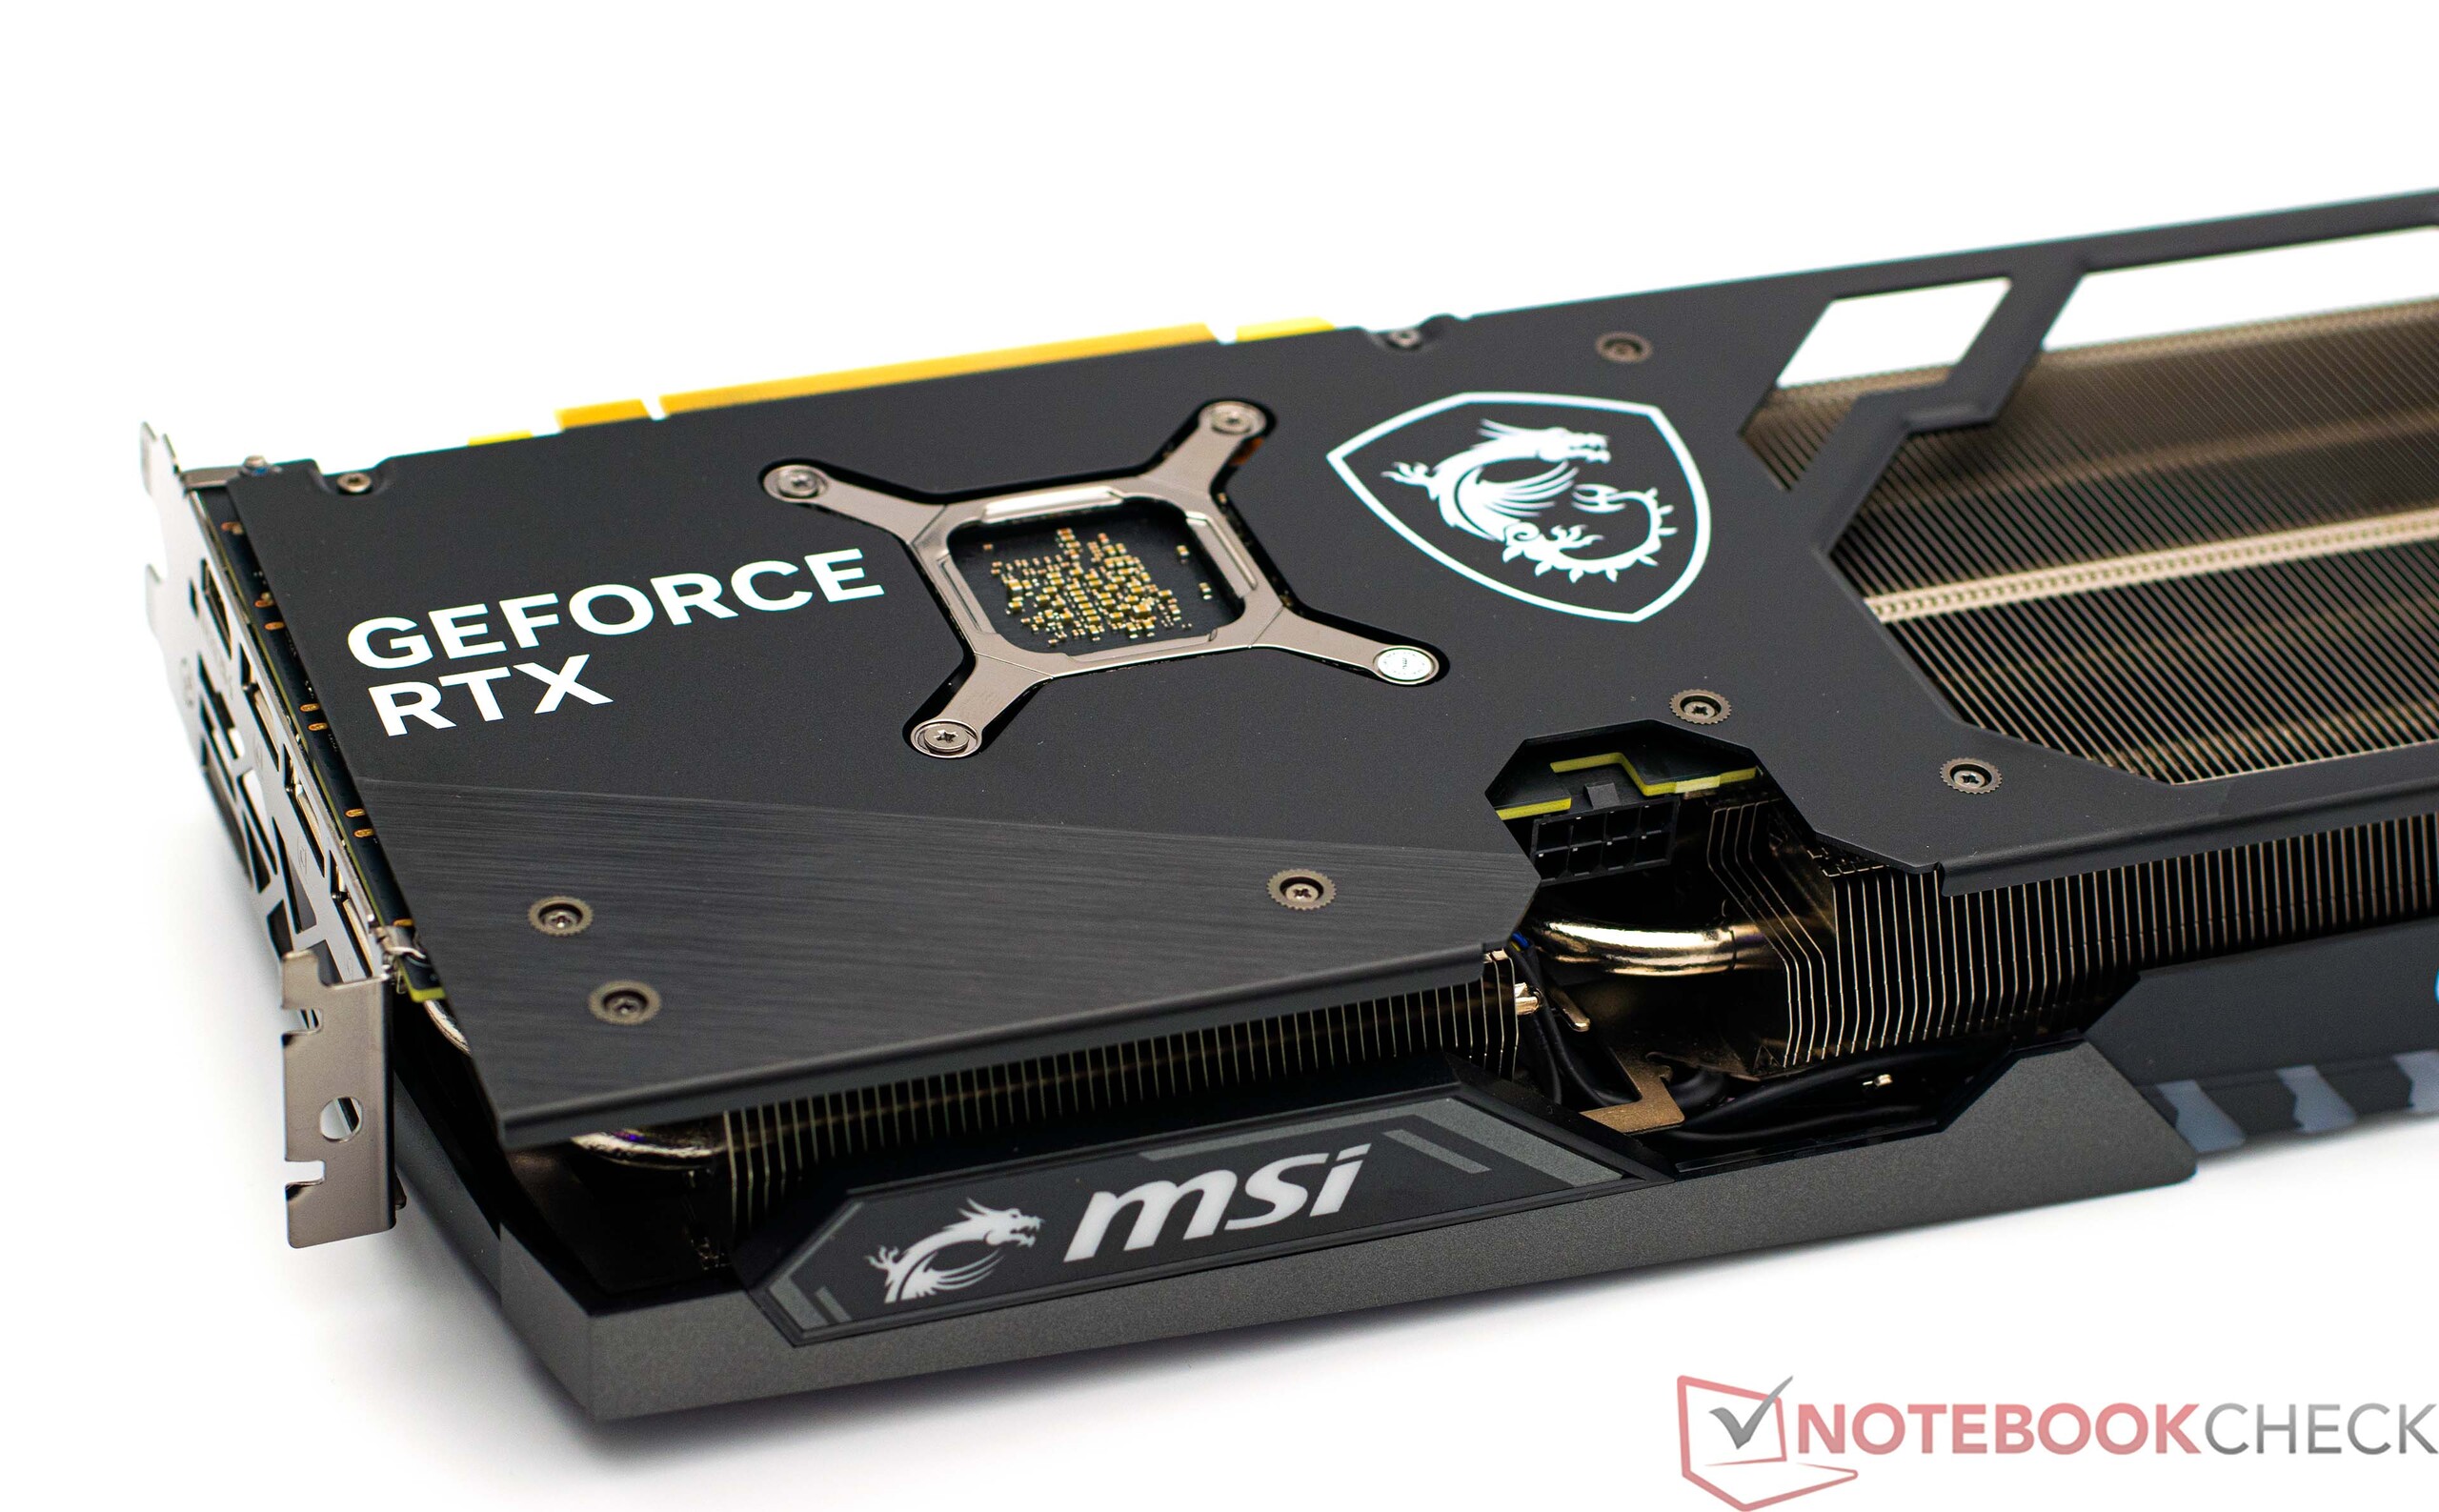
如前所述,其33.8厘米的尺寸已经非常大,这些都需要正确的外壳。同时,其PCB(印刷电路板)只有一半的长度。GPU的低功耗不会对电源造成压力。我们的测试样品配有一个6+2针PCIe电源连接器。Nvidia的模型,即创始人版,配备了一个12VHPWR连接。
两个外部连接都遵循典型的标准。它仍然不具备DisplayPort 2.1的功能。从正面看,但确实有1个HDMI 2.1a和3个DisplayPort 1.4a端口,这对大多数用户来说应该是绰绰有余。
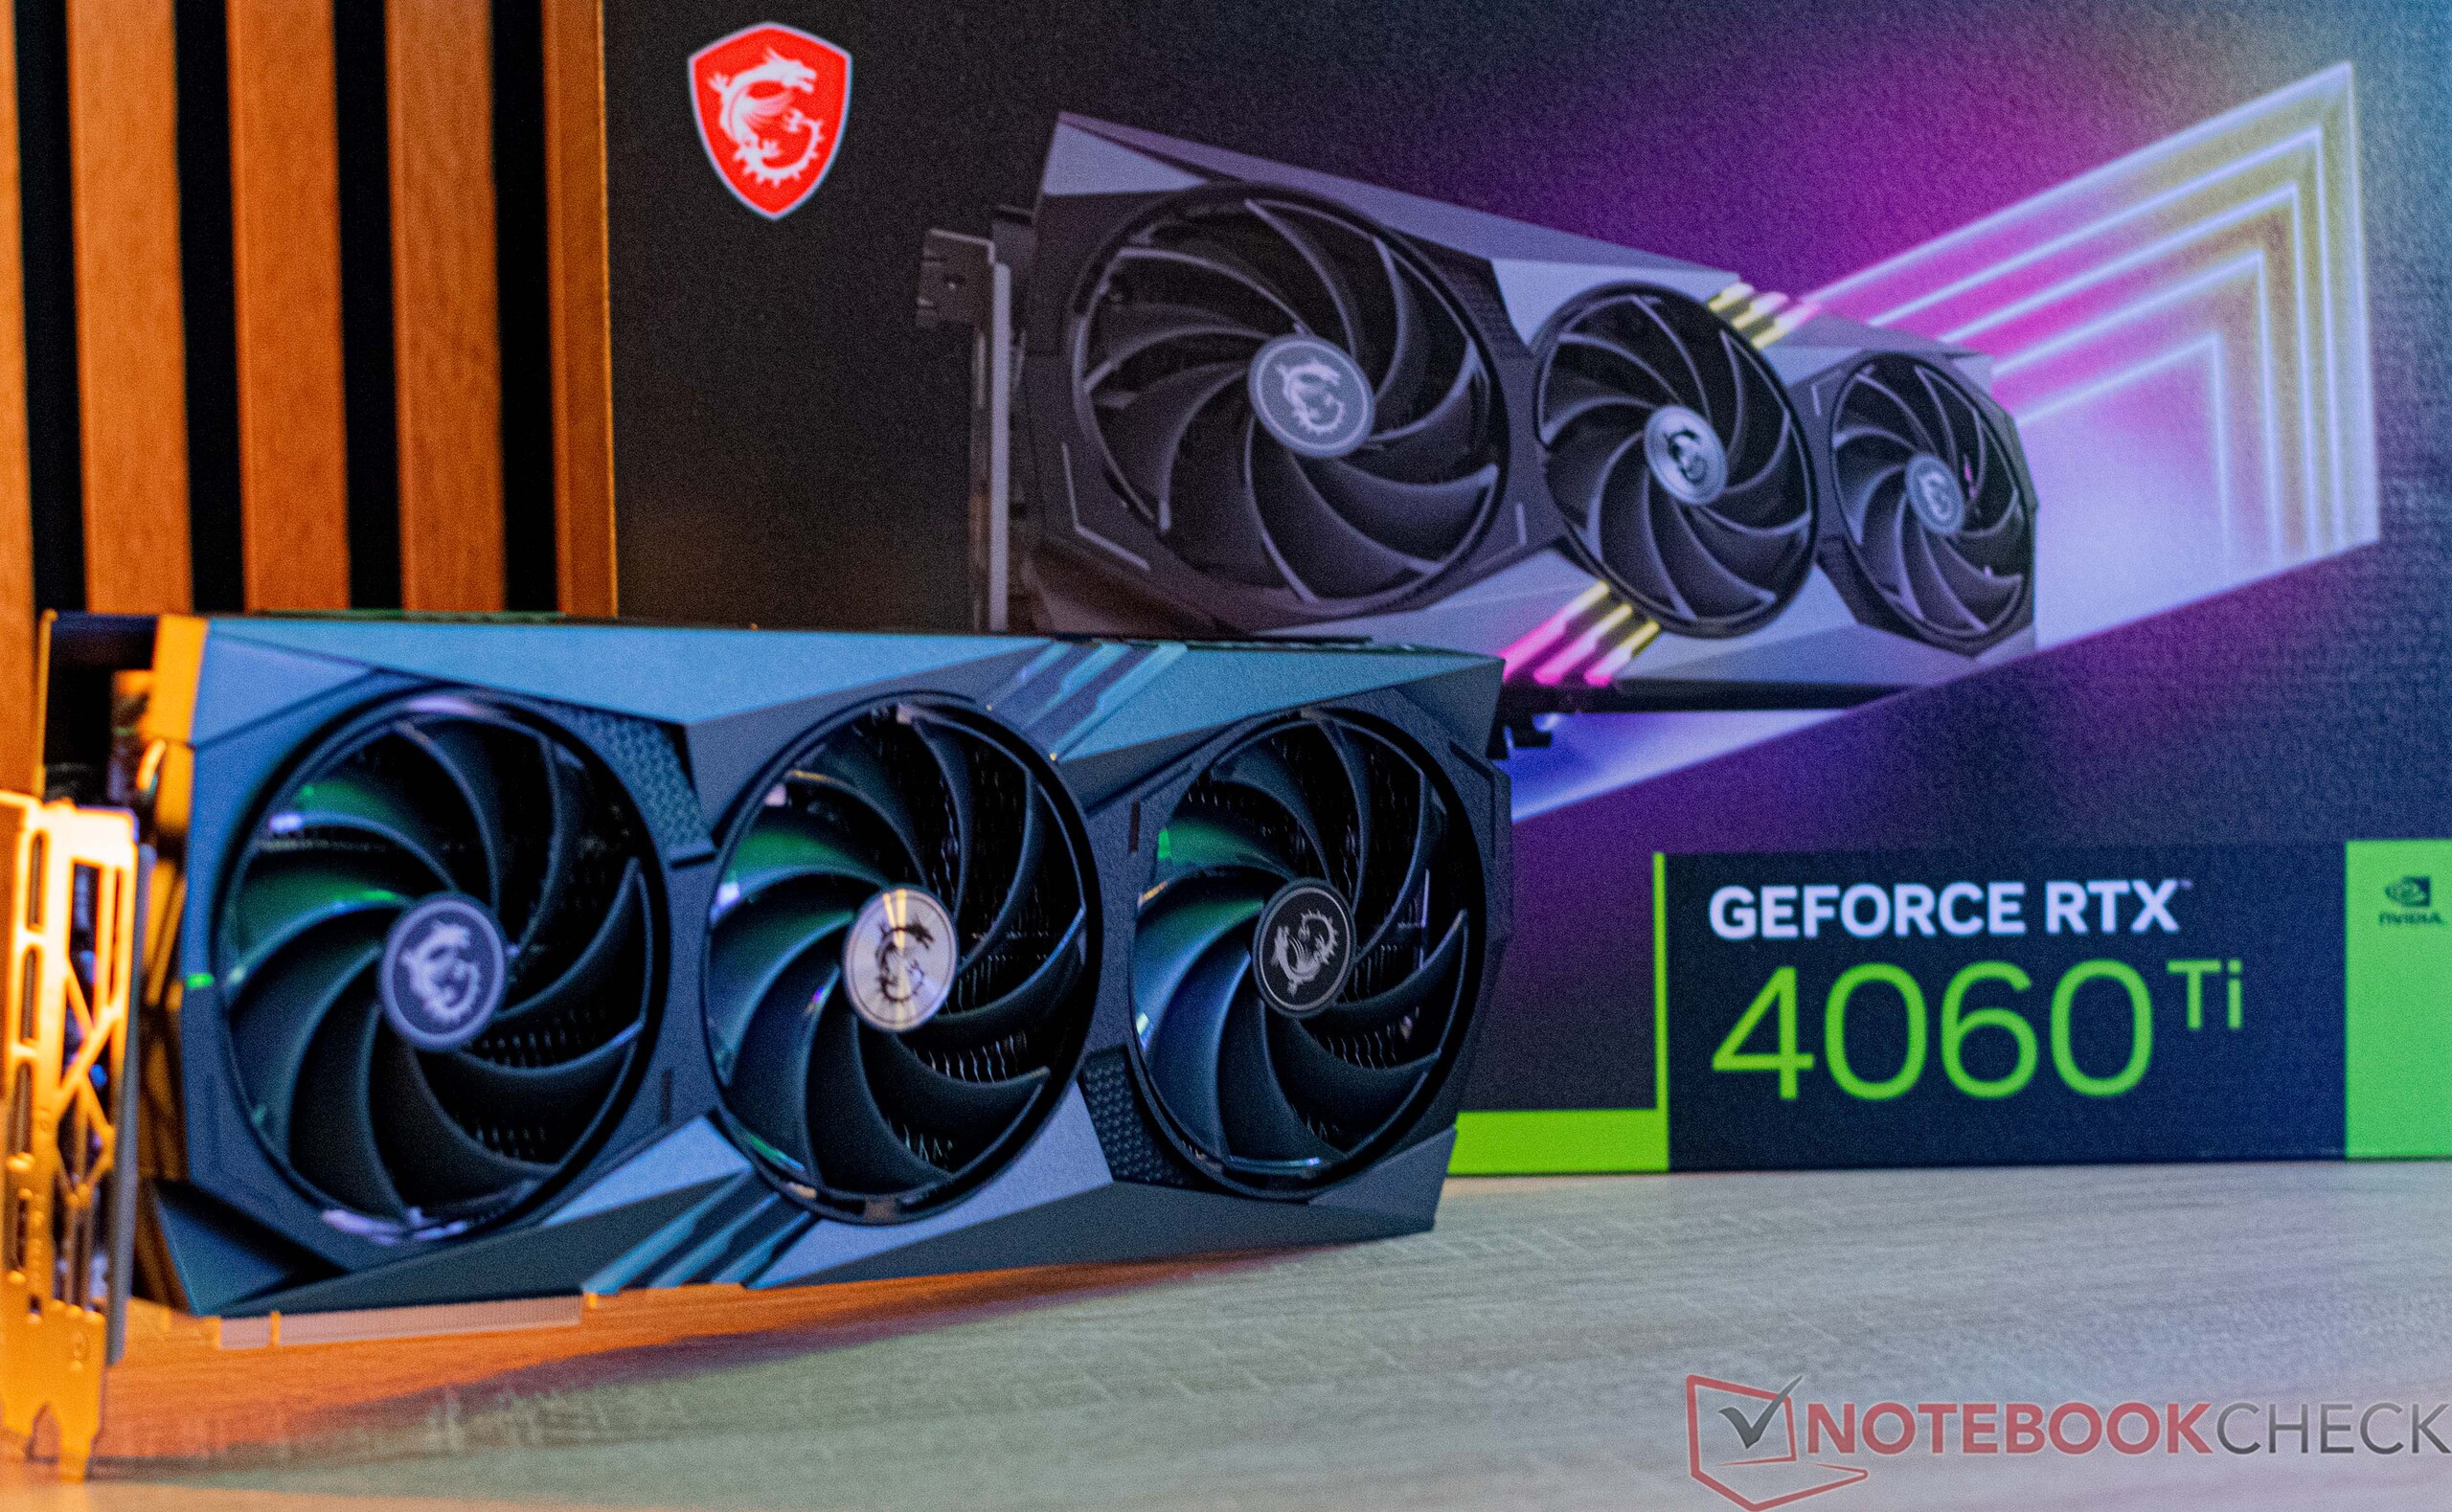
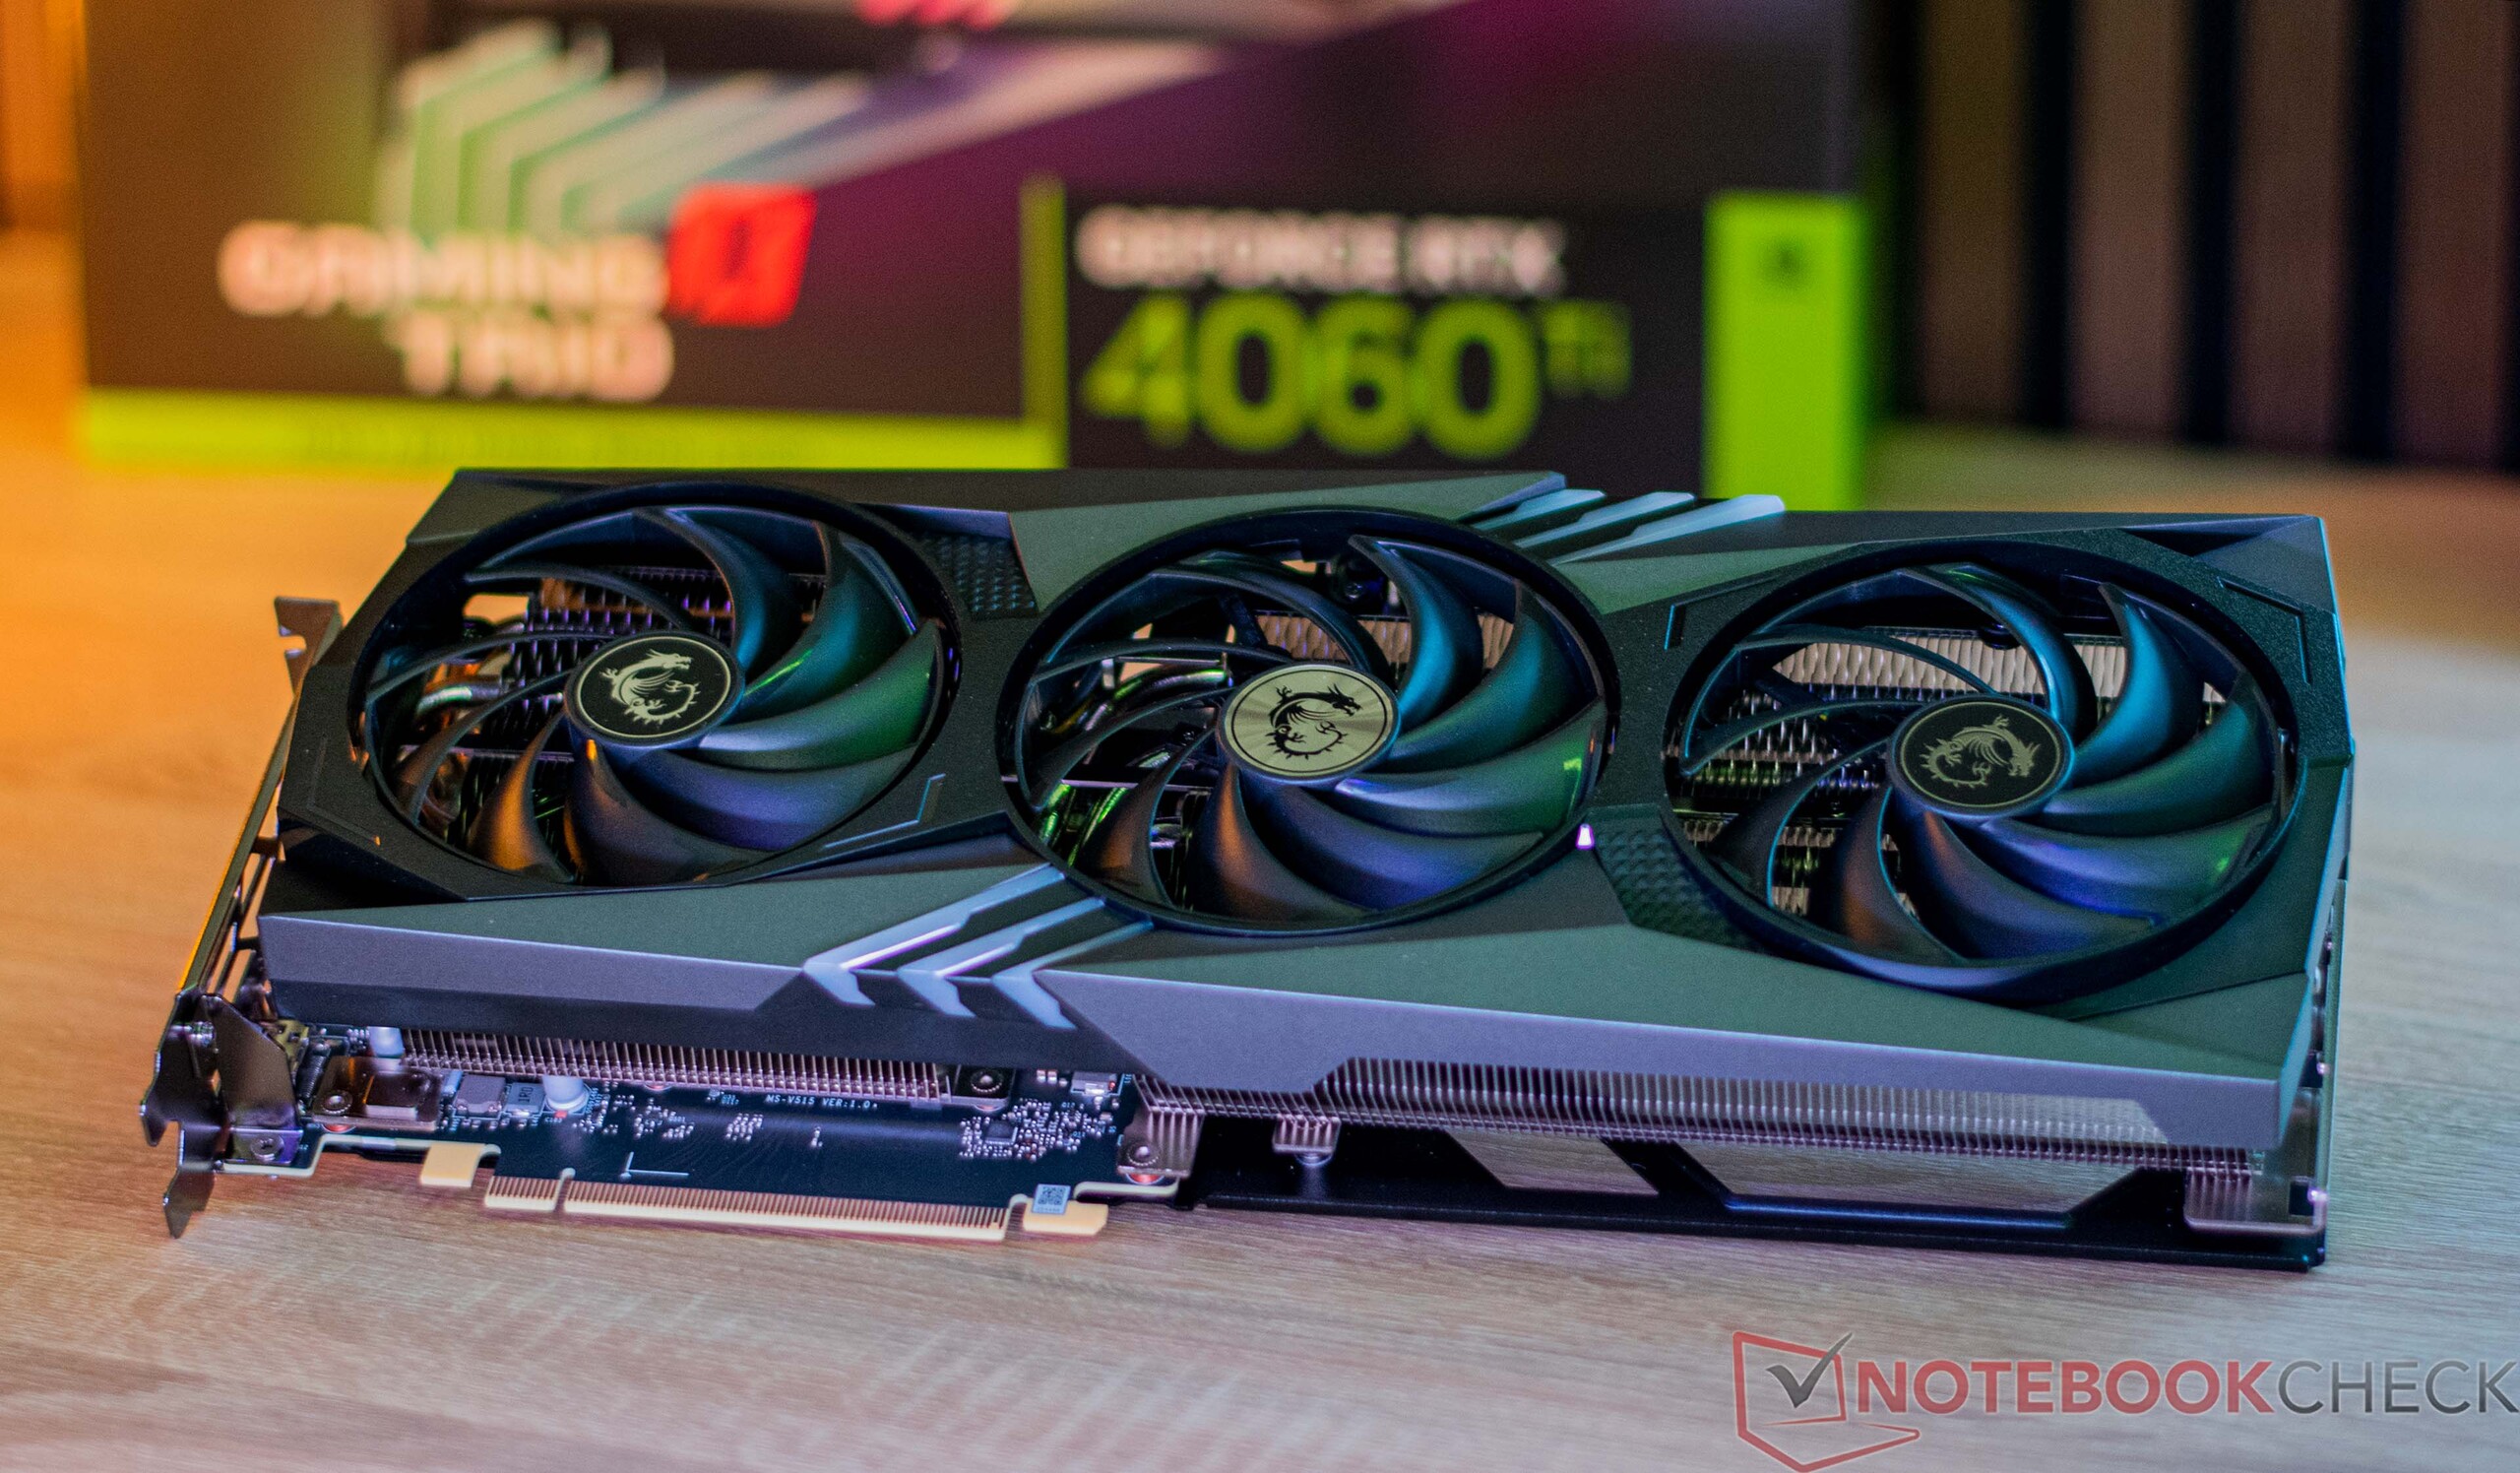
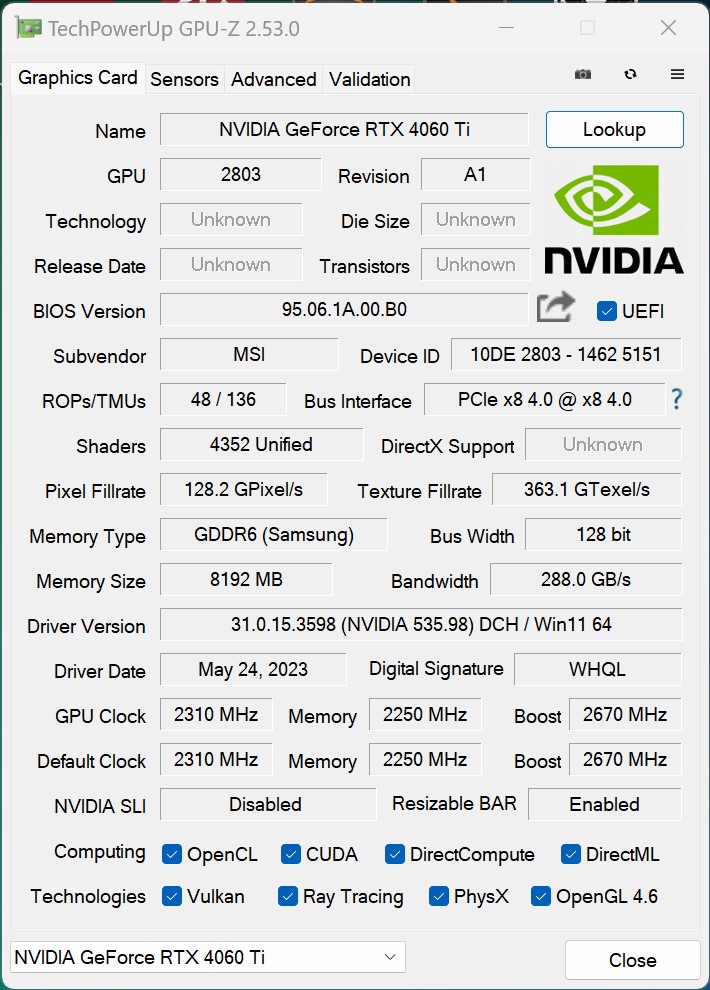
微星GeForce RTX 4060 Ti Gaming X Trio 8G的详细信息
GeForce 显卡规格比较
| 功能 | RTX 4090 | RTX 4080 | RTX 4070 Ti | RTX 4070 | RTX 4060 Ti | RTX 3070 | RTX 3060 Ti |
| 芯片 | AD102 | AD103 | AD104 | AD104 | AD106 | GA104 | GA104 |
| FinFET工艺 | 台积电4N | 台积电4N | 台积电4N | 台积电4N | 台积电4N | 8nm | 8nm |
| CUDA内核 | 16.384 | 9.728 | 7.680 | 5.888 | 4.352 | 5.888 | 4.864 |
| 纹理单元 | 512 | 304 | 240 | 184 | 136 | 184 | 152 |
| 张量核心 | 512 第四代 | 304 第四代 | 240 第四代 | 184 第四代 | 136 第四代 | 184 第三代 | 152 第三代。 |
| RT核心 | 128 | 76 | 60 | 46 | 34 | 46 | 38 |
| GPU基本时钟 | 2,235 MHz | 2,205 MHz | 2,310 MHz | 1,920 MHz | 2,310 MHz | 1,500 MHz | 1,410 MHz |
| GPU提升时钟 | 2,520 MHz | 2,505 MHz | 2,610 MHz | 2,475 MHz | 2,535 MHz | 1,725 MHz | 1,665 MHz |
| 内存总线 | 384位 | 256位 | 192位 | 192位 | 128位 | 256位 | 256位 |
| 内存带宽 | 1,008 GB/s | 716.8 GB/s | 504.2 GB/s | 504.2 GB/s | 288 GB/s | 448 GB/s | 448 GB/s |
| 显存 | 24 GB GDDR6X | 16 GB GDDR6X | 12 GB GDDR6 | 12 GB GDDR6X | 8GB GDDR6 | 8 GB GDDR6 | 8 GB GDDR6 |
| 消耗功率 | 450 W | 320 W | 285 W | 215 W | 160 W | 220 W | 200 W |
Infos about our test system
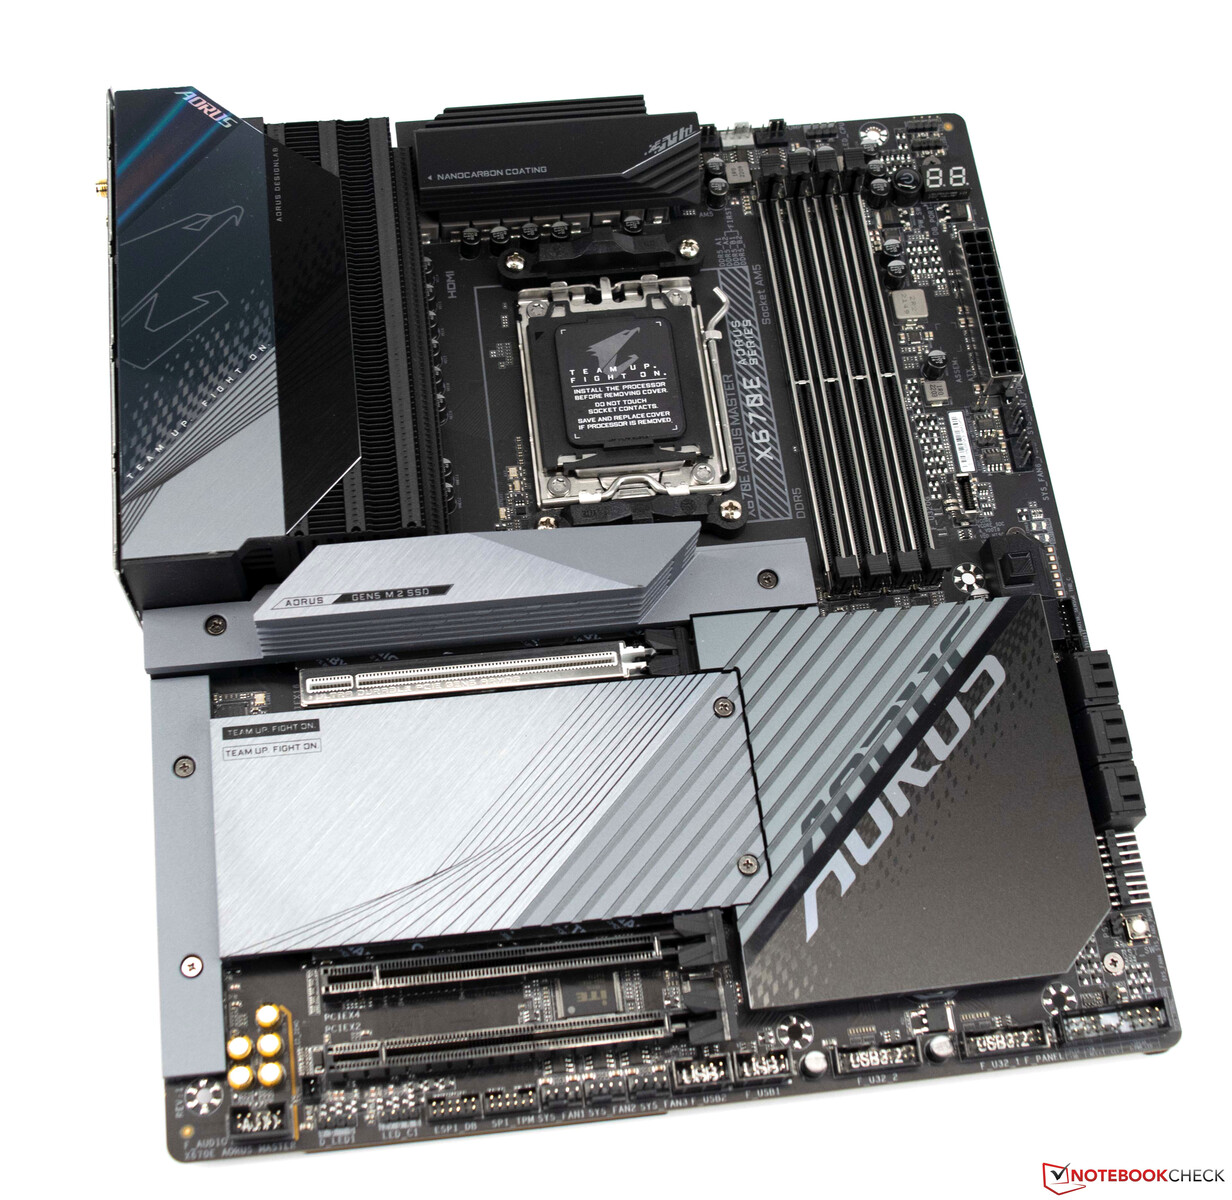
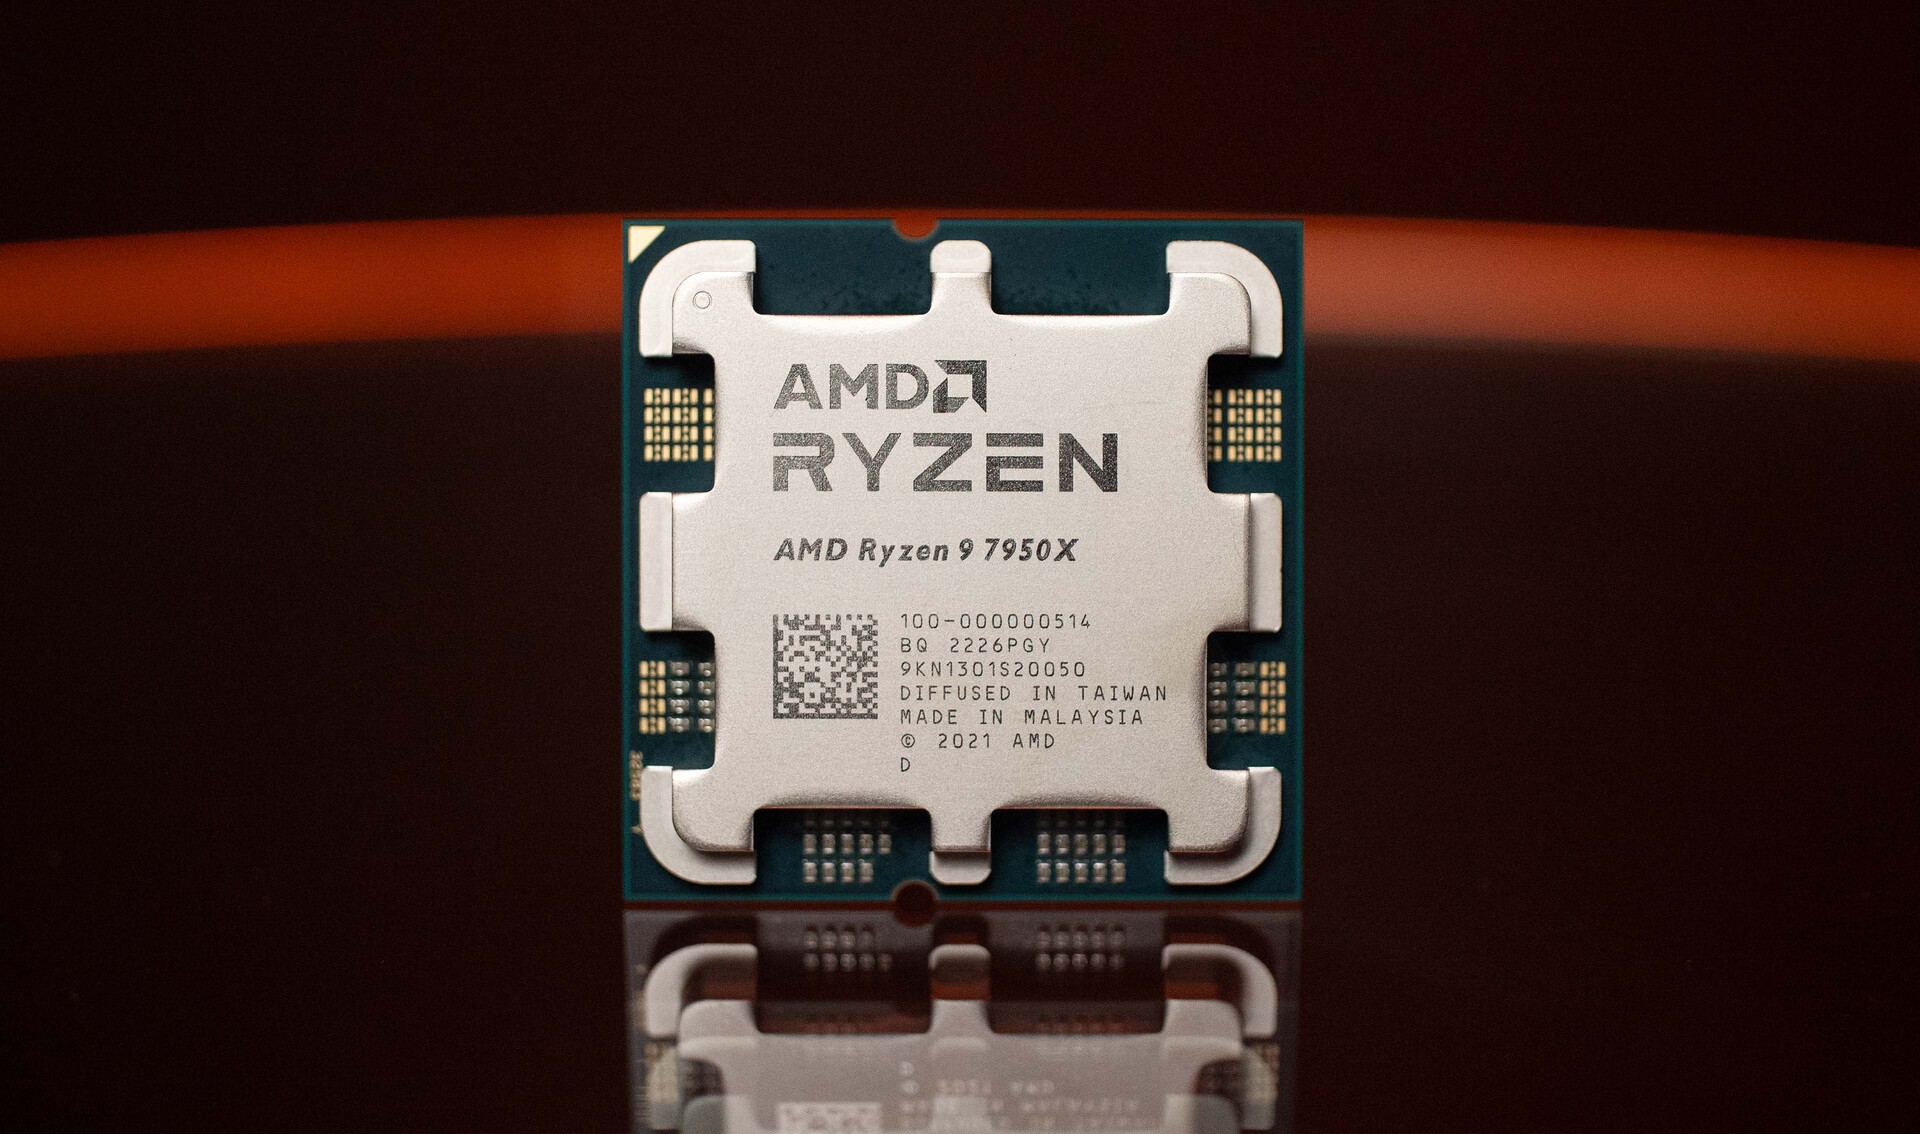
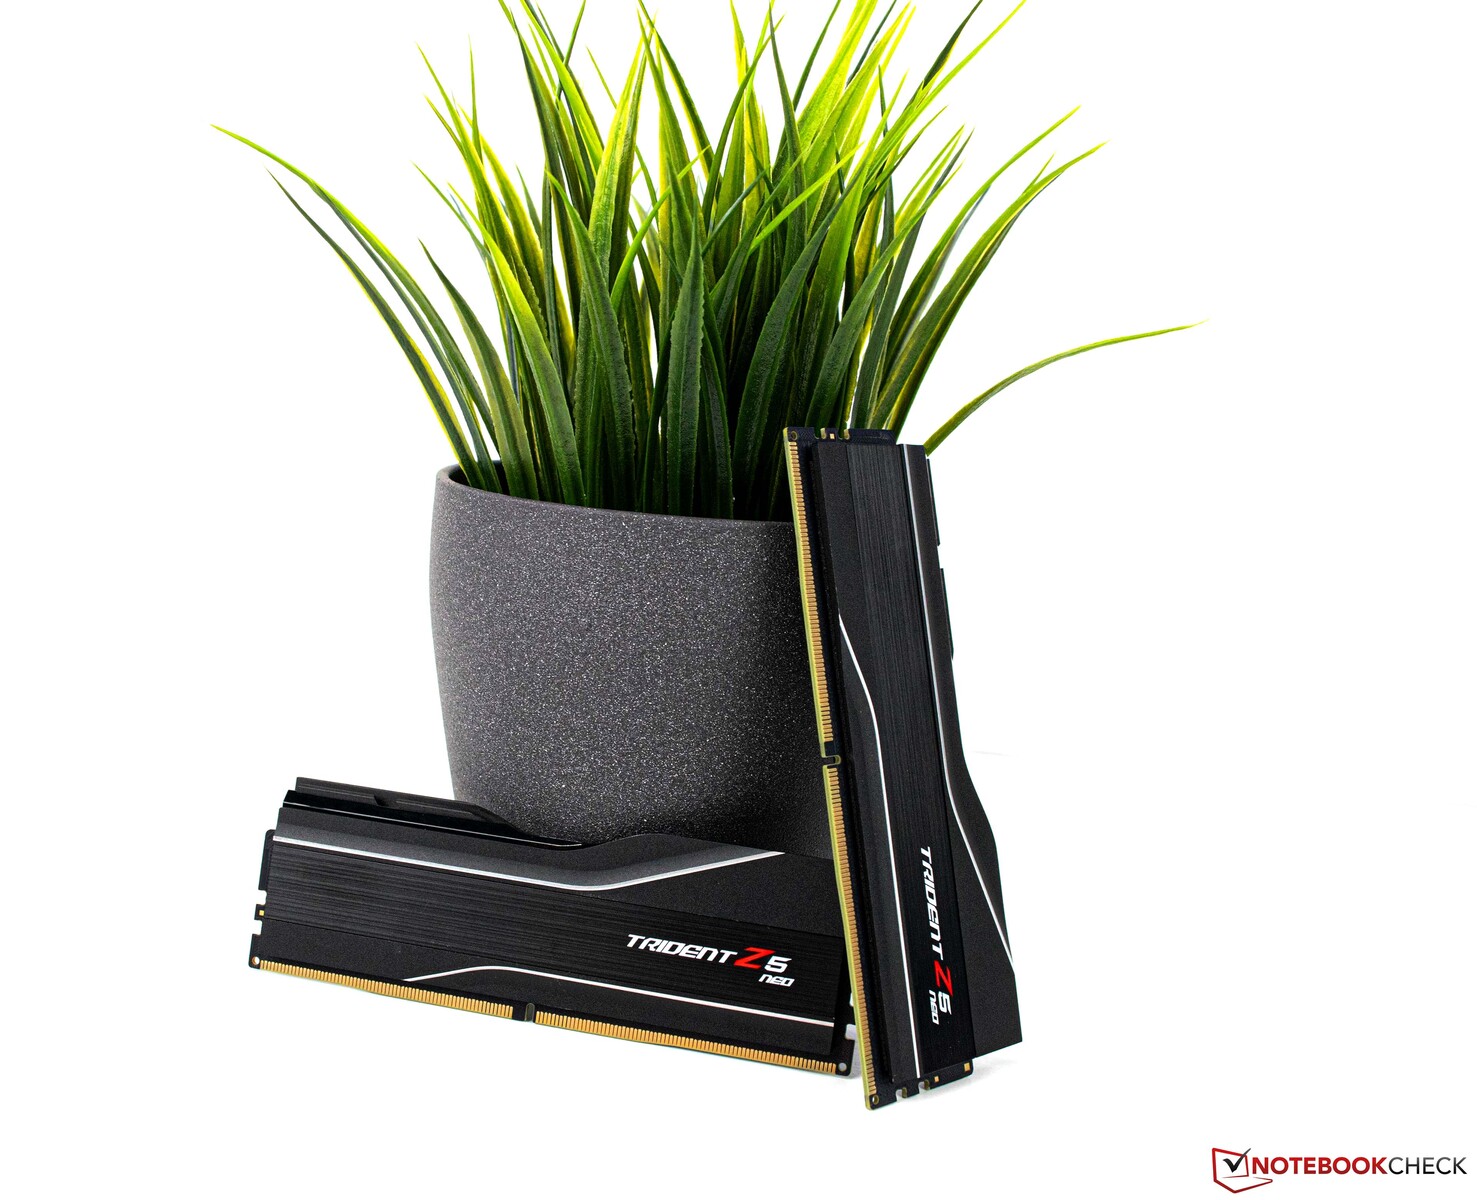
一个基于Gigabyte X670E Aorus Master的当前AMD平台作为我们的测试系统。CPU(AMD Ryzen 9 7950X)提供出色的性能,我们使用AiO解决方案Deepcool LT720作为冷却装置。32GB内存由G.Skill制造,使用匹配的EXPO配置文件进行操作。作为显示器,我们正在使用技嘉M32U。
测试系统的细节
我们用这个系统进行了以下基准测试和试验:
- Lian-Li O11动态
- AMD Ryzen 9 7950X
- Gigabyte X670E Aorus Master, BIOS:F11
- Deepcool LT720
- 海瑟尔HX1200i电源
- G.Skill Trident Z5 Neo DDR5-6000 2x 16 GB, EXPO (DDR5-6000 CL30-38-38-96)
- 海瑟尔MP600,2TB
- Crucial MX500, 2 TB
- 微软Windows 11专业版64位(版本22H2)
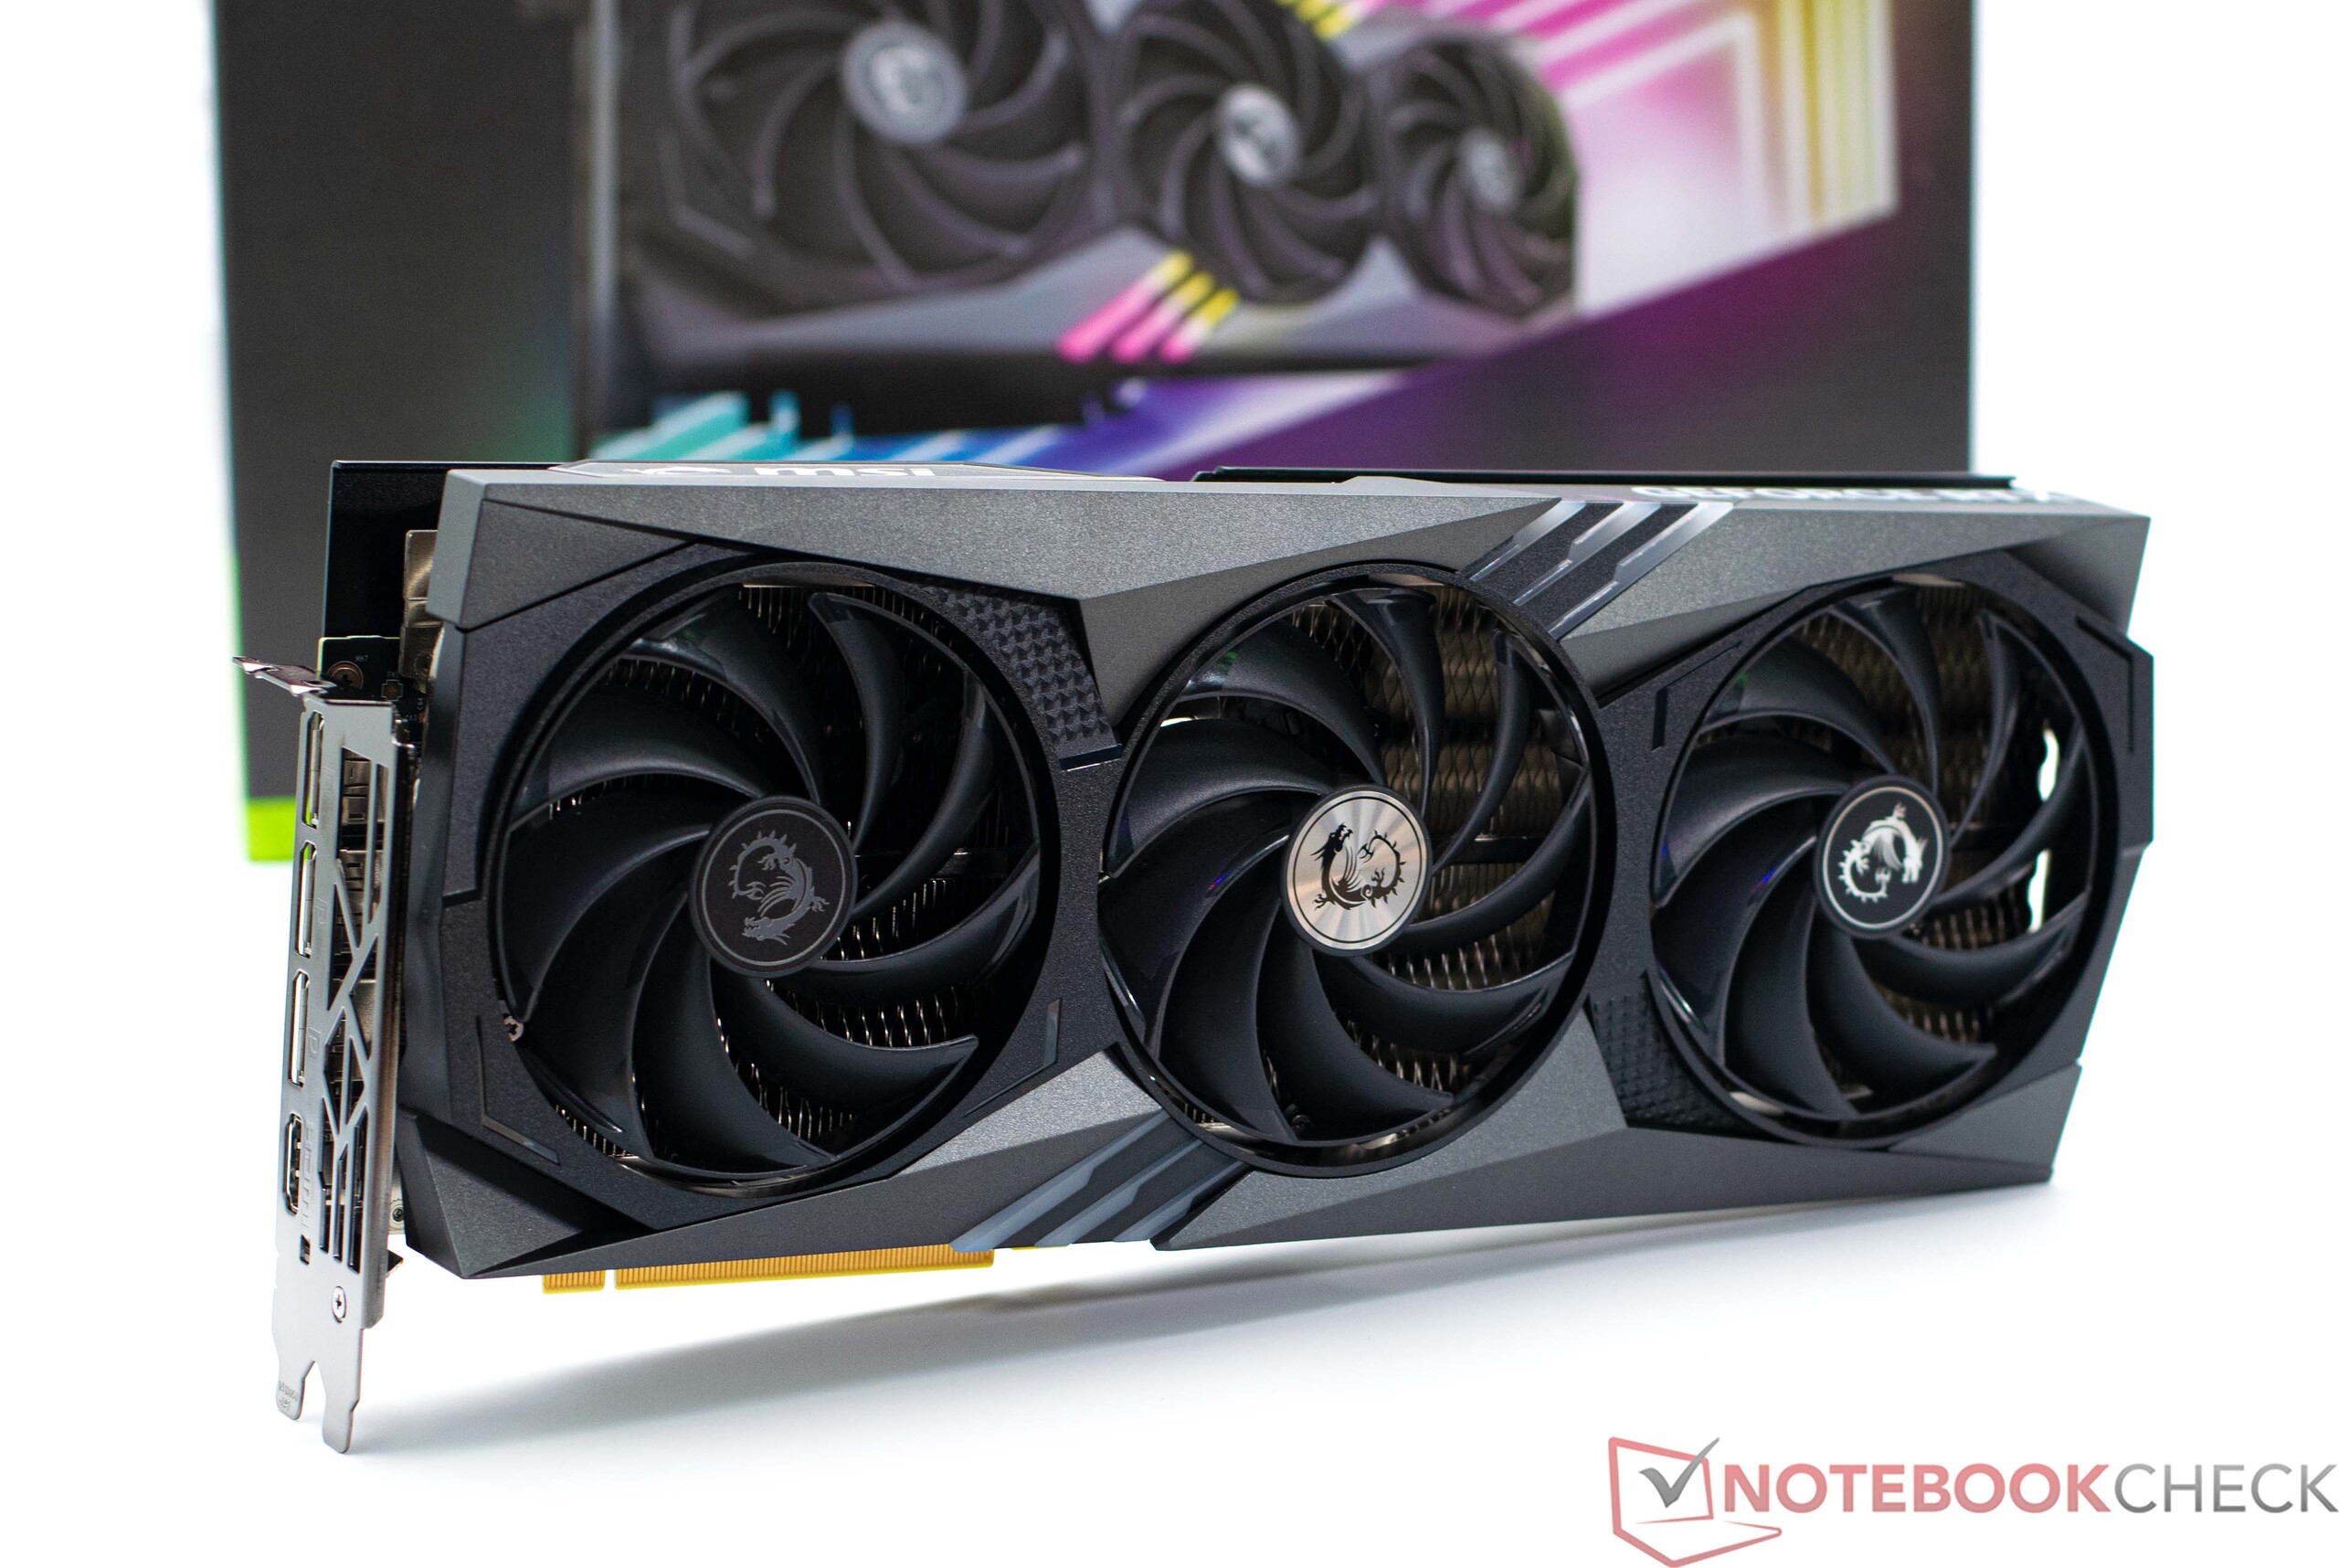
关于微星GeForce RTX 4060 Ti Gaming X Trio 8G的详细信息
与NvidiaGeForce RTX 4060 Ti的创始人版相比,微星GeForce RTX 4060 Ti Gaming X Trio 8G提供了更高的提升时钟速率。微星的状态率高达2,670兆赫--比Nvidia参考模型多135兆赫。与创始者版相比,VRAM没有变化。虽然,它的带宽现在减少了一半,相比于 NvidiaGeForce RTX 3060 Ti的128位。因此,其内存带宽现在也小得多,为288GB/s。我们将在我们的基准测试中发现这在实际使用中意味着什么。
合成基准
在我们的合成基准测试中,微星GeForce RTX 4060 Ti Gaming X Trio 8G的表现只比NvidiaGeForce RTX 3060 Ti.当谈到它的真实性能时,中端型号只能够稍微区别于上一代产品。我们没有看到与Nvidia RTX 3060 Ti一样的性能提升。NvidiaGeForce RTX 3090到NvidiaGeForce RTX 4090.其较低的着色器数量以及较小的存储连接使该GPU无法表现得更好。它与RTX 4070的差距为30%。GeForce RTX 4070是相当可观的,而且性能跃升到了GeForce RTX 3070 Ti将是一个更有用的步骤。与AMD的蓝宝石脉冲Radeon RX 6750 XT有12GB的VRAM,我们的测试样本实际上只慢了10%。
| Performance rating - Percent | |
| Palit GeForce RTX 4090 GameRock OC | |
| AMD Radeon RX 7900 XTX | |
| KFA2 GeForce RTX 4080 SG | |
| AMD Radeon RX 7900 XT | |
| KFA2 GeForce RTX 4070 Ti EX Gamer | |
| NVIDIA GeForce RTX 3090 Founders Edition | |
| KFA2 GeForce RTX 3080 SG | |
| KFA2 GeForce RTX 4070 EX Gamer | |
| Nvidia Titan RTX | |
| KFA2 GeForce RTX 3070 Ti SG | |
| Sapphire Pulse Radeon RX 6750 XT | |
| MSI GeForce RTX 4060 Ti Gaming X Trio 8G | |
| NVIDIA GeForce RTX 3060 Ti FE | |
| Nvidia GeForce RTX 2070 Super | |
| Sapphire Nitro+ Radeon RX 6650 XT | |
| Nvidia GeForce RTX 2060 Super | |
| KFA2 GeForce GTX 1660 Super | |
| PNY GeForce GTX 1660 | |
| LuxMark v2.0 64Bit | |
| Room GPUs-only | |
| NVIDIA GeForce RTX 4090 | |
| NVIDIA GeForce RTX 4080 | |
| NVIDIA GeForce RTX 4070 Ti | |
| NVIDIA GeForce RTX 4070 | |
| NVIDIA GeForce RTX 3090 | |
| NVIDIA GeForce RTX 3080 12 GB | |
| AMD Radeon RX 7900 XTX | |
| AMD Radeon RX 6950 XT | |
| NVIDIA Titan RTX | |
| NVIDIA GeForce RTX 4060 Ti 8G | |
| NVIDIA GeForce RTX 3070 Ti | |
| AMD Radeon RX 7900 XT | |
| NVIDIA GeForce RTX 3060 Ti | |
| AMD Radeon RX 6750 XT | |
| AMD Radeon RX 6650 XT | |
| Sala GPUs-only | |
| AMD Radeon RX 6950 XT | |
| NVIDIA GeForce RTX 4090 | |
| NVIDIA GeForce RTX 4080 | |
| NVIDIA GeForce RTX 4070 Ti | |
| AMD Radeon RX 7900 XTX | |
| NVIDIA GeForce RTX 3090 | |
| NVIDIA GeForce RTX 4070 | |
| NVIDIA GeForce RTX 3080 12 GB | |
| AMD Radeon RX 7900 XT | |
| NVIDIA GeForce RTX 4060 Ti 8G | |
| NVIDIA GeForce RTX 3070 Ti | |
| NVIDIA Titan RTX | |
| NVIDIA GeForce RTX 3060 Ti | |
| AMD Radeon RX 6750 XT | |
| AMD Radeon RX 6650 XT | |
| Photoshop PugetBench | |
| GPU Score | |
| AMD Radeon RX 6750 XT | |
| AMD Radeon RX 7900 XT | |
| AMD Radeon RX 7900 XTX | |
| NVIDIA GeForce RTX 4080 | |
| NVIDIA GeForce RTX 3070 Ti | |
| NVIDIA GeForce RTX 4090 | |
| NVIDIA GeForce RTX 2060 Super (Desktop) | |
| NVIDIA GeForce RTX 2070 Super (Desktop) | |
| NVIDIA GeForce GTX 1660 (Desktop) | |
| NVIDIA Titan RTX | |
| AMD Radeon RX 6950 XT | |
| AMD Radeon RX 6650 XT | |
| NVIDIA GeForce RTX 4060 Ti 8G | |
| NVIDIA GeForce RTX 4070 | |
| NVIDIA GeForce RTX 4070 Ti | |
| NVIDIA GeForce RTX 3080 12 GB | |
| Overall Score | |
| AMD Radeon RX 7900 XT | |
| AMD Radeon RX 6750 XT | |
| AMD Radeon RX 7900 XTX | |
| NVIDIA GeForce RTX 3070 Ti | |
| NVIDIA GeForce RTX 4080 | |
| NVIDIA GeForce RTX 4090 | |
| NVIDIA GeForce RTX 2060 Super (Desktop) | |
| NVIDIA GeForce RTX 2070 Super (Desktop) | |
| NVIDIA GeForce GTX 1660 (Desktop) | |
| NVIDIA GeForce RTX 4060 Ti 8G | |
| NVIDIA GeForce RTX 4070 | |
| NVIDIA Titan RTX | |
| NVIDIA GeForce RTX 4070 Ti | |
| AMD Radeon RX 6950 XT | |
| AMD Radeon RX 6650 XT | |
| NVIDIA GeForce RTX 3080 12 GB | |
| Premiere Pro PugetBench | |
| GPU 0.9 | |
| NVIDIA GeForce RTX 4090 | |
| NVIDIA GeForce RTX 4080 | |
| NVIDIA GeForce RTX 3080 12 GB | |
| NVIDIA GeForce RTX 4070 Ti | |
| NVIDIA GeForce RTX 4070 | |
| AMD Radeon RX 7900 XTX | |
| NVIDIA GeForce RTX 3070 Ti | |
| NVIDIA Titan RTX | |
| AMD Radeon RX 7900 XT | |
| AMD Radeon RX 6950 XT | |
| NVIDIA GeForce RTX 4060 Ti 8G | |
| NVIDIA GeForce RTX 2070 Super (Desktop) | |
| NVIDIA GeForce RTX 2060 Super (Desktop) | |
| AMD Radeon RX 6750 XT | |
| AMD Radeon RX 6650 XT | |
| NVIDIA GeForce GTX 1660 (Desktop) | |
| Overall Score 0.9 | |
| NVIDIA GeForce RTX 4090 | |
| NVIDIA GeForce RTX 4070 | |
| NVIDIA GeForce RTX 4080 | |
| NVIDIA Titan RTX | |
| NVIDIA GeForce RTX 4070 Ti | |
| NVIDIA GeForce RTX 4060 Ti 8G | |
| NVIDIA GeForce RTX 2060 Super (Desktop) | |
| AMD Radeon RX 7900 XTX | |
| NVIDIA GeForce RTX 2070 Super (Desktop) | |
| NVIDIA GeForce RTX 3070 Ti | |
| AMD Radeon RX 7900 XT | |
| AMD Radeon RX 6750 XT | |
| NVIDIA GeForce GTX 1660 (Desktop) | |
| NVIDIA GeForce RTX 3080 12 GB | |
| AMD Radeon RX 6950 XT | |
| AMD Radeon RX 6650 XT | |
| Affinity Photo 2 - Combined (Single / Multi GPU) | |
| NVIDIA GeForce RTX 4070 | |
| NVIDIA GeForce RTX 4070 Ti | |
| NVIDIA GeForce RTX 4090 | |
| NVIDIA GeForce RTX 4080 | |
| NVIDIA GeForce RTX 2070 Super (Desktop) | |
| NVIDIA GeForce RTX 3070 Ti | |
| NVIDIA GeForce RTX 2060 Super (Desktop) | |
| AMD Radeon RX 6750 XT | |
| NVIDIA GeForce RTX 4060 Ti 8G | |
| NVIDIA Titan RTX | |
| NVIDIA GeForce GTX 1660 (Desktop) | |
| NVIDIA GeForce GTX 1660 Super (Desktop) | |
| AMD Radeon RX 7900 XTX | |
| AMD Radeon RX 7900 XT | |
专业用途
在专业用途领域,我们的微星GeForce RTX 4060 Ti Gaming X Trio可以将差距缩小到NvidiaGeForce RTX 3070 Ti略有差距。然而,相比于NvidiaGeForce RTX 4070相比,你可以看到两者之间的差距要大得多。的Nvidia Titan RTX是专业显卡所能实现的一个很好的例子。这个模型取得了与我们的测试样本几乎相同的合成测试结果,但在这里,它却大幅领先200%。因此,我们不建议使用NvidiaGeForce RTX 4060 Ti在专业环境中使用。
| NVIDIA GeForce RTX 4060 Ti 8G R9 7950X | NVIDIA GeForce RTX 3060 Ti R9 5950X | NVIDIA GeForce RTX 3070 Ti R9 7950X | NVIDIA GeForce RTX 4070 R9 7950X | NVIDIA GeForce RTX 4070 Ti R9 7950X | NVIDIA GeForce RTX 4080 R9 7950X | NVIDIA GeForce RTX 4090 R9 7950X | AMD Radeon RX 7900 XT R9 7950X | AMD Radeon RX 7900 XTX R9 7950X | NVIDIA GeForce RTX 3080 12 GB R9 5900X | NVIDIA GeForce GTX 1660 (Desktop) R9 7950X | NVIDIA GeForce GTX 1660 Super (Desktop) R9 7950X | NVIDIA GeForce RTX 2060 Super (Desktop) R9 7950X | NVIDIA GeForce RTX 2070 Super (Desktop) R9 7950X | NVIDIA Titan RTX R9 7950X | Average of class | |
|---|---|---|---|---|---|---|---|---|---|---|---|---|---|---|---|---|
| SPECviewperf 12 | -20% | 8% | 26% | 50% | 74% | 91% | 414% | 462% | -12% | -48% | -43% | -28% | -15% | 262% | 13% | |
| 1900x1060 3ds Max (3dsmax-05) (fps) | 287 | 252 -12% | 330 15% | 382 33% | 436 52% | 502 75% | 571 99% | 502 75% | 553 93% | 334 16% | 153 -47% | 167 -42% | 220 -23% | 247 -14% | 315 10% | 206 ? -28% |
| 1900x1060 Catia (catia-04) (fps) | 128 | 109 -15% | 136 6% | 161 26% | 192 50% | 221 73% | 257 101% | 481 276% | 536 319% | 79.1 -38% | 65.1 -49% | 68 -47% | 84.5 -34% | 114 -11% | 332 159% | 113.6 ? -11% |
| 1900x1060 Creo (creo-01) (fps) | 75.4 | 57.8 -23% | 72.6 -4% | 89.1 18% | 99.4 32% | 110 46% | 115 53% | 176 133% | 187 148% | 74.4 -1% | 46.1 -39% | 45.5 -40% | 58.8 -22% | 65.7 -13% | 197 161% | 66.6 ? -12% |
| 1900x1060 Energy (energy-01) (fps) | 23 | 13.9 -40% | 18 -22% | 31.7 38% | 48 109% | 58.8 156% | 54.7 138% | 72.4 215% | 85.2 270% | 17.2 -25% | 6.31 -73% | 8.38 -64% | 11.6 -50% | 12.4 -46% | 28.8 25% | 16.9 ? -27% |
| 1900x1060 Maya (maya-04) (fps) | 254 | 197 -22% | 279 10% | 284 12% | 287 13% | 309 22% | 317 25% | 347 37% | 367 44% | 139 -45% | 131 -48% | 149 -41% | 200 -21% | 225 -11% | 260 2% | 117.7 ? -54% |
| 1900x1060 Medical (medical-01) (fps) | 110 | 59.4 -46% | 106 -4% | 132 20% | 157 43% | 171 55% | 119 8% | 288 162% | 347 215% | 40.3 -63% | 36 -67% | 38.2 -65% | 49.5 -55% | 55.9 -49% | 101 -8% | 59.2 ? -46% |
| 1900x1060 Showcase (showcase-01) (fps) | 120 | 144 20% | 199 66% | 190 58% | 244 103% | 333 178% | 457 281% | 278 132% | 322 168% | 226 88% | 65 -46% | 85.2 -29% | 121 1% | 135 13% | 197 64% | 103.7 ? -14% |
| 1900x1060 Siemens NX (snx-02) (fps) | 14.7 | 12.3 -16% | 14.7 0% | 16.4 12% | 19 29% | 21.6 47% | 27.1 84% | 373 2437% | 400 2621% | 12 -18% | 9.41 -36% | 9.38 -36% | 10.1 -31% | 13.9 -5% | 283 1825% | 60.9 ? 314% |
| 1900x1060 Solidworks (sw-03) (fps) | 95.7 | 71.1 -26% | 101 6% | 109 14% | 118 23% | 113 18% | 126 32% | 342 257% | 360 276% | 73.8 -23% | 69.3 -28% | 70.7 -26% | 79.7 -17% | 95.1 -1% | 207 116% | 89.4 ? -7% |
| SPECviewperf 13 | -17% | 6% | 27% | 51% | 80% | 117% | 401% | 452% | 12% | -50% | -46% | -29% | -15% | 247% | 35% | |
| 3ds Max (3dsmax-06) (fps) | 289 | 252 -13% | 330 14% | 381 32% | 433 50% | 497 72% | 563 95% | 506 75% | 564 95% | 334 16% | 153 -47% | 166 -43% | 218 -25% | 247 -15% | 321 11% | 196.9 ? -32% |
| Catia (catia-05) (fps) | 188 | 161 -14% | 201 7% | 241 28% | 290 54% | 340 81% | 402 114% | 728 287% | 825 339% | 206 10% | 90.3 -52% | 94.9 -50% | 119 -37% | 163 -13% | 534 184% | 211 ? 12% |
| Creo (creo-02) (fps) | 299 | 225 -25% | 286 -4% | 375 25% | 455 52% | 529 77% | 552 85% | 567 90% | 613 105% | 324 8% | 138 -54% | 141 -53% | 203 -32% | 240 -20% | 386 29% | 216 ? -28% |
| Energy (energy-02) (fps) | 45.7 | 25.6 -44% | 30 -34% | 54.2 19% | 72.8 59% | 92.6 103% | 126 176% | 147 222% | 187 309% | 37.6 -18% | 9.93 -78% | 11.3 -75% | 21.9 -52% | 23.8 -48% | 51.8 13% | 39.7 ? -13% |
| Maya (maya-05) (fps) | 396 | 344 -13% | 437 10% | 510 29% | 591 49% | 678 71% | 715 81% | 670 69% | 735 86% | 460 16% | 194 -51% | 214 -46% | 291 -27% | 344 -13% | 499 26% | 278 ? -30% |
| Medical (medical-02) (fps) | 92.9 | 72.2 -22% | 83.6 -10% | 112 21% | 132 42% | 150 61% | 186 100% | 237 155% | 263 183% | 102 10% | 40.5 -56% | 40.7 -56% | 54.2 -42% | 63.7 -31% | 92 -1% | 88.4 ? -5% |
| Showcase (showcase-02) (fps) | 120 | 145 21% | 198 65% | 191 59% | 244 103% | 334 178% | 455 279% | 279 133% | 323 169% | 228 90% | 64.9 -46% | 85.3 -29% | 122 2% | 135 13% | 198 65% | 126.2 ? 5% |
| Siemens NX (snx-03) (fps) | 26.4 | 22.3 -16% | 26.4 0% | 29.5 12% | 34.1 29% | 39 48% | 49.1 86% | 675 2457% | 725 2646% | 26.3 0% | 16.9 -36% | 16.9 -36% | 18.2 -31% | 25 -5% | 512 1839% | 136.6 ? 417% |
| Solidworks (sw-04) (fps) | 137 | 99.6 -27% | 146 7% | 157 15% | 168 23% | 179 31% | 186 36% | 307 124% | 323 136% | 108 -21% | 102 -26% | 104 -24% | 119 -13% | 136 -1% | 218 59% | 124.1 ? -9% |
| SPECviewperf 2020 | -19% | 11% | 31% | 57% | 86% | 140% | 430% | 490% | 20% | -50% | -48% | -30% | -19% | 300% | 57% | |
| 3840x2160 Siemens NX (snx-04) (fps) | 20.3 | 18.2 -10% | 22.2 9% | 23.9 18% | 27.5 35% | 31.9 57% | 41.3 103% | 476 2245% | 514 2432% | 21.8 7% | 12.7 -37% | 12.7 -37% | 14 -31% | 19.8 -2% | 375 1747% | 88.3 ? 335% |
| 3840x2160 Medical (medical-03) (fps) | 17.7 | 11.4 -36% | 16.3 -8% | 22.2 25% | 26.9 52% | 32.2 82% | 45.9 159% | 53.9 205% | 62.3 252% | 18.8 6% | 7.48 -58% | 7.41 -58% | 10.3 -42% | 12 -32% | 16.5 -7% | 24 ? 36% |
| 3840x2160 Maya (maya-06) (fps) | 226 | 215 -5% | 290 28% | 305 35% | 372 65% | 447 98% | 498 120% | 401 77% | 481 113% | 314 39% | 106 -53% | 118 -48% | 162 -28% | 185 -18% | 274 21% | 221 ? -2% |
| 3840x2160 Energy (energy-03) (fps) | 44.9 | 14.5 -68% | 39.1 -13% | 57.6 28% | 75.7 69% | 90.4 101% | 141 214% | 99.6 122% | 129 187% | 37.2 -17% | 12.5 -72% | 13.7 -69% | 22.9 -49% | 17.8 -60% | 93.9 109% | 50 ? 11% |
| 3840x2160 Creo (creo-03) (fps) | 96.1 | 76.6 -20% | 99.3 3% | 112 17% | 121 26% | 128 33% | 133 38% | 173 80% | 187 95% | 90 -6% | 55.2 -43% | 57.7 -40% | 77.2 -20% | 85.8 -11% | 135 40% | 78.3 ? -19% |
| 3840x2160 CATIA (catia-06) (fps) | 39.2 | 37.9 -3% | 48 22% | 51.6 32% | 61.2 56% | 75.5 93% | 95.3 143% | 113 188% | 127 224% | 53.7 37% | 19.2 -51% | 21 -46% | 30.5 -22% | 36.7 -6% | 90.9 132% | 48.9 ? 25% |
| 3840x2160 3ds Max (3dsmax-07) (fps) | 74.5 | 80.1 8% | 99 33% | 122 64% | 147 97% | 179 140% | 228 206% | 143 92% | 167 124% | 128 72% | 45.5 -39% | 48.3 -35% | 63.1 -15% | 69.7 -6% | 118 58% | 85 ? 14% |
| Total Average (Program / Settings) | -19% /
-19% | 8% /
8% | 28% /
28% | 53% /
53% | 80% /
80% | 116% /
114% | 415% /
414% | 468% /
466% | 7% /
6% | -49% /
-49% | -46% /
-45% | -29% /
-29% | -16% /
-16% | 270% /
267% | 35% /
33% |
游戏基准
根据Nvidia的说法,那些主要在1920×1080的环境下使用高至最大细节设置进行游戏的玩家是该公司的主要目标市场。如果你仔细看看我们测试的所有游戏的概况,GeForce RTX 4060 Ti并没有完全涵盖这一点。但是,你可以争论,直到奶牛回家,因为高帧率实际上意味着什么?如果我们将极限设置为60 FPS,那么GPU仍然处于绿色状态。然而,如果我们将其设置为144 FPS,那么结果就完全不同了。总的来说,微星GeForce RTX 4060 Ti Gaming X Trio的游戏性能真的不差,目前很适合充当1080p的游戏显卡。在我们的测试中,没有任何游戏是微星GeForce RTX 4060 Ti Gaming X Trio所不能胜任的。虽然,我们确实测量了偶尔的帧率下降。这方面的一个例子是《瘟疫故事安魂曲》。 在这里,我们在1,080p和预设的Ultra条件下测得67FPS的相对较好的平均值。同时,我们也测出了下降到37FPS的情况,这意味着你不能完全说是流畅的游戏。你必须区分不同类型的游戏,因为与更典型的基于故事的游戏相比,它在运行在线高FPS射击游戏时不会做得那么好。
与竞争对手相比,微星GeForce RTX 4060 Ti Gaming X Trio的表现相对较好,尤其是始终与蓝宝石脉冲Radeon RX 6750 XT 。即使在1,440p的情况下,GeForce RTX 4060 Ti的8GB VRAM慢慢耗尽,该显卡仍然能够跟上它的AMD竞争对手,尽管他们由于12GB VRAM而显示出更大的纹理空间。
| Metro Exodus | |
| 2560x1440 Ultra Quality AF:16x | |
| Palit GeForce RTX 4090 GameRock OC | |
| AMD Radeon RX 7900 XTX | |
| KFA2 GeForce RTX 4080 SG | |
| AMD Radeon RX 7900 XT | |
| KFA2 GeForce RTX 4070 Ti EX Gamer | |
| NVIDIA GeForce RTX 3090 Founders Edition | |
| KFA2 GeForce RTX 4070 EX Gamer | |
| KFA2 GeForce RTX 3080 SG | |
| Nvidia Titan RTX | |
| KFA2 GeForce RTX 3070 Ti SG | |
| MSI GeForce RTX 4060 Ti Gaming X Trio 8G | |
| Sapphire Pulse Radeon RX 6750 XT | |
| NVIDIA GeForce RTX 3060 Ti FE | |
| Nvidia GeForce RTX 2070 Super | |
| Nvidia GeForce RTX 2060 Super | |
| KFA2 GeForce GTX 1660 Super | |
| PNY GeForce GTX 1660 | |
| 1920x1080 Ultra Quality AF:16x | |
| Palit GeForce RTX 4090 GameRock OC | |
| AMD Radeon RX 7900 XTX | |
| KFA2 GeForce RTX 4080 SG | |
| AMD Radeon RX 7900 XT | |
| KFA2 GeForce RTX 4070 Ti EX Gamer | |
| NVIDIA GeForce RTX 3090 Founders Edition | |
| KFA2 GeForce RTX 4070 EX Gamer | |
| KFA2 GeForce RTX 3080 SG | |
| Nvidia Titan RTX | |
| KFA2 GeForce RTX 3070 Ti SG | |
| MSI GeForce RTX 4060 Ti Gaming X Trio 8G | |
| Sapphire Pulse Radeon RX 6750 XT | |
| NVIDIA GeForce RTX 3060 Ti FE | |
| Nvidia GeForce RTX 2070 Super | |
| Nvidia GeForce RTX 2060 Super | |
| KFA2 GeForce GTX 1660 Super | |
| PNY GeForce GTX 1660 | |
| F1 2021 | |
| 2560x1440 Ultra High Preset + Raytracing AA:T AF:16x | |
| Palit GeForce RTX 4090 GameRock OC (874931) | |
| KFA2 GeForce RTX 4080 SG (874931) | |
| AMD Radeon RX 7900 XTX (874931) | |
| KFA2 GeForce RTX 4070 Ti EX Gamer (874931) | |
| AMD Radeon RX 7900 XT (874931) | |
| NVIDIA GeForce RTX 3090 Founders Edition (874931) | |
| KFA2 GeForce RTX 4070 EX Gamer (874931) | |
| KFA2 GeForce RTX 3080 SG (874931) | |
| KFA2 GeForce RTX 3070 Ti SG (874931) | |
| MSI GeForce RTX 4060 Ti Gaming X Trio 8G (874931) | |
| Nvidia Titan RTX (874931) | |
| Sapphire Pulse Radeon RX 6750 XT (874931) | |
| Nvidia GeForce RTX 2070 Super (874931) | |
| KFA2 GeForce GTX 1660 Super (874931) | |
| Sapphire Nitro+ Radeon RX 6650 XT (874931) | |
| PNY GeForce GTX 1660 (874931) | |
| Nvidia GeForce RTX 2060 Super (874931) | |
| 1920x1080 Ultra High Preset + Raytracing AA:T AF:16x | |
| Palit GeForce RTX 4090 GameRock OC (874931) | |
| AMD Radeon RX 7900 XTX (874931) | |
| KFA2 GeForce RTX 4080 SG (874931) | |
| KFA2 GeForce RTX 4070 Ti EX Gamer (874931) | |
| AMD Radeon RX 7900 XT (874931) | |
| NVIDIA GeForce RTX 3090 Founders Edition (874931) | |
| KFA2 GeForce RTX 4070 EX Gamer (874931) | |
| KFA2 GeForce RTX 3080 SG (874931) | |
| KFA2 GeForce RTX 3070 Ti SG (874931) | |
| MSI GeForce RTX 4060 Ti Gaming X Trio 8G (874931) | |
| Nvidia Titan RTX (874931) | |
| Sapphire Pulse Radeon RX 6750 XT (874931) | |
| Nvidia GeForce RTX 2070 Super (874931) | |
| Sapphire Nitro+ Radeon RX 6650 XT (874931) | |
| KFA2 GeForce GTX 1660 Super (874931) | |
| Nvidia GeForce RTX 2060 Super (874931) | |
| PNY GeForce GTX 1660 (874931) | |
| F1 22 | |
| 2560x1440 Ultra High Preset AA:T AF:16x | |
| Palit GeForce RTX 4090 GameRock OC (923662) | |
| KFA2 GeForce RTX 4080 SG (939134) | |
| AMD Radeon RX 7900 XTX (939134) | |
| KFA2 GeForce RTX 4070 Ti EX Gamer (959964) | |
| AMD Radeon RX 7900 XT (939134) | |
| NVIDIA GeForce RTX 3090 Founders Edition (923650) | |
| KFA2 GeForce RTX 4070 EX Gamer (959964) | |
| KFA2 GeForce GTX 1660 Super (928484) | |
| PNY GeForce GTX 1660 (928484) | |
| KFA2 GeForce RTX 3070 Ti SG (939134) | |
| Nvidia Titan RTX (923650) | |
| MSI GeForce RTX 4060 Ti Gaming X Trio 8G (959964) | |
| Sapphire Pulse Radeon RX 6750 XT (959964) | |
| Nvidia GeForce RTX 2070 Super (923662) | |
| Nvidia GeForce RTX 2060 Super (923662) | |
| Sapphire Nitro+ Radeon RX 6650 XT | |
| 1920x1080 Ultra High Preset AA:T AF:16x | |
| Palit GeForce RTX 4090 GameRock OC | |
| KFA2 GeForce RTX 4080 SG (939134) | |
| AMD Radeon RX 7900 XTX (939134) | |
| KFA2 GeForce RTX 4070 Ti EX Gamer (959964) | |
| NVIDIA GeForce RTX 3090 Founders Edition (923650) | |
| AMD Radeon RX 7900 XT (939134) | |
| KFA2 GeForce RTX 4070 EX Gamer (959964) | |
| KFA2 GeForce GTX 1660 Super (928484) | |
| KFA2 GeForce RTX 3070 Ti SG (939134) | |
| PNY GeForce GTX 1660 (928484) | |
| Nvidia Titan RTX (923650) | |
| MSI GeForce RTX 4060 Ti Gaming X Trio 8G (959964) | |
| Sapphire Pulse Radeon RX 6750 XT (959964) | |
| Nvidia GeForce RTX 2070 Super (923662) | |
| Nvidia GeForce RTX 2060 Super (923662) | |
| Sapphire Nitro+ Radeon RX 6650 XT | |
| Cyberpunk 2077 1.6 | |
| 2560x1440 Ultra Preset | |
| Palit GeForce RTX 4090 GameRock OC (1.6) | |
| AMD Radeon RX 7900 XTX (1.61) | |
| KFA2 GeForce RTX 4080 SG (1.61) | |
| AMD Radeon RX 7900 XT (1.61) | |
| KFA2 GeForce RTX 4070 Ti EX Gamer | |
| KFA2 GeForce RTX 4070 EX Gamer | |
| KFA2 GeForce RTX 3070 Ti SG (1.61) | |
| Sapphire Pulse Radeon RX 6750 XT | |
| MSI GeForce RTX 4060 Ti Gaming X Trio 8G | |
| Nvidia GeForce RTX 2070 Super (1.6) | |
| Sapphire Nitro+ Radeon RX 6650 XT | |
| Nvidia GeForce RTX 2060 Super (1.6) | |
| KFA2 GeForce GTX 1660 Super (1.6) | |
| PNY GeForce GTX 1660 (1.6) | |
| 1920x1080 Ultra Preset | |
| Palit GeForce RTX 4090 GameRock OC (1.6) | |
| AMD Radeon RX 7900 XTX (1.61) | |
| KFA2 GeForce RTX 4080 SG (1.61) | |
| AMD Radeon RX 7900 XT (1.61) | |
| KFA2 GeForce RTX 4070 Ti EX Gamer | |
| KFA2 GeForce RTX 4070 EX Gamer | |
| KFA2 GeForce RTX 3070 Ti SG (1.61) | |
| MSI GeForce RTX 4060 Ti Gaming X Trio 8G | |
| Sapphire Pulse Radeon RX 6750 XT | |
| Sapphire Nitro+ Radeon RX 6650 XT | |
| Nvidia GeForce RTX 2070 Super (1.6) | |
| Nvidia GeForce RTX 2060 Super (1.6) | |
| KFA2 GeForce GTX 1660 Super (1.6) | |
| PNY GeForce GTX 1660 (1.6) | |
| A Plague Tale Requiem | |
| 2560x1440 Ultra Preset | |
| Palit GeForce RTX 4090 GameRock OC | |
| AMD Radeon RX 7900 XTX | |
| KFA2 GeForce RTX 4080 SG | |
| AMD Radeon RX 7900 XT | |
| KFA2 GeForce RTX 4070 Ti EX Gamer | |
| KFA2 GeForce RTX 4070 EX Gamer | |
| KFA2 GeForce RTX 3070 Ti SG | |
| Nvidia Titan RTX | |
| MSI GeForce RTX 4060 Ti Gaming X Trio 8G | |
| Sapphire Pulse Radeon RX 6750 XT | |
| Nvidia GeForce RTX 2070 Super | |
| Nvidia GeForce RTX 2060 Super | |
| KFA2 GeForce GTX 1660 Super | |
| PNY GeForce GTX 1660 | |
| 1920x1080 Ultra Preset | |
| Palit GeForce RTX 4090 GameRock OC | |
| KFA2 GeForce RTX 4080 SG | |
| AMD Radeon RX 7900 XTX | |
| AMD Radeon RX 7900 XT | |
| KFA2 GeForce RTX 4070 Ti EX Gamer | |
| KFA2 GeForce RTX 4070 EX Gamer | |
| KFA2 GeForce RTX 3070 Ti SG | |
| Nvidia Titan RTX | |
| MSI GeForce RTX 4060 Ti Gaming X Trio 8G | |
| Sapphire Pulse Radeon RX 6750 XT | |
| Nvidia GeForce RTX 2070 Super | |
| Nvidia GeForce RTX 2060 Super | |
| KFA2 GeForce GTX 1660 Super | |
| PNY GeForce GTX 1660 | |
| Need for Speed Unbound | |
| 2560x1440 Ultra Preset | |
| Palit GeForce RTX 4090 GameRock OC | |
| KFA2 GeForce RTX 4080 SG | |
| AMD Radeon RX 7900 XTX | |
| AMD Radeon RX 7900 XT | |
| KFA2 GeForce RTX 3070 Ti SG | |
| Nvidia Titan RTX | |
| Nvidia GeForce RTX 2070 Super | |
| Nvidia GeForce RTX 2060 Super | |
| KFA2 GeForce GTX 1660 Super | |
| PNY GeForce GTX 1660 | |
| 1920x1080 Ultra Preset | |
| Palit GeForce RTX 4090 GameRock OC | |
| AMD Radeon RX 7900 XTX | |
| KFA2 GeForce RTX 4080 SG | |
| AMD Radeon RX 7900 XT | |
| KFA2 GeForce RTX 3070 Ti SG | |
| Nvidia Titan RTX | |
| Nvidia GeForce RTX 2070 Super | |
| Nvidia GeForce RTX 2060 Super | |
| KFA2 GeForce GTX 1660 Super | |
| PNY GeForce GTX 1660 | |
| Spider-Man Miles Morales | |
| 2560x1440 Very High Preset AA:T | |
| KFA2 GeForce RTX 4080 SG | |
| Palit GeForce RTX 4090 GameRock OC | |
| AMD Radeon RX 7900 XTX | |
| KFA2 GeForce RTX 4070 Ti EX Gamer | |
| AMD Radeon RX 7900 XT | |
| KFA2 GeForce RTX 4070 EX Gamer | |
| KFA2 GeForce RTX 3070 Ti SG | |
| Nvidia Titan RTX | |
| MSI GeForce RTX 4060 Ti Gaming X Trio 8G | |
| Sapphire Pulse Radeon RX 6750 XT | |
| Nvidia GeForce RTX 2070 Super | |
| Nvidia GeForce RTX 2060 Super | |
| PNY GeForce GTX 1660 | |
| KFA2 GeForce GTX 1660 Super | |
| 1920x1080 Very High Preset AA:T | |
| Palit GeForce RTX 4090 GameRock OC | |
| KFA2 GeForce RTX 4070 Ti EX Gamer | |
| AMD Radeon RX 7900 XTX | |
| KFA2 GeForce RTX 4070 EX Gamer | |
| KFA2 GeForce RTX 4080 SG | |
| AMD Radeon RX 7900 XT | |
| KFA2 GeForce RTX 3070 Ti SG | |
| Nvidia Titan RTX | |
| MSI GeForce RTX 4060 Ti Gaming X Trio 8G | |
| Sapphire Pulse Radeon RX 6750 XT | |
| Nvidia GeForce RTX 2070 Super | |
| Nvidia GeForce RTX 2060 Super | |
| KFA2 GeForce GTX 1660 Super | |
| PNY GeForce GTX 1660 | |
| God of War | |
| 2560x1440 Ultra Preset | |
| Palit GeForce RTX 4090 GameRock OC | |
| AMD Radeon RX 7900 XTX | |
| AMD Radeon RX 7900 XT | |
| KFA2 GeForce RTX 4080 SG | |
| NVIDIA GeForce RTX 3090 Founders Edition | |
| KFA2 GeForce RTX 4070 EX Gamer | |
| Nvidia Titan RTX | |
| KFA2 GeForce RTX 3080 SG | |
| KFA2 GeForce RTX 3070 Ti SG | |
| Sapphire Pulse Radeon RX 6750 XT | |
| MSI GeForce RTX 4060 Ti Gaming X Trio 8G | |
| Nvidia GeForce RTX 2070 Super | |
| Sapphire Nitro+ Radeon RX 6650 XT | |
| Nvidia GeForce RTX 2060 Super | |
| KFA2 GeForce GTX 1660 Super | |
| PNY GeForce GTX 1660 | |
| 1920x1080 Ultra Preset | |
| Palit GeForce RTX 4090 GameRock OC | |
| AMD Radeon RX 7900 XTX | |
| AMD Radeon RX 7900 XT | |
| KFA2 GeForce RTX 4080 SG | |
| NVIDIA GeForce RTX 3090 Founders Edition | |
| KFA2 GeForce RTX 4070 EX Gamer | |
| Nvidia Titan RTX | |
| KFA2 GeForce RTX 3080 SG | |
| KFA2 GeForce RTX 3070 Ti SG | |
| Sapphire Pulse Radeon RX 6750 XT | |
| MSI GeForce RTX 4060 Ti Gaming X Trio 8G | |
| Nvidia GeForce RTX 2070 Super | |
| Sapphire Nitro+ Radeon RX 6650 XT | |
| Nvidia GeForce RTX 2060 Super | |
| KFA2 GeForce GTX 1660 Super | |
| PNY GeForce GTX 1660 | |
| The Quarry | |
| 2560x1440 Ultra Preset | |
| Palit GeForce RTX 4090 GameRock OC | |
| KFA2 GeForce RTX 4080 SG | |
| AMD Radeon RX 7900 XTX | |
| AMD Radeon RX 7900 XT | |
| KFA2 GeForce RTX 4070 Ti EX Gamer | |
| NVIDIA GeForce RTX 3090 Founders Edition | |
| KFA2 GeForce RTX 4070 EX Gamer | |
| KFA2 GeForce RTX 3070 Ti SG | |
| Nvidia Titan RTX | |
| MSI GeForce RTX 4060 Ti Gaming X Trio 8G | |
| Sapphire Pulse Radeon RX 6750 XT | |
| Nvidia GeForce RTX 2070 Super | |
| Sapphire Nitro+ Radeon RX 6650 XT | |
| Nvidia GeForce RTX 2060 Super | |
| KFA2 GeForce GTX 1660 Super | |
| PNY GeForce GTX 1660 | |
| 1920x1080 Ultra Preset | |
| Palit GeForce RTX 4090 GameRock OC | |
| KFA2 GeForce RTX 4080 SG | |
| AMD Radeon RX 7900 XTX | |
| AMD Radeon RX 7900 XT | |
| KFA2 GeForce RTX 4070 Ti EX Gamer | |
| NVIDIA GeForce RTX 3090 Founders Edition | |
| KFA2 GeForce RTX 4070 EX Gamer | |
| KFA2 GeForce RTX 3070 Ti SG | |
| Nvidia Titan RTX | |
| MSI GeForce RTX 4060 Ti Gaming X Trio 8G | |
| Sapphire Pulse Radeon RX 6750 XT | |
| Nvidia GeForce RTX 2070 Super | |
| Sapphire Nitro+ Radeon RX 6650 XT | |
| Nvidia GeForce RTX 2060 Super | |
| KFA2 GeForce GTX 1660 Super | |
| PNY GeForce GTX 1660 | |
| GRID Legends | |
| 2560x1440 Ultra Preset | |
| AMD Radeon RX 7900 XTX (643827) | |
| Palit GeForce RTX 4090 GameRock OC (591708) | |
| AMD Radeon RX 7900 XT (643827) | |
| KFA2 GeForce RTX 4080 SG (643827) | |
| KFA2 GeForce RTX 4070 Ti EX Gamer (712825) | |
| NVIDIA GeForce RTX 3090 Founders Edition (591708) | |
| KFA2 GeForce RTX 3070 Ti SG (643827) | |
| KFA2 GeForce RTX 4070 EX Gamer (712825) | |
| Sapphire Pulse Radeon RX 6750 XT (712825) | |
| Nvidia Titan RTX (591708) | |
| MSI GeForce RTX 4060 Ti Gaming X Trio 8G (800660) | |
| Sapphire Nitro+ Radeon RX 6650 XT | |
| Nvidia GeForce RTX 2070 Super (591708) | |
| Nvidia GeForce RTX 2060 Super (623651) | |
| KFA2 GeForce GTX 1660 Super (623651) | |
| PNY GeForce GTX 1660 (623651) | |
| 1920x1080 Ultra Preset | |
| AMD Radeon RX 7900 XTX (643827) | |
| AMD Radeon RX 7900 XT (643827) | |
| Palit GeForce RTX 4090 GameRock OC (591708) | |
| KFA2 GeForce RTX 4080 SG (643827) | |
| KFA2 GeForce RTX 4070 Ti EX Gamer (712825) | |
| NVIDIA GeForce RTX 3090 Founders Edition (591708) | |
| KFA2 GeForce RTX 4070 EX Gamer (712825) | |
| Sapphire Pulse Radeon RX 6750 XT (712825) | |
| KFA2 GeForce RTX 3070 Ti SG (643827) | |
| Nvidia Titan RTX (591708) | |
| MSI GeForce RTX 4060 Ti Gaming X Trio 8G (800660) | |
| Sapphire Nitro+ Radeon RX 6650 XT | |
| Nvidia GeForce RTX 2070 Super (591708) | |
| Nvidia GeForce RTX 2060 Super (623651) | |
| KFA2 GeForce GTX 1660 Super (623651) | |
| PNY GeForce GTX 1660 (623651) | |
| Final Fantasy XV Benchmark | |
| 1920x1080 High Quality | |
| Palit GeForce RTX 4090 GameRock OC (1.3) | |
| KFA2 GeForce RTX 4080 SG (1.3) | |
| AMD Radeon RX 7900 XTX (1.3) | |
| KFA2 GeForce RTX 4070 Ti EX Gamer (1.3) | |
| AMD Radeon RX 7900 XT (1.3) | |
| NVIDIA GeForce RTX 3090 Founders Edition (1.3) | |
| KFA2 GeForce RTX 4070 EX Gamer (1.3) | |
| KFA2 GeForce RTX 3080 SG (1.3) | |
| Nvidia Titan RTX (1.3) | |
| KFA2 GeForce RTX 3070 Ti SG (1.3) | |
| MSI GeForce RTX 4060 Ti Gaming X Trio 8G (1.3) | |
| Sapphire Pulse Radeon RX 6750 XT (1.3) | |
| Nvidia GeForce RTX 2070 Super (1.3) | |
| Sapphire Nitro+ Radeon RX 6650 XT (1.3) | |
| Nvidia GeForce RTX 2060 Super (1.3) | |
| KFA2 GeForce GTX 1660 Super (1.3) | |
| PNY GeForce GTX 1660 (1.3) | |
| 2560x1440 High Quality | |
| Palit GeForce RTX 4090 GameRock OC (1.3) | |
| KFA2 GeForce RTX 4080 SG (1.3) | |
| AMD Radeon RX 7900 XTX (1.3) | |
| KFA2 GeForce RTX 4070 Ti EX Gamer (1.3) | |
| AMD Radeon RX 7900 XT (1.3) | |
| NVIDIA GeForce RTX 3090 Founders Edition (1.3) | |
| KFA2 GeForce RTX 4070 EX Gamer (1.3) | |
| KFA2 GeForce RTX 3080 SG (1.3) | |
| KFA2 GeForce RTX 3070 Ti SG (1.3) | |
| Nvidia Titan RTX (1.3) | |
| MSI GeForce RTX 4060 Ti Gaming X Trio 8G (1.3) | |
| Sapphire Pulse Radeon RX 6750 XT (1.3) | |
| Nvidia GeForce RTX 2070 Super (1.3) | |
| Sapphire Nitro+ Radeon RX 6650 XT (1.3) | |
| Nvidia GeForce RTX 2060 Super (1.3) | |
| KFA2 GeForce GTX 1660 Super (1.3) | |
| PNY GeForce GTX 1660 (1.3) | |
光线追踪、DLSS和FG(帧生成)。
随着Ada Lovelace的发布,Nvidia已经改进了他们的光线追踪和DLSS功能--DLSS的第三个版本目前只在RTX 4000 GPU中发现。这意味着微星GeForce RTX 4060 Ti Gaming X Trio也受益于这些新功能,而且Frame Generation可以在你的屏幕上实现更高的帧率。然而,这首先要在所有的游戏中实现,在未来,他们可能会越来越多地对这个功能进行优化。绝对是GeForce RTX 4060 Ti的所有者在未来能够利用的一个功能,以实现可玩的帧率。如果将来显卡的计算能力还不太够用,那么你可以使用DLSS和FG来解决这个问题。在这里,我们可以再次以《瘟疫故事安魂曲》为例。在激活DLSS和FG的情况下,我们在UHD中实现了良好的50FPS。如果没有这些功能,我们只能达到25FPS,这绝对不足以正确享受游戏。
这款GPU的光线追踪功能与Nvidia RTX 20的水平相当。NvidiaGeForce RTX 2080 Ti.然而,随着该功能的激活,你确实必须考虑到更高的性能下降。即便如此,我们经常测得平均60 FPS。AMD,与他们的Radeon RX 6750 XT,根本无法跟上。
| Spider-Man Miles Morales - 1920x0180 Very High Preset + Ray-Tracing AA:T | |
| Palit GeForce RTX 4090 GameRock OC | |
| KFA2 GeForce RTX 4080 SG | |
| KFA2 GeForce RTX 4070 Ti EX Gamer | |
| AMD Radeon RX 7900 XTX | |
| AMD Radeon RX 7900 XT | |
| KFA2 GeForce RTX 4070 EX Gamer | |
| KFA2 GeForce RTX 3070 Ti SG | |
| MSI GeForce RTX 4060 Ti Gaming X Trio 8G | |
| Nvidia Titan RTX | |
| Sapphire Pulse Radeon RX 6750 XT | |
| Nvidia GeForce RTX 2070 Super | |
| Nvidia GeForce RTX 2060 Super | |
| Metro Exodus - 1920x1080 Ultra Quality DXR AF:16x | |
| Palit GeForce RTX 4090 GameRock OC | |
| KFA2 GeForce RTX 4080 SG | |
| AMD Radeon RX 7900 XTX | |
| KFA2 GeForce RTX 4070 Ti EX Gamer | |
| AMD Radeon RX 7900 XT | |
| NVIDIA GeForce RTX 3090 Founders Edition | |
| KFA2 GeForce RTX 4070 EX Gamer | |
| KFA2 GeForce RTX 3080 SG | |
| KFA2 GeForce RTX 3070 Ti SG | |
| Nvidia Titan RTX | |
| MSI GeForce RTX 4060 Ti Gaming X Trio 8G | |
| NVIDIA GeForce RTX 3060 Ti FE | |
| Sapphire Pulse Radeon RX 6750 XT | |
| Nvidia GeForce RTX 2070 Super | |
| Nvidia GeForce RTX 2060 Super | |
| Far Cry 6 - 1920x1080 Ultra Graphics Quality + HD Textures + DXR AA:T | |
| AMD Radeon RX 7900 XTX | |
| AMD Radeon RX 7900 XT | |
| KFA2 GeForce RTX 4070 Ti EX Gamer | |
| Palit GeForce RTX 4090 GameRock OC | |
| KFA2 GeForce RTX 4070 EX Gamer | |
| NVIDIA GeForce RTX 3090 Founders Edition | |
| KFA2 GeForce RTX 4080 SG | |
| Nvidia Titan RTX | |
| Sapphire Pulse Radeon RX 6750 XT | |
| MSI GeForce RTX 4060 Ti Gaming X Trio 8G | |
| KFA2 GeForce RTX 3070 Ti SG | |
| Nvidia GeForce RTX 2070 Super | |
| Nvidia GeForce RTX 2060 Super | |
| Cyberpunk 2077 1.6 | |
| 3840x2160 Ray Tracing Ultra Preset (DLSS off) | |
| Palit GeForce RTX 4090 GameRock OC (1.6) | |
| KFA2 GeForce RTX 4080 SG (1.61) | |
| KFA2 GeForce RTX 4070 Ti EX Gamer | |
| AMD Radeon RX 7900 XTX (1.61) | |
| KFA2 GeForce RTX 4070 EX Gamer | |
| AMD Radeon RX 7900 XT (1.61) | |
| Sapphire Pulse Radeon RX 6750 XT | |
| KFA2 GeForce RTX 3070 Ti SG (1.61) | |
| Nvidia GeForce RTX 2070 Super (1.6) | |
| MSI GeForce RTX 4060 Ti Gaming X Trio 8G | |
| 1920x1080 Ray Tracing Ultra Preset (DLSS off) | |
| Palit GeForce RTX 4090 GameRock OC (1.6) | |
| KFA2 GeForce RTX 4080 SG (1.61) | |
| KFA2 GeForce RTX 4070 Ti EX Gamer | |
| AMD Radeon RX 7900 XTX (1.61) | |
| KFA2 GeForce RTX 4070 EX Gamer | |
| AMD Radeon RX 7900 XT (1.61) | |
| MSI GeForce RTX 4060 Ti Gaming X Trio 8G | |
| KFA2 GeForce RTX 3070 Ti SG (1.61) | |
| Nvidia GeForce RTX 2070 Super (1.6) | |
| Sapphire Pulse Radeon RX 6750 XT | |
| Nvidia GeForce RTX 2060 Super (1.6) | |
| The Callisto Protocol - 1920x1080 Ultra Preset (without FSR Upscaling) + Full Ray-Tracing | |
| AMD Radeon RX 7900 XTX | |
| KFA2 GeForce RTX 4070 Ti EX Gamer | |
| Palit GeForce RTX 4090 GameRock OC | |
| AMD Radeon RX 7900 XT | |
| KFA2 GeForce RTX 4080 SG | |
| KFA2 GeForce RTX 4070 EX Gamer | |
| MSI GeForce RTX 4060 Ti Gaming X Trio 8G | |
| KFA2 GeForce RTX 3070 Ti SG | |
| Nvidia Titan RTX | |
| Nvidia GeForce RTX 2070 Super | |
| Nvidia GeForce RTX 2060 Super | |
| Sapphire Pulse Radeon RX 6750 XT | |
| PNY GeForce GTX 1660 | |
| KFA2 GeForce GTX 1660 Super | |
| Guardians of the Galaxy - 1920x1080 Ultra Preset + Ultra Ray-Tracing | |
| KFA2 GeForce RTX 4070 Ti EX Gamer | |
| AMD Radeon RX 7900 XTX | |
| KFA2 GeForce RTX 4070 EX Gamer | |
| AMD Radeon RX 7900 XT | |
| MSI GeForce RTX 4060 Ti Gaming X Trio 8G | |
| Nvidia Titan RTX | |
| Nvidia GeForce RTX 2070 Super | |
| Sapphire Pulse Radeon RX 6750 XT | |
| Nvidia GeForce RTX 2060 Super | |
| A Plague Tale Requiem | |
| 3840x2160 Ultra DLSS Quality + Frame Generation | |
| KFA2 GeForce RTX 4070 Ti EX Gamer | |
| KFA2 GeForce RTX 4070 EX Gamer | |
| MSI GeForce RTX 4060 Ti Gaming X Trio 8G | |
| 3840x2160 Ultra DLSS Quality | |
| KFA2 GeForce RTX 4070 Ti EX Gamer | |
| KFA2 GeForce RTX 4070 EX Gamer | |
| MSI GeForce RTX 4060 Ti Gaming X Trio 8G | |
| Control | |
| 1920x1080 High Quality Preset & High Ray Tracing Preset (DX12) | |
| Palit GeForce RTX 4090 GameRock OC | |
| KFA2 GeForce RTX 4080 SG | |
| AMD Radeon RX 7900 XTX | |
| KFA2 GeForce RTX 4070 Ti EX Gamer | |
| AMD Radeon RX 7900 XT | |
| KFA2 GeForce RTX 3080 SG | |
| KFA2 GeForce RTX 4070 EX Gamer | |
| Nvidia Titan RTX | |
| MSI GeForce RTX 4060 Ti Gaming X Trio 8G | |
| NVIDIA GeForce RTX 3060 Ti FE | |
| Sapphire Pulse Radeon RX 6750 XT | |
| Nvidia GeForce RTX 2070 Super | |
| Nvidia GeForce RTX 2060 Super | |
| Sapphire Nitro+ Radeon RX 6650 XT | |
| 3840x2160 High Quality Preset & High Ray Tracing Preset (DX12) | |
| KFA2 GeForce RTX 4070 Ti EX Gamer | |
| KFA2 GeForce RTX 4070 EX Gamer | |
| MSI GeForce RTX 4060 Ti Gaming X Trio 8G | |
| Sapphire Pulse Radeon RX 6750 XT | |
| 3840x2160 High Quality, High Ray Tracing, DLSS | |
| KFA2 GeForce RTX 4070 Ti EX Gamer | |
| KFA2 GeForce RTX 4070 EX Gamer | |
| MSI GeForce RTX 4060 Ti Gaming X Trio 8G | |
| The Last of Us - 3840x2160 Ultra Preset + Quality DLSS | |
| Palit GeForce RTX 4090 GameRock OC | |
| KFA2 GeForce RTX 4070 Ti EX Gamer | |
| KFA2 GeForce RTX 4070 EX Gamer | |
| Nvidia Titan RTX | |
| MSI GeForce RTX 4060 Ti Gaming X Trio 8G | |
| Nvidia GeForce RTX 2070 Super | |
| low | med. | high | ultra | QHD | 4K DLSS | 4K | |
|---|---|---|---|---|---|---|---|
| GTA V (2015) | 187.8 | 187.8 | 187.5 | 144.2 | 103.4 | 103.2 | |
| The Witcher 3 (2015) | 706.6 | 475.7 | 276.9 | 140.5 | 78.5 | ||
| Dota 2 Reborn (2015) | 297.3 | 262 | 257.4 | 228.4 | 165.8 | ||
| Final Fantasy XV Benchmark (2018) | 236 | 193.5 | 133.8 | 95.5 | 52.7 | ||
| X-Plane 11.11 (2018) | 218 | 196.2 | 149.1 | 126.2 | |||
| Far Cry 5 (2018) | 238 | 200 | 193 | 180 | 136 | 68 | |
| Strange Brigade (2018) | 697 | 351 | 276 | 239 | 154 | 80.1 | |
| Shadow of the Tomb Raider (2018) | 342 | 225 | 204 | 184 | 121.2 | 58.7 | |
| Far Cry New Dawn (2019) | 197 | 173 | 166 | 147 | 127 | 70 | |
| Metro Exodus (2019) | 311 | 173.6 | 130.8 | 101.8 | 80.1 | 49.3 | |
| Control (2019) | 239.9 | 162.4 | 120.2 | 75.2 | 43.5 | 37.3 | |
| Borderlands 3 (2019) | 241 | 206 | 157.3 | 123.5 | 85.2 | 43.7 | |
| F1 2020 (2020) | 548 | 426 | 342 | 232 | 177.8 | 97 | |
| F1 2021 (2021) | 671 | 471 | 359 | 179.8 | 128.9 | 67.2 | |
| Far Cry 6 (2021) | 233 | 190.4 | 163.2 | 145 | 102.5 | 21.4 | |
| Guardians of the Galaxy (2021) | 201 | 196 | 195 | 187 | 129 | 67 | |
| God of War (2022) | 178.3 | 146.2 | 116.4 | 85 | 69.9 | 46.6 | |
| GRID Legends (2022) | 243 | 218 | 194.6 | 164.2 | 137.3 | 84.7 | |
| Cyberpunk 2077 1.6 (2022) | 176.6 | 137.6 | 115.7 | 100.5 | 60.2 | 25.3 | |
| Ghostwire Tokyo (2022) | 235 | 224 | 221 | 207 | 128.8 | 58.3 | |
| Tiny Tina's Wonderlands (2022) | 303 | 237 | 155.3 | 119.7 | 81.1 | 36.9 | |
| F1 22 (2022) | 358 | 346 | 258 | 89.6 | 56.5 | 28.2 | |
| The Quarry (2022) | 228 | 167.4 | 137.2 | 108.8 | 72.3 | 23 | |
| A Plague Tale Requiem (2022) | 151.5 | 117 | 88.3 | 66.8 | 47.4 | 50.8 | 25.2 |
| Uncharted Legacy of Thieves Collection (2022) | 113.6 | 109.8 | 102.9 | 99.4 | 70.7 | 30.3 | |
| Spider-Man Miles Morales (2022) | 154.4 | 149.1 | 141.9 | 131.7 | 96.6 | 54.8 | |
| The Callisto Protocol (2022) | 232.1 | 178 | 167.8 | 103.6 | 79.5 | 48.8 | |
| High On Life (2023) | 346 | 225 | 167.3 | 139 | 78.3 | 32.3 | |
| The Witcher 3 v4 (2023) | 278 | 226 | 187.3 | 151.8 | 98.9 | 52.4 | |
| Dead Space Remake (2023) | 128.5 | 122.9 | 106.2 | 105.5 | 65.9 | 32 | |
| Hogwarts Legacy (2023) | 177.5 | 135.1 | 108 | 85 | 54.7 | 30.8 | |
| Returnal (2023) | 136 | 129 | 116 | 101 | 73 | 41 | |
| Atomic Heart (2023) | 264 | 202 | 116 | 93.7 | 69.5 | 38.9 | |
| Company of Heroes 3 (2023) | 293.5 | 243.8 | 180.6 | 179.6 | 133.6 | 72.3 | |
| Sons of the Forest (2023) | 118.1 | 109.9 | 105.6 | 103.1 | 81.9 | 49.6 | |
| Resident Evil 4 Remake (2023) | 207 | 135.7 | 150.4 | 98.6 | 69.1 | 37.9 | |
| The Last of Us (2023) | 126.1 | 102.1 | 89.6 | 74.6 | 46.5 | 36.5 | 19.6 |
| Dead Island 2 (2023) | 289 | 263 | 224 | 162.5 | 110.5 | 56.9 | |
| Star Wars Jedi Survivor (2023) | 114.2 | 98.6 | 91.3 | 84.7 | 54.4 | 25.7 | |
| Diablo 4 (2023) | 341 | 290 | 256 | 217 | 138.8 | 92.8 | 66 |
微星GeForce RTX 4060 Ti Gaming X Trio 8G的排放量
噪声排放
为了测量微星GeForce RTX 4060 Ti Gaming X Trio 8G的噪音排放,我们将其打开,没有任何额外的CPU或电源冷却。在空闲模式和低负载下,我们测试的模型实际上是无声的。即使当100毫米的风扇开始工作时,显卡仍然非常安静。在我们的压力测试中,我们测得只有31 dB(A),风扇转速只有每分钟1100转。当我们将功率目标提高到121%时,风扇以每分钟1310转的速度工作,其32.5 dB(A)的噪音排放仍然是令人难以置信的安静。
Noise level
| Idle |
| 30.1 / 30.1 / 30.1 dB(A) |
| Load |
| 30.15 / 31 dB(A) |
 | ||
30 dB silent 40 dB(A) audible 50 dB(A) loud |
||
min: | ||
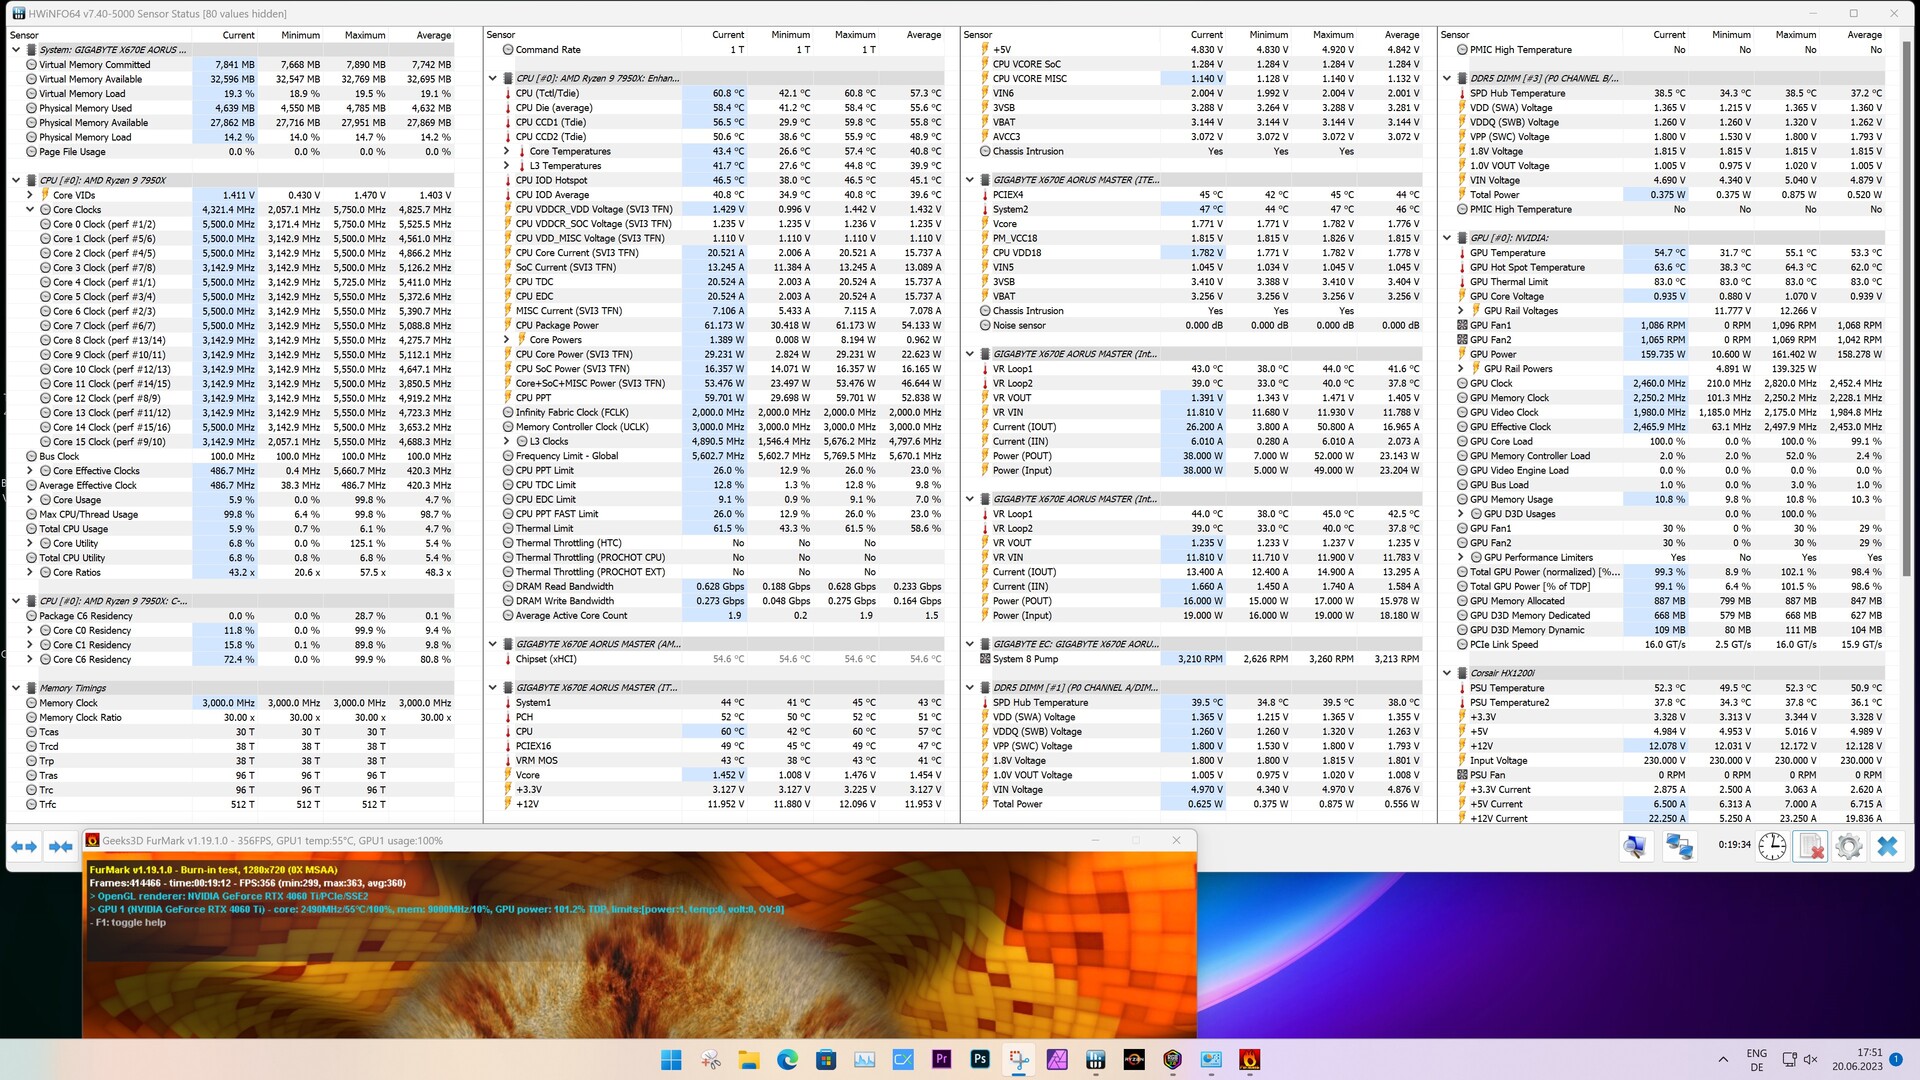
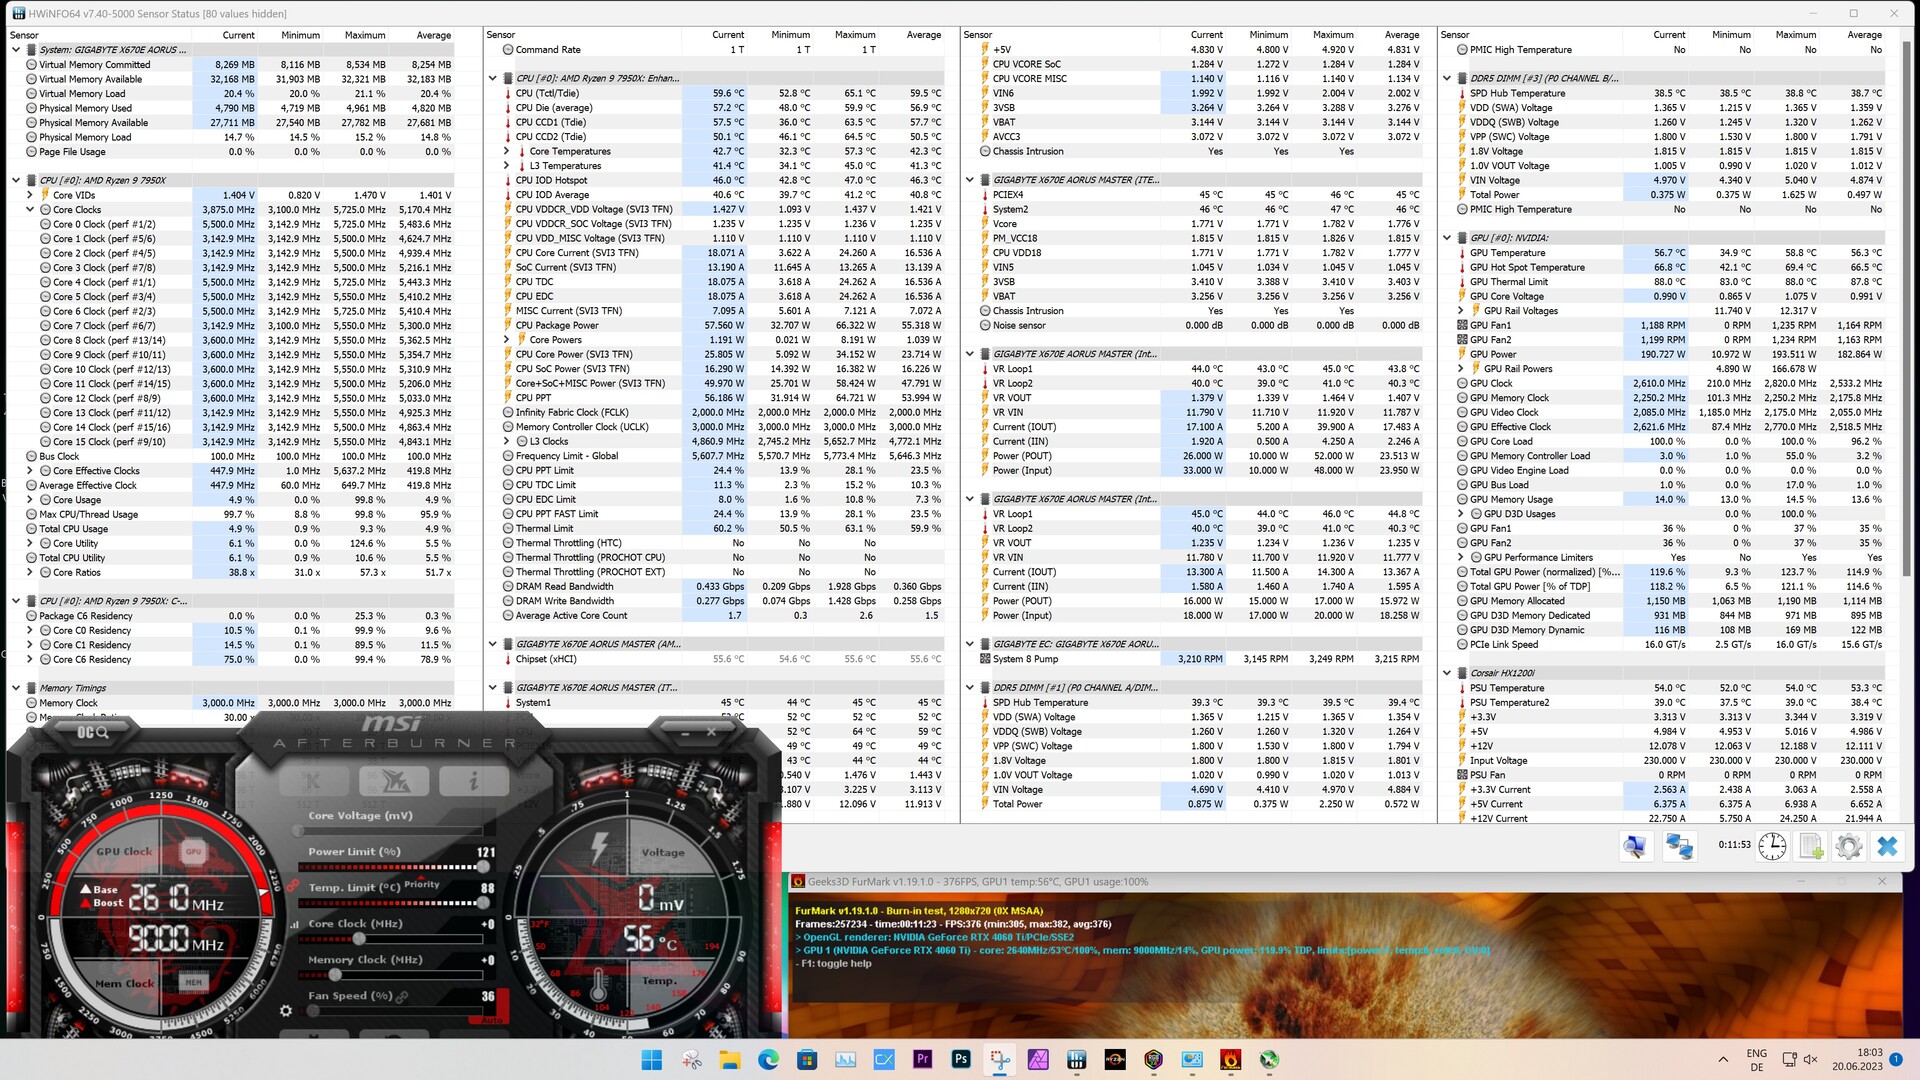
温度和功率消耗
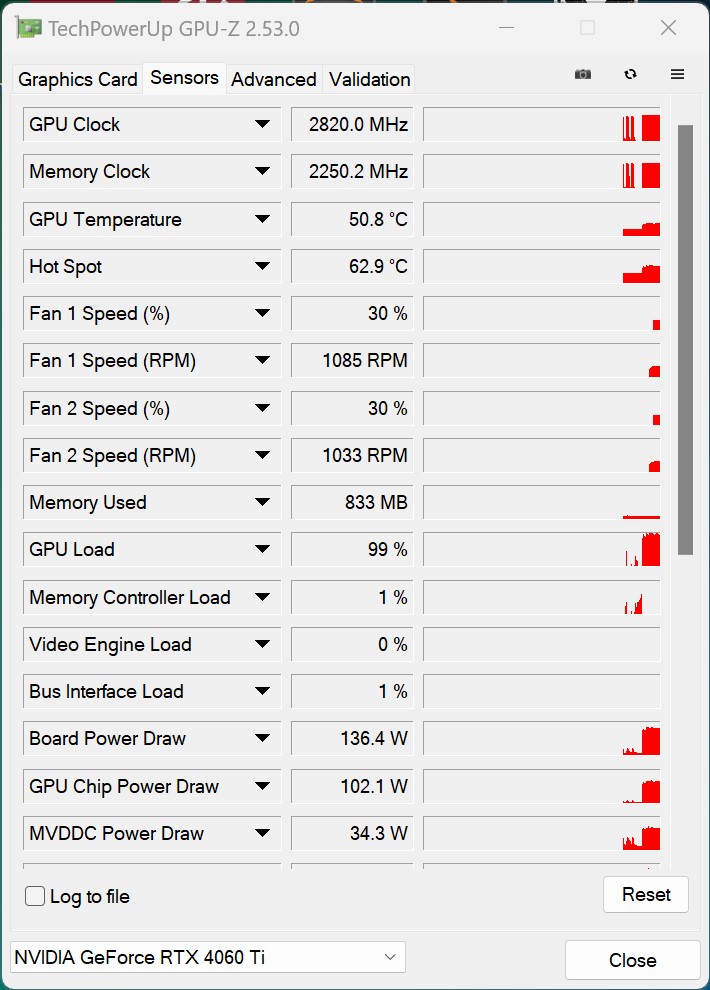
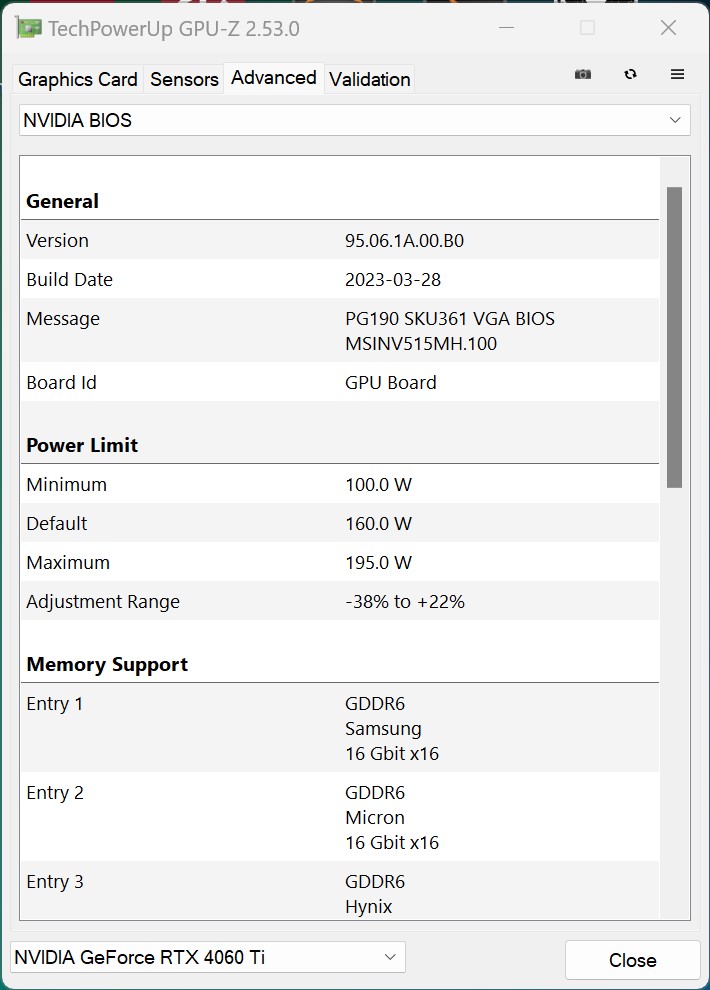
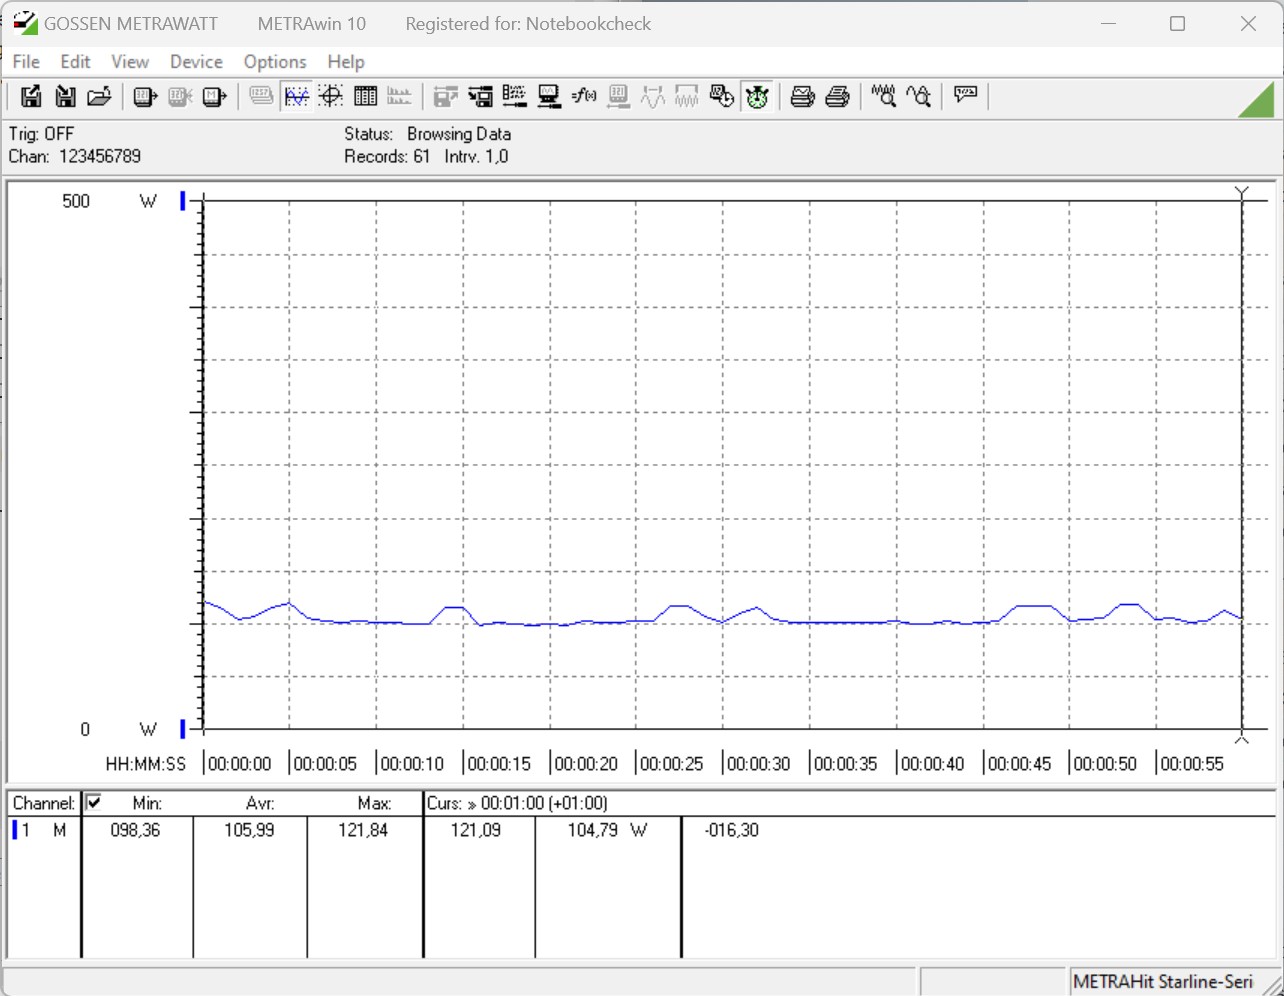
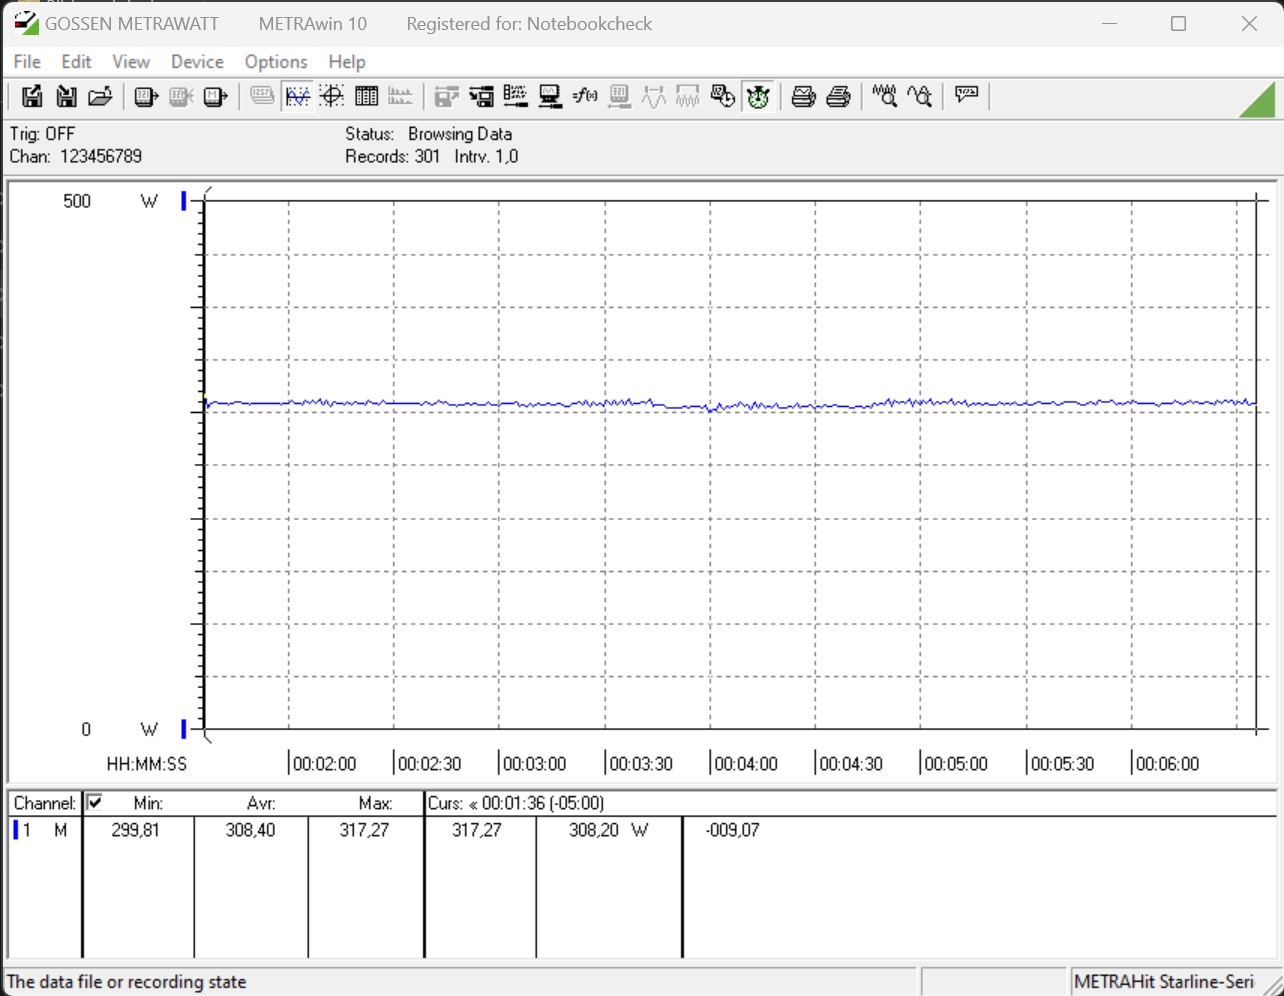
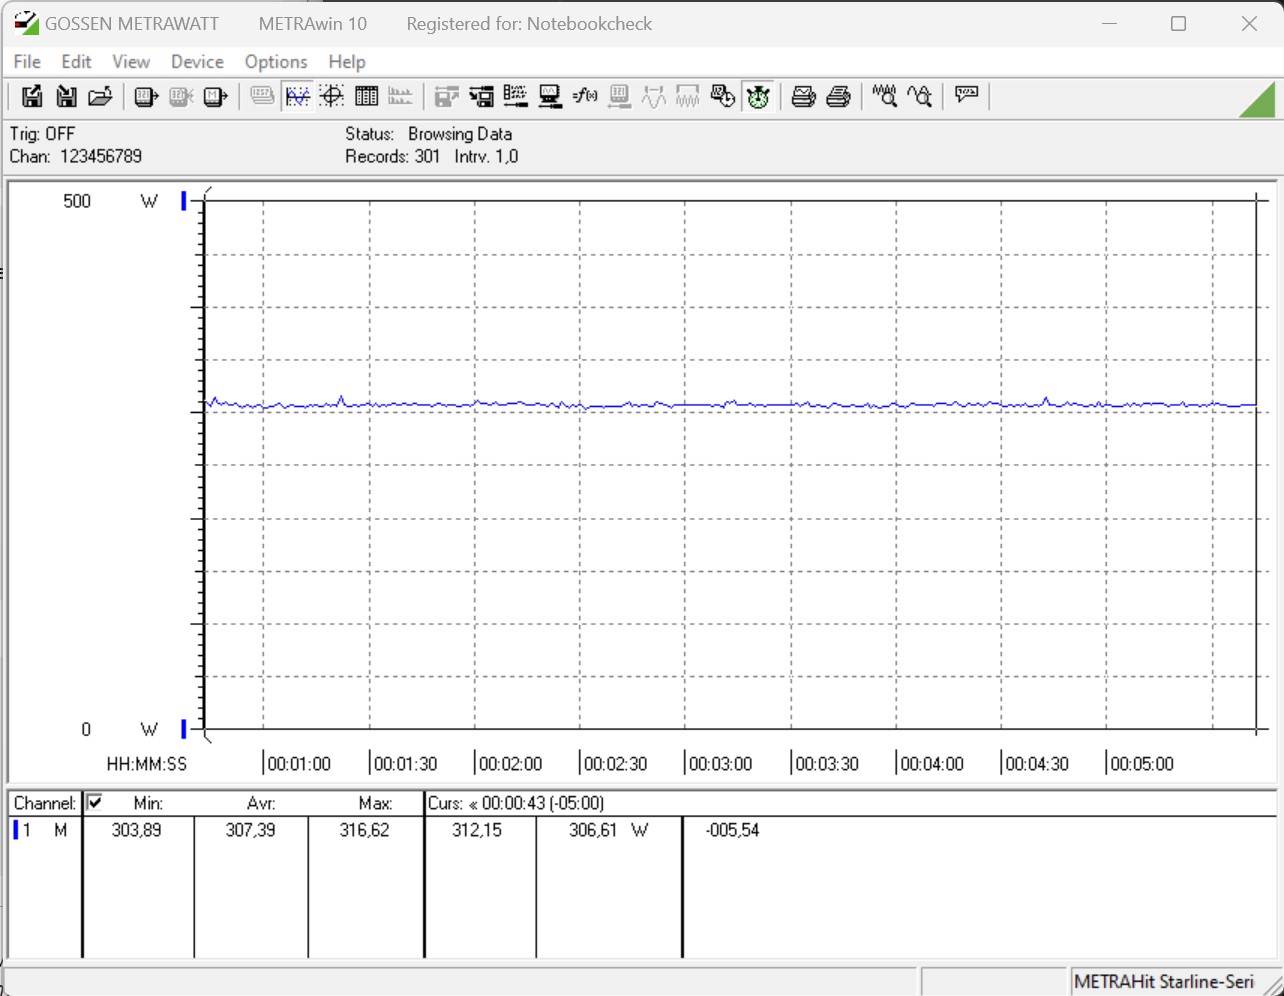
微星公司给GeForce RTX 4060 Ti Gaming X Trio 8G配备了一个非常大的冷却器,有三个轴流风扇。考虑到其功耗最多为160瓦(PT 100%),制造商可能有点反应过度。在谈到这个顶级型号的功率限制时,微星没有改变任何东西,而是紧跟Nvidia的指导方针。然而,你可以手动改变功率目标达21%,这意味着该显卡最多使用195瓦。在我们的压力测试以及游戏测试中,显卡的功率限制很容易被击中。我们的整个测试系统,不包括显示器,使用约300瓦。这使得微星GeForce RTX 4060 Ti Gaming X Trio 8G 90瓦的功率要比蓝宝石脉冲Radeon RX 6750 XT在同一测试系统中,比蓝宝石Pulse Radeon RX 6750 XT更节俭90瓦。这再次表明,这款显卡的效率确实很高。因此,根据制造商的说法,它只需要一个550瓦的电源。
温度问题对微星GeForce RTX 4060 Ti Gaming X Trio 8G来说是陌生的,当然是由于它的冷却器非常大。我们最多只测得64℃的热点温度,而在压力测试期间,芯片的平均温度为54.7℃。
| Power Consumption / The Witcher 3 ultra (external Monitor) | |
| AMD Radeon RX 7900 XTX (Idle: 86.5 W) | |
| NVIDIA GeForce RTX 3090 Founders Edition | |
| Palit GeForce RTX 4090 GameRock OC | |
| KFA2 GeForce RTX 3080 SG | |
| KFA2 GeForce RTX 4080 SG (Idle: 86.4 W) | |
| AMD Radeon RX 7900 XT (Idle: 84.6 W) | |
| KFA2 GeForce RTX 3070 Ti SG (Idle: 88.9 W) | |
| KFA2 GeForce RTX 4070 Ti EX Gamer | |
| Sapphire Pulse Radeon RX 6750 XT | |
| NVIDIA GeForce RTX 3060 Ti Founders Edition (Idle: 111.39 W) | |
| KFA2 GeForce RTX 4070 EX Gamer | |
| Sapphire Nitro+ Radeon RX 6650 XT | |
| MSI GeForce RTX 4060 Ti Gaming X Trio 8G | |
| Power Consumption / FurMark 1.19 GPU Stress Test (external Monitor) | |
| Palit GeForce RTX 4090 GameRock OC | |
| AMD Radeon RX 7900 XTX (Idle: 86.5 W) | |
| NVIDIA GeForce RTX 3090 Founders Edition | |
| AMD Radeon RX 7900 XT (Idle: 84.6 W) | |
| KFA2 GeForce RTX 3080 SG | |
| KFA2 GeForce RTX 3070 Ti SG (Idle: 88.9 W) | |
| KFA2 GeForce RTX 4080 SG (Idle: 86.4 W) | |
| KFA2 GeForce RTX 4070 Ti EX Gamer | |
| Sapphire Pulse Radeon RX 6750 XT | |
| NVIDIA GeForce RTX 3060 Ti Founders Edition (Idle: 111.39 W) | |
| Sapphire Nitro+ Radeon RX 6650 XT | |
| KFA2 GeForce RTX 4070 EX Gamer | |
| MSI GeForce RTX 4060 Ti Gaming X Trio 8G | |
| Power Consumption / Witcher 3 ultra Efficiency (external Monitor) | |
| Palit GeForce RTX 4090 GameRock OC | |
| KFA2 GeForce RTX 4080 SG | |
| AMD Radeon RX 7900 XT | |
| AMD Radeon RX 7900 XTX | |
| KFA2 GeForce RTX 4070 Ti EX Gamer | |
| KFA2 GeForce RTX 4070 EX Gamer | |
| MSI GeForce RTX 4060 Ti Gaming X Trio 8G | |
| Sapphire Pulse Radeon RX 6750 XT | |
| NVIDIA GeForce RTX 3090 Founders Edition | |
| KFA2 GeForce RTX 3070 Ti SG | |
| KFA2 GeForce RTX 3080 SG | |
| Sapphire Nitro+ Radeon RX 6650 XT | |
| NVIDIA GeForce RTX 3060 Ti Founders Edition | |
* ... smaller is better
Power consumption with external monitor
Pros
Cons
评语 - 非常安静,非常节俭

在这次审查中,我们仔细研究了微星GeForce RTX 4060 Ti Gaming X Trio 8G,这是另一款旨在吸引大众的显卡。Ada Lovelace显卡的性能提升是巨大的,但它在存储连接和处理单元方面的劣势意味着GeForce RTX 4060 Ti的性能只比一个NvidiaGeForce RTX 3060 Ti.然而,我们确实看到他们为1,080p游戏制造的显卡的目标正在实现。同时,NvidiaGeForce RTX 4060 Ti确实比NvidiaGeForce RTX 4070落后不少,这就引出了一个问题:Nvidia是否会在某个时候用进一步的模型来缩小这一差距。很快,就会有RTX 4060 Ti的版本,配备16GB的VRAM。尽管目前,我们不认为这些会比8GB型号带来巨大的性能提升。
在我们的测试中,微星模型以其出色的发射率给我们留下了深刻印象。该显卡始终保持着几乎无声的工作状态,温度问题对该组件来说是陌生的。反过来,该显卡具有一个巨大的冷却装置 - 甚至比我们的PalitGeForce RTX 4090 Gamerock OC.你在购买时必须考虑到这一点,因为微星GeForce RTX 4060 Ti Gaming X Trio 8G不会适合每个PC机箱。它的性能总体上是好的,虽然,你必须处理一些掉帧,因为在使用超预设时,会出现低FPS。
如果你正在寻找建立一个非常安静的PC,微星GeForce RTX 4060 Ti Gaming X Trio 8G是完美的。该显卡的低功耗会让你的钱包轻松,但目前,其8GB内存在市场上有点困难。
对于谁来说,这被证明是一个有趣的显卡?这是一个困难的问题,主要取决于你自己的个人喜好。我们只能将NvidiaGeForce RTX 4060 Ti部分地称为面向未来的产品。至少Nvidia还没有摆脱DLSS 3.0和FG(帧生成)等独家功能。当涉及到显卡的寿命时,这是一个说明显卡的要点。
从价格上看,微星GeForce RTX 4060 Ti Gaming X Trio 8G可以被放在GeForce RTX 4060 Ti模型的高端。这也难怪,因为制造商总是对他们的顶级型号收取更多的费用。目前,它可以以699美元左右的价格购买。你将不得不再投资至少100美元到一个NvidiaGeForce RTX 4070而AMD至少要为他们的Radeon RX 6750 XT.你可以找到其他更便宜的NvidiaGeForce RTX 4060 Ti模型,价格在350美元左右。
价格和可用性
目前,你可以在许多在线零售商,如亚马逊,购买微星GeForce RTX 4060 Ti Gaming X Trio 8G,价格为699美元。
Transparency
The selection of devices to be reviewed is made by our editorial team. The test sample was provided to the author as a loan by the manufacturer or retailer for the purpose of this review. The lender had no influence on this review, nor did the manufacturer receive a copy of this review before publication. There was no obligation to publish this review. As an independent media company, Notebookcheck is not subjected to the authority of manufacturers, retailers or publishers.
This is how Notebookcheck is testing
Every year, Notebookcheck independently reviews hundreds of laptops and smartphones using standardized procedures to ensure that all results are comparable. We have continuously developed our test methods for around 20 years and set industry standards in the process. In our test labs, high-quality measuring equipment is utilized by experienced technicians and editors. These tests involve a multi-stage validation process. Our complex rating system is based on hundreds of well-founded measurements and benchmarks, which maintains objectivity. Further information on our test methods can be found here.

