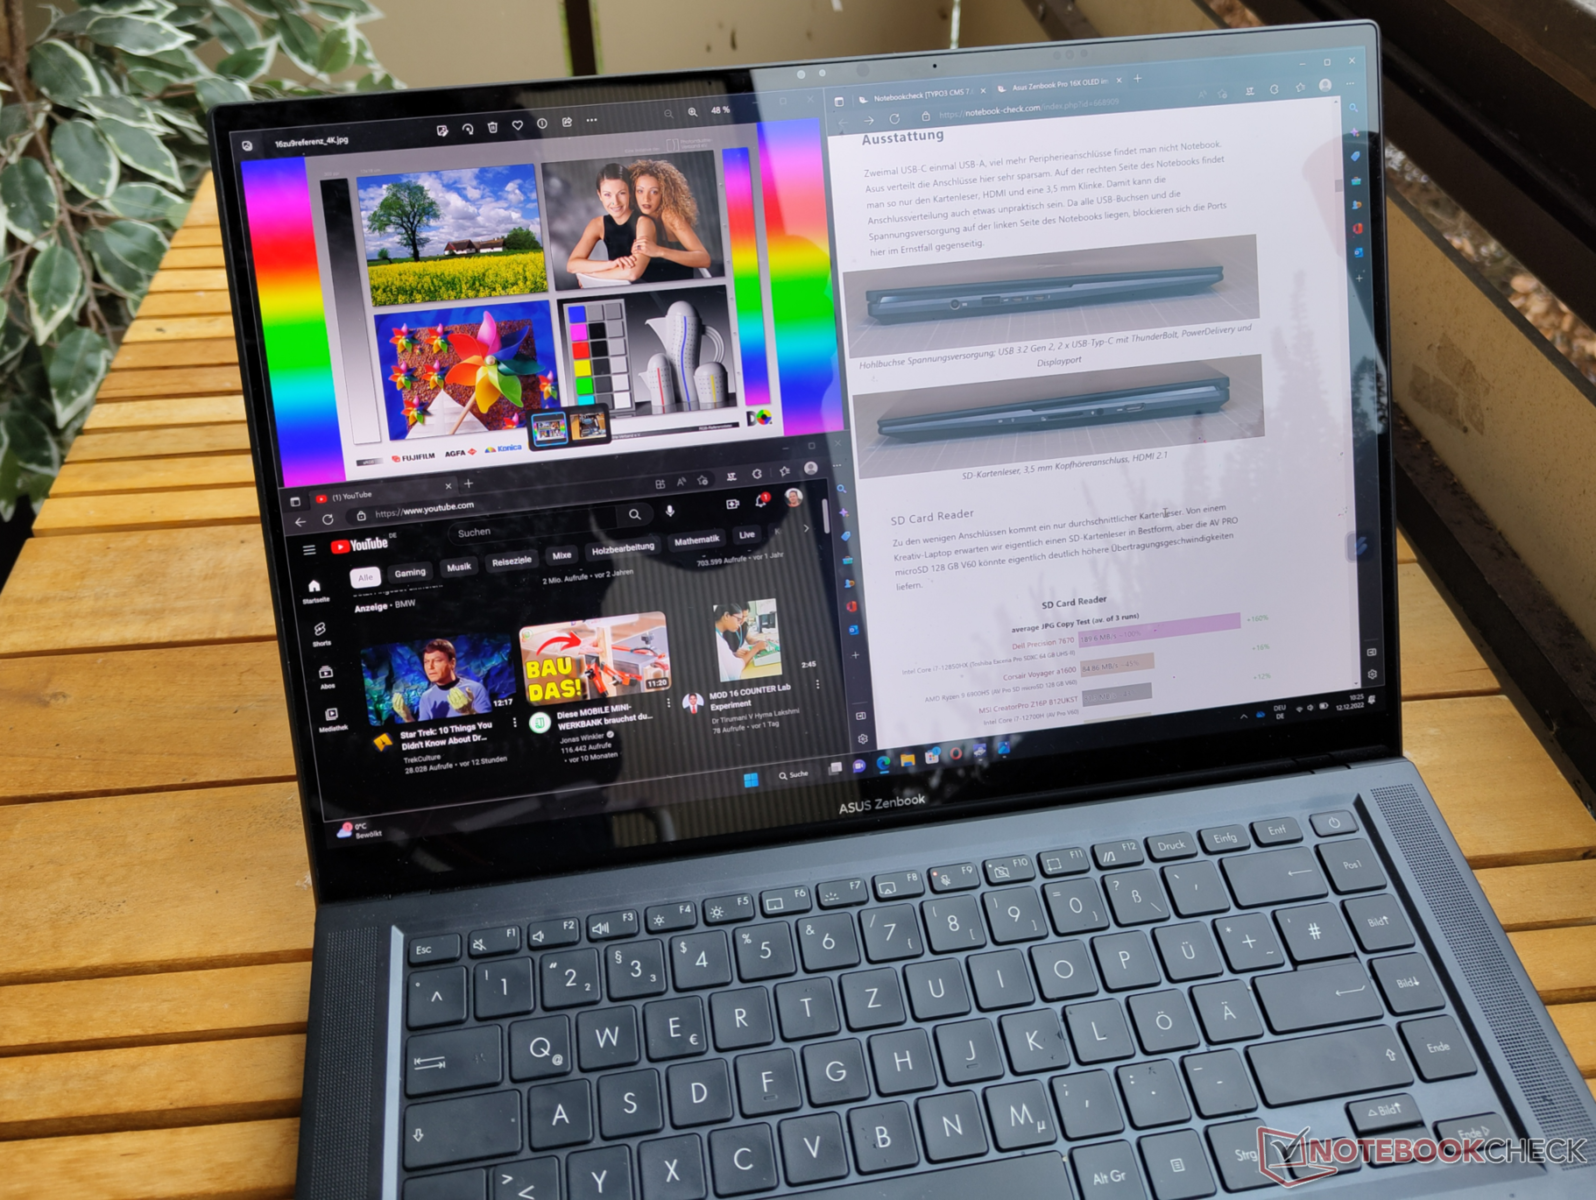
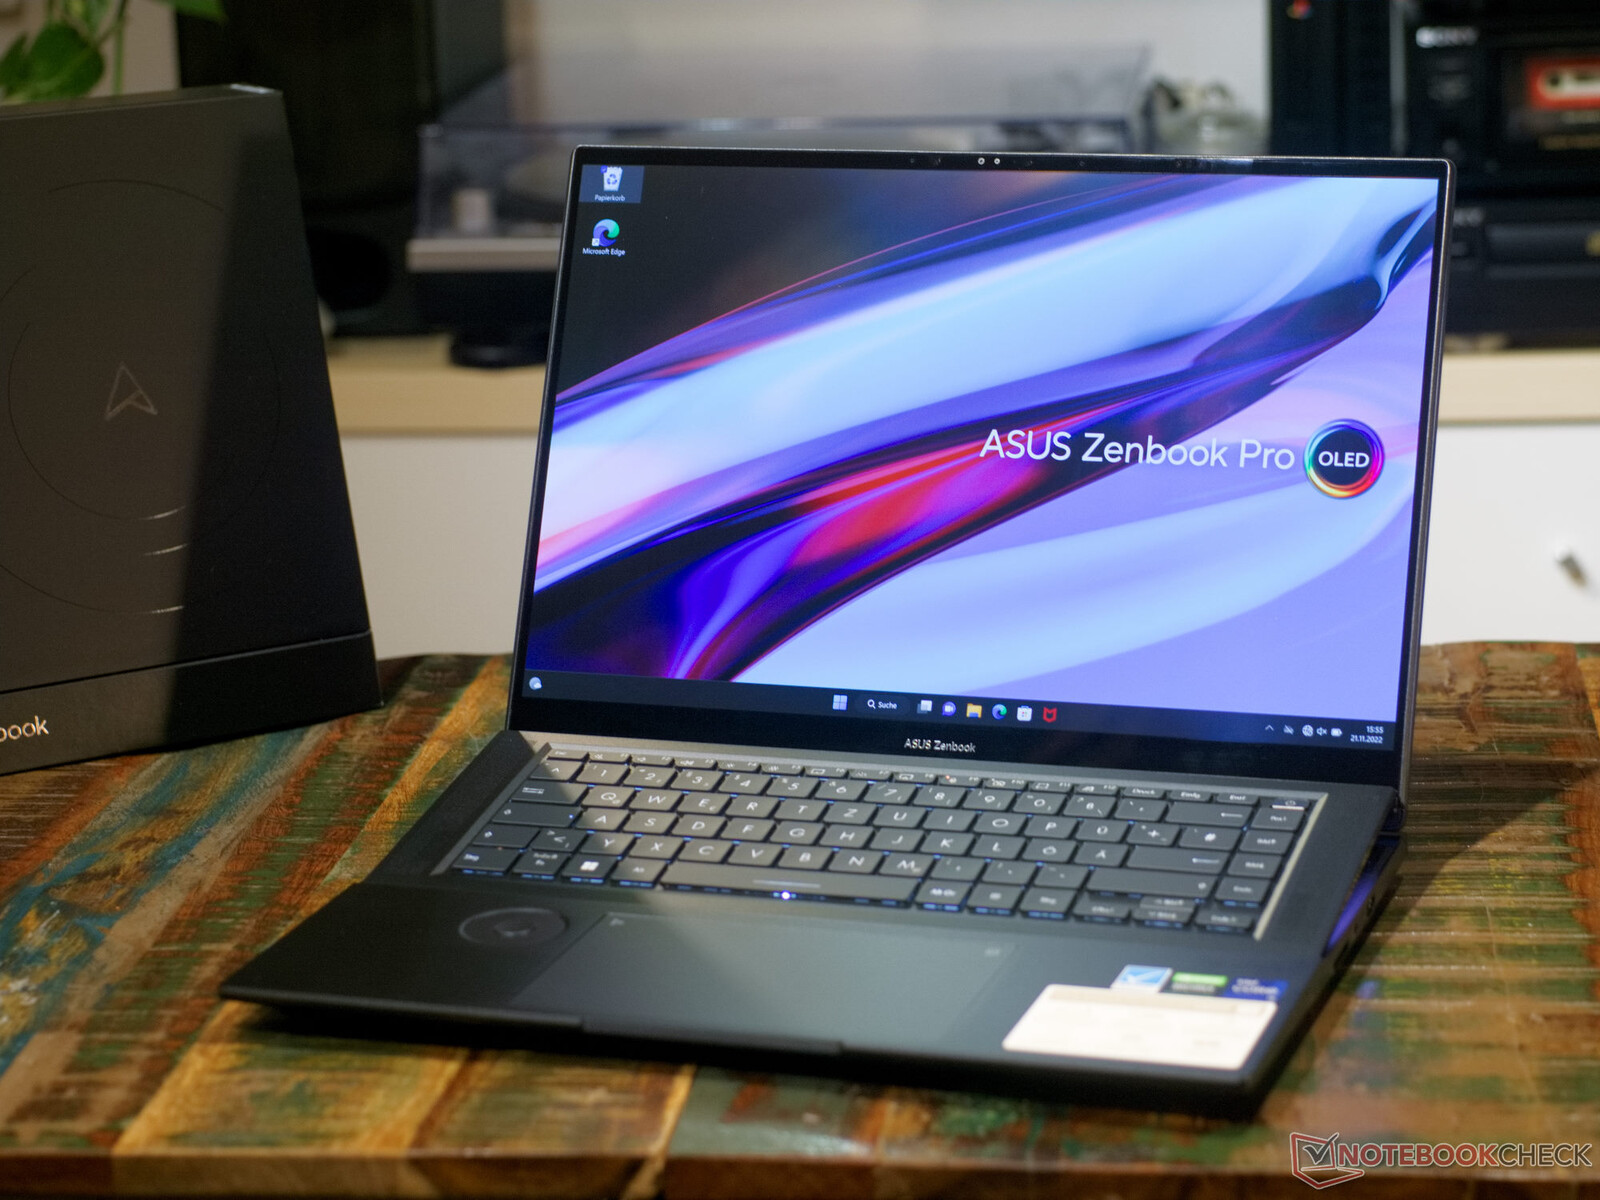
华硕Zenbook Pro 16X OLED评测--有特殊技巧的极致笔记本
Zenbook通常是奢侈的笔记本电脑,具有不寻常的功能和有趣的设计。该系列中最不寻常的代表可能是Zenbook 17 Fold。Zenbook Pro 16X OLED与可折叠笔记本一起看起来几乎是立体的,但只要你打开显示屏,Zenbook 17仍然在许多其他笔记本中脱颖而出。这是由于ASS超冷却,为此,键盘与屏幕一起折叠起来。键盘被放置在一个符合人体工程学的7度角,据说可以多提供30%的气流。 我们的审查显示,这款笔记本电脑并不总是有性能优势,但它可以长时间保持低工作温度。
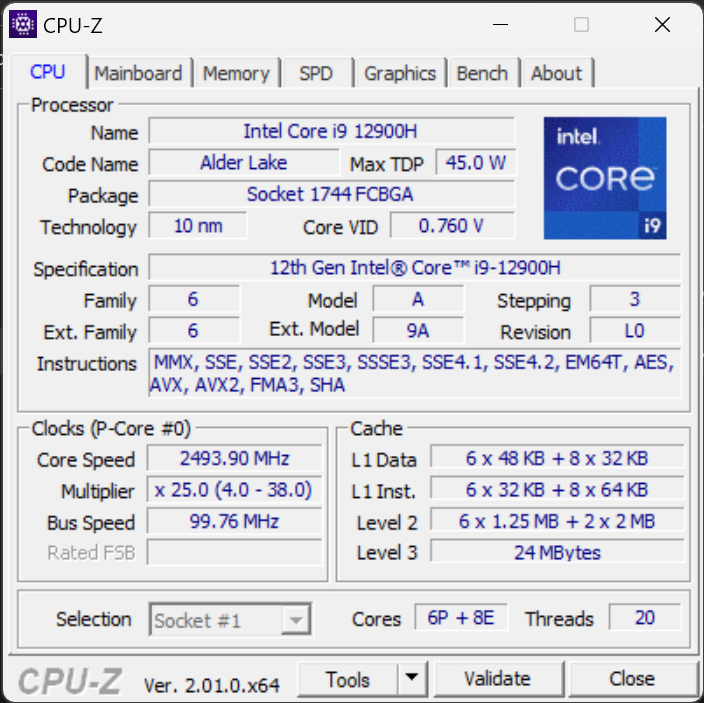
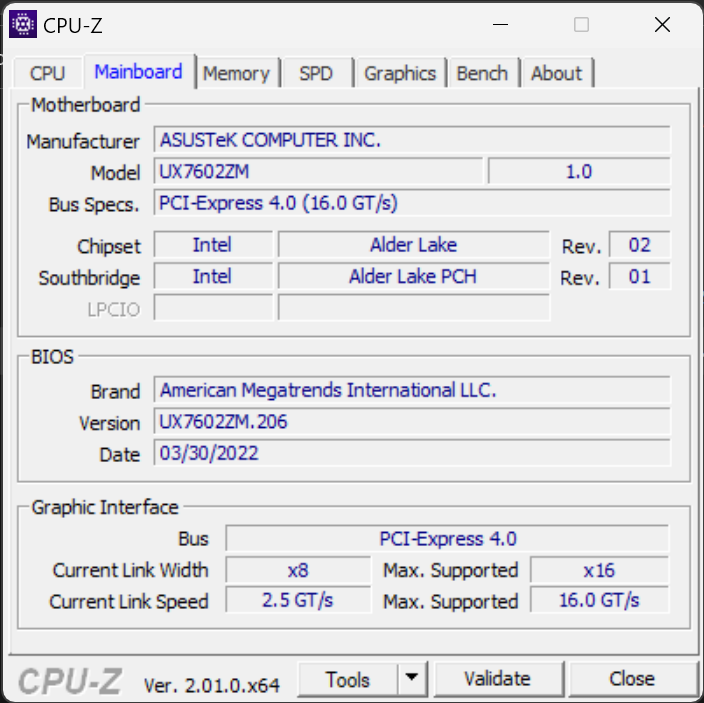
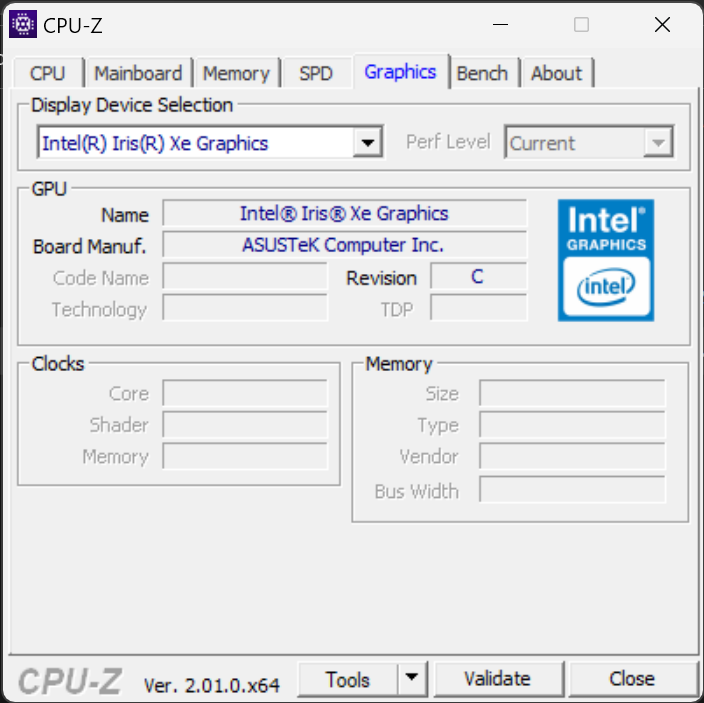
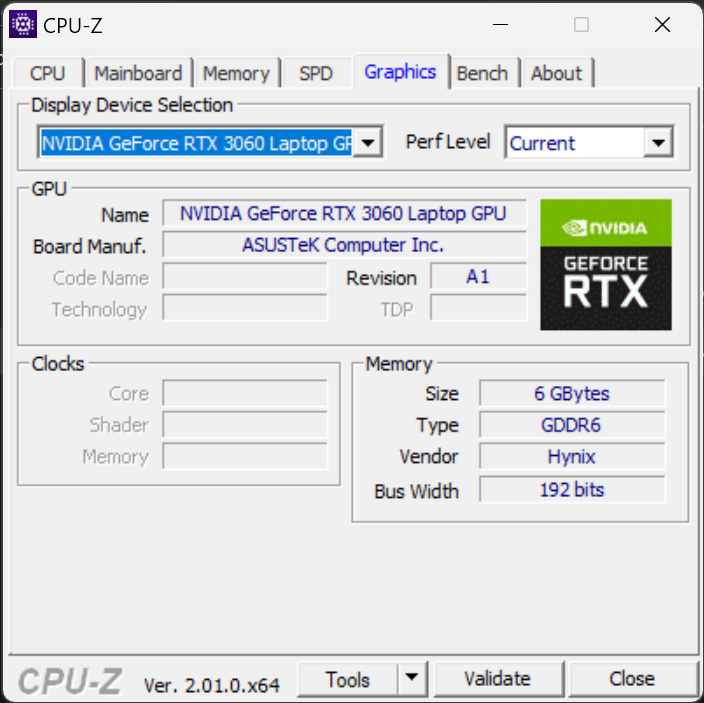
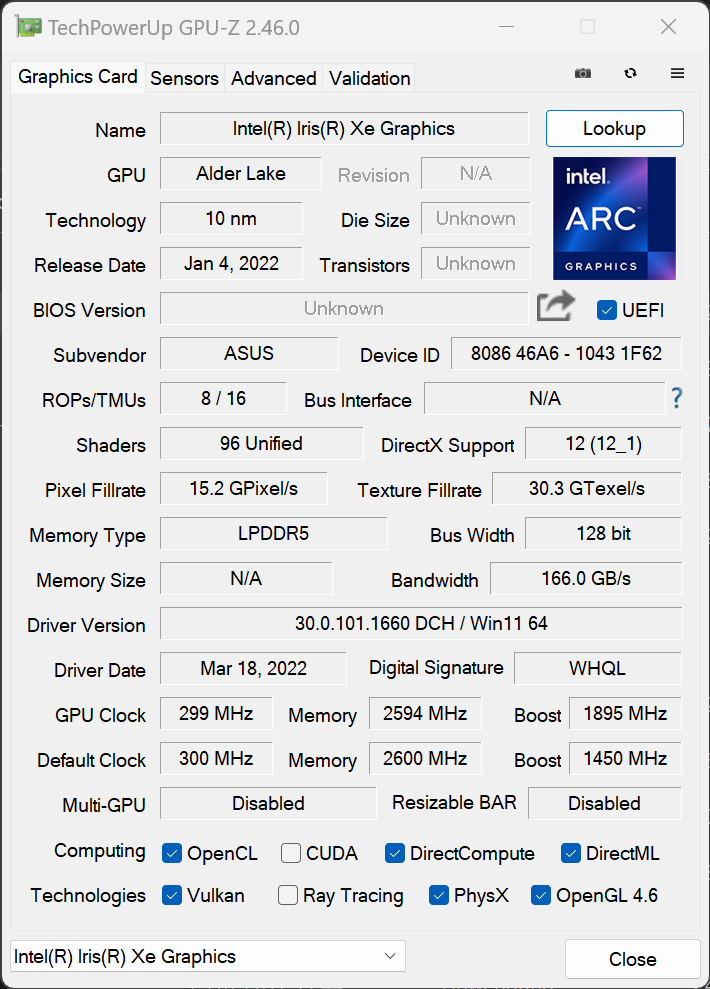
此外,Zenbook Pro 16X充满了有趣的功能。包括键盘的全RGBW背光、华硕拨号盘和手写笔输入,以及具有完整DisplayP3色彩空间覆盖的强大OLED显示屏。最后但并非最不重要的是,我们也许还应该提到Zenbook的强大硬件。一个 英特尔酷睿i9-12900H,32GB LPDDR5和一个 NvidiaGeForce RTX 3060被安装在这里,并由一个蒸汽室进行冷却。因此,在金属外壳中的潘通验证的16英寸笔记本电脑在许多类别中获得了高分。在价格方面,工作室的笔记本电脑处于可容忍的范围内,华硕的报价在3000美元左右。
我们从数据库中选择了各种16英寸笔记本作为对比设备。由于华硕ZenBook Pro 16X OLED的价格相对较高,它与一些配备专业图形芯片的工作站直接竞争,如微星CreatorPro Z16P或 惠普ZBook Studio 16 G9。游戏笔记本电脑,如 海盗船Voyager A1600也可以考虑作为华硕笔记本电脑的一个很好的替代品。那些喜欢简单而不是奢侈的人应该看看华硕的 VivoBook Pro 16X OLED,它也可以配备与ZenBook类似的功能。
潜在的竞争对手比较
Rating | Date | Model | Weight | Height | Size | Resolution | Price |
|---|---|---|---|---|---|---|---|
| 88.4 % v7 (old) | 12 / 2022 | Asus ZenBook Pro 16X OLED UX7602ZM-ME115W i9-12900H, GeForce RTX 3060 Laptop GPU | 2.4 kg | 19.5 mm | 16.00" | 3840x2400 | |
| 88.7 % v7 (old) | 12 / 2022 | Lenovo ThinkPad X1 Extreme G5-21DE003RGE i7-12700H, GeForce RTX 3060 Laptop GPU | 2.1 kg | 17.9 mm | 16.00" | 3840x2400 | |
| 86.4 % v7 (old) | 12 / 2022 | HP Omen 16-n0033dx R7 6800H, Radeon RX 6650M | 2.4 kg | 22.6 mm | 16.10" | 1920x1080 | |
| 90.1 % v7 (old) | 11 / 2022 | HP ZBook Studio 16 G9 62U04EA i7-12800H, RTX A2000 Laptop GPU | 1.8 kg | 19 mm | 16.00" | 3840x2400 | |
| 86.6 % v7 (old) | 12 / 2022 | Corsair Voyager a1600 R9 6900HS, Radeon RX 6800M | 2.4 kg | 19.9 mm | 16.00" | 2560x1600 | |
| 88.4 % v7 (old) | 10 / 2022 | Dell Precision 7670 i7-12850HX, RTX A2000 Laptop GPU | 2.7 kg | 24.7 mm | 16.00" | 3840x2400 | |
| 83.7 % v7 (old) | 11 / 2022 | Asus VivoBook Pro 16X OLED N7600PC-L2026X i7-11370H, GeForce RTX 3050 4GB Laptop GPU | 2 kg | 18.9 mm | 16.00" | 3840x2400 | |
| 84.3 % v7 (old) | 11 / 2022 | MSI CreatorPro Z16P B12UKST i7-12700H, RTX A3000 Laptop GPU | 2.4 kg | 19 mm | 16.00" | 2560x1600 |
案例 - 每一个细节都很不寻常
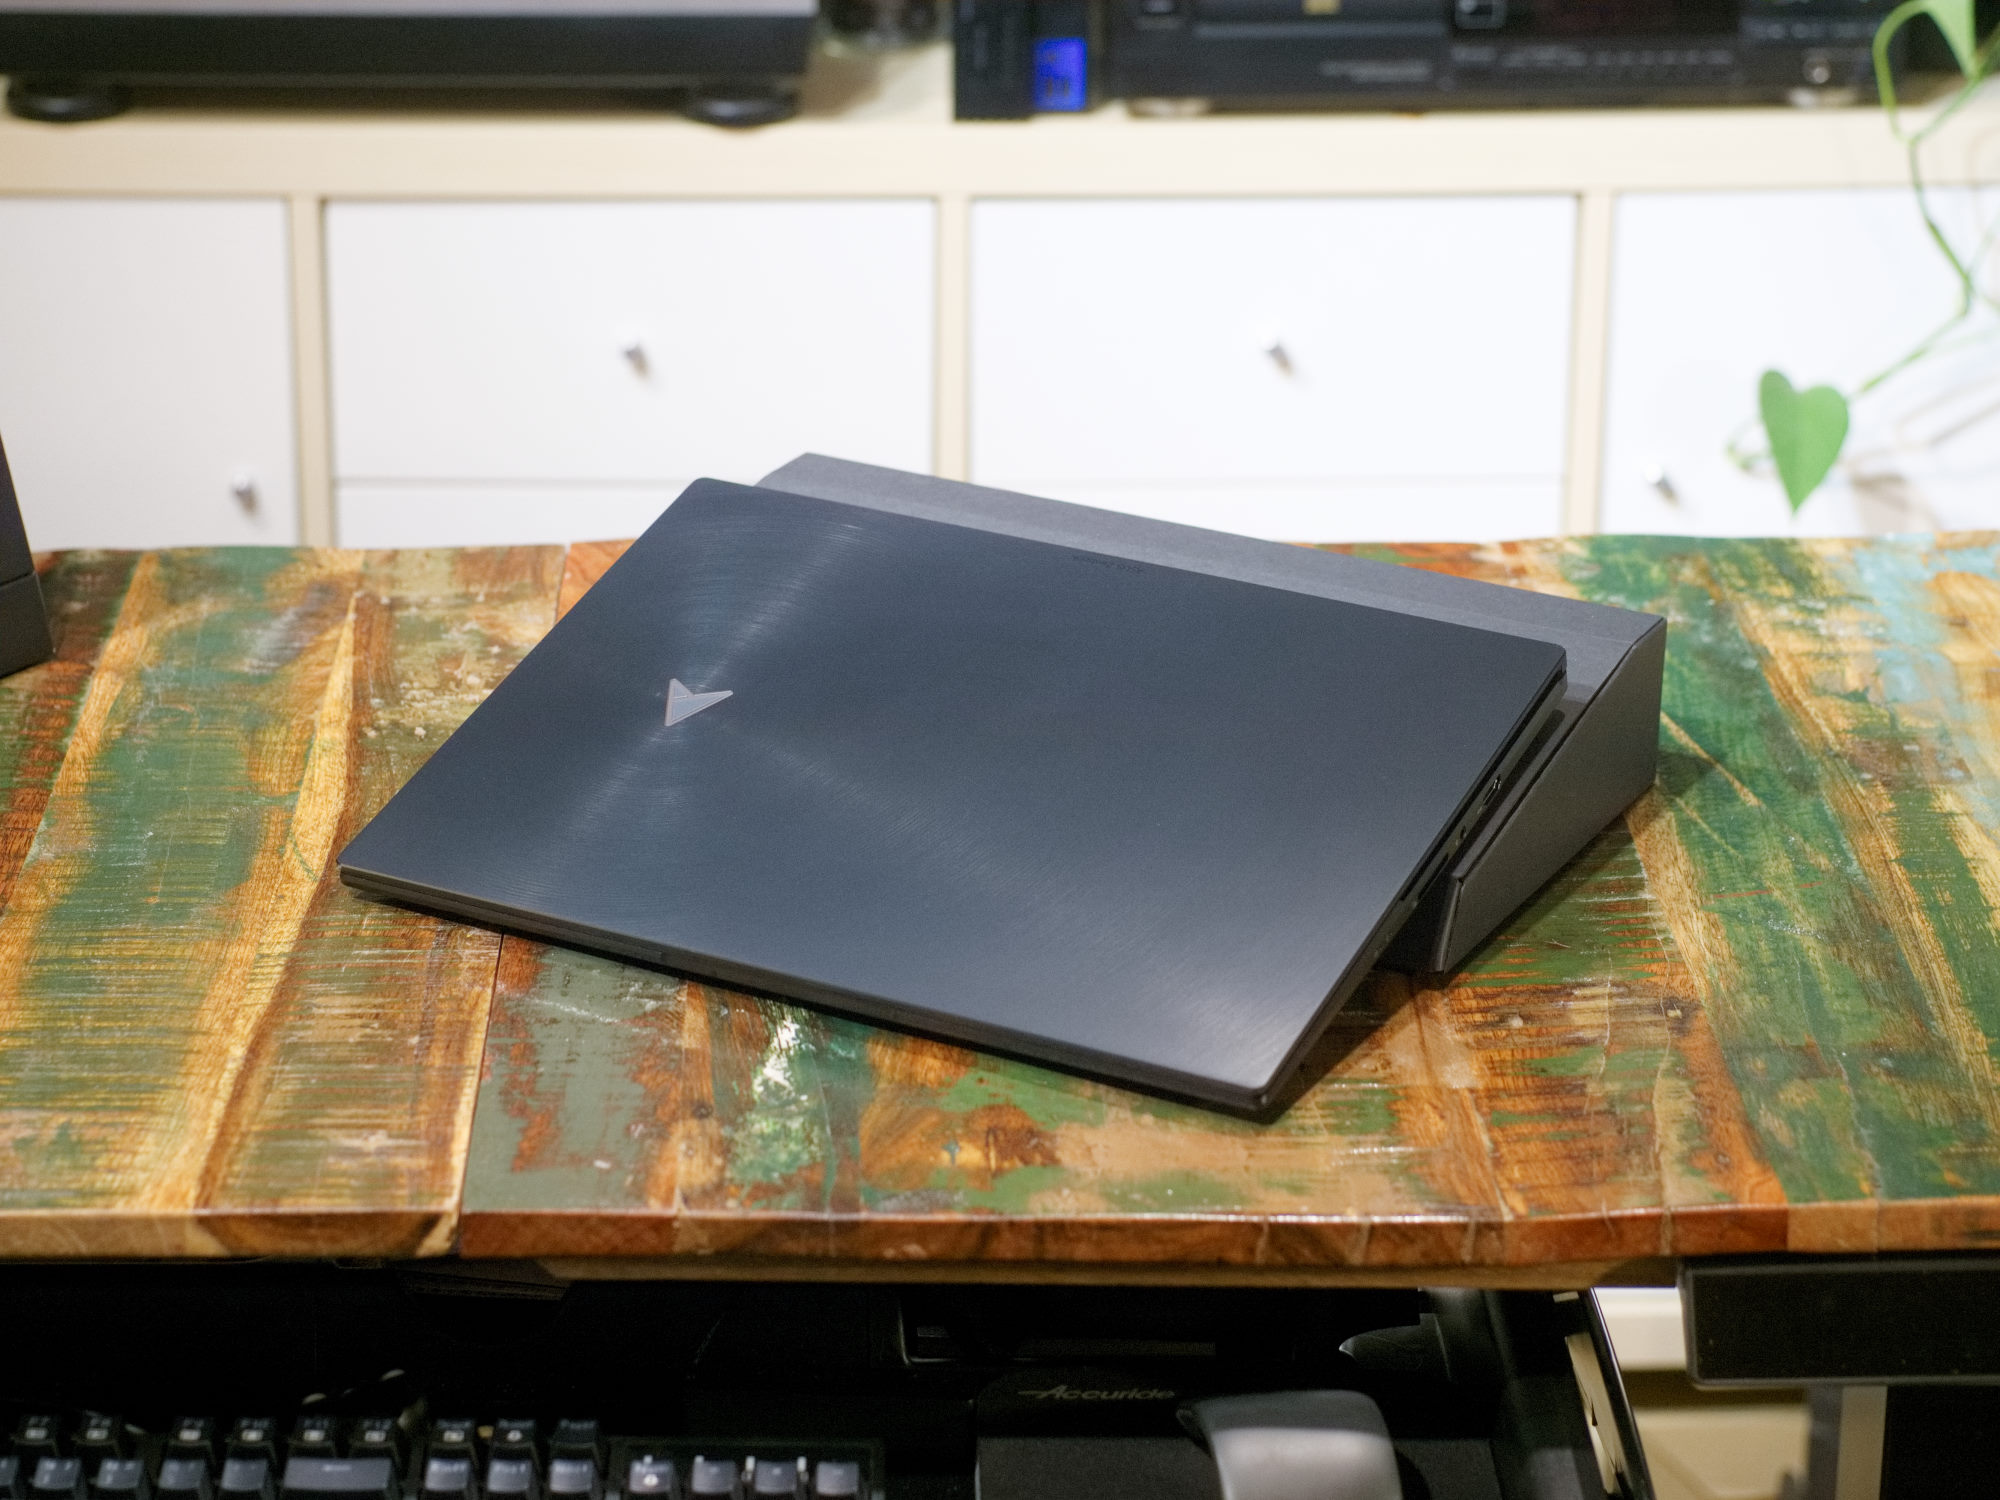
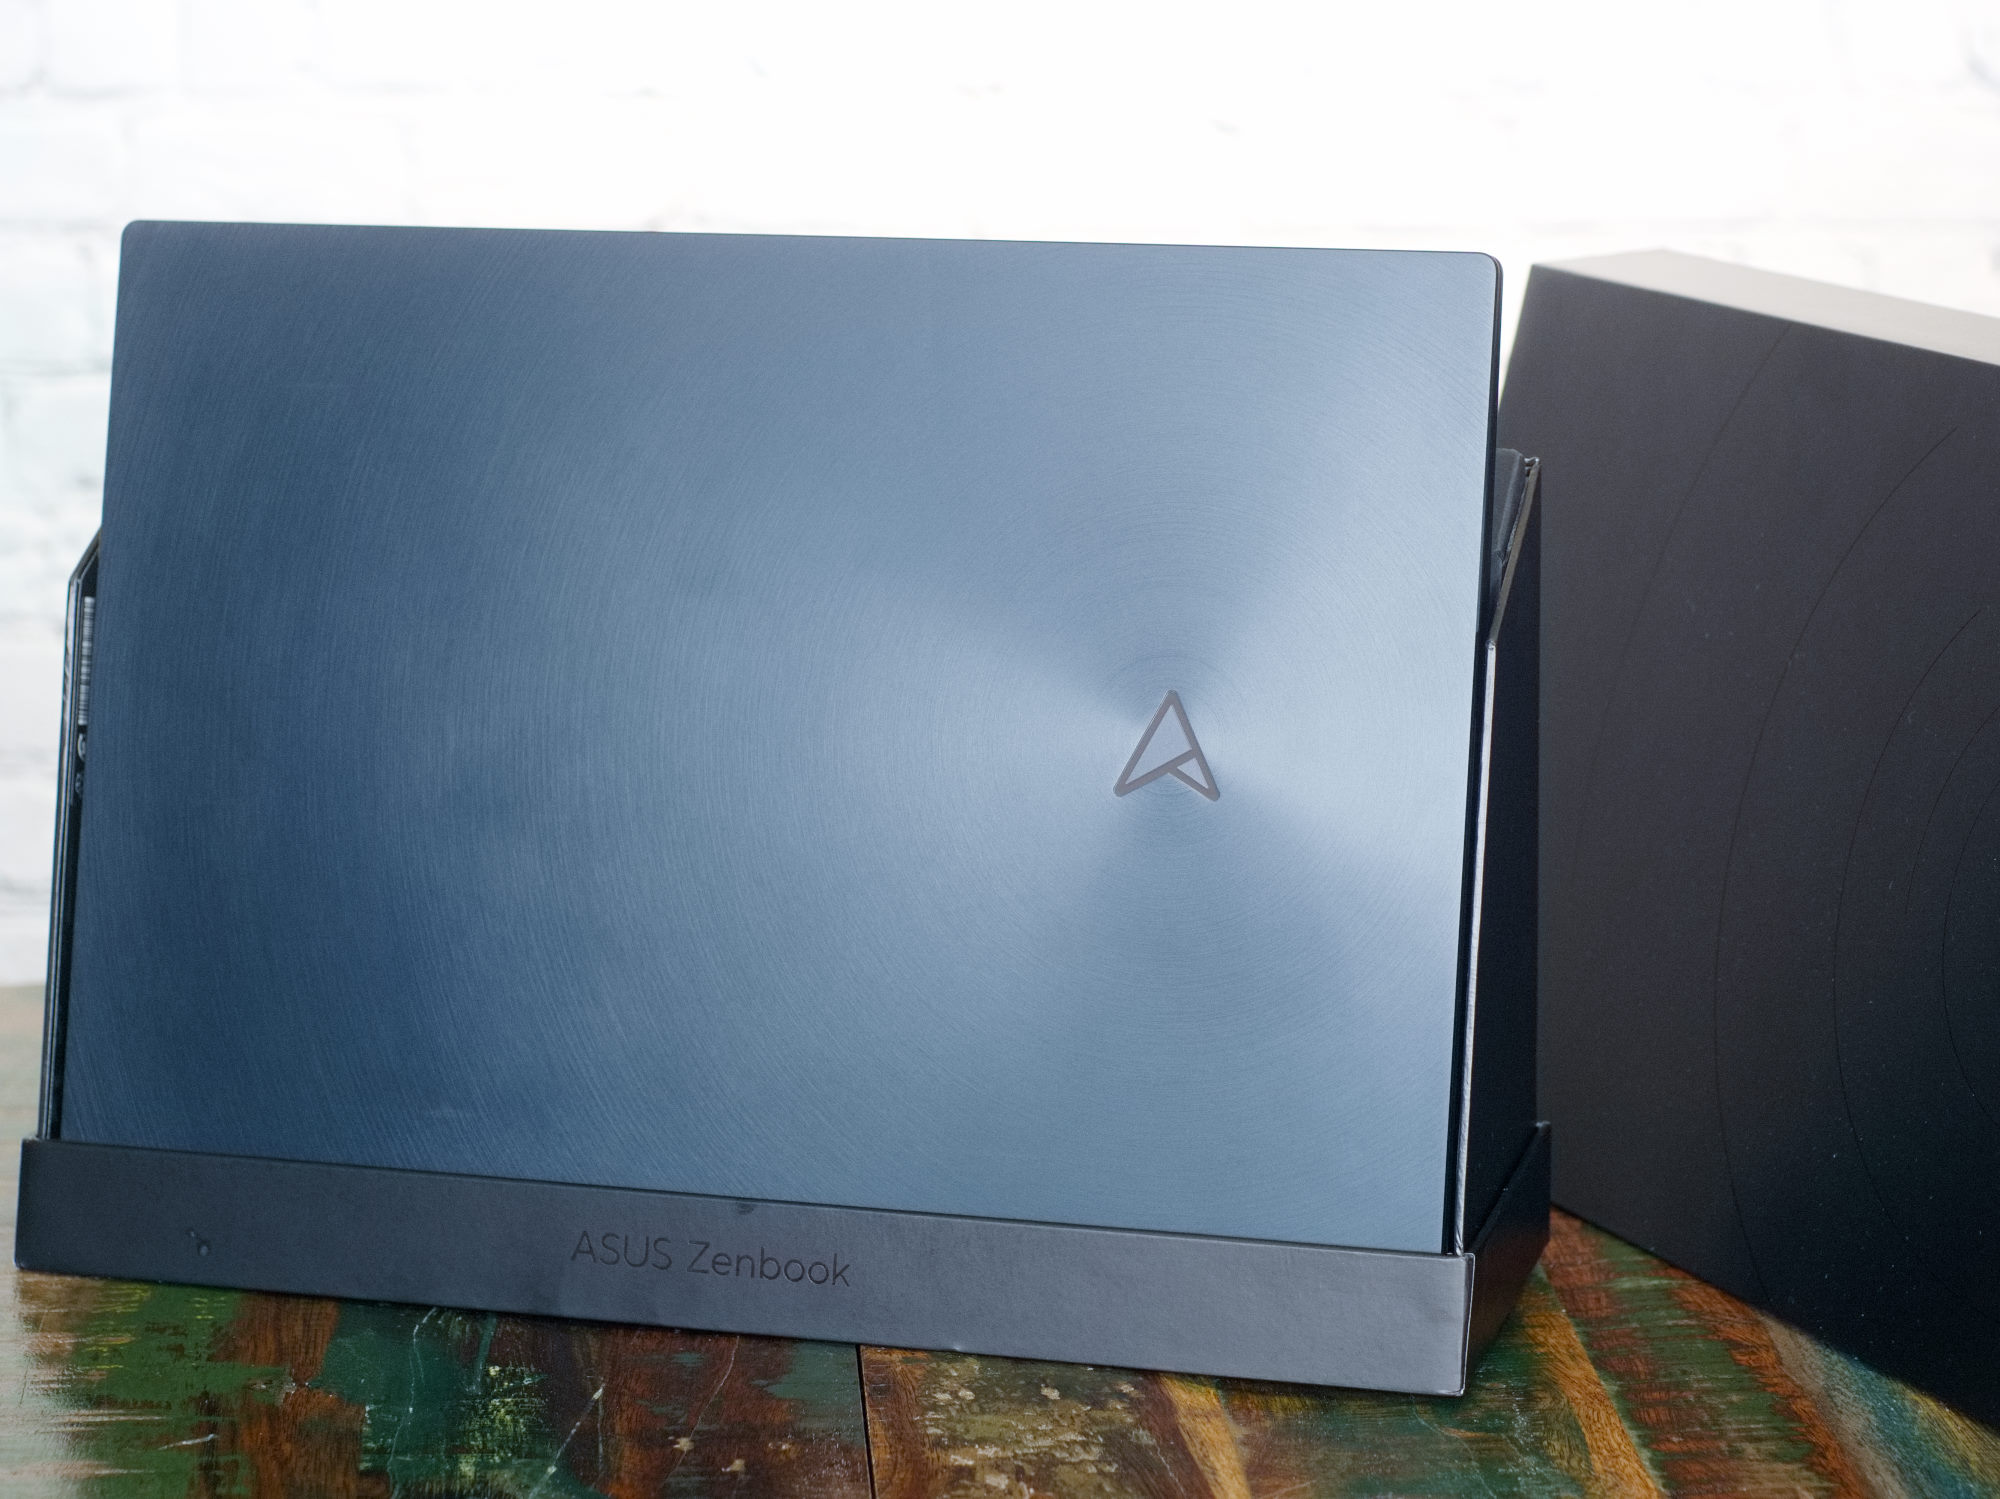
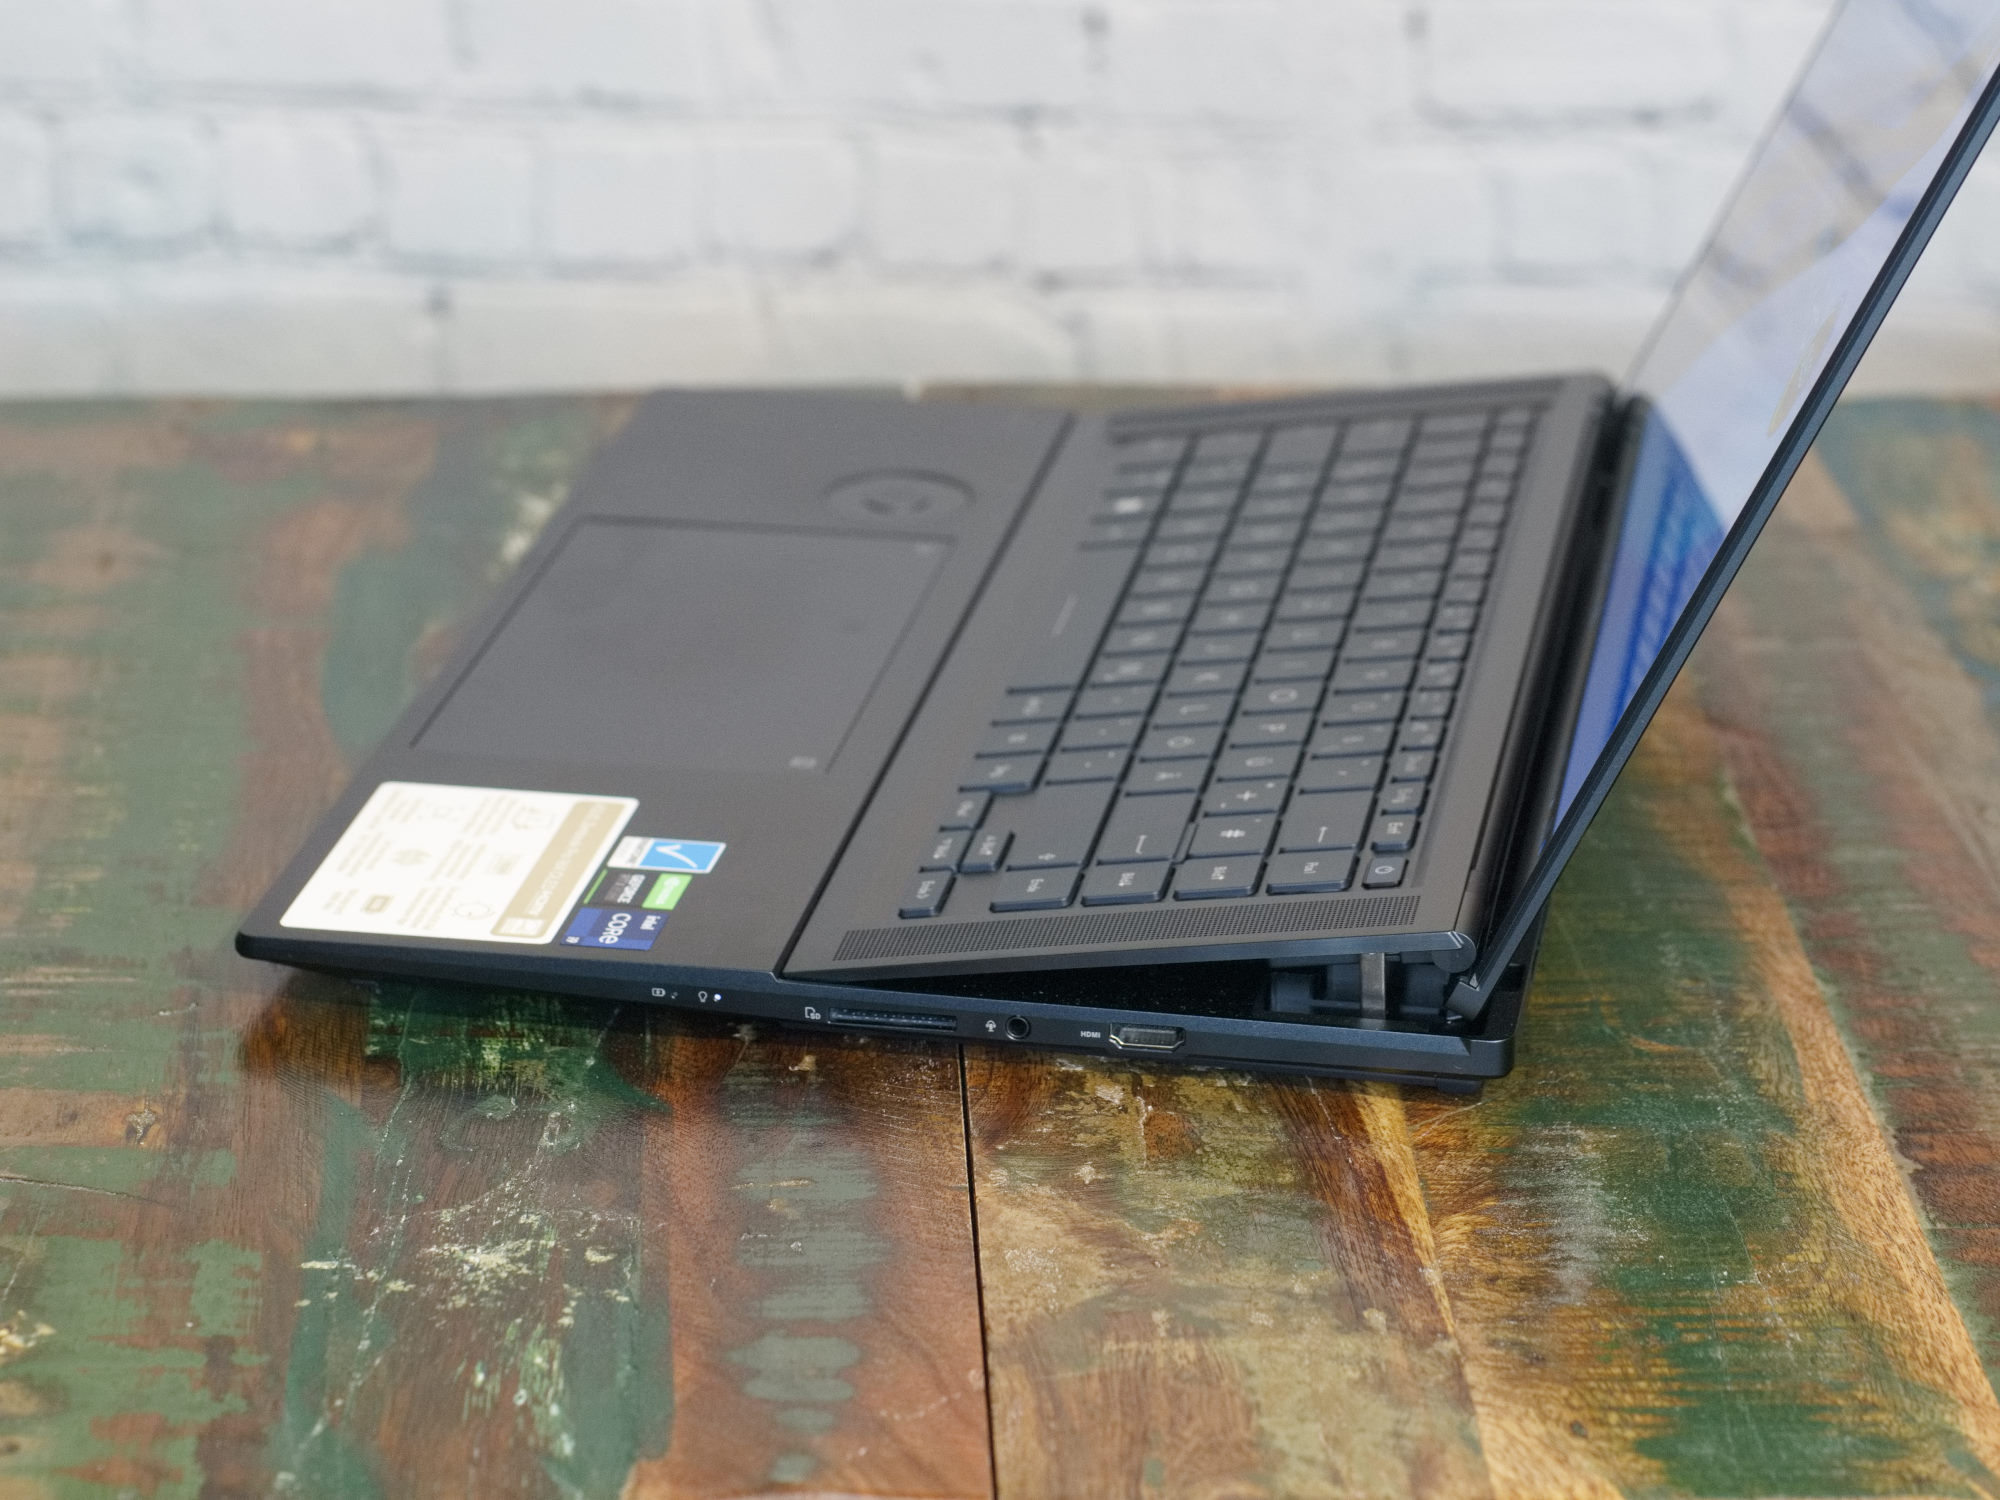
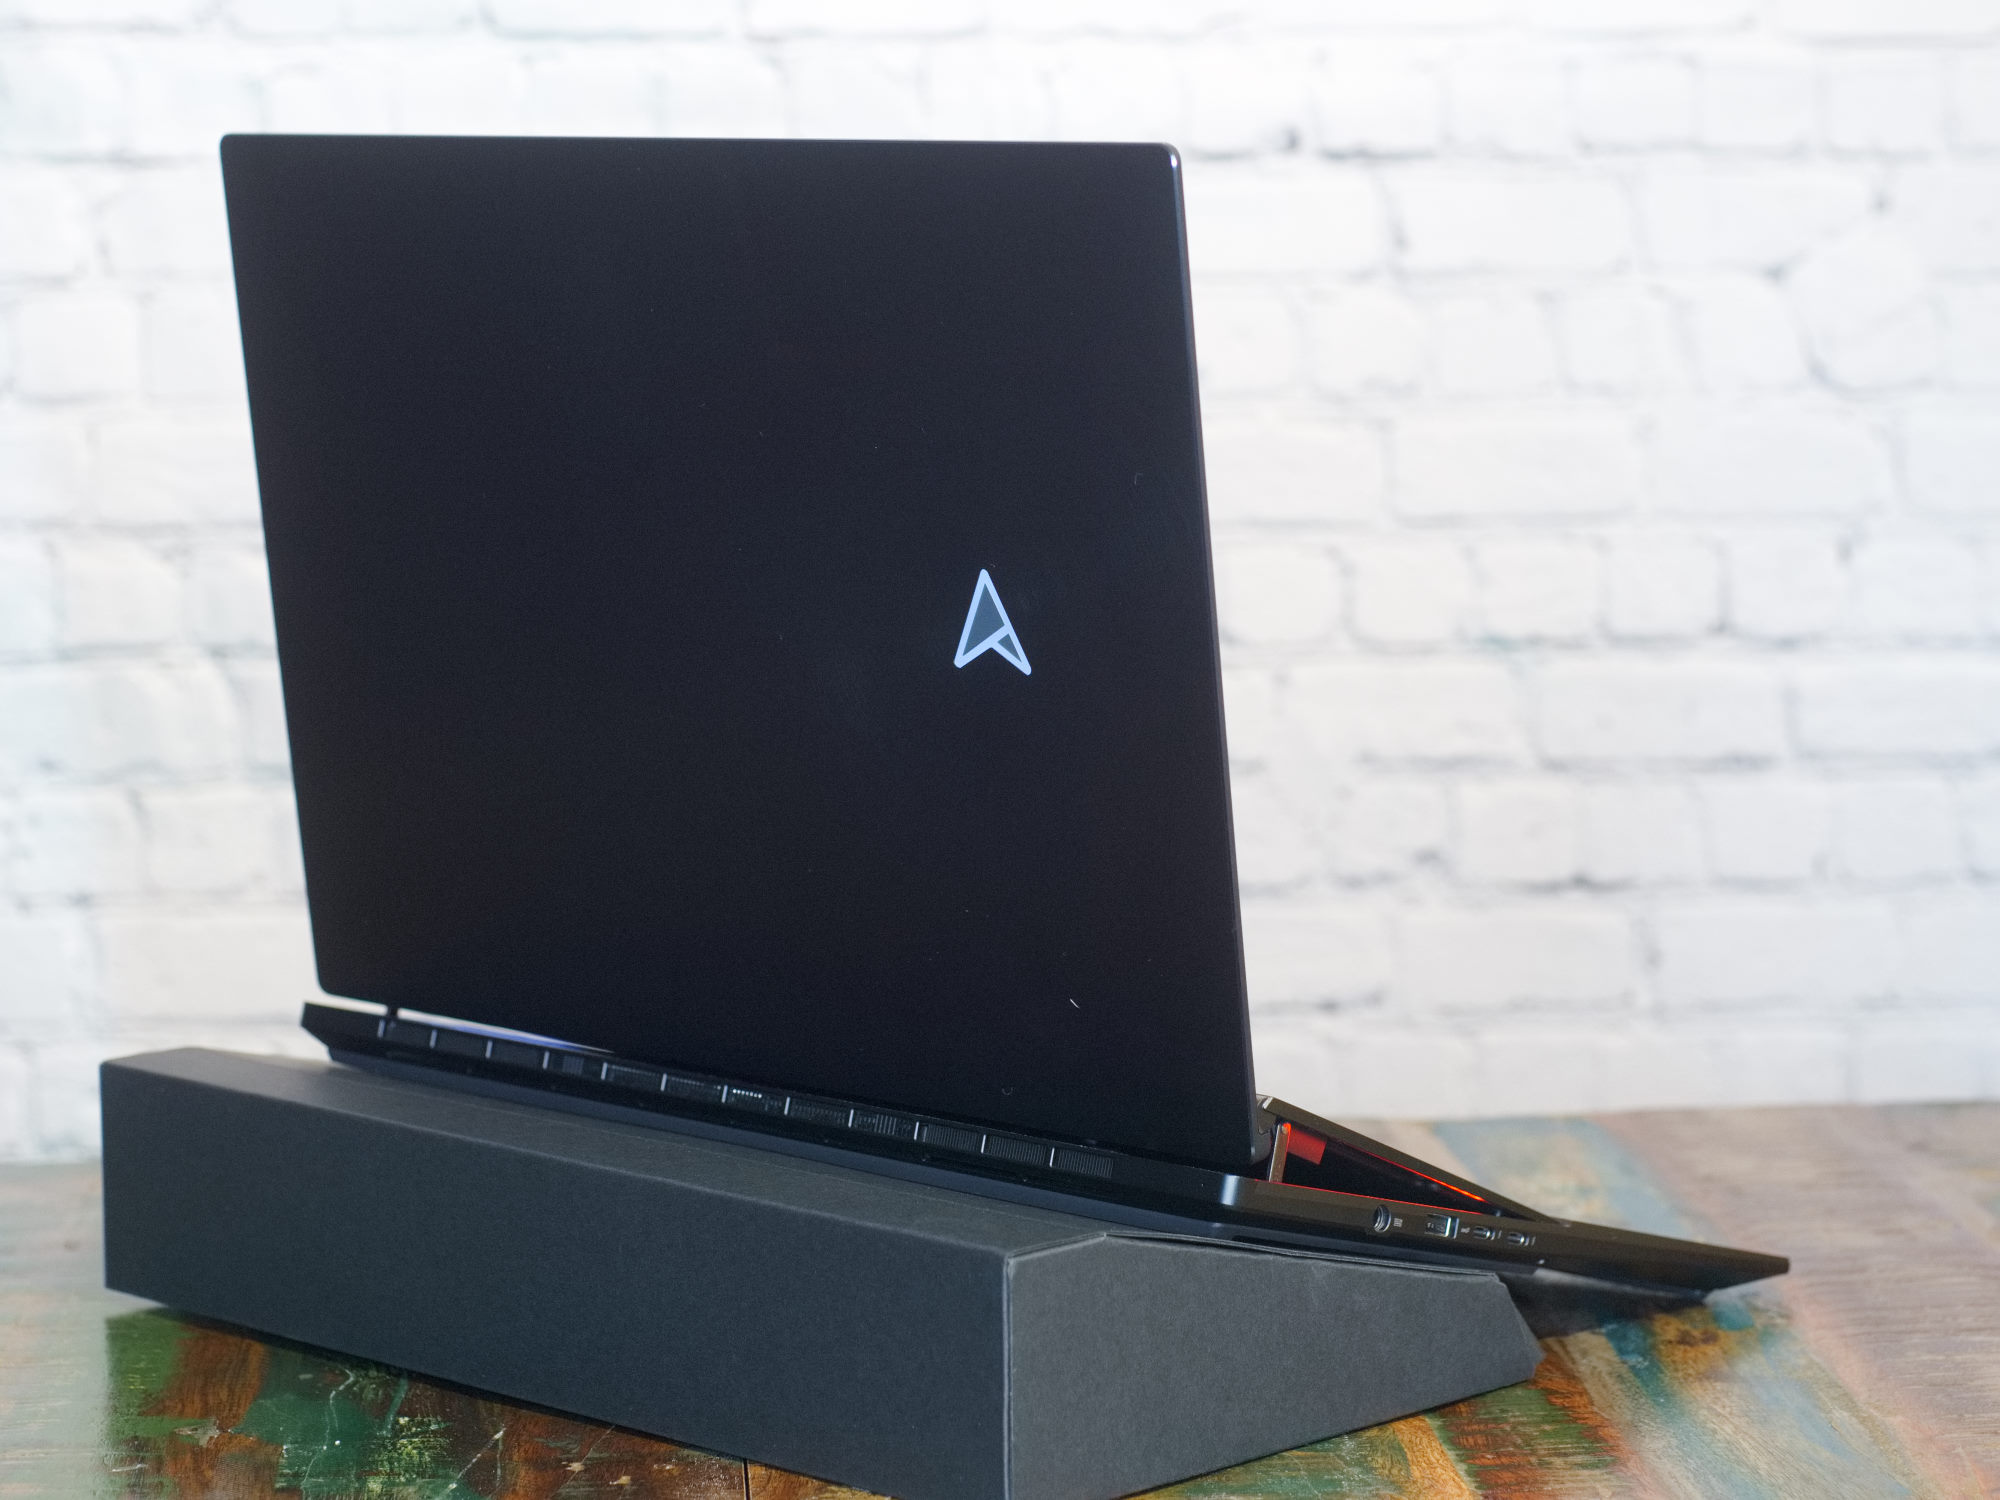
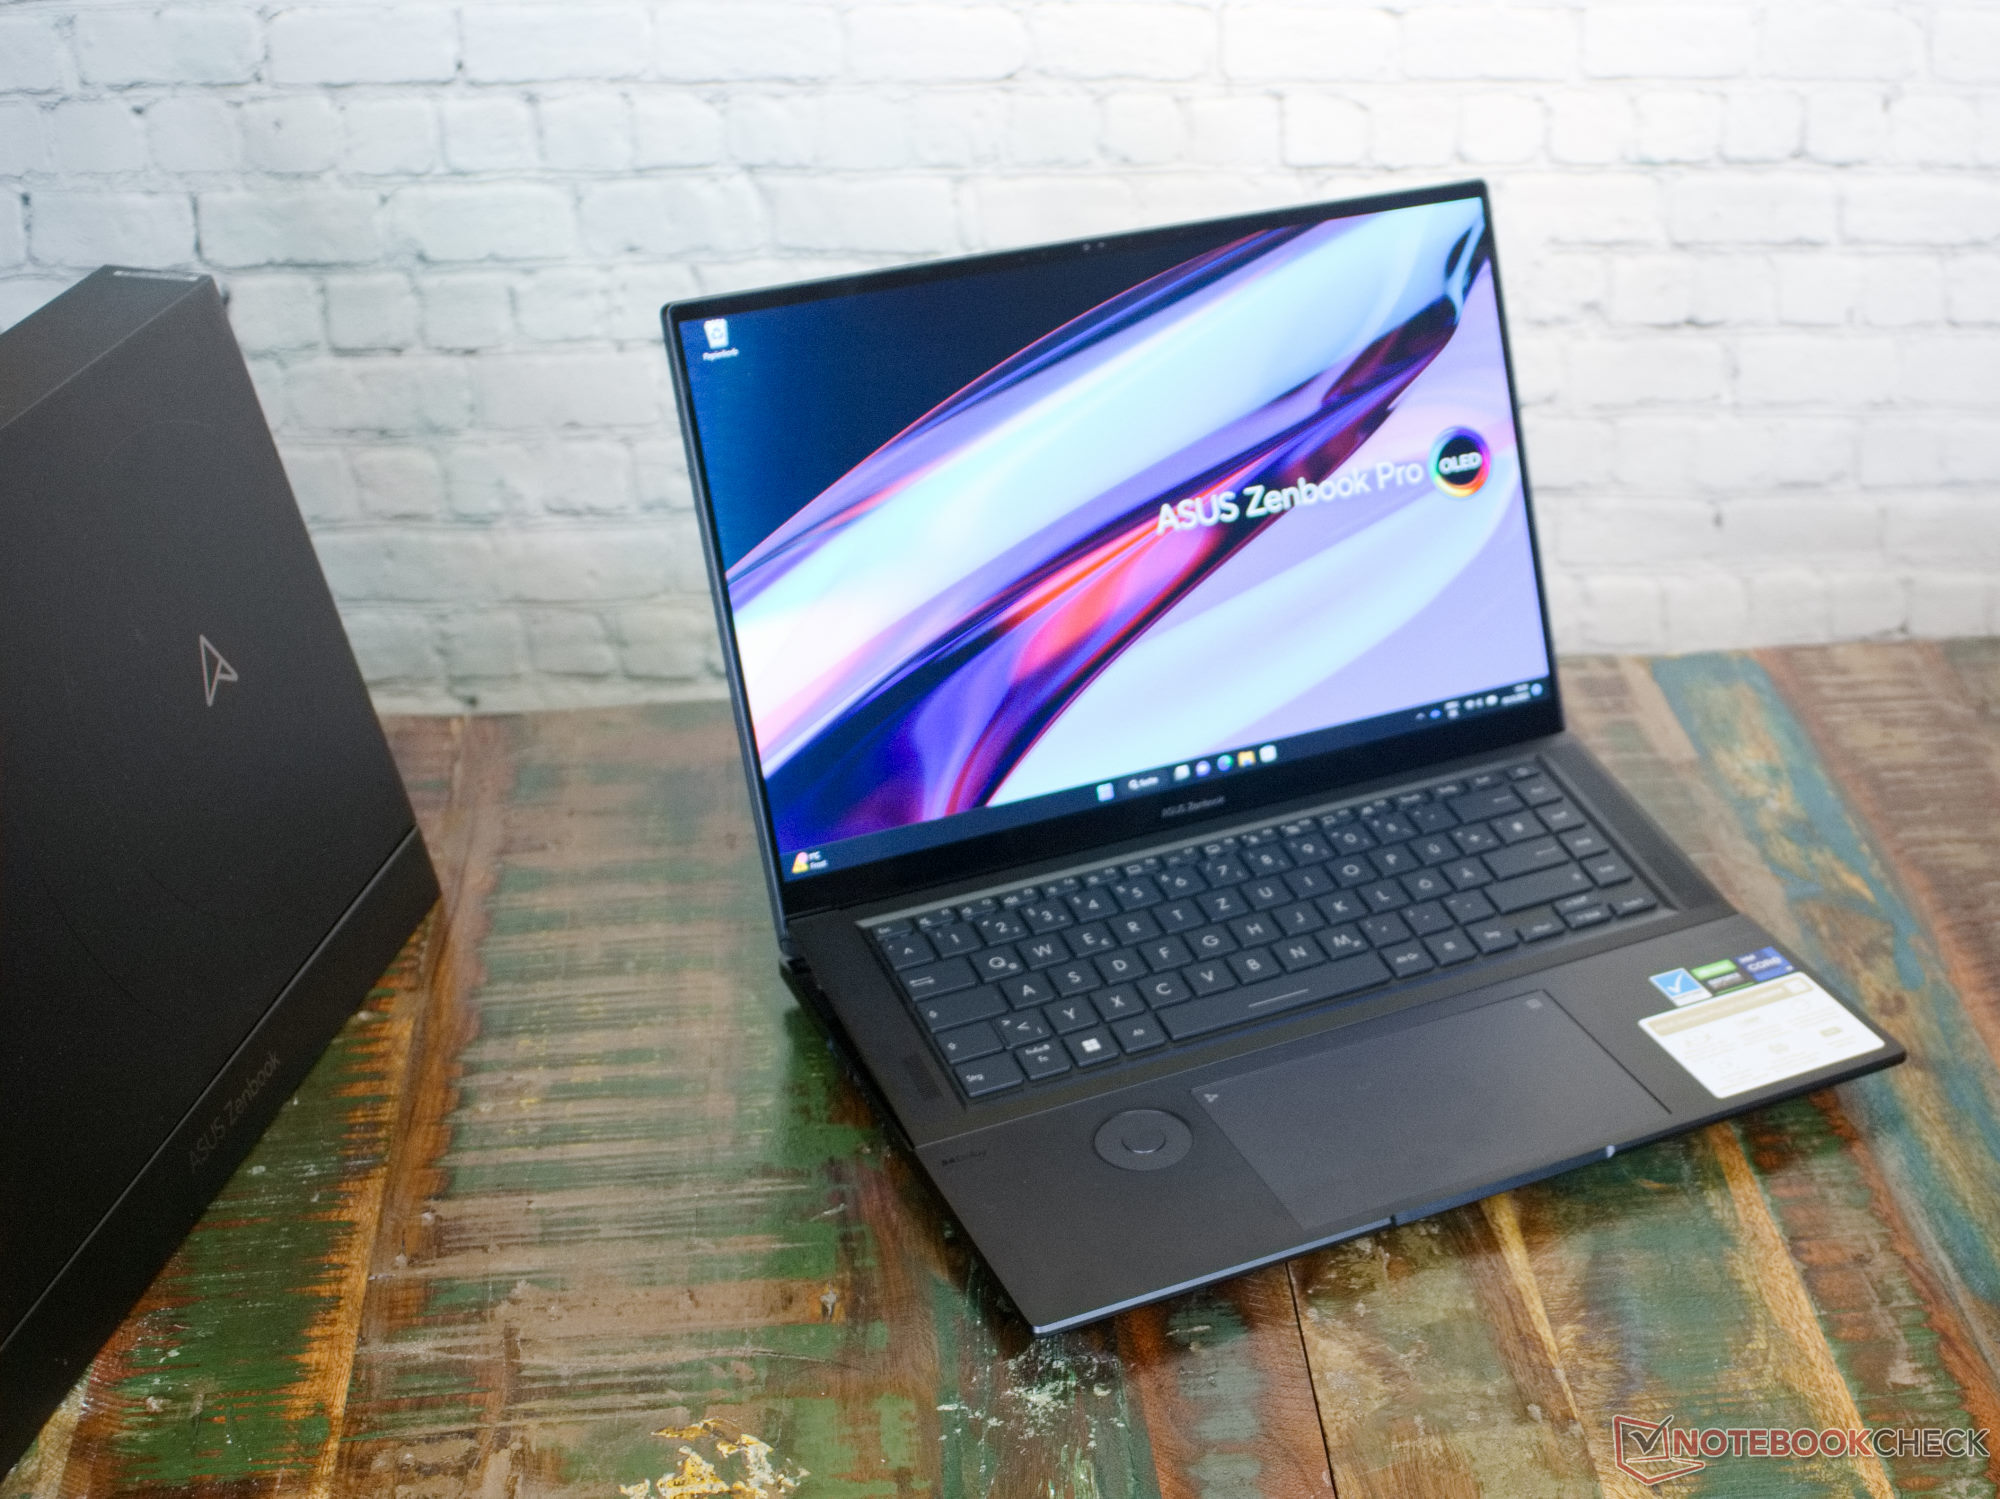
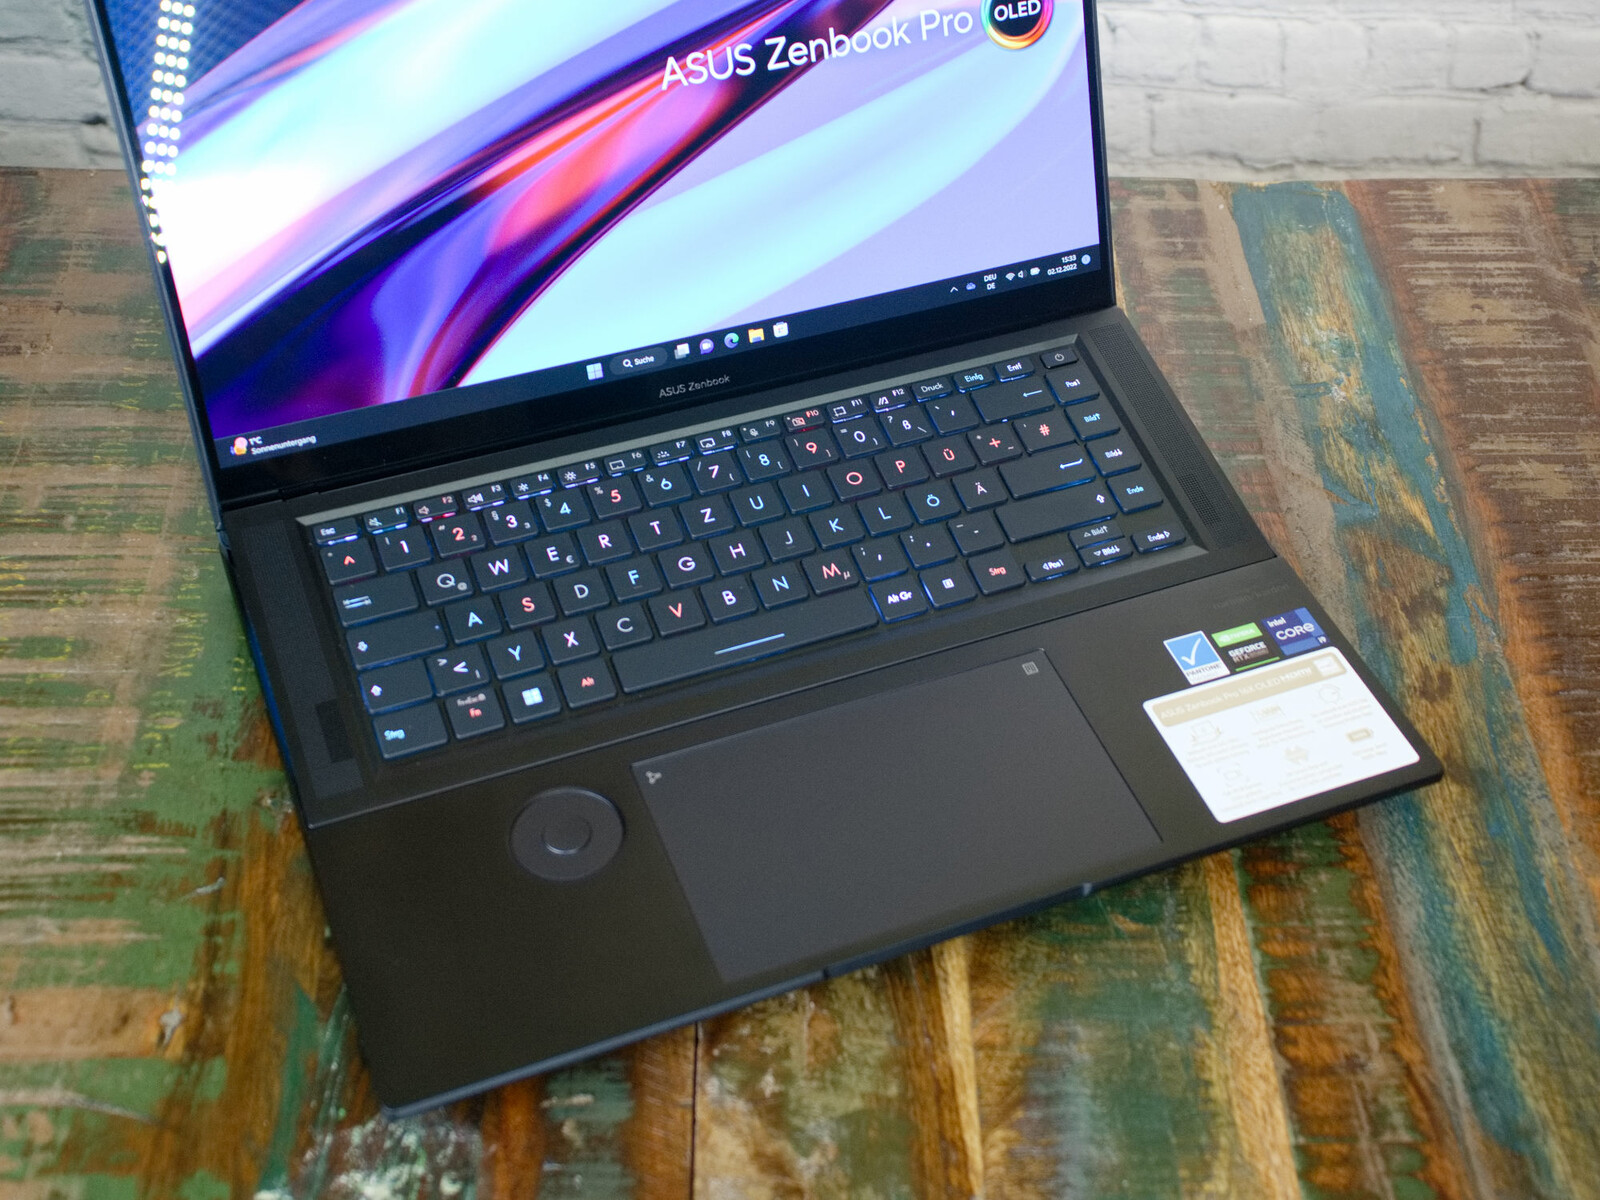
华硕总是推出具有独特设计的笔记本电脑,ZenBook 16X OLED也不例外。甚至笔记本电脑的包装也不寻常。当你第一次打开包装时,你会发现笔记本电脑的设计体现在包装上。同样,我们发现一个同心圆图案围绕着一个风格化的A。《星际迷航》的粉丝可能会发现这款笔记本特别有趣,仅仅因为这个原因。和键盘一样,向上的箭头是RGB背光。笔记本上的许多边缘被柔和的斜面所柔化,然而,这些斜面保留了一种咄咄逼人的外观。有时,Zenbook Pro 16X OLED看起来更像一台游戏笔记本。
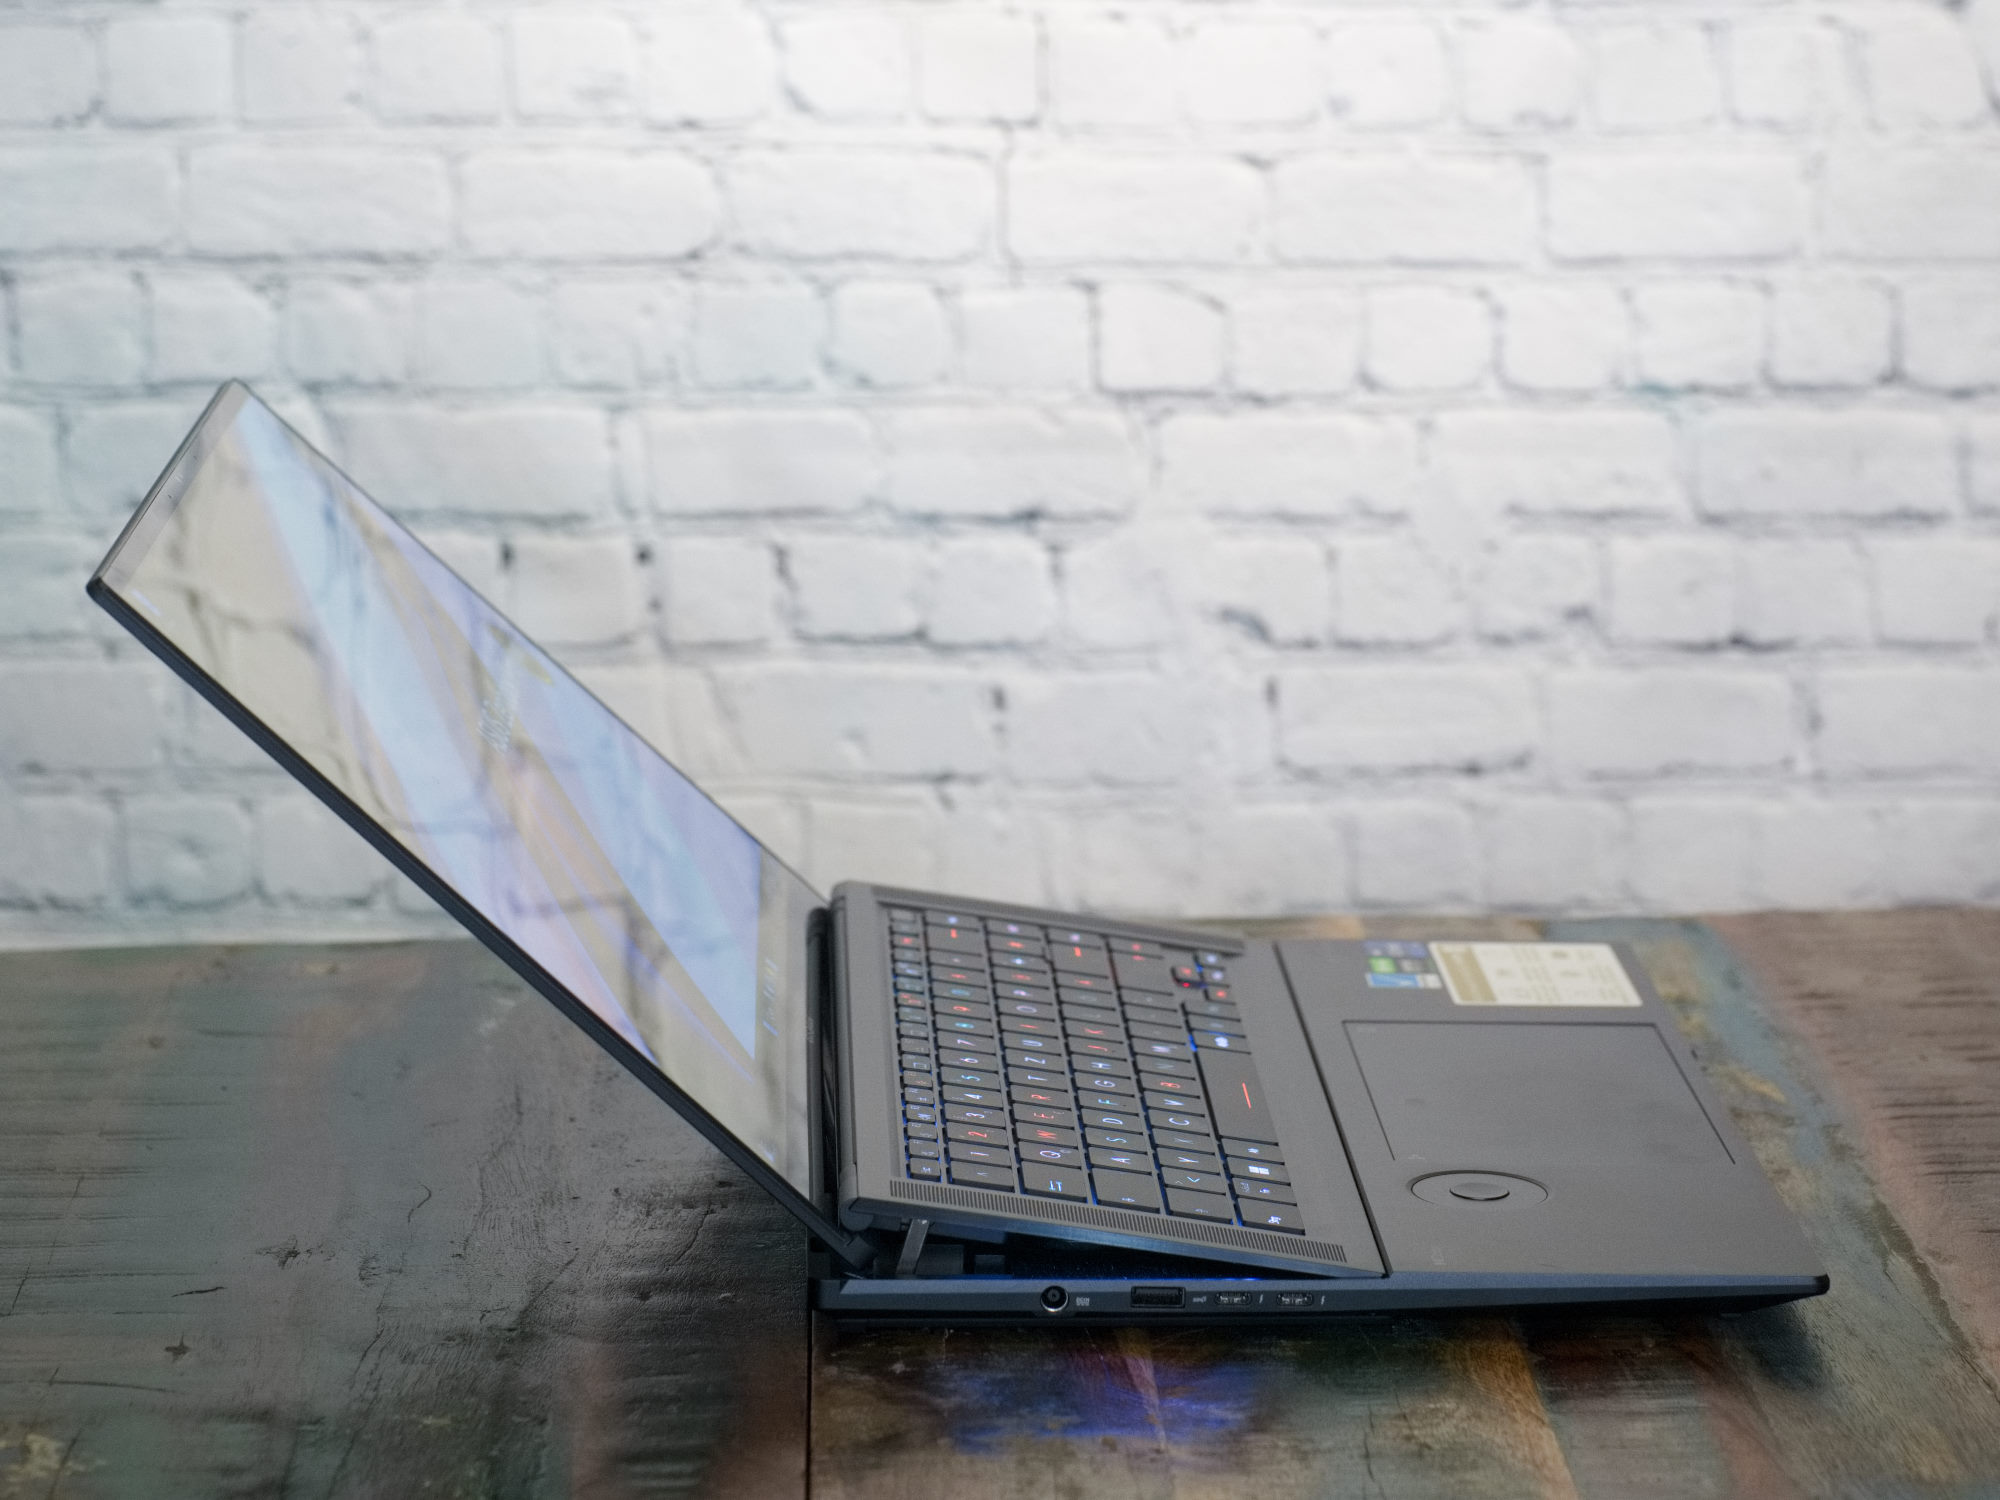
当你打开这台深灰色的笔记本电脑时,键盘在后面被抬高了约2厘米。这应该是为了确保硬件有更好的通风,以及打字时有更好的手部位置。华硕将该系统命名为 "AAS Ultra Cooling",并表示它赋予了空气流动增加30%的优势。笔记本电脑的最大打开角度约为145°。尽管有复杂的折叠机制,但打开很容易,可以用一只手完成,同时显得很精致和稳定。你看不到什么,但一切都保持在原位。屏幕似乎漂浮在距离底座几毫米的空中。不幸的是,折叠机制也稍有松动,所以屏幕在振动时可能会有轻微的响声。高质量材料的组合为这个箱子提供了一种稳定的感觉,大量的玻璃和铝构成了笔记本电脑的表面。

华硕Zenbook Pro 16X OLED并不是一个重量级产品,但它在拥有强大显卡的竞争对手中几乎没有突出表现。与NvidiaGeForce RTX 3060相当的图形芯片的整个比较领域,在尺寸和重量方面都不相上下。采用GA107图形芯片的笔记本电脑(RTX 3050和RTX A2000)大约要轻400至500克。
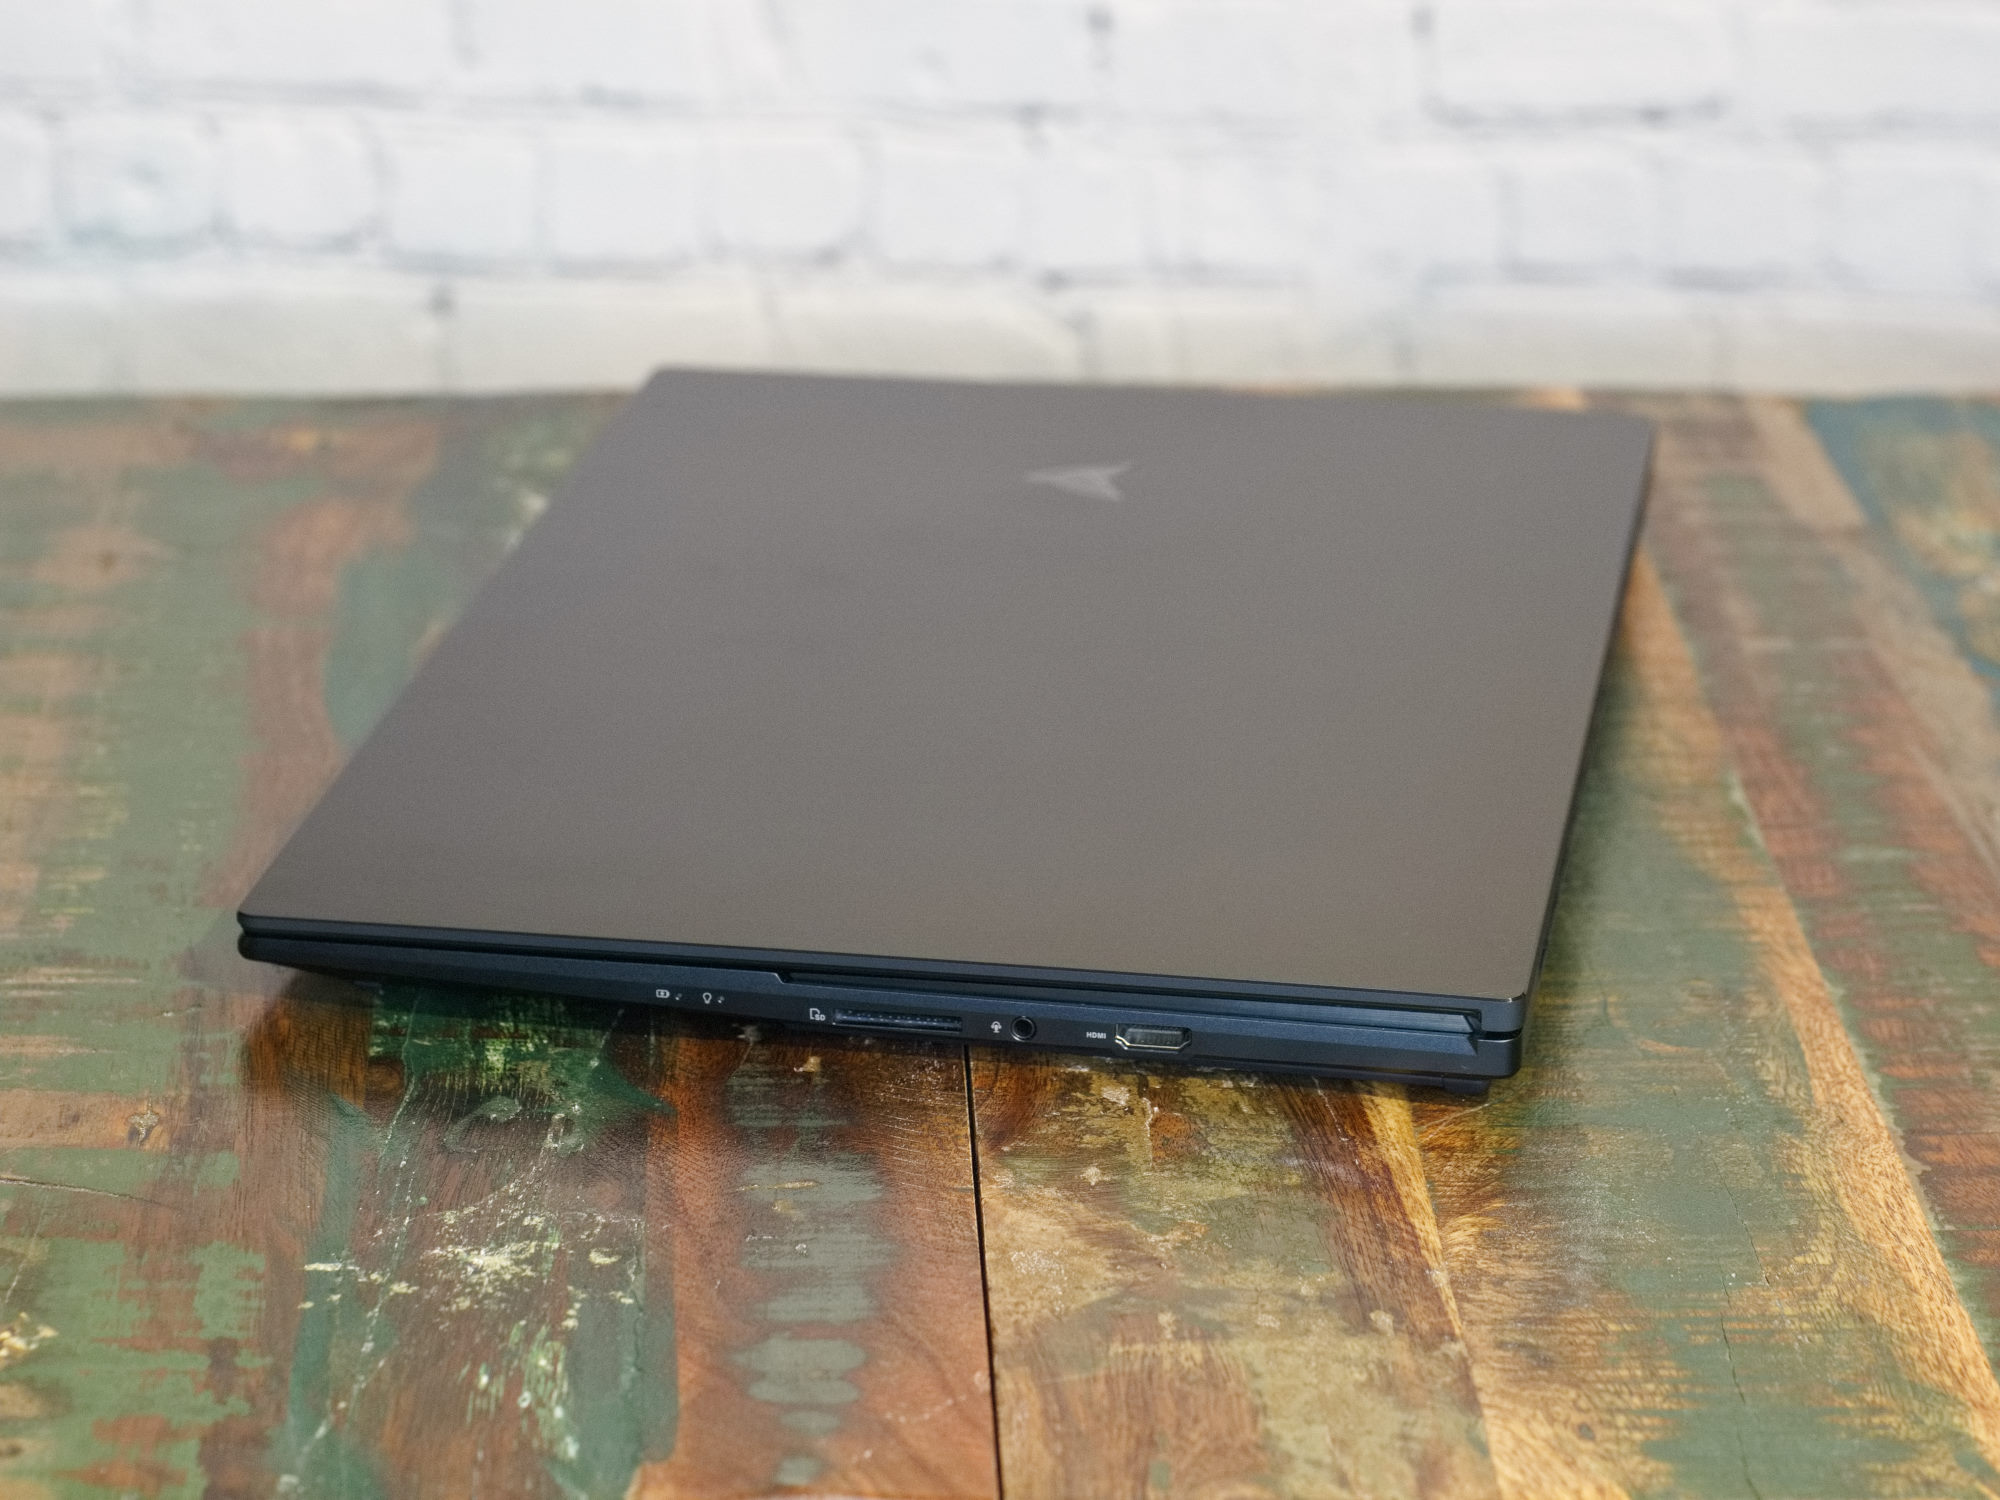
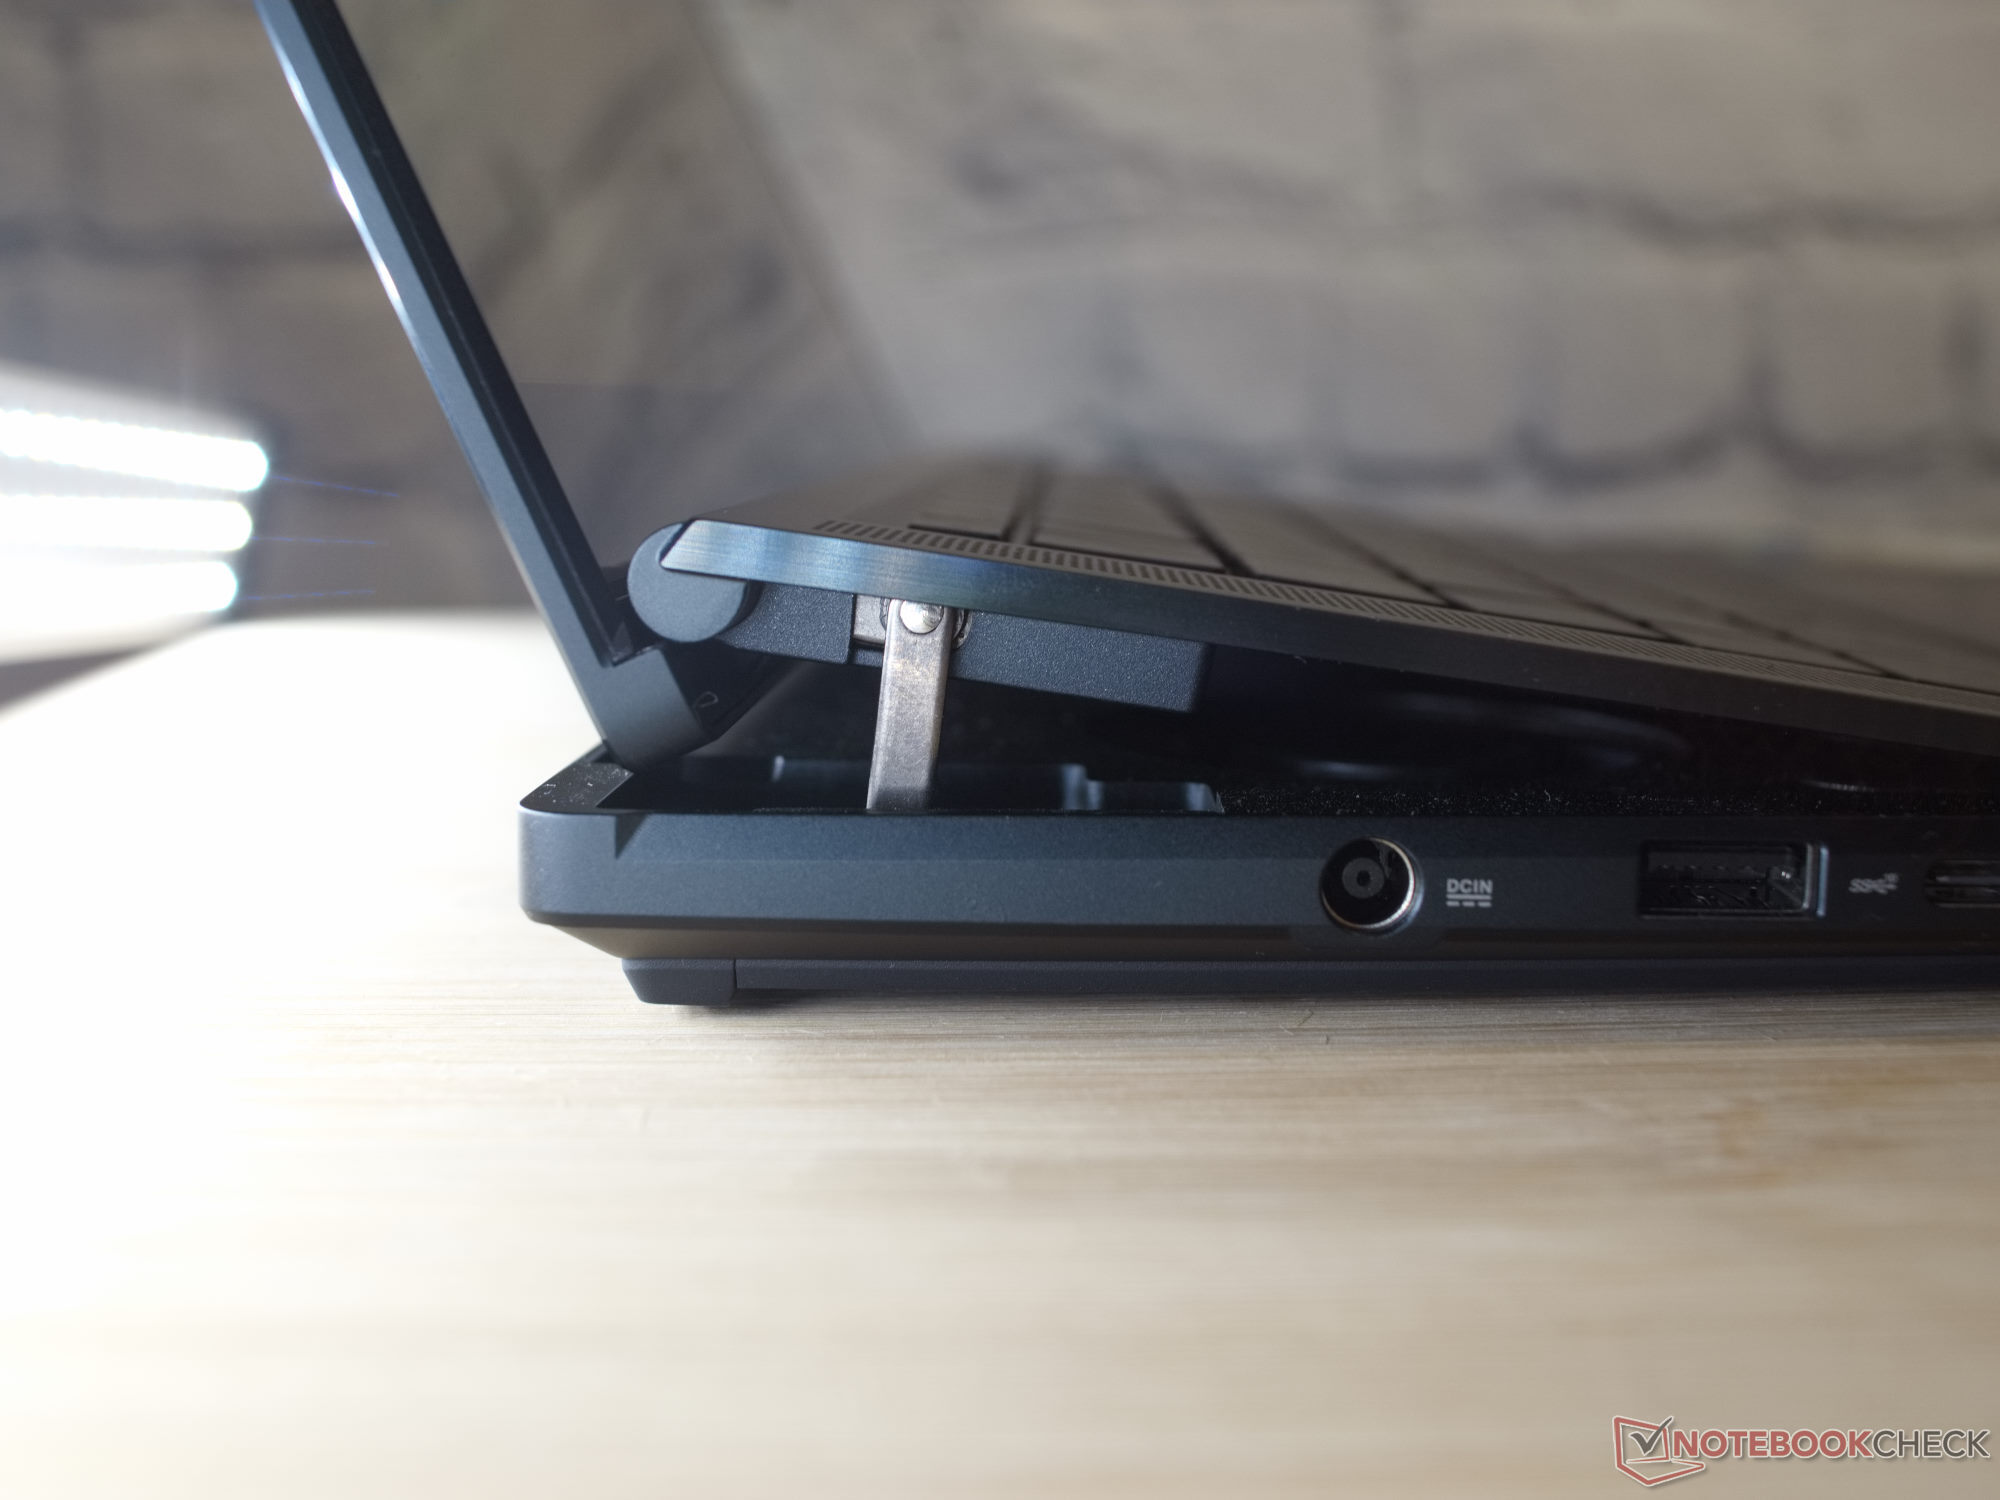
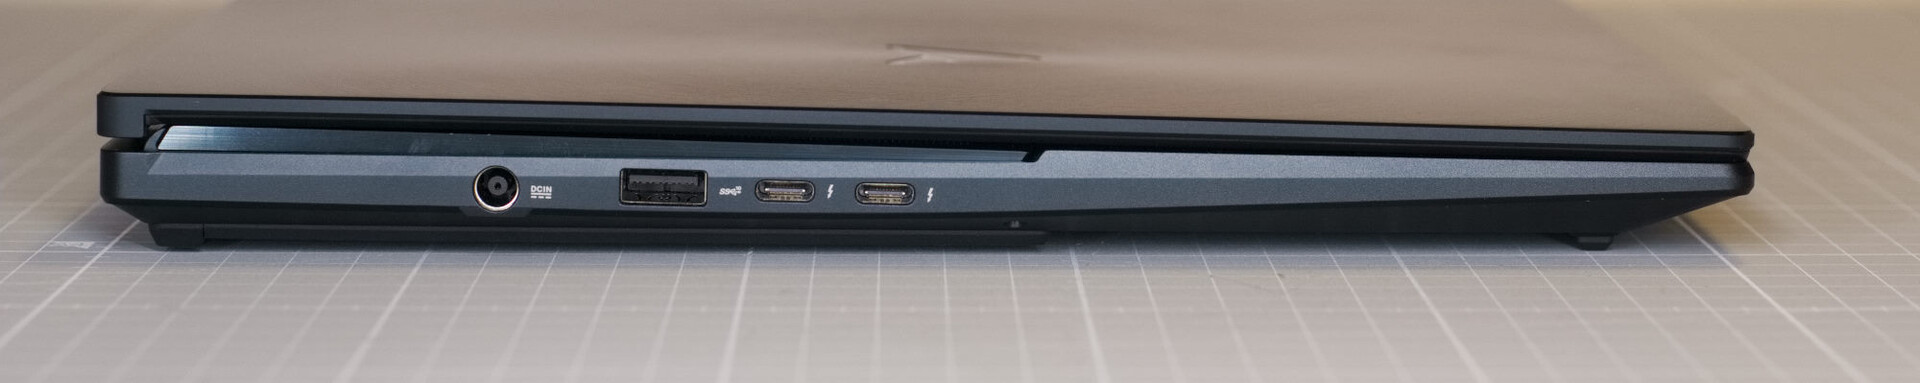
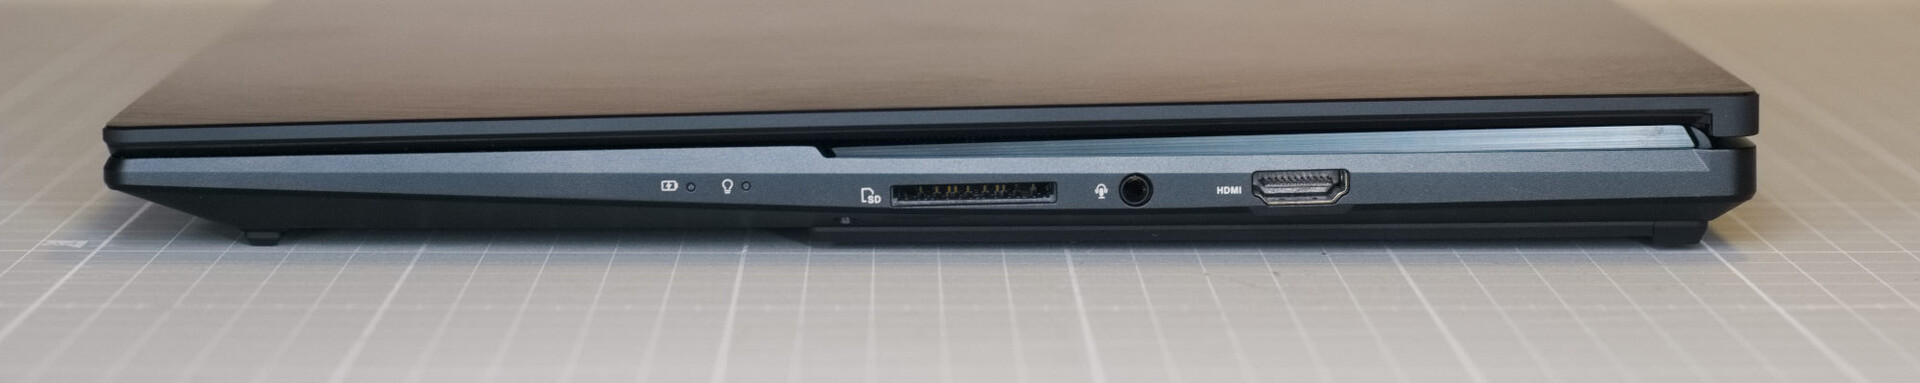
设备--微薄的端口选择
两个USB-C端口和一个USB-A端口--你不会在笔记本上找到更多的外围连接。华硕在这里非常节约地分配端口。在笔记本的右侧,你只能找到读卡器、HDMI和一个3.5毫米插孔,这使得端口分布有些不实用。由于所有的USB端口和电源都在笔记本的左侧,当所有的端口都在使用时,可能会互相阻塞。从长远来看,对接解决方案是唯一可能的补救办法。
SD卡阅读器
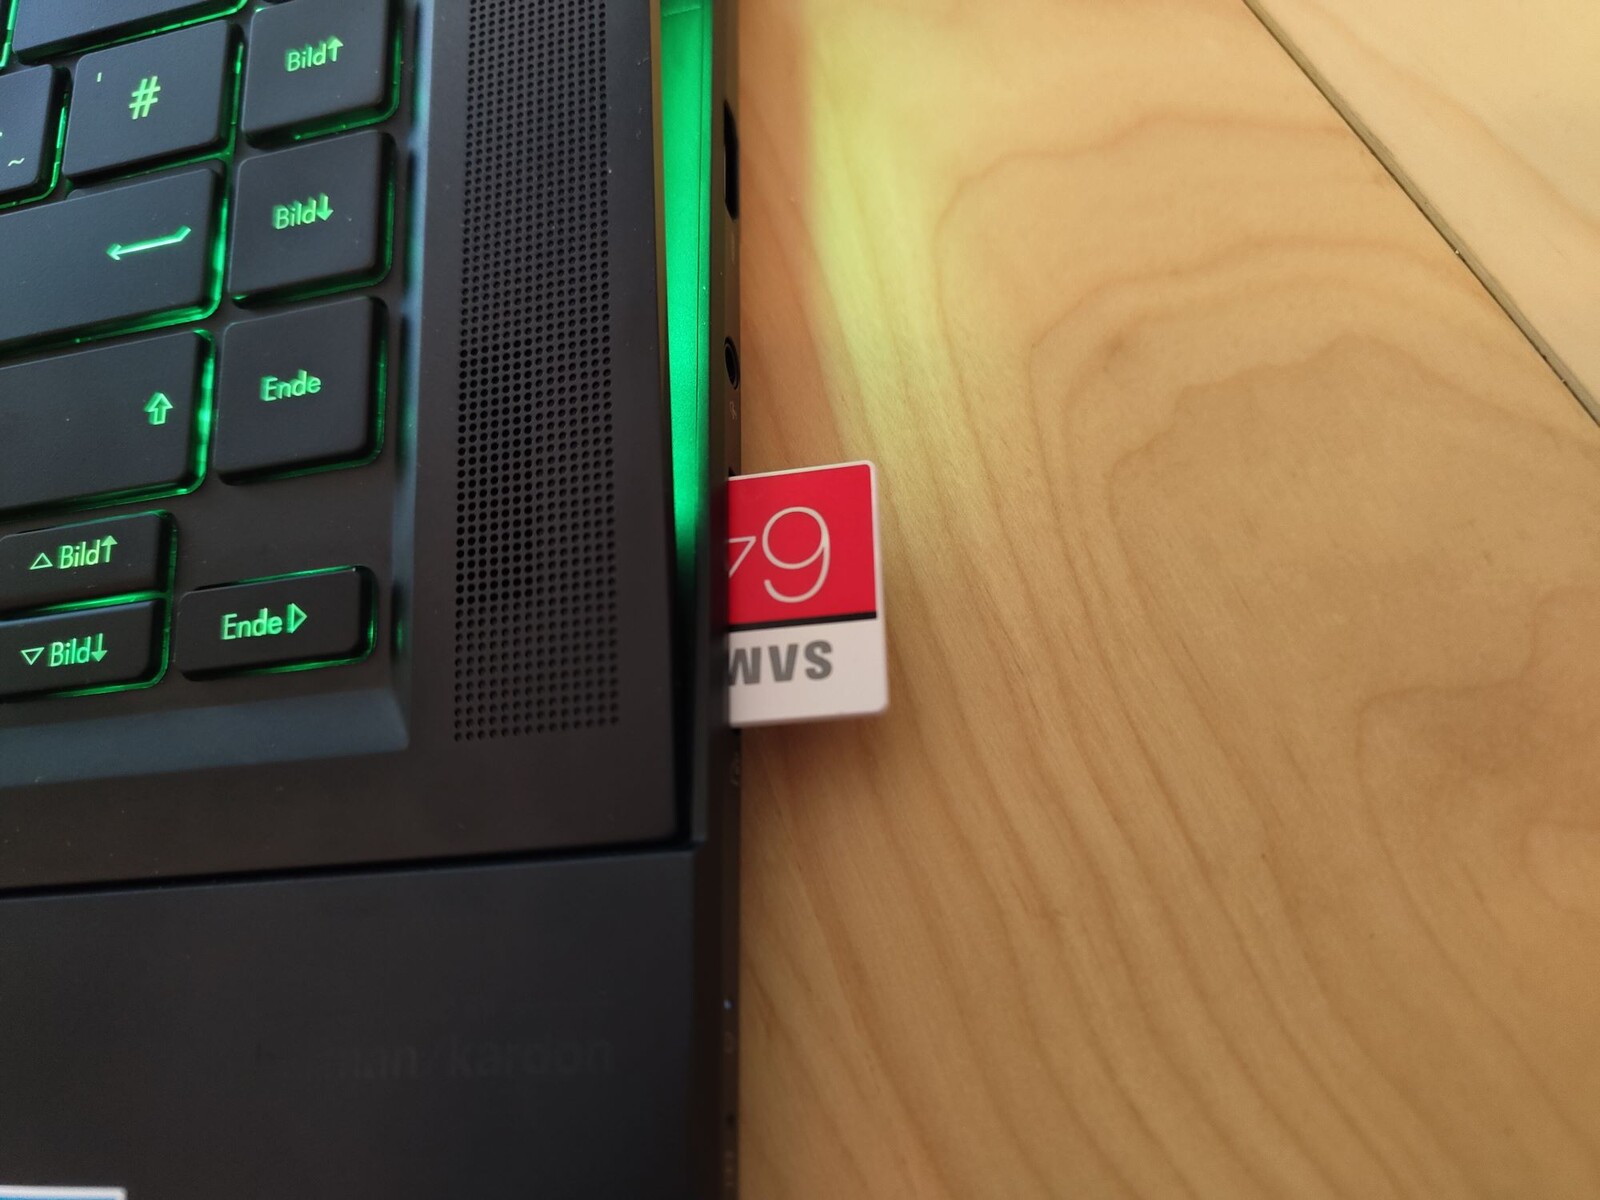
除了稀缺的端口选择之外,读卡器的性能也很一般。实际上,我们期望创意笔记本电脑中的SD读卡器是顶级的,但其他笔记本电脑设法用AV PRO microSD 128 GB V60提供更高的传输率。
沟通
在有金属外壳的笔记本电脑中,定位WLAN天线可能很困难。华硕在安排ZenBook Pro 16X OLED的三根天线时似乎没有做出好的选择。因此,上传和下载速度远远低于所安装的英特尔AX211模块的能力,尽管华硕已经安装了一个放大器,可以在两根天线之间自动切换。
网络摄像头
ZenBook有两个摄像头。一个红外摄像头通过面部识别来处理用户的识别过程。另一个带有全高清传感器的网络摄像头就在它旁边,提供良好的图像质量,在低环境光下表现良好。根据笔记本的用户手册,在一个完全黑暗的房间里也应该可以使用红外摄像头。不幸的是,我们无法为测试目的而激活该功能。不过,还有其他人工智能功能,旨在提高图像质量。


安全问题
通过红外网络摄像头的3D面部识别和指纹扫描仪可用于登录Windows。内置的英特尔酷睿i9-12900H还具有TPM2.0和安全启动等安全功能。
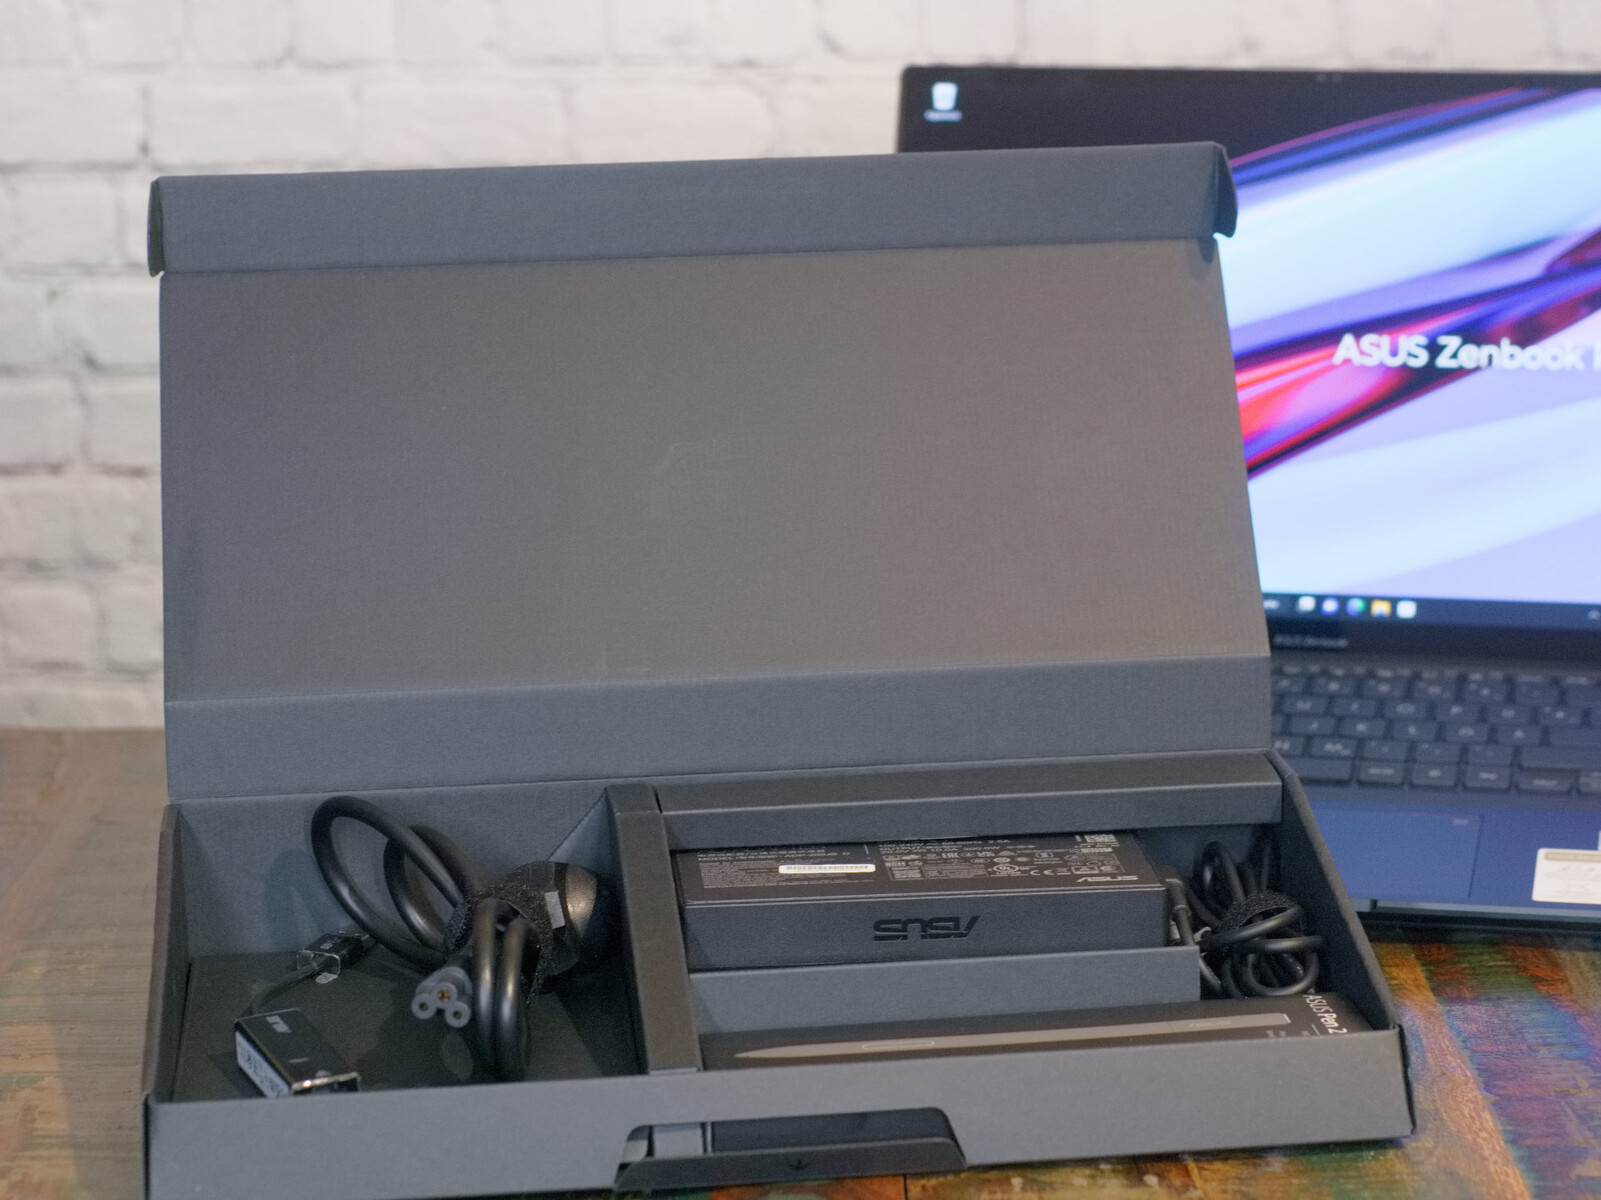
辅料
华硕ZenBook Pro 16X的配件还包括包装,它可以作为一个升高的平台,笔记本电脑可以放在上面。在盒子里,我们发现一支华硕笔2.0,附带充电线和三个额外的笔尖,用于不同的摩擦性能和硬度,一个电源适配器和一个LAN适配器。所有配件都可以方便地收在盒子里。
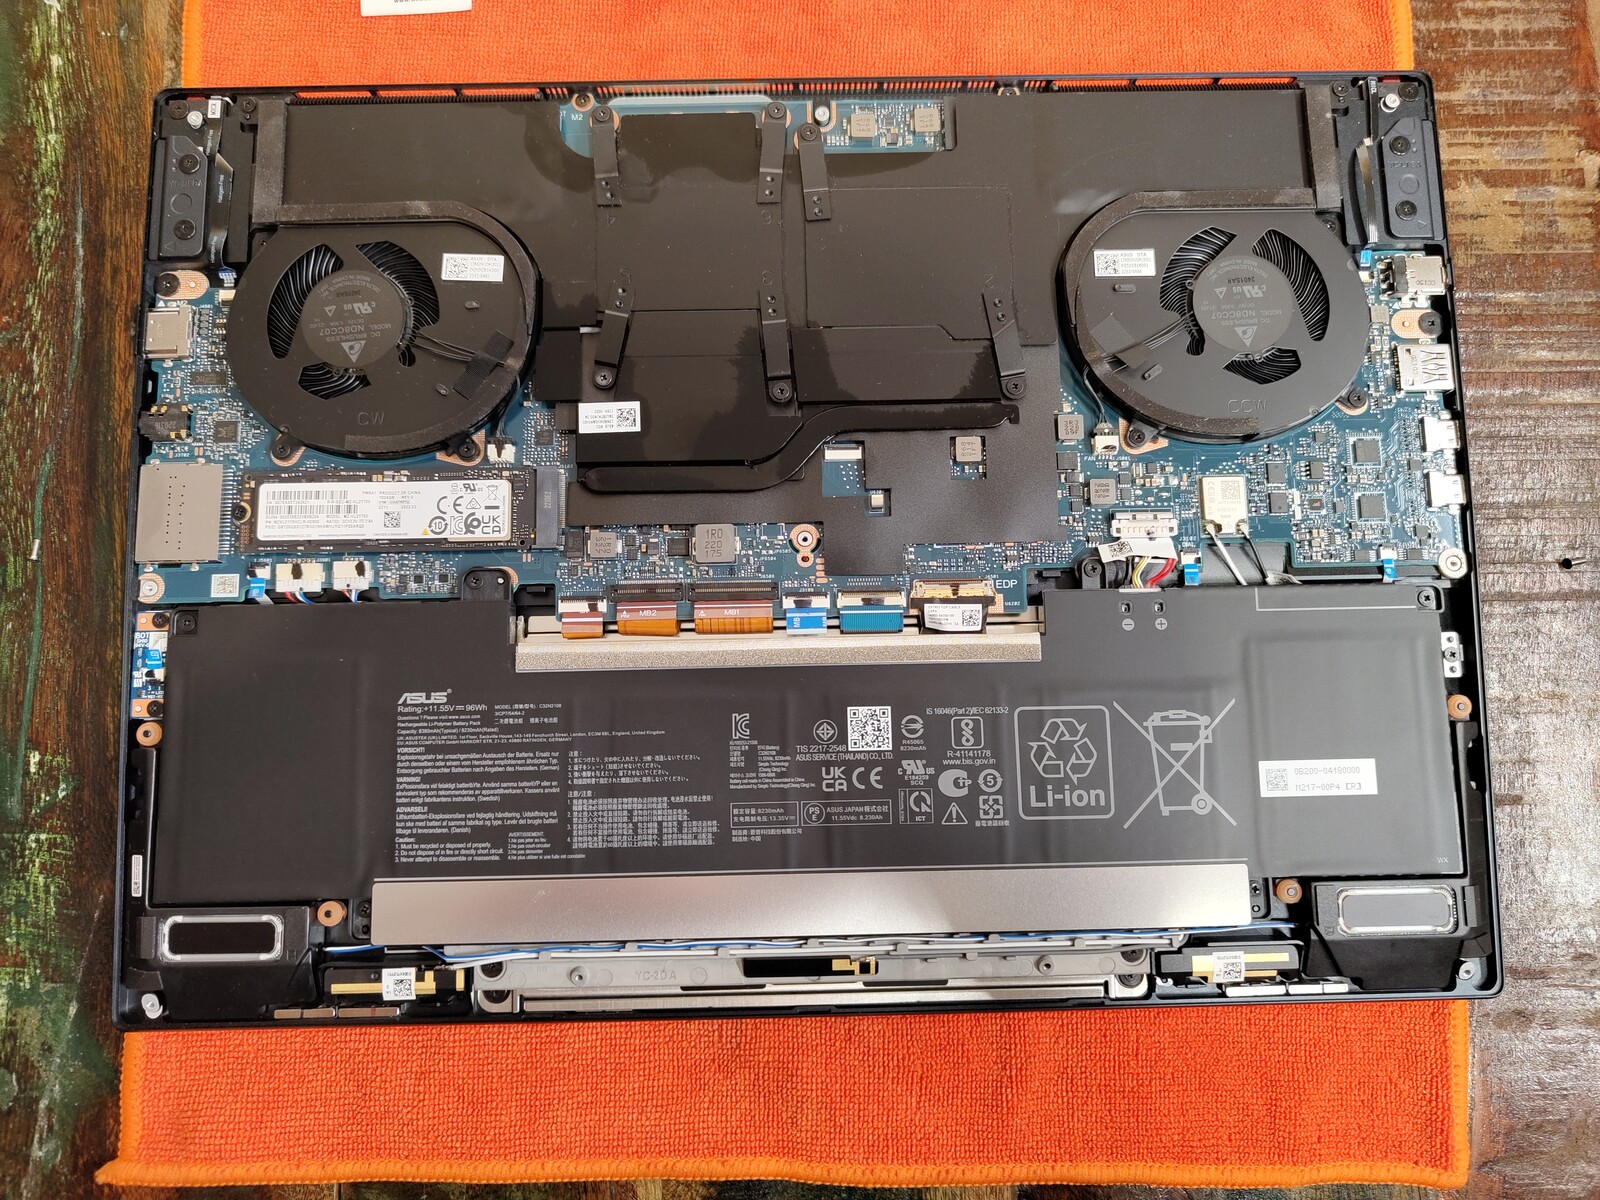
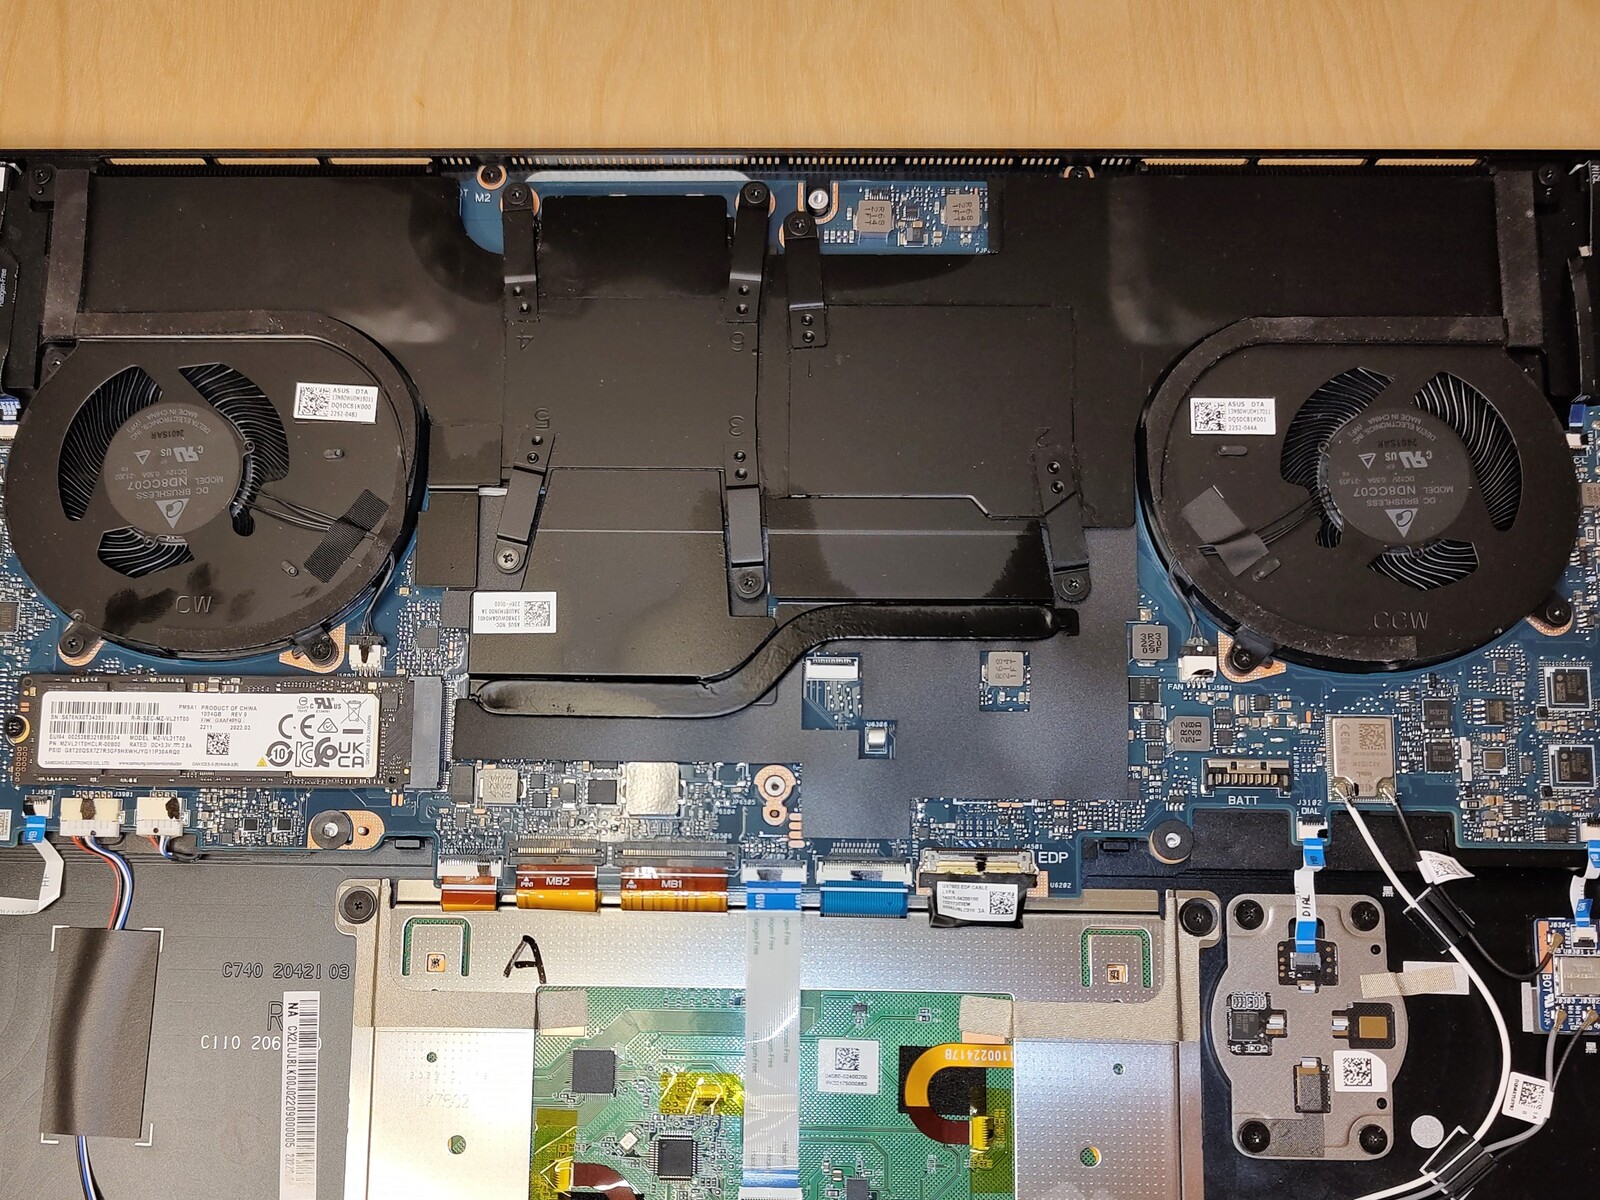
维护
可升级性不太可能是华硕Zenbook Pro 16X开发过程中的首要任务。一旦卸下底盖,只有NVMe固态硬盘是可以更换的。
担保
华硕Zenbook Pro 16X OLED在全球销售,有两年的保修期。然而,根据不同的地区,所提供的服务也有差异,所以有兴趣的买家应该在购买前向其供应商查询。
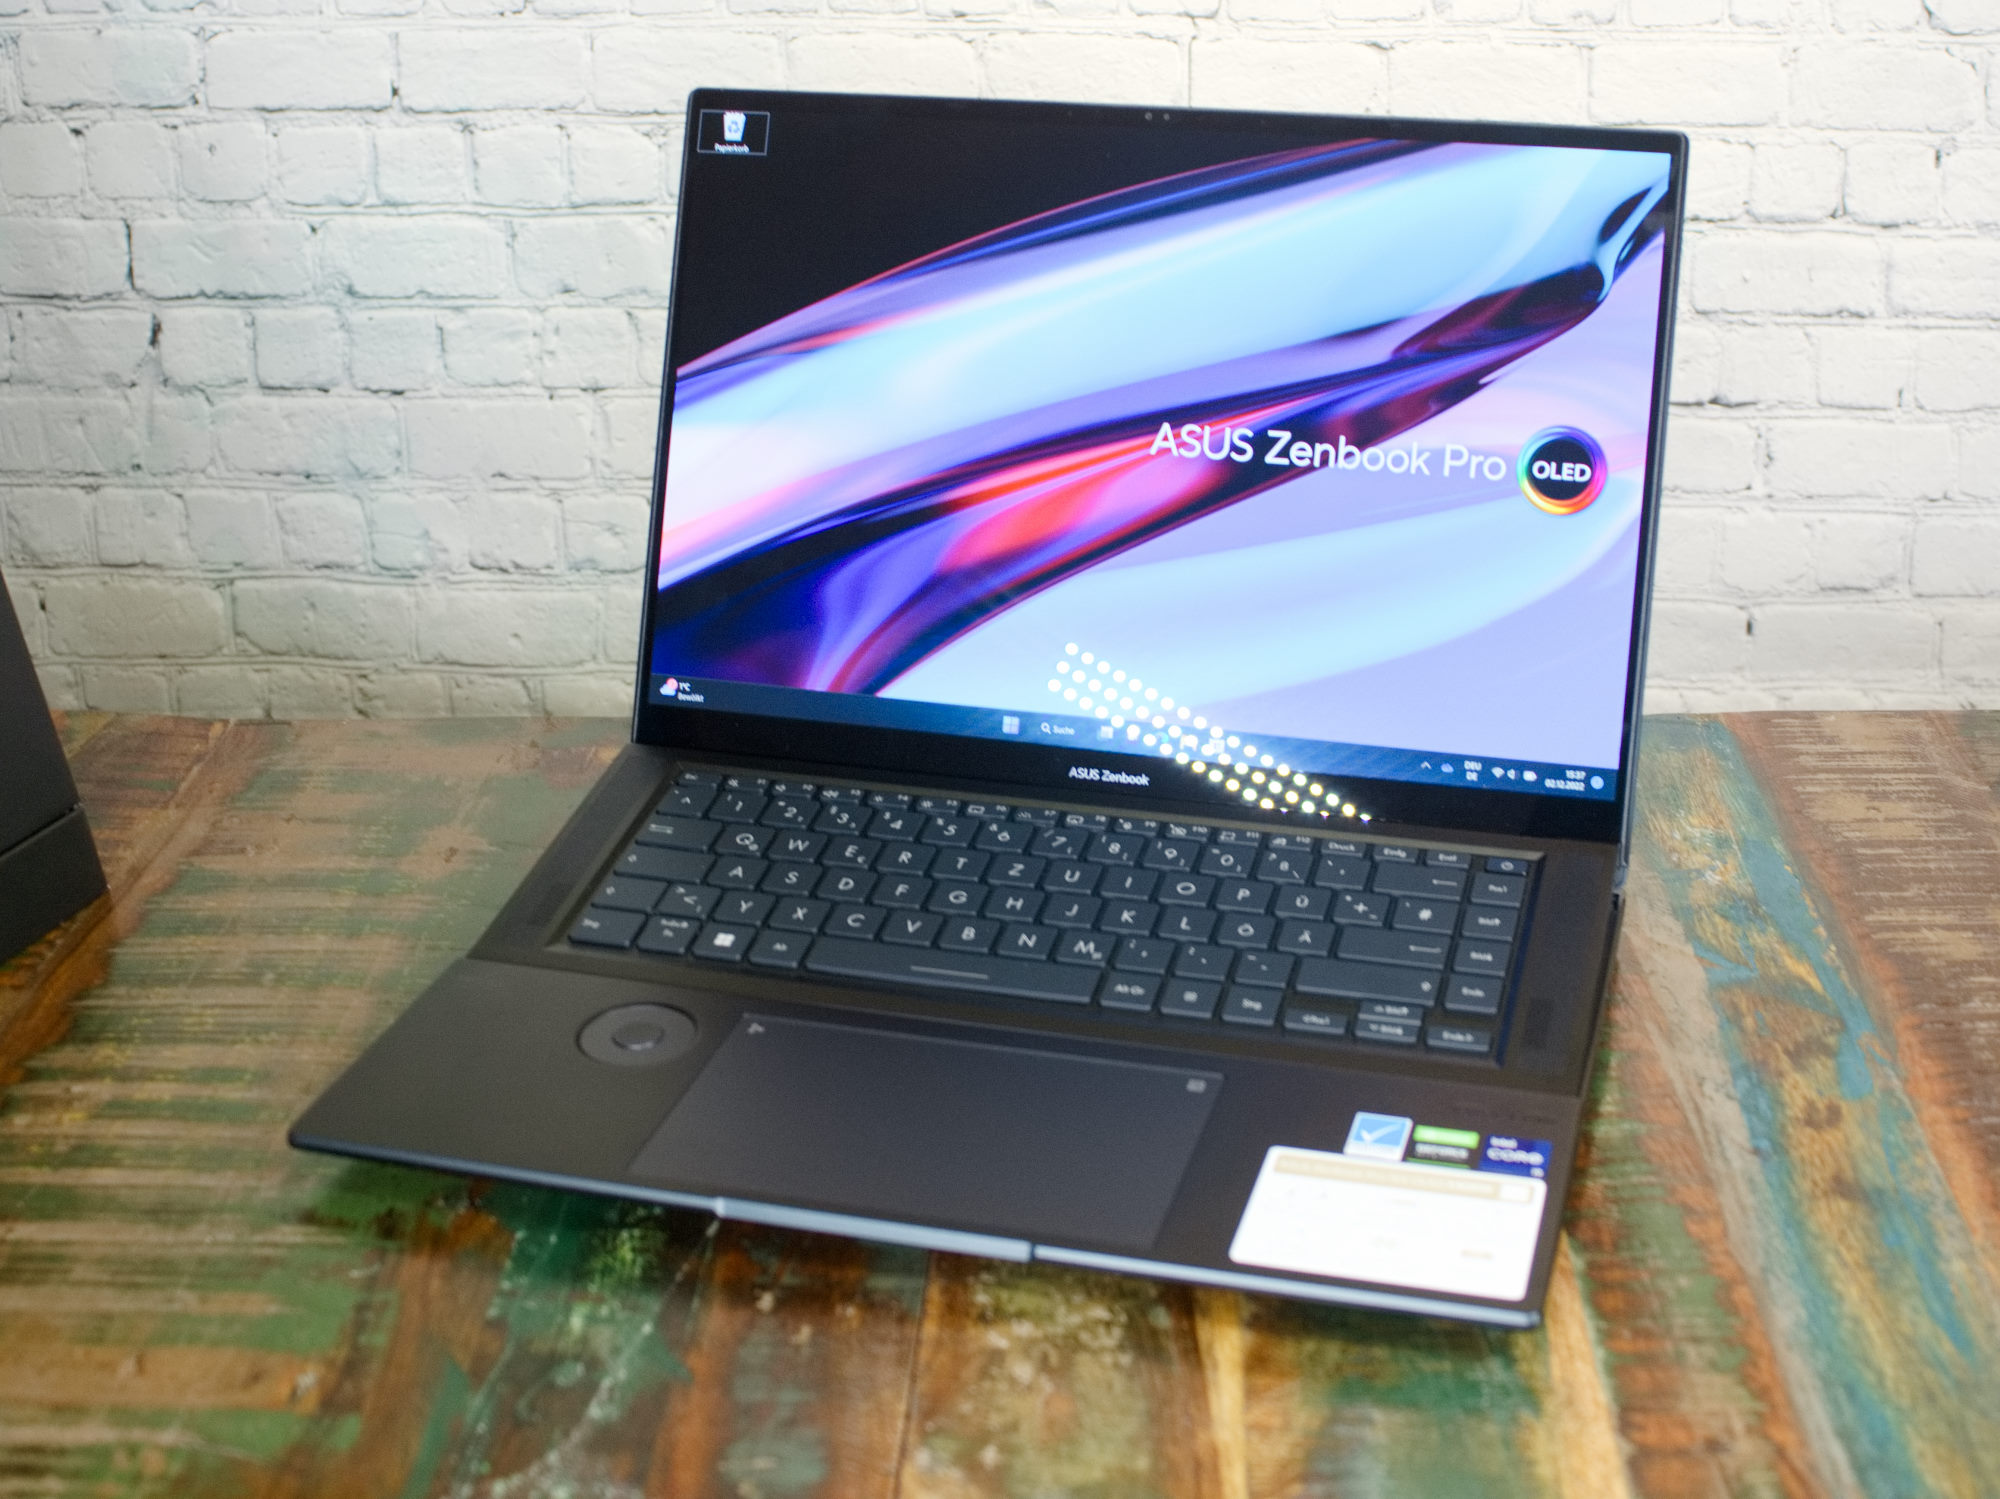
输入设备 - 带有华硕表盘、手写笔、触摸屏和触觉垫的Zenbook
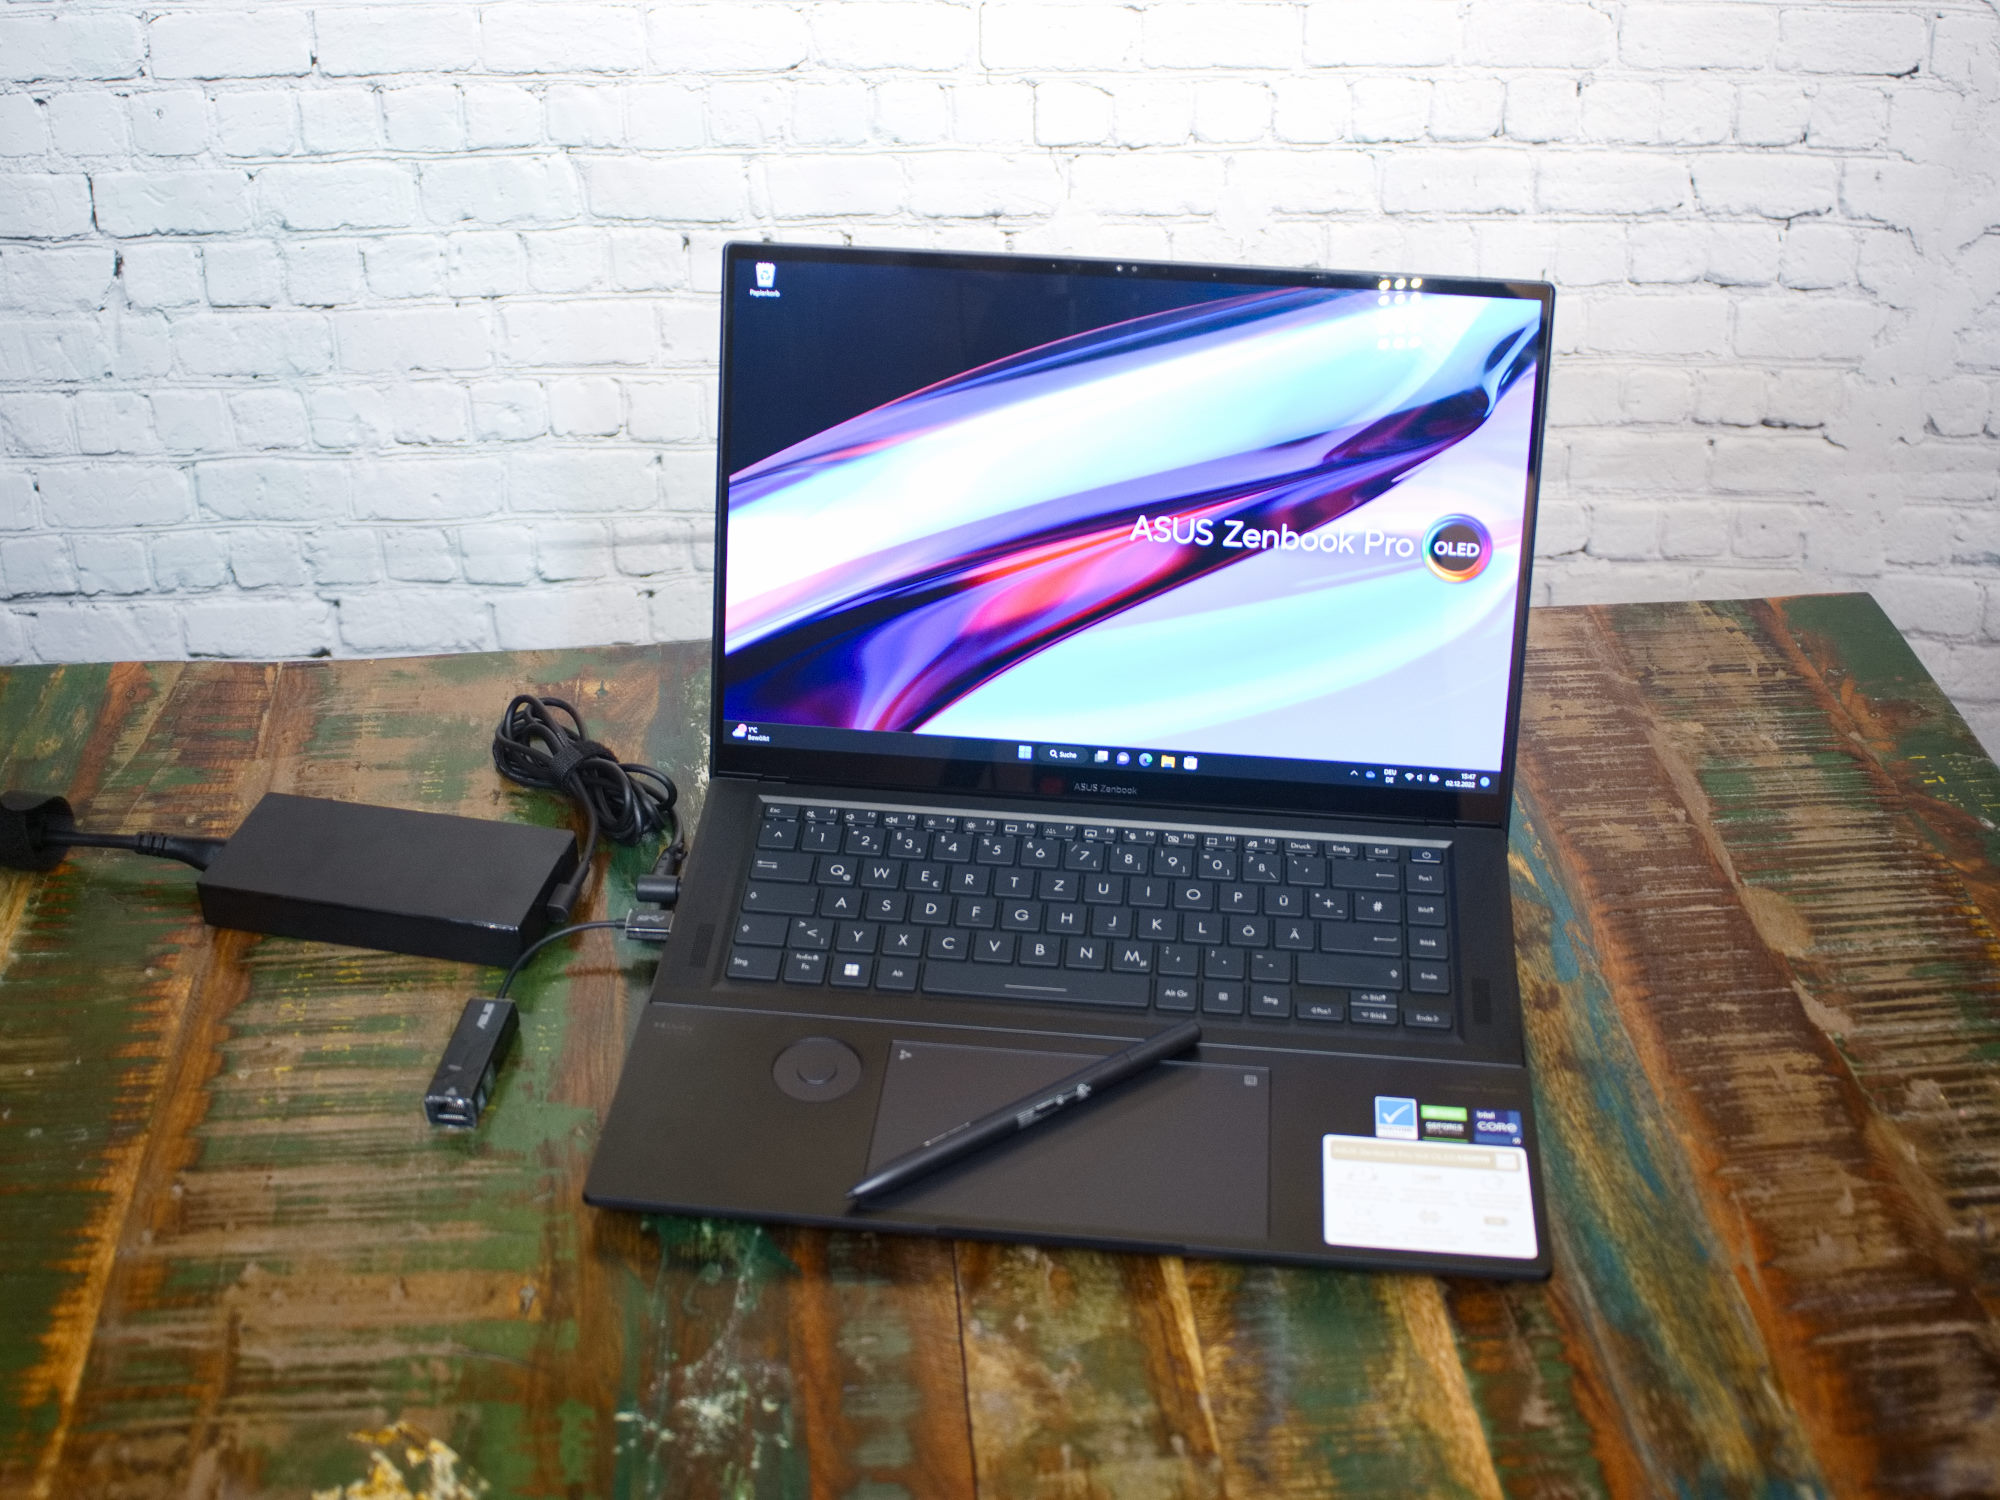
键盘、触摸板、触摸屏、华硕拨号盘和华硕笔2.0--华硕在选择输入法方面不遗余力。不幸的是,我们并不总是发现这里的各个元素的安排是实用的。各个元素往往会相互干扰。
键盘
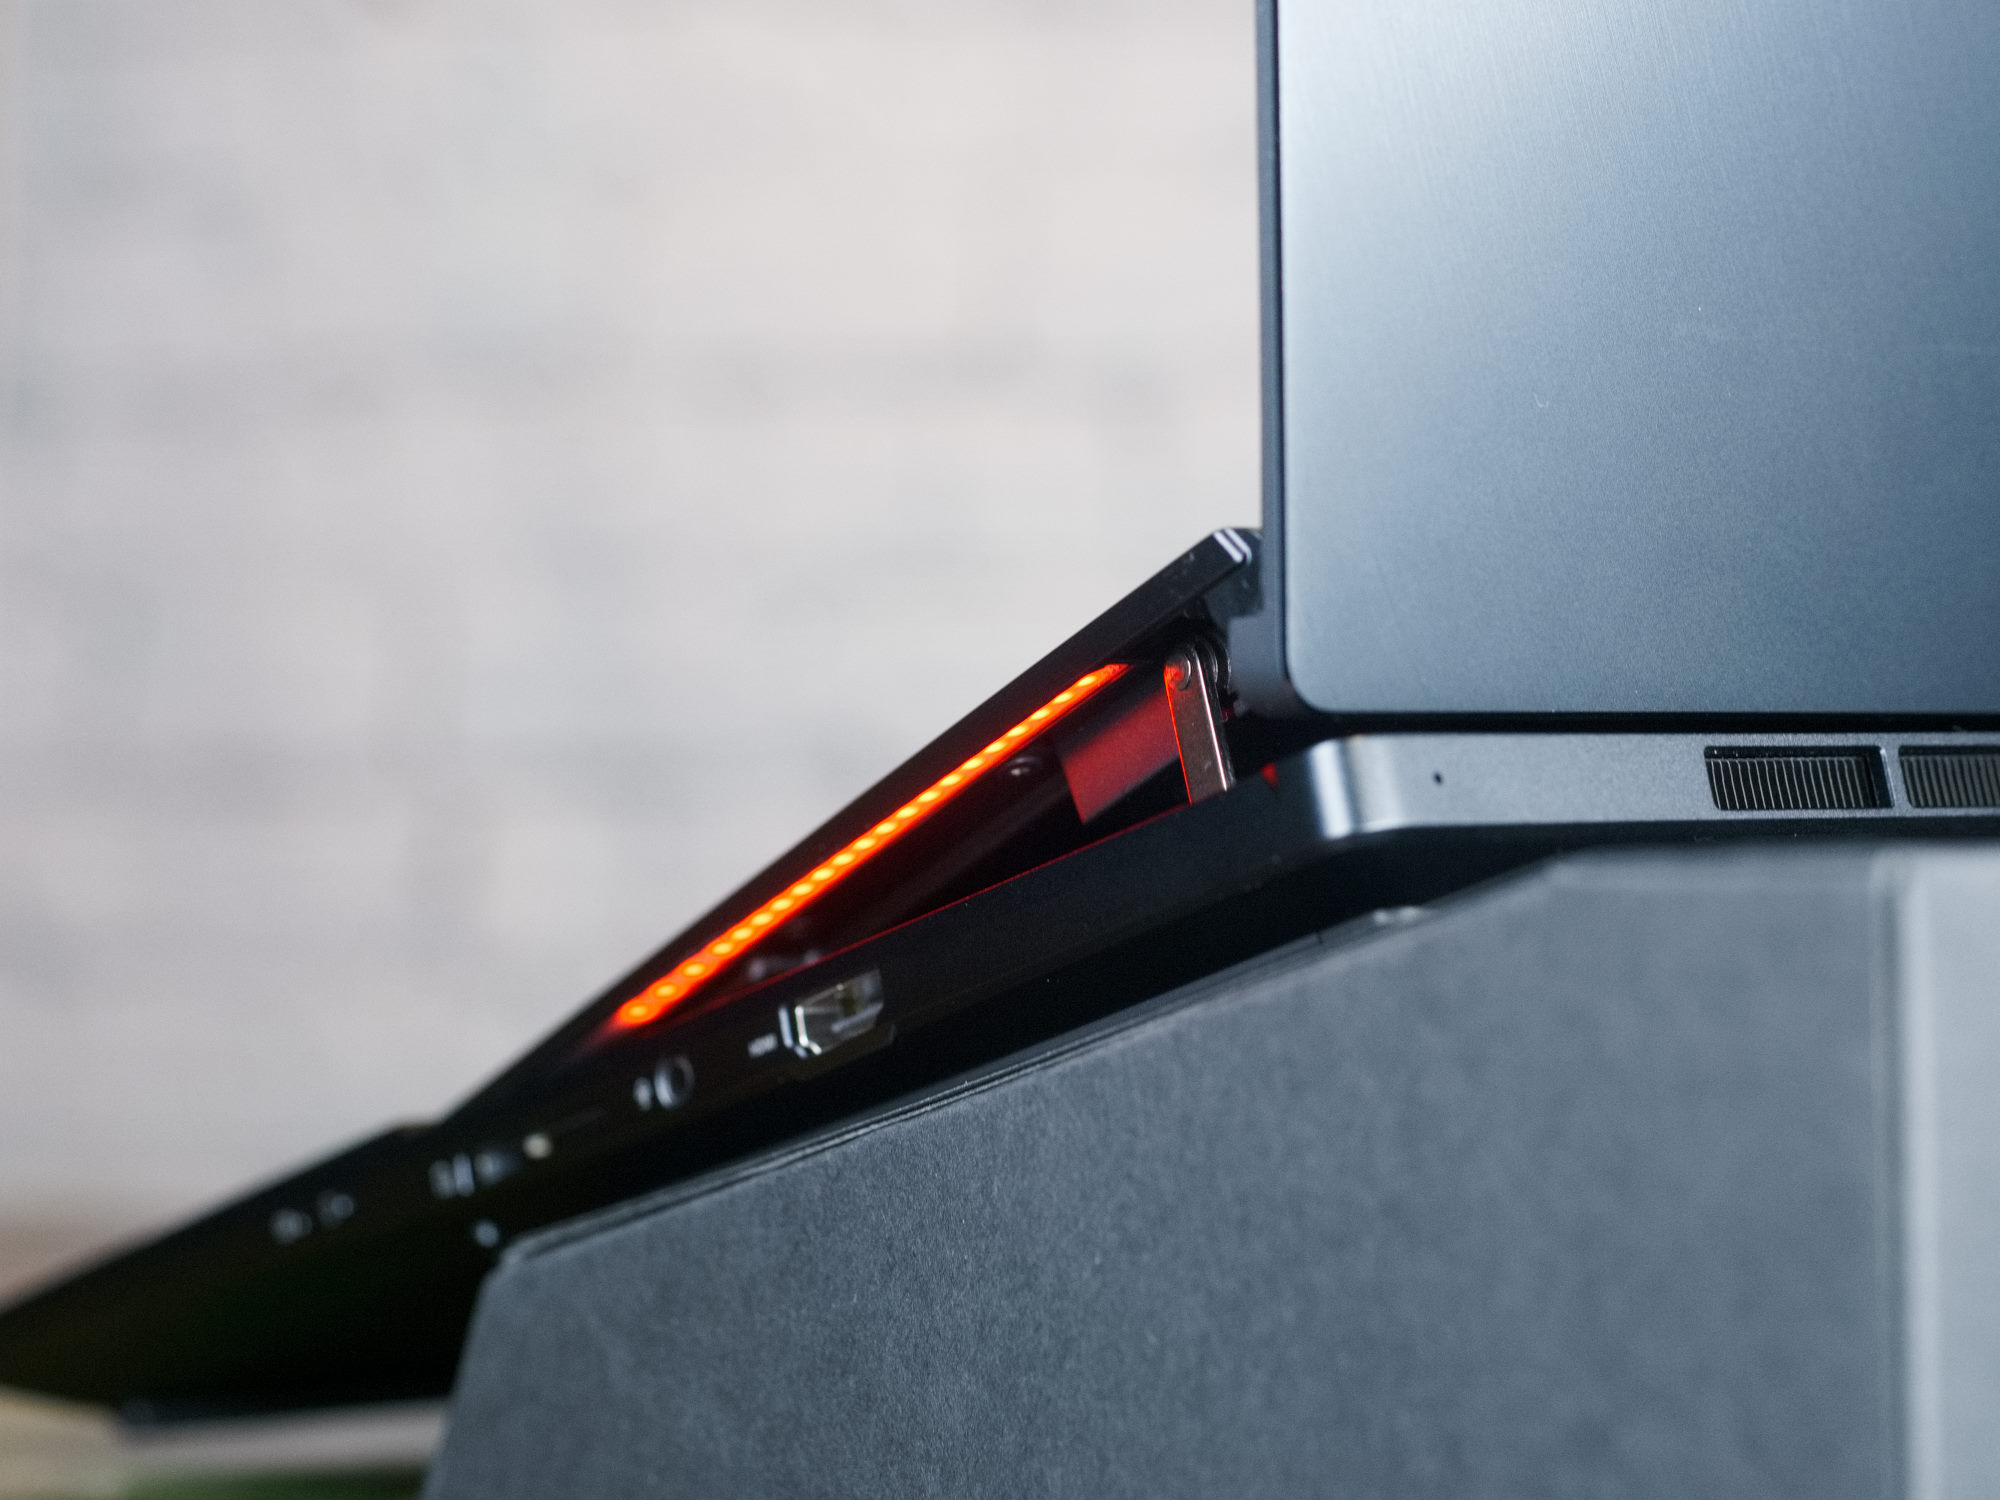
键盘的放置角度使得在Zenbook上打字比在平面笔记本上打字要舒服得多。RGBW照明确保了按键的完美可见性。每一个键都可以单独调整。带有N键翻转的Chiclet键盘还提供1.7毫米的键程。因此,如果不是因为压力点有点弱的话,键盘的人体工程学是再好不过了。
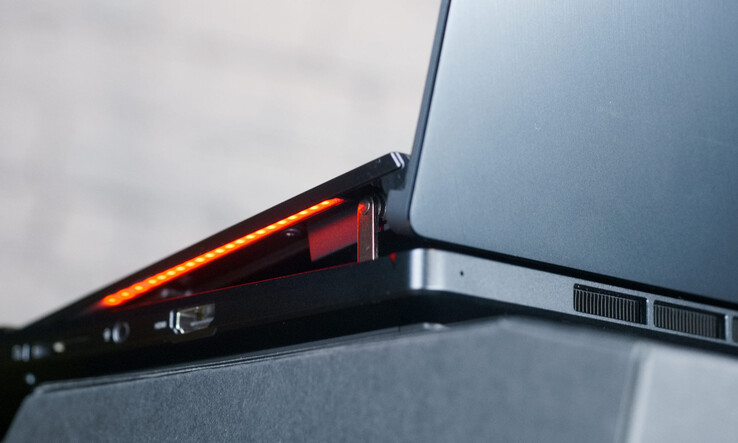
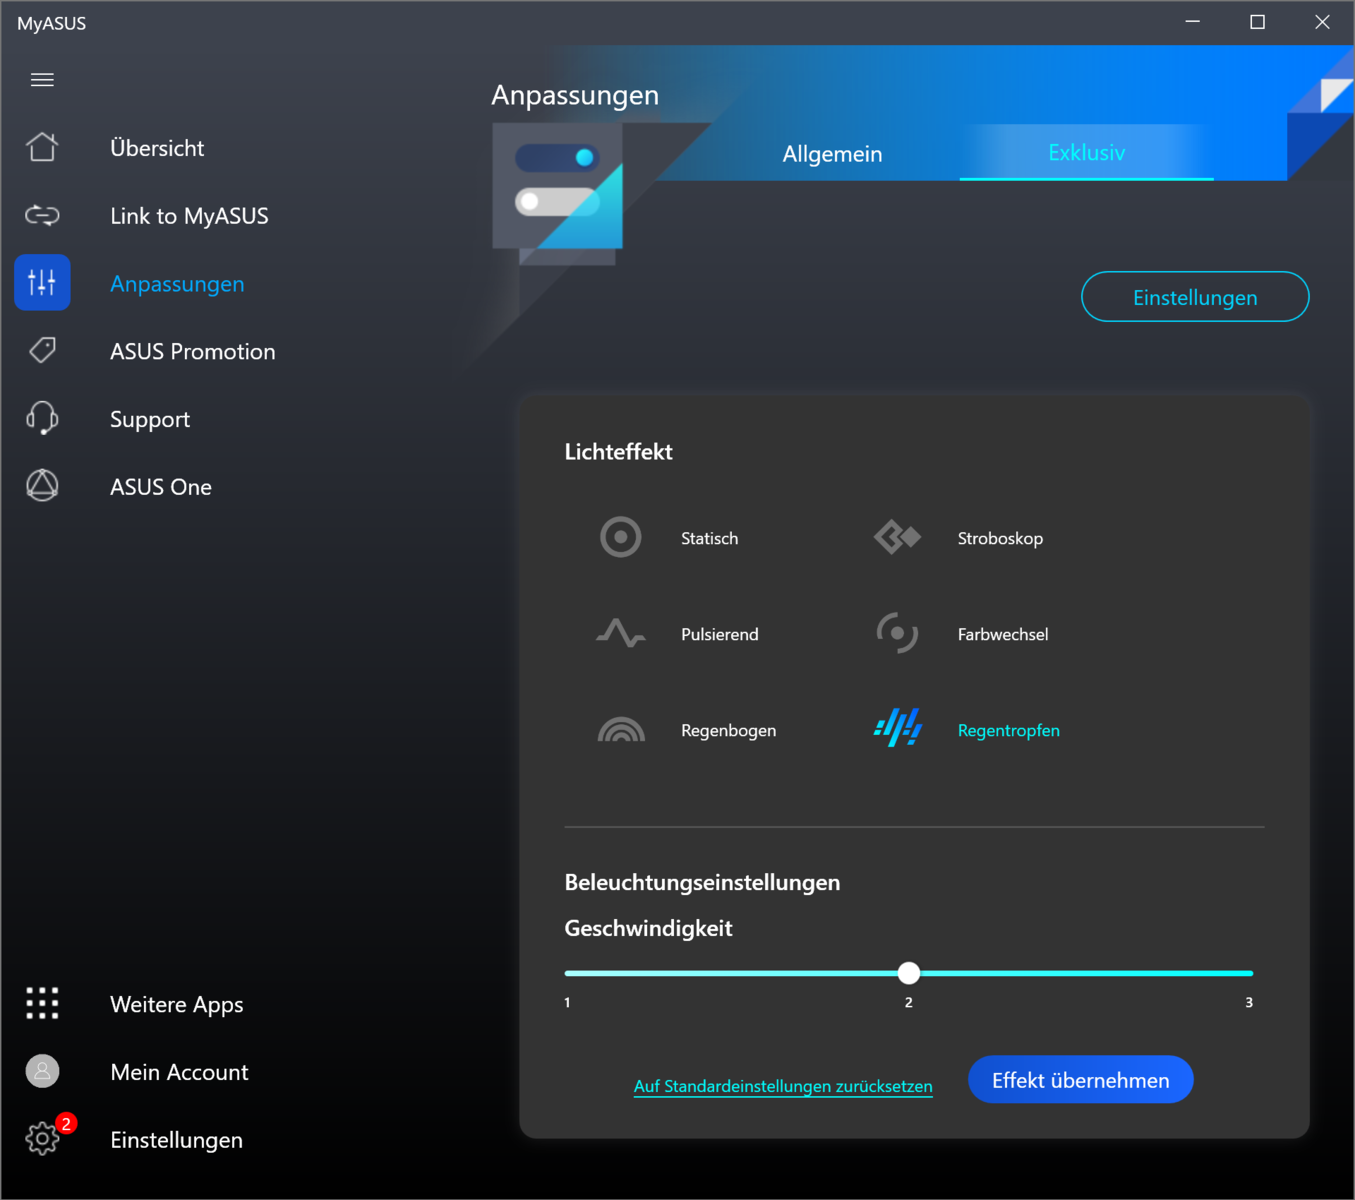
这里不仅键盘是RGBW照明,而且在键盘和底座之间的缝隙中还有另一条带有RBGW LED的灯带,它可以适应键盘的颜色。在黑暗的房间里,这创造了一种类似于偏光照明的效果。你还可以将笔记本电脑的照明与Windows中的系统通知联系起来,从而形成一个大的通知LED。那些希望只突出某些键进行游戏的人将会感到失望。MyAsus只为键盘提供了非常有限的照明效果选择,因此创建个人模式是不可能的。
触摸板
VivoBook上的触摸板比15×9厘米多一点。在这台笔记本上,击键的方式与通常情况下有很大不同。这里既没有安装触觉按钮,也没有安装鼠标按钮。相反,触摸板是压力敏感的,有一个模拟按键的触觉马达。从感觉上看,这种差别几乎不明显,但这种技术应该比普通按键更坚固耐用。触摸板的玻璃表面令人愉快,应该非常耐用。触摸板的触觉反馈也可以通过Windows中的设置关闭,但操作笔记本时感觉更有弹性。
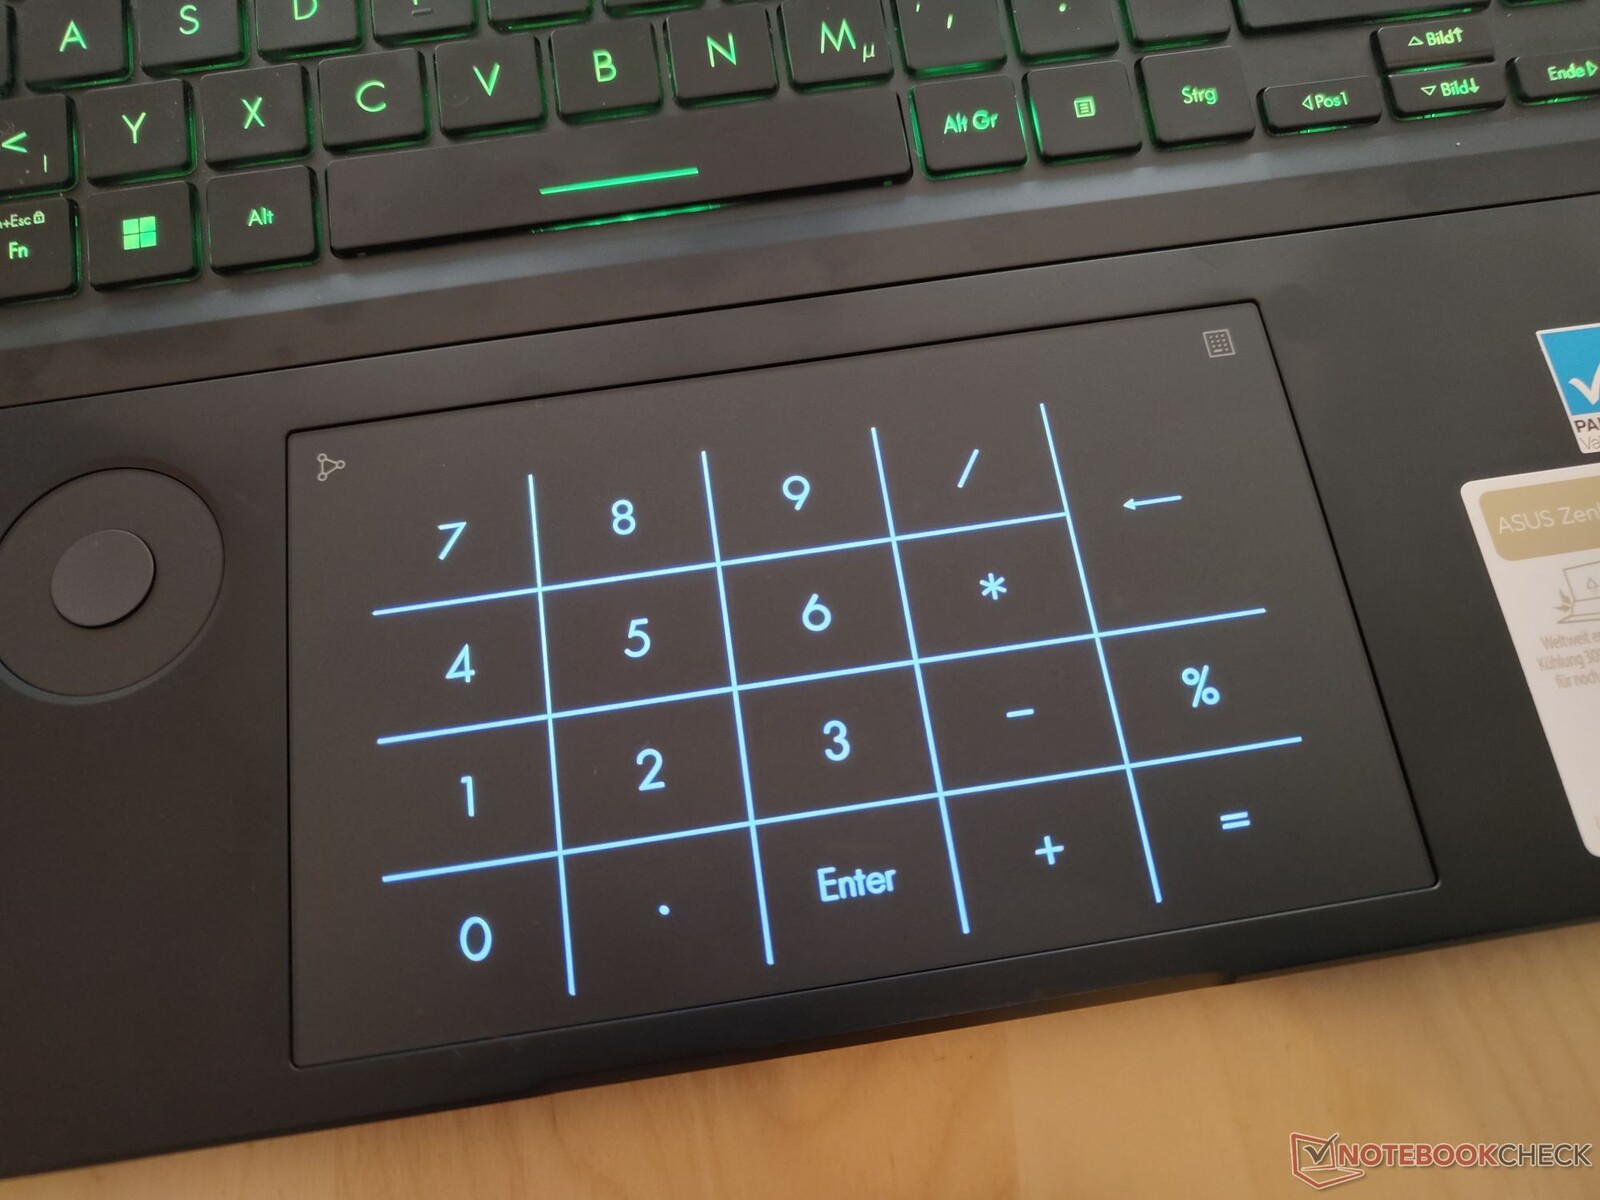
与许多华硕笔记本一样,Zenbook Pro 16X也在触摸板上提供了一个虚拟小键盘。在经过短暂的熟悉阶段后,可以快速输入长排数字。
可以立即注意到,ClickPad在寒风中的反应很慢。当触摸板温度低于15℃时,鼠标光标经常挂起。
华硕表盘
华硕拨号盘实际上应该被证明对许多用户是实用的,因为你用它来快速访问和调整许多控制。它还为Adobe Creative Cloud程序提供了一些选项,并可用于模拟微软Surface Dial及其一系列功能。
但是,当在笔记本电脑的键盘上工作时,华硕拨号盘经常被挡住。这是因为它正好位于打字时手跟所处的位置,所以你不断地做出不需要的输入。它似乎也没有手掌识别功能,只能通过ProArt Creator Hub应用程序打开和关闭。
华硕笔2.0
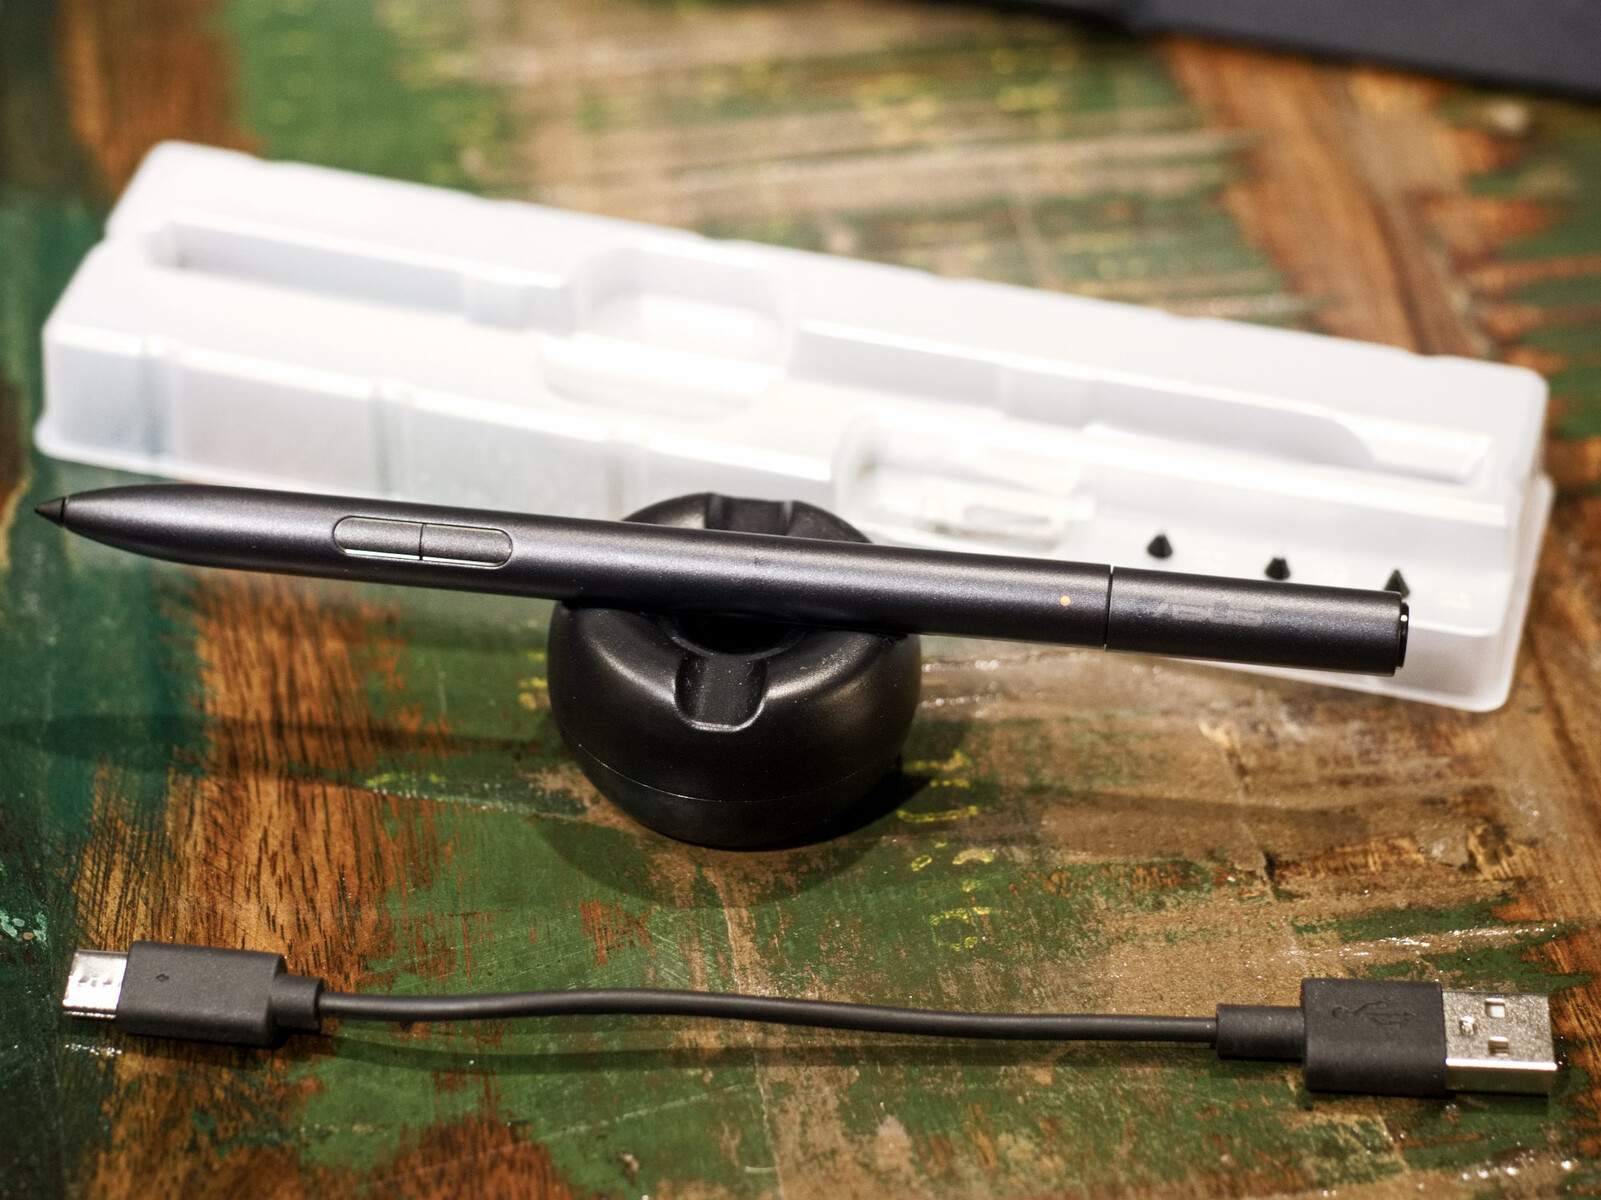
华硕笔本身非常棒,没有其他办法可以说。4096个压力级别和266赫兹的采样率确保了精确的工作。手写笔提供了三个可编程的按钮,也可以通过蓝牙连接在离屏幕一定的距离上使用。该笔可在30分钟内通过USB-C充电。据华硕称,这提供了长达140小时的电池寿命。通过随附的一系列书写提示,你可以更好地控制笔和屏幕之间的摩擦程度。但这是手写笔问题的开始:屏幕角度和笔记本的稳定性并不完全有利于手写笔工作。屏幕在压力下也会有轻微的屈服,这对笔输入来说相当不现实。
显示屏 - 经过潘通验证的OLED,覆盖DCI P3色彩空间

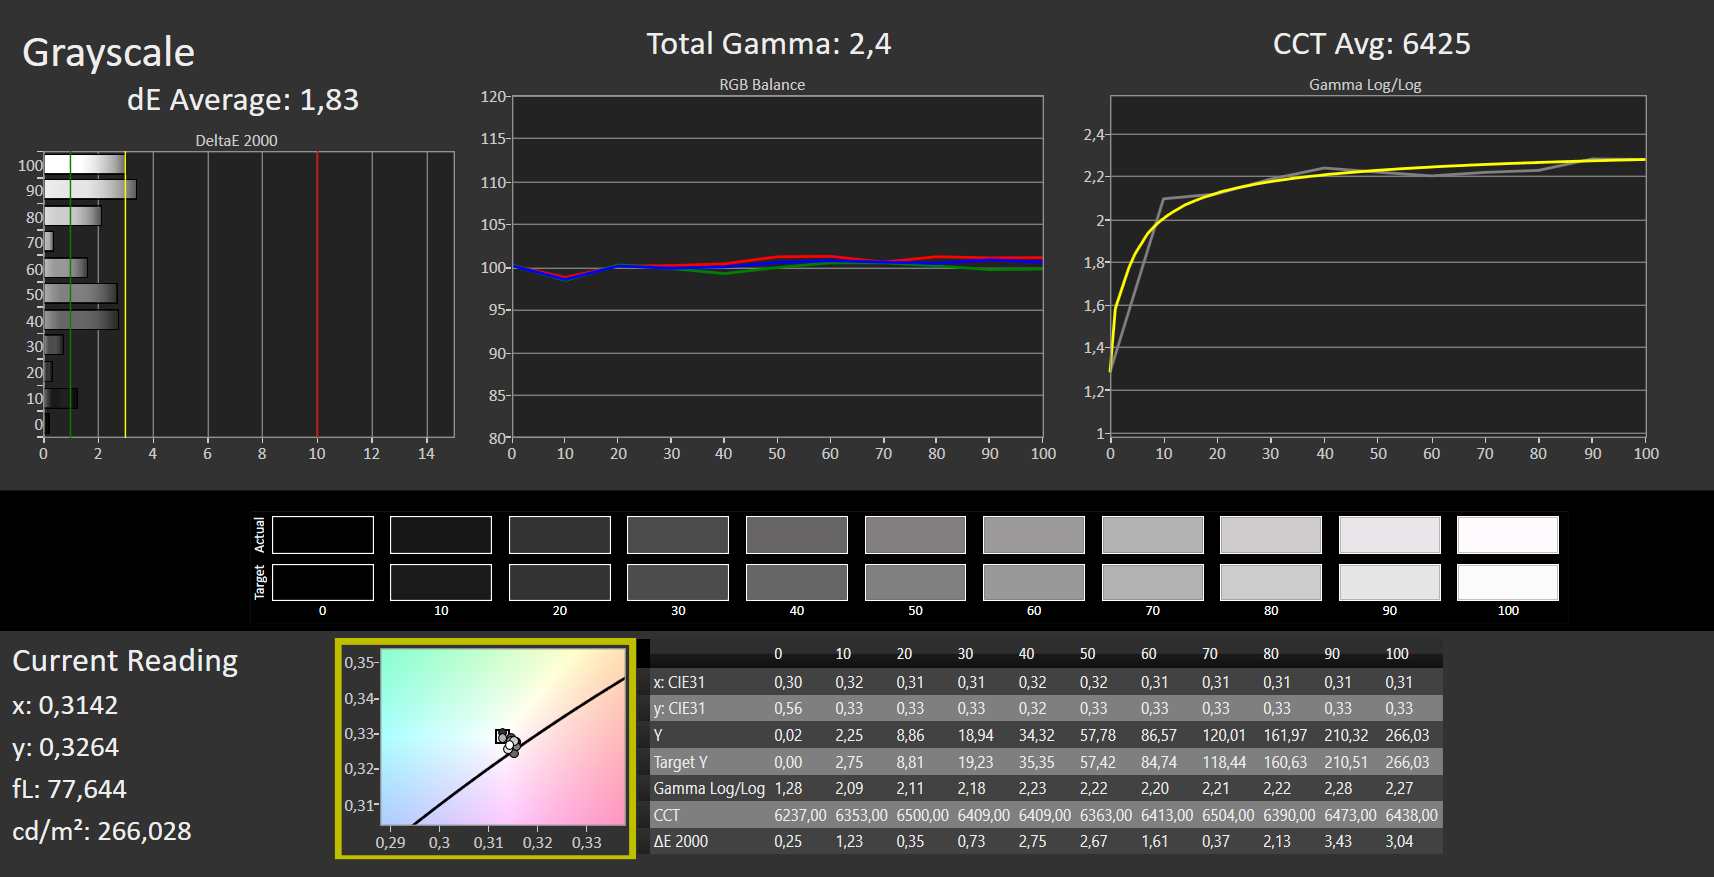
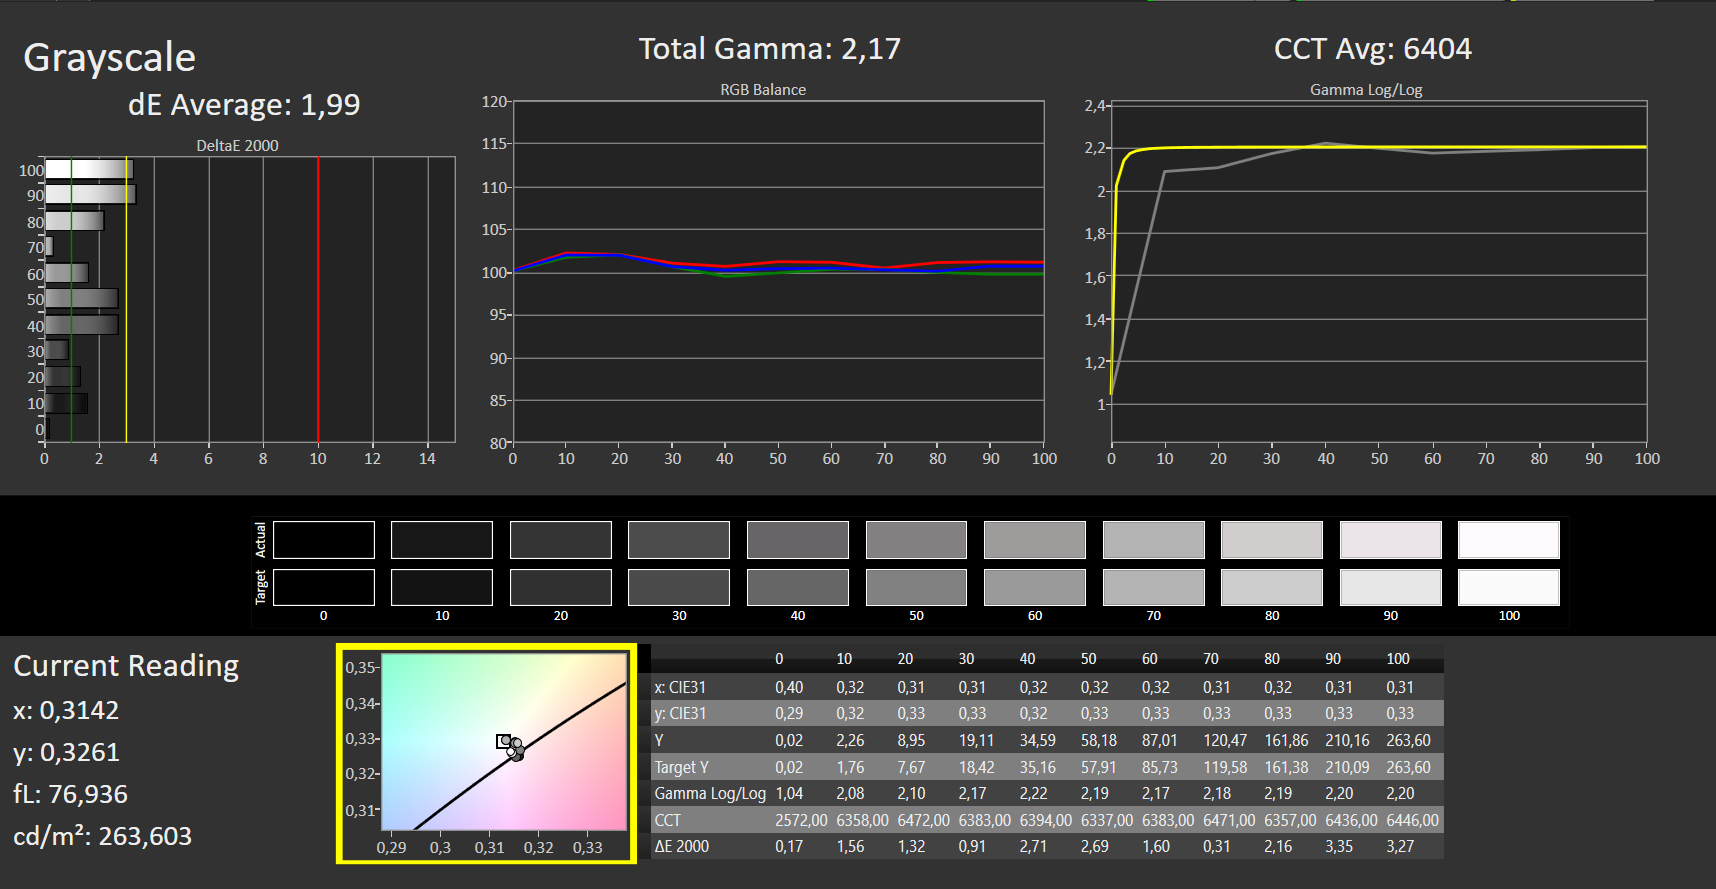
Zenbook Pro 16X的OLED显示屏的分辨率为3840 × 2400。16:10格式的UHD显示屏具有强烈的对比度和令人印象深刻的色彩。OLED显示屏通常不会出现屏幕出血或照度不均匀的情况。显示设置可通过MyAsus应用程序和ProArt Creator Hub进行调整。笔记本电脑有两个光线传感器,可以根据环境光线调整画面和屏幕亮度。我们确定这里的最大亮度为360cd/m²。色温和亮度会自动调整,以保持完美的画面质量。该显示器还支持几种HDR标准和杜比视界。有这么多的设置选项,很容易让人迷失方向。色彩空间表现、色温、亮度控制、HDR、传感器行为和许多其他因素都可以在这里进行个性化设置。不幸的是,各种选项分布在三个不同的程序中。对屏幕的一个批评是子像素矩阵中明显的孔。在全亮度下,有时可以看到显示屏上的小灰点。
华硕笔记本电脑的另一个特点是华硕GlideX。这个预装程序允许将显示屏扩展到任何Android 或iOS设备上,因此即使是旧的平板电脑也可以作为PC的扩展。
| |||||||||||||||||||||||||
Brightness Distribution: 96 %
Center on Battery: 346 cd/m²
Contrast: ∞:1 (Black: 0 cd/m²)
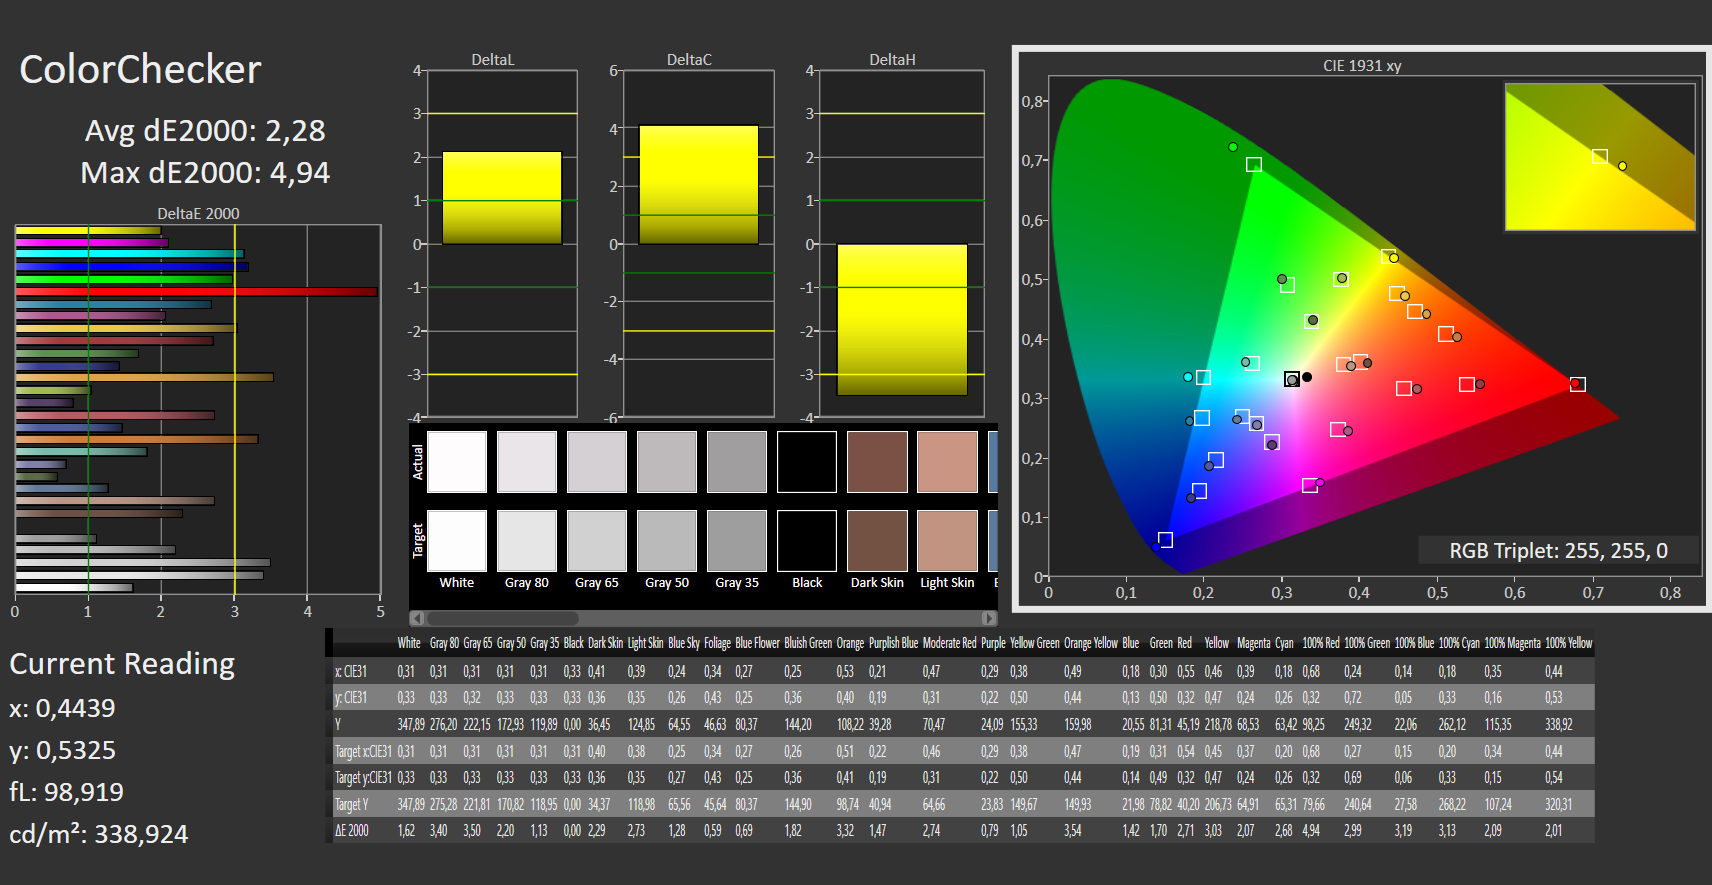
ΔE ColorChecker Calman: 2.28 | ∀{0.5-29.43 Ø4.71}
calibrated: 2.16
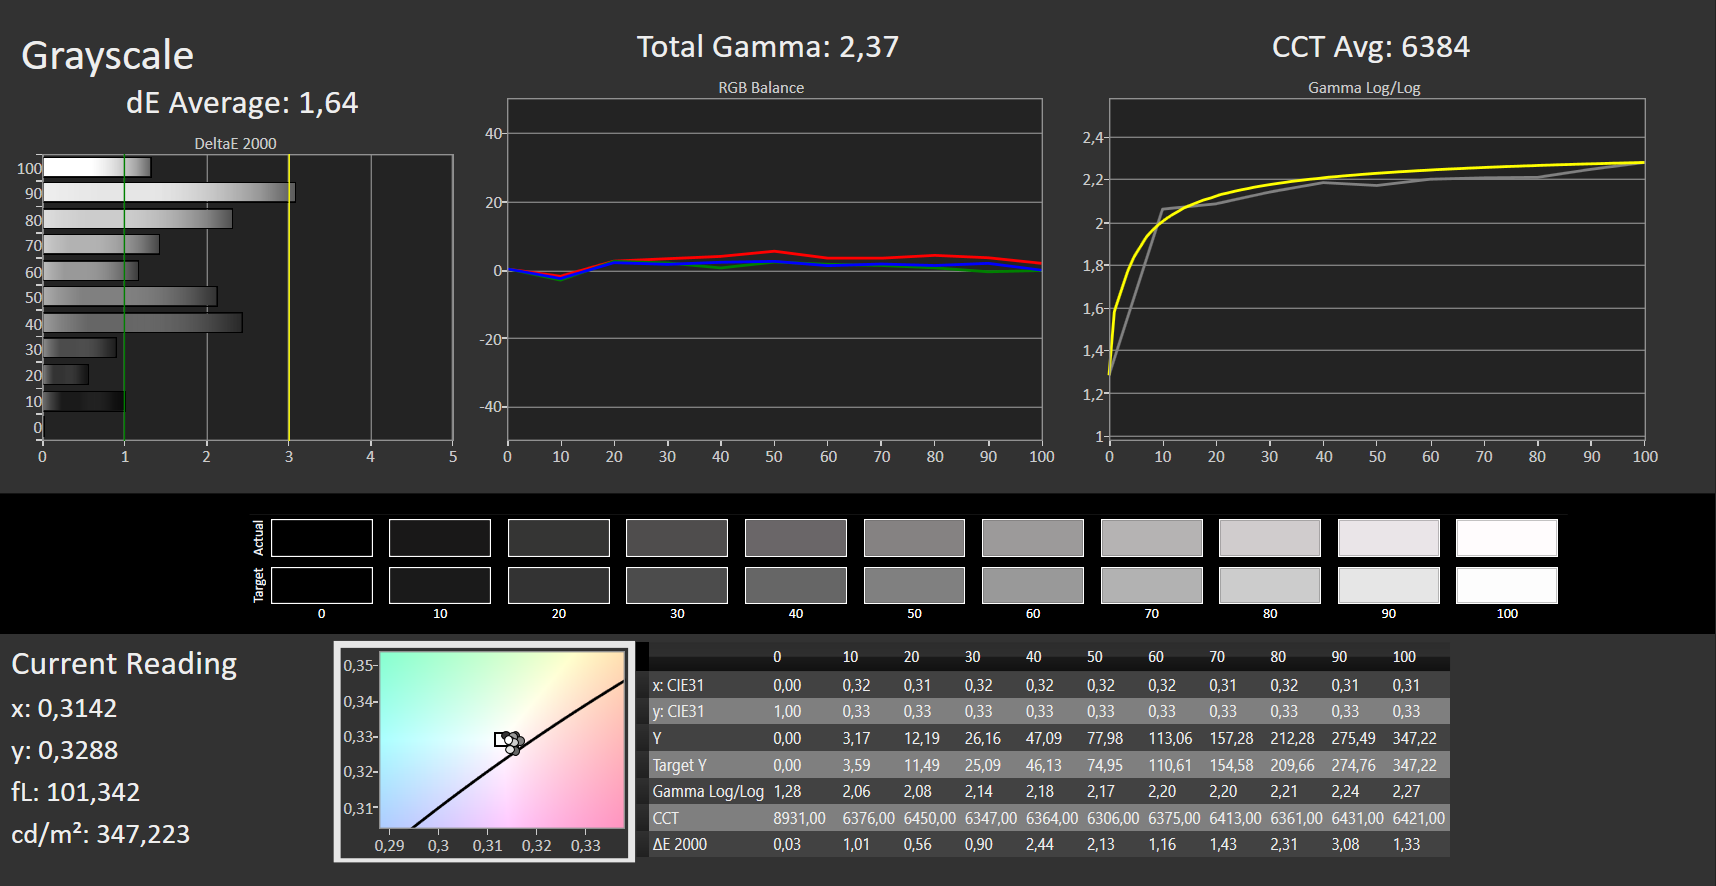
ΔE Greyscale Calman: 1.64 | ∀{0.09-98 Ø4.96}
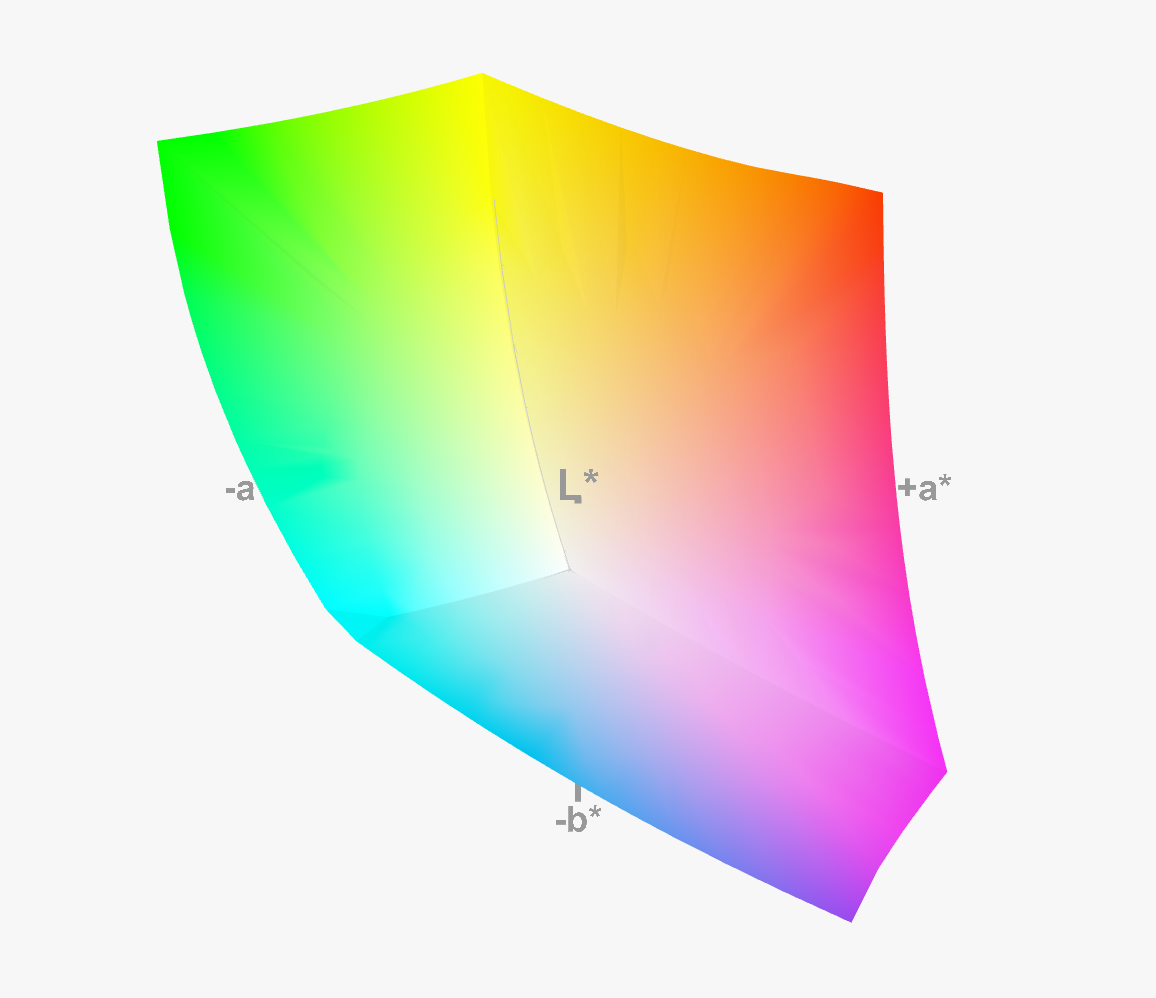
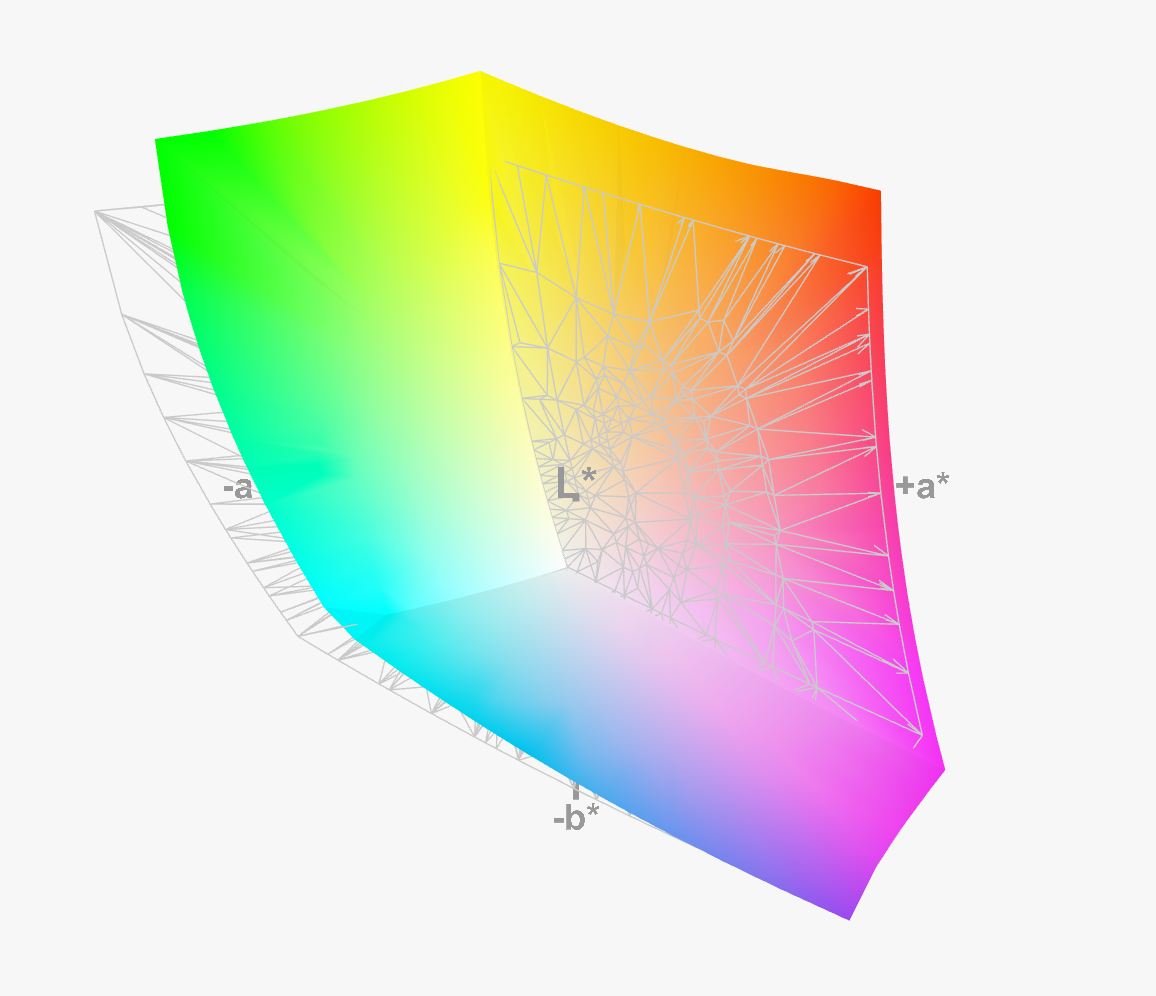
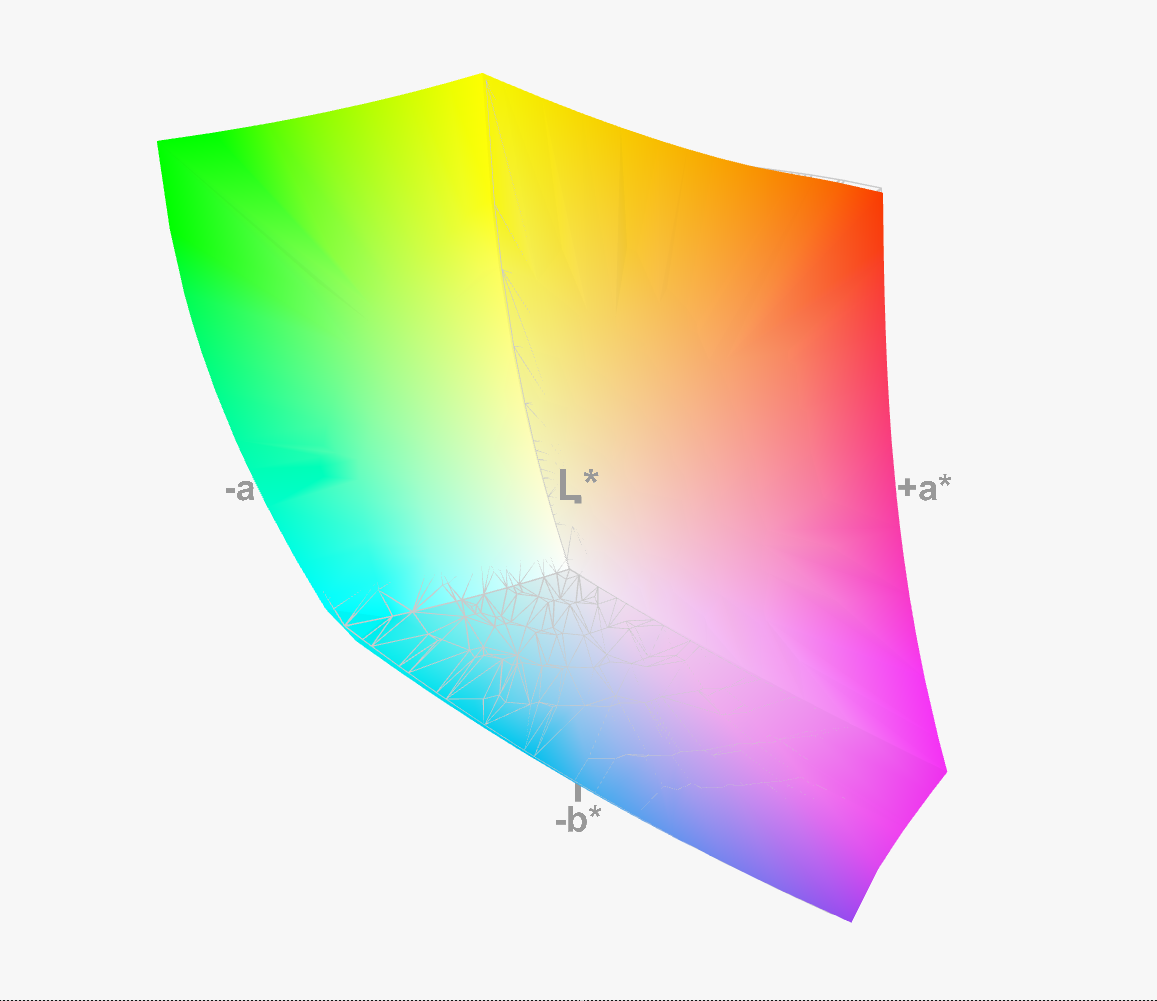
88.9% AdobeRGB 1998 (Argyll 3D)
99.99% sRGB (Argyll 3D)
99.84% Display P3 (Argyll 3D)
Gamma: 2.37
CCT: 6384 K
| Asus ZenBook Pro 16X OLED UX7602ZM-ME115W Samsung SDC415D, OLED, 3840x2400, 16" | Lenovo ThinkPad X1 Extreme G5-21DE003RGE LP160UQ1-SPB1, IPS, 3840x2400, 16" | HP Omen 16-n0033dx BOE0AAE, IPS, 1920x1080, 16.1" | HP ZBook Studio 16 G9 62U04EA BOE0A52, IPS, 3840x2400, 16" | Corsair Voyager a1600 BOE0A3B, IPS, 2560x1600, 16" | Dell Precision 7670 Samsung 160YV03, OLED, 3840x2400, 16" | Asus VivoBook Pro 16X OLED N7600PC-L2026X Samsung ATNA60YV02-0, OLED, 3840x2400, 16" | MSI CreatorPro Z16P B12UKST B160QAN02.N, IPS, 2560x1600, 16" | |
|---|---|---|---|---|---|---|---|---|
| Display | -2% | -14% | -2% | -18% | 3% | 3% | -1% | |
| Display P3 Coverage (%) | 99.84 | 84.6 -15% | 74.4 -25% | 97.5 -2% | 68.7 -31% | 99.9 0% | 99.9 0% | 97.6 -2% |
| sRGB Coverage (%) | 99.99 | 99.2 -1% | 99.2 -1% | 99.9 0% | 98.2 -2% | 100 0% | 100 0% | 99.9 0% |
| AdobeRGB 1998 Coverage (%) | 88.9 | 97.7 10% | 73.4 -17% | 86.3 -3% | 70.1 -21% | 97.5 10% | 98.05 10% | 87.4 -2% |
| Response Times | -1530% | -620% | -435% | -475% | 3% | 25% | -405% | |
| Response Time Grey 50% / Grey 80% * (ms) | 2 ? | 46 ? -2200% | 17.6 ? -780% | 15.3 ? -665% | 13 ? -550% | 1.9 ? 5% | 1 50% | 12.8 ? -540% |
| Response Time Black / White * (ms) | 2 ? | 19.2 ? -860% | 11.2 ? -460% | 6.1 ? -205% | 10 ? -400% | 2 ? -0% | 2 ? -0% | 7.4 ? -270% |
| PWM Frequency (Hz) | 59 ? | 59.5 ? | 247 ? | |||||
| Screen | 12% | -9% | 39% | -2% | -32% | 7% | 22% | |
| Brightness middle (cd/m²) | 346 | 476 38% | 373.3 8% | 554 60% | 355 3% | 340.1 -2% | 383 11% | 407 18% |
| Brightness (cd/m²) | 354 | 470 33% | 361 2% | 516 46% | 340 -4% | 342 -3% | 390 10% | 388 10% |
| Brightness Distribution (%) | 96 | 90 -6% | 79 -18% | 84 -12% | 91 -5% | 98 2% | 96 0% | 88 -8% |
| Black Level * (cd/m²) | 0.35 | 0.44 | 0.47 | 0.53 | 0.027 | 0.36 | ||
| Colorchecker dE 2000 * | 2.28 | 1.9 17% | 2.12 7% | 1 56% | 2.43 -7% | 2.5 -10% | 2.29 -0% | 1.3 43% |
| Colorchecker dE 2000 max. * | 4.94 | 4.7 5% | 5.62 -14% | 2.4 51% | 4.31 13% | 8.19 -66% | 3.47 30% | 2.5 49% |
| Colorchecker dE 2000 calibrated * | 2.16 | 1.3 40% | 2.06 5% | 0.6 72% | 1.14 47% | 0.7 68% | ||
| Greyscale dE 2000 * | 1.64 | 2.4 -46% | 2.5 -52% | 1.6 2% | 2.62 -60% | 3.5 -113% | 1.84 -12% | 2.1 -28% |
| Gamma | 2.37 93% | 2.24 98% | 2.3 96% | 2.29 96% | 2.28 96% | 2.12 104% | 2.32 95% | 2.26 97% |
| CCT | 6384 102% | 6377 102% | 6408 101% | 6458 101% | 6909 94% | 6704 97% | 6308 103% | 6437 101% |
| Contrast (:1) | 1360 | 848 | 1179 | 670 | 14185 | 1131 | ||
| Total Average (Program / Settings) | -507% /
-249% | -214% /
-112% | -133% /
-50% | -165% /
-85% | -9% /
-16% | 12% /
9% | -128% /
-55% |
* ... smaller is better
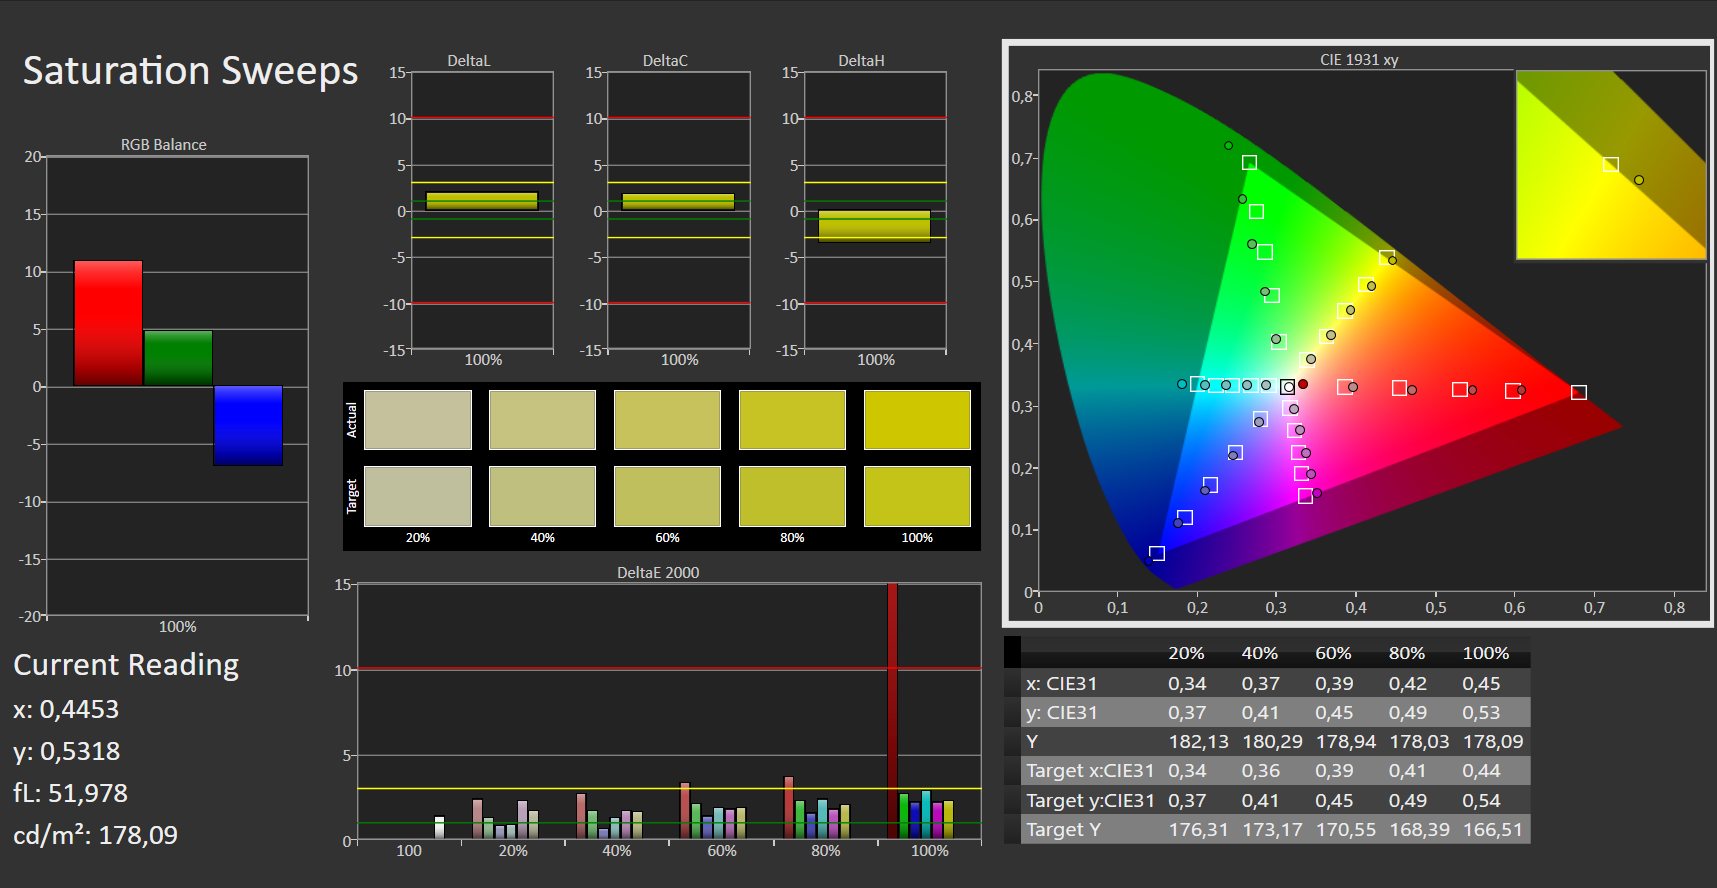
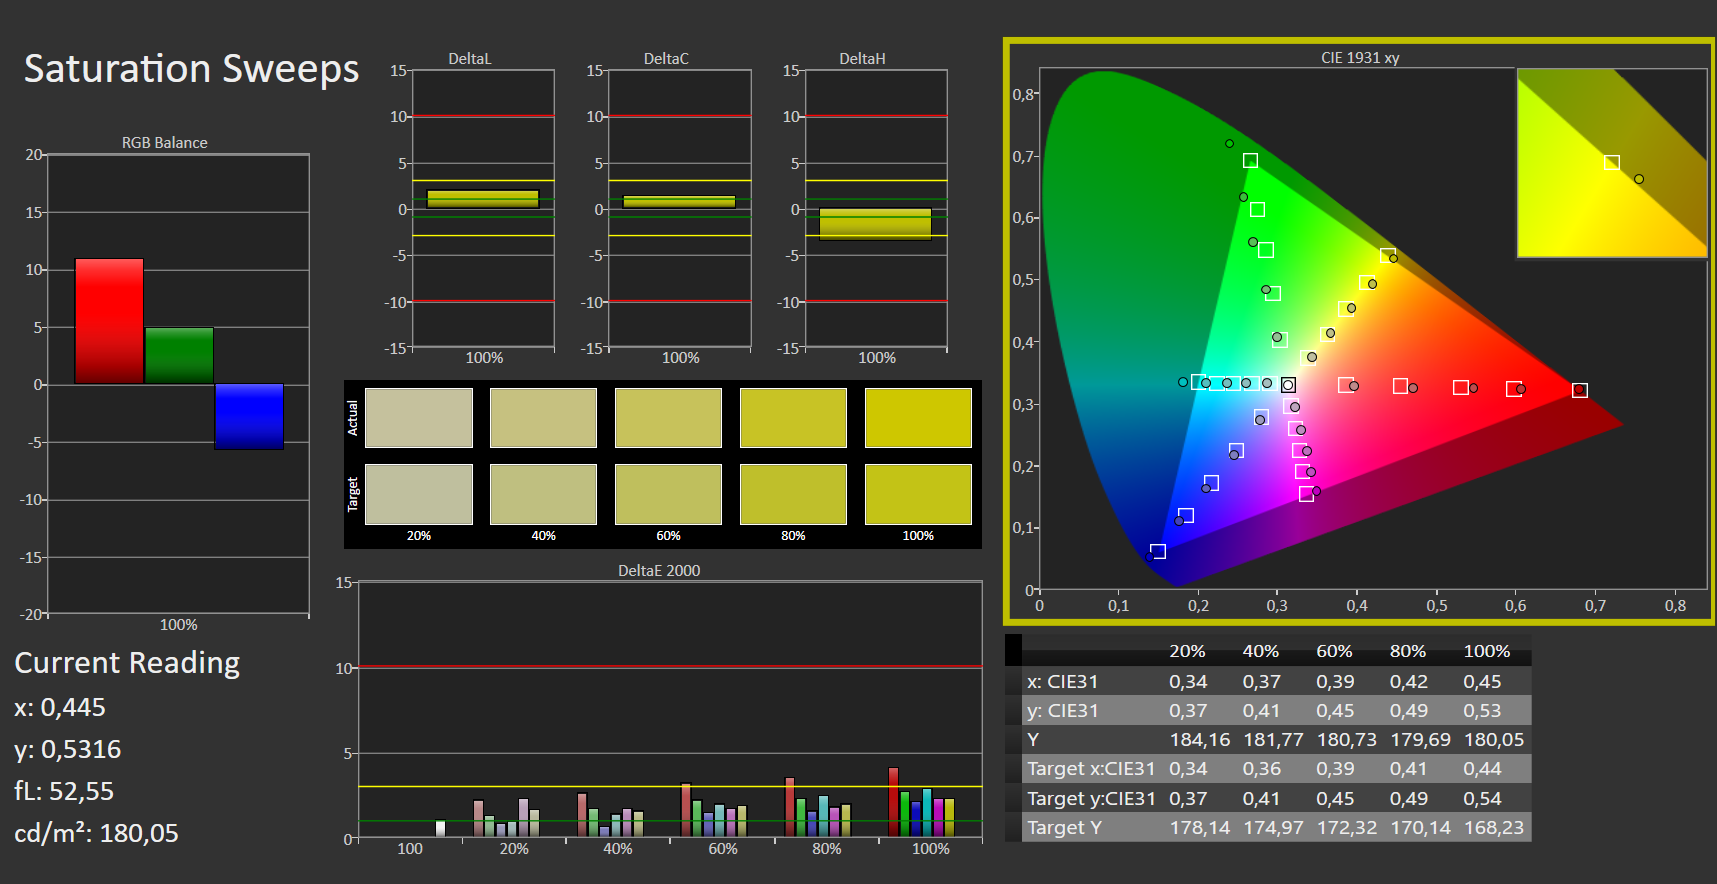
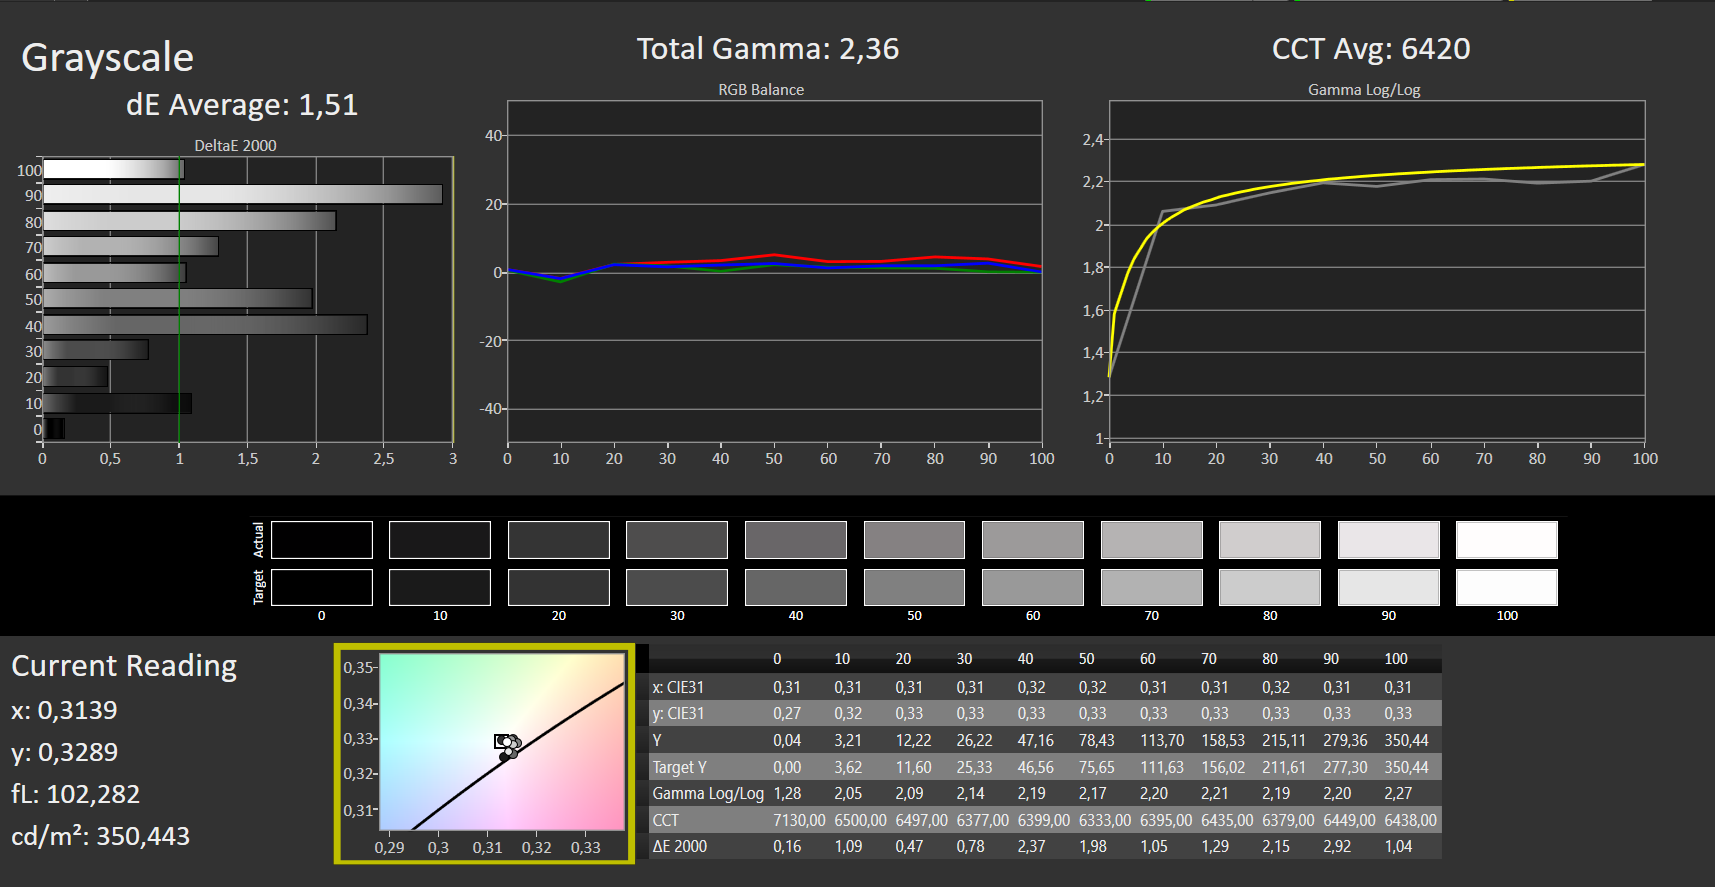
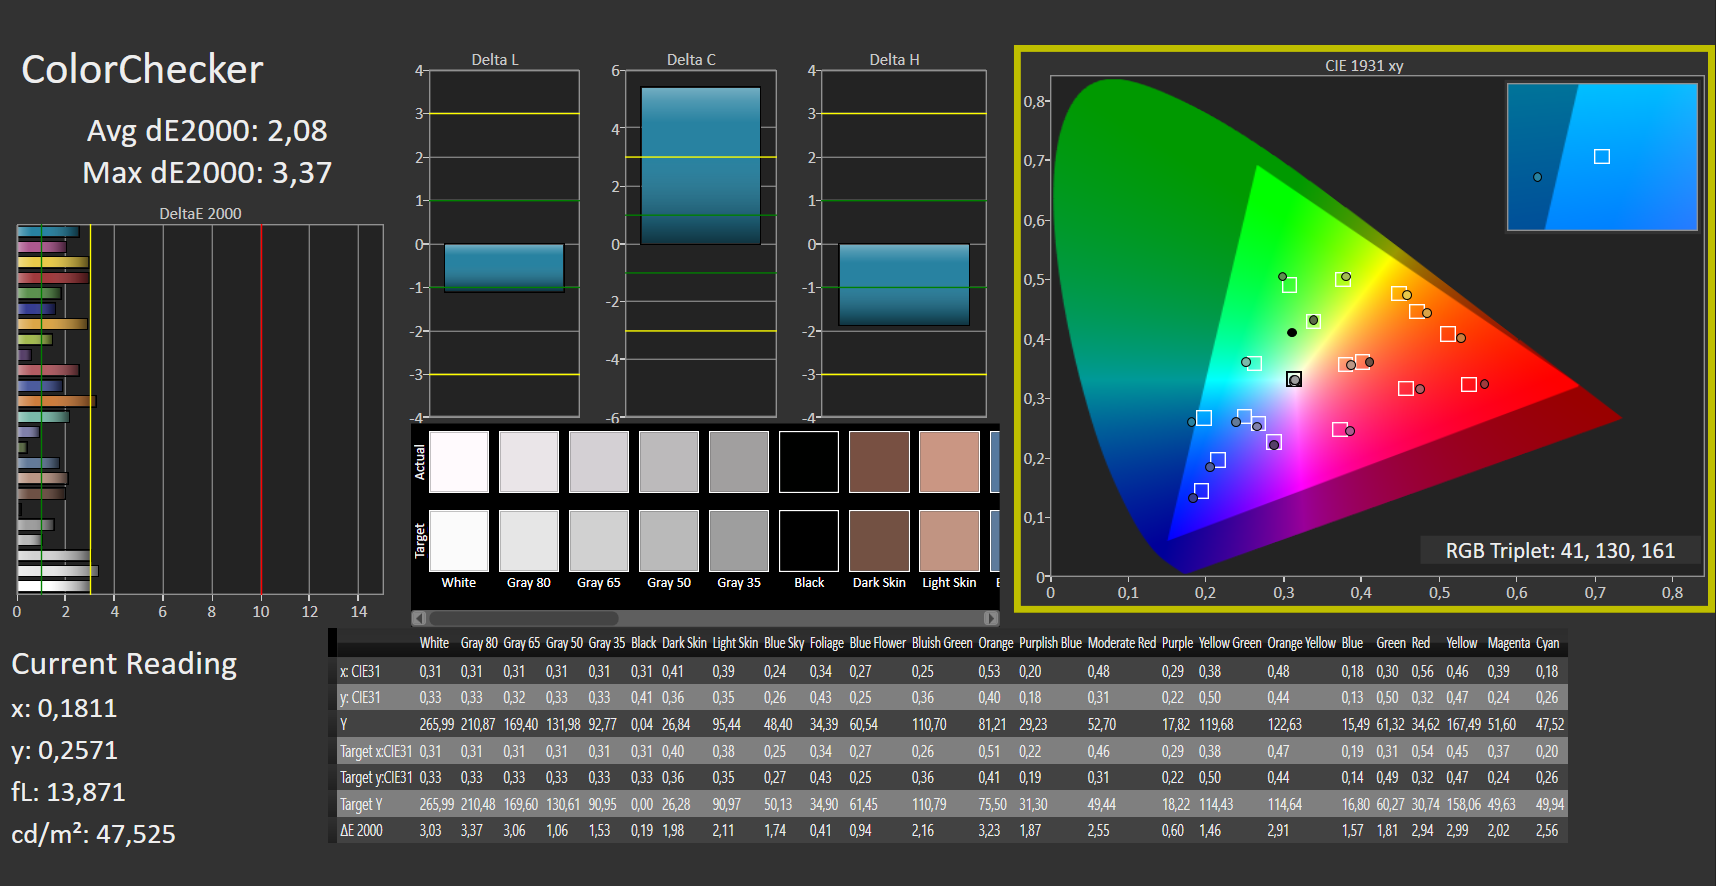
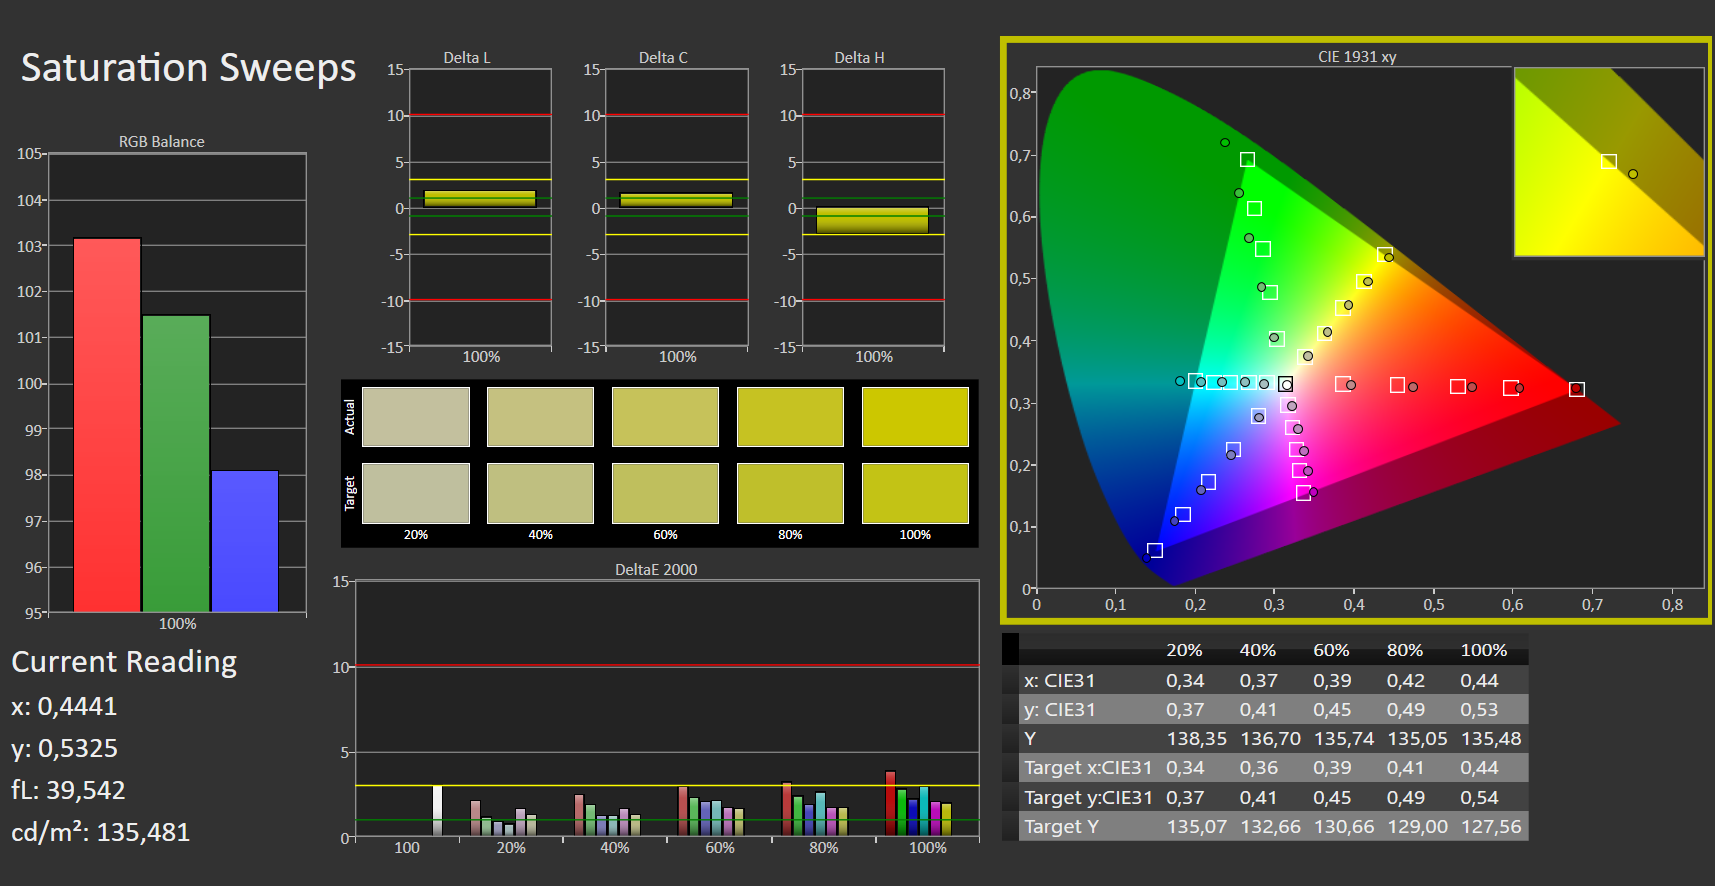
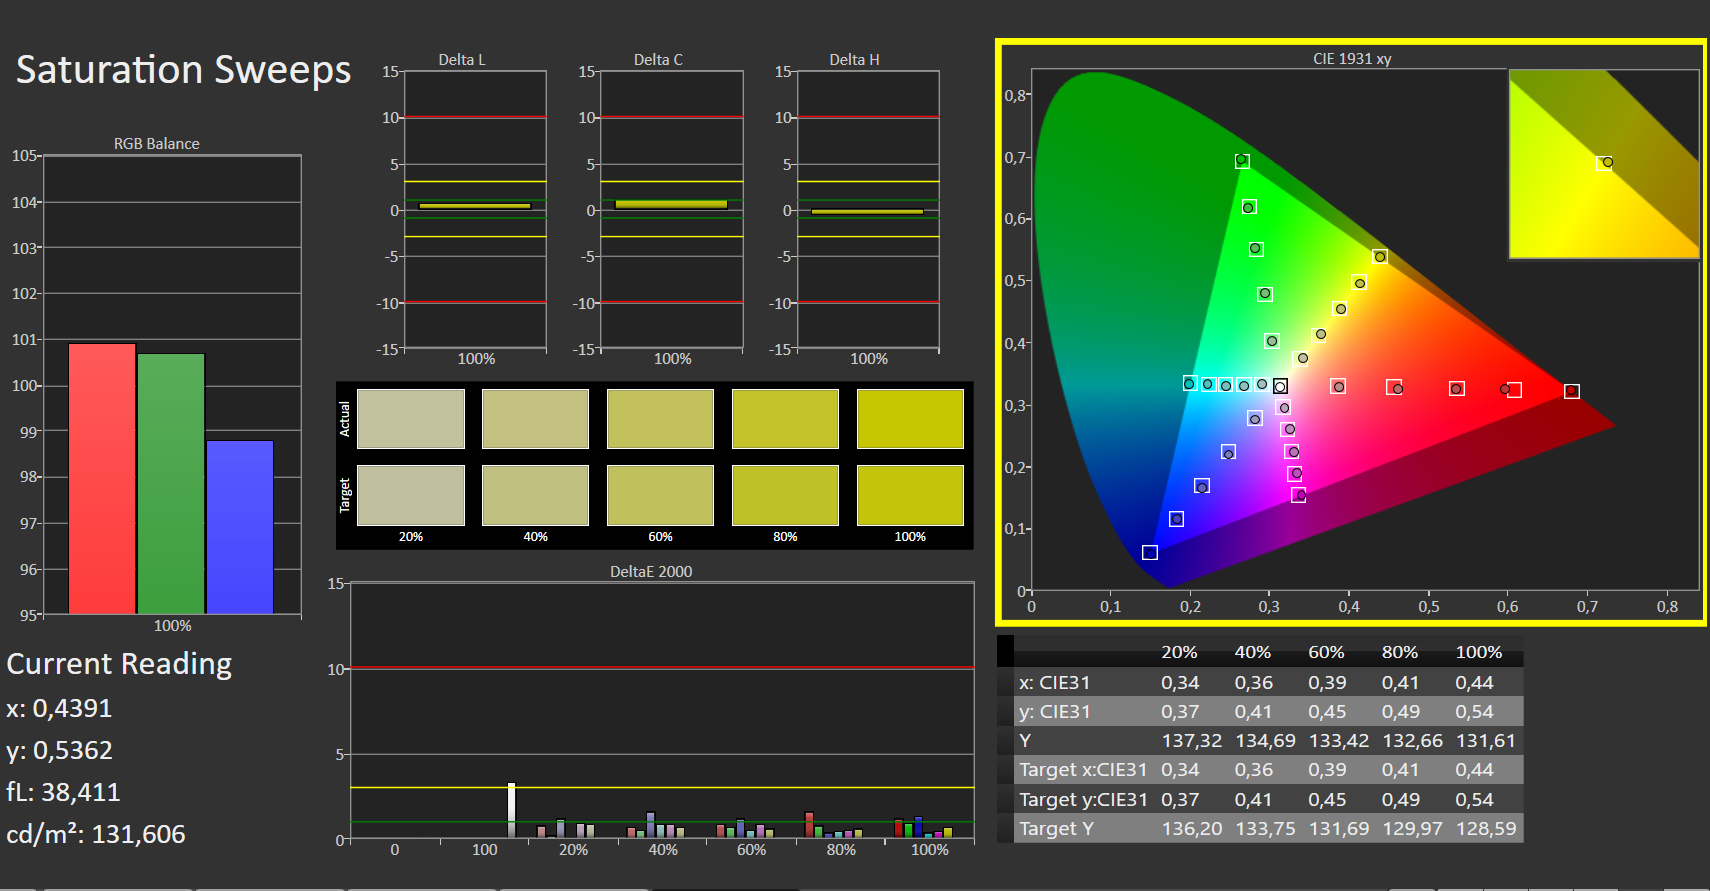
Zenbook有几个影响可显示色彩空间的显示选项。这里的测量是在DisplayP3模式下进行的。Zenbook Pro 16X几乎实现了DisplayP3和sRGB的100%覆盖。大约88%的色彩空间是在Adobe RGB中再现的。
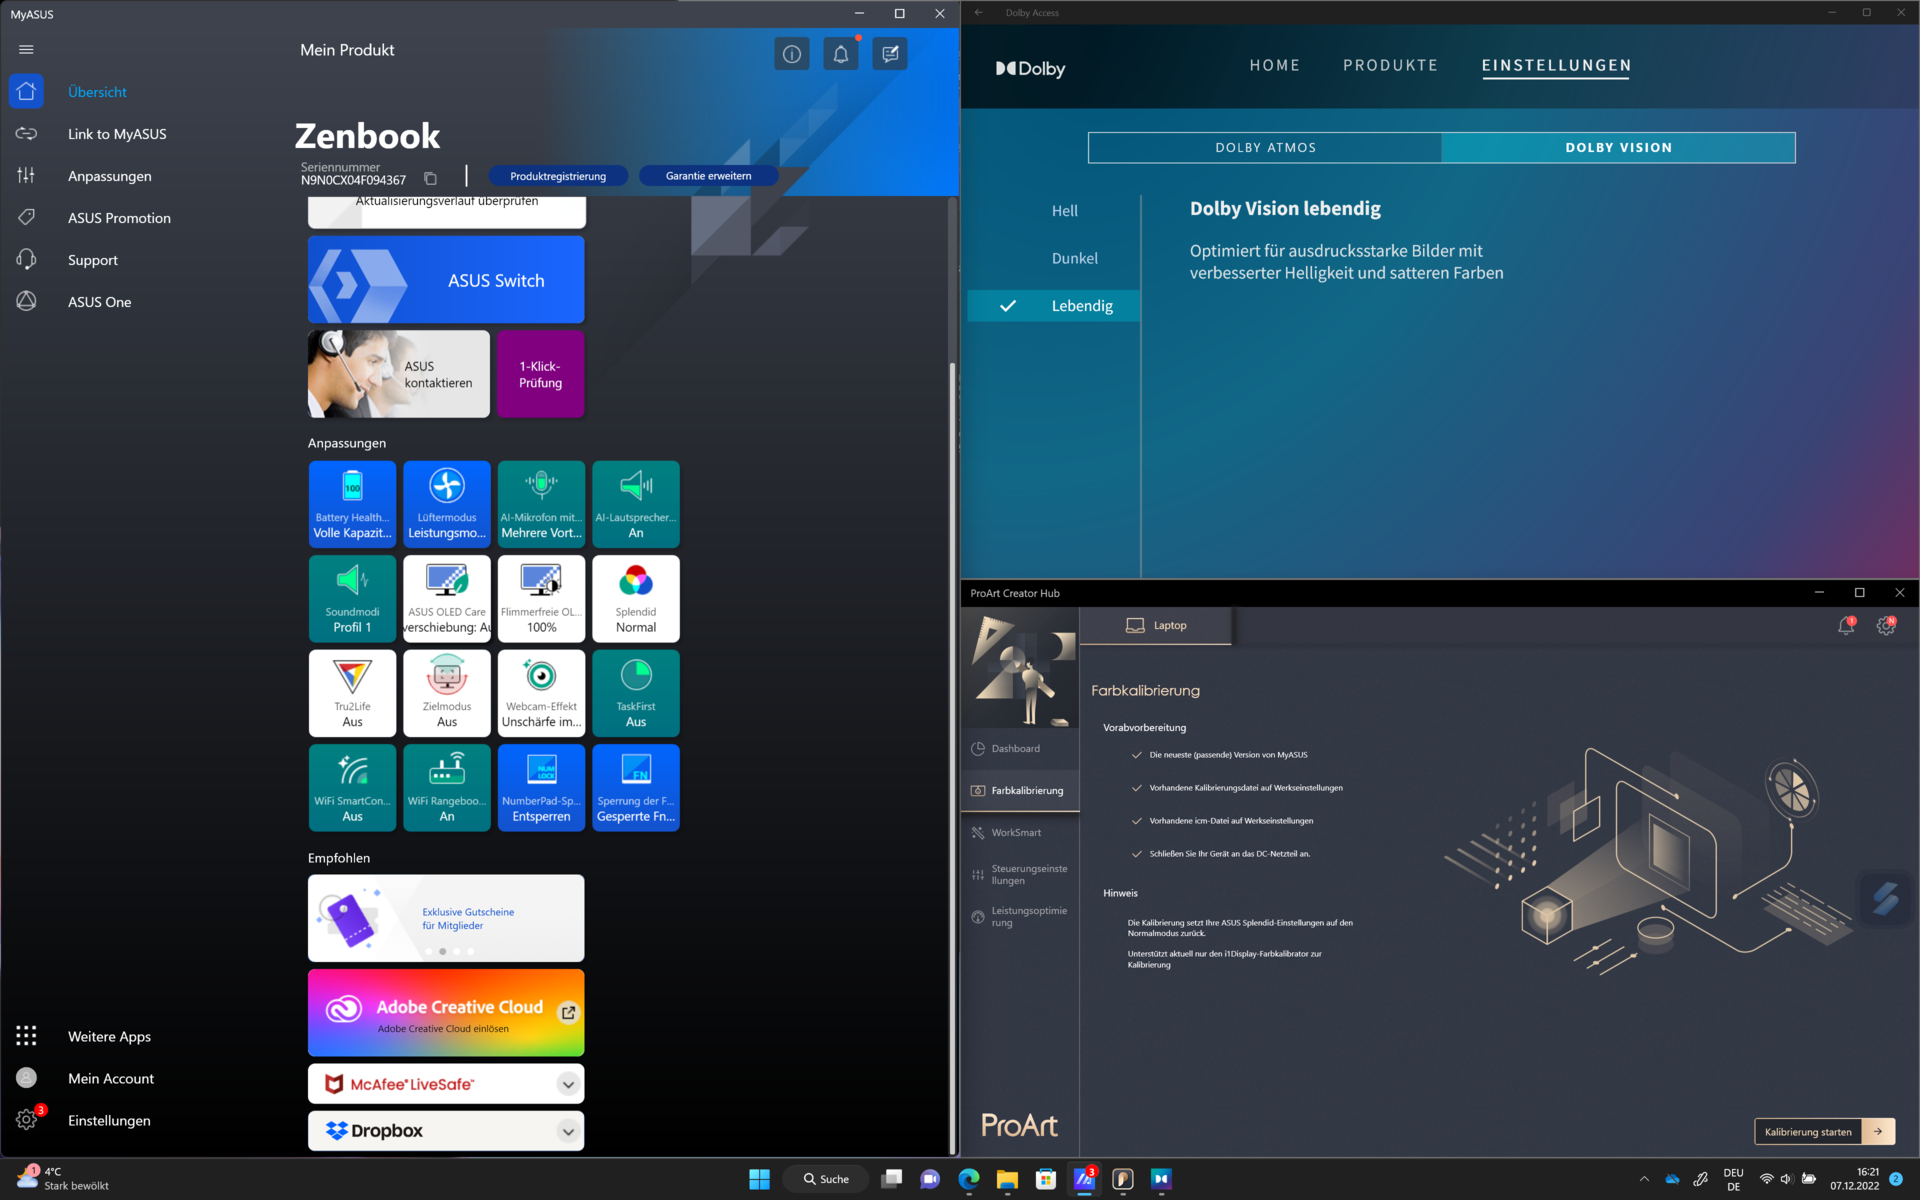
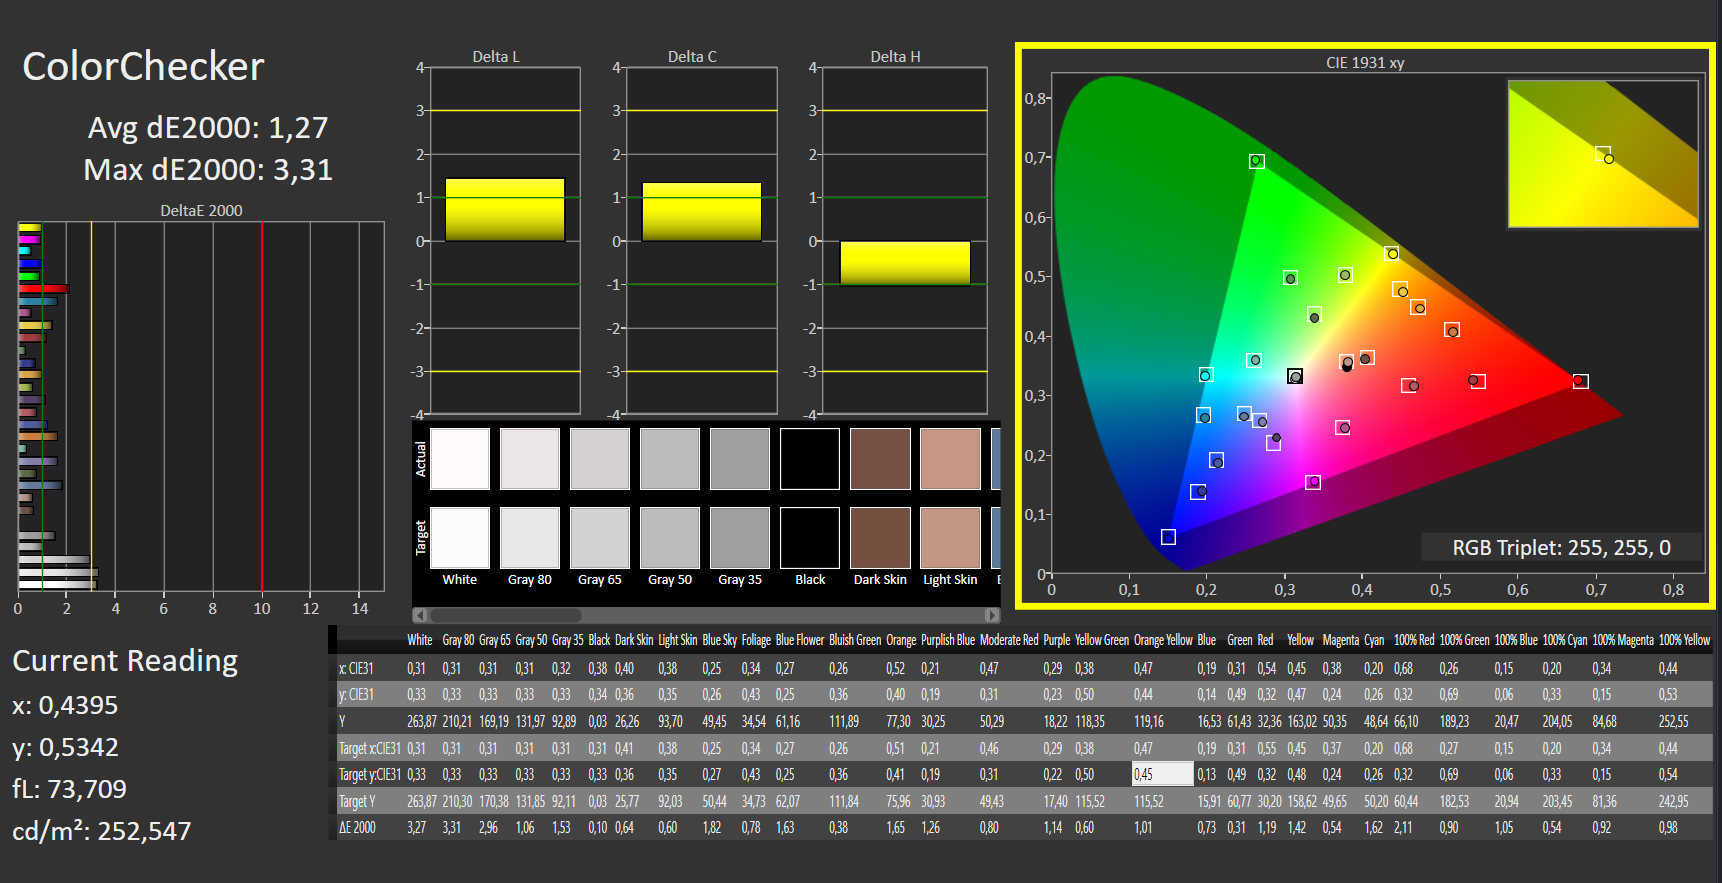
许多华硕笔记本电脑的屏幕都经过Pantone验证,在Zenbook Pro 16X上可以找到相应的贴纸。该证书指出,该笔记本非常准确地再现了约4000种潘通色。然而,在笔记本电脑可以显示的完整DisplayP3色彩空间中,有超过10亿种颜色。我们通过Calman ColorChecker和Xrite i1 Pro 2检查是否有偏差。由于这台笔记本电脑上有许多影响色彩再现的设置,验证测量结果可能很困难。这可能是华硕在ProArt Creator Hub中包含自己的颜色校准软件的原因之一。这也需要一个Xrite i1 Display Pro或i1 Display Plus色度计。然而,该应用程序似乎与我们使用的i1 Pro 2不兼容。华硕也已经存储了几个颜色配置文件,可以通过Windows显示设置访问。
我们在不同的设置下多次重复测量颜色偏差,得出的颜色偏差结果差异很大。在测试过程中,我们还覆盖了RGB环境光传感器,以避免结果被伪造。在DisplayP3色彩空间中,在华硕提供的DisplyP3 ICC配置文件和激活的DisplayP3屏幕模式下,实现了最低的色彩偏差。这里的平均色彩偏差只有ΔΕ1.27。

Display Response Times
| ↔ Response Time Black to White | ||
|---|---|---|
| 2 ms ... rise ↗ and fall ↘ combined | ↗ 1 ms rise |  |
| ↘ 1 ms fall | ||
| The screen shows very fast response rates in our tests and should be very well suited for fast-paced gaming. In comparison, all tested devices range from 0.1 (minimum) to 240 (maximum) ms. » 11 % of all devices are better. This means that the measured response time is better than the average of all tested devices (19.8 ms). | ||
| ↔ Response Time 50% Grey to 80% Grey | ||
| 2 ms ... rise ↗ and fall ↘ combined | ↗ 1 ms rise |  |
| ↘ 1 ms fall | ||
| The screen shows very fast response rates in our tests and should be very well suited for fast-paced gaming. In comparison, all tested devices range from 0.165 (minimum) to 636 (maximum) ms. » 10 % of all devices are better. This means that the measured response time is better than the average of all tested devices (31 ms). | ||
Screen Flickering / PWM (Pulse-Width Modulation)
| Screen flickering / PWM detected | 59 Hz | ≤ 80 % brightness setting |  |
The display backlight flickers at 59 Hz (worst case, e.g., utilizing PWM) Flickering detected at a brightness setting of 80 % and below. There should be no flickering or PWM above this brightness setting. The frequency of 59 Hz is very low, so the flickering may cause eyestrain and headaches after extended use. In comparison: 52 % of all tested devices do not use PWM to dim the display. If PWM was detected, an average of 7754 (minimum: 5 - maximum: 343500) Hz was measured. | |||
如同OLED显示器的典型情况,如果你只看测量结果,笔记本电脑的屏幕有时会出现相当强烈的闪烁。事实上,只有屏幕的一个滚动条变黑。然而,这是OLED显示器的正常现象。 如果我们试图在离屏幕更远的地方测量闪烁,我们将很难得到结果。因此,根据用户的情况,OLED显示器的闪烁根本不会被注意到,或者有时被认为是非常恼人的。这里只有你自己的经验可以决定。


屏幕的亮度应确保在户外有良好的可读性。然而,如果环境光线对显示器不利,OLED中的折射和反射性屏幕表面的强烈反射会变得明显。
当你改变Zenbook屏幕的观看角度时,色彩再现和可感知的亮度几乎没有变化。OLED面板的可视角度非常稳定。

性能 - AAS和Vapor-Chamber确保Core i9的低温。
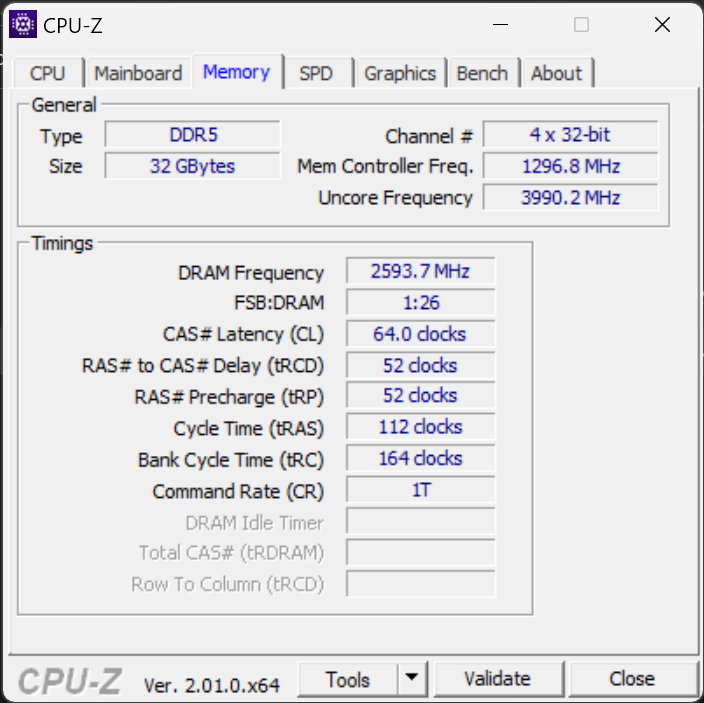
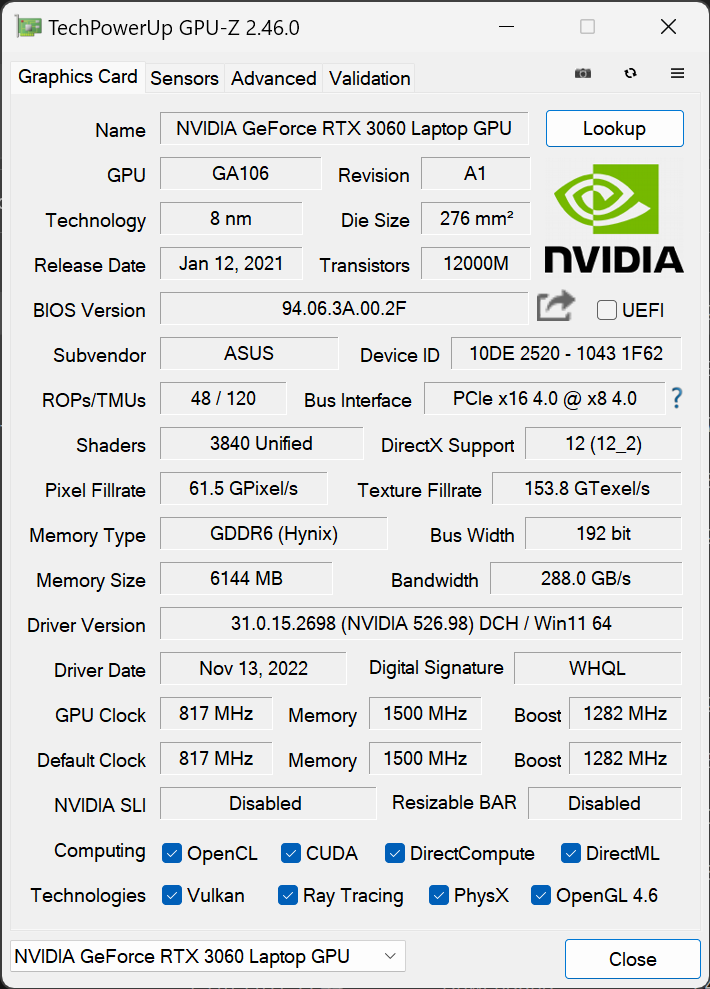
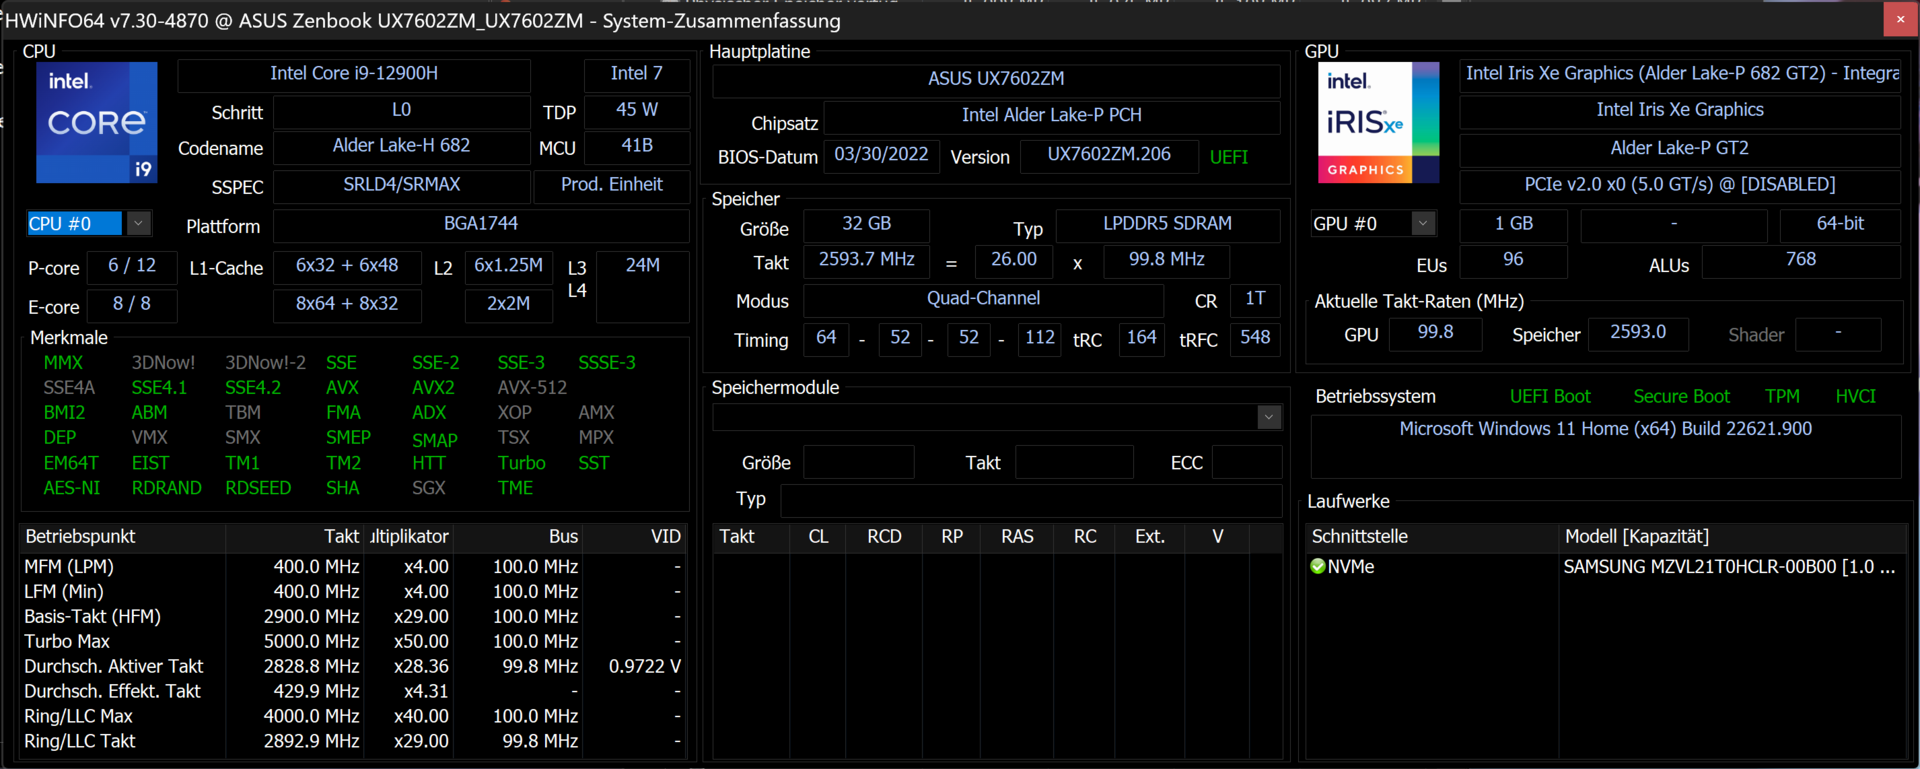
根据华硕Zenbook Pro16X OLED的产品页面,这款多媒体笔记本电脑只提供英特尔Core i9-12900H和NvidiaGeForce RTX 3060。你可以选择16或32GB的内存。安装的硬盘有更多一点选择。我们的审查样本有32GB LPDDR5内存和1TB硬盘。
工作室笔记本电脑的硬件显然是为复杂的应用而设计的。图像和视频编辑、3D渲染和各种当前游戏的处理都没有问题。
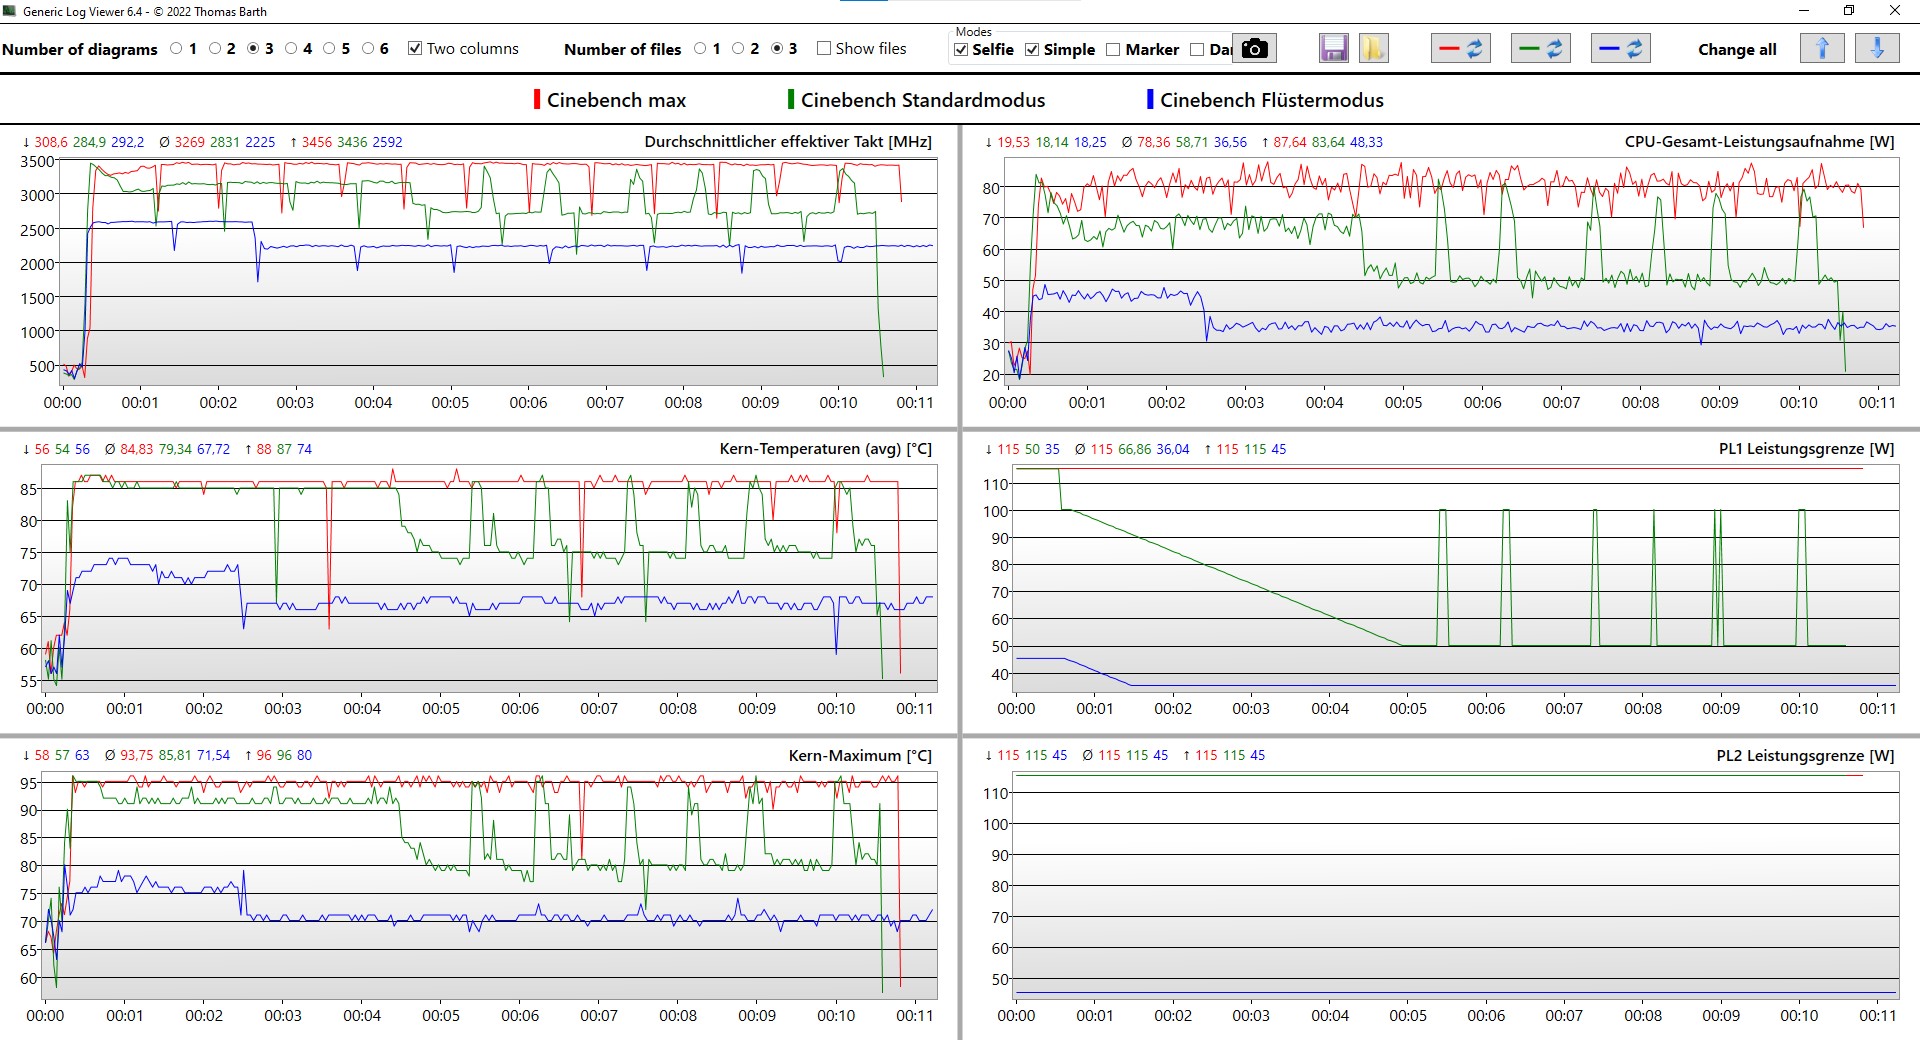
电源控制和测试条件
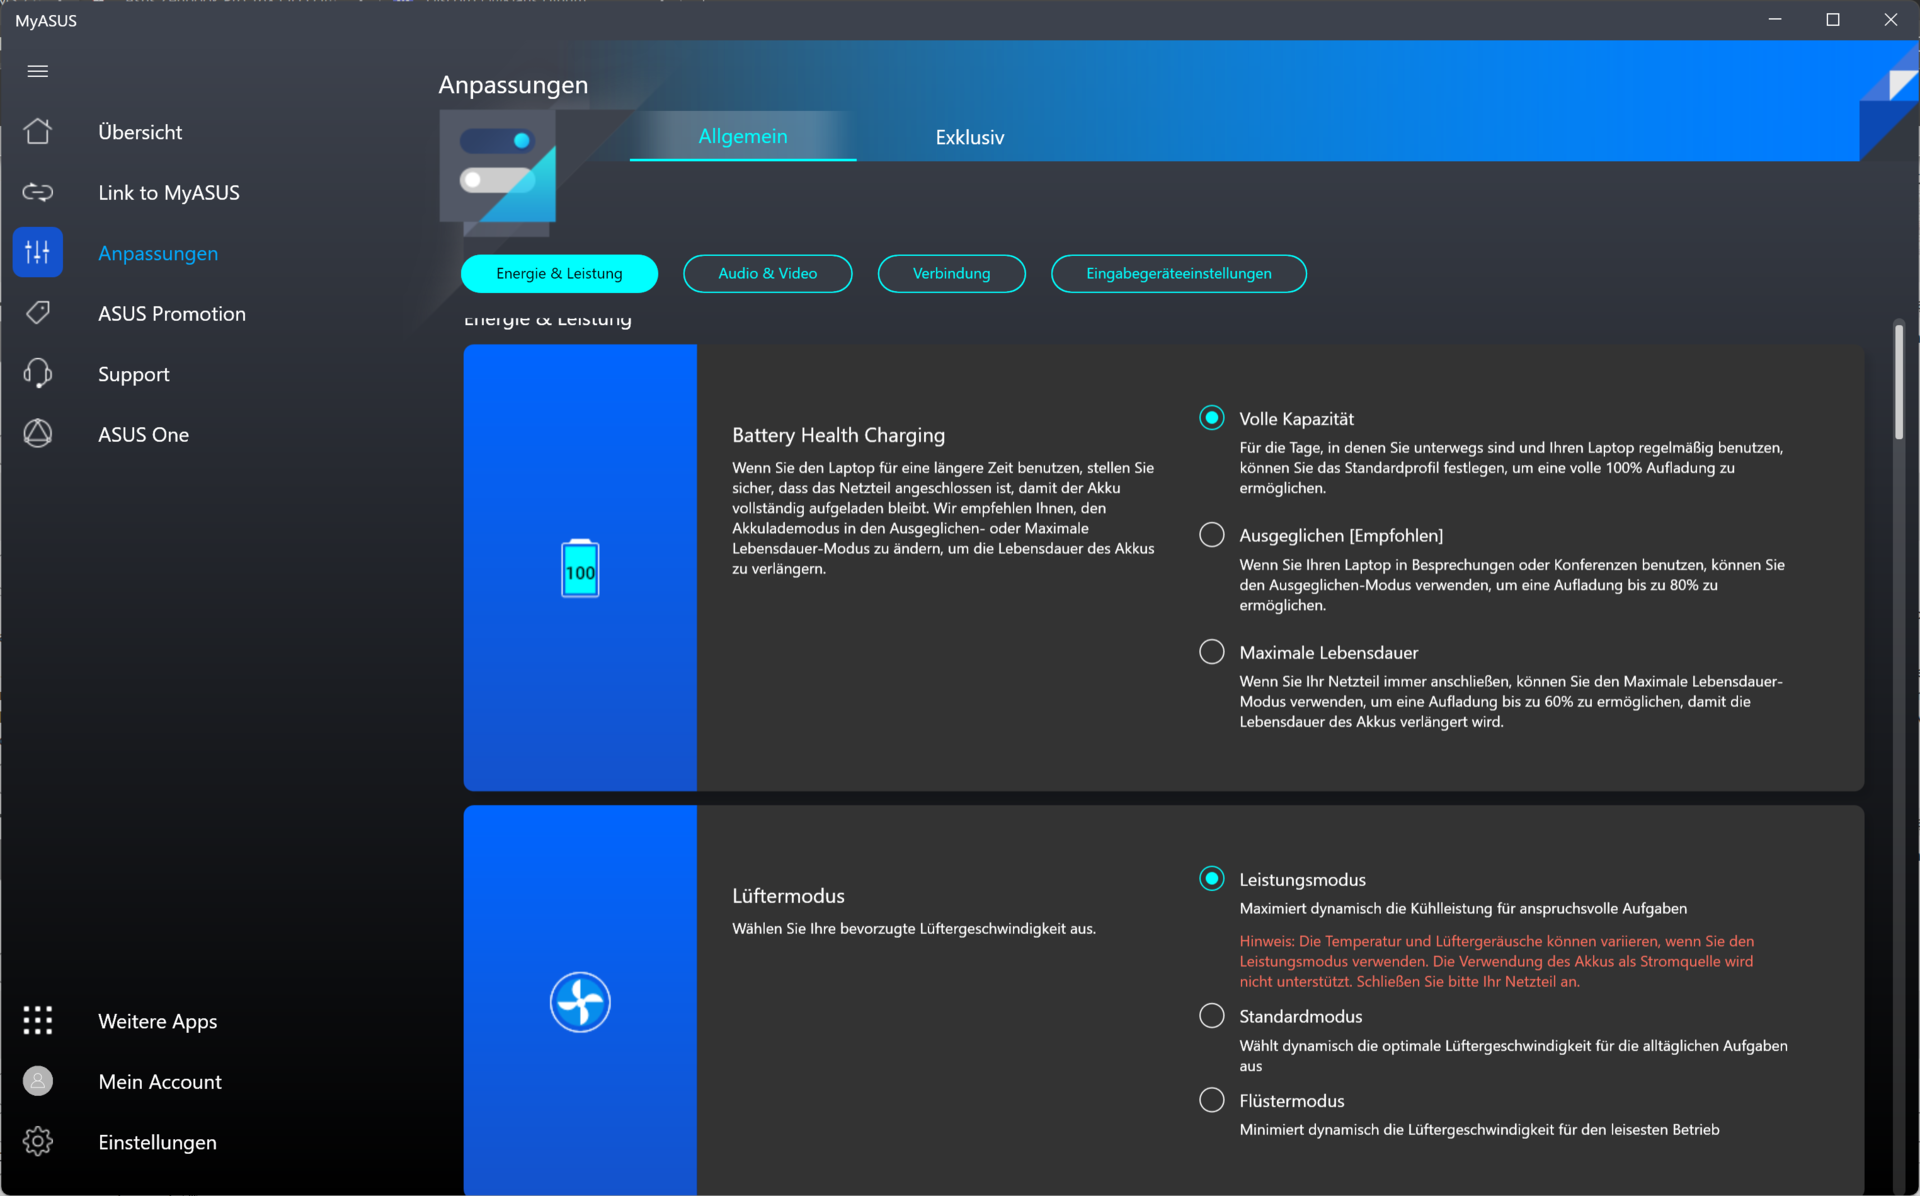
可以通过MyAsus应用程序设置大量的设置,改变笔记本的性能准备。在主电源操作中,有三种不同的性能选项(静音模式、标准模式、性能模式)。这三种模式或多或少地影响了GPU和CPU的可用性能。
在性能模式和标准模式下,英特尔酷睿i9的提升功率达到了120瓦,而在静音模式下,它的供应功率最大为45瓦。在标准和性能模式下,这个高端处理器的持续功率为85瓦。但在标准模式下,笔记本电脑在5分钟后就会自我限制,核心功率会缩减到75瓦左右。
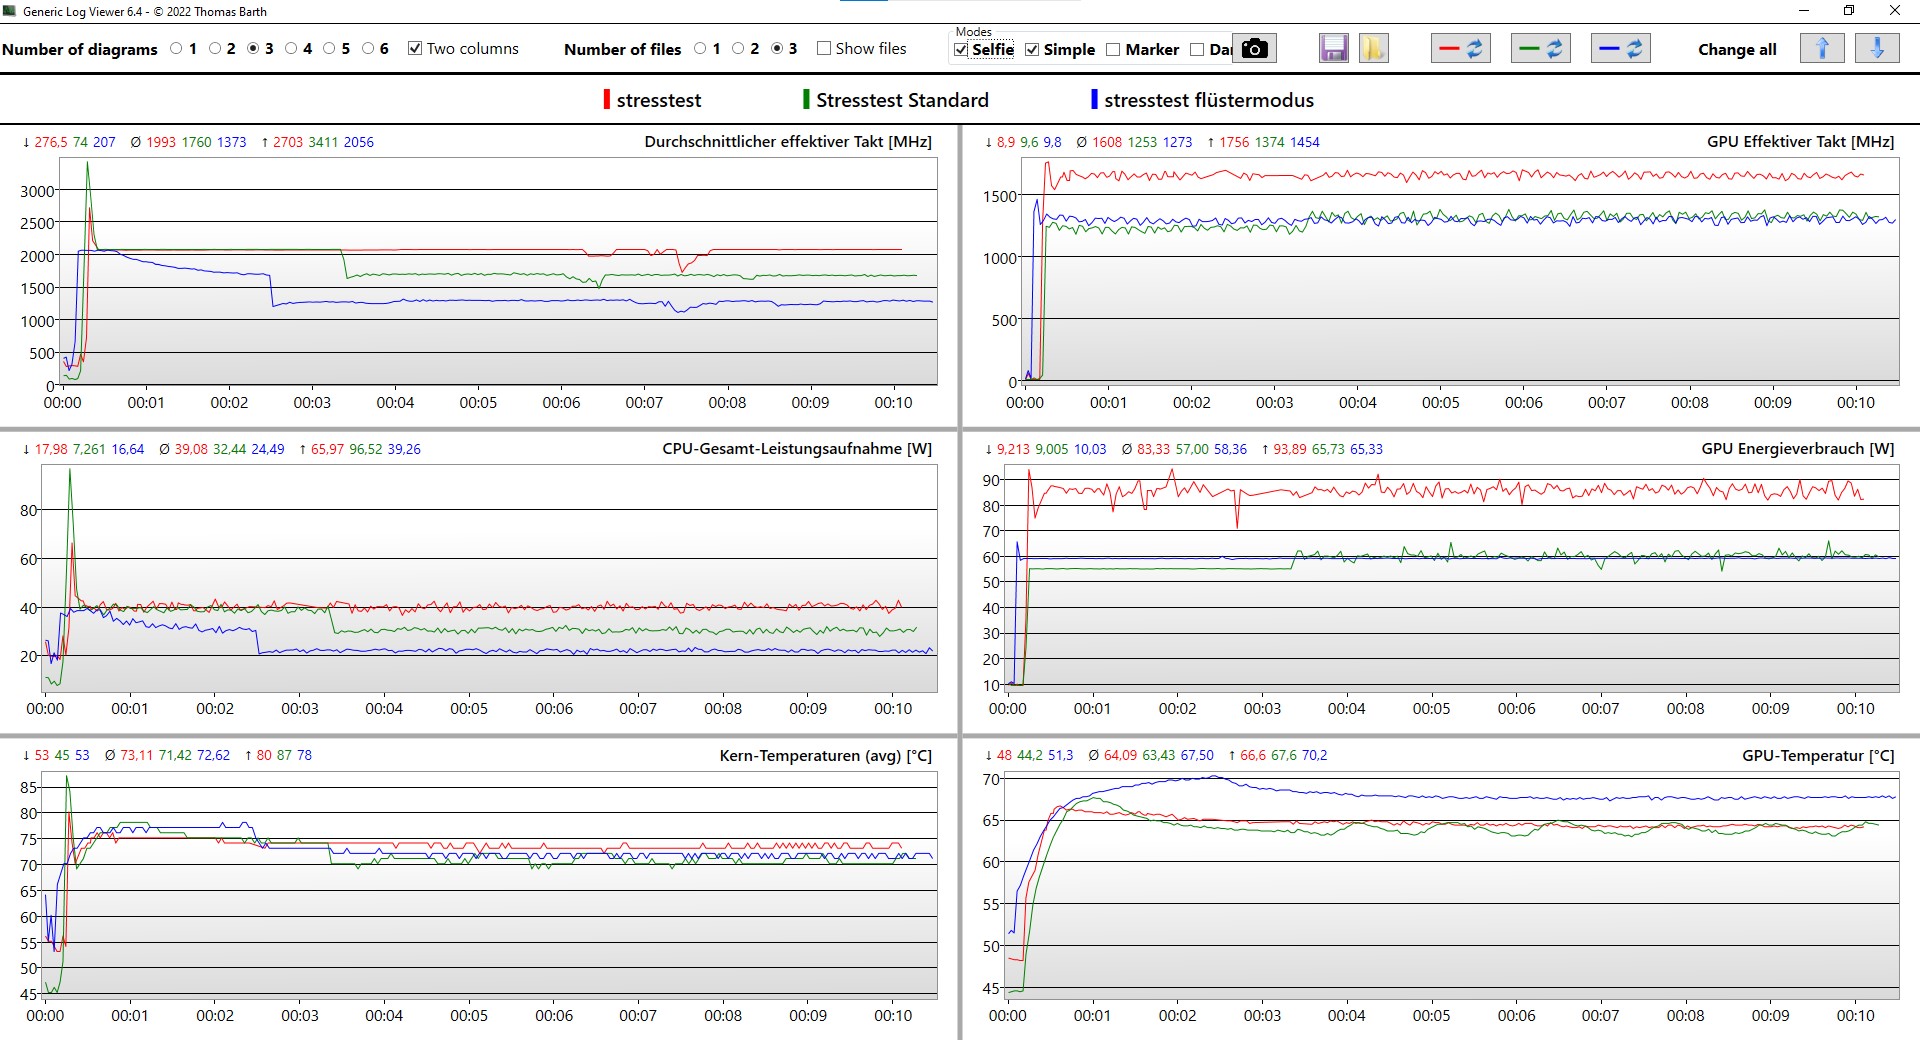
如果图形芯片和处理器一起工作,处理器的可用功率就会缩减到40瓦左右。根据性能模式的不同,持续功率也会在一段时间后减少;在标准模式下约为30瓦,在静音模式下为20瓦。这 NvidiaGeForce 3060在压力测试中被允许在性能模式下以大约83瓦的功率工作。在标准和静音模式下,这是60瓦特。如果只对显卡进行压力测试,例如通过Furmark,其连续功率会增加到95瓦。
华硕指定的系统TDP最高为140瓦。在我们的测试中只是勉强达到了这个数值。我们在日志中确定CPU和GPU的综合功率最大为137瓦。
所有的基准测试都在性能模式下运行。容量和功率测量是根据各自测试的要求创建的。
基金会
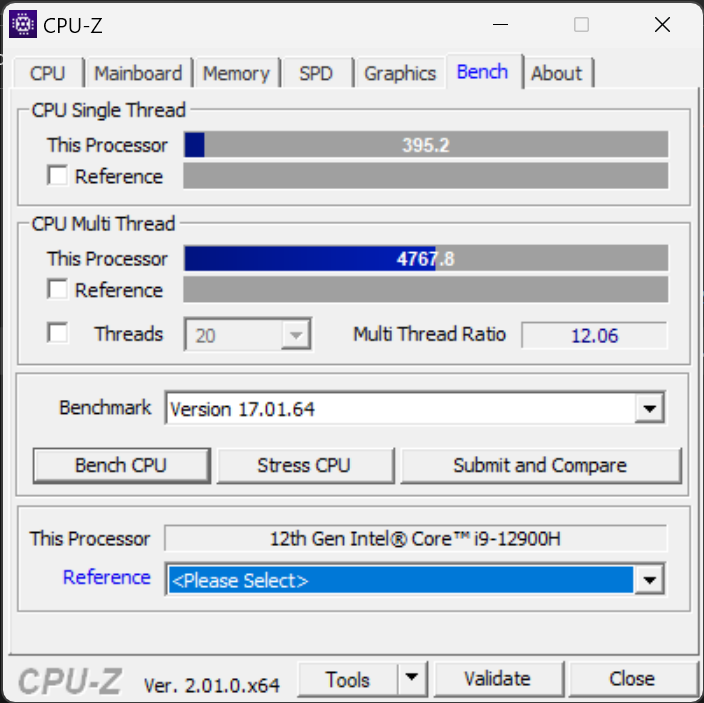
的 英特尔酷睿i9-12900H 是用于笔记本电脑的最强大的英特尔处理器之一。在华硕Zenbook Pro 16X OLED中,该处理器能够长时间以高性能工作。由于高达80瓦的功率分布在6个P和8个E核心上,它能快速劈开待处理的任务,从而取得良好的成绩。该处理器迅速加速到5GHz,由于有20个线程,能够同时处理各种任务。
这里唯一突出的是有些胆小的电源控制。处理器有时只有在长时间的负载后才能达到其全部性能,而且Zenbook的风扇也会延迟启动。因此,笔记本电脑在很长一段时间内保持尽可能的安静,但在这样做的过程中,无法在只要求短期性能的基准测试中达到顶级性能。在这一点上, 联想ThinkPad X1 Extreme G5证明是Zenbook的一个强劲对手。即使没有AAS,这款拥有所谓较弱处理器的笔记本电脑在几乎所有的处理器基准测试中都能达到同等或更高的性能。另一方面,关于Blender等创意应用程序的基准测试,Zenbook比ThinkPad更快地完成了即将到来的任务。因此,华硕在对该设备进行微调时,似乎在这里做出了正确的调整。
Cinebench R15 Multi Dauertest
Cinebench R23: Multi Core | Single Core
Cinebench R20: CPU (Multi Core) | CPU (Single Core)
Cinebench R15: CPU Multi 64Bit | CPU Single 64Bit
Blender: v2.79 BMW27 CPU
7-Zip 18.03: 7z b 4 | 7z b 4 -mmt1
Geekbench 5.5: Multi-Core | Single-Core
HWBOT x265 Benchmark v2.2: 4k Preset
LibreOffice : 20 Documents To PDF
R Benchmark 2.5: Overall mean
| CPU Performance rating | |
| HP ZBook Studio 16 G9 62U04EA | |
| Lenovo ThinkPad X1 Extreme G5-21DE003RGE | |
| Asus ZenBook Pro 16X OLED UX7602ZM-ME115W | |
| Average of class Multimedia | |
| MSI CreatorPro Z16P B12UKST | |
| Average Intel Core i9-12900H | |
| Dell Precision 7670 | |
| Corsair Voyager a1600 | |
| HP Omen 16-n0033dx | |
| Asus VivoBook Pro 16X OLED N7600PC-L2026X | |
| Cinebench R23 / Multi Core | |
| Lenovo ThinkPad X1 Extreme G5-21DE003RGE | |
| MSI CreatorPro Z16P B12UKST | |
| Average of class Multimedia (4861 - 33362, n=74, last 2 years) | |
| Asus ZenBook Pro 16X OLED UX7602ZM-ME115W | |
| HP ZBook Studio 16 G9 62U04EA | |
| Average Intel Core i9-12900H (7359 - 19648, n=28) | |
| Dell Precision 7670 | |
| Corsair Voyager a1600 | |
| HP Omen 16-n0033dx | |
| Asus VivoBook Pro 16X OLED N7600PC-L2026X | |
| Cinebench R23 / Single Core | |
| Average of class Multimedia (1128 - 2459, n=66, last 2 years) | |
| HP ZBook Studio 16 G9 62U04EA | |
| Average Intel Core i9-12900H (1634 - 1930, n=28) | |
| Lenovo ThinkPad X1 Extreme G5-21DE003RGE | |
| MSI CreatorPro Z16P B12UKST | |
| Asus ZenBook Pro 16X OLED UX7602ZM-ME115W | |
| Dell Precision 7670 | |
| Corsair Voyager a1600 | |
| Asus VivoBook Pro 16X OLED N7600PC-L2026X | |
| HP Omen 16-n0033dx | |
| Cinebench R20 / CPU (Multi Core) | |
| Lenovo ThinkPad X1 Extreme G5-21DE003RGE | |
| MSI CreatorPro Z16P B12UKST | |
| HP ZBook Studio 16 G9 62U04EA | |
| Average of class Multimedia (1887 - 12912, n=57, last 2 years) | |
| Dell Precision 7670 | |
| Asus ZenBook Pro 16X OLED UX7602ZM-ME115W | |
| Average Intel Core i9-12900H (2681 - 7471, n=28) | |
| Corsair Voyager a1600 | |
| HP Omen 16-n0033dx | |
| Asus VivoBook Pro 16X OLED N7600PC-L2026X | |
| Cinebench R20 / CPU (Single Core) | |
| Average of class Multimedia (425 - 853, n=57, last 2 years) | |
| HP ZBook Studio 16 G9 62U04EA | |
| Average Intel Core i9-12900H (624 - 738, n=28) | |
| Lenovo ThinkPad X1 Extreme G5-21DE003RGE | |
| Dell Precision 7670 | |
| Asus ZenBook Pro 16X OLED UX7602ZM-ME115W | |
| MSI CreatorPro Z16P B12UKST | |
| HP Omen 16-n0033dx | |
| Corsair Voyager a1600 | |
| Asus VivoBook Pro 16X OLED N7600PC-L2026X | |
| Cinebench R15 / CPU Multi 64Bit | |
| Lenovo ThinkPad X1 Extreme G5-21DE003RGE | |
| Asus ZenBook Pro 16X OLED UX7602ZM-ME115W | |
| Average of class Multimedia (856 - 5224, n=61, last 2 years) | |
| HP ZBook Studio 16 G9 62U04EA | |
| Average Intel Core i9-12900H (1395 - 3077, n=28) | |
| Dell Precision 7670 | |
| MSI CreatorPro Z16P B12UKST | |
| Corsair Voyager a1600 | |
| HP Omen 16-n0033dx | |
| Asus VivoBook Pro 16X OLED N7600PC-L2026X | |
| Cinebench R15 / CPU Single 64Bit | |
| Average of class Multimedia (184.8 - 326, n=59, last 2 years) | |
| HP ZBook Studio 16 G9 62U04EA | |
| Asus ZenBook Pro 16X OLED UX7602ZM-ME115W | |
| Asus ZenBook Pro 16X OLED UX7602ZM-ME115W | |
| Average Intel Core i9-12900H (235 - 277, n=29) | |
| Lenovo ThinkPad X1 Extreme G5-21DE003RGE | |
| Dell Precision 7670 | |
| Corsair Voyager a1600 | |
| HP Omen 16-n0033dx | |
| MSI CreatorPro Z16P B12UKST | |
| Asus VivoBook Pro 16X OLED N7600PC-L2026X | |
| Asus VivoBook Pro 16X OLED N7600PC-L2026X | |
| Blender / v2.79 BMW27 CPU | |
| Asus VivoBook Pro 16X OLED N7600PC-L2026X | |
| Average of class Multimedia (100 - 557, n=58, last 2 years) | |
| HP Omen 16-n0033dx | |
| Average Intel Core i9-12900H (160 - 451, n=28) | |
| Corsair Voyager a1600 | |
| Dell Precision 7670 | |
| MSI CreatorPro Z16P B12UKST | |
| HP ZBook Studio 16 G9 62U04EA | |
| Lenovo ThinkPad X1 Extreme G5-21DE003RGE | |
| Asus ZenBook Pro 16X OLED UX7602ZM-ME115W | |
| 7-Zip 18.03 / 7z b 4 | |
| Asus ZenBook Pro 16X OLED UX7602ZM-ME115W | |
| HP ZBook Studio 16 G9 62U04EA | |
| MSI CreatorPro Z16P B12UKST | |
| Lenovo ThinkPad X1 Extreme G5-21DE003RGE | |
| Corsair Voyager a1600 | |
| Average Intel Core i9-12900H (34684 - 76677, n=28) | |
| HP Omen 16-n0033dx | |
| Average of class Multimedia (26062 - 130368, n=55, last 2 years) | |
| Dell Precision 7670 | |
| Asus VivoBook Pro 16X OLED N7600PC-L2026X | |
| 7-Zip 18.03 / 7z b 4 -mmt1 | |
| HP ZBook Studio 16 G9 62U04EA | |
| Average of class Multimedia (3666 - 7545, n=56, last 2 years) | |
| Lenovo ThinkPad X1 Extreme G5-21DE003RGE | |
| Average Intel Core i9-12900H (5302 - 6289, n=28) | |
| Asus ZenBook Pro 16X OLED UX7602ZM-ME115W | |
| Corsair Voyager a1600 | |
| MSI CreatorPro Z16P B12UKST | |
| HP Omen 16-n0033dx | |
| Dell Precision 7670 | |
| Asus VivoBook Pro 16X OLED N7600PC-L2026X | |
| Geekbench 5.5 / Multi-Core | |
| Asus ZenBook Pro 16X OLED UX7602ZM-ME115W | |
| Average of class Multimedia (4652 - 20422, n=56, last 2 years) | |
| HP ZBook Studio 16 G9 62U04EA | |
| MSI CreatorPro Z16P B12UKST | |
| Average Intel Core i9-12900H (8519 - 14376, n=31) | |
| Lenovo ThinkPad X1 Extreme G5-21DE003RGE | |
| Dell Precision 7670 | |
| Corsair Voyager a1600 | |
| HP Omen 16-n0033dx | |
| Asus VivoBook Pro 16X OLED N7600PC-L2026X | |
| Geekbench 5.5 / Single-Core | |
| Average of class Multimedia (805 - 2974, n=56, last 2 years) | |
| HP ZBook Studio 16 G9 62U04EA | |
| Asus ZenBook Pro 16X OLED UX7602ZM-ME115W | |
| Lenovo ThinkPad X1 Extreme G5-21DE003RGE | |
| Average Intel Core i9-12900H (1631 - 1897, n=31) | |
| MSI CreatorPro Z16P B12UKST | |
| Dell Precision 7670 | |
| HP Omen 16-n0033dx | |
| Asus VivoBook Pro 16X OLED N7600PC-L2026X | |
| Corsair Voyager a1600 | |
| HWBOT x265 Benchmark v2.2 / 4k Preset | |
| HP ZBook Studio 16 G9 62U04EA | |
| MSI CreatorPro Z16P B12UKST | |
| Asus ZenBook Pro 16X OLED UX7602ZM-ME115W | |
| Average of class Multimedia (5.26 - 36.1, n=56, last 2 years) | |
| Dell Precision 7670 | |
| Lenovo ThinkPad X1 Extreme G5-21DE003RGE | |
| Average Intel Core i9-12900H (8.05 - 22.5, n=28) | |
| Corsair Voyager a1600 | |
| HP Omen 16-n0033dx | |
| Asus VivoBook Pro 16X OLED N7600PC-L2026X | |
| LibreOffice / 20 Documents To PDF | |
| HP Omen 16-n0033dx | |
| Corsair Voyager a1600 | |
| Asus VivoBook Pro 16X OLED N7600PC-L2026X | |
| Average of class Multimedia (23.9 - 146.7, n=57, last 2 years) | |
| Dell Precision 7670 | |
| HP ZBook Studio 16 G9 62U04EA | |
| Average Intel Core i9-12900H (36.8 - 59.8, n=28) | |
| Lenovo ThinkPad X1 Extreme G5-21DE003RGE | |
| Asus ZenBook Pro 16X OLED UX7602ZM-ME115W | |
| MSI CreatorPro Z16P B12UKST | |
| R Benchmark 2.5 / Overall mean | |
| Asus VivoBook Pro 16X OLED N7600PC-L2026X | |
| HP Omen 16-n0033dx | |
| Corsair Voyager a1600 | |
| Dell Precision 7670 | |
| Average of class Multimedia (0.3604 - 0.947, n=56, last 2 years) | |
| Lenovo ThinkPad X1 Extreme G5-21DE003RGE | |
| MSI CreatorPro Z16P B12UKST | |
| Average Intel Core i9-12900H (0.4218 - 0.506, n=28) | |
| Asus ZenBook Pro 16X OLED UX7602ZM-ME115W | |
| HP ZBook Studio 16 G9 62U04EA | |
* ... smaller is better
AIDA64: FP32 Ray-Trace | FPU Julia | CPU SHA3 | CPU Queen | FPU SinJulia | FPU Mandel | CPU AES | CPU ZLib | FP64 Ray-Trace | CPU PhotoWorxx
| Performance rating | |
| Corsair Voyager a1600 | |
| HP Omen 16-n0033dx | |
| MSI CreatorPro Z16P B12UKST | |
| Average of class Multimedia | |
| HP ZBook Studio 16 G9 62U04EA | |
| Asus ZenBook Pro 16X OLED UX7602ZM-ME115W | |
| Lenovo ThinkPad X1 Extreme G5-21DE003RGE | |
| Average Intel Core i9-12900H | |
| Dell Precision 7670 | |
| Asus VivoBook Pro 16X OLED N7600PC-L2026X | |
| AIDA64 / FP32 Ray-Trace | |
| Average of class Multimedia (2214 - 50388, n=53, last 2 years) | |
| Lenovo ThinkPad X1 Extreme G5-21DE003RGE | |
| Corsair Voyager a1600 | |
| HP Omen 16-n0033dx | |
| HP ZBook Studio 16 G9 62U04EA | |
| MSI CreatorPro Z16P B12UKST | |
| Asus ZenBook Pro 16X OLED UX7602ZM-ME115W | |
| Dell Precision 7670 | |
| Average Intel Core i9-12900H (4074 - 18289, n=29) | |
| Asus VivoBook Pro 16X OLED N7600PC-L2026X | |
| AIDA64 / FPU Julia | |
| Corsair Voyager a1600 | |
| HP Omen 16-n0033dx | |
| Average of class Multimedia (12867 - 201874, n=54, last 2 years) | |
| Lenovo ThinkPad X1 Extreme G5-21DE003RGE | |
| HP ZBook Studio 16 G9 62U04EA | |
| Asus ZenBook Pro 16X OLED UX7602ZM-ME115W | |
| MSI CreatorPro Z16P B12UKST | |
| Dell Precision 7670 | |
| Average Intel Core i9-12900H (22307 - 93236, n=29) | |
| Asus VivoBook Pro 16X OLED N7600PC-L2026X | |
| AIDA64 / CPU SHA3 | |
| Average of class Multimedia (626 - 8623, n=54, last 2 years) | |
| Lenovo ThinkPad X1 Extreme G5-21DE003RGE | |
| HP ZBook Studio 16 G9 62U04EA | |
| Asus ZenBook Pro 16X OLED UX7602ZM-ME115W | |
| MSI CreatorPro Z16P B12UKST | |
| Corsair Voyager a1600 | |
| HP Omen 16-n0033dx | |
| Dell Precision 7670 | |
| Average Intel Core i9-12900H (1378 - 4215, n=29) | |
| Asus VivoBook Pro 16X OLED N7600PC-L2026X | |
| AIDA64 / CPU Queen | |
| Asus ZenBook Pro 16X OLED UX7602ZM-ME115W | |
| HP ZBook Studio 16 G9 62U04EA | |
| HP Omen 16-n0033dx | |
| Corsair Voyager a1600 | |
| Lenovo ThinkPad X1 Extreme G5-21DE003RGE | |
| MSI CreatorPro Z16P B12UKST | |
| Average Intel Core i9-12900H (78172 - 111241, n=28) | |
| Average of class Multimedia (13483 - 181505, n=41, last 2 years) | |
| Asus VivoBook Pro 16X OLED N7600PC-L2026X | |
| Dell Precision 7670 | |
| AIDA64 / FPU SinJulia | |
| Corsair Voyager a1600 | |
| HP Omen 16-n0033dx | |
| Lenovo ThinkPad X1 Extreme G5-21DE003RGE | |
| Dell Precision 7670 | |
| Asus ZenBook Pro 16X OLED UX7602ZM-ME115W | |
| HP ZBook Studio 16 G9 62U04EA | |
| MSI CreatorPro Z16P B12UKST | |
| Average Intel Core i9-12900H (5709 - 10410, n=29) | |
| Average of class Multimedia (886 - 28794, n=54, last 2 years) | |
| Asus VivoBook Pro 16X OLED N7600PC-L2026X | |
| AIDA64 / FPU Mandel | |
| Corsair Voyager a1600 | |
| HP Omen 16-n0033dx | |
| Average of class Multimedia (6395 - 105740, n=53, last 2 years) | |
| Lenovo ThinkPad X1 Extreme G5-21DE003RGE | |
| HP ZBook Studio 16 G9 62U04EA | |
| Asus ZenBook Pro 16X OLED UX7602ZM-ME115W | |
| MSI CreatorPro Z16P B12UKST | |
| Dell Precision 7670 | |
| Average Intel Core i9-12900H (11257 - 45581, n=29) | |
| Asus VivoBook Pro 16X OLED N7600PC-L2026X | |
| AIDA64 / CPU AES | |
| HP Omen 16-n0033dx | |
| Corsair Voyager a1600 | |
| MSI CreatorPro Z16P B12UKST | |
| Average Intel Core i9-12900H (31935 - 151546, n=29) | |
| Lenovo ThinkPad X1 Extreme G5-21DE003RGE | |
| HP ZBook Studio 16 G9 62U04EA | |
| Asus ZenBook Pro 16X OLED UX7602ZM-ME115W | |
| Average of class Multimedia (8171 - 126790, n=54, last 2 years) | |
| Dell Precision 7670 | |
| Asus VivoBook Pro 16X OLED N7600PC-L2026X | |
| AIDA64 / CPU ZLib | |
| Lenovo ThinkPad X1 Extreme G5-21DE003RGE | |
| HP ZBook Studio 16 G9 62U04EA | |
| Asus ZenBook Pro 16X OLED UX7602ZM-ME115W | |
| MSI CreatorPro Z16P B12UKST | |
| Average of class Multimedia (143.8 - 2022, n=54, last 2 years) | |
| Average Intel Core i9-12900H (449 - 1193, n=29) | |
| HP Omen 16-n0033dx | |
| Corsair Voyager a1600 | |
| Dell Precision 7670 | |
| Asus VivoBook Pro 16X OLED N7600PC-L2026X | |
| AIDA64 / FP64 Ray-Trace | |
| Average of class Multimedia (1014 - 26875, n=54, last 2 years) | |
| Lenovo ThinkPad X1 Extreme G5-21DE003RGE | |
| HP ZBook Studio 16 G9 62U04EA | |
| Corsair Voyager a1600 | |
| HP Omen 16-n0033dx | |
| Asus ZenBook Pro 16X OLED UX7602ZM-ME115W | |
| MSI CreatorPro Z16P B12UKST | |
| Dell Precision 7670 | |
| Average Intel Core i9-12900H (2235 - 10511, n=29) | |
| Asus VivoBook Pro 16X OLED N7600PC-L2026X | |
| AIDA64 / CPU PhotoWorxx | |
| Average of class Multimedia (8187 - 88154, n=54, last 2 years) | |
| Asus ZenBook Pro 16X OLED UX7602ZM-ME115W | |
| MSI CreatorPro Z16P B12UKST | |
| Dell Precision 7670 | |
| HP ZBook Studio 16 G9 62U04EA | |
| Average Intel Core i9-12900H (20960 - 48269, n=30) | |
| Corsair Voyager a1600 | |
| HP Omen 16-n0033dx | |
| Lenovo ThinkPad X1 Extreme G5-21DE003RGE | |
| Asus VivoBook Pro 16X OLED N7600PC-L2026X | |
系统性能
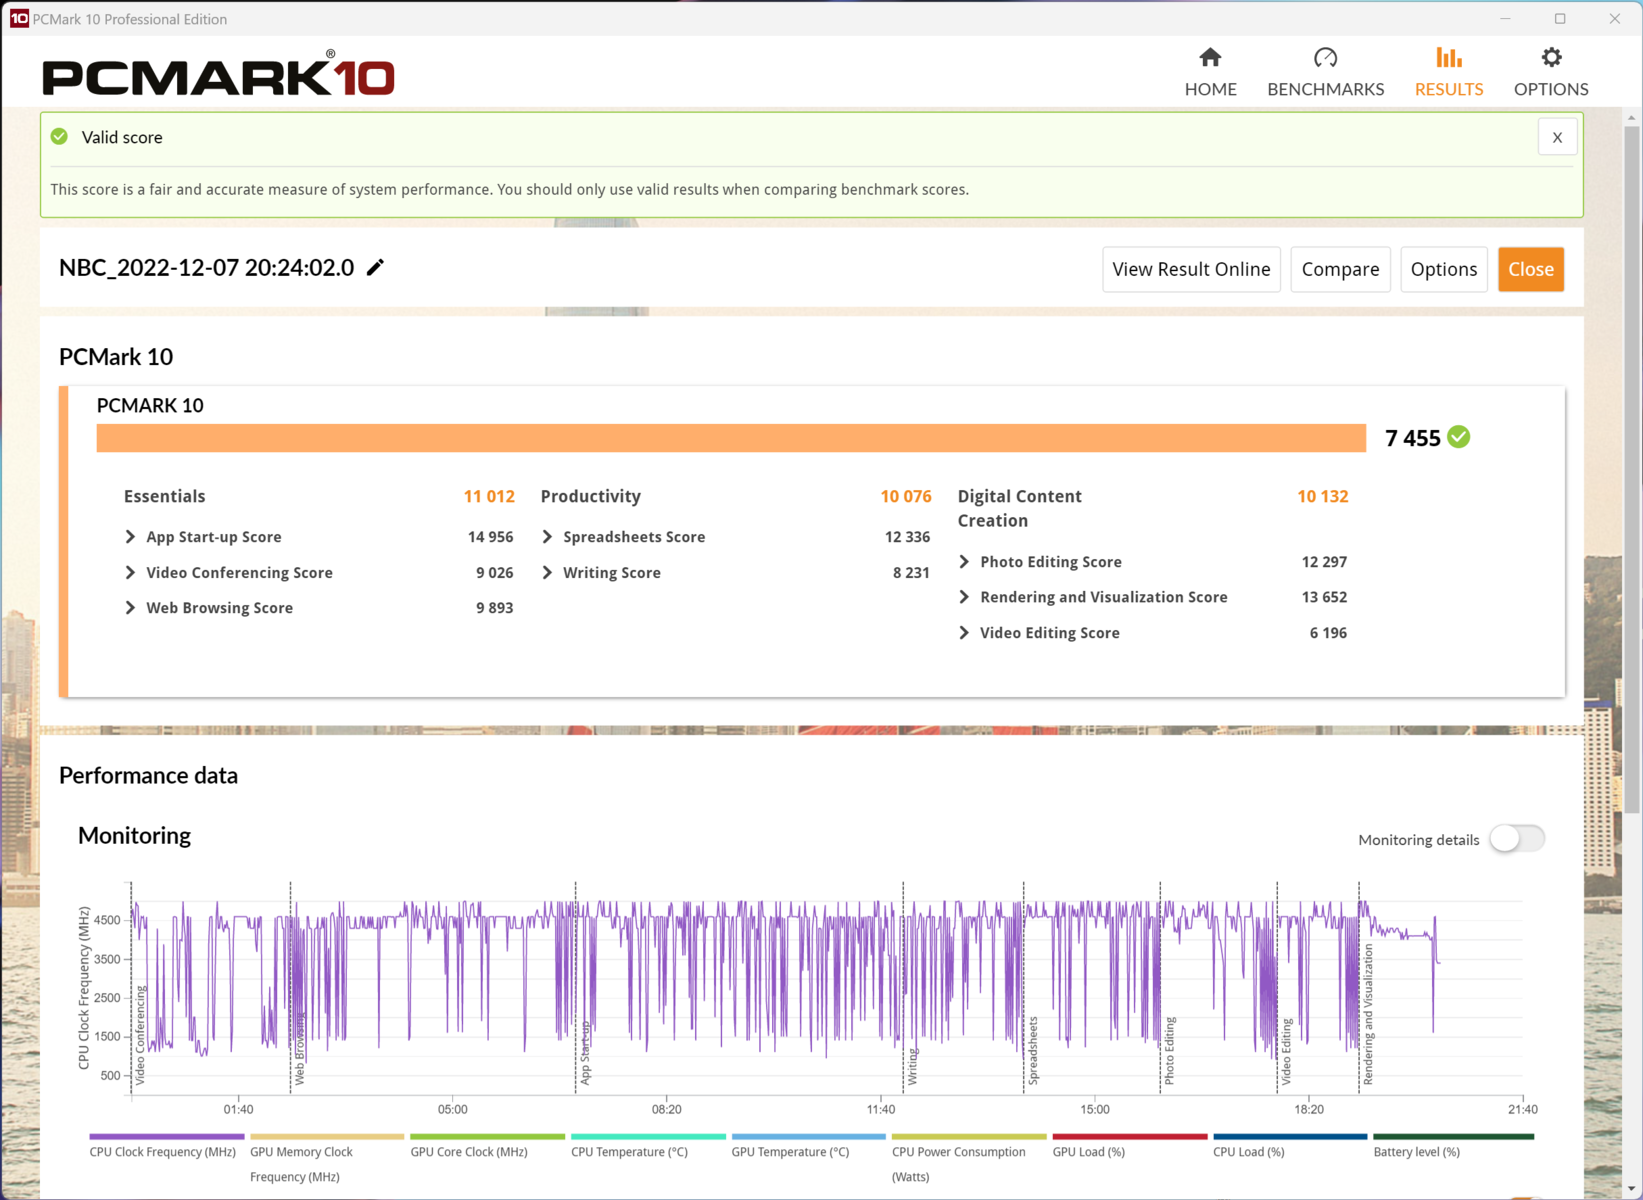
关于系统性能的基准测试,华硕Zenbook 16X OLED首次比ThinkPad X1 Extreme具有强大的优势。来自华硕的强大工作室笔记本电脑能够为其显卡提供比联想笔记本电脑至少多20瓦的功率。因此,我们的评测设备与它的Vapor Chamber在系统性能基准中取得优异的成绩并不令人惊讶。根据华硕的说法,Zenbook Pro 16X的总TDP为140瓦,由其支配。
这款笔记本的优势还体现在其响应速度和极快的反应时间上。无论设置何种性能模式,该笔记本在日常使用中没有显示出任何弱点。实际上,每个应用程序的启动速度都比平均水平快。无论是Blender、Fusion 360、Darktable还是DaVinci Resolve,这款笔记本电脑在视频编辑、3D应用和其他程序中都表现良好。大量的内存及其高带宽可能是造成这种情况的部分原因。
CrossMark: Overall | Productivity | Creativity | Responsiveness
| PCMark 10 / Score | |
| Average of class Multimedia (4325 - 10386, n=52, last 2 years) | |
| Average Intel Core i9-12900H, NVIDIA GeForce RTX 3060 Laptop GPU (7135 - 7861, n=4) | |
| Asus ZenBook Pro 16X OLED UX7602ZM-ME115W | |
| Lenovo ThinkPad X1 Extreme G5-21DE003RGE | |
| Corsair Voyager a1600 | |
| HP Omen 16-n0033dx | |
| MSI CreatorPro Z16P B12UKST | |
| Dell Precision 7670 | |
| HP ZBook Studio 16 G9 62U04EA | |
| Asus VivoBook Pro 16X OLED N7600PC-L2026X | |
| PCMark 10 / Essentials | |
| Asus ZenBook Pro 16X OLED UX7602ZM-ME115W | |
| Average Intel Core i9-12900H, NVIDIA GeForce RTX 3060 Laptop GPU (10380 - 11198, n=4) | |
| MSI CreatorPro Z16P B12UKST | |
| Dell Precision 7670 | |
| Lenovo ThinkPad X1 Extreme G5-21DE003RGE | |
| Average of class Multimedia (8025 - 11664, n=51, last 2 years) | |
| HP Omen 16-n0033dx | |
| Corsair Voyager a1600 | |
| HP ZBook Studio 16 G9 62U04EA | |
| Asus VivoBook Pro 16X OLED N7600PC-L2026X | |
| PCMark 10 / Productivity | |
| Average of class Multimedia (7323 - 18233, n=51, last 2 years) | |
| Average Intel Core i9-12900H, NVIDIA GeForce RTX 3060 Laptop GPU (9751 - 10486, n=4) | |
| Asus ZenBook Pro 16X OLED UX7602ZM-ME115W | |
| Lenovo ThinkPad X1 Extreme G5-21DE003RGE | |
| MSI CreatorPro Z16P B12UKST | |
| HP Omen 16-n0033dx | |
| Dell Precision 7670 | |
| Corsair Voyager a1600 | |
| Asus VivoBook Pro 16X OLED N7600PC-L2026X | |
| HP ZBook Studio 16 G9 62U04EA | |
| PCMark 10 / Digital Content Creation | |
| Corsair Voyager a1600 | |
| HP Omen 16-n0033dx | |
| Average of class Multimedia (3651 - 16240, n=51, last 2 years) | |
| Lenovo ThinkPad X1 Extreme G5-21DE003RGE | |
| Average Intel Core i9-12900H, NVIDIA GeForce RTX 3060 Laptop GPU (9741 - 11226, n=4) | |
| Asus ZenBook Pro 16X OLED UX7602ZM-ME115W | |
| MSI CreatorPro Z16P B12UKST | |
| HP ZBook Studio 16 G9 62U04EA | |
| Dell Precision 7670 | |
| Asus VivoBook Pro 16X OLED N7600PC-L2026X | |
| CrossMark / Overall | |
| Average Intel Core i9-12900H, NVIDIA GeForce RTX 3060 Laptop GPU (1789 - 2096, n=4) | |
| MSI CreatorPro Z16P B12UKST | |
| Average of class Multimedia (866 - 2728, n=60, last 2 years) | |
| HP ZBook Studio 16 G9 62U04EA | |
| Asus ZenBook Pro 16X OLED UX7602ZM-ME115W | |
| Lenovo ThinkPad X1 Extreme G5-21DE003RGE | |
| HP Omen 16-n0033dx | |
| Dell Precision 7670 | |
| Corsair Voyager a1600 | |
| Asus VivoBook Pro 16X OLED N7600PC-L2026X | |
| CrossMark / Productivity | |
| Average Intel Core i9-12900H, NVIDIA GeForce RTX 3060 Laptop GPU (1677 - 2062, n=4) | |
| MSI CreatorPro Z16P B12UKST | |
| Average of class Multimedia (931 - 2489, n=60, last 2 years) | |
| HP ZBook Studio 16 G9 62U04EA | |
| Asus ZenBook Pro 16X OLED UX7602ZM-ME115W | |
| Lenovo ThinkPad X1 Extreme G5-21DE003RGE | |
| HP Omen 16-n0033dx | |
| Dell Precision 7670 | |
| Corsair Voyager a1600 | |
| Asus VivoBook Pro 16X OLED N7600PC-L2026X | |
| CrossMark / Creativity | |
| Average of class Multimedia (907 - 3465, n=60, last 2 years) | |
| HP ZBook Studio 16 G9 62U04EA | |
| Average Intel Core i9-12900H, NVIDIA GeForce RTX 3060 Laptop GPU (2032 - 2125, n=4) | |
| MSI CreatorPro Z16P B12UKST | |
| Asus ZenBook Pro 16X OLED UX7602ZM-ME115W | |
| Lenovo ThinkPad X1 Extreme G5-21DE003RGE | |
| Dell Precision 7670 | |
| HP Omen 16-n0033dx | |
| Corsair Voyager a1600 | |
| Asus VivoBook Pro 16X OLED N7600PC-L2026X | |
| CrossMark / Responsiveness | |
| Average Intel Core i9-12900H, NVIDIA GeForce RTX 3060 Laptop GPU (1486 - 2230, n=4) | |
| MSI CreatorPro Z16P B12UKST | |
| HP ZBook Studio 16 G9 62U04EA | |
| Average of class Multimedia (605 - 2024, n=60, last 2 years) | |
| Asus ZenBook Pro 16X OLED UX7602ZM-ME115W | |
| Lenovo ThinkPad X1 Extreme G5-21DE003RGE | |
| Dell Precision 7670 | |
| HP Omen 16-n0033dx | |
| Asus VivoBook Pro 16X OLED N7600PC-L2026X | |
| Corsair Voyager a1600 | |
| PCMark 10 Score | 7455 points | |
Help | ||
| AIDA64 / Memory Copy | |
| Average of class Multimedia (11299 - 132135, n=54, last 2 years) | |
| Asus ZenBook Pro 16X OLED UX7602ZM-ME115W | |
| Dell Precision 7670 | |
| MSI CreatorPro Z16P B12UKST | |
| HP ZBook Studio 16 G9 62U04EA | |
| Average Intel Core i9-12900H (34438 - 74264, n=29) | |
| Corsair Voyager a1600 | |
| HP Omen 16-n0033dx | |
| Lenovo ThinkPad X1 Extreme G5-21DE003RGE | |
| Asus VivoBook Pro 16X OLED N7600PC-L2026X | |
| AIDA64 / Memory Read | |
| Average of class Multimedia (11624 - 174586, n=54, last 2 years) | |
| Asus ZenBook Pro 16X OLED UX7602ZM-ME115W | |
| Dell Precision 7670 | |
| MSI CreatorPro Z16P B12UKST | |
| HP ZBook Studio 16 G9 62U04EA | |
| Average Intel Core i9-12900H (36365 - 74642, n=29) | |
| Corsair Voyager a1600 | |
| HP Omen 16-n0033dx | |
| Lenovo ThinkPad X1 Extreme G5-21DE003RGE | |
| Asus VivoBook Pro 16X OLED N7600PC-L2026X | |
| AIDA64 / Memory Write | |
| Average of class Multimedia (11755 - 134998, n=54, last 2 years) | |
| MSI CreatorPro Z16P B12UKST | |
| HP ZBook Studio 16 G9 62U04EA | |
| Dell Precision 7670 | |
| Asus ZenBook Pro 16X OLED UX7602ZM-ME115W | |
| Average Intel Core i9-12900H (32276 - 67858, n=29) | |
| Corsair Voyager a1600 | |
| HP Omen 16-n0033dx | |
| Asus VivoBook Pro 16X OLED N7600PC-L2026X | |
| Lenovo ThinkPad X1 Extreme G5-21DE003RGE | |
| AIDA64 / Memory Latency | |
| Average of class Multimedia (7 - 535, n=53, last 2 years) | |
| Asus ZenBook Pro 16X OLED UX7602ZM-ME115W | |
| Corsair Voyager a1600 | |
| MSI CreatorPro Z16P B12UKST | |
| Asus VivoBook Pro 16X OLED N7600PC-L2026X | |
| HP ZBook Studio 16 G9 62U04EA | |
| Dell Precision 7670 | |
| HP Omen 16-n0033dx | |
| Lenovo ThinkPad X1 Extreme G5-21DE003RGE | |
| Average Intel Core i9-12900H (74.7 - 118.1, n=28) | |
* ... smaller is better
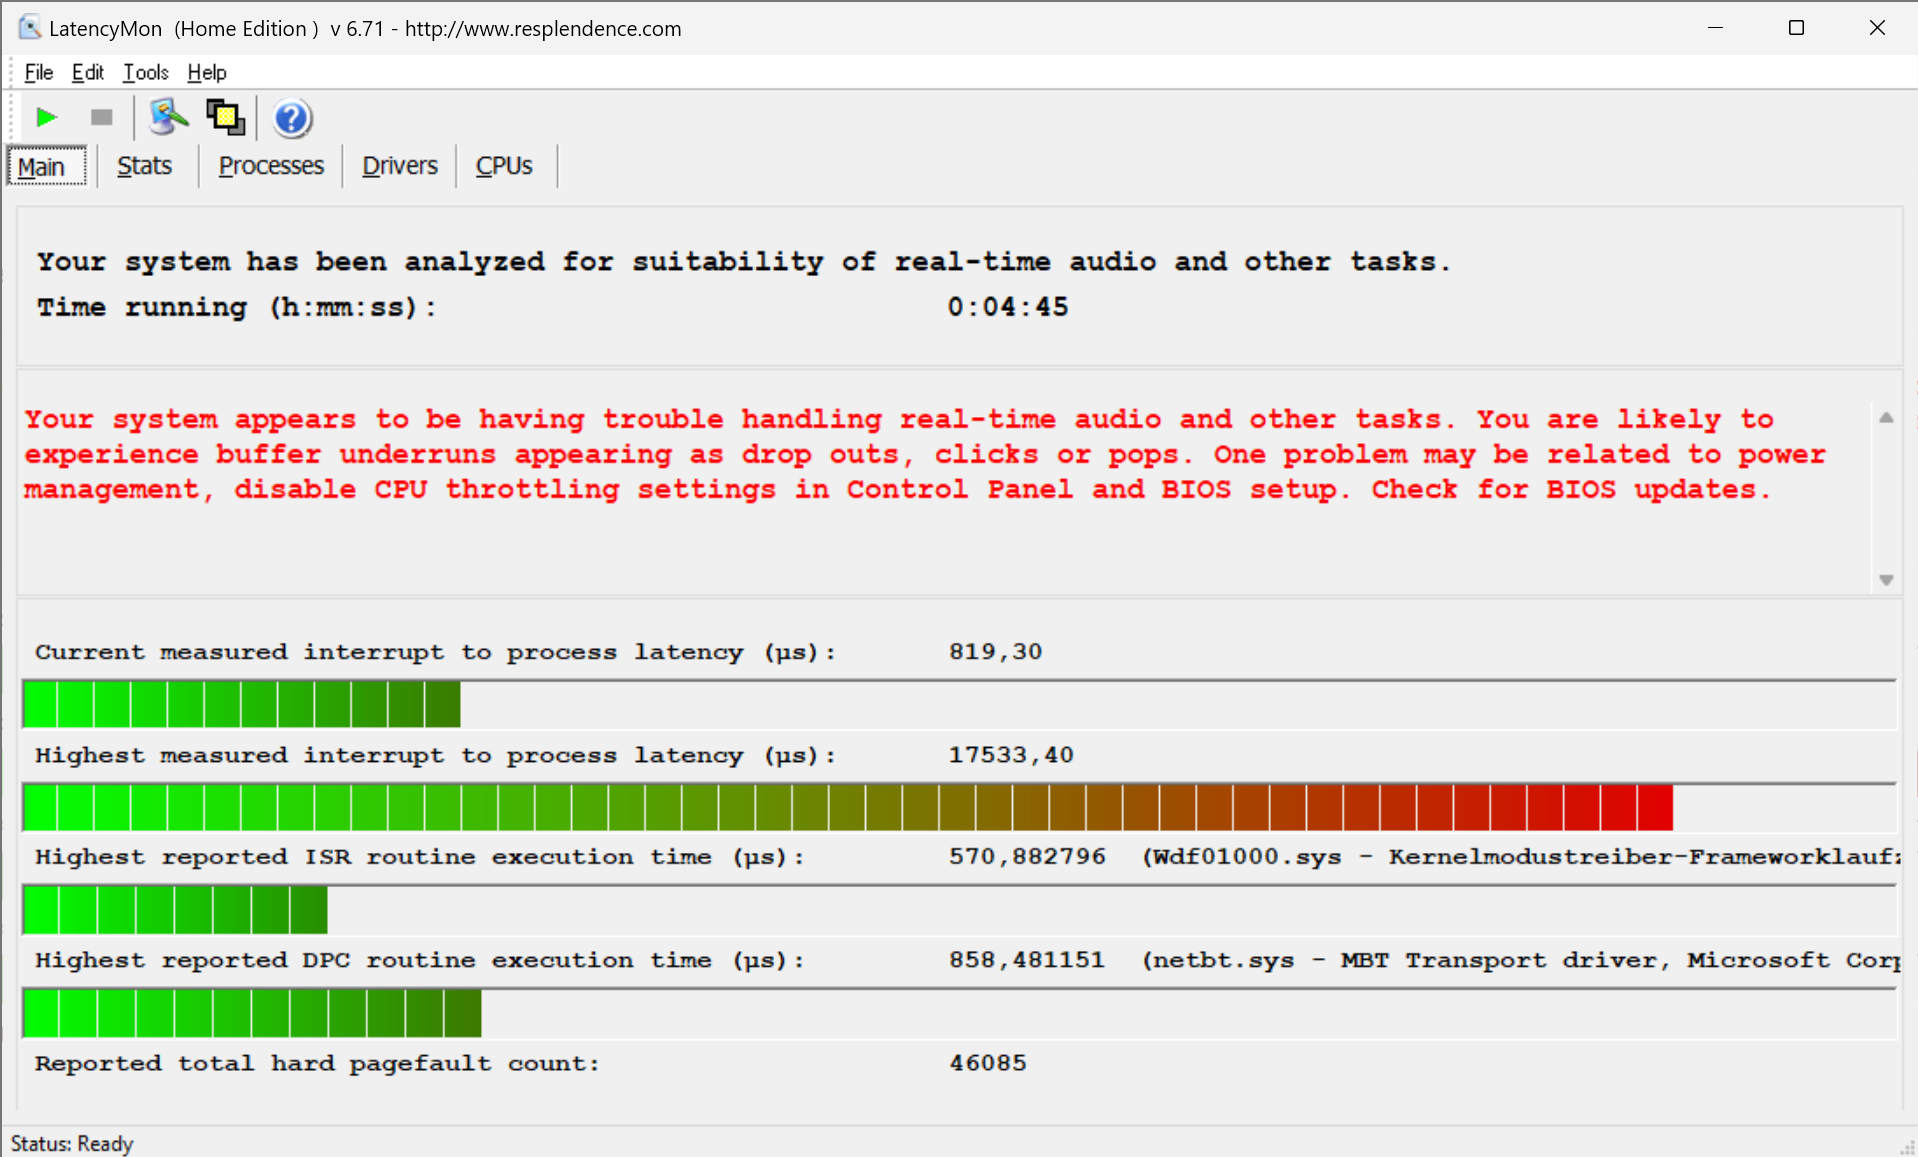
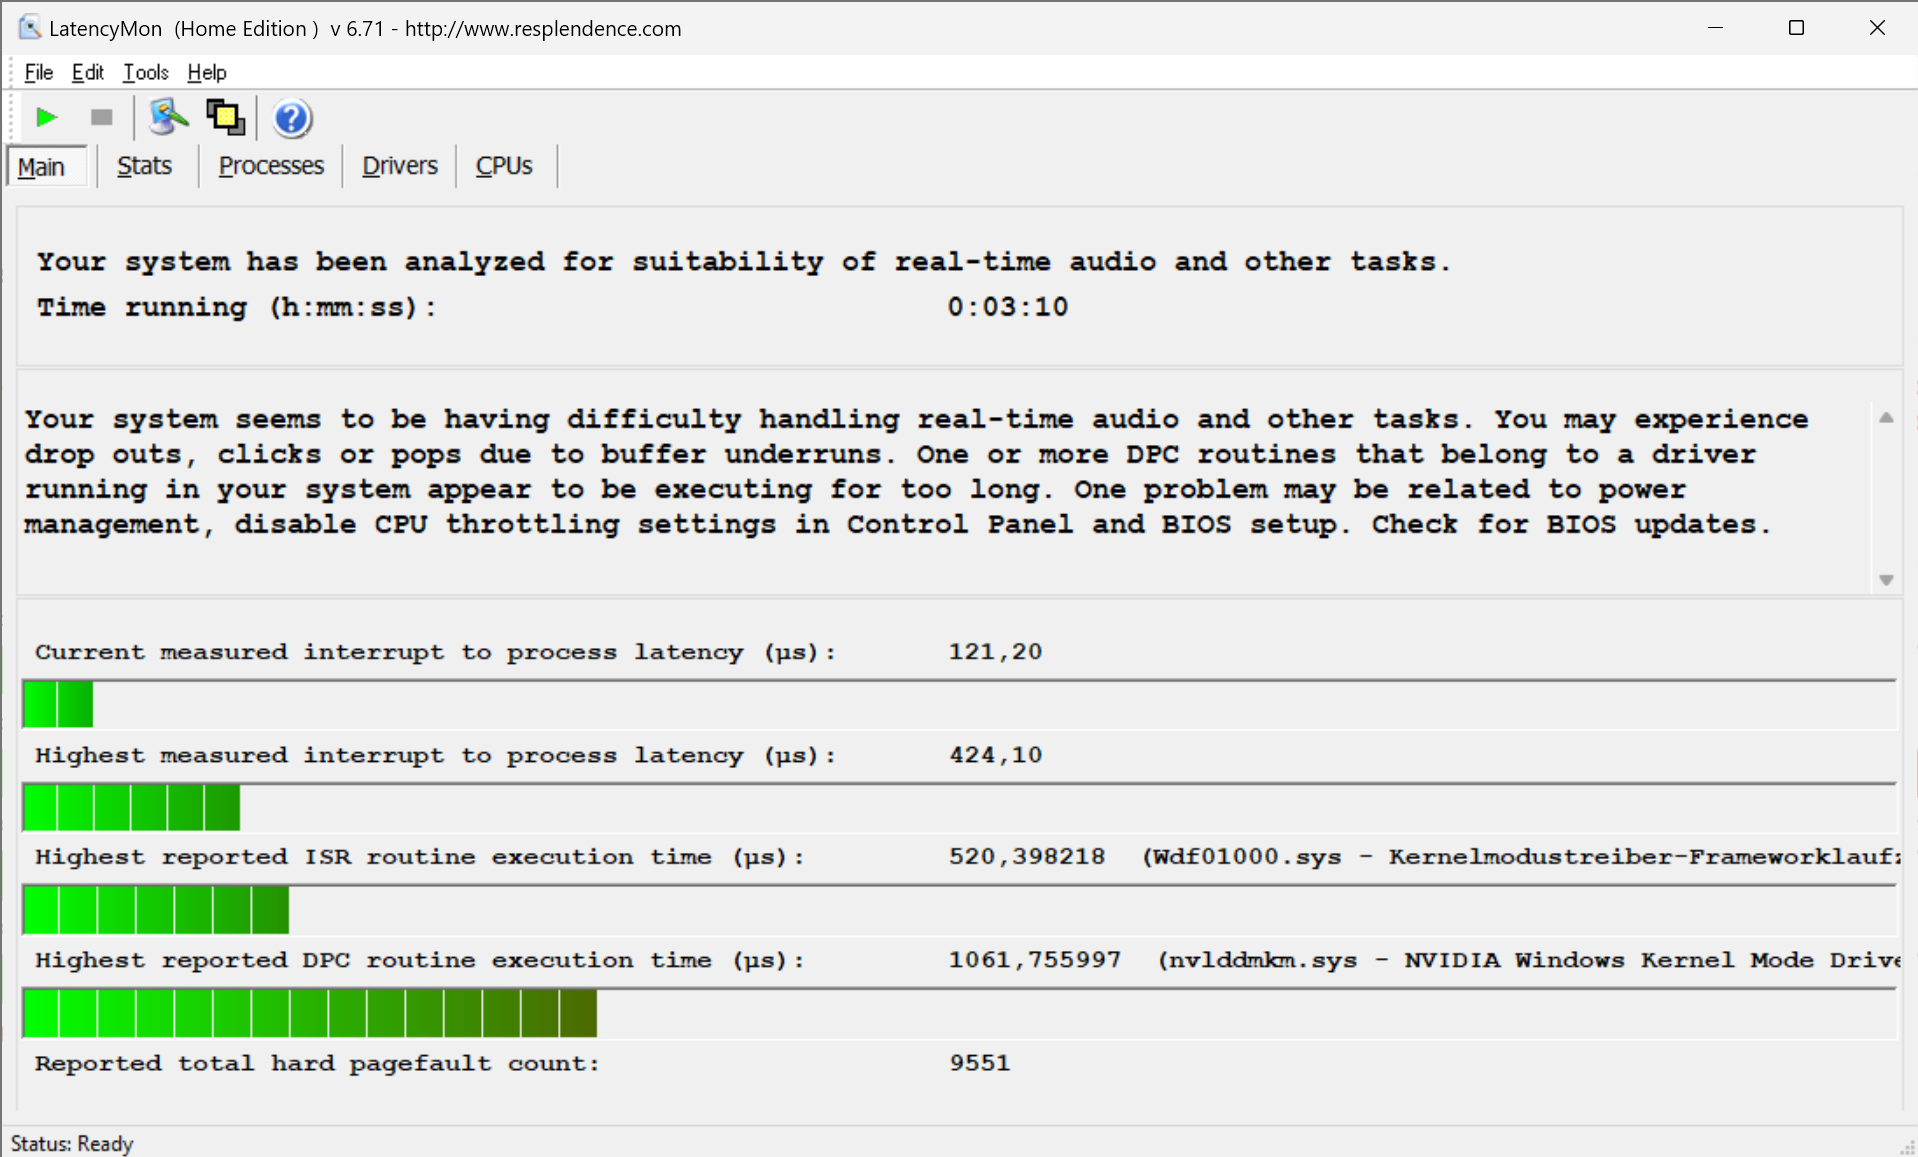
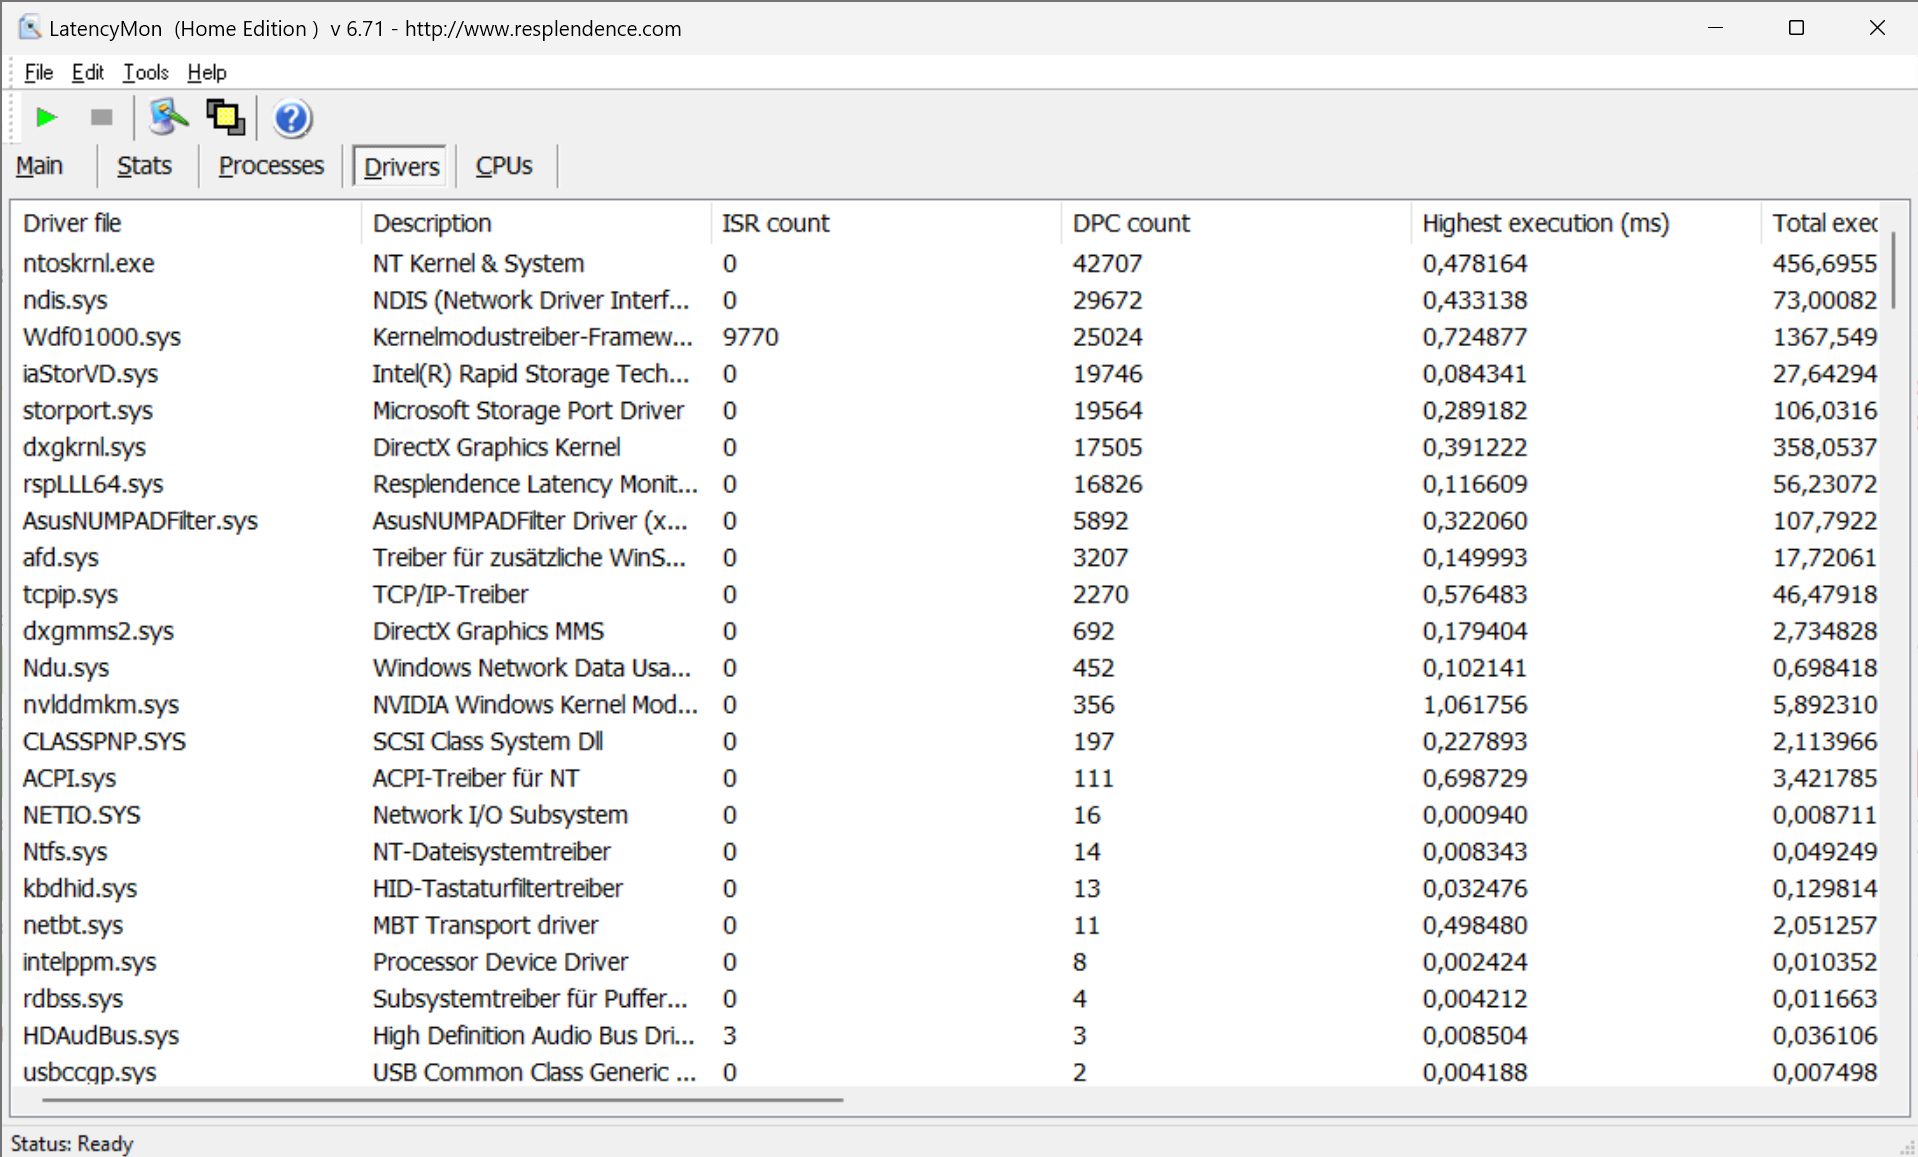
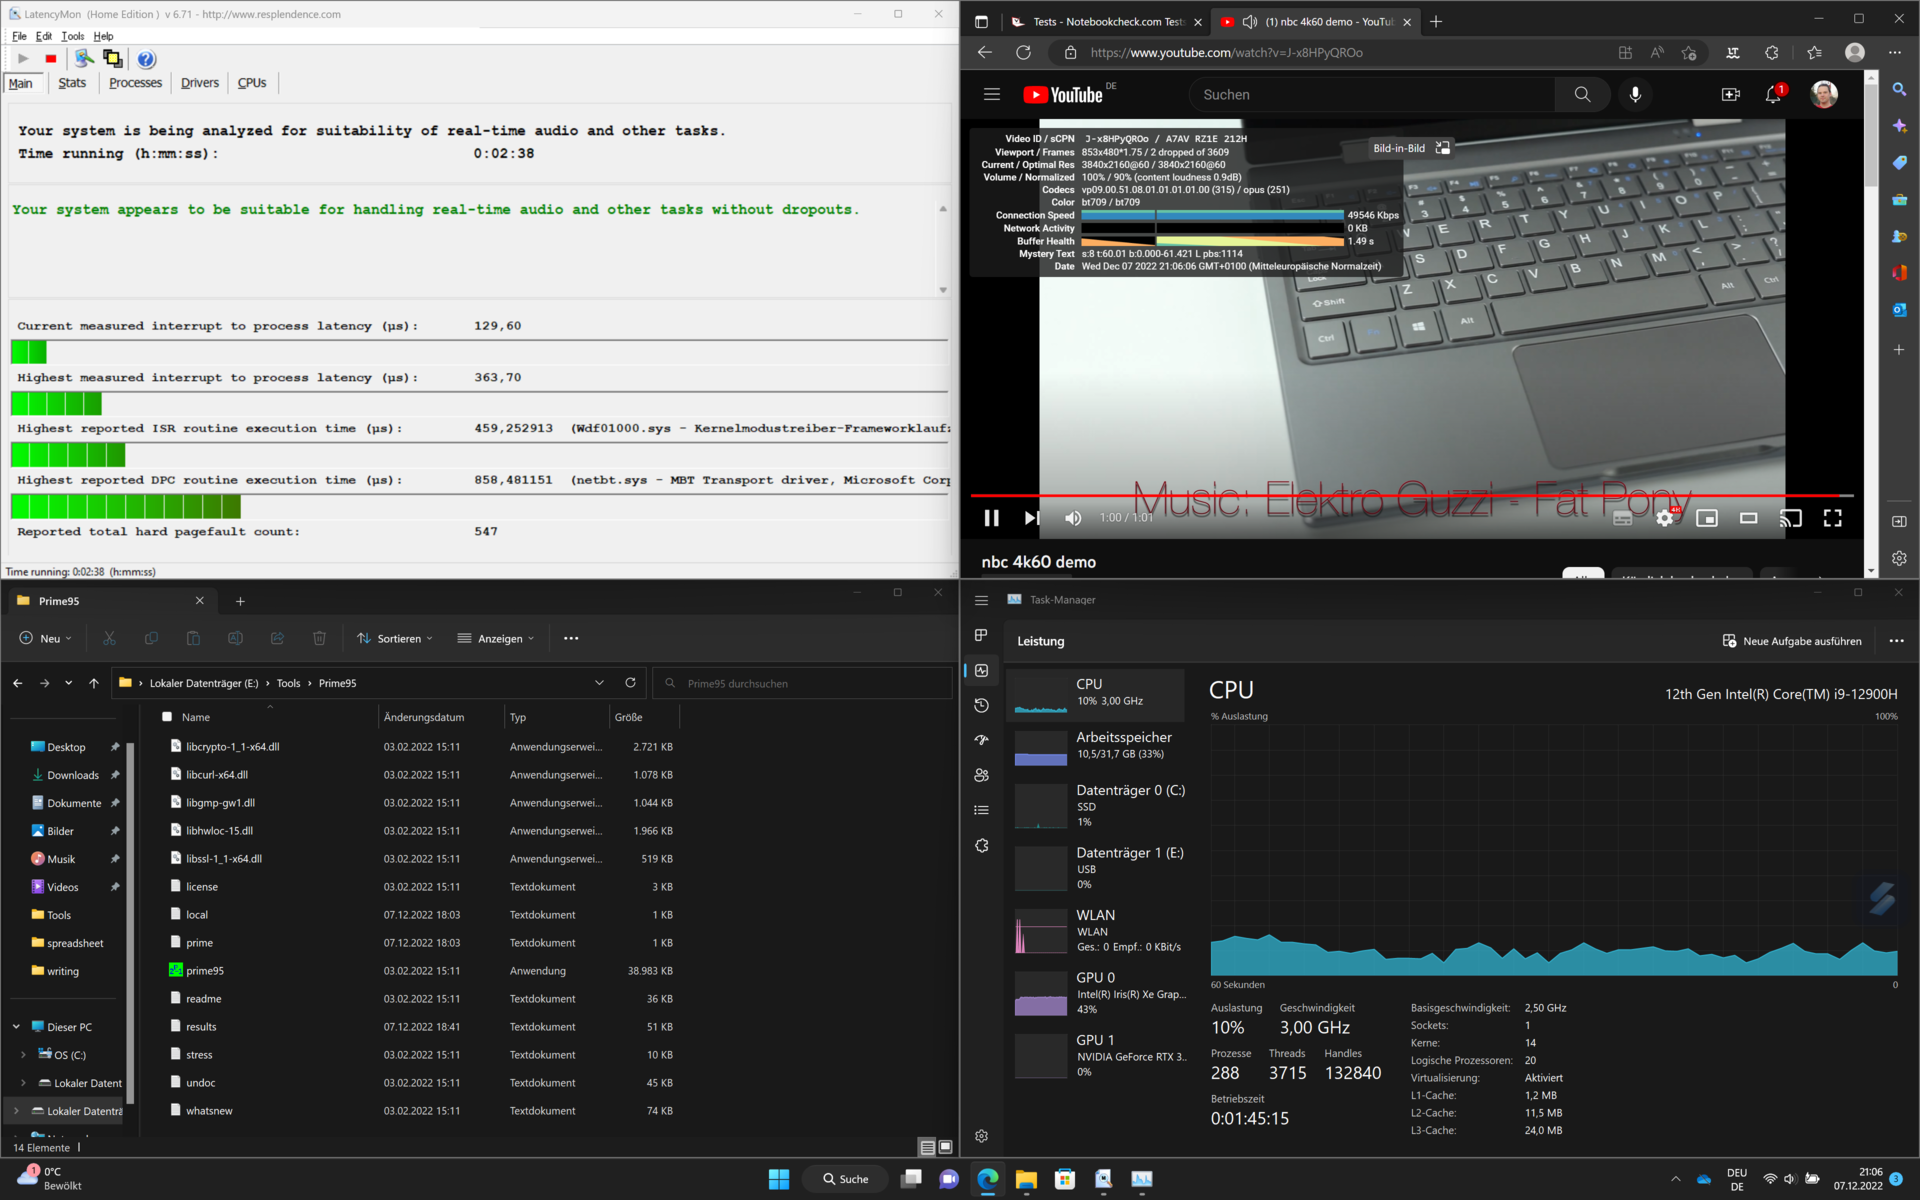
DPC延时
我们在这款笔记本上进行了两次DPC延迟测试。在第一次尝试中,Zenbook 16X几乎崩溃了。只要再多几毫秒,就会迫使Windows看门狗进行紧急关机。但是,尽管我们刻意尝试,这种行为并没有重复。因此,我们认为这只是一次性的。
YouTube的4K60Hz测试没有理由抱怨。只有两个帧被遗漏。
| DPC Latencies / LatencyMon - interrupt to process latency (max), Web, Youtube, Prime95 | |
| Dell Precision 7670 | |
| Lenovo ThinkPad X1 Extreme G5-21DE003RGE | |
| HP ZBook Studio 16 G9 62U04EA | |
| HP Omen 16-n0033dx | |
| Corsair Voyager a1600 | |
| MSI CreatorPro Z16P B12UKST | |
| Asus ZenBook Pro 16X OLED UX7602ZM-ME115W | |
| Asus VivoBook Pro 16X OLED N7600PC-L2026X | |
* ... smaller is better
存储设备
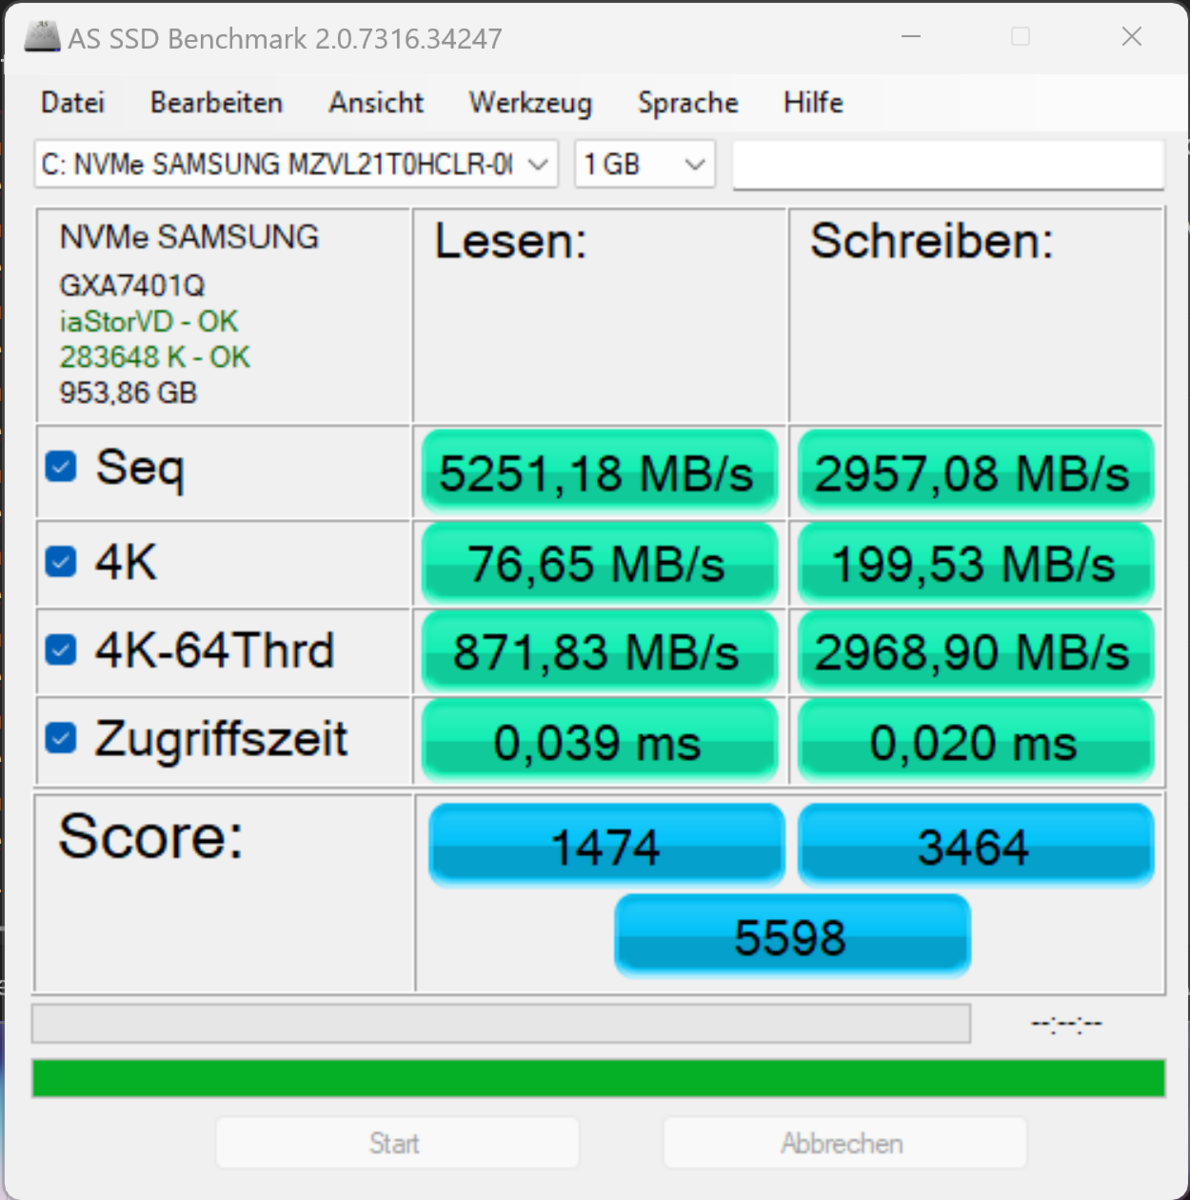
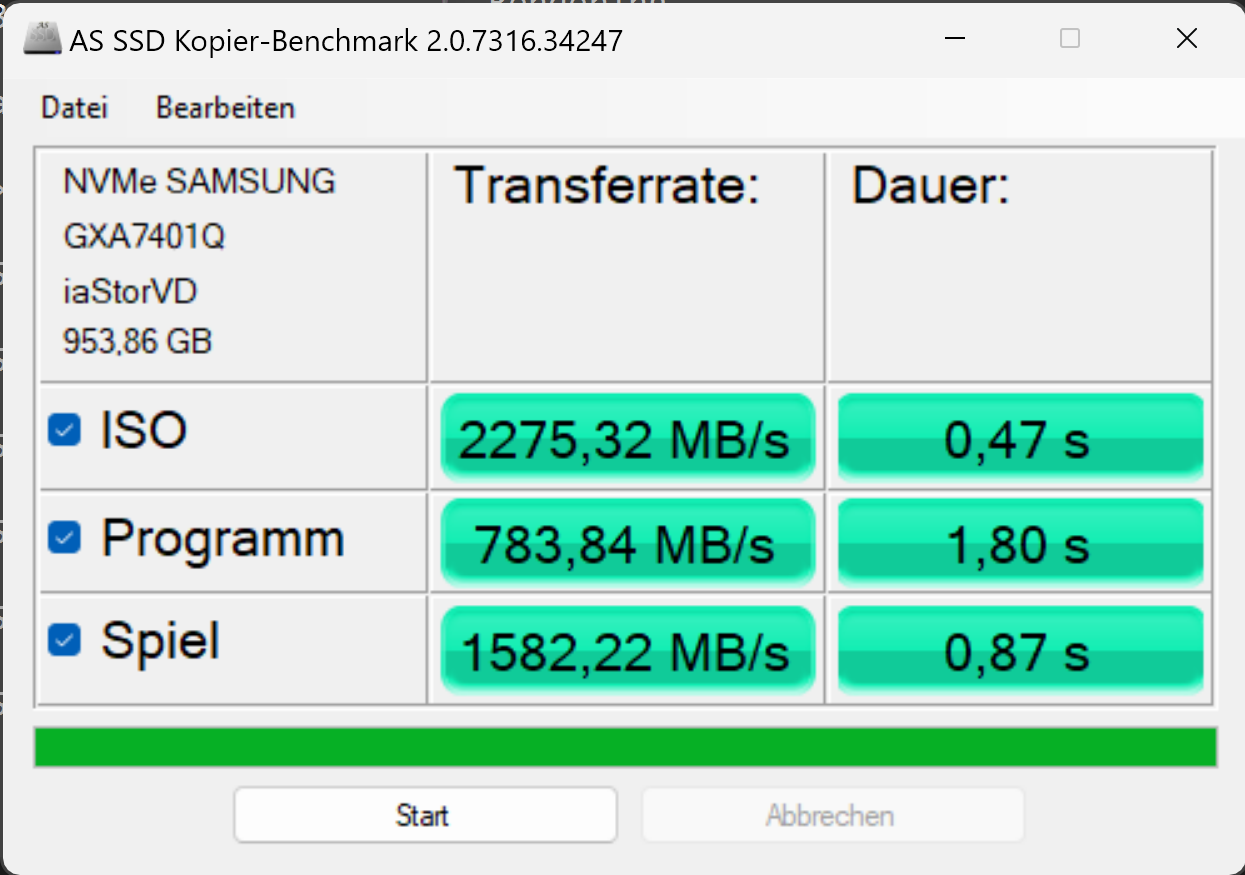
安装在我们评测设备中的三星PM9A1速度非常快。 硬盘的传输率非常高,对比设备中没有一个硬盘速度更快。然而,你不应该忽视传输速度的短暂下降,这表明三星固态硬盘存在温度问题。

* ... smaller is better
Sustained Read Performance: DiskSpd Read Loop, Queue Depth 8
图形卡
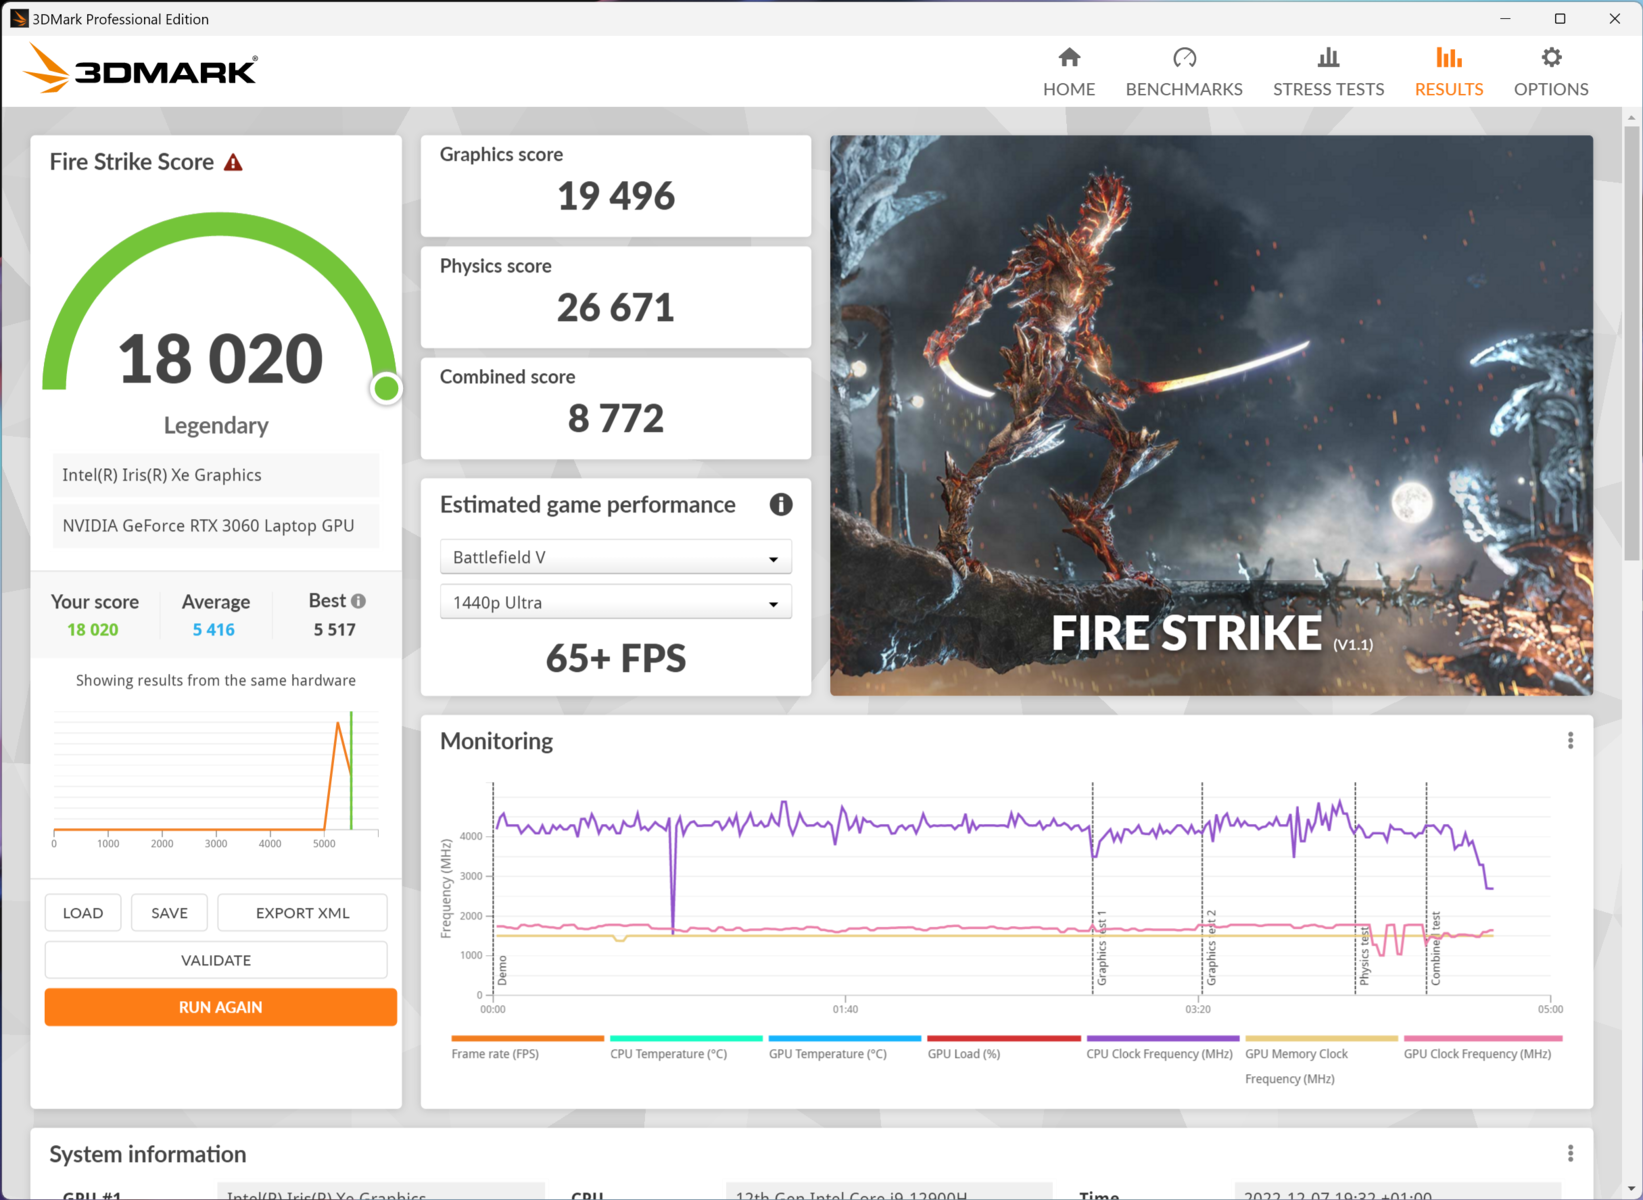
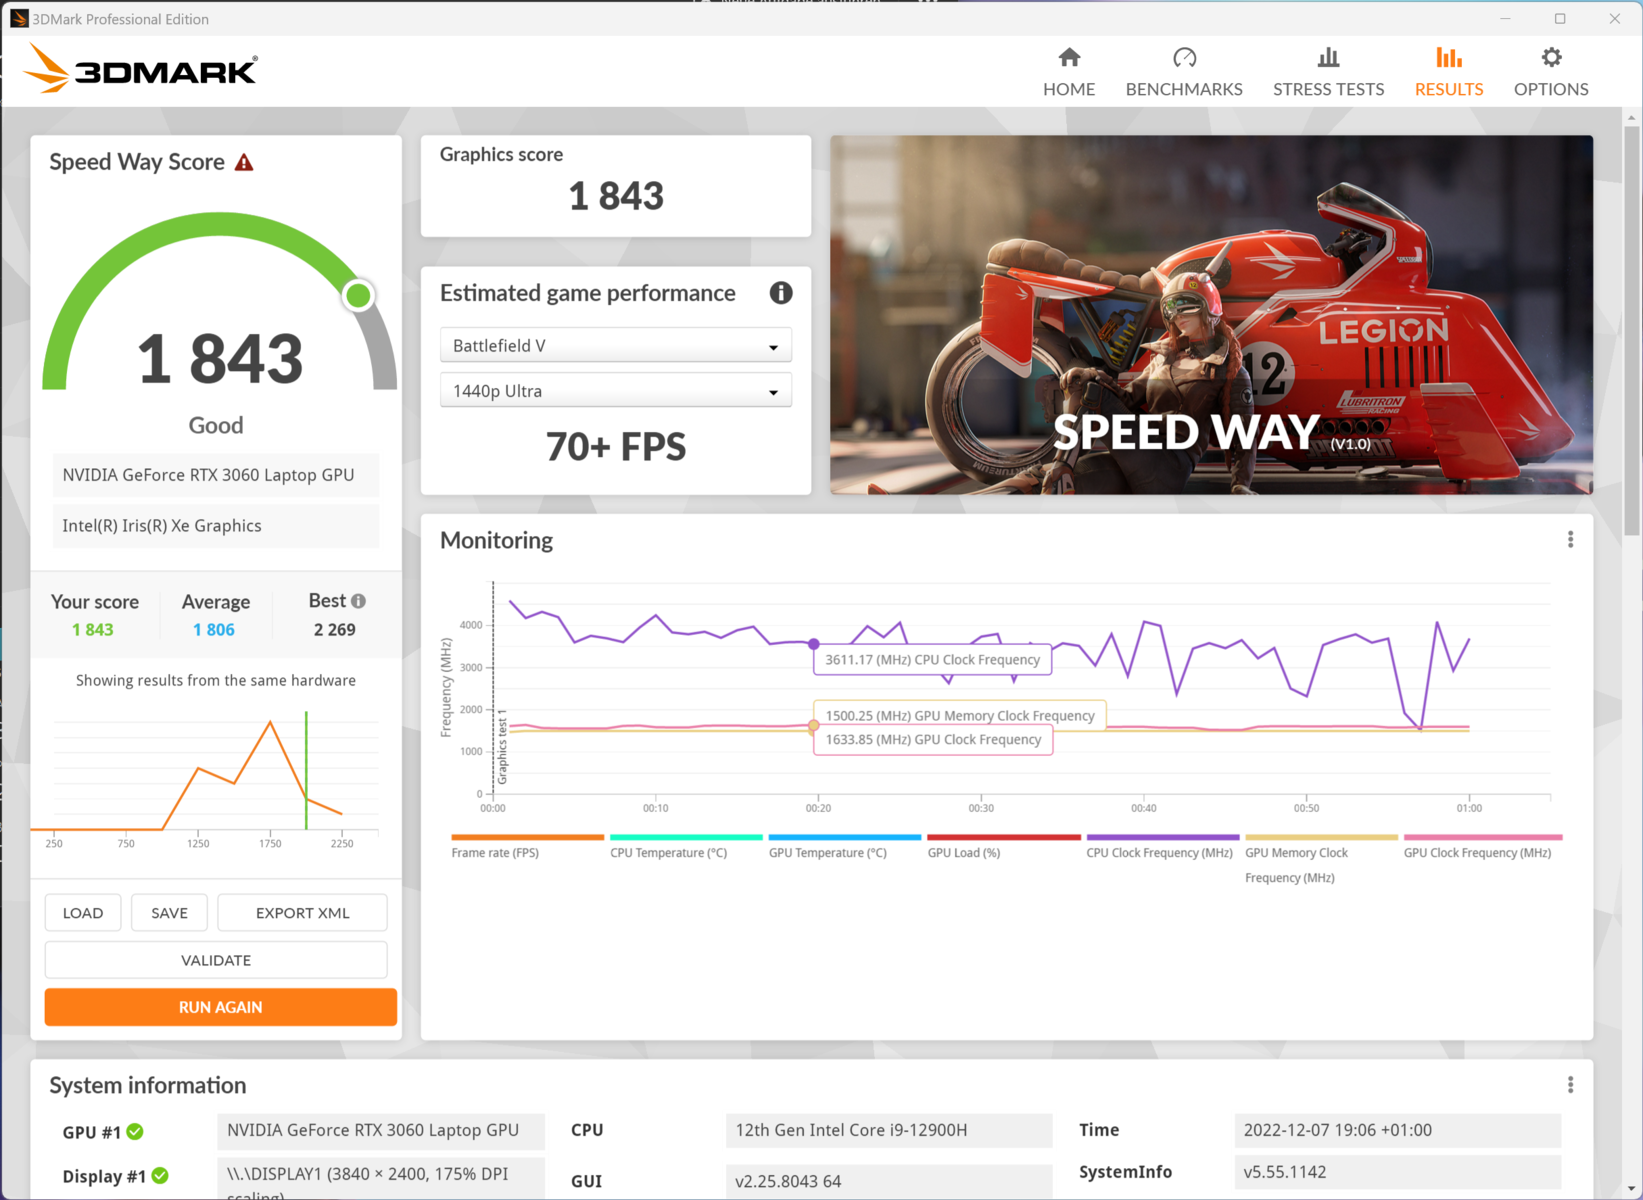
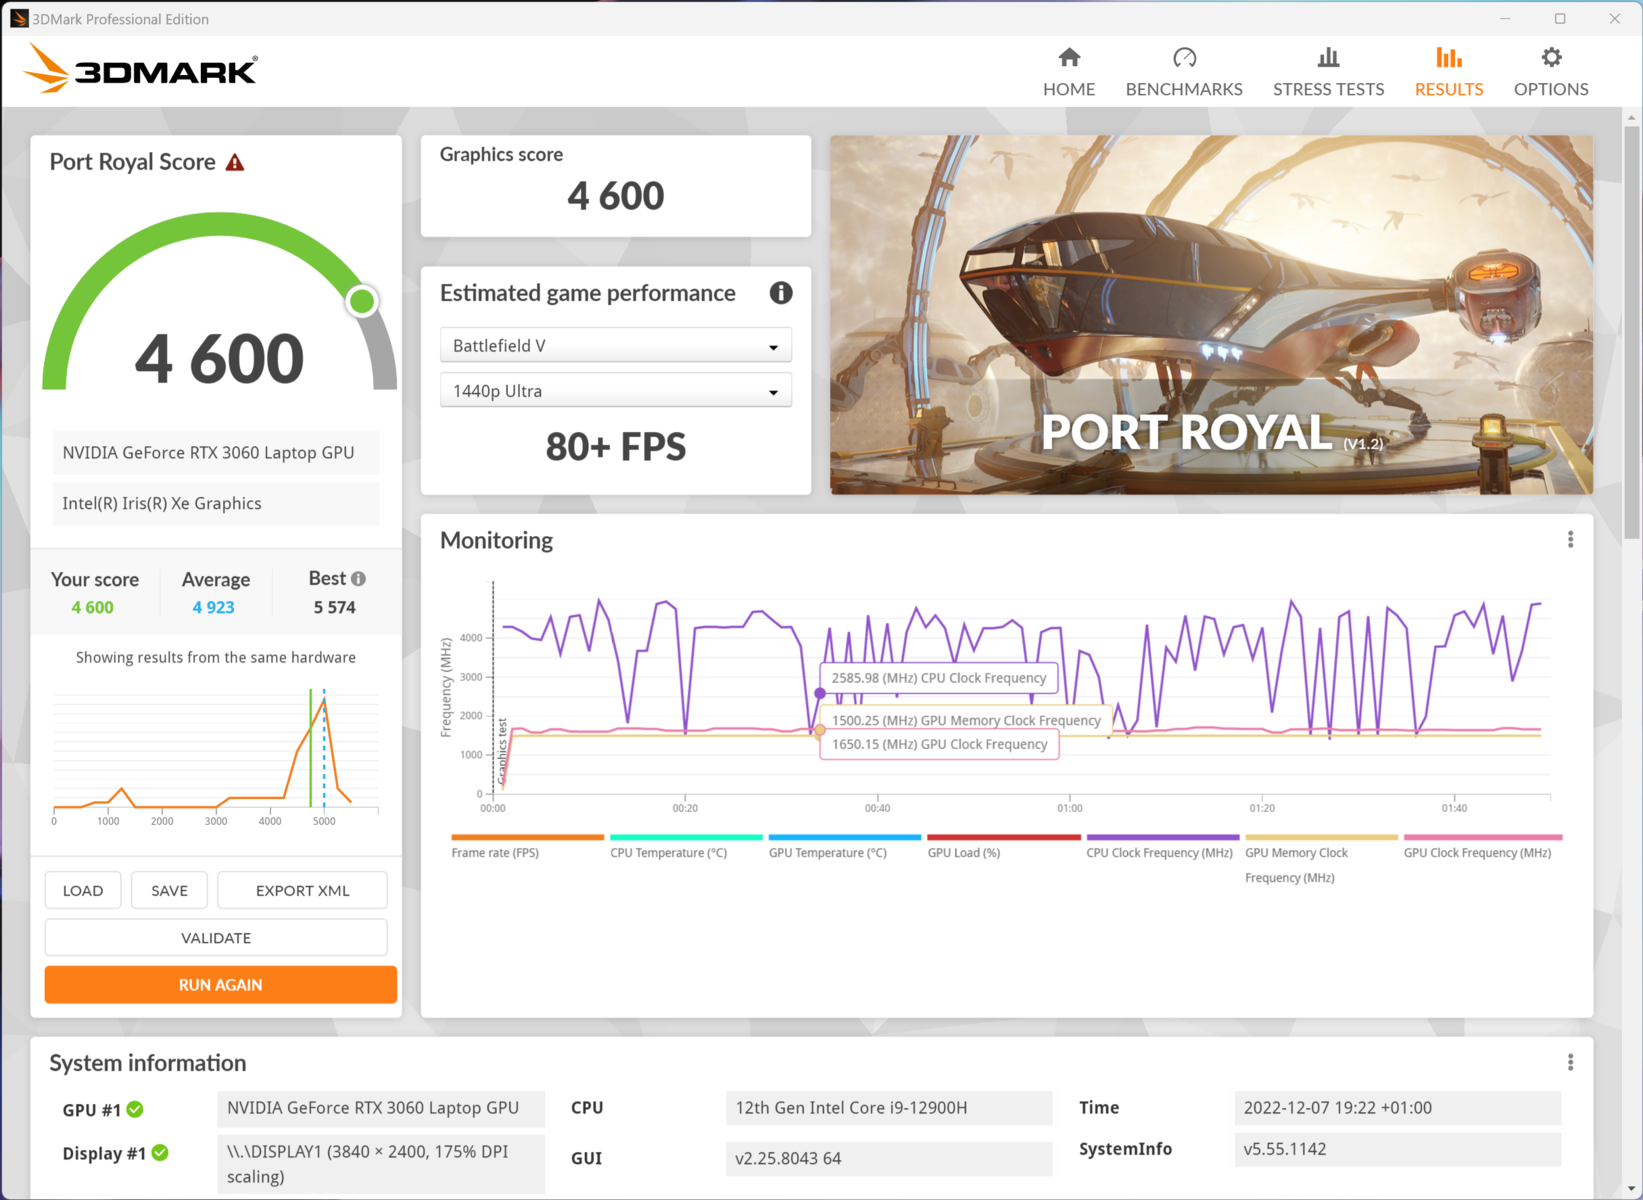
NvidiaGeForce RTX 3060是更强大的笔记本电脑GPU之一。Zenbook中的相应图形芯片在高达90瓦的TGP下工作。该显卡足够强大,可用于QHD分辨率的几个游戏和所有其他类型的任务。在需要图形芯片全部功率的应用中,AAS Ultra冷却系统的积极影响也很明显:图形芯片能够提供比其他同等大小的笔记本电脑明显更多的性能,同时长时间保持60℃至70℃的低温。
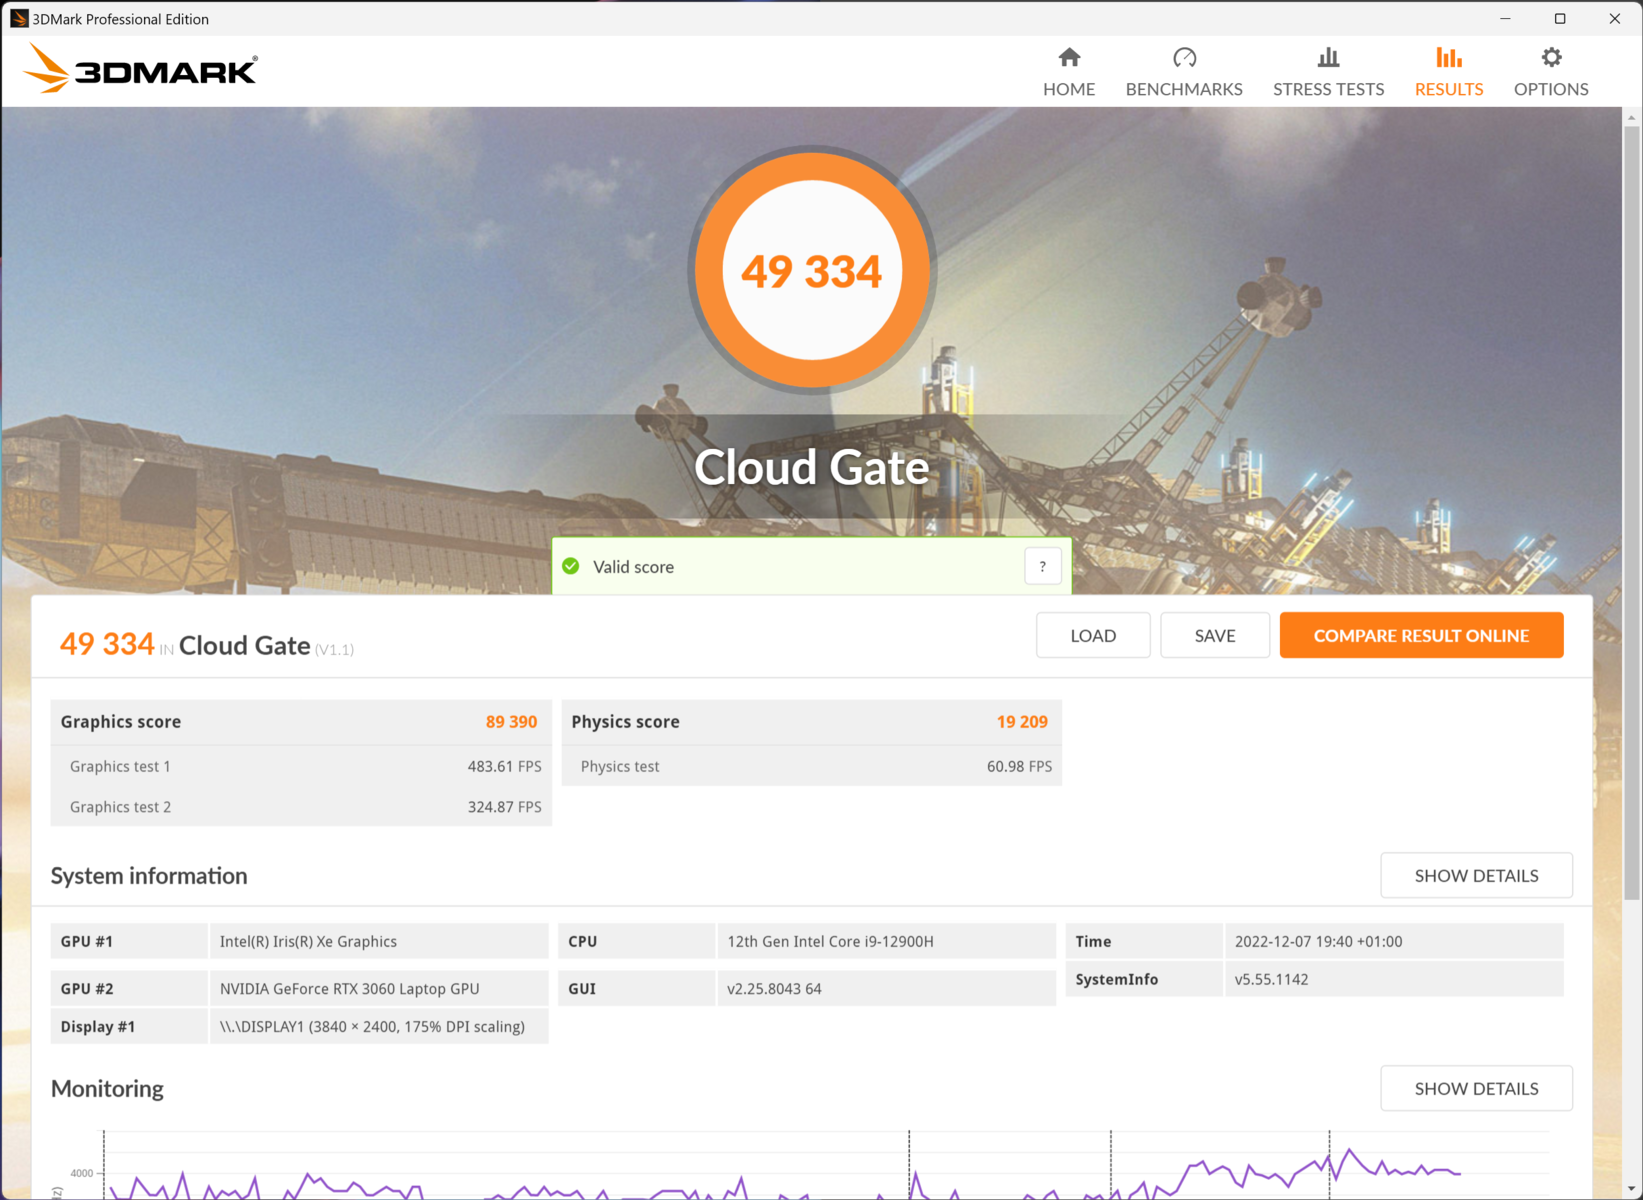
| 3DMark 11 Performance | 25678 points | |
| 3DMark Cloud Gate Standard Score | 49334 points | |
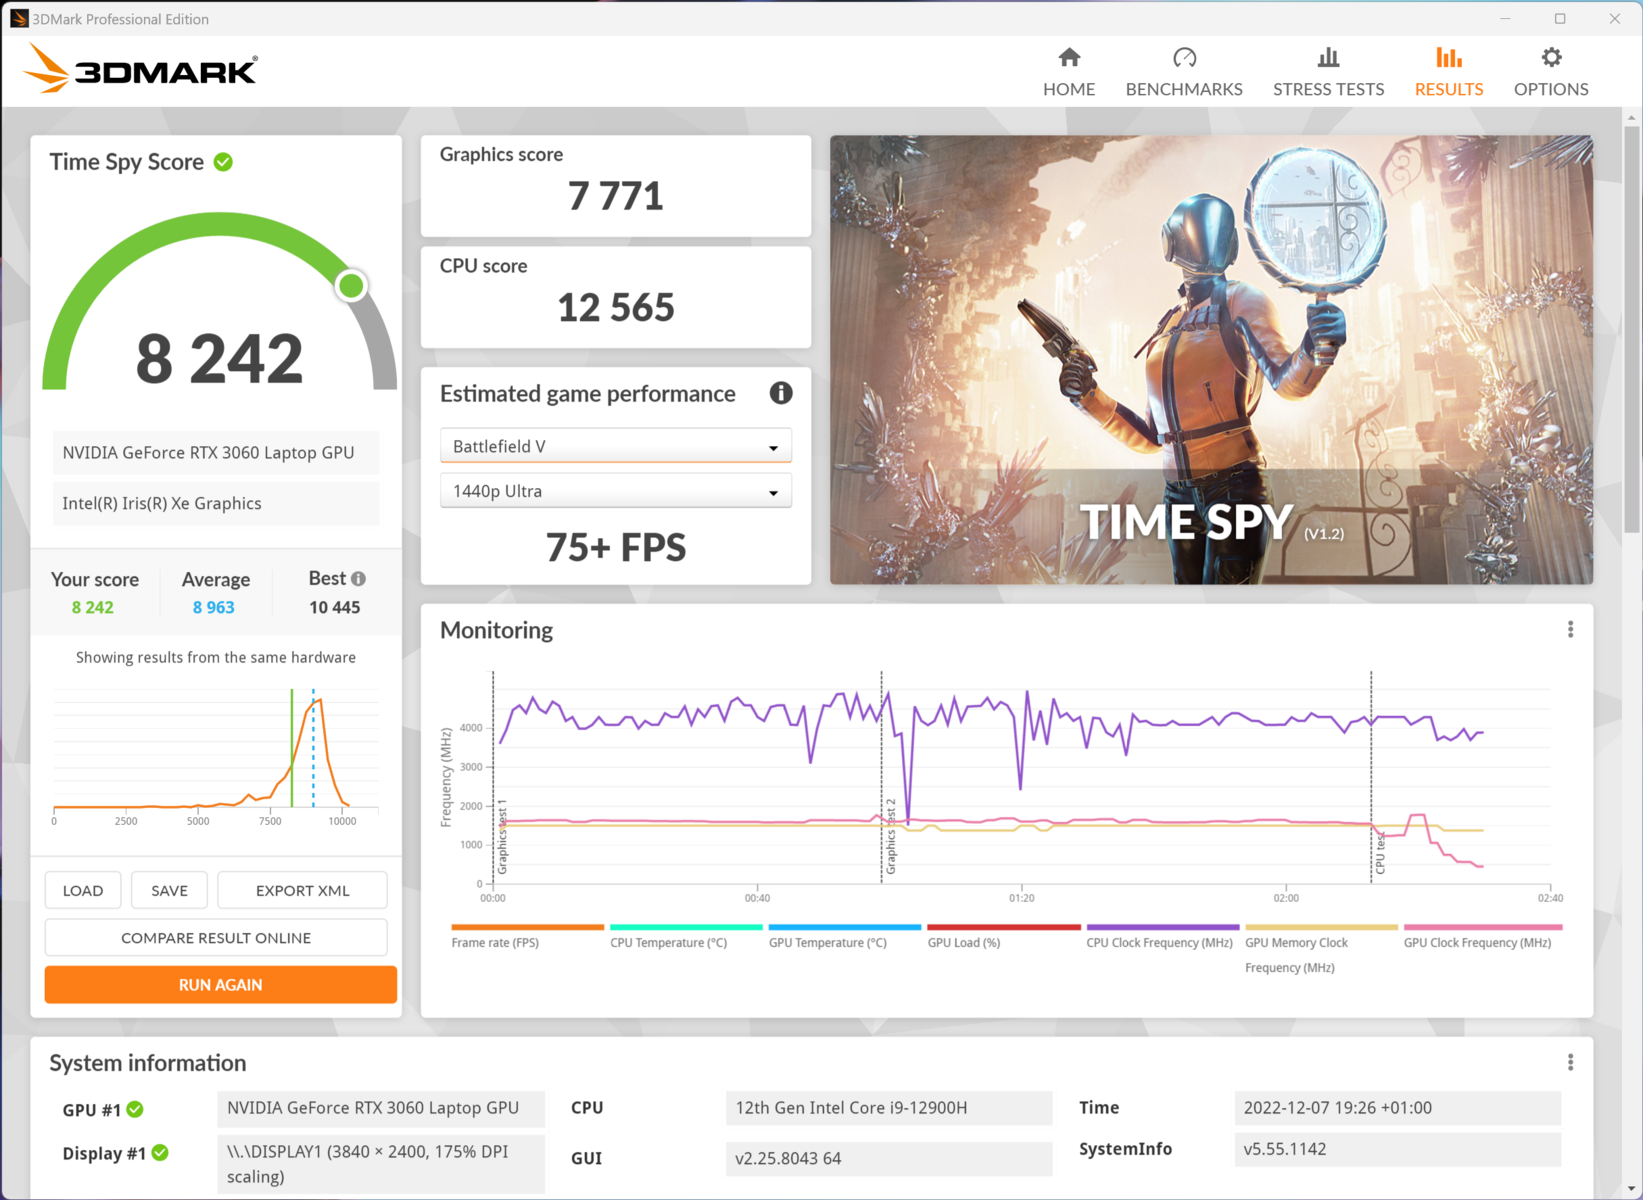
| 3DMark Fire Strike Score | 18020 points | |
| 3DMark Time Spy Score | 8242 points | |
Help | ||
* ... smaller is better
游戏性能
Zenbook并不具备高端游戏笔记本的性能,但它很好地利用了它所掌握的硬件,绝对适合游戏。很多游戏在全高清或四高清的最高质量设置下运行,帧率也相应很高。只有目前要求较高的游戏,如《F1 22》,才会使其不堪重负。 NvidiaGeForce 3060一点点。光线追踪也在一定程度上给显卡带来压力,这取决于分辨率。图形单元中的可用内存和光线追踪核心的数量很难满足Zenbook Pro16X OLED的全屏分辨率。由于这款笔记本只安装了60赫兹的屏幕,所以在这里使用V-Sync也是值得的,以便不必调用显卡的全部性能。
| The Witcher 3 - 1920x1080 Ultra Graphics & Postprocessing (HBAO+) | |
| Corsair Voyager a1600 | |
| Asus ZenBook Pro 16X OLED UX7602ZM-ME115W | |
| Lenovo ThinkPad X1 Extreme G5-21DE003RGE | |
| MSI CreatorPro Z16P B12UKST | |
| Dell Precision 7670 | |
| Average of class Multimedia (11 - 121, n=7, last 2 years) | |
| HP ZBook Studio 16 G9 62U04EA | |
| Asus VivoBook Pro 16X OLED N7600PC-L2026X | |
| low | med. | high | ultra | QHD | 4K | |
|---|---|---|---|---|---|---|
| GTA V (2015) | 174.8 | 167.8 | 97.6 | 76.4 | ||
| The Witcher 3 (2015) | 111 | 70 | 31.5 | |||
| Dota 2 Reborn (2015) | 161.3 | 147.2 | 139.5 | 135.1 | 100.1 | |
| Final Fantasy XV Benchmark (2018) | 112.1 | 83.8 | 62.1 | 35 | ||
| X-Plane 11.11 (2018) | 138.1 | 116.8 | 94.7 | 75 | ||
| Far Cry 5 (2018) | 125 | 117 | 109 | 83 | 40 | |
| Strange Brigade (2018) | 201 | 160.9 | 139.1 | 100.6 | ||
| F1 22 (2022) | 194.1 | 190.5 | 148.8 | 51.8 | 14.4 |
排放 - 尽管有140瓦的TDP,但相当安静
噪声
虽然AAS Ultra系统提供了更多的气流,但Zenbook并不比其他许多配备专用显卡的多媒体笔记本电脑更吵或更安静。唯一值得注意的是,风扇控制相当难以预测。有时在负载下需要两分钟才能做出相应的反应,风扇转速达到全速。根据使用情况,这也能确保Zenbook在很大程度上安静到无声。当浏览、运行办公应用程序,甚至是只引起短时负荷峰值的程序时,笔记本仍然几乎听不到声音。Zenbook的Vapor Chamber能够吸收许多这些应用程序的负载峰值,而不需要风扇。
Noise level
| Idle |
| 26 / 26 / 26 dB(A) |
| Load |
| 48 / 54.6 dB(A) |
 | ||
30 dB silent 40 dB(A) audible 50 dB(A) loud |
||
min: | ||
| Asus ZenBook Pro 16X OLED UX7602ZM-ME115W GeForce RTX 3060 Laptop GPU, i9-12900H, Samsung PM9A1 MZVL21T0HCLR | Lenovo ThinkPad X1 Extreme G5-21DE003RGE GeForce RTX 3060 Laptop GPU, i7-12700H, Micron 3400 1TB MTFDKBA1T0TFH | HP Omen 16-n0033dx Radeon RX 6650M, R7 6800H, Samsung PM9A1 MZVL21T0HCLR | HP ZBook Studio 16 G9 62U04EA RTX A2000 Laptop GPU, i7-12800H, Micron 3400 1TB MTFDKBA1T0TFH | Corsair Voyager a1600 Radeon RX 6800M, R9 6900HS, Samsung PM9A1 MZVL22T0HBLB | Dell Precision 7670 RTX A2000 Laptop GPU, i7-12850HX, SK Hynix HFS001TEJ9X115N | Asus VivoBook Pro 16X OLED N7600PC-L2026X GeForce RTX 3050 4GB Laptop GPU, i7-11370H, Intel Optane Memory H10 with Solid State Storage 32GB + 512GB HBRPEKNX0202A(L/H) | MSI CreatorPro Z16P B12UKST RTX A3000 Laptop GPU, i7-12700H, Samsung PM9A1 MZVL21T0HCLR | |
|---|---|---|---|---|---|---|---|---|
| Noise | 11% | 2% | 5% | -9% | 8% | -13% | 3% | |
| off / environment * (dB) | 26 | 23.2 11% | 24.2 7% | 24 8% | 29.9 -15% | 22.7 13% | 25.15 3% | 24.1 7% |
| Idle Minimum * (dB) | 26 | 23.2 11% | 27.4 -5% | 24 8% | 30.5 -17% | 22.9 12% | 30 -15% | 27.1 -4% |
| Idle Average * (dB) | 26 | 23.2 11% | 27.4 -5% | 27.7 -7% | 30.6 -18% | 22.9 12% | 30 -15% | 27.1 -4% |
| Idle Maximum * (dB) | 26 | 23.2 11% | 28.9 -11% | 27.7 -7% | 30.7 -18% | 24.5 6% | 30 -15% | 27.1 -4% |
| Load Average * (dB) | 48 | 45.5 5% | 32.3 33% | 39.8 17% | 44.5 7% | 48.7 -1% | 57.6 -20% | 42.9 11% |
| Load Maximum * (dB) | 54.6 | 45.5 17% | 57.6 -5% | 47.7 13% | 51.1 6% | 52.1 5% | 62.9 -15% | 47 14% |
| Witcher 3 ultra * (dB) | 45.5 | 54.1 | 44.3 | 45.2 | 44 |
* ... smaller is better
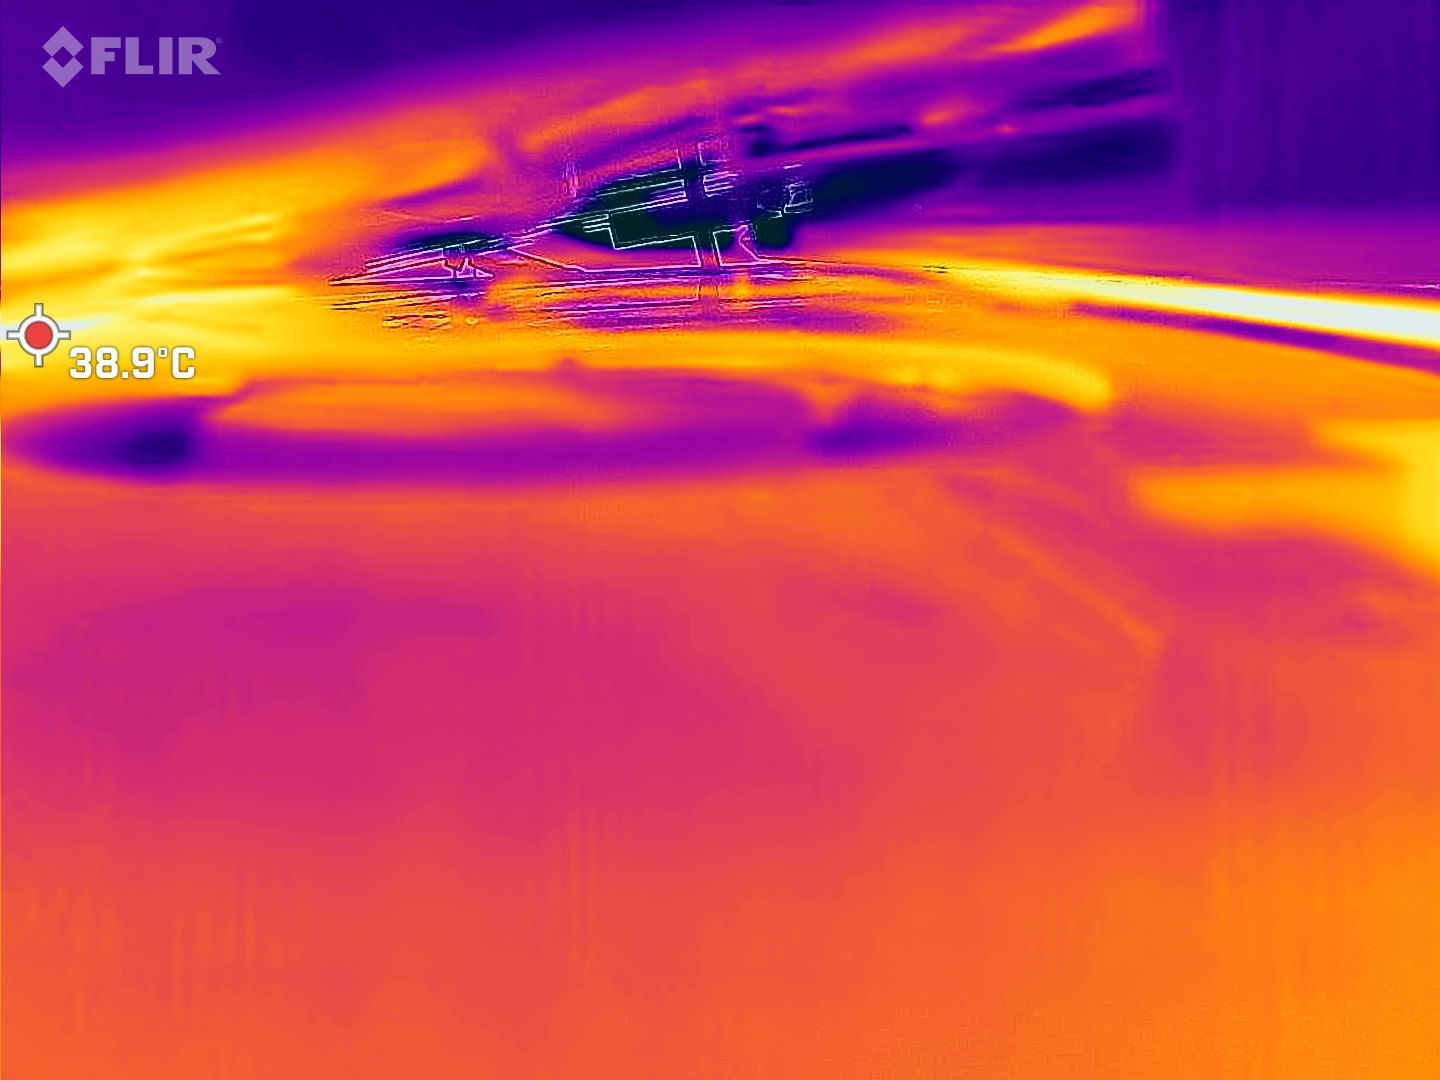
温度
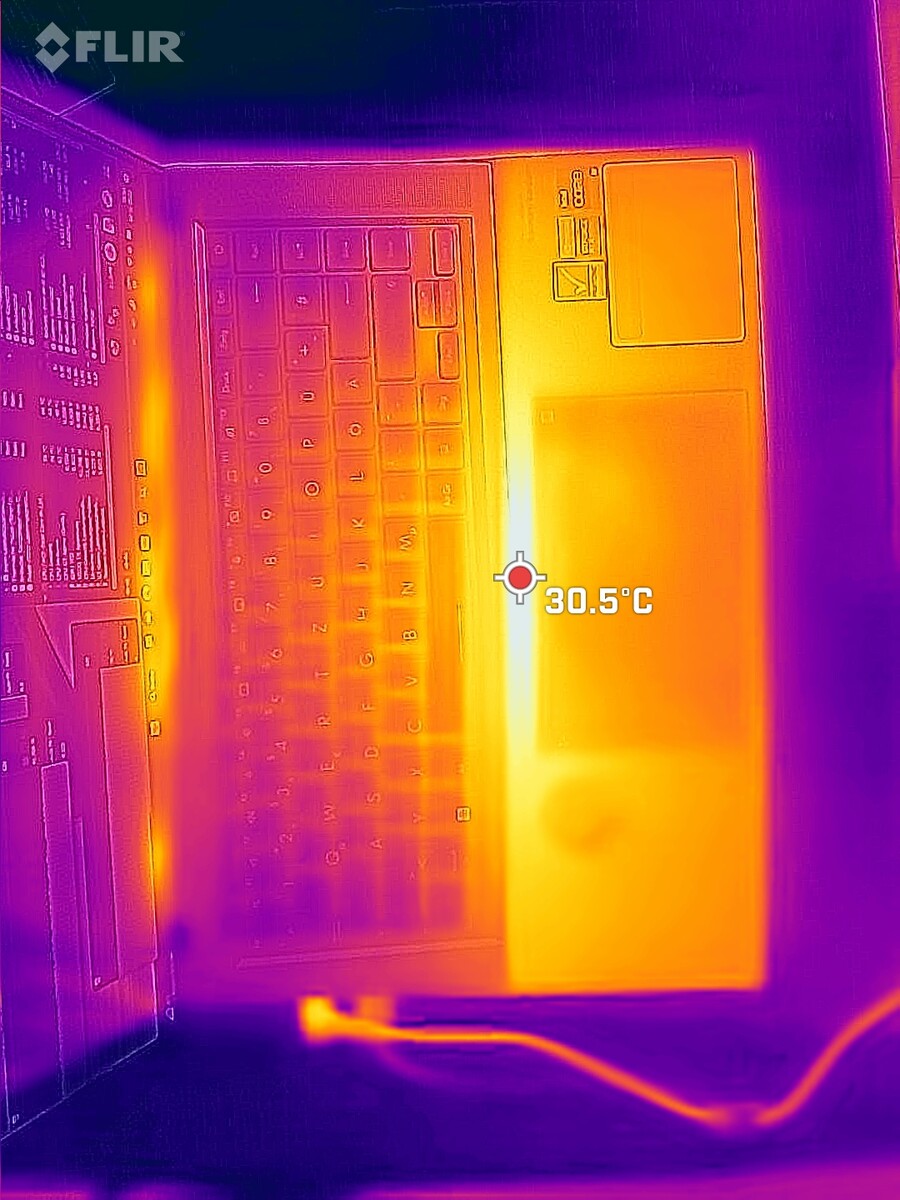
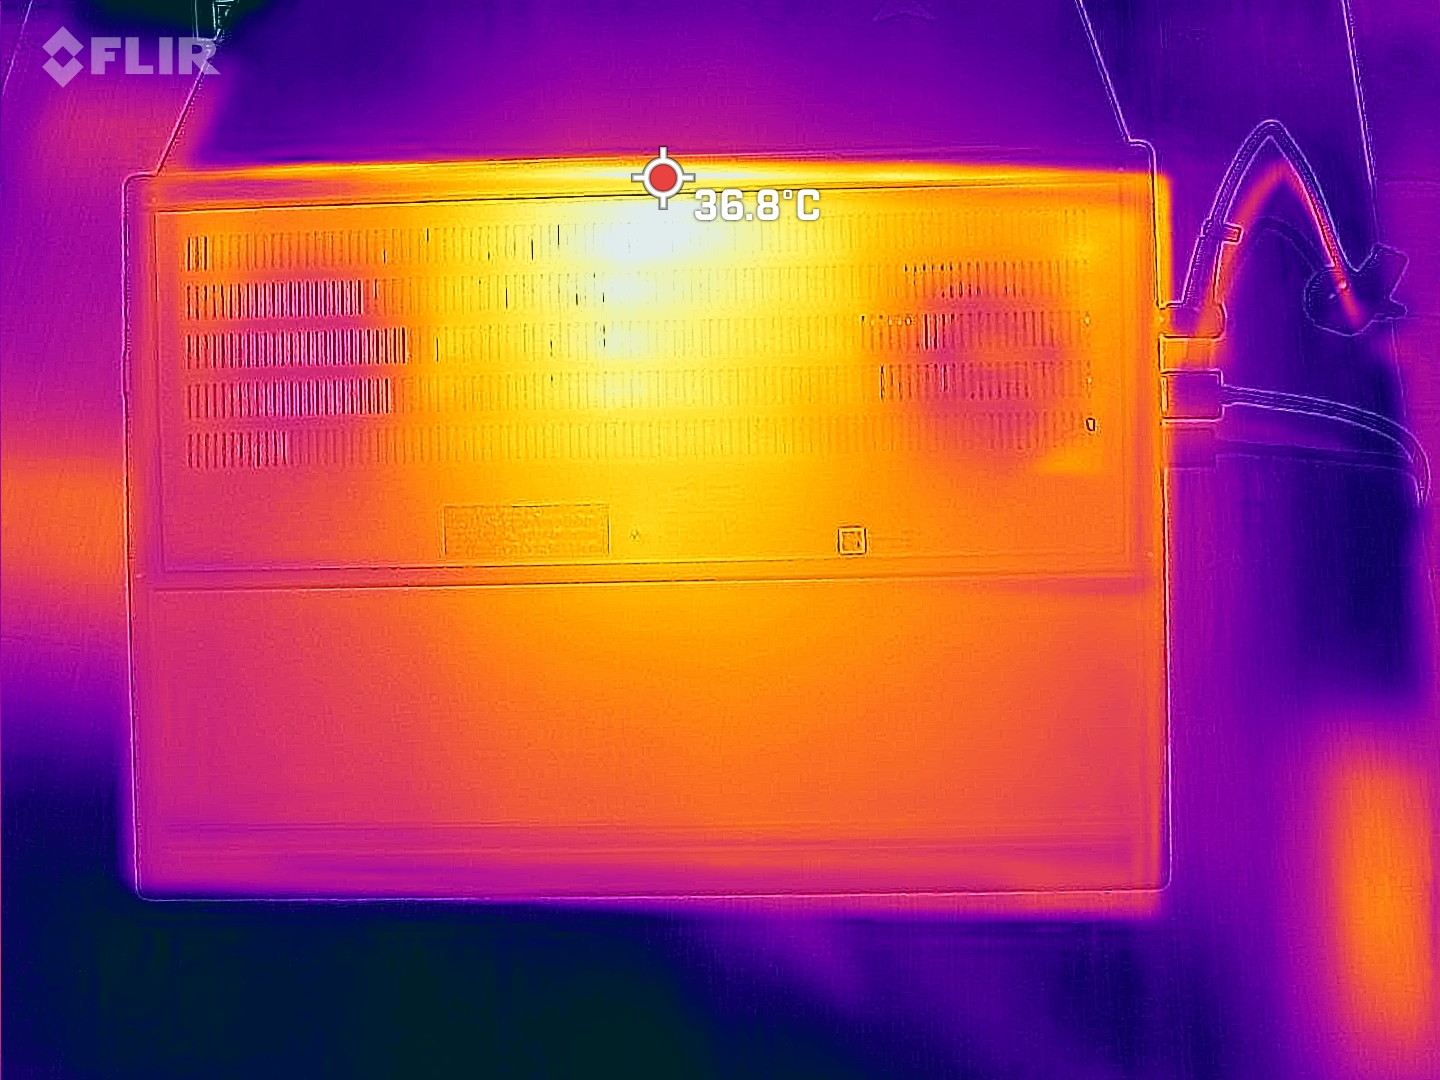
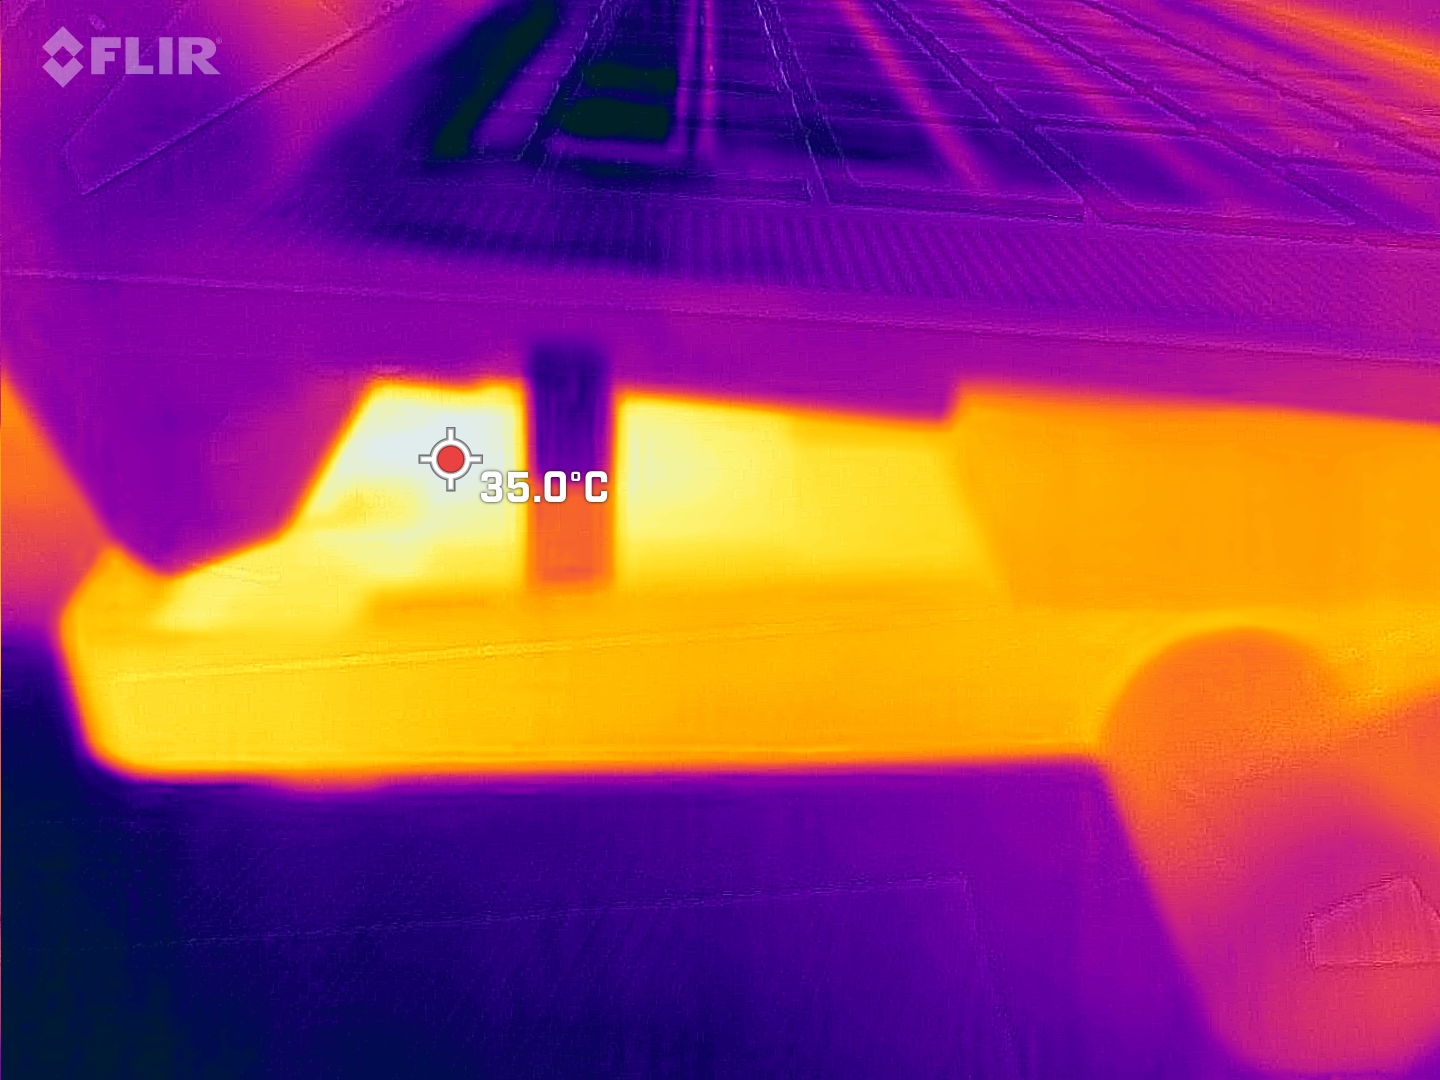
AAS-Ultra系统将键盘抬高,其主要目的是保持笔记本电脑的温度。这正是它所做的。通过使键盘略微远离笔记本电脑的热源,它仍然是绝对的凉爽。事实上,即使在一个小时的压力测试之后,笔记本上部最热的地方也在30℃左右徘徊。笔记本电脑的底部也基本保持在40℃以下。键盘和底座之间的缝隙中的温度明显较高,但不会超过40℃的大关。蒸气室、AAS-Ultra冷却系统和笔记本电脑设定的性能极限确保了系统的冷却。
(+) The maximum temperature on the upper side is 32 °C / 90 F, compared to the average of 36.8 °C / 98 F, ranging from 21 to 71 °C for the class Multimedia.
(±) The bottom heats up to a maximum of 41.6 °C / 107 F, compared to the average of 39.1 °C / 102 F
(+) In idle usage, the average temperature for the upper side is 31.6 °C / 89 F, compared to the device average of 31.3 °C / 88 F.
(+) Playing The Witcher 3, the average temperature for the upper side is 30.3 °C / 87 F, compared to the device average of 31.3 °C / 88 F.
(+) The palmrests and touchpad are reaching skin temperature as a maximum (32.7 °C / 90.9 F) and are therefore not hot.
(-) The average temperature of the palmrest area of similar devices was 28.7 °C / 83.7 F (-4 °C / -7.2 F).
| Asus ZenBook Pro 16X OLED UX7602ZM-ME115W Intel Core i9-12900H, NVIDIA GeForce RTX 3060 Laptop GPU | Lenovo ThinkPad X1 Extreme G5-21DE003RGE Intel Core i7-12700H, NVIDIA GeForce RTX 3060 Laptop GPU | HP Omen 16-n0033dx AMD Ryzen 7 6800H, AMD Radeon RX 6650M | HP ZBook Studio 16 G9 62U04EA Intel Core i7-12800H, NVIDIA RTX A2000 Laptop GPU | Corsair Voyager a1600 AMD Ryzen 9 6900HS, AMD Radeon RX 6800M | Asus VivoBook Pro 16X OLED N7600PC-L2026X Intel Core i7-11370H, NVIDIA GeForce RTX 3050 4GB Laptop GPU | |
|---|---|---|---|---|---|---|
| Heat | -14% | -4% | -5% | -23% | -6% | |
| Maximum Upper Side * (°C) | 32 | 52 -63% | 41.2 -29% | 38.7 -21% | 50.7 -58% | 40.6 -27% |
| Maximum Bottom * (°C) | 41.6 | 56.4 -36% | 53.2 -28% | 53.4 -28% | 54.2 -30% | 53 -27% |
| Idle Upper Side * (°C) | 32.6 | 26.4 19% | 26.4 19% | 27.3 16% | 35.8 -10% | 29 11% |
| Idle Bottom * (°C) | 36 | 27.2 24% | 27.8 23% | 31.6 12% | 33 8% | 28.3 21% |
* ... smaller is better
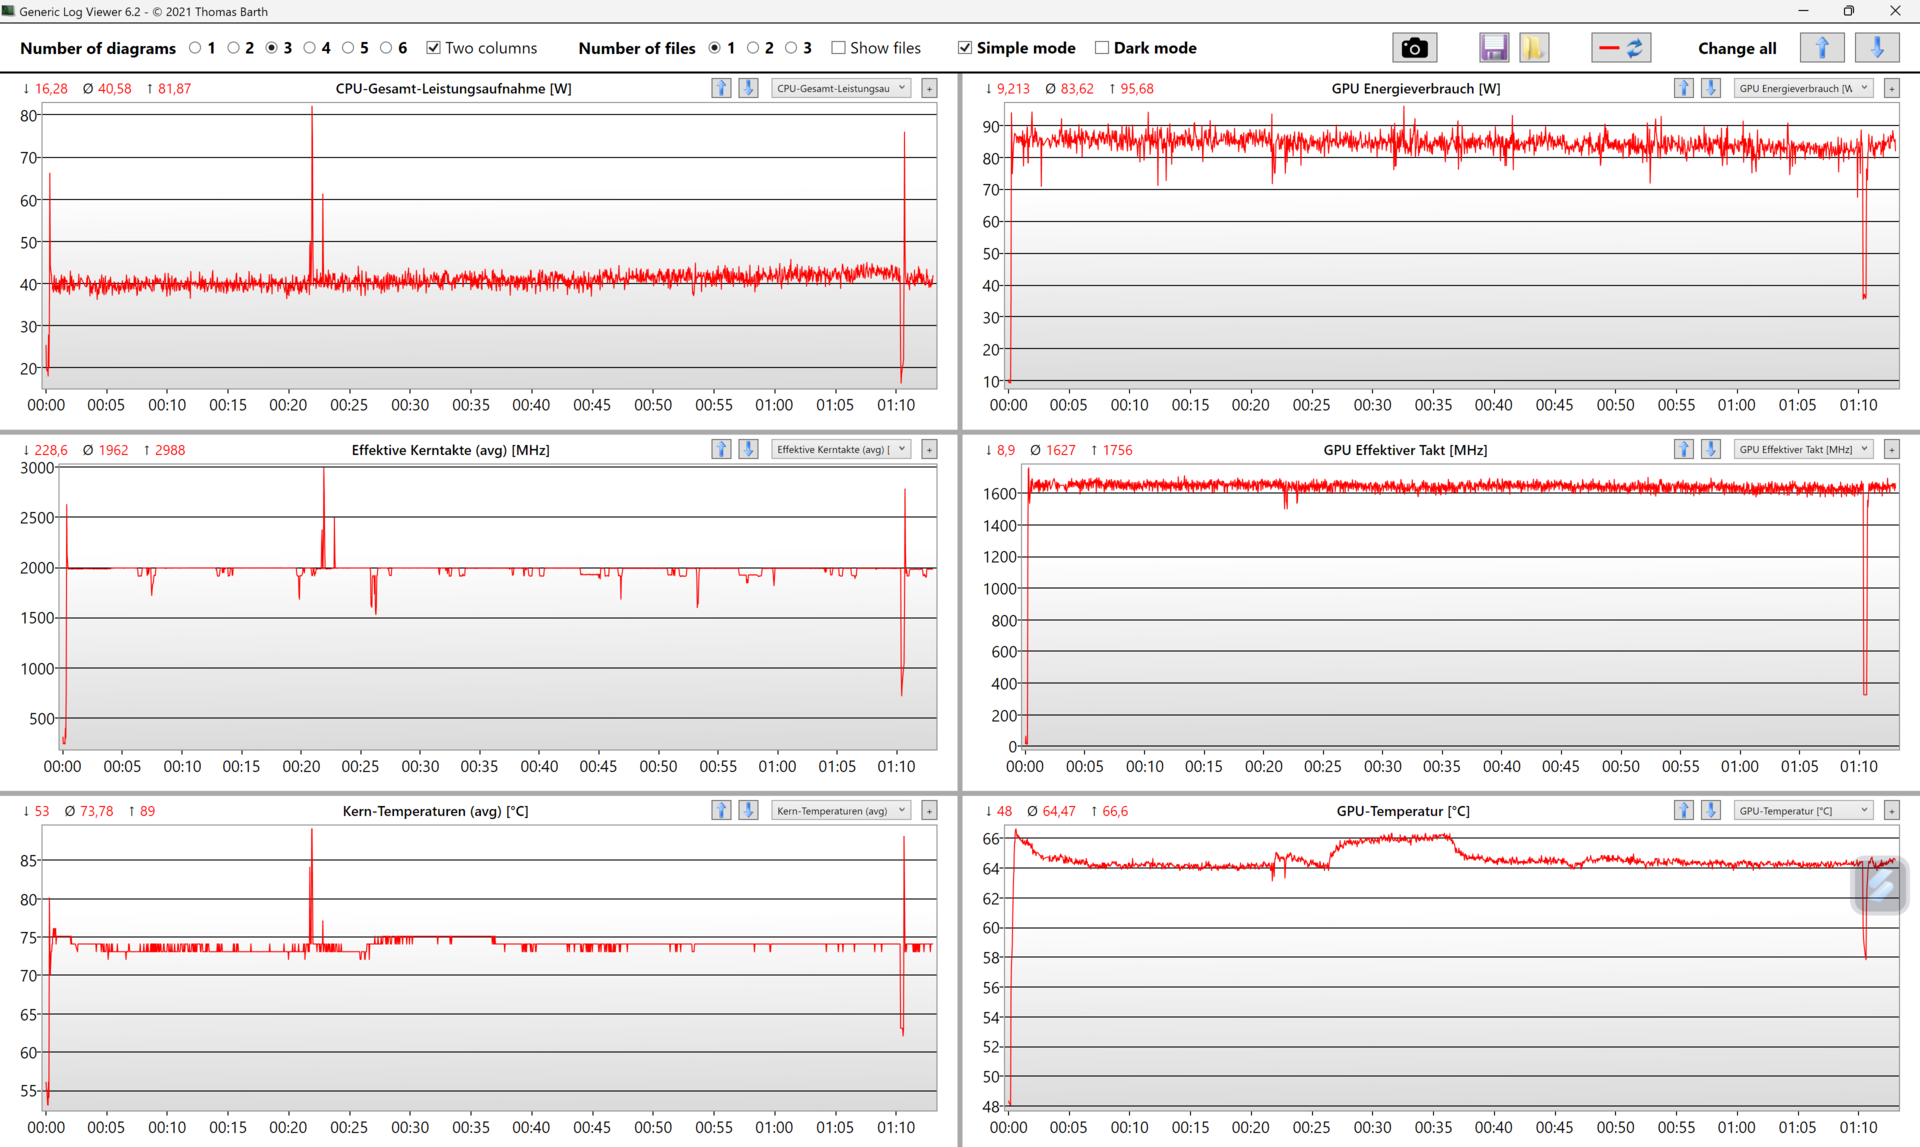
压力测试
Zenbook Pro 16X OLED在压力测试下能够持续保持高水平的性能。由于采用了翻转式键盘,从表面上看,这台工作室的笔记本电脑能够不断散去其运行的热量。40瓦的处理器功率和大约84瓦的显卡功率确保了处理器和图形芯片的温度不会太高。在平均温度分别为75℃和65℃的情况下,Zenbook很可能对这两个芯片造成更大的压力。但根据日志分析,这里的整体性能受到了能耗的限制。华硕似乎在这里设定了具体的数值,CPU-GPU的综合性能约为140瓦。
发言人
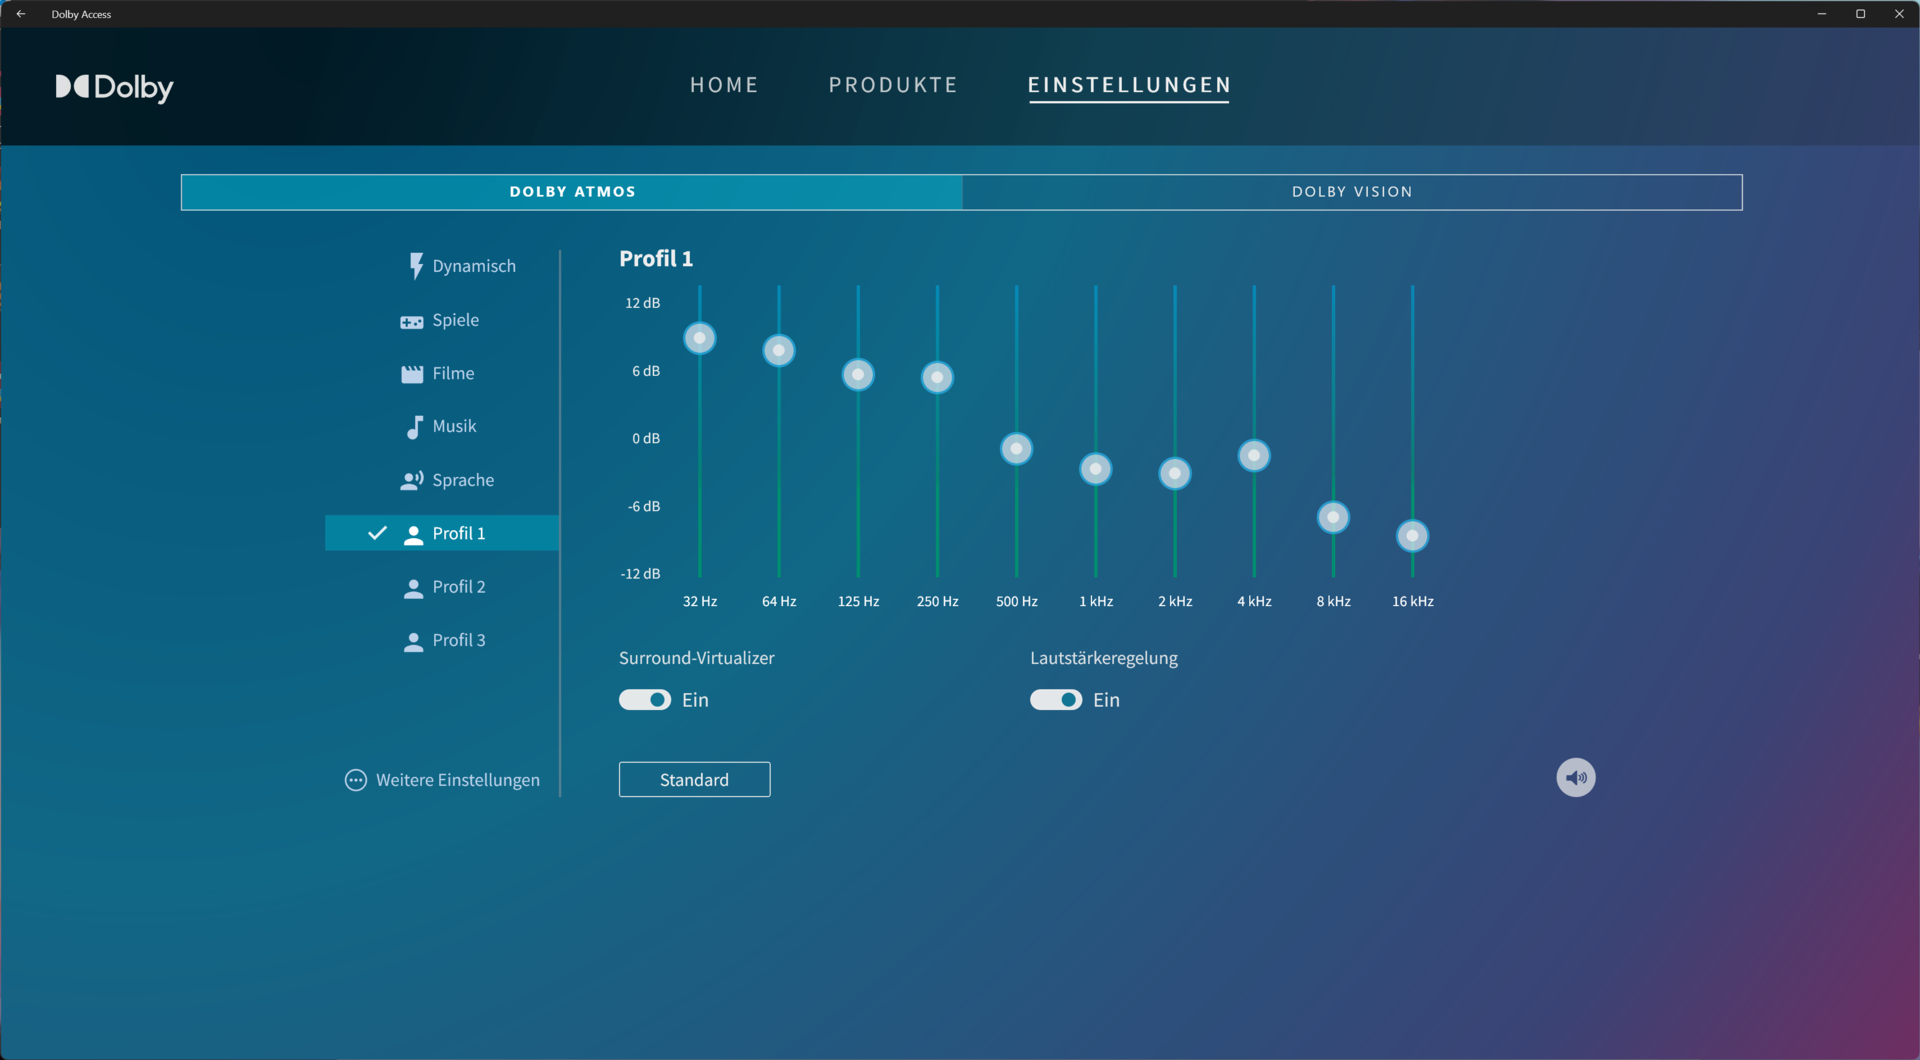
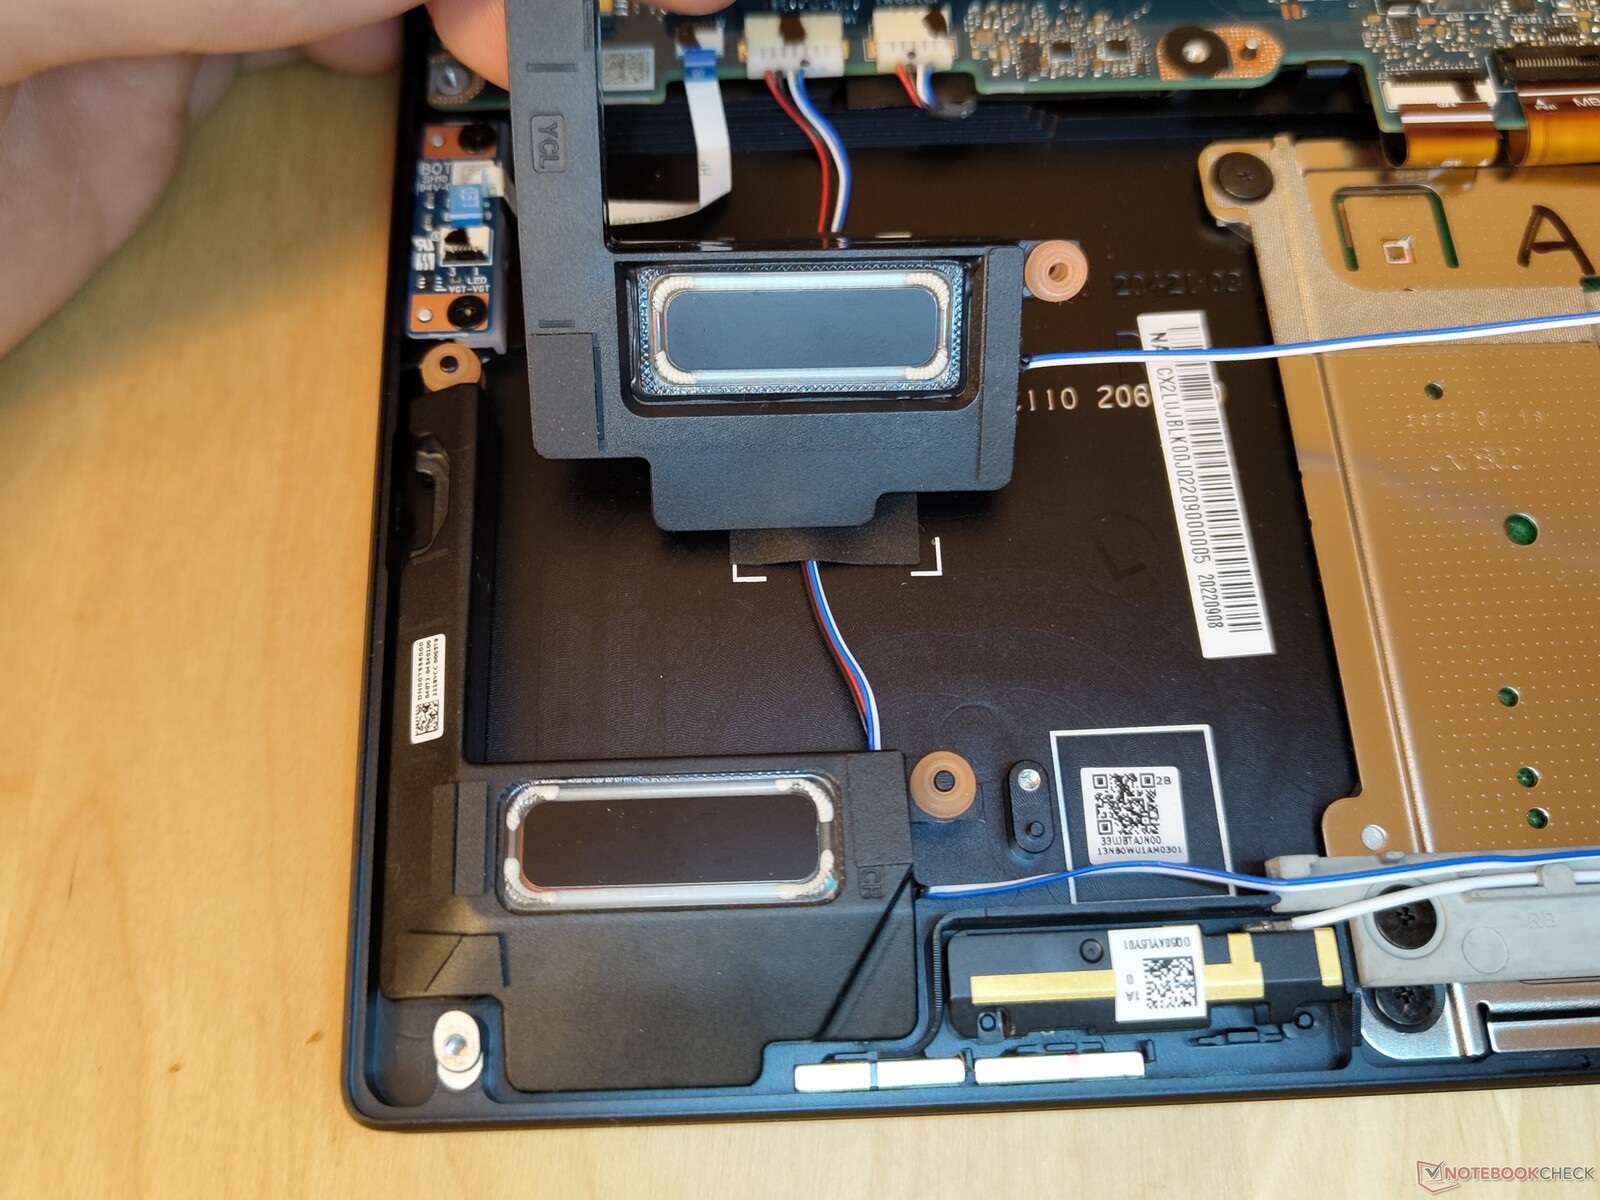
华硕Zenbook Pro 16X OLED中安装了六个扬声器。键盘的左右两边是笔记本电脑的高音喇叭。在底座上,还有两对用于中音和低音的扬声器,分别朝上和朝下,形成了良好的声音体验。同时,这款笔记本电脑也可以达到94.7 dB(A)的真正音量,而不会出现音频质量明显下降的情况。不建议将音量调到最大,因为低频会变得有点太弱。在最大音量的80%时,笔记本的音量仍然足以淹没其风扇。在Zenbook上还有各种杜比全景声设置,这可以对听觉体验产生积极的影响。总而言之,华硕设备总体上提供了令人印象深刻的音质。
Asus ZenBook Pro 16X OLED UX7602ZM-ME115W audio analysis
(+) | speakers can play relatively loud (94.7 dB)
Bass 100 - 315 Hz
(-) | nearly no bass - on average 16% lower than median
(±) | linearity of bass is average (7.9% delta to prev. frequency)
Mids 400 - 2000 Hz
(+) | balanced mids - only 1.8% away from median
(+) | mids are linear (3.8% delta to prev. frequency)
Highs 2 - 16 kHz
(±) | higher highs - on average 6.2% higher than median
(+) | highs are linear (2.8% delta to prev. frequency)
Overall 100 - 16.000 Hz
(+) | overall sound is linear (13.3% difference to median)
Compared to same class
» 28% of all tested devices in this class were better, 4% similar, 68% worse
» The best had a delta of 5%, average was 17%, worst was 45%
Compared to all devices tested
» 14% of all tested devices were better, 3% similar, 83% worse
» The best had a delta of 4%, average was 23%, worst was 134%
Corsair Voyager a1600 audio analysis
(-) | not very loud speakers (69 dB)
Bass 100 - 315 Hz
(±) | reduced bass - on average 10.2% lower than median
(±) | linearity of bass is average (13.7% delta to prev. frequency)
Mids 400 - 2000 Hz
(±) | higher mids - on average 7.8% higher than median
(±) | linearity of mids is average (7% delta to prev. frequency)
Highs 2 - 16 kHz
(+) | balanced highs - only 1.8% away from median
(±) | linearity of highs is average (11.4% delta to prev. frequency)
Overall 100 - 16.000 Hz
(±) | linearity of overall sound is average (25.5% difference to median)
Compared to same class
» 91% of all tested devices in this class were better, 2% similar, 7% worse
» The best had a delta of 6%, average was 18%, worst was 132%
Compared to all devices tested
» 78% of all tested devices were better, 4% similar, 17% worse
» The best had a delta of 4%, average was 23%, worst was 134%
电源管理--巨大的电池提供耐力
消耗功率
Zenbook很少满负荷地运行其200瓦的电源。在各种能量测量测试中,Witcher 3 ,197瓦是记录的最高耗电水平。一般来说,硬件越强大,需要的能量就越多。因此,我们为华硕笔记本电脑测量的数值属于其性能等级的相应范围。最多,该笔记本在空闲模式下的消耗率略高。
| Off / Standby | |
| Idle | |
| Load |
|
Key:
min: | |
| Asus ZenBook Pro 16X OLED UX7602ZM-ME115W i9-12900H, GeForce RTX 3060 Laptop GPU, Samsung PM9A1 MZVL21T0HCLR, OLED, 3840x2400, 16" | Lenovo ThinkPad X1 Extreme G5-21DE003RGE i7-12700H, GeForce RTX 3060 Laptop GPU, Micron 3400 1TB MTFDKBA1T0TFH, IPS, 3840x2400, 16" | HP Omen 16-n0033dx R7 6800H, Radeon RX 6650M, Samsung PM9A1 MZVL21T0HCLR, IPS, 1920x1080, 16.1" | HP ZBook Studio 16 G9 62U04EA i7-12800H, RTX A2000 Laptop GPU, Micron 3400 1TB MTFDKBA1T0TFH, IPS, 3840x2400, 16" | Corsair Voyager a1600 R9 6900HS, Radeon RX 6800M, Samsung PM9A1 MZVL22T0HBLB, IPS, 2560x1600, 16" | Asus VivoBook Pro 16X OLED N7600PC-L2026X i7-11370H, GeForce RTX 3050 4GB Laptop GPU, Intel Optane Memory H10 with Solid State Storage 32GB + 512GB HBRPEKNX0202A(L/H), OLED, 3840x2400, 16" | Average NVIDIA GeForce RTX 3060 Laptop GPU | Average of class Multimedia | |
|---|---|---|---|---|---|---|---|---|
| Power Consumption | -29% | -7% | -1% | -46% | 26% | -11% | 34% | |
| Idle Minimum * (Watt) | 11.1 | 11.8 -6% | 7.9 29% | 7.2 35% | 16.9 -52% | 8.9 20% | 10.4 ? 6% | 5.66 ? 49% |
| Idle Average * (Watt) | 11.4 | 22.4 -96% | 11.5 -1% | 18.1 -59% | 20.3 -78% | 10.2 11% | 14.5 ? -27% | 10.2 ? 11% |
| Idle Maximum * (Watt) | 14.4 | 23.1 -60% | 18.3 -27% | 18.5 -28% | 22.2 -54% | 12 17% | 21.4 ? -49% | 12.5 ? 13% |
| Load Average * (Watt) | 137.4 | 138 -0% | 88.1 36% | 112.8 18% | 133.4 3% | 94 32% | 109.3 ? 20% | 65.2 ? 53% |
| Witcher 3 ultra * (Watt) | 136 | 129.9 4% | 206 -51% | 106.7 22% | 206 -51% | 93.1 32% | ||
| Load Maximum * (Watt) | 197 | 225.6 -15% | 246.4 -25% | 186 6% | 112 43% | 206 ? -5% | 113.5 ? 42% |
* ... smaller is better
Power consumption Witcher 3 / Stress test
Power consumption with an external monitor
电池寿命
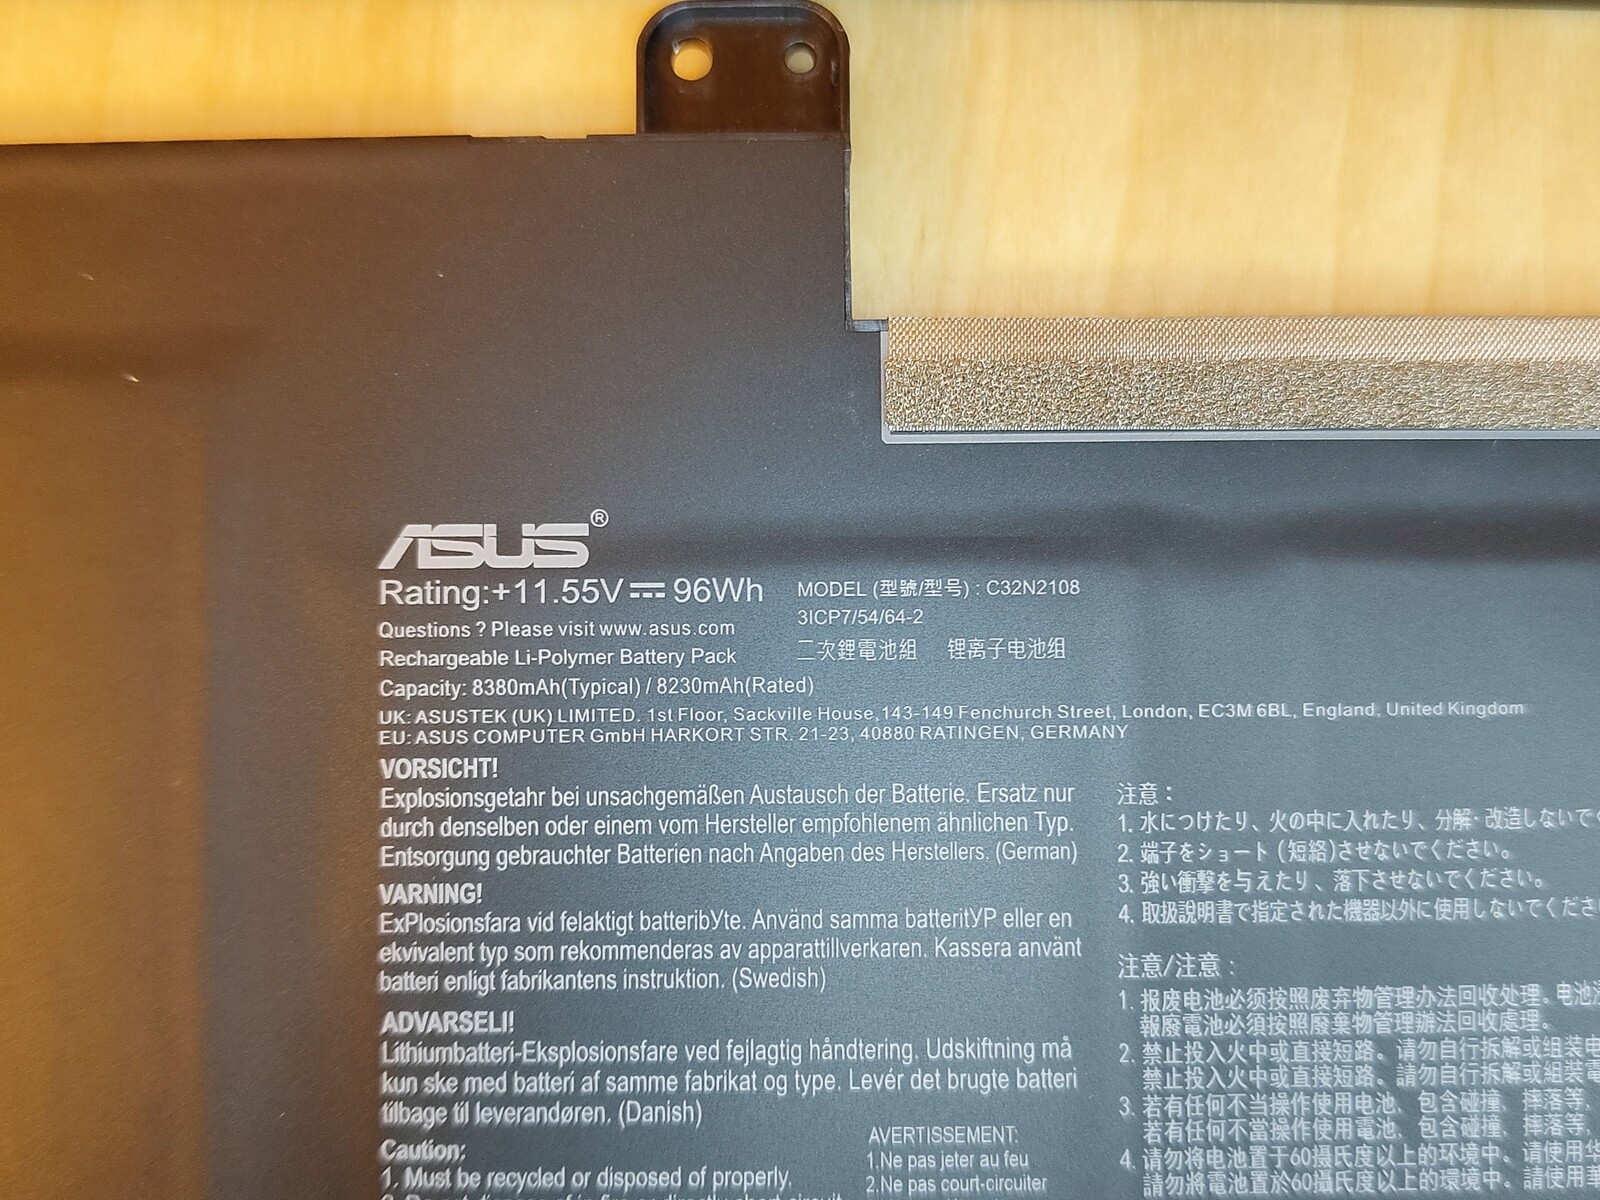
华硕Zenbook在电池寿命方面非常强大。一台笔记本电脑的电池最大可以有100瓦时,而Zenbook有96瓦时。因此,华硕的工作室笔记本电脑在所有的电池测试中都领先于其竞争对手。相较于 华硕Vivobook Pro 16X OLED,Zenbook在硬件方面也要持久得多,略显现代。
| Asus ZenBook Pro 16X OLED UX7602ZM-ME115W i9-12900H, GeForce RTX 3060 Laptop GPU, 96 Wh | Lenovo ThinkPad X1 Extreme G5-21DE003RGE i7-12700H, GeForce RTX 3060 Laptop GPU, 90 Wh | HP Omen 16-n0033dx R7 6800H, Radeon RX 6650M, 68 Wh | HP ZBook Studio 16 G9 62U04EA i7-12800H, RTX A2000 Laptop GPU, 86 Wh | Corsair Voyager a1600 R9 6900HS, Radeon RX 6800M, 99 Wh | Asus VivoBook Pro 16X OLED N7600PC-L2026X i7-11370H, GeForce RTX 3050 4GB Laptop GPU, 96 Wh | Average of class Multimedia | |
|---|---|---|---|---|---|---|---|
| Battery runtime | -30% | -33% | -44% | -33% | -6% | 32% | |
| Reader / Idle (h) | 12.7 | 10 -21% | 7 -45% | 11.1 -13% | 24.9 ? 96% | ||
| WiFi v1.3 (h) | 8.9 | 6.7 -25% | 7 -21% | 6.3 -29% | 5.8 -35% | 8.7 -2% | 12.2 ? 37% |
| Load (h) | 2.6 | 1.7 -35% | 1.1 -58% | 1.1 -58% | 2.1 -19% | 2.5 -4% | 1.664 ? -36% |
| H.264 (h) | 7.3 | 8.5 | 6 | 17.1 ? |
Pros
Cons
评语 - 表现强劲,但潜力被浪费了
华硕现在经常推出具有不同寻常功能的笔记本电脑。Zenbook Pro 16X的翻转式键盘无疑是这些功能之一。如果需要的话,许多RGBW LED也很突出。AAS Ultra系统的功能比预期的要好。总的来说,这款笔记本电脑的概念很有趣,但它肯定可以做得更多。华硕对Zenbook的硬件进行了束缚,用试探性的性能控制不必要地降低了笔记本的速度。当然,Zenbook比许多竞争对手快,但日志结果显示,硬件仍有改进的余地。另一方面,人们可以肯定地说,这款笔记本电脑比,例如,类似的装备,要强得多,冷得多 联想ThinkPad X1 Extreme具有液态金属冷却功能。
华硕的笔记本电脑几乎是同类产品中的旗舰。高计算能力、真彩OLED显示屏、平衡的声音和良好的网络摄像头是该笔记本的一些优势。
我们在该设备中没有发现真正的批评点。相反,让我们烦恼的是一些小东西,如触摸板,它在寒冷的环境中拒绝正常工作,或者亚像素矩阵,它在全亮度下变得很明显。键盘和底座之间的缝隙中聚集的灰尘也令人恼火,因为你几乎无法将其清理干净。归根结底,购买Zenbook是一个品味和金钱的问题。毕竟,许多笔记本电脑以类似或更低的价格提供类似的性能。比如说 Vivobook Pro 16X OLED 在类似的配置变体中要便宜500美元。那些寻找更专业的笔记本电脑的人将在 惠普ZBook Studio或 微星CreatorPro.两者都有Nvidia的专业显卡,并安装了特殊的驱动程序。
价格和可用性
在美国,配备32GB内存的华硕Zenbook Pro 16X OLED目前在亚马逊上以2.999,00美元上市。.
Asus ZenBook Pro 16X OLED UX7602ZM-ME115W
- 12/13/2022 v7 (old)
Marc Herter
Price comparison

