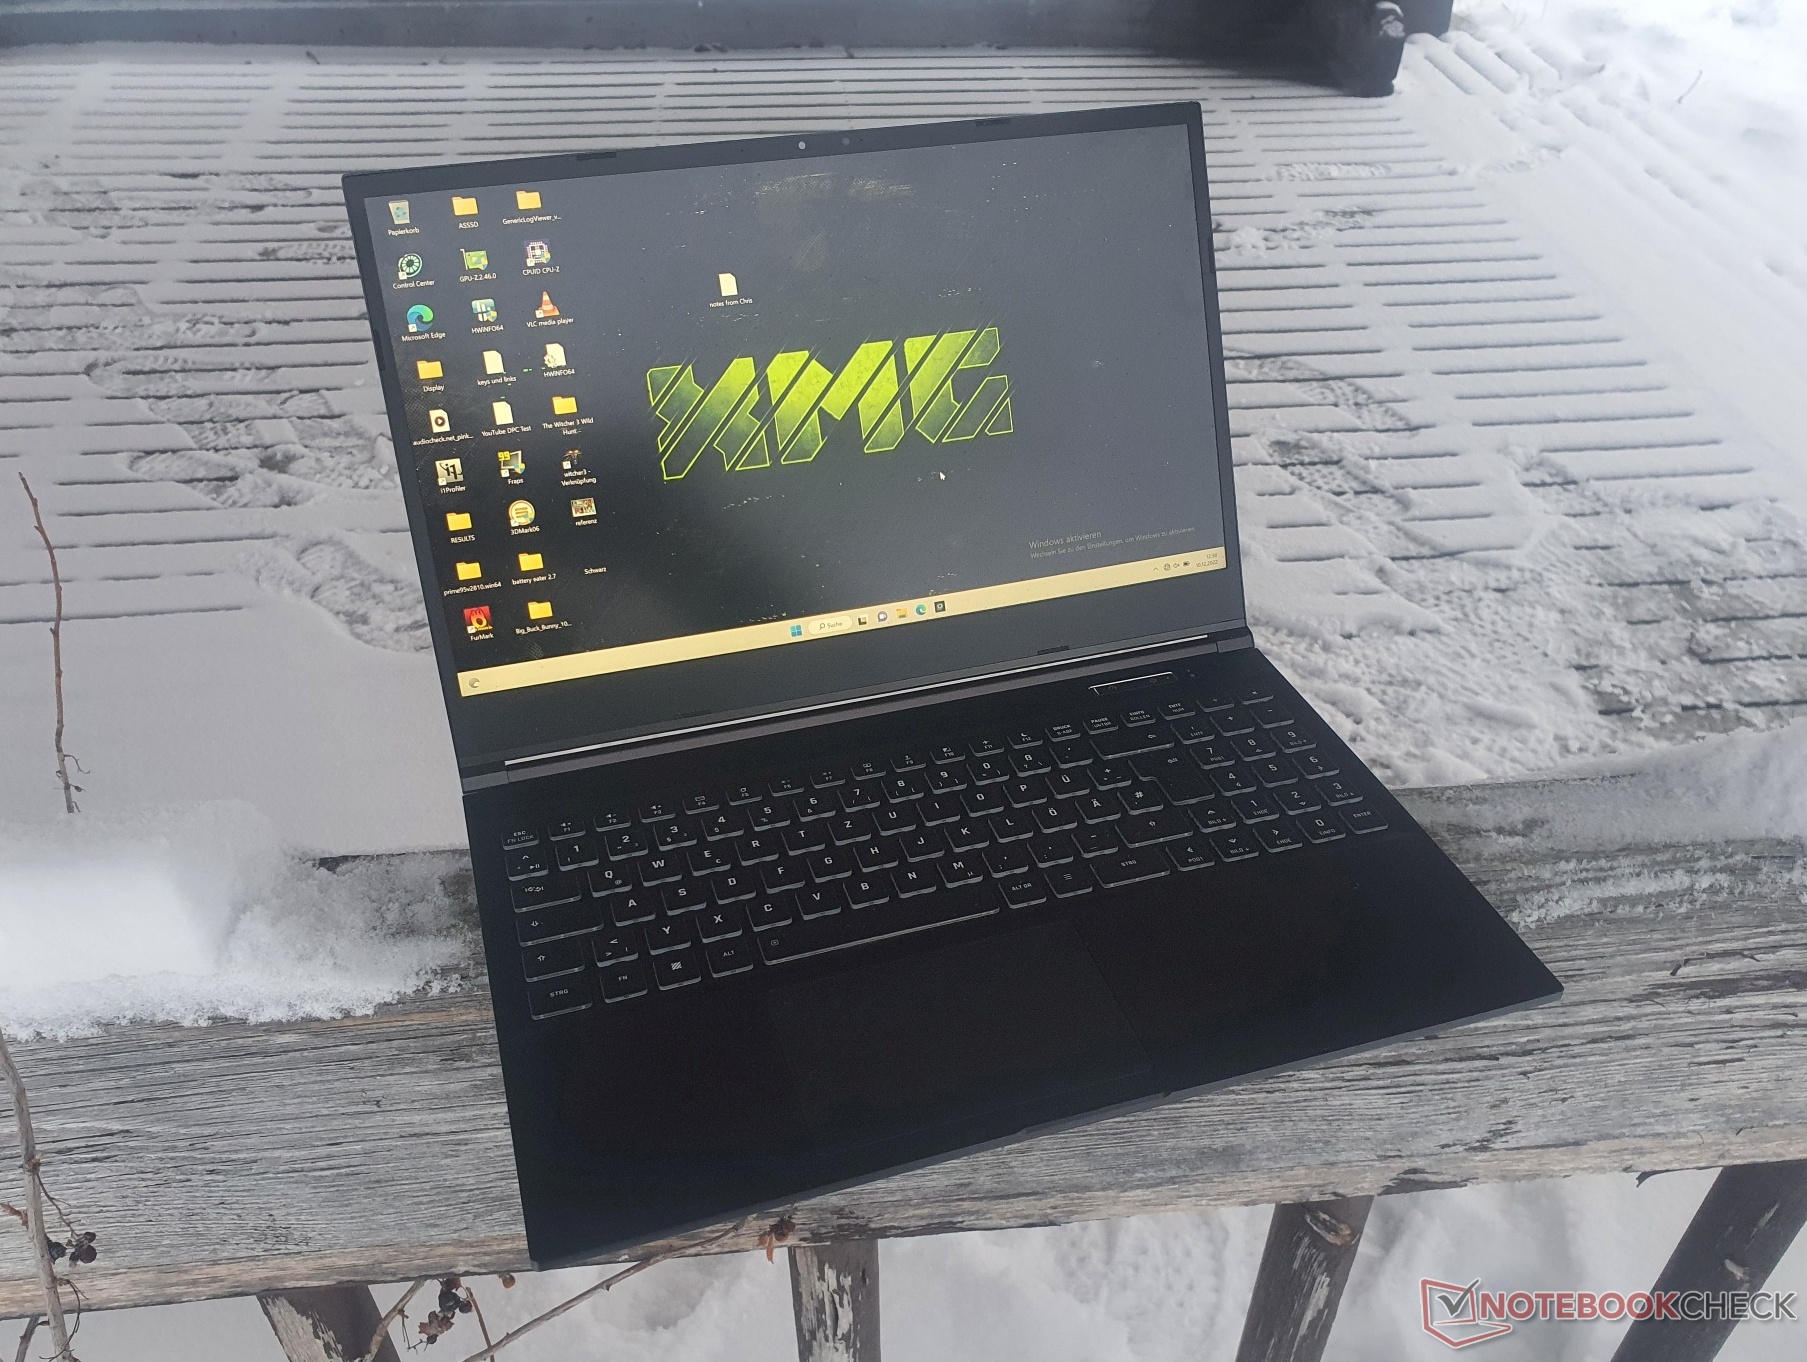
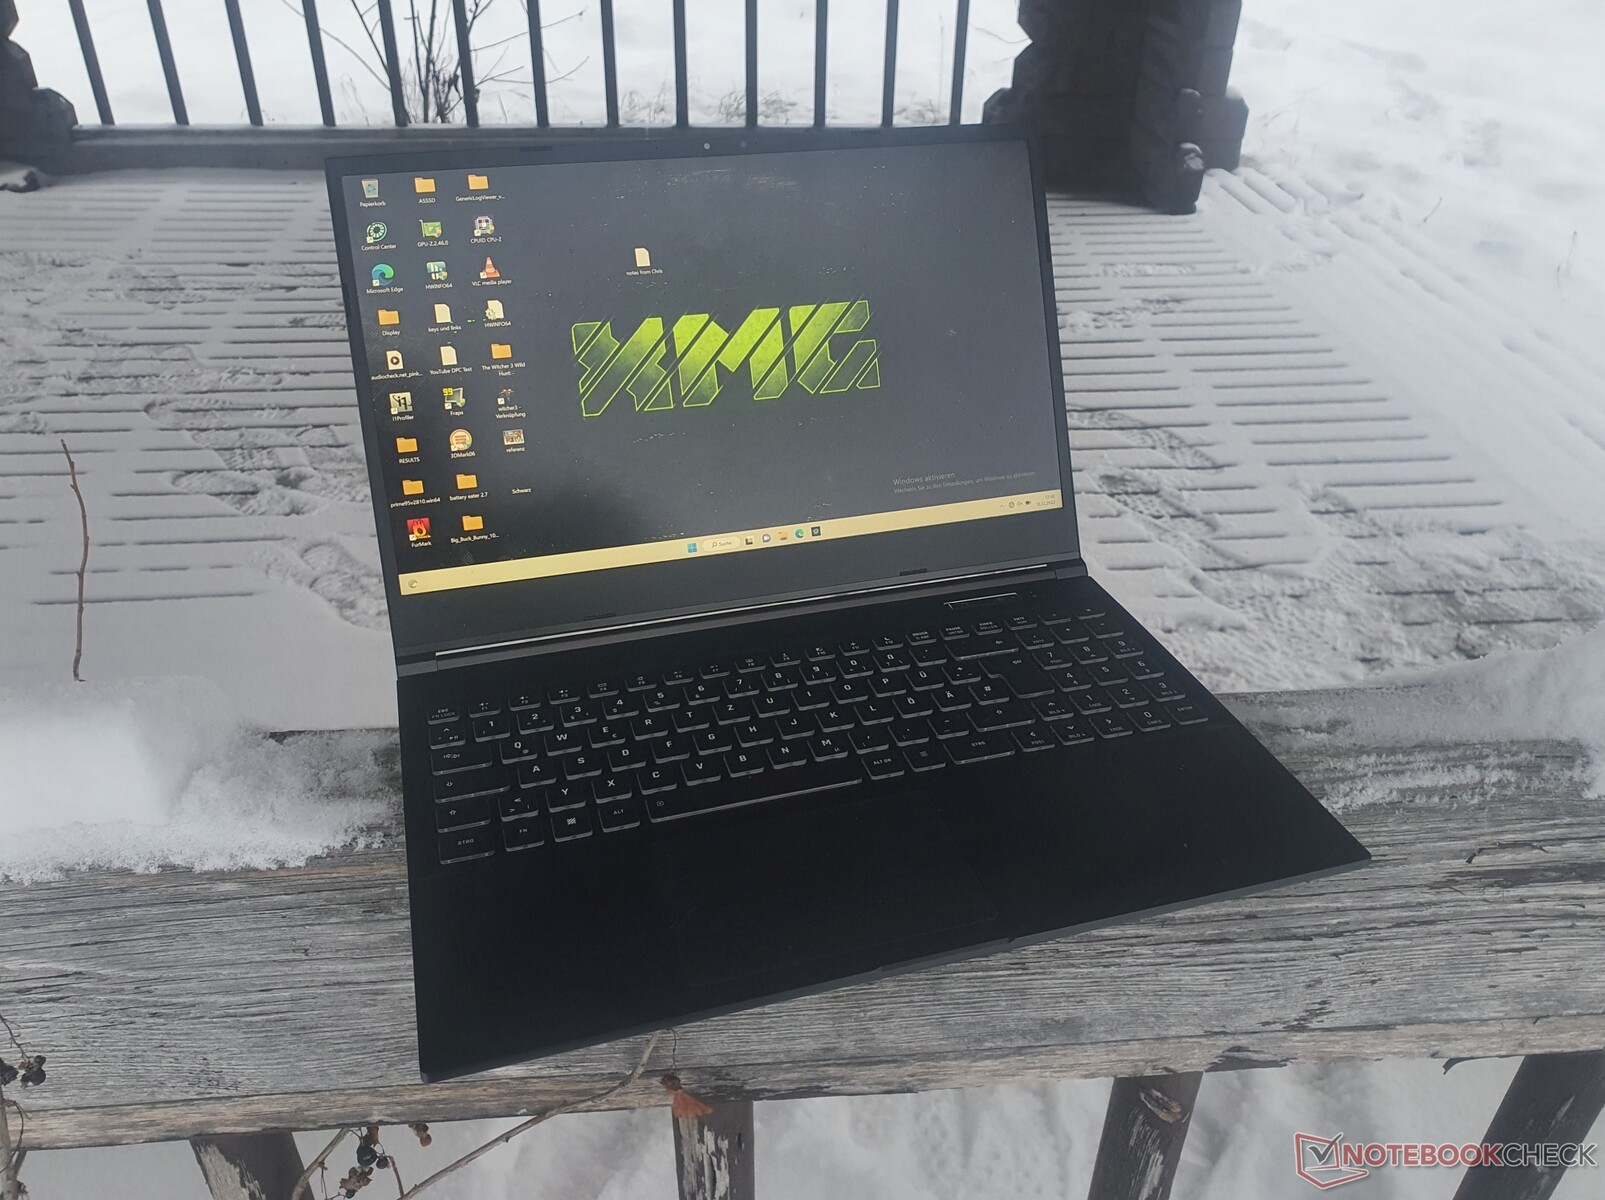
申克XMG Core 15 M22的回顾。水路连接的游戏中音
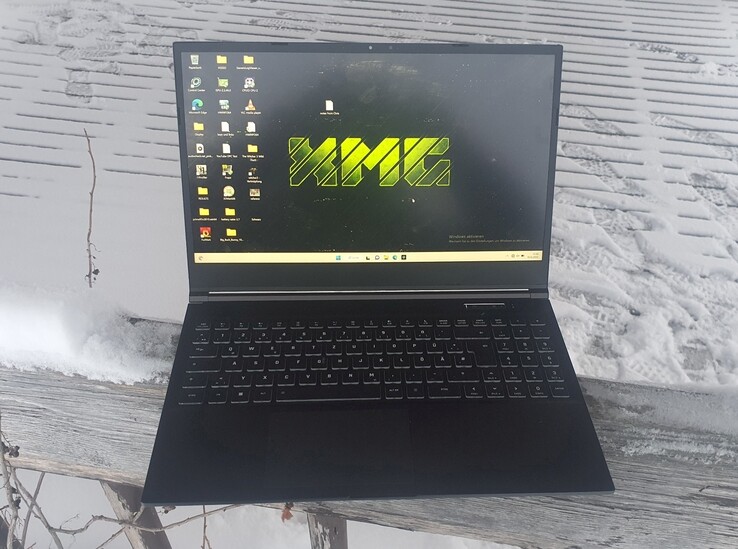
申克公司将提供一个强大的中上层游戏笔记本电脑作为其目标,推出了XMG Core 15(M22)。因此,这不仅提供了Nvidia的最大140 W TGP GeForce RTX 3060包括MUX开关,而且还提供了快速的AMD Ryzen 7 6800H.
你可以得到一个165赫兹的快速WQHD面板,以及支持外部水冷,否则只用于申克的绝对上层,我们已经看到,例如在 XMG Neo 15我们已经在XMG Neo 15中看到了这一点,我们已经对其进行了详细的测试。所有这些都可以以1817欧元(约1935美元)的价格获得。Core 15的排名介于 Apex 15和Neo 15之间。
在中端市场上有很多竞争,例如华硕的TUF Gaming F15,联想的 Legion 5和 Alienware m15.XMG自己的Fusion 15在我们的比较中也很有意思。
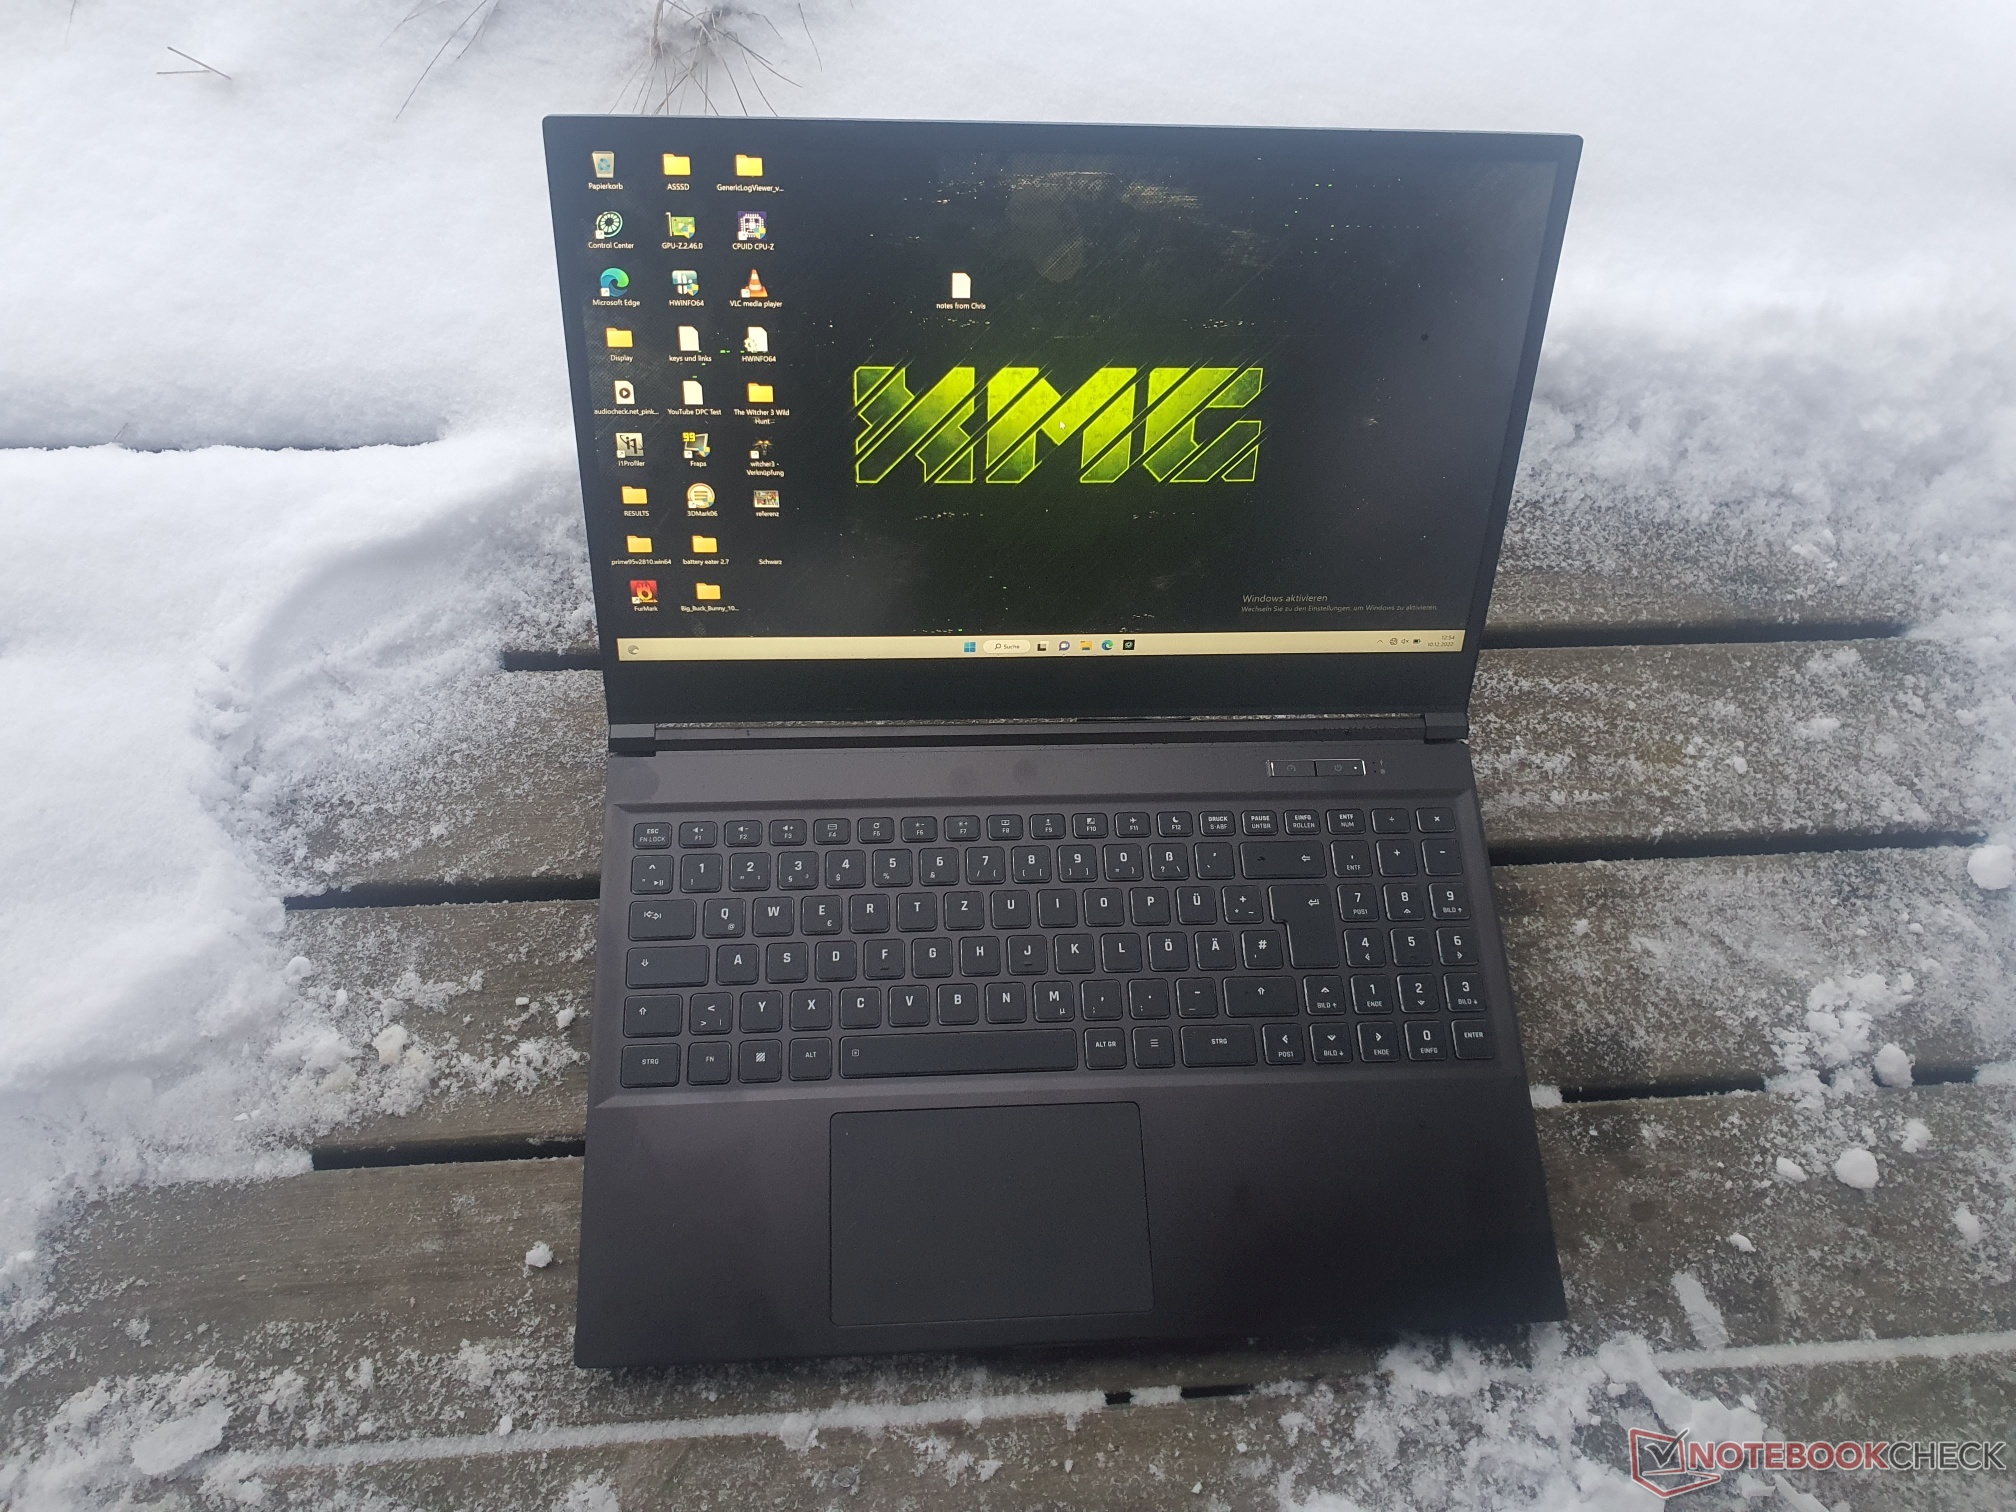
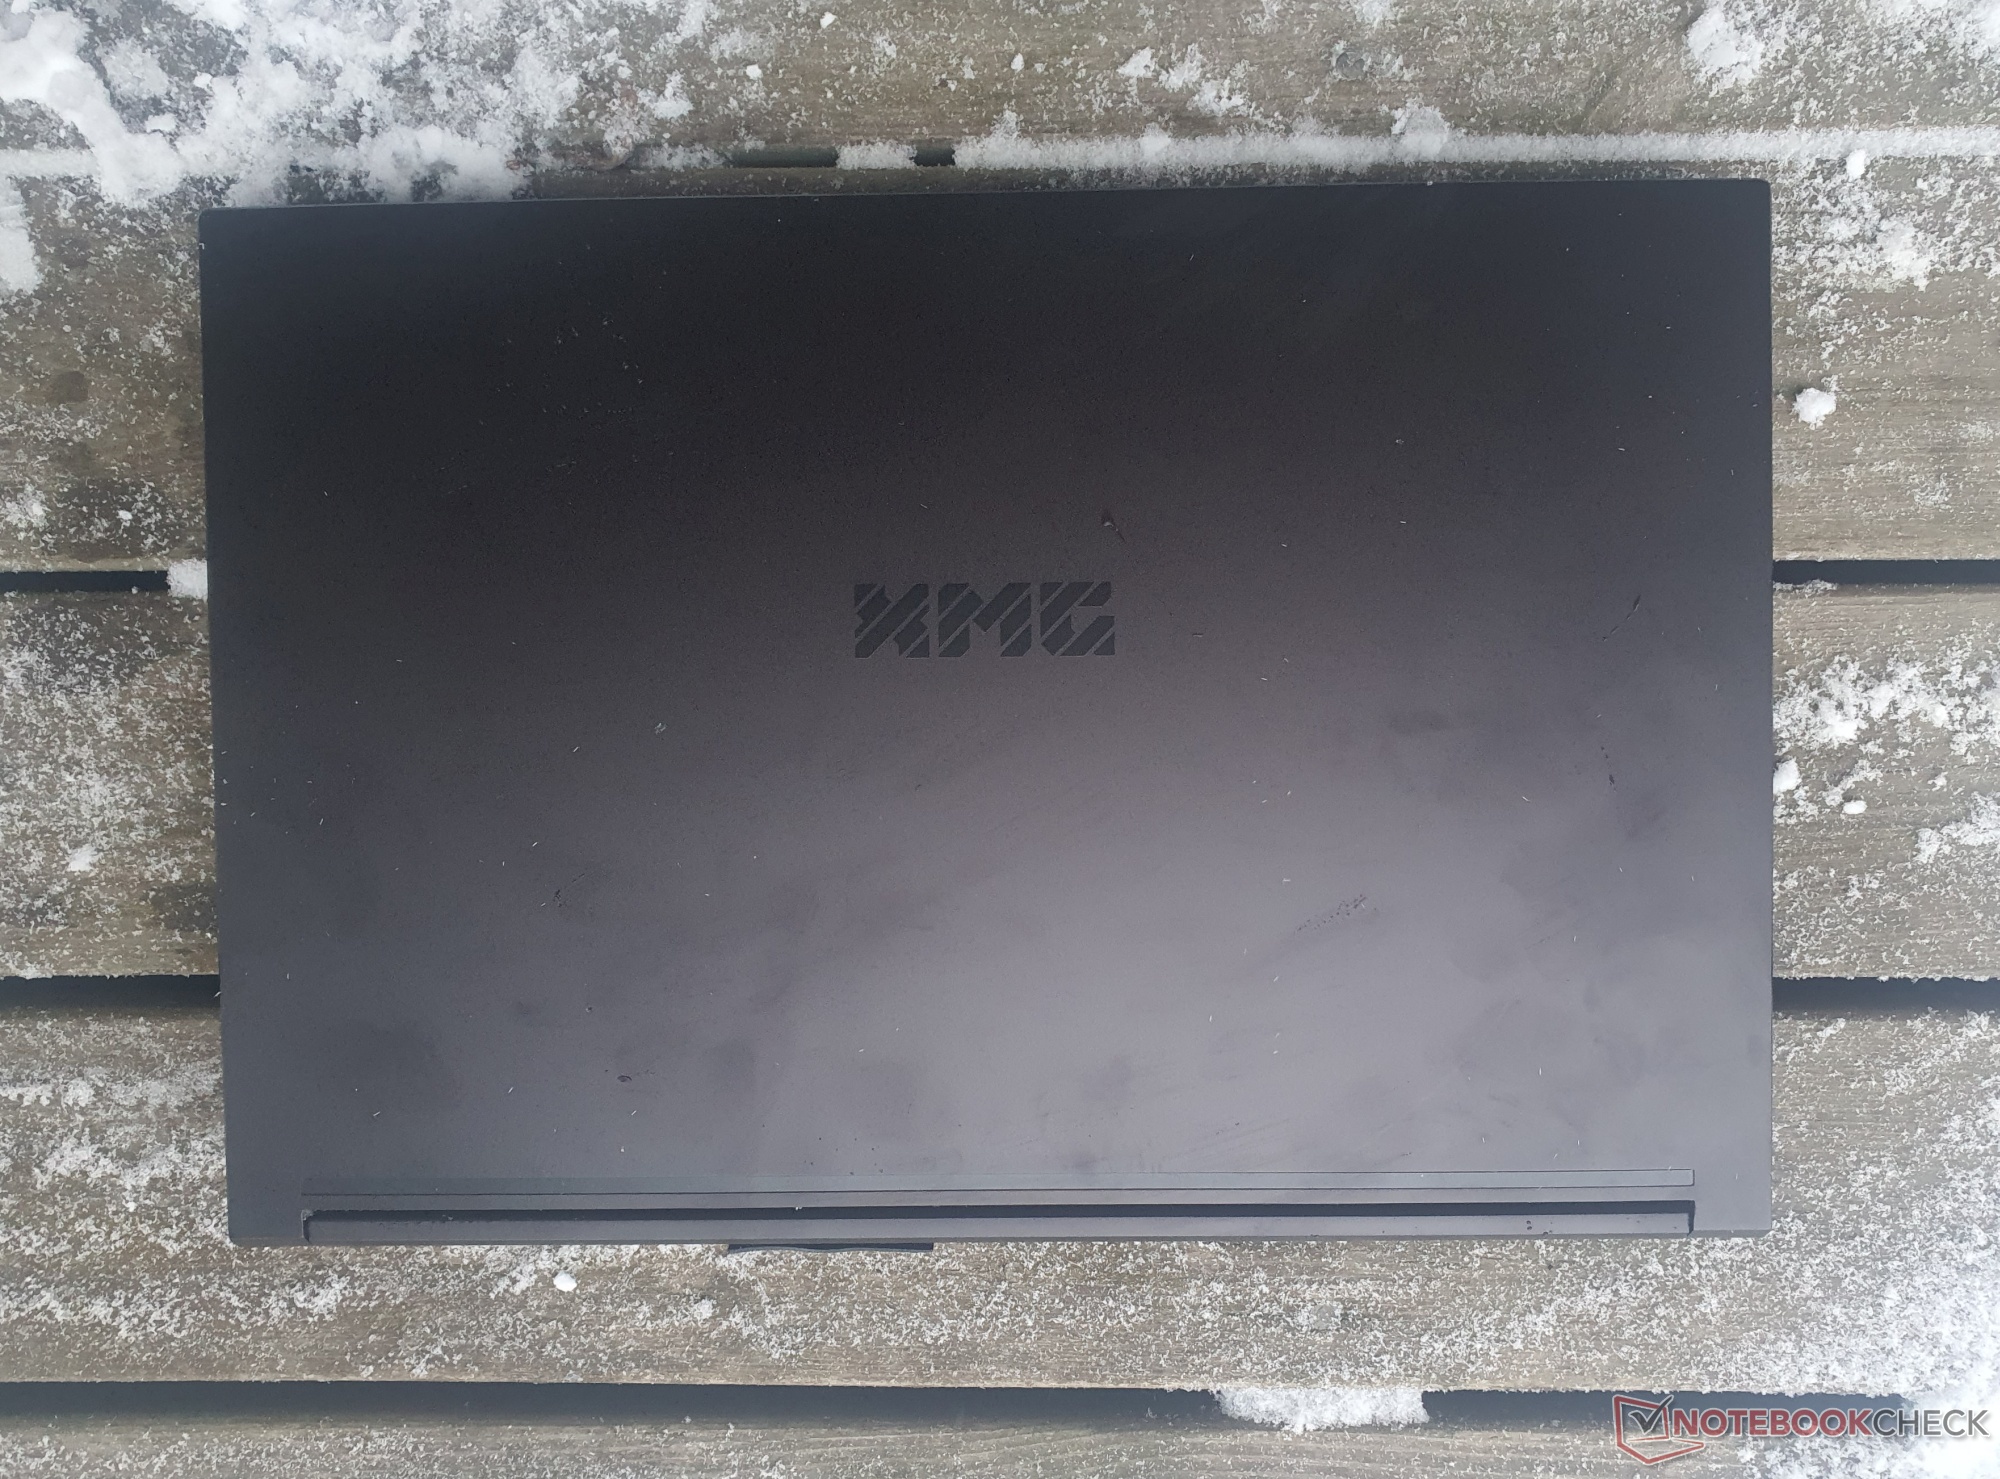
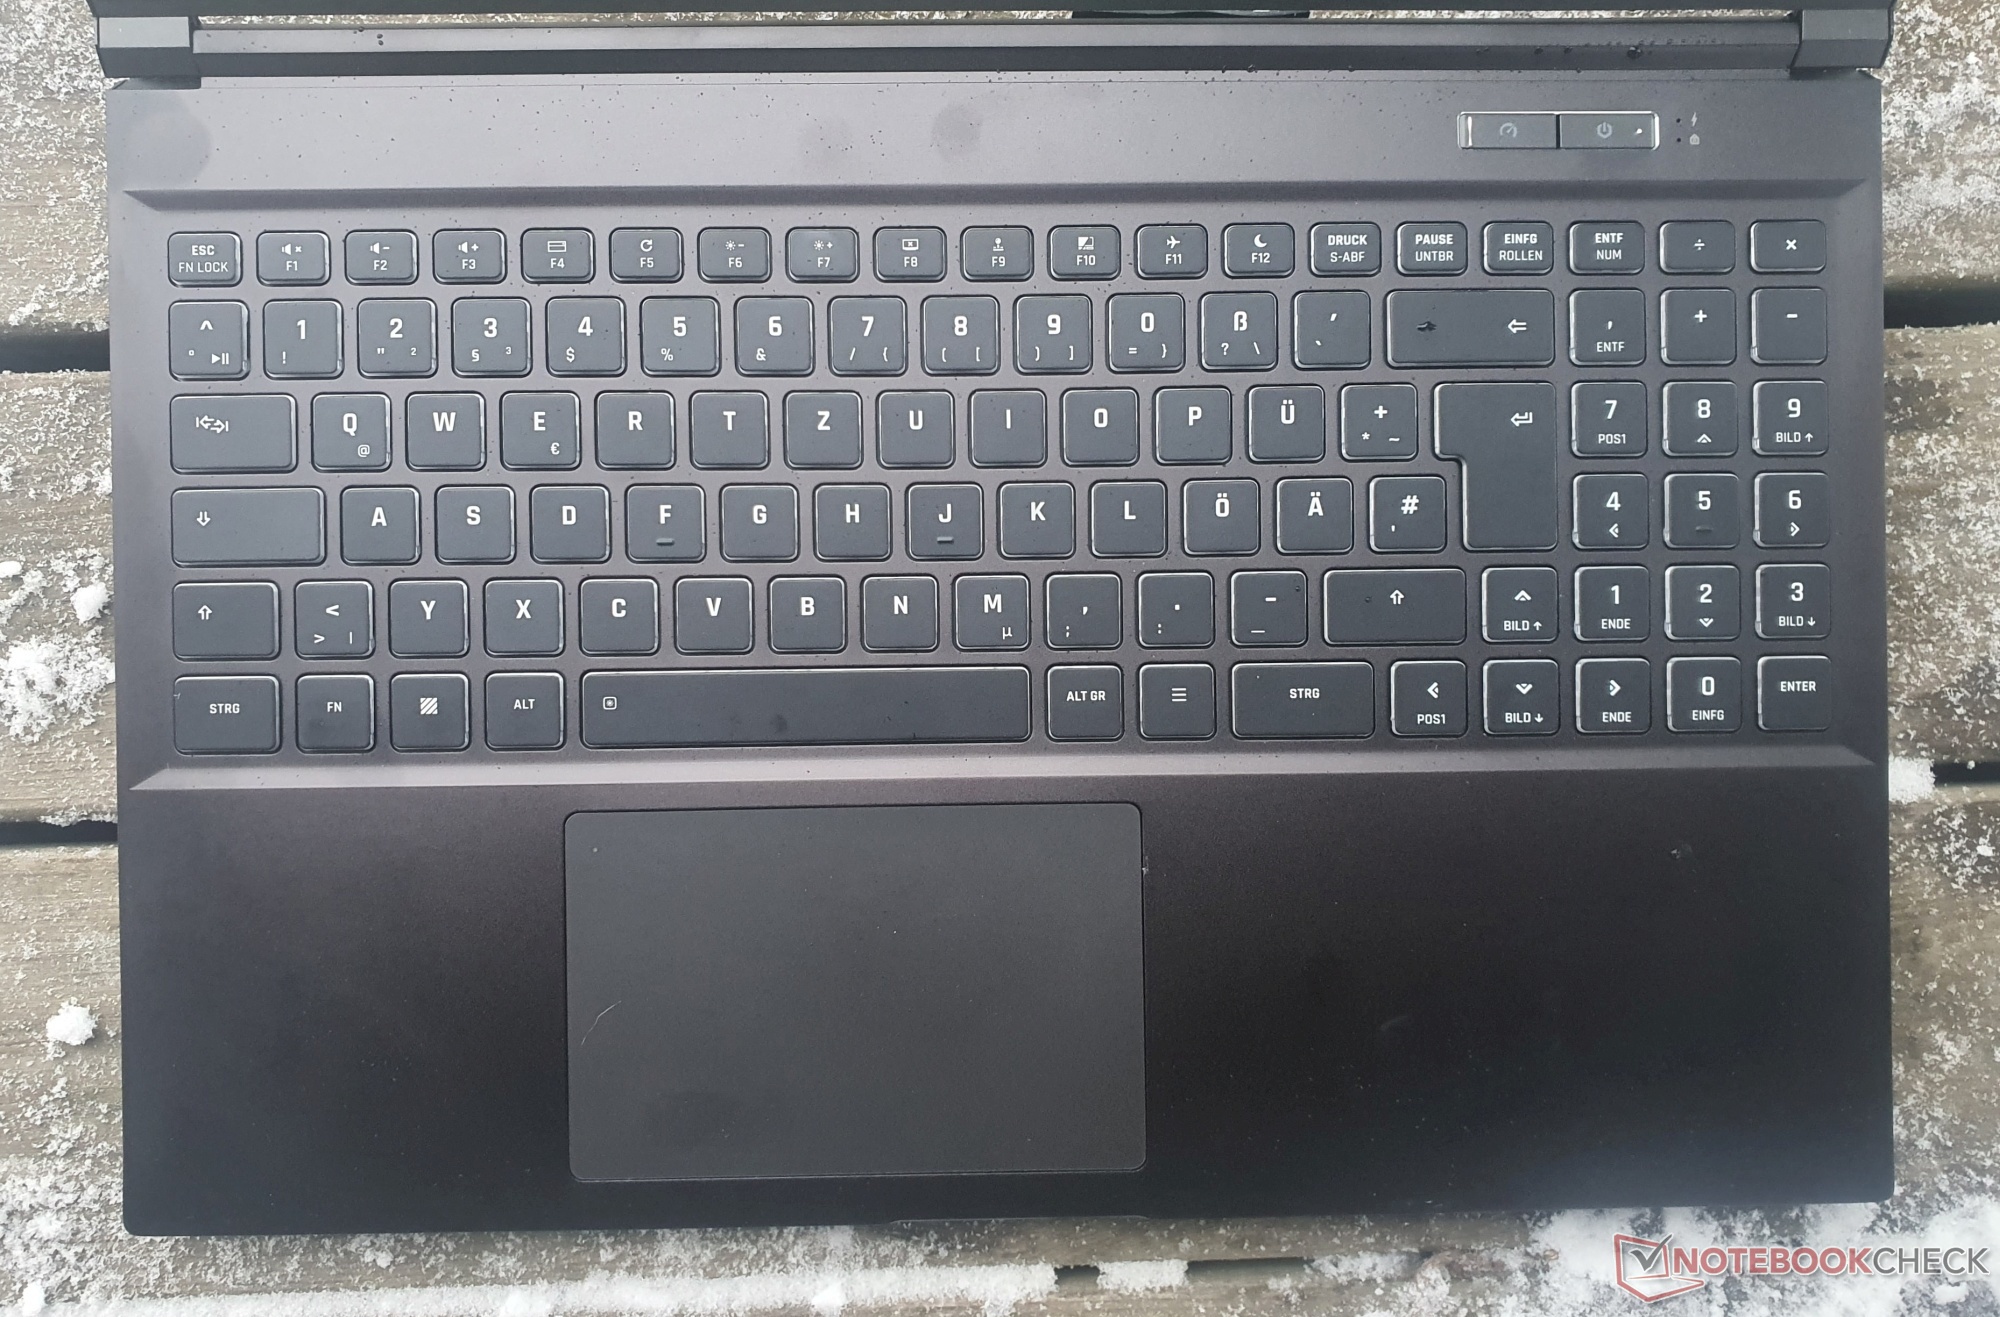
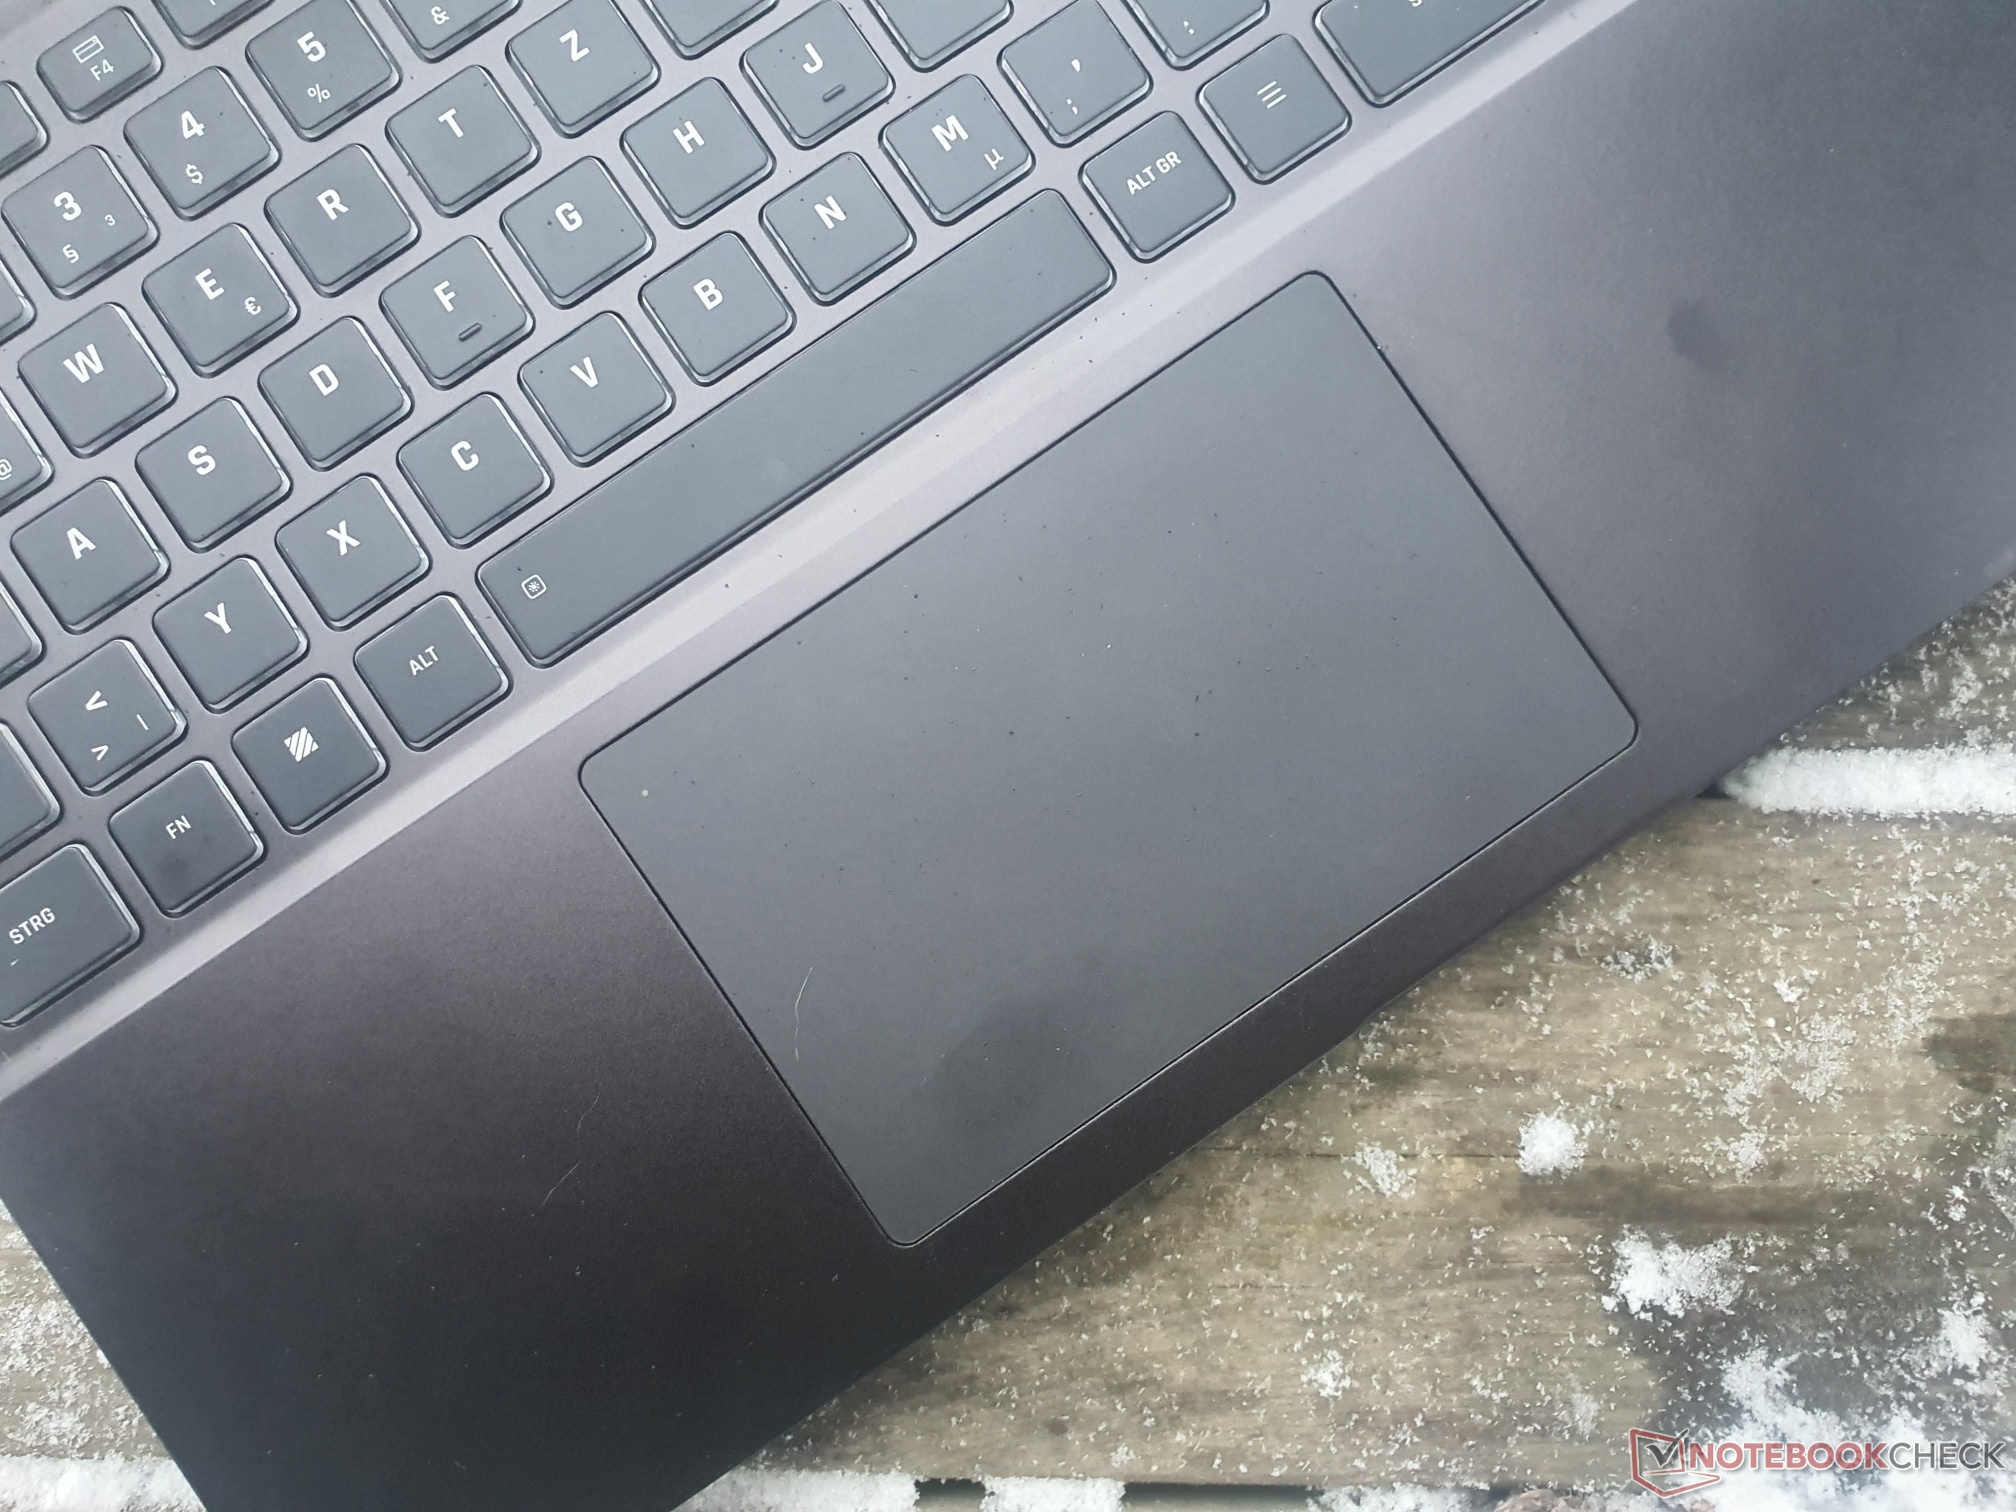
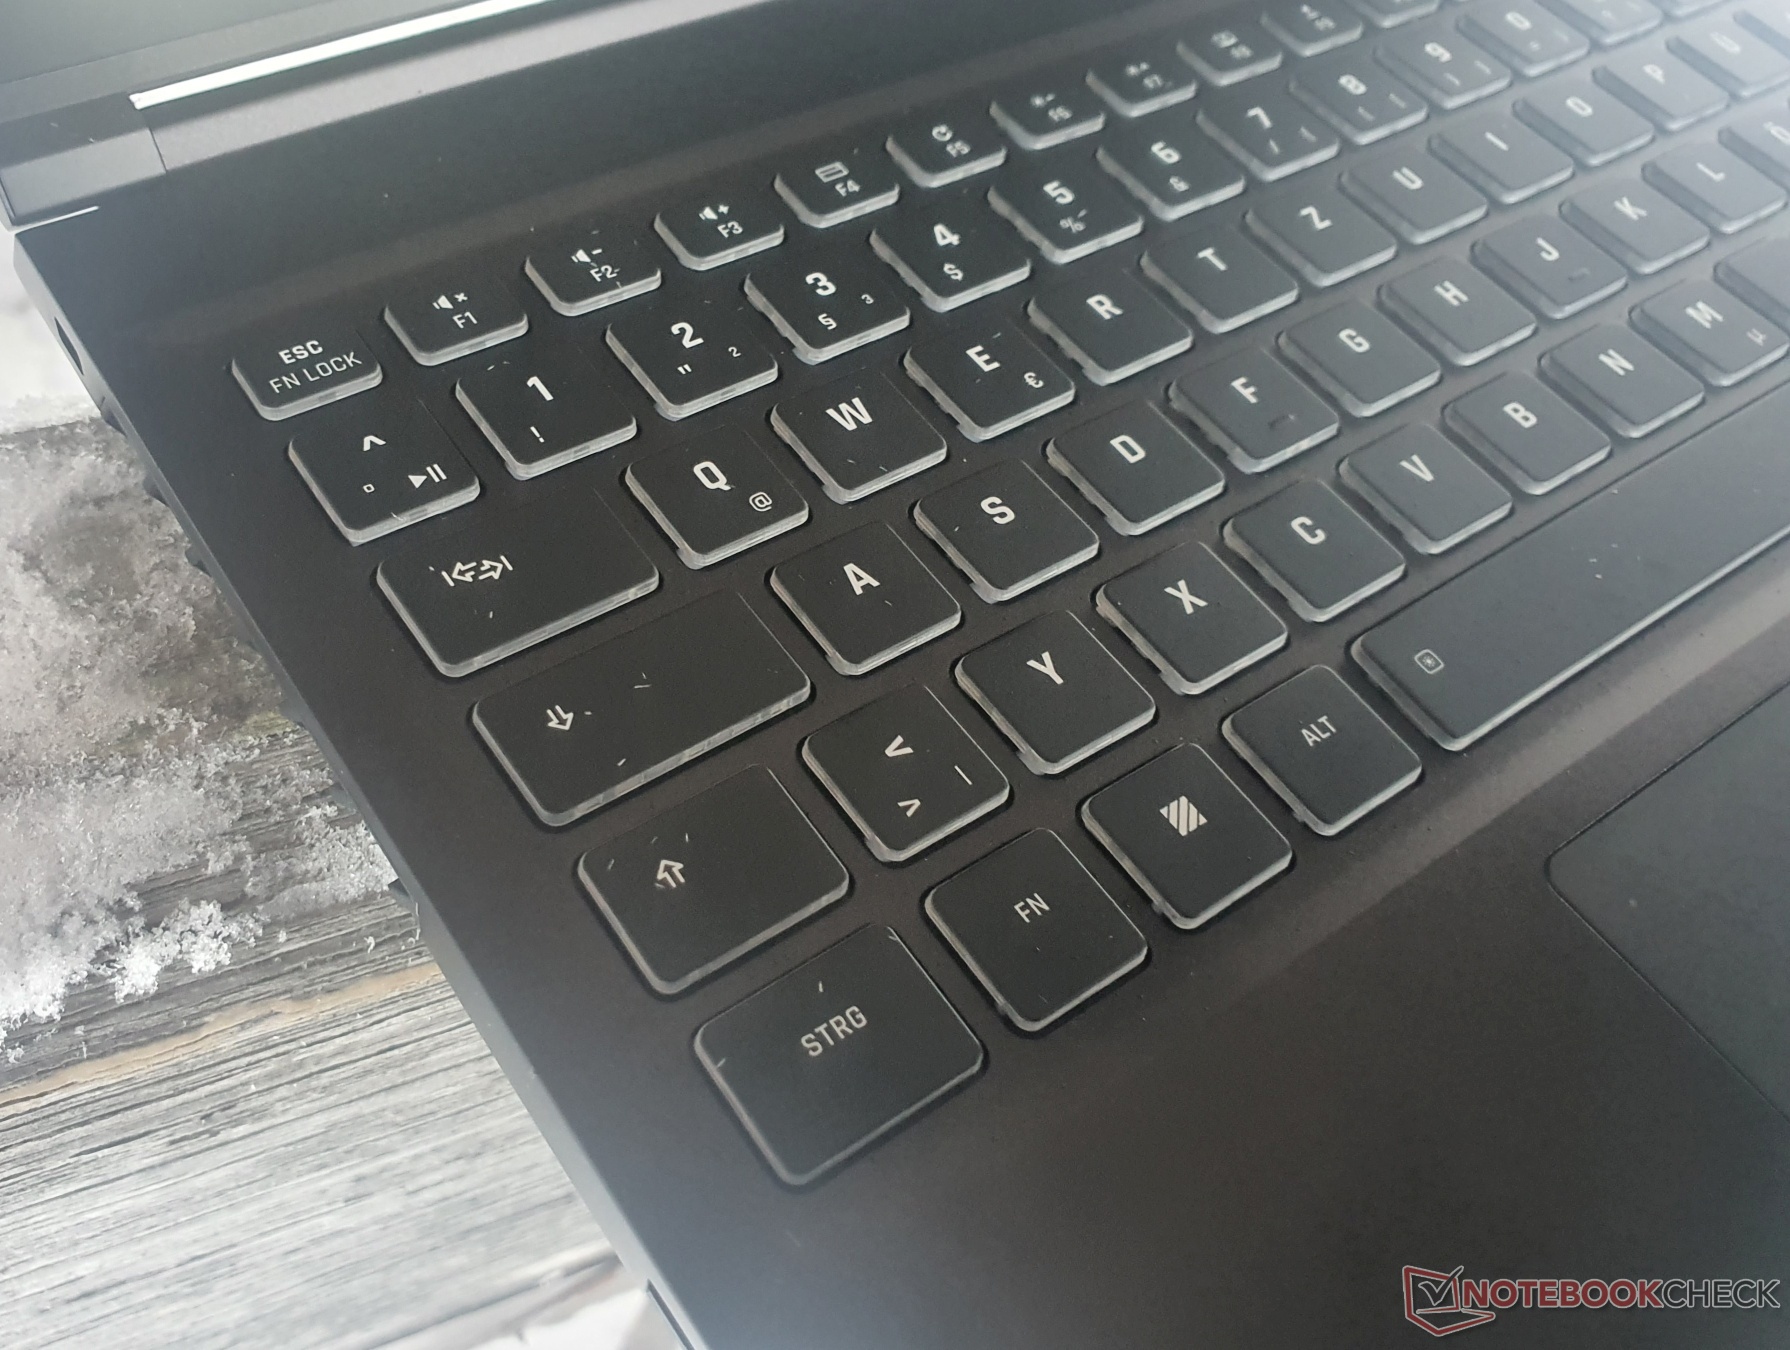
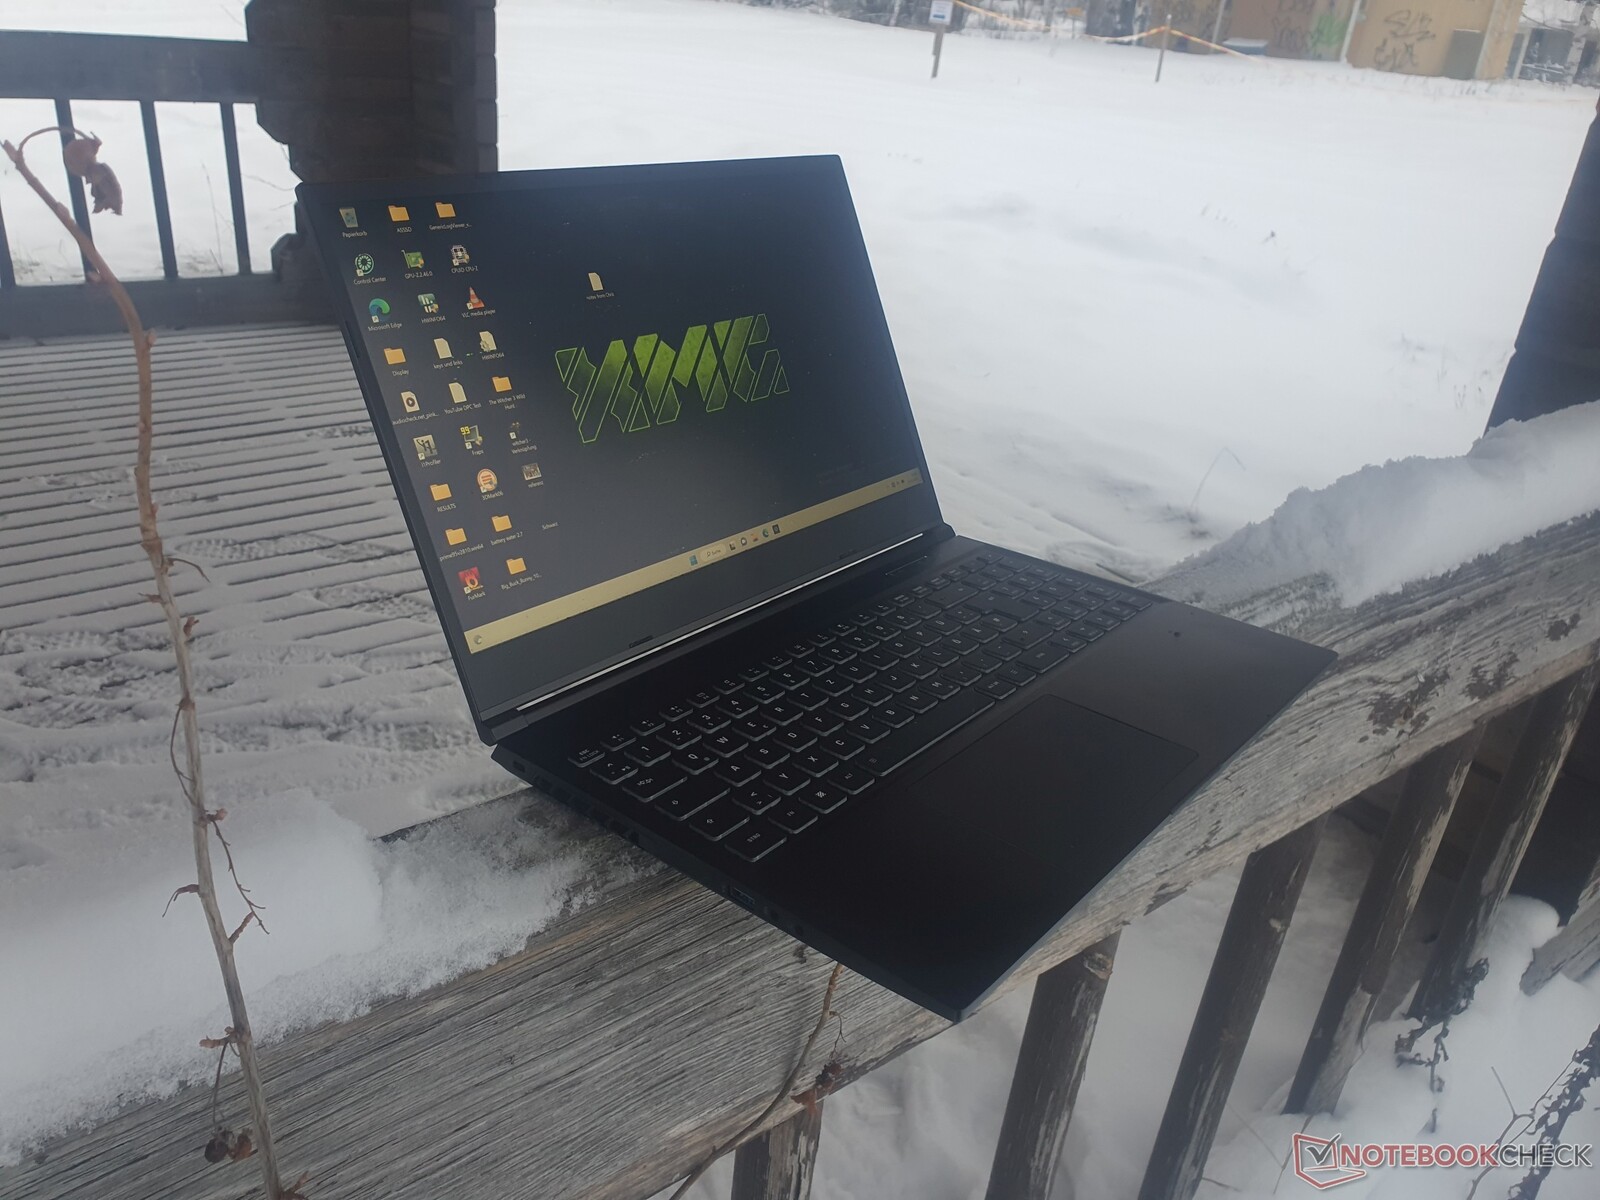
Core 15的外壳基本保持不变,所以你可以在我们的 "上一代机型评测 "中了解其细节和输入设备。 上一代机型的评论.
更多Schenker评论。
XMG Neo 15(Ryzen 9 6900HX, RTX 3070 Ti, 机械键盘, XMG Oasis)
XMG Neo 17 (Ryzen 9 6900HX, RTX 3080 Ti, 机械键盘, XMG Oasis)
XMG Fusion 15(Core i7-11800H, RTX 3070, 机械键盘)
XMG Pro 15(Core i7-12700H, RTX 3080 Ti)
XMG Pro 17(酷睿 i9-12900H, RTX 3080 Ti)
XMG Apex 15 Max(Ryzen 9 5900X桌面CPU, RTX 3070)
潜在的竞争对手比较
Rating | Date | Model | Weight | Height | Size | Resolution | Price |
|---|---|---|---|---|---|---|---|
| 87.9 % v7 (old) | 01 / 2023 | Schenker XMG Core 15 (M22) R7 6800H, GeForce RTX 3060 Laptop GPU | 2.1 kg | 23 mm | 15.60" | 2560x1440 | |
| 87.5 % v7 (old) | 11 / 2022 | Lenovo Legion 5 15IAH7H 82RB i7-12700H, GeForce RTX 3060 Laptop GPU | 2.4 kg | 19.99 mm | 15.60" | 1920x1080 | |
| 87.4 % v7 (old) | 08 / 2022 | Schenker XMG Fusion 15 (Mid 22) i7-11800H, GeForce RTX 3070 Laptop GPU | 1.9 kg | 21.65 mm | 15.60" | 2560x1440 | |
| 87.2 % v7 (old) | 03 / 2022 | Asus TUF Gaming F15 FX507ZM i7-12700H, GeForce RTX 3060 Laptop GPU | 2.1 kg | 24.95 mm | 15.60" | 1920x1080 | |
| 84.7 % v7 (old) | 08 / 2025 | Alienware m15 R5 Ryzen Edition R7 5800H, GeForce RTX 3060 Laptop GPU | 2.5 kg | 22.85 mm | 15.60" | 1920x1080 | |
| 84.9 % v7 (old) | Schenker XMG Core 15 Ampere R7 4800H, GeForce RTX 3060 Laptop GPU | 2 kg | 22.9 mm | 15.60" | 2560x1440 |
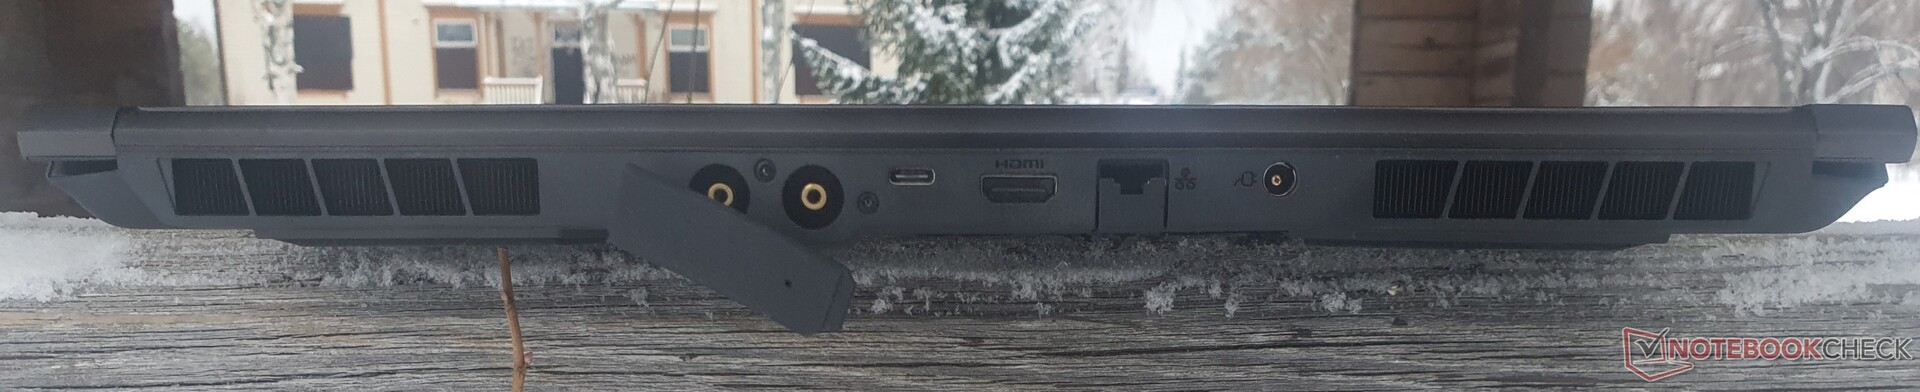
特点:水口,但没有USB4和USB-C-PD
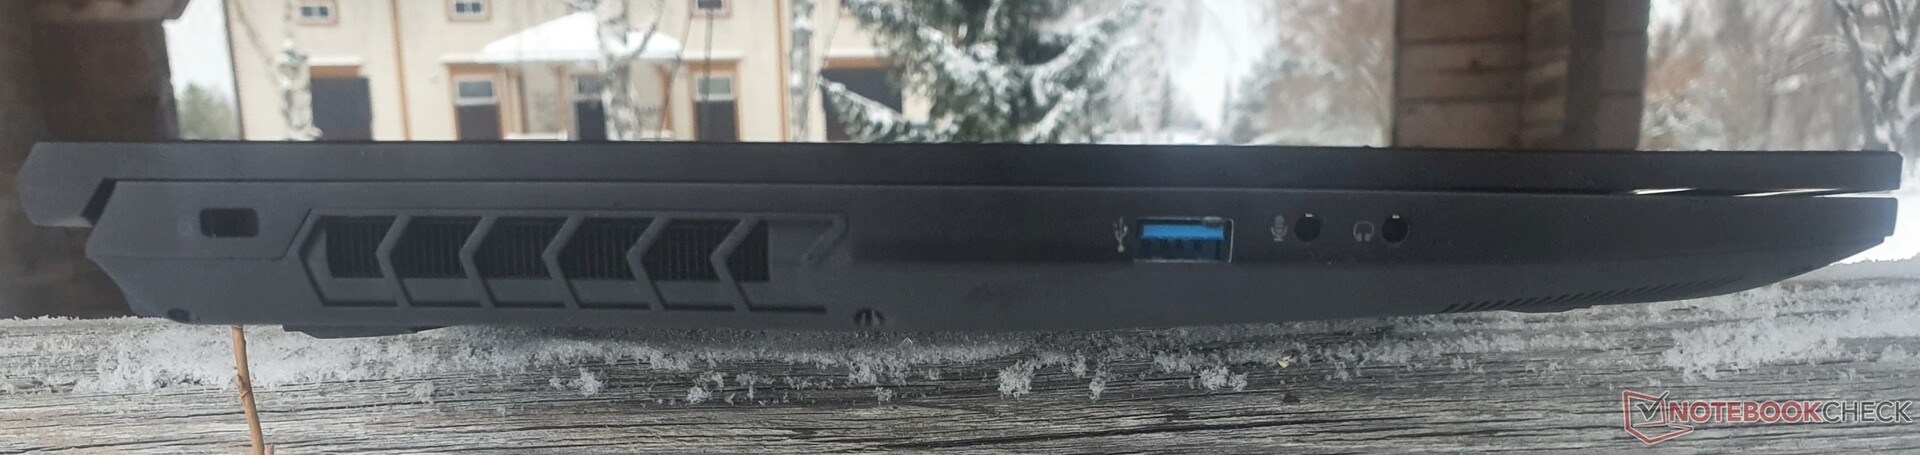
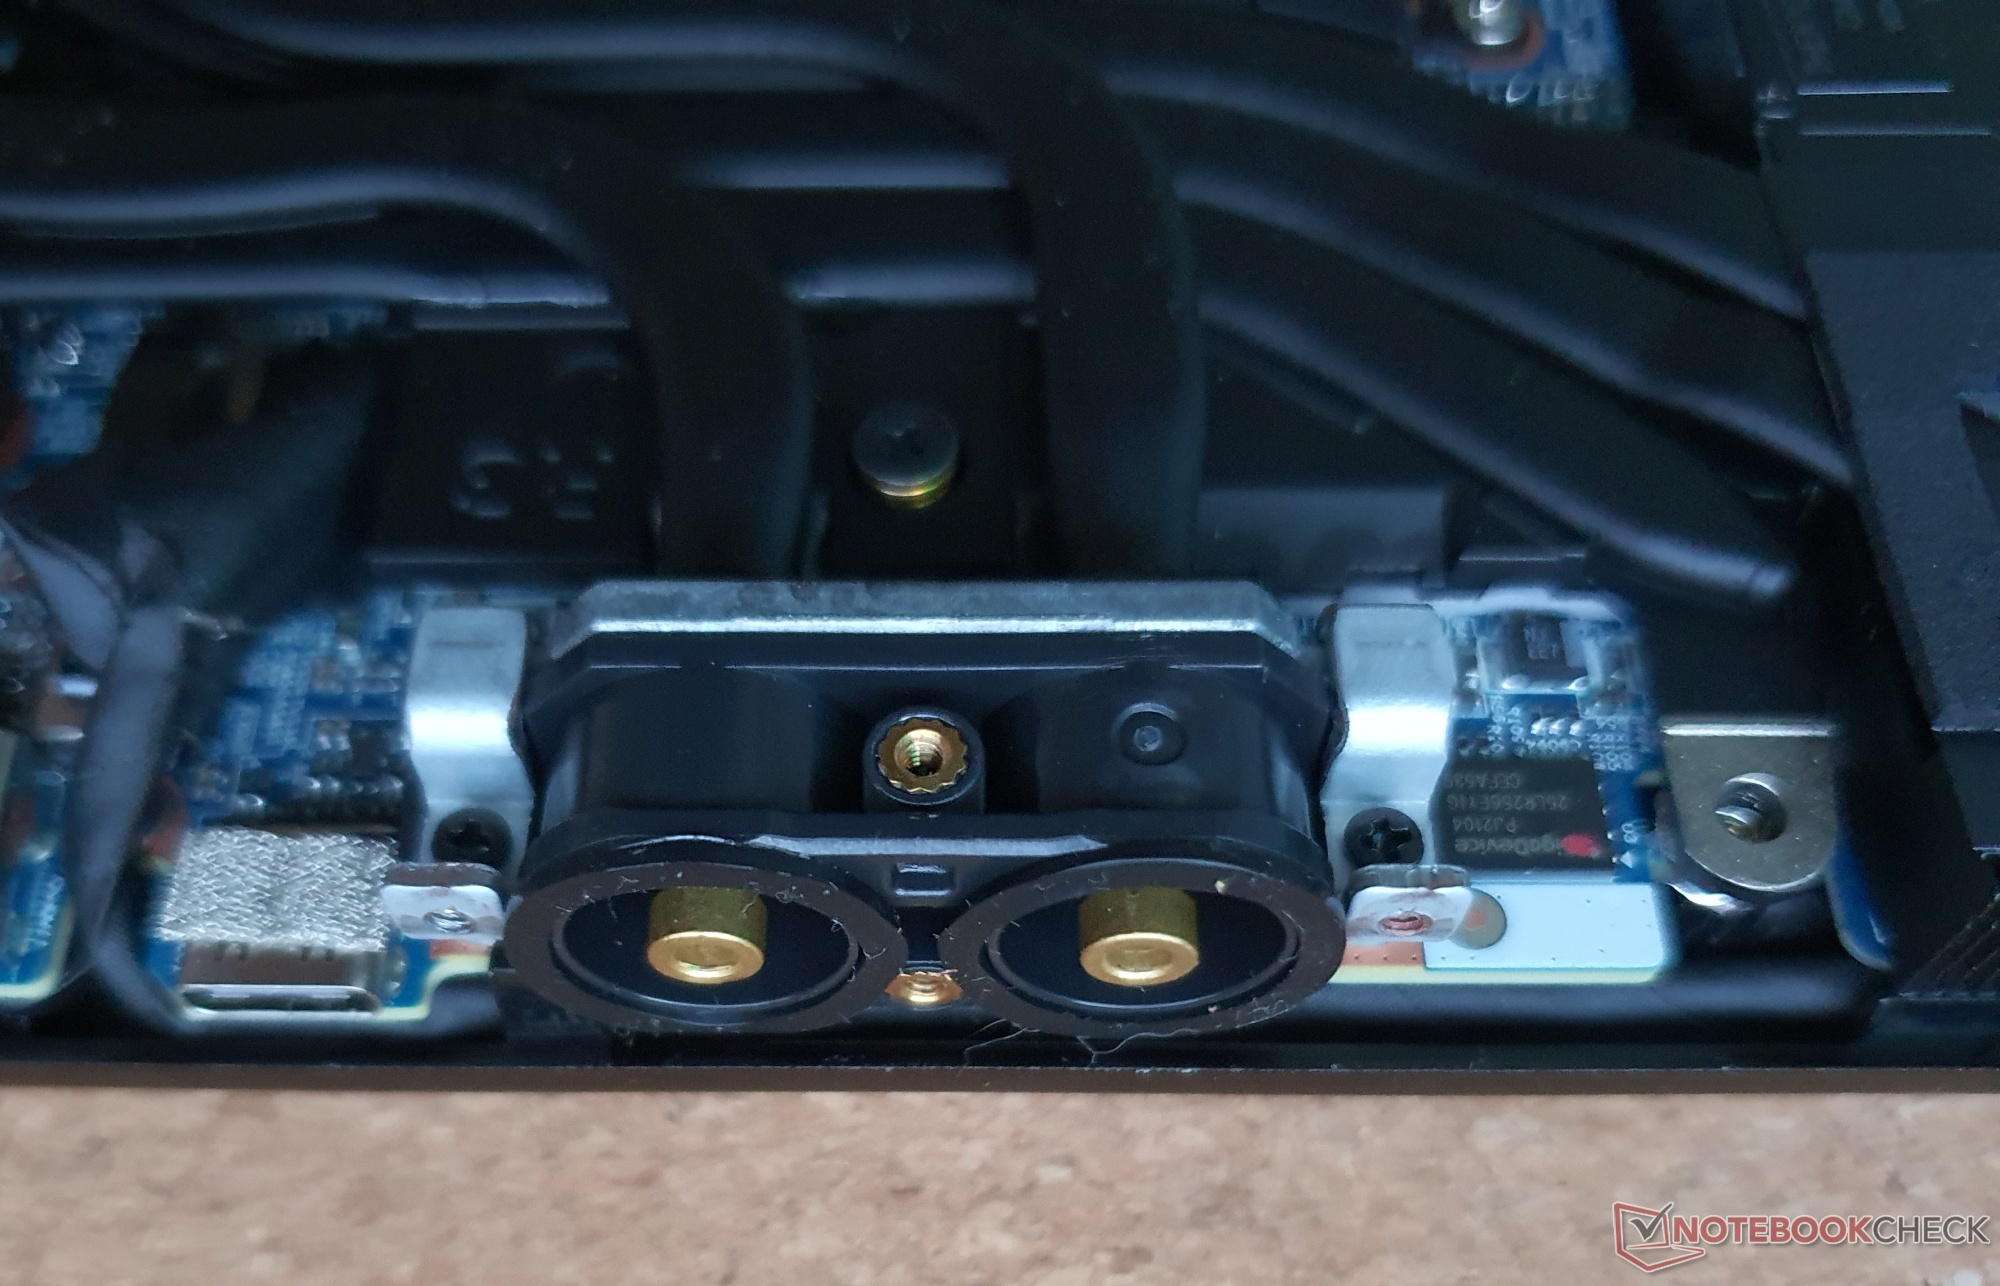
与前代产品相比,用于外部XMG Oasis水冷的端口是一个有趣和有用的创新。左侧的USB 2.0端口让位于更快的USB-A 3.2 Gen2,而我们仍然错过了USB4和通过USB-C充电。
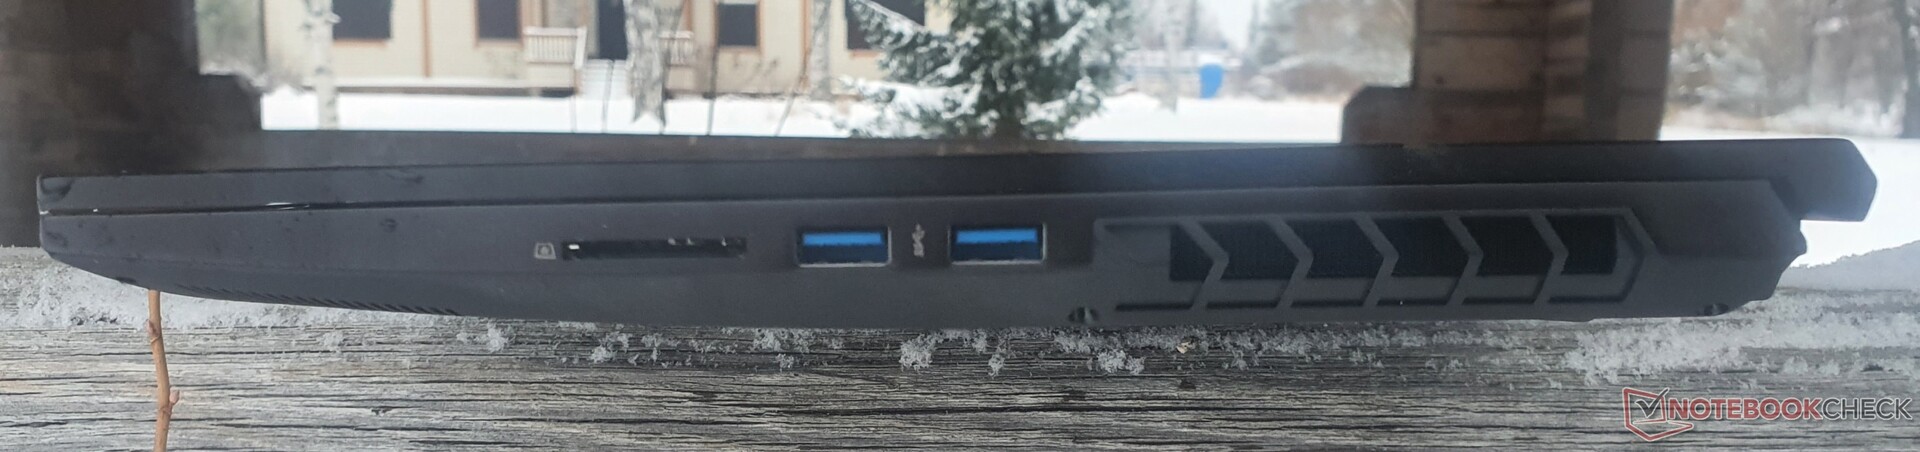
SD卡阅读器
| SD Card Reader | |
| average JPG Copy Test (av. of 3 runs) | |
| Average of class Gaming (20.9 - 210, n=54, last 2 years) | |
| Schenker XMG Core 15 Ampere (Toshiba Exceria Pro SDXC 64 GB UHS-II) | |
| Schenker XMG Apex 15 Max (AV PRO microSD 128 GB V60) | |
| Schenker XMG Fusion 15 (Mid 22) (AV PRO microSD 128 GB V60) | |
| Schenker XMG Core 15 (M22) (AV PRO microSD 128 GB V60) | |
| maximum AS SSD Seq Read Test (1GB) | |
| Average of class Gaming (25.5 - 261, n=51, last 2 years) | |
| Schenker XMG Apex 15 Max (AV PRO microSD 128 GB V60) | |
| Schenker XMG Core 15 Ampere (Toshiba Exceria Pro SDXC 64 GB UHS-II) | |
| Schenker XMG Core 15 (M22) (AV PRO microSD 128 GB V60) | |
沟通

| Networking | |
| iperf3 receive AXE11000 6GHz | |
| Lenovo Legion 5 15IAH7H 82RB | |
| Schenker XMG Core 15 (M22) | |
| Average MediaTek RZ608 (430 - 961, n=16) | |
| iperf3 receive AXE11000 | |
| Schenker XMG Fusion 15 (Mid 22) | |
| Lenovo Legion 5 15IAH7H 82RB | |
| Schenker XMG Core 15 (M22) | |
| Average MediaTek RZ608 (430 - 975, n=20) | |
| iperf3 transmit AXE11000 6GHz | |
| Lenovo Legion 5 15IAH7H 82RB | |
| Schenker XMG Core 15 (M22) | |
| Average MediaTek RZ608 (572 - 980, n=16) | |
| iperf3 transmit AXE11000 | |
| Lenovo Legion 5 15IAH7H 82RB | |
| Schenker XMG Fusion 15 (Mid 22) | |
| Schenker XMG Core 15 (M22) | |
| Average MediaTek RZ608 (572 - 979, n=20) | |
| iperf3 receive AX12 | |
| Asus TUF Gaming F15 FX507ZM | |
| Schenker XMG Core 15 Ampere | |
| Alienware m15 R5 Ryzen Edition | |
| Average MediaTek RZ608 (837 - 880, n=2) | |
| iperf3 transmit AX12 | |
| Schenker XMG Core 15 Ampere | |
| Alienware m15 R5 Ryzen Edition | |
| Asus TUF Gaming F15 FX507ZM | |
| Average MediaTek RZ608 (657 - 821, n=2) | |

 GeForce RTX 3060 Laptop GPU, R7 6800H, Samsung SSD 980 Pro 1TB MZ-V8P1T0BW")
 GeForce RTX 3060 Laptop GPU, R7 6800H, Samsung SSD 980 Pro 1TB MZ-V8P1T0BW")
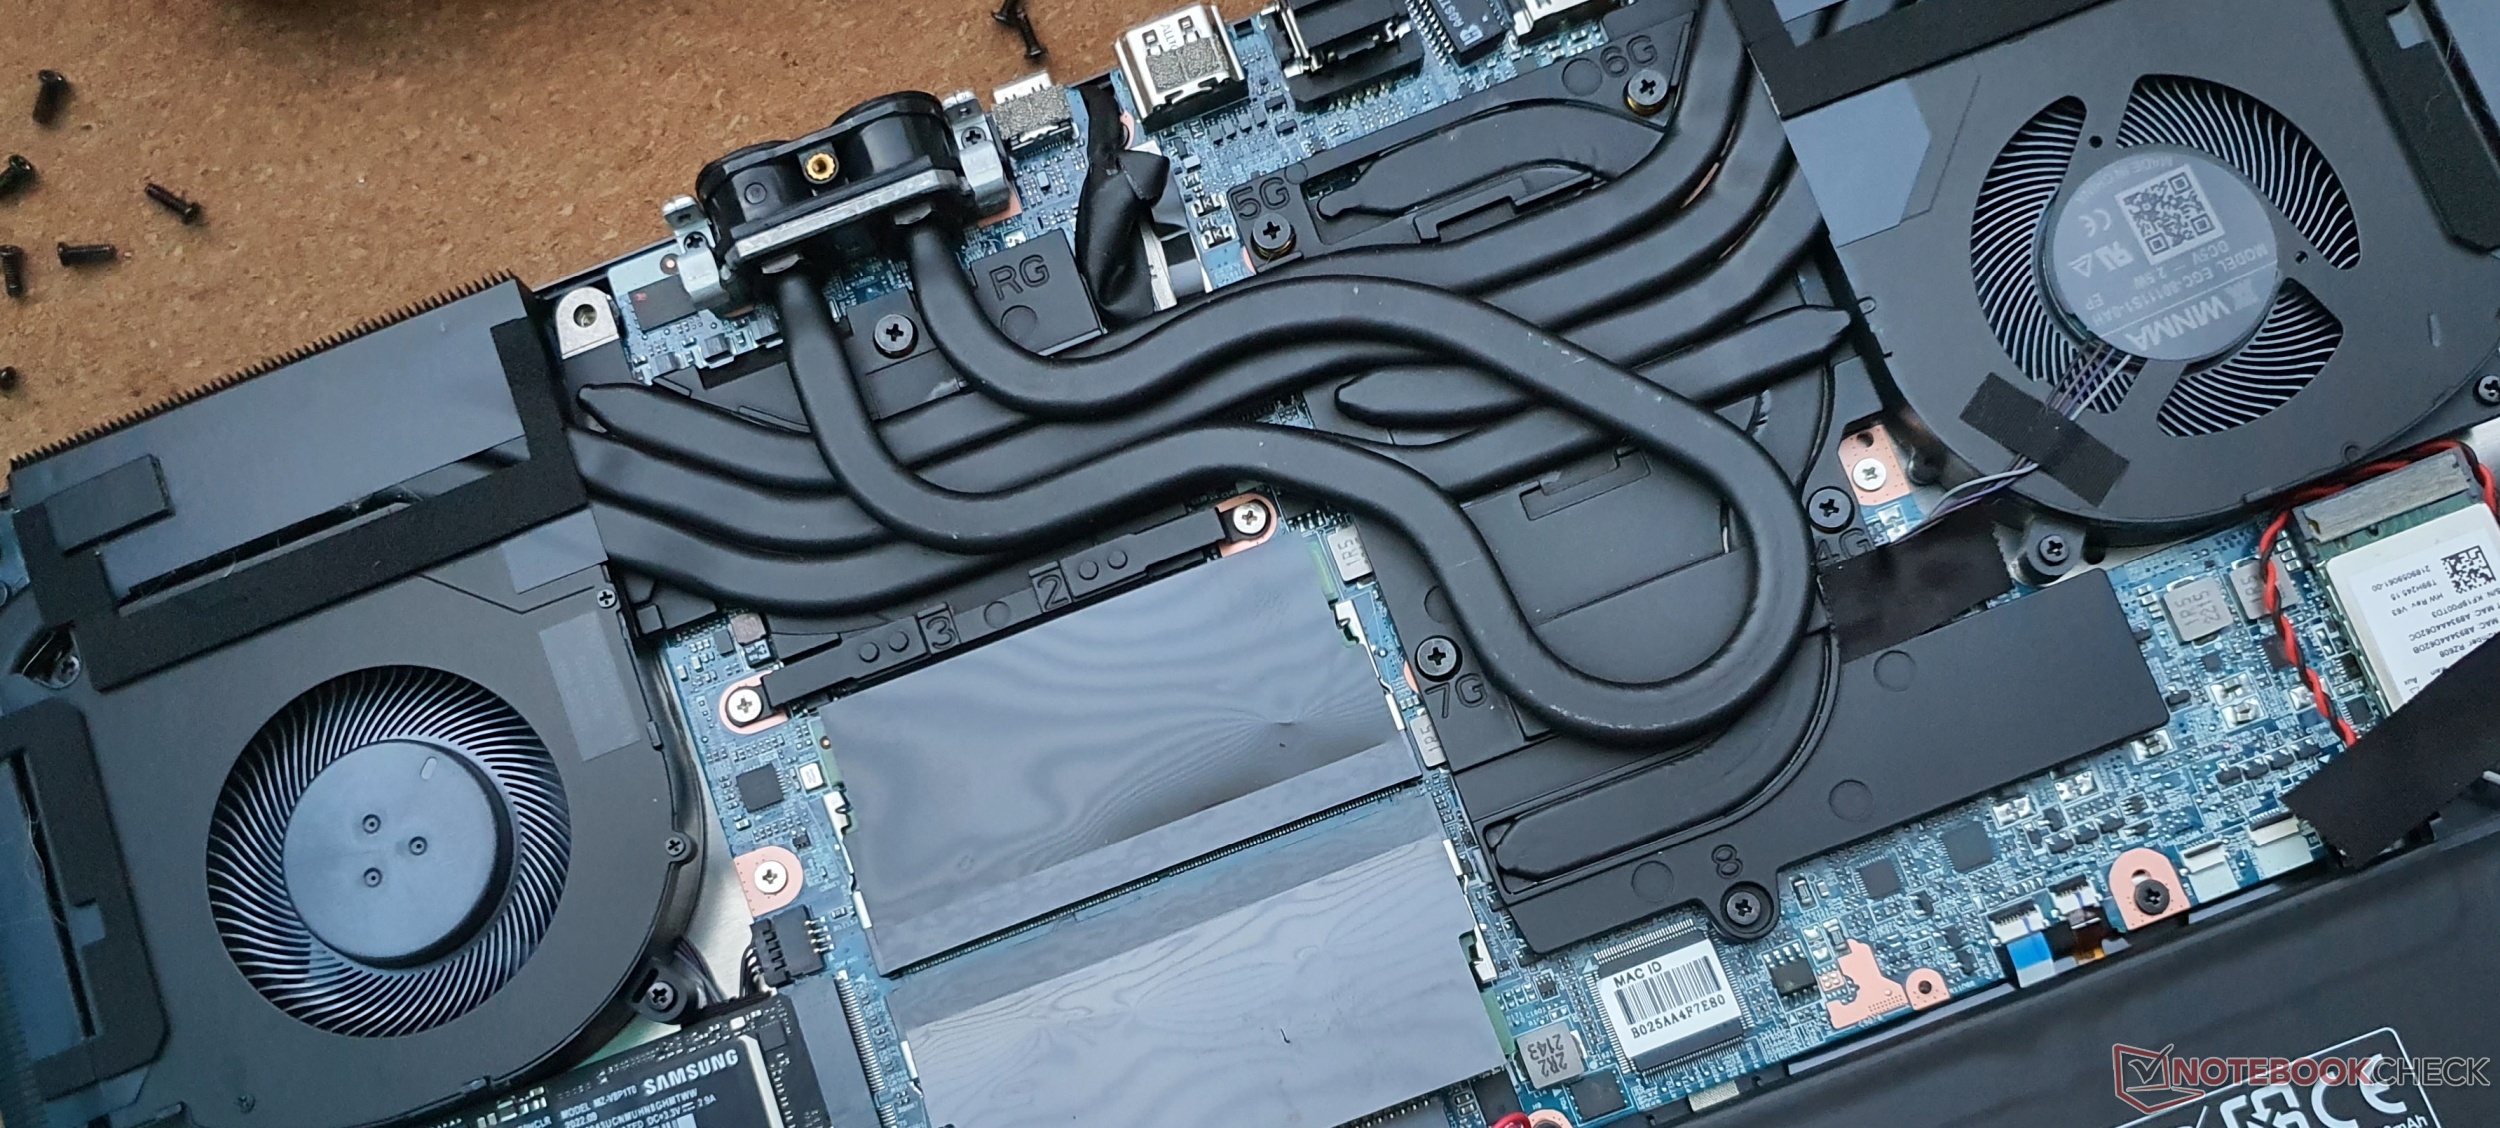
维护
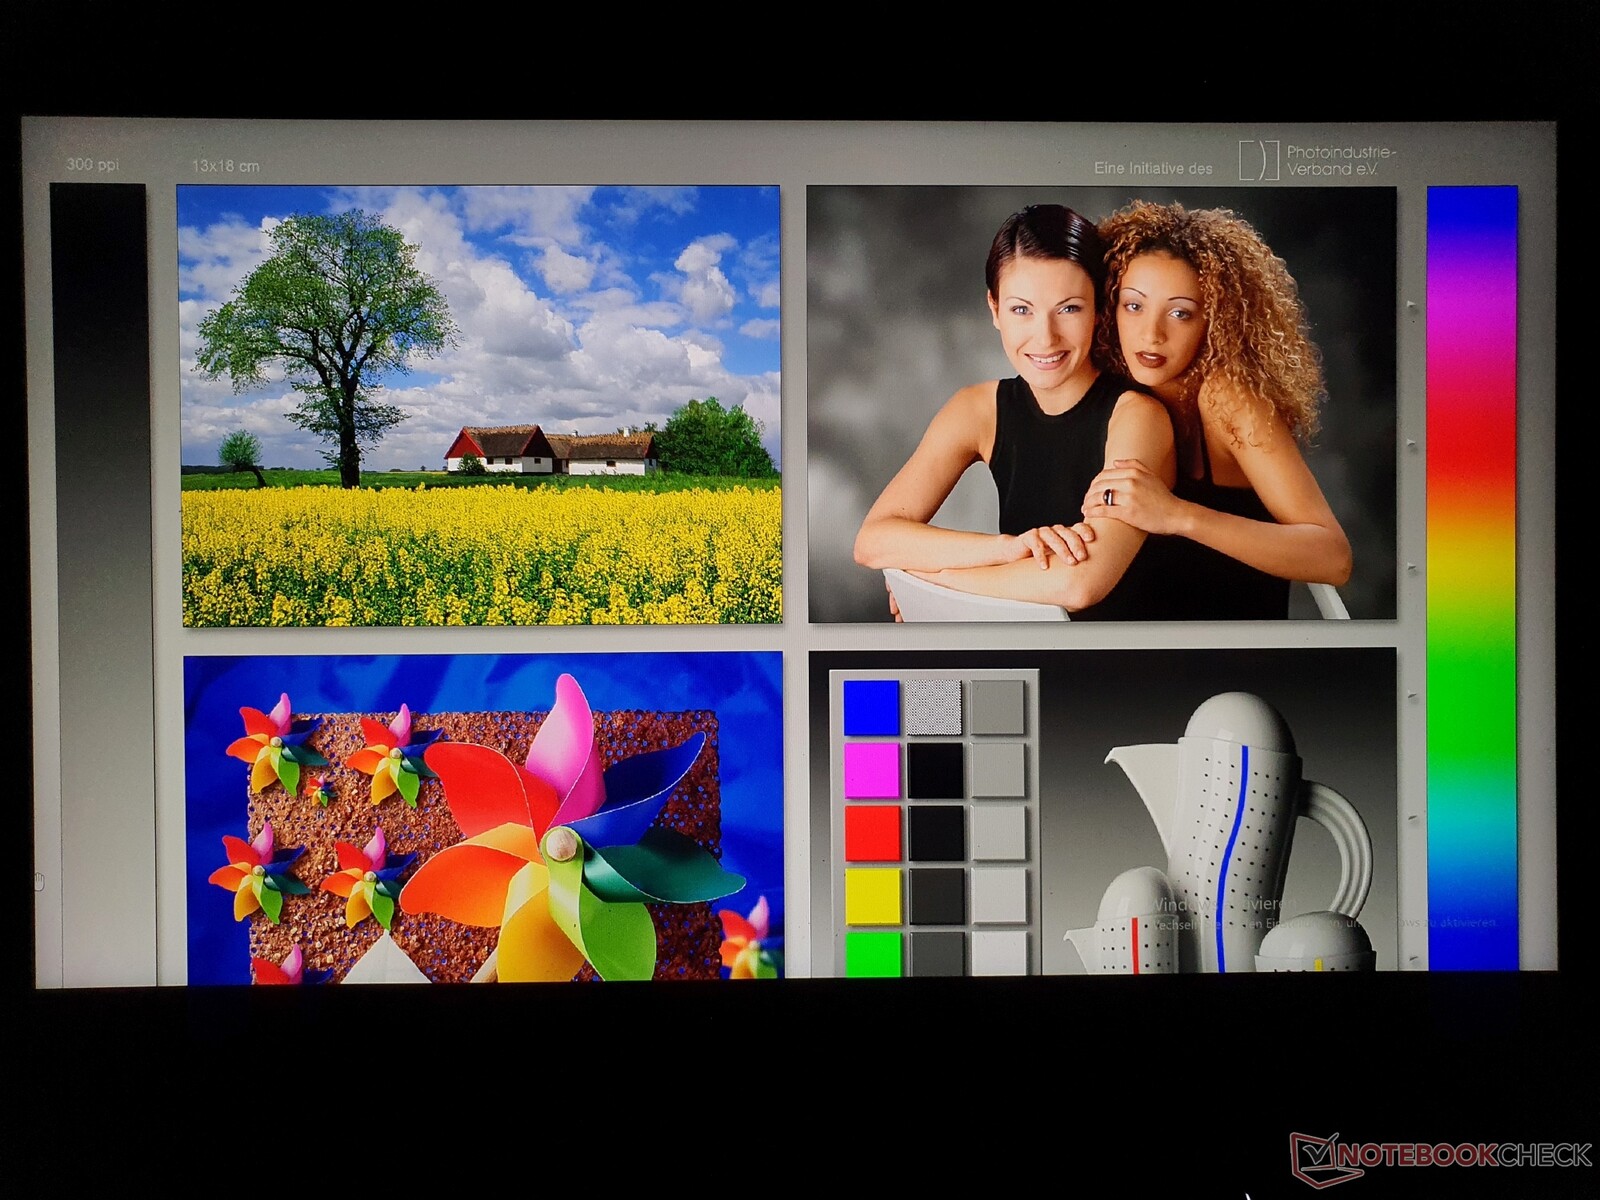
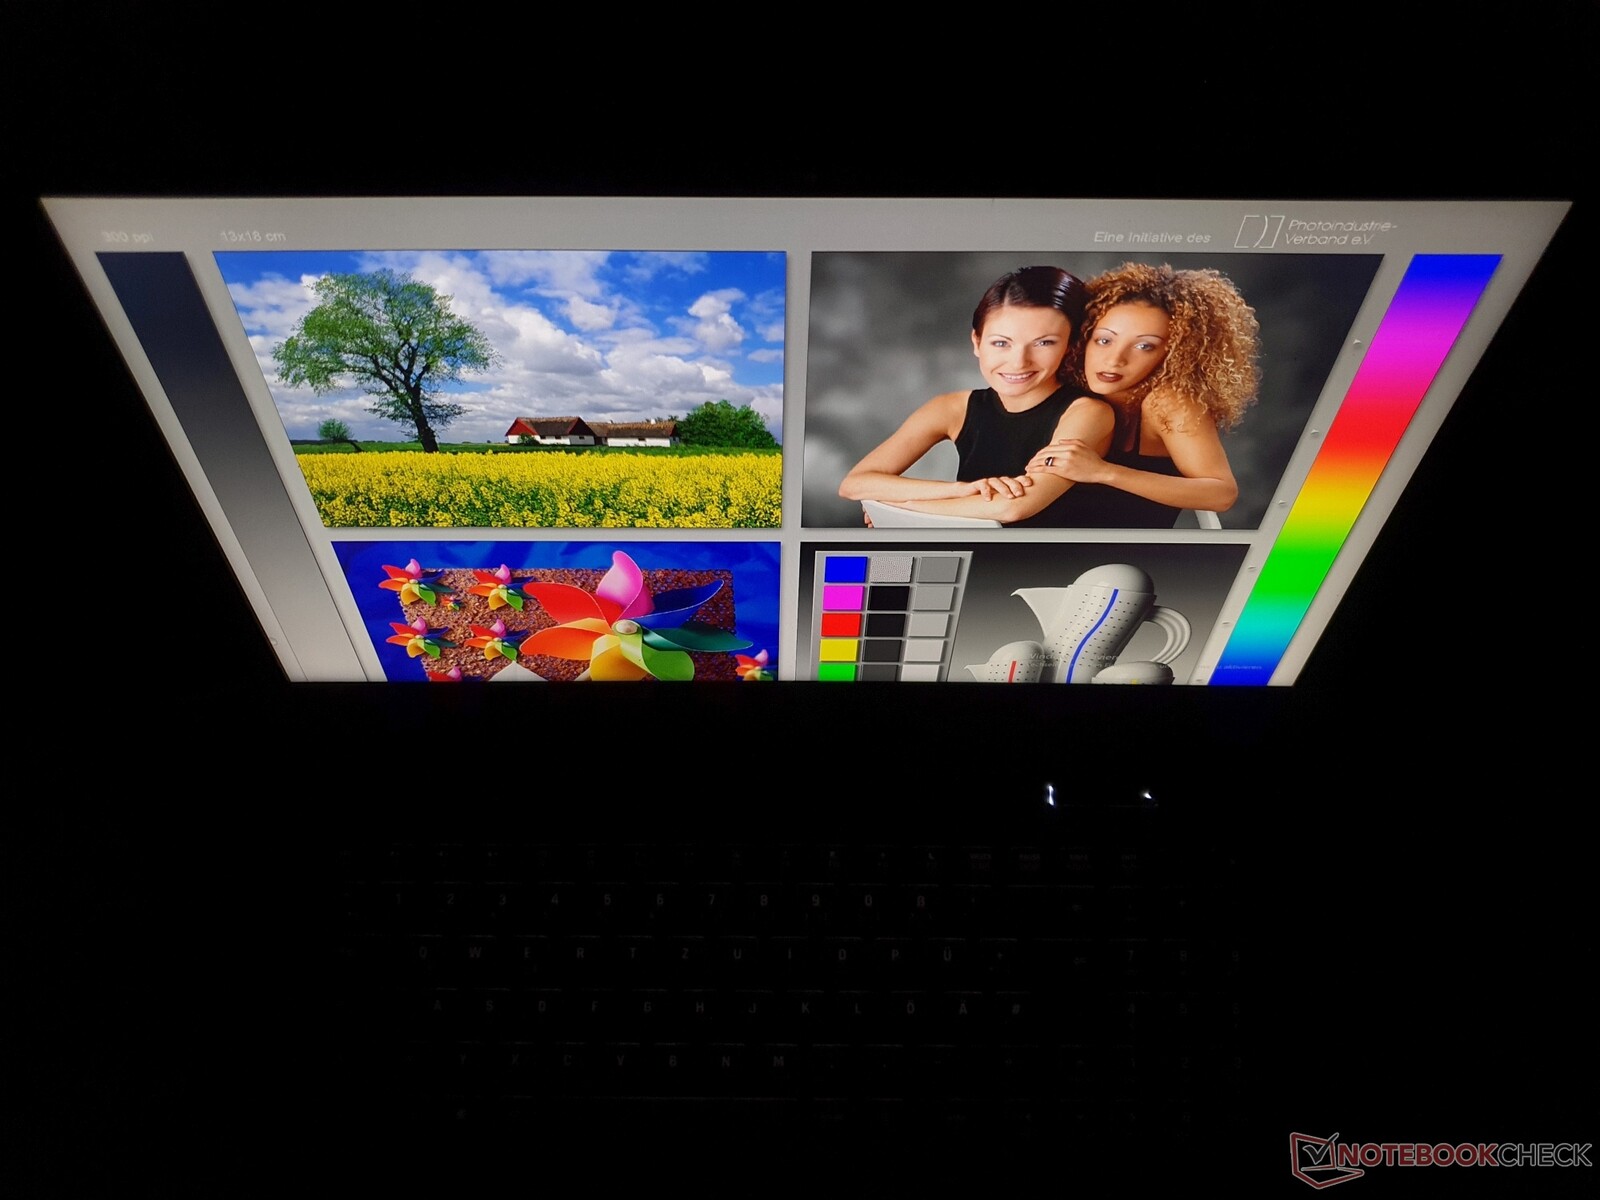
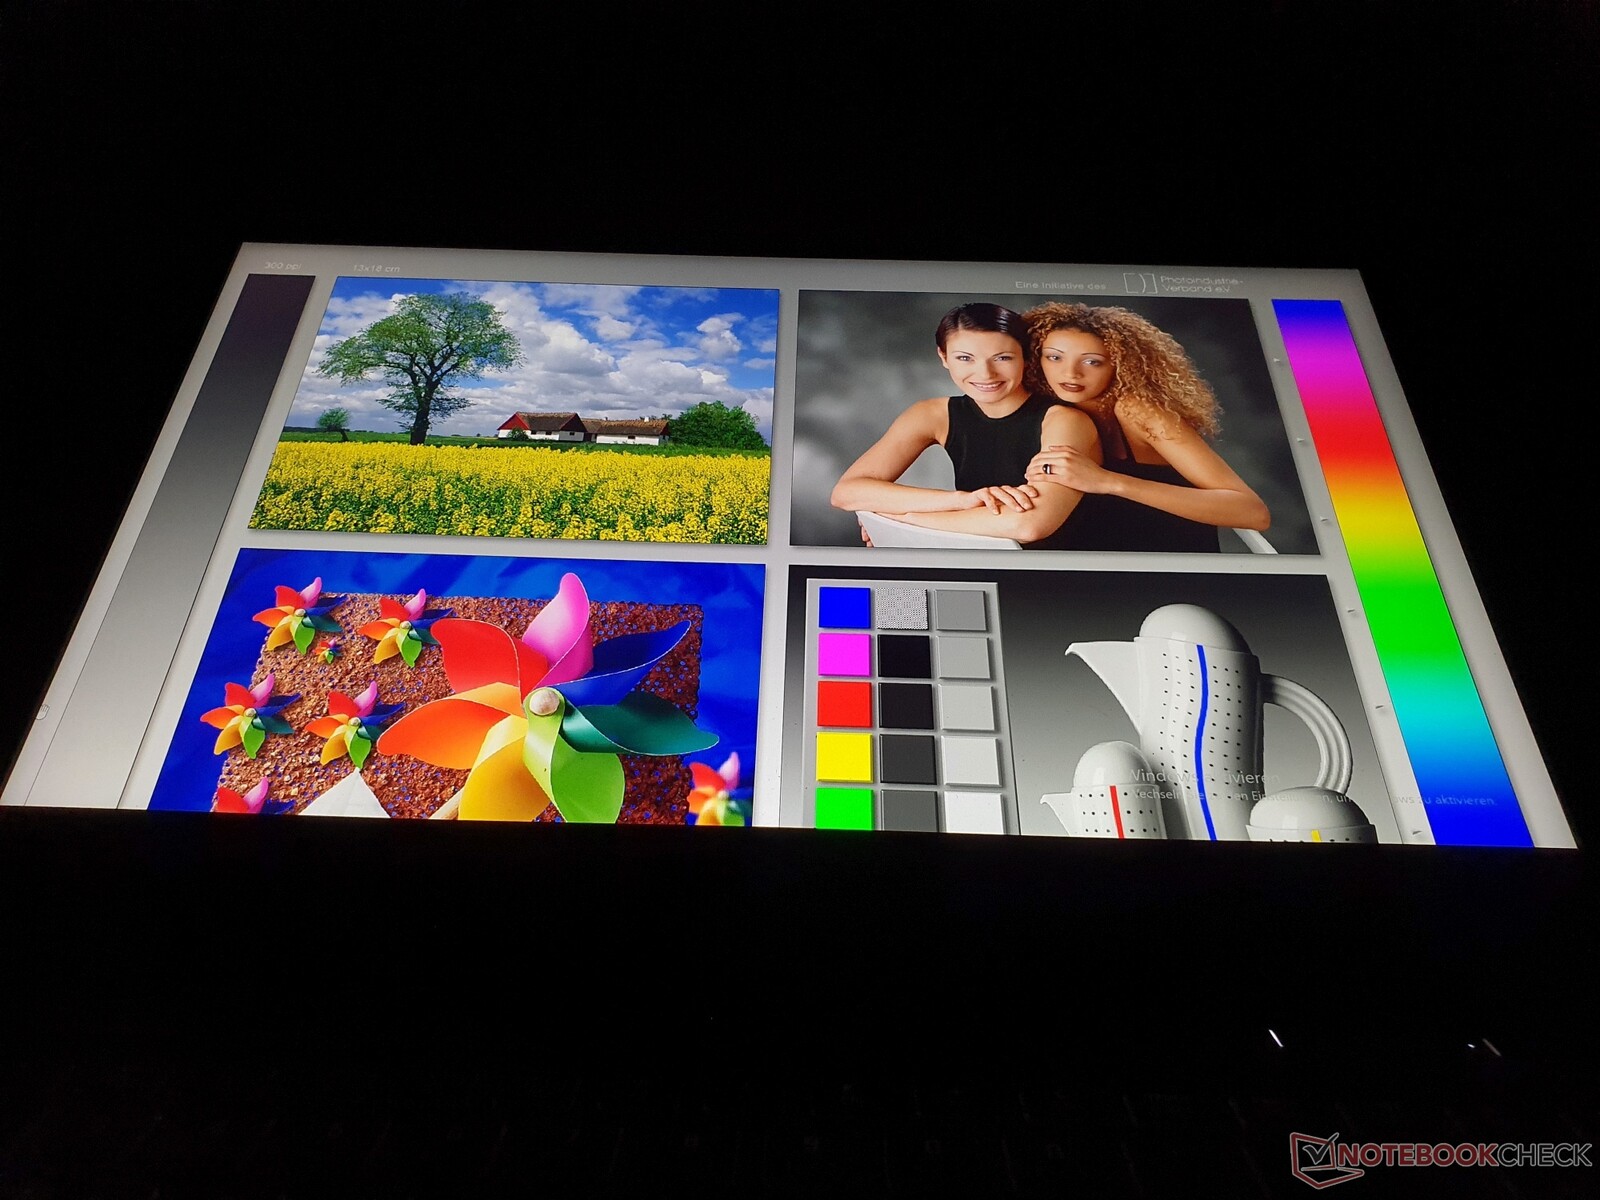
显示。WQHD 165 Hz,响应时间快
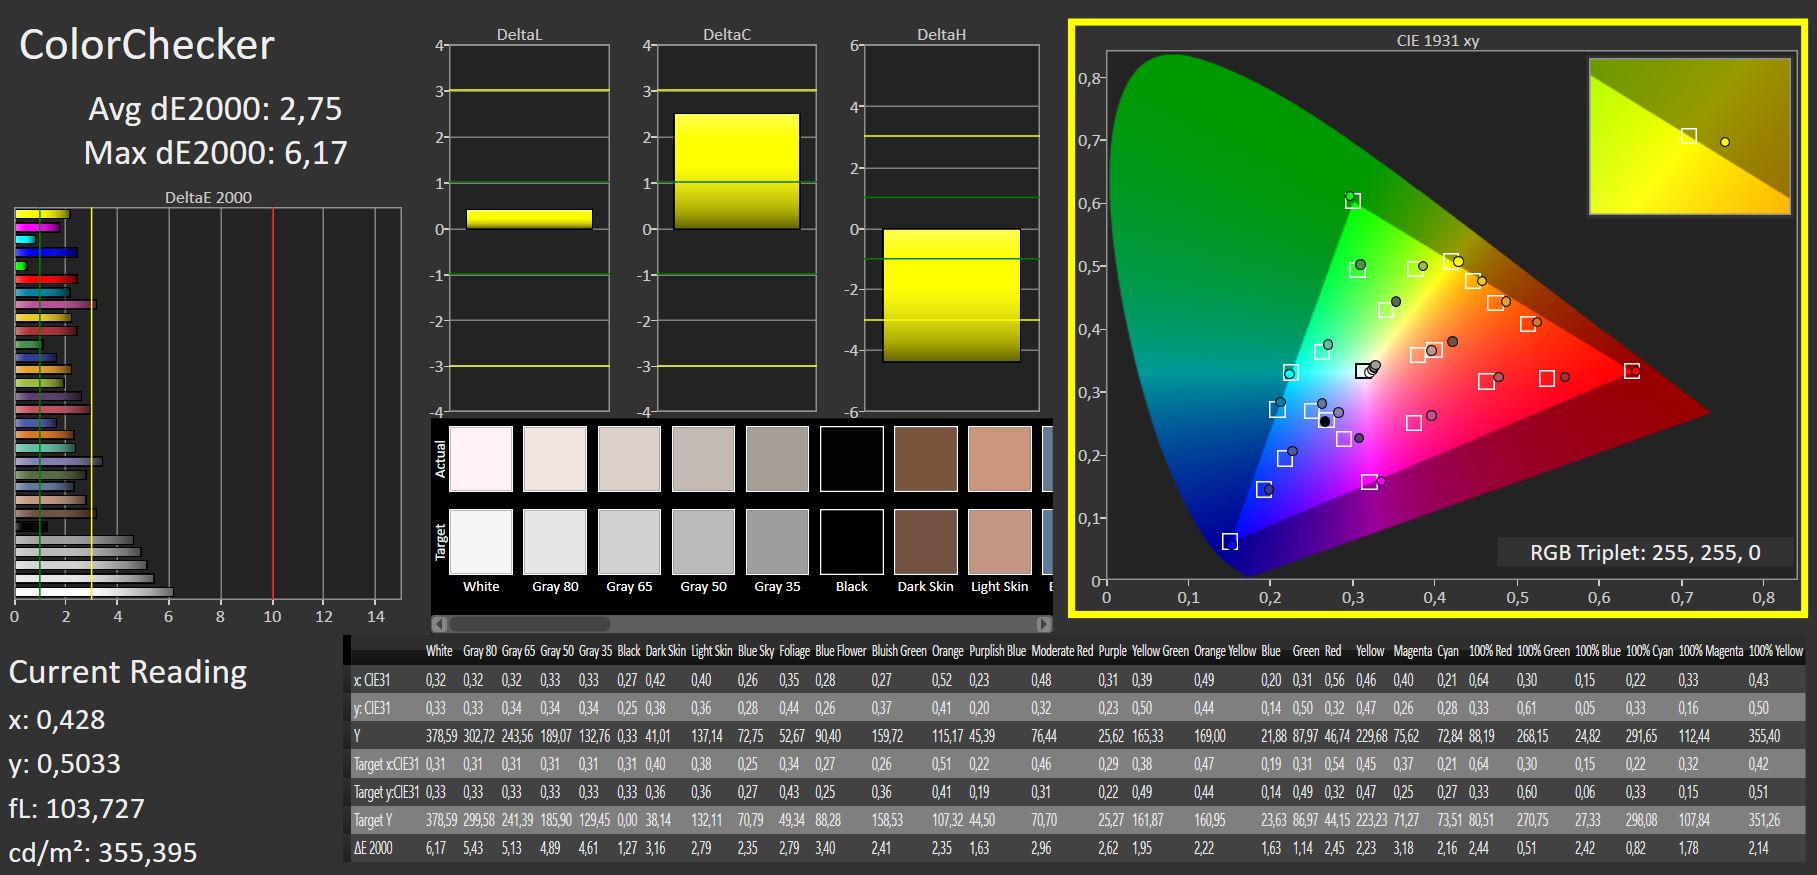
Schenker为XMG Core 15提供了两种显示选项:FHD 144 Hz,300 cd/m²和90% sRGB,以及安装在测试设备中的WQHD面板(2,560 x 1,440),165 Hz(83-165 Hz动态),指定350 cd/m²和95% sRGB。哑光16:9显示屏的亮度规格超过了平均371 cd/m²。该 Legion 5 Pro更加明亮,为500 cd/m²,这在户外使用时很有用。
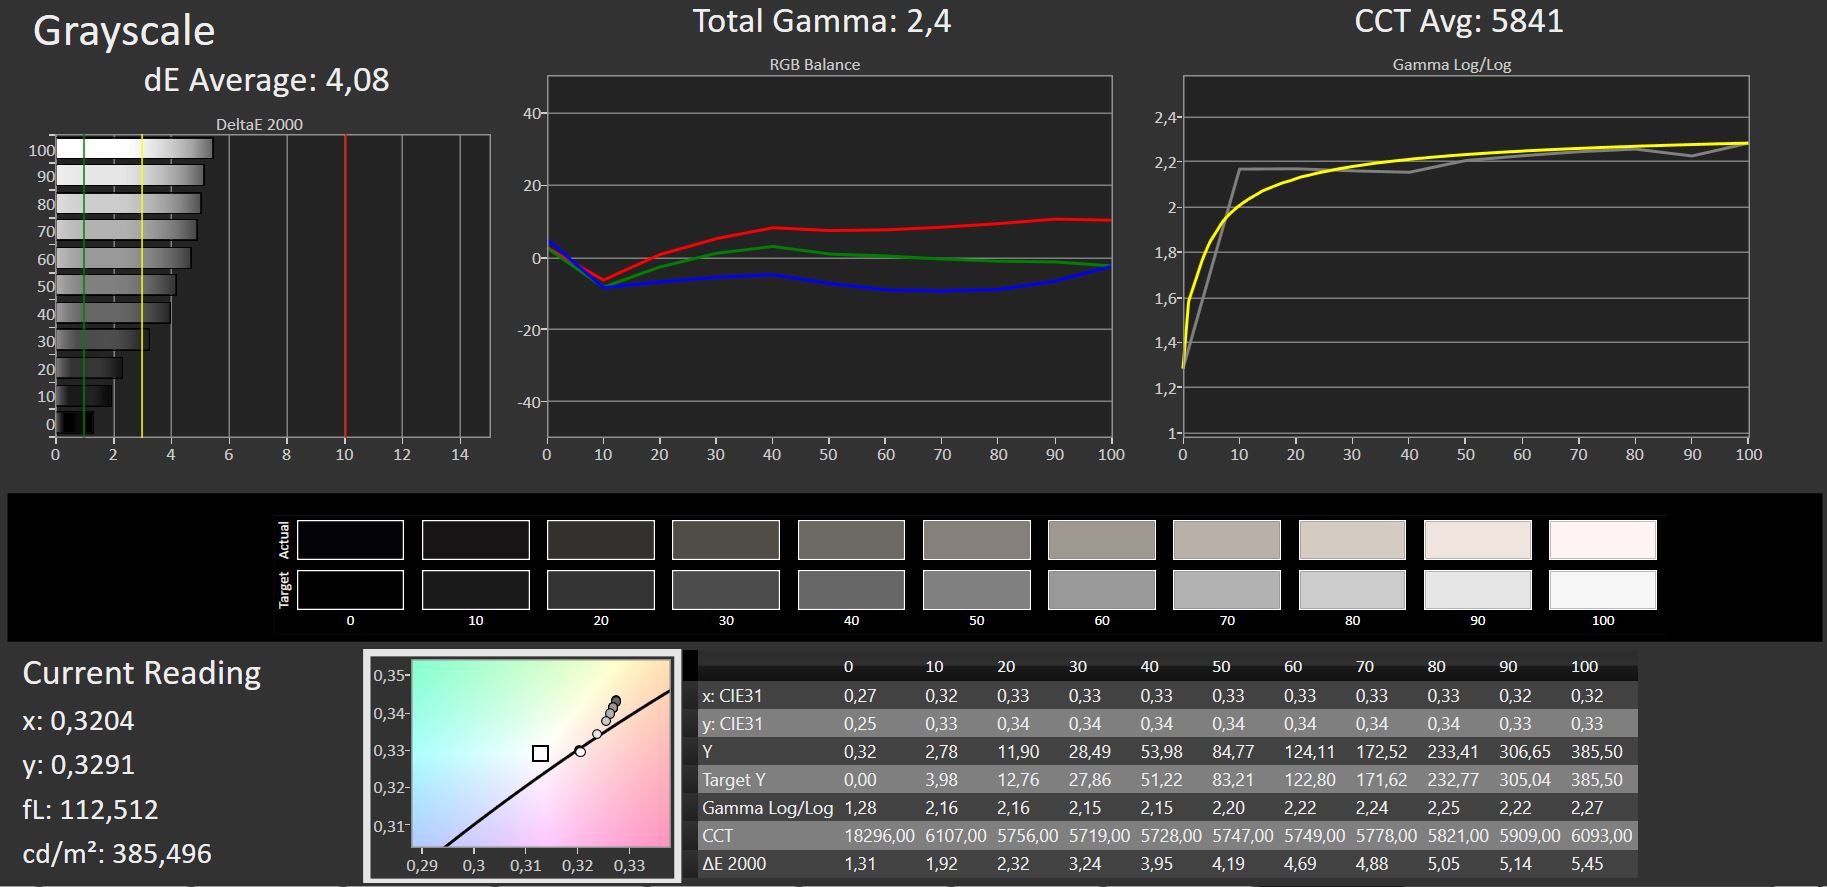
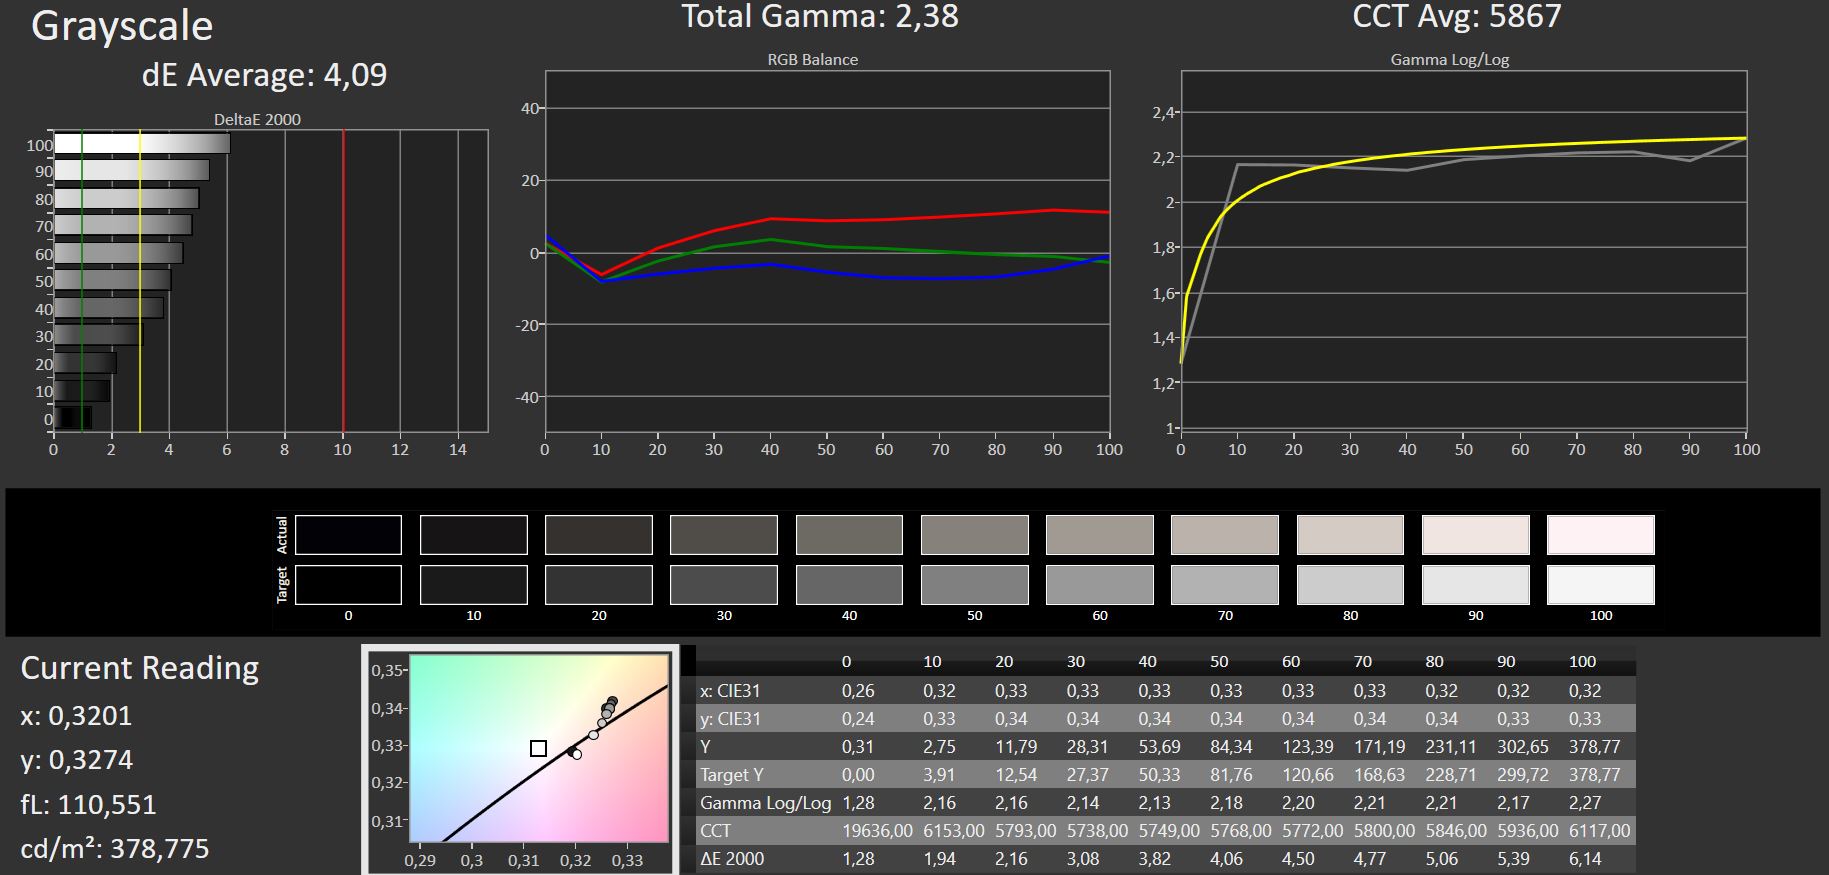
对比度和黑色水平处于良好水平,分别为1,145:1和0.32 cd/m²,而照度相当均匀。5,841K的白光值离最佳值(6,500K)有一定距离。
响应时间短到非常短,为16毫秒(GtG)以及7.6毫秒(BtW),而只有Alienware m15 ,在这个领域取得了明显的优势。我们无法确定任何PWM闪烁的情况。
| |||||||||||||||||||||||||
Brightness Distribution: 93 %
Center on Battery: 384 cd/m²
Contrast: 1145:1 (Black: 0.33 cd/m²)
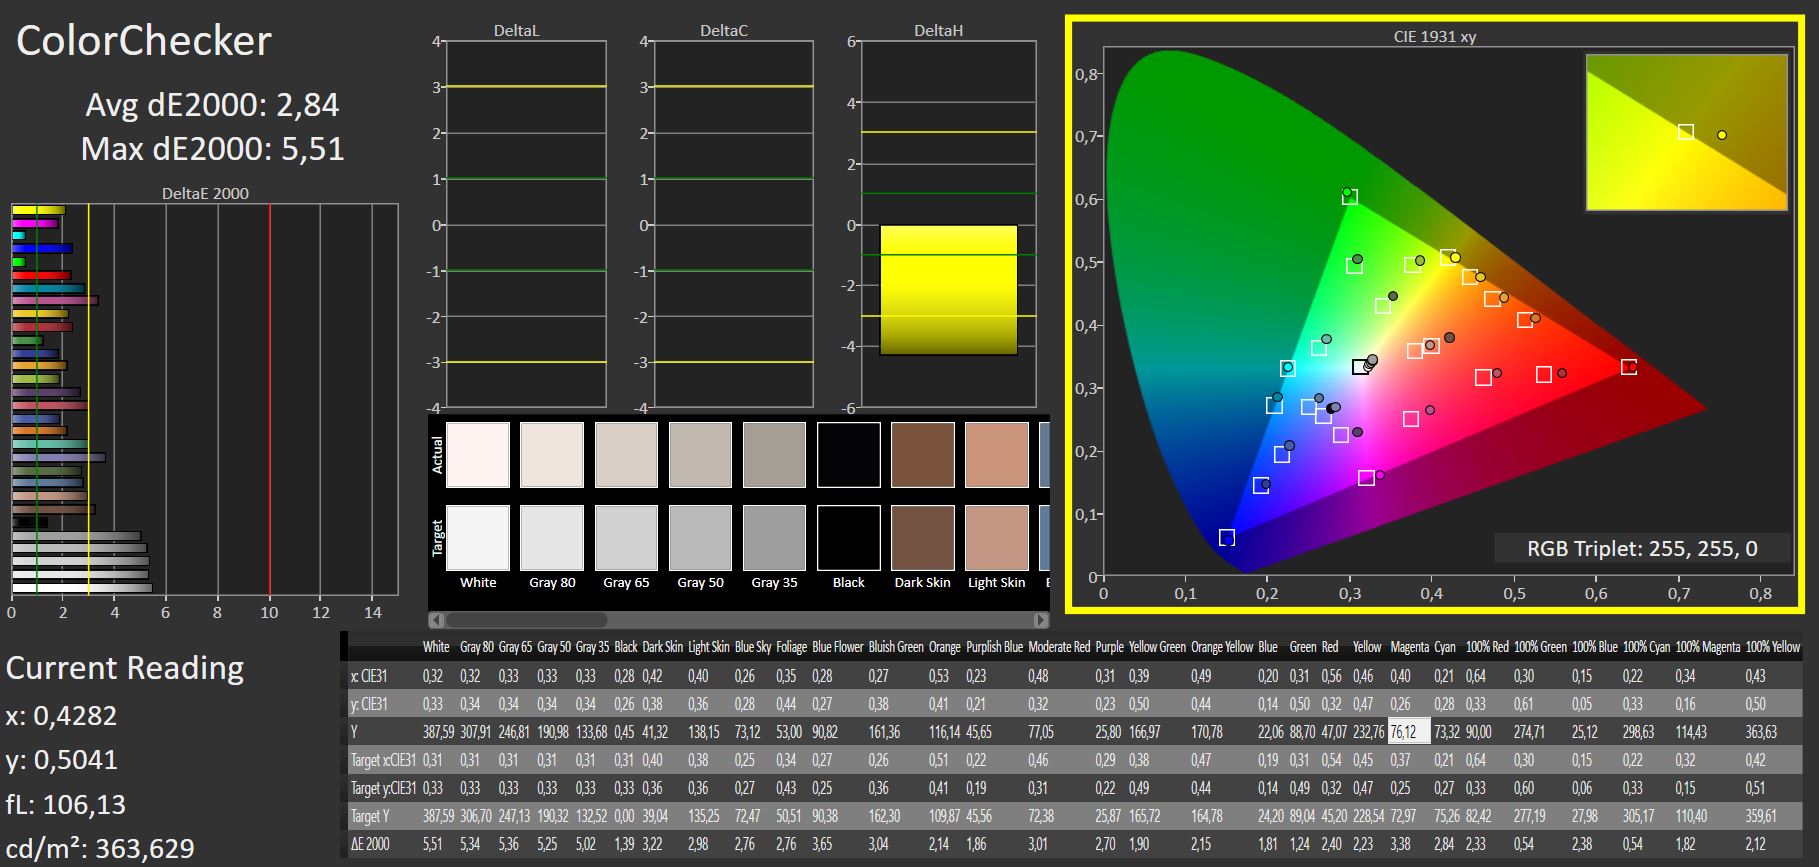
ΔE ColorChecker Calman: 2.84 | ∀{0.5-29.43 Ø4.71}
calibrated: 2.75
ΔE Greyscale Calman: 4.08 | ∀{0.09-98 Ø4.96}
69.9% AdobeRGB 1998 (Argyll 3D)
99.3% sRGB (Argyll 3D)
68.8% Display P3 (Argyll 3D)
Gamma: 2.4
CCT: 5841 K
| Schenker XMG Core 15 (M22) CSOT MNF601CA1-1, IPS, 2560x1440, 15.6" | Schenker XMG Fusion 15 (Mid 22) BOE CQ NE156QHM-NY2, IPS, 2560x1440, 15.6" | Lenovo Legion 5 15IAH7H 82RB CSOT MNF601CA1-3, IPS, 1920x1080, 15.6" | Asus TUF Gaming F15 FX507ZM TL156VDXP0101, IPS, 1920x1080, 15.6" | Alienware m15 R5 Ryzen Edition B156HAN, IPS, 1920x1080, 15.6" | Schenker XMG Core 15 Ampere BOE CQ NE156QHM-NY2, IPS, 2560x1440, 15.6" | |
|---|---|---|---|---|---|---|
| Display | -2% | 0% | -2% | 0% | ||
| Display P3 Coverage (%) | 68.8 | 67.3 -2% | 69.1 0% | 66.4 -3% | 69.8 1% | |
| sRGB Coverage (%) | 99.3 | 96.7 -3% | 99.5 0% | 97 -2% | 98.8 -1% | |
| AdobeRGB 1998 Coverage (%) | 69.9 | 68.2 -2% | 70 0% | 68.5 -2% | 70.7 1% | |
| Response Times | 18% | -26% | -2% | 32% | -15% | |
| Response Time Grey 50% / Grey 80% * (ms) | 16 ? | 11.6 ? 27% | 14.8 ? 7% | 5.6 ? 65% | 4 ? 75% | 14.8 ? 7% |
| Response Time Black / White * (ms) | 7.6 ? | 7 ? 8% | 12 ? -58% | 12.8 ? -68% | 8.4 ? -11% | 10.4 ? -37% |
| PWM Frequency (Hz) | ||||||
| Screen | -11% | -13% | 19% | 10% | 23% | |
| Brightness middle (cd/m²) | 378 | 326 -14% | 363.5 -4% | 353.7 -6% | 329 -13% | 347 -8% |
| Brightness (cd/m²) | 371 | 303 -18% | 350 -6% | 340 -8% | 321 -13% | 328 -12% |
| Brightness Distribution (%) | 93 | 89 -4% | 89 -4% | 89 -4% | 92 -1% | 89 -4% |
| Black Level * (cd/m²) | 0.33 | 0.33 -0% | 0.39 -18% | 0.34 -3% | 0.27 18% | 0.27 18% |
| Contrast (:1) | 1145 | 988 -14% | 932 -19% | 1040 -9% | 1219 6% | 1285 12% |
| Colorchecker dE 2000 * | 2.84 | 2.73 4% | 3.68 -30% | 1.74 39% | 2.78 2% | 1.66 42% |
| Colorchecker dE 2000 max. * | 5.51 | 9.54 -73% | 8.92 -62% | 3.63 34% | 4.88 11% | 3.03 45% |
| Colorchecker dE 2000 calibrated * | 2.75 | 1.36 51% | 0.53 81% | 0.5 82% | 1.63 41% | 1.23 55% |
| Greyscale dE 2000 * | 4.08 | 5.2 -27% | 6.5 -59% | 2.1 49% | 2.5 39% | 1.6 61% |
| Gamma | 2.4 92% | 2.074 106% | 2.2 100% | 2.3 96% | 2.106 104% | 2.278 97% |
| CCT | 5841 111% | 6911 94% | 5995 108% | 6257 104% | 6201 105% | 6430 101% |
| Color Space (Percent of AdobeRGB 1998) (%) | 76 | 71 | ||||
| Color Space (Percent of sRGB) (%) | 99 | 94 | ||||
| Total Average (Program / Settings) | 2% /
-5% | -13% /
-12% | 5% /
12% | 21% /
14% | 3% /
13% |
* ... smaller is better
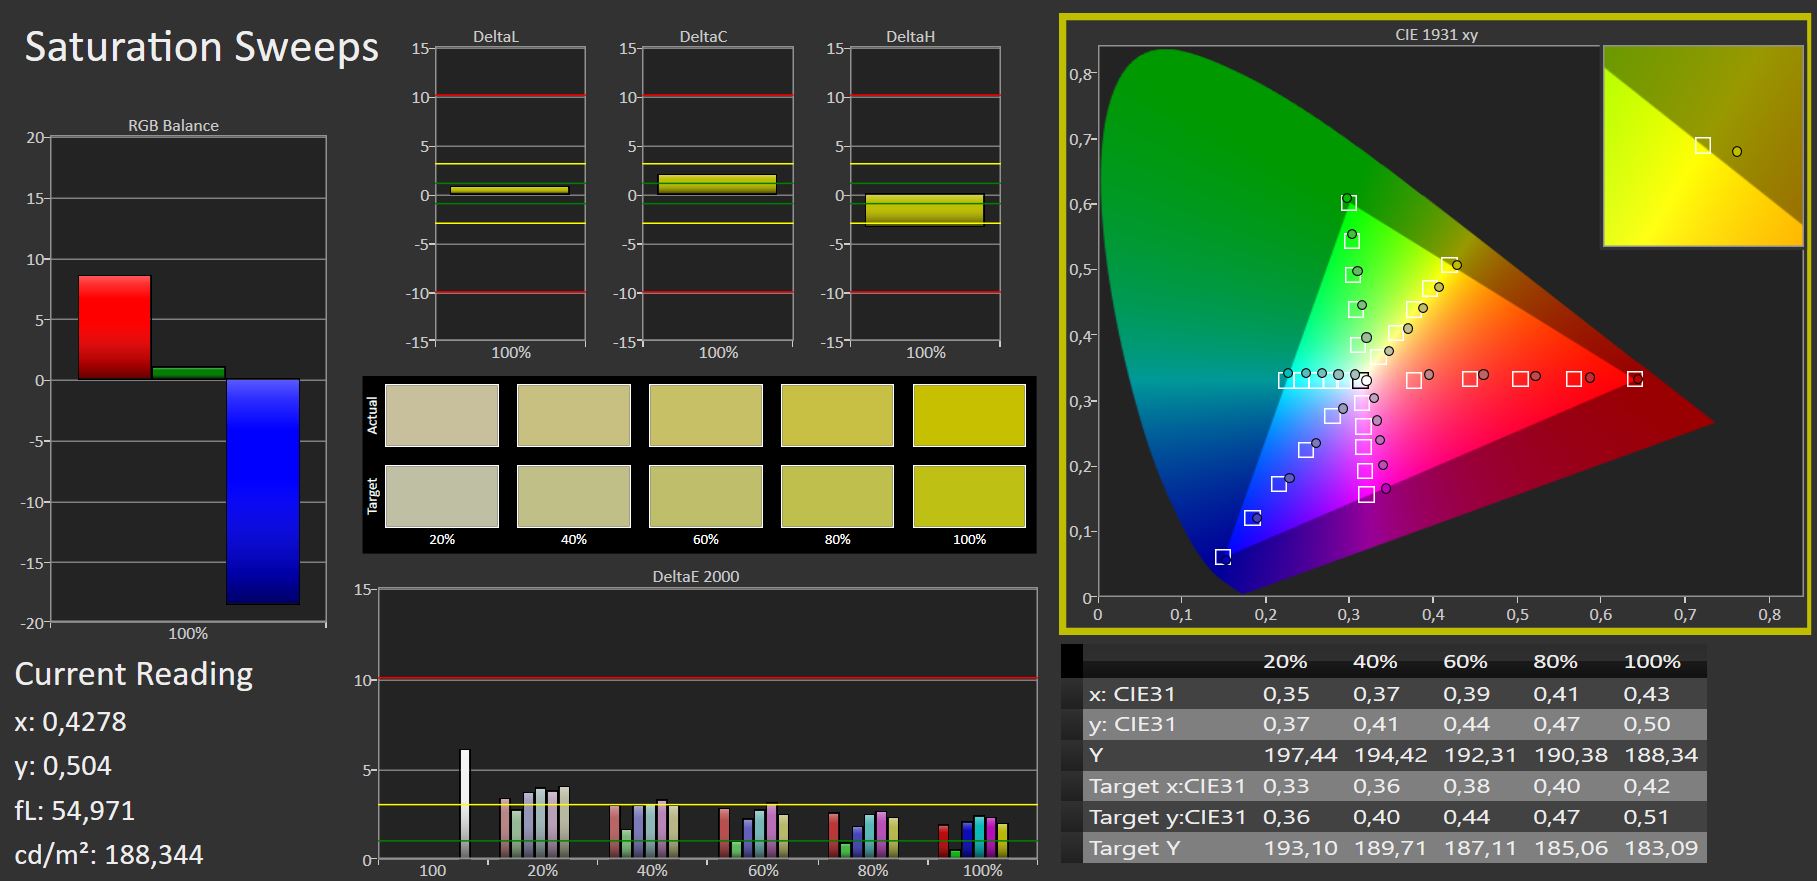
sRGB色彩空间的覆盖率为99.3%,这使得数字领域的专业图像编辑成为可能。然而,更大的色彩空间,如用于视频编辑的DCI-P3和以专业打印编辑过的图像为目标的AdobeRGB,只被覆盖了 覆盖,而Alienware m15和 惠普Envy 16几乎完全覆盖了它们。
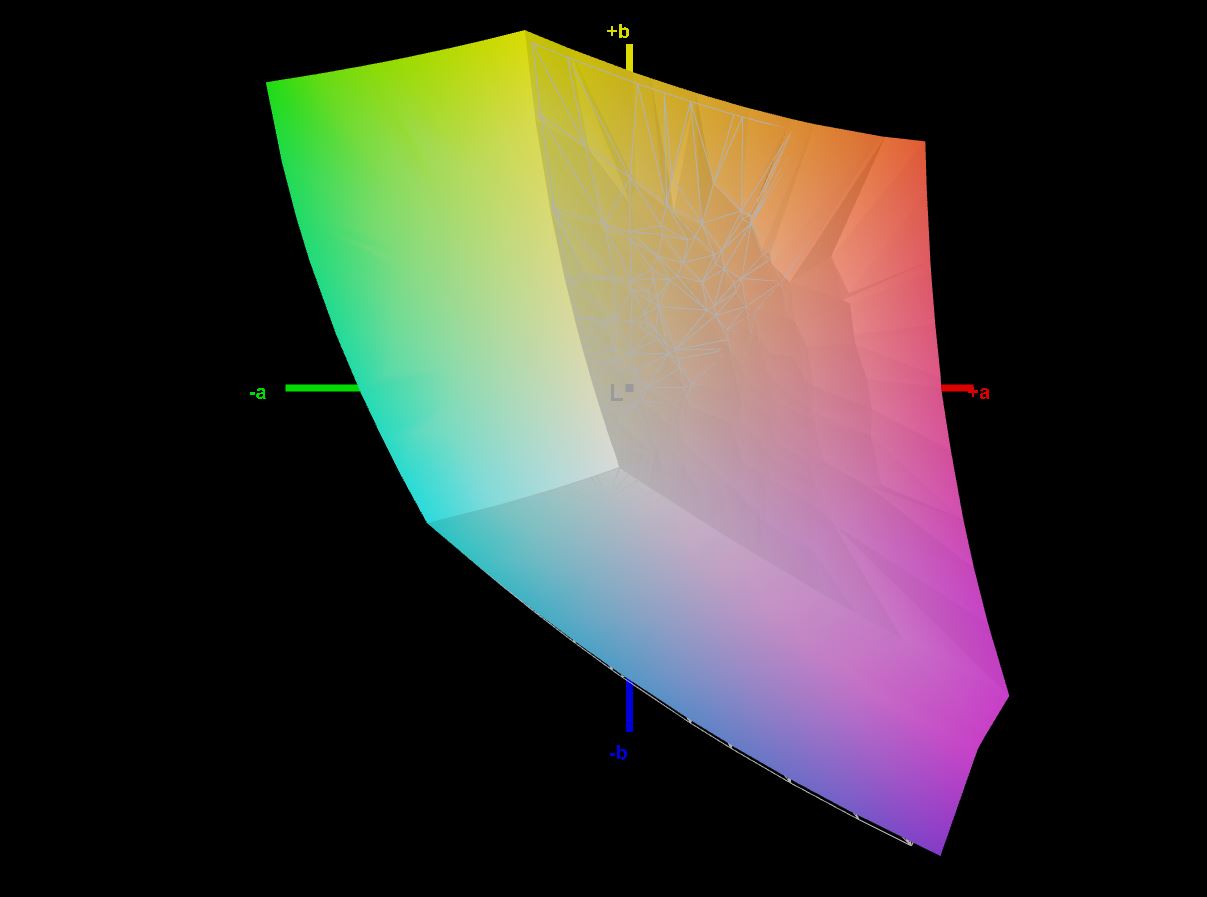
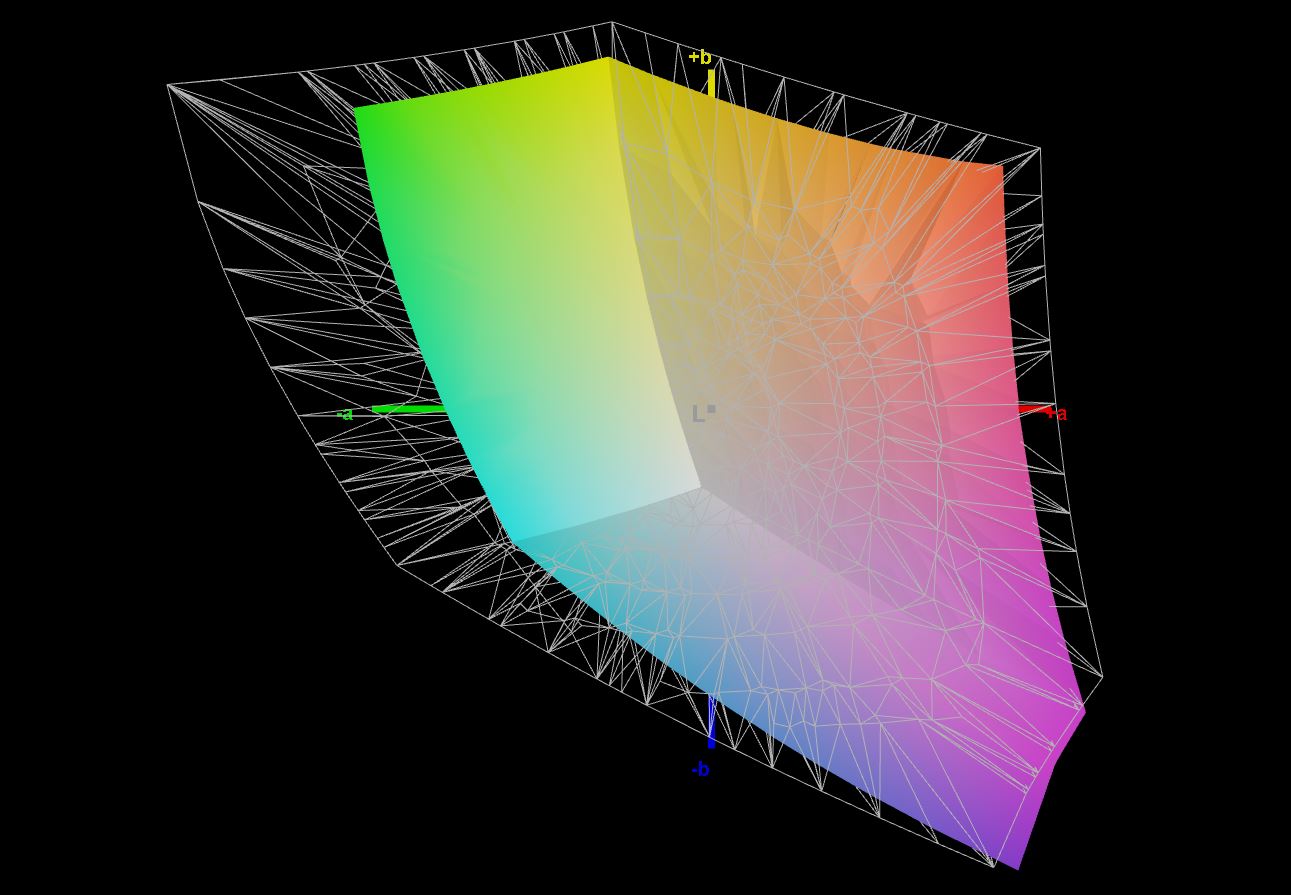
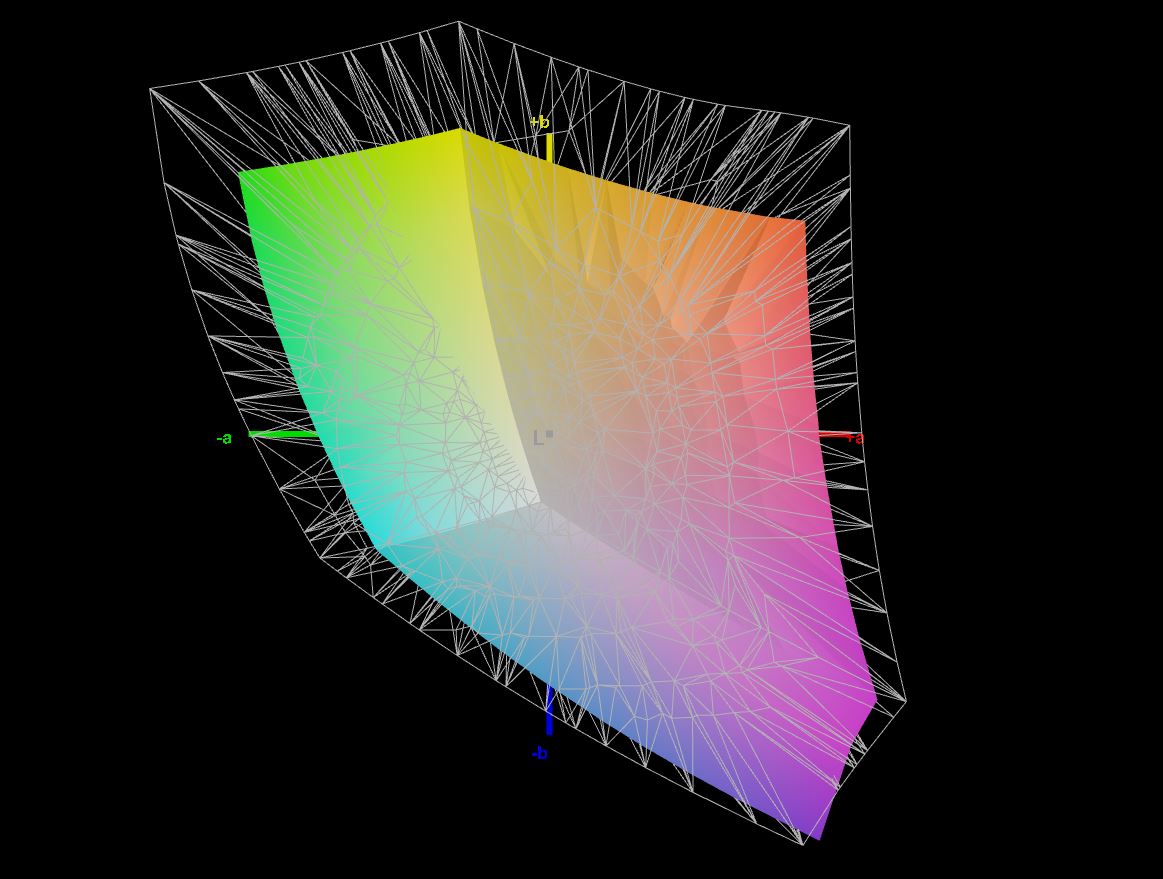
几乎所有的颜色都保持在DeltaE 3的阈值以下。然而,在出厂前可以看到轻微的偏红,即使在我们校准后也不会消失。我们校准过的颜色配置文件可以下载这里.

Display Response Times
| ↔ Response Time Black to White | ||
|---|---|---|
| 7.6 ms ... rise ↗ and fall ↘ combined | ↗ 3 ms rise | 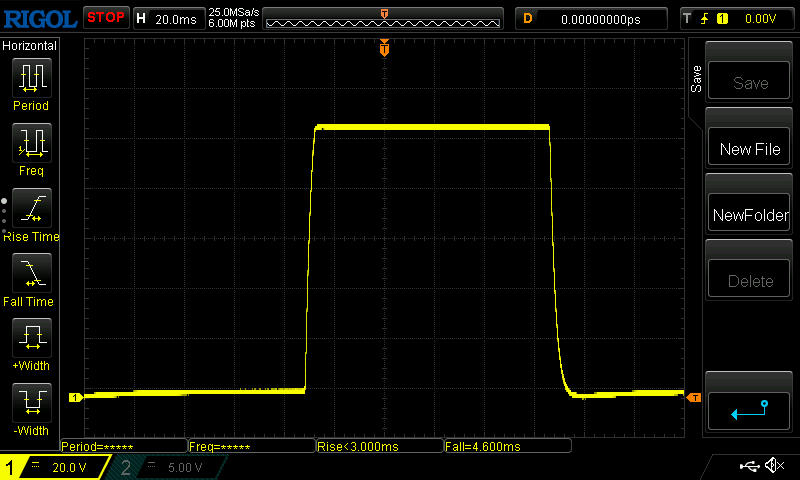 |
| ↘ 4.6 ms fall | ||
| The screen shows very fast response rates in our tests and should be very well suited for fast-paced gaming. In comparison, all tested devices range from 0.1 (minimum) to 240 (maximum) ms. » 22 % of all devices are better. This means that the measured response time is better than the average of all tested devices (19.8 ms). | ||
| ↔ Response Time 50% Grey to 80% Grey | ||
| 16 ms ... rise ↗ and fall ↘ combined | ↗ 7 ms rise | 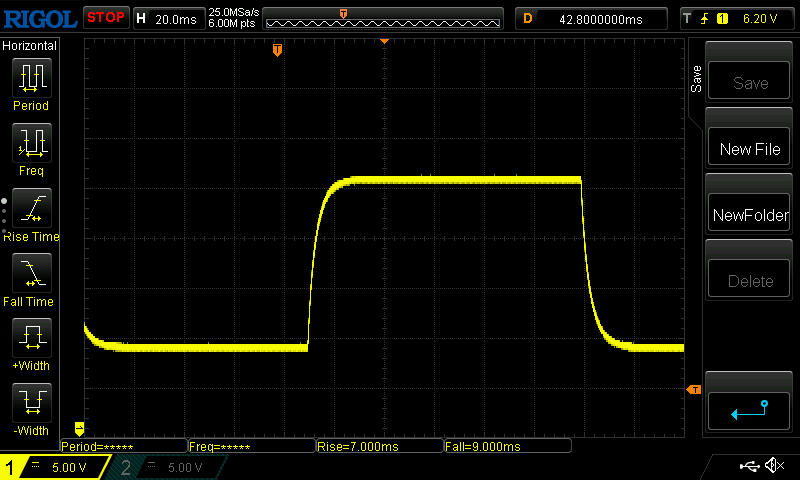 |
| ↘ 9 ms fall | ||
| The screen shows good response rates in our tests, but may be too slow for competitive gamers. In comparison, all tested devices range from 0.165 (minimum) to 636 (maximum) ms. » 30 % of all devices are better. This means that the measured response time is better than the average of all tested devices (31 ms). | ||
Screen Flickering / PWM (Pulse-Width Modulation)
| Screen flickering / PWM not detected | 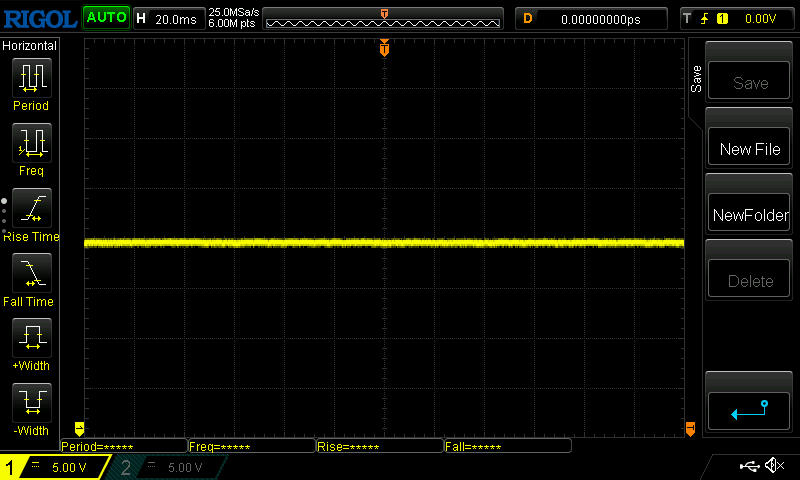 | ||
In comparison: 52 % of all tested devices do not use PWM to dim the display. If PWM was detected, an average of 7757 (minimum: 5 - maximum: 343500) Hz was measured. | |||
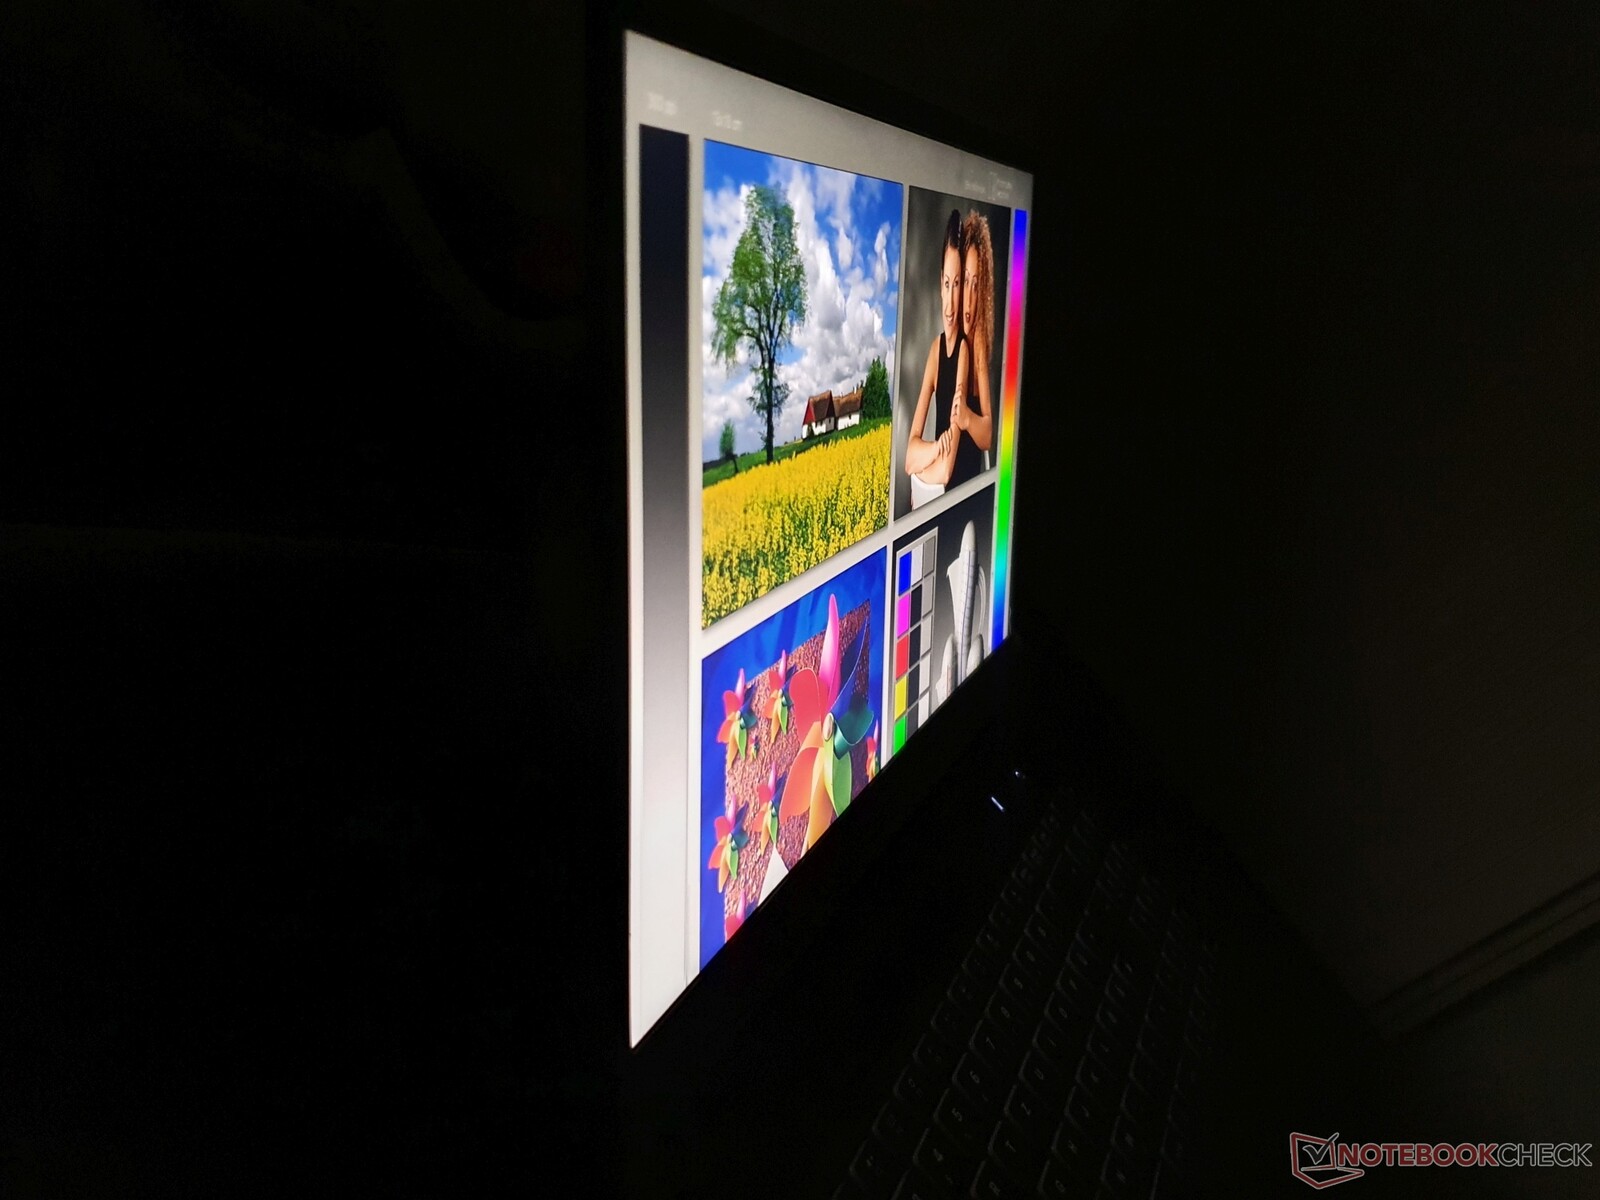
显示屏的371cd/m²只有在没有阳光直射的情况下才能很好地阅读,尽管它是哑光处理。

性能。RTX 3060的最大TGP,但也有更快的。
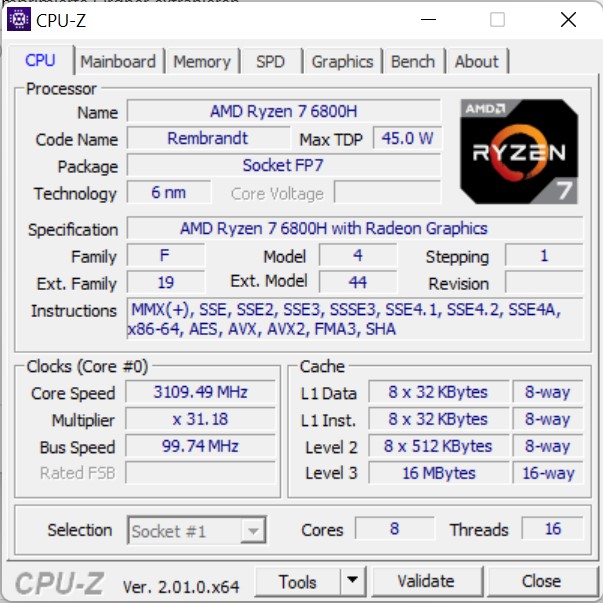
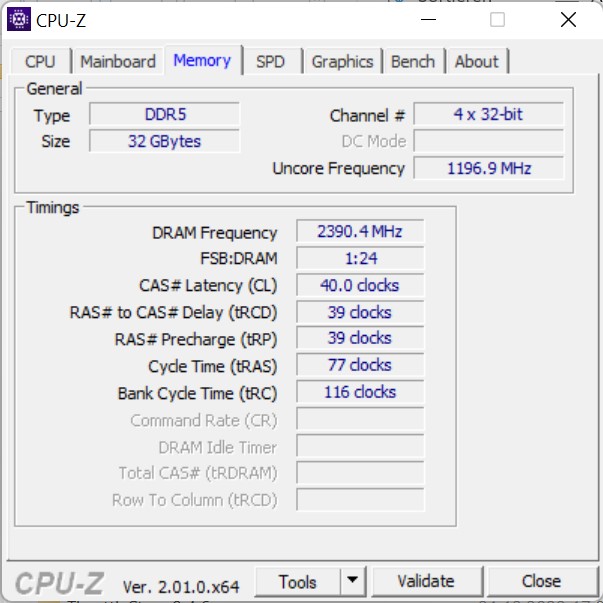
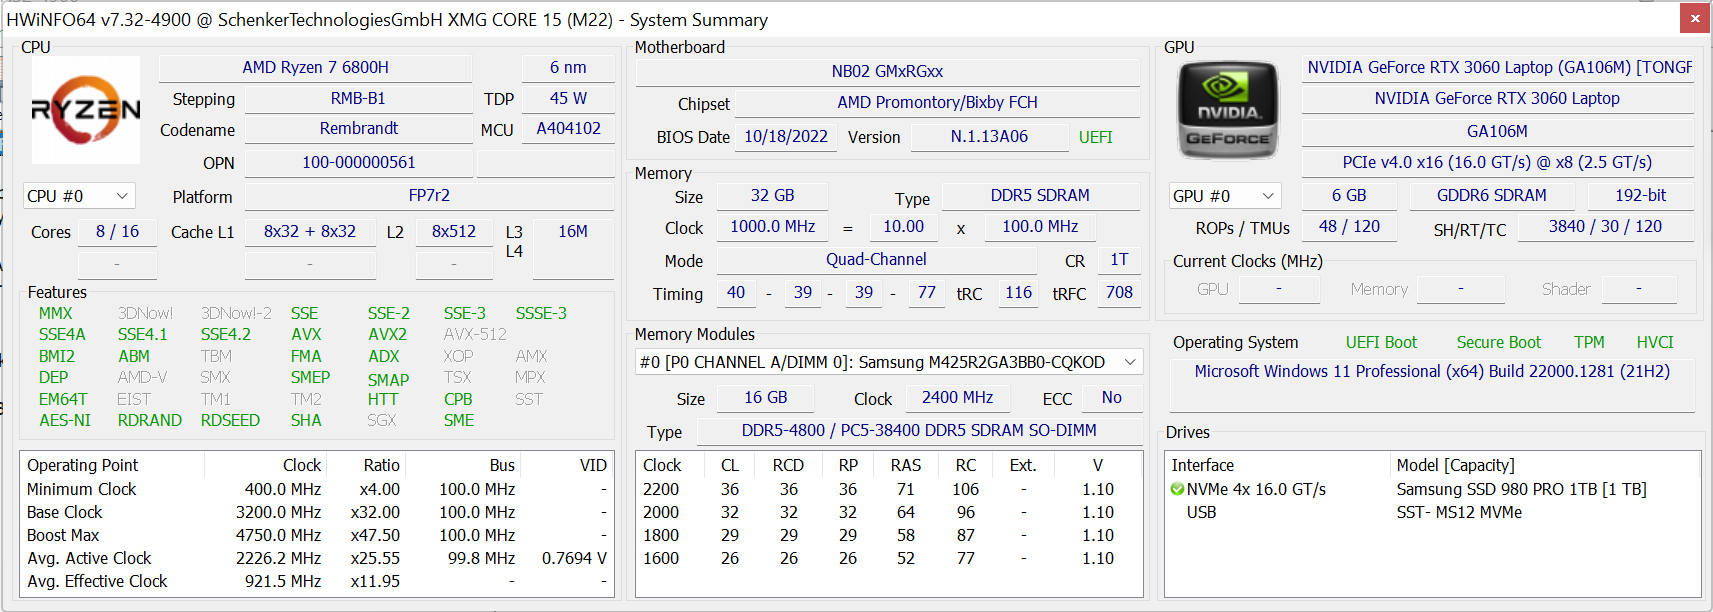
这款15.6英寸的游戏笔记本电脑非常强大,因为它的 Nvidia RTX 3060与140 W TGP为当前游戏设计,没有其他GPU选择。Ryzen 7 6800H 处理器也很强大,是唯一的选择。内存和大容量存储都很慷慨,分别为32GB DDR5-4800(最大64GB)和1TB PCIe 4.0 SSD。工作站任务和视频工作也能快速完成,在使用外部水冷时,产生的排放量非常低。
测试条件
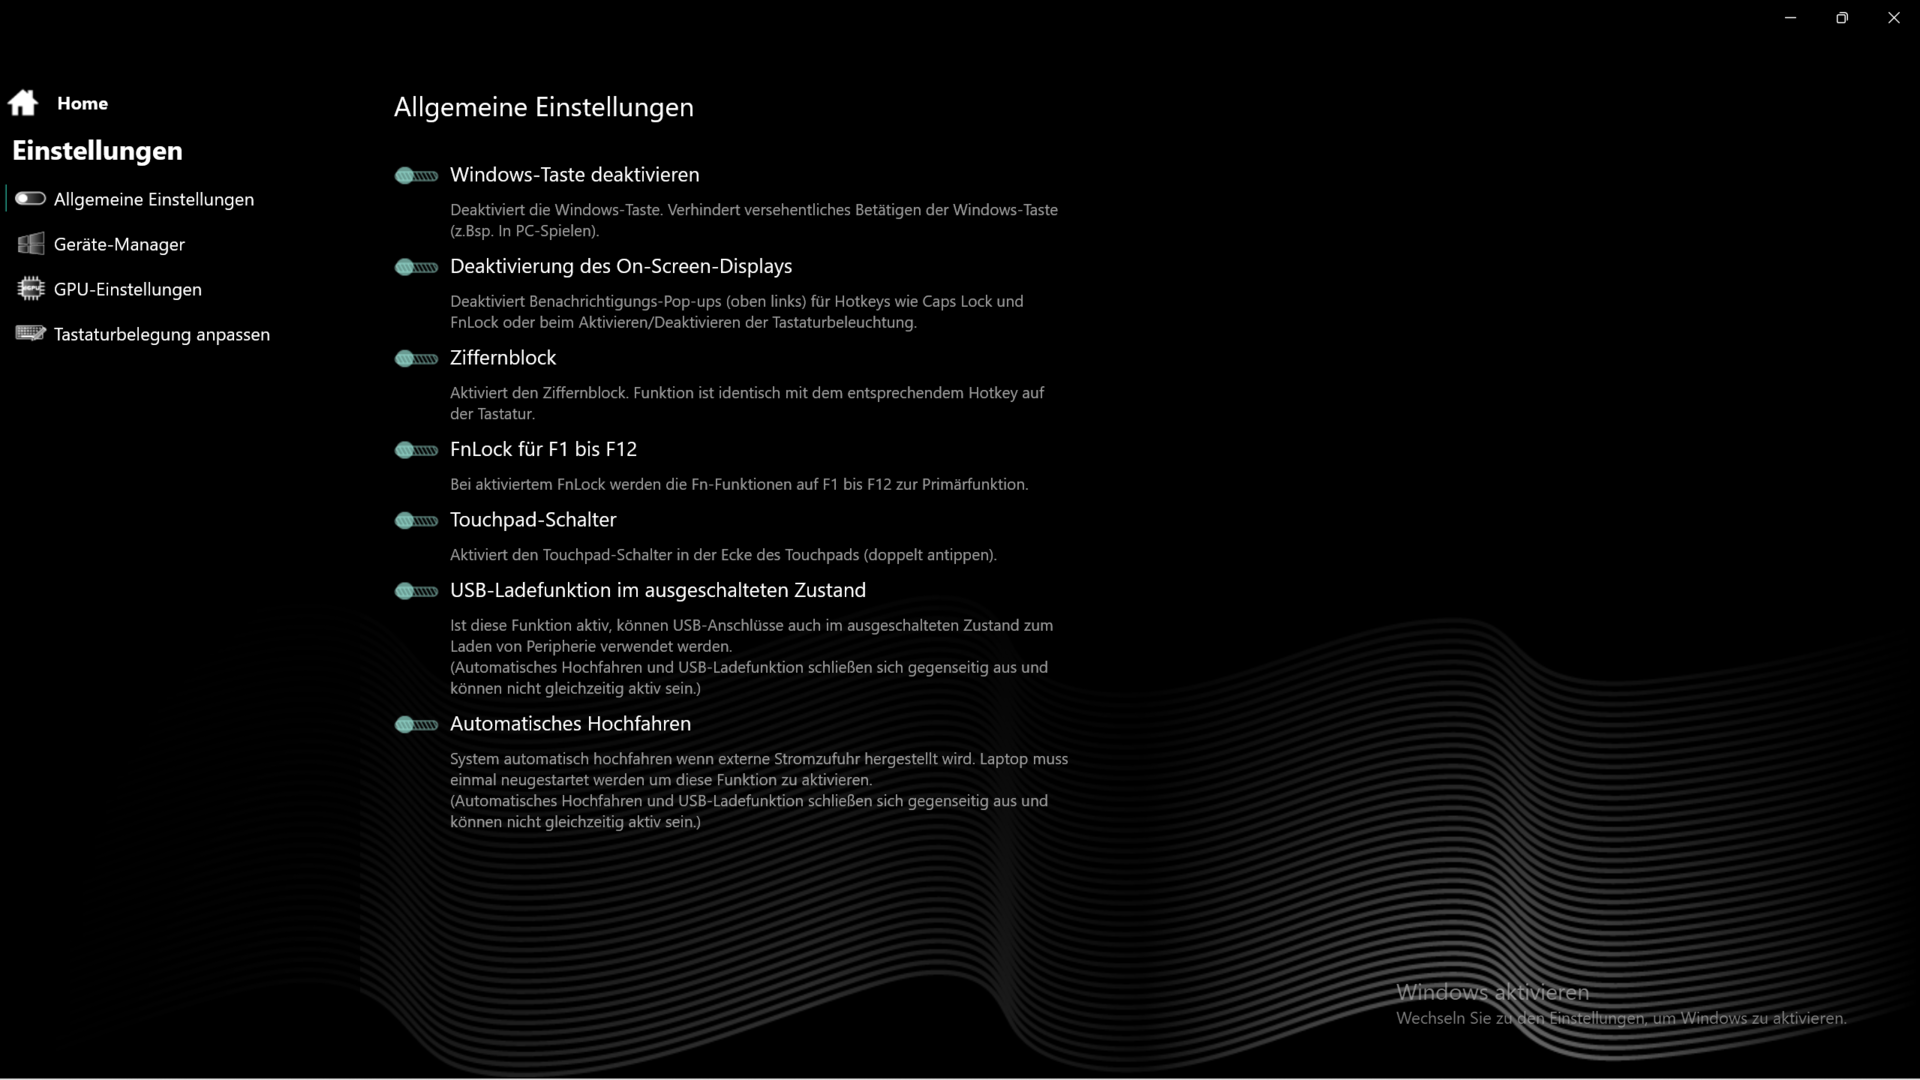
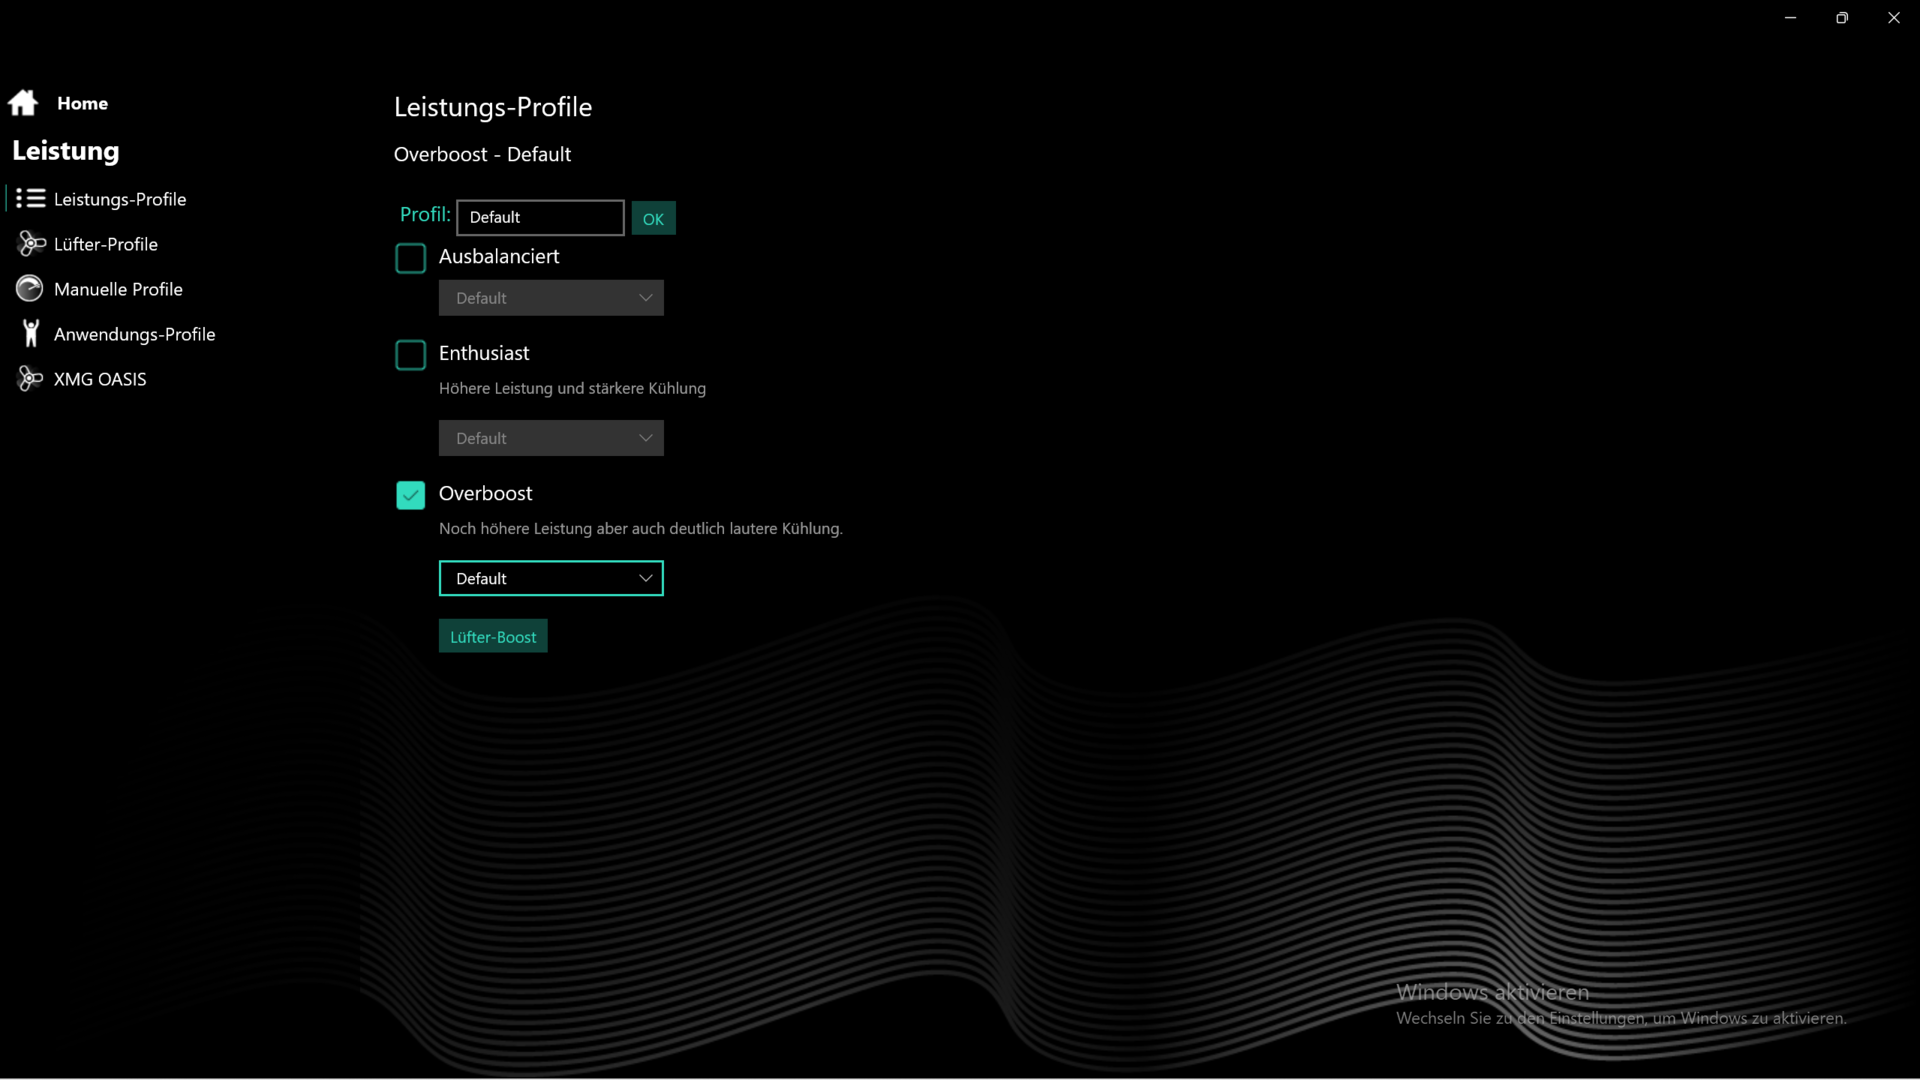
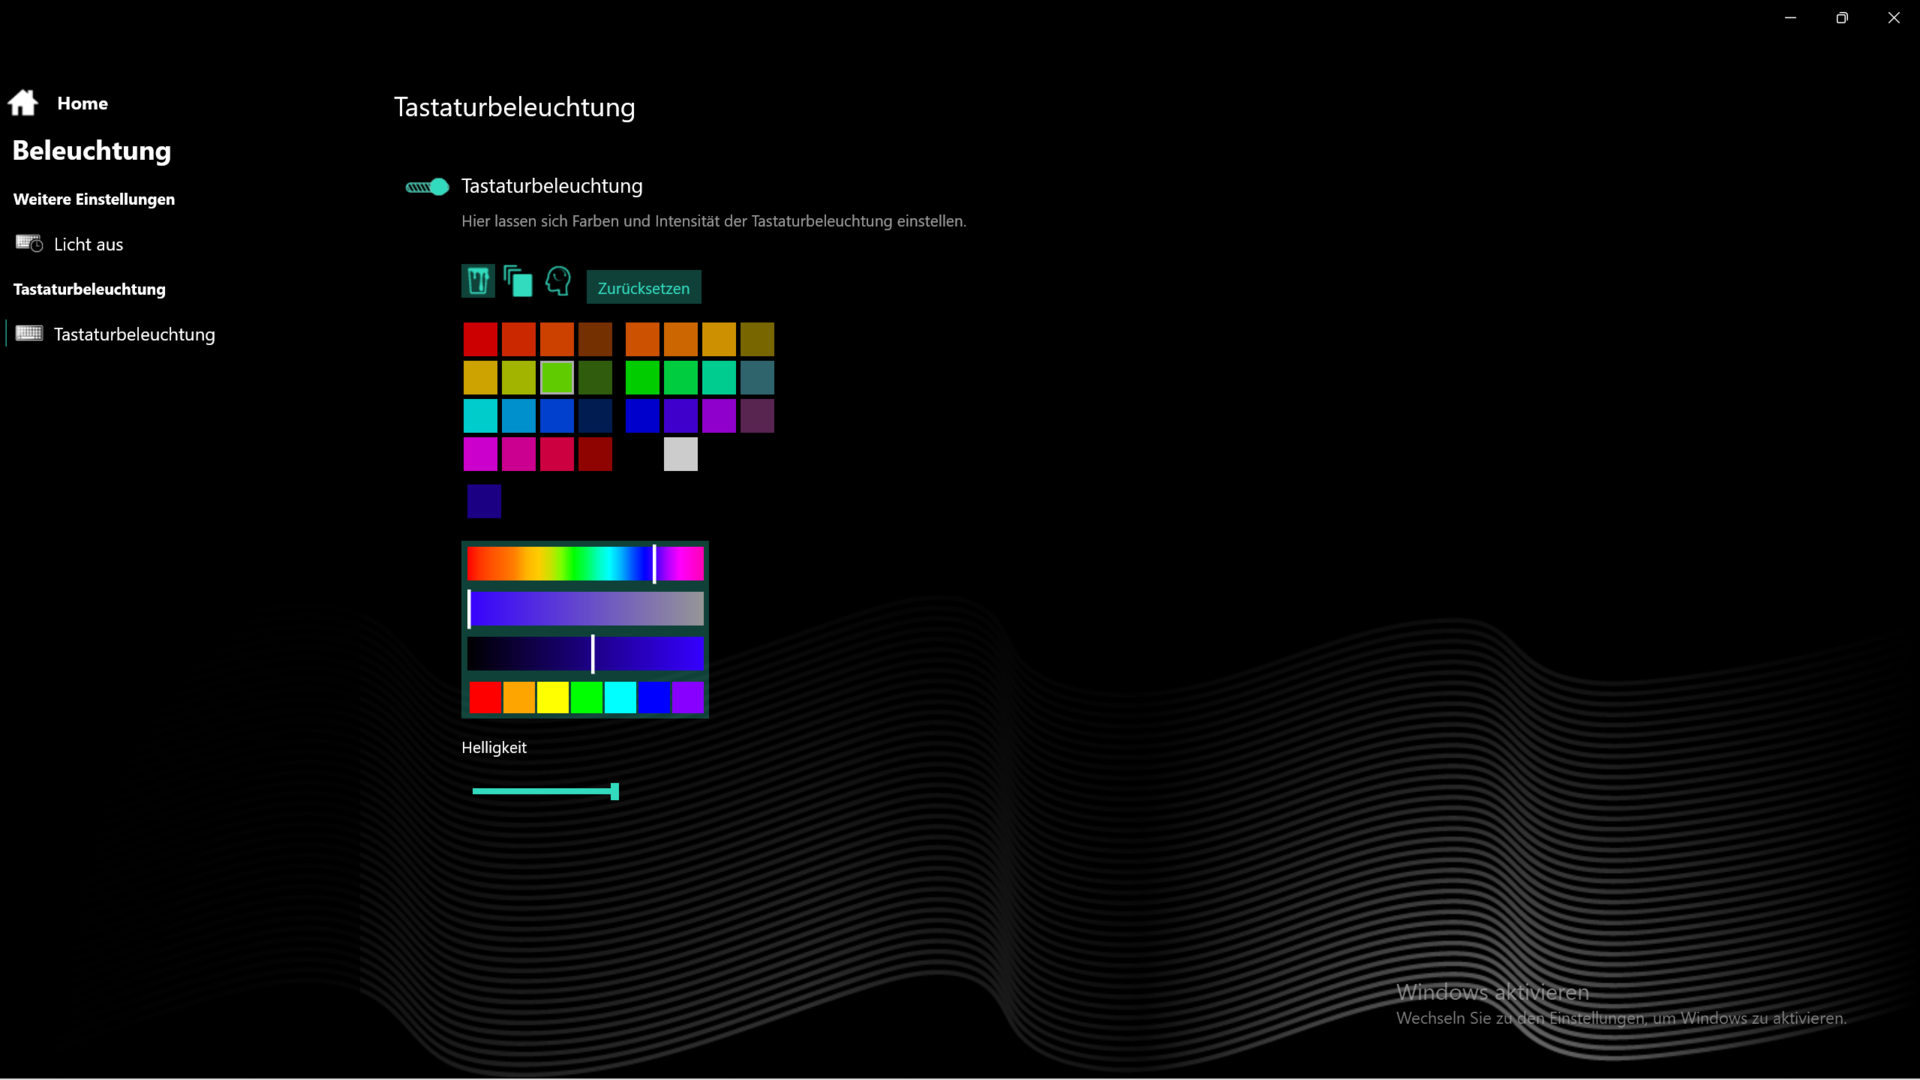
Schenker在Core 15中提供了三种电源模式,但也有单独的配置文件。电源按钮左边的按钮可以用来(取消)激活一个配置文件,这对许多情况下都是有用的。Overboost 允许CPU的永久功率限制为75瓦,Enthusiast 为60瓦,Balanced模式为35瓦。还有一个风扇提升功能,它可以使CPU的温度保持在5℃左右,而噪音水平则要高得多。
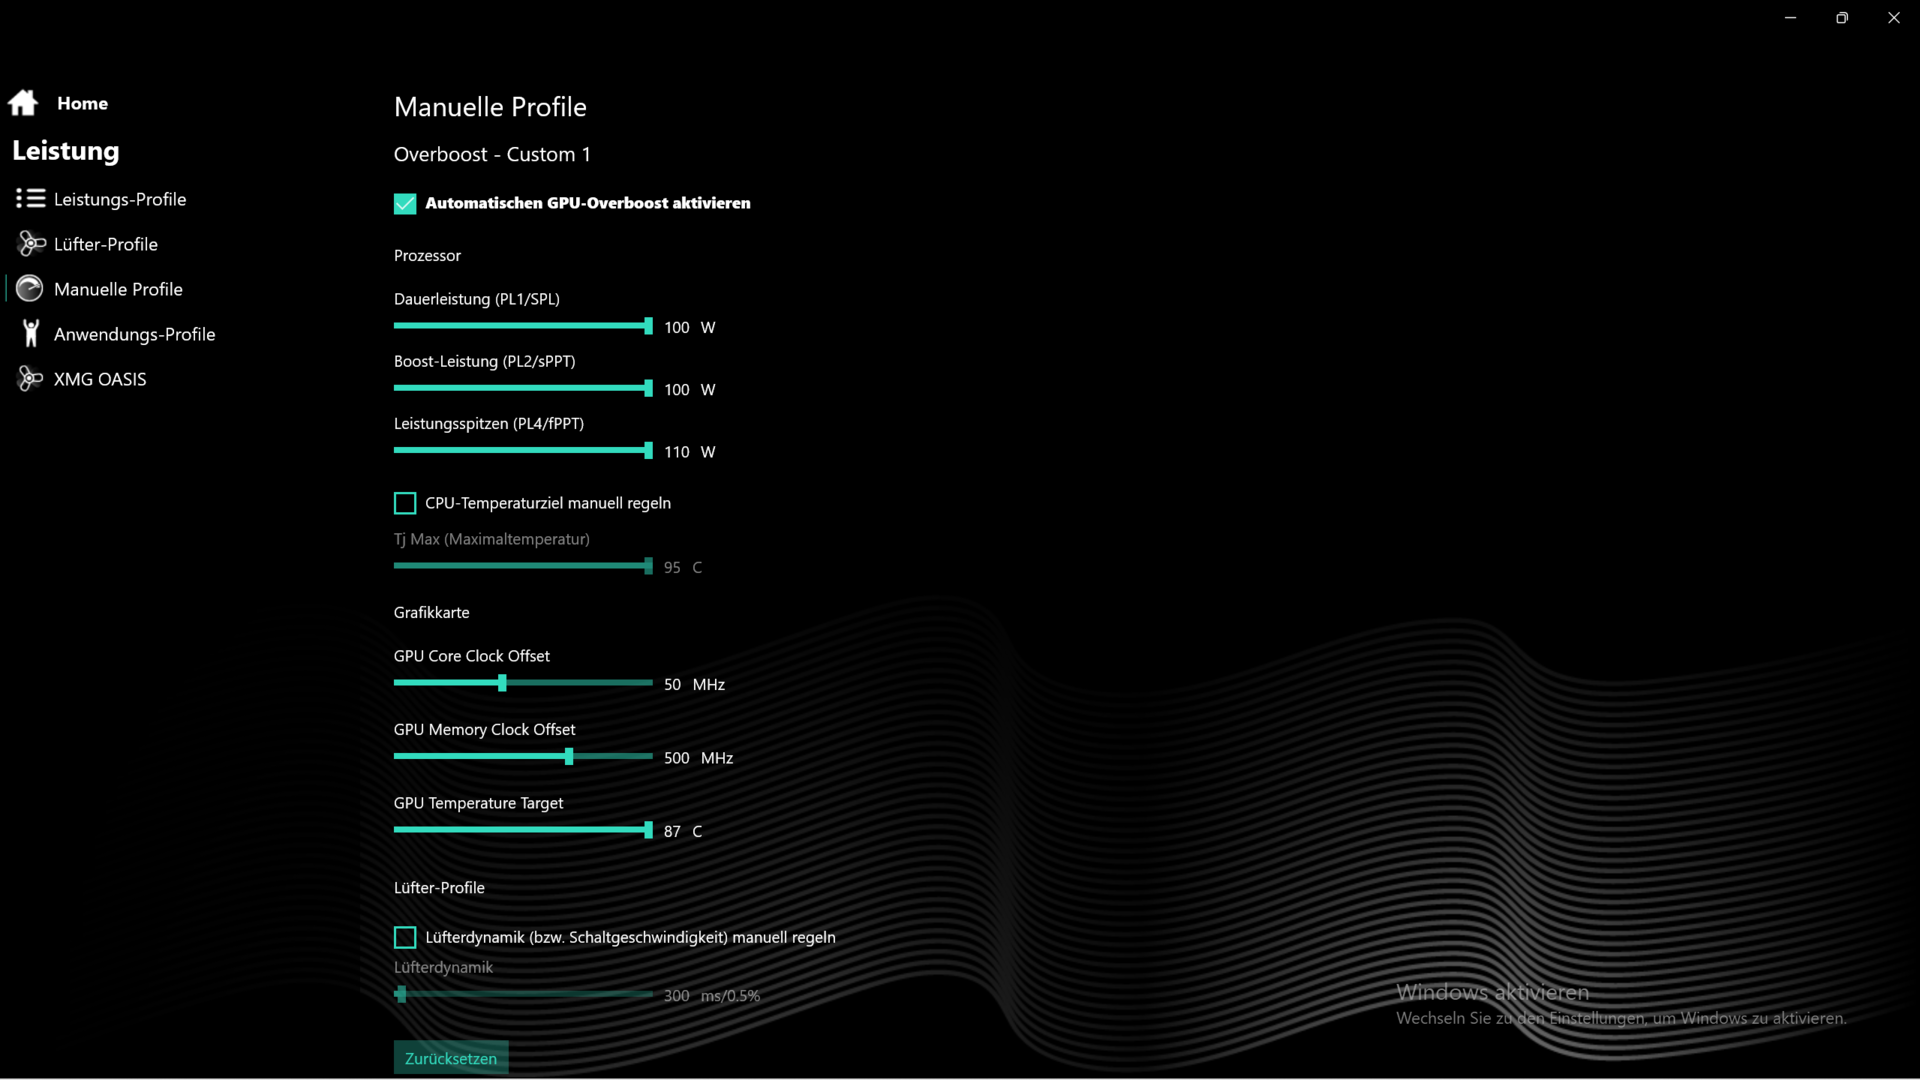
性能基准是在Overboost预设下运行的,但我们仍然推荐Enthusiast,它基本上具有相同的性能,但噪音更低。将TDP滑块移到100W只增加了5W的功率限制,而将GPU超频到推荐值(见 "GPU设置 "屏幕截图)则增加了几个额外的百分比。
处理器
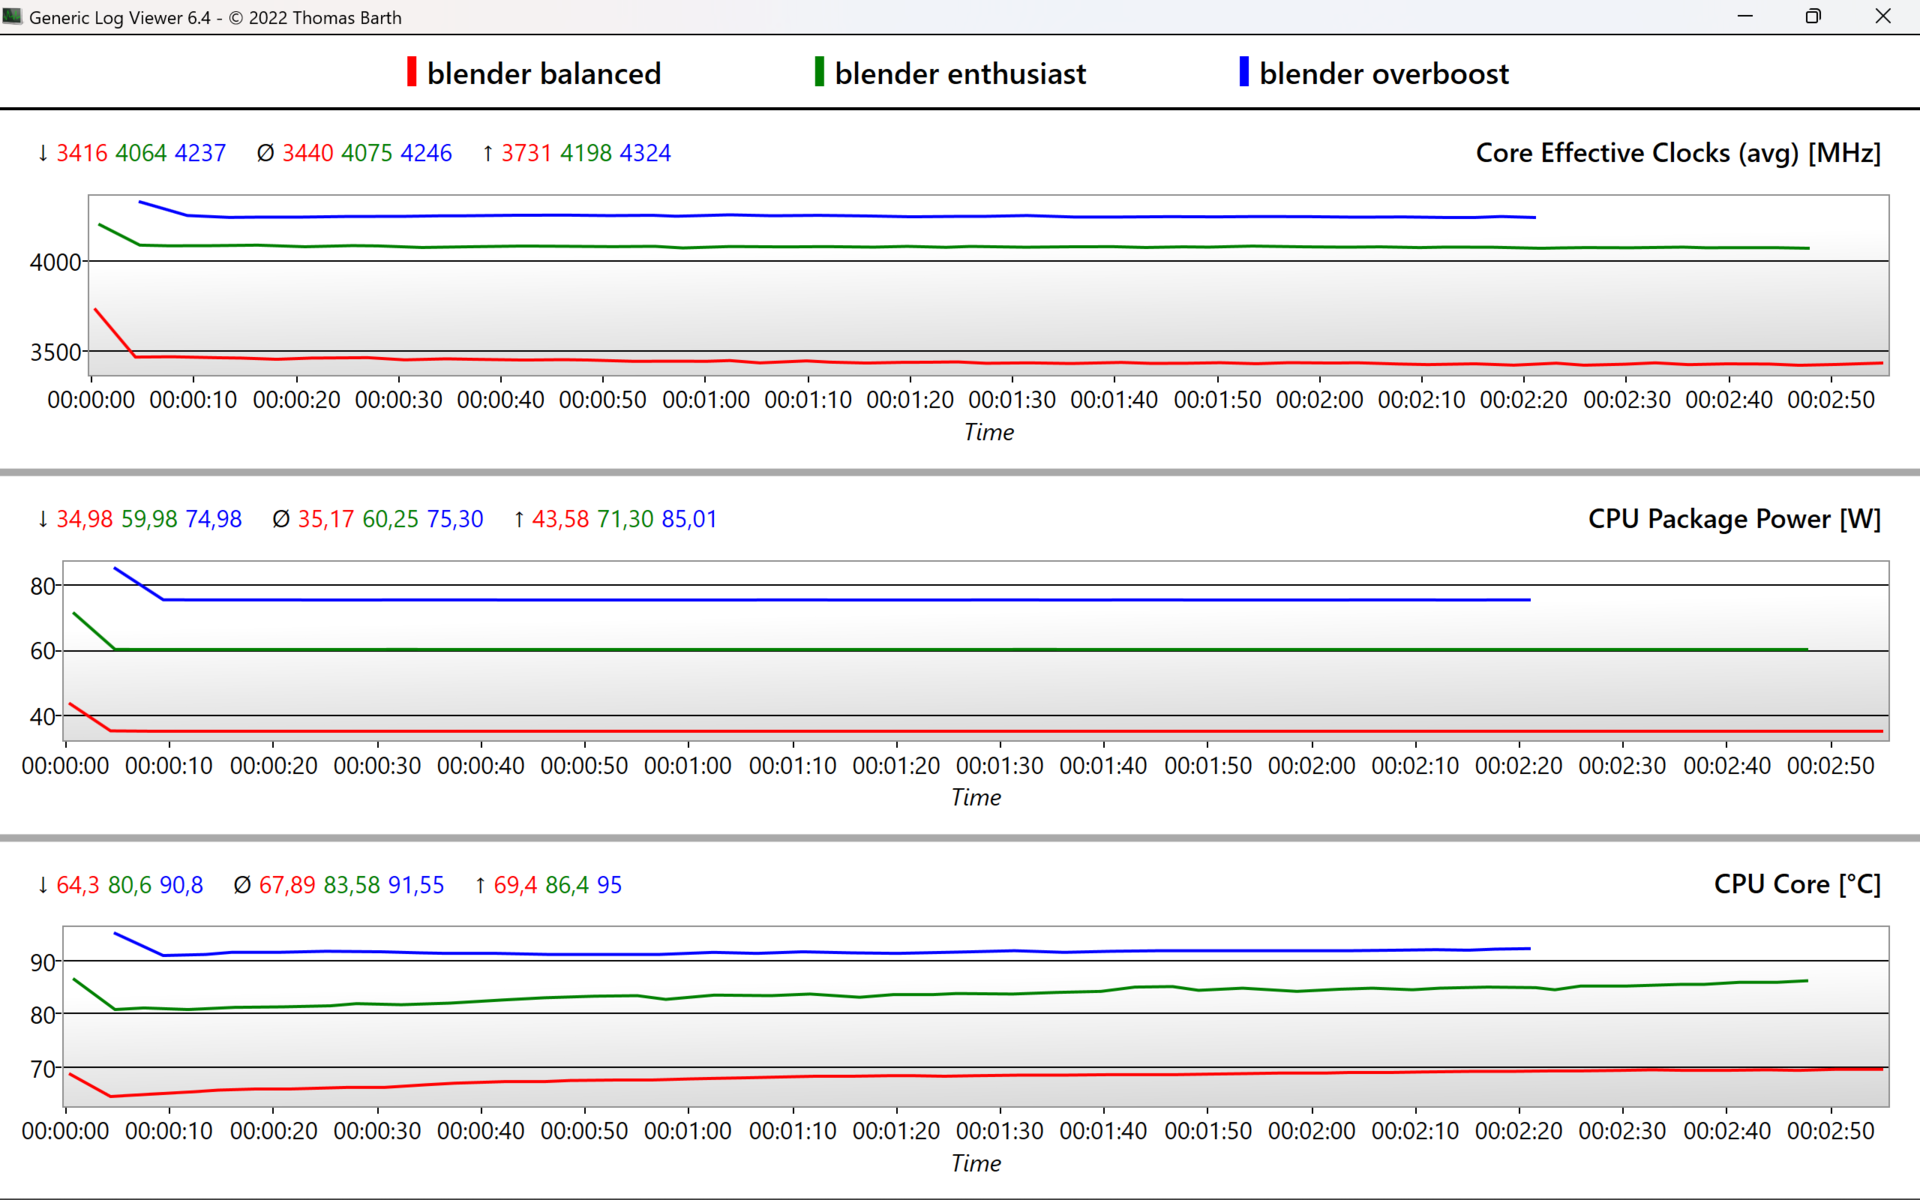
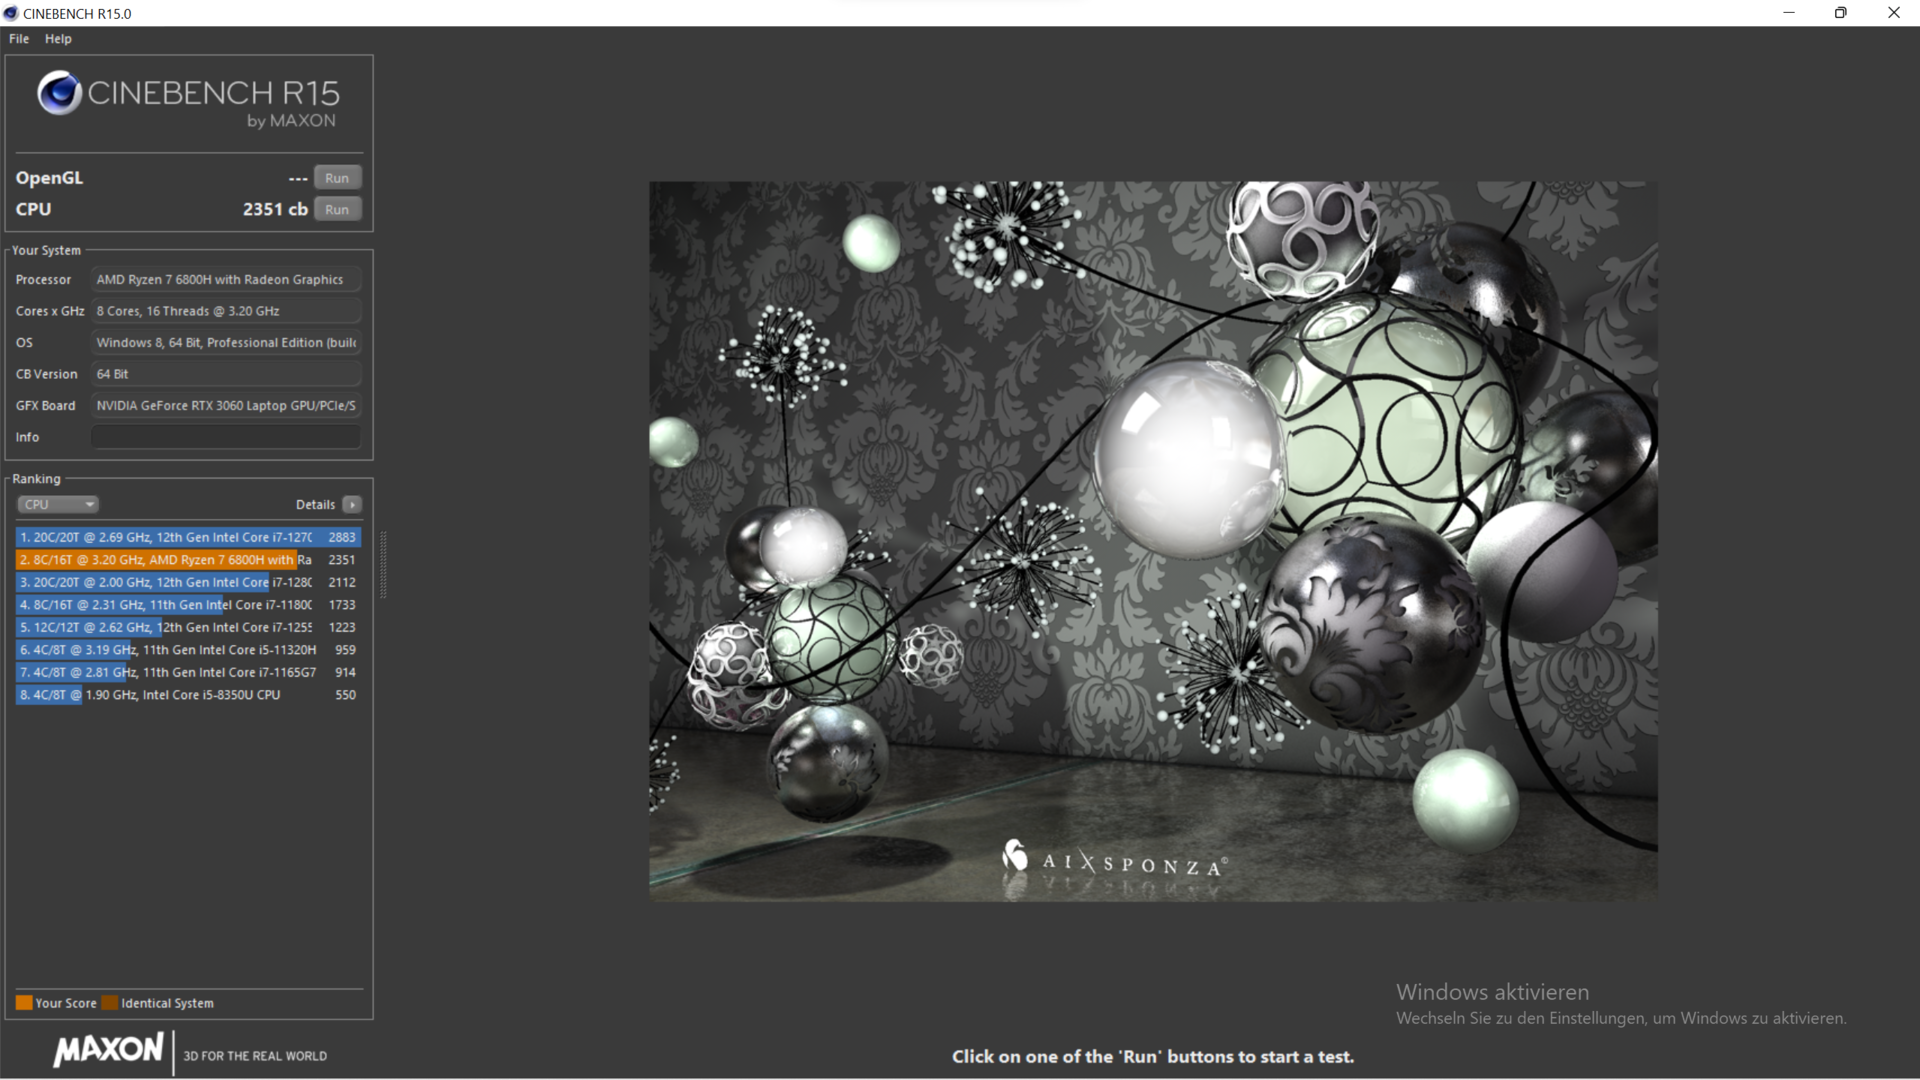
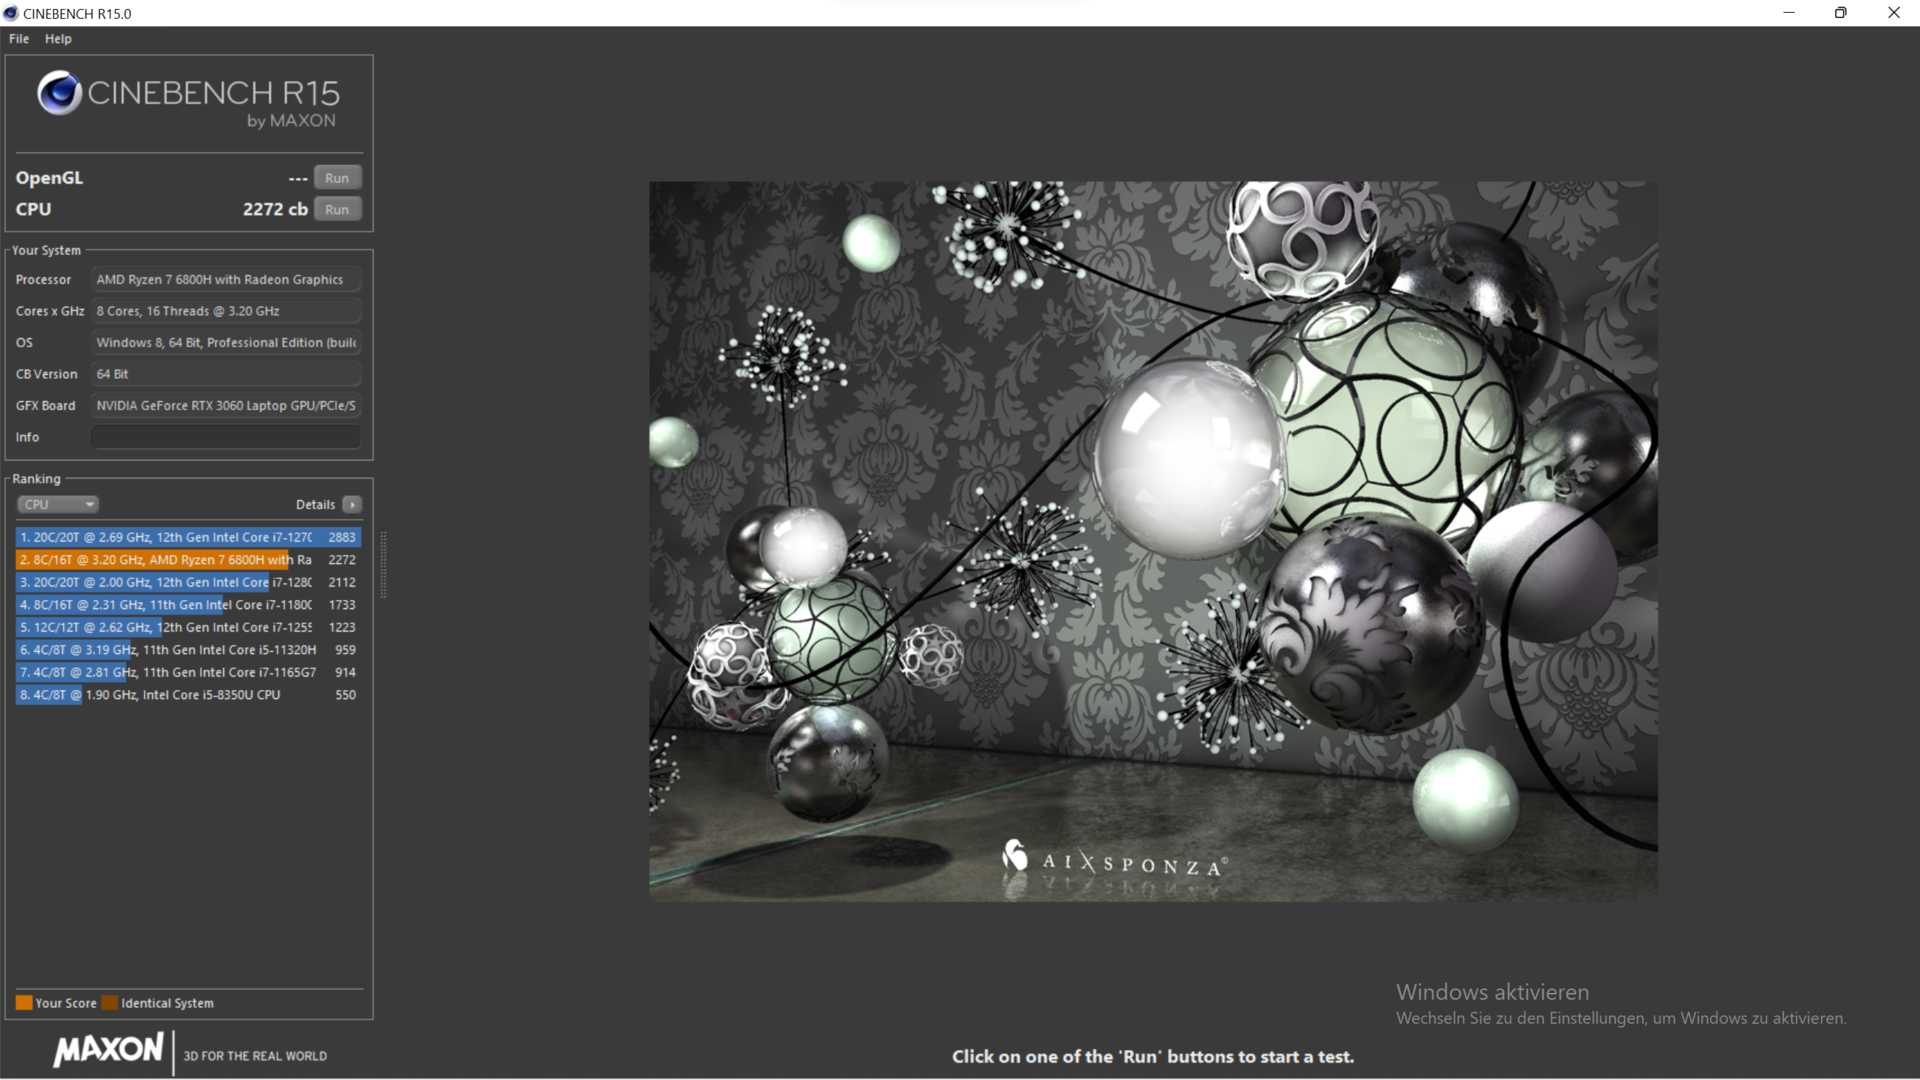
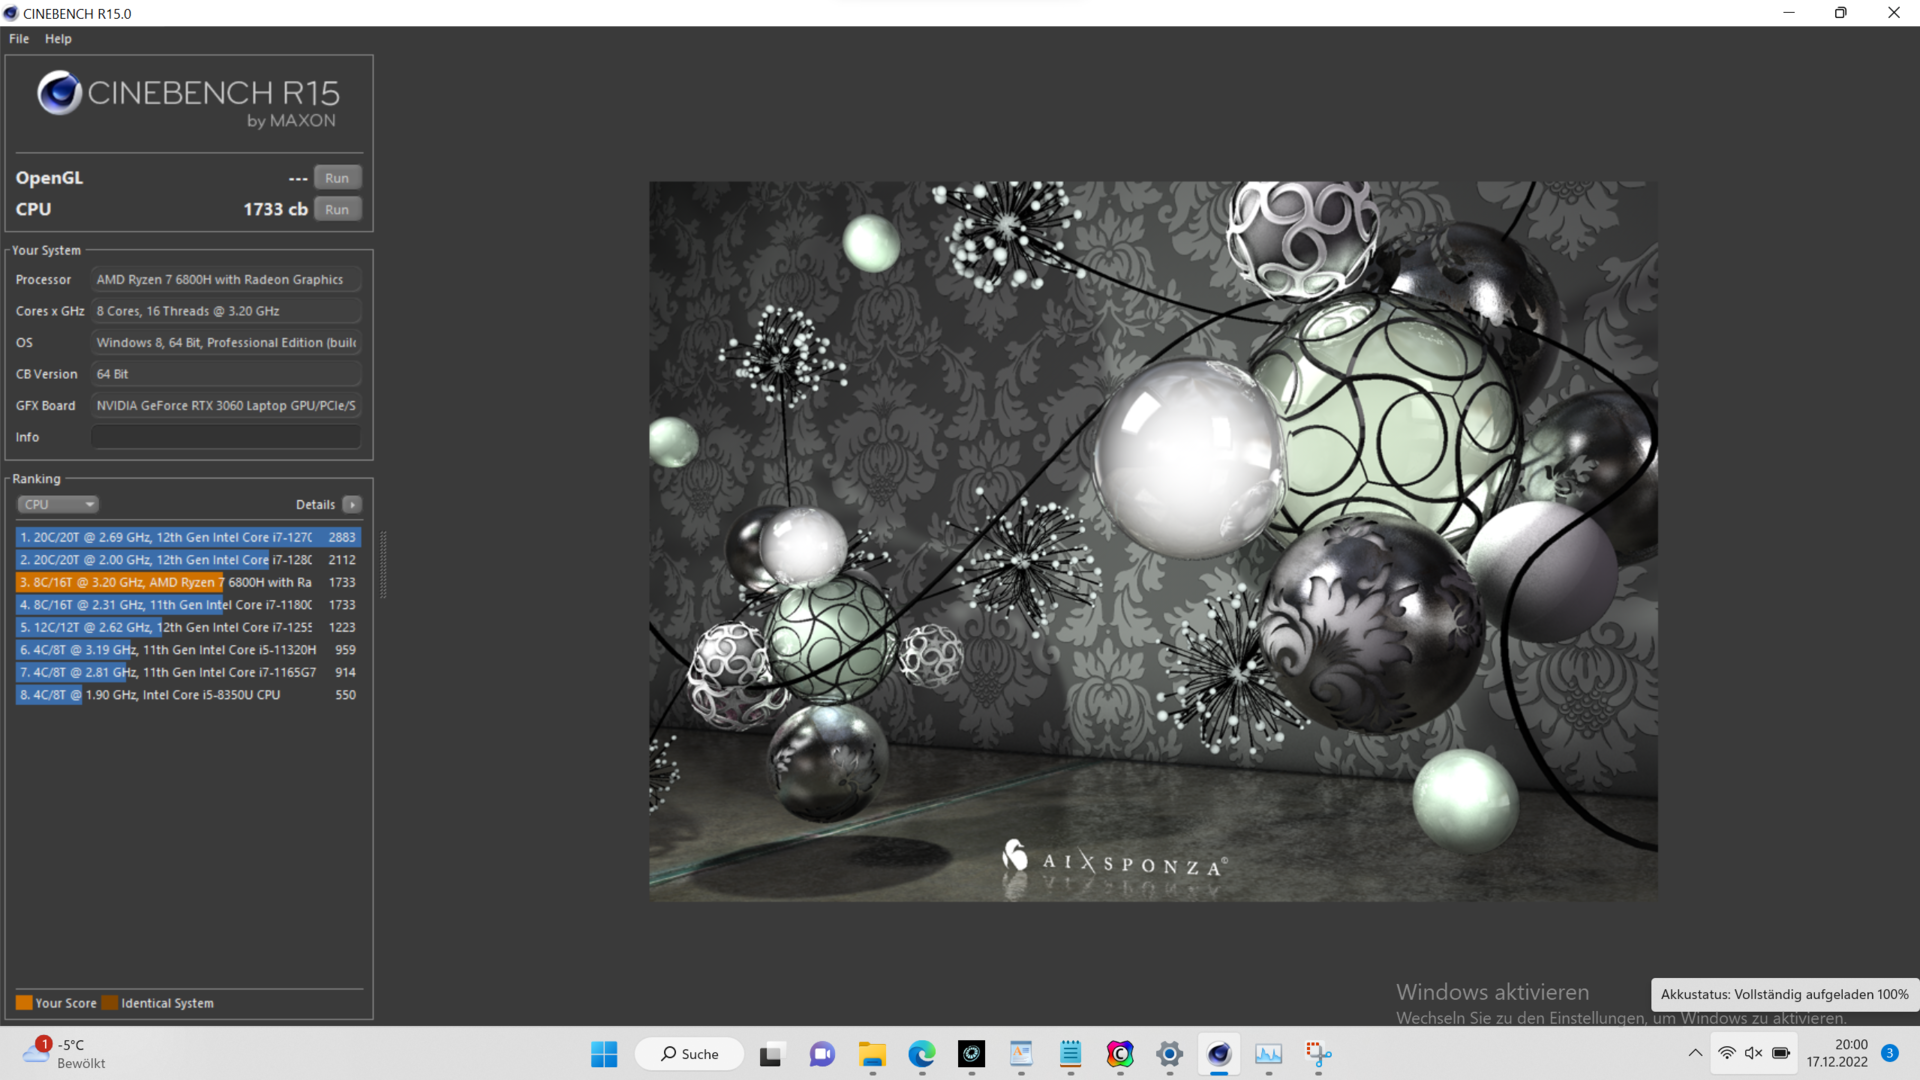
AMD的Ryzen 7 6800H 是一个45W的CPU,在XMG Core 15中以75W的功率永久运行,这样所有八个核心的4.3GHz的时钟可以保持在大约92℃(约198°F)。在几秒钟内,向处理器提供85W。
我们的Cinebench R15循环显示,酷睿i7-12700H ,在Legion 5 和TUF Gaming F15 ,尽管XMG开发了Ryzen 7 6800H的潜力,但工作速度明显更快。在35W的功率限制下(平衡模式),高效的Ryzen CPU的性能只下降了20%。
在电池模式下,尽管有Overboost,性能还是降低了约25%。

Cinebench R15 Multi endurance test
Cinebench R23: Multi Core | Single Core
Cinebench R20: CPU (Multi Core) | CPU (Single Core)
Cinebench R15: CPU Multi 64Bit | CPU Single 64Bit
Blender: v2.79 BMW27 CPU
7-Zip 18.03: 7z b 4 | 7z b 4 -mmt1
Geekbench 5.5: Multi-Core | Single-Core
HWBOT x265 Benchmark v2.2: 4k Preset
LibreOffice : 20 Documents To PDF
R Benchmark 2.5: Overall mean
| CPU Performance rating | |
| Average of class Gaming | |
| Lenovo Legion 5 15IAH7H 82RB | |
| Asus TUF Gaming F15 FX507ZM | |
| Schenker XMG Core 15 (M22) | |
| Average AMD Ryzen 7 6800H | |
| Alienware m15 R5 Ryzen Edition | |
| Schenker XMG Fusion 15 (Mid 22) | |
| Schenker XMG Core 15 Ampere | |
| Cinebench R23 / Multi Core | |
| Average of class Gaming (10488 - 42661, n=107, last 2 years) | |
| Lenovo Legion 5 15IAH7H 82RB | |
| Asus TUF Gaming F15 FX507ZM | |
| Schenker XMG Core 15 (M22) | |
| Average AMD Ryzen 7 6800H (11481 - 14660, n=11) | |
| Alienware m15 R5 Ryzen Edition | |
| Schenker XMG Core 15 Ampere | |
| Schenker XMG Fusion 15 (Mid 22) | |
| Cinebench R23 / Single Core | |
| Average of class Gaming (1166 - 2415, n=107, last 2 years) | |
| Lenovo Legion 5 15IAH7H 82RB | |
| Asus TUF Gaming F15 FX507ZM | |
| Schenker XMG Core 15 (M22) | |
| Average AMD Ryzen 7 6800H (1500 - 1552, n=9) | |
| Schenker XMG Fusion 15 (Mid 22) | |
| Alienware m15 R5 Ryzen Edition | |
| Schenker XMG Core 15 Ampere | |
| Cinebench R20 / CPU (Multi Core) | |
| Average of class Gaming (4029 - 16433, n=106, last 2 years) | |
| Lenovo Legion 5 15IAH7H 82RB | |
| Asus TUF Gaming F15 FX507ZM | |
| Schenker XMG Core 15 (M22) | |
| Average AMD Ryzen 7 6800H (4460 - 5661, n=9) | |
| Alienware m15 R5 Ryzen Edition | |
| Schenker XMG Core 15 Ampere | |
| Schenker XMG Fusion 15 (Mid 22) | |
| Cinebench R20 / CPU (Single Core) | |
| Average of class Gaming (442 - 913, n=106, last 2 years) | |
| Lenovo Legion 5 15IAH7H 82RB | |
| Asus TUF Gaming F15 FX507ZM | |
| Schenker XMG Core 15 (M22) | |
| Average AMD Ryzen 7 6800H (580 - 605, n=9) | |
| Schenker XMG Fusion 15 (Mid 22) | |
| Alienware m15 R5 Ryzen Edition | |
| Schenker XMG Core 15 Ampere | |
| Cinebench R15 / CPU Multi 64Bit | |
| Average of class Gaming (1578 - 6330, n=105, last 2 years) | |
| Lenovo Legion 5 15IAH7H 82RB | |
| Asus TUF Gaming F15 FX507ZM | |
| Schenker XMG Core 15 (M22) | |
| Average AMD Ryzen 7 6800H (1585 - 2366, n=10) | |
| Alienware m15 R5 Ryzen Edition | |
| Schenker XMG Core 15 Ampere | |
| Schenker XMG Fusion 15 (Mid 22) | |
| Cinebench R15 / CPU Single 64Bit | |
| Average of class Gaming (188.8 - 350, n=106, last 2 years) | |
| Lenovo Legion 5 15IAH7H 82RB | |
| Asus TUF Gaming F15 FX507ZM | |
| Schenker XMG Core 15 (M22) | |
| Average AMD Ryzen 7 6800H (182.7 - 250, n=10) | |
| Alienware m15 R5 Ryzen Edition | |
| Schenker XMG Fusion 15 (Mid 22) | |
| Schenker XMG Core 15 Ampere | |
| Blender / v2.79 BMW27 CPU | |
| Schenker XMG Fusion 15 (Mid 22) | |
| Alienware m15 R5 Ryzen Edition | |
| Schenker XMG Core 15 Ampere | |
| Average AMD Ryzen 7 6800H (213 - 268, n=8) | |
| Schenker XMG Core 15 (M22) | |
| Asus TUF Gaming F15 FX507ZM | |
| Lenovo Legion 5 15IAH7H 82RB | |
| Average of class Gaming (79 - 330, n=104, last 2 years) | |
| 7-Zip 18.03 / 7z b 4 | |
| Average of class Gaming (33491 - 148086, n=105, last 2 years) | |
| Lenovo Legion 5 15IAH7H 82RB | |
| Asus TUF Gaming F15 FX507ZM | |
| Schenker XMG Core 15 (M22) | |
| Average AMD Ryzen 7 6800H (55067 - 64817, n=8) | |
| Alienware m15 R5 Ryzen Edition | |
| Schenker XMG Core 15 Ampere | |
| Schenker XMG Fusion 15 (Mid 22) | |
| 7-Zip 18.03 / 7z b 4 -mmt1 | |
| Average of class Gaming (4199 - 7436, n=105, last 2 years) | |
| Lenovo Legion 5 15IAH7H 82RB | |
| Schenker XMG Core 15 (M22) | |
| Average AMD Ryzen 7 6800H (5521 - 5803, n=8) | |
| Alienware m15 R5 Ryzen Edition | |
| Schenker XMG Fusion 15 (Mid 22) | |
| Asus TUF Gaming F15 FX507ZM | |
| Schenker XMG Core 15 Ampere | |
| Geekbench 5.5 / Multi-Core | |
| Average of class Gaming (6460 - 28263, n=105, last 2 years) | |
| Lenovo Legion 5 15IAH7H 82RB | |
| Asus TUF Gaming F15 FX507ZM | |
| Schenker XMG Core 15 (M22) | |
| Average AMD Ryzen 7 6800H (8898 - 10355, n=10) | |
| Schenker XMG Fusion 15 (Mid 22) | |
| Schenker XMG Core 15 Ampere | |
| Alienware m15 R5 Ryzen Edition | |
| Geekbench 5.5 / Single-Core | |
| Average of class Gaming (986 - 2474, n=105, last 2 years) | |
| Lenovo Legion 5 15IAH7H 82RB | |
| Asus TUF Gaming F15 FX507ZM | |
| Schenker XMG Fusion 15 (Mid 22) | |
| Schenker XMG Core 15 (M22) | |
| Average AMD Ryzen 7 6800H (1518 - 1568, n=10) | |
| Alienware m15 R5 Ryzen Edition | |
| Schenker XMG Core 15 Ampere | |
| HWBOT x265 Benchmark v2.2 / 4k Preset | |
| Average of class Gaming (11.5 - 44.4, n=105, last 2 years) | |
| Lenovo Legion 5 15IAH7H 82RB | |
| Asus TUF Gaming F15 FX507ZM | |
| Schenker XMG Core 15 (M22) | |
| Average AMD Ryzen 7 6800H (14.9 - 18.5, n=9) | |
| Alienware m15 R5 Ryzen Edition | |
| Schenker XMG Core 15 Ampere | |
| Schenker XMG Fusion 15 (Mid 22) | |
| LibreOffice / 20 Documents To PDF | |
| Schenker XMG Core 15 (M22) | |
| Schenker XMG Core 15 Ampere | |
| Alienware m15 R5 Ryzen Edition | |
| Average AMD Ryzen 7 6800H (48.7 - 79.5, n=8) | |
| Asus TUF Gaming F15 FX507ZM | |
| Average of class Gaming (33.2 - 88.8, n=105, last 2 years) | |
| Schenker XMG Fusion 15 (Mid 22) | |
| Lenovo Legion 5 15IAH7H 82RB | |
| R Benchmark 2.5 / Overall mean | |
| Schenker XMG Core 15 Ampere | |
| Schenker XMG Fusion 15 (Mid 22) | |
| Alienware m15 R5 Ryzen Edition | |
| Average AMD Ryzen 7 6800H (0.4783 - 0.515, n=8) | |
| Schenker XMG Core 15 (M22) | |
| Asus TUF Gaming F15 FX507ZM | |
| Lenovo Legion 5 15IAH7H 82RB | |
| Average of class Gaming (0.3439 - 0.759, n=106, last 2 years) | |
* ... smaller is better
AIDA64: FP32 Ray-Trace | FPU Julia | CPU SHA3 | CPU Queen | FPU SinJulia | FPU Mandel | CPU AES | CPU ZLib | FP64 Ray-Trace | CPU PhotoWorxx
| Performance rating | |
| Average of class Gaming | |
| Lenovo Legion 5 15IAH7H 82RB | |
| Schenker XMG Core 15 (M22) | |
| Average AMD Ryzen 7 6800H | |
| Alienware m15 R5 Ryzen Edition | |
| Schenker XMG Core 15 Ampere | |
| Schenker XMG Fusion 15 (Mid 22) | |
| Asus TUF Gaming F15 FX507ZM | |
| AIDA64 / FP32 Ray-Trace | |
| Average of class Gaming (10227 - 85542, n=105, last 2 years) | |
| Lenovo Legion 5 15IAH7H 82RB | |
| Schenker XMG Core 15 (M22) | |
| Average AMD Ryzen 7 6800H (12876 - 17031, n=8) | |
| Schenker XMG Core 15 Ampere | |
| Alienware m15 R5 Ryzen Edition | |
| Schenker XMG Fusion 15 (Mid 22) | |
| Asus TUF Gaming F15 FX507ZM | |
| AIDA64 / FPU Julia | |
| Average of class Gaming (51376 - 238426, n=105, last 2 years) | |
| Schenker XMG Core 15 (M22) | |
| Average AMD Ryzen 7 6800H (82673 - 105987, n=8) | |
| Alienware m15 R5 Ryzen Edition | |
| Lenovo Legion 5 15IAH7H 82RB | |
| Schenker XMG Core 15 Ampere | |
| Schenker XMG Fusion 15 (Mid 22) | |
| Asus TUF Gaming F15 FX507ZM | |
| AIDA64 / CPU SHA3 | |
| Average of class Gaming (2180 - 10115, n=105, last 2 years) | |
| Lenovo Legion 5 15IAH7H 82RB | |
| Schenker XMG Fusion 15 (Mid 22) | |
| Schenker XMG Core 15 (M22) | |
| Asus TUF Gaming F15 FX507ZM | |
| Average AMD Ryzen 7 6800H (2886 - 3634, n=8) | |
| Alienware m15 R5 Ryzen Edition | |
| Schenker XMG Core 15 Ampere | |
| AIDA64 / CPU Queen | |
| Average of class Gaming (49785 - 173351, n=90, last 2 years) | |
| Lenovo Legion 5 15IAH7H 82RB | |
| Asus TUF Gaming F15 FX507ZM | |
| Schenker XMG Core 15 Ampere | |
| Average AMD Ryzen 7 6800H (75117 - 106322, n=8) | |
| Alienware m15 R5 Ryzen Edition | |
| Schenker XMG Core 15 (M22) | |
| Schenker XMG Fusion 15 (Mid 22) | |
| AIDA64 / FPU SinJulia | |
| Average of class Gaming (4424 - 33636, n=105, last 2 years) | |
| Schenker XMG Core 15 Ampere | |
| Schenker XMG Core 15 (M22) | |
| Average AMD Ryzen 7 6800H (11771 - 13120, n=8) | |
| Alienware m15 R5 Ryzen Edition | |
| Lenovo Legion 5 15IAH7H 82RB | |
| Asus TUF Gaming F15 FX507ZM | |
| Schenker XMG Fusion 15 (Mid 22) | |
| AIDA64 / FPU Mandel | |
| Average of class Gaming (25115 - 128721, n=105, last 2 years) | |
| Schenker XMG Core 15 (M22) | |
| Average AMD Ryzen 7 6800H (45287 - 58327, n=8) | |
| Alienware m15 R5 Ryzen Edition | |
| Lenovo Legion 5 15IAH7H 82RB | |
| Schenker XMG Core 15 Ampere | |
| Schenker XMG Fusion 15 (Mid 22) | |
| Asus TUF Gaming F15 FX507ZM | |
| AIDA64 / CPU AES | |
| Lenovo Legion 5 15IAH7H 82RB | |
| Schenker XMG Fusion 15 (Mid 22) | |
| Alienware m15 R5 Ryzen Edition | |
| Average AMD Ryzen 7 6800H (67816 - 137383, n=8) | |
| Average of class Gaming (39258 - 247074, n=105, last 2 years) | |
| Schenker XMG Core 15 Ampere | |
| Schenker XMG Core 15 (M22) | |
| Asus TUF Gaming F15 FX507ZM | |
| AIDA64 / CPU ZLib | |
| Average of class Gaming (574 - 2531, n=105, last 2 years) | |
| Asus TUF Gaming F15 FX507ZM | |
| Lenovo Legion 5 15IAH7H 82RB | |
| Schenker XMG Core 15 (M22) | |
| Schenker XMG Core 15 Ampere | |
| Average AMD Ryzen 7 6800H (732 - 901, n=8) | |
| Alienware m15 R5 Ryzen Edition | |
| Schenker XMG Fusion 15 (Mid 22) | |
| AIDA64 / FP64 Ray-Trace | |
| Average of class Gaming (5509 - 45446, n=105, last 2 years) | |
| Lenovo Legion 5 15IAH7H 82RB | |
| Schenker XMG Core 15 (M22) | |
| Average AMD Ryzen 7 6800H (6917 - 8980, n=8) | |
| Schenker XMG Core 15 Ampere | |
| Alienware m15 R5 Ryzen Edition | |
| Schenker XMG Fusion 15 (Mid 22) | |
| Asus TUF Gaming F15 FX507ZM | |
| AIDA64 / CPU PhotoWorxx | |
| Average of class Gaming (12271 - 89891, n=105, last 2 years) | |
| Lenovo Legion 5 15IAH7H 82RB | |
| Asus TUF Gaming F15 FX507ZM | |
| Schenker XMG Core 15 (M22) | |
| Average AMD Ryzen 7 6800H (26496 - 30360, n=8) | |
| Schenker XMG Core 15 Ampere | |
| Schenker XMG Fusion 15 (Mid 22) | |
| Alienware m15 R5 Ryzen Edition | |
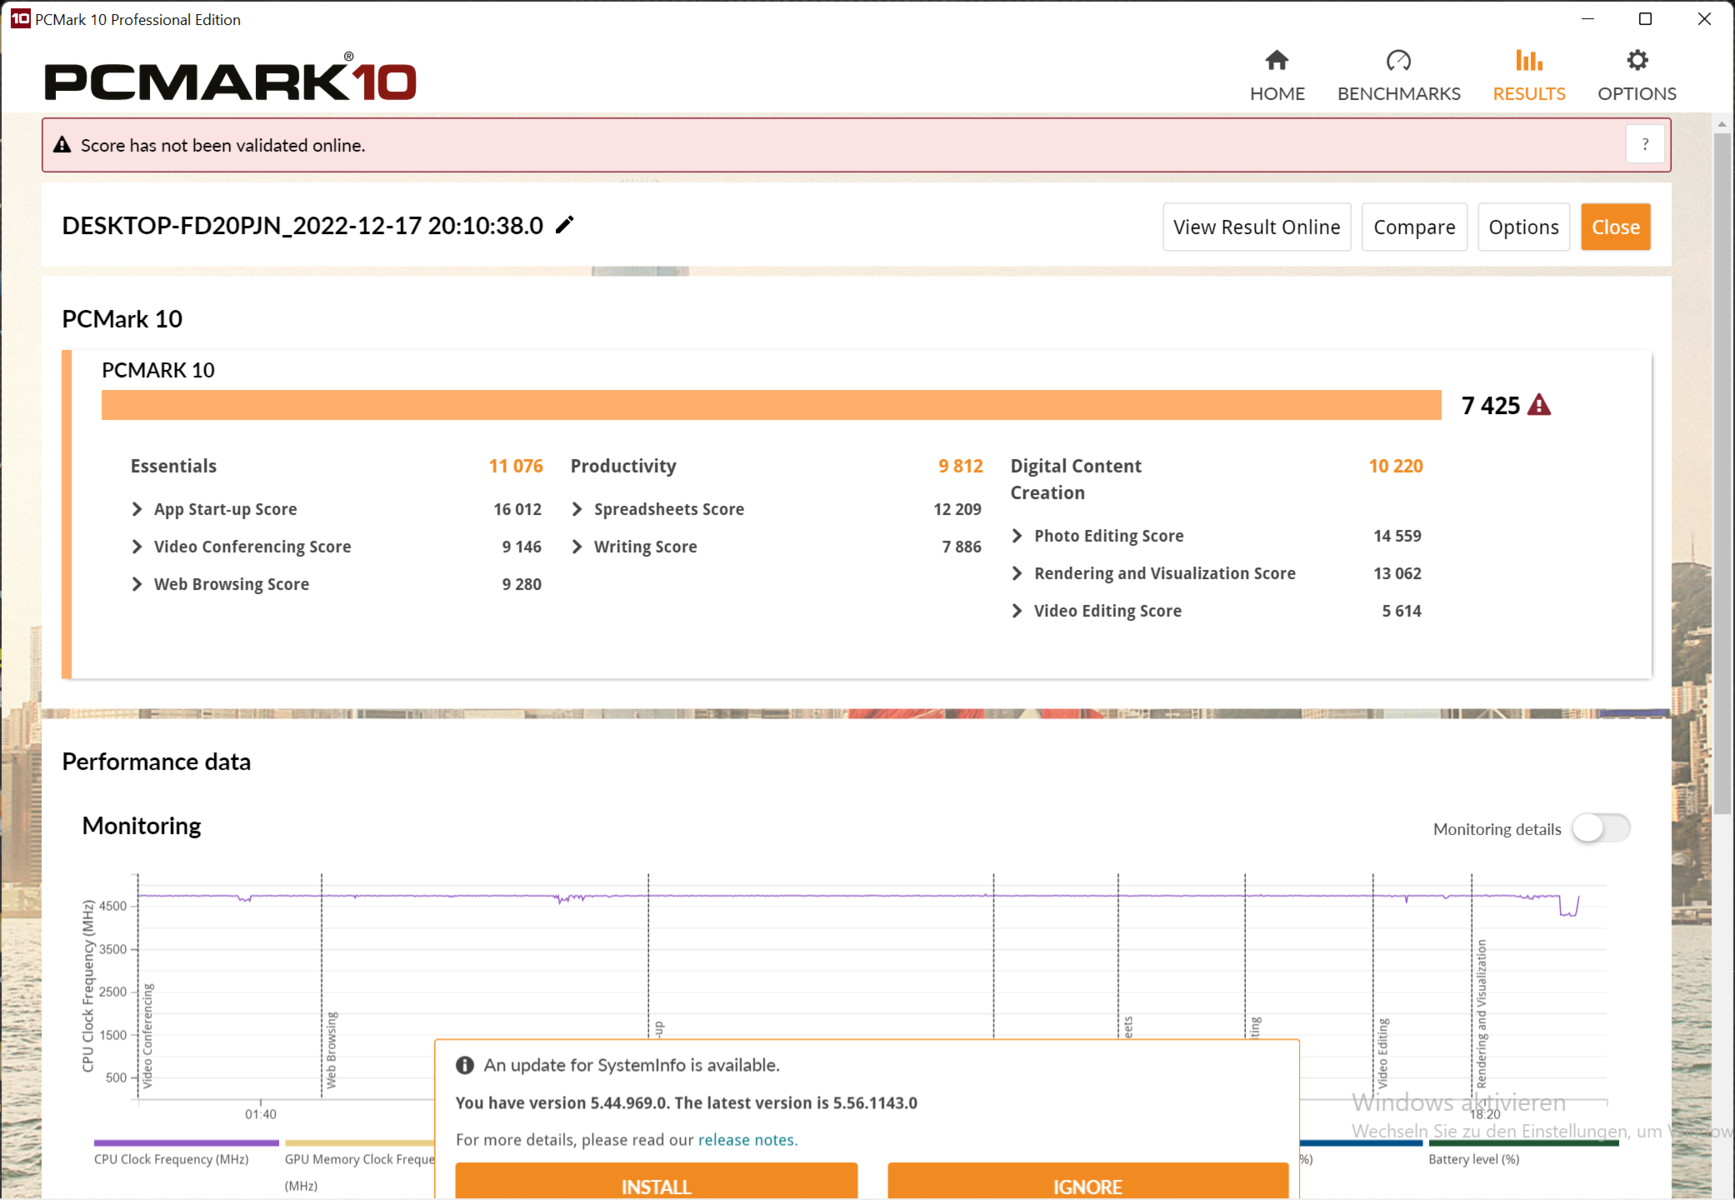
系统性能
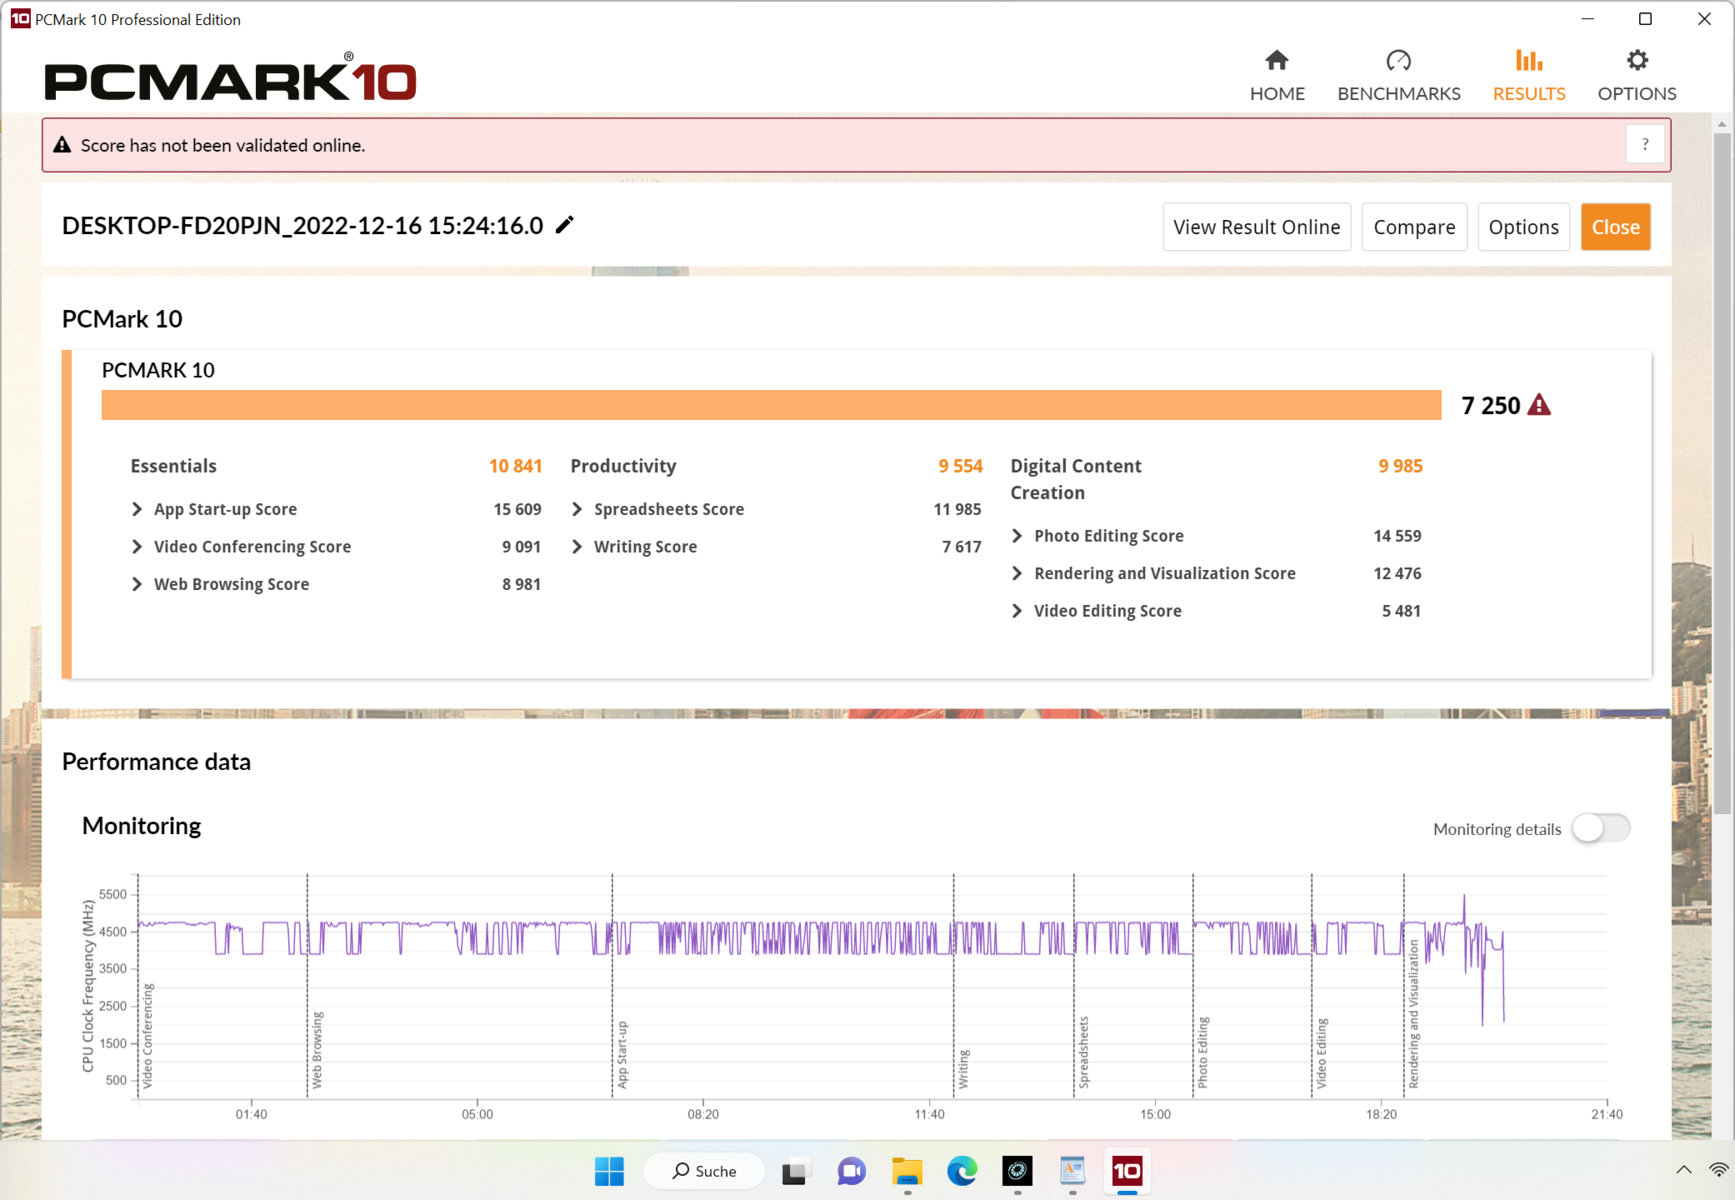
PCMark 10基准测试显示了该系统配置的预期水平的结果。日常任务的处理很迅速,没有滞后。
由于更强的Turbo和单核性能,英特尔系统的网上冲浪速度更快一些--但在实践中几乎看不出差别。
CrossMark: Overall | Productivity | Creativity | Responsiveness
Mozilla Kraken 1.1: Total
Speedometer 2.0: Result 2.0
Octane V2: Total Score
Jetstream 2: 2.0 Total
WebXPRT 3: Overall
WebXPRT 4: Overall
| PCMark 10 / Score | |
| Average of class Gaming (5828 - 12414, n=93, last 2 years) | |
| Lenovo Legion 5 15IAH7H 82RB | |
| Asus TUF Gaming F15 FX507ZM | |
| Schenker XMG Core 15 (M22) | |
| Average AMD Ryzen 7 6800H, NVIDIA GeForce RTX 3060 Laptop GPU (n=1) | |
| Alienware m15 R5 Ryzen Edition | |
| Schenker XMG Fusion 15 (Mid 22) | |
| Schenker XMG Core 15 Ampere | |
| PCMark 10 / Essentials | |
| Lenovo Legion 5 15IAH7H 82RB | |
| Schenker XMG Core 15 (M22) | |
| Average AMD Ryzen 7 6800H, NVIDIA GeForce RTX 3060 Laptop GPU (n=1) | |
| Average of class Gaming (8810 - 11935, n=97, last 2 years) | |
| Asus TUF Gaming F15 FX507ZM | |
| Alienware m15 R5 Ryzen Edition | |
| Schenker XMG Fusion 15 (Mid 22) | |
| Schenker XMG Core 15 Ampere | |
| PCMark 10 / Productivity | |
| Average of class Gaming (6845 - 25323, n=95, last 2 years) | |
| Lenovo Legion 5 15IAH7H 82RB | |
| Schenker XMG Core 15 (M22) | |
| Average AMD Ryzen 7 6800H, NVIDIA GeForce RTX 3060 Laptop GPU (n=1) | |
| Asus TUF Gaming F15 FX507ZM | |
| Alienware m15 R5 Ryzen Edition | |
| Schenker XMG Fusion 15 (Mid 22) | |
| Schenker XMG Core 15 Ampere | |
| PCMark 10 / Digital Content Creation | |
| Average of class Gaming (7602 - 19954, n=95, last 2 years) | |
| Lenovo Legion 5 15IAH7H 82RB | |
| Asus TUF Gaming F15 FX507ZM | |
| Schenker XMG Core 15 (M22) | |
| Average AMD Ryzen 7 6800H, NVIDIA GeForce RTX 3060 Laptop GPU (n=1) | |
| Alienware m15 R5 Ryzen Edition | |
| Schenker XMG Core 15 Ampere | |
| Schenker XMG Fusion 15 (Mid 22) | |
| CrossMark / Overall | |
| Lenovo Legion 5 15IAH7H 82RB | |
| Average of class Gaming (1366 - 2409, n=94, last 2 years) | |
| Schenker XMG Fusion 15 (Mid 22) | |
| Schenker XMG Core 15 (M22) | |
| Average AMD Ryzen 7 6800H, NVIDIA GeForce RTX 3060 Laptop GPU (n=1) | |
| CrossMark / Productivity | |
| Lenovo Legion 5 15IAH7H 82RB | |
| Average of class Gaming (1386 - 2254, n=94, last 2 years) | |
| Schenker XMG Fusion 15 (Mid 22) | |
| Schenker XMG Core 15 (M22) | |
| Average AMD Ryzen 7 6800H, NVIDIA GeForce RTX 3060 Laptop GPU (n=1) | |
| CrossMark / Creativity | |
| Average of class Gaming (1343 - 2786, n=94, last 2 years) | |
| Lenovo Legion 5 15IAH7H 82RB | |
| Schenker XMG Core 15 (M22) | |
| Average AMD Ryzen 7 6800H, NVIDIA GeForce RTX 3060 Laptop GPU (n=1) | |
| Schenker XMG Fusion 15 (Mid 22) | |
| CrossMark / Responsiveness | |
| Lenovo Legion 5 15IAH7H 82RB | |
| Average of class Gaming (1226 - 2334, n=94, last 2 years) | |
| Schenker XMG Fusion 15 (Mid 22) | |
| Schenker XMG Core 15 (M22) | |
| Average AMD Ryzen 7 6800H, NVIDIA GeForce RTX 3060 Laptop GPU (n=1) | |
| Mozilla Kraken 1.1 / Total | |
| Schenker XMG Core 15 Ampere | |
| Schenker XMG Fusion 15 (Mid 22) | |
| Alienware m15 R5 Ryzen Edition | |
| Schenker XMG Core 15 (M22) | |
| Average AMD Ryzen 7 6800H, NVIDIA GeForce RTX 3060 Laptop GPU (n=1) | |
| Asus TUF Gaming F15 FX507ZM | |
| Lenovo Legion 5 15IAH7H 82RB | |
| Average of class Gaming (391 - 590, n=100, last 2 years) | |
| Speedometer 2.0 / Result 2.0 | |
| Average of class Gaming (29 - 736, n=27, last 2 years) | |
| Schenker XMG Core 15 (M22) | |
| Average AMD Ryzen 7 6800H, NVIDIA GeForce RTX 3060 Laptop GPU (n=1) | |
| Alienware m15 R5 Ryzen Edition | |
| Octane V2 / Total Score | |
| Average of class Gaming (93292 - 139447, n=27, last 2 years) | |
| Schenker XMG Core 15 (M22) | |
| Average AMD Ryzen 7 6800H, NVIDIA GeForce RTX 3060 Laptop GPU (n=1) | |
| Alienware m15 R5 Ryzen Edition | |
| Jetstream 2 / 2.0 Total | |
| Average of class Gaming (334 - 516, n=27, last 2 years) | |
| Lenovo Legion 5 15IAH7H 82RB | |
| Asus TUF Gaming F15 FX507ZM | |
| Schenker XMG Core 15 (M22) | |
| Average AMD Ryzen 7 6800H, NVIDIA GeForce RTX 3060 Laptop GPU (n=1) | |
| Alienware m15 R5 Ryzen Edition | |
| WebXPRT 3 / Overall | |
| Lenovo Legion 5 15IAH7H 82RB | |
| Average of class Gaming (220 - 532, n=98, last 2 years) | |
| Asus TUF Gaming F15 FX507ZM | |
| Schenker XMG Core 15 (M22) | |
| Average AMD Ryzen 7 6800H, NVIDIA GeForce RTX 3060 Laptop GPU (n=1) | |
| Alienware m15 R5 Ryzen Edition | |
| Schenker XMG Fusion 15 (Mid 22) | |
| Schenker XMG Core 15 Ampere | |
| WebXPRT 4 / Overall | |
| Average of class Gaming (165 - 354, n=98, last 2 years) | |
| Lenovo Legion 5 15IAH7H 82RB | |
| Schenker XMG Core 15 (M22) | |
| Average AMD Ryzen 7 6800H, NVIDIA GeForce RTX 3060 Laptop GPU (n=1) | |
| Schenker XMG Fusion 15 (Mid 22) | |
* ... smaller is better
| PCMark 10 Score | 7250 points | |
Help | ||
| AIDA64 / Memory Copy | |
| Average of class Gaming (21750 - 129946, n=105, last 2 years) | |
| Asus TUF Gaming F15 FX507ZM | |
| Lenovo Legion 5 15IAH7H 82RB | |
| Schenker XMG Core 15 (M22) | |
| Average AMD Ryzen 7 6800H (48209 - 51186, n=8) | |
| Schenker XMG Fusion 15 (Mid 22) | |
| Schenker XMG Core 15 Ampere | |
| Alienware m15 R5 Ryzen Edition | |
| AIDA64 / Memory Read | |
| Average of class Gaming (22956 - 118858, n=105, last 2 years) | |
| Lenovo Legion 5 15IAH7H 82RB | |
| Asus TUF Gaming F15 FX507ZM | |
| Schenker XMG Core 15 (M22) | |
| Average AMD Ryzen 7 6800H (43828 - 51778, n=8) | |
| Schenker XMG Fusion 15 (Mid 22) | |
| Schenker XMG Core 15 Ampere | |
| Alienware m15 R5 Ryzen Edition | |
| AIDA64 / Memory Write | |
| Average of class Gaming (22297 - 135096, n=105, last 2 years) | |
| Lenovo Legion 5 15IAH7H 82RB | |
| Asus TUF Gaming F15 FX507ZM | |
| Schenker XMG Core 15 (M22) | |
| Average AMD Ryzen 7 6800H (51116 - 55307, n=8) | |
| Schenker XMG Fusion 15 (Mid 22) | |
| Schenker XMG Core 15 Ampere | |
| Alienware m15 R5 Ryzen Edition | |
| AIDA64 / Memory Latency | |
| Average of class Gaming (75.3 - 259, n=105, last 2 years) | |
| Lenovo Legion 5 15IAH7H 82RB | |
| Schenker XMG Fusion 15 (Mid 22) | |
| Average AMD Ryzen 7 6800H (83.1 - 104.1, n=8) | |
| Schenker XMG Core 15 (M22) | |
| Schenker XMG Core 15 Ampere | |
| Alienware m15 R5 Ryzen Edition | |
| Asus TUF Gaming F15 FX507ZM | |
* ... smaller is better
DPC延迟
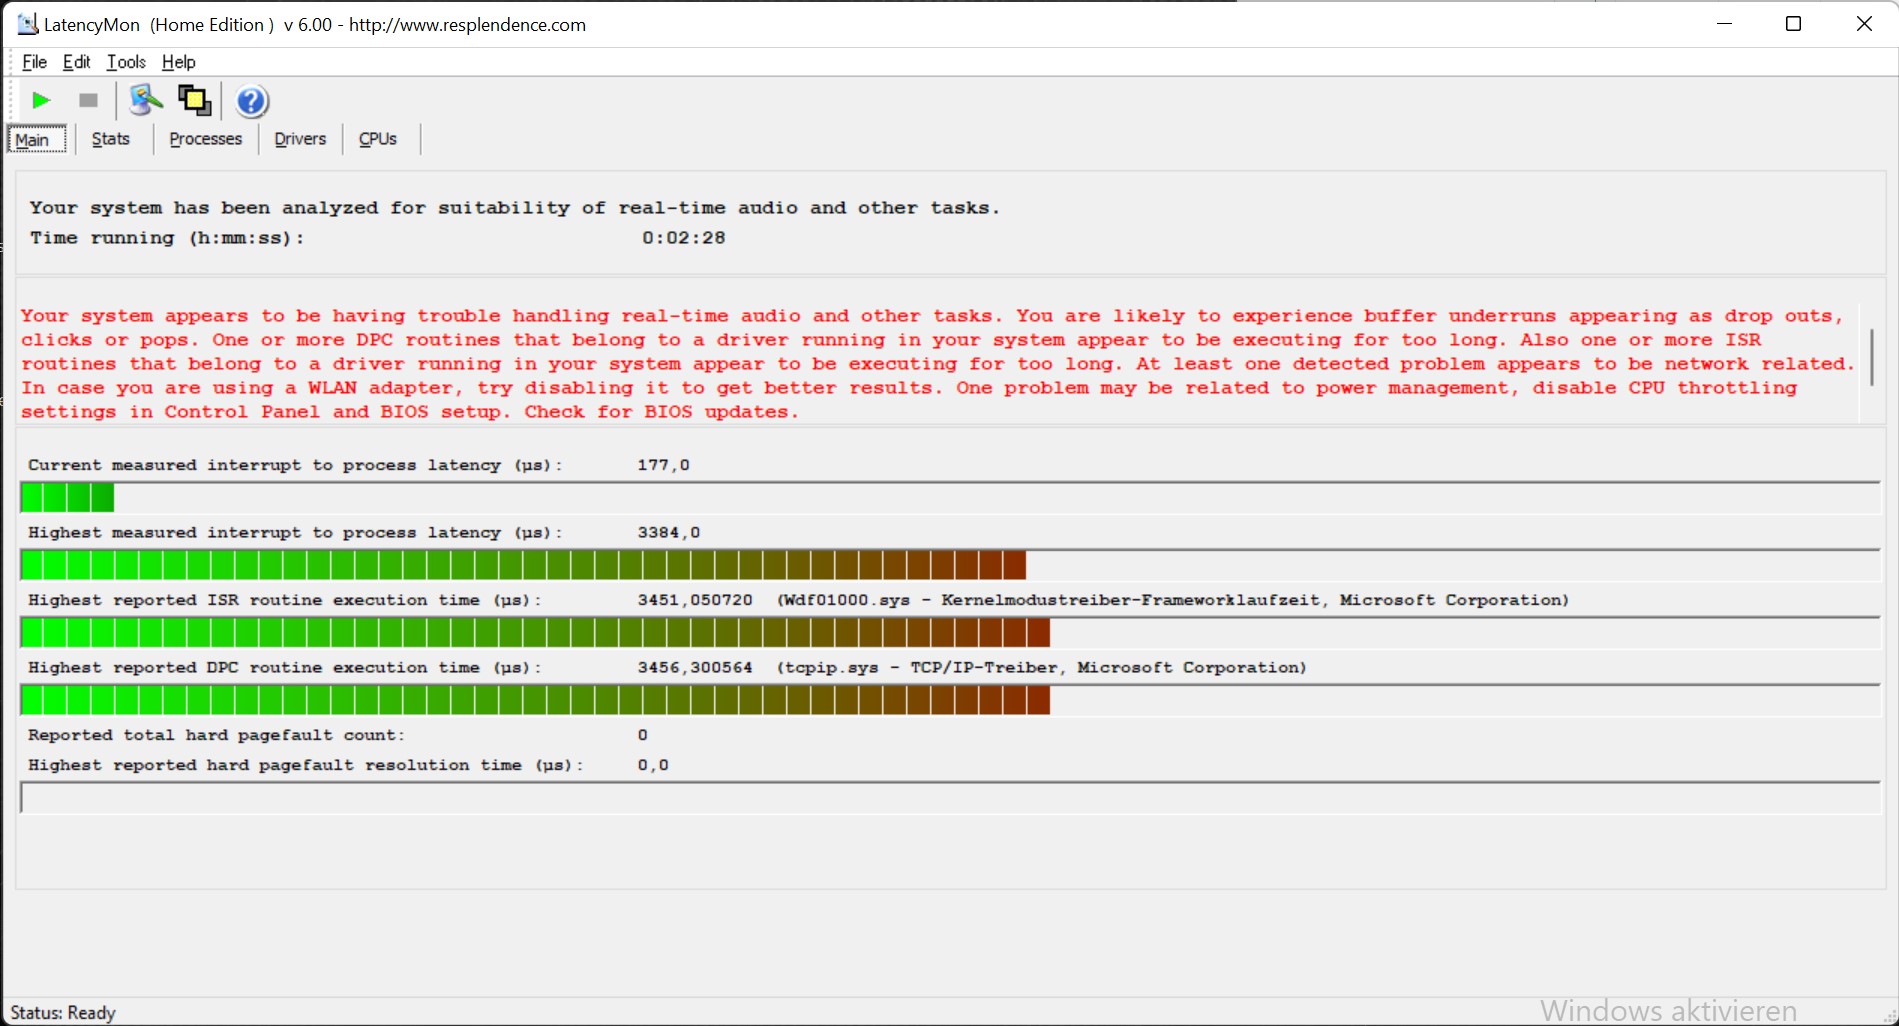
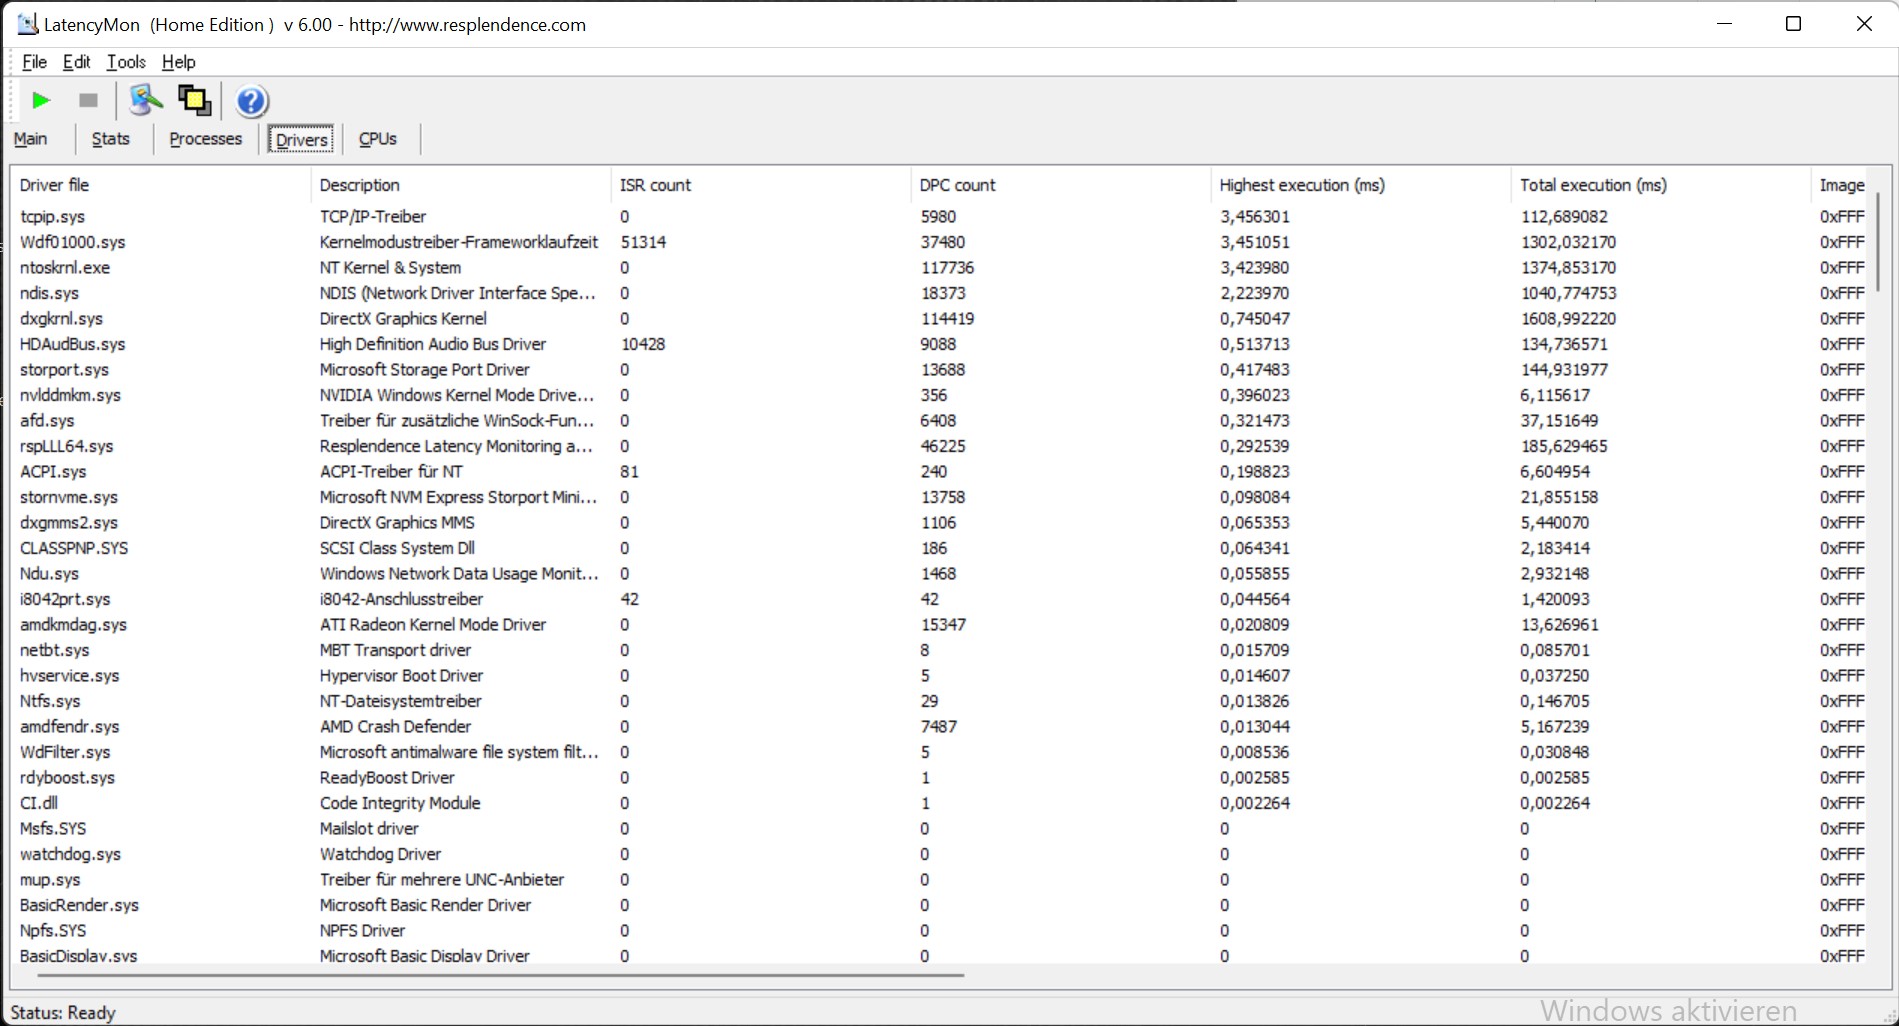
| DPC Latencies / LatencyMon - interrupt to process latency (max), Web, Youtube, Prime95 | |
| Schenker XMG Core 15 (M22) | |
| Schenker XMG Fusion 15 (Mid 22) | |
| Lenovo Legion 5 15IAH7H 82RB | |
| Asus TUF Gaming F15 FX507ZM | |
| Schenker XMG Core 15 Ampere | |
| Alienware m15 R5 Ryzen Edition | |
* ... smaller is better
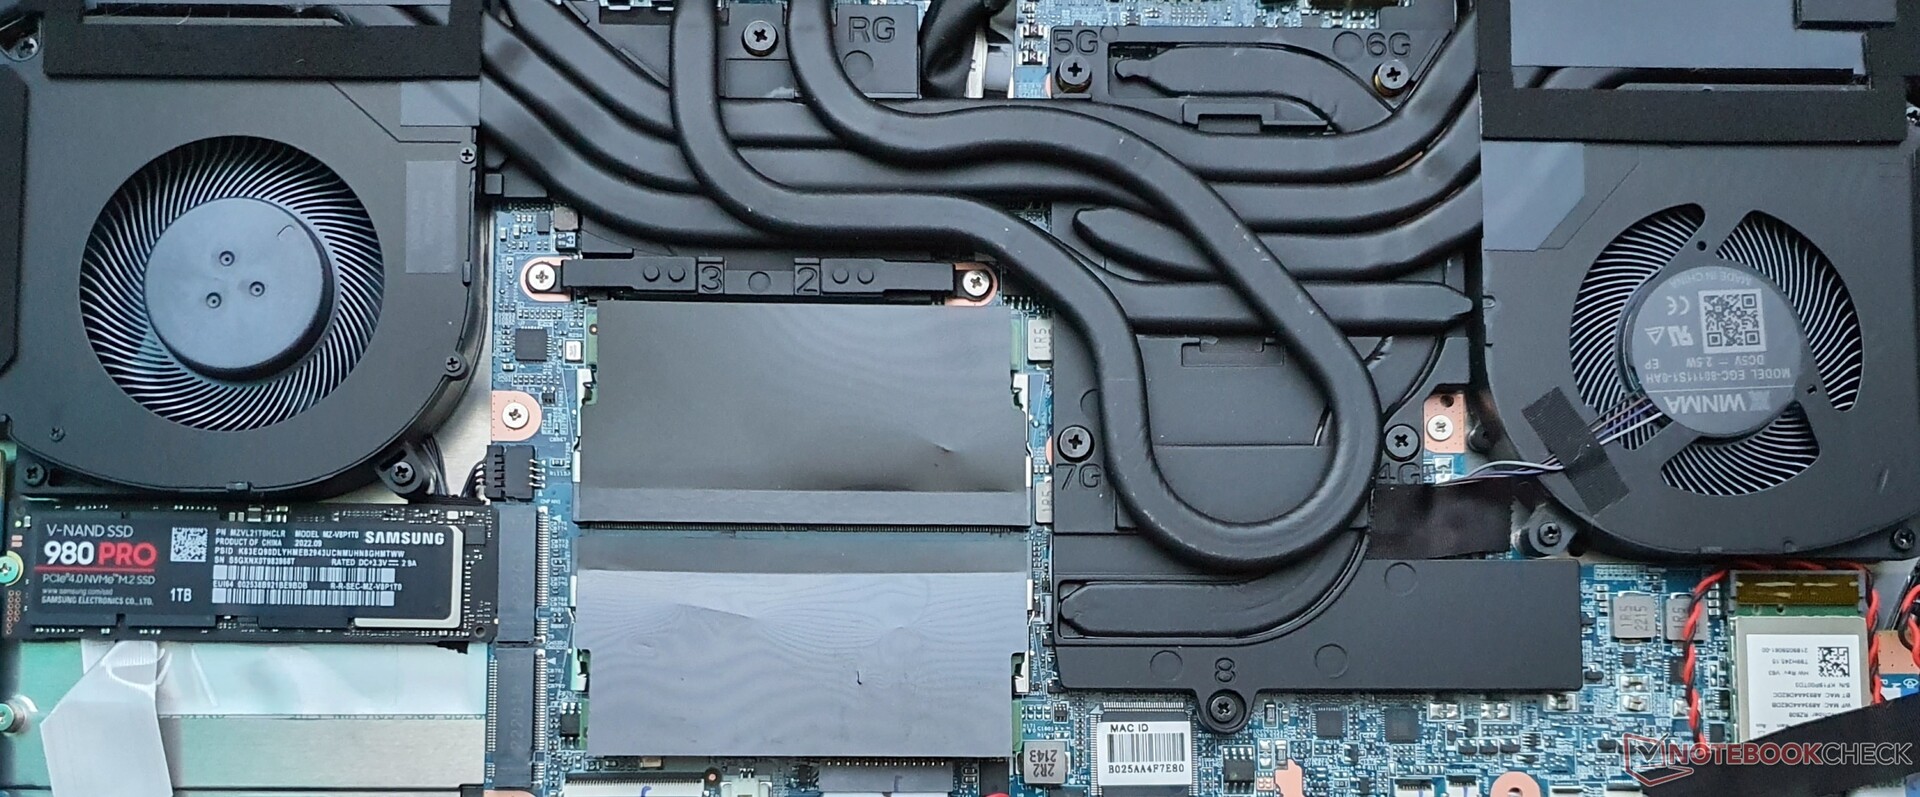
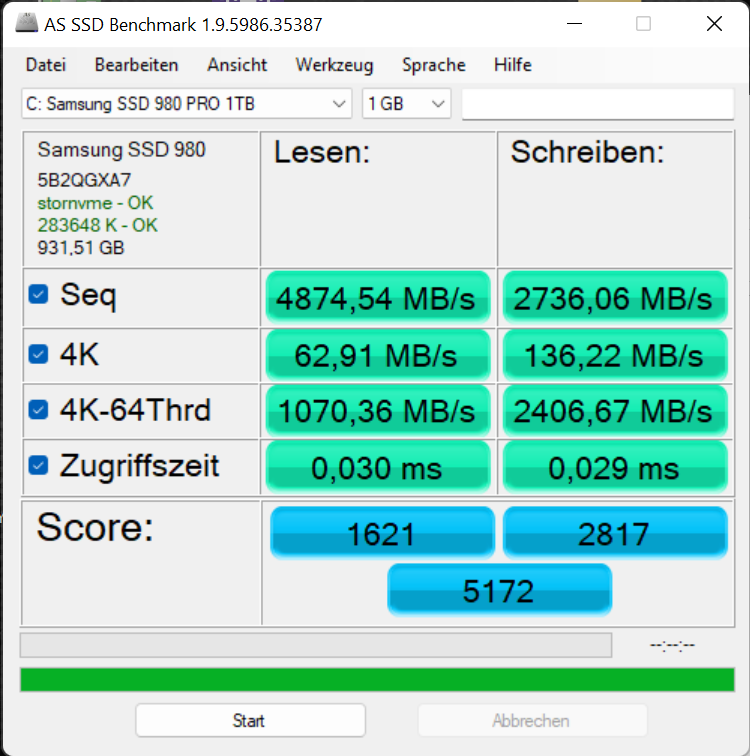
大容量存储

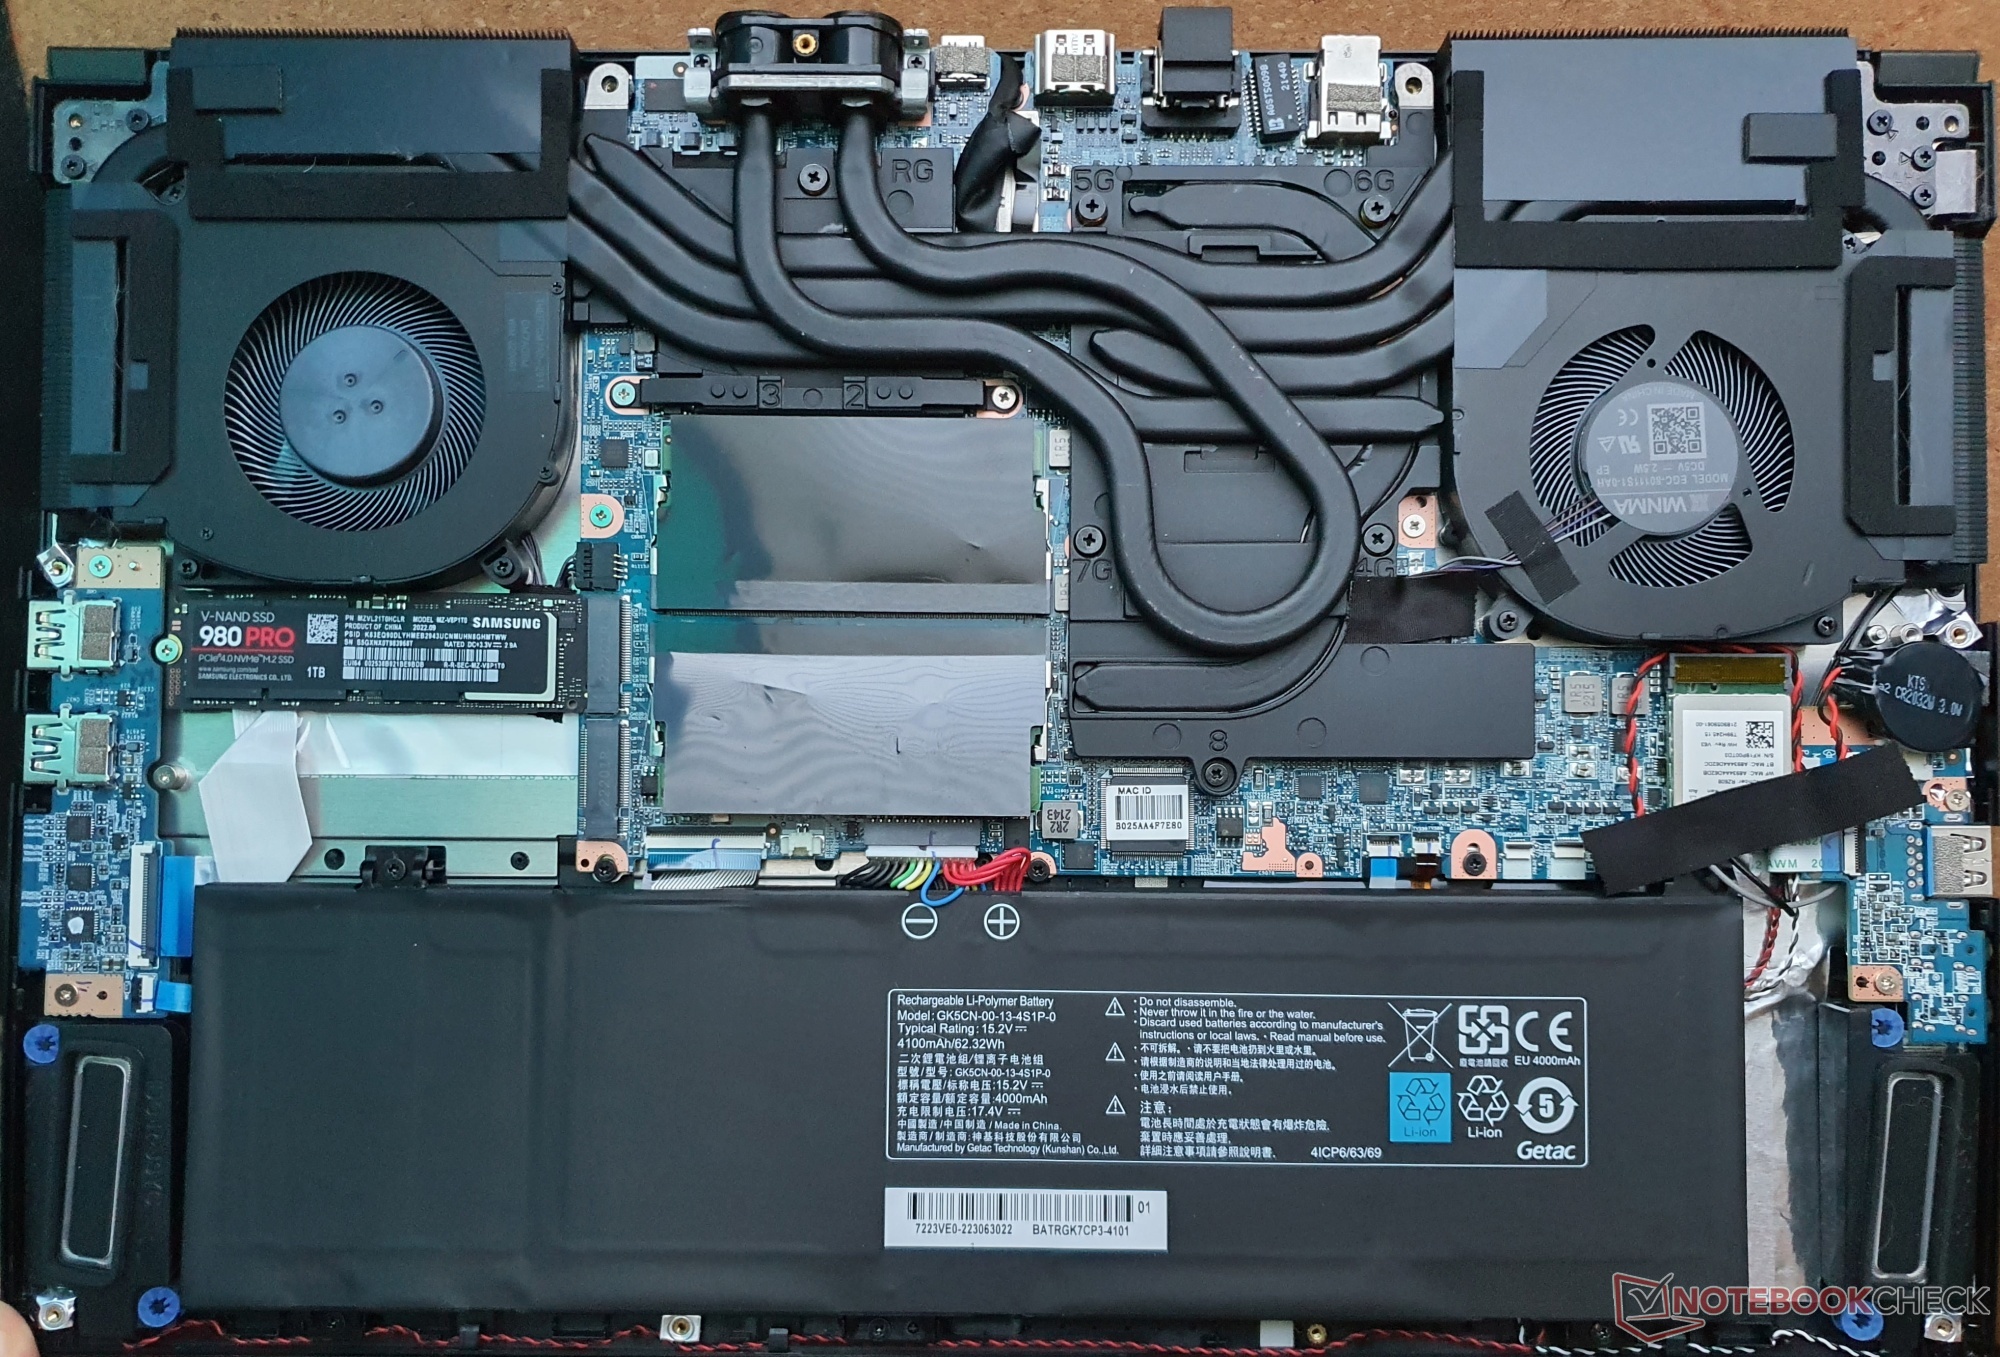
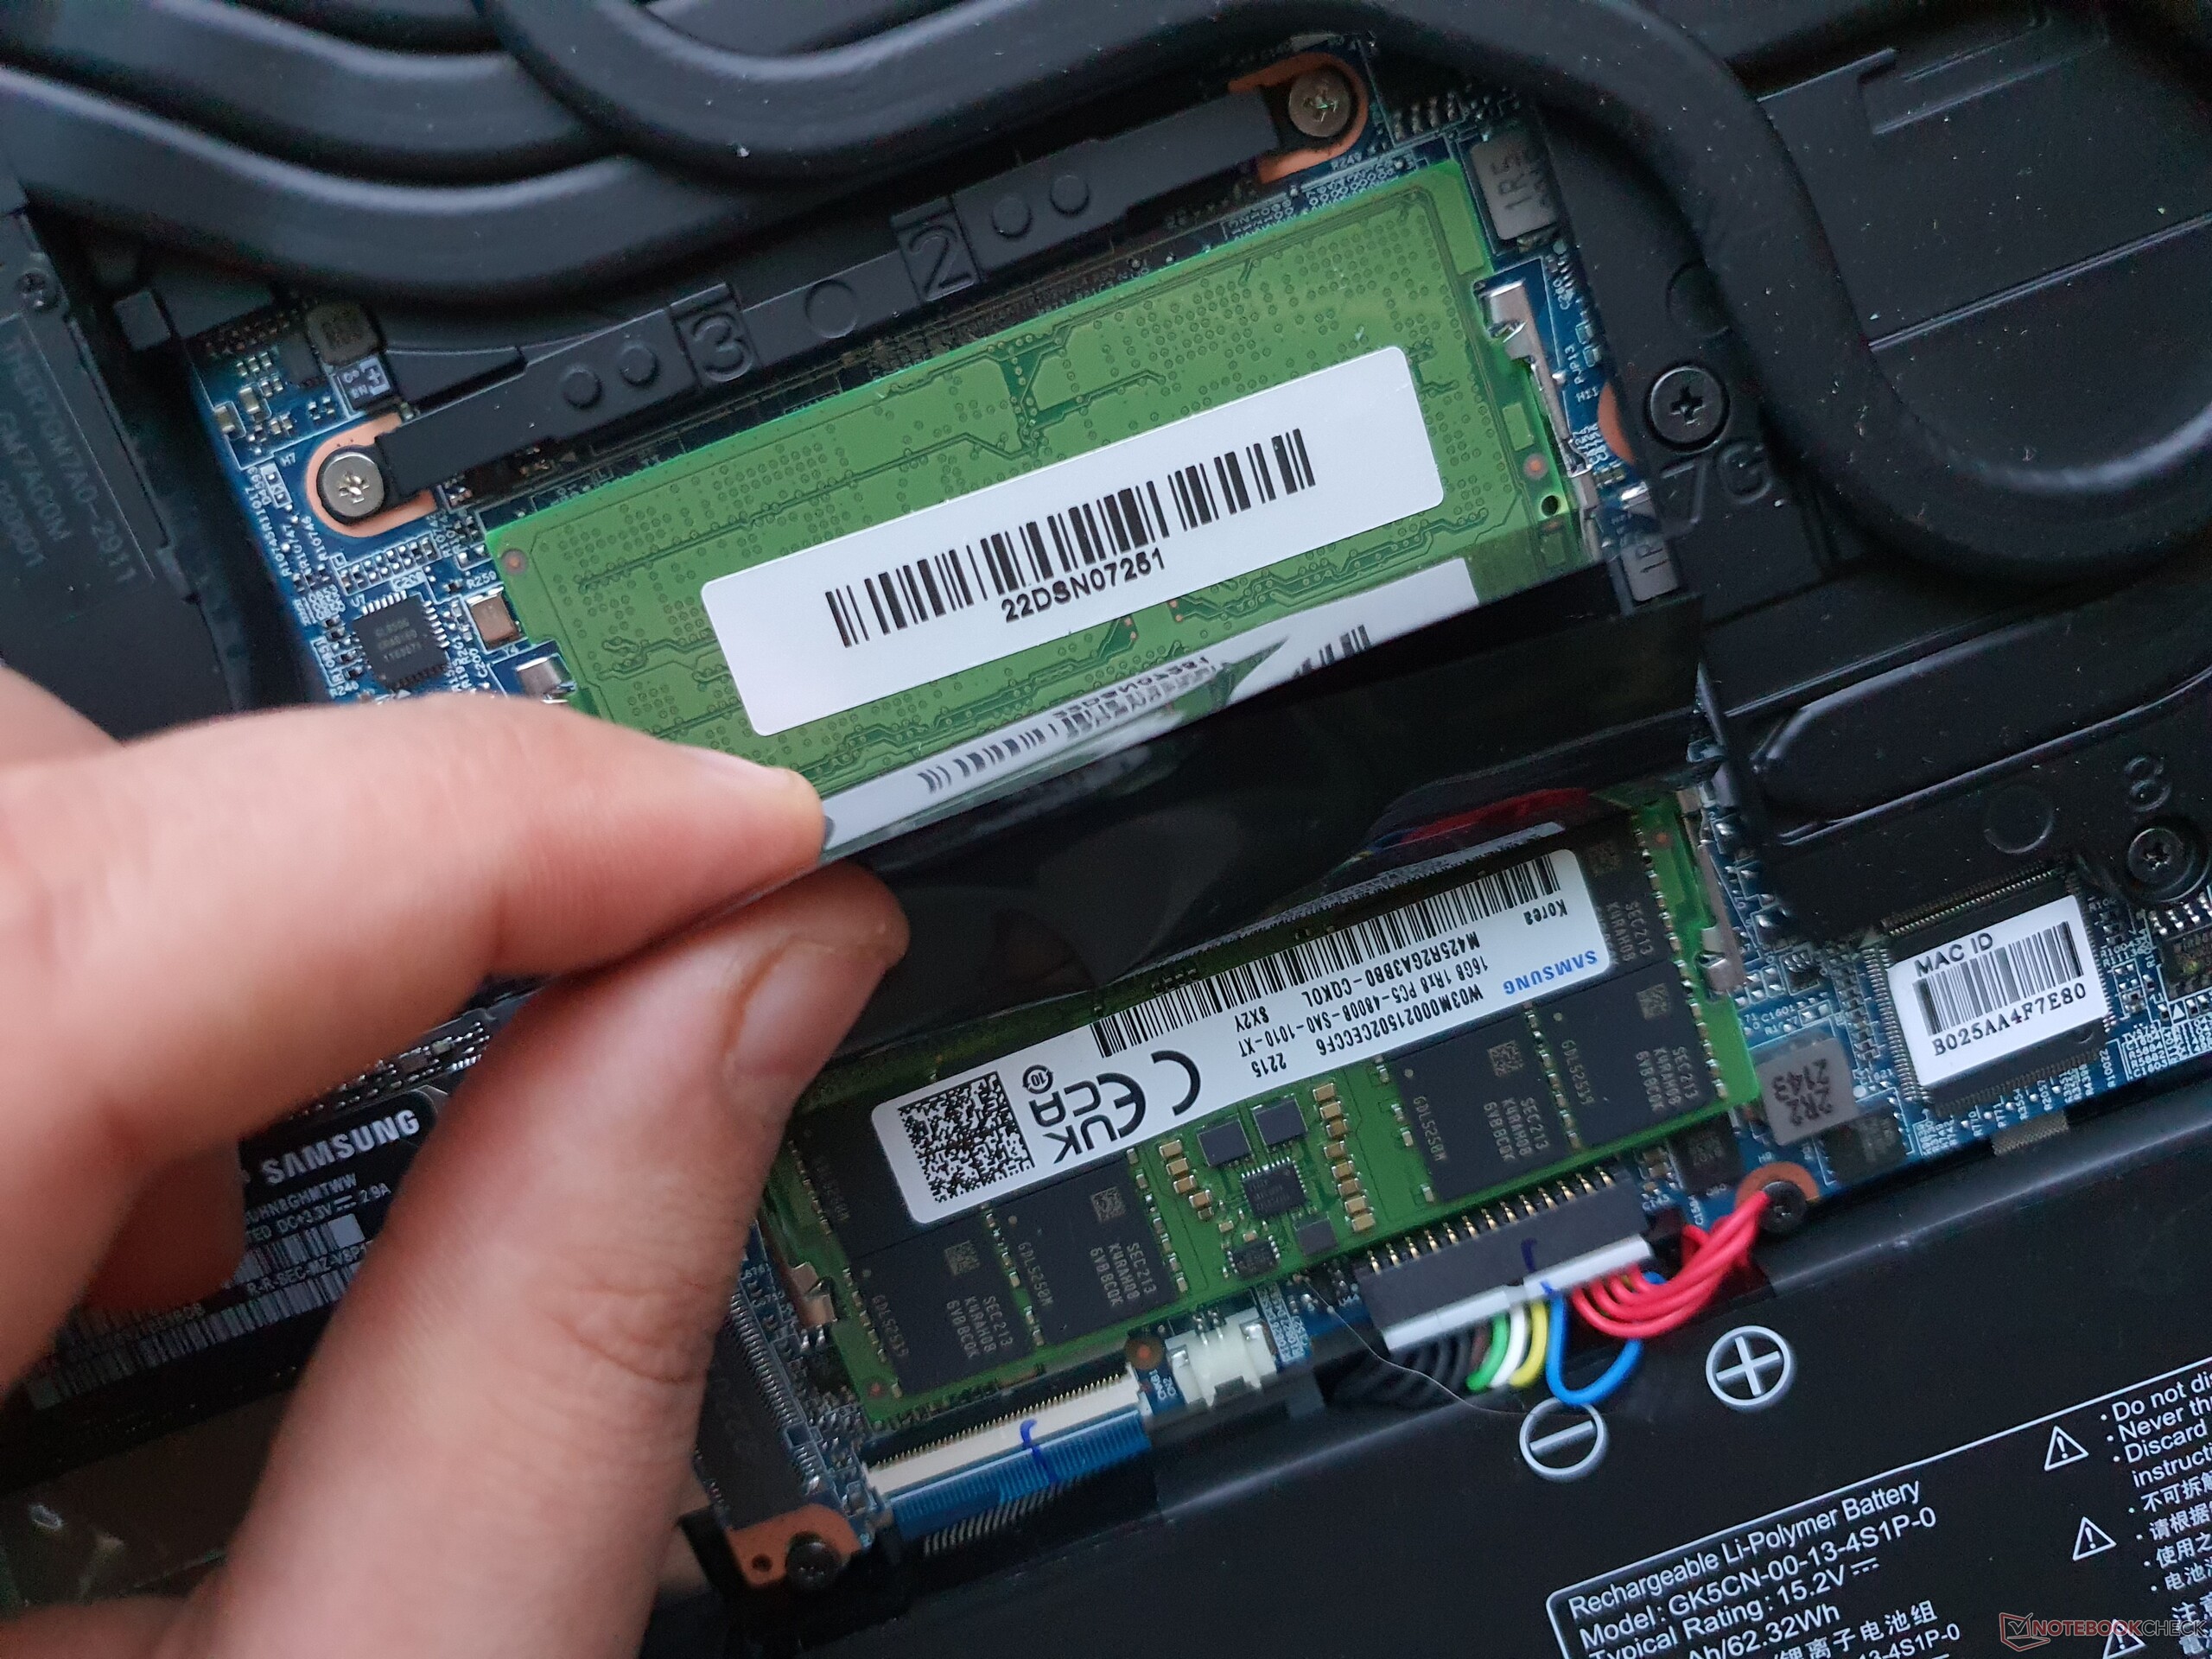
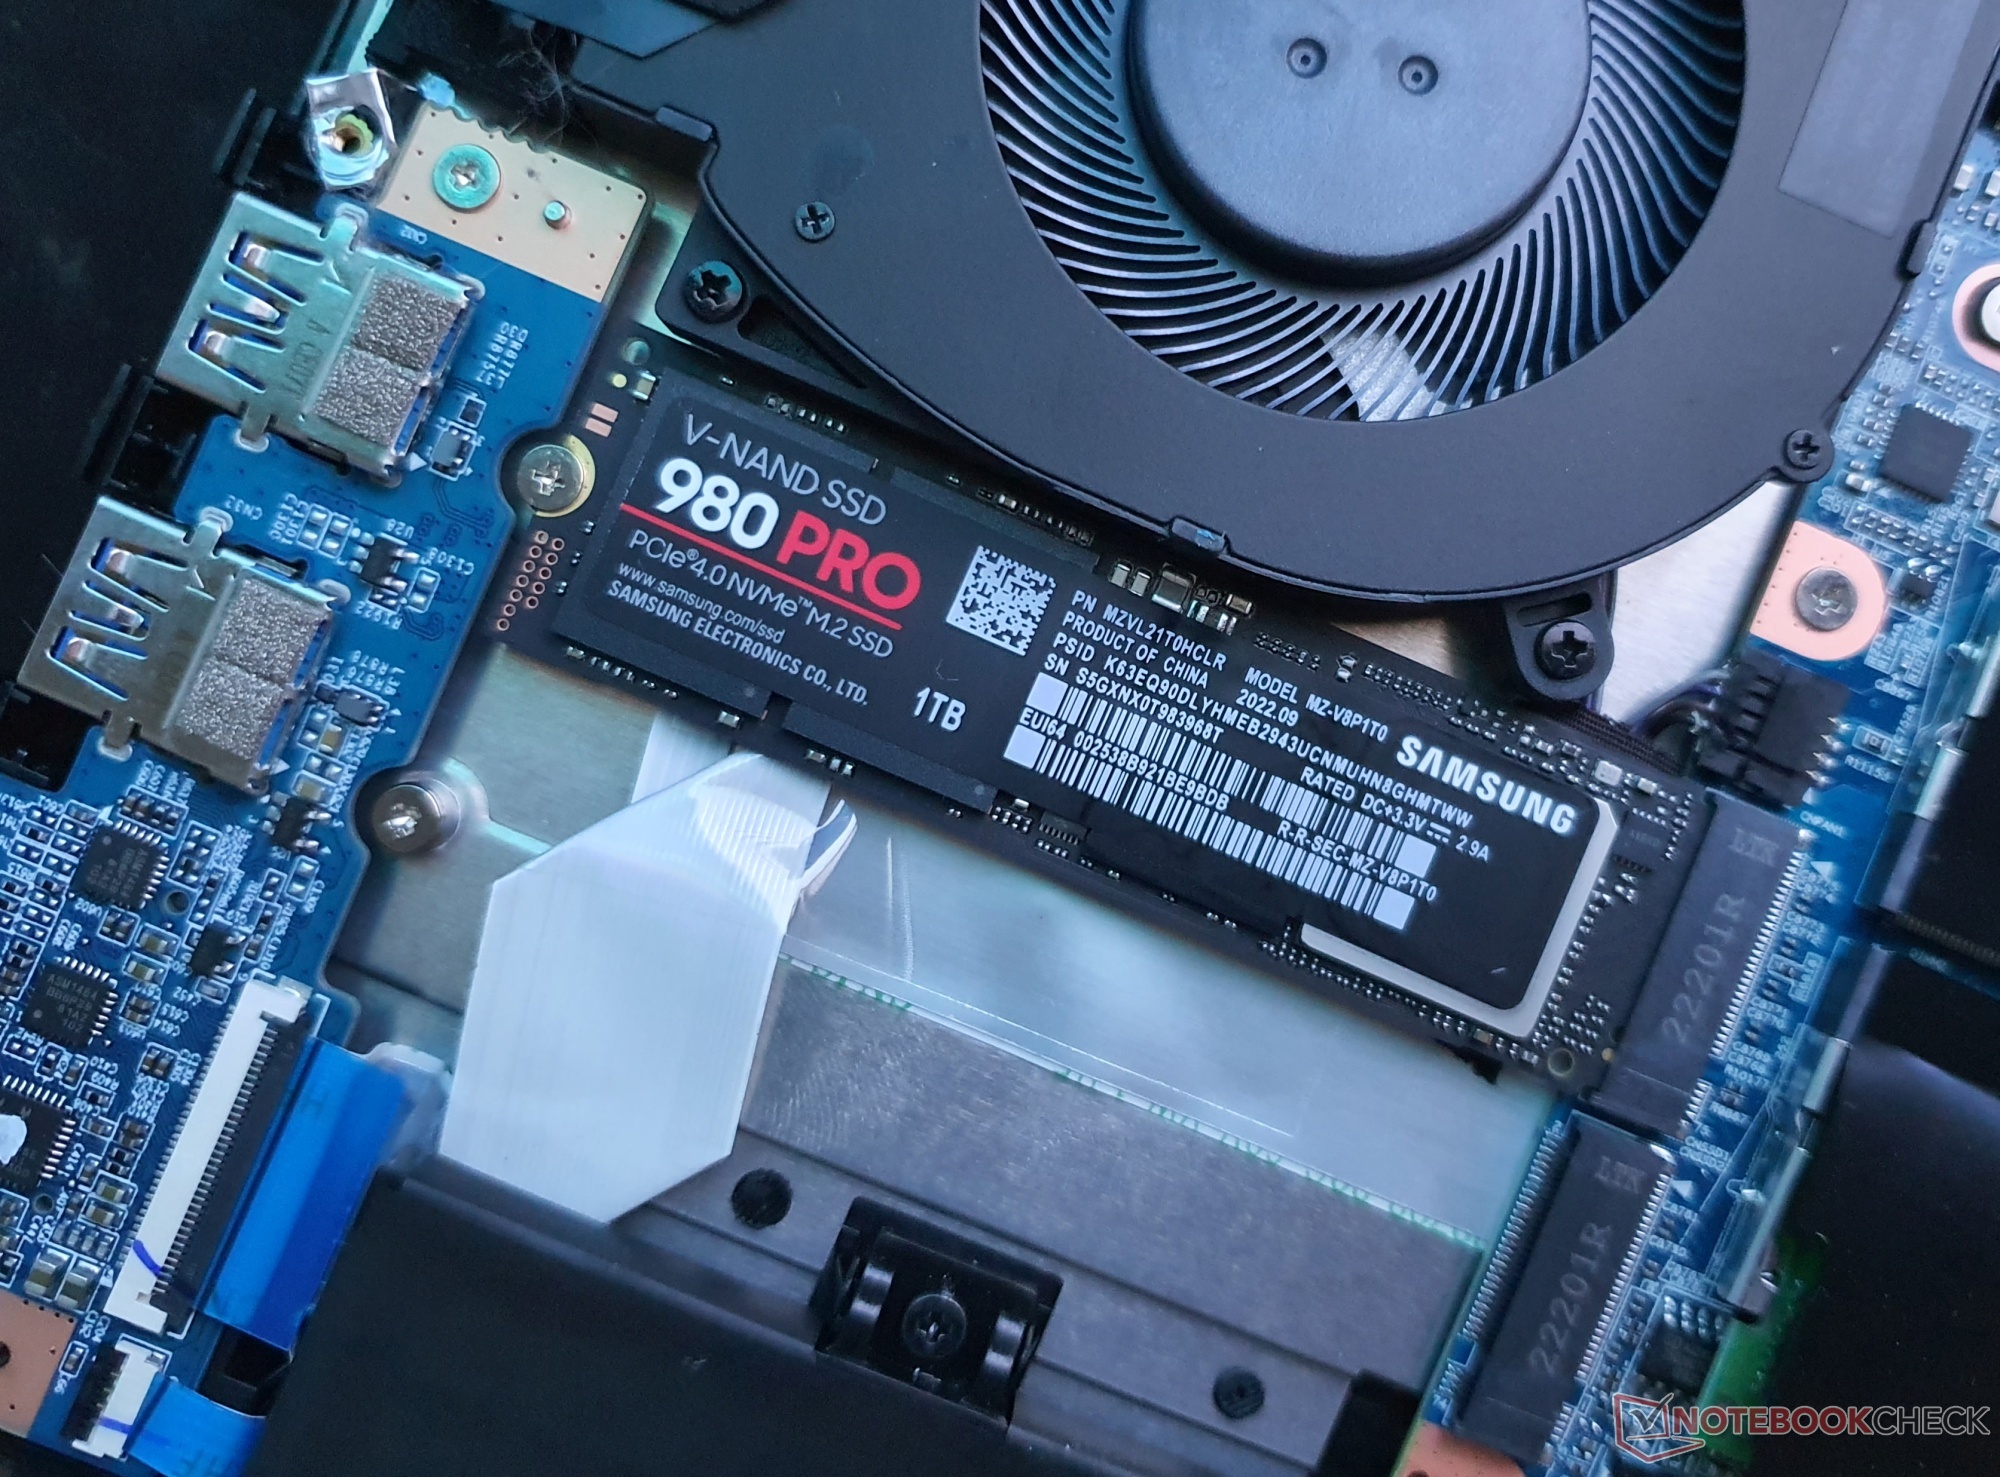
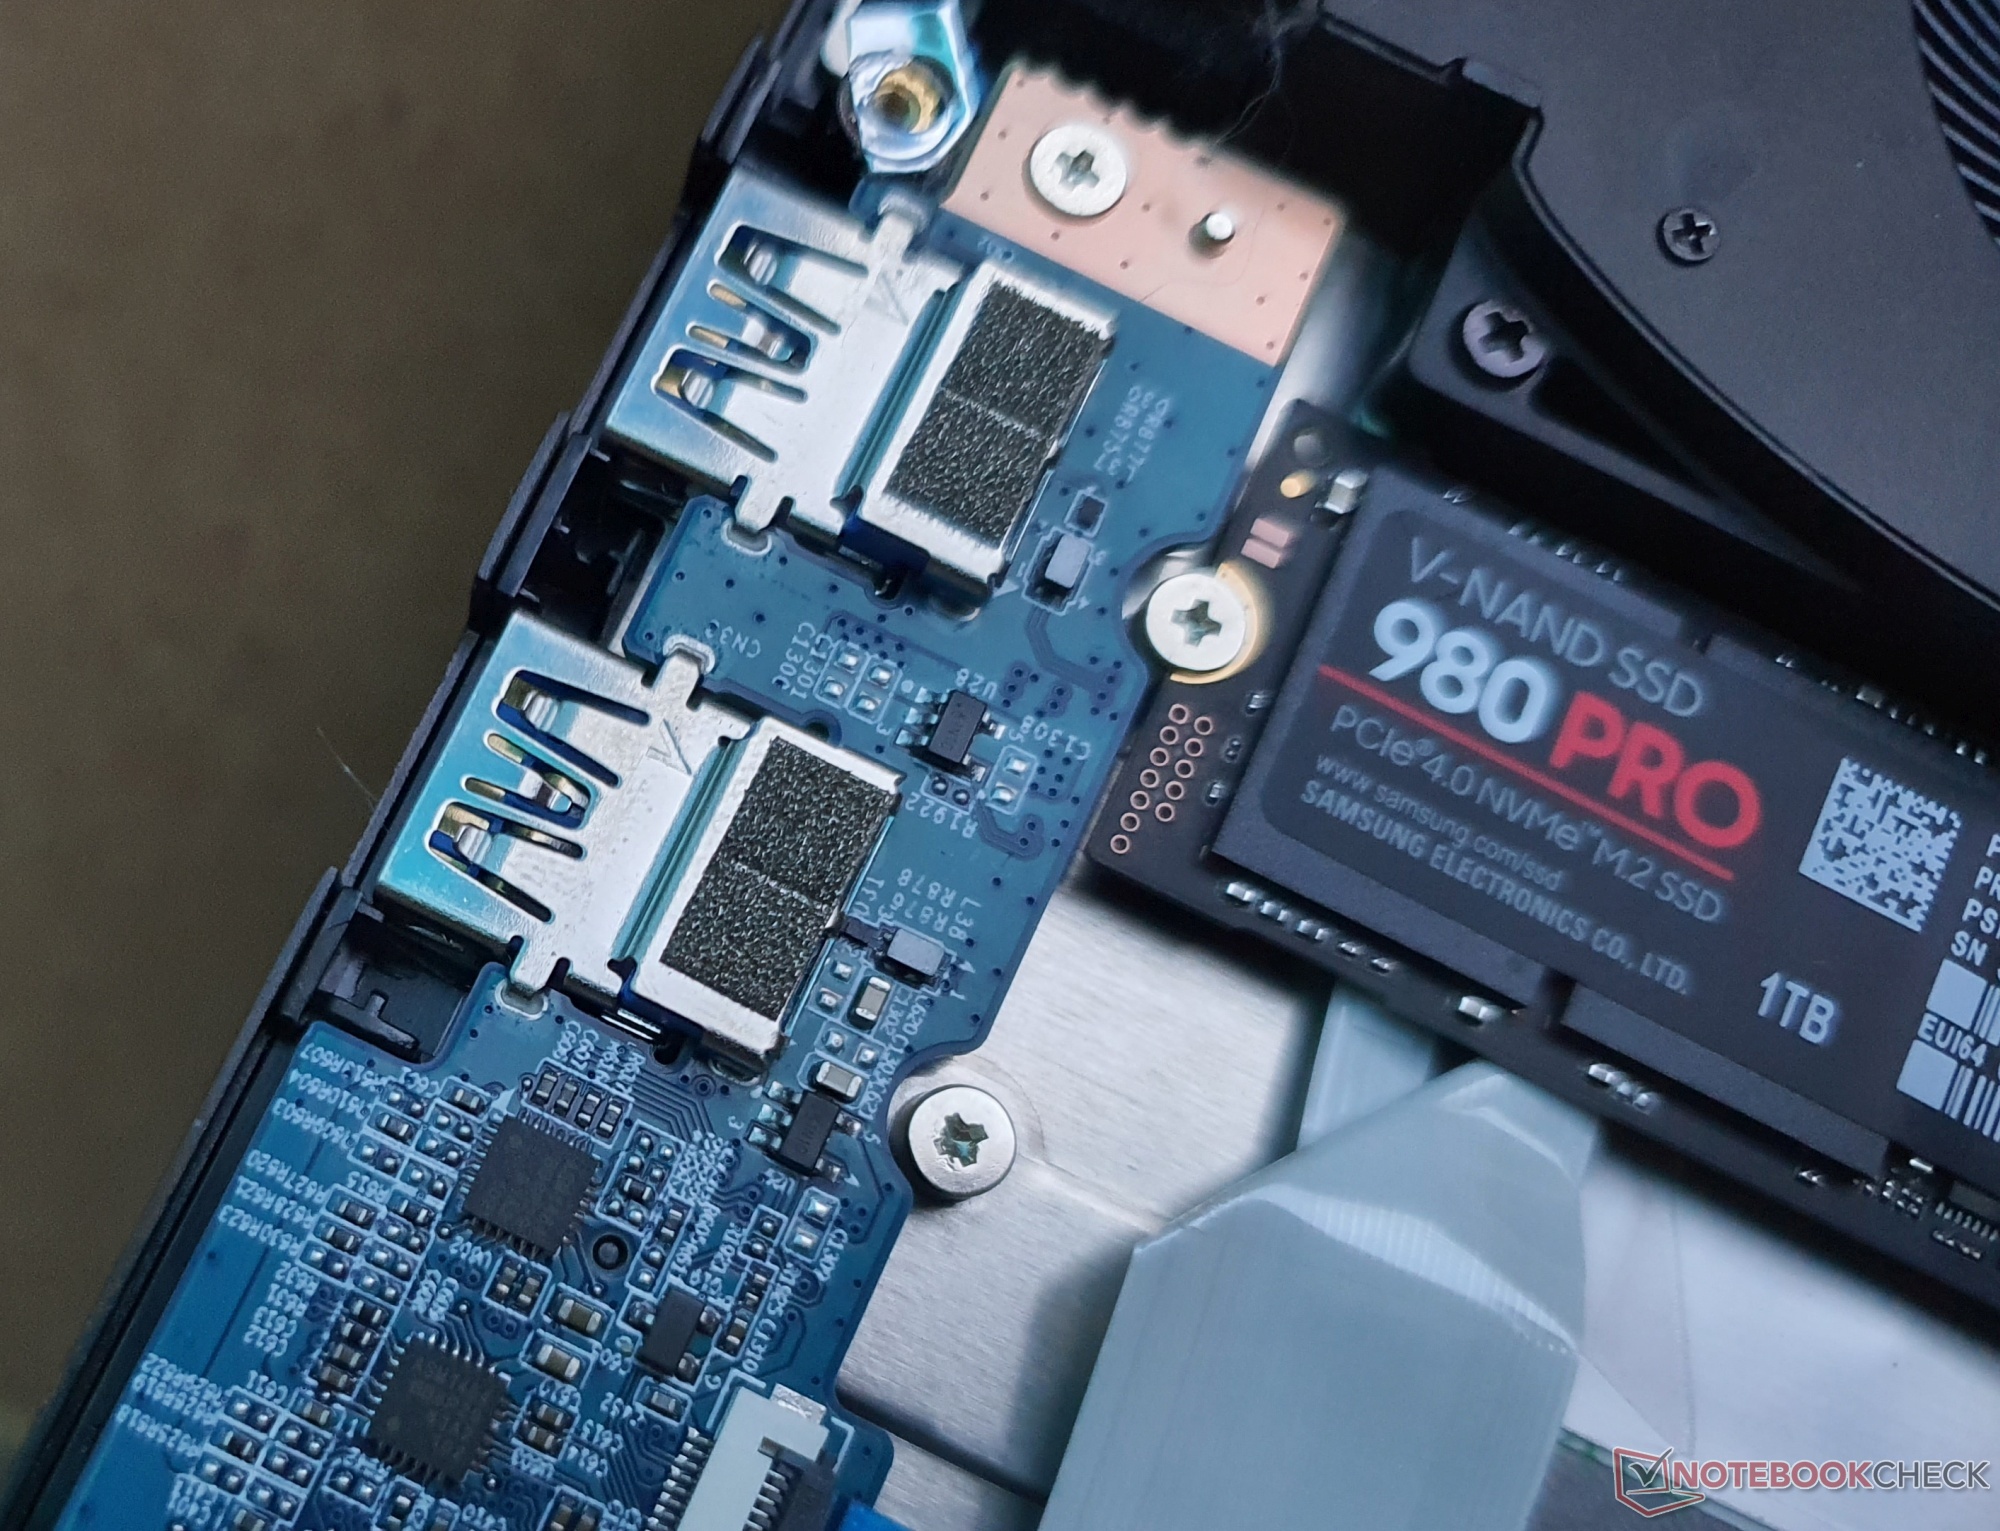
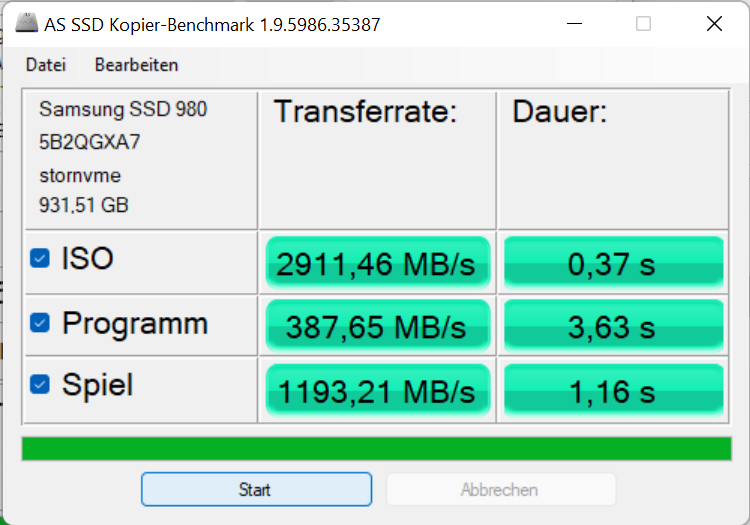
安装的三星980 Pro 1 TB即使在永久负载下也能达到PCIe 4.0的速度,但在XMG笔记本电脑中同时进行32至64个4K读写过程时却很吃力,这主要与服务器有关。同样的固态硬盘在XMG Fusion 15中的速度更快,所以它的潜力并没有被Core 15充分挖掘出来。
| Schenker XMG Core 15 (M22) Samsung SSD 980 Pro 1TB MZ-V8P1T0BW | Lenovo Legion 5 15IAH7H 82RB | Schenker XMG Fusion 15 (Mid 22) Samsung SSD 980 Pro 1TB MZ-V8P1T0BW | Asus TUF Gaming F15 FX507ZM SK Hynix HFM001TD3JX013N | Alienware m15 R5 Ryzen Edition Toshiba KBG40ZNS512G NVMe | Schenker XMG Core 15 Ampere Samsung SSD 970 EVO Plus 1TB | |
|---|---|---|---|---|---|---|
| AS SSD | 37% | 21% | 7% | -78% | 5% | |
| Seq Read (MB/s) | 4874 | 5844.9 20% | 5171.96 6% | 3013 -38% | 2082 -57% | 2829 -42% |
| Seq Write (MB/s) | 2711 | 2038.42 -25% | 3881.37 43% | 2768 2% | 825 -70% | 2646 -2% |
| 4K Read (MB/s) | 63 | 71.99 14% | 66.29 5% | 66.9 6% | 42.41 -33% | 54.8 -13% |
| 4K Write (MB/s) | 136 | 310.54 128% | 189.98 40% | 184.8 36% | 98.3 -28% | 179.1 32% |
| 4K-64 Read (MB/s) | 1070 | 2771.98 159% | 2539.3 137% | 1923 80% | 1255 17% | 1734 62% |
| 4K-64 Write (MB/s) | 2407 | 4007.67 67% | 3144.88 31% | 2198 -9% | 738 -69% | 2396 0% |
| Access Time Read * (ms) | 0.03 | 0.037 -23% | 0.07 -133% | 0.03 -0% | 0.109 -263% | 0.033 -10% |
| Access Time Write * (ms) | 0.029 | 0.053 -83% | 0.022 24% | 0.081 -179% | 0.17 -486% | 0.021 28% |
| Score Read (Points) | 1621 | 3428 111% | 3123 93% | 2291 41% | 1506 -7% | 2072 28% |
| Score Write (Points) | 2814 | 4522 61% | 3723 32% | 2660 -5% | 918 -67% | 2839 1% |
| Score Total (Points) | 5168 | 9510 84% | 8376 62% | 6117 18% | 3136 -39% | 5965 15% |
| Copy ISO MB/s (MB/s) | 2911 | 2320.82 -20% | 2364.44 -19% | 2143 -26% | 1391 -52% | 2119 -27% |
| Copy Program MB/s (MB/s) | 388 | 429.5 11% | 329.45 -15% | 871 124% | 645 66% | 406.1 5% |
| Copy Game MB/s (MB/s) | 1193 | 1290.19 8% | 1079.59 -10% | 1840 54% | 1101 -8% | 1086 -9% |
| DiskSpd | 135% | 174% | 80% | -24% | 84% | |
| seq read (MB/s) | 3429 | 5217 52% | 4199 22% | 2383 -31% | 1726 -50% | 2367 -31% |
| seq write (MB/s) | 3148 | 4897 56% | 4299 37% | 2894 -8% | 1520 -52% | 2601 -17% |
| seq q8 t1 read (MB/s) | 6850 | 7087 3% | 6847 0% | 3554 -48% | 2314 -66% | 3347 -51% |
| seq q8 t1 write (MB/s) | 4927 | 1498 -70% | 4999 1% | 2869 -42% | 1449 -71% | 3263 -34% |
| 4k q1 t1 read (MB/s) | 61.1 | 74.8 22% | 77.9 27% | 69.4 14% | 48.3 -21% | 52.3 -14% |
| 4k q1 t1 write (MB/s) | 132.2 | 369 179% | 239 81% | 211 60% | 121 -8% | 204 54% |
| 4k q32 t16 read (MB/s) | 1010 | 4443 340% | 4309 327% | 2217 120% | 1301 29% | 1853 83% |
| 4k q32 t16 write (MB/s) | 345 | 2050 494% | 3435 896% | 2314 571% | 497 44% | 2683 678% |
| Total Average (Program / Settings) | 86% /
72% | 98% /
77% | 44% /
34% | -51% /
-59% | 45% /
33% |
* ... smaller is better
| Drive Performance rating - Percent | |
| Lenovo Legion 5 15IAH7H 82RB | |
| Schenker XMG Fusion 15 (Mid 22) | |
| Average Samsung SSD 980 Pro 1TB MZ-V8P1T0BW | |
| Average of class Gaming | |
| Asus TUF Gaming F15 FX507ZM | |
| Schenker XMG Core 15 Ampere | |
| Schenker XMG Core 15 (M22) | |
| Alienware m15 R5 Ryzen Edition | |
* ... smaller is better
Continuous: DiskSpd Read Loop, Queue Depth 8
图形卡
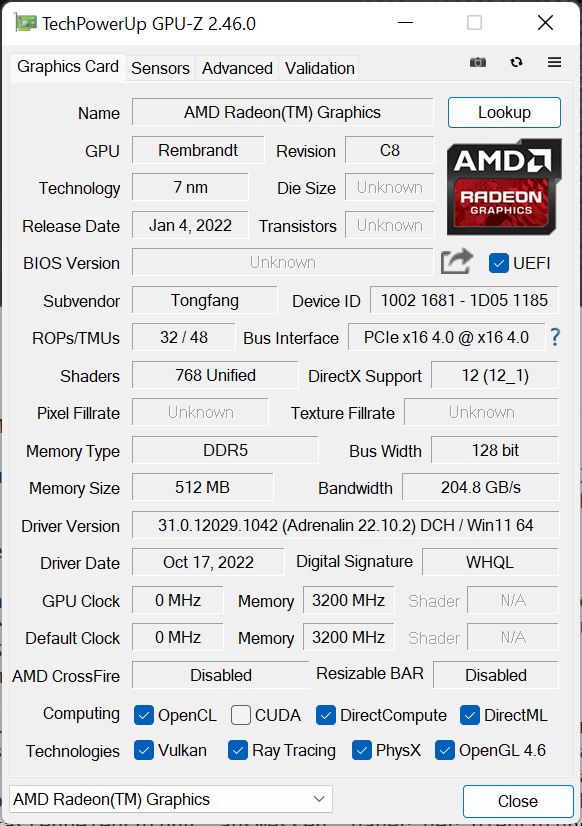
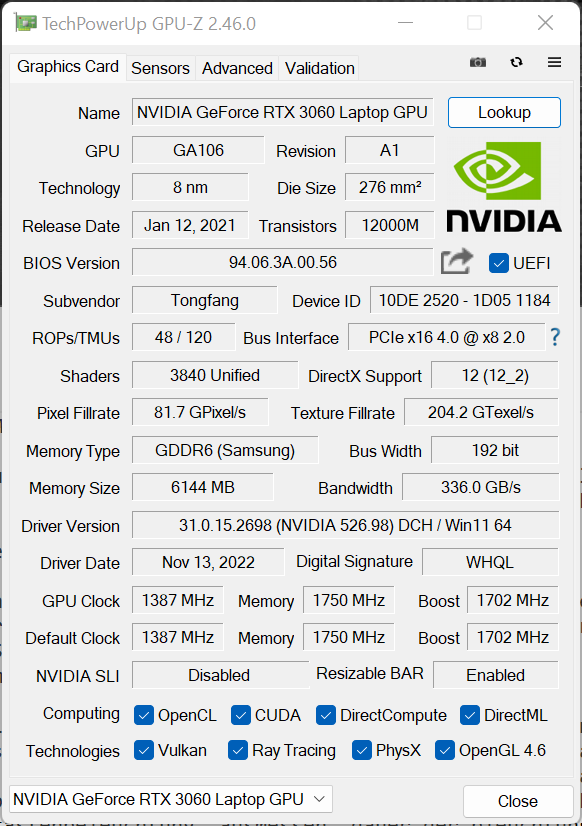
除了集成的Radeon 680M ,游戏笔记本电脑自然有一个专用的图形单元--就XMG Core 15而言,是一个GeForce RTX 3060 ,有140-W TGP。
许多较新的游戏可以在原生WQHD分辨率下顺利渲染,但对性能要求很高的游戏可能不得不在FullHD或较低的细节水平下享受。
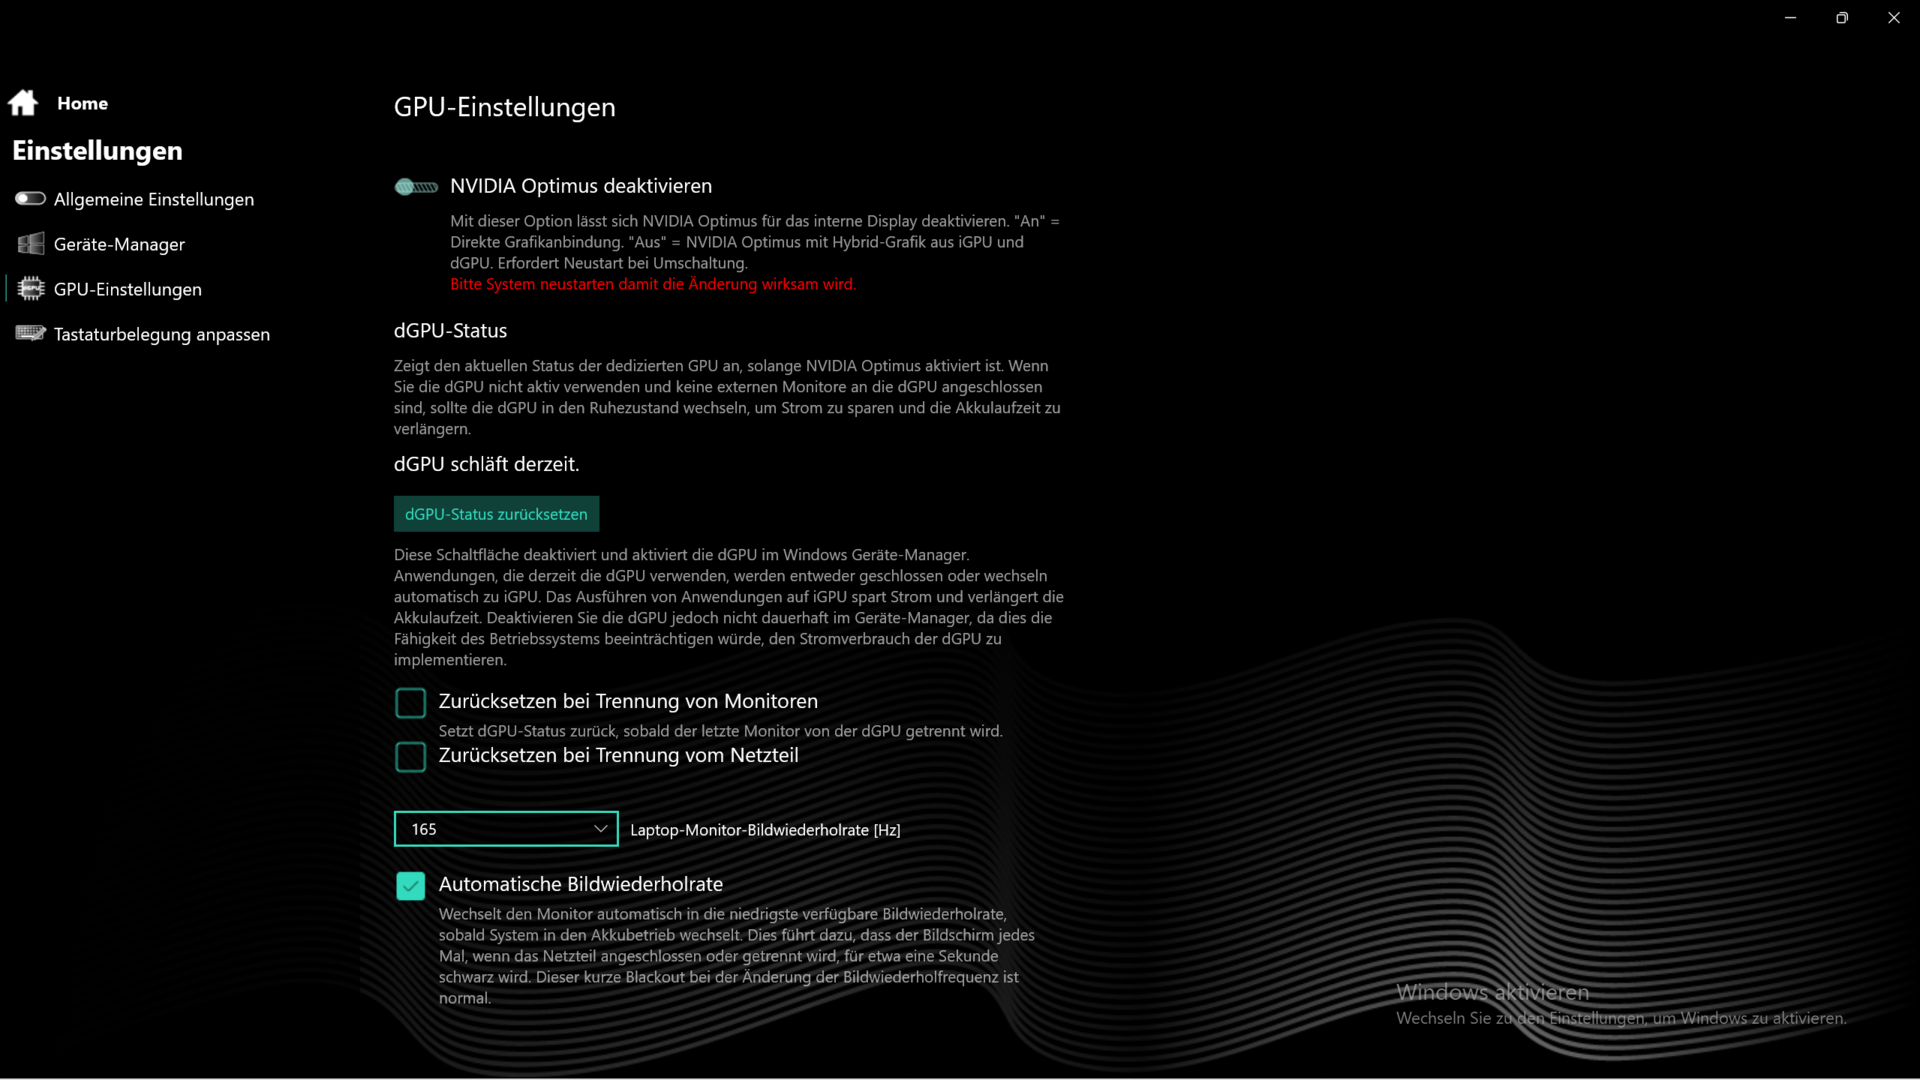
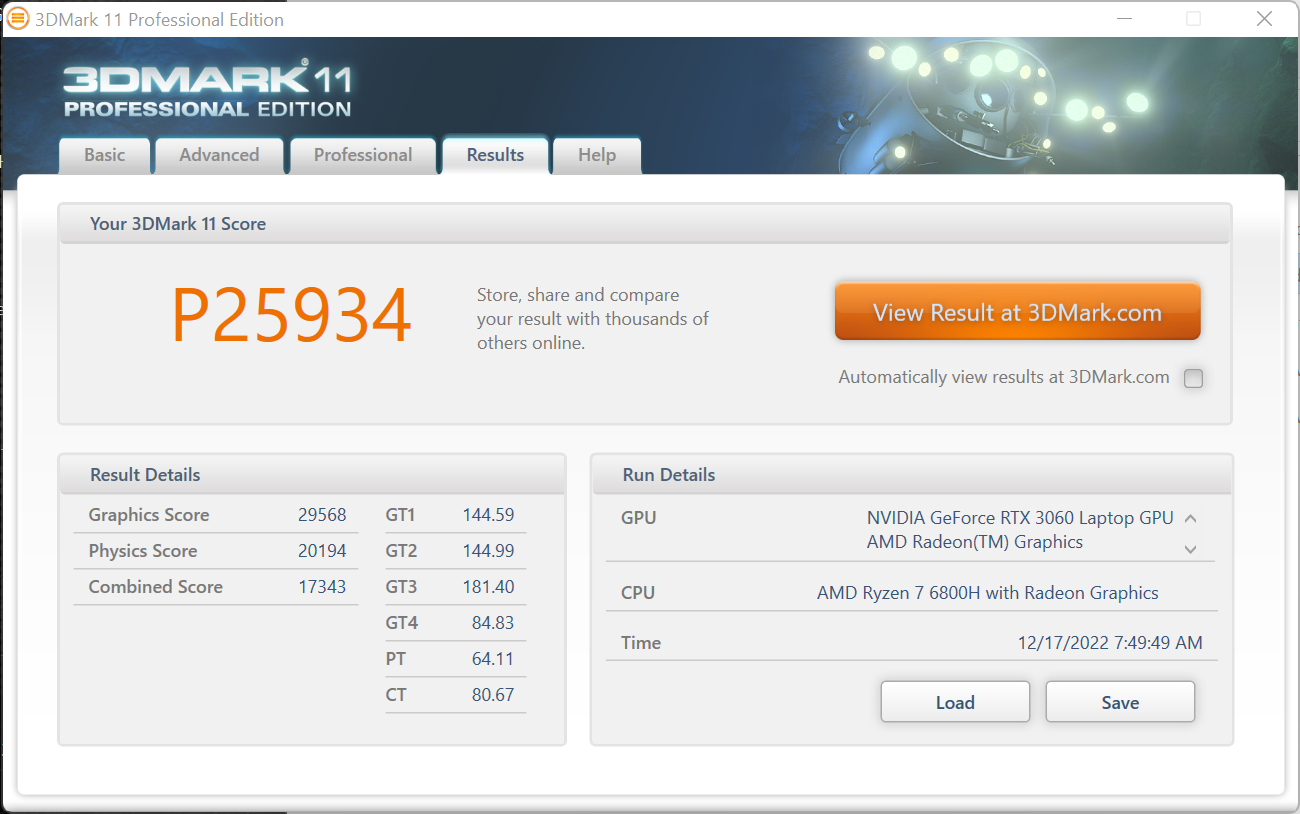
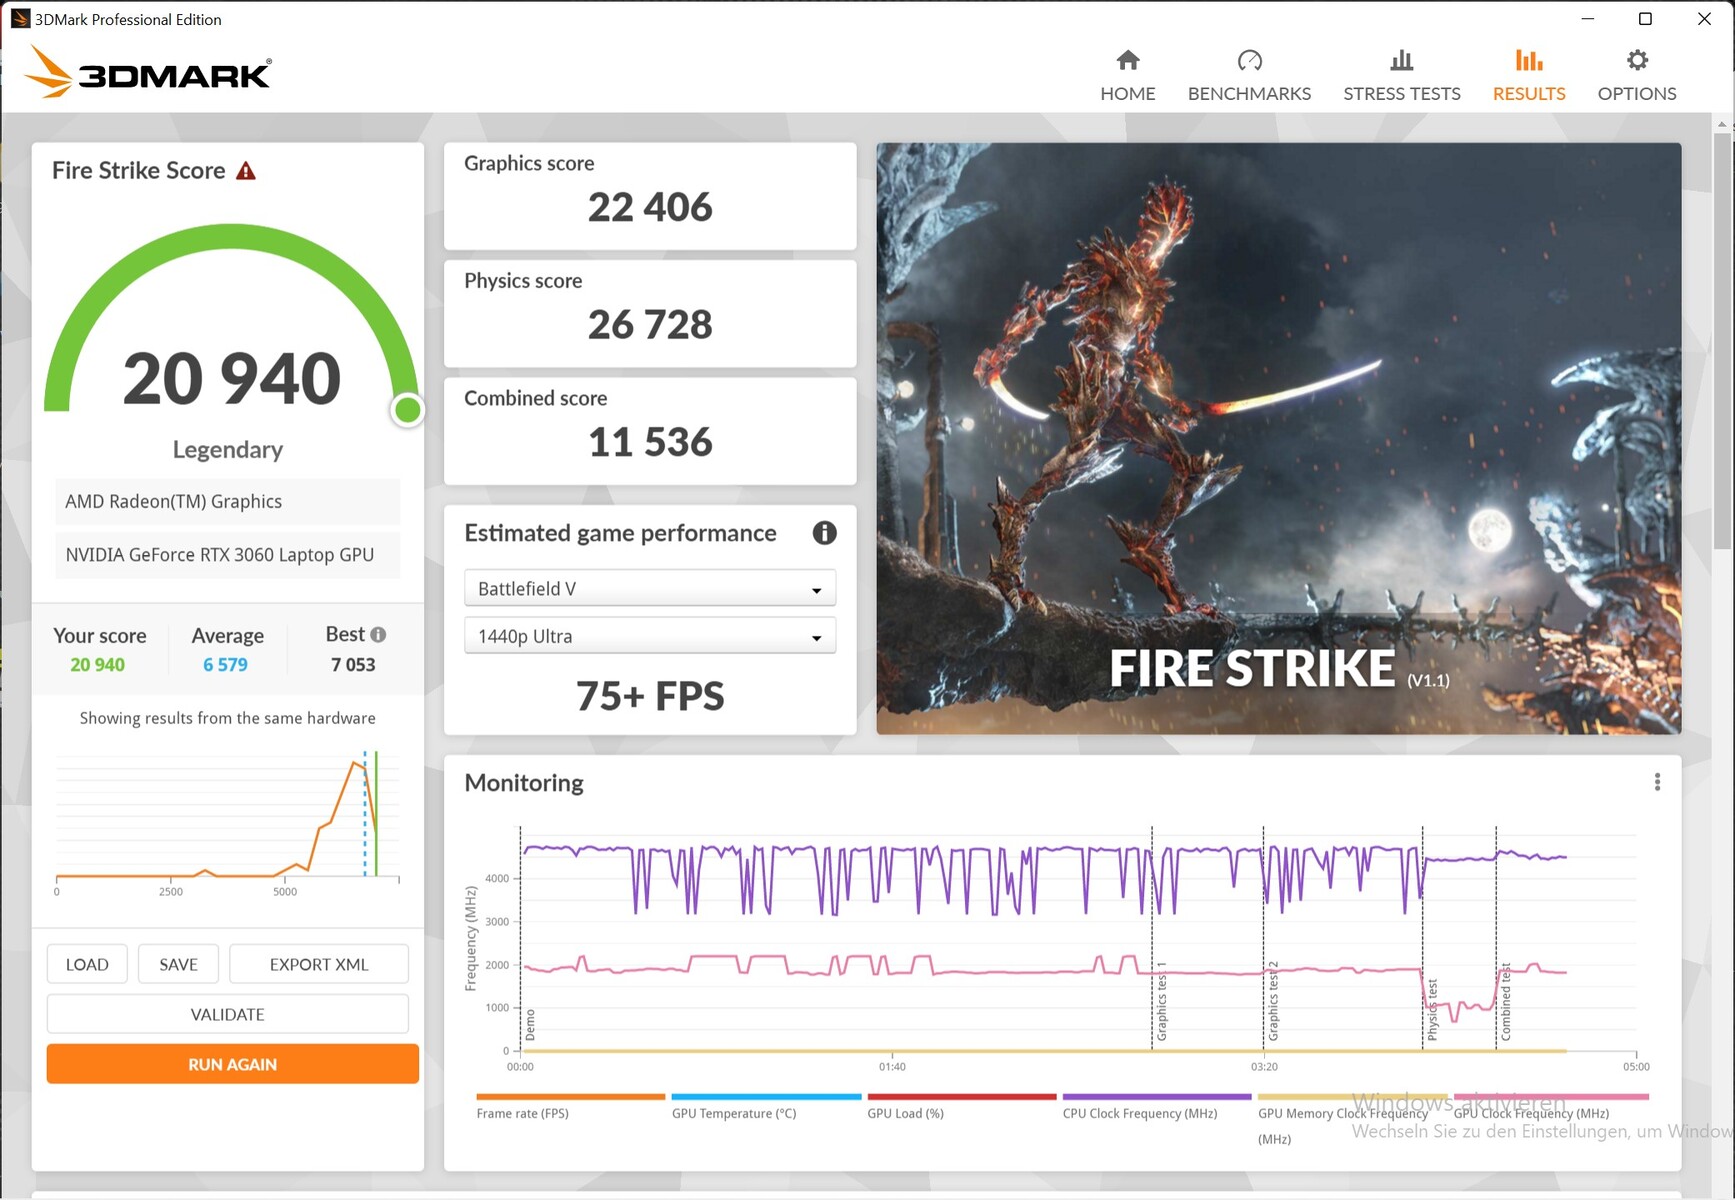
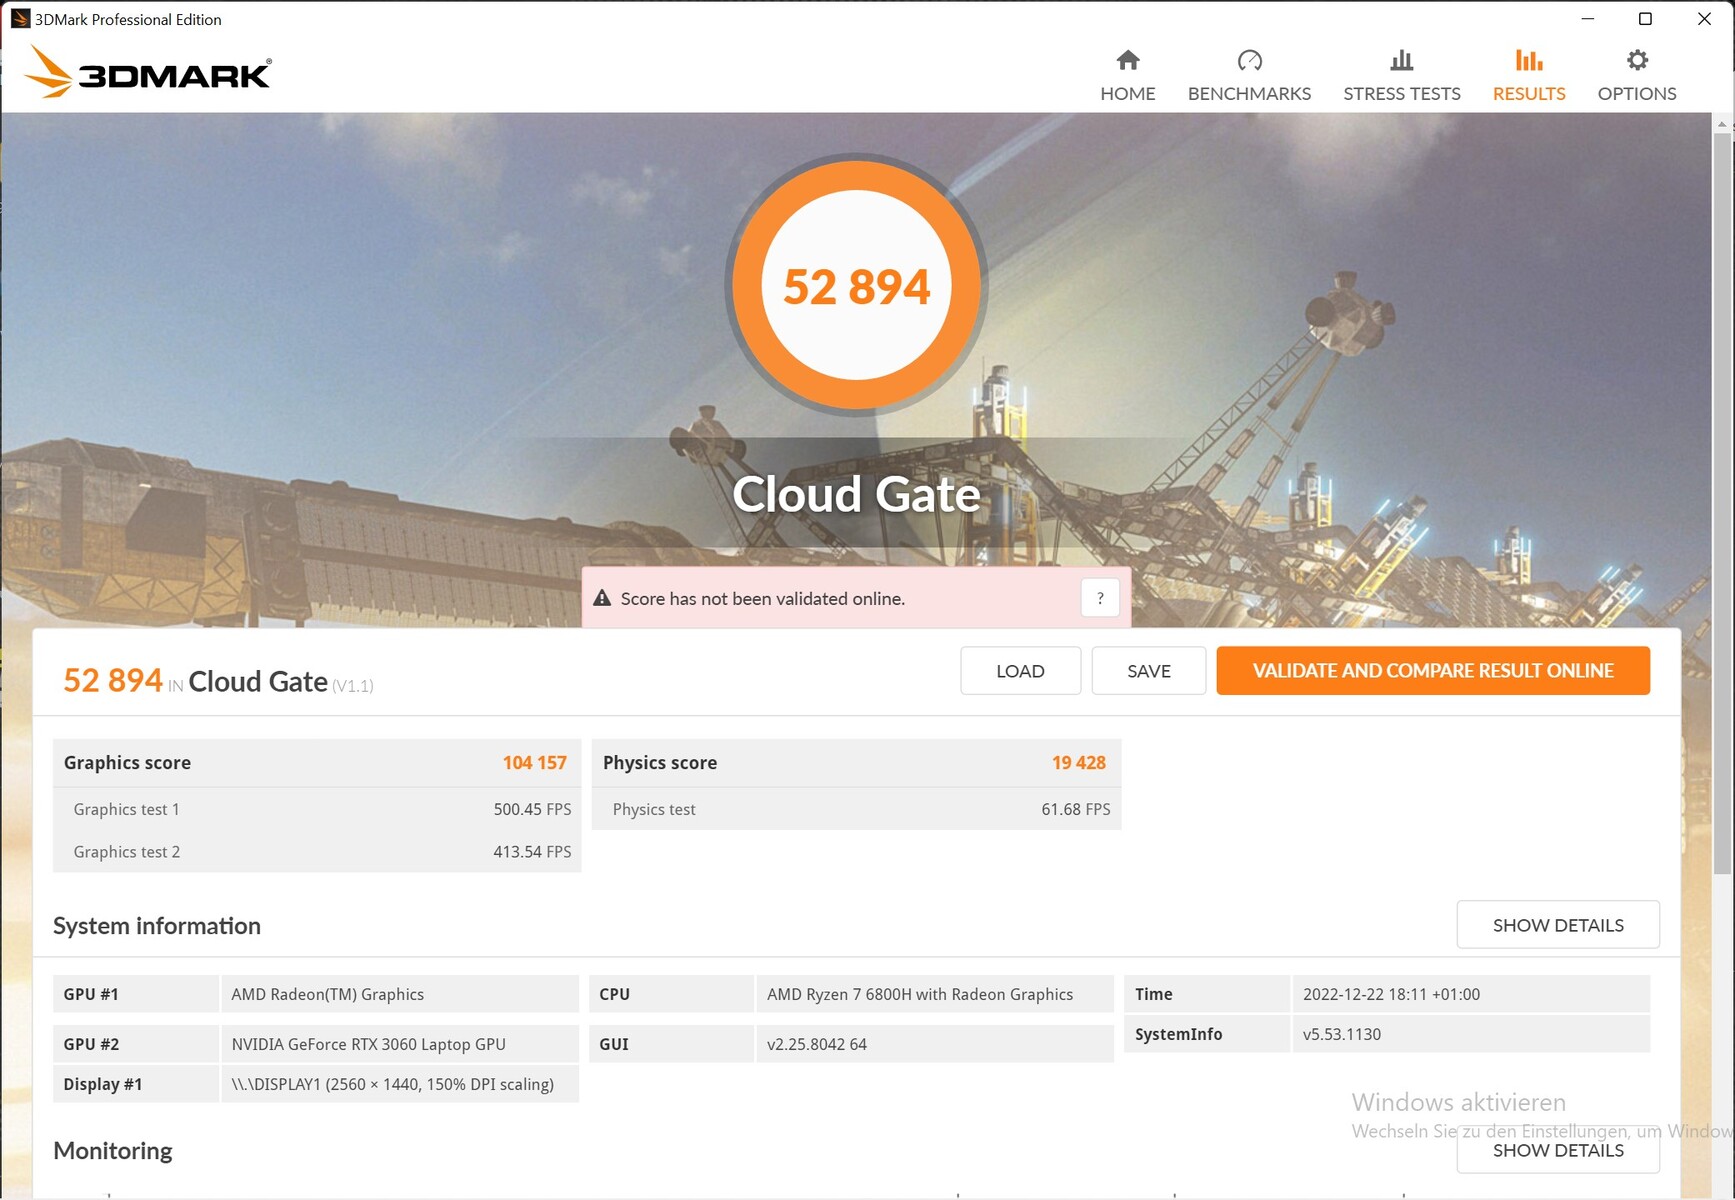
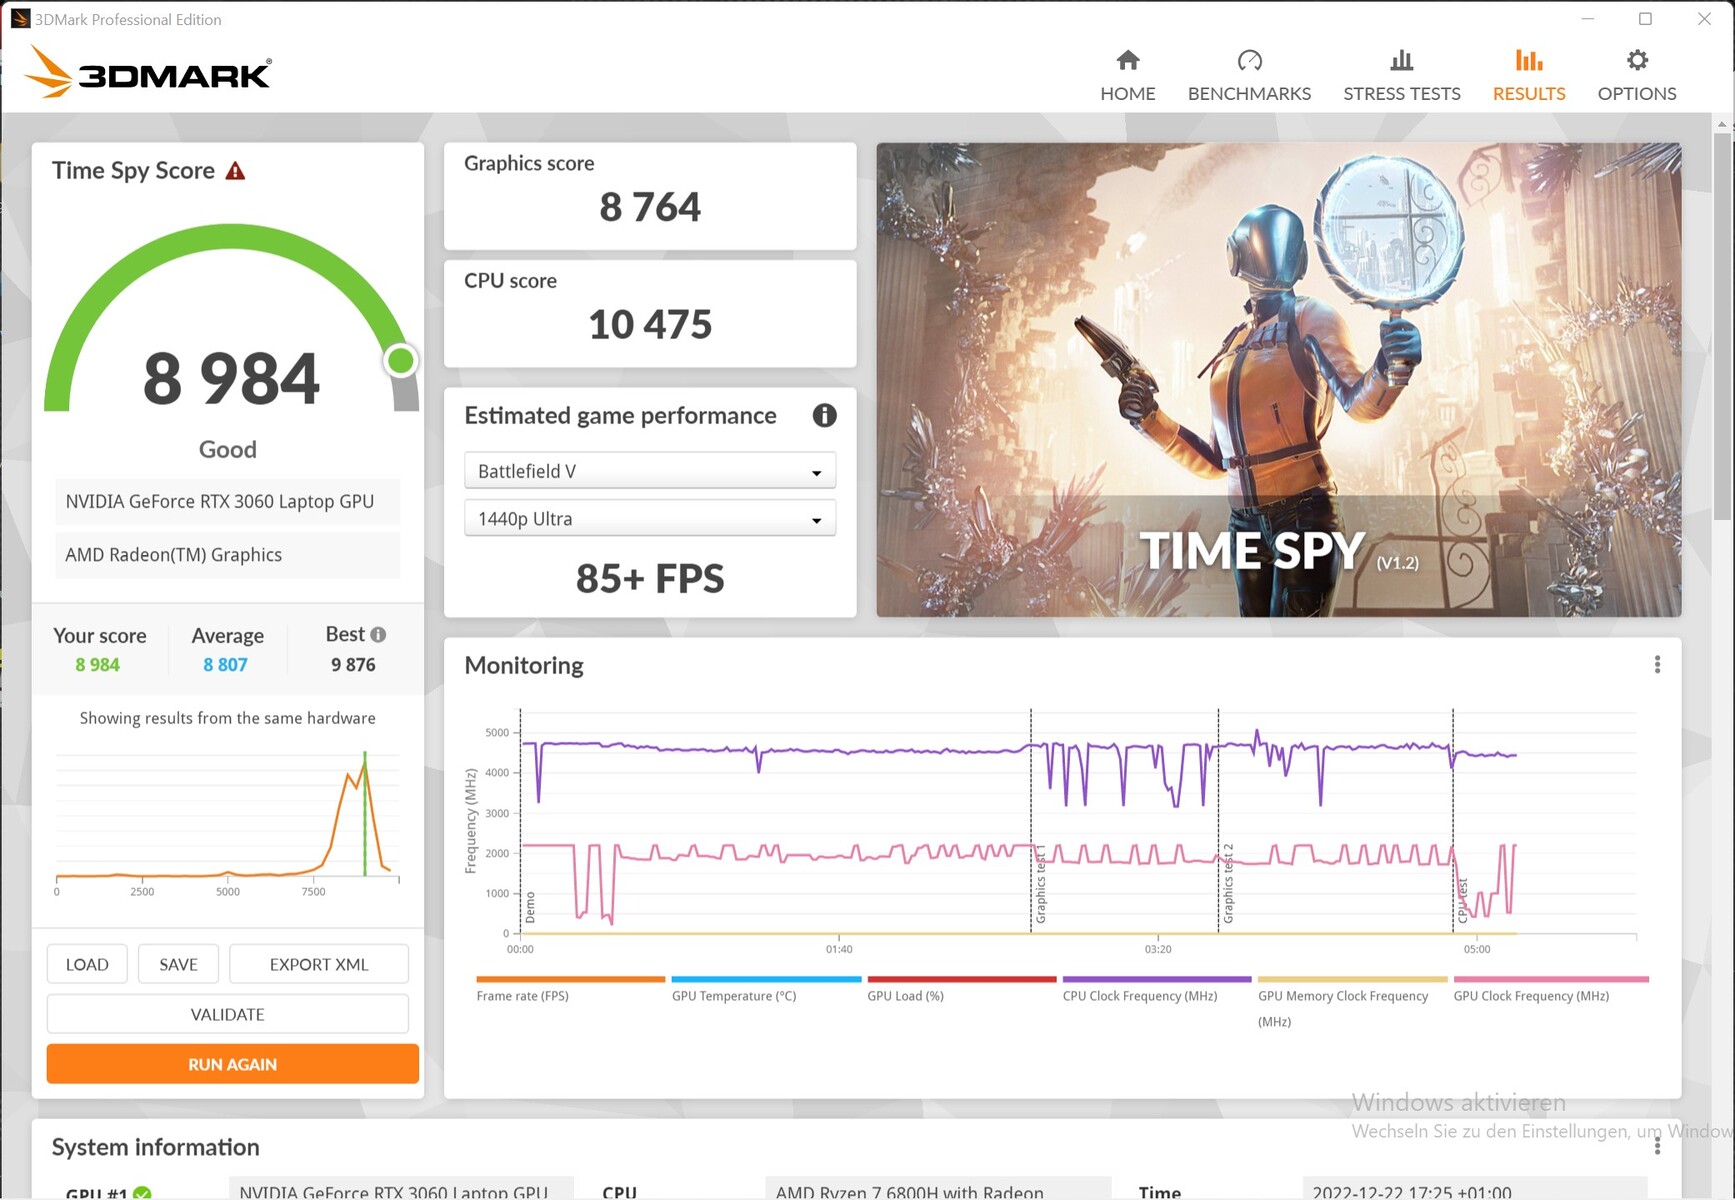
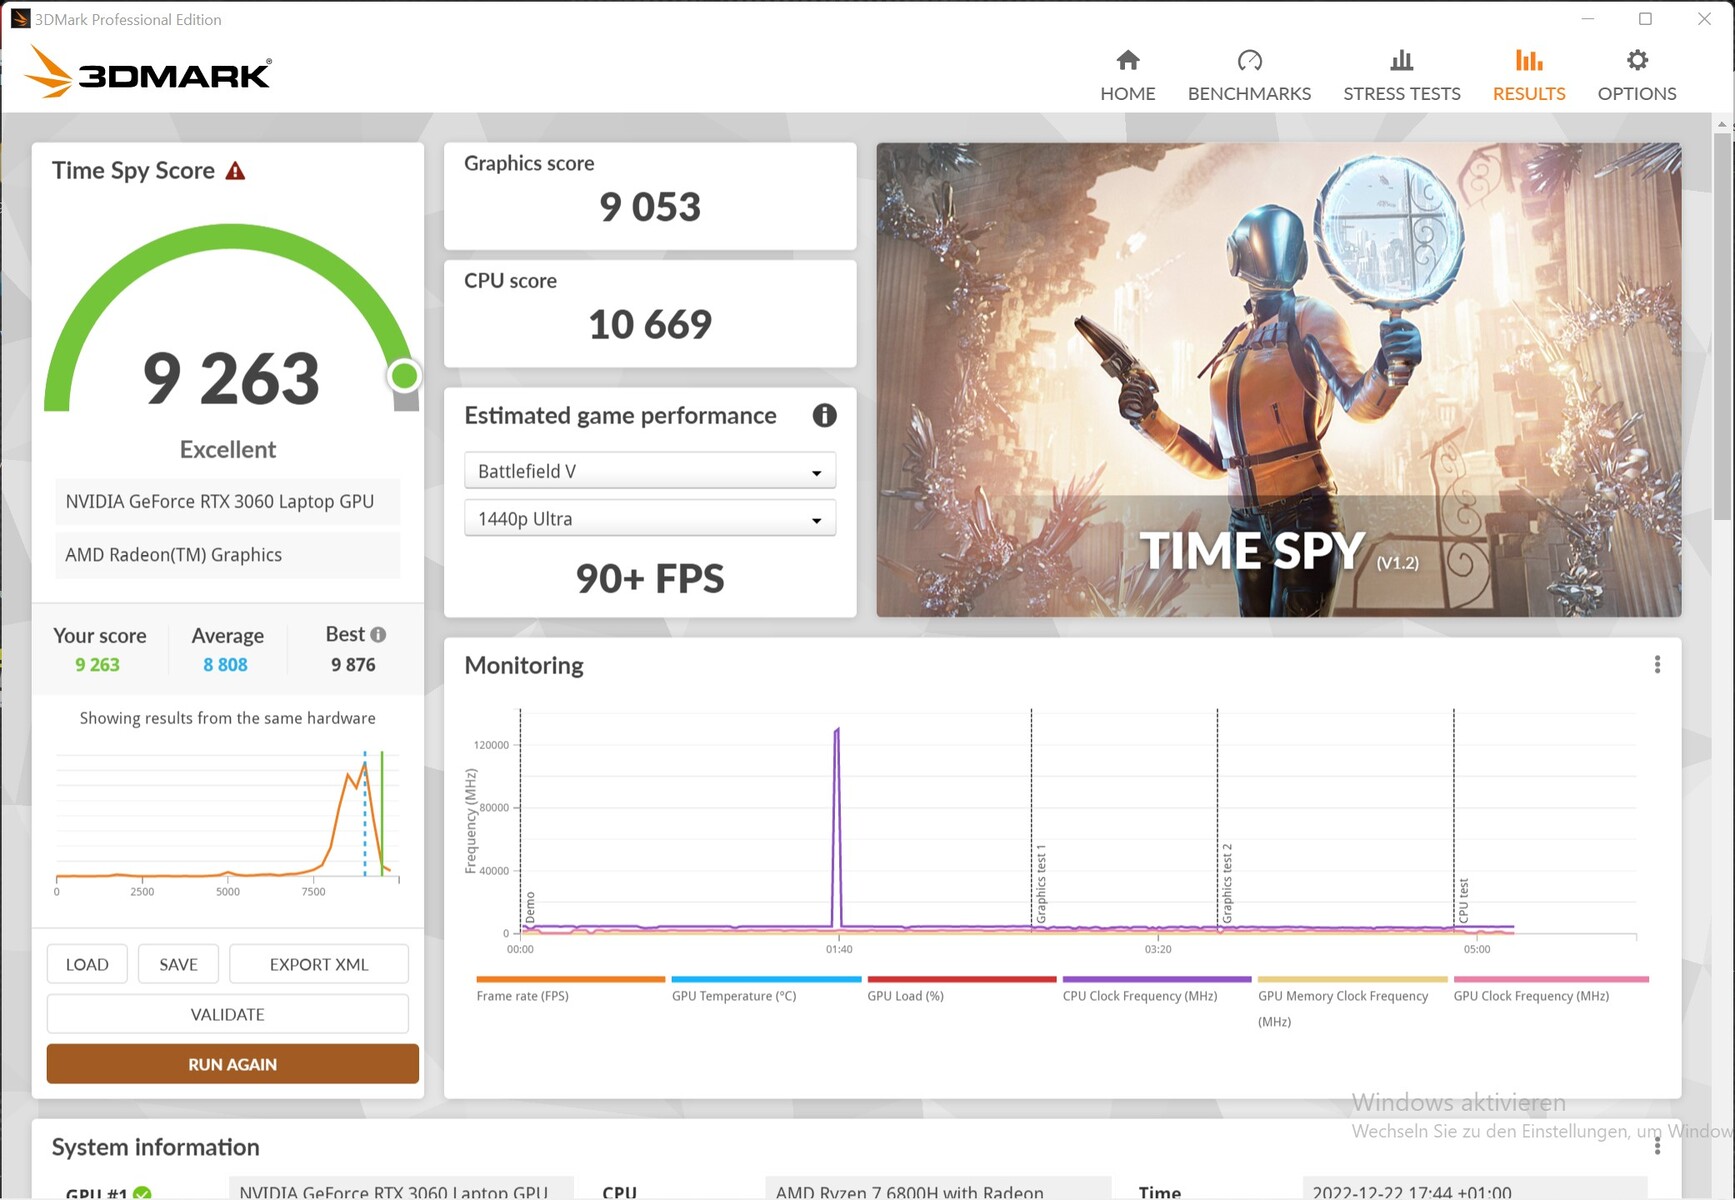
XMG控制中心的超频功能可以将性能提高3-4%,这取决于3D应用,而MUX开关(需要重新启动)可以增加~5%。尽管如此,面对其他RTX 3060玩家,Core 15不得不承认失败,尽管差距不是很大。
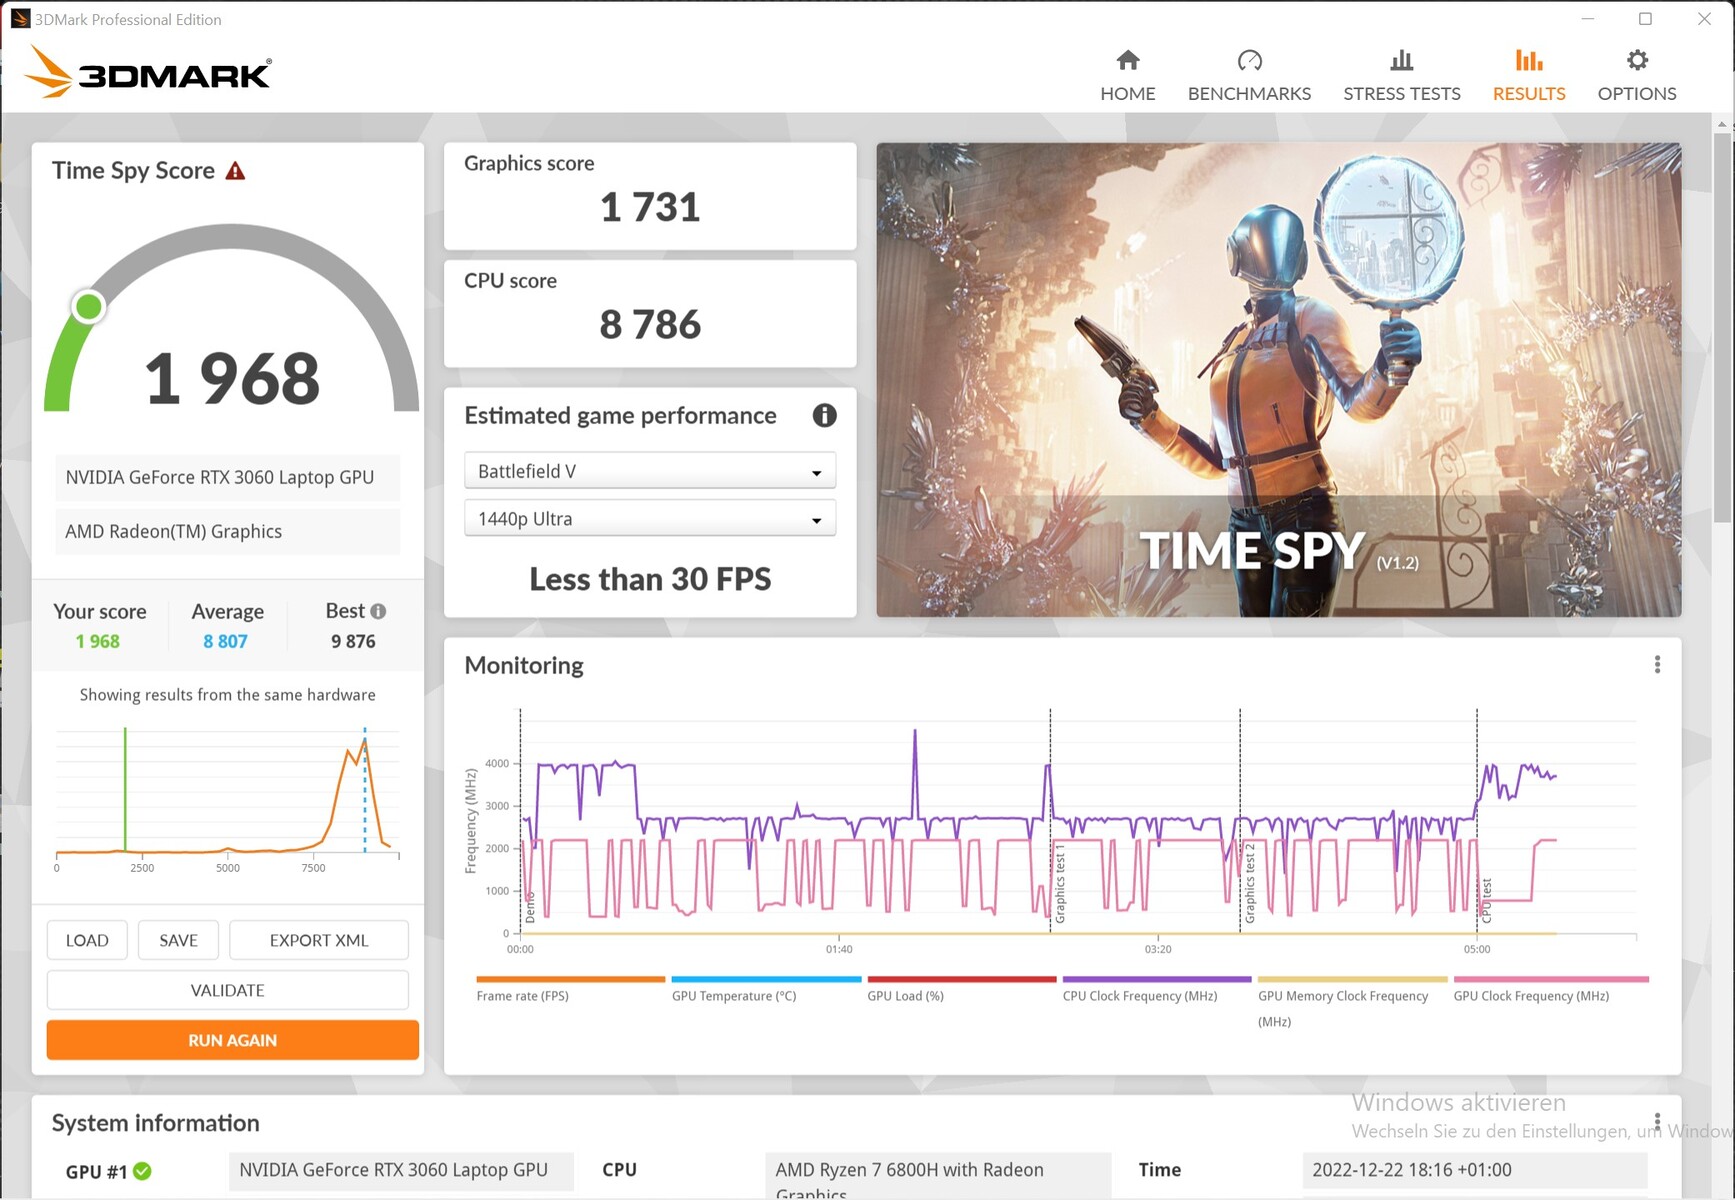
在电池供电的情况下,图形性能明显下降,所以只剩下原来性能的25%。这部分是由于62Wh的小电池,否则会放电过快。
| 3DMark Performance rating - Percent | |
| Average of class Gaming | |
| Schenker XMG Fusion 15 (Mid 22) | |
| Asus TUF Gaming F15 FX507ZM | |
| Lenovo Legion 5 15ACH-82JU00C6GE-FL | |
| Schenker XMG Core 15 Ampere | |
| Schenker XMG Core 15 (M22) | |
| Schenker XMG Apex 15 NH57E PS | |
| Average NVIDIA GeForce RTX 3060 Laptop GPU | |
| Alienware m15 R5 Ryzen Edition | |
| 3DMark 11 Performance | 25934 points | |
| 3DMark Cloud Gate Standard Score | 52894 points | |
| 3DMark Fire Strike Score | 20940 points | |
| 3DMark Time Spy Score | 8984 points | |
Help | ||
| 3DMark - 2560x1440 Time Spy Graphics | |
| Asus TUF Gaming F15 FX507ZM | |
| Lenovo Legion 5 15IAH7H 82RB | |
| Schenker XMG Fusion 15 (Mid 22) | |
| Schenker XMG Core 15 (M22) | |
| Schenker XMG Core 15 Ampere | |
| Alienware m15 R5 Ryzen Edition | |
| HP Envy 16 h0112nr | |
| MSI CreatorPro Z16P B12UKST | |
| HP ZBook Studio 16 G9 62U04EA | |
| V-Ray Benchmark Next 4.10 - GPU | |
| Schenker XMG Fusion 15 (Mid 22) | |
| Schenker XMG Core 15 (M22) | |
| Schenker XMG Core 15 Ampere | |
| Alienware m15 R5 Ryzen Edition | |
| MSI CreatorPro Z16P B12UKST | |
| HP ZBook Studio 16 G9 62U04EA | |
| Geekbench 5.5 - OpenCL Score | |
| Schenker XMG Fusion 15 (Mid 22) | |
| Asus TUF Gaming F15 FX507ZM | |
| Lenovo Legion 5 15IAH7H 82RB | |
| Schenker XMG Core 15 (M22) | |
| Alienware m15 R5 Ryzen Edition | |
| MSI CreatorPro Z16P B12UKST | |
| Schenker XMG Core 15 Ampere | |
| HP Envy 16 h0112nr | |
| HP ZBook Studio 16 G9 62U04EA | |
* ... smaller is better
游戏性能
尽管XMG Core 15的TGP很高,但在游戏中,具有相同图形单元的竞争者比XMG Core 15高出13%,我们测得的TGP为134W,而它至少在84℃(约183°F)时不会太热。1,800 MHz的核心时钟已经超过了1,702 MHz的规格。其性能相当于中上等水平。
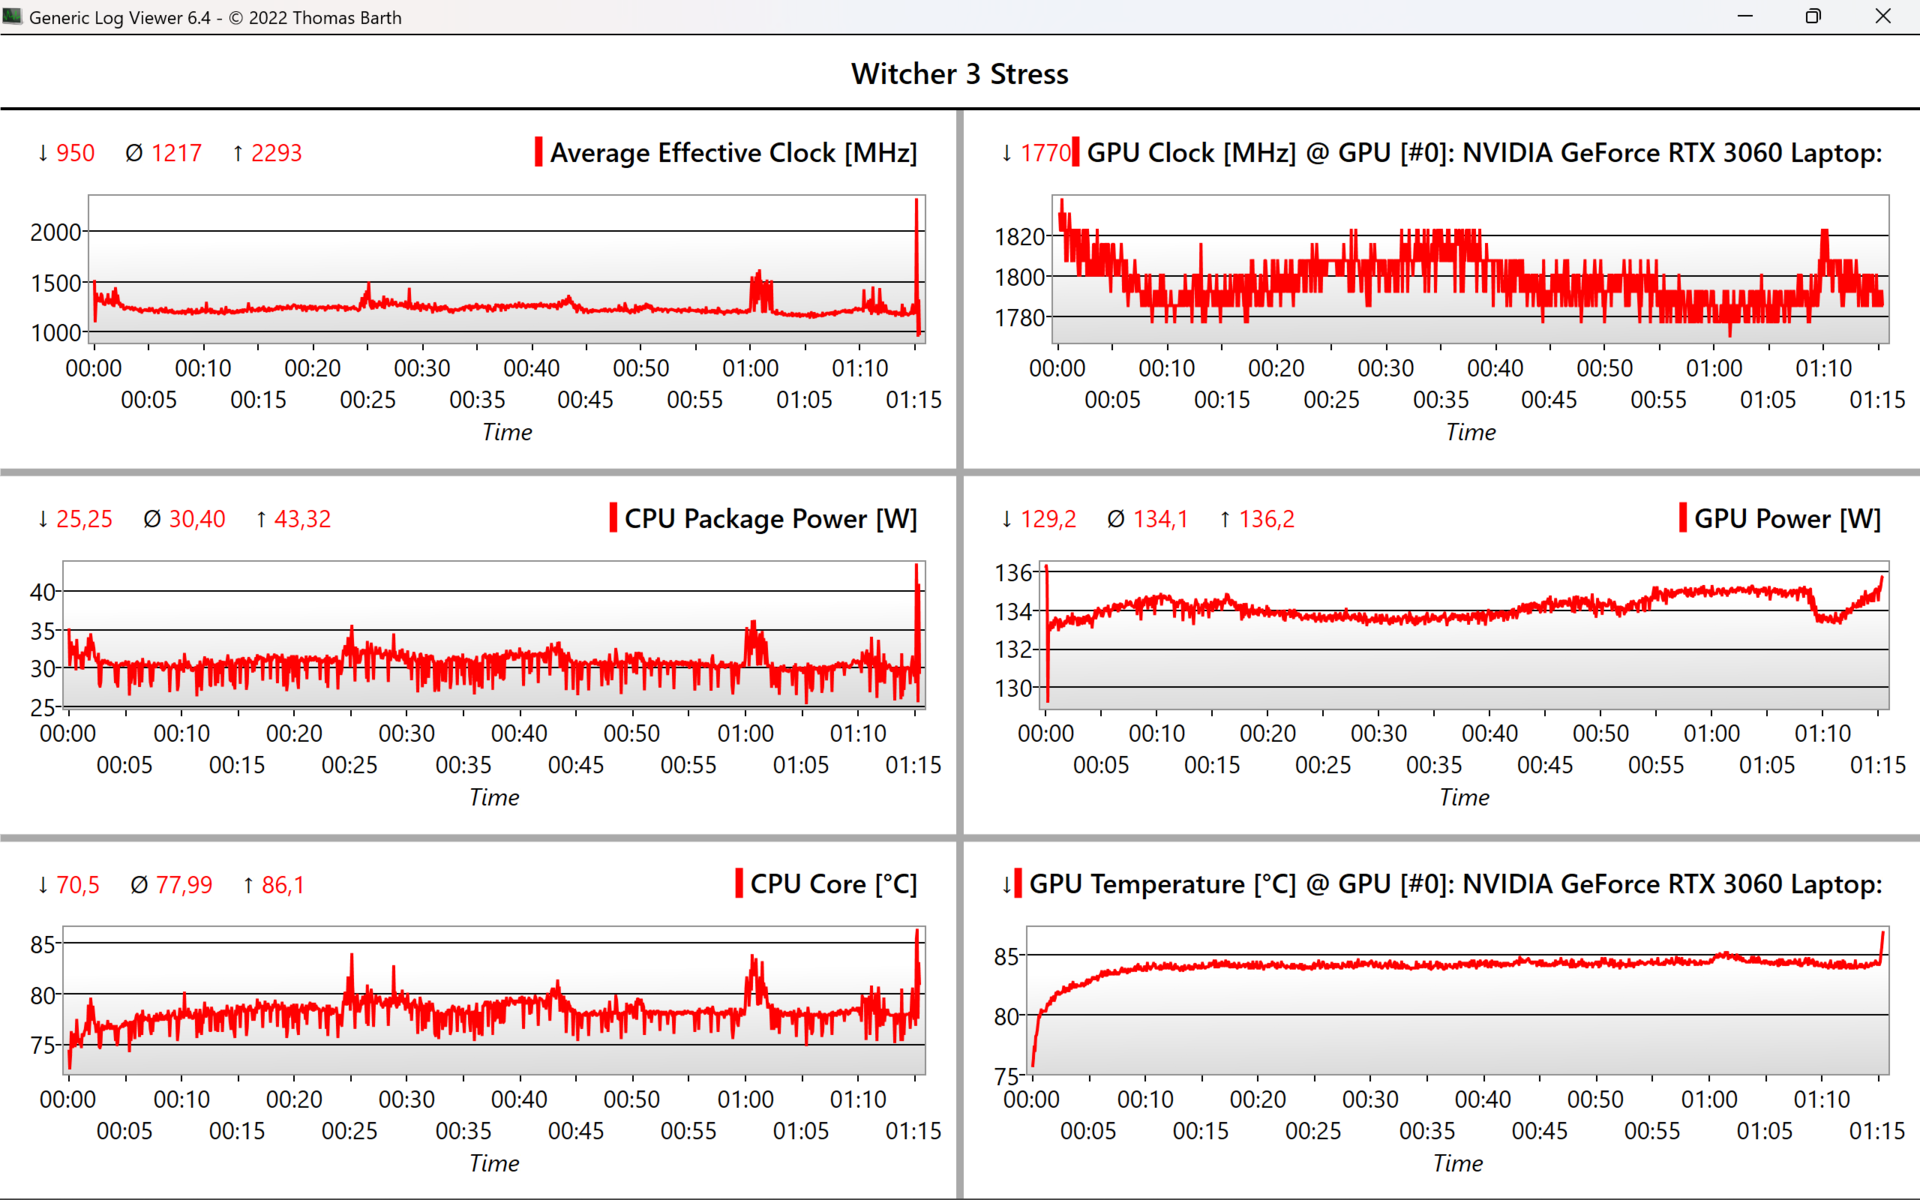
即使在《Witcher 3 》中使用了一个小时,时钟速率仍然保持稳定,因此FPS也是如此,正如下面两张图所示。
Witcher 3 FPS-Diagram
| low | med. | high | ultra | QHD | |
|---|---|---|---|---|---|
| GTA V (2015) | 178.7 | 172.1 | 158.4 | 97.3 | 86.5 |
| The Witcher 3 (2015) | 303 | 253 | 159.7 | 81.5 | |
| Dota 2 Reborn (2015) | 136.8 | 126.5 | 117.6 | 112.3 | |
| Final Fantasy XV Benchmark (2018) | 178.4 | 119.5 | 91.9 | 67.5 | |
| X-Plane 11.11 (2018) | 104.8 | 93.3 | 74.2 | ||
| Far Cry 5 (2018) | 118 | 107 | 90 | ||
| Strange Brigade (2018) | 273 | 200 | 171.7 | 152.7 | |
| God of War (2022) | 92.6 | 73.1 | 51.5 | 44 |
排放。使用XMG Core 15,可以实现安静的游戏和高FPS。
噪声排放
风扇在空转时和网上冲浪时大多保持关闭。虽然在CPU满负荷时有42 dB(A)的噪音,但这可以通过平衡模式得到控制,因为它仍然有足够的功率。
在游戏过程中,它变得非常响亮,达到55 dB(A),但低频噪音仍然比较令人愉快。在这里,平衡模式也提供了一个明显的补救措施,而在《GTA V》中,FPS只下降了5%,例如,这是一个非常好的结果。出厂后,XMG Fusion 15 和Alienware m15在游戏时仍然明显更安静,分别为46和48 dB(A)。
.
Noise level
| Idle |
| 23 / 23 / 23 dB(A) |
| Load |
| 42.41 / 55.05 dB(A) |
 | ||
30 dB silent 40 dB(A) audible 50 dB(A) loud |
||
min: | ||
| Schenker XMG Core 15 (M22) R7 6800H, GeForce RTX 3060 Laptop GPU | Lenovo Legion 5 15IAH7H 82RB i7-12700H, GeForce RTX 3060 Laptop GPU | Schenker XMG Fusion 15 (Mid 22) i7-11800H, GeForce RTX 3070 Laptop GPU | Asus TUF Gaming F15 FX507ZM i7-12700H, GeForce RTX 3060 Laptop GPU | Alienware m15 R5 Ryzen Edition R7 5800H, GeForce RTX 3060 Laptop GPU | Schenker XMG Core 15 Ampere R7 4800H, GeForce RTX 3060 Laptop GPU | |
|---|---|---|---|---|---|---|
| Noise | 3% | -9% | -1% | -7% | -8% | |
| off / environment * (dB) | 23 | 23.3 -1% | 26 -13% | 23.2 -1% | 24 -4% | 24 -4% |
| Idle Minimum * (dB) | 23 | 23.5 -2% | 26 -13% | 23.6 -3% | 24 -4% | 26 -13% |
| Idle Average * (dB) | 23 | 23.5 -2% | 28 -22% | 23.6 -3% | 25 -9% | 28 -22% |
| Idle Maximum * (dB) | 23 | 26.8 -17% | 31 -35% | 25.4 -10% | 35 -52% | 30 -30% |
| Load Average * (dB) | 42.41 | 29.3 31% | 45 -6% | 38 10% | 44 -4% | 42 1% |
| Witcher 3 ultra * (dB) | 54.71 | 51.4 6% | 46 16% | 54.1 1% | 48 12% | 50 9% |
| Load Maximum * (dB) | 55.05 | 53 4% | 48 13% | 57.2 -4% | 50 9% | 52 6% |
* ... smaller is better
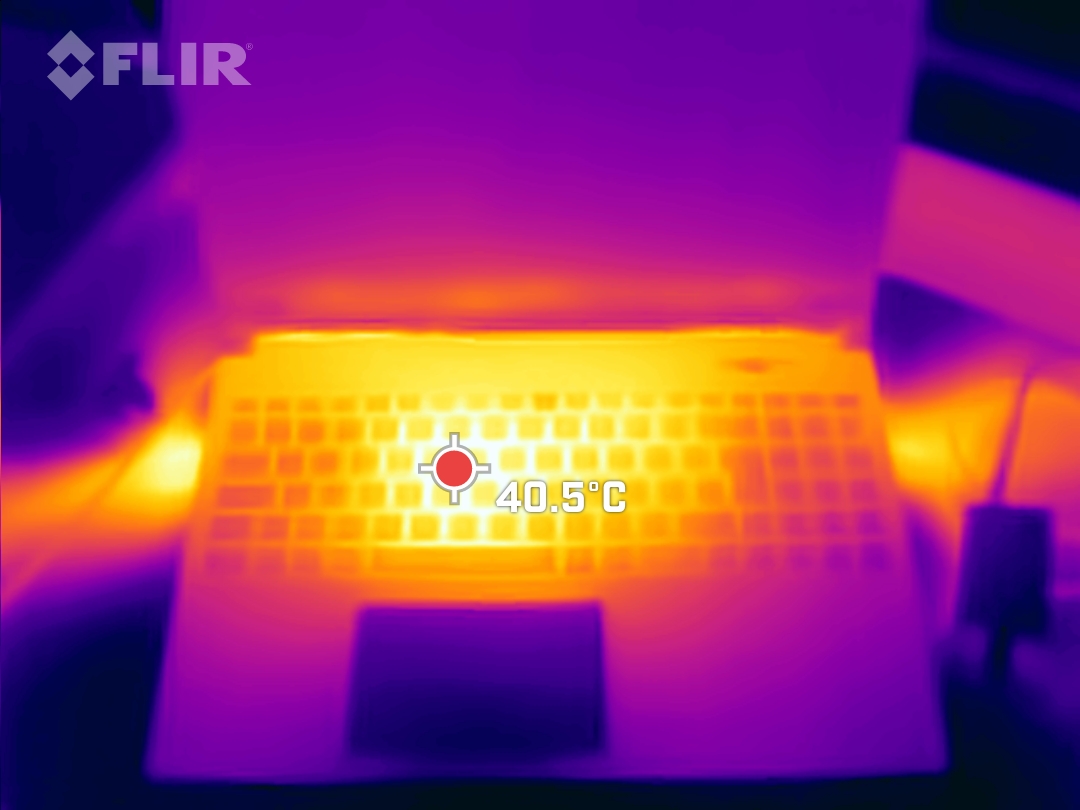
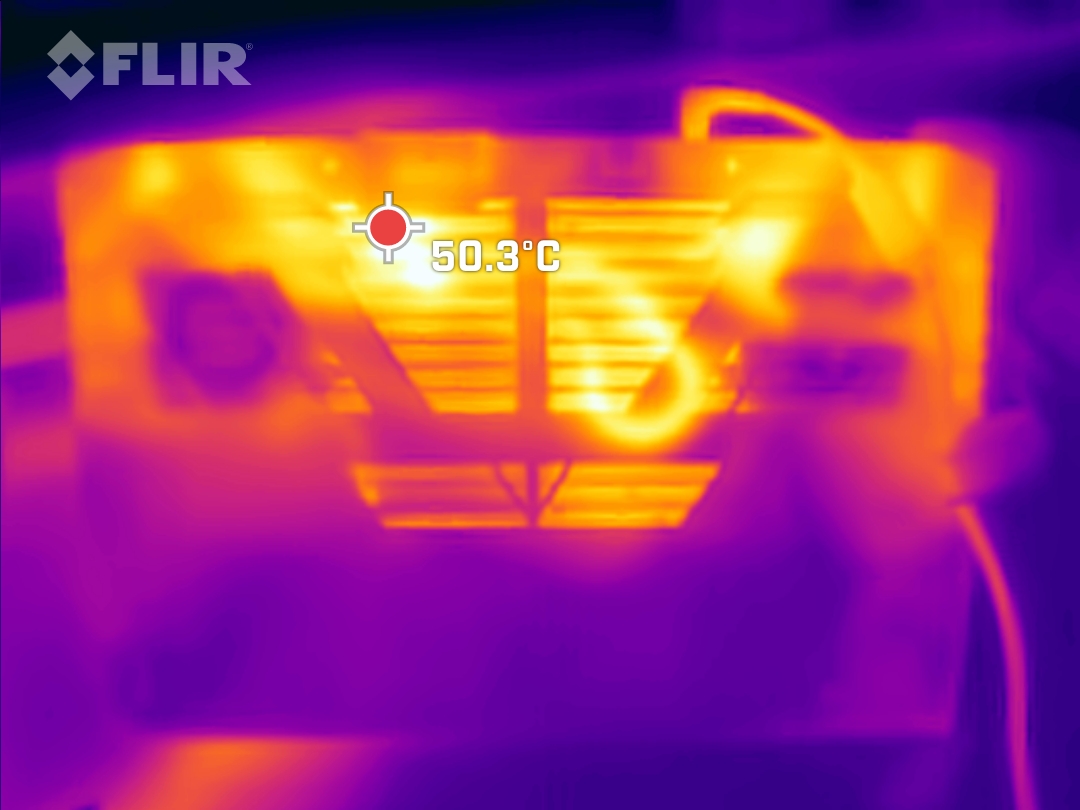
温度
即使在游戏过程中,温度也从未进入热区。在最大负荷下,设备底部有一个51℃(约124°F)的热点,而Alienware m15和Schenker XMG Fusion 15的运行温度要高得多,分别为61℃和63℃(约142和约145°F)。
(-) The maximum temperature on the upper side is 48 °C / 118 F, compared to the average of 40.4 °C / 105 F, ranging from 21.2 to 68.8 °C for the class Gaming.
(-) The bottom heats up to a maximum of 51 °C / 124 F, compared to the average of 43.2 °C / 110 F
(+) In idle usage, the average temperature for the upper side is 25.6 °C / 78 F, compared to the device average of 33.9 °C / 93 F.
(±) Playing The Witcher 3, the average temperature for the upper side is 34.9 °C / 95 F, compared to the device average of 33.9 °C / 93 F.
(+) The palmrests and touchpad are cooler than skin temperature with a maximum of 28 °C / 82.4 F and are therefore cool to the touch.
(±) The average temperature of the palmrest area of similar devices was 28.8 °C / 83.8 F (+0.8 °C / 1.4 F).
| Schenker XMG Core 15 (M22) AMD Ryzen 7 6800H, NVIDIA GeForce RTX 3060 Laptop GPU | Lenovo Legion 5 15IAH7H 82RB Intel Core i7-12700H, NVIDIA GeForce RTX 3060 Laptop GPU | Schenker XMG Fusion 15 (Mid 22) Intel Core i7-11800H, NVIDIA GeForce RTX 3070 Laptop GPU | Asus TUF Gaming F15 FX507ZM Intel Core i7-12700H, NVIDIA GeForce RTX 3060 Laptop GPU | Alienware m15 R5 Ryzen Edition AMD Ryzen 7 5800H, NVIDIA GeForce RTX 3060 Laptop GPU | Schenker XMG Core 15 Ampere AMD Ryzen 7 4800H, NVIDIA GeForce RTX 3060 Laptop GPU | |
|---|---|---|---|---|---|---|
| Heat | 11% | -20% | -11% | -20% | 2% | |
| Maximum Upper Side * (°C) | 48 | 37.8 21% | 52 -8% | 44.4 7% | 62 -29% | 48 -0% |
| Maximum Bottom * (°C) | 51 | 51 -0% | 63 -24% | 48.8 4% | 61 -20% | 50 2% |
| Idle Upper Side * (°C) | 28 | 25.8 8% | 37 -32% | 37.8 -35% | 36 -29% | 28 -0% |
| Idle Bottom * (°C) | 33 | 28.8 13% | 38 -15% | 39.6 -20% | 33 -0% | 31 6% |
* ... smaller is better
压力测试
即使在综合压力测试中,CPU的计算速度仍然略高于3.2GHz的基本时钟,而在前40分钟内升温到86°C(约187°F),之后随着综合TDP向CPU转移而升温到93°C(约199°F),从而恢复到4GHz。这里的GPU温度为86℃,而时钟频率仍为1400MHz。
之后直接执行的GPU基准测试没有性能损失。
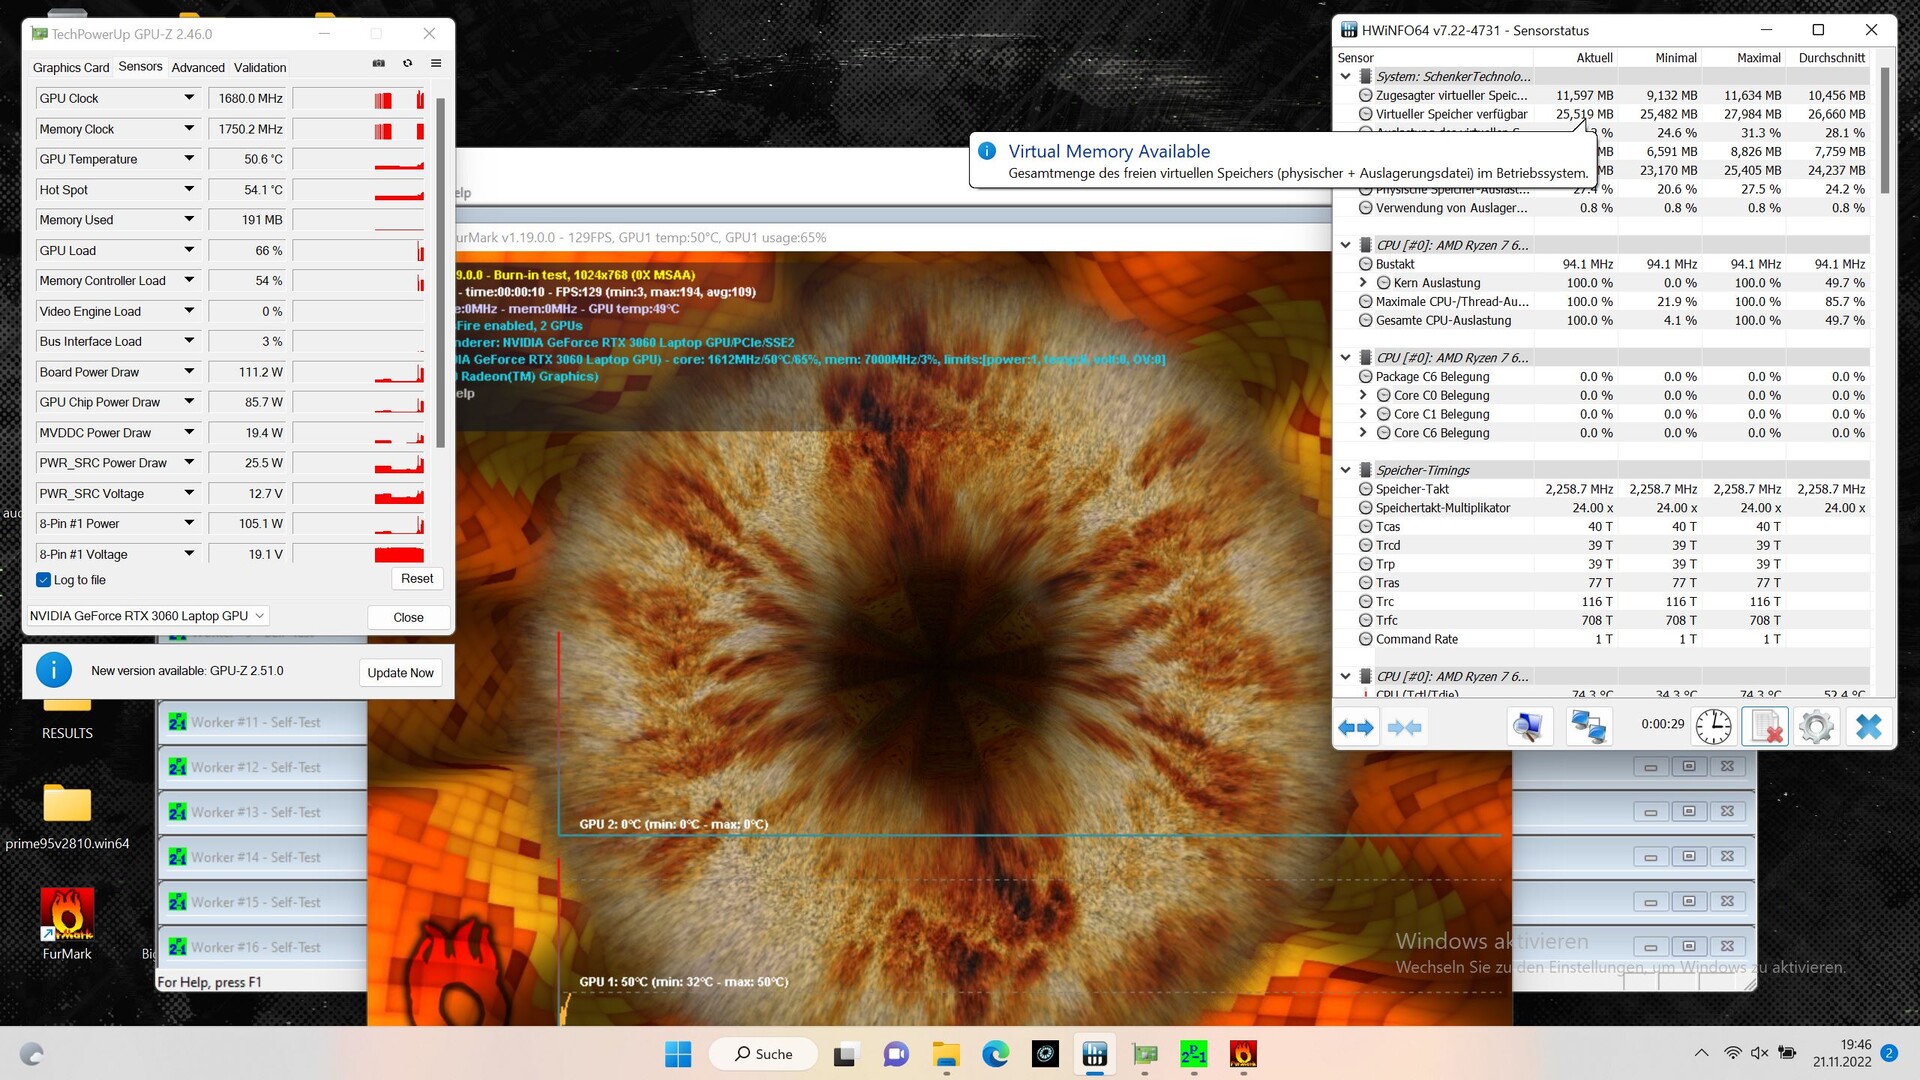
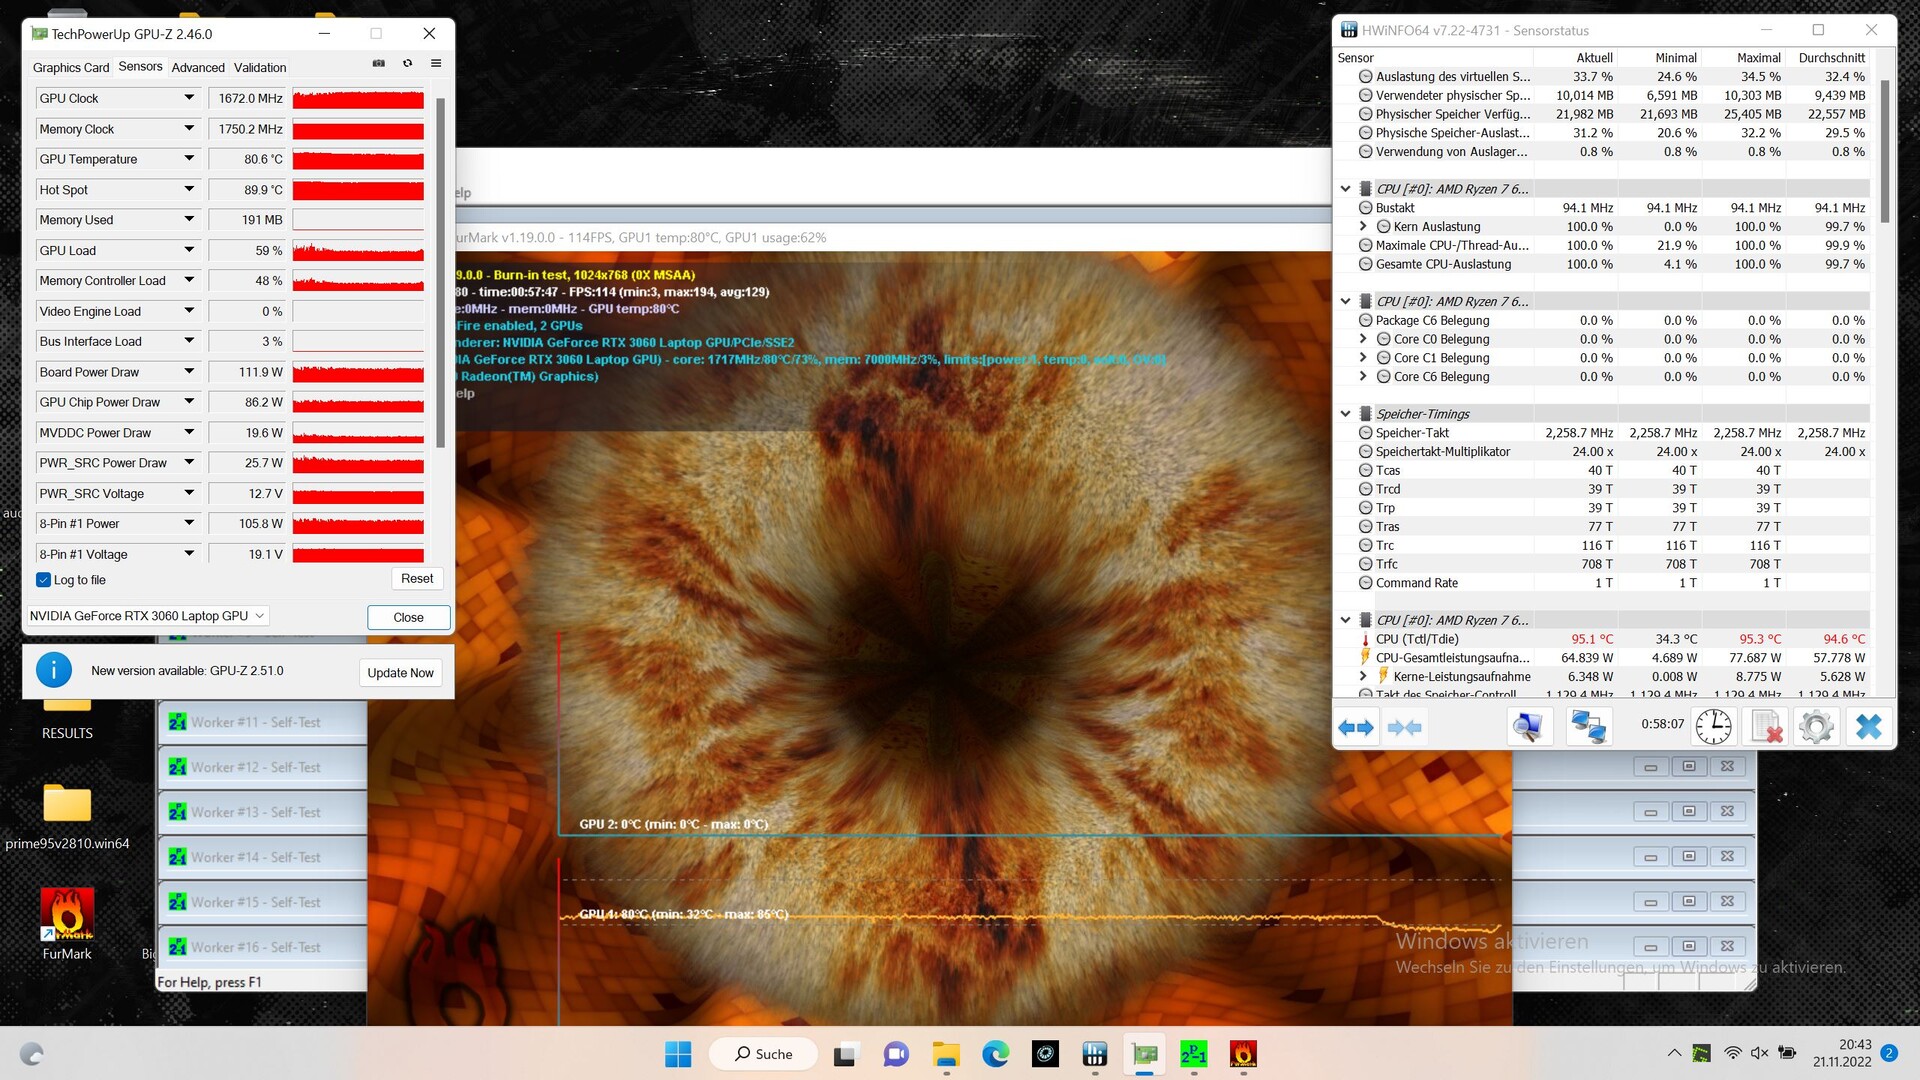
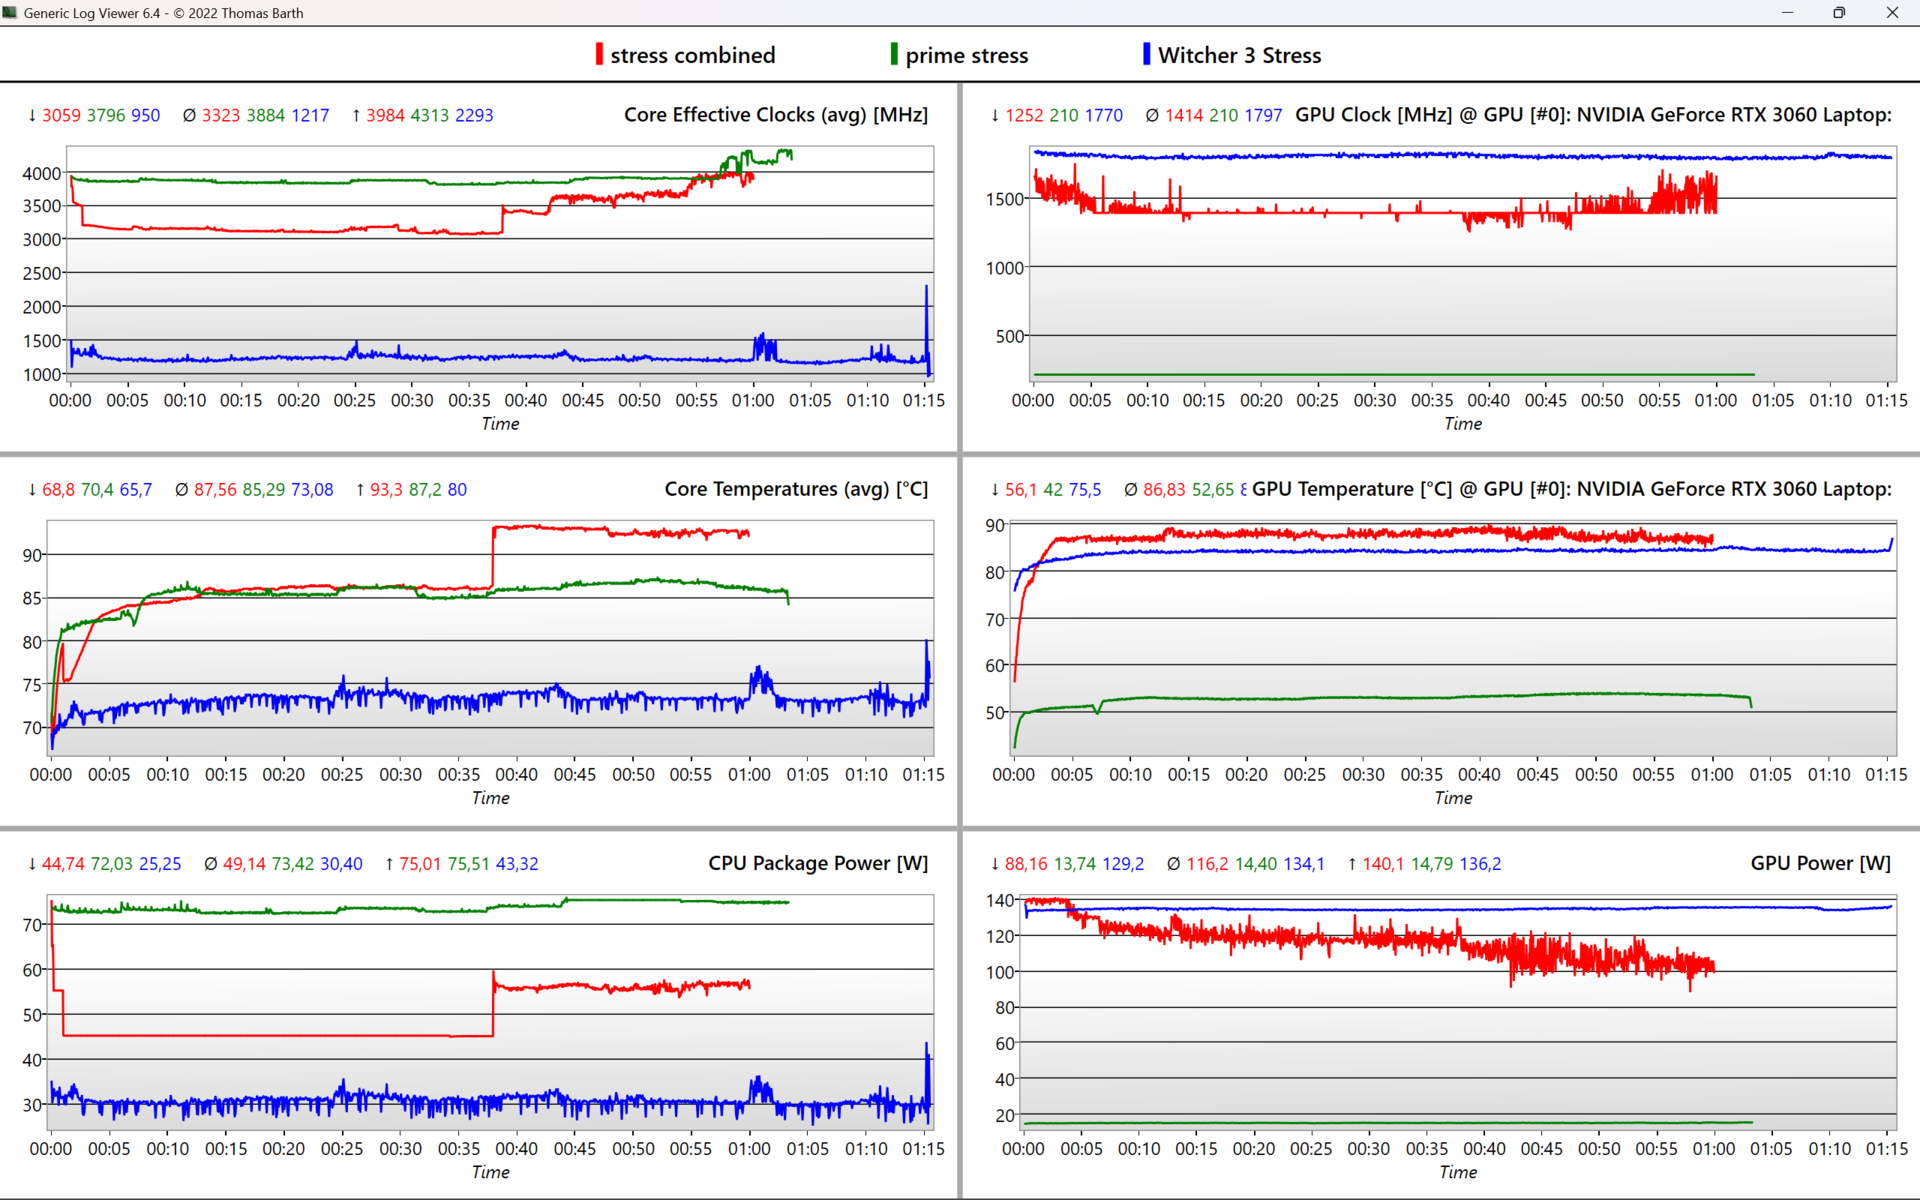
| CPU时钟(GHz) | GPU时钟(MHz) | CPU平均温度(℃) | GPU平均温度(℃) | |
| 系统空闲 | 0.15 | 200 | 34 | 42 |
| Prime95, Stress | 3.9 | 200 | 85 | 53 |
| Prime95 + FurMark, Stress | 3.3 | 1,400 | 93 | 87 |
| Witcher 3, Stress | 1.2 | 1,800 | 73 | 84 |
演讲者
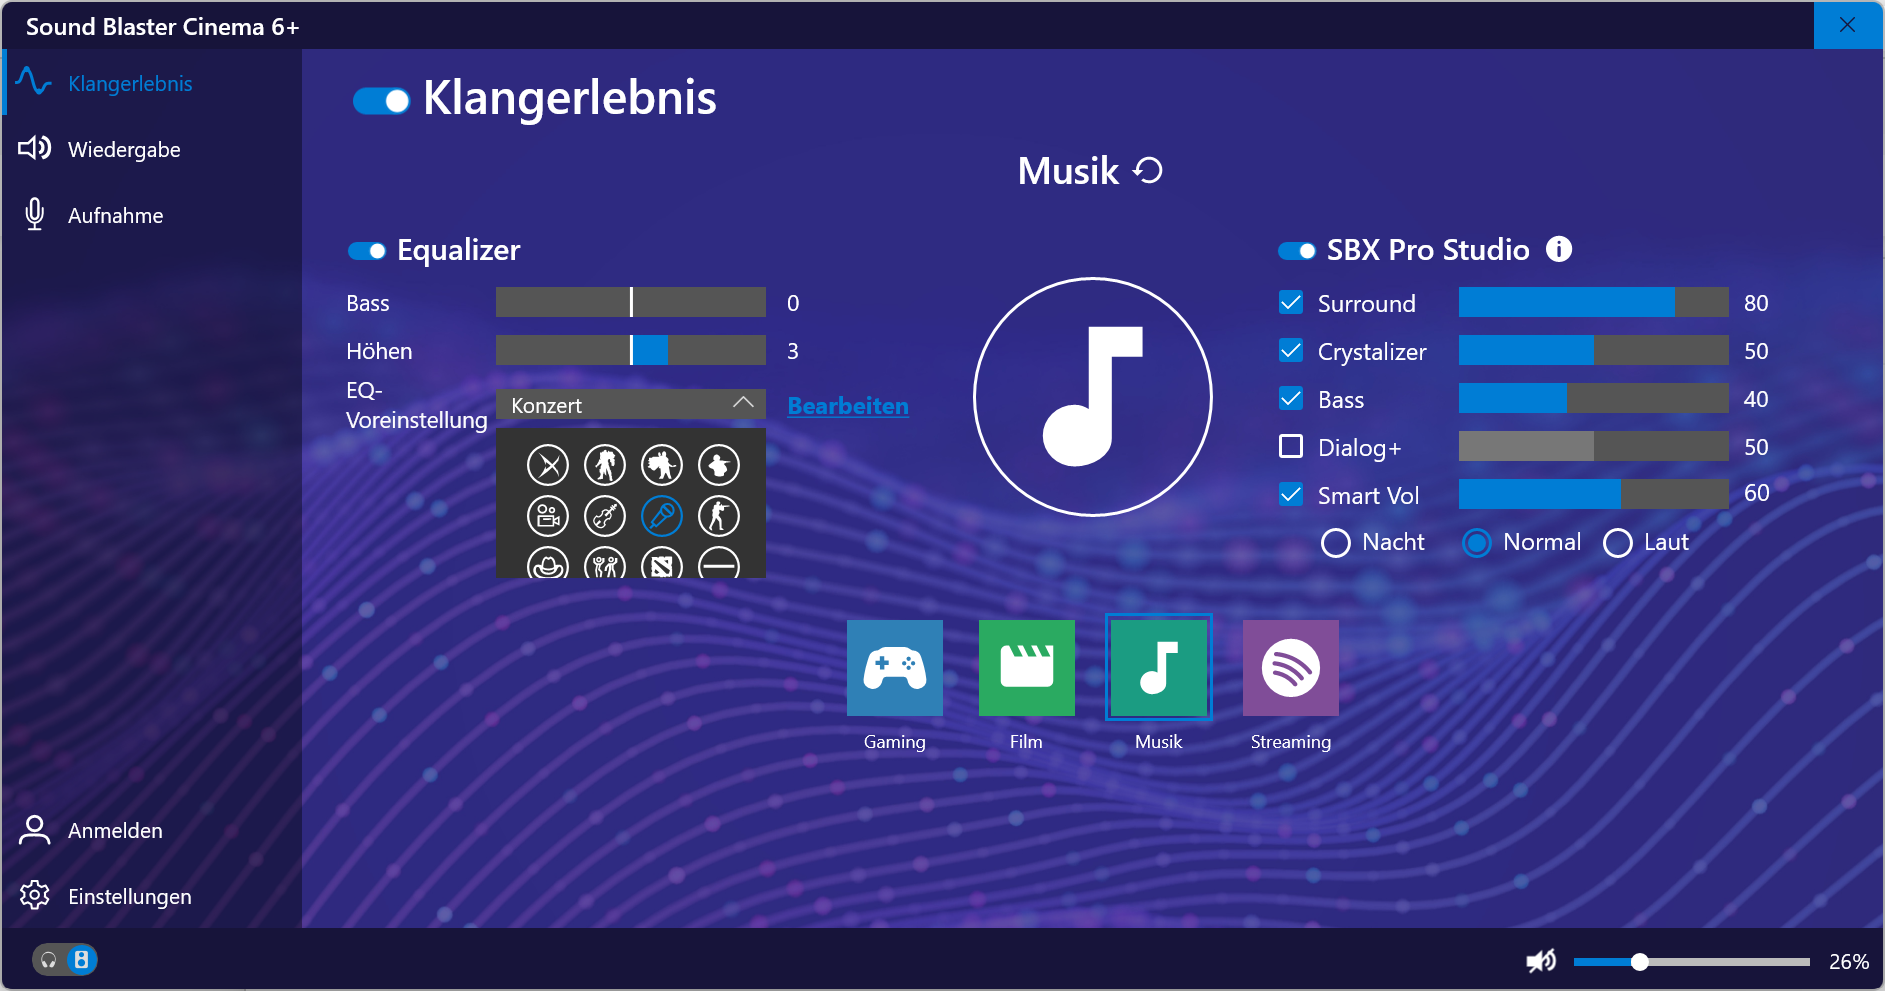
立体声系统提供线性和平衡的高音,甚至有隐含的低音。Sound Blaster Cinema 6+软件通过选择不同的模式来改善声音。为了获得更好的声音体验,仍应通过插孔或蓝牙连接耳机或外部音响系统。
Schenker XMG Core 15 (M22) audio analysis
(±) | speaker loudness is average but good (81.28 dB)
Bass 100 - 315 Hz
(-) | nearly no bass - on average 19.8% lower than median
(+) | bass is linear (6.4% delta to prev. frequency)
Mids 400 - 2000 Hz
(±) | higher mids - on average 6.2% higher than median
(±) | linearity of mids is average (7.9% delta to prev. frequency)
Highs 2 - 16 kHz
(+) | balanced highs - only 1.8% away from median
(+) | highs are linear (4.8% delta to prev. frequency)
Overall 100 - 16.000 Hz
(±) | linearity of overall sound is average (17.1% difference to median)
Compared to same class
» 46% of all tested devices in this class were better, 12% similar, 43% worse
» The best had a delta of 6%, average was 18%, worst was 132%
Compared to all devices tested
» 31% of all tested devices were better, 8% similar, 61% worse
» The best had a delta of 4%, average was 23%, worst was 134%
Lenovo Legion Slim 7-16IAH 82TF004YGE audio analysis
(±) | speaker loudness is average but good (73.4 dB)
Bass 100 - 315 Hz
(±) | reduced bass - on average 10% lower than median
(±) | linearity of bass is average (13.4% delta to prev. frequency)
Mids 400 - 2000 Hz
(+) | balanced mids - only 1.2% away from median
(+) | mids are linear (3.3% delta to prev. frequency)
Highs 2 - 16 kHz
(±) | higher highs - on average 5.5% higher than median
(±) | linearity of highs is average (10.6% delta to prev. frequency)
Overall 100 - 16.000 Hz
(+) | overall sound is linear (13% difference to median)
Compared to same class
» 18% of all tested devices in this class were better, 3% similar, 79% worse
» The best had a delta of 6%, average was 18%, worst was 132%
Compared to all devices tested
» 13% of all tested devices were better, 3% similar, 85% worse
» The best had a delta of 4%, average was 23%, worst was 134%
电源管理。具有可用的电池寿命的AMD游戏笔记本电脑
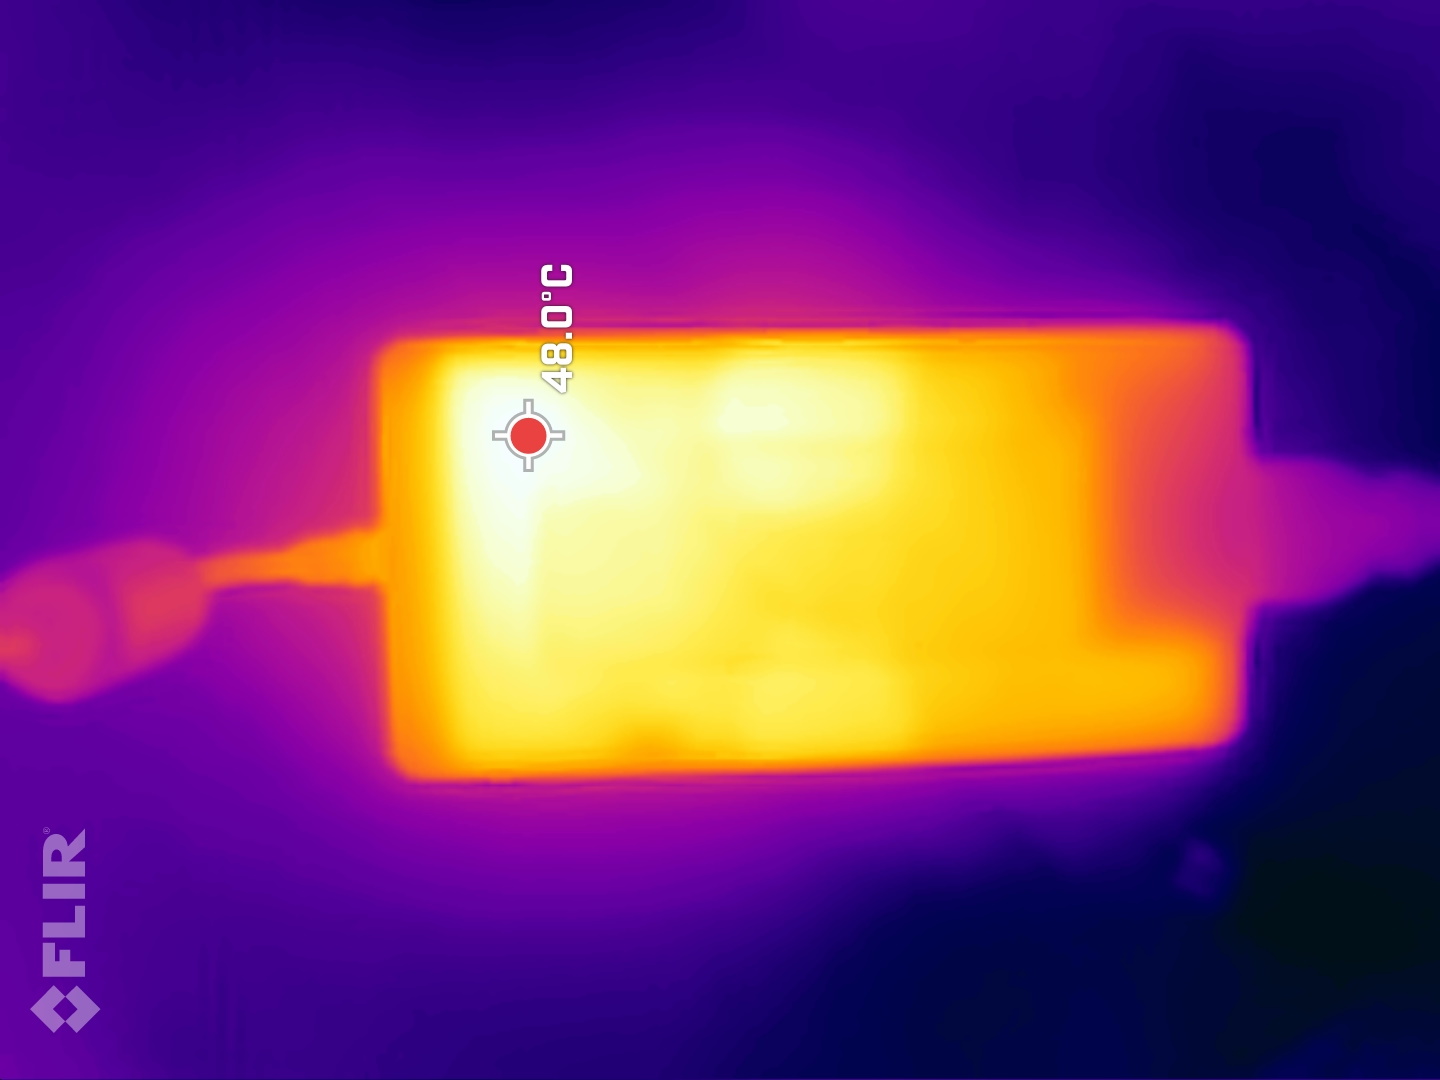
能源消耗
能源消耗基本上处于预期水平,与我们比较领域的竞争对手大致相当。只有 Legion 5在空闲状态下从插座中抽取的能量要多得多,而 TUF Gaming F15是我们比较中最节俭的空闲状态。230瓦的电源是可以完成任务的,因为它在峰值时很少达到236瓦。
| Idle | |
| Load |
|
Key:
min: | |
| Schenker XMG Core 15 (M22) R7 6800H, GeForce RTX 3060 Laptop GPU, Samsung SSD 980 Pro 1TB MZ-V8P1T0BW, IPS, 2560x1440, 15.6" | Lenovo Legion 5 15IAH7H 82RB i7-12700H, GeForce RTX 3060 Laptop GPU, , IPS, 1920x1080, 15.6" | Schenker XMG Fusion 15 (Mid 22) i7-11800H, GeForce RTX 3070 Laptop GPU, Samsung SSD 980 Pro 1TB MZ-V8P1T0BW, IPS, 2560x1440, 15.6" | Asus TUF Gaming F15 FX507ZM i7-12700H, GeForce RTX 3060 Laptop GPU, SK Hynix HFM001TD3JX013N, IPS, 1920x1080, 15.6" | Alienware m15 R5 Ryzen Edition R7 5800H, GeForce RTX 3060 Laptop GPU, Toshiba KBG40ZNS512G NVMe, IPS, 1920x1080, 15.6" | Schenker XMG Core 15 Ampere R7 4800H, GeForce RTX 3060 Laptop GPU, Samsung SSD 970 EVO Plus 1TB, IPS, 2560x1440, 15.6" | Average NVIDIA GeForce RTX 3060 Laptop GPU | Average of class Gaming | |
|---|---|---|---|---|---|---|---|---|
| Power Consumption | -64% | -10% | -1% | -12% | -2% | -5% | -25% | |
| Idle Minimum * (Watt) | 11.8 | 19.8 -68% | 12 -2% | 6.3 47% | 11 7% | 11 7% | 10.4 ? 12% | 13 ? -10% |
| Idle Average * (Watt) | 14.7 | 26.2 -78% | 17 -16% | 9.8 33% | 14 5% | 14 5% | 14.5 ? 1% | 19 ? -29% |
| Idle Maximum * (Watt) | 15 | 48.2 -221% | 24 -60% | 26.5 -77% | 25 -67% | 20 -33% | 21.4 ? -43% | 24.6 ? -64% |
| Load Average * (Watt) | 100 | 102.9 -3% | 106 -6% | 103.8 -4% | 123 -23% | 94 6% | 109.3 ? -9% | 110.7 ? -11% |
| Witcher 3 ultra * (Watt) | 184 | 186.7 -1% | 159.9 13% | 189 -3% | 176 4% | 167 9% | ||
| Load Maximum * (Watt) | 237 | 268 -13% | 208 12% | 241.9 -2% | 226 5% | 251 -6% | 206 ? 13% | 259 ? -9% |
* ... smaller is better
Energy consumption Witcher 3 / Stress test
Energy consumption with external monitor
电池寿命
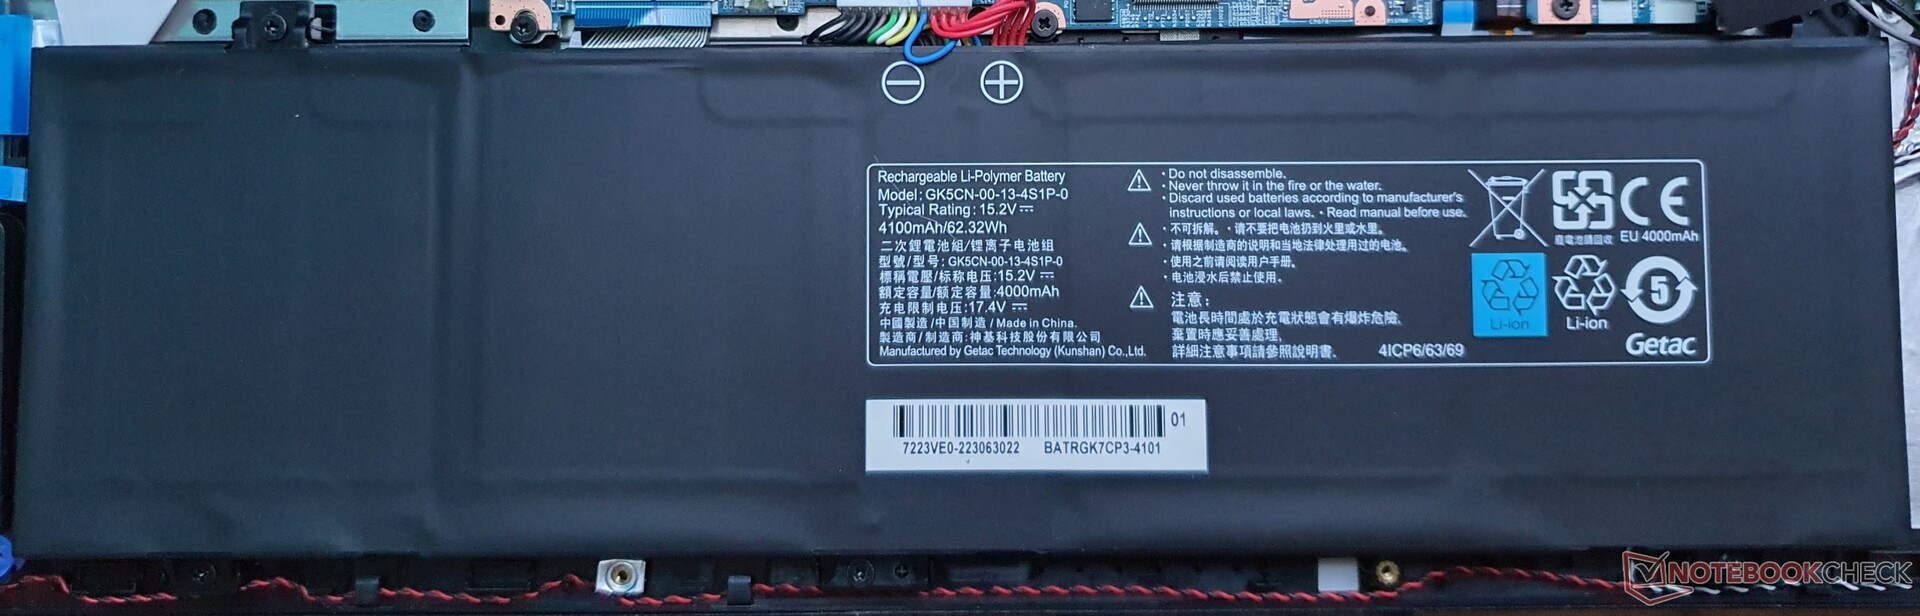
尽管62Wh的小电池,但7:45小时的运行时间,例如在150cd/m²的情况下上网冲浪,是相当不错的。我们在爱好者 模式下进行了测试,而刷新率在电池供电的情况下自动降低到60赫兹。
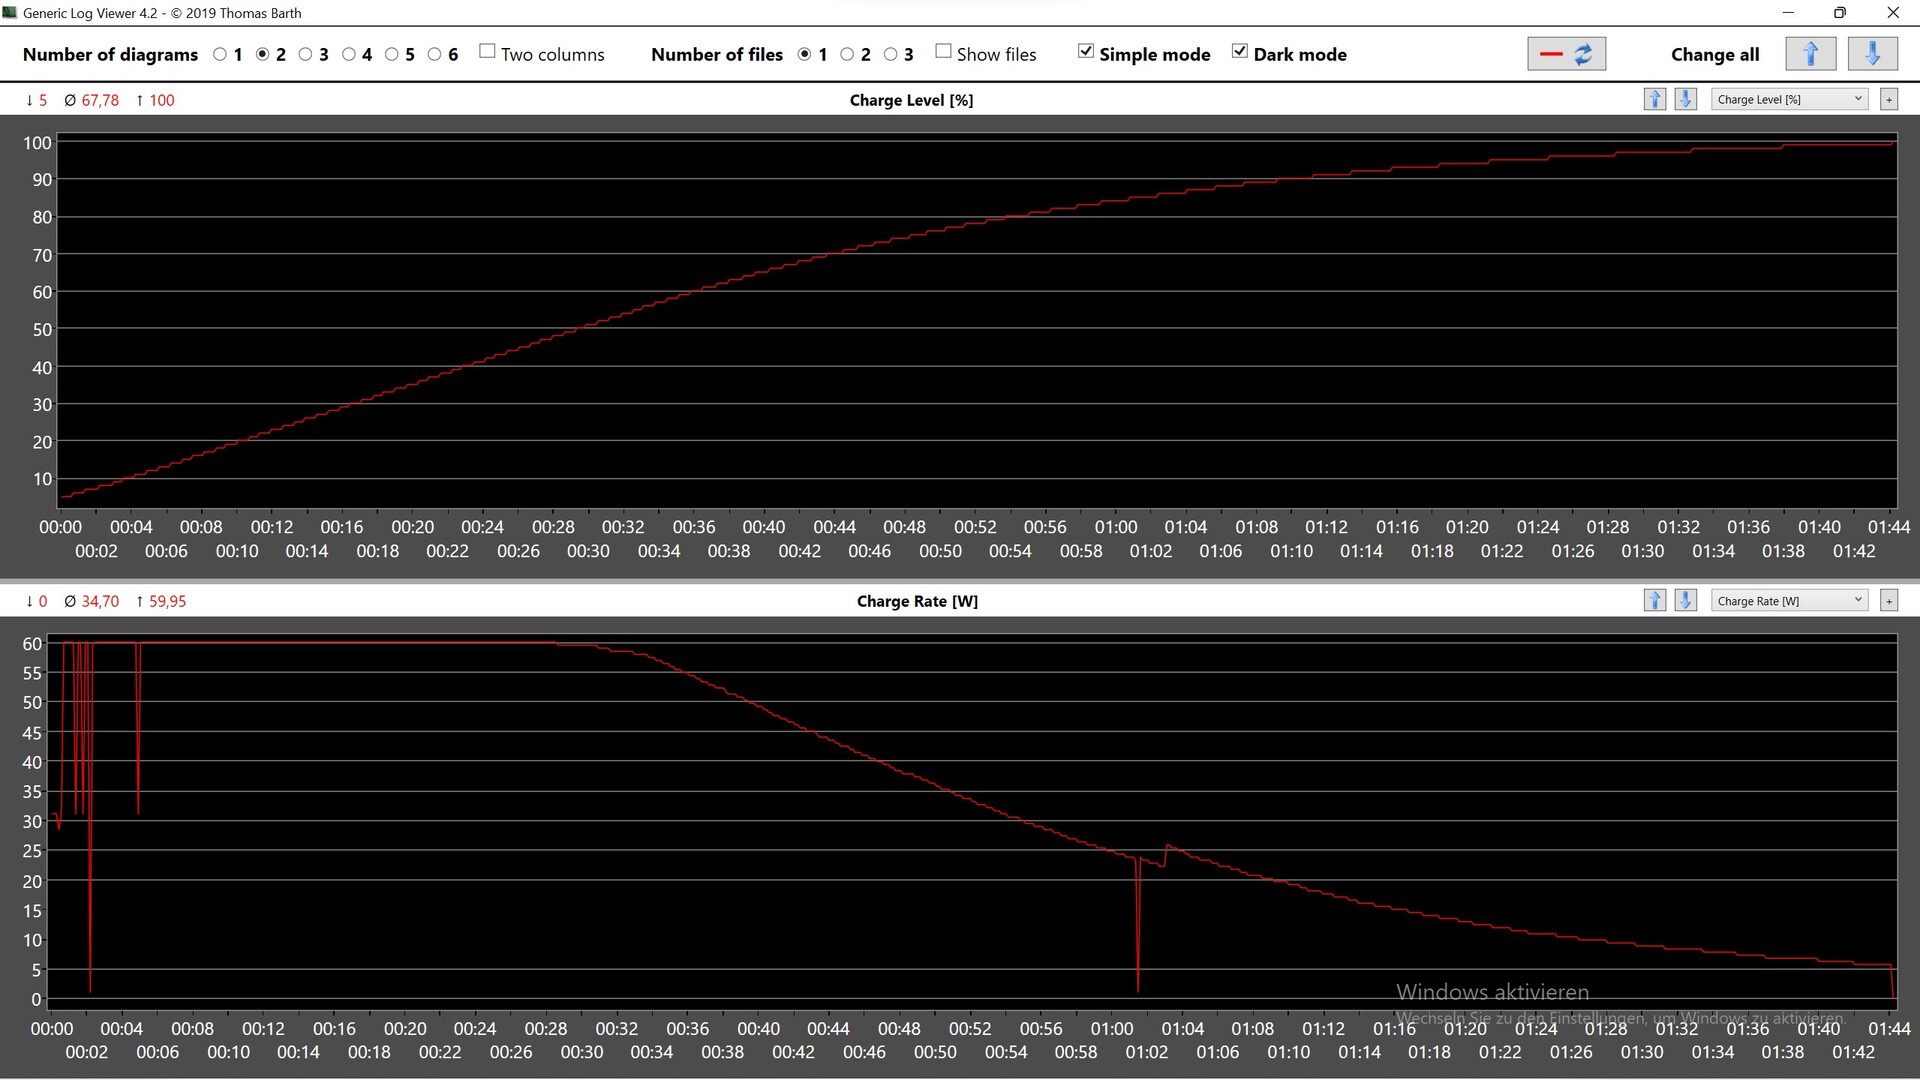
因此,XMG Core 15在我们的比较领域中持续时间最长,是一个高效的游戏机,因为竞争对手都依赖于更大的电池,80至93Wh。电池在30分钟内就能充电一半。
| Schenker XMG Core 15 (M22) R7 6800H, GeForce RTX 3060 Laptop GPU, 62 Wh | Lenovo Legion 5 15IAH7H 82RB i7-12700H, GeForce RTX 3060 Laptop GPU, 80 Wh | Schenker XMG Fusion 15 (Mid 22) i7-11800H, GeForce RTX 3070 Laptop GPU, 93.48 Wh | Asus TUF Gaming F15 FX507ZM i7-12700H, GeForce RTX 3060 Laptop GPU, 90 Wh | Alienware m15 R5 Ryzen Edition R7 5800H, GeForce RTX 3060 Laptop GPU, 86 Wh | Schenker XMG Core 15 Ampere R7 4800H, GeForce RTX 3060 Laptop GPU, 62 Wh | Average of class Gaming | |
|---|---|---|---|---|---|---|---|
| Battery runtime | -18% | 30% | -19% | -27% | -9% | 14% | |
| WiFi v1.3 (h) | 7.8 | 5 -36% | 7.4 -5% | 4.8 -38% | 5.1 -35% | 5.8 -26% | 7.11 ? -9% |
| Load (h) | 1.1 | 1.1 0% | 1.8 64% | 1.1 0% | 0.9 -18% | 1.2 9% | 1.502 ? 37% |
| H.264 (h) | 7.5 | 8.8 | 6 | 8.32 ? | |||
| Witcher 3 ultra (h) | 1.6 |
Pros
Cons
结论。带有RTX 3060的快速申克游戏笔记本
总的来说,Schenker的XMG Core 15变成了一个坚实的中上层游戏机。3D性能处于高于平均水平,但一些具有相同TGP的型号,如华硕TUF Gaming或华硕ROG Strix Scar,甚至更快。AMD Ryzen 7 6800H至少有助于节俭的操作,尽管它落后于英特尔对手的i7-12700H(最小)。
尽管只有62Wh的小电池,这款紧凑的游戏笔记本电脑在我们的比较领域中实现了最长的7:45小时的电池寿命,而165Hz的哑光WQHD显示屏和快速响应时间也是非常值得尊敬的。由于采用了平衡 模式,安静的游戏是可能的,没有重大的性能损失,但远离电源插座的游戏乐趣是非常有限的。
那些可以不使用USB4、Power Delivery和用电池供电游戏的人将得到一个坚实的、可能安静的中端游戏机,可选择水冷,价格为1817欧元(约1935美元)。
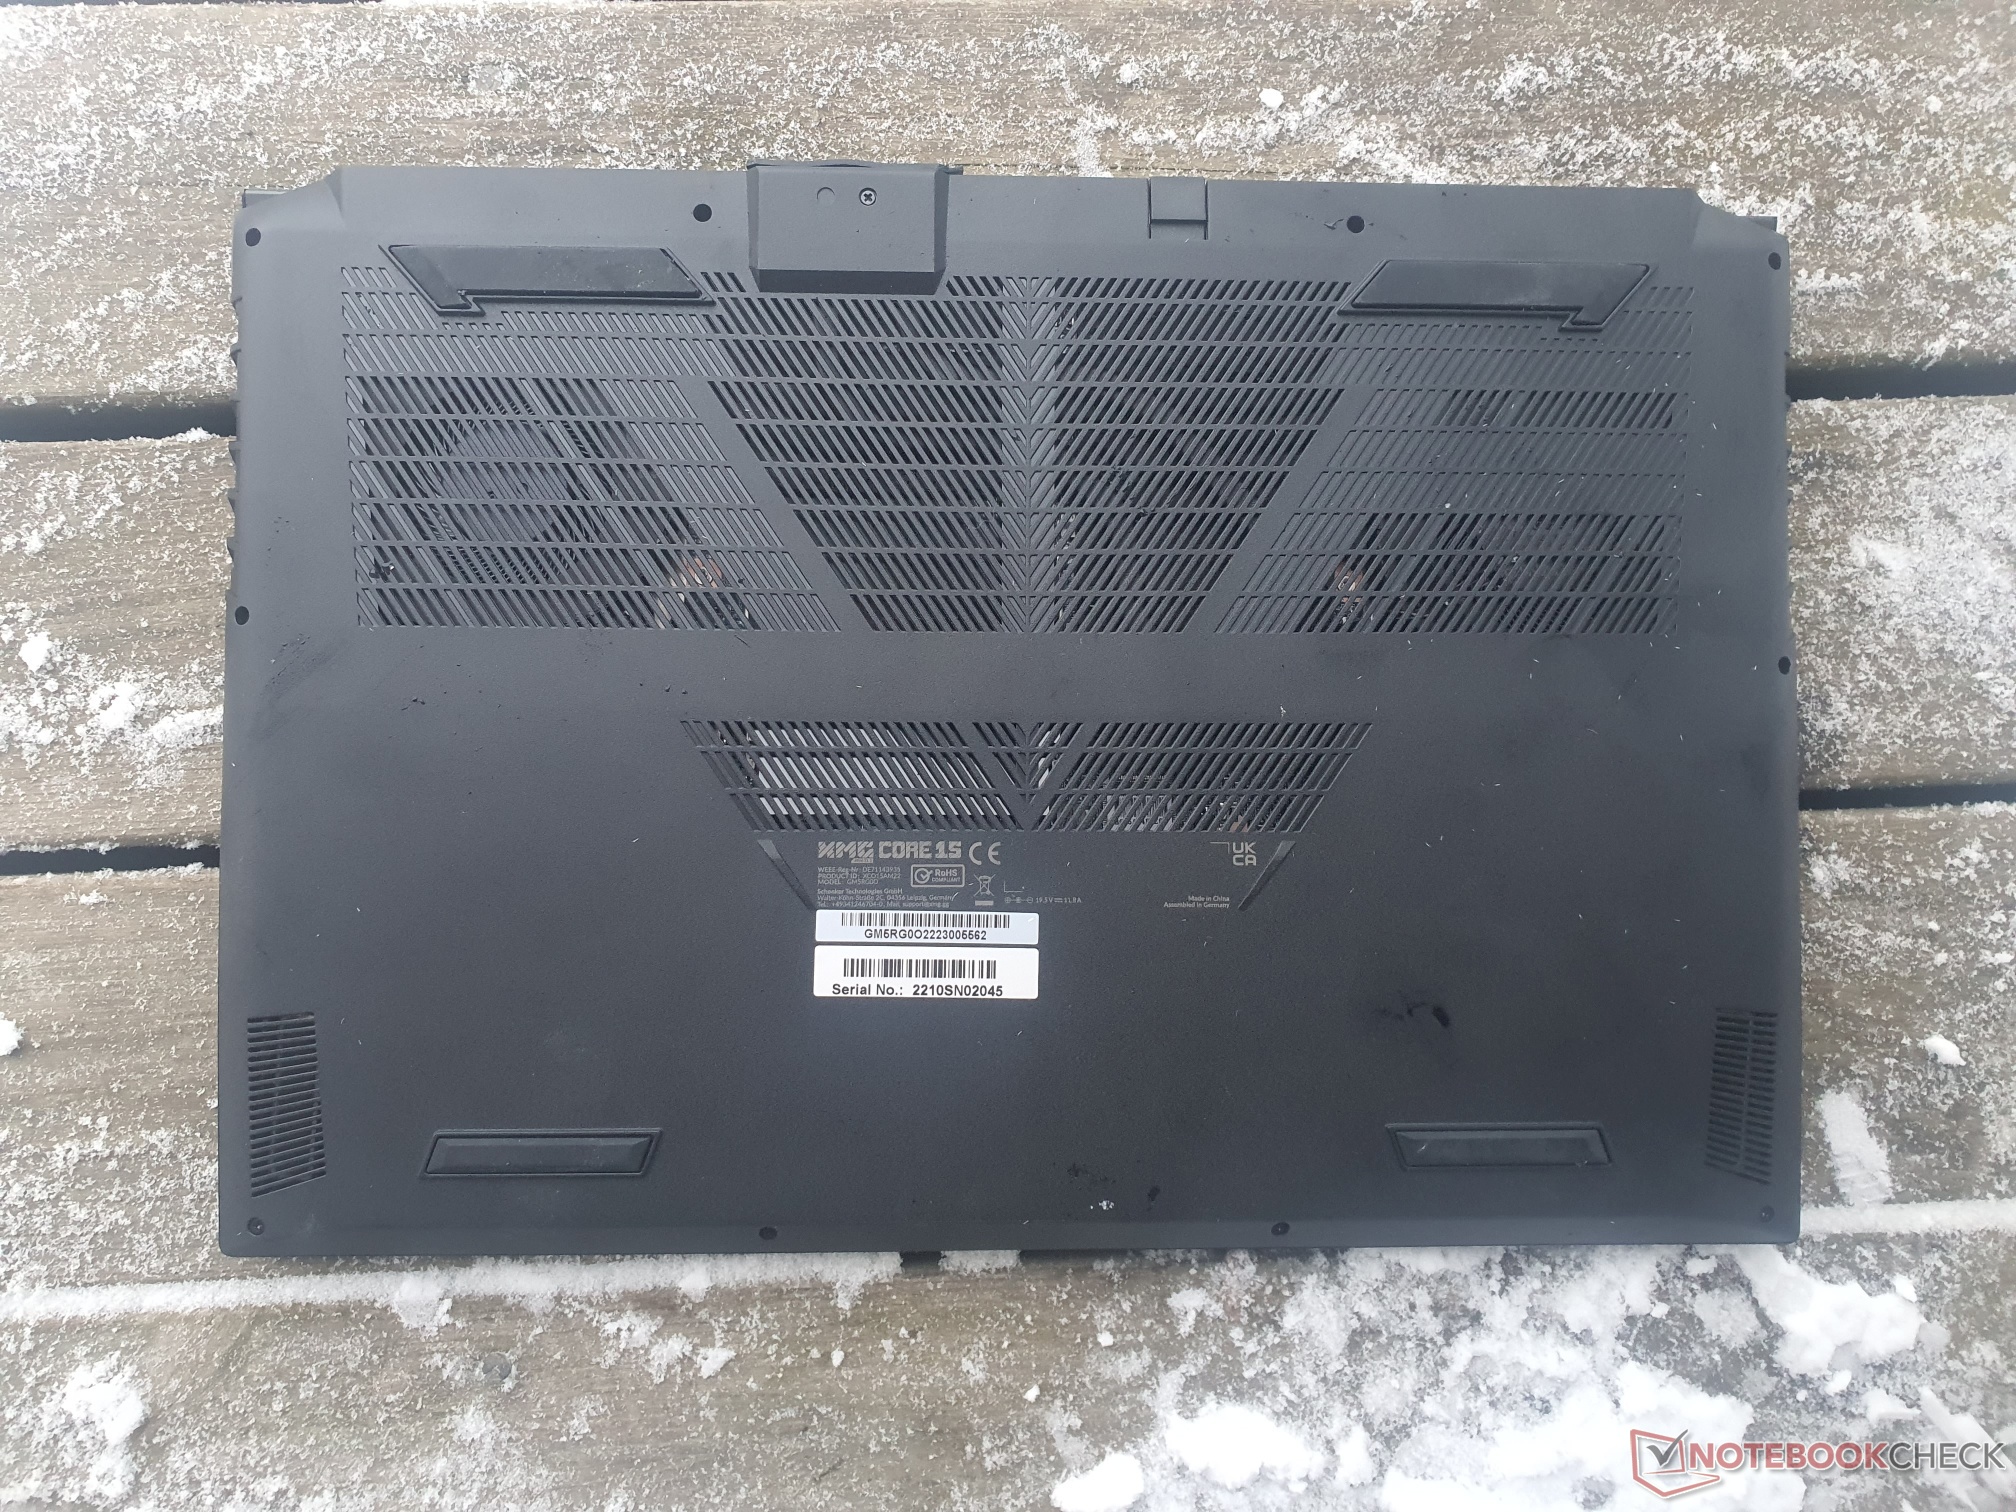
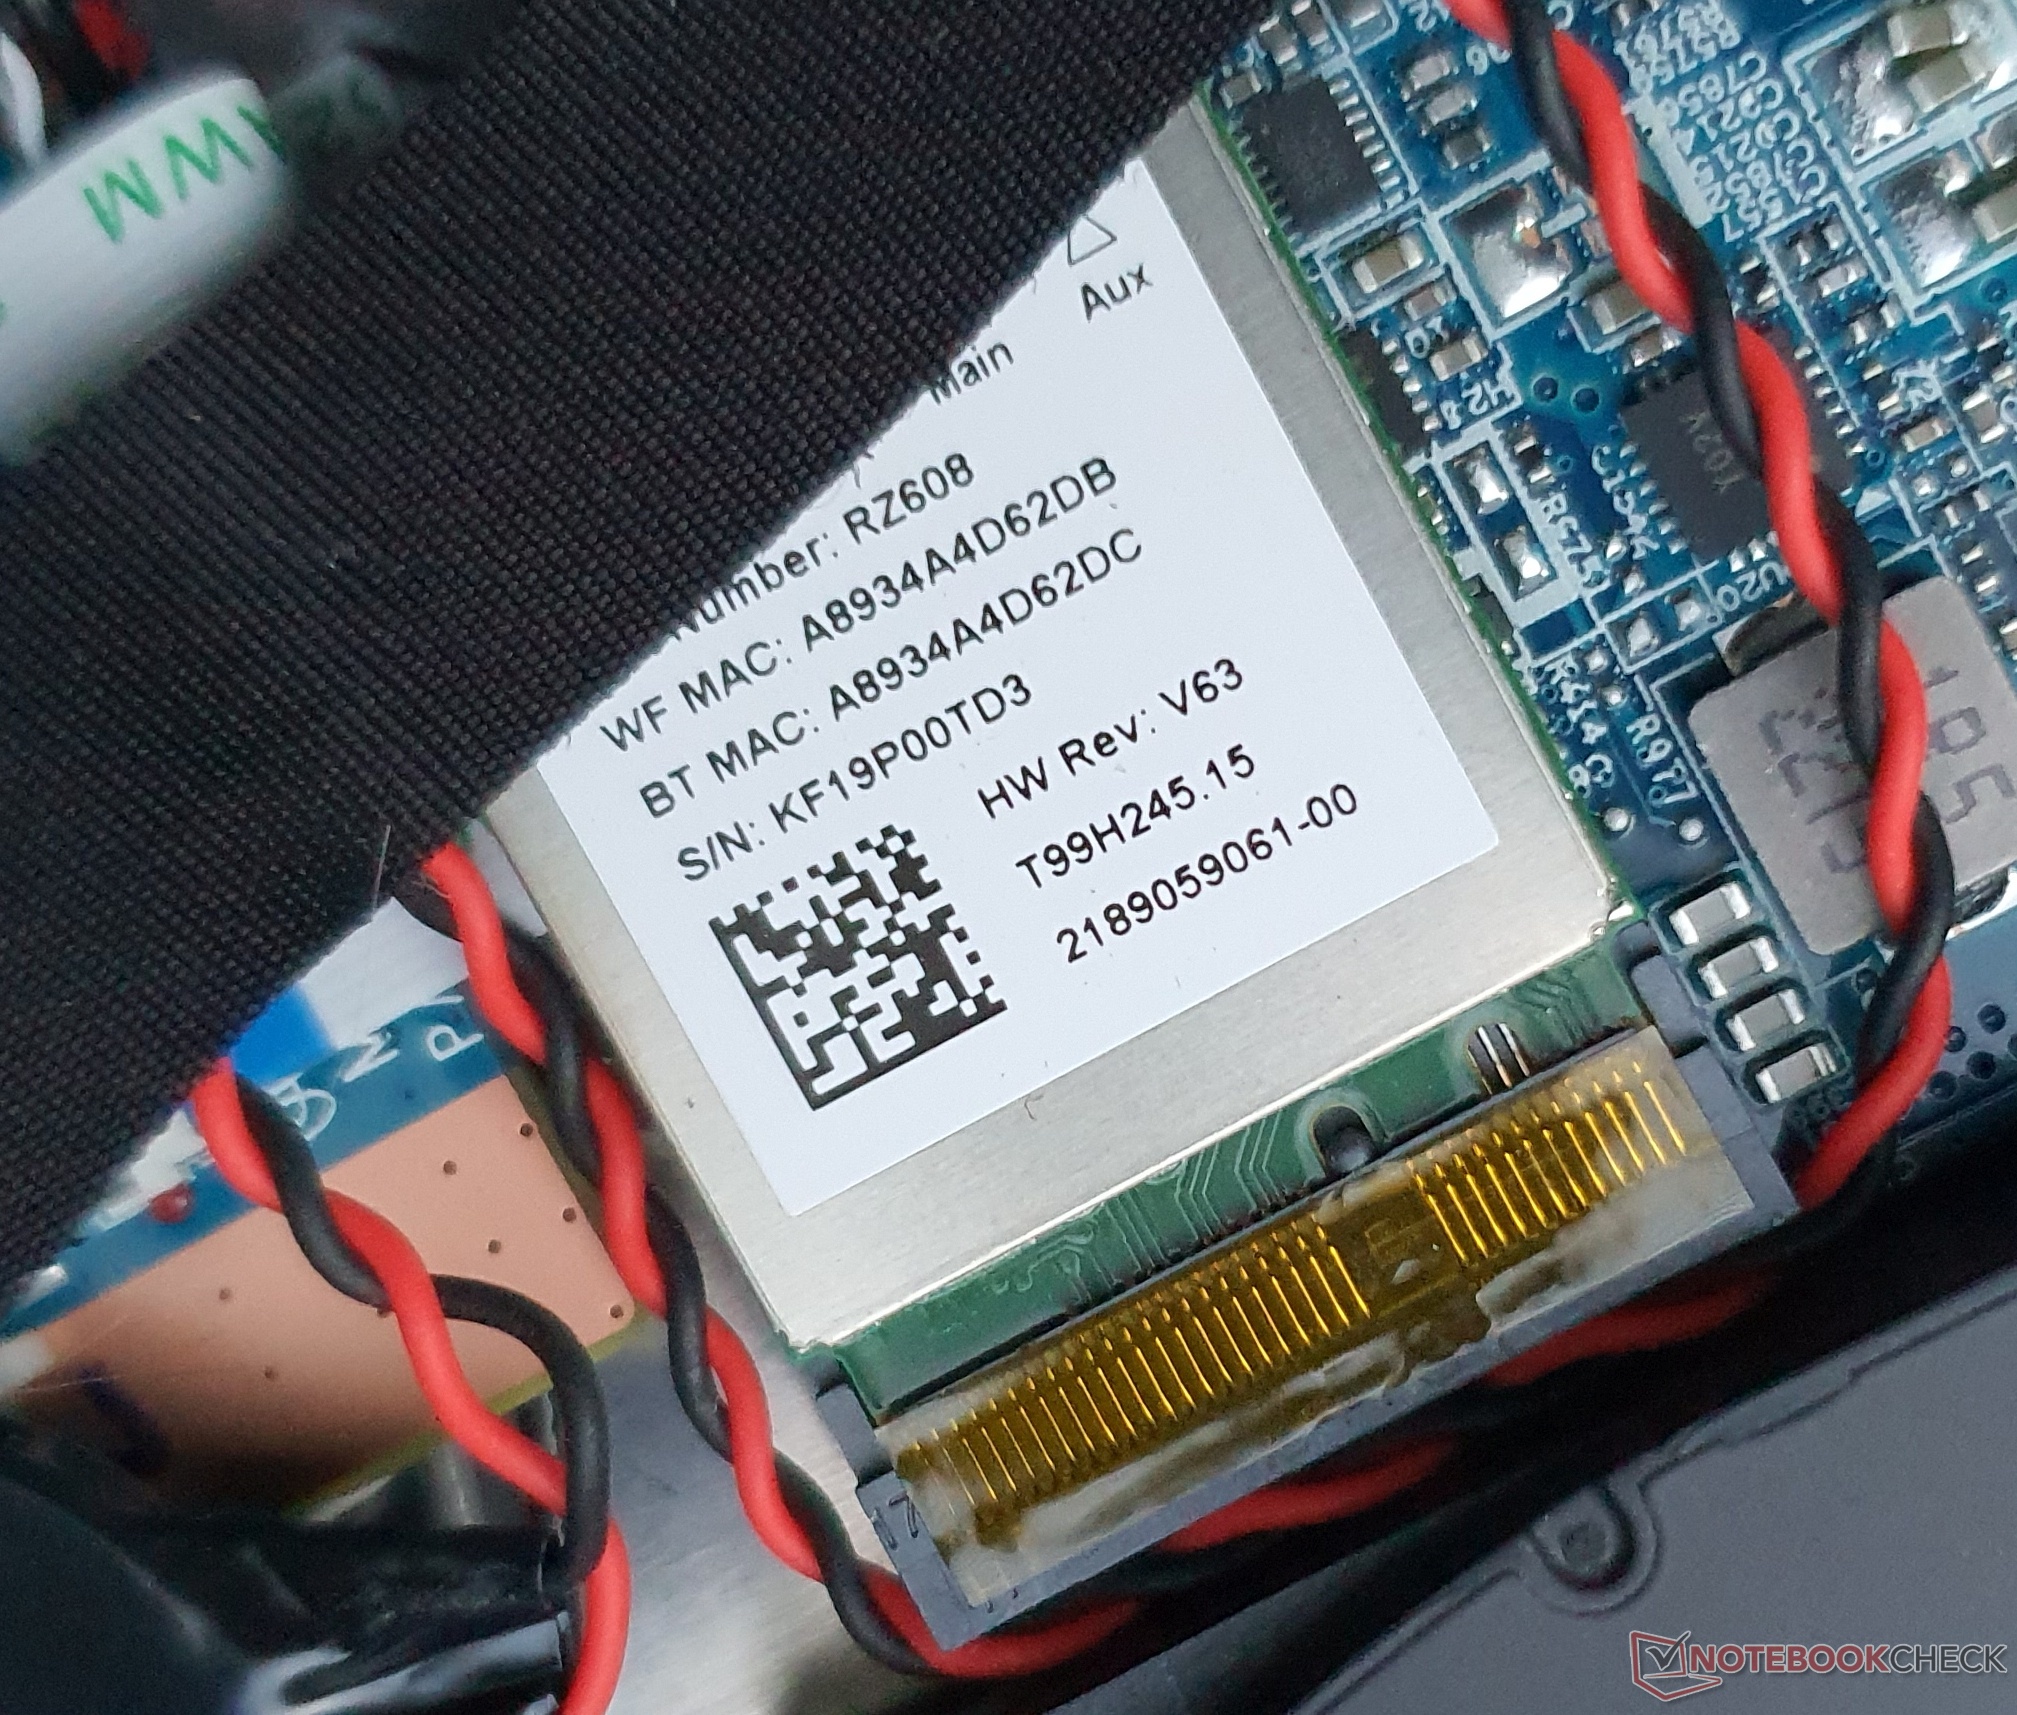
维护变得很容易,因为有两个M.2-2280插槽用于PCIe 4.0固态硬盘,加上两个内存插槽,有点慢的WiFi模块也可以改变。每键RGB和高级优化必须放弃,但有一个MUX开关,以及超频GPU的选项。
联想的Legion 5 Pro ,提供可能更快的RTX 3070 ,更亮更大的16:10显示屏,以及更好的键盘,价格也差不多。联想的XMG Fusion 15 提供了一个更好的,因为它是机械的。 Legion Slim 7i 也是一个推荐,因为在这次审查时,它已经以1529欧元(约1629美元)的类似配置出售。
.
价格和可用性
Schenker的XMG Core 15 (M22)目前在Bestware的测试配置中提供1,817欧元(约1935美元)。.目前最便宜的型号有相同的CPU+GPU,但内存较少,FHD 144 Hz面板的价格低至1492欧元(约1589美元)。
Schenker XMG Core 15 (M22)
- 01/02/2023 v7 (old)
Marvin Gollor
Price comparison
