宏碁Nitro 5 AN515-46评论:强大的FHD游戏与USB 4
宏碁的Nitro 5系列由入门级和中档游戏设备组成。这些笔记本电脑的定位低于Predator系列,价格高达2,500欧元。今天的测试设备从1,750欧元起售。宏碁为这个模型结合了一个节能的Ryzen 7-6800H APU和一个GeForce RTX 3070-Ti GPU(TGP为150瓦)。从理论上讲,这可能使一个强大的笔记本具有低排放和长电池寿命。该设备的竞争对手包括Schenker XMG Fusion 15 (Mid 22),以及MSI Katana GF66 12UGS,以及华硕TUF Dash F15 FX517ZR.
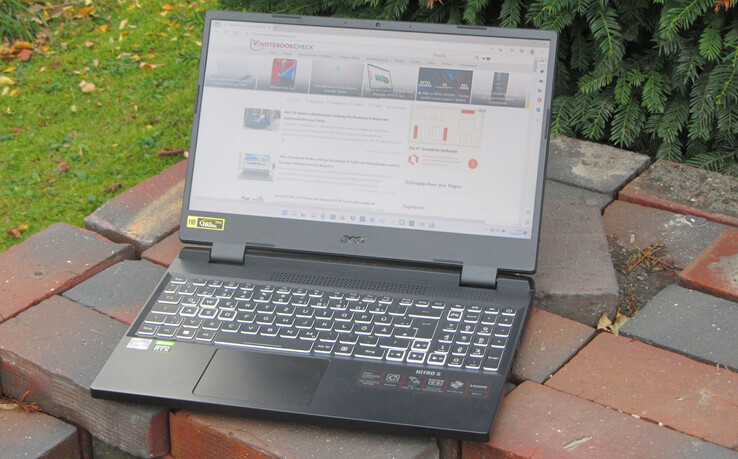
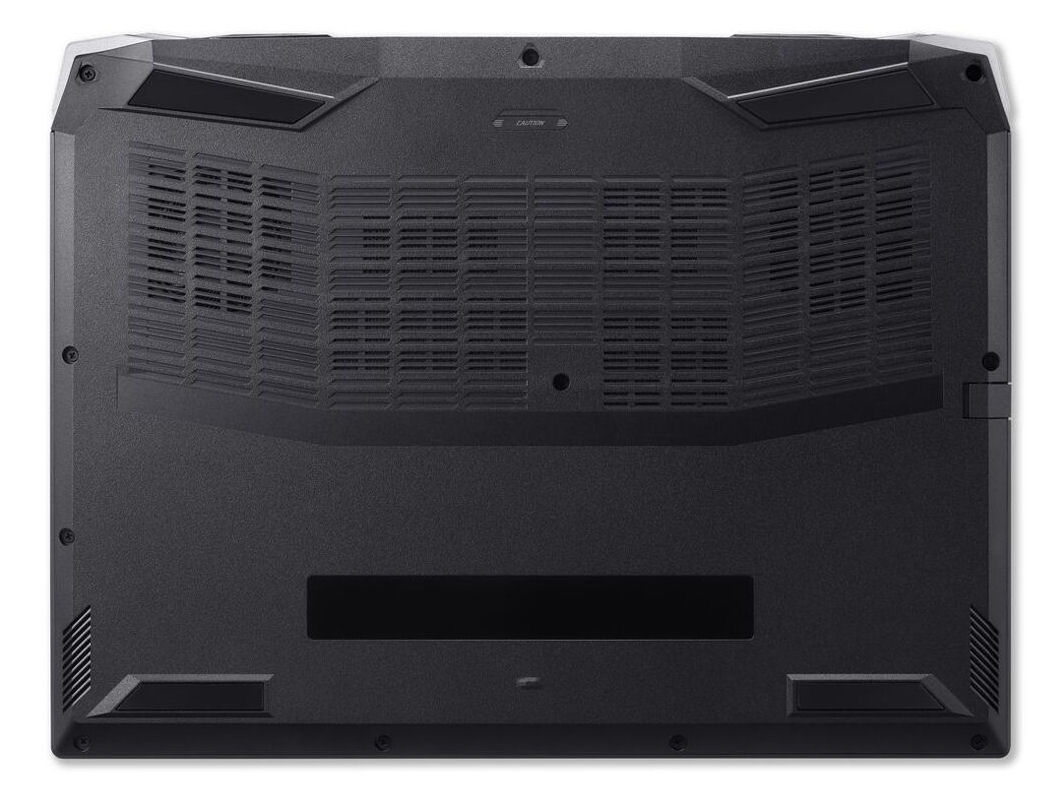
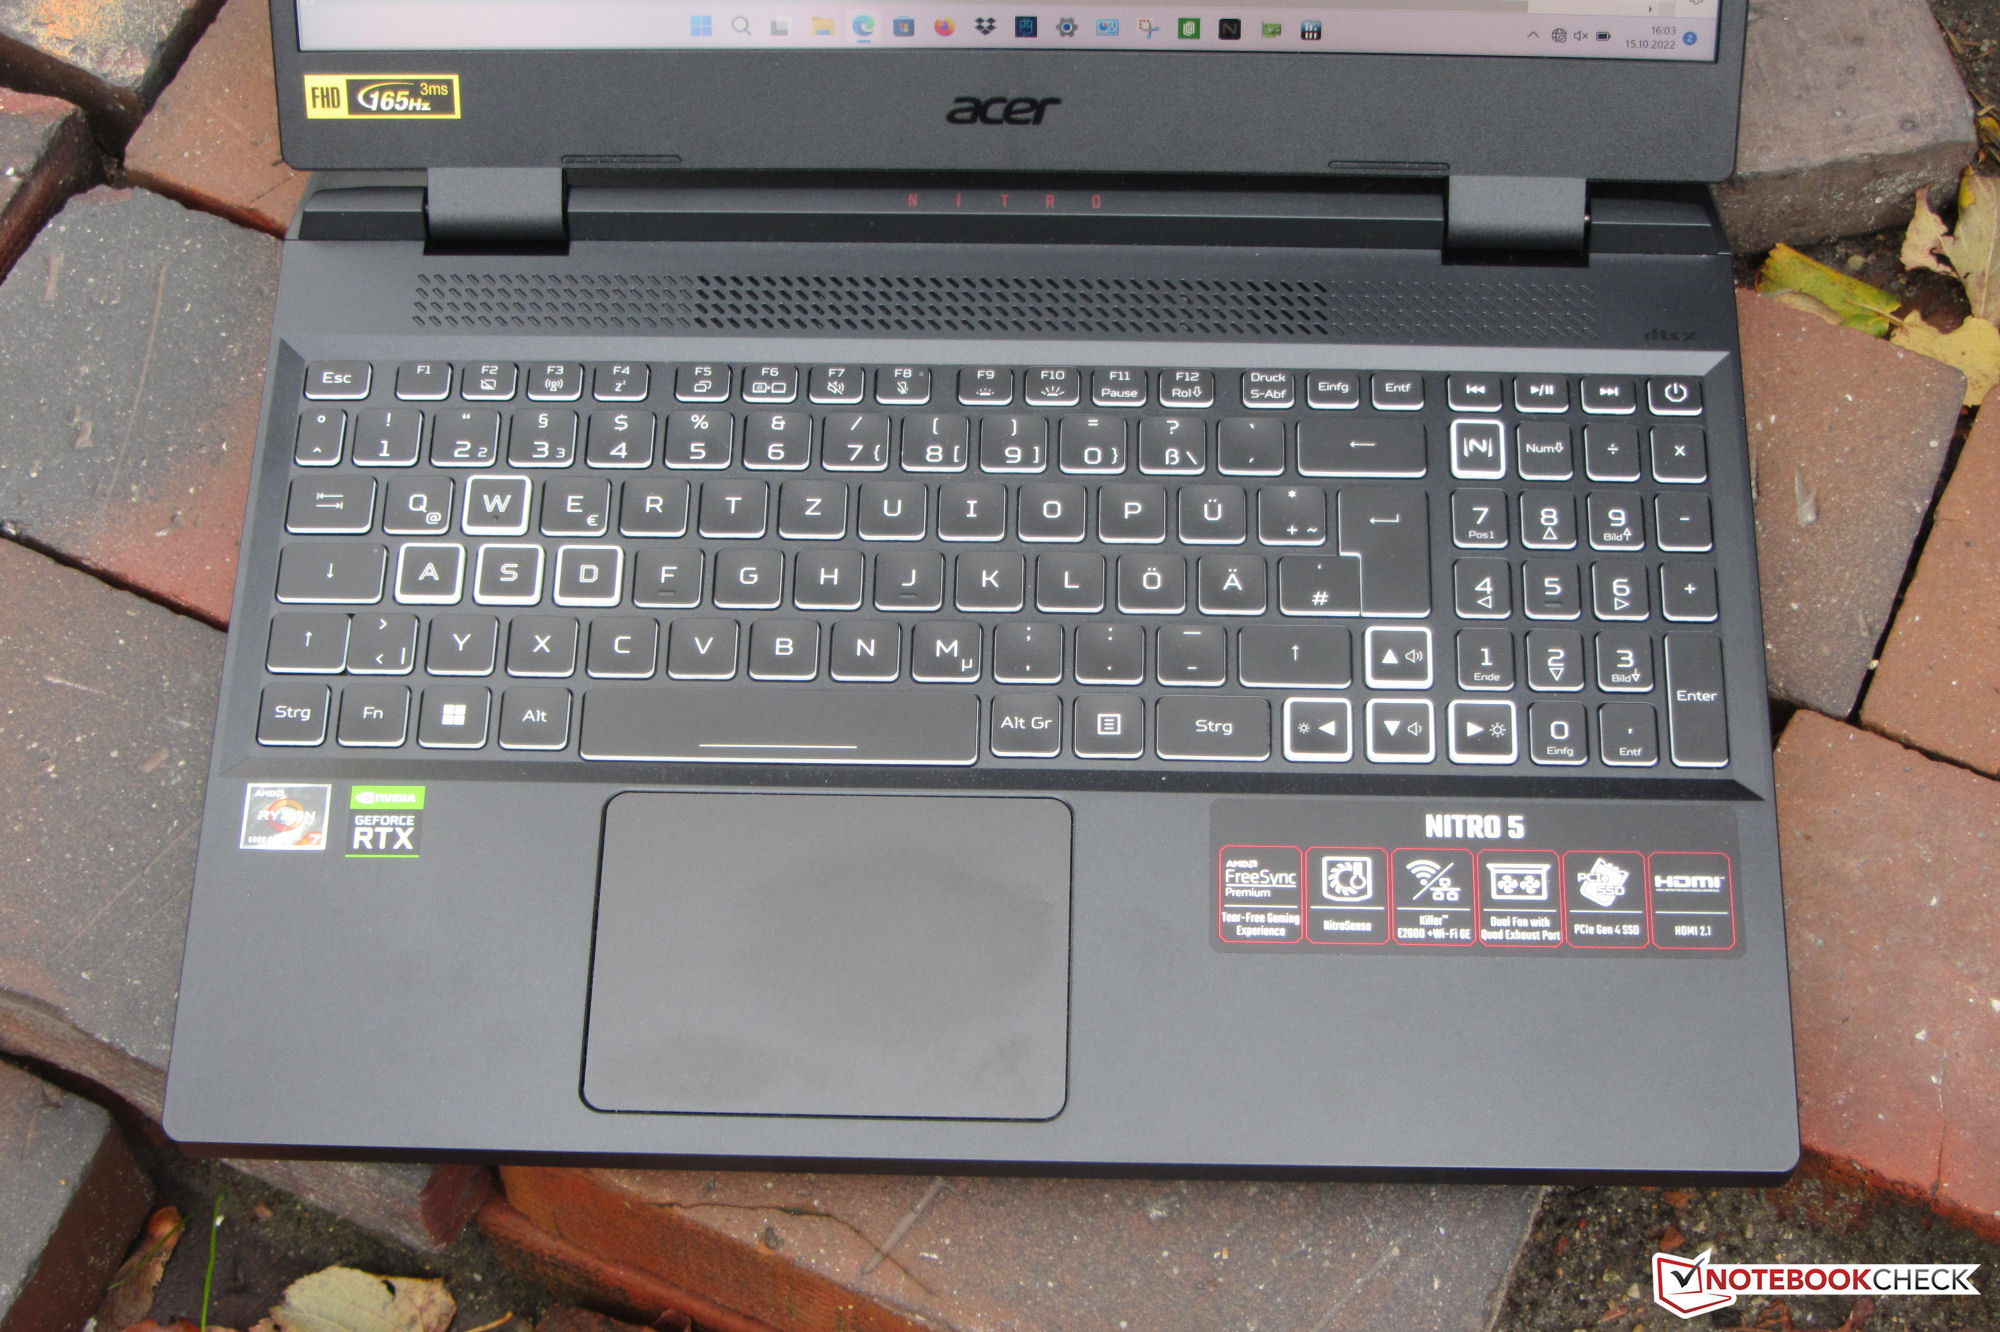
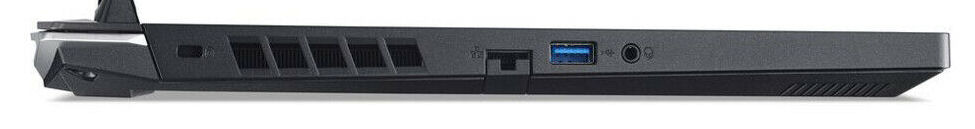
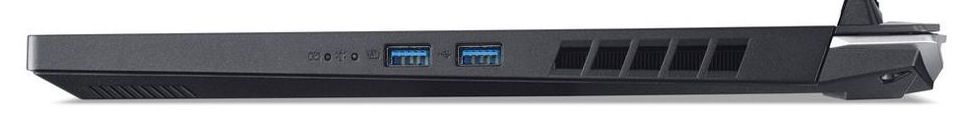
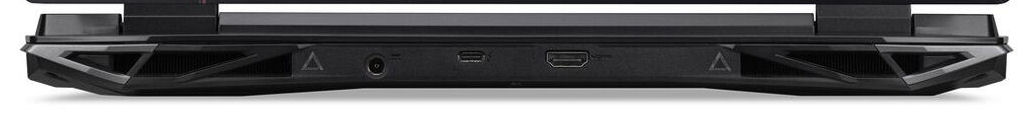
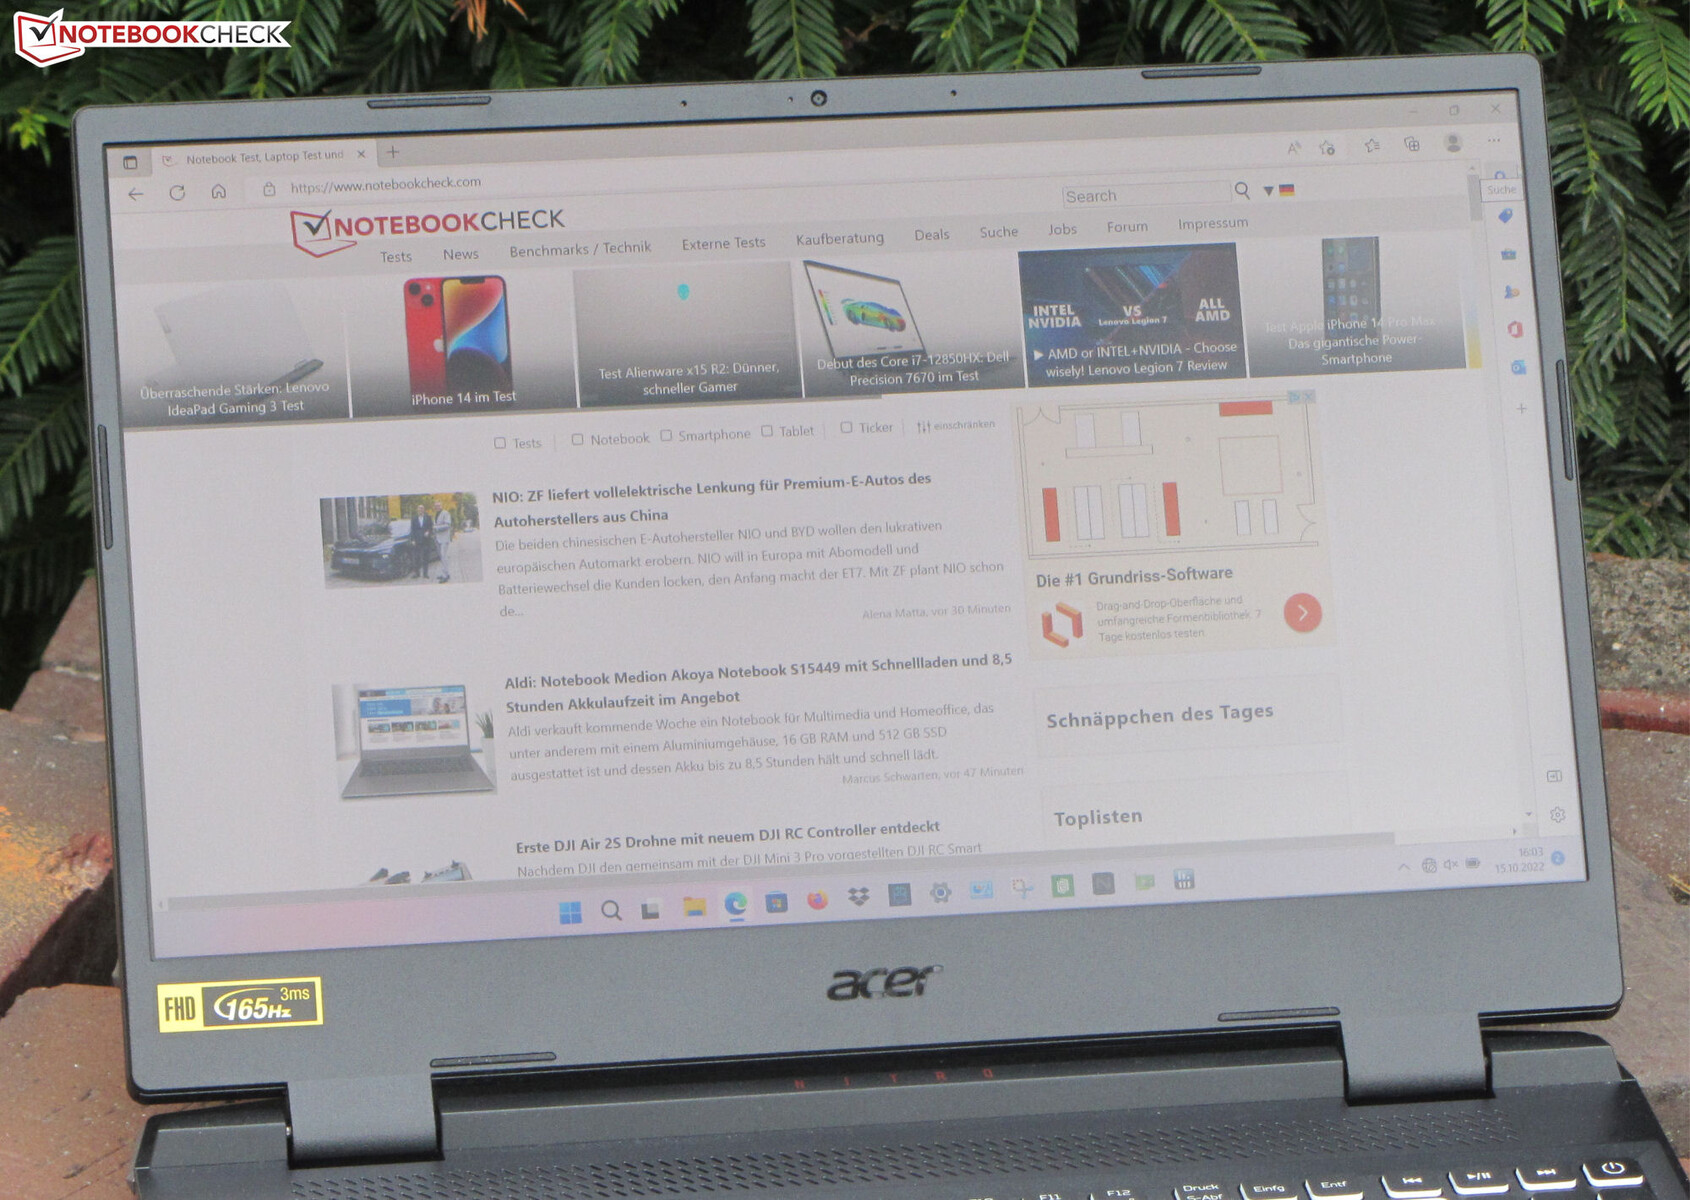
AN515-58被安装在与它基于英特尔的兄弟姐妹相同的箱子里,我们已经测试过了。要了解更多关于机箱、连接和输入设备的信息,请看我们对Nitro 5 AN515-58(Core i7, QHD)。
潜在的竞争对手比较
Rating | Date | Model | Weight | Height | Size | Resolution | Price |
|---|---|---|---|---|---|---|---|
| 83.9 % v7 (old) | 11 / 2022 | Acer Nitro 5 AN515-46-R1A1 R7 6800H, GeForce RTX 3070 Ti Laptop GPU | 2.5 kg | 26.8 mm | 15.60" | 1920x1080 | |
| 80.3 % v7 (old) | 06 / 2022 | MSI Katana GF66 12UGS i7-12700H, GeForce RTX 3070 Ti Laptop GPU | 2.3 kg | 27.5 mm | 15.60" | 1920x1080 | |
| 87.4 % v7 (old) | 08 / 2022 | Schenker XMG Fusion 15 (Mid 22) i7-11800H, GeForce RTX 3070 Laptop GPU | 1.9 kg | 21.65 mm | 15.60" | 2560x1440 | |
| 85.8 % v7 (old) | 07 / 2022 | Asus TUF Dash F15 FX517ZR i7-12650H, GeForce RTX 3070 Laptop GPU | 2 kg | 20.7 mm | 15.60" | 2560x1440 |
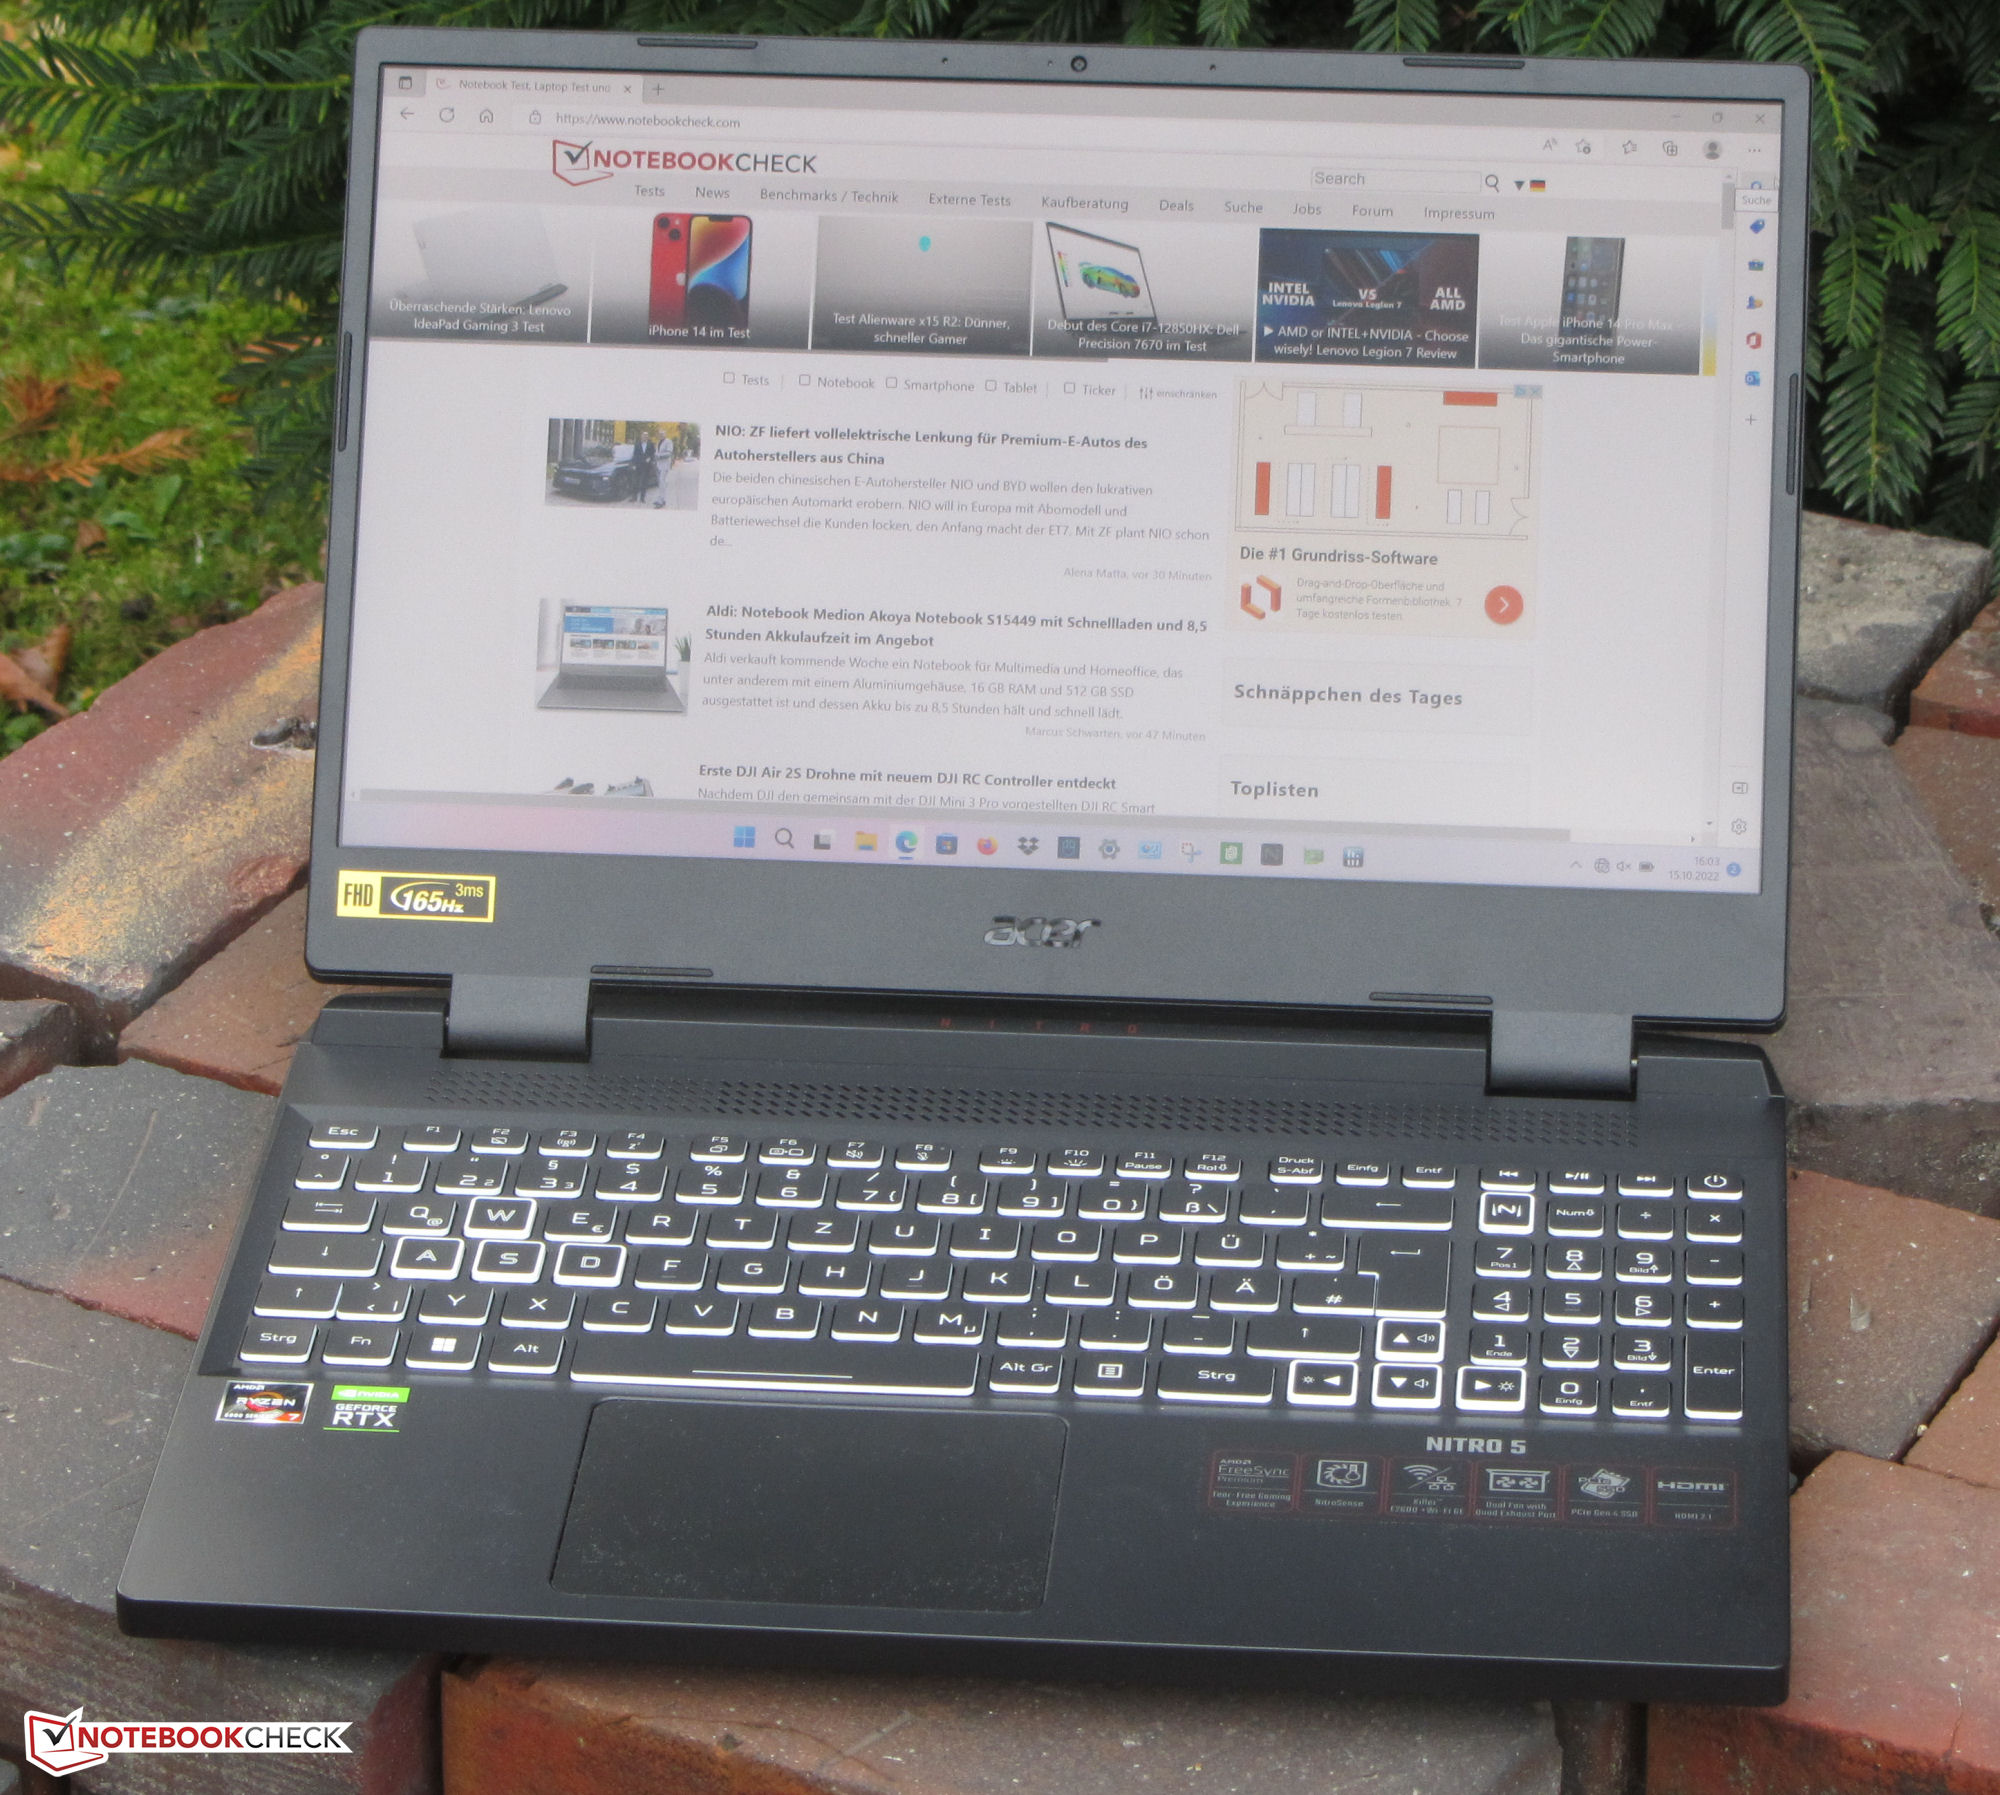


显示屏--宏碁笔记本的165-Hz面板

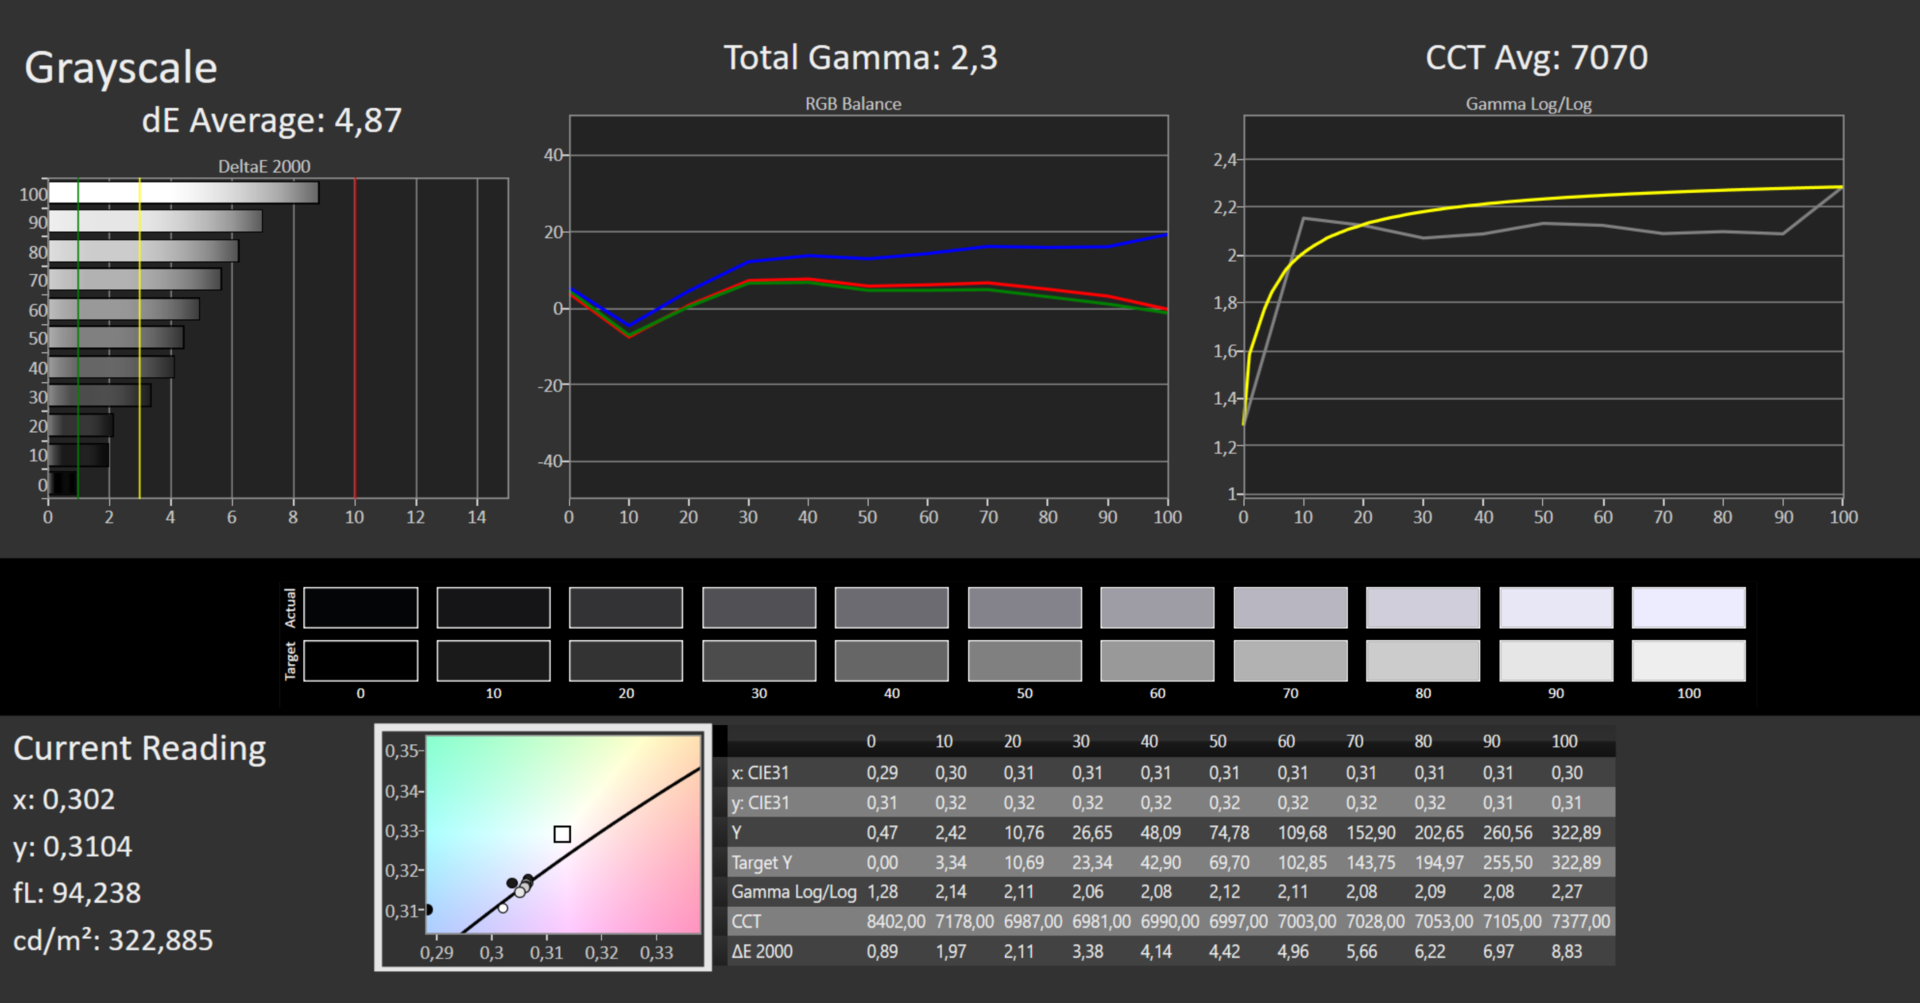
哑光15.6英寸(1,920 x 1,080像素)显示屏的亮度为320.2 cd/m²,满足我们的最低要求(>300 cd/m²)。其对比度为1,363:1,绰绰有余,轻松击败了竞争对手。165-Hz面板的响应时间很短,在任何亮度水平上都不使用PWM。
该显示器支持AMD的FreeSync技术。其目的是为了创造最流畅的图像--尤其是在电脑游戏中。
| |||||||||||||||||||||||||
Brightness Distribution: 93 %
Center on Battery: 334 cd/m²
Contrast: 1363:1 (Black: 0.24 cd/m²)
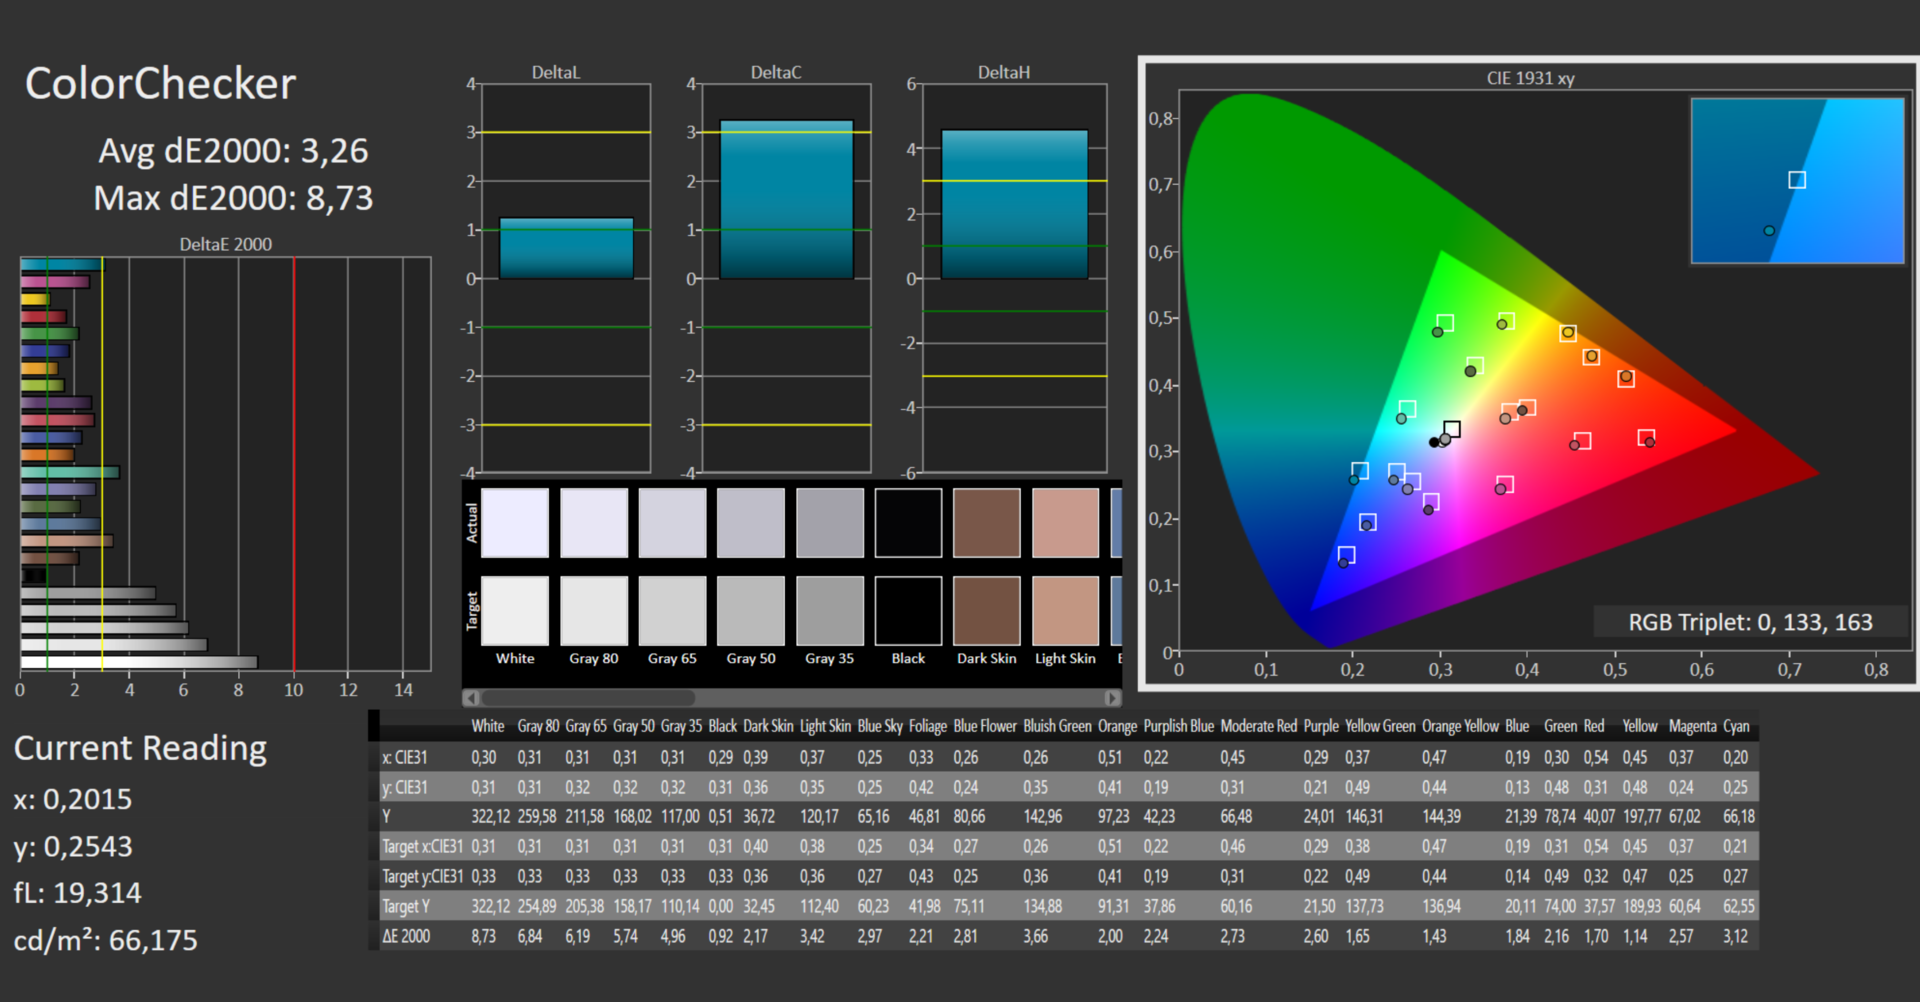
ΔE ColorChecker Calman: 3.26 | ∀{0.5-29.43 Ø4.72}
calibrated: 0.87
ΔE Greyscale Calman: 4.87 | ∀{0.09-98 Ø4.97}
69.7% AdobeRGB 1998 (Argyll 3D)
98.1% sRGB (Argyll 3D)
68.8% Display P3 (Argyll 3D)
Gamma: 2.3
CCT: 7070 K
| Acer Nitro 5 AN515-46-R1A1 AU Optronics B156HAN12.H, IPS, 1920x1080, 15.6" | MSI Katana GF66 12UGS AU Optronics AUOAF90, IPS, 1920x1080, 15.6" | Schenker XMG Fusion 15 (Mid 22) BOE CQ NE156QHM-NY2, IPS, 2560x1440, 15.6" | Asus TUF Dash F15 FX517ZR BOE CQ NE156QHM-NY1, IPS, 2560x1440, 15.6" | Acer Nitro 5 AN515-58-72QR Chi Mei N156KME-GNA, IPS, 2560x1440, 15.6" | |
|---|---|---|---|---|---|
| Display | -42% | -2% | 23% | 21% | |
| Display P3 Coverage (%) | 68.8 | 39.1 -43% | 67.3 -2% | 98.4 43% | 95.6 39% |
| sRGB Coverage (%) | 98.1 | 58.3 -41% | 96.7 -1% | 99.9 2% | 99.8 2% |
| AdobeRGB 1998 Coverage (%) | 69.7 | 40.4 -42% | 68.2 -2% | 85.9 23% | 85.2 22% |
| Response Times | -232% | 12% | 20% | -24% | |
| Response Time Grey 50% / Grey 80% * (ms) | 13 ? | 40 ? -208% | 11.6 ? 11% | 5.6 ? 57% | 15.7 ? -21% |
| Response Time Black / White * (ms) | 8 ? | 28.4 ? -255% | 7 ? 12% | 9.4 ? -18% | 10.2 ? -27% |
| PWM Frequency (Hz) | |||||
| Screen | -55% | -15% | 9% | -2% | |
| Brightness middle (cd/m²) | 327 | 227 -31% | 326 0% | 286 -13% | 332 2% |
| Brightness (cd/m²) | 320 | 225 -30% | 303 -5% | 266 -17% | 303 -5% |
| Brightness Distribution (%) | 93 | 90 -3% | 89 -4% | 87 -6% | 86 -8% |
| Black Level * (cd/m²) | 0.24 | 0.21 12% | 0.33 -38% | 0.25 -4% | 0.29 -21% |
| Contrast (:1) | 1363 | 1081 -21% | 988 -28% | 1144 -16% | 1145 -16% |
| Colorchecker dE 2000 * | 3.26 | 4.19 -29% | 2.73 16% | 2.14 34% | 3.61 -11% |
| Colorchecker dE 2000 max. * | 8.73 | 17.45 -100% | 9.54 -9% | 5.22 40% | 7.71 12% |
| Colorchecker dE 2000 calibrated * | 0.87 | 3.81 -338% | 1.36 -56% | 0.67 23% | 0.59 32% |
| Greyscale dE 2000 * | 4.87 | 2.7 45% | 5.2 -7% | 2.8 43% | 5.2 -7% |
| Gamma | 2.3 96% | 2.208 100% | 2.074 106% | 2.23 99% | 2.155 102% |
| CCT | 7070 92% | 6176 105% | 6911 94% | 7092 92% | 6724 97% |
| Total Average (Program / Settings) | -110% /
-77% | -2% /
-8% | 17% /
14% | -2% /
-1% |
* ... smaller is better
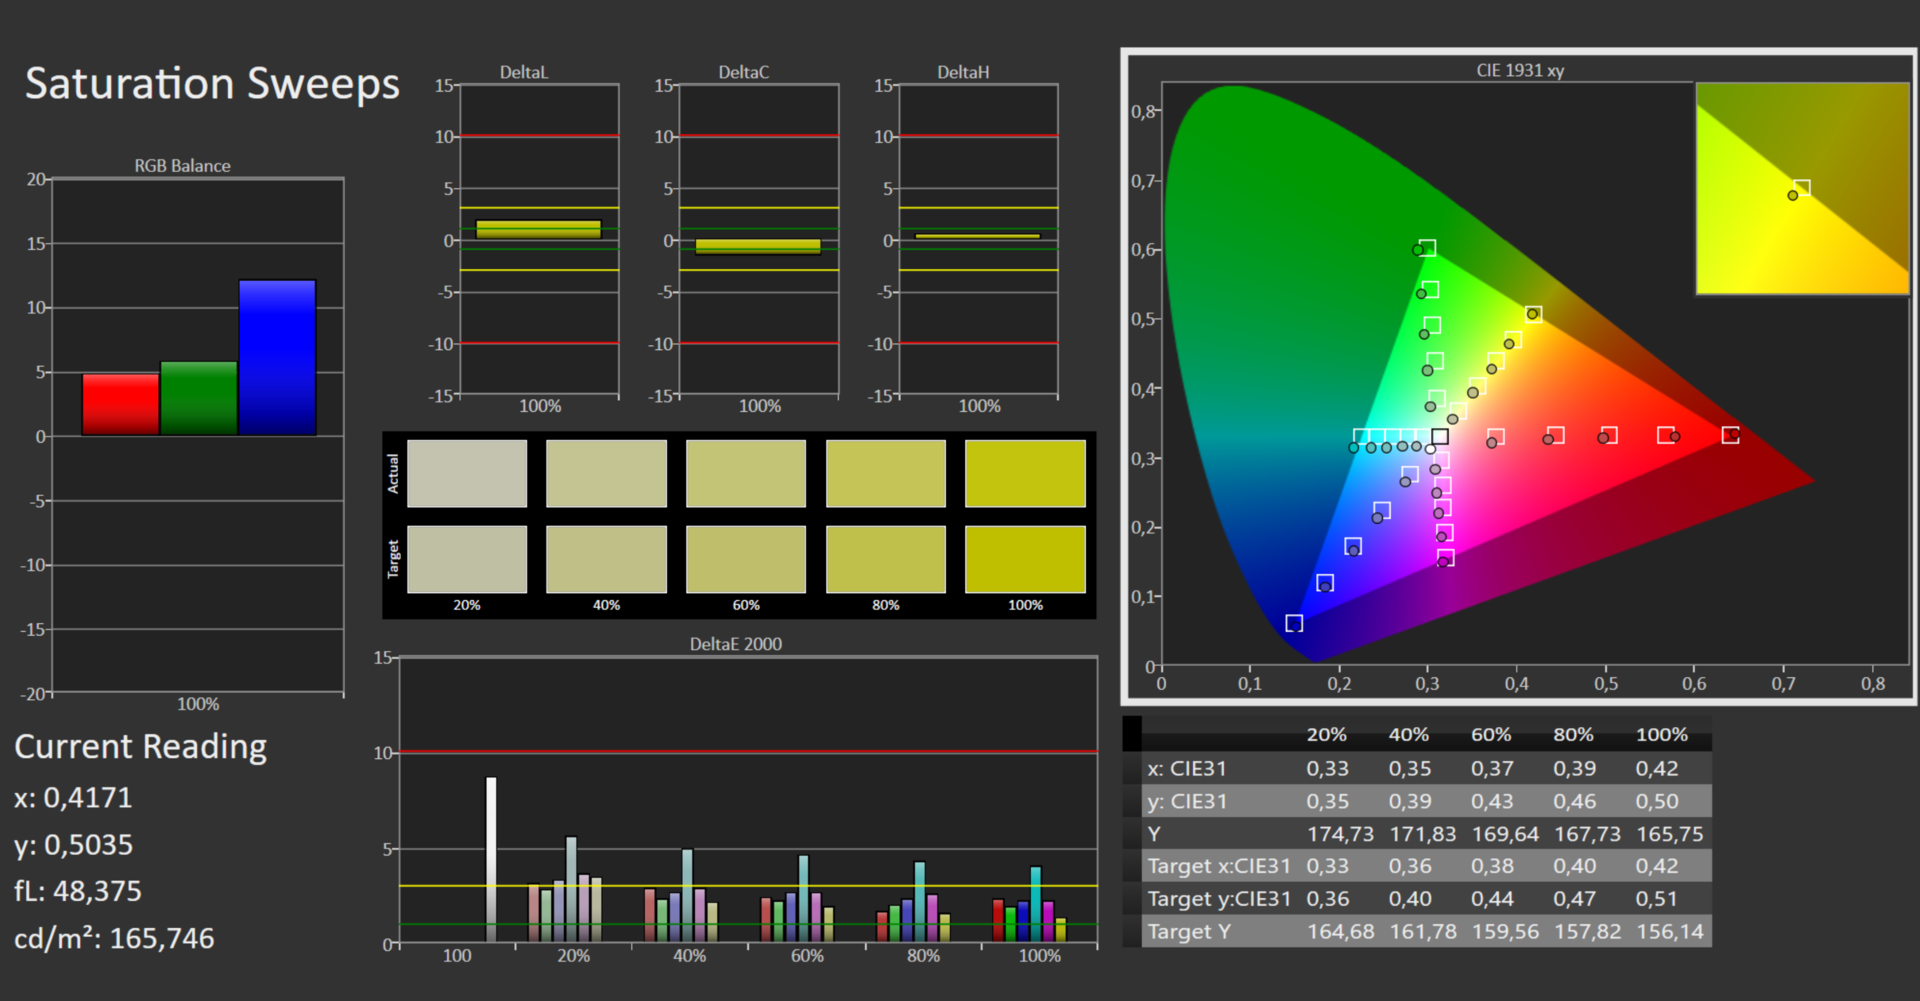
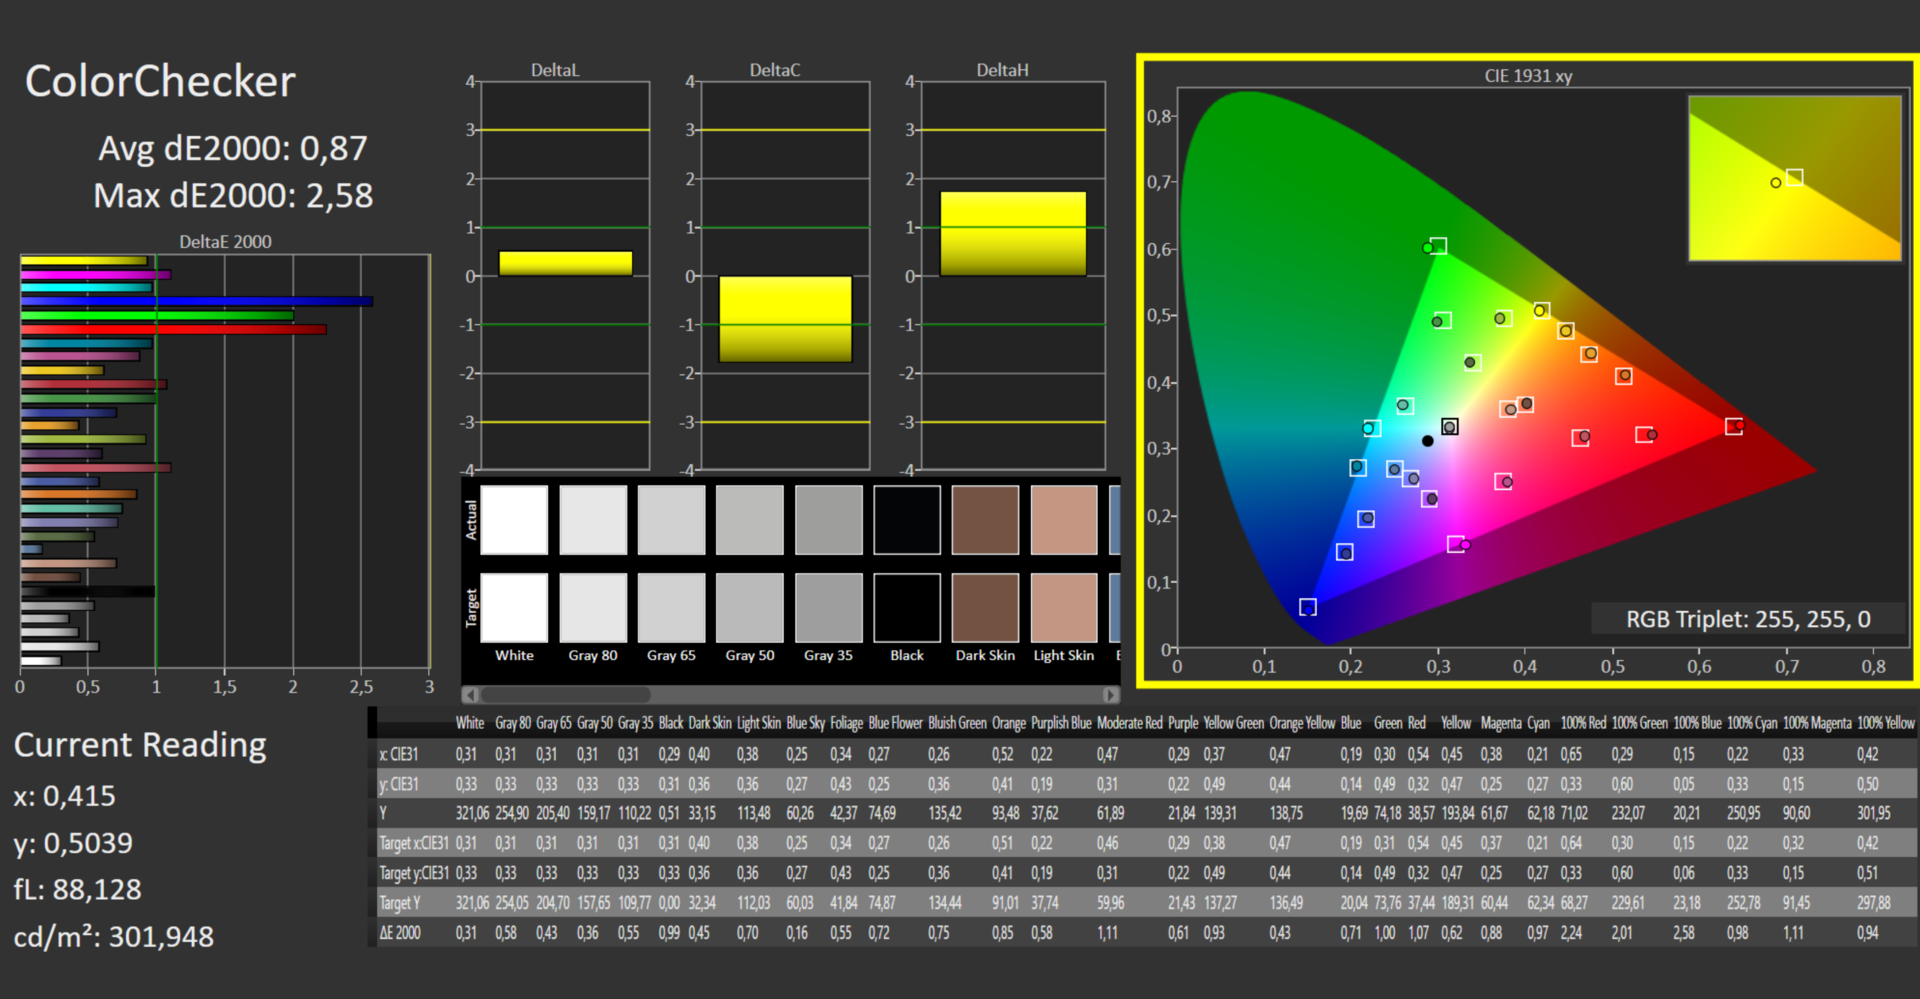
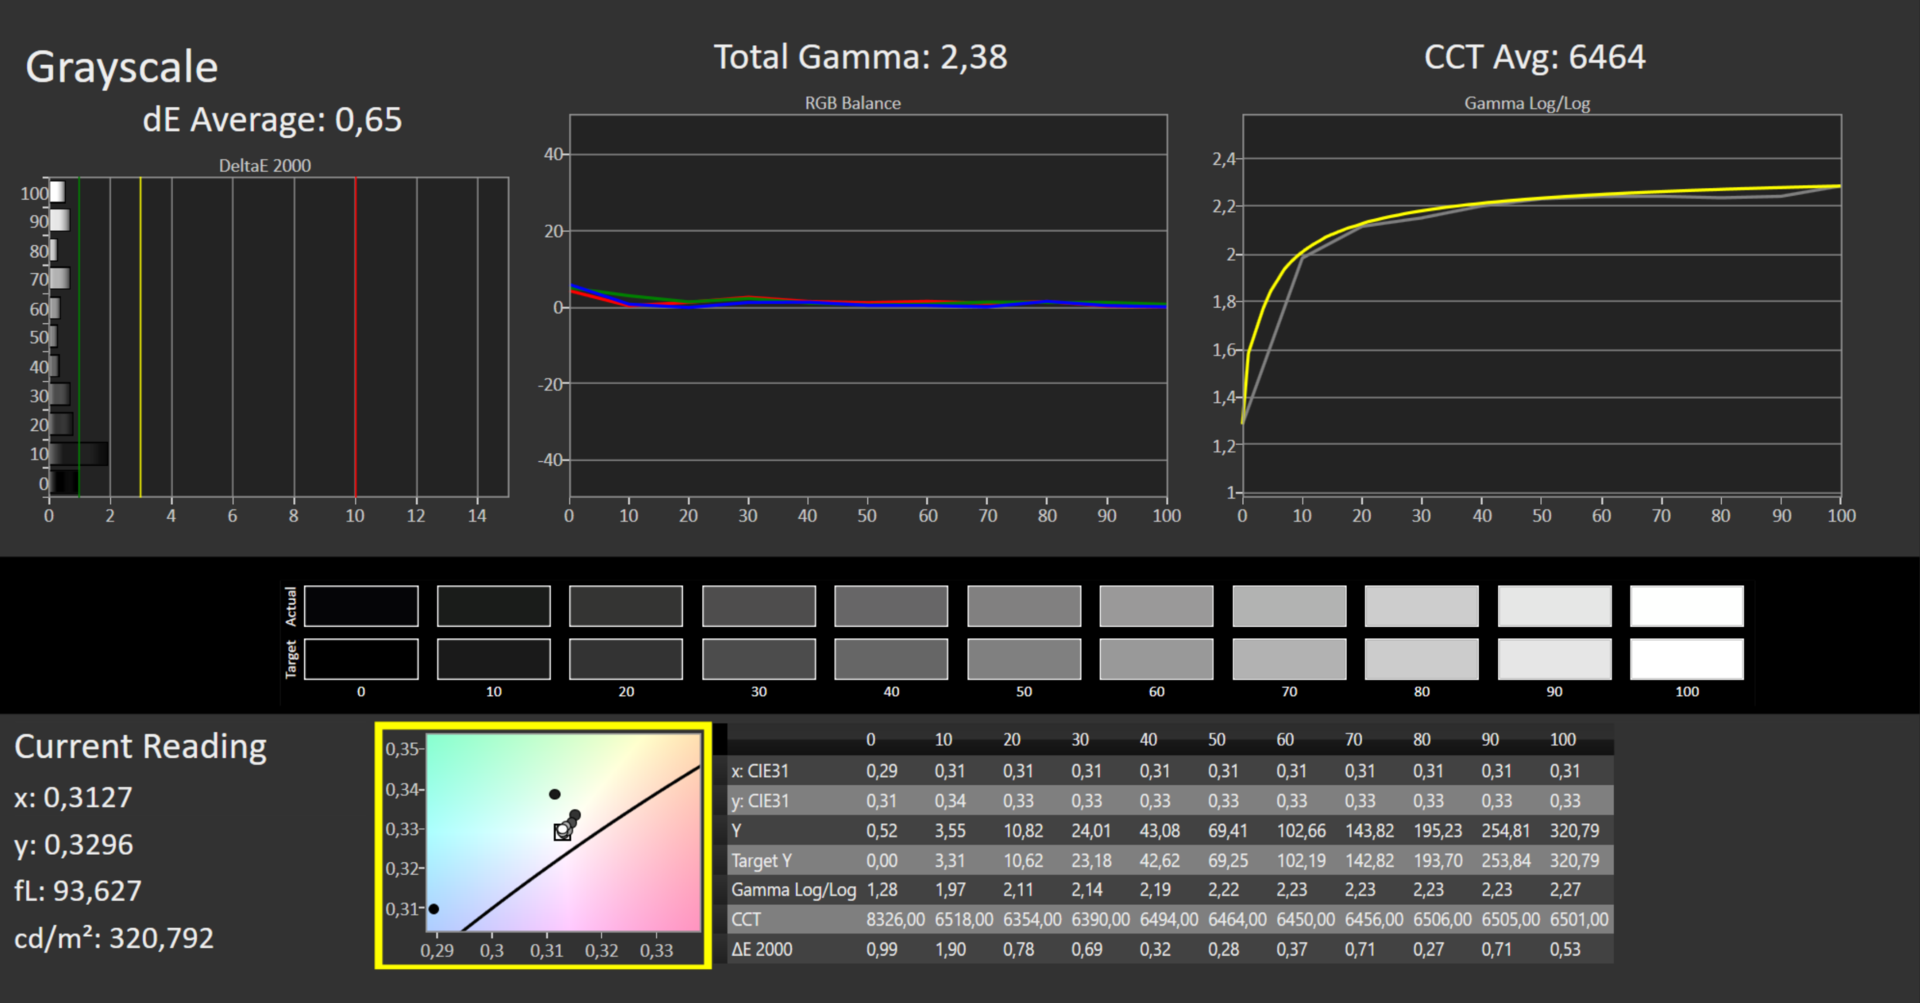
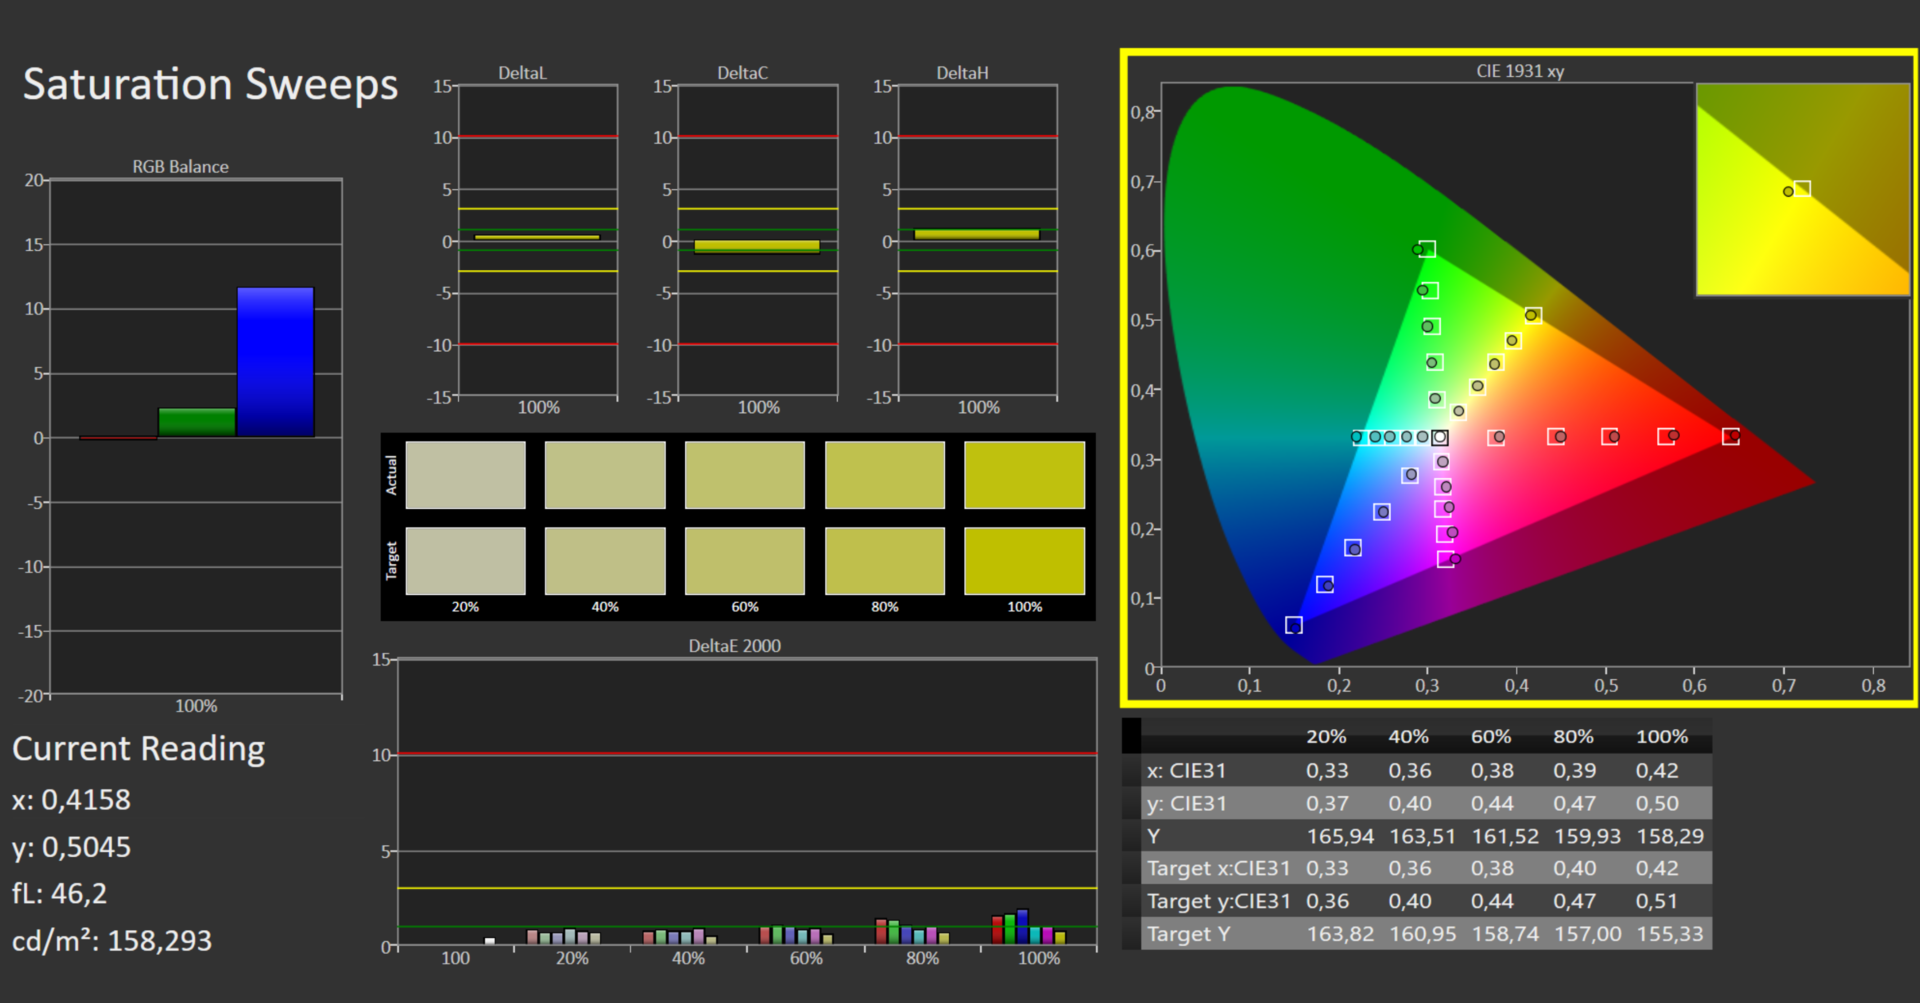
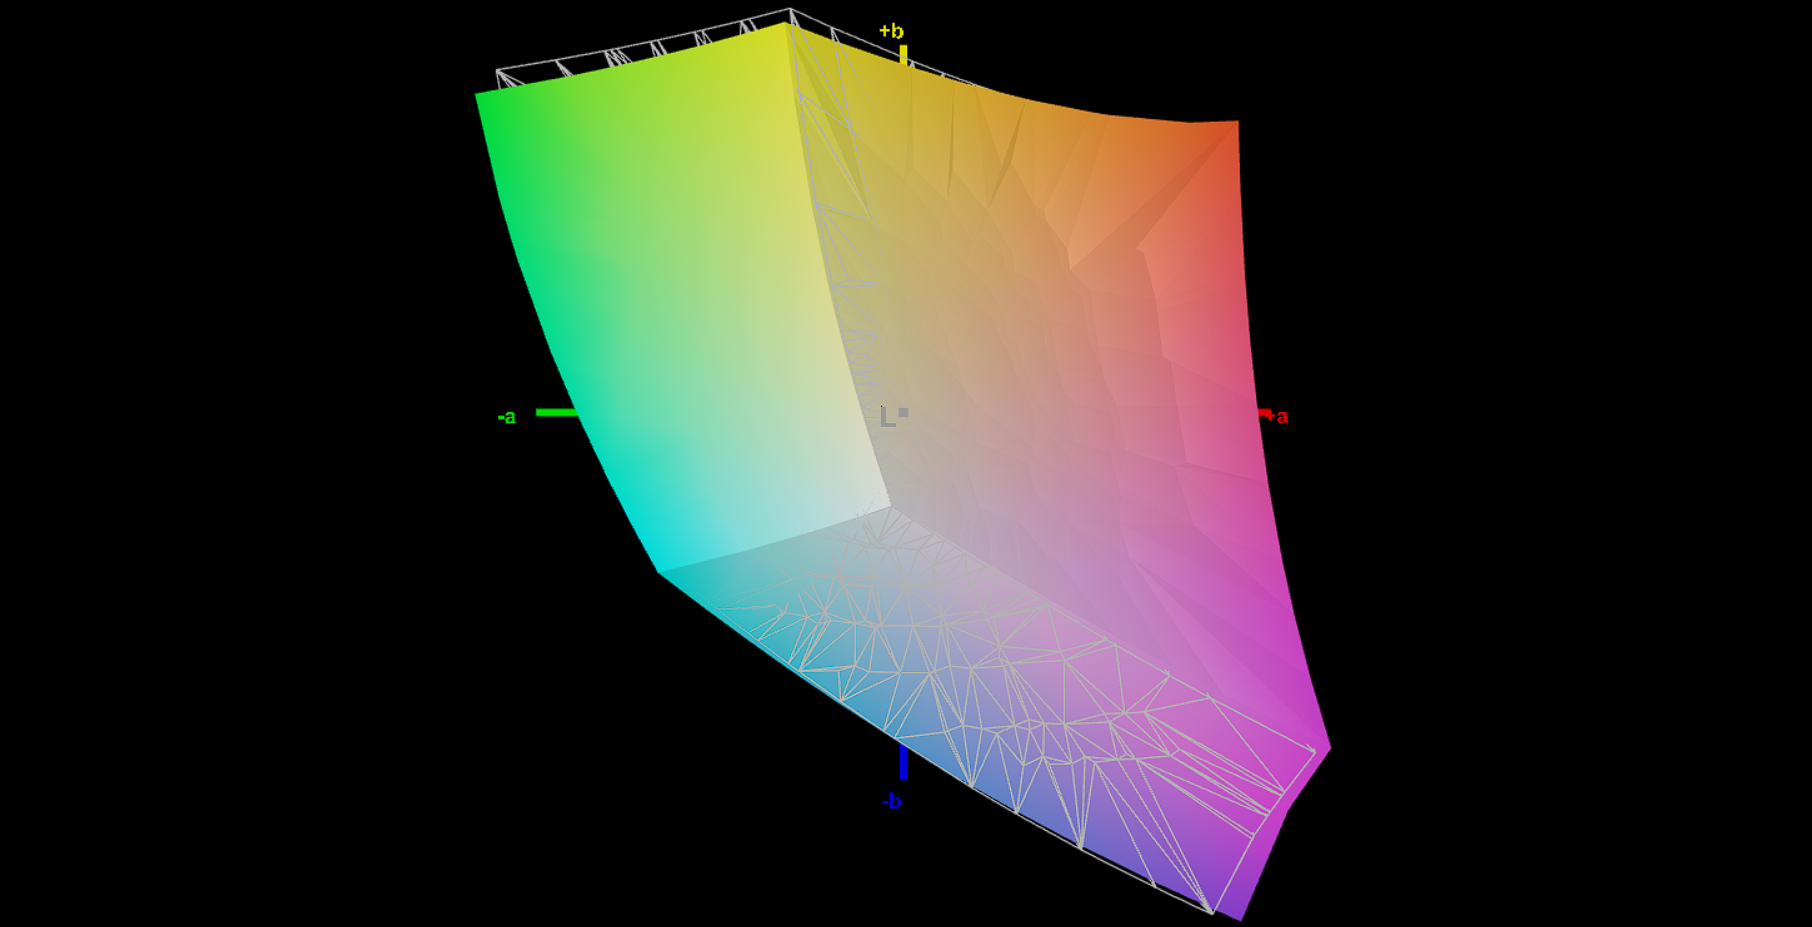
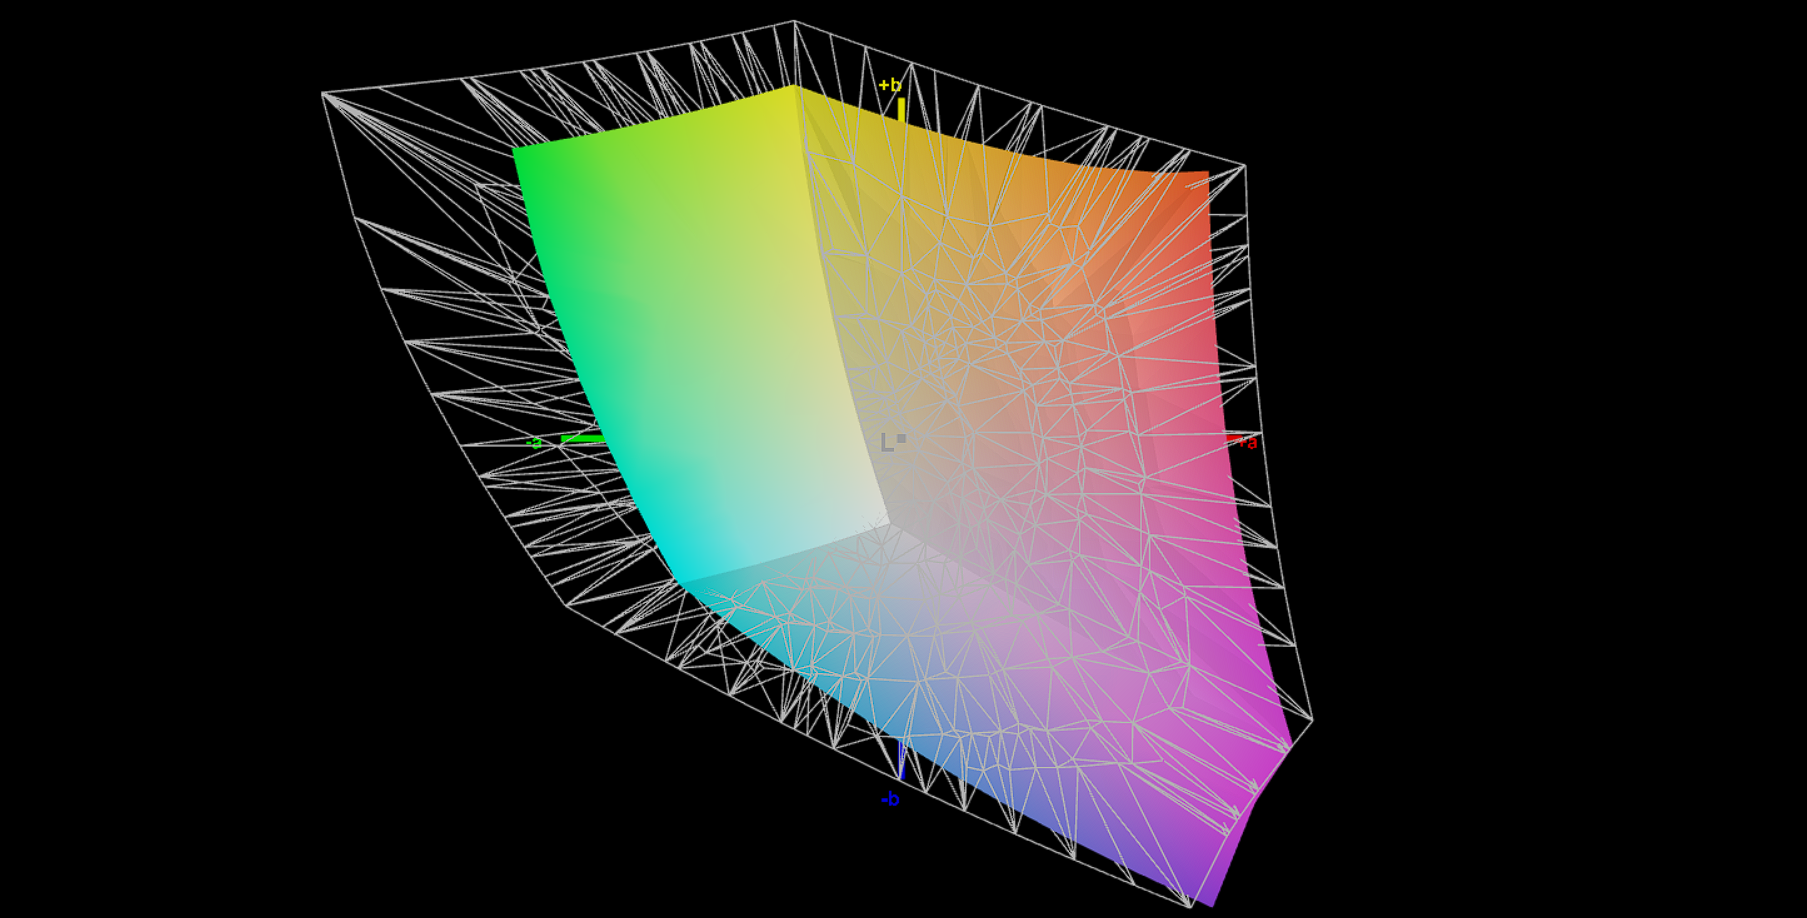
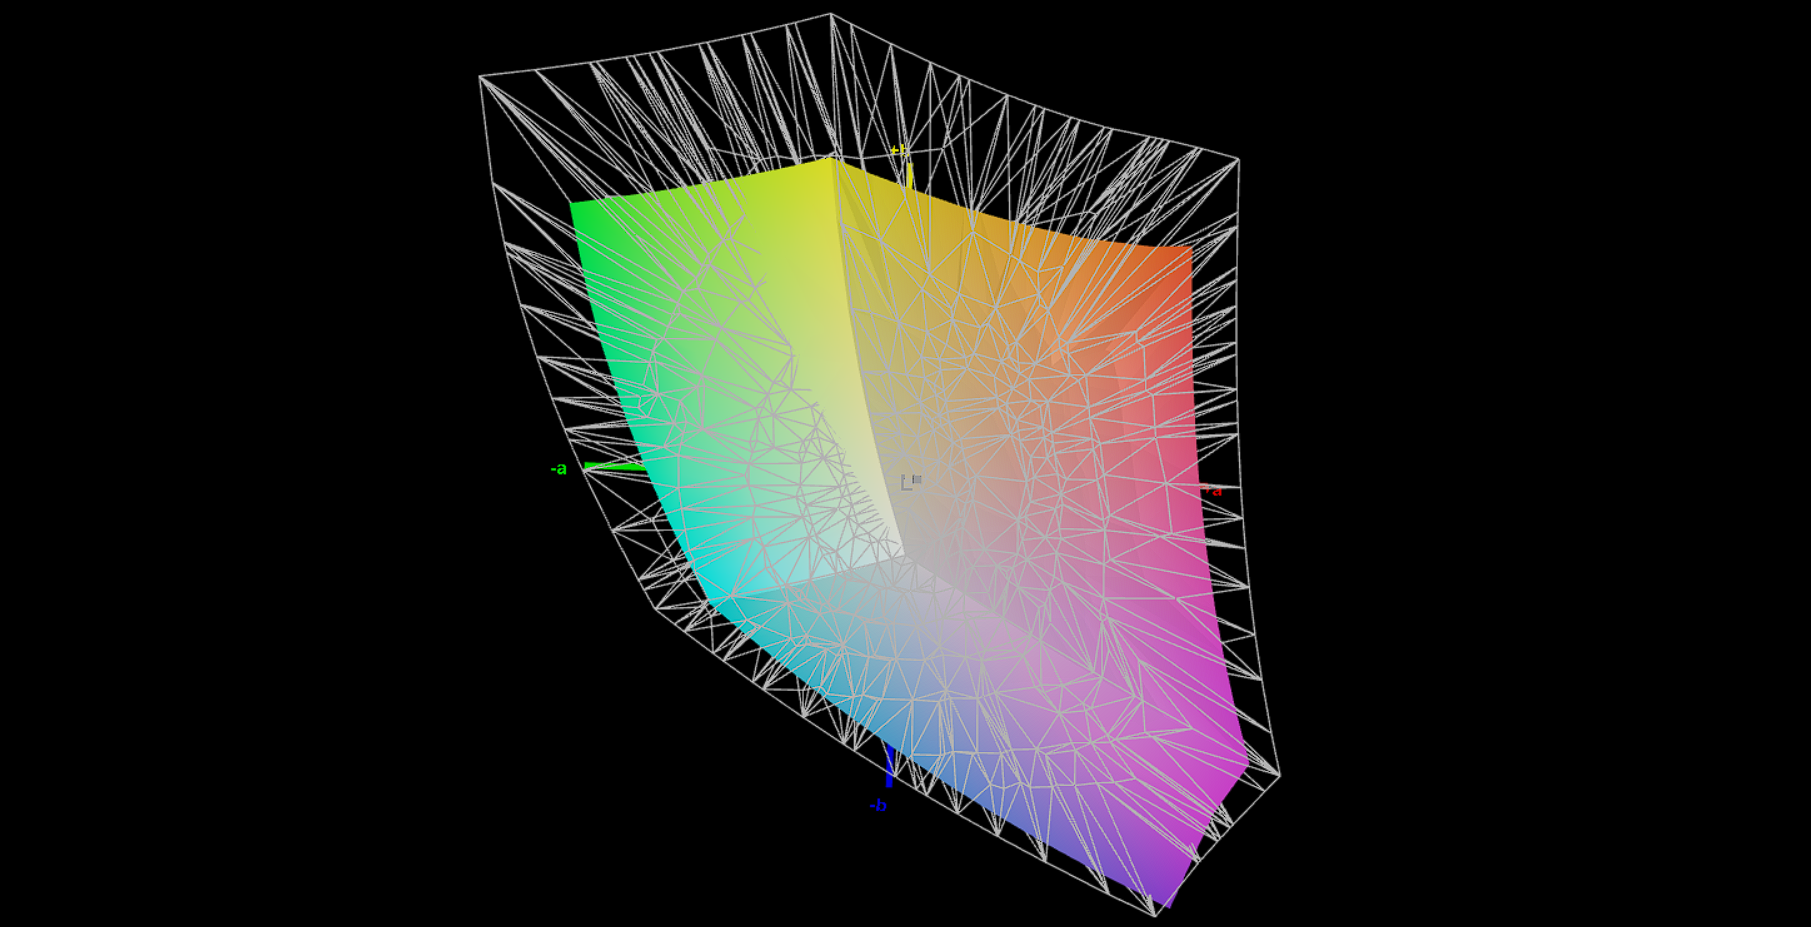
屏幕显示的颜色在出厂时相当好。我们测量的色彩偏差为3.26,仅略高于理想值(DeltaE<3)。校准显示器可以将偏差降低到0.87,并使灰度看起来更加均匀。该面板几乎可以显示整个sRGB色彩空间(98.1%),并涵盖70%的AdobeRGB和69%的DCI-P3。姊妹机型的QHD面板实现了更好的整体色彩空间覆盖。
你可以免费下载和使用我们创建的颜色配置文件。链接在上面的信息框中。
Display Response Times
| ↔ Response Time Black to White | ||
|---|---|---|
| 8 ms ... rise ↗ and fall ↘ combined | ↗ 4 ms rise |  |
| ↘ 4 ms fall | ||
| The screen shows fast response rates in our tests and should be suited for gaming. In comparison, all tested devices range from 0.1 (minimum) to 240 (maximum) ms. » 22 % of all devices are better. This means that the measured response time is better than the average of all tested devices (19.9 ms). | ||
| ↔ Response Time 50% Grey to 80% Grey | ||
| 13 ms ... rise ↗ and fall ↘ combined | ↗ 6 ms rise |  |
| ↘ 7 ms fall | ||
| The screen shows good response rates in our tests, but may be too slow for competitive gamers. In comparison, all tested devices range from 0.165 (minimum) to 636 (maximum) ms. » 26 % of all devices are better. This means that the measured response time is better than the average of all tested devices (31.1 ms). | ||
Screen Flickering / PWM (Pulse-Width Modulation)
| Screen flickering / PWM not detected |  | ||
In comparison: 52 % of all tested devices do not use PWM to dim the display. If PWM was detected, an average of 7784 (minimum: 5 - maximum: 343500) Hz was measured. | |||


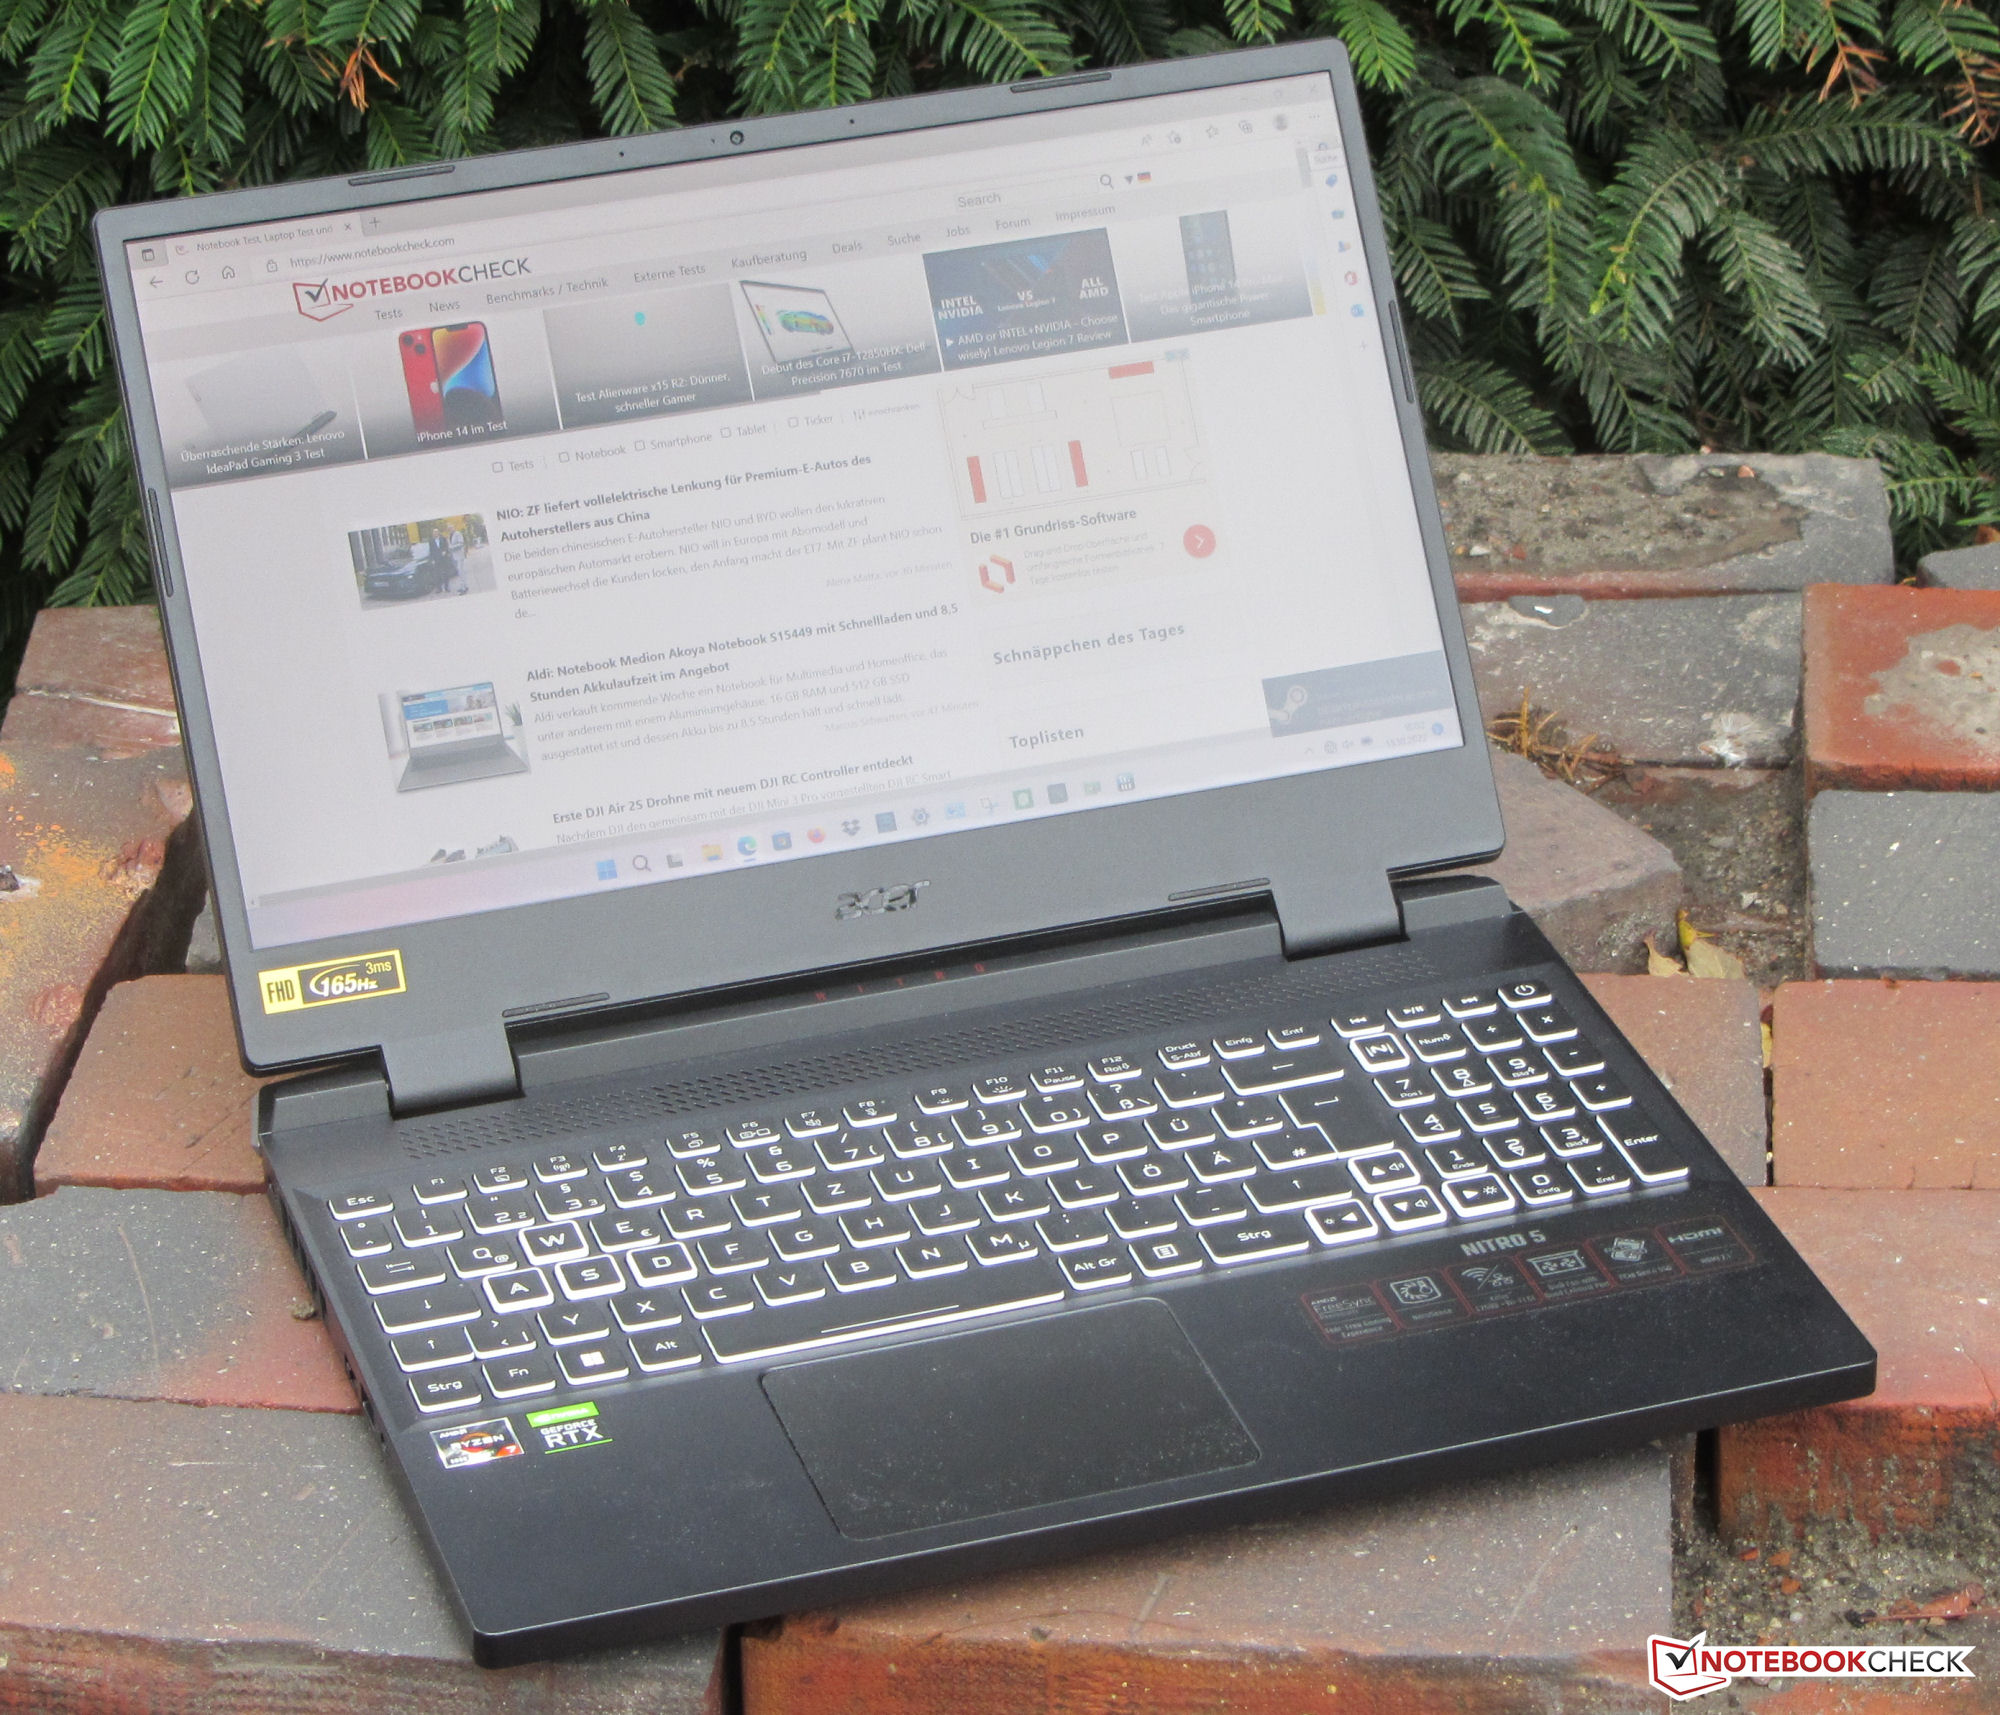
IPS面板具有稳定的可视角度,可以从任何位置阅读。它也可以在户外使用,只要阳光不是太亮。

表演--安培和伦勃朗的硝基笔记本
宏碁Nitro 5 AN515--一款15.6英寸的游戏笔记本--有一系列的配置,可以配备英特尔或AMD处理器。入门级配置目前约为800欧元(Core i5-11400H,RTX 3050,8GB内存,512GB SSD,无Windows)。最昂贵的型号(Ryzen 9 6900HX,RTX 3070 Ti,32GB内存,1TB SSD)的标价为2400欧元。
测试条件
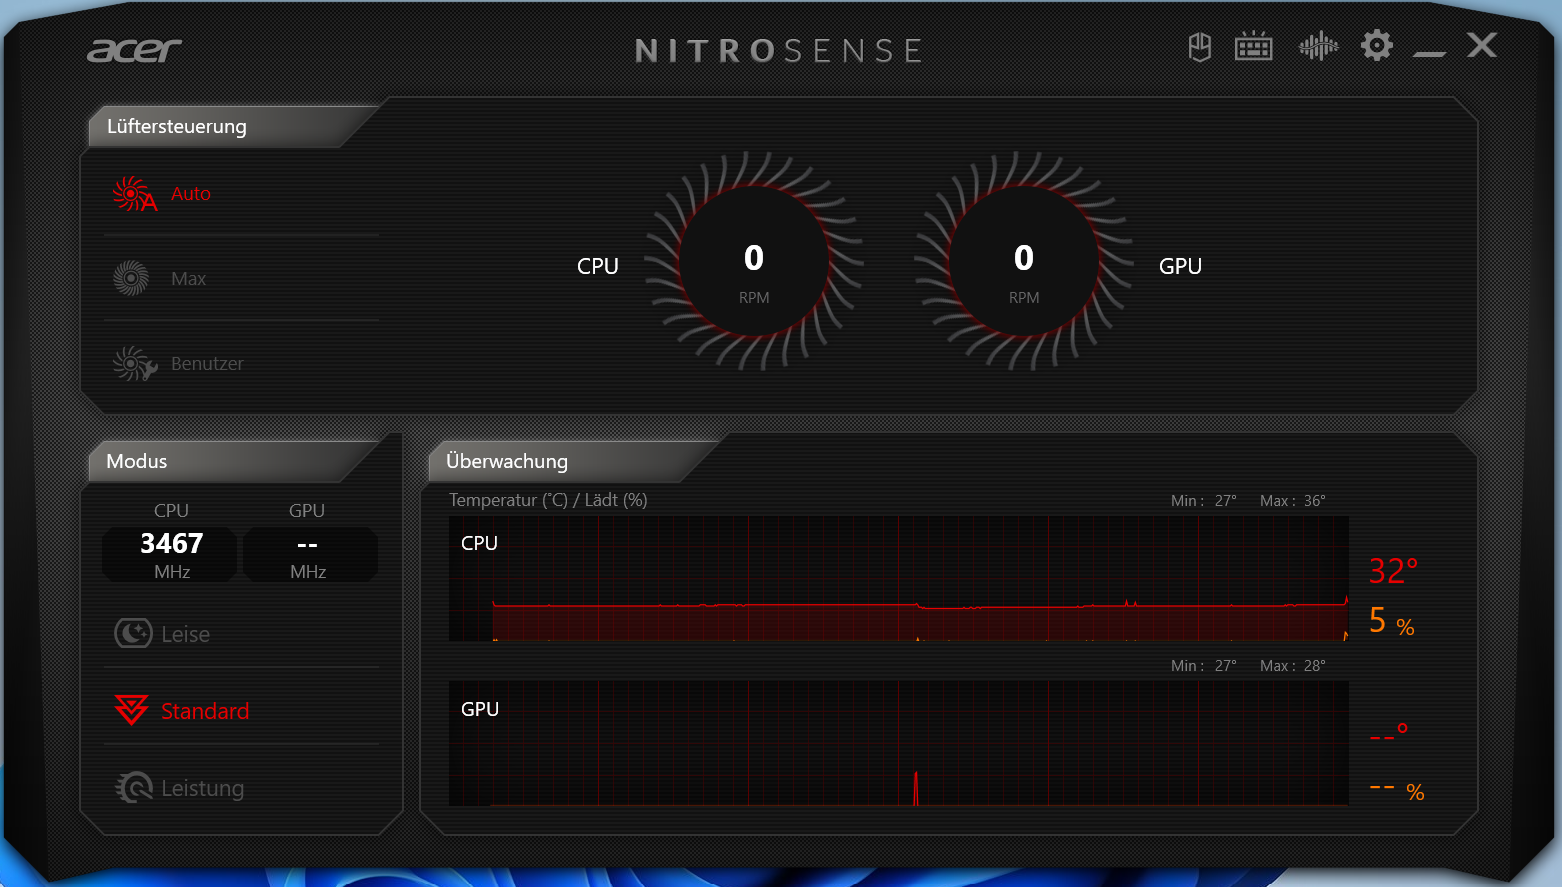
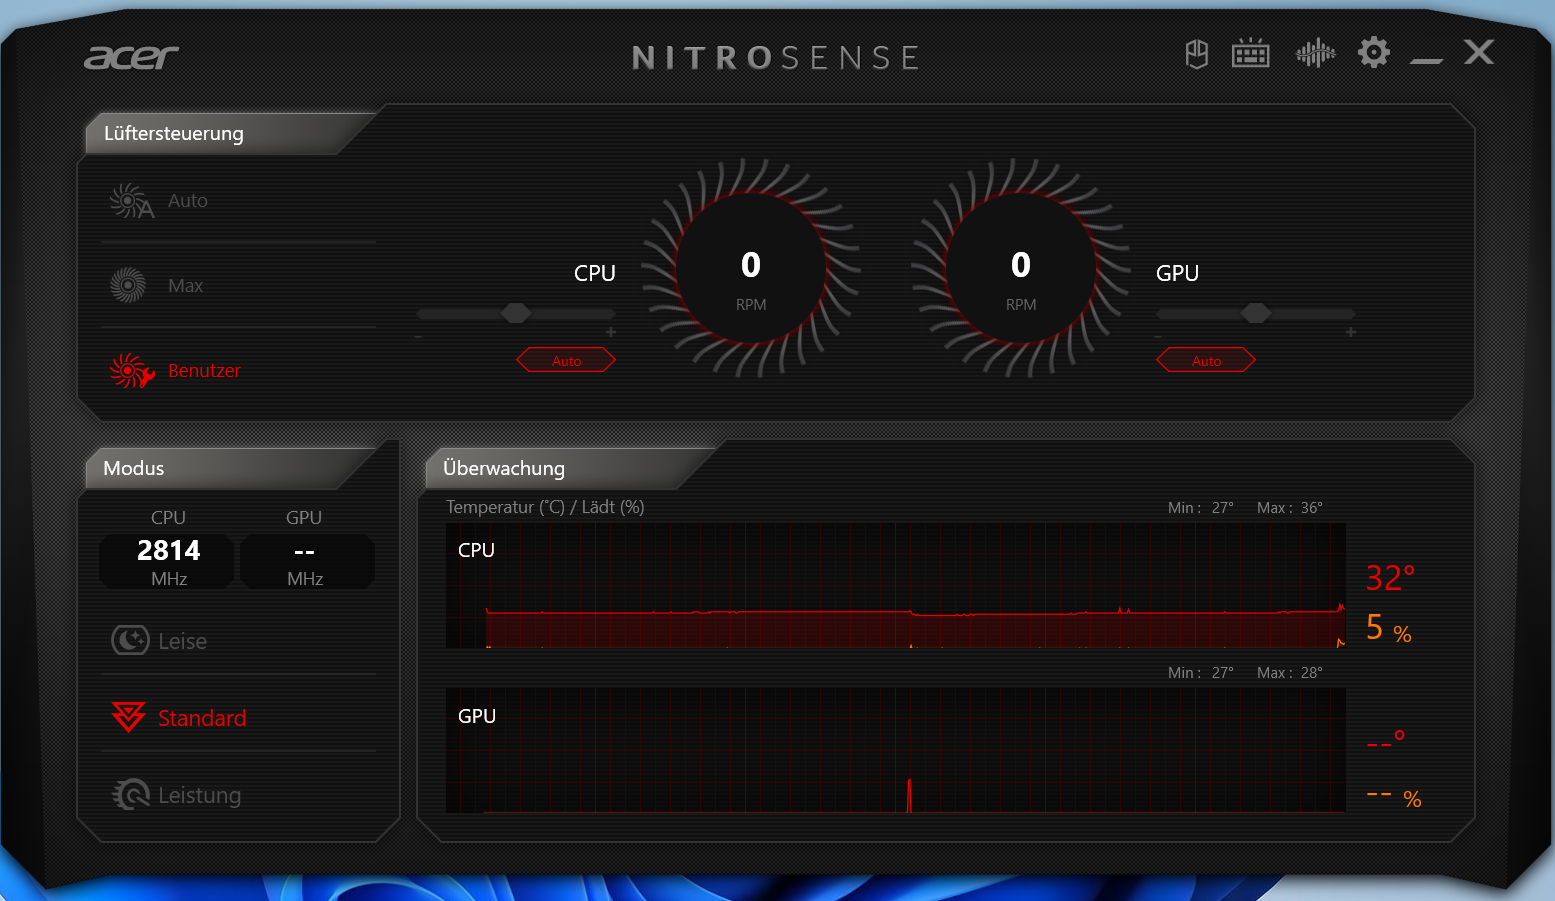
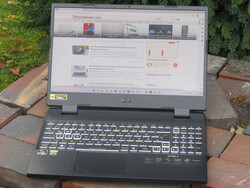
预装的NitroSense软件(笔记本的控制中心,见图片)可以用来在制造商设定的性能配置文件("性能"、"标准 "和 "安静")之间进行切换。我们用 "标准 "配置文件进行了所有测试,并将风扇控制设置为自动。在所有性能配置中,CPU的性能是相同的;GPU的性能略有不同。
处理器
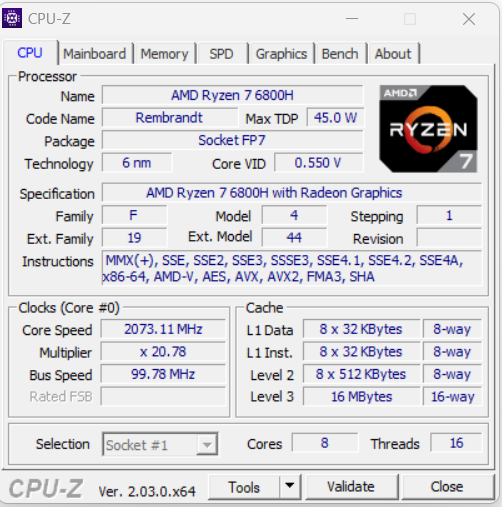
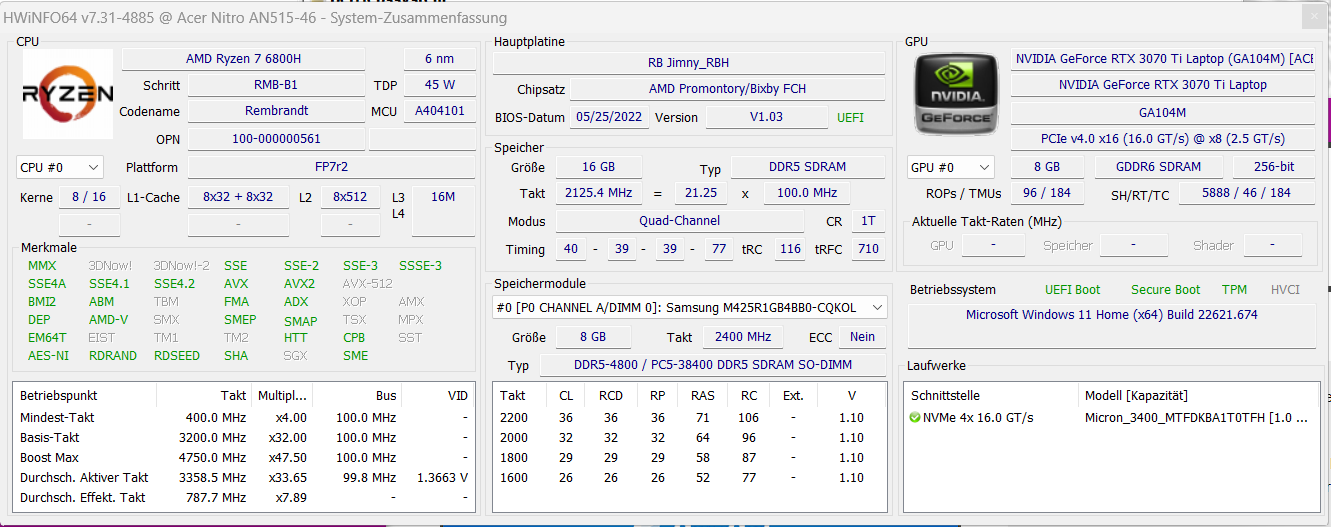
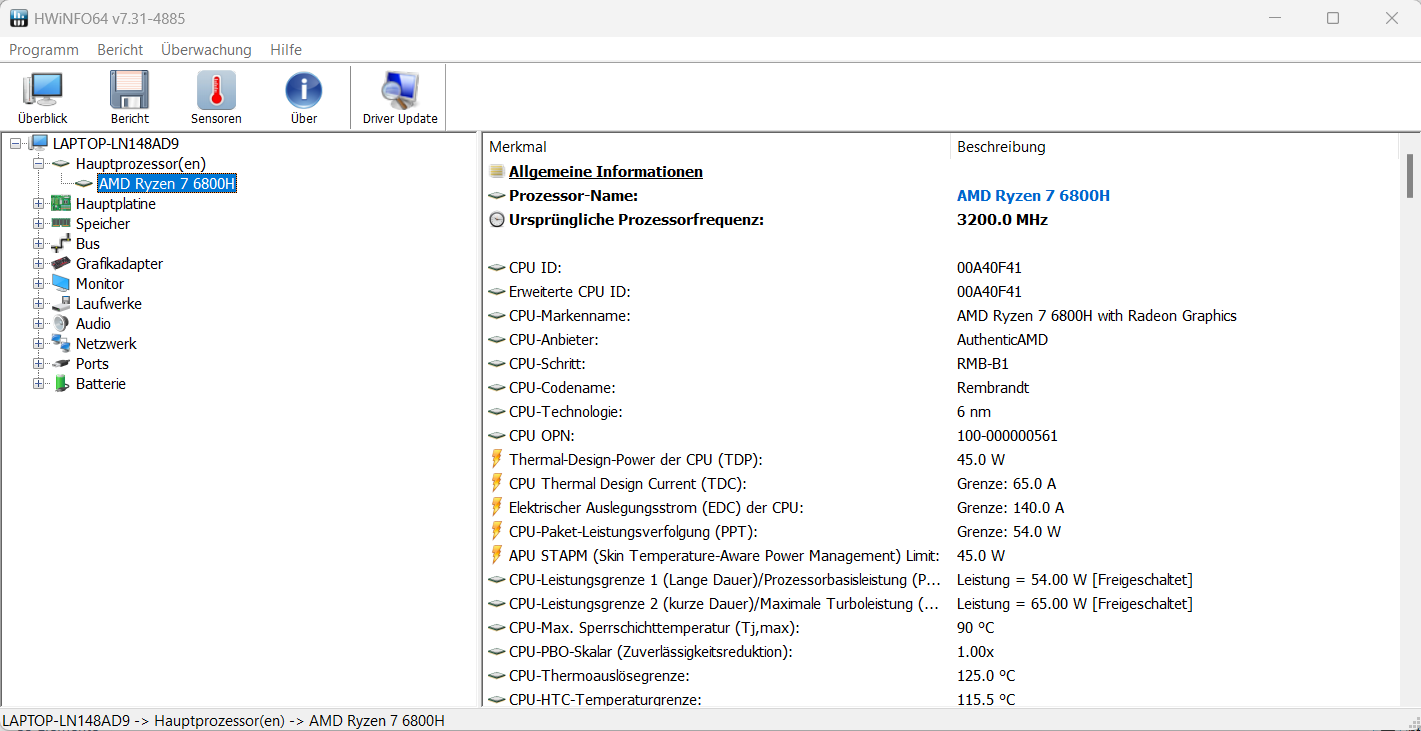
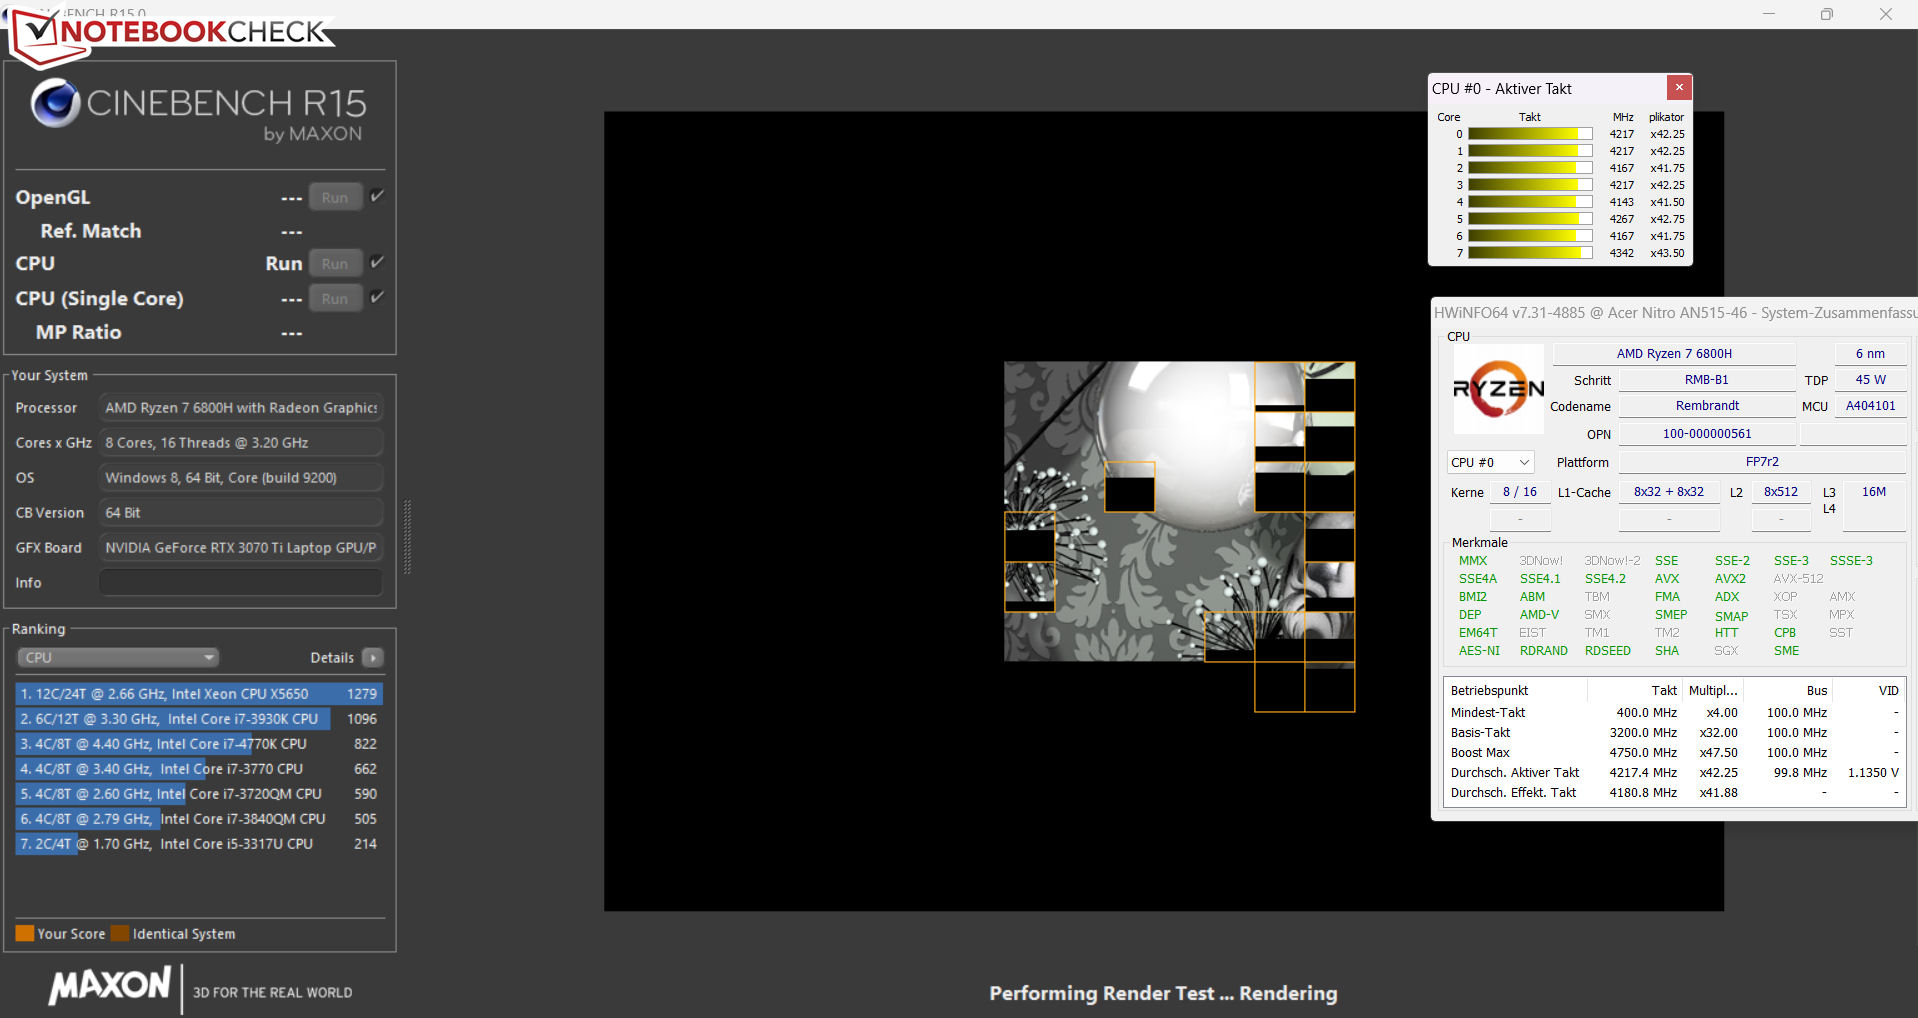
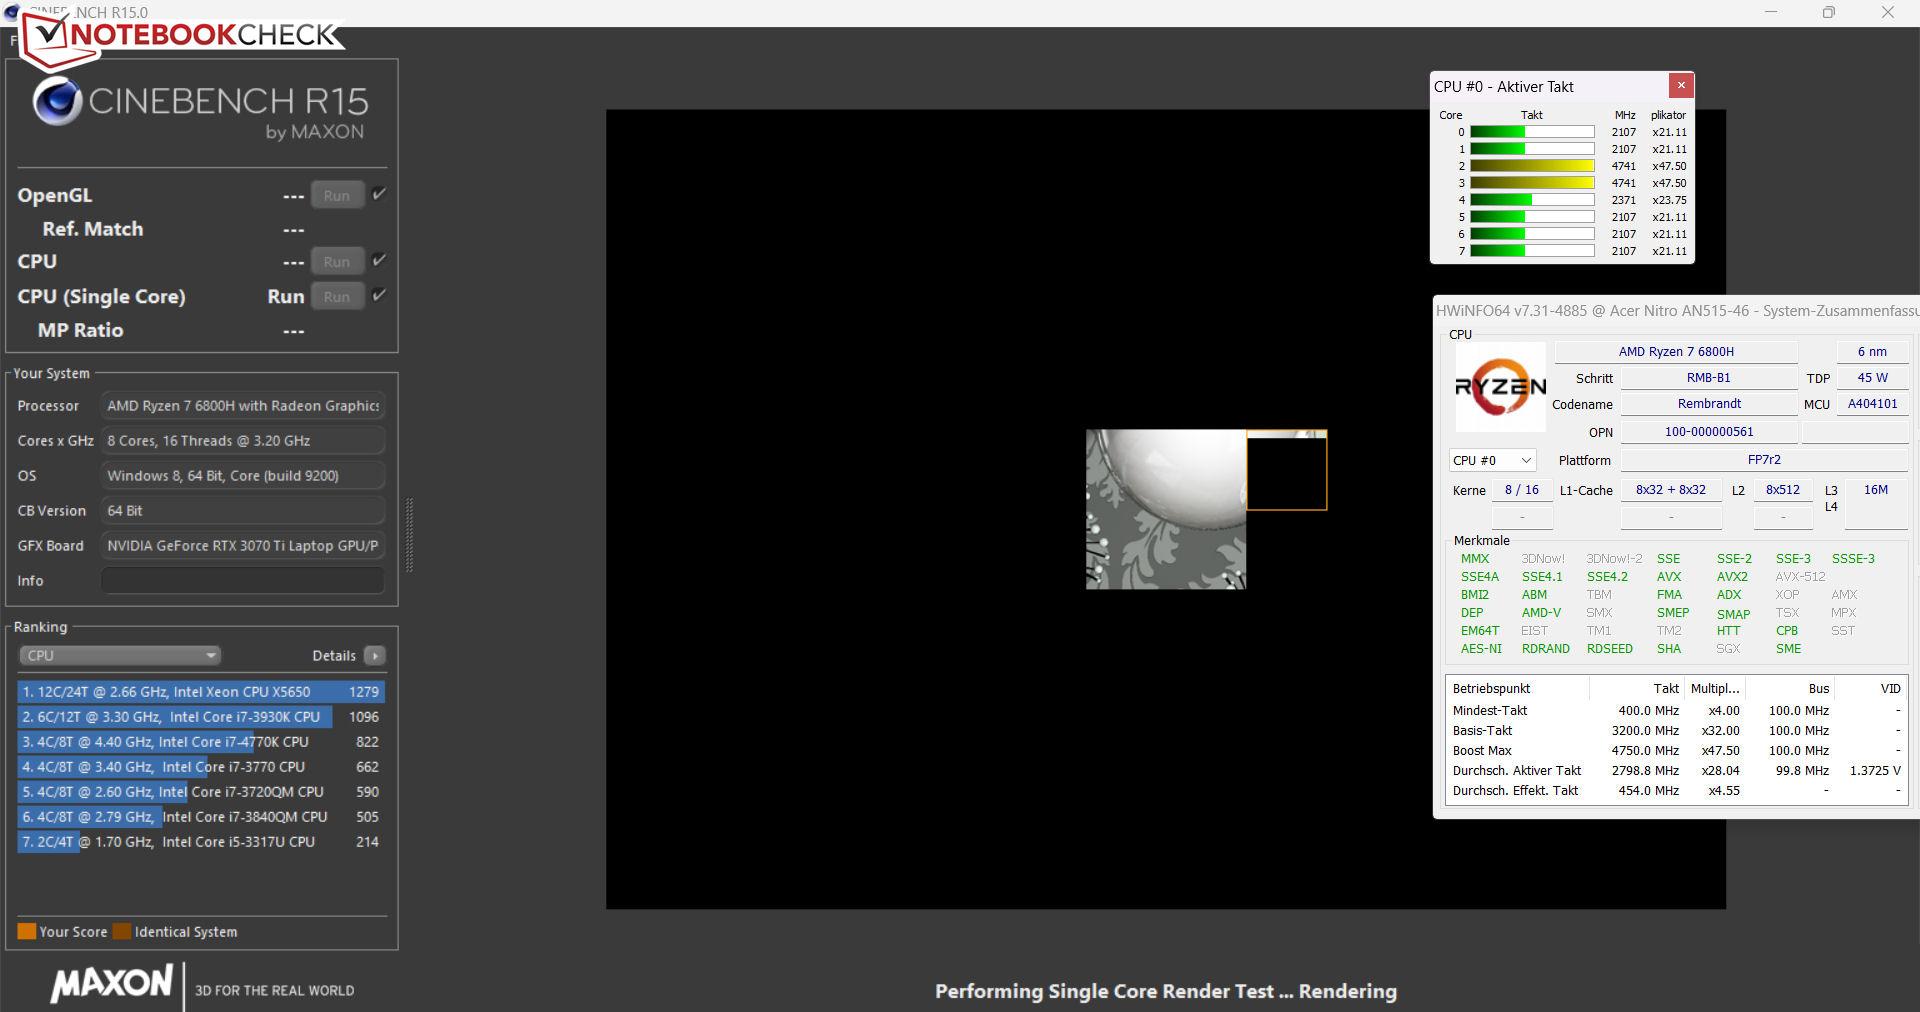
Ryzen 7 6800H APU(Rembrandt)的CPU部分由一个八核处理器组成,基本时钟频率为3.2 GHz。由于采用了涡轮增压,时钟速率可以提高到4.75GHz。该芯片支持同步多线程(每个核心工作两个线程)。CPU基准测试结果在所有三个性能配置文件中都是一样的。
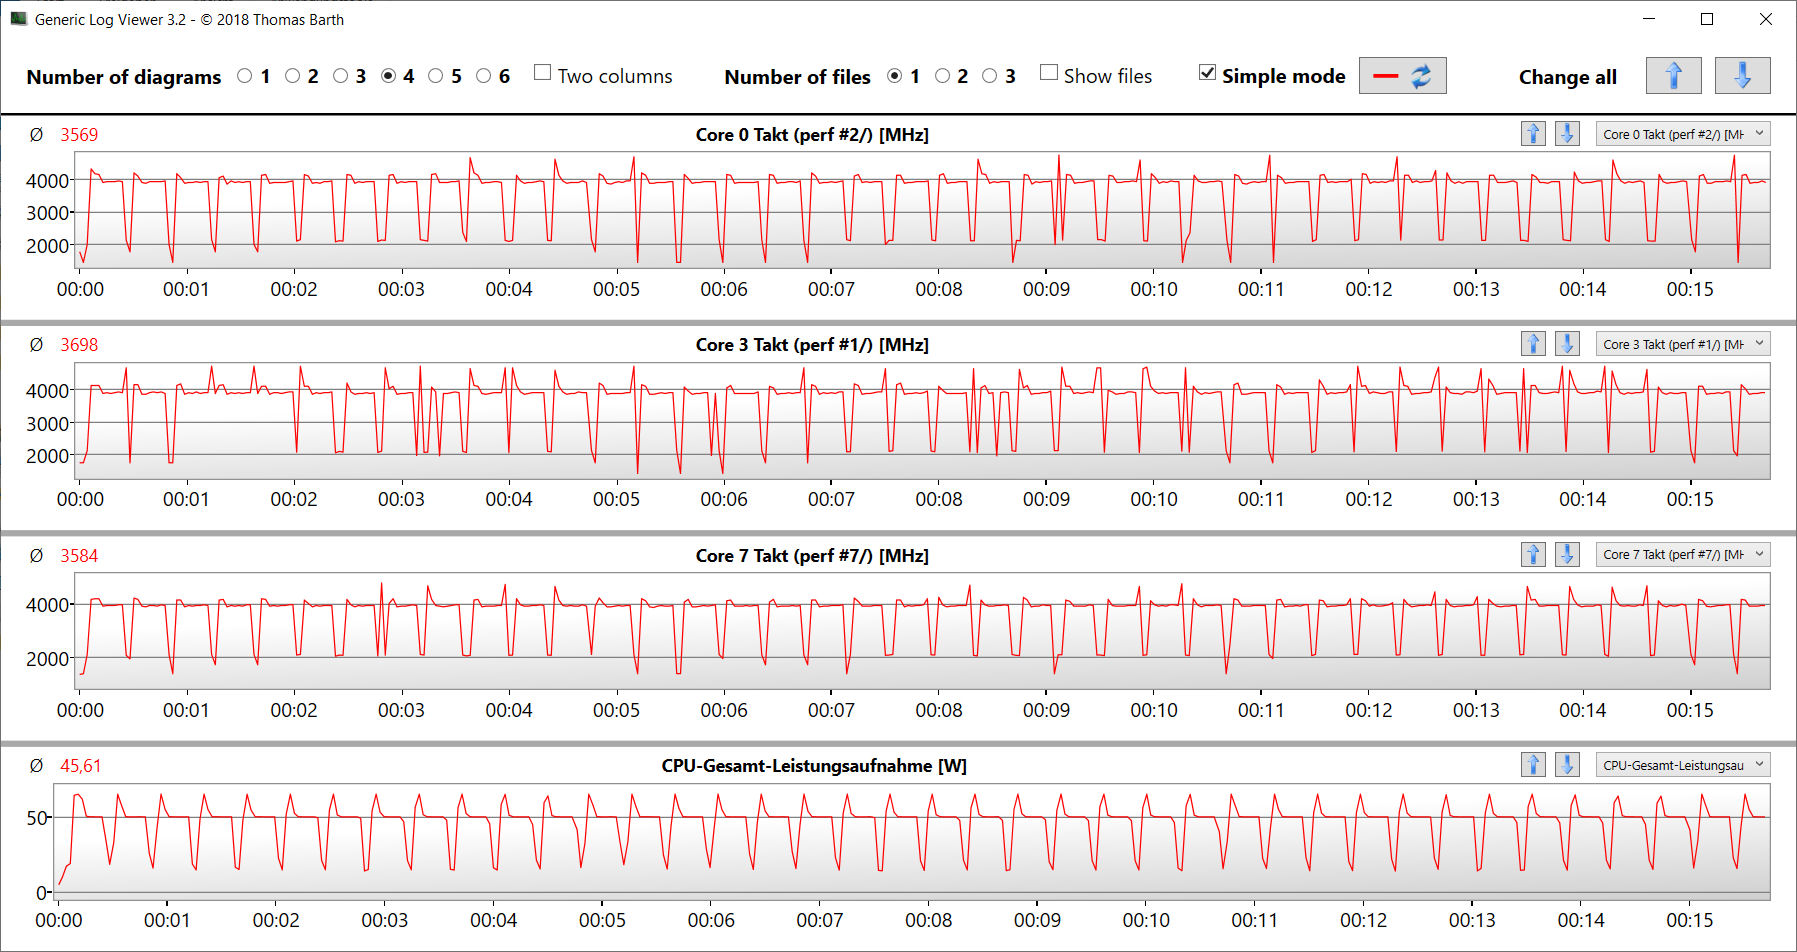
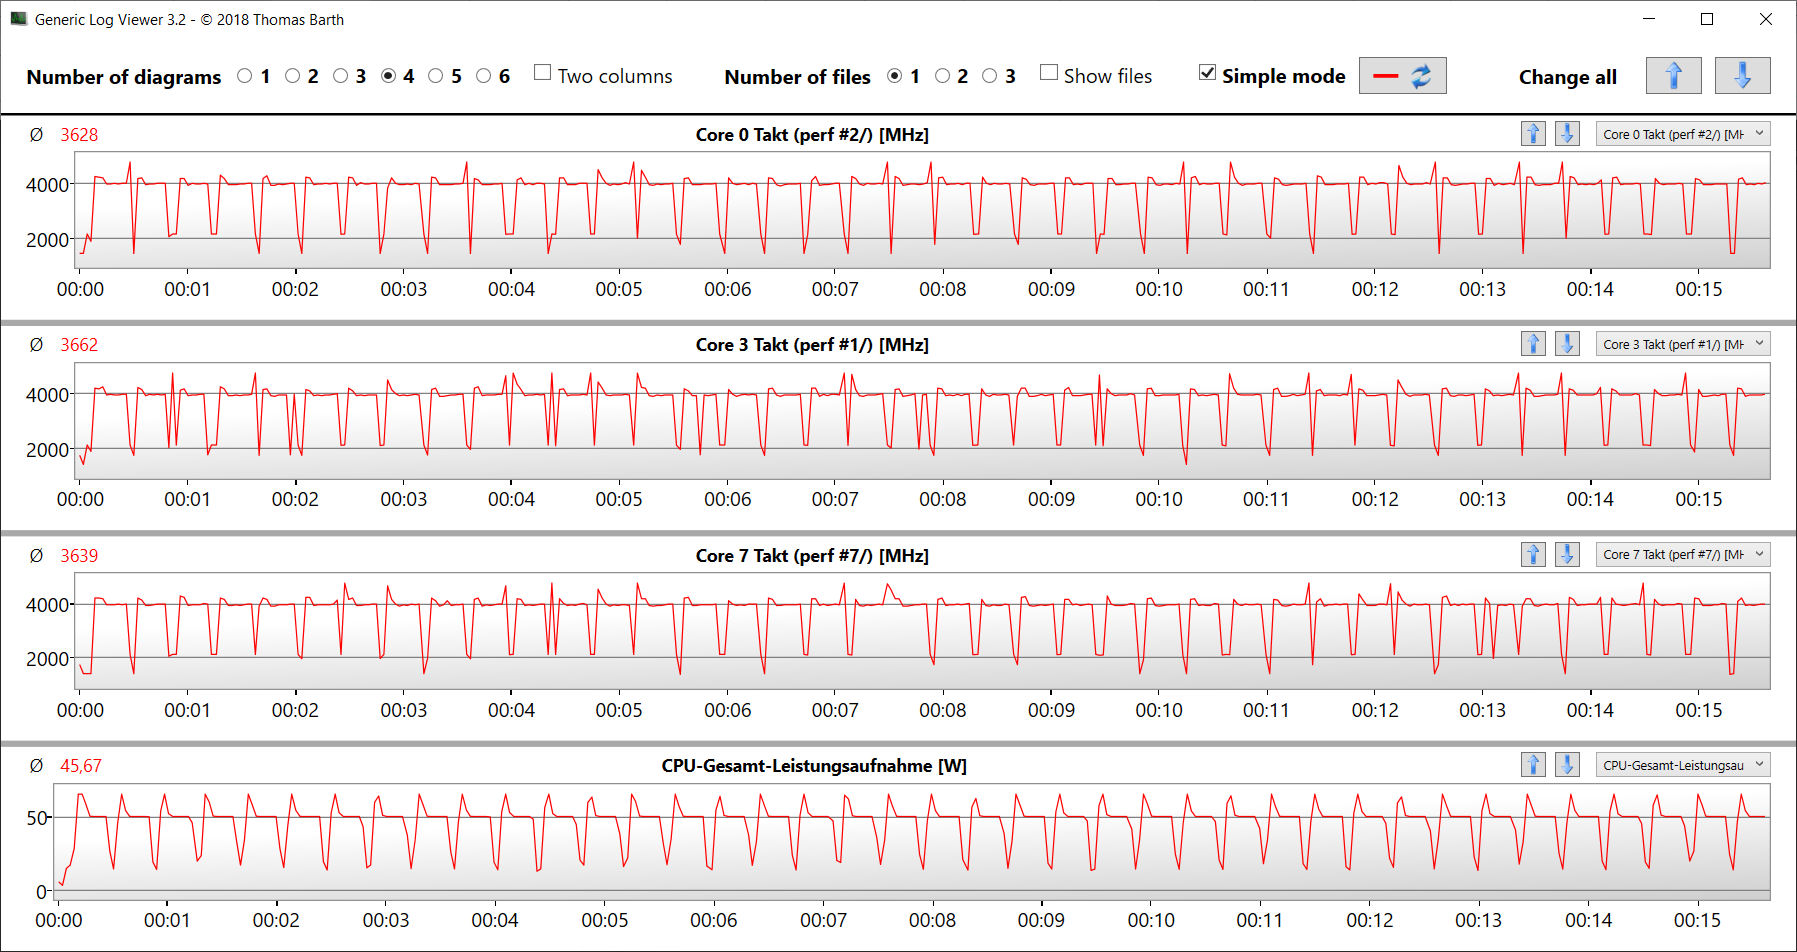
Cinebench R15多线程测试的结果是时钟速率在4至4.2GHz之间。单线程测试以2至4.75GHz完成。在电池上,CPU的时钟频率为2.5GHz(多线程)和1.2至2.5GHz(单线程)。CB15循环基准测试证实,CPU涡轮增压可以连续使用。
该处理器总体上提供了一个良好的性能。它确实偶尔会落后于英特尔Alder Lake CPU,特别是当他们可以利用其额外的CPU核心时。
Cinebench R15 Multi Loop
* ... smaller is better
AIDA64: FP32 Ray-Trace | FPU Julia | CPU SHA3 | CPU Queen | FPU SinJulia | FPU Mandel | CPU AES | CPU ZLib | FP64 Ray-Trace | CPU PhotoWorxx
| Performance rating | |
| Average of class Gaming | |
| Acer Nitro 5 AN515-46-R1A1 | |
| Average AMD Ryzen 7 6800H | |
| Schenker XMG Fusion 15 (Mid 22) | |
| Asus TUF Dash F15 FX517ZR | |
| MSI Katana GF66 12UGS | |
| Acer Nitro 5 AN515-58-72QR | |
| AIDA64 / FP32 Ray-Trace | |
| Average of class Gaming (10227 - 85542, n=107, last 2 years) | |
| Acer Nitro 5 AN515-46-R1A1 | |
| Average AMD Ryzen 7 6800H (12876 - 17031, n=8) | |
| Asus TUF Dash F15 FX517ZR | |
| Schenker XMG Fusion 15 (Mid 22) | |
| MSI Katana GF66 12UGS | |
| Acer Nitro 5 AN515-58-72QR | |
| AIDA64 / FPU Julia | |
| Average of class Gaming (51376 - 238426, n=107, last 2 years) | |
| Acer Nitro 5 AN515-46-R1A1 | |
| Average AMD Ryzen 7 6800H (82673 - 105987, n=8) | |
| Asus TUF Dash F15 FX517ZR | |
| Schenker XMG Fusion 15 (Mid 22) | |
| Acer Nitro 5 AN515-58-72QR | |
| MSI Katana GF66 12UGS | |
| AIDA64 / CPU SHA3 | |
| Average of class Gaming (2180 - 9817, n=107, last 2 years) | |
| Schenker XMG Fusion 15 (Mid 22) | |
| Acer Nitro 5 AN515-46-R1A1 | |
| Average AMD Ryzen 7 6800H (2886 - 3634, n=8) | |
| MSI Katana GF66 12UGS | |
| Acer Nitro 5 AN515-58-72QR | |
| Asus TUF Dash F15 FX517ZR | |
| AIDA64 / CPU Queen | |
| Average of class Gaming (49785 - 173351, n=98, last 2 years) | |
| Acer Nitro 5 AN515-46-R1A1 | |
| MSI Katana GF66 12UGS | |
| Acer Nitro 5 AN515-58-72QR | |
| Average AMD Ryzen 7 6800H (75117 - 106322, n=8) | |
| Asus TUF Dash F15 FX517ZR | |
| Schenker XMG Fusion 15 (Mid 22) | |
| AIDA64 / FPU SinJulia | |
| Average of class Gaming (4424 - 33636, n=107, last 2 years) | |
| Acer Nitro 5 AN515-46-R1A1 | |
| Average AMD Ryzen 7 6800H (11771 - 13120, n=8) | |
| Acer Nitro 5 AN515-58-72QR | |
| MSI Katana GF66 12UGS | |
| Schenker XMG Fusion 15 (Mid 22) | |
| Asus TUF Dash F15 FX517ZR | |
| AIDA64 / FPU Mandel | |
| Average of class Gaming (25115 - 128721, n=107, last 2 years) | |
| Acer Nitro 5 AN515-46-R1A1 | |
| Average AMD Ryzen 7 6800H (45287 - 58327, n=8) | |
| Schenker XMG Fusion 15 (Mid 22) | |
| Asus TUF Dash F15 FX517ZR | |
| Acer Nitro 5 AN515-58-72QR | |
| MSI Katana GF66 12UGS | |
| AIDA64 / CPU AES | |
| Schenker XMG Fusion 15 (Mid 22) | |
| Acer Nitro 5 AN515-46-R1A1 | |
| Average AMD Ryzen 7 6800H (67816 - 137383, n=8) | |
| Average of class Gaming (39258 - 247074, n=107, last 2 years) | |
| MSI Katana GF66 12UGS | |
| Asus TUF Dash F15 FX517ZR | |
| Acer Nitro 5 AN515-58-72QR | |
| AIDA64 / CPU ZLib | |
| Average of class Gaming (574 - 2531, n=107, last 2 years) | |
| Acer Nitro 5 AN515-58-72QR | |
| MSI Katana GF66 12UGS | |
| Asus TUF Dash F15 FX517ZR | |
| Acer Nitro 5 AN515-46-R1A1 | |
| Average AMD Ryzen 7 6800H (732 - 901, n=8) | |
| Schenker XMG Fusion 15 (Mid 22) | |
| AIDA64 / FP64 Ray-Trace | |
| Average of class Gaming (5509 - 45446, n=107, last 2 years) | |
| Acer Nitro 5 AN515-46-R1A1 | |
| Average AMD Ryzen 7 6800H (6917 - 8980, n=8) | |
| Asus TUF Dash F15 FX517ZR | |
| Schenker XMG Fusion 15 (Mid 22) | |
| Acer Nitro 5 AN515-58-72QR | |
| MSI Katana GF66 12UGS | |
| AIDA64 / CPU PhotoWorxx | |
| Average of class Gaming (12271 - 89891, n=107, last 2 years) | |
| Asus TUF Dash F15 FX517ZR | |
| Average AMD Ryzen 7 6800H (26496 - 30360, n=8) | |
| Acer Nitro 5 AN515-46-R1A1 | |
| MSI Katana GF66 12UGS | |
| Schenker XMG Fusion 15 (Mid 22) | |
| Acer Nitro 5 AN515-58-72QR | |
系统性能
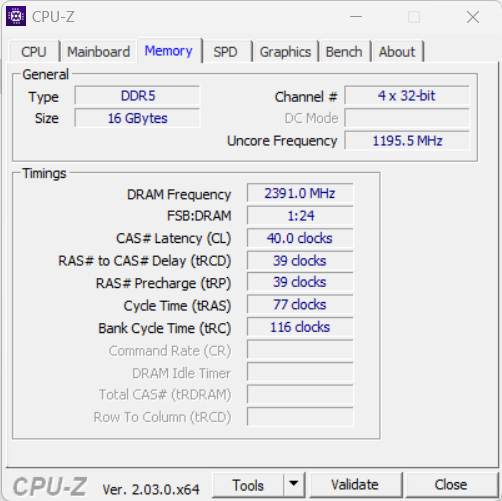
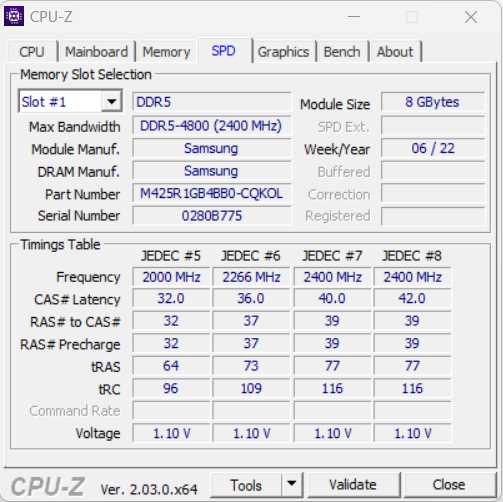
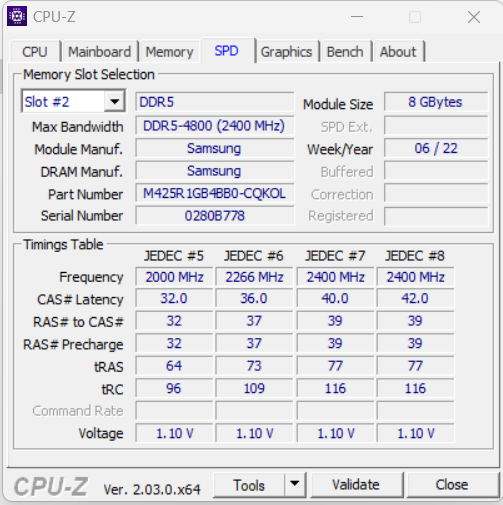
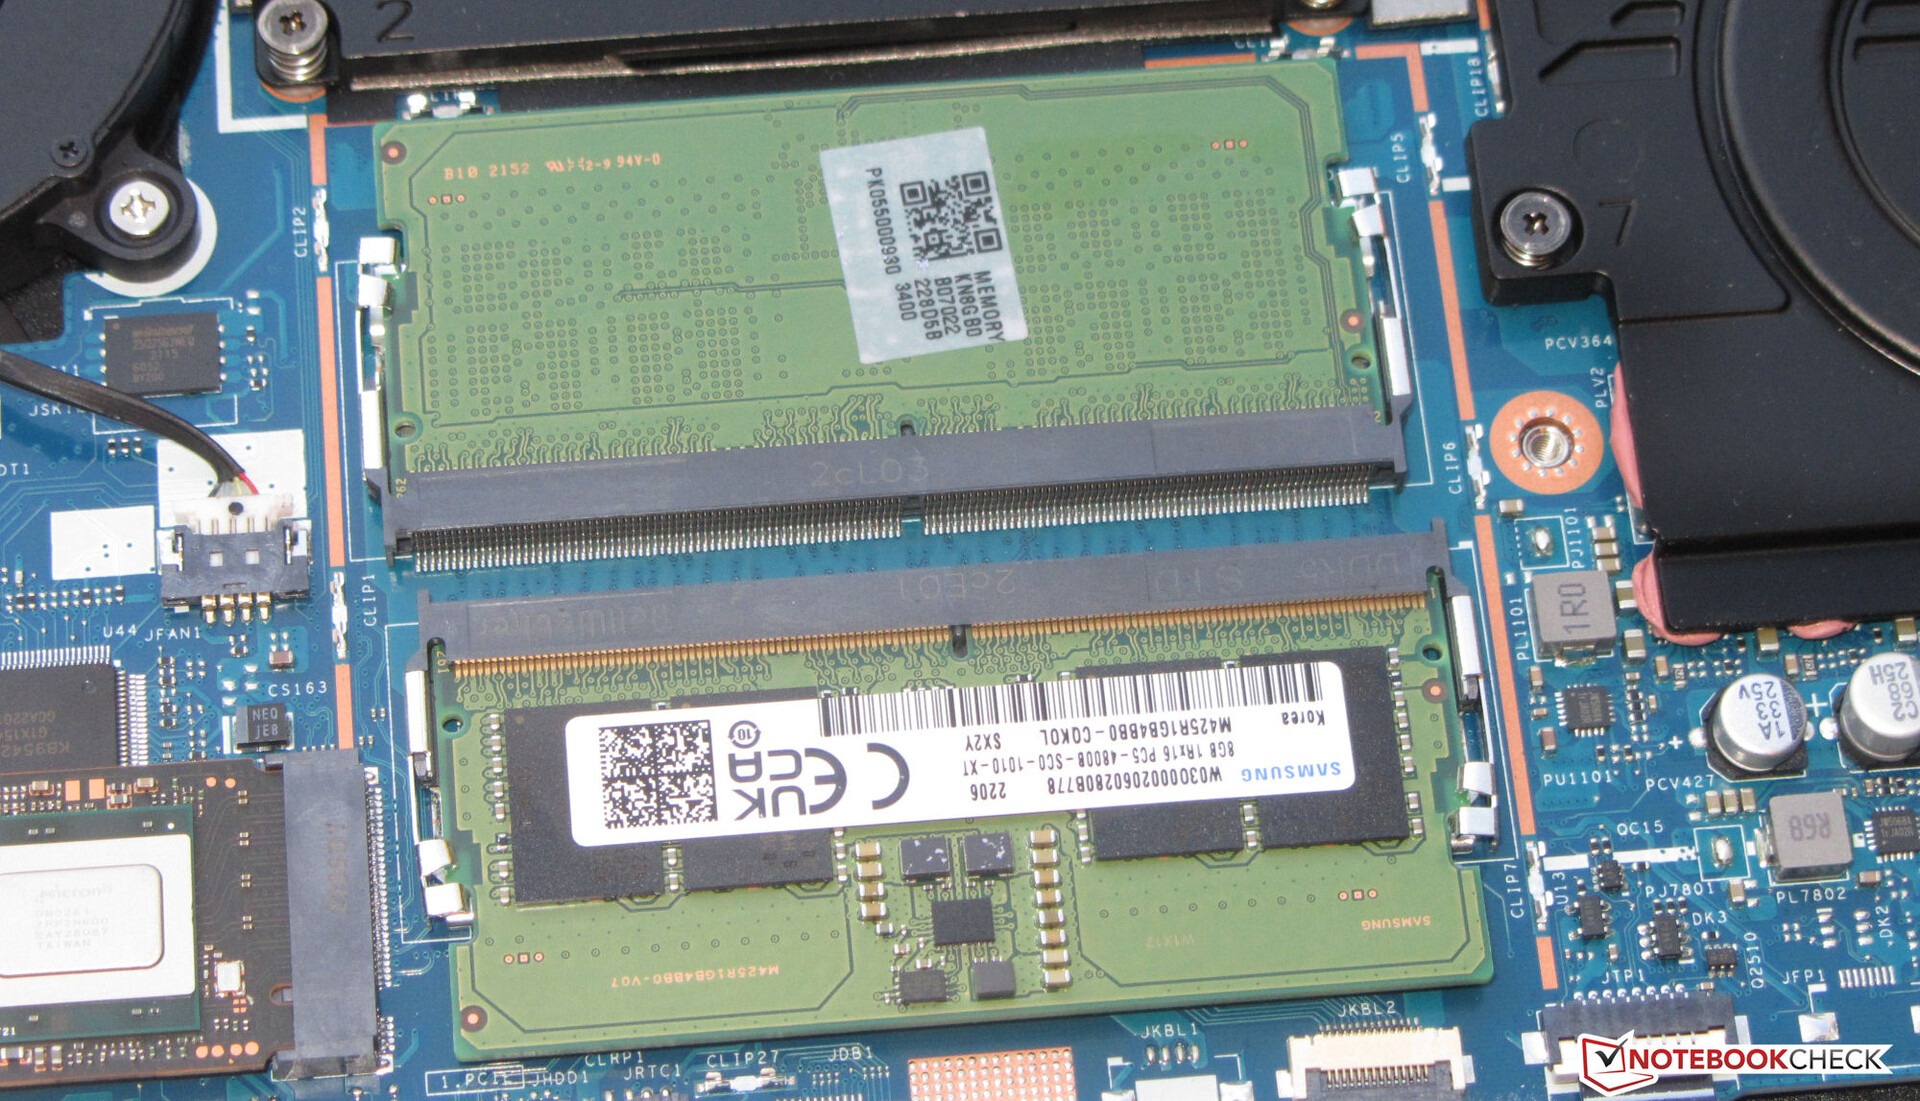
这个全面的、运行流畅的系统为渲染、视频处理和游戏等苛刻的应用提供了足够的计算能力。PCMark的结果是好的。内存的传输率(DDR5-4800)比华硕TUF Dash F15等同类笔记本略低。
CrossMark: Overall | Productivity | Creativity | Responsiveness
| PCMark 10 / Score | |
| Average of class Gaming (5828 - 11574, n=94, last 2 years) | |
| MSI Katana GF66 12UGS | |
| Average AMD Ryzen 7 6800H, NVIDIA GeForce RTX 3070 Ti Laptop GPU (6783 - 7549, n=2) | |
| Acer Nitro 5 AN515-58-72QR | |
| Asus TUF Dash F15 FX517ZR | |
| Acer Nitro 5 AN515-46-R1A1 | |
| Schenker XMG Fusion 15 (Mid 22) | |
| PCMark 10 / Essentials | |
| Average of class Gaming (8810 - 12600, n=98, last 2 years) | |
| Average AMD Ryzen 7 6800H, NVIDIA GeForce RTX 3070 Ti Laptop GPU (10343 - 10472, n=2) | |
| MSI Katana GF66 12UGS | |
| Acer Nitro 5 AN515-46-R1A1 | |
| Asus TUF Dash F15 FX517ZR | |
| Acer Nitro 5 AN515-58-72QR | |
| Schenker XMG Fusion 15 (Mid 22) | |
| PCMark 10 / Productivity | |
| Average of class Gaming (6845 - 18766, n=96, last 2 years) | |
| MSI Katana GF66 12UGS | |
| Asus TUF Dash F15 FX517ZR | |
| Average AMD Ryzen 7 6800H, NVIDIA GeForce RTX 3070 Ti Laptop GPU (8991 - 9479, n=2) | |
| Acer Nitro 5 AN515-58-72QR | |
| Acer Nitro 5 AN515-46-R1A1 | |
| Schenker XMG Fusion 15 (Mid 22) | |
| PCMark 10 / Digital Content Creation | |
| Average of class Gaming (7602 - 19657, n=96, last 2 years) | |
| MSI Katana GF66 12UGS | |
| Average AMD Ryzen 7 6800H, NVIDIA GeForce RTX 3070 Ti Laptop GPU (9108 - 11759, n=2) | |
| Acer Nitro 5 AN515-58-72QR | |
| Asus TUF Dash F15 FX517ZR | |
| Acer Nitro 5 AN515-46-R1A1 | |
| Schenker XMG Fusion 15 (Mid 22) | |
| CrossMark / Overall | |
| Average of class Gaming (1366 - 2409, n=96, last 2 years) | |
| MSI Katana GF66 12UGS | |
| Asus TUF Dash F15 FX517ZR | |
| Acer Nitro 5 AN515-58-72QR | |
| Schenker XMG Fusion 15 (Mid 22) | |
| Average AMD Ryzen 7 6800H, NVIDIA GeForce RTX 3070 Ti Laptop GPU (1522 - 1643, n=2) | |
| Acer Nitro 5 AN515-46-R1A1 | |
| CrossMark / Productivity | |
| MSI Katana GF66 12UGS | |
| Average of class Gaming (1386 - 2254, n=96, last 2 years) | |
| Acer Nitro 5 AN515-58-72QR | |
| Asus TUF Dash F15 FX517ZR | |
| Schenker XMG Fusion 15 (Mid 22) | |
| Average AMD Ryzen 7 6800H, NVIDIA GeForce RTX 3070 Ti Laptop GPU (1530 - 1600, n=2) | |
| Acer Nitro 5 AN515-46-R1A1 | |
| CrossMark / Creativity | |
| Average of class Gaming (1343 - 2729, n=96, last 2 years) | |
| Asus TUF Dash F15 FX517ZR | |
| MSI Katana GF66 12UGS | |
| Acer Nitro 5 AN515-58-72QR | |
| Schenker XMG Fusion 15 (Mid 22) | |
| Average AMD Ryzen 7 6800H, NVIDIA GeForce RTX 3070 Ti Laptop GPU (1589 - 1746, n=2) | |
| Acer Nitro 5 AN515-46-R1A1 | |
| CrossMark / Responsiveness | |
| MSI Katana GF66 12UGS | |
| Average of class Gaming (1226 - 2334, n=96, last 2 years) | |
| Acer Nitro 5 AN515-58-72QR | |
| Schenker XMG Fusion 15 (Mid 22) | |
| Asus TUF Dash F15 FX517ZR | |
| Average AMD Ryzen 7 6800H, NVIDIA GeForce RTX 3070 Ti Laptop GPU (1316 - 1481, n=2) | |
| Acer Nitro 5 AN515-46-R1A1 | |
| PCMark 8 Home Score Accelerated v2 | 5074 points | |
| PCMark 8 Work Score Accelerated v2 | 5934 points | |
| PCMark 10 Score | 6783 points | |
Help | ||
| AIDA64 / Memory Copy | |
| Average of class Gaming (21750 - 129946, n=107, last 2 years) | |
| Asus TUF Dash F15 FX517ZR | |
| Average AMD Ryzen 7 6800H (48209 - 51186, n=8) | |
| Acer Nitro 5 AN515-46-R1A1 | |
| Schenker XMG Fusion 15 (Mid 22) | |
| MSI Katana GF66 12UGS | |
| Acer Nitro 5 AN515-58-72QR | |
| AIDA64 / Memory Read | |
| Average of class Gaming (22956 - 118858, n=107, last 2 years) | |
| Asus TUF Dash F15 FX517ZR | |
| Acer Nitro 5 AN515-46-R1A1 | |
| Average AMD Ryzen 7 6800H (43828 - 51778, n=8) | |
| Schenker XMG Fusion 15 (Mid 22) | |
| MSI Katana GF66 12UGS | |
| Acer Nitro 5 AN515-58-72QR | |
| AIDA64 / Memory Write | |
| Average of class Gaming (22297 - 135096, n=107, last 2 years) | |
| Asus TUF Dash F15 FX517ZR | |
| Acer Nitro 5 AN515-46-R1A1 | |
| Average AMD Ryzen 7 6800H (51116 - 55307, n=8) | |
| MSI Katana GF66 12UGS | |
| Schenker XMG Fusion 15 (Mid 22) | |
| Acer Nitro 5 AN515-58-72QR | |
| AIDA64 / Memory Latency | |
| Average of class Gaming (75.3 - 259, n=107, last 2 years) | |
| MSI Katana GF66 12UGS | |
| Asus TUF Dash F15 FX517ZR | |
| Schenker XMG Fusion 15 (Mid 22) | |
| Acer Nitro 5 AN515-46-R1A1 | |
| Average AMD Ryzen 7 6800H (83.1 - 104.1, n=8) | |
| Acer Nitro 5 AN515-58-72QR | |
| Acer Nitro 5 AN515-58-72QR | |
* ... smaller is better
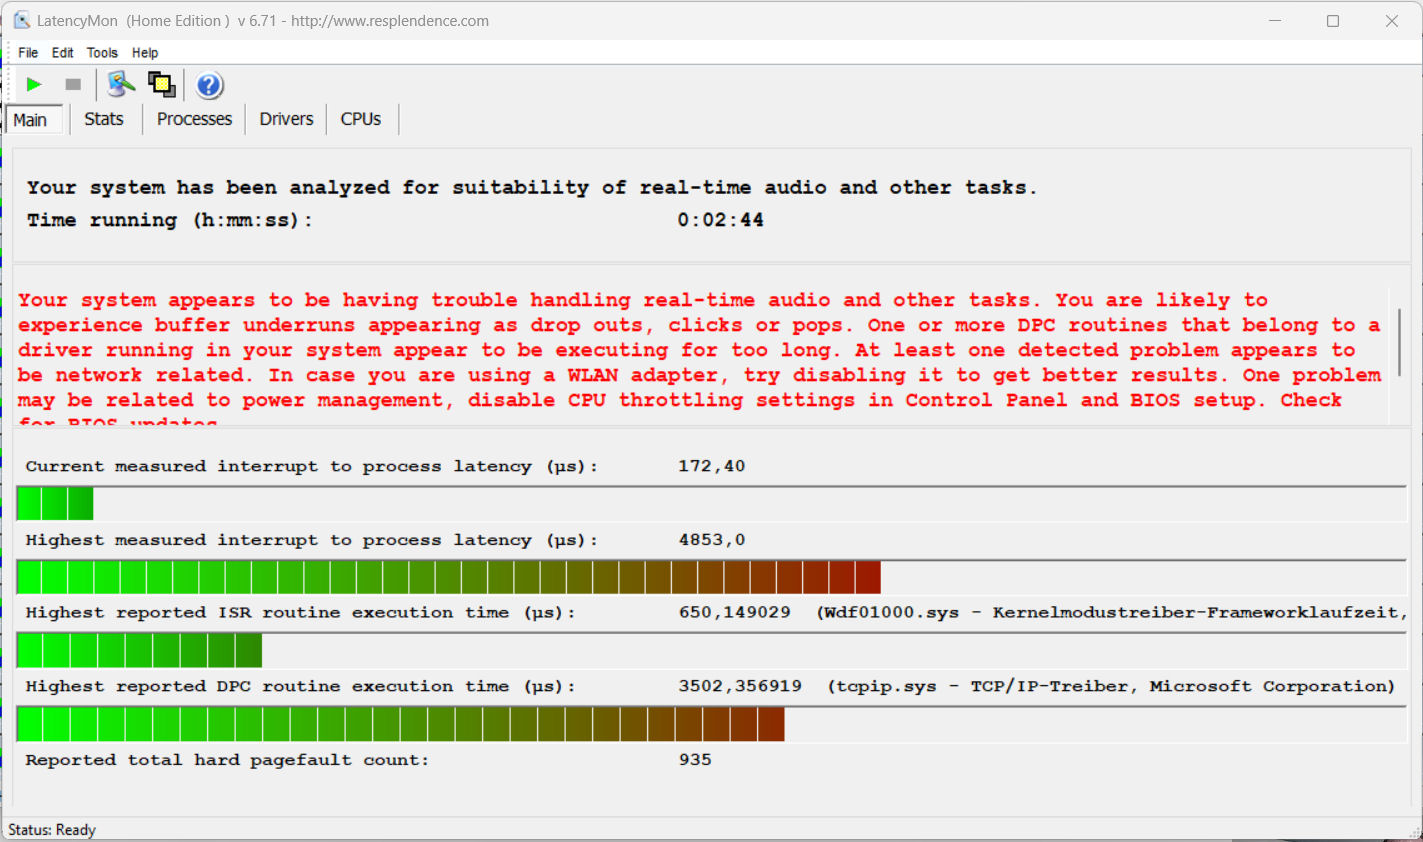
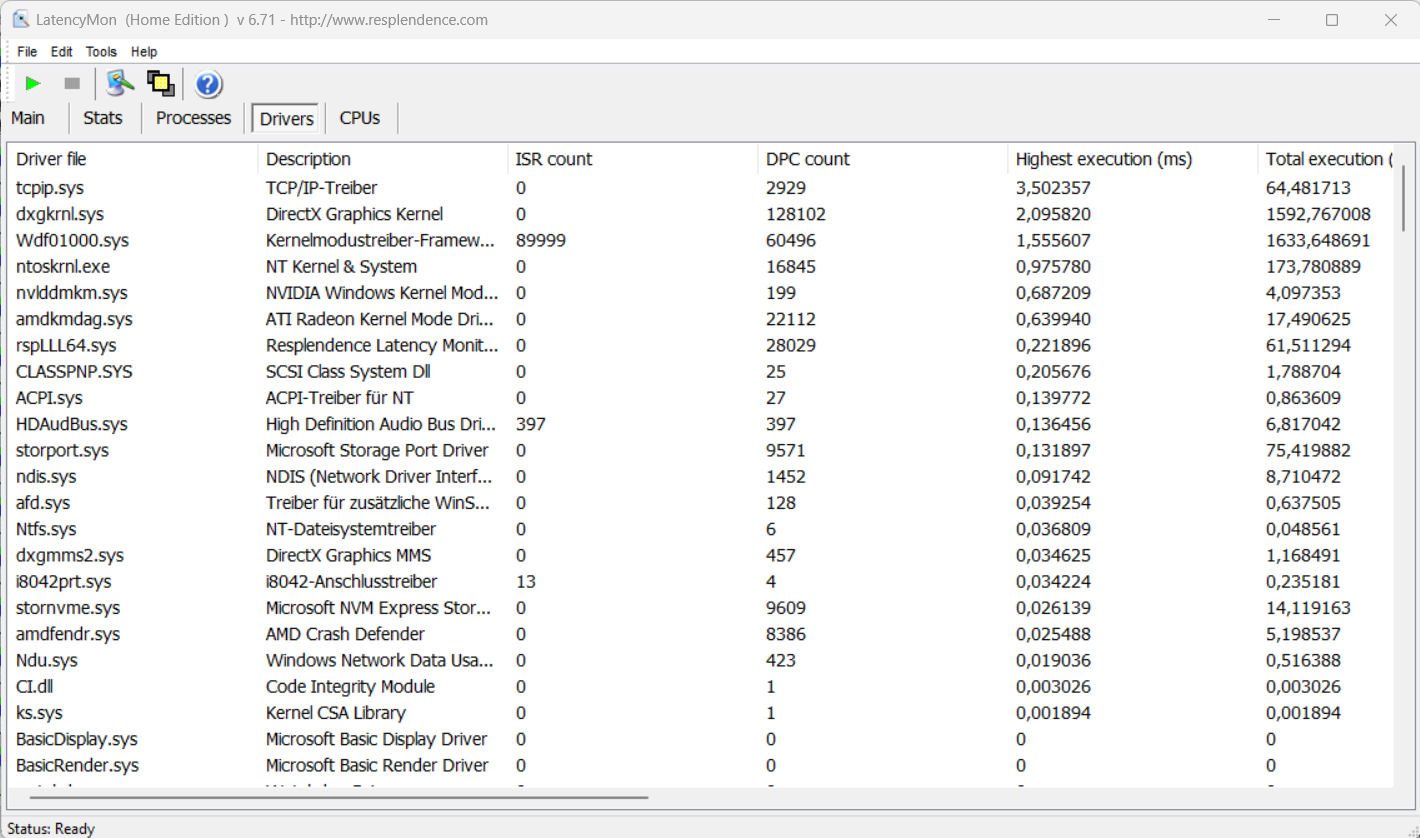
DPC延迟
标准化的延迟监测测试(浏览、播放4K视频、运行Prime95高负载)显示了DPC延迟方面的一些弱点。该系统似乎不适合实时视频和音频处理。未来的软件更新可能会改善甚至恶化这种情况。
| DPC Latencies / LatencyMon - interrupt to process latency (max), Web, Youtube, Prime95 | |
| Acer Nitro 5 AN515-46-R1A1 | |
| Schenker XMG Fusion 15 (Mid 22) | |
| Acer Nitro 5 AN515-58-72QR | |
| MSI Katana GF66 12UGS | |
| Asus TUF Dash F15 FX517ZR | |
* ... smaller is better
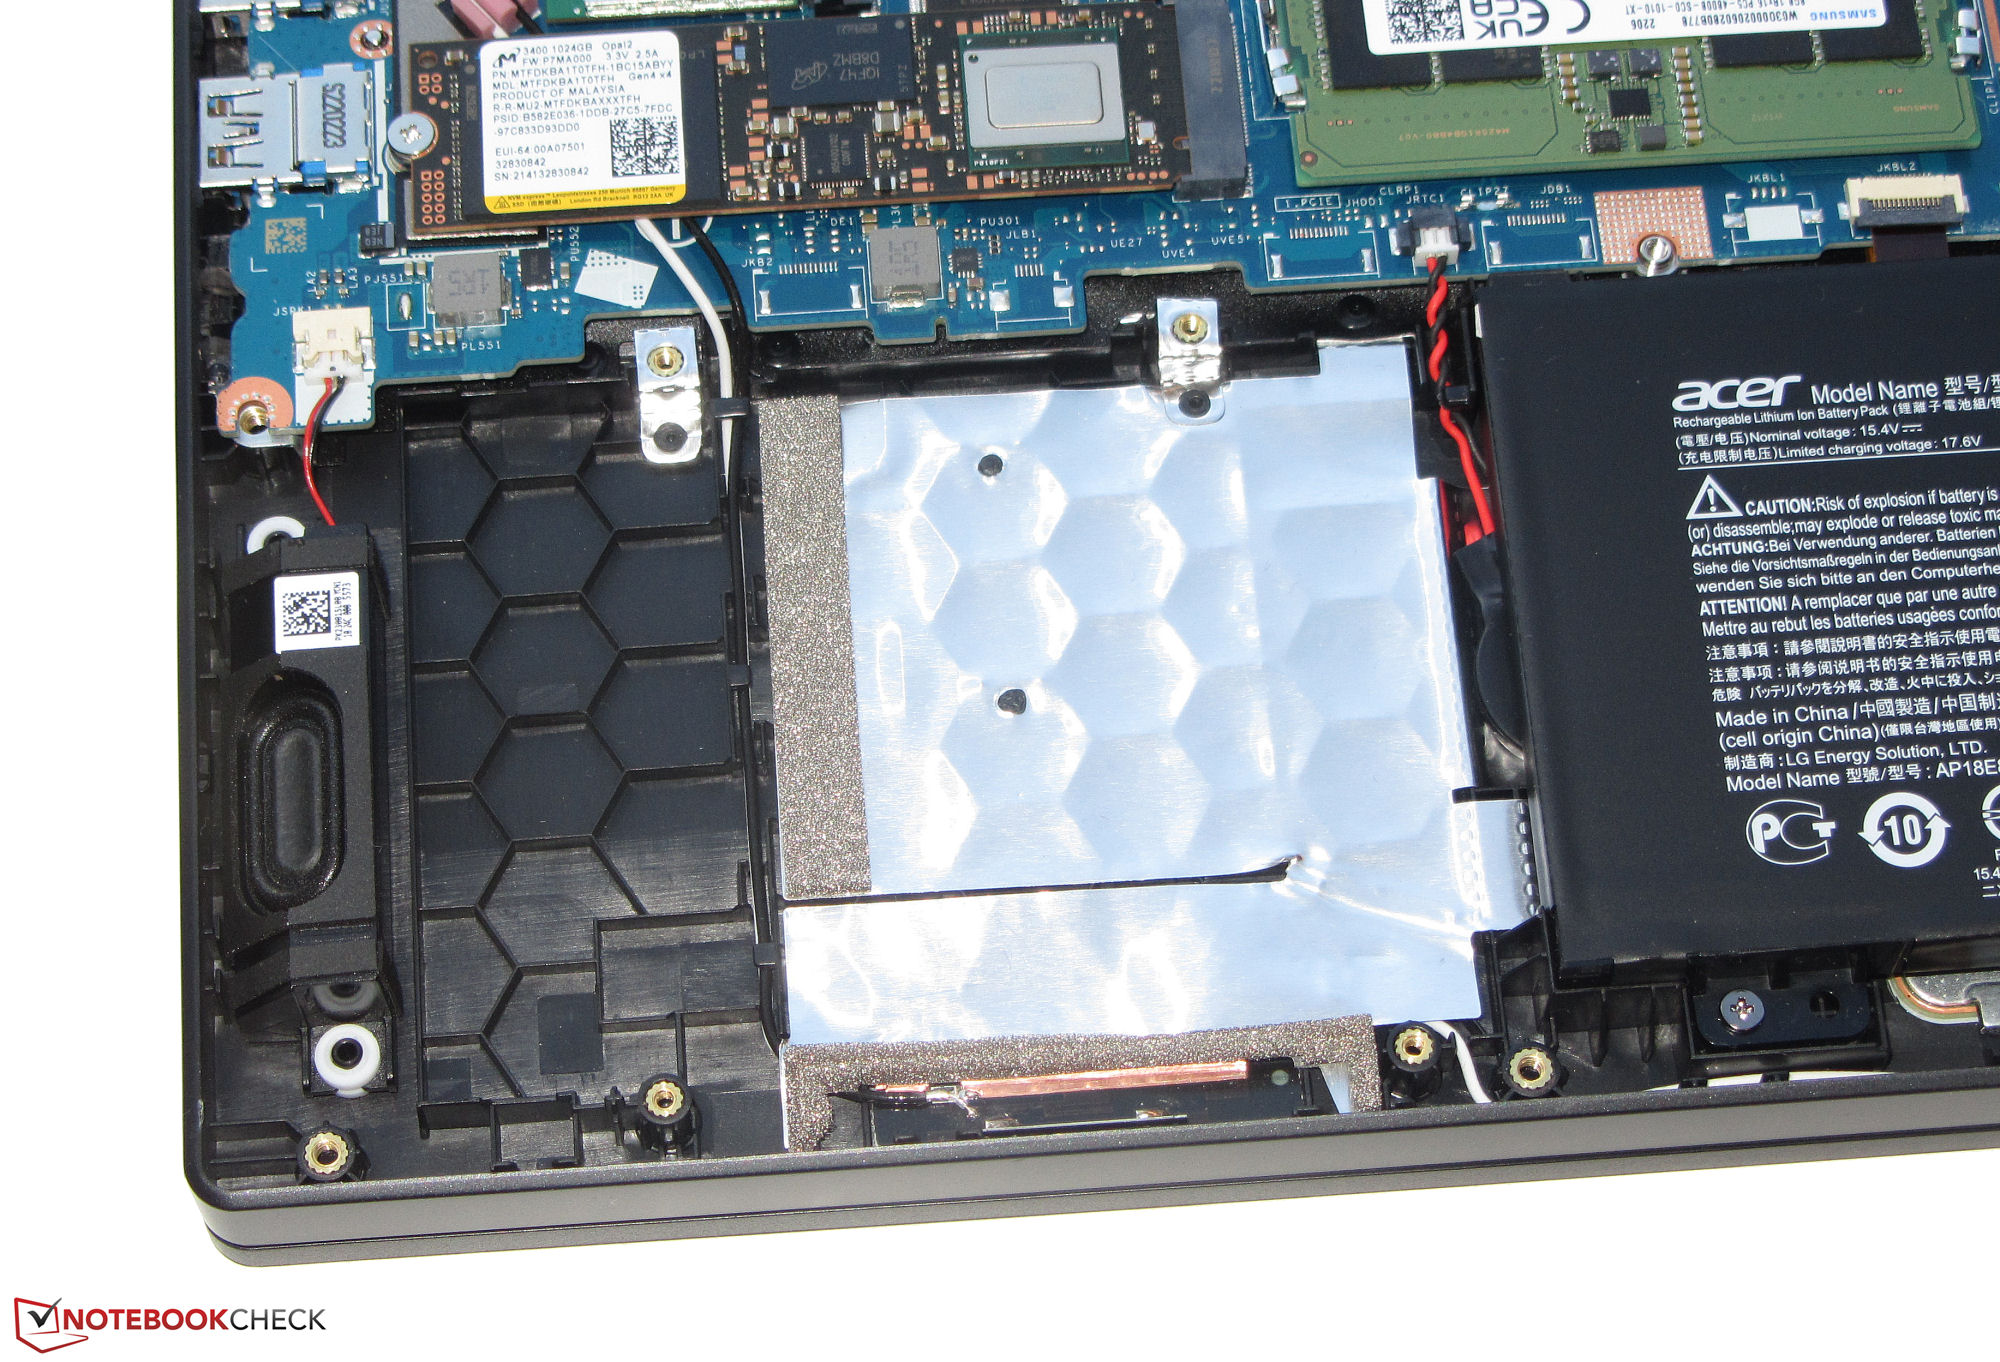
存储设备
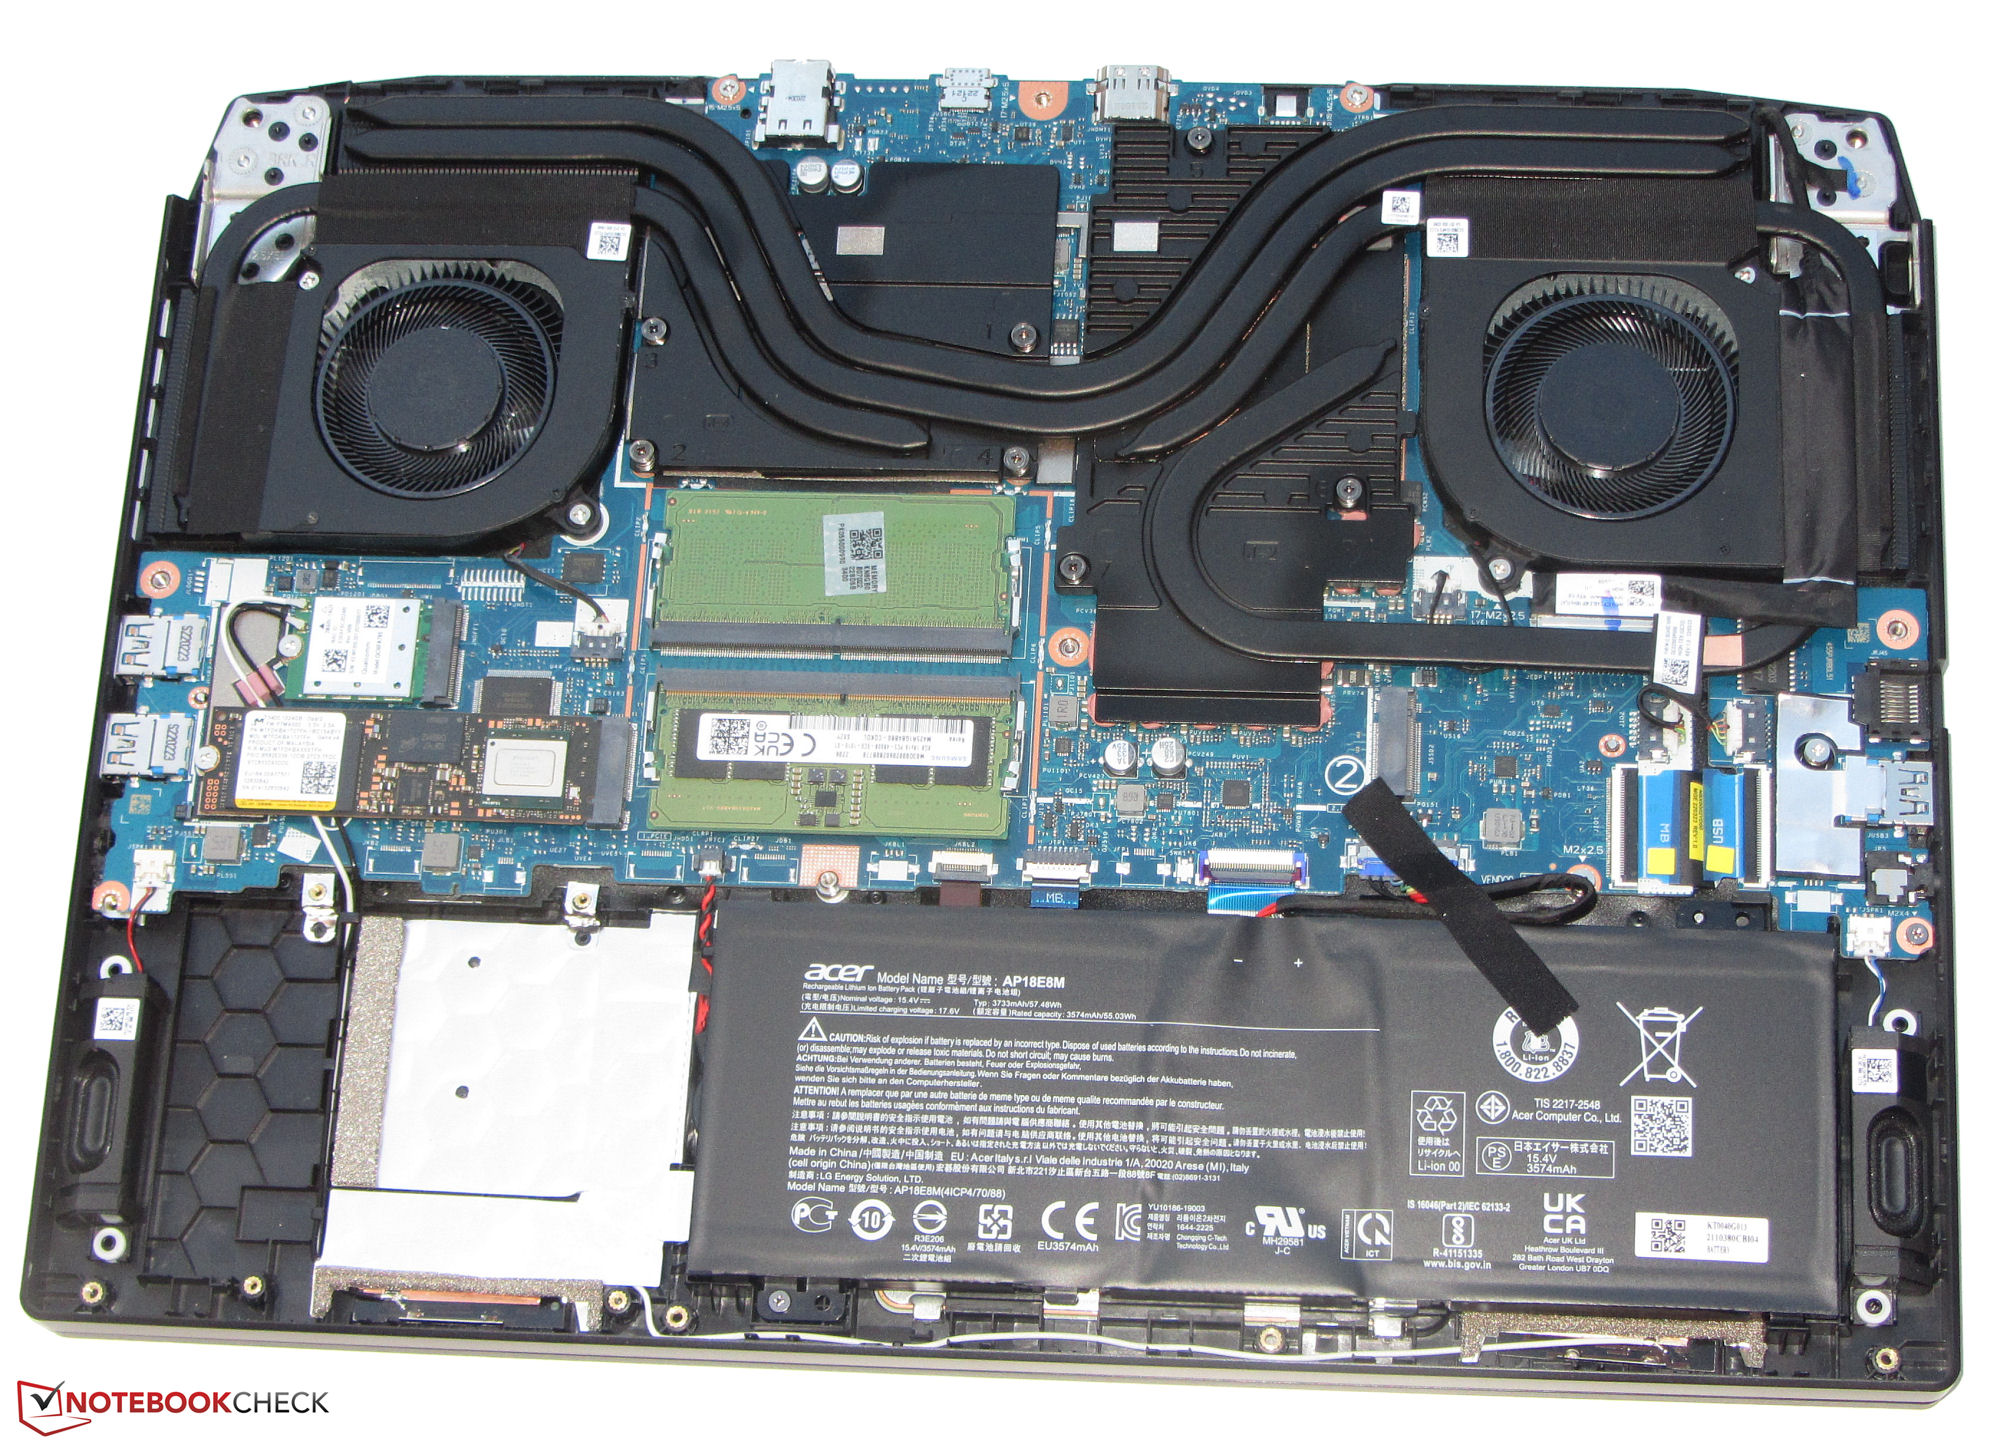
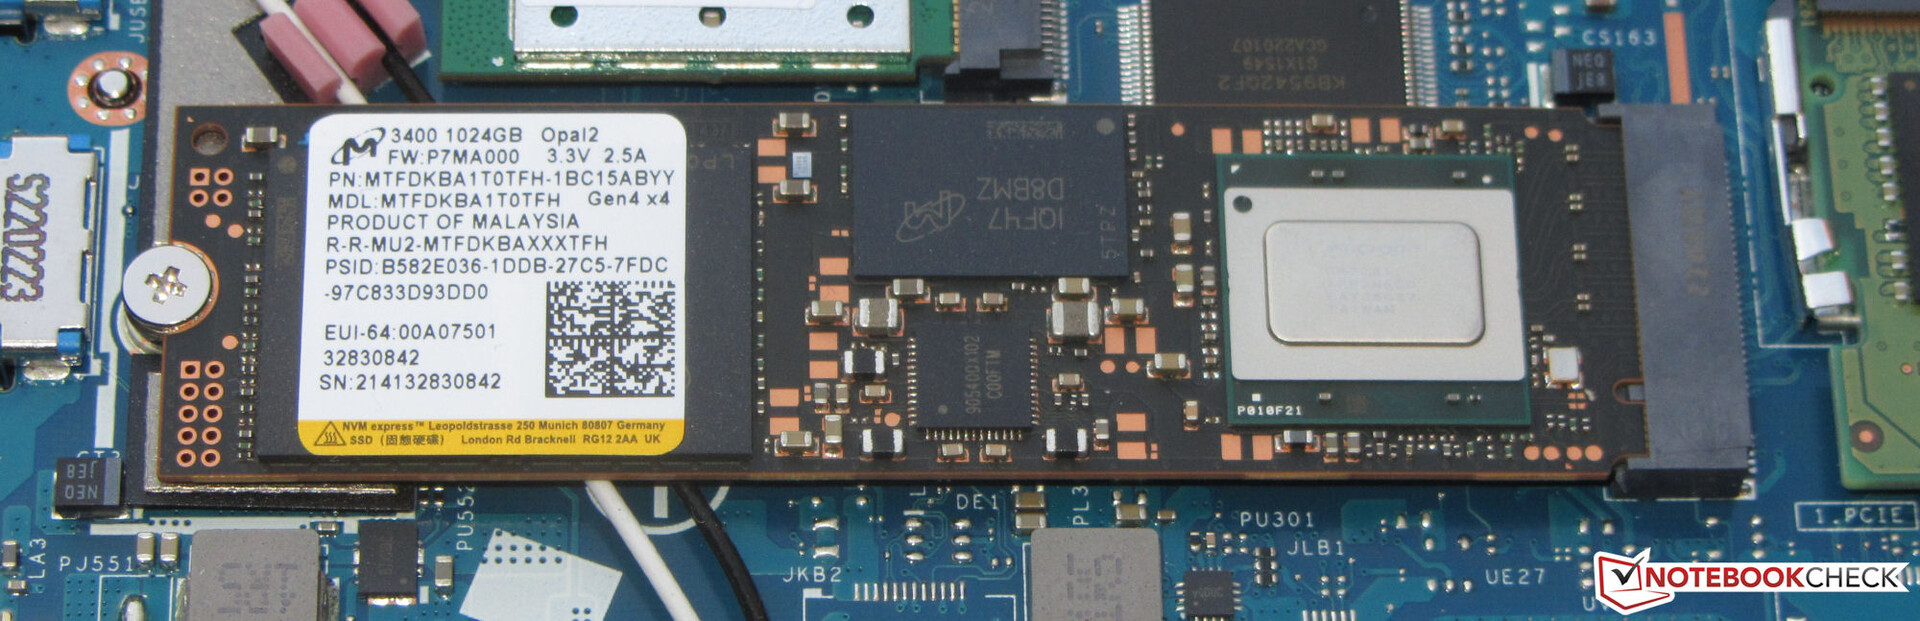
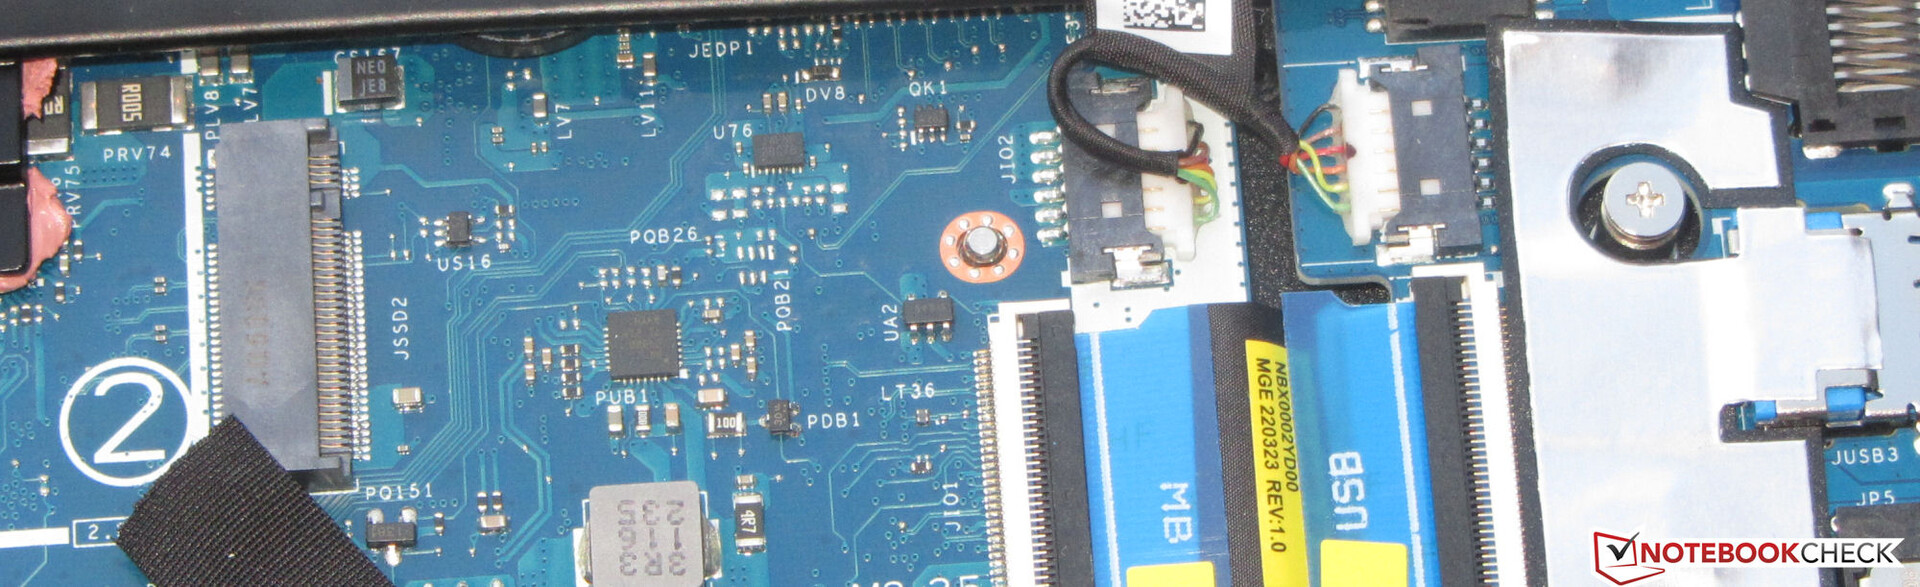
美光公司的1TB固态硬盘(PCIe 4,M.2-2280)具有非常好的传输率,但由于热节流而导致性能下降的问题。AN515有另一个插槽,用于安装第二个PCIe 4固态硬盘。理论上,这款笔记本也可以配备一个2.5英寸的存储设备,但该设备没有配备必要的SATA插槽,也没有合适的驱动器盒。

* ... smaller is better
Disk Throttling: DiskSpd Read Loop, Queue Depth 8
图形
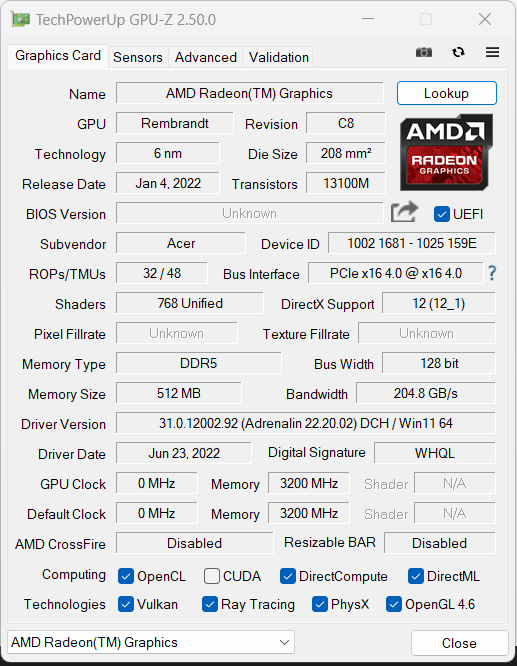
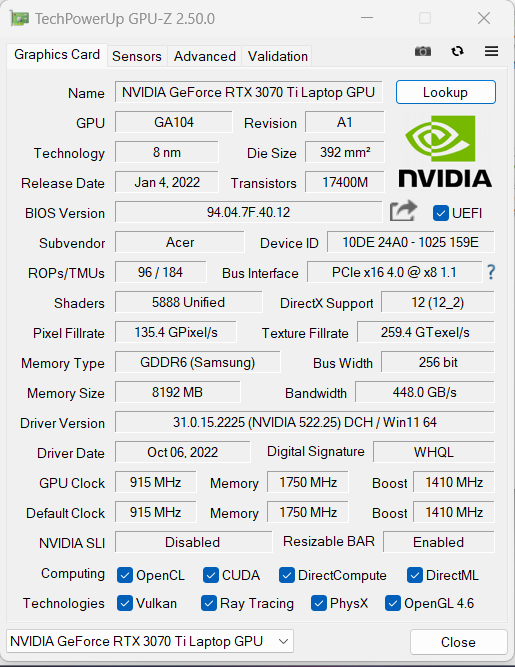
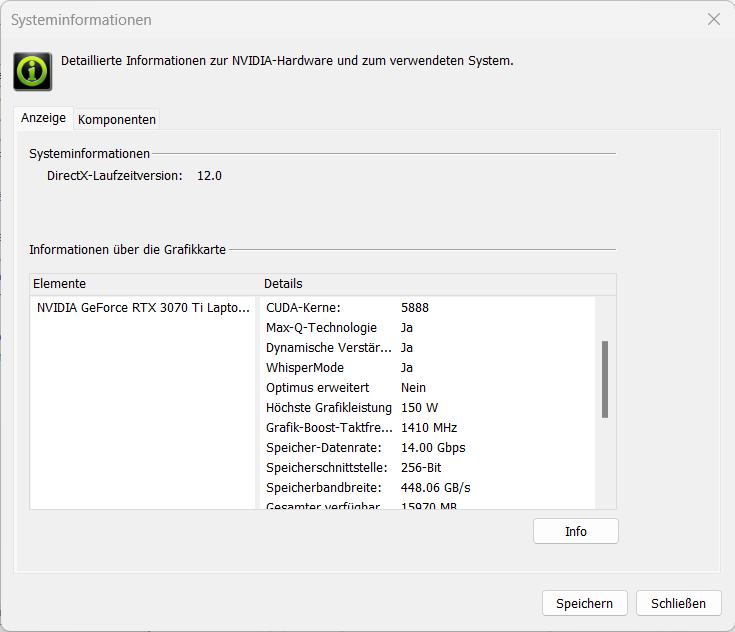
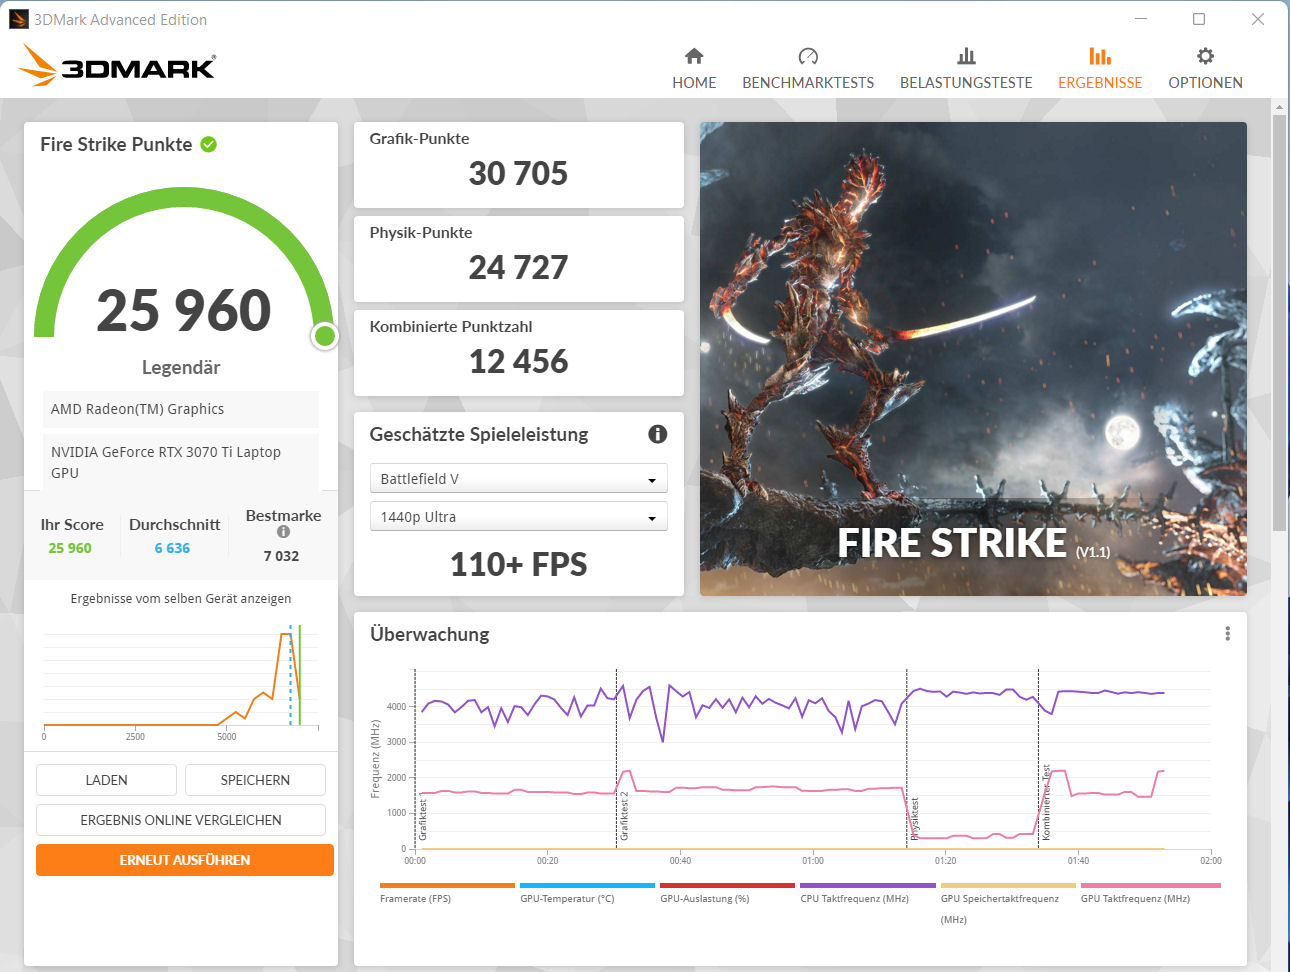
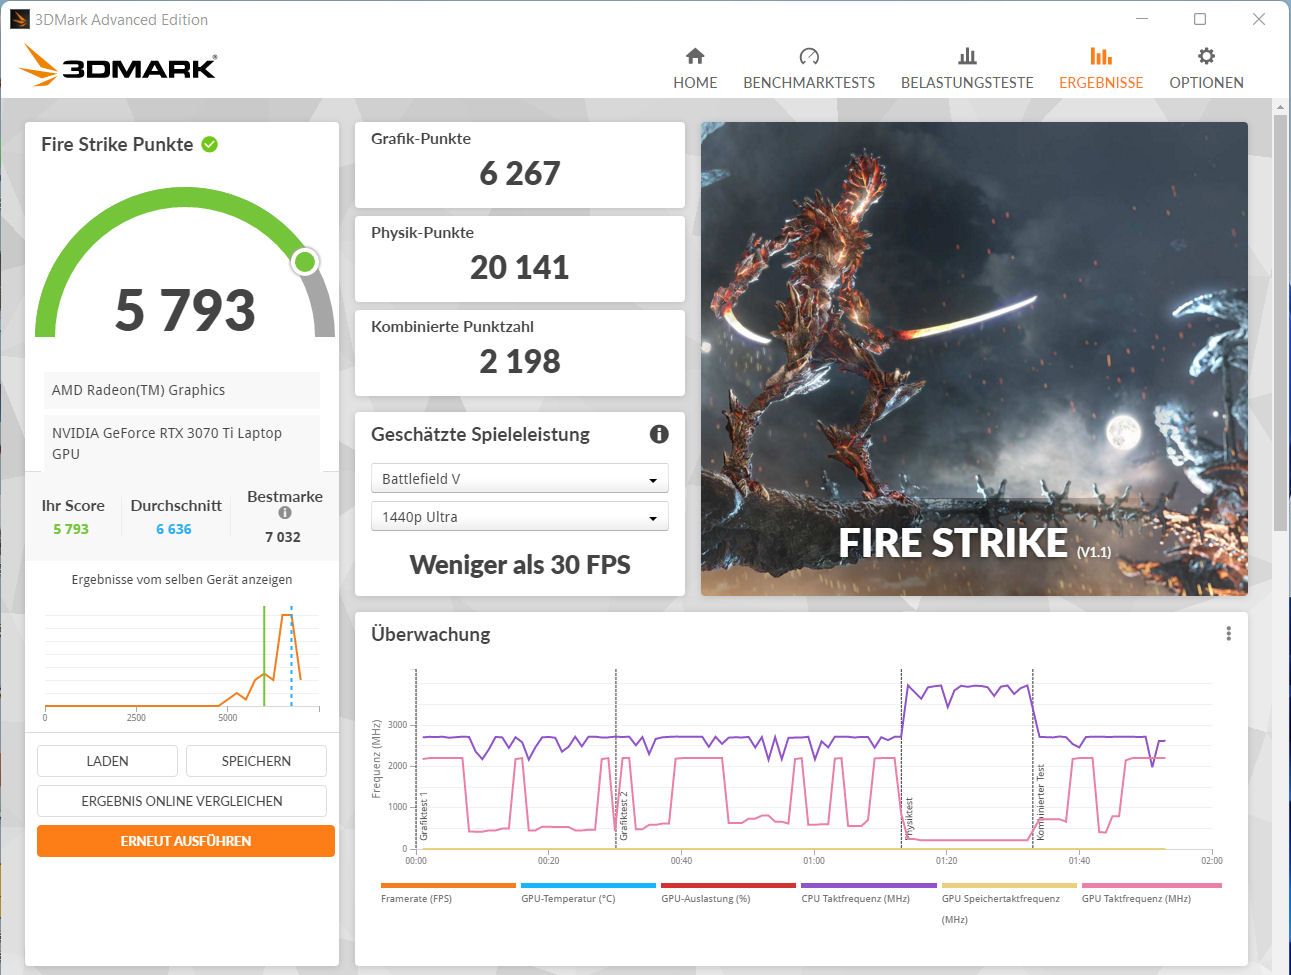
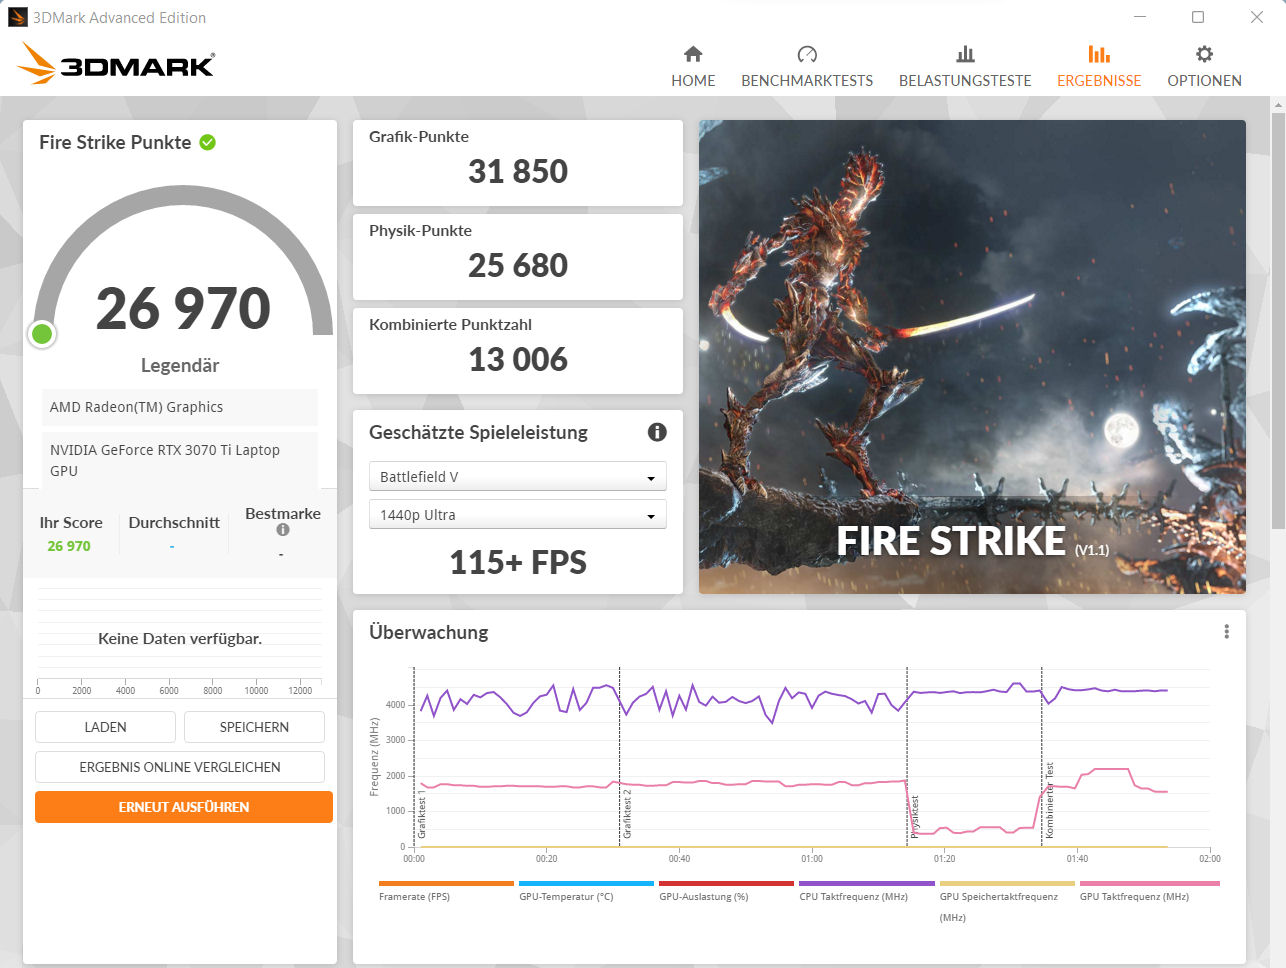
宏碁给GeForce RTX 3070 Ti(VRAM:8,192 MB GDDR6)的最大TGP为150瓦(125瓦+25瓦的动态提升)。3DMark的结果高于迄今为止RTX 3070 Ti GPU的平均测量值。各个性能配置文件之间的差异很小(见Fire Strike 截图)。从我们的Witcher 3 测试中可以看出,该设备利用了动态提升功能。
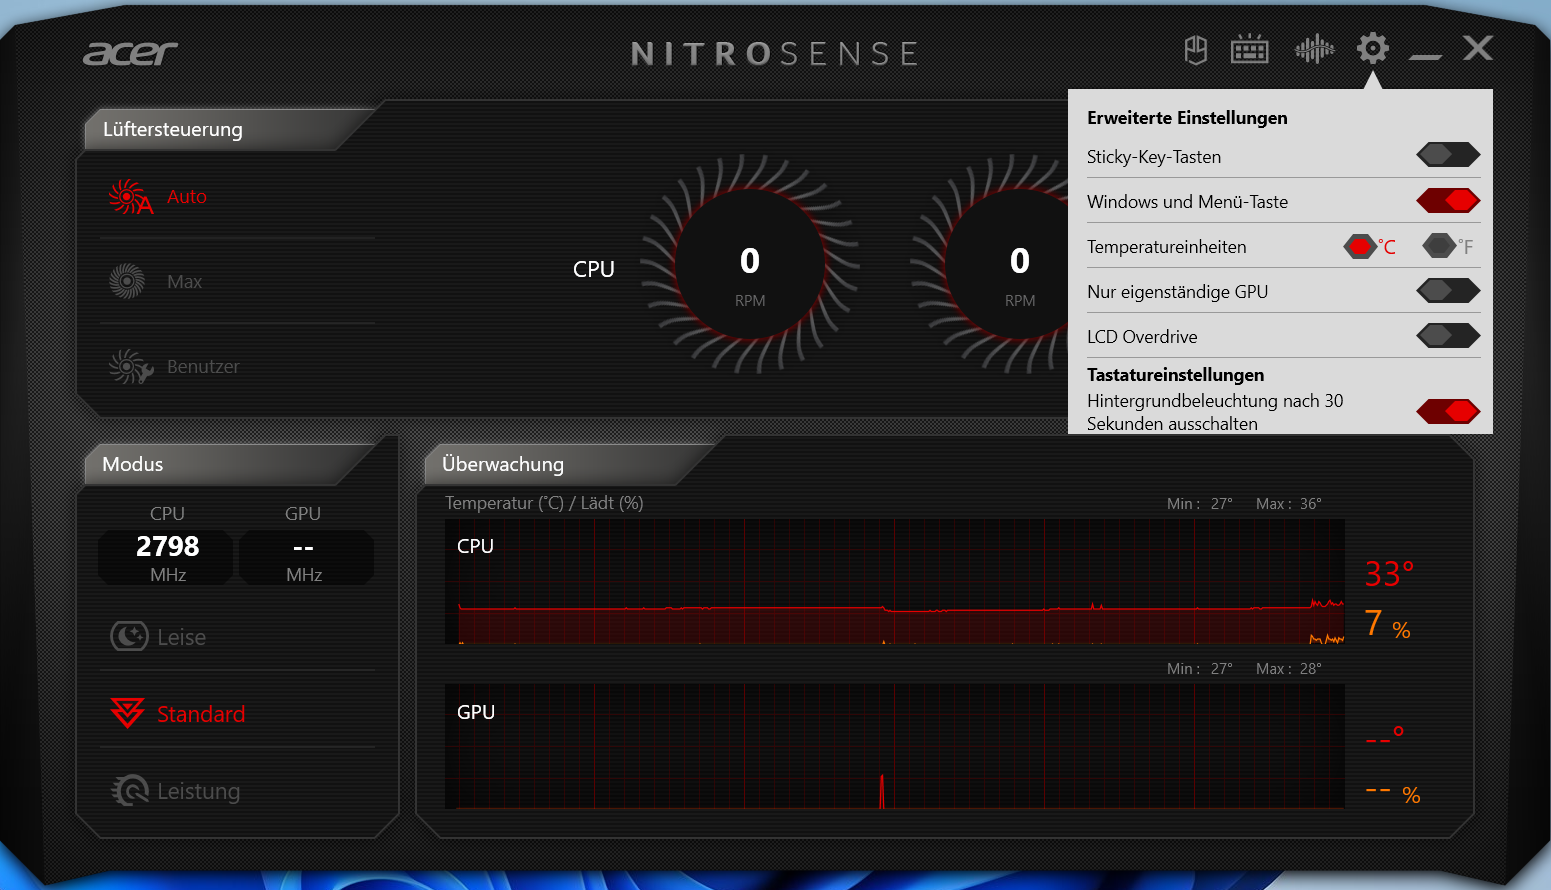
通过设置从GeForce GPU直接输出图像,可以稍微提高图形性能。这个开关可以在BIOS中或通过NitroSense软件进行(点击设置符号)。宏碁使用MUX开关,该设备不支持高级优化。

| 3DMark Performance rating - Percent | |
| Average of class Gaming | |
| Acer Nitro 5 AN515-46-R1A1 | |
| Acer Nitro 5 AN515-46-R1A1 | |
| Average NVIDIA GeForce RTX 3070 Ti Laptop GPU | |
| Acer Nitro 5 AN515-58-72QR | |
| MSI Katana GF66 12UGS | |
| Schenker XMG Fusion 15 (Mid 22) | |
| Asus TUF Dash F15 FX517ZR | |
| 3DMark 11 - 1280x720 Performance GPU | |
| Average of class Gaming (21841 - 80022, n=106, last 2 years) | |
| Acer Nitro 5 AN515-46-R1A1 (dGPU) | |
| Acer Nitro 5 AN515-46-R1A1 | |
| Acer Nitro 5 AN515-58-72QR | |
| Average NVIDIA GeForce RTX 3070 Ti Laptop GPU (13799 - 42569, n=36) | |
| MSI Katana GF66 12UGS | |
| Schenker XMG Fusion 15 (Mid 22) | |
| Asus TUF Dash F15 FX517ZR | |
| 3DMark | |
| 1920x1080 Fire Strike Graphics | |
| Average of class Gaming (12242 - 62849, n=118, last 2 years) | |
| Acer Nitro 5 AN515-46-R1A1 (dGPU) | |
| Acer Nitro 5 AN515-46-R1A1 | |
| Average NVIDIA GeForce RTX 3070 Ti Laptop GPU (22612 - 32550, n=37) | |
| Acer Nitro 5 AN515-58-72QR | |
| MSI Katana GF66 12UGS | |
| Schenker XMG Fusion 15 (Mid 22) | |
| Asus TUF Dash F15 FX517ZR | |
| 2560x1440 Time Spy Graphics | |
| Average of class Gaming (5012 - 26212, n=117, last 2 years) | |
| Acer Nitro 5 AN515-46-R1A1 (dGPU) | |
| Acer Nitro 5 AN515-46-R1A1 | |
| Average NVIDIA GeForce RTX 3070 Ti Laptop GPU (8142 - 12324, n=37) | |
| Acer Nitro 5 AN515-58-72QR | |
| MSI Katana GF66 12UGS | |
| Schenker XMG Fusion 15 (Mid 22) | |
| Asus TUF Dash F15 FX517ZR | |
| 2560x1440 Port Royal Graphics | |
| Average of class Gaming (4395 - 17286, n=70, last 2 years) | |
| Acer Nitro 5 AN515-46-R1A1 (dGPU) | |
| Acer Nitro 5 AN515-46-R1A1 | |
| Average NVIDIA GeForce RTX 3070 Ti Laptop GPU (5091 - 7510, n=23) | |
| Acer Nitro 5 AN515-58-72QR | |
| MSI Katana GF66 12UGS | |
| Schenker XMG Fusion 15 (Mid 22) | |
| Asus TUF Dash F15 FX517ZR | |
| 3DMark 06 Standard Score | 43453 points | |
| 3DMark 11 Performance | 28137 points | |
| 3DMark Cloud Gate Standard Score | 56030 points | |
| 3DMark Fire Strike Score | 25960 points | |
| 3DMark Time Spy Score | 11042 points | |
Help | ||
| Blender | |
| v3.3 Classroom OPTIX/RTX | |
| Asus TUF Dash F15 FX517ZR | |
| Acer Nitro 5 AN515-46-R1A1 (3.3.0) | |
| Acer Nitro 5 AN515-46-R1A1 (3.3.0, dGPU) | |
| Average of class Gaming (9 - 32, n=109, last 2 years) | |
| v3.3 Classroom CUDA | |
| Asus TUF Dash F15 FX517ZR | |
| Acer Nitro 5 AN515-46-R1A1 (3.3.0) | |
| Acer Nitro 5 AN515-46-R1A1 (3.3.0, dGPU) | |
| Average of class Gaming (15 - 228, n=109, last 2 years) | |
| v3.3 Classroom CPU | |
| Schenker XMG Fusion 15 (Mid 22) | |
| Asus TUF Dash F15 FX517ZR | |
| Acer Nitro 5 AN515-46-R1A1 (3.3.0) | |
| Acer Nitro 5 AN515-46-R1A1 (3.3.0, dGPU) | |
| Average of class Gaming (122 - 565, n=105, last 2 years) | |
* ... smaller is better
游戏性能
该硬件支持最大设置下的FHD游戏。所测试的标题的刷新率往往高于RTX 3070 Ti的平均水平。通过GeForce GPU的图像输出增加了帧率。Witcher 3 测试证实,刷新率在很长一段时间内保持稳定。
| The Witcher 3 - 1920x1080 Ultra Graphics & Postprocessing (HBAO+) | |
| Average of class Gaming (95 - 240, n=8, last 2 years) | |
| Acer Nitro 5 AN515-46-R1A1 (dGPU) | |
| Acer Nitro 5 AN515-46-R1A1 | |
| Average NVIDIA GeForce RTX 3070 Ti Laptop GPU (76.8 - 124.1, n=39) | |
| Acer Nitro 5 AN515-58-72QR | |
| MSI Katana GF66 12UGS | |
| Schenker XMG Fusion 15 (Mid 22) | |
| Asus TUF Dash F15 FX517ZR | |
| Dota 2 Reborn - 1920x1080 ultra (3/3) best looking | |
| Average of class Gaming (84.8 - 248, n=110, last 2 years) | |
| MSI Katana GF66 12UGS | |
| Average NVIDIA GeForce RTX 3070 Ti Laptop GPU (68.7 - 160.5, n=38) | |
| Acer Nitro 5 AN515-58-72QR | |
| Schenker XMG Fusion 15 (Mid 22) | |
| Acer Nitro 5 AN515-46-R1A1 (dGPU) | |
| Asus TUF Dash F15 FX517ZR | |
| Acer Nitro 5 AN515-46-R1A1 | |
| X-Plane 11.11 - 1920x1080 high (fps_test=3) | |
| MSI Katana GF66 12UGS | |
| Asus TUF Dash F15 FX517ZR | |
| Average of class Gaming (52.1 - 143.5, n=113, last 2 years) | |
| Average NVIDIA GeForce RTX 3070 Ti Laptop GPU (51.6 - 116.9, n=37) | |
| Acer Nitro 5 AN515-58-72QR | |
| Schenker XMG Fusion 15 (Mid 22) | |
| Acer Nitro 5 AN515-46-R1A1 (dGPU) | |
| Acer Nitro 5 AN515-46-R1A1 | |
| Final Fantasy XV Benchmark - 1920x1080 High Quality | |
| Average of class Gaming (41 - 215, n=101, last 2 years) | |
| Acer Nitro 5 AN515-46-R1A1 (1.3, dGPU) | |
| Acer Nitro 5 AN515-46-R1A1 (1.3) | |
| Average NVIDIA GeForce RTX 3070 Ti Laptop GPU (49.5 - 122.4, n=35) | |
| Schenker XMG Fusion 15 (Mid 22) (1.3) | |
| MSI Katana GF66 12UGS (1.3) | |
| Acer Nitro 5 AN515-58-72QR (1.3) | |
| Asus TUF Dash F15 FX517ZR (1.3) | |
| GTA V - 1920x1080 Highest AA:4xMSAA + FX AF:16x | |
| Average of class Gaming (48.3 - 186.9, n=100, last 2 years) | |
| Average NVIDIA GeForce RTX 3070 Ti Laptop GPU (44 - 123.9, n=36) | |
| Asus TUF Dash F15 FX517ZR | |
| MSI Katana GF66 12UGS | |
| Schenker XMG Fusion 15 (Mid 22) | |
| Acer Nitro 5 AN515-58-72QR | |
| Acer Nitro 5 AN515-46-R1A1 | |
| Acer Nitro 5 AN515-46-R1A1 (dGPU) | |
| Strange Brigade - 1920x1080 ultra AA:ultra AF:16 | |
| Average of class Gaming (76.3 - 456, n=91, last 2 years) | |
| Acer Nitro 5 AN515-46-R1A1 (1.47.22.14 D3D12, dGPU) | |
| Average NVIDIA GeForce RTX 3070 Ti Laptop GPU (109 - 221, n=37) | |
| Acer Nitro 5 AN515-58-72QR (1.47.22.14 D3D12) | |
| Acer Nitro 5 AN515-46-R1A1 (1.47.22.14 D3D12) | |
| MSI Katana GF66 12UGS (1.47.22.14 D3D12) | |
| Schenker XMG Fusion 15 (Mid 22) (1.47.22.14 D3D12) | |
| Asus TUF Dash F15 FX517ZR (1.47.22.14 D3D12) | |
| F1 22 - 1920x1080 Ultra High Preset AA:T AF:16x | |
| Acer Nitro 5 AN515-46-R1A1 (923650, dGPU) | |
| Average of class Gaming (40.1 - 121.2, n=5, last 2 years) | |
| Acer Nitro 5 AN515-46-R1A1 (923662) | |
| Average NVIDIA GeForce RTX 3070 Ti Laptop GPU (58.1 - 80, n=8) | |
| Far Cry 5 - 1920x1080 Ultra Preset AA:T | |
| Average NVIDIA GeForce RTX 3070 Ti Laptop GPU (91 - 138, n=25) | |
| Average of class Gaming (70 - 151, n=10, last 2 years) | |
| MSI Katana GF66 12UGS | |
| Acer Nitro 5 AN515-46-R1A1 (dGPU) | |
| Schenker XMG Fusion 15 (Mid 22) | |
| Acer Nitro 5 AN515-46-R1A1 | |
| Asus TUF Dash F15 FX517ZR | |
| Acer Nitro 5 AN515-58-72QR | |
| Hitman 3 - 1920x1080 Maximum Settings AF:16x | |
| Acer Nitro 5 AN515-46-R1A1 | |
| Average NVIDIA GeForce RTX 3070 Ti Laptop GPU (138 - 157.7, n=3) | |
| God of War - 1920x1080 Ultra Preset | |
| Average of class Gaming (n=1last 2 years) | |
| Acer Nitro 5 AN515-46-R1A1 | |
| Average NVIDIA GeForce RTX 3070 Ti Laptop GPU (55.1 - 64.3, n=5) | |
| Tiny Tina's Wonderlands - 1920x1080 Badass Preset (DX12) | |
| Average of class Gaming (55 - 159.4, n=5, last 2 years) | |
| Acer Nitro 5 AN515-46-R1A1 | |
| Average NVIDIA GeForce RTX 3070 Ti Laptop GPU (89.8 - 93.7, n=4) | |
| Asus TUF Dash F15 FX517ZR | |
| Vampire Bloodhunt - 1920x1080 Ultra Preset | |
| Average NVIDIA GeForce RTX 3070 Ti Laptop GPU (168.6 - 189.9, n=2) | |
| Acer Nitro 5 AN515-46-R1A1 | |
| The Quarry - 1920x1080 Ultra Preset | |
| Acer Nitro 5 AN515-46-R1A1 | |
| Average NVIDIA GeForce RTX 3070 Ti Laptop GPU (80 - 81.5, n=2) | |
Witcher 3 FPS diagram
| low | med. | high | ultra | |
|---|---|---|---|---|
| GTA V (2015) | 174.2 | 167.3 | 149.5 | 92.5 |
| The Witcher 3 (2015) | 284 | 237 | 179.4 | 108.5 |
| Dota 2 Reborn (2015) | 130.9 | 120 | 112.1 | 108.5 |
| Final Fantasy XV Benchmark (2018) | 171.8 | 139.9 | 108.6 | |
| X-Plane 11.11 (2018) | 100.3 | 89.3 | 72.3 | |
| Far Cry 5 (2018) | 134 | 116 | 112 | 106 |
| Strange Brigade (2018) | 289 | 212 | 190.3 | 177 |
| Hitman 3 (2021) | 207.9 | 169.1 | 162.1 | 157.7 |
| God of War (2022) | 117.3 | 104.8 | 88.7 | 64.3 |
| Tiny Tina's Wonderlands (2022) | 183.3 | 159.8 | 118.3 | 93.7 |
| Vampire Bloodhunt (2022) | 197.6 | 185.1 | 172.7 | 168.6 |
| F1 22 (2022) | 207 | 205 | 192.3 | 73.2 |
| The Quarry (2022) | 149.6 | 120.7 | 101.5 | 81.5 |
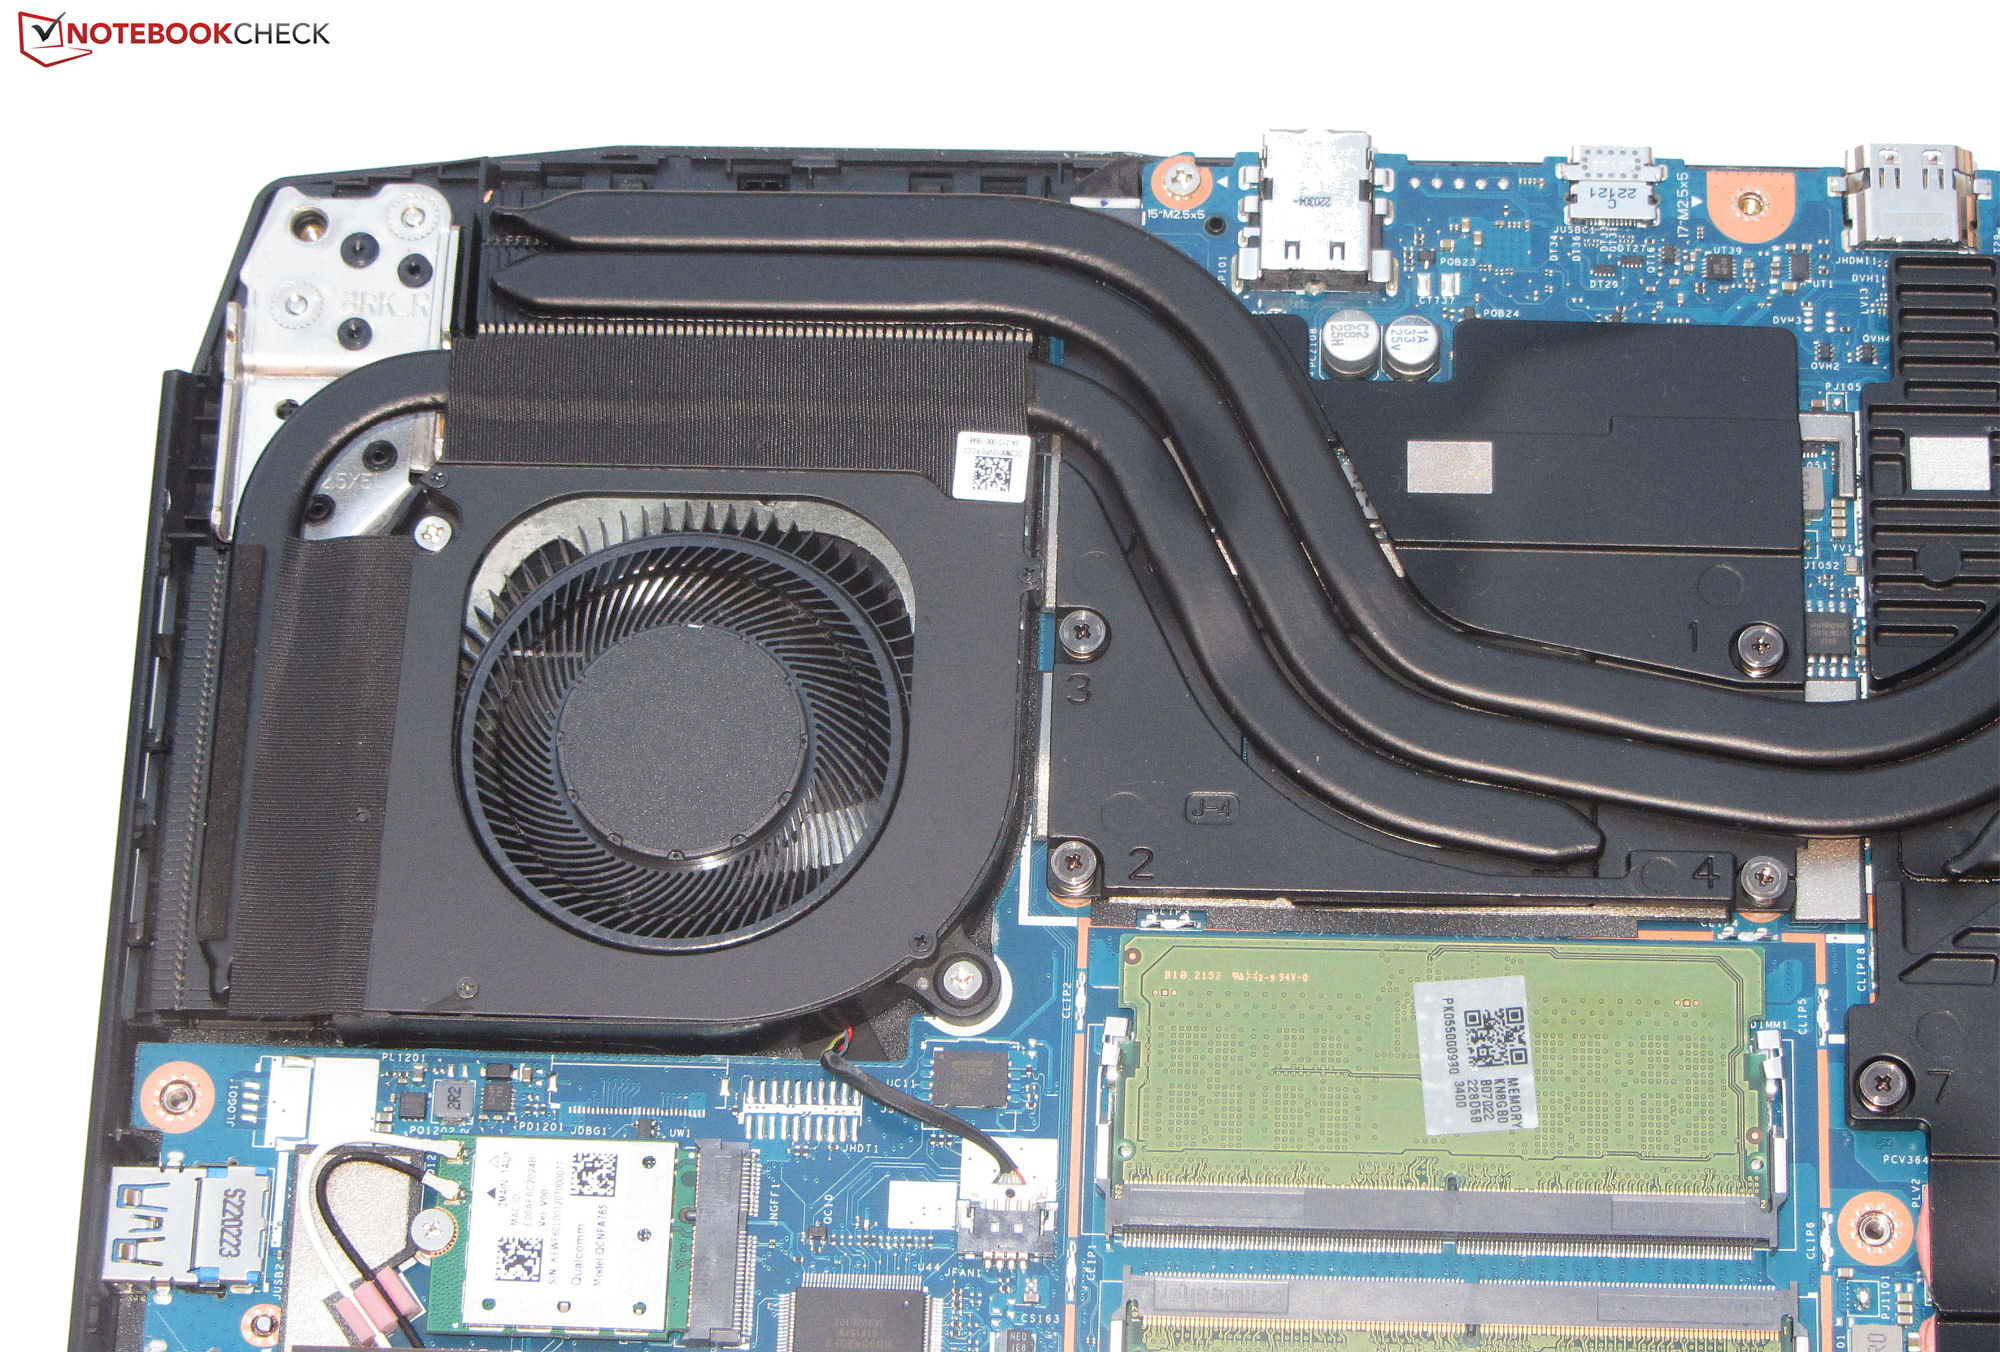
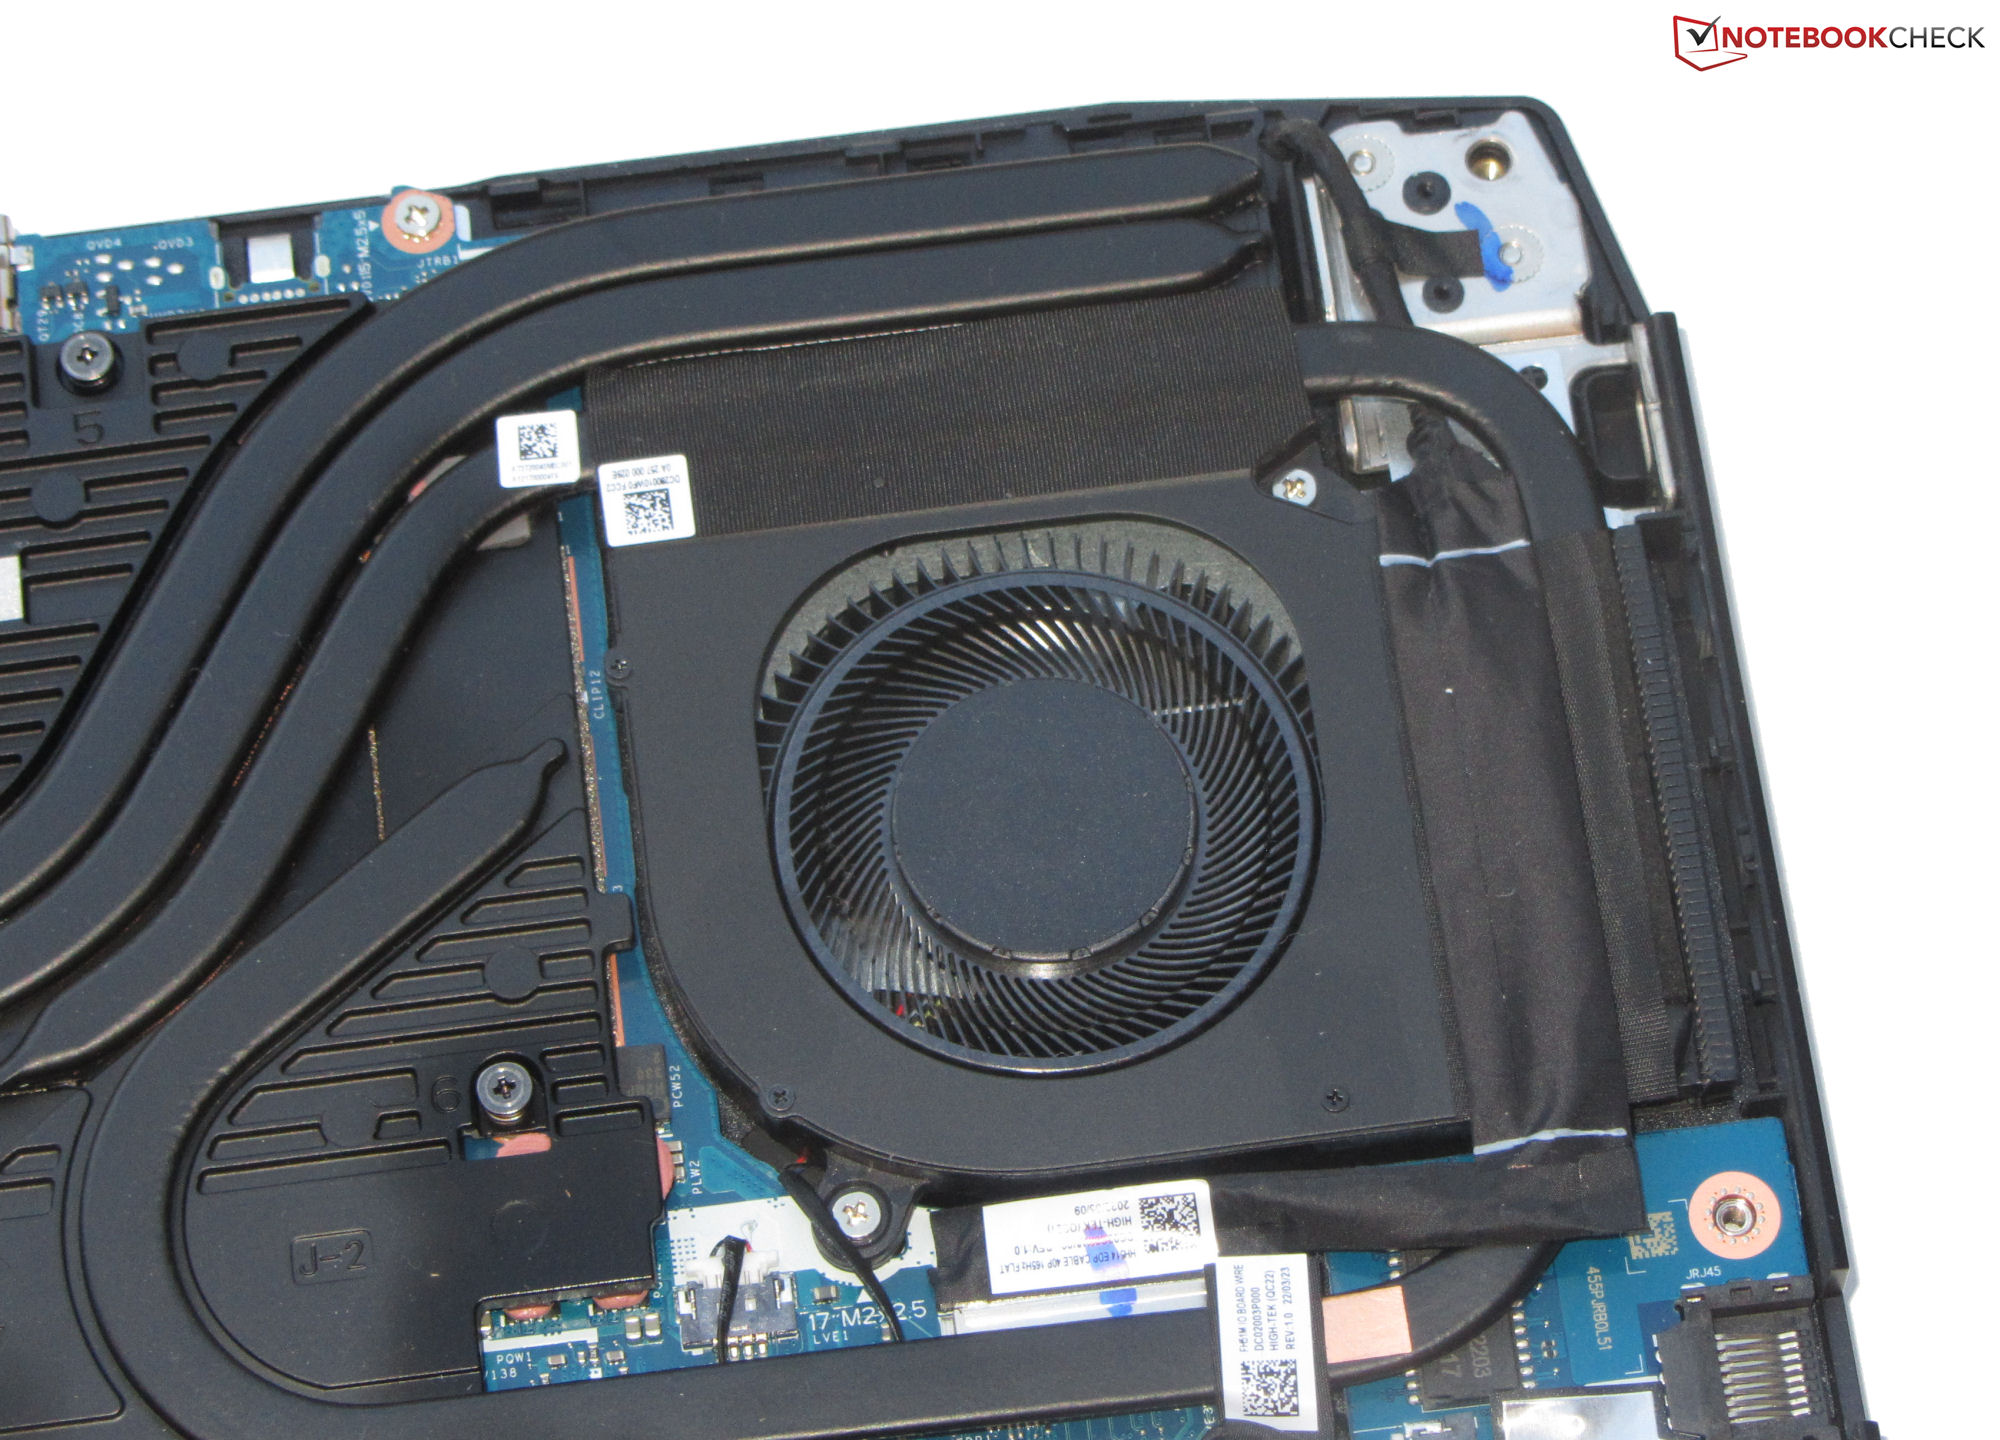
排放--AN515只是适度发热
噪声排放
在日常使用(办公室、互联网)和空转时,这两个风扇仍然足够安静,甚至可以偶尔停止运行。不过,它们还是有些不可预测,噪音水平可以增加到44.3 dB(A)。在负载情况下,我们测得的最大噪音为53.6 dB(A),这相当响亮。
在设备的NitroSense软件的帮助下,风扇速度可以减慢,但风扇曲线不能调整。在 "安静 "和 "标准 "模式下,噪音发展非常相似。
Noise level
| Idle |
| 25 / 28.6 / 44.3 dB(A) |
| Load |
| 47.6 / 53.6 dB(A) |
 | ||
30 dB silent 40 dB(A) audible 50 dB(A) loud |
||
min: | ||
| Acer Nitro 5 AN515-46-R1A1 GeForce RTX 3070 Ti Laptop GPU, R7 6800H, Micron 3400 1TB MTFDKBA1T0TFH | MSI Katana GF66 12UGS GeForce RTX 3070 Ti Laptop GPU, i7-12700H, Micron 2450 1TB MTFDKBA1T0TFK | Schenker XMG Fusion 15 (Mid 22) GeForce RTX 3070 Laptop GPU, i7-11800H, Samsung SSD 980 Pro 1TB MZ-V8P1T0BW | Asus TUF Dash F15 FX517ZR GeForce RTX 3070 Laptop GPU, i7-12650H, Samsung PM991a MZVLQ1T0HBLB | Acer Nitro 5 AN515-58-72QR GeForce RTX 3070 Ti Laptop GPU, i7-12700H, Samsung PM9A1 MZVL21T0HCLR | |
|---|---|---|---|---|---|
| Noise | 7% | 7% | 2% | 3% | |
| off / environment * (dB) | 25 | 26 -4% | 26 -4% | 26 -4% | 26 -4% |
| Idle Minimum * (dB) | 25 | 27 -8% | 26 -4% | 26 -4% | 26 -4% |
| Idle Average * (dB) | 28.6 | 28 2% | 28 2% | 32 -12% | 29 -1% |
| Idle Maximum * (dB) | 44.3 | 31 30% | 31 30% | 33 26% | 33 26% |
| Load Average * (dB) | 47.6 | 44 8% | 45 5% | 48 -1% | 47 1% |
| Load Maximum * (dB) | 53.6 | 45 16% | 48 10% | 49 9% | 53 1% |
| Witcher 3 ultra * (dB) | 44 | 46 | 47 | 53 |
* ... smaller is better
温度
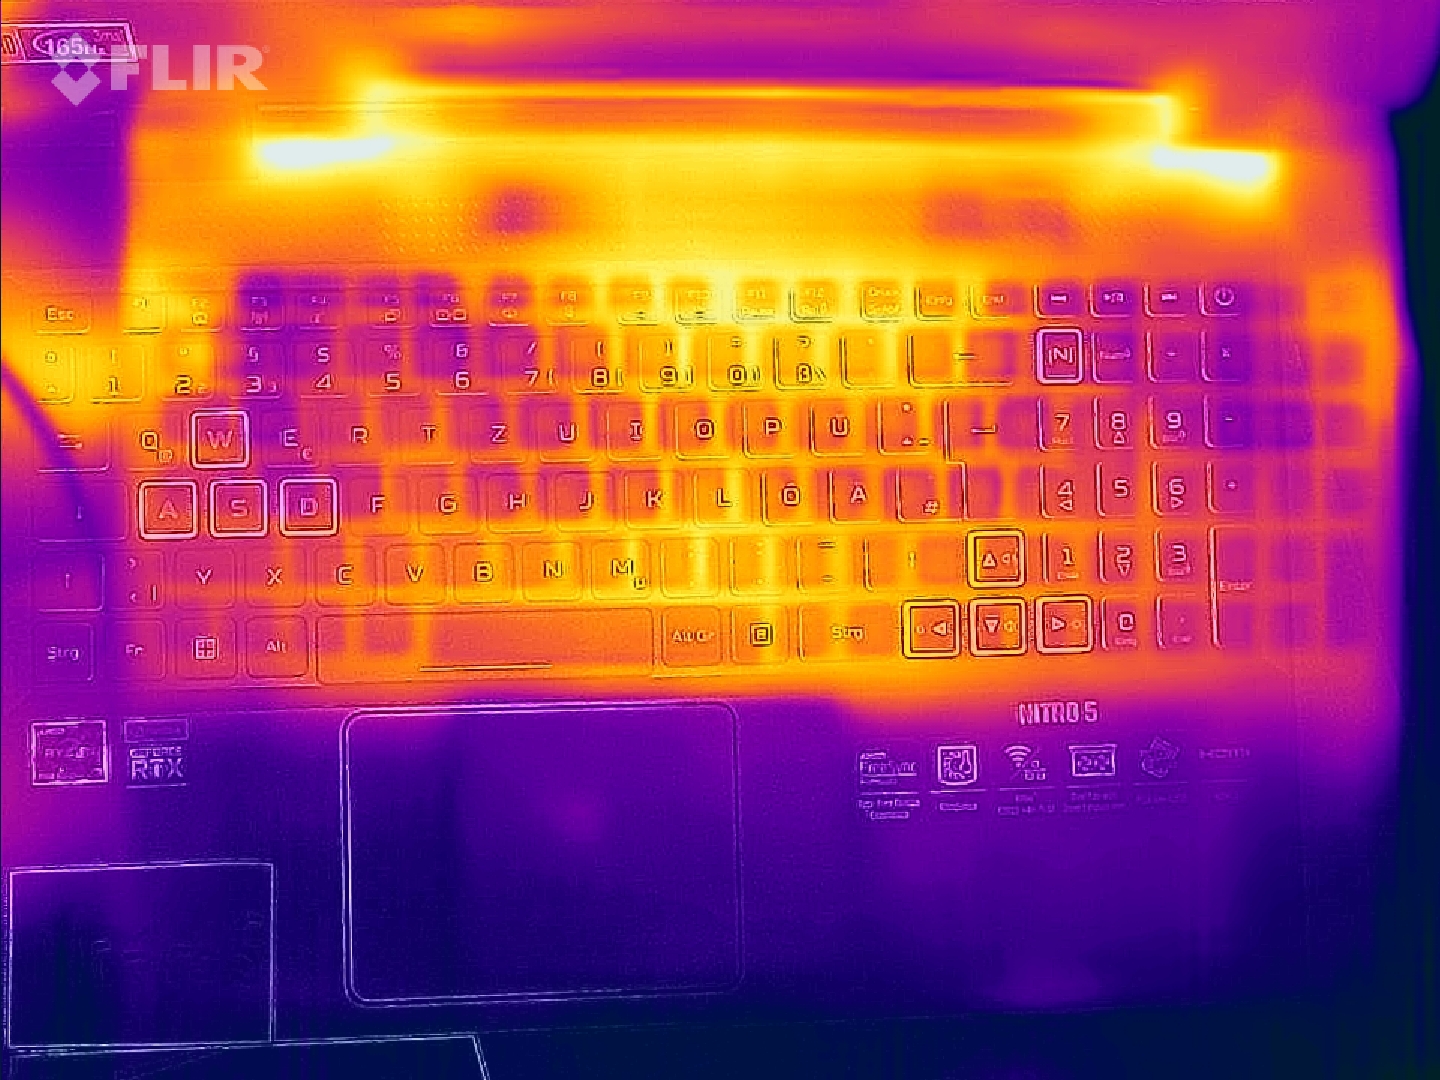
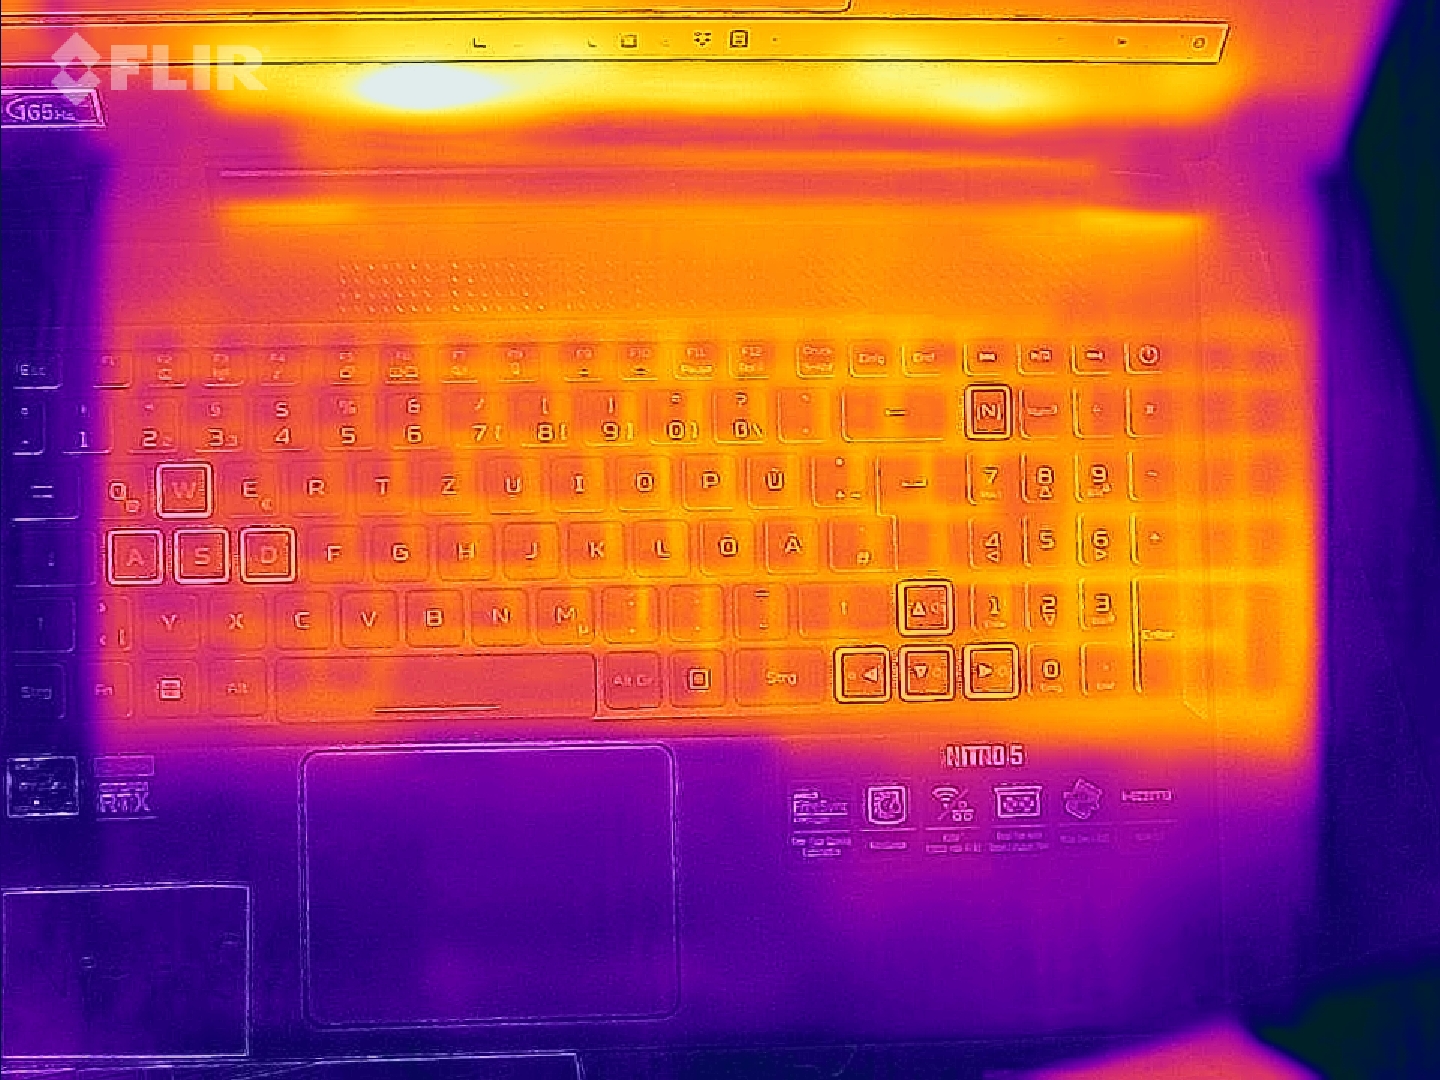
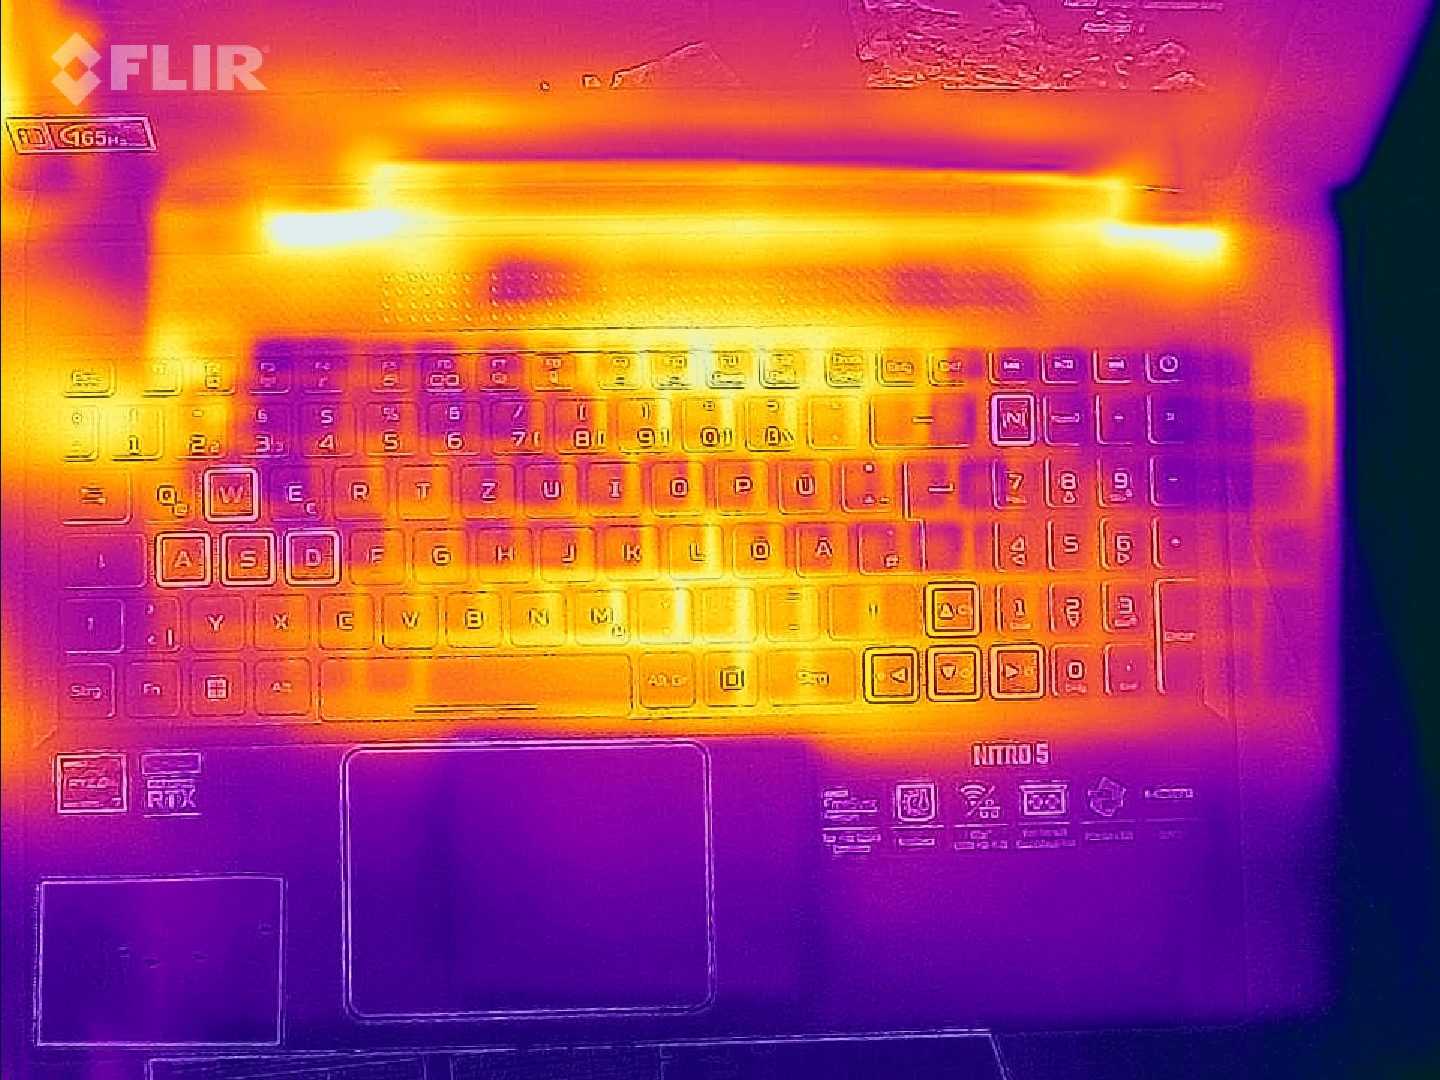
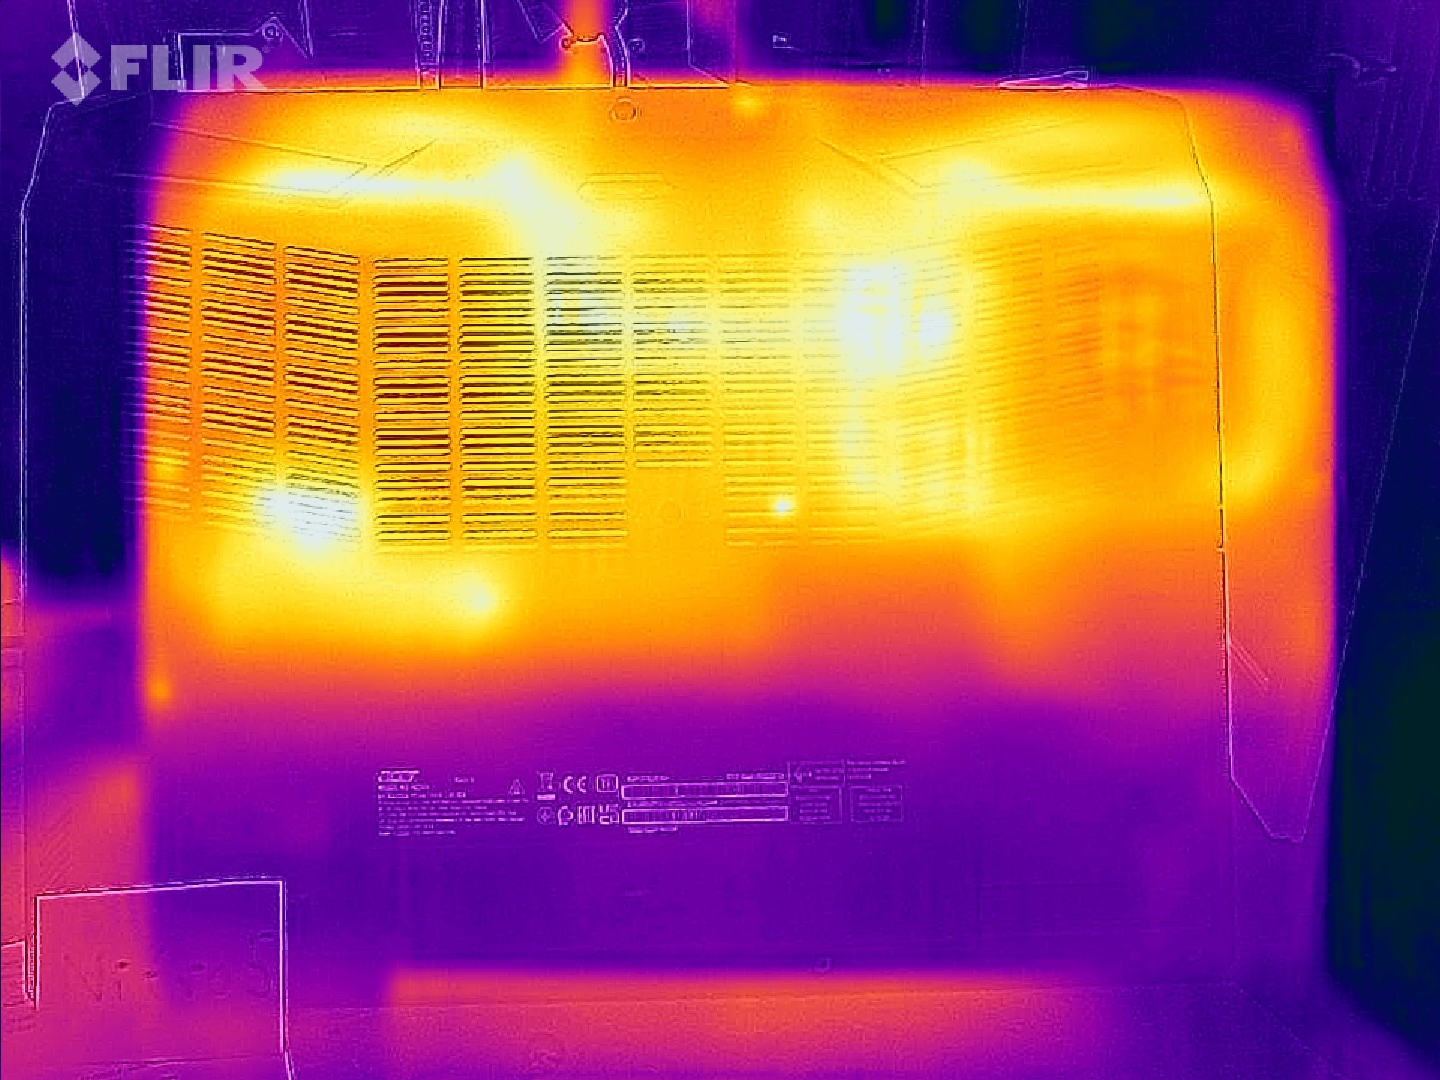
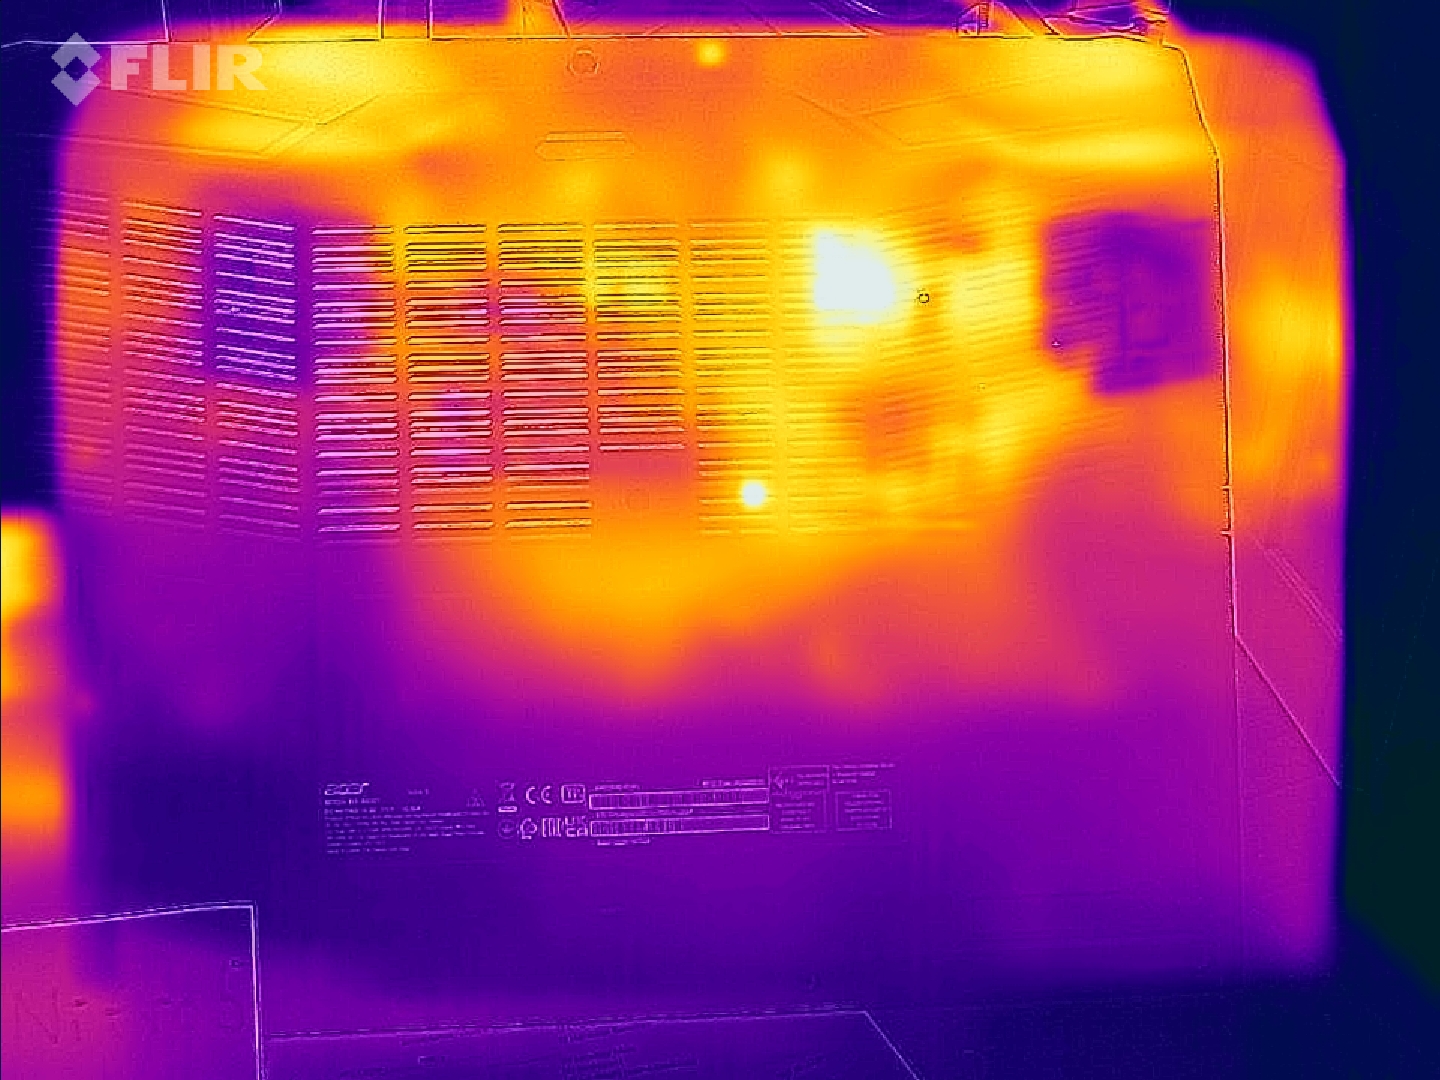
在日常使用中(办公室、互联网),表面温度仍然可以接受,只有在负载(压力测试,Witcher 3 )下才会适度增加。这与姐姐的模型非常不同。
(-) The maximum temperature on the upper side is 48.1 °C / 119 F, compared to the average of 40.4 °C / 105 F, ranging from 21.2 to 68.8 °C for the class Gaming.
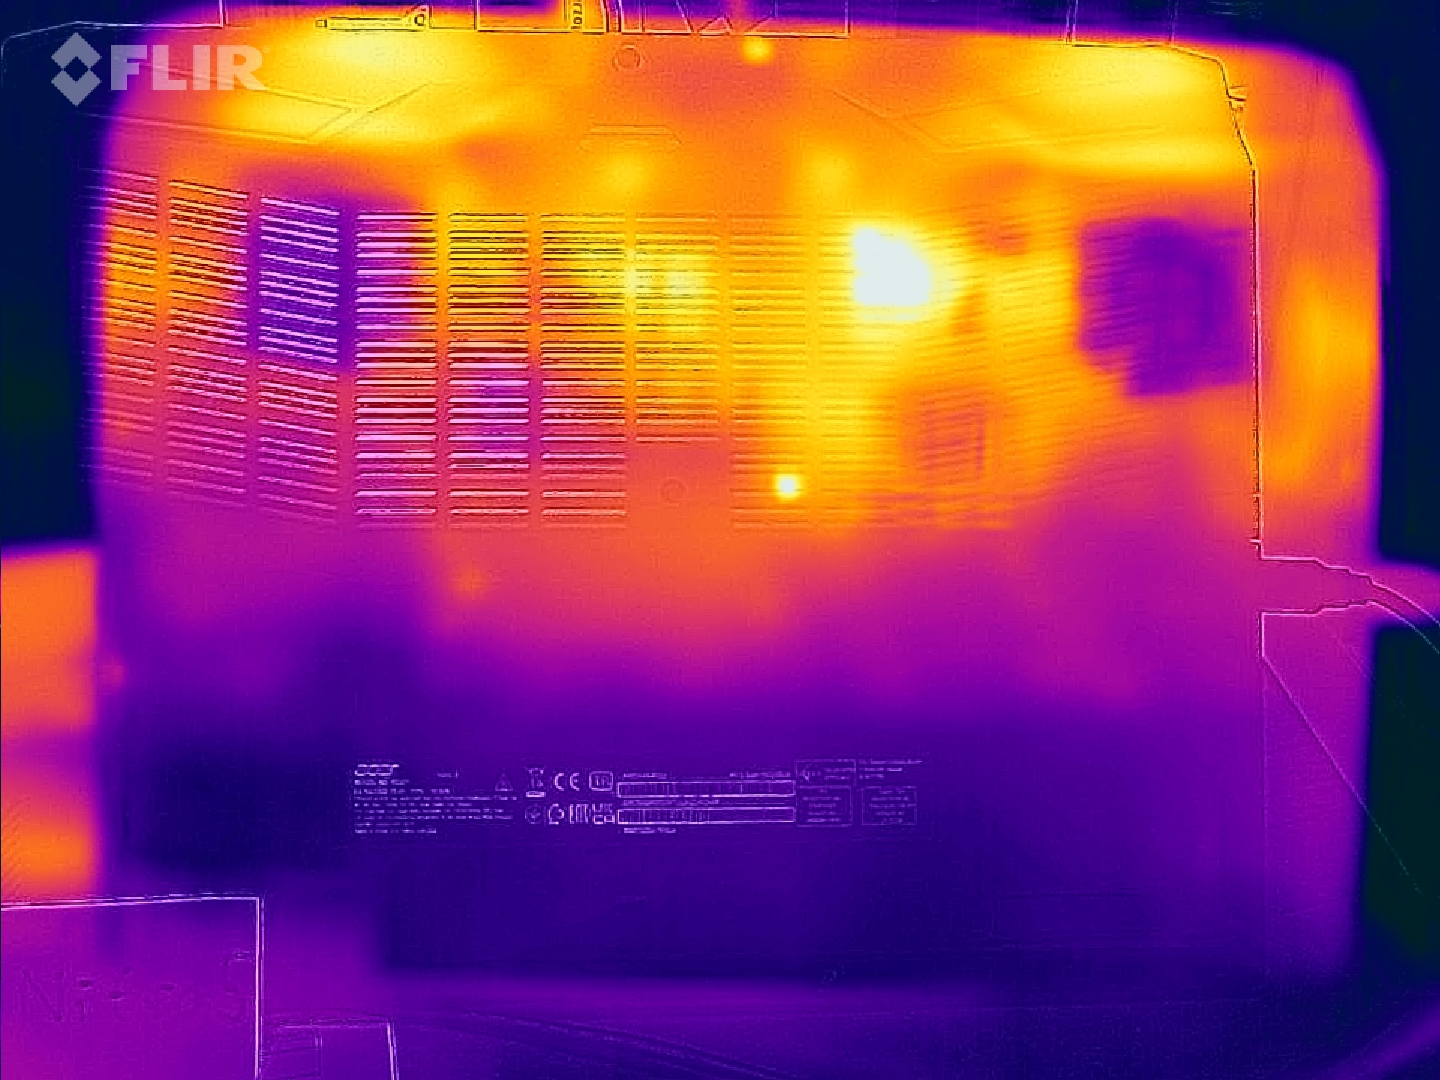
(-) The bottom heats up to a maximum of 49.7 °C / 121 F, compared to the average of 43.2 °C / 110 F
(+) In idle usage, the average temperature for the upper side is 26.4 °C / 80 F, compared to the device average of 33.9 °C / 93 F.
(+) Playing The Witcher 3, the average temperature for the upper side is 31.8 °C / 89 F, compared to the device average of 33.9 °C / 93 F.
(+) The palmrests and touchpad are cooler than skin temperature with a maximum of 25.2 °C / 77.4 F and are therefore cool to the touch.
(+) The average temperature of the palmrest area of similar devices was 28.8 °C / 83.8 F (+3.6 °C / 6.4 F).
| Acer Nitro 5 AN515-46-R1A1 AMD Ryzen 7 6800H, NVIDIA GeForce RTX 3070 Ti Laptop GPU | MSI Katana GF66 12UGS Intel Core i7-12700H, NVIDIA GeForce RTX 3070 Ti Laptop GPU | Schenker XMG Fusion 15 (Mid 22) Intel Core i7-11800H, NVIDIA GeForce RTX 3070 Laptop GPU | Asus TUF Dash F15 FX517ZR Intel Core i7-12650H, NVIDIA GeForce RTX 3070 Laptop GPU | Acer Nitro 5 AN515-58-72QR Intel Core i7-12700H, NVIDIA GeForce RTX 3070 Ti Laptop GPU | |
|---|---|---|---|---|---|
| Heat | -25% | -20% | -9% | -5% | |
| Maximum Upper Side * (°C) | 48.1 | 61 -27% | 52 -8% | 52 -8% | 48 -0% |
| Maximum Bottom * (°C) | 49.7 | 55 -11% | 63 -27% | 52 -5% | 51 -3% |
| Idle Upper Side * (°C) | 30 | 43 -43% | 37 -23% | 33 -10% | 34 -13% |
| Idle Bottom * (°C) | 31.7 | 38 -20% | 38 -20% | 36 -14% | 33 -4% |
* ... smaller is better
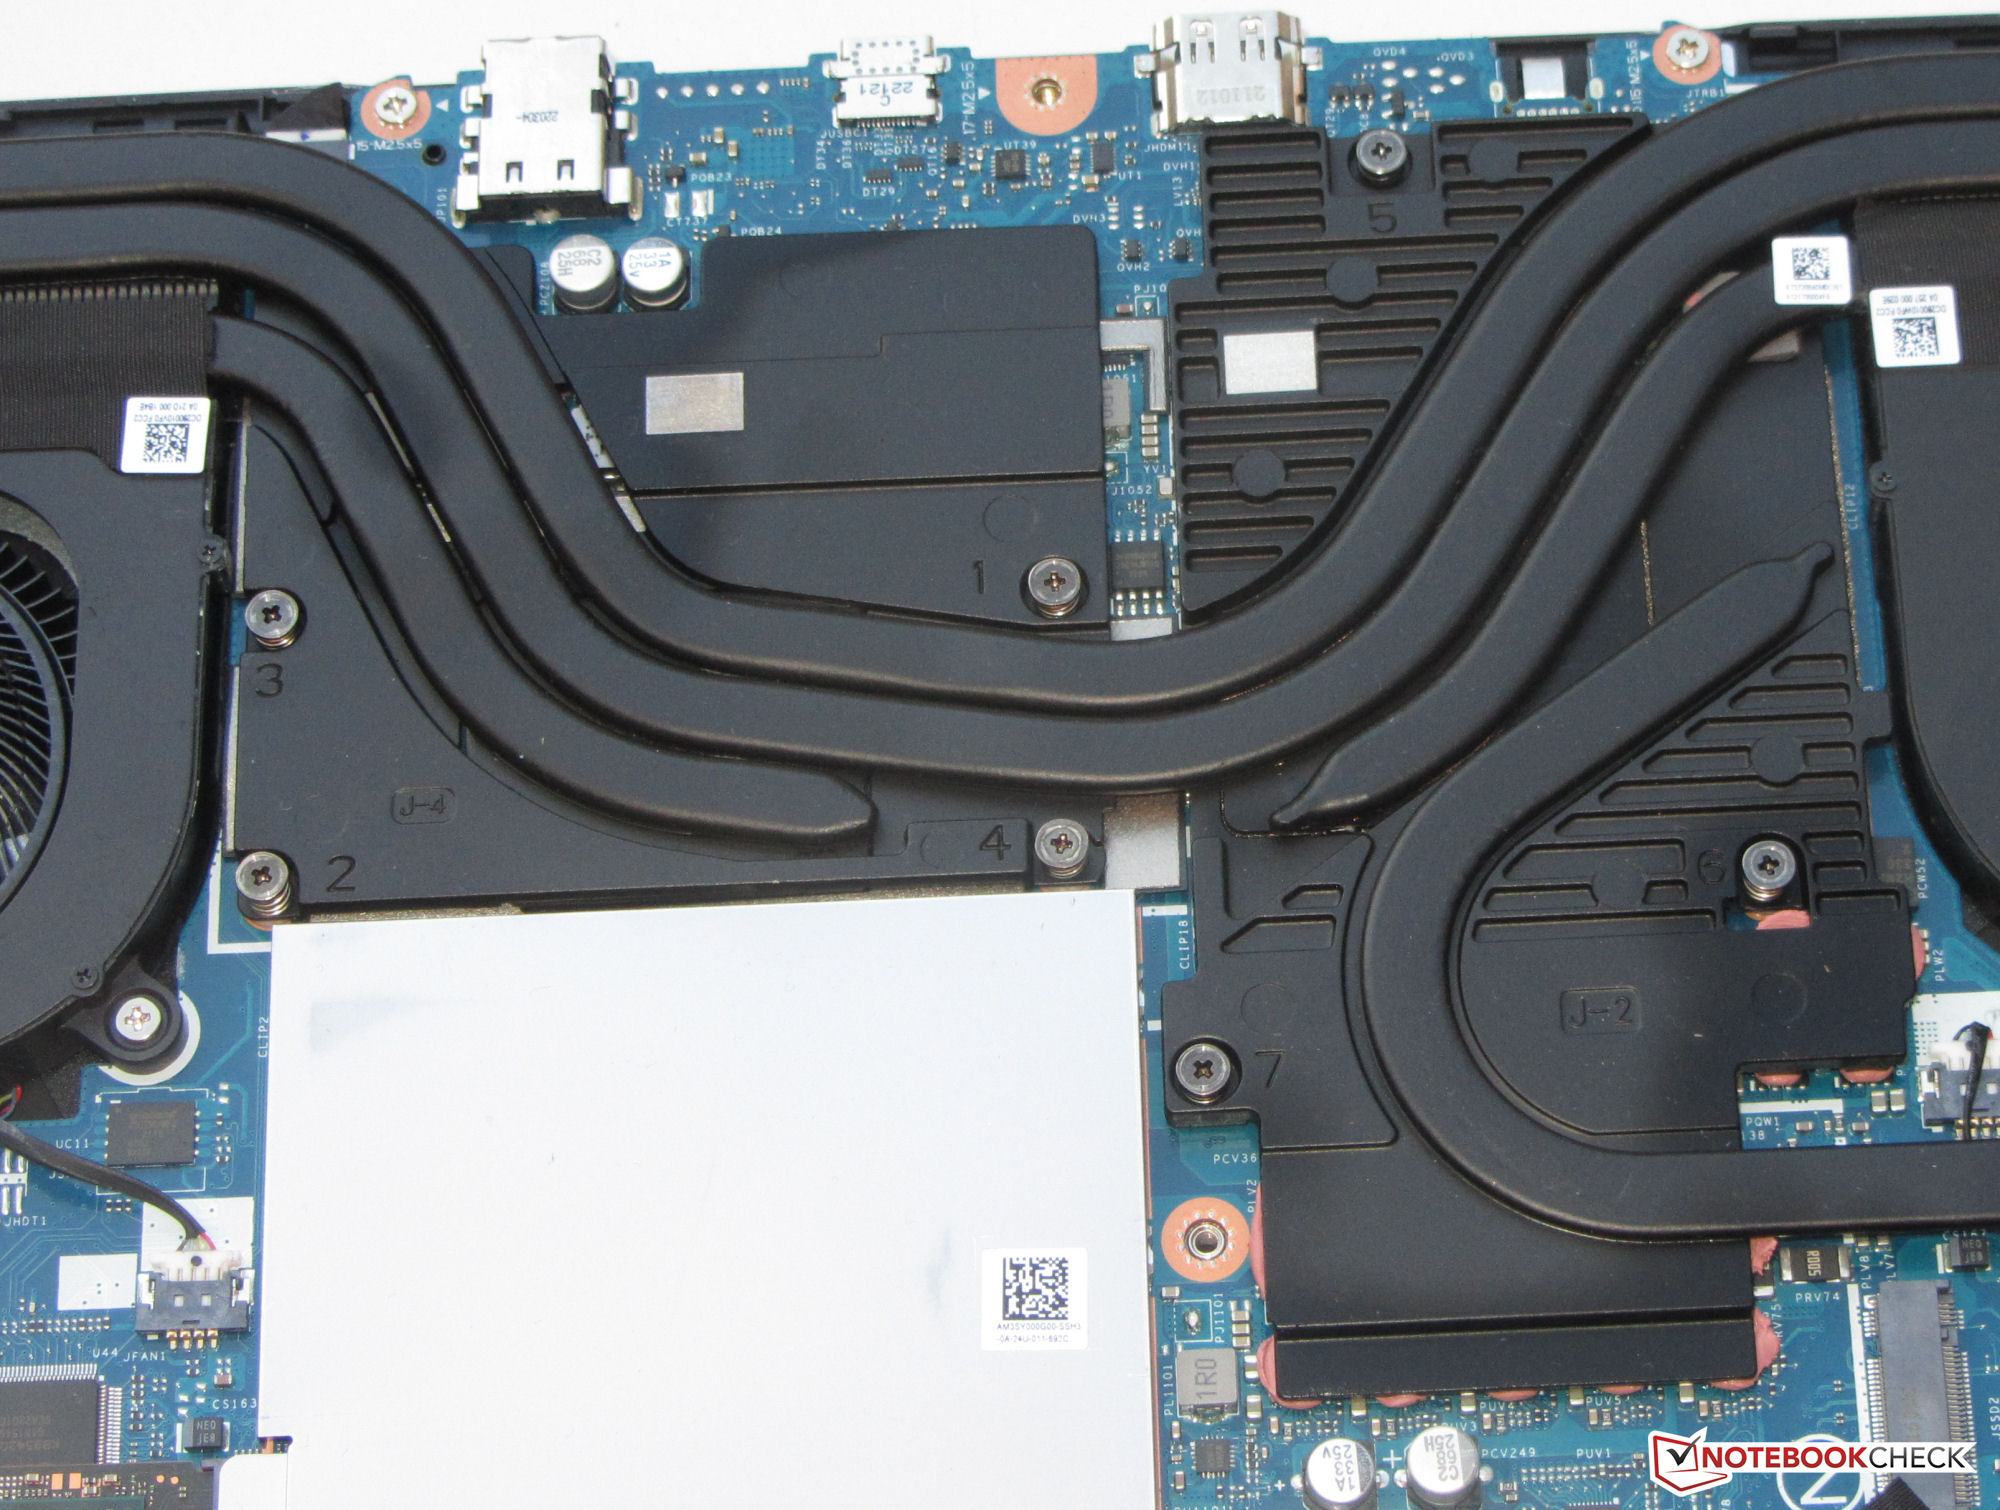
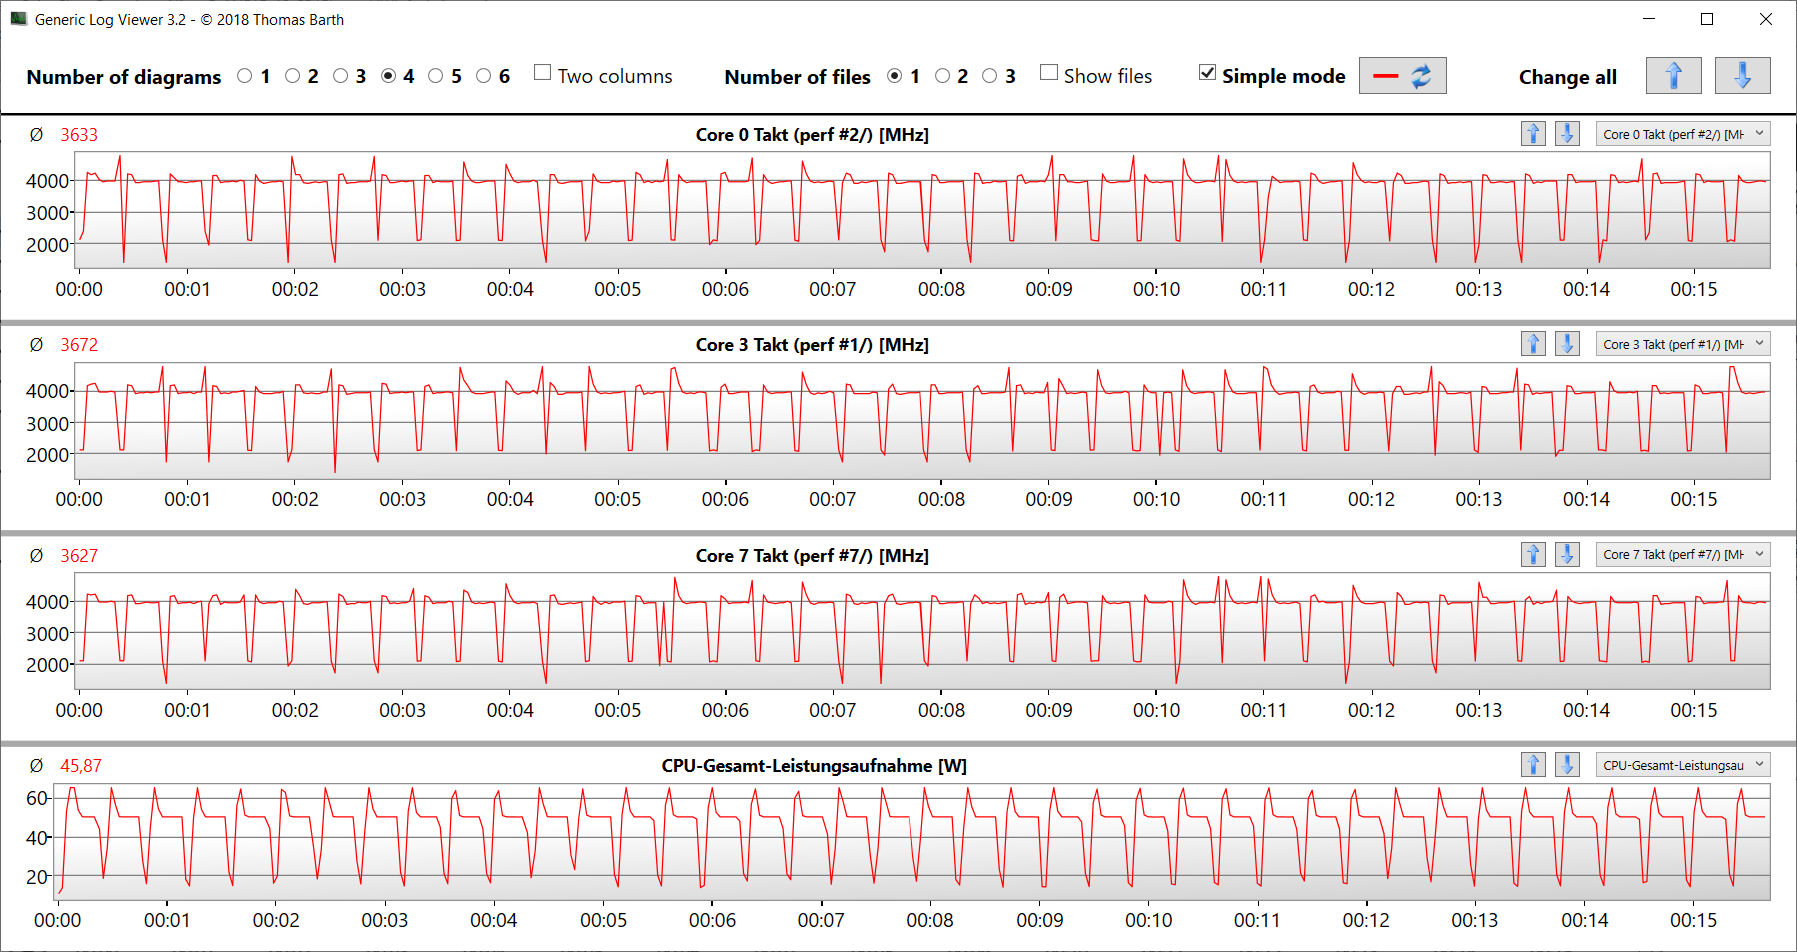
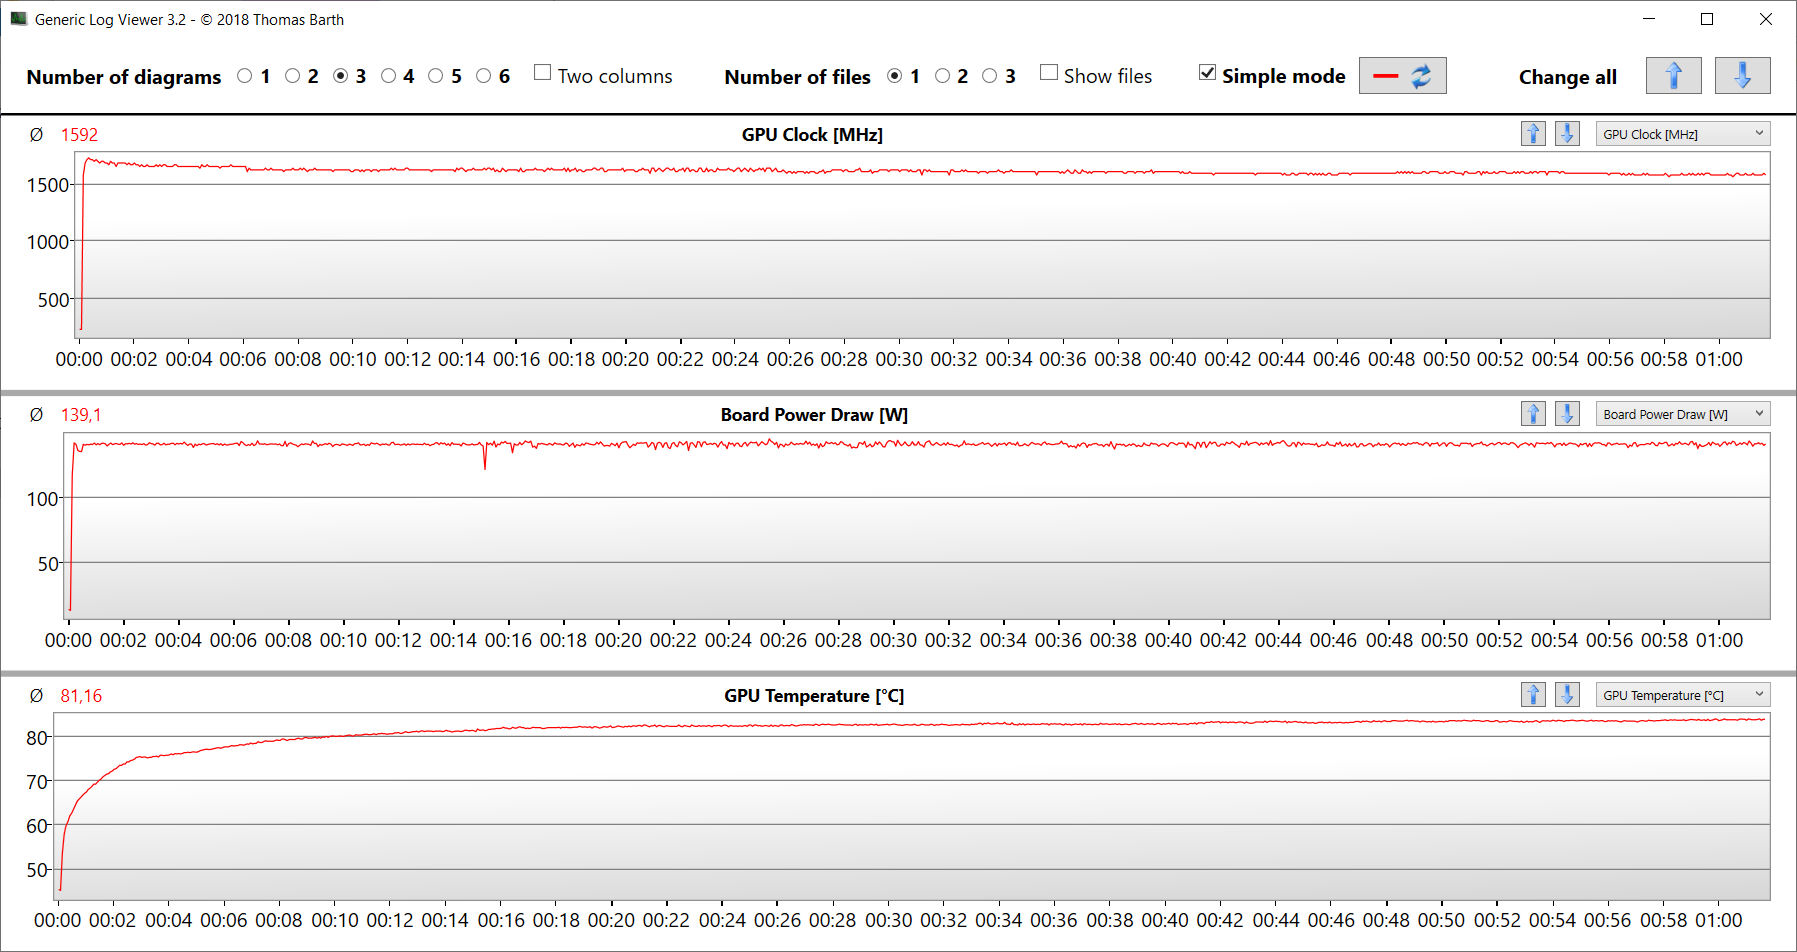
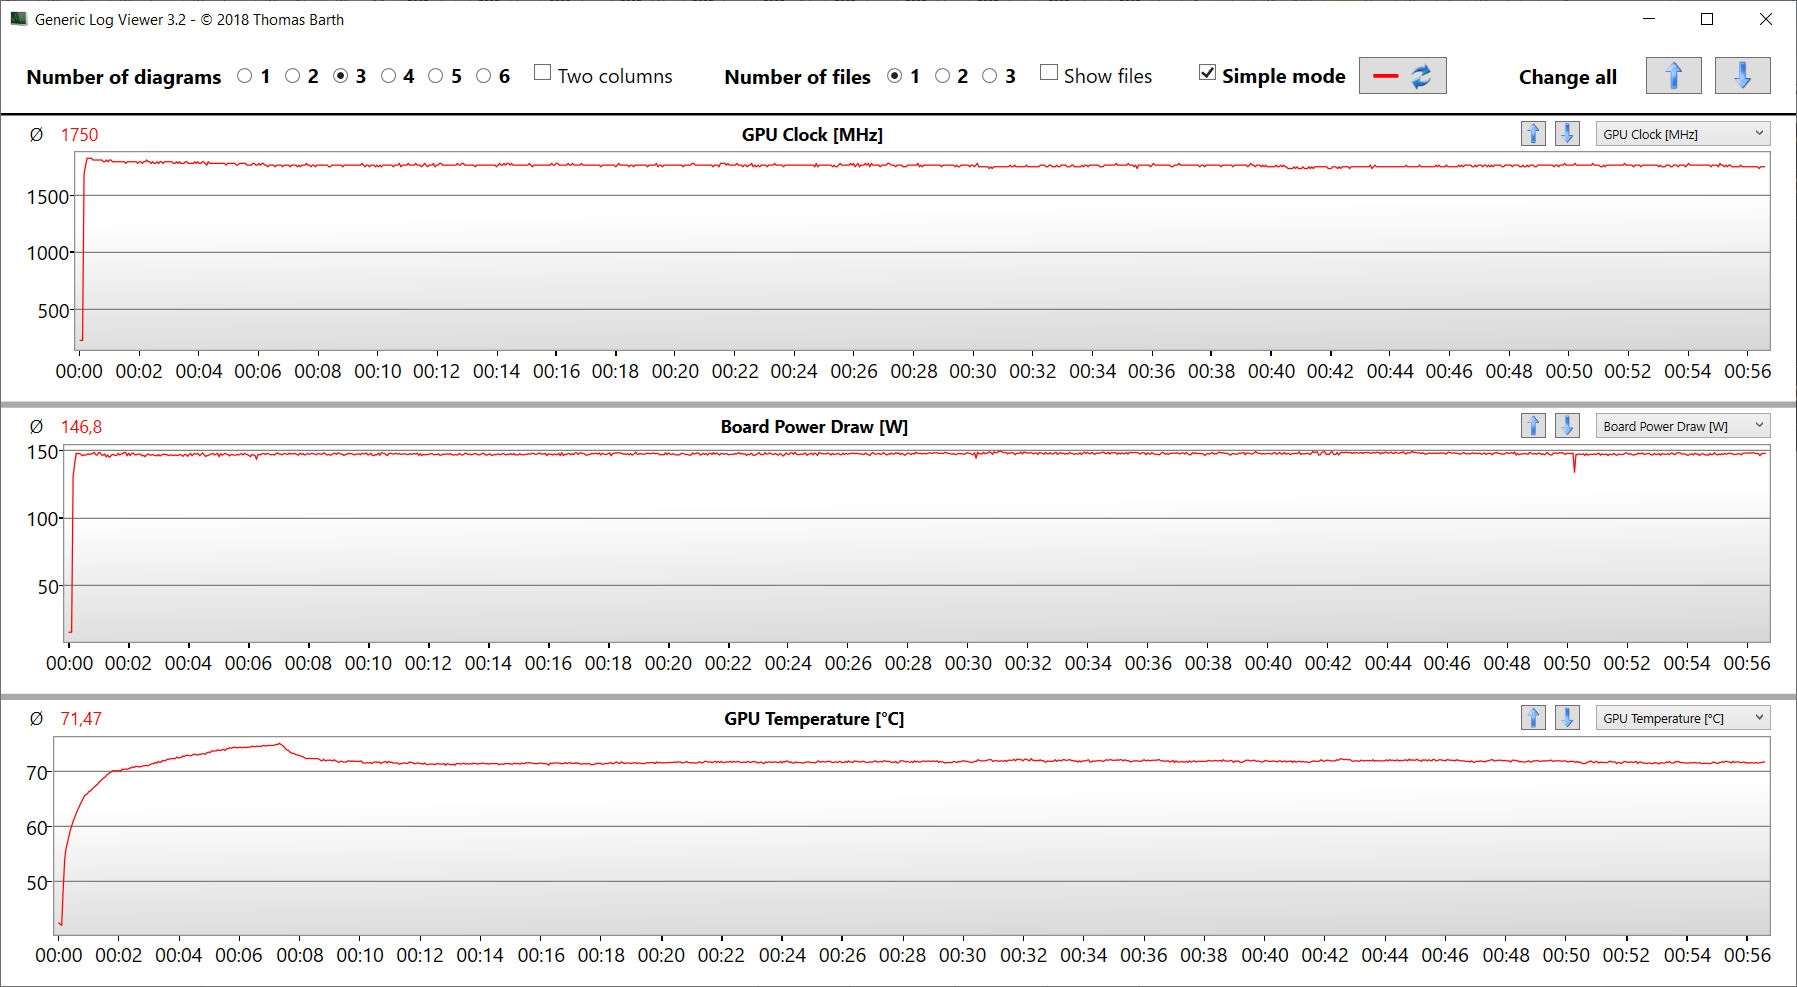
压力测试
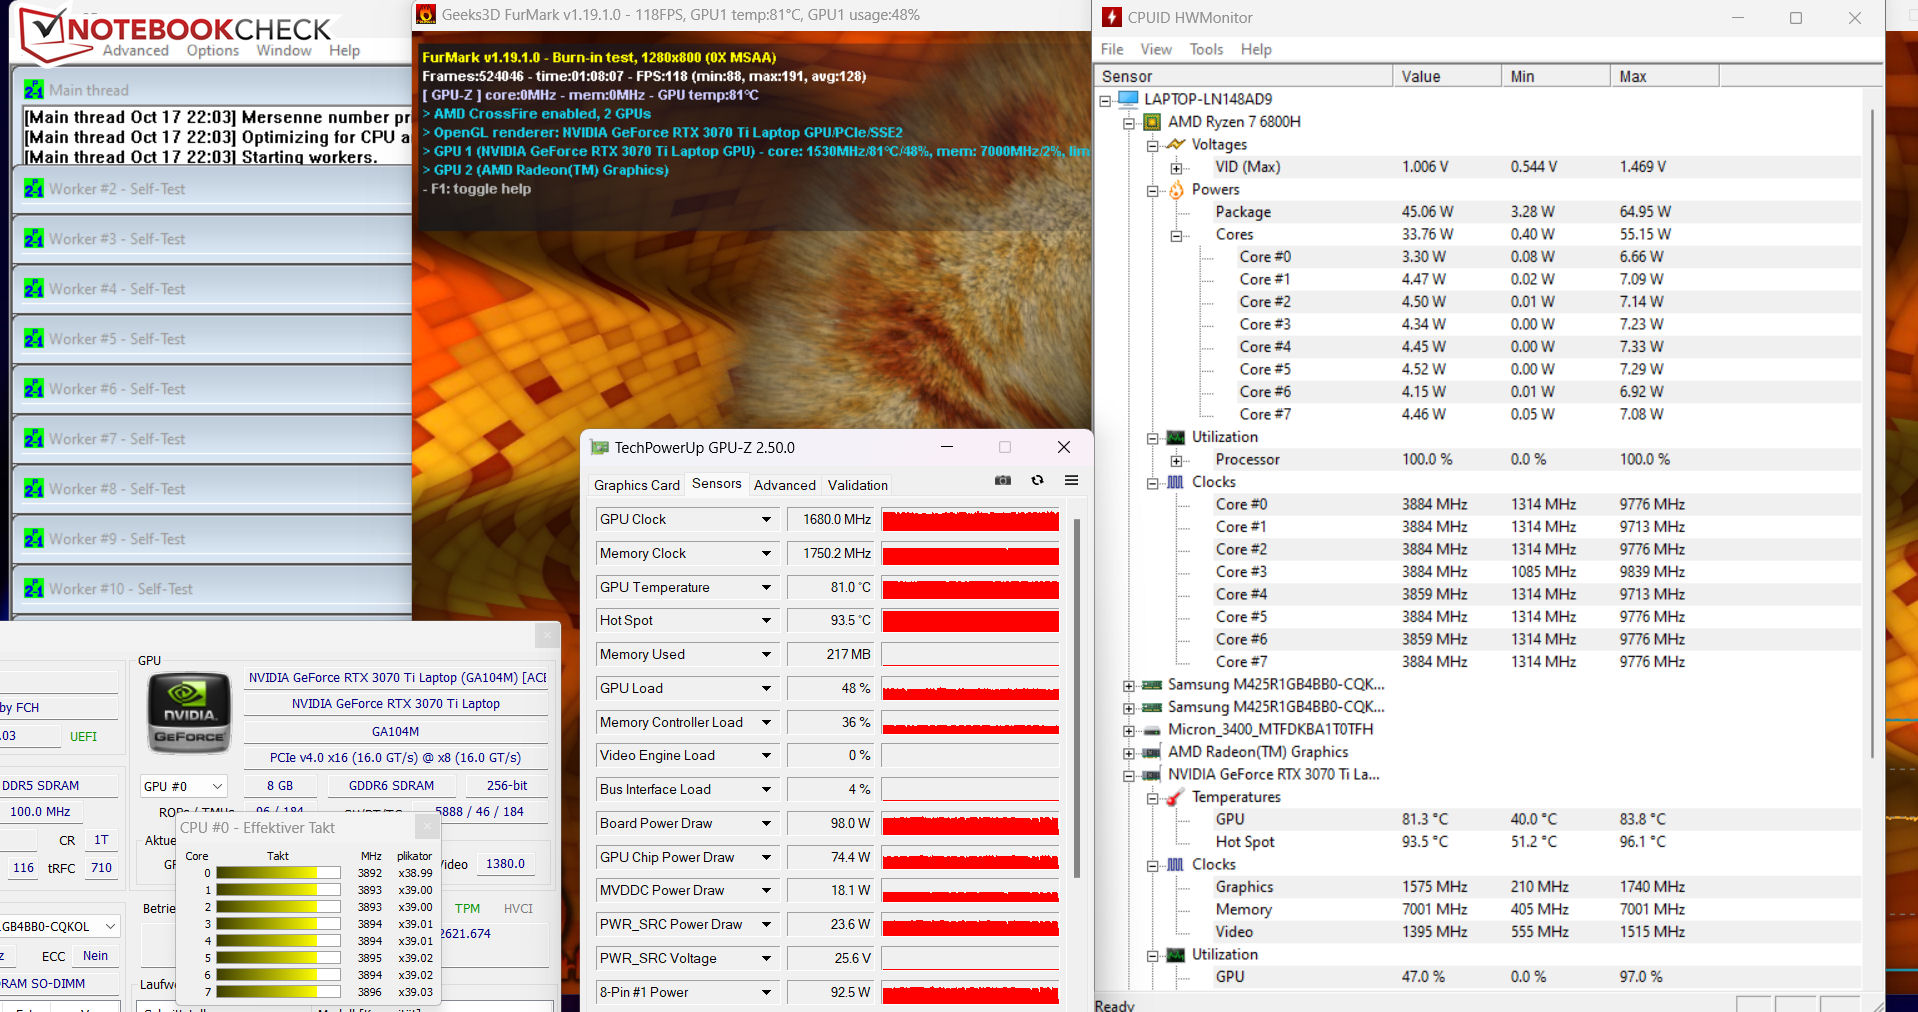
压力测试(Prime95和FurMark被连续激活)是一个极端情况,使我们能够检查系统在最大负荷下的稳定性。CPU(4.2至4.3 GHz)和GPU(1,000至1,600 MHz)以高时钟速率开始测试。虽然CPU的时钟速率在测试过程中略有下降,但GPU的时钟速率却稳定在一个较高的水平。
发言人
立体声扬声器产生的声音是足够的,但可以从更多的低音中受益。
Acer Nitro 5 AN515-46-R1A1 audio analysis
(±) | speaker loudness is average but good (76.3 dB)
Bass 100 - 315 Hz
(-) | nearly no bass - on average 23% lower than median
(±) | linearity of bass is average (14.2% delta to prev. frequency)
Mids 400 - 2000 Hz
(+) | balanced mids - only 3.1% away from median
(+) | mids are linear (6.9% delta to prev. frequency)
Highs 2 - 16 kHz
(+) | balanced highs - only 3.4% away from median
(+) | highs are linear (6.3% delta to prev. frequency)
Overall 100 - 16.000 Hz
(±) | linearity of overall sound is average (19.7% difference to median)
Compared to same class
» 69% of all tested devices in this class were better, 6% similar, 25% worse
» The best had a delta of 6%, average was 18%, worst was 132%
Compared to all devices tested
» 50% of all tested devices were better, 7% similar, 43% worse
» The best had a delta of 4%, average was 24%, worst was 134%
Schenker XMG Fusion 15 (Mid 22) audio analysis
(+) | speakers can play relatively loud (82 dB)
Bass 100 - 315 Hz
(-) | nearly no bass - on average 17.6% lower than median
(±) | linearity of bass is average (12.1% delta to prev. frequency)
Mids 400 - 2000 Hz
(+) | balanced mids - only 3% away from median
(+) | mids are linear (3.9% delta to prev. frequency)
Highs 2 - 16 kHz
(+) | balanced highs - only 2.8% away from median
(+) | highs are linear (5.5% delta to prev. frequency)
Overall 100 - 16.000 Hz
(+) | overall sound is linear (13.3% difference to median)
Compared to same class
» 19% of all tested devices in this class were better, 5% similar, 76% worse
» The best had a delta of 6%, average was 18%, worst was 132%
Compared to all devices tested
» 14% of all tested devices were better, 3% similar, 83% worse
» The best had a delta of 4%, average was 24%, worst was 134%
能源管理--宏碁电脑的电池寿命尚可
能源消耗
在谈到AN515的能耗时,我们没有注意到任何不一致的地方。在压力测试/Witcher 3 ,消耗量增加到230瓦,平均为203瓦,但在这两项测试中都保持稳定。交流适配器(额定输出:280瓦)足够大,可以满足该设备的需求。
| Off / Standby | |
| Idle | |
| Load |
|
Key:
min: | |
| Acer Nitro 5 AN515-46-R1A1 R7 6800H, GeForce RTX 3070 Ti Laptop GPU, Micron 3400 1TB MTFDKBA1T0TFH, IPS, 1920x1080, 15.6" | MSI Katana GF66 12UGS i7-12700H, GeForce RTX 3070 Ti Laptop GPU, Micron 2450 1TB MTFDKBA1T0TFK, IPS, 1920x1080, 15.6" | Schenker XMG Fusion 15 (Mid 22) i7-11800H, GeForce RTX 3070 Laptop GPU, Samsung SSD 980 Pro 1TB MZ-V8P1T0BW, IPS, 2560x1440, 15.6" | Asus TUF Dash F15 FX517ZR i7-12650H, GeForce RTX 3070 Laptop GPU, Samsung PM991a MZVLQ1T0HBLB, IPS, 2560x1440, 15.6" | Acer Nitro 5 AN515-58-72QR i7-12700H, GeForce RTX 3070 Ti Laptop GPU, Samsung PM9A1 MZVL21T0HCLR, IPS, 2560x1440, 15.6" | Average NVIDIA GeForce RTX 3070 Ti Laptop GPU | Average of class Gaming | |
|---|---|---|---|---|---|---|---|
| Power Consumption | -5% | -25% | -8% | -15% | -56% | -47% | |
| Idle Minimum * (Watt) | 7 | 9 -29% | 12 -71% | 10 -43% | 7 -0% | 14.2 ? -103% | 13.2 ? -89% |
| Idle Average * (Watt) | 8.9 | 13 -46% | 17 -91% | 14 -57% | 15 -69% | 19.9 ? -124% | 18.9 ? -112% |
| Idle Maximum * (Watt) | 14.4 | 20 -39% | 24 -67% | 20 -39% | 24 -67% | 26.2 ? -82% | 24.3 ? -69% |
| Load Average * (Watt) | 202 | 100 50% | 106 48% | 122 40% | 124 39% | 125.8 ? 38% | 108.3 ? 46% |
| Witcher 3 ultra * (Watt) | 203 | 149 27% | 159.9 21% | 138.6 32% | 195.1 4% | ||
| Load Maximum * (Watt) | 230 | 212 8% | 208 10% | 189 18% | 220 4% | 248 ? -8% | 254 ? -10% |
* ... smaller is better
Power consumption Witcher 3 / stress test
Power consumption with an external screen
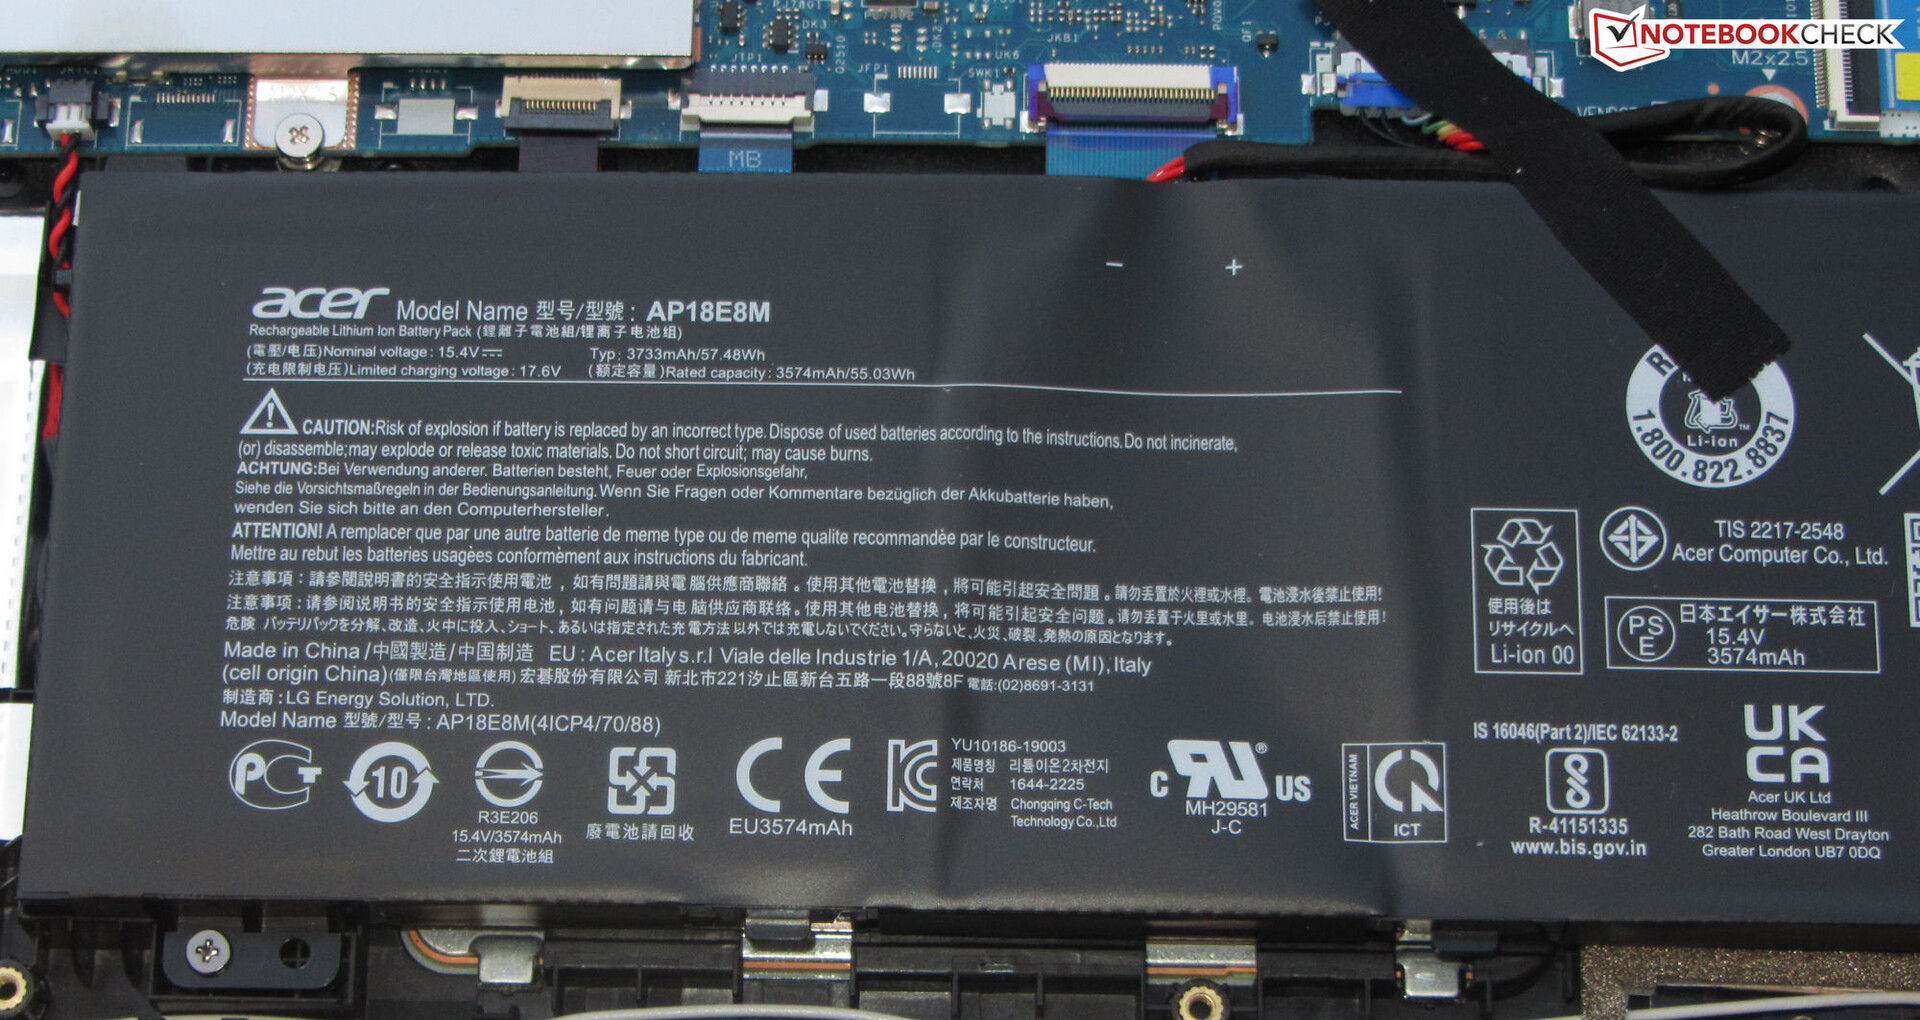
电池寿命
在微星Katana(52Wh)之后,Nitro是我们比较领域中电池容量最低的(57.5Wh)。不过,它的电池寿命还算不错,甚至可以跟上一些装备更丰富的竞争对手。由于采用了更节俭的AMD处理器和更低的屏幕分辨率,它显然比基于英特尔的姐妹机型更耐用。
| Acer Nitro 5 AN515-46-R1A1 R7 6800H, GeForce RTX 3070 Ti Laptop GPU, 57.5 Wh | MSI Katana GF66 12UGS i7-12700H, GeForce RTX 3070 Ti Laptop GPU, 52 Wh | Schenker XMG Fusion 15 (Mid 22) i7-11800H, GeForce RTX 3070 Laptop GPU, 93.48 Wh | Asus TUF Dash F15 FX517ZR i7-12650H, GeForce RTX 3070 Laptop GPU, 76 Wh | Acer Nitro 5 AN515-58-72QR i7-12700H, GeForce RTX 3070 Ti Laptop GPU, 57.5 Wh | Average of class Gaming | |
|---|---|---|---|---|---|---|
| Battery runtime | -26% | 37% | 26% | -26% | 16% | |
| Reader / Idle (h) | 10.5 | 15.5 48% | 10.8 3% | 5.7 -46% | 8.71 ? -17% | |
| H.264 (h) | 5.7 | 7.5 32% | 5.8 2% | 4.7 -18% | 8.26 ? 45% | |
| WiFi v1.3 (h) | 5.8 | 2.4 -59% | 7.4 28% | 7 21% | 3.9 -33% | 7.04 ? 21% |
| Load (h) | 1.3 | 1.4 8% | 1.8 38% | 2.3 77% | 1.2 -8% | 1.47 ? 13% |
Pros
Cons
结论 - 一个全面的游戏笔记本
Nitro 5是为最大设置下的FHD游戏而制造的--由于采用了Ryzen 7-6800HAPU和一个GeForce RTX 3070-Ti LaptopGPU(TGP:150W)。快速的PCIe-4固态硬盘(1TB)提供了必要的存储空间,并确保短的加载时间。
宏碁的Nitro 5 AN515-46是一款快速的FHD游戏笔记本,没有显示任何严重的弱点。
CPU和GPU可以提供持续的高时钟率。该设备只有在负载下才会适度发热。不幸的是,它的噪音排放并没有比平时好:Nitro 5可能相当响。哑光的15.6英寸面板(FHD,IPS,165Hz)给我们留下了良好的印象。
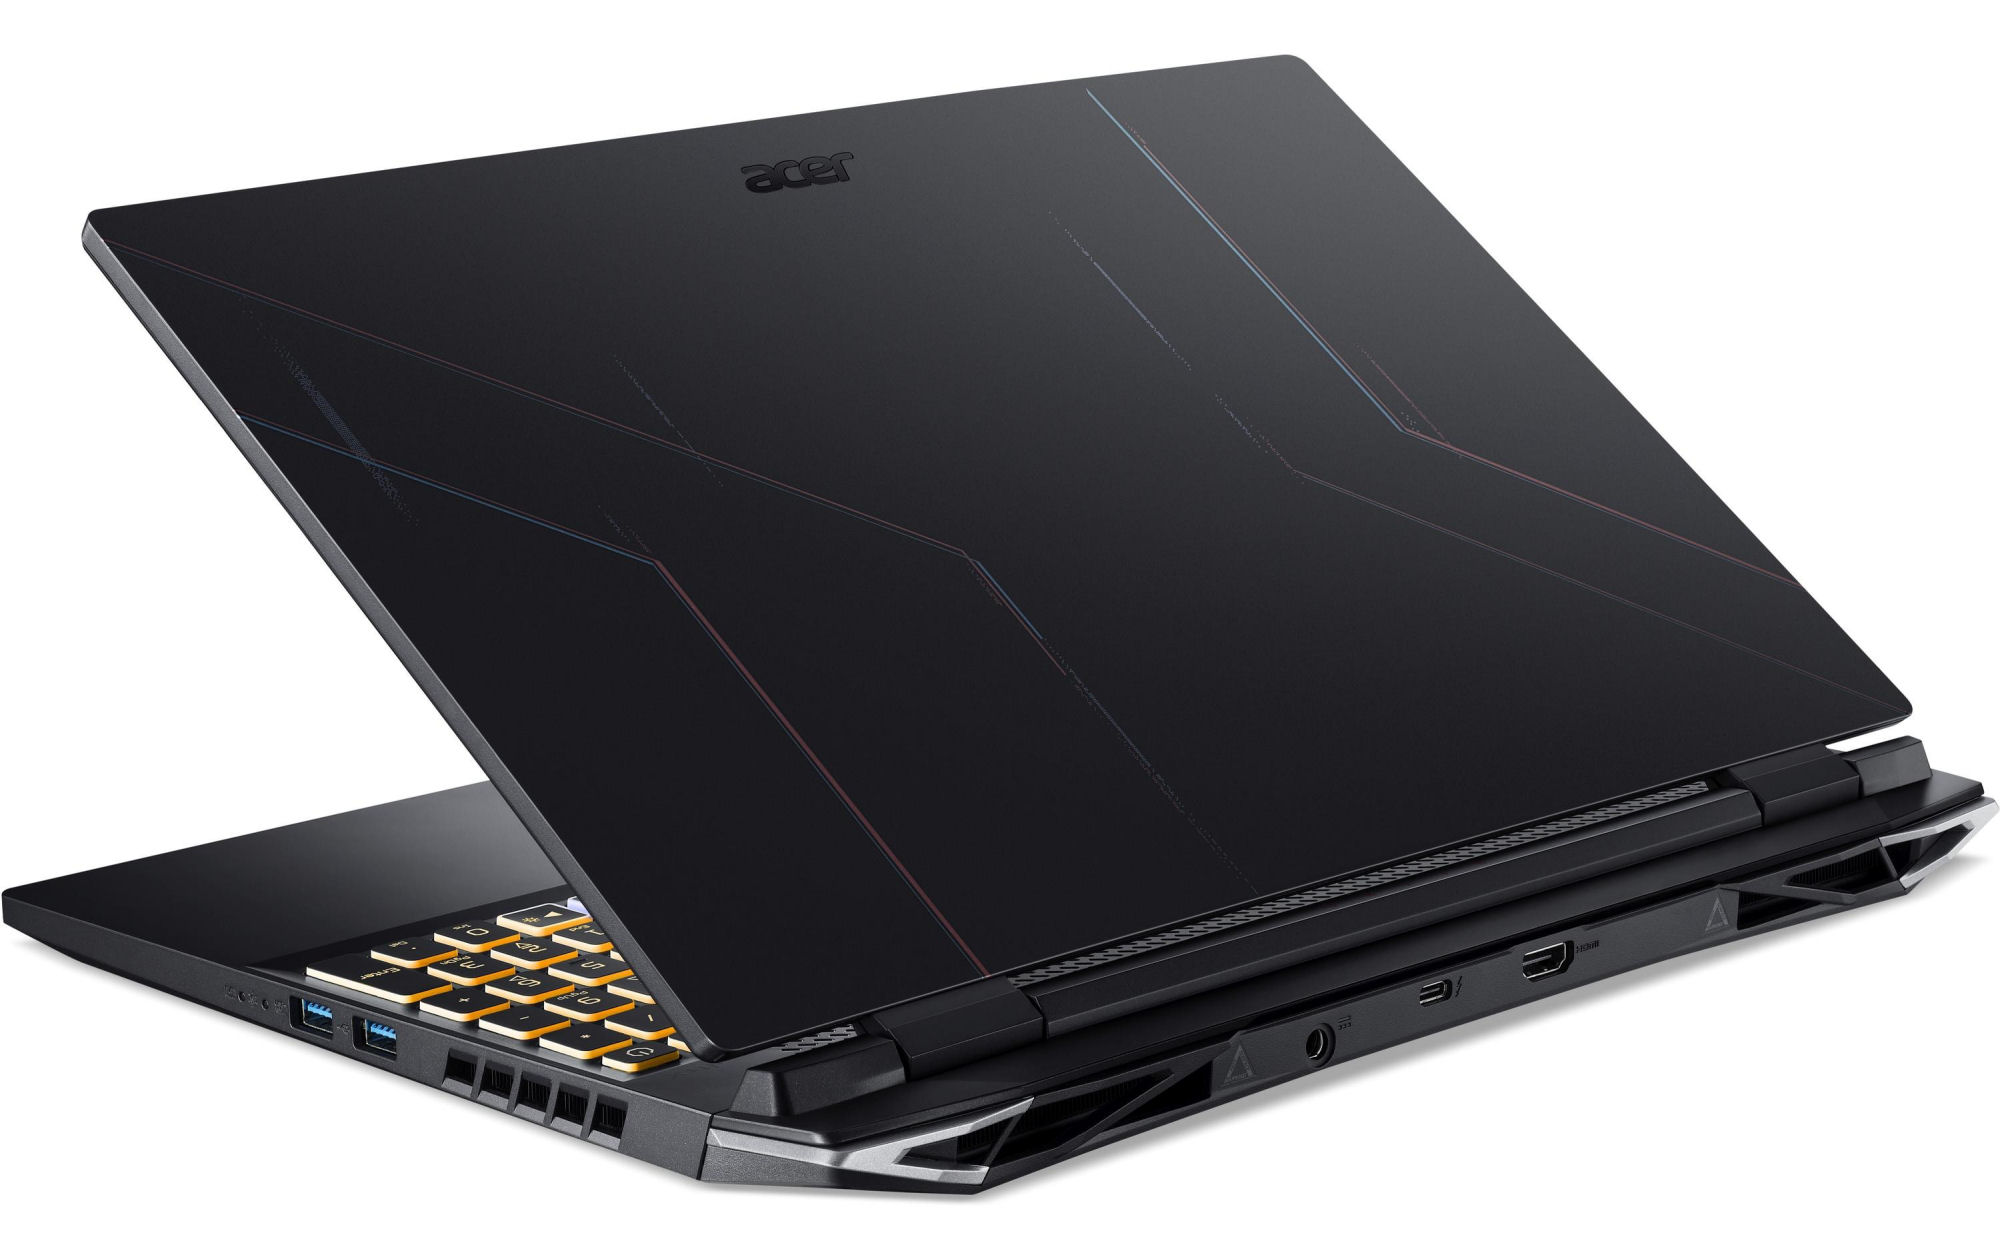
这款笔记本的电池寿命还不错,但没有什么出奇之处。电池可以用通用的USB-C交流适配器充电(最小65瓦,20伏),因为USB 4端口支持Power Delivery(和DisplayPort)。这意味着用户不一定要随身携带重达280瓦的电源。
哪个Nitro 5型号是更好的选择?这取决于你的需求。AMD版本有DDR5内存,能耗值低,电池寿命更好。它的发热也比较小。而英特尔型号提供更高的单线程CPU性能,Thunderbolt 4和更好的显示器。但请记住:两个Nitro版本都有FHD或QHD面板可供选择。
Nitro的一些替代品包括申克XMG Fusion 15 (Mid 22)和华硕TUF Dash F15.这两款设备的GPU性能较低,而且在负载下会明显发热。另一方面,它们更加紧凑,重量更轻,电池寿命更长。到目前为止,Fusion提供最长的运行时间。
价格和可用性
宏碁Nitro 5 AN515-46在制造商的网站上以2200美元的价格出售。
Acer Nitro 5 AN515-46-R1A1
- 10/28/2022 v7 (old)
Sascha Mölck
Price comparison

