联想ThinkBook 16p Gen 3 ARH笔记本电脑评测。戴尔XPS 15的挑战者

16英寸ThinkBook 16p Gen 3是去年ThinkBook 16p Gen 2的继任者。它配备了升级的AMD Zen 3+ CPU选项,以取代2021年机型中的Zen 3系列。正如本评论所解释的那样,还有其他一些小的差异,但2022款在其他方面与2021款在视觉上是相同的。因此,我们建议查看我们对 ThinkBook 16p第二代 以了解更多关于第三代的物理特性。
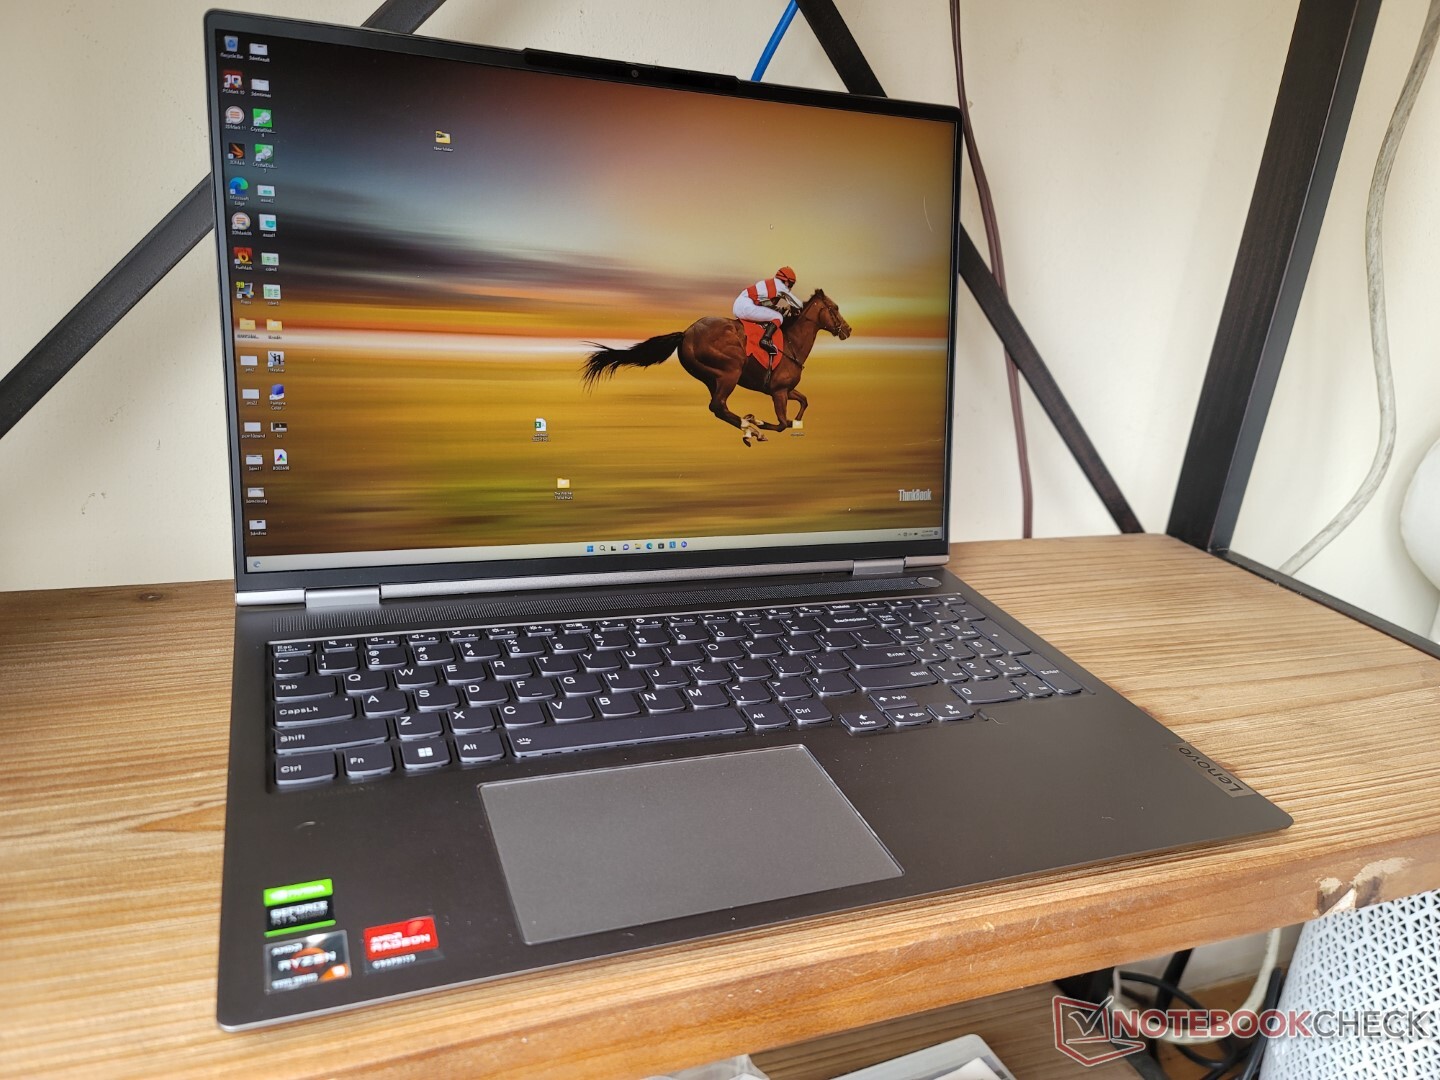
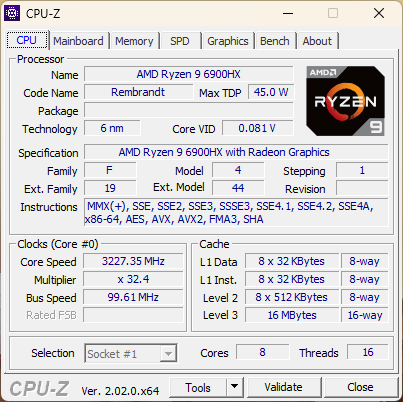
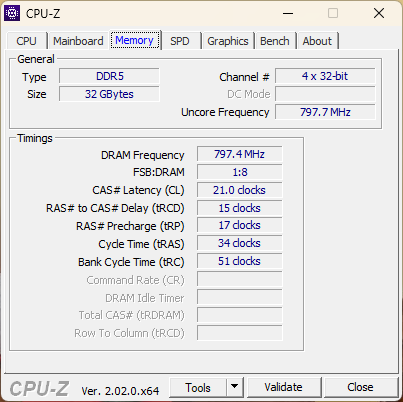
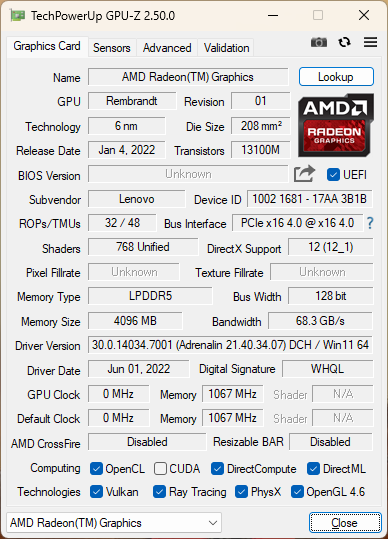
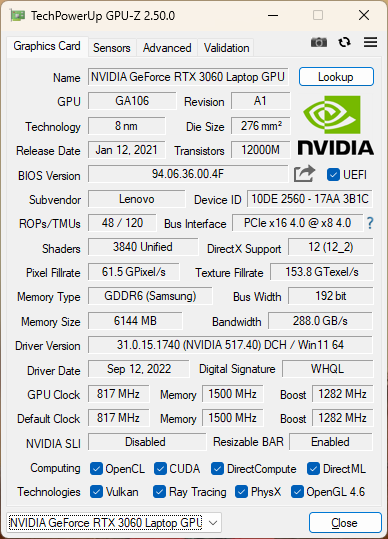
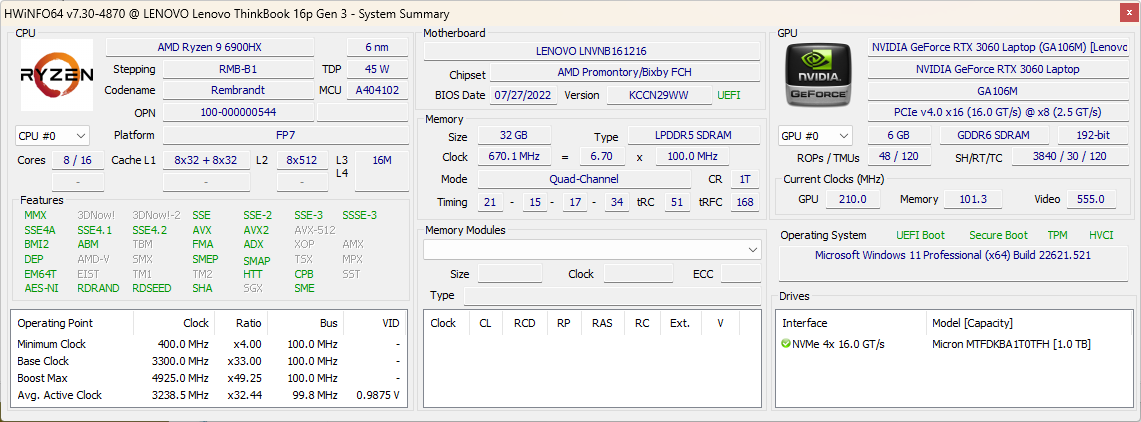
我们的具体测试设备配备了Ryzen 9 6900HX CPU,90 WGeForce RTX 3060 GPU,32 GB LPDDR5内存,以及165 Hz 2560 x 1600分辨率IPS显示屏,零售价约为2600美元。配备60赫兹显示屏和Ryzen 5 6600H或Ryzen 7 6800H处理器的较小的SKU也有供应。
直接竞争对手包括其他高端16英寸多媒体或Nvidia Studio笔记本电脑,如 HP Envy 16, 戴尔 Inspiron 16 Plus 7620, Acer Swift X 16, 或 微星创造者Z16.
更多联想评论。
潜在的竞争对手比较
Rating | Date | Model | Weight | Height | Size | Resolution | Price |
|---|---|---|---|---|---|---|---|
| 87.9 % v7 (old) | 10 / 2022 | Lenovo ThinkBook 16p G3 ARH R9 6900HX, GeForce RTX 3060 Laptop GPU | 2.1 kg | 19.5 mm | 16.00" | 2560x1600 | |
| 86.9 % v7 (old) | 09 / 2022 | HP Envy 16 h0112nr i7-12700H, GeForce RTX 3060 Laptop GPU | 2.3 kg | 19.8 mm | 16.00" | 3840x2400 | |
| 87 % v7 (old) | 09 / 2021 | Lenovo ThinkBook 16p G2 ACH R9 5900HX, GeForce RTX 3060 Laptop GPU | 2 kg | 19.5 mm | 16.00" | 2560x1600 | |
| 85.7 % v7 (old) | 09 / 2022 | Lenovo IdeaPad 5 Pro 16ARH7 R5 6600HS, Radeon 660M | 1.9 kg | 18.4 mm | 16.00" | 2560x1600 | |
| 86.2 % v7 (old) | 07 / 2022 | Acer Swift X SFX16-51G-5388 i5-11320H, GeForce RTX 3050 4GB Laptop GPU | 1.8 kg | 18.9 mm | 16.10" | 1920x1080 | |
| 86.6 % v7 (old) | 07 / 2022 | Lenovo Legion 5 Pro 16IAH7H i7-12700H, GeForce RTX 3060 Laptop GPU | 2.6 kg | 27 mm | 16.00" | 2560x1600 |
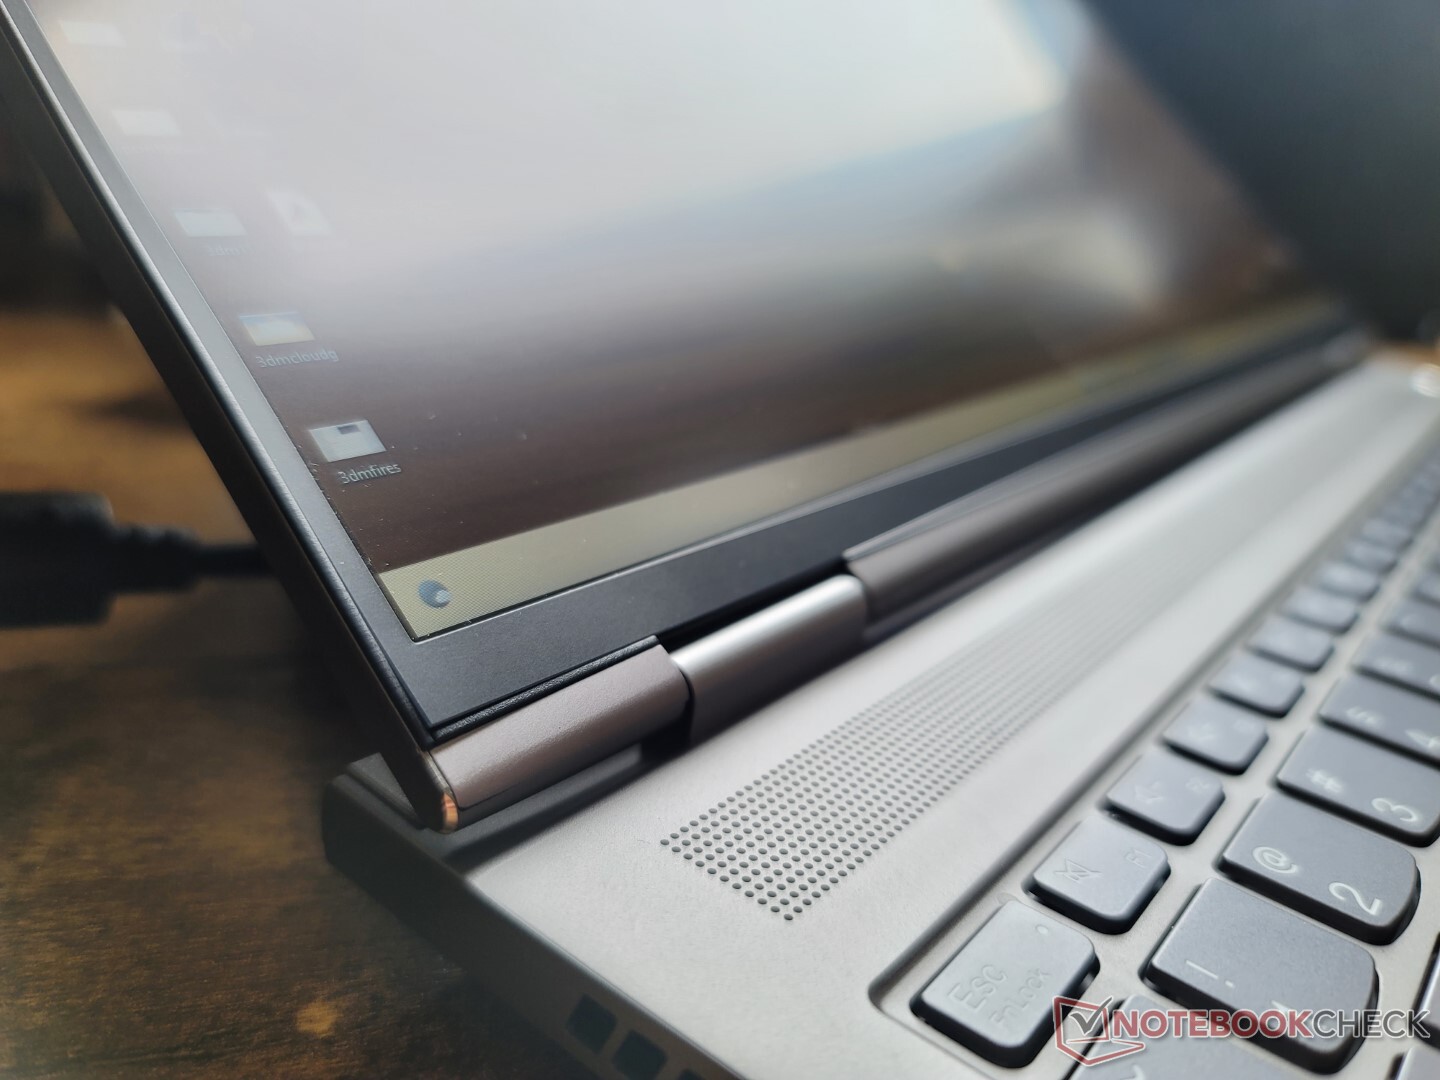
案例
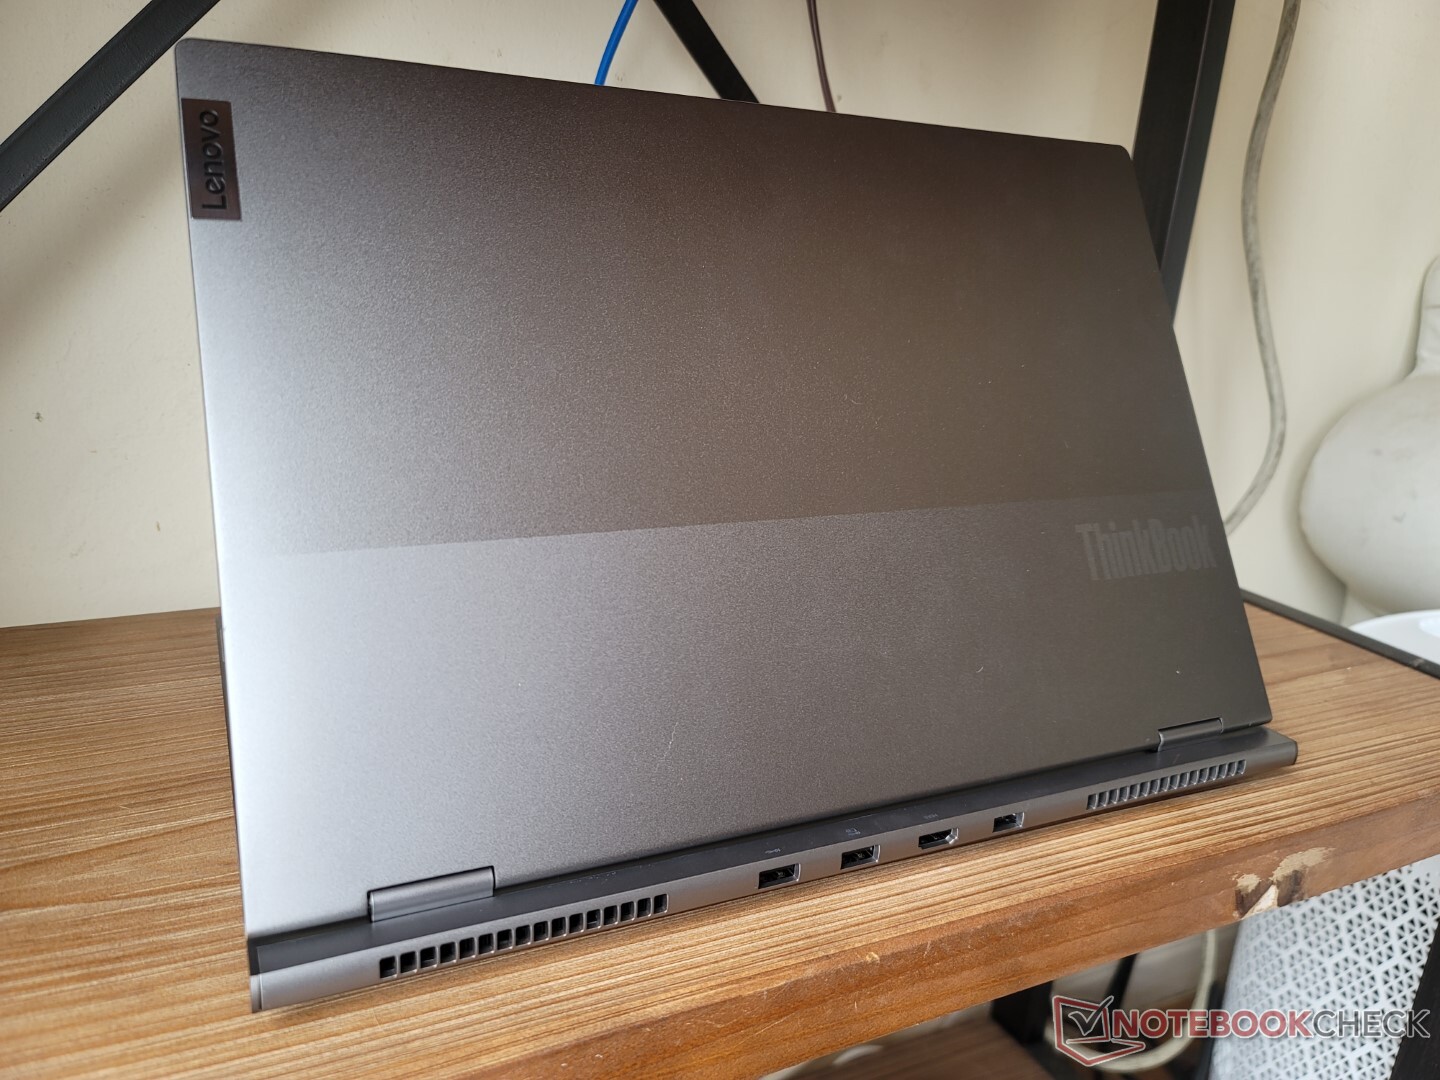
虽然机箱在视觉上与去年的第二代机型相同,但有一个简单的方法可以将第三代机型与第二代机型区分开来:沿着后部有一个HDMI端口。相比之下,第2代机型没有携带HDMI端口。
SD卡阅读器
| SD Card Reader | |
| average JPG Copy Test (av. of 3 runs) | |
| Lenovo IdeaPad 5 Pro 16ARH7 (AV PRO microSD 128 GB V60) | |
| Lenovo ThinkBook 16p G2 ACH | |
| Lenovo ThinkBook 16p G3 ARH (AV PRO microSD 128 GB V60) | |
| HP Envy 16 h0112nr (AV Pro SD microSD 128 GB V60) | |
| maximum AS SSD Seq Read Test (1GB) | |
| Lenovo ThinkBook 16p G2 ACH | |
| Lenovo ThinkBook 16p G3 ARH (AV PRO microSD 128 GB V60) | |
| HP Envy 16 h0112nr (AV Pro SD microSD 128 GB V60) | |
沟通
| Networking | |
| iperf3 transmit AX12 | |
| Acer Swift X SFX16-51G-5388 | |
| Lenovo ThinkBook 16p G2 ACH | |
| iperf3 receive AX12 | |
| Acer Swift X SFX16-51G-5388 | |
| Lenovo ThinkBook 16p G2 ACH | |
| iperf3 receive AXE11000 6GHz | |
| Lenovo Legion 5 Pro 16IAH7H | |
| HP Envy 16 h0112nr | |
| iperf3 receive AXE11000 | |
| Lenovo ThinkBook 16p G3 ARH | |
| Lenovo IdeaPad 5 Pro 16ARH7 | |
| iperf3 transmit AXE11000 6GHz | |
| Lenovo Legion 5 Pro 16IAH7H | |
| HP Envy 16 h0112nr | |
| iperf3 transmit AXE11000 | |
| Lenovo ThinkBook 16p G3 ARH | |
| Lenovo IdeaPad 5 Pro 16ARH7 | |
网络摄像头


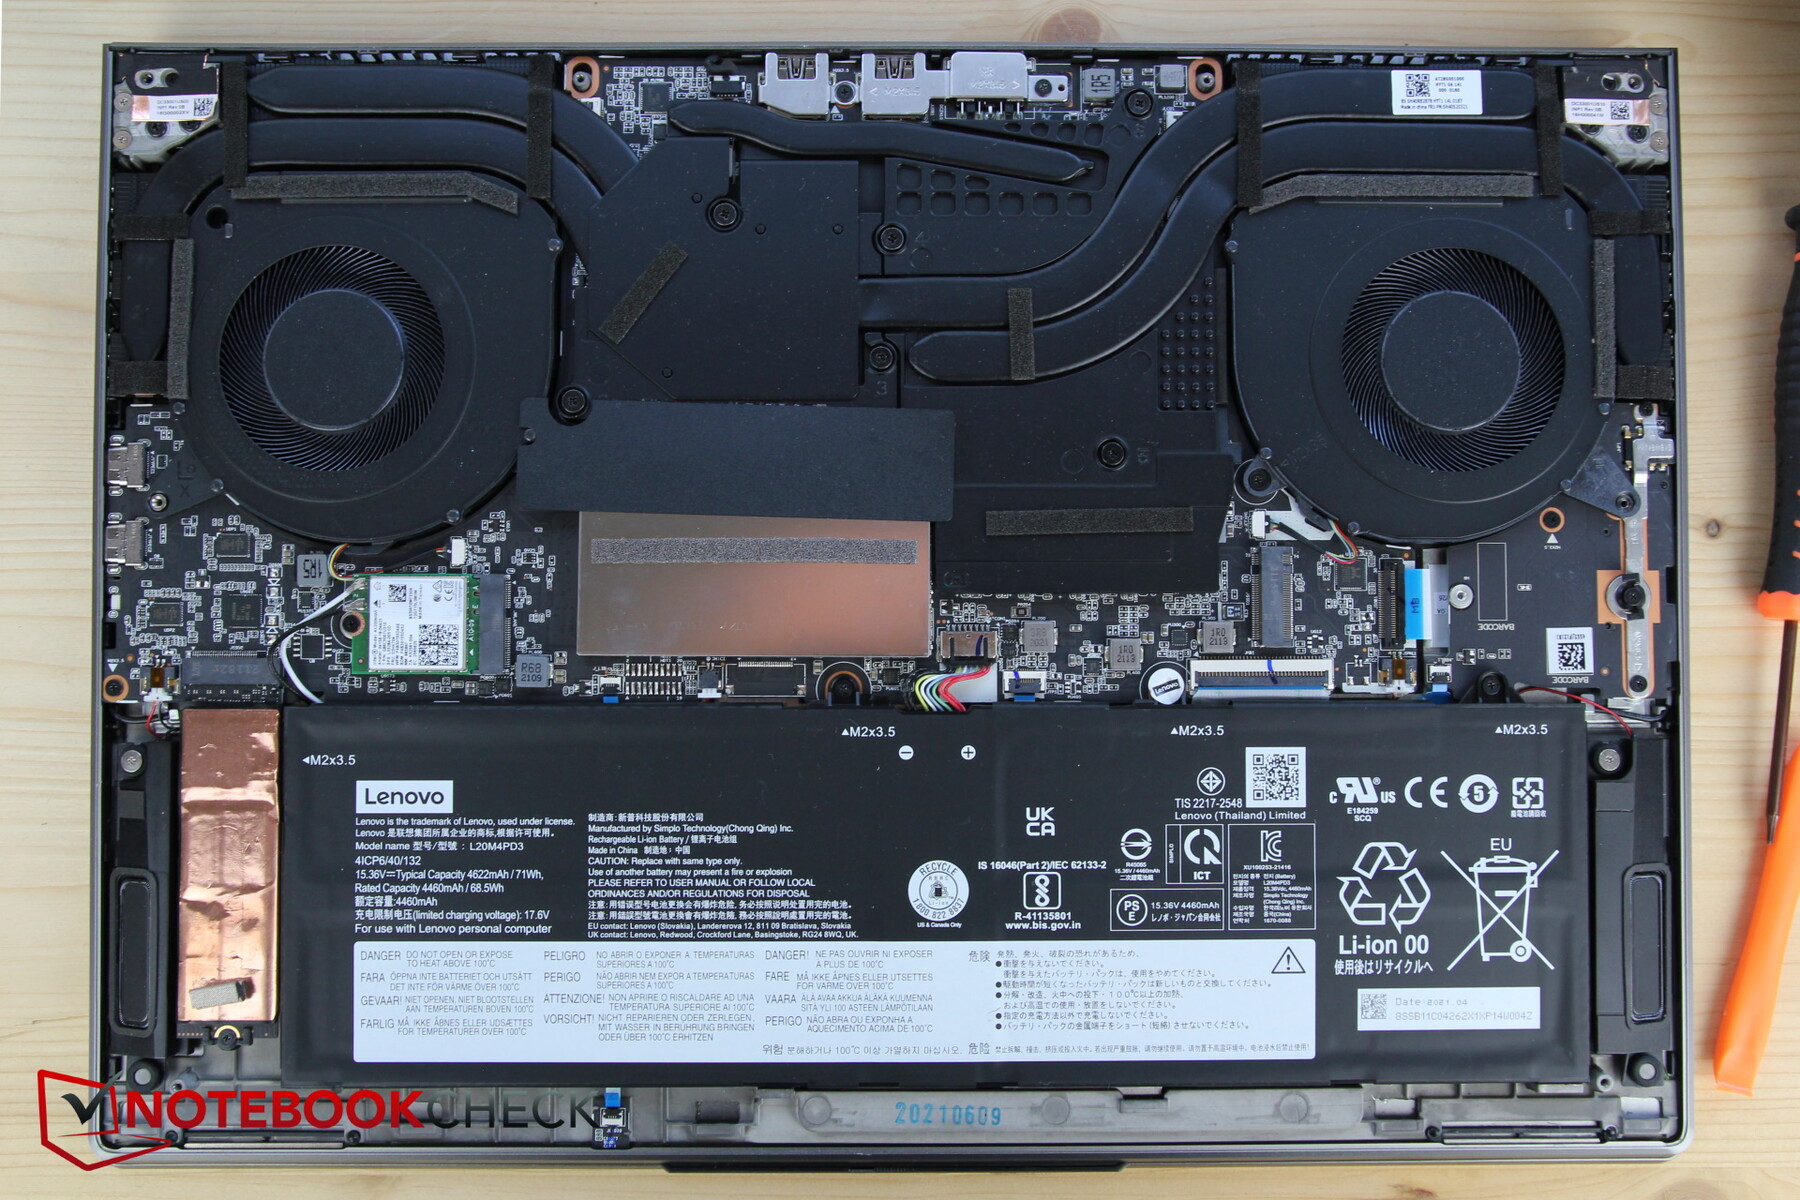
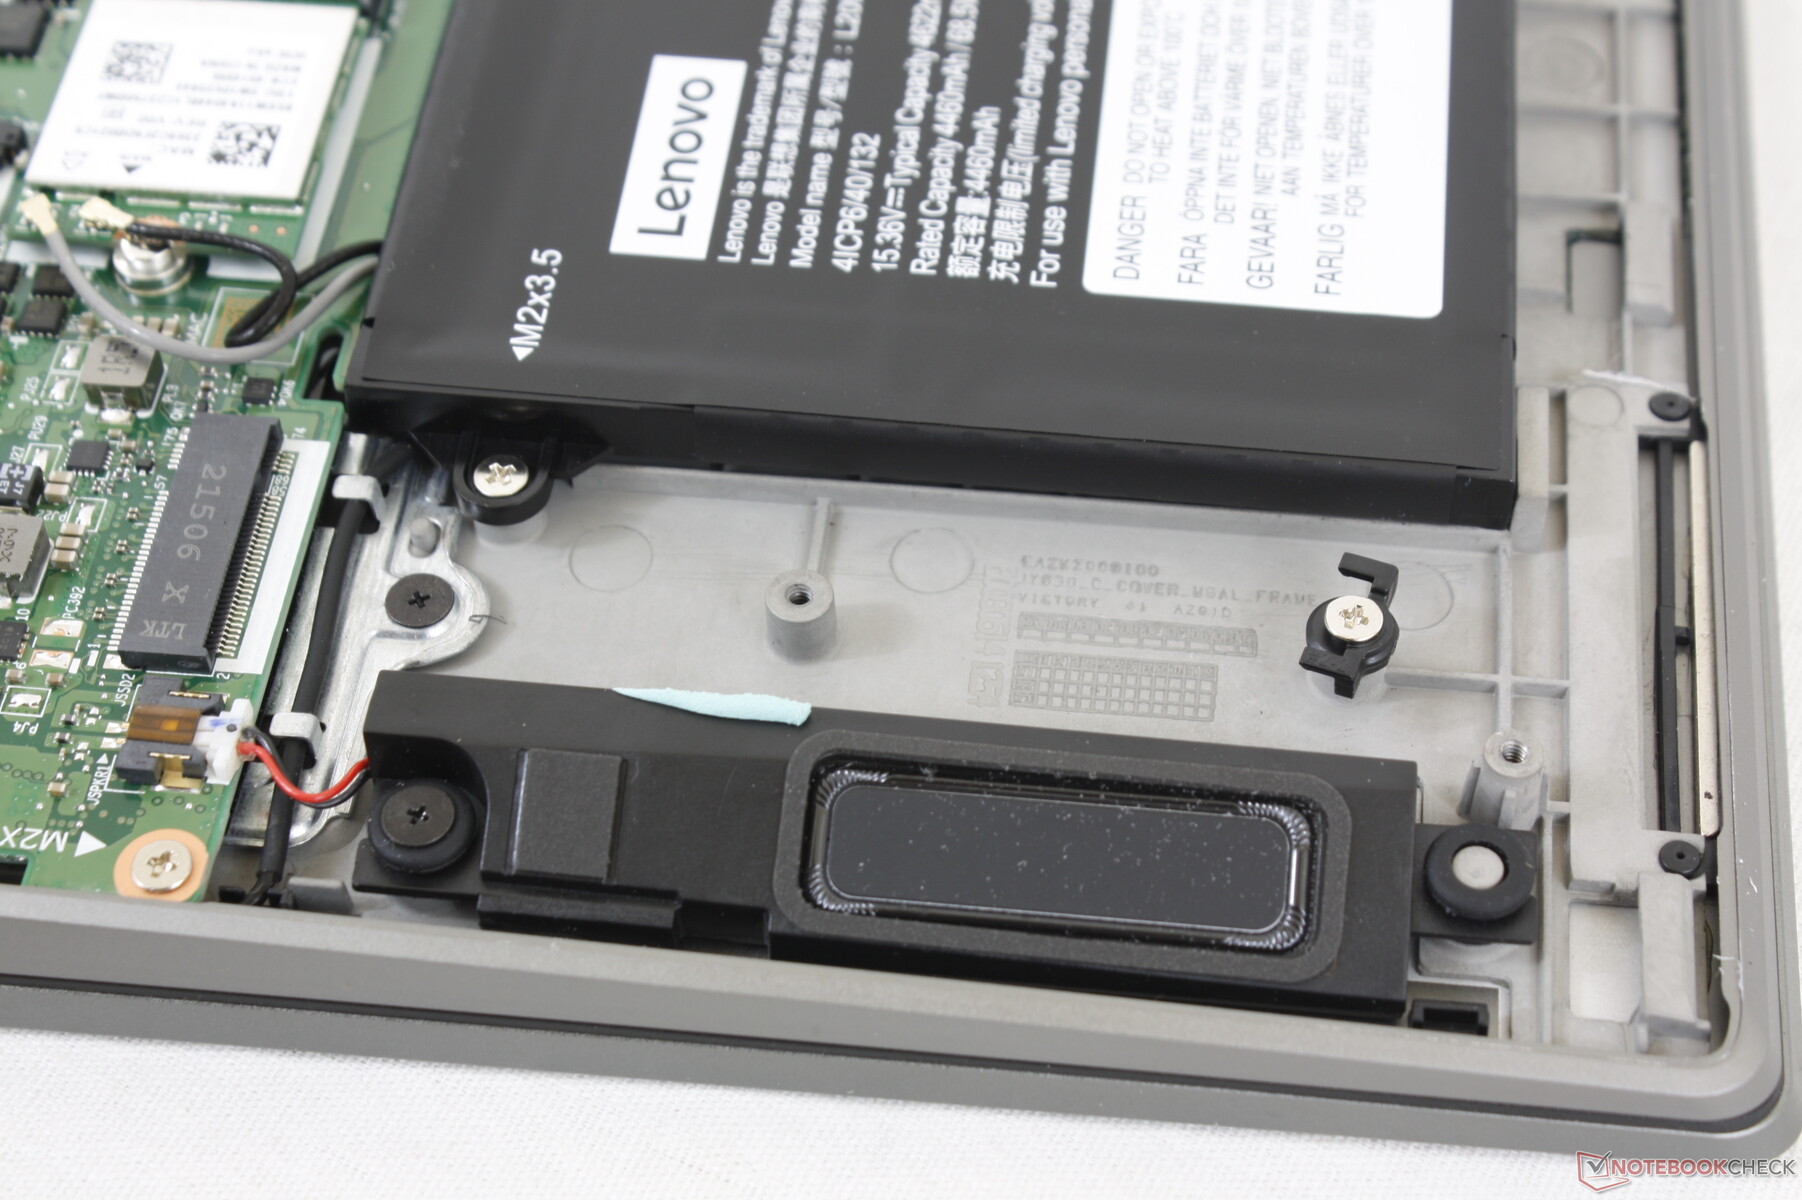
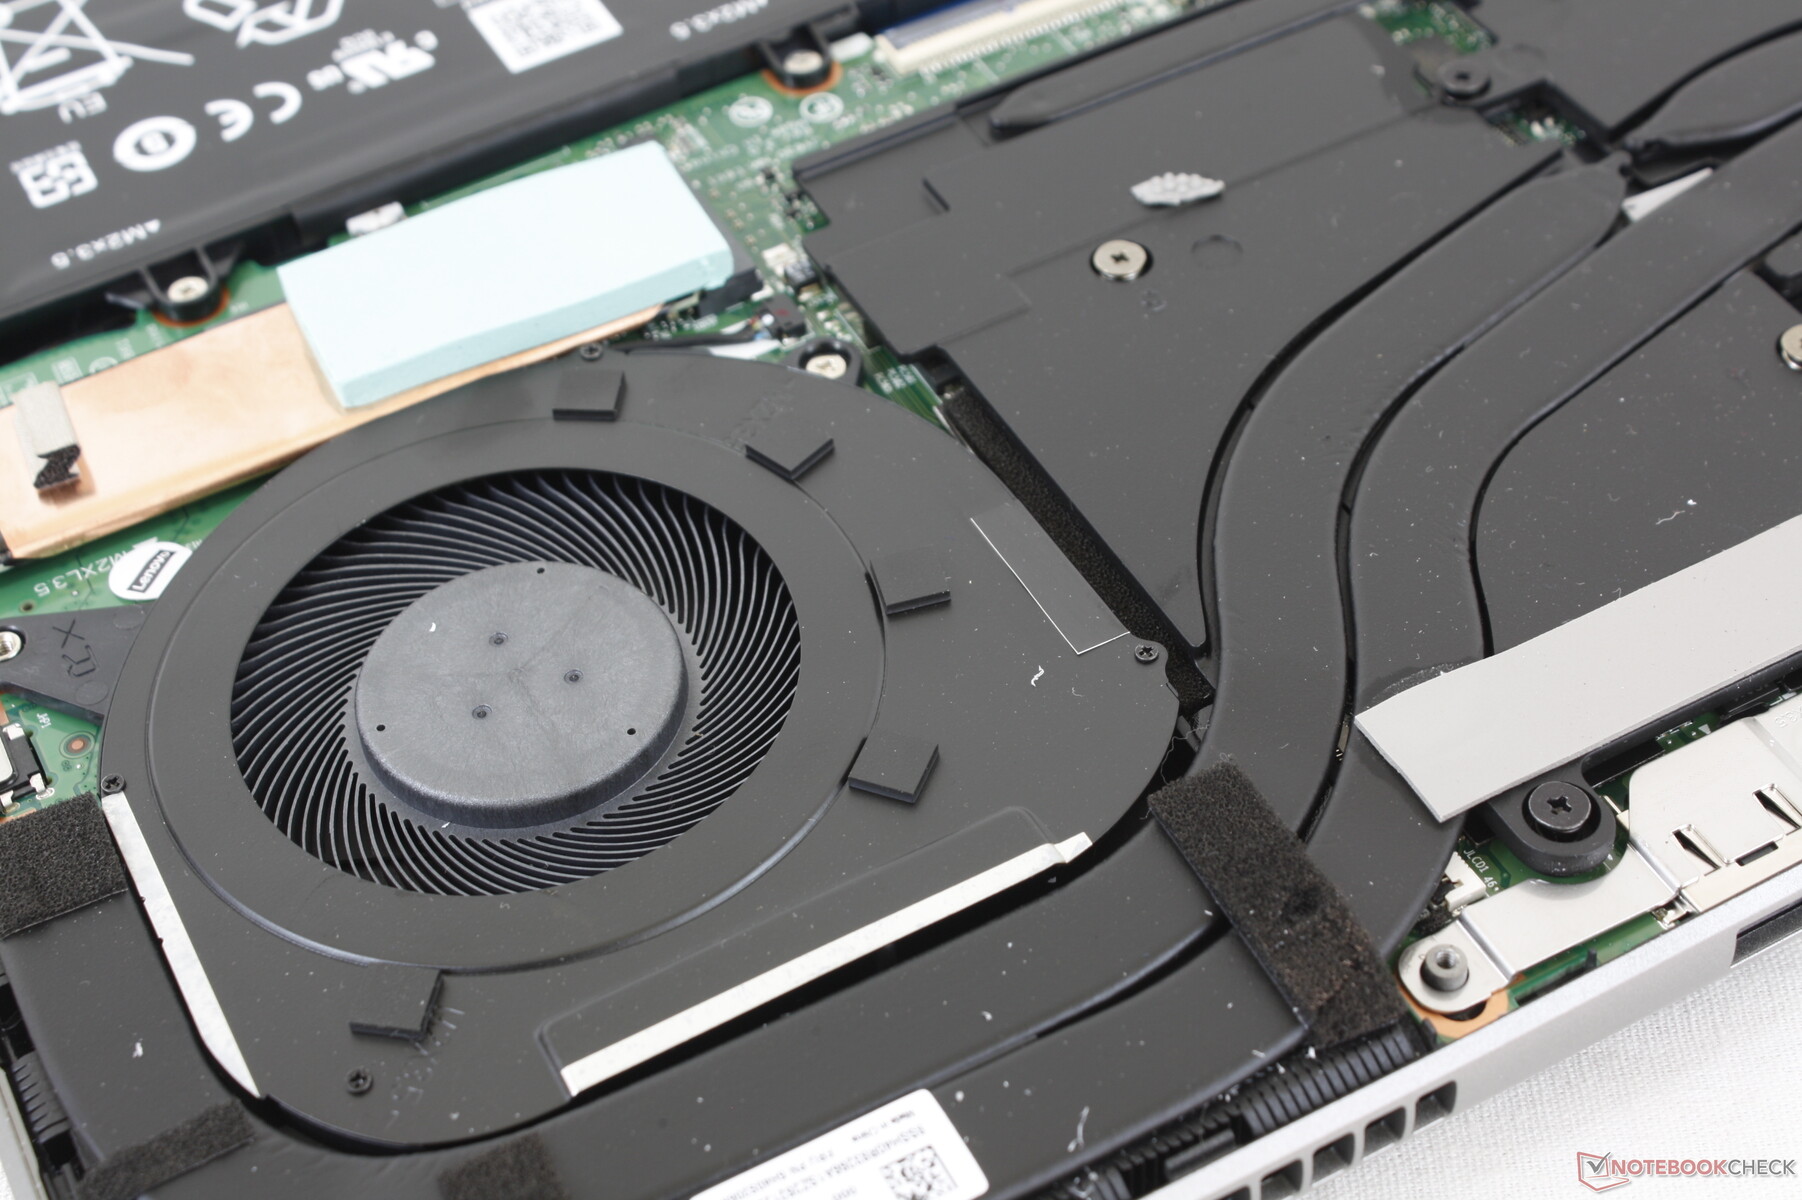
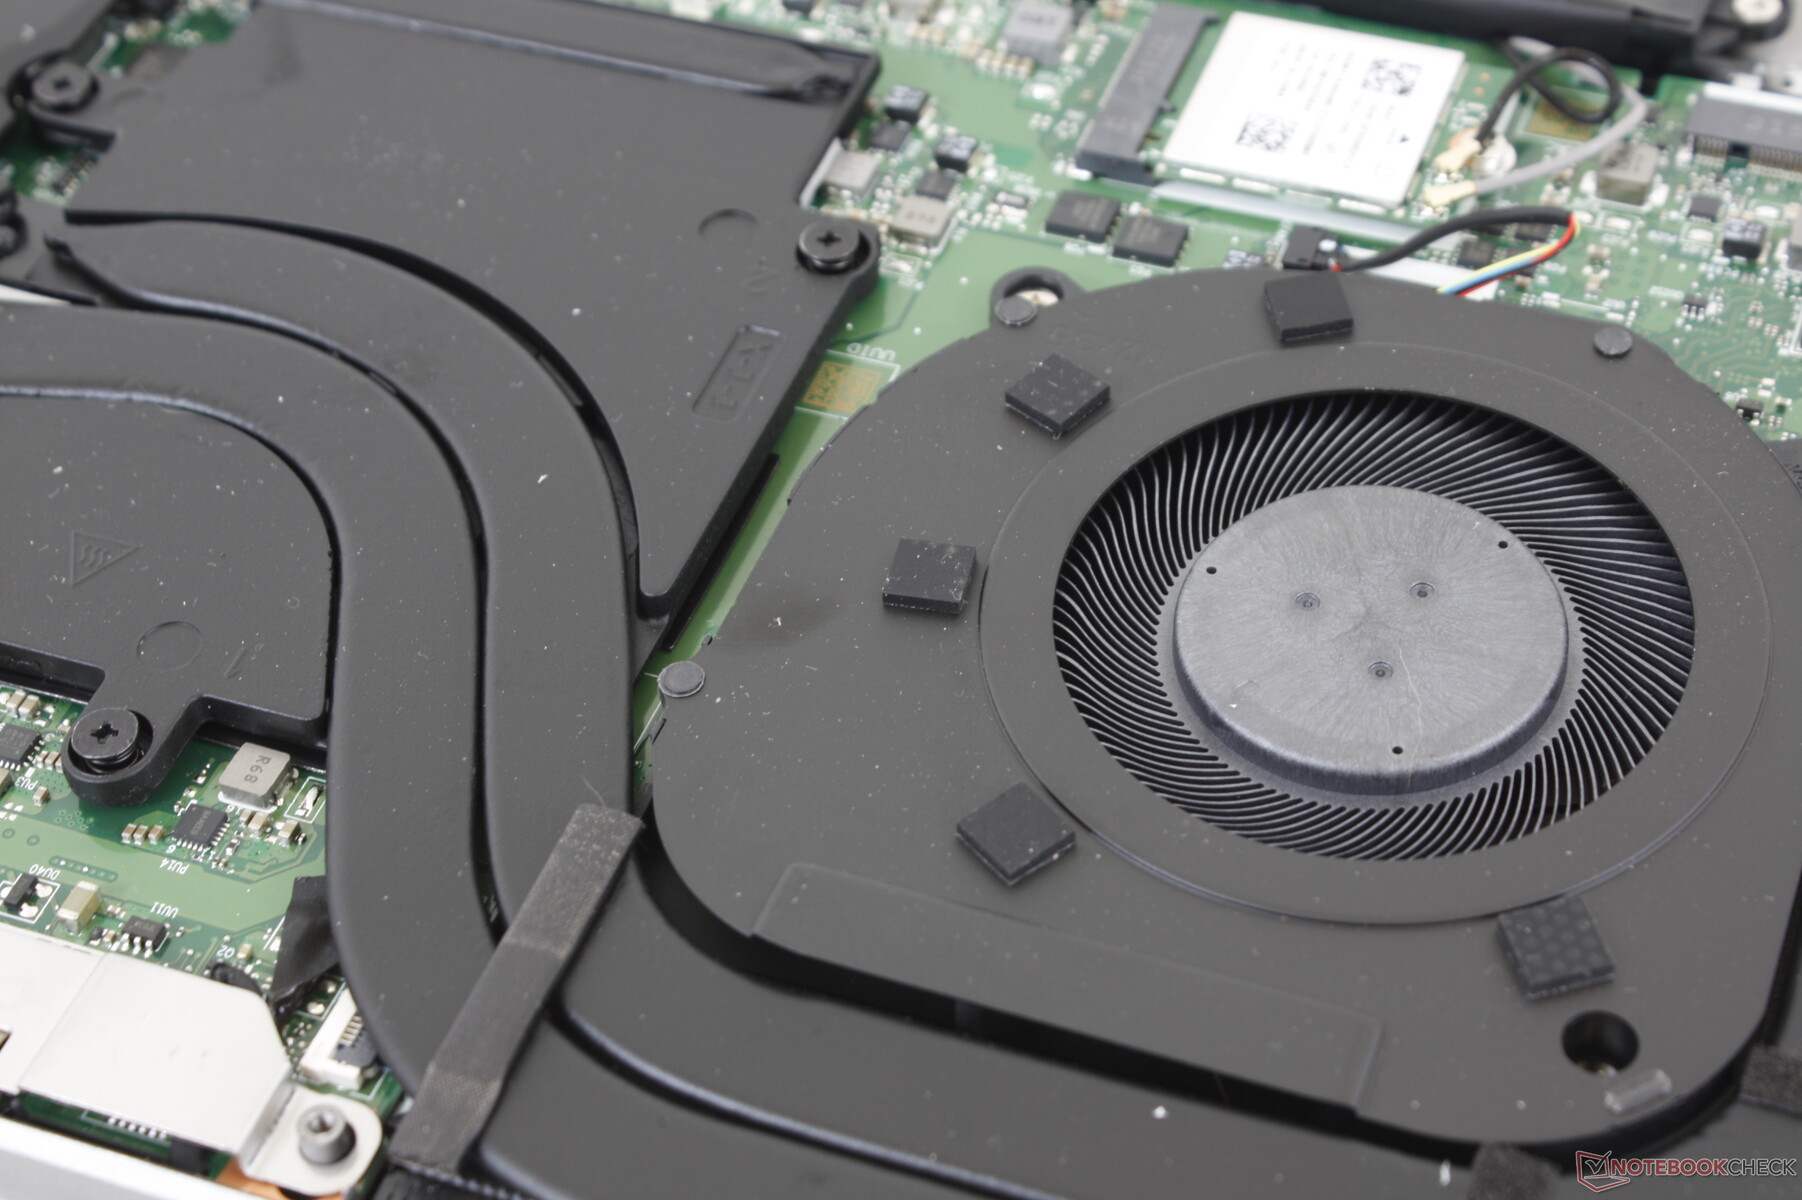
维护
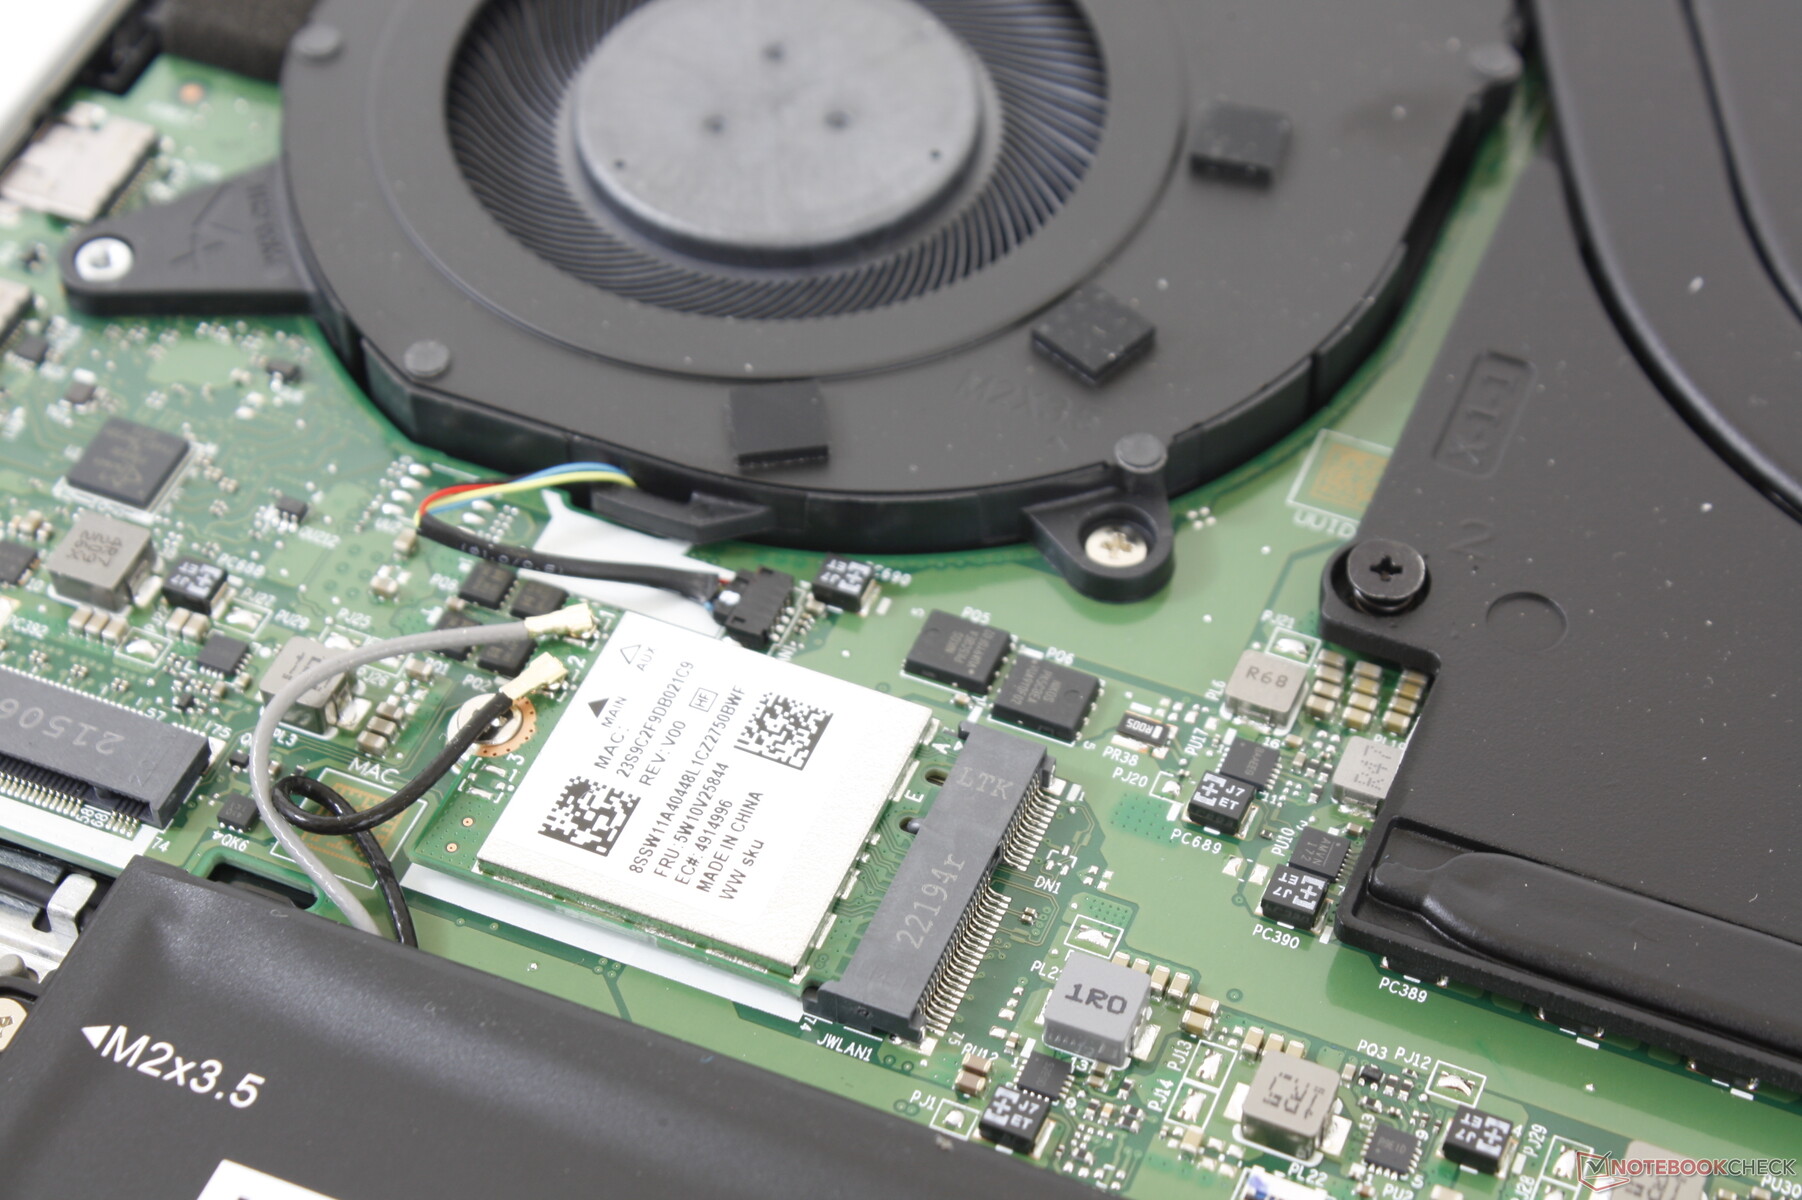
第3代机型使用焊接的RAM,而第2代机型有一个可移动的SODIMM插槽。
显示
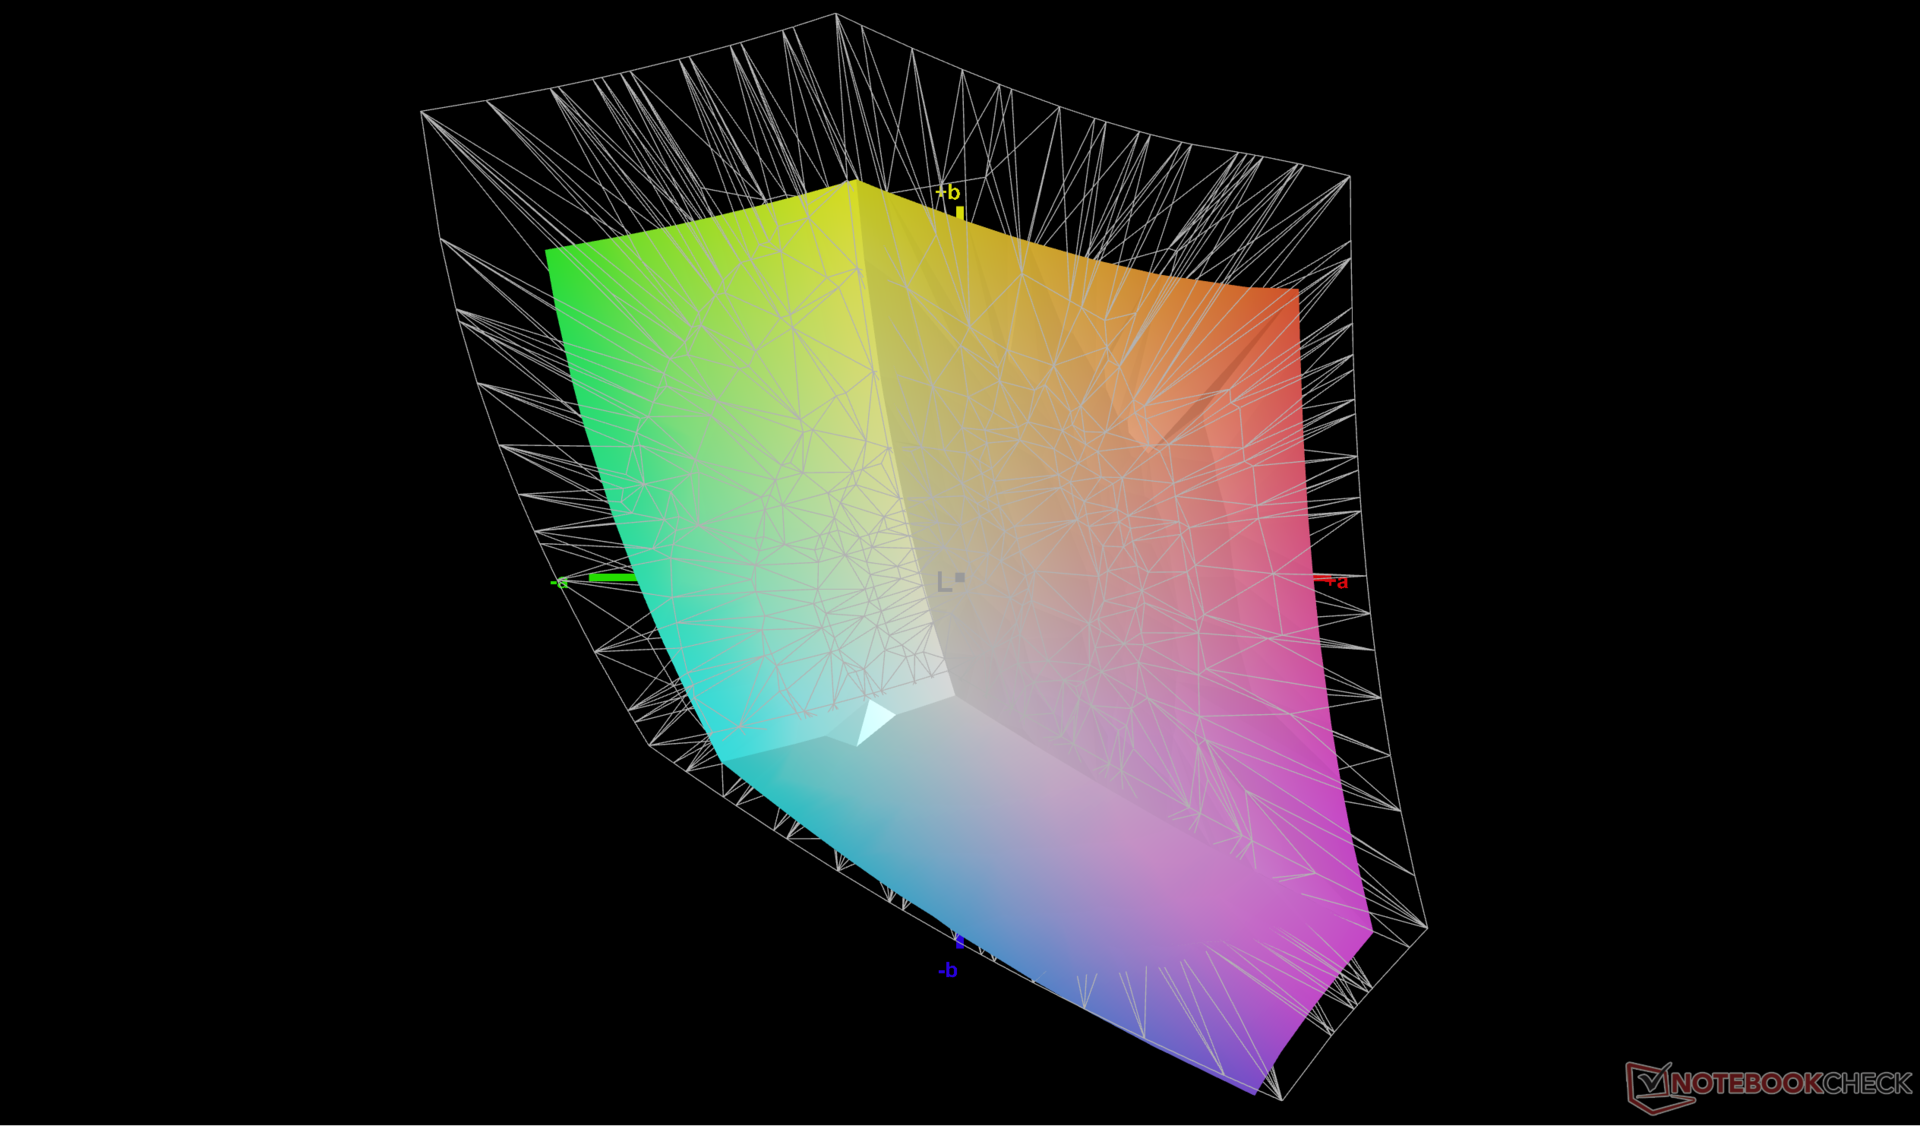
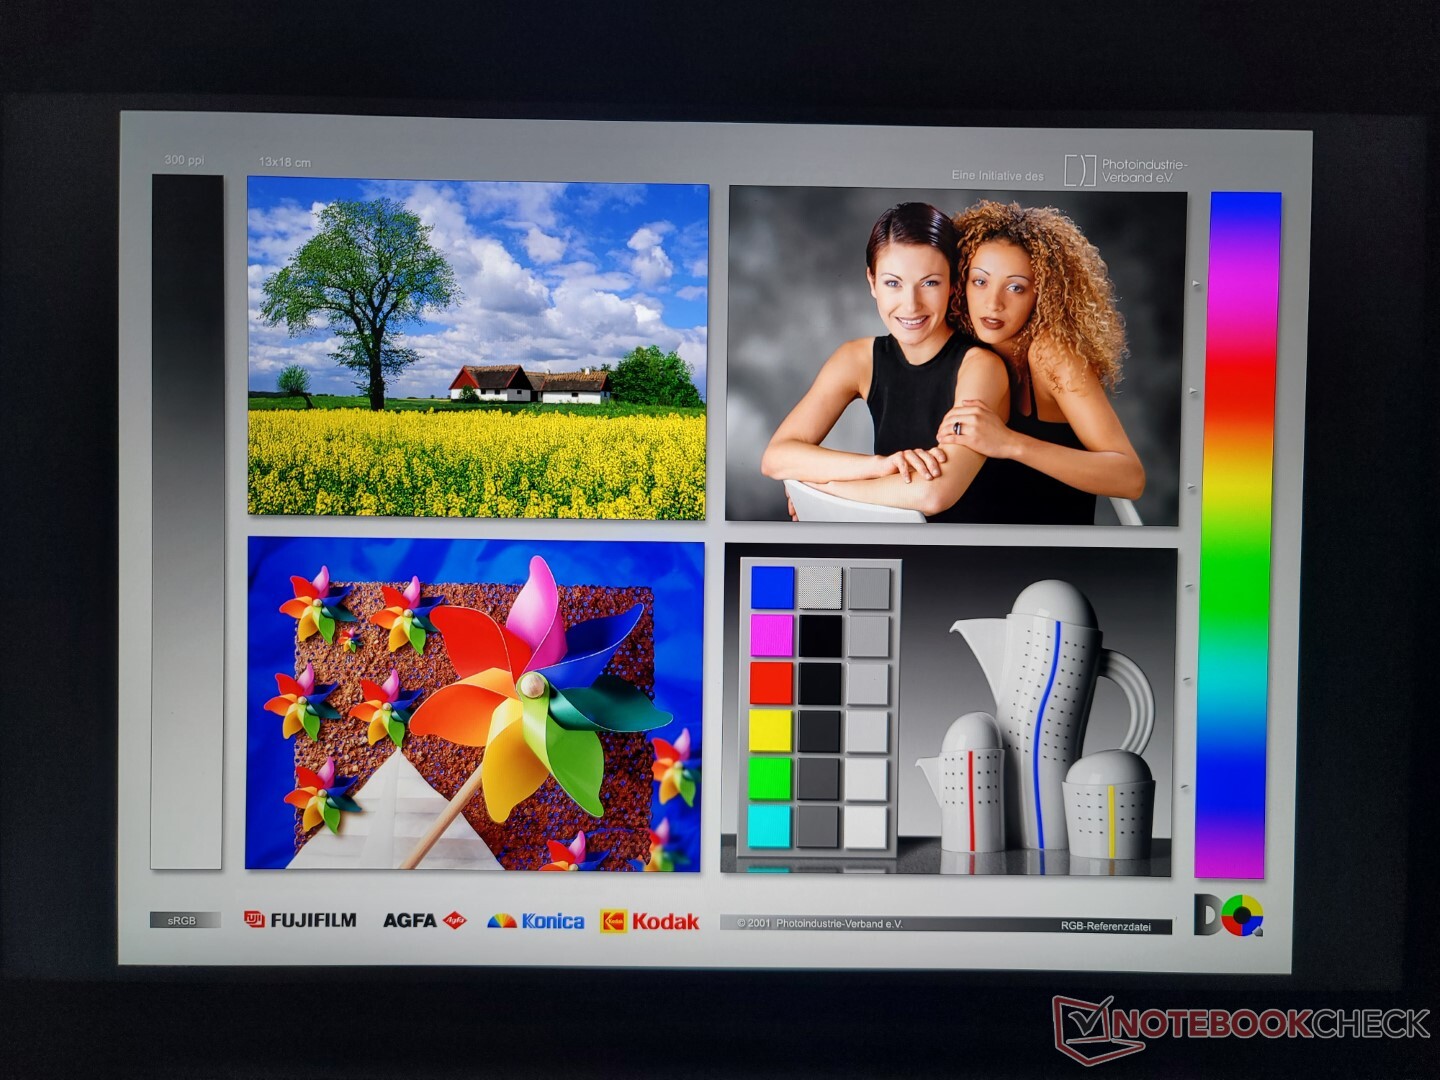
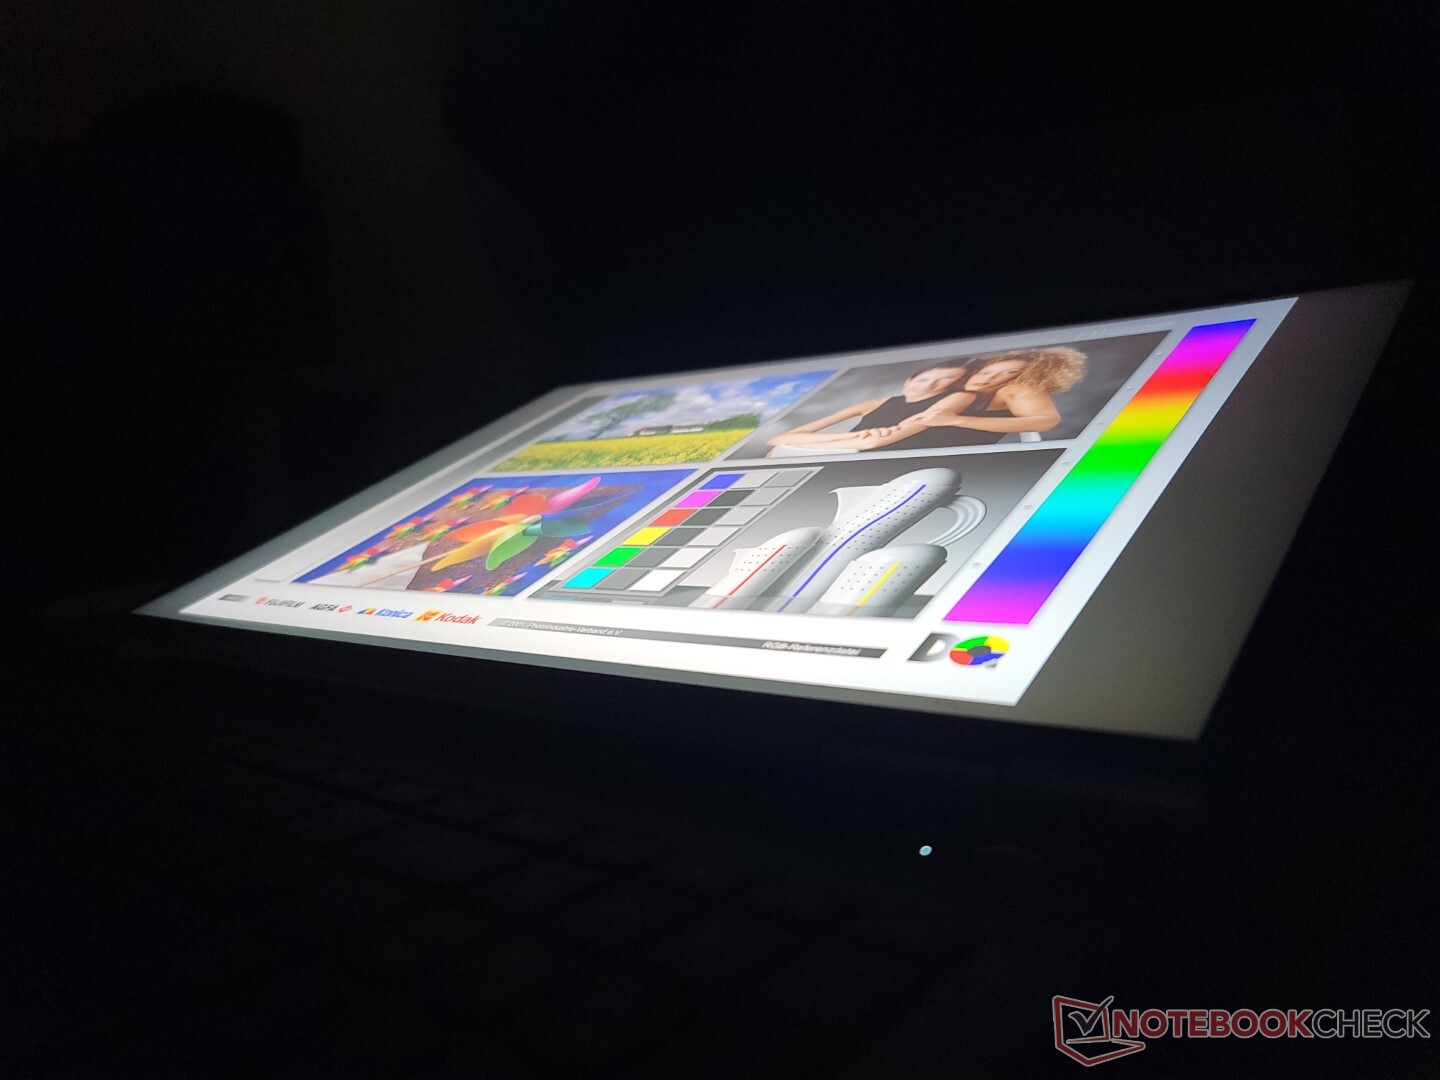
我们的165赫兹显示屏是我们第二代测试设备上的60赫兹面板的升级版。它还提供更快的响应时间,更明亮的背光,以及相同的全sRGB覆盖。不幸的是,目前没有OLED或P3面板选项。


| |||||||||||||||||||||||||
Brightness Distribution: 94 %
Center on Battery: 532.8 cd/m²
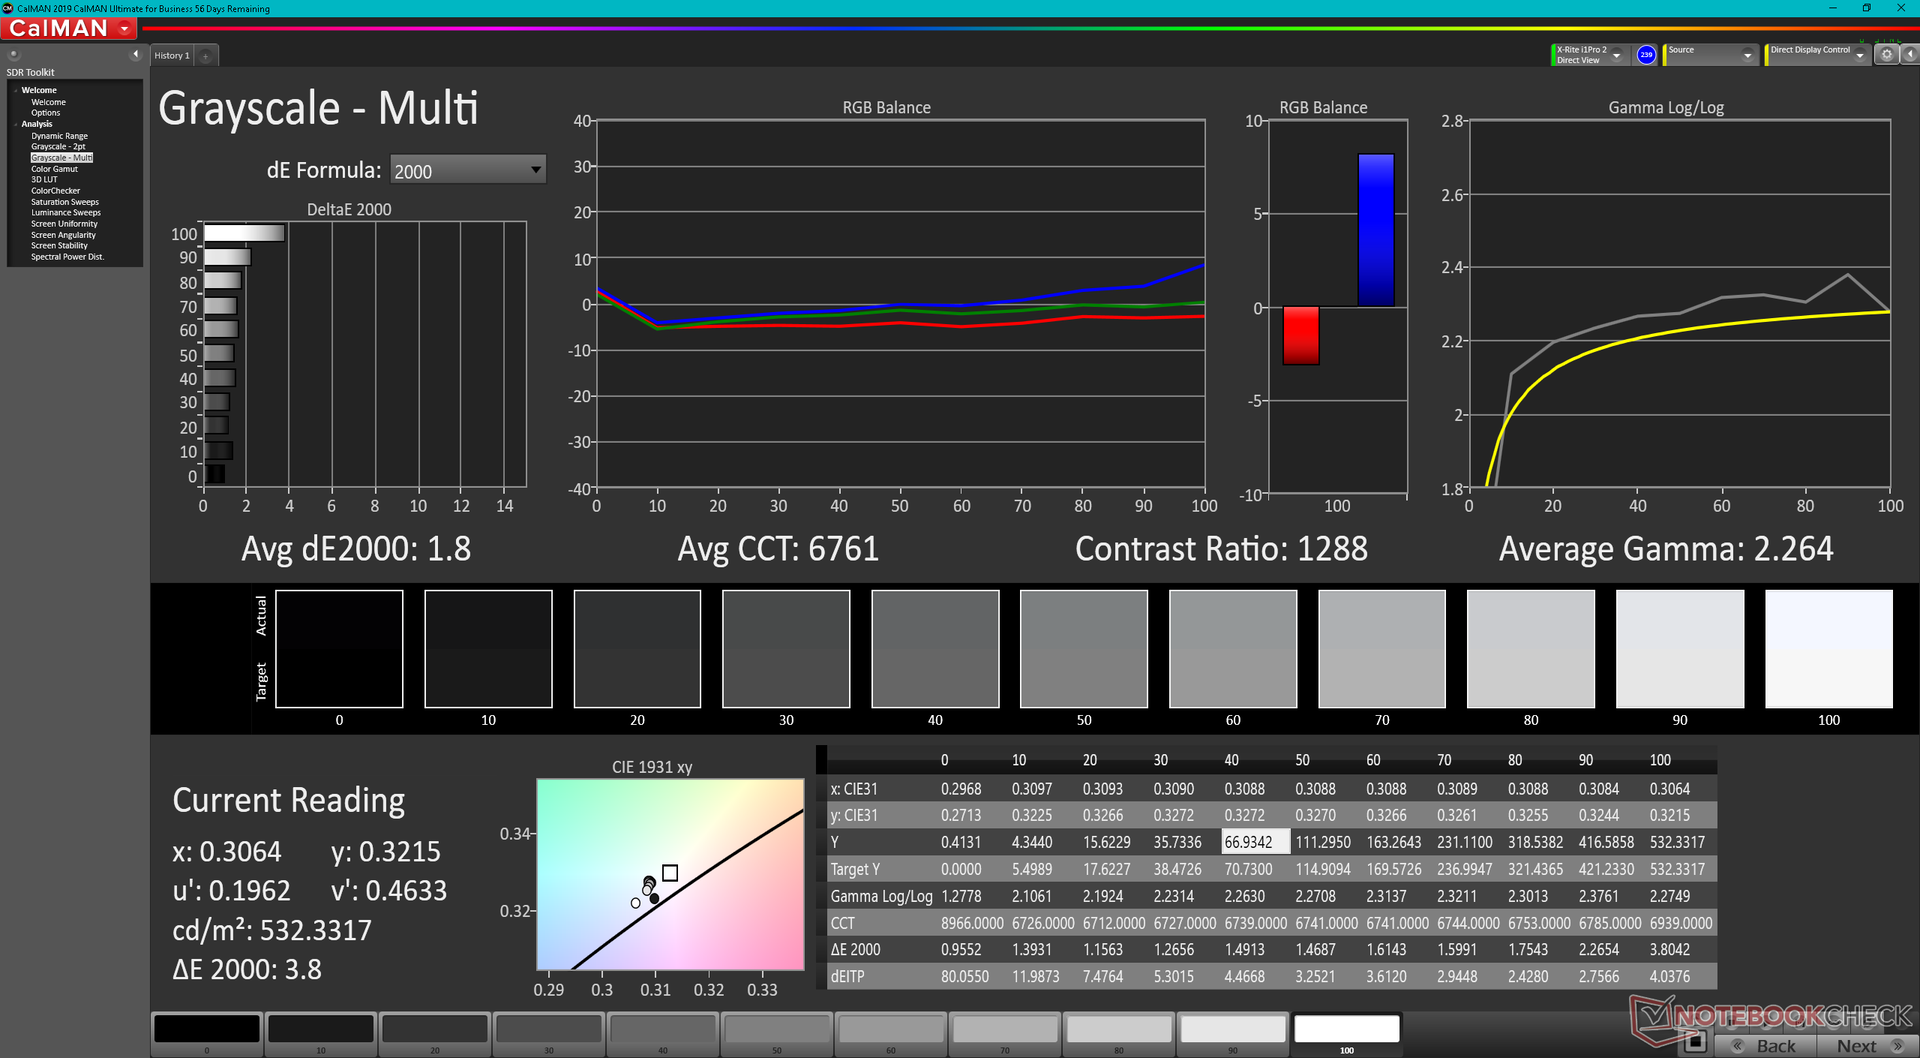
Contrast: 969:1 (Black: 0.55 cd/m²)
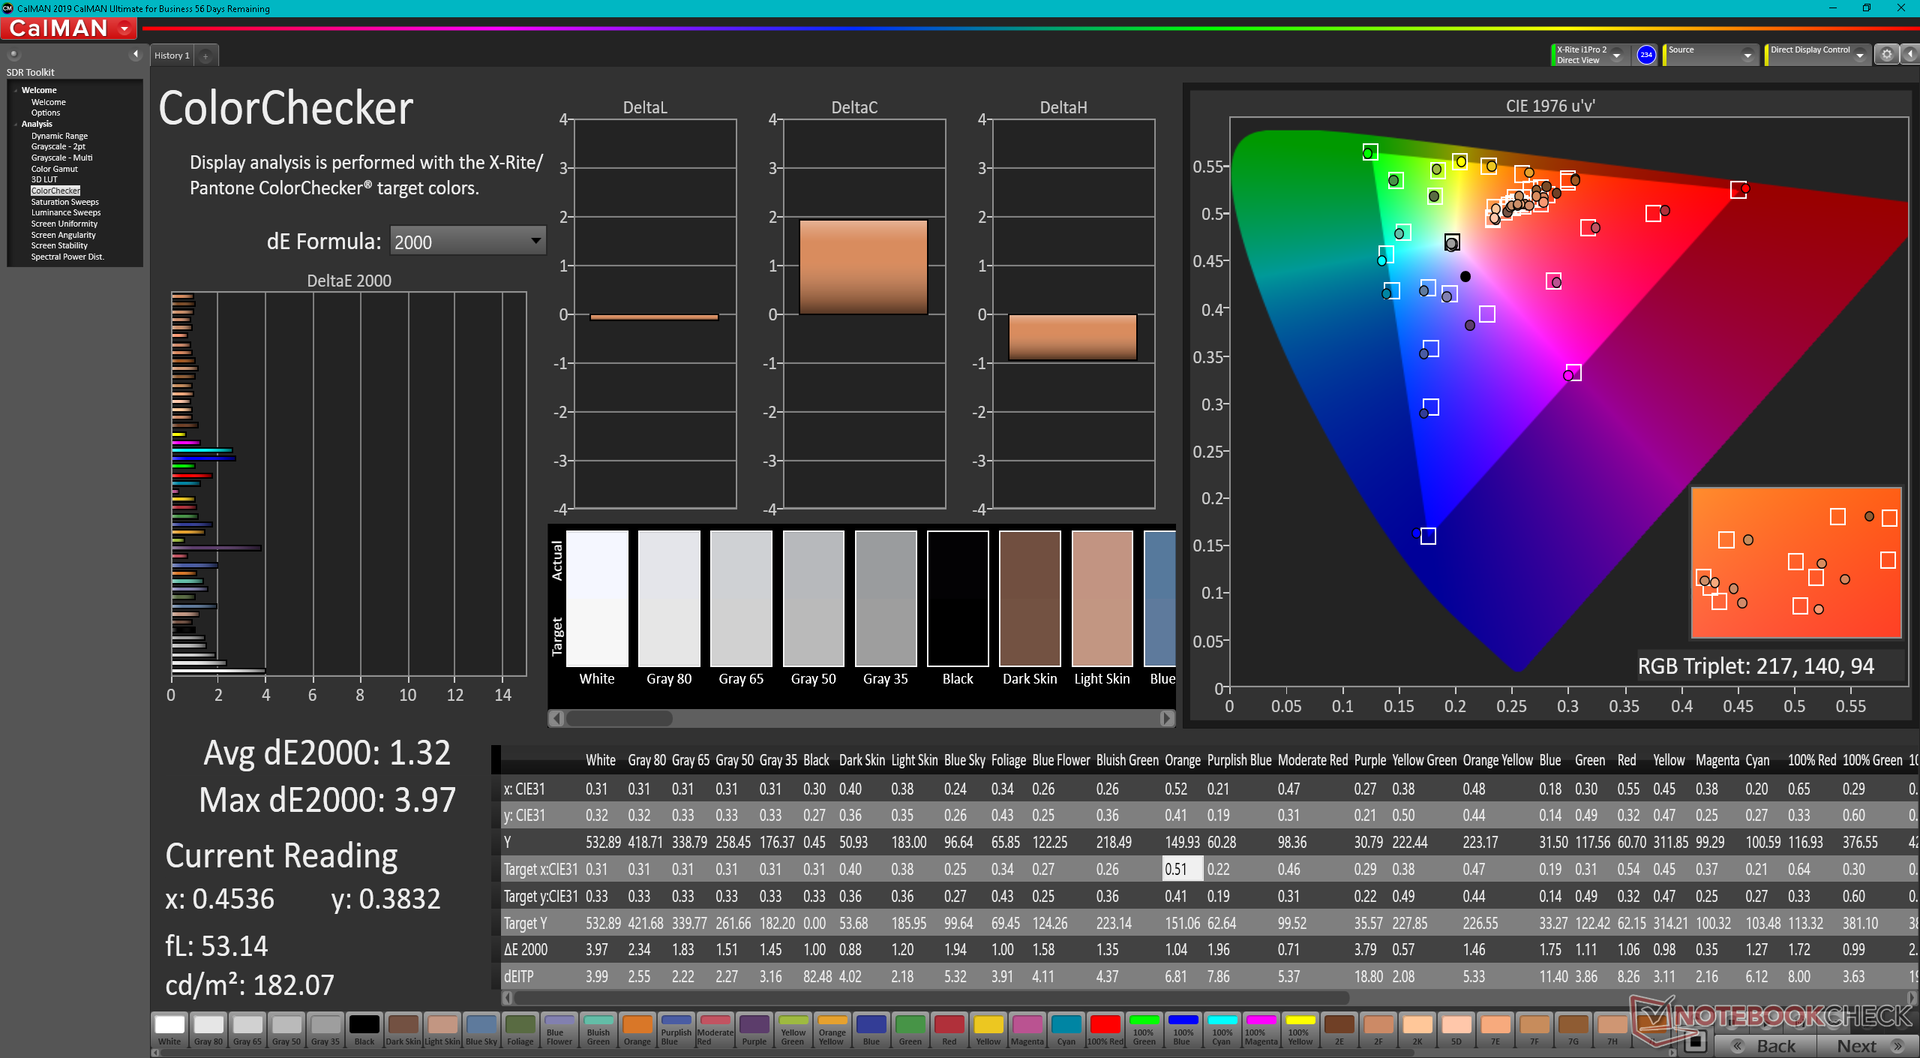
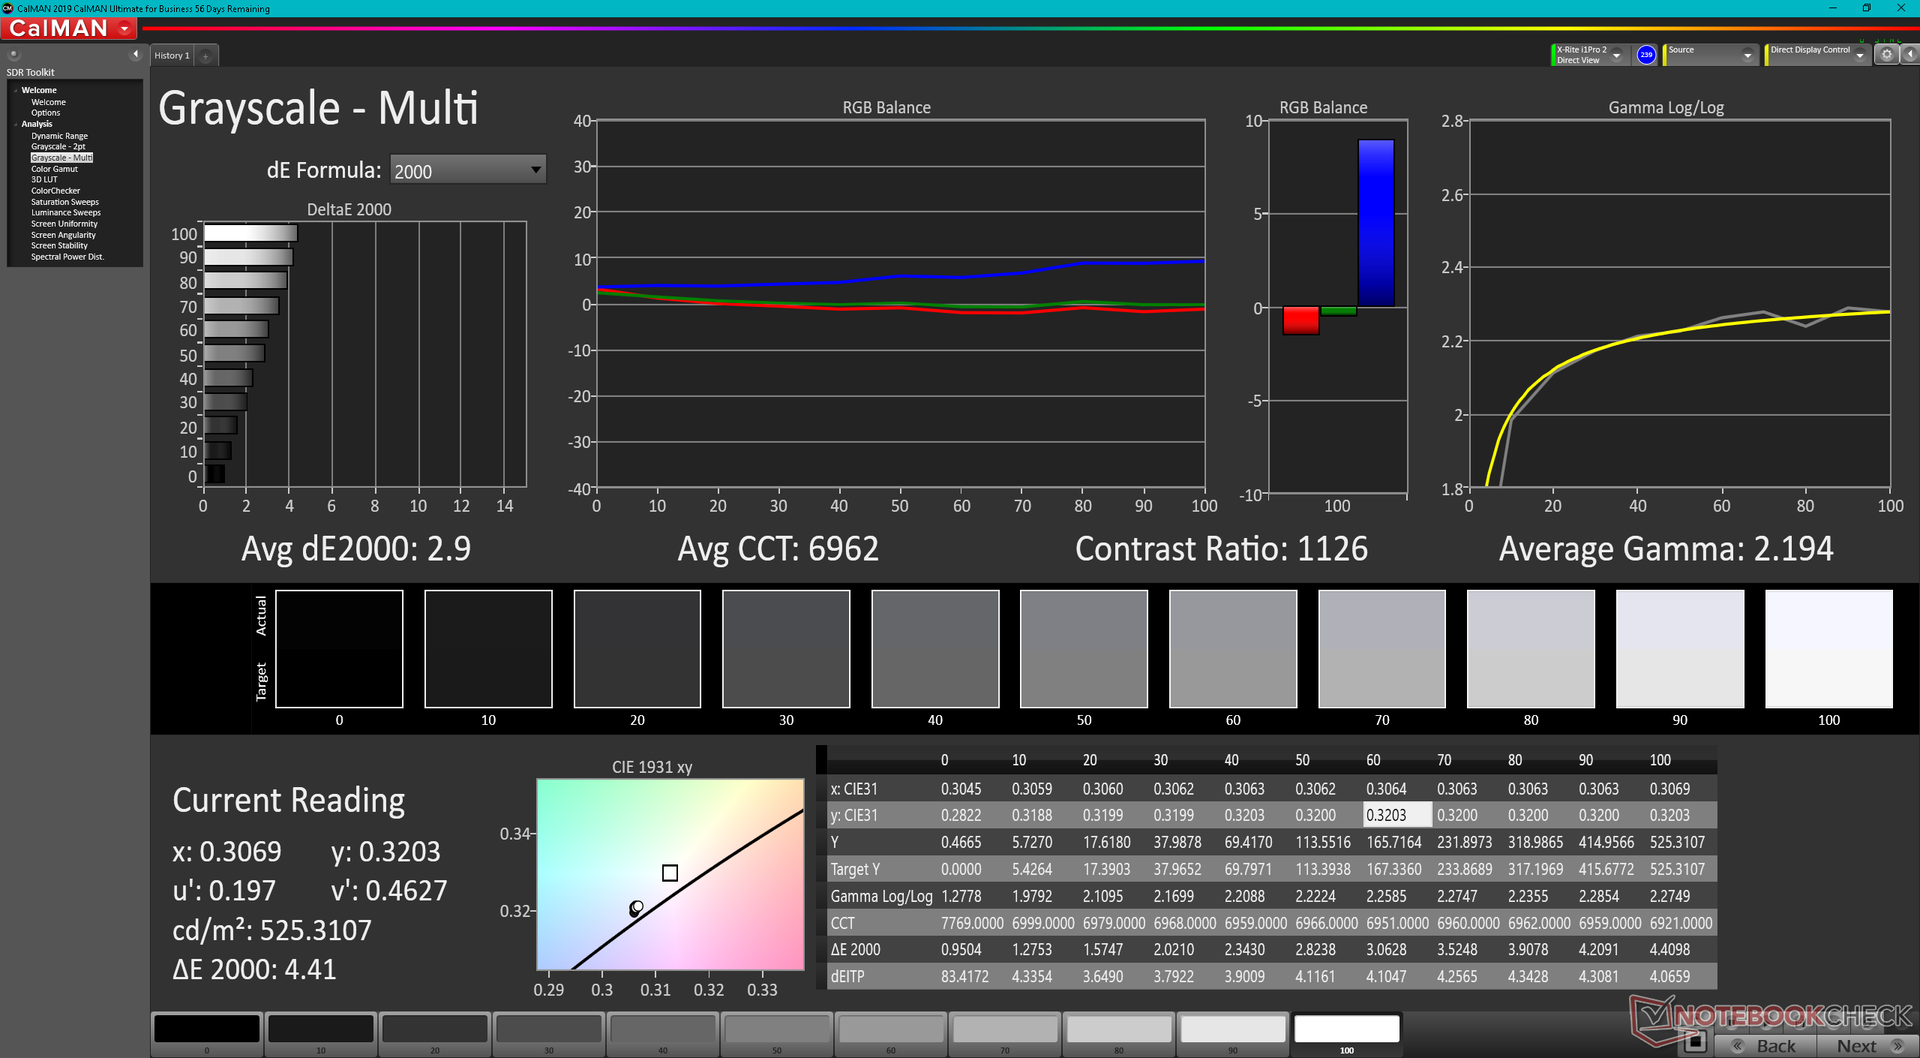
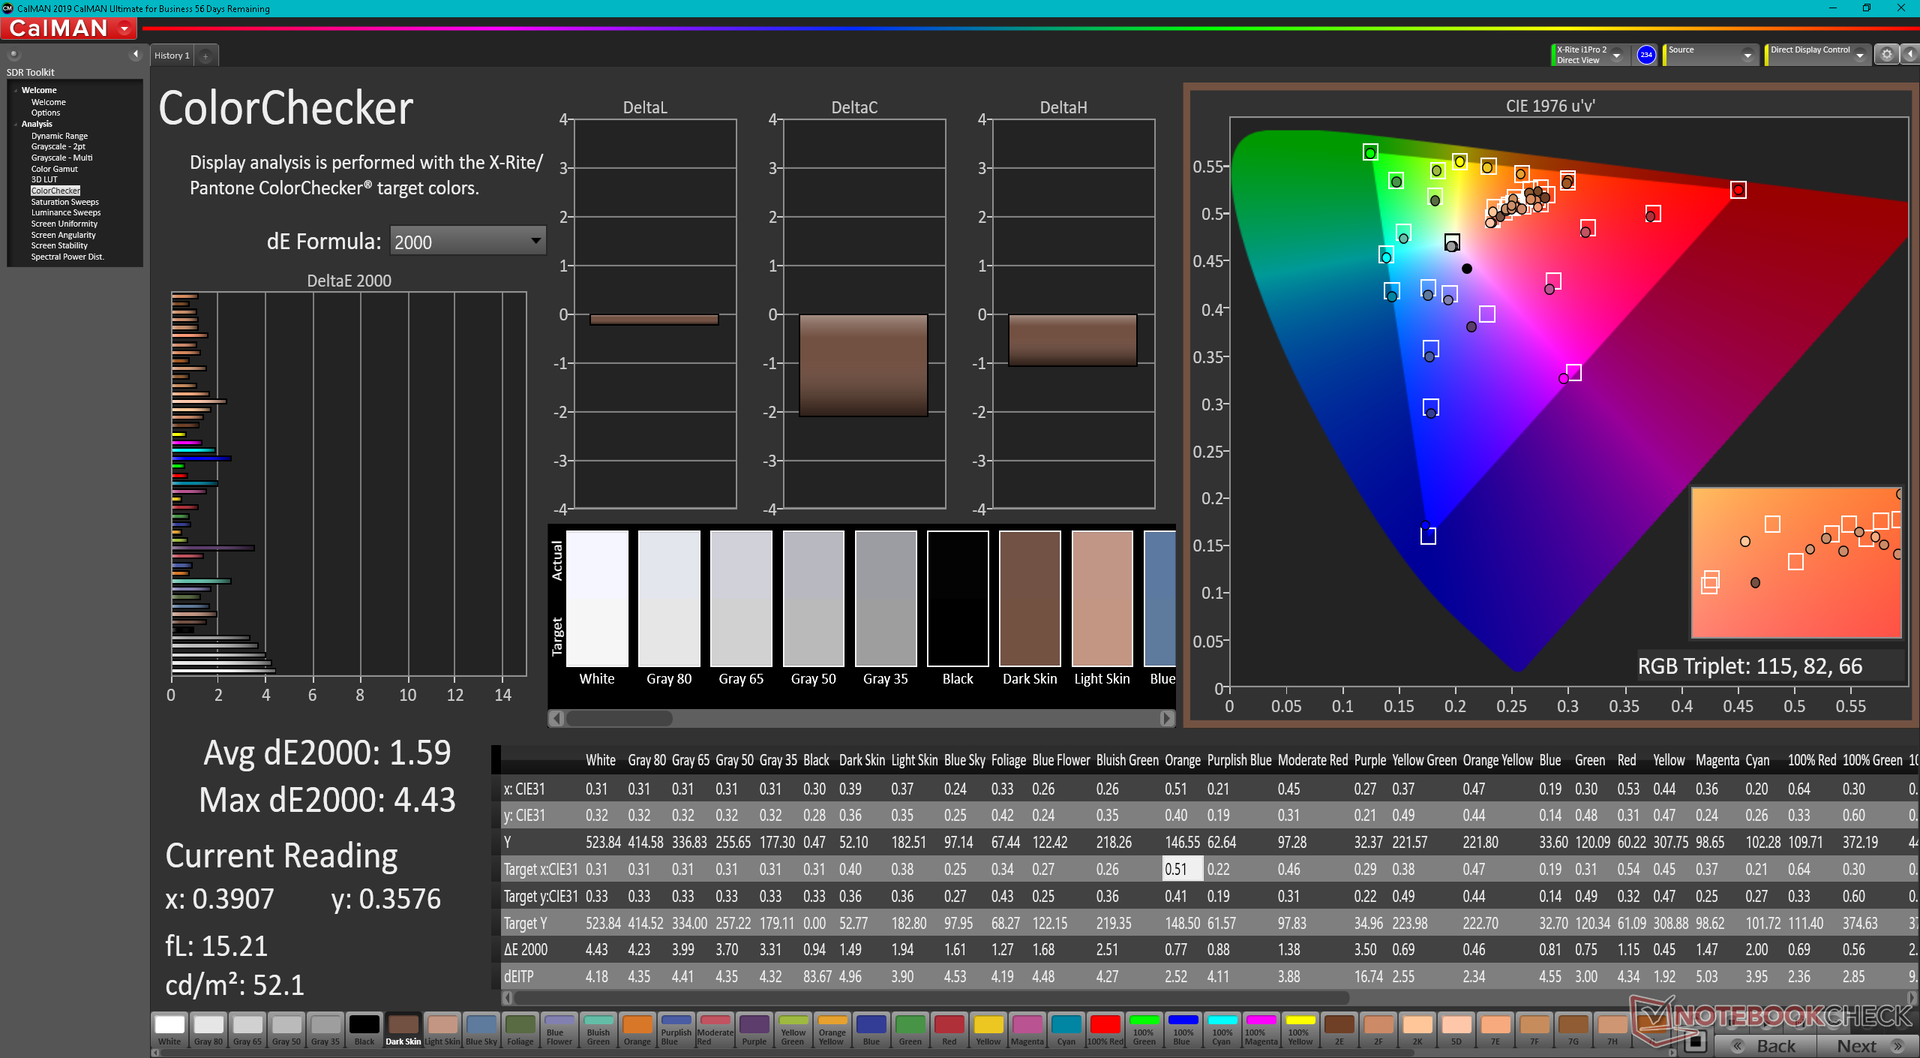
ΔE ColorChecker Calman: 1.32 | ∀{0.5-29.43 Ø4.71}
calibrated: 1.59
ΔE Greyscale Calman: 1.8 | ∀{0.09-98 Ø4.96}
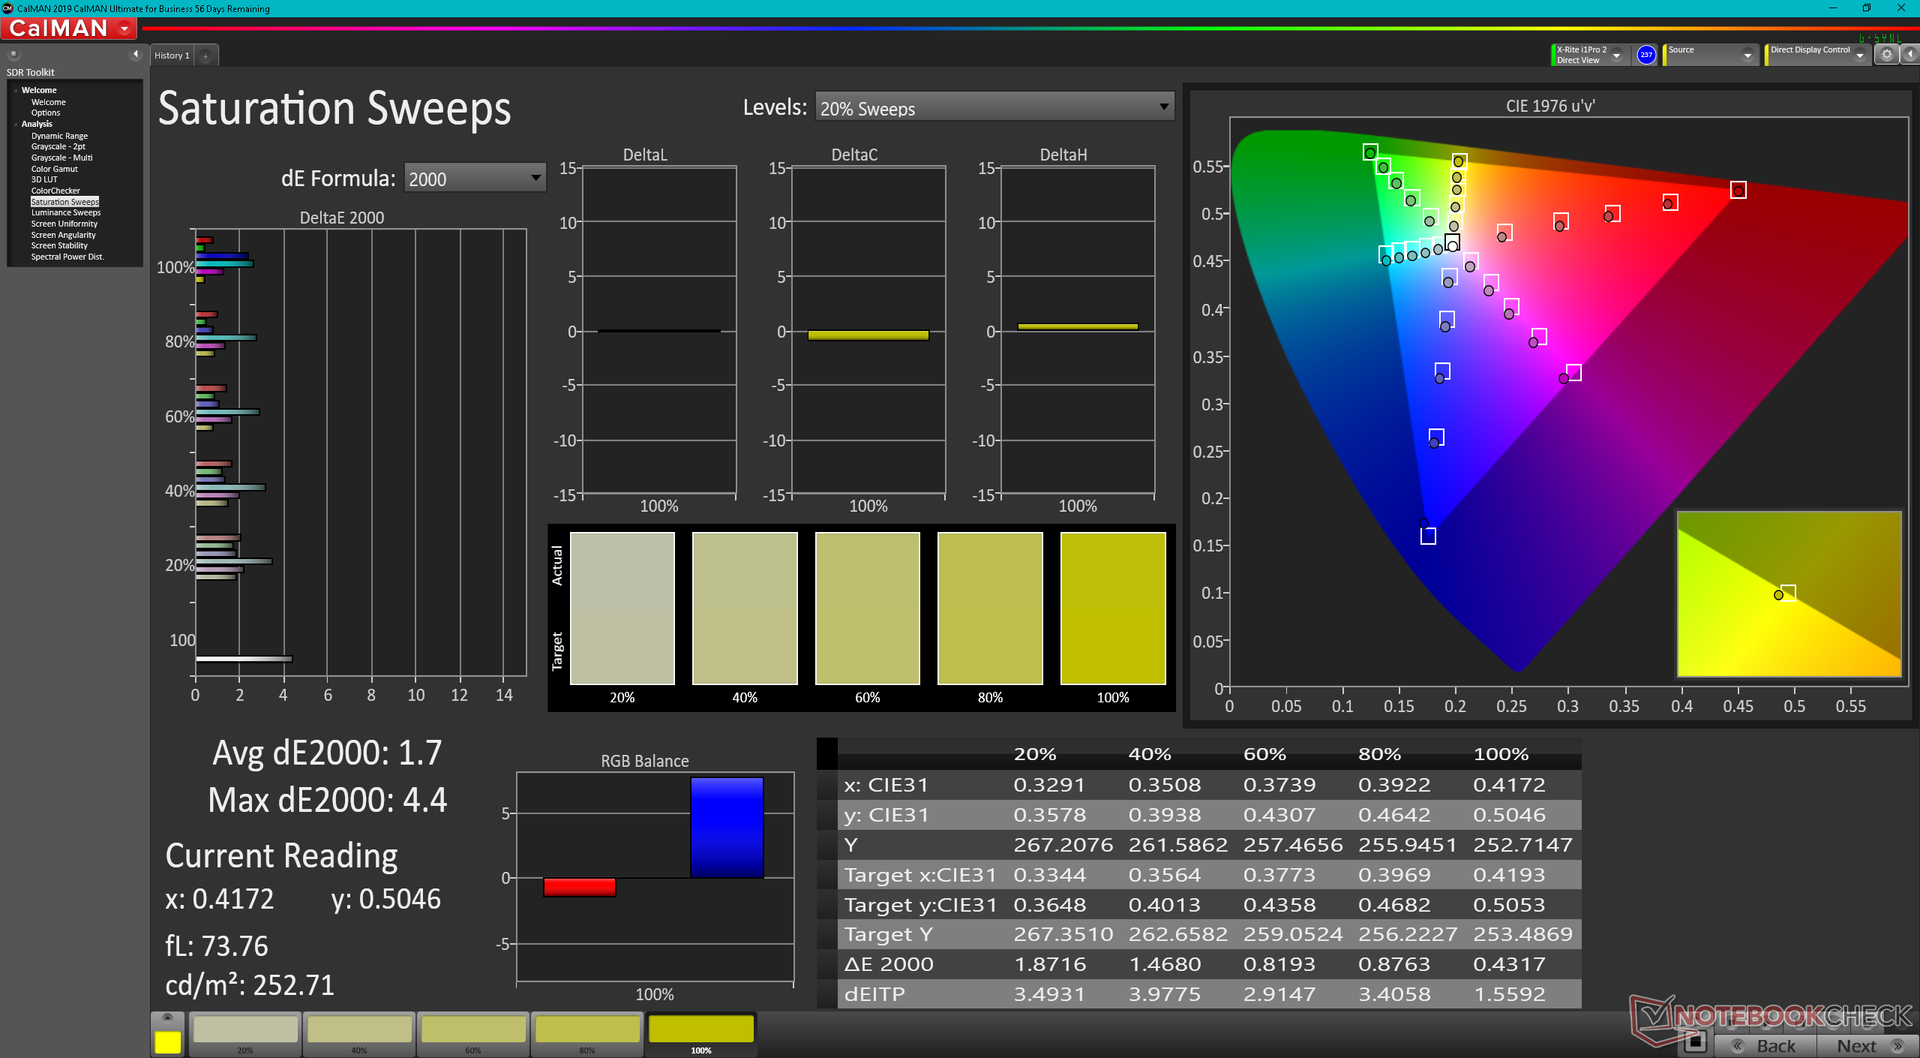
71.4% AdobeRGB 1998 (Argyll 3D)
98.2% sRGB (Argyll 3D)
69.8% Display P3 (Argyll 3D)
Gamma: 2.64
CCT: 6761 K
| Lenovo ThinkBook 16p G3 ARH BOE CQ NE160QDM-NY1, IPS, 2560x1600, 16" | HP Envy 16 h0112nr Samsung SDC4174, OLED, 3840x2400, 16" | Lenovo ThinkBook 16p G2 ACH Lenovo LEN8A95 (AUO B160QAN02.M), IPS, 2560x1600, 16" | Lenovo IdeaPad 5 Pro 16ARH7 AUO B160QAN02.H, IPS, 2560x1600, 16" | Acer Swift X SFX16-51G-5388 Chi Mei N161HCA-EA3, , 1920x1080, 16.1" | Lenovo Legion 5 Pro 16IAH7H BOE CCQ_NE160QDM_NY1, IPS, 2560x1600, 16" | |
|---|---|---|---|---|---|---|
| Display | 22% | 6% | -4% | -6% | -1% | |
| Display P3 Coverage (%) | 69.8 | 99.3 42% | 76.4 9% | 65 -7% | 65.1 -7% | 68.53 -2% |
| sRGB Coverage (%) | 98.2 | 100 2% | 100 2% | 98 0% | 95.65 -3% | 98.38 0% |
| AdobeRGB 1998 Coverage (%) | 71.4 | 88 23% | 77.4 8% | 67.2 -6% | 66.75 -7% | 70.45 -1% |
| Response Times | 85% | -89% | 24% | -86% | 28% | |
| Response Time Grey 50% / Grey 80% * (ms) | 15.6 ? | 2 ? 87% | 36 -131% | 14.1 ? 10% | 30 ? -92% | 14 ? 10% |
| Response Time Black / White * (ms) | 11.2 ? | 1.9 ? 83% | 16.4 -46% | 7.1 ? 37% | 20 ? -79% | 6 ? 46% |
| PWM Frequency (Hz) | 240.4 ? | |||||
| Screen | -19% | -1% | -11% | 2% | -11% | |
| Brightness middle (cd/m²) | 532.8 | 328.8 -38% | 439 -18% | 415 -22% | 276 -48% | 515 -3% |
| Brightness (cd/m²) | 519 | 332 -36% | 397 -24% | 409 -21% | 264 -49% | 475 -8% |
| Brightness Distribution (%) | 94 | 97 3% | 83 -12% | 91 -3% | 85 -10% | 85 -10% |
| Black Level * (cd/m²) | 0.55 | 0.44 20% | 0.32 42% | 0.16 71% | 0.45 18% | |
| Contrast (:1) | 969 | 998 3% | 1297 34% | 1725 78% | 1144 18% | |
| Colorchecker dE 2000 * | 1.32 | 1.53 -16% | 1.68 -27% | 1.92 -45% | 1.8 -36% | 2.38 -80% |
| Colorchecker dE 2000 max. * | 3.97 | 6.04 -52% | 2.36 41% | 5.71 -44% | 3.77 5% | 4.37 -10% |
| Colorchecker dE 2000 calibrated * | 1.59 | 1.57 1% | 0.58 64% | 0.63 60% | 1.1 31% | |
| Greyscale dE 2000 * | 1.8 | 1.3 28% | 1.64 9% | 3.7 -106% | 2.76 -53% | 2.71 -51% |
| Gamma | 2.64 83% | 2.18 101% | 2.39 92% | 2.272 97% | 2.37 93% | 2.49 88% |
| CCT | 6761 96% | 6362 102% | 6616 98% | 7132 91% | 6564 99% | 6117 106% |
| Total Average (Program / Settings) | 29% /
11% | -28% /
-12% | 3% /
-5% | -30% /
-12% | 5% /
-3% |
* ... smaller is better
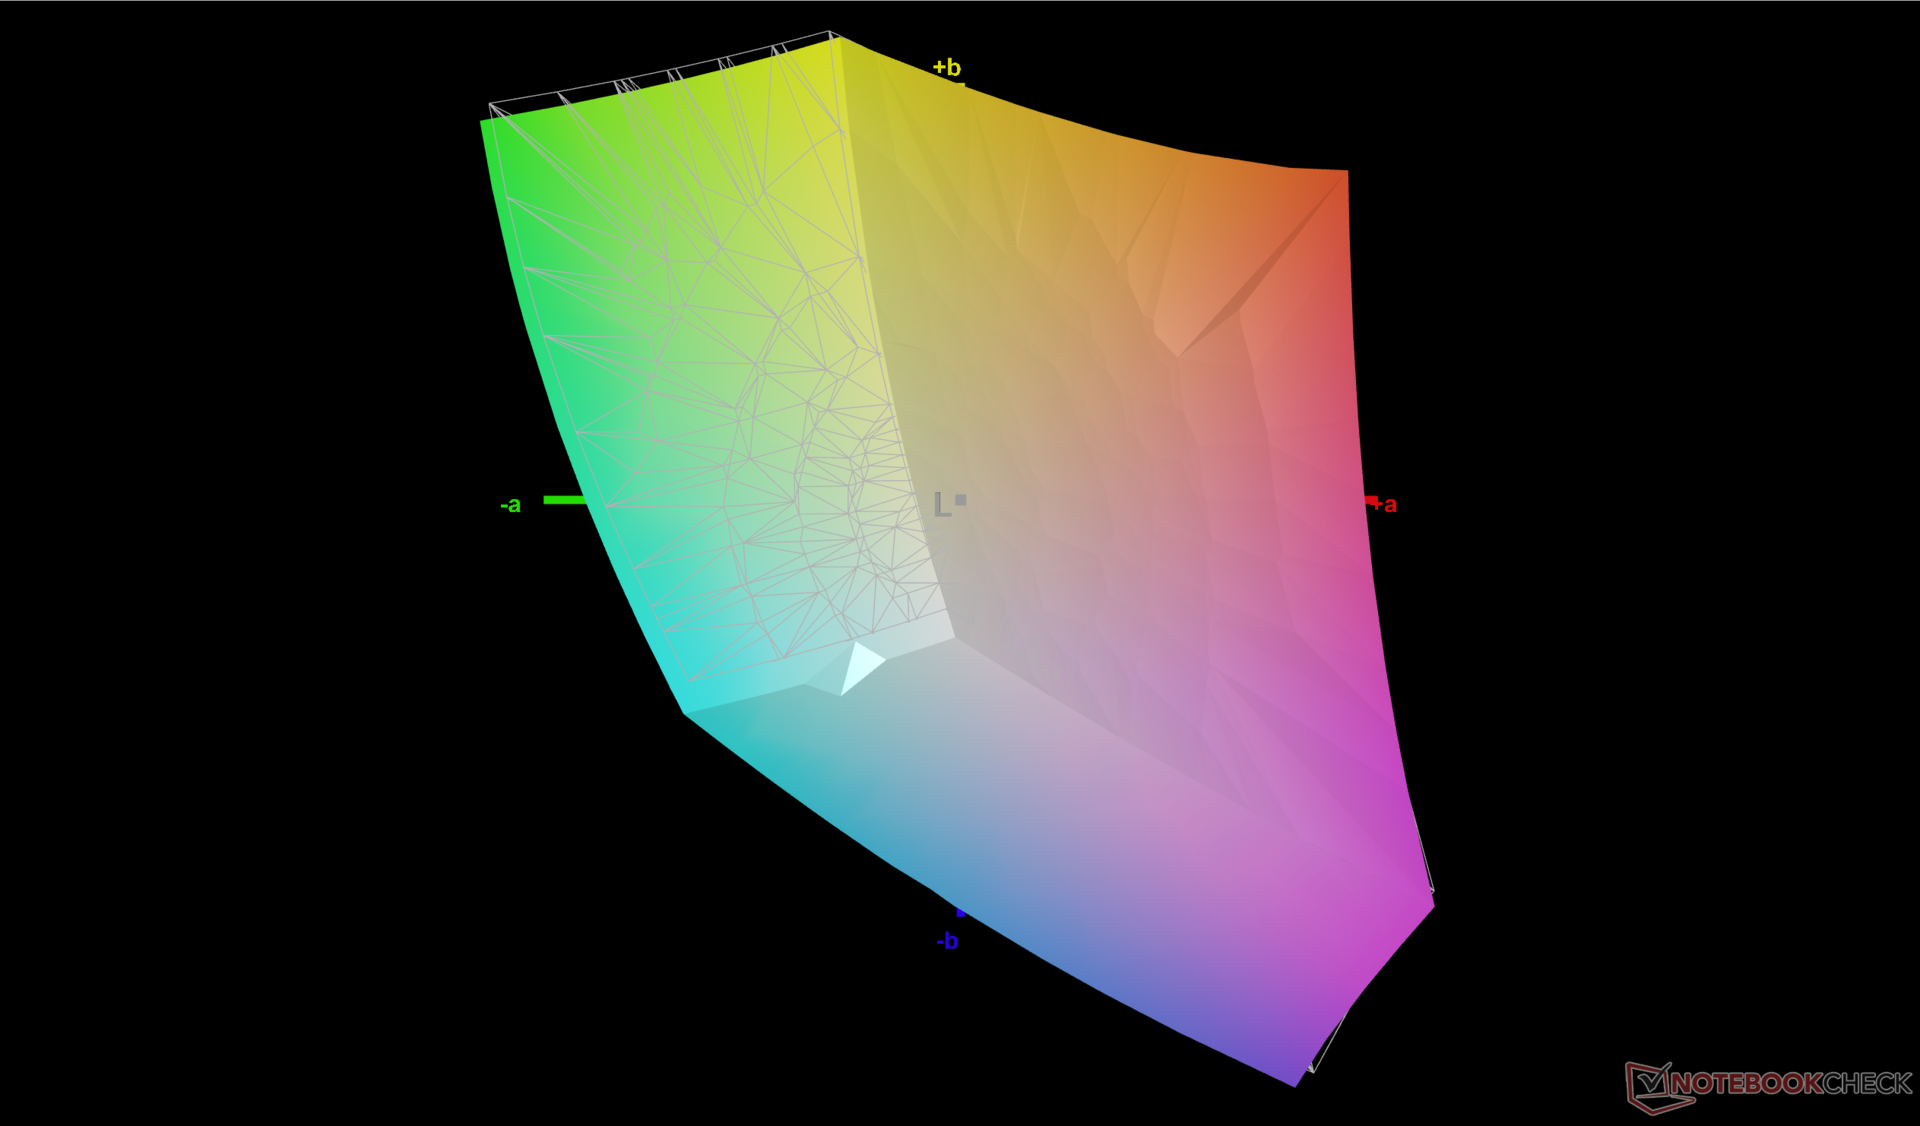
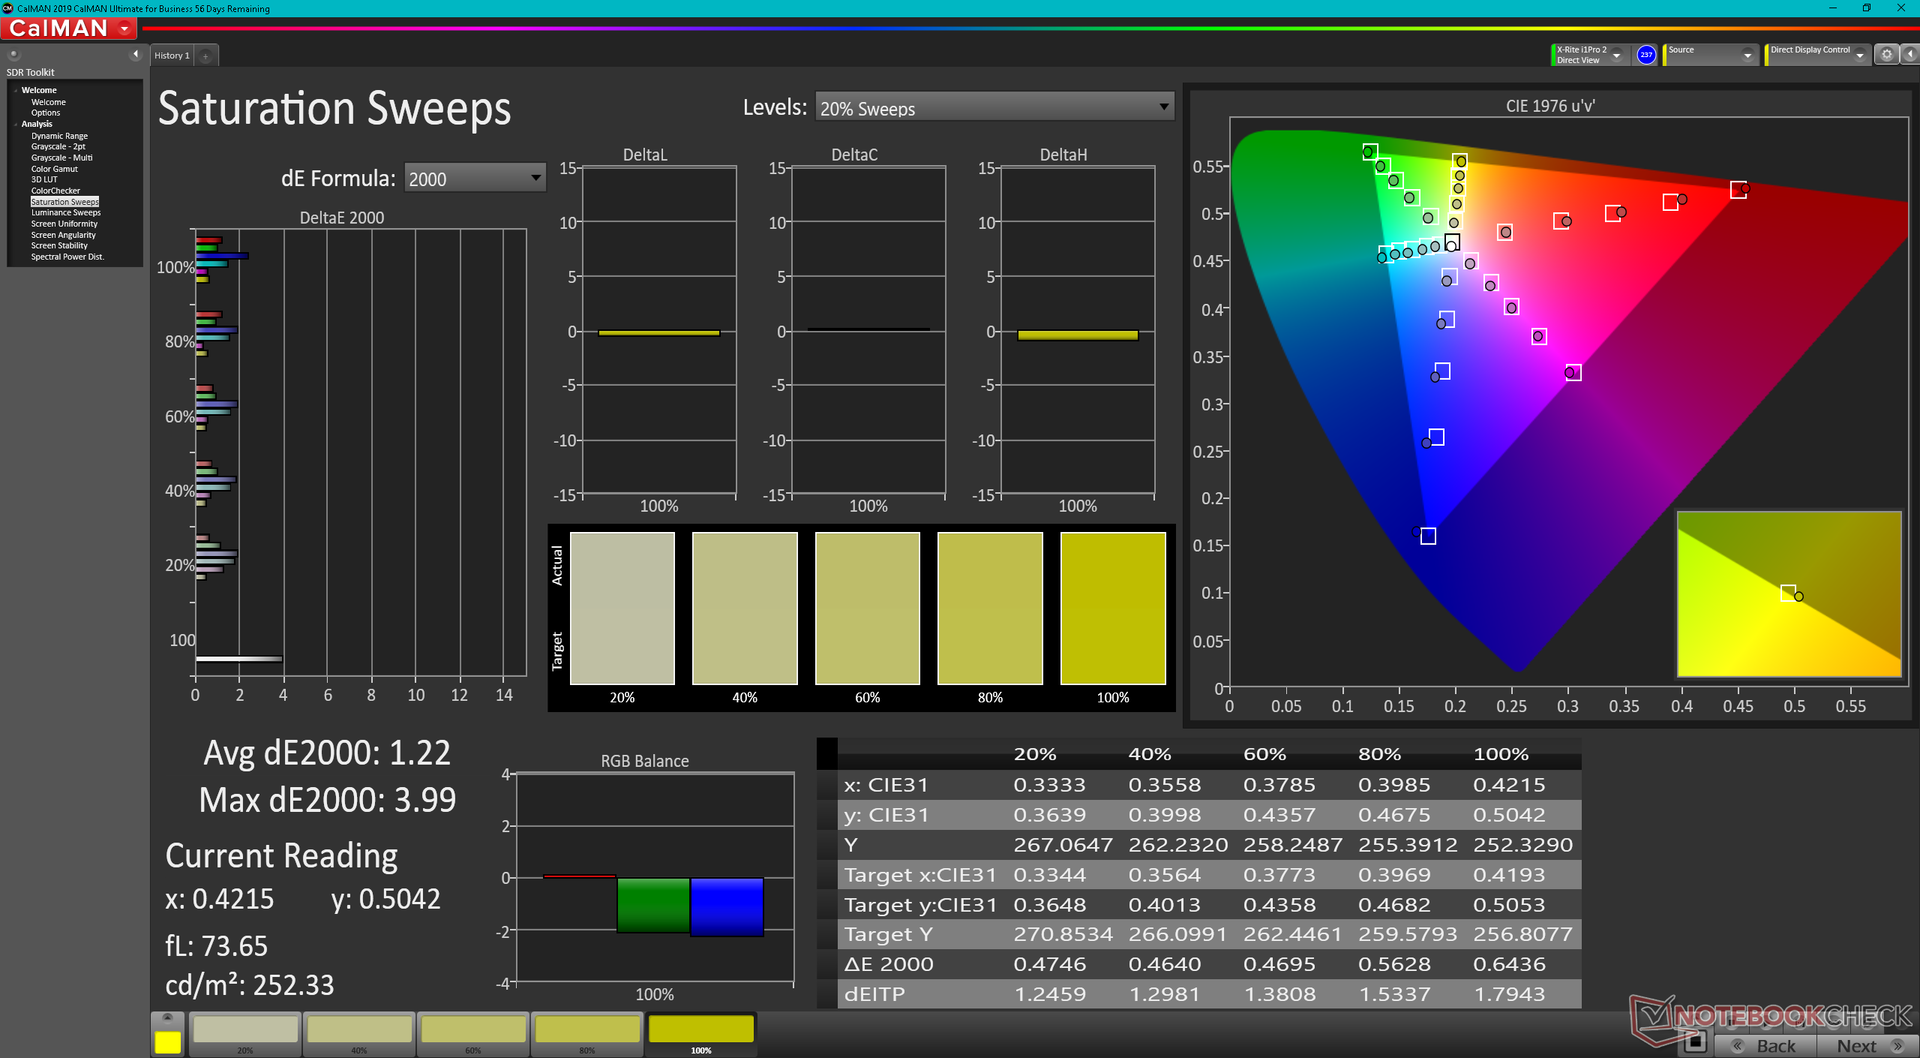
该显示器根据sRGB标准预先进行了校准。平均灰度和色彩deltaE值分别只有1.8和1.32,因此没有必要进行终端用户校准。
Display Response Times
| ↔ Response Time Black to White | ||
|---|---|---|
| 11.2 ms ... rise ↗ and fall ↘ combined | ↗ 6 ms rise | 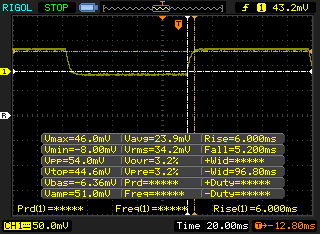 |
| ↘ 5.2 ms fall | ||
| The screen shows good response rates in our tests, but may be too slow for competitive gamers. In comparison, all tested devices range from 0.1 (minimum) to 240 (maximum) ms. » 30 % of all devices are better. This means that the measured response time is better than the average of all tested devices (19.8 ms). | ||
| ↔ Response Time 50% Grey to 80% Grey | ||
| 15.6 ms ... rise ↗ and fall ↘ combined | ↗ 7.2 ms rise |  |
| ↘ 8.4 ms fall | ||
| The screen shows good response rates in our tests, but may be too slow for competitive gamers. In comparison, all tested devices range from 0.165 (minimum) to 636 (maximum) ms. » 30 % of all devices are better. This means that the measured response time is better than the average of all tested devices (31 ms). | ||
Screen Flickering / PWM (Pulse-Width Modulation)
| Screen flickering / PWM not detected |  | ||
In comparison: 52 % of all tested devices do not use PWM to dim the display. If PWM was detected, an average of 7754 (minimum: 5 - maximum: 343500) Hz was measured. | |||
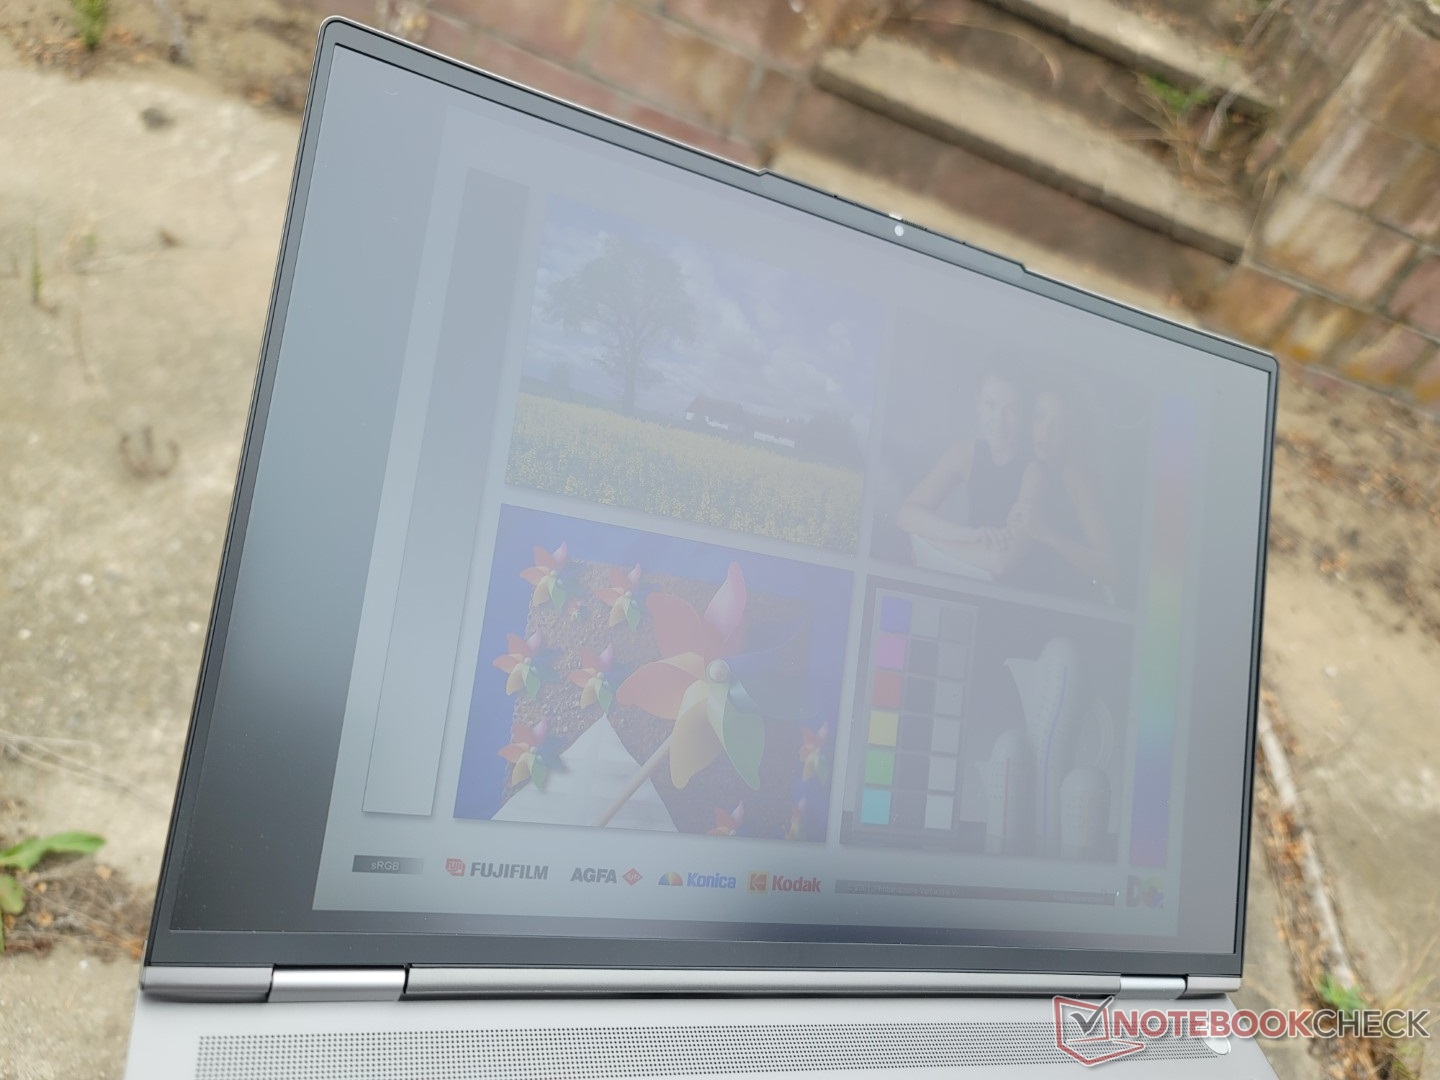
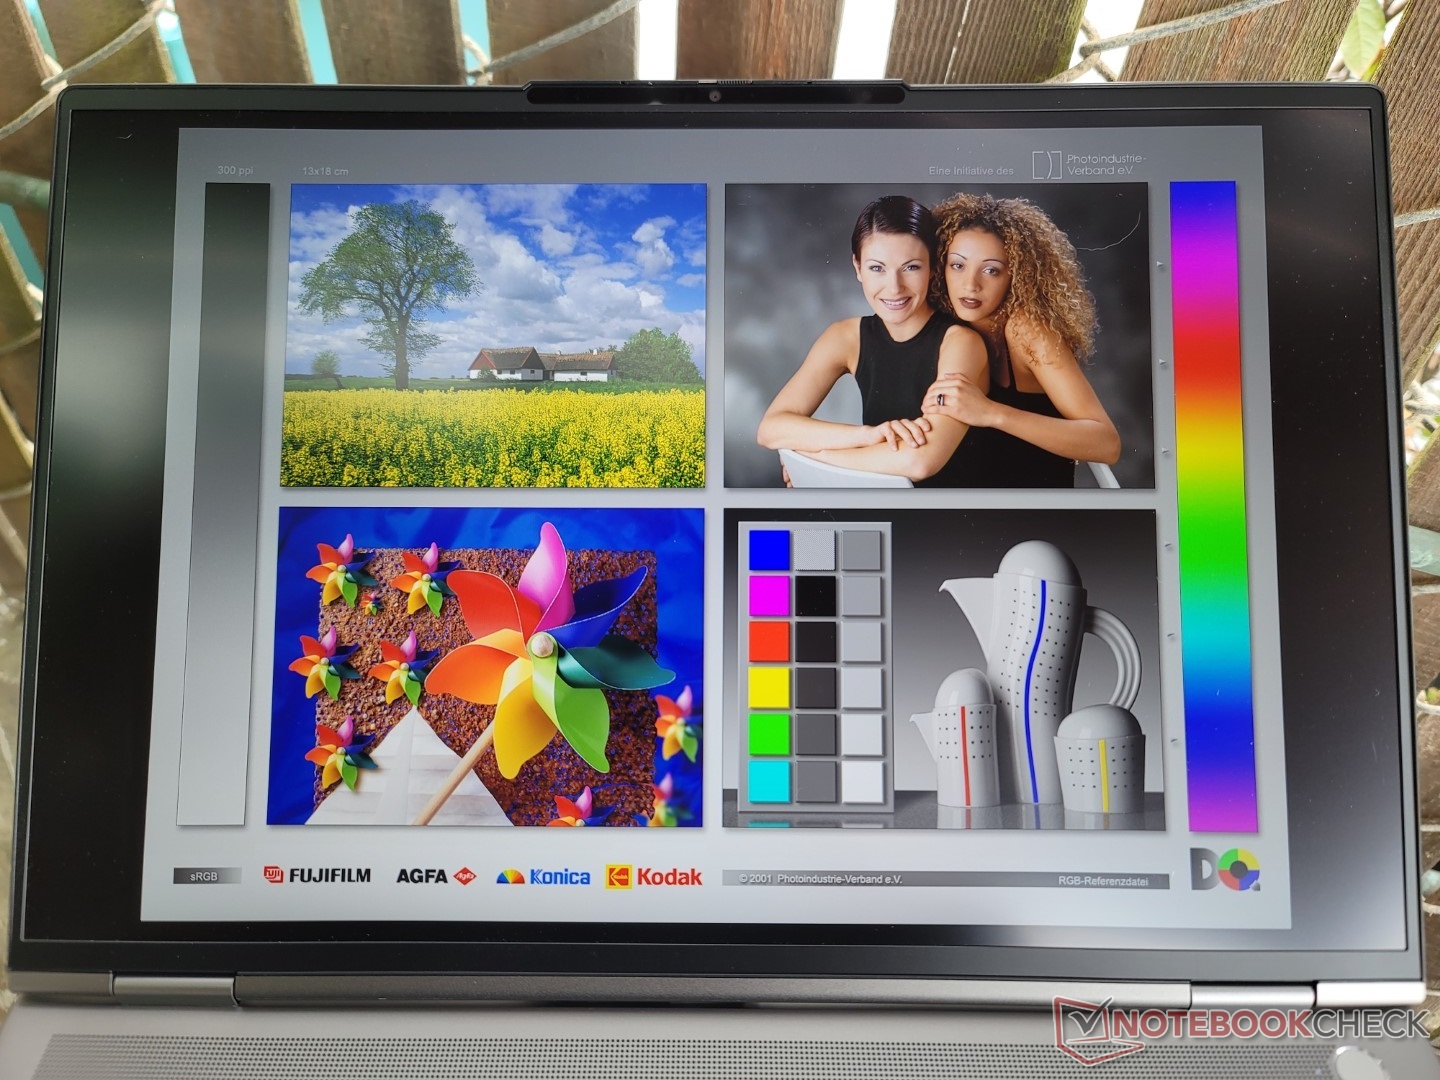
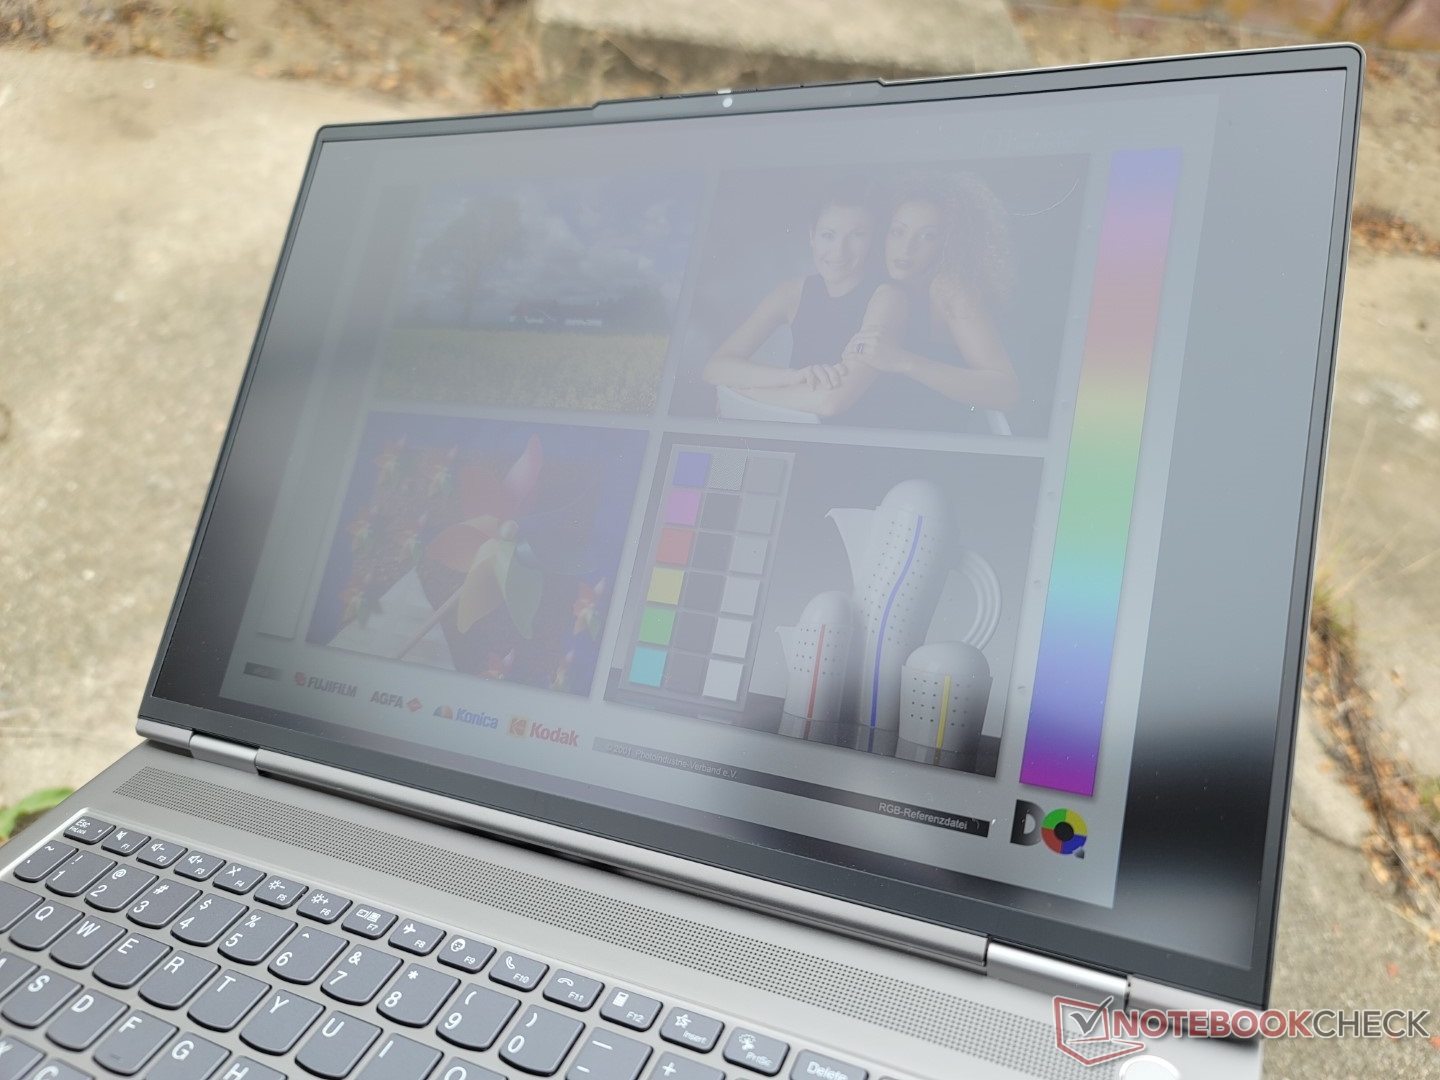
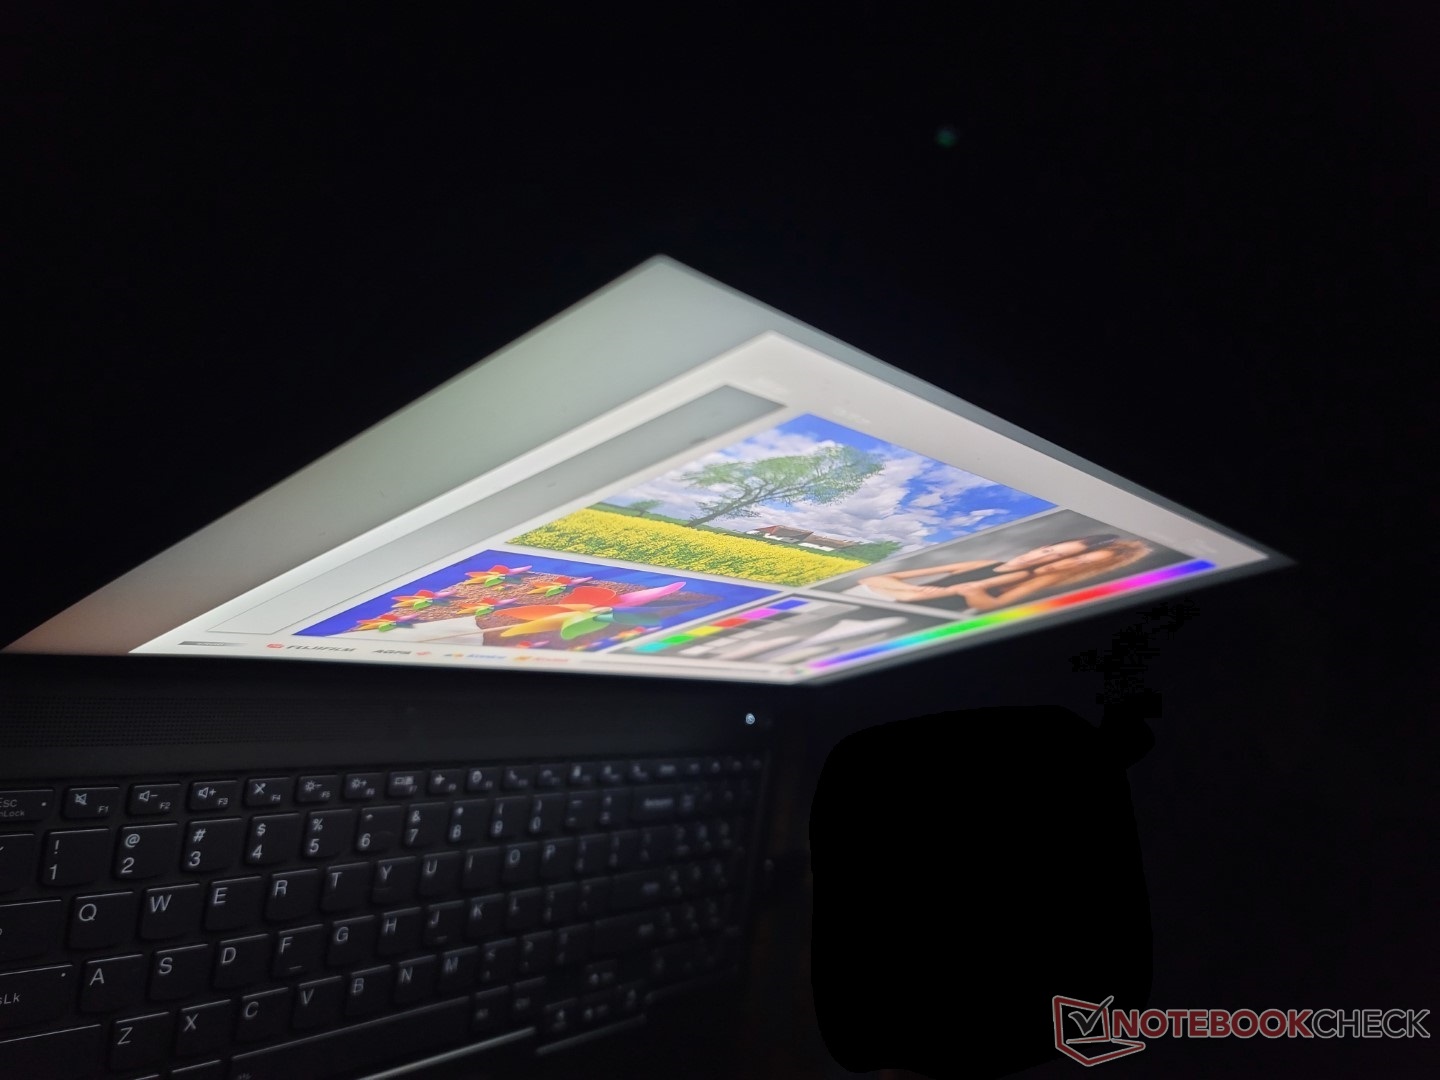
如果在阴凉处,户外能见度还算不错。哑光覆盖层和相对明亮的500尼特背光有助于最大限度地减少眩光,这比光亮的替代品更有意义。
业绩
测试条件
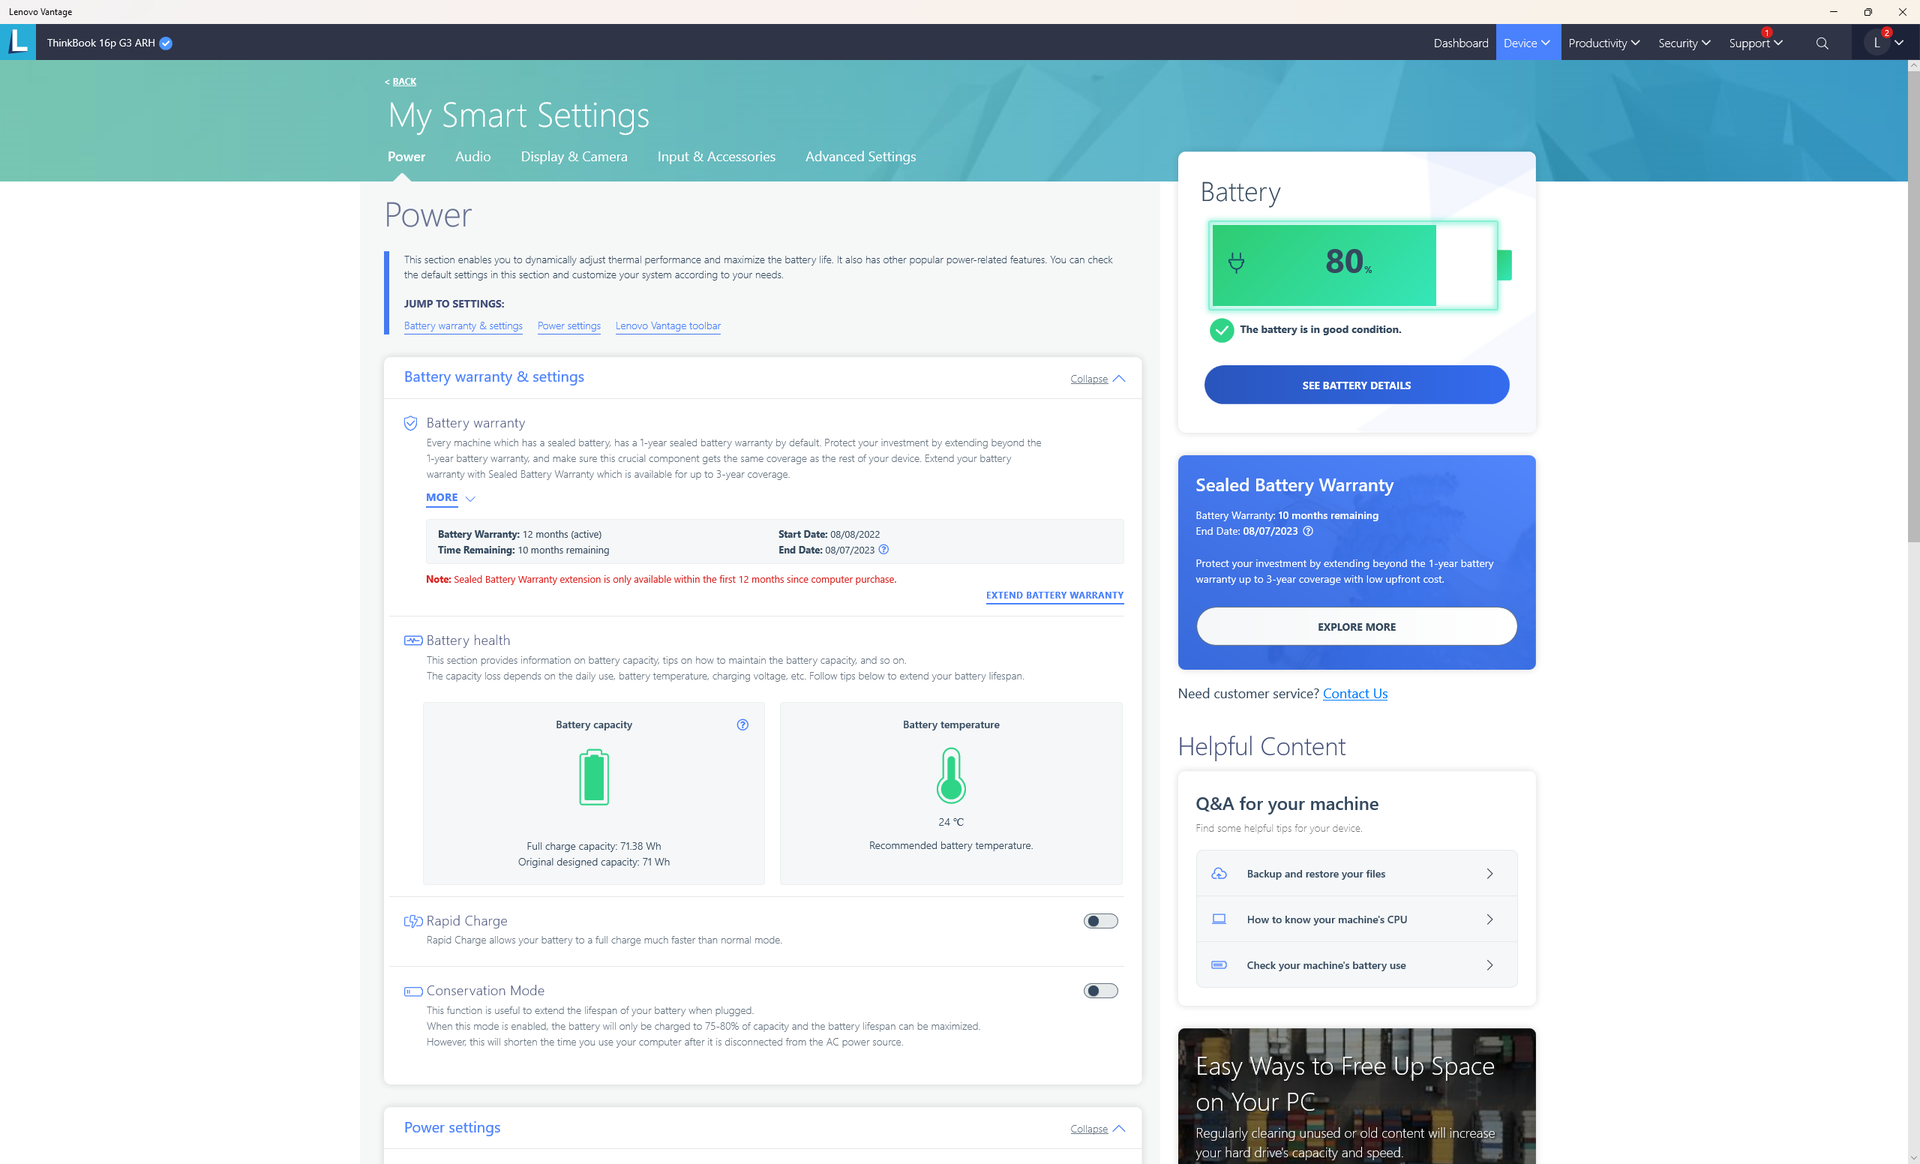
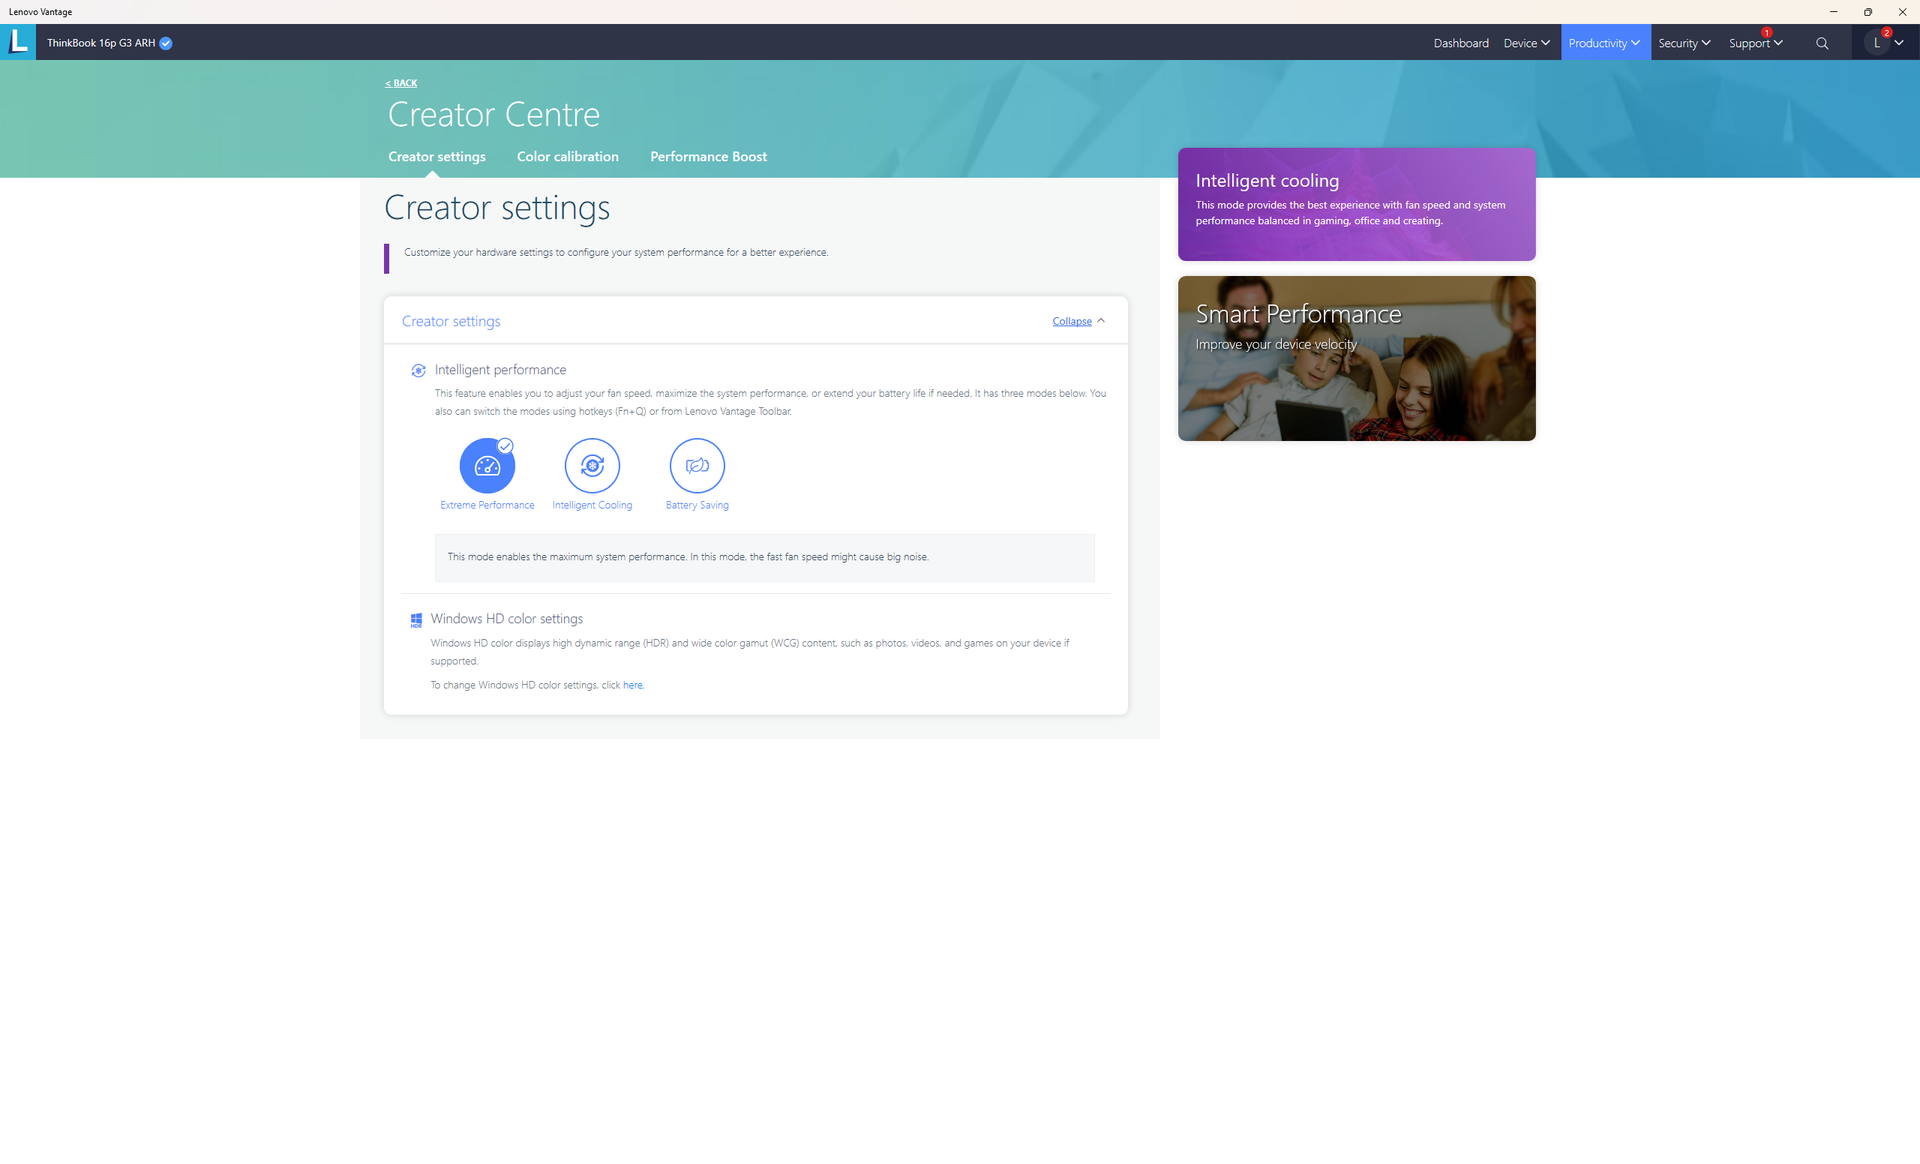
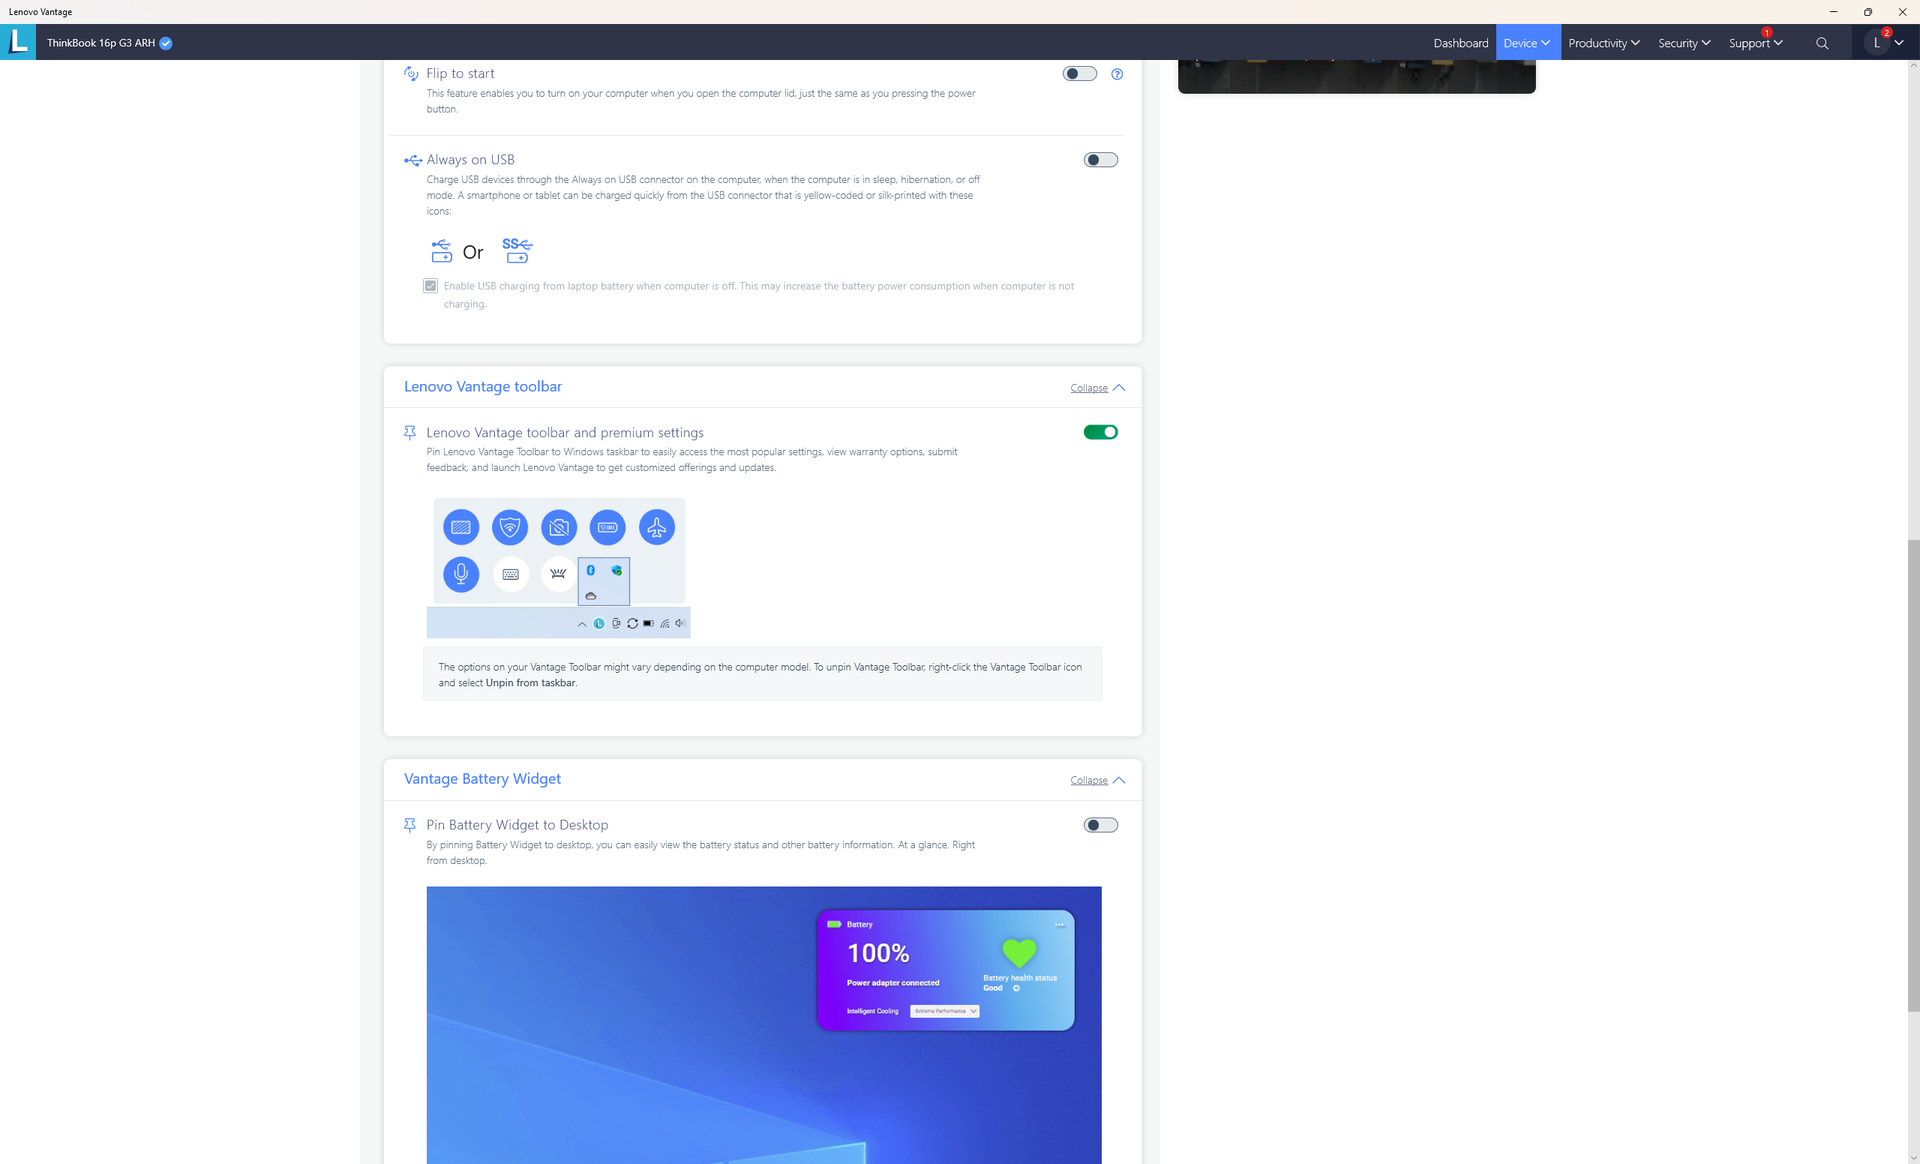
在运行以下任何基准测试之前,我们通过Windows将我们的设备设置为性能模式,并通过联想Vantage软件设置为极限性能模式。建议熟悉联想Vantage,因为它是更新和设置的控制中心,如下面的截图所示。

处理器
CPU性能是一个混合的袋子。虽然 Ryzen 9 6900HX当然是AMD最快的移动CPU之一,但性能基本上与 Ryzen 9 5900HX.事实上,它的速度几乎没有超过 Ryzen 7 6800H.降级到 Ryzen 5 6600H配置将使单线程和多线程性能分别降低约5%和20%。
Cinebench R15 Multi Loop
Cinebench R23: Multi Core | Single Core
Cinebench R15: CPU Multi 64Bit | CPU Single 64Bit
Blender: v2.79 BMW27 CPU
7-Zip 18.03: 7z b 4 | 7z b 4 -mmt1
Geekbench 5.5: Multi-Core | Single-Core
HWBOT x265 Benchmark v2.2: 4k Preset
LibreOffice : 20 Documents To PDF
R Benchmark 2.5: Overall mean
| Cinebench R20 / CPU (Multi Core) | |
| Lenovo Legion 5 Pro 16IAH7H | |
| Razer Blade 15 2022 | |
| Lenovo ThinkBook 16p G3 ARH | |
| Average AMD Ryzen 9 6900HX (3742 - 5813, n=19) | |
| Lenovo ThinkBook 16p G2 ACH | |
| HP Envy 16 h0112nr | |
| Asus ROG Zephyrus G14 GA402RJ | |
| Lenovo IdeaPad 5 Pro 16ACH | |
| Lenovo Legion 5 Pro 16 ARH7H-82RG0047GE | |
| Aorus 15P XC | |
| Acer Swift X SFX16-51G-5388 | |
| Cinebench R20 / CPU (Single Core) | |
| Razer Blade 15 2022 | |
| HP Envy 16 h0112nr | |
| Lenovo Legion 5 Pro 16IAH7H | |
| Average AMD Ryzen 9 6900HX (595 - 631, n=19) | |
| Lenovo ThinkBook 16p G3 ARH | |
| Lenovo ThinkBook 16p G2 ACH | |
| Lenovo Legion 5 Pro 16 ARH7H-82RG0047GE | |
| Asus ROG Zephyrus G14 GA402RJ | |
| Acer Swift X SFX16-51G-5388 | |
| Lenovo IdeaPad 5 Pro 16ACH | |
| Aorus 15P XC | |
| Cinebench R23 / Multi Core | |
| Lenovo Legion 5 Pro 16IAH7H | |
| Razer Blade 15 2022 | |
| Lenovo ThinkBook 16p G3 ARH | |
| Average AMD Ryzen 9 6900HX (9709 - 15100, n=19) | |
| Lenovo ThinkBook 16p G2 ACH | |
| HP Envy 16 h0112nr | |
| Asus ROG Zephyrus G14 GA402RJ | |
| Lenovo IdeaPad 5 Pro 16ACH | |
| Lenovo Legion 5 Pro 16 ARH7H-82RG0047GE | |
| Aorus 15P XC | |
| Acer Swift X SFX16-51G-5388 | |
| Cinebench R23 / Single Core | |
| Razer Blade 15 2022 | |
| HP Envy 16 h0112nr | |
| Lenovo Legion 5 Pro 16IAH7H | |
| Average AMD Ryzen 9 6900HX (1516 - 1616, n=19) | |
| Lenovo ThinkBook 16p G3 ARH | |
| Lenovo ThinkBook 16p G2 ACH | |
| Lenovo Legion 5 Pro 16 ARH7H-82RG0047GE | |
| Asus ROG Zephyrus G14 GA402RJ | |
| Lenovo IdeaPad 5 Pro 16ACH | |
| Acer Swift X SFX16-51G-5388 | |
| Aorus 15P XC | |
| Cinebench R15 / CPU Multi 64Bit | |
| Lenovo Legion 5 Pro 16IAH7H | |
| HP Envy 16 h0112nr | |
| Razer Blade 15 2022 | |
| Average AMD Ryzen 9 6900HX (1588 - 2411, n=19) | |
| Lenovo ThinkBook 16p G3 ARH | |
| Lenovo ThinkBook 16p G2 ACH | |
| Asus ROG Zephyrus G14 GA402RJ | |
| Lenovo IdeaPad 5 Pro 16ACH | |
| Lenovo Legion 5 Pro 16 ARH7H-82RG0047GE | |
| Aorus 15P XC | |
| Acer Swift X SFX16-51G-5388 | |
| Cinebench R15 / CPU Single 64Bit | |
| Razer Blade 15 2022 | |
| HP Envy 16 h0112nr | |
| Lenovo Legion 5 Pro 16IAH7H | |
| Average AMD Ryzen 9 6900HX (241 - 261, n=19) | |
| Lenovo ThinkBook 16p G3 ARH | |
| Lenovo ThinkBook 16p G2 ACH | |
| Lenovo Legion 5 Pro 16 ARH7H-82RG0047GE | |
| Asus ROG Zephyrus G14 GA402RJ | |
| Lenovo IdeaPad 5 Pro 16ACH | |
| Acer Swift X SFX16-51G-5388 | |
| Aorus 15P XC | |
| Blender / v2.79 BMW27 CPU | |
| Acer Swift X SFX16-51G-5388 | |
| Aorus 15P XC | |
| Lenovo Legion 5 Pro 16 ARH7H-82RG0047GE | |
| Lenovo IdeaPad 5 Pro 16ACH | |
| Asus ROG Zephyrus G14 GA402RJ | |
| HP Envy 16 h0112nr | |
| Lenovo ThinkBook 16p G3 ARH | |
| Average AMD Ryzen 9 6900HX (212 - 357, n=21) | |
| Lenovo ThinkBook 16p G2 ACH | |
| Razer Blade 15 2022 | |
| Lenovo Legion 5 Pro 16IAH7H | |
| 7-Zip 18.03 / 7z b 4 | |
| Lenovo Legion 5 Pro 16IAH7H | |
| Razer Blade 15 2022 | |
| Average AMD Ryzen 9 6900HX (49526 - 65336, n=20) | |
| Lenovo ThinkBook 16p G2 ACH | |
| Asus ROG Zephyrus G14 GA402RJ | |
| Lenovo ThinkBook 16p G3 ARH | |
| HP Envy 16 h0112nr | |
| Lenovo IdeaPad 5 Pro 16ACH | |
| Lenovo Legion 5 Pro 16 ARH7H-82RG0047GE | |
| Aorus 15P XC | |
| Acer Swift X SFX16-51G-5388 | |
| 7-Zip 18.03 / 7z b 4 -mmt1 | |
| Average AMD Ryzen 9 6900HX (5090 - 6070, n=20) | |
| Lenovo ThinkBook 16p G2 ACH | |
| Razer Blade 15 2022 | |
| HP Envy 16 h0112nr | |
| Lenovo Legion 5 Pro 16 ARH7H-82RG0047GE | |
| Asus ROG Zephyrus G14 GA402RJ | |
| Lenovo Legion 5 Pro 16IAH7H | |
| Lenovo IdeaPad 5 Pro 16ACH | |
| Aorus 15P XC | |
| Lenovo ThinkBook 16p G3 ARH | |
| Acer Swift X SFX16-51G-5388 | |
| Geekbench 5.5 / Multi-Core | |
| Lenovo Legion 5 Pro 16IAH7H | |
| HP Envy 16 h0112nr | |
| Razer Blade 15 2022 | |
| Average AMD Ryzen 9 6900HX (8313 - 10490, n=21) | |
| Lenovo ThinkBook 16p G3 ARH | |
| Asus ROG Zephyrus G14 GA402RJ | |
| Lenovo ThinkBook 16p G2 ACH | |
| Aorus 15P XC | |
| Lenovo Legion 5 Pro 16 ARH7H-82RG0047GE | |
| Lenovo IdeaPad 5 Pro 16ACH | |
| Acer Swift X SFX16-51G-5388 | |
| Geekbench 5.5 / Single-Core | |
| HP Envy 16 h0112nr | |
| Razer Blade 15 2022 | |
| Lenovo Legion 5 Pro 16IAH7H | |
| Average AMD Ryzen 9 6900HX (1523 - 1652, n=21) | |
| Lenovo ThinkBook 16p G3 ARH | |
| Lenovo ThinkBook 16p G2 ACH | |
| Acer Swift X SFX16-51G-5388 | |
| Asus ROG Zephyrus G14 GA402RJ | |
| Lenovo Legion 5 Pro 16 ARH7H-82RG0047GE | |
| Lenovo IdeaPad 5 Pro 16ACH | |
| Aorus 15P XC | |
| HWBOT x265 Benchmark v2.2 / 4k Preset | |
| Lenovo Legion 5 Pro 16IAH7H | |
| Razer Blade 15 2022 | |
| Lenovo ThinkBook 16p G3 ARH | |
| Average AMD Ryzen 9 6900HX (12.6 - 18.7, n=20) | |
| Lenovo ThinkBook 16p G2 ACH | |
| Asus ROG Zephyrus G14 GA402RJ | |
| HP Envy 16 h0112nr | |
| Lenovo Legion 5 Pro 16 ARH7H-82RG0047GE | |
| Lenovo IdeaPad 5 Pro 16ACH | |
| Aorus 15P XC | |
| Acer Swift X SFX16-51G-5388 | |
| LibreOffice / 20 Documents To PDF | |
| Lenovo Legion 5 Pro 16 ARH7H-82RG0047GE | |
| Lenovo ThinkBook 16p G3 ARH | |
| Asus ROG Zephyrus G14 GA402RJ | |
| Lenovo ThinkBook 16p G2 ACH | |
| Aorus 15P XC | |
| Average AMD Ryzen 9 6900HX (44.8 - 81.7, n=20) | |
| Razer Blade 15 2022 | |
| Acer Swift X SFX16-51G-5388 | |
| Lenovo IdeaPad 5 Pro 16ACH | |
| HP Envy 16 h0112nr | |
| Lenovo Legion 5 Pro 16IAH7H | |
| R Benchmark 2.5 / Overall mean | |
| Acer Swift X SFX16-51G-5388 | |
| Aorus 15P XC | |
| Lenovo IdeaPad 5 Pro 16ACH | |
| Asus ROG Zephyrus G14 GA402RJ | |
| Lenovo Legion 5 Pro 16 ARH7H-82RG0047GE | |
| Lenovo ThinkBook 16p G2 ACH | |
| Lenovo ThinkBook 16p G3 ARH | |
| Average AMD Ryzen 9 6900HX (0.4627 - 0.4974, n=20) | |
| Lenovo Legion 5 Pro 16IAH7H | |
| Razer Blade 15 2022 | |
| HP Envy 16 h0112nr | |
* ... smaller is better
AIDA64: FP32 Ray-Trace | FPU Julia | CPU SHA3 | CPU Queen | FPU SinJulia | FPU Mandel | CPU AES | CPU ZLib | FP64 Ray-Trace | CPU PhotoWorxx
| Performance rating | |
| Average AMD Ryzen 9 6900HX | |
| Lenovo ThinkBook 16p G2 ACH | |
| Lenovo ThinkBook 16p G3 ARH | |
| Lenovo Legion 5 Pro 16IAH7H | |
| HP Envy 16 h0112nr | |
| Lenovo IdeaPad 5 Pro 16ARH7 | |
| Acer Swift X SFX16-51G-5388 | |
| AIDA64 / FP32 Ray-Trace | |
| Lenovo ThinkBook 16p G3 ARH | |
| Lenovo ThinkBook 16p G2 ACH | |
| Average AMD Ryzen 9 6900HX (10950 - 17963, n=20) | |
| Lenovo Legion 5 Pro 16IAH7H | |
| Lenovo Legion 5 Pro 16IAH7H | |
| HP Envy 16 h0112nr | |
| Lenovo IdeaPad 5 Pro 16ARH7 | |
| Acer Swift X SFX16-51G-5388 | |
| AIDA64 / CPU Queen | |
| Lenovo ThinkBook 16p G3 ARH | |
| Lenovo ThinkBook 16p G2 ACH | |
| HP Envy 16 h0112nr | |
| Average AMD Ryzen 9 6900HX (84185 - 107544, n=20) | |
| Lenovo Legion 5 Pro 16IAH7H | |
| Lenovo IdeaPad 5 Pro 16ARH7 | |
| Acer Swift X SFX16-51G-5388 | |
| AIDA64 / FPU SinJulia | |
| Lenovo ThinkBook 16p G3 ARH | |
| Average AMD Ryzen 9 6900HX (10970 - 13205, n=20) | |
| Lenovo ThinkBook 16p G2 ACH | |
| Lenovo Legion 5 Pro 16IAH7H | |
| Lenovo Legion 5 Pro 16IAH7H | |
| Lenovo IdeaPad 5 Pro 16ARH7 | |
| HP Envy 16 h0112nr | |
| Acer Swift X SFX16-51G-5388 | |
| AIDA64 / FP64 Ray-Trace | |
| Lenovo ThinkBook 16p G3 ARH | |
| Lenovo ThinkBook 16p G2 ACH | |
| Average AMD Ryzen 9 6900HX (5798 - 9540, n=20) | |
| Lenovo Legion 5 Pro 16IAH7H | |
| Lenovo Legion 5 Pro 16IAH7H | |
| HP Envy 16 h0112nr | |
| Lenovo IdeaPad 5 Pro 16ARH7 | |
| Acer Swift X SFX16-51G-5388 | |
| AIDA64 / CPU PhotoWorxx | |
| HP Envy 16 h0112nr | |
| Acer Swift X SFX16-51G-5388 | |
| Lenovo Legion 5 Pro 16IAH7H | |
| Lenovo Legion 5 Pro 16IAH7H | |
| Average AMD Ryzen 9 6900HX (26873 - 30604, n=20) | |
| Lenovo IdeaPad 5 Pro 16ARH7 | |
| Lenovo ThinkBook 16p G3 ARH | |
| Lenovo ThinkBook 16p G2 ACH | |
系统性能
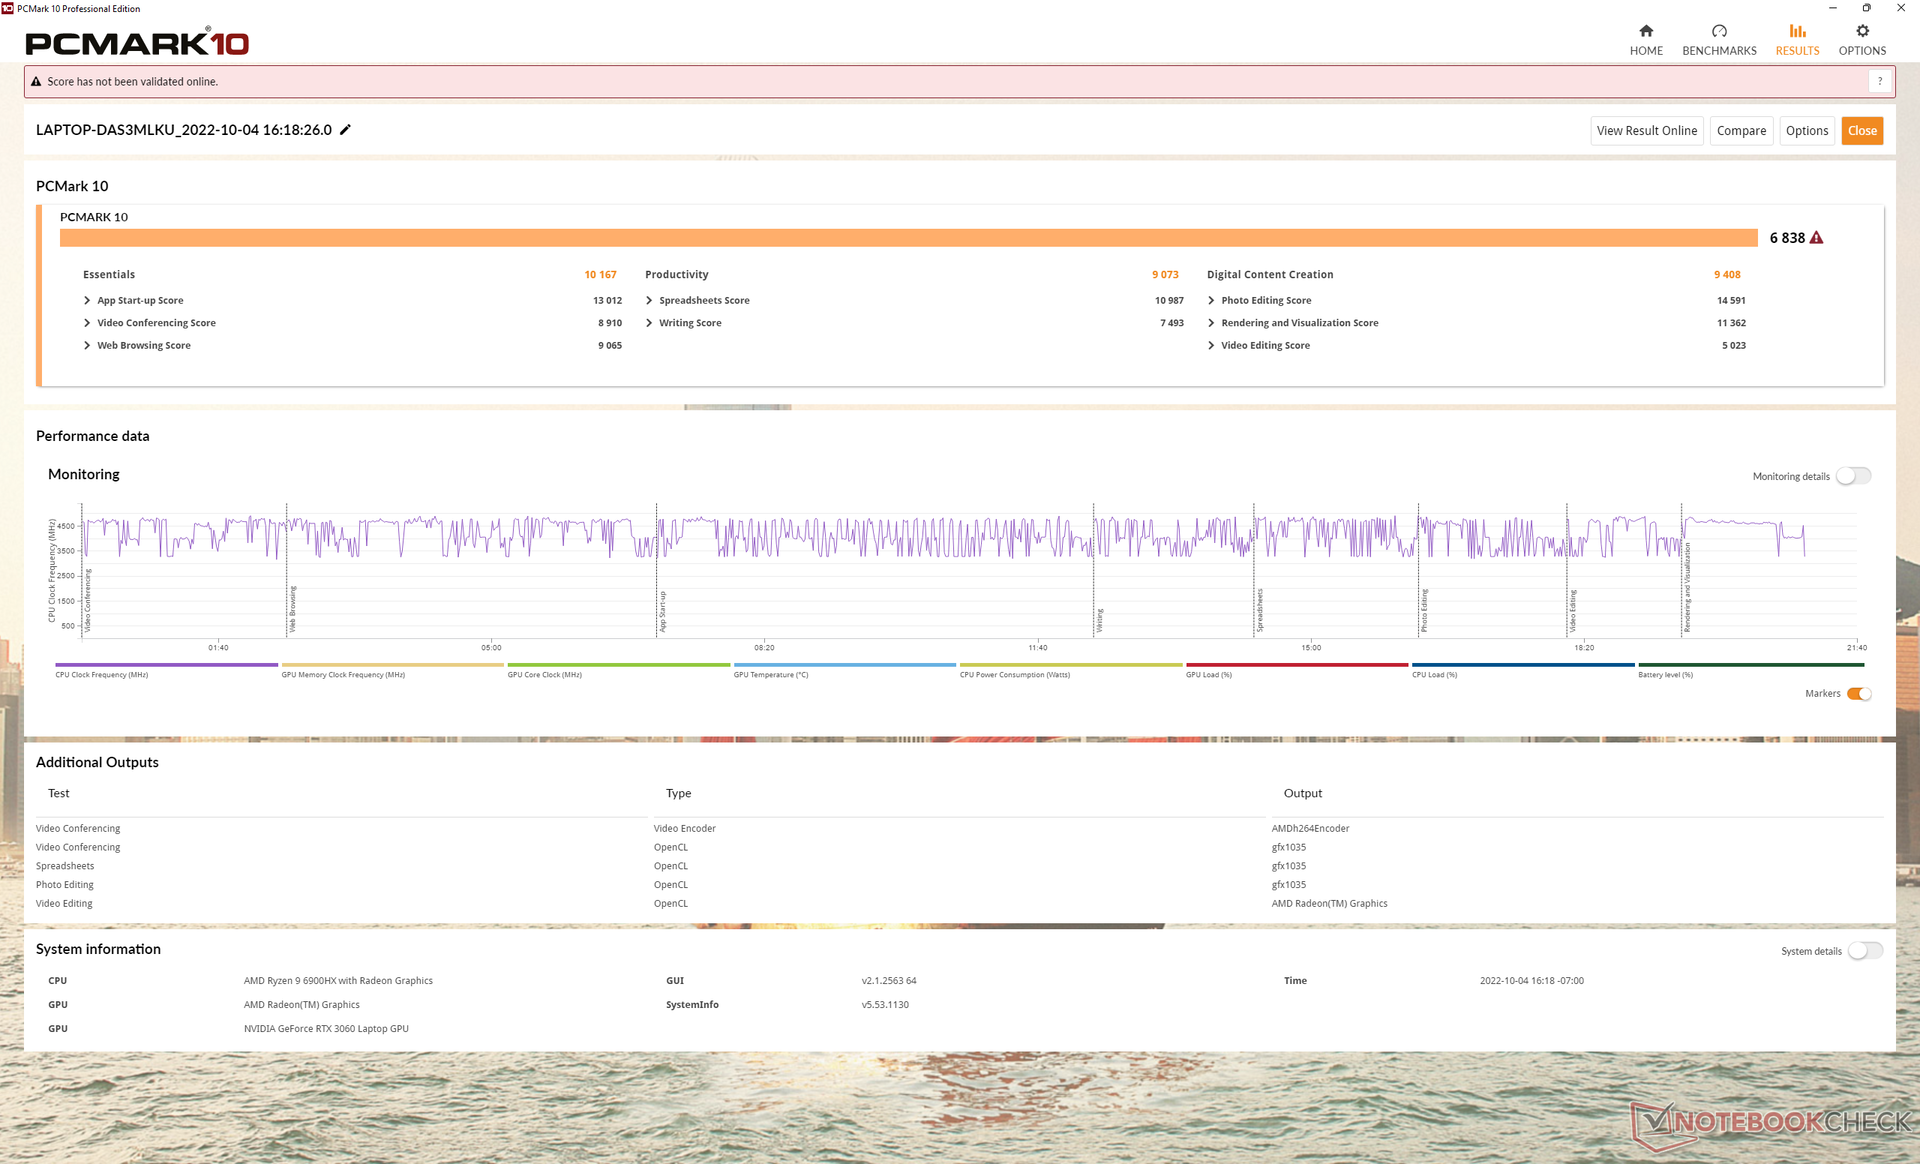
PCMark的结果几乎与ThinkBook 16p Gen 2相同,因为如上所述,CPU性能几乎没有任何改善。
CrossMark: Overall | Productivity | Creativity | Responsiveness
| PCMark 10 / Score | |
| HP Envy 16 h0112nr | |
| Lenovo Legion 5 Pro 16IAH7H | |
| Lenovo ThinkBook 16p G3 ARH | |
| Average AMD Ryzen 9 6900HX, NVIDIA GeForce RTX 3060 Laptop GPU (n=1) | |
| Lenovo ThinkBook 16p G2 ACH | |
| Lenovo IdeaPad 5 Pro 16ARH7 | |
| Acer Swift X SFX16-51G-5388 | |
| PCMark 10 / Essentials | |
| HP Envy 16 h0112nr | |
| Lenovo Legion 5 Pro 16IAH7H | |
| Lenovo ThinkBook 16p G2 ACH | |
| Lenovo ThinkBook 16p G3 ARH | |
| Average AMD Ryzen 9 6900HX, NVIDIA GeForce RTX 3060 Laptop GPU (n=1) | |
| Lenovo IdeaPad 5 Pro 16ARH7 | |
| Acer Swift X SFX16-51G-5388 | |
| PCMark 10 / Productivity | |
| Lenovo Legion 5 Pro 16IAH7H | |
| HP Envy 16 h0112nr | |
| Lenovo ThinkBook 16p G2 ACH | |
| Lenovo ThinkBook 16p G3 ARH | |
| Average AMD Ryzen 9 6900HX, NVIDIA GeForce RTX 3060 Laptop GPU (n=1) | |
| Lenovo IdeaPad 5 Pro 16ARH7 | |
| Acer Swift X SFX16-51G-5388 | |
| PCMark 10 / Digital Content Creation | |
| Lenovo Legion 5 Pro 16IAH7H | |
| HP Envy 16 h0112nr | |
| Lenovo ThinkBook 16p G3 ARH | |
| Average AMD Ryzen 9 6900HX, NVIDIA GeForce RTX 3060 Laptop GPU (n=1) | |
| Lenovo ThinkBook 16p G2 ACH | |
| Acer Swift X SFX16-51G-5388 | |
| Lenovo IdeaPad 5 Pro 16ARH7 | |
| CrossMark / Overall | |
| HP Envy 16 h0112nr | |
| Lenovo Legion 5 Pro 16IAH7H | |
| Lenovo ThinkBook 16p G3 ARH | |
| Average AMD Ryzen 9 6900HX, NVIDIA GeForce RTX 3060 Laptop GPU (n=1) | |
| Acer Swift X SFX16-51G-5388 | |
| CrossMark / Productivity | |
| HP Envy 16 h0112nr | |
| Lenovo Legion 5 Pro 16IAH7H | |
| Lenovo ThinkBook 16p G3 ARH | |
| Average AMD Ryzen 9 6900HX, NVIDIA GeForce RTX 3060 Laptop GPU (n=1) | |
| Acer Swift X SFX16-51G-5388 | |
| CrossMark / Creativity | |
| HP Envy 16 h0112nr | |
| Lenovo Legion 5 Pro 16IAH7H | |
| Lenovo ThinkBook 16p G3 ARH | |
| Average AMD Ryzen 9 6900HX, NVIDIA GeForce RTX 3060 Laptop GPU (n=1) | |
| Acer Swift X SFX16-51G-5388 | |
| CrossMark / Responsiveness | |
| Lenovo Legion 5 Pro 16IAH7H | |
| HP Envy 16 h0112nr | |
| Lenovo ThinkBook 16p G3 ARH | |
| Average AMD Ryzen 9 6900HX, NVIDIA GeForce RTX 3060 Laptop GPU (n=1) | |
| Acer Swift X SFX16-51G-5388 | |
| PCMark 10 Score | 6838 points | |
Help | ||
| AIDA64 / Memory Copy | |
| HP Envy 16 h0112nr | |
| Acer Swift X SFX16-51G-5388 | |
| Lenovo Legion 5 Pro 16IAH7H | |
| Lenovo Legion 5 Pro 16IAH7H | |
| Lenovo IdeaPad 5 Pro 16ARH7 | |
| Average AMD Ryzen 9 6900HX (47938 - 53345, n=20) | |
| Lenovo ThinkBook 16p G3 ARH | |
| Lenovo ThinkBook 16p G2 ACH | |
| AIDA64 / Memory Read | |
| HP Envy 16 h0112nr | |
| Lenovo Legion 5 Pro 16IAH7H | |
| Lenovo Legion 5 Pro 16IAH7H | |
| Acer Swift X SFX16-51G-5388 | |
| Average AMD Ryzen 9 6900HX (43892 - 53321, n=20) | |
| Lenovo ThinkBook 16p G2 ACH | |
| Lenovo IdeaPad 5 Pro 16ARH7 | |
| Lenovo ThinkBook 16p G3 ARH | |
| AIDA64 / Memory Write | |
| Lenovo IdeaPad 5 Pro 16ARH7 | |
| Acer Swift X SFX16-51G-5388 | |
| Lenovo Legion 5 Pro 16IAH7H | |
| Lenovo Legion 5 Pro 16IAH7H | |
| HP Envy 16 h0112nr | |
| Average AMD Ryzen 9 6900HX (51085 - 57202, n=20) | |
| Lenovo ThinkBook 16p G3 ARH | |
| Lenovo ThinkBook 16p G2 ACH | |
| AIDA64 / Memory Latency | |
| Lenovo ThinkBook 16p G3 ARH | |
| Lenovo IdeaPad 5 Pro 16ARH7 | |
| Lenovo Legion 5 Pro 16IAH7H | |
| Lenovo Legion 5 Pro 16IAH7H | |
| Acer Swift X SFX16-51G-5388 | |
| HP Envy 16 h0112nr | |
| Average AMD Ryzen 9 6900HX (80.7 - 120.6, n=20) | |
| Lenovo ThinkBook 16p G2 ACH | |
* ... smaller is better
DPC延时
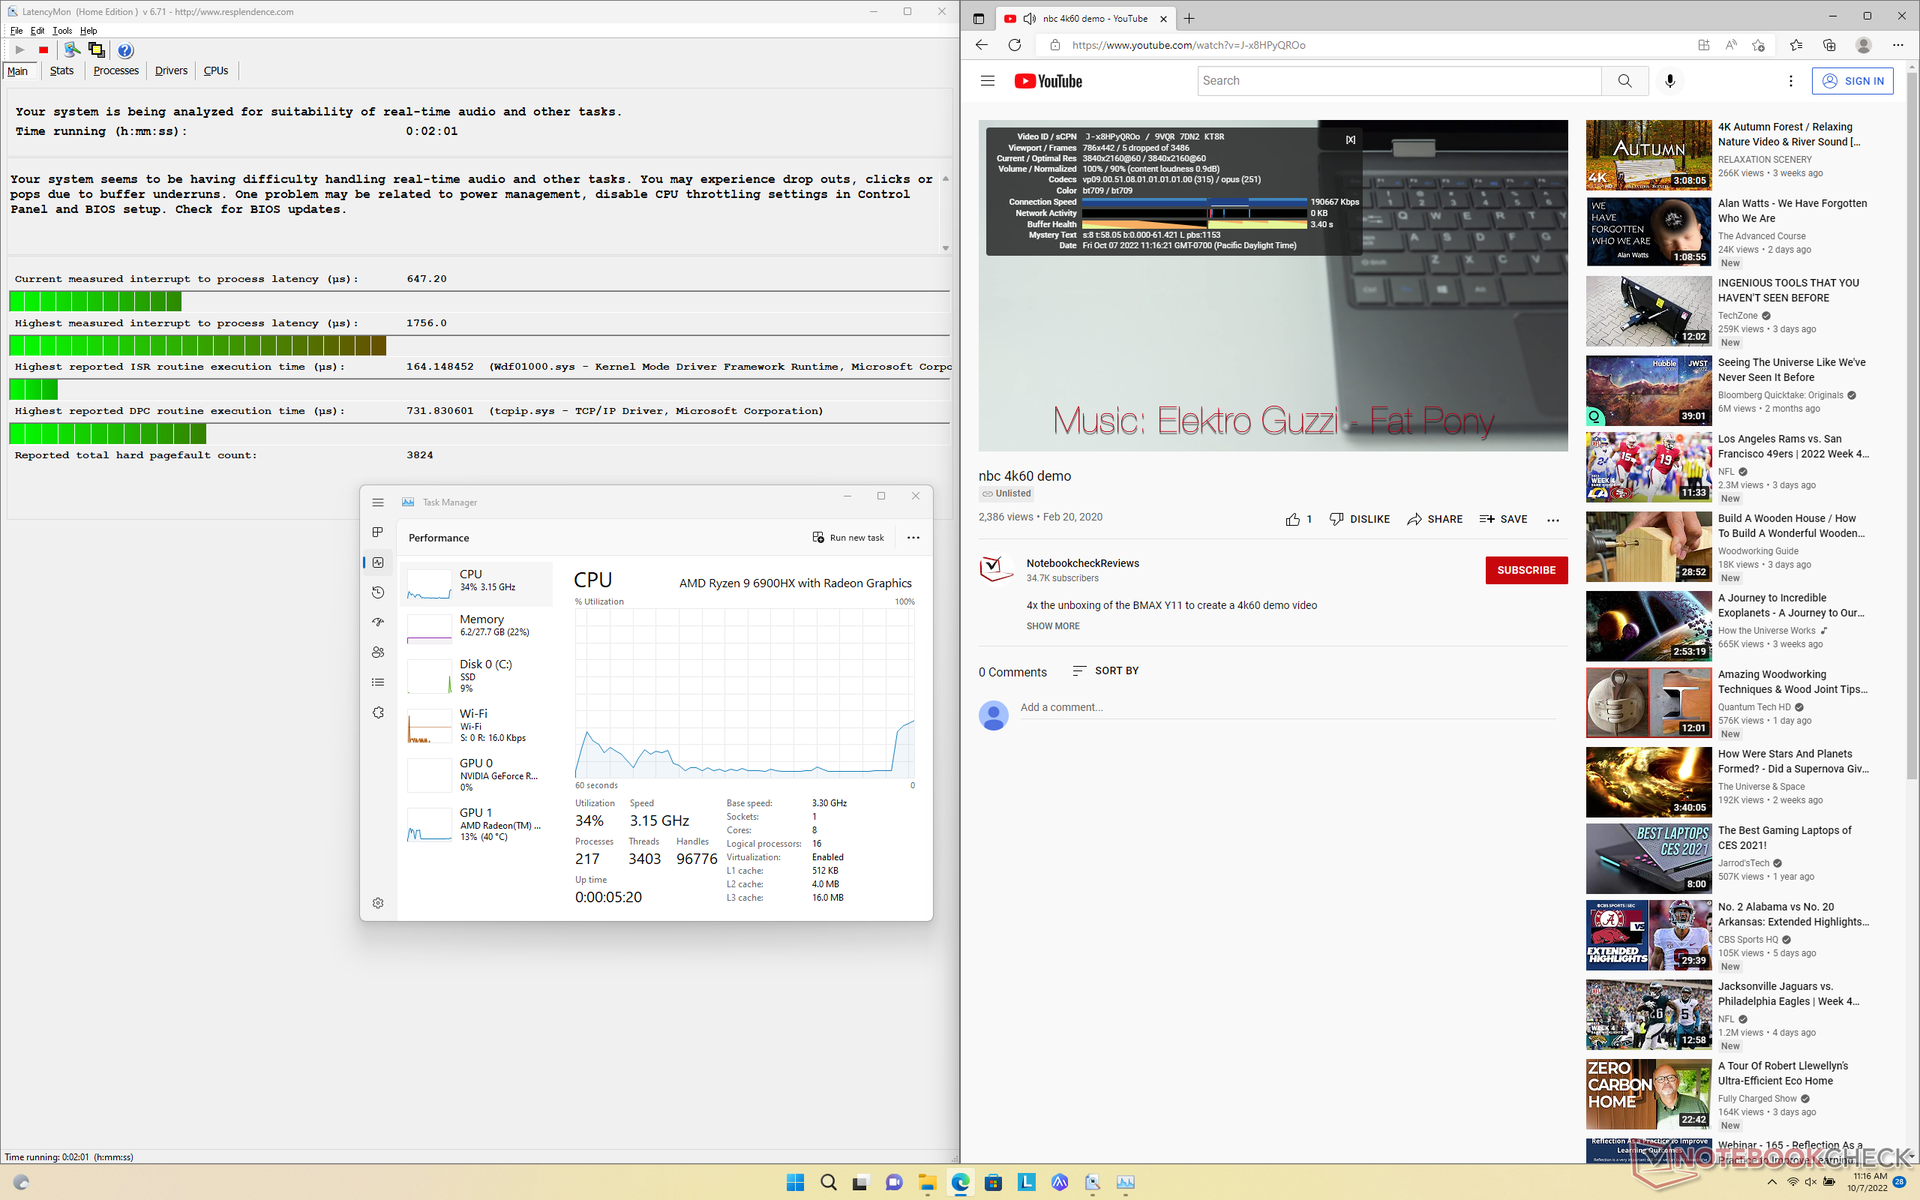
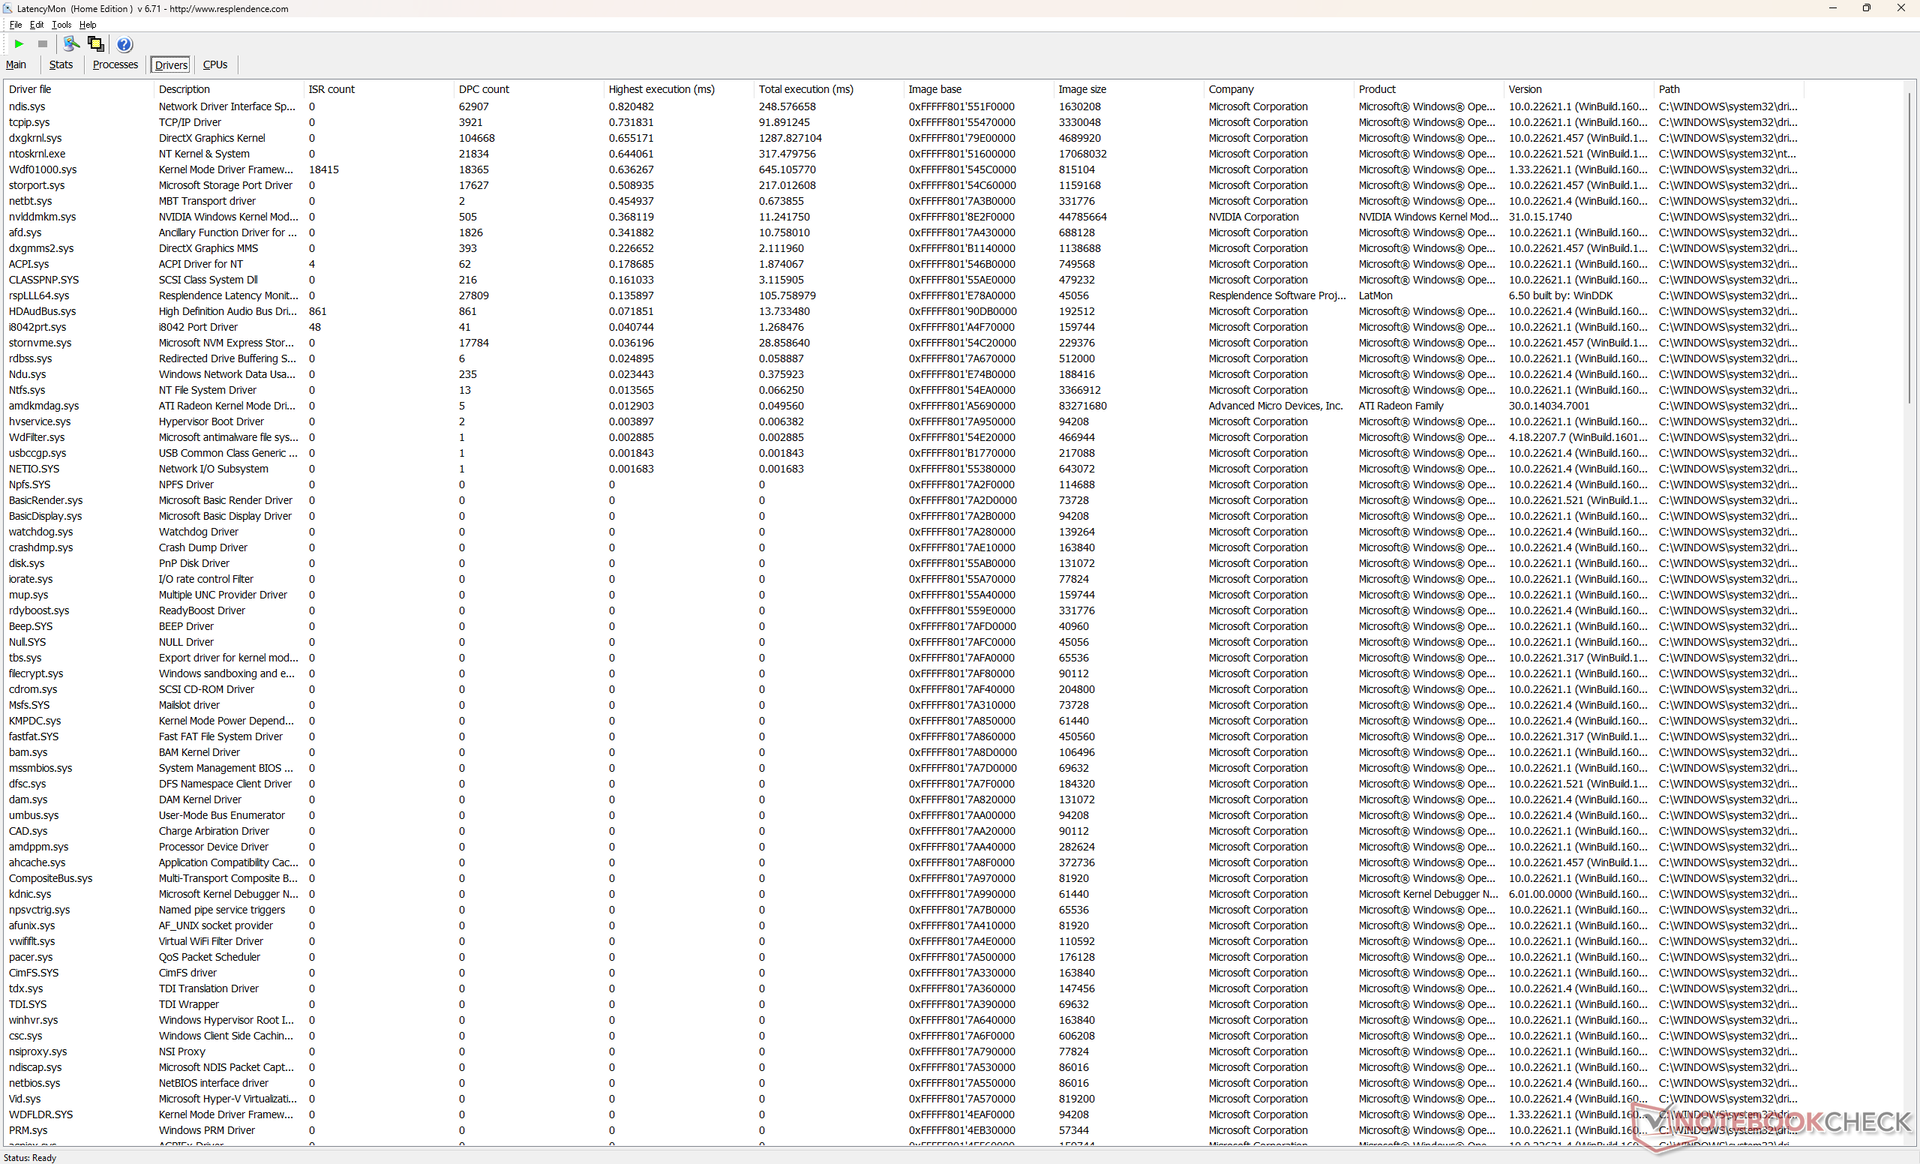
LatencyMon显示,在打开我们的主页的多个浏览器标签时有轻微的DPC问题。在60 FPS下的4K视频播放也不完美,在我们长达1分钟的测试视频中出现了5个丢帧。
| DPC Latencies / LatencyMon - interrupt to process latency (max), Web, Youtube, Prime95 | |
| Acer Swift X SFX16-51G-5388 | |
| Lenovo ThinkBook 16p G3 ARH | |
| HP Envy 16 h0112nr | |
| Lenovo IdeaPad 5 Pro 16ARH7 | |
| Lenovo Legion 5 Pro 16IAH7H | |
| Lenovo ThinkBook 16p G2 ACH | |
* ... smaller is better
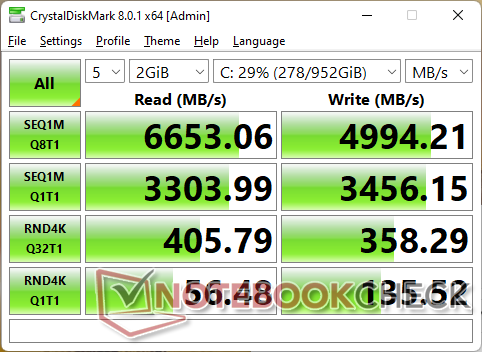
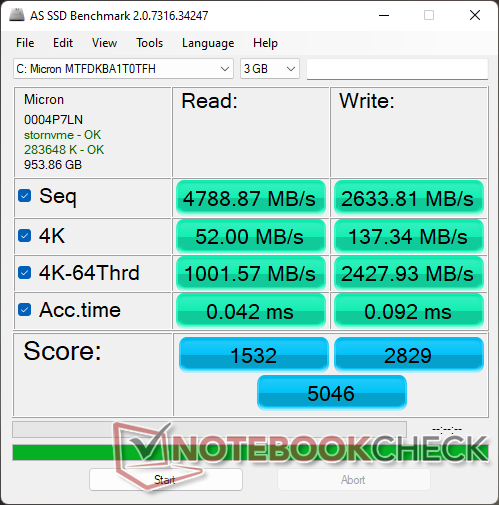
存储设备
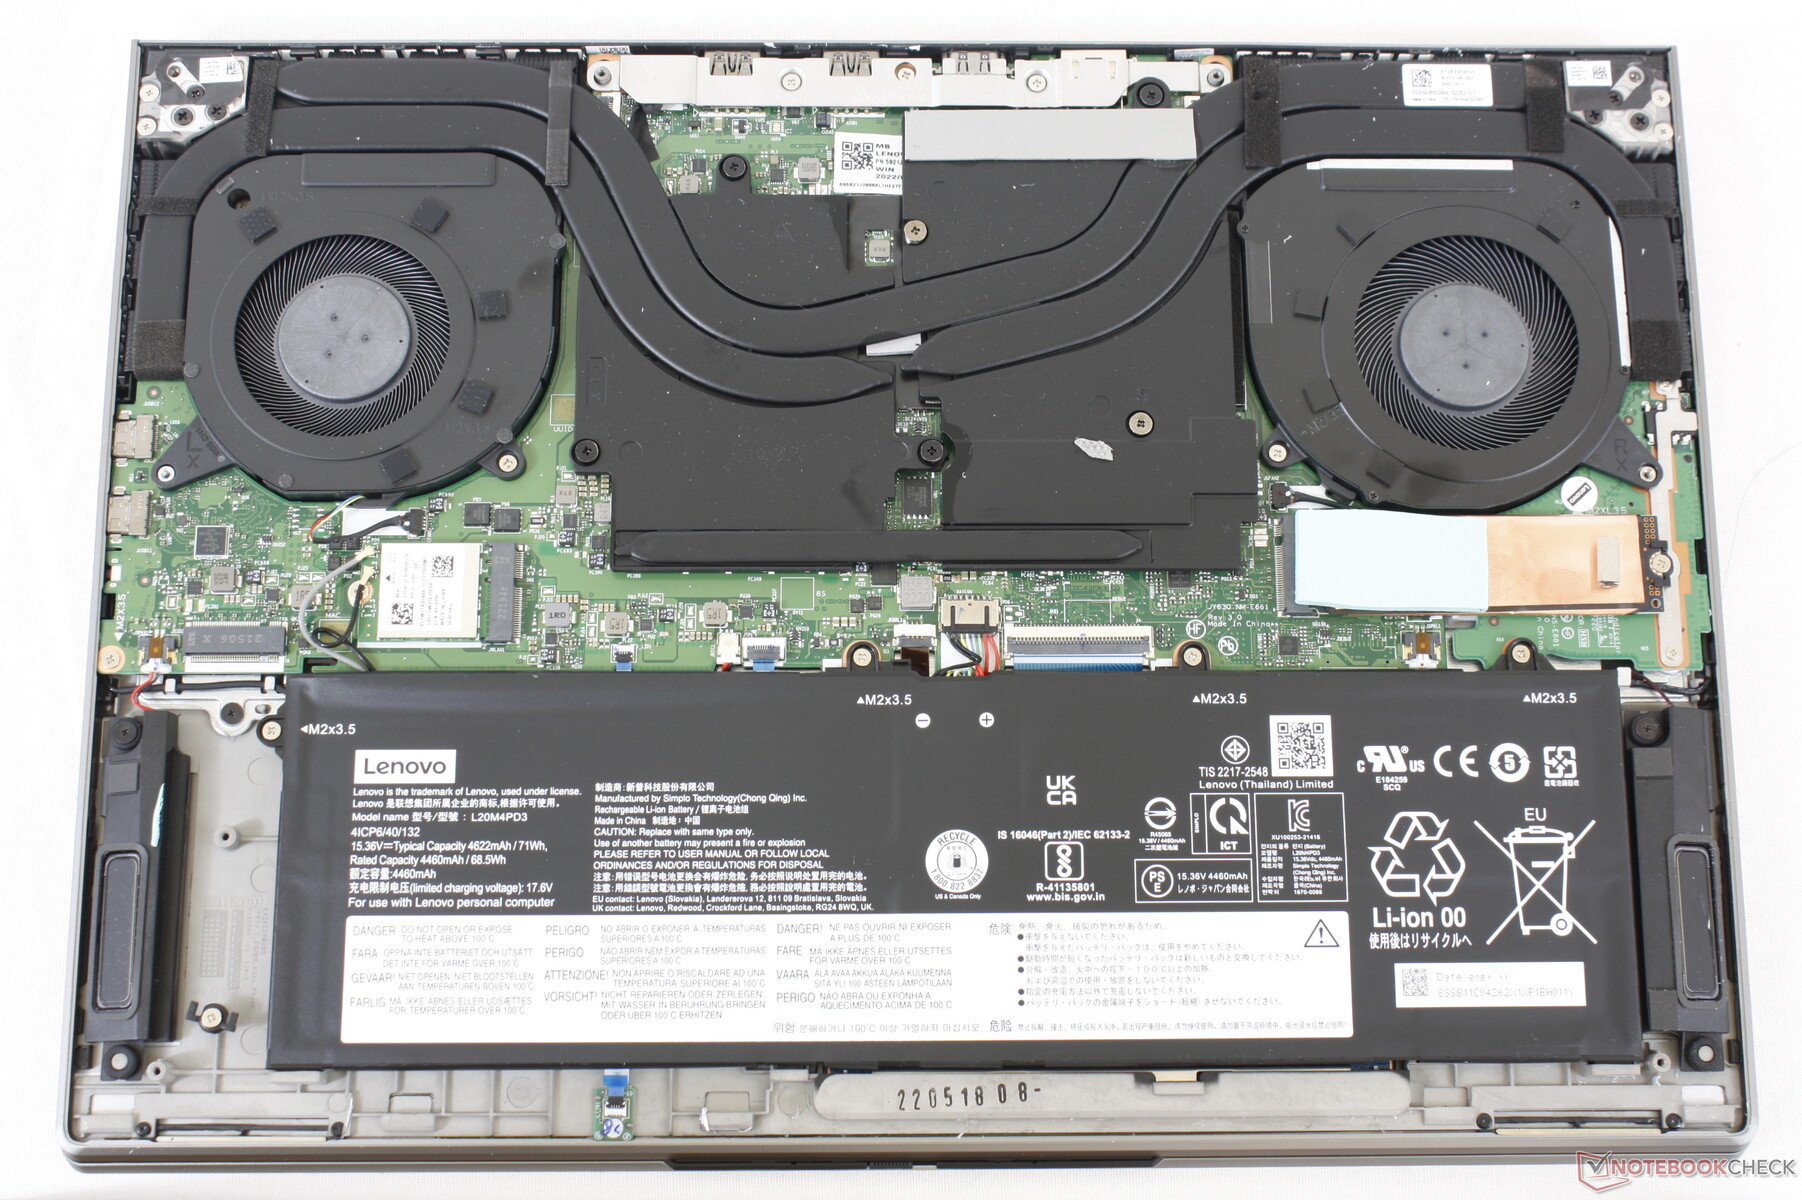
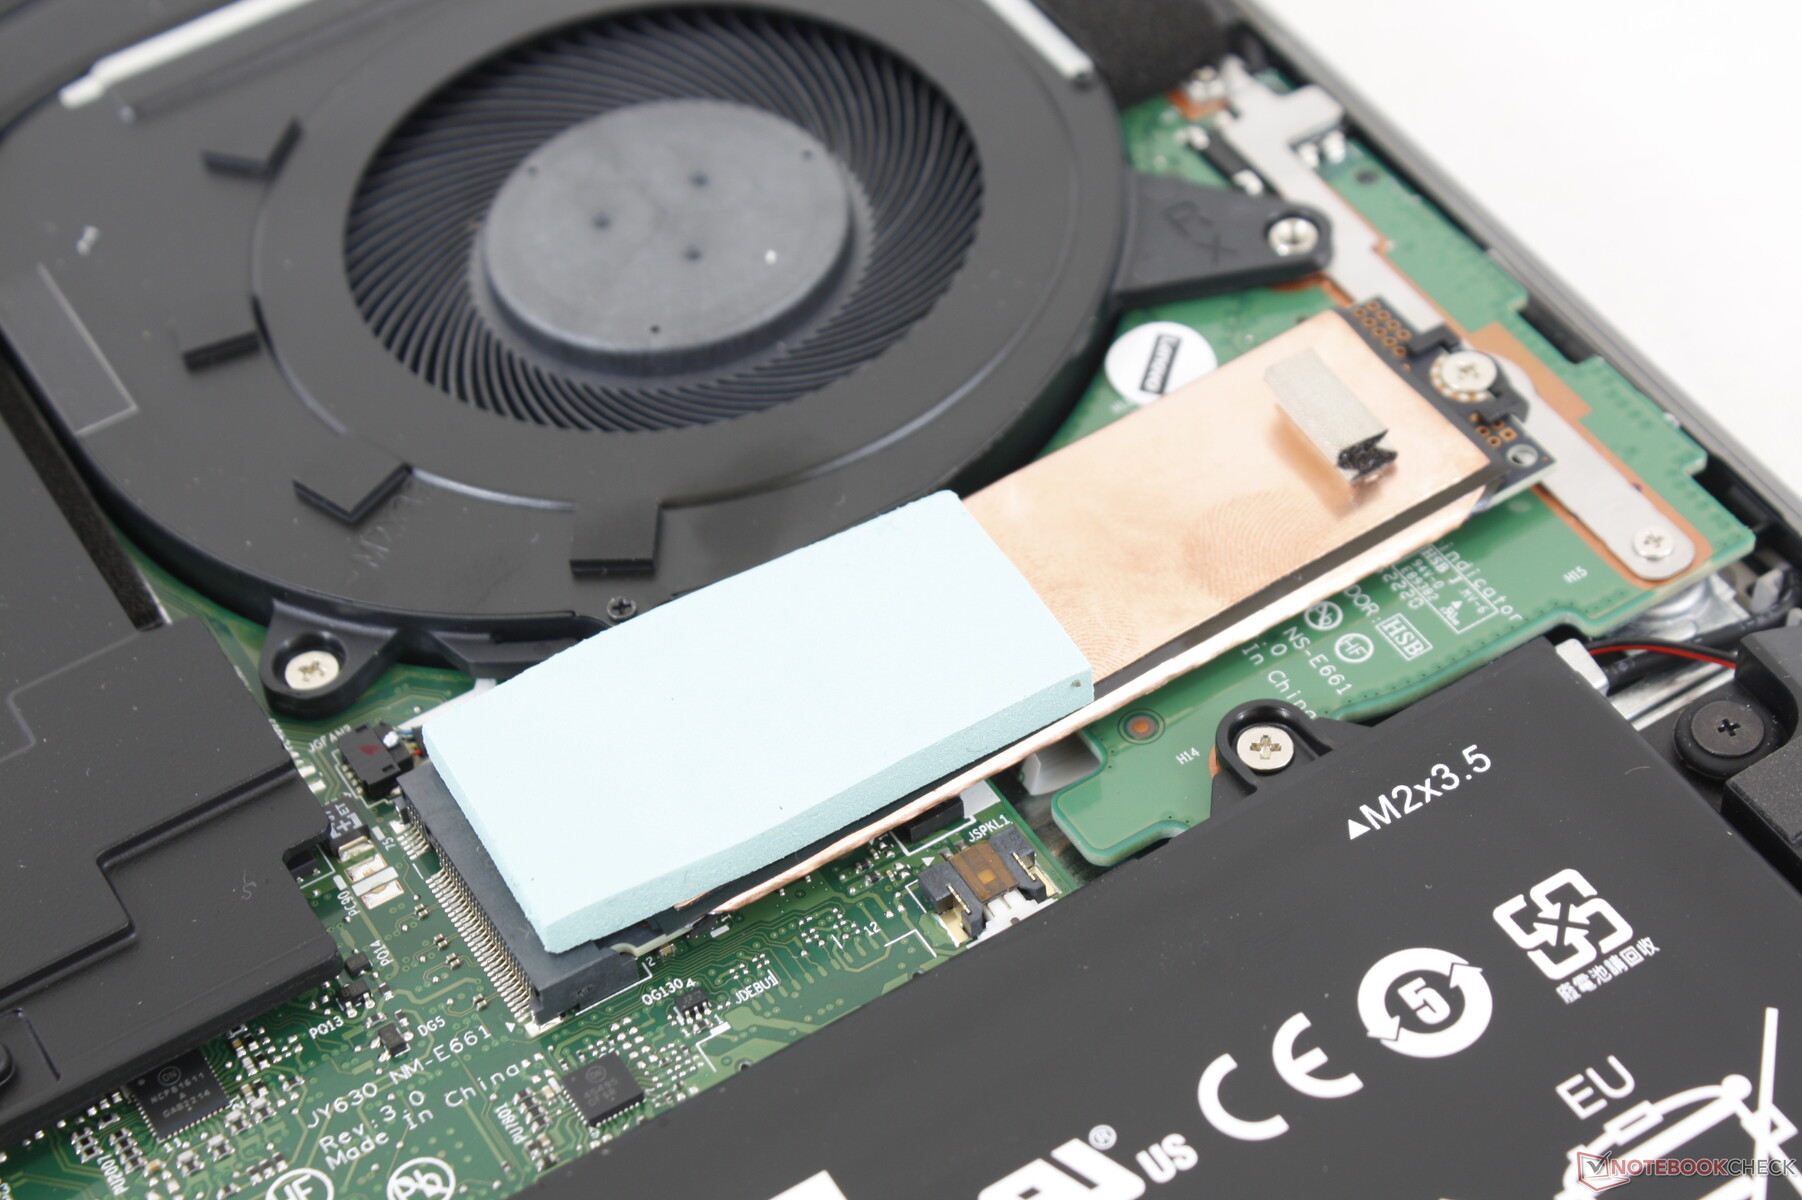
包含的PCIe4 x4固态硬盘有自己的散热器和热垫,以帮助散热。如下图所示,在循环运行DiskSpd时,我们的硬盘没有表现出节流问题。

| Drive Performance rating - Percent | |
| Lenovo Legion 5 Pro 16IAH7H | |
| Lenovo ThinkBook 16p G2 ACH | |
| HP Envy 16 h0112nr | |
| Lenovo ThinkBook 16p G3 ARH | |
| Lenovo IdeaPad 5 Pro 16ARH7 | |
| Acer Swift X SFX16-51G-5388 | |
* ... smaller is better
Disk Throttling: DiskSpd Read Loop, Queue Depth 8
GPU性能
联想已经提高了 GeForce RTX 3060TGP从ThinkBook 16p第二代的75瓦提高到ThinkBook 16p第三代的90瓦。即便如此,性能最多只能提高10%左右。
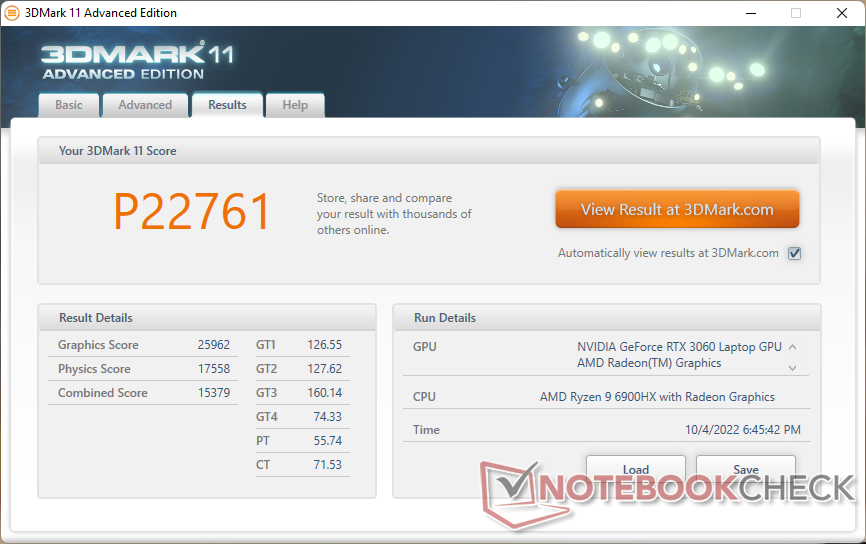
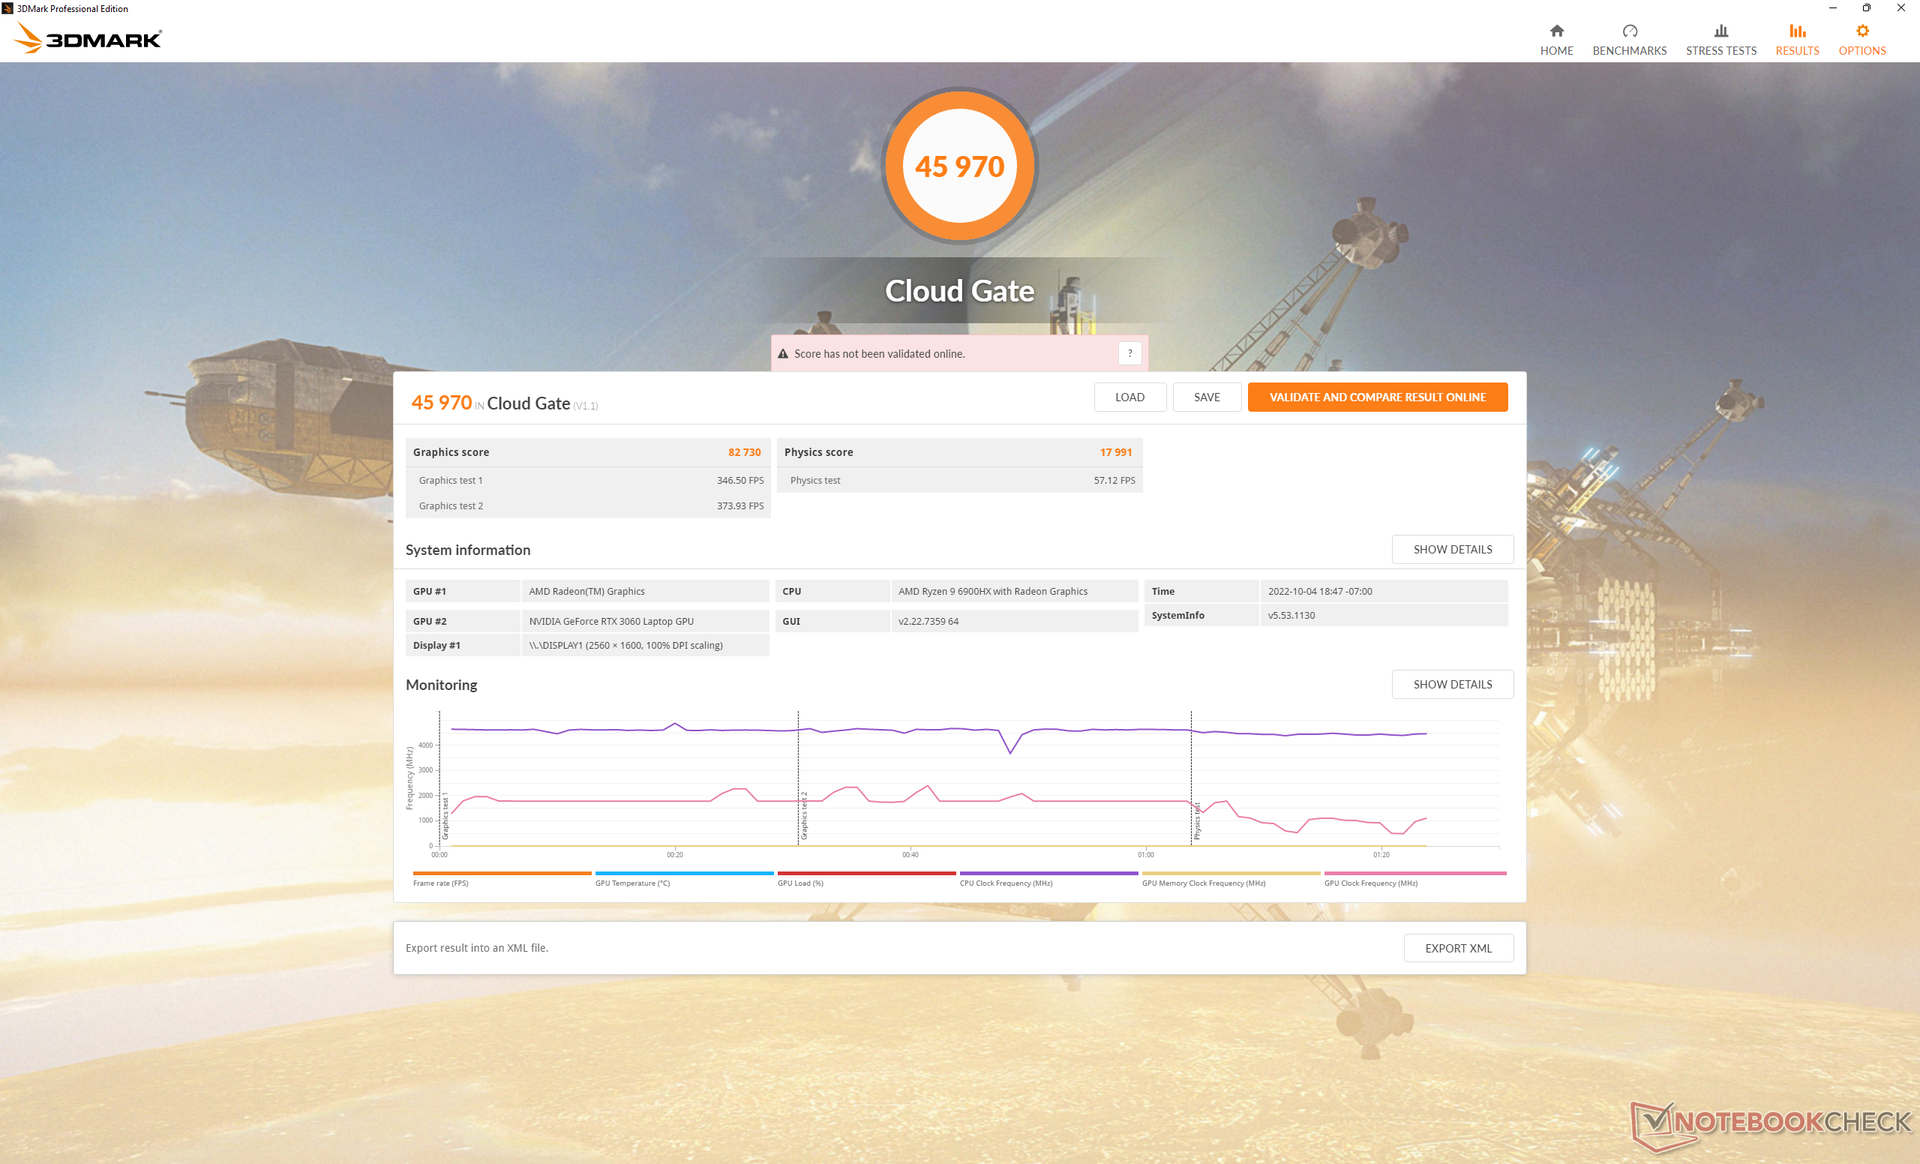
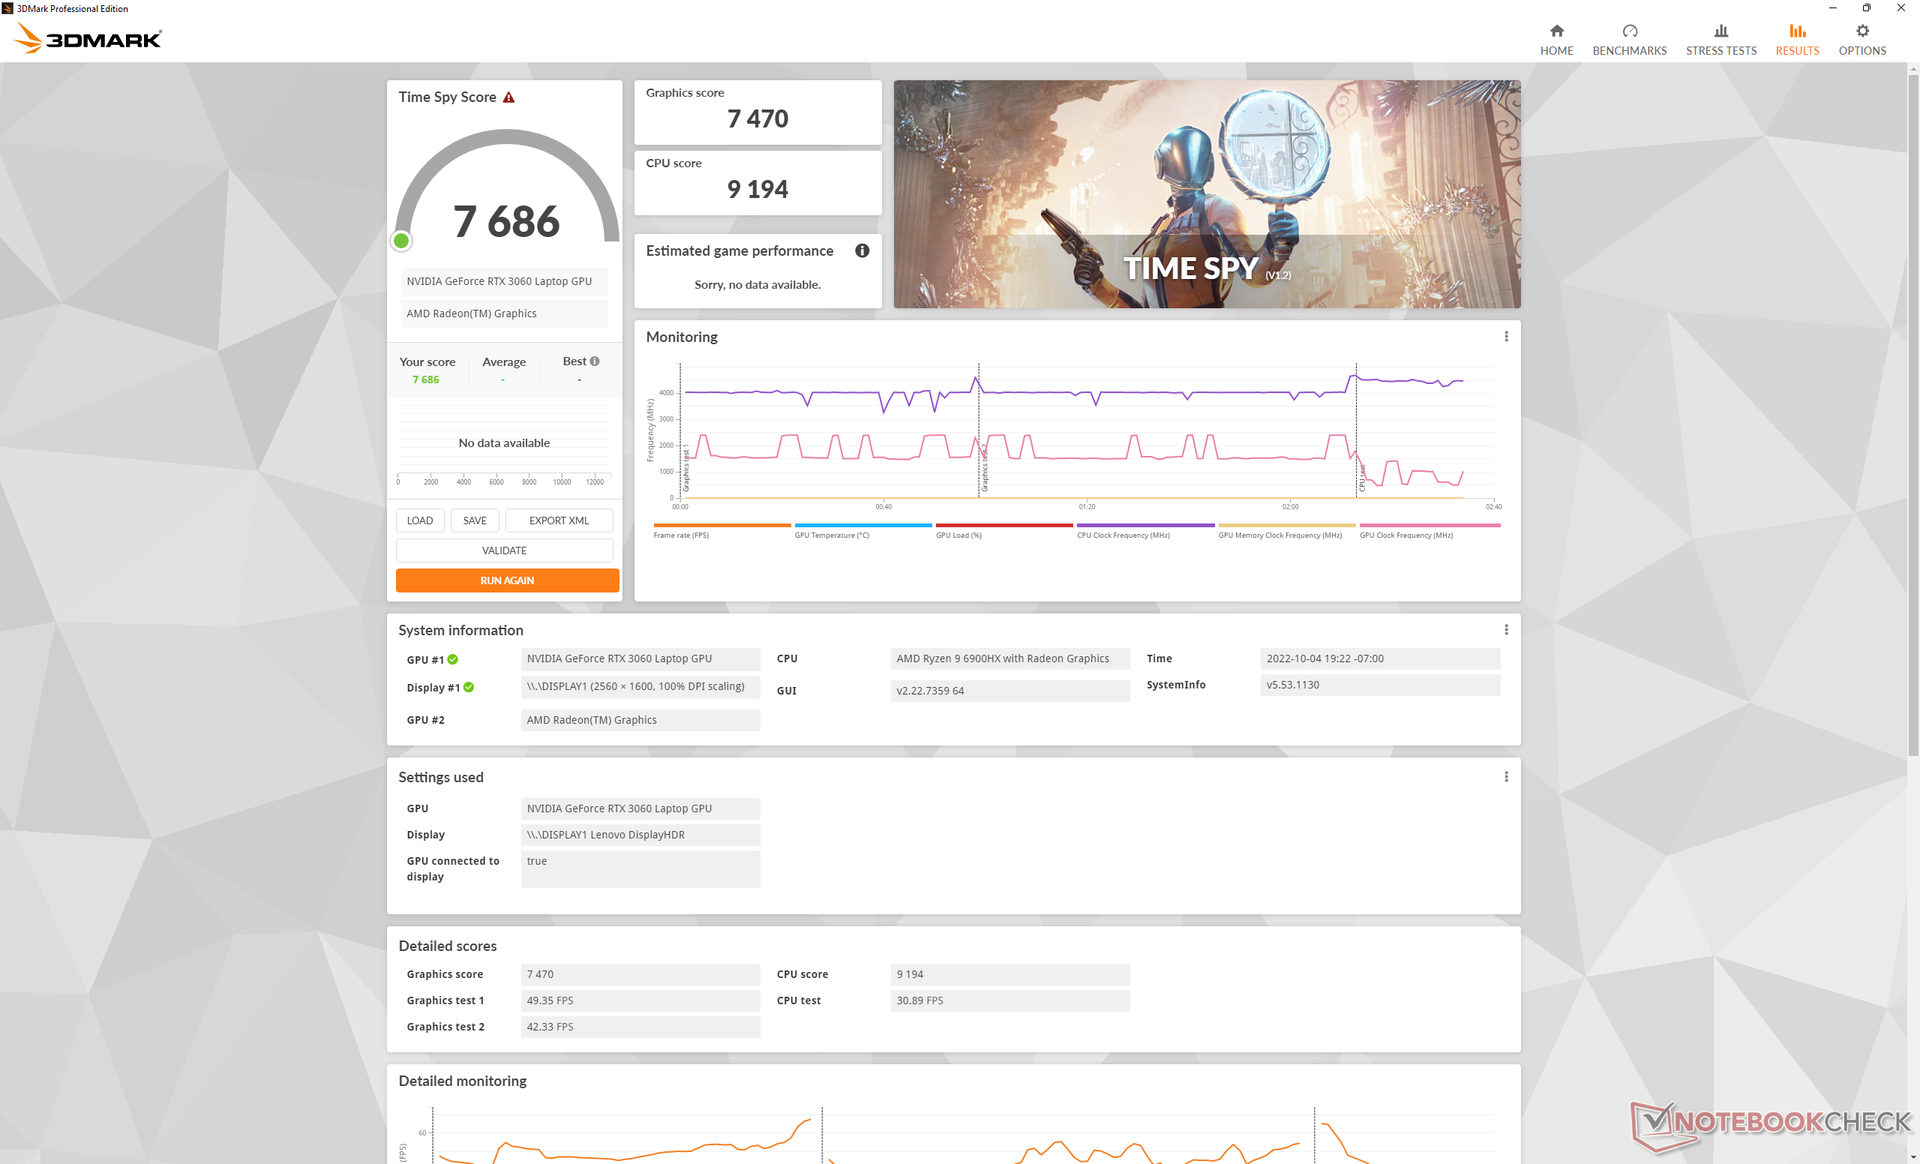
| 3DMark 11 Performance | 22761 points | |
| 3DMark Cloud Gate Standard Score | 45970 points | |
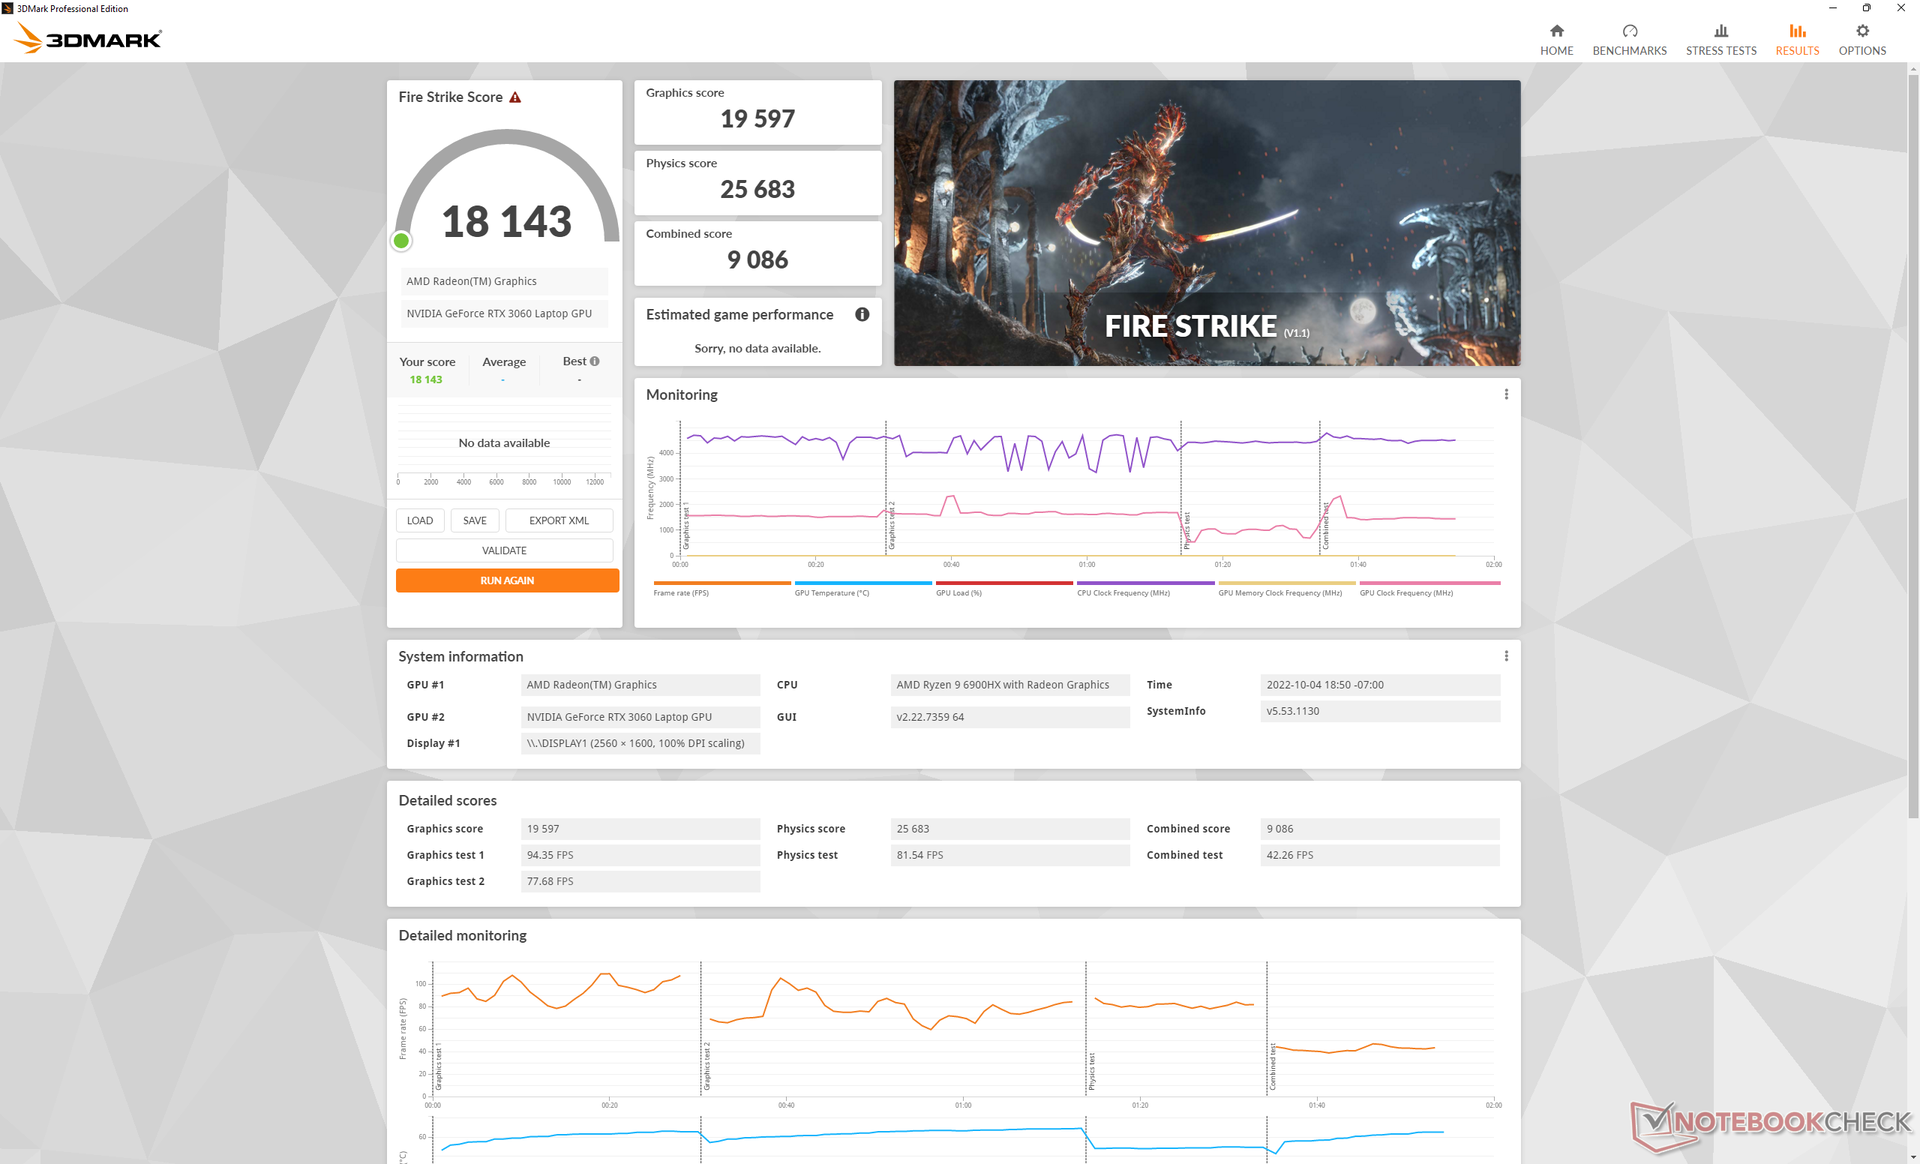
| 3DMark Fire Strike Score | 18143 points | |
| 3DMark Time Spy Score | 7686 points | |
Help | ||
* ... smaller is better
| Final Fantasy XV Benchmark | |
| 1280x720 Lite Quality | |
| Razer Blade 15 2022 | |
| Average NVIDIA GeForce RTX 3060 Laptop GPU (122.5 - 214, n=33) | |
| Lenovo ThinkBook 16p G3 ARH | |
| MSI Stealth 15M A11SEK | |
| Acer Swift X SFX16-51G-5388 | |
| Lenovo IdeaPad 5 Pro 16ARH7 | |
| 1920x1080 Standard Quality | |
| Razer Blade 15 2022 | |
| Average NVIDIA GeForce RTX 3060 Laptop GPU (70.4 - 133.5, n=37) | |
| Lenovo ThinkBook 16p G3 ARH | |
| MSI Stealth 15M A11SEK | |
| Acer Swift X SFX16-51G-5388 | |
| Lenovo IdeaPad 5 Pro 16ARH7 | |
| 1920x1080 High Quality | |
| Razer Blade 15 2022 | |
| Average NVIDIA GeForce RTX 3060 Laptop GPU (55 - 100.9, n=42) | |
| Lenovo ThinkBook 16p G3 ARH | |
| MSI Stealth 15M A11SEK | |
| Acer Swift X SFX16-51G-5388 | |
| Lenovo IdeaPad 5 Pro 16ARH7 | |
| 2560x1440 High Quality | |
| Razer Blade 15 2022 | |
| Average NVIDIA GeForce RTX 3060 Laptop GPU (41.1 - 73.7, n=25) | |
| Lenovo ThinkBook 16p G3 ARH | |
| Cyberpunk 2077 1.6 | |
| 1920x1080 Low Preset | |
| Average NVIDIA GeForce RTX 3060 Laptop GPU (80 - 135.7, n=14) | |
| Lenovo ThinkBook 16p G3 ARH | |
| Lenovo IdeaPad 5 Pro 16ARH7 | |
| 1920x1080 Medium Preset | |
| Average NVIDIA GeForce RTX 3060 Laptop GPU (68 - 118, n=14) | |
| Lenovo ThinkBook 16p G3 ARH | |
| Lenovo IdeaPad 5 Pro 16ARH7 | |
| 1920x1080 High Preset | |
| Average NVIDIA GeForce RTX 3060 Laptop GPU (42.2 - 87.7, n=14) | |
| Lenovo ThinkBook 16p G3 ARH | |
| Lenovo IdeaPad 5 Pro 16ARH7 | |
| 1920x1080 Ultra Preset | |
| Average NVIDIA GeForce RTX 3060 Laptop GPU (40 - 78.8, n=16) | |
| Lenovo ThinkBook 16p G3 ARH | |
| 2560x1440 Ultra Preset | |
| Average NVIDIA GeForce RTX 3060 Laptop GPU (23 - 45.8, n=9) | |
| Lenovo ThinkBook 16p G3 ARH | |
Witcher 3 FPS Chart
| low | med. | high | ultra | QHD | |
|---|---|---|---|---|---|
| GTA V (2015) | 165.4 | 158.9 | 134.6 | 78.5 | 68.8 |
| The Witcher 3 (2015) | 259.5 | 211.4 | 138.5 | 73.4 | |
| Dota 2 Reborn (2015) | 112.5 | 106 | 98.9 | 96.8 | |
| Final Fantasy XV Benchmark (2018) | 141.8 | 104.1 | 78.2 | 58.5 | |
| X-Plane 11.11 (2018) | 90.6 | 81.8 | 64.8 | ||
| Strange Brigade (2018) | 253 | 170.9 | 147.7 | 132.5 | 99.3 |
| Cyberpunk 2077 1.6 (2022) | 100.8 | 87.7 | 67.8 | 56 | 35 |
排放
系统噪音
运行高负荷时的风扇噪音与Acer Swift X SFX16但比惠普Envy 16更安静。惠普Envy 16.在浏览网页、播放视频或运行其他不需要的负载时,内部风扇并不经常跳动,总体上是一种安静的体验。
Noise level
| Idle |
| 23.1 / 23.2 / 23.6 dB(A) |
| Load |
| 30.6 / 47.5 dB(A) |
 | ||
30 dB silent 40 dB(A) audible 50 dB(A) loud |
||
min: | ||
| Lenovo ThinkBook 16p G3 ARH GeForce RTX 3060 Laptop GPU, R9 6900HX, Micron 3400 1TB MTFDKBA1T0TFH | HP Envy 16 h0112nr GeForce RTX 3060 Laptop GPU, i7-12700H, Micron 3400 1TB MTFDKBA1T0TFH | Lenovo ThinkBook 16p G2 ACH GeForce RTX 3060 Laptop GPU, R9 5900HX, WDC PC SN730 SDBPNTY-1T00 | Lenovo IdeaPad 5 Pro 16ARH7 Radeon 660M, R5 6600HS, Samsung PM9A1 MZVL2512HCJQ | Acer Swift X SFX16-51G-5388 GeForce RTX 3050 4GB Laptop GPU, i5-11320H, Samsung PM991 MZVLQ512HBLU | Lenovo Legion 5 Pro 16IAH7H GeForce RTX 3060 Laptop GPU, i7-12700H, 2x Samsung PM9A1 MZVL21T0HCLR (RAID 0) | |
|---|---|---|---|---|---|---|
| Noise | -11% | -2% | -6% | -14% | -28% | |
| off / environment * (dB) | 22.7 | 22.8 -0% | 23 -1% | 25 -10% | 25.4 -12% | 24.6 -8% |
| Idle Minimum * (dB) | 23.1 | 22.9 1% | 23 -0% | 25 -8% | 25.4 -10% | 28.7 -24% |
| Idle Average * (dB) | 23.2 | 22.9 1% | 23 1% | 26 -12% | 25.4 -9% | 32 -38% |
| Idle Maximum * (dB) | 23.6 | 30.5 -29% | 23 3% | 28 -19% | 27.8 -18% | 32 -36% |
| Load Average * (dB) | 30.6 | 41.4 -35% | 35.66 -17% | 44 -44% | 41 -34% | 45.2 -48% |
| Witcher 3 ultra * (dB) | 47.6 | 51.1 -7% | 48.7 -2% | 35 26% | ||
| Load Maximum * (dB) | 47.5 | 51.4 -8% | 48.13 -1% | 35 26% | 47 1% | 54.4 -15% |
* ... smaller is better
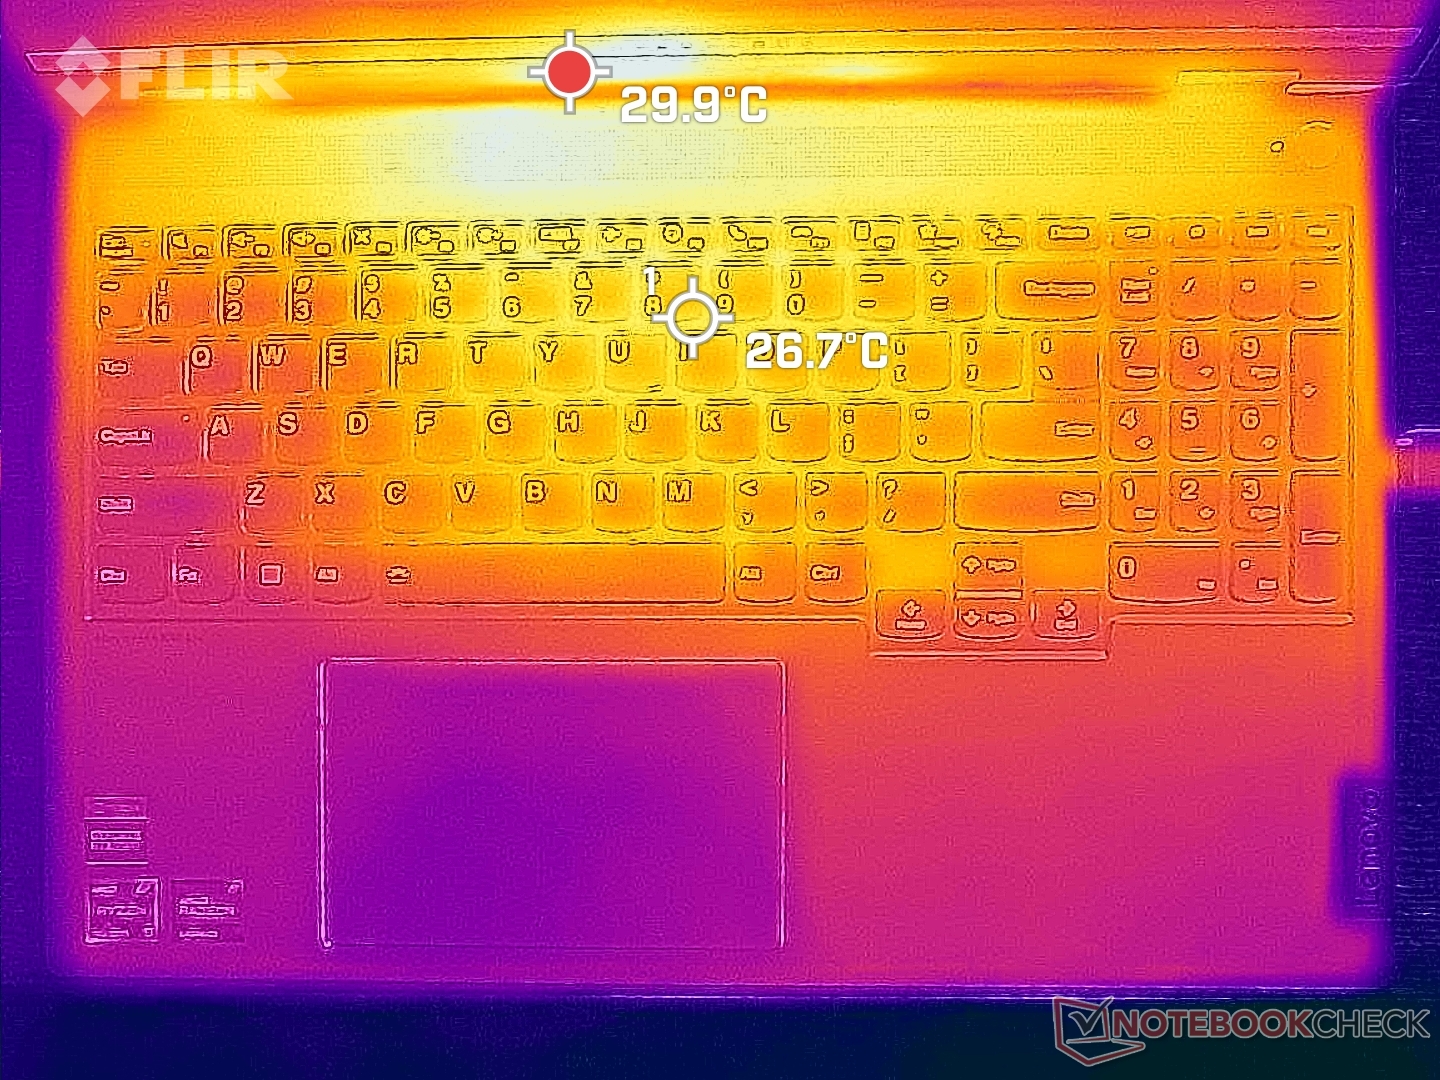
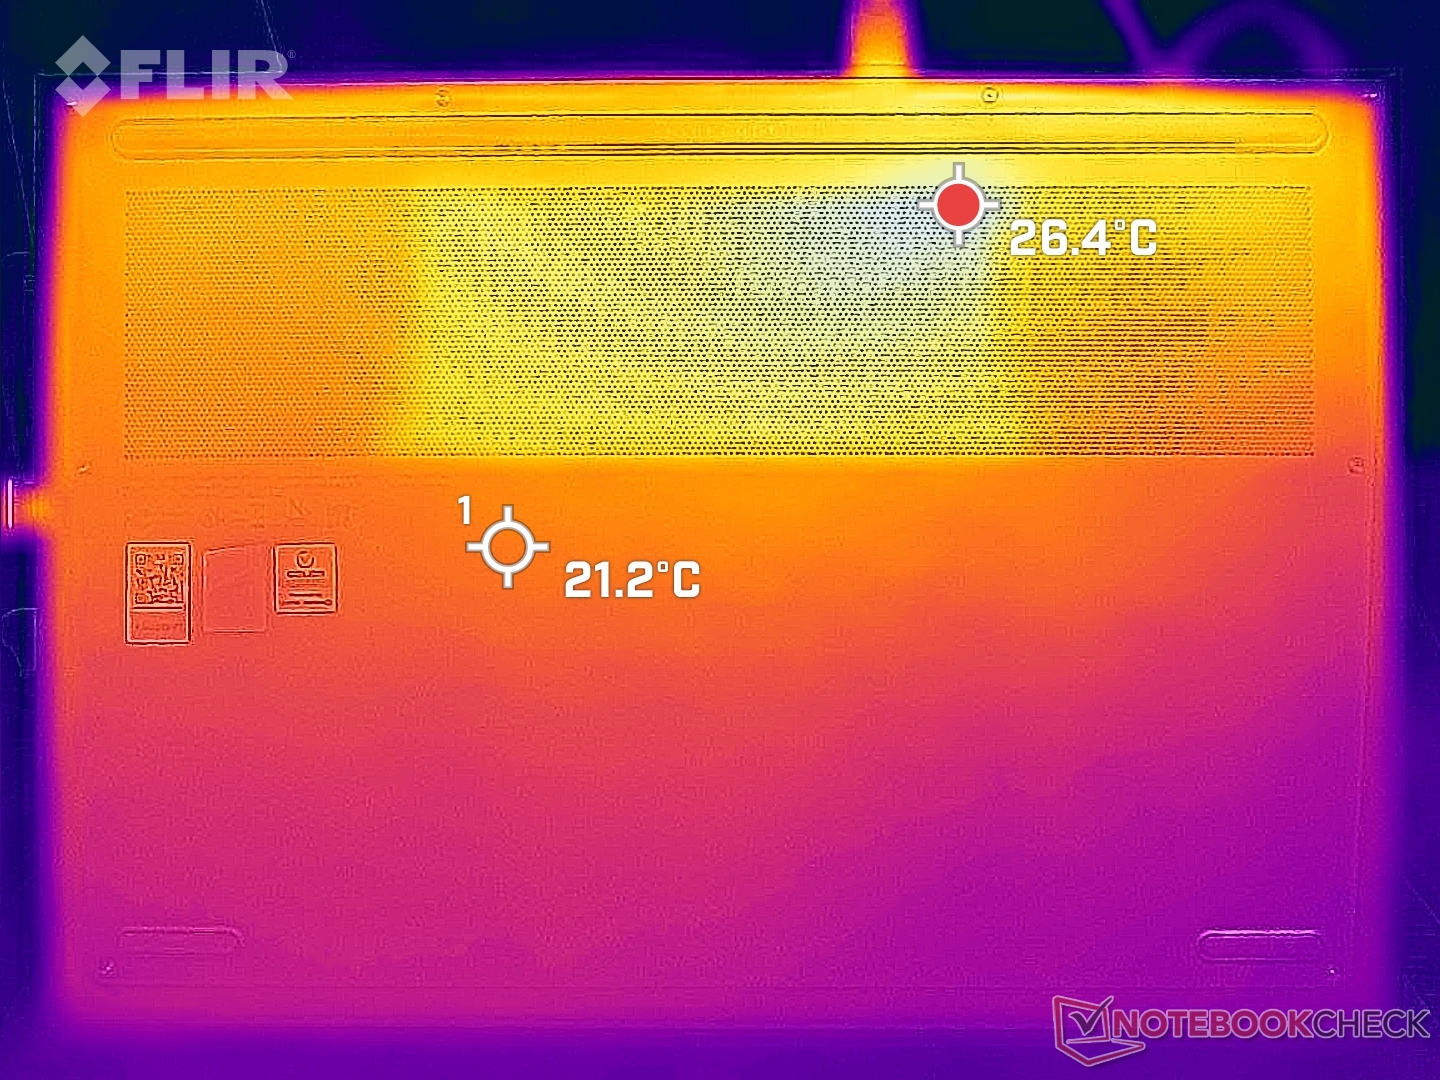
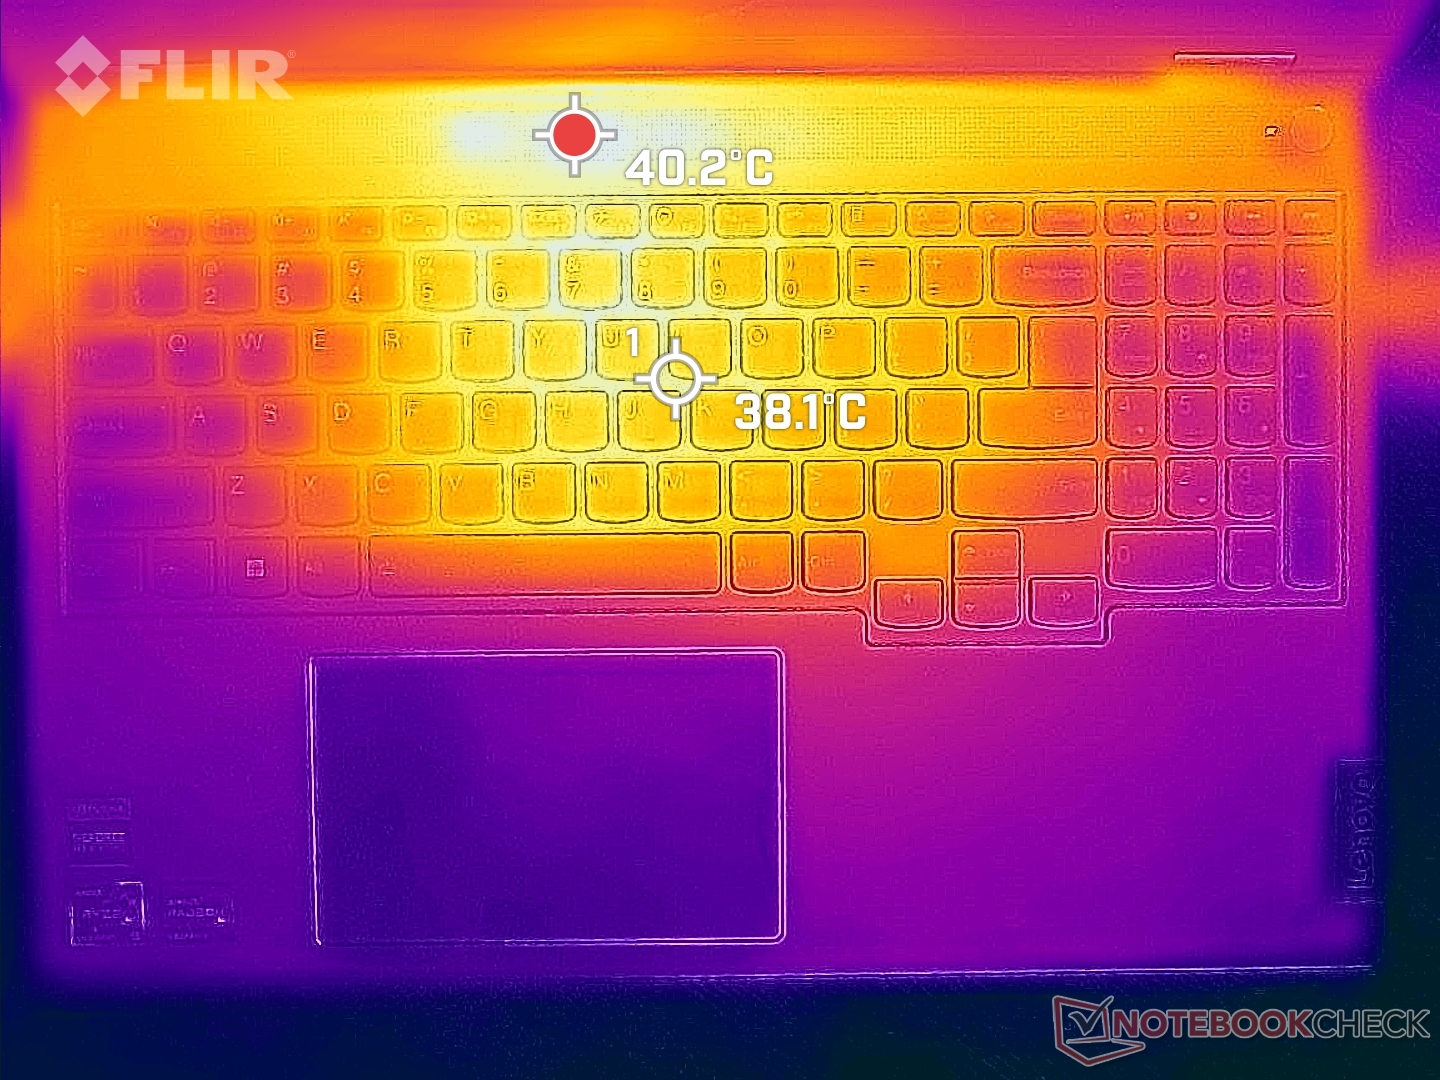
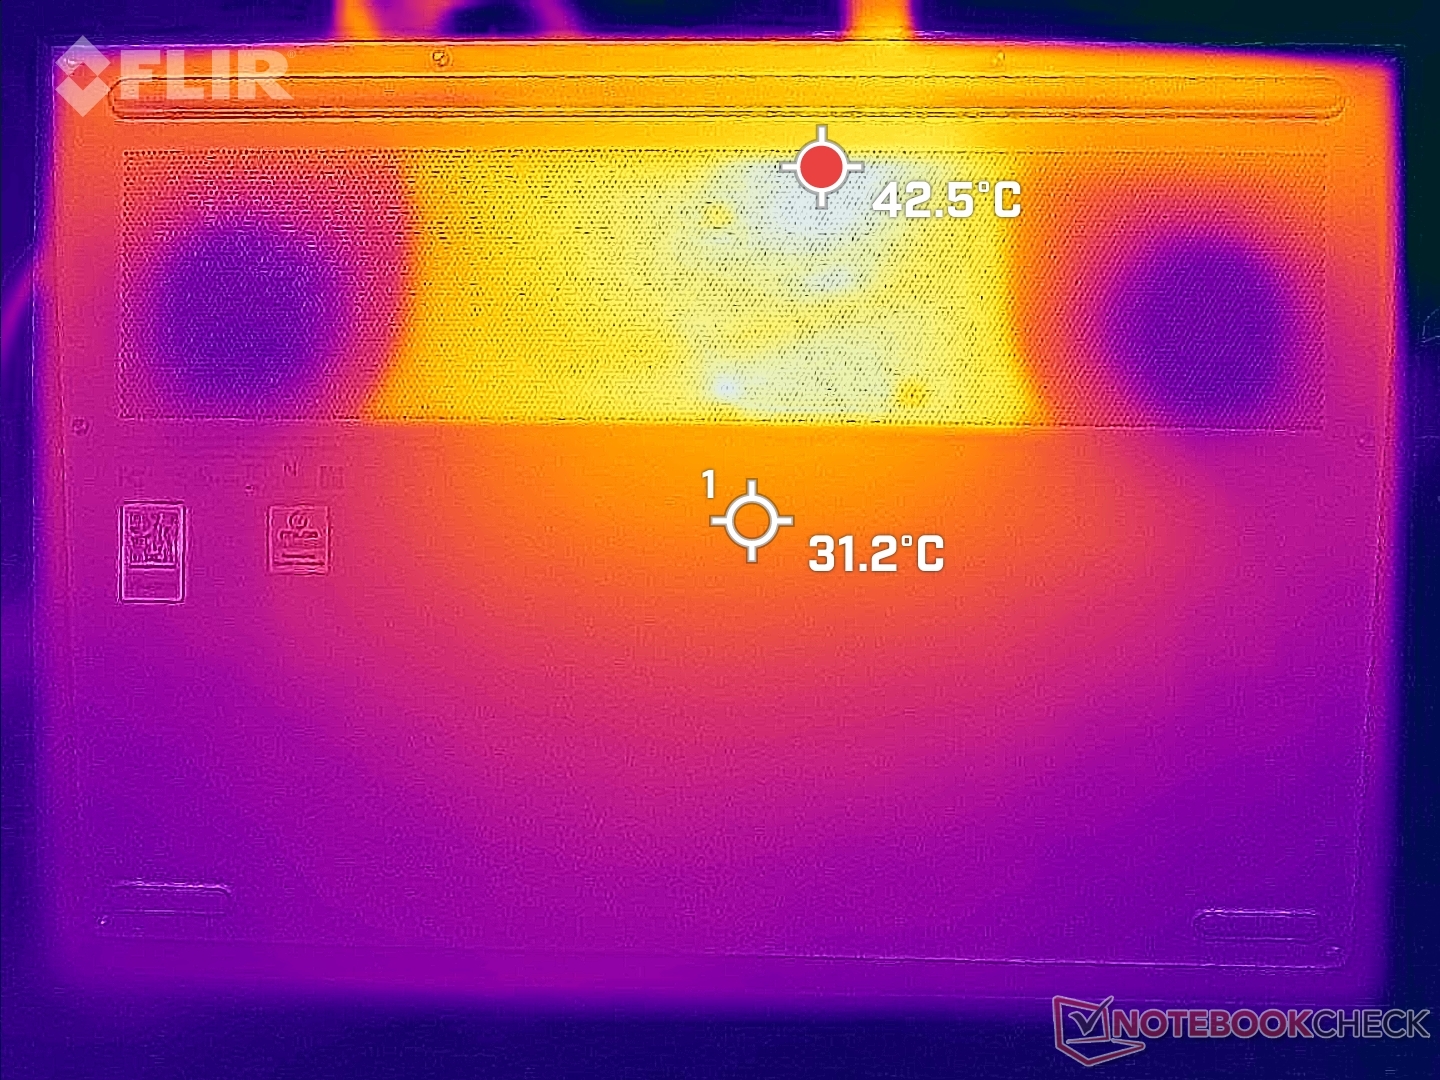
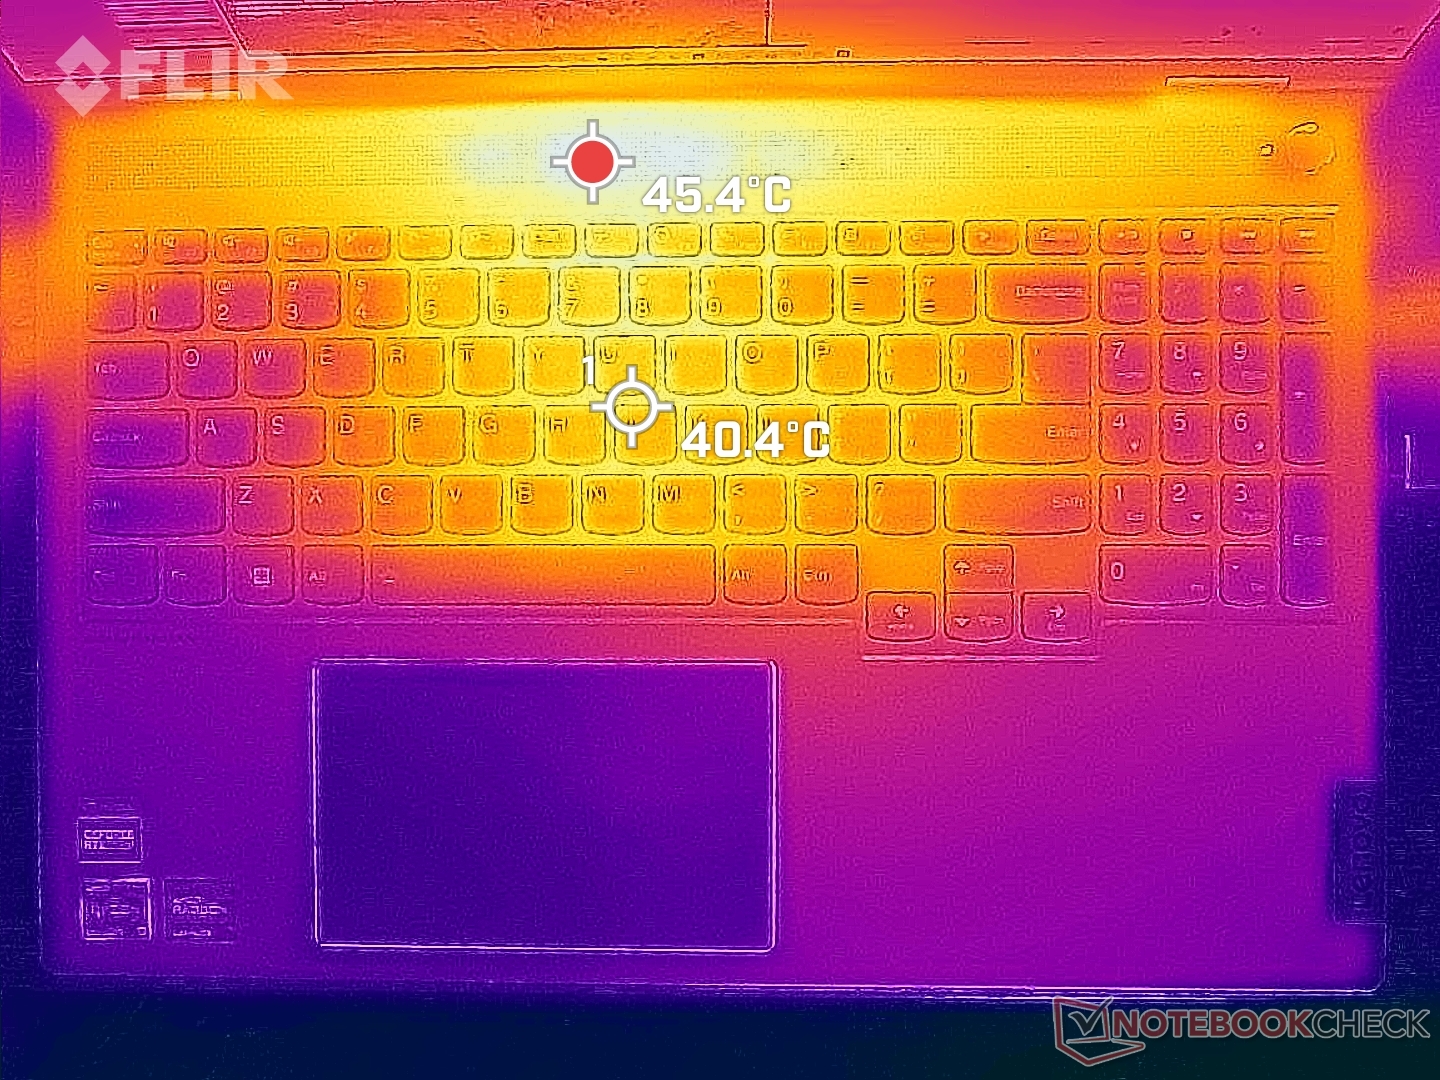
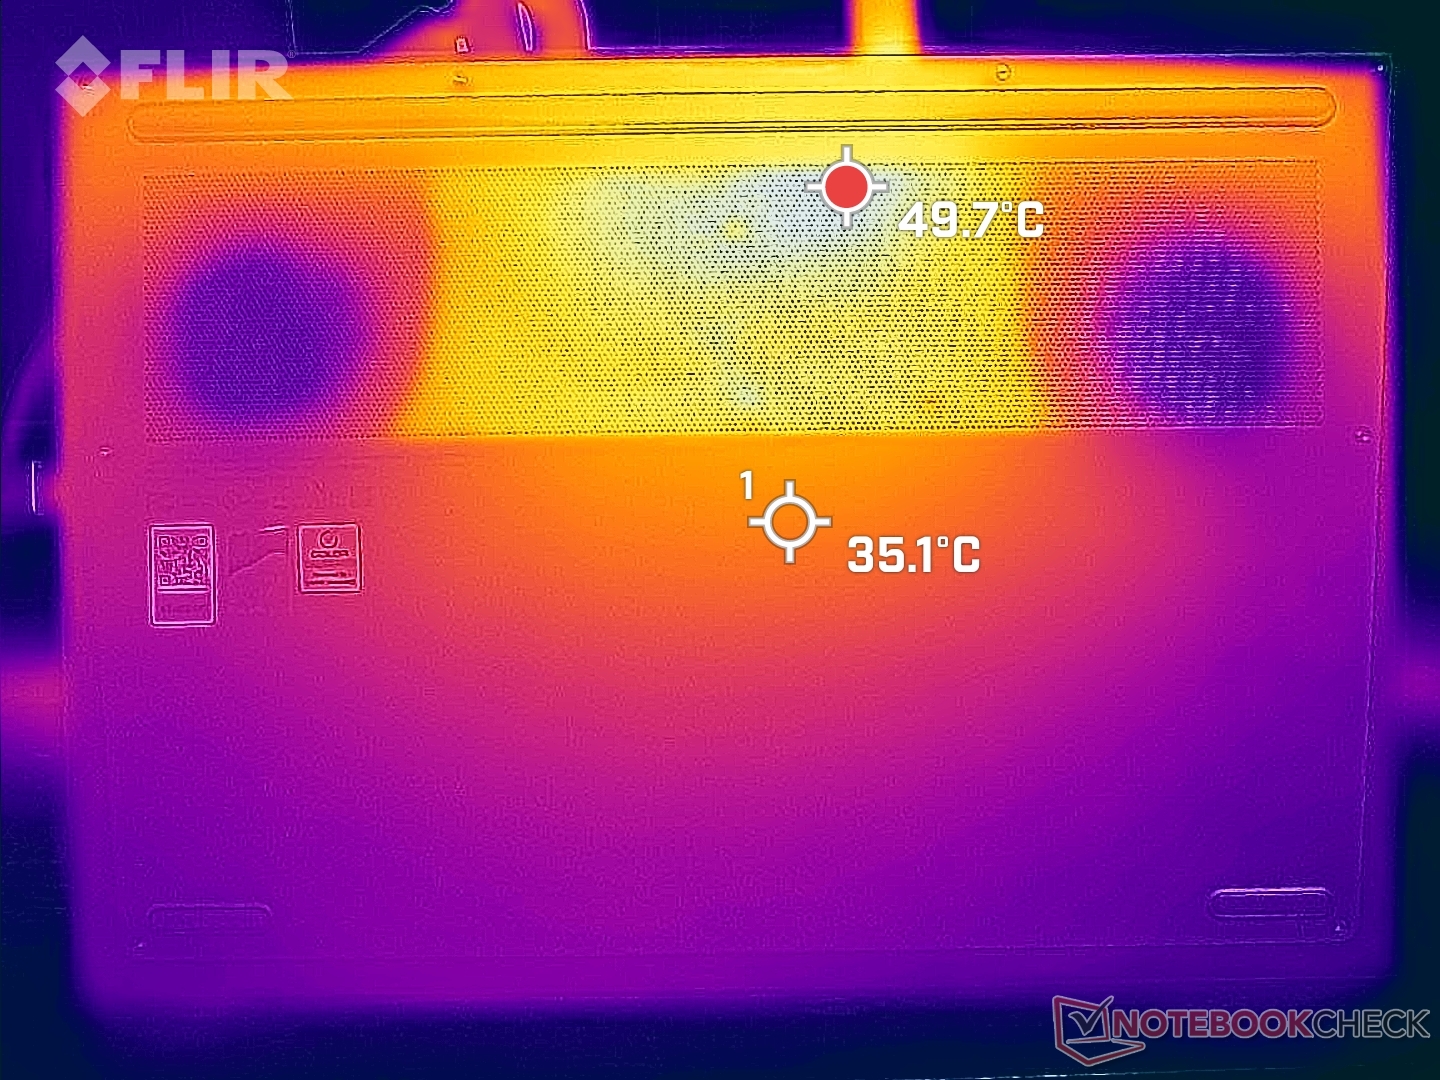
温度
表面热点在顶部和底部可以达到近50摄氏度,与我们在第二代机型上观察到的情况相似,或者说是戴尔 Inspiron 16 Plus.
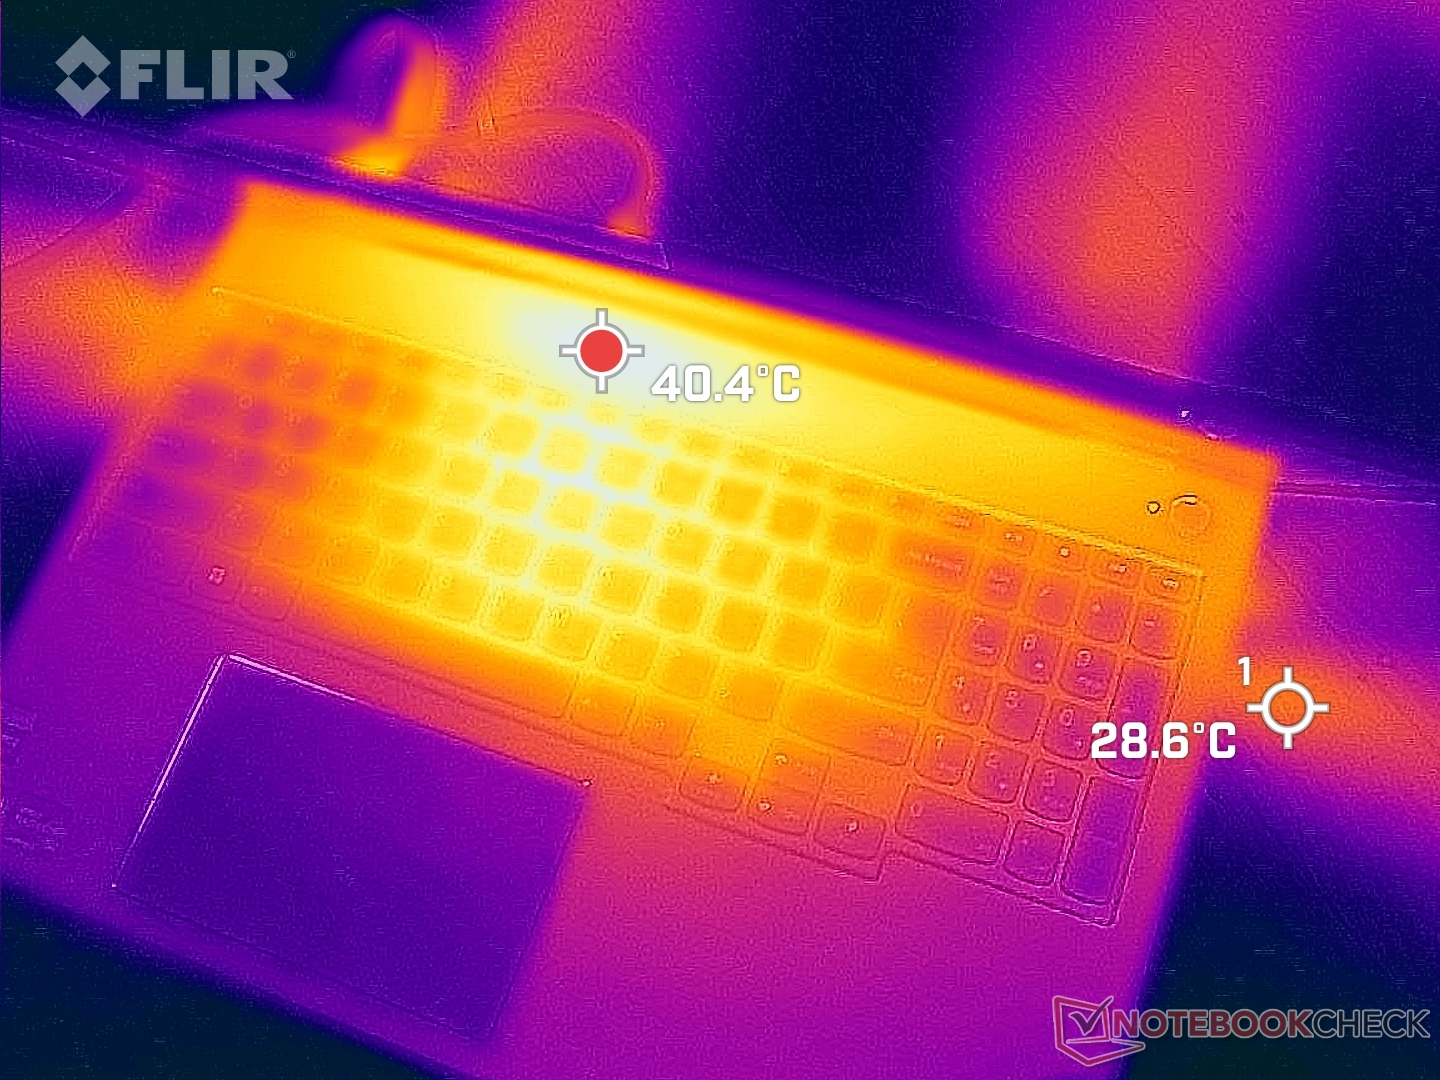
(-) The maximum temperature on the upper side is 48.2 °C / 119 F, compared to the average of 36.8 °C / 98 F, ranging from 21 to 71 °C for the class Multimedia.
(-) The bottom heats up to a maximum of 49.6 °C / 121 F, compared to the average of 39.1 °C / 102 F
(+) In idle usage, the average temperature for the upper side is 29.3 °C / 85 F, compared to the device average of 31.3 °C / 88 F.
(±) Playing The Witcher 3, the average temperature for the upper side is 34.3 °C / 94 F, compared to the device average of 31.3 °C / 88 F.
(+) The palmrests and touchpad are cooler than skin temperature with a maximum of 29.4 °C / 84.9 F and are therefore cool to the touch.
(±) The average temperature of the palmrest area of similar devices was 28.7 °C / 83.7 F (-0.7 °C / -1.2 F).
| Lenovo ThinkBook 16p G3 ARH AMD Ryzen 9 6900HX, NVIDIA GeForce RTX 3060 Laptop GPU | HP Envy 16 h0112nr Intel Core i7-12700H, NVIDIA GeForce RTX 3060 Laptop GPU | Lenovo ThinkBook 16p G2 ACH AMD Ryzen 9 5900HX, NVIDIA GeForce RTX 3060 Laptop GPU | Lenovo IdeaPad 5 Pro 16ARH7 AMD Ryzen 5 6600HS, AMD Radeon 660M | Acer Swift X SFX16-51G-5388 Intel Core i5-11320H, NVIDIA GeForce RTX 3050 4GB Laptop GPU | Lenovo Legion 5 Pro 16IAH7H Intel Core i7-12700H, NVIDIA GeForce RTX 3060 Laptop GPU | |
|---|---|---|---|---|---|---|
| Heat | 4% | 2% | 10% | 1% | -4% | |
| Maximum Upper Side * (°C) | 48.2 | 45.2 6% | 50 -4% | 46 5% | 52.4 -9% | 45.8 5% |
| Maximum Bottom * (°C) | 49.6 | 44 11% | 53 -7% | 48 3% | 50 -1% | 66.3 -34% |
| Idle Upper Side * (°C) | 31.8 | 33.6 -6% | 29 9% | 28 12% | 30.3 5% | 30.4 4% |
| Idle Bottom * (°C) | 33.6 | 32.6 3% | 30 11% | 27 20% | 30.4 10% | 30.4 10% |
* ... smaller is better
压力测试
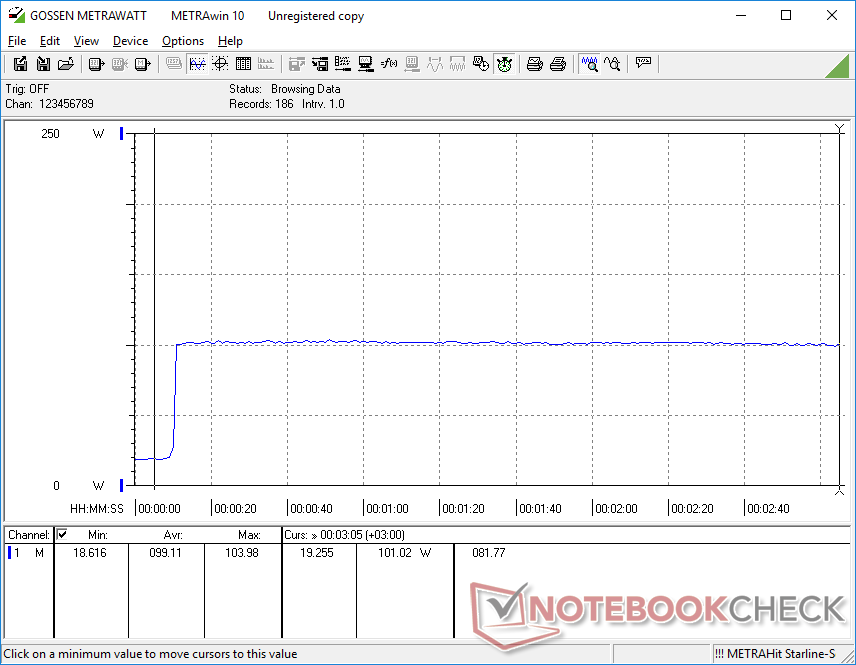
在启动Prime95压力时,CPU时钟速率、温度和电路板功耗将分别飙升至4.1 GHz、77 C和65 W。此后不久,该处理器将最终稳定在3.7 GHz、82 C和54 W。相比之下,更厚的Legion 7 16ARHA与相同的Ryzen 9 6900HX CPU在运行相同的Prime95测试时将稳定在4.2 GHz、89 C和99 W。
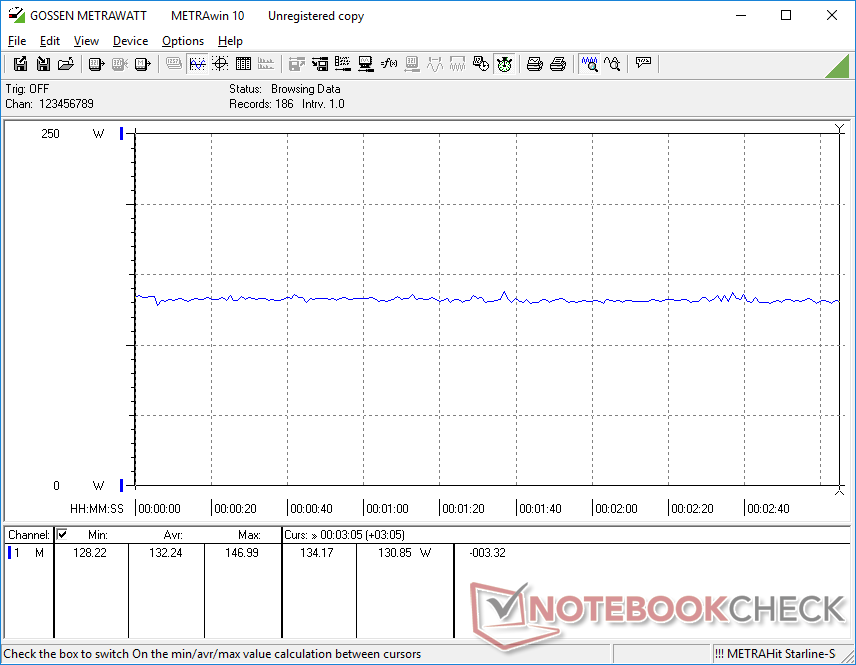
运行Witcher 3 时,GPU时钟速率、温度和板卡功耗将稳定在1582 MHz、69 C和69 W。即使在极限性能模式下,我们也无法接近系统所要达到的90 W TGP目标。
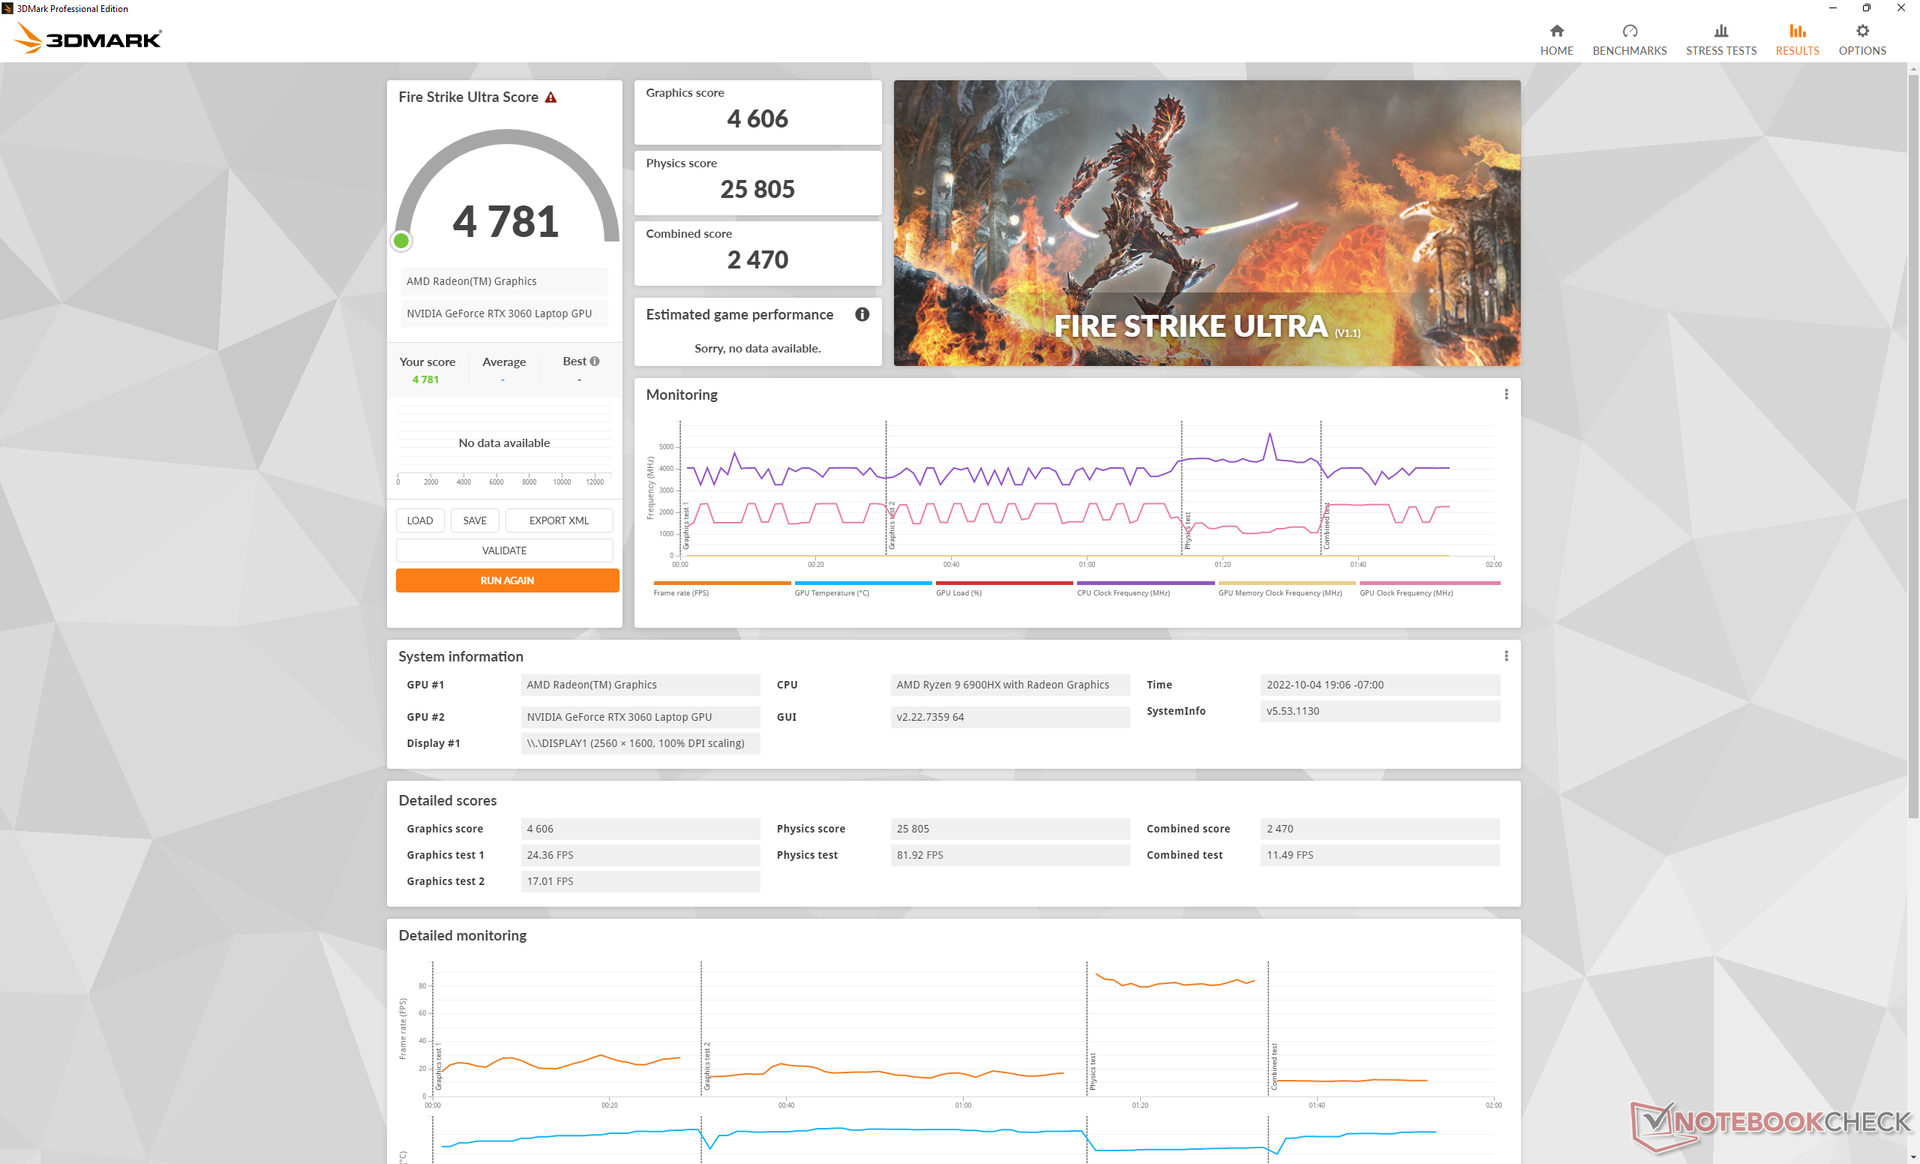
用电池运行会降低性能。在电池供电的情况下进行Fire Strike 测试,物理学和图形学得分分别为17799和10557分,而在主电源供电时则为25683和19597分。
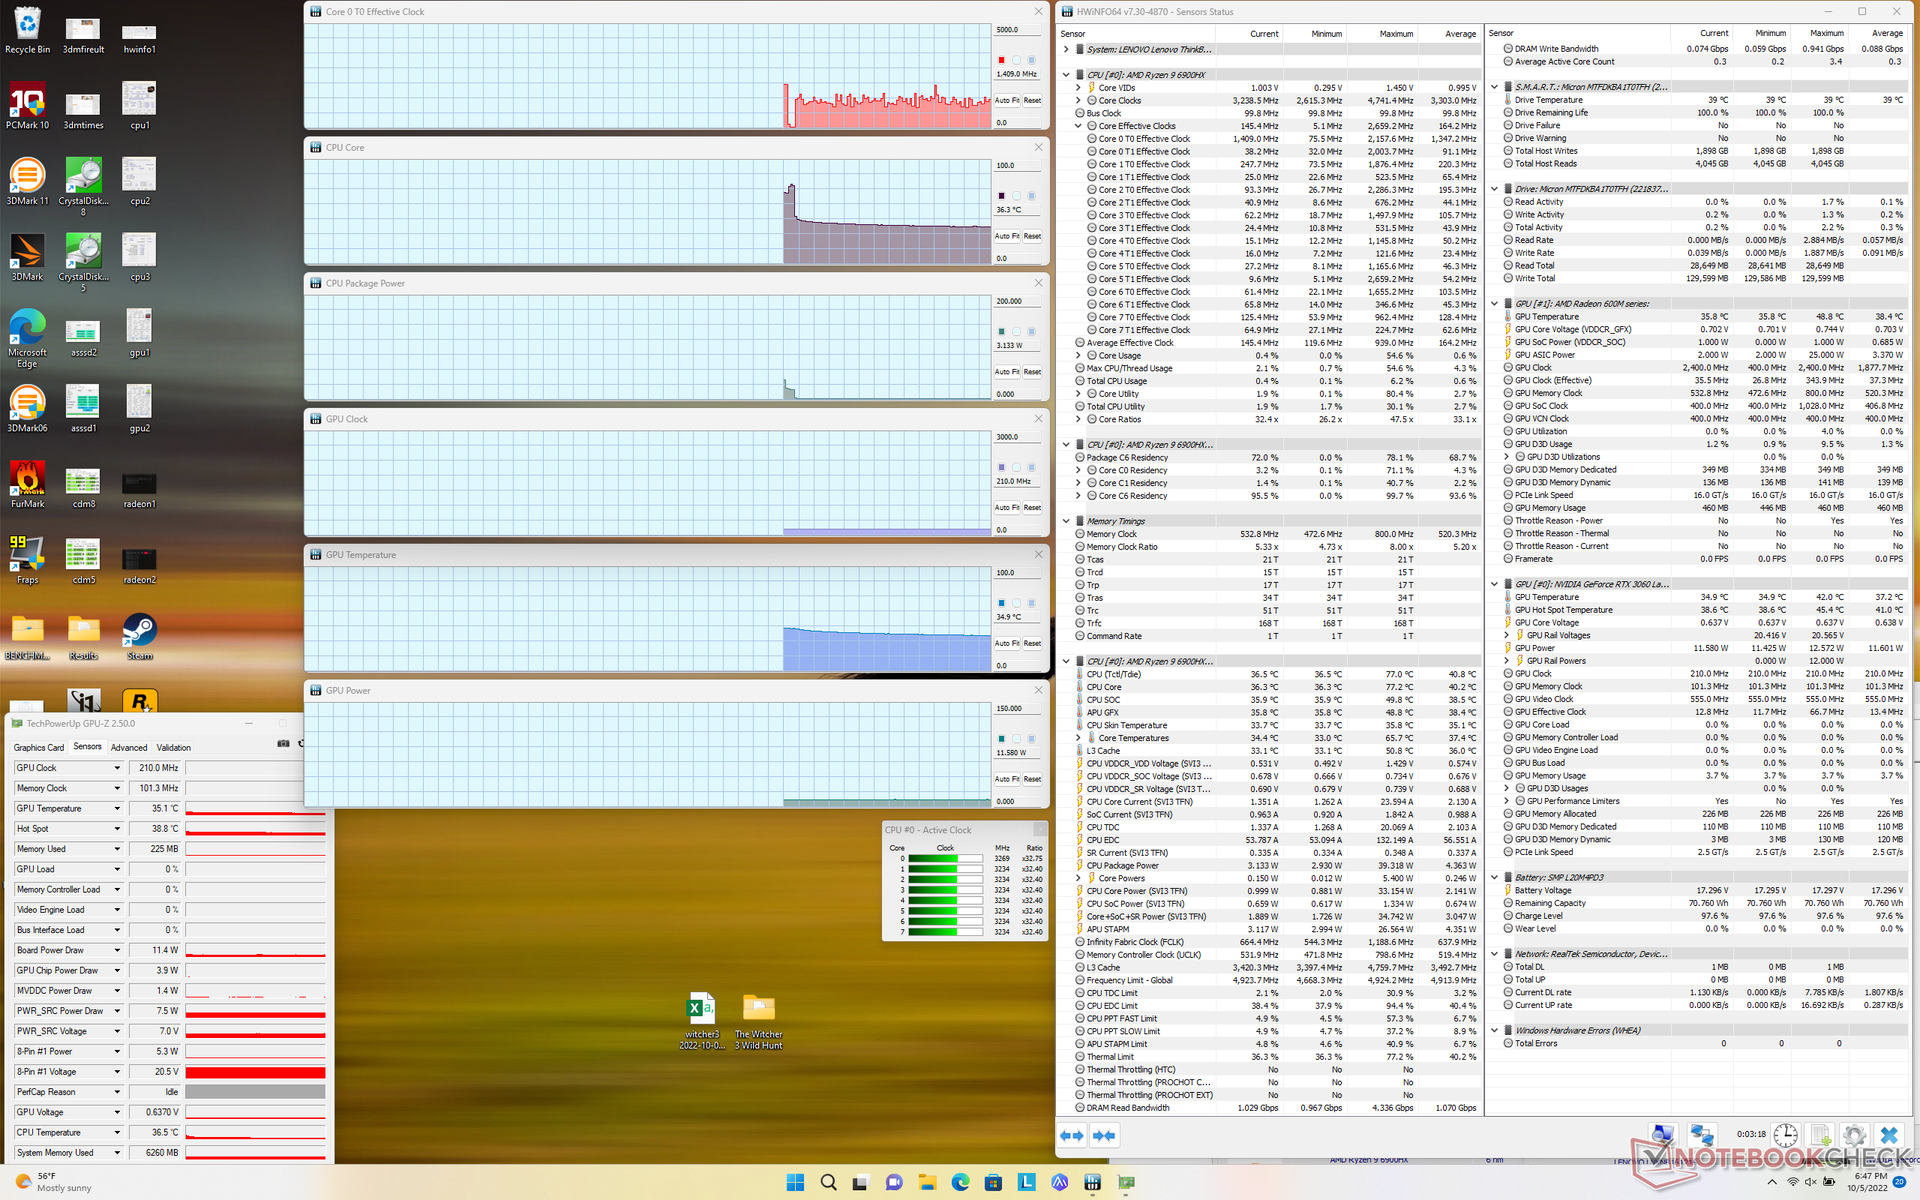
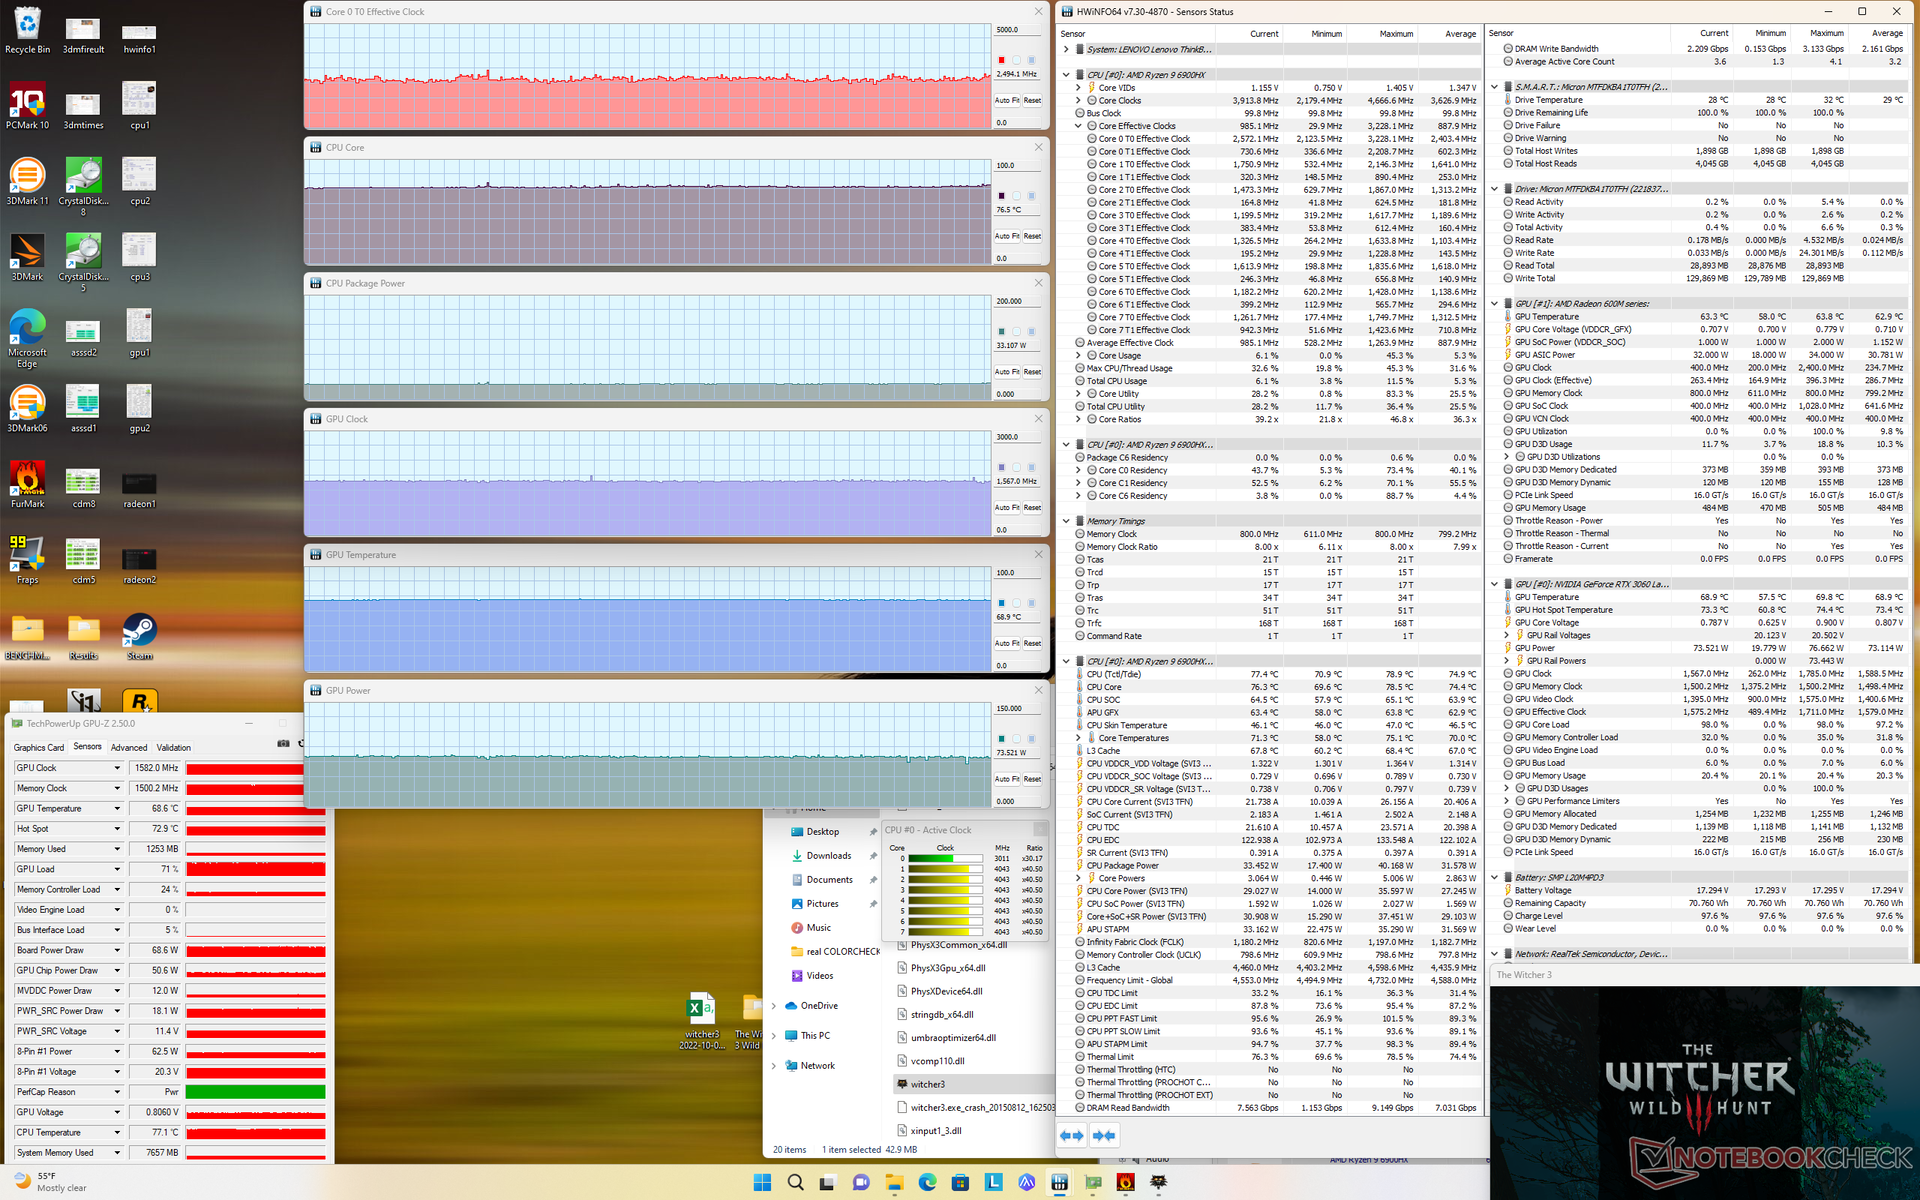
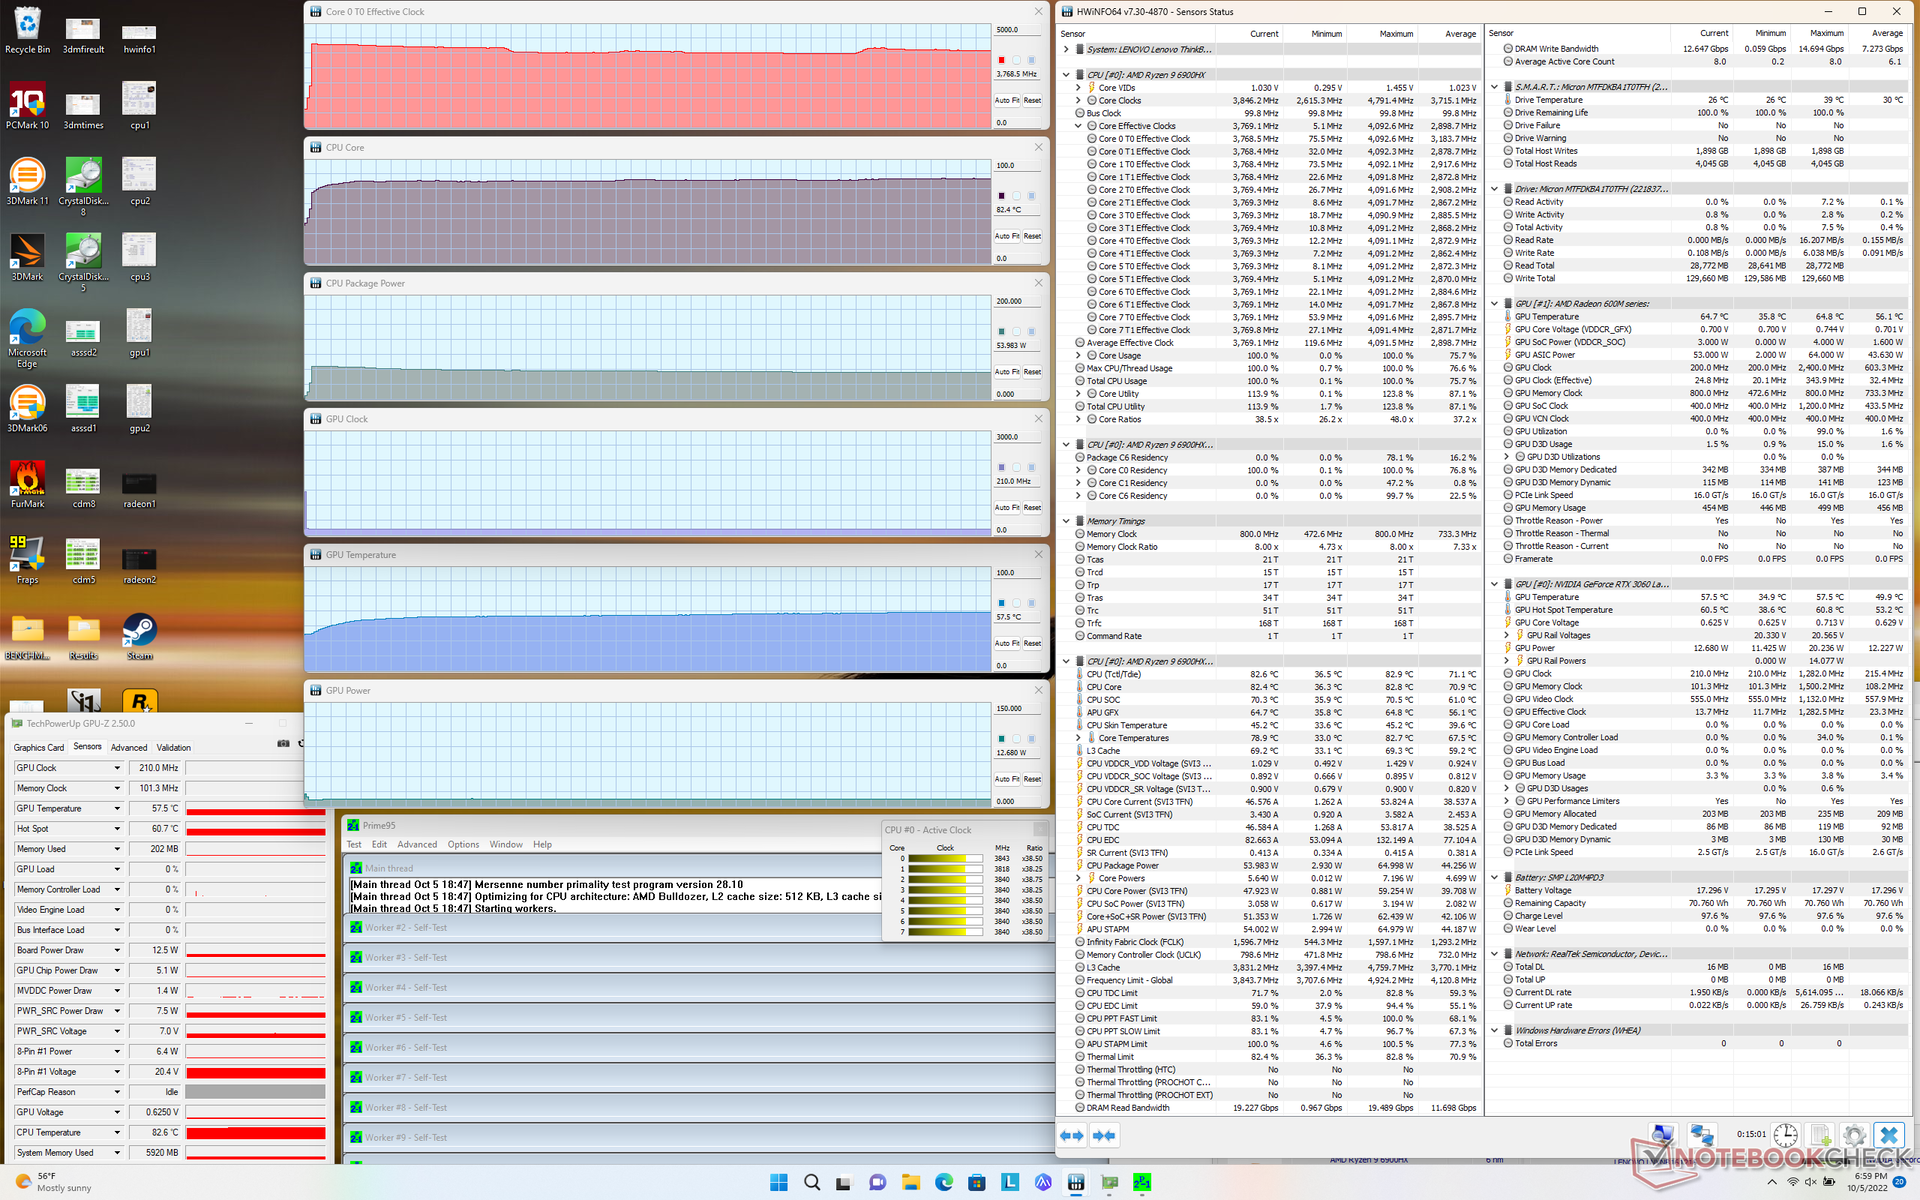
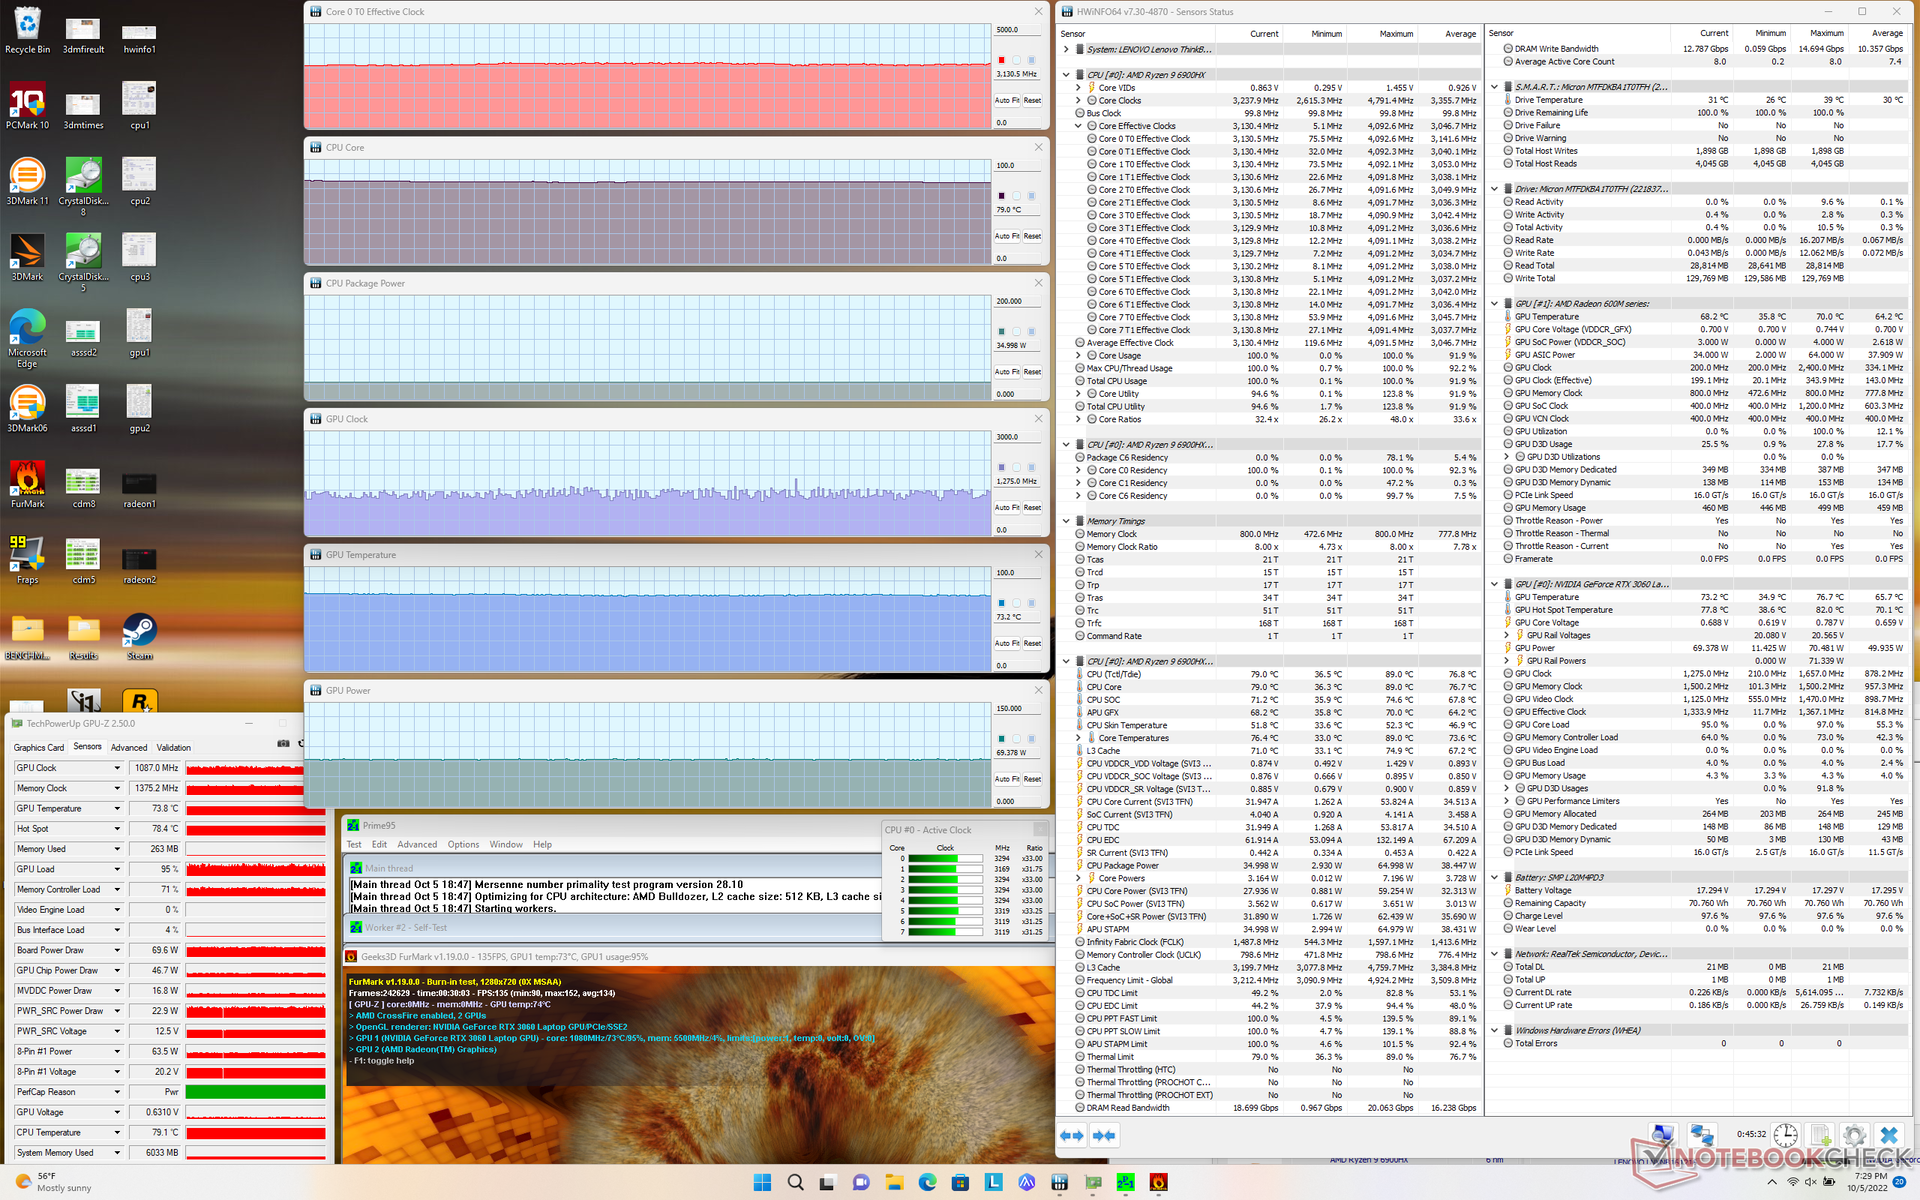
| CPU时钟(GHz) | GPU时钟(MHz) | CPU平均温度(℃) | GPU平均温度(℃) | |
| 系统空闲 | -- | -- | 36 | 34 |
| Prime95压力 | 3.7 | -- | 82 | 58 |
| Prime95 + FurMark 压力 | 3.1 | ~1275 | 79 | 73 |
| Witcher 3 应力 | ~2.5 | 1582 | 77 | 69 |
发言人
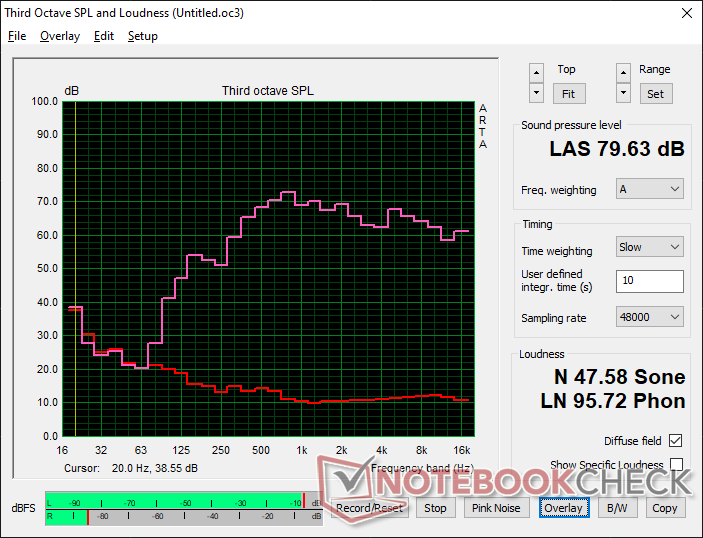
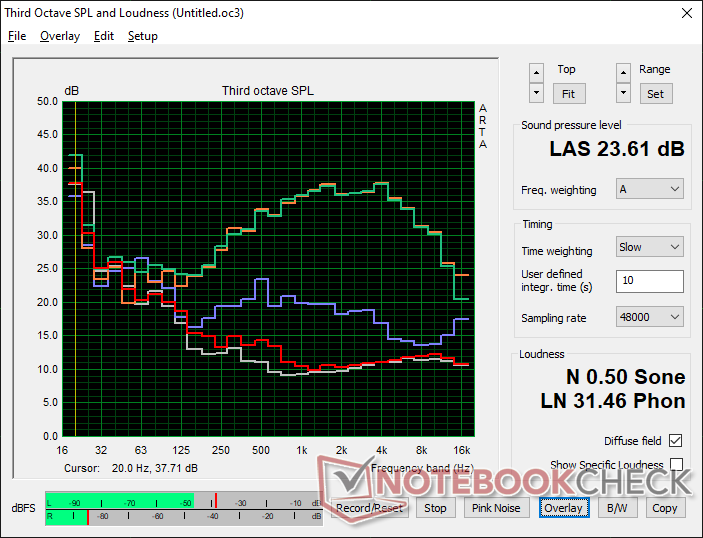
Lenovo ThinkBook 16p G3 ARH audio analysis
(±) | speaker loudness is average but good (79.6 dB)
Bass 100 - 315 Hz
(±) | reduced bass - on average 13.4% lower than median
(±) | linearity of bass is average (11.9% delta to prev. frequency)
Mids 400 - 2000 Hz
(+) | balanced mids - only 4.8% away from median
(+) | mids are linear (5.5% delta to prev. frequency)
Highs 2 - 16 kHz
(+) | balanced highs - only 1.6% away from median
(+) | highs are linear (4.6% delta to prev. frequency)
Overall 100 - 16.000 Hz
(+) | overall sound is linear (13% difference to median)
Compared to same class
» 26% of all tested devices in this class were better, 5% similar, 70% worse
» The best had a delta of 5%, average was 17%, worst was 45%
Compared to all devices tested
» 13% of all tested devices were better, 3% similar, 85% worse
» The best had a delta of 4%, average was 23%, worst was 134%
Apple MacBook Pro 16 2021 M1 Pro audio analysis
(+) | speakers can play relatively loud (84.7 dB)
Bass 100 - 315 Hz
(+) | good bass - only 3.8% away from median
(+) | bass is linear (5.2% delta to prev. frequency)
Mids 400 - 2000 Hz
(+) | balanced mids - only 1.3% away from median
(+) | mids are linear (2.1% delta to prev. frequency)
Highs 2 - 16 kHz
(+) | balanced highs - only 1.9% away from median
(+) | highs are linear (2.7% delta to prev. frequency)
Overall 100 - 16.000 Hz
(+) | overall sound is linear (4.6% difference to median)
Compared to same class
» 0% of all tested devices in this class were better, 0% similar, 100% worse
» The best had a delta of 5%, average was 17%, worst was 45%
Compared to all devices tested
» 0% of all tested devices were better, 0% similar, 100% worse
» The best had a delta of 4%, average was 23%, worst was 134%
能源管理
消耗功率
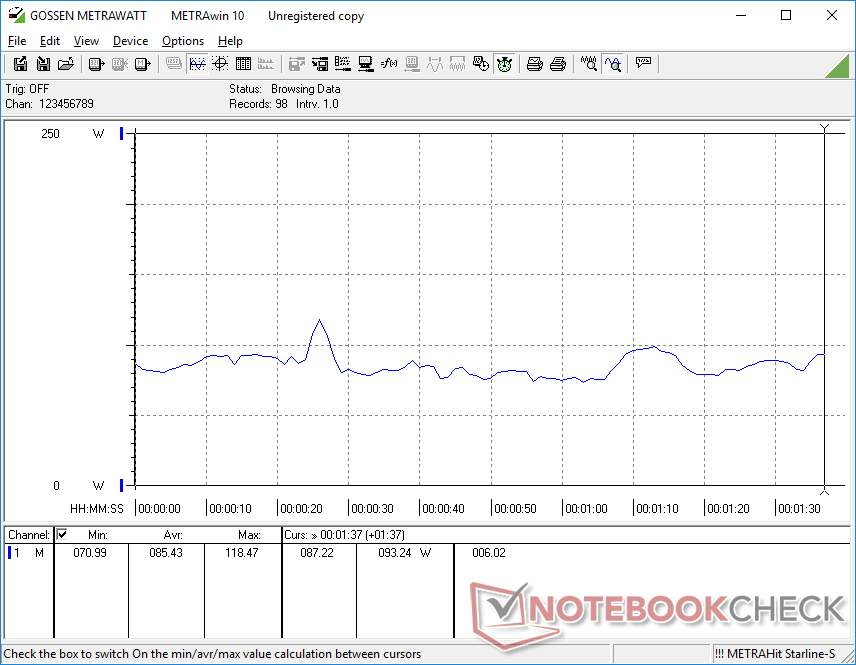
在桌面上闲置时的消耗量将在10瓦到24瓦之间,这取决于电源配置文件和亮度,而第二代机型只有10瓦到19瓦。总体消耗量明显低于 Legion 5 Pro 16它配备了相同的GeForce RTX 3060 GPU,但有一个更快的英特尔第12代酷睿i7 CPU。
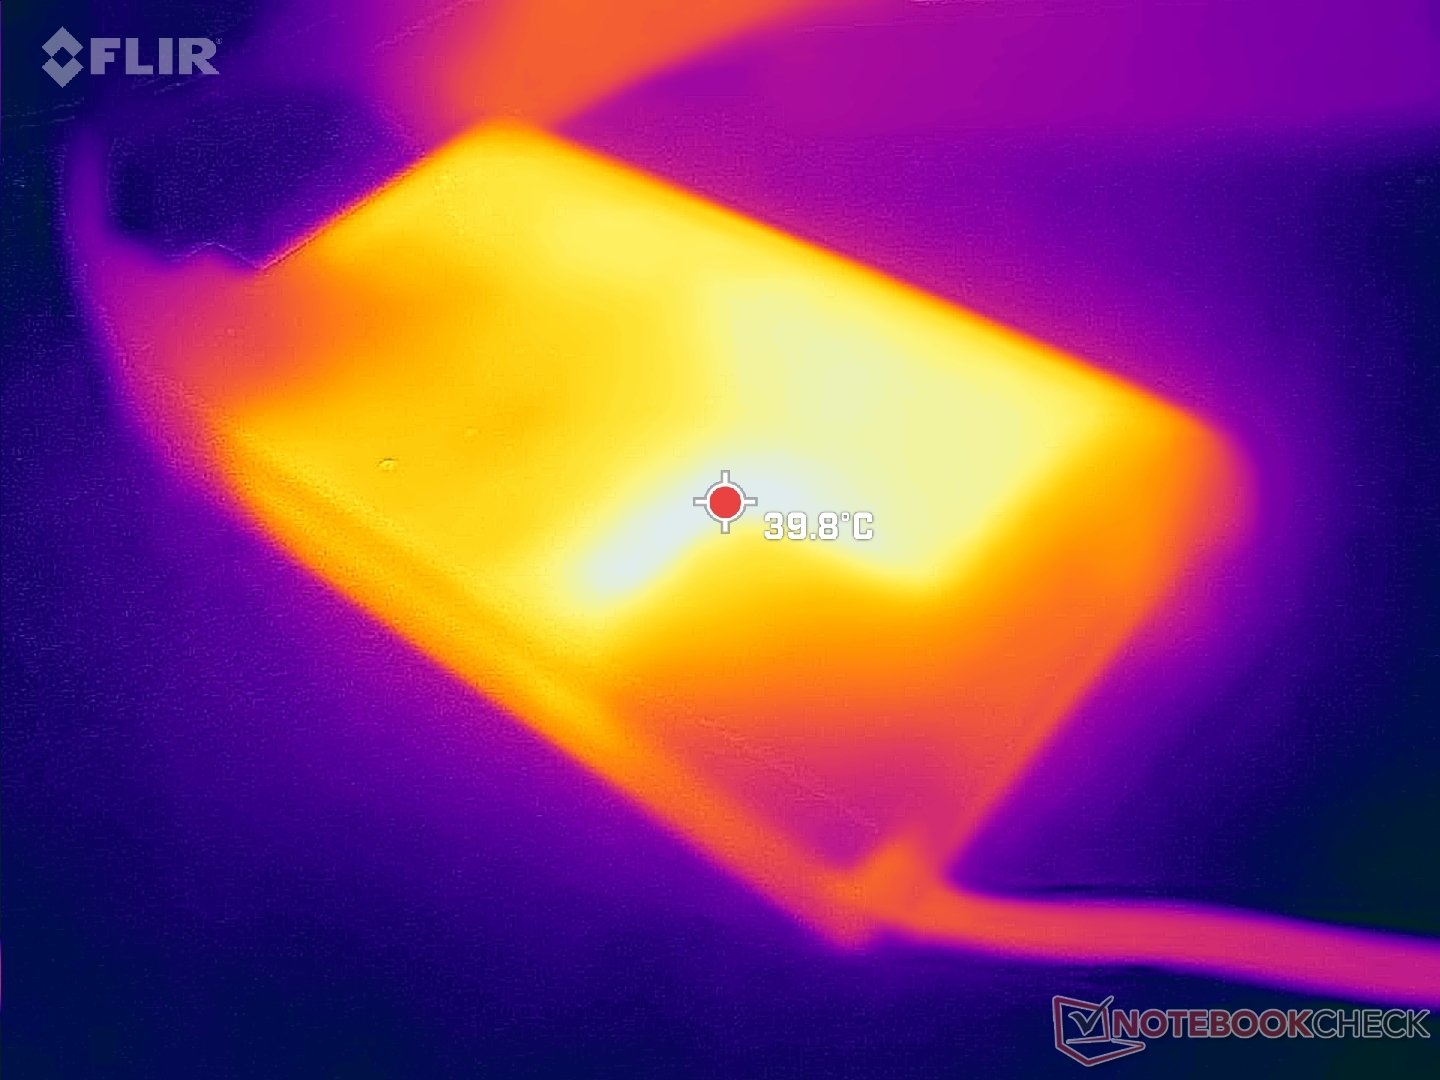
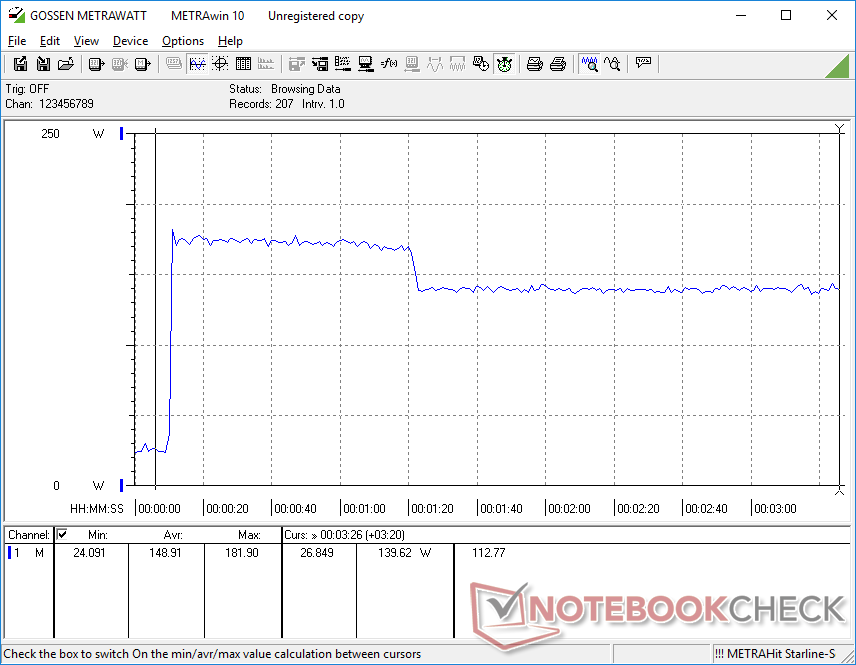
当CPU和GPU各自处于100%的利用率时,我们能够从中等大小(约16 x 8.8 x 2.8厘米)的230 W交流适配器中达到最大的182 W。
| Off / Standby | |
| Idle | |
| Load |
|
Key:
min: | |
| Lenovo ThinkBook 16p G3 ARH R9 6900HX, GeForce RTX 3060 Laptop GPU, Micron 3400 1TB MTFDKBA1T0TFH, IPS, 2560x1600, 16" | HP Envy 16 h0112nr i7-12700H, GeForce RTX 3060 Laptop GPU, Micron 3400 1TB MTFDKBA1T0TFH, OLED, 3840x2400, 16" | Lenovo ThinkBook 16p G2 ACH R9 5900HX, GeForce RTX 3060 Laptop GPU, WDC PC SN730 SDBPNTY-1T00, IPS, 2560x1600, 16" | Lenovo IdeaPad 5 Pro 16ARH7 R5 6600HS, Radeon 660M, Samsung PM9A1 MZVL2512HCJQ, IPS, 2560x1600, 16" | Acer Swift X SFX16-51G-5388 i5-11320H, GeForce RTX 3050 4GB Laptop GPU, Samsung PM991 MZVLQ512HBLU, , 1920x1080, 16.1" | Lenovo Legion 5 Pro 16IAH7H i7-12700H, GeForce RTX 3060 Laptop GPU, 2x Samsung PM9A1 MZVL21T0HCLR (RAID 0), IPS, 2560x1600, 16" | |
|---|---|---|---|---|---|---|
| Power Consumption | -6% | 4% | 52% | 39% | -77% | |
| Idle Minimum * (Watt) | 10.3 | 10 3% | 13.2 -28% | 4 61% | 7 32% | 22.8 -121% |
| Idle Average * (Watt) | 16 | 10.9 32% | 17 -6% | 7 56% | 10.1 37% | 26.5 -66% |
| Idle Maximum * (Watt) | 24 | 27.8 -16% | 18.6 22% | 13 46% | 15 37% | 41 -71% |
| Load Average * (Watt) | 85.4 | 116.4 -36% | 88.8 -4% | 61 29% | 63.3 26% | 191 -124% |
| Witcher 3 ultra * (Watt) | 132.2 | 133.7 -1% | 123 7% 123 7% | 42.8 68% | 63.3 52% | 194.7 -47% |
| Load Maximum * (Watt) | 181.9 | 209.8 -15% | 132 27% | 88 52% | 94 48% | 238 -31% |
* ... smaller is better
Power Consumption Witcher 3 / Stresstest
Power Consumption external Monitor
电池寿命
WLAN运行时间比我们在第二代机型上记录的时间短了约2小时,尽管它们拥有相同的71Wh电池。我们的显示屏刷新率较高(165赫兹对60赫兹),这可能是电池寿命较短的部分原因。
从空电到满电大约需要1.5到2小时。该系统不能通过USB-C充电。
| Lenovo ThinkBook 16p G3 ARH R9 6900HX, GeForce RTX 3060 Laptop GPU, 71 Wh | HP Envy 16 h0112nr i7-12700H, GeForce RTX 3060 Laptop GPU, 83 Wh | Lenovo ThinkBook 16p G2 ACH R9 5900HX, GeForce RTX 3060 Laptop GPU, 71 Wh | Lenovo IdeaPad 5 Pro 16ARH7 R5 6600HS, Radeon 660M, 75 Wh | Acer Swift X SFX16-51G-5388 i5-11320H, GeForce RTX 3050 4GB Laptop GPU, 58.7 Wh | Lenovo Legion 5 Pro 16IAH7H i7-12700H, GeForce RTX 3060 Laptop GPU, 80 Wh | |
|---|---|---|---|---|---|---|
| Battery runtime | 22% | 31% | 51% | 25% | -45% | |
| WiFi v1.3 (h) | 6.5 | 7.9 22% | 8.5 31% | 9.8 51% | 8.1 25% | 3.6 -45% |
| Reader / Idle (h) | 17.8 | |||||
| Load (h) | 1.6 | 2 | 1.5 | 0.6 | ||
| H.264 (h) | 7 | 8.4 | 4.1 | |||
| Gaming (h) | 1.1 | |||||
| Witcher 3 ultra (h) | 2.1 |
Pros
Cons
结论--不考虑去年的模型
与从第11代英特尔到第12代英特尔的性能跳跃不同,从AMD Zen 3到Zen 3+的跳跃充其量只带来微小的好处。事实上,Ryzen 9 5900HX 在 2021年ThinkBook 16p第二代2021年ThinkBook 16p第2代中的Ryzen 9 5900HX的性能与2022年ThinkBook 16p第3代中的Ryzen 9 6900HX的性能相差不到5%,如果你追求的是处理器性能,那么这款最新机型是一个比较困难的推荐。
然而,2022年机型上其他地方的变化非常值得一提。特别是新的165赫兹G-Sync面板比60赫兹面板有了重大升级,使游戏体验更加顺畅。我们也很欣赏新增的HDMI端口,但改用焊接的内存可能最终会让一些用户感到不安。我们怀疑联想选择了不可拆卸的RAM,以便为更快的90W TGP GPU支持一个稍大的冷却方案。
与ThinkBook 16p第二代相比,同比的性能更新太小,在大多数情况下都不明显。然而,新的和更令人印象深刻的165赫兹显示选项有助于将ThinkBook 16p第三代与目前市场上大多数其他16英寸笔记本电脑区分开来。
用户可以通过购买较旧但视觉上相同的2代版本来节省一点钱,并获得与3代机型几乎相同的性能水平。请记住,目前联想对ThinkBook 15p第3代的收费与竞争者相比要高一些。 戴尔 Inspiron 16 Plus 7620或 惠普Envy 16.联想的机型包括165赫兹的面板选项,这在上述戴尔或惠普的替代品上目前是不存在的。
价格和可用性
ThinkBook 16p还没有通过亚马逊、百思买或新蛋等第三方渠道广泛销售。我们建议直接从联想购买https://lenovo.vzew.net/c/2597802/218864/3808?subId1=news&u=https%3A%2F%2Fwww.lenovo.com%2Fau%2Fen%2Fp%2Flaptops%2Fthinkbook%2Fthinkbook-p%2Fthinkbook-16p-gen-3-(16-inch-amd)%2Flen101b0018%3Forg联想目前正在运送Ryzen 5 6600H和Ryzen 7 6800H配置,起价2460美元。
Lenovo ThinkBook 16p G3 ARH
- 10/08/2022 v7 (old)
Allen Ngo
Price comparison

