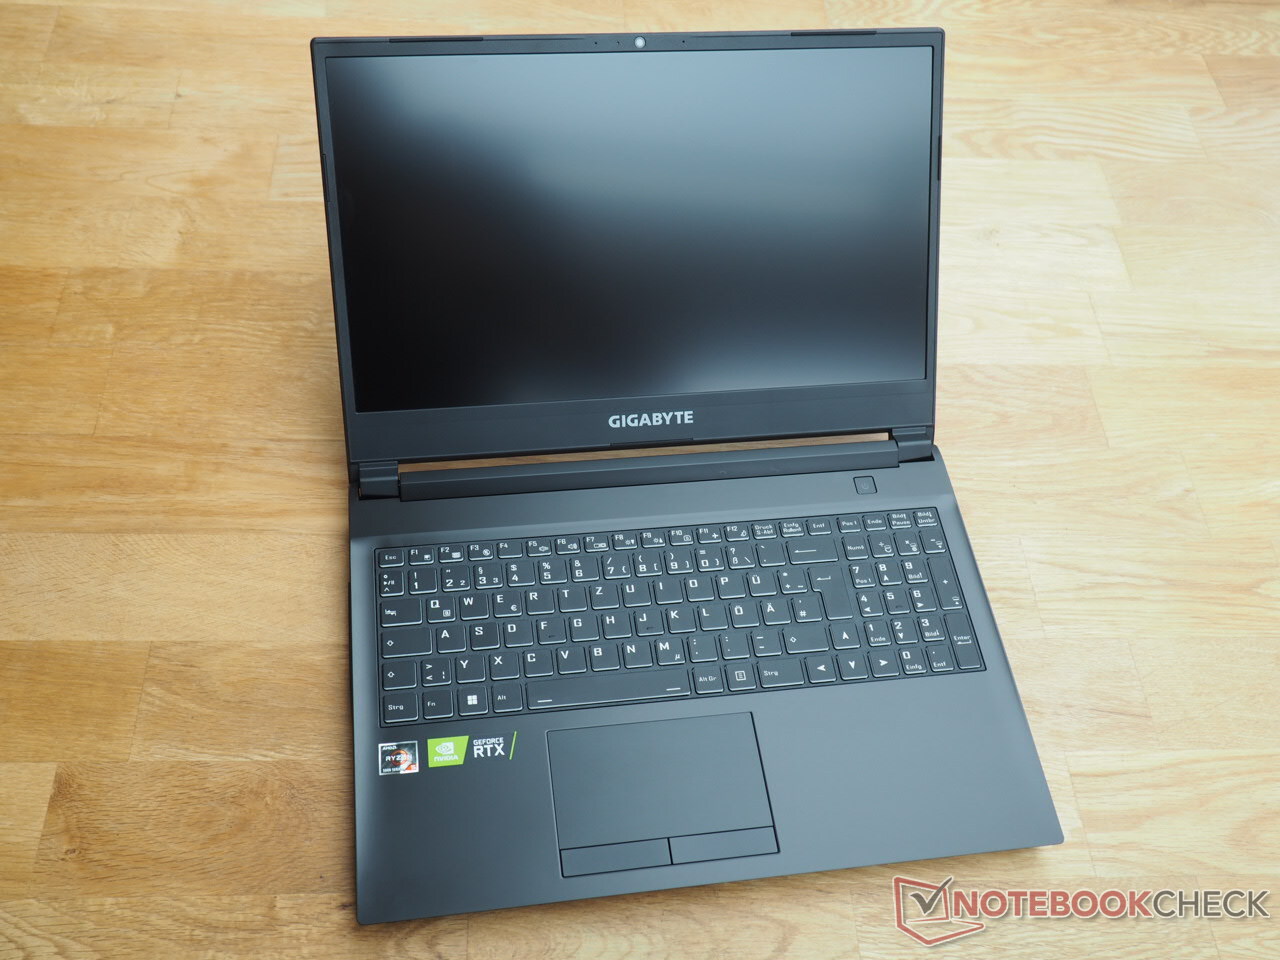
Gigabyte A5 K1评测。老式的游戏笔记本

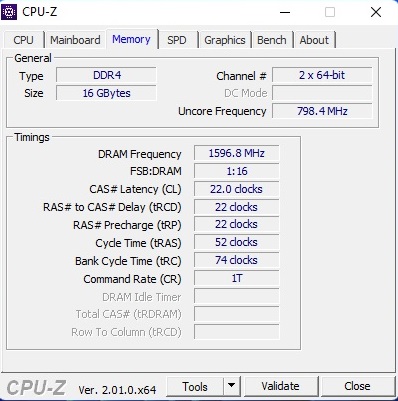
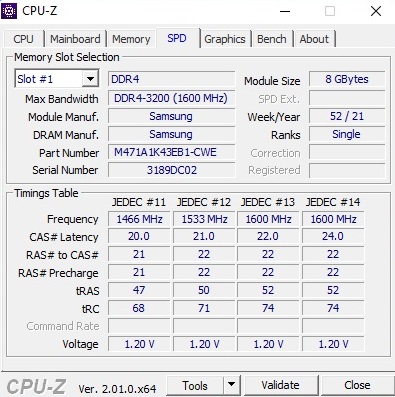
在我们已经测试了不到1800欧元(约1788美元)的A5 X1与 Ryzen 9 5900HX和 GeForce RTX 3070现在,技嘉给我们送来了便宜得多的A5 K1,它也有16GB DDR4内存(2x 8GB双通道)和512GB基于NVM的固态硬盘,但不得不用较少的CPU和GPU功率来做。然而,一个Ryzen 5 5600H和一个 GeForce RTX 3060在900欧元左右(约894美元)是非常可敬的。在这个价格范围内,你通常只能得到一个 GeForce RTX 3050或 3050 Ti.技嘉(或裸机制造商Clevo)使用1920 x 1080像素的哑光144赫兹面板作为显示器。请注意。这台电脑实际上只配备了FreeDOS。不过,技嘉很好地提前为我们安装了Windows 11 Pro。
A5 K1的竞争对手包括其他15英寸的游戏机,GeForce RTX 3060或同等型号的产品 Radeon RX 6600M像 华硕TUF Gaming F15 FX507ZM,以及 联想Legion 5 15ACH6A和 MSI Alpha 15 B5EEK除了Legion ,它们都要贵得多。后者的笔记本作为对比设备出现在表中。
潜在的竞争对手比较
Rating | Date | Model | Weight | Height | Size | Resolution | Price |
|---|---|---|---|---|---|---|---|
| 82.3 % v7 (old) | 09 / 2022 | Gigabyte A5 K1 R5 5600H, GeForce RTX 3060 Laptop GPU | 2.2 kg | 34 mm | 15.60" | 1920x1080 | |
| 87.2 % v7 (old) | 03 / 2022 | Asus TUF Gaming F15 FX507ZM i7-12700H, GeForce RTX 3060 Laptop GPU | 2.1 kg | 24.95 mm | 15.60" | 1920x1080 | |
| 82.6 % v7 (old) | 05 / 2022 | Lenovo Legion 5 15ACH6A-82NW0010GE R5 5600H, Radeon RX 6600M | 2.5 kg | 25.75 mm | 15.60" | 1920x1080 | |
| 82.6 % v7 (old) | 01 / 2022 | MSI Alpha 15 B5EEK-008 R7 5800H, Radeon RX 6600M | 2.4 kg | 23.95 mm | 15.60" | 1920x1080 | |
| 84.1 % v7 (old) | 01 / 2022 | Gigabyte A5 X1 R9 5900HX, GeForce RTX 3070 Laptop GPU | 2.2 kg | 25.3 mm | 15.60" | 1920x1080 |
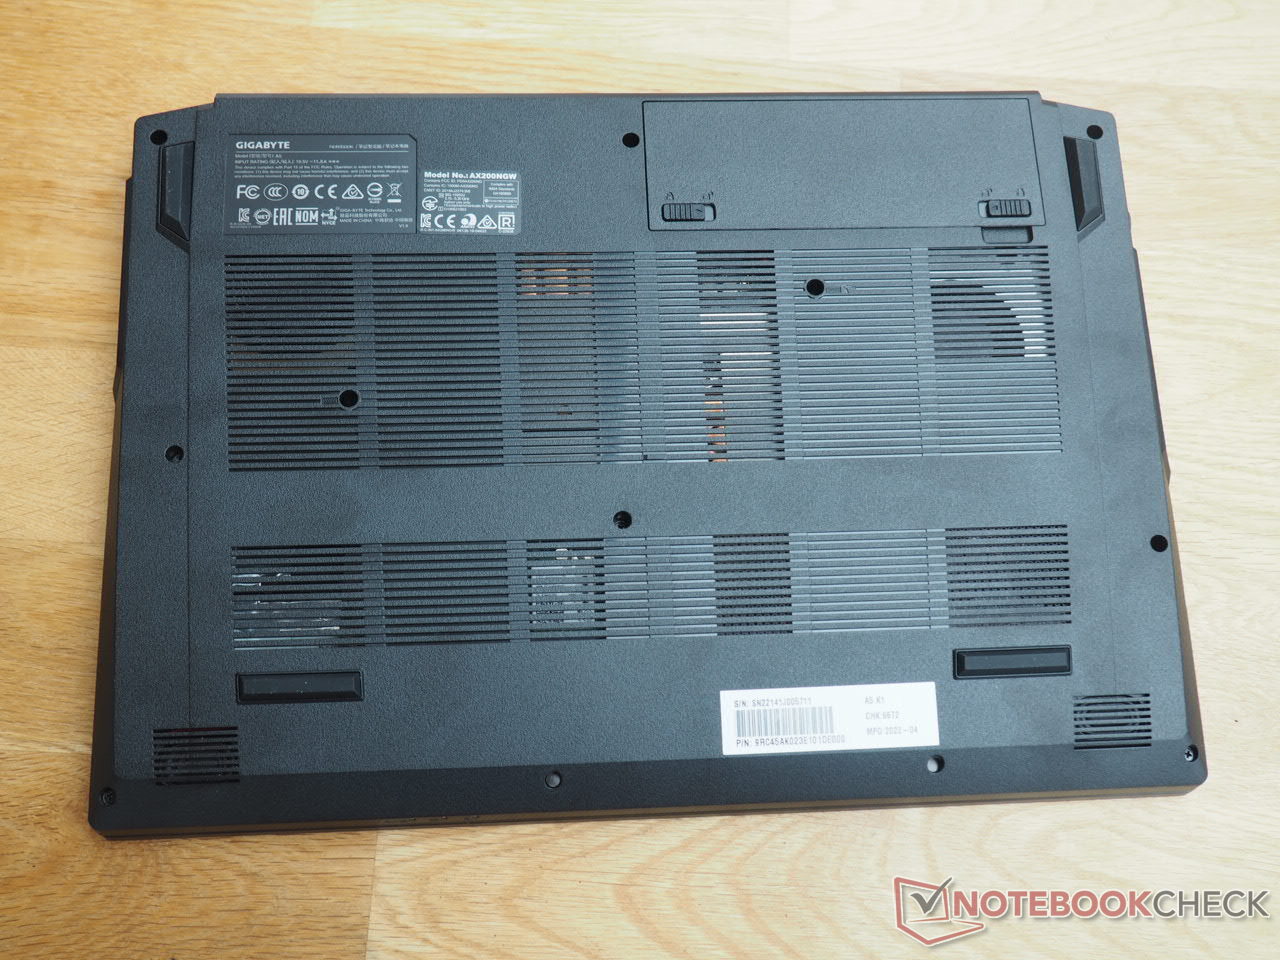
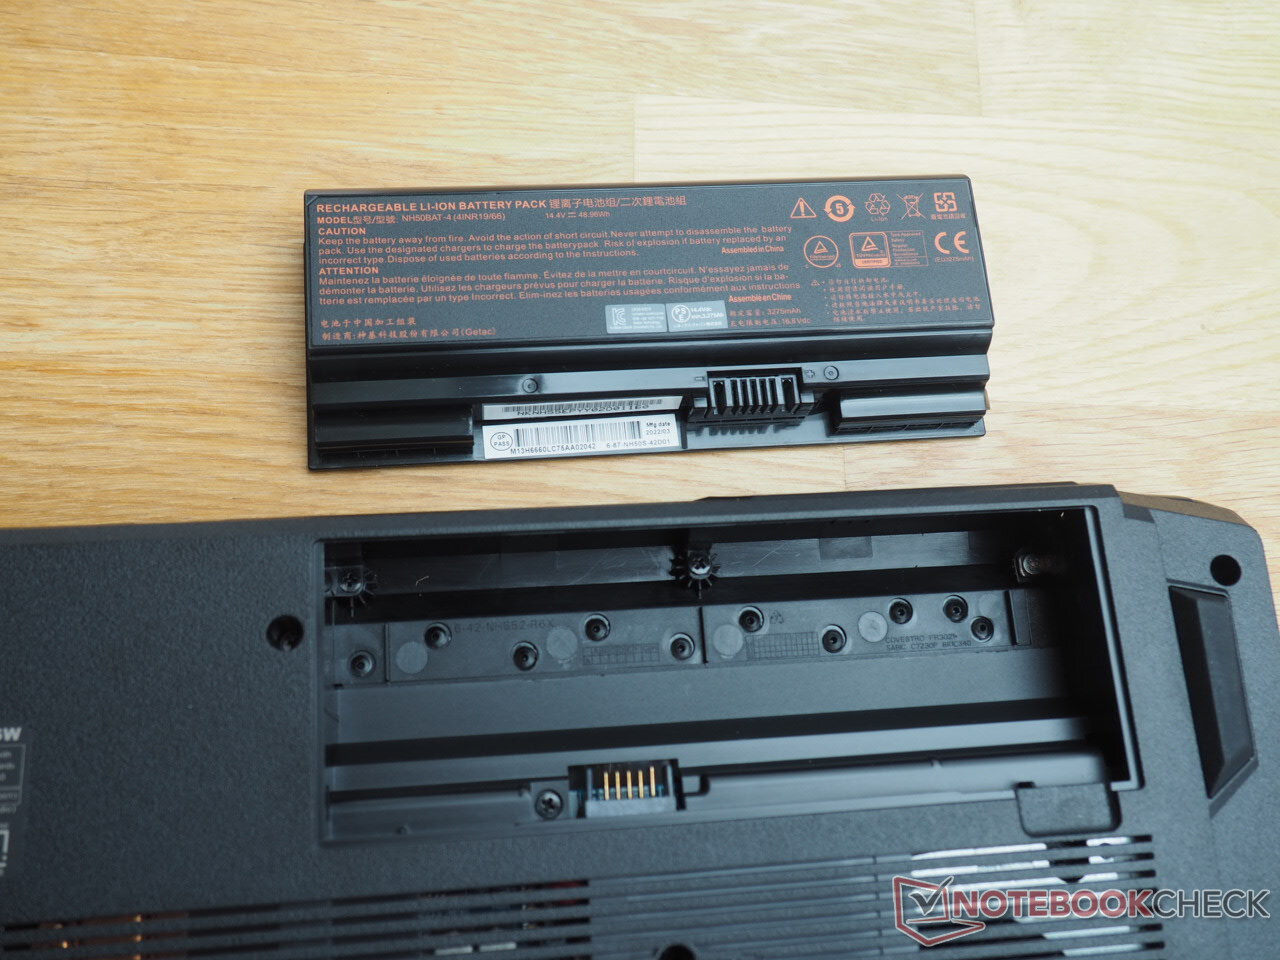
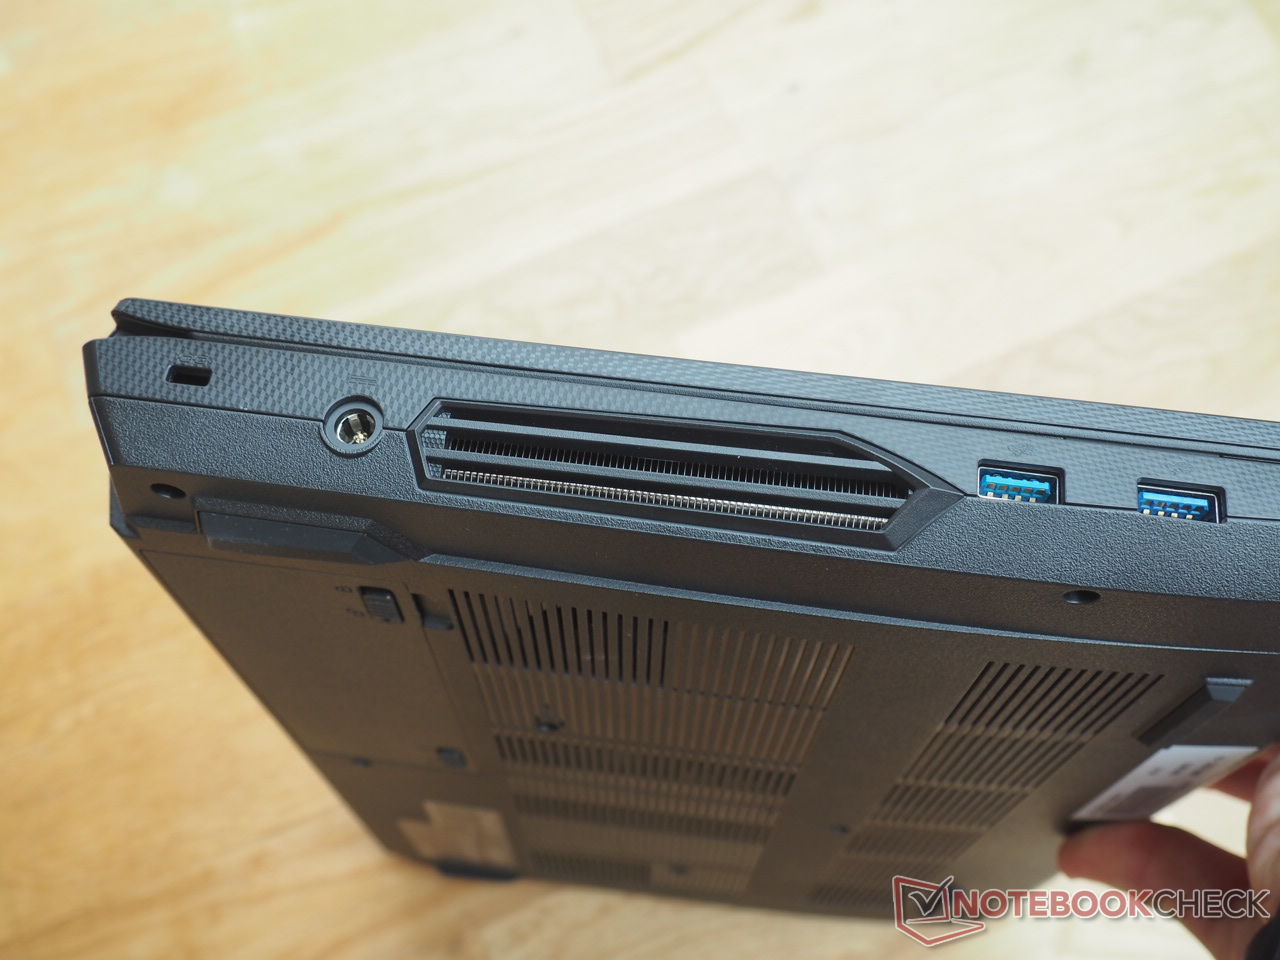
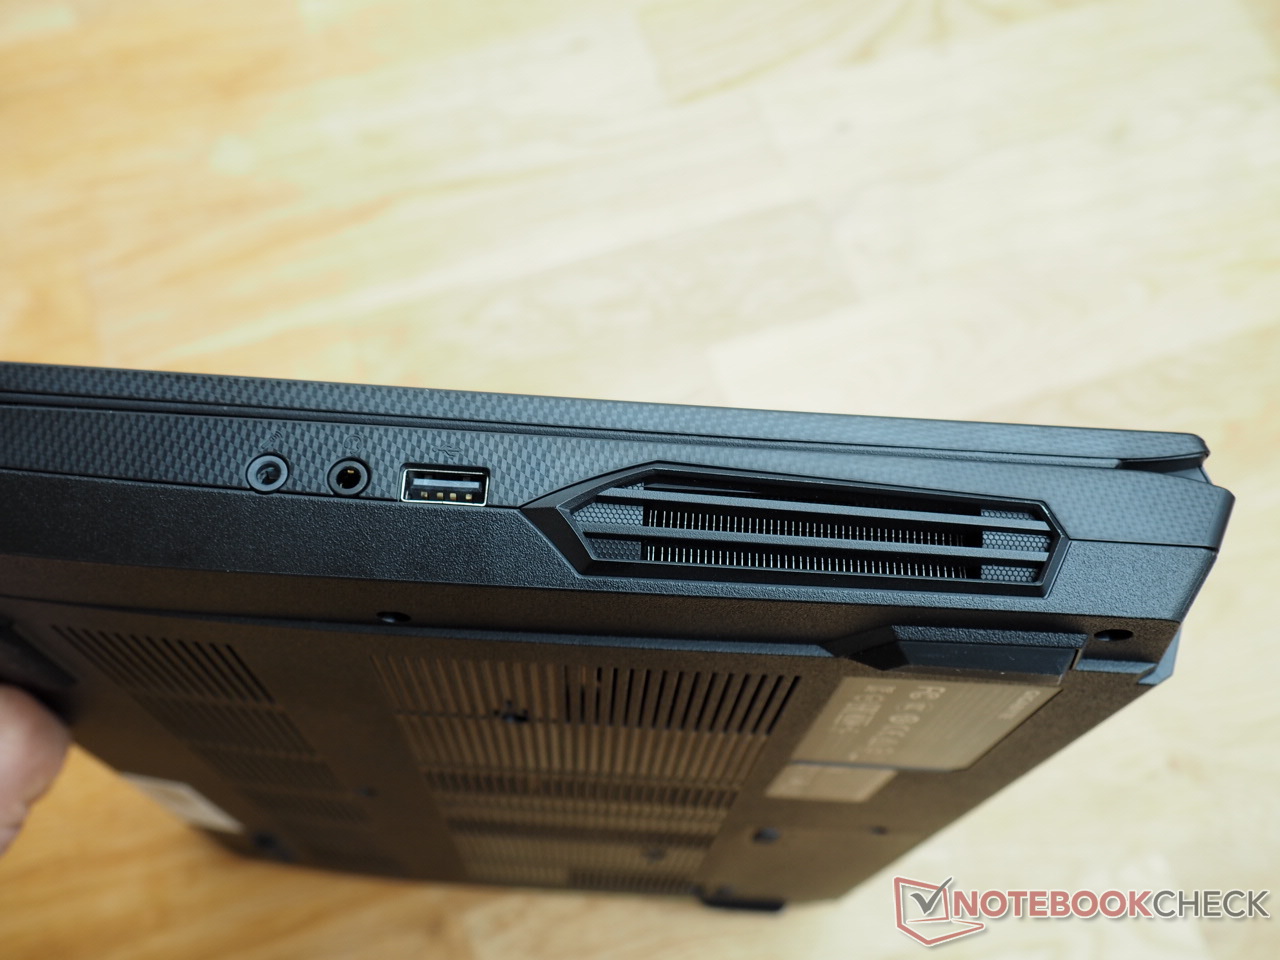
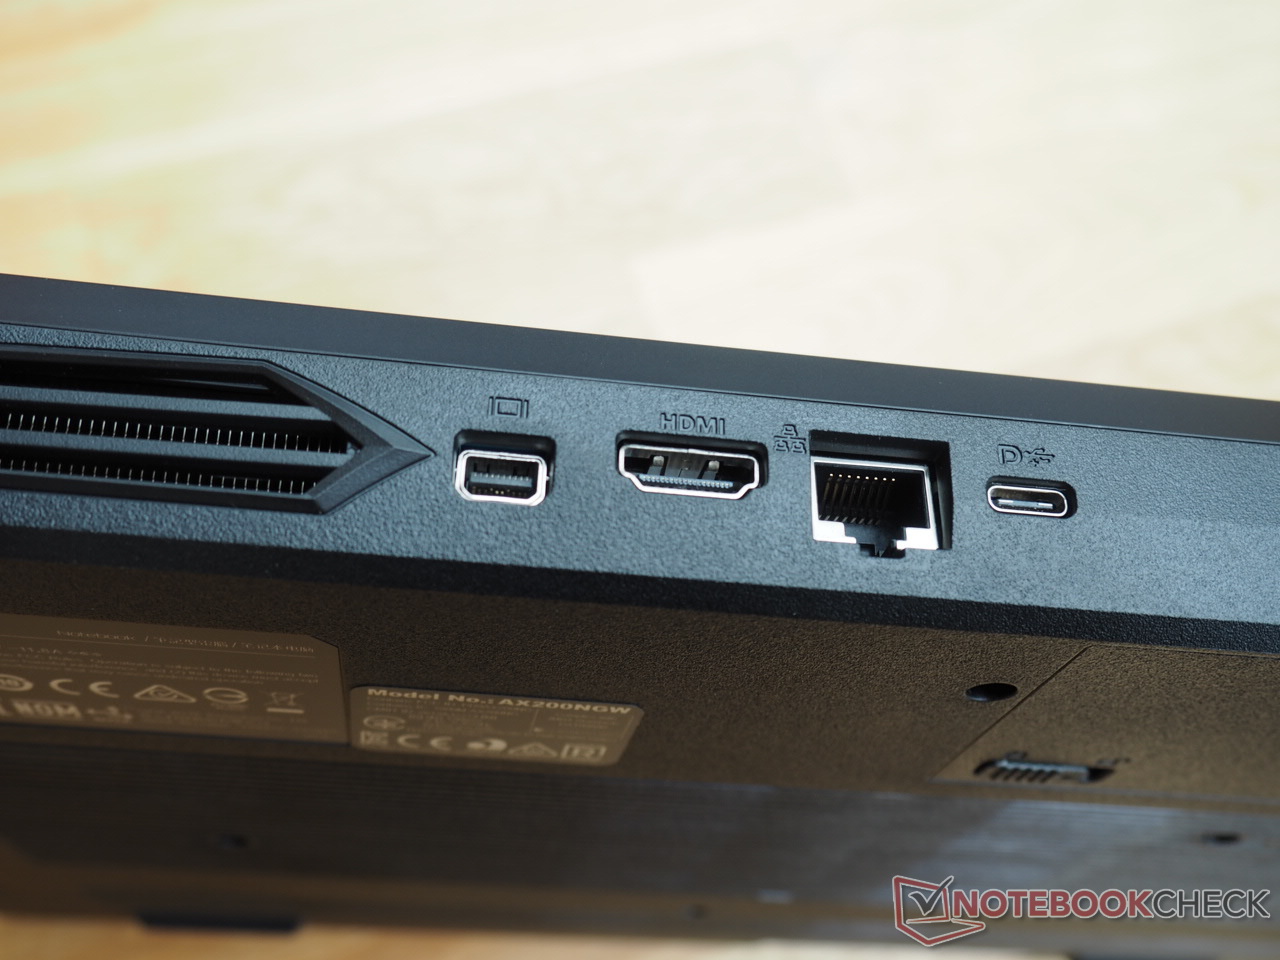
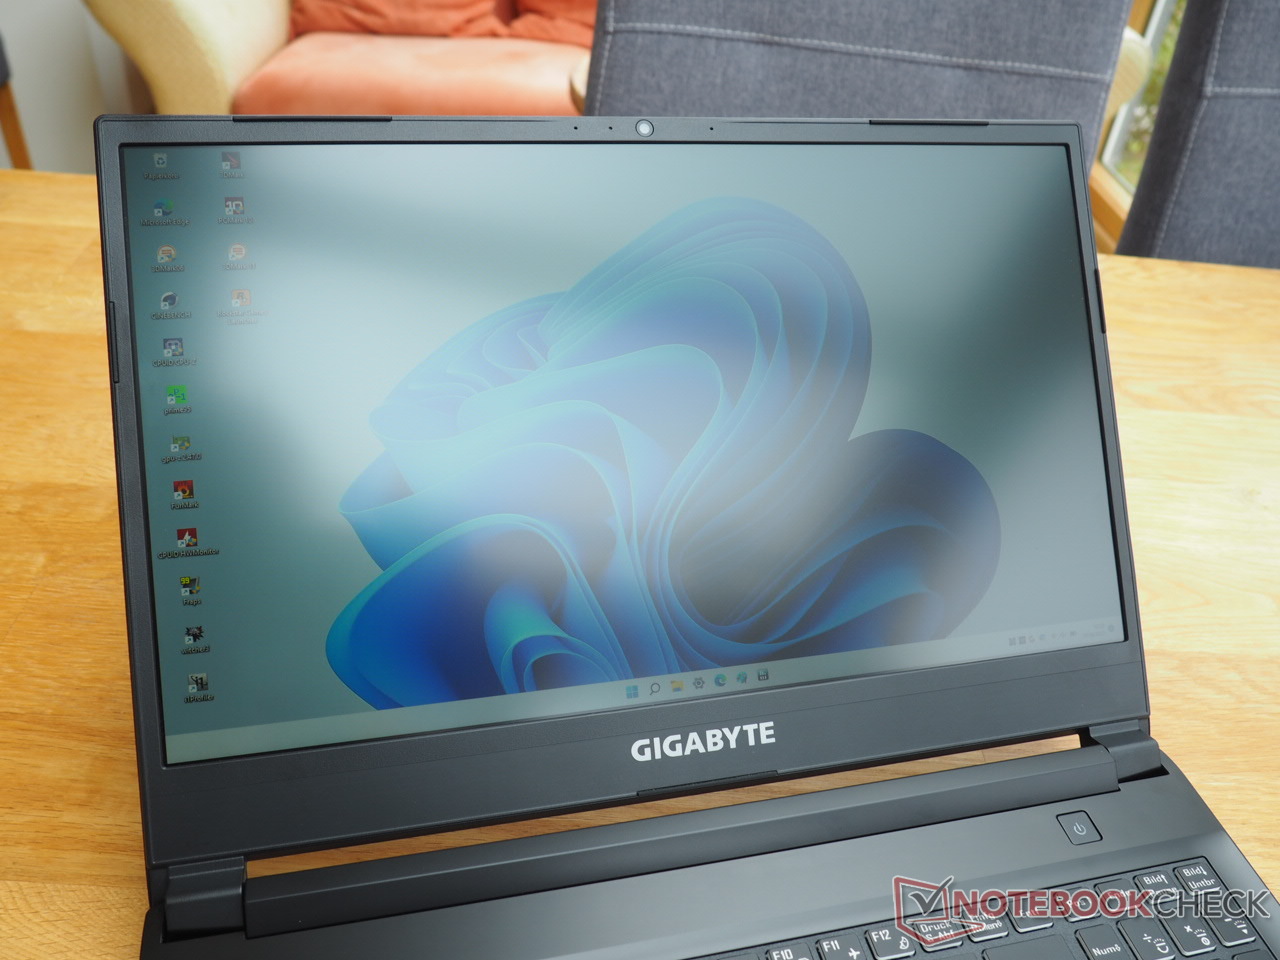
由于机箱在结构上与A5 X1相同,除了最小的变化(侧面现在有纹理/结构的地方),我们将不在本文中重新评估机箱、端口和输入设备。你可以在下面的测试报告中找到相应的信息 链接的测试报告.
沟通
| Networking | |
| iperf3 transmit AXE11000 | |
| Gigabyte A5 K1 | |
| Average of class Gaming (560 - 1862, n=88, last 2 years) | |
| Average Intel Wi-Fi 6 AX200 (429 - 1748, n=28) | |
| iperf3 receive AXE11000 | |
| Gigabyte A5 K1 | |
| Average of class Gaming (680 - 1745, n=88, last 2 years) | |
| Average Intel Wi-Fi 6 AX200 (451 - 1746, n=28) | |
网络摄像头


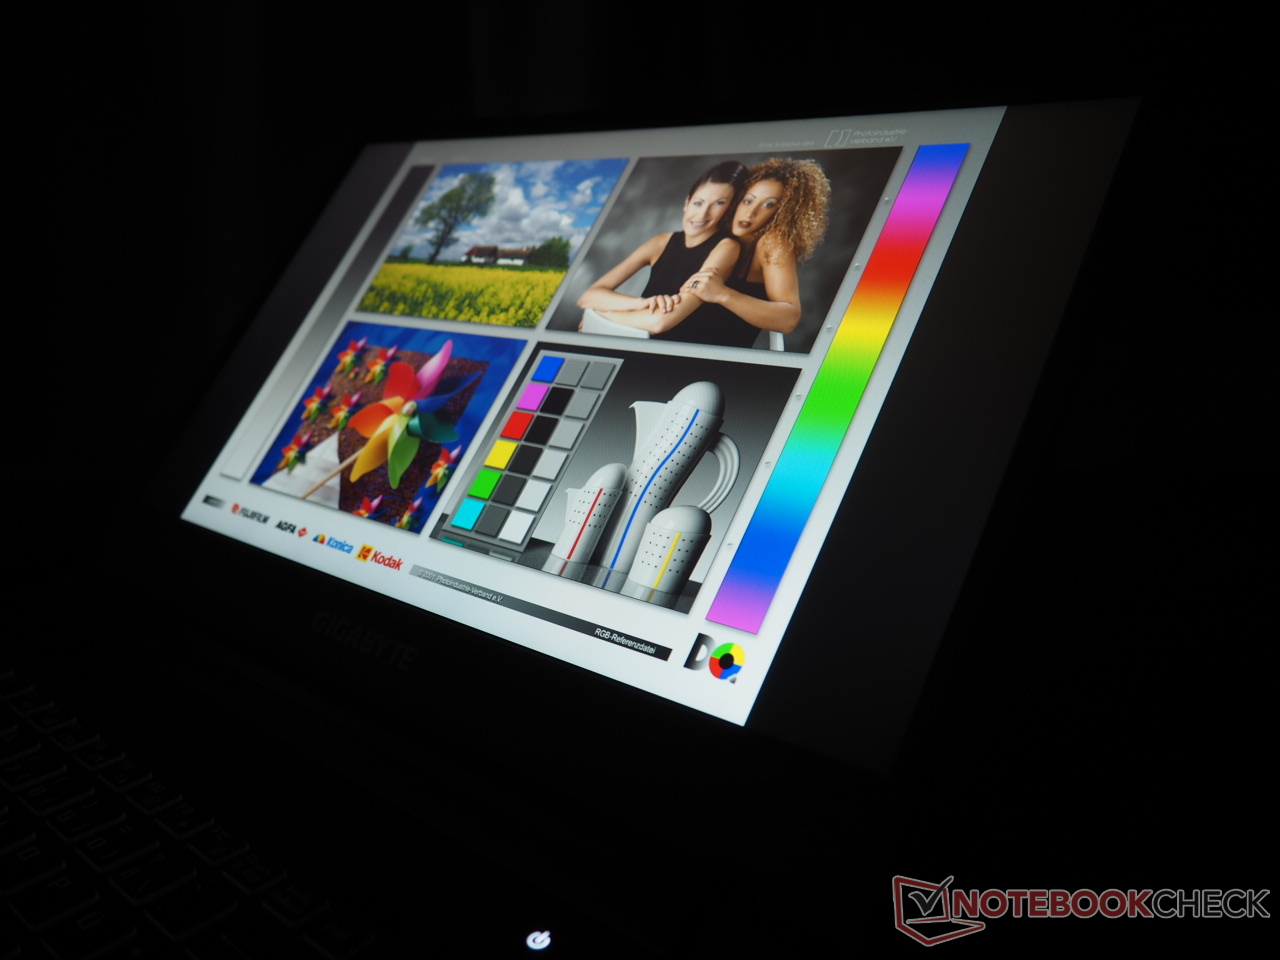
显示
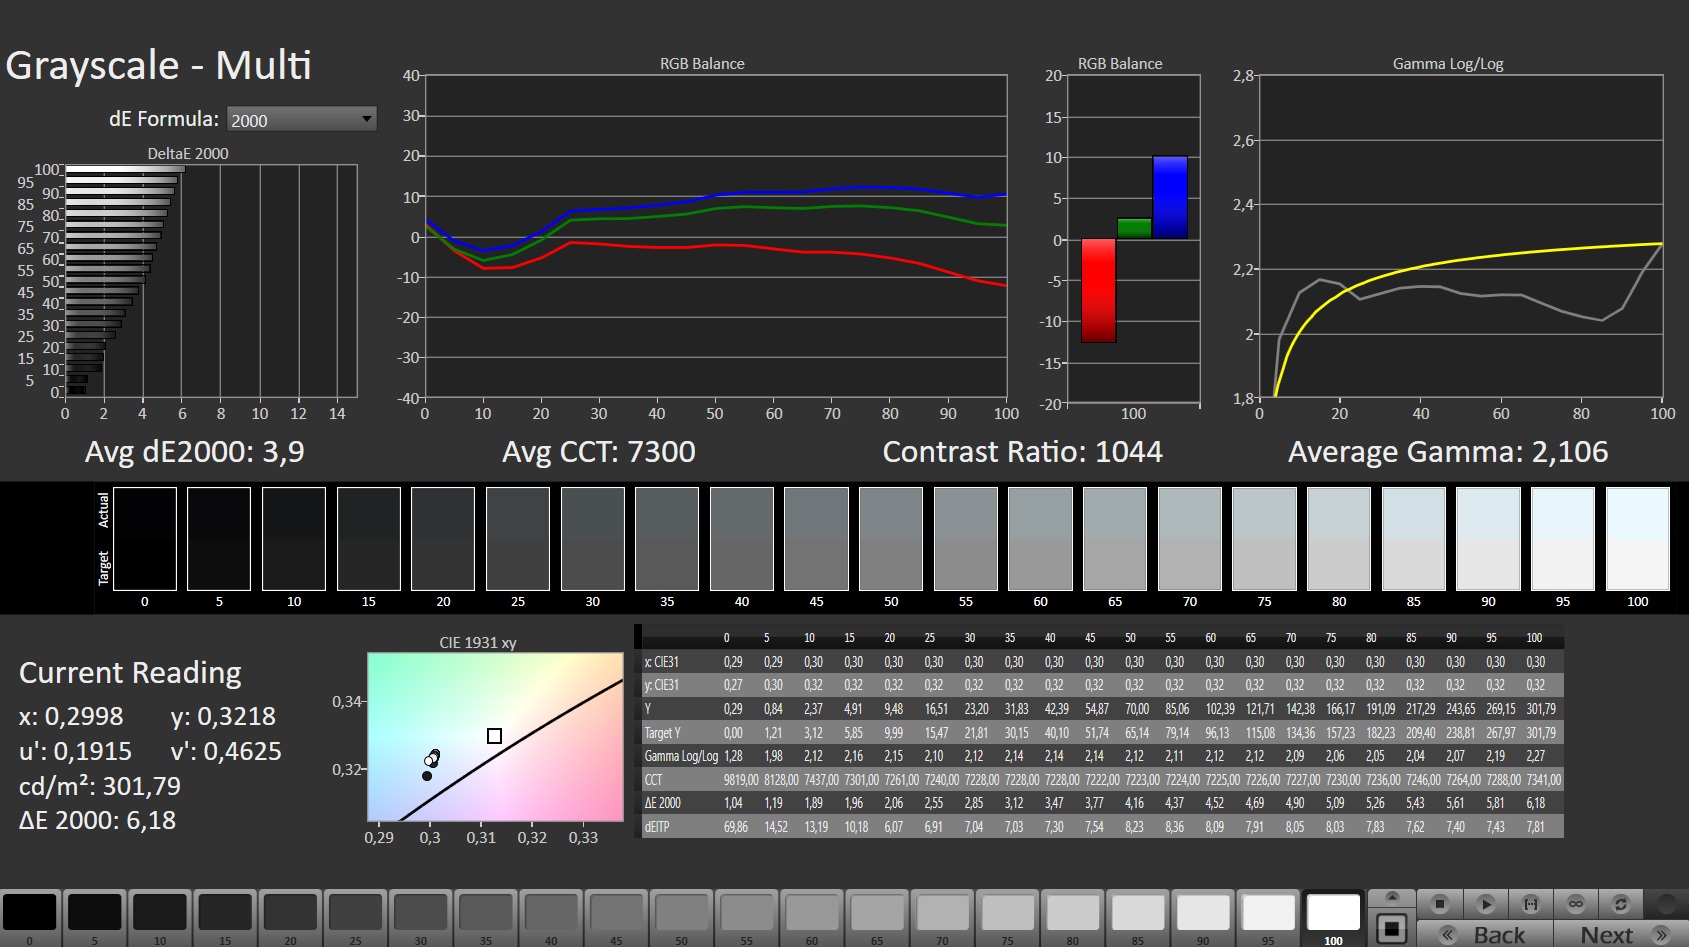
与A5 X1相比,屏幕的得分稍弱,但总体上仍处于相当好的水平。
| |||||||||||||||||||||||||
Brightness Distribution: 83 %
Center on Battery: 295 cd/m²
Contrast: 1017:1 (Black: 0.29 cd/m²)
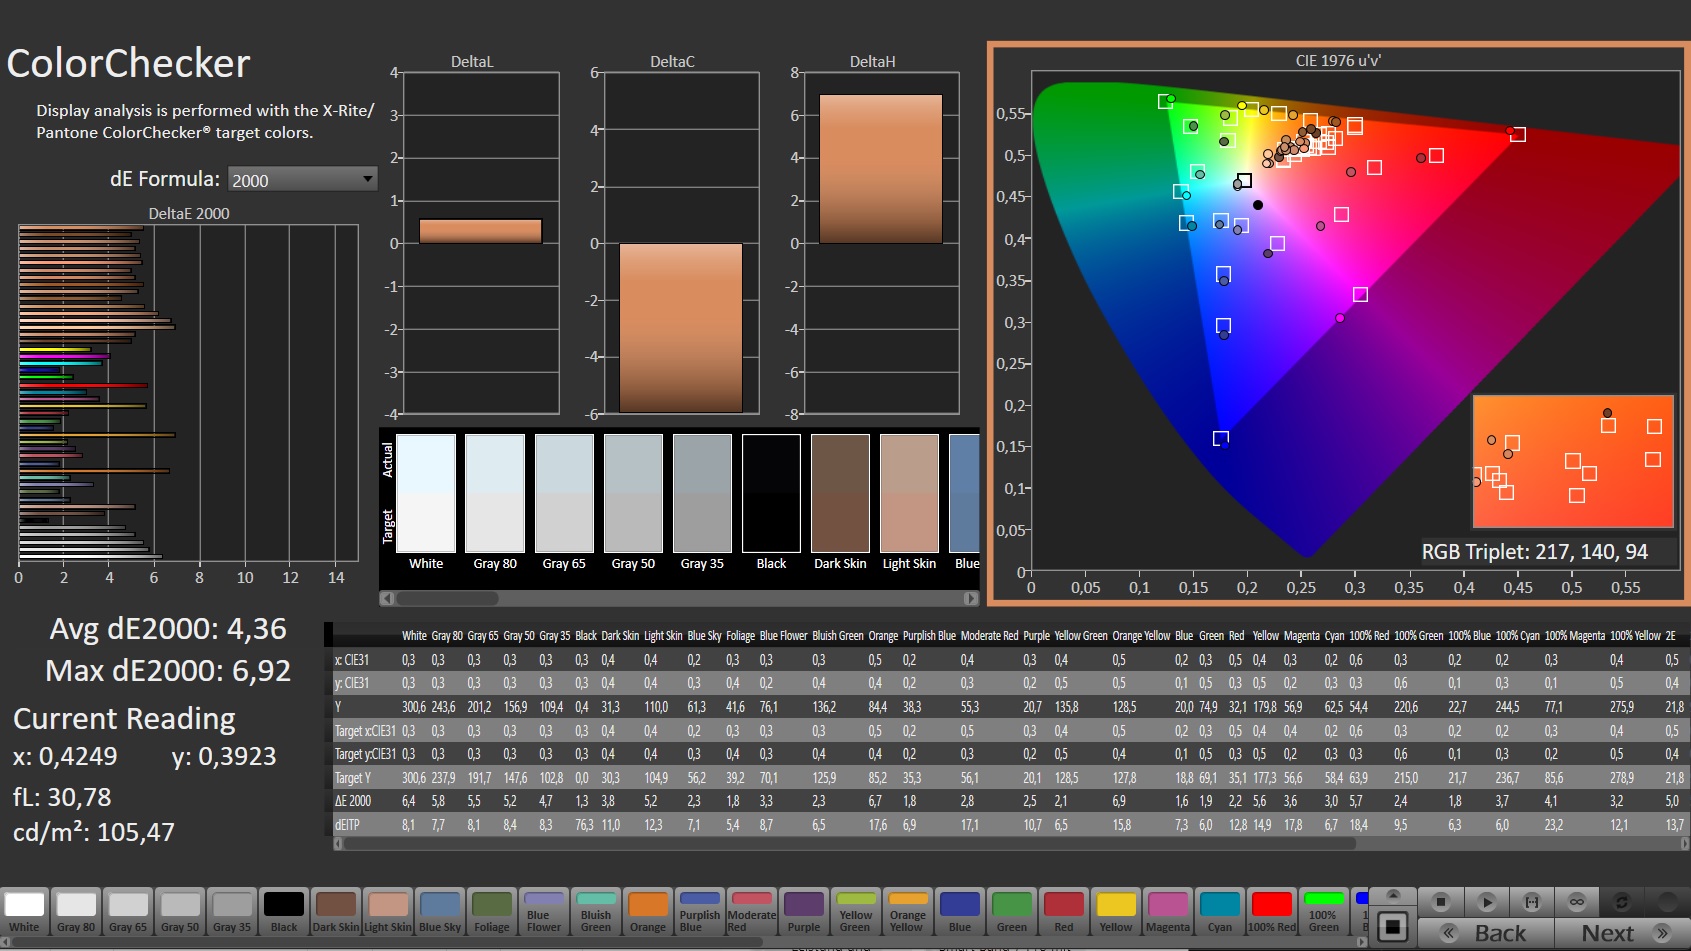
ΔE ColorChecker Calman: 4.36 | ∀{0.5-29.43 Ø4.71}
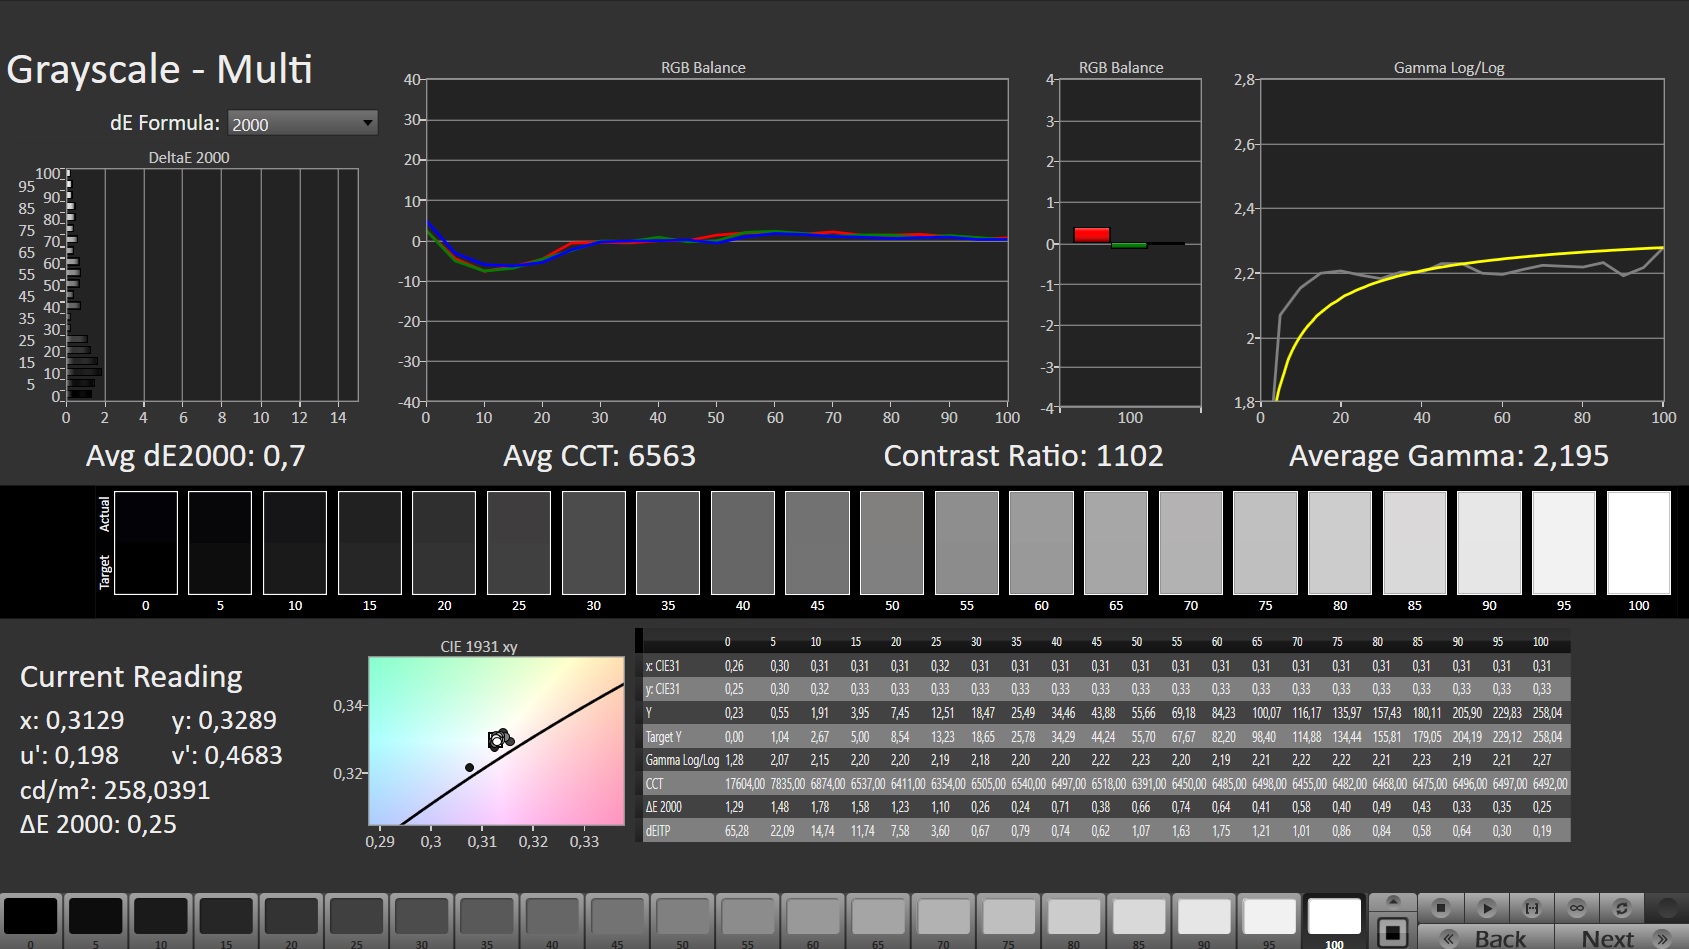
calibrated: 1.2
ΔE Greyscale Calman: 3.9 | ∀{0.09-98 Ø4.96}
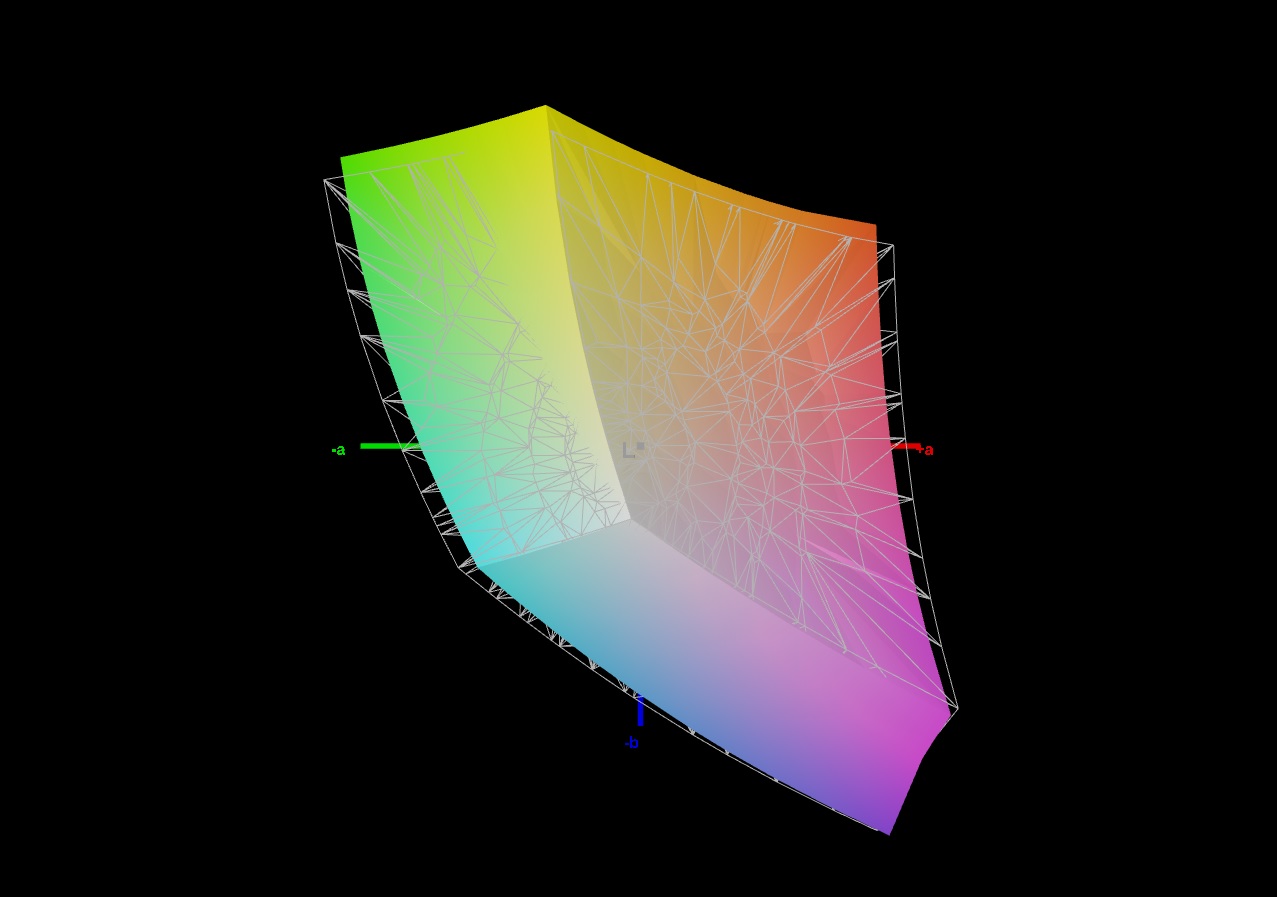
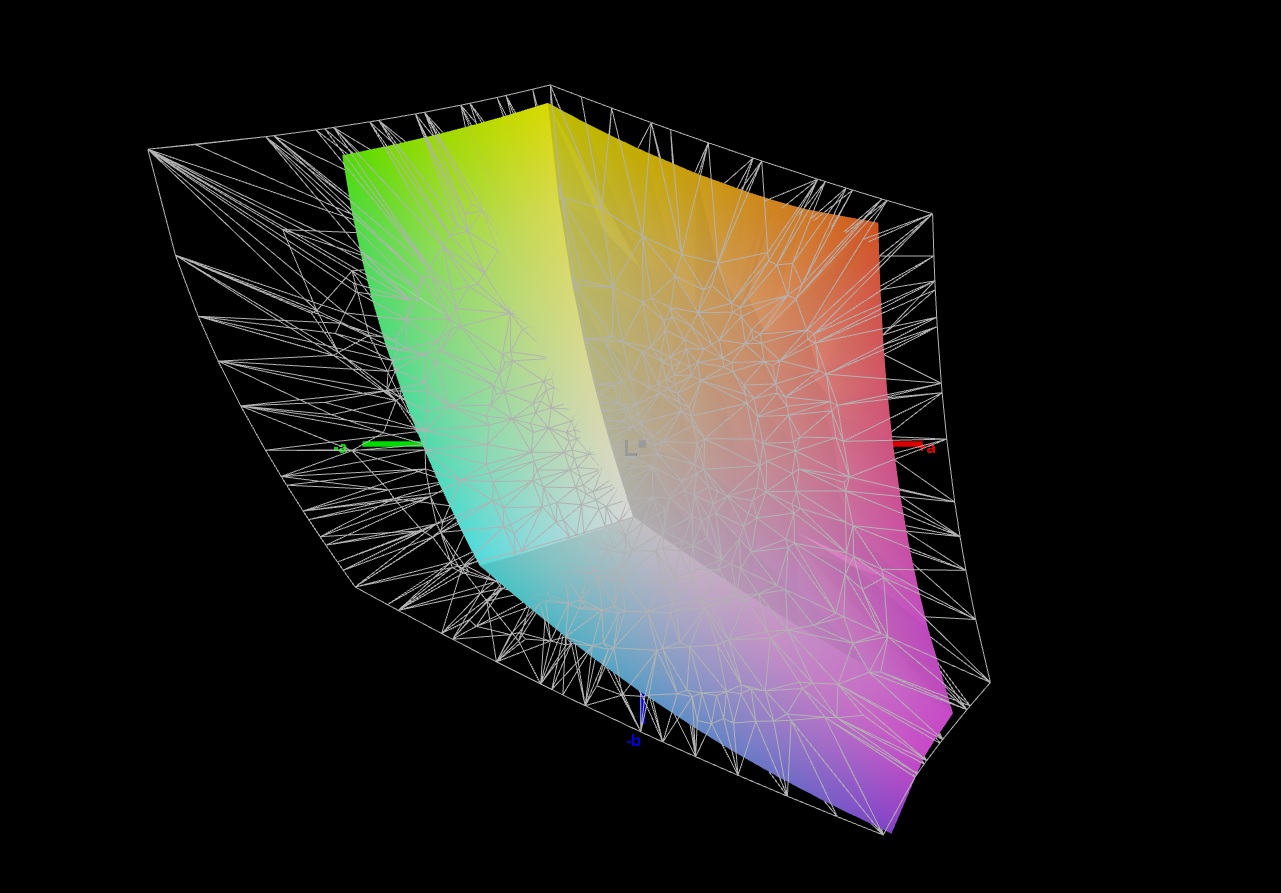
66.1% AdobeRGB 1998 (Argyll 3D)
92.5% sRGB (Argyll 3D)
64.4% Display P3 (Argyll 3D)
Gamma: 2.106
CCT: 7300 K
| Gigabyte A5 K1 BOEhydis NV156FHM-N4K (BOE08B3), IPS, 1920x1080, 15.6" | Asus TUF Gaming F15 FX507ZM TL156VDXP0101, IPS, 1920x1080, 15.6" | Lenovo Legion 5 15ACH6A-82NW0010GE LGD06A5, IPS, 1920x1080, 15.6" | MSI Alpha 15 B5EEK-008 AU Optronics B156HAN08.0, IPS, 1920x1080, 15.6" | Gigabyte A5 X1 AU Optronics B156HAN12.0, IPS, 1920x1080, 15.6" | |
|---|---|---|---|---|---|
| Display | 4% | 9% | 1% | 7% | |
| Display P3 Coverage (%) | 64.4 | 66.4 3% | 71.1 10% | 65.9 2% | 69.6 8% |
| sRGB Coverage (%) | 92.5 | 97 5% | 99.1 7% | 91.6 -1% | 98.6 7% |
| AdobeRGB 1998 Coverage (%) | 66.1 | 68.5 4% | 72.3 9% | 67 1% | 70.8 7% |
| Response Times | 13% | 17% | 44% | 25% | |
| Response Time Grey 50% / Grey 80% * (ms) | 14.5 ? | 5.6 ? 61% | 15 ? -3% | 5.06 ? 65% | 4.8 ? 67% |
| Response Time Black / White * (ms) | 9.5 ? | 12.8 ? -35% | 6 ? 37% | 7.44 ? 22% | 11.2 ? -18% |
| PWM Frequency (Hz) | |||||
| Screen | 27% | 7% | -10% | 3% | |
| Brightness middle (cd/m²) | 295 | 353.7 20% | 371 26% | 311 5% | 335 14% |
| Brightness (cd/m²) | 281 | 340 21% | 328 17% | 325 16% | 325 16% |
| Brightness Distribution (%) | 83 | 89 7% | 85 2% | 84 1% | 90 8% |
| Black Level * (cd/m²) | 0.29 | 0.34 -17% | 0.32 -10% | 0.22 24% | 0.4 -38% |
| Contrast (:1) | 1017 | 1040 2% | 1159 14% | 1414 39% | 838 -18% |
| Colorchecker dE 2000 * | 4.36 | 1.74 60% | 3.25 25% | 5.06 -16% | 2.63 40% |
| Colorchecker dE 2000 max. * | 6.92 | 3.63 48% | 6.33 9% | 8.37 -21% | 7.71 -11% |
| Colorchecker dE 2000 calibrated * | 1.2 | 0.5 58% | 1.11 7% | 2.62 -118% | 0.97 19% |
| Greyscale dE 2000 * | 3.9 | 2.1 46% | 4.94 -27% | 4.8 -23% | 4 -3% |
| Gamma | 2.106 104% | 2.3 96% | 2.45 90% | 2.12 104% | 2.129 103% |
| CCT | 7300 89% | 6257 104% | 6064 107% | 8002 81% | 7434 87% |
| Total Average (Program / Settings) | 15% /
20% | 11% /
9% | 12% /
-0% | 12% /
7% |
* ... smaller is better
我们的A5 K1的测试配置没有采用友达光电的面板,而是采用了京东方的面板。除了照明问题(显示器在可见的屏幕出血方面很挣扎),亮度也可以更好。平均281cd/m²的亮度对于大多数室内环境来说可能是足够的,但在冬季花园、阳台或露台等较亮的地方,你会很快希望有更高的亮度。更昂贵的兄弟在这里仍然达到325cd/m²。
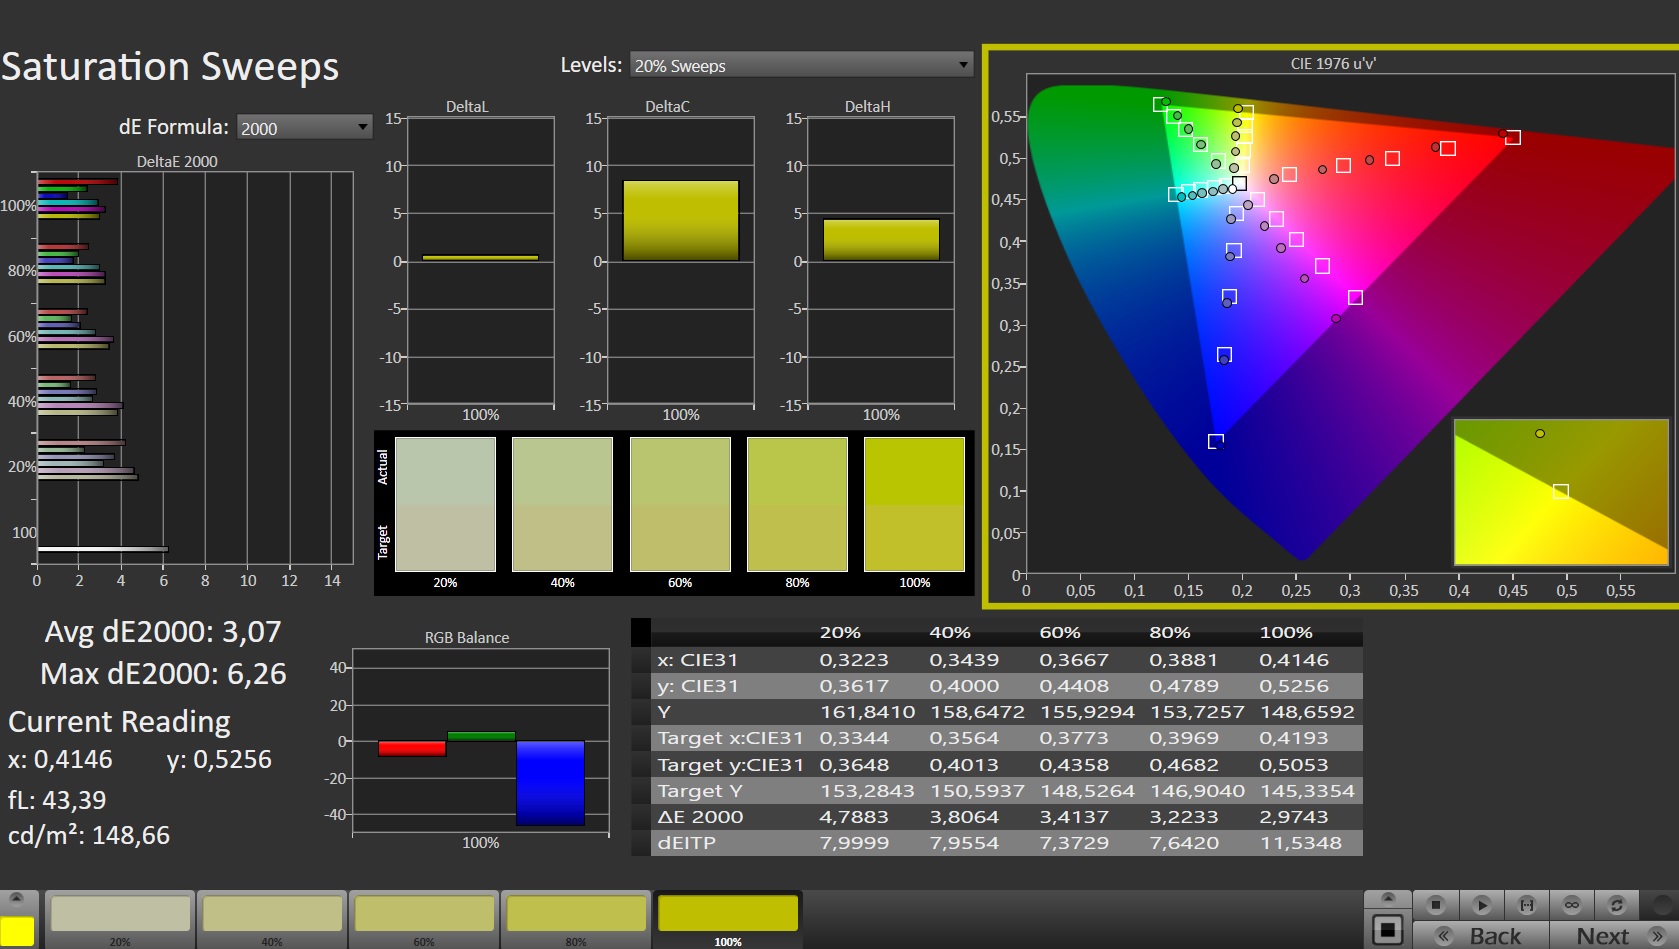
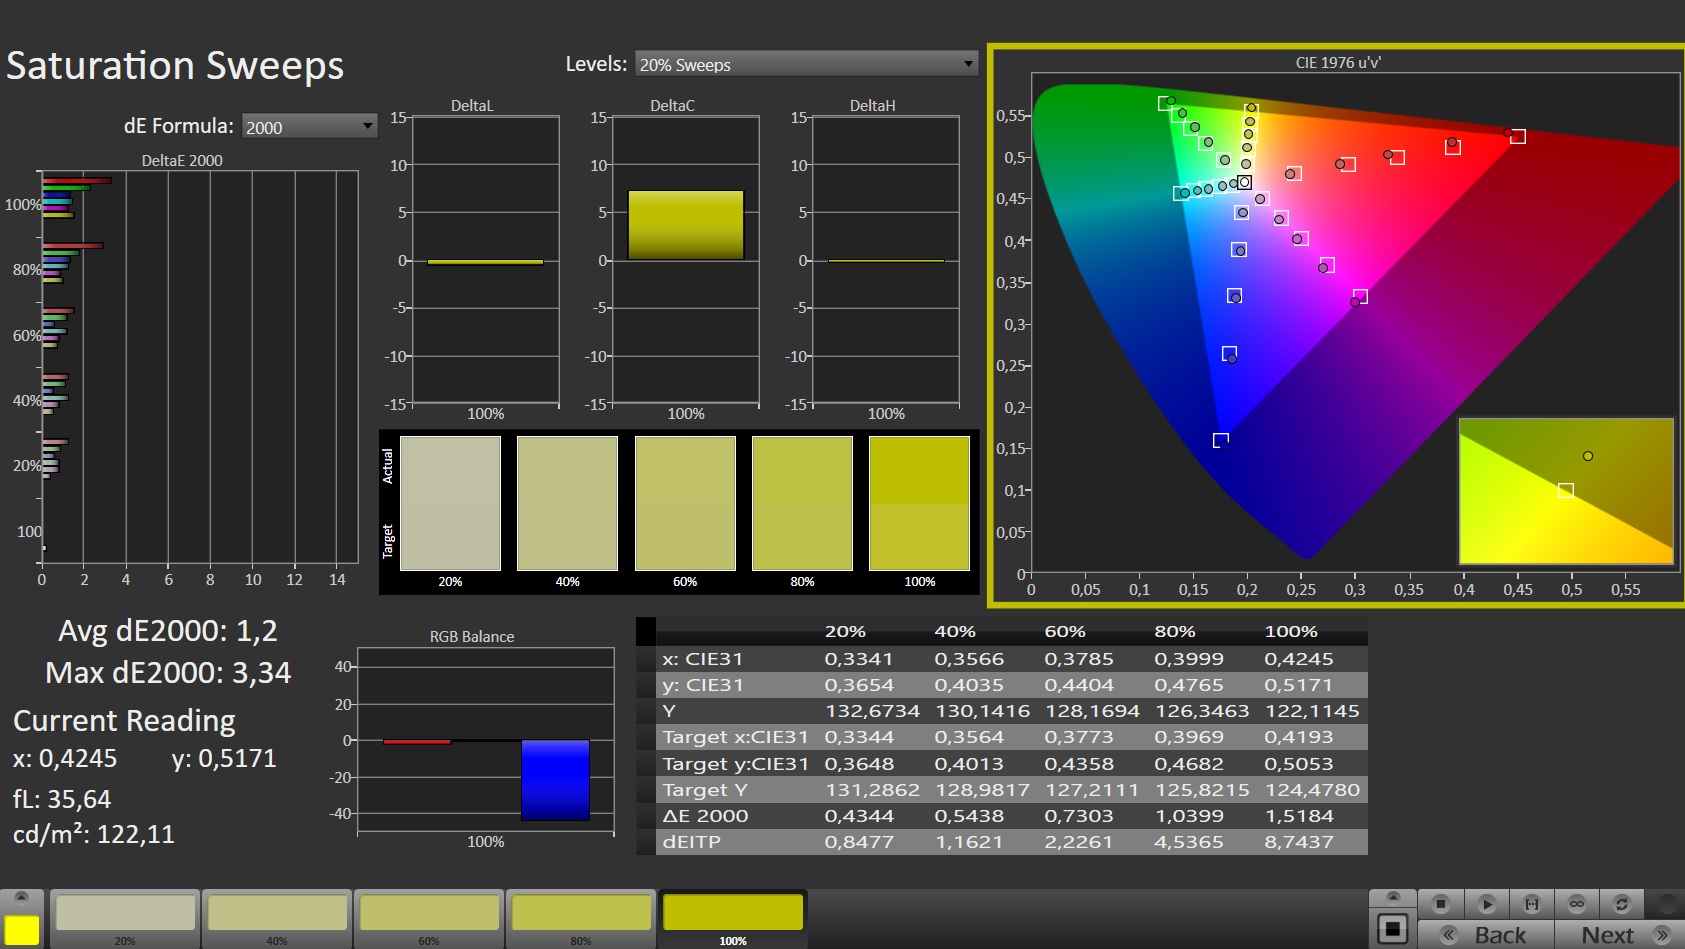
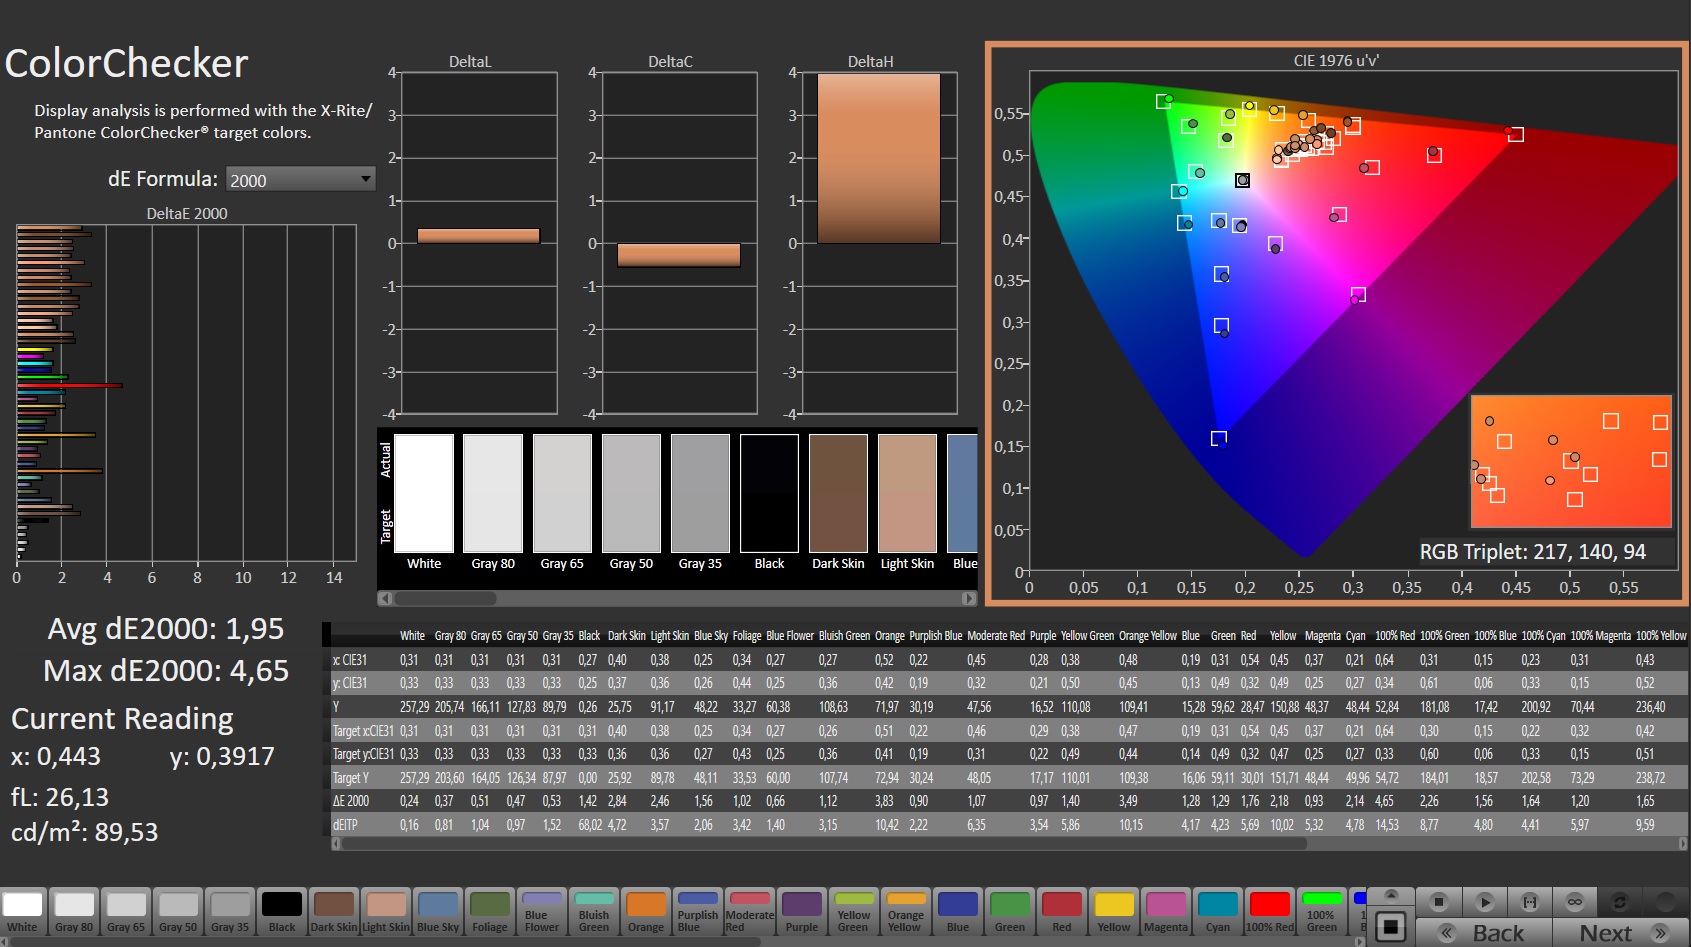
A5 K1的优点是黑值略低(0.29 vs 0.4 cd/m²),这导致纸张上的对比度明显提高(1107:1 vs 838:1)。然而,由于A5 X1提供了更大的色彩空间,因此在实践中的差异是有限的。
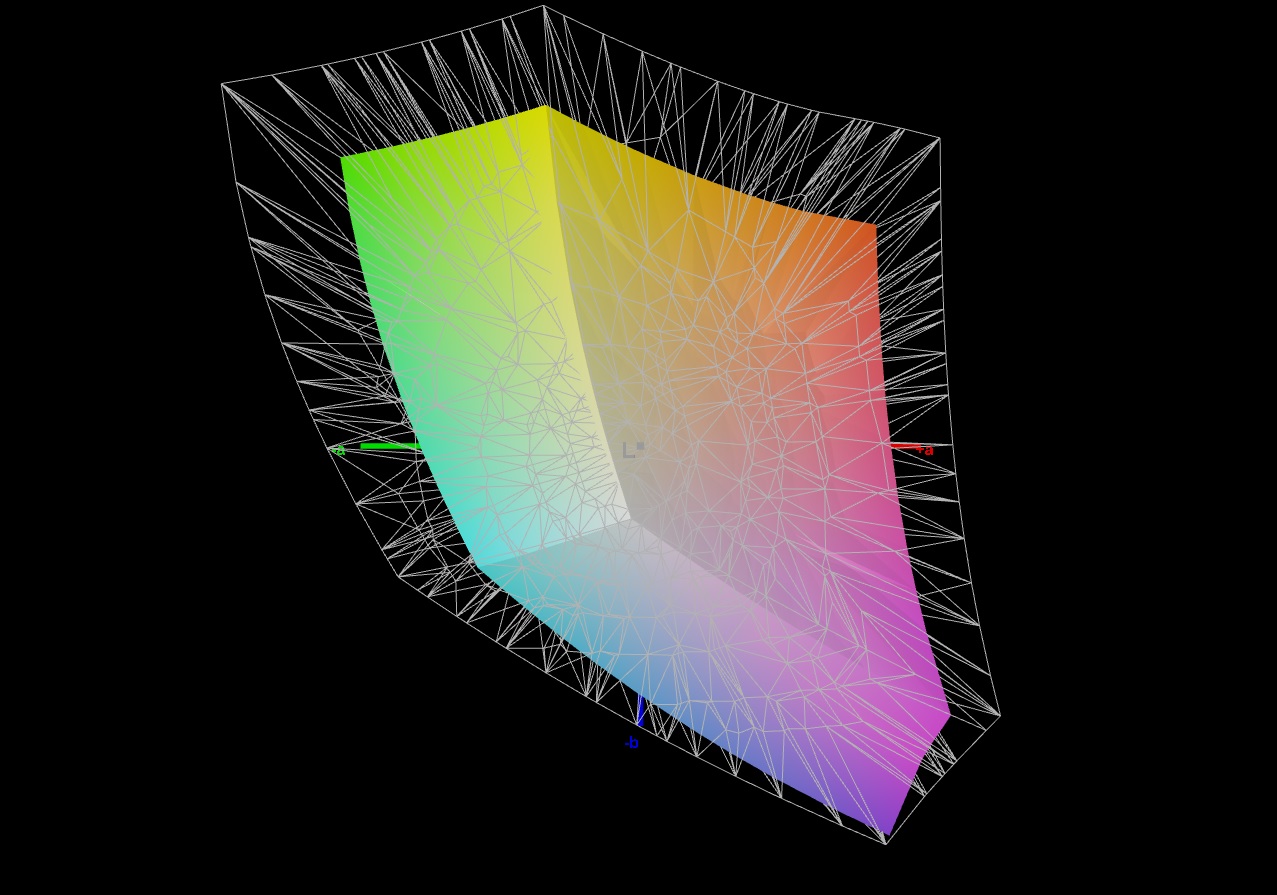
后者在色彩准确性方面也略微领先。两台设备的可视角度和响应时间都令人满意。
Display Response Times
| ↔ Response Time Black to White | ||
|---|---|---|
| 9.5 ms ... rise ↗ and fall ↘ combined | ↗ 5.5 ms rise | 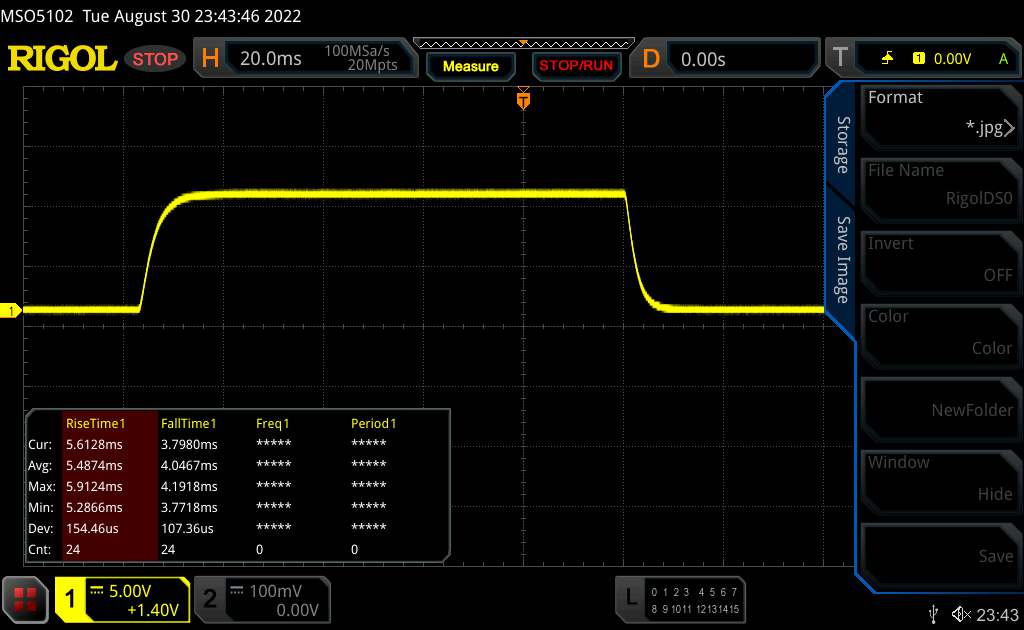 |
| ↘ 4 ms fall | ||
| The screen shows fast response rates in our tests and should be suited for gaming. In comparison, all tested devices range from 0.1 (minimum) to 240 (maximum) ms. » 26 % of all devices are better. This means that the measured response time is better than the average of all tested devices (19.8 ms). | ||
| ↔ Response Time 50% Grey to 80% Grey | ||
| 14.5 ms ... rise ↗ and fall ↘ combined | ↗ 6.8 ms rise | 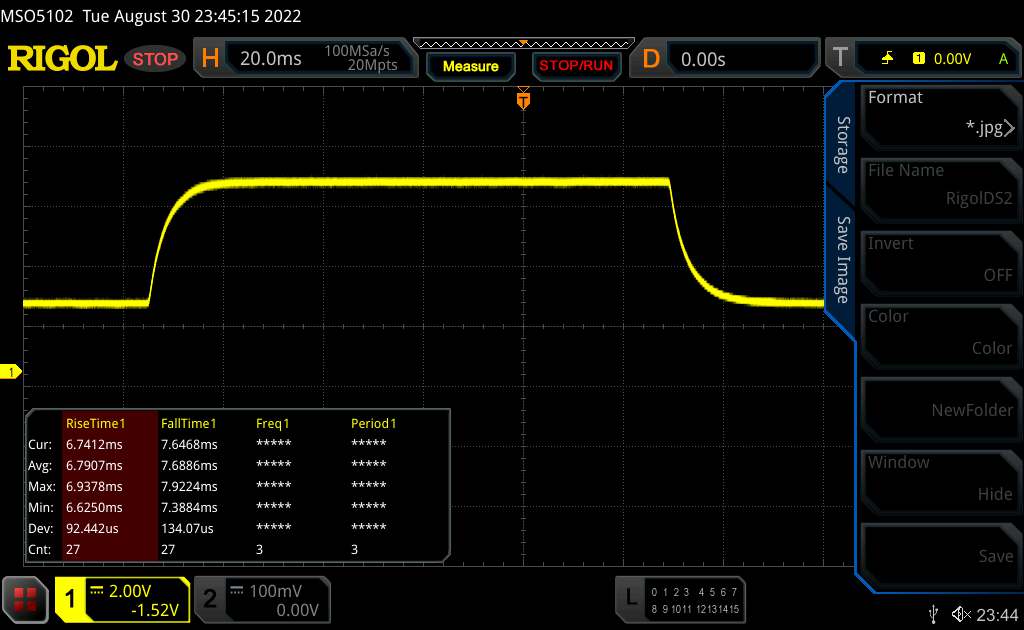 |
| ↘ 7.7 ms fall | ||
| The screen shows good response rates in our tests, but may be too slow for competitive gamers. In comparison, all tested devices range from 0.165 (minimum) to 636 (maximum) ms. » 29 % of all devices are better. This means that the measured response time is better than the average of all tested devices (31 ms). | ||
Screen Flickering / PWM (Pulse-Width Modulation)
| Screen flickering / PWM not detected | 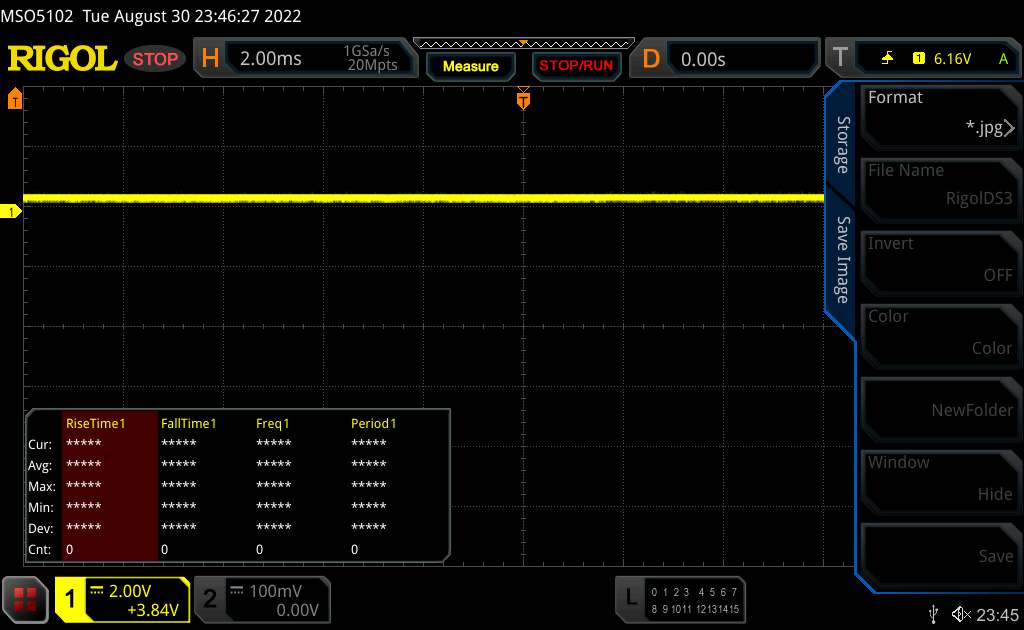 | ||
In comparison: 52 % of all tested devices do not use PWM to dim the display. If PWM was detected, an average of 7754 (minimum: 5 - maximum: 343500) Hz was measured. | |||
权力
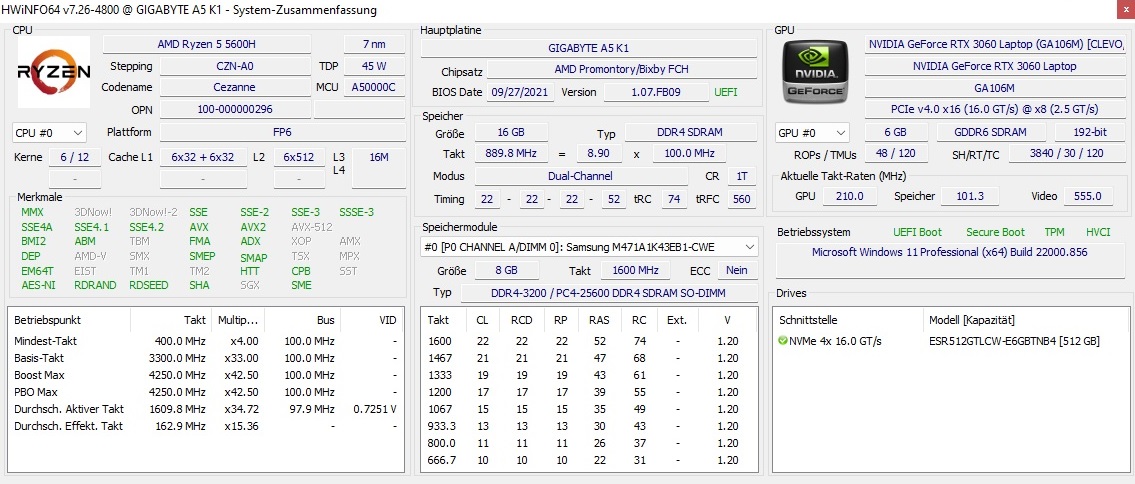
凭借六核CPU和6GB GPU,A5 K1使自己在中端和高端之间游刃有余。16GB的内存对于广告中的价格来说也不错。
测试条件
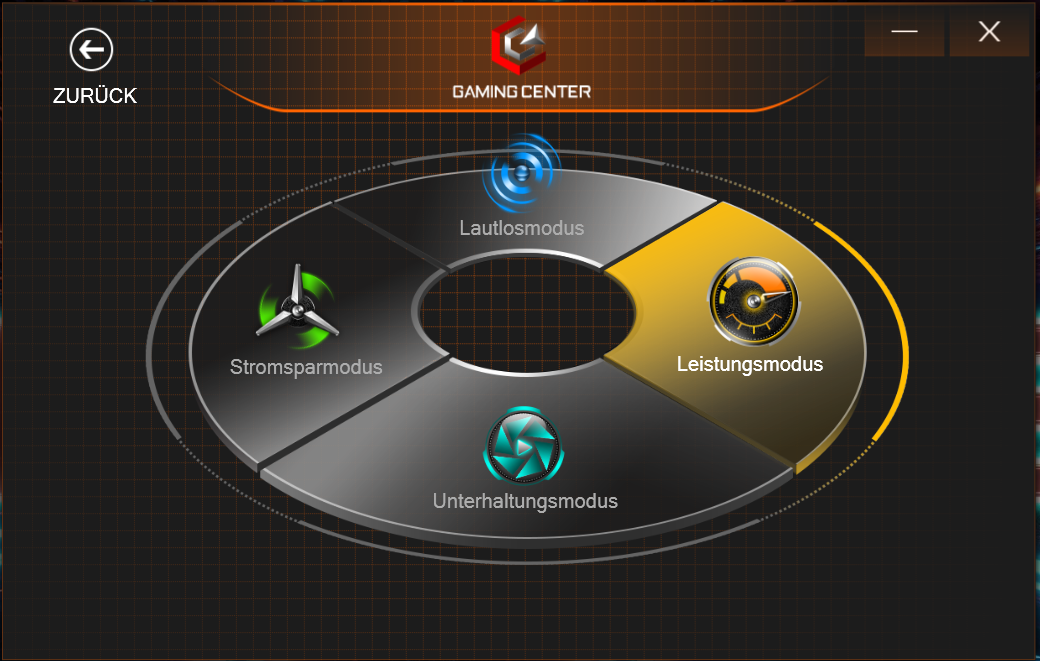
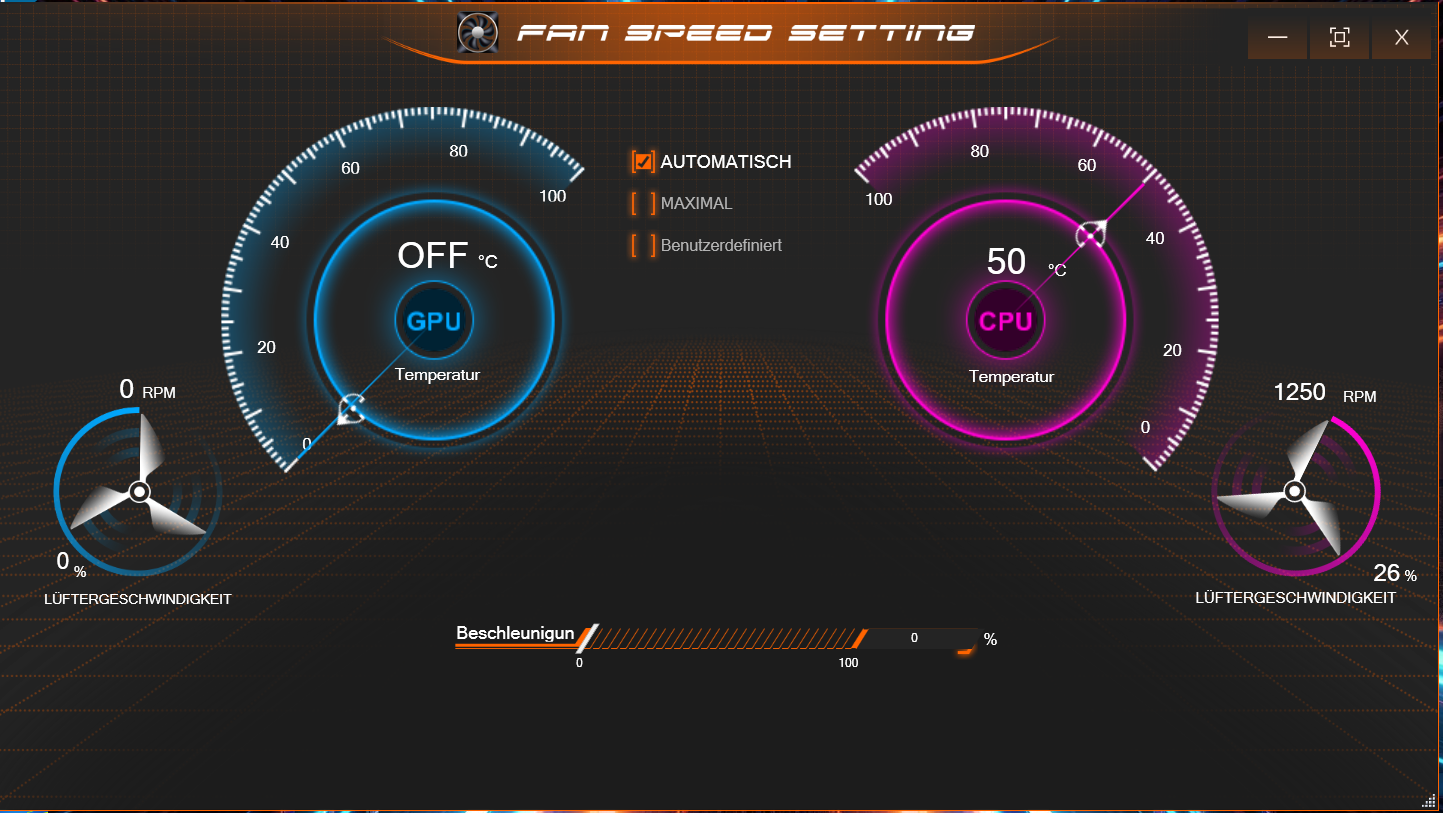
在其他方面,电源模式可以在预装的游戏中心中改变,这在视觉上与其他Clevo裸机很熟悉。除了在娱乐模式下进行的电池测试外,我们的测量是在电源配置文件(包括自动风扇速度设置)下进行的。为了获得更长的电池寿命和更低的运行噪音,我们建议使用省电模式和静音模式,这并不完全符合其名称。
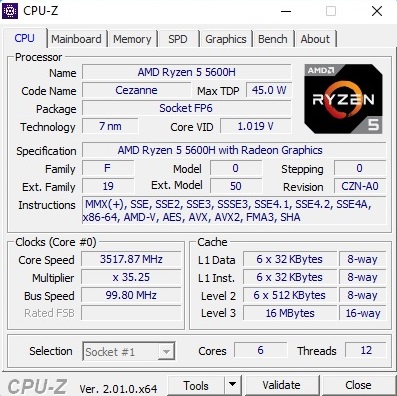
处理器
Ryzen 5 5600H是GeForce RTX 3060的一个理想伴侣。这款来自AMD塞尚一代的六核型号提供16MB L3缓存,并可通过SMT并行处理多达12个线程。这款7纳米芯片的TDP为45瓦。尽管Ryzen 5 5600H不出所料地不能与更强大的AMD兄弟竞争 Ryzen 7 5800H和Ryzen 9 5900HX,但该处理器提供了良好的性能。在Cinebench R15的循环测试中,结果仍然非常稳定,与同样配备5600H的联想Legion 5持平。
Cinebench R15 Multi Endurance test
Cinebench R23: Multi Core | Single Core
Cinebench R20: CPU (Multi Core) | CPU (Single Core)
Cinebench R15: CPU Multi 64Bit | CPU Single 64Bit
Blender: v2.79 BMW27 CPU
7-Zip 18.03: 7z b 4 | 7z b 4 -mmt1
Geekbench 5.5: Multi-Core | Single-Core
HWBOT x265 Benchmark v2.2: 4k Preset
LibreOffice : 20 Documents To PDF
R Benchmark 2.5: Overall mean
| CPU Performance rating | |
| Average of class Gaming | |
| Asus TUF Gaming F15 FX507ZM | |
| Gigabyte A5 X1 | |
| MSI Alpha 15 B5EEK-008 | |
| Lenovo Legion 5 15ACH6A-82NW0010GE | |
| Gigabyte A5 K1 | |
| Average AMD Ryzen 5 5600H | |
| Cinebench R23 / Multi Core | |
| Average of class Gaming (10488 - 42661, n=107, last 2 years) | |
| Asus TUF Gaming F15 FX507ZM | |
| Gigabyte A5 X1 | |
| MSI Alpha 15 B5EEK-008 | |
| Lenovo Legion 5 15ACH6A-82NW0010GE | |
| Gigabyte A5 K1 | |
| Average AMD Ryzen 5 5600H (7945 - 10416, n=13) | |
| Cinebench R23 / Single Core | |
| Average of class Gaming (1166 - 2415, n=107, last 2 years) | |
| Asus TUF Gaming F15 FX507ZM | |
| Gigabyte A5 X1 | |
| MSI Alpha 15 B5EEK-008 | |
| Gigabyte A5 K1 | |
| Lenovo Legion 5 15ACH6A-82NW0010GE | |
| Average AMD Ryzen 5 5600H (1316 - 1381, n=13) | |
| Cinebench R20 / CPU (Multi Core) | |
| Average of class Gaming (4029 - 16433, n=106, last 2 years) | |
| Asus TUF Gaming F15 FX507ZM | |
| Gigabyte A5 X1 | |
| MSI Alpha 15 B5EEK-008 | |
| Lenovo Legion 5 15ACH6A-82NW0010GE | |
| Gigabyte A5 K1 | |
| Average AMD Ryzen 5 5600H (3074 - 4059, n=16) | |
| Cinebench R20 / CPU (Single Core) | |
| Average of class Gaming (442 - 913, n=106, last 2 years) | |
| Asus TUF Gaming F15 FX507ZM | |
| Gigabyte A5 X1 | |
| MSI Alpha 15 B5EEK-008 | |
| Gigabyte A5 K1 | |
| Lenovo Legion 5 15ACH6A-82NW0010GE | |
| Average AMD Ryzen 5 5600H (527 - 538, n=15) | |
| Cinebench R15 / CPU Multi 64Bit | |
| Average of class Gaming (1578 - 6330, n=105, last 2 years) | |
| Asus TUF Gaming F15 FX507ZM | |
| Gigabyte A5 X1 | |
| MSI Alpha 15 B5EEK-008 | |
| Lenovo Legion 5 15ACH6A-82NW0010GE | |
| Gigabyte A5 K1 | |
| Average AMD Ryzen 5 5600H (1319 - 1723, n=16) | |
| Cinebench R15 / CPU Single 64Bit | |
| Average of class Gaming (188.8 - 350, n=106, last 2 years) | |
| Asus TUF Gaming F15 FX507ZM | |
| Gigabyte A5 X1 | |
| MSI Alpha 15 B5EEK-008 | |
| Gigabyte A5 K1 | |
| Lenovo Legion 5 15ACH6A-82NW0010GE | |
| Average AMD Ryzen 5 5600H (218 - 225, n=14) | |
| Blender / v2.79 BMW27 CPU | |
| Average AMD Ryzen 5 5600H (300 - 384, n=14) | |
| Lenovo Legion 5 15ACH6A-82NW0010GE | |
| Gigabyte A5 K1 | |
| MSI Alpha 15 B5EEK-008 | |
| Gigabyte A5 X1 | |
| Asus TUF Gaming F15 FX507ZM | |
| Average of class Gaming (79 - 330, n=104, last 2 years) | |
| 7-Zip 18.03 / 7z b 4 | |
| Average of class Gaming (33491 - 148086, n=105, last 2 years) | |
| Asus TUF Gaming F15 FX507ZM | |
| Gigabyte A5 X1 | |
| MSI Alpha 15 B5EEK-008 | |
| Gigabyte A5 K1 | |
| Lenovo Legion 5 15ACH6A-82NW0010GE | |
| Average AMD Ryzen 5 5600H (36315 - 46562, n=14) | |
| 7-Zip 18.03 / 7z b 4 -mmt1 | |
| Average of class Gaming (4199 - 7436, n=105, last 2 years) | |
| Gigabyte A5 X1 | |
| MSI Alpha 15 B5EEK-008 | |
| Gigabyte A5 K1 | |
| Asus TUF Gaming F15 FX507ZM | |
| Average AMD Ryzen 5 5600H (5213 - 5446, n=14) | |
| Lenovo Legion 5 15ACH6A-82NW0010GE | |
| Geekbench 5.5 / Multi-Core | |
| Average of class Gaming (6460 - 28263, n=105, last 2 years) | |
| Asus TUF Gaming F15 FX507ZM | |
| Gigabyte A5 X1 | |
| MSI Alpha 15 B5EEK-008 | |
| Gigabyte A5 K1 | |
| Lenovo Legion 5 15ACH6A-82NW0010GE | |
| Average AMD Ryzen 5 5600H (4990 - 7253, n=14) | |
| Geekbench 5.5 / Single-Core | |
| Average of class Gaming (986 - 2474, n=105, last 2 years) | |
| Asus TUF Gaming F15 FX507ZM | |
| Gigabyte A5 X1 | |
| MSI Alpha 15 B5EEK-008 | |
| Gigabyte A5 K1 | |
| Lenovo Legion 5 15ACH6A-82NW0010GE | |
| Average AMD Ryzen 5 5600H (1365 - 1445, n=14) | |
| HWBOT x265 Benchmark v2.2 / 4k Preset | |
| Average of class Gaming (11.5 - 44.4, n=105, last 2 years) | |
| Asus TUF Gaming F15 FX507ZM | |
| Gigabyte A5 X1 | |
| MSI Alpha 15 B5EEK-008 | |
| Gigabyte A5 K1 | |
| Lenovo Legion 5 15ACH6A-82NW0010GE | |
| Average AMD Ryzen 5 5600H (9.92 - 13.3, n=14) | |
| LibreOffice / 20 Documents To PDF | |
| Gigabyte A5 X1 | |
| Gigabyte A5 K1 | |
| Average AMD Ryzen 5 5600H (52.2 - 81.5, n=14) | |
| MSI Alpha 15 B5EEK-008 | |
| Lenovo Legion 5 15ACH6A-82NW0010GE | |
| Asus TUF Gaming F15 FX507ZM | |
| Average of class Gaming (33.2 - 88.8, n=105, last 2 years) | |
| R Benchmark 2.5 / Overall mean | |
| Average AMD Ryzen 5 5600H (0.526 - 0.596, n=14) | |
| Lenovo Legion 5 15ACH6A-82NW0010GE | |
| Gigabyte A5 K1 | |
| MSI Alpha 15 B5EEK-008 | |
| Gigabyte A5 X1 | |
| Asus TUF Gaming F15 FX507ZM | |
| Average of class Gaming (0.3439 - 0.759, n=106, last 2 years) | |
* ... smaller is better
AIDA64: FP32 Ray-Trace | FPU Julia | CPU SHA3 | CPU Queen | FPU SinJulia | FPU Mandel | CPU AES | CPU ZLib | FP64 Ray-Trace | CPU PhotoWorxx
| Performance rating | |
| Average of class Gaming | |
| Gigabyte A5 X1 | |
| MSI Alpha 15 B5EEK-008 | |
| Asus TUF Gaming F15 FX507ZM | |
| Lenovo Legion 5 15ACH6A-82NW0010GE | |
| Gigabyte A5 K1 | |
| Average AMD Ryzen 5 5600H | |
| AIDA64 / FP32 Ray-Trace | |
| Average of class Gaming (10227 - 85542, n=105, last 2 years) | |
| Gigabyte A5 X1 | |
| MSI Alpha 15 B5EEK-008 | |
| Lenovo Legion 5 15ACH6A-82NW0010GE | |
| Gigabyte A5 K1 | |
| Average AMD Ryzen 5 5600H (9181 - 12636, n=14) | |
| Asus TUF Gaming F15 FX507ZM | |
| AIDA64 / FPU Julia | |
| Average of class Gaming (51376 - 238426, n=105, last 2 years) | |
| Gigabyte A5 X1 | |
| MSI Alpha 15 B5EEK-008 | |
| Lenovo Legion 5 15ACH6A-82NW0010GE | |
| Gigabyte A5 K1 | |
| Average AMD Ryzen 5 5600H (51994 - 78250, n=14) | |
| Asus TUF Gaming F15 FX507ZM | |
| AIDA64 / CPU SHA3 | |
| Average of class Gaming (2180 - 10115, n=105, last 2 years) | |
| Gigabyte A5 X1 | |
| Asus TUF Gaming F15 FX507ZM | |
| MSI Alpha 15 B5EEK-008 | |
| Lenovo Legion 5 15ACH6A-82NW0010GE | |
| Gigabyte A5 K1 | |
| Average AMD Ryzen 5 5600H (1587 - 2675, n=14) | |
| AIDA64 / CPU Queen | |
| Average of class Gaming (49785 - 173351, n=90, last 2 years) | |
| Gigabyte A5 X1 | |
| Asus TUF Gaming F15 FX507ZM | |
| MSI Alpha 15 B5EEK-008 | |
| Gigabyte A5 K1 | |
| Lenovo Legion 5 15ACH6A-82NW0010GE | |
| Average AMD Ryzen 5 5600H (66699 - 77213, n=14) | |
| AIDA64 / FPU SinJulia | |
| Average of class Gaming (4424 - 33636, n=105, last 2 years) | |
| Gigabyte A5 X1 | |
| MSI Alpha 15 B5EEK-008 | |
| Asus TUF Gaming F15 FX507ZM | |
| Gigabyte A5 K1 | |
| Lenovo Legion 5 15ACH6A-82NW0010GE | |
| Average AMD Ryzen 5 5600H (8340 - 9159, n=14) | |
| AIDA64 / FPU Mandel | |
| Average of class Gaming (25115 - 128721, n=105, last 2 years) | |
| Gigabyte A5 X1 | |
| MSI Alpha 15 B5EEK-008 | |
| Lenovo Legion 5 15ACH6A-82NW0010GE | |
| Gigabyte A5 K1 | |
| Average AMD Ryzen 5 5600H (28268 - 43274, n=14) | |
| Asus TUF Gaming F15 FX507ZM | |
| AIDA64 / CPU AES | |
| Gigabyte A5 X1 | |
| MSI Alpha 15 B5EEK-008 | |
| Average of class Gaming (39258 - 247074, n=105, last 2 years) | |
| Lenovo Legion 5 15ACH6A-82NW0010GE | |
| Average AMD Ryzen 5 5600H (39852 - 98939, n=14) | |
| Asus TUF Gaming F15 FX507ZM | |
| Gigabyte A5 K1 | |
| AIDA64 / CPU ZLib | |
| Average of class Gaming (574 - 2531, n=105, last 2 years) | |
| Asus TUF Gaming F15 FX507ZM | |
| Gigabyte A5 X1 | |
| MSI Alpha 15 B5EEK-008 | |
| Lenovo Legion 5 15ACH6A-82NW0010GE | |
| Gigabyte A5 K1 | |
| Average AMD Ryzen 5 5600H (507 - 649, n=14) | |
| AIDA64 / FP64 Ray-Trace | |
| Average of class Gaming (5509 - 45446, n=105, last 2 years) | |
| Gigabyte A5 X1 | |
| MSI Alpha 15 B5EEK-008 | |
| Lenovo Legion 5 15ACH6A-82NW0010GE | |
| Gigabyte A5 K1 | |
| Average AMD Ryzen 5 5600H (4811 - 6652, n=14) | |
| Asus TUF Gaming F15 FX507ZM | |
| AIDA64 / CPU PhotoWorxx | |
| Average of class Gaming (12271 - 89891, n=105, last 2 years) | |
| Asus TUF Gaming F15 FX507ZM | |
| MSI Alpha 15 B5EEK-008 | |
| Gigabyte A5 K1 | |
| Gigabyte A5 X1 | |
| Average AMD Ryzen 5 5600H (7419 - 24746, n=14) | |
| Lenovo Legion 5 15ACH6A-82NW0010GE | |
系统性能
虽然它在PCMark 10的测试领域得分垫底,但A5 K1的系统性能大多令人信服。 6.考虑到该笔记本的价格,341分绝对是值得尊敬的。
CrossMark: Overall | Productivity | Creativity | Responsiveness
| PCMark 10 / Score | |
| Average of class Gaming (5828 - 12414, n=93, last 2 years) | |
| Asus TUF Gaming F15 FX507ZM | |
| Lenovo Legion 5 15ACH6A-82NW0010GE | |
| MSI Alpha 15 B5EEK-008 | |
| Gigabyte A5 X1 | |
| Average AMD Ryzen 5 5600H, NVIDIA GeForce RTX 3060 Laptop GPU (6341 - 6615, n=2) | |
| Gigabyte A5 K1 | |
| PCMark 10 / Essentials | |
| Average of class Gaming (8810 - 11935, n=97, last 2 years) | |
| Lenovo Legion 5 15ACH6A-82NW0010GE | |
| Asus TUF Gaming F15 FX507ZM | |
| Gigabyte A5 K1 | |
| Gigabyte A5 X1 | |
| MSI Alpha 15 B5EEK-008 | |
| Average AMD Ryzen 5 5600H, NVIDIA GeForce RTX 3060 Laptop GPU (9639 - 10127, n=2) | |
| PCMark 10 / Productivity | |
| Average of class Gaming (6845 - 25323, n=95, last 2 years) | |
| Gigabyte A5 X1 | |
| Lenovo Legion 5 15ACH6A-82NW0010GE | |
| Asus TUF Gaming F15 FX507ZM | |
| Average AMD Ryzen 5 5600H, NVIDIA GeForce RTX 3060 Laptop GPU (8829 - 9027, n=2) | |
| MSI Alpha 15 B5EEK-008 | |
| Gigabyte A5 K1 | |
| PCMark 10 / Digital Content Creation | |
| Average of class Gaming (7602 - 19954, n=95, last 2 years) | |
| Asus TUF Gaming F15 FX507ZM | |
| MSI Alpha 15 B5EEK-008 | |
| Lenovo Legion 5 15ACH6A-82NW0010GE | |
| Gigabyte A5 X1 | |
| Average AMD Ryzen 5 5600H, NVIDIA GeForce RTX 3060 Laptop GPU (7740 - 9026, n=2) | |
| Gigabyte A5 K1 | |
| CrossMark / Overall | |
| Average of class Gaming (1366 - 2409, n=94, last 2 years) | |
| Average AMD Ryzen 5 5600H, NVIDIA GeForce RTX 3060 Laptop GPU (n=1) | |
| MSI Alpha 15 B5EEK-008 | |
| CrossMark / Productivity | |
| Average of class Gaming (1386 - 2254, n=94, last 2 years) | |
| Average AMD Ryzen 5 5600H, NVIDIA GeForce RTX 3060 Laptop GPU (n=1) | |
| MSI Alpha 15 B5EEK-008 | |
| CrossMark / Creativity | |
| Average of class Gaming (1343 - 2786, n=94, last 2 years) | |
| MSI Alpha 15 B5EEK-008 | |
| Average AMD Ryzen 5 5600H, NVIDIA GeForce RTX 3060 Laptop GPU (n=1) | |
| CrossMark / Responsiveness | |
| Average of class Gaming (1226 - 2334, n=94, last 2 years) | |
| Average AMD Ryzen 5 5600H, NVIDIA GeForce RTX 3060 Laptop GPU (n=1) | |
| MSI Alpha 15 B5EEK-008 | |
| PCMark 10 Score | 6341 points | |
Help | ||
| AIDA64 / Memory Copy | |
| Average of class Gaming (21750 - 129946, n=105, last 2 years) | |
| Asus TUF Gaming F15 FX507ZM | |
| Gigabyte A5 K1 | |
| MSI Alpha 15 B5EEK-008 | |
| Gigabyte A5 X1 | |
| Average AMD Ryzen 5 5600H (20549 - 42141, n=14) | |
| Lenovo Legion 5 15ACH6A-82NW0010GE | |
| AIDA64 / Memory Read | |
| Average of class Gaming (22956 - 118858, n=105, last 2 years) | |
| Asus TUF Gaming F15 FX507ZM | |
| Gigabyte A5 K1 | |
| MSI Alpha 15 B5EEK-008 | |
| Gigabyte A5 X1 | |
| Average AMD Ryzen 5 5600H (22917 - 47595, n=14) | |
| Lenovo Legion 5 15ACH6A-82NW0010GE | |
| AIDA64 / Memory Write | |
| Average of class Gaming (22297 - 135096, n=105, last 2 years) | |
| Asus TUF Gaming F15 FX507ZM | |
| MSI Alpha 15 B5EEK-008 | |
| Gigabyte A5 K1 | |
| Gigabyte A5 X1 | |
| Average AMD Ryzen 5 5600H (20226 - 44872, n=14) | |
| Lenovo Legion 5 15ACH6A-82NW0010GE | |
| AIDA64 / Memory Latency | |
| Average of class Gaming (75.3 - 259, n=105, last 2 years) | |
| Lenovo Legion 5 15ACH6A-82NW0010GE | |
| MSI Alpha 15 B5EEK-008 | |
| Average AMD Ryzen 5 5600H (75 - 89.1, n=14) | |
| Gigabyte A5 X1 | |
| Gigabyte A5 K1 | |
| Asus TUF Gaming F15 FX507ZM | |
* ... smaller is better
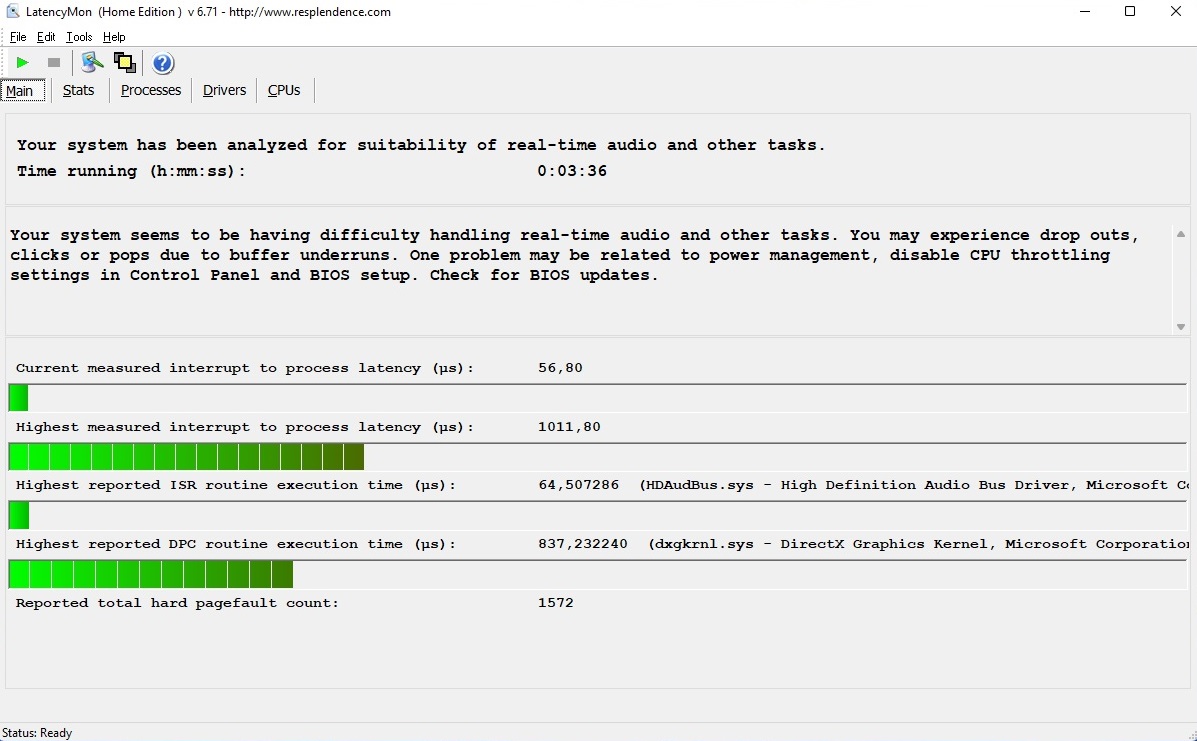
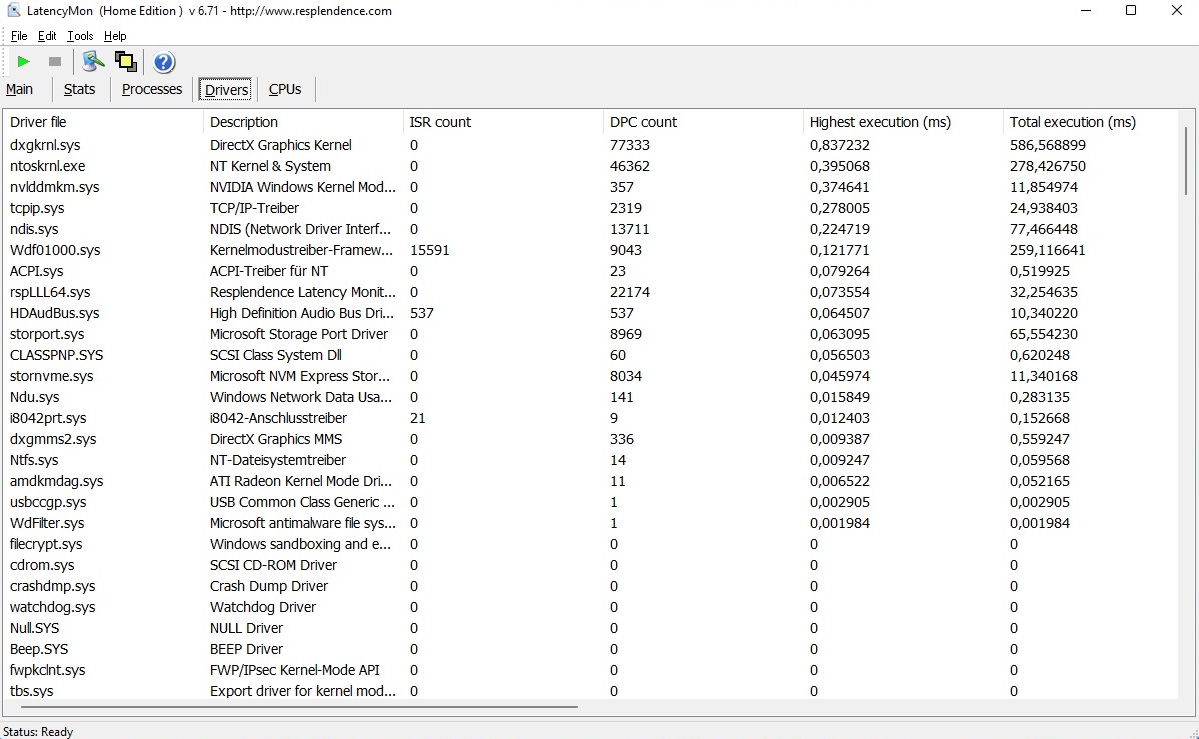
DPC延迟
笔记本电脑在延迟方面做得不太理想。根据LatencyMon工具,那些想实时编辑音频或视频的人应该宁可寻找替代方案(或手动操作),许多笔记本在这里暴露出弱点。
| DPC Latencies / LatencyMon - interrupt to process latency (max), Web, Youtube, Prime95 | |
| Gigabyte A5 K1 | |
| MSI Alpha 15 B5EEK-008 | |
| Lenovo Legion 5 15ACH6A-82NW0010GE | |
| Asus TUF Gaming F15 FX507ZM | |
| Gigabyte A5 X1 | |
* ... smaller is better
大容量存储
安装的512GB固态硬盘对于NVMe硬盘来说,既不是特别快,也不是特别慢,但表现在比较设备的中场。我们必须特别批评其长期性能。在用DiskSpd进行的长期测试中,速度在几次运行后大幅下降,然后稳定在一个中等水平。积极的一面是,该机箱最多可以容纳两个M.2驱动器(PCIe 2280)和一个2.5英寸驱动器。

| Drive Performance rating - Percent | |
| Average of class Gaming | |
| Asus TUF Gaming F15 FX507ZM | |
| Average ESR512GTLG-E6GBTNB4 | |
| Gigabyte A5 K1 | |
| MSI Alpha 15 B5EEK-008 | |
| Gigabyte A5 X1 | |
| Lenovo Legion 5 15ACH6A-82NW0010GE | |
* ... smaller is better
Read continuous power: DiskSpd Read Loop, Queue Depth 8
图形卡
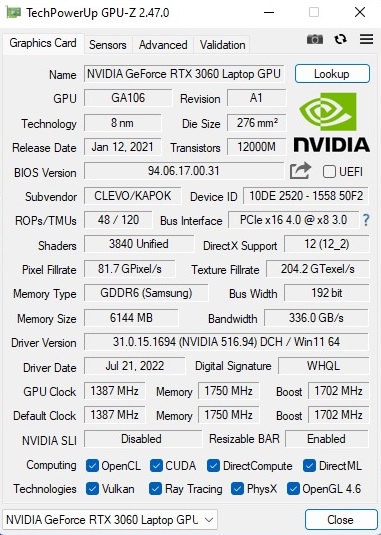
GeForce RTX 3060是一个基于Nvidia安培架构的光线追踪GPU。DirectX 12模型有3840个着色器单元,尽管性能在很大程度上取决于TGP设置。技嘉为RTX 3060选择了一个非常高的数值,最大功率为130瓦,这在基准测试结果中也可以看到。这些结果比之前确定的3060的平均值几乎好10%。另一方面,RTX 3070在GPU部分的速度约为20%。内存配置已经不太符合要求了。6GB的VRAM在要求高的游戏中已经达到了极限--至少在更高的分辨率和设置下是这样。热情的游戏玩家至少应该使用8GB的GPU。
| 3DMark Performance rating - Percent | |
| Average of class Gaming | |
| Gigabyte A5 X1 -1! | |
| Lenovo Legion 5 15ACH6A-82NW0010GE -1! | |
| Asus TUF Gaming F15 FX507ZM | |
| Gigabyte A5 K1 | |
| Average NVIDIA GeForce RTX 3060 Laptop GPU | |
| MSI Alpha 15 B5EEK-008 | |
| 3DMark 11 Performance | 22909 points | |
| 3DMark Cloud Gate Standard Score | 44621 points | |
| 3DMark Fire Strike Score | 19308 points | |
| 3DMark Time Spy Score | 8551 points | |
Help | ||
游戏性能
在1,920 x 1,080的原生分辨率下,A5 K1可以非常流畅地运行几乎所有当前的游戏,并具有高到最大的细节。超过60FPS不是例外,而是规则,这对144Hz的屏幕有利。
| The Witcher 3 | |
| 1920x1080 High Graphics & Postprocessing (Nvidia HairWorks Off) | |
| Average of class Gaming (341 - 404, n=2, last 2 years) | |
| Asus TUF Gaming F15 FX507ZM | |
| Gigabyte A5 X1 | |
| Gigabyte A5 K1 | |
| Average NVIDIA GeForce RTX 3060 Laptop GPU (81 - 186.8, n=41) | |
| Lenovo Legion 5 15ACH6A-82NW0010GE | |
| MSI Alpha 15 B5EEK-008 | |
| 1920x1080 Ultra Graphics & Postprocessing (HBAO+) | |
| Average of class Gaming (104.7 - 240, n=7, last 2 years) | |
| Gigabyte A5 X1 | |
| Asus TUF Gaming F15 FX507ZM | |
| Lenovo Legion 5 15ACH6A-82NW0010GE | |
| Gigabyte A5 K1 | |
| Average NVIDIA GeForce RTX 3060 Laptop GPU (58.2 - 91.5, n=48) | |
| MSI Alpha 15 B5EEK-008 | |
与CPU循环类似,在长期测试中(60分钟),显卡也出现了一些问题。的Witcher 3)并没有显示出任何异常。GeForce RTX 3060以稳定的帧率运行。
Witcher 3 FPS-Diagram
| low | med. | high | ultra | |
|---|---|---|---|---|
| GTA V (2015) | 154.2 | 91.4 | ||
| The Witcher 3 (2015) | 153 | 78.8 | ||
| Dota 2 Reborn (2015) | 143.1 | 129.6 | 123.1 | 115.4 |
| Final Fantasy XV Benchmark (2018) | 84.8 | |||
| X-Plane 11.11 (2018) | 99.1 | 84.1 | 69.6 | |
| Strange Brigade (2018) | 172.9 | 149.1 | ||
| God of War (2022) | 74 | 52.8 | ||
| Rainbow Six Extraction (2022) | 155 | 125 | ||
| Dying Light 2 (2022) | 64.4 | |||
| Elden Ring (2022) | 60 | 60 | ||
| Elex 2 (2022) | 73 | 68.9 | ||
| Ghostwire Tokyo (2022) | 126 | 124 | ||
| Vampire Bloodhunt (2022) | 157 | 152 | ||
| F1 22 (2022) | 135 | 53 | ||
| The Quarry (2022) | 82.7 | 66.4 |
排放
噪声排放
正如预期的那样,RTX 3060的高TGP是以噪音发展为代价的。当使用性能模式时,这台15英寸的机器在负载下达到了非常高的56至58 dB(A)。这是一个令人讨厌的响亮水平,迫使人们使用耳机,尽管一些竞争对手也会有类似的响亮--尽管这些对手提供更薄的机箱。Clevo裸机在闲置模式和简单的任务(如办公、视频和网络)中通常要接受很多批评。然而,A5 K1在这里给人以积极的惊喜,因为风扇部分不活动,而且启动阶段的频率和强度按Clevo的标准是有限的。然而,潜在的噪音是该设备的弱点之一。
Noise level
| Idle |
| 26 / 29 / 32 dB(A) |
| Load |
| 57 / 58 dB(A) |
 | ||
30 dB silent 40 dB(A) audible 50 dB(A) loud |
||
min: | ||
| Gigabyte A5 K1 R5 5600H, GeForce RTX 3060 Laptop GPU | Asus TUF Gaming F15 FX507ZM i7-12700H, GeForce RTX 3060 Laptop GPU | Lenovo Legion 5 15ACH6A-82NW0010GE R5 5600H, Radeon RX 6600M | MSI Alpha 15 B5EEK-008 R7 5800H, Radeon RX 6600M | Gigabyte A5 X1 R9 5900HX, GeForce RTX 3070 Laptop GPU | |
|---|---|---|---|---|---|
| Noise | 14% | 6% | 1% | 0% | |
| off / environment * (dB) | 26 | 23.2 11% | 25 4% | 25.49 2% | 25 4% |
| Idle Minimum * (dB) | 26 | 23.6 9% | 25 4% | 29.57 -14% | 27 -4% |
| Idle Average * (dB) | 29 | 23.6 19% | 25 14% | 29.57 -2% | 29 -0% |
| Idle Maximum * (dB) | 32 | 25.4 21% | 34.5 -8% | 29.57 8% | 32 -0% |
| Load Average * (dB) | 57 | 38 33% | 51.1 10% | 48.61 15% | 57 -0% |
| Witcher 3 ultra * (dB) | 56 | 54.1 3% | 59 -5% | 56 -0% | |
| Load Maximum * (dB) | 58 | 57.2 1% | 51.3 12% | 57.66 1% | 58 -0% |
* ... smaller is better
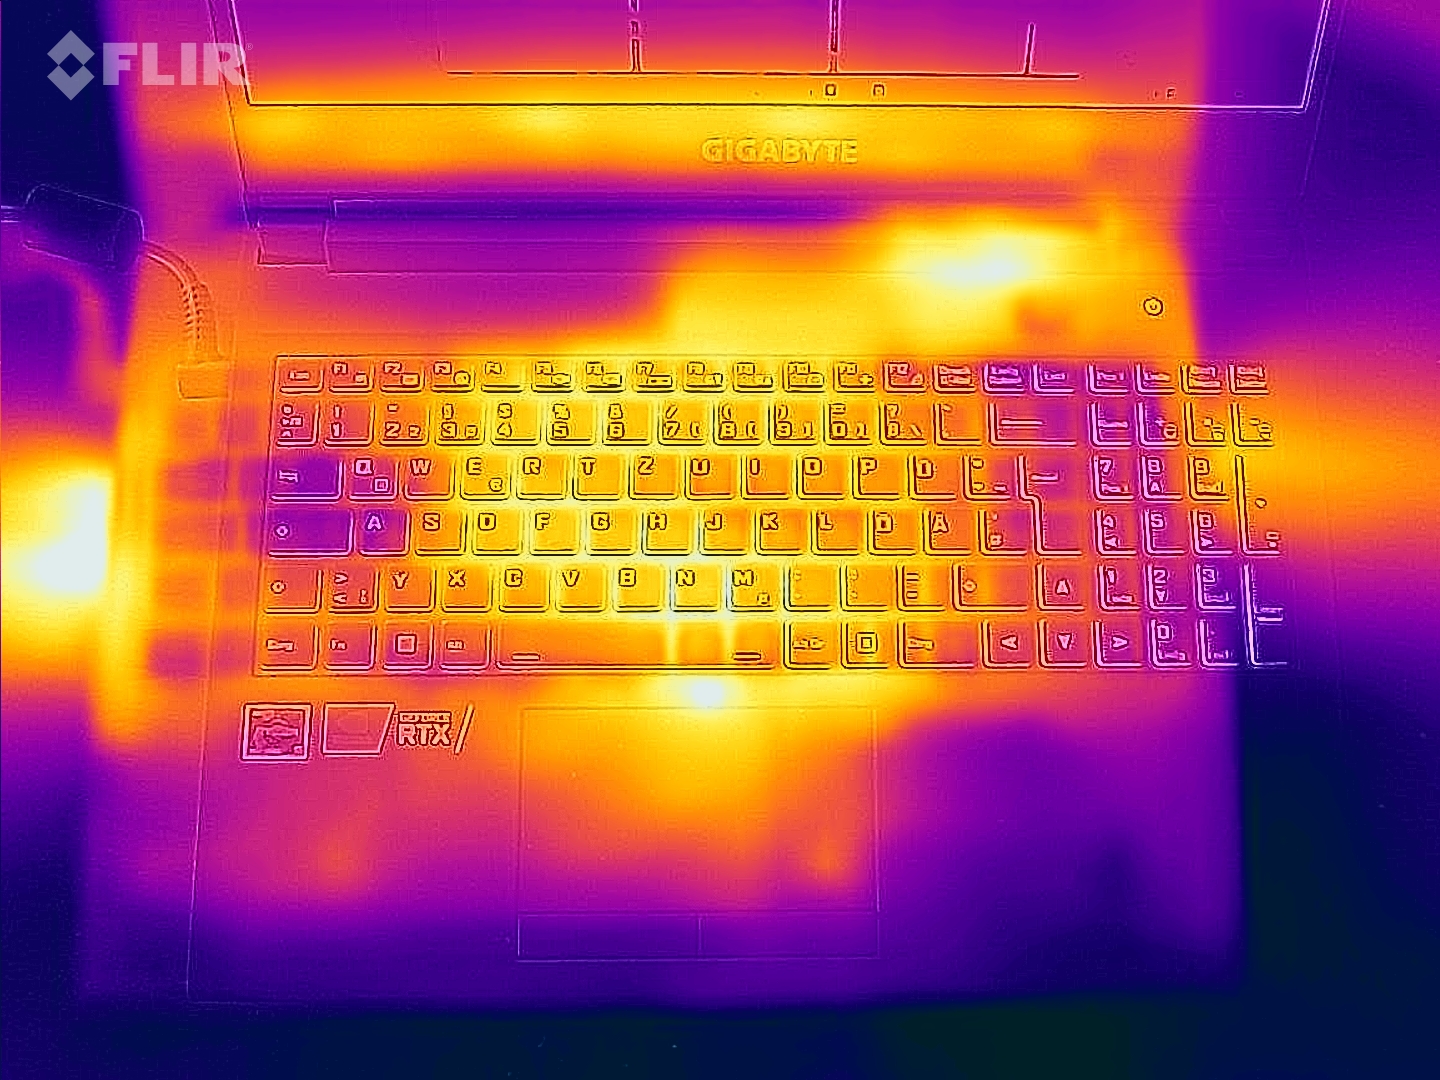
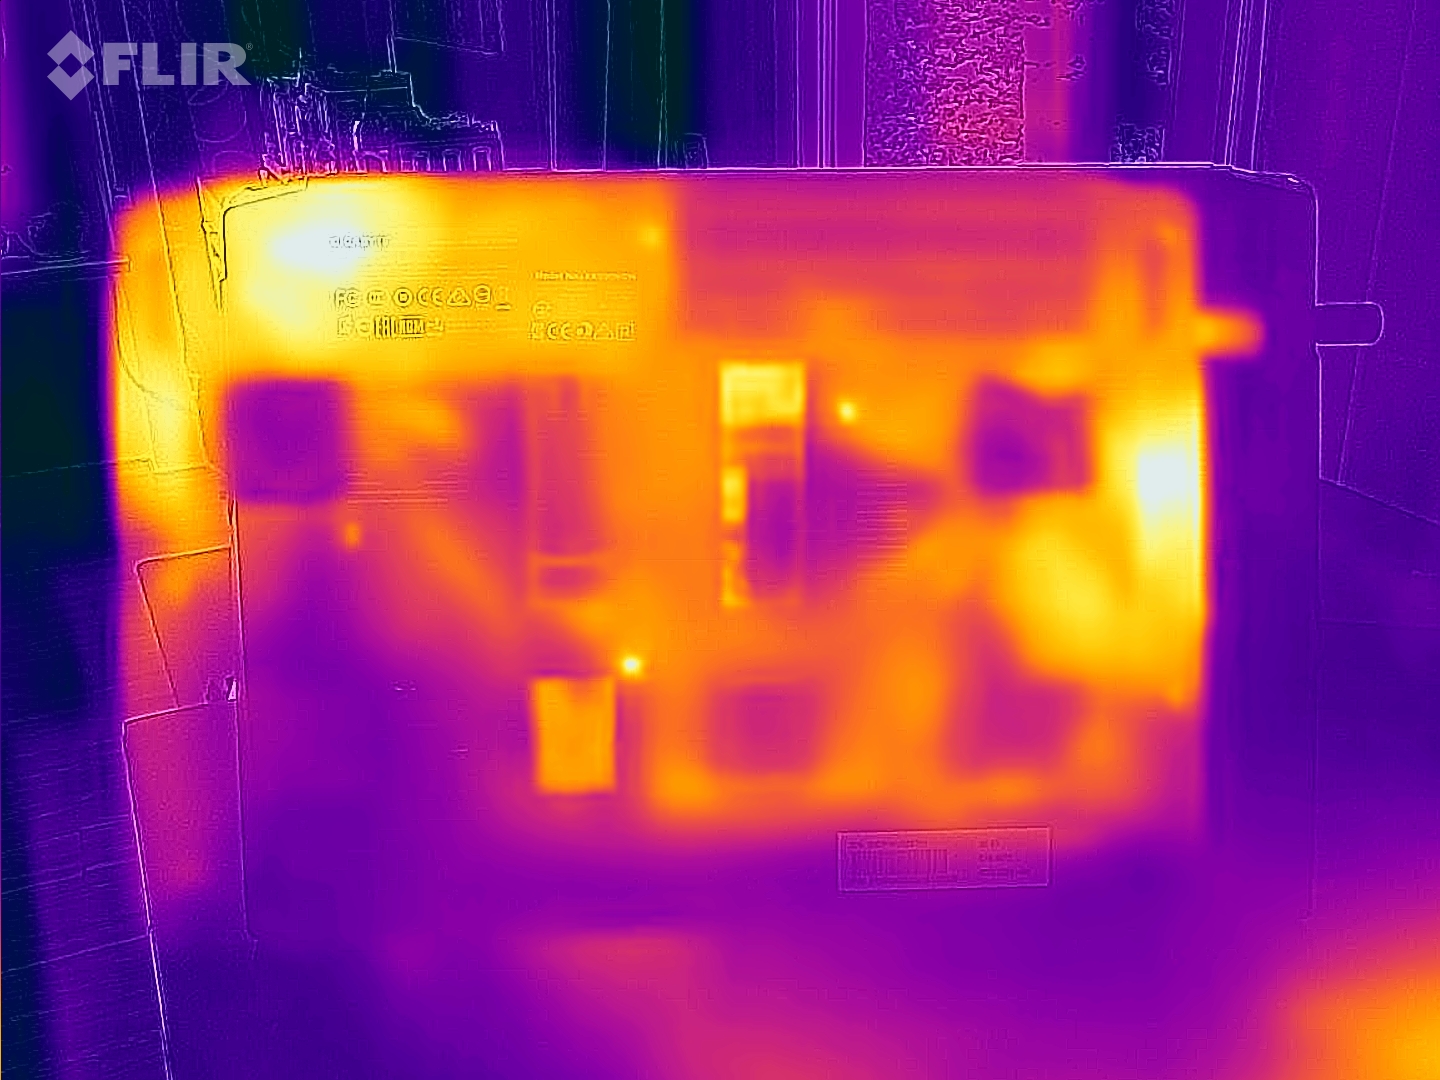
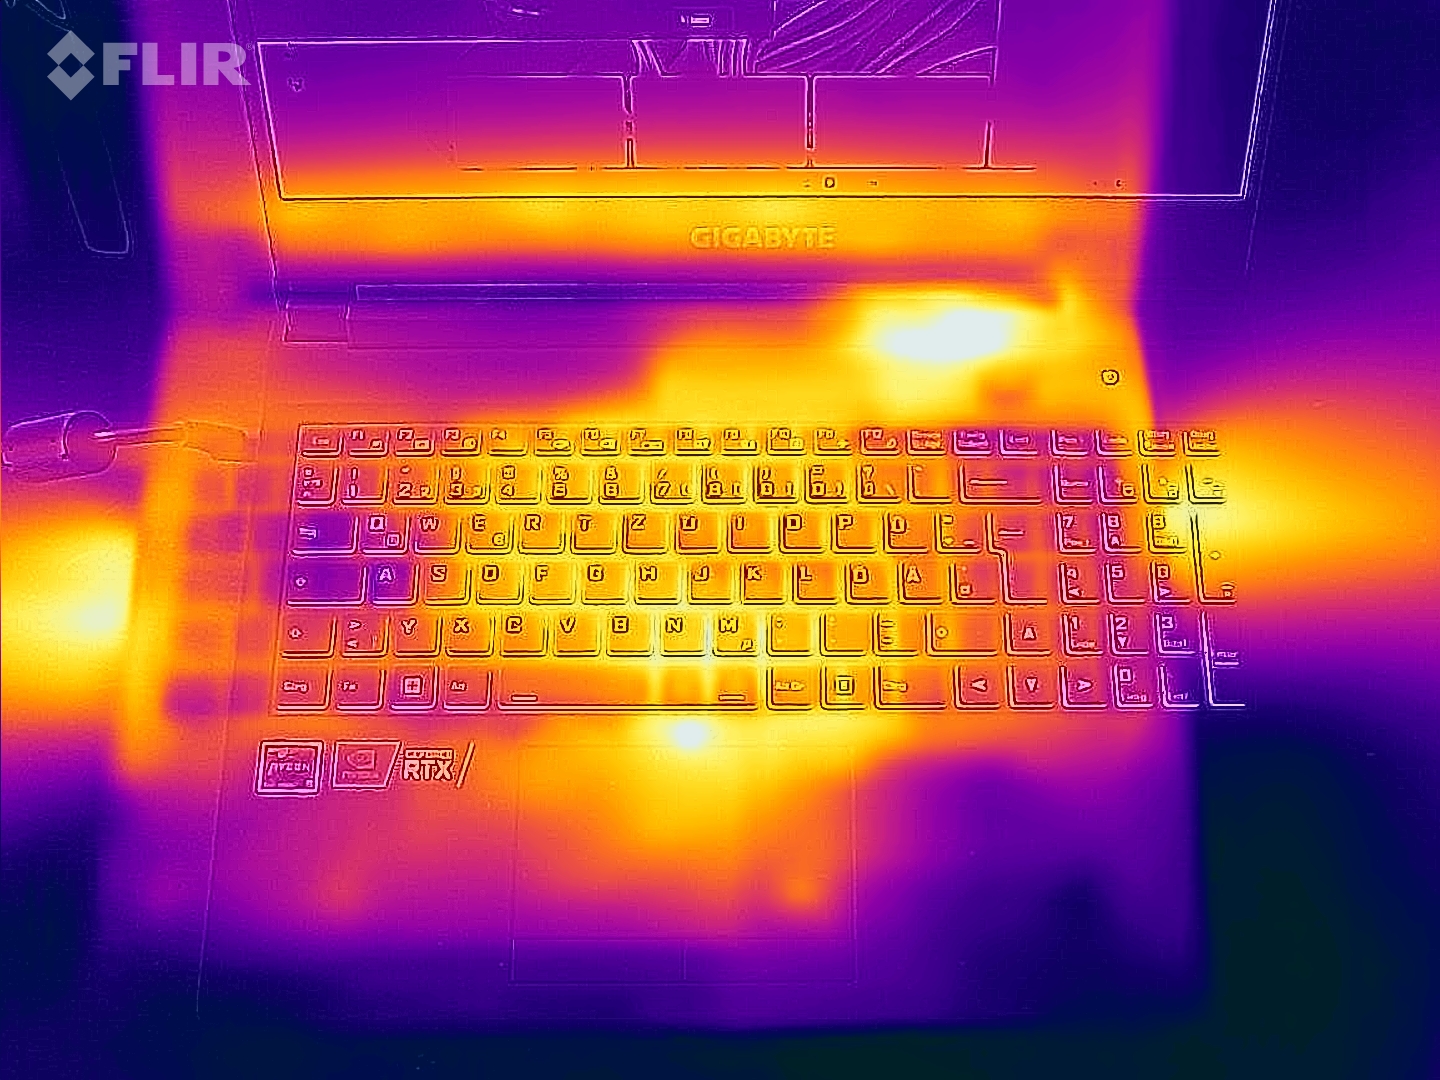
温度
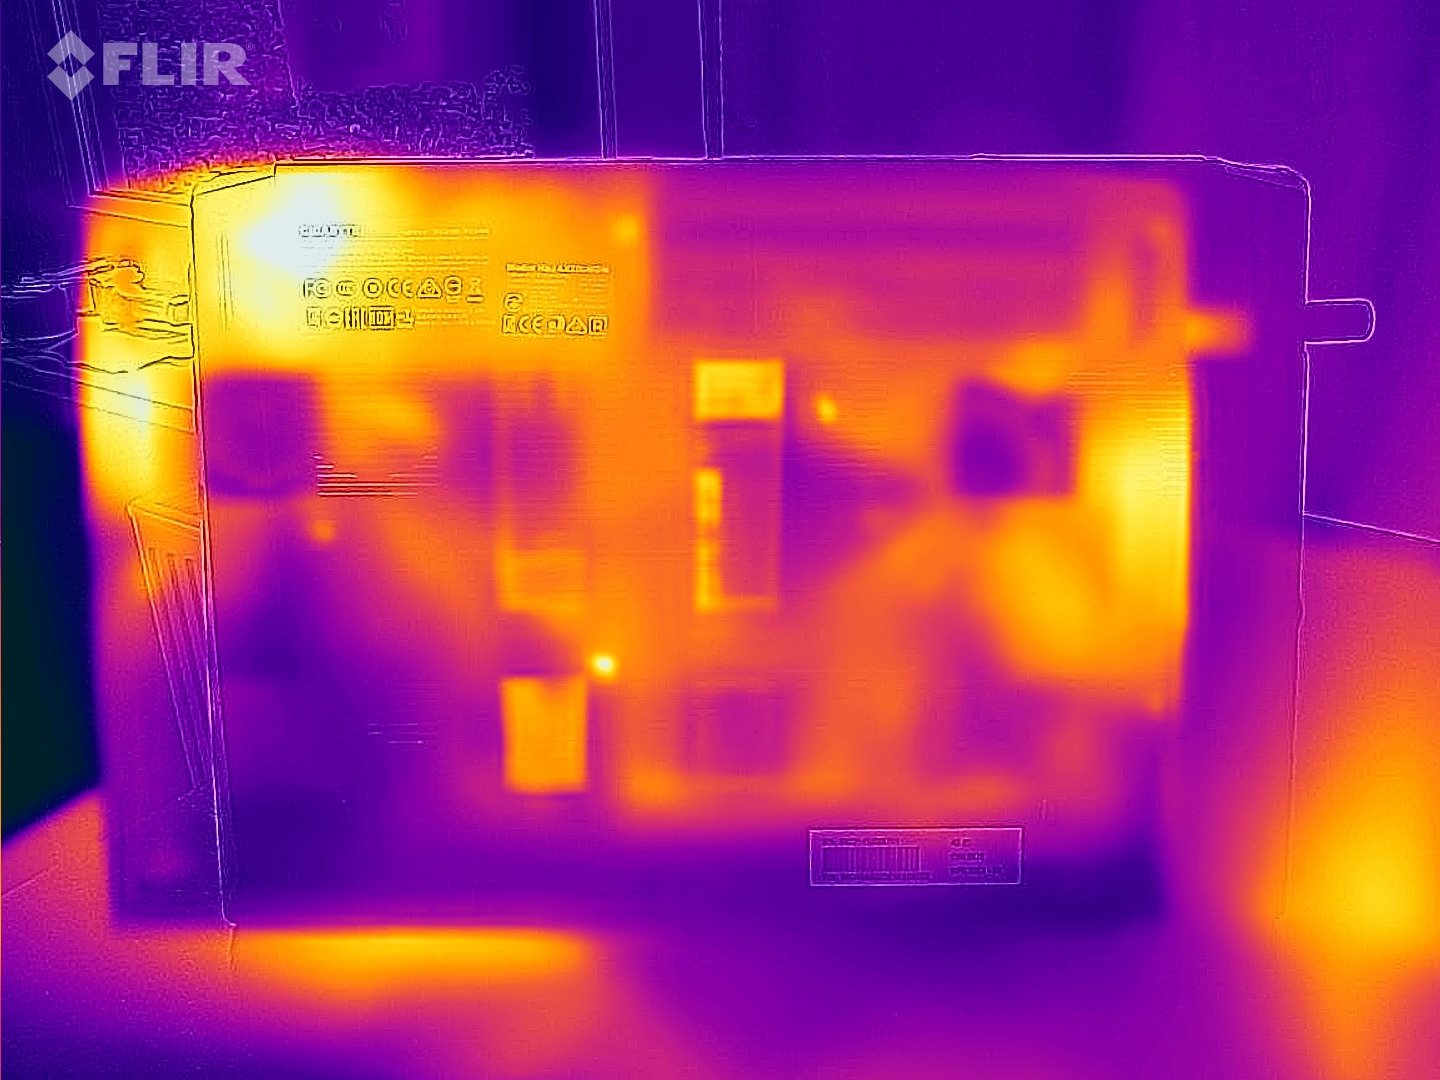
A5 K1的温度发展也并不出色--尽管它的高度很慷慨。满载60分钟后,上侧最高温度为50℃(122°F),下侧最高温度为51℃(123.8°F),比许多具有类似设备的更薄的笔记本电脑还要高。
(-) The maximum temperature on the upper side is 50 °C / 122 F, compared to the average of 40.4 °C / 105 F, ranging from 21.2 to 68.8 °C for the class Gaming.
(-) The bottom heats up to a maximum of 51 °C / 124 F, compared to the average of 43.2 °C / 110 F
(+) In idle usage, the average temperature for the upper side is 27.9 °C / 82 F, compared to the device average of 33.9 °C / 93 F.
(-) Playing The Witcher 3, the average temperature for the upper side is 42.7 °C / 109 F, compared to the device average of 33.9 °C / 93 F.
(-) The palmrests and touchpad can get very hot to the touch with a maximum of 44 °C / 111.2 F.
(-) The average temperature of the palmrest area of similar devices was 28.8 °C / 83.8 F (-15.2 °C / -27.4 F).
| Gigabyte A5 K1 R5 5600H, GeForce RTX 3060 Laptop GPU | Asus TUF Gaming F15 FX507ZM i7-12700H, GeForce RTX 3060 Laptop GPU | Lenovo Legion 5 15ACH6A-82NW0010GE R5 5600H, Radeon RX 6600M | MSI Alpha 15 B5EEK-008 R7 5800H, Radeon RX 6600M | Gigabyte A5 X1 R9 5900HX, GeForce RTX 3070 Laptop GPU | |
|---|---|---|---|---|---|
| Heat | -8% | 6% | 4% | 6% | |
| Maximum Upper Side * (°C) | 50 | 44.4 11% | 39.9 20% | 44.4 11% | 47 6% |
| Maximum Bottom * (°C) | 51 | 48.8 4% | 43.8 14% | 48.6 5% | 51 -0% |
| Idle Upper Side * (°C) | 30 | 37.8 -26% | 34.1 -14% | 31.2 -4% | 27 10% |
| Idle Bottom * (°C) | 33 | 39.6 -20% | 31.7 4% | 32.2 2% | 30 9% |
* ... smaller is better
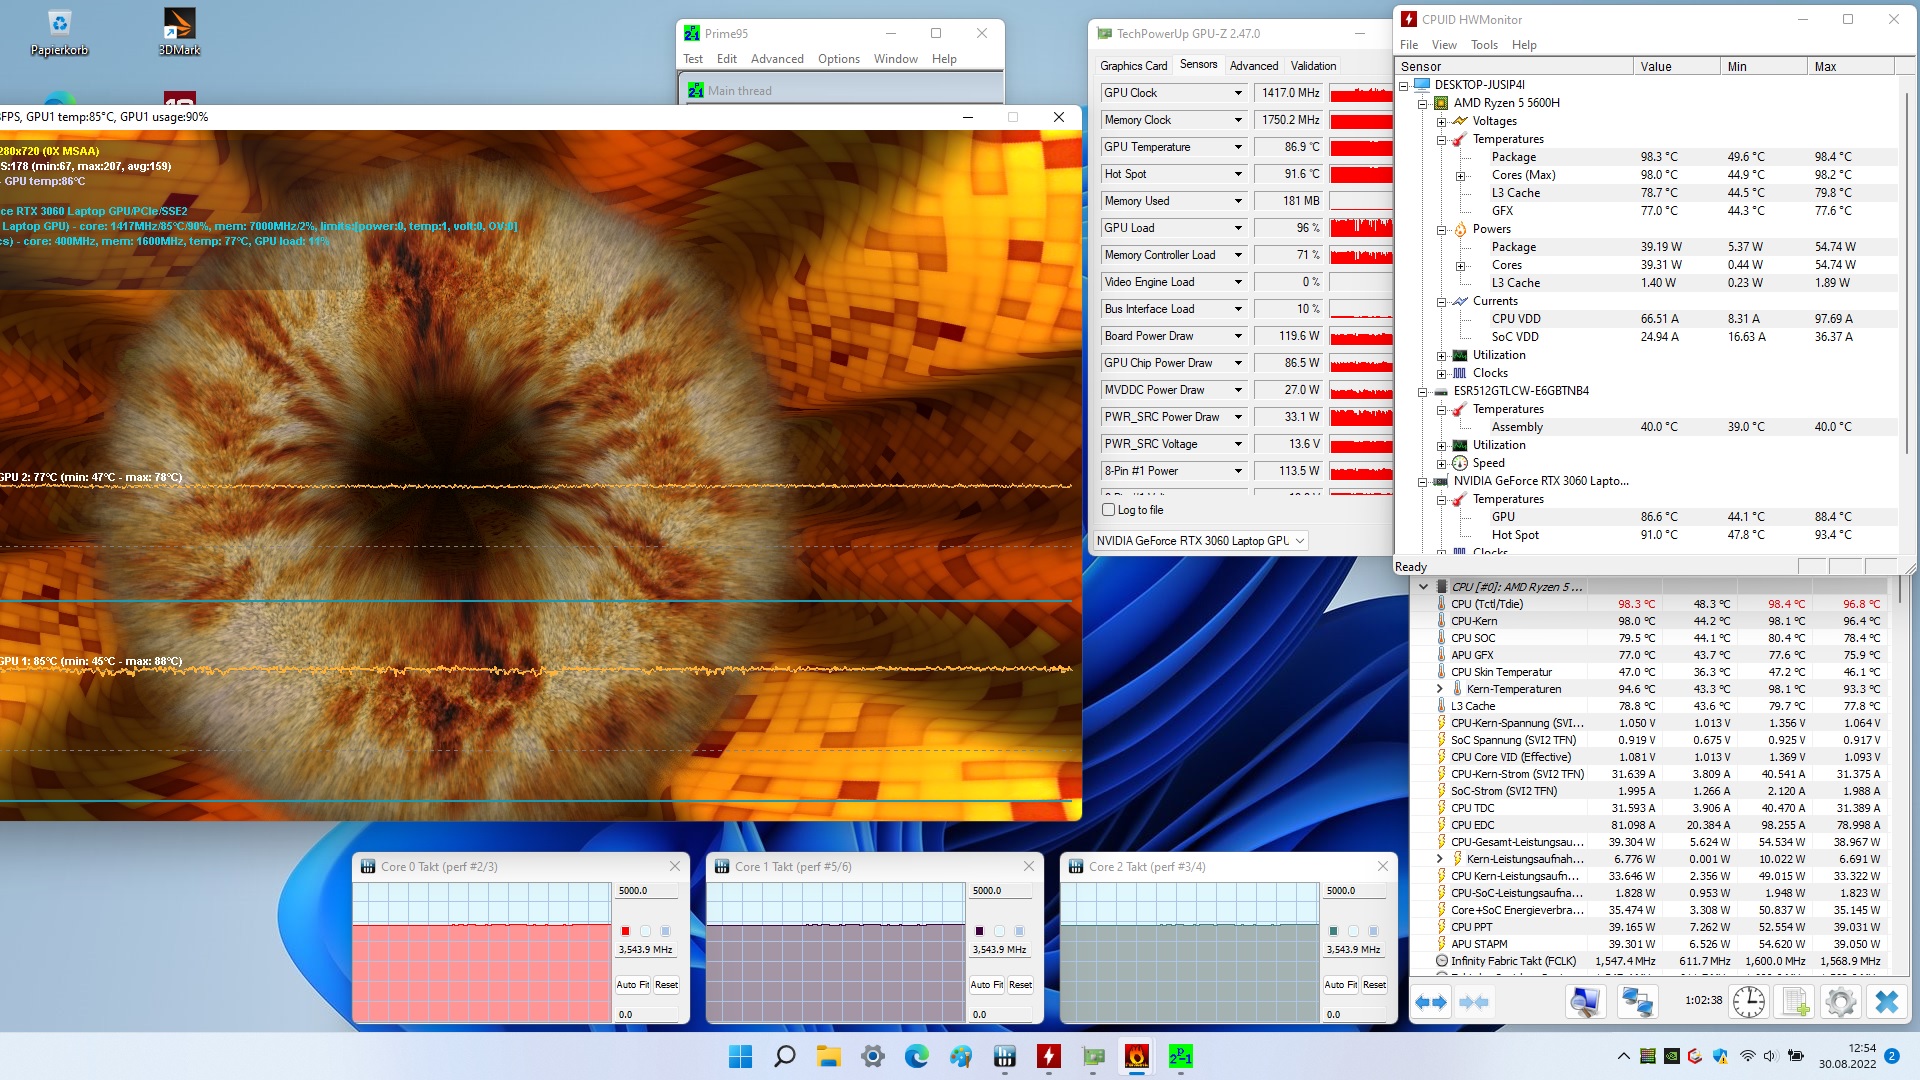
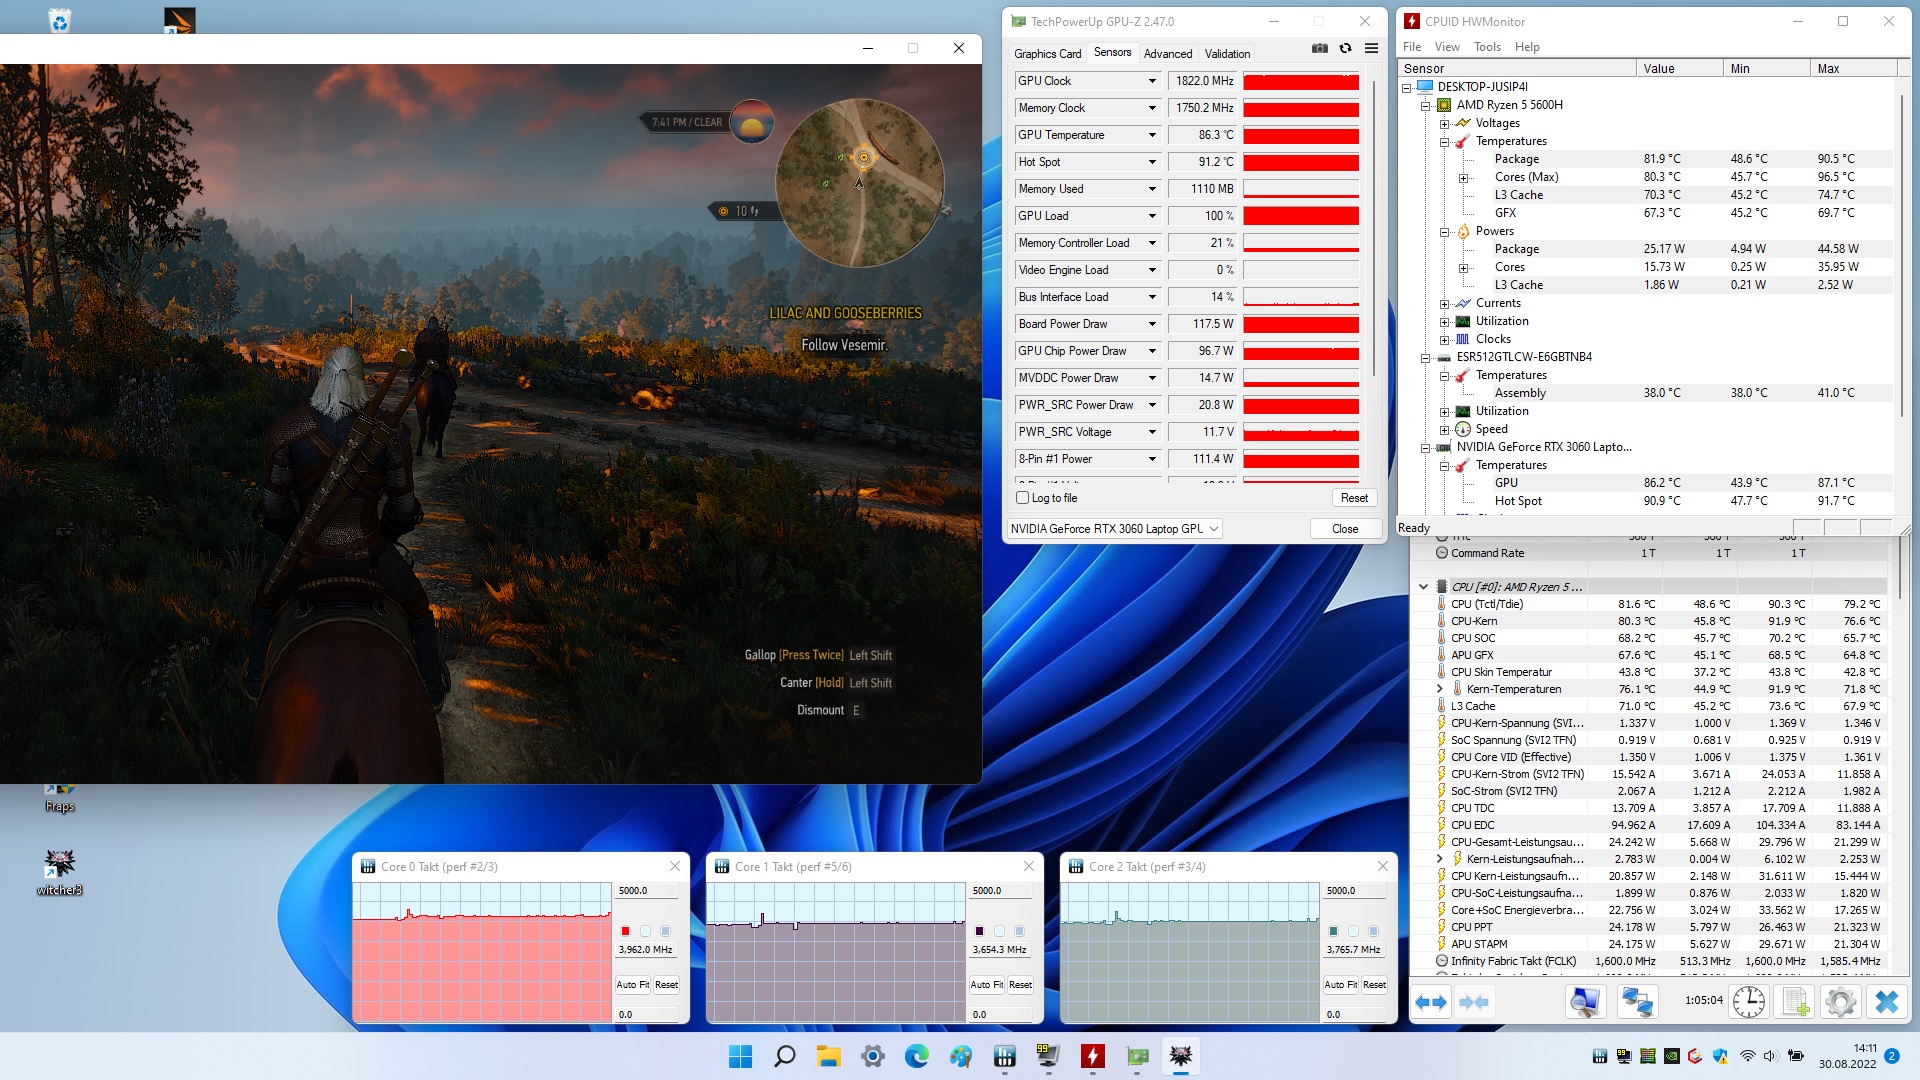
压力测试
机箱内的情况不一定更好。尽管在用FurMark和Prime95工具进行压力测试时,CPU和GPU没有节流,这不是一个问题,但Ryzen 5 5600H的最高温度为98℃(208.4°F),GeForce RTX 3060的最高温度为88℃(190.4°F)(数据来自HWMonitor工具),这是一个边界线。
演讲者
Gigabyte A5 K1 audio analysis
(+) | speakers can play relatively loud (82 dB)
Bass 100 - 315 Hz
(-) | nearly no bass - on average 28.4% lower than median
(±) | linearity of bass is average (14.8% delta to prev. frequency)
Mids 400 - 2000 Hz
(+) | balanced mids - only 4.9% away from median
(±) | linearity of mids is average (8.1% delta to prev. frequency)
Highs 2 - 16 kHz
(±) | higher highs - on average 6.2% higher than median
(±) | linearity of highs is average (8.4% delta to prev. frequency)
Overall 100 - 16.000 Hz
(±) | linearity of overall sound is average (22.8% difference to median)
Compared to same class
» 82% of all tested devices in this class were better, 5% similar, 13% worse
» The best had a delta of 6%, average was 18%, worst was 132%
Compared to all devices tested
» 68% of all tested devices were better, 5% similar, 27% worse
» The best had a delta of 4%, average was 23%, worst was 134%
Asus TUF Gaming F15 FX507ZM audio analysis
(±) | speaker loudness is average but good (76.7 dB)
Bass 100 - 315 Hz
(±) | reduced bass - on average 13.7% lower than median
(±) | linearity of bass is average (10.1% delta to prev. frequency)
Mids 400 - 2000 Hz
(±) | higher mids - on average 5.2% higher than median
(+) | mids are linear (4.9% delta to prev. frequency)
Highs 2 - 16 kHz
(+) | balanced highs - only 4.1% away from median
(±) | linearity of highs is average (8.6% delta to prev. frequency)
Overall 100 - 16.000 Hz
(±) | linearity of overall sound is average (15.9% difference to median)
Compared to same class
» 38% of all tested devices in this class were better, 7% similar, 56% worse
» The best had a delta of 6%, average was 18%, worst was 132%
Compared to all devices tested
» 25% of all tested devices were better, 5% similar, 70% worse
» The best had a delta of 4%, average was 23%, worst was 134%
电源管理
能源消耗
由于图形切换(Nvidia 优化),这款笔记本电脑在空闲模式下相当节俭,只有10到17瓦的功率。在负载情况下,我们可以从这台15英寸的笔记本电脑中哄骗出113到245瓦,这对于所安装的硬件和提供的性能来说是一个典型的消耗。
| Off / Standby | |
| Idle | |
| Load |
|
Key:
min: | |
| Gigabyte A5 K1 R5 5600H, GeForce RTX 3060 Laptop GPU | Asus TUF Gaming F15 FX507ZM i7-12700H, GeForce RTX 3060 Laptop GPU | Lenovo Legion 5 15ACH6A-82NW0010GE R5 5600H, Radeon RX 6600M | MSI Alpha 15 B5EEK-008 R7 5800H, Radeon RX 6600M | Gigabyte A5 X1 R9 5900HX, GeForce RTX 3070 Laptop GPU | Average of class Gaming | |
|---|---|---|---|---|---|---|
| Power Consumption | 1% | -6% | 18% | -5% | -27% | |
| Idle Minimum * (Watt) | 10 | 6.3 37% | 10 -0% | 9.1 9% | 10 -0% | 13 ? -30% |
| Idle Average * (Watt) | 12 | 9.8 18% | 13.2 -10% | 14.61 -22% | 12 -0% | 19 ? -58% |
| Idle Maximum * (Watt) | 17 | 26.5 -56% | 15.6 8% | 15.05 11% | 16 6% | 24.6 ? -45% |
| Load Average * (Watt) | 113 | 103.8 8% | 178 -58% | 77.8 31% | 124 -10% | 110.7 ? 2% |
| Witcher 3 ultra * (Watt) | 181.4 | 189 -4% | 181 -0% | 131 28% | 204 -12% | |
| Load Maximum * (Watt) | 245 | 241.9 1% | 180 27% | 114.42 53% | 272 -11% | 259 ? -6% |
* ... smaller is better
Power consumption - The Witcher 3 / Stresstest
Power consumption with external monitor
电池寿命
电池寿命与更昂贵的兄弟相差无几。通过WLAN上网的时间不到7小时(显示亮度降低到150cd/m²),只被一些竞争对手打败。然而,这些产品还提供更大的电池(80多瓦特,而不是49瓦特)。
| Gigabyte A5 K1 R5 5600H, GeForce RTX 3060 Laptop GPU, 48.96 Wh | Asus TUF Gaming F15 FX507ZM i7-12700H, GeForce RTX 3060 Laptop GPU, 90 Wh | Lenovo Legion 5 15ACH6A-82NW0010GE R5 5600H, Radeon RX 6600M, 80 Wh | MSI Alpha 15 B5EEK-008 R7 5800H, Radeon RX 6600M, 90 Wh | Gigabyte A5 X1 R9 5900HX, GeForce RTX 3070 Laptop GPU, 48.96 Wh | Average of class Gaming | |
|---|---|---|---|---|---|---|
| Battery runtime | -30% | 33% | 26% | -7% | 3% | |
| WiFi v1.3 (h) | 6.9 | 4.8 -30% | 9.2 33% | 8.7 26% | 6.4 -7% | 7.11 ? 3% |
| Reader / Idle (h) | 15.8 | 12.8 | 12.3 | 10.1 | 8.27 ? | |
| Load (h) | 1.1 | 2 | 1.5 | 1.3 | 1.502 ? | |
| H.264 (h) | 9.8 | 7.3 | 8.32 ? | |||
| Witcher 3 ultra (h) | 1.9 |
Pros
Cons
判决书
如果忽略价格,技嘉A5 K1在与同样快速的15英寸竞争产品的竞争中很难胜出。除了3D模式(性能模式)下的巨大噪音外,组件的高温发展也应该在缺点上提及。尽管外壳相对较厚,但笔记本电脑在负载下变得非常温暖和响亮,这并不能完全说明冷却系统的作用。
说到机箱。机箱在质量方面并没有特别好的表现。塑料表面看起来相当便宜,而且还容易发出响声。在大多数其他方面--无论是输入设备、屏幕、连接性还是电池运行时间--技嘉笔记本电脑都相当不出众,无论是正面还是负面,都没有在人群中脱颖而出。
然而,那些主要关注性价比的人将通过A5 K1获得一个相当不错的报价。
大多数低于1000欧元(约993美元)的游戏笔记本要么速度较慢,要么不得不使用较差的显示屏(关键词:色彩空间)。
价格和可用性
评论的技嘉A5 K1配备Ryzen 5 5600H,GeForce RTX 3060,16GB内存和512GB固态硬盘,在各种网上商店(例如Notebooksbilliger)的售价约为900欧元(约894美元)。).
Gigabyte A5 K1
- 09/01/2022 v7 (old)
Florian Glaser
Price comparison
