申科Vision 16 Pro笔记本电脑评测--配备RTX 3070 Ti的轻量级16英寸超极本
申克公司愿景14去年推出的是一款非常轻巧的14英寸超极本,它结合了轻巧的镁质机箱和大量的端口、高分辨率显示器以及可选的GeForce GPU。这个概念现在也有16英寸的外形尺寸,称为Vision 16和Vision 16 Pro。两种型号都使用相同的机箱,以及现代英特尔阿尔德湖处理器(酷睿i7-12700H),区别仅限于显示屏、内存(DDR4与DDR5)和DGPU的选择。普通的Vision 16配备了90赫兹的面板,可作为iGPU型号,或配备可选的GeForce RTX 3050 Ti(65W),而专业版配备了240赫兹的屏幕,并默认配备GeForce RTX 3060。有可能升级到RTX 3070 Ti和RTX 3080(95W版本)。
今天,我们回顾了Schenker Vision 16 Pro,配备32GB内存,1TB PCIe 4.0固态硬盘,以及GeForce RTX 3070 Ti为2561欧元。配备RTX 3060、16GB内存和500GB固态硬盘的基本型号起价为1899欧元。我们还将很快看到带有RTX 3050 Ti的普通Vision 16。我们把Vision 16 Pro归类为多媒体笔记本电脑,但由于强大的GPU,它也可以成为超薄游戏笔记本电脑的竞争者(如联想Legion Slim 7,例如)。如果你喜欢Linux,还有类似结构的Tuxedo InfinityBook Pro 16 Gen7的最高性能版(最高RTX 3070 Ti),起价2069欧元。
潜在的竞争对手比较
Rating | Date | Model | Weight | Height | Size | Resolution | Price |
|---|---|---|---|---|---|---|---|
| 87.8 % v7 (old) | 11 / 2022 | Schenker Vision 16 Pro RTX 3070 Ti i7-12700H, GeForce RTX 3070 Ti Laptop GPU | 1.7 kg | 17.1 mm | 16.00" | 2560x1600 | |
| 93.2 % v7 (old) | 11 / 2021 | Apple MacBook Pro 16 2021 M1 Pro M1 Pro, M1 Pro 16-Core GPU | 2.2 kg | 16.8 mm | 16.20" | 3456x2234 | |
| 87.9 % v7 (old) | 11 / 2022 | Lenovo Legion Slim 7-16IAH 82TF004YGE i7-12700H, GeForce RTX 3060 Laptop GPU | 2.2 kg | 16.9 mm | 16.00" | 2560x1600 | |
| 87.9 % v7 (old) | 10 / 2022 | Lenovo ThinkBook 16p G3 ARH R9 6900HX, GeForce RTX 3060 Laptop GPU | 2.1 kg | 19.5 mm | 16.00" | 2560x1600 | |
| 86.9 % v7 (old) | 09 / 2022 | HP Envy 16 h0112nr i7-12700H, GeForce RTX 3060 Laptop GPU | 2.3 kg | 19.8 mm | 16.00" | 3840x2400 |
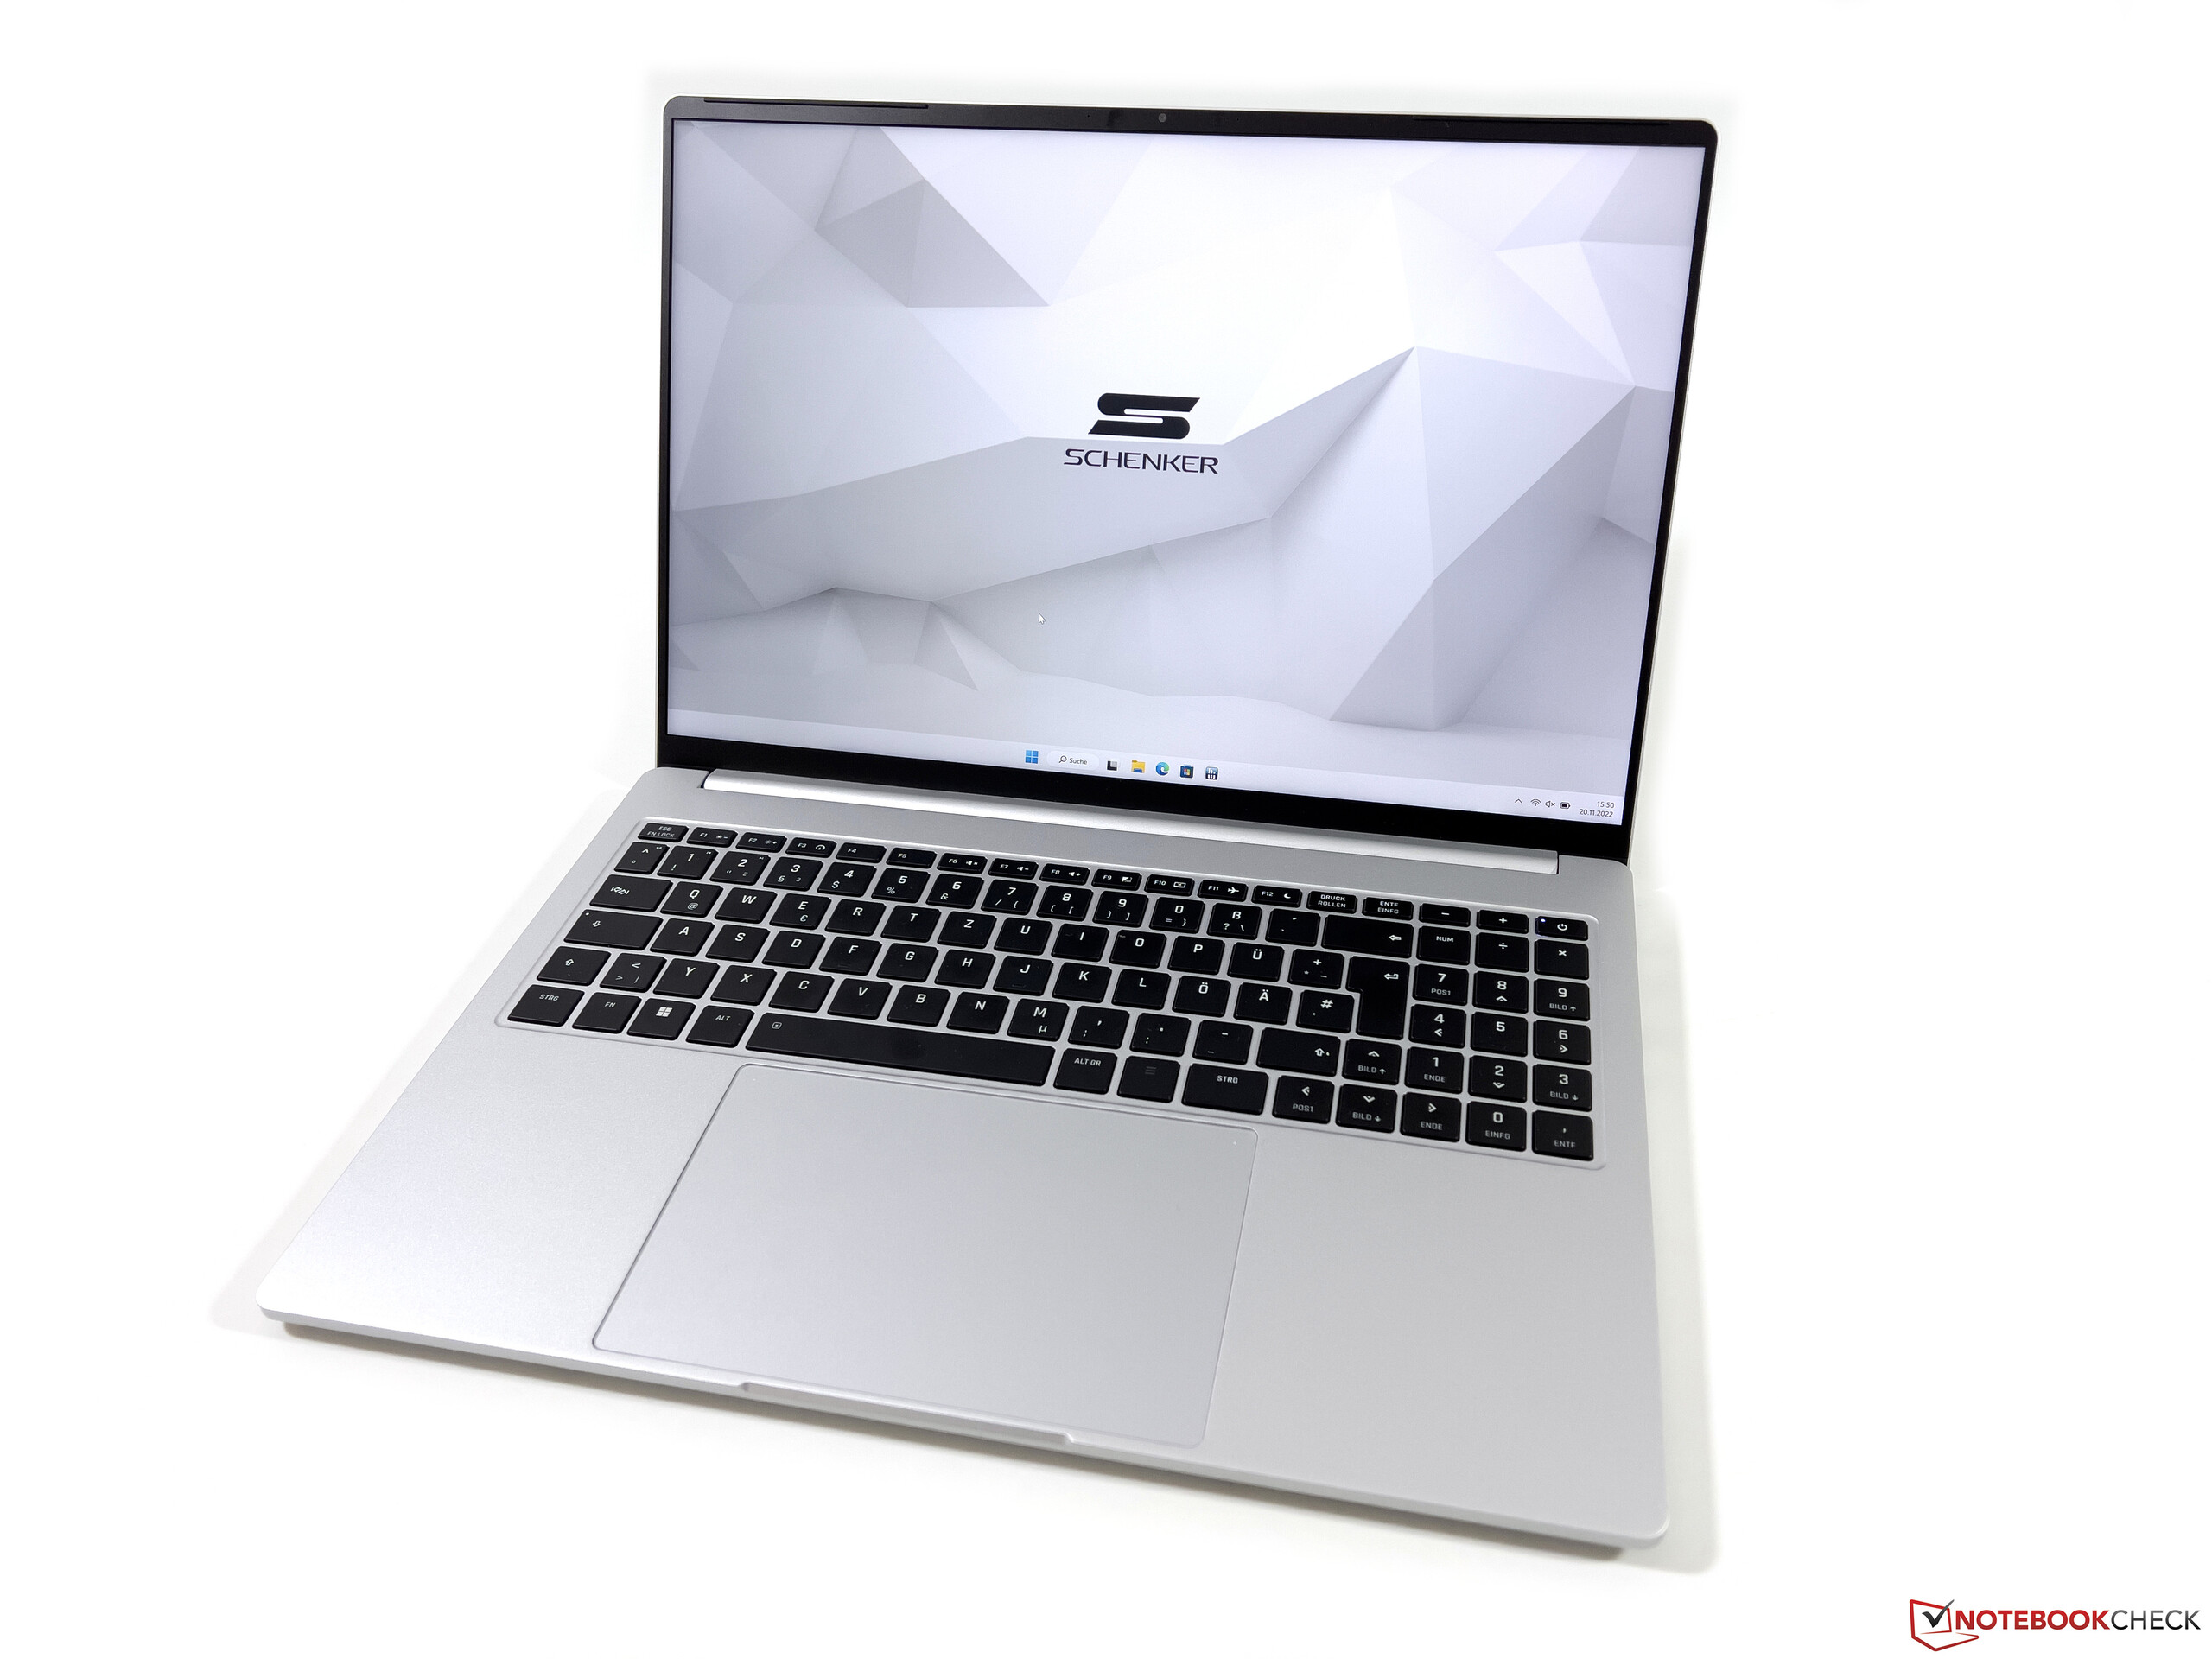
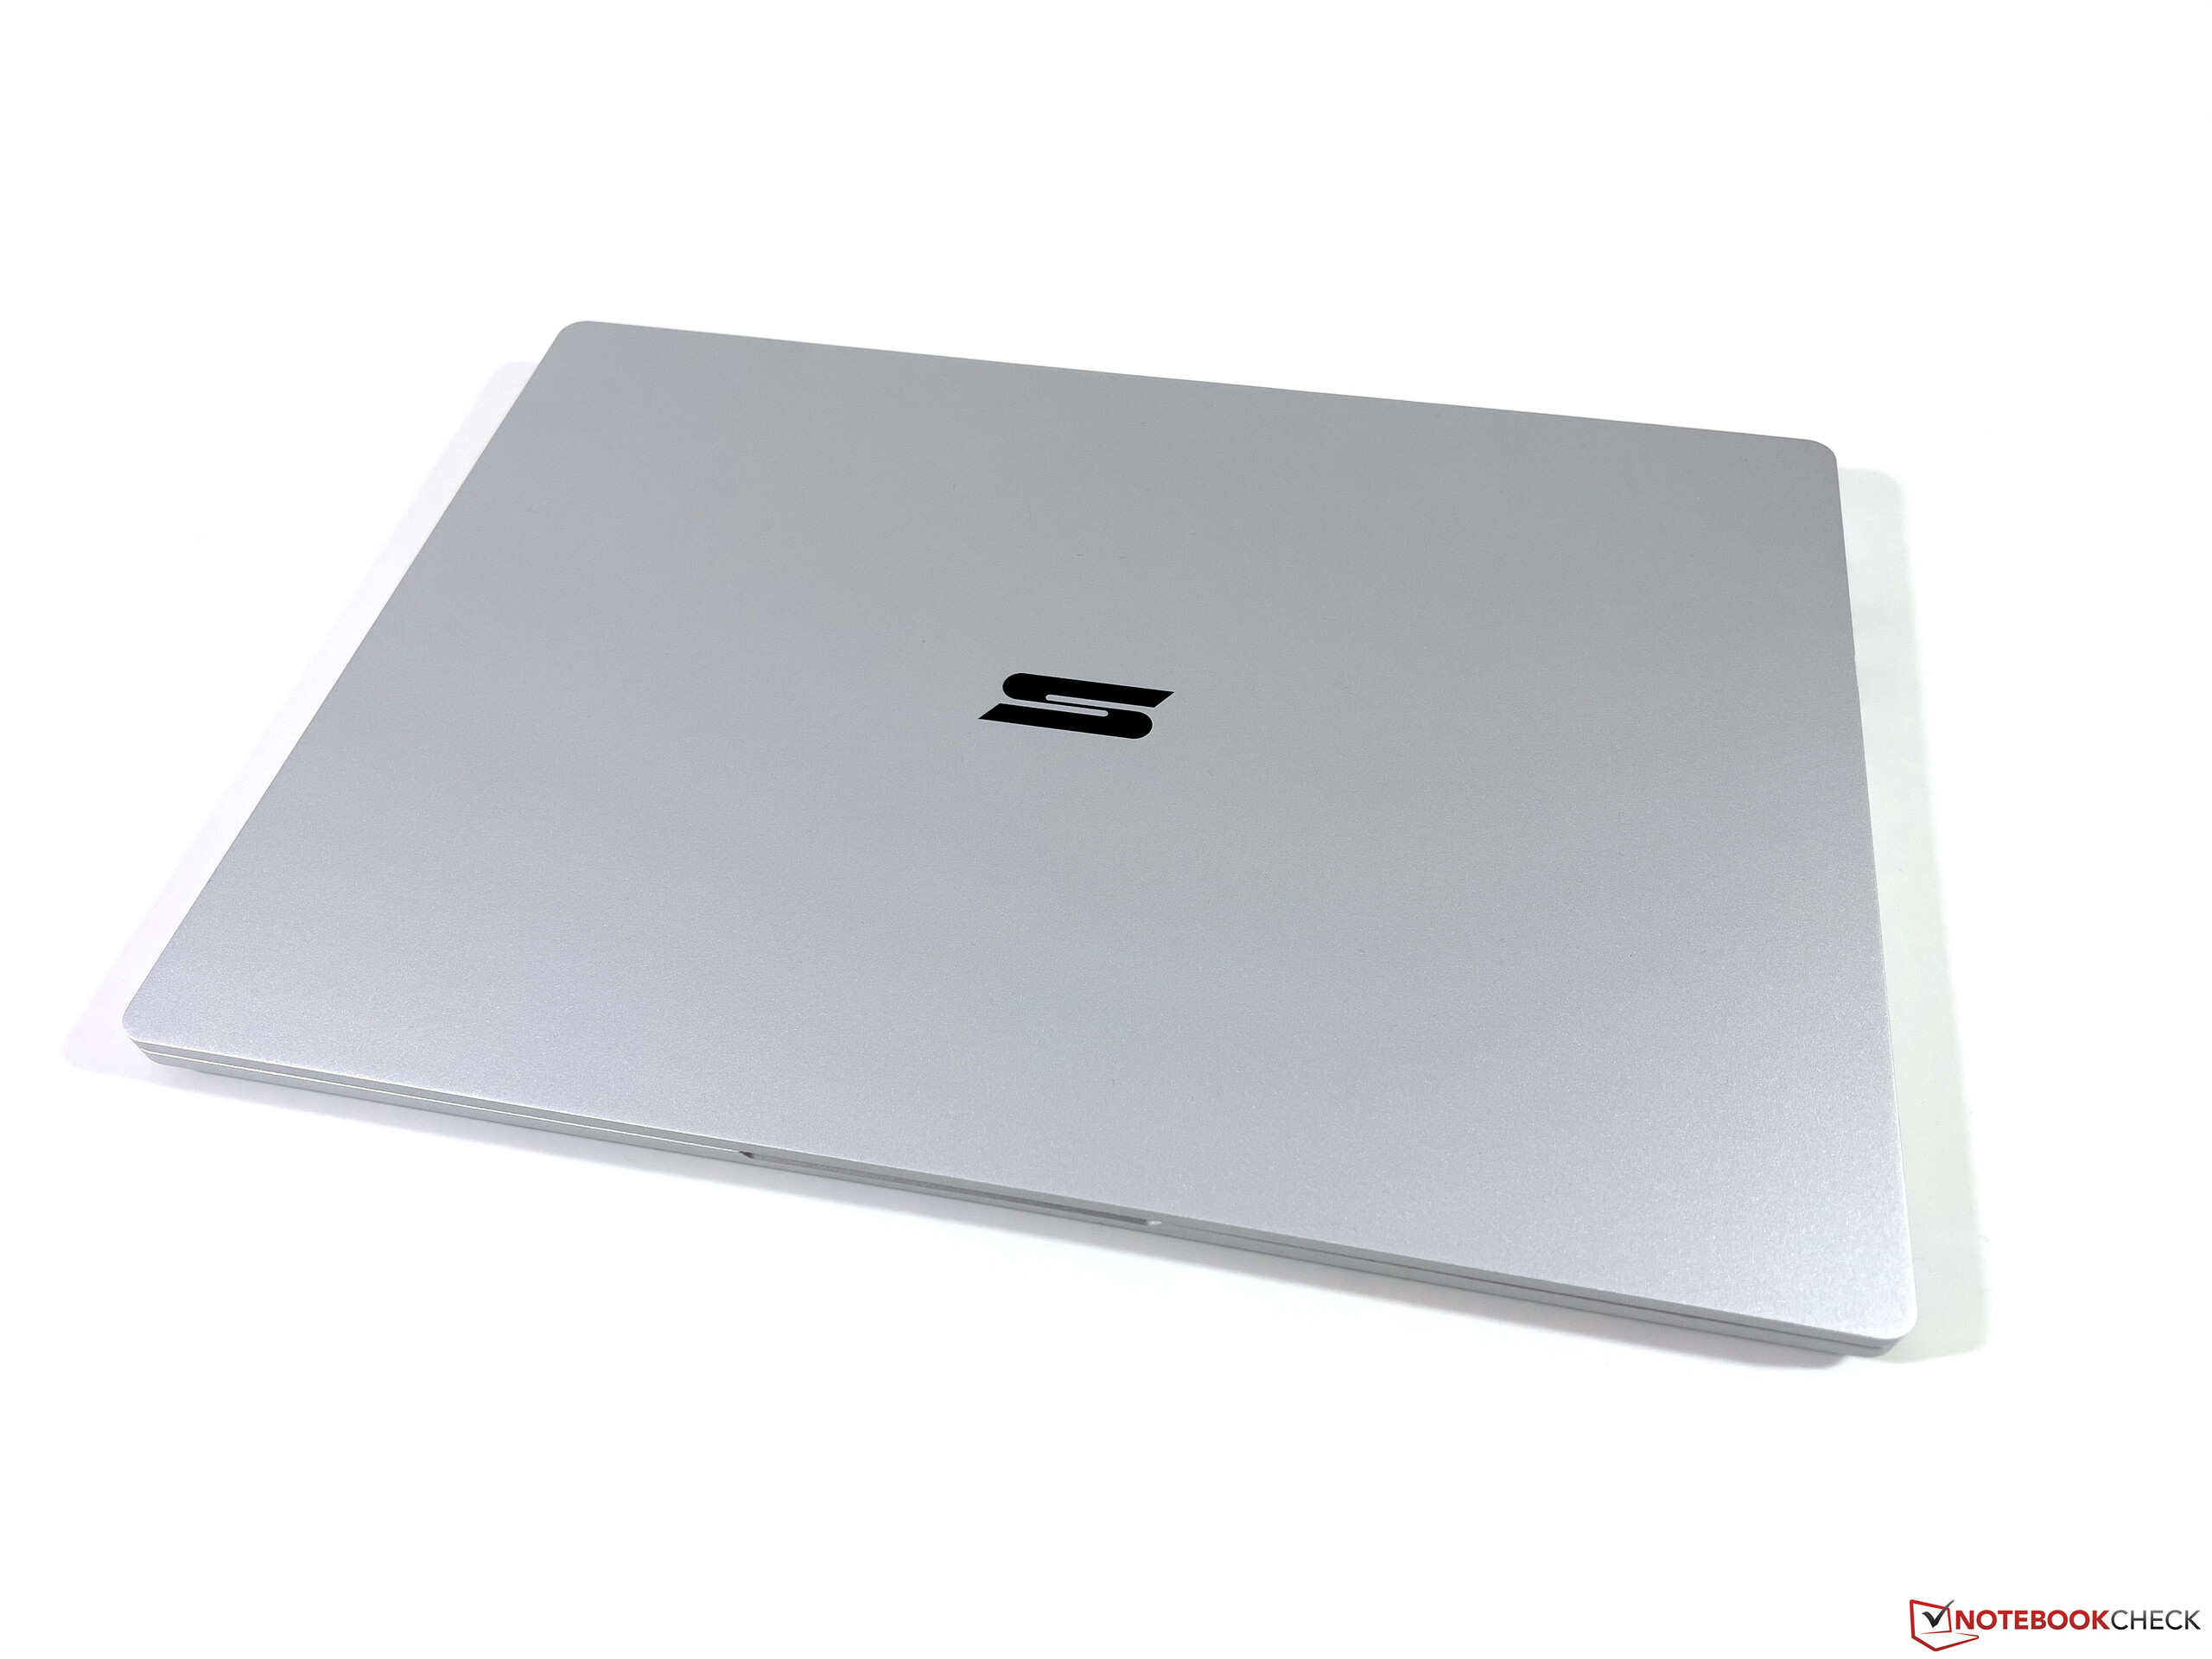
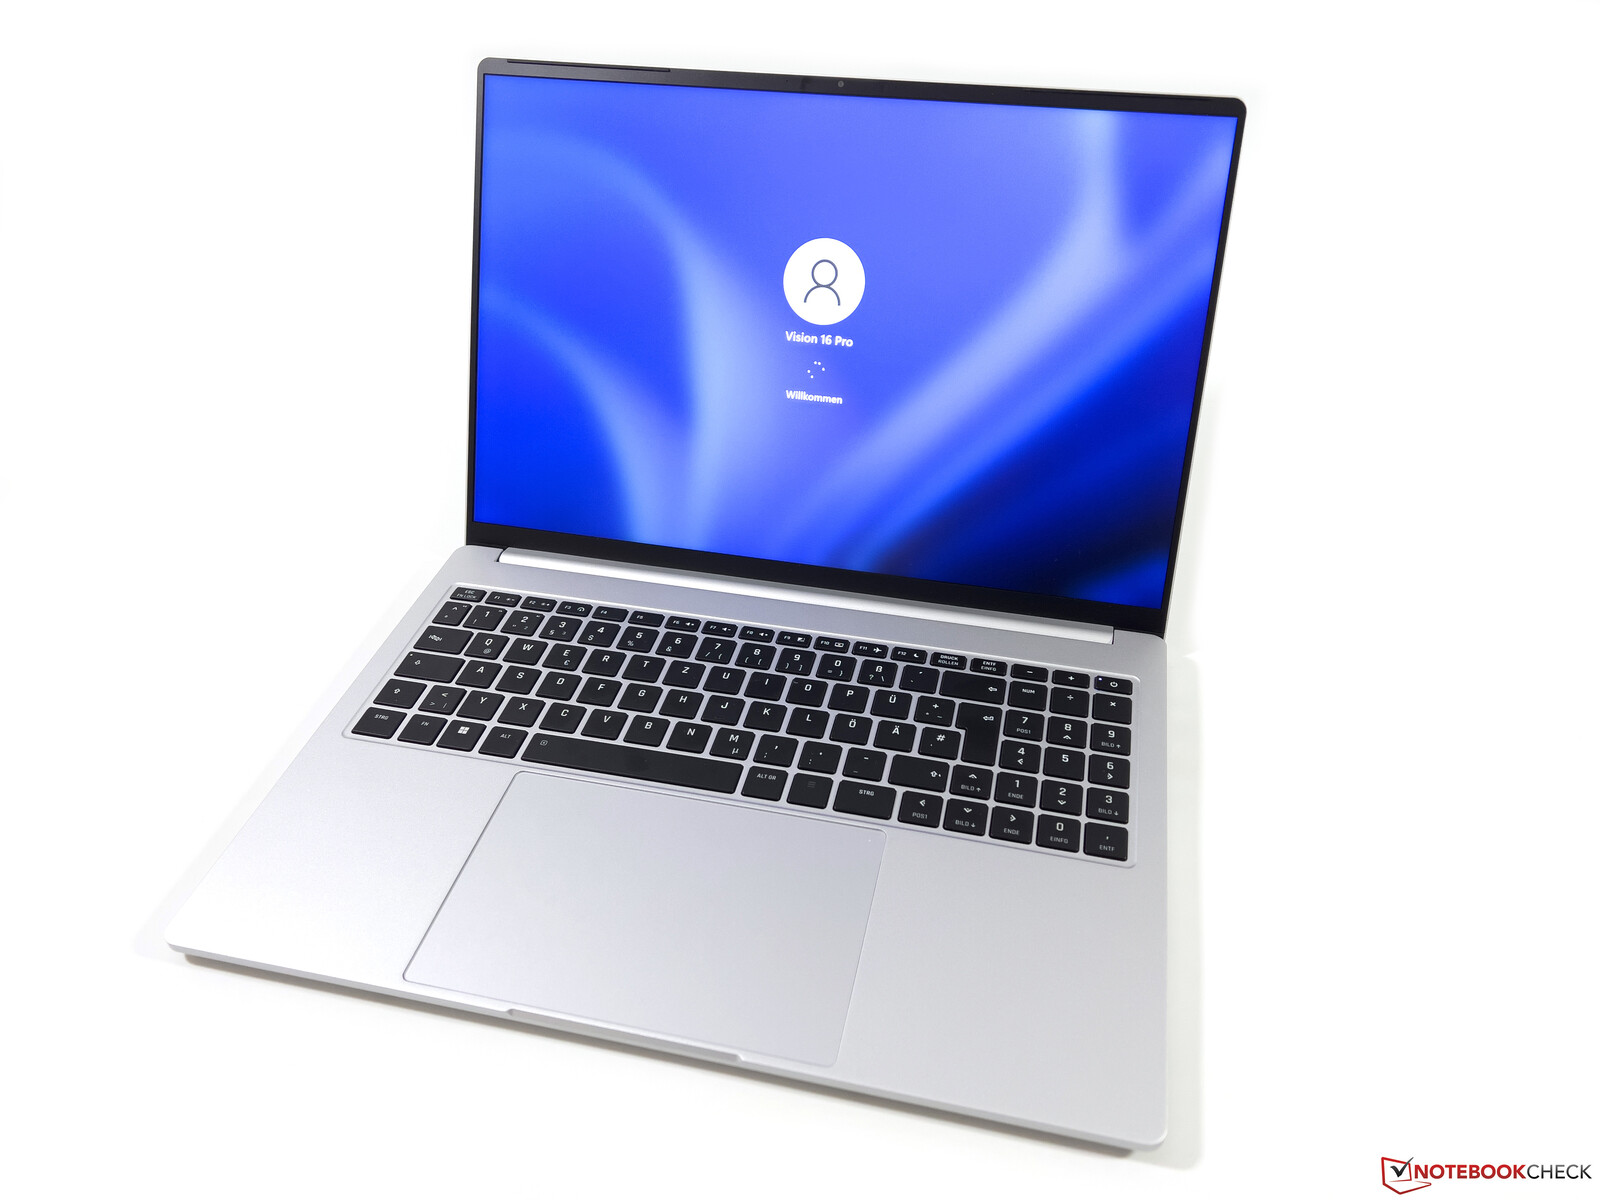
机箱 - Vision 16 Pro 镁合金机箱
新的Vision 16 Pro的设计与较小的Vision 14 Pro没有区别。视觉14,不显眼的底盘(银色或黑色)只是大了一点。申克公司也采用了相同的材料,底座和盖子采用了镁合金,而显示屏框架则采用了塑料。侧面的边框非常窄,只有4毫米,这使得屏幕与身体的比例达到85%。
这款16英寸的设备在质量方面给人留下了很好的印象,它的底座很结实,只是在键盘的中间有轻微的弯曲,但没有吱吱作响的声音。盖子非常薄,我们可以通过从后面集中施压来引起轻微的图片失真,尽管这在常规使用中不应该是一个问题。与较小的Vision 14一样,我们对显示屏的铰链并不完全满意,因为有一些晃动,而且最大开启角度也被限制在140度。
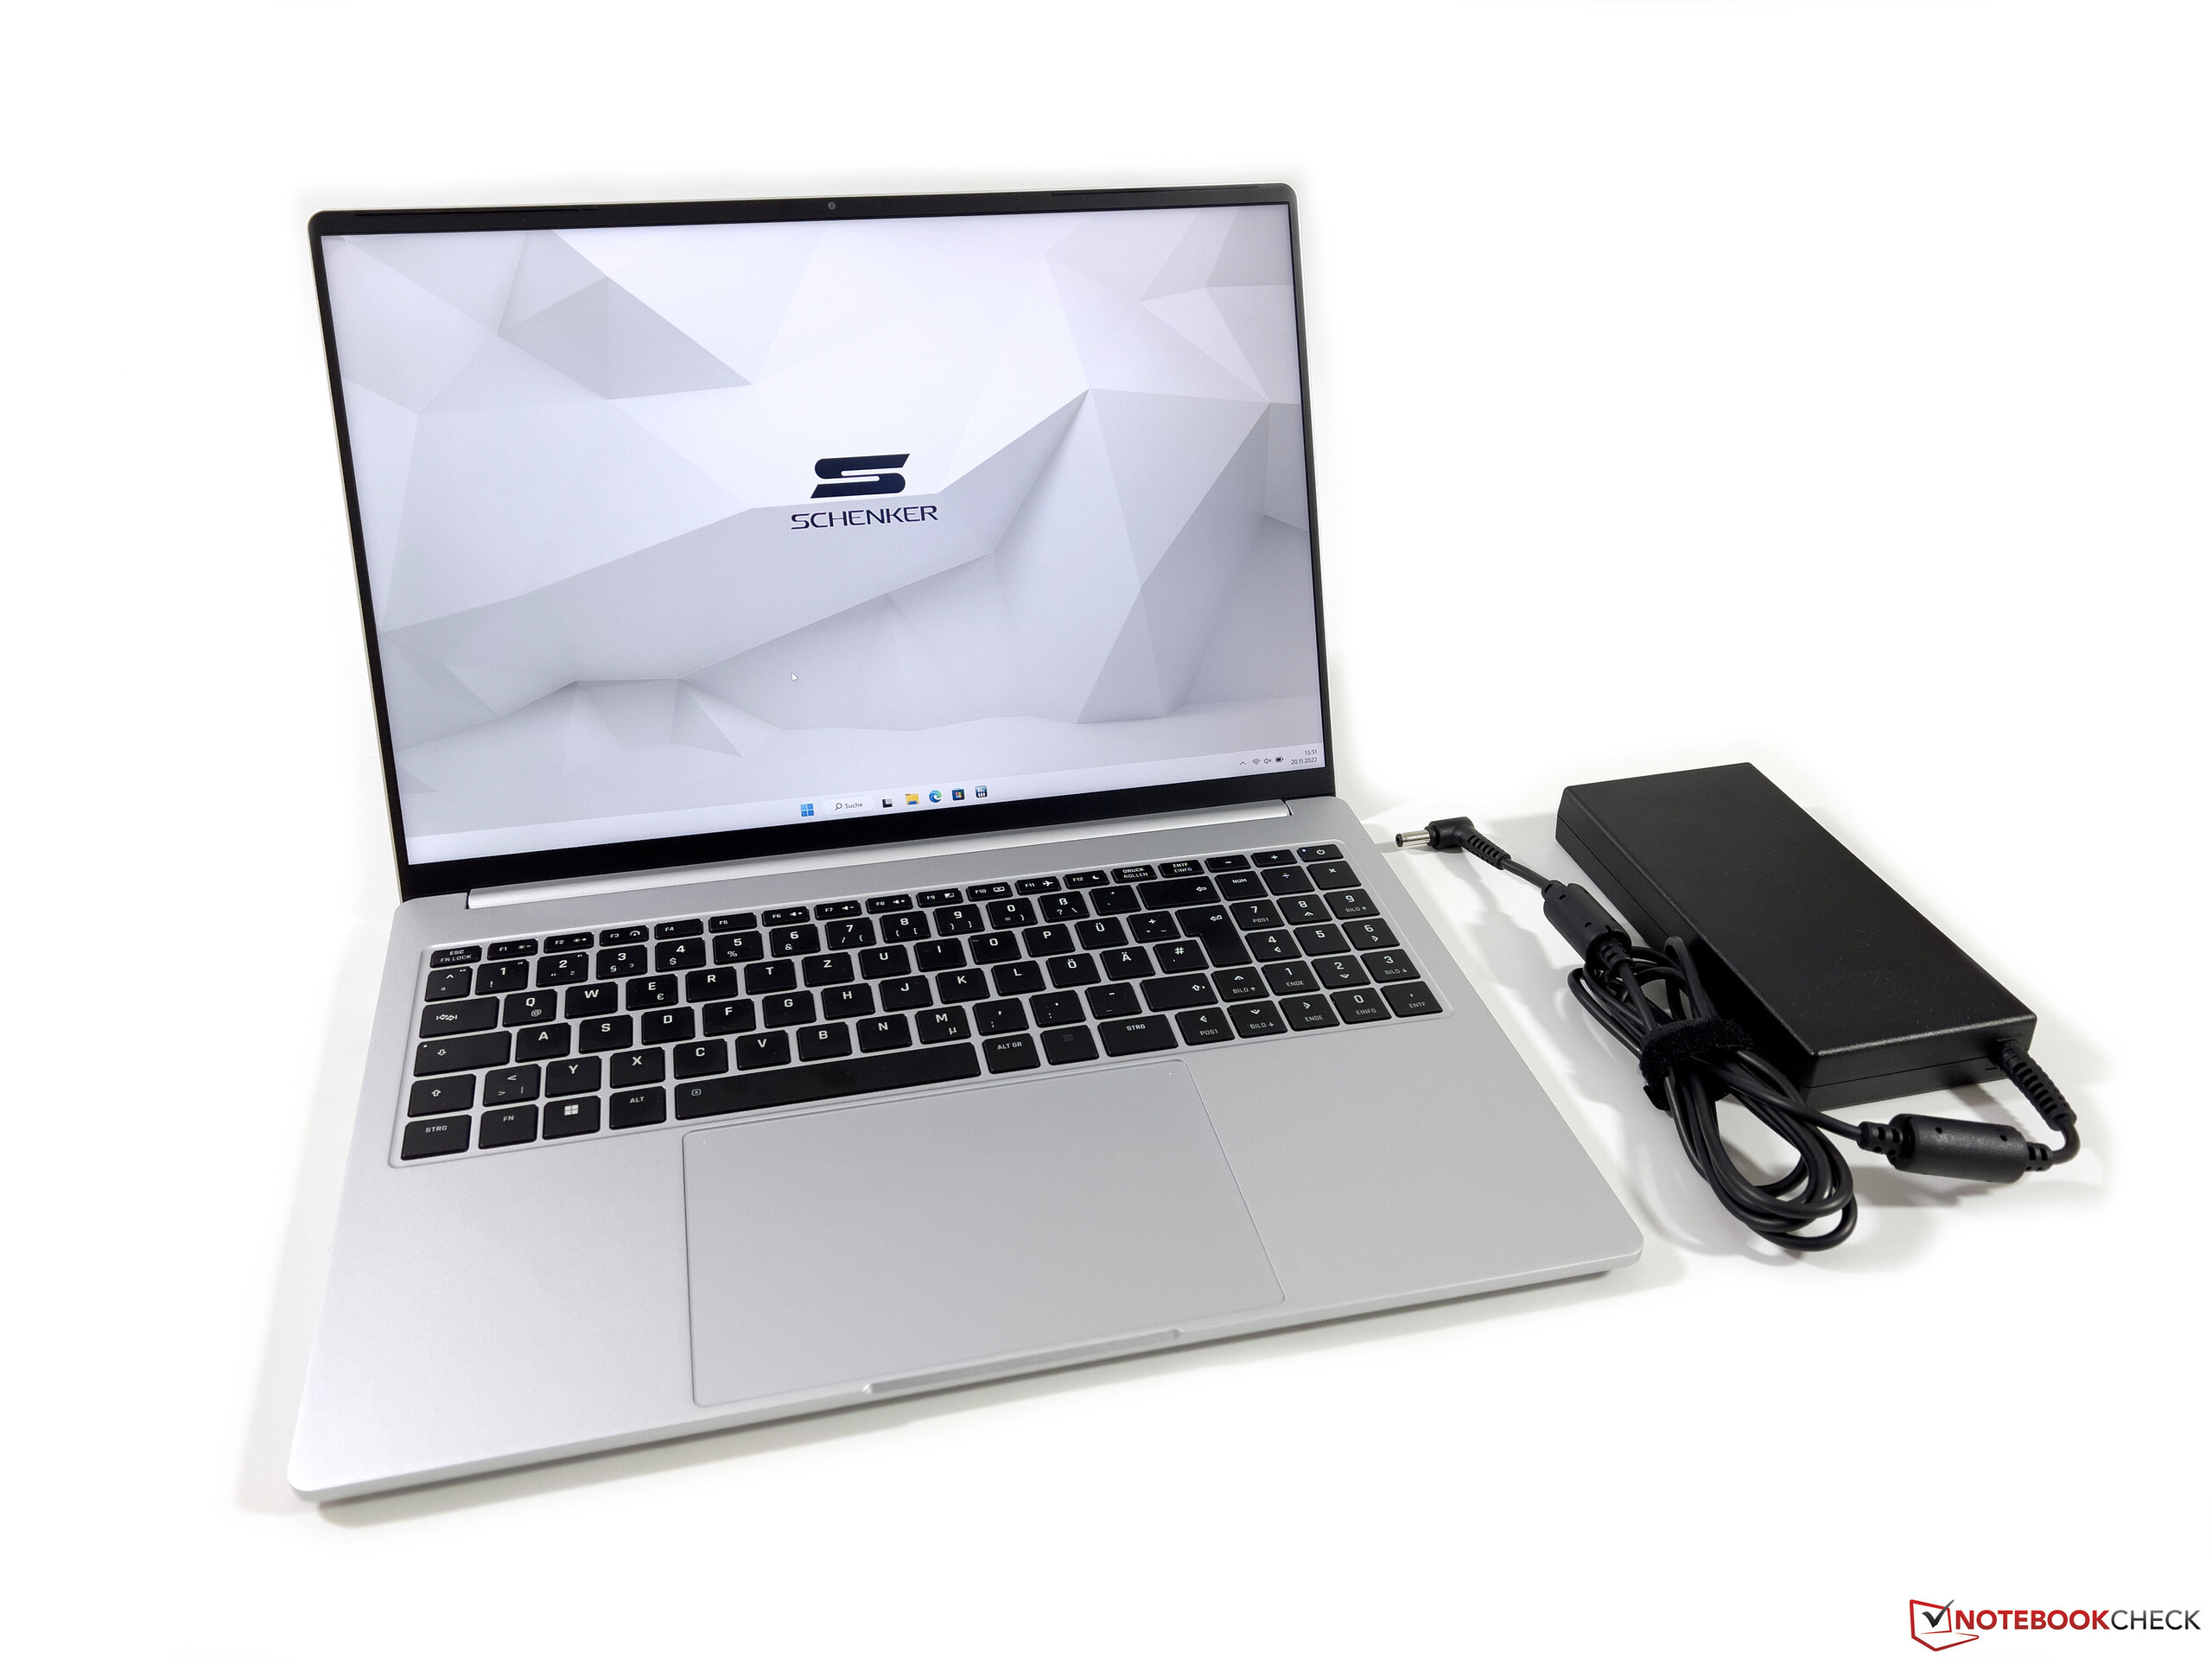
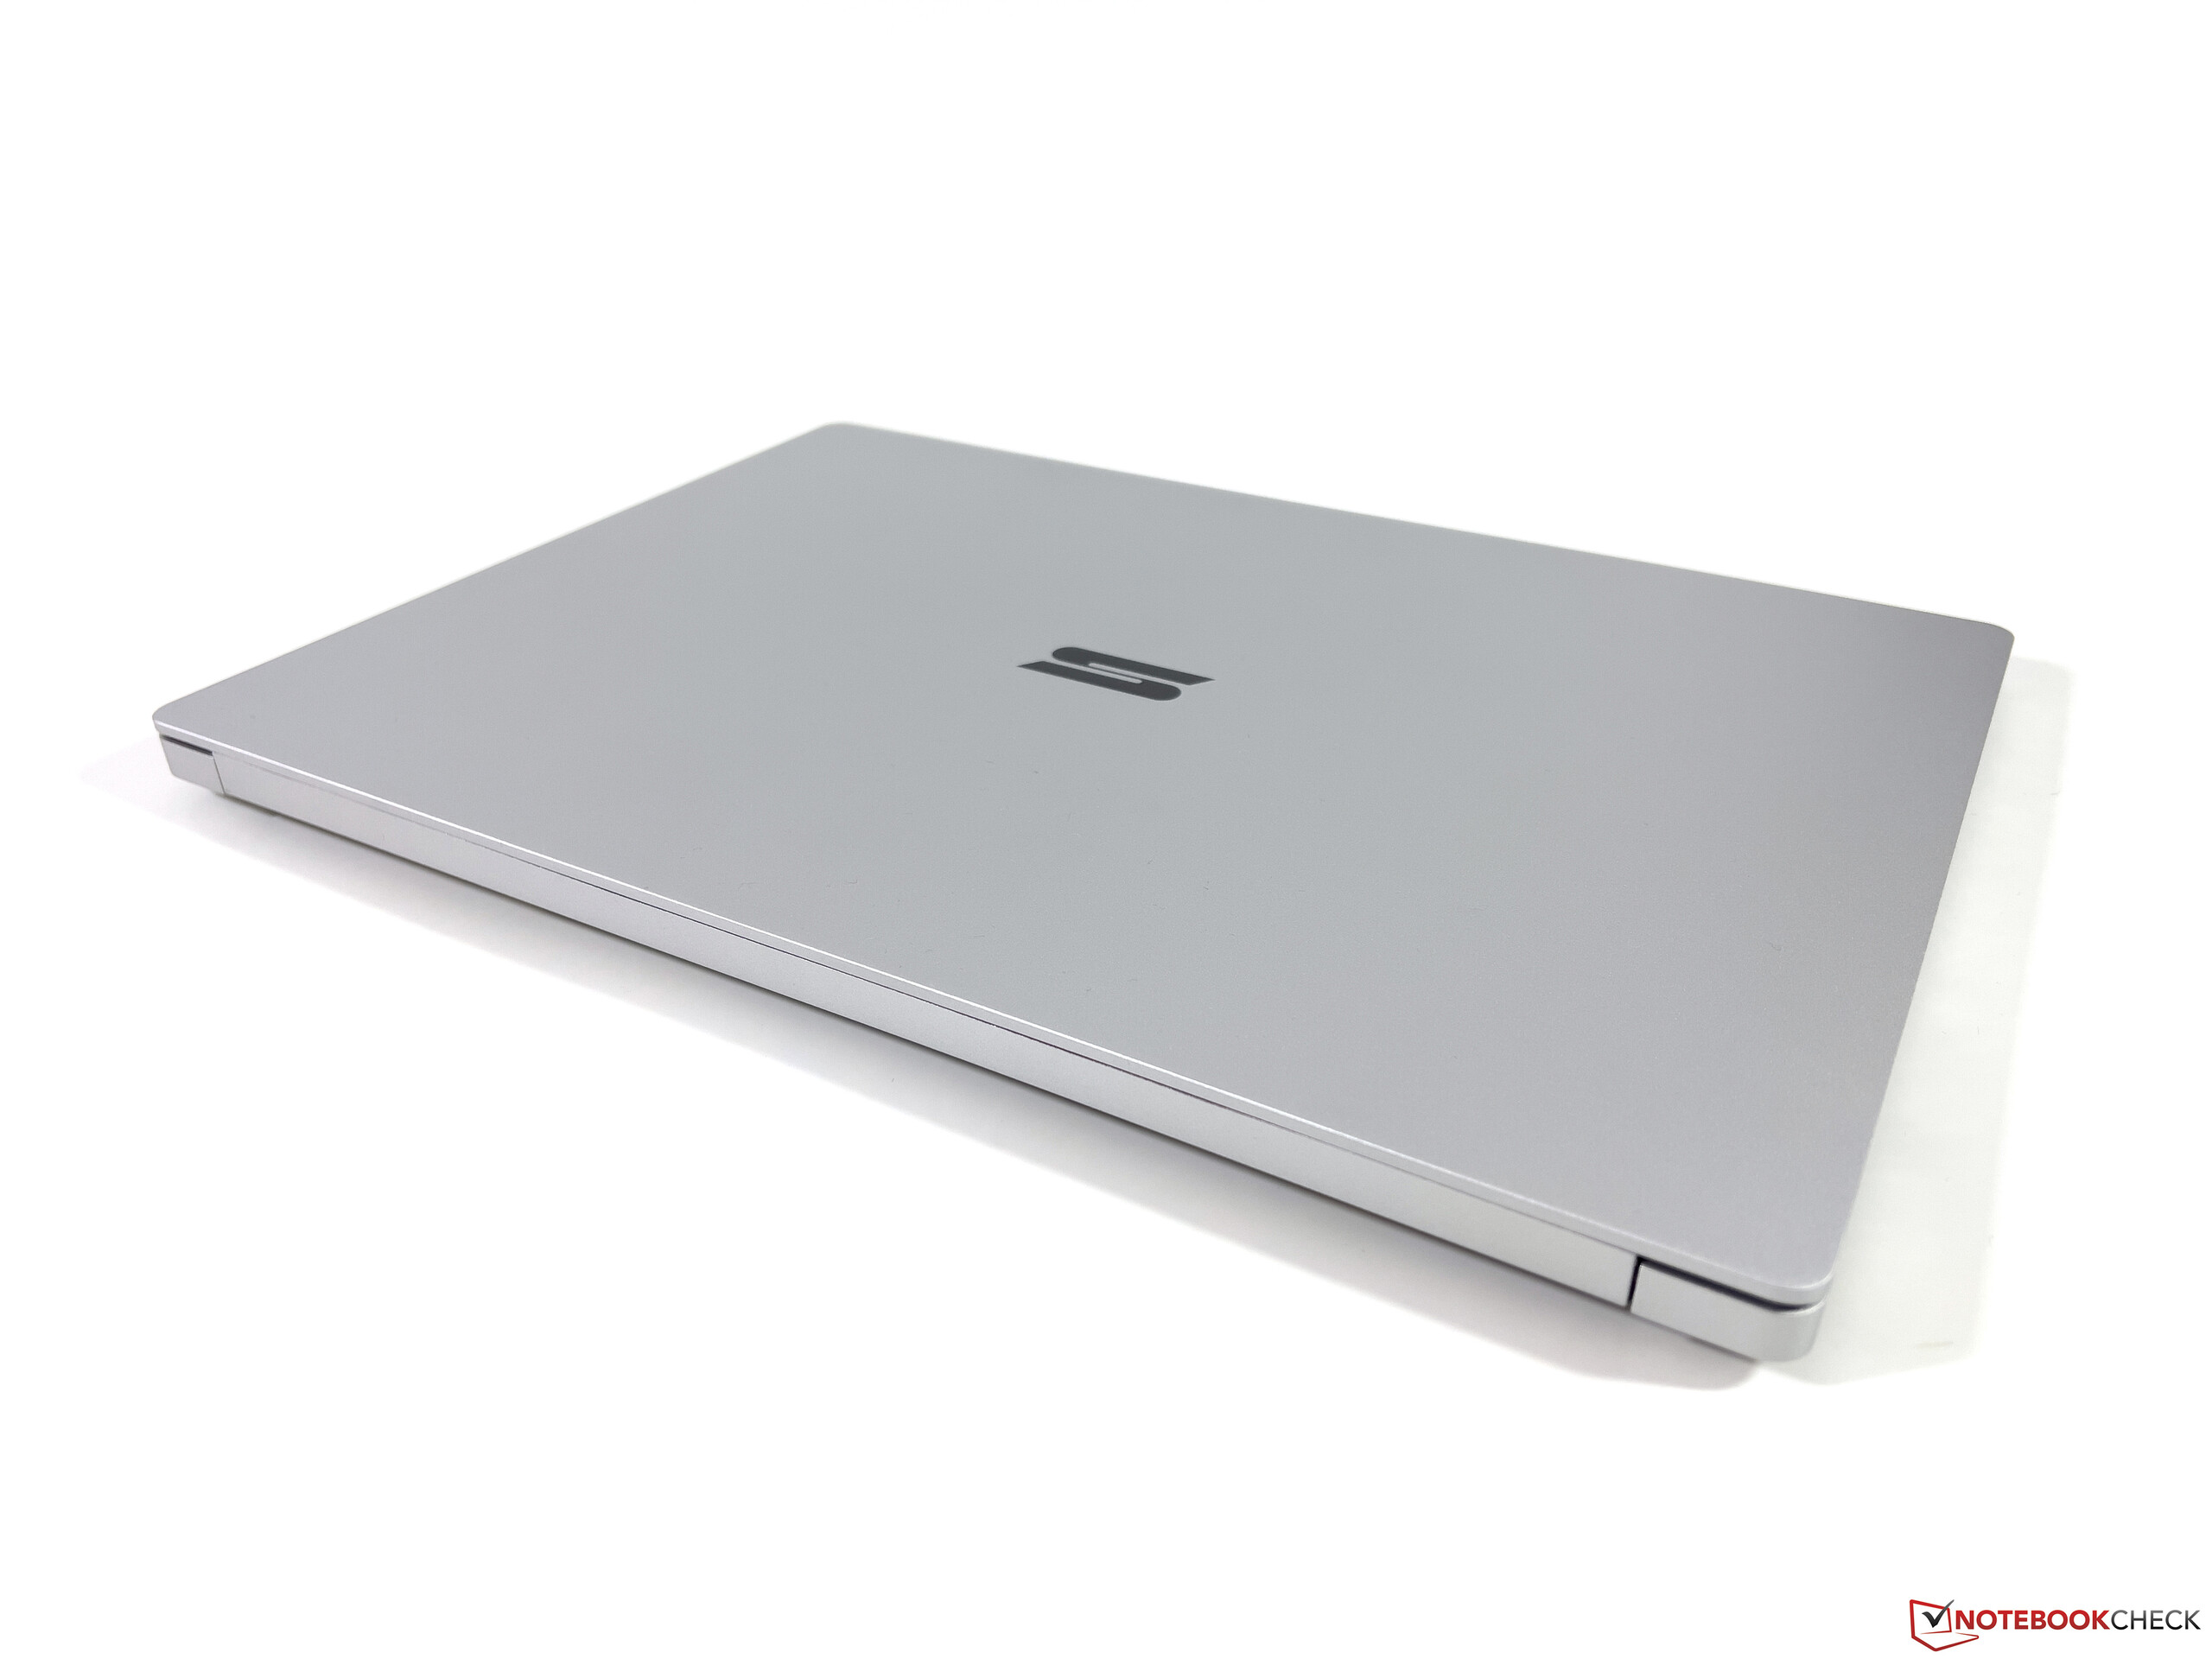
我们的RTX 3070 Ti的规格是Vision 16 Pro的最重版本,尽管对于一个强大的16英寸机器来说,1.651公斤的重量很难被称为重。这意味着Vision 16 Pro比大多数多媒体或薄型游戏笔记本轻500克左右。当你使用它时,该设备也感觉非常轻巧,但180W电源适配器相当重,超过800克。
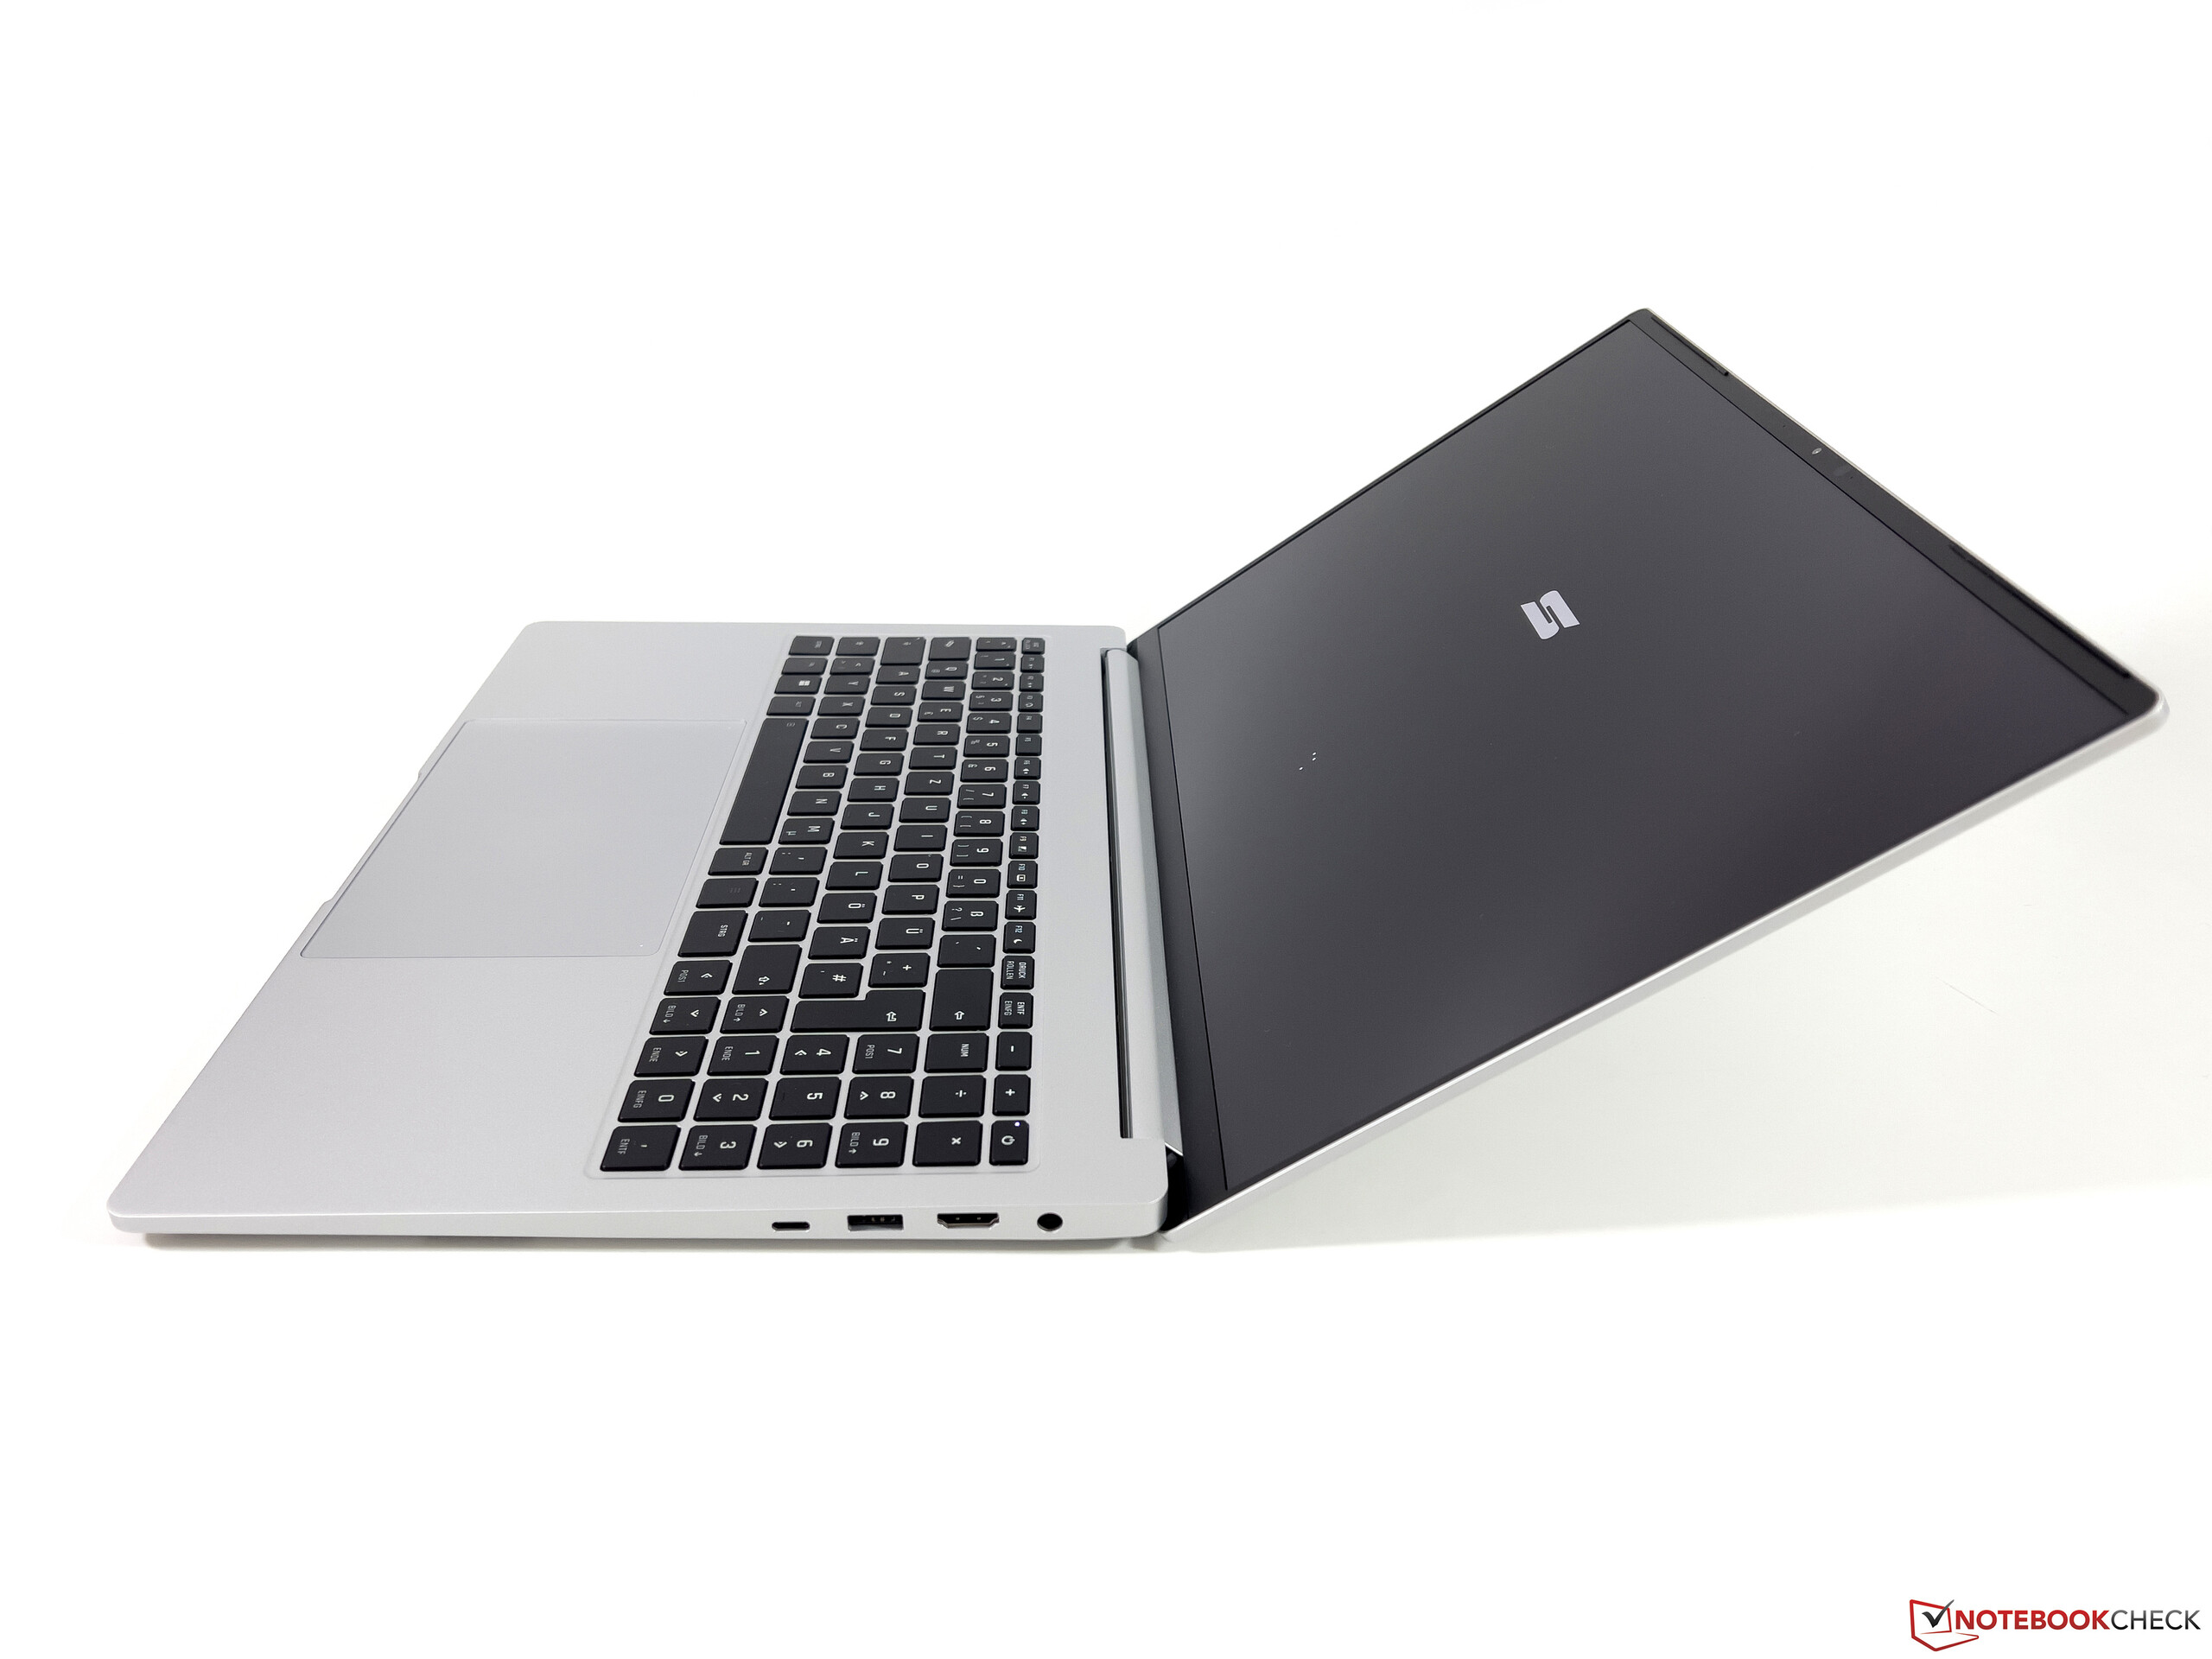
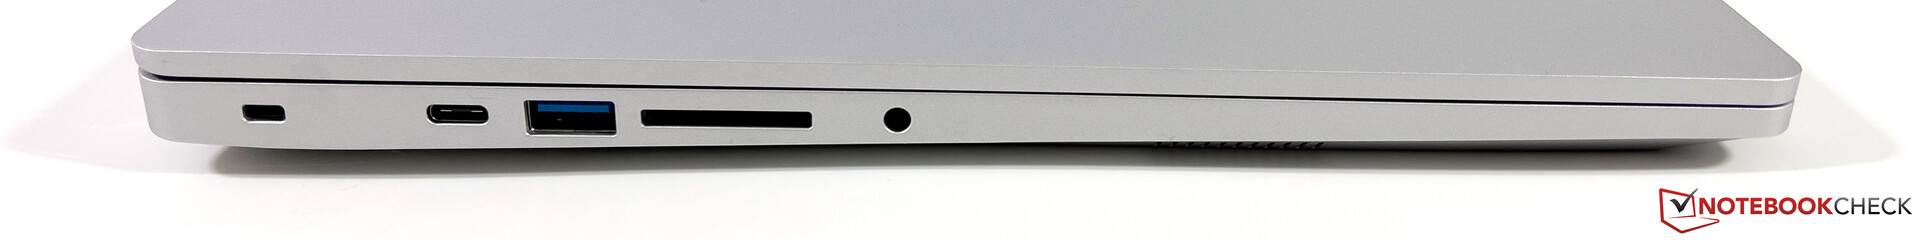
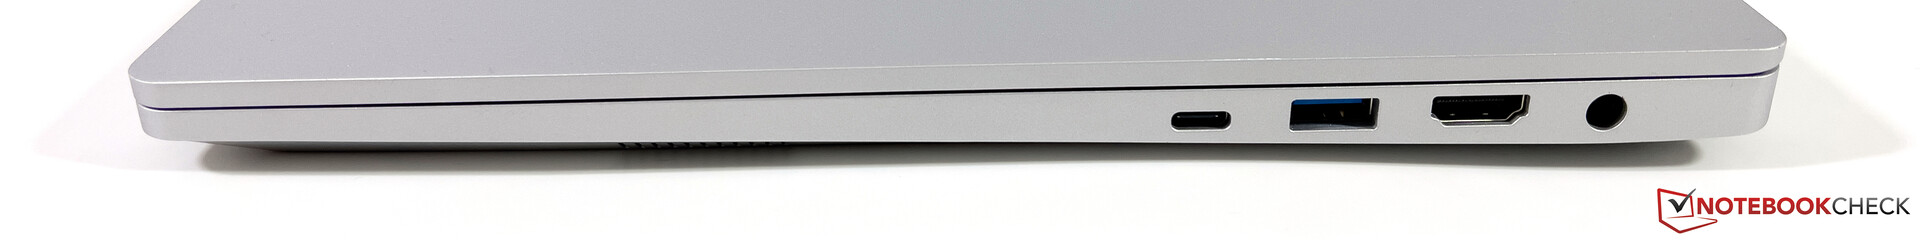
连接性 - 大量的端口,但没有Wi-Fi 6E
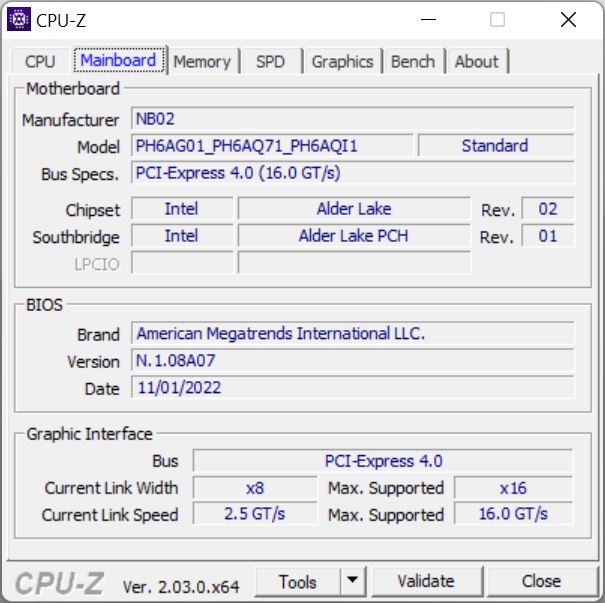
Schenker延续了Vision 14的趋势,包括大量的端口,包括一个全尺寸读卡器。除了Thunderbolt 4之外,还有一个HDMI 2.1输出,你可以通过USB-C(最高100W)为电池充电,尽管在这种情况下你将无法利用组件的全部性能。然而,当你在路上时,它仍然可以非常方便。通过USB-C(DisplayPort ALT模式)的视频输出是通过Nvidia Optimus连接的,但HDMI输出是直接连接到GeForce GPU。这可以提高连接到外部显示器的游戏性能,但也会导致更高的消耗数字。
SD卡阅读器
左边的读卡器在使用我们的参考卡(Angelbird AV Pro V60)时,平均传输速率为~80 MB/s。该读卡器不适合永久放置,因为插入的卡会突出约2厘米。
| SD Card Reader | |
| average JPG Copy Test (av. of 3 runs) | |
| Average of class Multimedia (23 - 531, n=37, last 2 years) | |
| Apple MacBook Pro 16 2021 M1 Pro (Angelbird AV Pro V60) | |
| Schenker Vision 16 Pro RTX 3070 Ti (AV Pro V60) | |
| Lenovo ThinkBook 16p G3 ARH (AV PRO microSD 128 GB V60) | |
| Lenovo Legion Slim 7-16IAH 82TF004YGE | |
| HP Envy 16 h0112nr (AV Pro SD microSD 128 GB V60) | |
| maximum AS SSD Seq Read Test (1GB) | |
| Average of class Multimedia (37.3 - 1455, n=36, last 2 years) | |
| Lenovo Legion Slim 7-16IAH 82TF004YGE | |
| Lenovo ThinkBook 16p G3 ARH (AV PRO microSD 128 GB V60) | |
| HP Envy 16 h0112nr (AV Pro SD microSD 128 GB V60) | |
| Schenker Vision 16 Pro RTX 3070 Ti (AV Pro V60) | |
沟通
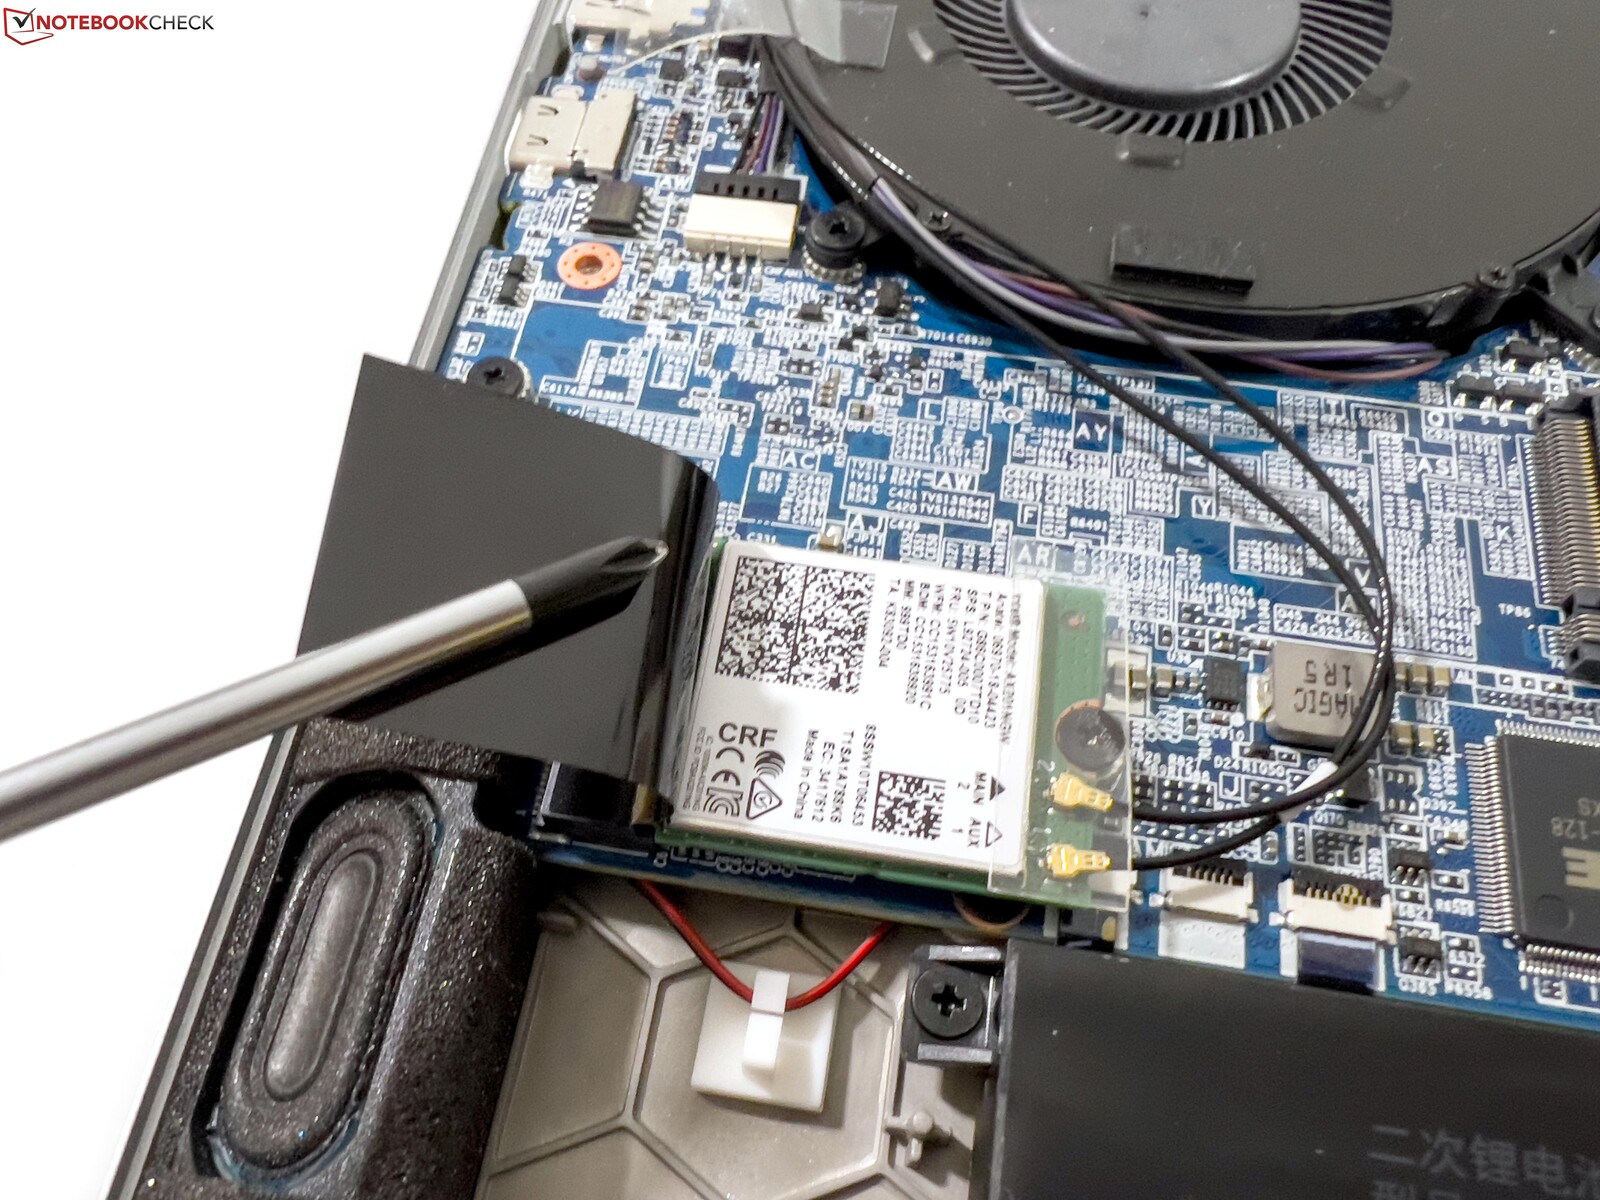
Vision 16 Pro的天线配置不支持6GHz网络(Wi-Fi 6E),所以Schenker没有提供相应的模块。在我们的评测装置中,英特尔的AX201卡仍然支持Wi-Fi 6标准,并在我们与华硕的参考路由器进行的Wi-Fi测试中管理着非常高和稳定的传输速率。
| Networking | |
| Schenker Vision 16 Pro RTX 3070 Ti | |
| iperf3 receive AXE11000 | |
| iperf3 transmit AXE11000 | |
| Apple MacBook Pro 16 2021 M1 Pro | |
| iperf3 transmit AX12 | |
| iperf3 receive AX12 | |
| iperf3 receive AXE11000 | |
| iperf3 transmit AXE11000 | |
| Lenovo Legion Slim 7-16IAH 82TF004YGE | |
| iperf3 receive AXE11000 | |
| iperf3 transmit AXE11000 | |
| Lenovo ThinkBook 16p G3 ARH | |
| iperf3 receive AXE11000 | |
| iperf3 transmit AXE11000 | |
| HP Envy 16 h0112nr | |
| iperf3 receive AXE11000 6GHz | |
| iperf3 transmit AXE11000 6GHz | |
网络摄像头
Schenker在顶部边框中包括一个1080p的网络摄像头,它由一个额外的红外网络摄像头(用于面部识别)支持。在良好的照明条件下,照片的质量还可以。


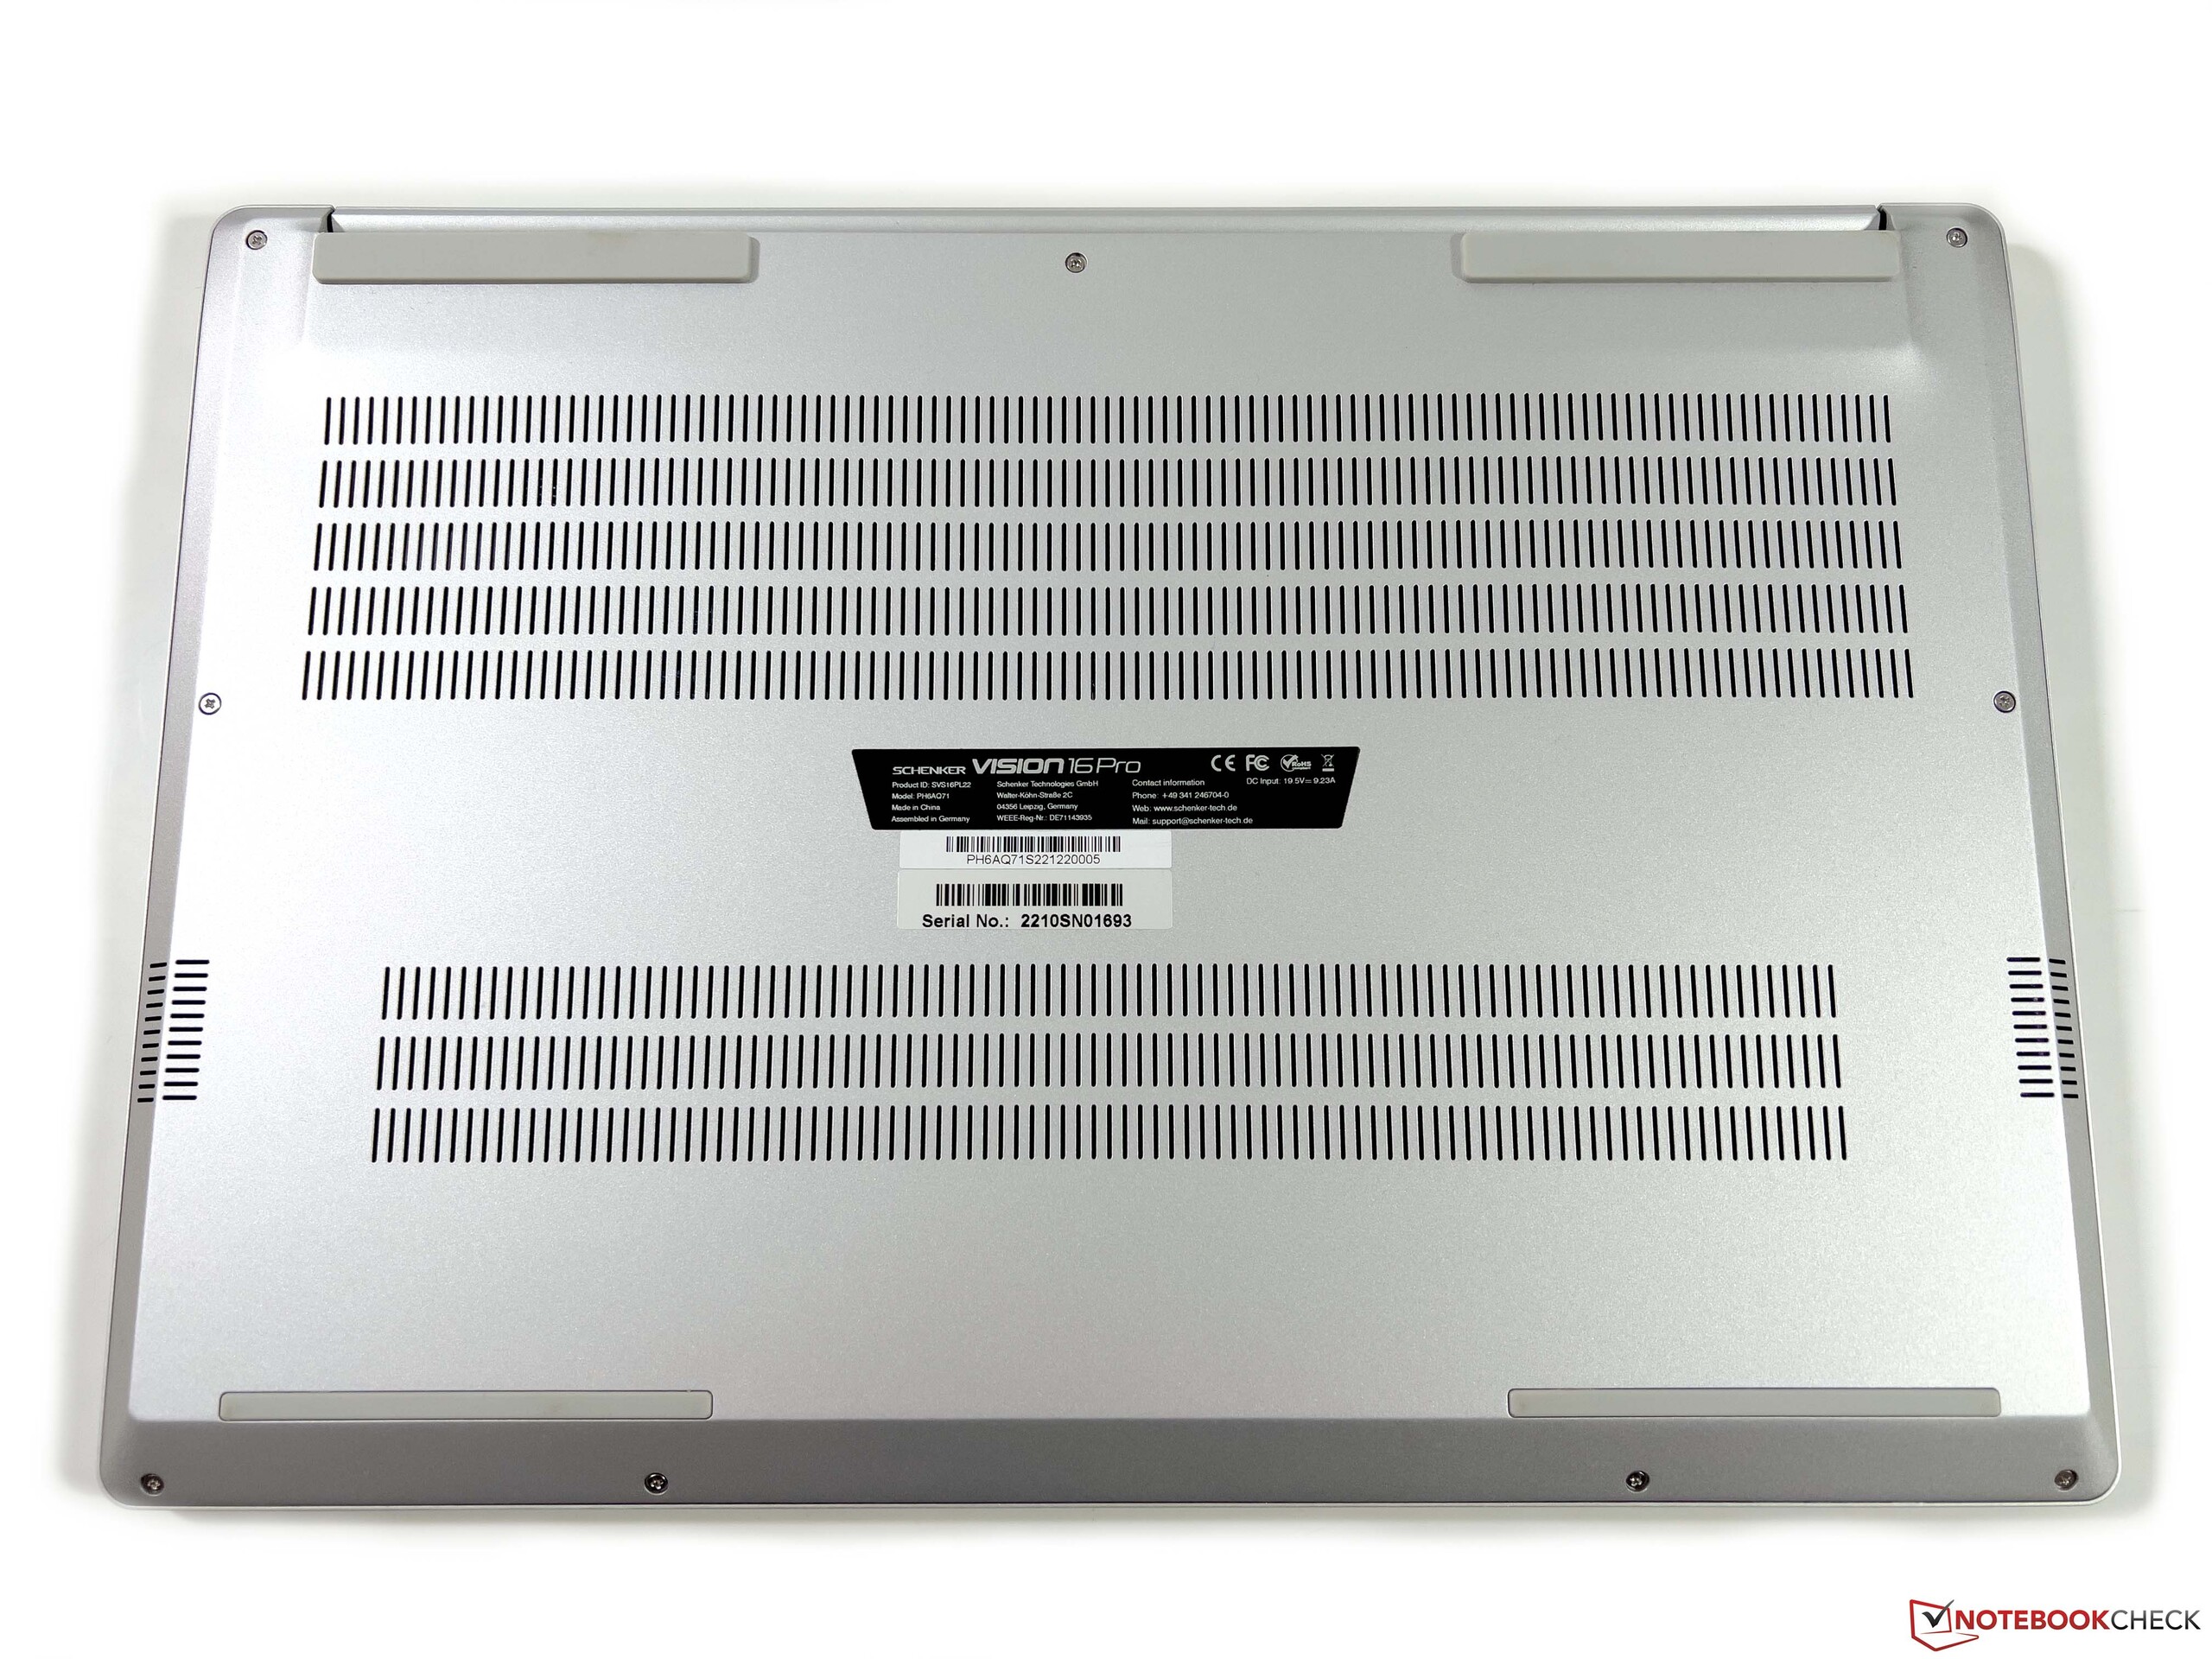
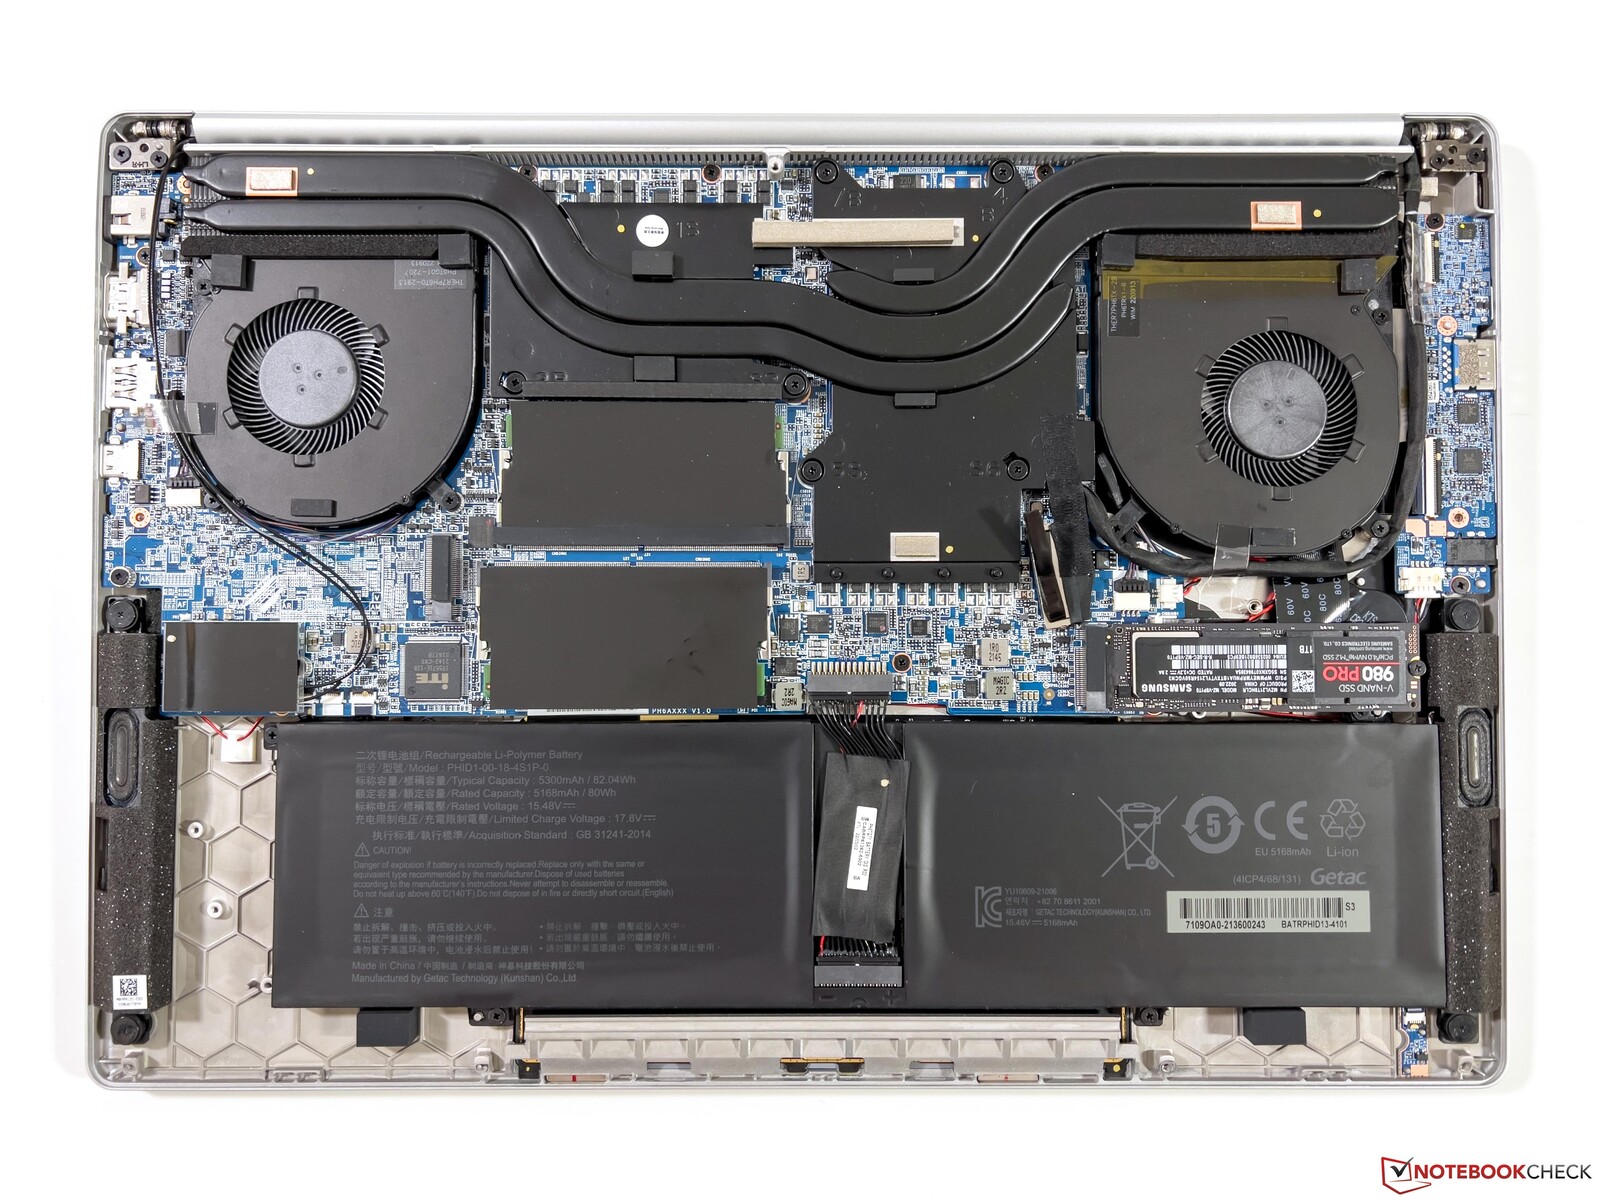
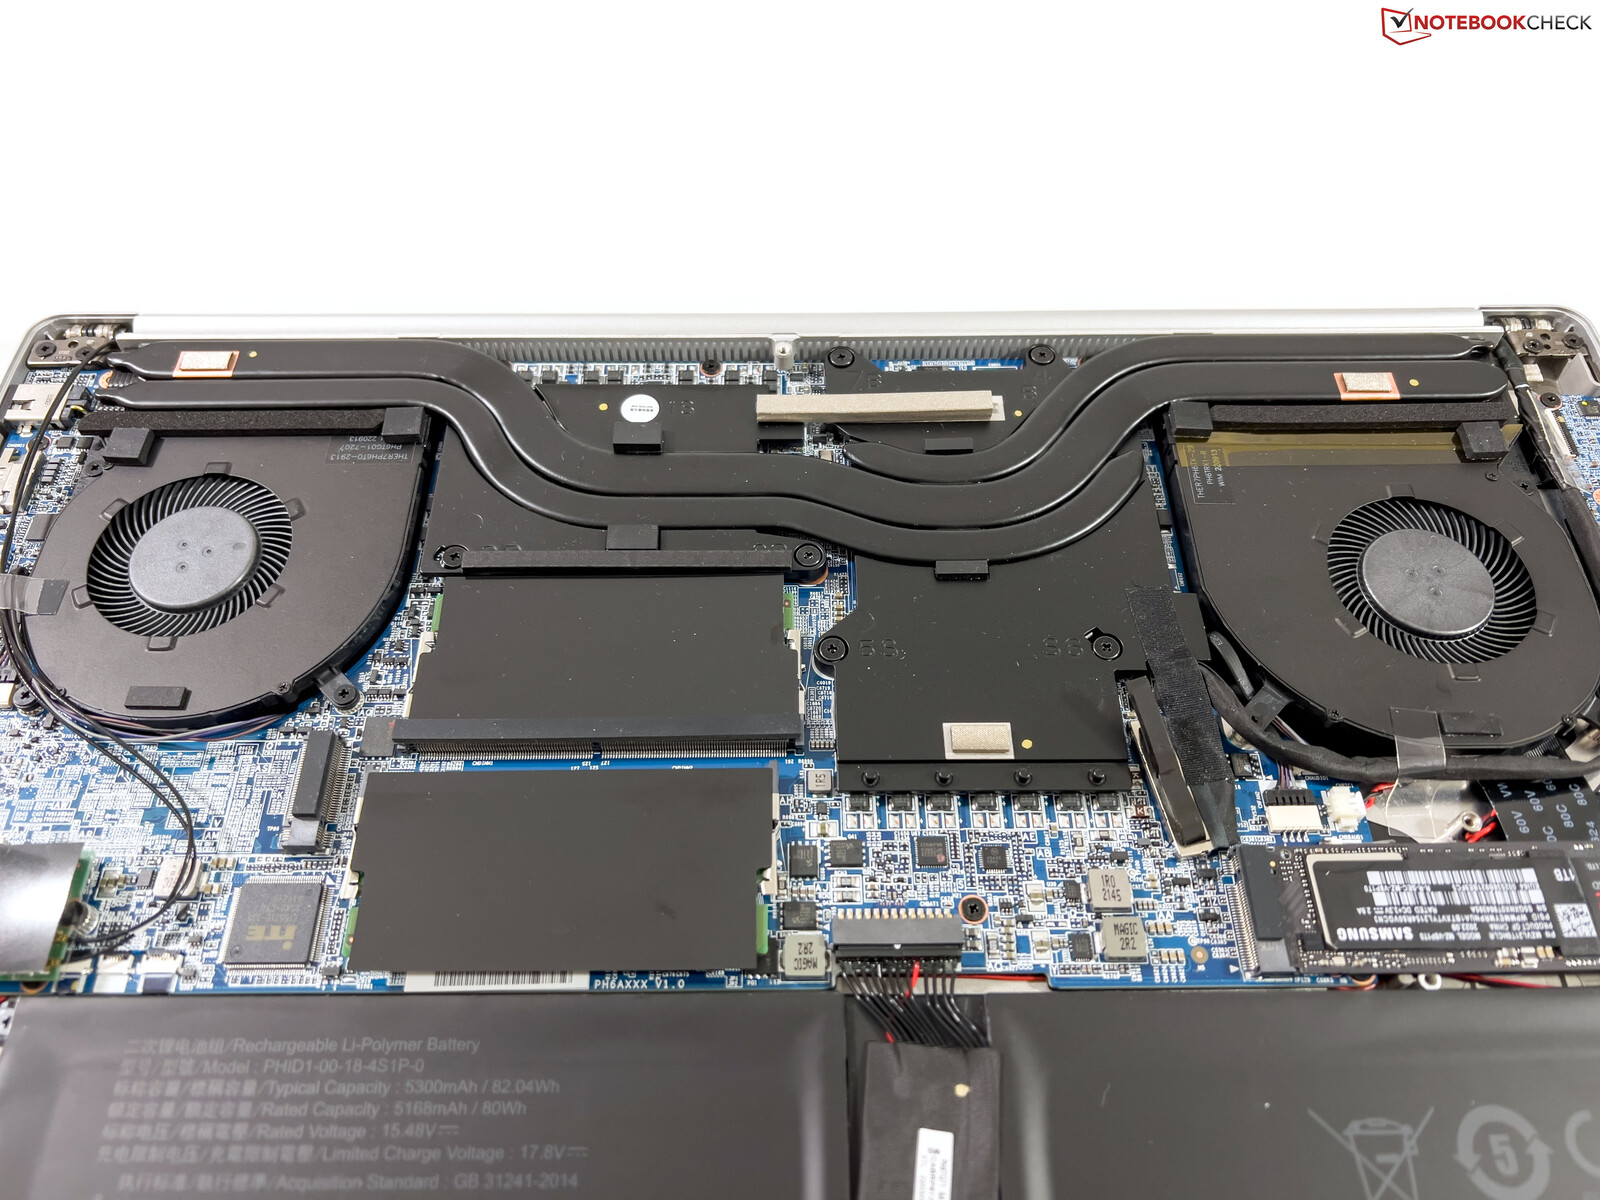
维护
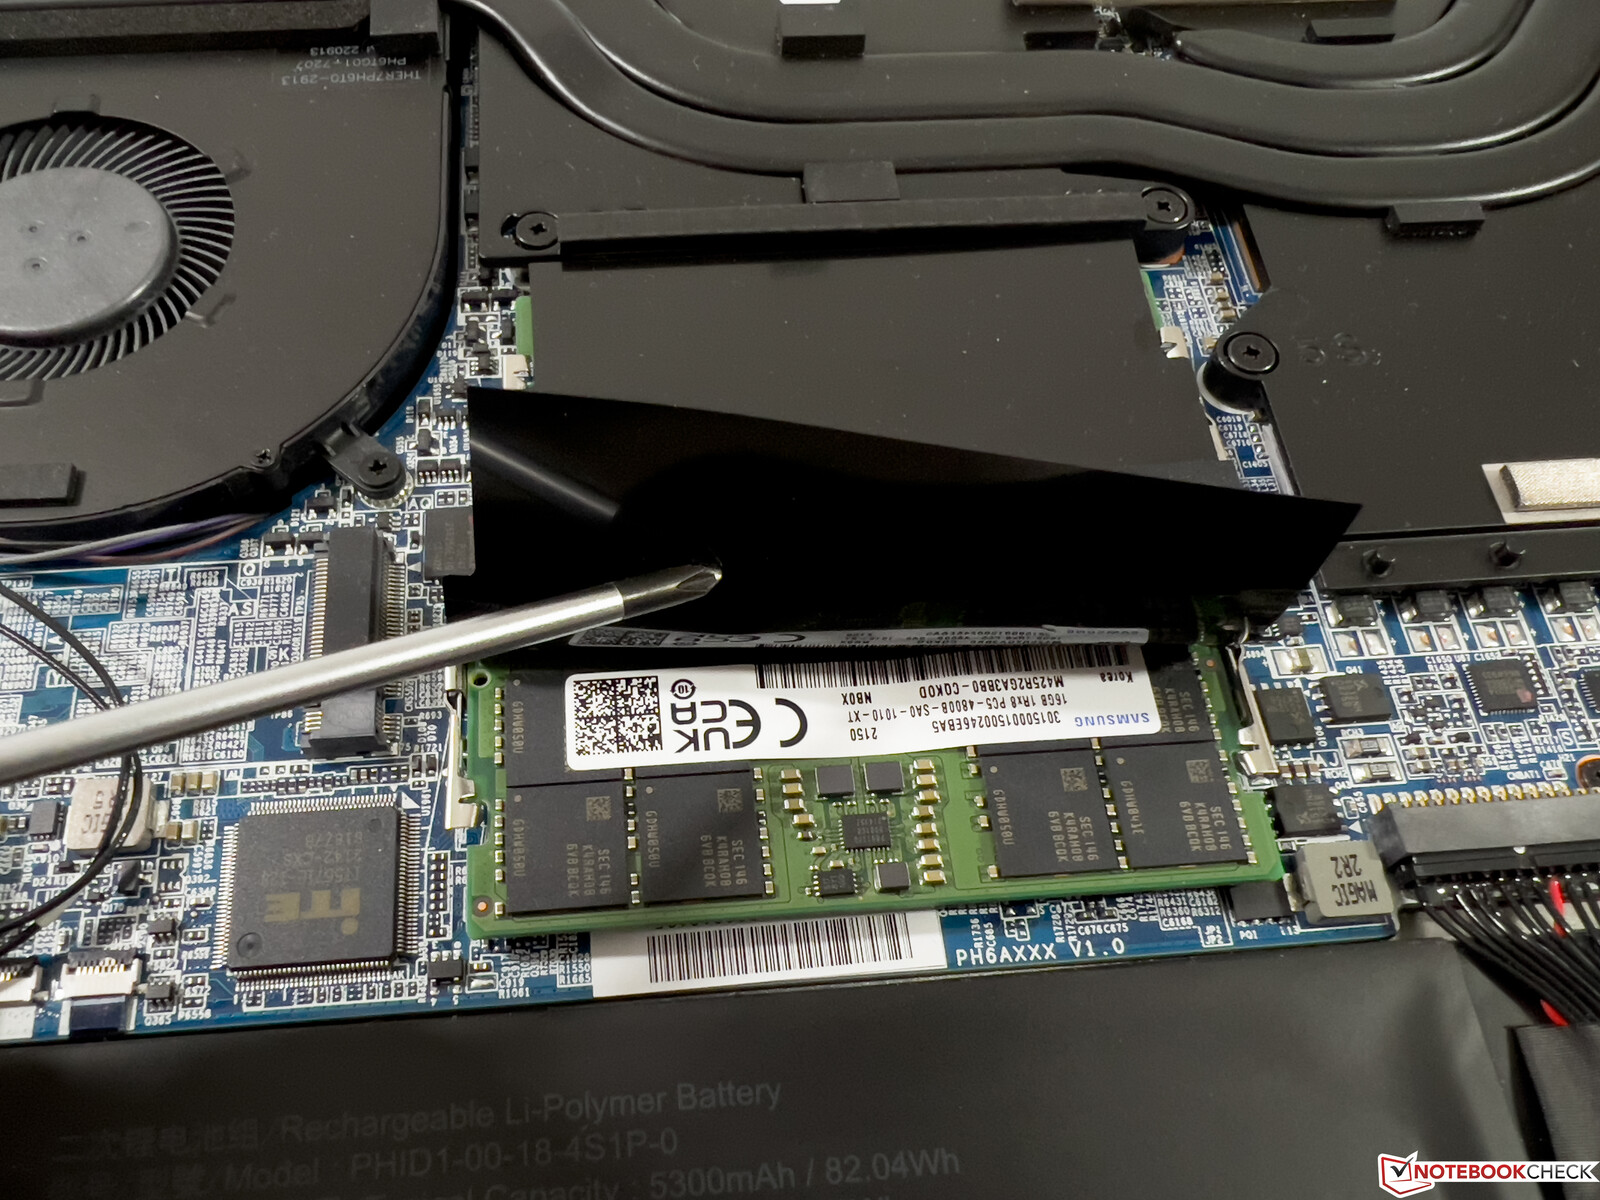
底部的面板由普通的飞利浦螺钉固定,非常容易拆卸。除了两个风扇外,你可以进入两个SODIMM内存插槽以及两个用于M.2-SSD的快速PCIe-4.0插槽。你还可以更换Wi-Fi模块,电池也是拧的。在一个紧凑的设备中,它不会变得更好。
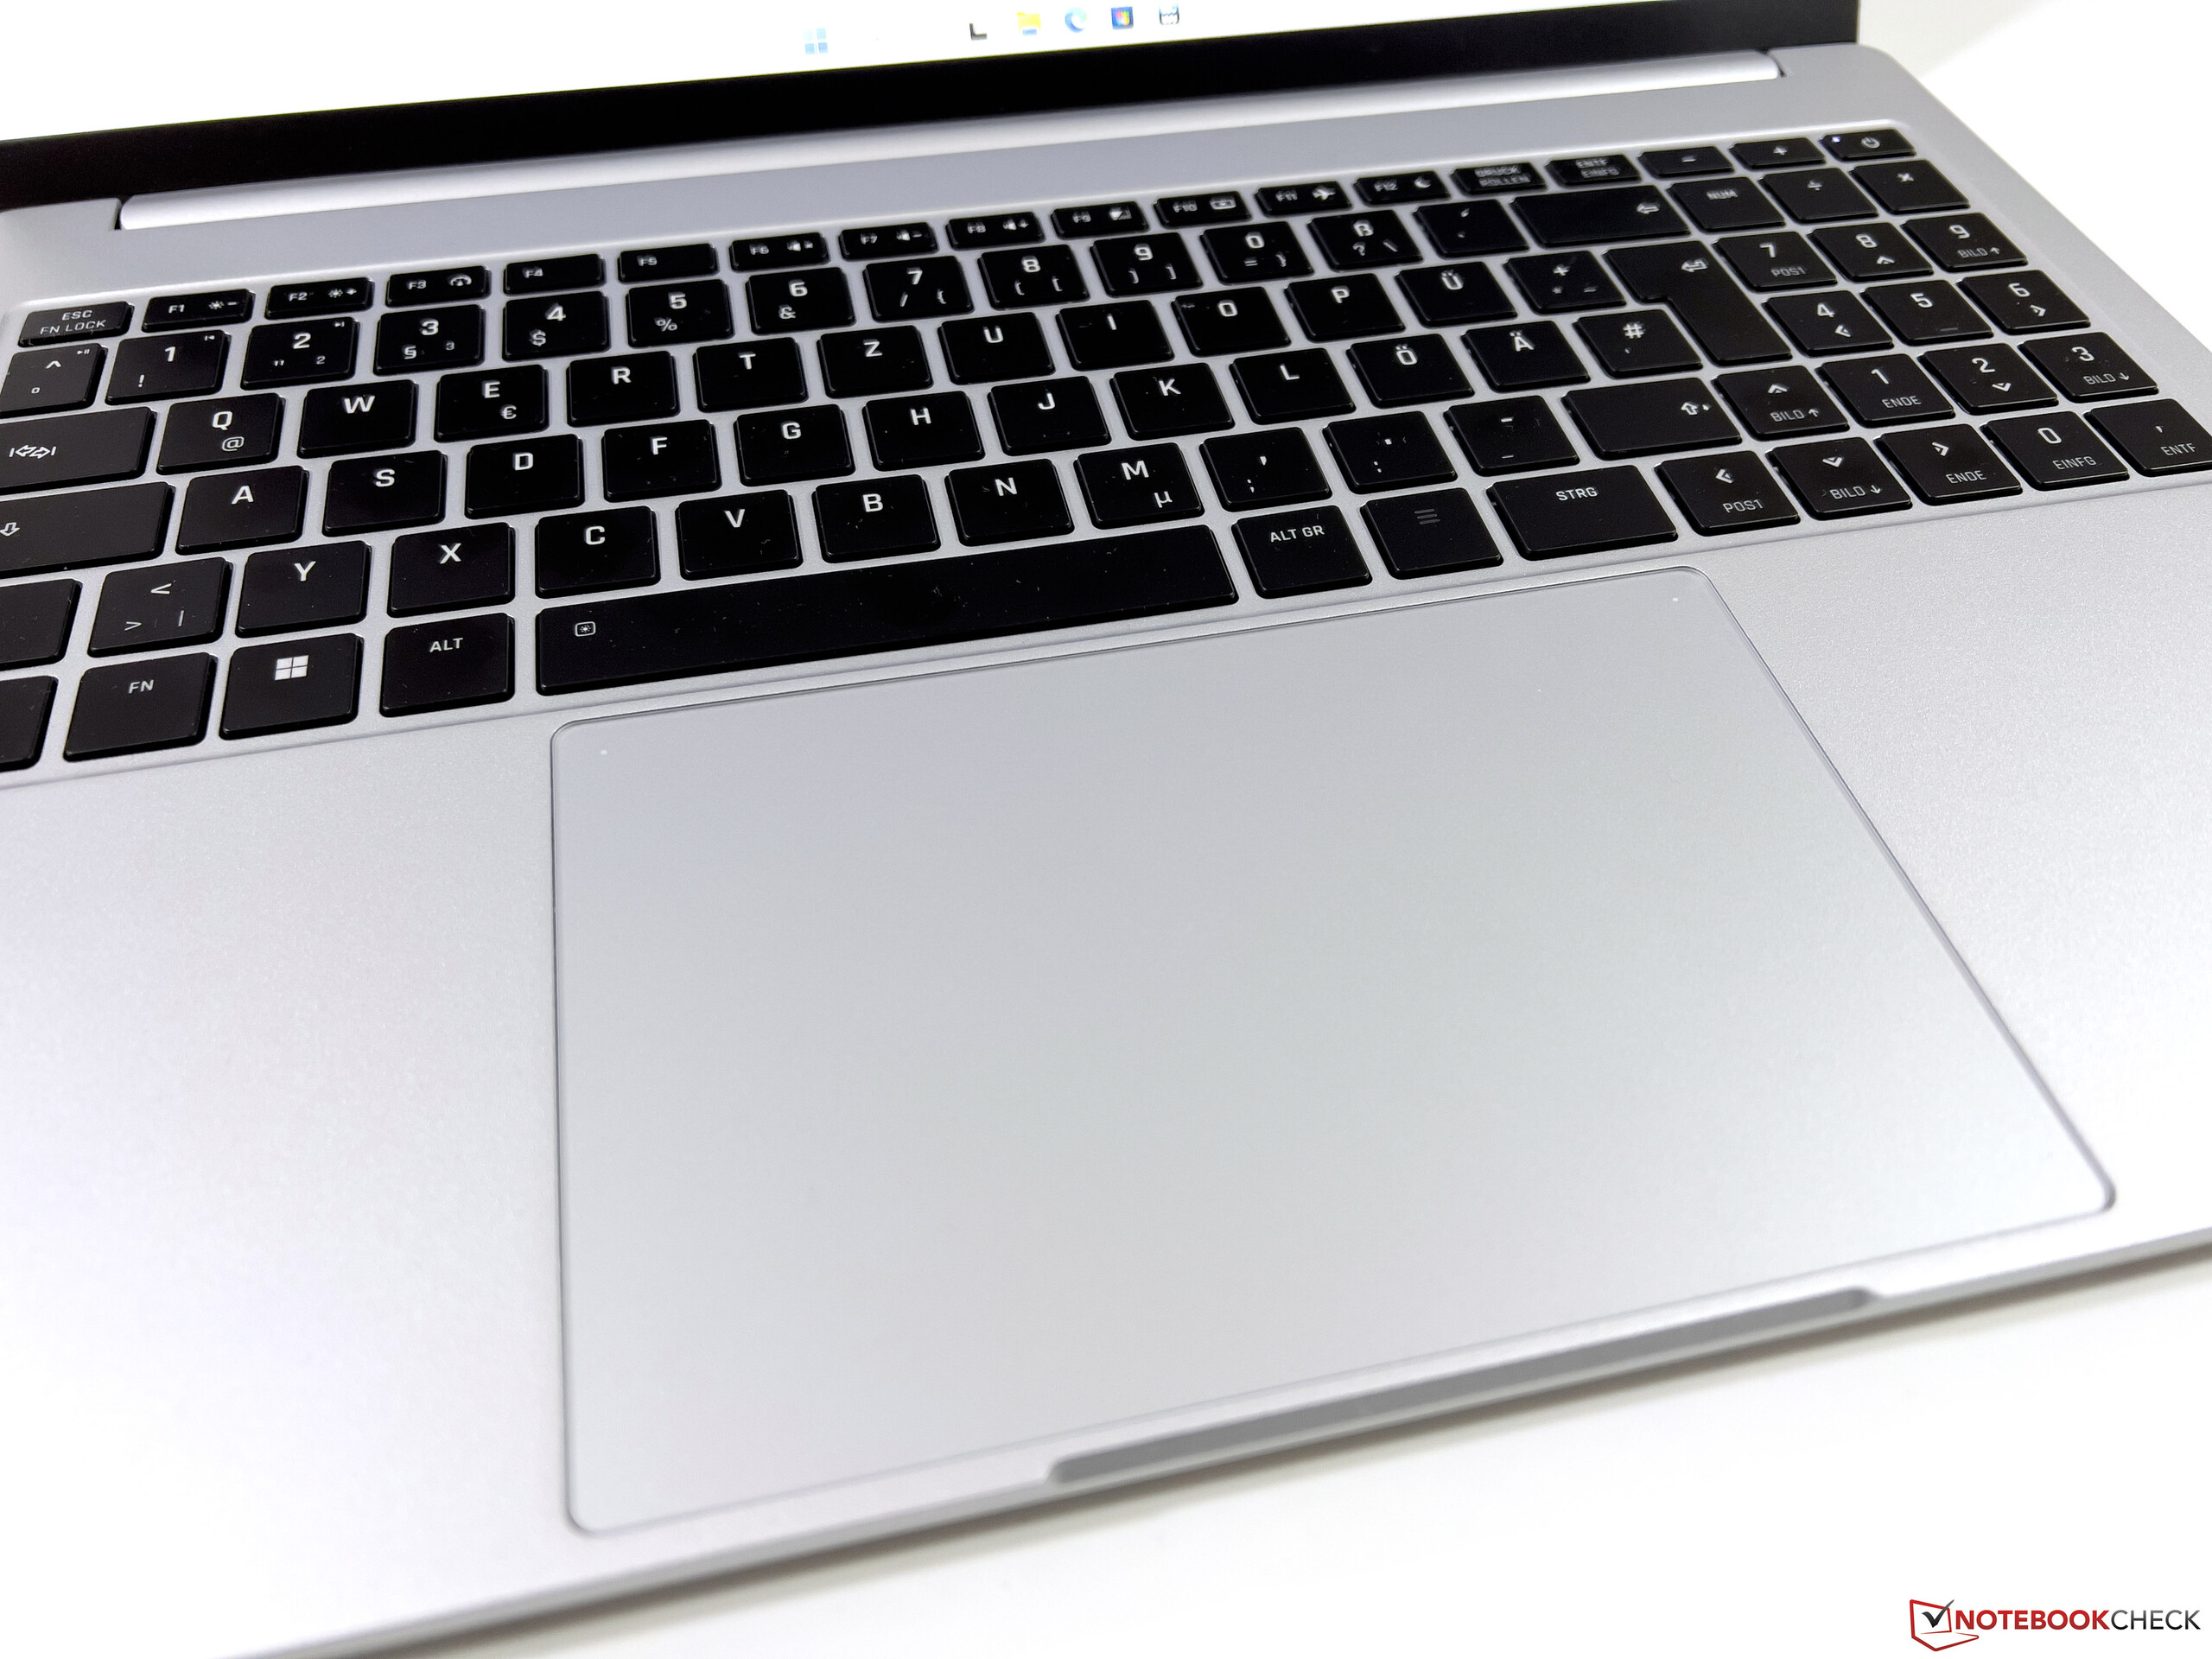
输入设备 - 带有巨大点击板的Vision 16
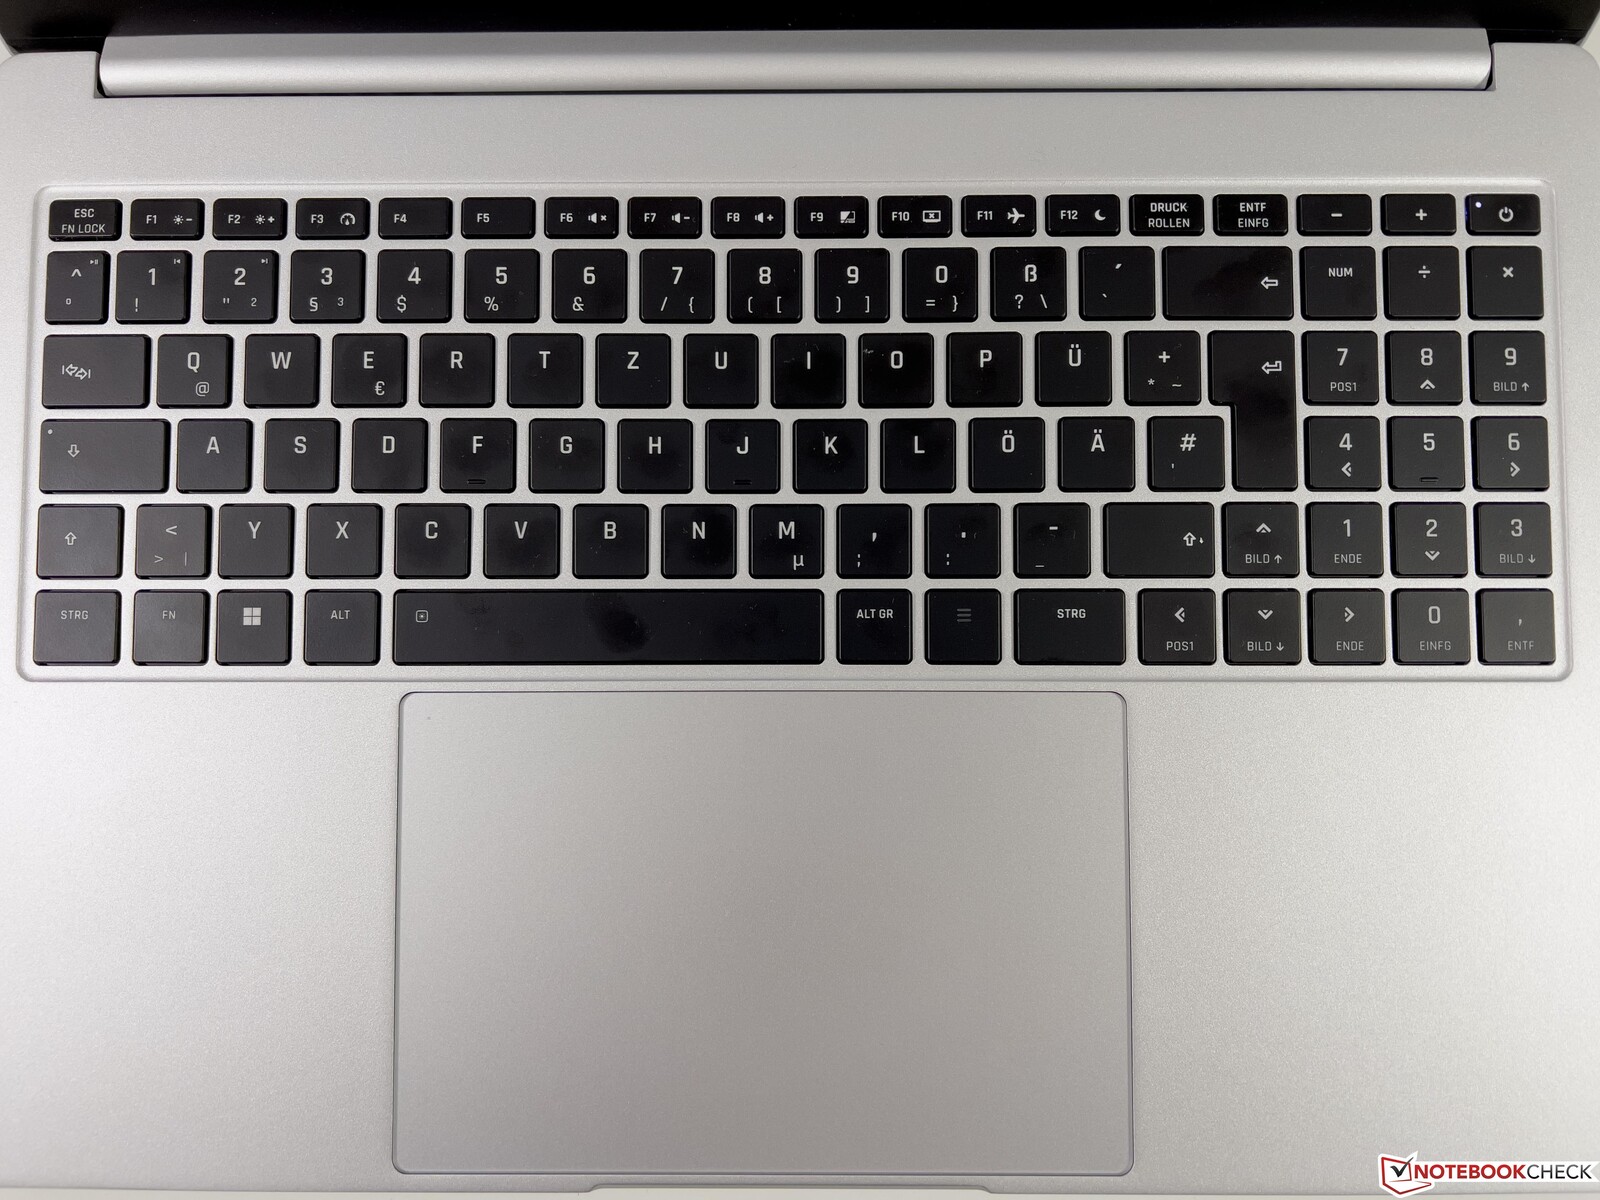
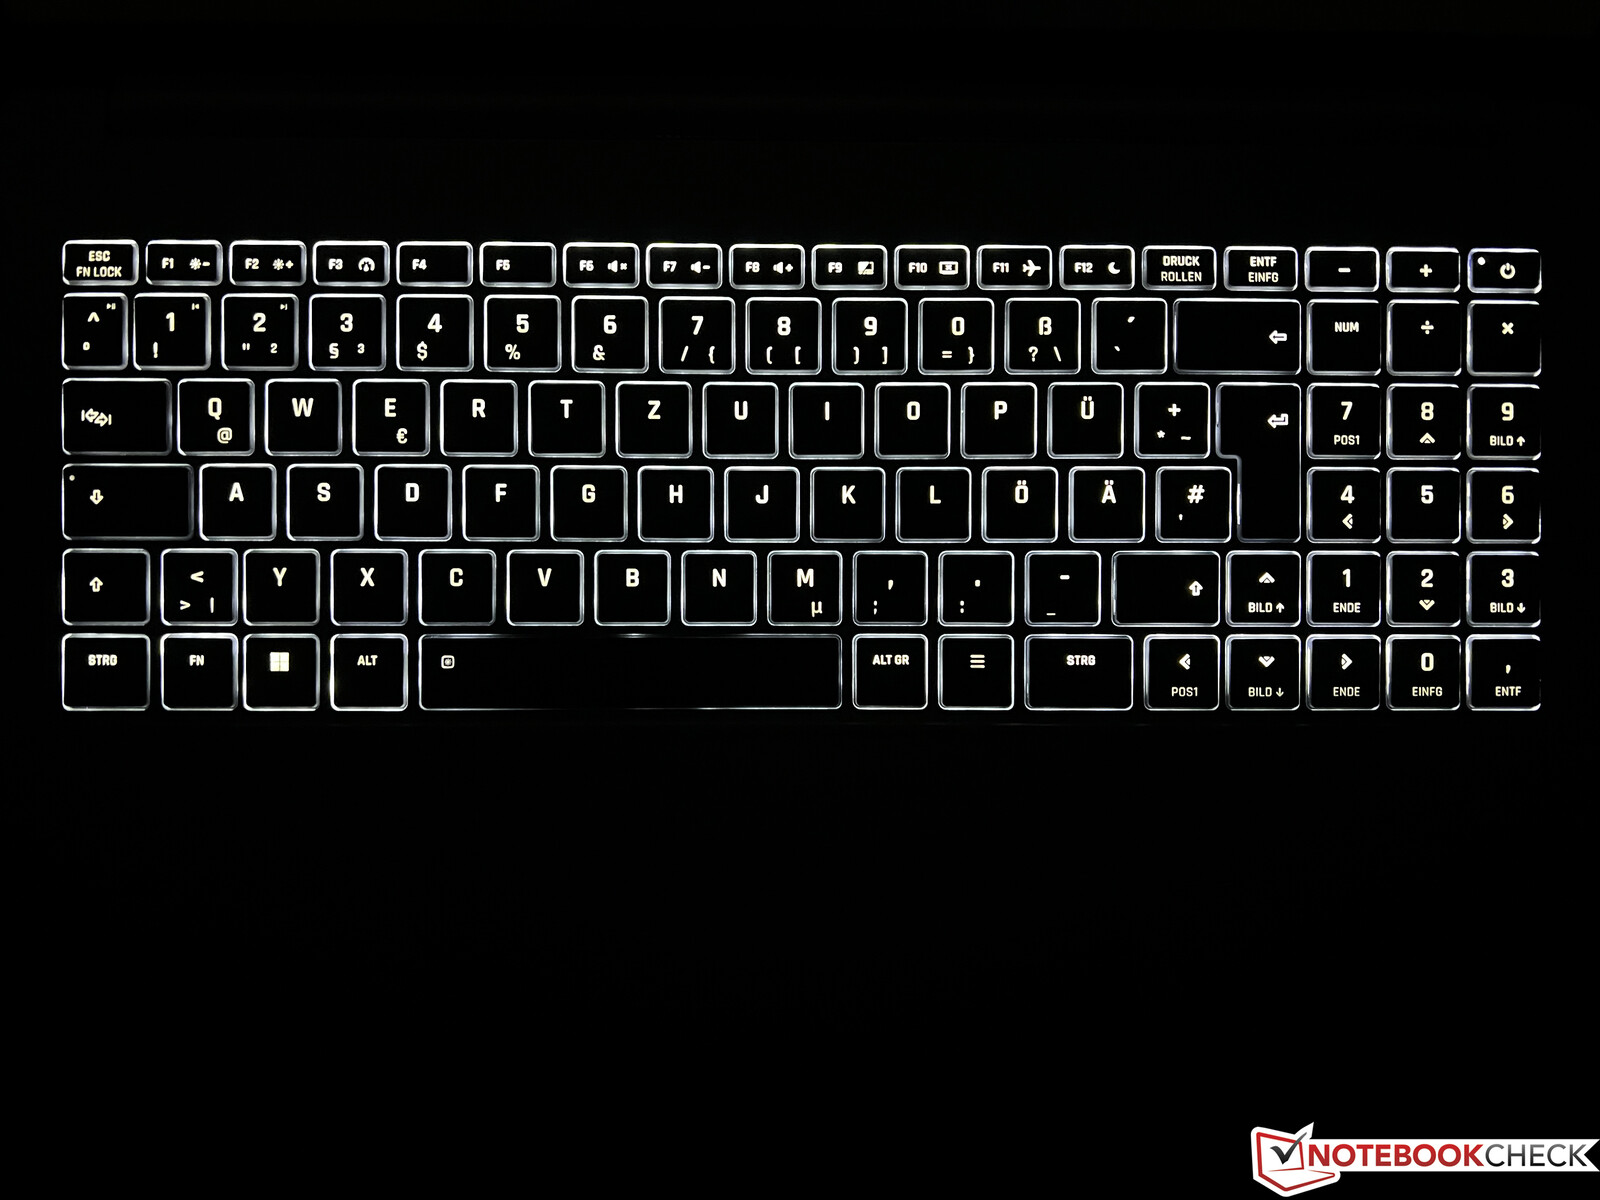
黑色的键盘与银色的机箱颜色形成了很好的对比,包括一个全尺寸的小键盘以及两级背景照明(白色)。制造商决定包括全尺寸的方向键,但这意味着小键盘不提供二级返回键。上一页/下一页也只限于通过方向键的辅助功能。
键盘很精确,除了较大的回车键和空格键的声音明显较大外,其他按键的敲击声都非常安静。Schenker没有说明键程,但整体打字体验非常舒适,即使是较长的文本也没有问题。
最大的亮点无疑是15.4 x 10厘米的巨大点击板。它工作得非常好,提供了良好的滑行能力,但点击的声音(当你真正按下下半部分时)相当响亮。通过左上角的双击可以很容易地停用键盘,有一个小的LED指示。这是有道理的,当你用外部鼠标玩游戏时。
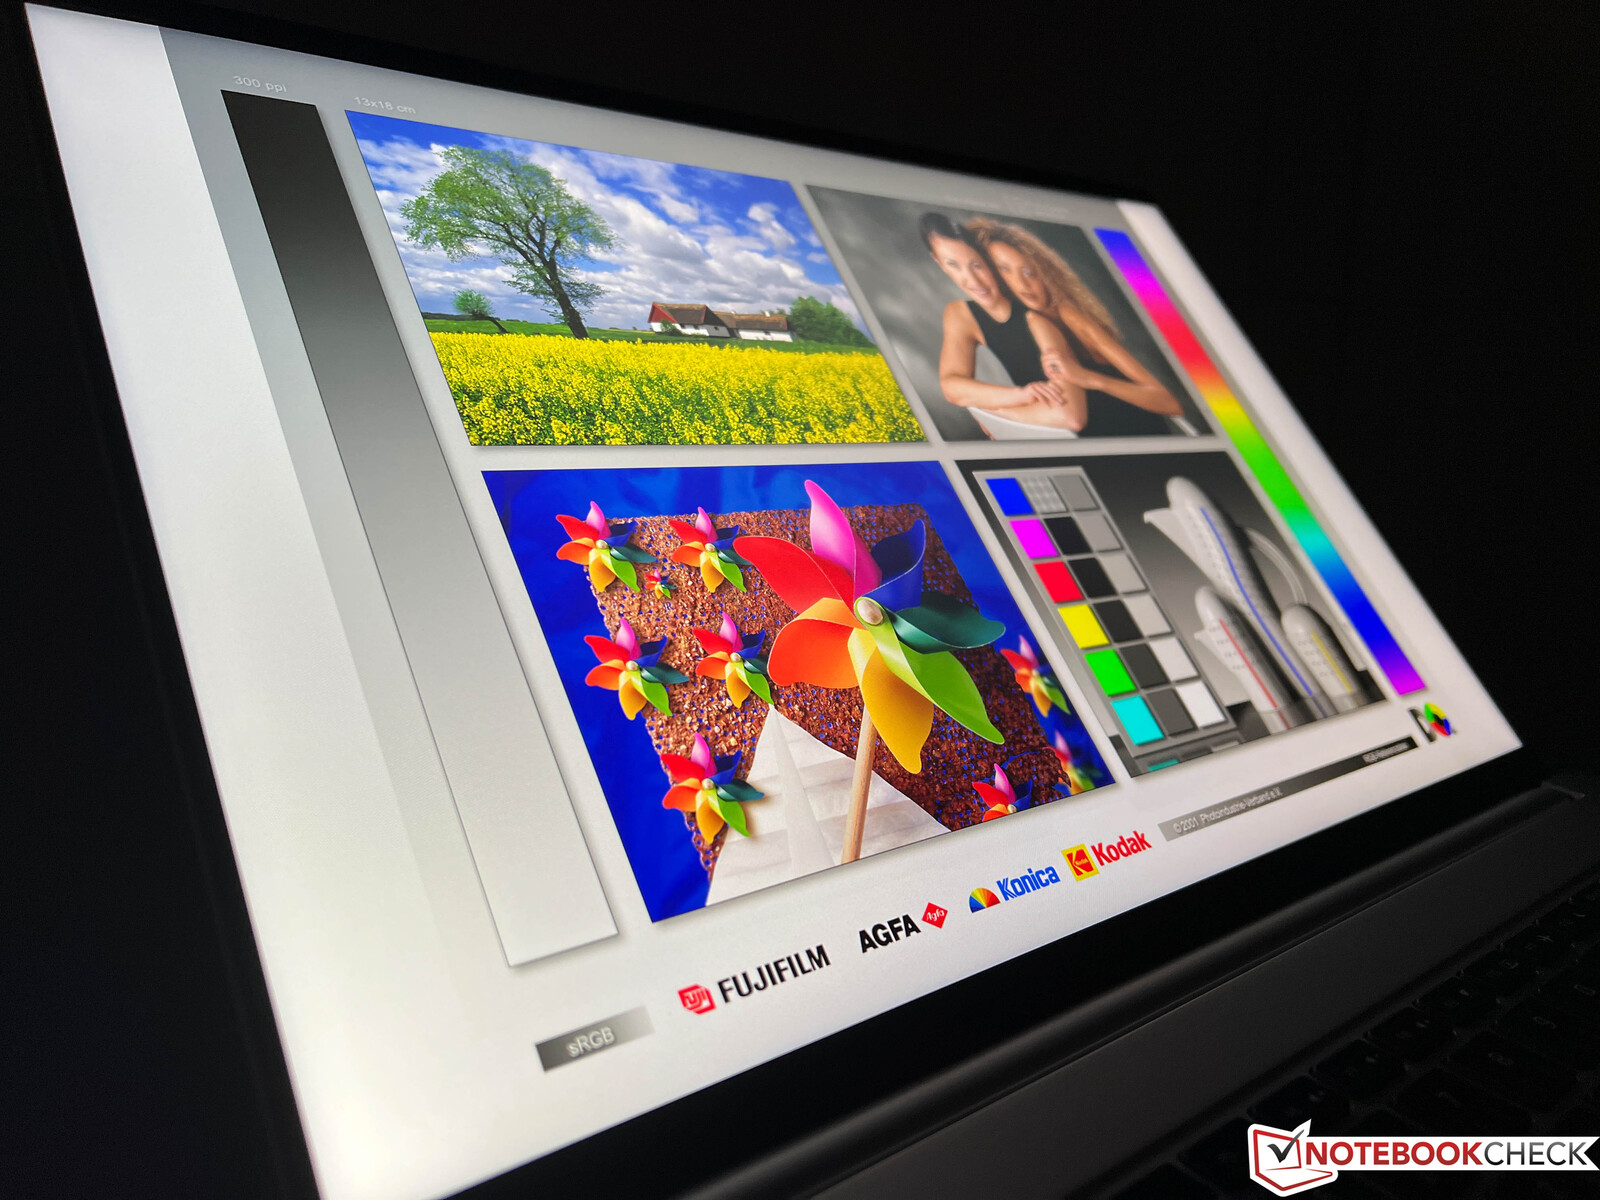
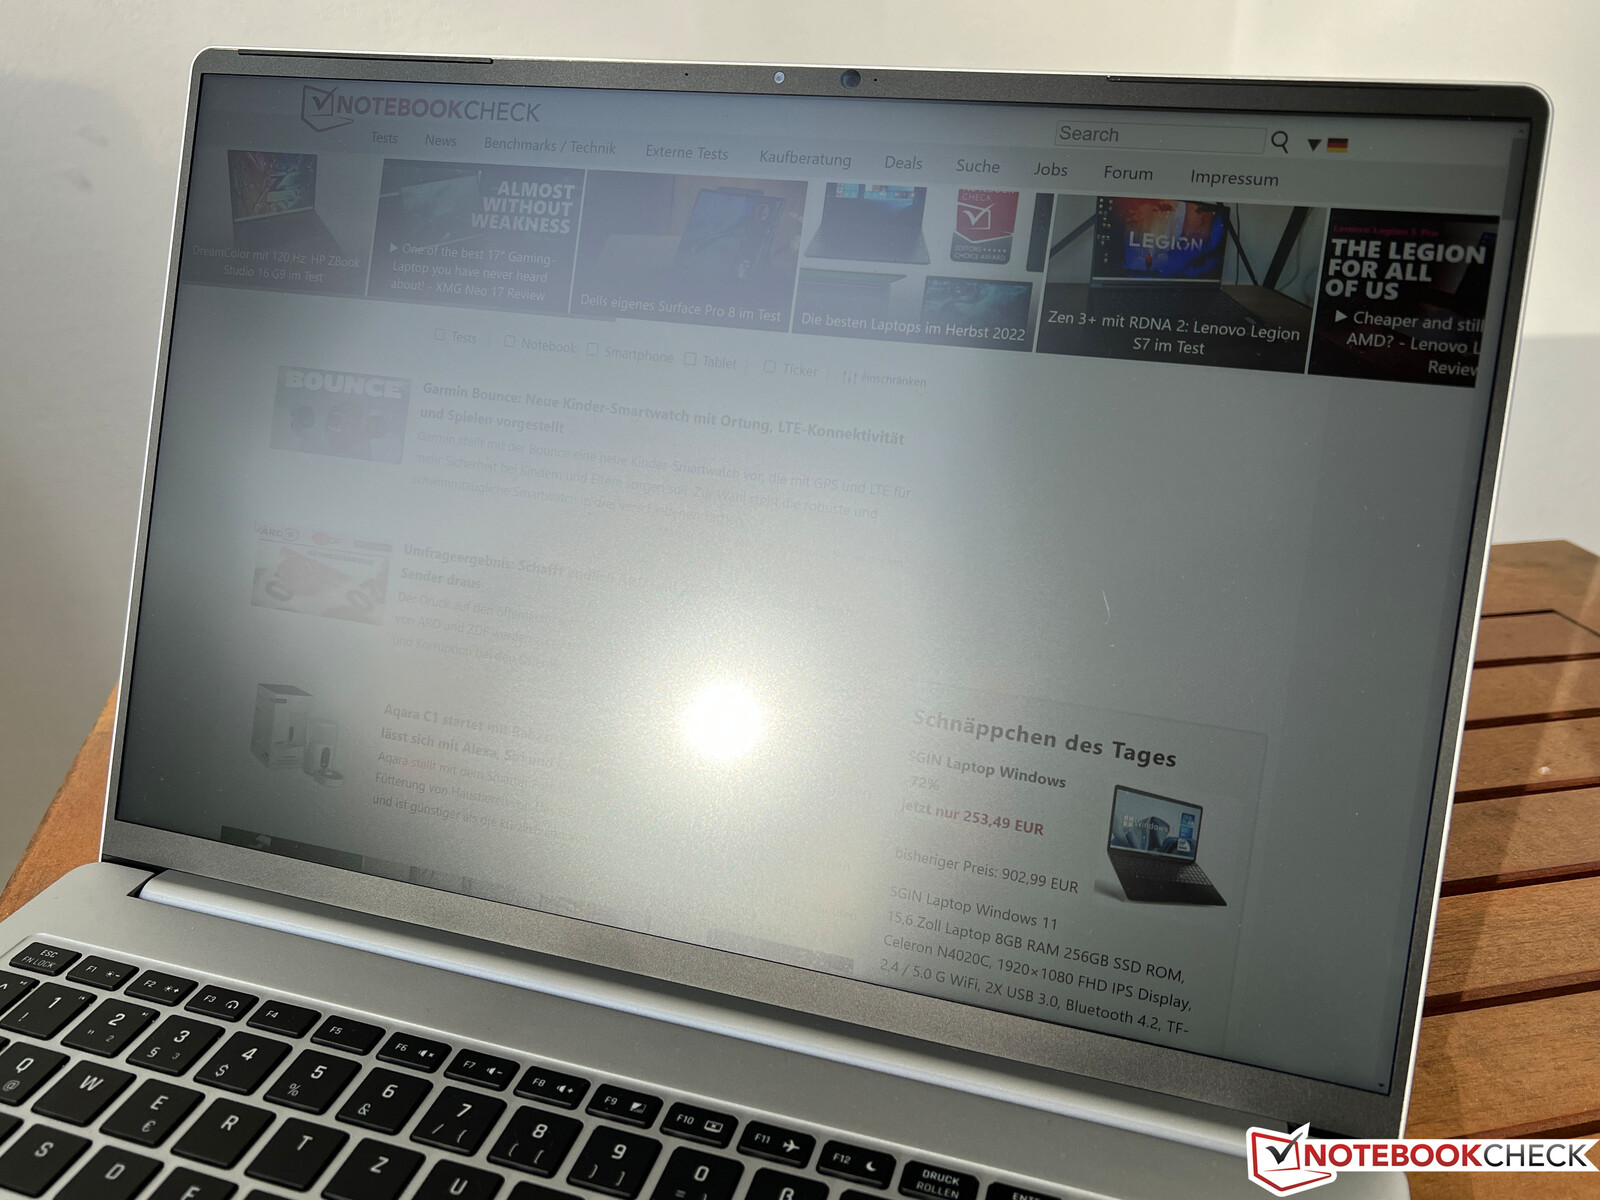
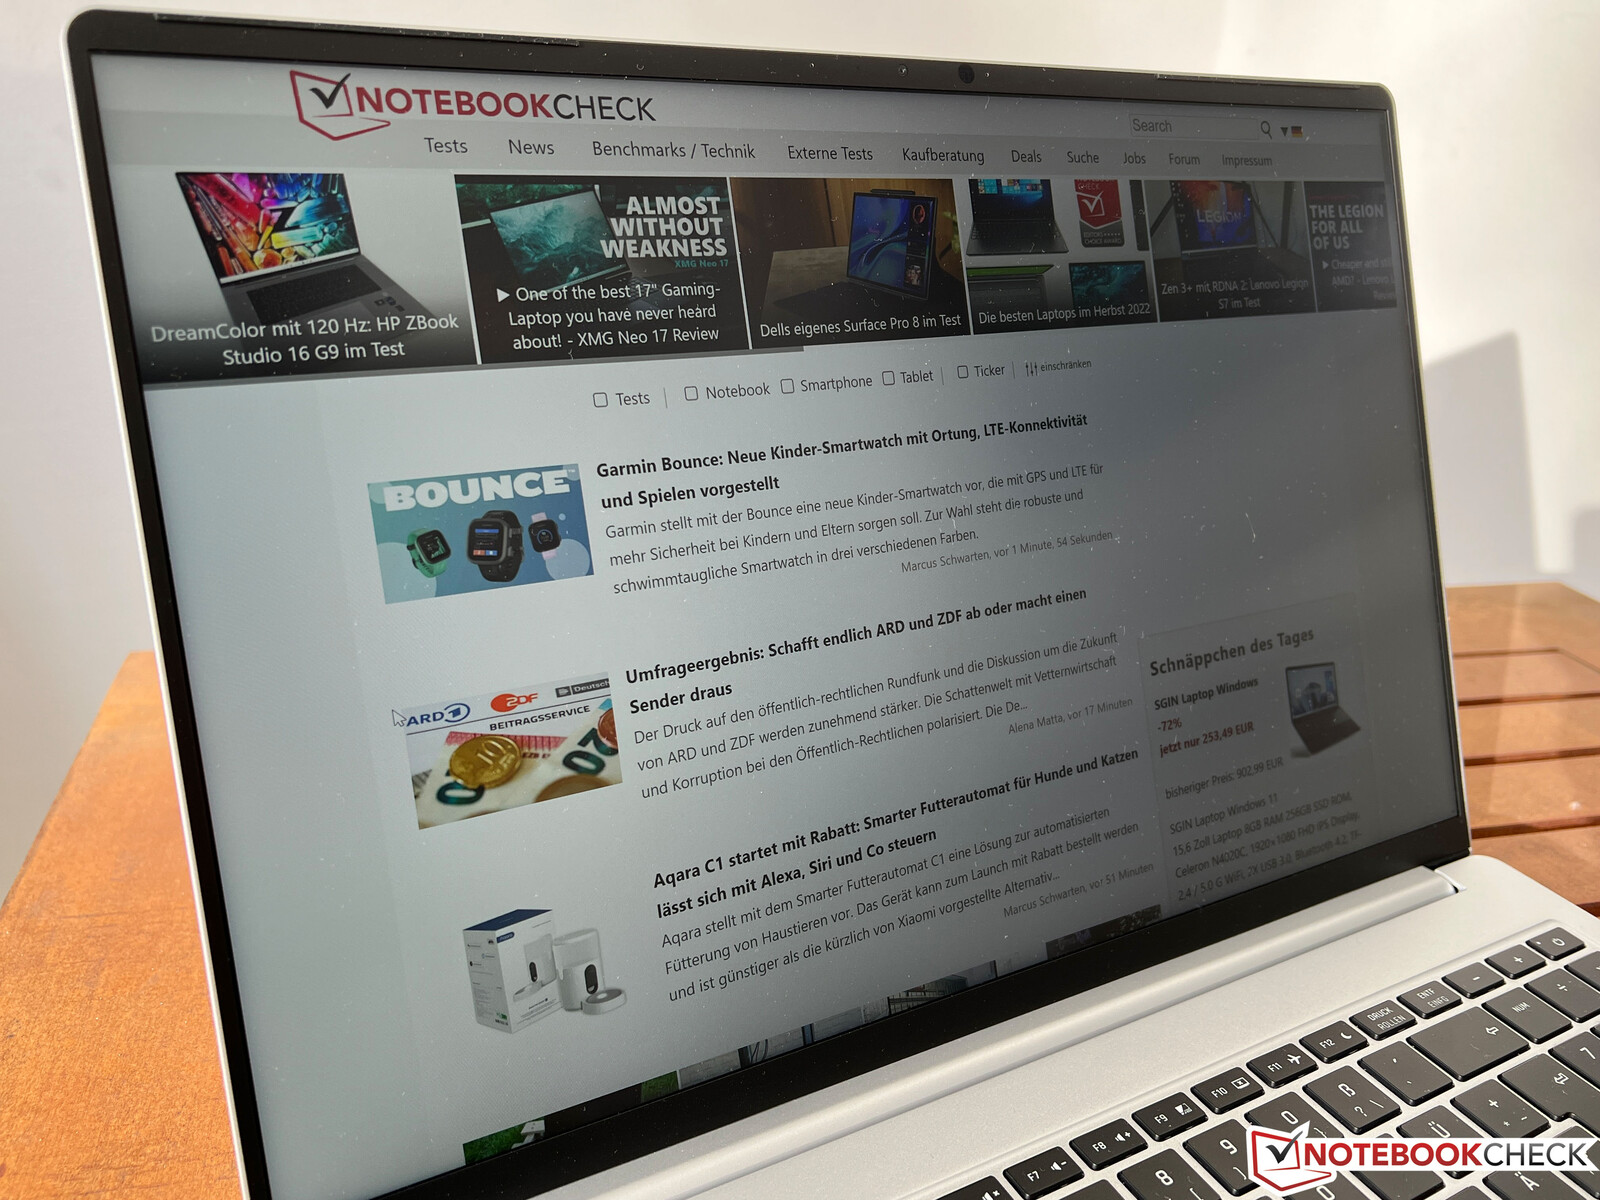
显示屏 - 申克公司使用240赫兹的哑光IPS面板
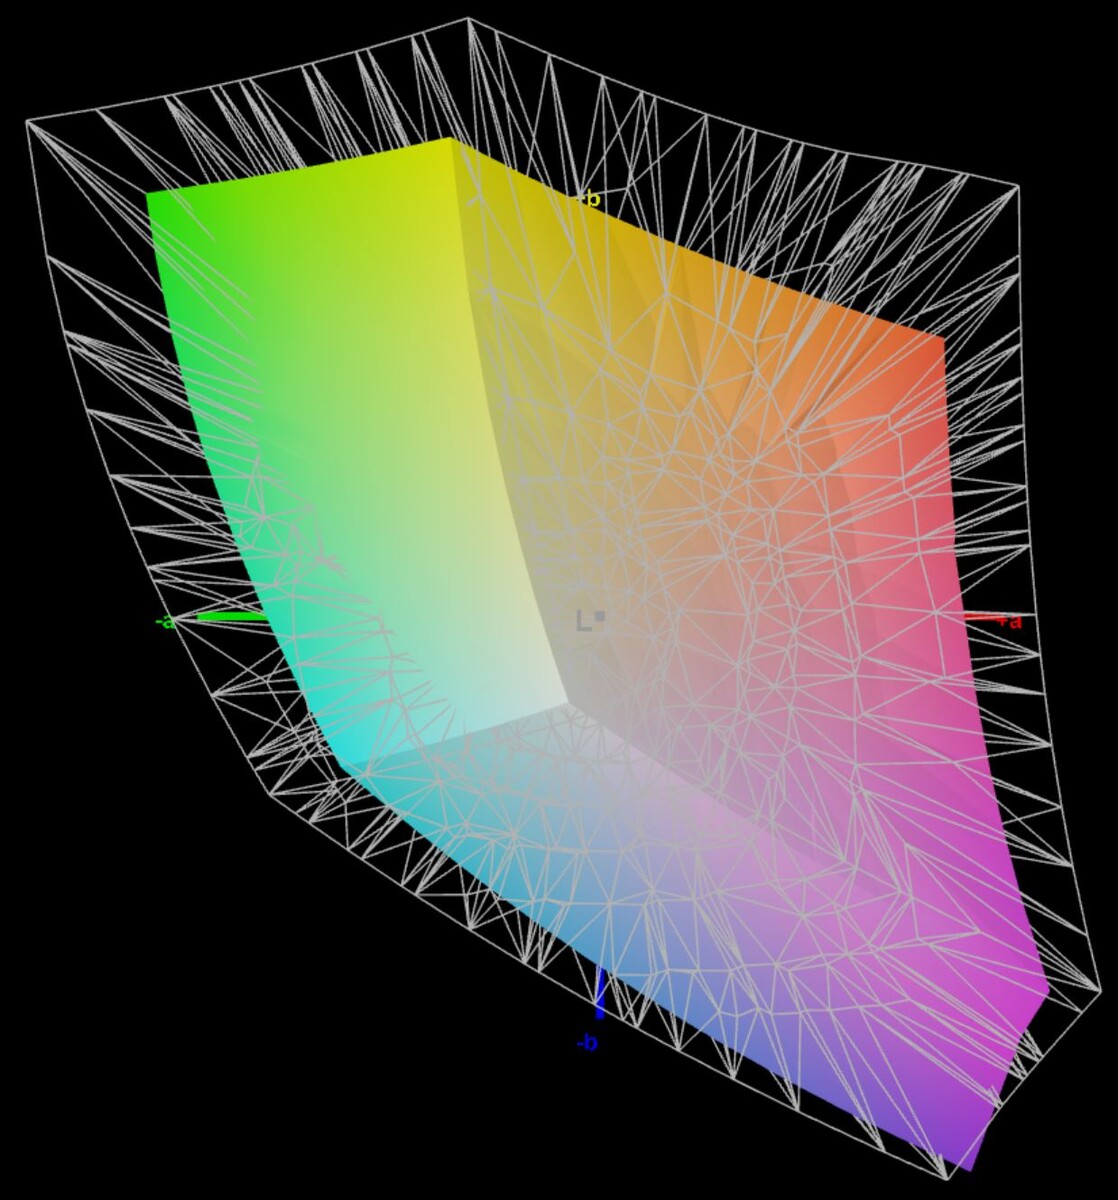
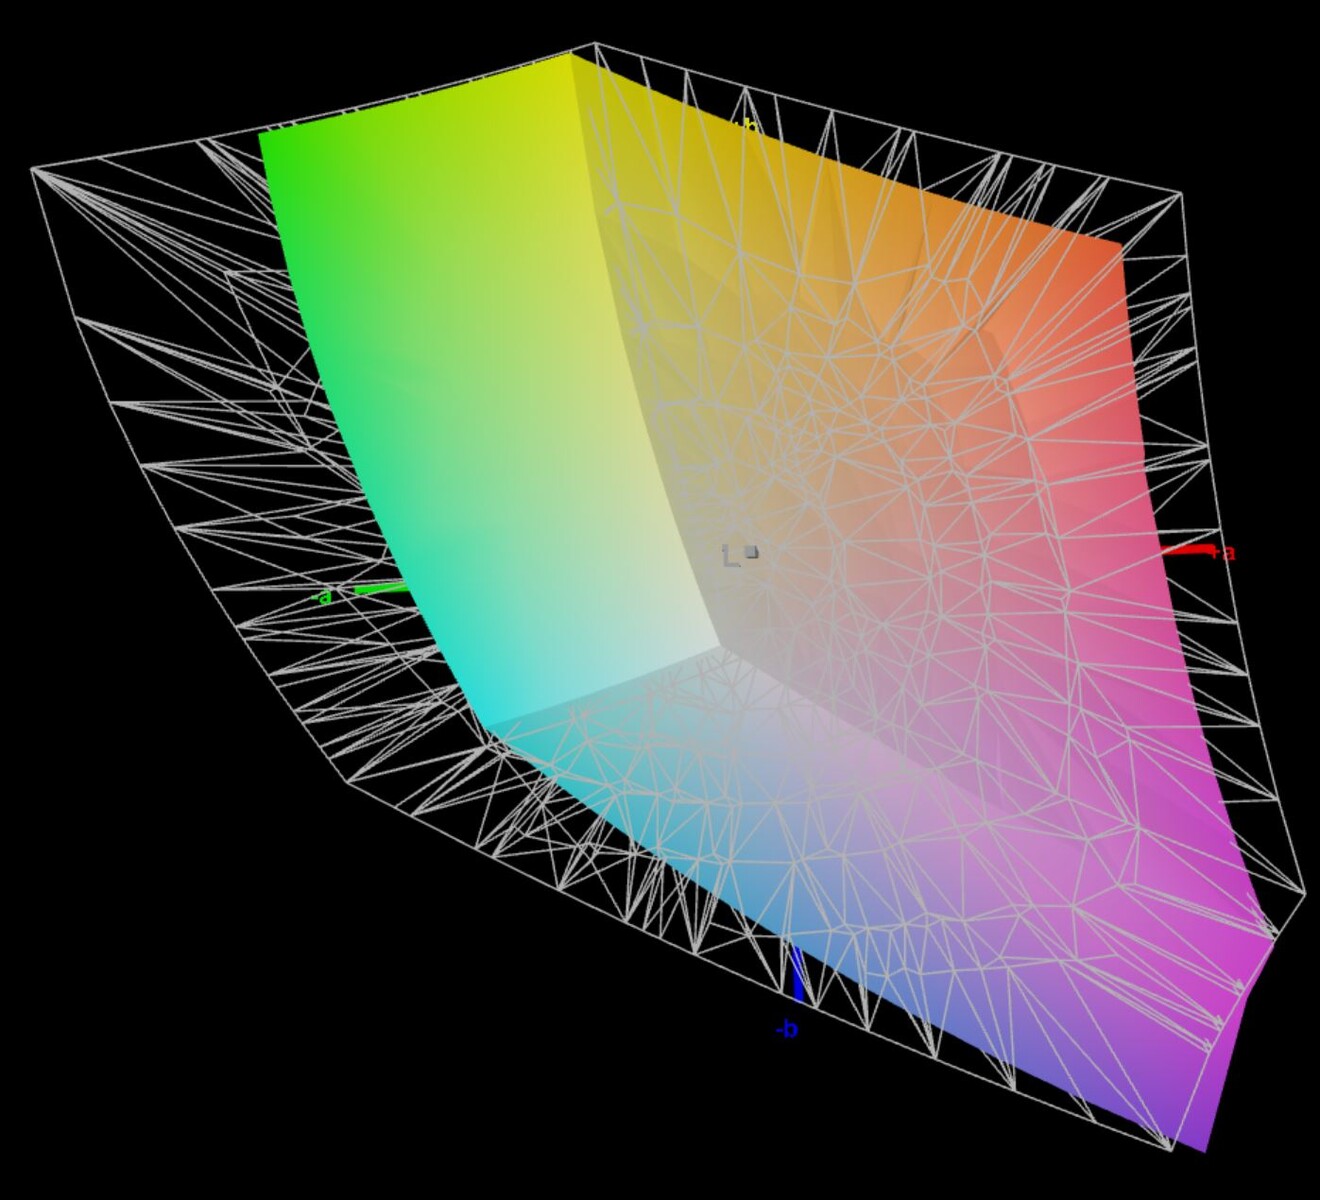
申克公司只为Vision 16 Pro提供了京东方的哑光WQHD面板(NE160QDM-NZ1,2560 x 1600像素),它也支持240 Hz。画面的主观印象非常好,因为内容很清晰,明亮的表面没有颗粒感。颜色看起来也不错,但是OLED屏幕,例如,提供更丰富的色彩。
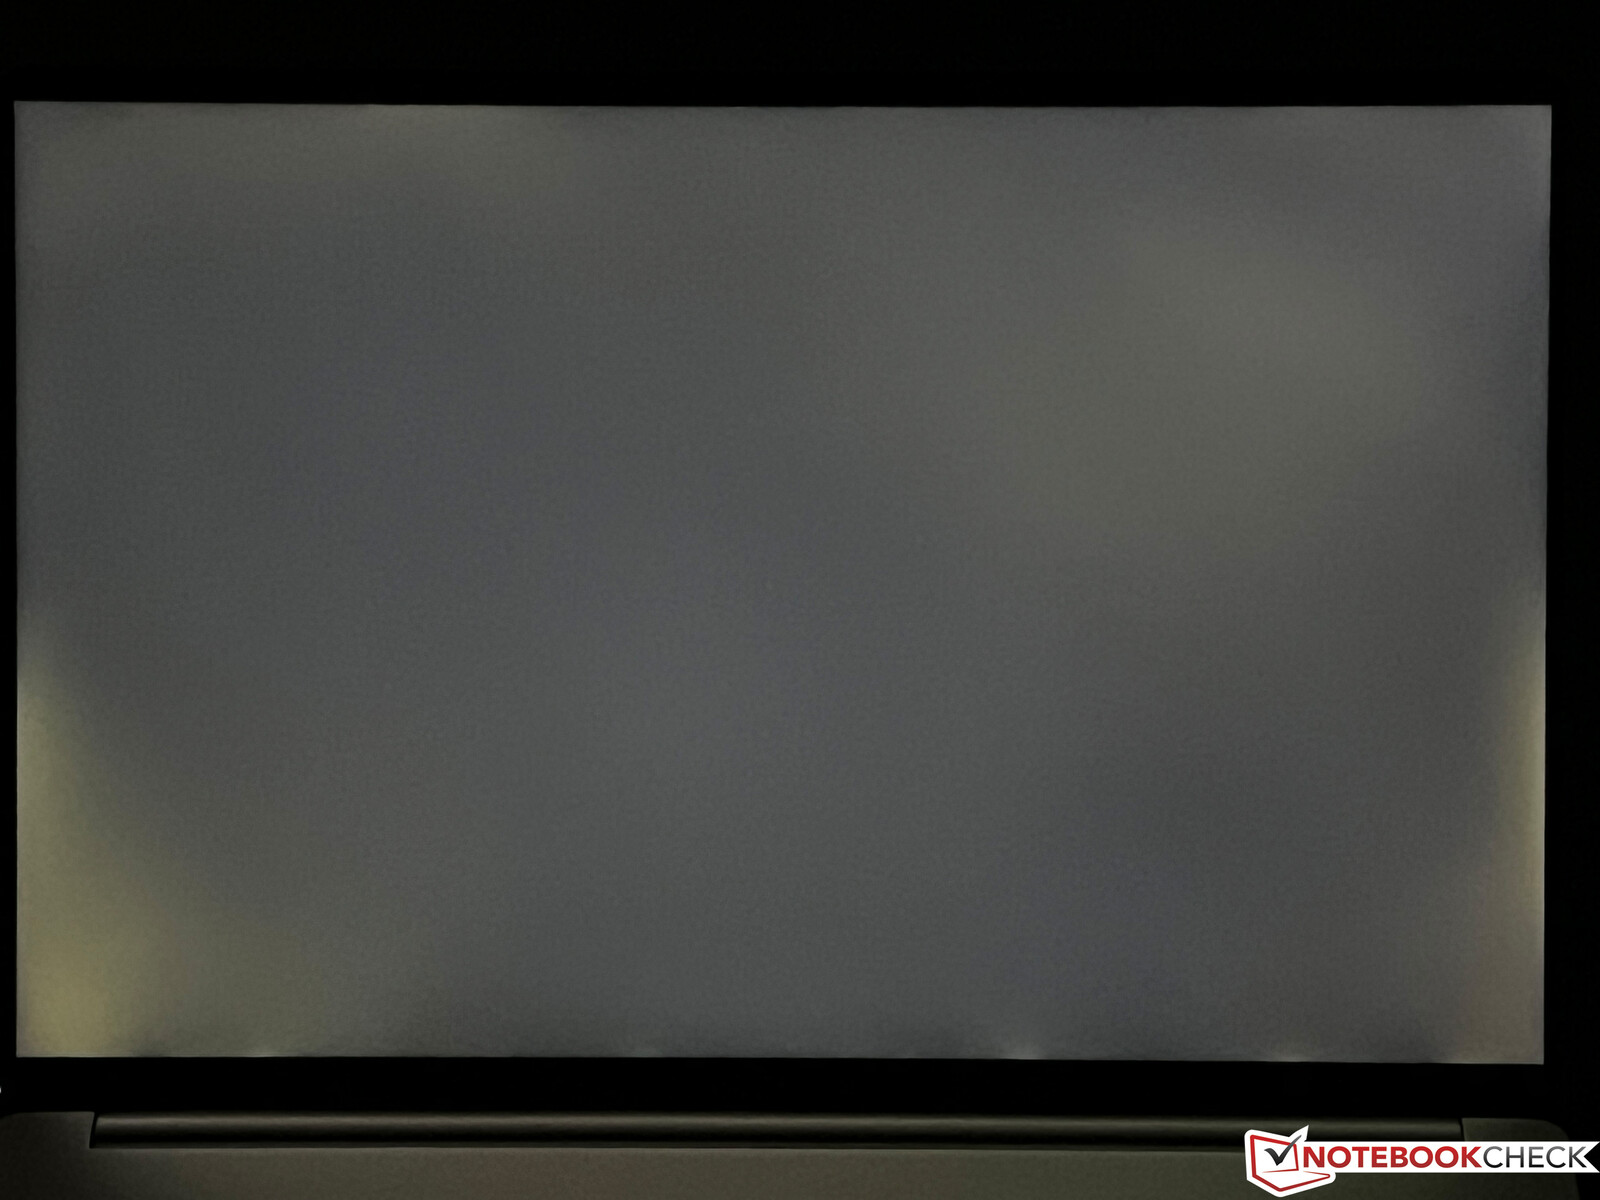
申克公司宣传的亮度为350尼特,我们可以证实这一点。黑值在0.3还是可以的,这使得对比度超过1200:1。响应时间很快,没有PWM,IPS面板的可视角度稳定性很好。在高亮度值下有明显的屏幕出血现象,当你观看有黑条的视频时,这一点特别明显。

| |||||||||||||||||||||||||
Brightness Distribution: 89 %
Center on Battery: 364 cd/m²
Contrast: 1213:1 (Black: 0.3 cd/m²)
ΔE ColorChecker Calman: 3.3 | ∀{0.5-29.43 Ø4.71}
calibrated: 2.5
ΔE Greyscale Calman: 5.2 | ∀{0.09-98 Ø4.96}
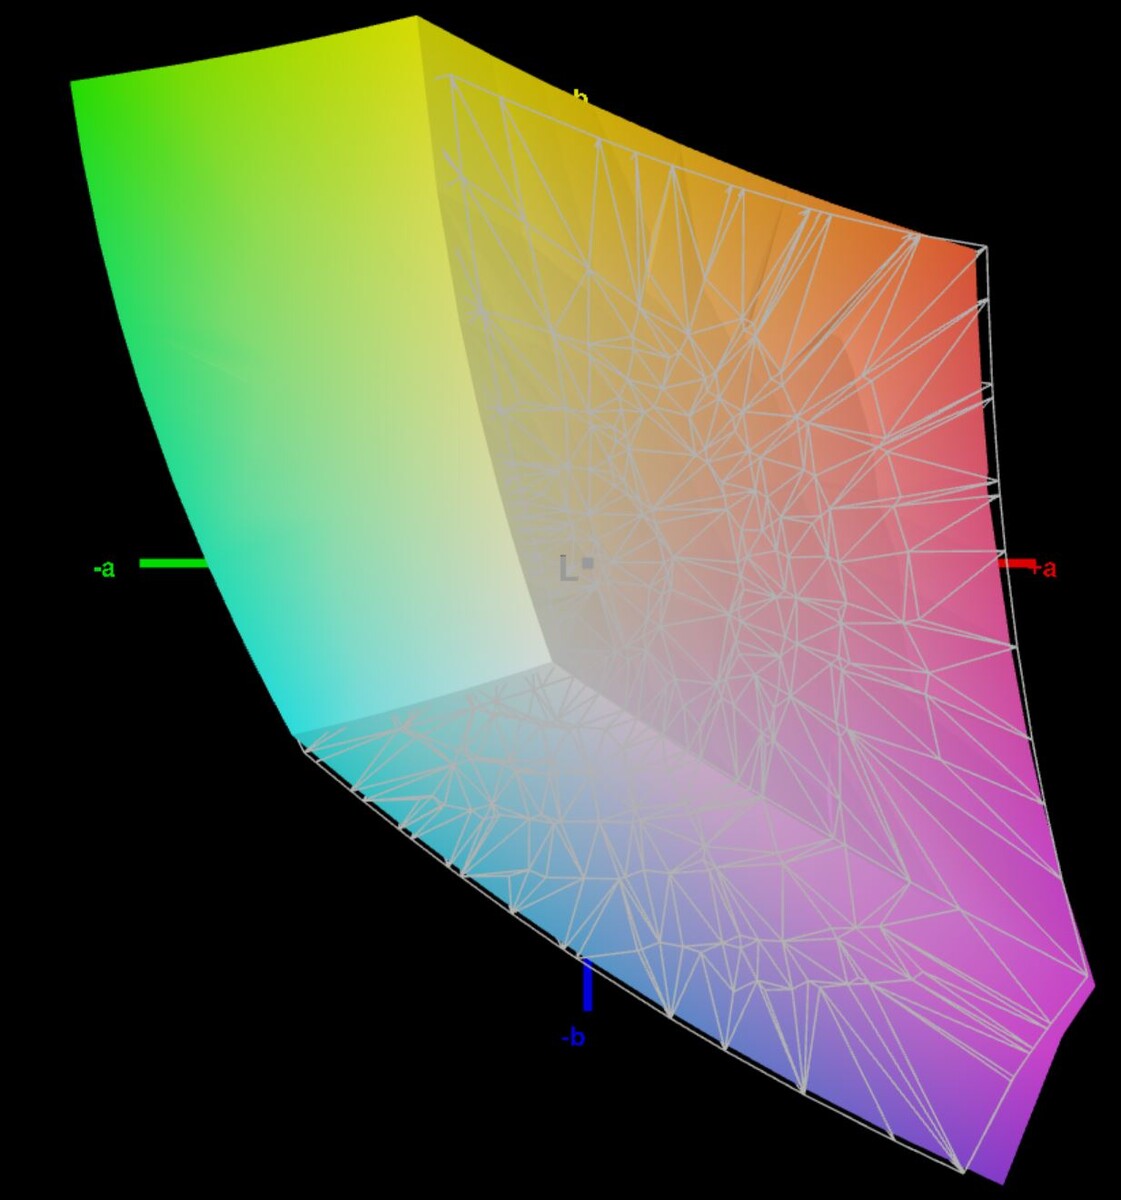
70% AdobeRGB 1998 (Argyll 3D)
96.7% sRGB (Argyll 3D)
68.7% Display P3 (Argyll 3D)
Gamma: 2.14
CCT: 6331 K
| Schenker Vision 16 Pro RTX 3070 Ti N160QDM-NZ1, IPS, 2560x1600, 16" | Apple MacBook Pro 16 2021 M1 Pro Liquid Retina XDR, Mini-LED, 3456x2234, 16.2" | Lenovo Legion Slim 7-16IAH 82TF004YGE MNG007DA1-G , IPS LED, 2560x1600, 16" | Lenovo ThinkBook 16p G3 ARH BOE CQ NE160QDM-NY1, IPS, 2560x1600, 16" | HP Envy 16 h0112nr Samsung SDC4174, OLED, 3840x2400, 16" | |
|---|---|---|---|---|---|
| Display | 24% | 3% | 2% | 25% | |
| Display P3 Coverage (%) | 68.7 | 99.1 44% | 70.5 3% | 69.8 2% | 99.3 45% |
| sRGB Coverage (%) | 96.7 | 100 3% | 99.1 2% | 98.2 2% | 100 3% |
| AdobeRGB 1998 Coverage (%) | 70 | 88 26% | 72.8 4% | 71.4 2% | 88 26% |
| Response Times | -582% | 18% | -20% | 82% | |
| Response Time Grey 50% / Grey 80% * (ms) | 14.3 ? | 42.8 ? -199% | 12 ? 16% | 15.6 ? -9% | 2 ? 86% |
| Response Time Black / White * (ms) | 8.6 ? | 91.6 ? -965% | 7 ? 19% | 11.2 ? -30% | 1.9 ? 78% |
| PWM Frequency (Hz) | 14880 | 240.4 ? | |||
| Screen | 297% | 23% | 22% | 22% | |
| Brightness middle (cd/m²) | 364 | 514 41% | 523 44% | 532.8 46% | 328.8 -10% |
| Brightness (cd/m²) | 347 | 497 43% | 494 42% | 519 50% | 332 -4% |
| Brightness Distribution (%) | 89 | 95 7% | 90 1% | 94 6% | 97 9% |
| Black Level * (cd/m²) | 0.3 | 0.02 93% | 0.4 -33% | 0.55 -83% | |
| Contrast (:1) | 1213 | 25700 2019% | 1308 8% | 969 -20% | |
| Colorchecker dE 2000 * | 3.3 | 1.4 58% | 2.6 21% | 1.32 60% | 1.53 54% |
| Colorchecker dE 2000 max. * | 6.6 | 2.8 58% | 5 24% | 3.97 40% | 6.04 8% |
| Colorchecker dE 2000 calibrated * | 2.5 | 1 60% | 1.59 36% | ||
| Greyscale dE 2000 * | 5.2 | 2.3 56% | 3.3 37% | 1.8 65% | 1.3 75% |
| Gamma | 2.14 103% | 2.27 97% | 2.17 101% | 2.64 83% | 2.18 101% |
| CCT | 6331 103% | 6792 96% | 6013 108% | 6761 96% | 6362 102% |
| Total Average (Program / Settings) | -87% /
99% | 15% /
18% | 1% /
12% | 43% /
34% |
* ... smaller is better
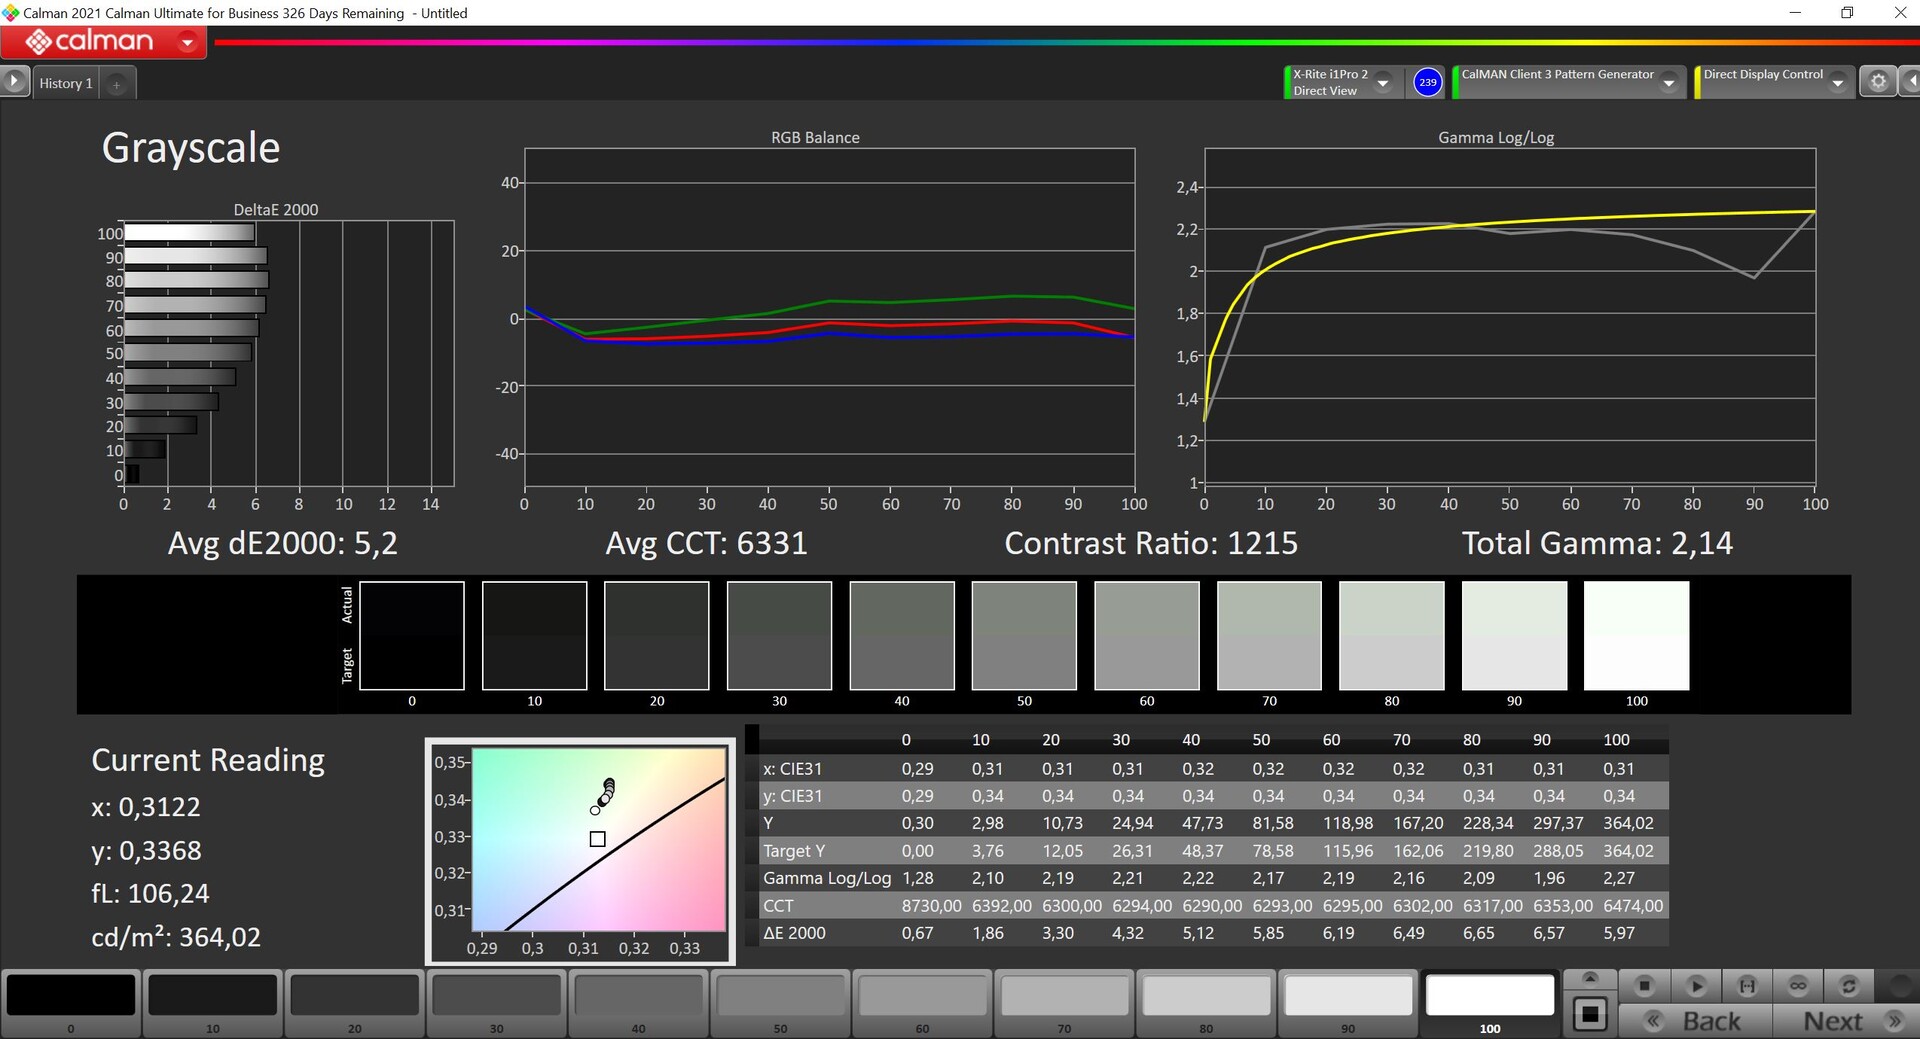
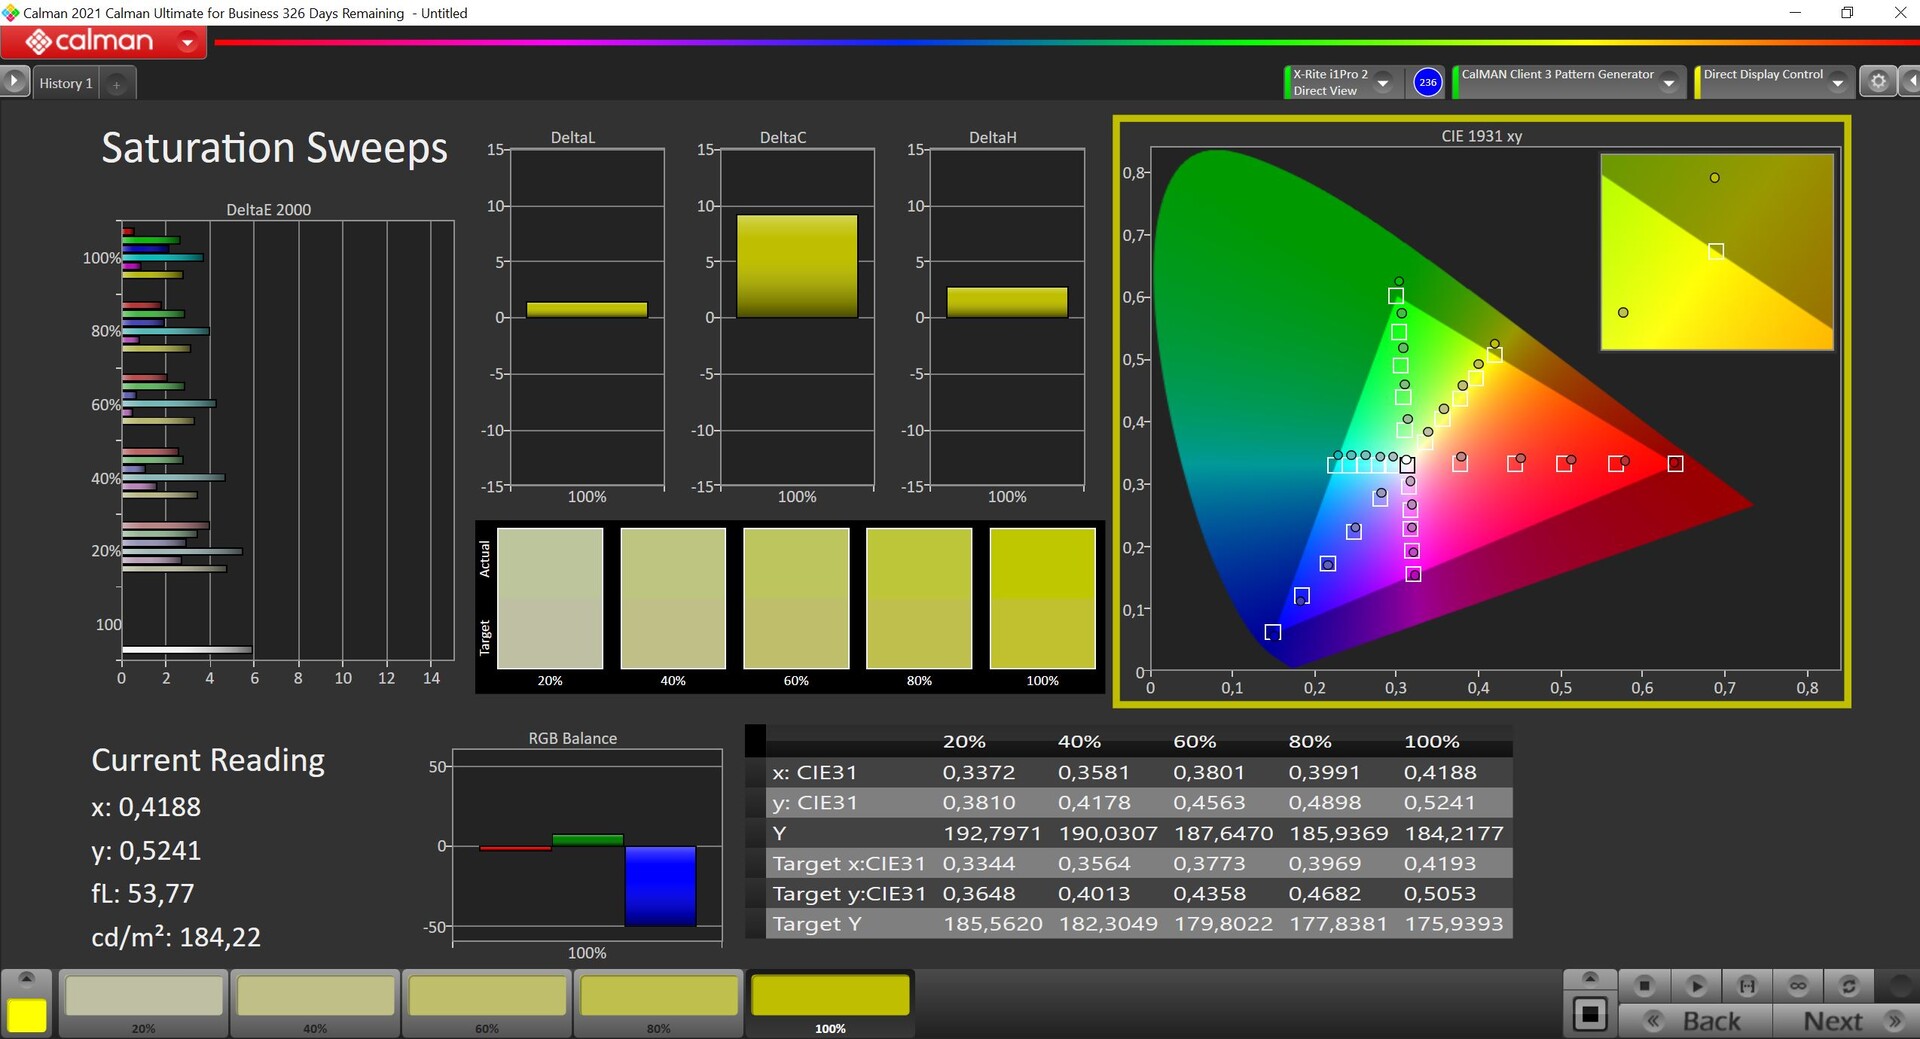
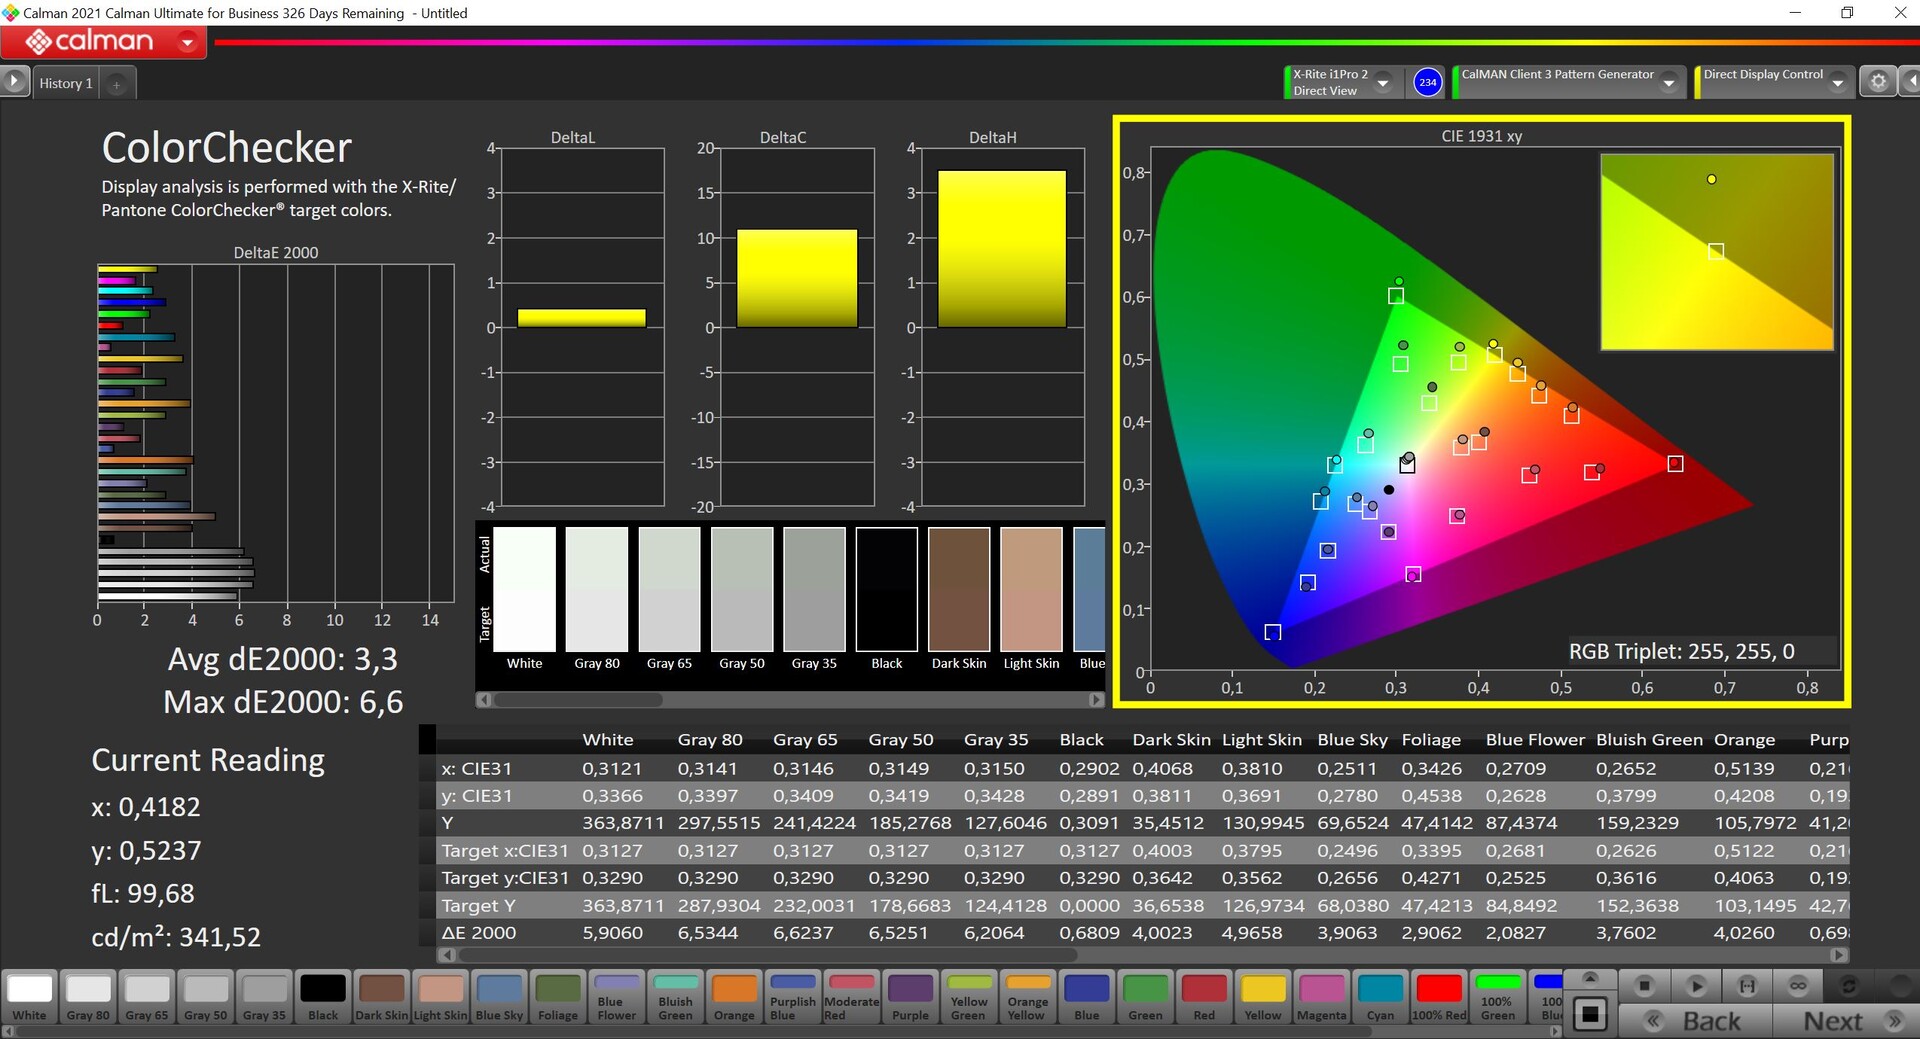
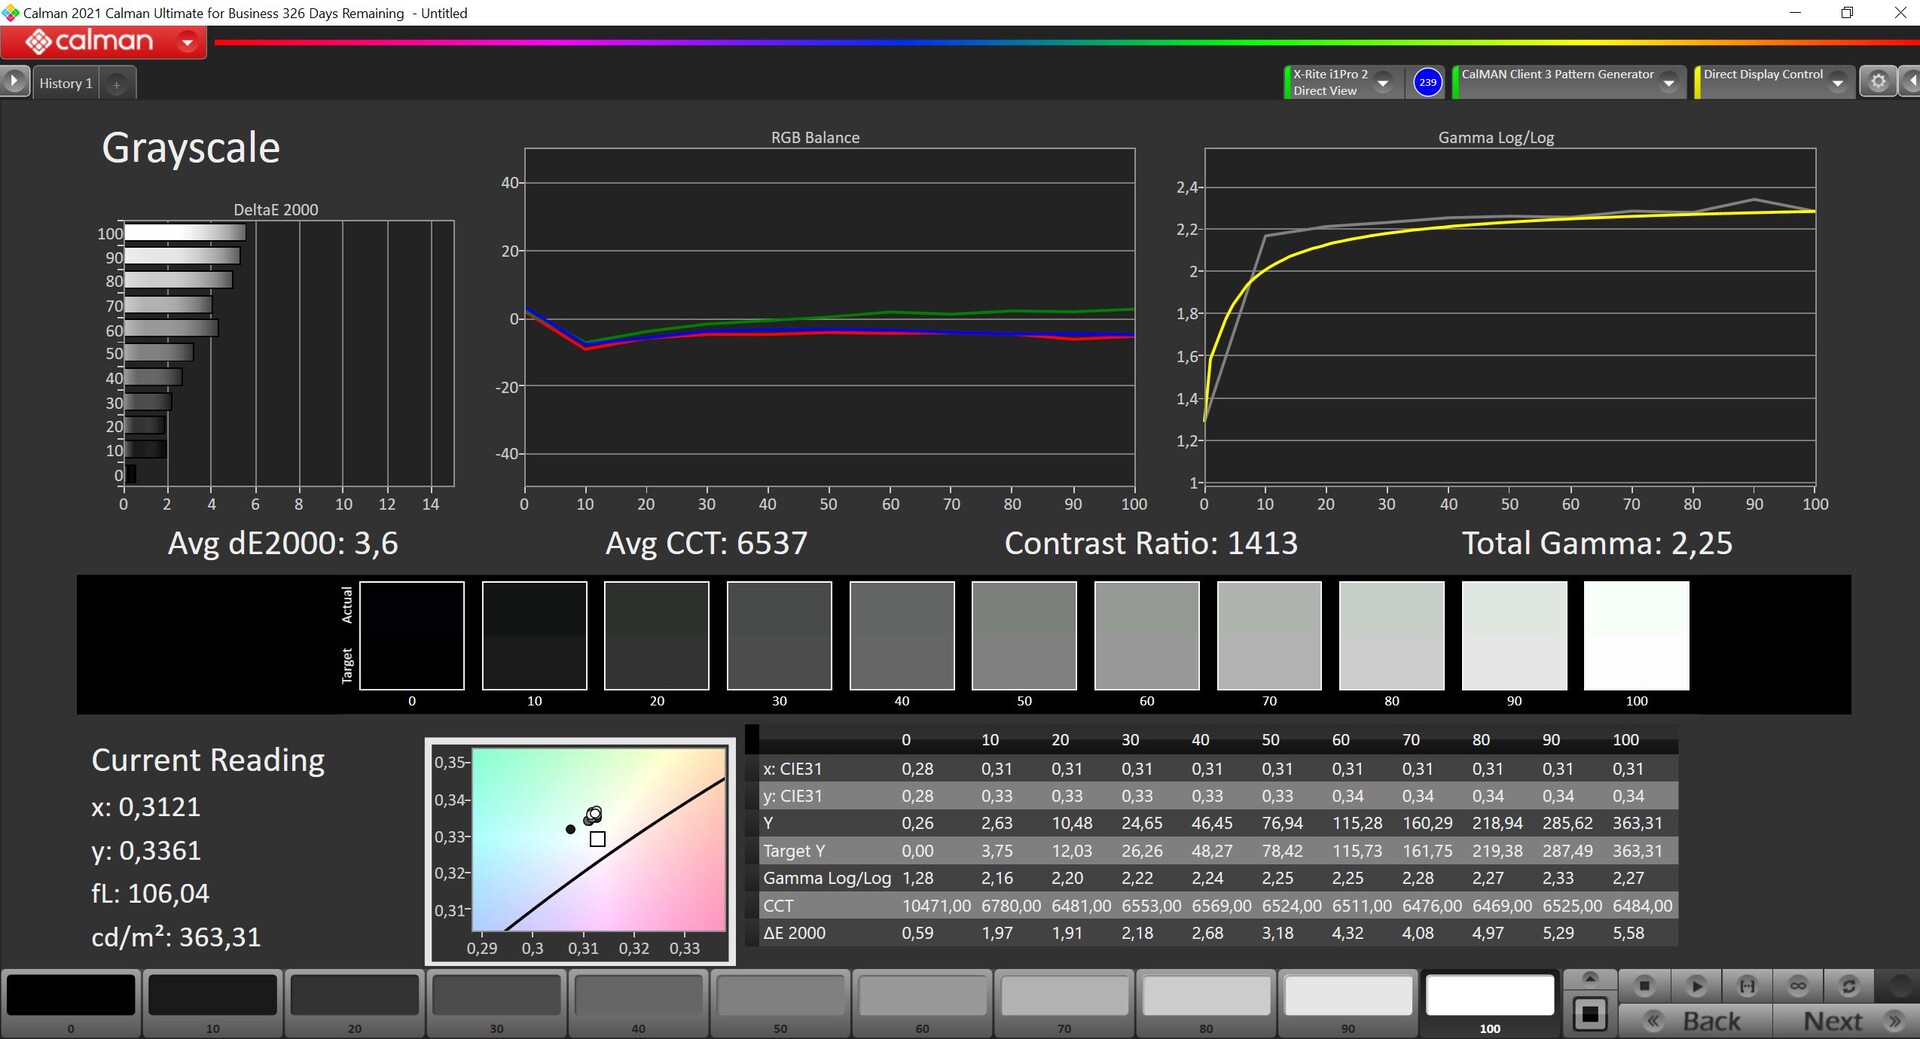
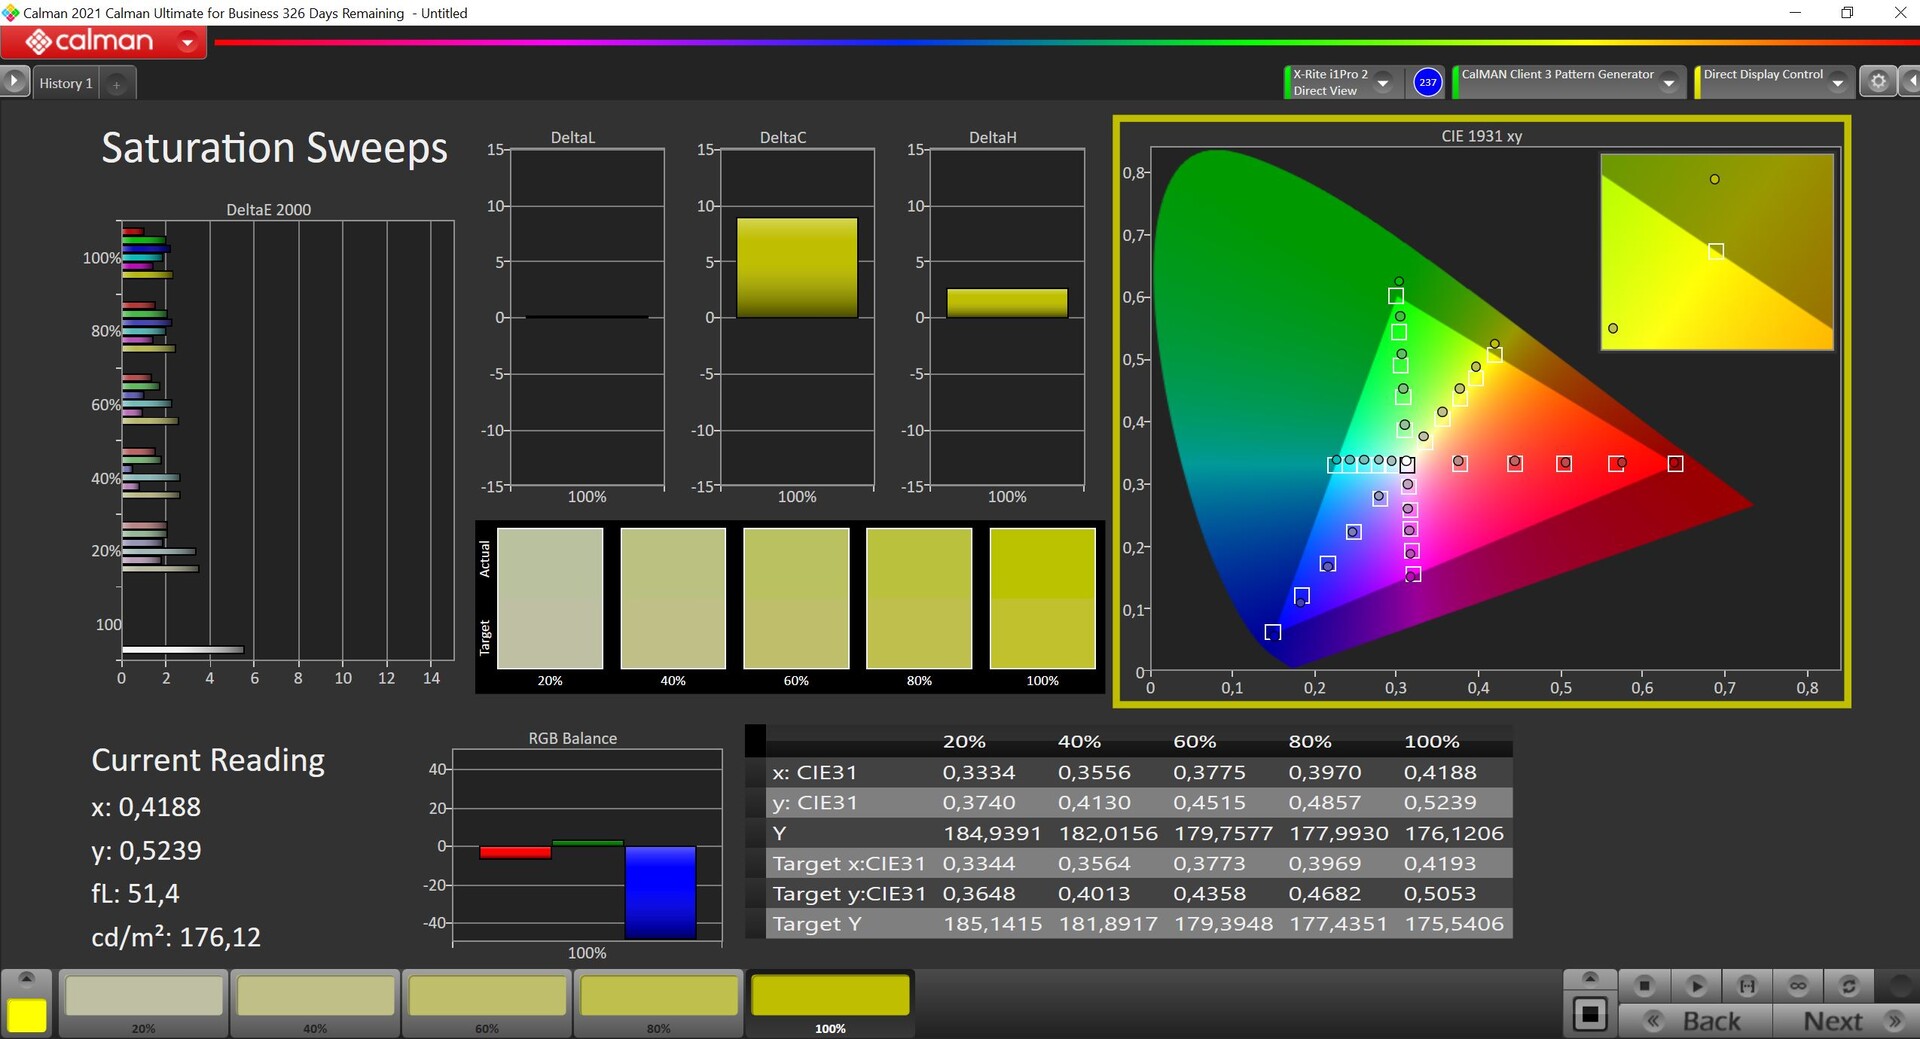
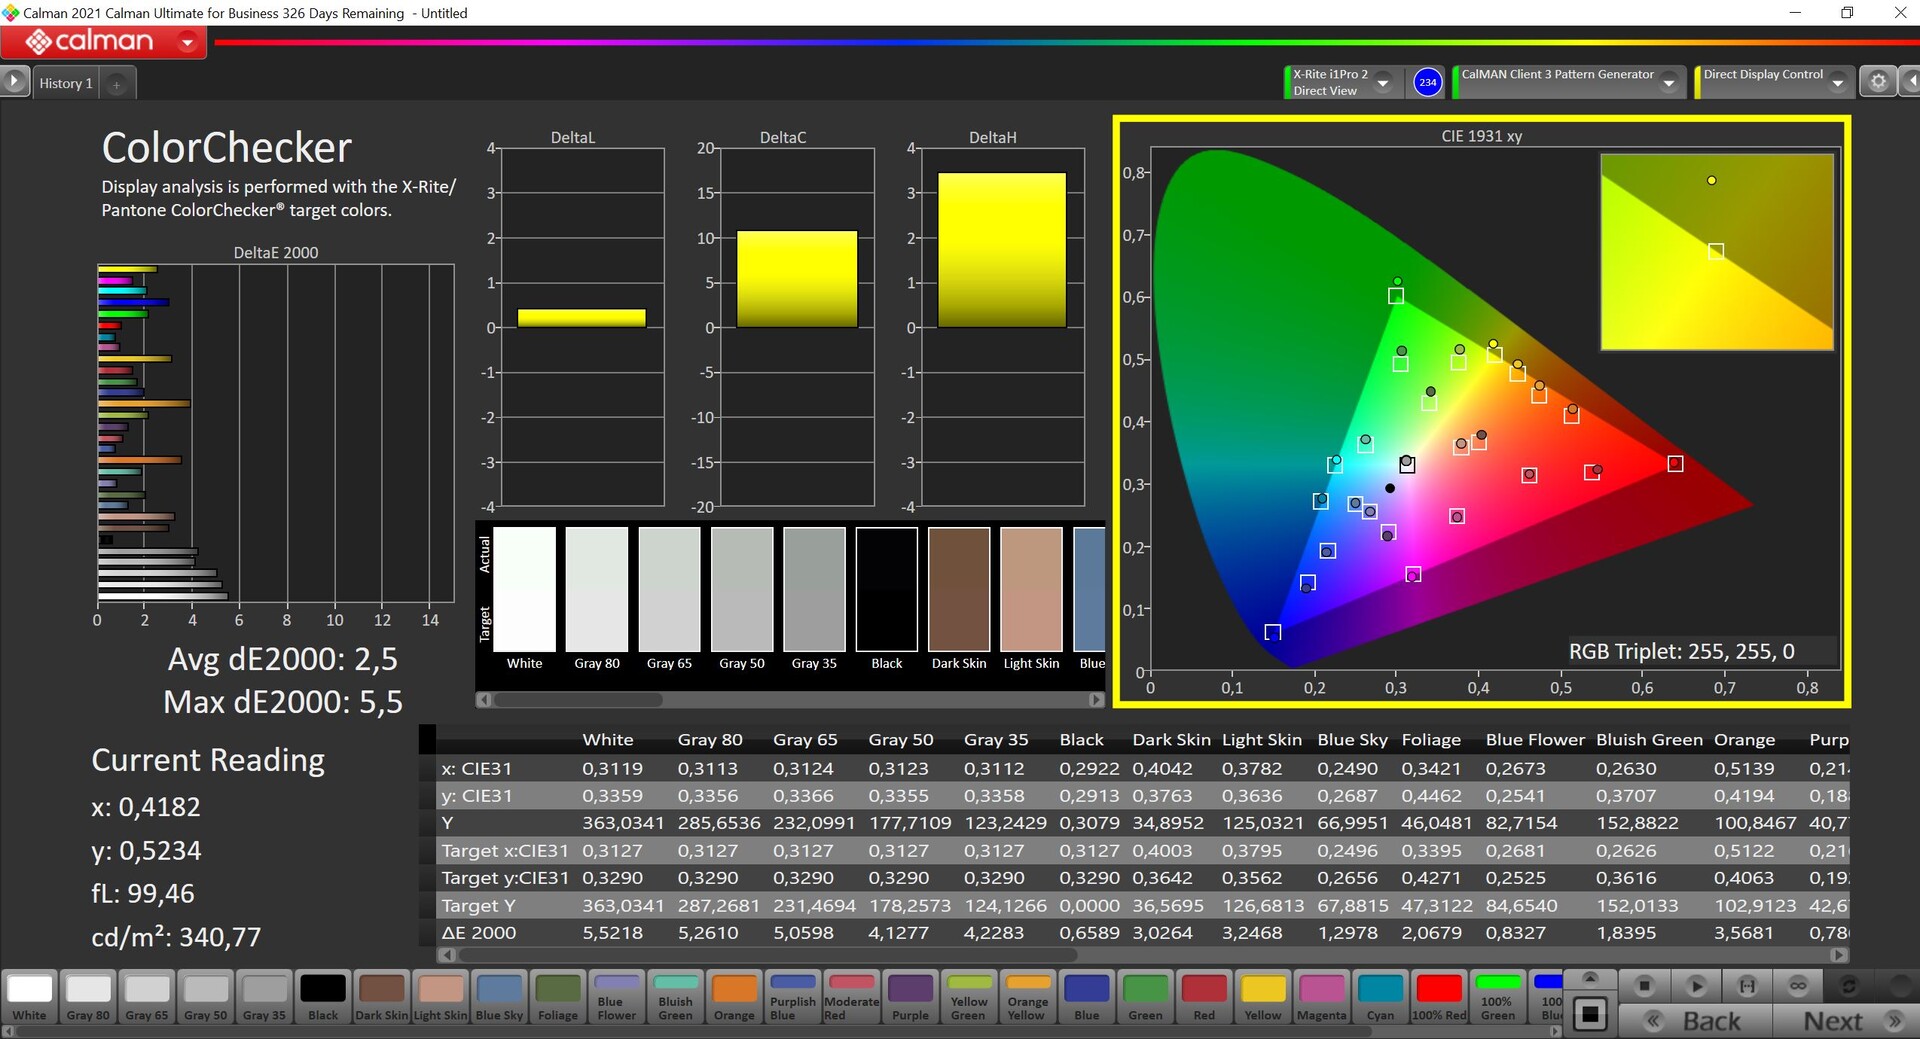
我们用专业的CalMAN软件(X-Rite i1 Pro 2)测试了该面板,开箱后有轻微的绿色色调,同时色温略微过暖。我们还看到一些颜色的偏差超过3。我们自己的校准(配置文件可以在上面的方框中免费下载)改善了性能,但与sRGB参考色彩空间相比,一些颜色的DeltaE-2000偏差仍然超过3。该面板几乎完全覆盖了小型sRGB参考空间。
240赫兹显示器的重点是面向游戏,但考虑到价格和设备的总体定位,我们更倾向于另一种选择(更精确的颜色,扩展的色域,HDR和更低的频率)。
Display Response Times
| ↔ Response Time Black to White | ||
|---|---|---|
| 8.6 ms ... rise ↗ and fall ↘ combined | ↗ 3.9 ms rise | 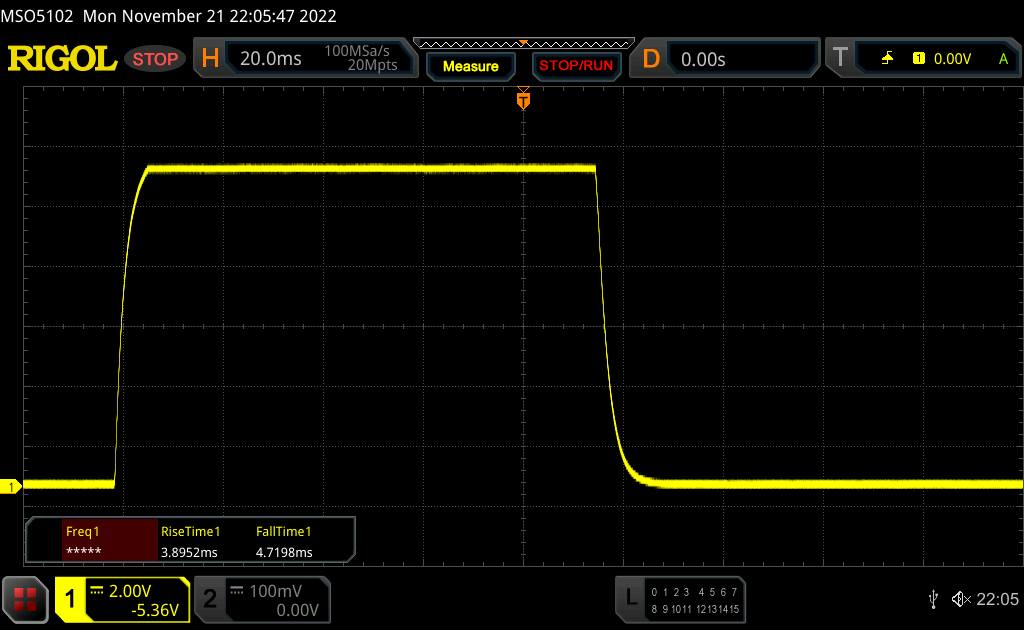 |
| ↘ 4.7 ms fall | ||
| The screen shows fast response rates in our tests and should be suited for gaming. In comparison, all tested devices range from 0.1 (minimum) to 240 (maximum) ms. » 24 % of all devices are better. This means that the measured response time is better than the average of all tested devices (19.8 ms). | ||
| ↔ Response Time 50% Grey to 80% Grey | ||
| 14.3 ms ... rise ↗ and fall ↘ combined | ↗ 6.8 ms rise | 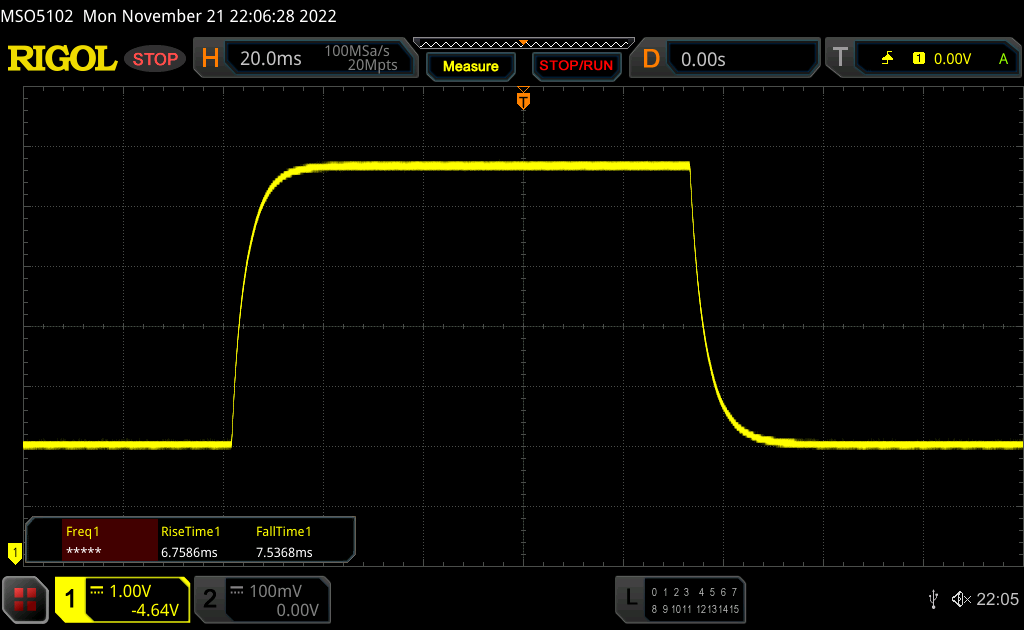 |
| ↘ 7.5 ms fall | ||
| The screen shows good response rates in our tests, but may be too slow for competitive gamers. In comparison, all tested devices range from 0.165 (minimum) to 636 (maximum) ms. » 28 % of all devices are better. This means that the measured response time is better than the average of all tested devices (31 ms). | ||
Screen Flickering / PWM (Pulse-Width Modulation)
| Screen flickering / PWM not detected |  | ||
In comparison: 52 % of all tested devices do not use PWM to dim the display. If PWM was detected, an average of 7754 (minimum: 5 - maximum: 343500) Hz was measured. | |||
哑光的屏幕表面有助于在明亮的环境中找到合适的位置,但为了在户外获得真正舒适的工作体验,显示屏应该更加明亮。

性能 - Vision 16 Pro with Alder Lake
审查设置
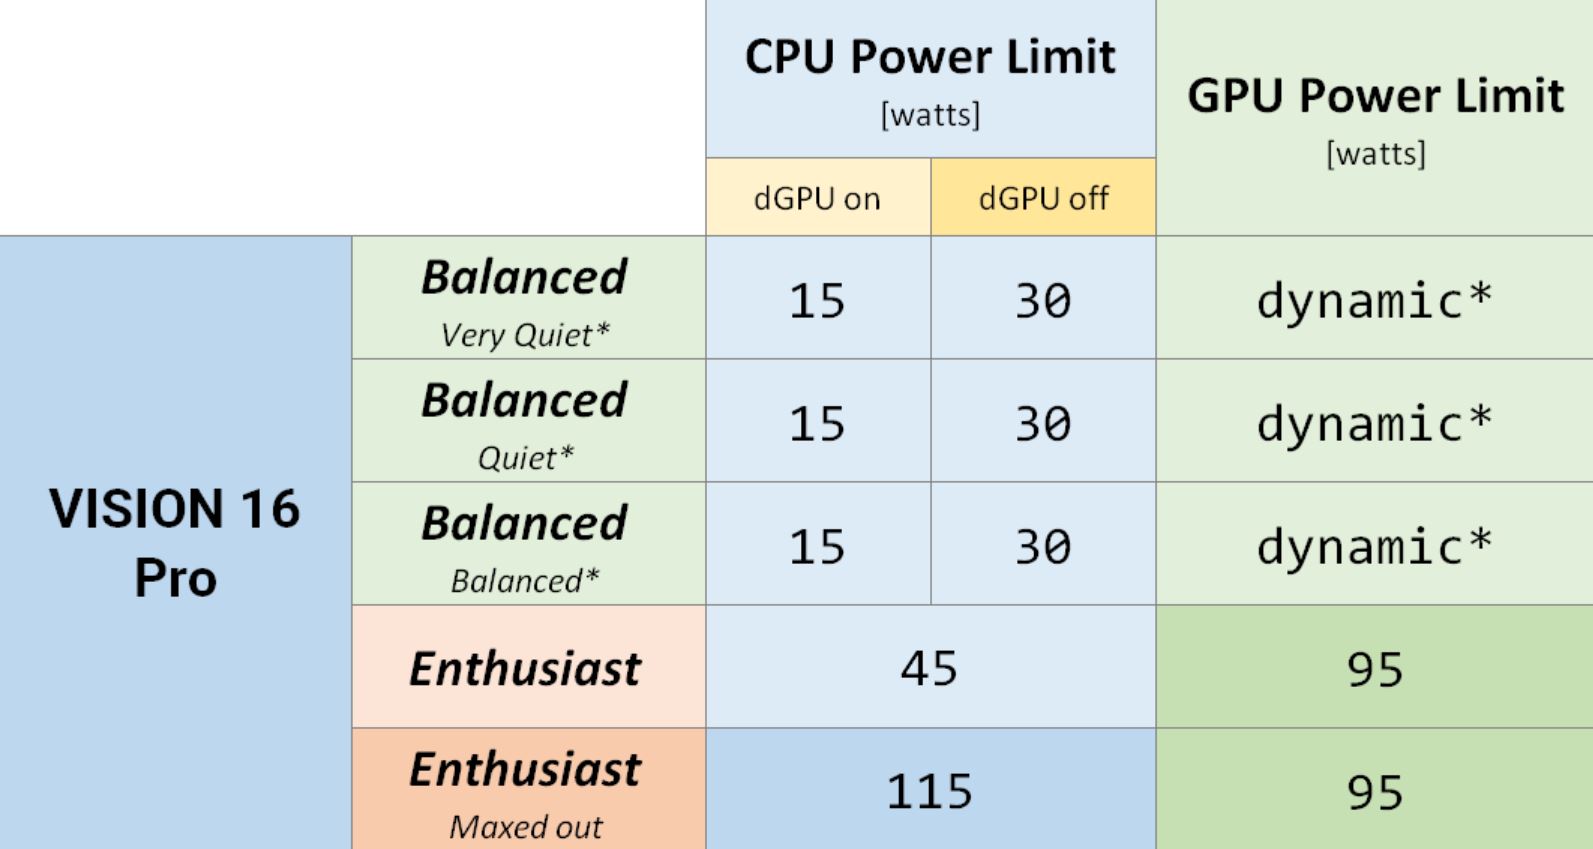
Schenker的Vision 16 Pro提供了不同的电源配置文件,在控制中心有CPU和GPU的手动控制。我们无法测试所有的模式,但我们想提及的是,申克公司提供了关于配置文件和性能结果的全面信息。根据我们的发现,我们可以确认这些数字。当你使用平衡模式时,GPU消耗是通过Nvidia的Whisper Mode技术动态控制的。
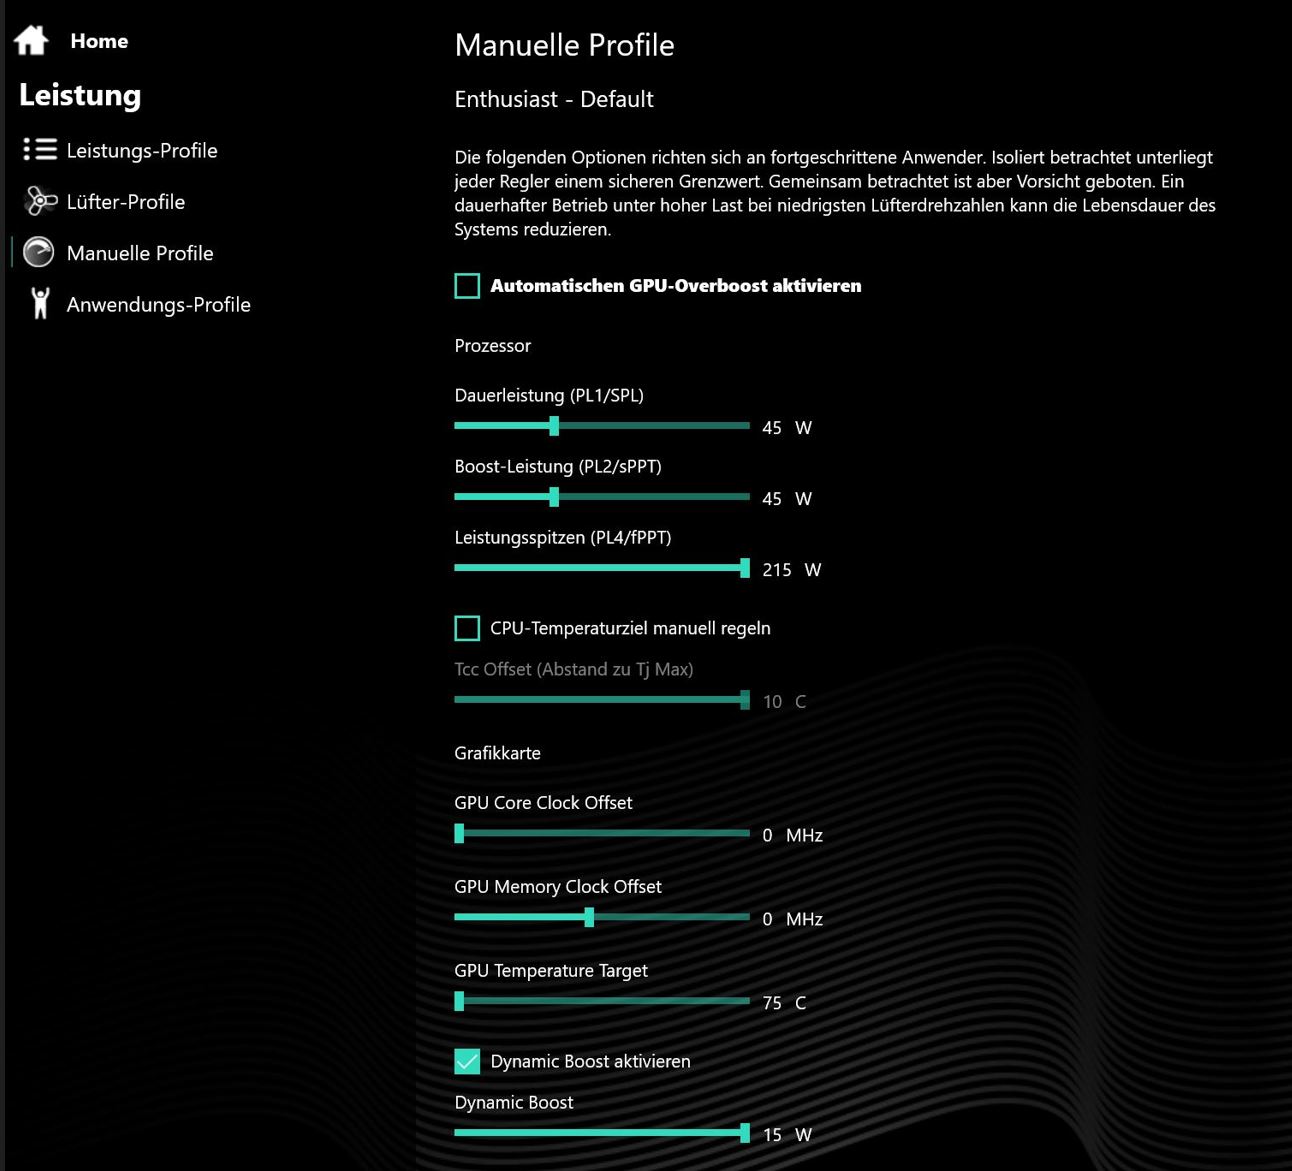
我们在评论中使用了爱好者(默认)配置文件,但我们也会在一些章节中对其他配置文件进行考察。要在配置文件之间切换,你可以使用控制中心的F3键(尽管这只限于主要的配置文件)。
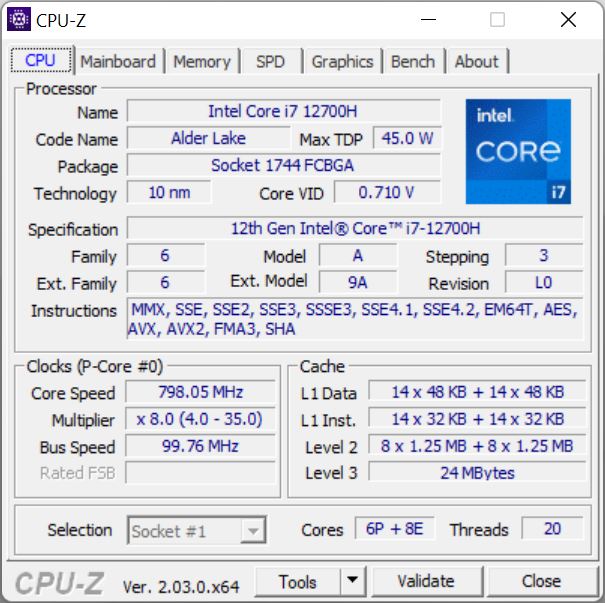
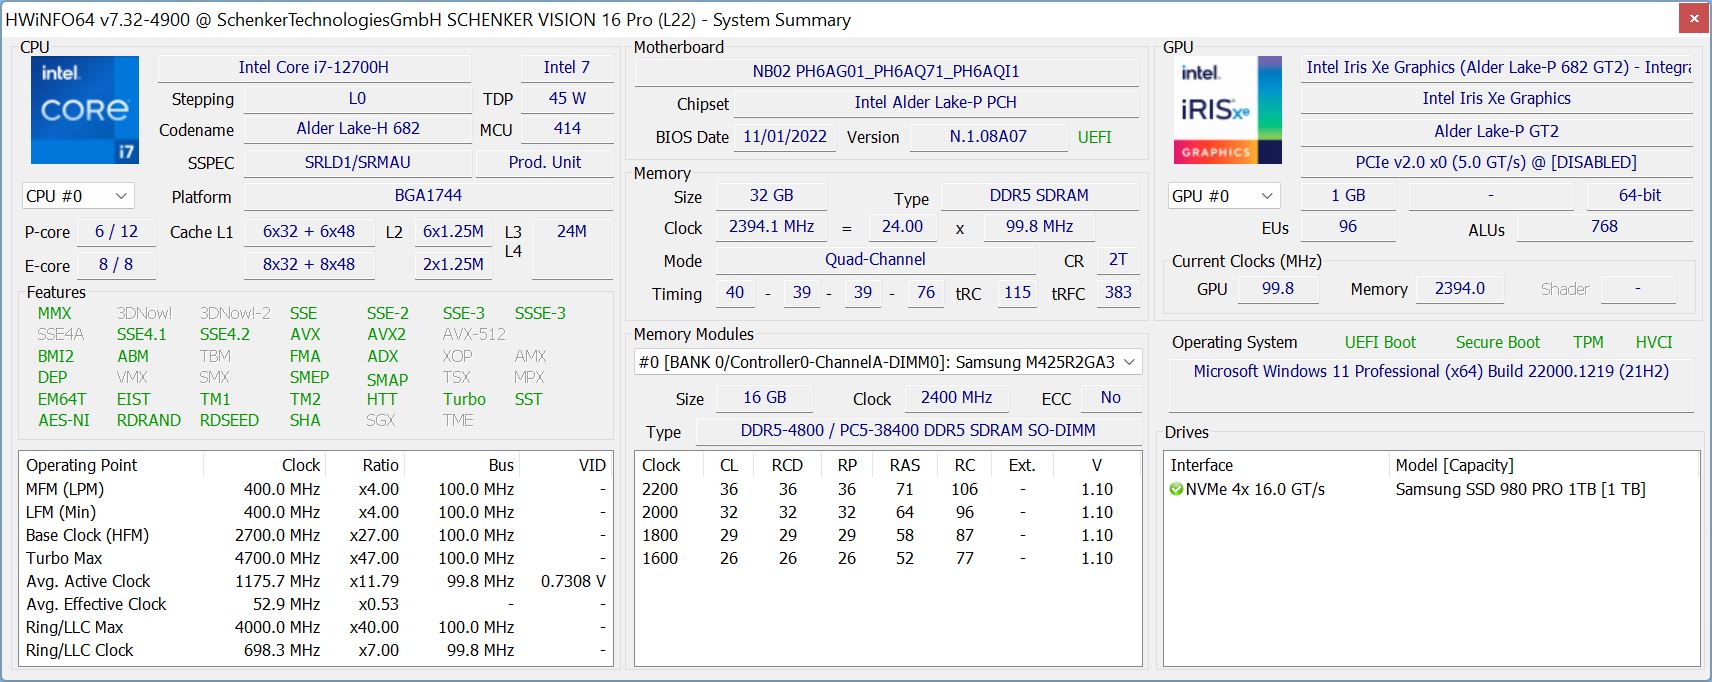
处理器 - 酷睿i7-12700H
Vision 16 Pro只配备了英特尔酷睿i7-12700H(Alder Lake第12代),它提供6个性能核心和8个效率核心。性能会因TDP值的不同而有很大差异,申克公司决定将处理器默认限制在45W。这避免了日常场景中不必要的风扇活动,但在标准应用中的性能已经非常好。如果你需要更多的CPU性能,你可以直接手动增加功率限制,一直增加到115W,这也是系统所利用的。然而,风扇的噪音也会更大(38.5对44.4 dB(A))。
Cinebench R15 Multi Loop
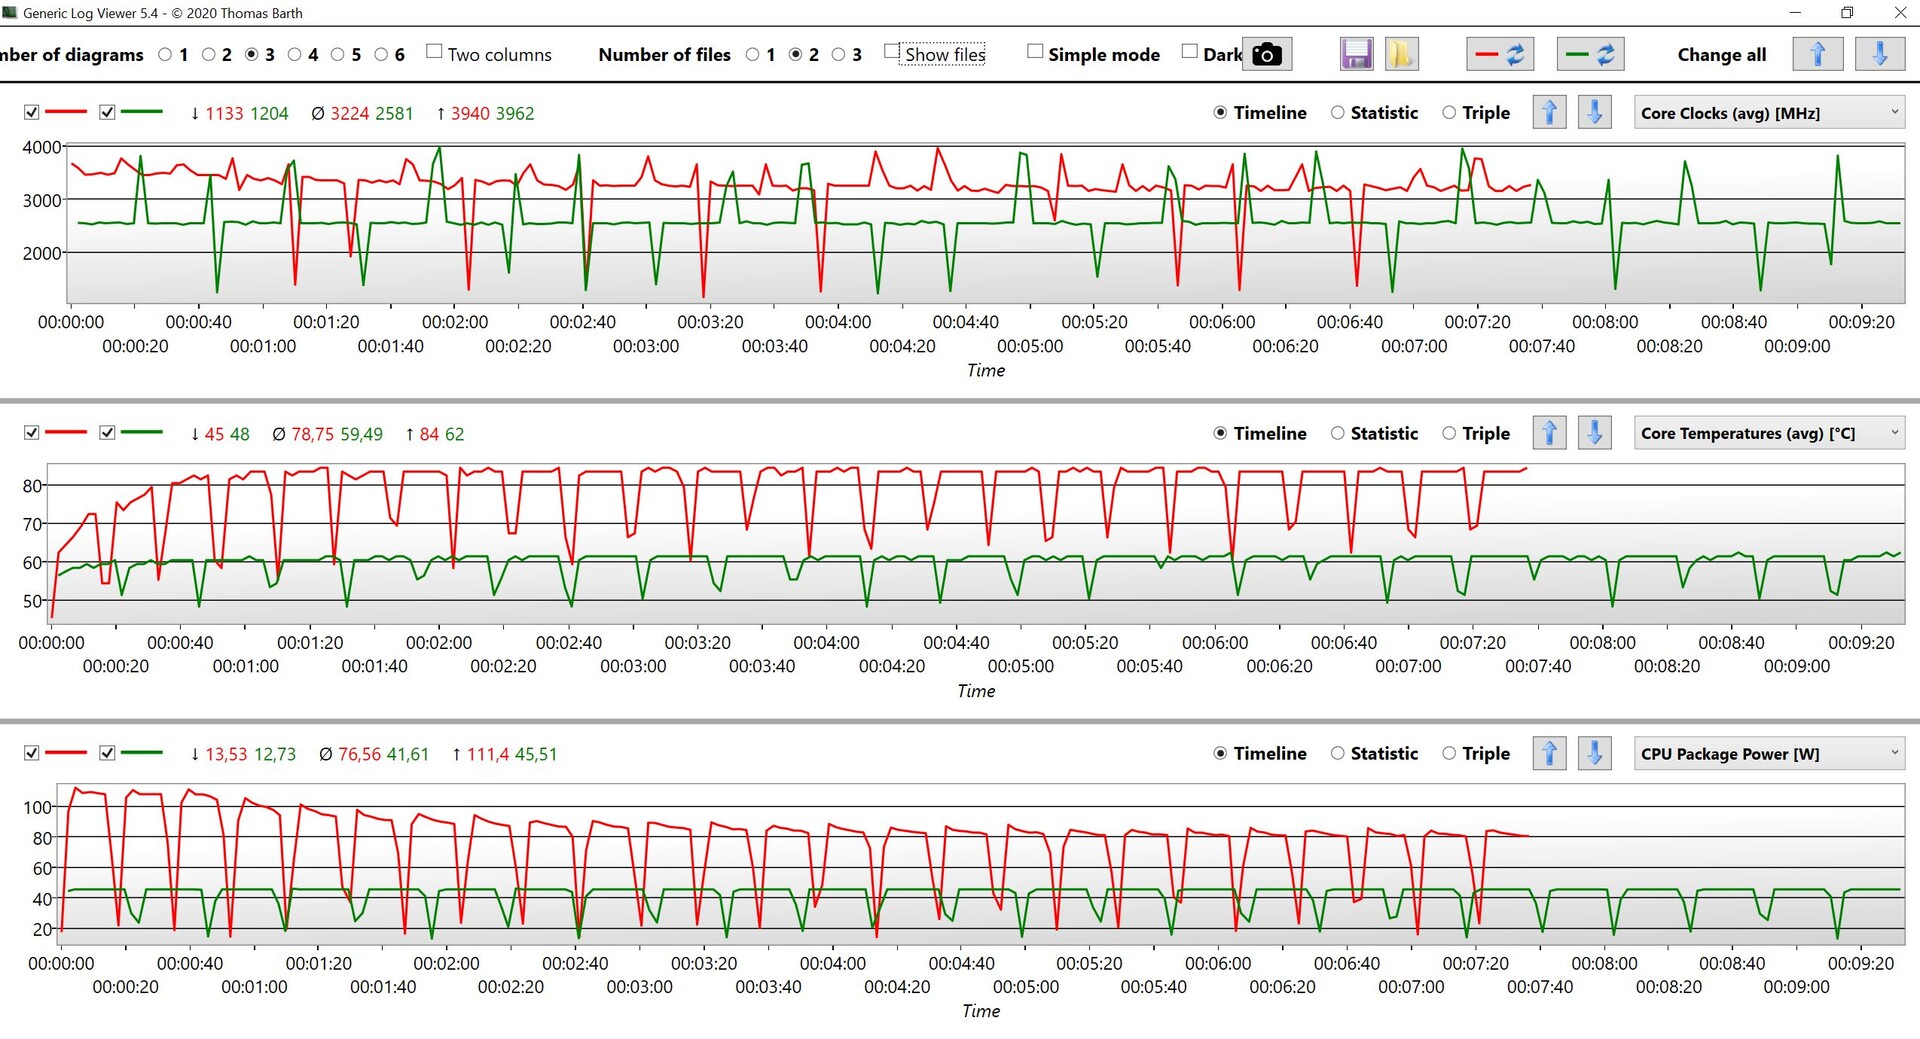
我们对Cinebench循环的分析清楚地表明,CPU可以很容易地保持45W,并且仍然有足够的空间。在增加功率限制的情况下,CPU能够在一段时间内保持在100W以上,甚至在持续的工作负载中保持在80W以上,所以测试设备是我们比较组中最快的型号之一。在这两种情况下,单核性能都很好。
虽然CPU在电池上被限制在25W,这意味着性能受到了明显的打击(与45W相比-35%)。更多的CPU基准测试被列在我们的 技术部分.
Cinebench R23: Multi Core | Single Core
Cinebench R20: CPU (Multi Core) | CPU (Single Core)
Cinebench R15: CPU Multi 64Bit | CPU Single 64Bit
Blender: v2.79 BMW27 CPU
7-Zip 18.03: 7z b 4 | 7z b 4 -mmt1
Geekbench 5.5: Multi-Core | Single-Core
HWBOT x265 Benchmark v2.2: 4k Preset
LibreOffice : 20 Documents To PDF
R Benchmark 2.5: Overall mean
| CPU Performance rating | |
| Lenovo Legion Slim 7-16IAH 82TF004YGE | |
| Average of class Multimedia | |
| Average Intel Core i7-12700H | |
| HP Envy 16 h0112nr | |
| Schenker Vision 16 Pro RTX 3070 Ti | |
| Apple MacBook Pro 16 2021 M1 Pro -5! | |
| Lenovo ThinkBook 16p G3 ARH | |
| Cinebench R23 / Multi Core | |
| Lenovo Legion Slim 7-16IAH 82TF004YGE | |
| Average of class Multimedia (4861 - 33362, n=74, last 2 years) | |
| Average Intel Core i7-12700H (4032 - 19330, n=64) | |
| Lenovo ThinkBook 16p G3 ARH | |
| HP Envy 16 h0112nr | |
| Schenker Vision 16 Pro RTX 3070 Ti | |
| Apple MacBook Pro 16 2021 M1 Pro | |
| Cinebench R23 / Single Core | |
| Average of class Multimedia (1128 - 2459, n=66, last 2 years) | |
| Schenker Vision 16 Pro RTX 3070 Ti | |
| HP Envy 16 h0112nr | |
| Average Intel Core i7-12700H (778 - 1826, n=63) | |
| Lenovo Legion Slim 7-16IAH 82TF004YGE | |
| Lenovo ThinkBook 16p G3 ARH | |
| Apple MacBook Pro 16 2021 M1 Pro | |
| Cinebench R20 / CPU (Multi Core) | |
| Lenovo Legion Slim 7-16IAH 82TF004YGE | |
| Average of class Multimedia (1887 - 12912, n=57, last 2 years) | |
| Average Intel Core i7-12700H (1576 - 7407, n=64) | |
| Lenovo ThinkBook 16p G3 ARH | |
| HP Envy 16 h0112nr | |
| Schenker Vision 16 Pro RTX 3070 Ti | |
| Apple MacBook Pro 16 2021 M1 Pro | |
| Cinebench R20 / CPU (Single Core) | |
| Average of class Multimedia (425 - 853, n=57, last 2 years) | |
| Schenker Vision 16 Pro RTX 3070 Ti | |
| HP Envy 16 h0112nr | |
| Average Intel Core i7-12700H (300 - 704, n=64) | |
| Lenovo Legion Slim 7-16IAH 82TF004YGE | |
| Lenovo ThinkBook 16p G3 ARH | |
| Apple MacBook Pro 16 2021 M1 Pro | |
| Cinebench R15 / CPU Multi 64Bit | |
| Lenovo Legion Slim 7-16IAH 82TF004YGE | |
| Schenker Vision 16 Pro RTX 3070 Ti (Turbo) | |
| Schenker Vision 16 Pro RTX 3070 Ti | |
| Average of class Multimedia (856 - 5224, n=61, last 2 years) | |
| HP Envy 16 h0112nr | |
| Average Intel Core i7-12700H (1379 - 2916, n=70) | |
| Lenovo ThinkBook 16p G3 ARH | |
| Apple MacBook Pro 16 2021 M1 Pro | |
| Cinebench R15 / CPU Single 64Bit | |
| Average of class Multimedia (184.8 - 326, n=59, last 2 years) | |
| Schenker Vision 16 Pro RTX 3070 Ti | |
| HP Envy 16 h0112nr | |
| Lenovo Legion Slim 7-16IAH 82TF004YGE | |
| Average Intel Core i7-12700H (113 - 263, n=65) | |
| Lenovo ThinkBook 16p G3 ARH | |
| Apple MacBook Pro 16 2021 M1 Pro | |
| Blender / v2.79 BMW27 CPU | |
| Schenker Vision 16 Pro RTX 3070 Ti | |
| Average of class Multimedia (100 - 557, n=58, last 2 years) | |
| HP Envy 16 h0112nr | |
| Lenovo ThinkBook 16p G3 ARH | |
| Average Intel Core i7-12700H (168 - 732, n=63) | |
| Apple MacBook Pro 16 2021 M1 Pro (Blender 3.0 Beta M1) | |
| Lenovo Legion Slim 7-16IAH 82TF004YGE | |
| 7-Zip 18.03 / 7z b 4 | |
| Lenovo Legion Slim 7-16IAH 82TF004YGE | |
| Average Intel Core i7-12700H (22844 - 73067, n=63) | |
| Average of class Multimedia (26062 - 130368, n=55, last 2 years) | |
| Lenovo ThinkBook 16p G3 ARH | |
| HP Envy 16 h0112nr | |
| Schenker Vision 16 Pro RTX 3070 Ti | |
| 7-Zip 18.03 / 7z b 4 -mmt1 | |
| Average of class Multimedia (3666 - 7545, n=56, last 2 years) | |
| Schenker Vision 16 Pro RTX 3070 Ti | |
| HP Envy 16 h0112nr | |
| Average Intel Core i7-12700H (2743 - 5972, n=63) | |
| Lenovo Legion Slim 7-16IAH 82TF004YGE | |
| Lenovo ThinkBook 16p G3 ARH | |
| Geekbench 5.5 / Multi-Core | |
| Average of class Multimedia (4652 - 20422, n=56, last 2 years) | |
| HP Envy 16 h0112nr | |
| Lenovo Legion Slim 7-16IAH 82TF004YGE | |
| Apple MacBook Pro 16 2021 M1 Pro | |
| Average Intel Core i7-12700H (5144 - 13745, n=64) | |
| Schenker Vision 16 Pro RTX 3070 Ti | |
| Lenovo ThinkBook 16p G3 ARH | |
| Geekbench 5.5 / Single-Core | |
| Average of class Multimedia (805 - 2974, n=56, last 2 years) | |
| Schenker Vision 16 Pro RTX 3070 Ti | |
| HP Envy 16 h0112nr | |
| Apple MacBook Pro 16 2021 M1 Pro | |
| Average Intel Core i7-12700H (803 - 1851, n=64) | |
| Lenovo Legion Slim 7-16IAH 82TF004YGE | |
| Lenovo ThinkBook 16p G3 ARH | |
| HWBOT x265 Benchmark v2.2 / 4k Preset | |
| Lenovo Legion Slim 7-16IAH 82TF004YGE | |
| Average of class Multimedia (5.26 - 36.1, n=56, last 2 years) | |
| Lenovo ThinkBook 16p G3 ARH | |
| Average Intel Core i7-12700H (4.67 - 21.8, n=64) | |
| HP Envy 16 h0112nr | |
| Schenker Vision 16 Pro RTX 3070 Ti | |
| LibreOffice / 20 Documents To PDF | |
| Lenovo ThinkBook 16p G3 ARH | |
| Average of class Multimedia (23.9 - 146.7, n=57, last 2 years) | |
| Average Intel Core i7-12700H (34.2 - 95.3, n=63) | |
| HP Envy 16 h0112nr | |
| Schenker Vision 16 Pro RTX 3070 Ti | |
| Lenovo Legion Slim 7-16IAH 82TF004YGE | |
| R Benchmark 2.5 / Overall mean | |
| Lenovo ThinkBook 16p G3 ARH | |
| Average Intel Core i7-12700H (0.4441 - 1.052, n=63) | |
| Lenovo Legion Slim 7-16IAH 82TF004YGE | |
| Average of class Multimedia (0.3604 - 0.947, n=56, last 2 years) | |
| HP Envy 16 h0112nr | |
| Schenker Vision 16 Pro RTX 3070 Ti | |
* ... smaller is better
AIDA64: FP32 Ray-Trace | FPU Julia | CPU SHA3 | CPU Queen | FPU SinJulia | FPU Mandel | CPU AES | CPU ZLib | FP64 Ray-Trace | CPU PhotoWorxx
| Performance rating | |
| Lenovo Legion Slim 7-16IAH 82TF004YGE | |
| Average of class Multimedia | |
| Lenovo ThinkBook 16p G3 ARH | |
| HP Envy 16 h0112nr | |
| Schenker Vision 16 Pro RTX 3070 Ti | |
| Average Intel Core i7-12700H | |
| AIDA64 / FP32 Ray-Trace | |
| Average of class Multimedia (2214 - 50388, n=53, last 2 years) | |
| Lenovo Legion Slim 7-16IAH 82TF004YGE | |
| Lenovo ThinkBook 16p G3 ARH | |
| Schenker Vision 16 Pro RTX 3070 Ti | |
| HP Envy 16 h0112nr | |
| Average Intel Core i7-12700H (2585 - 17957, n=64) | |
| AIDA64 / FPU Julia | |
| Lenovo ThinkBook 16p G3 ARH | |
| Average of class Multimedia (12867 - 201874, n=54, last 2 years) | |
| Lenovo Legion Slim 7-16IAH 82TF004YGE | |
| Schenker Vision 16 Pro RTX 3070 Ti | |
| HP Envy 16 h0112nr | |
| Average Intel Core i7-12700H (12439 - 90760, n=64) | |
| AIDA64 / CPU SHA3 | |
| Lenovo Legion Slim 7-16IAH 82TF004YGE | |
| Average of class Multimedia (626 - 8623, n=54, last 2 years) | |
| Lenovo ThinkBook 16p G3 ARH | |
| Average Intel Core i7-12700H (833 - 4242, n=64) | |
| Schenker Vision 16 Pro RTX 3070 Ti | |
| HP Envy 16 h0112nr | |
| AIDA64 / CPU Queen | |
| Lenovo Legion Slim 7-16IAH 82TF004YGE | |
| Lenovo ThinkBook 16p G3 ARH | |
| HP Envy 16 h0112nr | |
| Average Intel Core i7-12700H (57923 - 103202, n=63) | |
| Schenker Vision 16 Pro RTX 3070 Ti | |
| Average of class Multimedia (13483 - 181505, n=41, last 2 years) | |
| AIDA64 / FPU SinJulia | |
| Lenovo ThinkBook 16p G3 ARH | |
| Lenovo Legion Slim 7-16IAH 82TF004YGE | |
| Average Intel Core i7-12700H (3249 - 9939, n=64) | |
| Average of class Multimedia (886 - 28794, n=54, last 2 years) | |
| Schenker Vision 16 Pro RTX 3070 Ti | |
| HP Envy 16 h0112nr | |
| AIDA64 / FPU Mandel | |
| Lenovo ThinkBook 16p G3 ARH | |
| Average of class Multimedia (6395 - 105740, n=53, last 2 years) | |
| Lenovo Legion Slim 7-16IAH 82TF004YGE | |
| Schenker Vision 16 Pro RTX 3070 Ti | |
| HP Envy 16 h0112nr | |
| Average Intel Core i7-12700H (7135 - 44760, n=64) | |
| AIDA64 / CPU AES | |
| Lenovo Legion Slim 7-16IAH 82TF004YGE | |
| HP Envy 16 h0112nr | |
| Average Intel Core i7-12700H (31839 - 144360, n=64) | |
| Average of class Multimedia (8171 - 126790, n=54, last 2 years) | |
| Schenker Vision 16 Pro RTX 3070 Ti | |
| Lenovo ThinkBook 16p G3 ARH | |
| AIDA64 / CPU ZLib | |
| Lenovo Legion Slim 7-16IAH 82TF004YGE | |
| Average of class Multimedia (143.8 - 2022, n=54, last 2 years) | |
| Average Intel Core i7-12700H (305 - 1171, n=64) | |
| Lenovo ThinkBook 16p G3 ARH | |
| Schenker Vision 16 Pro RTX 3070 Ti | |
| HP Envy 16 h0112nr | |
| AIDA64 / FP64 Ray-Trace | |
| Average of class Multimedia (1014 - 26875, n=54, last 2 years) | |
| Lenovo Legion Slim 7-16IAH 82TF004YGE | |
| Lenovo ThinkBook 16p G3 ARH | |
| Schenker Vision 16 Pro RTX 3070 Ti | |
| HP Envy 16 h0112nr | |
| Average Intel Core i7-12700H (1437 - 9692, n=64) | |
| AIDA64 / CPU PhotoWorxx | |
| Average of class Multimedia (8187 - 88154, n=54, last 2 years) | |
| Schenker Vision 16 Pro RTX 3070 Ti | |
| HP Envy 16 h0112nr | |
| Lenovo Legion Slim 7-16IAH 82TF004YGE | |
| Average Intel Core i7-12700H (12863 - 52207, n=64) | |
| Lenovo ThinkBook 16p G3 ARH | |
系统性能
Vision 16 Pro是一个反应非常快的系统,我们在审查期间没有发现任何问题。然而,合成的PCMark 10反复崩溃,所以我们不能提供任何分数。CrossMark基准测试中的体面结果证实了我们的主观性能印象。
| CrossMark / Overall | |
| Average of class Multimedia (866 - 2728, n=60, last 2 years) | |
| Lenovo Legion Slim 7-16IAH 82TF004YGE | |
| HP Envy 16 h0112nr | |
| Average Intel Core i7-12700H, NVIDIA GeForce RTX 3070 Ti Laptop GPU (974 - 2000, n=12) | |
| Schenker Vision 16 Pro RTX 3070 Ti | |
| Apple MacBook Pro 16 2021 M1 Pro | |
| Lenovo ThinkBook 16p G3 ARH | |
| CrossMark / Productivity | |
| Lenovo Legion Slim 7-16IAH 82TF004YGE | |
| Average of class Multimedia (931 - 2489, n=60, last 2 years) | |
| Average Intel Core i7-12700H, NVIDIA GeForce RTX 3070 Ti Laptop GPU (907 - 1962, n=12) | |
| HP Envy 16 h0112nr | |
| Schenker Vision 16 Pro RTX 3070 Ti | |
| Lenovo ThinkBook 16p G3 ARH | |
| Apple MacBook Pro 16 2021 M1 Pro | |
| CrossMark / Creativity | |
| Average of class Multimedia (907 - 3465, n=60, last 2 years) | |
| Apple MacBook Pro 16 2021 M1 Pro | |
| HP Envy 16 h0112nr | |
| Lenovo Legion Slim 7-16IAH 82TF004YGE | |
| Average Intel Core i7-12700H, NVIDIA GeForce RTX 3070 Ti Laptop GPU (1027 - 2057, n=12) | |
| Schenker Vision 16 Pro RTX 3070 Ti | |
| Lenovo ThinkBook 16p G3 ARH | |
| CrossMark / Responsiveness | |
| Average Intel Core i7-12700H, NVIDIA GeForce RTX 3070 Ti Laptop GPU (1029 - 2142, n=12) | |
| Lenovo Legion Slim 7-16IAH 82TF004YGE | |
| HP Envy 16 h0112nr | |
| Average of class Multimedia (605 - 2024, n=60, last 2 years) | |
| Schenker Vision 16 Pro RTX 3070 Ti | |
| Lenovo ThinkBook 16p G3 ARH | |
| Apple MacBook Pro 16 2021 M1 Pro | |
» No benchmarks for this notebook found!
| AIDA64 / Memory Copy | |
| Average of class Multimedia (11299 - 132135, n=54, last 2 years) | |
| Schenker Vision 16 Pro RTX 3070 Ti | |
| HP Envy 16 h0112nr | |
| Average Intel Core i7-12700H (25615 - 80511, n=64) | |
| Lenovo ThinkBook 16p G3 ARH | |
| Lenovo Legion Slim 7-16IAH 82TF004YGE | |
| AIDA64 / Memory Read | |
| Average of class Multimedia (11624 - 174586, n=54, last 2 years) | |
| HP Envy 16 h0112nr | |
| Schenker Vision 16 Pro RTX 3070 Ti | |
| Lenovo Legion Slim 7-16IAH 82TF004YGE | |
| Average Intel Core i7-12700H (25586 - 79442, n=64) | |
| Lenovo ThinkBook 16p G3 ARH | |
| AIDA64 / Memory Write | |
| Average of class Multimedia (11755 - 134998, n=54, last 2 years) | |
| Schenker Vision 16 Pro RTX 3070 Ti | |
| HP Envy 16 h0112nr | |
| Lenovo Legion Slim 7-16IAH 82TF004YGE | |
| Average Intel Core i7-12700H (23679 - 88660, n=64) | |
| Lenovo ThinkBook 16p G3 ARH | |
| AIDA64 / Memory Latency | |
| Average of class Multimedia (7 - 535, n=53, last 2 years) | |
| Lenovo ThinkBook 16p G3 ARH | |
| Lenovo Legion Slim 7-16IAH 82TF004YGE | |
| Schenker Vision 16 Pro RTX 3070 Ti | |
| HP Envy 16 h0112nr | |
| Average Intel Core i7-12700H (76.2 - 133.9, n=62) | |
* ... smaller is better
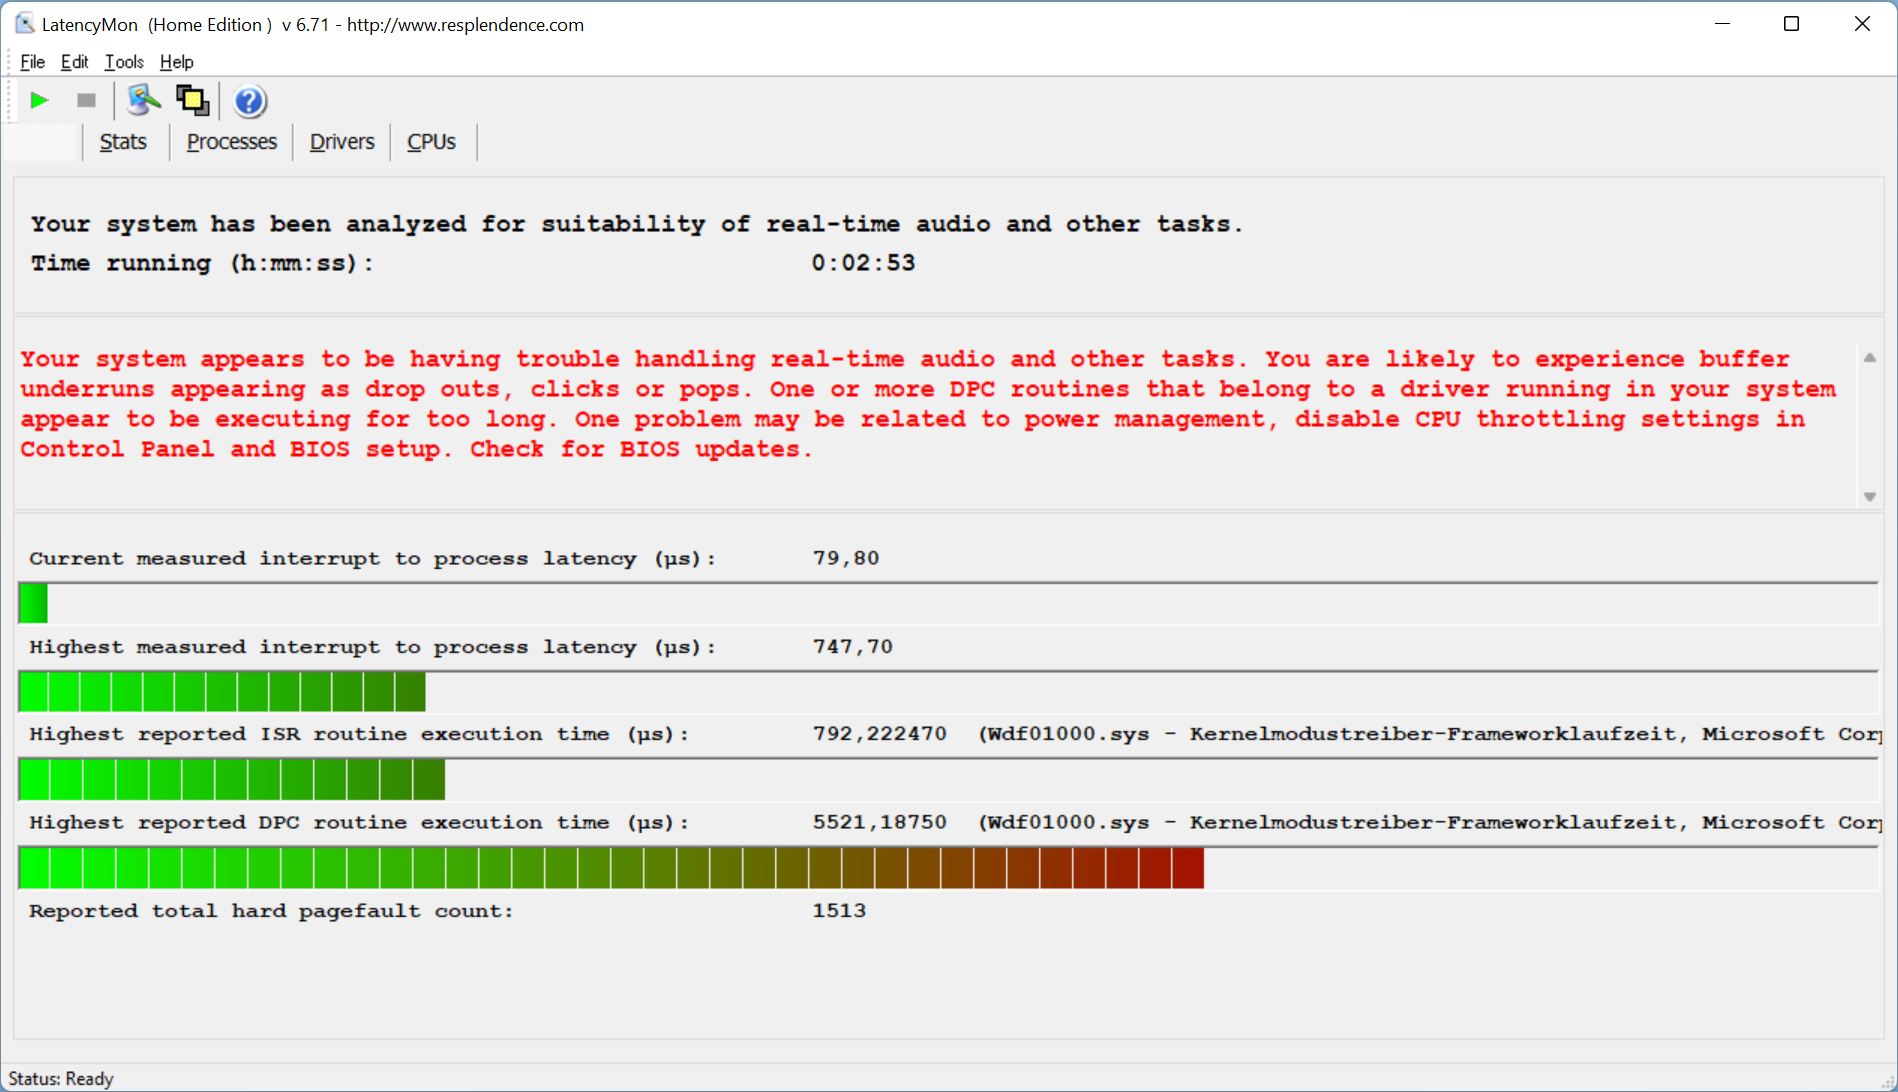
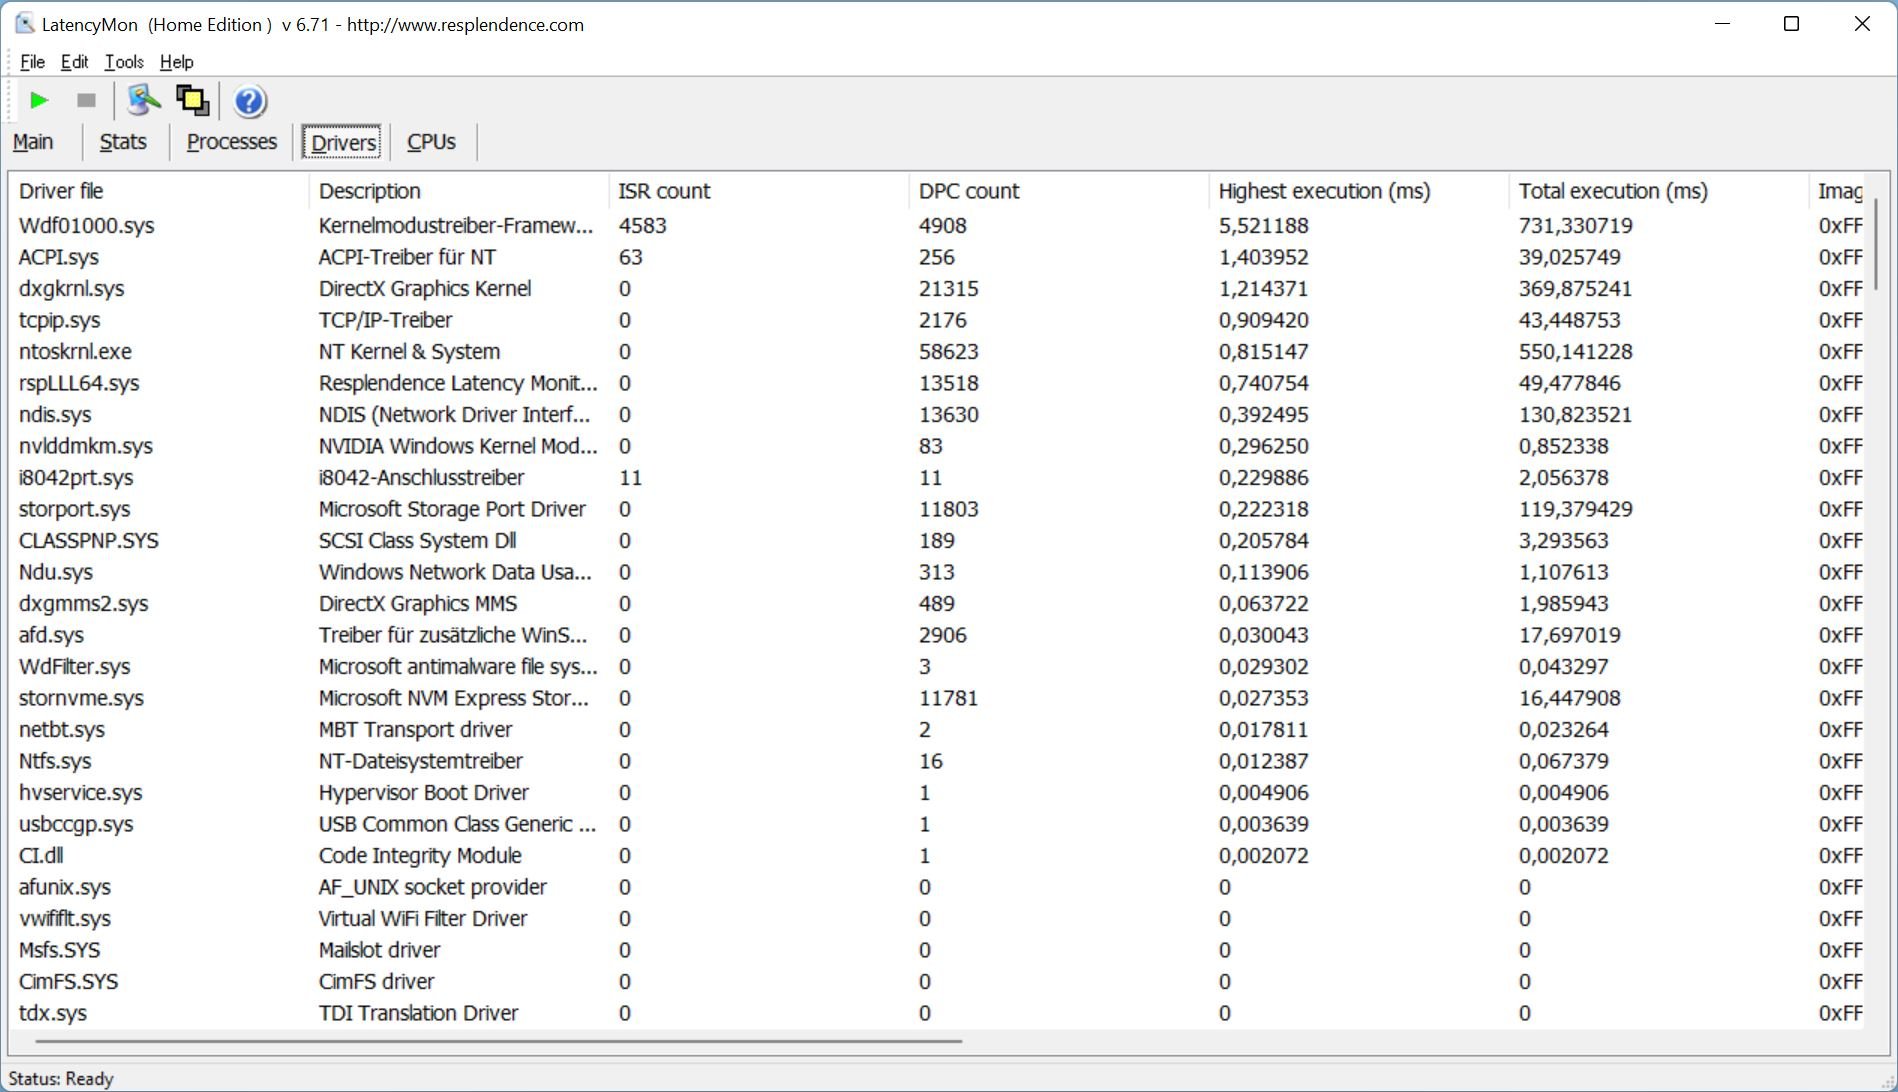
DPC延时
我们的标准化延迟测试(网页浏览、4K YouTube播放、CPU负载)显示,采用当前BIOS版本的Vision 16 Pro没有一般问题(没有中断到处理延迟的临界值),但有一个驱动程序显示出一个大的峰值。
| DPC Latencies / LatencyMon - interrupt to process latency (max), Web, Youtube, Prime95 | |
| Lenovo ThinkBook 16p G3 ARH | |
| HP Envy 16 h0112nr | |
| Schenker Vision 16 Pro RTX 3070 Ti | |
| Lenovo Legion Slim 7-16IAH 82TF004YGE | |
* ... smaller is better
存储设备
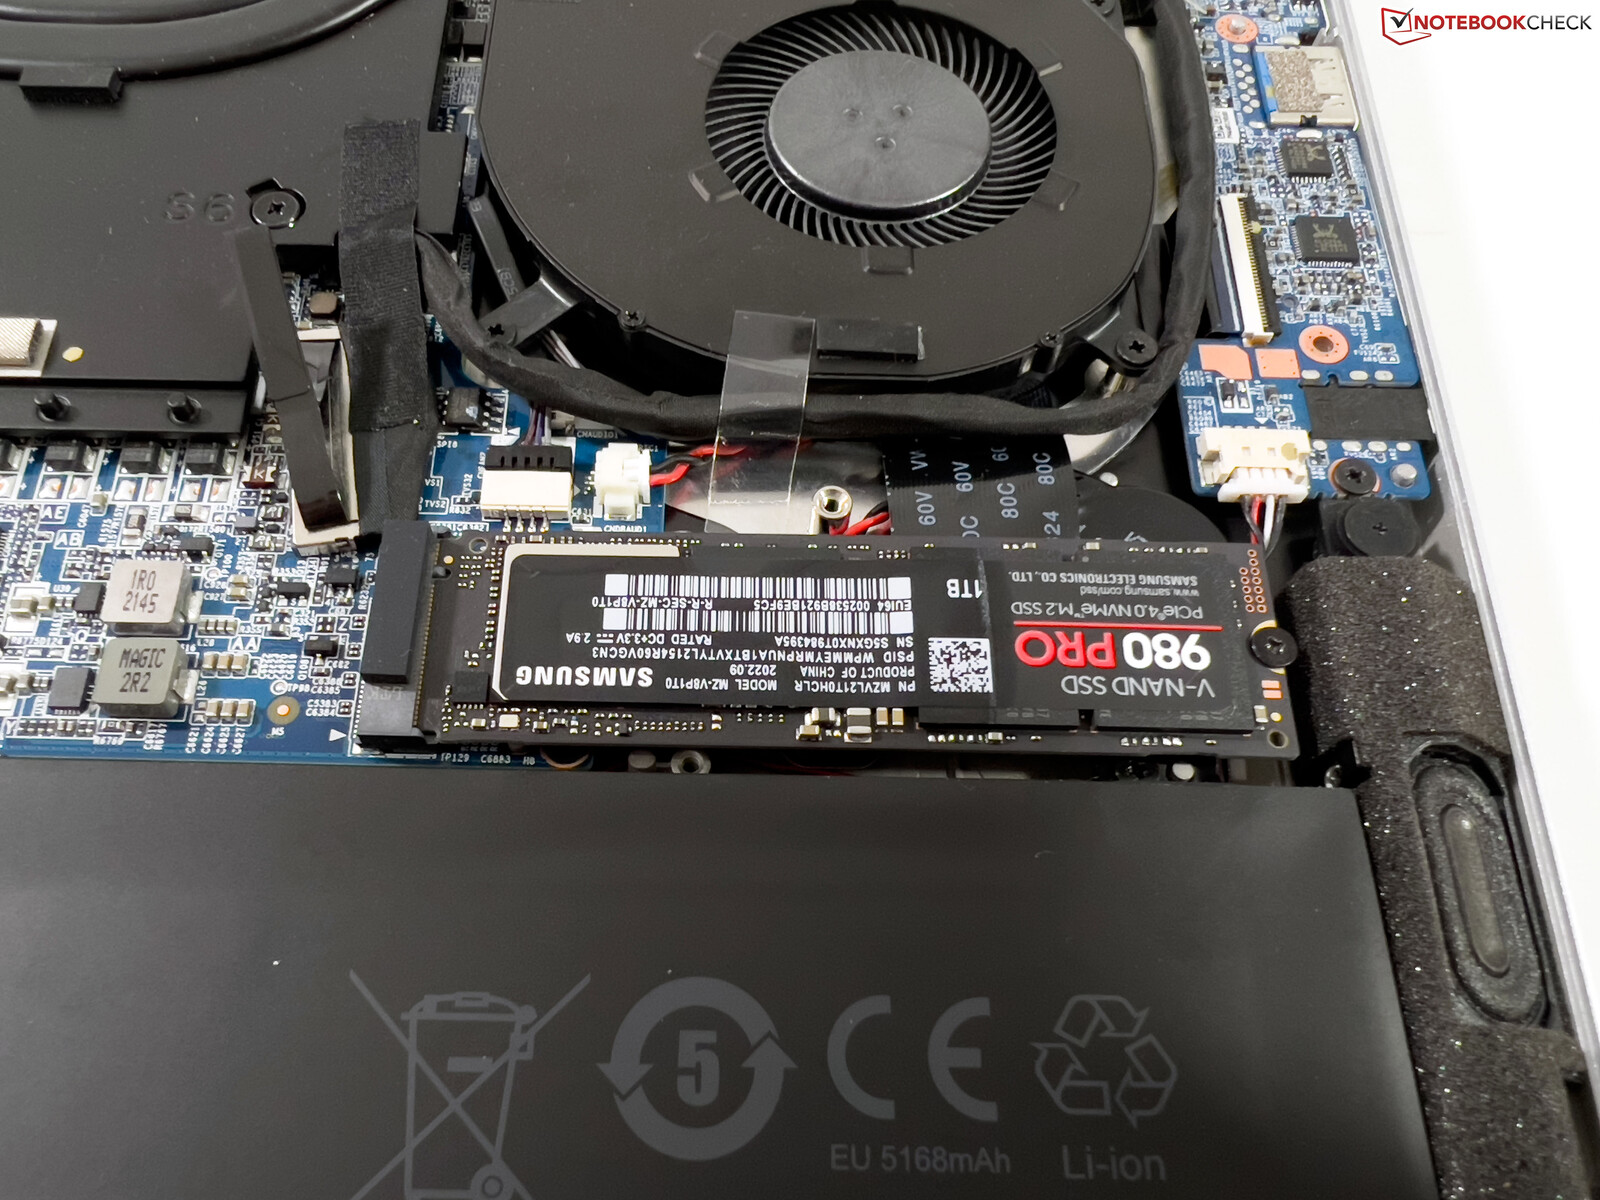
Vision 16 Pro提供两个快速的PCIe-4.0插槽,可以容纳两面的固态硬盘。我们的评测装置配备了快速的三星980 Pro,存储容量为1TB(初始设置后,用户可获得865GB)。传输速率非常高,但更重要的是,在持续的工作负荷下,Vision 16 Pro的性能可以保持。更多的SSD基准测试可在 这里.

* ... smaller is better
Disk Throttling: DiskSpd Read Loop, Queue Depth 8
GPU性能 - RTX 3070 Ti
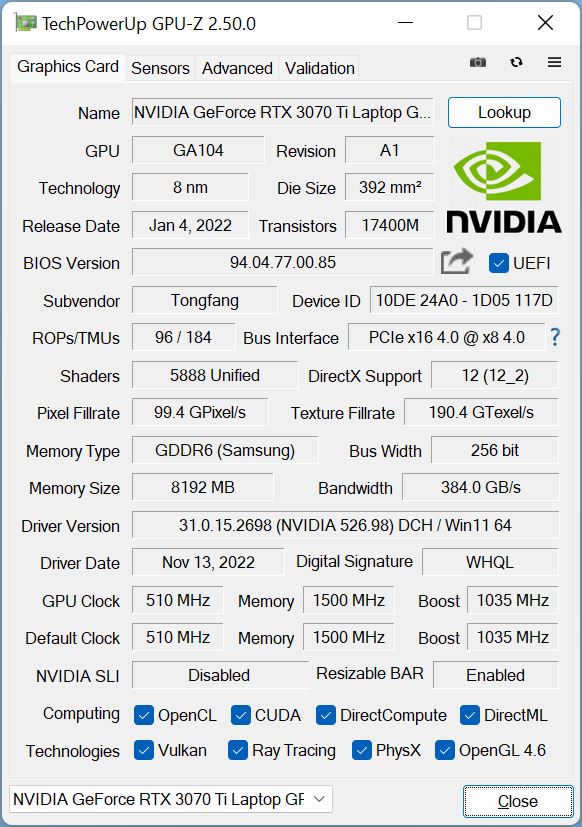
我们的评测装置配备了专用的NvidiaGeForce RTX 3070 Ti与8GB GDDR6-VRAM。它是70W的版本,但GPU也可以使用CPU的25W(动态提升2.0),所以最大TGP是95W。这意味着它不是最快的版本之一,但考虑到机箱尺寸,它仍然是一个体面的价值。
合成基准测试显示,由于RTX 3070 Ti主要用于快速和笨重的游戏笔记本电脑,该GPU比我们数据库中该GPU的平均结果要慢10-15%左右,但Vision 16 Pro仍然领先于其他竞争对手的RTX 3060.同样令人印象深刻的是,该GPU性能非常稳定。Time Spy 压力测试只是在96.8%时没有通过,但这种轻微的性能下降在实践中是不明显的。
在电池供电的情况下,GPU的消耗被限制在35W,这导致了80%的巨大性能赤字。请看我们的 技术部分了解更多的GPU基准测试。
| 3DMark 11 Performance | 27642 points | |
| 3DMark Fire Strike Score | 21451 points | |
| 3DMark Time Spy Score | 9259 points | |
Help | ||
| Blender / v3.3 Classroom OPTIX/RTX | |
| HP Envy 16 h0112nr | |
| Average of class Multimedia (12 - 105, n=22, last 2 years) | |
| Lenovo ThinkBook 16p G3 ARH | |
| Lenovo Legion Slim 7-16IAH 82TF004YGE | |
| Schenker Vision 16 Pro RTX 3070 Ti | |
| Average NVIDIA GeForce RTX 3070 Ti Laptop GPU (22 - 30, n=15) | |
| Blender / v3.3 Classroom CUDA | |
| HP Envy 16 h0112nr | |
| Average of class Multimedia (20 - 186, n=22, last 2 years) | |
| Lenovo ThinkBook 16p G3 ARH | |
| Lenovo Legion Slim 7-16IAH 82TF004YGE | |
| Schenker Vision 16 Pro RTX 3070 Ti | |
| Average NVIDIA GeForce RTX 3070 Ti Laptop GPU (36 - 46, n=16) | |
| Blender / v3.3 Classroom CPU | |
| HP Envy 16 h0112nr | |
| Schenker Vision 16 Pro RTX 3070 Ti | |
| Lenovo ThinkBook 16p G3 ARH | |
| Average of class Multimedia (134.5 - 1042, n=62, last 2 years) | |
| Average NVIDIA GeForce RTX 3070 Ti Laptop GPU (285 - 459, n=16) | |
| Lenovo Legion Slim 7-16IAH 82TF004YGE | |
* ... smaller is better
游戏性能
当你使用内部屏幕时,Vision 16 Pro不提供MUX开关来停用iGPU。这只能通过直接连接到Nvidia GPU的HDMI来实现。游戏性能证实了合成结果,评测单位领先于竞争对手的GeForce RTX 3060(显然还有许多其他使用RTX 3050 Ti的多媒体笔记本电脑),但它不是RTX 3070 Ti的最快版本。
| Performance rating - Percent | |
| Schenker Vision 16 Pro RTX 3070 Ti | |
| HP Envy 16 h0112nr | |
| Lenovo Legion Slim 7-16IAH 82TF004YGE | |
| Lenovo ThinkBook 16p G3 ARH | |
| Average of class Multimedia | |
| The Witcher 3 - 1920x1080 Ultra Graphics & Postprocessing (HBAO+) | |
| Schenker Vision 16 Pro RTX 3070 Ti | |
| HP Envy 16 h0112nr | |
| Lenovo Legion Slim 7-16IAH 82TF004YGE | |
| Lenovo ThinkBook 16p G3 ARH | |
| Average of class Multimedia (11 - 121, n=7, last 2 years) | |
| GTA V - 1920x1080 Highest AA:4xMSAA + FX AF:16x | |
| Schenker Vision 16 Pro RTX 3070 Ti | |
| HP Envy 16 h0112nr | |
| Lenovo Legion Slim 7-16IAH 82TF004YGE | |
| Lenovo ThinkBook 16p G3 ARH | |
| Average of class Multimedia (7.92 - 141.6, n=55, last 2 years) | |
| Final Fantasy XV Benchmark - 1920x1080 High Quality | |
| Schenker Vision 16 Pro RTX 3070 Ti | |
| HP Envy 16 h0112nr | |
| Lenovo ThinkBook 16p G3 ARH | |
| Lenovo Legion Slim 7-16IAH 82TF004YGE | |
| Average of class Multimedia (7.61 - 144.4, n=57, last 2 years) | |
| Strange Brigade - 1920x1080 ultra AA:ultra AF:16 | |
| Schenker Vision 16 Pro RTX 3070 Ti | |
| HP Envy 16 h0112nr | |
| Lenovo ThinkBook 16p G3 ARH | |
| Lenovo Legion Slim 7-16IAH 82TF004YGE | |
| Average of class Multimedia (13.3 - 303, n=57, last 2 years) | |
| Dota 2 Reborn - 1920x1080 ultra (3/3) best looking | |
| Schenker Vision 16 Pro RTX 3070 Ti | |
| Lenovo Legion Slim 7-16IAH 82TF004YGE | |
| HP Envy 16 h0112nr | |
| Lenovo ThinkBook 16p G3 ARH | |
| Average of class Multimedia (29 - 179.9, n=59, last 2 years) | |
| X-Plane 11.11 - 1920x1080 high (fps_test=3) | |
| Lenovo Legion Slim 7-16IAH 82TF004YGE | |
| HP Envy 16 h0112nr | |
| Schenker Vision 16 Pro RTX 3070 Ti | |
| Lenovo ThinkBook 16p G3 ARH | |
| Average of class Multimedia (16.9 - 141.1, n=54, last 2 years) | |
Vision 16 Pro的游戏性能通常足以满足原生分辨率下的最大细节,即使是在玩高要求的游戏时也是如此。在较长时间的游戏过程中,性能也很稳定,这也是我们的Witcher 3 测试所显示的。更多的游戏基准测试列在 这里.
| The Witcher 3 | |
| 1920x1080 High Graphics & Postprocessing (Nvidia HairWorks Off) | |
| Average NVIDIA GeForce RTX 3070 Ti Laptop GPU (139.7 - 226, n=27) | |
| Schenker Vision 16 Pro RTX 3070 Ti | |
| HP Envy 16 h0112nr | |
| Lenovo Legion Slim 7-16IAH 82TF004YGE | |
| Lenovo ThinkBook 16p G3 ARH | |
| Average of class Multimedia (22 - 224, n=7, last 2 years) | |
| 1920x1080 Ultra Graphics & Postprocessing (HBAO+) | |
| Average NVIDIA GeForce RTX 3070 Ti Laptop GPU (76.8 - 124.1, n=39) | |
| Schenker Vision 16 Pro RTX 3070 Ti | |
| HP Envy 16 h0112nr | |
| Lenovo Legion Slim 7-16IAH 82TF004YGE | |
| Lenovo ThinkBook 16p G3 ARH | |
| Average of class Multimedia (11 - 121, n=7, last 2 years) | |
| Cyberpunk 2077 1.6 | |
| 2560x1440 Ultra Preset | |
| Average NVIDIA GeForce RTX 3070 Ti Laptop GPU (40 - 62, n=10) | |
| Schenker Vision 16 Pro RTX 3070 Ti | |
| Lenovo ThinkBook 16p G3 ARH | |
| 1920x1080 Ultra Preset | |
| Average NVIDIA GeForce RTX 3070 Ti Laptop GPU (48.5 - 104, n=13) | |
| Schenker Vision 16 Pro RTX 3070 Ti | |
| HP Envy 16 h0112nr | |
| Lenovo ThinkBook 16p G3 ARH | |
| F1 22 | |
| 2560x1440 Ultra High Preset AA:T AF:16x | |
| Average NVIDIA GeForce RTX 3070 Ti Laptop GPU (36.8 - 50.5, n=7) | |
| Schenker Vision 16 Pro RTX 3070 Ti | |
| 1920x1080 Ultra High Preset AA:T AF:16x | |
| Average NVIDIA GeForce RTX 3070 Ti Laptop GPU (58.1 - 80, n=8) | |
| Schenker Vision 16 Pro RTX 3070 Ti | |
| Average of class Multimedia (11 - 54.1, n=8, last 2 years) | |
| Far Cry 5 | |
| 2560x1440 Ultra Preset AA:T | |
| Average NVIDIA GeForce RTX 3070 Ti Laptop GPU (77 - 111, n=15) | |
| Schenker Vision 16 Pro RTX 3070 Ti | |
| Average of class Multimedia (45 - 106, n=4, last 2 years) | |
| 1920x1080 Ultra Preset AA:T | |
| Average NVIDIA GeForce RTX 3070 Ti Laptop GPU (91 - 138, n=25) | |
| Schenker Vision 16 Pro RTX 3070 Ti | |
| Average of class Multimedia (17 - 145, n=16, last 2 years) | |
Witcher 3 FPS chart
| low | med. | high | ultra | QHD | |
|---|---|---|---|---|---|
| GTA V (2015) | 185.9 | 182.1 | 173.5 | 110.1 | 88.8 |
| The Witcher 3 (2015) | 385 | 267 | 172 | 84.9 | |
| Dota 2 Reborn (2015) | 178 | 164.7 | 155.4 | 146.7 | |
| Final Fantasy XV Benchmark (2018) | 183.6 | 117.7 | 91.4 | 67 | |
| X-Plane 11.11 (2018) | 143.2 | 125 | 101 | ||
| Far Cry 5 (2018) | 159 | 131 | 121 | 114 | 92 |
| Strange Brigade (2018) | 405 | 229 | 186.1 | 162.6 | 119.3 |
| F1 2021 (2021) | 332 | 231 | 194.4 | 109.1 | 82.2 |
| Cyberpunk 2077 1.6 (2022) | 105 | 93 | 77 | 64 | 40 |
| F1 22 (2022) | 209 | 205 | 157.3 | 58.1 | 36.8 |
排放 - 良好的风扇控制
系统噪音
一个拥有强大组件的超薄设备对风扇和风扇控制总是一个挑战。Vision 16 Pro的两个风扇始终处于活动状态,即使在空转时也是如此,但在普通距离上是听不到的。这种解决方案的优点是,在短时峰值负载情况下没有脉动,所以设备在日常情况下非常安静。将CPU限制在45W的决定也得到了回报,因为我们在多核全负荷下只测得38.5分贝(A),而不是在最大功率限制的涡轮模式下测得44.4分贝(A)。在游戏过程中和满负荷状态下,你应该期望几分钟后达到51分贝(A)。我们在平衡功率配置文件中只测量到38.5 dB(A),所以可能值得在这种模式下检查游戏性能。
在我们的压力测试中,CPU性能全开的涡轮模式将导致53.4 dB(A),这也与风扇提升模式相对应。在负载期结束后,风扇将以38.5 dB(A)的速度旋转几分钟。我们没有听到任何其他电子声音。
Noise level
| Idle |
| 24.3 / 24.3 / 24.3 dB(A) |
| Load |
| 38.5 / 51 dB(A) |
 | ||
30 dB silent 40 dB(A) audible 50 dB(A) loud |
||
min: | ||
| Schenker Vision 16 Pro RTX 3070 Ti GeForce RTX 3070 Ti Laptop GPU, i7-12700H, Samsung SSD 980 Pro 1TB MZ-V8P1T0BW | Apple MacBook Pro 16 2021 M1 Pro M1 Pro 16-Core GPU, M1 Pro, Apple SSD AP1024R | Lenovo Legion Slim 7-16IAH 82TF004YGE GeForce RTX 3060 Laptop GPU, i7-12700H, SK Hynix HFS001TEJ9X115N | Lenovo ThinkBook 16p G3 ARH GeForce RTX 3060 Laptop GPU, R9 6900HX, Micron 3400 1TB MTFDKBA1T0TFH | HP Envy 16 h0112nr GeForce RTX 3060 Laptop GPU, i7-12700H, Micron 3400 1TB MTFDKBA1T0TFH | |
|---|---|---|---|---|---|
| Noise | 8% | -0% | 7% | -3% | |
| off / environment * (dB) | 22.9 | 24.7 -8% | 23 -0% | 22.7 1% | 22.8 -0% |
| Idle Minimum * (dB) | 24.3 | 24.7 -2% | 23 5% | 23.1 5% | 22.9 6% |
| Idle Average * (dB) | 24.3 | 24.7 -2% | 23 5% | 23.2 5% | 22.9 6% |
| Idle Maximum * (dB) | 24.3 | 24.7 -2% | 23 5% | 23.6 3% | 30.5 -26% |
| Load Average * (dB) | 38.5 | 26.1 32% | 43.7 -14% | 30.6 21% | 41.4 -8% |
| Witcher 3 ultra * (dB) | 51 | 51.7 -1% | 47.6 7% | 51.1 -0% | |
| Load Maximum * (dB) | 51 | 37.4 27% | 52 -2% | 47.5 7% | 51.4 -1% |
* ... smaller is better
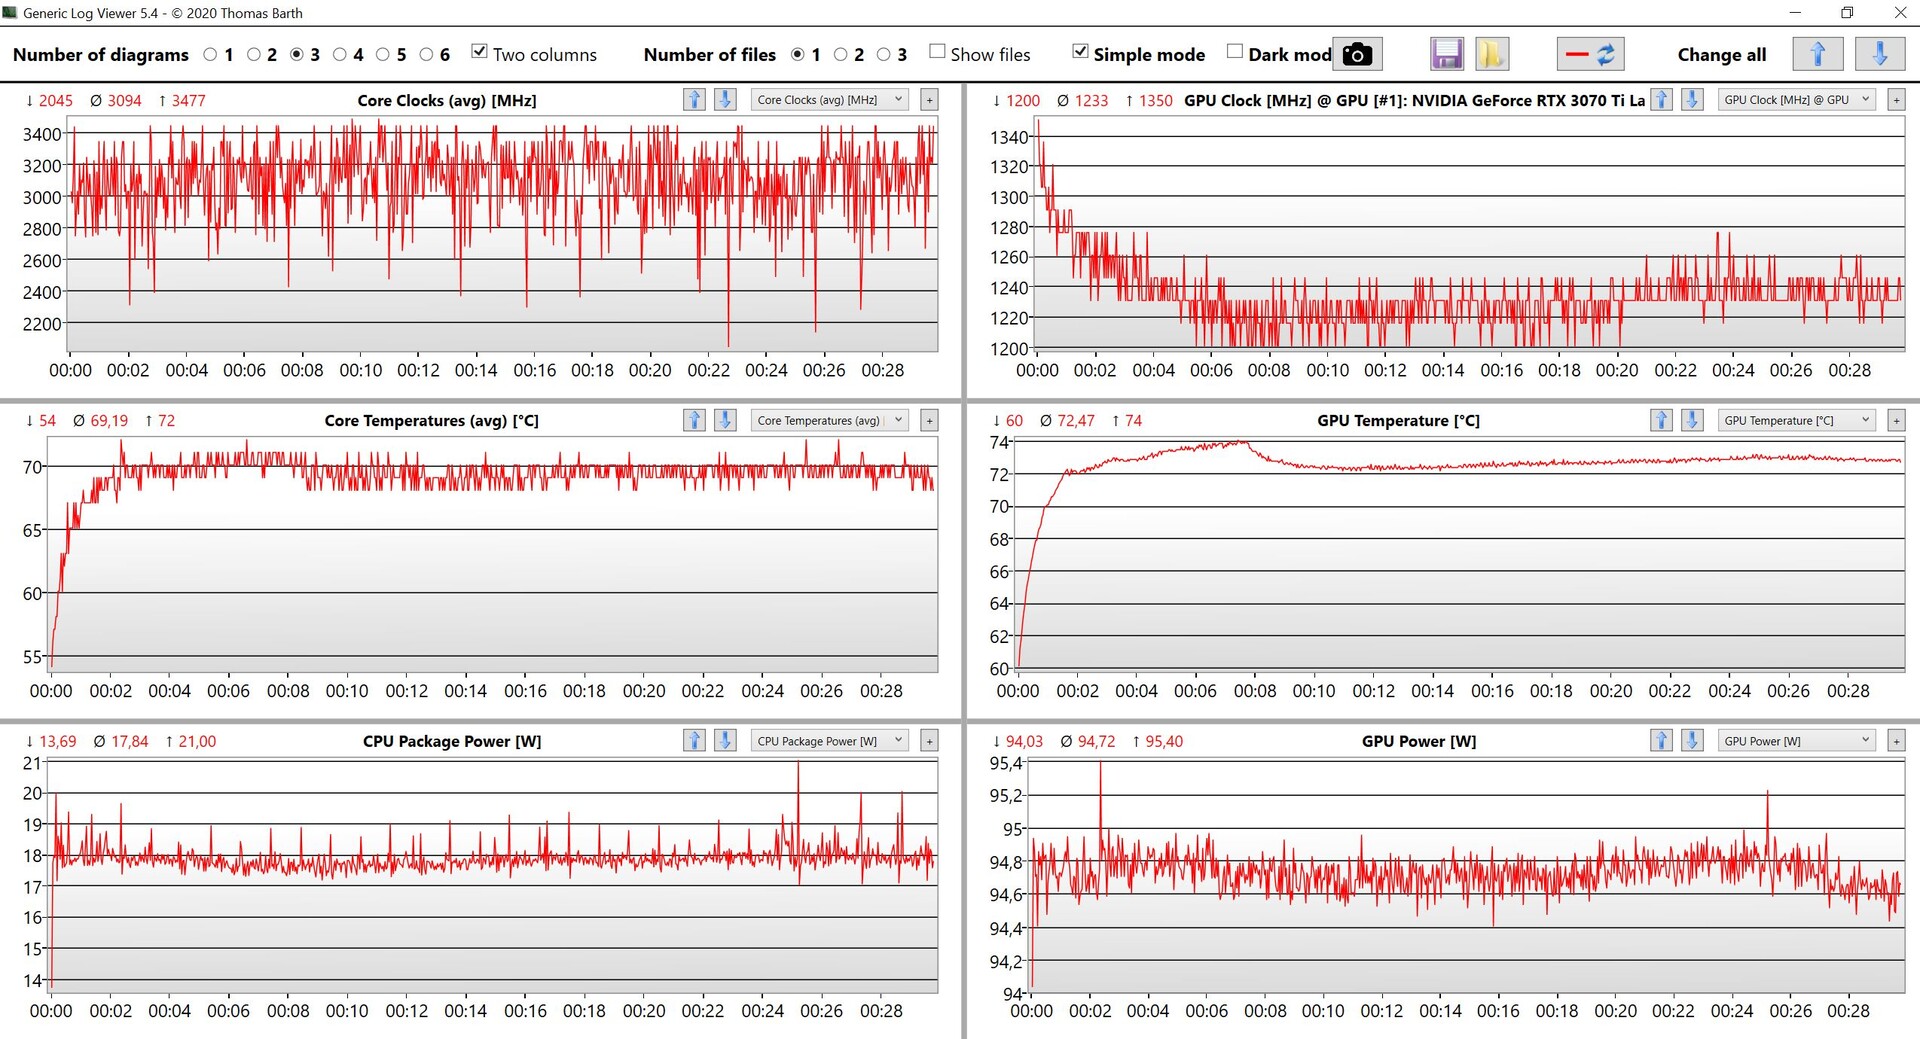
温度
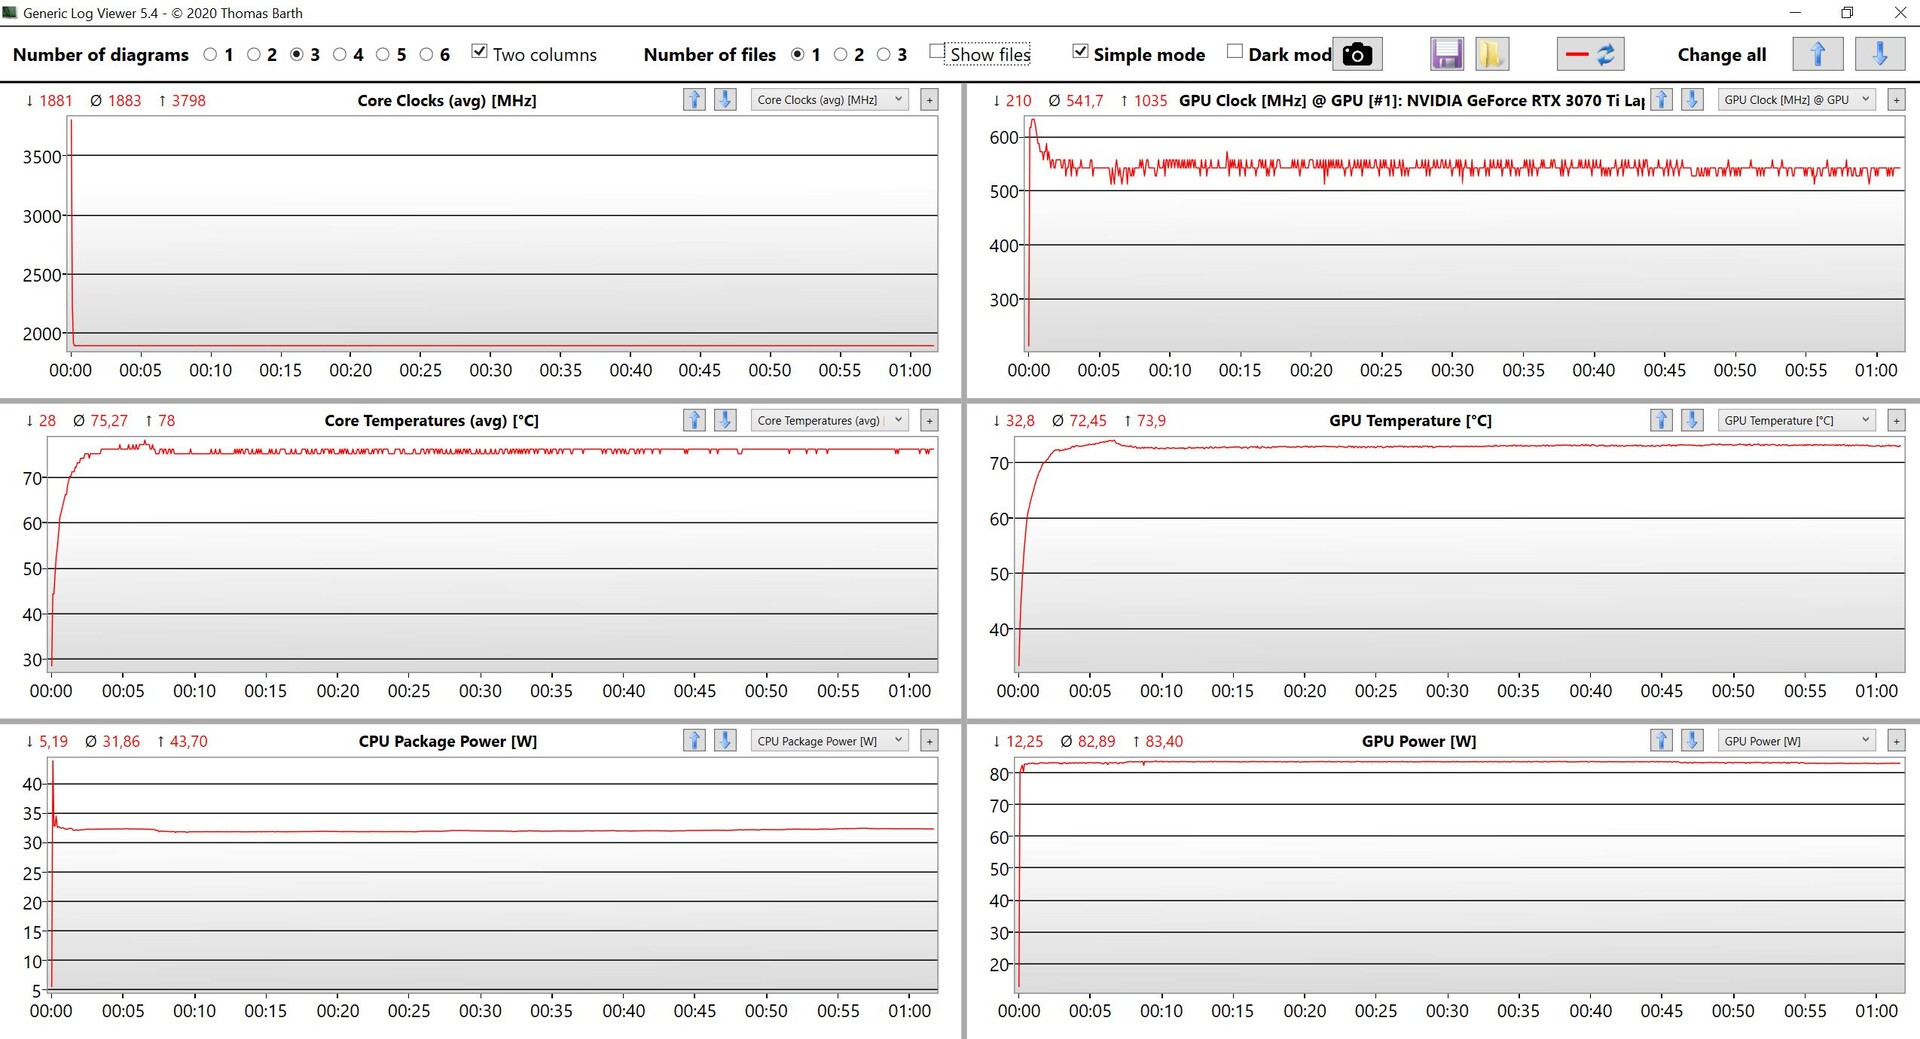
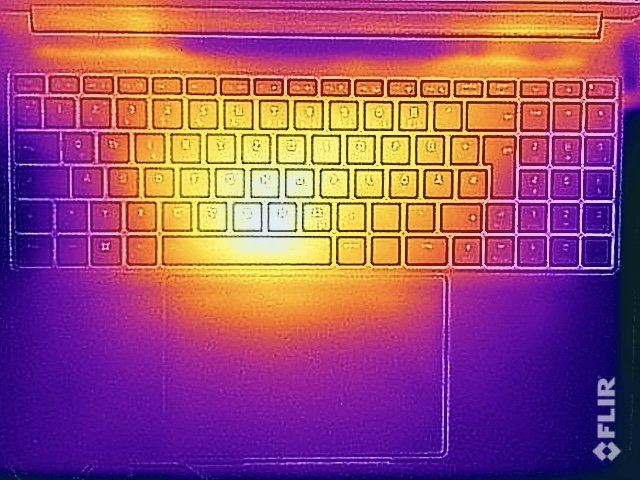
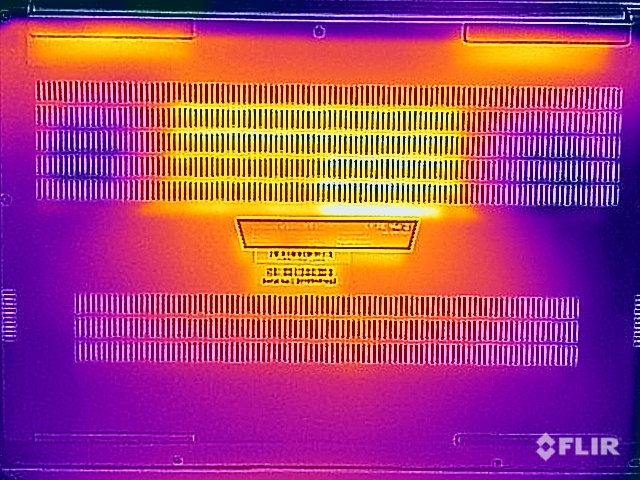
Vision 16 Pro在空转和轻度工作负荷时没有温度问题或热点,这也是不断旋转的风扇的好处。然而,在负载下或玩游戏时,它会变热。基本单元的底部在46°C以下仍然没有问题,你仍然可以把它放在腿上,但是中央键盘区域升温到50°C以上,这是明显的,已经有点令人不快了。幸运的是,当你玩游戏时,这不是一个大问题(你主要使用WASD和周围的键)。
我们的压力测试表明,GPU是系统的首选,其消耗量稳定在80W以上,而处理器很快就平息在~32W。总而言之,这是一个体面的结果,我们没有注意到在压力测试后立即出现性能下降。
(-) The maximum temperature on the upper side is 50.8 °C / 123 F, compared to the average of 36.8 °C / 98 F, ranging from 21 to 71 °C for the class Multimedia.
(-) The bottom heats up to a maximum of 46.3 °C / 115 F, compared to the average of 39.1 °C / 102 F
(+) In idle usage, the average temperature for the upper side is 25.5 °C / 78 F, compared to the device average of 31.3 °C / 88 F.
(-) Playing The Witcher 3, the average temperature for the upper side is 39.4 °C / 103 F, compared to the device average of 31.3 °C / 88 F.
(+) The palmrests and touchpad are cooler than skin temperature with a maximum of 29.8 °C / 85.6 F and are therefore cool to the touch.
(±) The average temperature of the palmrest area of similar devices was 28.7 °C / 83.7 F (-1.1 °C / -1.9 F).
| Schenker Vision 16 Pro RTX 3070 Ti Intel Core i7-12700H, NVIDIA GeForce RTX 3070 Ti Laptop GPU | Apple MacBook Pro 16 2021 M1 Pro Apple M1 Pro, Apple M1 Pro 16-Core GPU | Lenovo Legion Slim 7-16IAH 82TF004YGE Intel Core i7-12700H, NVIDIA GeForce RTX 3060 Laptop GPU | Lenovo ThinkBook 16p G3 ARH AMD Ryzen 9 6900HX, NVIDIA GeForce RTX 3060 Laptop GPU | HP Envy 16 h0112nr Intel Core i7-12700H, NVIDIA GeForce RTX 3060 Laptop GPU | |
|---|---|---|---|---|---|
| Heat | 14% | -22% | -11% | -8% | |
| Maximum Upper Side * (°C) | 50.8 | 41 19% | 48.3 5% | 48.2 5% | 45.2 11% |
| Maximum Bottom * (°C) | 46.3 | 39 16% | 55.3 -19% | 49.6 -7% | 44 5% |
| Idle Upper Side * (°C) | 27.2 | 24 12% | 35.7 -31% | 31.8 -17% | 33.6 -24% |
| Idle Bottom * (°C) | 26.6 | 24 10% | 37.6 -41% | 33.6 -26% | 32.6 -23% |
* ... smaller is better
发言人
有两个立体声扬声器,提供了一个体面的声音体验,有精确的高音,但系统缺乏一些冲力,Vision 16 Pro无法跟上优秀的音响系统,如在MacBook Pro 16等优秀的音响系统。预装的Nahimic软件提供了多种预设,你应该激活该软件,否则声音会更差、更安静。
Schenker Vision 16 Pro RTX 3070 Ti audio analysis
(±) | speaker loudness is average but good (77.6 dB)
Bass 100 - 315 Hz
(-) | nearly no bass - on average 17.9% lower than median
(±) | linearity of bass is average (12.2% delta to prev. frequency)
Mids 400 - 2000 Hz
(+) | balanced mids - only 3.3% away from median
(+) | mids are linear (4.9% delta to prev. frequency)
Highs 2 - 16 kHz
(+) | balanced highs - only 2.8% away from median
(+) | highs are linear (5.1% delta to prev. frequency)
Overall 100 - 16.000 Hz
(±) | linearity of overall sound is average (15.1% difference to median)
Compared to same class
» 36% of all tested devices in this class were better, 4% similar, 60% worse
» The best had a delta of 5%, average was 17%, worst was 45%
Compared to all devices tested
» 21% of all tested devices were better, 4% similar, 75% worse
» The best had a delta of 4%, average was 23%, worst was 134%
Apple MacBook Pro 16 2021 M1 Pro audio analysis
(+) | speakers can play relatively loud (84.7 dB)
Bass 100 - 315 Hz
(+) | good bass - only 3.8% away from median
(+) | bass is linear (5.2% delta to prev. frequency)
Mids 400 - 2000 Hz
(+) | balanced mids - only 1.3% away from median
(+) | mids are linear (2.1% delta to prev. frequency)
Highs 2 - 16 kHz
(+) | balanced highs - only 1.9% away from median
(+) | highs are linear (2.7% delta to prev. frequency)
Overall 100 - 16.000 Hz
(+) | overall sound is linear (4.6% difference to median)
Compared to same class
» 0% of all tested devices in this class were better, 0% similar, 100% worse
» The best had a delta of 5%, average was 17%, worst was 45%
Compared to all devices tested
» 0% of all tested devices were better, 0% similar, 100% worse
» The best had a delta of 4%, average was 23%, worst was 134%
能源管理 - 240赫兹模式消耗更多电力
消耗功率
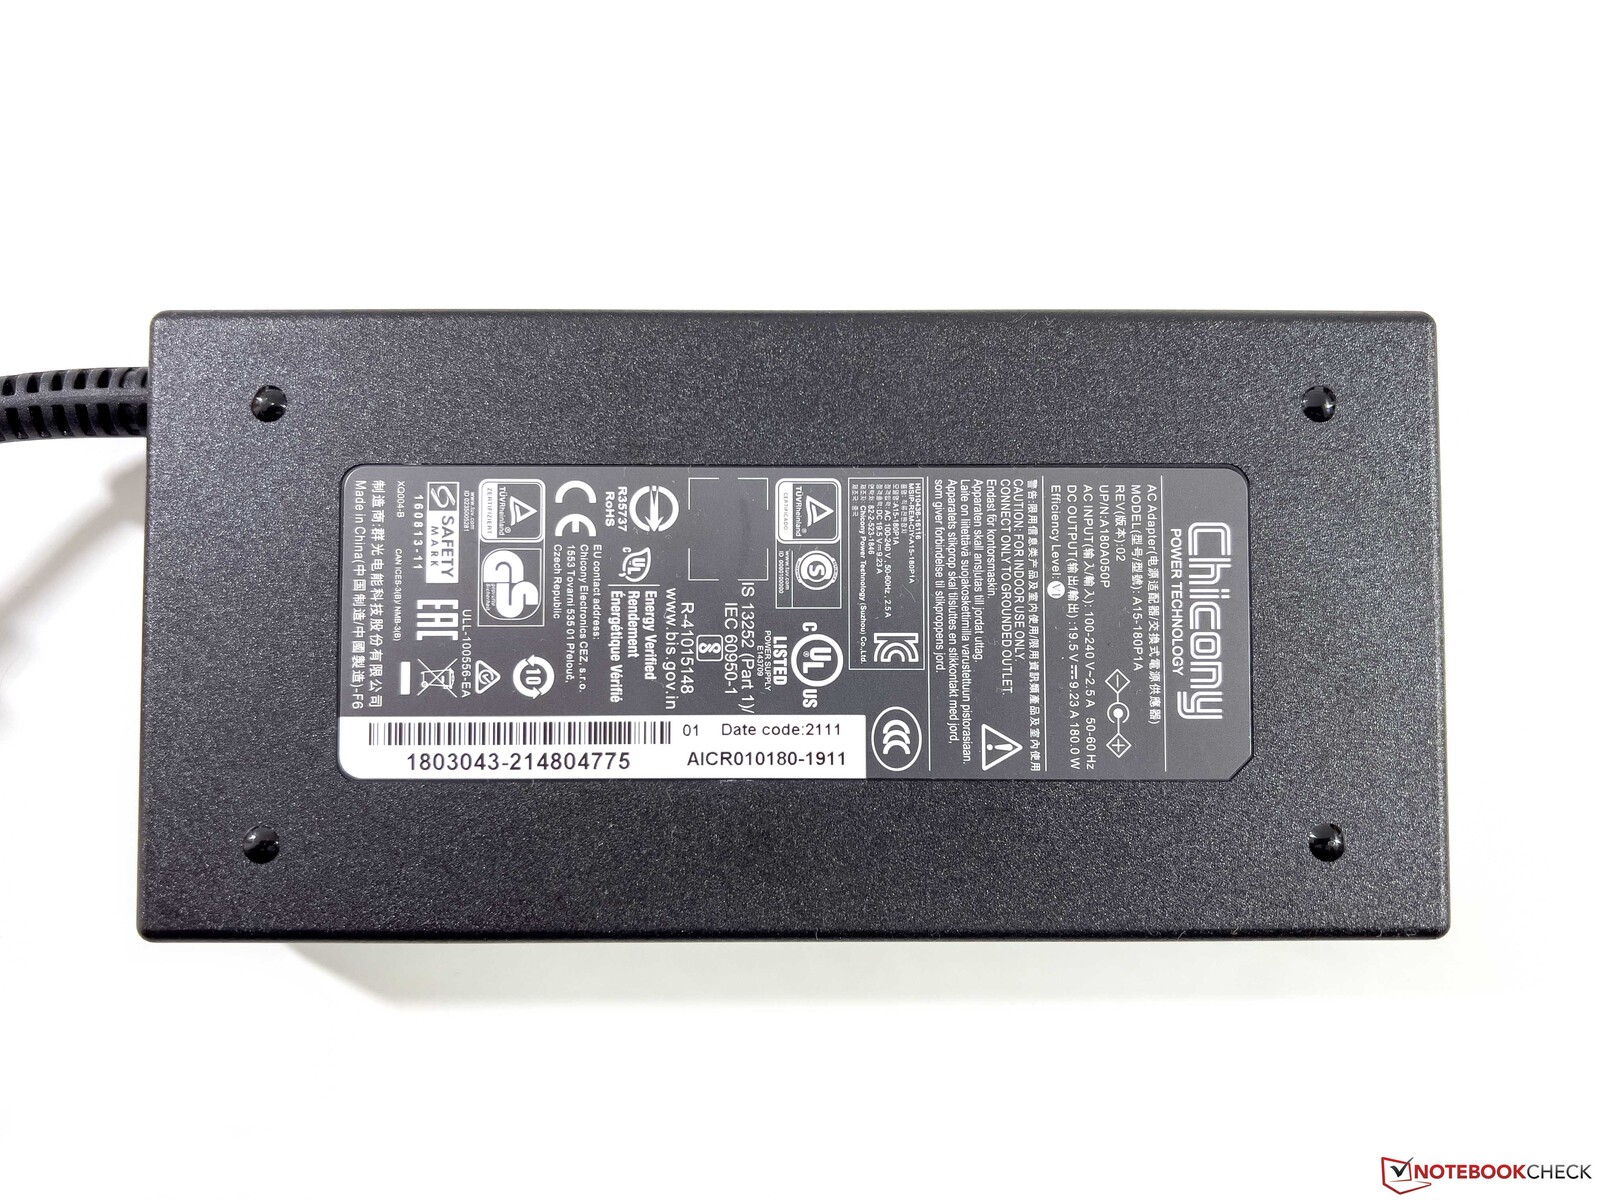
我们测量了在激活240赫兹的情况下空转时高达14.3W,而在60赫兹模式下为11.8W,所以减少电池电量的频率是值得的。我们的压力测试结果是最大消耗172W,在压力测试结束时仍然是160W,这在游戏时也应该是预期的。因此,所提供的180W电源适配器是足够的,在这些情况下,它仍然有一些空间为电池充电。
| Off / Standby | |
| Idle | |
| Load |
|
Key:
min: | |
| Schenker Vision 16 Pro RTX 3070 Ti i7-12700H, GeForce RTX 3070 Ti Laptop GPU, Samsung SSD 980 Pro 1TB MZ-V8P1T0BW, IPS, 2560x1600, 16" | Apple MacBook Pro 16 2021 M1 Pro M1 Pro, M1 Pro 16-Core GPU, Apple SSD AP1024R, Mini-LED, 3456x2234, 16.2" | Lenovo Legion Slim 7-16IAH 82TF004YGE i7-12700H, GeForce RTX 3060 Laptop GPU, SK Hynix HFS001TEJ9X115N, IPS LED, 2560x1600, 16" | Lenovo ThinkBook 16p G3 ARH R9 6900HX, GeForce RTX 3060 Laptop GPU, Micron 3400 1TB MTFDKBA1T0TFH, IPS, 2560x1600, 16" | HP Envy 16 h0112nr i7-12700H, GeForce RTX 3060 Laptop GPU, Micron 3400 1TB MTFDKBA1T0TFH, OLED, 3840x2400, 16" | Average NVIDIA GeForce RTX 3070 Ti Laptop GPU | Average of class Multimedia | |
|---|---|---|---|---|---|---|---|
| Power Consumption | 24% | -27% | -12% | -17% | -51% | 29% | |
| Idle Minimum * (Watt) | 9 | 5 44% | 13.3 -48% | 10.3 -14% | 10 -11% | 14.2 ? -58% | 5.66 ? 37% |
| Idle Average * (Watt) | 13.3 | 15.1 -14% | 17.5 -32% | 16 -20% | 10.9 18% | 19.9 ? -50% | 10.2 ? 23% |
| Idle Maximum * (Watt) | 14.3 | 15.5 -8% | 18.4 -29% | 24 -68% | 27.8 -94% | 26.2 ? -83% | 12.5 ? 13% |
| Load Average * (Watt) | 107 | 54 50% | 122.8 -15% | 85.4 20% | 116.4 -9% | 125.8 ? -18% | 65.2 ? 39% |
| Witcher 3 ultra * (Watt) | 155.2 | 154.7 -0% | 132.2 15% | 133.7 14% | |||
| Load Maximum * (Watt) | 172 | 90 48% | 232.6 -35% | 181.9 -6% | 209.8 -22% | 248 ? -44% | 113.5 ? 34% |
* ... smaller is better
Power consumption Witcher 3 / stress test
Power consumption external screen (USB-C)
电池运行时间
Vision 16 Pro中的80Wh电池无法管理极长的运行时间,因为功耗太高。在150尼特(最大亮度的41%)的Wi-Fi和视频测试中,我们确定240赫兹的运行时间约为6小时,在全亮度的Wi-Fi测试中为5小时。60赫兹模式在150尼特下的运行时间增加了约1.5小时。
当设备开启时,电池完全充电需要107分钟;大约50分钟后,80%的容量可以使用。
| Schenker Vision 16 Pro RTX 3070 Ti i7-12700H, GeForce RTX 3070 Ti Laptop GPU, 80 Wh | Apple MacBook Pro 16 2021 M1 Pro M1 Pro, M1 Pro 16-Core GPU, 99.6 Wh | Lenovo Legion Slim 7-16IAH 82TF004YGE i7-12700H, GeForce RTX 3060 Laptop GPU, 99.99 Wh | Lenovo ThinkBook 16p G3 ARH R9 6900HX, GeForce RTX 3060 Laptop GPU, 71 Wh | HP Envy 16 h0112nr i7-12700H, GeForce RTX 3060 Laptop GPU, 83 Wh | Average of class Multimedia | |
|---|---|---|---|---|---|---|
| Battery runtime | 185% | 14% | 8% | 28% | 104% | |
| H.264 (h) | 6.1 | 17.5 187% | 9.5 56% | 17.1 ? 180% | ||
| WiFi v1.3 (h) | 6 | 16.9 182% | 5.2 -13% | 6.5 8% | 7.9 32% | 12.2 ? 103% |
| Load (h) | 1.3 | 1.3 0% | 1.6 23% | 1.664 ? 28% | ||
| Witcher 3 ultra (h) | 1.5 |
Pros
Cons
结论 - Vision 16 Pro以高性能的数据令人信服
全球国际货运代理公司延续了这一概念。愿景14新的Vision 16 Pro延续了Vision 14的概念,并提供了一个尺寸紧凑的轻量级16英寸笔记本电脑,它还提供了大量的端口和强大的组件。配备快速GPU的型号,如GeForce RTX 3070 Ti与大多数其他多媒体笔记本电脑相比,提供了更多的GPU性能,这些笔记本电脑通常只限于RTX 3050 Ti或3060.组件(CPU、GPU和SSD)的性能在持续的工作负荷下也很稳定,考虑到纤细轻巧的机身,这并不是一个问题。
还有更多的优点,如良好的维护选项,因为你可以改变Wi-Fi模块,并访问两个SODIMM插槽以及两个M.2-2280插槽的SSD。我们也喜欢这些输入设备,尤其是巨大的触摸板。240赫兹的WQHD面板主要面向游戏玩家,但只覆盖了sRGB色域,即使在我们自己校准后仍有一些颜色偏差。考虑到多媒体分类和高价格,如果能有另一个显示器的选项就更好了。哑光屏的主观画质还是很好的,没有PWM闪烁。
Schenker Vision 16 Pro提供了一个非常有说服力的整体包装,它将紧凑轻巧的16英寸机箱与良好的维护选项、大量的端口和强大的组件相结合。
不幸的是,新的16英寸型号也与较小的14英寸Vision 14有一些共同的弱点,包括略微摇晃的显示器铰链和天线配置,不支持最新的6GHz网络(Wi-Fi 6E)。当你真正给硬件施加压力时(例如在游戏过程中),表面温度和风扇噪音也很高,但热量必须从纤细的机箱中散出。
Vision 16 Pro比直接竞争对手要轻得多,但也更强大。根据使用情况,会有更好的替代品,如MacBook Pro 16拥有卓越的Mini-LED显示屏和不受限制的电池电量性能(但你应该考虑更昂贵的M1 Max型号,以获得相当的GPU性能)。与轻量级游戏笔记本电脑相比,如联想的Legion Slim 7或多媒体笔记本电脑HP Envy 16,申克的整体表现非常好。
价格和可用性
您可以在bestware.com上配置Vision 16 Pro。起价为1.899欧元。
Schenker Vision 16 Pro RTX 3070 Ti
- 11/24/2022 v7 (old)
Andreas Osthoff
Price comparison

