联想ThinkPad X1 Extreme G5笔记本评测--旗舰级ThinkPad,CPU功率更大
就在去年其旗舰产品Thinkpad X1 Extreme接受了广泛的第四代更新之后,联想现在正集中精力提高新机型--G5的内在质量,安装了新的和改进的液态金属冷却系统,以及当前的第12代英特尔处理器(Alder Lake H)。显卡继续来自Nvidia的RTX 3000系列的GPU,包括快速的RTX 3080 Ti选项。
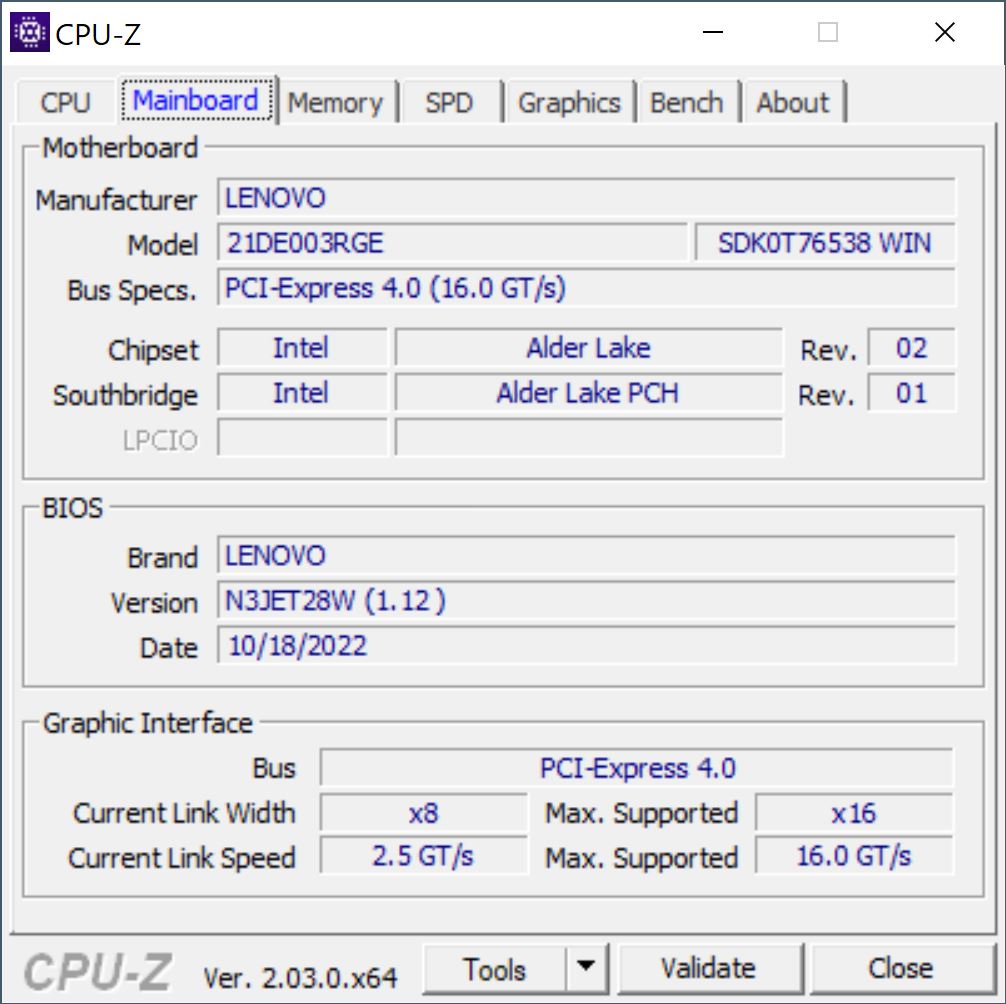
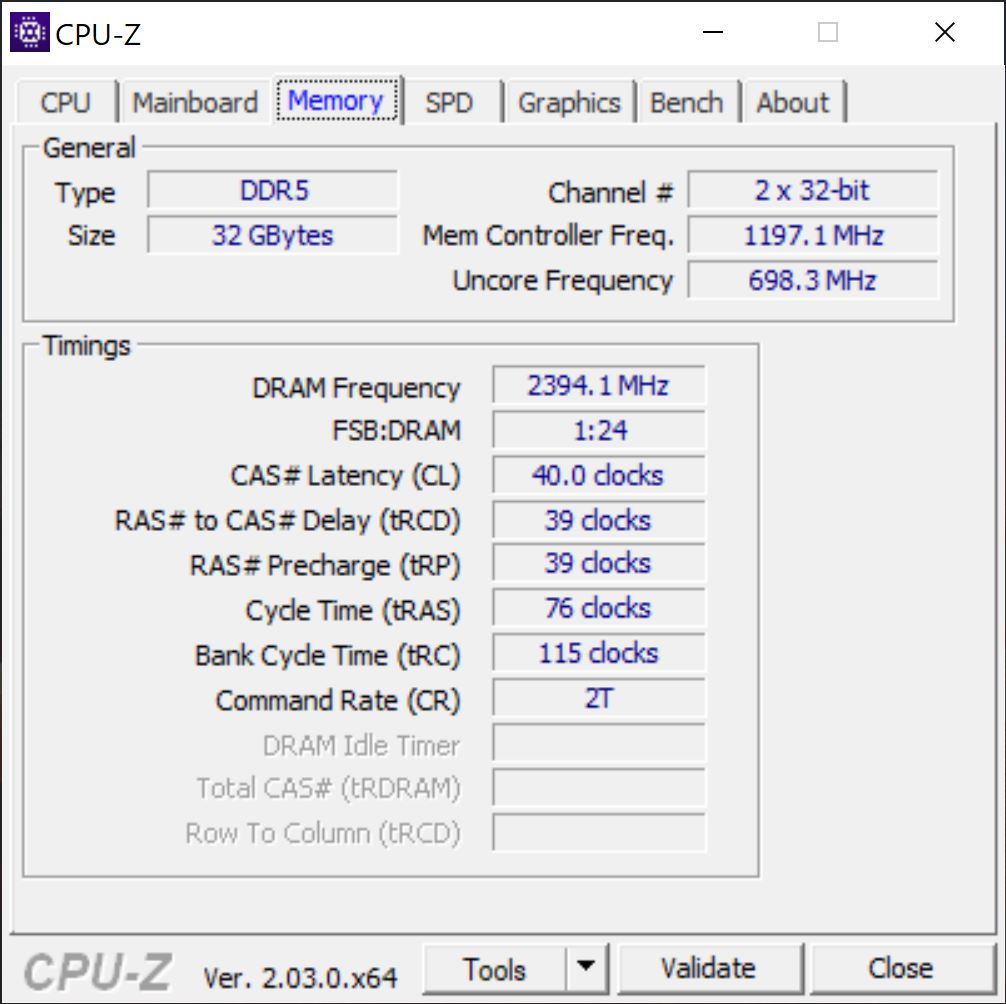
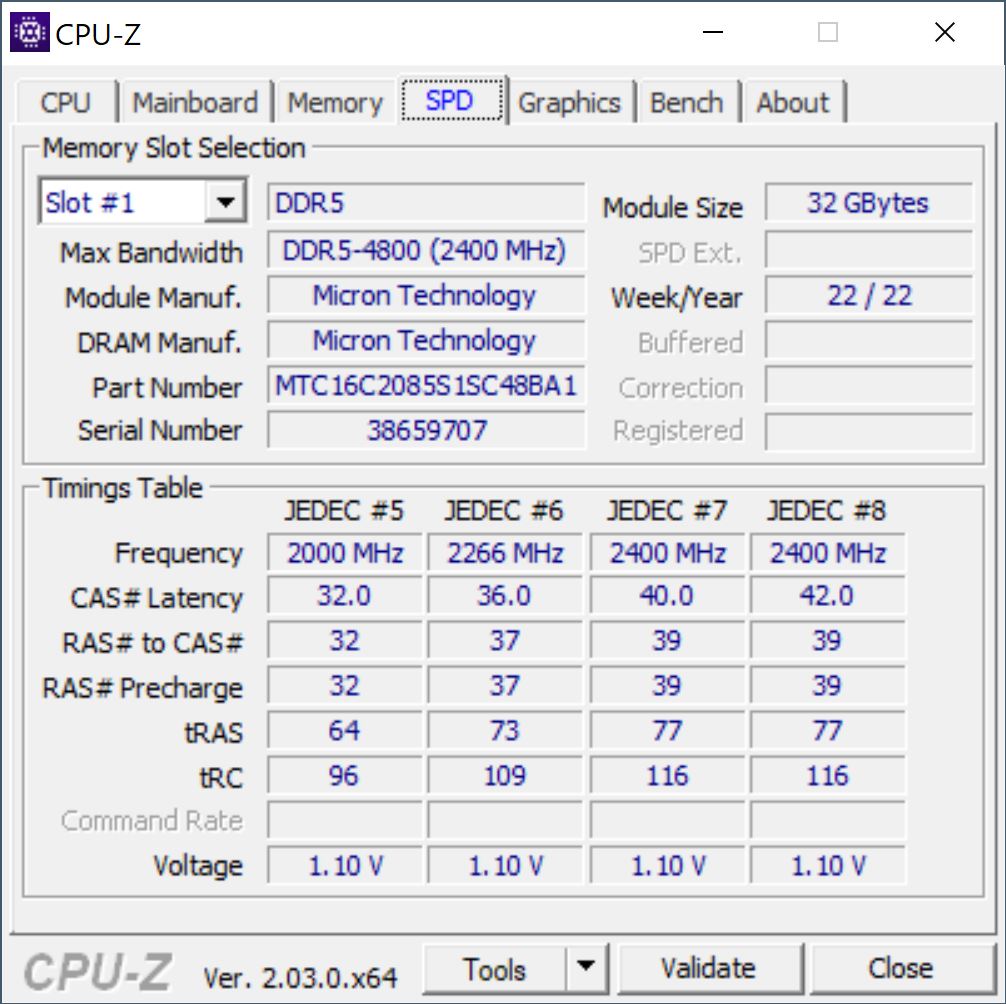
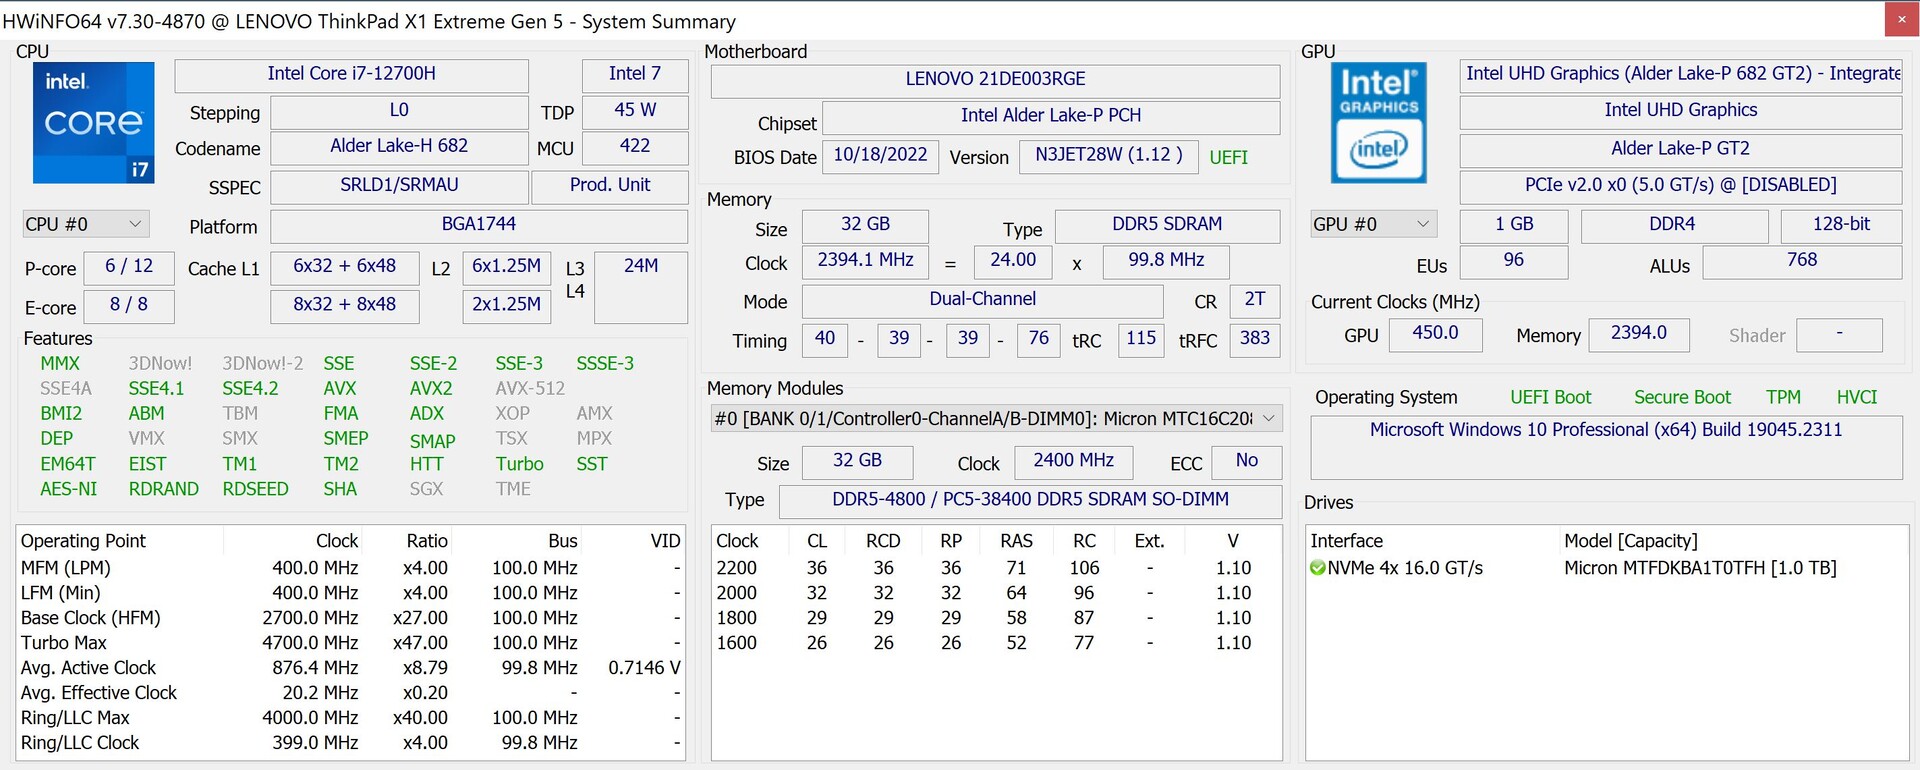
我们的评测模型,21DE003RGE,价格约为3600美元,配备英特尔酷睿i7-12700H,32GB DDR5-4800内存,1TB PCIe 4.0固态硬盘,4K IPS显示屏,AdobeRGB全覆盖,以及专用GPU,GeForce RTX 3060。我们的模型预装了Windows 10 Pro(通过从Windows 11 Pro降级的权利)。不幸的是,我们遇到了一些性能问题,包括Wi-Fi 6E在Windows 10下无法工作。出于这个原因,我们在测试期间使用了Windows 11 Pro,并且还向所有用户推荐这一更新。
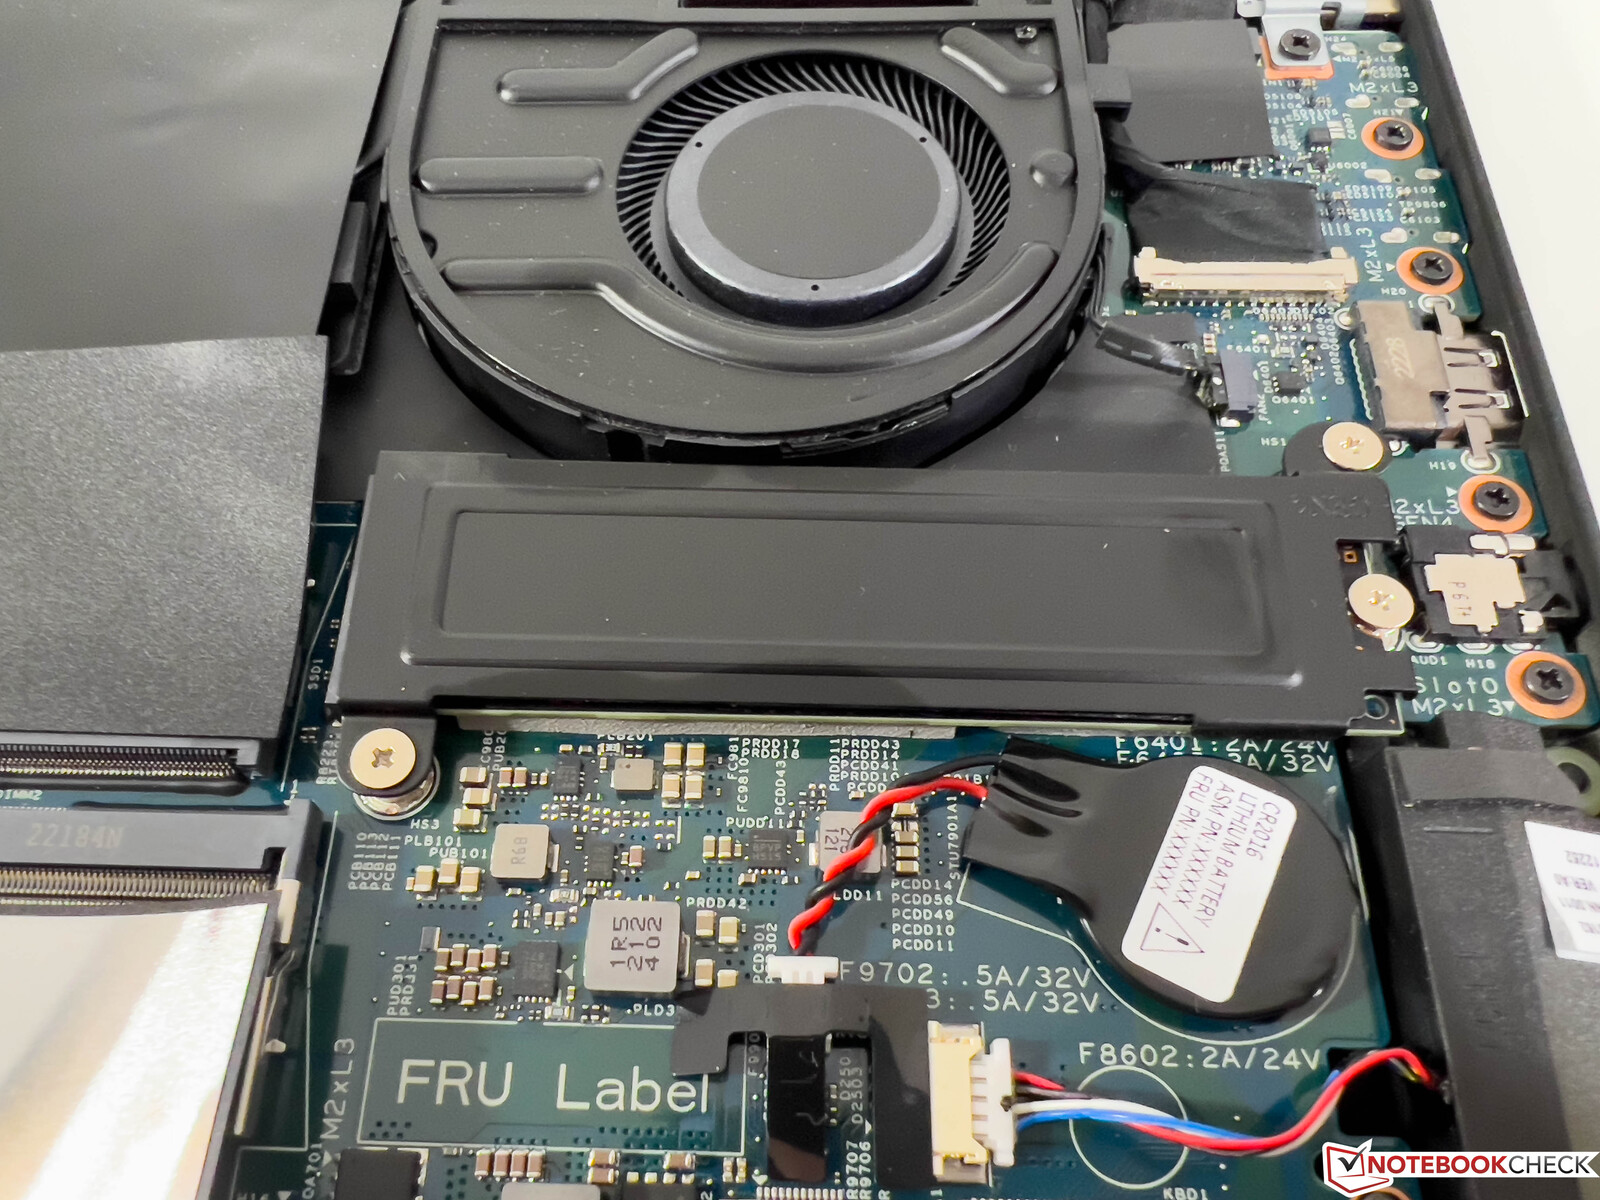
注意:与上一个型号一样,X1 Extreme G5有两个基本版本。配备RTX 3050 Ti的配置使用正常的基于热管的冷却,这就是为什么有额外的空间用于第二个M.2 SSD以及WWAN模块。配置更强大的GPU(从RTX 3060和更高版本)时,配备了一个更大的蒸汽室冷却系统,导致只实施一个M.2 SSD。
潜在的竞争对手比较
Rating | Date | Model | Weight | Height | Size | Resolution | Price |
|---|---|---|---|---|---|---|---|
| 88.7 % v7 (old) | 12 / 2022 | Lenovo ThinkPad X1 Extreme G5-21DE003RGE i7-12700H, GeForce RTX 3060 Laptop GPU | 2.1 kg | 17.9 mm | 16.00" | 3840x2400 | |
| 86.9 % v7 (old) | 09 / 2022 | HP Envy 16 h0112nr i7-12700H, GeForce RTX 3060 Laptop GPU | 2.3 kg | 19.8 mm | 16.00" | 3840x2400 | |
| 87.8 % v7 (old) | 11 / 2022 | Schenker Vision 16 Pro RTX 3070 Ti i7-12700H, GeForce RTX 3070 Ti Laptop GPU | 1.7 kg | 17.1 mm | 16.00" | 2560x1600 | |
| 89.5 % v7 (old) | 05 / 2022 | Dell XPS 15 9520 RTX 3050 Ti i7-12700H, GeForce RTX 3050 Ti Laptop GPU | 1.9 kg | 18 mm | 15.60" | 3456x2160 | |
| 93.2 % v7 (old) | 11 / 2021 | Apple MacBook Pro 16 2021 M1 Pro M1 Pro, M1 Pro 16-Core GPU | 2.2 kg | 16.8 mm | 16.20" | 3456x2234 | |
| 88.8 % v7 (old) | 06 / 2022 | Dell XPS 17 9720 RTX 3060 i7-12700H, GeForce RTX 3060 Laptop GPU | 2.5 kg | 19.5 mm | 17.00" | 3840x2400 |
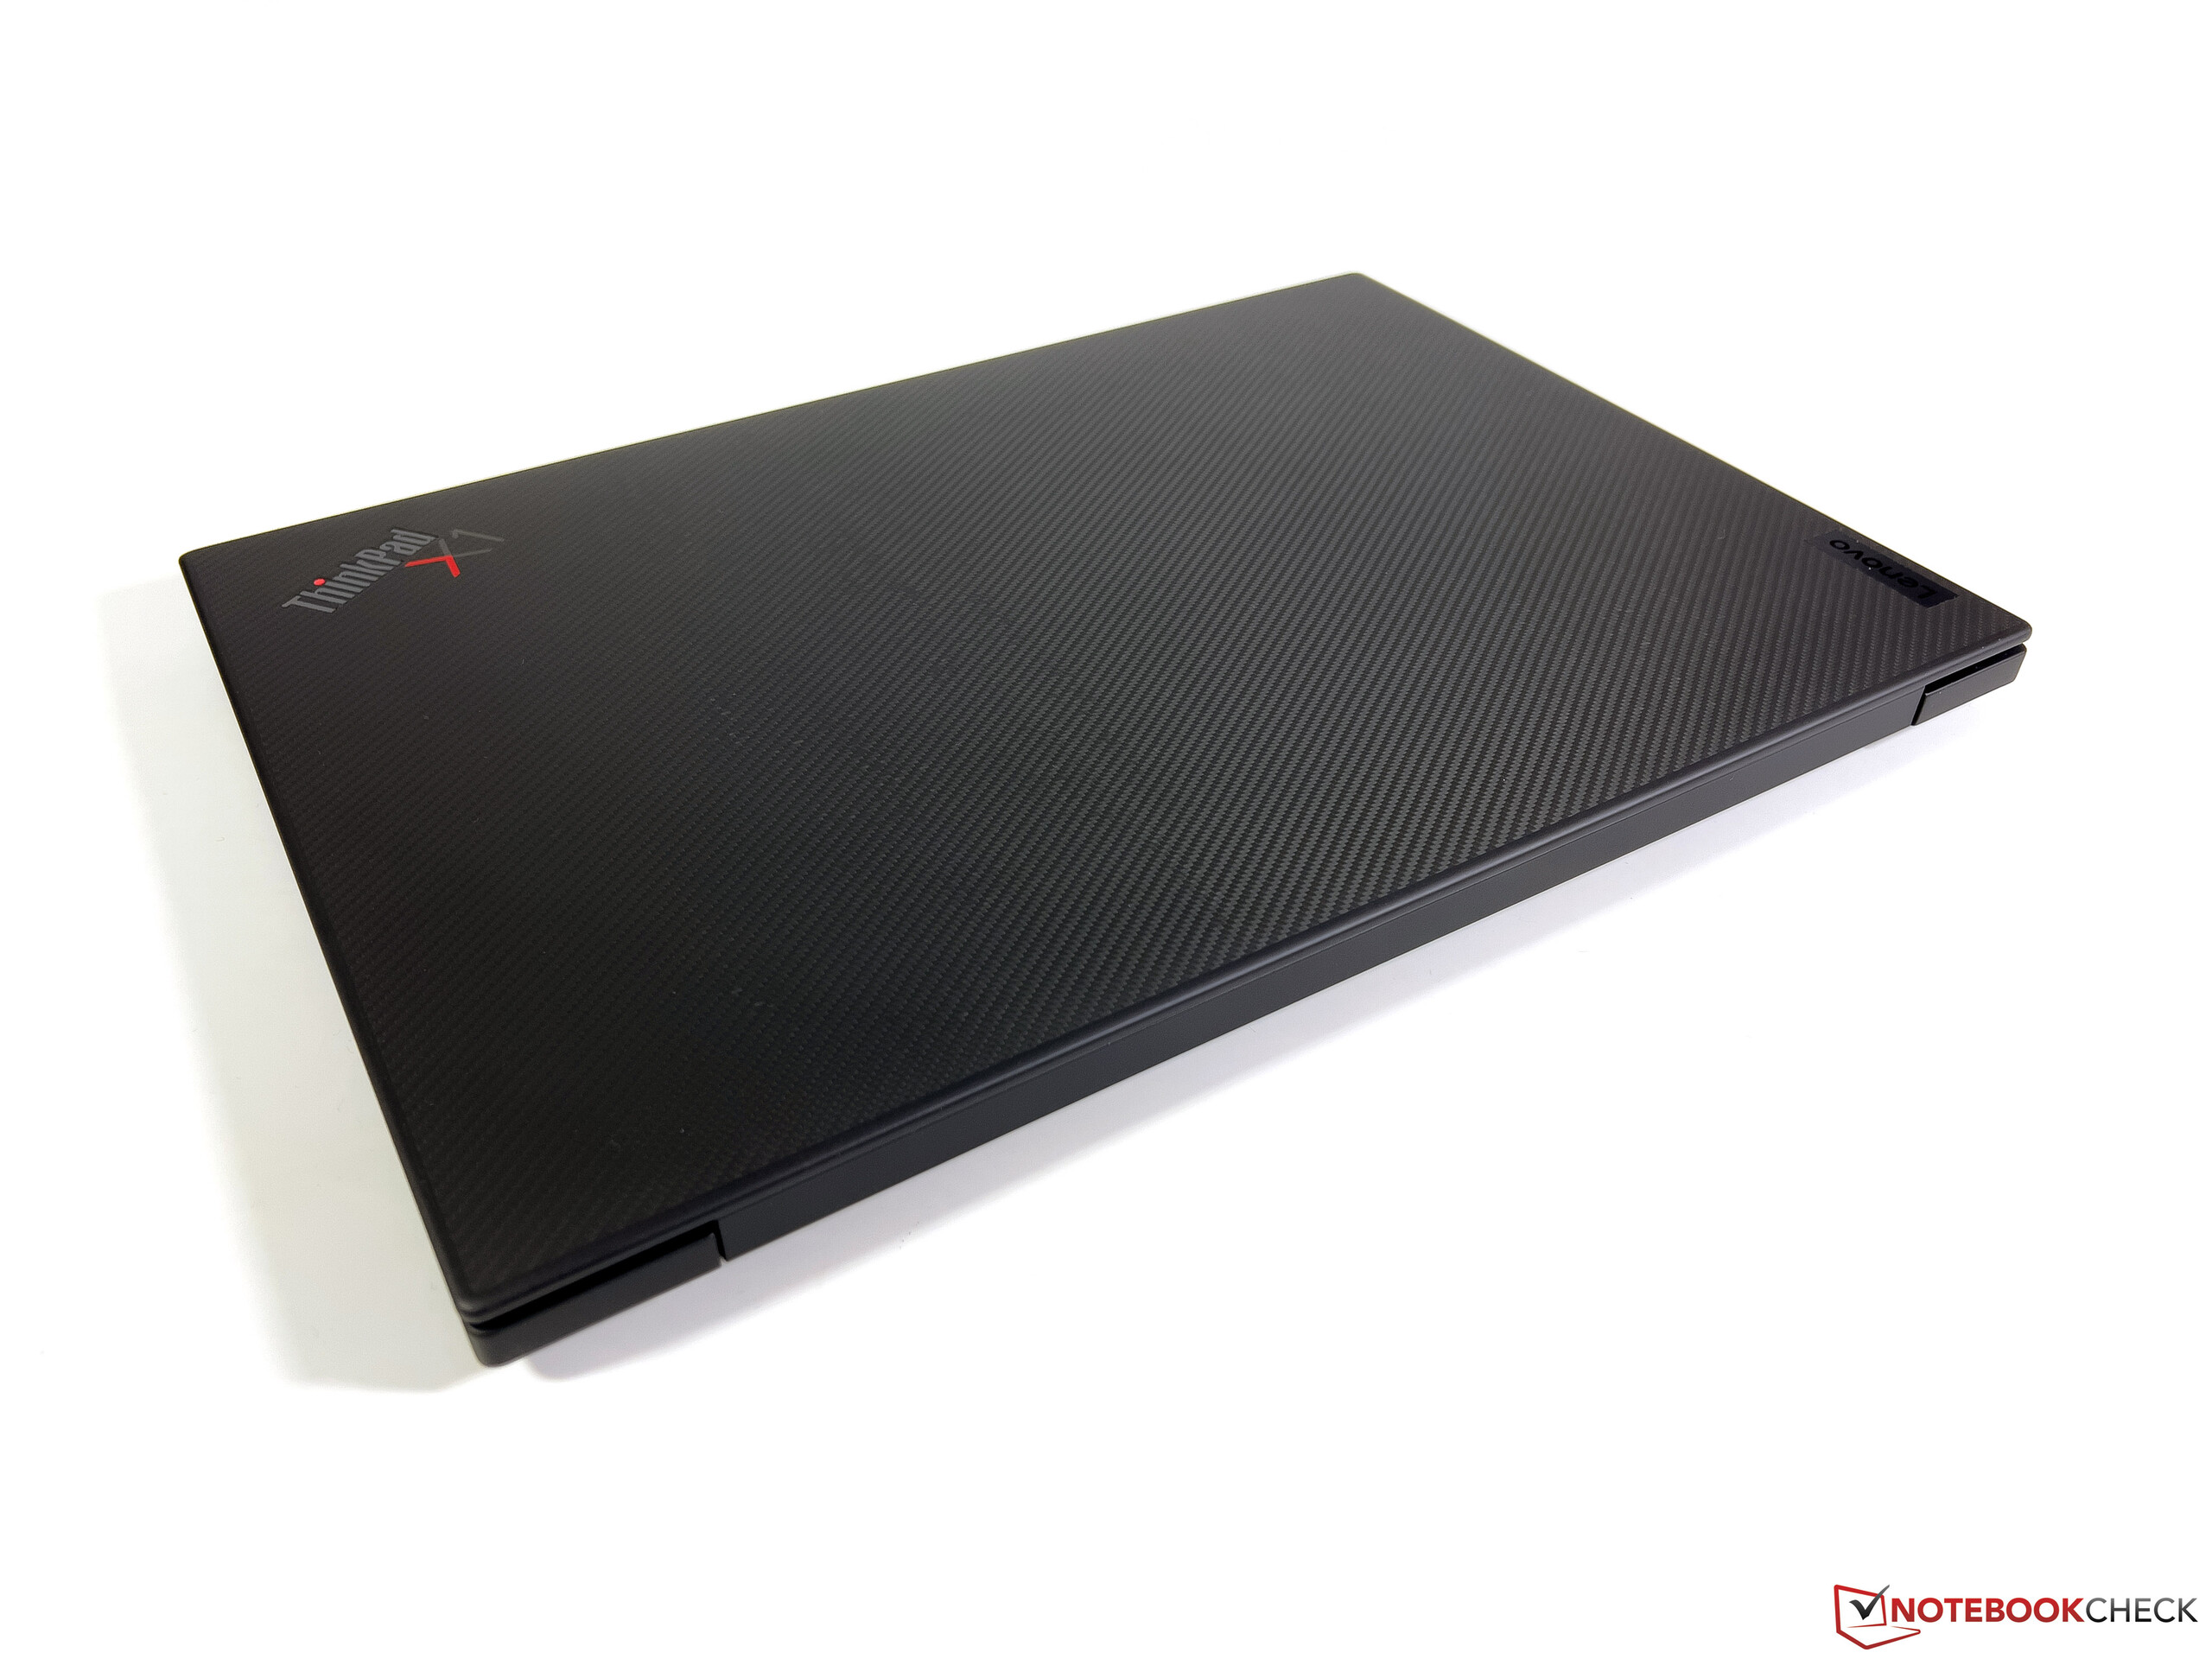
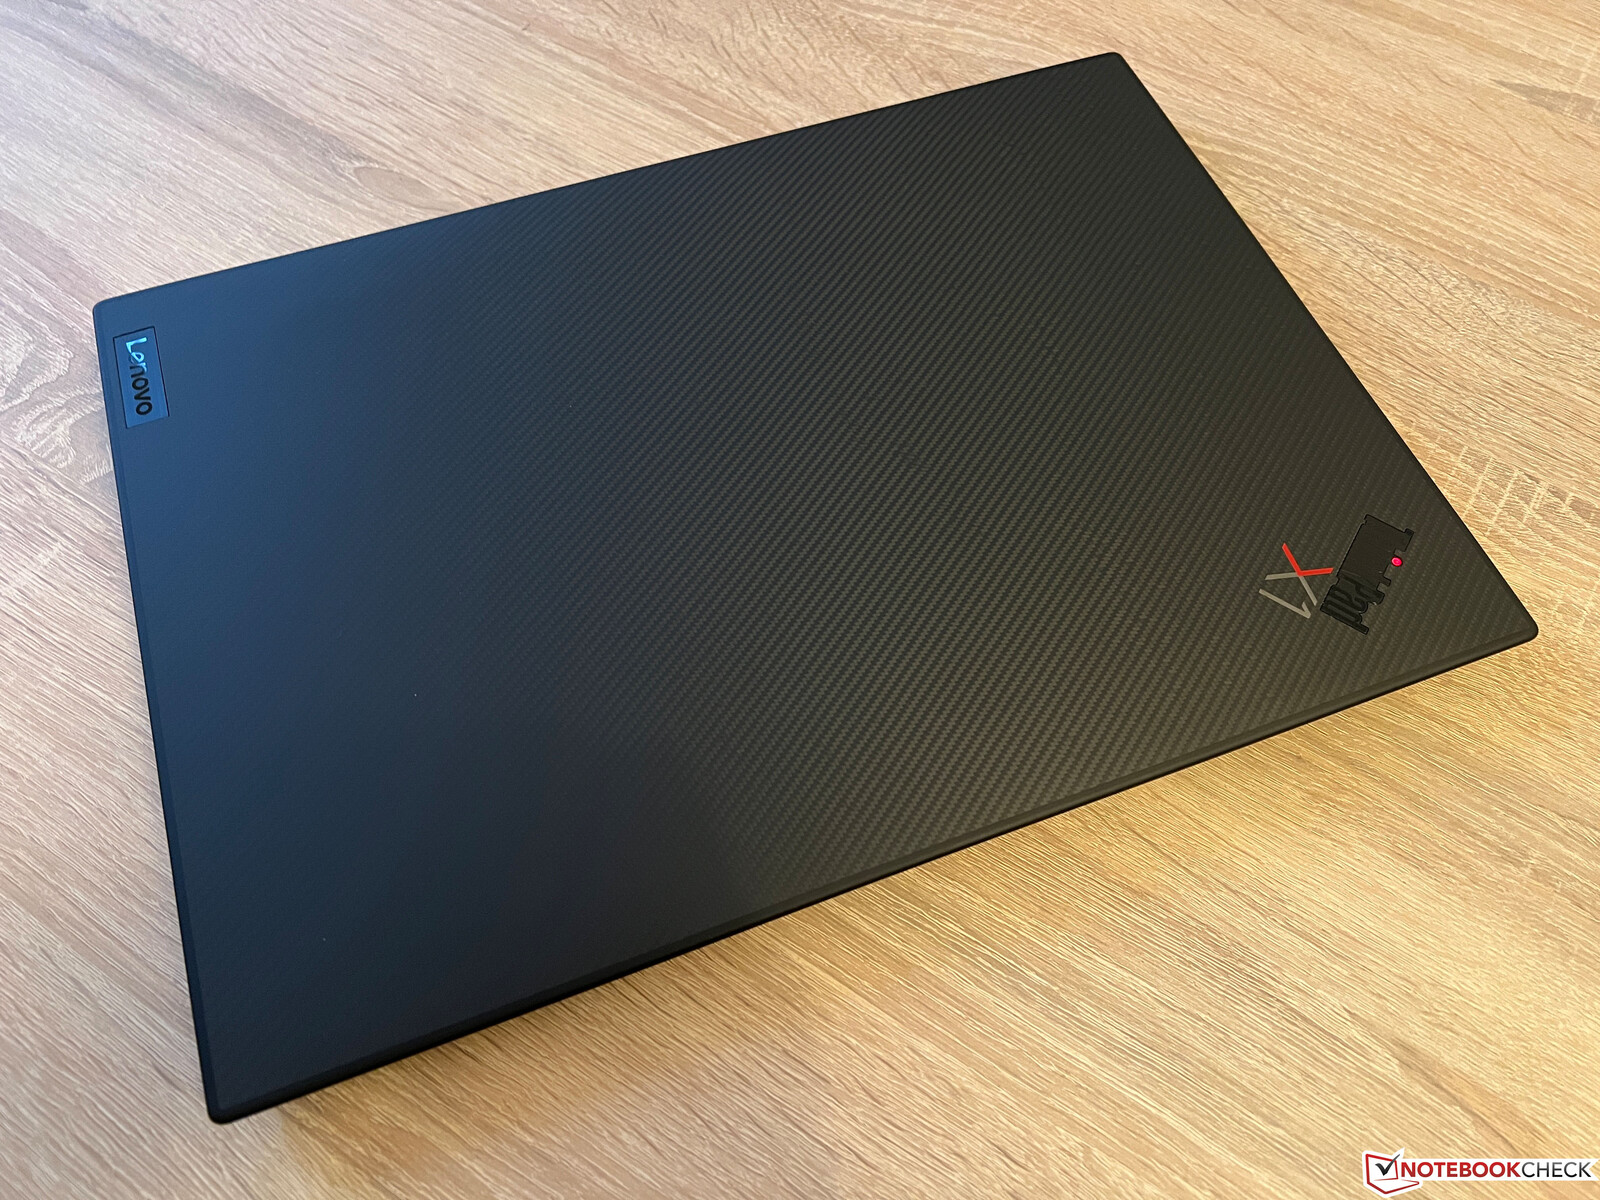
外壳--联想采用碳纤维和镁合金材质
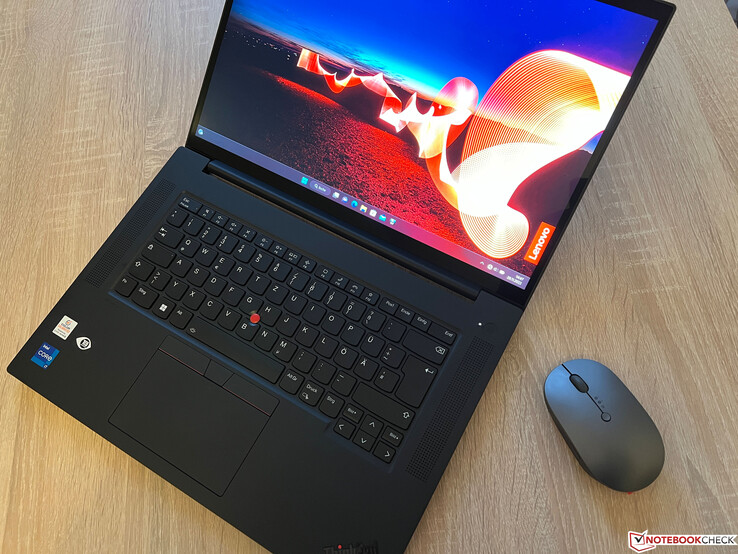
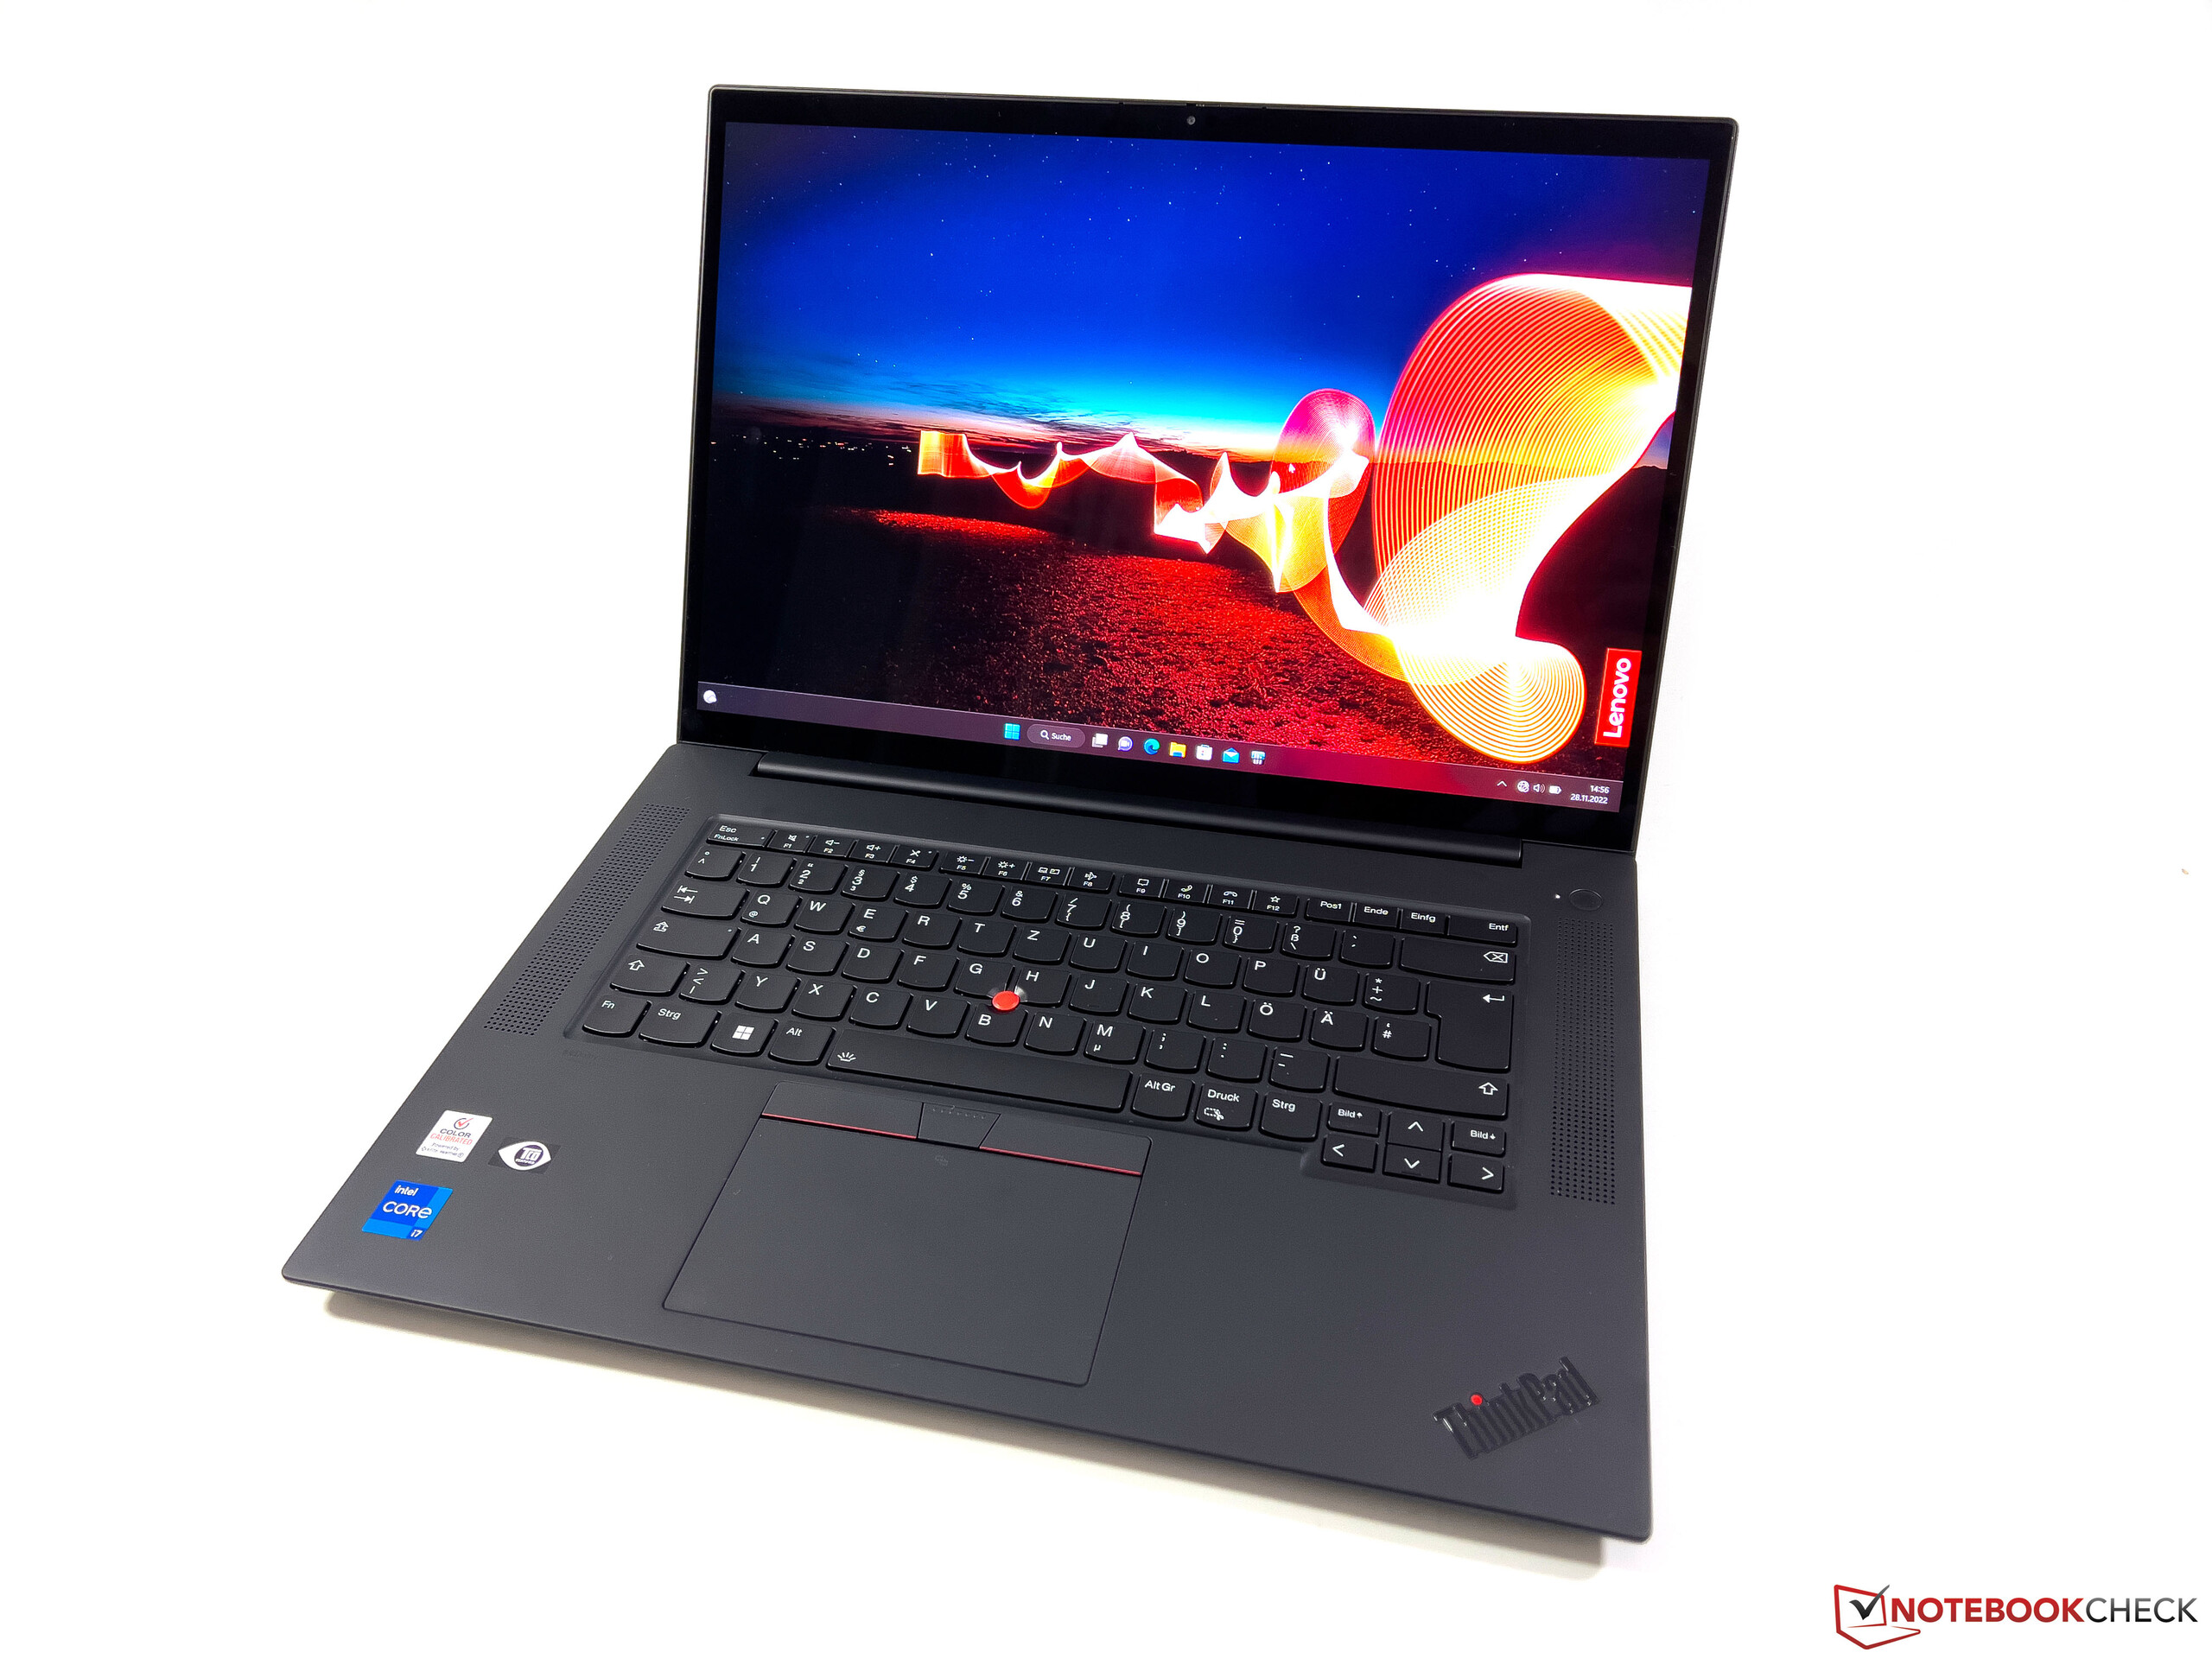
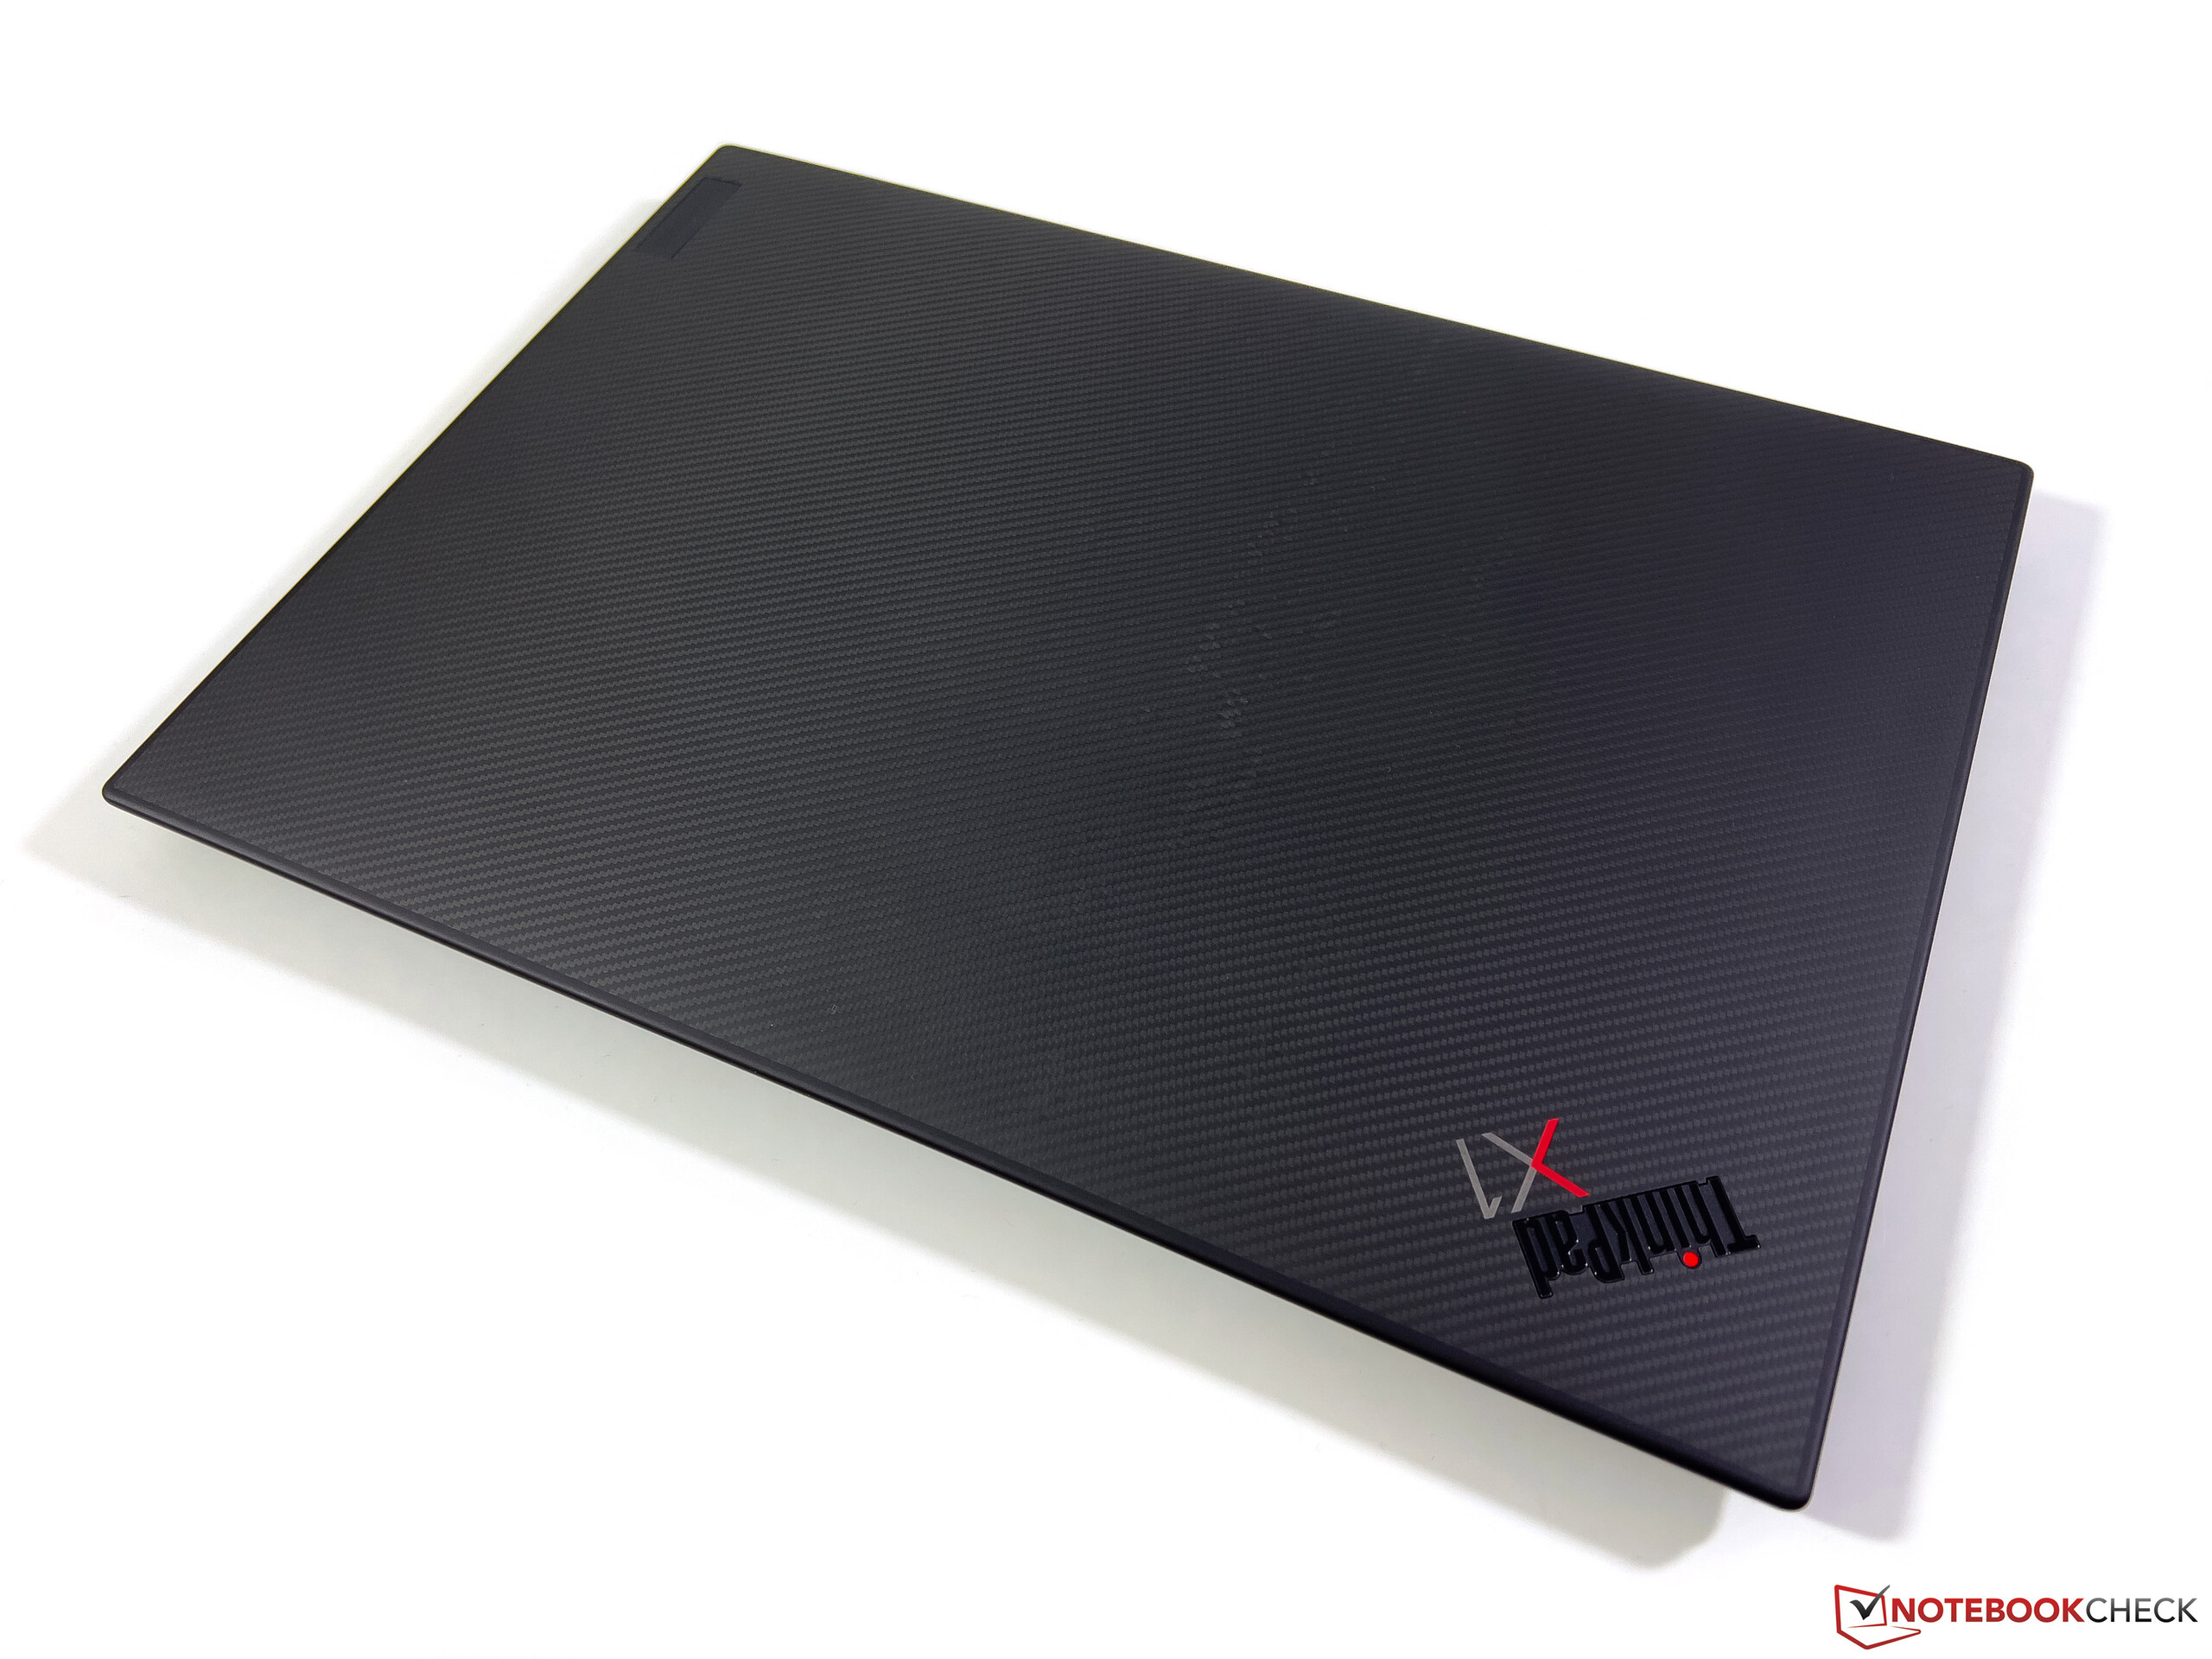
在去年的重大重新设计之后,X1 Extreme G5的外壳保持不变,继续混合使用碳纤维和镁合金。此外,4K机型的盖子也有碳纤维外观,尽管这只是一个印记。否则,黑色的ThinkPad看起来非常矜持,颜色的重点集中在标志以及键盘中间的红色TrackPoint上。
底座和显示器盖子都非常稳定,这意味着只有在中间区域施加很大的压力,键盘才有可能弯曲。显示屏铰链的校准也非常好,因为显示屏盖可以用一只手轻松打开,从而几乎完全避免了任何摇晃动作。最大打开角度为180度。
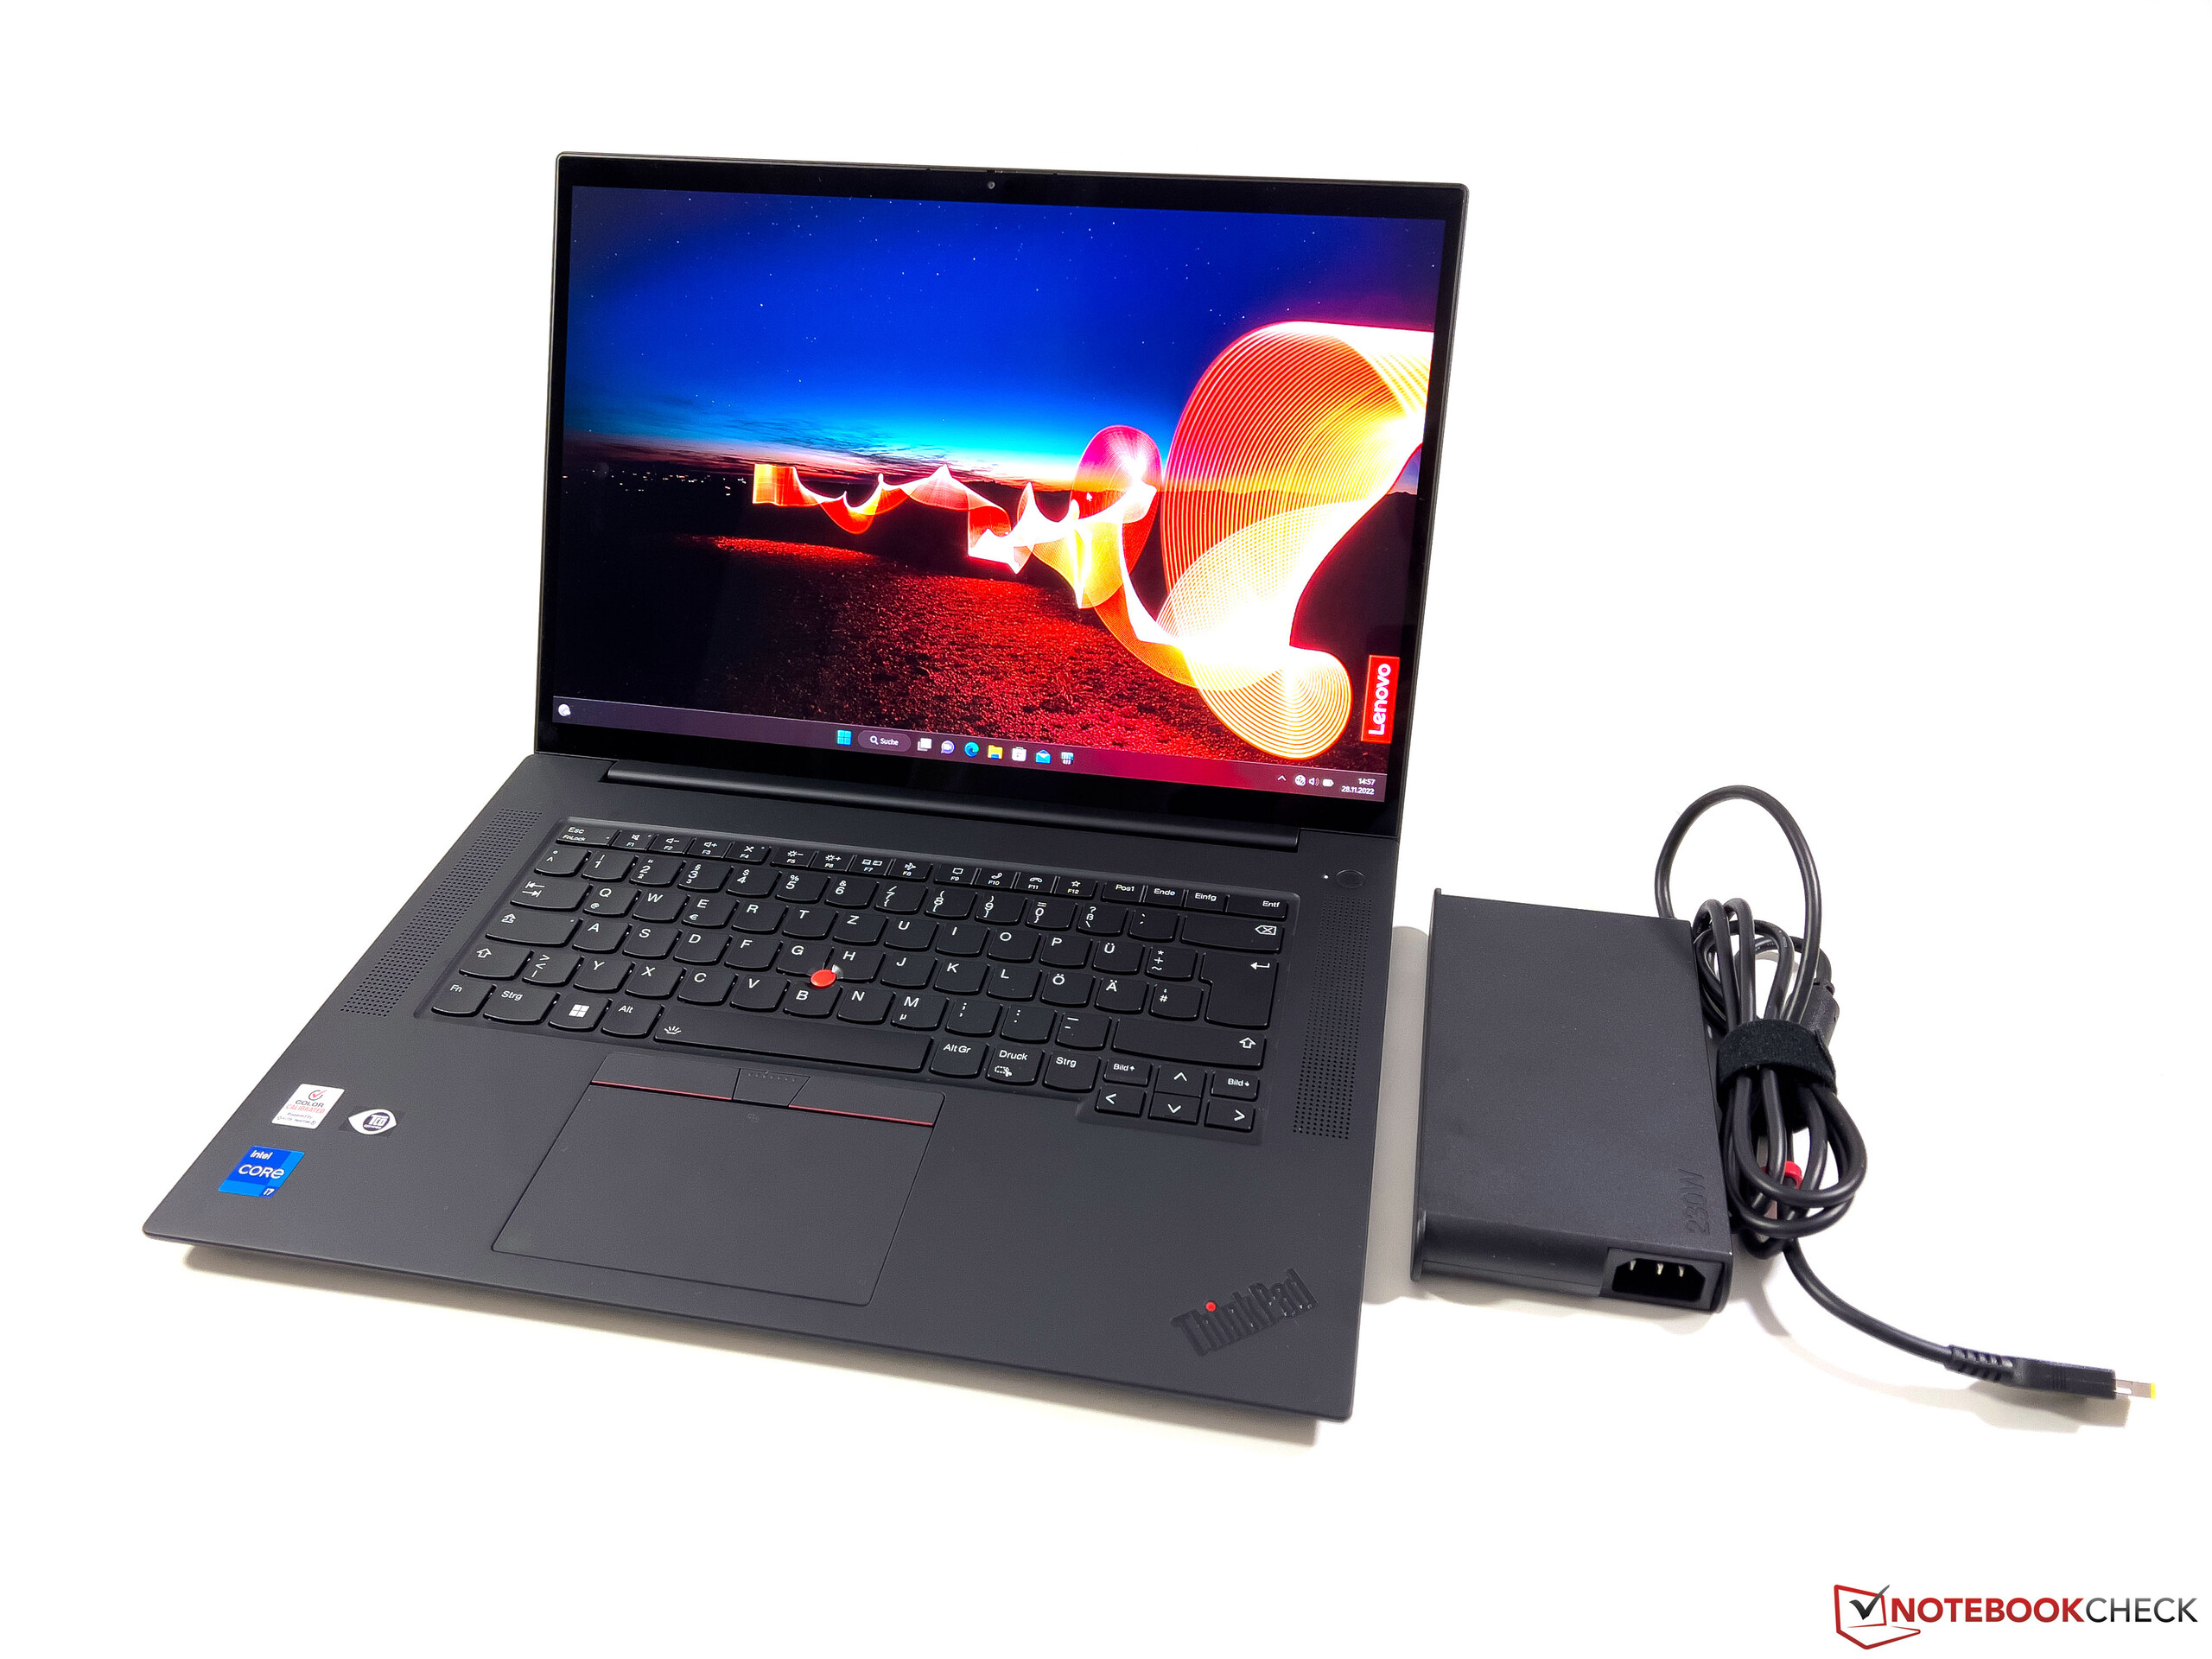
与竞争对手相比,我们的评测机型仅有2.1公斤,处于中间位置,因此15和17英寸的XPS机型不应包括在比较中。在16英寸的类别中,只有申克Vision 16 Pro要轻得多,而且X1 Extreme也有最大的占地面积。在旅途中,必须为电源再增加880克的重量。
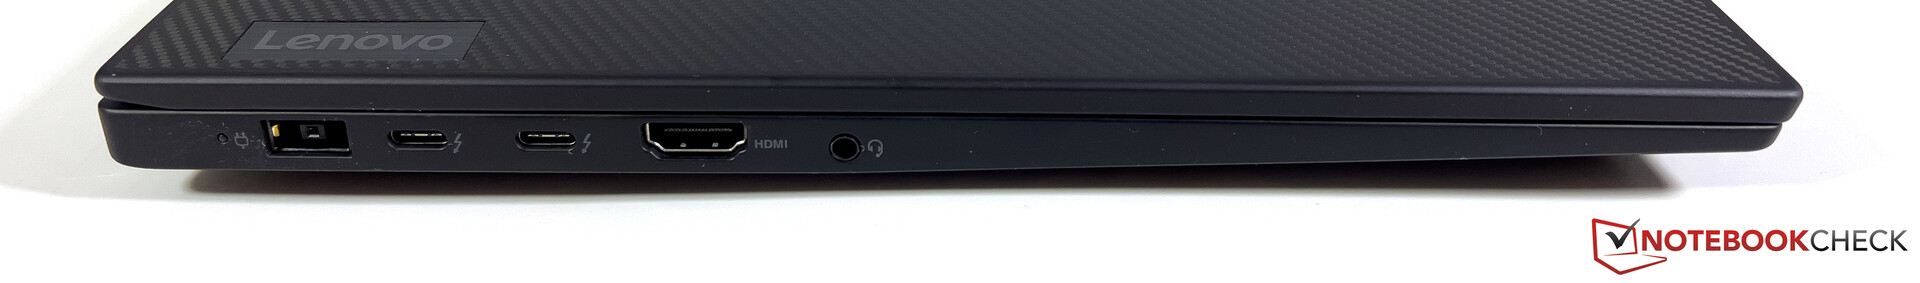
连接性 - X1 Extreme G5,带TB4和Wi-Fi 6E
在连接方面,该设备的两侧与前代产品没有任何变化。除了通过USB-C的Thunderbolt 4之外,还有常规的USB-A端口。在旅途中,X1 Extreme G5可以通过USB-C充电,尽管至少需要一个90瓦的电源。总共可以连接四个显示器(1个内部+3个外部)。
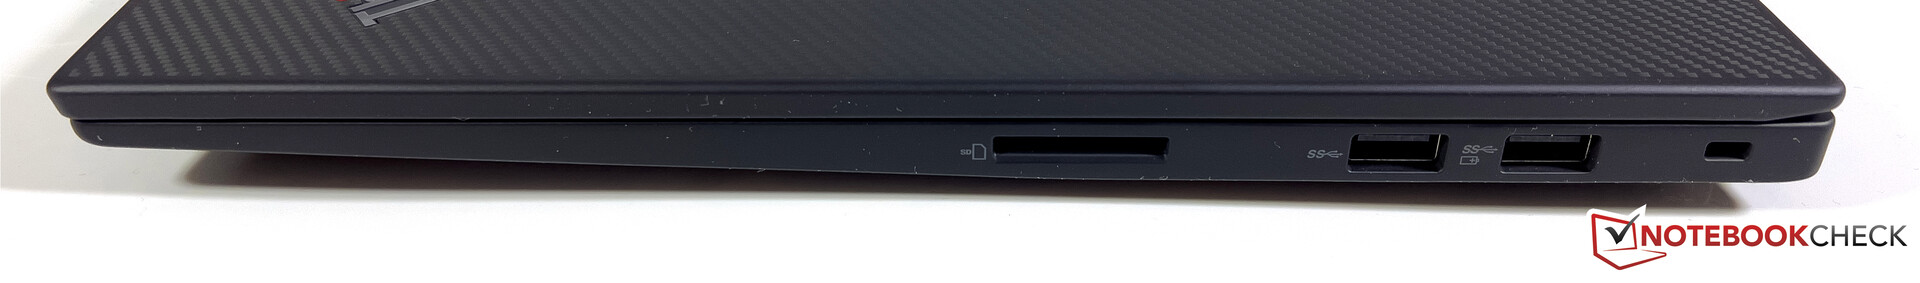
SD卡阅读器
在设备的右侧,SD读卡器继续接受全尺寸的SD卡,但与前者相比,速度有所降低。使用我们目前的(Angelbird AV Pro V60)以及以前的参考卡,只能达到80MB/s。这款X1 Extreme G4能够管理超过170MB/s。
| SD Card Reader | |
| average JPG Copy Test (av. of 3 runs) | |
| Dell XPS 17 9720 RTX 3060 (Toshiba Exceria Pro SDXC 64 GB UHS-II) | |
| Lenovo ThinkPad X1 Extreme G4-20Y5CTO1WW (3050 Ti) (AV Pro V60) | |
| Dell XPS 15 9520 RTX 3050 Ti (Toshiba Exceria Pro SDXC 64 GB UHS-II) | |
| Average of class Multimedia (23 - 531, n=36, last 2 years) | |
| Apple MacBook Pro 16 2021 M1 Pro (Angelbird AV Pro V60) | |
| Schenker Vision 16 Pro RTX 3070 Ti (AV Pro V60) | |
| Lenovo ThinkPad X1 Extreme G5-21DE003RGE (AV Pro V60) | |
| HP Envy 16 h0112nr (AV Pro SD microSD 128 GB V60) | |
| maximum AS SSD Seq Read Test (1GB) | |
| Dell XPS 17 9720 RTX 3060 (Toshiba Exceria Pro SDXC 64 GB UHS-II) | |
| Average of class Multimedia (37.3 - 1455, n=35, last 2 years) | |
| Dell XPS 15 9520 RTX 3050 Ti (Toshiba Exceria Pro SDXC 64 GB UHS-II) | |
| Lenovo ThinkPad X1 Extreme G4-20Y5CTO1WW (3050 Ti) (AV Pro V60) | |
| HP Envy 16 h0112nr (AV Pro SD microSD 128 GB V60) | |
| Schenker Vision 16 Pro RTX 3070 Ti (AV Pro V60) | |
| Lenovo ThinkPad X1 Extreme G5-21DE003RGE (AV Pro V60) | |
沟通
联想为X1 Extreme G5配备了英特尔的AX211模块,支持当前的Wi-Fi-6E标准。为了能够连接到6GHz网络,Windows 11是必要的。更新后,我们能够连接到我们的华硕参考路由器的6GHz网络。传输速率非常高且稳定,还支持蓝牙5.2。有线网络只能通过Thunderbolt/USB-C的适当适配器来使用。
配备RTX 3050 Ti和传统冷却系统的性能较差的X1 Extreme G5是可选的,也可使用5G,但配置器中的附加费用高达330美元。此外,没有准备相应的天线,只要在工厂不配置WWAN,也没有Nano SIM卡插槽。
| Networking | |
| Lenovo ThinkPad X1 Extreme G5-21DE003RGE | |
| iperf3 receive AXE11000 6GHz | |
| iperf3 transmit AXE11000 6GHz | |
| HP Envy 16 h0112nr | |
| iperf3 receive AXE11000 6GHz | |
| iperf3 transmit AXE11000 6GHz | |
| Schenker Vision 16 Pro RTX 3070 Ti | |
| iperf3 receive AXE11000 | |
| iperf3 transmit AXE11000 | |
| Dell XPS 15 9520 RTX 3050 Ti | |
| iperf3 receive AXE11000 | |
| iperf3 transmit AXE11000 | |
| Apple MacBook Pro 16 2021 M1 Pro | |
| iperf3 transmit AX12 | |
| iperf3 receive AX12 | |
| iperf3 receive AXE11000 | |
| iperf3 transmit AXE11000 | |
| Dell XPS 17 9720 RTX 3060 | |
| iperf3 receive AXE11000 | |
| iperf3 transmit AXE11000 | |
网络摄像头
关于1080p网络摄像头及其机械隐私快门没有任何变化。其质量略好于旧的720p模块,但没有真正产生令人信服的结果--即使在有利的照明条件下。一个额外的红外模块在手,用于人脸识别。


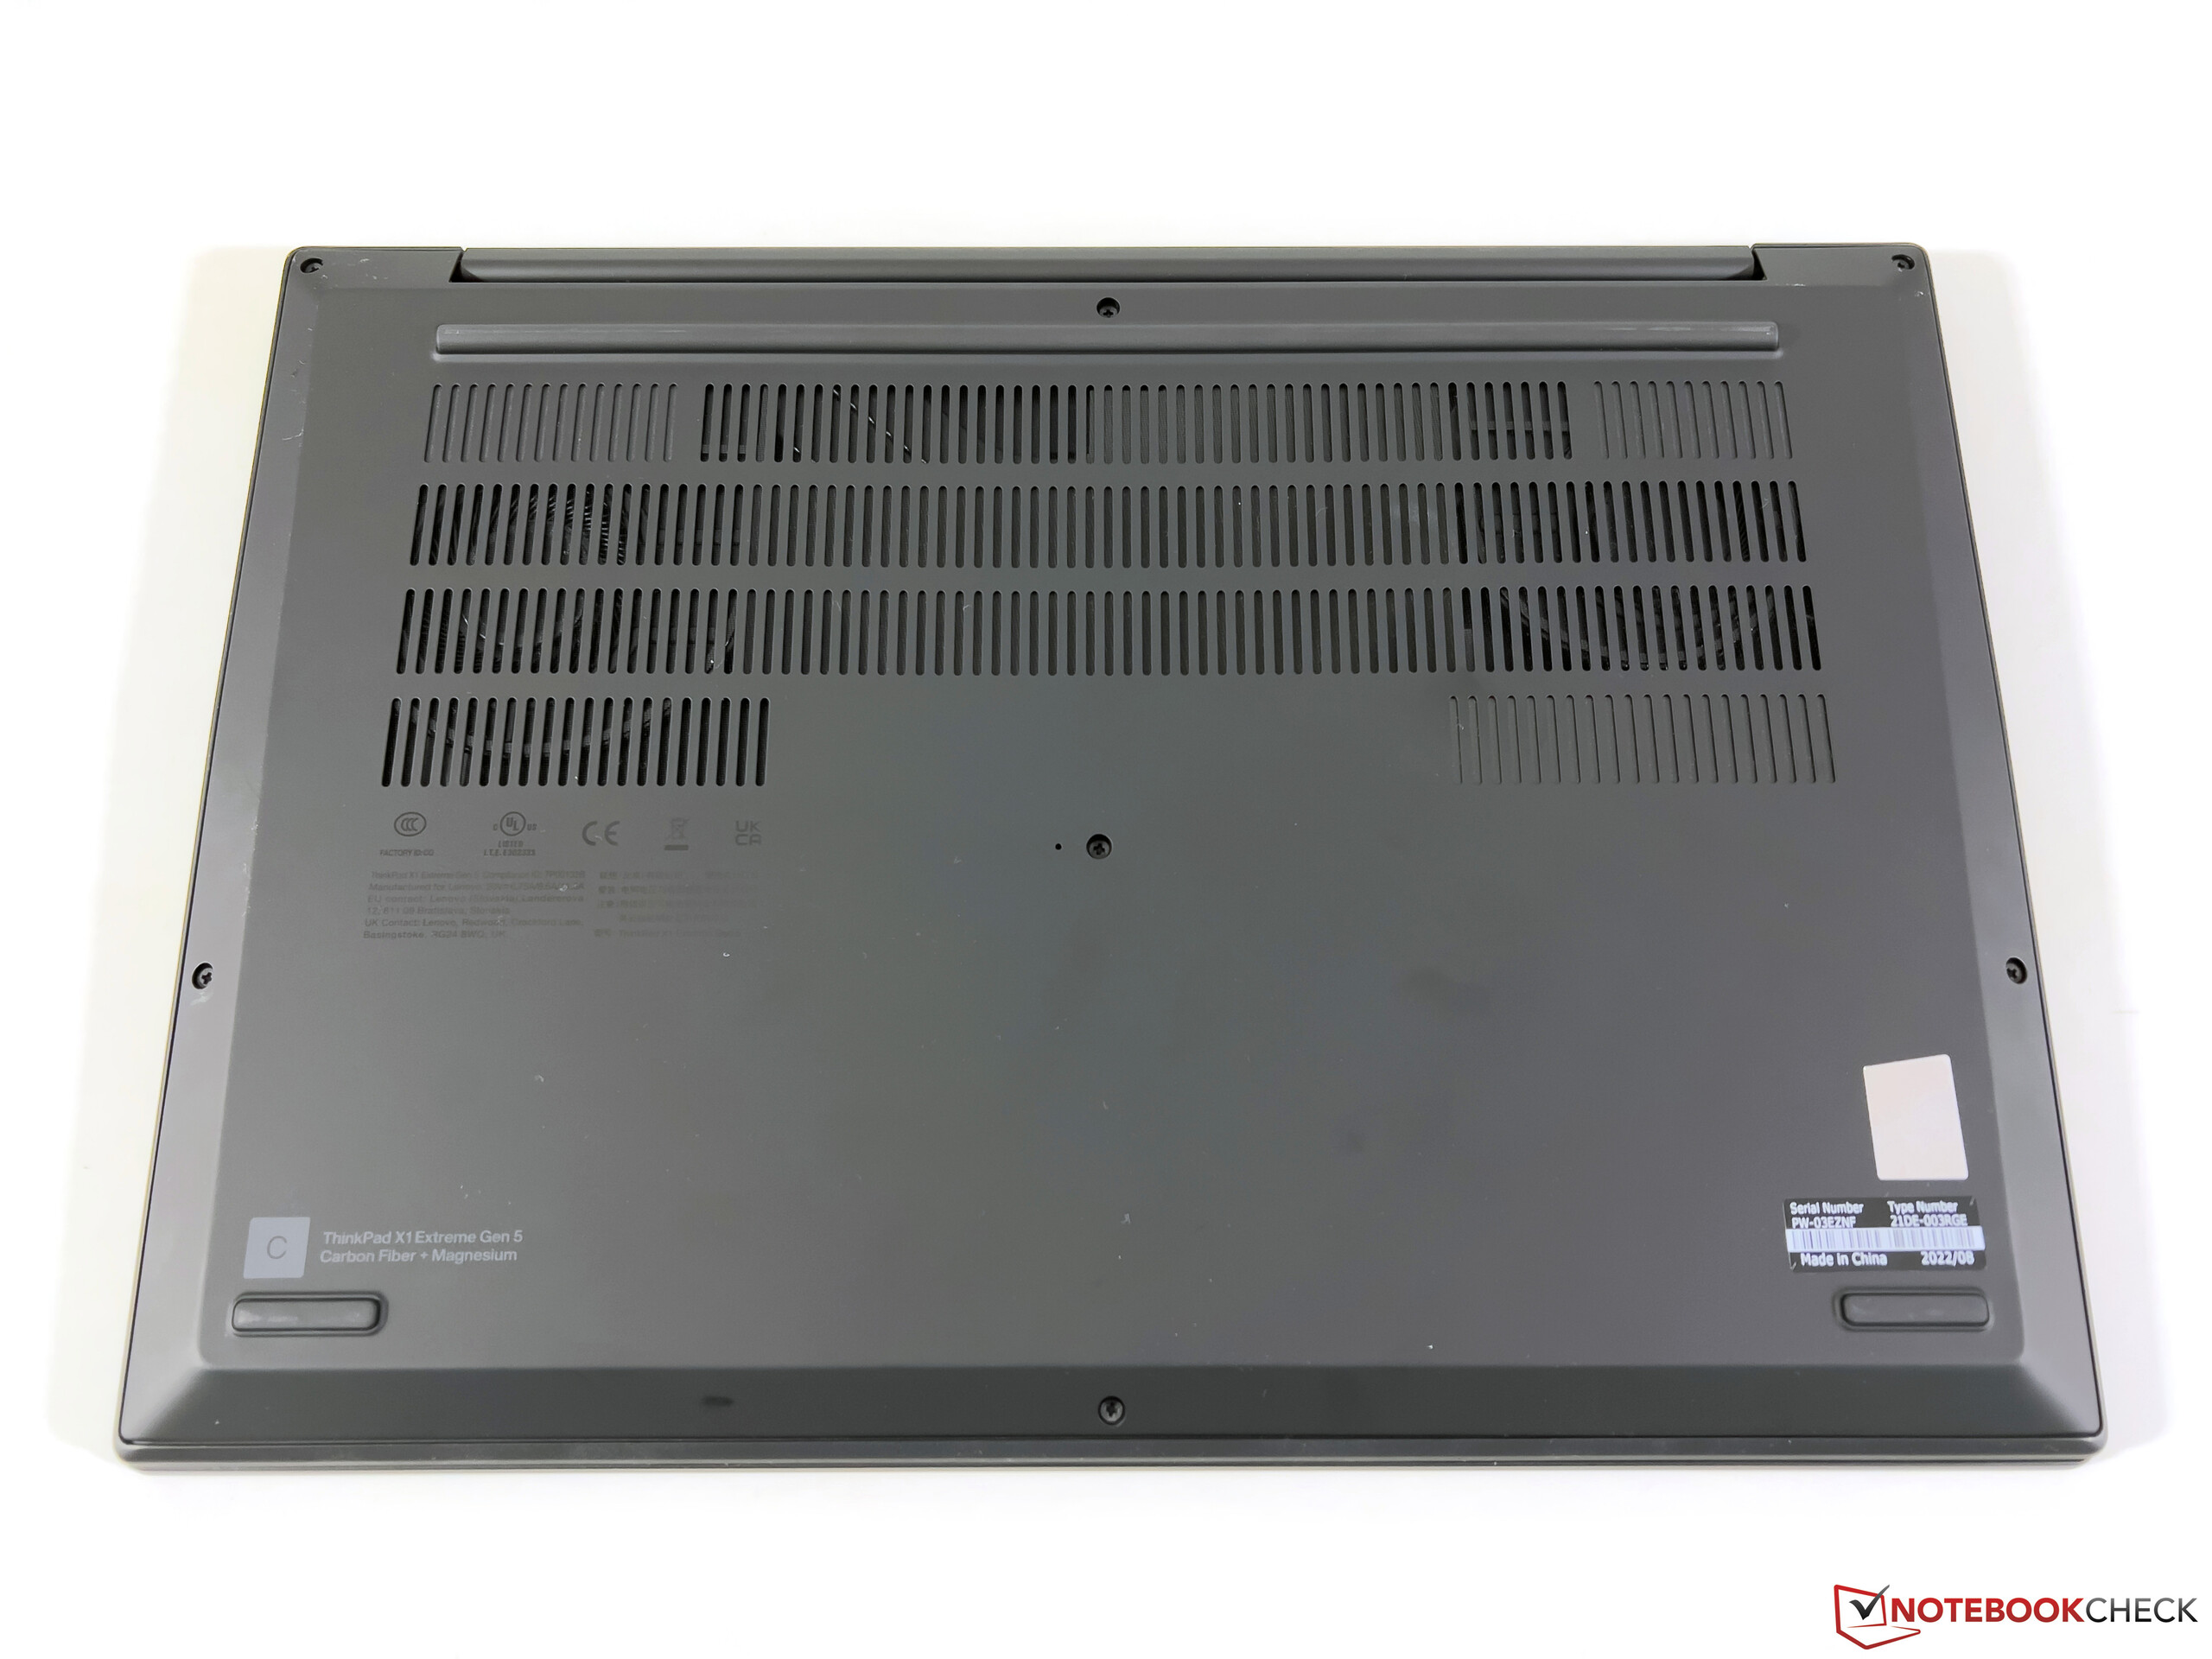
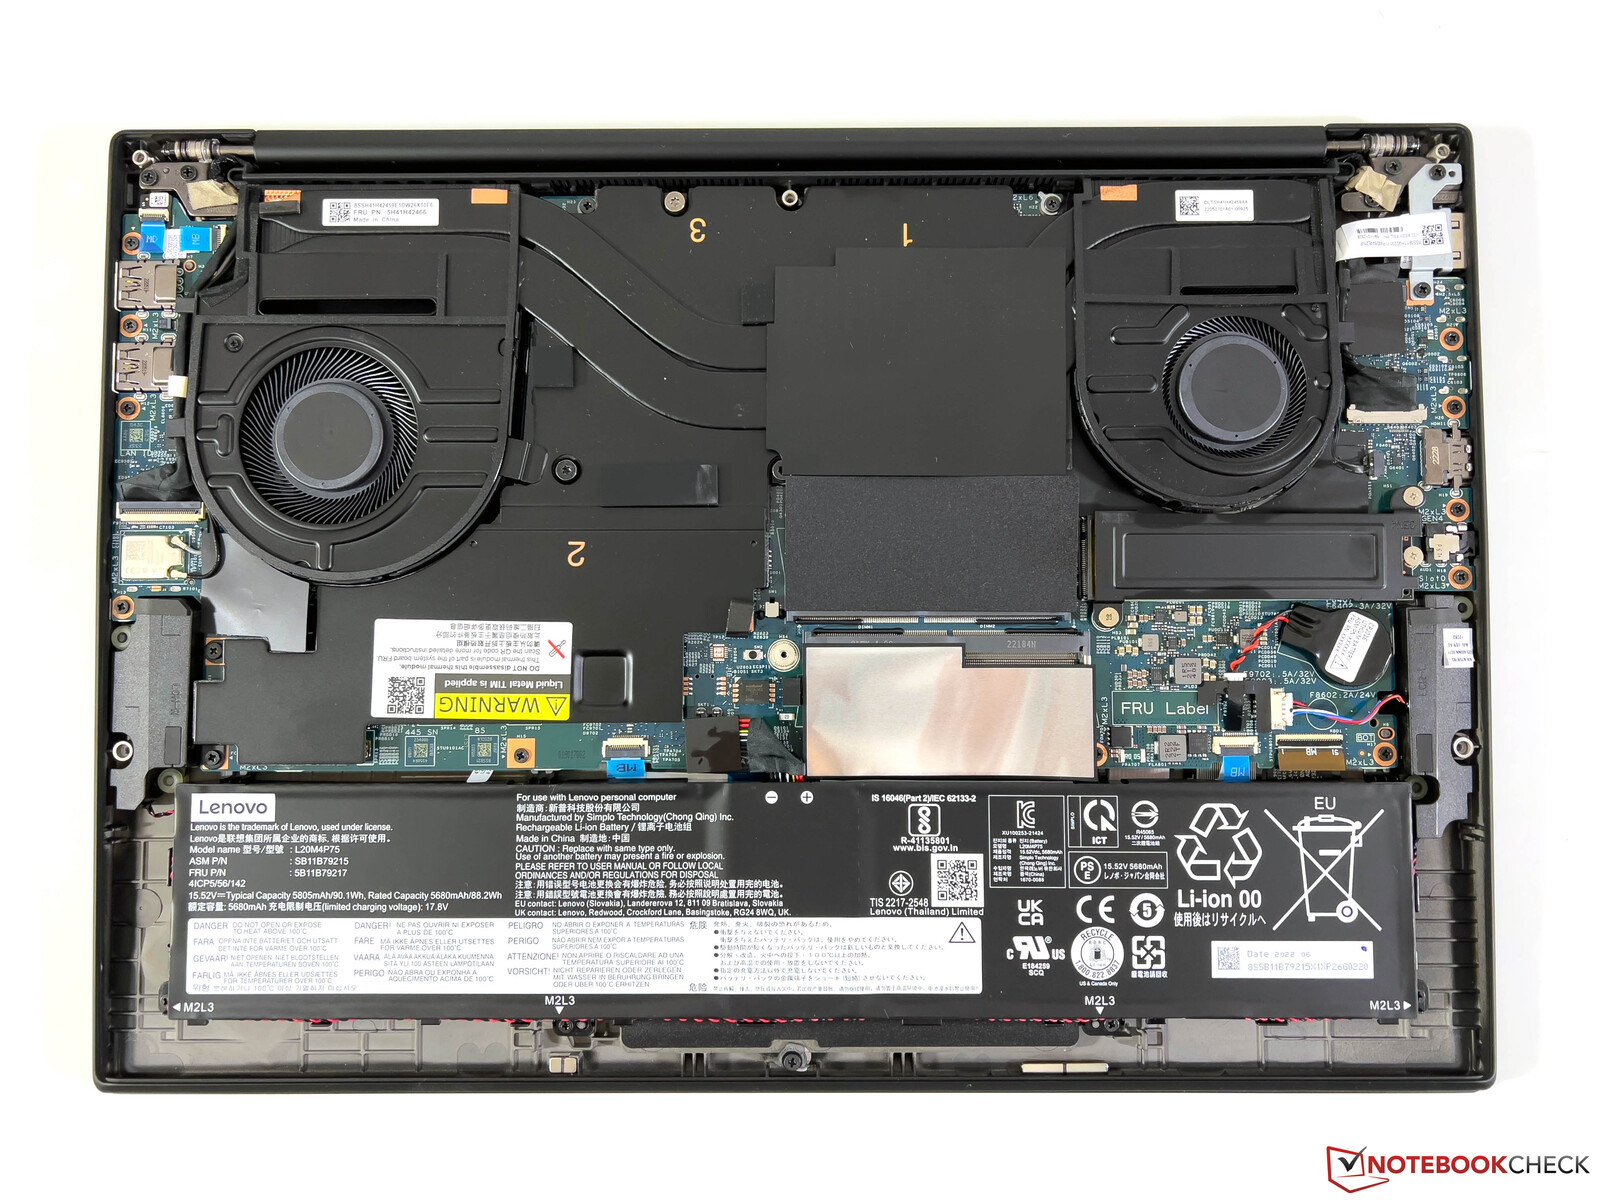
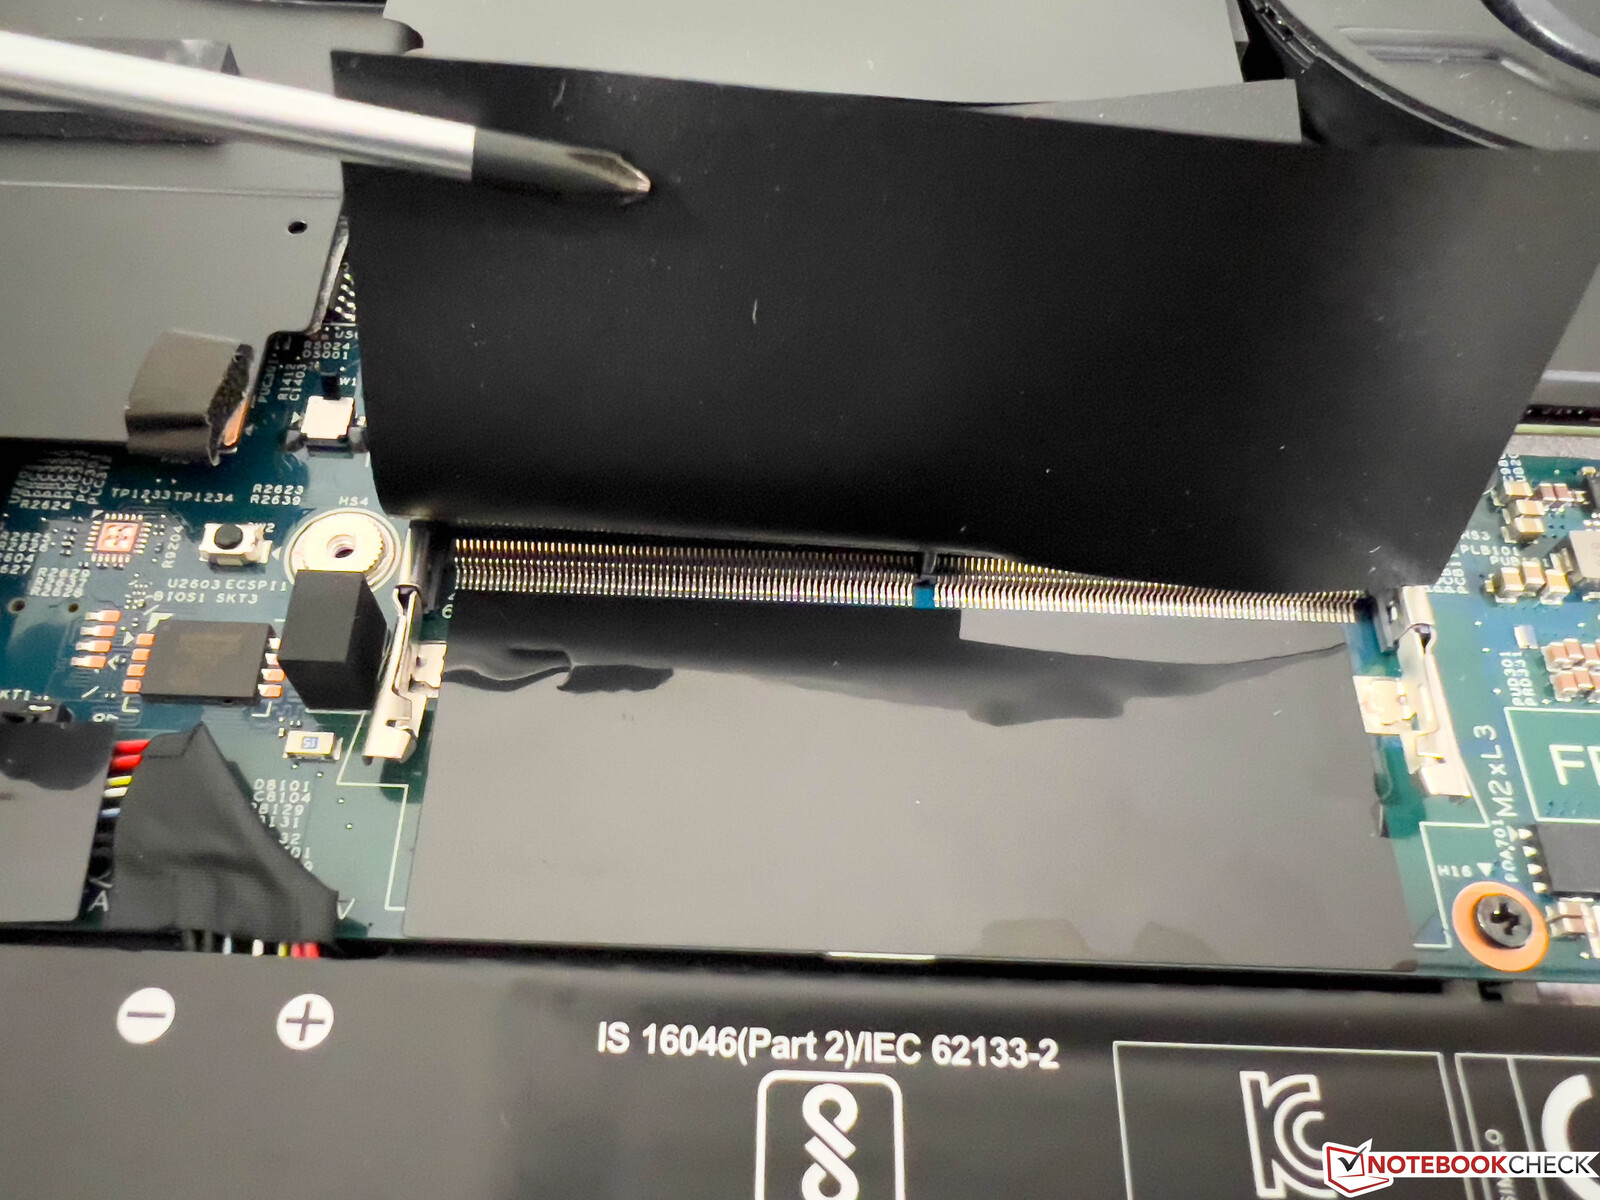
维护
底盖只用六颗普通的十字头螺钉固定(注意:只需松开,不要完全拧开),可以非常容易地取下。在里面你可以接触到两个风扇、M.2 2280固态硬盘和两个内存插槽。
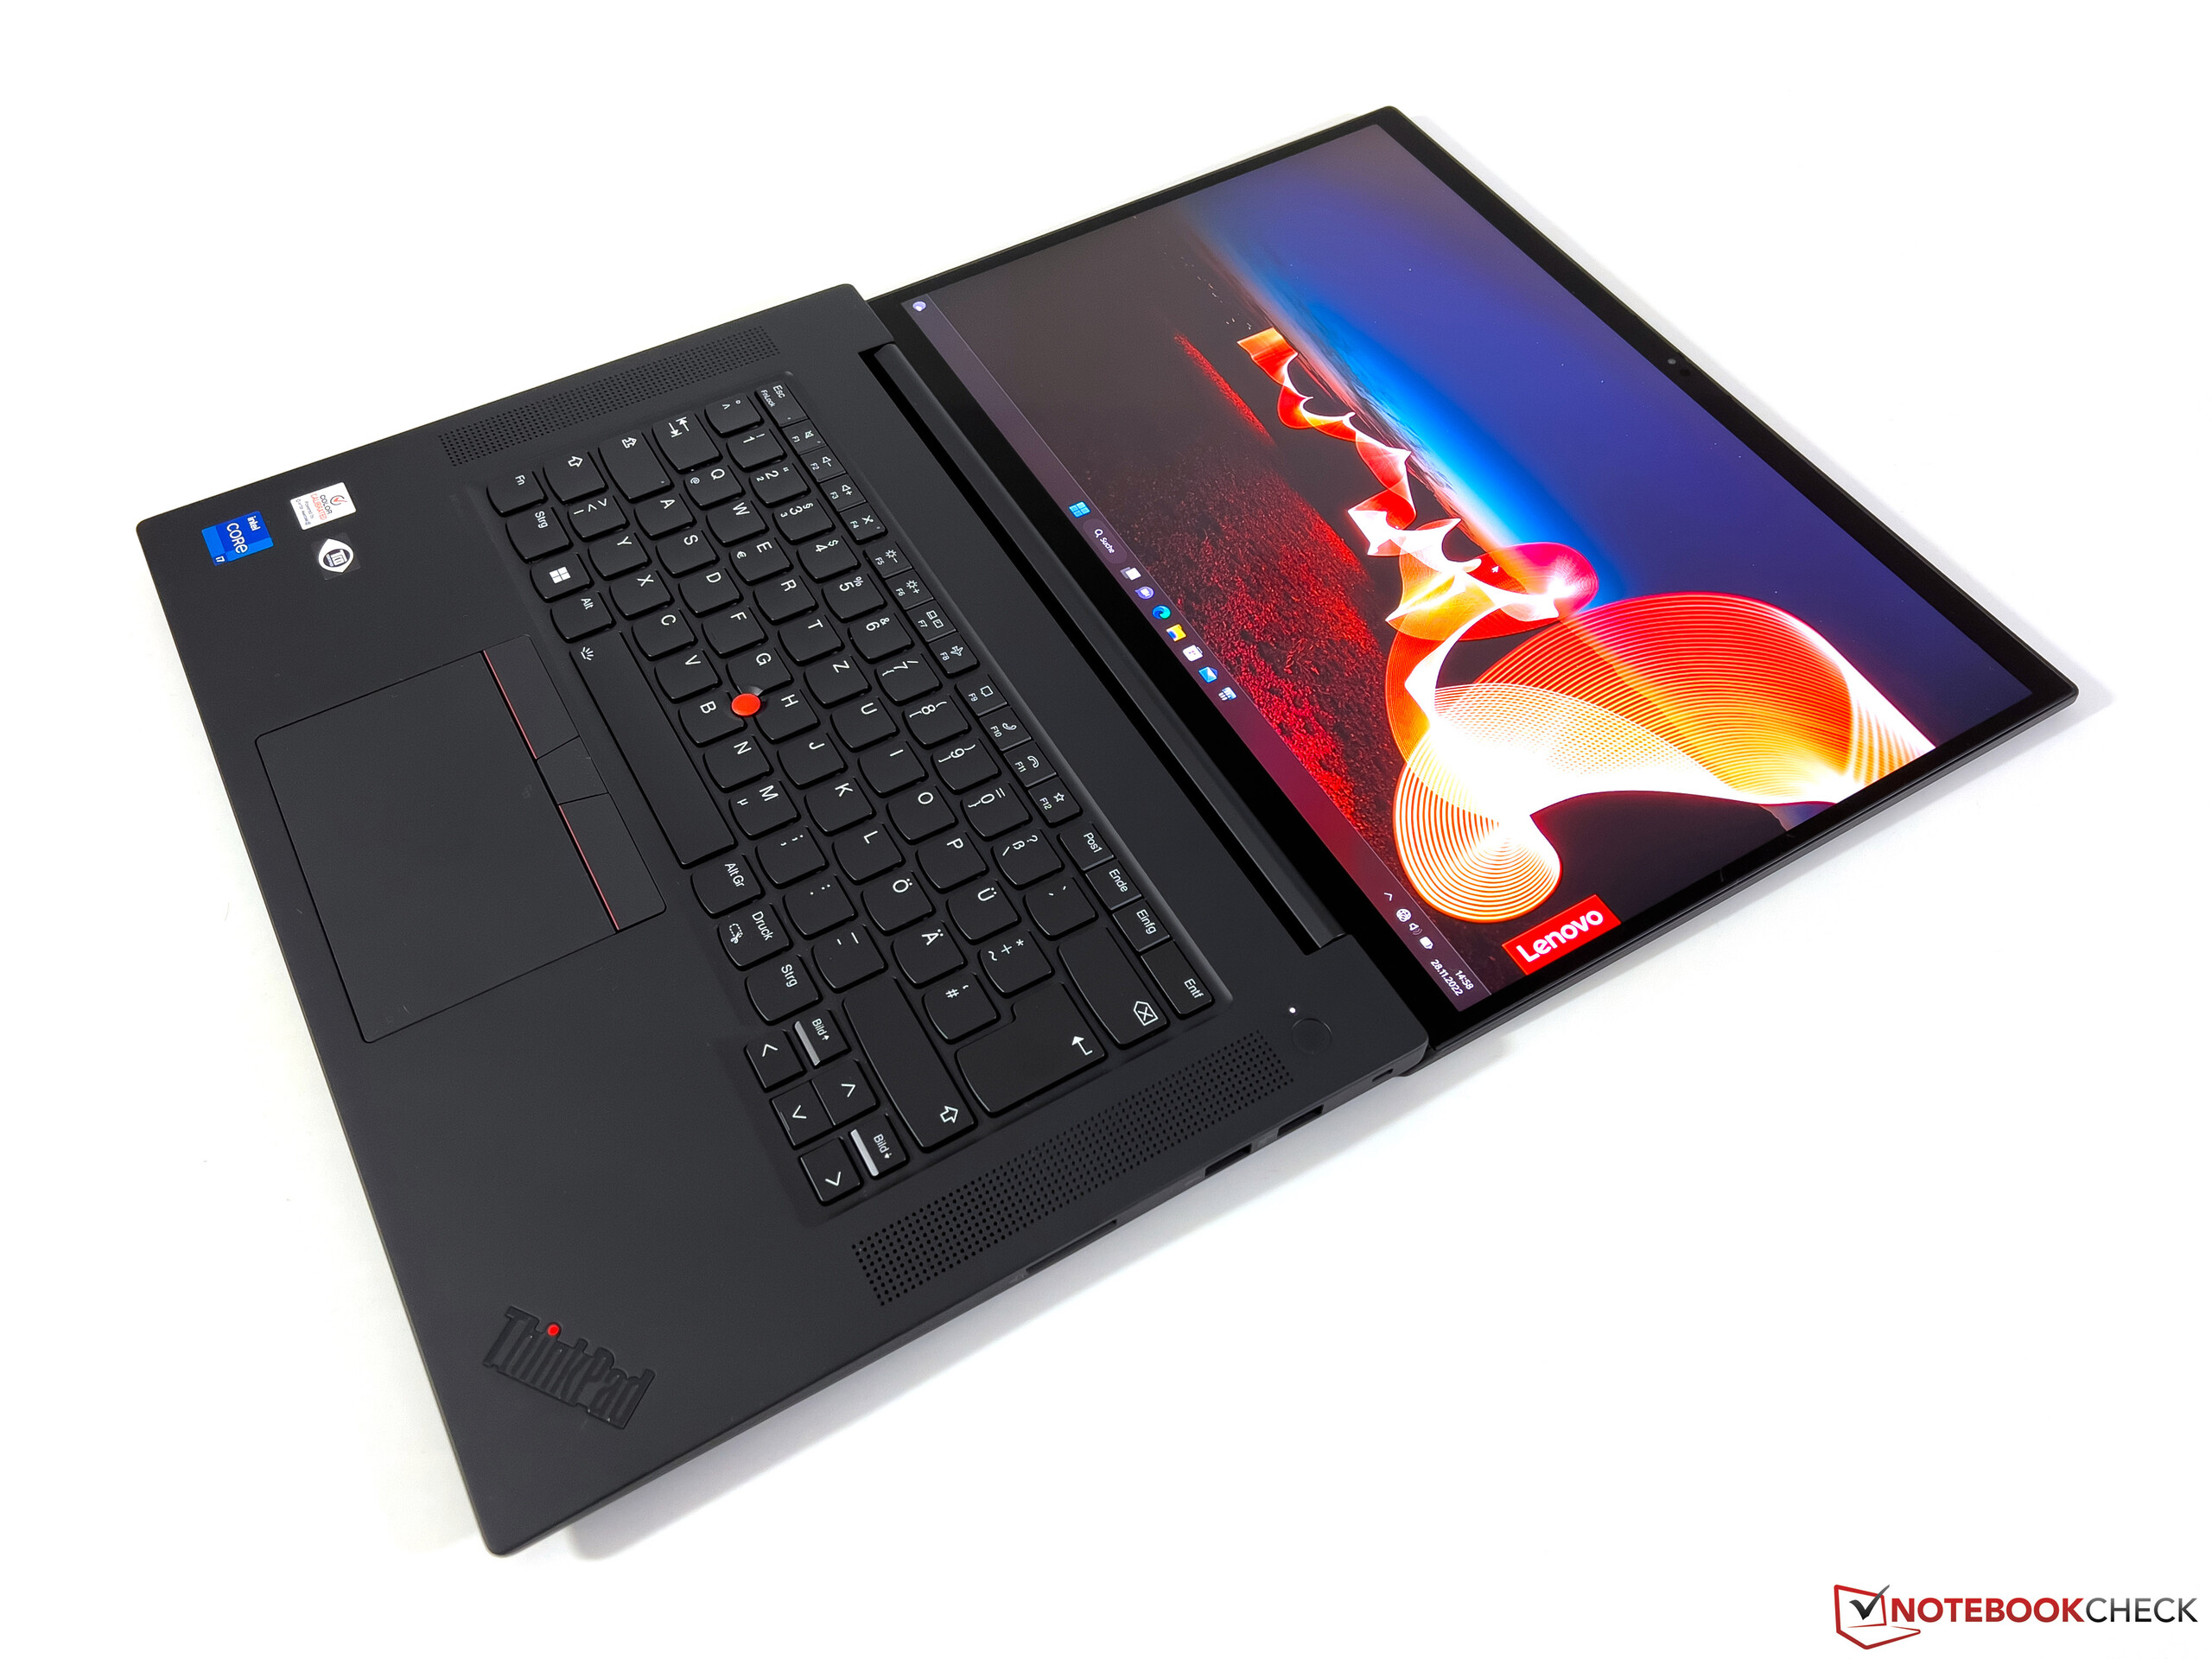
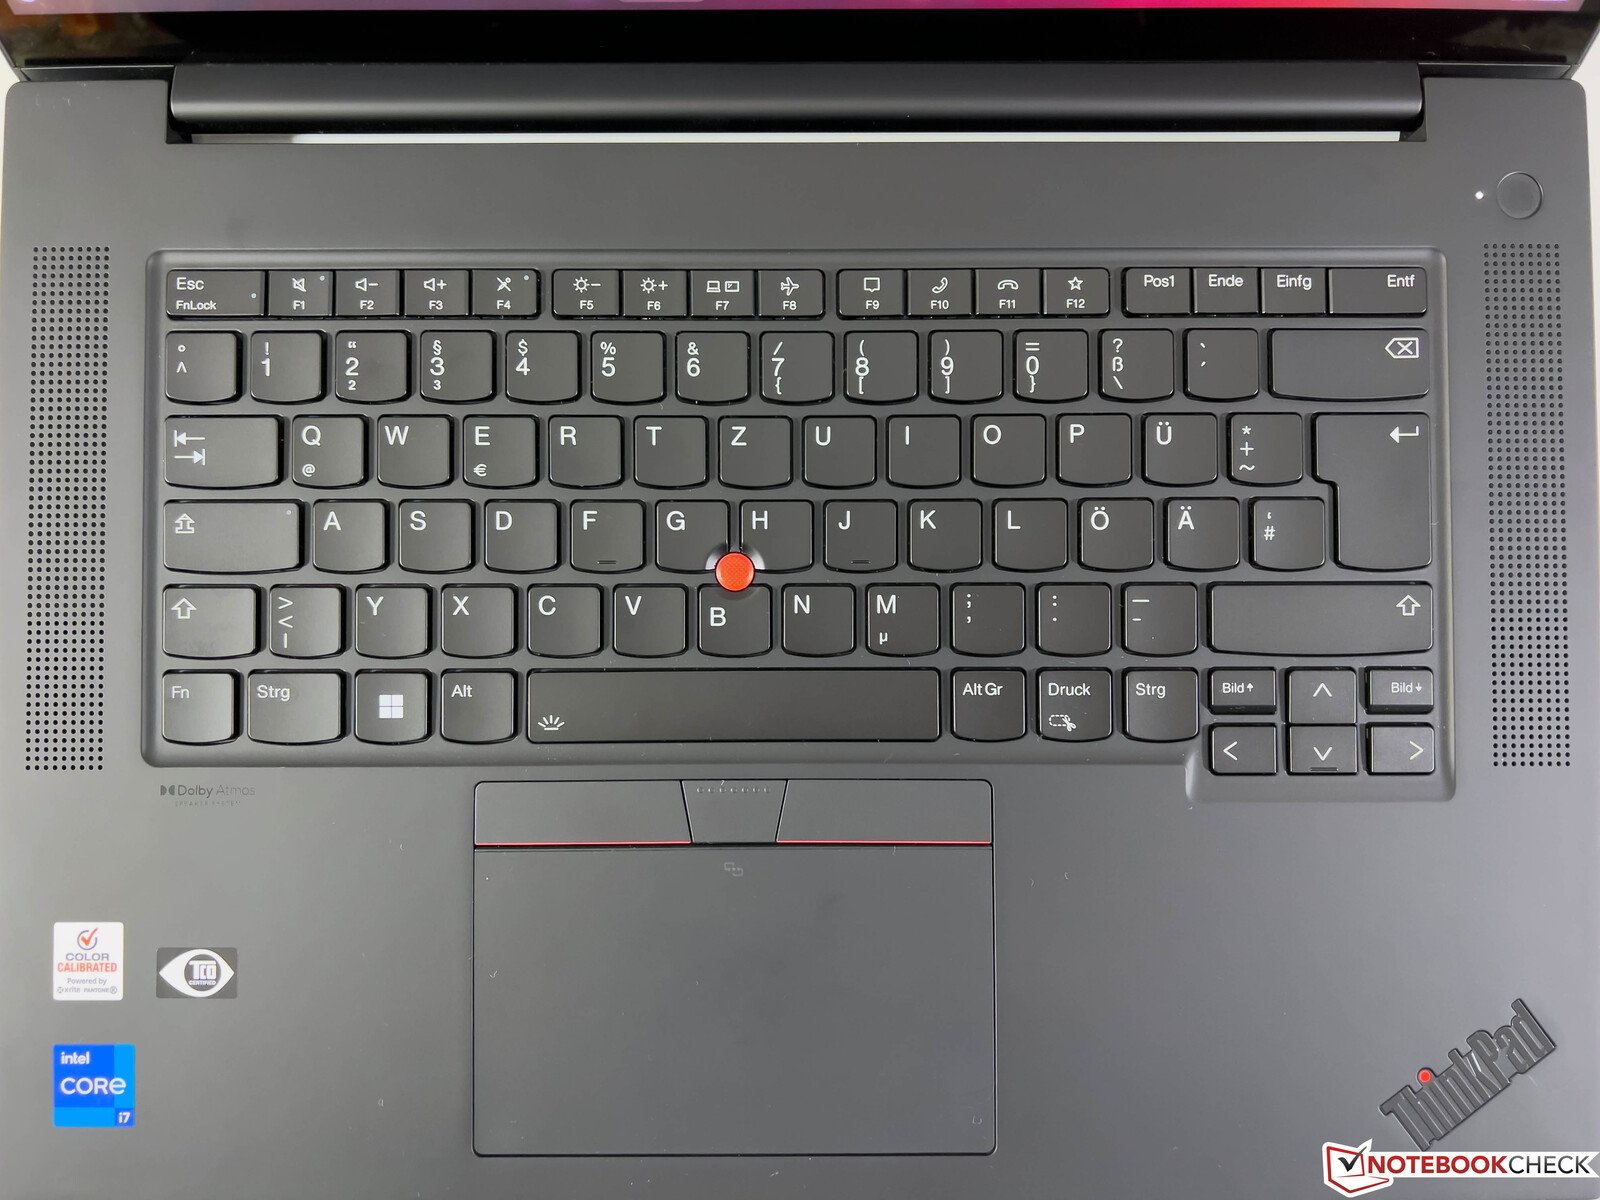
输入设备 - 旗舰型ThinkPad,按键行程1.5毫米
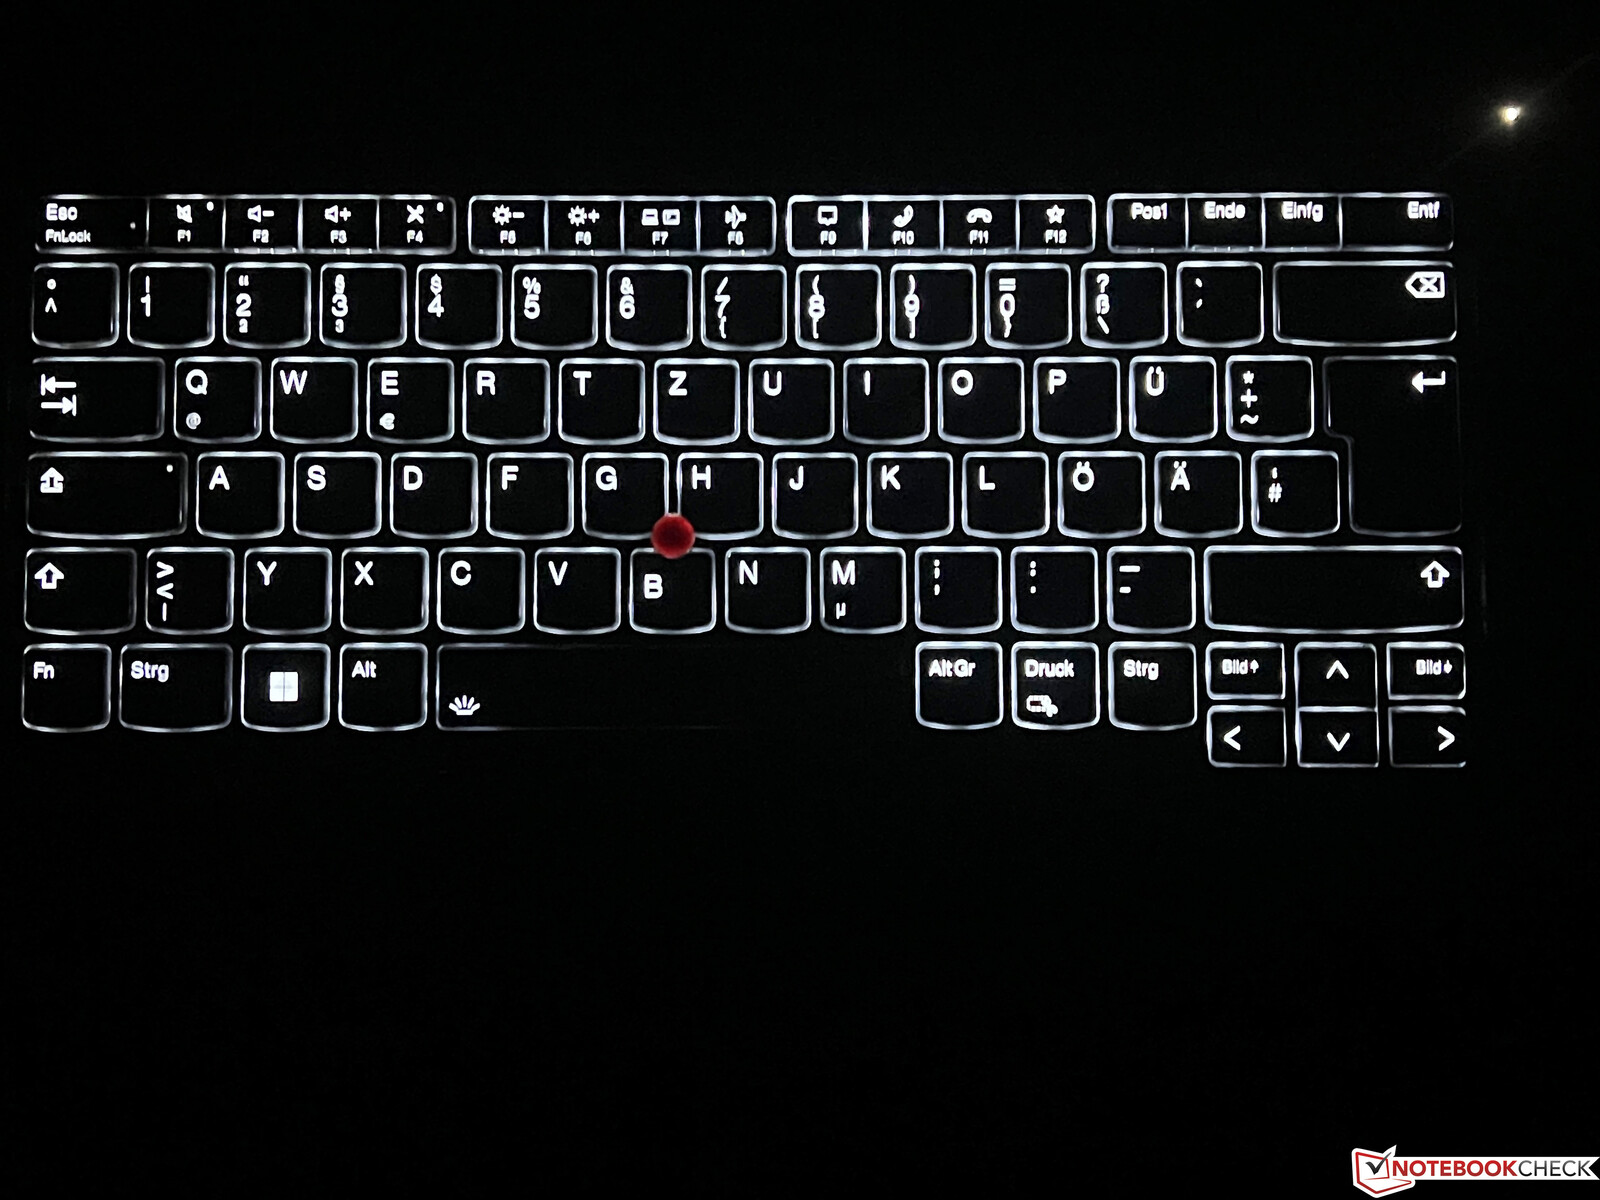
在去年的X1 Extreme G4中,联想改用了键程较短的键盘,因此与旧型号(1.8毫米键程)相比,质量明显下降。目前的键盘并不差,但让我们不明白联想为什么选择在X1 Extreme G5这样大的设备上缩短键程。唯一的ThinkPad键盘优势现在没有了。像往常一样,键盘有白色的两级背光,指纹扫描仪被集成在键盘上方右侧的电源按钮中。
触控板的触感非常光滑,提供了良好的机械性能,有安静、高质量的点击声。此外,还有一个带有专用键的TrackPoint,可以用来控制指针。扁平的按键提供了一个良好的、安静的响应,具有直观的控制作用。在此基础上,还提供了一个电容式触摸屏,也支持手写笔输入(与可选的联想主动笔2和联想笔Pro兼容)。
显示屏 - X1 Extreme仍然配备了AdobeRGB


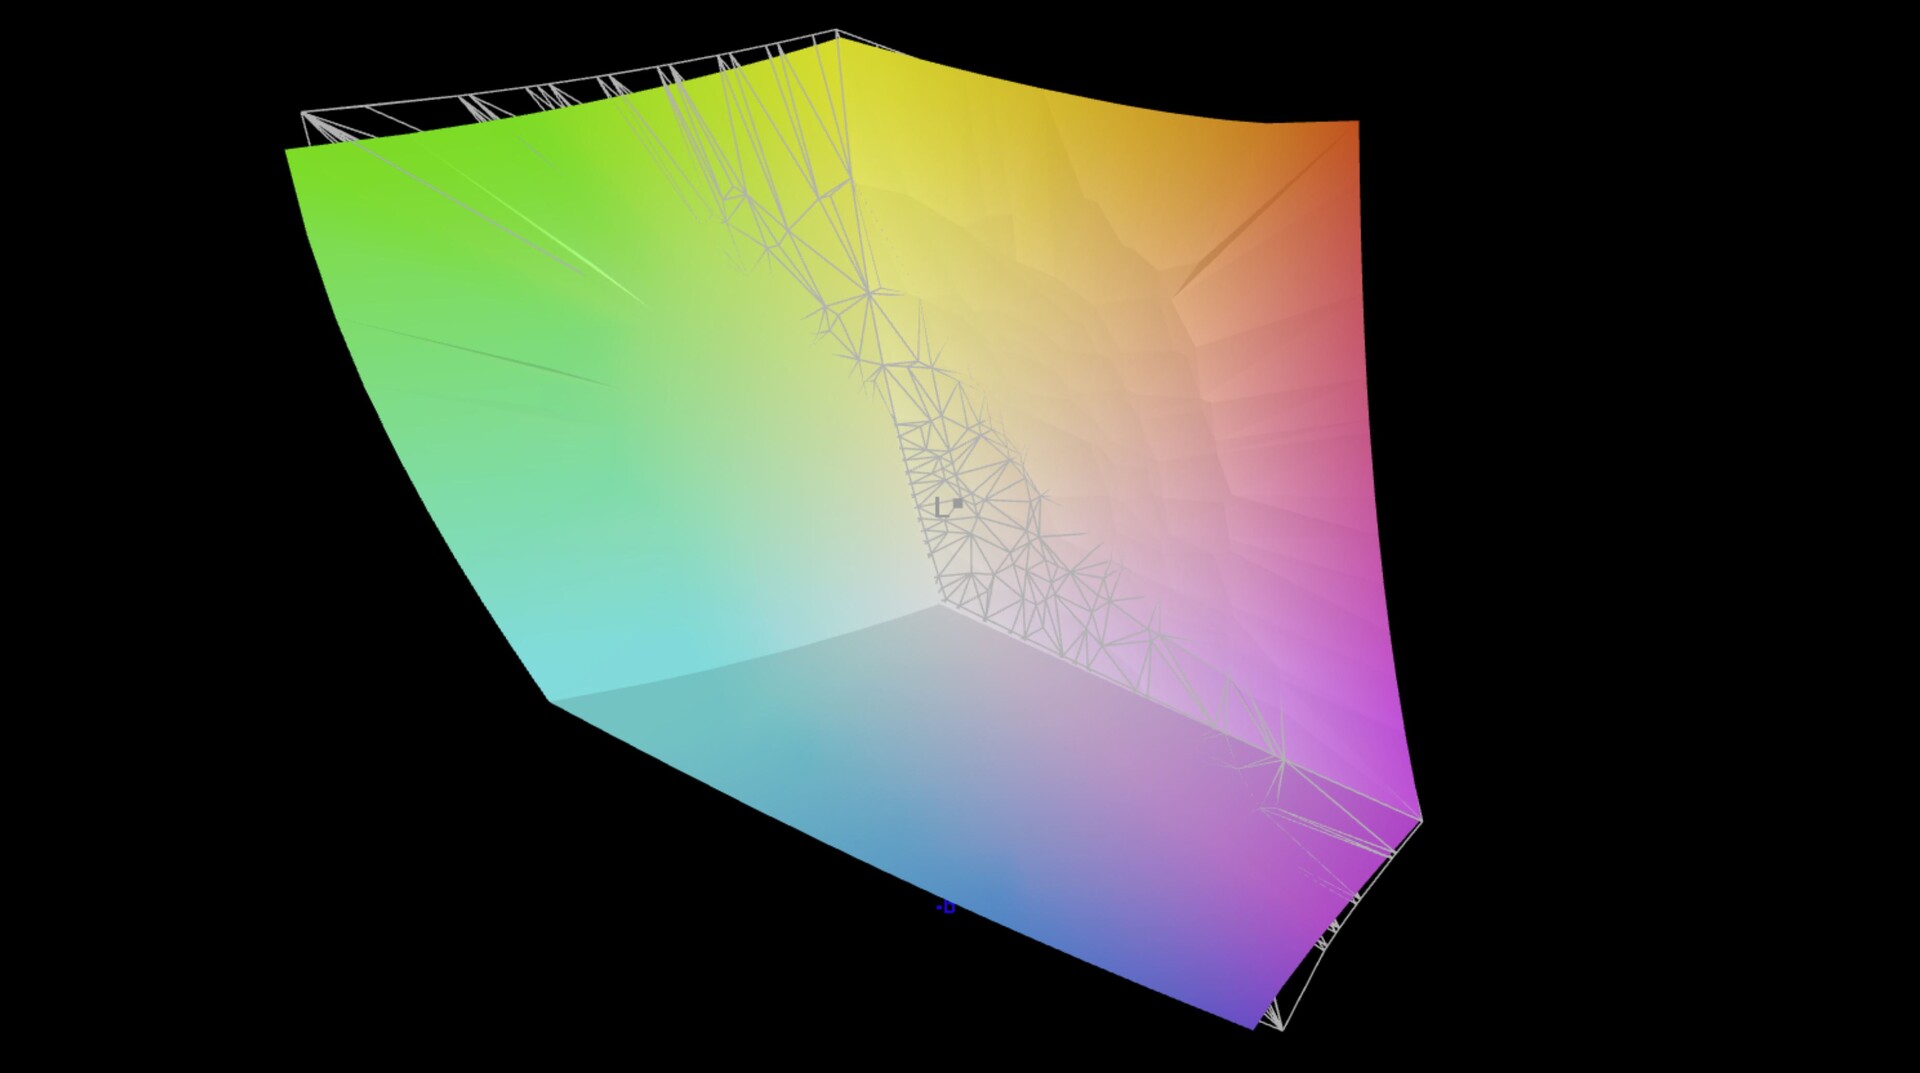
联想是少数仍然提供AdobeRGB显示屏的制造商之一。16:10格式(3840 x 2400像素)的4K触摸屏与上一代产品相同。这一代的一个新特点是哑光、165赫兹的WQHD面板,我们不久将在ThinkPad P1 G5中对其进行测试。从主观上看,反射式面板给人留下了很好的视觉印象。尽管联想使用了与前代产品相同的面板,但我们的测试显示,显示屏的平均亮度为470cd/m²,这一次不仅大大降低,而且低于制造商规定的600cd/m²的规格。然而,与此同时,黑色水平有所提高,对比度保持不变,略低于1400:1。此外,该显示器支持HDR,没有任何PWM的暗示。除此之外,响应时间也比前代产品要好。
| |||||||||||||||||||||||||
Brightness Distribution: 90 %
Center on Battery: 475 cd/m²
Contrast: 1360:1 (Black: 0.35 cd/m²)
ΔE ColorChecker Calman: 1.9 | ∀{0.5-29.43 Ø4.71}
calibrated: 1.3
ΔE Greyscale Calman: 2.4 | ∀{0.09-98 Ø4.96}
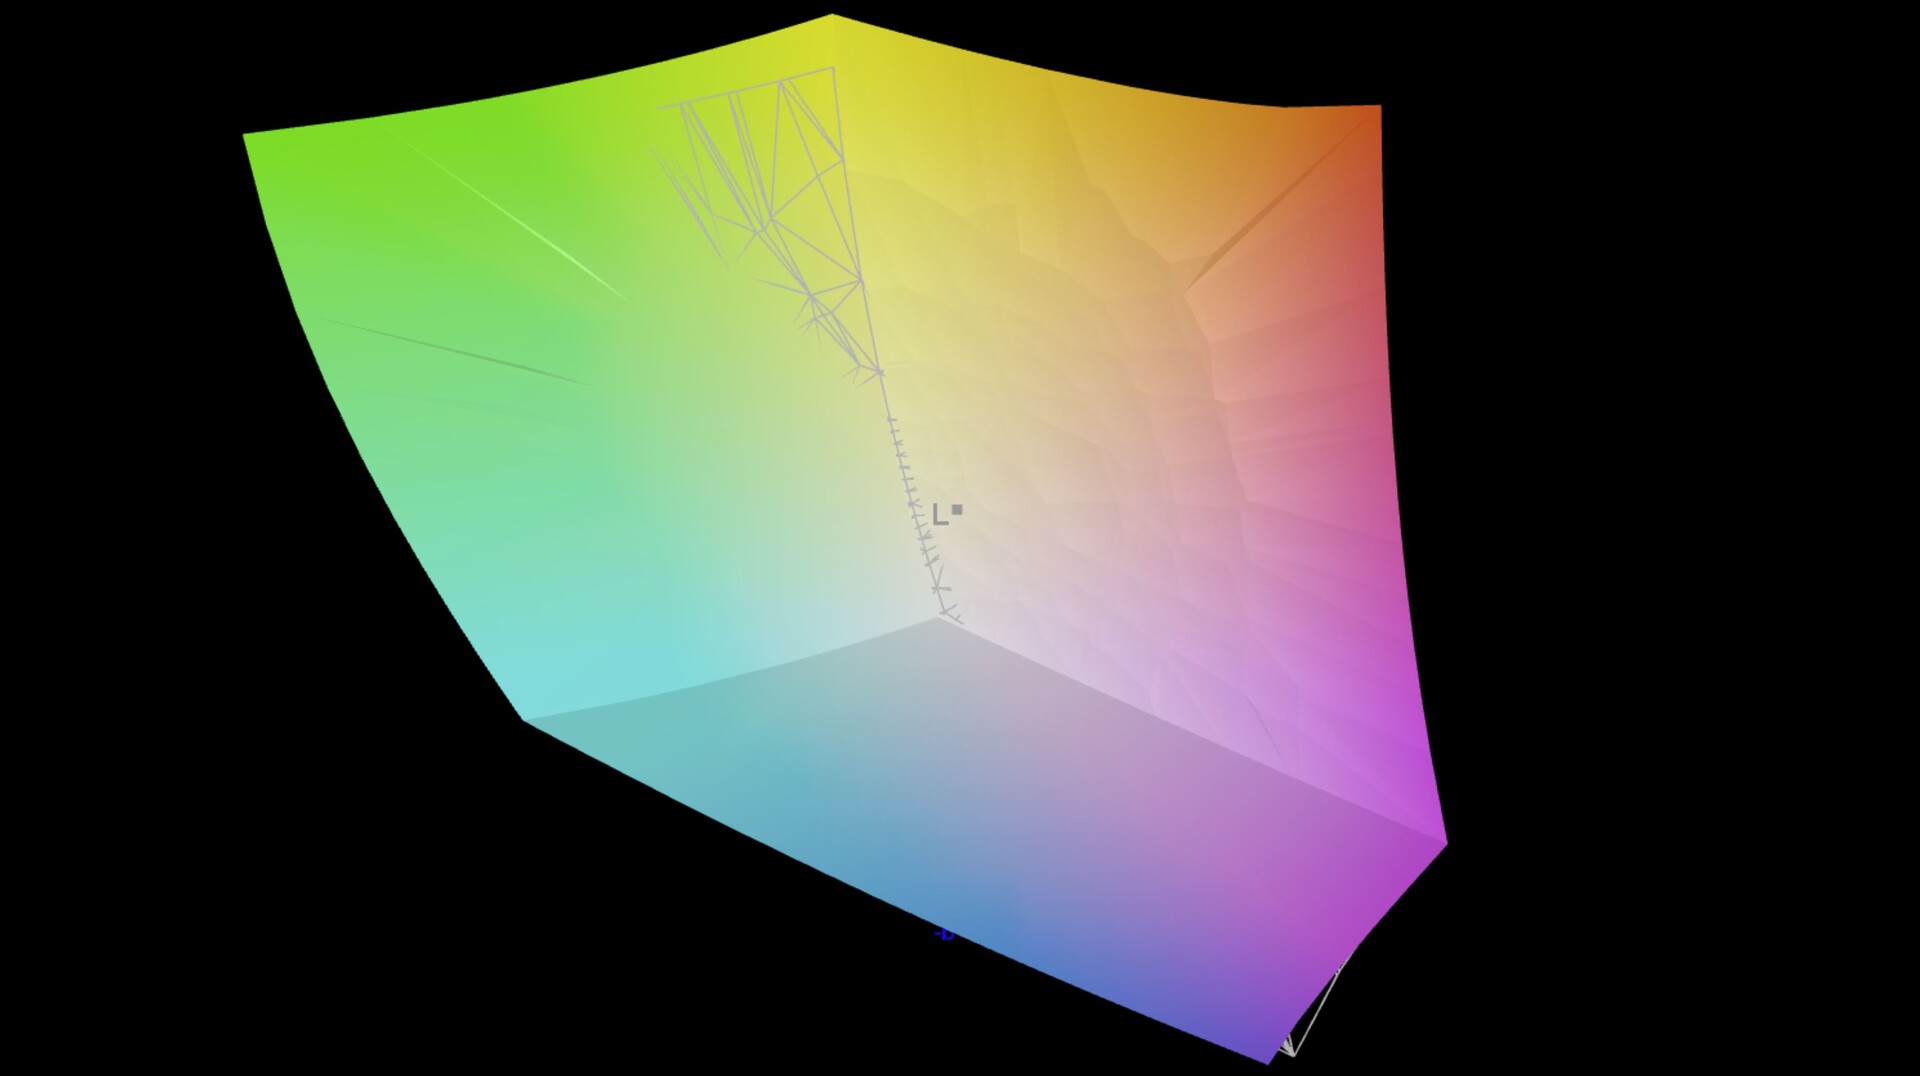
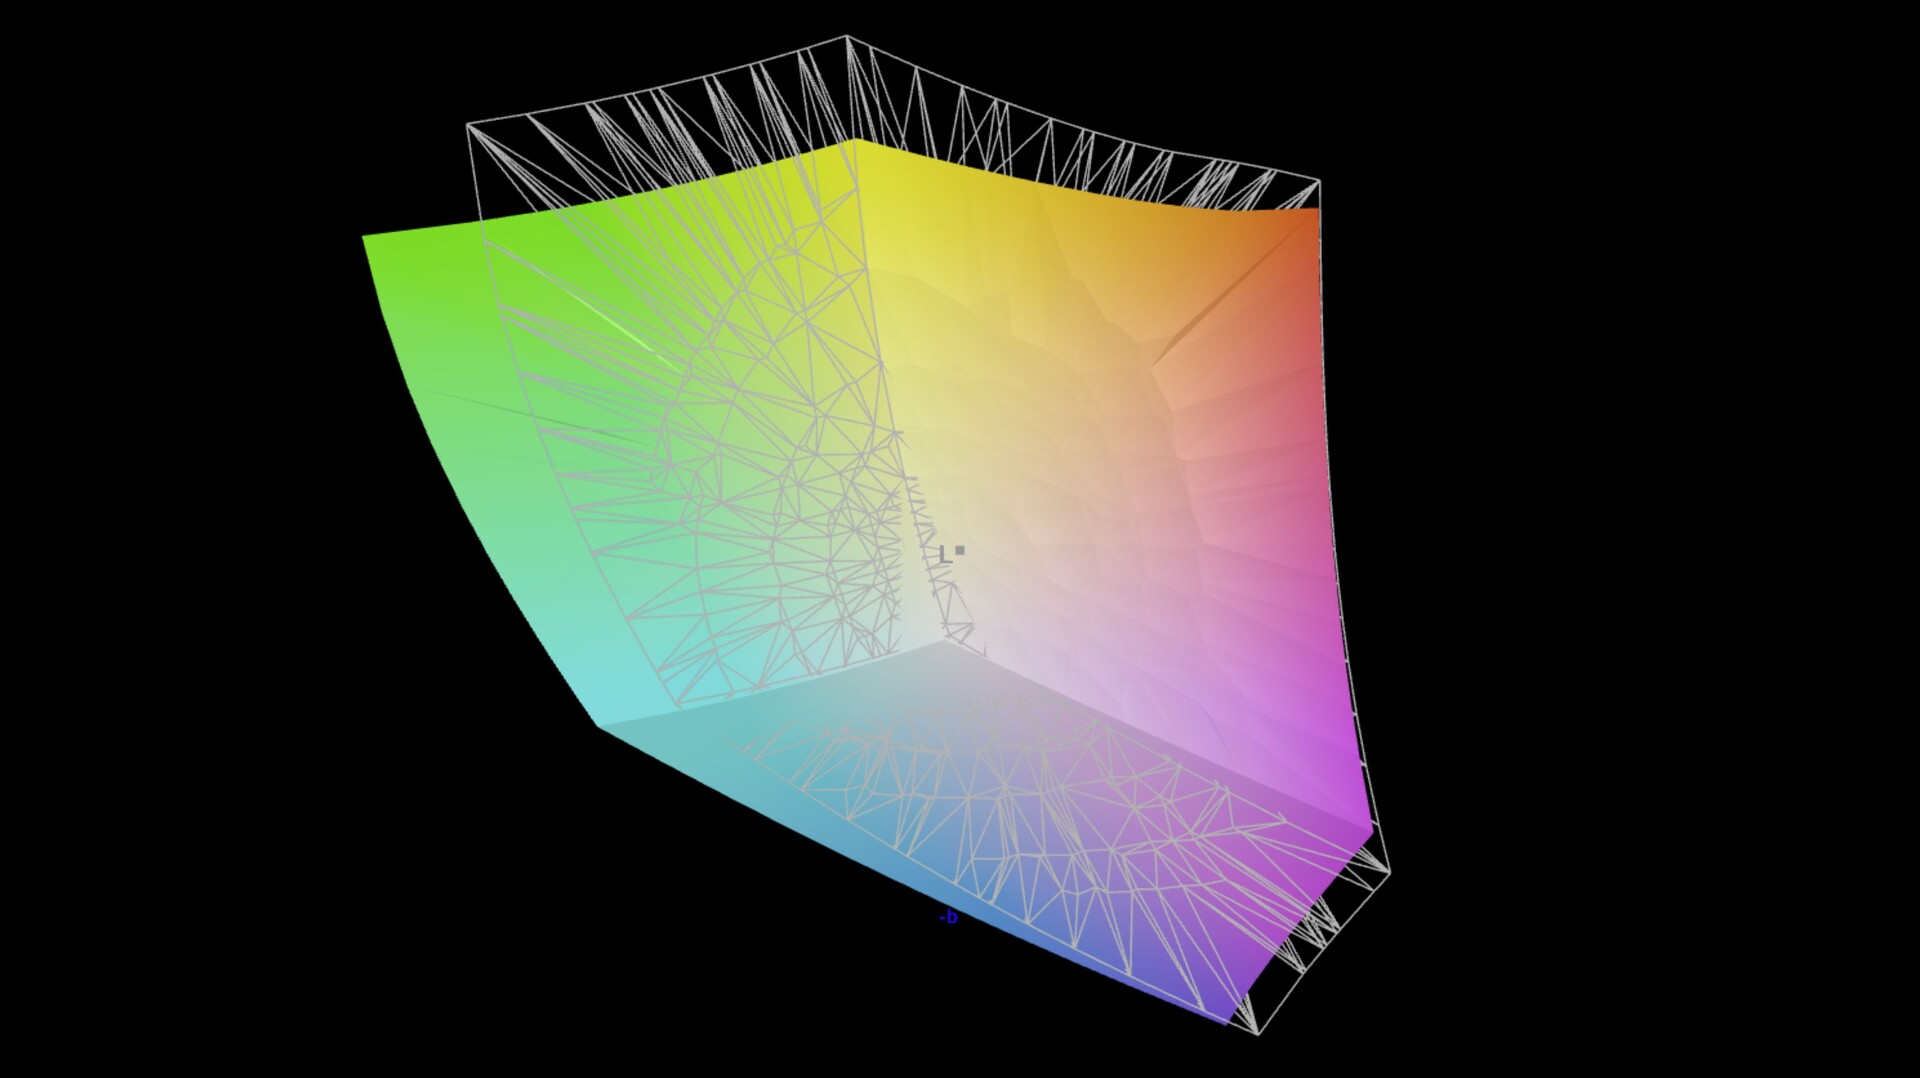
97.7% AdobeRGB 1998 (Argyll 3D)
99.2% sRGB (Argyll 3D)
84.6% Display P3 (Argyll 3D)
Gamma: 2.24
CCT: 6377 K
| Lenovo ThinkPad X1 Extreme G5-21DE003RGE LP160UQ1-SPB1, IPS, 3840x2400, 16" | HP Envy 16 h0112nr Samsung SDC4174, OLED, 3840x2400, 16" | Schenker Vision 16 Pro RTX 3070 Ti N160QDM-NZ1, IPS, 2560x1600, 16" | Dell XPS 15 9520 RTX 3050 Ti Samsung 156XG01, OLED, 3456x2160, 15.6" | Apple MacBook Pro 16 2021 M1 Pro Liquid Retina XDR, Mini-LED, 3456x2234, 16.2" | Dell XPS 17 9720 RTX 3060 Sharp LQ170R1, IPS, 3840x2400, 17" | Lenovo ThinkPad X1 Extreme G4-20Y5CTO1WW (3050 Ti) LP160UQ1-SPB1, IPS LED, 3840x2400, 16" | |
|---|---|---|---|---|---|---|---|
| Display | 3% | -17% | 2% | 3% | -1% | -0% | |
| Display P3 Coverage (%) | 84.6 | 99.3 17% | 68.7 -19% | 97.8 16% | 99.1 17% | 92.9 10% | 84.3 0% |
| sRGB Coverage (%) | 99.2 | 100 1% | 96.7 -3% | 99.9 1% | 100 1% | 100 1% | 98.3 -1% |
| AdobeRGB 1998 Coverage (%) | 97.7 | 88 -10% | 70 -28% | 86 -12% | 88 -10% | 85.3 -13% | 97.8 0% |
| Response Times | 93% | 62% | 93% | -185% | -47% | -75% | |
| Response Time Grey 50% / Grey 80% * (ms) | 46 ? | 2 ? 96% | 14.3 ? 69% | 1.9 ? 96% | 42.8 ? 7% | 51.2 ? -11% | 60 ? -30% |
| Response Time Black / White * (ms) | 19.2 ? | 1.9 ? 90% | 8.6 ? 55% | 1.9 ? 90% | 91.6 ? -377% | 35.2 ? -83% | 42 ? -119% |
| PWM Frequency (Hz) | 240.4 ? | 59.52 ? | 14880 | ||||
| Screen | -3% | -41% | -40% | 247% | -68% | 2% | |
| Brightness middle (cd/m²) | 476 | 328.8 -31% | 364 -24% | 381.4 -20% | 514 8% | 512.7 8% | 639 34% |
| Brightness (cd/m²) | 470 | 332 -29% | 347 -26% | 384 -18% | 497 6% | 463 -1% | 612 30% |
| Brightness Distribution (%) | 90 | 97 8% | 89 -1% | 95 6% | 95 6% | 85 -6% | 84 -7% |
| Black Level * (cd/m²) | 0.35 | 0.3 14% | 0.02 94% | 0.32 9% | 0.47 -34% | ||
| Contrast (:1) | 1360 | 1213 -11% | 25700 1790% | 1602 18% | 1360 0% | ||
| Colorchecker dE 2000 * | 1.9 | 1.53 19% | 3.3 -74% | 4.34 -128% | 1.4 26% | 5.98 -215% | 2.2 -16% |
| Colorchecker dE 2000 max. * | 4.7 | 6.04 -29% | 6.6 -40% | 9.24 -97% | 2.8 40% | 12.09 -157% | 5.3 -13% |
| Colorchecker dE 2000 calibrated * | 1.3 | 2.5 -92% | 1.4 -8% | ||||
| Greyscale dE 2000 * | 2.4 | 1.3 46% | 5.2 -117% | 2 17% | 2.3 4% | 7.2 -200% | 1.7 29% |
| Gamma | 2.24 98% | 2.18 101% | 2.14 103% | 2.13 103% | 2.27 97% | 2.54 87% | 2.31 95% |
| CCT | 6377 102% | 6362 102% | 6331 103% | 6210 105% | 6792 96% | 6914 94% | 6390 102% |
| Total Average (Program / Settings) | 31% /
16% | 1% /
-21% | 18% /
-4% | 22% /
124% | -39% /
-49% | -24% /
-10% |
* ... smaller is better
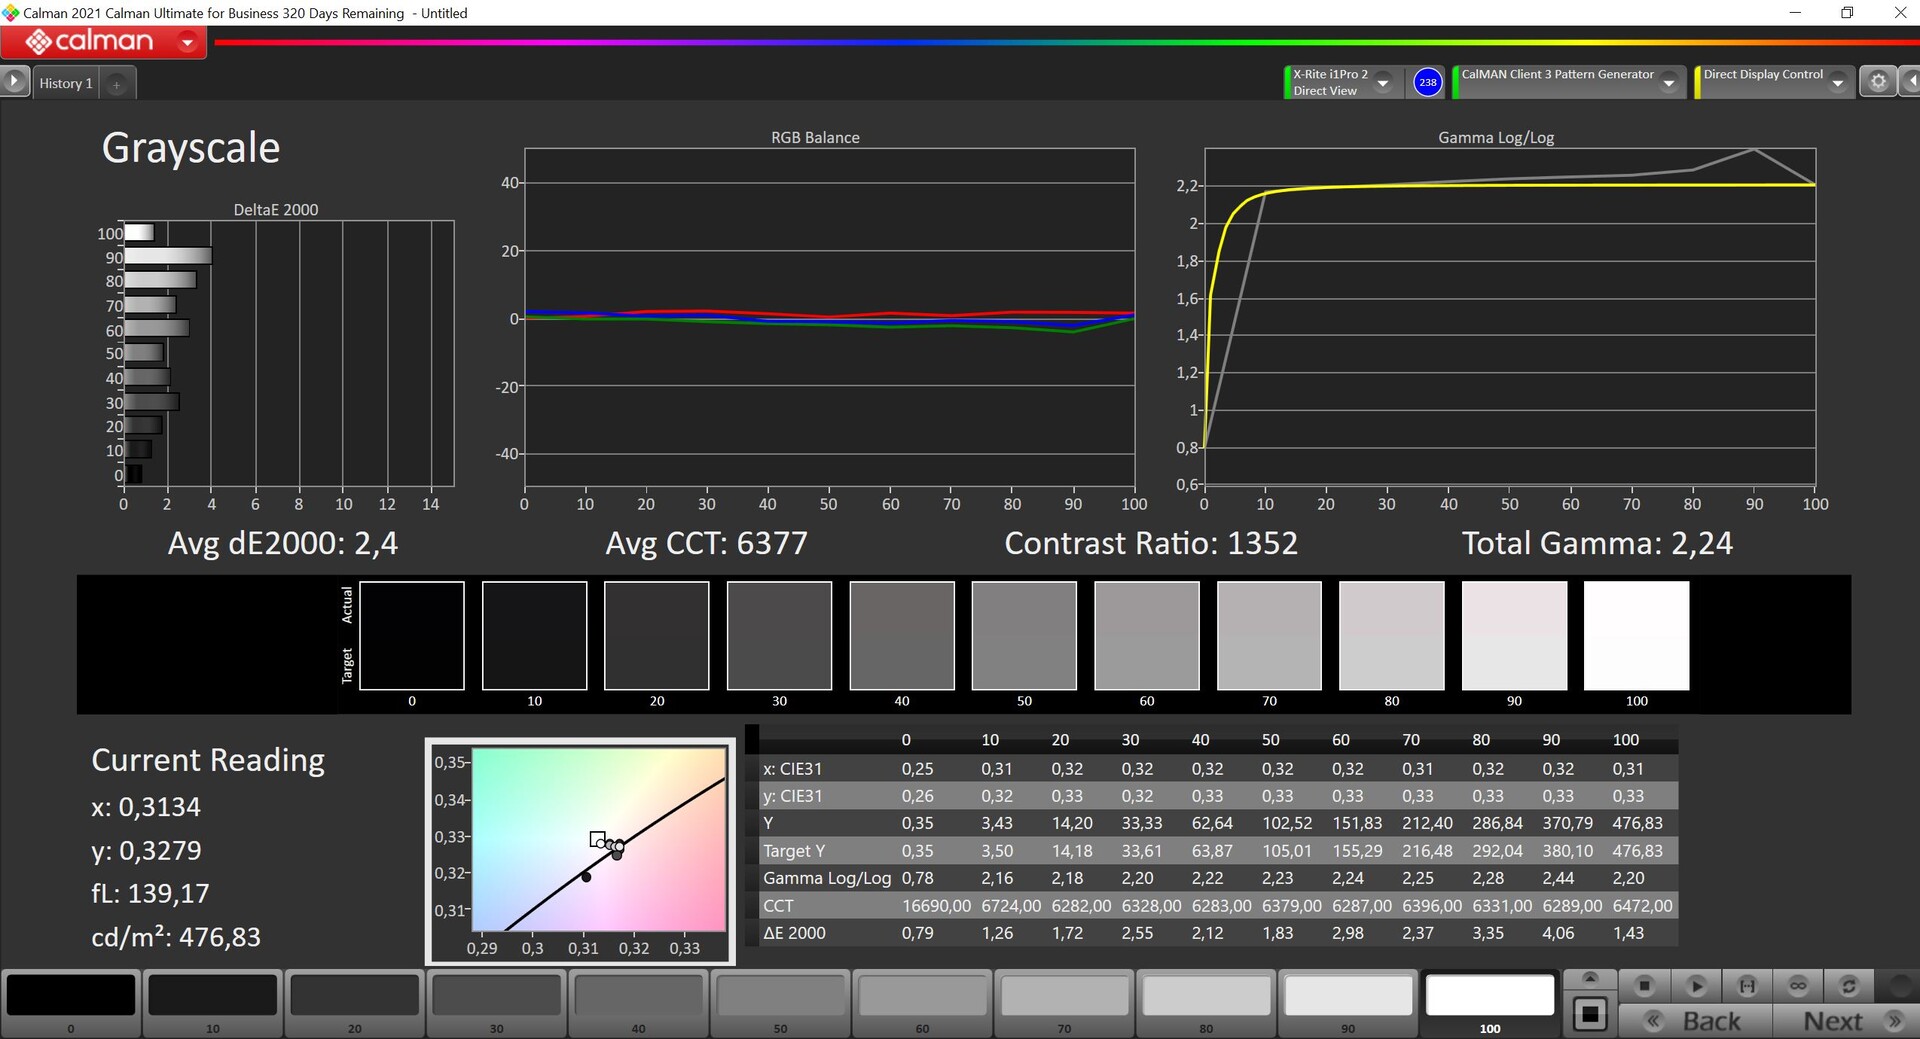
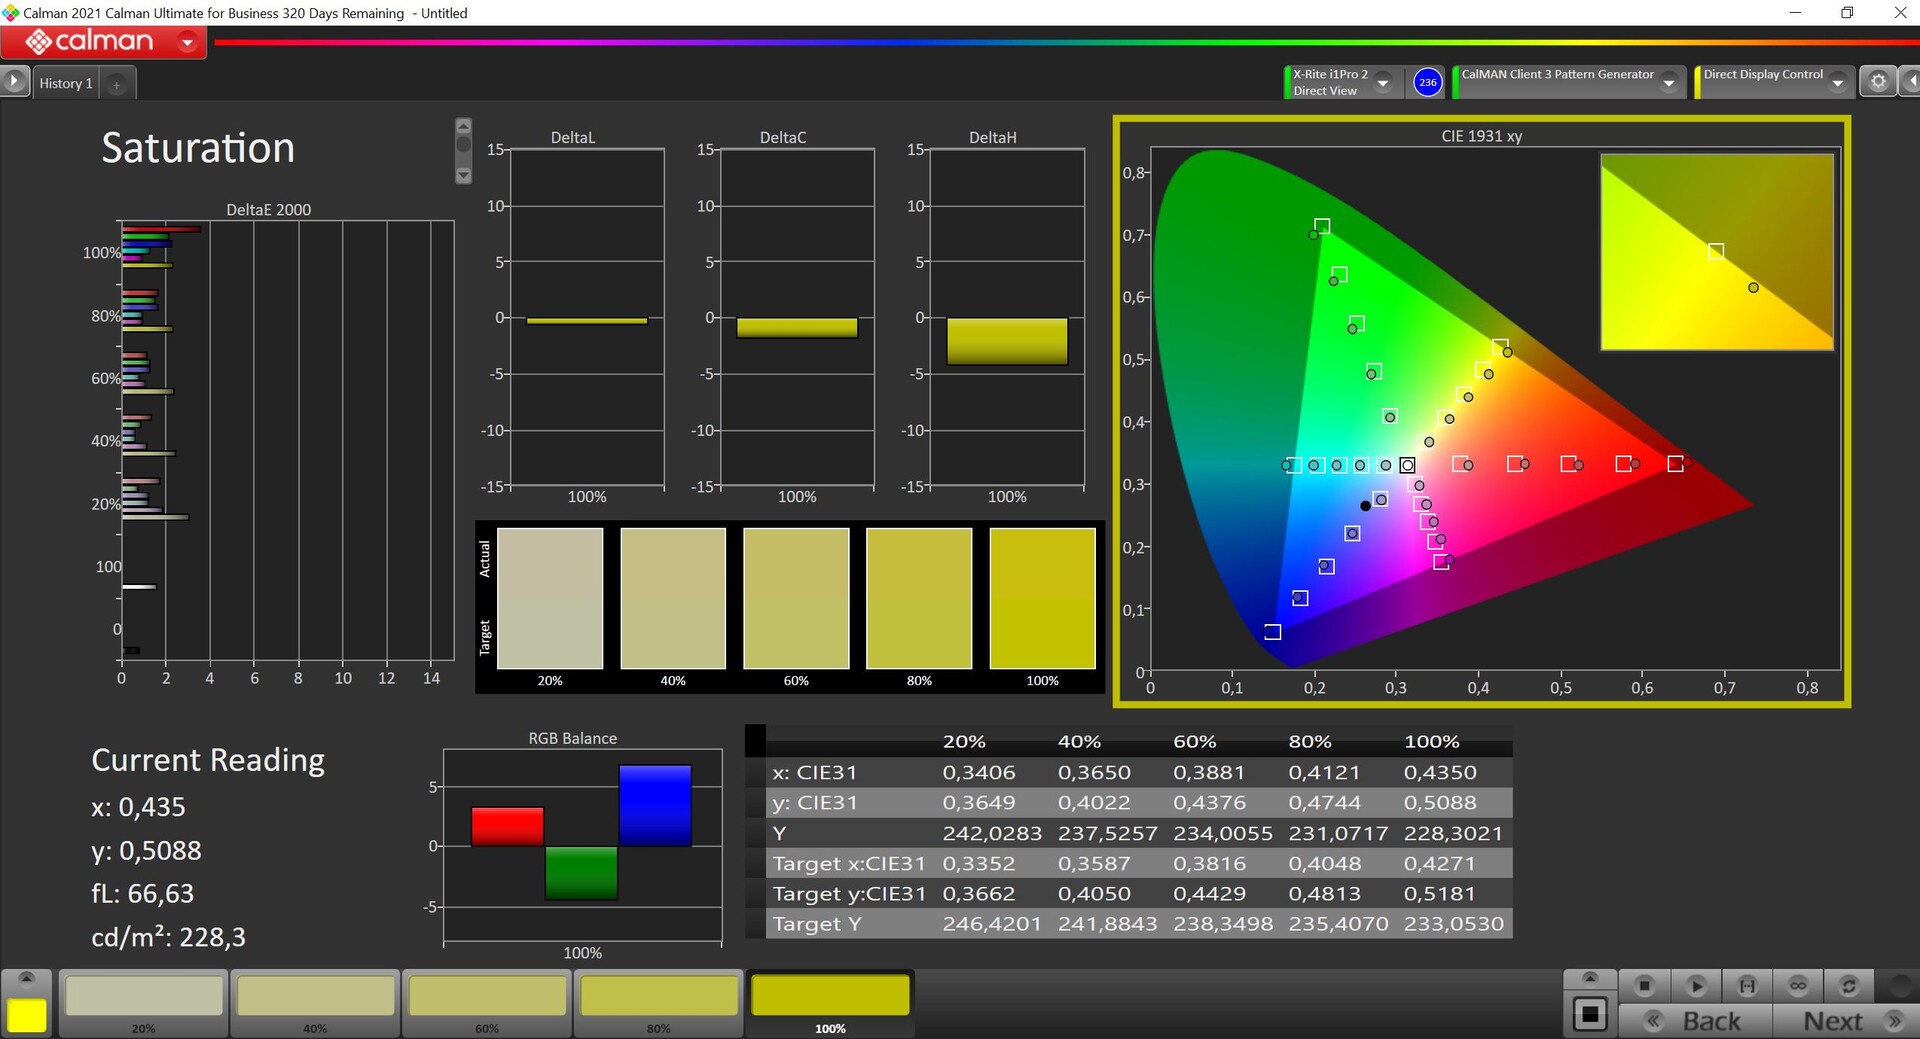
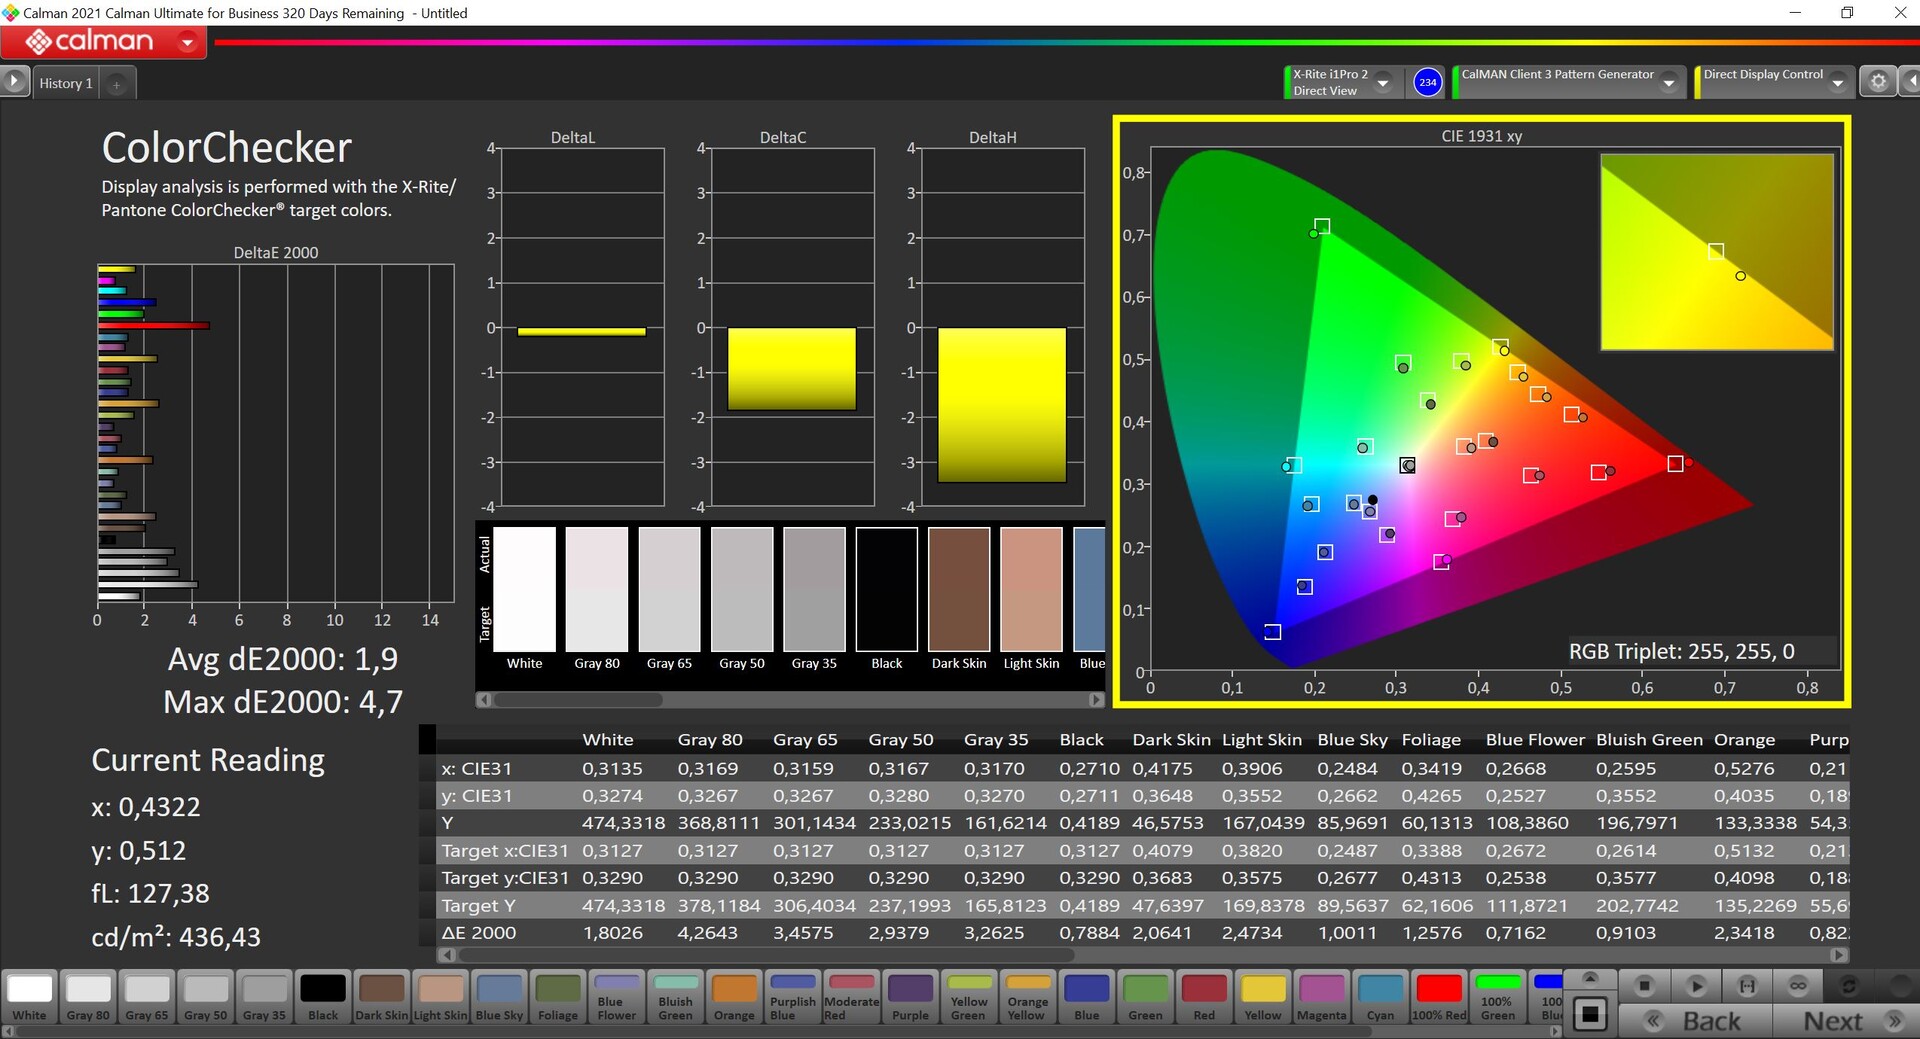

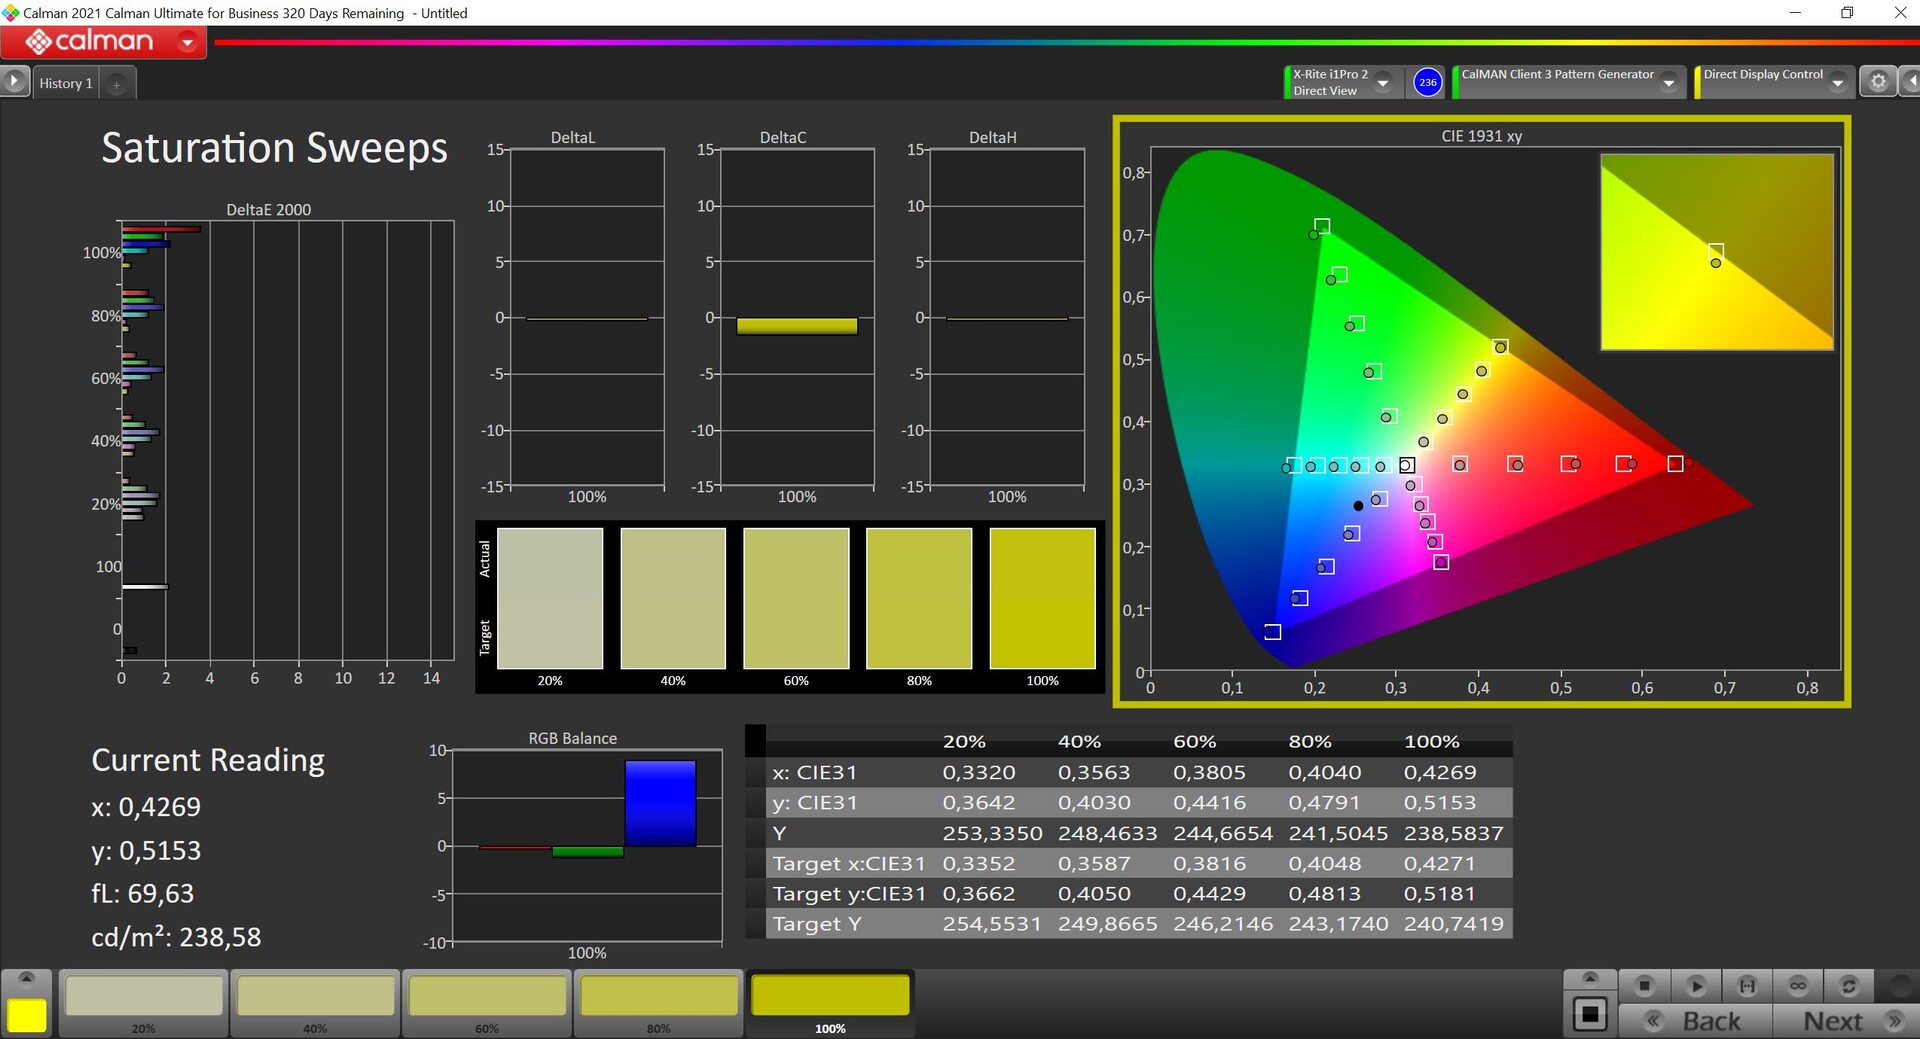
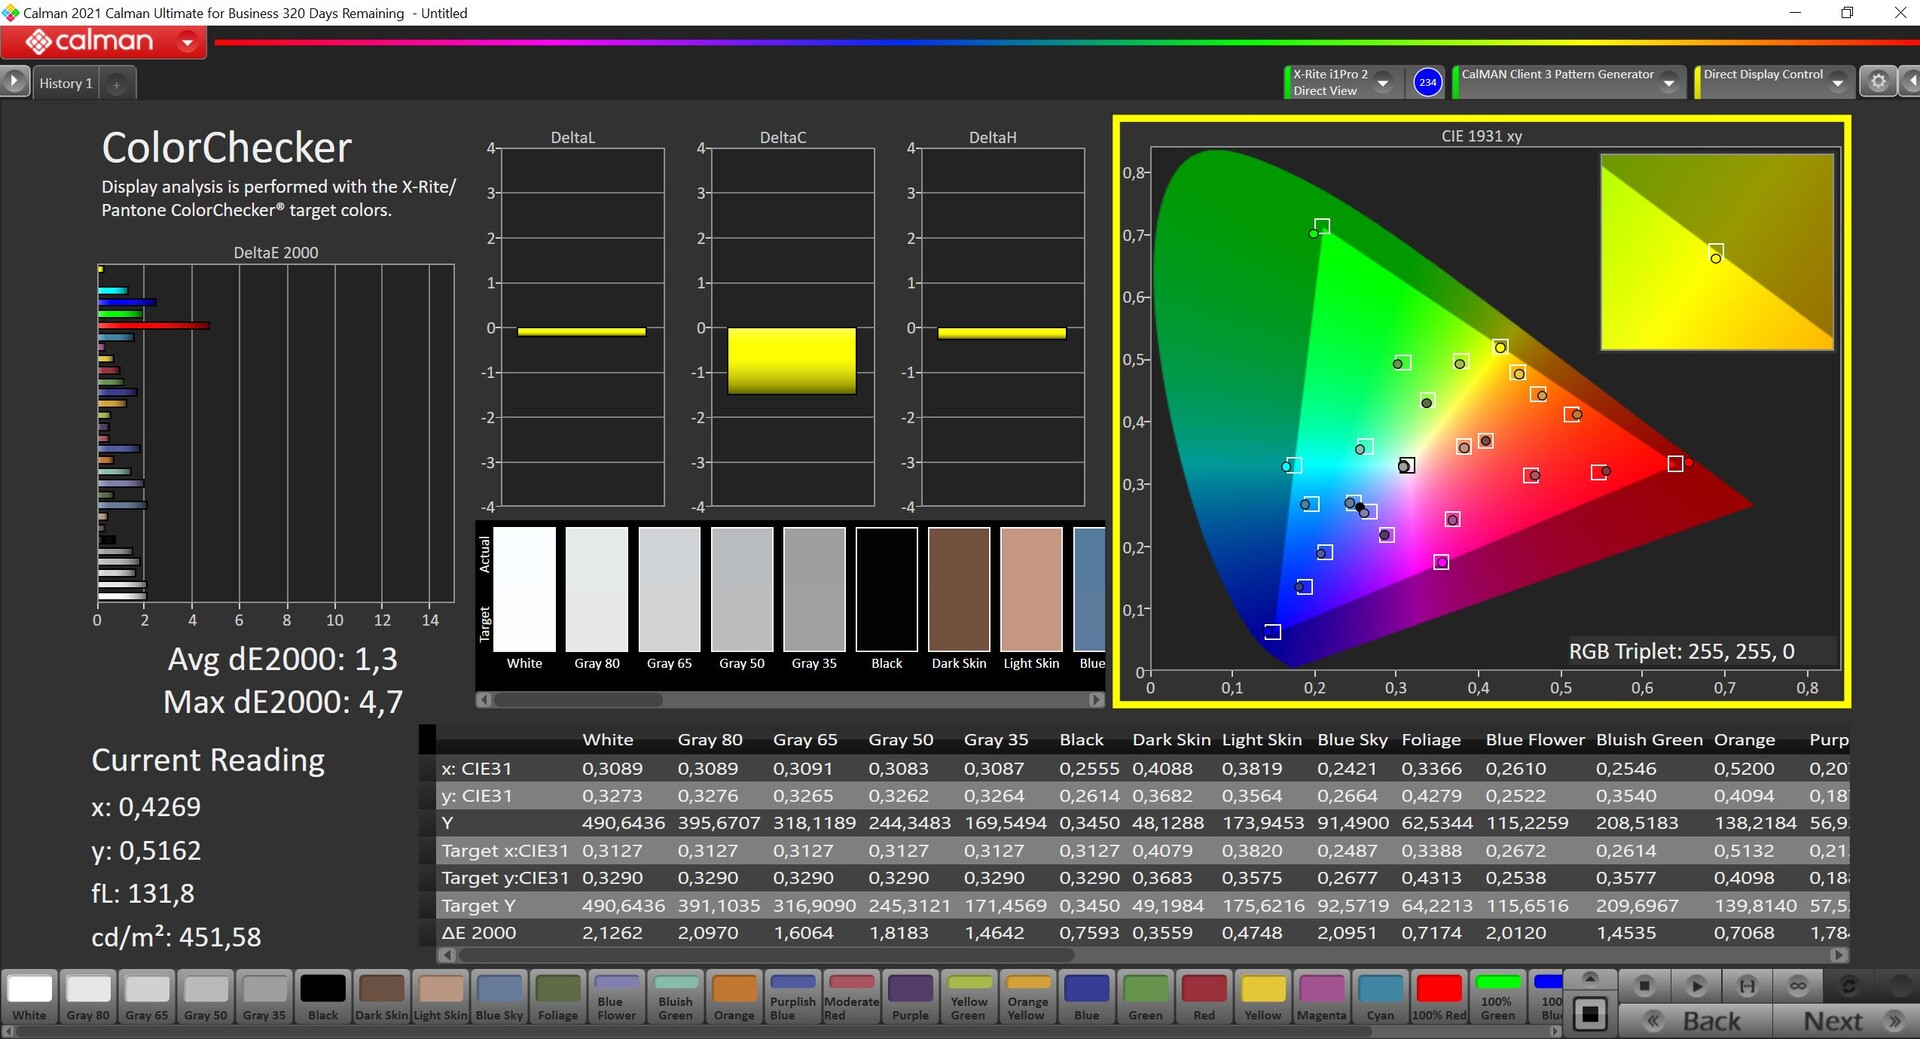
这台4K显示器预装了X-Rite软件,并提供了各种配置文件。我们用专业的CalMAN软件包(X-Rite i1 Pro 2)分析了显示器,使用了预先设置的 "本地 "配置文件。与AdobeRGB参考值相比,没有不必要的色调偏移,DeltaE 2000灰度的平均偏差低于目标值3。这也适用于颜色,只有100%的红色显示出强烈的偏差。我们能够通过自己的校准来减少这种偏差,即使其他偏差较小。因此,后续的校准是没有必要的,这也使得该面板由于其几乎100%的AdobeRGB覆盖而非常适用于图像编辑。
Display Response Times
| ↔ Response Time Black to White | ||
|---|---|---|
| 19.2 ms ... rise ↗ and fall ↘ combined | ↗ 6 ms rise | 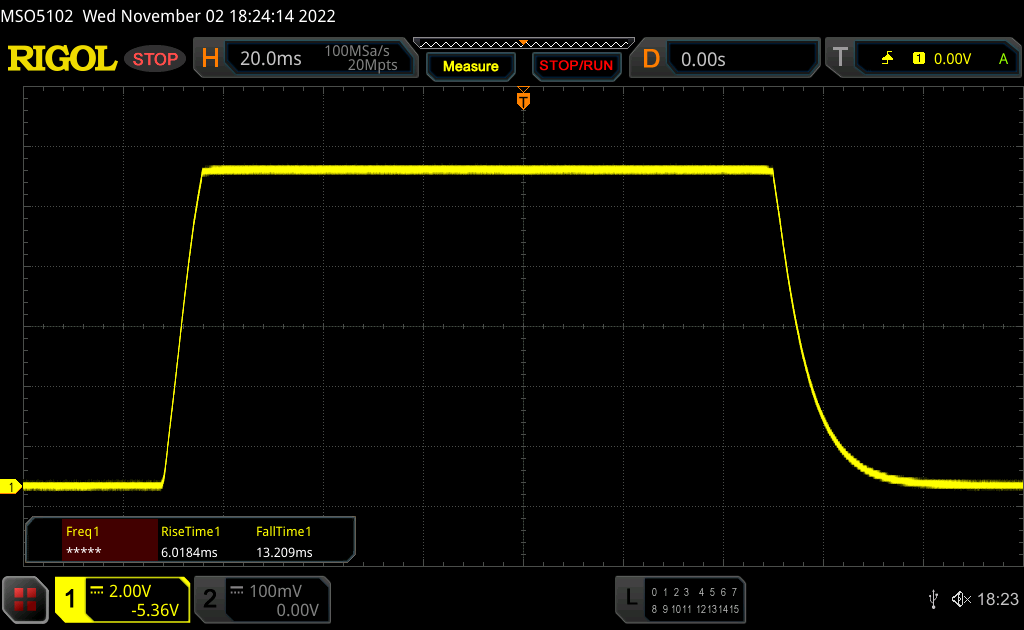 |
| ↘ 13.2 ms fall | ||
| The screen shows good response rates in our tests, but may be too slow for competitive gamers. In comparison, all tested devices range from 0.1 (minimum) to 240 (maximum) ms. » 43 % of all devices are better. This means that the measured response time is similar to the average of all tested devices (19.8 ms). | ||
| ↔ Response Time 50% Grey to 80% Grey | ||
| 46 ms ... rise ↗ and fall ↘ combined | ↗ 21.2 ms rise | 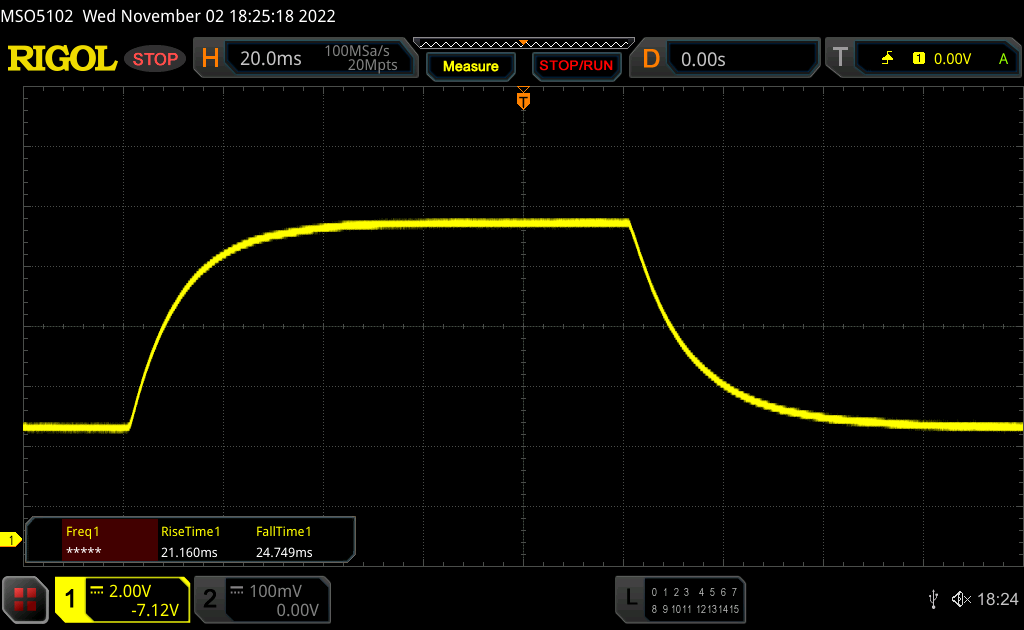 |
| ↘ 24.8 ms fall | ||
| The screen shows slow response rates in our tests and will be unsatisfactory for gamers. In comparison, all tested devices range from 0.165 (minimum) to 636 (maximum) ms. » 79 % of all devices are better. This means that the measured response time is worse than the average of all tested devices (31 ms). | ||
Screen Flickering / PWM (Pulse-Width Modulation)
| Screen flickering / PWM not detected | 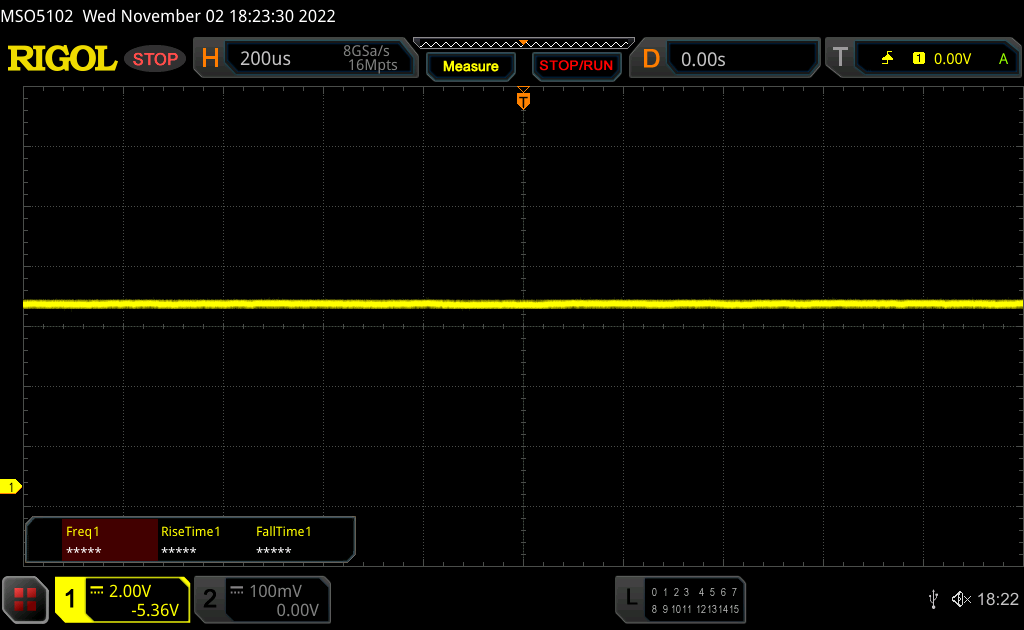 | ||
In comparison: 52 % of all tested devices do not use PWM to dim the display. If PWM was detected, an average of 7751 (minimum: 5 - maximum: 343500) Hz was measured. | |||
在户外,特别是在明亮的日子里,由于光面显示屏不可避免地会有很强的反射,所以很难舒适地工作。因此,经常发现自己在旅途中工作的X1 Extreme G5用户最好考虑使用哑光面板的配置。尽管如此,在IPS面板的视角稳定性方面没有发现任何问题。

性能 - X1 Extreme G5可选择配备RTX 3080 Ti
ThinkPad X1 Extreme G5可使用一系列英特尔处理器,包括可选的vPro型号。图形卡从GeForce RTX 3050 Ti开始,一直到RTX 3080 Ti.对于专业的GPU,值得看一下ThinkPad P1 G5。我们的评测设备配备了单一的RAM模块(32GB),只在单通道模式下运行。
测试条件
联想没有提供额外的能源配置文件,而是将这些设置与常规的Windows能源设置联系起来,这在实践中是非常方便的。与一些AMD ThinkPads相比,没有办法激活或停用 "智能冷却 "功能。
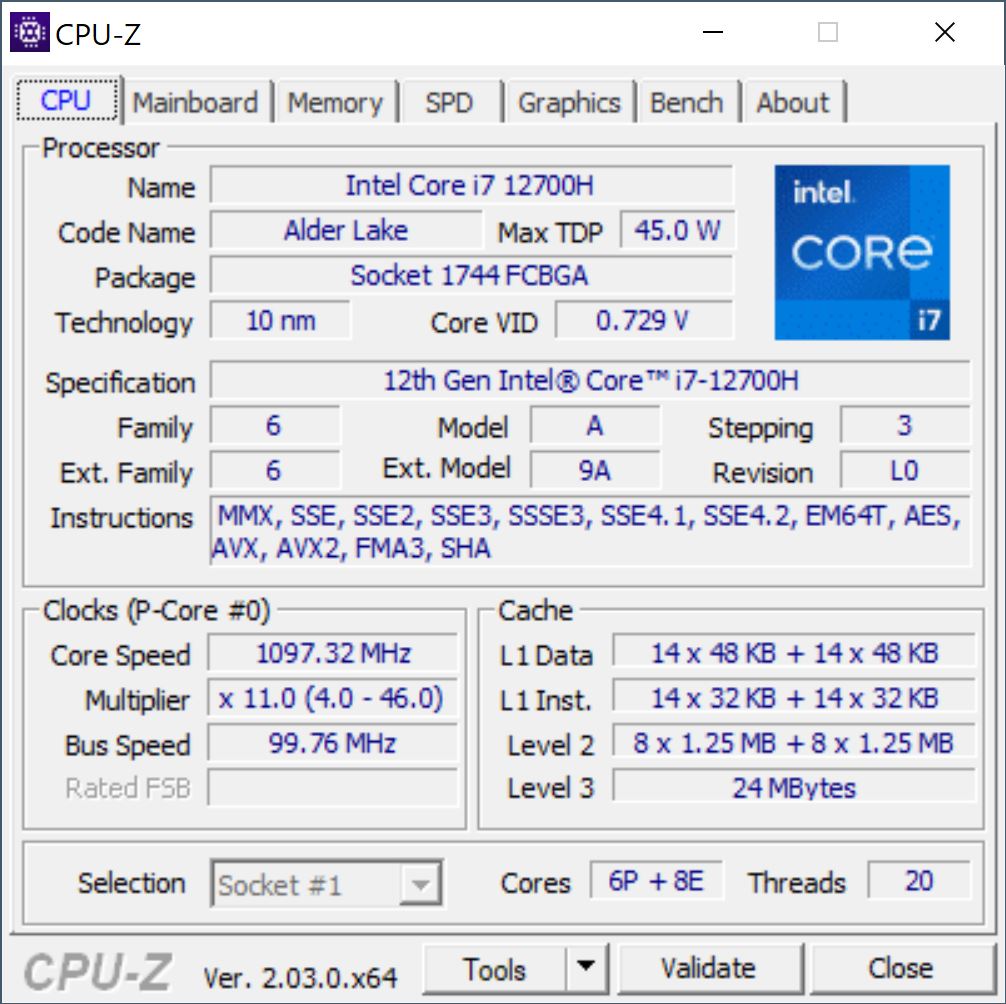
处理器 - 酷睿i7-12700H
芯片酷睿i7-12700H属于英特尔目前的Alder Lake一代,提供6个性能以及8个效率核心。在短期使用中,ThinkPad的处理器耗电112瓦,在持续使用中耗电80瓦,这就是为什么基准测试结果很好,即使在较长的负载下也是如此。由于这个原因,ThinkPad在我们的比较组中属于最快的型号。如果考虑到所有的CPU基准测试,X1 Extreme G5比它的前辈领先28%。 前辈的28%。 联想ThinkPad X1 Extreme第四代笔记本电脑评测。带16:10触摸屏的高性能旗舰机酷睿i7-11800H.这也是液态金属热熔胶更强的冷却能力真正得到回报的地方。
该处理器在电池模式下仍然使用约70瓦,导致多核测试的性能只下降了13%;单核性能不受影响。其他CPU基准测试可以在我们的技术部分找到 。
Cinebench R15 Multi endurance test
Cinebench R23: Multi Core | Single Core
Cinebench R20: CPU (Multi Core) | CPU (Single Core)
Cinebench R15: CPU Multi 64Bit | CPU Single 64Bit
Blender: v2.79 BMW27 CPU
7-Zip 18.03: 7z b 4 | 7z b 4 -mmt1
Geekbench 5.5: Multi-Core | Single-Core
HWBOT x265 Benchmark v2.2: 4k Preset
LibreOffice : 20 Documents To PDF
R Benchmark 2.5: Overall mean
| CPU Performance rating | |
| Lenovo ThinkPad X1 Extreme G5-21DE003RGE | |
| Average of class Multimedia | |
| Dell XPS 17 9720 RTX 3060 | |
| Average Intel Core i7-12700H | |
| Dell XPS 15 9520 RTX 3050 Ti | |
| HP Envy 16 h0112nr | |
| Schenker Vision 16 Pro RTX 3070 Ti | |
| Apple MacBook Pro 16 2021 M1 Pro -5! | |
| Lenovo ThinkPad X1 Extreme G4-20Y5CTO1WW (3050 Ti) | |
| Cinebench R23 / Multi Core | |
| Lenovo ThinkPad X1 Extreme G5-21DE003RGE | |
| Dell XPS 17 9720 RTX 3060 | |
| Average of class Multimedia (4861 - 33362, n=65, last 2 years) | |
| Average Intel Core i7-12700H (4032 - 19330, n=64) | |
| Dell XPS 15 9520 RTX 3050 Ti | |
| HP Envy 16 h0112nr | |
| Schenker Vision 16 Pro RTX 3070 Ti | |
| Lenovo ThinkPad X1 Extreme G4-20Y5CTO1WW (3050 Ti) | |
| Apple MacBook Pro 16 2021 M1 Pro | |
| Cinebench R23 / Single Core | |
| Average of class Multimedia (1128 - 2459, n=64, last 2 years) | |
| Lenovo ThinkPad X1 Extreme G5-21DE003RGE | |
| Schenker Vision 16 Pro RTX 3070 Ti | |
| Dell XPS 15 9520 RTX 3050 Ti | |
| HP Envy 16 h0112nr | |
| Dell XPS 17 9720 RTX 3060 | |
| Average Intel Core i7-12700H (778 - 1826, n=63) | |
| Apple MacBook Pro 16 2021 M1 Pro | |
| Lenovo ThinkPad X1 Extreme G4-20Y5CTO1WW (3050 Ti) | |
| Cinebench R20 / CPU (Multi Core) | |
| Lenovo ThinkPad X1 Extreme G5-21DE003RGE | |
| Dell XPS 17 9720 RTX 3060 | |
| Average of class Multimedia (1887 - 12912, n=56, last 2 years) | |
| Average Intel Core i7-12700H (1576 - 7407, n=64) | |
| Dell XPS 15 9520 RTX 3050 Ti | |
| HP Envy 16 h0112nr | |
| Schenker Vision 16 Pro RTX 3070 Ti | |
| Lenovo ThinkPad X1 Extreme G4-20Y5CTO1WW (3050 Ti) | |
| Apple MacBook Pro 16 2021 M1 Pro | |
| Cinebench R20 / CPU (Single Core) | |
| Average of class Multimedia (425 - 853, n=56, last 2 years) | |
| Lenovo ThinkPad X1 Extreme G5-21DE003RGE | |
| Schenker Vision 16 Pro RTX 3070 Ti | |
| HP Envy 16 h0112nr | |
| Dell XPS 15 9520 RTX 3050 Ti | |
| Average Intel Core i7-12700H (300 - 704, n=64) | |
| Dell XPS 17 9720 RTX 3060 | |
| Lenovo ThinkPad X1 Extreme G4-20Y5CTO1WW (3050 Ti) | |
| Apple MacBook Pro 16 2021 M1 Pro | |
| Cinebench R15 / CPU Multi 64Bit | |
| Lenovo ThinkPad X1 Extreme G5-21DE003RGE | |
| Schenker Vision 16 Pro RTX 3070 Ti | |
| Schenker Vision 16 Pro RTX 3070 Ti | |
| Average of class Multimedia (856 - 5224, n=60, last 2 years) | |
| HP Envy 16 h0112nr | |
| Average Intel Core i7-12700H (1379 - 2916, n=70) | |
| Dell XPS 17 9720 RTX 3060 | |
| Dell XPS 15 9520 RTX 3050 Ti | |
| Lenovo ThinkPad X1 Extreme G4-20Y5CTO1WW (3050 Ti) | |
| Apple MacBook Pro 16 2021 M1 Pro | |
| Cinebench R15 / CPU Single 64Bit | |
| Average of class Multimedia (184.8 - 326, n=58, last 2 years) | |
| Schenker Vision 16 Pro RTX 3070 Ti | |
| Lenovo ThinkPad X1 Extreme G5-21DE003RGE | |
| HP Envy 16 h0112nr | |
| Dell XPS 17 9720 RTX 3060 | |
| Average Intel Core i7-12700H (113 - 263, n=65) | |
| Dell XPS 15 9520 RTX 3050 Ti | |
| Lenovo ThinkPad X1 Extreme G4-20Y5CTO1WW (3050 Ti) | |
| Apple MacBook Pro 16 2021 M1 Pro | |
| Blender / v2.79 BMW27 CPU | |
| Schenker Vision 16 Pro RTX 3070 Ti | |
| Lenovo ThinkPad X1 Extreme G4-20Y5CTO1WW (3050 Ti) | |
| Average of class Multimedia (100 - 557, n=57, last 2 years) | |
| HP Envy 16 h0112nr | |
| Dell XPS 15 9520 RTX 3050 Ti | |
| Average Intel Core i7-12700H (168 - 732, n=63) | |
| Dell XPS 17 9720 RTX 3060 | |
| Lenovo ThinkPad X1 Extreme G5-21DE003RGE | |
| Apple MacBook Pro 16 2021 M1 Pro | |
| 7-Zip 18.03 / 7z b 4 | |
| Dell XPS 17 9720 RTX 3060 | |
| Lenovo ThinkPad X1 Extreme G5-21DE003RGE | |
| Dell XPS 15 9520 RTX 3050 Ti | |
| Average Intel Core i7-12700H (22844 - 73067, n=63) | |
| Average of class Multimedia (26062 - 130368, n=54, last 2 years) | |
| HP Envy 16 h0112nr | |
| Schenker Vision 16 Pro RTX 3070 Ti | |
| Lenovo ThinkPad X1 Extreme G4-20Y5CTO1WW (3050 Ti) | |
| 7-Zip 18.03 / 7z b 4 -mmt1 | |
| Average of class Multimedia (3666 - 7545, n=55, last 2 years) | |
| Lenovo ThinkPad X1 Extreme G5-21DE003RGE | |
| Schenker Vision 16 Pro RTX 3070 Ti | |
| Dell XPS 15 9520 RTX 3050 Ti | |
| HP Envy 16 h0112nr | |
| Dell XPS 17 9720 RTX 3060 | |
| Average Intel Core i7-12700H (2743 - 5972, n=63) | |
| Lenovo ThinkPad X1 Extreme G4-20Y5CTO1WW (3050 Ti) | |
| Geekbench 5.5 / Multi-Core | |
| Average of class Multimedia (4652 - 20422, n=55, last 2 years) | |
| HP Envy 16 h0112nr | |
| Apple MacBook Pro 16 2021 M1 Pro | |
| Dell XPS 17 9720 RTX 3060 | |
| Dell XPS 15 9520 RTX 3050 Ti | |
| Lenovo ThinkPad X1 Extreme G5-21DE003RGE | |
| Average Intel Core i7-12700H (5144 - 13745, n=64) | |
| Schenker Vision 16 Pro RTX 3070 Ti | |
| Lenovo ThinkPad X1 Extreme G4-20Y5CTO1WW (3050 Ti) | |
| Geekbench 5.5 / Single-Core | |
| Average of class Multimedia (805 - 2974, n=55, last 2 years) | |
| Schenker Vision 16 Pro RTX 3070 Ti | |
| Lenovo ThinkPad X1 Extreme G5-21DE003RGE | |
| HP Envy 16 h0112nr | |
| Dell XPS 15 9520 RTX 3050 Ti | |
| Apple MacBook Pro 16 2021 M1 Pro | |
| Average Intel Core i7-12700H (803 - 1851, n=64) | |
| Dell XPS 17 9720 RTX 3060 | |
| Lenovo ThinkPad X1 Extreme G4-20Y5CTO1WW (3050 Ti) | |
| HWBOT x265 Benchmark v2.2 / 4k Preset | |
| Average of class Multimedia (5.26 - 36.1, n=55, last 2 years) | |
| Lenovo ThinkPad X1 Extreme G5-21DE003RGE | |
| Average Intel Core i7-12700H (4.67 - 21.8, n=64) | |
| Dell XPS 17 9720 RTX 3060 | |
| Dell XPS 15 9520 RTX 3050 Ti | |
| HP Envy 16 h0112nr | |
| Schenker Vision 16 Pro RTX 3070 Ti | |
| Lenovo ThinkPad X1 Extreme G4-20Y5CTO1WW (3050 Ti) | |
| LibreOffice / 20 Documents To PDF | |
| Average of class Multimedia (23.9 - 146.7, n=56, last 2 years) | |
| Average Intel Core i7-12700H (34.2 - 95.3, n=63) | |
| HP Envy 16 h0112nr | |
| Schenker Vision 16 Pro RTX 3070 Ti | |
| Dell XPS 17 9720 RTX 3060 | |
| Lenovo ThinkPad X1 Extreme G4-20Y5CTO1WW (3050 Ti) | |
| Dell XPS 15 9520 RTX 3050 Ti | |
| Lenovo ThinkPad X1 Extreme G5-21DE003RGE | |
| R Benchmark 2.5 / Overall mean | |
| Lenovo ThinkPad X1 Extreme G4-20Y5CTO1WW (3050 Ti) | |
| Average Intel Core i7-12700H (0.4441 - 1.052, n=63) | |
| Average of class Multimedia (0.3604 - 0.947, n=55, last 2 years) | |
| Lenovo ThinkPad X1 Extreme G5-21DE003RGE | |
| Dell XPS 17 9720 RTX 3060 | |
| HP Envy 16 h0112nr | |
| Schenker Vision 16 Pro RTX 3070 Ti | |
| Dell XPS 15 9520 RTX 3050 Ti | |
* ... smaller is better
AIDA64: FP32 Ray-Trace | FPU Julia | CPU SHA3 | CPU Queen | FPU SinJulia | FPU Mandel | CPU AES | CPU ZLib | FP64 Ray-Trace | CPU PhotoWorxx
| Performance rating | |
| Average of class Multimedia | |
| Lenovo ThinkPad X1 Extreme G5-21DE003RGE | |
| Lenovo ThinkPad X1 Extreme G4-20Y5CTO1WW (3050 Ti) | |
| HP Envy 16 h0112nr | |
| Schenker Vision 16 Pro RTX 3070 Ti | |
| Average Intel Core i7-12700H | |
| Dell XPS 17 9720 RTX 3060 | |
| Dell XPS 15 9520 RTX 3050 Ti | |
| AIDA64 / FP32 Ray-Trace | |
| Average of class Multimedia (2214 - 50388, n=53, last 2 years) | |
| Lenovo ThinkPad X1 Extreme G5-21DE003RGE | |
| Lenovo ThinkPad X1 Extreme G4-20Y5CTO1WW (3050 Ti) | |
| Schenker Vision 16 Pro RTX 3070 Ti | |
| HP Envy 16 h0112nr | |
| Average Intel Core i7-12700H (2585 - 17957, n=64) | |
| Dell XPS 15 9520 RTX 3050 Ti | |
| Dell XPS 17 9720 RTX 3060 | |
| AIDA64 / FPU Julia | |
| Average of class Multimedia (12867 - 201874, n=53, last 2 years) | |
| Lenovo ThinkPad X1 Extreme G5-21DE003RGE | |
| Schenker Vision 16 Pro RTX 3070 Ti | |
| Lenovo ThinkPad X1 Extreme G4-20Y5CTO1WW (3050 Ti) | |
| HP Envy 16 h0112nr | |
| Average Intel Core i7-12700H (12439 - 90760, n=64) | |
| Dell XPS 17 9720 RTX 3060 | |
| Dell XPS 15 9520 RTX 3050 Ti | |
| AIDA64 / CPU SHA3 | |
| Lenovo ThinkPad X1 Extreme G4-20Y5CTO1WW (3050 Ti) | |
| Average of class Multimedia (626 - 8623, n=53, last 2 years) | |
| Lenovo ThinkPad X1 Extreme G5-21DE003RGE | |
| Average Intel Core i7-12700H (833 - 4242, n=64) | |
| Schenker Vision 16 Pro RTX 3070 Ti | |
| HP Envy 16 h0112nr | |
| Dell XPS 15 9520 RTX 3050 Ti | |
| Dell XPS 17 9720 RTX 3060 | |
| AIDA64 / CPU Queen | |
| Lenovo ThinkPad X1 Extreme G5-21DE003RGE | |
| HP Envy 16 h0112nr | |
| Dell XPS 17 9720 RTX 3060 | |
| Dell XPS 15 9520 RTX 3050 Ti | |
| Average Intel Core i7-12700H (57923 - 103202, n=63) | |
| Lenovo ThinkPad X1 Extreme G4-20Y5CTO1WW (3050 Ti) | |
| Schenker Vision 16 Pro RTX 3070 Ti | |
| Average of class Multimedia (13483 - 181505, n=40, last 2 years) | |
| AIDA64 / FPU SinJulia | |
| Lenovo ThinkPad X1 Extreme G5-21DE003RGE | |
| Lenovo ThinkPad X1 Extreme G4-20Y5CTO1WW (3050 Ti) | |
| Average Intel Core i7-12700H (3249 - 9939, n=64) | |
| Dell XPS 17 9720 RTX 3060 | |
| Dell XPS 15 9520 RTX 3050 Ti | |
| Average of class Multimedia (886 - 28794, n=53, last 2 years) | |
| Schenker Vision 16 Pro RTX 3070 Ti | |
| HP Envy 16 h0112nr | |
| AIDA64 / FPU Mandel | |
| Average of class Multimedia (6395 - 105740, n=53, last 2 years) | |
| Lenovo ThinkPad X1 Extreme G5-21DE003RGE | |
| Lenovo ThinkPad X1 Extreme G4-20Y5CTO1WW (3050 Ti) | |
| Schenker Vision 16 Pro RTX 3070 Ti | |
| HP Envy 16 h0112nr | |
| Average Intel Core i7-12700H (7135 - 44760, n=64) | |
| Dell XPS 15 9520 RTX 3050 Ti | |
| Dell XPS 17 9720 RTX 3060 | |
| AIDA64 / CPU AES | |
| Lenovo ThinkPad X1 Extreme G4-20Y5CTO1WW (3050 Ti) | |
| HP Envy 16 h0112nr | |
| Average Intel Core i7-12700H (31839 - 144360, n=64) | |
| Dell XPS 15 9520 RTX 3050 Ti | |
| Dell XPS 17 9720 RTX 3060 | |
| Lenovo ThinkPad X1 Extreme G5-21DE003RGE | |
| Average of class Multimedia (8171 - 126790, n=53, last 2 years) | |
| Schenker Vision 16 Pro RTX 3070 Ti | |
| AIDA64 / CPU ZLib | |
| Lenovo ThinkPad X1 Extreme G5-21DE003RGE | |
| Average Intel Core i7-12700H (305 - 1171, n=64) | |
| Average of class Multimedia (143.8 - 2022, n=53, last 2 years) | |
| Dell XPS 17 9720 RTX 3060 | |
| Schenker Vision 16 Pro RTX 3070 Ti | |
| Dell XPS 15 9520 RTX 3050 Ti | |
| HP Envy 16 h0112nr | |
| Lenovo ThinkPad X1 Extreme G4-20Y5CTO1WW (3050 Ti) | |
| AIDA64 / FP64 Ray-Trace | |
| Average of class Multimedia (1014 - 26875, n=53, last 2 years) | |
| Lenovo ThinkPad X1 Extreme G5-21DE003RGE | |
| Lenovo ThinkPad X1 Extreme G4-20Y5CTO1WW (3050 Ti) | |
| Schenker Vision 16 Pro RTX 3070 Ti | |
| HP Envy 16 h0112nr | |
| Average Intel Core i7-12700H (1437 - 9692, n=64) | |
| Dell XPS 15 9520 RTX 3050 Ti | |
| Dell XPS 17 9720 RTX 3060 | |
| AIDA64 / CPU PhotoWorxx | |
| Average of class Multimedia (8187 - 88154, n=53, last 2 years) | |
| Schenker Vision 16 Pro RTX 3070 Ti | |
| Dell XPS 17 9720 RTX 3060 | |
| HP Envy 16 h0112nr | |
| Dell XPS 15 9520 RTX 3050 Ti | |
| Average Intel Core i7-12700H (12863 - 52207, n=64) | |
| Lenovo ThinkPad X1 Extreme G5-21DE003RGE | |
| Lenovo ThinkPad X1 Extreme G4-20Y5CTO1WW (3050 Ti) | |
系统性能
ThinkPad X1 Extreme G5基本上是一个非常快速和反应灵敏的设备,但没有双通道内存配置是很明显的,特别是在合成测试中。虽然可以轻松升级内存,但板载的32GB即使对大多数用户来说也应该是足够的。然而,2 x 16 GB的出厂配置将是一个更明智的选择。正如一开始所提到的,我们在使用Windows 10时偶尔会遇到性能问题,因此我们建议不更新到Windows 11 Pro。
CrossMark: Overall | Productivity | Creativity | Responsiveness
| PCMark 10 / Score | |
| Average of class Multimedia (4325 - 10386, n=51, last 2 years) | |
| HP Envy 16 h0112nr | |
| Dell XPS 17 9720 RTX 3060 | |
| Lenovo ThinkPad X1 Extreme G5-21DE003RGE | |
| Average Intel Core i7-12700H, NVIDIA GeForce RTX 3060 Laptop GPU (5986 - 8156, n=12) | |
| Dell XPS 15 9520 RTX 3050 Ti | |
| Lenovo ThinkPad X1 Extreme G4-20Y5CTO1WW (3050 Ti) | |
| PCMark 10 / Essentials | |
| HP Envy 16 h0112nr | |
| Dell XPS 15 9520 RTX 3050 Ti | |
| Lenovo ThinkPad X1 Extreme G4-20Y5CTO1WW (3050 Ti) | |
| Dell XPS 17 9720 RTX 3060 | |
| Average Intel Core i7-12700H, NVIDIA GeForce RTX 3060 Laptop GPU (9289 - 12144, n=12) | |
| Lenovo ThinkPad X1 Extreme G5-21DE003RGE | |
| Average of class Multimedia (8025 - 11664, n=50, last 2 years) | |
| PCMark 10 / Productivity | |
| Average of class Multimedia (7323 - 18233, n=50, last 2 years) | |
| Dell XPS 15 9520 RTX 3050 Ti | |
| Dell XPS 17 9720 RTX 3060 | |
| Lenovo ThinkPad X1 Extreme G5-21DE003RGE | |
| HP Envy 16 h0112nr | |
| Average Intel Core i7-12700H, NVIDIA GeForce RTX 3060 Laptop GPU (6161 - 10362, n=12) | |
| Lenovo ThinkPad X1 Extreme G4-20Y5CTO1WW (3050 Ti) | |
| PCMark 10 / Digital Content Creation | |
| Average Intel Core i7-12700H, NVIDIA GeForce RTX 3060 Laptop GPU (8950 - 12554, n=12) | |
| HP Envy 16 h0112nr | |
| Average of class Multimedia (3651 - 16240, n=50, last 2 years) | |
| Lenovo ThinkPad X1 Extreme G5-21DE003RGE | |
| Dell XPS 17 9720 RTX 3060 | |
| Dell XPS 15 9520 RTX 3050 Ti | |
| Lenovo ThinkPad X1 Extreme G4-20Y5CTO1WW (3050 Ti) | |
| CrossMark / Overall | |
| Dell XPS 17 9720 RTX 3060 | |
| Average of class Multimedia (866 - 2728, n=59, last 2 years) | |
| Dell XPS 15 9520 RTX 3050 Ti | |
| HP Envy 16 h0112nr | |
| Average Intel Core i7-12700H, NVIDIA GeForce RTX 3060 Laptop GPU (1649 - 2017, n=11) | |
| Lenovo ThinkPad X1 Extreme G5-21DE003RGE | |
| Schenker Vision 16 Pro RTX 3070 Ti | |
| Apple MacBook Pro 16 2021 M1 Pro | |
| CrossMark / Productivity | |
| Dell XPS 15 9520 RTX 3050 Ti | |
| Average of class Multimedia (931 - 2489, n=59, last 2 years) | |
| Dell XPS 17 9720 RTX 3060 | |
| HP Envy 16 h0112nr | |
| Average Intel Core i7-12700H, NVIDIA GeForce RTX 3060 Laptop GPU (1536 - 1958, n=11) | |
| Lenovo ThinkPad X1 Extreme G5-21DE003RGE | |
| Schenker Vision 16 Pro RTX 3070 Ti | |
| Apple MacBook Pro 16 2021 M1 Pro | |
| CrossMark / Creativity | |
| Average of class Multimedia (907 - 3465, n=59, last 2 years) | |
| Dell XPS 17 9720 RTX 3060 | |
| Apple MacBook Pro 16 2021 M1 Pro | |
| HP Envy 16 h0112nr | |
| Dell XPS 15 9520 RTX 3050 Ti | |
| Average Intel Core i7-12700H, NVIDIA GeForce RTX 3060 Laptop GPU (1816 - 2084, n=11) | |
| Lenovo ThinkPad X1 Extreme G5-21DE003RGE | |
| Schenker Vision 16 Pro RTX 3070 Ti | |
| CrossMark / Responsiveness | |
| Dell XPS 15 9520 RTX 3050 Ti | |
| Dell XPS 17 9720 RTX 3060 | |
| Average Intel Core i7-12700H, NVIDIA GeForce RTX 3060 Laptop GPU (1210 - 2207, n=11) | |
| HP Envy 16 h0112nr | |
| Average of class Multimedia (605 - 2024, n=59, last 2 years) | |
| Lenovo ThinkPad X1 Extreme G5-21DE003RGE | |
| Schenker Vision 16 Pro RTX 3070 Ti | |
| Apple MacBook Pro 16 2021 M1 Pro | |
| PCMark 10 Score | 7243 points | |
Help | ||
| AIDA64 / Memory Copy | |
| Average of class Multimedia (11299 - 132135, n=53, last 2 years) | |
| Schenker Vision 16 Pro RTX 3070 Ti | |
| Dell XPS 17 9720 RTX 3060 | |
| Dell XPS 15 9520 RTX 3050 Ti | |
| HP Envy 16 h0112nr | |
| Average Intel Core i7-12700H (25615 - 80511, n=64) | |
| Lenovo ThinkPad X1 Extreme G4-20Y5CTO1WW (3050 Ti) | |
| Lenovo ThinkPad X1 Extreme G5-21DE003RGE | |
| AIDA64 / Memory Read | |
| Average of class Multimedia (11624 - 174586, n=53, last 2 years) | |
| Dell XPS 17 9720 RTX 3060 | |
| HP Envy 16 h0112nr | |
| Schenker Vision 16 Pro RTX 3070 Ti | |
| Dell XPS 15 9520 RTX 3050 Ti | |
| Average Intel Core i7-12700H (25586 - 79442, n=64) | |
| Lenovo ThinkPad X1 Extreme G4-20Y5CTO1WW (3050 Ti) | |
| Lenovo ThinkPad X1 Extreme G5-21DE003RGE | |
| AIDA64 / Memory Write | |
| Average of class Multimedia (11755 - 134998, n=53, last 2 years) | |
| Schenker Vision 16 Pro RTX 3070 Ti | |
| Dell XPS 17 9720 RTX 3060 | |
| HP Envy 16 h0112nr | |
| Dell XPS 15 9520 RTX 3050 Ti | |
| Average Intel Core i7-12700H (23679 - 88660, n=64) | |
| Lenovo ThinkPad X1 Extreme G4-20Y5CTO1WW (3050 Ti) | |
| Lenovo ThinkPad X1 Extreme G5-21DE003RGE | |
| AIDA64 / Memory Latency | |
| Average of class Multimedia (7 - 535, n=52, last 2 years) | |
| Dell XPS 15 9520 RTX 3050 Ti | |
| Dell XPS 17 9720 RTX 3060 | |
| Schenker Vision 16 Pro RTX 3070 Ti | |
| HP Envy 16 h0112nr | |
| Lenovo ThinkPad X1 Extreme G5-21DE003RGE | |
| Lenovo ThinkPad X1 Extreme G4-20Y5CTO1WW (3050 Ti) | |
| Average Intel Core i7-12700H (76.2 - 133.9, n=62) | |
* ... smaller is better
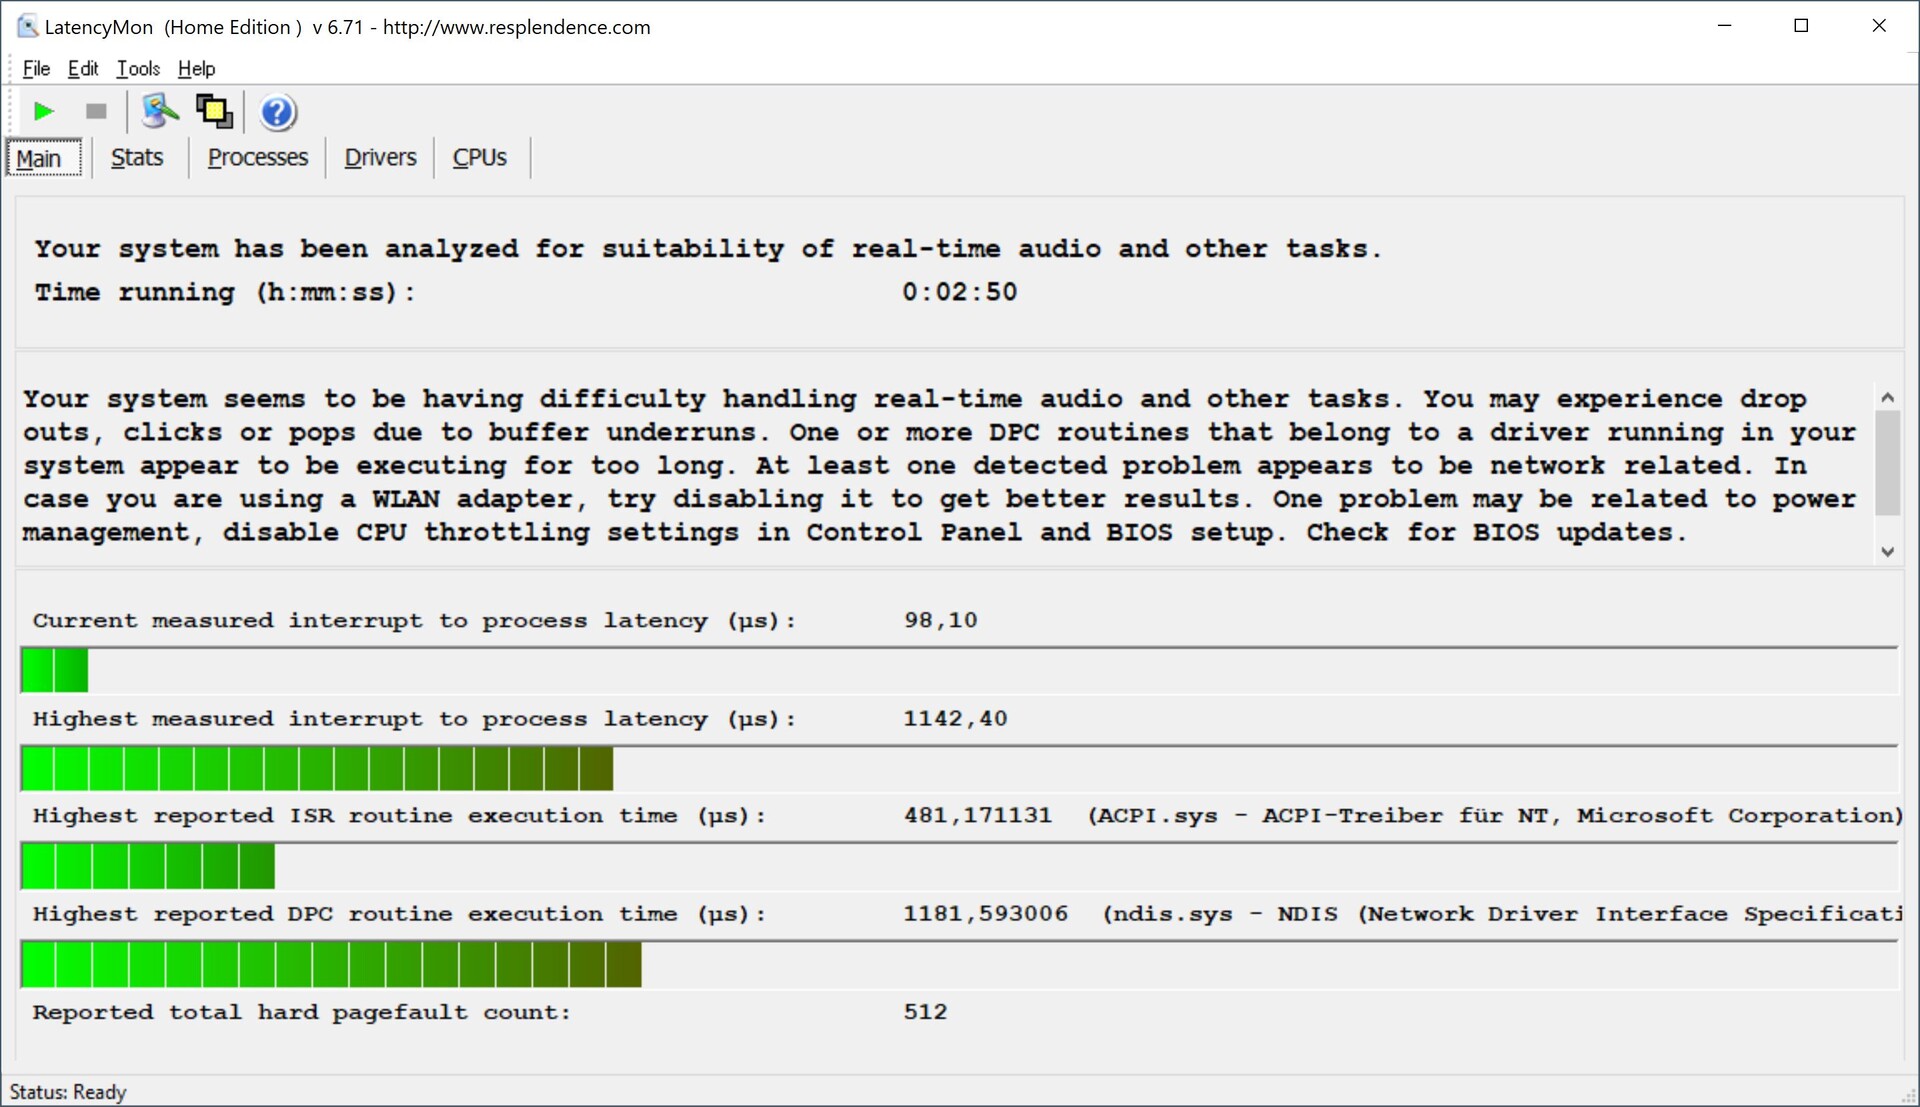
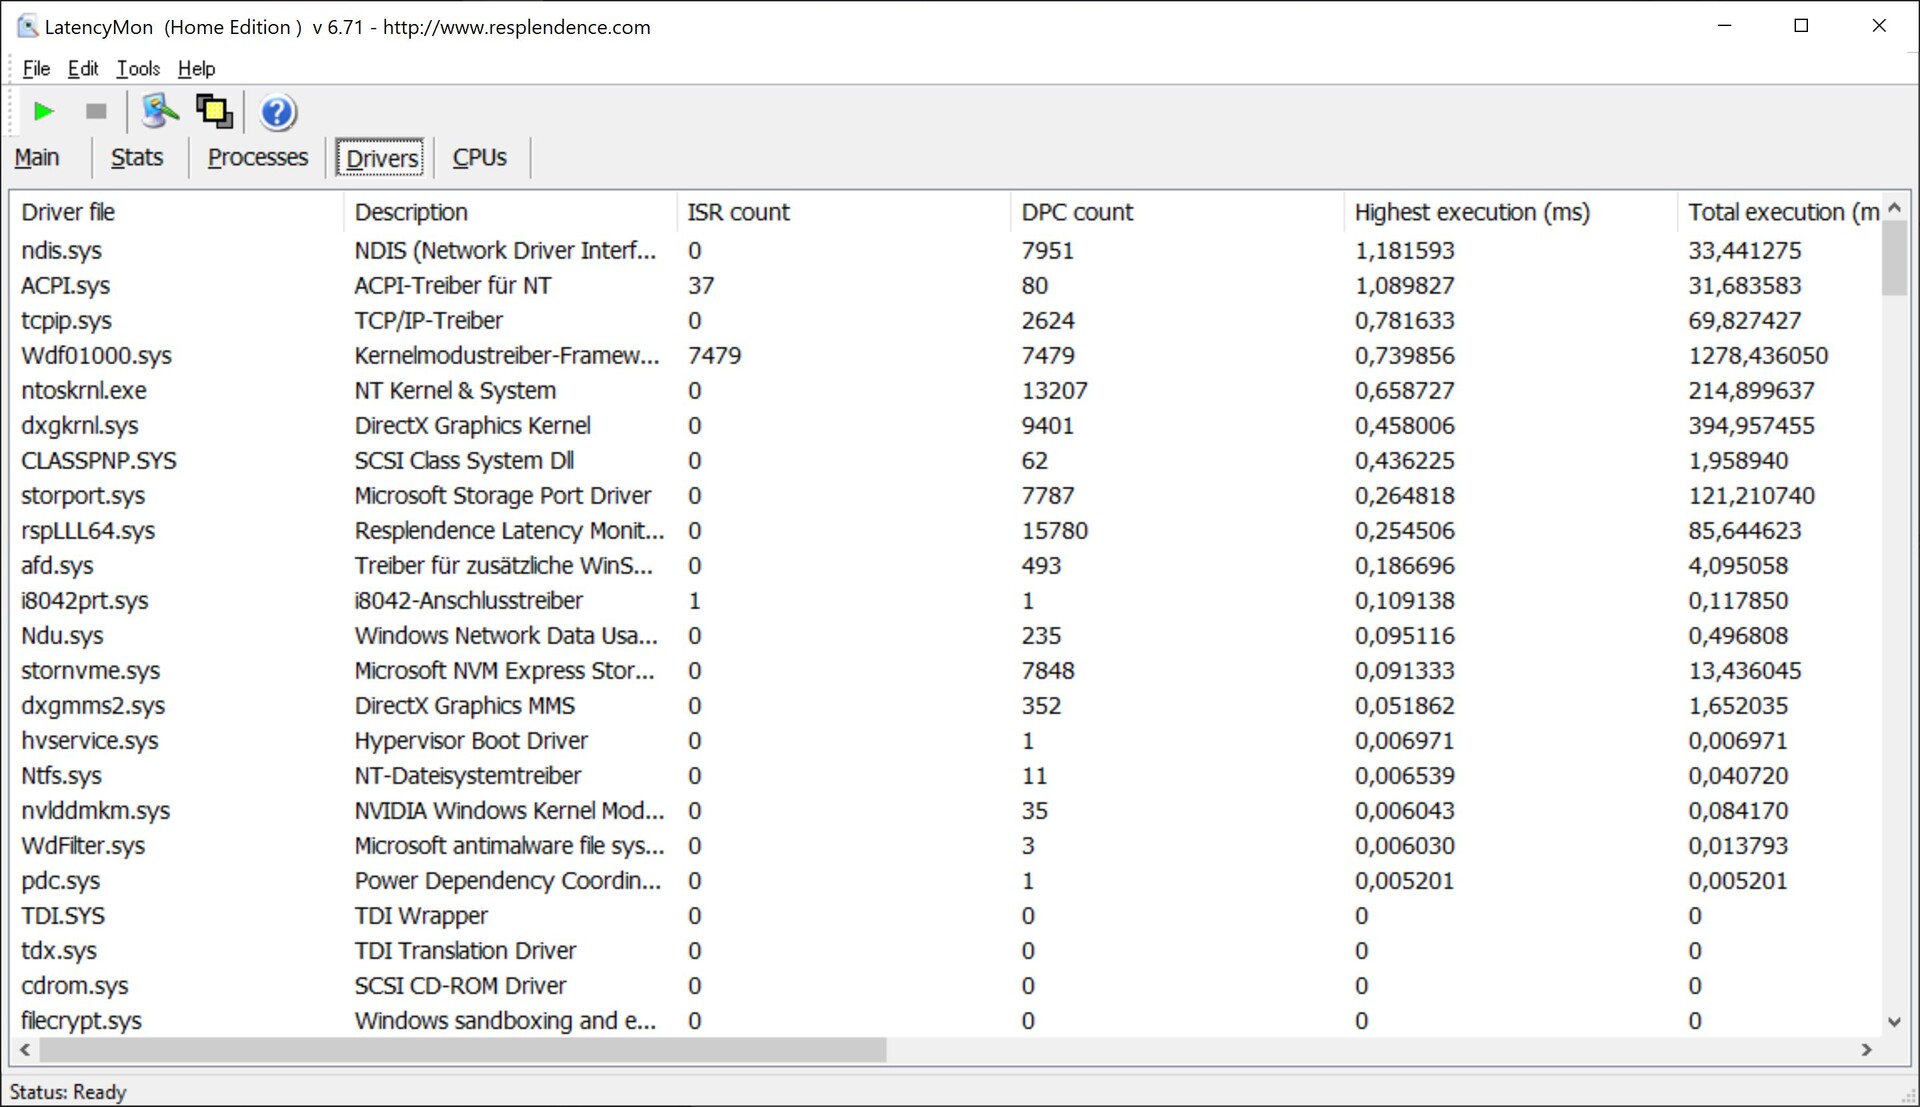
DPC延迟
在我们的标准化延迟测试中(上网冲浪、4K YouTube播放、CPU负载),评测设备展示了目前BIOS版本的一些局限性,因此更适合使用实时音频应用程序。
| DPC Latencies / LatencyMon - interrupt to process latency (max), Web, Youtube, Prime95 | |
| Lenovo ThinkPad X1 Extreme G5-21DE003RGE | |
| Lenovo ThinkPad X1 Extreme G4-20Y5CTO1WW (3050 Ti) | |
| Dell XPS 15 9520 RTX 3050 Ti | |
| HP Envy 16 h0112nr | |
| Schenker Vision 16 Pro RTX 3070 Ti | |
| Dell XPS 17 9720 RTX 3060 | |
* ... smaller is better
大容量存储
在我们的评测设备中,联想为X1 Extreme G5配备了来自美光的快速PCIe 4.0固态硬盘(3400),提供了1TB的存储容量,首次安装后可获得900GB。总而言之,有一些更快的PCIe 4.0驱动器,然而,在实践中的差异可以忽略不计,设备在较长时间的负载中也完全保持稳定。更多的SSD基准测试可以在 这里.Laptop solid state disks (HDD, SSD) benchmarks

* ... smaller is better
Continuous load read: DiskSpd Read Loop, Queue Depth 8
图形卡
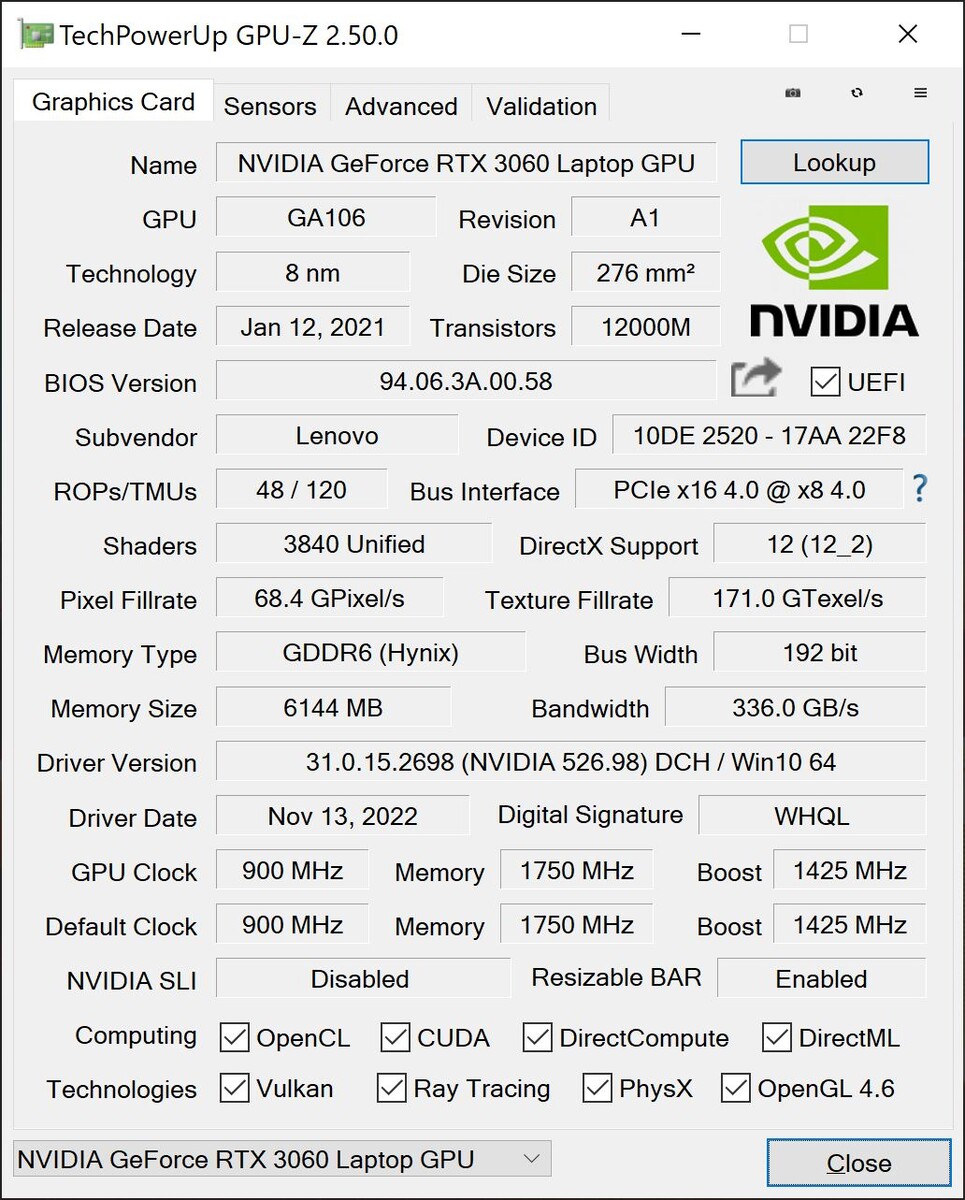
联想使用的是80瓦版本的NvidiaGeForce RTX 3060.该GPU还可以使用15瓦的动态提升,从而使它的总功率达到95瓦。RTX 3060提供6GB GDDR6 VRAM,系统可以通过Optimus技术在集成和专用GPU之间动态切换。我们假设,两个可选 RTX 3070 Ti和 RTX 3080 TiGPU是最慢的版本,因为它们可以分别以最大80瓦和95瓦的功率使用。
然而,基准测试很快显示,系统不能长时间保持95瓦,GPU很快就降到80瓦。这就解释了与惠普Envy 16相比的轻微不足。 HP Envy 16相比,后者同样配备了90瓦的RTX 3060版本。此外,ThinkPad在3DMarkTime Spy 压力测试中未能达到91%的合格分数。在电池模式下,有一个小的性能赤字,约为30%。其他GPU基准测试可以在 这里.
| 3DMark 11 Performance | 22654 points | |
| 3DMark Fire Strike Score | 15945 points | |
| 3DMark Time Spy Score | 7111 points | |
Help | ||
| Blender / v3.3 Classroom OPTIX/RTX | |
| HP Envy 16 h0112nr | |
| Lenovo ThinkPad X1 Extreme G5-21DE003RGE | |
| Average of class Multimedia (12 - 105, n=21, last 2 years) | |
| Average NVIDIA GeForce RTX 3060 Laptop GPU (30 - 56, n=15) | |
| Schenker Vision 16 Pro RTX 3070 Ti | |
| Blender / v3.3 Classroom CUDA | |
| HP Envy 16 h0112nr | |
| Lenovo ThinkPad X1 Extreme G5-21DE003RGE | |
| Average of class Multimedia (20 - 186, n=21, last 2 years) | |
| Average NVIDIA GeForce RTX 3060 Laptop GPU (51 - 89, n=15) | |
| Schenker Vision 16 Pro RTX 3070 Ti | |
| Blender / v3.3 Classroom CPU | |
| HP Envy 16 h0112nr | |
| Schenker Vision 16 Pro RTX 3070 Ti | |
| Average of class Multimedia (134.5 - 1042, n=61, last 2 years) | |
| Average NVIDIA GeForce RTX 3060 Laptop GPU (291 - 508, n=15) | |
| Lenovo ThinkPad X1 Extreme G5-21DE003RGE | |
* ... smaller is better
游戏性能
基本上, RTX 3060提供了体面的游戏能力,尽管这里的性能下降也是明显的。我们对Witcher 3 循环的评估表明,只要处理器被推动,显卡只用了70瓦多一点。昂贵的蒸汽室冷却有些令人失望。凭借其RTX 3060,X1 Extreme G5 RTX 3060发现自己领先于旧的 RTX 3050 Ti模型,但比预期的幅度要小--这对于更快、更贵的 RTX 3070 Ti和 RTX 3080 TiGeForce GPU。
一般来说,X1 Extreme G5中的RTX 3060提供了足够的性能,在1080p的情况下,甚至在QHD分辨率下的最大细节设置,这取决于标题。对于原生4K分辨率,该GPU太弱了。其他游戏基准测试列在 这里.
| The Witcher 3 - 1920x1080 Ultra Graphics & Postprocessing (HBAO+) | |
| Schenker Vision 16 Pro RTX 3070 Ti | |
| HP Envy 16 h0112nr | |
| Dell XPS 17 9720 RTX 3060 | |
| Lenovo ThinkPad X1 Extreme G5-21DE003RGE | |
| Lenovo ThinkPad X1 Extreme G4-20Y5CTO1WW (3050 Ti) | |
| Average of class Multimedia (11 - 107, n=5, last 2 years) | |
| Dell XPS 15 9520 RTX 3050 Ti | |
| Final Fantasy XV Benchmark - 1920x1080 High Quality | |
| Schenker Vision 16 Pro RTX 3070 Ti | |
| HP Envy 16 h0112nr | |
| Dell XPS 17 9720 RTX 3060 | |
| Lenovo ThinkPad X1 Extreme G5-21DE003RGE | |
| Average of class Multimedia (7.61 - 144.4, n=56, last 2 years) | |
| Dell XPS 15 9520 RTX 3050 Ti | |
Witcher 3 FPS diagram
| low | med. | high | ultra | QHD | 4K | |
|---|---|---|---|---|---|---|
| GTA V (2015) | 182.6 | 176.9 | 146.8 | 72 | 52 | 42.8 |
| The Witcher 3 (2015) | 313 | 210 | 126 | 60.5 | 26 | |
| Dota 2 Reborn (2015) | 169.6 | 150.7 | 143.2 | 133.4 | 66.1 | |
| Final Fantasy XV Benchmark (2018) | 123.2 | 70.4 | 55 | 41.1 | 22.9 | |
| X-Plane 11.11 (2018) | 135.1 | 110.1 | 91.6 | 58.5 | ||
| Far Cry 5 (2018) | 148 | 106 | 98 | 92 | 58 | 32 |
| Strange Brigade (2018) | 357 | 154.9 | 115.6 | 102.2 | 75.4 | 40 |
| F1 2021 (2021) | 263 | 163.7 | 128.9 | 76.2 | 47.5 | 25.9 |
| Cyberpunk 2077 1.6 (2022) | 80 | 68 | 48 | 40 | 23 | 11 |
| F1 22 (2022) | 144.2 | 135.2 | 112.9 | 36.6 | 22.8 | 10.6 |
排放--G5型号中更安静的风扇
噪声排放
采用GeForce RTX 3060或更快的配置,配备了联想的蒸汽室冷却。两个风扇在空闲使用时通常是关闭的,在低负载时通常是无声或非常安静。然而,一旦对处理器和/或显卡提出更多要求,两个风扇就会达到最大速度,相当于45.5分贝(A)的噪音水平。我们在游戏和压力测试中都能确定这一测量值。通过实现这一点,新的X1 Extreme G5明显比配备RTX 30的G4型号更安静。G4型号的RTX 3050 Ti传统的冷却方式。
当然,更安静的风扇总是受欢迎的,但我们至少希望更稳定的GPU性能与使用最快能源配置文件设置的稍大噪音的风扇相结合。我们无法检测到任何其他电子噪音。
Noise level
| Idle |
| 23.2 / 23.2 / 23.2 dB(A) |
| Load |
| 45.5 / 45.5 dB(A) |
 | ||
30 dB silent 40 dB(A) audible 50 dB(A) loud |
||
min: | ||
| Lenovo ThinkPad X1 Extreme G5-21DE003RGE GeForce RTX 3060 Laptop GPU, i7-12700H, Micron 3400 1TB MTFDKBA1T0TFH | HP Envy 16 h0112nr GeForce RTX 3060 Laptop GPU, i7-12700H, Micron 3400 1TB MTFDKBA1T0TFH | Schenker Vision 16 Pro RTX 3070 Ti GeForce RTX 3070 Ti Laptop GPU, i7-12700H, Samsung SSD 980 Pro 1TB MZ-V8P1T0BW | Dell XPS 15 9520 RTX 3050 Ti GeForce RTX 3050 Ti Laptop GPU, i7-12700H, WDC PC SN810 512GB | Apple MacBook Pro 16 2021 M1 Pro M1 Pro 16-Core GPU, M1 Pro, Apple SSD AP1024R | Dell XPS 17 9720 RTX 3060 GeForce RTX 3060 Laptop GPU, i7-12700H, Samsung PM9A1 MZVL21T0HCLR | Lenovo ThinkPad X1 Extreme G4-20Y5CTO1WW (3050 Ti) GeForce RTX 3050 Ti Laptop GPU, i7-11800H, Samsung PM9A1 MZVL21T0HCLR | |
|---|---|---|---|---|---|---|---|
| Noise | -6% | -3% | 8% | 6% | -3% | -4% | |
| off / environment * (dB) | 23.2 | 22.8 2% | 22.9 1% | 22.8 2% | 24.7 -6% | 23.8 -3% | 23.52 -1% |
| Idle Minimum * (dB) | 23.2 | 22.9 1% | 24.3 -5% | 22.9 1% | 24.7 -6% | 24.1 -4% | 23.52 -1% |
| Idle Average * (dB) | 23.2 | 22.9 1% | 24.3 -5% | 22.9 1% | 24.7 -6% | 24.1 -4% | 23.52 -1% |
| Idle Maximum * (dB) | 23.2 | 30.5 -31% | 24.3 -5% | 22.9 1% | 24.7 -6% | 24.1 -4% | 23.52 -1% |
| Load Average * (dB) | 45.5 | 41.4 9% | 38.5 15% | 30.9 32% | 26.1 43% | 43.2 5% | 42.9 6% |
| Witcher 3 ultra * (dB) | 45.5 | 51.1 -12% | 51 -12% | 37.8 17% | 48 -5% | 52.5 -15% | |
| Load Maximum * (dB) | 45.5 | 51.4 -13% | 51 -12% | 44.7 2% | 37.4 18% | 48 -5% | 52.45 -15% |
* ... smaller is better
温度

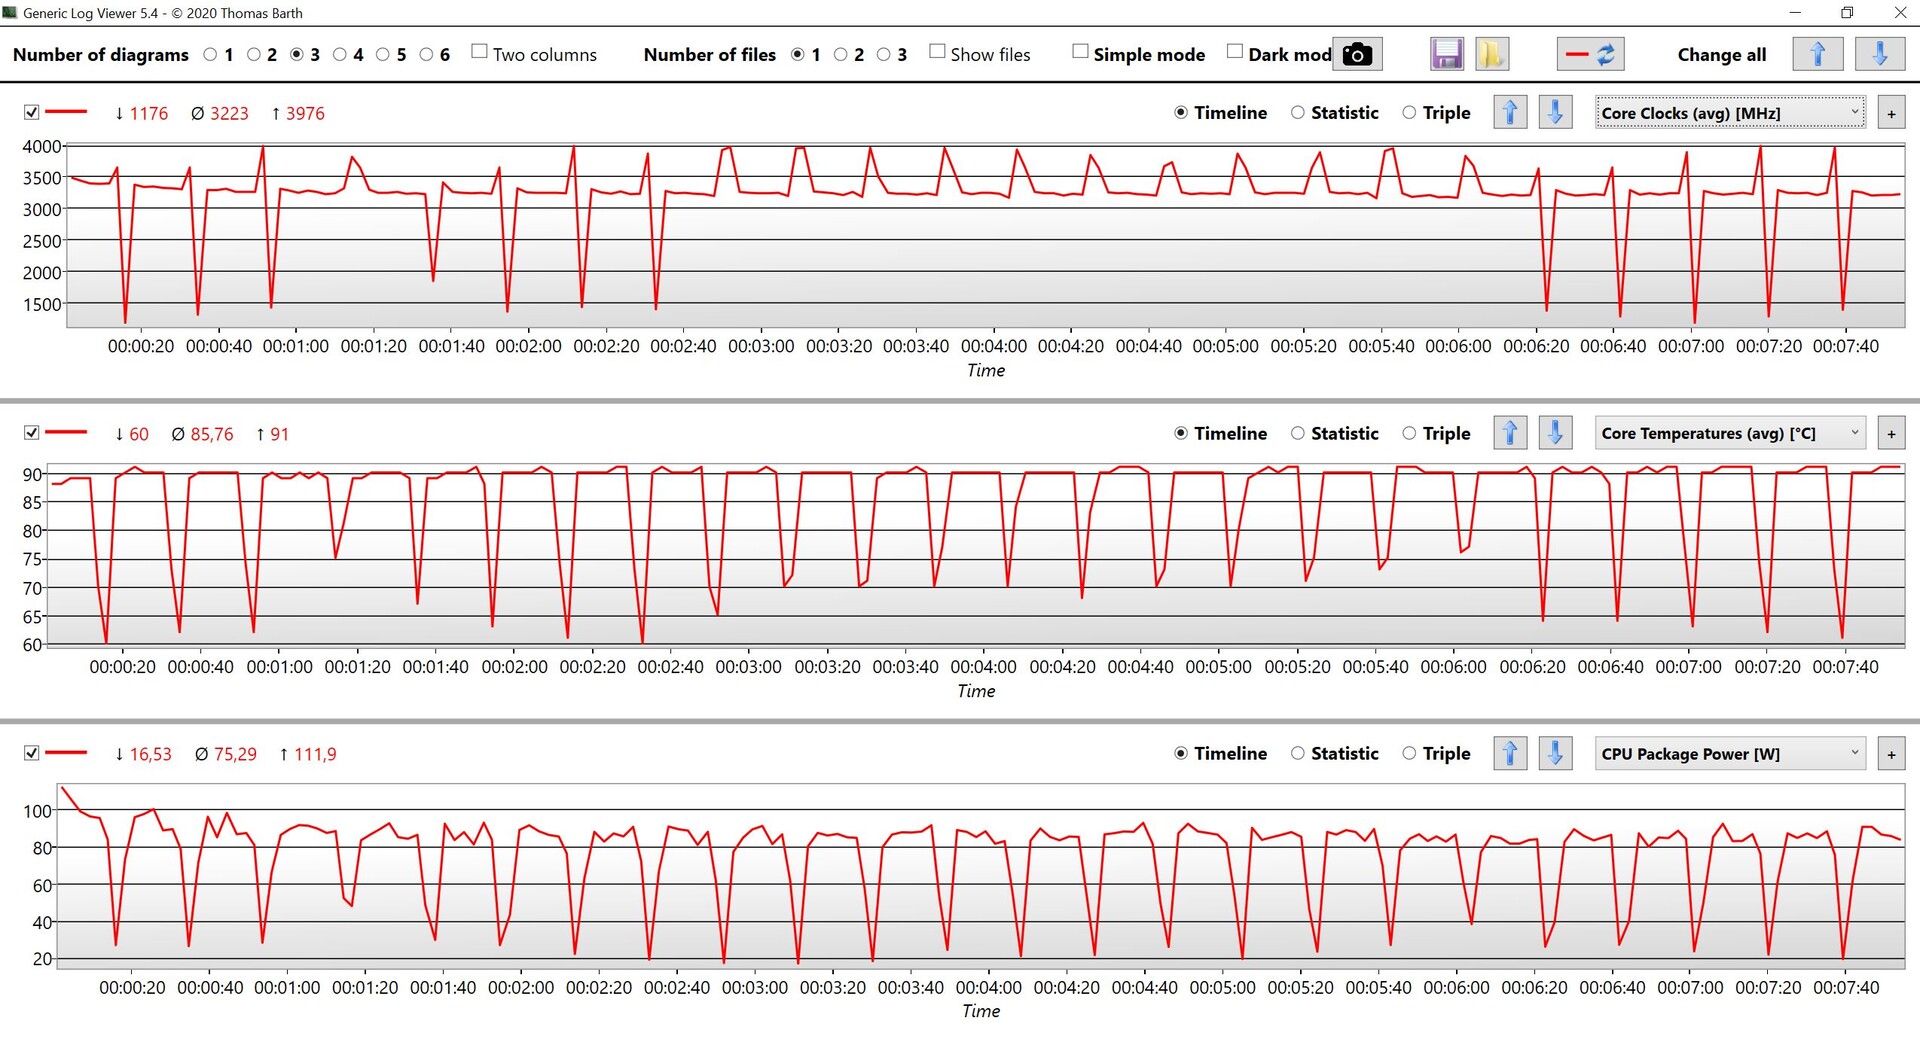
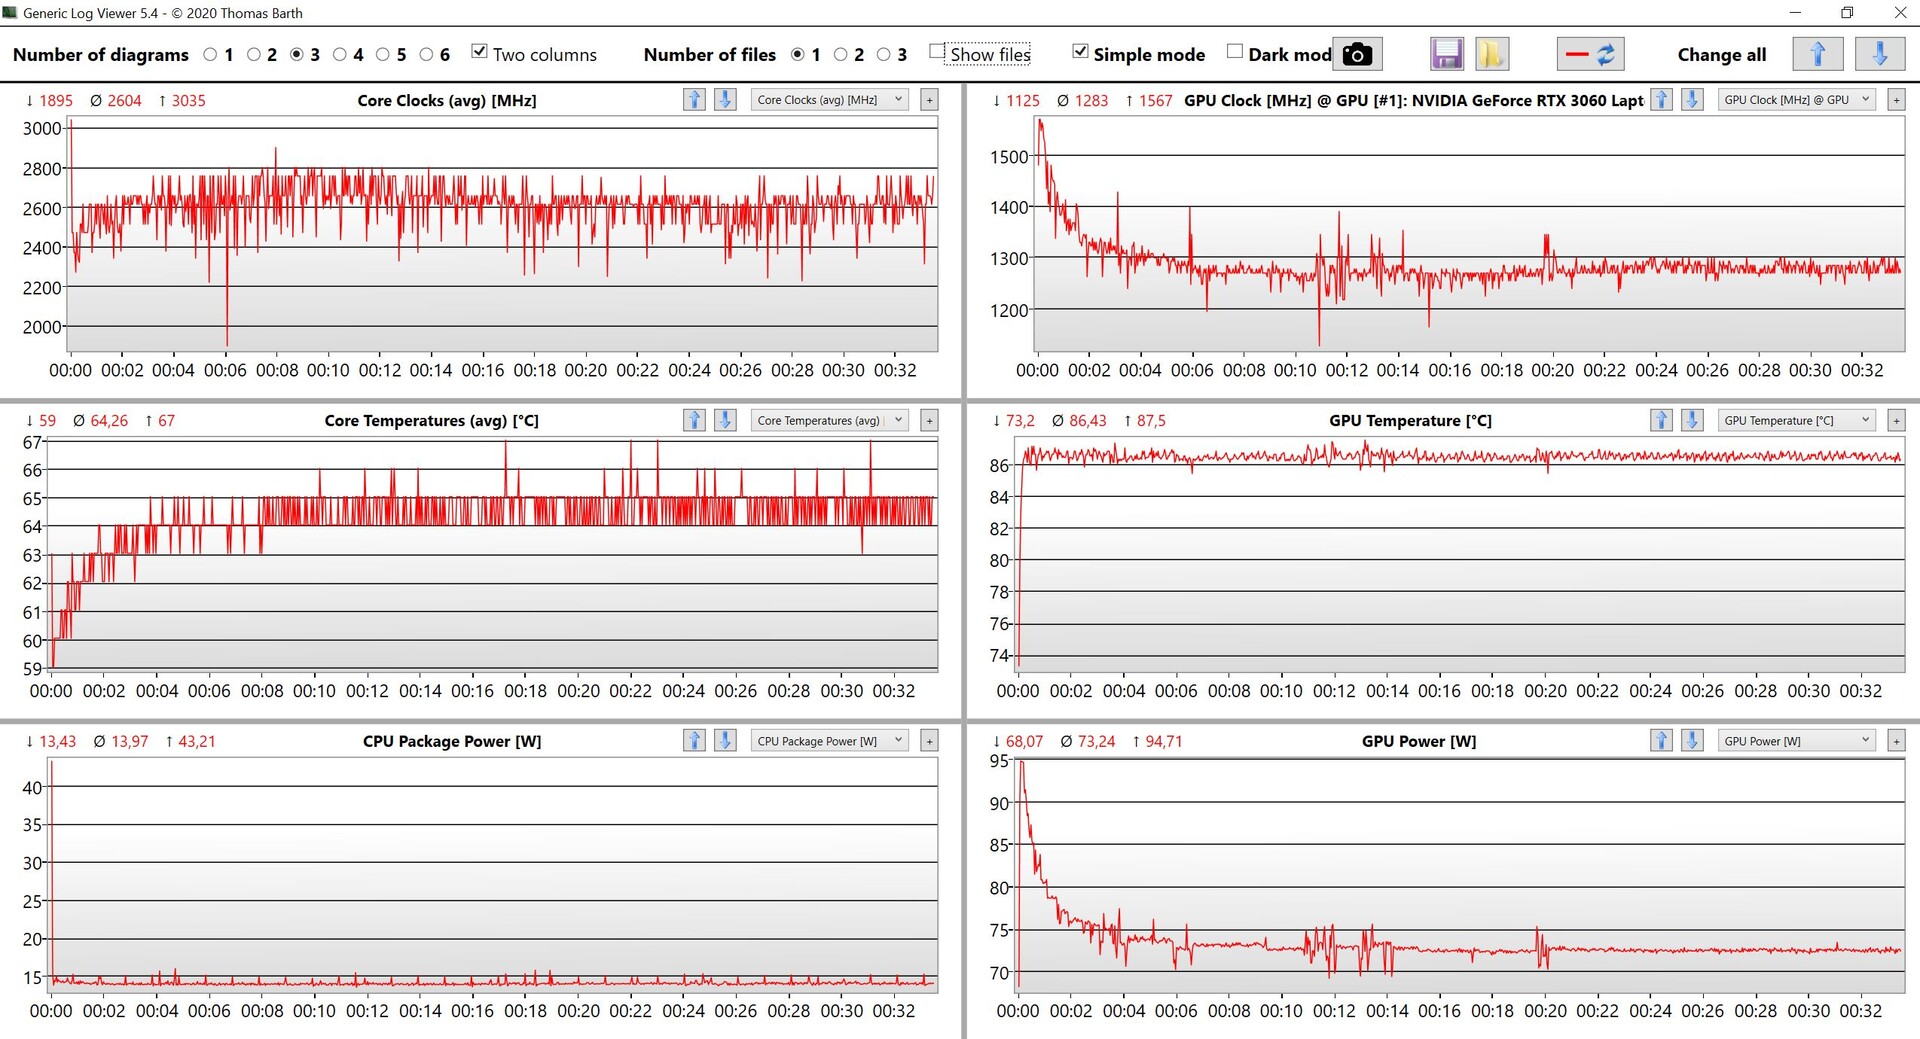
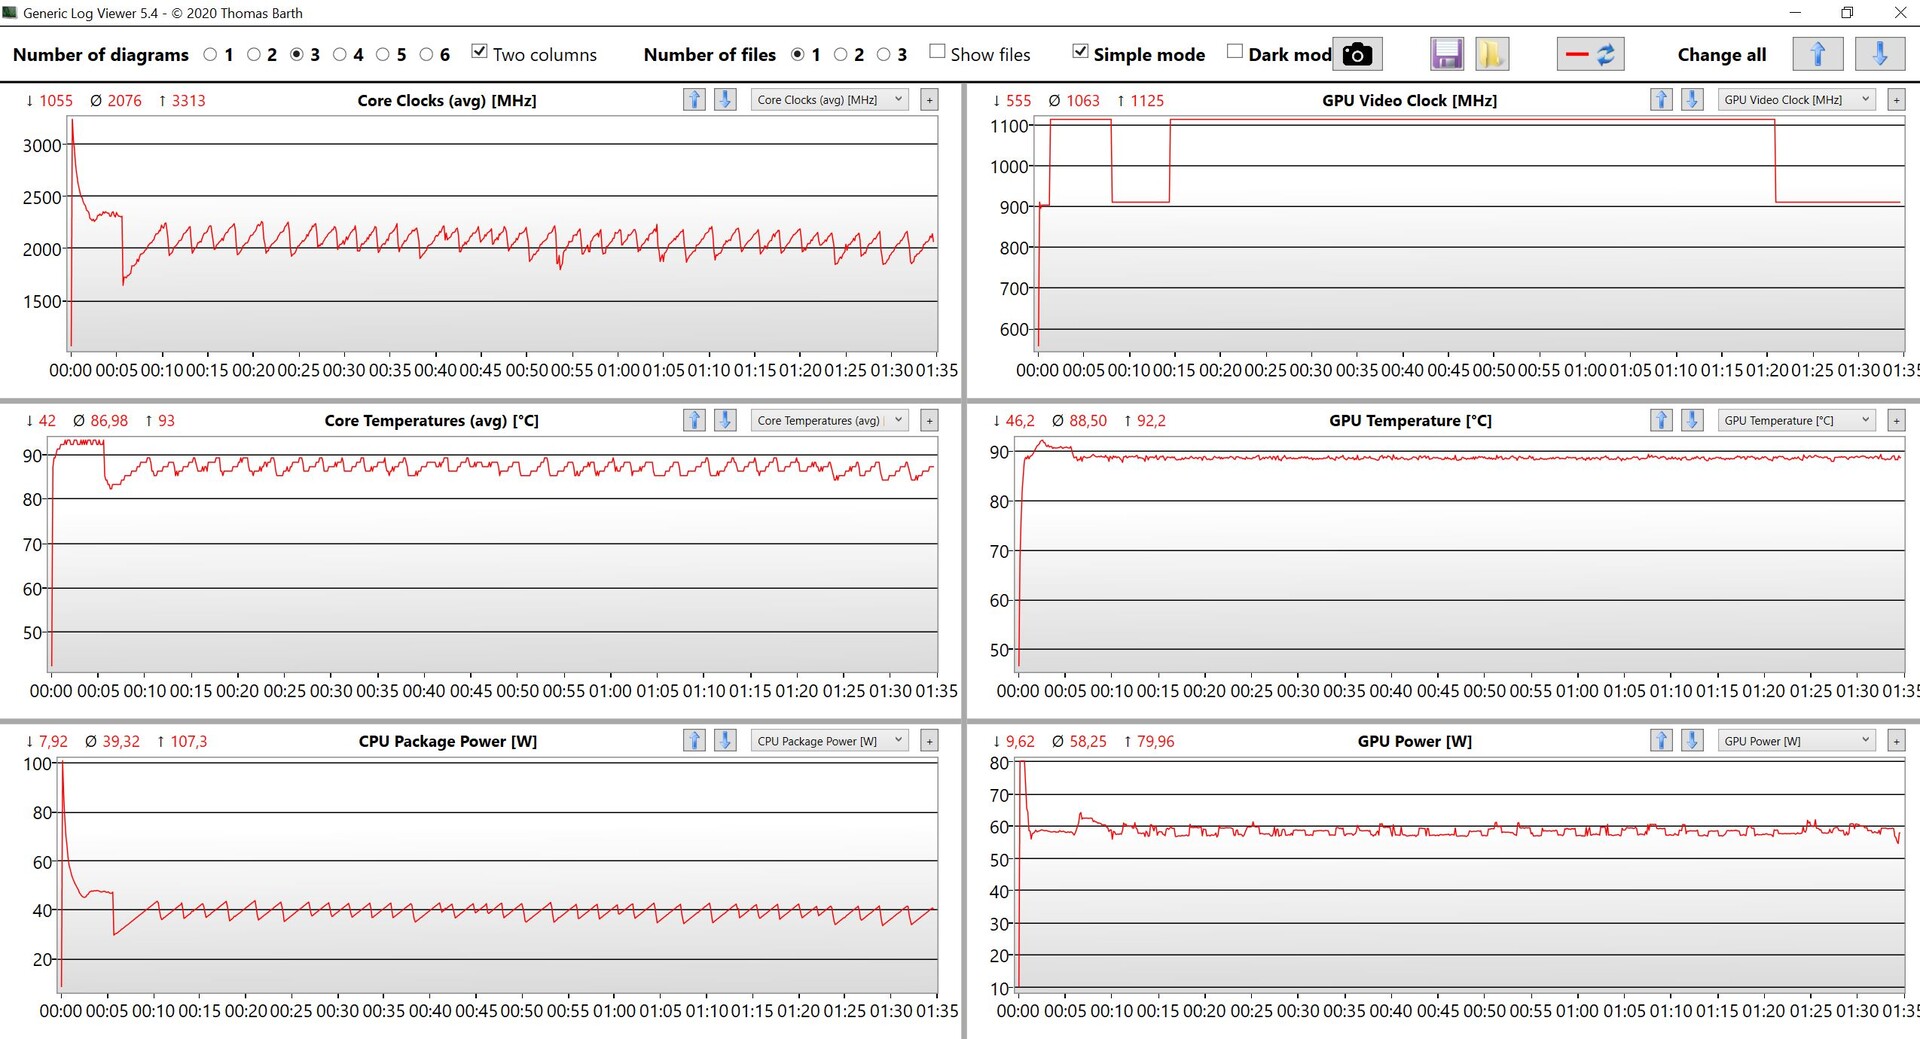
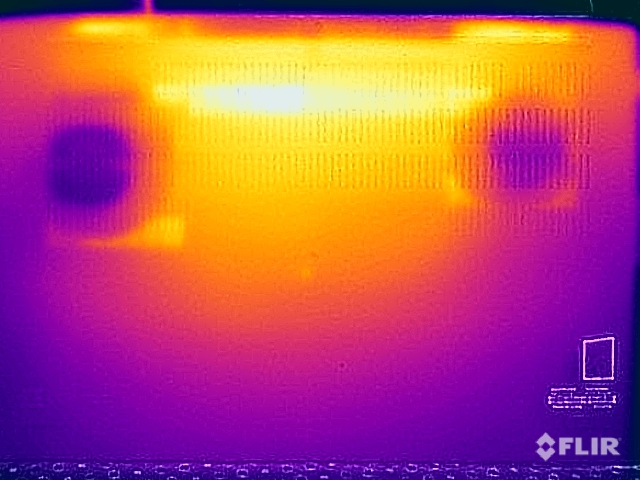
最近,联想一直在CPU中使用液态金属散热膏,这已经对CPU的性能产生了积极影响。然而,事情在负载下变得很热,与较慢的风扇有关。在游戏和压力测试期间,我们在基本单元的底部和顶部分别测得超过55℃和50℃。在负载情况下,将设备放在用户的腿上是不明智的,打字时手指发热也是可以预料的。然而,在日常工作中没有温度问题。
在压力测试中,CPU和GPU分别在40和60瓦时迅速趋于平稳,这意味着系统能够冷却的总功率为100瓦。在90℃时,这两个组件迅速变得非常热。在压力测试完成后,性能没有下降。
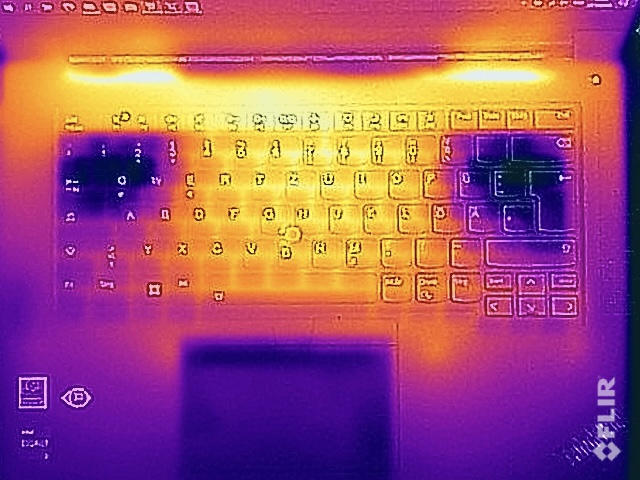
(-) The maximum temperature on the upper side is 52 °C / 126 F, compared to the average of 36.8 °C / 98 F, ranging from 21 to 71 °C for the class Multimedia.
(-) The bottom heats up to a maximum of 56.4 °C / 134 F, compared to the average of 39.1 °C / 102 F
(+) In idle usage, the average temperature for the upper side is 25.6 °C / 78 F, compared to the device average of 31.3 °C / 88 F.
(-) Playing The Witcher 3, the average temperature for the upper side is 41.1 °C / 106 F, compared to the device average of 31.3 °C / 88 F.
(±) The palmrests and touchpad can get very hot to the touch with a maximum of 36.1 °C / 97 F.
(-) The average temperature of the palmrest area of similar devices was 28.7 °C / 83.7 F (-7.4 °C / -13.3 F).
| Lenovo ThinkPad X1 Extreme G5-21DE003RGE Intel Core i7-12700H, NVIDIA GeForce RTX 3060 Laptop GPU | HP Envy 16 h0112nr Intel Core i7-12700H, NVIDIA GeForce RTX 3060 Laptop GPU | Schenker Vision 16 Pro RTX 3070 Ti Intel Core i7-12700H, NVIDIA GeForce RTX 3070 Ti Laptop GPU | Dell XPS 15 9520 RTX 3050 Ti Intel Core i7-12700H, NVIDIA GeForce RTX 3050 Ti Laptop GPU | Apple MacBook Pro 16 2021 M1 Pro Apple M1 Pro, Apple M1 Pro 16-Core GPU | Dell XPS 17 9720 RTX 3060 Intel Core i7-12700H, NVIDIA GeForce RTX 3060 Laptop GPU | Lenovo ThinkPad X1 Extreme G4-20Y5CTO1WW (3050 Ti) Intel Core i7-11800H, NVIDIA GeForce RTX 3050 Ti Laptop GPU | |
|---|---|---|---|---|---|---|---|
| Heat | -3% | 5% | -6% | 18% | -8% | -1% | |
| Maximum Upper Side * (°C) | 52 | 45.2 13% | 50.8 2% | 51.4 1% | 41 21% | 51.8 -0% | 49 6% |
| Maximum Bottom * (°C) | 56.4 | 44 22% | 46.3 18% | 51 10% | 39 31% | 44.2 22% | 44.4 21% |
| Idle Upper Side * (°C) | 26.4 | 33.6 -27% | 27.2 -3% | 30 -14% | 24 9% | 34.8 -32% | 32.1 -22% |
| Idle Bottom * (°C) | 27.2 | 32.6 -20% | 26.6 2% | 33 -21% | 24 12% | 33.2 -22% | 29.8 -10% |
* ... smaller is better
发言人
联想继续为该设备配备了两个立体声扬声器,不仅能够输出20瓦的功率,还能产生体面的声音。然而,其结果是根本没有拥有更多模块的竞争对手那样响亮或有力,如MacBook Pro 16有六个扬声器,或 XPS 17有四个。
Lenovo ThinkPad X1 Extreme G5-21DE003RGE audio analysis
(±) | speaker loudness is average but good (81.4 dB)
Bass 100 - 315 Hz
(±) | reduced bass - on average 11.5% lower than median
(±) | linearity of bass is average (10.6% delta to prev. frequency)
Mids 400 - 2000 Hz
(±) | higher mids - on average 6.1% higher than median
(+) | mids are linear (4.6% delta to prev. frequency)
Highs 2 - 16 kHz
(+) | balanced highs - only 3.4% away from median
(+) | highs are linear (4.2% delta to prev. frequency)
Overall 100 - 16.000 Hz
(+) | overall sound is linear (14.5% difference to median)
Compared to same class
» 34% of all tested devices in this class were better, 4% similar, 61% worse
» The best had a delta of 5%, average was 17%, worst was 45%
Compared to all devices tested
» 18% of all tested devices were better, 4% similar, 77% worse
» The best had a delta of 4%, average was 23%, worst was 134%
Apple MacBook Pro 16 2021 M1 Pro audio analysis
(+) | speakers can play relatively loud (84.7 dB)
Bass 100 - 315 Hz
(+) | good bass - only 3.8% away from median
(+) | bass is linear (5.2% delta to prev. frequency)
Mids 400 - 2000 Hz
(+) | balanced mids - only 1.3% away from median
(+) | mids are linear (2.1% delta to prev. frequency)
Highs 2 - 16 kHz
(+) | balanced highs - only 1.9% away from median
(+) | highs are linear (2.7% delta to prev. frequency)
Overall 100 - 16.000 Hz
(+) | overall sound is linear (4.6% difference to median)
Compared to same class
» 0% of all tested devices in this class were better, 0% similar, 100% worse
» The best had a delta of 5%, average was 17%, worst was 45%
Compared to all devices tested
» 0% of all tested devices were better, 0% similar, 100% worse
» The best had a delta of 4%, average was 23%, worst was 134%
能源管理--一个耗电的4K面板
能源消耗
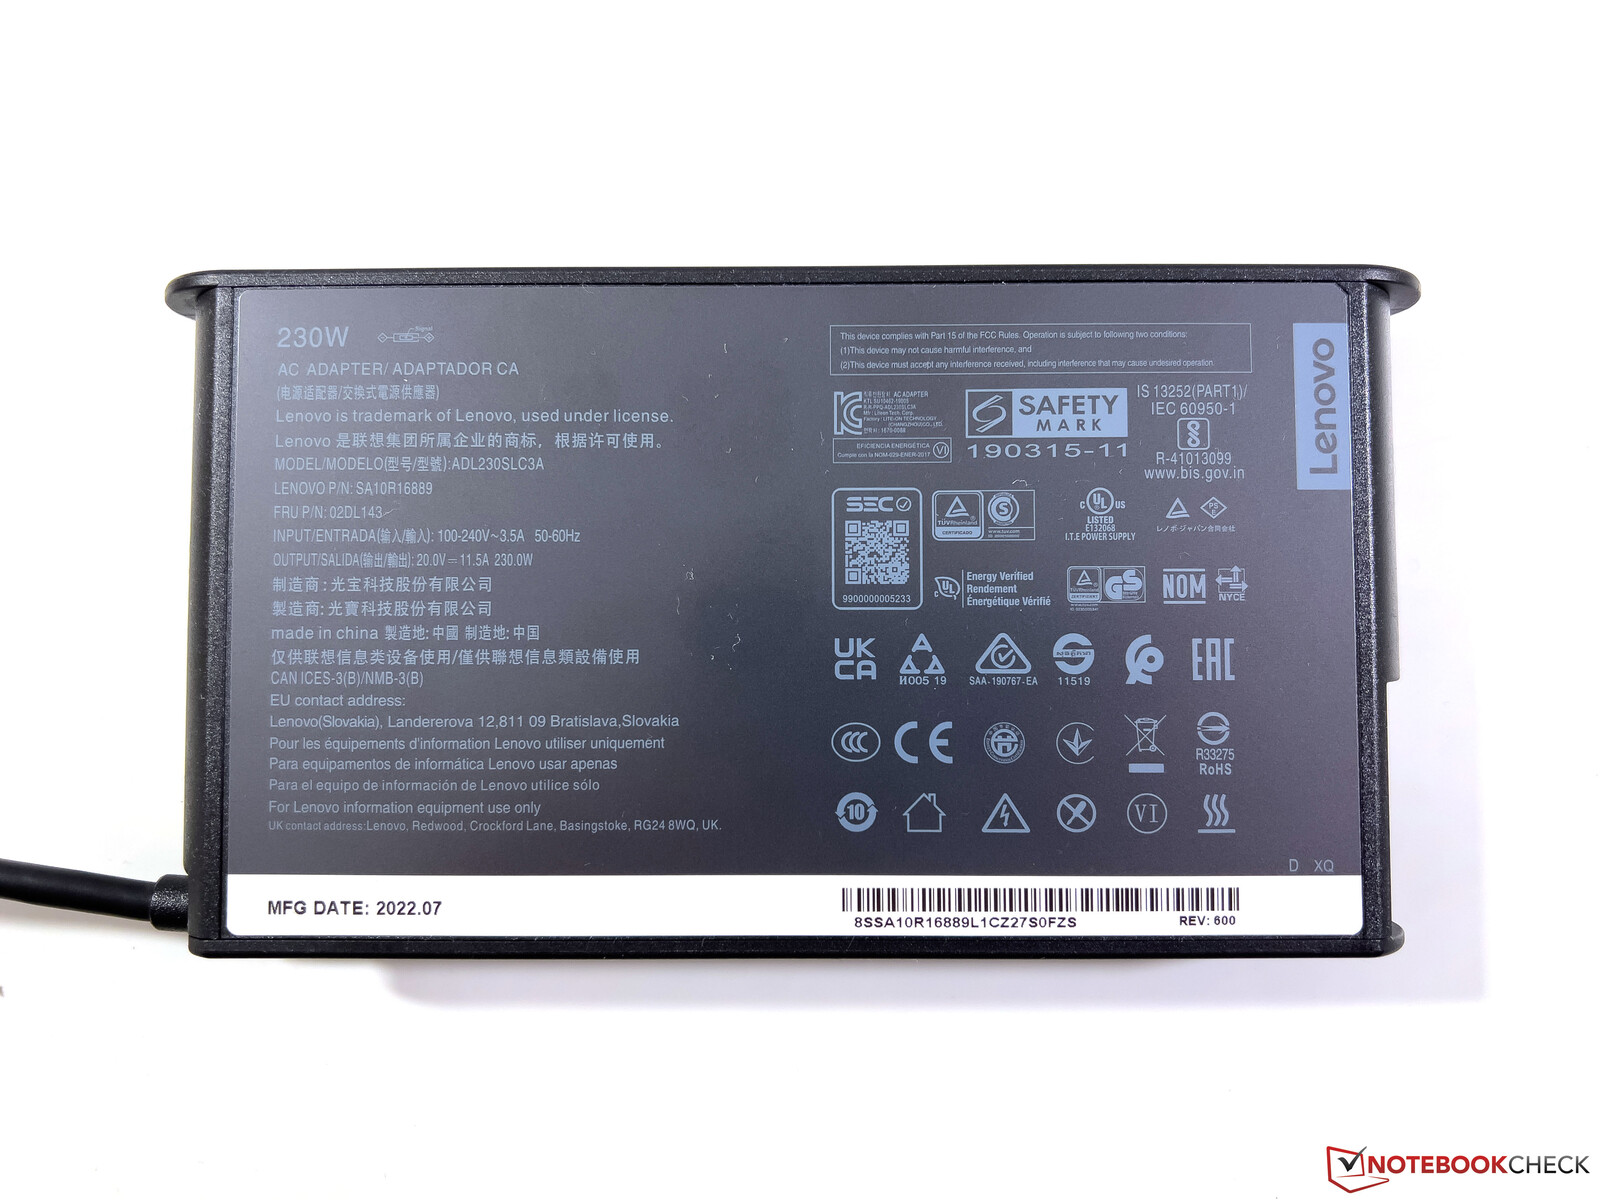
正如预期,我们的能源分析没有发现任何惊喜。4K面板继续消耗大量的电力,在空闲使用时测量到23瓦。在负载情况下,我们短暂地看到226瓦,然后消耗量迅速趋于平稳,为156瓦。在游戏过程中,该设备消耗130瓦,这意味着所提供的230瓦的电源是绰绰有余的,甚至能够在负载下为设备充电。在1.3瓦的情况下,待机用量有点高。
| Off / Standby | |
| Idle | |
| Load |
|
Key:
min: | |
| Lenovo ThinkPad X1 Extreme G5-21DE003RGE i7-12700H, GeForce RTX 3060 Laptop GPU, Micron 3400 1TB MTFDKBA1T0TFH, IPS, 3840x2400, 16" | HP Envy 16 h0112nr i7-12700H, GeForce RTX 3060 Laptop GPU, Micron 3400 1TB MTFDKBA1T0TFH, OLED, 3840x2400, 16" | Schenker Vision 16 Pro RTX 3070 Ti i7-12700H, GeForce RTX 3070 Ti Laptop GPU, Samsung SSD 980 Pro 1TB MZ-V8P1T0BW, IPS, 2560x1600, 16" | Dell XPS 15 9520 RTX 3050 Ti i7-12700H, GeForce RTX 3050 Ti Laptop GPU, WDC PC SN810 512GB, OLED, 3456x2160, 15.6" | Apple MacBook Pro 16 2021 M1 Pro M1 Pro, M1 Pro 16-Core GPU, Apple SSD AP1024R, Mini-LED, 3456x2234, 16.2" | Dell XPS 17 9720 RTX 3060 i7-12700H, GeForce RTX 3060 Laptop GPU, Samsung PM9A1 MZVL21T0HCLR, IPS, 3840x2400, 17" | Lenovo ThinkPad X1 Extreme G4-20Y5CTO1WW (3050 Ti) i7-11800H, GeForce RTX 3050 Ti Laptop GPU, Samsung PM9A1 MZVL21T0HCLR, IPS LED, 3840x2400, 16" | Average NVIDIA GeForce RTX 3060 Laptop GPU | Average of class Multimedia | |
|---|---|---|---|---|---|---|---|---|---|
| Power Consumption | 11% | 22% | 45% | 49% | 22% | 16% | 17% | 51% | |
| Idle Minimum * (Watt) | 11.8 | 10 15% | 9 24% | 5.5 53% | 5 58% | 5.9 50% | 10.3 13% | 10.4 ? 12% | 5.62 ? 52% |
| Idle Average * (Watt) | 22.4 | 10.9 51% | 13.3 41% | 7.2 68% | 15.1 33% | 15.8 29% | 22.06 2% | 14.5 ? 35% | 10.2 ? 54% |
| Idle Maximum * (Watt) | 23.1 | 27.8 -20% | 14.3 38% | 16 31% | 15.5 33% | 26.7 -16% | 23 -0% | 21.4 ? 7% | 12.5 ? 46% |
| Load Average * (Watt) | 138 | 116.4 16% | 107 22% | 91.8 33% | 54 61% | 117.4 15% | 102.57 26% | 109.3 ? 21% | 65 ? 53% |
| Witcher 3 ultra * (Watt) | 129.9 | 133.7 -3% | 155.2 -19% | 74.6 43% | 114.8 12% | 106 18% | |||
| Load Maximum * (Watt) | 225.6 | 209.8 7% | 172 24% | 134.7 40% | 90 60% | 136.6 39% | 147.8 34% | 206 ? 9% | 111.9 ? 50% |
* ... smaller is better
Energy consumption Witcher 3 / stress test
Energy consumption with an external monitor
电池寿命
关于90瓦特小时的电池没有任何变化,运行时间通常与它的前辈相当。 前代产品我们也用4K面板进行了测试。在150cd/m²的亮度下(占最大亮度的56%),视频测试运行超过7小时,Wi-Fi测试大约6.5小时。在最大亮度下,运行时间可能只有4.5小时。
充满电需要100分钟,14分钟后可达到35%的电量,大约52分钟后可达到80%的电量。
| Lenovo ThinkPad X1 Extreme G5-21DE003RGE i7-12700H, GeForce RTX 3060 Laptop GPU, 90 Wh | HP Envy 16 h0112nr i7-12700H, GeForce RTX 3060 Laptop GPU, 83 Wh | Schenker Vision 16 Pro RTX 3070 Ti i7-12700H, GeForce RTX 3070 Ti Laptop GPU, 80 Wh | Dell XPS 15 9520 RTX 3050 Ti i7-12700H, GeForce RTX 3050 Ti Laptop GPU, 86 Wh | Apple MacBook Pro 16 2021 M1 Pro M1 Pro, M1 Pro 16-Core GPU, 99.6 Wh | Dell XPS 17 9720 RTX 3060 i7-12700H, GeForce RTX 3060 Laptop GPU, 97 Wh | Lenovo ThinkPad X1 Extreme G4-20Y5CTO1WW (3050 Ti) i7-11800H, GeForce RTX 3050 Ti Laptop GPU, 90 Wh | Average of class Multimedia | |
|---|---|---|---|---|---|---|---|---|
| Battery runtime | 6% | -17% | 60% | 146% | -6% | -13% | 70% | |
| H.264 (h) | 7.3 | 6.1 -16% | 17.5 140% | 6.7 -8% | 16.8 ? 130% | |||
| WiFi v1.3 (h) | 6.7 | 7.9 18% | 6 -10% | 8.8 31% | 16.9 152% | 8.7 30% | 6.6 -1% | 12.3 ? 84% |
| Load (h) | 1.7 | 1.6 -6% | 1.3 -24% | 3.2 88% | 1 -41% | 1.2 -29% | 1.645 ? -3% |
Pros
Cons
结论 - 一款增加了CPU功率的ThinkPad

即使在外观上似乎没有什么变化,联想已经设法为其第五代ThinkPad X1 Extreme引入了一些有趣的创新。与旧型号相比,现在的处理器消耗的功率要大得多。加上新的Alder Lake处理器,这有助于切实提高性能。这就是使用液态金属散热膏的真正好处。一般来说,蒸气室冷却做得很好,虽然风扇保持相对安静,但图形性能却不稳定。
ThinkPad仍然搭载了Windows 10 Pro,这让我们遇到了一些性能问题。Wi-Fi 6E仅由Windows 11支持,这也是我们建议更新的原因之一。可选的5G调制解调器也是可用的,但WWAN模块必须订购前工程,否则必要的天线和SIM卡插槽都没有准备。此外,一个限制仍然存在,即WWAN模块(以及第二个M.2 SSD)只适用于配备了 RTX 3050 Ti它使用传统的冷却方式。单通道内存配置有些令人遗憾,因为32GB对大多数用户来说已经足够,而两个16GB模块无疑是更好的选择。
通过ThinkPad X1 Extreme G5,联想主要提高了处理能力,并提供可选的5G连接,图形性能仍然有些不稳定。
我们再次觉得有必要批评一下键盘的质量。到G3型号为止,X1 Extreme的键盘属于移动领域所能提供的最好的。我们仍然感到困惑的是,为什么联想认为有必要减少像X1 Extreme这样相对较厚的设备的键程(毕竟,我们不是在处理X1 Nano或X1 Carbon这里)。
联想仍然是为数不多的提供完全覆盖AdobeRGB的面板的厂商之一,因为即使是惠普也已经有一段时间只使用其P3色彩空间的DramColor面板。从主观上看,图像质量非常好,没有受到PWM问题的影响。然而,功耗非常高,户外反射可能是一个问题。我们不久将测试ThinkPad P1 G5工作站分支中发现的新的165 Hz WQHD面板。
X1 Extreme G5有很多完成的地方,特别是考虑到高价位的时候。这要从精彩的 MacBook Pro 16及其迷你LED显示屏,以及新来者,如申克尔Vision 16 Pro,它在更小、更轻的外形中提供了更多动力。然而,这两款设备都无法夸耀其更好的电池寿命。惠普的 Envy 16更重更厚一些,但提供更稳定的GPU性能。目前,戴尔还没有更新其XPS 16,使潜在的买家只能在XPS 15和XPS 16之间选择。 XPS 15和 17.
价格和可用性
ThinkPad X1 Extreme可以在Lenovos Online-Store上配置,价格为2189美元。.我们的审查配置可在,在亚马逊上从3643美元起。.
Lenovo ThinkPad X1 Extreme G5-21DE003RGE
- 12/05/2022 v7 (old)
Andreas Osthoff
Price comparison

