联想ThinkPad T14 G3评论。商务笔记本采用AMD Ryzen Pro更胜一筹
多年来,ThinkPad T14及其前身一直是最受欢迎和最好的14英寸商务笔记本电脑之一。联想现在在新的T14 G3中引入了广泛的重新设计,包括一个新的外壳,现在再次配备了16:10的面板。该制造商继续提供采用AMD和英特尔CPU的机型,但差异更大一些,其技术细节将在我们的评测过程中揭晓。
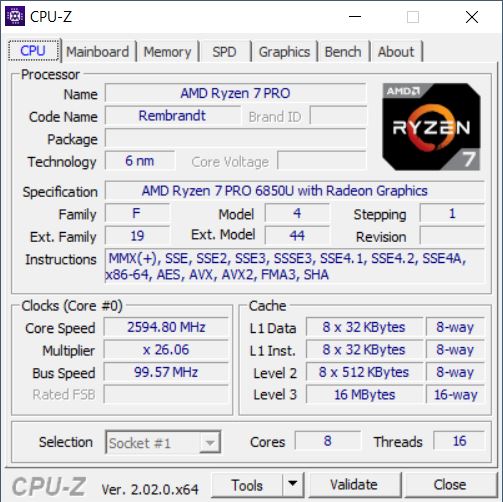
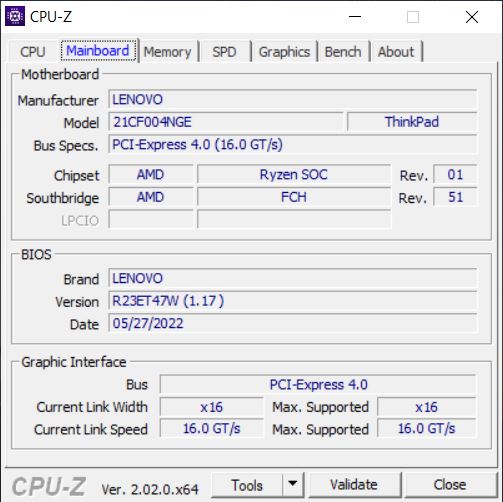
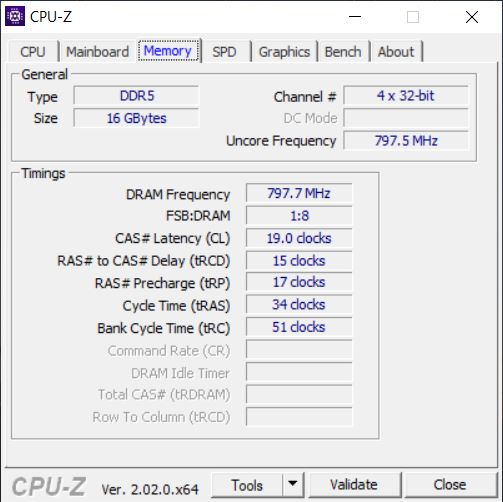
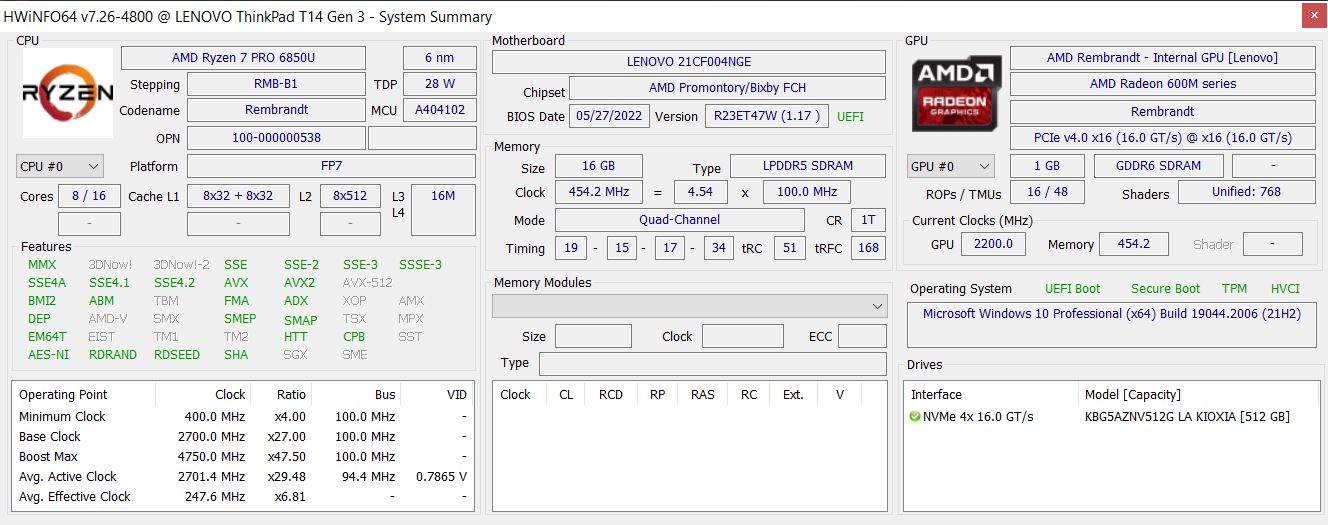
我们的评测样本是ThinkPad T14 G3-21CF004NGE型号,配备了一个AMD Ryzen 7 Pro 6850U,一个集成的 Radeon-680M-GPU16GB LPDDR5-6400内存,512GB PCIe 4.0固态硬盘,以及14英寸16:10格式的显示屏,分辨率为1920x1200。该配置的建议零售价为1,859欧元(约合1,800美元),或相同的Campus型号为1,649欧元(约合1,596美元)。
基本型号的价格,即T14 G3 AMD与Ryzen 5 Pro 6650U ,因国家而异(更多细节见本评论末尾的 "价格和可用性")。例如,在美国,起价是1,038.95美元 。对于配有Core i5-1235U的英特尔变体 ,起价为US$1,054.50 。
潜在的竞争对手比较
Rating | Date | Model | Weight | Height | Size | Resolution | Price |
|---|---|---|---|---|---|---|---|
| 88.8 % v7 (old) | 09 / 2022 | Lenovo ThinkPad T14 G3-21CF004NGE R7 PRO 6850U, Radeon 680M | 1.4 kg | 17.9 mm | 14.00" | 1920x1200 | |
| 90.1 % v7 (old) | 04 / 2022 | Dell Latitude 7420 JW6MH i5-1145G7, Iris Xe G7 80EUs | 1.3 kg | 17.3 mm | 14.00" | 1920x1080 | |
| 90.3 % v7 (old) | 09 / 2022 | Huawei MateBook X Pro 2022 i7-1260P, Iris Xe G7 96EUs | 1.3 kg | 15.6 mm | 14.20" | 3120x2080 | |
| 88.6 % v7 (old) | 07 / 2022 | HP EliteBook 845 G9 6F6H6EA R9 PRO 6950HS, Radeon 680M | 1.5 kg | 19.3 mm | 14.00" | 1920x1200 | |
| 88.1 % v7 (old) | Lenovo ThinkPad T14 Gen2-20W1S00000 i7-1165G7, GeForce MX450 | 1.5 kg | 17.9 mm | 14.00" | 1920x1080 | ||
| 90.1 % v7 (old) | 03 / 2022 | Lenovo ThinkPad T14s G2 20XGS01100 R7 PRO 5850U, Vega 8 | 1.3 kg | 16.14 mm | 14.00" | 1920x1080 |
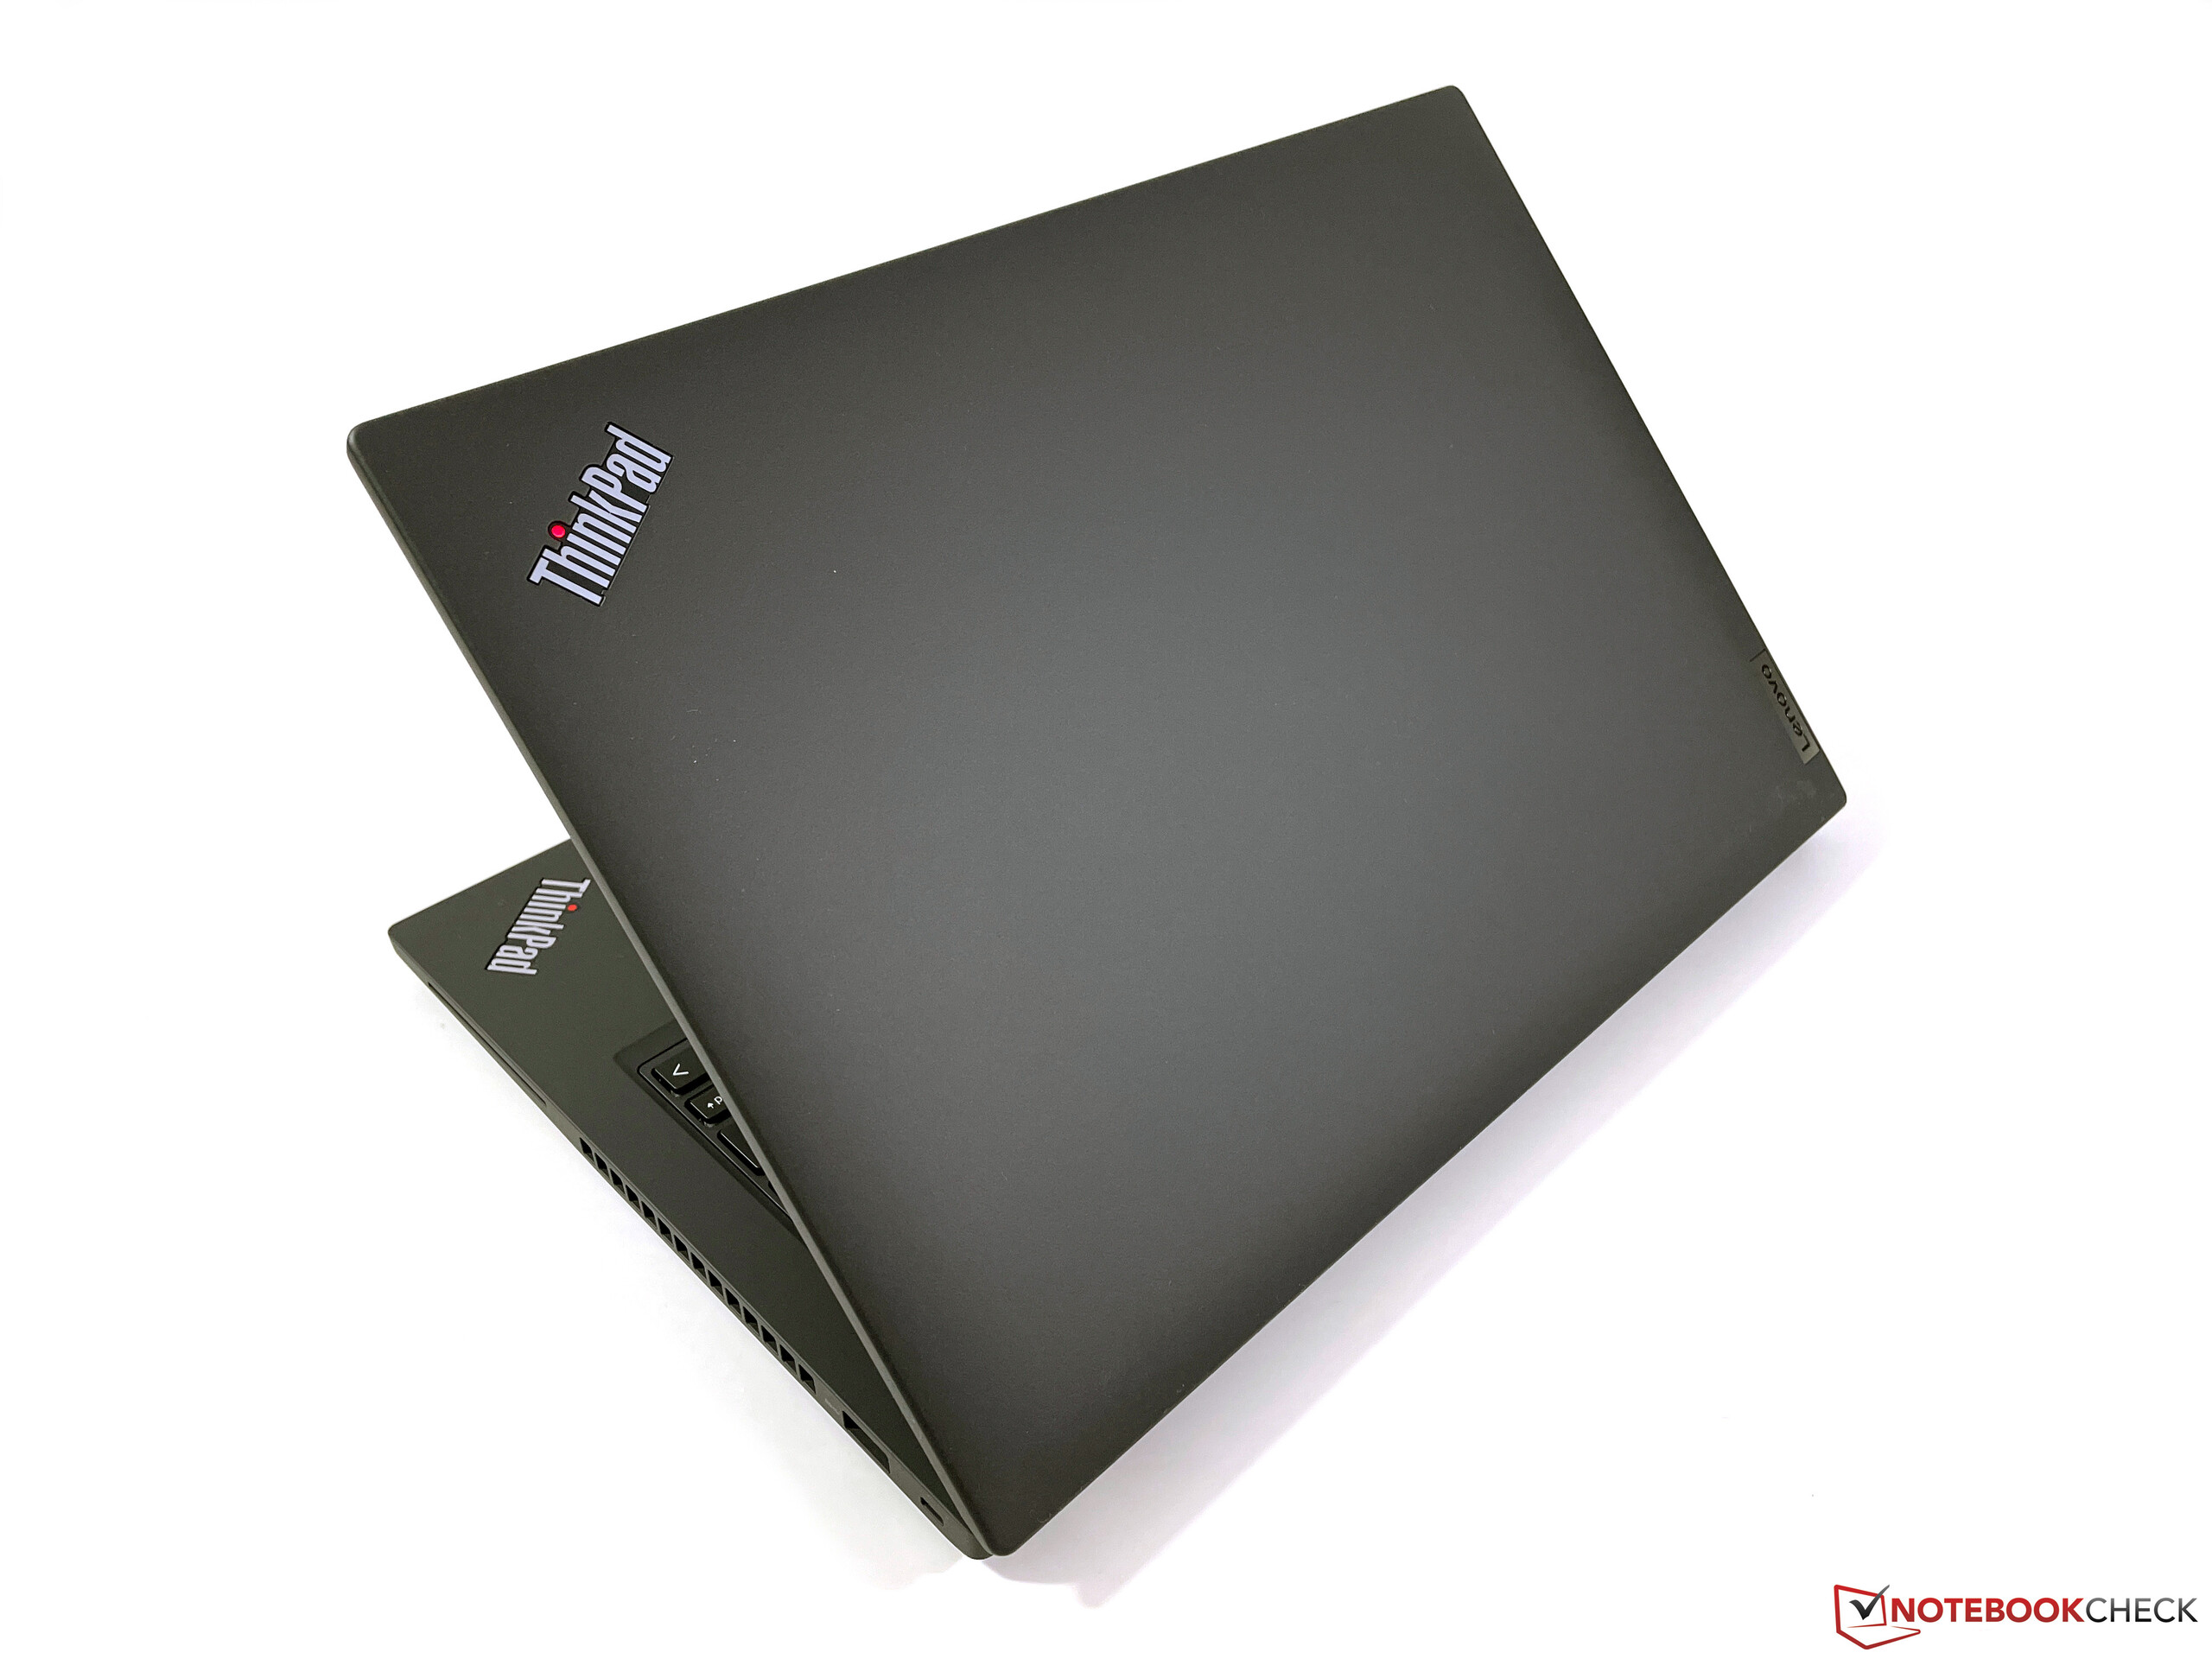
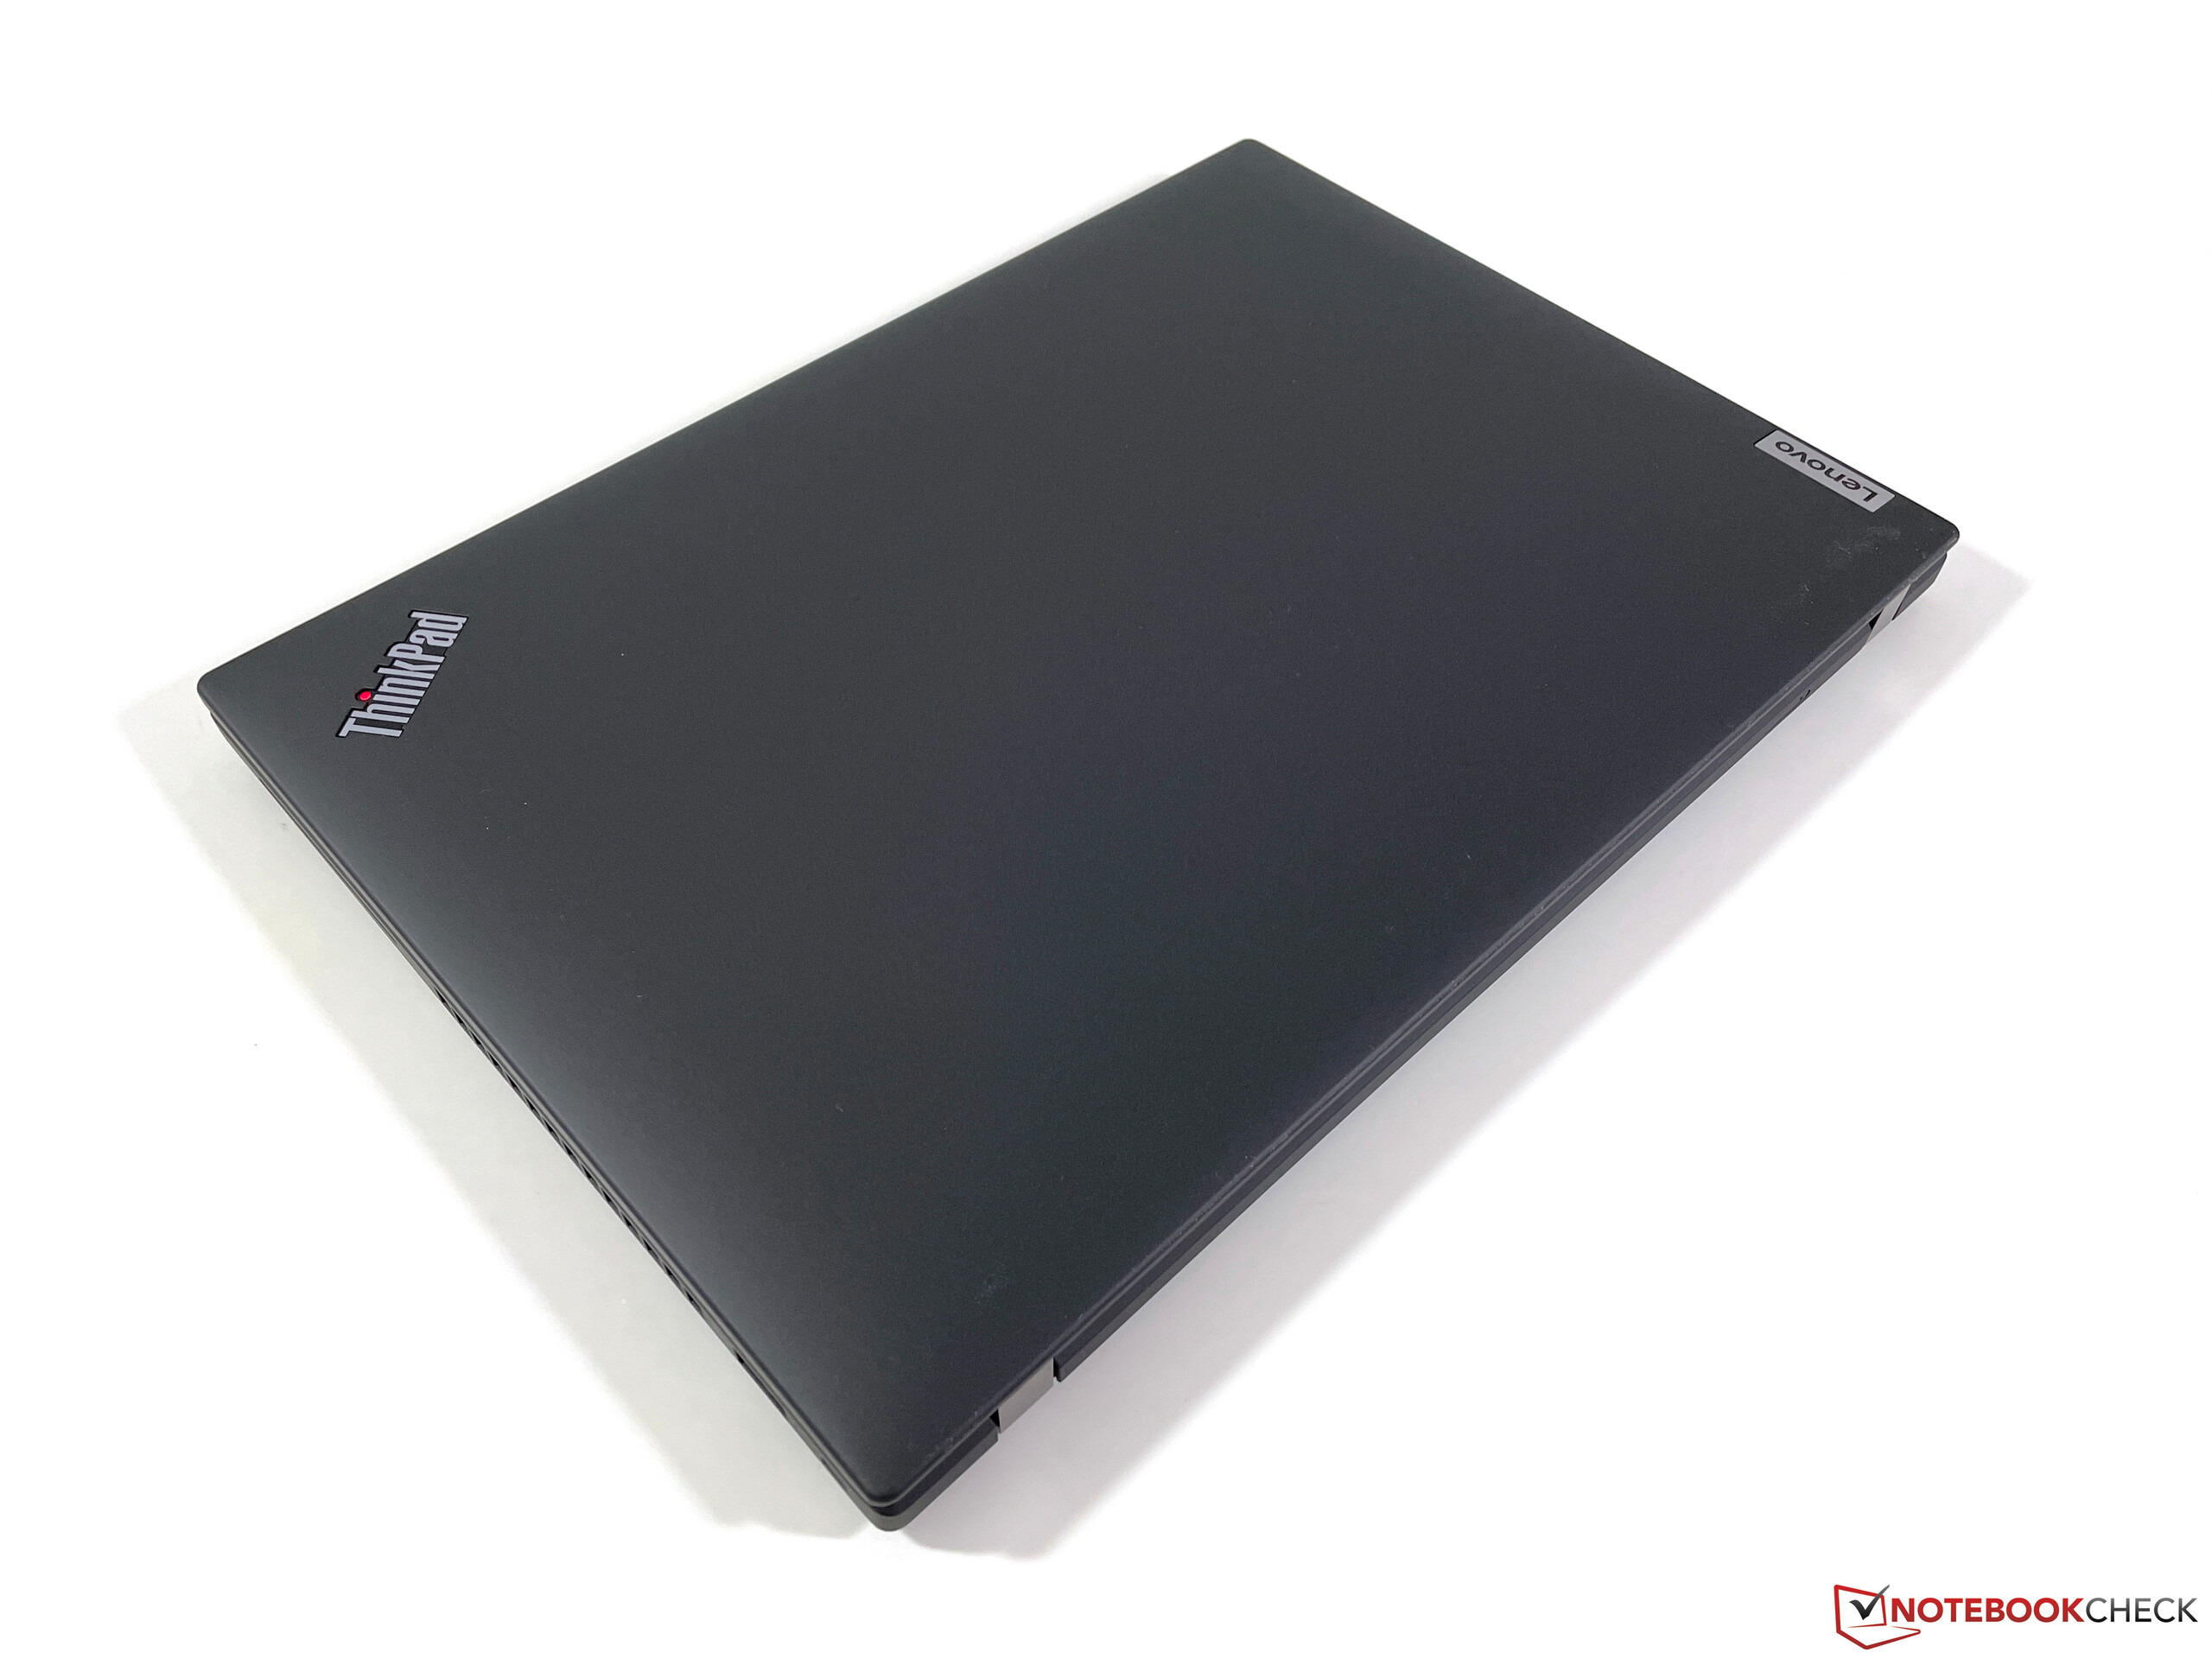
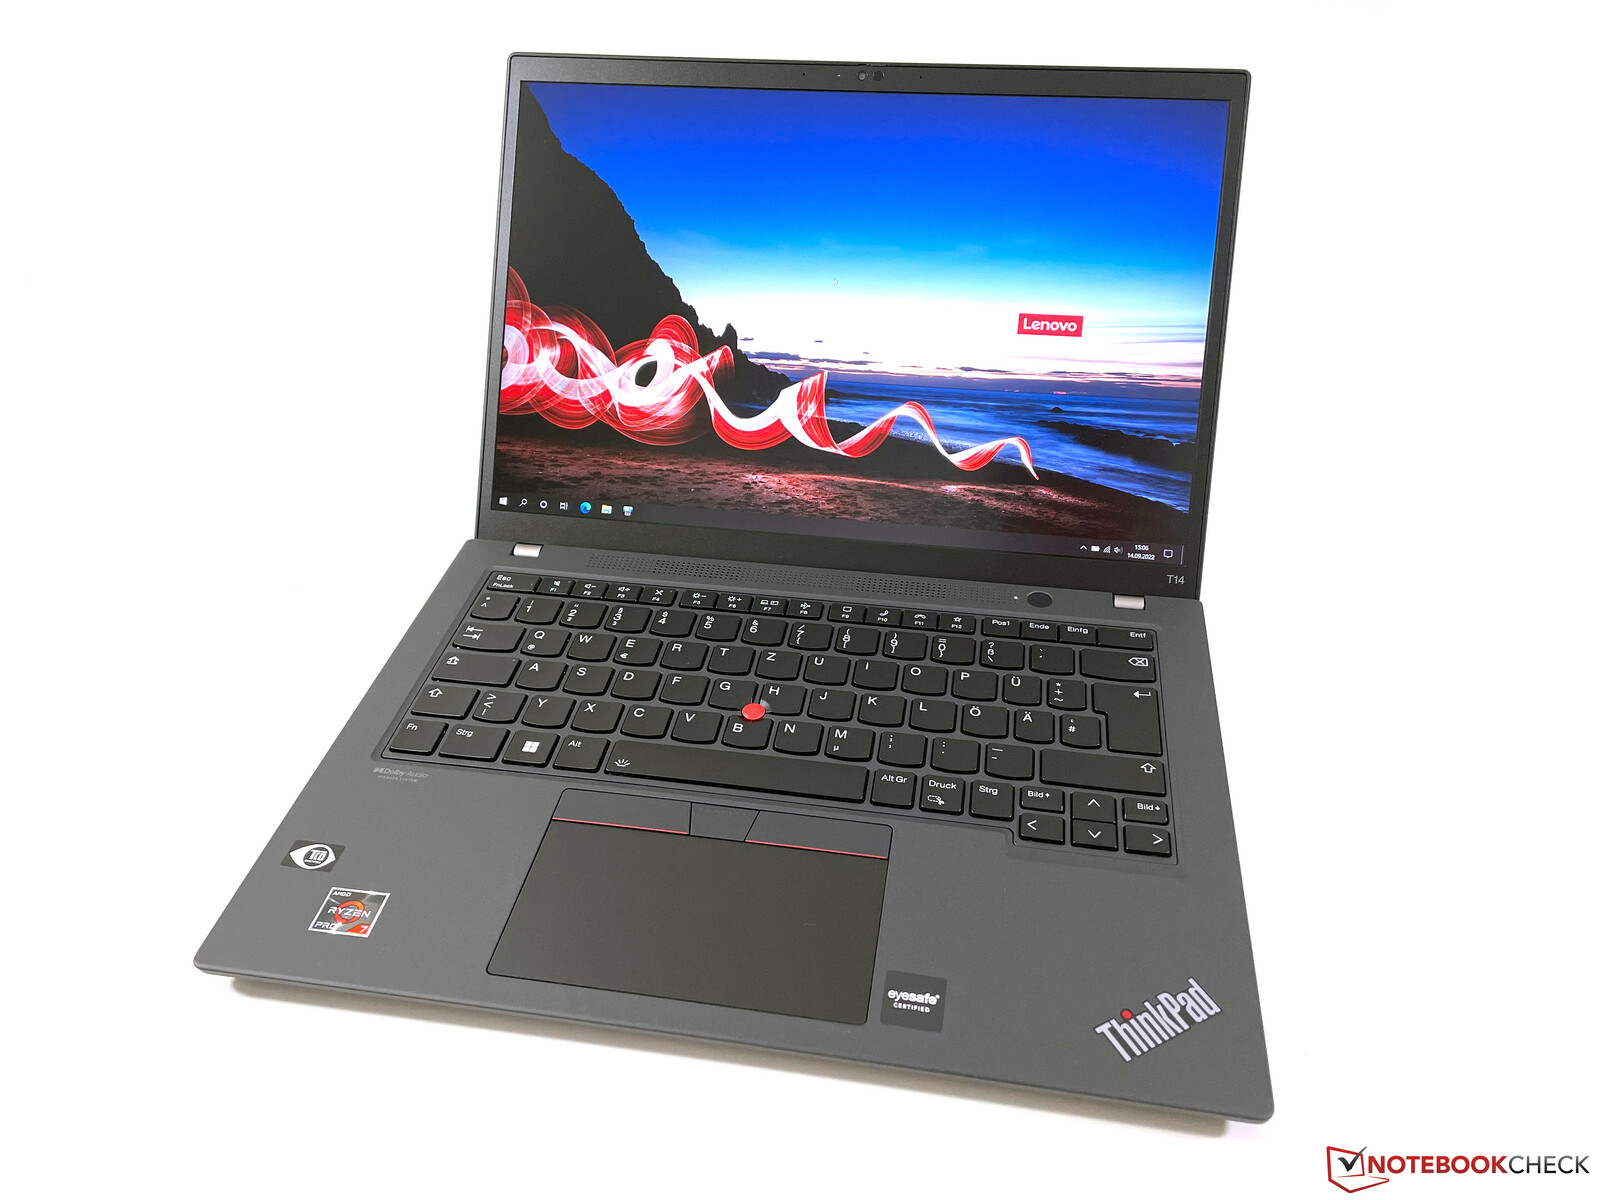
外壳--ThinkPad的碳纤维和镁合金外壳
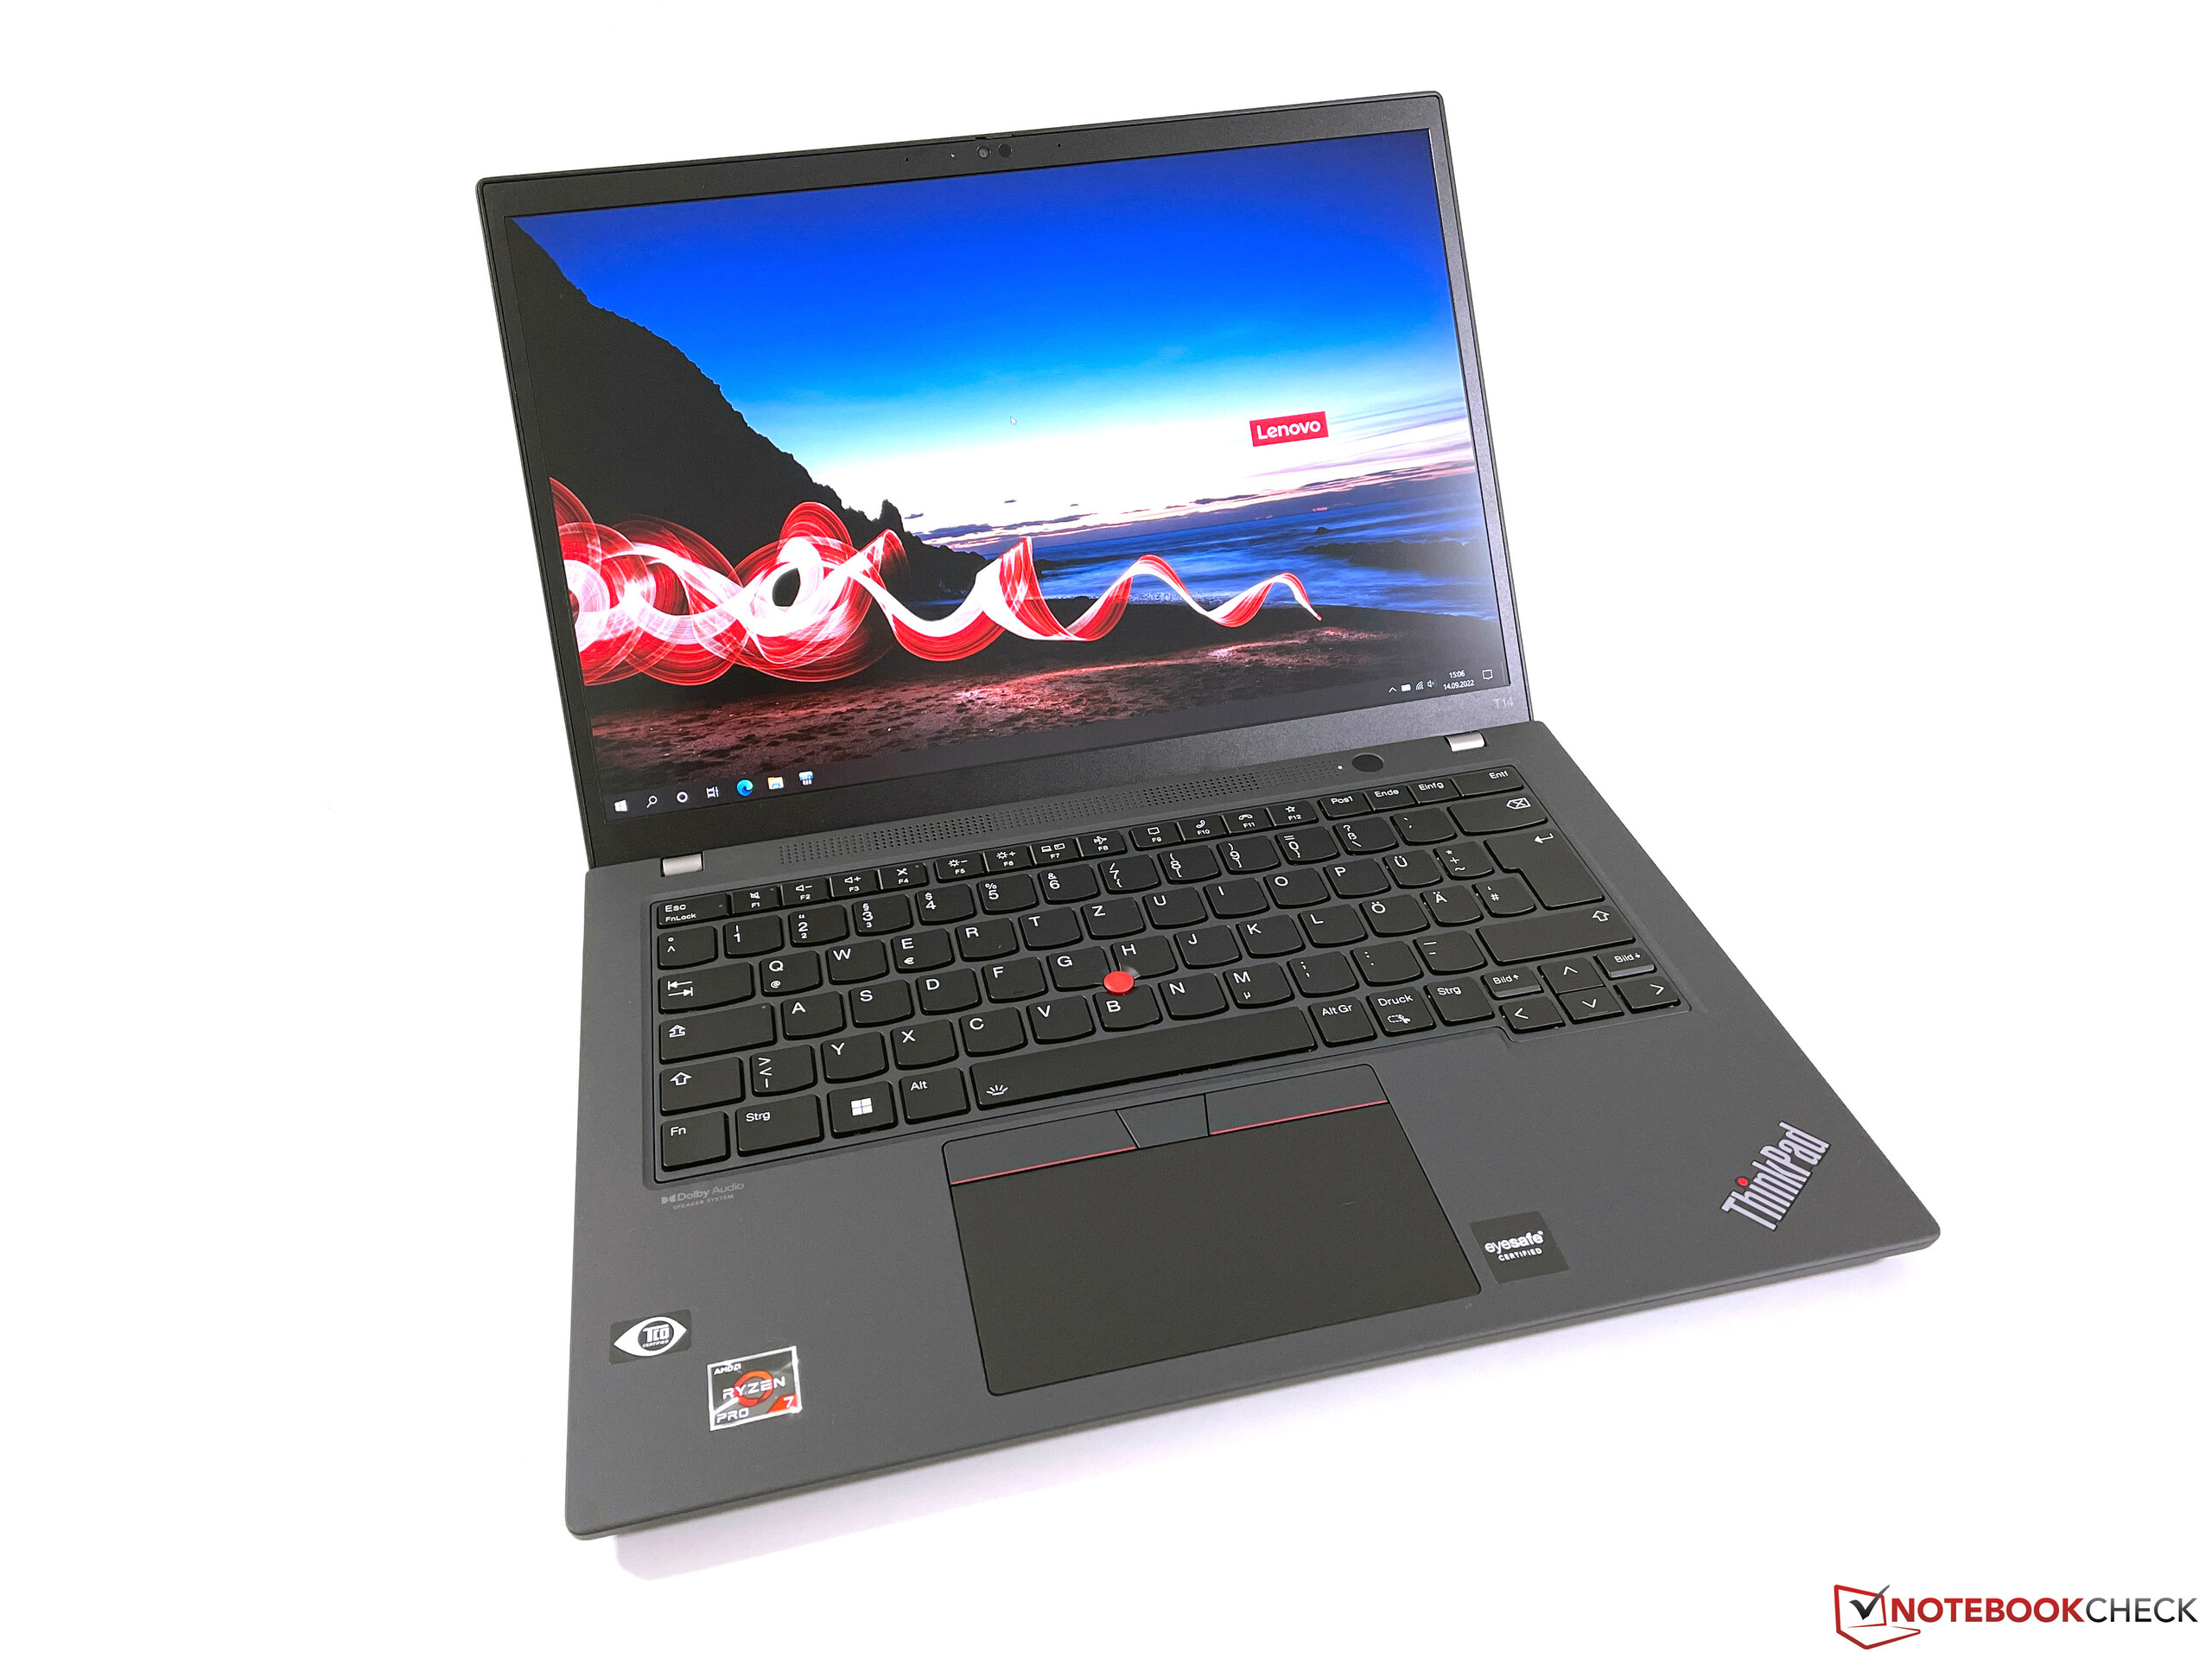
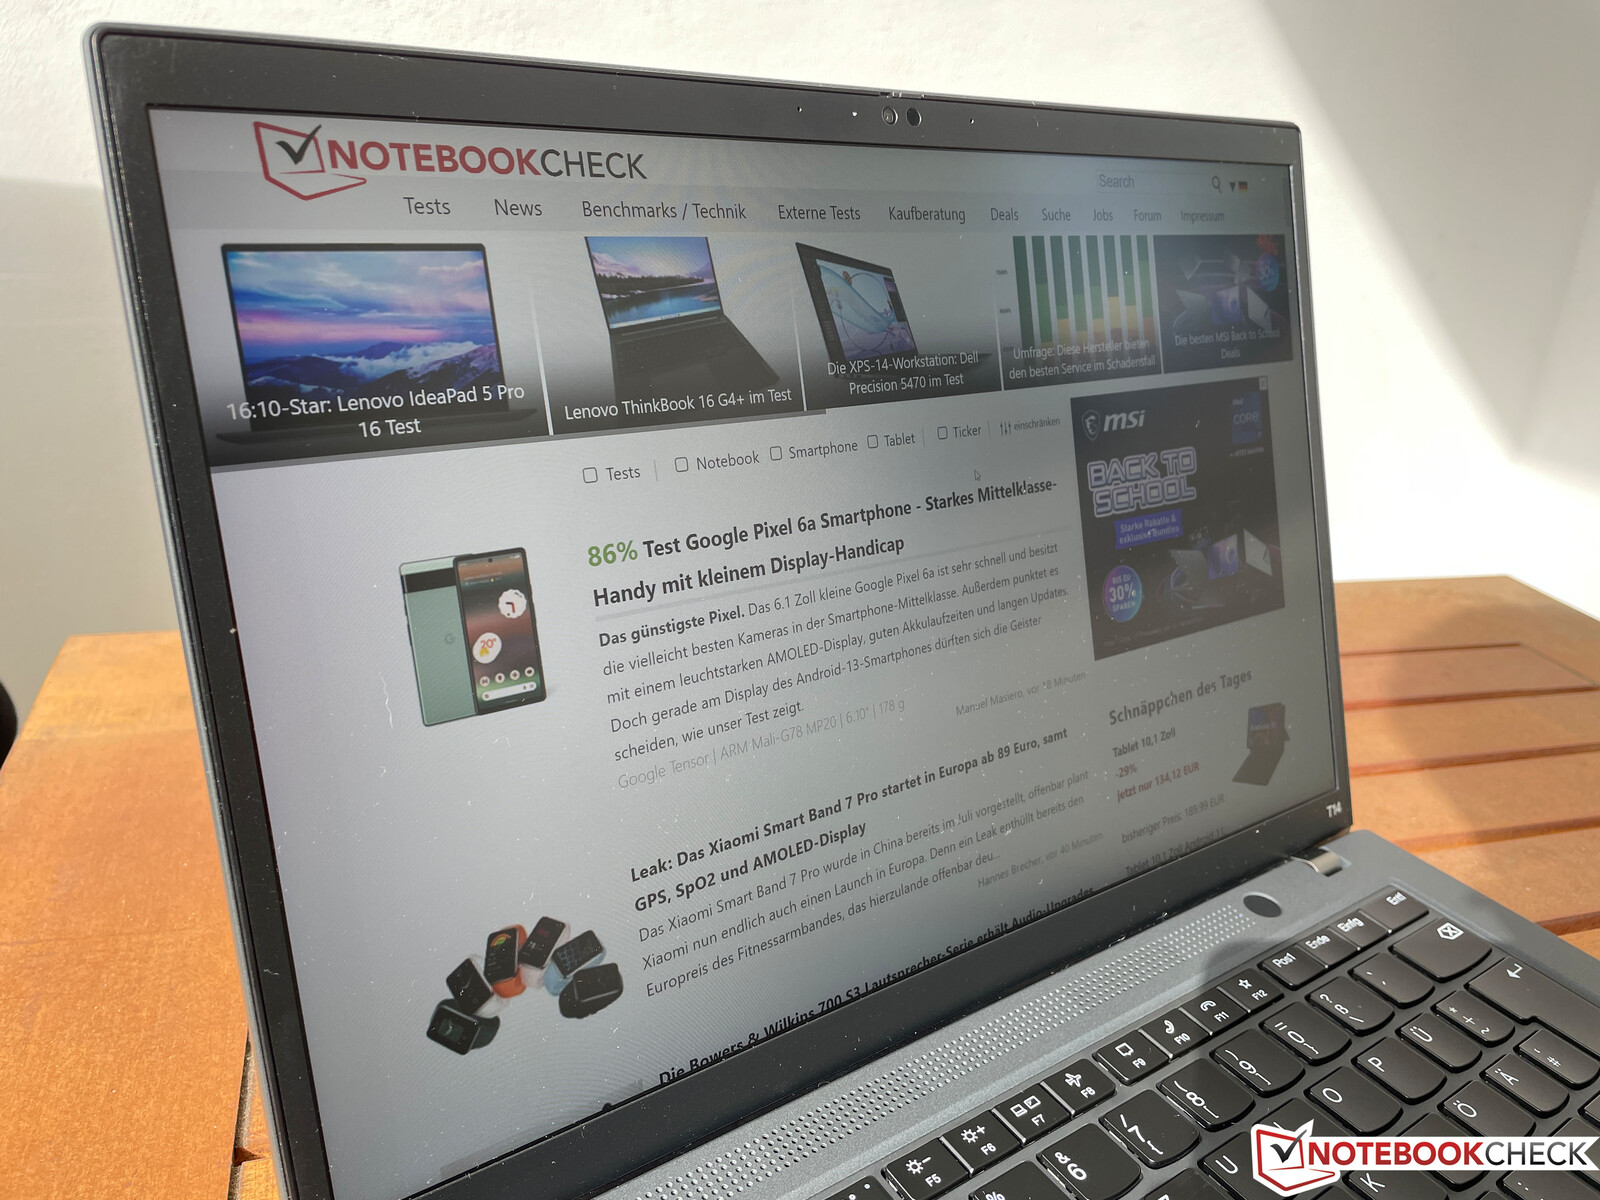
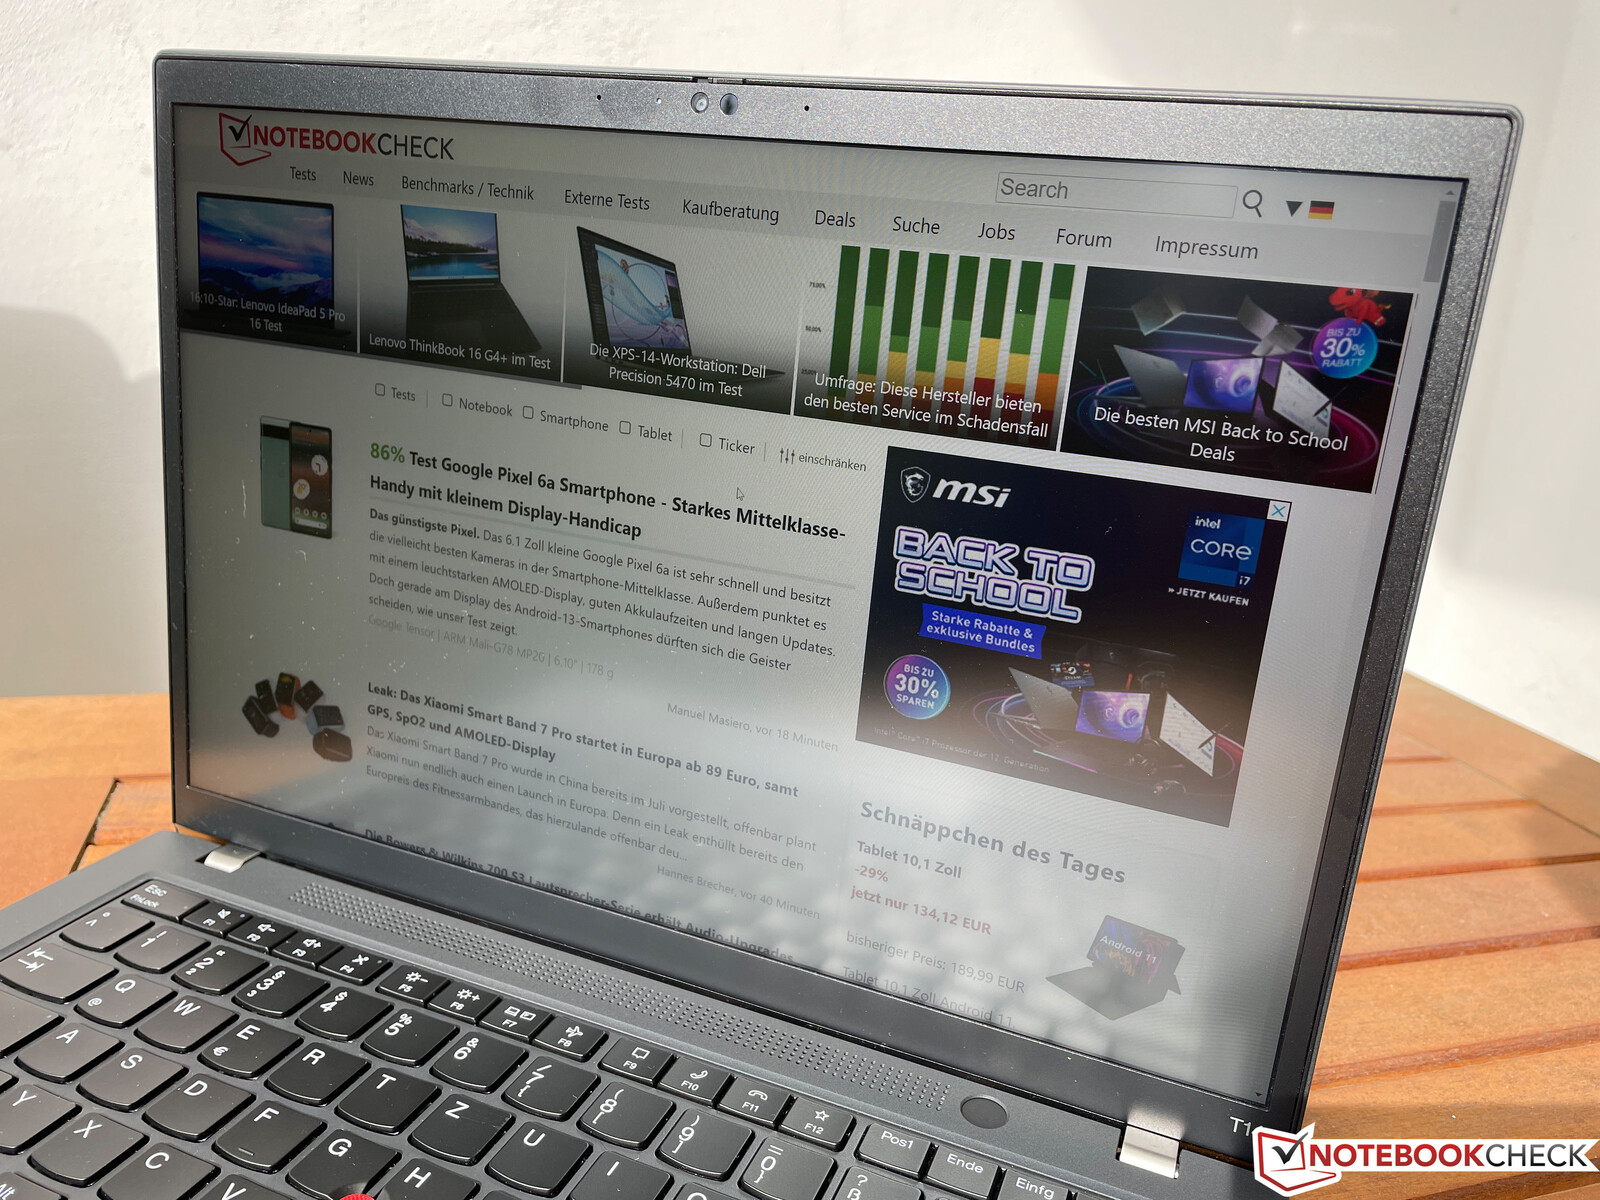
虽然是新的外壳,但联想并没有改变基本设计,因此新的T14 G3一眼就能看出是ThinkPad。然而,与上一代产品 ,有两个很大的区别。外壳现在更多的是无烟煤的颜色,也就是说比以前更亮一些,所以你可以看到与黑色输入设备的对比。此外,更薄的屏幕边缘立即引人注目;特别是非常宽的底部边缘现在已经成为过去。与当代消费类笔记本电脑相比,边缘仍然相当宽,两侧为8毫米,面板上方和下方为14毫米,但该设备现在看起来整体上更加现代。除了黑色/烟灰色的变体,联想还提供了一个带有银色输入设备的银色变体。
外壳采用了混合材料。例如,玻璃纤维/镁的组合被用于底板,碳/玻璃纤维增强塑料用于盖子。表面的粗糙感或天鹅绒感很小,但一个积极的方面是,我们在审查过程中遇到的指纹问题比许多其他ThinkPads要少得多。
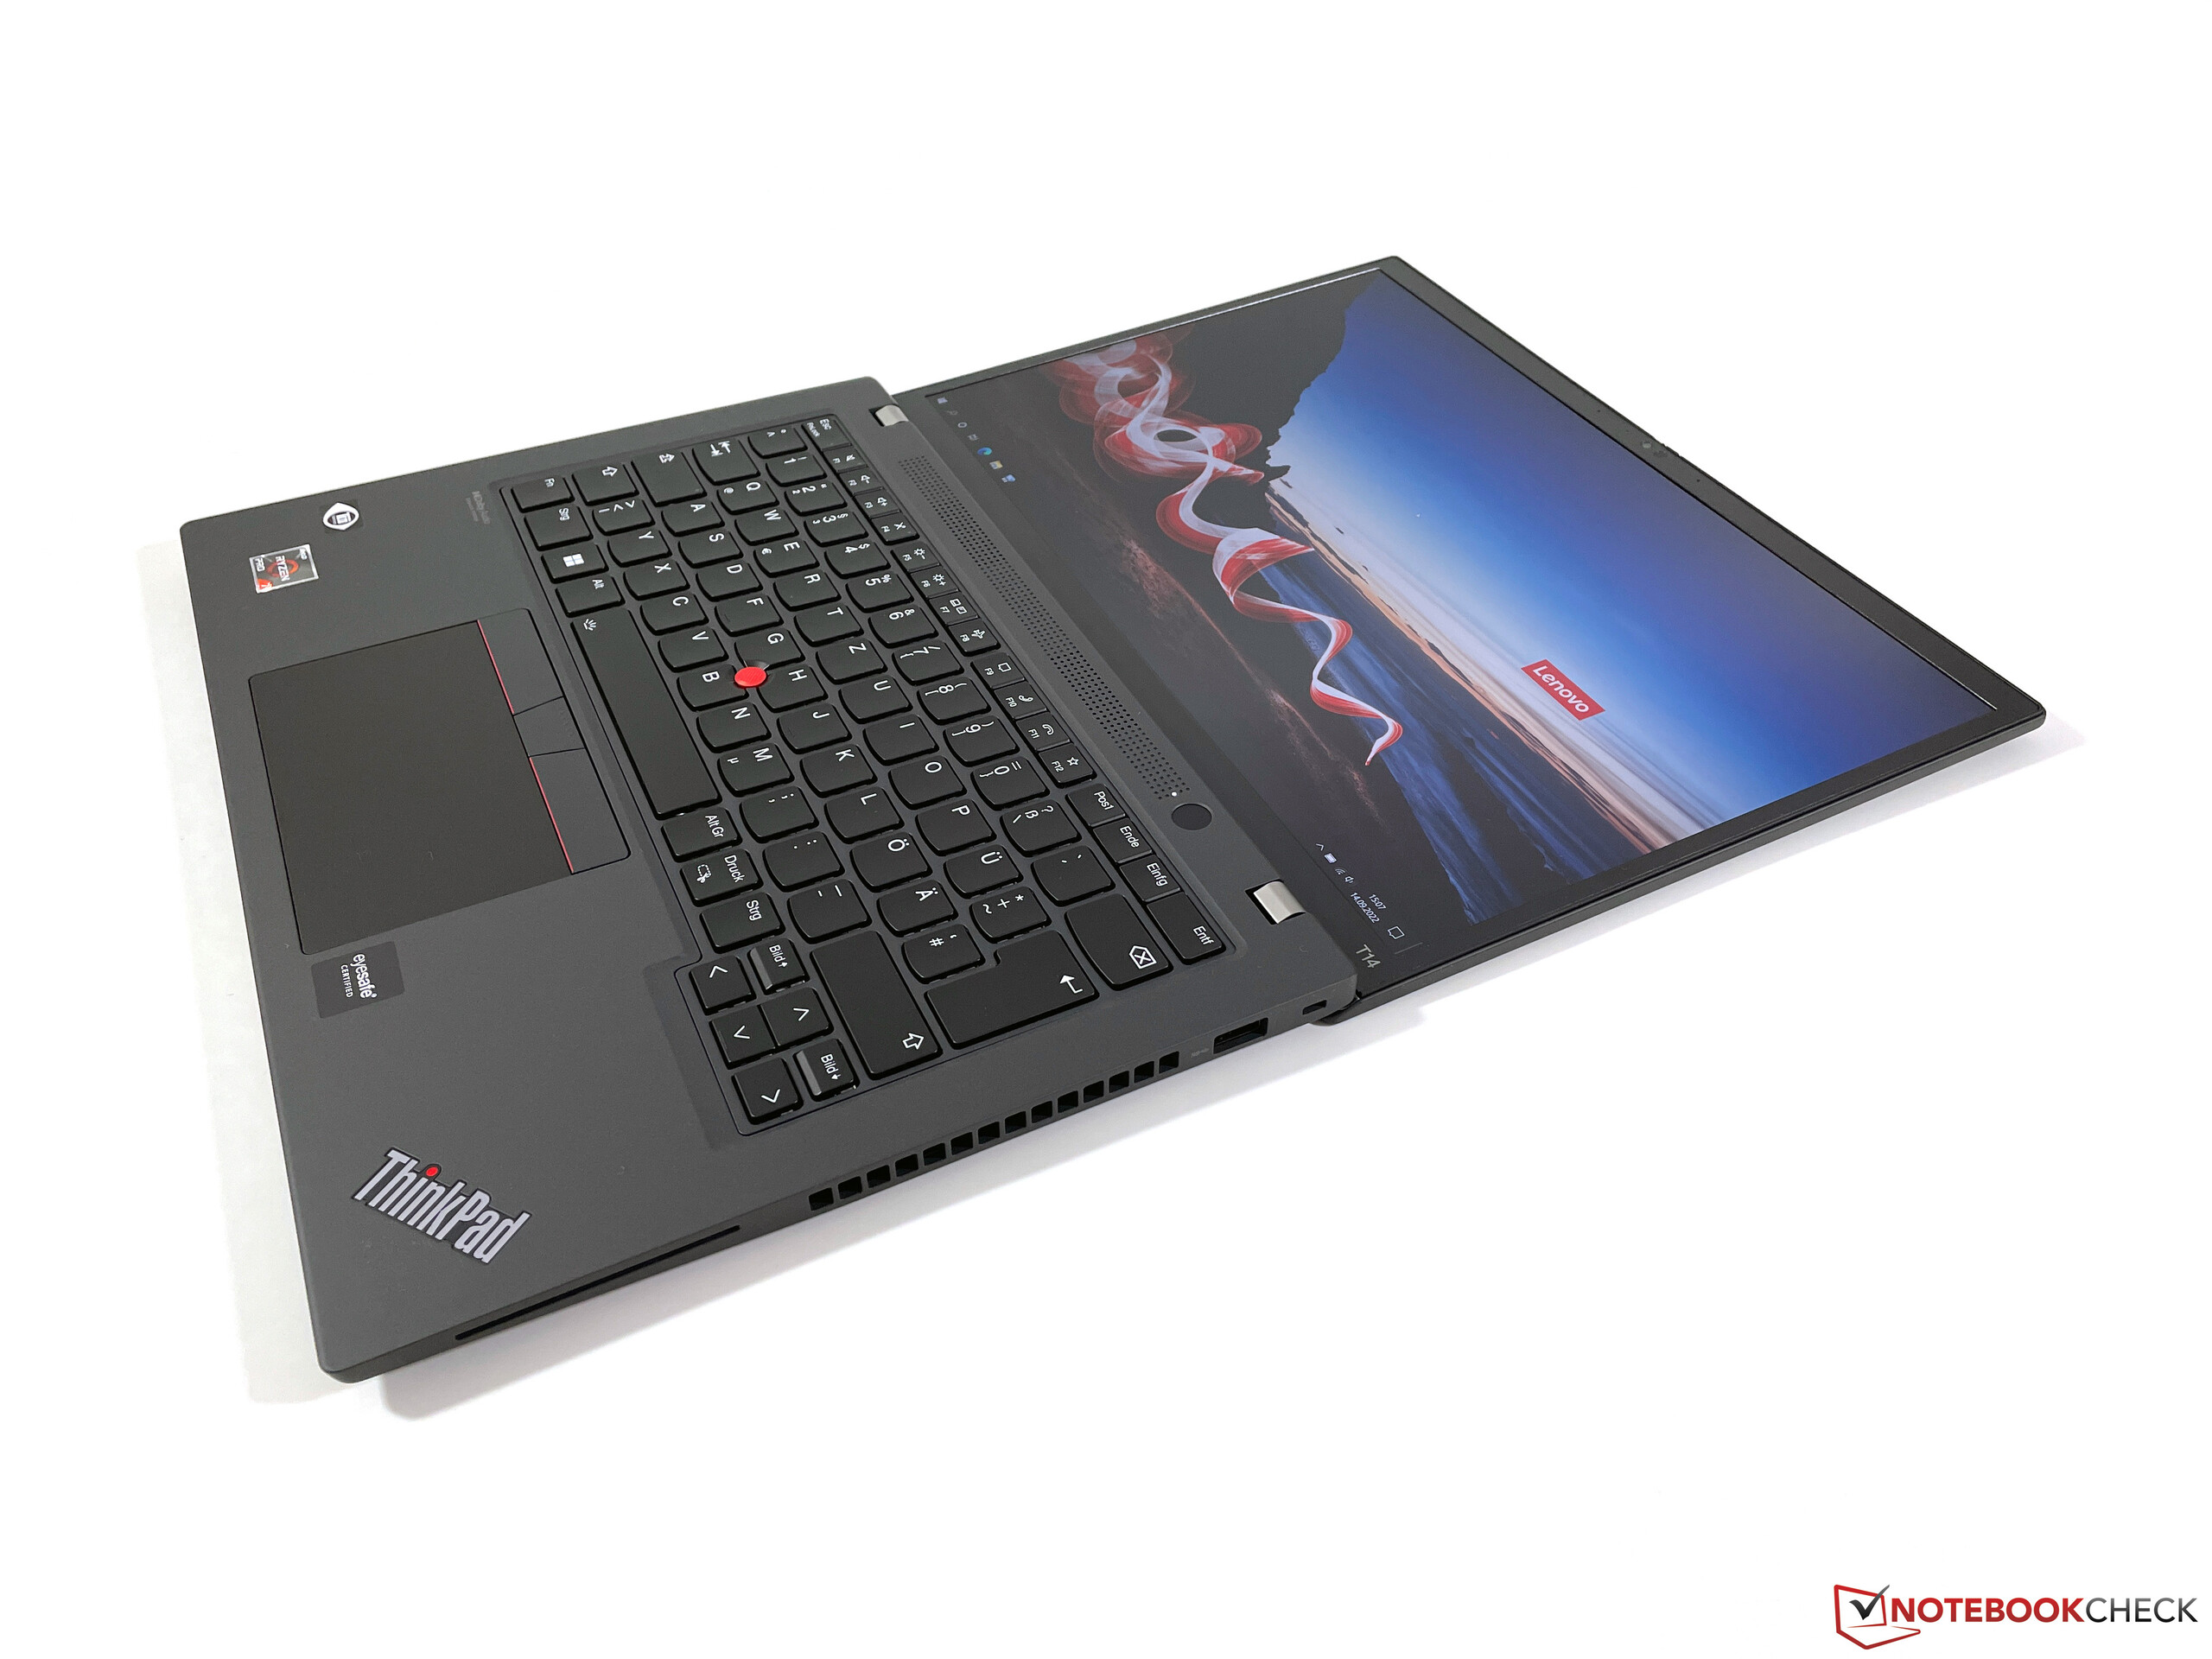
基本单元的稳定性很好,但并不突出。中间的键盘区域可以明显地用一点力气压住,但这在实践中并没有转化为限制,即使对精力充沛的打字员来说也是如此。在对底座施加扭转压力时,可以听到轻微的吱嘎声。两个铰链提供了很好的稳定性,有效地防止了屏幕的晃动,但它们也非常紧--仅用一只手改变打开角度(最大180度)几乎是不可能的,更不用说用一只手打开盖子。盖子本身的稳定性非常好,因为它几乎不能弯曲(这里没有吱吱作响的声音),即使有选择地在背面施压,我们也无法引起任何图像错误。
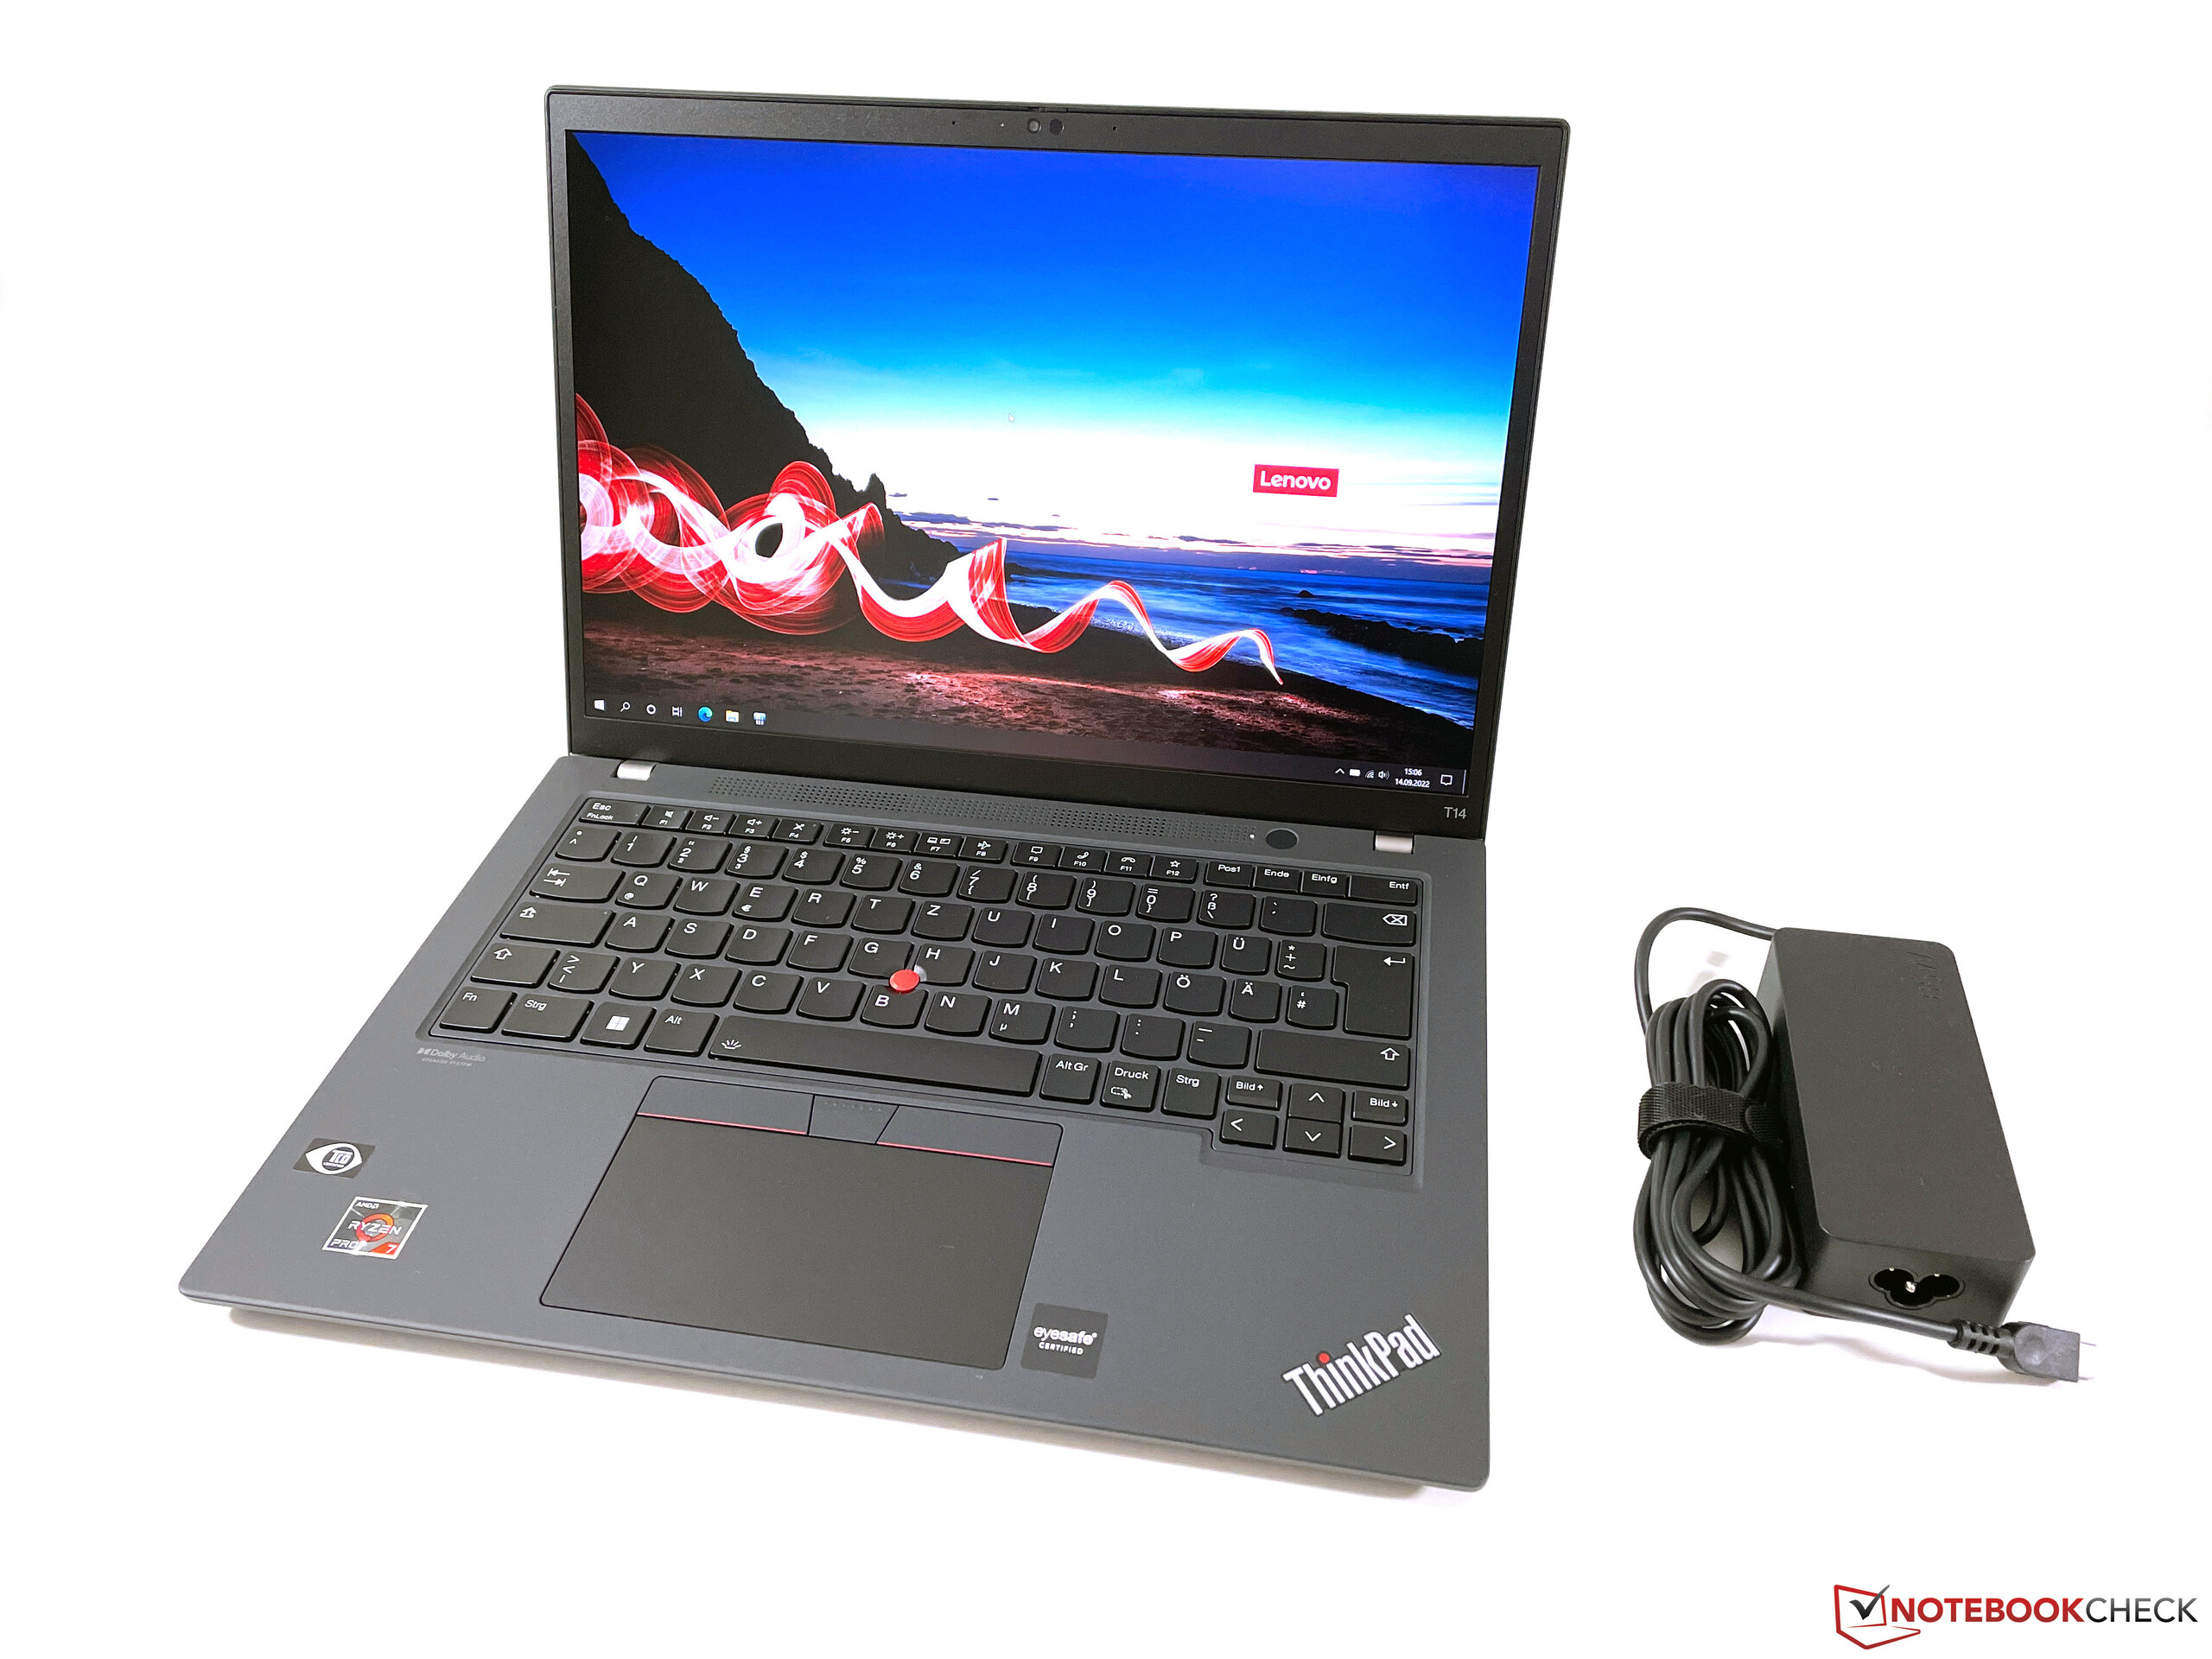
与之相比 前代产品,新的ThinkPad T14 G3变得更薄了一些,但同时,16:10的屏幕并没有导致更深的外壳。重量也略微降低,刚刚超过1.4公斤。有趣的是,联想还提供了一个配备较小的3芯电池的版本,重量轻了约100克。熟悉的65瓦电源适配器重约350克,也用于英特尔版本,甚至用于带有专用的 GeForce MX550,这对我们来说是一个强烈的惊喜。
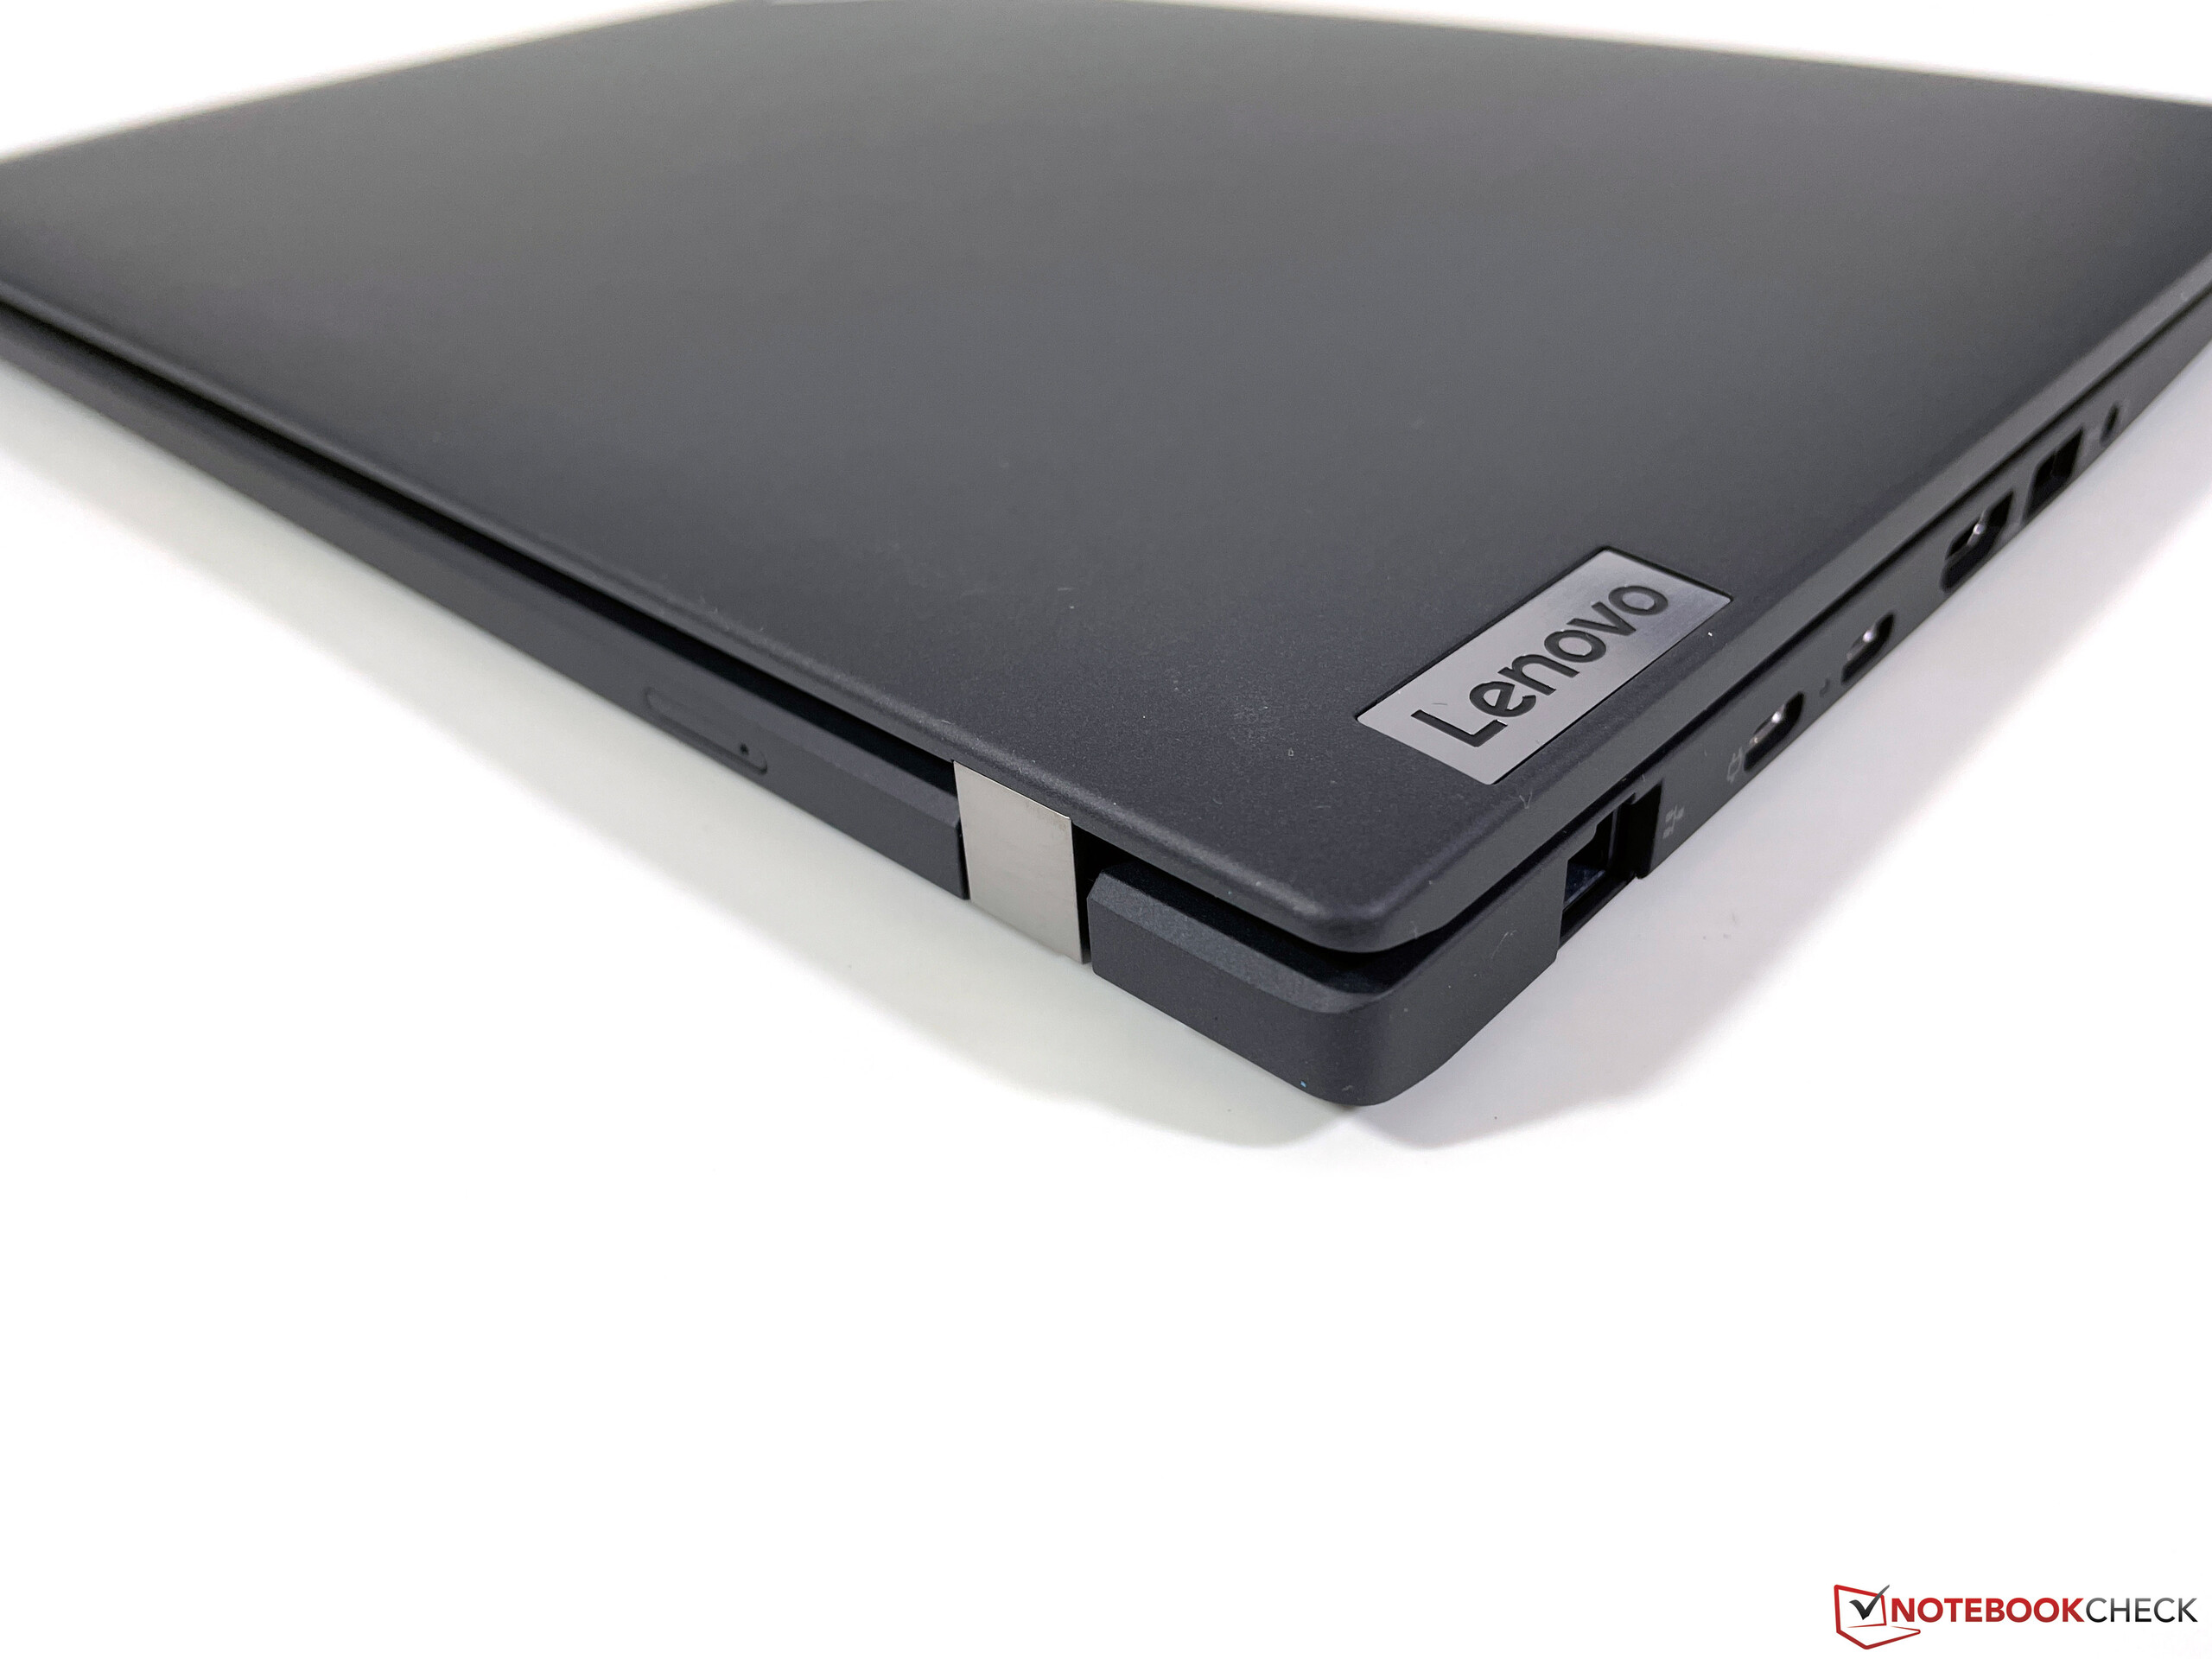
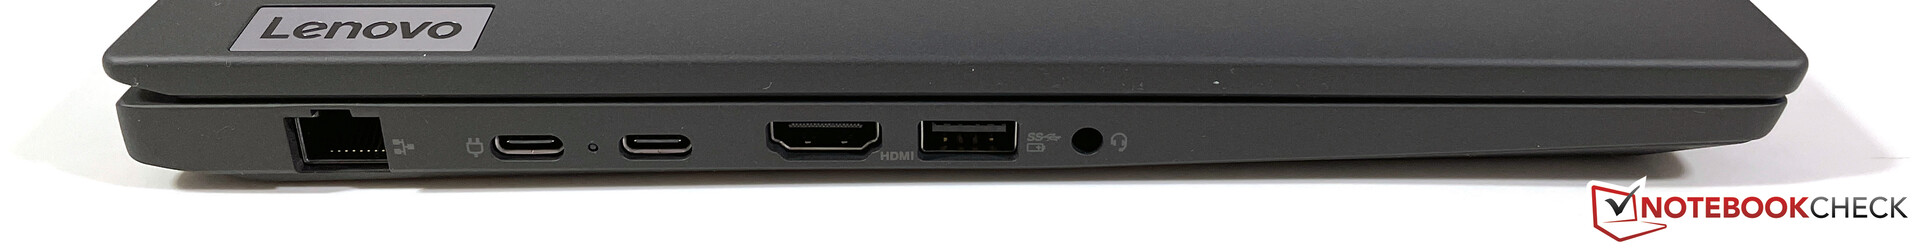
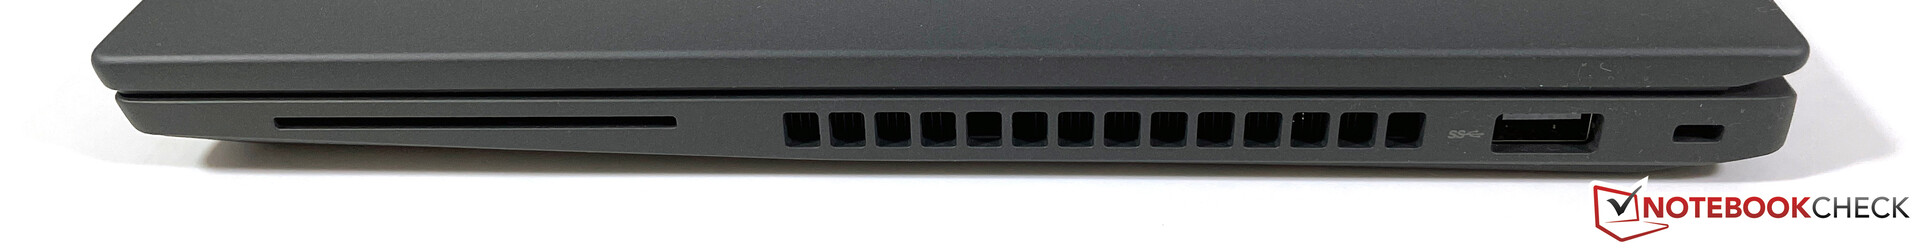
设备 - 联想省略了USB 4
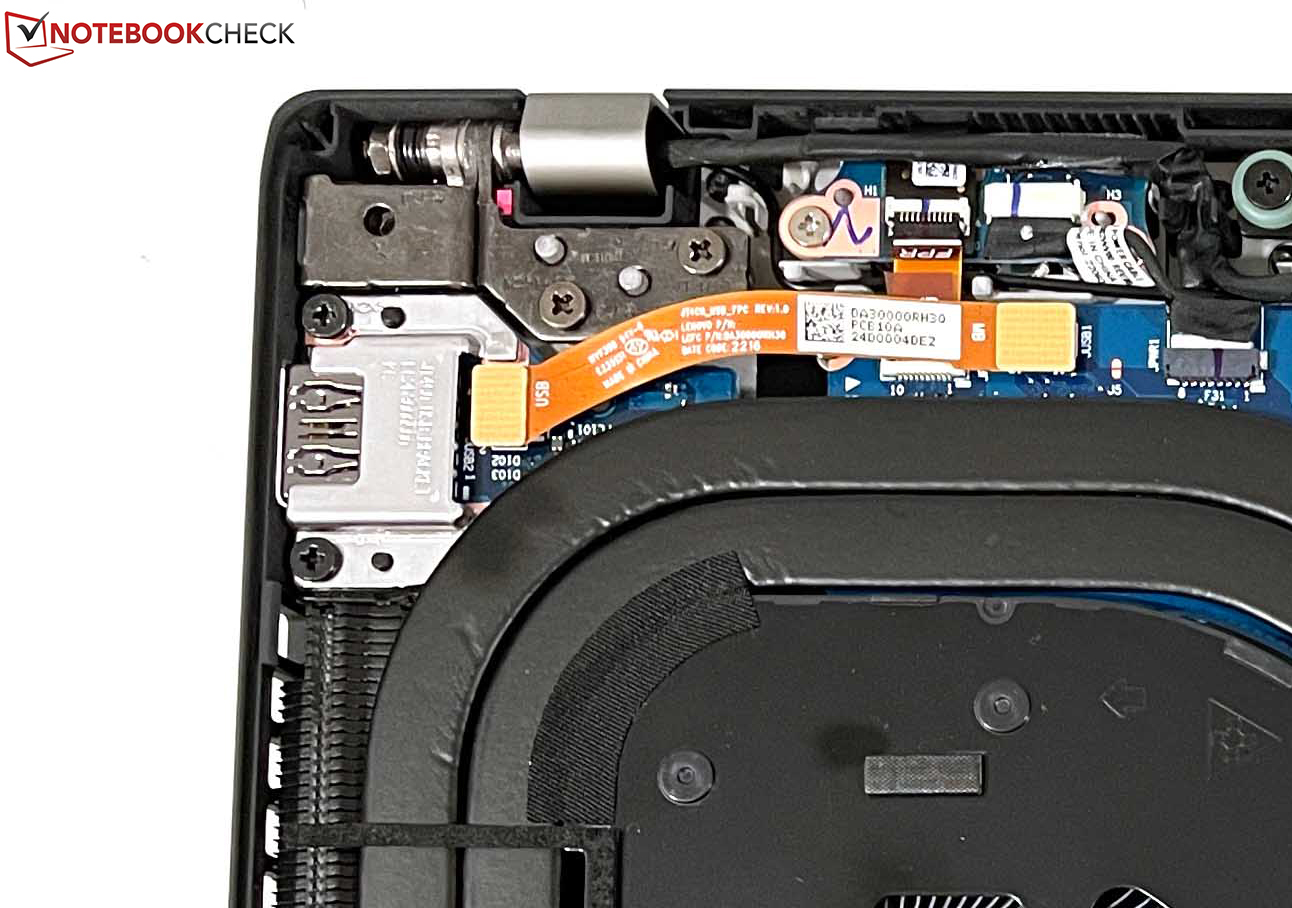
ThinkPad T14 G3提供了各种端口,包括普通的USB-A端口、一个HDMI输出和一个千兆以太网端口。然而,USB 4的遗漏令人费解,因为左边的两个USB-C端口只支持3.2 Gen.2标准。这是无法理解的,在我们看来,这是一个不必要的限制,因为联想在配备AMD CPU的消费者机型中提供了USB 4支持。右前方还有一个可选的智能卡读卡器。你也只能没有读卡器了。
沟通
在通信模块方面,你几乎可以支配整个频谱,因为除了千兆以太网端口外,还使用了高通公司的现代Wi-Fi 6E模块(NFA725A),它还支持蓝牙5.2和现代6GHz网络。连接到我们的华硕参考路由器的6GHz网络没有任何问题,传输速率和信号质量都很好。使用Wi-Fi 5路由器(Fritz!Box 7590)时也没有问题。
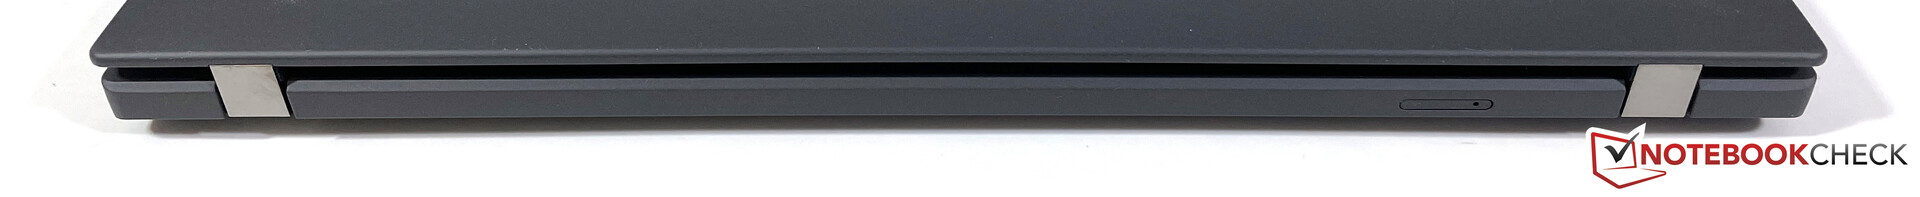
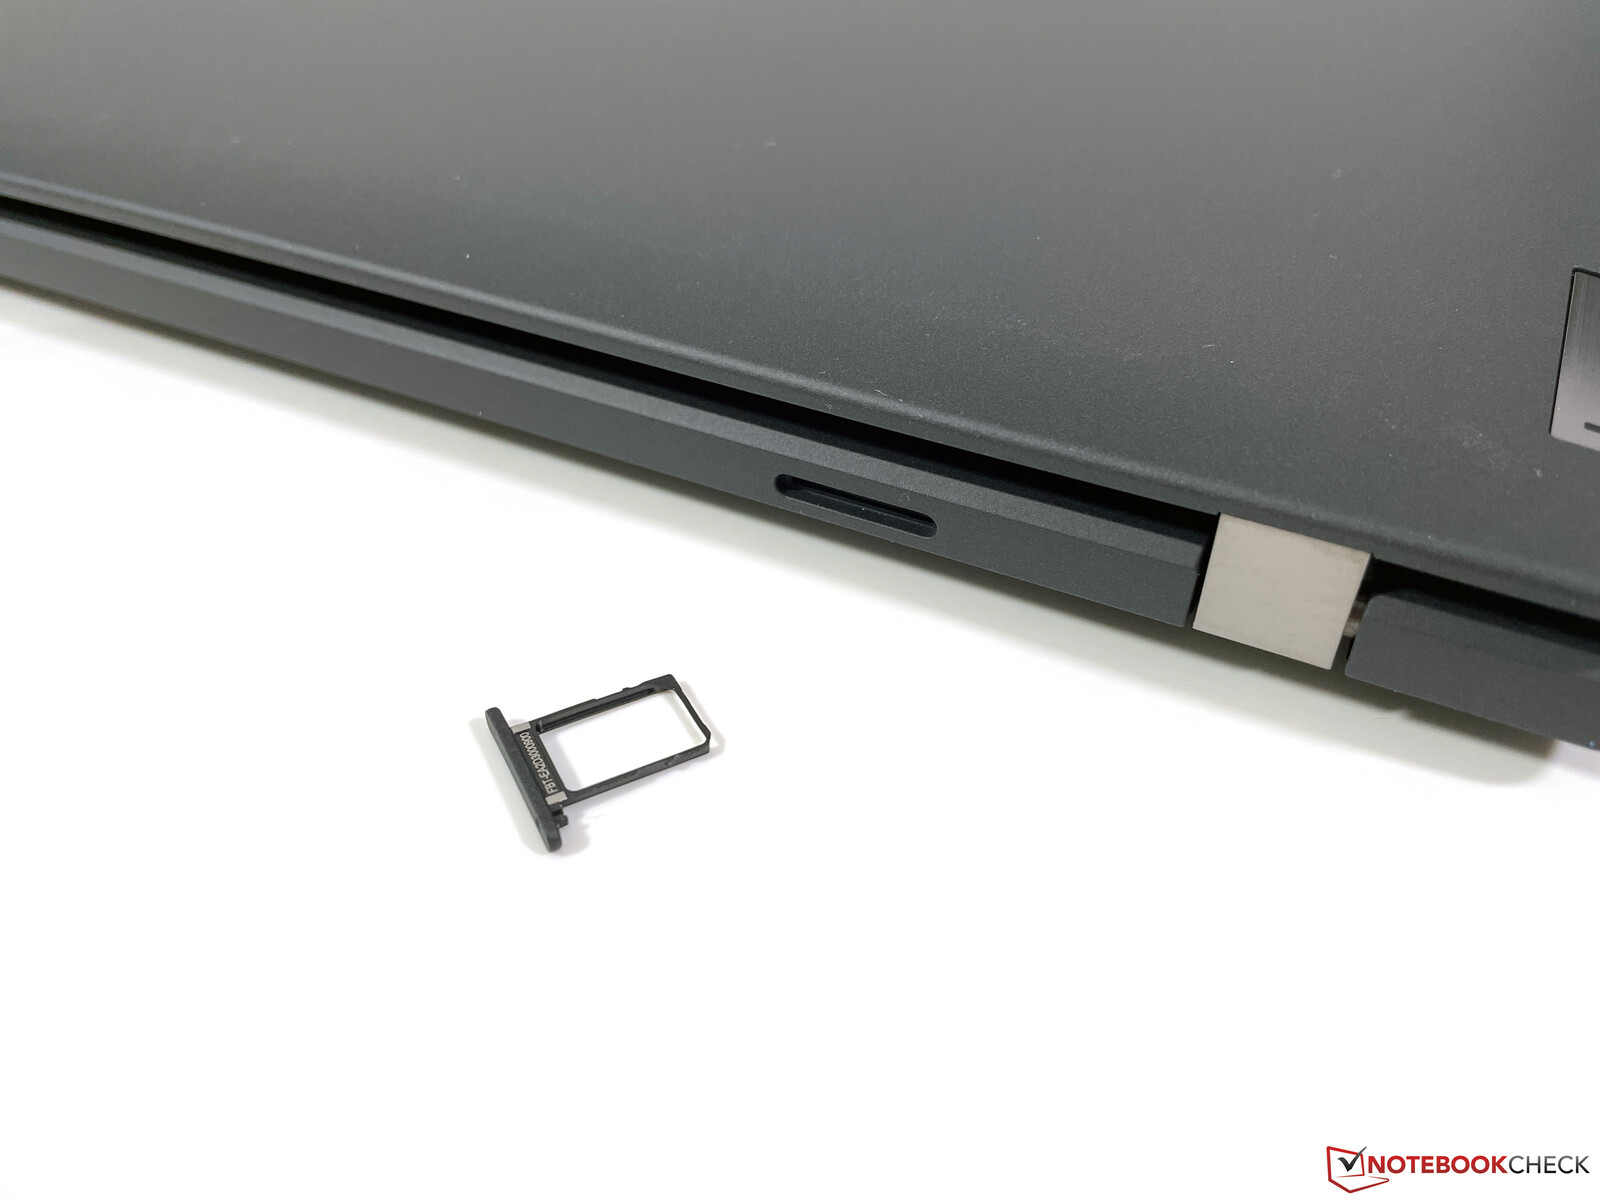
那些依赖移动互联网的人可以选择为T14 G3配置WWAN模块,但这里 "只 "使用4G/LTE模块;5G模块不可用。然而,在配置或购买该设备时,你必须小心,因为大多数配置都不具备WWAN功能,所以没有天线,也没有背面的nano-SIM插槽。这是不可理解的,因为联想在配置器中提供了一个WWAN-ready选项,不需要额外收费。在这里,你可以简单地提供所有带有WWAN的型号,就像过去的情况一样。
T14 G3的AMD和英特尔版本都可以选择使用Quectel EM05-G WWAN模块(LTE Cat.4),并且各自提供一个eSIM和一个nano-SIM插槽。在测试中,我们能够毫无问题地使用Telekom SIM卡,在LTE网络中冲浪没有任何问题。在城市地区,信号强度非常好,也比智能手机的信号强度好。根据官方规格表,还应该有一个Fibocom L860 GL-16模块(Cat.16)。
网络摄像头
联想在屏幕上边框安装了一个带有机械快门的1080p网络摄像头,与旧的720p传感器相比,它的图像质量更好。还安装了一个用于通过Windows Hello进行面部识别的红外摄像头。


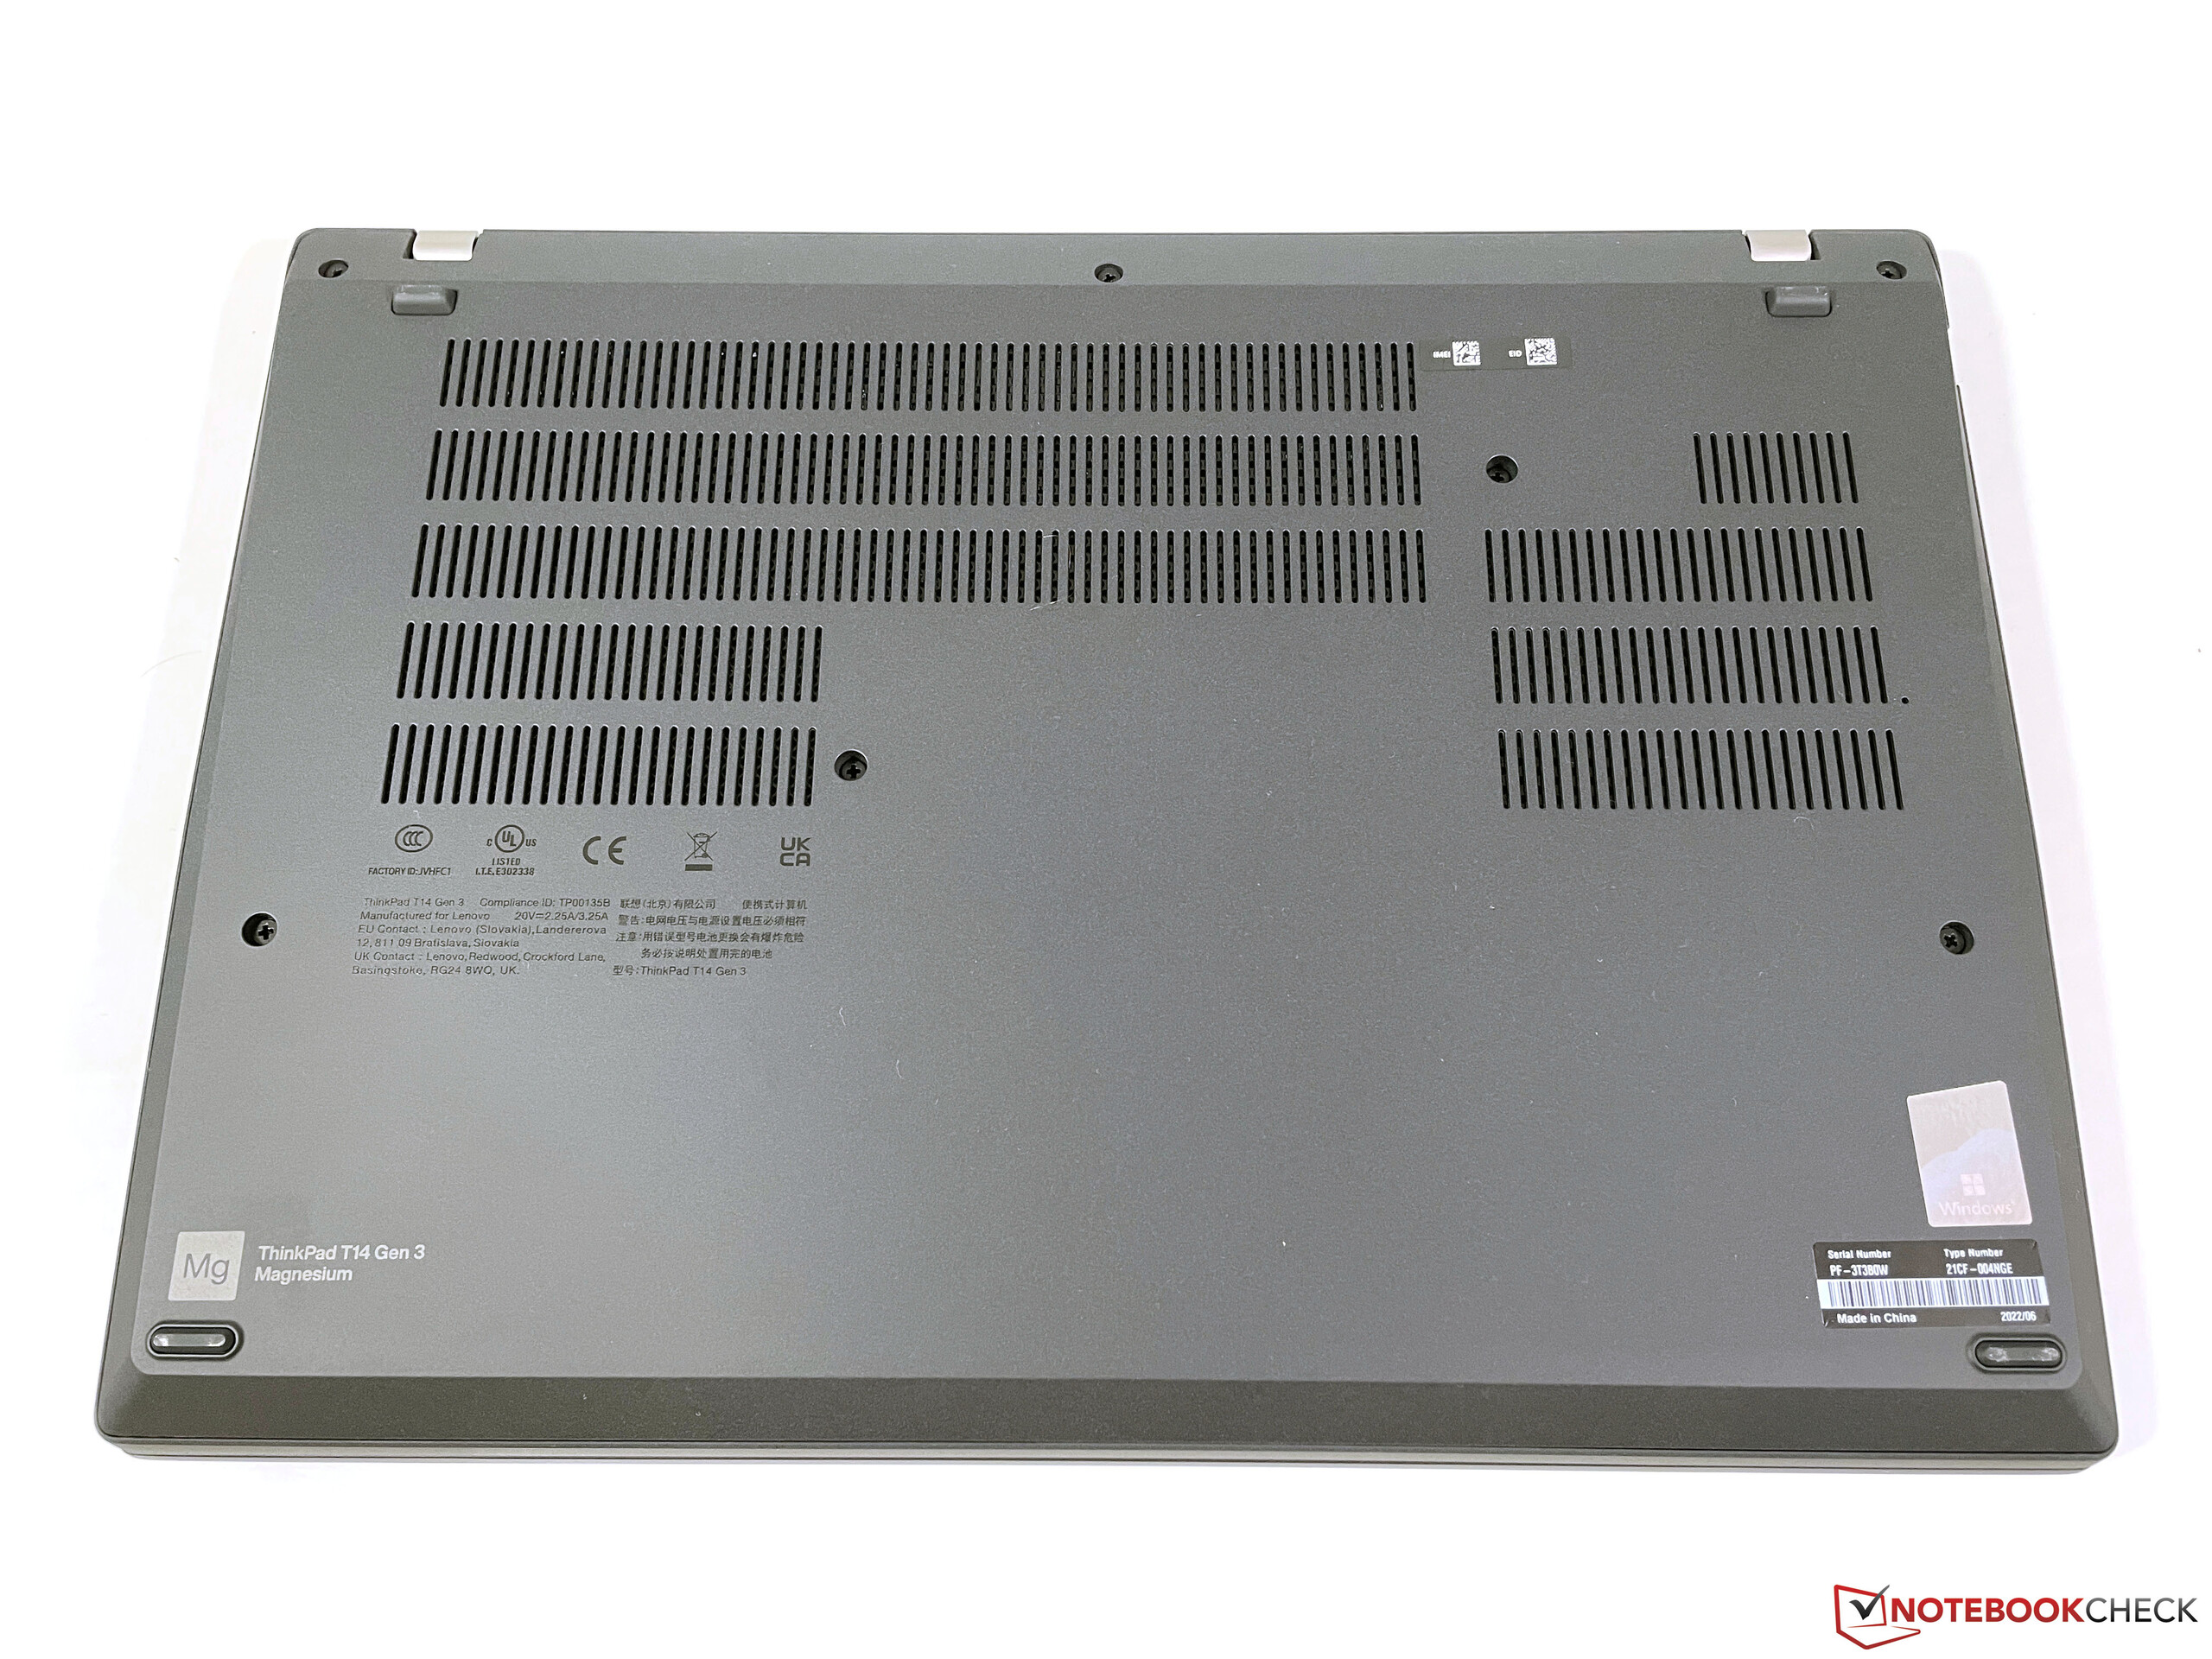
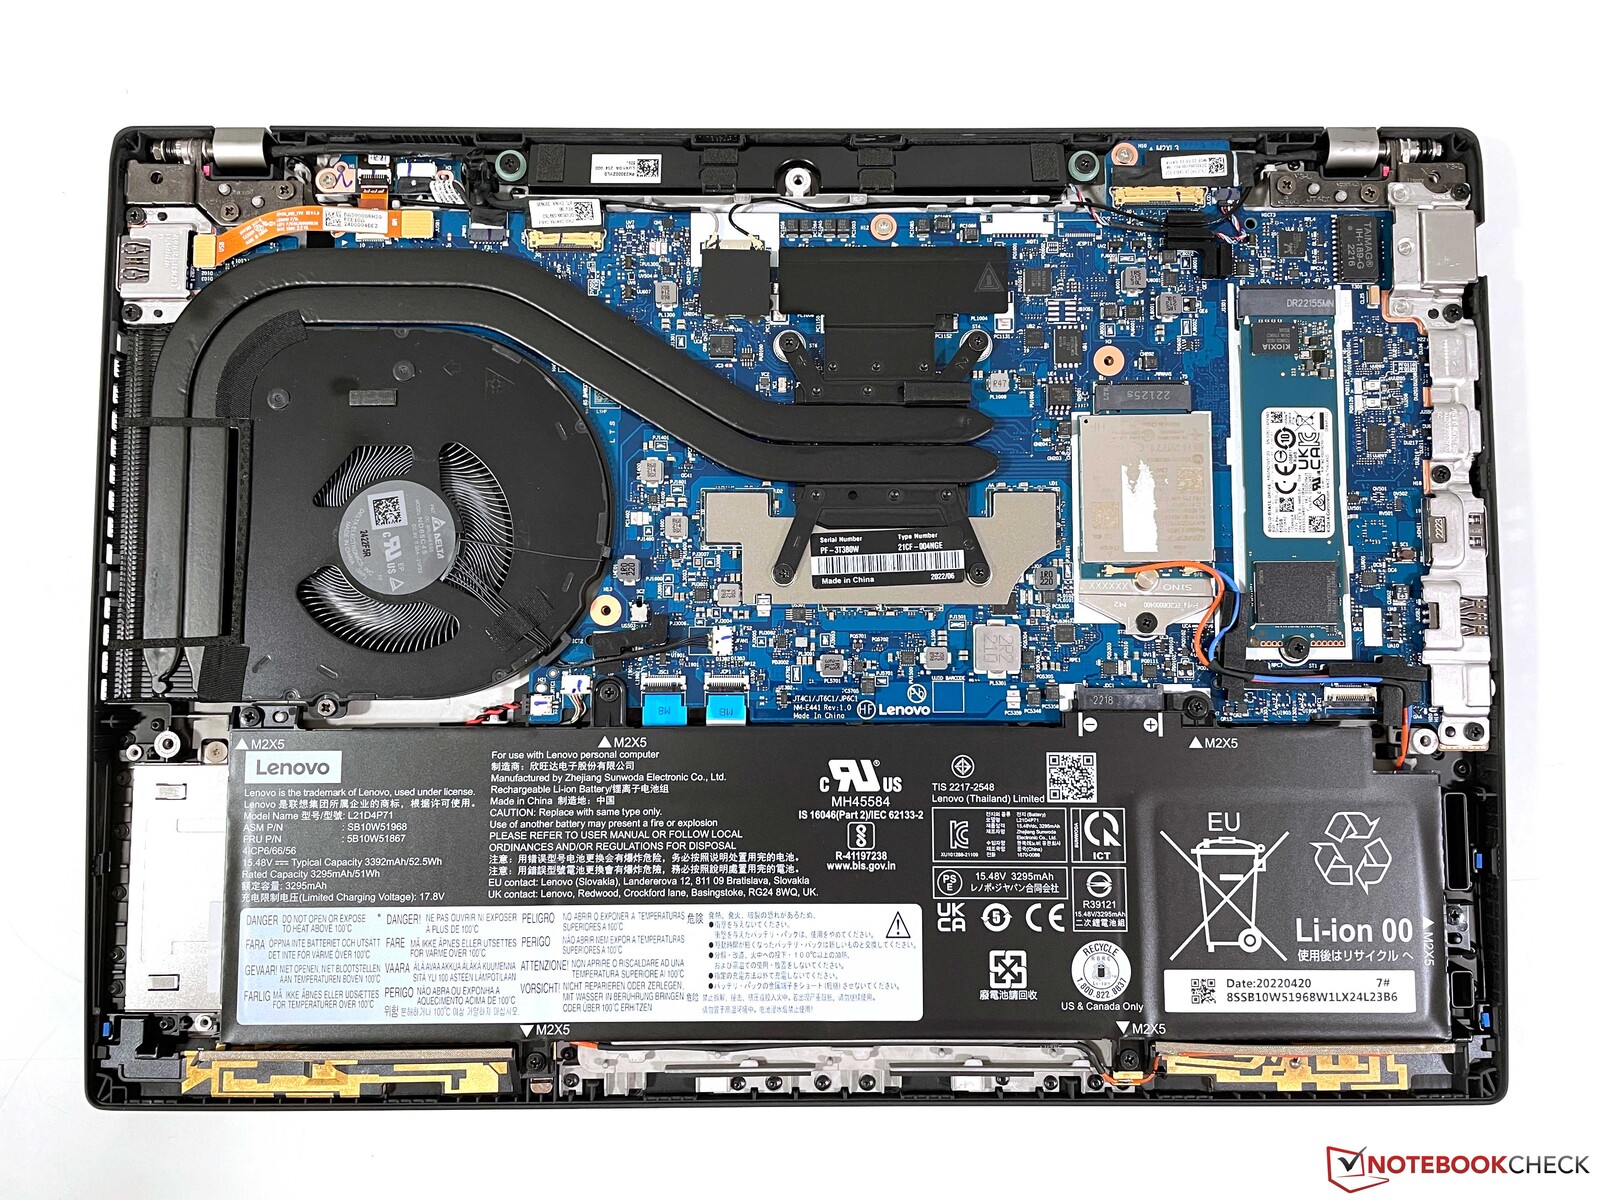
维护
联想简化了对组件的访问,因为现在没有那么多塑料夹子。松开7个普通的飞利浦螺丝后,盖子可以非常容易地被卸下。在这里,你可以接触到风扇、M.2-2280固态硬盘以及WWAN模块,但WLAN模块是不可更换的。然而,AMD型号的内存是焊接的(最大32GB LPDDR5-6400),而英特尔型号在焊接的模块旁边提供一个内存插槽,这就是为什么最大48GB内存(DDR4-3200)是可能的。电池只用螺丝固定,必要时可以更换。键盘也可以非常容易地更换,松开底部的两个螺丝,然后将键盘稍稍向前推,就可以将其取出。
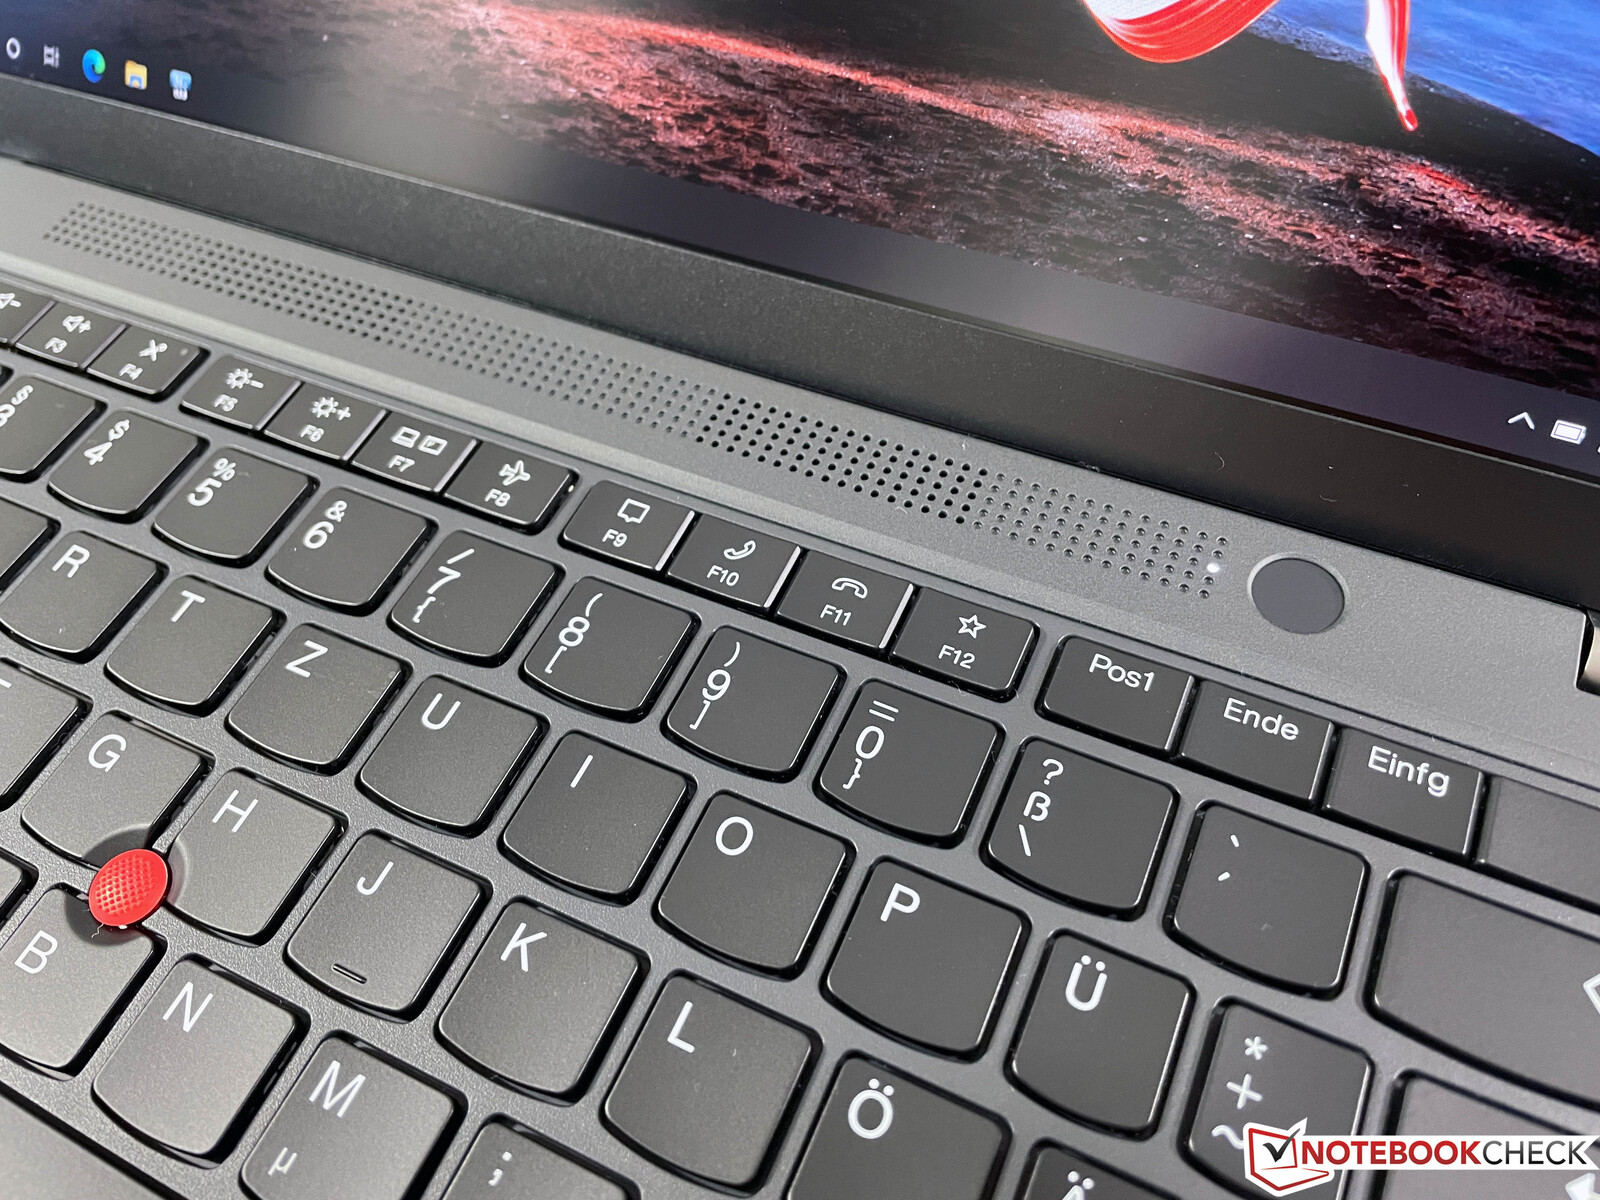
输入设备--ThinkPad T14只有1.5毫米的键距
键盘
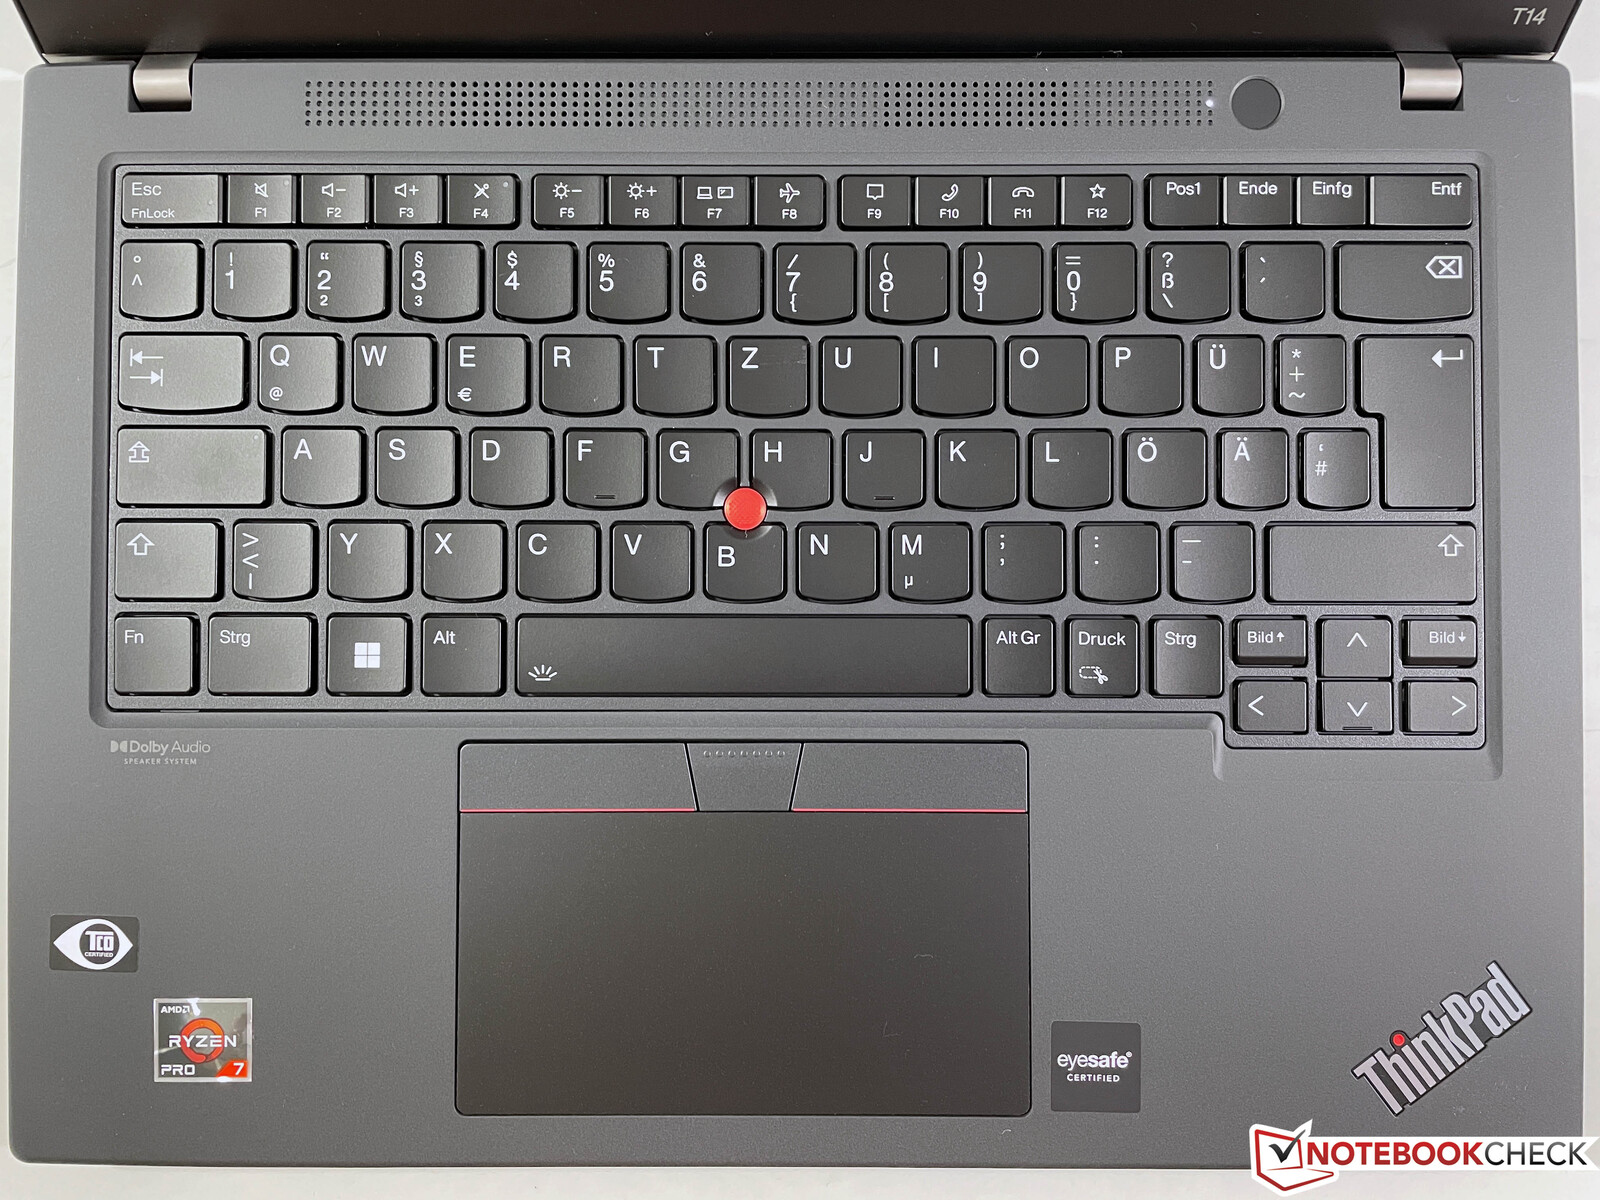
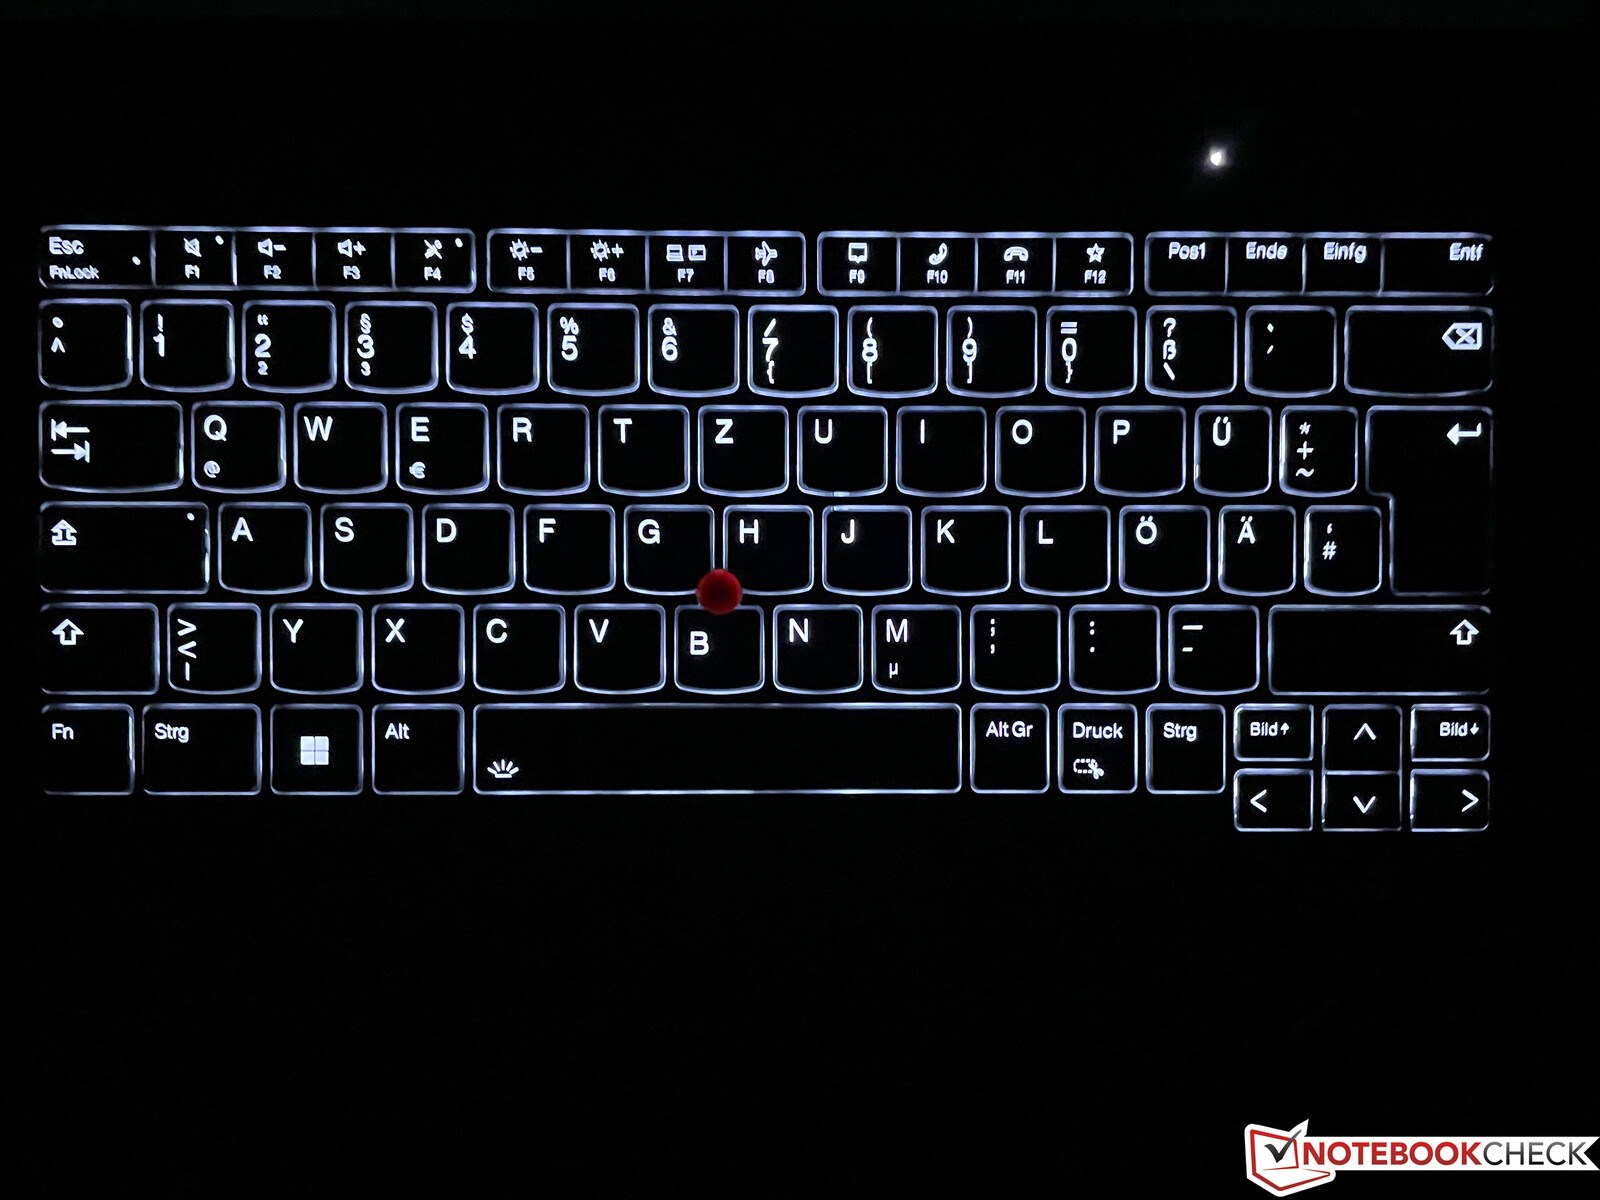
和其他ThinkPads一样,联想将T14的新G3型号的键程从1.8毫米减少到1.5毫米,这在实践中是很明显的。虽然按键反馈仍然简洁,而且这不是一个坏的键盘,但旧型号的键盘简直更好、更舒适。与其他商务笔记本相比,联想在这里不再有优势,戴尔以及惠普的键盘现在处于一个相当的水平。键盘还提供两段式白色背光,但这不能通过亮度传感器自动激活。指纹扫描仪已被整合到电源按钮中,该按钮位于键盘上方。
触摸板和跟踪点
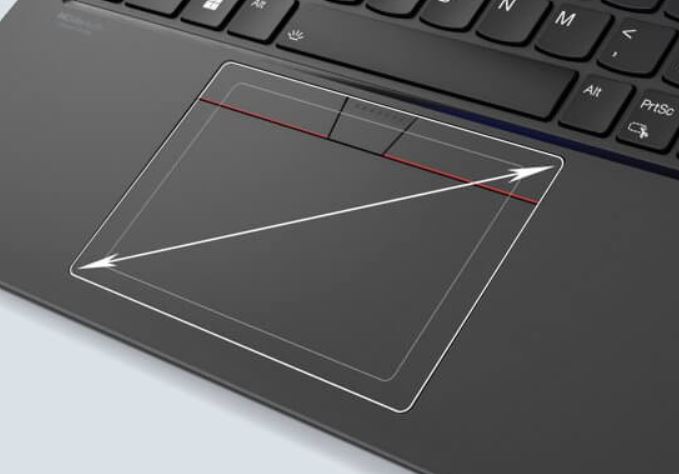
触摸板的尺寸比前代产品而且在实际使用中效果非常好。在测试中,我们对正常的指针控制和最多四个手指的手势都没有问题。触摸板的下部区域可以被按下,这时会发出相当低沉的点击声。
当然,键盘中央的TrackPoint也可用于指针移动,而且功能非常好。我们对新的TrackPoint键感到惊讶,它现在更宽了,与触摸板相似。这些按键现在提供了稍多的行程,并且在我们的评测样本中得到了完美的实现,所以没有不稳定或摇晃的情况。它们还提供了一个非常丰富和消沉的点击噪音。
显示屏 - T14 G3现在有16:10的显示屏
在再次为高端设备,如诸如ThinkPad X1 Carbon自上一代以来,ThinkPad T14 G3和T14s G3型号再次配备了16:10面板,现在也正在进行转换。联想为T14 G3 AMD提供了总共6种不同的14英寸面板(欧洲为5种),这些面板在图像质量和亮度方面会有很大差异。
- WUXGA (1.920 x 1.200), 300尼特, IPS, 700:1, 45% NTSC
- WUXGA (1.920 x 1.200), 400尼特, IPS, 800:1, 100% sRGB, 附加费约110美元
- WUXGA (1.920 x 1.200), 300尼特, IPS, 触摸, 700:1, 45% NTSC, 附加费用约100美元
- WUXGA (1.920 x 1.200), 500 Nits, IPS, Touch, Privacy Guard, 1000:1, 100% sRGB, 附加费用约为360美元
- 2.2K (2.240 x 1.400), 300尼特, IPS, 1500:1, 100% sRGB
- WQUXGA (3.840 x 2.400), 500尼特, 1500:1, 100% DCI-P3, DolbyVision HDR 400, 附加费约420美元
2.2K显示屏在欧洲没有供应。我们的评测样品有400尼特非触摸显示屏,这可能是生产性使用中最受欢迎的变体,根据经验,它提供了图像质量和效率之间的最佳折衷。正如前辈 ,可能又会有不同的供应商,所以不能排除某种面板抽奖的可能性,这就是为什么对比度为800:1的最低规格如此之低。
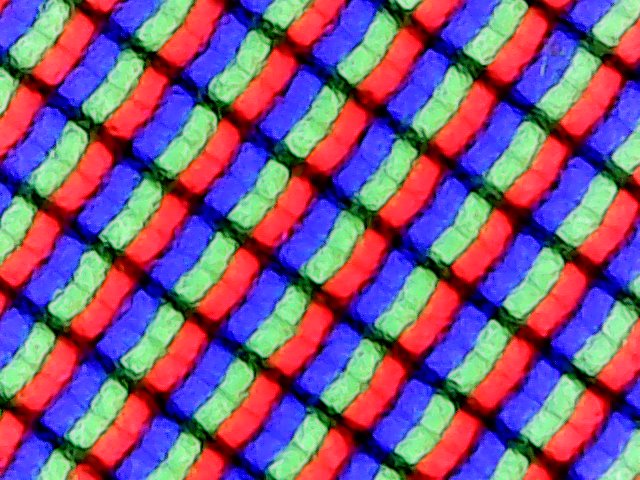
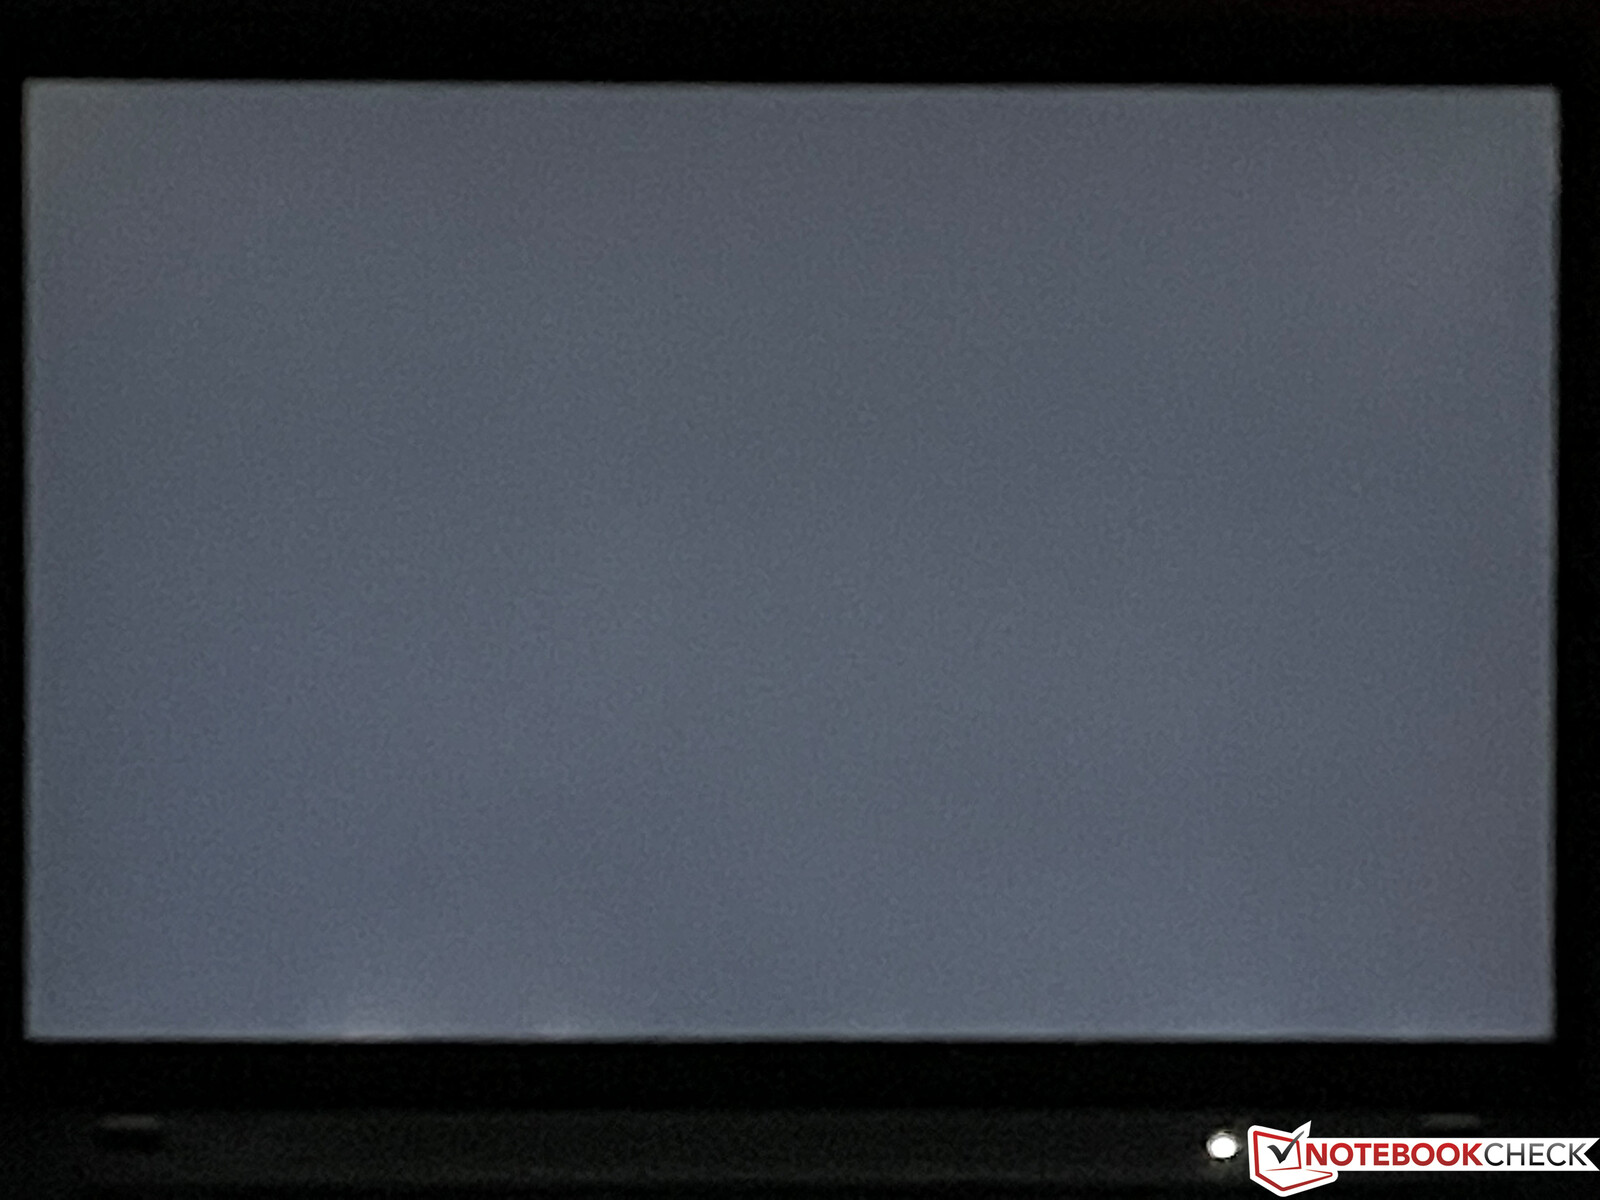
我们的面板来自LG(LP140WU1-SPB2),考虑到预期用途,几乎在所有领域都表现良好。尽管采用了磨砂表面,但明亮的表面完全没有颗粒感,尽管是正常的FHD分辨率,但内容足够清晰,颜色也看起来很鲜艳。看一下测量值也可以看出为什么会这样。对比度超过2100:1,这对IPS面板来说是非常好的。规定的400cd/m²的亮度也被我们的审查样本超过,平均为432cd/m²。同时,0.21的黑值也非常低。在最大亮度下只有极少的光晕,而且没有检测到PWM闪烁。此外,IPS屏幕的可视角度稳定性也非常好。
| |||||||||||||||||||||||||
Brightness Distribution: 94 %
Center on Battery: 451 cd/m²
Contrast: 2148:1 (Black: 0.21 cd/m²)
ΔE ColorChecker Calman: 2.4 | ∀{0.5-29.43 Ø4.71}
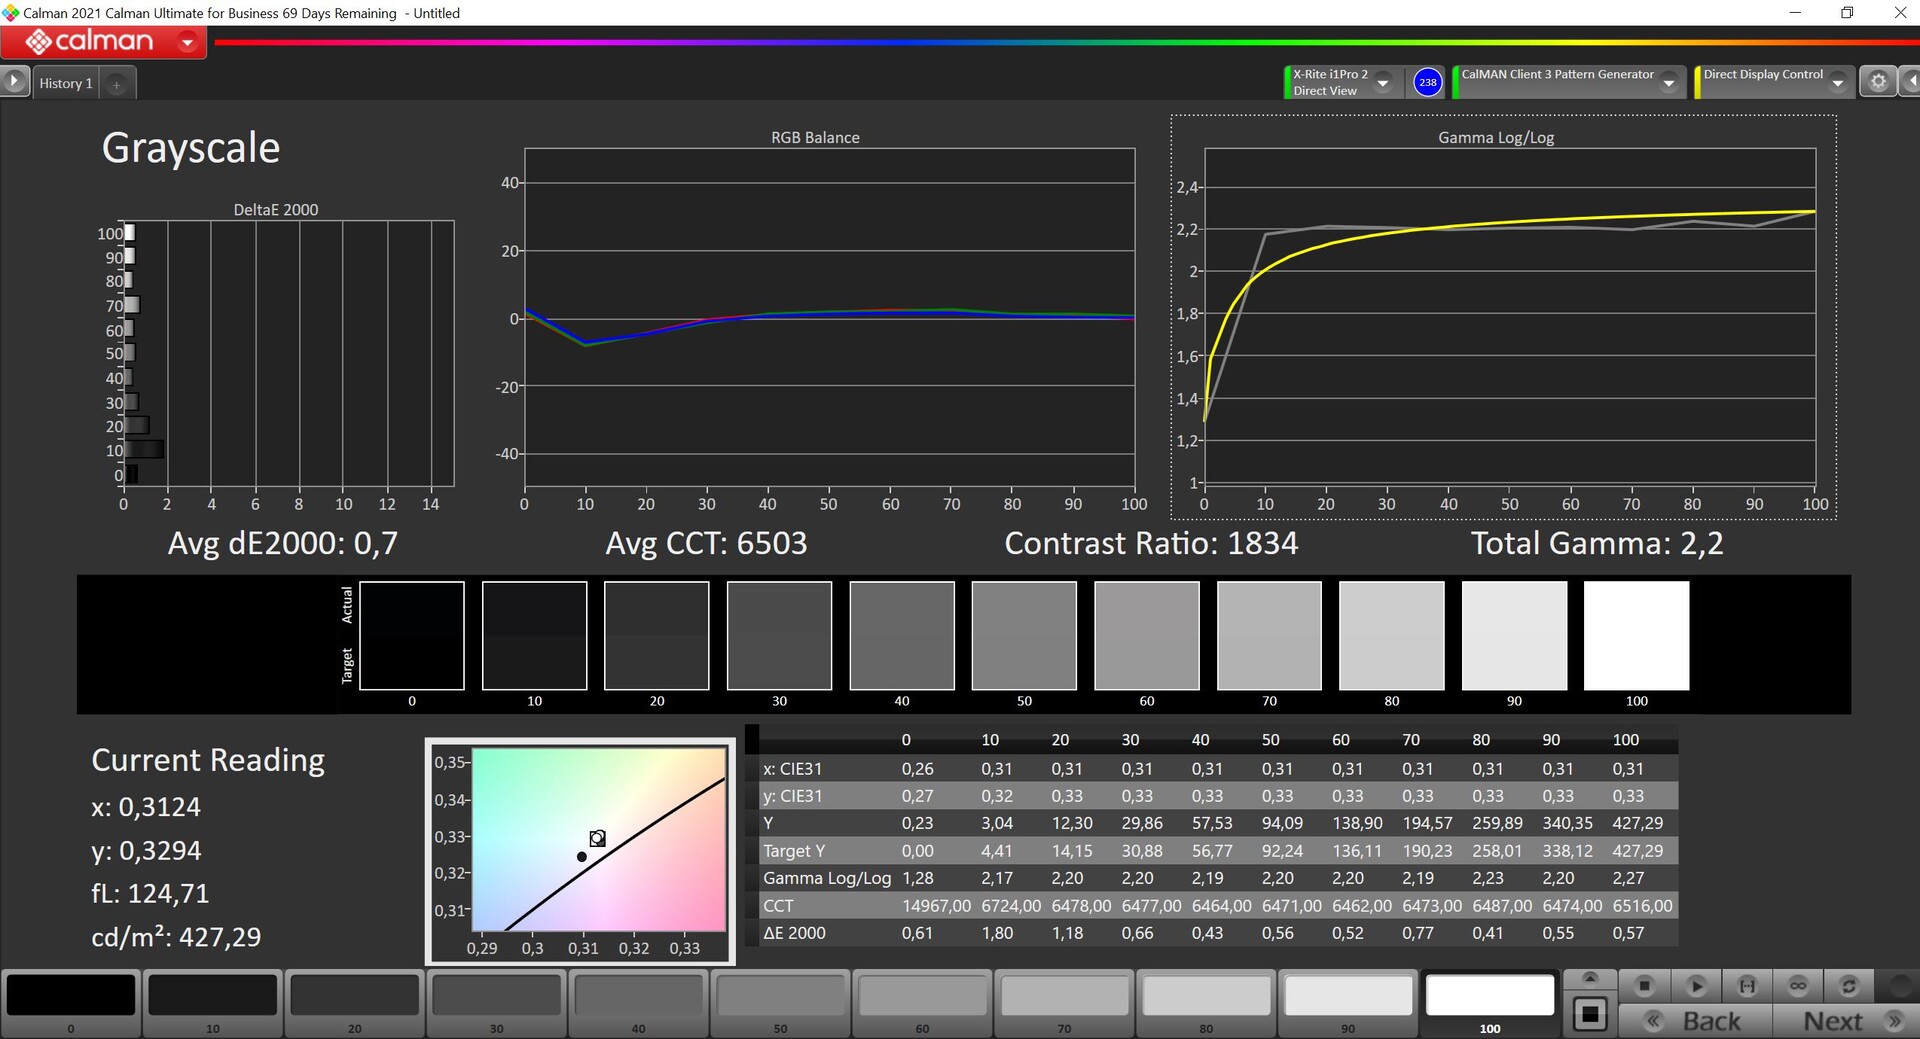
calibrated: 1.3
ΔE Greyscale Calman: 3.3 | ∀{0.09-98 Ø4.96}
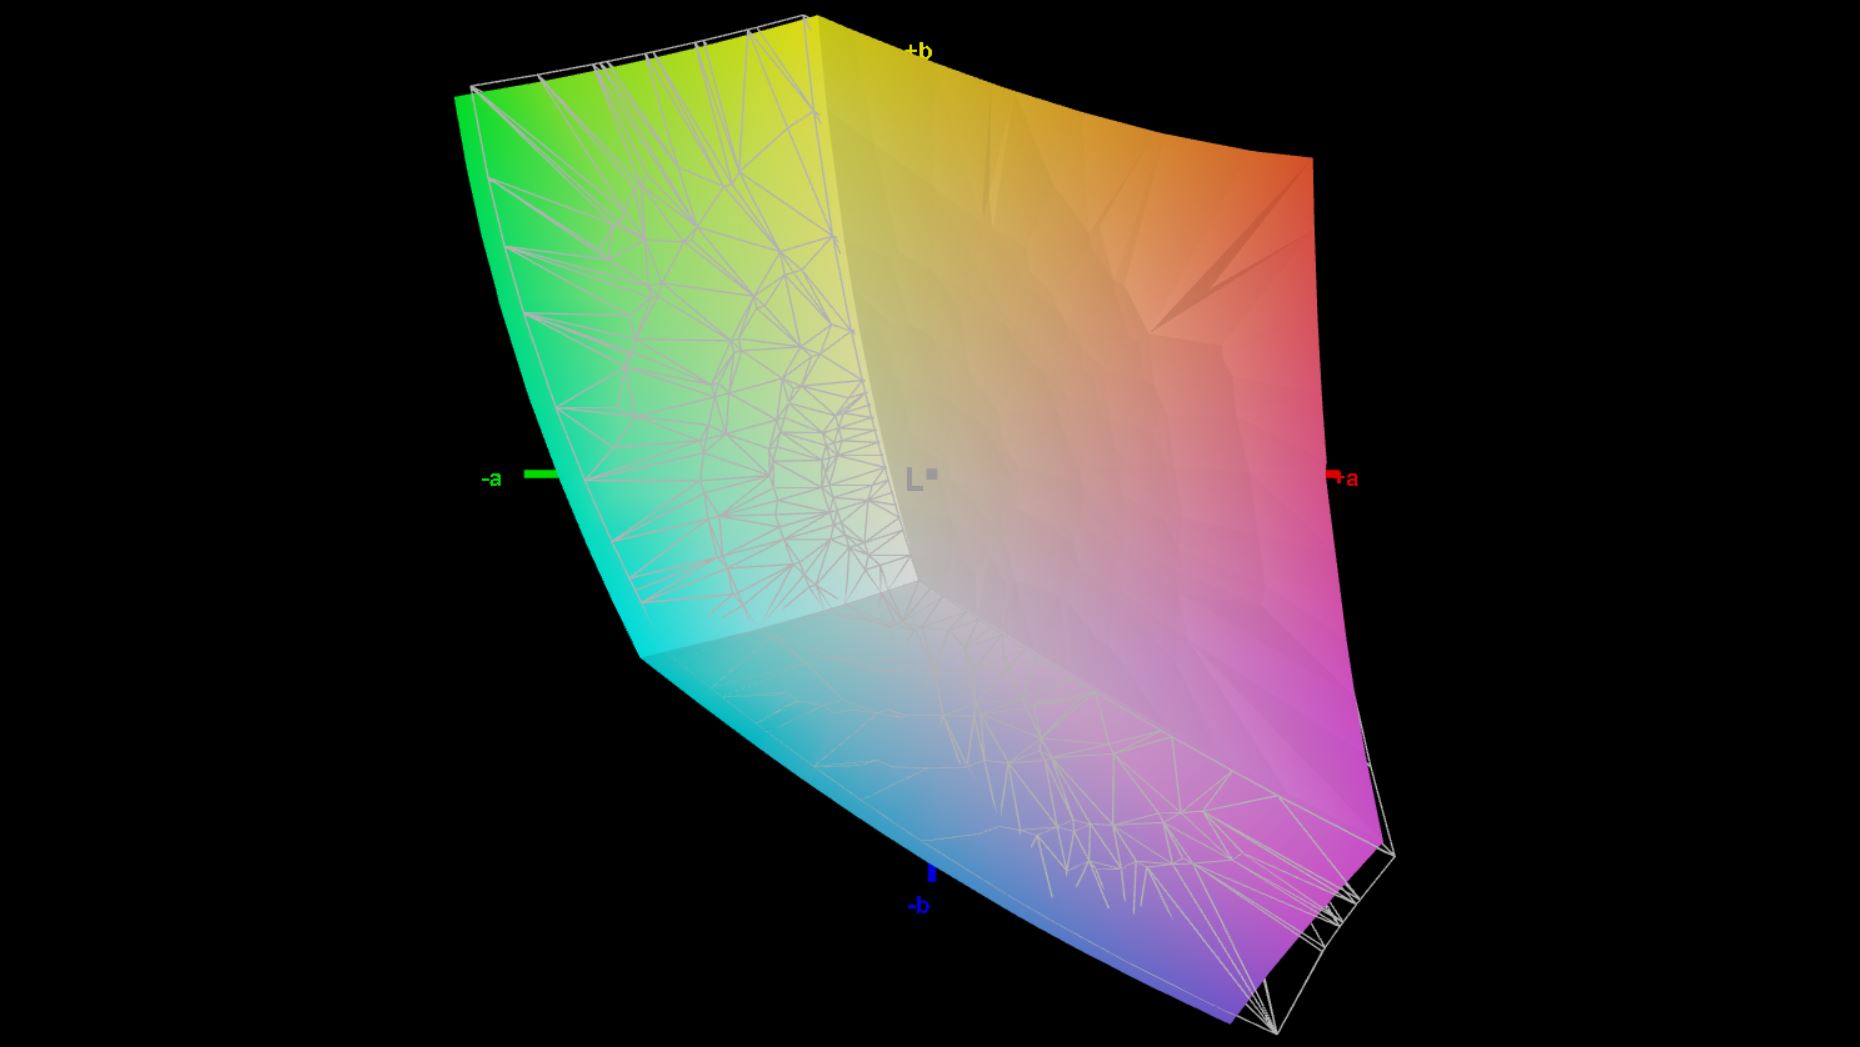
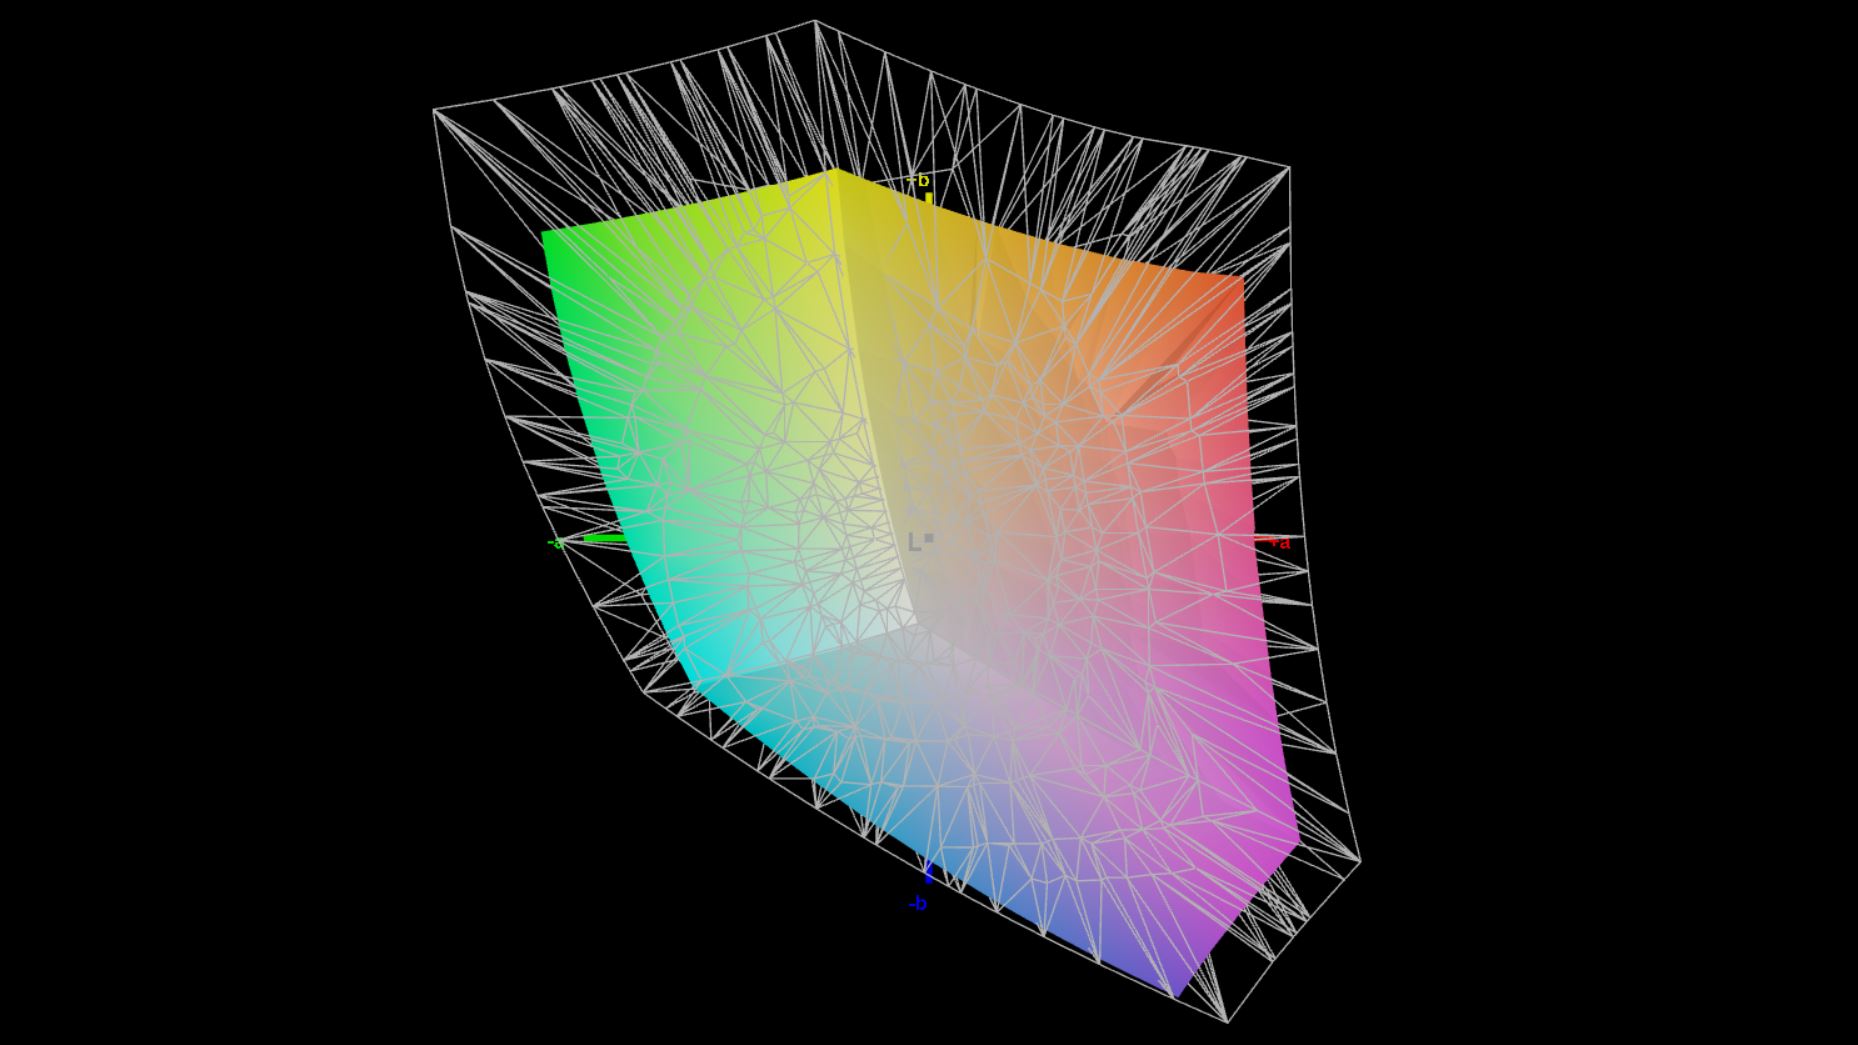
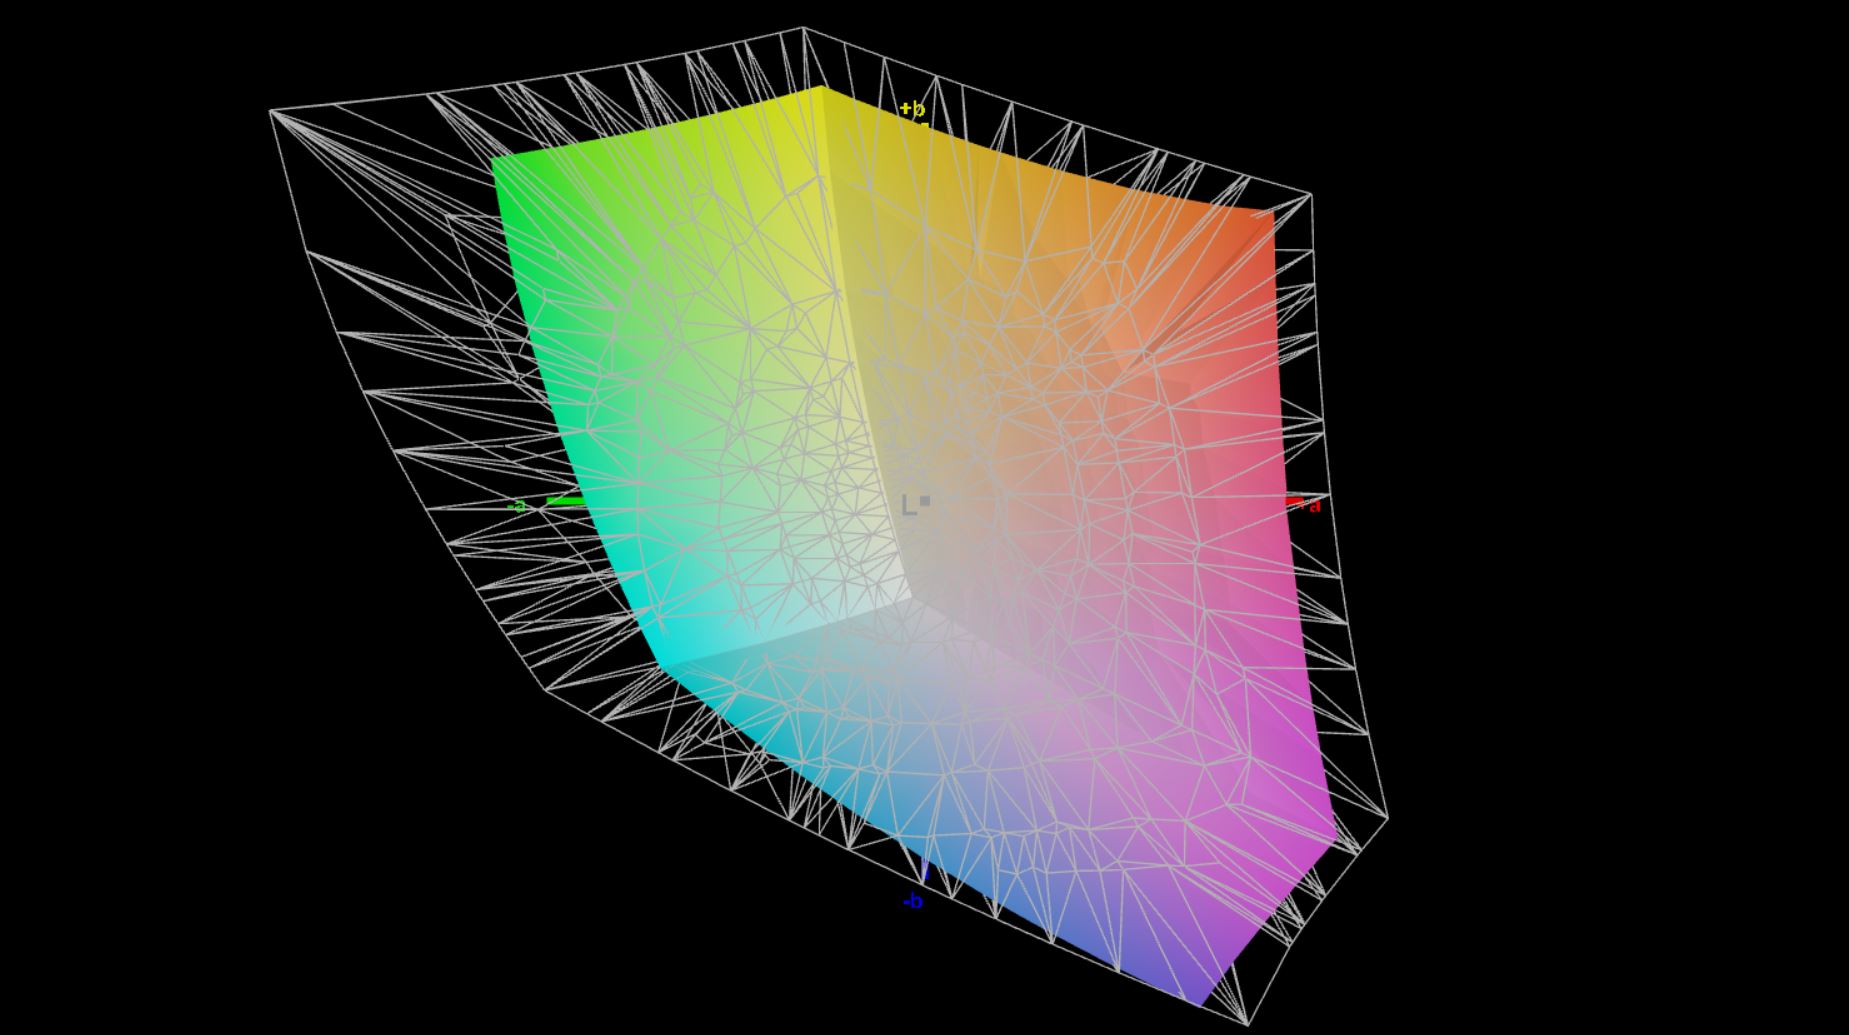
71.5% AdobeRGB 1998 (Argyll 3D)
97.4% sRGB (Argyll 3D)
69.2% Display P3 (Argyll 3D)
Gamma: 2.13
CCT: 6848 K
| Lenovo ThinkPad T14 G3-21CF004NGE LP140WU1-SPB2, IPS, 1920x1200, 14" | Dell Latitude 7420 JW6MH Chi Mei CMN1416 CHF07 140HCG, IPS, 1920x1080, 14" | Huawei MateBook X Pro 2022 TMX1422, IPS, 3120x2080, 14.2" | HP EliteBook 845 G9 6F6H6EA InfoVision X140NV4J, IPS, 1920x1200, 14" | Lenovo ThinkPad T14 Gen2-20W1S00000 LP140WF9-SPF2, IPS LED, 1920x1080, 14" | Lenovo ThinkPad T14s G2 20XGS01100 NE140FHM-N61, IPS LED, 1920x1080, 14" | |
|---|---|---|---|---|---|---|
| Display | -1% | 20% | 0% | -6% | -4% | |
| Display P3 Coverage (%) | 69.2 | 68 -2% | 94.6 37% | 69 0% | 64.3 -7% | 69.7 1% |
| sRGB Coverage (%) | 97.4 | 99 2% | 99.5 2% | 99 2% | 95.4 -2% | 91.8 -6% |
| AdobeRGB 1998 Coverage (%) | 71.5 | 70 -2% | 86.5 21% | 70 -2% | 65.5 -8% | 67.2 -6% |
| Response Times | -34% | 25% | 8% | -38% | -148% | |
| Response Time Grey 50% / Grey 80% * (ms) | 41.4 ? | 55 ? -33% | 25.4 ? 39% | 31 ? 25% | 57.2 ? -38% | 84 ? -103% |
| Response Time Black / White * (ms) | 19.2 ? | 26 ? -35% | 17.1 ? 11% | 21 ? -9% | 26.4 ? -38% | 56 ? -192% |
| PWM Frequency (Hz) | 2451 ? | |||||
| Screen | 9% | 13% | -13% | -20% | -71% | |
| Brightness middle (cd/m²) | 451 | 408 -10% | 603 34% | 678 50% | 382 -15% | 397 -12% |
| Brightness (cd/m²) | 435 | 378 -13% | 586 35% | 745 71% | 367 -16% | 386 -11% |
| Brightness Distribution (%) | 94 | 86 -9% | 91 -3% | 69 -27% | 88 -6% | 88 -6% |
| Black Level * (cd/m²) | 0.21 | 0.22 -5% | 0.39 -86% | 0.33 -57% | 0.14 33% | 0.28 -33% |
| Contrast (:1) | 2148 | 1855 -14% | 1546 -28% | 2055 -4% | 2729 27% | 1418 -34% |
| Colorchecker dE 2000 * | 2.4 | 1.54 36% | 1.1 54% | 3.56 -48% | 4.2 -75% | 5.8 -142% |
| Colorchecker dE 2000 max. * | 4.1 | 2.72 34% | 2.2 46% | 7.23 -76% | 7.9 -93% | 12.6 -207% |
| Colorchecker dE 2000 calibrated * | 1.3 | 1.08 17% | 1.2 8% | 1.05 19% | 0.9 31% | 1.9 -46% |
| Greyscale dE 2000 * | 3.3 | 1.95 41% | 1.5 55% | 4.93 -49% | 5.4 -64% | 8.3 -152% |
| Gamma | 2.13 103% | 2.33 94% | 2.17 101% | 2.63 84% | 2.31 95% | 2.07 106% |
| CCT | 6848 95% | 6806 96% | 6549 99% | 7114 91% | 7499 87% | 6867 95% |
| Color Space (Percent of AdobeRGB 1998) (%) | 60.6 | |||||
| Color Space (Percent of sRGB) (%) | 95.4 | |||||
| Total Average (Program / Settings) | -9% /
1% | 19% /
16% | -2% /
-8% | -21% /
-19% | -74% /
-68% |
* ... smaller is better
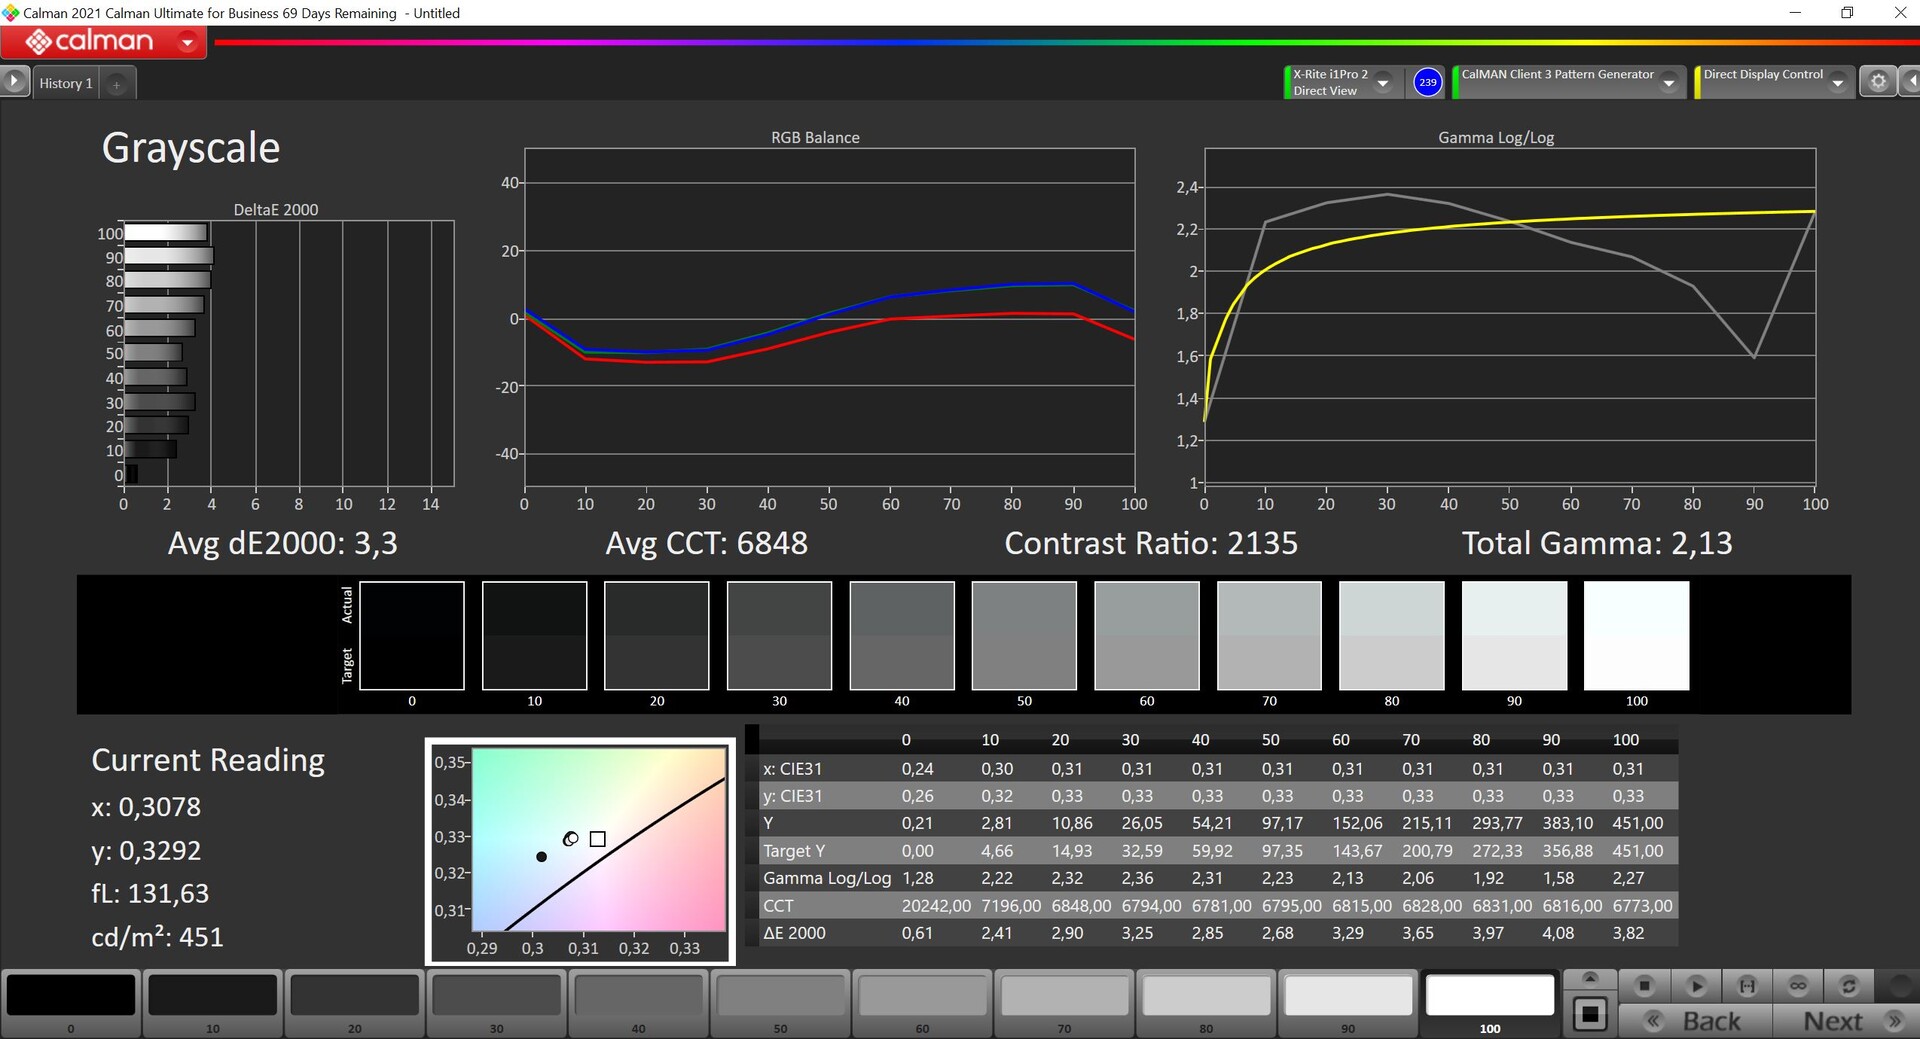

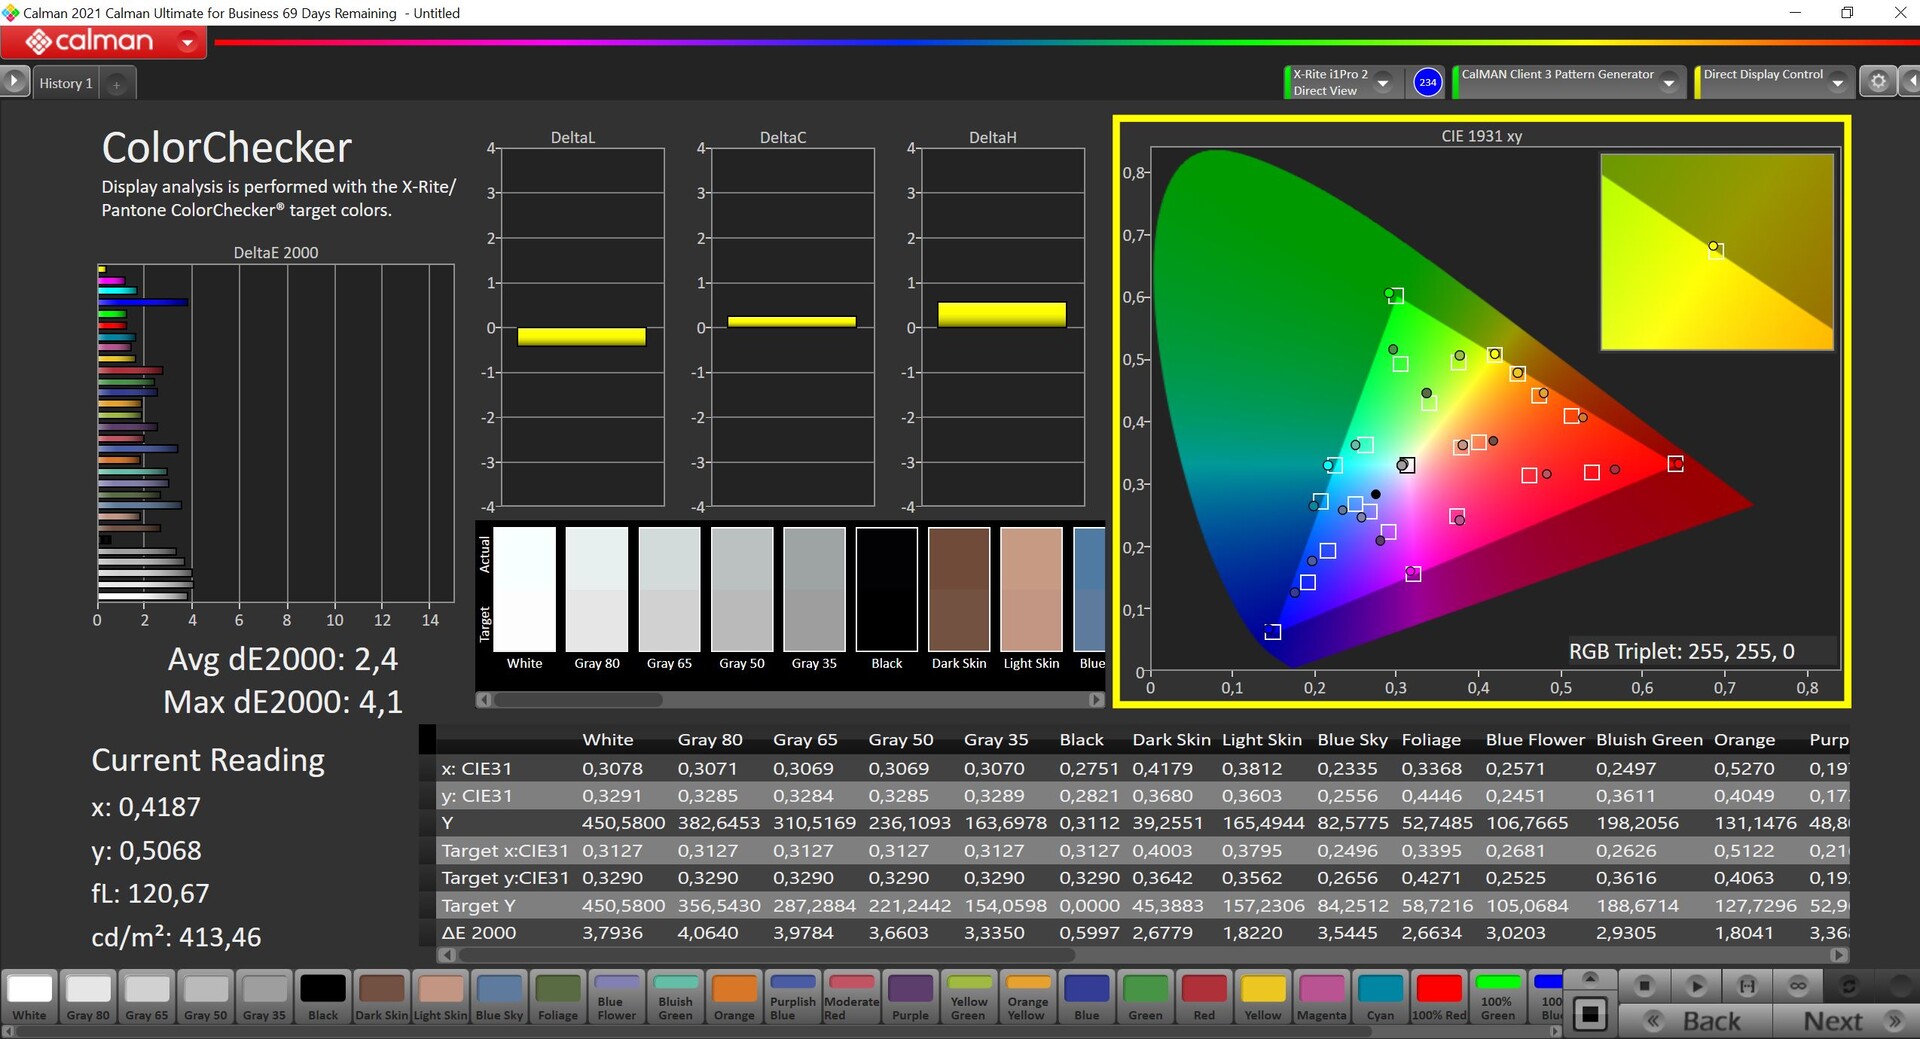
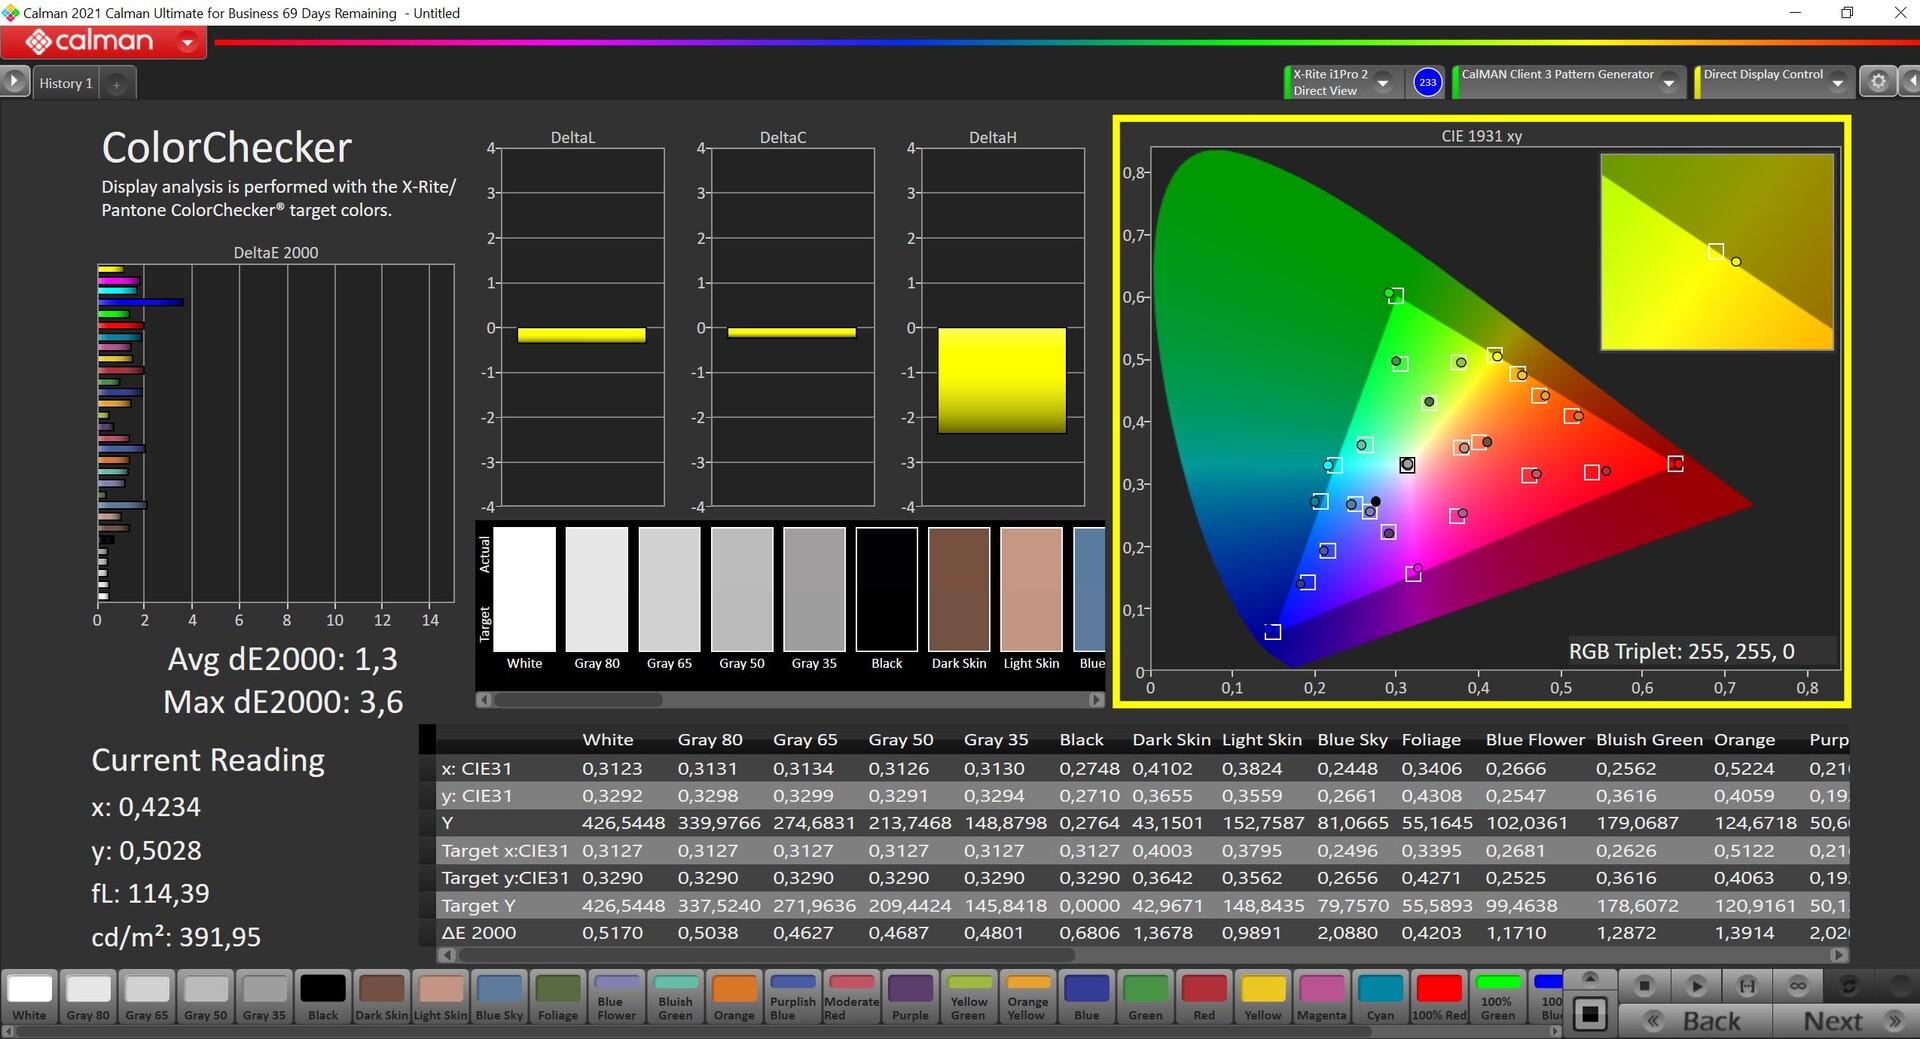
在使用刚开箱的笔记本电脑时,我们用专业的CalMAN软件(X-Rite i1 Pro 2)进行分析,发现有轻微的偏蓝/绿的色彩,同时色温也略微过冷。另一方面,在灰度或色彩方面,与sRGB参考色彩空间没有大的偏差,因此该面板在正常的办公室使用中不一定需要校准。
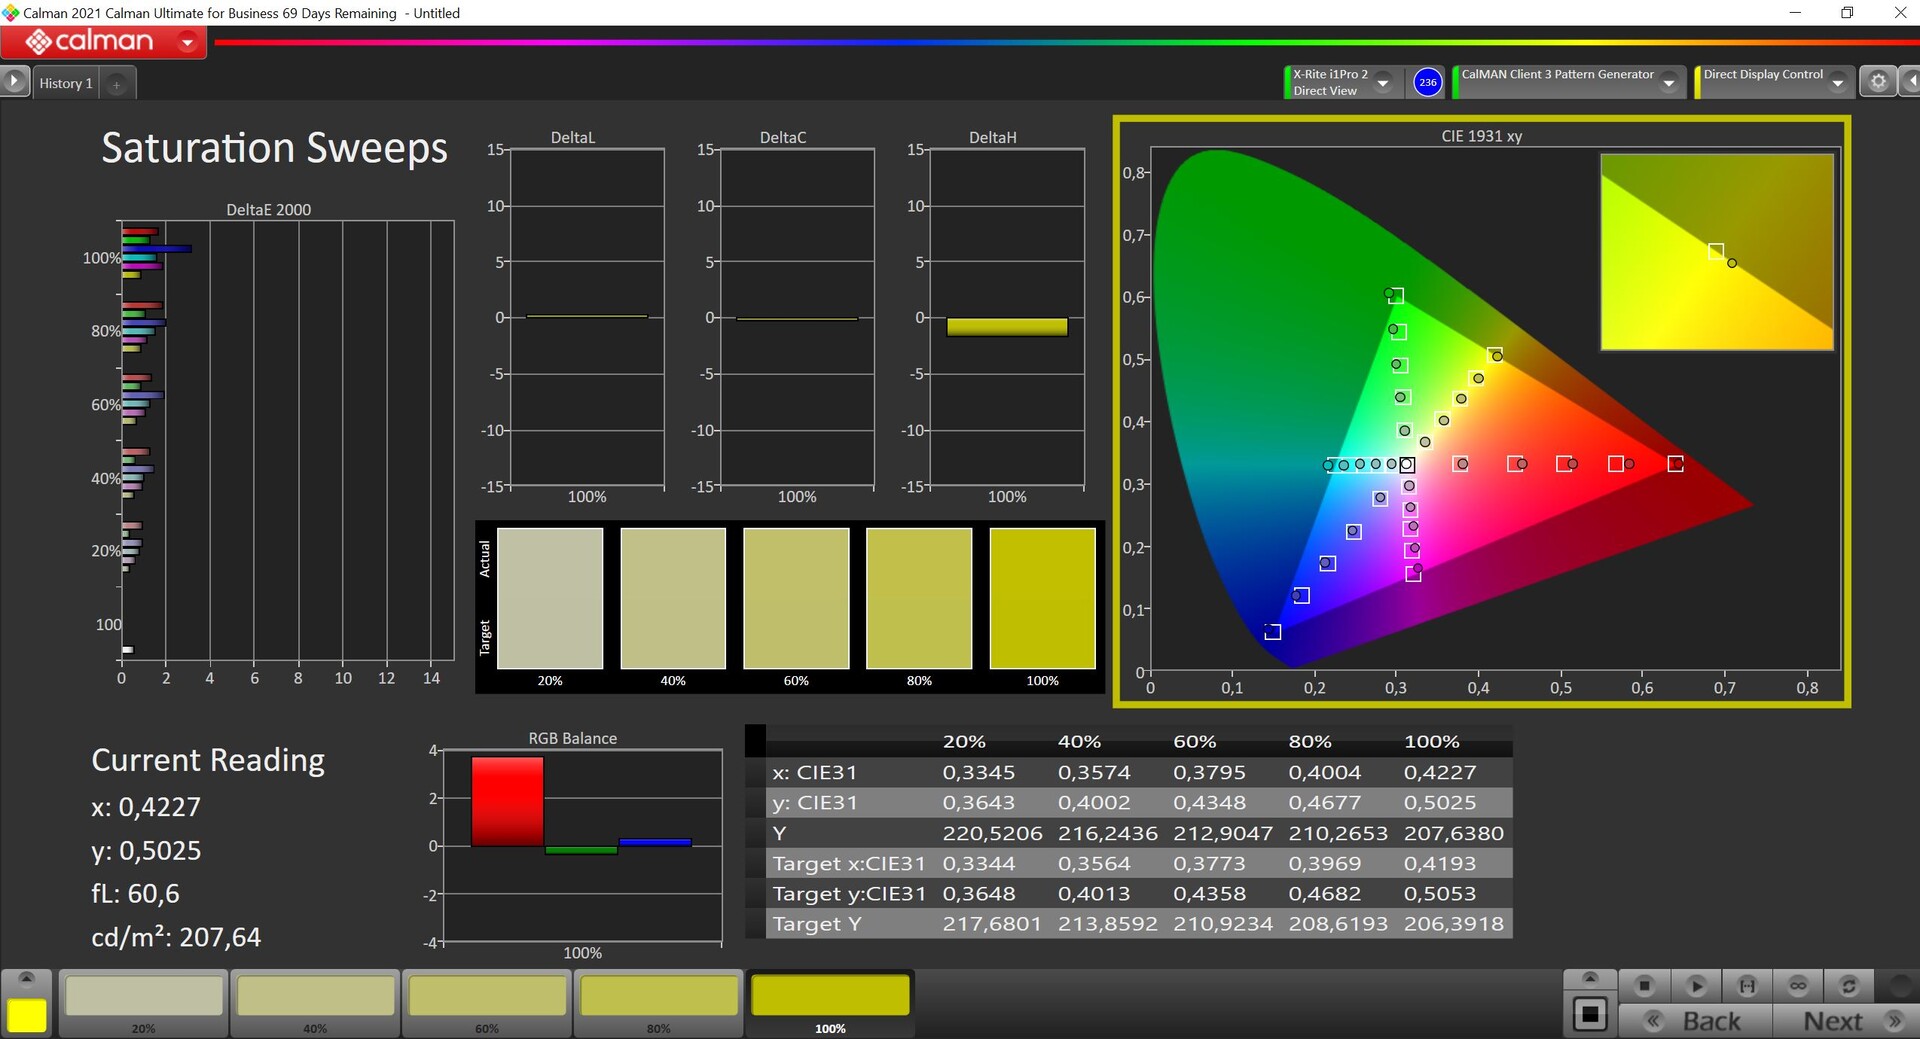
我们自己的校准(配置文件可在上面免费下载)带来了显示质量的改善,并进一步减少了色彩偏差。只有100%的蓝色刚刚超过3的重要限制,再加上几乎完全的sRGB覆盖,因此该面板非常适用于sRGB色彩空间的视频/图像编辑。
Display Response Times
| ↔ Response Time Black to White | ||
|---|---|---|
| 19.2 ms ... rise ↗ and fall ↘ combined | ↗ 6.8 ms rise | 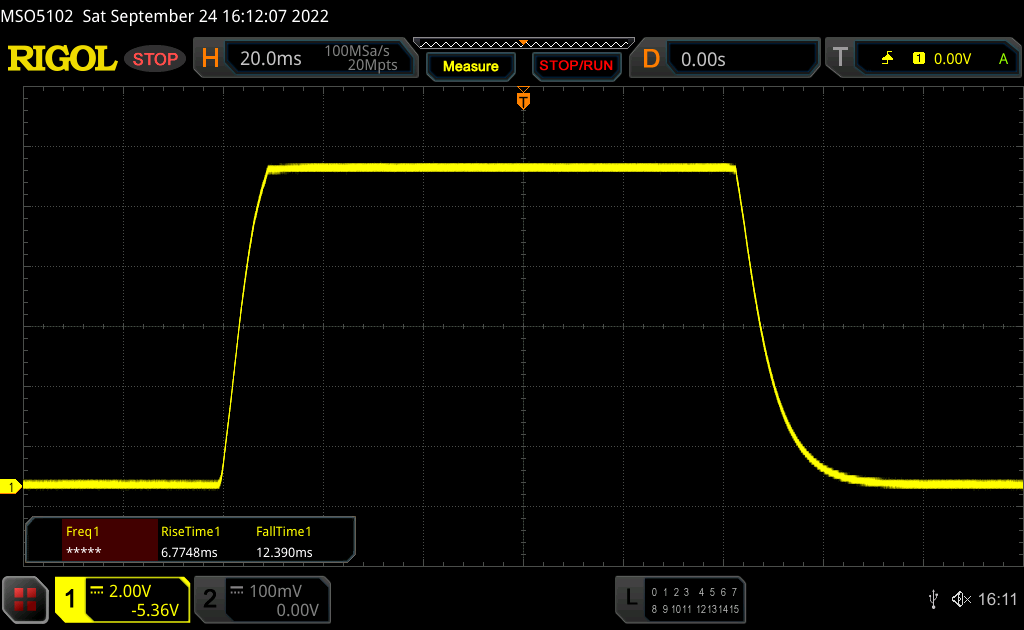 |
| ↘ 12.4 ms fall | ||
| The screen shows good response rates in our tests, but may be too slow for competitive gamers. In comparison, all tested devices range from 0.1 (minimum) to 240 (maximum) ms. » 43 % of all devices are better. This means that the measured response time is similar to the average of all tested devices (19.8 ms). | ||
| ↔ Response Time 50% Grey to 80% Grey | ||
| 41.4 ms ... rise ↗ and fall ↘ combined | ↗ 18.8 ms rise | 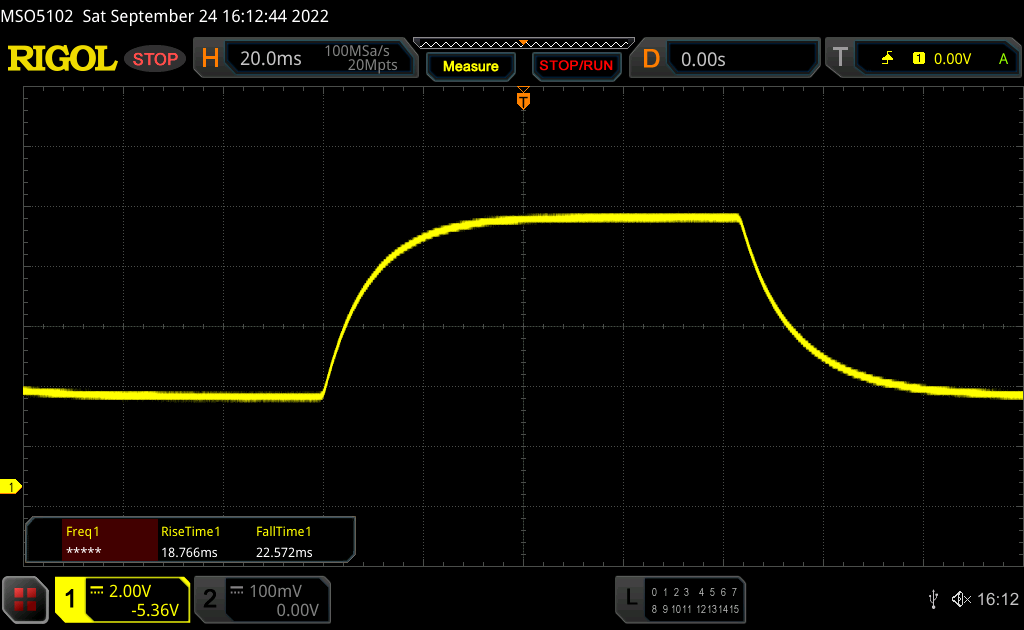 |
| ↘ 22.6 ms fall | ||
| The screen shows slow response rates in our tests and will be unsatisfactory for gamers. In comparison, all tested devices range from 0.165 (minimum) to 636 (maximum) ms. » 67 % of all devices are better. This means that the measured response time is worse than the average of all tested devices (31 ms). | ||
Screen Flickering / PWM (Pulse-Width Modulation)
| Screen flickering / PWM not detected | 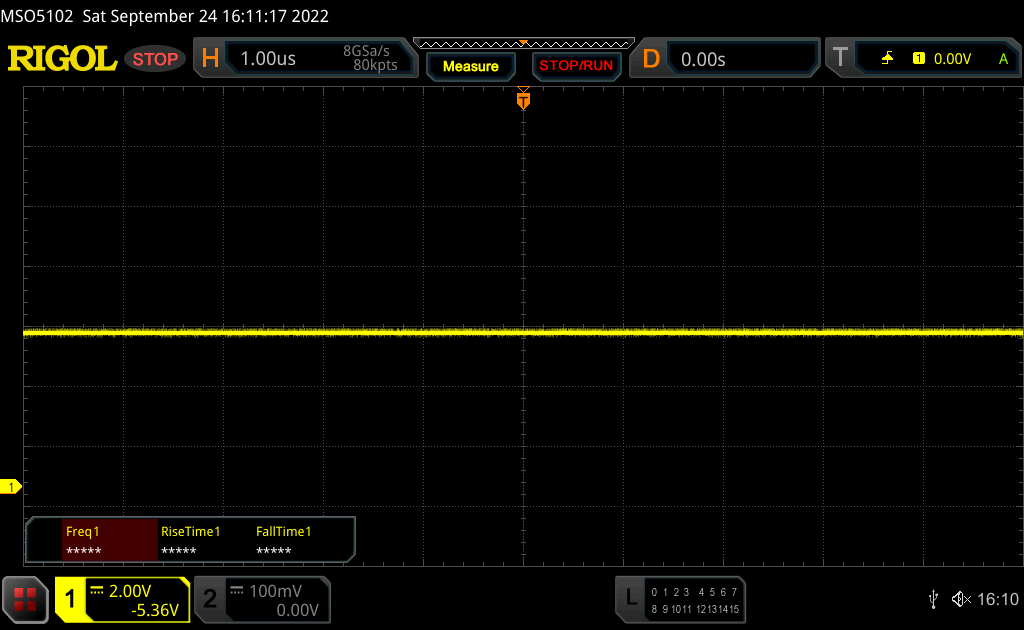 | ||
In comparison: 52 % of all tested devices do not use PWM to dim the display. If PWM was detected, an average of 7757 (minimum: 5 - maximum: 343500) Hz was measured. | |||
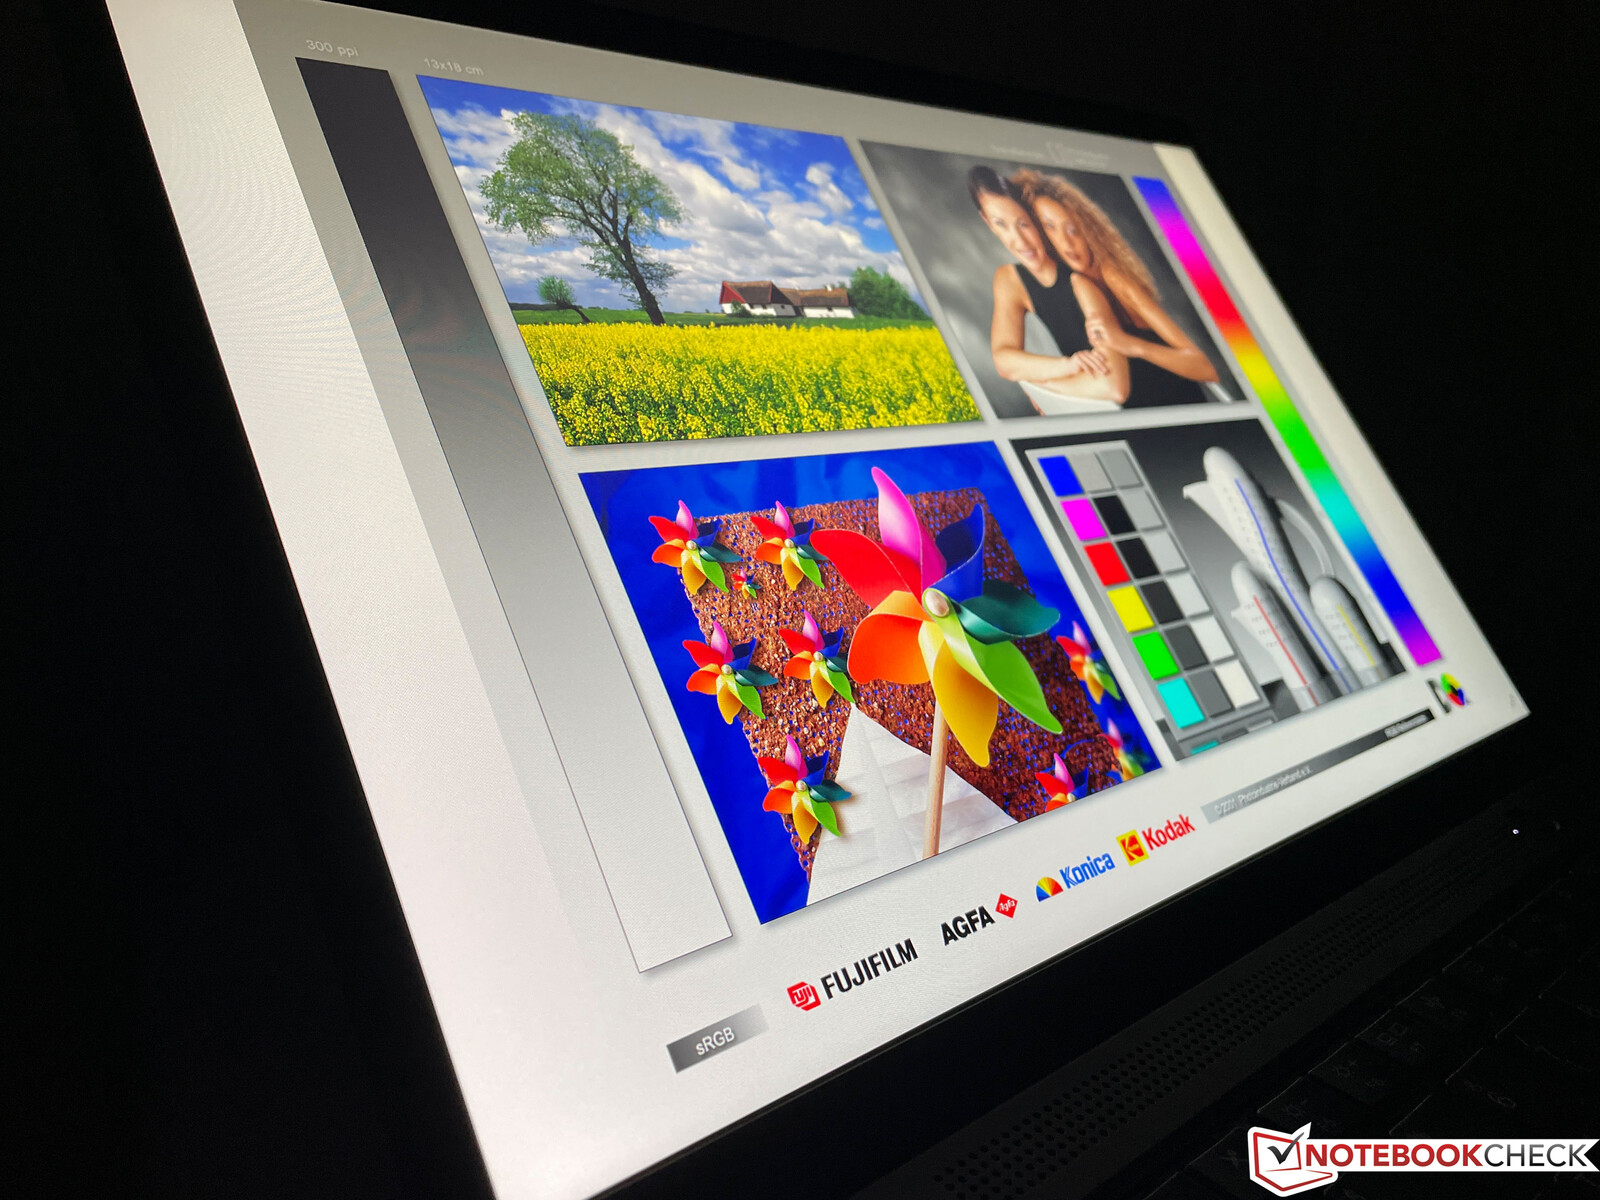
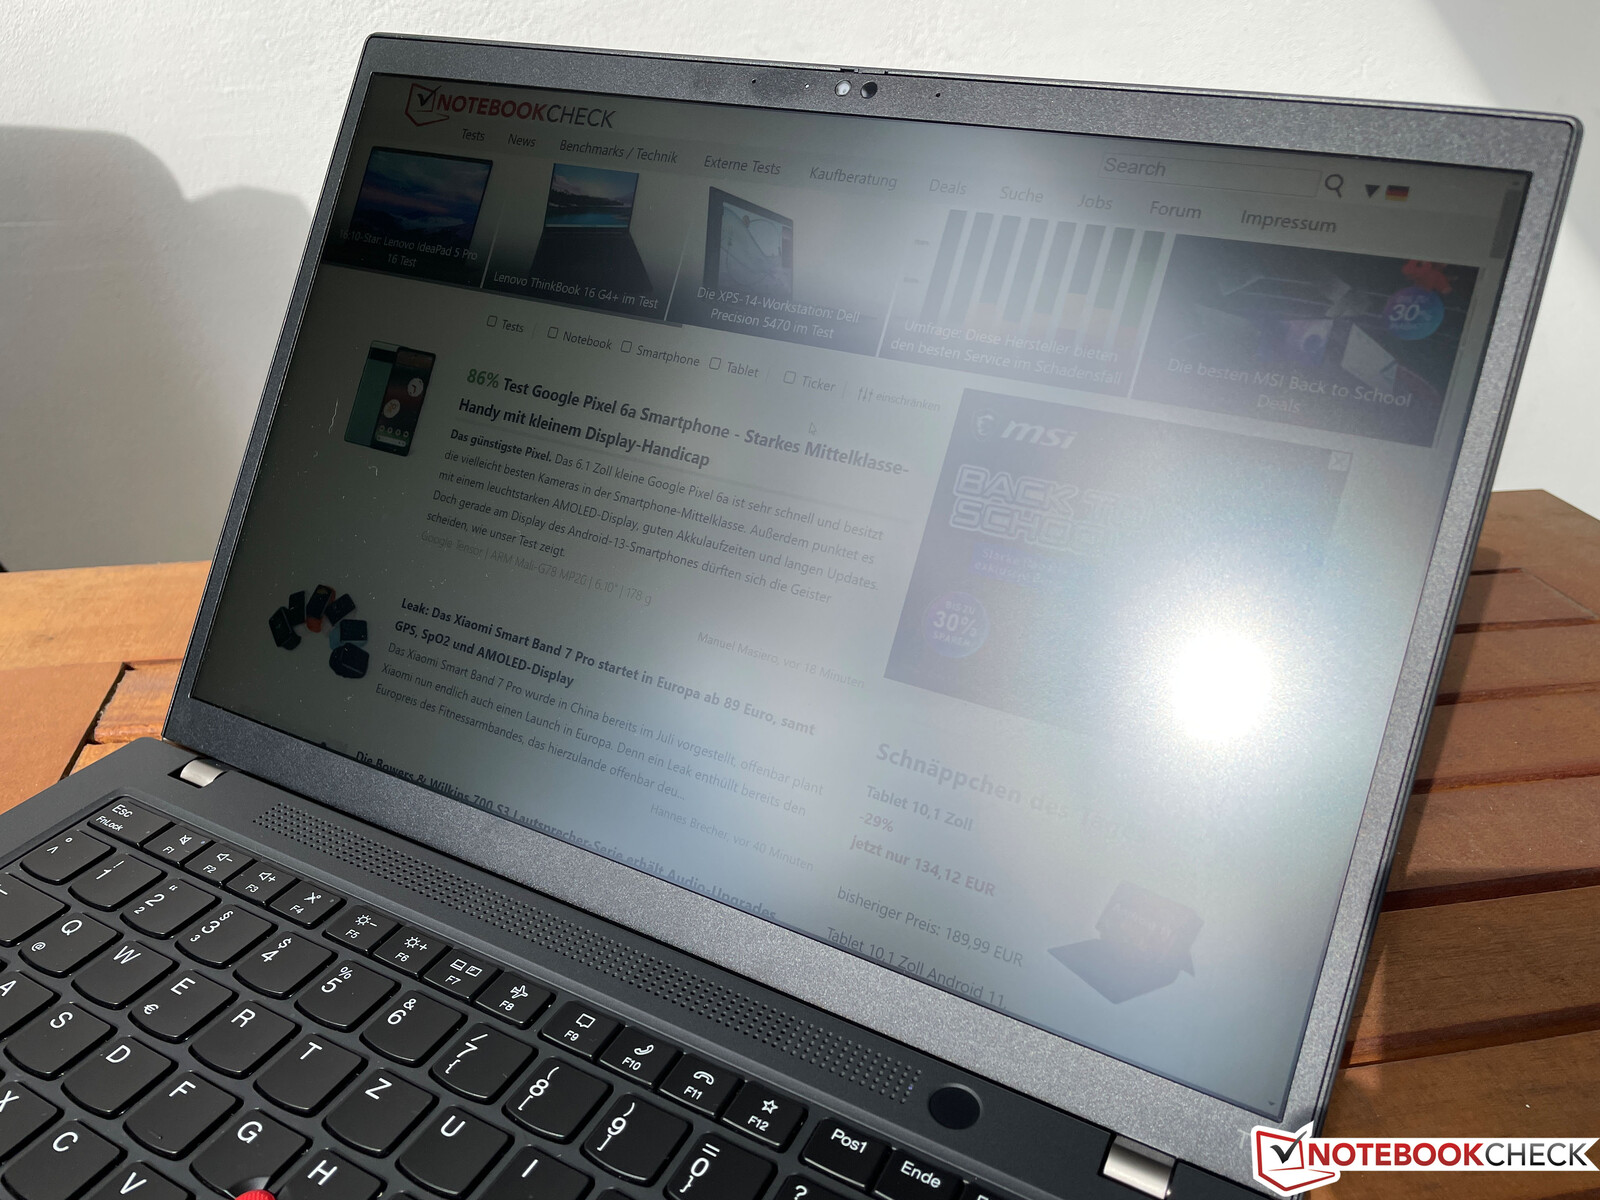
只要避免光源的直接反射,用户就可以使用ThinkPad T14 G3在户外工作,没有问题。即使在有阳光的明亮日子里,也可以在全亮度下的磨砂屏幕表面很好地看到内容。然而,对于亮度为300cd/m²的标准面板来说,这可能有些困难。
性能 - AMD Ryzen Pro和PCIe 4.0
在配置方面,AMD和英特尔版本的ThinkPad T14 G3之间存在很大差异。虽然AMD型号提供了两种最新的Ryzen Pro型号的选择,并具有扩展的安全功能和快速的iGPU,但英特尔版本则要复杂得多。联想同时提供目前的Alder Lake U和P处理器(vPro仅需支付附加费用),要么配备相应的iGPU,要么配备专用的NvidiaGeForce MX550.一些技术文件甚至列出了 GeForce RTX 2050但我们无法在这里找到任何相应的配置,而且鉴于TGP的高等级(从35瓦开始),T14 G3中的RTX 2050也会让我们吃惊。
| ThinkPad T14 G3 AMD | ThinkPad T14 G3 Intel | |
|---|---|---|
| CPU | AMD Ryzen 5 Pro 6650UAMD Ryzen 7 Pro 6850U |
Intel Alder Lake-U (i5-1235U, i5-1245U, i7-1255U, i7-1265U) Intel Alder Lake-P (i5-1240P, i5-1250P, i7-1260P, i7-1270P, i7-1280P) |
| GPU | AMD Radeon 660MAMD Radeon 680M |
Intel Iris Xe Graphics G7 (80 oder 96 EUs) NvidiaGeForce MX550 2 GB |
| RAM | 最大。32 GB LPDDR5-6400板载内存 | 最大。48 GB DDR4-3200内存,8/16 GB板载+1插槽 |
测试条件
与其他联想笔记本电脑不同,ThinkPad机型的电源设置与常规Windows电源设置直接挂钩已有一段时间,这在日常使用中被证明是非常方便的。我们在最佳性能模式下进行了以下基准测试和测量,其中TDP值为短期负载30瓦,永久负载25瓦。在更好的性能模式下,这相当于26/22瓦,在激活更多电池效率 设置后,甚至进一步下降到14瓦。这些限制明显低于目前的Alder Lake CPU,其中U系列芯片在峰值负载期间可以轻松地消耗超过50瓦的功率。
处理器 - AMD Ryzen 7 Pro 6850U
的 AMD Ryzen 7 Pro 6850U基本上与著名的Ryzen 7 6800U相同,但Pro版本提供了类似于英特尔vPro CPU的额外管理和安全功能。因此,Ryzen 7 Pro提供了8个现代Zen3+内核,使用现代6纳米工艺制造。8个核心(16个线程)的最大时钟为4.7 GHz。我们已经详细分析了普通的Ryzen 7 6800U,因此请参考我们的 特别文章以了解更多细节。
基本上,我们可以说,英特尔目前的Alder Lake CPU以其混合架构提供了更多的单核性能(适用于Alder Lake-U和Alder Lake-P),但单核功耗也更高。在单核效率方面,Alder Lake-U芯片大致持平,这取决于TDP设置。另一方面,在多核测试中,英特尔的移动处理器只有在非常高的消耗率(40瓦或以上)下才具有真正的竞争力,但那时它们不再是特别高效。
| Power Consumption / Cinebench R23 Single Power Efficiency - external Monitor | |
| Apple M2 | |
| Intel Core i7-1255U | |
| AMD Ryzen 7 PRO 6850U | |
| AMD Ryzen 7 6800U | |
| Intel Core i7-1260P | |
| Intel Core i7-1260P | |
| Power Consumption / Cinebench R23 Multi Power Efficiency - external Monitor | |
| Apple M2 | |
| AMD Ryzen 7 PRO 6850U | |
| AMD Ryzen 7 6800U | |
| Intel Core i7-1260P | |
| Intel Core i7-1255U | |
| Intel Core i7-1260P | |
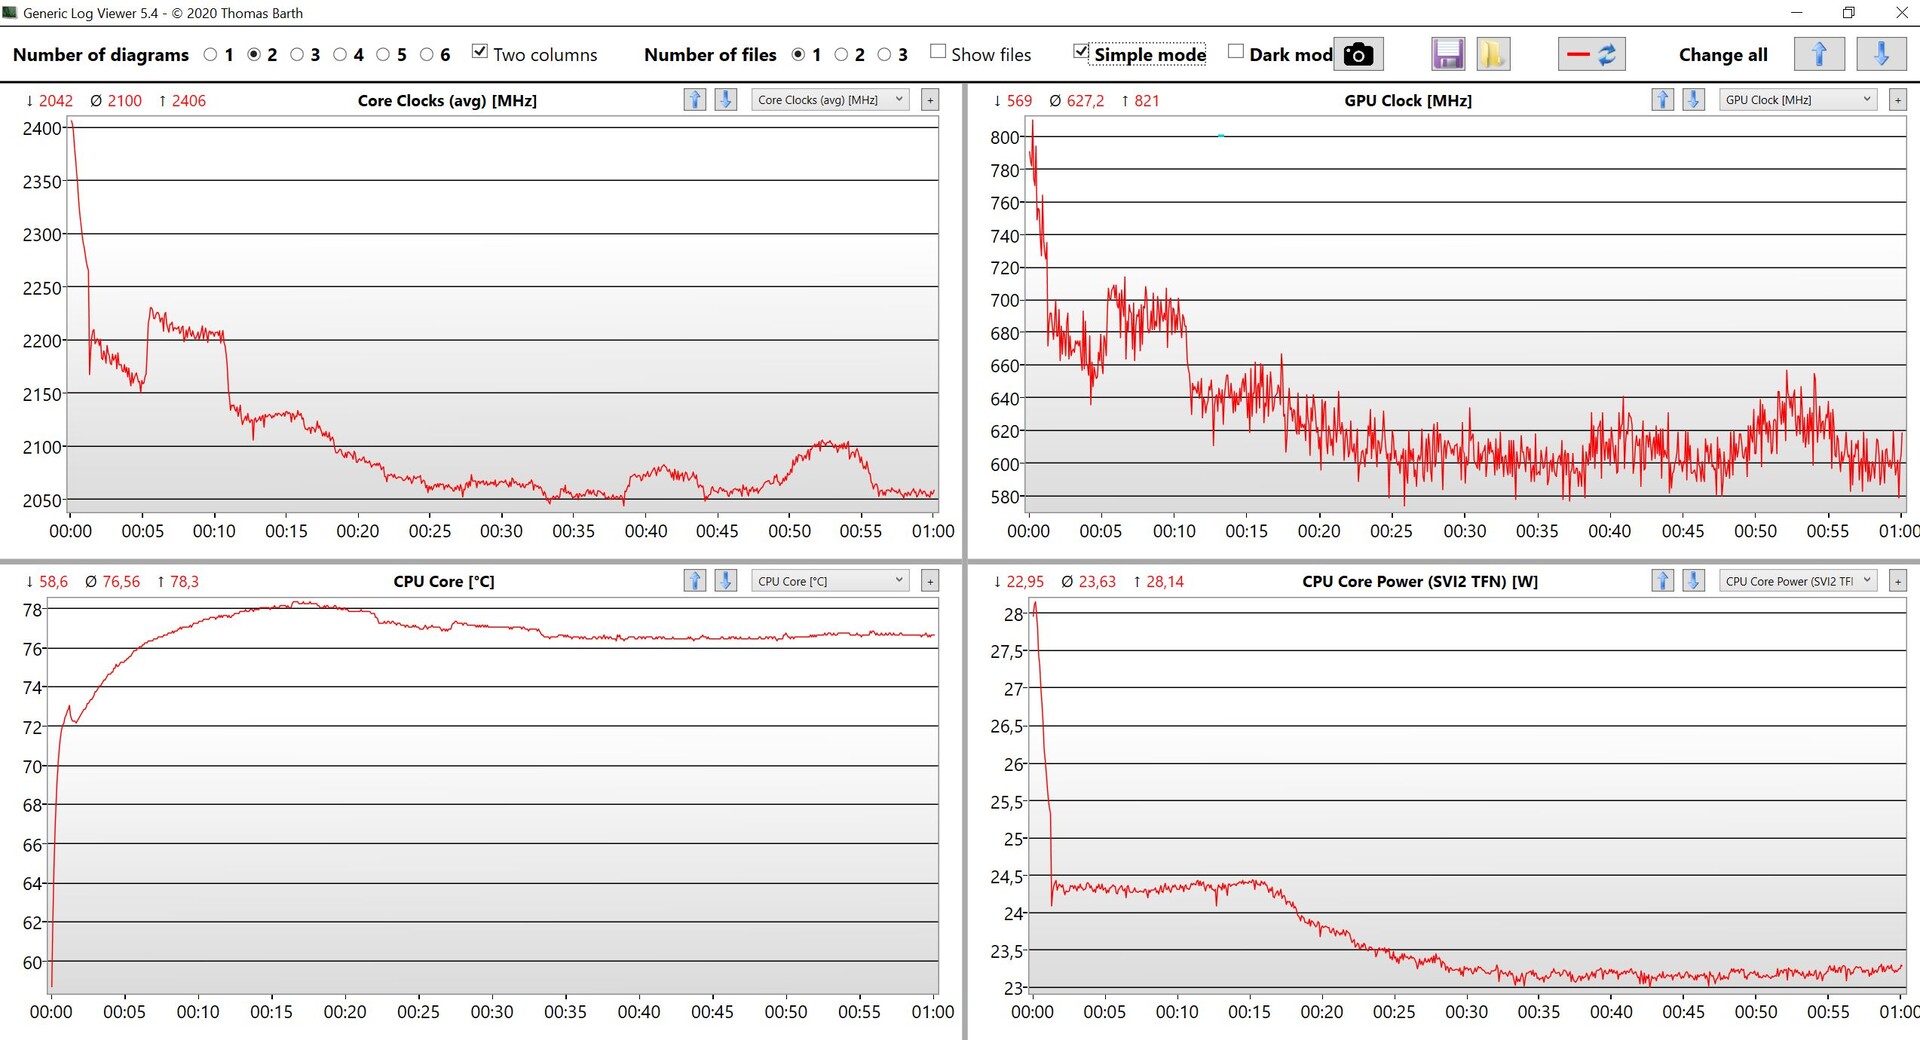
在30/25瓦的TDP配置下,配备Ryzen 7 Pro 6850U的ThinkPad T14 G3在持续负载下的性能只出现了最小的下降(稳定在约1650分),在我们的Cinebench R15循环中,Ryzen 7 Pro仅被以下产品击败Ryzen 9 Pro 6950HS在 HP EliteBook 845 G9尽管它的功耗更高,达到40瓦。英特尔Alder Lake P处理器通常可以在短负荷下保持多核测试,这一点从以下的测试中可以看出 酷睿i7-1260P中的 华为MateBook X Pro中的酷睿i7-1260P就是证明。.它在30瓦的时候取得了~1400分,在25瓦的时候刚刚超过1200分,这与我们的AMD评测样本相对应。因此,在可比的功耗下,当所有核心都处于负载状态时,Alder Lake P芯片的速度大约慢25%。这款 酷睿i7-1255U也只能在23瓦的情况下达到1150分左右。英特尔最快的移动处理器,即 酷睿i7-1280P有两个额外的性能核心,在23瓦的情况下也被打败了。 ThinkPad X1 Nano Gen.2.
Cinebench R15 Multi Sustained Load
如果我们假设英特尔CPU的TDP值相当,那么更快的芯片的附加费用实际上是不值得的,因为即使是23瓦的酷睿i7-1280P也不比23瓦的酷睿i7-1255U快,尽管有四个额外的性能核心。
在其他两种性能模式下,Ryzen 7 Pro 6850U仍然很有竞争力,22瓦时有~1570分,14瓦时有~1220分,在日常使用中也足够快,同时你还能从一个更安静的风扇中受益。
在电池模式下,性能不会降低,因为与英特尔的CPU相比,没有极高的功率限制。更多的CPU基准测试可在我们的技术部分.
Cinebench R23: Multi Core | Single Core
Cinebench R20: CPU (Multi Core) | CPU (Single Core)
Cinebench R15: CPU Multi 64Bit | CPU Single 64Bit
Blender: v2.79 BMW27 CPU
7-Zip 18.03: 7z b 4 | 7z b 4 -mmt1
Geekbench 5.5: Multi-Core | Single-Core
HWBOT x265 Benchmark v2.2: 4k Preset
LibreOffice : 20 Documents To PDF
R Benchmark 2.5: Overall mean
| CPU Performance rating | |
| Average of class Office | |
| Huawei MateBook X Pro 2022 | |
| HP EliteBook 845 G9 6F6H6EA | |
| Average AMD Ryzen 7 PRO 6850U | |
| Lenovo ThinkPad T14 G3-21CF004NGE | |
| Lenovo ThinkPad T14s G2 20XGS01100 | |
| Dell Inspiron 14 7420 2-in-1 | |
| Lenovo ThinkPad Z13 21D2CTO1WW | |
| Lenovo ThinkPad T14 Gen2-20W1S00000 | |
| Dell Latitude 7420 JW6MH | |
| Cinebench R23 / Multi Core | |
| Average of class Office (1673 - 22808, n=76, last 2 years) | |
| HP EliteBook 845 G9 6F6H6EA | |
| Average AMD Ryzen 7 PRO 6850U (9923 - 12945, n=7) | |
| Lenovo ThinkPad T14 G3-21CF004NGE | |
| Huawei MateBook X Pro 2022 | |
| Lenovo ThinkPad Z13 21D2CTO1WW | |
| Lenovo ThinkPad T14s G2 20XGS01100 | |
| Dell Inspiron 14 7420 2-in-1 | |
| Lenovo ThinkPad T14 Gen2-20W1S00000 | |
| Dell Latitude 7420 JW6MH | |
| Cinebench R23 / Single Core | |
| Dell Inspiron 14 7420 2-in-1 | |
| Average of class Office (708 - 2130, n=76, last 2 years) | |
| Huawei MateBook X Pro 2022 | |
| HP EliteBook 845 G9 6F6H6EA | |
| Lenovo ThinkPad T14 Gen2-20W1S00000 | |
| Average AMD Ryzen 7 PRO 6850U (1409 - 1536, n=7) | |
| Lenovo ThinkPad T14 G3-21CF004NGE | |
| Lenovo ThinkPad Z13 21D2CTO1WW | |
| Lenovo ThinkPad T14s G2 20XGS01100 | |
| Dell Latitude 7420 JW6MH | |
| Cinebench R20 / CPU (Multi Core) | |
| HP EliteBook 845 G9 6F6H6EA | |
| Average of class Office (648 - 8840, n=75, last 2 years) | |
| Average AMD Ryzen 7 PRO 6850U (3784 - 5022, n=7) | |
| Lenovo ThinkPad T14 G3-21CF004NGE | |
| Huawei MateBook X Pro 2022 | |
| Lenovo ThinkPad Z13 21D2CTO1WW | |
| Lenovo ThinkPad T14s G2 20XGS01100 | |
| Dell Inspiron 14 7420 2-in-1 | |
| Lenovo ThinkPad T14 Gen2-20W1S00000 | |
| Dell Latitude 7420 JW6MH | |
| Cinebench R20 / CPU (Single Core) | |
| Dell Inspiron 14 7420 2-in-1 | |
| Huawei MateBook X Pro 2022 | |
| Average of class Office (345 - 816, n=75, last 2 years) | |
| HP EliteBook 845 G9 6F6H6EA | |
| Average AMD Ryzen 7 PRO 6850U (587 - 596, n=7) | |
| Lenovo ThinkPad T14 G3-21CF004NGE | |
| Lenovo ThinkPad T14 Gen2-20W1S00000 | |
| Lenovo ThinkPad Z13 21D2CTO1WW | |
| Lenovo ThinkPad T14s G2 20XGS01100 | |
| Dell Latitude 7420 JW6MH | |
| Cinebench R15 / CPU Multi 64Bit | |
| Huawei MateBook X Pro 2022 | |
| Huawei MateBook X Pro 2022 | |
| HP EliteBook 845 G9 6F6H6EA | |
| Average of class Office (250 - 3380, n=77, last 2 years) | |
| Average AMD Ryzen 7 PRO 6850U (1652 - 2092, n=7) | |
| Lenovo ThinkPad T14 G3-21CF004NGE | |
| Lenovo ThinkPad Z13 21D2CTO1WW | |
| Lenovo ThinkPad T14s G2 20XGS01100 | |
| Dell Inspiron 14 7420 2-in-1 | |
| Lenovo ThinkPad T14 Gen2-20W1S00000 | |
| Dell Latitude 7420 JW6MH | |
| Cinebench R15 / CPU Single 64Bit | |
| Dell Inspiron 14 7420 2-in-1 | |
| Average of class Office (99.5 - 316, n=77, last 2 years) | |
| Huawei MateBook X Pro 2022 | |
| HP EliteBook 845 G9 6F6H6EA | |
| Lenovo ThinkPad T14 G3-21CF004NGE | |
| Average AMD Ryzen 7 PRO 6850U (228 - 244, n=7) | |
| Lenovo ThinkPad Z13 21D2CTO1WW | |
| Lenovo ThinkPad T14s G2 20XGS01100 | |
| Lenovo ThinkPad T14 Gen2-20W1S00000 | |
| Dell Latitude 7420 JW6MH | |
| Blender / v2.79 BMW27 CPU | |
| Dell Latitude 7420 JW6MH | |
| Lenovo ThinkPad T14 Gen2-20W1S00000 | |
| Lenovo ThinkPad Z13 21D2CTO1WW | |
| Dell Inspiron 14 7420 2-in-1 | |
| Average of class Office (158 - 1940, n=76, last 2 years) | |
| Lenovo ThinkPad T14s G2 20XGS01100 | |
| Huawei MateBook X Pro 2022 | |
| Lenovo ThinkPad T14 G3-21CF004NGE | |
| Average AMD Ryzen 7 PRO 6850U (241 - 307, n=7) | |
| HP EliteBook 845 G9 6F6H6EA | |
| 7-Zip 18.03 / 7z b 4 | |
| Lenovo ThinkPad T14 G3-21CF004NGE | |
| Average AMD Ryzen 7 PRO 6850U (44011 - 59045, n=7) | |
| HP EliteBook 845 G9 6F6H6EA | |
| Lenovo ThinkPad T14s G2 20XGS01100 | |
| Average of class Office (7098 - 76886, n=77, last 2 years) | |
| Huawei MateBook X Pro 2022 | |
| Lenovo ThinkPad Z13 21D2CTO1WW | |
| Dell Inspiron 14 7420 2-in-1 | |
| Lenovo ThinkPad T14 Gen2-20W1S00000 | |
| Dell Latitude 7420 JW6MH | |
| 7-Zip 18.03 / 7z b 4 -mmt1 | |
| Dell Inspiron 14 7420 2-in-1 | |
| HP EliteBook 845 G9 6F6H6EA | |
| Average of class Office (3387 - 6469, n=77, last 2 years) | |
| Average AMD Ryzen 7 PRO 6850U (5057 - 5662, n=7) | |
| Lenovo ThinkPad T14 Gen2-20W1S00000 | |
| Huawei MateBook X Pro 2022 | |
| Lenovo ThinkPad T14 G3-21CF004NGE | |
| Lenovo ThinkPad T14s G2 20XGS01100 | |
| Lenovo ThinkPad Z13 21D2CTO1WW | |
| Dell Latitude 7420 JW6MH | |
| Geekbench 5.5 / Multi-Core | |
| Huawei MateBook X Pro 2022 | |
| Average of class Office (1483 - 16999, n=73, last 2 years) | |
| Average AMD Ryzen 7 PRO 6850U (7044 - 9241, n=7) | |
| Lenovo ThinkPad T14 G3-21CF004NGE | |
| HP EliteBook 845 G9 6F6H6EA | |
| Lenovo ThinkPad T14s G2 20XGS01100 | |
| Dell Inspiron 14 7420 2-in-1 | |
| Lenovo ThinkPad Z13 21D2CTO1WW | |
| Dell Latitude 7420 JW6MH | |
| Lenovo ThinkPad T14 Gen2-20W1S00000 | |
| Geekbench 5.5 / Single-Core | |
| Average of class Office (811 - 2175, n=73, last 2 years) | |
| Huawei MateBook X Pro 2022 | |
| Dell Inspiron 14 7420 2-in-1 | |
| HP EliteBook 845 G9 6F6H6EA | |
| Lenovo ThinkPad T14 G3-21CF004NGE | |
| Average AMD Ryzen 7 PRO 6850U (1433 - 1533, n=7) | |
| Lenovo ThinkPad T14 Gen2-20W1S00000 | |
| Lenovo ThinkPad Z13 21D2CTO1WW | |
| Lenovo ThinkPad T14s G2 20XGS01100 | |
| Dell Latitude 7420 JW6MH | |
| HWBOT x265 Benchmark v2.2 / 4k Preset | |
| Average of class Office (2.21 - 26, n=76, last 2 years) | |
| Lenovo ThinkPad T14 G3-21CF004NGE | |
| Average AMD Ryzen 7 PRO 6850U (11.7 - 16.3, n=7) | |
| HP EliteBook 845 G9 6F6H6EA | |
| Huawei MateBook X Pro 2022 | |
| Lenovo ThinkPad T14s G2 20XGS01100 | |
| Dell Inspiron 14 7420 2-in-1 | |
| Lenovo ThinkPad Z13 21D2CTO1WW | |
| Lenovo ThinkPad T14 Gen2-20W1S00000 | |
| Dell Latitude 7420 JW6MH | |
| LibreOffice / 20 Documents To PDF | |
| HP EliteBook 845 G9 6F6H6EA | |
| Average of class Office (39.9 - 102.3, n=76, last 2 years) | |
| Lenovo ThinkPad Z13 21D2CTO1WW | |
| Average AMD Ryzen 7 PRO 6850U (46.3 - 74, n=7) | |
| Dell Latitude 7420 JW6MH | |
| Lenovo ThinkPad T14 G3-21CF004NGE | |
| Dell Inspiron 14 7420 2-in-1 | |
| Lenovo ThinkPad T14s G2 20XGS01100 | |
| Lenovo ThinkPad T14 Gen2-20W1S00000 | |
| Huawei MateBook X Pro 2022 | |
| R Benchmark 2.5 / Overall mean | |
| Dell Latitude 7420 JW6MH | |
| Lenovo ThinkPad T14 Gen2-20W1S00000 | |
| Lenovo ThinkPad Z13 21D2CTO1WW | |
| Lenovo ThinkPad T14s G2 20XGS01100 | |
| Lenovo ThinkPad T14 G3-21CF004NGE | |
| Average AMD Ryzen 7 PRO 6850U (0.4932 - 0.544, n=7) | |
| Average of class Office (0.393 - 0.888, n=76, last 2 years) | |
| HP EliteBook 845 G9 6F6H6EA | |
| Huawei MateBook X Pro 2022 | |
| Dell Inspiron 14 7420 2-in-1 | |
* ... smaller is better
AIDA64: FP32 Ray-Trace | FPU Julia | CPU SHA3 | CPU Queen | FPU SinJulia | FPU Mandel | CPU AES | CPU ZLib | FP64 Ray-Trace | CPU PhotoWorxx
| Performance rating | |
| HP EliteBook 845 G9 6F6H6EA | |
| Average AMD Ryzen 7 PRO 6850U | |
| Average of class Office | |
| Lenovo ThinkPad T14 G3-21CF004NGE | |
| Lenovo ThinkPad T14s G2 20XGS01100 | |
| Huawei MateBook X Pro 2022 | |
| Dell Latitude 7420 JW6MH | |
| Lenovo ThinkPad T14 Gen2-20W1S00000 | |
| AIDA64 / FP32 Ray-Trace | |
| HP EliteBook 845 G9 6F6H6EA | |
| Average of class Office (2083 - 31245, n=83, last 2 years) | |
| Average AMD Ryzen 7 PRO 6850U (11272 - 14704, n=8) | |
| Lenovo ThinkPad T14 G3-21CF004NGE | |
| Lenovo ThinkPad T14s G2 20XGS01100 | |
| Lenovo ThinkPad T14 Gen2-20W1S00000 | |
| Dell Latitude 7420 JW6MH | |
| Huawei MateBook X Pro 2022 | |
| AIDA64 / FPU Julia | |
| HP EliteBook 845 G9 6F6H6EA | |
| Average AMD Ryzen 7 PRO 6850U (72242 - 92957, n=8) | |
| Lenovo ThinkPad T14 G3-21CF004NGE | |
| Lenovo ThinkPad T14s G2 20XGS01100 | |
| Average of class Office (8191 - 125394, n=83, last 2 years) | |
| Lenovo ThinkPad T14 Gen2-20W1S00000 | |
| Dell Latitude 7420 JW6MH | |
| Huawei MateBook X Pro 2022 | |
| AIDA64 / CPU SHA3 | |
| HP EliteBook 845 G9 6F6H6EA | |
| Average of class Office (433 - 5755, n=83, last 2 years) | |
| Average AMD Ryzen 7 PRO 6850U (2419 - 3104, n=8) | |
| Lenovo ThinkPad T14 G3-21CF004NGE | |
| Lenovo ThinkPad T14s G2 20XGS01100 | |
| Lenovo ThinkPad T14 Gen2-20W1S00000 | |
| Dell Latitude 7420 JW6MH | |
| Huawei MateBook X Pro 2022 | |
| AIDA64 / CPU Queen | |
| HP EliteBook 845 G9 6F6H6EA | |
| Average AMD Ryzen 7 PRO 6850U (86644 - 96912, n=7) | |
| Lenovo ThinkPad T14 G3-21CF004NGE | |
| Lenovo ThinkPad T14s G2 20XGS01100 | |
| Huawei MateBook X Pro 2022 | |
| Average of class Office (22784 - 115197, n=67, last 2 years) | |
| Lenovo ThinkPad T14 Gen2-20W1S00000 | |
| Dell Latitude 7420 JW6MH | |
| AIDA64 / FPU SinJulia | |
| HP EliteBook 845 G9 6F6H6EA | |
| Average AMD Ryzen 7 PRO 6850U (10917 - 12571, n=8) | |
| Lenovo ThinkPad T14 G3-21CF004NGE | |
| Lenovo ThinkPad T14s G2 20XGS01100 | |
| Average of class Office (1378 - 18321, n=83, last 2 years) | |
| Huawei MateBook X Pro 2022 | |
| Lenovo ThinkPad T14 Gen2-20W1S00000 | |
| Dell Latitude 7420 JW6MH | |
| AIDA64 / FPU Mandel | |
| HP EliteBook 845 G9 6F6H6EA | |
| Average AMD Ryzen 7 PRO 6850U (39609 - 51296, n=8) | |
| Lenovo ThinkPad T14 G3-21CF004NGE | |
| Lenovo ThinkPad T14s G2 20XGS01100 | |
| Average of class Office (4601 - 66922, n=83, last 2 years) | |
| Lenovo ThinkPad T14 Gen2-20W1S00000 | |
| Dell Latitude 7420 JW6MH | |
| Huawei MateBook X Pro 2022 | |
| AIDA64 / CPU AES | |
| Lenovo ThinkPad T14s G2 20XGS01100 | |
| Lenovo ThinkPad T14 Gen2-20W1S00000 | |
| Dell Latitude 7420 JW6MH | |
| Huawei MateBook X Pro 2022 | |
| HP EliteBook 845 G9 6F6H6EA | |
| Average of class Office (4854 - 155900, n=83, last 2 years) | |
| Average AMD Ryzen 7 PRO 6850U (45568 - 60867, n=8) | |
| Lenovo ThinkPad T14 G3-21CF004NGE | |
| AIDA64 / CPU ZLib | |
| HP EliteBook 845 G9 6F6H6EA | |
| Average of class Office (114.6 - 1366, n=83, last 2 years) | |
| Average AMD Ryzen 7 PRO 6850U (641 - 805, n=8) | |
| Lenovo ThinkPad T14 G3-21CF004NGE | |
| Huawei MateBook X Pro 2022 | |
| Lenovo ThinkPad T14s G2 20XGS01100 | |
| Lenovo ThinkPad T14 Gen2-20W1S00000 | |
| Dell Latitude 7420 JW6MH | |
| AIDA64 / FP64 Ray-Trace | |
| Average of class Office (1109 - 17834, n=83, last 2 years) | |
| HP EliteBook 845 G9 6F6H6EA | |
| Average AMD Ryzen 7 PRO 6850U (5967 - 7821, n=8) | |
| Lenovo ThinkPad T14 G3-21CF004NGE | |
| Lenovo ThinkPad T14s G2 20XGS01100 | |
| Lenovo ThinkPad T14 Gen2-20W1S00000 | |
| Dell Latitude 7420 JW6MH | |
| Huawei MateBook X Pro 2022 | |
| AIDA64 / CPU PhotoWorxx | |
| Average of class Office (11090 - 65229, n=83, last 2 years) | |
| Huawei MateBook X Pro 2022 | |
| Dell Latitude 7420 JW6MH | |
| Average AMD Ryzen 7 PRO 6850U (19707 - 27840, n=8) | |
| Lenovo ThinkPad T14 G3-21CF004NGE | |
| Lenovo ThinkPad T14s G2 20XGS01100 | |
| HP EliteBook 845 G9 6F6H6EA | |
| Lenovo ThinkPad T14 Gen2-20W1S00000 | |
系统性能
ThinkPad T14 G3是一台反应非常迅速的笔记本电脑,我们在测试中没有观察到任何卡顿、挂起或其他问题。合成基准测试中的良好结果进一步证实了这一点。我们的评测设备是以Windows 10专业版出厂的,但也可以毫无问题地切换到Windows 11专业版。
CrossMark: Overall | Productivity | Creativity | Responsiveness
| PCMark 10 / Score | |
| Average of class Office (2601 - 9298, n=68, last 2 years) | |
| Average AMD Ryzen 7 PRO 6850U, AMD Radeon 680M (5873 - 6311, n=7) | |
| Huawei MateBook X Pro 2022 | |
| Lenovo ThinkPad T14 G3-21CF004NGE | |
| Lenovo ThinkPad T14s G2 20XGS01100 | |
| HP EliteBook 845 G9 6F6H6EA | |
| Lenovo ThinkPad T14 Gen2-20W1S00000 | |
| Dell Inspiron 14 7420 2-in-1 | |
| Dell Latitude 7420 JW6MH | |
| PCMark 10 / Essentials | |
| Huawei MateBook X Pro 2022 | |
| Lenovo ThinkPad T14s G2 20XGS01100 | |
| Dell Inspiron 14 7420 2-in-1 | |
| Average of class Office (3245 - 11594, n=68, last 2 years) | |
| Lenovo ThinkPad T14 Gen2-20W1S00000 | |
| Dell Latitude 7420 JW6MH | |
| Lenovo ThinkPad T14 G3-21CF004NGE | |
| Average AMD Ryzen 7 PRO 6850U, AMD Radeon 680M (9151 - 10263, n=7) | |
| HP EliteBook 845 G9 6F6H6EA | |
| PCMark 10 / Productivity | |
| Average of class Office (5336 - 17243, n=68, last 2 years) | |
| Lenovo ThinkPad T14s G2 20XGS01100 | |
| Lenovo ThinkPad T14 Gen2-20W1S00000 | |
| Huawei MateBook X Pro 2022 | |
| Average AMD Ryzen 7 PRO 6850U, AMD Radeon 680M (8435 - 8891, n=7) | |
| Lenovo ThinkPad T14 G3-21CF004NGE | |
| HP EliteBook 845 G9 6F6H6EA | |
| Dell Latitude 7420 JW6MH | |
| Dell Inspiron 14 7420 2-in-1 | |
| PCMark 10 / Digital Content Creation | |
| Average of class Office (2049 - 13541, n=68, last 2 years) | |
| Average AMD Ryzen 7 PRO 6850U, AMD Radeon 680M (6796 - 8422, n=7) | |
| HP EliteBook 845 G9 6F6H6EA | |
| Lenovo ThinkPad T14 G3-21CF004NGE | |
| Huawei MateBook X Pro 2022 | |
| Lenovo ThinkPad T14s G2 20XGS01100 | |
| Dell Inspiron 14 7420 2-in-1 | |
| Lenovo ThinkPad T14 Gen2-20W1S00000 | |
| Dell Latitude 7420 JW6MH | |
| CrossMark / Overall | |
| Huawei MateBook X Pro 2022 | |
| Average of class Office (381 - 2010, n=75, last 2 years) | |
| Dell Inspiron 14 7420 2-in-1 | |
| Lenovo ThinkPad T14 G3-21CF004NGE | |
| Average AMD Ryzen 7 PRO 6850U, AMD Radeon 680M (1154 - 1442, n=7) | |
| Lenovo ThinkPad T14s G2 20XGS01100 | |
| HP EliteBook 845 G9 6F6H6EA | |
| Dell Latitude 7420 JW6MH | |
| CrossMark / Productivity | |
| Huawei MateBook X Pro 2022 | |
| Dell Inspiron 14 7420 2-in-1 | |
| Average of class Office (464 - 1880, n=75, last 2 years) | |
| Lenovo ThinkPad T14 G3-21CF004NGE | |
| HP EliteBook 845 G9 6F6H6EA | |
| Average AMD Ryzen 7 PRO 6850U, AMD Radeon 680M (1188 - 1444, n=7) | |
| Lenovo ThinkPad T14s G2 20XGS01100 | |
| Dell Latitude 7420 JW6MH | |
| CrossMark / Creativity | |
| Huawei MateBook X Pro 2022 | |
| Average of class Office (319 - 2361, n=75, last 2 years) | |
| Dell Inspiron 14 7420 2-in-1 | |
| Lenovo ThinkPad T14 G3-21CF004NGE | |
| Lenovo ThinkPad T14s G2 20XGS01100 | |
| Average AMD Ryzen 7 PRO 6850U, AMD Radeon 680M (1180 - 1523, n=7) | |
| HP EliteBook 845 G9 6F6H6EA | |
| Dell Latitude 7420 JW6MH | |
| CrossMark / Responsiveness | |
| Huawei MateBook X Pro 2022 | |
| Average of class Office (360 - 1820, n=75, last 2 years) | |
| Dell Inspiron 14 7420 2-in-1 | |
| Dell Latitude 7420 JW6MH | |
| Lenovo ThinkPad T14 G3-21CF004NGE | |
| Average AMD Ryzen 7 PRO 6850U, AMD Radeon 680M (990 - 1282, n=7) | |
| HP EliteBook 845 G9 6F6H6EA | |
| Lenovo ThinkPad T14s G2 20XGS01100 | |
| PCMark 10 Score | 6060 points | |
Help | ||
| AIDA64 / Memory Copy | |
| Average of class Office (20075 - 110930, n=80, last 2 years) | |
| Huawei MateBook X Pro 2022 | |
| Dell Latitude 7420 JW6MH | |
| Lenovo ThinkPad T14 G3-21CF004NGE | |
| Average AMD Ryzen 7 PRO 6850U (31003 - 48605, n=8) | |
| Lenovo ThinkPad T14s G2 20XGS01100 | |
| HP EliteBook 845 G9 6F6H6EA | |
| Lenovo ThinkPad T14 Gen2-20W1S00000 | |
| AIDA64 / Memory Read | |
| Huawei MateBook X Pro 2022 | |
| Average of class Office (10084 - 128030, n=81, last 2 years) | |
| Dell Latitude 7420 JW6MH | |
| Average AMD Ryzen 7 PRO 6850U (34682 - 45912, n=8) | |
| Lenovo ThinkPad T14 G3-21CF004NGE | |
| Lenovo ThinkPad T14s G2 20XGS01100 | |
| HP EliteBook 845 G9 6F6H6EA | |
| Lenovo ThinkPad T14 Gen2-20W1S00000 | |
| AIDA64 / Memory Write | |
| Average of class Office (20073 - 119858, n=81, last 2 years) | |
| Huawei MateBook X Pro 2022 | |
| Dell Latitude 7420 JW6MH | |
| Lenovo ThinkPad T14 G3-21CF004NGE | |
| Average AMD Ryzen 7 PRO 6850U (34532 - 51096, n=8) | |
| Lenovo ThinkPad T14s G2 20XGS01100 | |
| HP EliteBook 845 G9 6F6H6EA | |
| Lenovo ThinkPad T14 Gen2-20W1S00000 | |
| AIDA64 / Memory Latency | |
| Lenovo ThinkPad T14 G3-21CF004NGE | |
| Huawei MateBook X Pro 2022 | |
| Lenovo ThinkPad T14s G2 20XGS01100 | |
| Average AMD Ryzen 7 PRO 6850U (86.1 - 135.3, n=8) | |
| Average of class Office (7.6 - 162.9, n=76, last 2 years) | |
| HP EliteBook 845 G9 6F6H6EA | |
| Dell Latitude 7420 JW6MH | |
| Lenovo ThinkPad T14 Gen2-20W1S00000 | |
* ... smaller is better
DPC延时
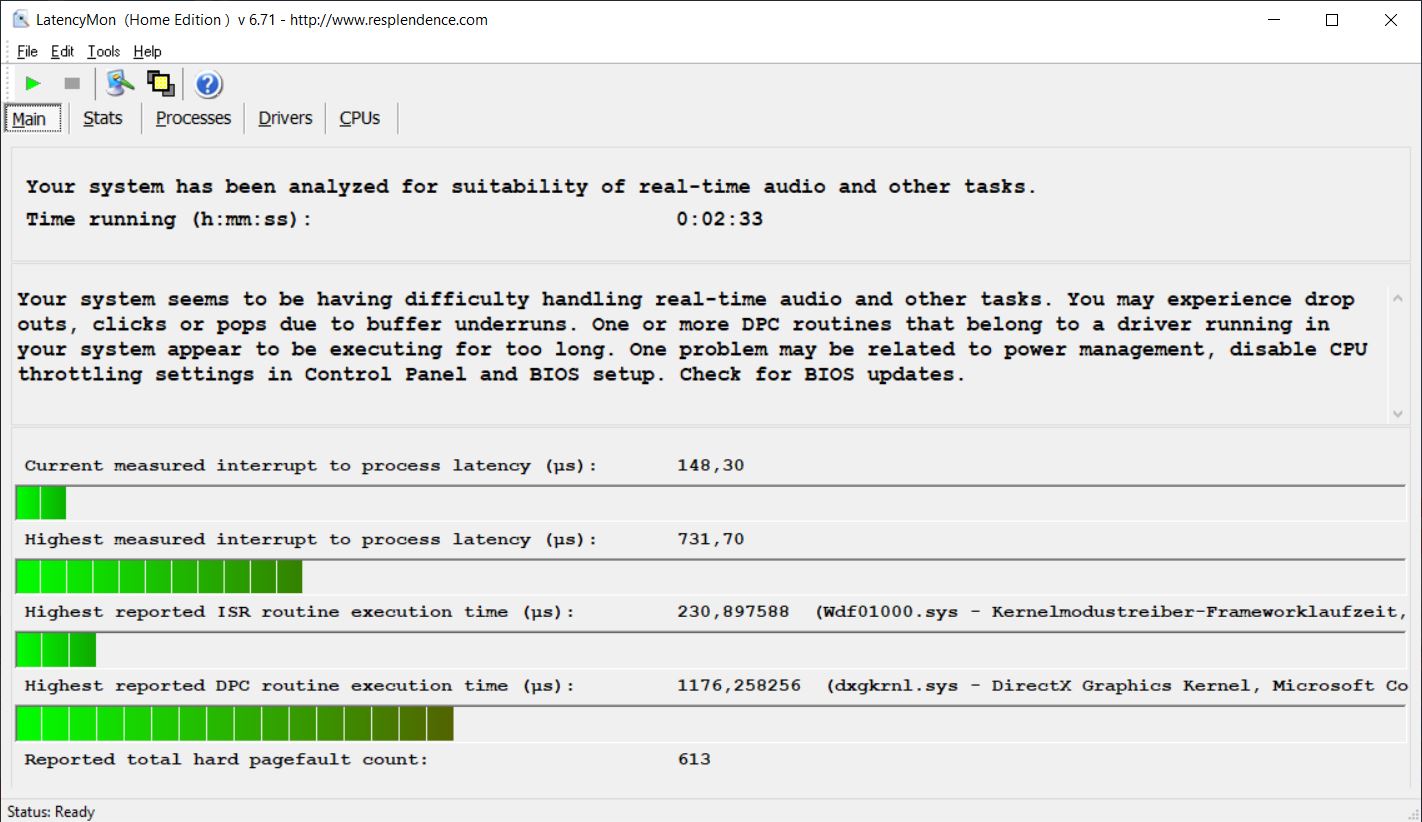
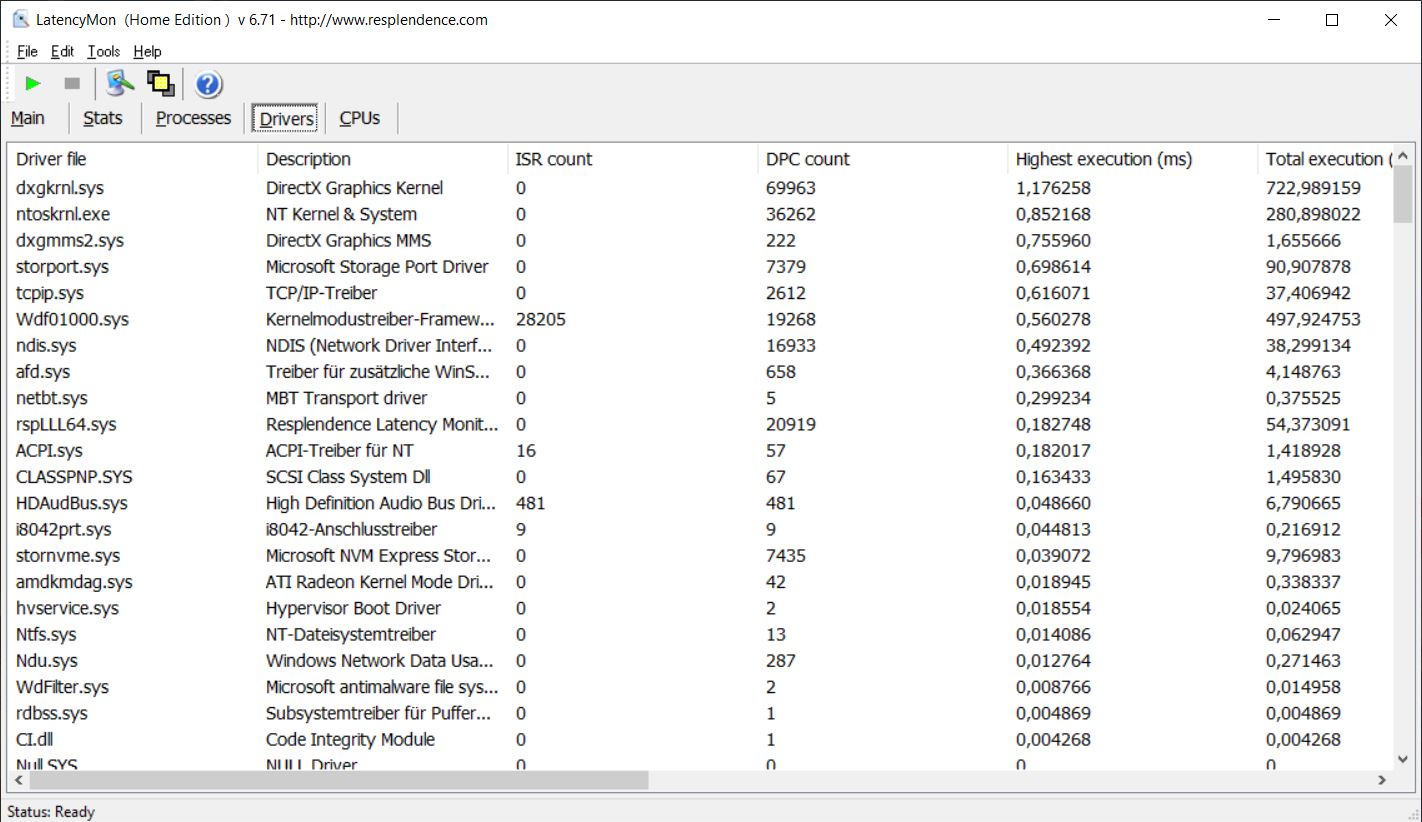
在我们的标准化延迟测试中(网页浏览、4K YouTube播放、CPU负载),ThinkPad T14 G3在当前BIOS版本下没有显示出任何基本的限制,但一个驱动程序(DirectX图形内核)导致延迟略有增加。尽管如此,该评测设备在比较领域的得分仍然很高。
| DPC Latencies / LatencyMon - interrupt to process latency (max), Web, Youtube, Prime95 | |
| Lenovo ThinkPad T14 Gen2-20W1S00000 | |
| Lenovo ThinkPad T14s G2 20XGS01100 | |
| HP EliteBook 845 G9 6F6H6EA | |
| Dell Latitude 7420 JW6MH | |
| Huawei MateBook X Pro 2022 | |
| Lenovo ThinkPad T14 G3-21CF004NGE | |
* ... smaller is better
存储设备
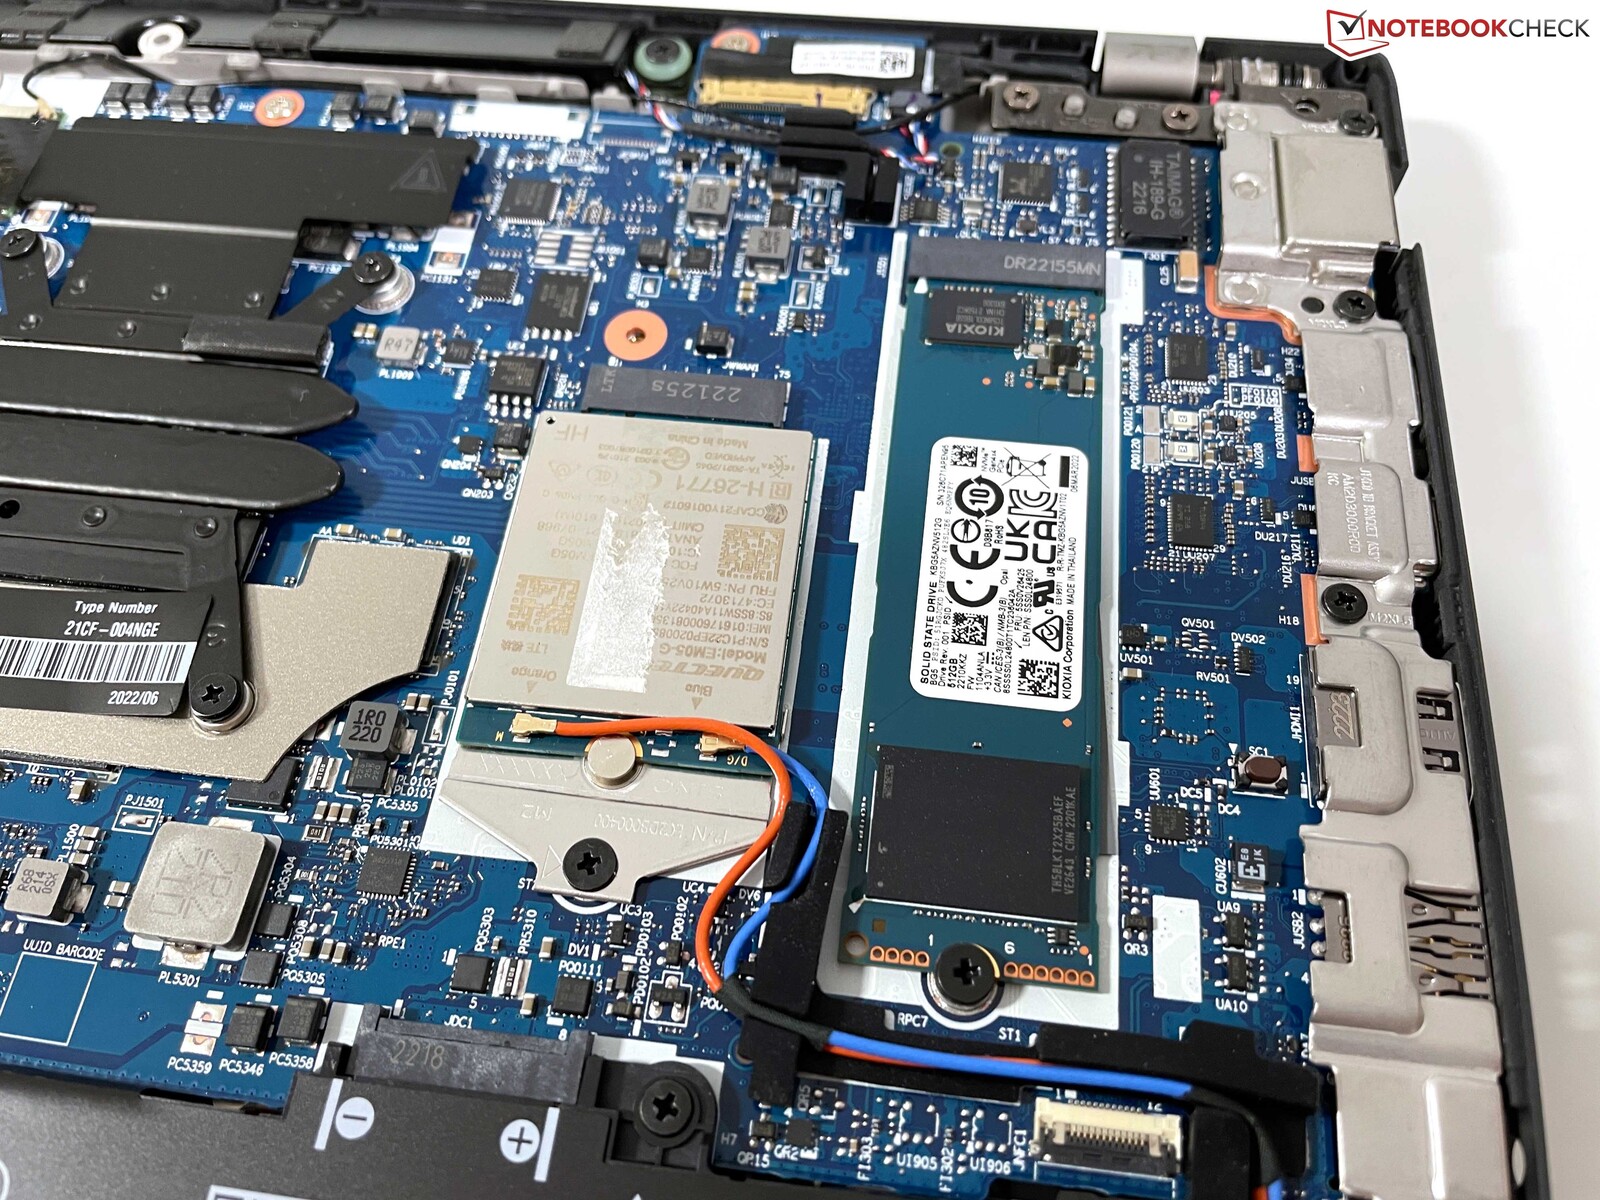
AMD版本的ThinkPad T14 G3为M.2-2280-SSD提供了一个快速的PCIe 4.0插槽,在我们的评测样本中配备了一个Kioxia BG5。这是一个现代的PCIe 4.0-SSD,但不是最快的模块之一,其规定的最大传输速率为3.5 GB/s。在我们的基准测试中,结果在3GB/s左右的时候还算不错,但在这里还有可能。至少在长时间的负载下,性能仍然相当稳定,不会因为温度问题而下降。我们的审查配置提供了512GB的存储空间,其中434GB在第一次启动后可用。更多的SSD基准测试列在这里.

| Drive Performance rating - Percent | |
| Lenovo ThinkPad T14 Gen2-20W1S00000 | |
| Huawei MateBook X Pro 2022 | |
| HP EliteBook 845 G9 6F6H6EA | |
| Average of class Office | |
| Lenovo ThinkPad T14s G2 20XGS01100 | |
| Dell Latitude 7420 JW6MH | |
| Lenovo ThinkPad T14 G3-21CF004NGE | |
| Average Kioxia BG5 KBG5AZNV512G | |
* ... smaller is better
Sustained Read Performance: DiskSpd Read Loop, Queue Depth 8
图形卡
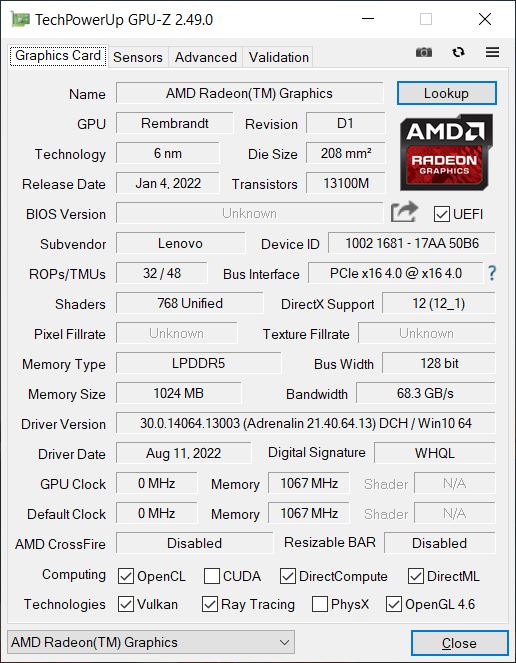
芯片 Radeon 680M是目前市场上最快的集成显卡,能够与入门级显卡竞争,如 GeForce MX450的竞争,而且与MX550也相差无几。 GeForce MX550,这也是英特尔机型的可选配置。然而,我们只有MX550的结果,其TGP非常高,为35瓦;我们预计T14 G3为25瓦。因此,ThinkPad T14中的MX550很可能不会比680M提供更多性能。集成的 英特尔Xe Graphics G7显然被打败了,并且与ThinkPad T14中较小的Radeon 660M大致持平。 Radeon 660M中的 Ryzen 5 Pro 6650U.
除了高图形性能,即使在长时间的负载和电池模式下也保持稳定,集成的视频解码器也是非常高效的。例如,在我们的4K YouTube视频测试中,GPU的负载只有1%,而目前Alder Lake处理器的Iris Xe Graphics G7的负载是43-44%。更多的GPU基准测试可在这里.
| 3DMark Performance rating - Percent | |
| Lenovo IdeaCentre AIO 3 24IAP7 | |
| Lenovo ThinkPad T14 G3-21CF004NGE | |
| Average AMD Radeon 680M | |
| Average of class Office | |
| Huawei MateBook X Pro 2022 | |
| HP EliteBook 845 G9 6F6H6EA | |
| Lenovo ThinkPad T14 Gen2-20W1S00000 -1! | |
| Lenovo ThinkPad Z13 21D2CTO1WW | |
| Lenovo ThinkPad T14s G2 20XGS01100 | |
| Dell Inspiron 14 7420 2-in-1 -1! | |
| Dell Latitude 7420 JW6MH | |
| V-Ray Benchmark Next 4.10 - GPU | |
| Lenovo IdeaCentre AIO 3 24IAP7 | |
| Average of class Office (8 - 550, n=70, last 2 years) | |
| HP EliteBook 845 G9 6F6H6EA | |
| Average AMD Radeon 680M (29 - 78, n=27) | |
| Lenovo ThinkPad T14 G3-21CF004NGE | |
| Huawei MateBook X Pro 2022 | |
| Lenovo ThinkPad T14s G2 20XGS01100 | |
| Lenovo ThinkPad Z13 21D2CTO1WW | |
| Lenovo ThinkPad T14 Gen2-20W1S00000 | |
| Dell Latitude 7420 JW6MH | |
| 3DMark 11 Performance | 10275 points | |
| 3DMark Cloud Gate Standard Score | 32012 points | |
| 3DMark Fire Strike Score | 6486 points | |
| 3DMark Time Spy Score | 2555 points | |
Help | ||
在Blender基准测试中,Radeon 680M也比Iris Xe Graphics G7有优势。由于Blender从3.0版本开始不再支持OpenCL,AMD再次通过HIP(Heterogeneous-computing Interface for Portability)支持GPU渲染,这是Nvidia CUDA技术的竞争对手。这将教室基准中的渲染时间从525秒(CPU)减少到335秒(HIP)。我们还没有很多关于CUDA GPU的结果,但是RTX A1000和RTX 3050都至少快三倍。因此,我们很想知道GeForce MX550在这里的表现如何。
| Blender / v3.3 Classroom CPU | |
| Beelink SEi11 Pro | |
| Lenovo ThinkPad Z13 21D2CTO1WW | |
| Asus VivoBook Pro 16X OLED N7600PC-L2026X (3.3.0) | |
| Huawei MateBook X Pro 2022 | |
| Average of class Office (245 - 3219, n=75, last 2 years) | |
| Lenovo ThinkPad T14 G3-21CF004NGE (3.2.0) | |
| HP Envy 16 h0112nr (3.2.0) | |
| Dell Precision 5000 5470 | |
| Blender / v3.3 Classroom HIP/AMD | |
| Lenovo ThinkPad Z13 21D2CTO1WW | |
| Average of class Office (296 - 507, n=5, last 2 years) | |
| Lenovo ThinkPad T14 G3-21CF004NGE (3.2.0) | |
| Blender / v3.3 Classroom OPTIX/RTX | |
| Average of class Office (29 - 242, n=2, last 2 years) | |
| Dell Precision 5000 5470 | |
| Asus VivoBook Pro 16X OLED N7600PC-L2026X (3.3.0) | |
| HP Envy 16 h0112nr (3.2.0) | |
| Blender / v3.3 Classroom CUDA | |
| Dell Precision 5000 5470 | |
| Asus VivoBook Pro 16X OLED N7600PC-L2026X (3.3.0) | |
| Average of class Office (53 - 214, n=3, last 2 years) | |
| HP Envy 16 h0112nr (3.2.0) | |
* ... smaller is better
虽然ThinkPad T14 G3不是工作站,但Radeon 680M在专业的SPECviewperf基准测试中仍然表现相当出色。英特尔Xe Graphics G7在几乎所有的测试中都明显胜出,而与专用的GeForce MX550的比较则取决于不同的情况。680M在某些情况下更快,GeForce 在其他情况下更快。至少,小型项目可以在ThinkPad T14 G3 AMD上进行。
游戏性能
ThinkPad T14 G3首先是一台商务笔记本电脑,但由于其快速集成的GPU,你绝对也可以做一些游戏。这款Radeon 680M在1080p分辨率下,只要游戏要求不高,Radeon 680M往往能在中等和高细节上实现流畅的游戏。在游戏基准测试中,快速的35瓦版本的 GeForce MX550往往略快,但与ThinkPad T14 G3中的MX550的差异几乎不值得一提。
| The Witcher 3 | |
| 1920x1080 High Graphics & Postprocessing (Nvidia HairWorks Off) | |
| Lenovo IdeaCentre AIO 3 24IAP7 | |
| Lenovo ThinkPad T14 G3-21CF004NGE | |
| Average AMD Radeon 680M (22.3 - 48, n=33) | |
| Average of class Office (23.7 - 53.4, n=3, last 2 years) | |
| Huawei MateBook X Pro 2022 | |
| Lenovo ThinkPad T14 Gen2-20W1S00000 | |
| Dell Inspiron 14 7420 2-in-1 | |
| HP EliteBook 845 G9 6F6H6EA | |
| Lenovo ThinkPad T14s G2 20XGS01100 | |
| Dell Latitude 7420 JW6MH | |
| 1920x1080 Ultra Graphics & Postprocessing (HBAO+) | |
| Lenovo IdeaCentre AIO 3 24IAP7 | |
| Lenovo ThinkPad T14 G3-21CF004NGE | |
| Average AMD Radeon 680M (14.3 - 27.1, n=33) | |
| Average of class Office (14.8 - 28.1, n=3, last 2 years) | |
| Lenovo ThinkPad T14 Gen2-20W1S00000 | |
| Lenovo ThinkPad T14 Gen2-20W1S00000 | |
| HP EliteBook 845 G9 6F6H6EA | |
| Huawei MateBook X Pro 2022 | |
| Lenovo ThinkPad T14s G2 20XGS01100 | |
| Dell Inspiron 14 7420 2-in-1 | |
| Dell Latitude 7420 JW6MH | |
| F1 2021 | |
| 1920x1080 High Preset AA:T AF:16x | |
| Average AMD Radeon 680M (26.8 - 69, n=21) | |
| Lenovo ThinkPad T14 G3-21CF004NGE (874931) | |
| Lenovo IdeaCentre AIO 3 24IAP7 (874931) | |
| Huawei MateBook X Pro 2022 (874931) | |
| 1920x1080 Ultra High Preset + Raytracing AA:T AF:16x | |
| Lenovo IdeaCentre AIO 3 24IAP7 (874931) | |
| Huawei MateBook X Pro 2022 (874931) | |
| Average AMD Radeon 680M (16.1 - 29.1, n=18) | |
| Lenovo ThinkPad T14 G3-21CF004NGE (874931) | |
| Dota 2 Reborn | |
| 1920x1080 high (2/3) | |
| Lenovo IdeaCentre AIO 3 24IAP7 | |
| Lenovo ThinkPad T14 Gen2-20W1S00000 | |
| Lenovo ThinkPad T14 G3-21CF004NGE | |
| Average AMD Radeon 680M (33.2 - 89.1, n=41) | |
| Huawei MateBook X Pro 2022 | |
| Average of class Office (16.2 - 143.3, n=77, last 2 years) | |
| Dell Latitude 7420 JW6MH | |
| Lenovo ThinkPad T14s G2 20XGS01100 | |
| HP EliteBook 845 G9 6F6H6EA | |
| Dell Inspiron 14 7420 2-in-1 | |
| 1920x1080 ultra (3/3) best looking | |
| Lenovo IdeaCentre AIO 3 24IAP7 | |
| Lenovo ThinkPad T14 Gen2-20W1S00000 | |
| Lenovo ThinkPad T14 G3-21CF004NGE | |
| Average AMD Radeon 680M (33.2 - 84.9, n=41) | |
| Huawei MateBook X Pro 2022 | |
| Average of class Office (14.6 - 135, n=77, last 2 years) | |
| Lenovo ThinkPad T14s G2 20XGS01100 | |
| Dell Latitude 7420 JW6MH | |
| HP EliteBook 845 G9 6F6H6EA | |
| Dell Inspiron 14 7420 2-in-1 | |
| Final Fantasy XV Benchmark | |
| 1920x1080 Standard Quality | |
| Lenovo IdeaCentre AIO 3 24IAP7 (1.3) | |
| Lenovo ThinkPad T14 G3-21CF004NGE (1.3) | |
| Average of class Office (7.86 - 105.7, n=73, last 2 years) | |
| Average AMD Radeon 680M (18.3 - 36.9, n=40) | |
| Huawei MateBook X Pro 2022 (1.3) | |
| HP EliteBook 845 G9 6F6H6EA (1.3) | |
| Dell Latitude 7420 JW6MH (1.3) | |
| Dell Inspiron 14 7420 2-in-1 (1.3) | |
| 1920x1080 High Quality | |
| Lenovo IdeaCentre AIO 3 24IAP7 (1.3) | |
| Lenovo ThinkPad T14 G3-21CF004NGE (1.3) | |
| Average of class Office (8.09 - 79.5, n=71, last 2 years) | |
| Average AMD Radeon 680M (12.9 - 26.2, n=40) | |
| Huawei MateBook X Pro 2022 (1.3) | |
| HP EliteBook 845 G9 6F6H6EA (1.3) | |
| Dell Inspiron 14 7420 2-in-1 (1.3) | |
| Strange Brigade | |
| 1920x1080 high AA:high AF:8 | |
| Lenovo IdeaCentre AIO 3 24IAP7 (1.47.22.14 D3D12) | |
| Lenovo ThinkPad T14 G3-21CF004NGE | |
| Average of class Office (9.8 - 164.3, n=53, last 2 years) | |
| Average AMD Radeon 680M (25.3 - 53.1, n=38) | |
| Huawei MateBook X Pro 2022 (1.47.22.14 D3D12) | |
| Lenovo ThinkPad T14s G2 20XGS01100 (1.47.22.14 D3D12) | |
| HP EliteBook 845 G9 6F6H6EA (1.47.22.14 D3D12) | |
| Dell Inspiron 14 7420 2-in-1 (1.47.22.14 D3D12) | |
| Dell Latitude 7420 JW6MH (1.47.22.14 D3D12) | |
| 1920x1080 ultra AA:ultra AF:16 | |
| Lenovo ThinkPad T14 G3-21CF004NGE | |
| Average of class Office (12.9 - 142.1, n=53, last 2 years) | |
| Lenovo IdeaCentre AIO 3 24IAP7 (1.47.22.14 D3D12) | |
| Average AMD Radeon 680M (22 - 46, n=38) | |
| Huawei MateBook X Pro 2022 (1.47.22.14 D3D12) | |
| Lenovo ThinkPad T14s G2 20XGS01100 (1.47.22.14 D3D12) | |
| HP EliteBook 845 G9 6F6H6EA (1.47.22.14 D3D12) | |
| Dell Inspiron 14 7420 2-in-1 (1.47.22.14 D3D12) | |
| Dell Latitude 7420 JW6MH (1.47.22.14 D3D12) | |
| Farming Simulator 22 | |
| 1920x1080 High Preset | |
| Lenovo IdeaCentre AIO 3 24IAP7 | |
| Average AMD Radeon 680M (30 - 72.5, n=4) | |
| Lenovo ThinkPad T14 G3-21CF004NGE | |
| Huawei MateBook X Pro 2022 | |
| 1920x1080 Very High Preset | |
| Lenovo ThinkPad T14 G3-21CF004NGE | |
| Lenovo IdeaCentre AIO 3 24IAP7 | |
| Average AMD Radeon 680M (27 - 53, n=4) | |
| Huawei MateBook X Pro 2022 | |
在长时间的负载下,游戏性能也保持稳定,这在我们的Witcher 3 循环中得到了很好的说明。在评估外部屏幕的功耗时(为了排除评测设备的不同内部面板的影响因素),与MX550特别是Iris Xe Graphics G7相比,其出色的效率再次显现出来。然而,在游戏性能方面,令人遗憾的是,联想省略了USB 4,因为这实际上意味着你不能连接外部显卡,否则,由于强大的处理器,显卡会非常好用。在电池模式下,性能保持稳定。更多游戏基准测试可在 这里.
Witcher 3 FPS-Diagramm
| Power Consumption - Witcher 3 ultra Efficiency (external Monitor) | |
| AMD Radeon 680M | |
| AMD Radeon 680M | |
| NVIDIA GeForce MX550 | |
| AMD Radeon RX Vega 8 (Ryzen 4000/5000) | |
| Intel Iris Xe Graphics G7 80EUs | |
| Intel Iris Xe Graphics G7 96EUs | |
| Intel Iris Xe Graphics G7 96EUs | |
| Intel Iris Xe Graphics G7 96EUs | |
| low | med. | high | ultra | |
|---|---|---|---|---|
| GTA V (2015) | 133.6 | 120.1 | 99.1 | 22.2 |
| The Witcher 3 (2015) | 117 | 79 | 41 | 23.9 |
| Dota 2 Reborn (2015) | 111.4 | 96 | 72.8 | 63.1 |
| Final Fantasy XV Benchmark (2018) | 62 | 32.4 | 23 | |
| X-Plane 11.11 (2018) | 48.9 | 39.5 | 33.5 | |
| Far Cry 5 (2018) | 58 | 36 | 34 | 32 |
| Strange Brigade (2018) | 139 | 58 | 48 | 41 |
| F1 2021 (2021) | 140.5 | 70.8 | 55.1 | 21.2 |
| Farming Simulator 22 (2021) | 121 | 61 | 49 | 43 |
| F1 22 (2022) | 66.5 | 60.3 | 42.3 | 9.16 |
排放--AMD ThinkPad仍然保持令人愉快的安静
噪声
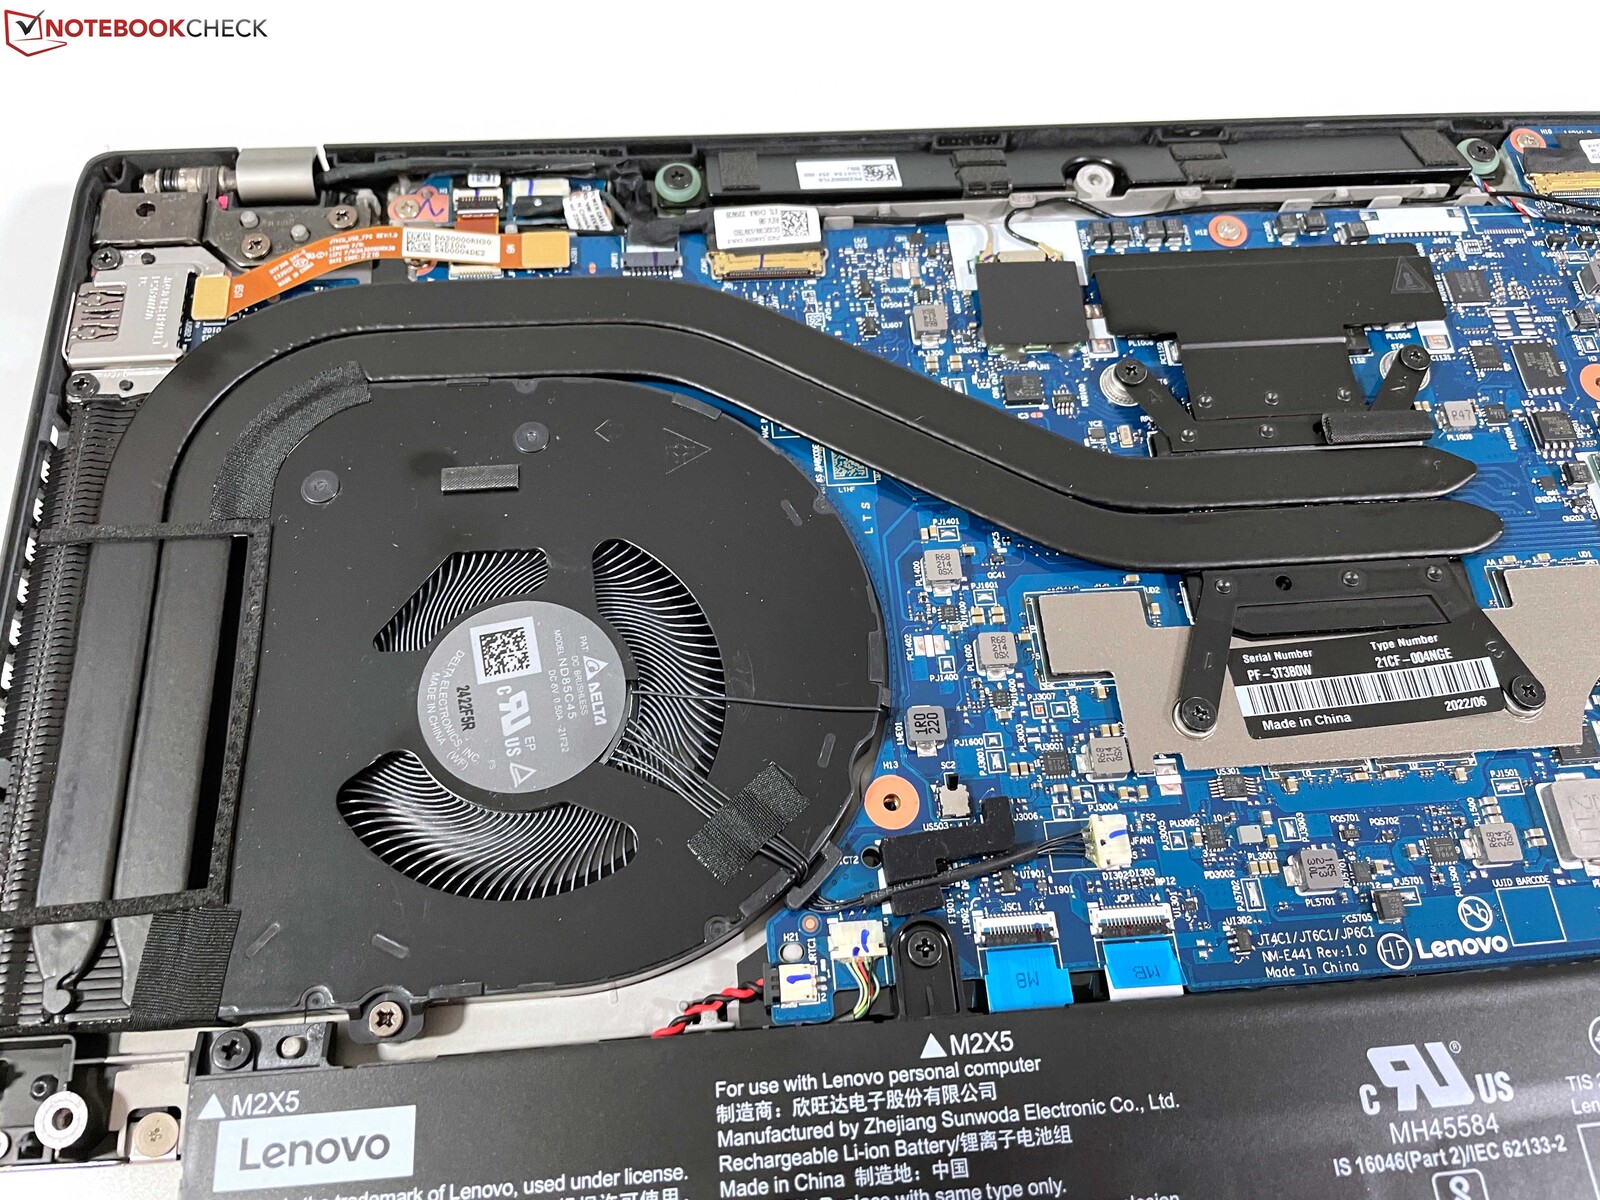
单个风扇在日常使用中保持令人愉快的安静,在简单的任务中经常被停用,或者只有非常安静的噪音,几乎听不到。在负载情况下,风扇最大达到38 dB(A),但噪音并不高,也不令人厌烦。只要TDP稳定下来,风扇的噪音就会再次下降到34dB(A)左右,我们在游戏过程中也测到了这个噪音。总的来说,这使得ThinkPad T14 G3成为比较领域中最安静的设备之一,如果你选择最有效的电源模式,即使在负载下也几乎听不到风扇的声音。没有发现其他电子噪音,如线圈啸叫。
Noise level
| Idle |
| 24.2 / 24.2 / 25.8 dB(A) |
| Load |
| 32.2 / 38.8 dB(A) |
 | ||
30 dB silent 40 dB(A) audible 50 dB(A) loud |
||
min: | ||
| Lenovo ThinkPad T14 G3-21CF004NGE Radeon 680M, R7 PRO 6850U, Kioxia BG5 KBG5AZNV512G | Dell Latitude 7420 JW6MH Iris Xe G7 80EUs, i5-1145G7, SK Hynix BC711 HFM512GD3HX015N | Huawei MateBook X Pro 2022 Iris Xe G7 96EUs, i7-1260P, Silicon Motion PCIe-8 SSD 1TB | HP EliteBook 845 G9 6F6H6EA Radeon 680M, R9 PRO 6950HS, WDC PC SN810 1TB | Lenovo ThinkPad T14 Gen2-20W1S00000 GeForce MX450, i7-1165G7, Samsung PM981a MZVLB1T0HBLR | Lenovo ThinkPad T14s G2 20XGS01100 Vega 8, R7 PRO 5850U, Lenovo UMIS AM630 RPETJ1T24MGE2QDQ | |
|---|---|---|---|---|---|---|
| Noise | -11% | -1% | -8% | -4% | -3% | |
| off / environment * (dB) | 24.2 | 25.3 -5% | 23.5 3% | 25.5 -5% | 24.2 -0% | 26.81 -11% |
| Idle Minimum * (dB) | 24.2 | 25.3 -5% | 23.5 3% | 25.5 -5% | 24.2 -0% | 26.81 -11% |
| Idle Average * (dB) | 24.2 | 25.3 -5% | 23.5 3% | 25.5 -5% | 24.2 -0% | 26.81 -11% |
| Idle Maximum * (dB) | 25.8 | 25.3 2% | 25.9 -0% | 25.5 1% | 24.2 6% | 26.81 -4% |
| Load Average * (dB) | 32.2 | 44.9 -39% | 33.8 -5% | 38.1 -18% | 35.4 -10% | 30.16 6% |
| Witcher 3 ultra * (dB) | 34.1 | 35.4 -4% | 40.1 -18% | |||
| Load Maximum * (dB) | 38.8 | 44.9 -16% | 40.6 -5% | 44 -13% | 40.1 -3% | 33.98 12% |
* ... smaller is better
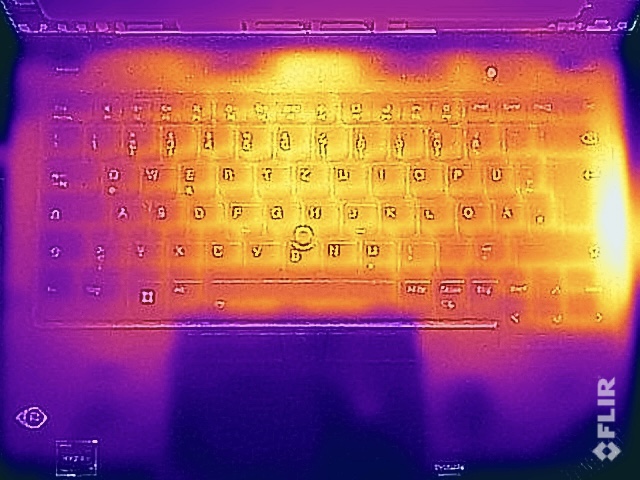
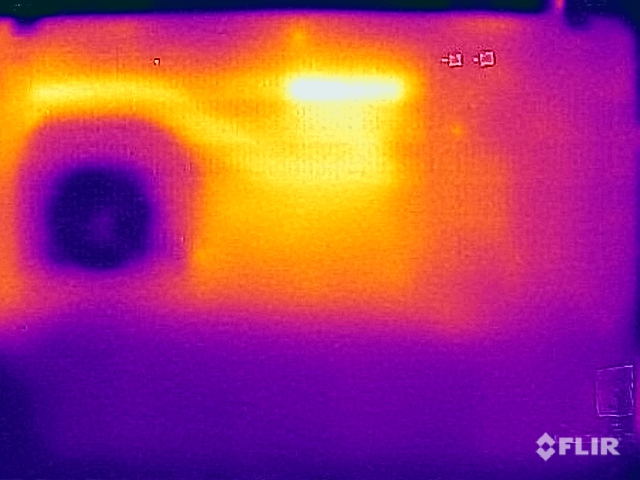
温度
ThinkPad T14 G3的外壳在低负载下几乎不发热,但在负载下情况就不同了。特别是,底部的中央后部区域和键盘旁边的风扇出口上方的盖子发热非常强烈。我们已经熟悉了前辈们在键盘旁边的温暖表面。在负载情况下,ThinkPad T14 G3不应该放在腿上,否则就应该切换到省电模式。这对于带有专用GeForce MX550的T14 G3的配置来说可能会有问题,这自然伴随着热负荷的增加。
在CPU/GPU组合负载的压力测试中,SoC的功耗在最初的15分钟里在25瓦左右波动,然后稳定在23瓦。在压力测试结束后,没有观察到随后的性能下降。
(-) The maximum temperature on the upper side is 48.2 °C / 119 F, compared to the average of 34.3 °C / 94 F, ranging from 21.2 to 62.5 °C for the class Office.
(-) The bottom heats up to a maximum of 52.8 °C / 127 F, compared to the average of 36.8 °C / 98 F
(+) In idle usage, the average temperature for the upper side is 23.9 °C / 75 F, compared to the device average of 29.5 °C / 85 F.
(±) Playing The Witcher 3, the average temperature for the upper side is 37.8 °C / 100 F, compared to the device average of 29.5 °C / 85 F.
(+) The palmrests and touchpad are cooler than skin temperature with a maximum of 29.8 °C / 85.6 F and are therefore cool to the touch.
(-) The average temperature of the palmrest area of similar devices was 27.5 °C / 81.5 F (-2.3 °C / -4.1 F).
| Lenovo ThinkPad T14 G3-21CF004NGE AMD Ryzen 7 PRO 6850U, AMD Radeon 680M | Dell Latitude 7420 JW6MH Intel Core i5-1145G7, Intel Iris Xe Graphics G7 80EUs | Huawei MateBook X Pro 2022 Intel Core i7-1260P, Intel Iris Xe Graphics G7 96EUs | HP EliteBook 845 G9 6F6H6EA AMD Ryzen 9 PRO 6950HS, AMD Radeon 680M | Lenovo ThinkPad T14 Gen2-20W1S00000 Intel Core i7-1165G7, NVIDIA GeForce MX450 | Lenovo ThinkPad T14s G2 20XGS01100 AMD Ryzen 7 PRO 5850U, AMD Radeon RX Vega 8 (Ryzen 4000/5000) | |
|---|---|---|---|---|---|---|
| Heat | 6% | -2% | -12% | -7% | 1% | |
| Maximum Upper Side * (°C) | 48.2 | 37.1 23% | 43.1 11% | 49.4 -2% | 47 2% | 44.2 8% |
| Maximum Bottom * (°C) | 52.8 | 38.7 27% | 42 20% | 48 9% | 58.4 -11% | 38.9 26% |
| Idle Upper Side * (°C) | 24.4 | 27.3 -12% | 29.4 -20% | 30.8 -26% | 25.3 -4% | 27.7 -14% |
| Idle Bottom * (°C) | 24.5 | 28.1 -15% | 29.4 -20% | 31.4 -28% | 27.7 -13% | 28.3 -16% |
* ... smaller is better
发言人
两个立体声扬声器位于键盘上方,将声音导向用户。然而,由于这两个模块的位置非常接近,所以没有立体声效果,整体声音相当单薄。其优点是线性的高音,有利于会议期间的语音再现。然而,除了一些背景音乐或偶尔的视频外,你最好使用外部扬声器或耳机。
Lenovo ThinkPad T14 G3-21CF004NGE audio analysis
(±) | speaker loudness is average but good (77.2 dB)
Bass 100 - 315 Hz
(-) | nearly no bass - on average 24.6% lower than median
(±) | linearity of bass is average (10.1% delta to prev. frequency)
Mids 400 - 2000 Hz
(+) | balanced mids - only 2.6% away from median
(+) | mids are linear (4.6% delta to prev. frequency)
Highs 2 - 16 kHz
(+) | balanced highs - only 3.3% away from median
(+) | highs are linear (3.8% delta to prev. frequency)
Overall 100 - 16.000 Hz
(±) | linearity of overall sound is average (18.8% difference to median)
Compared to same class
» 35% of all tested devices in this class were better, 7% similar, 58% worse
» The best had a delta of 7%, average was 21%, worst was 53%
Compared to all devices tested
» 43% of all tested devices were better, 8% similar, 49% worse
» The best had a delta of 4%, average was 23%, worst was 134%
Dell Latitude 7420 JW6MH audio analysis
(+) | speakers can play relatively loud (82.7 dB)
Bass 100 - 315 Hz
(-) | nearly no bass - on average 15.6% lower than median
(±) | linearity of bass is average (12.8% delta to prev. frequency)
Mids 400 - 2000 Hz
(+) | balanced mids - only 2.9% away from median
(+) | mids are linear (4% delta to prev. frequency)
Highs 2 - 16 kHz
(+) | balanced highs - only 2.5% away from median
(+) | highs are linear (4.3% delta to prev. frequency)
Overall 100 - 16.000 Hz
(+) | overall sound is linear (12.5% difference to median)
Compared to same class
» 5% of all tested devices in this class were better, 2% similar, 93% worse
» The best had a delta of 7%, average was 21%, worst was 53%
Compared to all devices tested
» 11% of all tested devices were better, 2% similar, 87% worse
» The best had a delta of 4%, average was 23%, worst was 134%
电源管理 - AMD ThinkPad非常高效
消耗功率
凭借400尼特的显示屏和AMD处理器,ThinkPad T14 G3非常省电。即使在全亮度下,空闲功耗也不到6瓦。在负载情况下,我们清楚地看到与目前英特尔系统的不同之处,在峰值负载期间,英特尔系统经常达到65瓦的电源适配器的极限,偶尔会被迫使用电池供电。另一方面,AMD处理器在负载下最多只消耗50瓦,所以65瓦的电源完全足够。
| Off / Standby | |
| Idle | |
| Load |
|
Key:
min: | |
| Lenovo ThinkPad T14 G3-21CF004NGE R7 PRO 6850U, Radeon 680M, Kioxia BG5 KBG5AZNV512G, IPS, 1920x1200, 14" | Dell Latitude 7420 JW6MH i5-1145G7, Iris Xe G7 80EUs, SK Hynix BC711 HFM512GD3HX015N, IPS, 1920x1080, 14" | Huawei MateBook X Pro 2022 i7-1260P, Iris Xe G7 96EUs, Silicon Motion PCIe-8 SSD 1TB, IPS, 3120x2080, 14.2" | HP EliteBook 845 G9 6F6H6EA R9 PRO 6950HS, Radeon 680M, WDC PC SN810 1TB, IPS, 1920x1200, 14" | Lenovo ThinkPad T14 Gen2-20W1S00000 i7-1165G7, GeForce MX450, Samsung PM981a MZVLB1T0HBLR, IPS LED, 1920x1080, 14" | Lenovo ThinkPad T14s G2 20XGS01100 R7 PRO 5850U, Vega 8, Lenovo UMIS AM630 RPETJ1T24MGE2QDQ, IPS LED, 1920x1080, 14" | Average AMD Radeon 680M | Average of class Office | |
|---|---|---|---|---|---|---|---|---|
| Power Consumption | -10% | -111% | -111% | -47% | -4% | -84% | -41% | |
| Idle Minimum * (Watt) | 2.4 | 2.7 -13% | 6.5 -171% | 6.4 -167% | 3.8 -58% | 3.16 -32% | 6.93 ? -189% | 4.26 ? -78% |
| Idle Average * (Watt) | 5.3 | 6 -13% | 13.7 -158% | 12.4 -134% | 7.3 -38% | 5.6 -6% | 8.98 ? -69% | 7.31 ? -38% |
| Idle Maximum * (Watt) | 5.6 | 7.6 -36% | 14.4 -157% | 18 -221% | 11.2 -100% | 7.13 -27% | 10.5 ? -88% | 8.55 ? -53% |
| Load Average * (Watt) | 39.7 | 37 7% | 64.6 -63% | 63 -59% | 61.2 -54% | 30.86 22% | 53.5 ? -35% | 43.8 ? -10% |
| Witcher 3 ultra * (Watt) | 42.8 | 33.2 22% | 57.2 -34% | 63.6 -49% | 41.2 4% | 37 14% | ||
| Load Maximum * (Watt) | 50.6 | 65 -28% | 90.9 -80% | 68 -34% | 67.5 -33% | 46.55 8% | 70.5 ? -39% | 64.5 ? -27% |
* ... smaller is better
Power consumption Witcher 3 / Stress test
Power consumption with an external monitor
电池寿命
52.5Wh的电池确保了极好的运行时间。在150cd/m²的调整亮度下(相当于我们评测样本中最大亮度的65%),我们的视频测试运行了近16.5小时,这再次证实了非常有效的视频解码器。WLAN测试持续了近13个小时,在最大亮度下持续了近10个小时。我们还重复了WLAN测试(150cd/m²),并有一个活跃的LTE连接,结果是10:18分钟。
凭借65瓦的电源,ThinkPad支持RapidCharge技术,在设备打开的情况下,充满电只需要不到100分钟;仅30分钟后就可以达到50%,53分钟后达到80%。
| Lenovo ThinkPad T14 G3-21CF004NGE R7 PRO 6850U, Radeon 680M, 52.5 Wh | Dell Latitude 7420 JW6MH i5-1145G7, Iris Xe G7 80EUs, 63 Wh | Huawei MateBook X Pro 2022 i7-1260P, Iris Xe G7 96EUs, 60 Wh | HP EliteBook 845 G9 6F6H6EA R9 PRO 6950HS, Radeon 680M, 51 Wh | Lenovo ThinkPad T14 Gen2-20W1S00000 i7-1165G7, GeForce MX450, 50 Wh | Lenovo ThinkPad T14s G2 20XGS01100 R7 PRO 5850U, Vega 8, 57 Wh | Average of class Office | |
|---|---|---|---|---|---|---|---|
| Battery runtime | 55% | -22% | -14% | -15% | 12% | 12% | |
| H.264 (h) | 16.4 | 7.6 -54% | 14 -15% | 14.9 -9% | 15.5 ? -5% | ||
| WiFi v1.3 (h) | 12.9 | 14.1 9% | 7.5 -42% | 9.3 -28% | 9 -30% | 14.6 13% | 13.2 ? 2% |
| Load (h) | 1.3 | 2.6 100% | 1.7 31% | 1.3 0% | 1.3 0% | 1.7 31% | 1.808 ? 39% |
Pros
Cons
结论 - ThinkPad T3 G3非常好,但有不必要的限制

ThinkPad T14是一款非常好的商务笔记本。它既不是最薄的,也不是最轻的14英寸笔记本,它并不试图成为这样的笔记本,而这种做法在日常使用中蕴含着优势,比如广泛的连接性。联想为新的T14 G3带来了广泛的重新设计,这在许多方面也是成功的。16:10的屏幕和谐地融入了整体概念,极宽的底部屏幕边缘终于消失了。较大的触摸板也很讨人喜欢,TrackPoint按键是我们在ThinkPad上体验过的最好的按键之一,其点击声丰富而安静。
然而,一个消极的方面是关于键盘的。在这里,联想采用了其他ThinkPad的方法,如 X1 Carbon的做法,将按键的落差从1.8毫米减少到1.5毫米,考虑到机箱的厚度,这是不必要的。而且你在打字的时候会注意到这种差别。真正遗憾的是,联想继续进一步削弱以前的强大亮点,故意满足于较差的质量。新款T14 G3的键盘绝不是坏的,但与惠普等其他商业竞争对手相比,它不再有优势。联想应该在这里重新考虑其策略。
新款ThinkPad T14 G3是一款非常好的商务笔记本电脑,整体上是一款全面的设备,采用快速高效的AMD Ryzen 7 Pro,在许多方面比英特尔的变种有优势。
当在配备AMD或英特尔CPU的ThinkPad T14 G3之间进行选择时,AMD显然是最受欢迎的,因为除了在多核测试和集成GPU方面的高性能外,它在效率方面也特别令人印象深刻。我们对以前的Alder Lake笔记本电脑的经验表明,非常高的功率限制往往导致日常使用中的风扇反应非常快,耗电量更大,这通常需要更强的电源适配器。AMD系统即使在负载下也是令人愉快的安静,电池运行时间也被证明是非常好的。英特尔版本有一个专门的 GeForce MX550但这不太可能比集成的 Radeon 680M更不用说额外的热负荷了。英特尔版本唯一真正的优势是支持Thunderbolt,尽管人们必须严格质疑为什么联想决定放弃实施USB 4,而这在消费类机型中是可行的,例如 瑜伽7 14.此外,AMD机型的内存不能扩展,但使用更快的工作内存作为回报(LPDDR5-6400对DDR4-3200)。
AMD版本缺乏USB 4是联想的一个不必要的限制,我们也建议制造商重新考虑其关于键盘的策略。在这里,质量不断下降,以前更好的键盘的优势已经不复存在。
买家在选择显示屏时应该有点警惕,因为基本的面板没有什么乐趣。我们的评测版本,亮度为400cd/m²,是图像质量和功耗之间的最佳妥协,早期版本也是如此。亮度非常好,对比度非常高,图像清晰度也完全够用--这简直是一款非常好的商务用显示器。此外,它非常高效,确保了非常好的电池运行时间。可选的具有DCI-P3覆盖率的4K面板将提供更好的图像质量,但也需要明显更多的电力。
ThinkPad T14 G3最强大的竞争对手可能是EliteBook 845 G9 ,因为它使用更强大的AMD Ryzen 9 Pro 6950HS,但你应该避免使用Sure View面板。戴尔Latitude 7420 ,另一方面,它的性能明显较差,而且其Tiger Lake 处理器的声音明显较大。未来几周还将对其他当前的商务笔记本电脑进行评测,包括新的ThinkPad T14s G3以及ThinkPad T14 G3的英特尔/英伟达变体。
价格和可用性
Lenovo ThinkPad T14 G3-21CF004NGE
- 09/23/2022 v7 (old)
Andreas Osthoff
Price comparison

