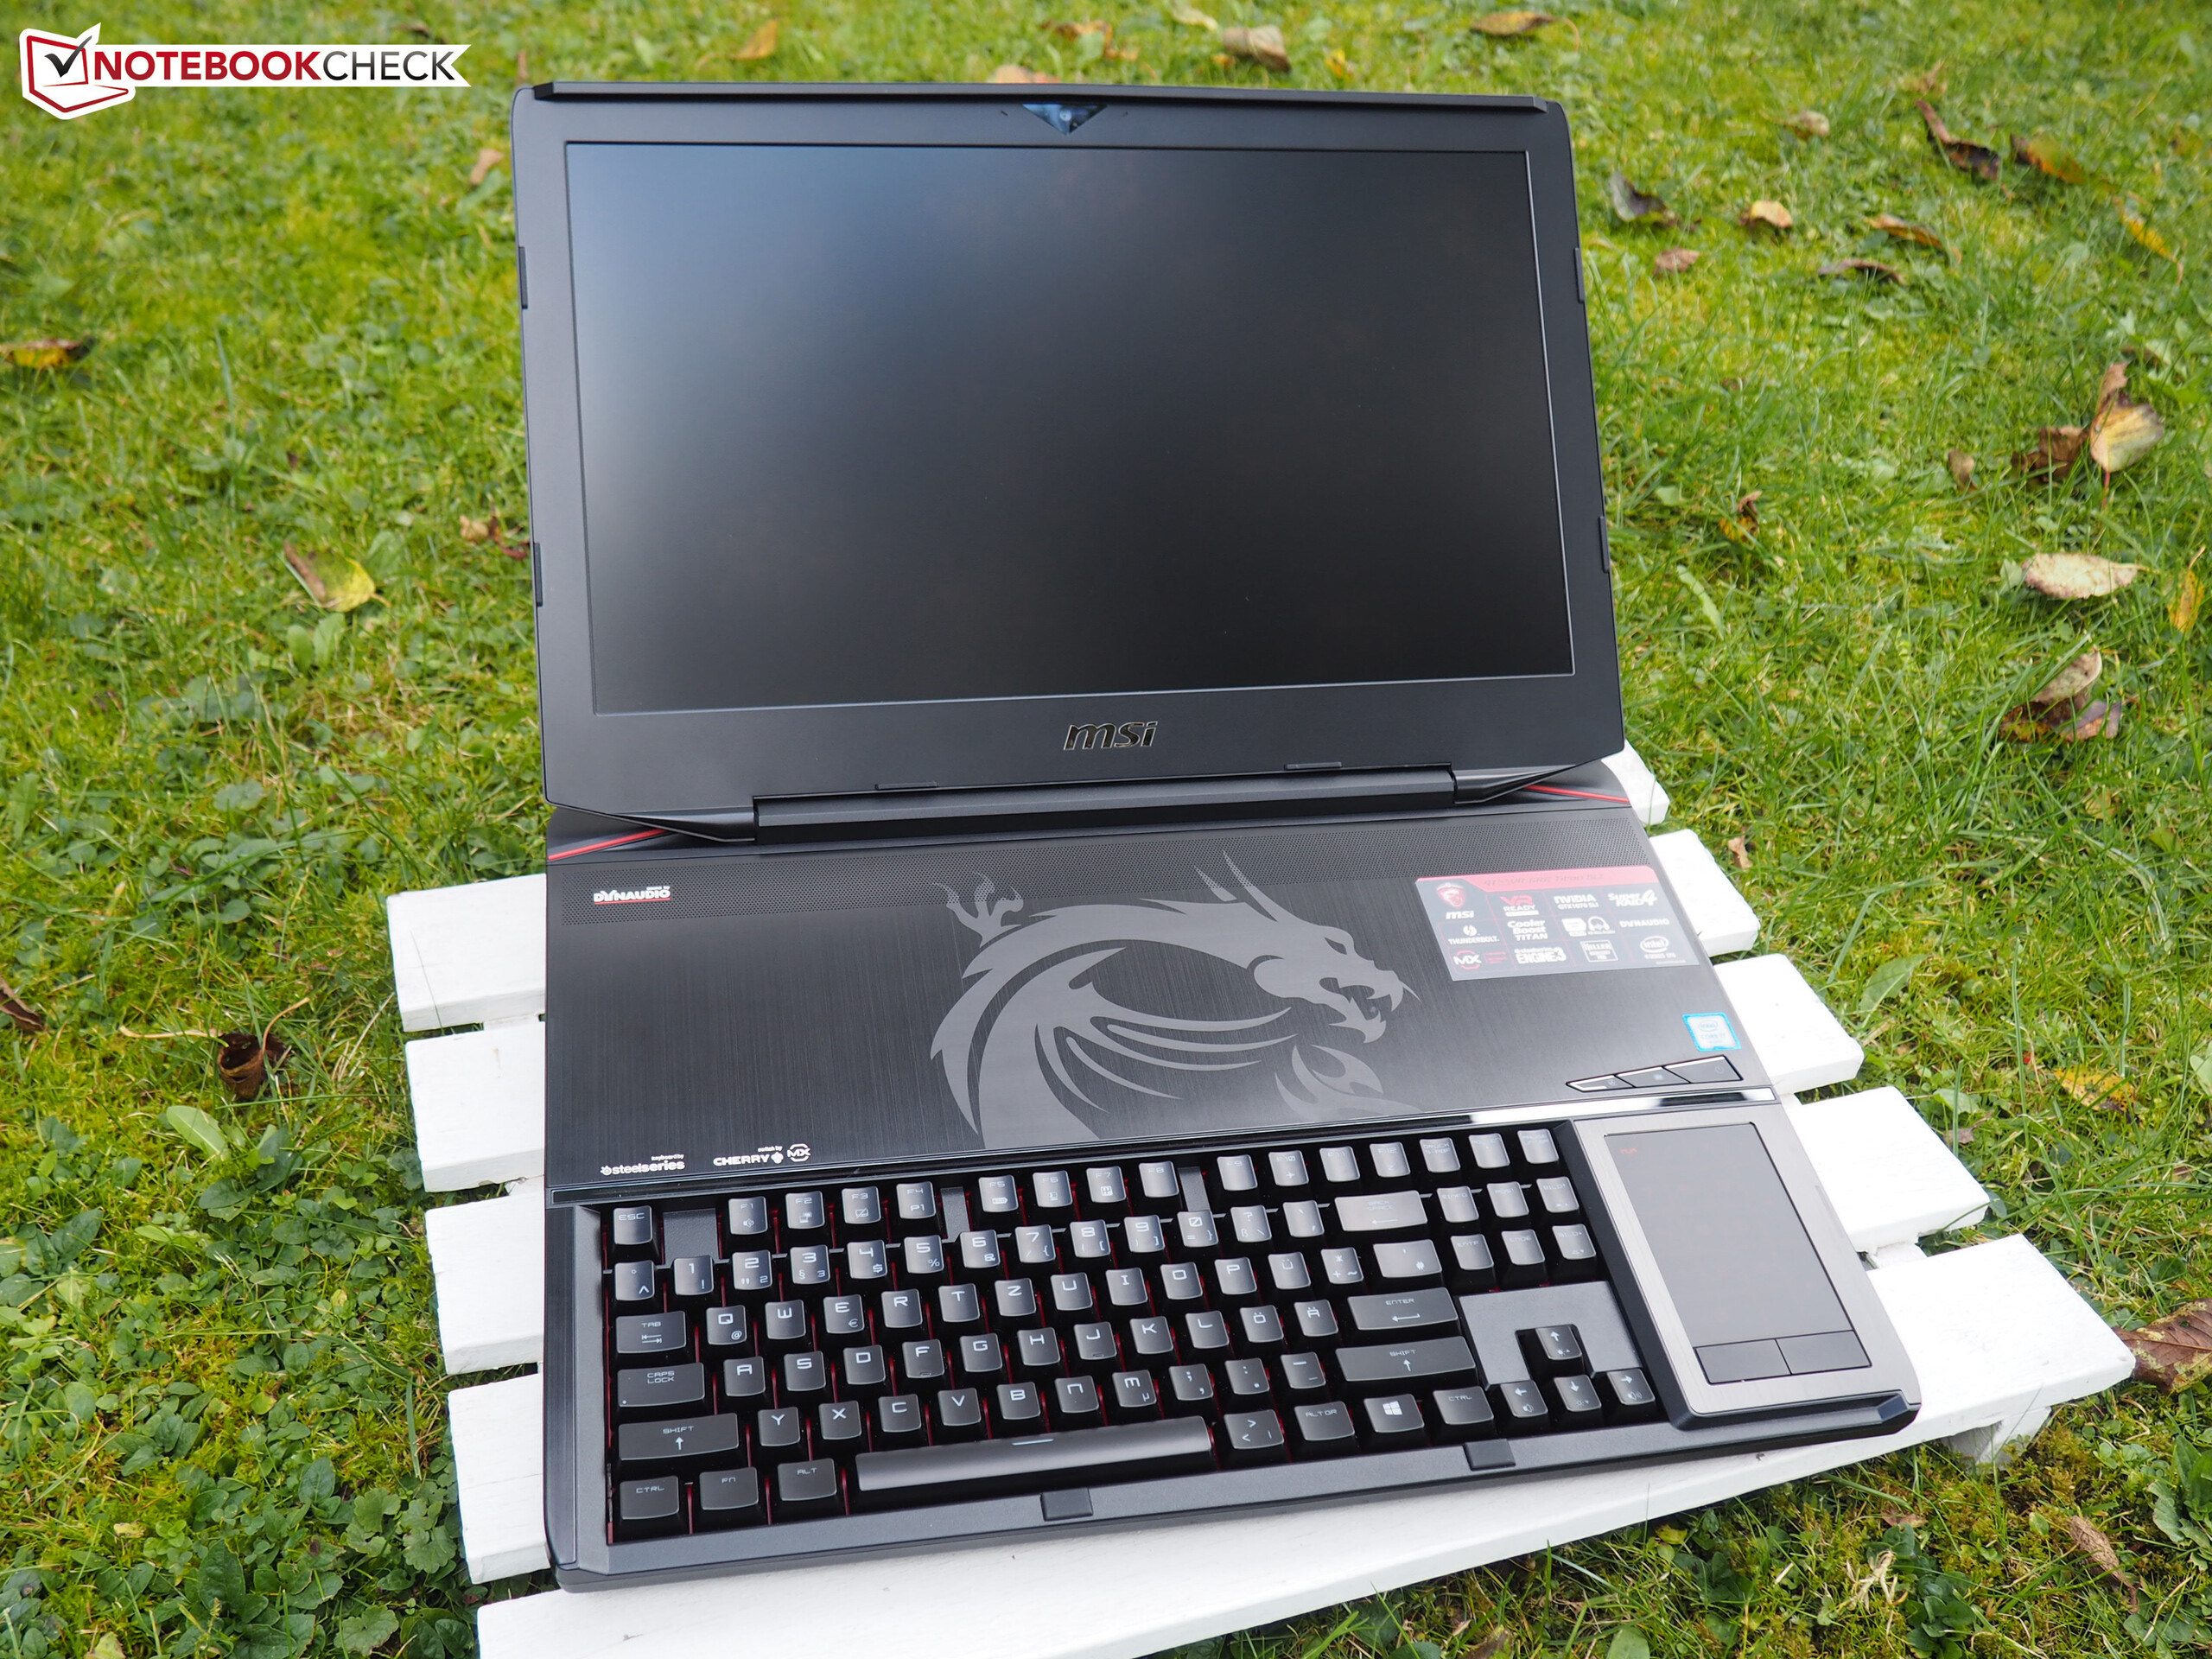
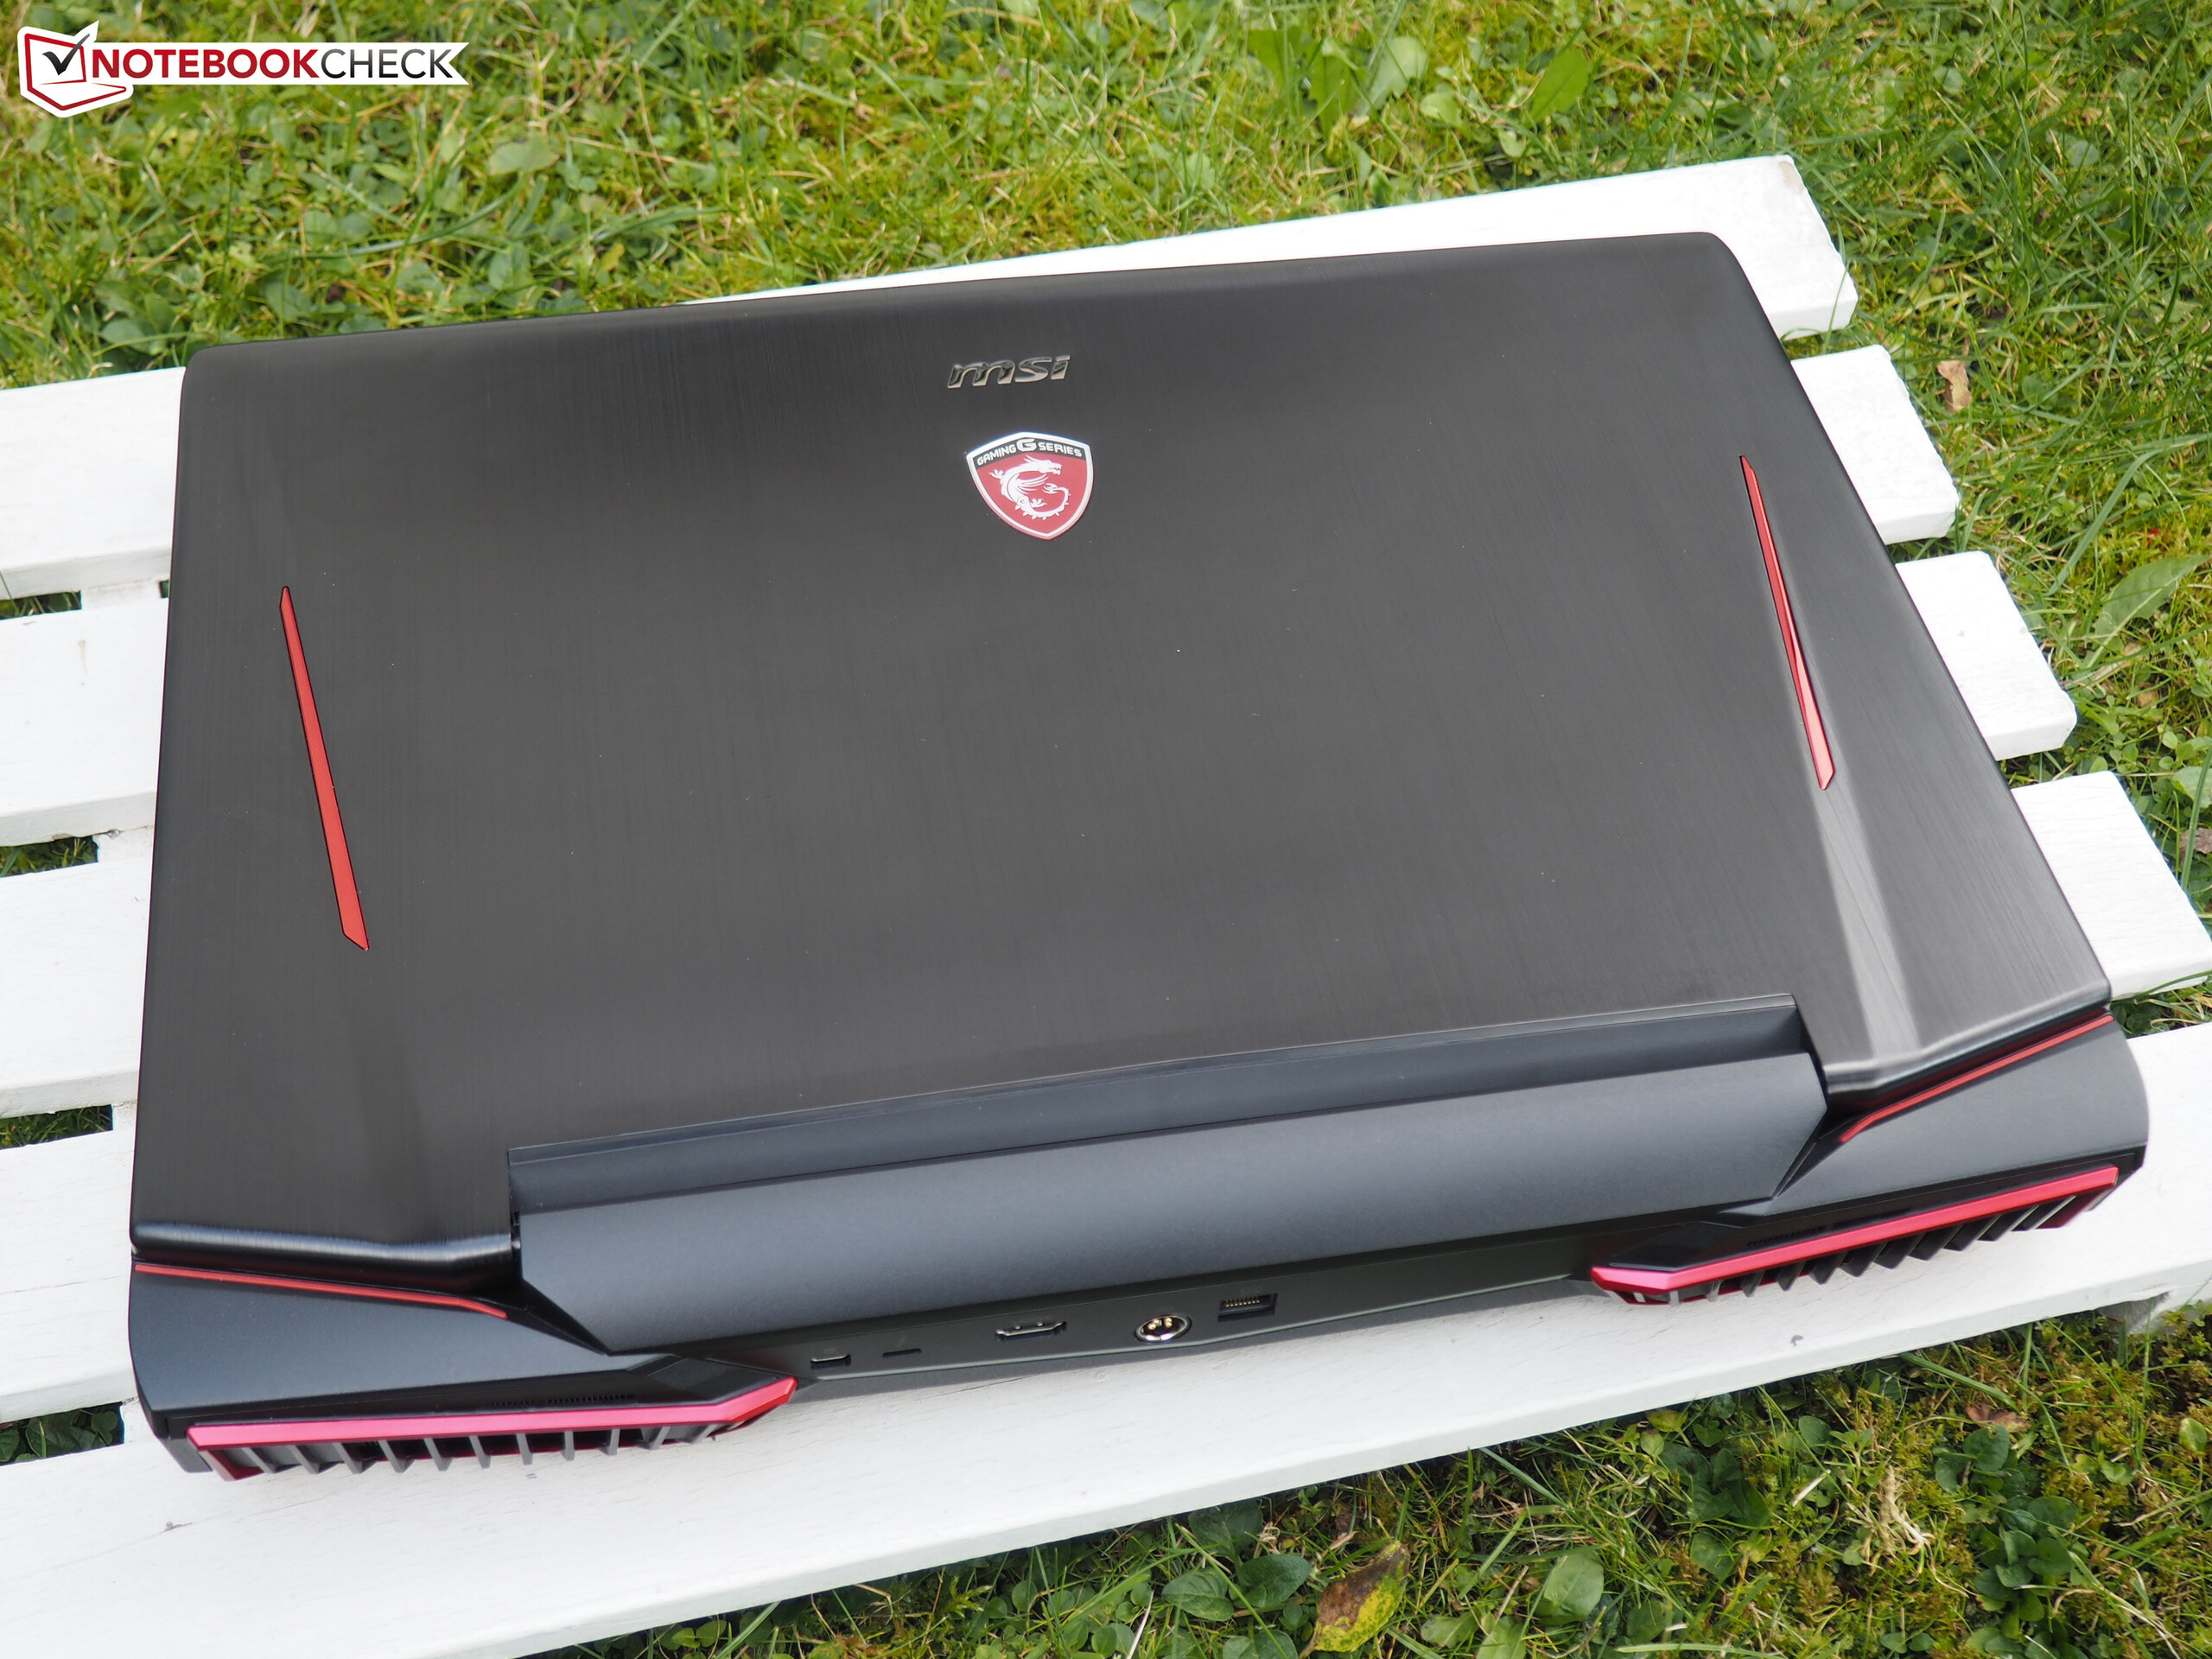
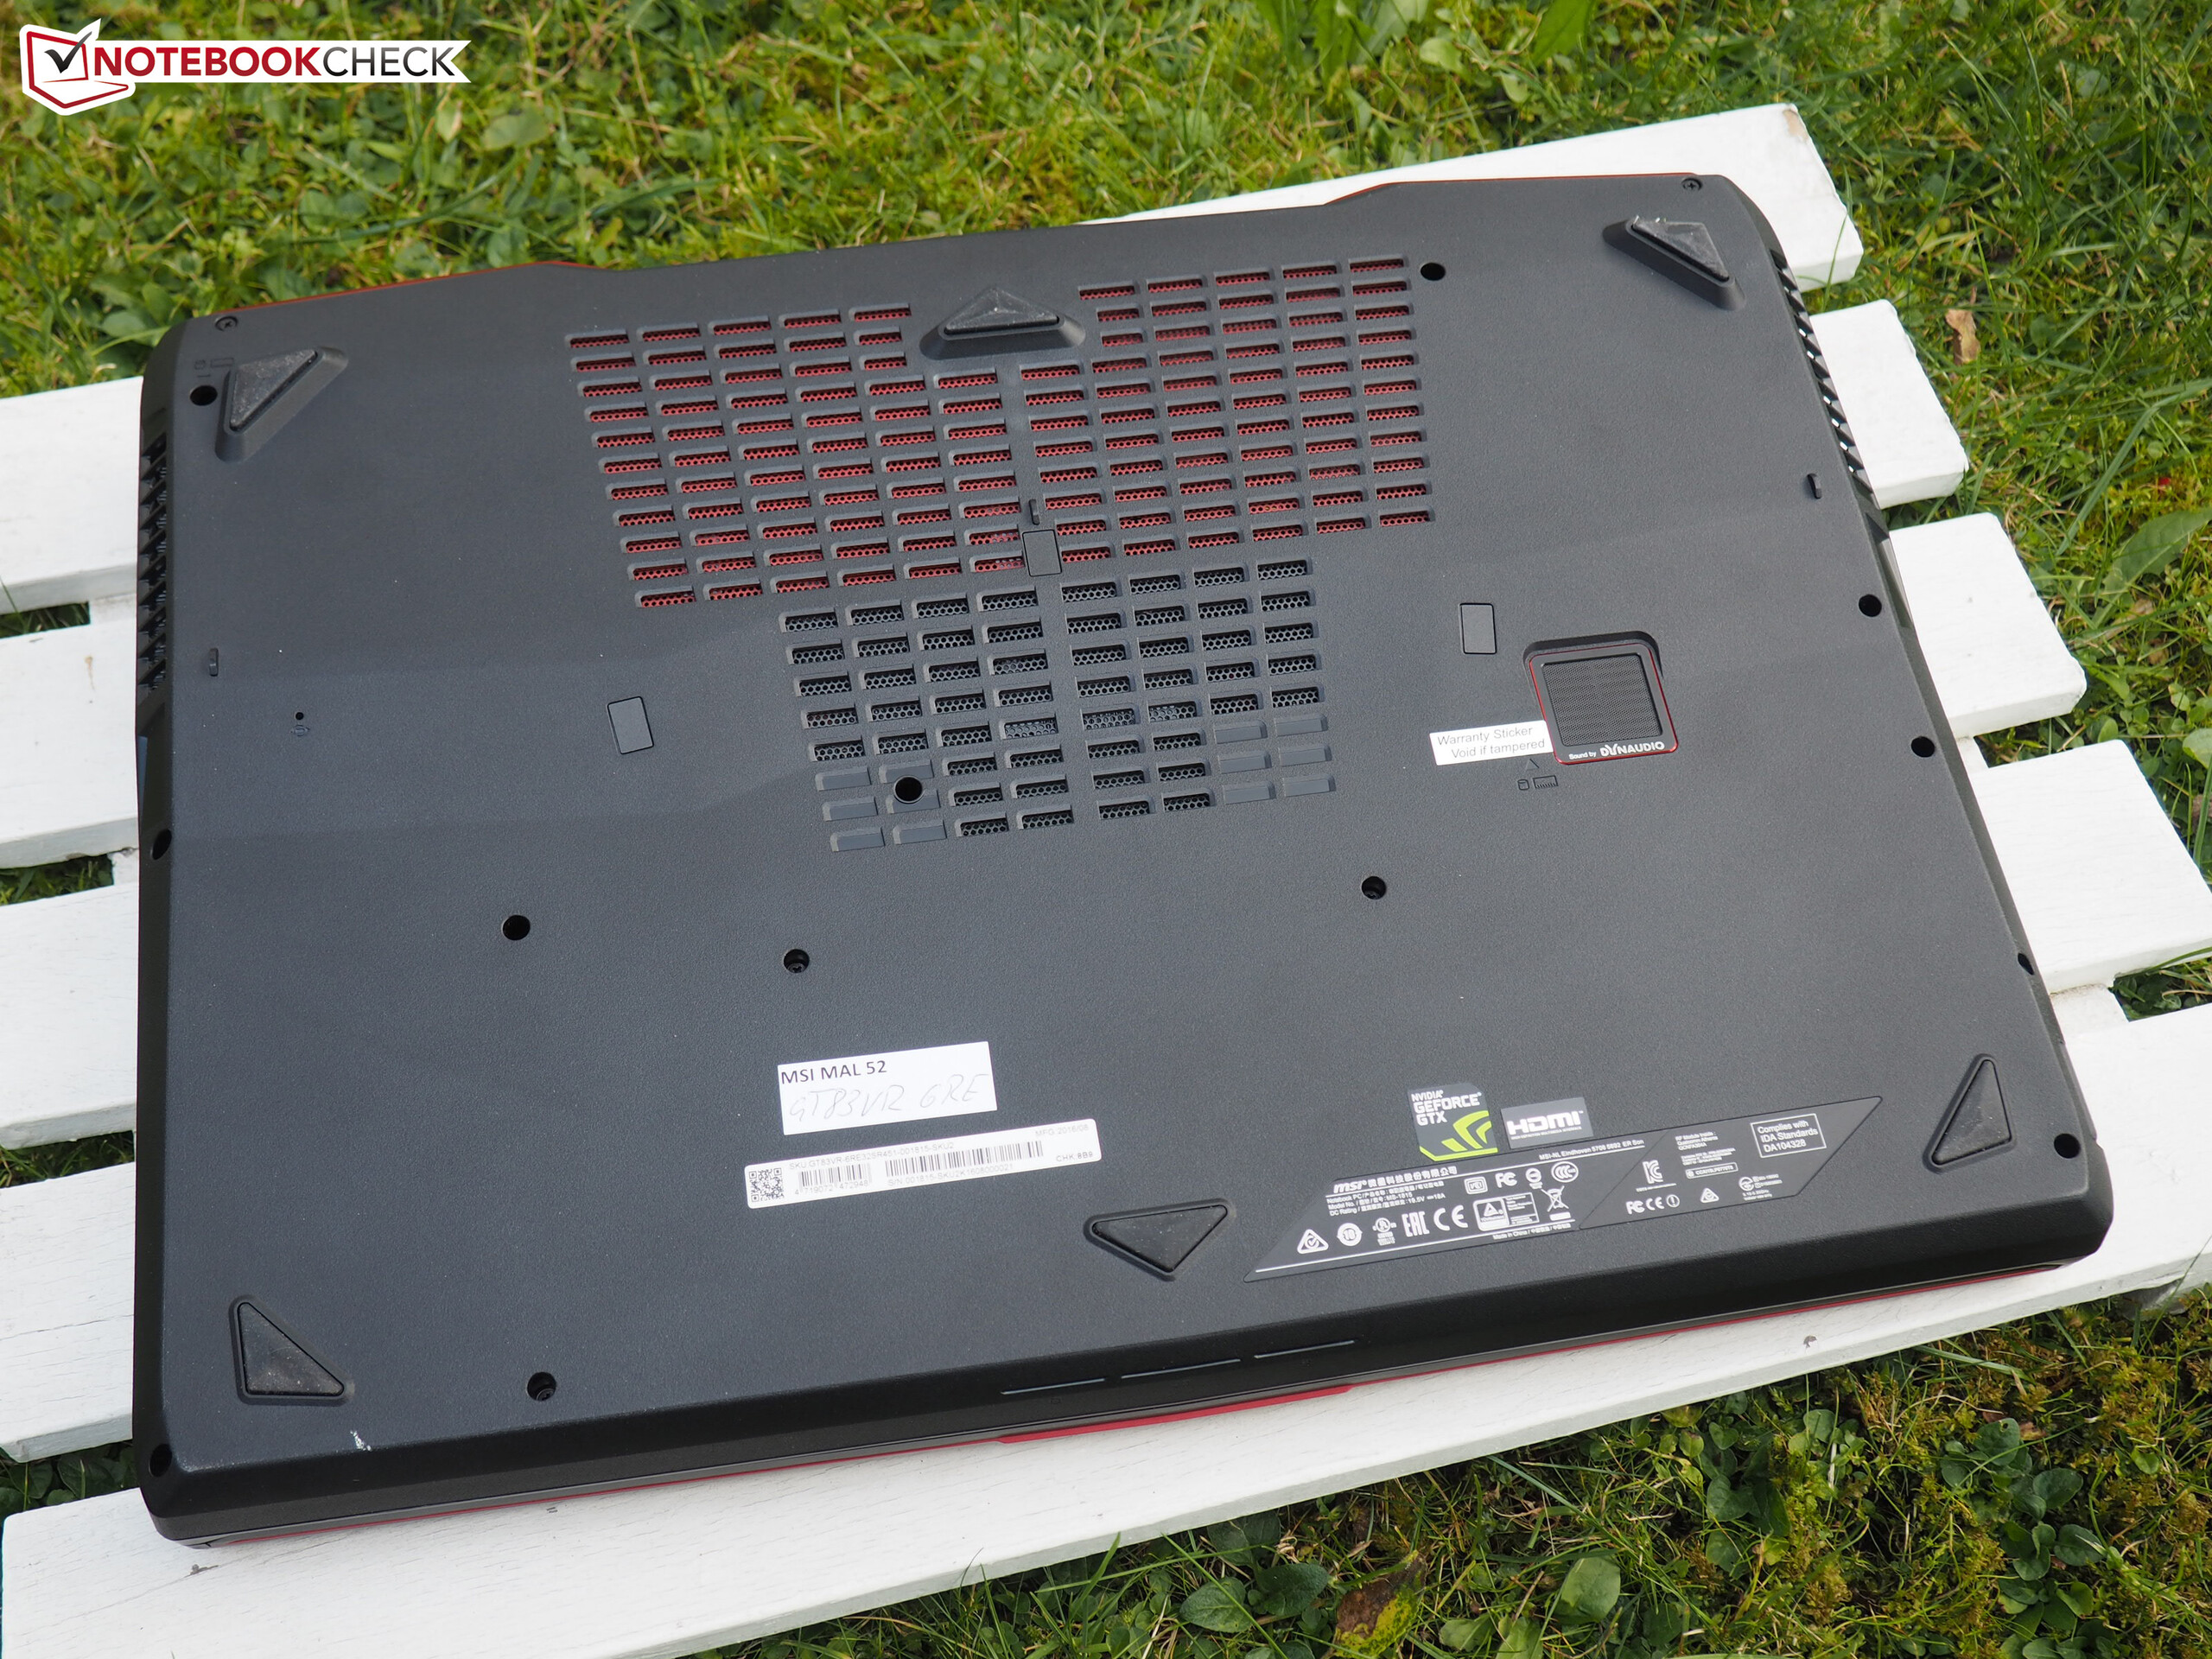
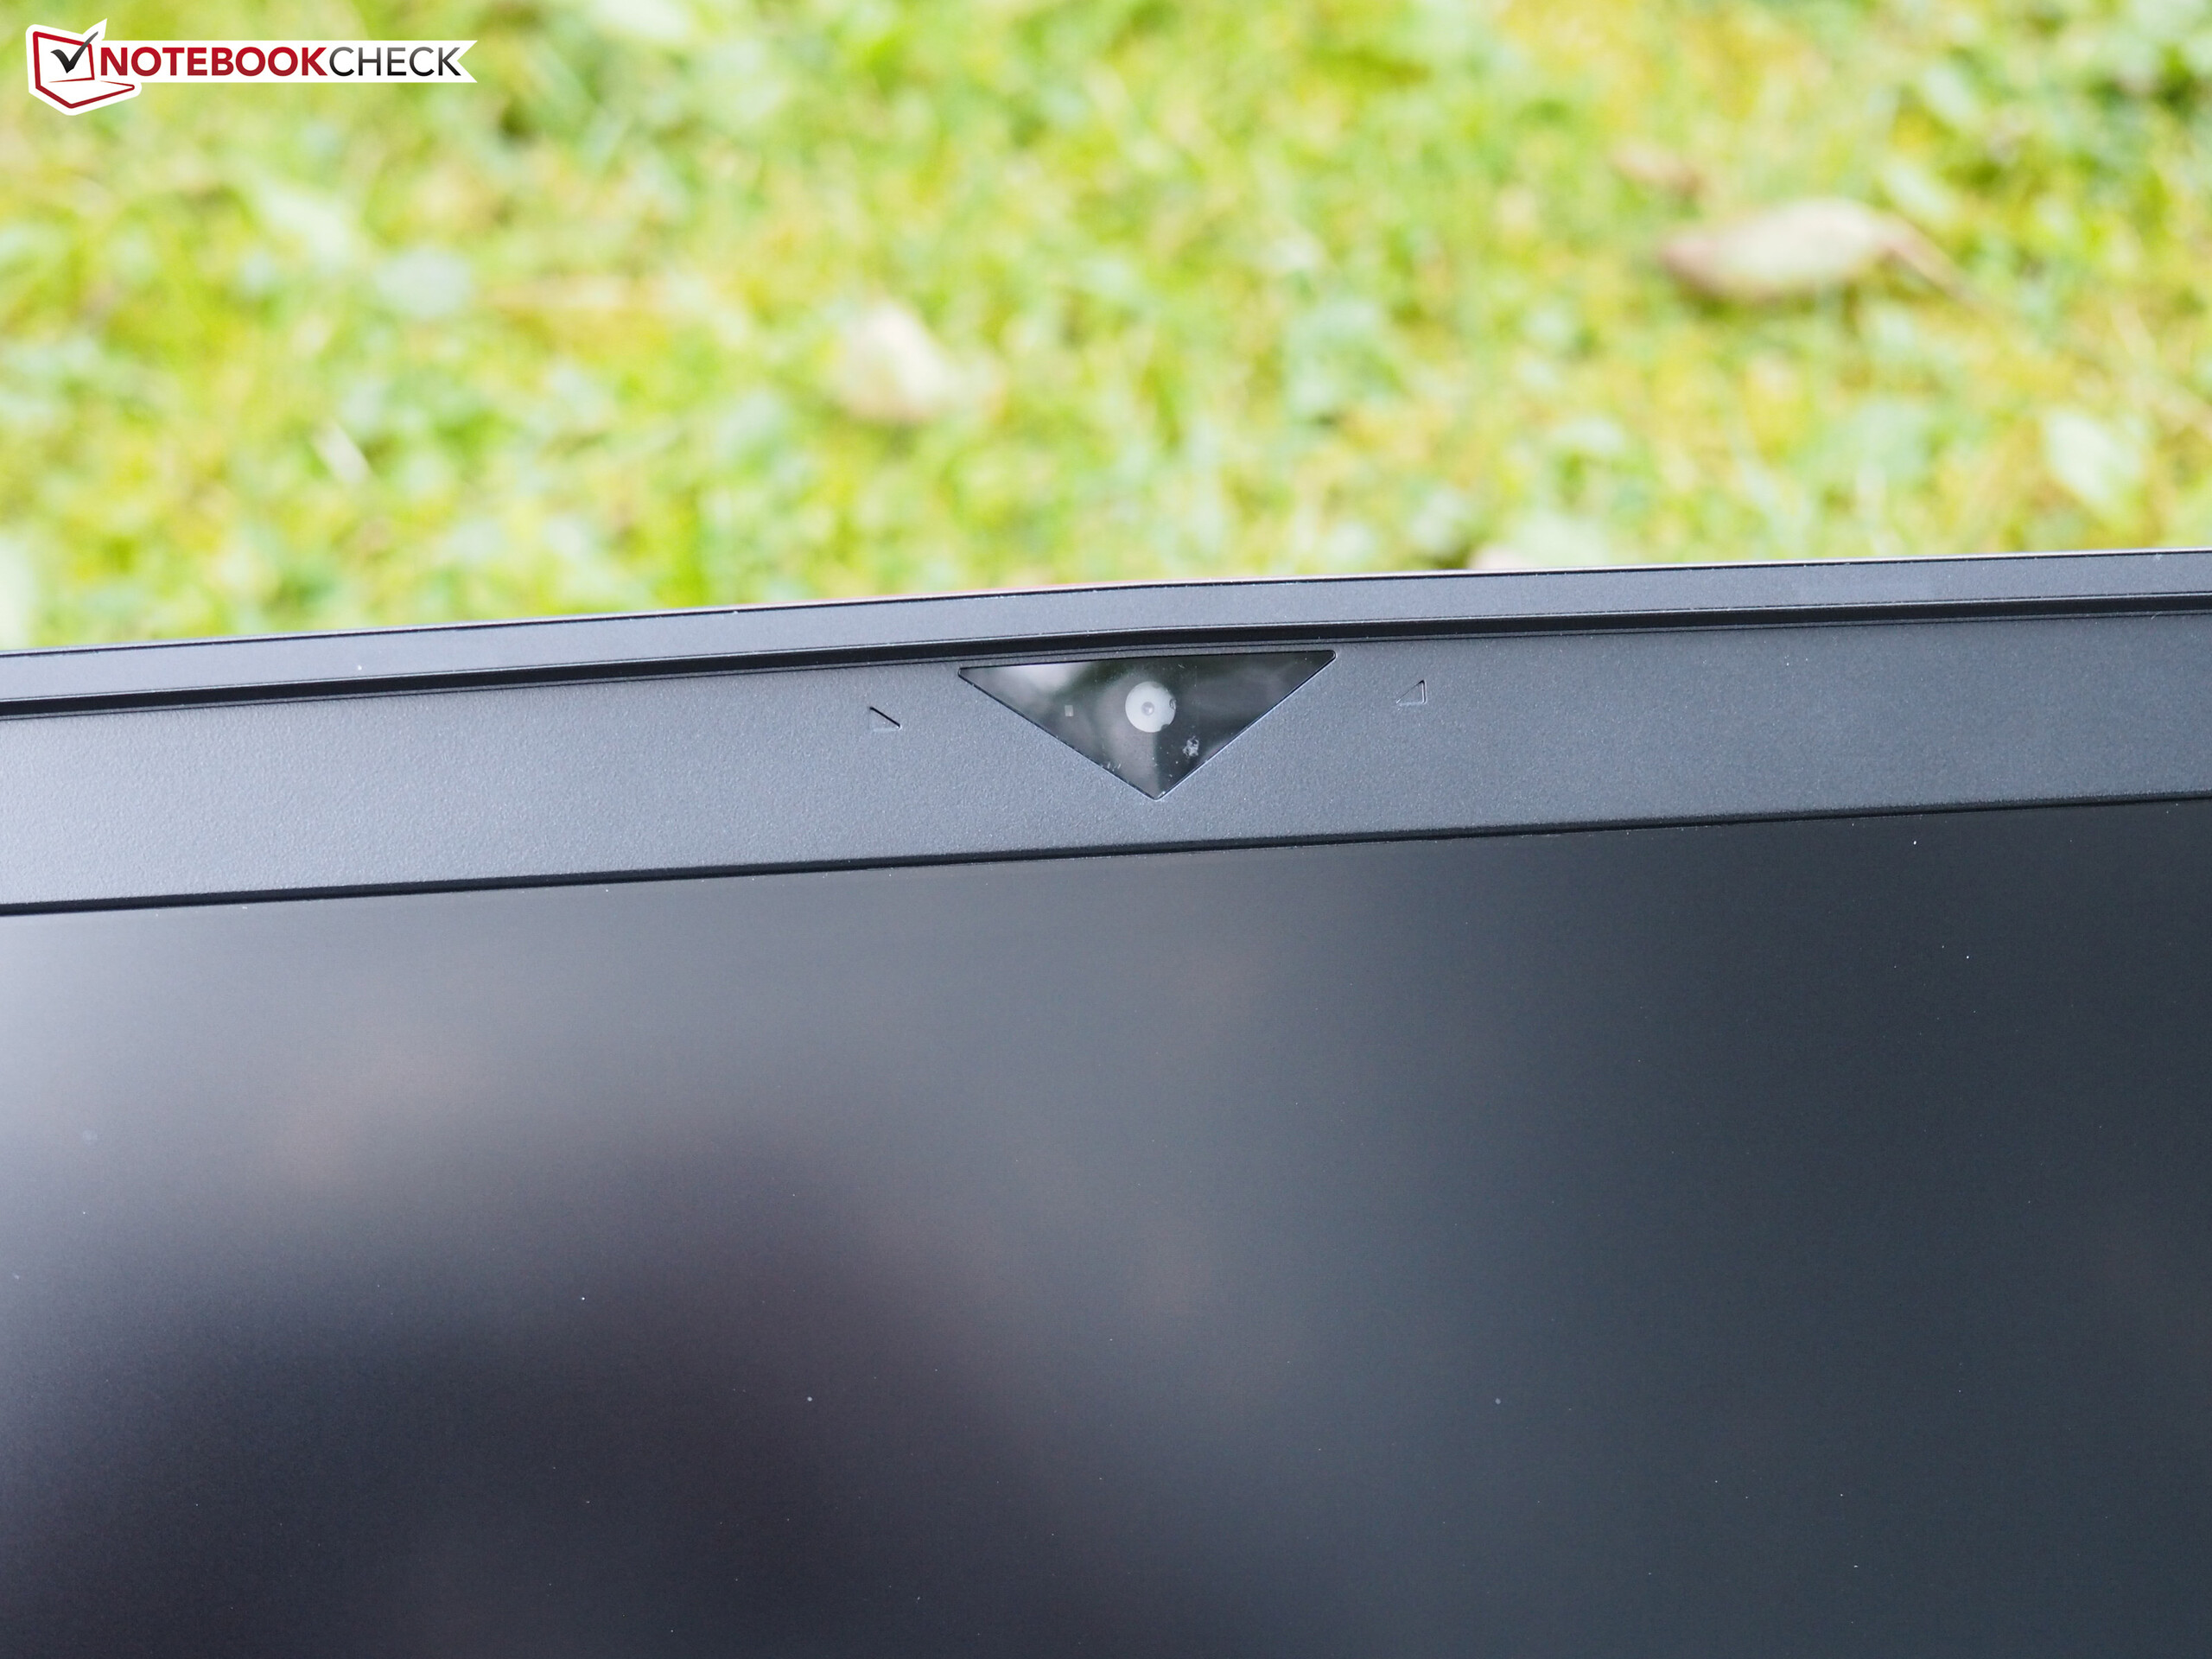
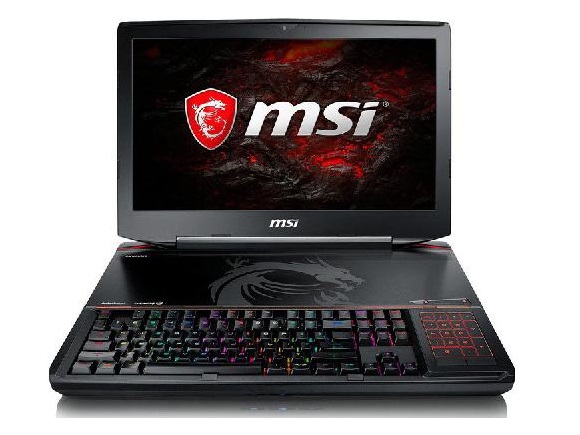
微星 GT83VR 7RF (7920HQ, GTX 1080 SLI, 全高清) 笔记本电脑简短评测
| SD Card Reader | |
| average JPG Copy Test (av. of 3 runs) | |
| Asus G701VIK-BA049T | |
| MSI GT73VR 7RF-296 | |
| Schenker XMG U727 2017 | |
| MSI GT83VR-6RE32SR451 | |
| MSI GT83VR 7RF-206 Titan SLI | |
| Acer Predator 17 X GX-792-76DL | |
| maximum AS SSD Seq Read Test (1GB) | |
| Asus G701VIK-BA049T | |
| MSI GT73VR 7RF-296 | |
| Schenker XMG U727 2017 | |
| MSI GT83VR 7RF-206 Titan SLI | |
| MSI GT83VR-6RE32SR451 | |
| Acer Predator 17 X GX-792-76DL | |
| |||||||||||||||||||||||||
Brightness Distribution: 83 %
Center on Battery: 266 cd/m²
Contrast: 760:1 (Black: 0.35 cd/m²)
ΔE ColorChecker Calman: 3.88 | ∀{0.5-29.43 Ø4.71}
ΔE Greyscale Calman: 5.2 | ∀{0.09-98 Ø4.96}
91% sRGB (Argyll 1.6.3 3D)
59% AdobeRGB 1998 (Argyll 1.6.3 3D)
66.4% AdobeRGB 1998 (Argyll 3D)
90.8% sRGB (Argyll 3D)
65.7% Display P3 (Argyll 3D)
Gamma: 2.41
CCT: 7680 K
| MSI GT83VR 7RF-206 Titan SLI Samsung 184HL (SDC4C48), 1920x1080, 18.4" | MSI GT83VR-6RE32SR451 Samsung 184HL (SDC4C48), 1920x1080, 18.4" | Schenker XMG U727 2017 AU Optronics B173ZAN01.0 (AUO109B), 3840x2160, 17.3" | Acer Predator 17 X GX-792-76DL LP173WF4-SPF5 (LGD056D), 1920x1080, 17.3" | Asus G701VIK-BA049T B173HAN01.1 (AUO119D), 1920x1080, 17.3" | MSI GT73VR 7RF-296 N173HHE-G32 (CMN1747), 1920x1080, 17.3" | |
|---|---|---|---|---|---|---|
| Display | -0% | 31% | -5% | -0% | 25% | |
| Display P3 Coverage (%) | 65.7 | 65.8 0% | 86.6 32% | 66 0% | 68.8 5% | 90.6 38% |
| sRGB Coverage (%) | 90.8 | 90.3 -1% | 99.9 10% | 83.7 -8% | 87.7 -3% | 99.9 10% |
| AdobeRGB 1998 Coverage (%) | 66.4 | 66.1 0% | 99.5 50% | 61.2 -8% | 64.1 -3% | 84.7 28% |
| Response Times | 8% | -16% | -17% | 9% | 52% | |
| Response Time Grey 50% / Grey 80% * (ms) | 38.4 ? | 37 ? 4% | 44 ? -15% | 45 ? -17% | 38 ? 1% | 26 ? 32% |
| Response Time Black / White * (ms) | 24 ? | 21 ? 12% | 28 ? -17% | 28 ? -17% | 20 ? 17% | 7 ? 71% |
| PWM Frequency (Hz) | 250 ? | 250 ? | ||||
| Screen | 20% | 31% | 14% | 15% | -18% | |
| Brightness middle (cd/m²) | 266 | 310 17% | 362 36% | 380 43% | 306 15% | 307 15% |
| Brightness (cd/m²) | 243 | 277 14% | 344 42% | 362 49% | 299 23% | 284 17% |
| Brightness Distribution (%) | 83 | 84 1% | 85 2% | 91 10% | 91 10% | 85 2% |
| Black Level * (cd/m²) | 0.35 | 0.4 -14% | 0.35 -0% | 0.37 -6% | 0.27 23% | 0.25 29% |
| Contrast (:1) | 760 | 775 2% | 1034 36% | 1027 35% | 1133 49% | 1228 62% |
| Colorchecker dE 2000 * | 3.88 | 1.83 53% | 2.46 37% | 4.12 -6% | 3.98 -3% | 9.65 -149% |
| Colorchecker dE 2000 max. * | 8.31 | 3.92 53% | 4.26 49% | 8.19 1% | 7.29 12% | 16.36 -97% |
| Greyscale dE 2000 * | 5.2 | 1.38 73% | 2.9 44% | 3.95 24% | 4.15 20% | 10.07 -94% |
| Gamma | 2.41 91% | 2.44 90% | 2.31 95% | 2.47 89% | 2.45 90% | 2.12 104% |
| CCT | 7680 85% | 6723 97% | 6120 106% | 6539 99% | 7386 88% | 12145 54% |
| Color Space (Percent of AdobeRGB 1998) (%) | 59 | 59 0% | 88 49% | 55 -7% | 58 -2% | 75 27% |
| Color Space (Percent of sRGB) (%) | 91 | 90 -1% | 100 10% | 84 -8% | 89 -2% | 100 10% |
| Total Average (Program / Settings) | 9% /
14% | 15% /
24% | -3% /
6% | 8% /
11% | 20% /
0% |
* ... smaller is better
Display Response Times
| ↔ Response Time Black to White | ||
|---|---|---|
| 24 ms ... rise ↗ and fall ↘ combined | ↗ 14.8 ms rise | 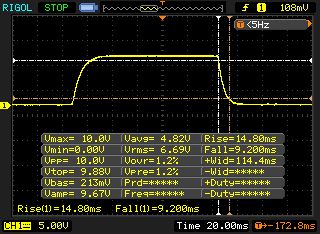 |
| ↘ 9.2 ms fall | ||
| The screen shows good response rates in our tests, but may be too slow for competitive gamers. In comparison, all tested devices range from 0.1 (minimum) to 240 (maximum) ms. » 54 % of all devices are better. This means that the measured response time is worse than the average of all tested devices (19.8 ms). | ||
| ↔ Response Time 50% Grey to 80% Grey | ||
| 38.4 ms ... rise ↗ and fall ↘ combined | ↗ 18.8 ms rise | 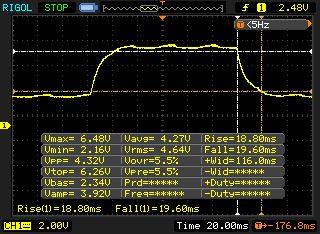 |
| ↘ 19.6 ms fall | ||
| The screen shows slow response rates in our tests and will be unsatisfactory for gamers. In comparison, all tested devices range from 0.165 (minimum) to 636 (maximum) ms. » 58 % of all devices are better. This means that the measured response time is worse than the average of all tested devices (30.9 ms). | ||
Screen Flickering / PWM (Pulse-Width Modulation)
| Screen flickering / PWM detected | 250 Hz | ≤ 90 % brightness setting | 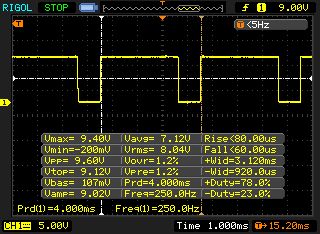 |
The display backlight flickers at 250 Hz (worst case, e.g., utilizing PWM) Flickering detected at a brightness setting of 90 % and below. There should be no flickering or PWM above this brightness setting. The frequency of 250 Hz is relatively low, so sensitive users will likely notice flickering and experience eyestrain at the stated brightness setting and below. In comparison: 52 % of all tested devices do not use PWM to dim the display. If PWM was detected, an average of 7744 (minimum: 5 - maximum: 343500) Hz was measured. | |||
| PCMark 8 | |
| Home Score Accelerated v2 | |
| Acer Predator 17 X GX-792-76DL | |
| Asus G701VIK-BA049T | |
| MSI GT83VR-6RE32SR451 | |
| MSI GT83VR 7RF-206 Titan SLI | |
| Schenker XMG U727 2017 | |
| Work Score Accelerated v2 | |
| Acer Predator 17 X GX-792-76DL | |
| Asus G701VIK-BA049T | |
| MSI GT83VR-6RE32SR451 | |
| MSI GT83VR 7RF-206 Titan SLI | |
| Schenker XMG U727 2017 | |
| PCMark 8 Home Score Accelerated v2 | 5159 points | |
| PCMark 8 Work Score Accelerated v2 | 5487 points | |
| PCMark 10 Score | 5489 points | |
Help | ||
| MSI GT83VR 7RF-206 Titan SLI 2x Toshiba NVMe THNSN5256GPU7 (RAID 0) | MSI GT83VR-6RE32SR451 2x Samsung SM951 MZVPV256HDGL (RAID 0) | Schenker XMG U727 2017 Samsung SM961 MZVPW256 m.2 PCI-e | Acer Predator 17 X GX-792-76DL Toshiba NVMe THNSN5512GPU7 | Asus G701VIK-BA049T 2x Samsung SM961 MZVPW256HEGL NVMe (RAID 0) | MSI GT73VR 7RF-296 2x Samsung SM951 MZVPV256HDGL (RAID 0) | |
|---|---|---|---|---|---|---|
| CrystalDiskMark 3.0 | 5% | -7% | -16% | 19% | 13% | |
| Read Seq (MB/s) | 3045 | 3284 8% | 1781 -42% | 1494 -51% | 3487 15% | 3219 6% |
| Write Seq (MB/s) | 2149 | 2548 19% | 1515 -30% | 1371 -36% | 2690 25% | 2572 20% |
| Read 512 (MB/s) | 1774 | 1728 -3% | 371.4 -79% | 898 -49% | 1499 -16% | 1776 0% |
| Write 512 (MB/s) | 1788 | 2352 32% | 1073 -40% | 1273 -29% | 2493 39% | 2445 37% |
| Read 4k (MB/s) | 40.84 | 50.1 23% | 61.5 51% | 43.82 7% | 53.7 31% | 51.1 25% |
| Write 4k (MB/s) | 138.9 | 137.6 -1% | 195.6 41% | 161.6 16% | 133.2 -4% | 141.3 2% |
| Read 4k QD32 (MB/s) | 635 | 506 -20% | 755 19% | 669 5% | 795 25% | 658 4% |
| Write 4k QD32 (MB/s) | 512 | 435.4 -15% | 642 25% | 552 8% | 699 37% | 554 8% |

| 3DMark - 1920x1080 Fire Strike Graphics | |
| MSI GT83VR 7RF-206 Titan SLI | |
| MSI GT83VR-6RE32SR451 | |
| Asus G701VIK-BA049T | |
| Acer Predator 17 X GX-792-76DL | |
| Schenker XMG U727 2017 | |
| MSI GT73VR 7RF-296 | |
| 3DMark 11 - 1280x720 Performance GPU | |
| MSI GT83VR 7RF-206 Titan SLI | |
| MSI GT83VR-6RE32SR451 | |
| Asus G701VIK-BA049T | |
| Schenker XMG U727 2017 | |
| MSI GT73VR 7RF-296 | |
| Acer Predator 17 X GX-792-76DL | |
| 3DMark 11 Performance | 25018 points | |
| 3DMark Ice Storm Standard Score | 161549 points | |
| 3DMark Cloud Gate Standard Score | 32233 points | |
| 3DMark Fire Strike Score | 22192 points | |
Help | ||
| The Witcher 3 | |
| 3840x2160 High Graphics & Postprocessing (Nvidia HairWorks Off) | |
| MSI GT83VR 7RF-206 Titan SLI | |
| Schenker XMG U727 2017 | |
| 1920x1080 Ultra Graphics & Postprocessing (HBAO+) | |
| MSI GT83VR 7RF-206 Titan SLI | |
| Schenker XMG U727 2017 | |
| Deus Ex Mankind Divided - 1920x1080 Ultra Preset AA:2xMS AF:8x | |
| MSI GT83VR 7RF-206 Titan SLI | |
| Battlefield 1 | |
| 3840x2160 High Preset AA:T | |
| MSI GT83VR 7RF-206 Titan SLI | |
| Schenker XMG U727 2017 | |
| 1920x1080 Ultra Preset AA:T | |
| MSI GT83VR 7RF-206 Titan SLI | |
| Schenker XMG U727 2017 | |
| Titanfall 2 | |
| 3840x2160 High / Enabled AA:TS AF:8x | |
| MSI GT83VR 7RF-206 Titan SLI | |
| Schenker XMG U727 2017 | |
| 1920x1080 Very High (Insane Texture Quality) / Enabled AA:TS AF:16x | |
| MSI GT83VR 7RF-206 Titan SLI | |
| Schenker XMG U727 2017 | |
| Call of Duty Infinite Warfare | |
| 3840x2160 High / On AA:FX | |
| MSI GT83VR 7RF-206 Titan SLI | |
| Schenker XMG U727 2017 | |
| 1920x1080 Ultra / On AA:T2X SM | |
| MSI GT83VR 7RF-206 Titan SLI | |
| Schenker XMG U727 2017 | |
| Dishonored 2 | |
| 3840x2160 High Preset AA:TX | |
| MSI GT83VR 7RF-206 Titan SLI | |
| Schenker XMG U727 2017 | |
| 1920x1080 Ultra Preset AA:TX | |
| Schenker XMG U727 2017 | |
| MSI GT83VR 7RF-206 Titan SLI | |
| Watch Dogs 2 | |
| 3840x2160 High Preset | |
| MSI GT83VR 7RF-206 Titan SLI | |
| Schenker XMG U727 2017 | |
| 1920x1080 Ultra Preset | |
| MSI GT83VR 7RF-206 Titan SLI | |
| Schenker XMG U727 2017 | |
| Resident Evil 7 | |
| 3840x2160 High / On AA:FXAA+T | |
| Desktop PC | |
| MSI GT83VR 7RF-206 Titan SLI | |
| Schenker XMG U727 2017 | |
| 1920x1080 Very High / On AA:FXAA+T | |
| Desktop PC | |
| Schenker XMG U727 2017 | |
| MSI GT83VR 7RF-206 Titan SLI | |
| For Honor | |
| 3840x2160 High Preset AA:T AF:8x | |
| MSI GT83VR 7RF-206 Titan SLI | |
| Desktop PC | |
| Schenker XMG U727 2017 | |
| 1920x1080 Extreme Preset AA:T AF:16x | |
| MSI GT83VR 7RF-206 Titan SLI | |
| Desktop PC | |
| Schenker XMG U727 2017 | |
| Ghost Recon Wildlands | |
| 3840x2160 Very High Preset AA:T AF:8x | |
| MSI GT83VR 7RF-206 Titan SLI | |
| Desktop PC | |
| 1920x1080 Ultra Preset AA:T AF:16x | |
| MSI GT83VR 7RF-206 Titan SLI | |
| Desktop PC | |
| Mass Effect Andromeda | |
| 3840x2160 High Preset (Resolution Scale Mode off) AA:T | |
| MSI GT83VR 7RF-206 Titan SLI | |
| Desktop PC | |
| 1920x1080 Ultra Preset (Resolution Scale Mode off) AA:T | |
| Desktop PC | |
| MSI GT83VR 7RF-206 Titan SLI | |
| Warhammer 40.000: Dawn of War III | |
| 3840x2160 High / On (100 % Gameplay Resolution) AA:High | |
| MSI GT83VR 7RF-206 Titan SLI | |
| Desktop PC | |
| 1920x1080 Maximum / On (100 % Gameplay Resolution) AA:High | |
| MSI GT83VR 7RF-206 Titan SLI | |
| Desktop PC | |
| Prey | |
| 3840x2160 High Preset AA:2TX SM AF:8x | |
| MSI GT83VR 7RF-206 Titan SLI | |
| Desktop PC | |
| 1920x1080 Very High Preset AA:2TX SM AF:16x | |
| Desktop PC | |
| MSI GT83VR 7RF-206 Titan SLI | |
| Rocket League | |
| 3840x2160 High Quality AA:High FX | |
| MSI GT83VR 7RF-206 Titan SLI | |
| Desktop PC | |
| 1920x1080 High Quality AA:High FX | |
| Desktop PC | |
| MSI GT83VR 7RF-206 Titan SLI | |
| Dirt 4 - 1920x1080 Ultra Preset AA:4xMS AF:16x | |
| Desktop PC | |
| MSI GT83VR 7RF-206 Titan SLI | |
| low | med. | high | ultra | 4K | |
|---|---|---|---|---|---|
| The Witcher 3 (2015) | 181 | 115 | 89.2 | ||
| Deus Ex Mankind Divided (2016) | 79.7 | 73.3 | |||
| Battlefield 1 (2016) | 157 | 145 | 76.7 | ||
| Titanfall 2 (2016) | 144 | 143 | 74.2 | ||
| Call of Duty Infinite Warfare (2016) | 124 | 124 | 76.1 | ||
| Dishonored 2 (2016) | 88.1 | 77.4 | 71.2 | ||
| Watch Dogs 2 (2016) | 118 | 102 | 75.6 | ||
| Resident Evil 7 (2017) | 192 | 162 | 56.3 | ||
| For Honor (2017) | 194 | 182 | 108 | ||
| Ghost Recon Wildlands (2017) | 122 | 82.7 | 65.4 | ||
| Mass Effect Andromeda (2017) | 89 | 83.6 | 60 | ||
| Warhammer 40.000: Dawn of War III (2017) | 100 | 97.4 | 79.8 | ||
| Prey (2017) | 143 | 141 | 83.9 | ||
| Rocket League (2017) | 232 | 169 | |||
| Dirt 4 (2017) | 134 | 84.1 |
Noise level
| Idle |
| 35 / 38 / 41 dB(A) |
| DVD |
| 38 / dB(A) |
| Load |
| 52 / 59 dB(A) |
 | ||
30 dB silent 40 dB(A) audible 50 dB(A) loud |
||
min: | ||
| MSI GT83VR 7RF-206 Titan SLI GeForce GTX 1080 SLI (Laptop), i7-7920HQ | MSI GT83VR-6RE32SR451 GeForce GTX 1070 SLI (Laptop), 6820HK | Schenker XMG U727 2017 GeForce GTX 1080 Mobile, i7-7700K | Acer Predator 17 X GX-792-76DL GeForce GTX 1080 Mobile, i7-7820HK | Asus G701VIK-BA049T GeForce GTX 1080 Mobile, i7-7820HK | MSI GT73VR 7RF-296 GeForce GTX 1080 Mobile, i7-7820HK | |
|---|---|---|---|---|---|---|
| Noise | 8% | 9% | 11% | 10% | 9% | |
| off / environment * (dB) | 31 | 30 3% | 30 3% | 30 3% | 30 3% | 30 3% |
| Idle Minimum * (dB) | 35 | 33 6% | 31 11% | 33 6% | 30 14% | 34 3% |
| Idle Average * (dB) | 38 | 34 11% | 34 11% | 35 8% | 31 18% | 35 8% |
| Idle Maximum * (dB) | 41 | 35 15% | 37 10% | 37 10% | 36 12% | 37 10% |
| Load Average * (dB) | 52 | 48 8% | 44 15% | 40 23% | 47 10% | 39 25% |
| Witcher 3 ultra * (dB) | 53 | 51 4% | ||||
| Load Maximum * (dB) | 59 | 57 3% | 52 12% | 50 15% | 56 5% | 56 5% |
* ... smaller is better
(-) The maximum temperature on the upper side is 46 °C / 115 F, compared to the average of 40.4 °C / 105 F, ranging from 21.2 to 68.8 °C for the class Gaming.
(-) The bottom heats up to a maximum of 53 °C / 127 F, compared to the average of 43.2 °C / 110 F
(+) In idle usage, the average temperature for the upper side is 29.7 °C / 85 F, compared to the device average of 33.9 °C / 93 F.
(±) Playing The Witcher 3, the average temperature for the upper side is 35.7 °C / 96 F, compared to the device average of 33.9 °C / 93 F.
(+) The palmrests and touchpad are cooler than skin temperature with a maximum of 26 °C / 78.8 F and are therefore cool to the touch.
(+) The average temperature of the palmrest area of similar devices was 28.8 °C / 83.8 F (+2.8 °C / 5 F).
| MSI GT83VR 7RF-206 Titan SLI GeForce GTX 1080 SLI (Laptop), i7-7920HQ | MSI GT83VR-6RE32SR451 GeForce GTX 1070 SLI (Laptop), 6820HK | Schenker XMG U727 2017 GeForce GTX 1080 Mobile, i7-7700K | Acer Predator 17 X GX-792-76DL GeForce GTX 1080 Mobile, i7-7820HK | Asus G701VIK-BA049T GeForce GTX 1080 Mobile, i7-7820HK | MSI GT73VR 7RF-296 GeForce GTX 1080 Mobile, i7-7820HK | |
|---|---|---|---|---|---|---|
| Heat | 22% | -8% | 3% | 4% | 12% | |
| Maximum Upper Side * (°C) | 46 | 35.8 22% | 47.5 -3% | 44.2 4% | 50.9 -11% | 39.8 13% |
| Maximum Bottom * (°C) | 53 | 42.8 19% | 56 -6% | 43 19% | 44.6 16% | 47.8 10% |
| Idle Upper Side * (°C) | 33 | 24.7 25% | 34.5 -5% | 32.4 2% | 29.9 9% | 27.1 18% |
| Idle Bottom * (°C) | 29 | 22.8 21% | 33.6 -16% | 32.8 -13% | 28.8 1% | 27.4 6% |
* ... smaller is better
MSI GT83VR 7RF-206 Titan SLI audio analysis
(+) | speakers can play relatively loud (90 dB)
Bass 100 - 315 Hz
(±) | reduced bass - on average 14.3% lower than median
(±) | linearity of bass is average (9% delta to prev. frequency)
Mids 400 - 2000 Hz
(+) | balanced mids - only 4.8% away from median
(+) | mids are linear (2.6% delta to prev. frequency)
Highs 2 - 16 kHz
(+) | balanced highs - only 3.6% away from median
(+) | highs are linear (3.2% delta to prev. frequency)
Overall 100 - 16.000 Hz
(+) | overall sound is linear (13.7% difference to median)
Compared to same class
» 21% of all tested devices in this class were better, 7% similar, 72% worse
» The best had a delta of 6%, average was 18%, worst was 132%
Compared to all devices tested
» 15% of all tested devices were better, 4% similar, 81% worse
» The best had a delta of 4%, average was 23%, worst was 134%
Schenker XMG U727 2017 audio analysis
(+) | speakers can play relatively loud (89 dB)
Bass 100 - 315 Hz
(±) | reduced bass - on average 7.9% lower than median
(±) | linearity of bass is average (10.7% delta to prev. frequency)
Mids 400 - 2000 Hz
(+) | balanced mids - only 4.3% away from median
(+) | mids are linear (4.4% delta to prev. frequency)
Highs 2 - 16 kHz
(+) | balanced highs - only 2.3% away from median
(+) | highs are linear (4.6% delta to prev. frequency)
Overall 100 - 16.000 Hz
(+) | overall sound is linear (11.4% difference to median)
Compared to same class
» 9% of all tested devices in this class were better, 3% similar, 88% worse
» The best had a delta of 6%, average was 18%, worst was 132%
Compared to all devices tested
» 7% of all tested devices were better, 2% similar, 90% worse
» The best had a delta of 4%, average was 23%, worst was 134%
| Off / Standby | |
| Idle | |
| Load |
|
Key:
min: | |
| MSI GT83VR 7RF-206 Titan SLI GeForce GTX 1080 SLI (Laptop), i7-7920HQ | MSI GT83VR-6RE32SR451 GeForce GTX 1070 SLI (Laptop), 6820HK | Schenker XMG U727 2017 GeForce GTX 1080 Mobile, i7-7700K | Acer Predator 17 X GX-792-76DL GeForce GTX 1080 Mobile, i7-7820HK | Asus G701VIK-BA049T GeForce GTX 1080 Mobile, i7-7820HK | MSI GT73VR 7RF-296 GeForce GTX 1080 Mobile, i7-7820HK | |
|---|---|---|---|---|---|---|
| Power Consumption | 22% | 26% | 43% | 44% | 40% | |
| Idle Minimum * (Watt) | 45 | 32 29% | 32 29% | 27 40% | 24 47% | 29 36% |
| Idle Average * (Watt) | 54 | 47 13% | 43 20% | 32 41% | 31 43% | 35 35% |
| Idle Maximum * (Watt) | 62 | 52 16% | 51 18% | 41 34% | 38 39% | 40 35% |
| Load Average * (Watt) | 178 | 152 15% | 138 22% | 102 43% | 98 45% | 94 47% |
| Witcher 3 ultra * (Watt) | 380 | 279 27% | ||||
| Load Maximum * (Watt) | 586 | 366 38% | 350 40% | 248 58% | 320 45% | 315 46% |
* ... smaller is better
| MSI GT83VR 7RF-206 Titan SLI GeForce GTX 1080 SLI (Laptop), i7-7920HQ, 75.24 Wh | MSI GT83VR-6RE32SR451 GeForce GTX 1070 SLI (Laptop), 6820HK, 75 Wh | Schenker XMG U727 2017 GeForce GTX 1080 Mobile, i7-7700K, 89 Wh | Acer Predator 17 X GX-792-76DL GeForce GTX 1080 Mobile, i7-7820HK, 88.8 Wh | Asus G701VIK-BA049T GeForce GTX 1080 Mobile, i7-7820HK, 93 Wh | MSI GT73VR 7RF-296 GeForce GTX 1080 Mobile, i7-7820HK, 75.2 Wh | |
|---|---|---|---|---|---|---|
| Battery runtime | -2% | 51% | 92% | 93% | 35% | |
| Reader / Idle (h) | 2.4 | 2.5 4% | 3.7 54% | 5.2 117% | 5.7 138% | |
| WiFi v1.3 (h) | 2 | 2 0% | 2.8 40% | 4.2 110% | 4 100% | 2.7 35% |
| Load (h) | 1 | 0.9 -10% | 1.6 60% | 1.5 50% | 1.4 40% | |
| H.264 (h) | 3.4 | 2.4 |
Pros
Cons
如果只是考虑性能的话,微星GT83VR可以说非常出色。
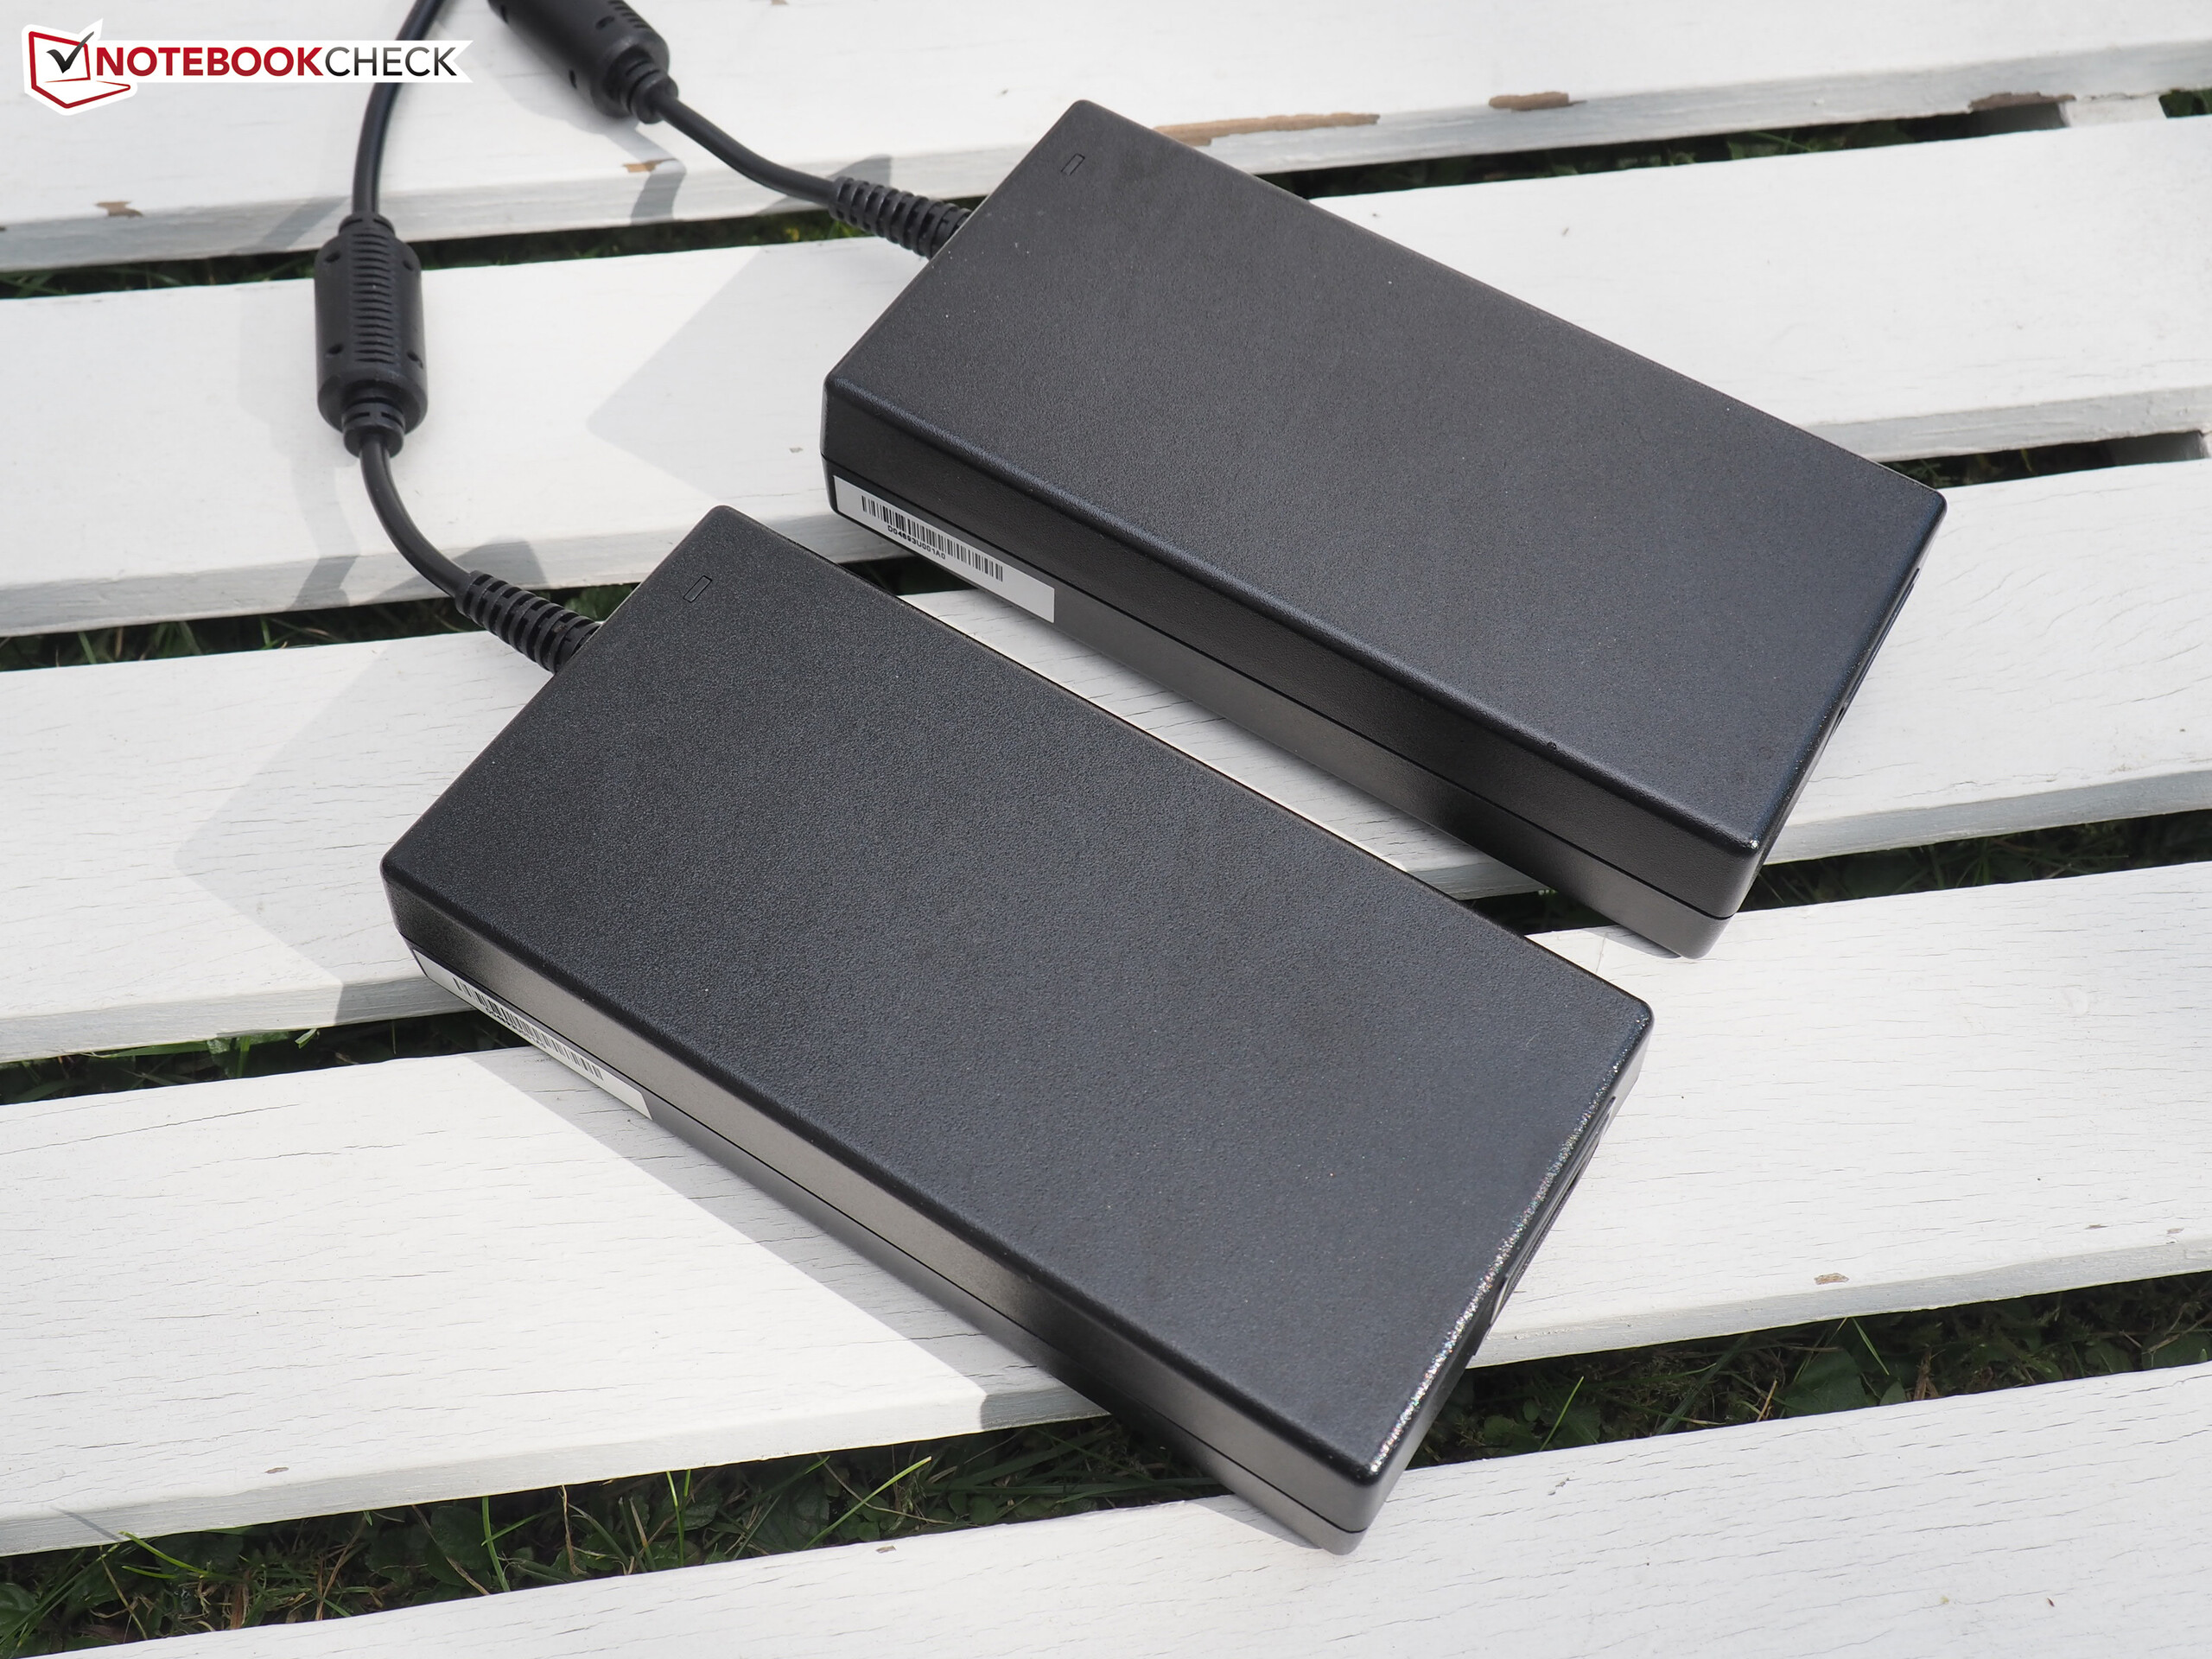
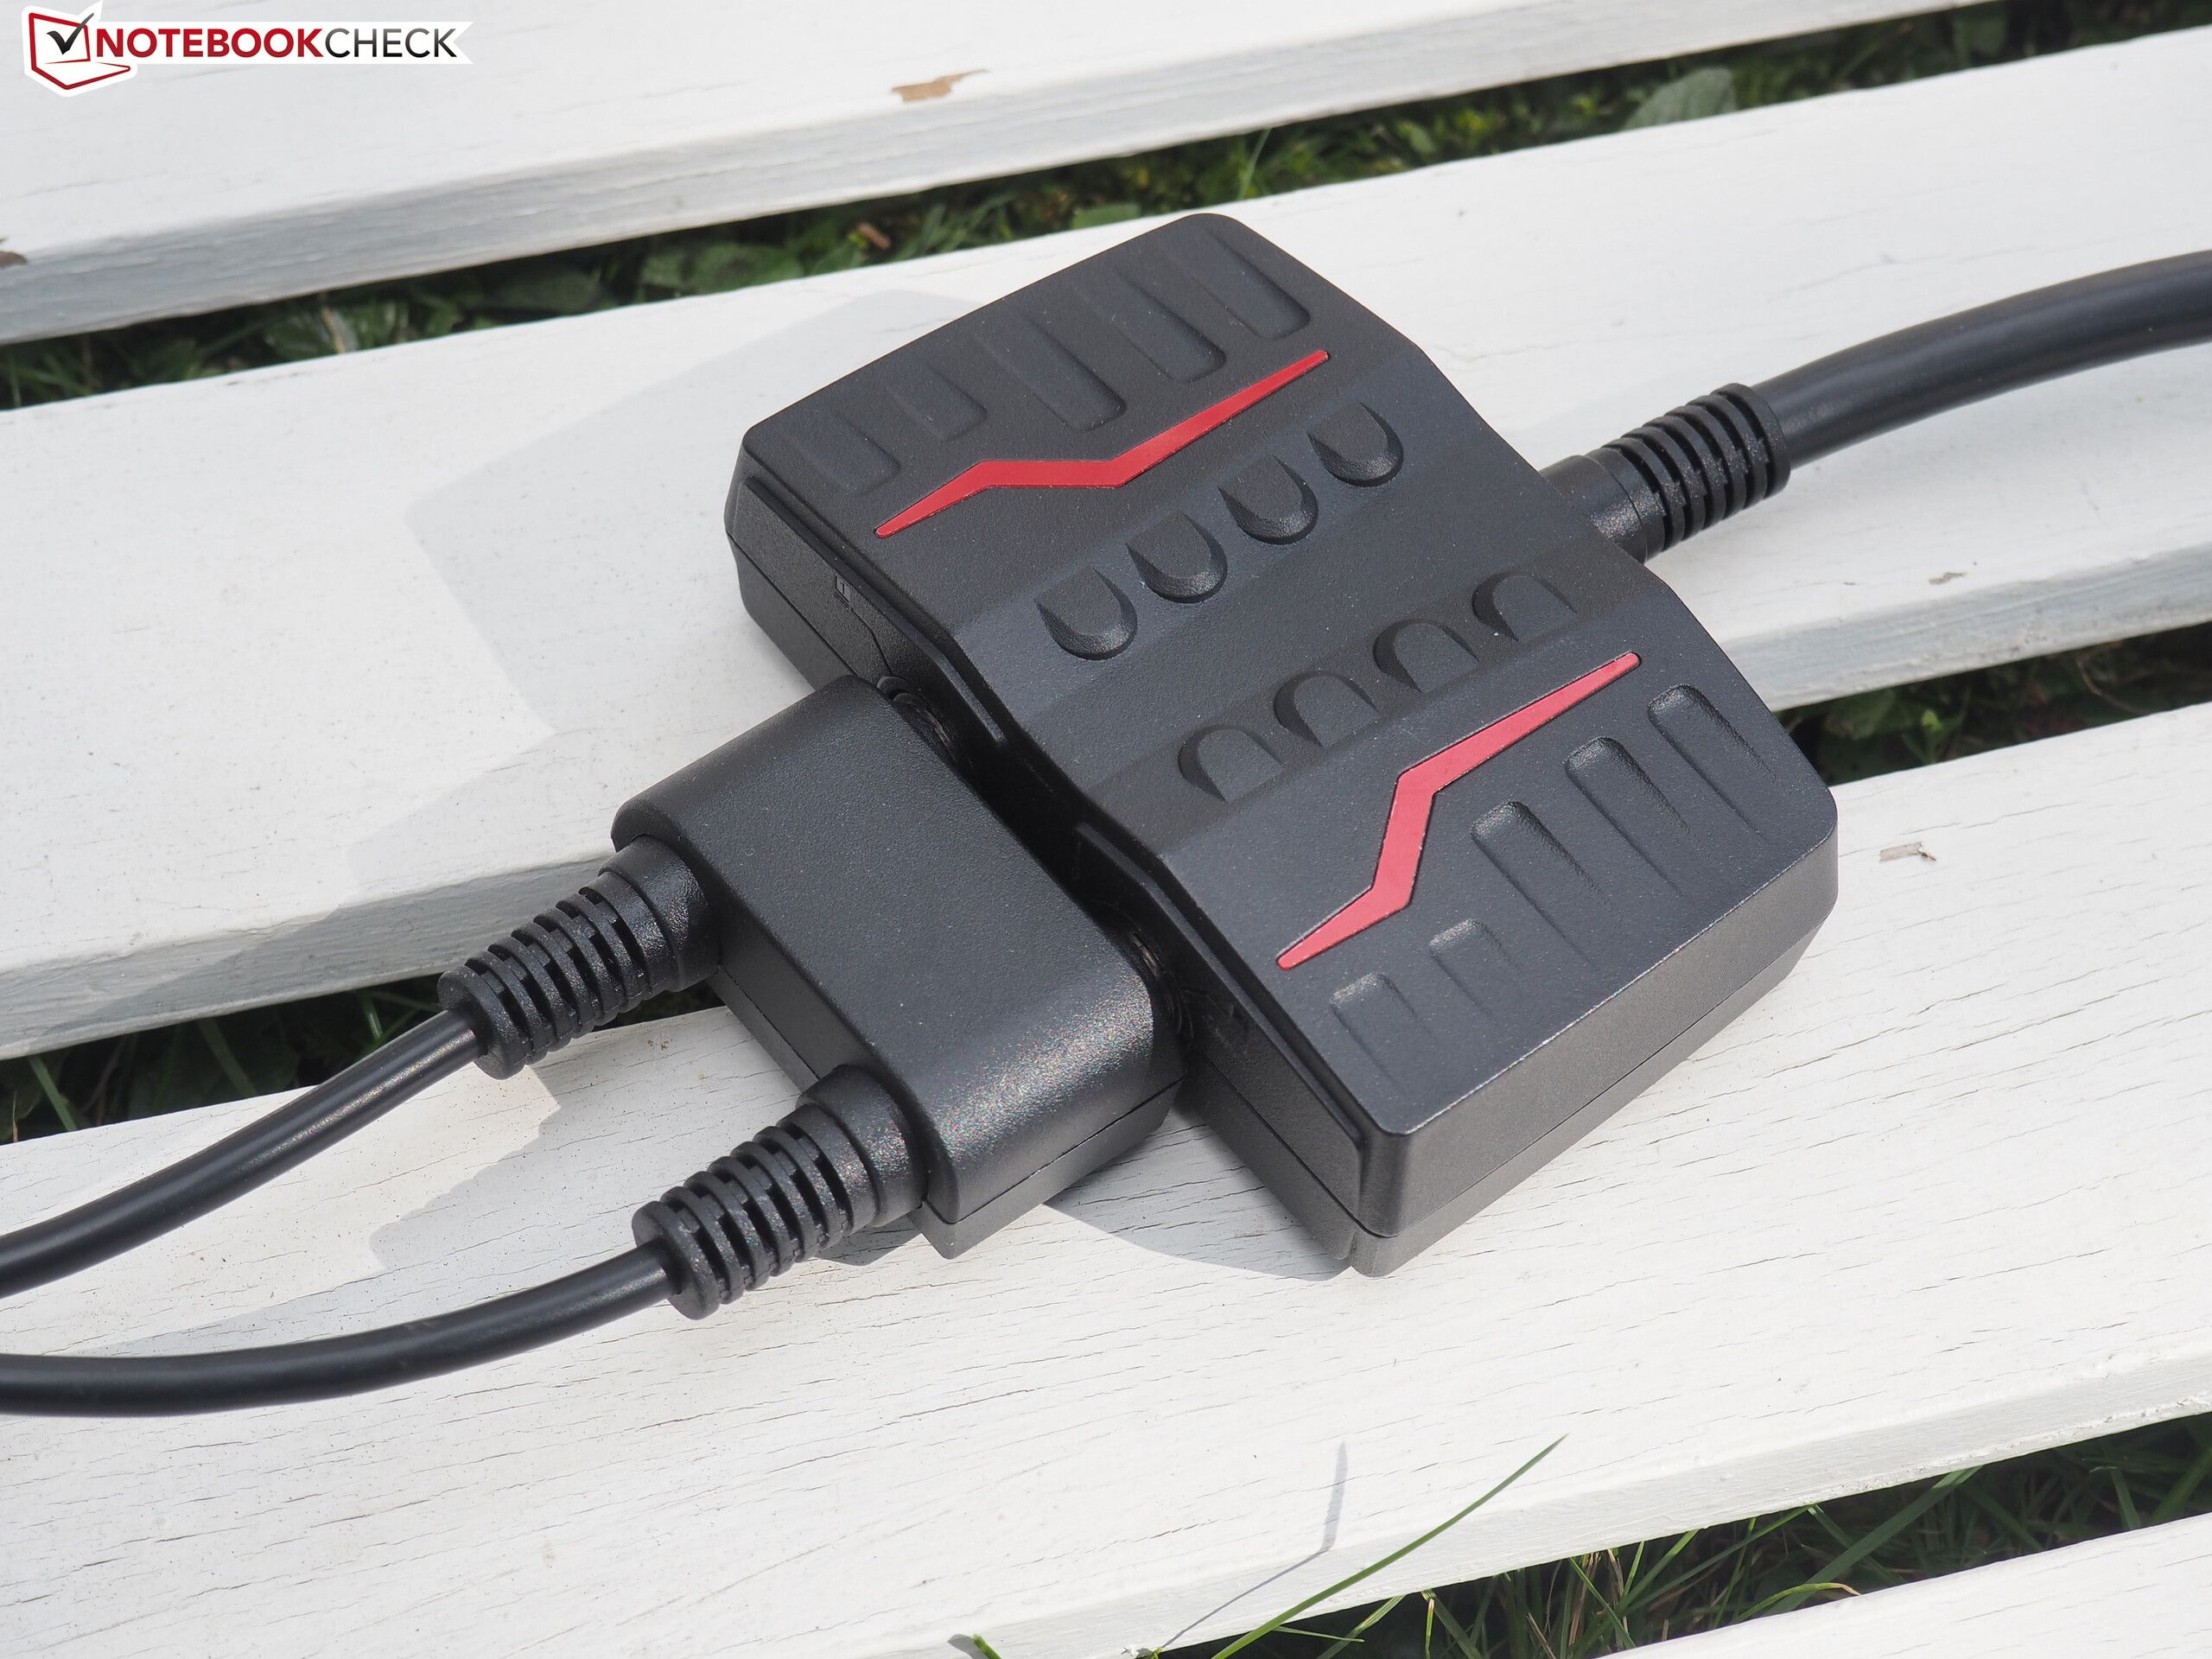
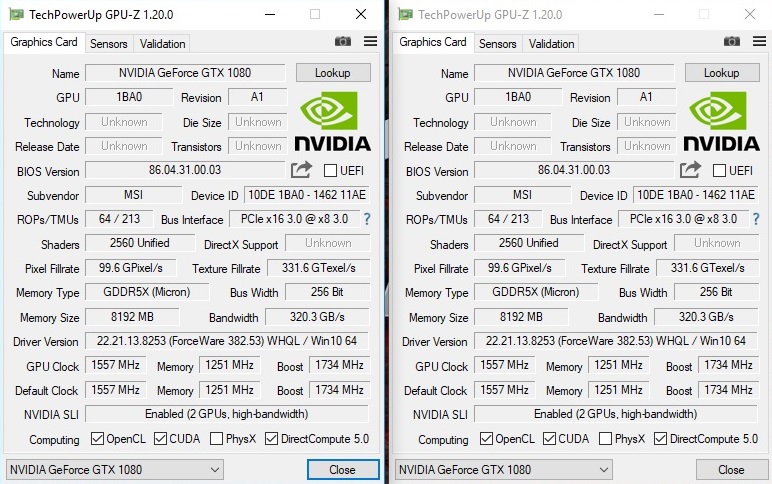
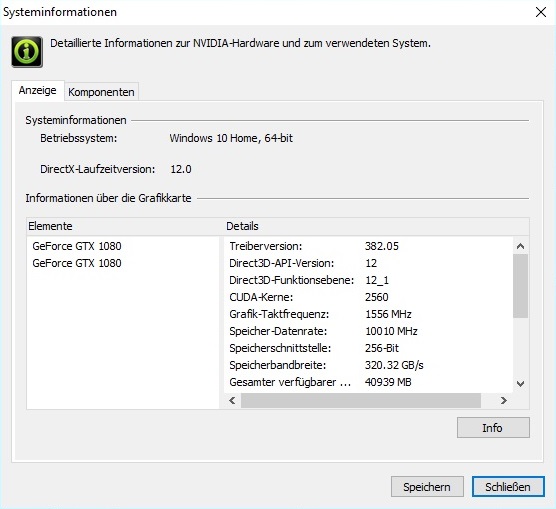
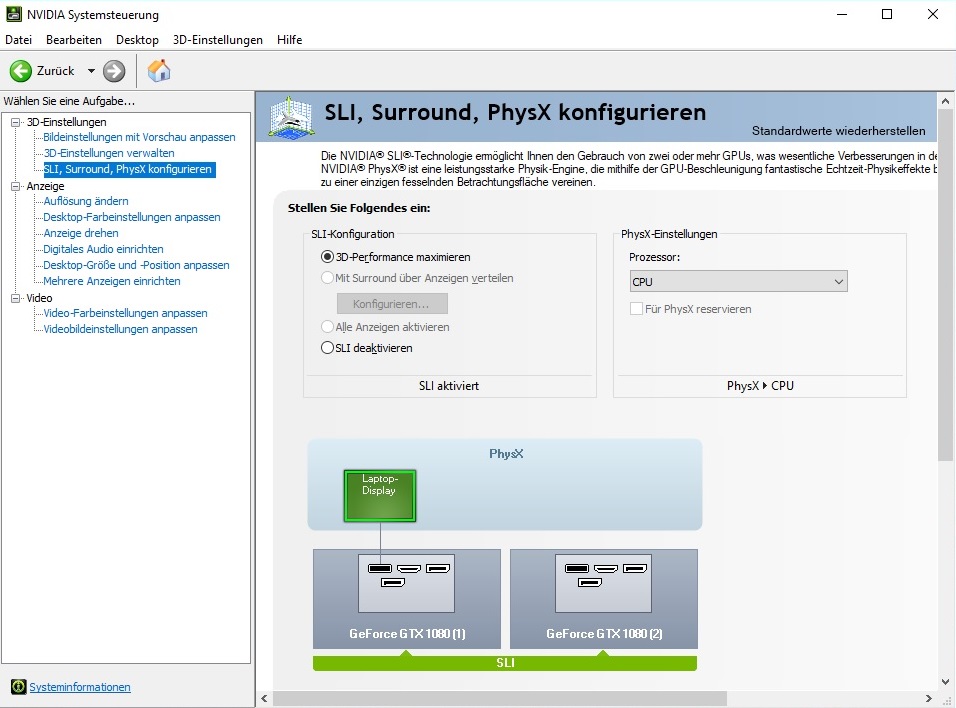
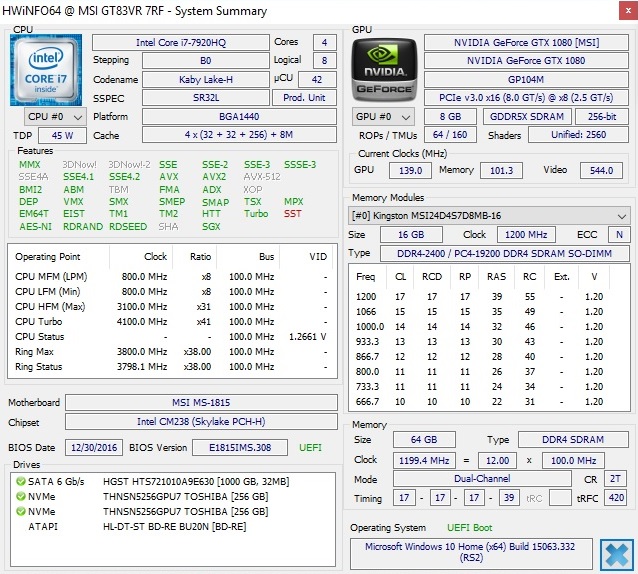
目前几乎没有任何其他高端笔记本电脑提供了如此强劲的游戏性能——不论是处理器,显卡还是内存的配置都无可挑剔。不过,它的价位不仅会让你的存款受到不小的打击(我们的测试机售价超过了5000欧元,约5600美元),它的笨重机身也需要不小的力量才可以搬动。
我们对它的不满之处主要在于屏幕品质和噪音。对于1920x1080像素和60赫兹的屏幕,其实只需要一块GTX-1080就可以十分轻松的完成渲染的运算,从这个角度来说,它昂贵的SLI系统几乎不会对FPS游戏带来任何优势。因此,我们认为GT83VR应该搭配一块4K屏幕。而在3D运行中它较大的噪音和待机时的电流声也成为了阻碍它进入游戏本Top 10的原因。
如果它会得到进一步改进的话,我们希望它能够采用17寸的机身(市场上有很多可供选择的此尺寸120赫兹和4K分辨率屏幕),并且能够更加安静,提供对Max-Q-Graphics和G-Sync的支持。一台相对更薄的18寸单显卡机型也可能会是一款有潜力的设备,它可能会适合希望笔记本电脑屏幕越大越好的用户
注:本文是基于完整评测的缩减版本,阅读完整的英文评测,请点击这里。
MSI GT83VR 7RF-206 Titan SLI
- 06/17/2017 v6 (old)
Florian Glaser
Price comparison