Gigabyte G7 KE在审查。负担得起的游戏笔记本电脑与强大的RTX 3060
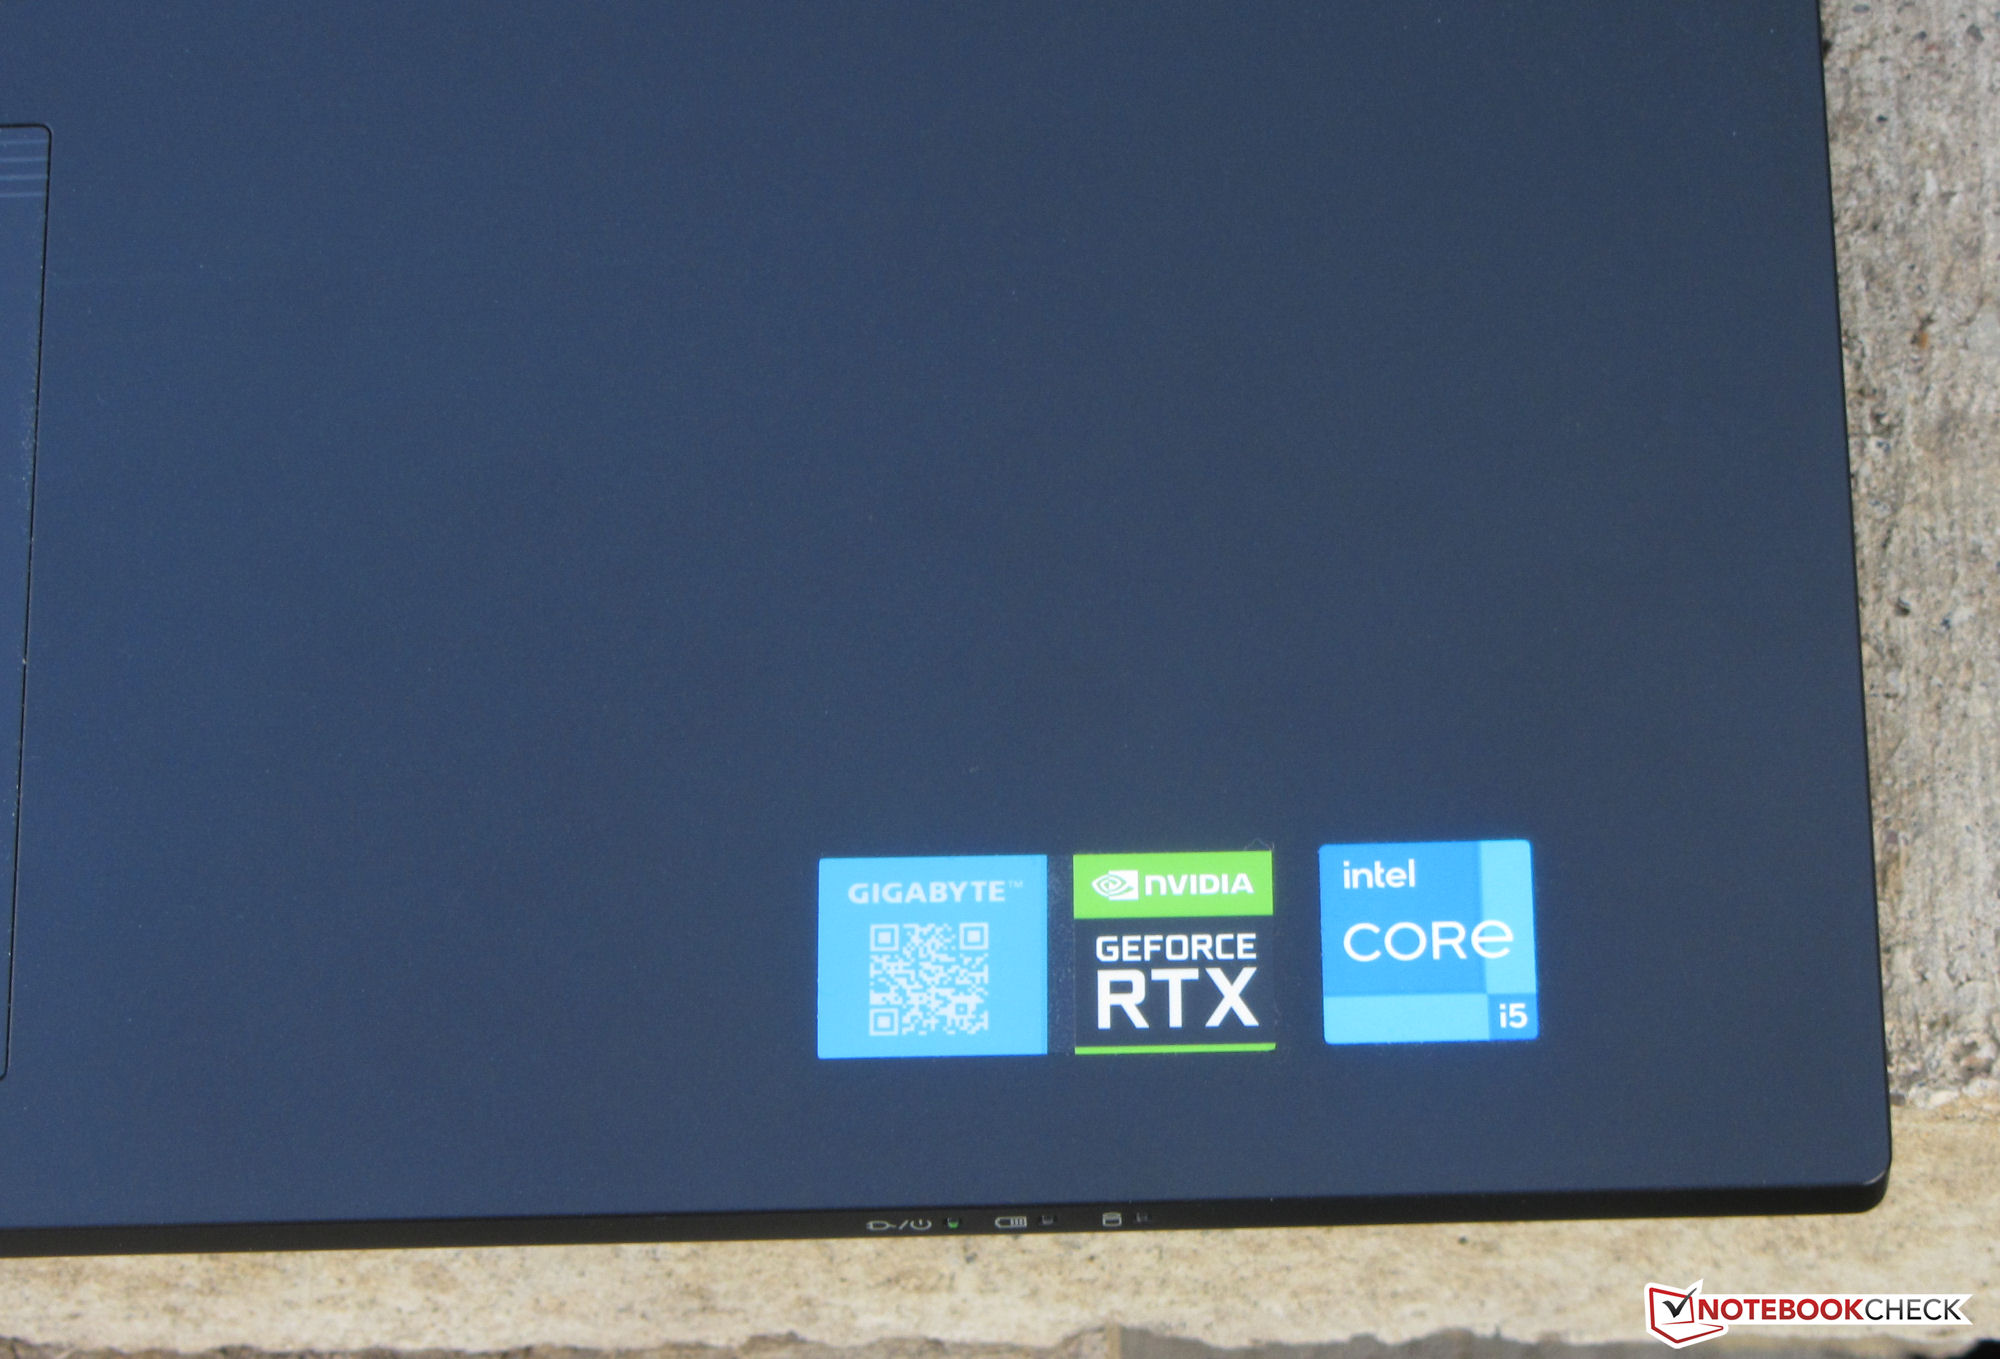
G7 KE是一款低价位的17.3英寸游戏笔记本电脑。技嘉公司将桤木湖酷睿i5处理器与一个 RTX 3060GPU,价格约为1,200欧元(约1,300美元)。更便宜的型号有一个 GeForce RTX 3050(G7 GE)或 GeForce RTX 3050 Ti(G7 ME)的更便宜的型号也是可用的。竞争者包括以下设备 惠普Pavilion Gaming 17, Acer Nitro 5 AN517-55, 联想IdeaPad Gaming 3 15IAH7或 华硕TUF游戏F17 FX707Z.
潜在的竞争对手比较
Rating | Date | Model | Weight | Height | Size | Resolution | Price |
|---|---|---|---|---|---|---|---|
| 83.3 % v7 (old) | 01 / 2023 | Gigabyte G7 KE i5-12500H, GeForce RTX 3060 Laptop GPU | 2.6 kg | 25 mm | 17.30" | 1920x1080 | |
| 82.7 % v7 (old) | 09 / 2022 | HP Pavilion Gaming 17-cd2146ng i5-11300H, GeForce RTX 3050 Ti Laptop GPU | 2.8 kg | 25 mm | 17.30" | 1920x1080 | |
| 83.9 % v7 (old) | 08 / 2022 | Acer Nitro 5 AN517-55-738R i7-12700H, GeForce RTX 3060 Laptop GPU | 3.1 kg | 28.6 mm | 17.30" | 1920x1080 | |
| 84.1 % v7 (old) | 04 / 2022 | Asus TUF Gaming F17 FX707Z-HX011W i7-12700H, GeForce RTX 3060 Laptop GPU | 2.5 kg | 25 mm | 17.30" | 1920x1080 | |
| 82.8 % v7 (old) | 10 / 2022 | Lenovo IdeaPad Gaming 3 15IAH7 i5-12500H, GeForce RTX 3050 Ti Laptop GPU | 2.4 kg | 26 mm | 15.60" | 1920x1080 |
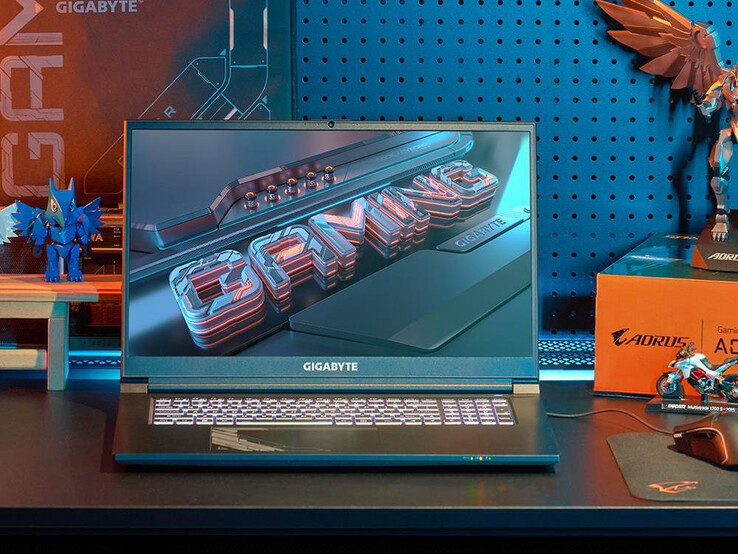
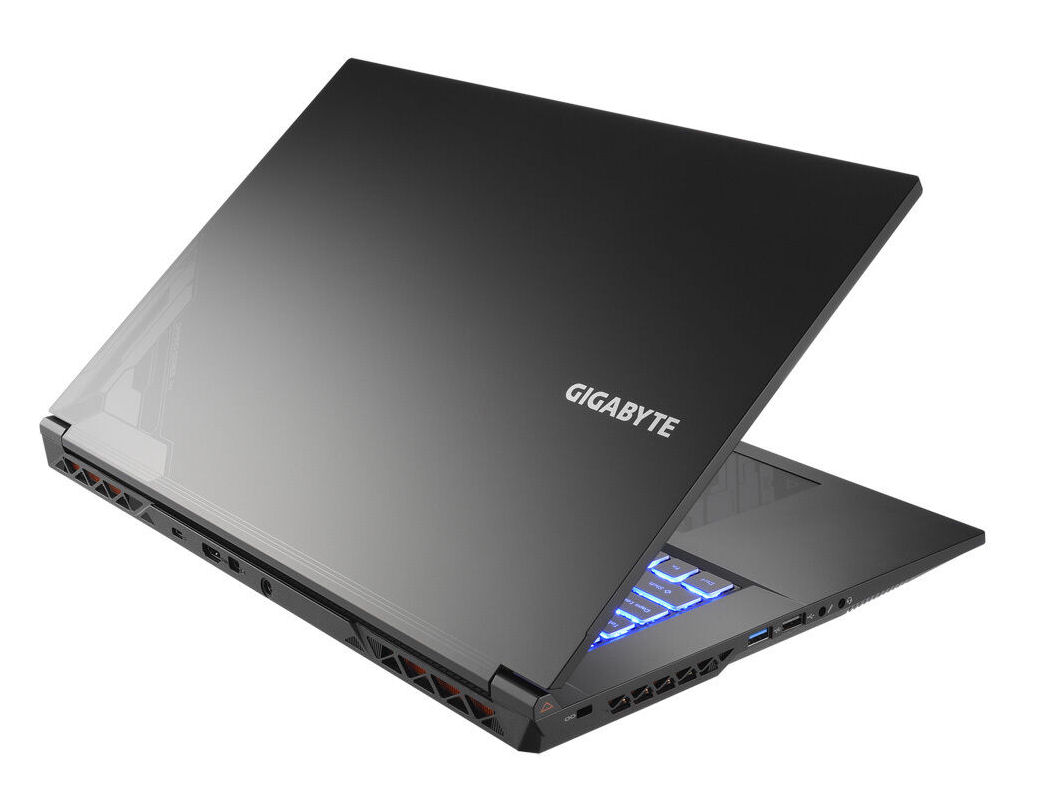
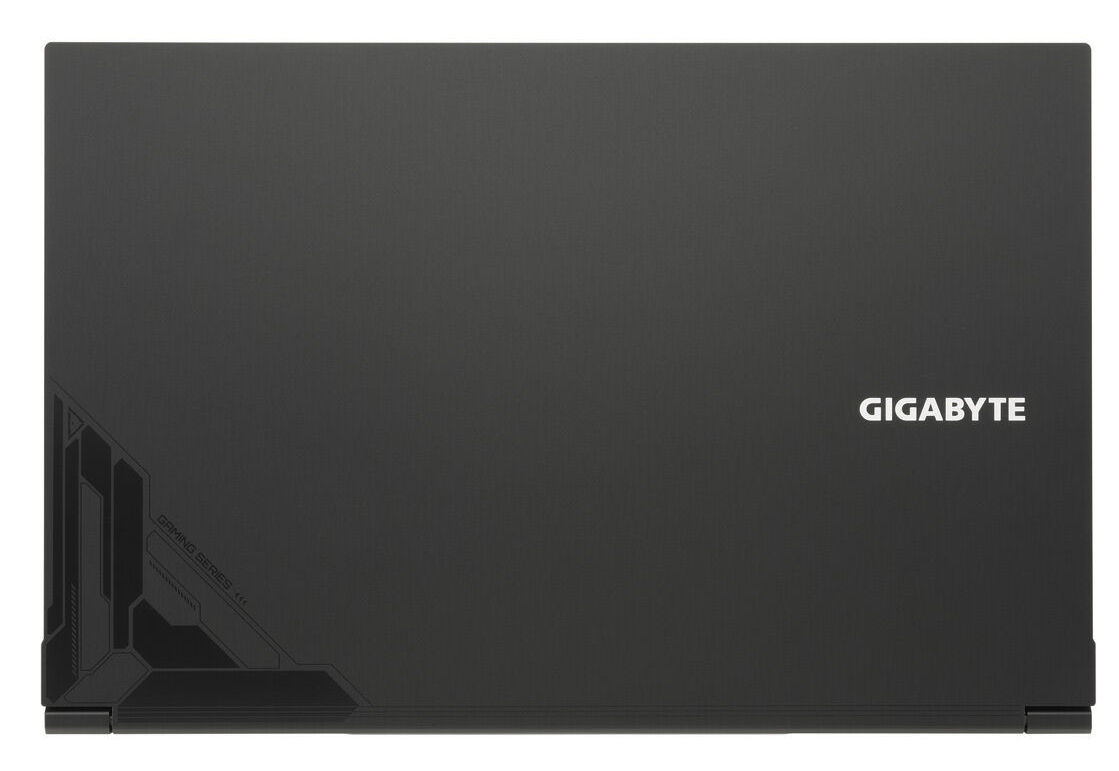
机箱 - G7带塑料底盘
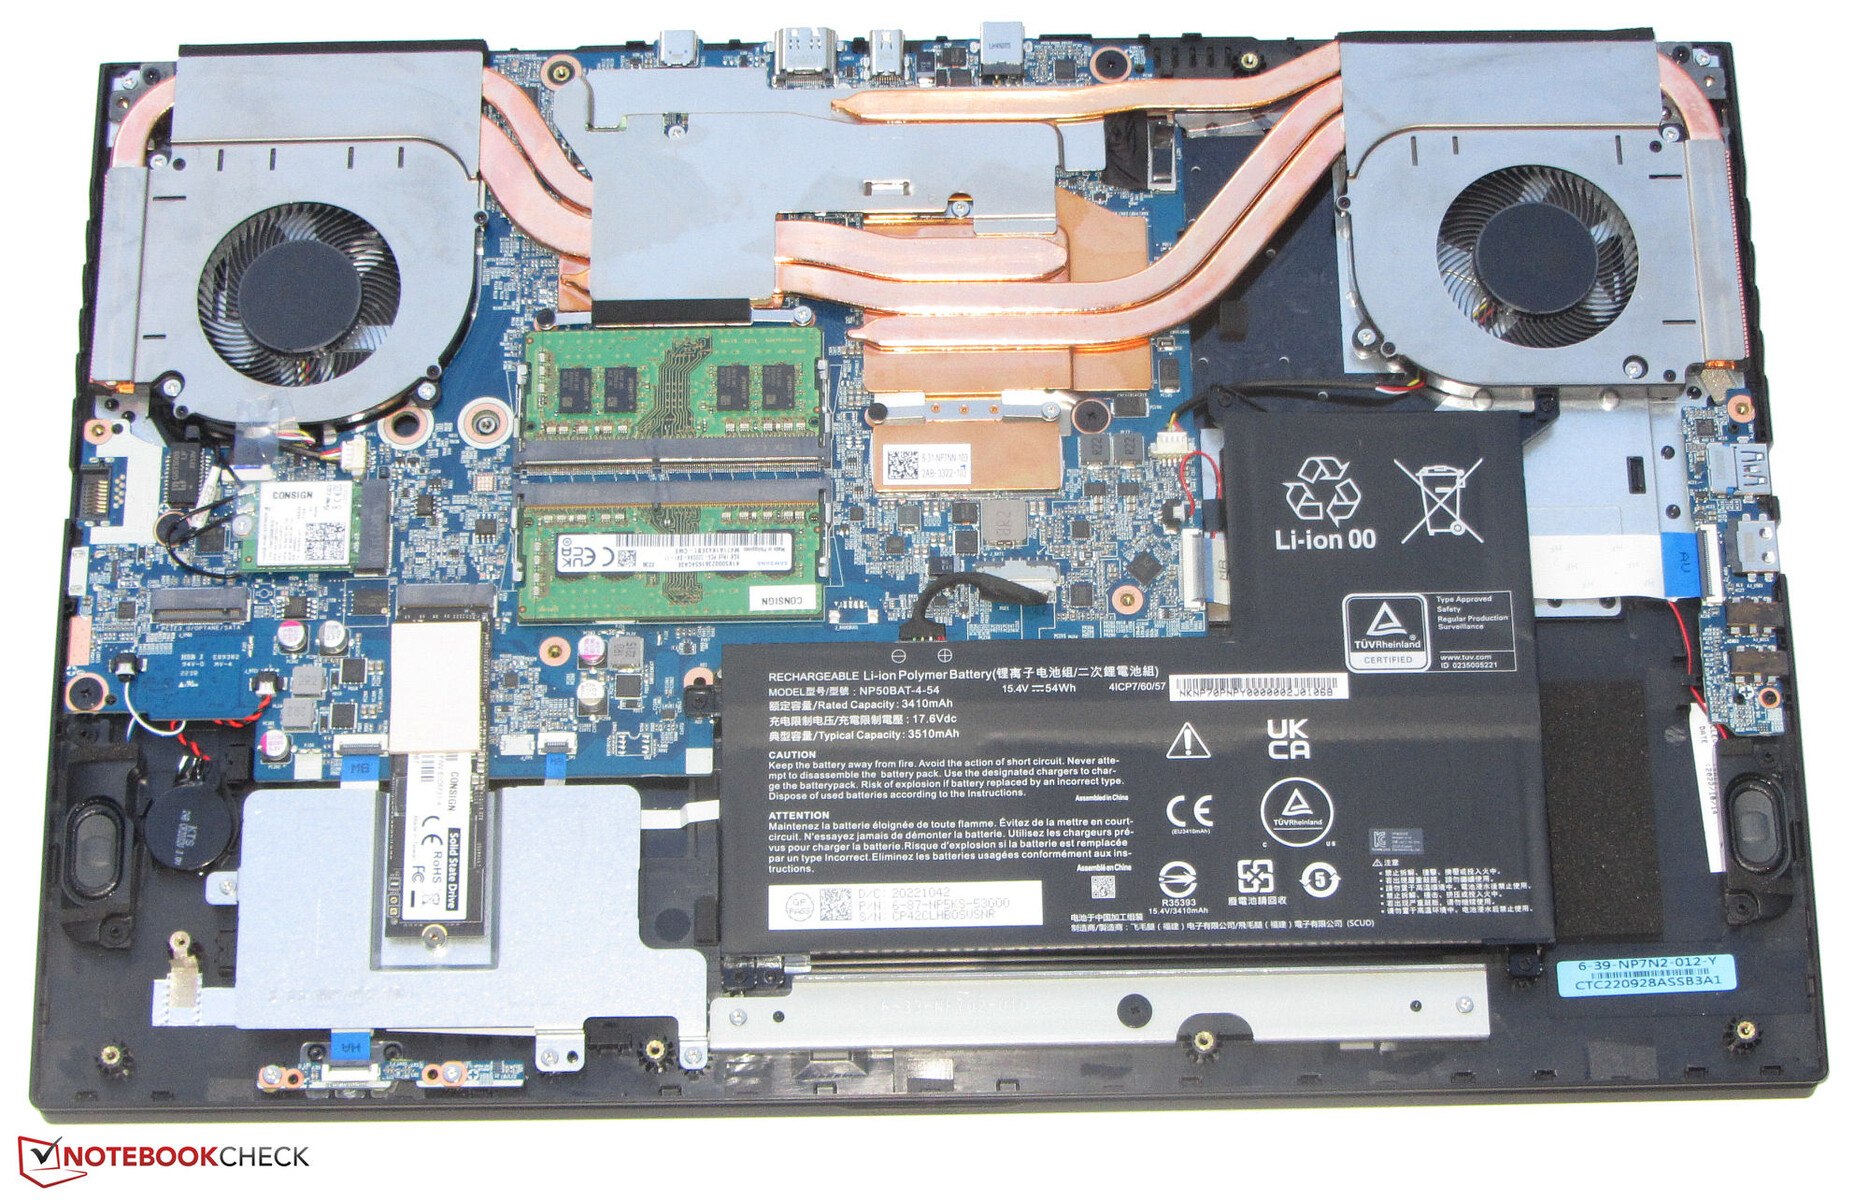
Gigabyte并没有在G7的机箱上使用高级材料。相反,制造商依靠的是黑色塑料,表面光滑、无光泽。在盖子的背面和点击板上印有一些微妙的、视觉上的、黑色和灰色的点缀。机箱的设计在其他方面非常直截了当,可以说是 "功能性"。电池(用螺丝固定,不是用胶水)和其他内部组件可以在拆下底板后接触到。
机箱的制造质量不值得批评。间隙很紧,没有突出的多余材料。虽然底座可以从四角扭转,但这在日常使用中应该不是问题。然而,盖子的硬度还有待改进。虽然铰链将显示器牢牢地固定在原位,但它们允许有一些摇摆。显示器可以打开到最大的角度,大约是140度。用一只手打开盖子是可能的。
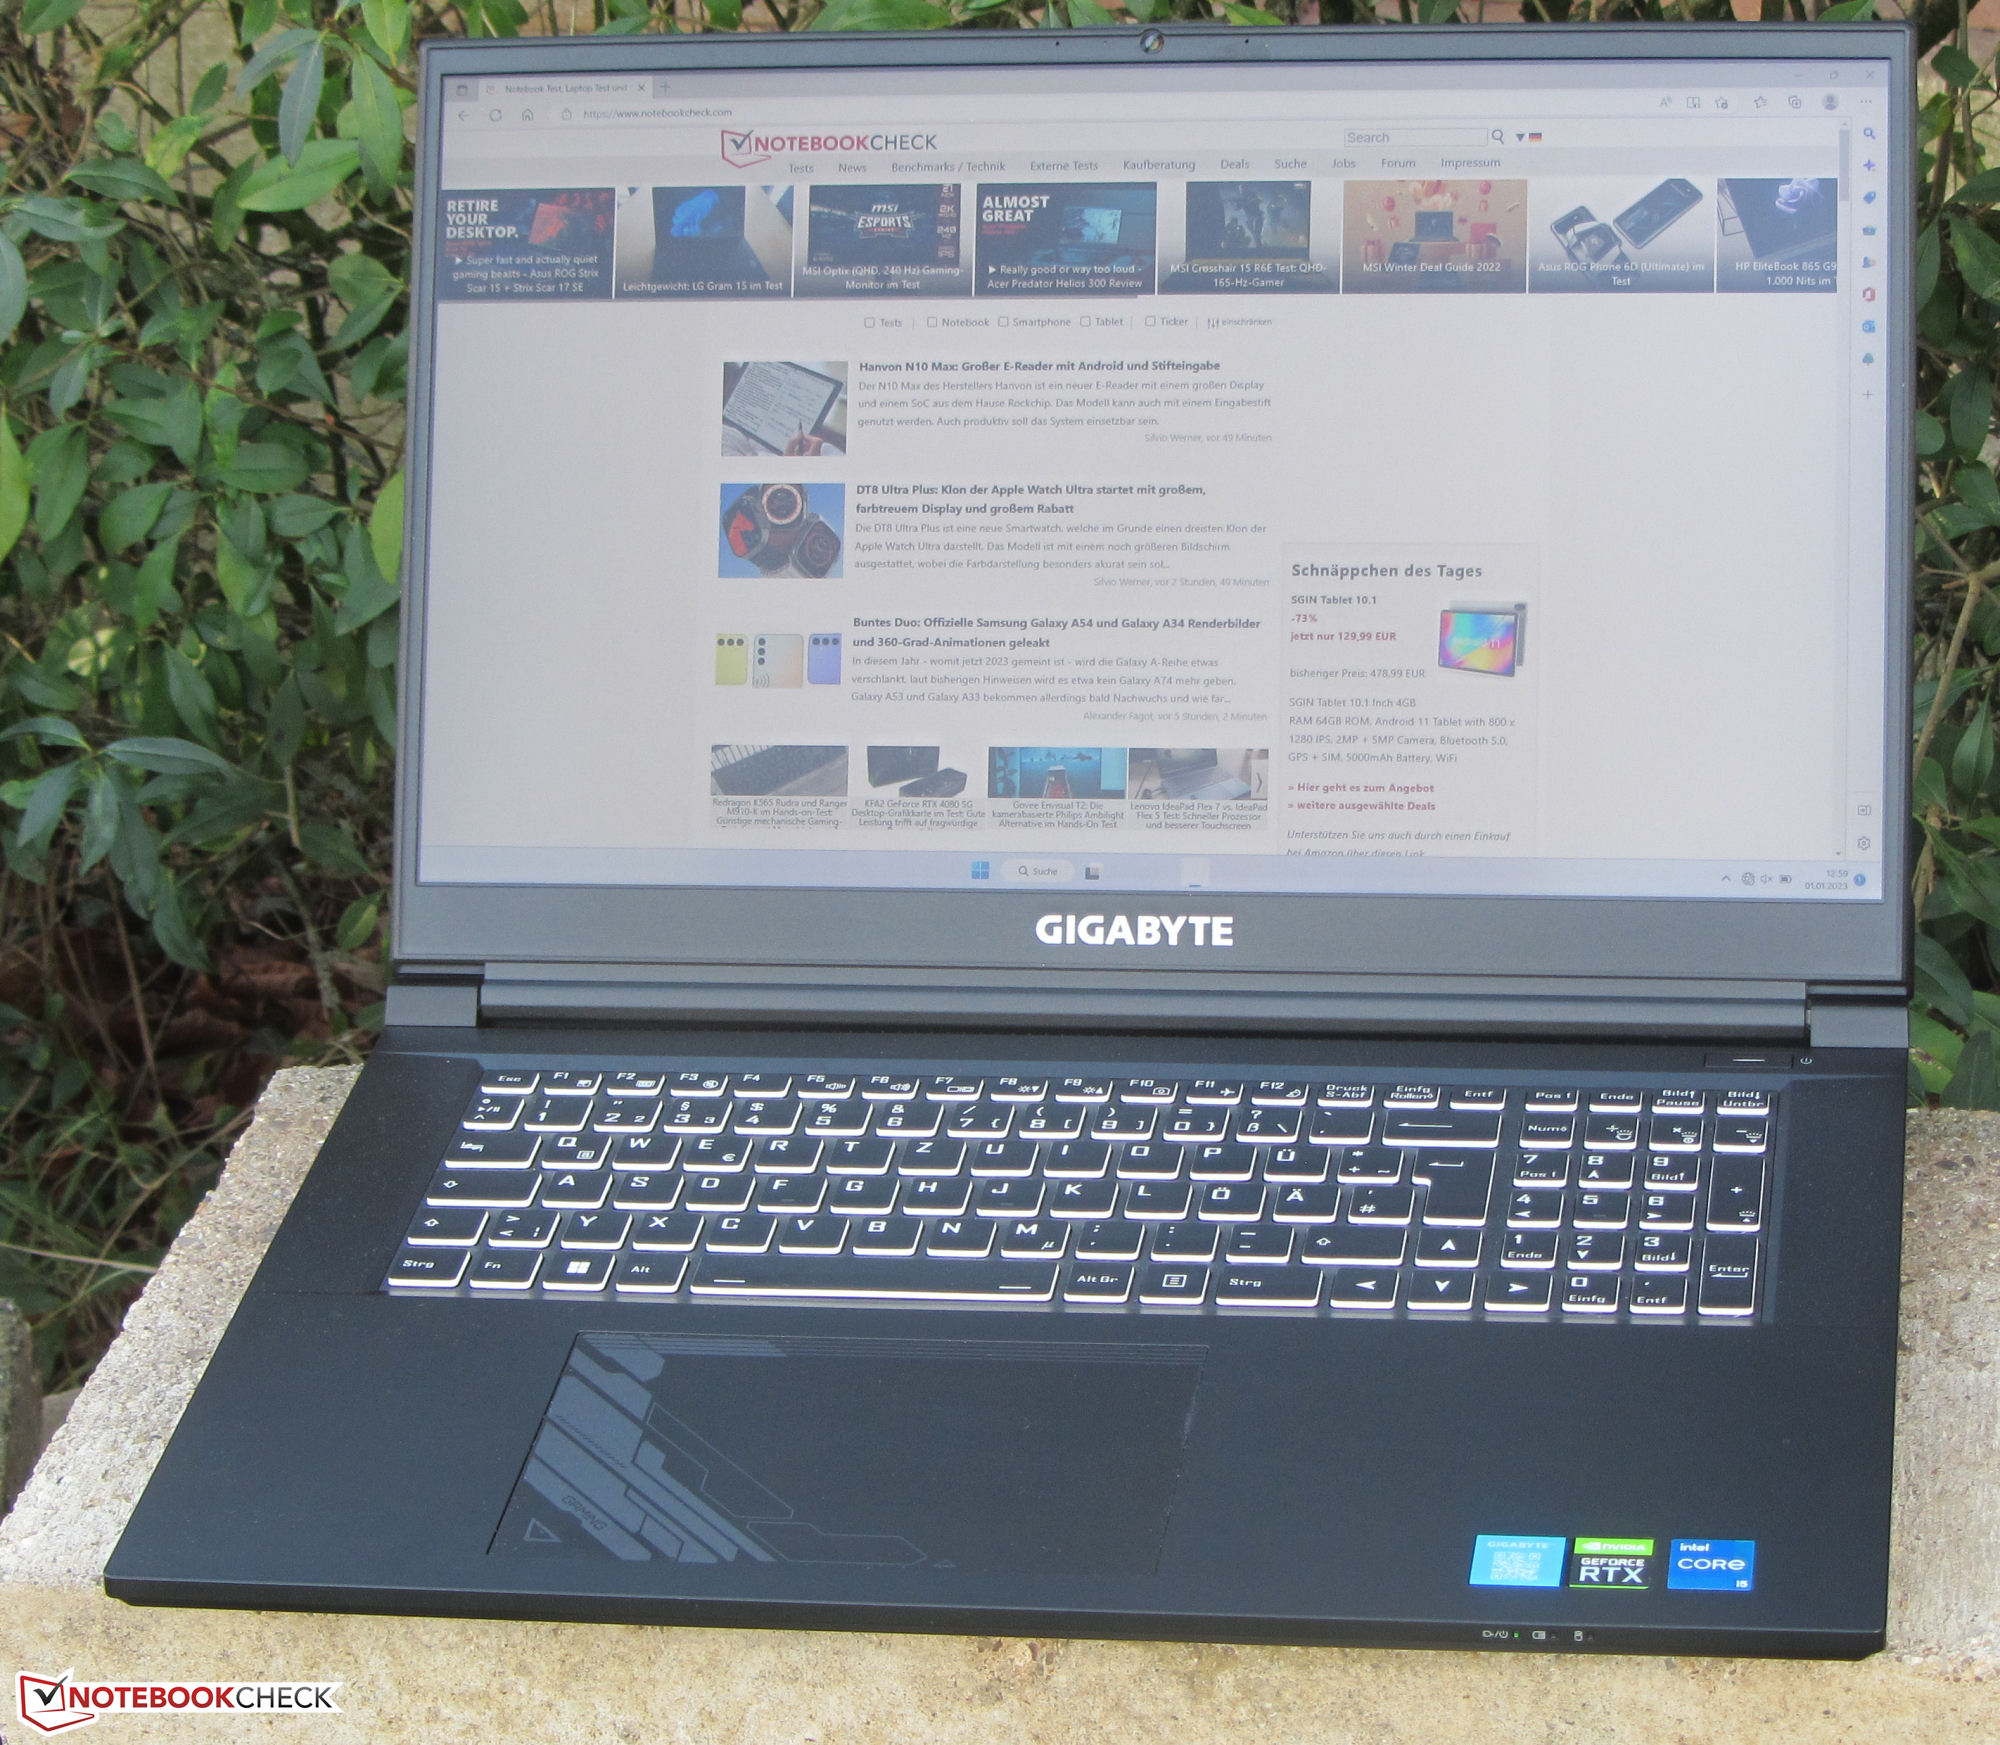
G7是我们比较中最紧凑和最轻的17.3英寸设备之一。只有 华硕TUF游戏机F17能够以很小的幅度超过它。
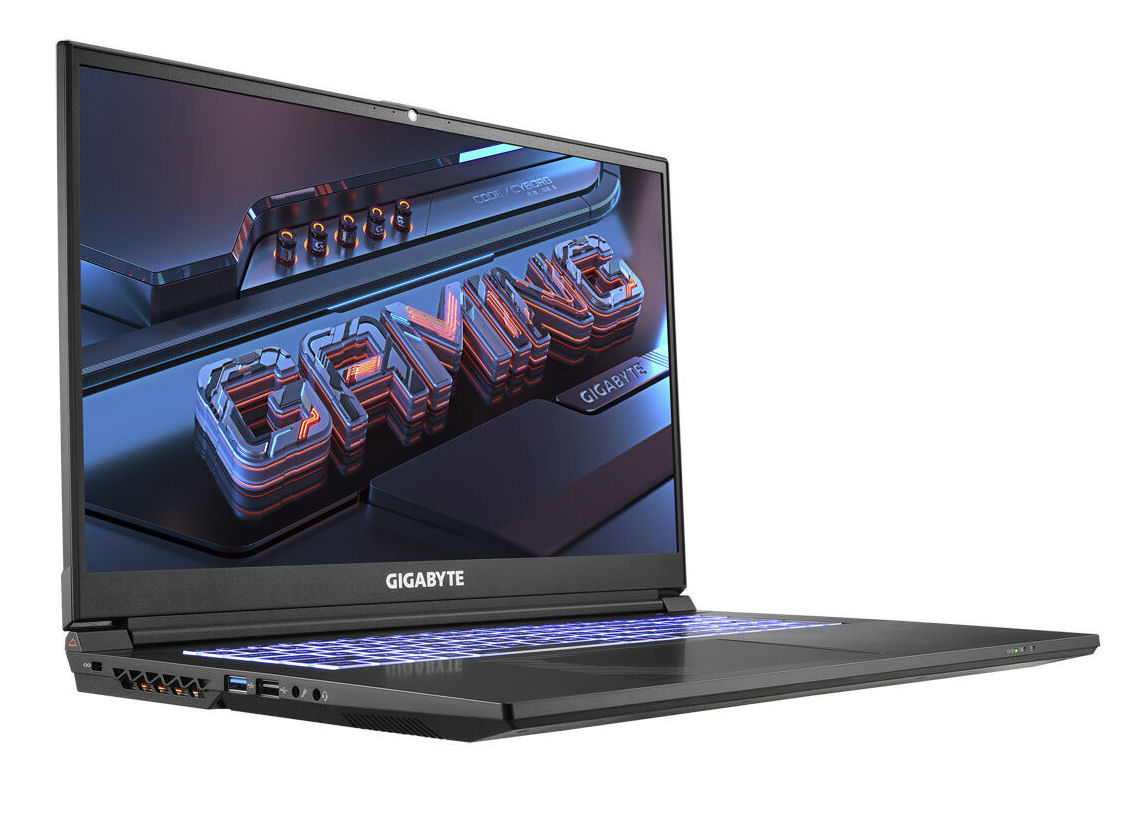
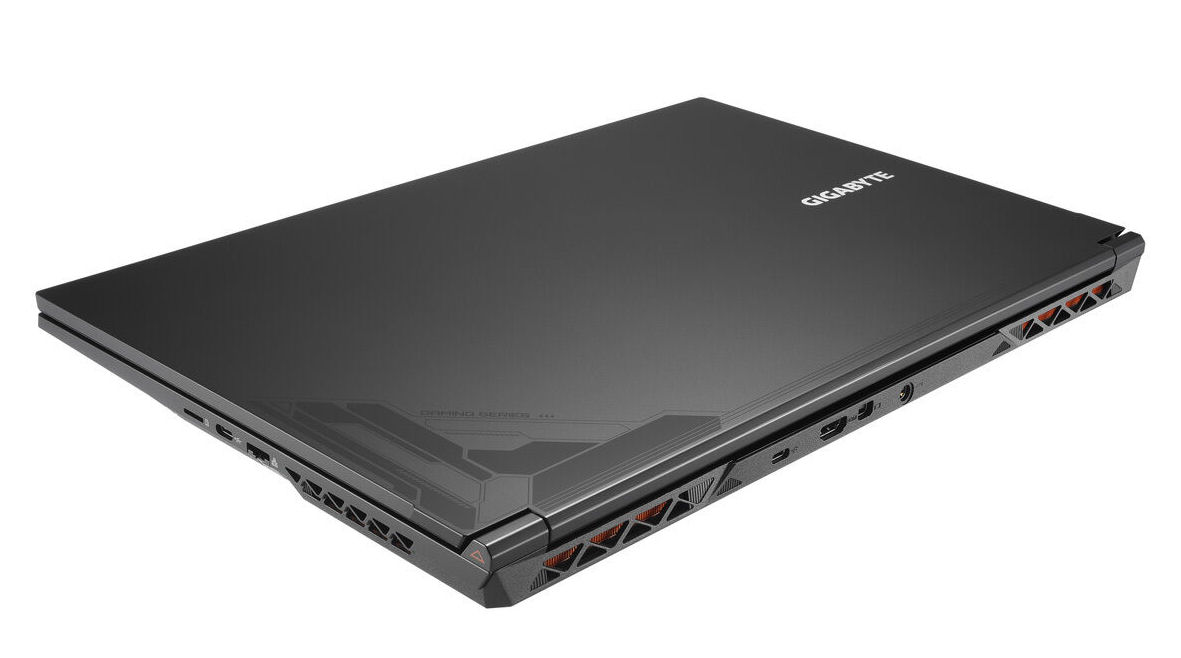
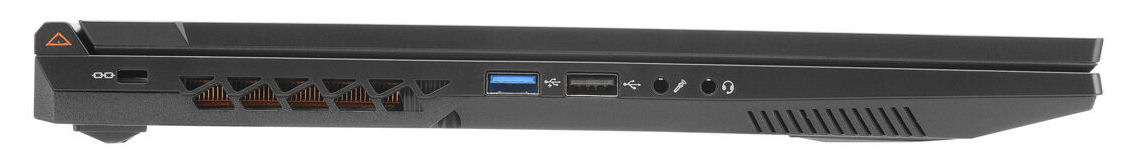
连接性 - 带有Thunderbolt 4的Gigabyte笔记本
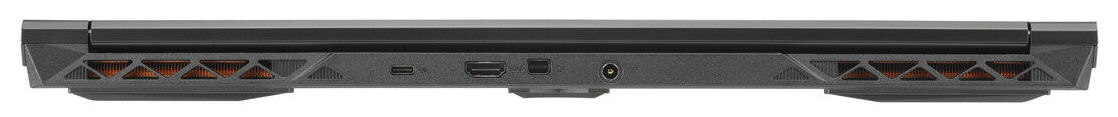
G7有两个USB-A接口(1个USB 2.0,1个USB 3.2 gen. 1)和两个USB-C接口(1个USB 3.2 gen. 2,1个雷电4)。C型接口不支持Power Delivery,只有TB4端口通过USB-C支持DisplayPort。结合HDMI端口(2.1)和专用的Mini DisplayPort(1.4),这相当于总共有三个视频输出。
G7的端口分布在笔记本电脑的三个侧面。两个专用视频输出位于设备的背面。因此,连接的电缆沿着后部运行,不会碍事。对于以太网电缆来说,这一点并不成立。该端口可以在模型的右侧边缘找到。
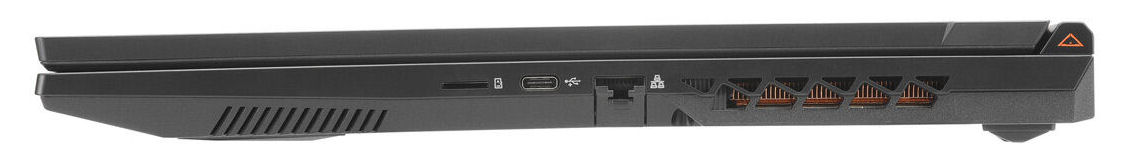
SD卡阅读器
microSD读卡器(参考卡:AV Pro SD microSD 128 GB V60)的性能一般,连续读取速度约为89 MB/s。
| SD Card Reader | |
| average JPG Copy Test (av. of 3 runs) | |
| Average of class Gaming (20.9 - 210, n=54, last 2 years) | |
| HP Pavilion Gaming 17-cd2146ng (AV PRO microSD 128 GB V60) | |
| maximum AS SSD Seq Read Test (1GB) | |
| Average of class Gaming (25.5 - 261, n=51, last 2 years) | |
| Gigabyte G7 KE (AV PRO microSD 128 GB V60) | |
沟通
在理想的条件下(附近没有其他Wi-Fi设备,笔记本电脑和服务器之间的距离较短),Wi-Fi传输速度非常好,或多或少地耗尽了Wi-Fi模块(英特尔AX211;Wi-Fi 6E,802.11ax)的能力。同时,英特尔的千兆以太网接口(I-219V)处理有线网络。
| Networking | |
| iperf3 transmit AXE11000 | |
| Gigabyte G7 KE | |
| Average of class Gaming (560 - 1862, n=88, last 2 years) | |
| Average Intel Wi-Fi 6E AX211 (64 - 1921, n=276) | |
| iperf3 receive AXE11000 | |
| Gigabyte G7 KE | |
| Average of class Gaming (680 - 1745, n=88, last 2 years) | |
| Average Intel Wi-Fi 6E AX211 (582 - 1890, n=276) | |
| HP Pavilion Gaming 17-cd2146ng | |
| Lenovo IdeaPad Gaming 3 15IAH7 | |
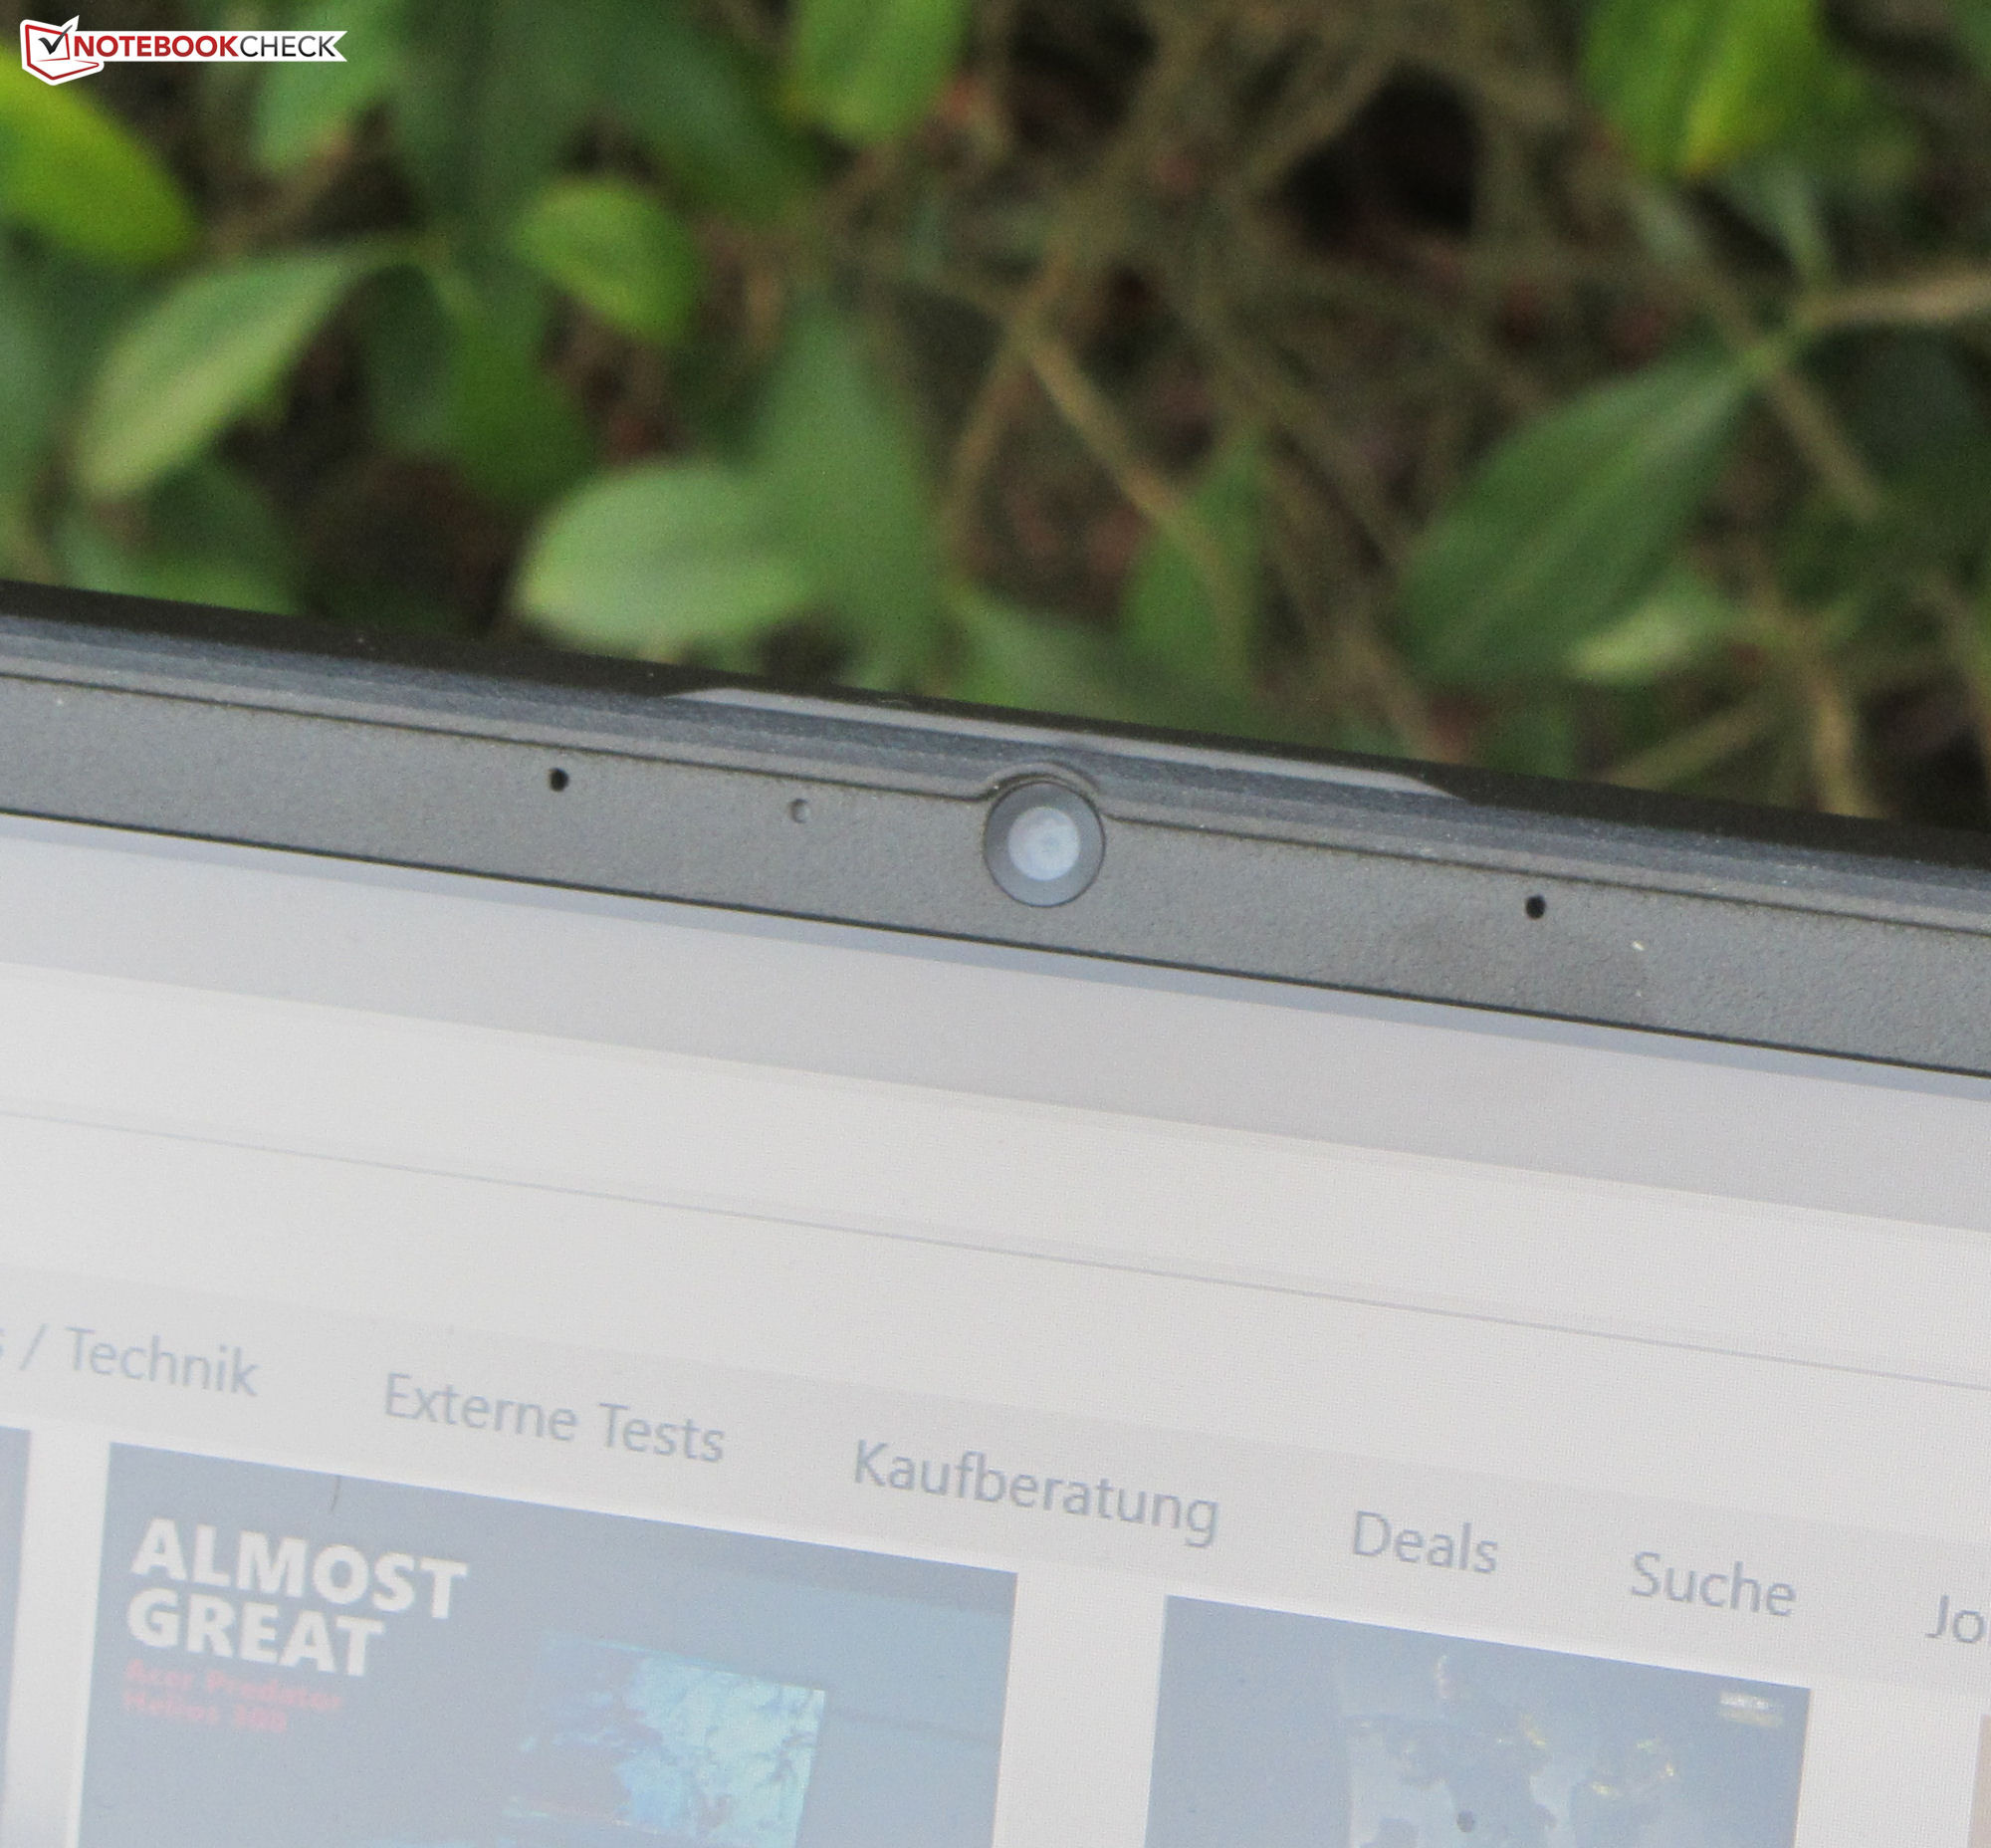
网络摄像头
网络摄像头(0.9MP)捕捉的照片最大分辨率为1280 x 720像素。该摄像头产生的效果还不错,整体色彩偏差相对较低。该相机没有配备机械的网络摄像头快门。


辅料
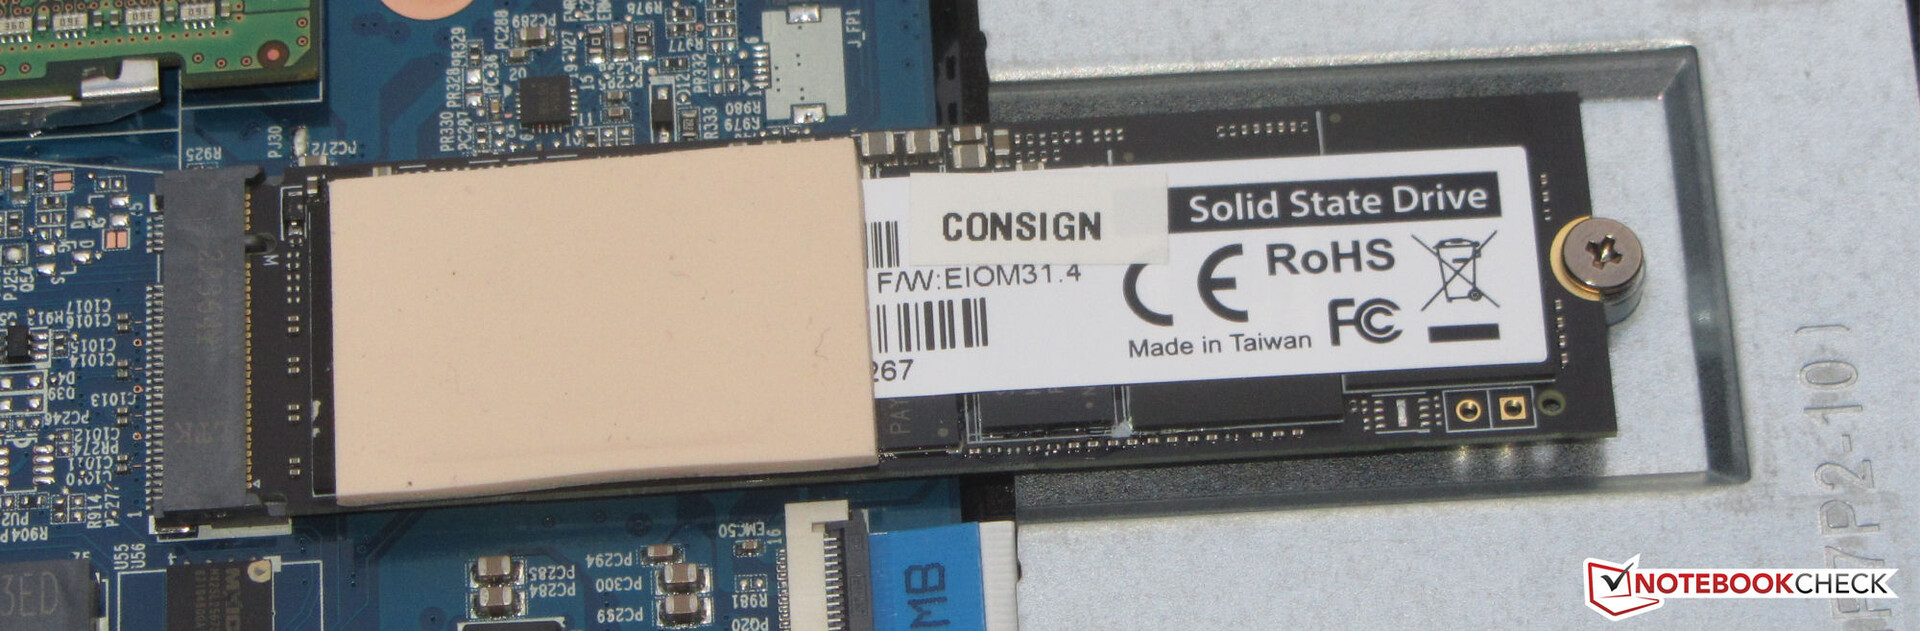
除了通常的文书工作(快速启动指南和保修信息),笔记本电脑还包括一个用于安装的螺丝和一个用于冷却次级SSD的热垫。
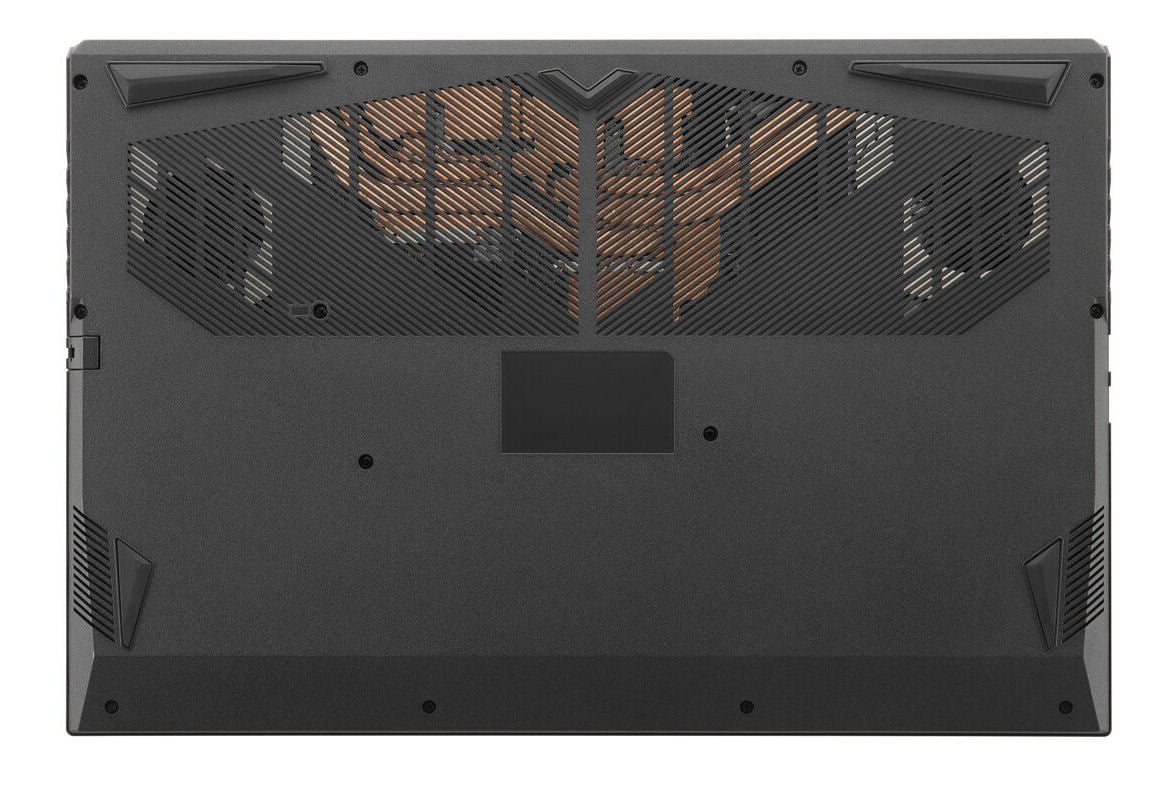
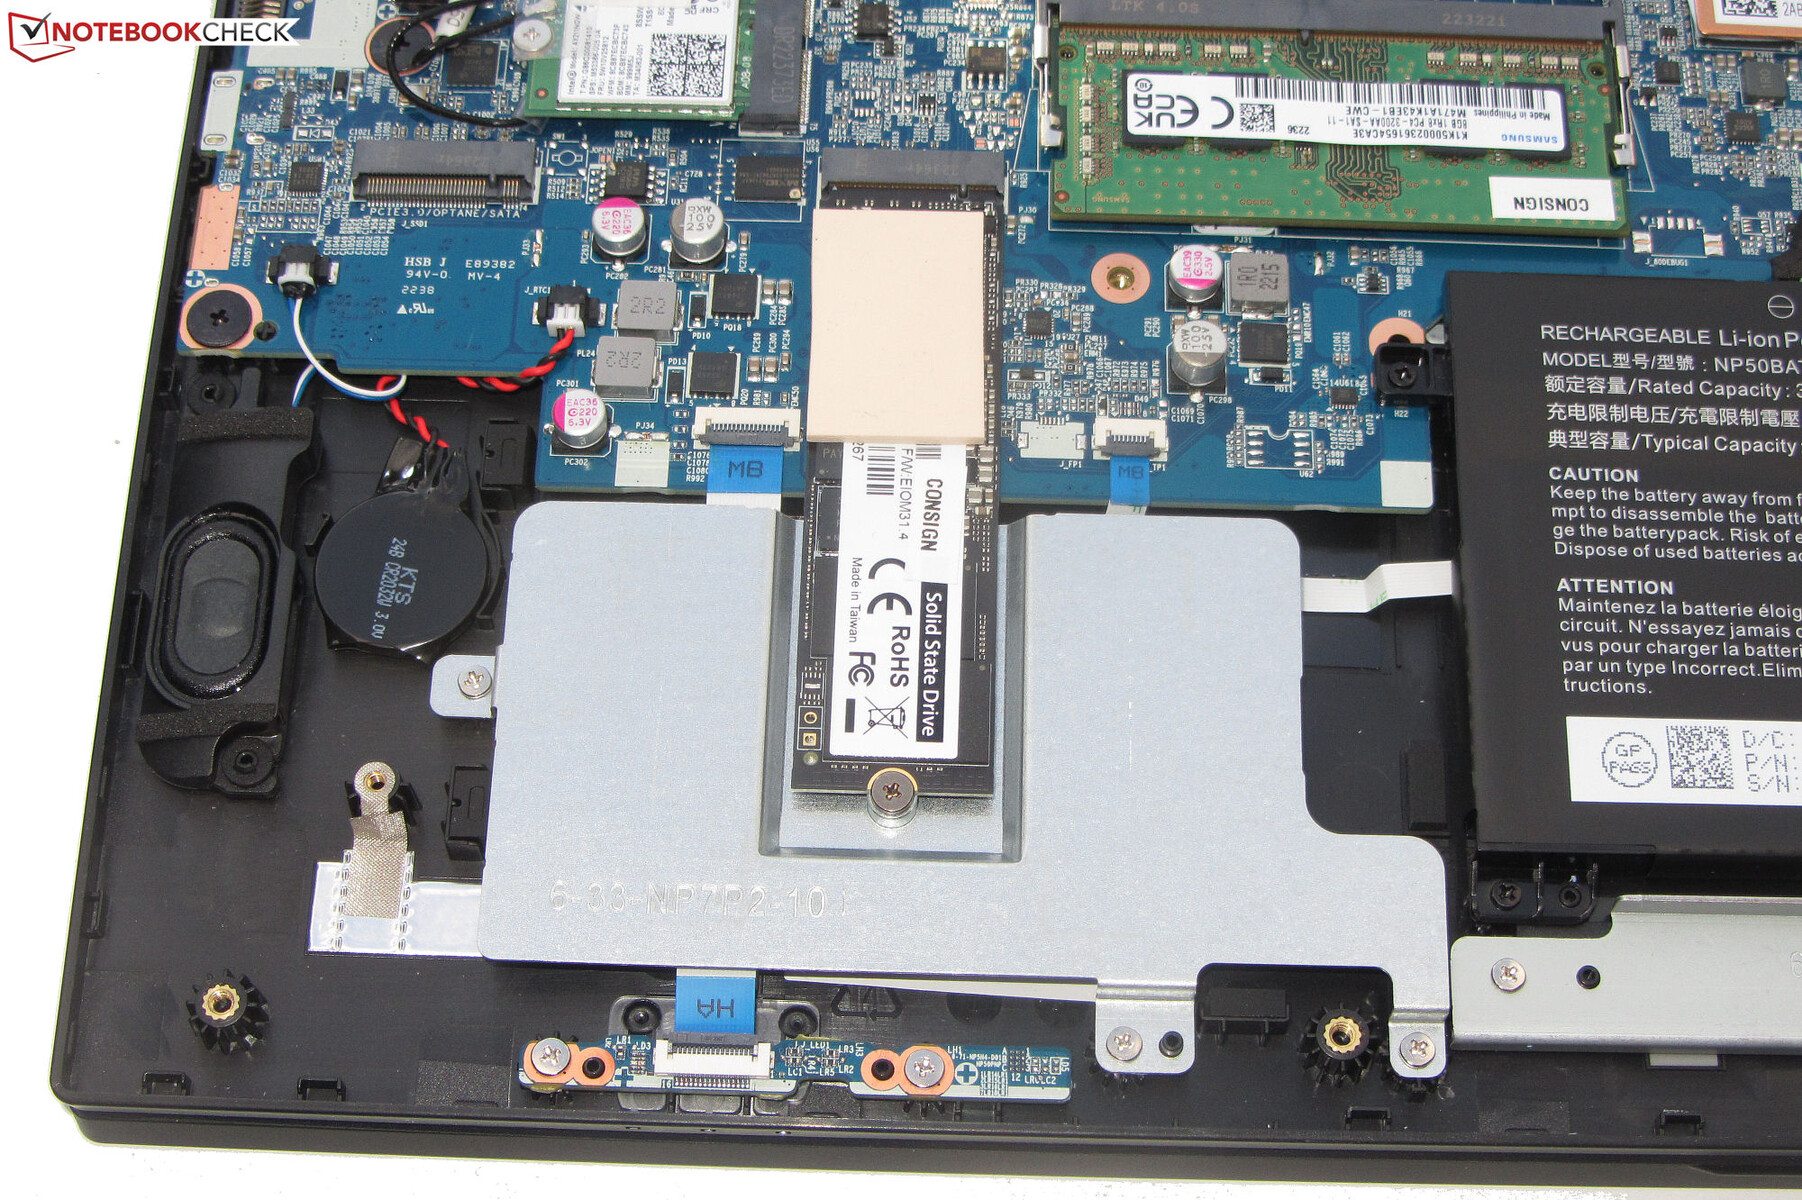
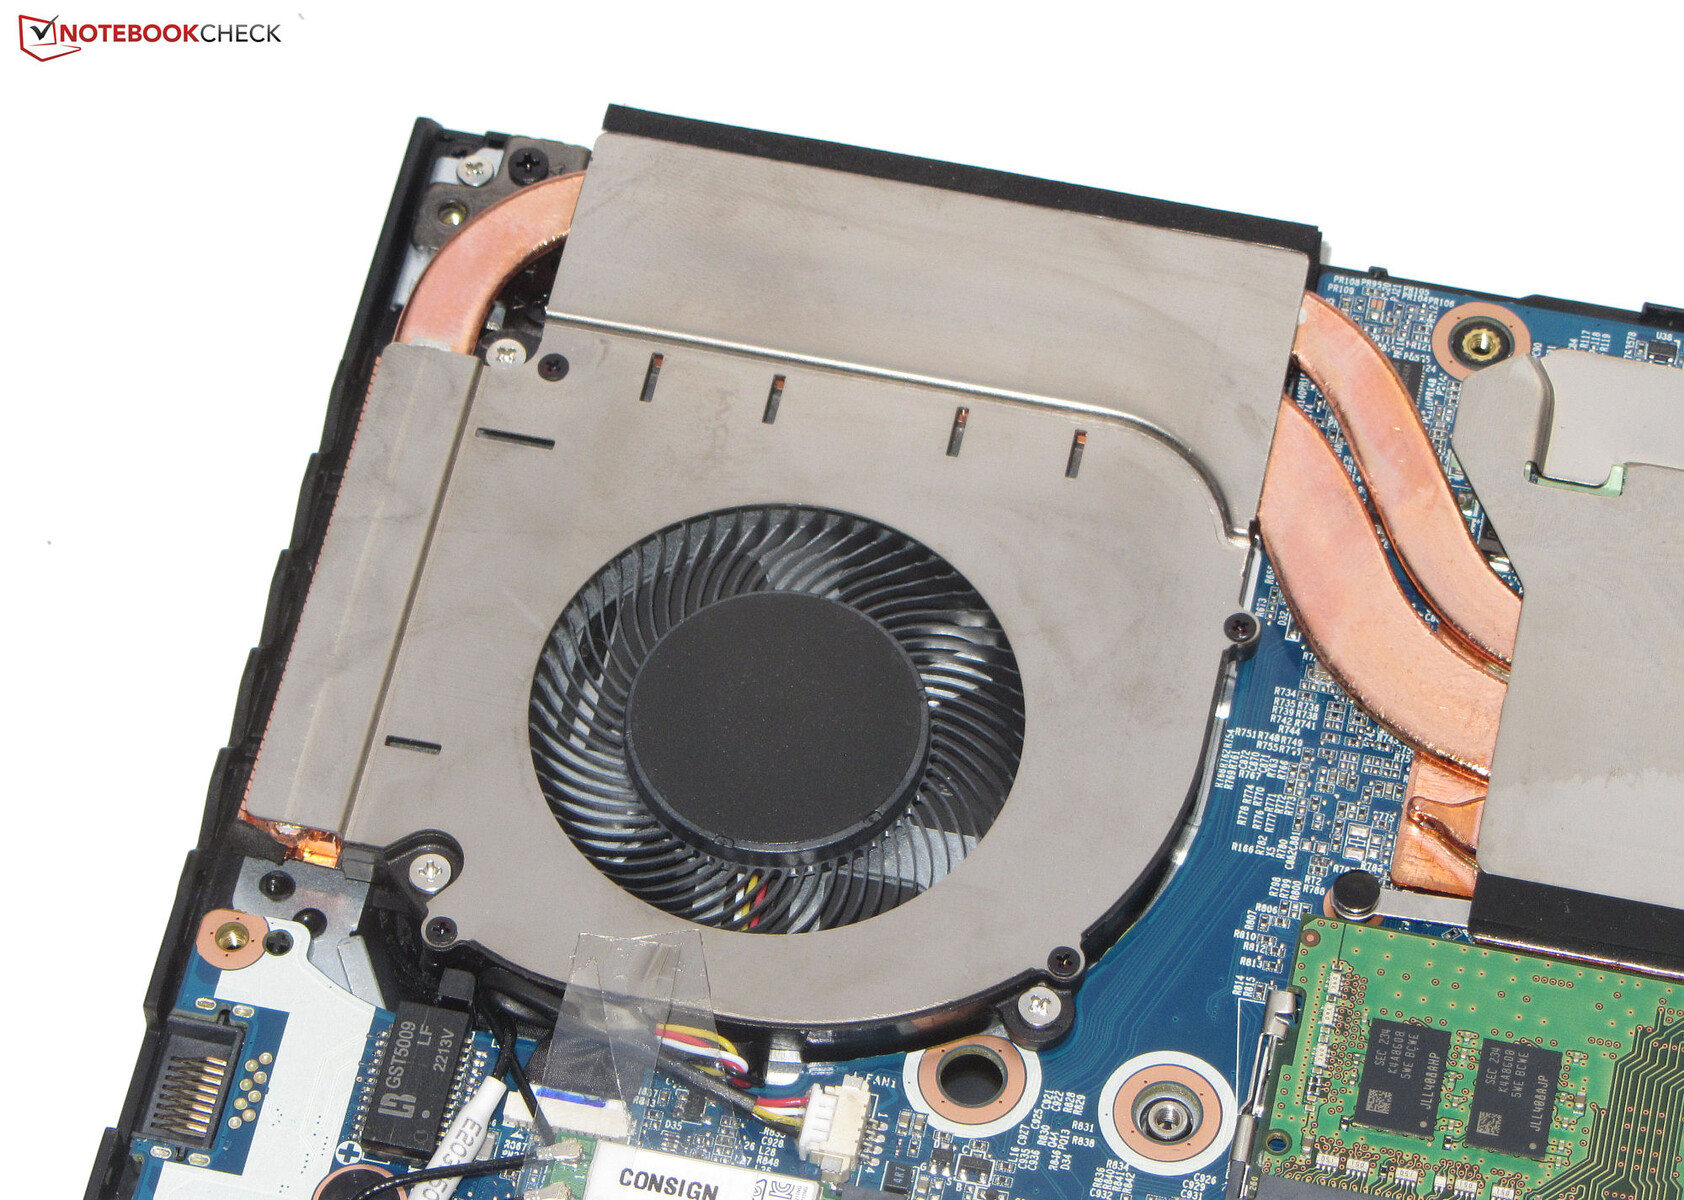
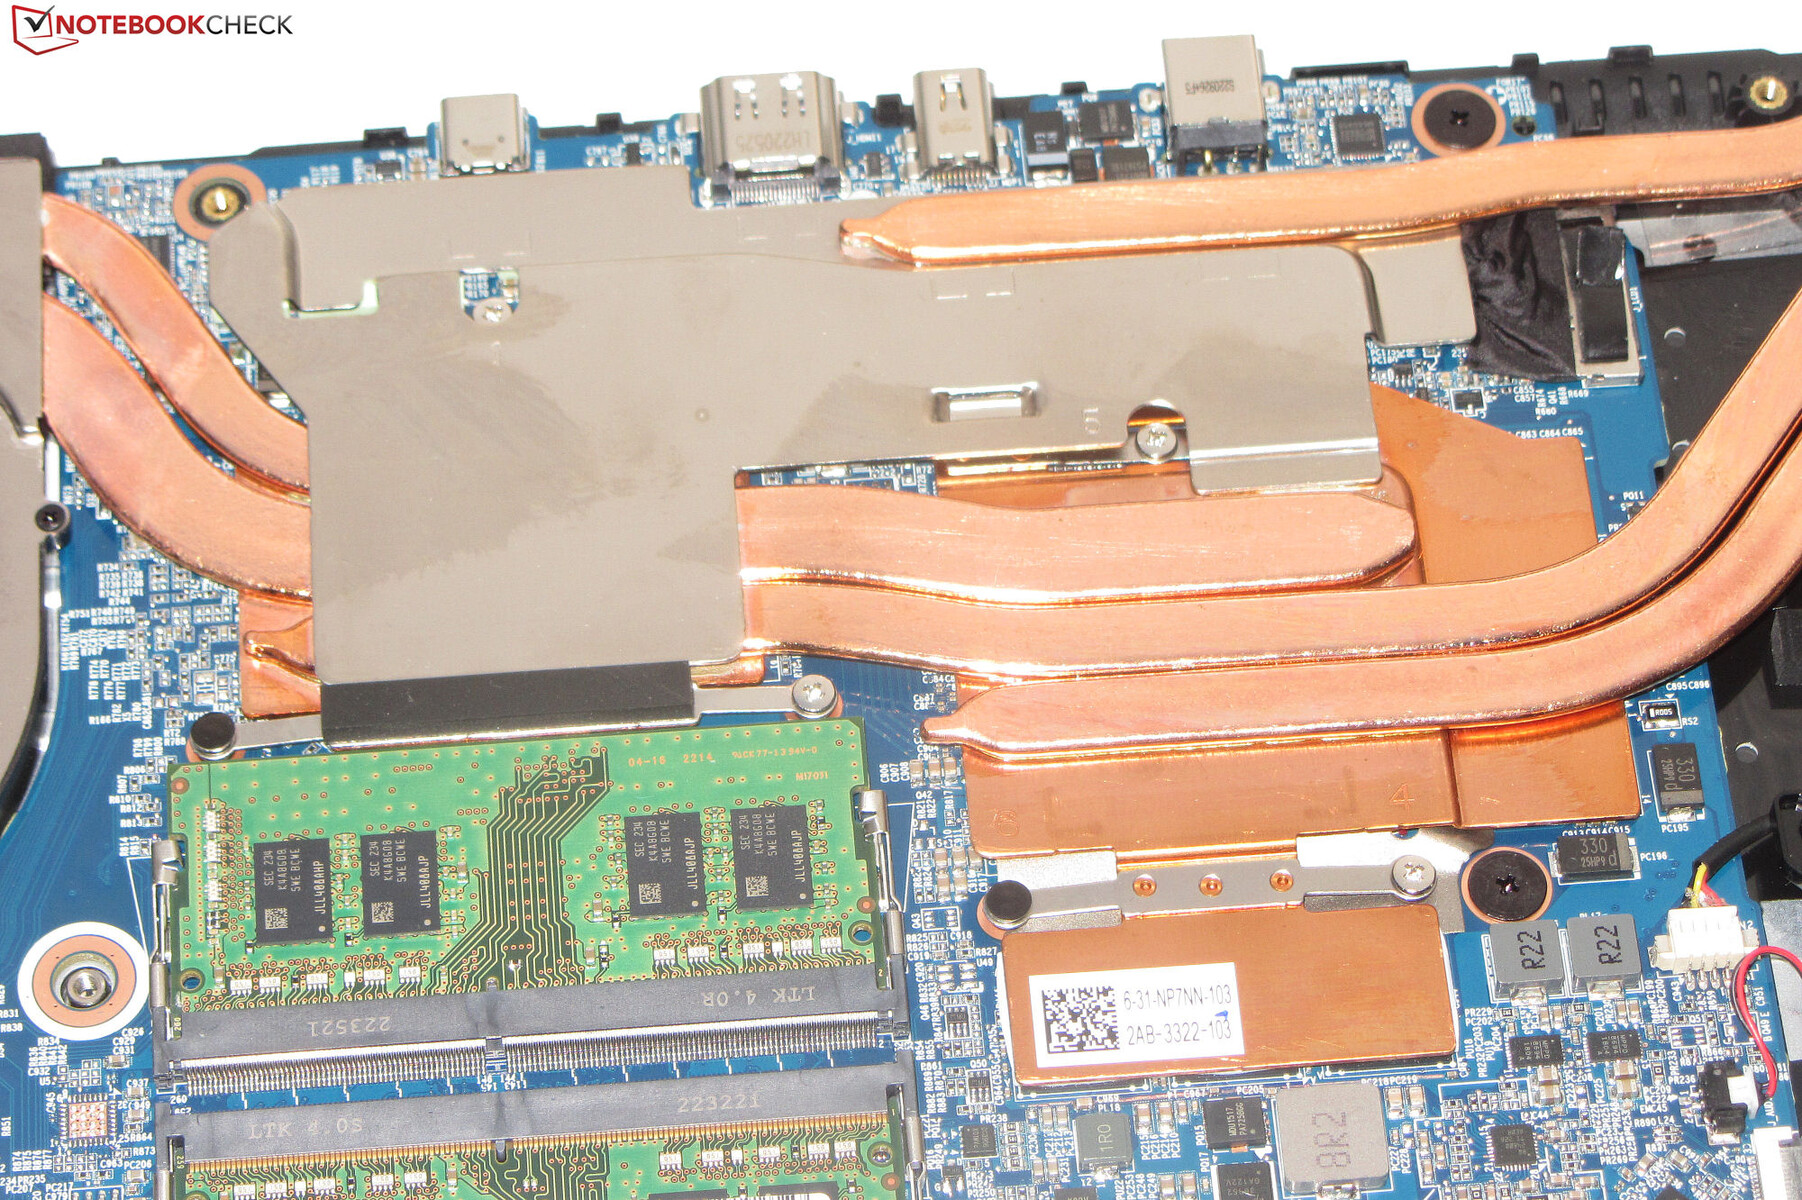
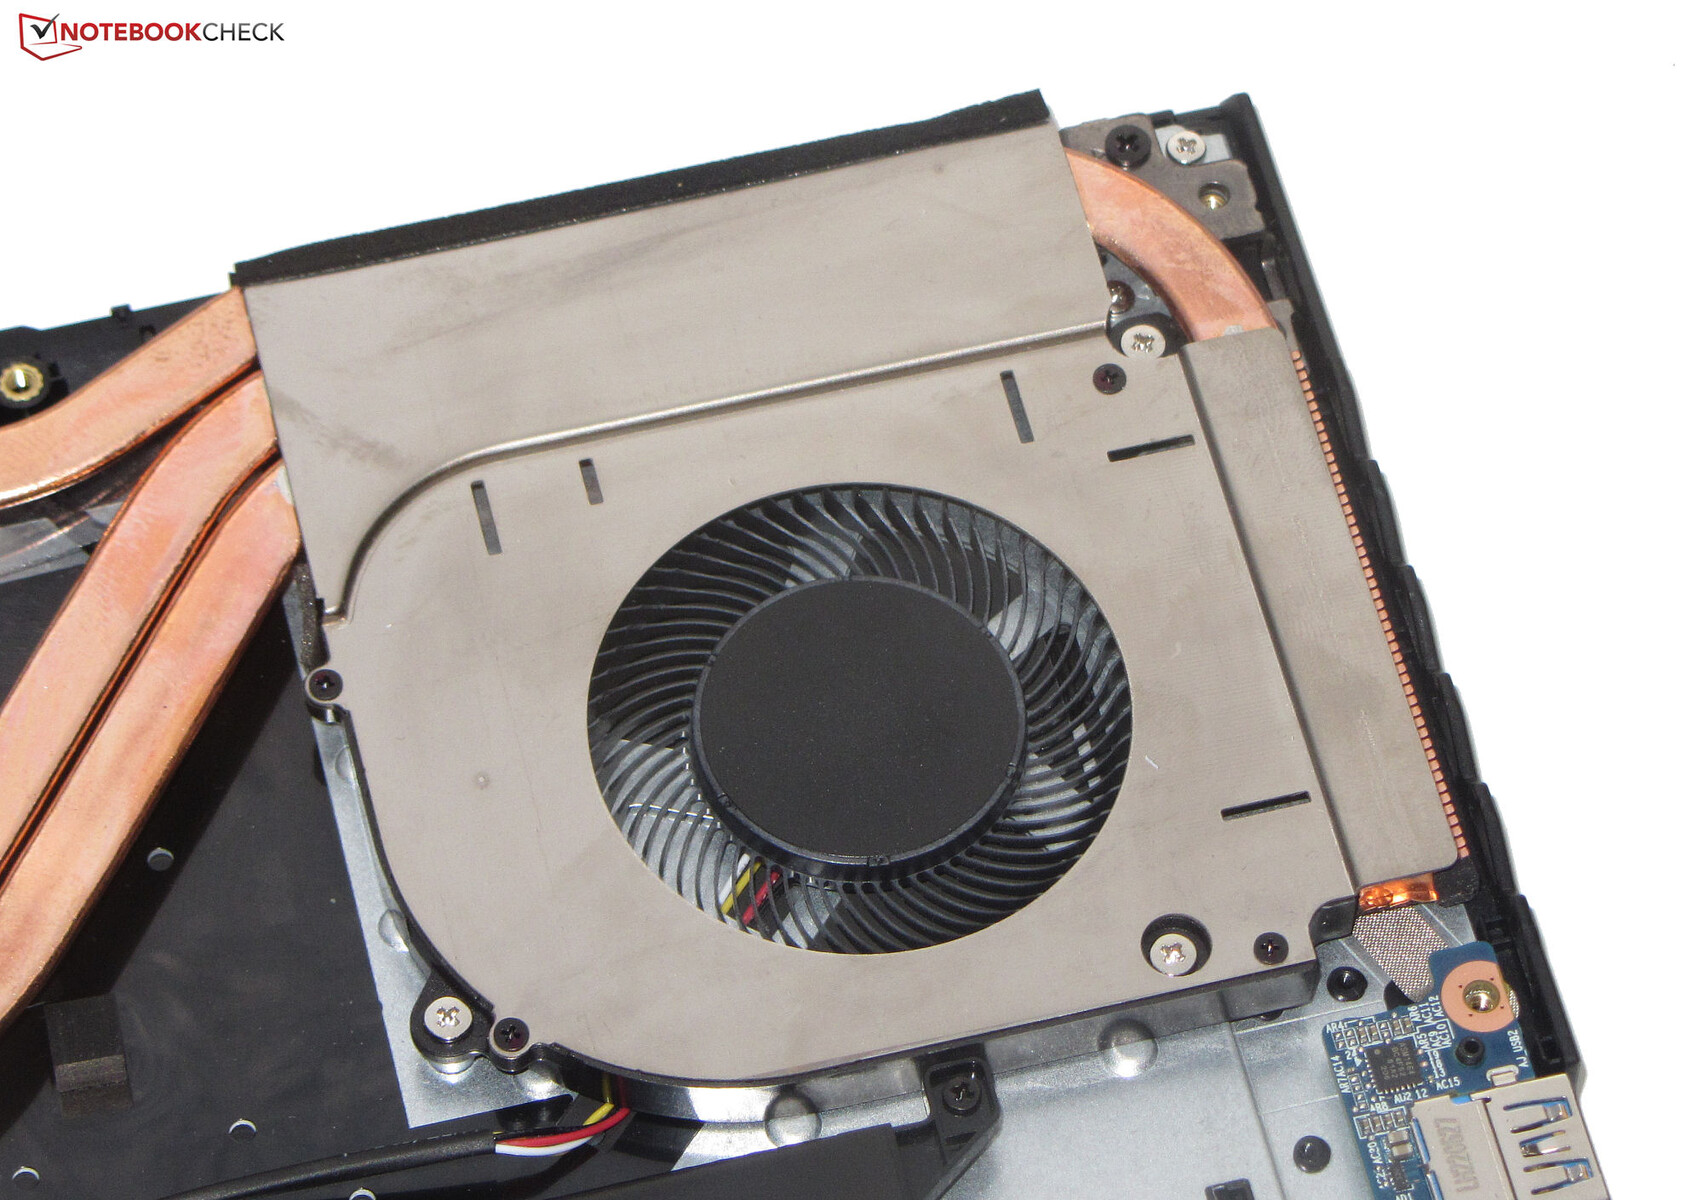
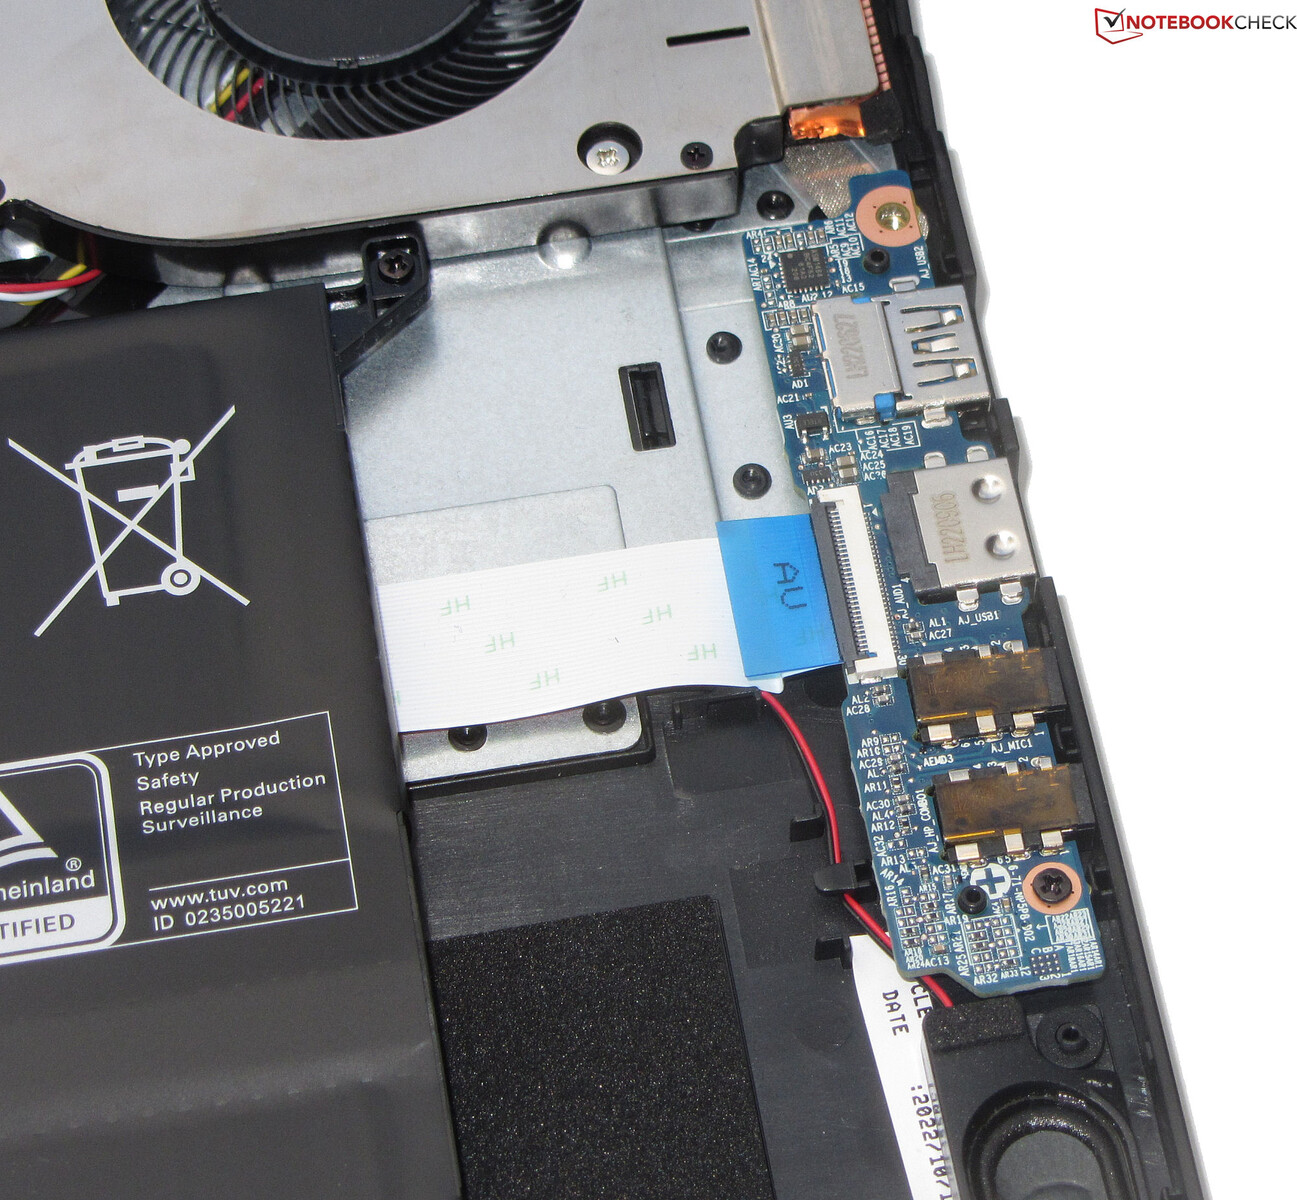
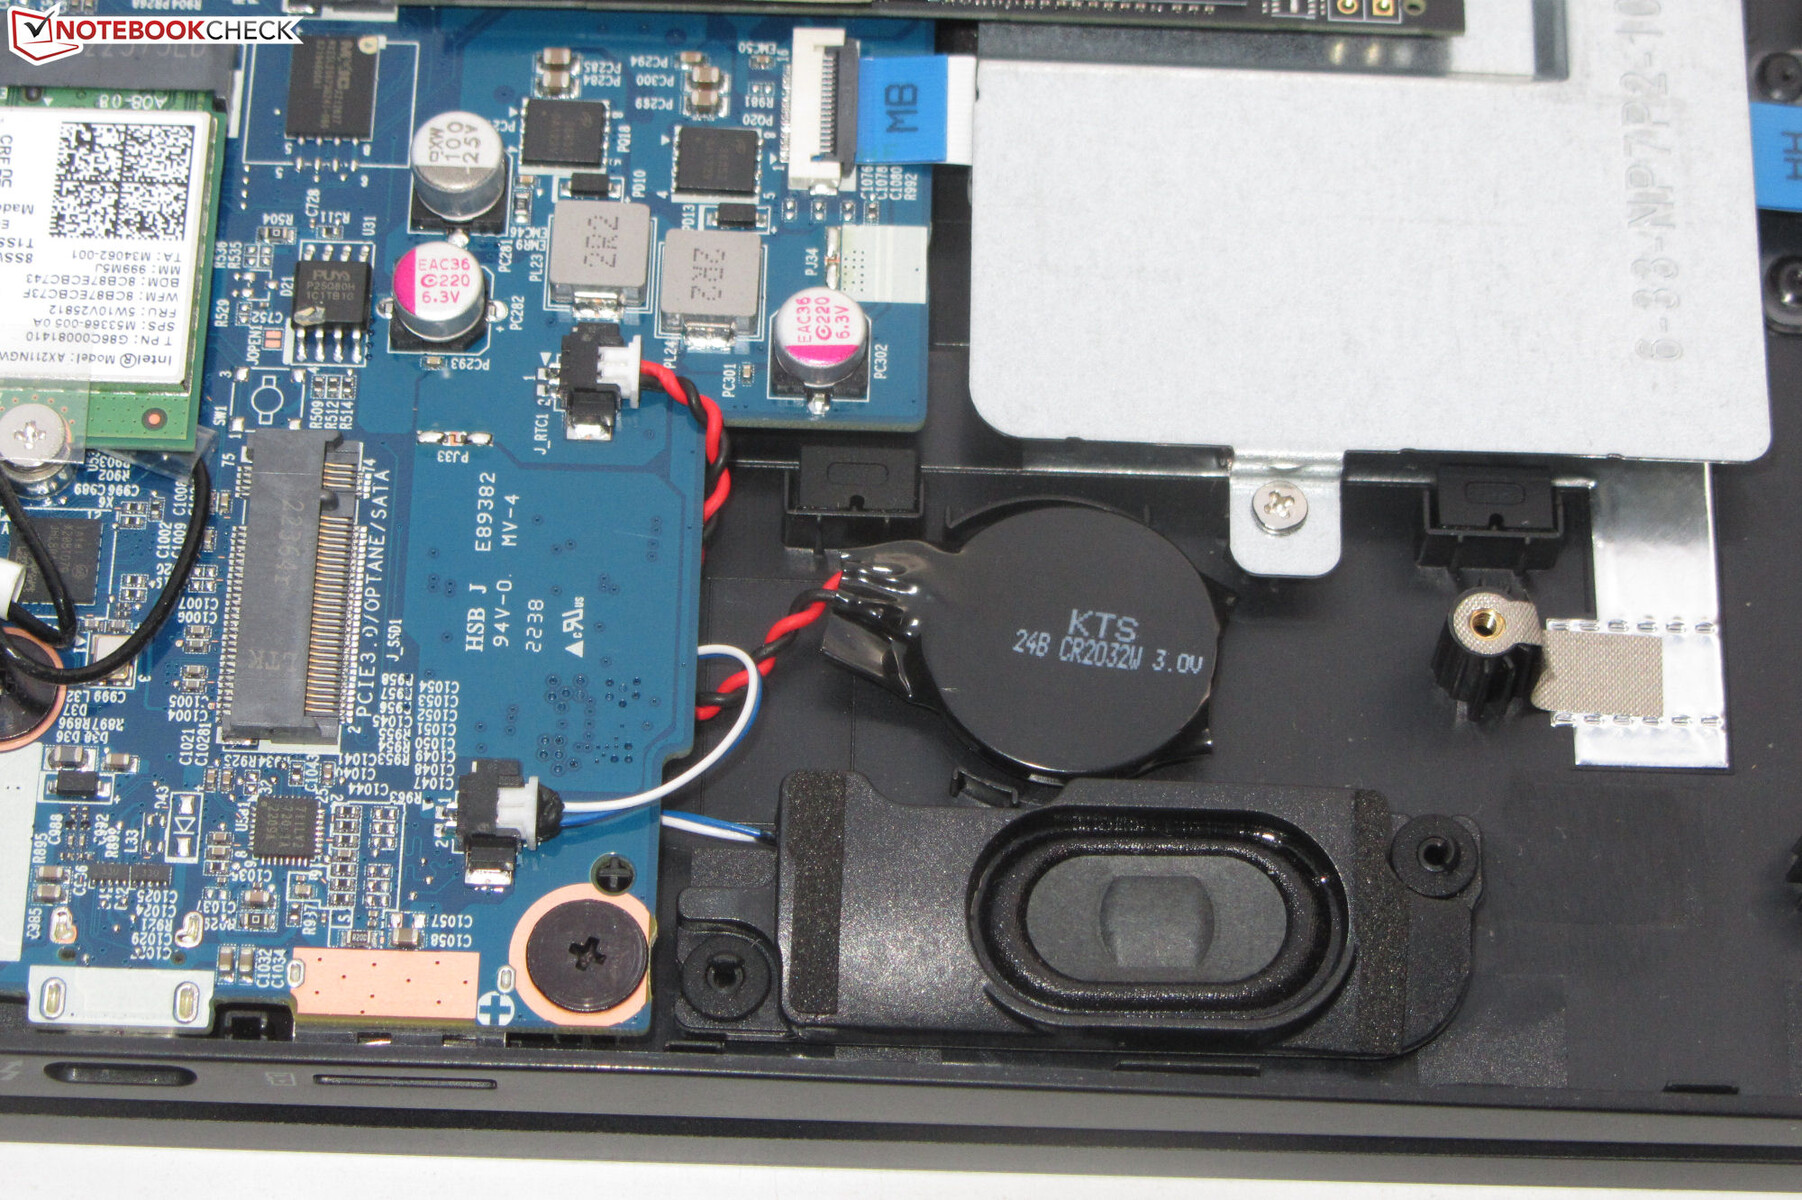
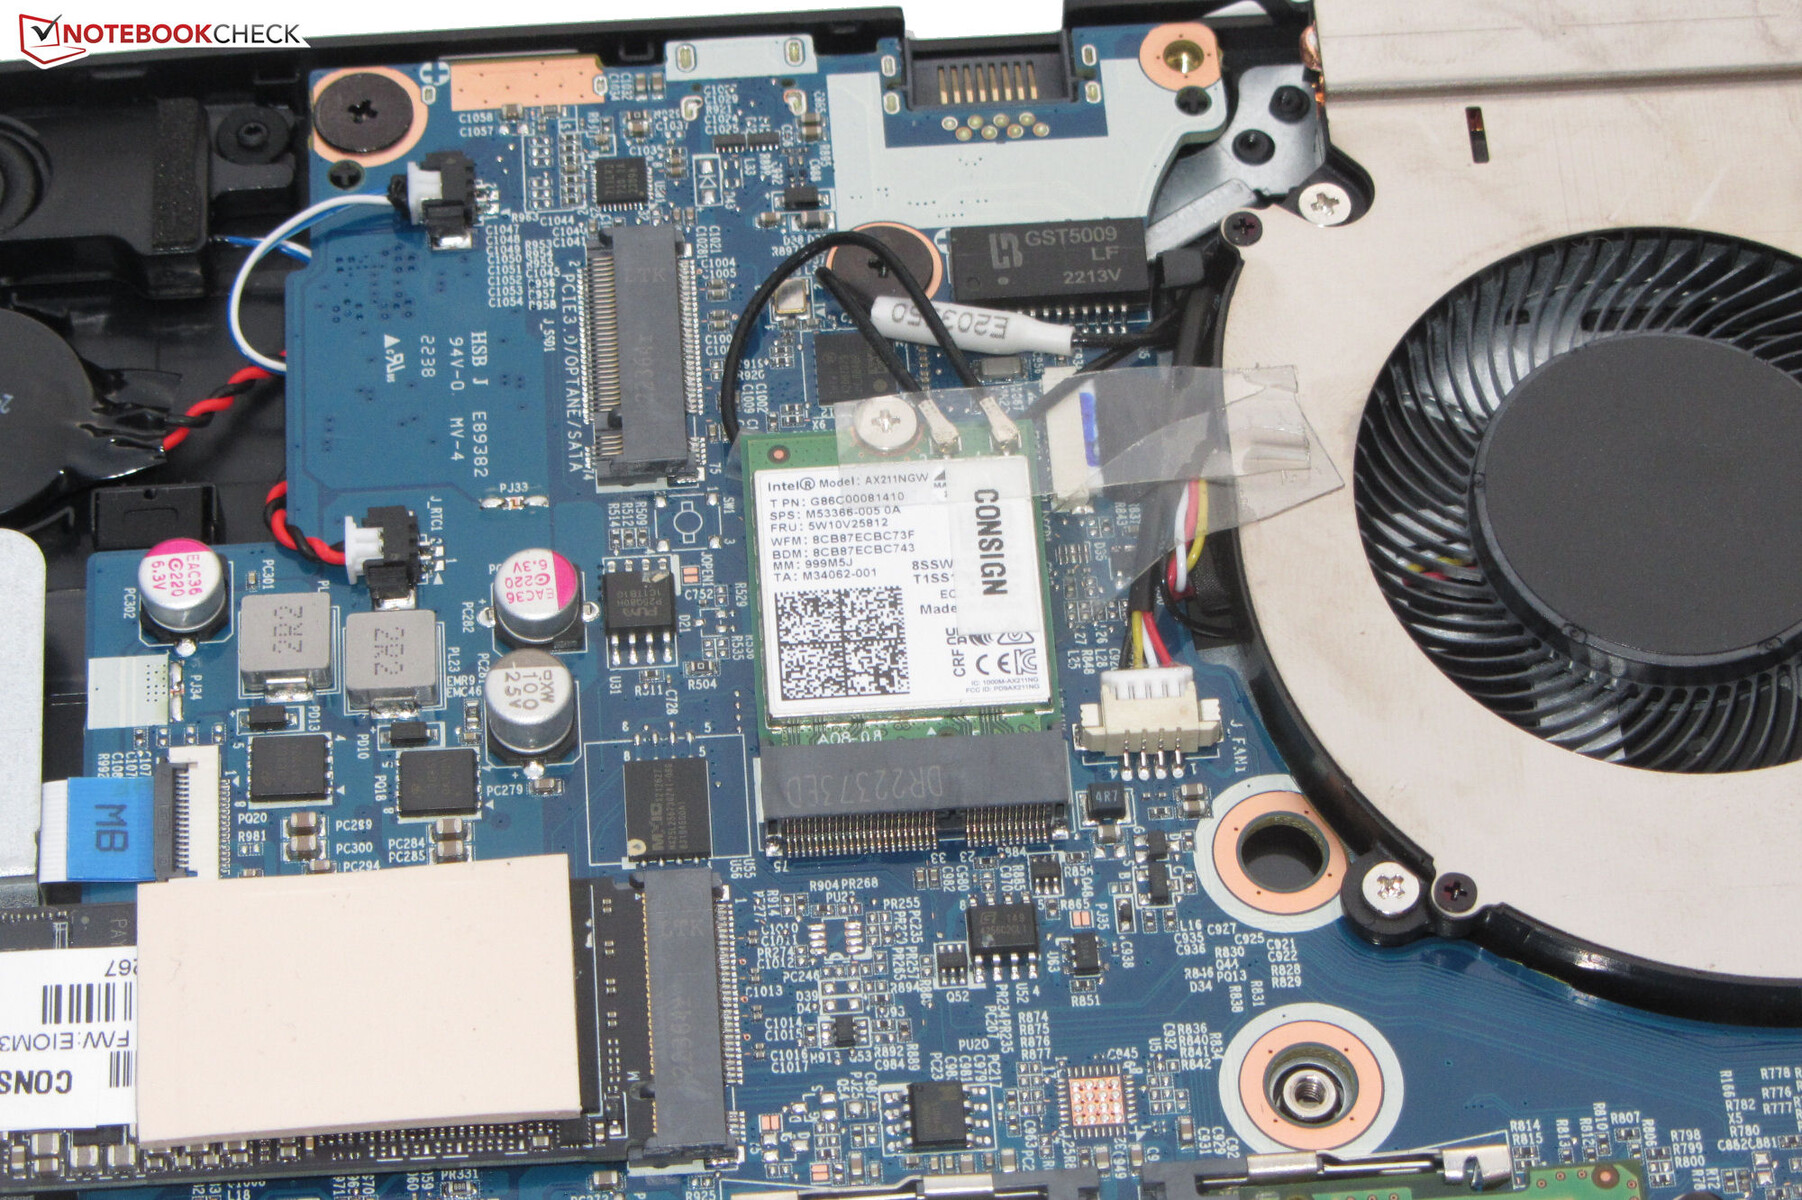
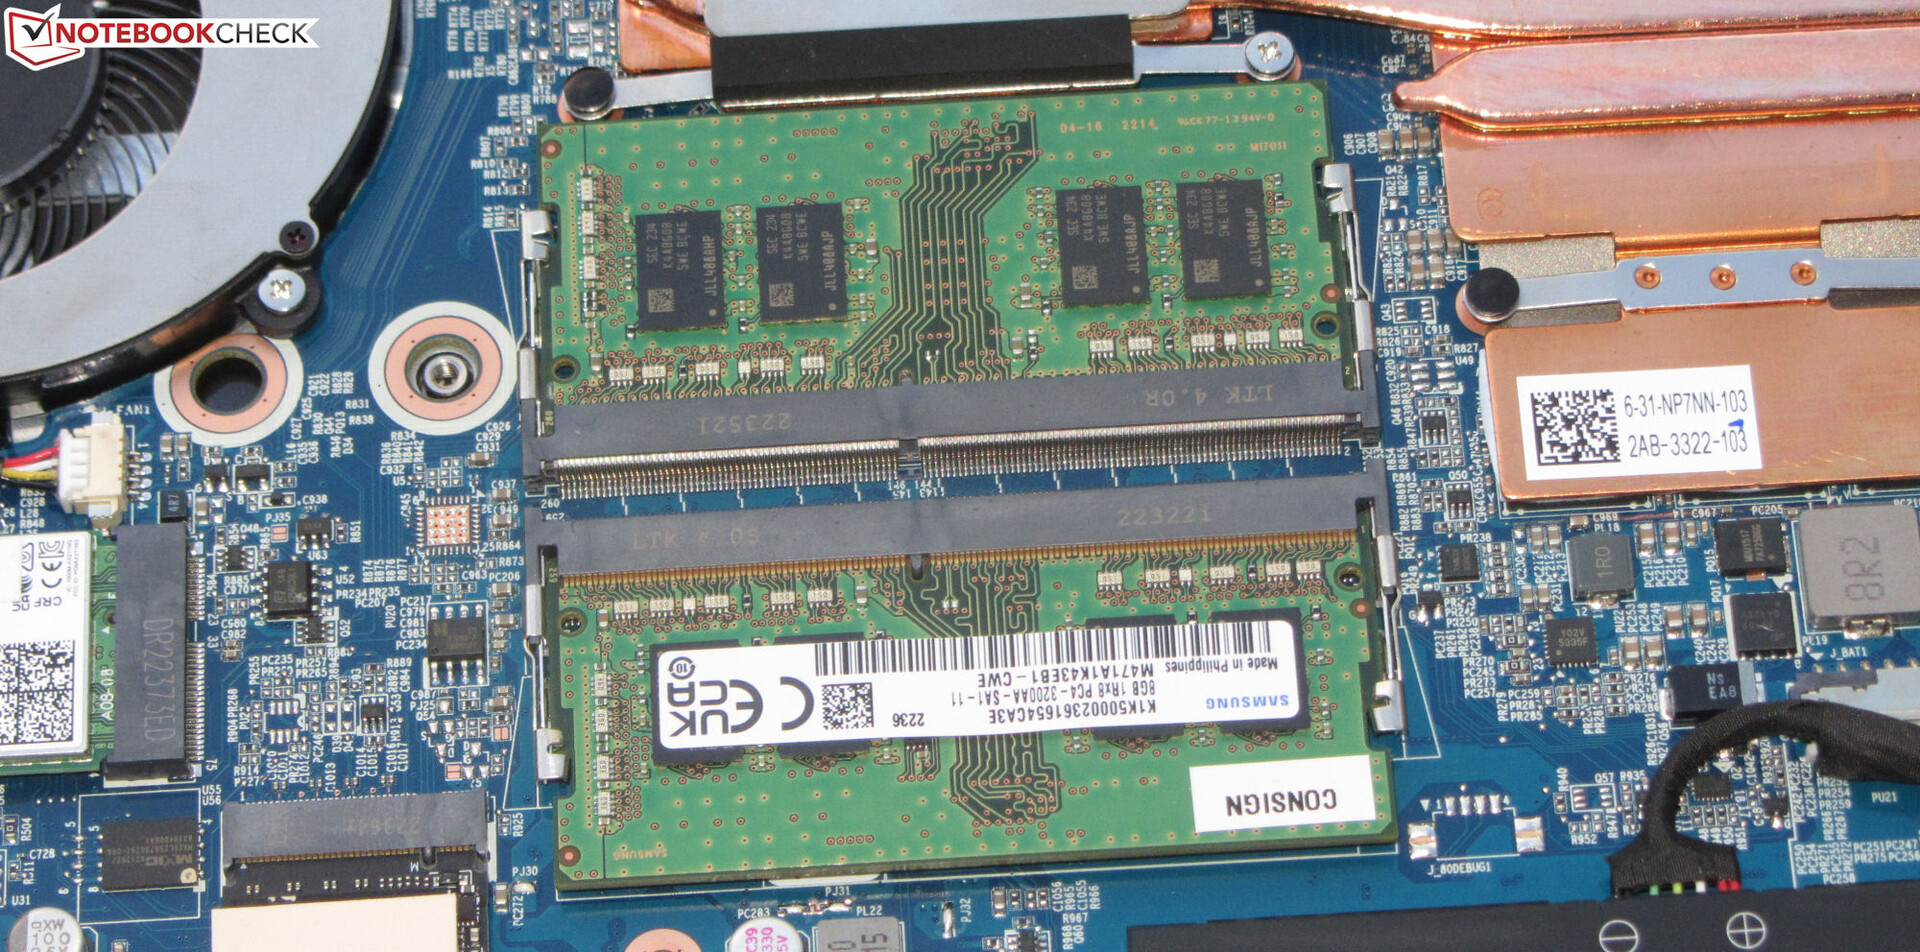
维护
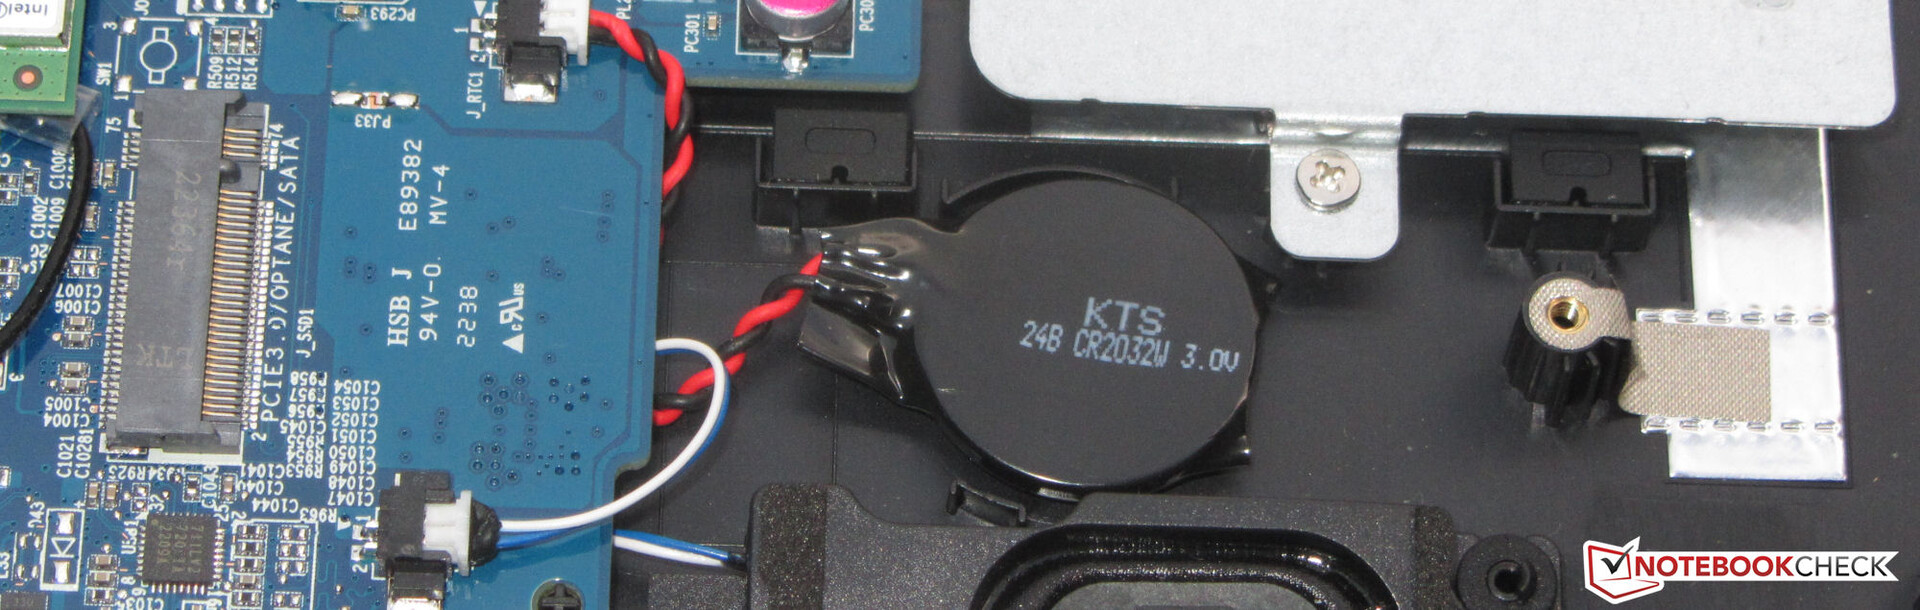
在卸下设备底部的所有螺丝后,可以借助锋利的边缘将底板卸下--不过,它在某些地方连接得非常牢固。在内部,用户可以接触到固态硬盘(PCIe 4)、次级M.2插槽(PCIe 3)、Wi-Fi模块、内存插槽(都在使用)、BIOS电池、风扇和主电池。
担保
17.3英寸的技嘉机型有一个标准的一年有限保修。目前没有延长保修期的规定。
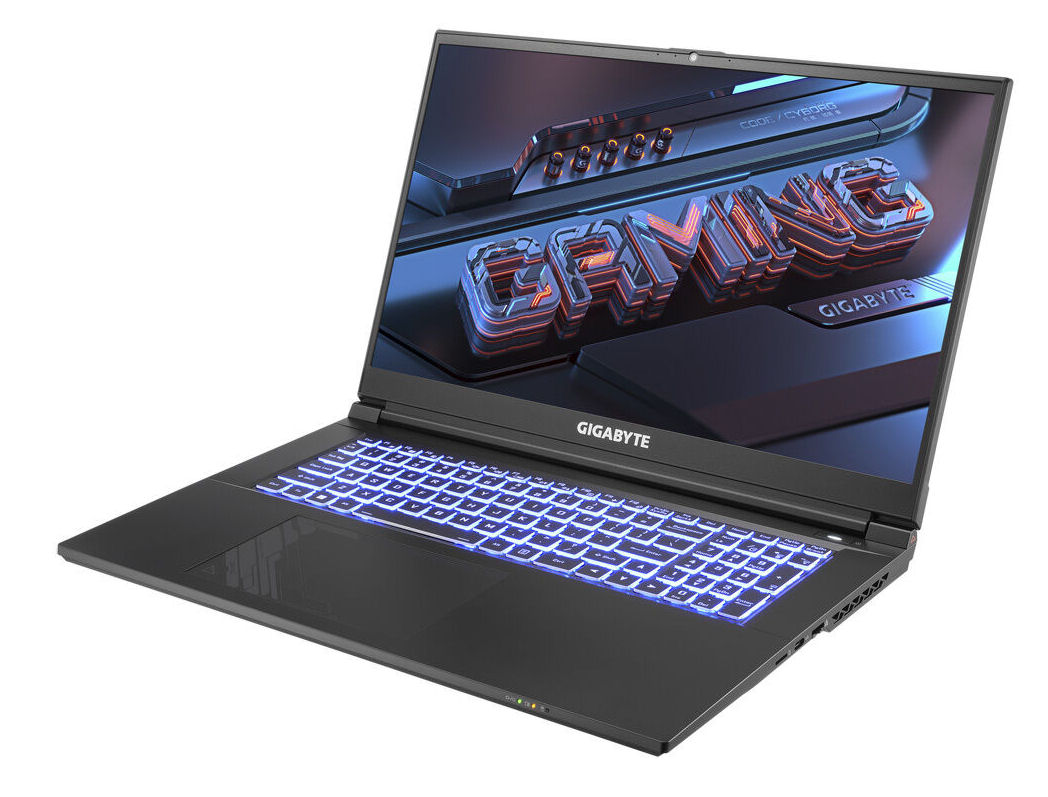
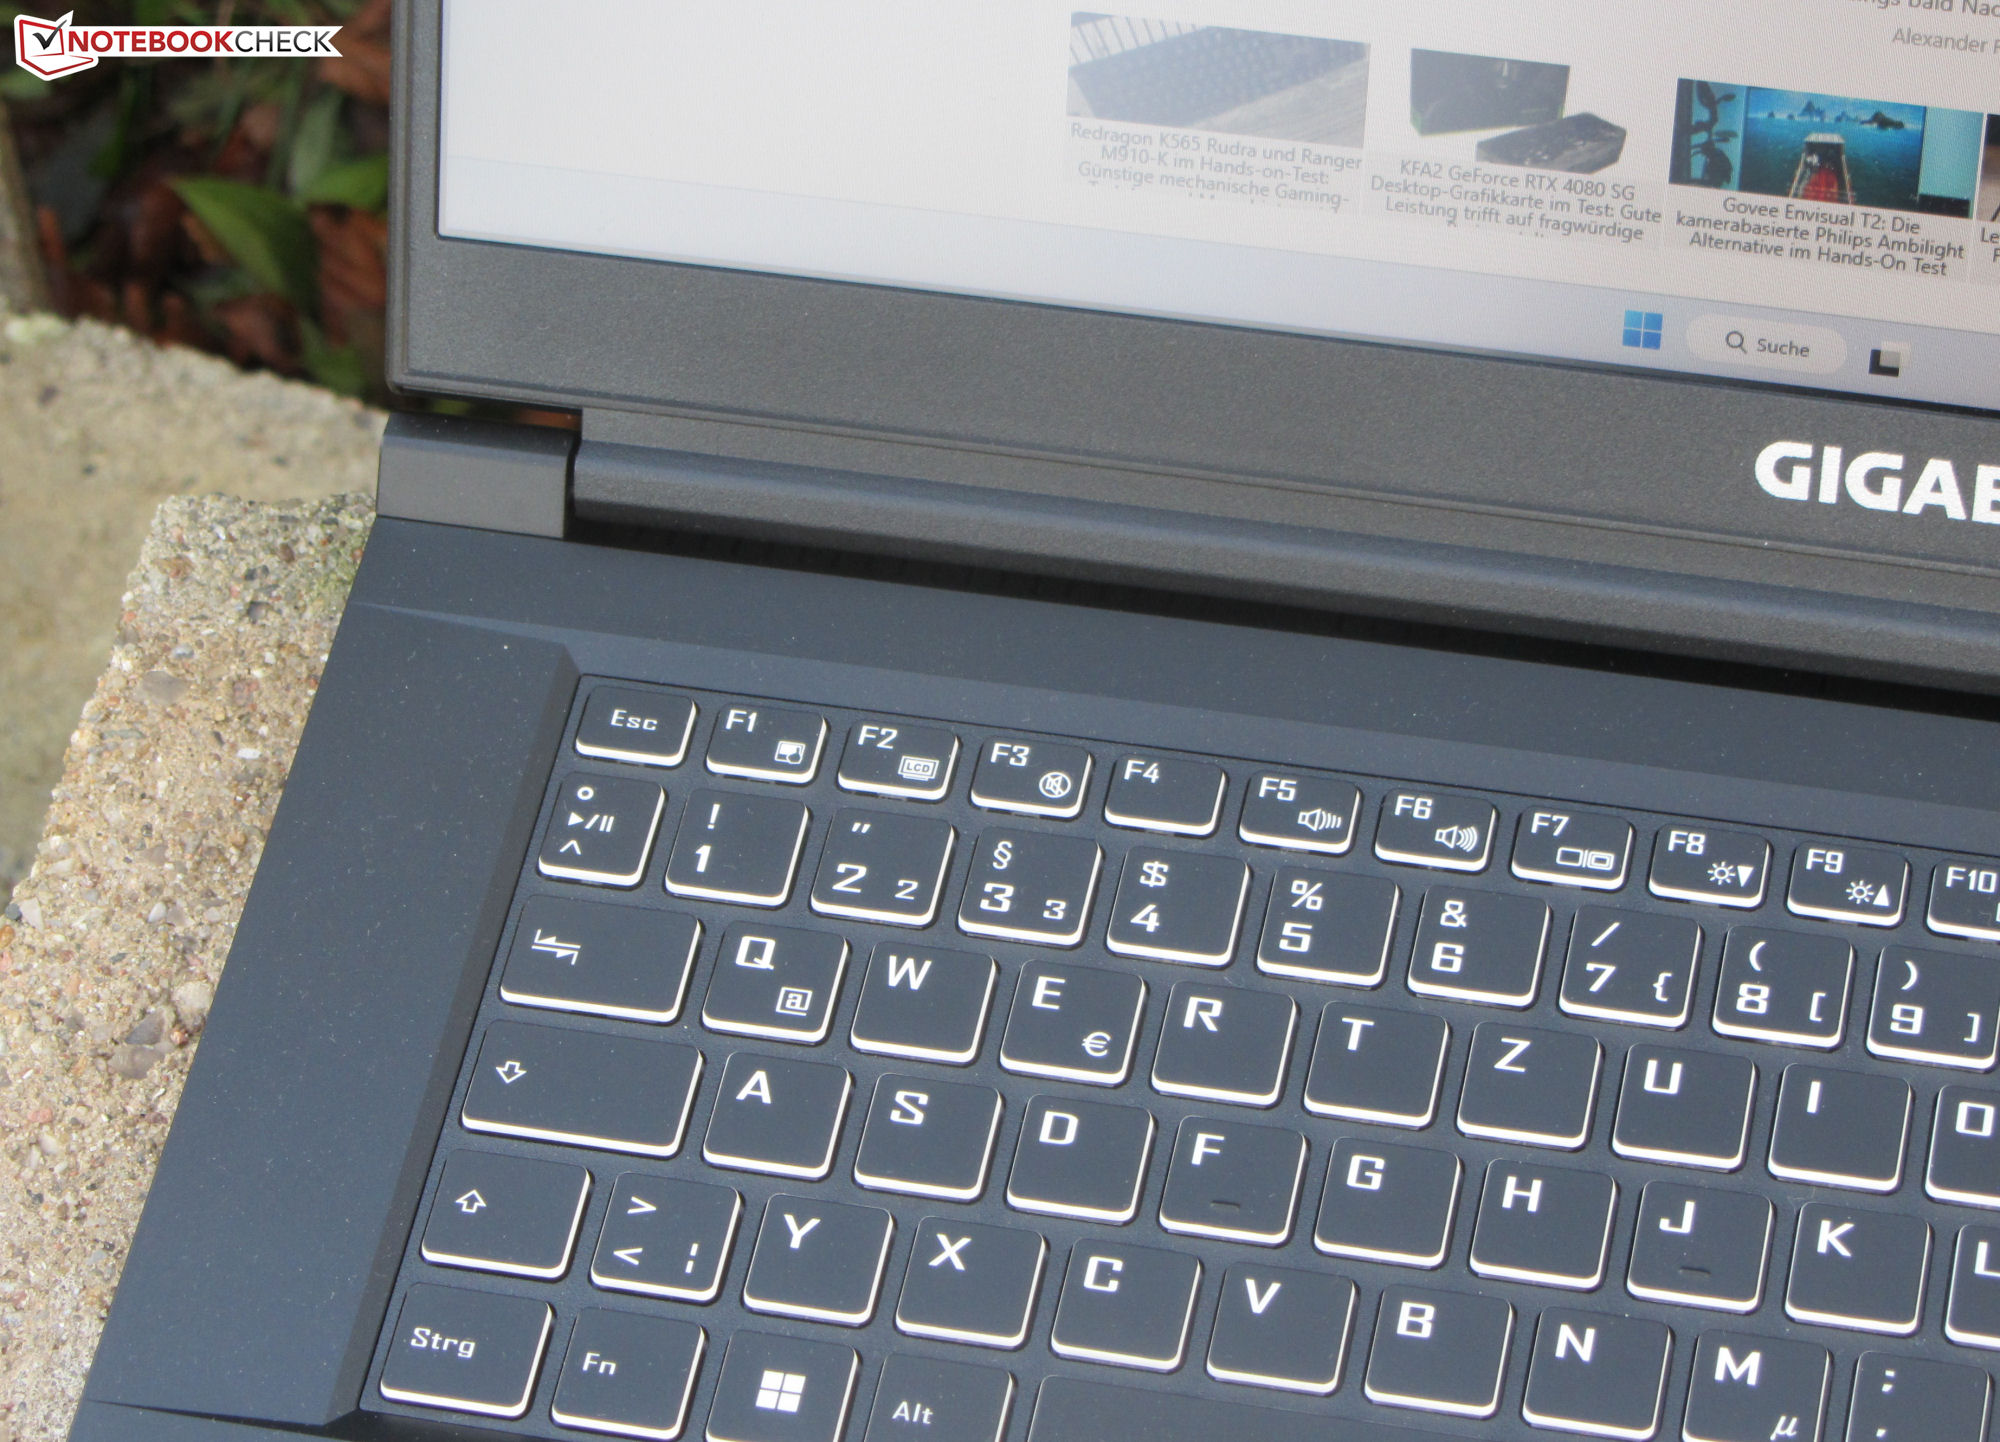
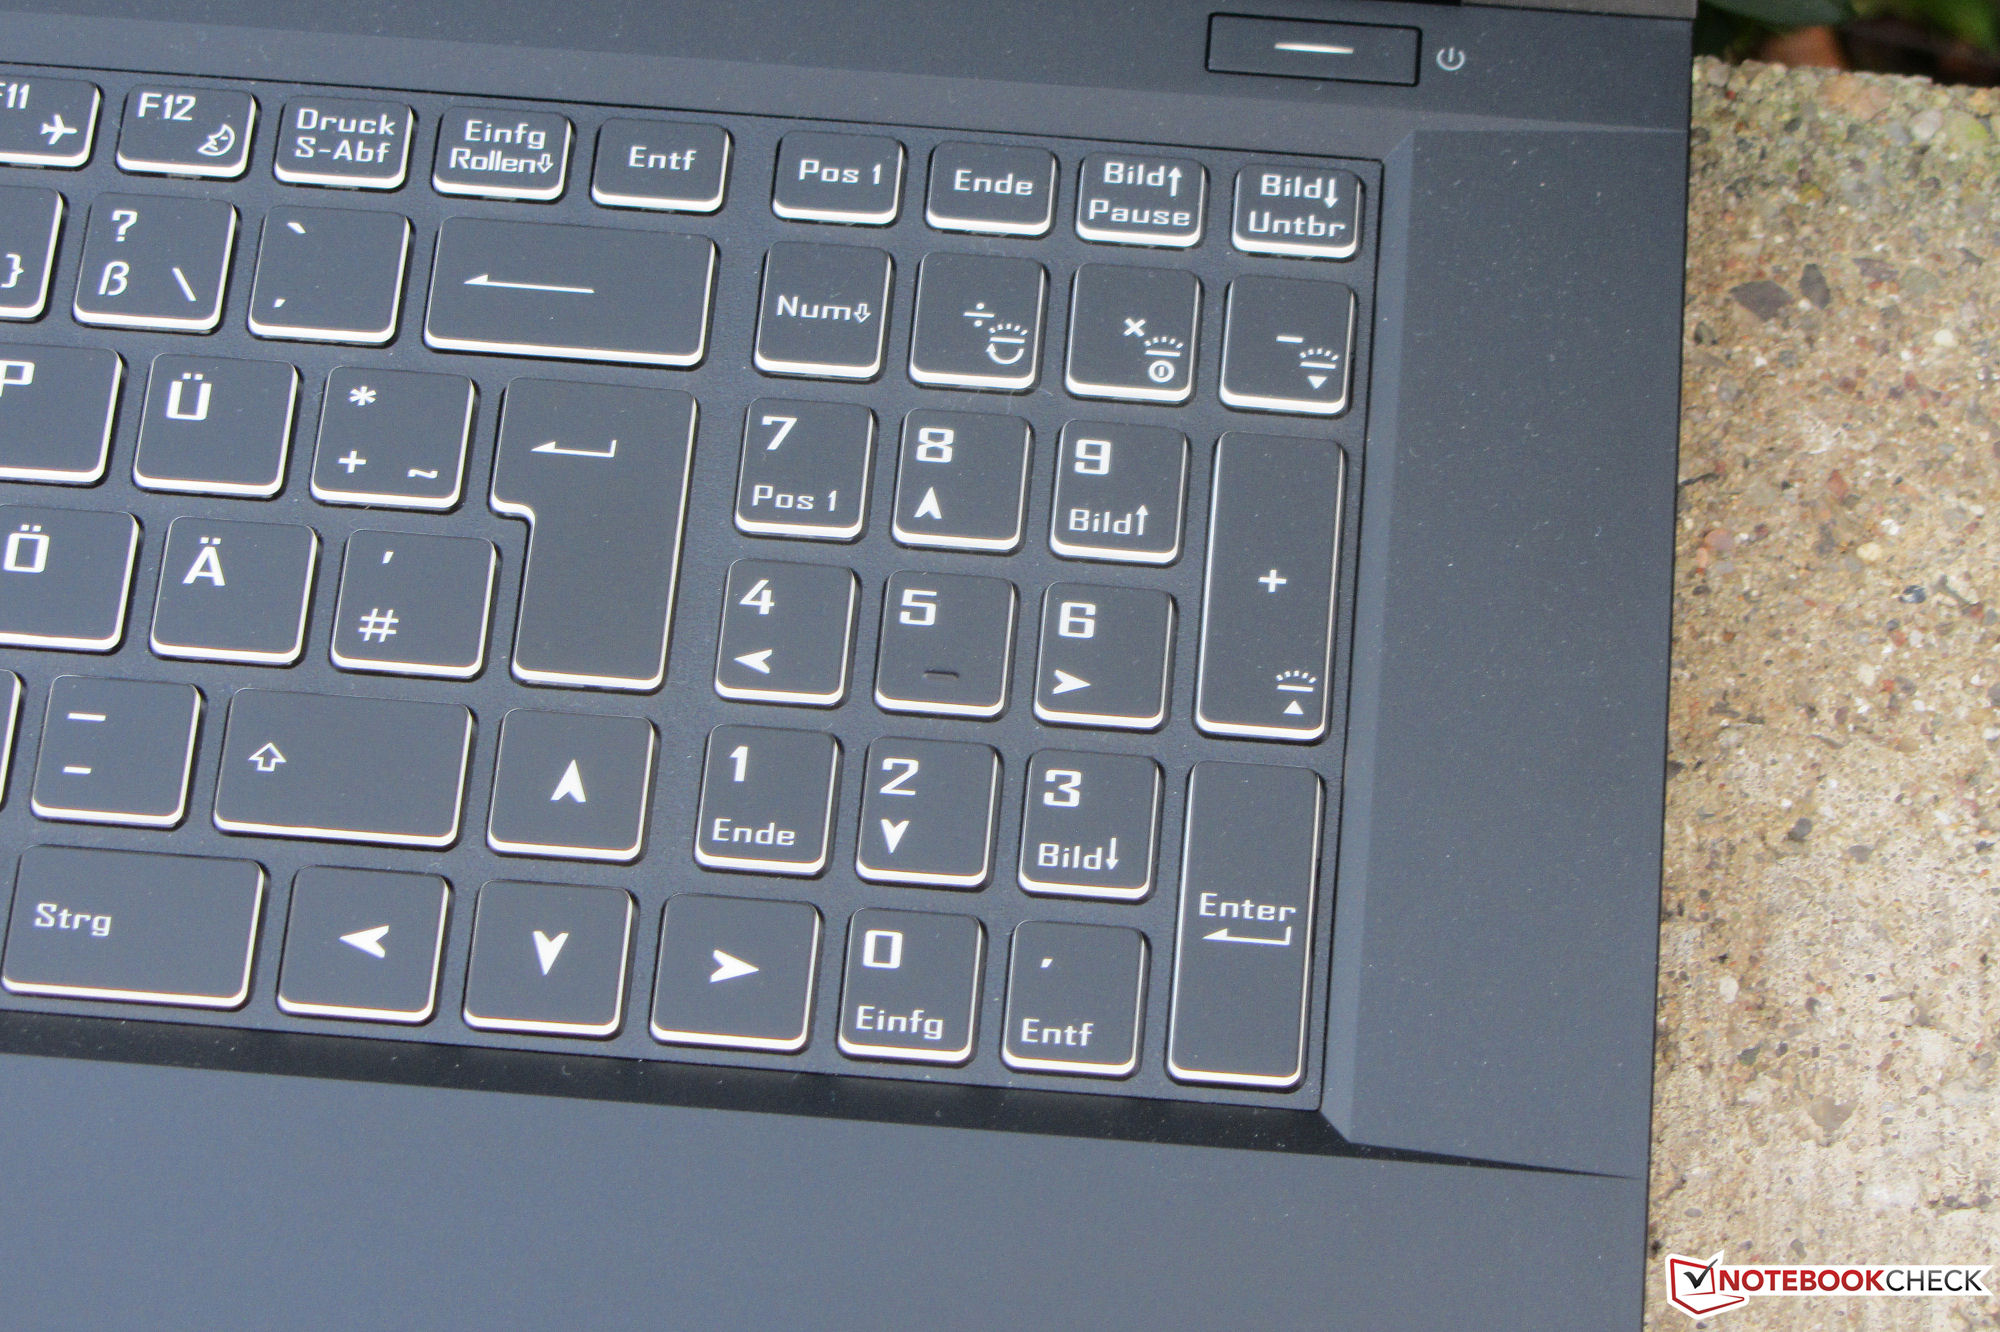
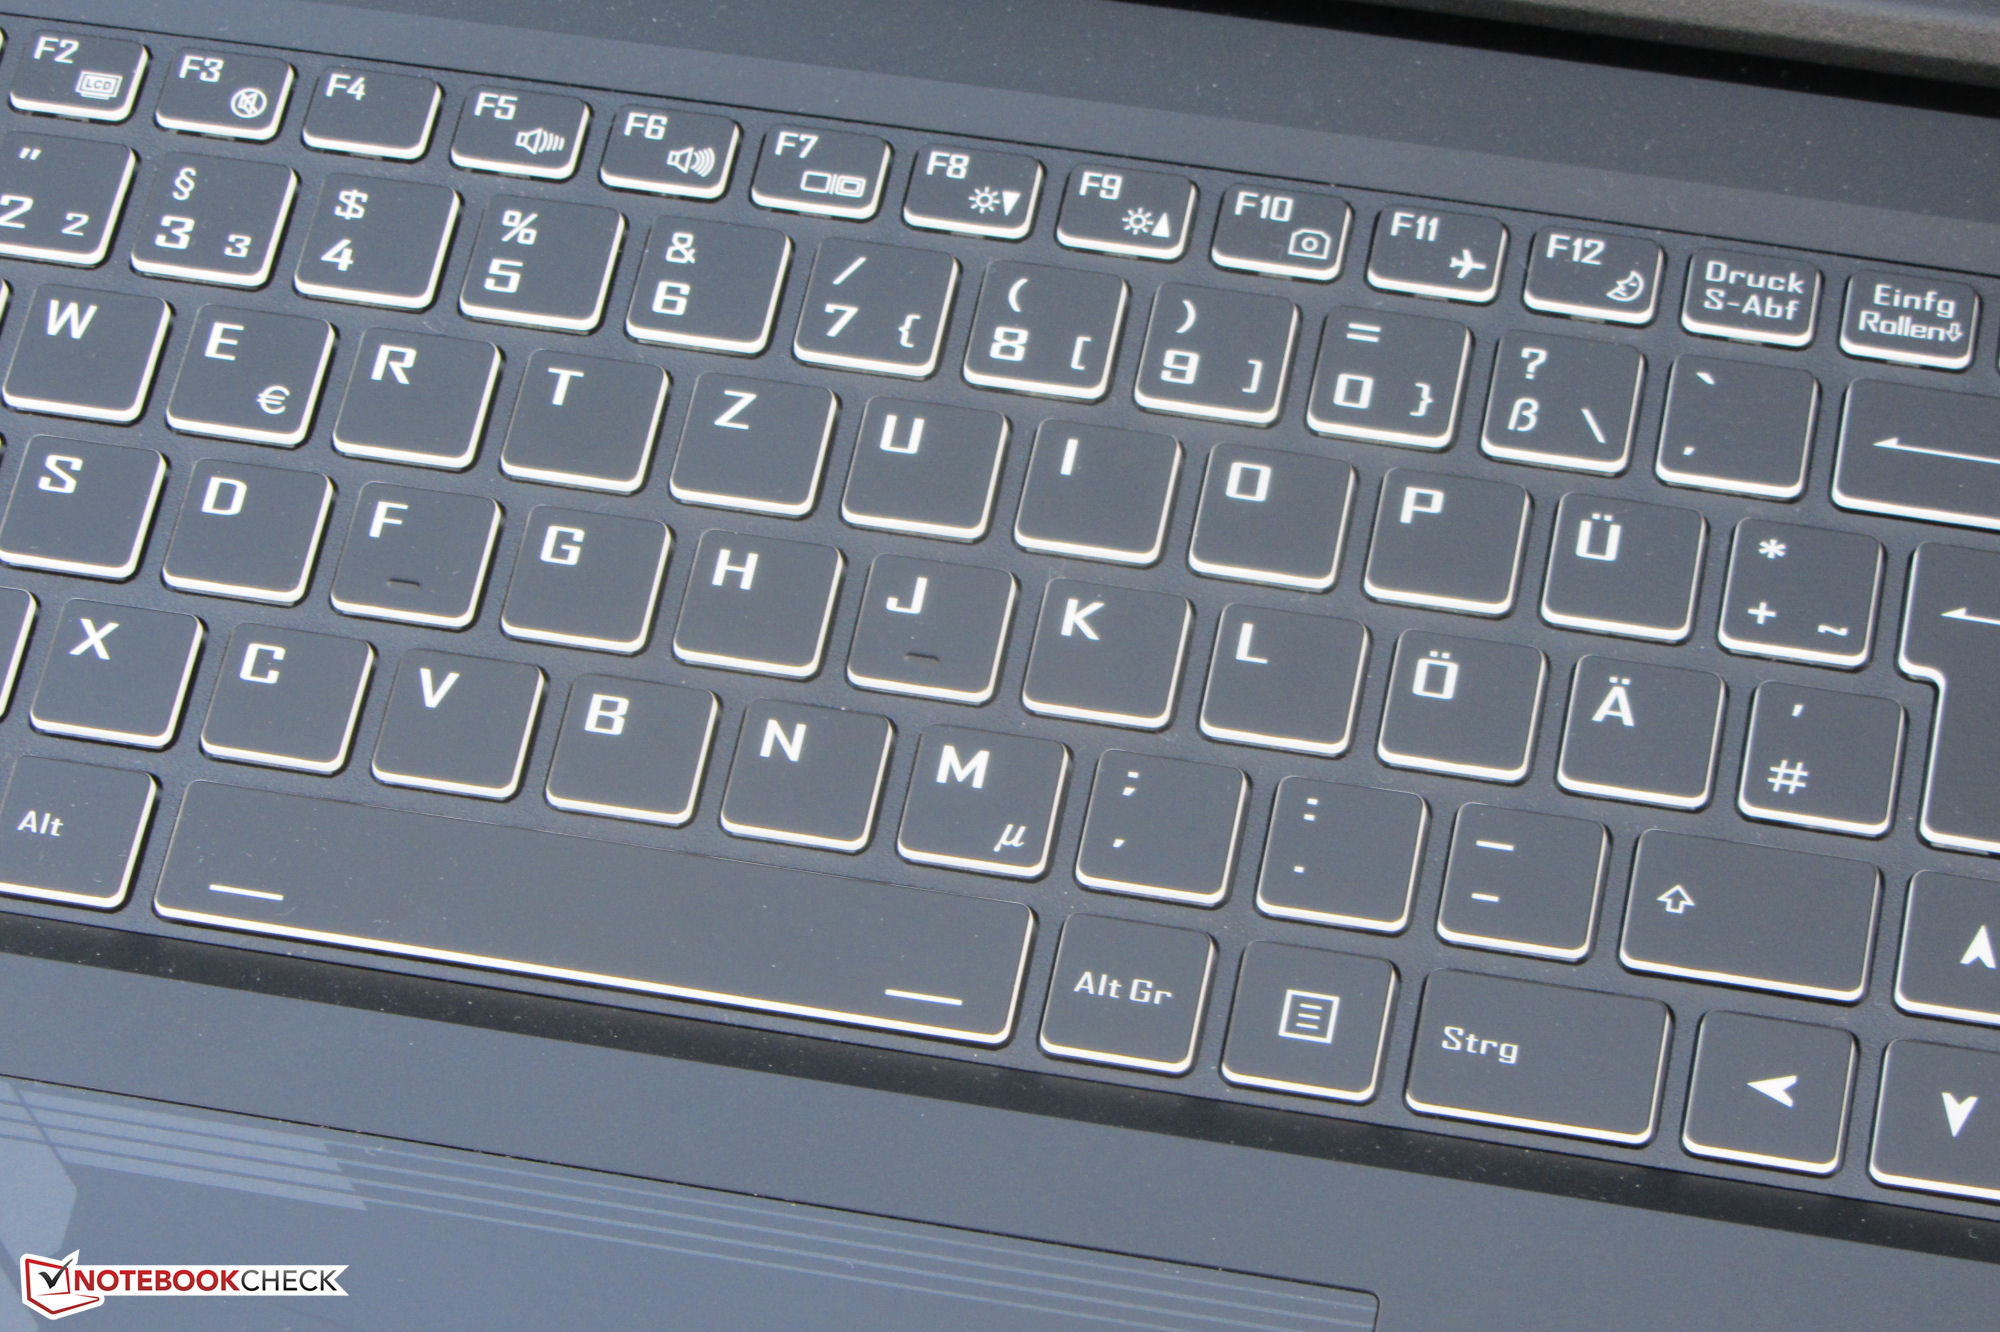
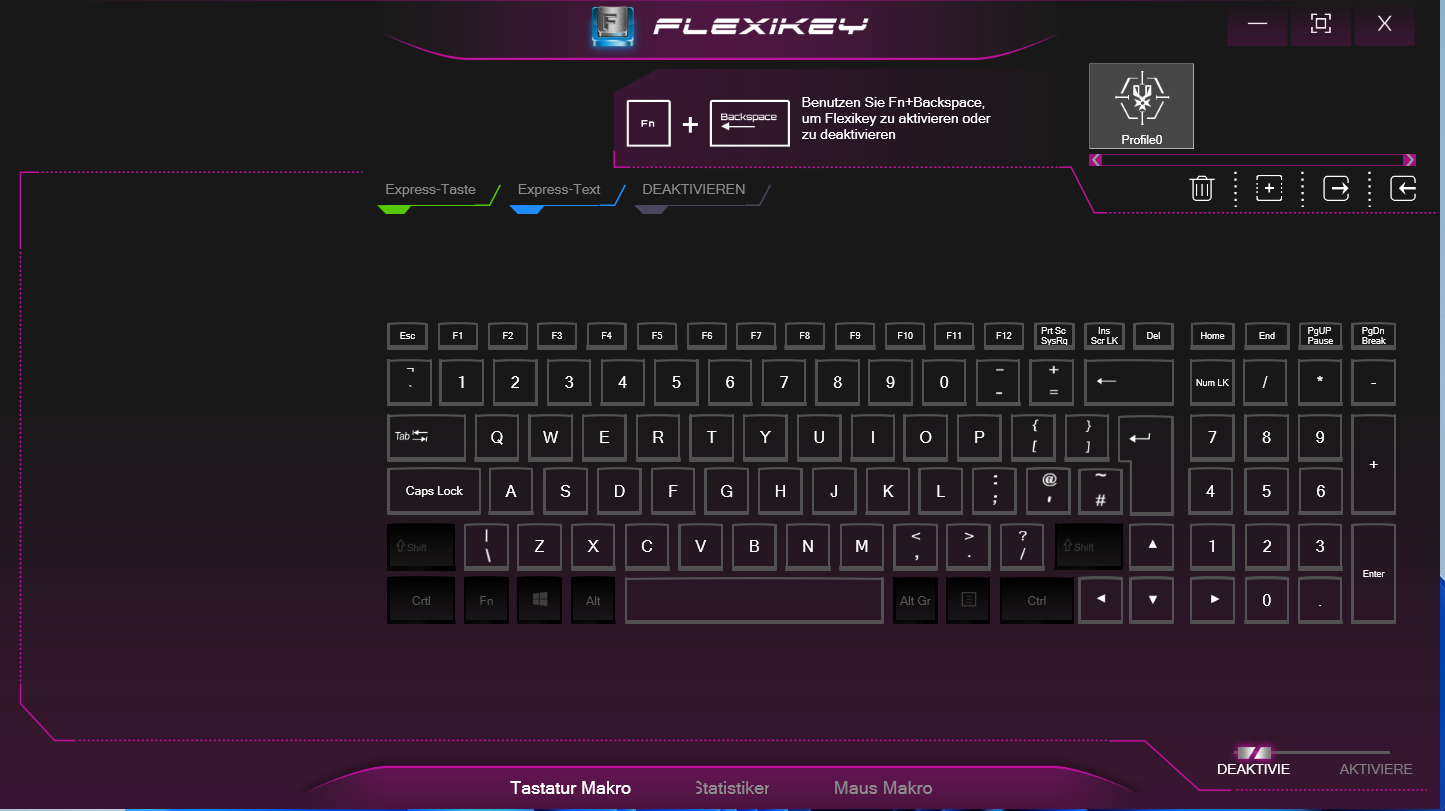
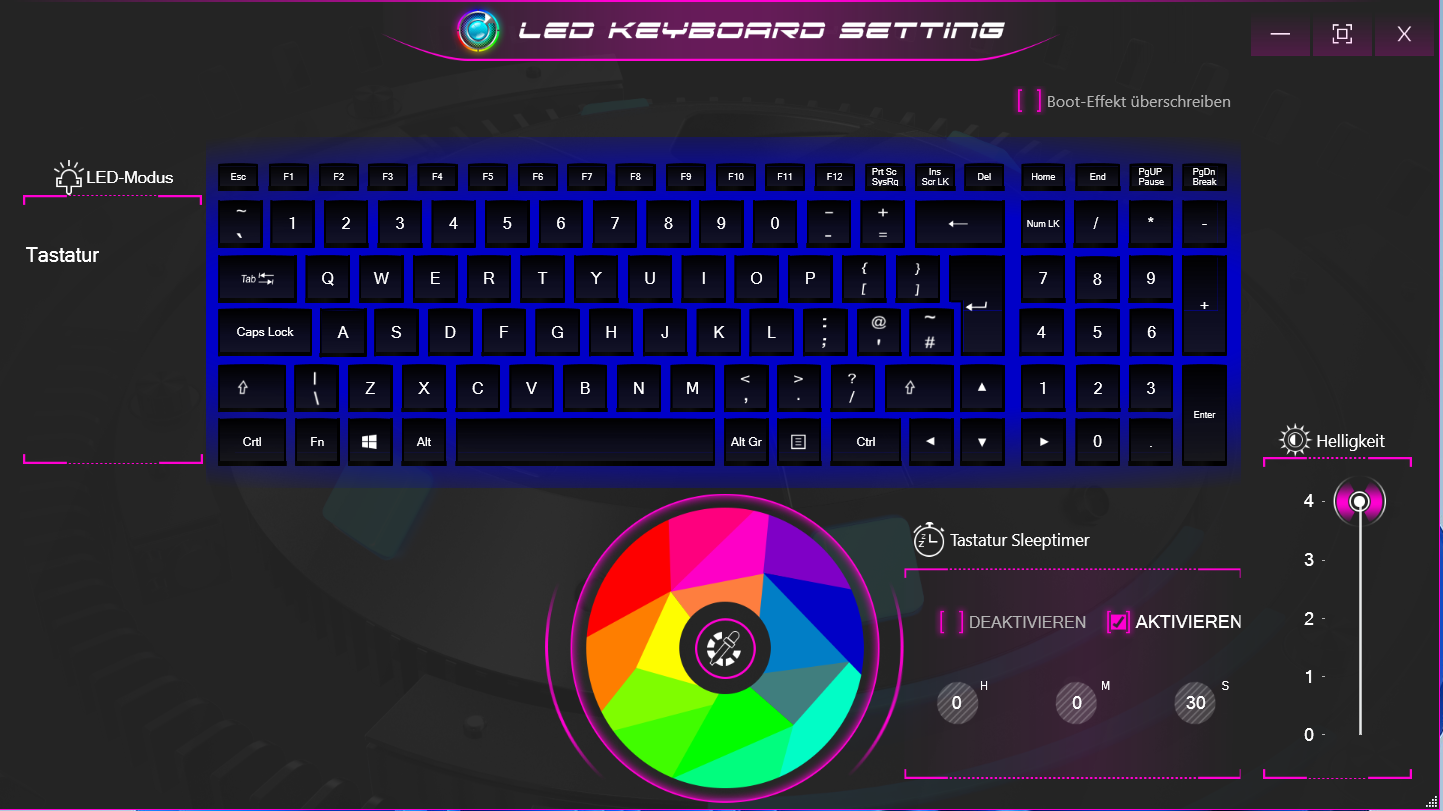
输入设备 - 带RGB背光的键盘
键盘
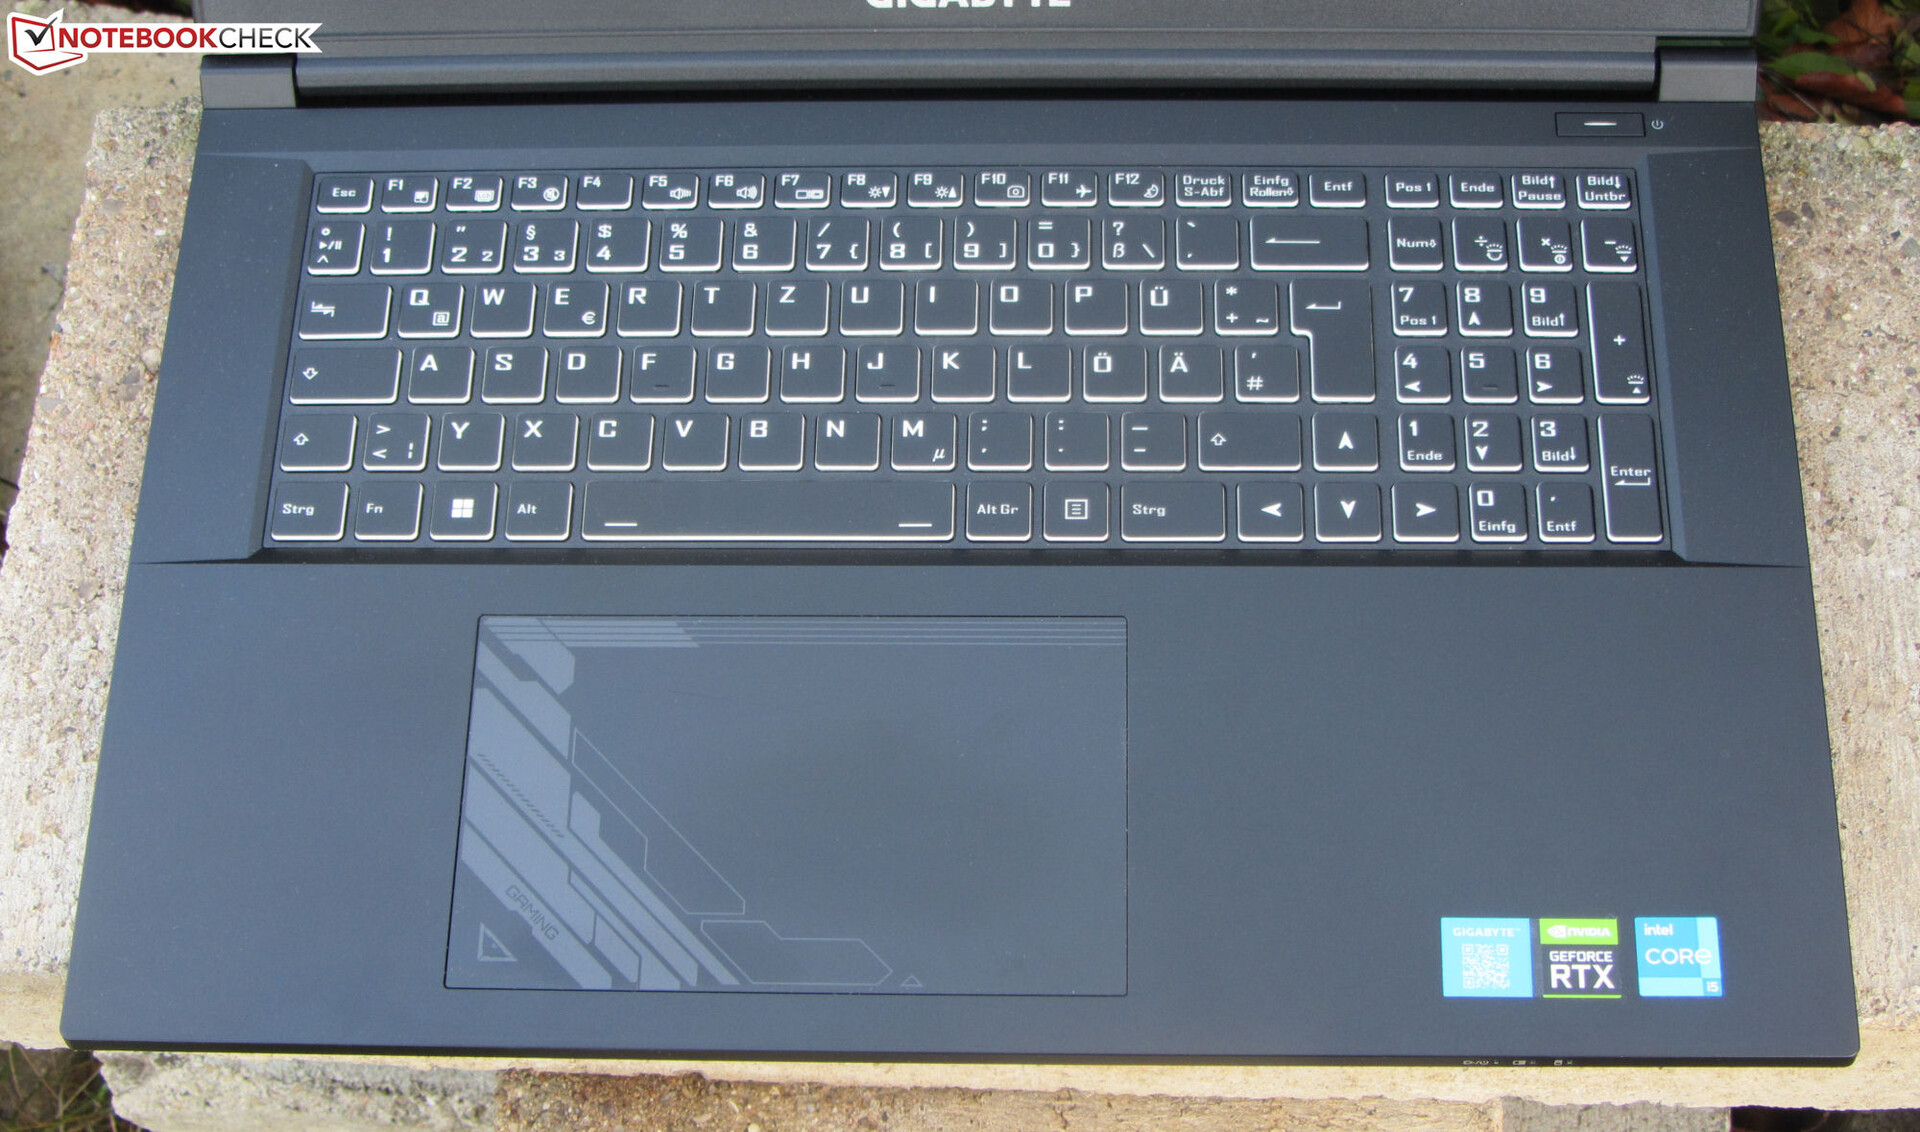
背光Chiclet键盘的平坦、光滑的按键具有适度的行程和明显的启动点。键的反馈可以更牢固。键盘区域在打字时略微有些松动,尽管这在实践中不应该是一个问题。好。键盘使用全尺寸的方向键。RGB背光(四级)可以通过三个功能键控制。总的来说,技嘉提供了一个适合日常使用的好键盘。
触摸板
由于大的、支持多点触摸的点击板(约15.2 x 9.1厘米),在技术上不需要外部鼠标,因为光滑的表面提供了良好的滑行性能。它对所有的角落都有反应。触摸板的行程很短,有一个明显的启动点。
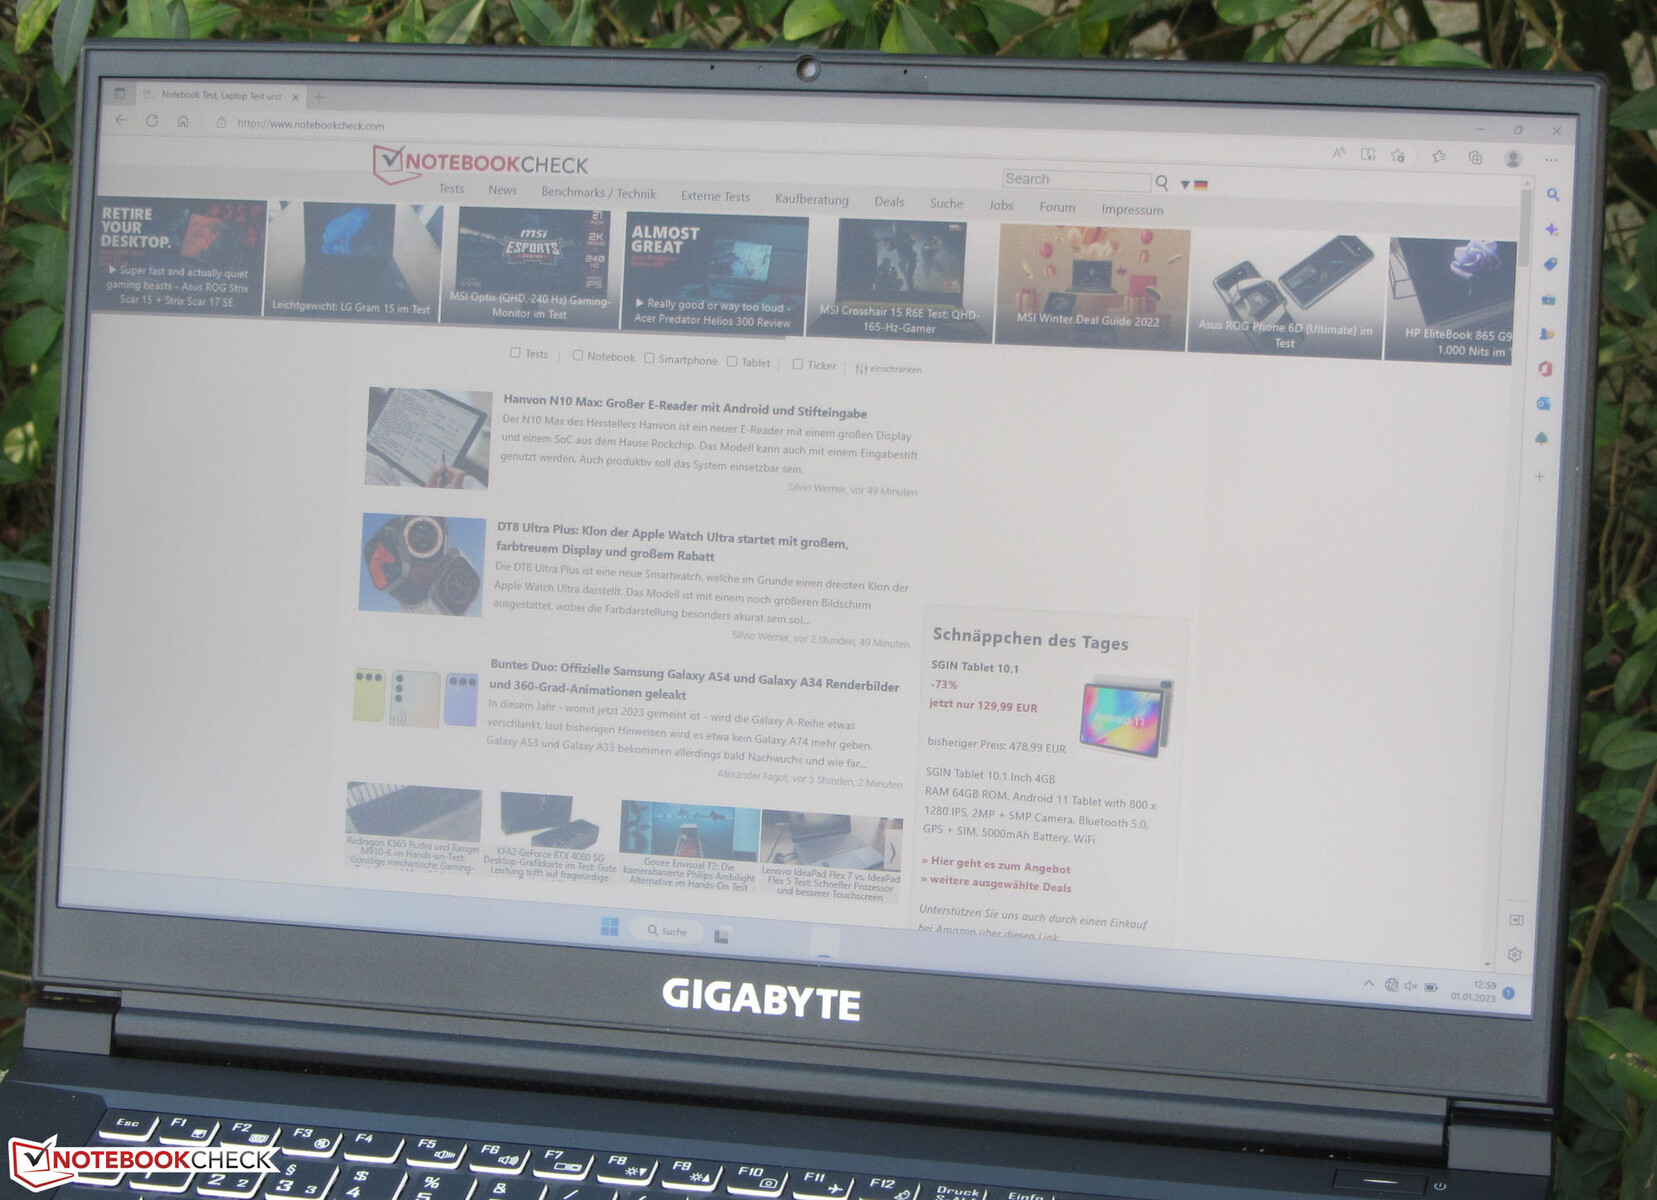
显示屏 - 300-Hz IPS
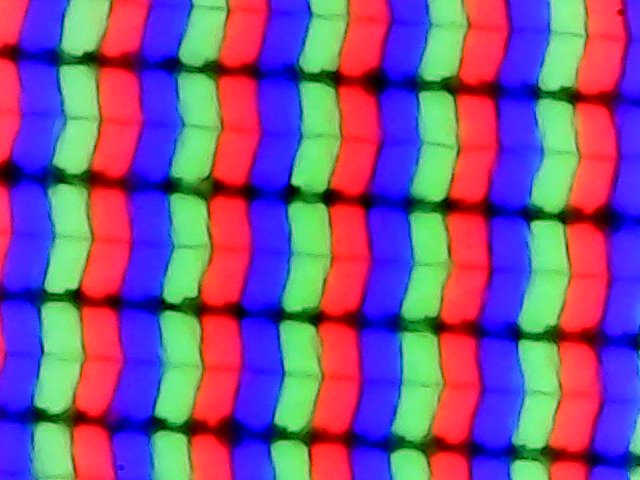
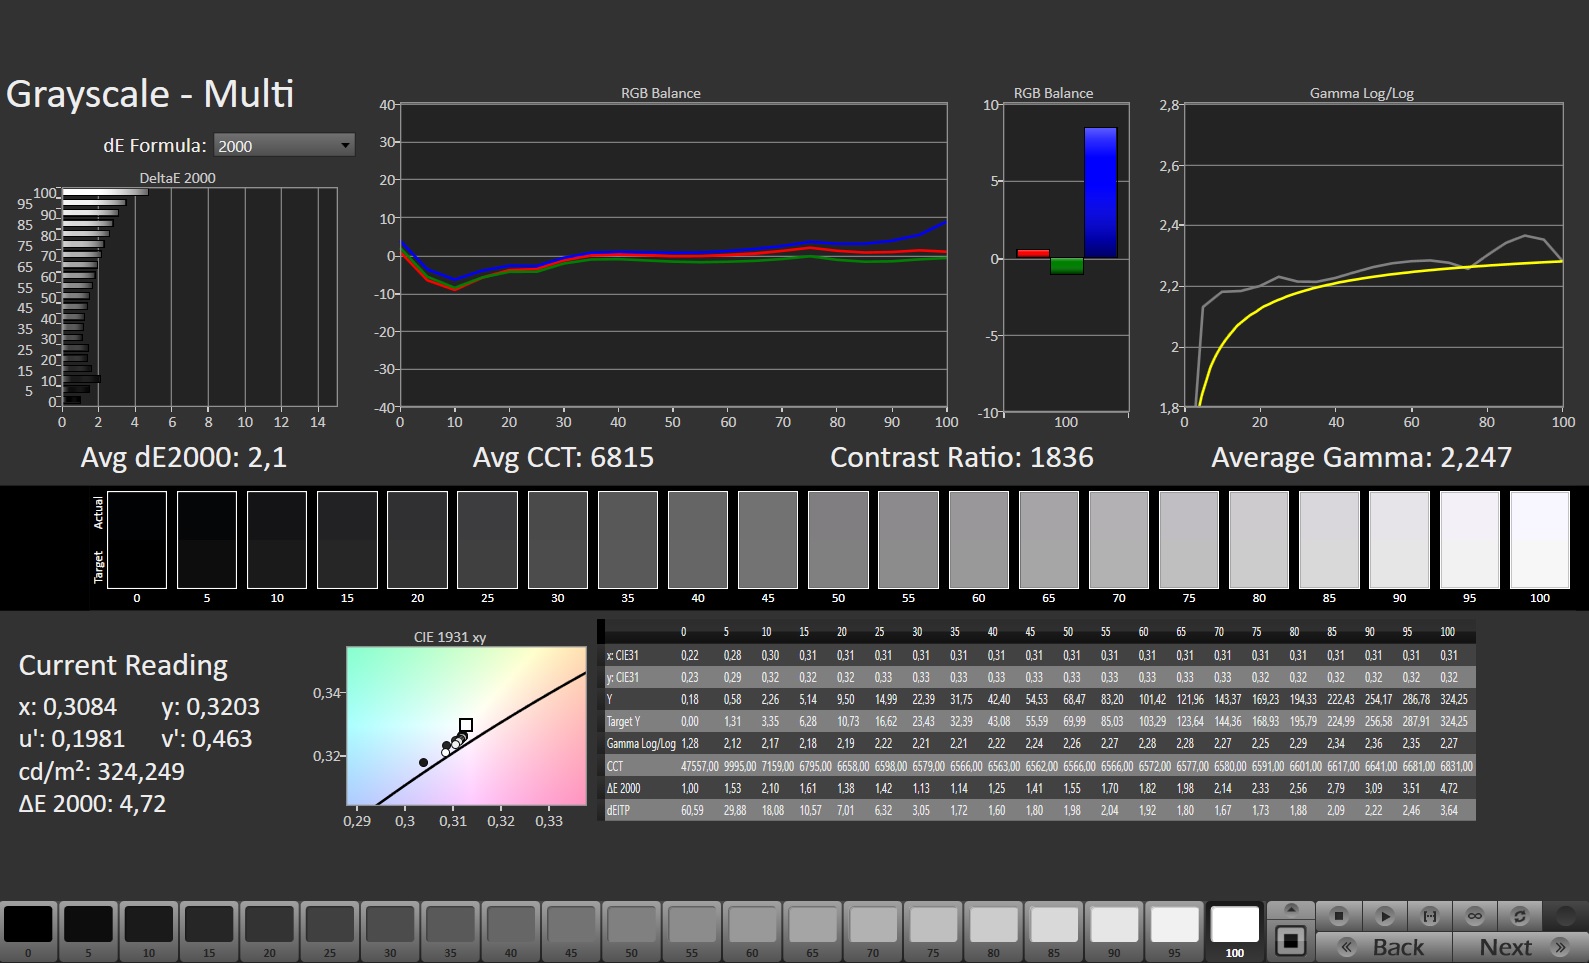
Gigabyte为G7配备了一个哑光的17.3英寸屏幕(1920 x 1080像素)。响应式300-Hz面板的亮度(300尼特)和对比度(1535:1)达到并超过了我们的预期(>300尼特和1000:1)。此外,该显示器在任何亮度水平下都不会出现PWM闪烁的情况。
| |||||||||||||||||||||||||
Brightness Distribution: 93 %
Center on Battery: 307 cd/m²
Contrast: 1535:1 (Black: 0.2 cd/m²)
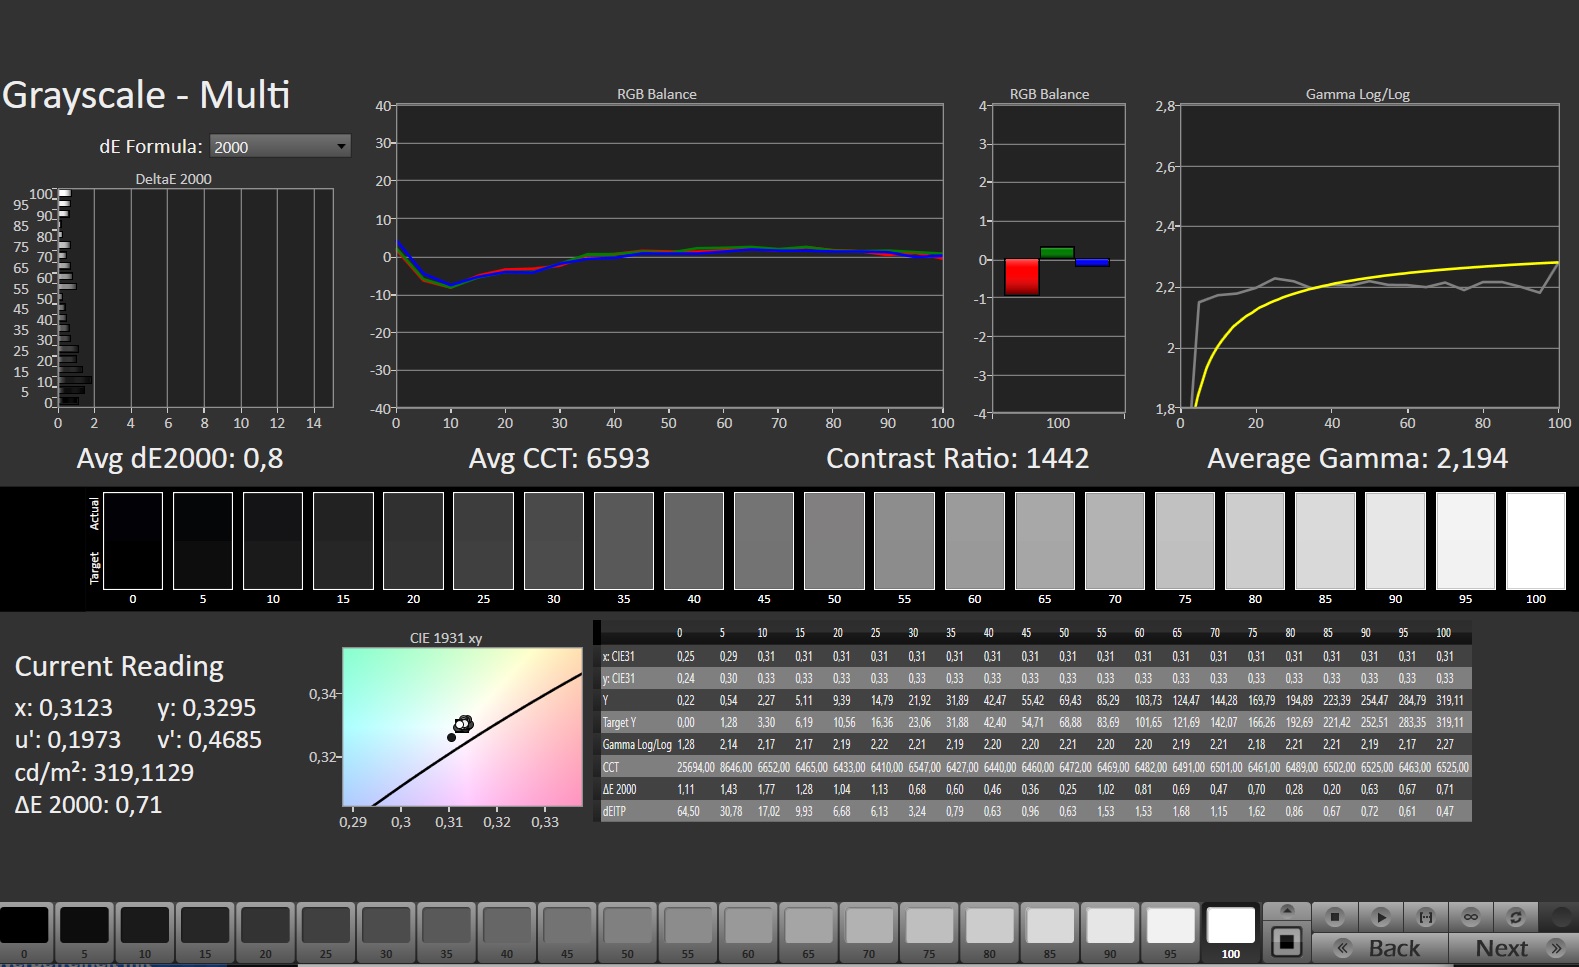
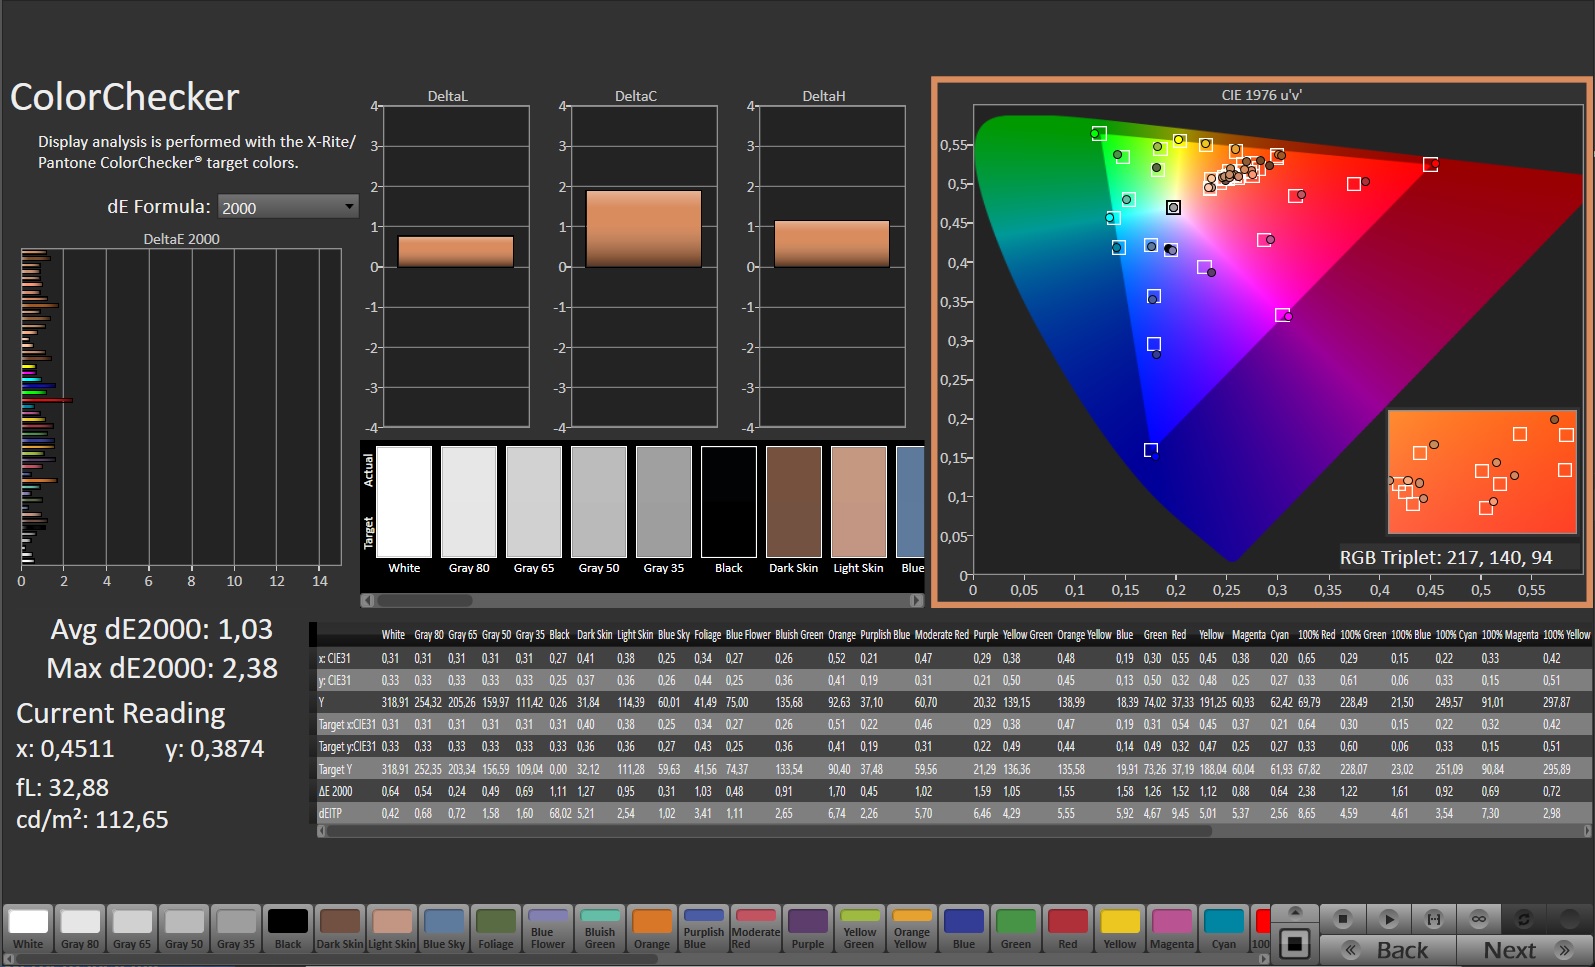
ΔE ColorChecker Calman: 1.32 | ∀{0.5-29.43 Ø4.71}
calibrated: 1.03
ΔE Greyscale Calman: 2.1 | ∀{0.09-98 Ø4.96}
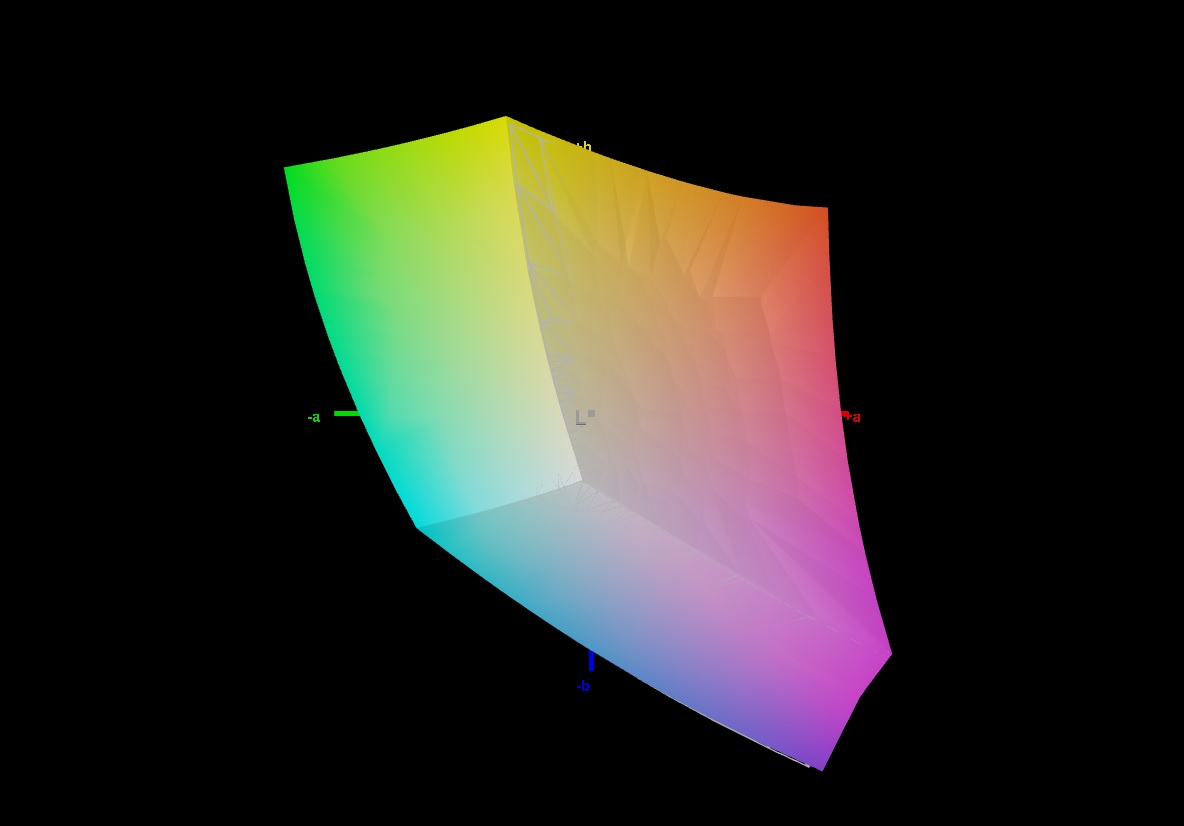
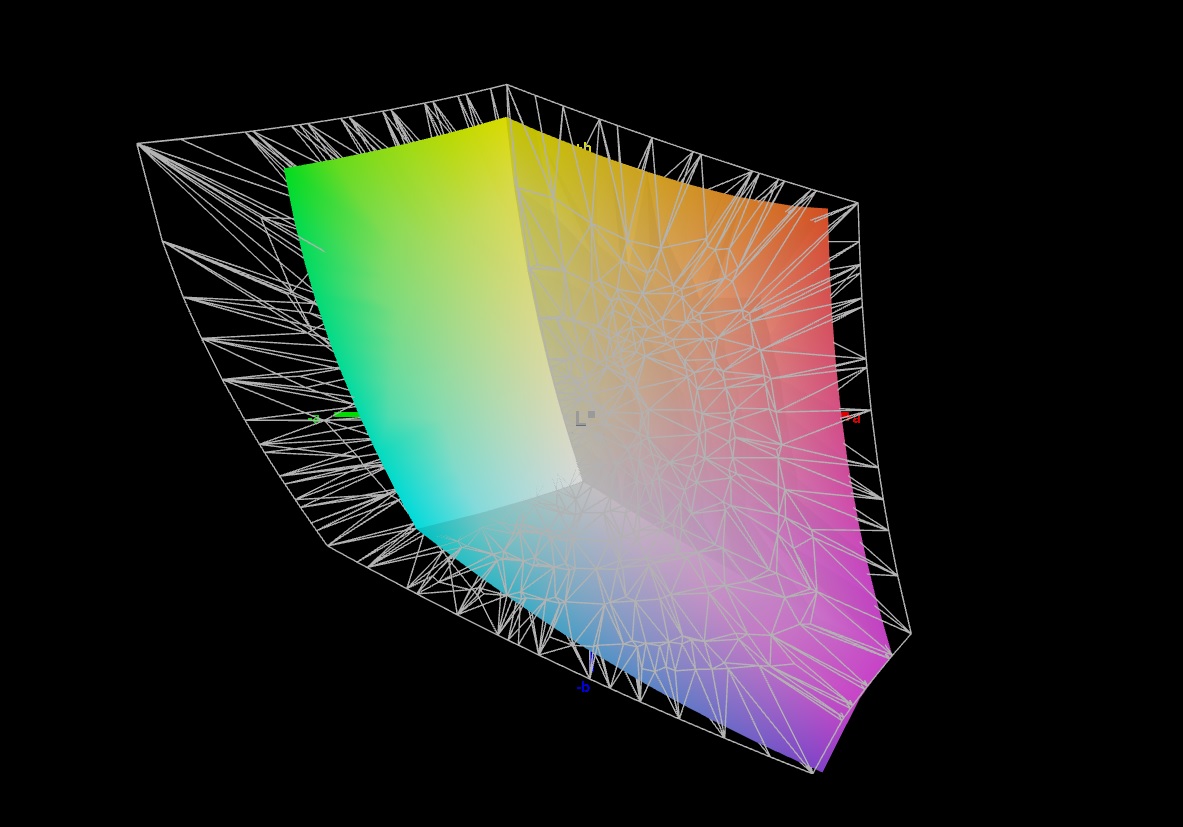
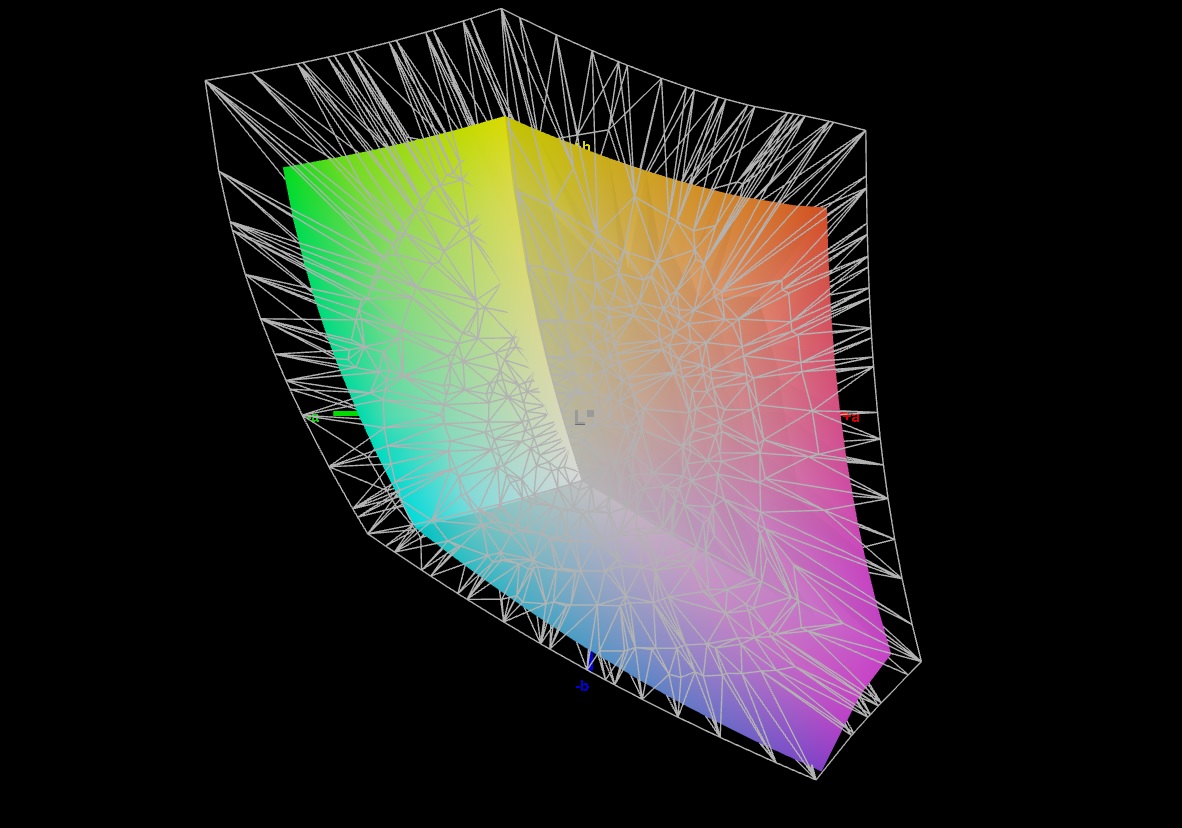
71.7% AdobeRGB 1998 (Argyll 3D)
99.8% sRGB (Argyll 3D)
70.4% Display P3 (Argyll 3D)
Gamma: 2.247
CCT: 6815 K
| Gigabyte G7 KE AU Optronics B173HAN05.1, IPS, 1920x1080, 17.3" | HP Pavilion Gaming 17-cd2146ng LGD0611, IPS, 1920x1080, 17.3" | Acer Nitro 5 AN517-55-738R B173HAN04.0, IPS, 1920x1080, 17.3" | Asus TUF Gaming F17 FX707Z-HX011W AU Optronics B173HAN04.9 (AUO4B9D), IPS, 1920x1080, 17.3" | Lenovo IdeaPad Gaming 3 15IAH7 Lenovo LEN156FHD, IPS, 1920x1080, 15.6" | |
|---|---|---|---|---|---|
| Display | -6% | -15% | -42% | -2% | |
| Display P3 Coverage (%) | 70.4 | 64.8 -8% | 58.9 -16% | 40.2 -43% | 69.1 -2% |
| sRGB Coverage (%) | 99.8 | 96.8 -3% | 86.4 -13% | 59.7 -40% | 99.2 -1% |
| AdobeRGB 1998 Coverage (%) | 71.7 | 66.5 -7% | 60.5 -16% | 41.5 -42% | 69.9 -3% |
| Response Times | -80% | -8% | -471% | -81% | |
| Response Time Grey 50% / Grey 80% * (ms) | 5 ? | 12.7 ? -154% | 6 ? -20% | 39.2 ? -684% | 13 ? -160% |
| Response Time Black / White * (ms) | 8.3 ? | 8.7 ? -5% | 8 ? 4% | 29.6 ? -257% | 8.4 ? -1% |
| PWM Frequency (Hz) | |||||
| Screen | -44% | -59% | -97% | -46% | |
| Brightness middle (cd/m²) | 307 | 328 7% | 286 -7% | 287 -7% | 338 10% |
| Brightness (cd/m²) | 301 | 317 5% | 278 -8% | 268 -11% | 329 9% |
| Brightness Distribution (%) | 93 | 94 1% | 89 -4% | 89 -4% | 92 -1% |
| Black Level * (cd/m²) | 0.2 | 0.23 -15% | 0.32 -60% | 0.17 15% | 0.27 -35% |
| Contrast (:1) | 1535 | 1426 -7% | 894 -42% | 1688 10% | 1252 -18% |
| Colorchecker dE 2000 * | 1.32 | 3.83 -190% | 3.05 -131% | 5.1 -286% | 2.88 -118% |
| Colorchecker dE 2000 max. * | 4.6 | 8.51 -85% | 5.83 -27% | 8.72 -90% | 9.35 -103% |
| Colorchecker dE 2000 calibrated * | 1.03 | 0.83 19% | 3.13 -204% | 5.1 -395% | 1.22 -18% |
| Greyscale dE 2000 * | 2.1 | 4.9 -133% | 3.17 -51% | 4.24 -102% | 5 -138% |
| Gamma | 2.247 98% | 2.177 101% | 2.29 96% | 2.44 90% | 2.162 102% |
| CCT | 6815 95% | 7881 82% | 6916 94% | 6008 108% | 7497 87% |
| Total Average (Program / Settings) | -43% /
-41% | -27% /
-43% | -203% /
-138% | -43% /
-41% |
* ... smaller is better
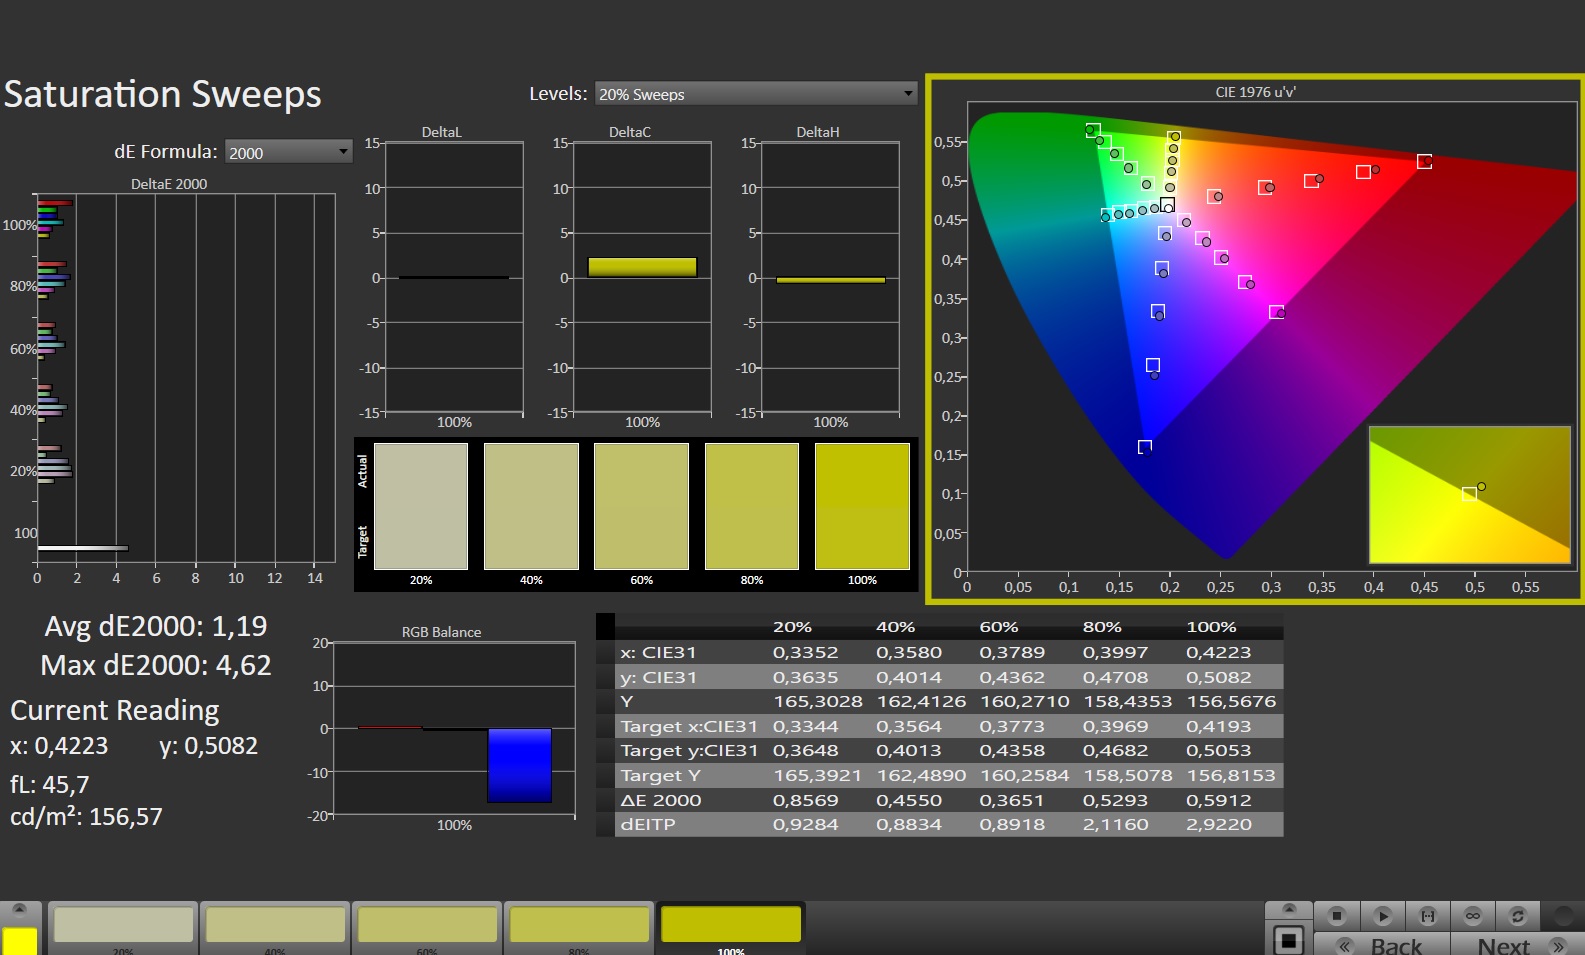
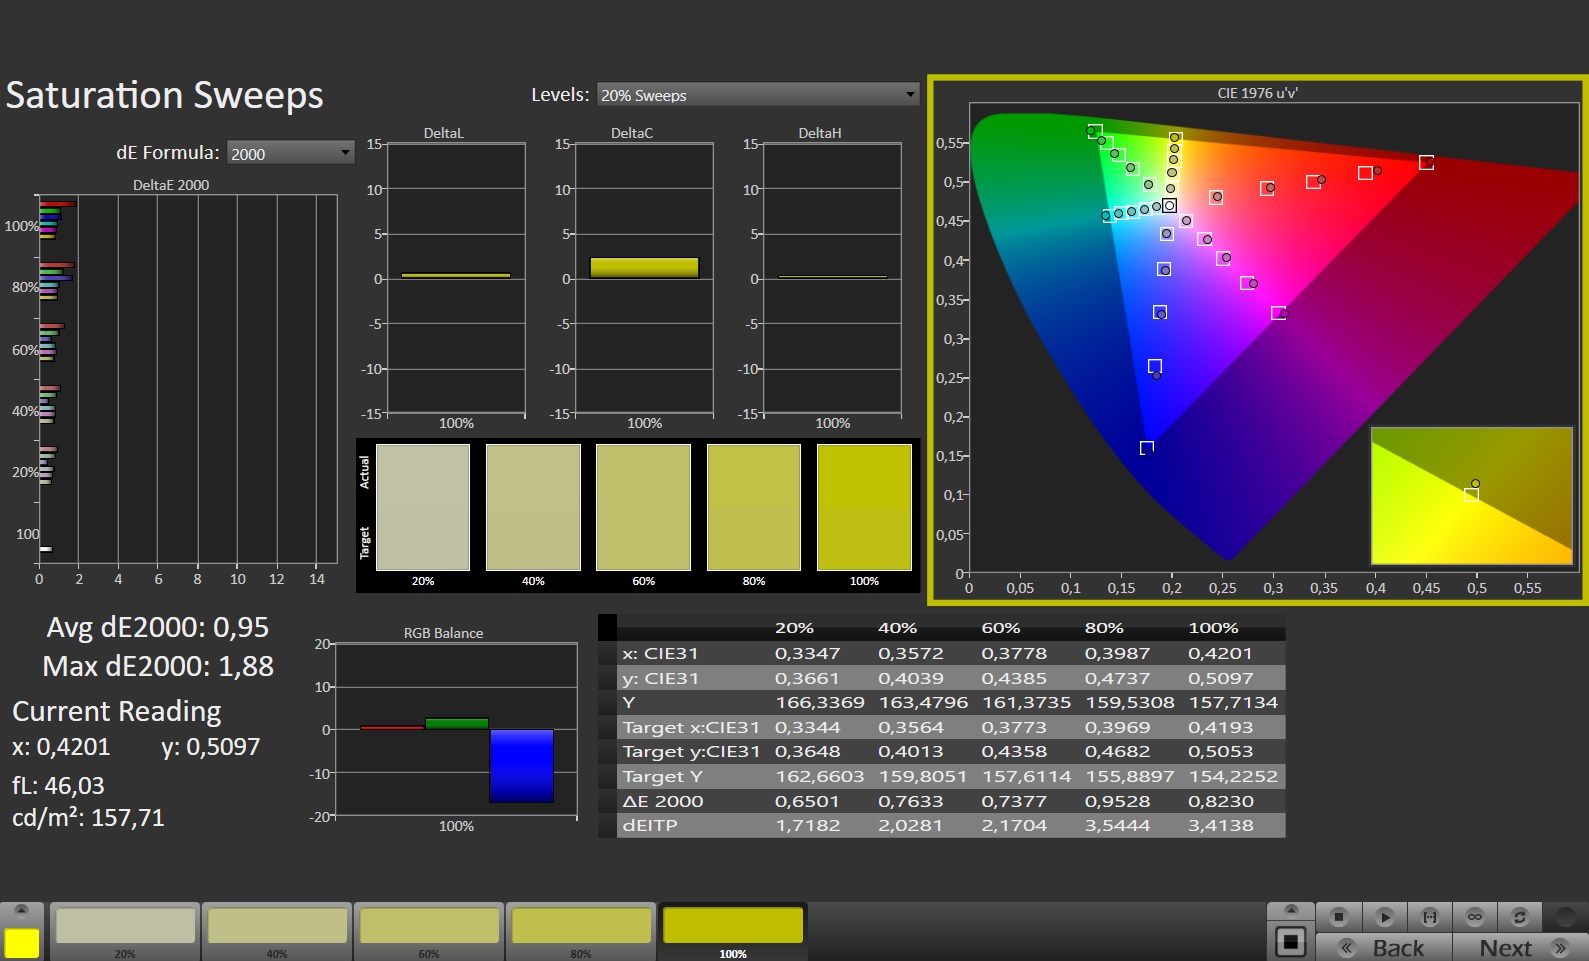
显示屏的色彩精确度在出厂时就非常好。偏差为1.32,它舒适地落在理想范围内(deltaE < 3)。在自己校准显示器后,偏差降至1.03,可以更精确地表现灰度。该显示器能够再现整个sRGB色彩空间(100%),而AdobeRGB(72%)和DCI-P3(70%)色彩空间则无法完整显示。这些结果与大多数竞争对手的结果相似。

Display Response Times
| ↔ Response Time Black to White | ||
|---|---|---|
| 8.3 ms ... rise ↗ and fall ↘ combined | ↗ 4.2 ms rise | 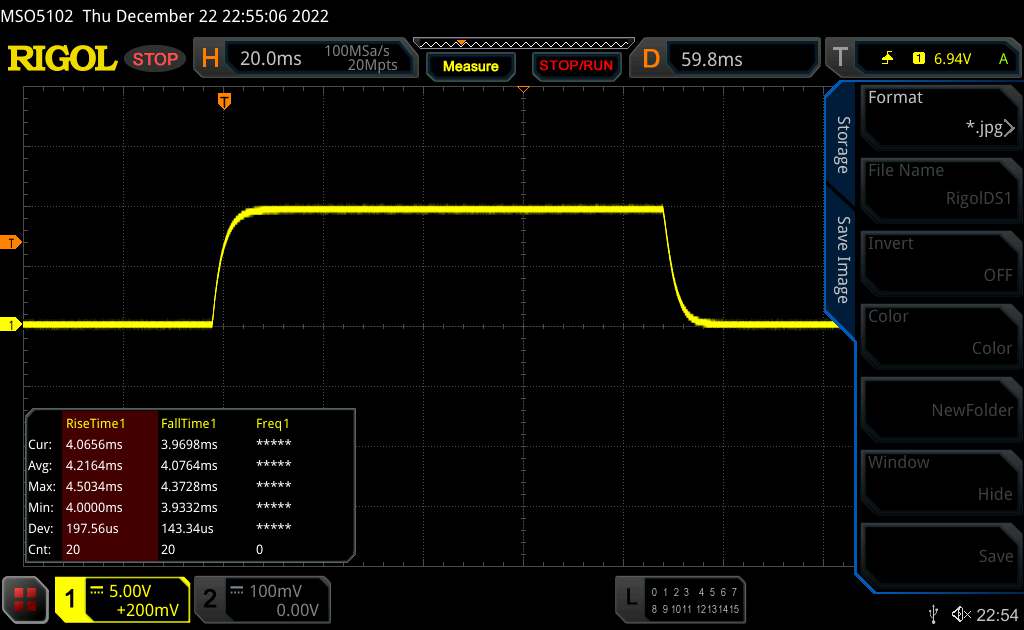 |
| ↘ 4.1 ms fall | ||
| The screen shows fast response rates in our tests and should be suited for gaming. In comparison, all tested devices range from 0.1 (minimum) to 240 (maximum) ms. » 24 % of all devices are better. This means that the measured response time is better than the average of all tested devices (19.8 ms). | ||
| ↔ Response Time 50% Grey to 80% Grey | ||
| 5 ms ... rise ↗ and fall ↘ combined | ↗ 2.1 ms rise | 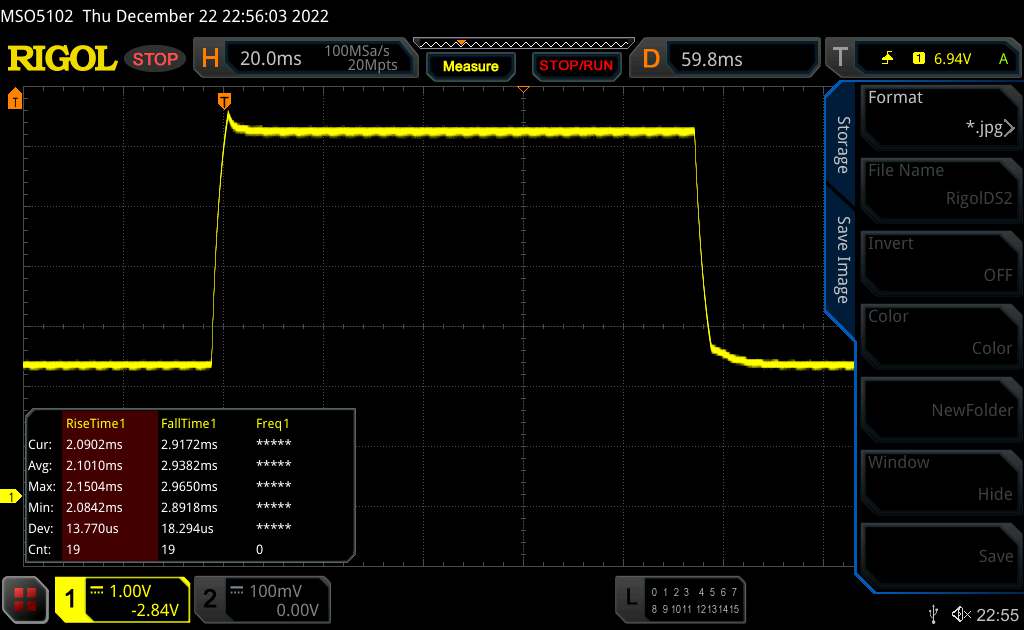 |
| ↘ 2.9 ms fall | ||
| The screen shows very fast response rates in our tests and should be very well suited for fast-paced gaming. In comparison, all tested devices range from 0.165 (minimum) to 636 (maximum) ms. » 17 % of all devices are better. This means that the measured response time is better than the average of all tested devices (31 ms). | ||
Screen Flickering / PWM (Pulse-Width Modulation)
| Screen flickering / PWM not detected | 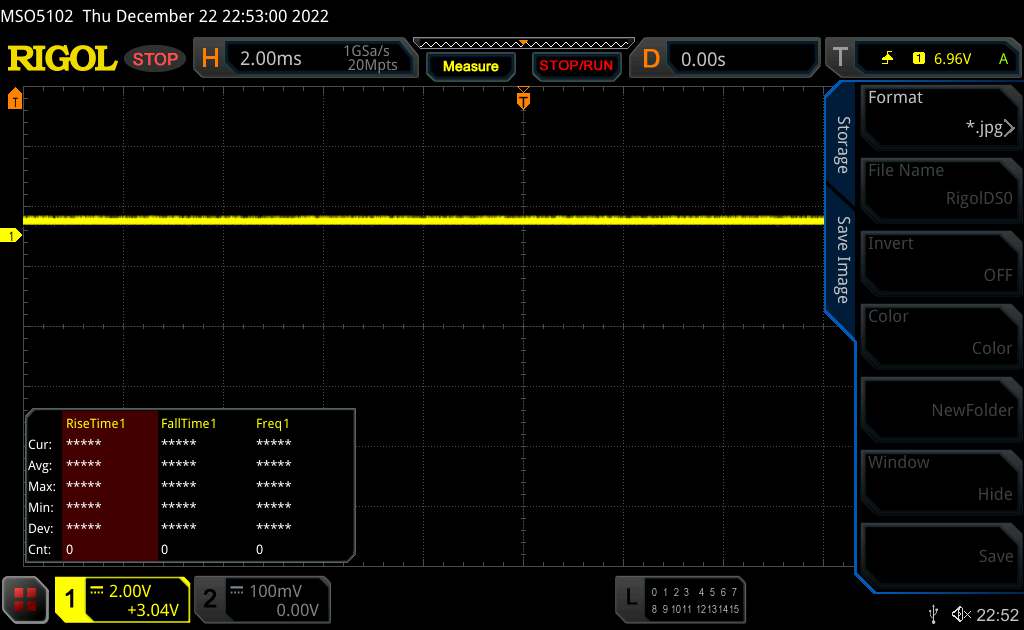 | ||
In comparison: 52 % of all tested devices do not use PWM to dim the display. If PWM was detected, an average of 7747 (minimum: 5 - maximum: 343500) Hz was measured. | |||
IPS面板具有良好的可视角度,可以从任何角度进行阅读。室外的可读性也很好,只要阳光不是太亮。

性能--技嘉依靠桤木湖和安培的力量
Gigabyte提供的G7 KE ein verhältnismäßig günstiges Gaming-Notebook,在FHD-Gaming(hohe bis maximale Settings)下是支持的,但在Videobearbeitung和Rendering等领域也能提供良好的数据。
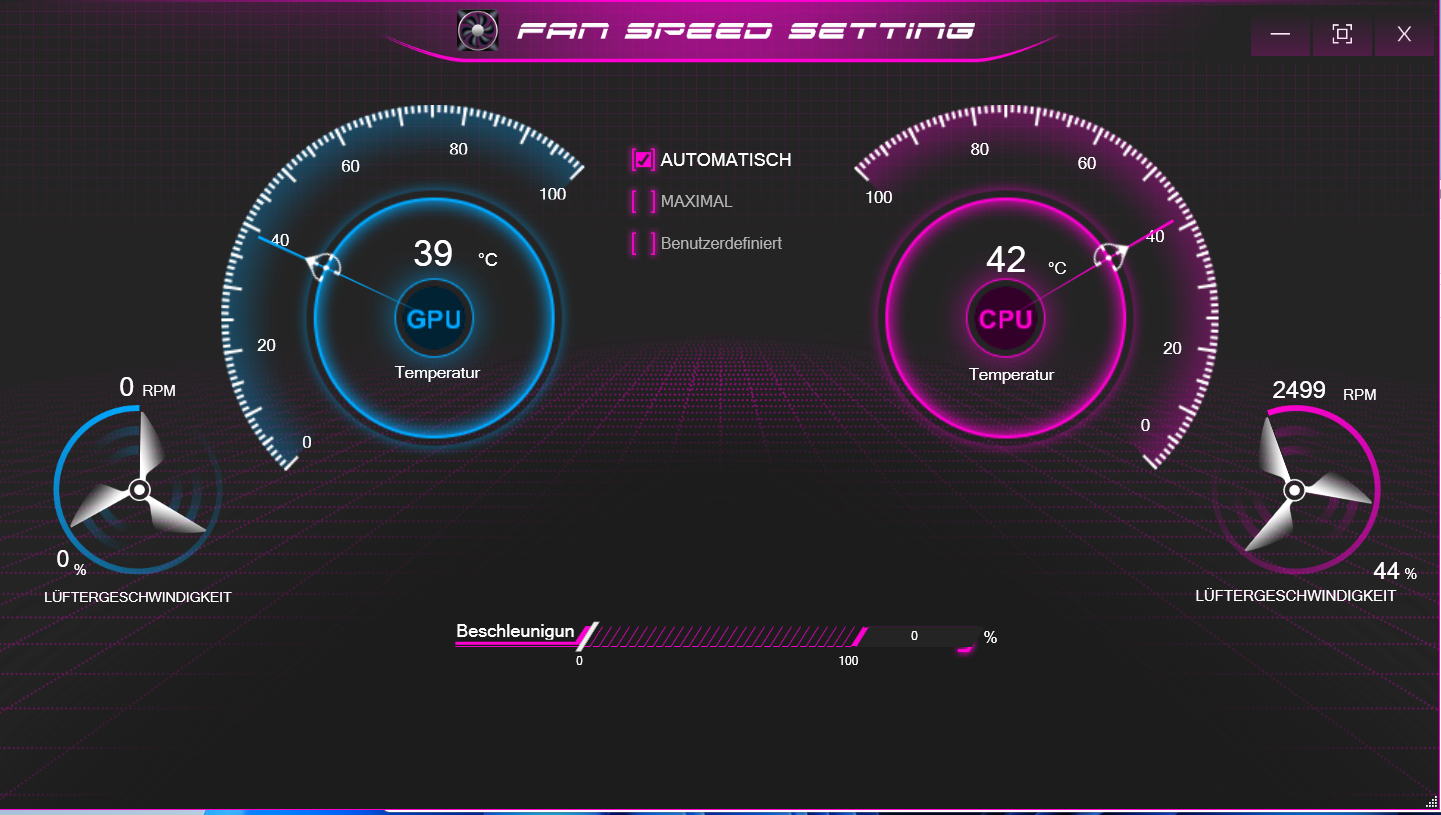
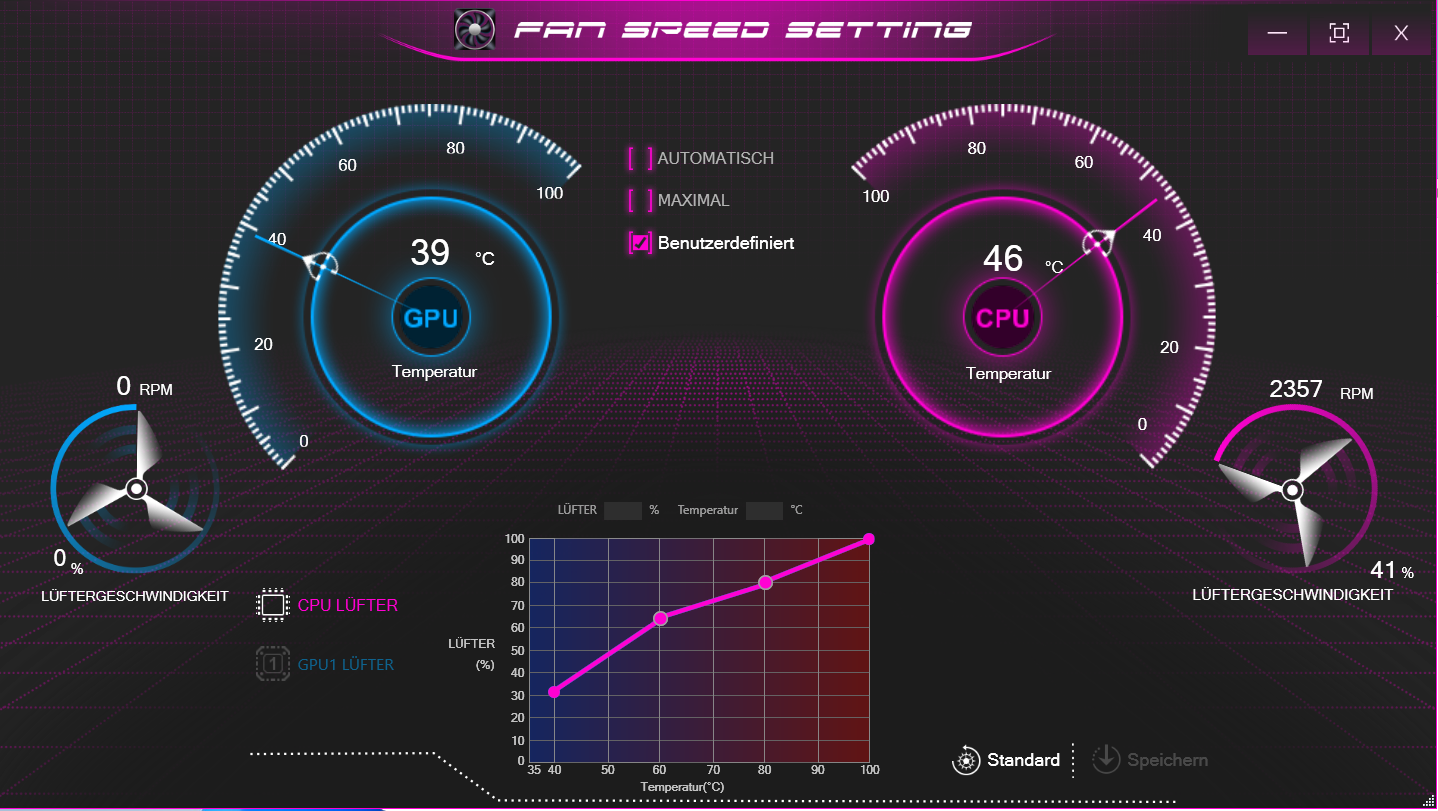
测试条件
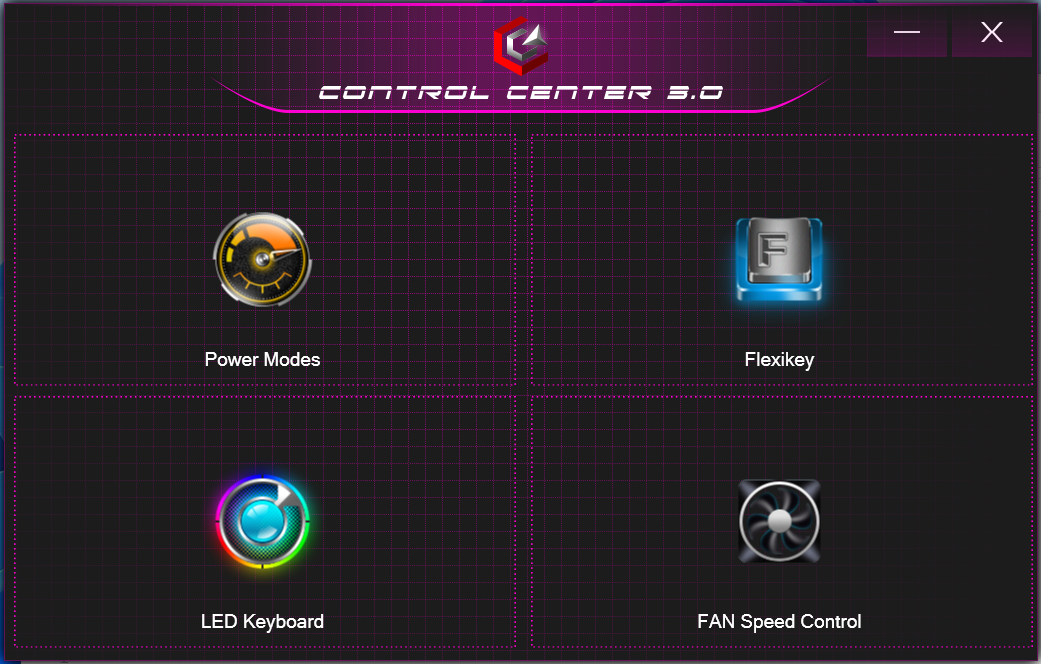
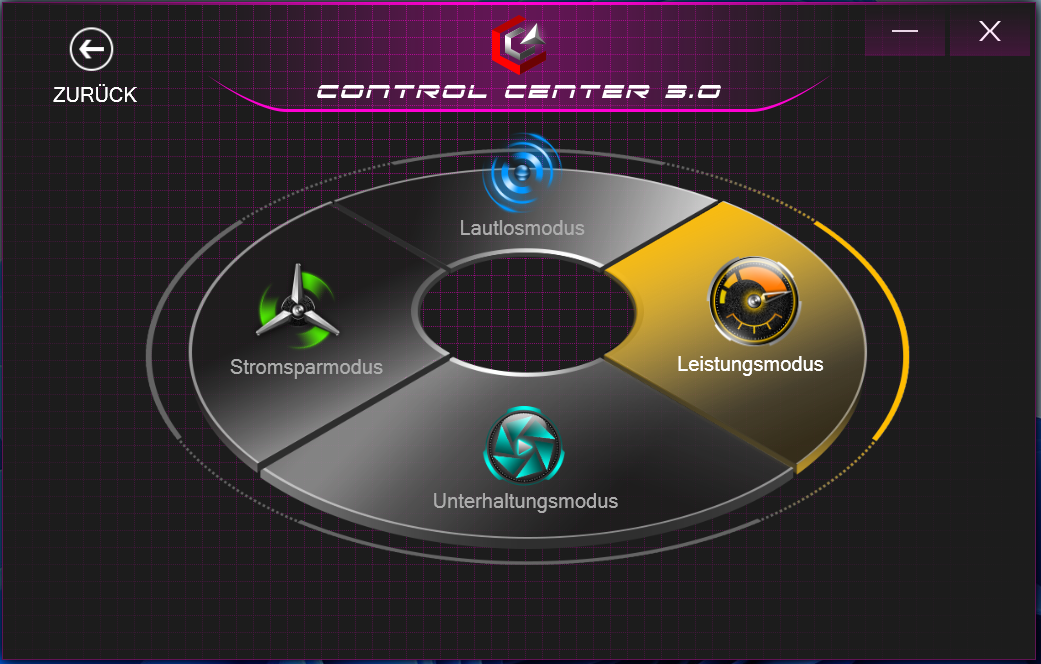
预装的控制中心允许用户控制各种参数,如选择一个电源配置文件(见表)。我们使用了 "性能"(基准测试)和 "节能"(电池测试)配置文件。
| 电源简介 | 娱乐模式 | 节能模式 | 静音模式 | |
|---|---|---|---|---|
| 功率限制1 | 80瓦 | 45瓦 | 15瓦 | 15瓦 |
| 功率限制2 | 135瓦 | 115瓦 | 30瓦 | 30瓦 |
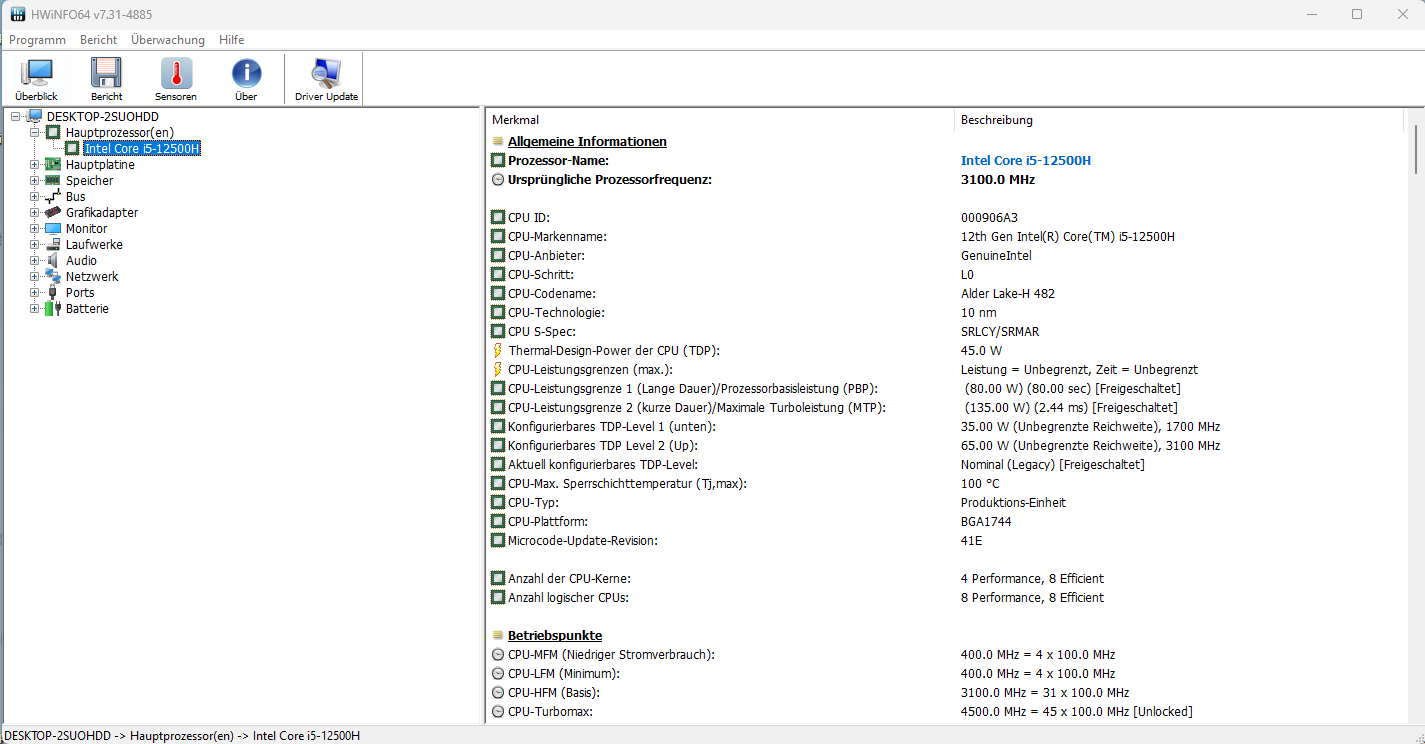
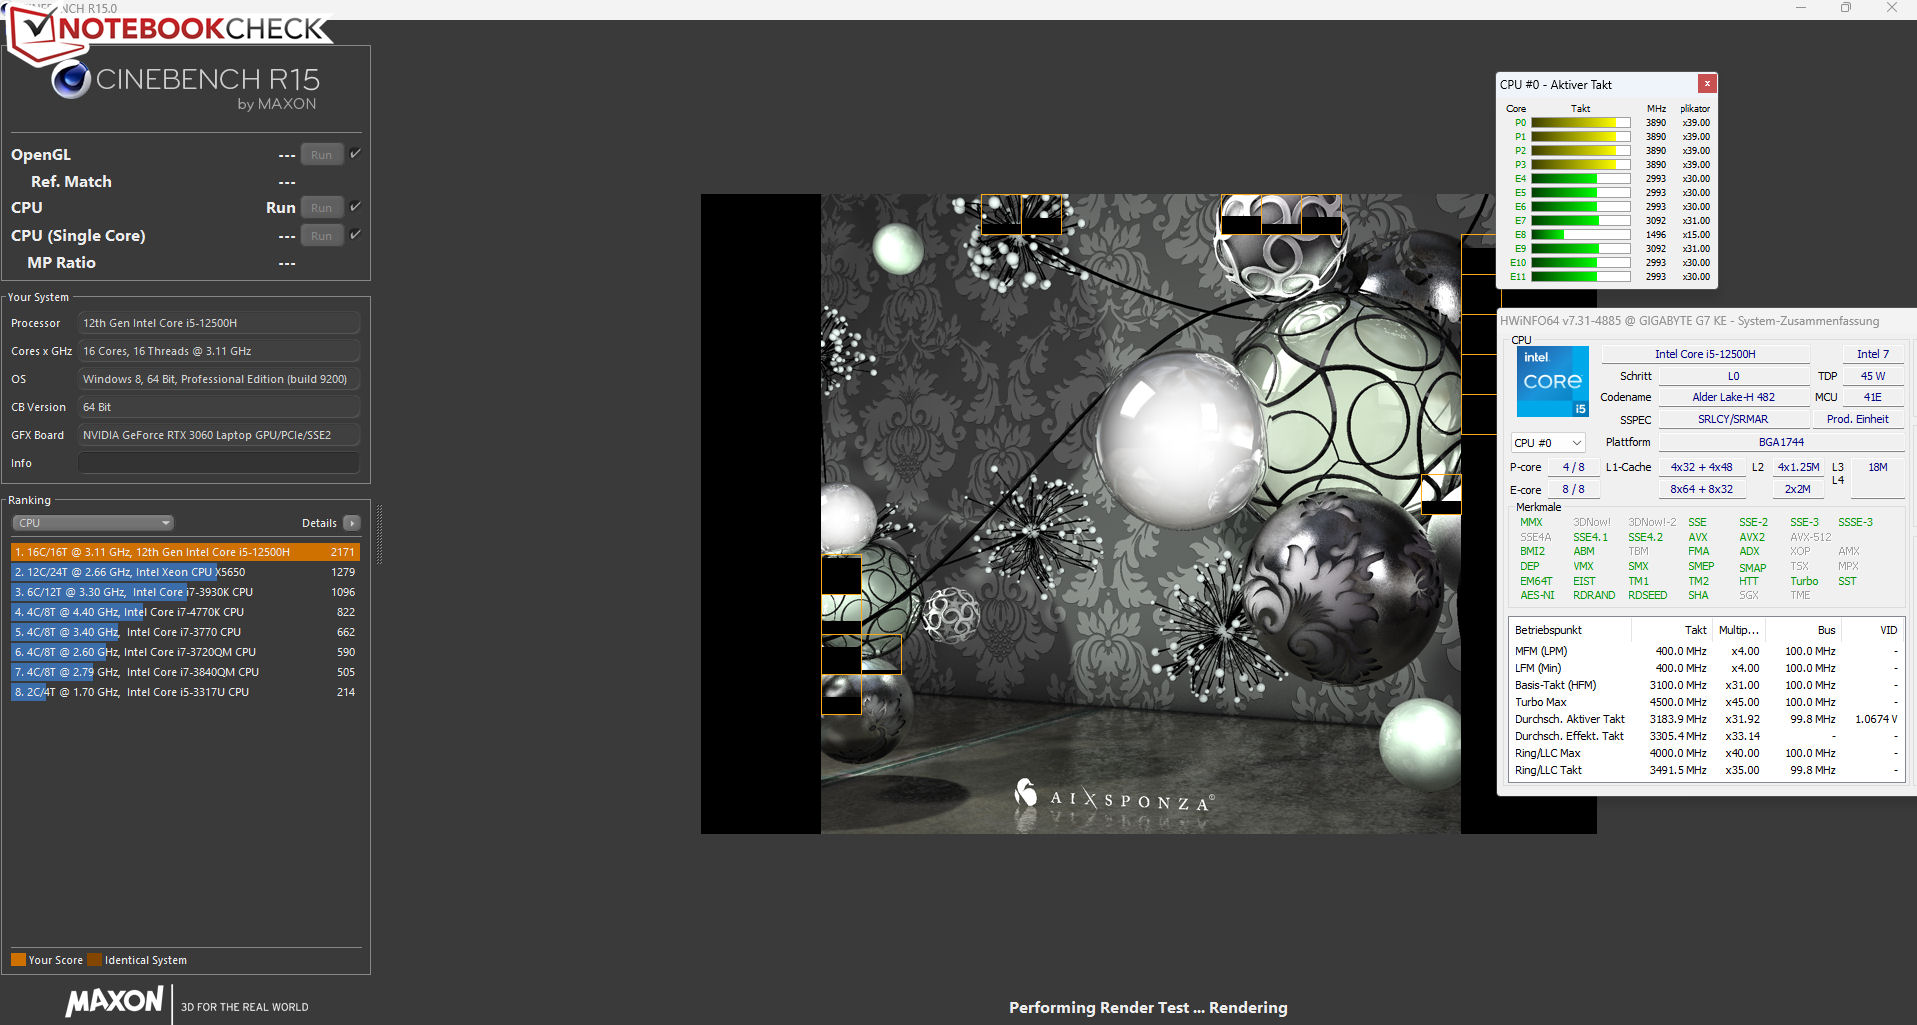
处理器
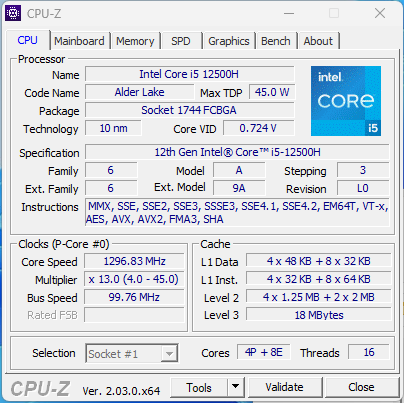
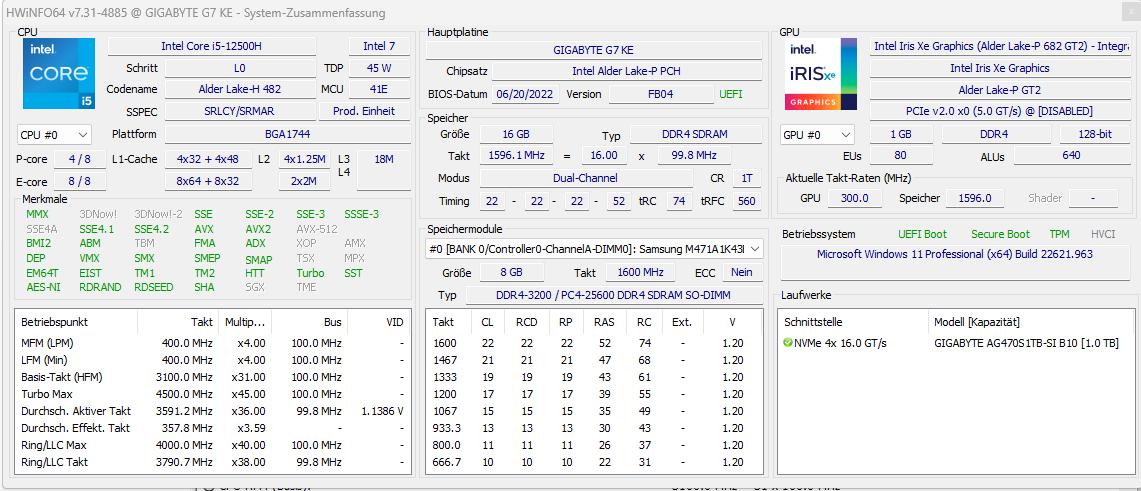
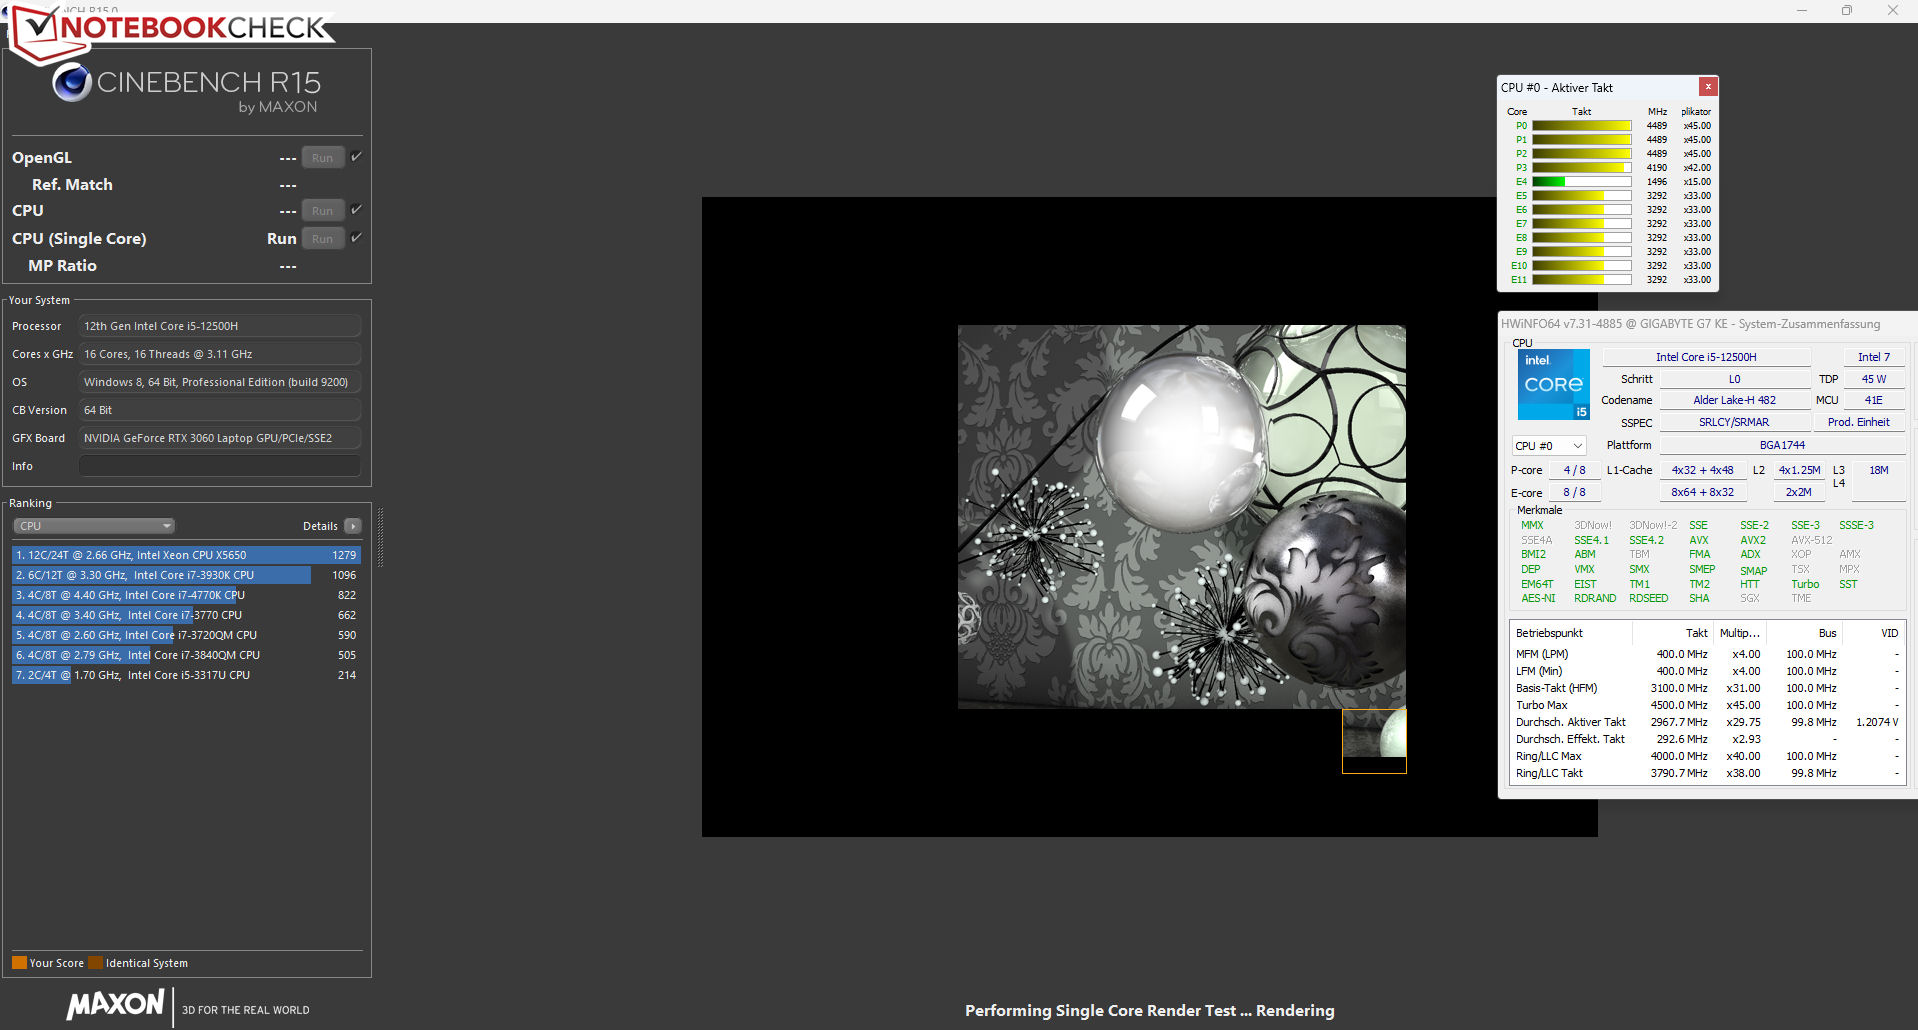
芯片 酷睿i5-12500H处理器(Alder Lake)包括四个性能核心(超线程,2.5至4.5 GHz)和八个效率核心(无超线程,1.8至3.3 GHz)。因此,总共有16个逻辑CPU核心。
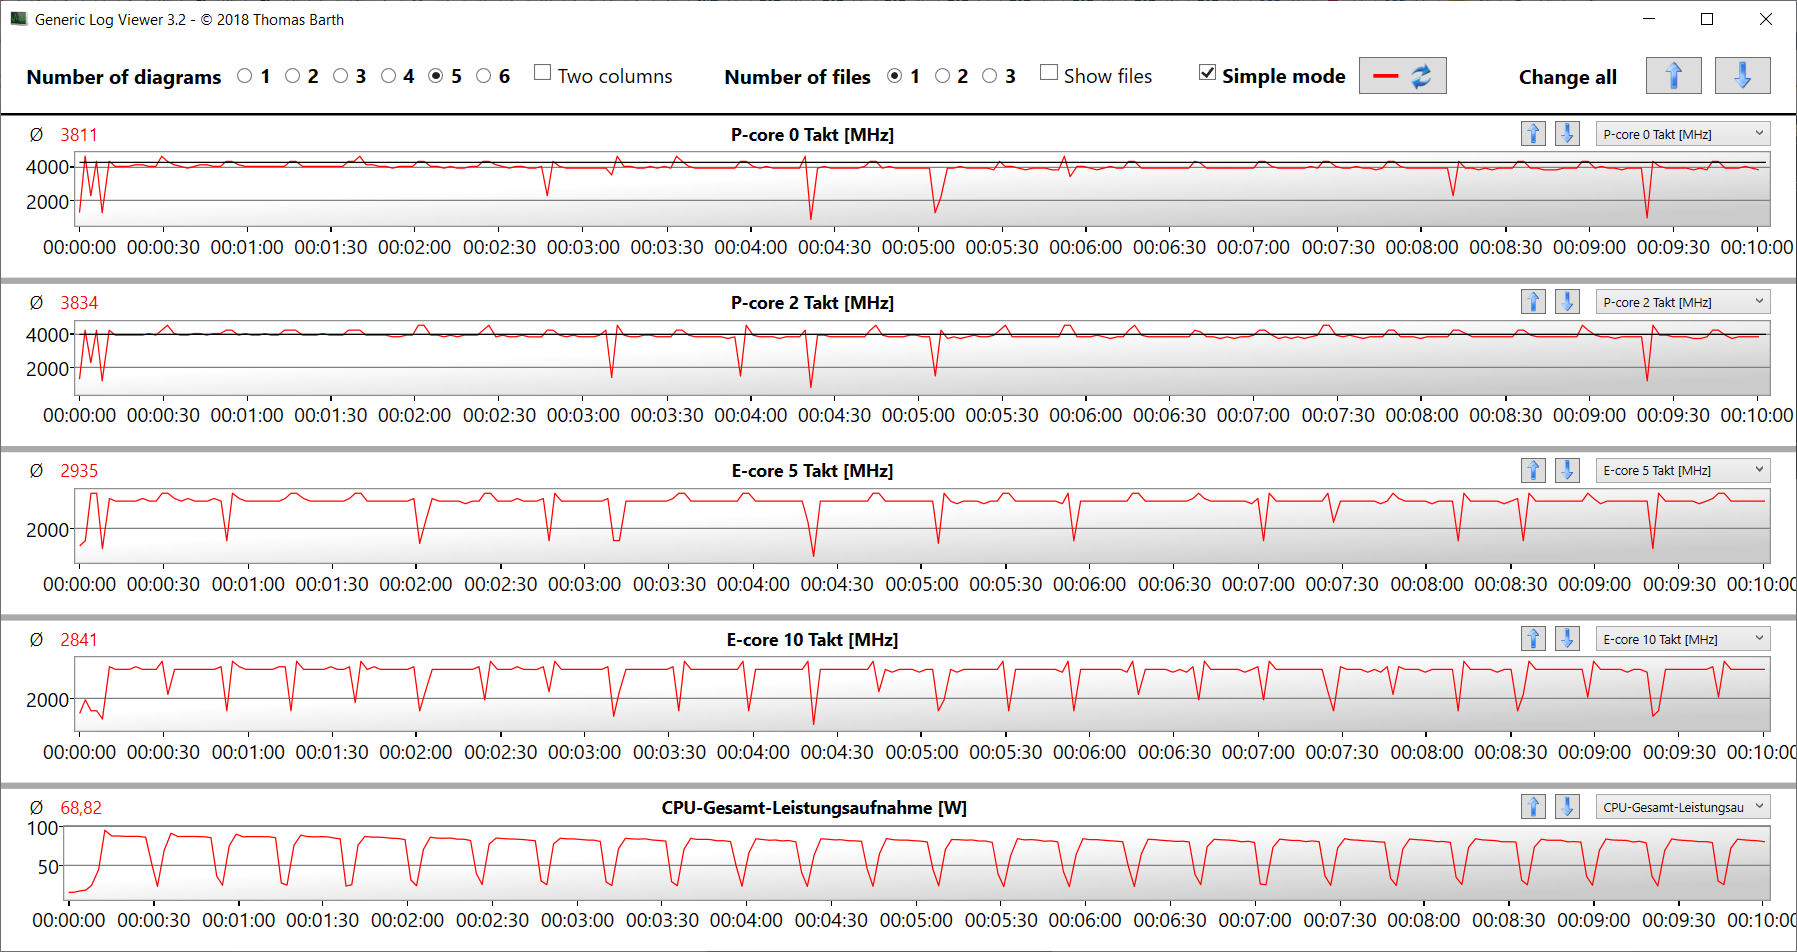
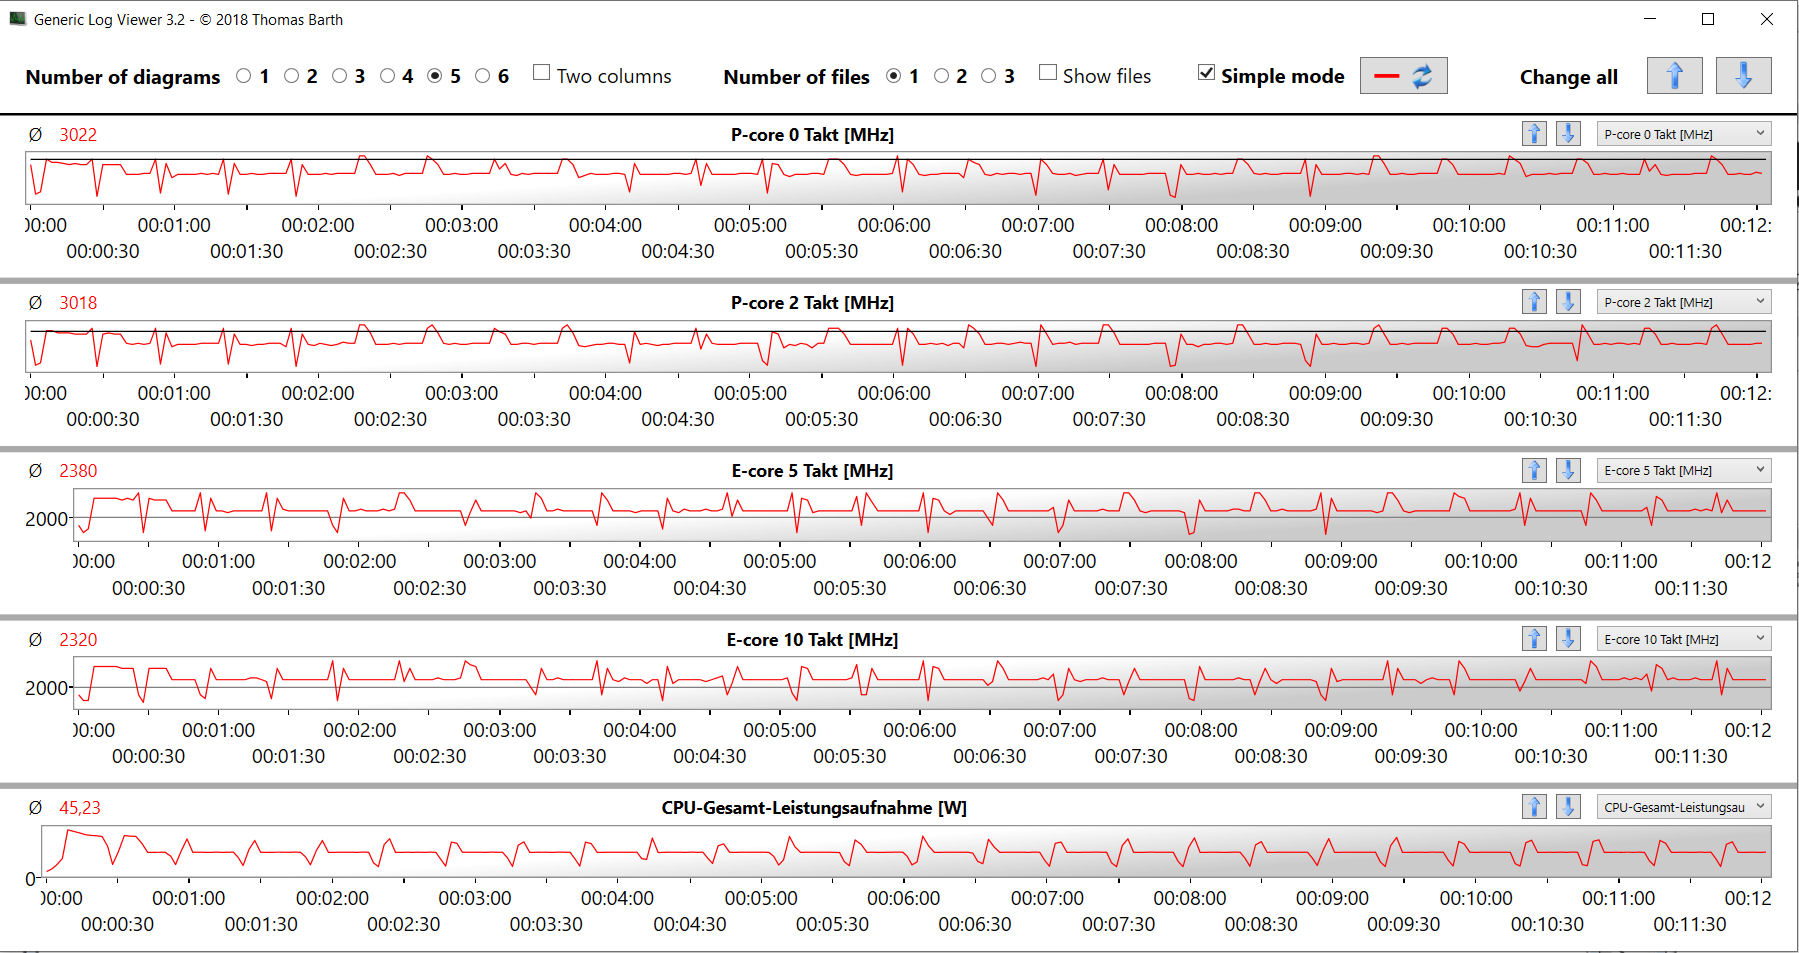
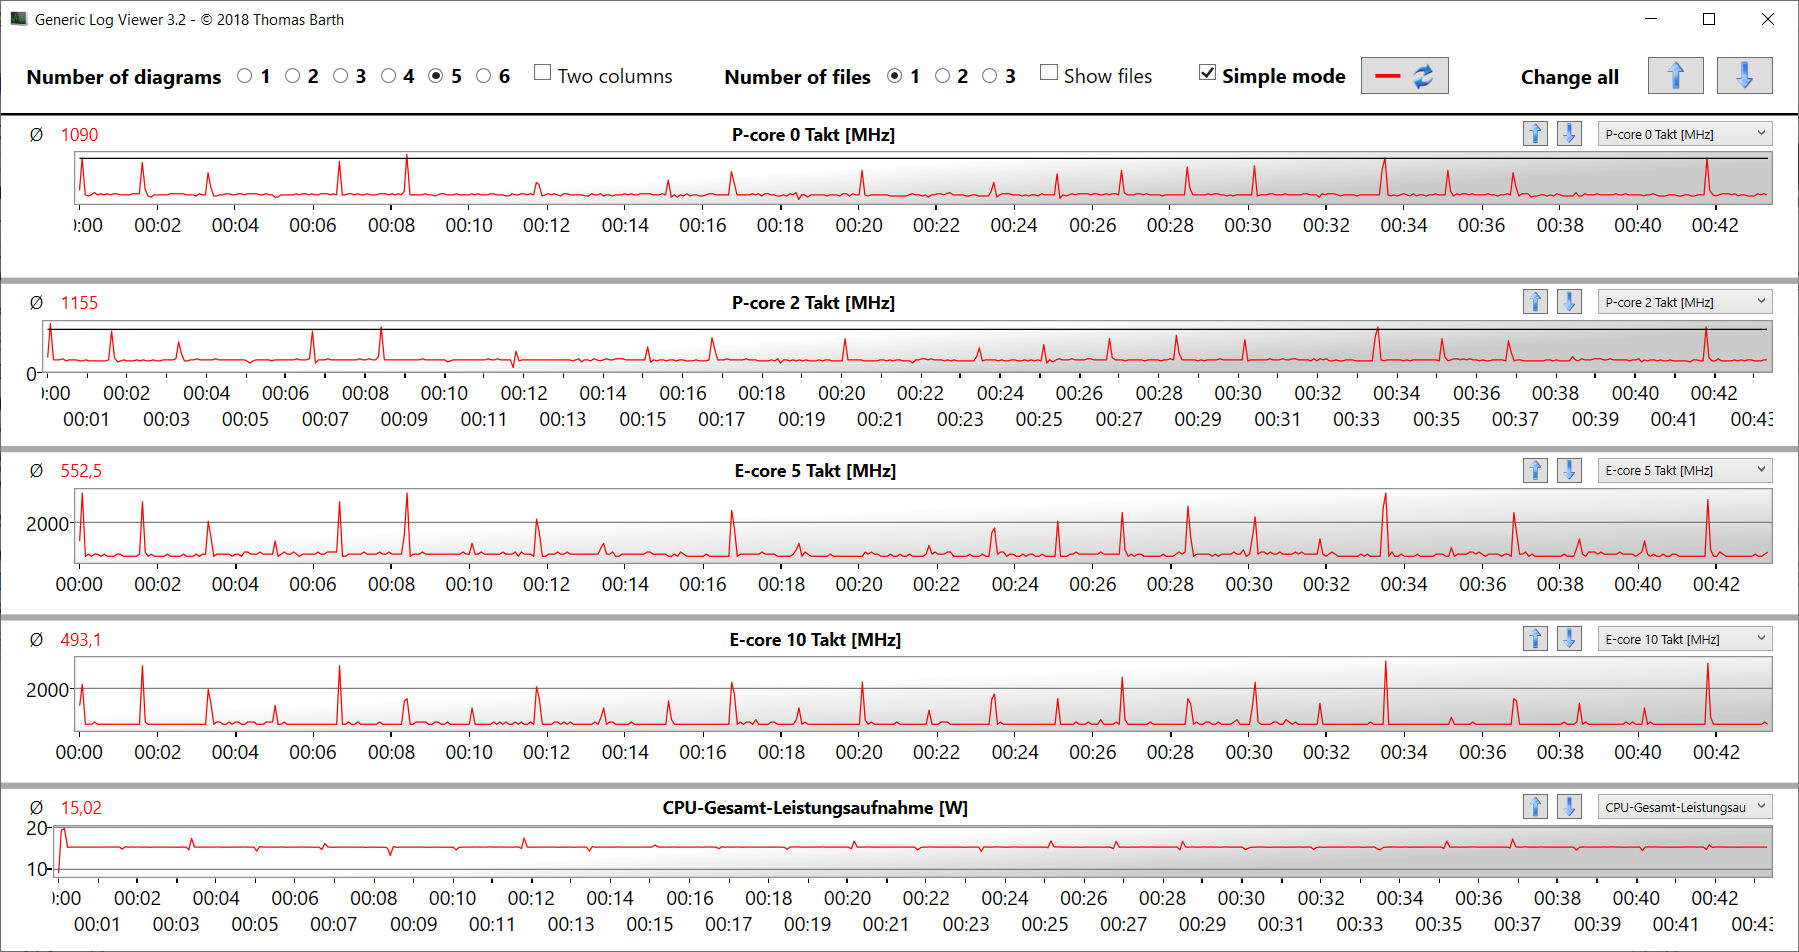
在多核(P核:3.9至4.2GHz,E核:1.5至3.1GHz)和单核(P核:4.2至4.5GHz,E核:1.5至3.3GHz)基准测试中,平均时钟速度都很高。在电池模式下,时钟速度会降低。通过我们的CB15循环,我们能够确认CPU Turbo的连续使用。酷睿i5的基准测试结果总体上略高于平均水平。
Cinebench R15 Multi Loop
* ... smaller is better
AIDA64: FP32 Ray-Trace | FPU Julia | CPU SHA3 | CPU Queen | FPU SinJulia | FPU Mandel | CPU AES | CPU ZLib | FP64 Ray-Trace | CPU PhotoWorxx
| Performance rating | |
| Average of class Gaming | |
| Gigabyte G7 KE | |
| Lenovo IdeaPad Gaming 3 15IAH7 | |
| Average Intel Core i5-12500H | |
| Acer Nitro 5 AN517-55-738R | |
| Asus TUF Gaming F17 FX707Z-HX011W | |
| HP Pavilion Gaming 17-cd2146ng | |
| AIDA64 / FP32 Ray-Trace | |
| Average of class Gaming (10227 - 85542, n=105, last 2 years) | |
| Lenovo IdeaPad Gaming 3 15IAH7 | |
| Gigabyte G7 KE | |
| Average Intel Core i5-12500H (6851 - 13947, n=9) | |
| Acer Nitro 5 AN517-55-738R | |
| HP Pavilion Gaming 17-cd2146ng | |
| Asus TUF Gaming F17 FX707Z-HX011W | |
| AIDA64 / FPU Julia | |
| Average of class Gaming (51376 - 238426, n=105, last 2 years) | |
| Lenovo IdeaPad Gaming 3 15IAH7 | |
| Gigabyte G7 KE | |
| Average Intel Core i5-12500H (29874 - 68178, n=9) | |
| Acer Nitro 5 AN517-55-738R | |
| Asus TUF Gaming F17 FX707Z-HX011W | |
| HP Pavilion Gaming 17-cd2146ng | |
| AIDA64 / CPU SHA3 | |
| Average of class Gaming (2180 - 10115, n=105, last 2 years) | |
| Lenovo IdeaPad Gaming 3 15IAH7 | |
| Gigabyte G7 KE | |
| Average Intel Core i5-12500H (2287 - 3337, n=9) | |
| Acer Nitro 5 AN517-55-738R | |
| Asus TUF Gaming F17 FX707Z-HX011W | |
| HP Pavilion Gaming 17-cd2146ng | |
| AIDA64 / CPU Queen | |
| Average of class Gaming (49785 - 173351, n=90, last 2 years) | |
| Asus TUF Gaming F17 FX707Z-HX011W | |
| Acer Nitro 5 AN517-55-738R | |
| Lenovo IdeaPad Gaming 3 15IAH7 | |
| Gigabyte G7 KE | |
| Average Intel Core i5-12500H (77935 - 80703, n=9) | |
| HP Pavilion Gaming 17-cd2146ng | |
| AIDA64 / FPU SinJulia | |
| Average of class Gaming (4424 - 33636, n=105, last 2 years) | |
| Acer Nitro 5 AN517-55-738R | |
| Asus TUF Gaming F17 FX707Z-HX011W | |
| Gigabyte G7 KE | |
| Lenovo IdeaPad Gaming 3 15IAH7 | |
| Average Intel Core i5-12500H (6590 - 7431, n=9) | |
| HP Pavilion Gaming 17-cd2146ng | |
| AIDA64 / FPU Mandel | |
| Average of class Gaming (25115 - 128721, n=105, last 2 years) | |
| Lenovo IdeaPad Gaming 3 15IAH7 | |
| Gigabyte G7 KE | |
| Average Intel Core i5-12500H (18252 - 34041, n=9) | |
| Acer Nitro 5 AN517-55-738R | |
| Asus TUF Gaming F17 FX707Z-HX011W | |
| HP Pavilion Gaming 17-cd2146ng | |
| AIDA64 / CPU AES | |
| Lenovo IdeaPad Gaming 3 15IAH7 | |
| Gigabyte G7 KE | |
| Average of class Gaming (39258 - 247074, n=105, last 2 years) | |
| Average Intel Core i5-12500H (50298 - 111567, n=9) | |
| Acer Nitro 5 AN517-55-738R | |
| Asus TUF Gaming F17 FX707Z-HX011W | |
| HP Pavilion Gaming 17-cd2146ng | |
| AIDA64 / CPU ZLib | |
| Average of class Gaming (574 - 2531, n=105, last 2 years) | |
| Gigabyte G7 KE | |
| Acer Nitro 5 AN517-55-738R | |
| Lenovo IdeaPad Gaming 3 15IAH7 | |
| Average Intel Core i5-12500H (746 - 924, n=9) | |
| Asus TUF Gaming F17 FX707Z-HX011W | |
| HP Pavilion Gaming 17-cd2146ng | |
| AIDA64 / FP64 Ray-Trace | |
| Average of class Gaming (5509 - 45446, n=105, last 2 years) | |
| Lenovo IdeaPad Gaming 3 15IAH7 | |
| Gigabyte G7 KE | |
| Average Intel Core i5-12500H (3848 - 7405, n=9) | |
| Acer Nitro 5 AN517-55-738R | |
| Asus TUF Gaming F17 FX707Z-HX011W | |
| HP Pavilion Gaming 17-cd2146ng | |
| AIDA64 / CPU PhotoWorxx | |
| Average of class Gaming (12271 - 89891, n=105, last 2 years) | |
| Asus TUF Gaming F17 FX707Z-HX011W | |
| Average Intel Core i5-12500H (13686 - 43813, n=9) | |
| Gigabyte G7 KE | |
| HP Pavilion Gaming 17-cd2146ng | |
| Acer Nitro 5 AN517-55-738R | |
| Lenovo IdeaPad Gaming 3 15IAH7 | |
系统性能
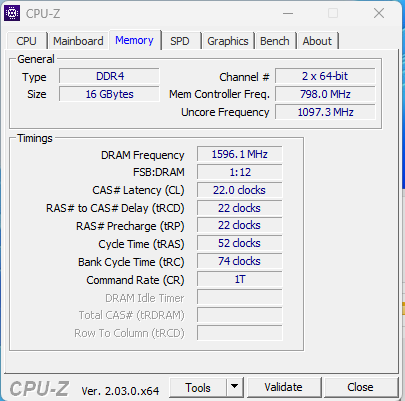
该系统流畅,反应迅速,为渲染、视频编辑和游戏目的提供了足够的性能。PCMark测试的结果很好。对于DDR4-3200内存,系统内存的传输速率符合我们的预期。
CrossMark: Overall | Productivity | Creativity | Responsiveness
| PCMark 10 / Score | |
| Average of class Gaming (5828 - 12414, n=93, last 2 years) | |
| Lenovo IdeaPad Gaming 3 15IAH7 | |
| Average Intel Core i5-12500H, NVIDIA GeForce RTX 3060 Laptop GPU (6126 - 7201, n=2) | |
| Acer Nitro 5 AN517-55-738R | |
| Gigabyte G7 KE | |
| Asus TUF Gaming F17 FX707Z-HX011W | |
| HP Pavilion Gaming 17-cd2146ng | |
| PCMark 10 / Essentials | |
| Average Intel Core i5-12500H, NVIDIA GeForce RTX 3060 Laptop GPU (10301 - 11150, n=2) | |
| Average of class Gaming (8810 - 11935, n=97, last 2 years) | |
| Gigabyte G7 KE | |
| Lenovo IdeaPad Gaming 3 15IAH7 | |
| Acer Nitro 5 AN517-55-738R | |
| Asus TUF Gaming F17 FX707Z-HX011W | |
| HP Pavilion Gaming 17-cd2146ng | |
| PCMark 10 / Productivity | |
| Average of class Gaming (6845 - 25323, n=95, last 2 years) | |
| Lenovo IdeaPad Gaming 3 15IAH7 | |
| Average Intel Core i5-12500H, NVIDIA GeForce RTX 3060 Laptop GPU (9038 - 9475, n=2) | |
| Acer Nitro 5 AN517-55-738R | |
| Gigabyte G7 KE | |
| HP Pavilion Gaming 17-cd2146ng | |
| Asus TUF Gaming F17 FX707Z-HX011W | |
| PCMark 10 / Digital Content Creation | |
| Average of class Gaming (7602 - 19954, n=95, last 2 years) | |
| Asus TUF Gaming F17 FX707Z-HX011W | |
| Acer Nitro 5 AN517-55-738R | |
| Lenovo IdeaPad Gaming 3 15IAH7 | |
| Average Intel Core i5-12500H, NVIDIA GeForce RTX 3060 Laptop GPU (6703 - 9593, n=2) | |
| Gigabyte G7 KE | |
| HP Pavilion Gaming 17-cd2146ng | |
| CrossMark / Overall | |
| Average of class Gaming (1366 - 2409, n=94, last 2 years) | |
| Gigabyte G7 KE | |
| Acer Nitro 5 AN517-55-738R | |
| Average Intel Core i5-12500H, NVIDIA GeForce RTX 3060 Laptop GPU (1752 - 1824, n=2) | |
| Asus TUF Gaming F17 FX707Z-HX011W | |
| CrossMark / Productivity | |
| Average of class Gaming (1386 - 2254, n=94, last 2 years) | |
| Gigabyte G7 KE | |
| Acer Nitro 5 AN517-55-738R | |
| Average Intel Core i5-12500H, NVIDIA GeForce RTX 3060 Laptop GPU (1720 - 1804, n=2) | |
| Asus TUF Gaming F17 FX707Z-HX011W | |
| CrossMark / Creativity | |
| Average of class Gaming (1343 - 2786, n=94, last 2 years) | |
| Asus TUF Gaming F17 FX707Z-HX011W | |
| Acer Nitro 5 AN517-55-738R | |
| Gigabyte G7 KE | |
| Average Intel Core i5-12500H, NVIDIA GeForce RTX 3060 Laptop GPU (1778 - 1800, n=2) | |
| CrossMark / Responsiveness | |
| Gigabyte G7 KE | |
| Average Intel Core i5-12500H, NVIDIA GeForce RTX 3060 Laptop GPU (1771 - 1966, n=2) | |
| Acer Nitro 5 AN517-55-738R | |
| Average of class Gaming (1226 - 2334, n=94, last 2 years) | |
| Asus TUF Gaming F17 FX707Z-HX011W | |
| PCMark 8 Home Score Accelerated v2 | 4560 points | |
| PCMark 8 Work Score Accelerated v2 | 6853 points | |
| PCMark 10 Score | 6126 points | |
Help | ||
| AIDA64 / Memory Copy | |
| Average of class Gaming (21750 - 129946, n=105, last 2 years) | |
| Asus TUF Gaming F17 FX707Z-HX011W | |
| Average Intel Core i5-12500H (23850 - 66598, n=9) | |
| Gigabyte G7 KE | |
| Acer Nitro 5 AN517-55-738R | |
| HP Pavilion Gaming 17-cd2146ng | |
| Lenovo IdeaPad Gaming 3 15IAH7 | |
| AIDA64 / Memory Read | |
| Average of class Gaming (22956 - 118858, n=105, last 2 years) | |
| Asus TUF Gaming F17 FX707Z-HX011W | |
| Average Intel Core i5-12500H (24879 - 68013, n=9) | |
| Gigabyte G7 KE | |
| Acer Nitro 5 AN517-55-738R | |
| HP Pavilion Gaming 17-cd2146ng | |
| Lenovo IdeaPad Gaming 3 15IAH7 | |
| AIDA64 / Memory Write | |
| Average of class Gaming (22297 - 135096, n=105, last 2 years) | |
| Asus TUF Gaming F17 FX707Z-HX011W | |
| Acer Nitro 5 AN517-55-738R | |
| Average Intel Core i5-12500H (23543 - 58797, n=9) | |
| Gigabyte G7 KE | |
| HP Pavilion Gaming 17-cd2146ng | |
| Lenovo IdeaPad Gaming 3 15IAH7 | |
| AIDA64 / Memory Latency | |
| Average of class Gaming (75.3 - 259, n=105, last 2 years) | |
| Average Intel Core i5-12500H (83.8 - 114.7, n=9) | |
| Lenovo IdeaPad Gaming 3 15IAH7 | |
| Gigabyte G7 KE | |
| HP Pavilion Gaming 17-cd2146ng | |
| Asus TUF Gaming F17 FX707Z-HX011W | |
| Acer Nitro 5 AN517-55-738R | |
* ... smaller is better
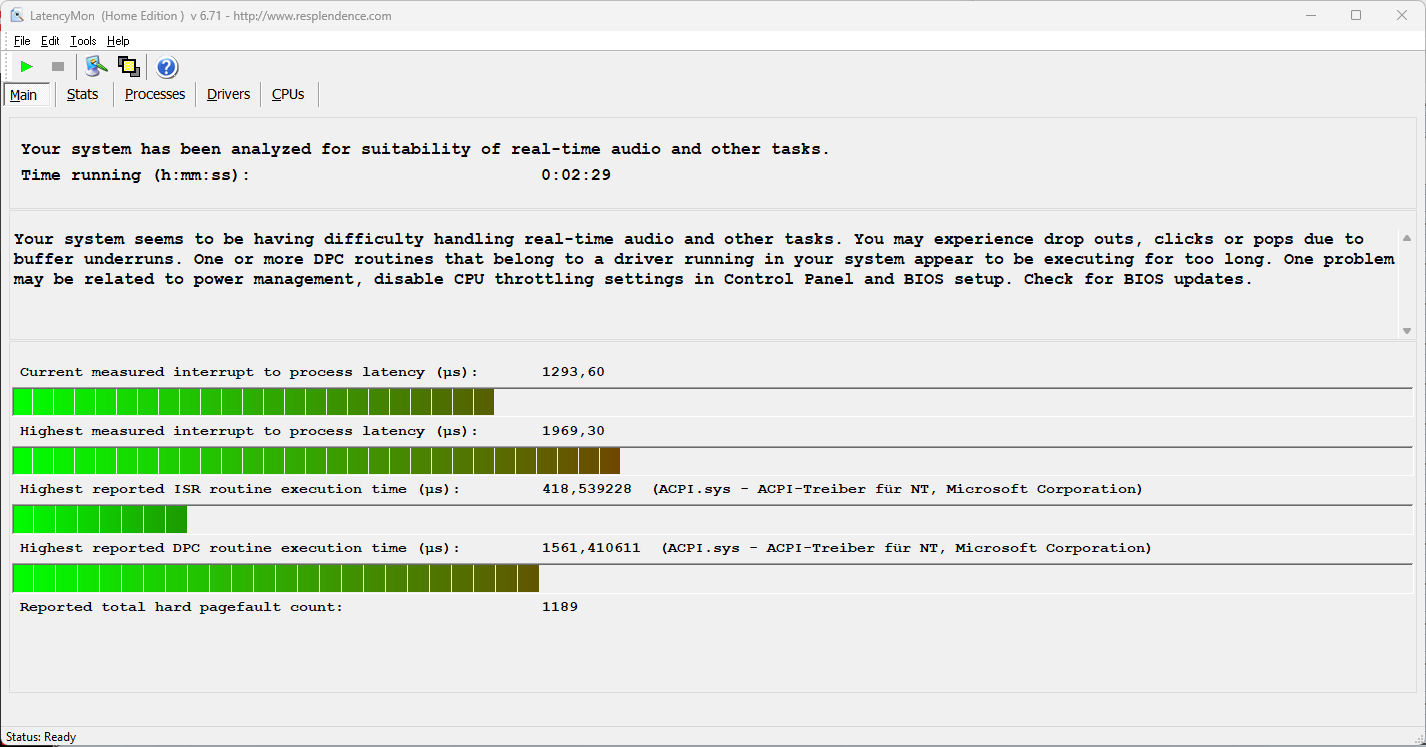
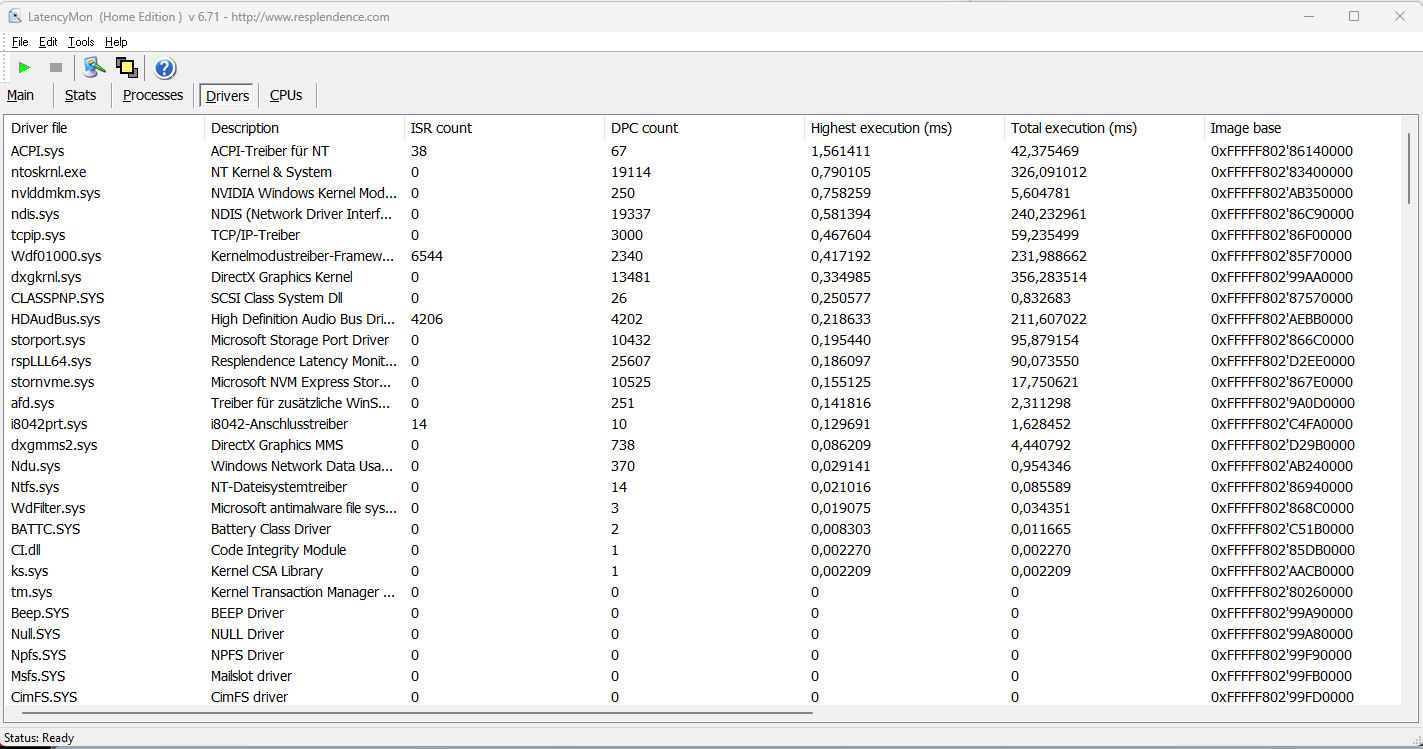
DPC延时
我们的标准化延迟监测测试(网页浏览、4K视频播放、Prime95高负载)显示了有问题的DPC延迟。以测试时的硬件和软件设置,该系统似乎不适合实时音频和视频编辑。未来的软件更新可能会改善或恶化这个问题。
| DPC Latencies / LatencyMon - interrupt to process latency (max), Web, Youtube, Prime95 | |
| Asus TUF Gaming F17 FX707Z-HX011W | |
| Gigabyte G7 KE | |
| Lenovo IdeaPad Gaming 3 15IAH7 | |
| HP Pavilion Gaming 17-cd2146ng | |
| Acer Nitro 5 AN517-55-738R | |
* ... smaller is better
存储解决方案
技嘉为笔记本电脑配备了自己的PCI-4固态硬盘(1TB,M.2-2280),实现了出色的传输速率。不幸的是,尽管底板内侧有金属冷却片,但该驱动器受到热节流的影响。总共有两个M.2-2280固态硬盘的空间(1个PCIe 4.0,1个PCIe 3.0)。

* ... smaller is better
Disk Throttling: DiskSpd Read Loop, Queue Depth 8
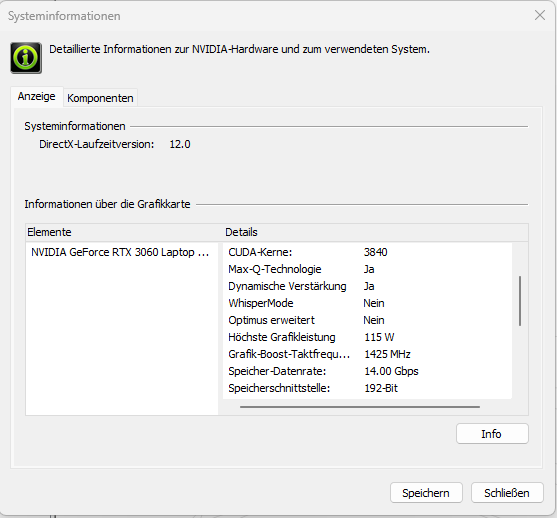
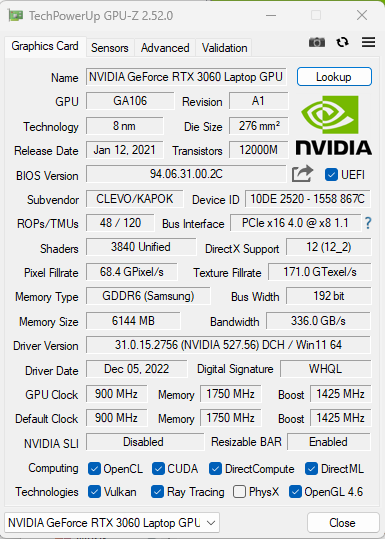
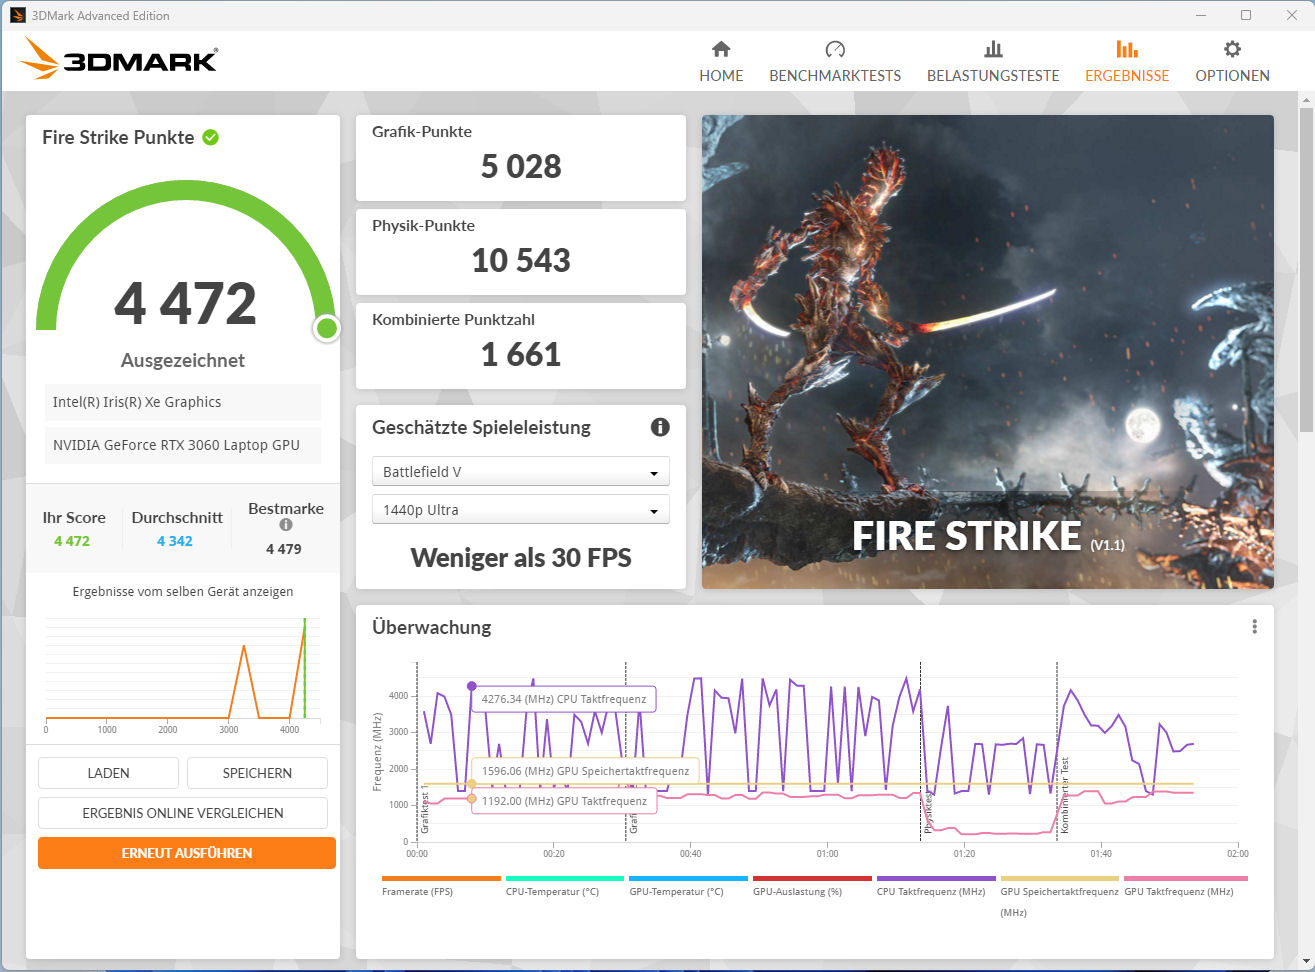
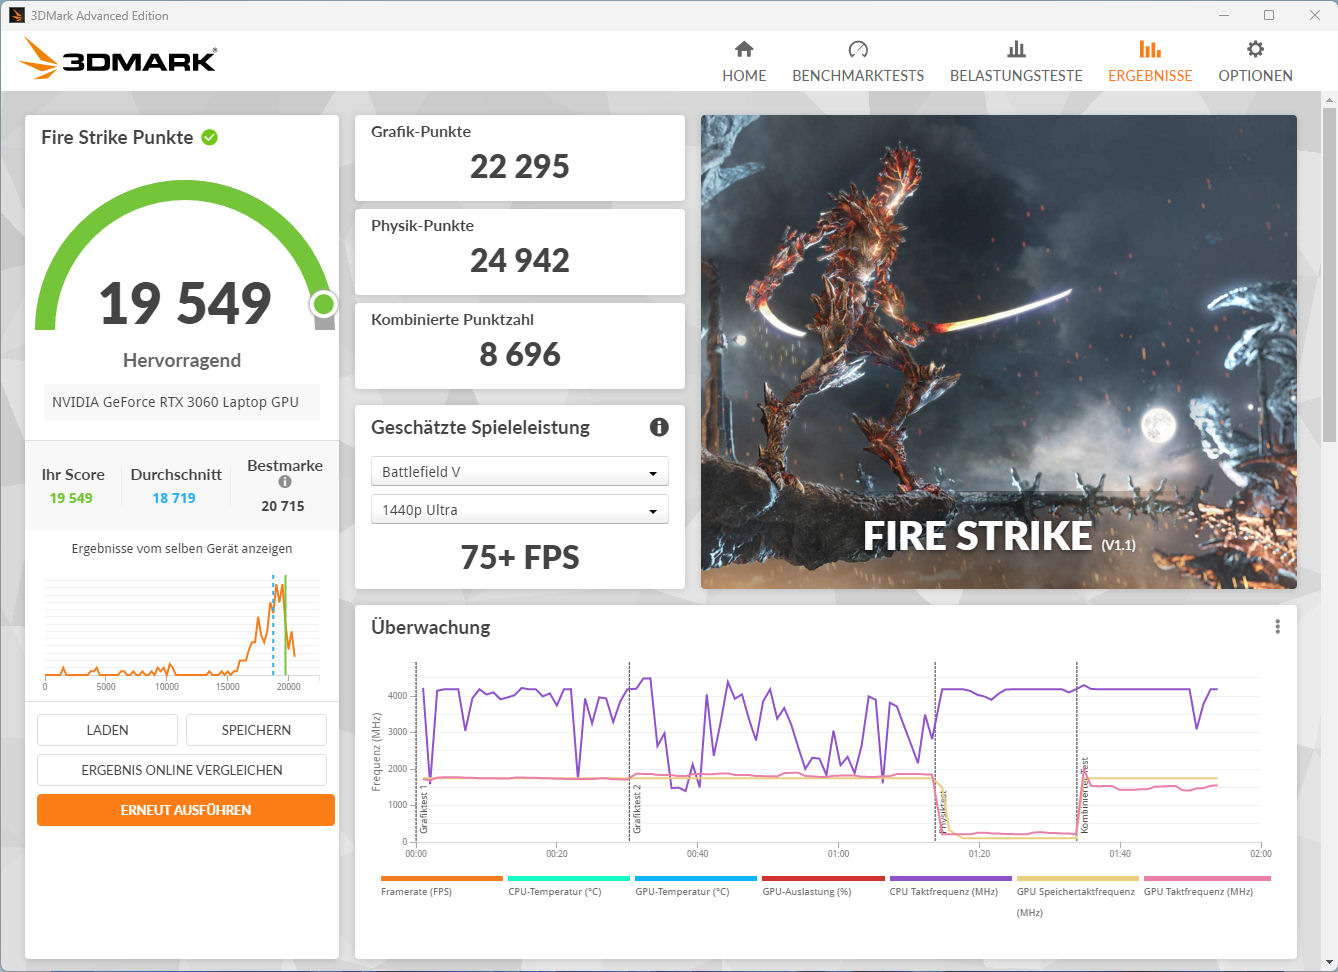
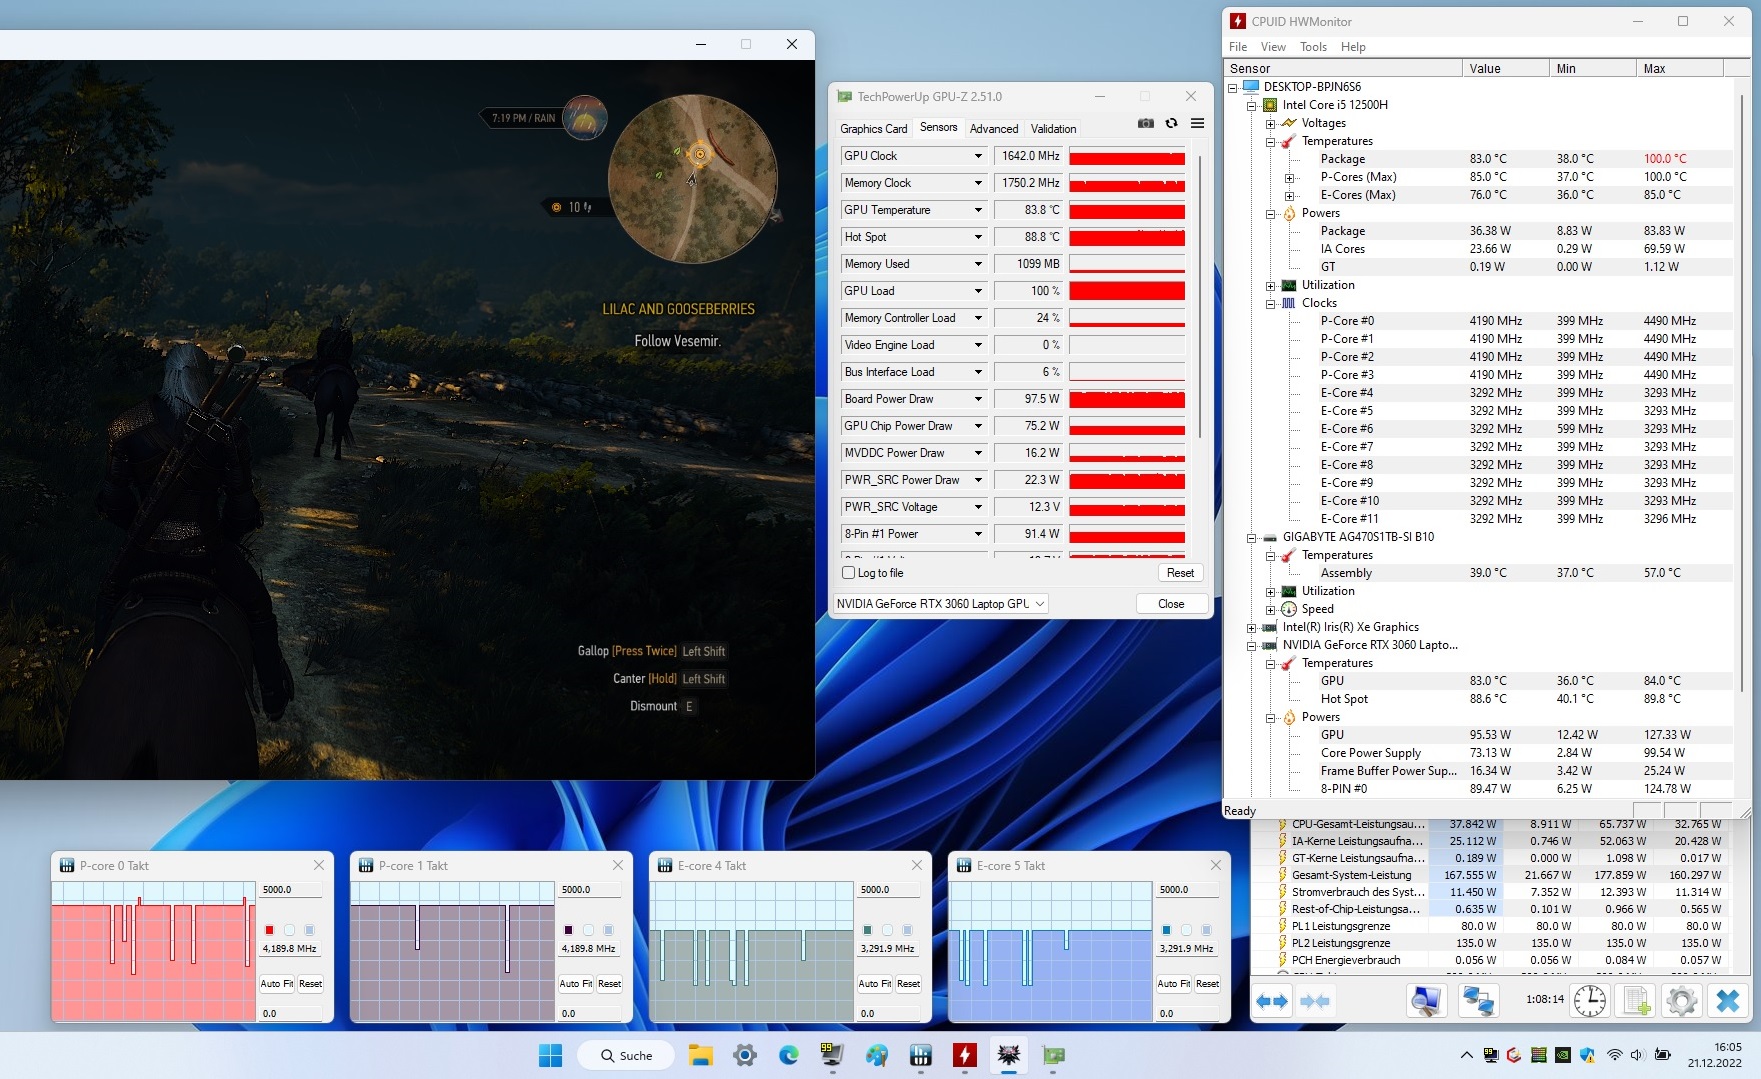
GPU性能
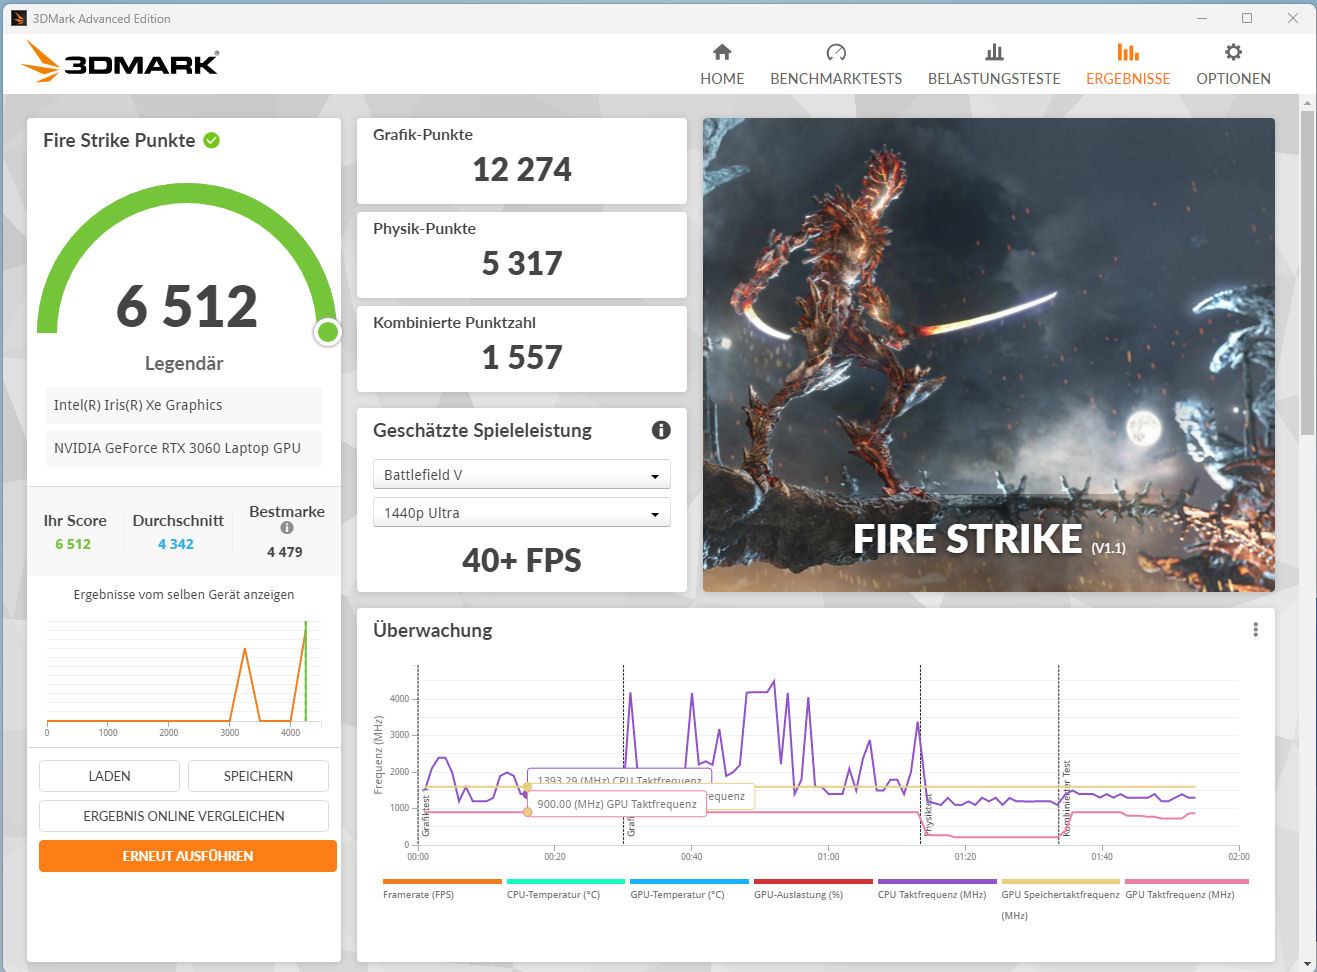
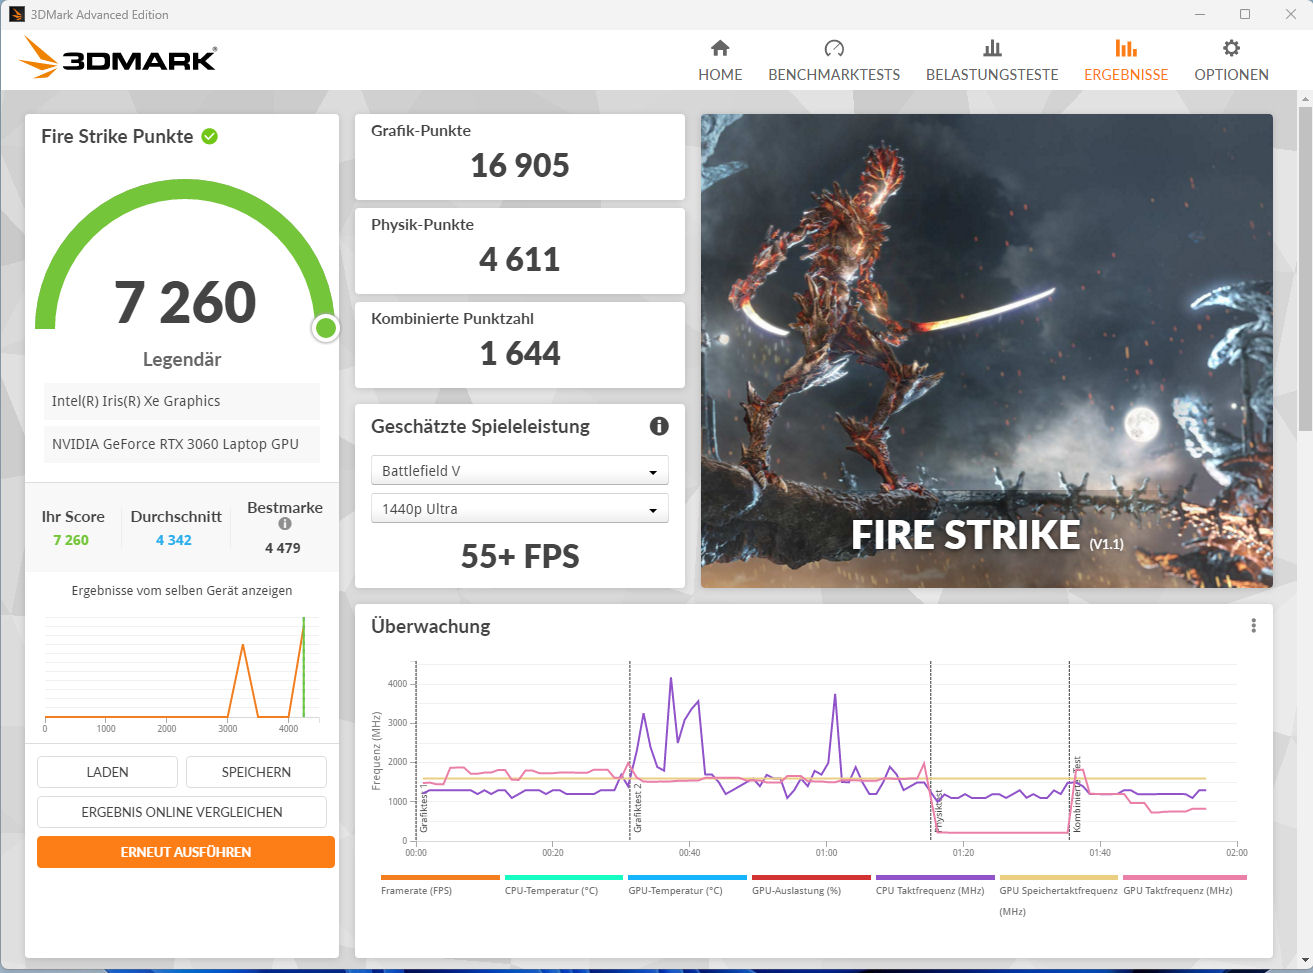
RTX-3000 GPU的性能在实践中取决于几个因素。冷却方案、内存配置和最大TGP,这是由笔记本电脑制造商在Nvidia的指定范围内设置的。在这种情况下,技嘉设置了专用的TGP的最大TGP GeForce RTX 3060笔记本电脑GPU为115瓦。正如我们的 Witcher 3然而,测试表明,这个TGP值并没有完全达到。
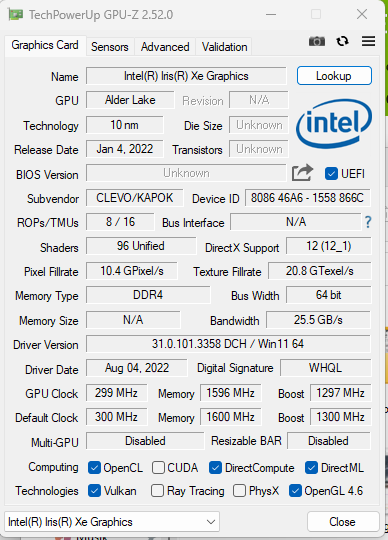
3DMark的结果超过了我们之前审查的RTX 3060模型的平均水平。该GPU可以访问快速的GDDR6显存(6144 MB)。该Iris Xe Graphics G7 80EU处理器的集成图形解决方案是活跃的,笔记本电脑使用Nvidia的Optimus图形切换技术。虽然有dGPU模式,但它并没有带来性能的提高。

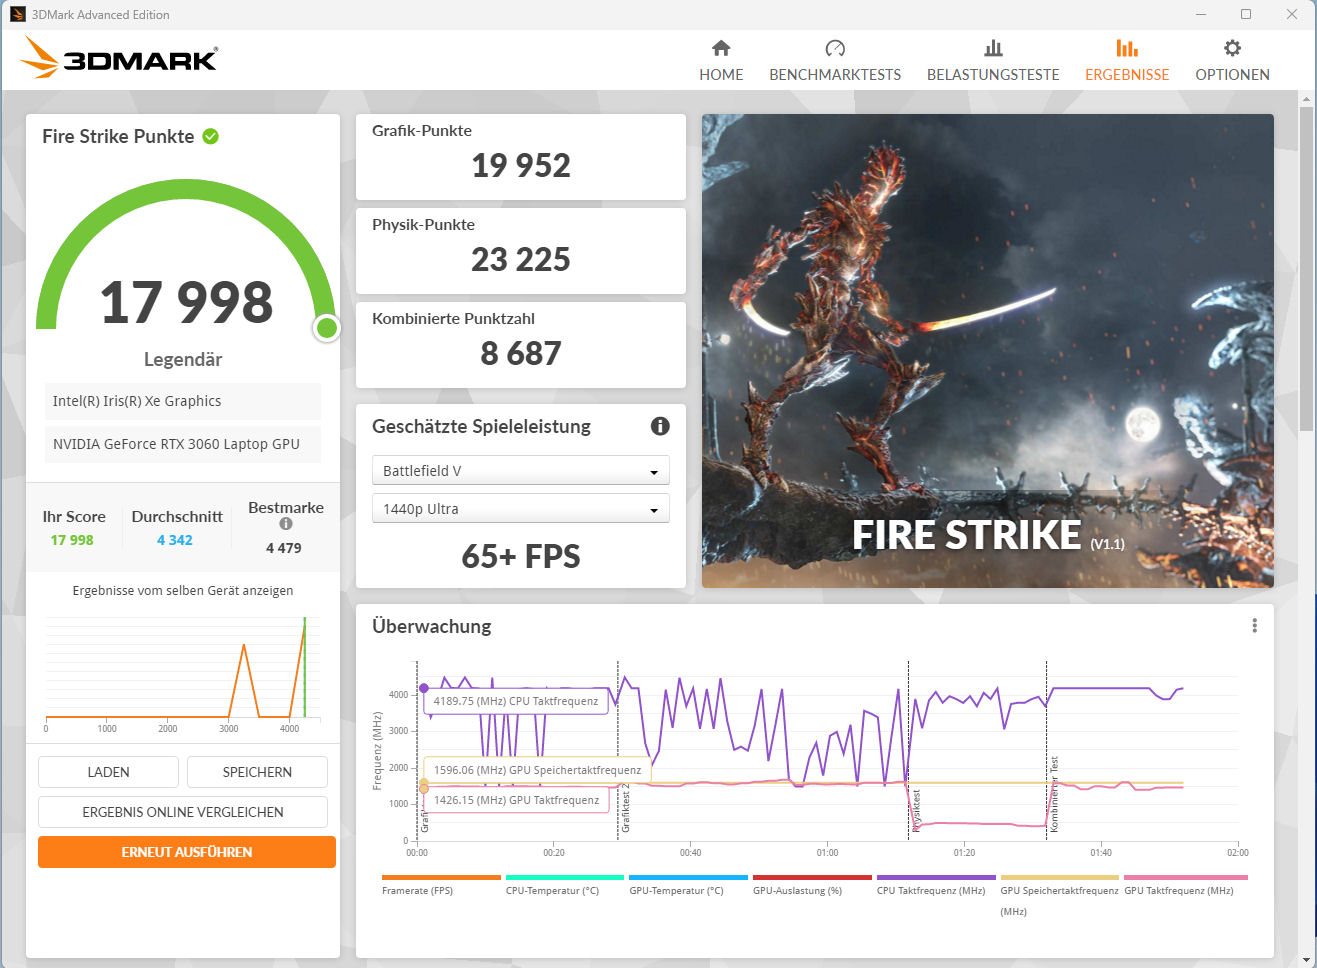
| 3DMark 06 Standard Score | 47733 points | |
| 3DMark 11 Performance | 26102 points | |
| 3DMark Cloud Gate Standard Score | 37608 points | |
| 3DMark Fire Strike Score | 20063 points | |
| 3DMark Time Spy Score | 8799 points | |
Help | ||
| GPUScore: Sacred Path | |
| 2560x1440 Official VRS | |
| Average of class Gaming (13.8 - 330, n=139, last 2 years) | |
| Average NVIDIA GeForce RTX 3060 Laptop GPU (111.2 - 113.7, n=2) | |
| Gigabyte G7 KE | |
| 2560x1440 Official | |
| Average of class Gaming (11 - 331, n=232, last 2 years) | |
| Average NVIDIA GeForce RTX 3060 Laptop GPU (2.34 - 110.1, n=3) | |
| Gigabyte G7 KE | |
| Geekbench 5.5 - Vulkan Score 5.5 | |
| Average of class Gaming (18857 - 246759, n=76, last 2 years) | |
| Average NVIDIA GeForce RTX 3060 Laptop GPU (46619 - 81150, n=25) | |
| Gigabyte G7 KE | |
| Acer Nitro 5 AN517-55-738R | |
* ... smaller is better
游戏性能
所安装的组件允许在高至最高设置下进行FHD游戏。使用具有更高分辨率的外部显示器也是可能的,尽管这可能需要降低设置。帧率超过了我们数据库中RTX 3060的平均水平。
| The Witcher 3 - 1920x1080 Ultra Graphics & Postprocessing (HBAO+) | |
| Average of class Gaming (104.7 - 240, n=6, last 2 years) | |
| Asus TUF Gaming F17 FX707Z-HX011W | |
| Acer Nitro 5 AN517-55-738R | |
| Gigabyte G7 KE | |
| Average NVIDIA GeForce RTX 3060 Laptop GPU (58.2 - 91.5, n=48) | |
| Lenovo IdeaPad Gaming 3 15IAH7 | |
| HP Pavilion Gaming 17-cd2146ng | |
为了确定帧率是否在很长一段时间内保持一致,我们在全高清分辨率和最大质量设置下运行了TheWitcher 3 约60分钟。在整个过程中,角色没有被移动。我们没有观察到性能上的下降。
Witcher 3 FPS Graph
| low | med. | high | ultra | |
|---|---|---|---|---|
| GTA V (2015) | 182.8 | 179.5 | 172.1 | 103 |
| The Witcher 3 (2015) | 339 | 233 | 137.1 | 82.4 |
| Dota 2 Reborn (2015) | 170.5 | 153 | 145.9 | 137.3 |
| Final Fantasy XV Benchmark (2018) | 180.4 | 112.4 | 84.7 | |
| X-Plane 11.11 (2018) | 120.5 | 106 | 86.8 | |
| Far Cry 5 (2018) | 168 | 131 | 122 | 115 |
| Strange Brigade (2018) | 369 | 211 | 168 | 146.4 |
| Flight Simulator 2020 (2020) | 135.7 | 85.1 | 62.8 | 45.9 |
| Guardians of the Galaxy (2021) | 120 | 114 | 114 | 110 |
| Cyberpunk 2077 1.6 (2022) | 96.7 | 75.5 | 66 | 60.7 |
| F1 22 (2022) | 190.5 | 186.3 | 149.6 | 54.4 |
| The Quarry (2022) | 126.9 | 97.2 | 80 | 64.1 |
| A Plague Tale Requiem (2022) | 87.5 | 73 | 62.8 | 52.8 |
| Uncharted Legacy of Thieves Collection (2022) | 72.2 | 69.8 | 65.6 | 62.3 |
| Call of Duty Modern Warfare 2 2022 (2022) | 111 | 99 | 77 | 72 |
| Spider-Man Miles Morales (2022) | 103.3 | 94.2 | 86.4 | 77.5 |
| The Callisto Protocol (2022) | 105.5 | 83.9 | 55.6 | 55.3 |
| Need for Speed Unbound (2022) | 114.9 | 106.7 | 88.6 | 76.6 |
| High On Life (2023) | 177.1 | 134.2 | 99.3 | 79.4 |
| The Witcher 3 v4 (2023) | 170.1 | 132.2 | 108.4 | 87.5 |
| Dead Space Remake (2023) | 69.2 | 66.5 | 59 | 54 |
排放--千兆系统可能非常响亮
噪声排放
即使在日常使用中(办公室、网络),这两个风扇也经常引人注目--噪音水平可能达到38 dB(A)。它们只是很少空转。在负载情况下,笔记本电脑可以达到非常高的噪音水平,高达59 dB(A)(压力测试)和56 dB(A) (Witcher 3)--这使得我们的测试模型在这些情况下比大多数竞争对手的噪音大得多。通过使用 "娱乐"、"节能"、"安静 "三种性能配置之一,可以减少噪音排放--以牺牲一些性能为代价。
Noise level
| Idle |
| 27 / 35 / 38 dB(A) |
| Load |
| 52 / 59 dB(A) |
 | ||
30 dB silent 40 dB(A) audible 50 dB(A) loud |
||
min: | ||
| Gigabyte G7 KE i5-12500H, GeForce RTX 3060 Laptop GPU | HP Pavilion Gaming 17-cd2146ng i5-11300H, GeForce RTX 3050 Ti Laptop GPU | Acer Nitro 5 AN517-55-738R i7-12700H, GeForce RTX 3060 Laptop GPU | Asus TUF Gaming F17 FX707Z-HX011W i7-12700H, GeForce RTX 3060 Laptop GPU | Lenovo IdeaPad Gaming 3 15IAH7 i5-12500H, GeForce RTX 3050 Ti Laptop GPU | |
|---|---|---|---|---|---|
| Noise | 17% | 9% | 21% | 11% | |
| off / environment * (dB) | 27 | 25 7% | 25.5 6% | 24 11% | 25 7% |
| Idle Minimum * (dB) | 27 | 27 -0% | 25.5 6% | 24 11% | 29 -7% |
| Idle Average * (dB) | 35 | 28 20% | 25.5 27% | 24 31% | 30 14% |
| Idle Maximum * (dB) | 38 | 30 21% | 27 29% | 24 37% | 32 16% |
| Load Average * (dB) | 52 | 39 25% | 52.6 -1% | 42.6 18% | 42 19% |
| Witcher 3 ultra * (dB) | 56 | 44 21% | 46.84 16% | 46 18% | |
| Load Maximum * (dB) | 59 | 46 22% | 68.2 -16% | 46.84 21% | 54 8% |
* ... smaller is better
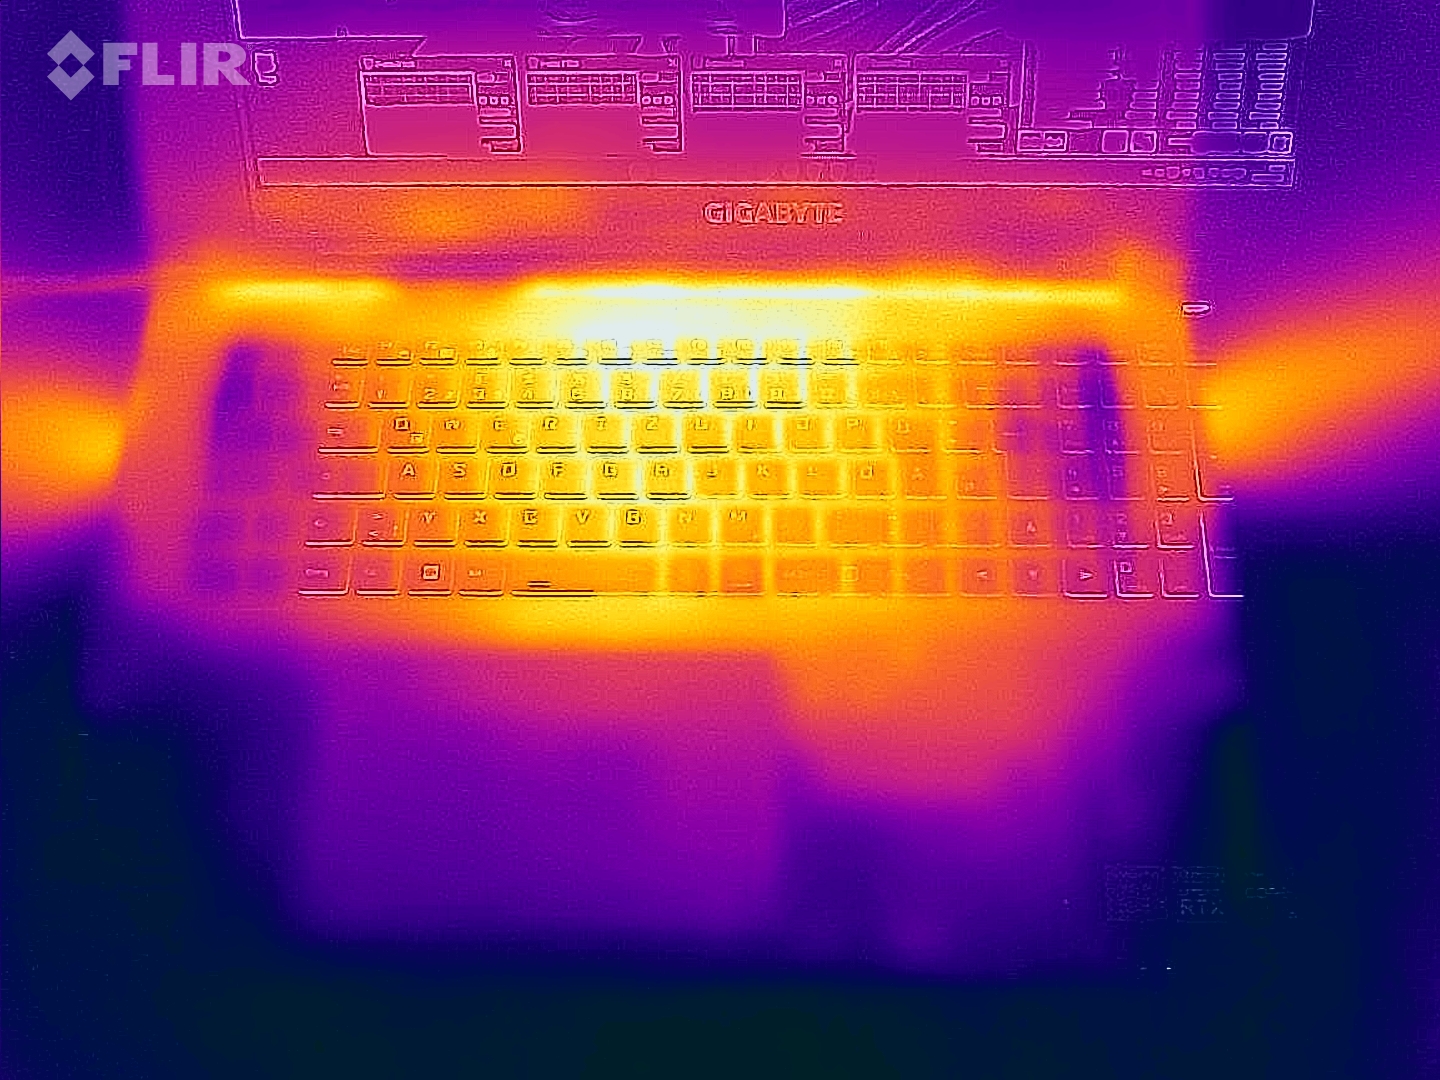
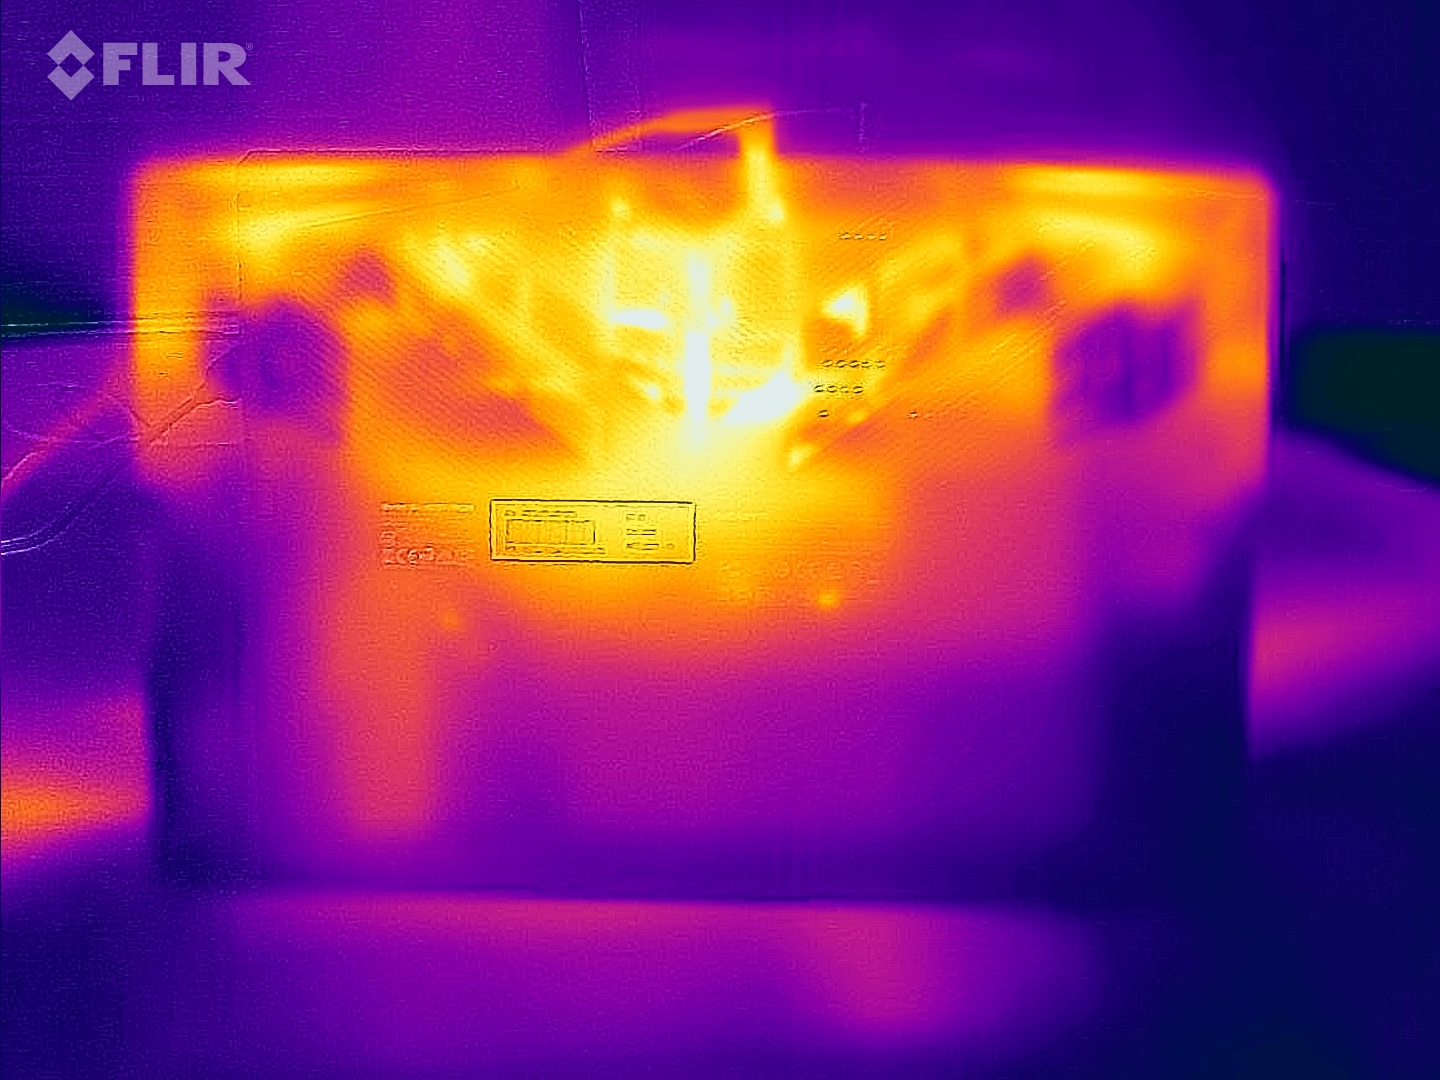
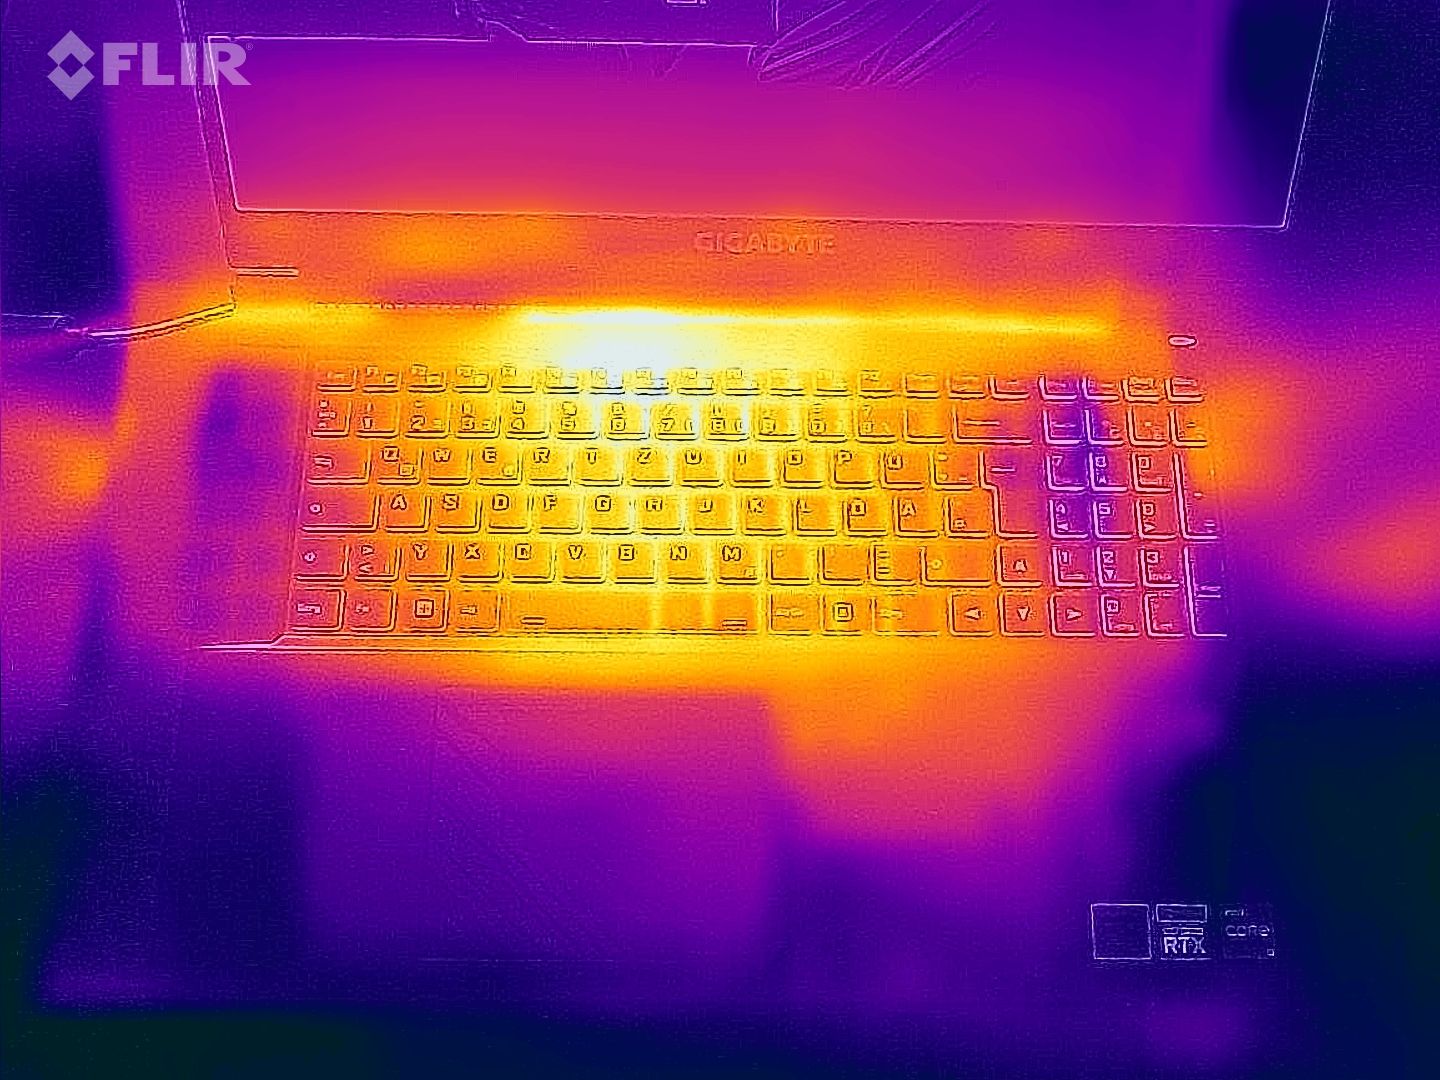
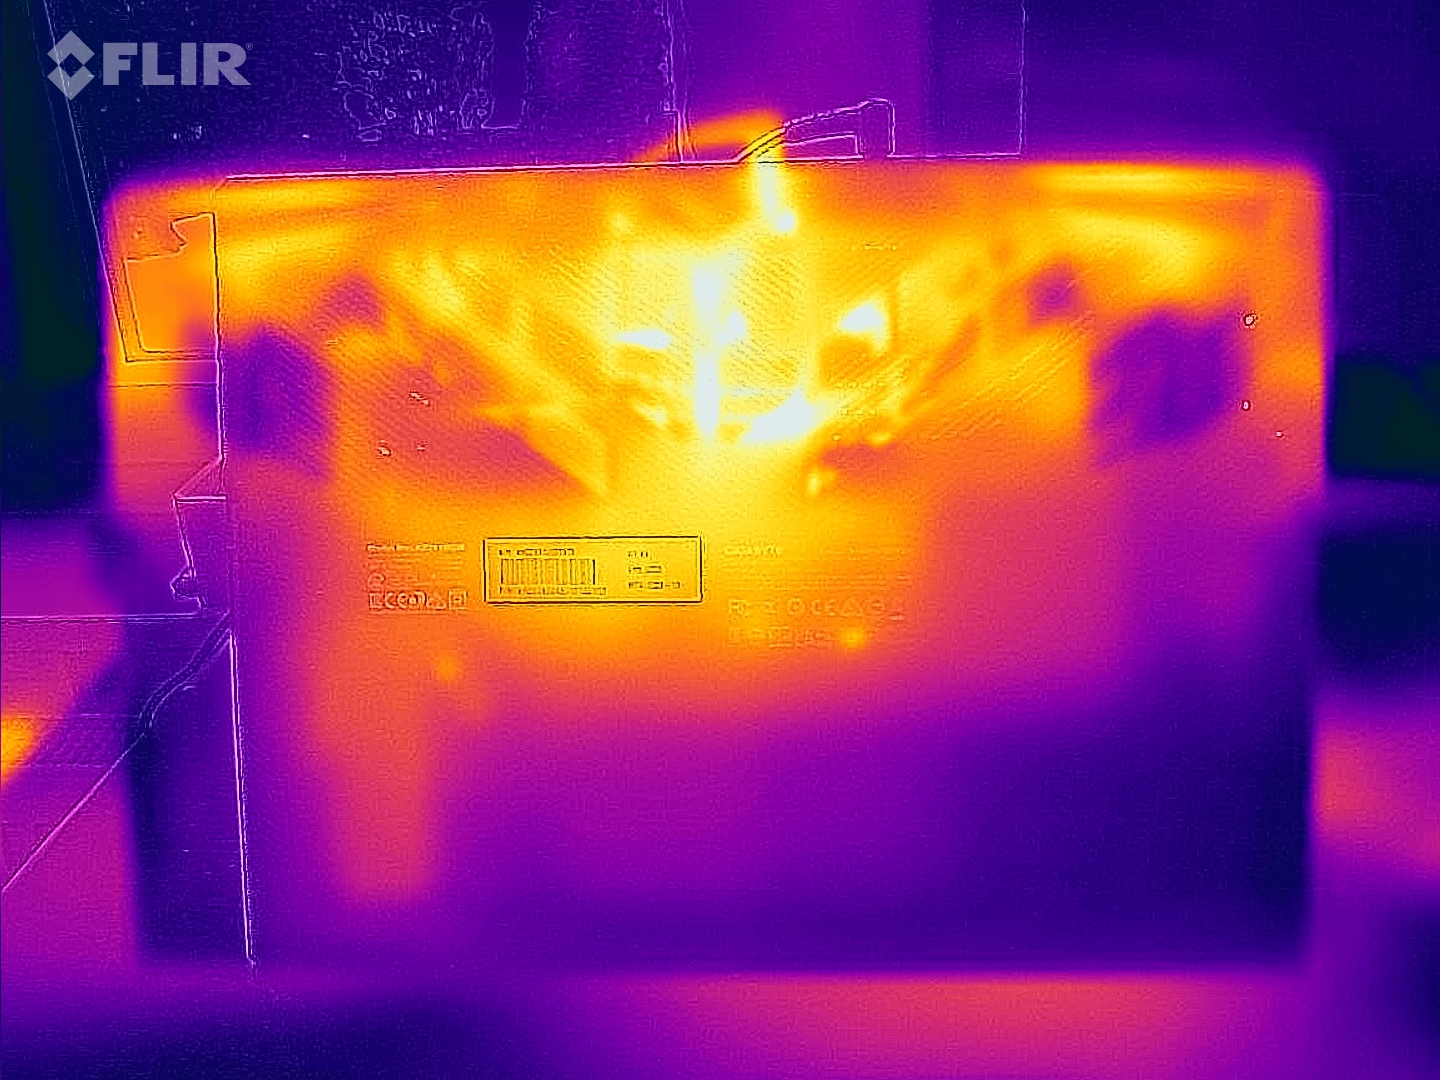
温度
在日常使用中(办公室、网络),表面温度保持合理。虽然负载下的热量发展(压力测试。 Witcher 3)下的热量发展是显著的,但没有达到关键水平。CPU达到的温度接近其100℃的极限。
(-) The maximum temperature on the upper side is 52 °C / 126 F, compared to the average of 40.4 °C / 105 F, ranging from 21.2 to 68.8 °C for the class Gaming.
(-) The bottom heats up to a maximum of 54 °C / 129 F, compared to the average of 43.2 °C / 110 F
(+) In idle usage, the average temperature for the upper side is 26.6 °C / 80 F, compared to the device average of 33.9 °C / 93 F.
(-) Playing The Witcher 3, the average temperature for the upper side is 40.6 °C / 105 F, compared to the device average of 33.9 °C / 93 F.
(+) The palmrests and touchpad are reaching skin temperature as a maximum (34 °C / 93.2 F) and are therefore not hot.
(-) The average temperature of the palmrest area of similar devices was 28.8 °C / 83.8 F (-5.2 °C / -9.4 F).
| Gigabyte G7 KE Intel Core i5-12500H, NVIDIA GeForce RTX 3060 Laptop GPU | HP Pavilion Gaming 17-cd2146ng Intel Core i5-11300H, NVIDIA GeForce RTX 3050 Ti Laptop GPU | Acer Nitro 5 AN517-55-738R Intel Core i7-12700H, NVIDIA GeForce RTX 3060 Laptop GPU | Asus TUF Gaming F17 FX707Z-HX011W Intel Core i7-12700H, NVIDIA GeForce RTX 3060 Laptop GPU | Lenovo IdeaPad Gaming 3 15IAH7 Intel Core i5-12500H, NVIDIA GeForce RTX 3050 Ti Laptop GPU | |
|---|---|---|---|---|---|
| Heat | 12% | -6% | 1% | 13% | |
| Maximum Upper Side * (°C) | 52 | 44 15% | 48.3 7% | 52 -0% | 47 10% |
| Maximum Bottom * (°C) | 54 | 48 11% | 52 4% | 47 13% | 52 4% |
| Idle Upper Side * (°C) | 28 | 27 4% | 34.5 -23% | 31 -11% | 25 11% |
| Idle Bottom * (°C) | 32 | 27 16% | 35.8 -12% | 31 3% | 24 25% |
* ... smaller is better
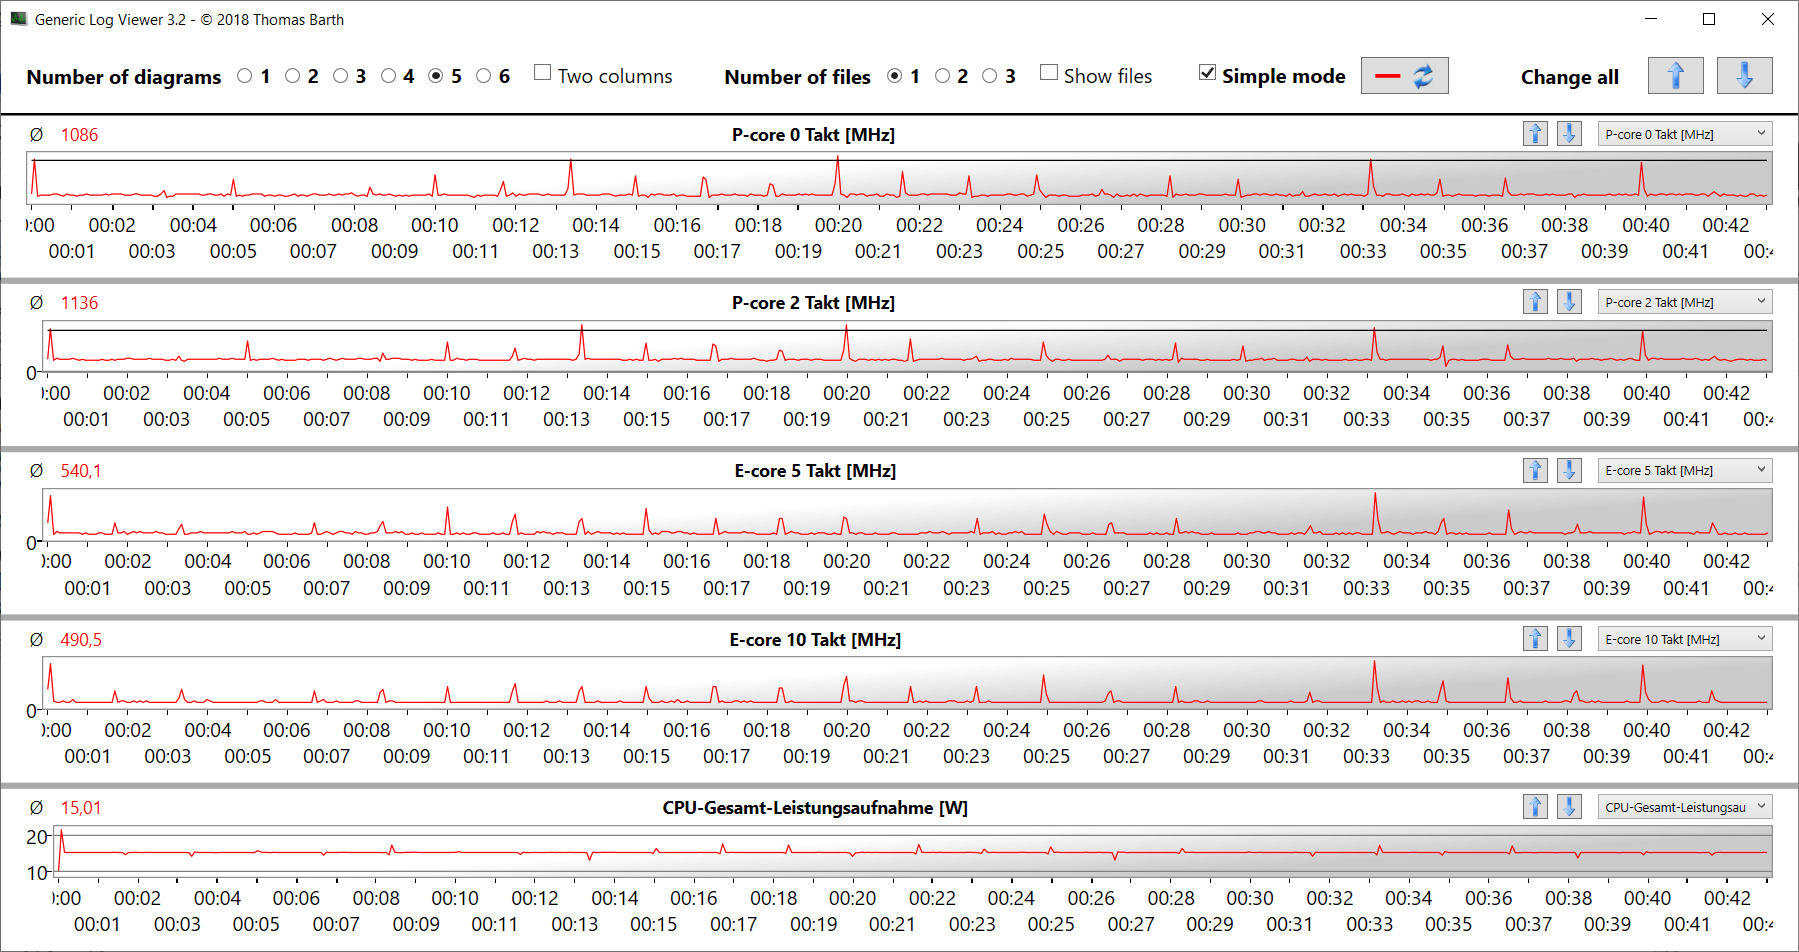
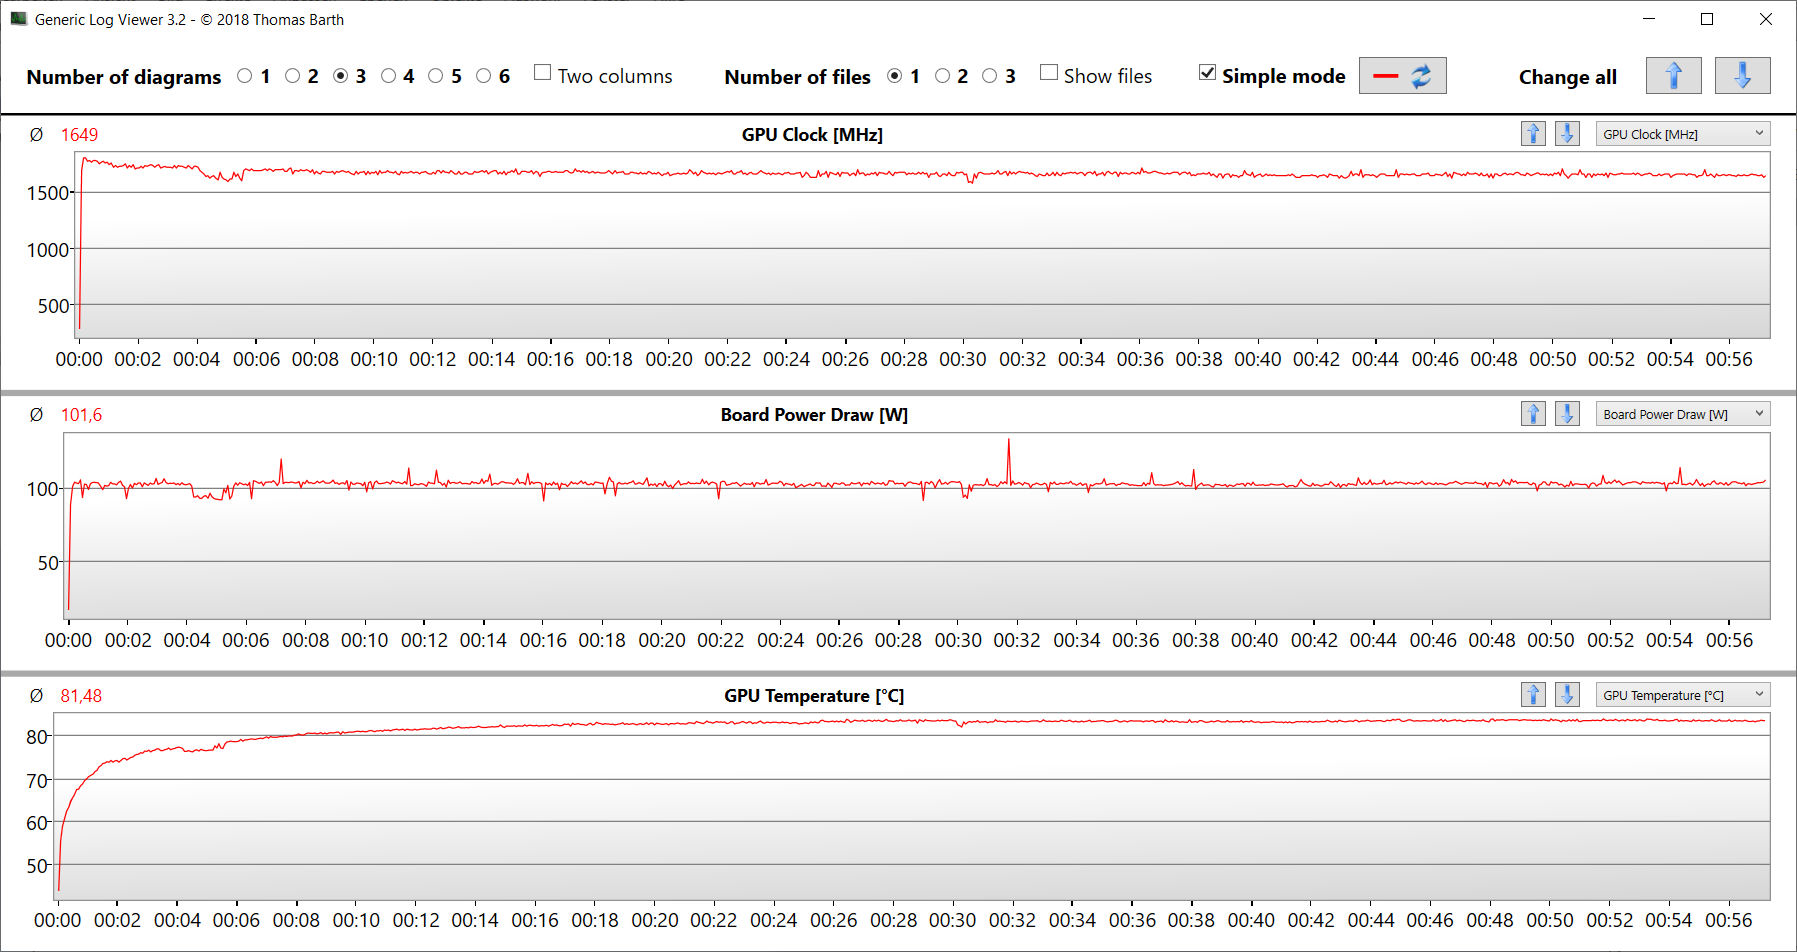
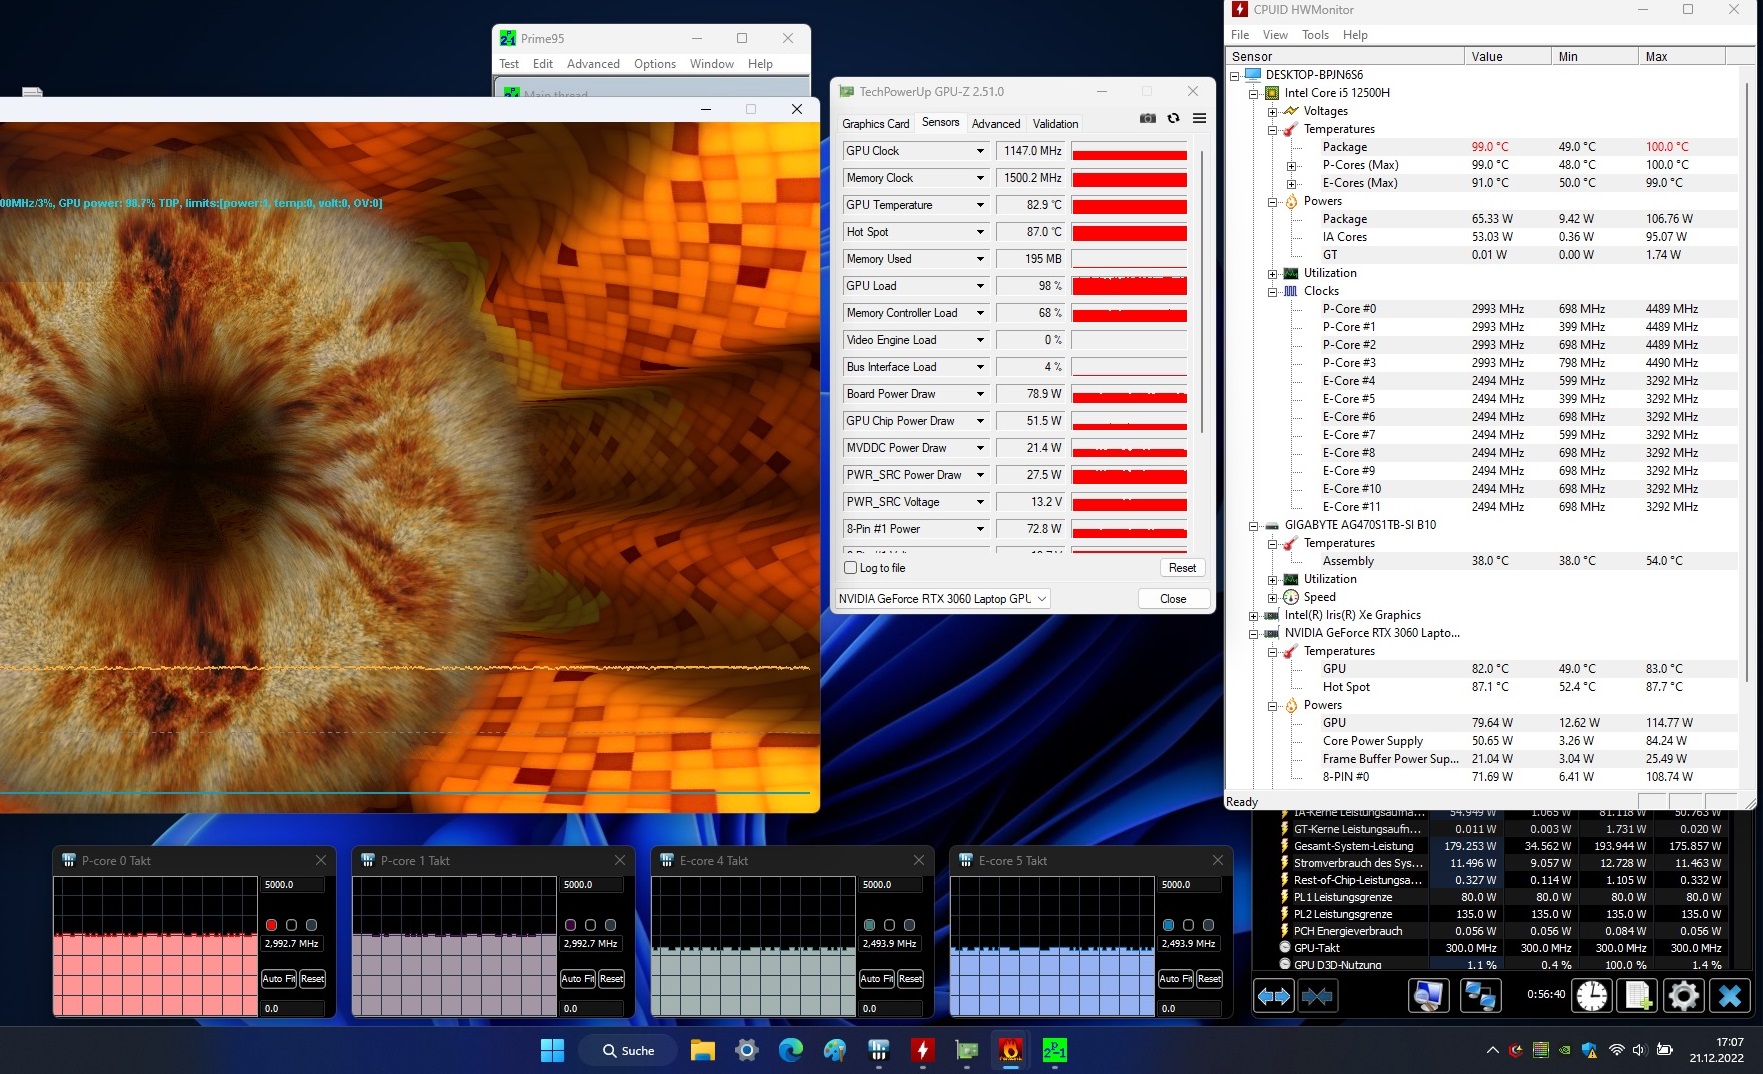
压力测试
我们的压力测试(连续的Prime95和FurMark压力)代表了一种极端情况,并作为系统处于100%负载时的稳定性测试。在15分钟内,CPU时钟速度从4.1GHz(P核)和3.1GHz(E核)下降到基本时钟附近(P:3GHz,E:2.5GHz),然后保持在这个水平。GPU的时钟速度最初在1200MHz和1500MHz之间波动,最后稳定在1150MHz。
发言人
立体声扬声器产生的声音很薄,而且缺乏低音。我们建议使用外部耳机或扬声器以获得更好的音效。
Gigabyte G7 KE audio analysis
(±) | speaker loudness is average but good (79 dB)
Bass 100 - 315 Hz
(-) | nearly no bass - on average 23.4% lower than median
(±) | linearity of bass is average (10.8% delta to prev. frequency)
Mids 400 - 2000 Hz
(±) | higher mids - on average 11.1% higher than median
(±) | linearity of mids is average (10.6% delta to prev. frequency)
Highs 2 - 16 kHz
(±) | higher highs - on average 6.5% higher than median
(±) | linearity of highs is average (7.7% delta to prev. frequency)
Overall 100 - 16.000 Hz
(-) | overall sound is not linear (32% difference to median)
Compared to same class
» 97% of all tested devices in this class were better, 1% similar, 2% worse
» The best had a delta of 6%, average was 18%, worst was 132%
Compared to all devices tested
» 91% of all tested devices were better, 2% similar, 7% worse
» The best had a delta of 4%, average was 23%, worst was 134%
HP Pavilion Gaming 17-cd2146ng audio analysis
(±) | speaker loudness is average but good (80 dB)
Bass 100 - 315 Hz
(-) | nearly no bass - on average 19.5% lower than median
(±) | linearity of bass is average (11.5% delta to prev. frequency)
Mids 400 - 2000 Hz
(+) | balanced mids - only 3.2% away from median
(+) | mids are linear (3.8% delta to prev. frequency)
Highs 2 - 16 kHz
(±) | higher highs - on average 8.6% higher than median
(±) | linearity of highs is average (8% delta to prev. frequency)
Overall 100 - 16.000 Hz
(±) | linearity of overall sound is average (20.5% difference to median)
Compared to same class
» 73% of all tested devices in this class were better, 5% similar, 22% worse
» The best had a delta of 6%, average was 18%, worst was 132%
Compared to all devices tested
» 54% of all tested devices were better, 8% similar, 38% worse
» The best had a delta of 4%, average was 23%, worst was 134%
能源管理 - 可接受的运行时间的G7笔记本电脑
能源消耗
在空闲时,我们观察到技嘉笔记本电脑的耗电量略有增加。看一眼竞争对手,就知道Optimus笔记本电脑的正常范围在哪里。在压力测试和 Witcher 3测试中,耗电量符合我们对所安装组件的预期。附带的交流适配器尺寸很好,能够管理短时的消费高峰,超过其额定功率(180瓦)。
| Off / Standby | |
| Idle | |
| Load |
|
Key:
min: | |
| Gigabyte G7 KE i5-12500H, GeForce RTX 3060 Laptop GPU | HP Pavilion Gaming 17-cd2146ng i5-11300H, GeForce RTX 3050 Ti Laptop GPU | Acer Nitro 5 AN517-55-738R i7-12700H, GeForce RTX 3060 Laptop GPU | Asus TUF Gaming F17 FX707Z-HX011W i7-12700H, GeForce RTX 3060 Laptop GPU | Lenovo IdeaPad Gaming 3 15IAH7 i5-12500H, GeForce RTX 3050 Ti Laptop GPU | Average of class Gaming | |
|---|---|---|---|---|---|---|
| Power Consumption | 35% | 3% | 25% | 28% | -4% | |
| Idle Minimum * (Watt) | 15 | 3 80% | 9.7 35% | 6.6 56% | 8 47% | 13 ? 13% |
| Idle Average * (Watt) | 17 | 8 53% | 14.6 14% | 8.3 51% | 10 41% | 18.7 ? -10% |
| Idle Maximum * (Watt) | 24 | 28 -17% | 16.7 30% | 11.8 51% | 16 33% | 24.3 ? -1% |
| Load Average * (Watt) | 111 | 88 21% | 166 -50% | 119 -7% | 99 11% | 110.2 ? 1% |
| Witcher 3 ultra * (Watt) | 174.1 | 98.2 44% | 169 3% | 144.6 17% | ||
| Load Maximum * (Watt) | 208 | 152 27% | 235 -13% | 222 -7% | 168 19% | 258 ? -24% |
* ... smaller is better
Consumption Witcher 3 / Stress Test
Consumption external Monitor
电池寿命
在我们的Wi-Fi(通过脚本浏览网页)和视频测试(循环播放H.264编解码器、FHD短片《Big Buck Bunny》)中,17.3英寸笔记本电脑的运行时间分别达到了5:17小时和2:12小时。在进行测试之前,我们禁用了笔记本电脑的节能功能,并将显示器的亮度设置为大约150尼特。此外,我们在视频测试中禁用了无线模块。
视频运行时间是非常令人失望的。通常情况下,我们会期望至少与Wi-Fi的运行时间持平。显然,该系统在播放过程中受到了功耗增加的影响。为了排除软件问题,我们测试了英特尔iGPU的多个不同版本的驱动程序,该驱动程序被用于播放。同样,操作系统似乎也不是罪魁祸首:我们观察到Windows 10和Windows 11下的运行时间都很短。这表明一个内部问题,可能只有技嘉能够解决。
| Gigabyte G7 KE i5-12500H, GeForce RTX 3060 Laptop GPU, 54 Wh | HP Pavilion Gaming 17-cd2146ng i5-11300H, GeForce RTX 3050 Ti Laptop GPU, 52.5 Wh | Acer Nitro 5 AN517-55-738R i7-12700H, GeForce RTX 3060 Laptop GPU, 90.61 Wh | Asus TUF Gaming F17 FX707Z-HX011W i7-12700H, GeForce RTX 3060 Laptop GPU, 90 Wh | Lenovo IdeaPad Gaming 3 15IAH7 i5-12500H, GeForce RTX 3050 Ti Laptop GPU, 60 Wh | Average of class Gaming | |
|---|---|---|---|---|---|---|
| Battery runtime | -6% | 69% | 130% | 11% | 92% | |
| Reader / Idle (h) | 7.1 | 11.7 65% | 8.71 ? 23% | |||
| H.264 (h) | 2.2 | 5.3 141% | 7.7 250% | 8.64 ? 293% | ||
| WiFi v1.3 (h) | 5.3 | 5 -6% | 6.5 23% | 8.7 64% | 5.9 11% | 7.11 ? 34% |
| Load (h) | 1.3 | 1.9 46% | 2.3 77% | 1.502 ? 16% |
Pros
Cons
结论 - 负担得起的游戏笔记本
通过G7 KE,技嘉创造了一个相对实惠的FHD游戏笔记本电脑,在视频编辑和渲染方面也有良好的表现 - 这是由 酷睿i5-12500HCPU和 GeForce RTX 3060笔记本电脑GPU。同时,极快的PCIe-4固态硬盘(1TB)确保了短的加载时间。
技嘉G7 KE是一个坚实的游戏笔记本电脑。我们发现的缺点是相当小的。
虽然该系统在负载下的热量发展并不过分,但由此产生的噪音水平相对较高--许多竞争对手在这方面表现得更好。我们对17.3英寸哑光显示屏(FHD,IPS,300赫兹,sRGB)的整体质量感到满意。
尽管G7的电池容量不大(54Wh),但它的运行时间相当可接受。不幸的是,电池不能通过通用的USB-C充电器进行充电--USB-C端口(1个雷电4,1个USB 3.2 gen.2)都不支持Power Delivery。
缺乏附带的Windows操作系统对于相对便宜的价格来说也是一个不小的原因。如果你没有有效的Windows许可,也不想购买,安装一个Linux发行版也是可能的。然而,替代操作系统的安装和设置过程对一些用户来说可能非常具有挑战性。
笔记本 华硕TUF游戏机F17可以作为G7 KE的替代品。虽然它配备了相同的GPU,但其3D性能略好,电池寿命也更长。也就是说,该系统的价格约为200-300美元。
价格和可用性
虽然配置的技嘉G7 KE还没有在美国的主要零售商处广泛销售,但我们预计模型将很快到达,价格约为1200美元。
Gigabyte G7 KE
- 01/21/2023 v7 (old)
Sascha Mölck
Price comparison

