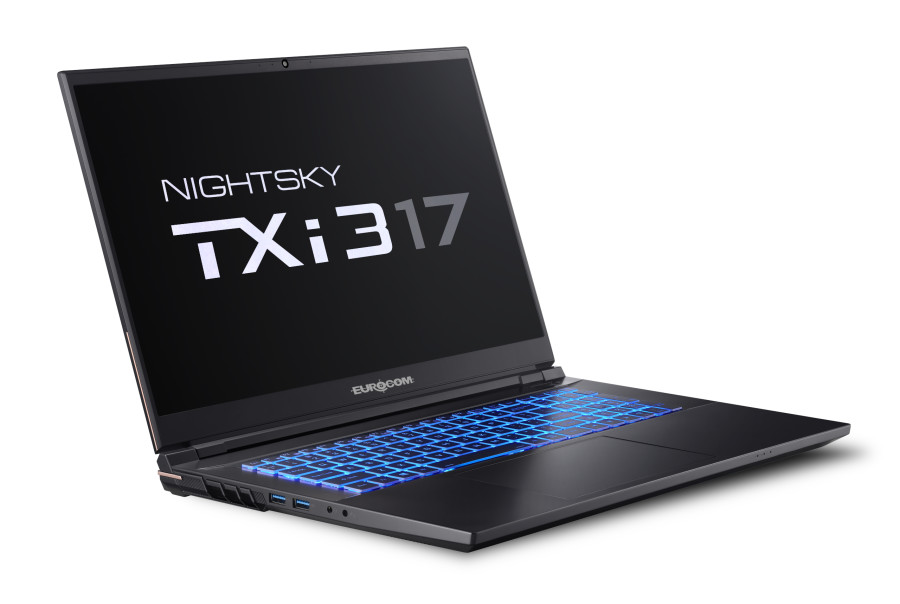
Eurocom Nightsky TXi317笔记本电脑回顾。125 WGeForce RTX 3080 Ti speedster
")
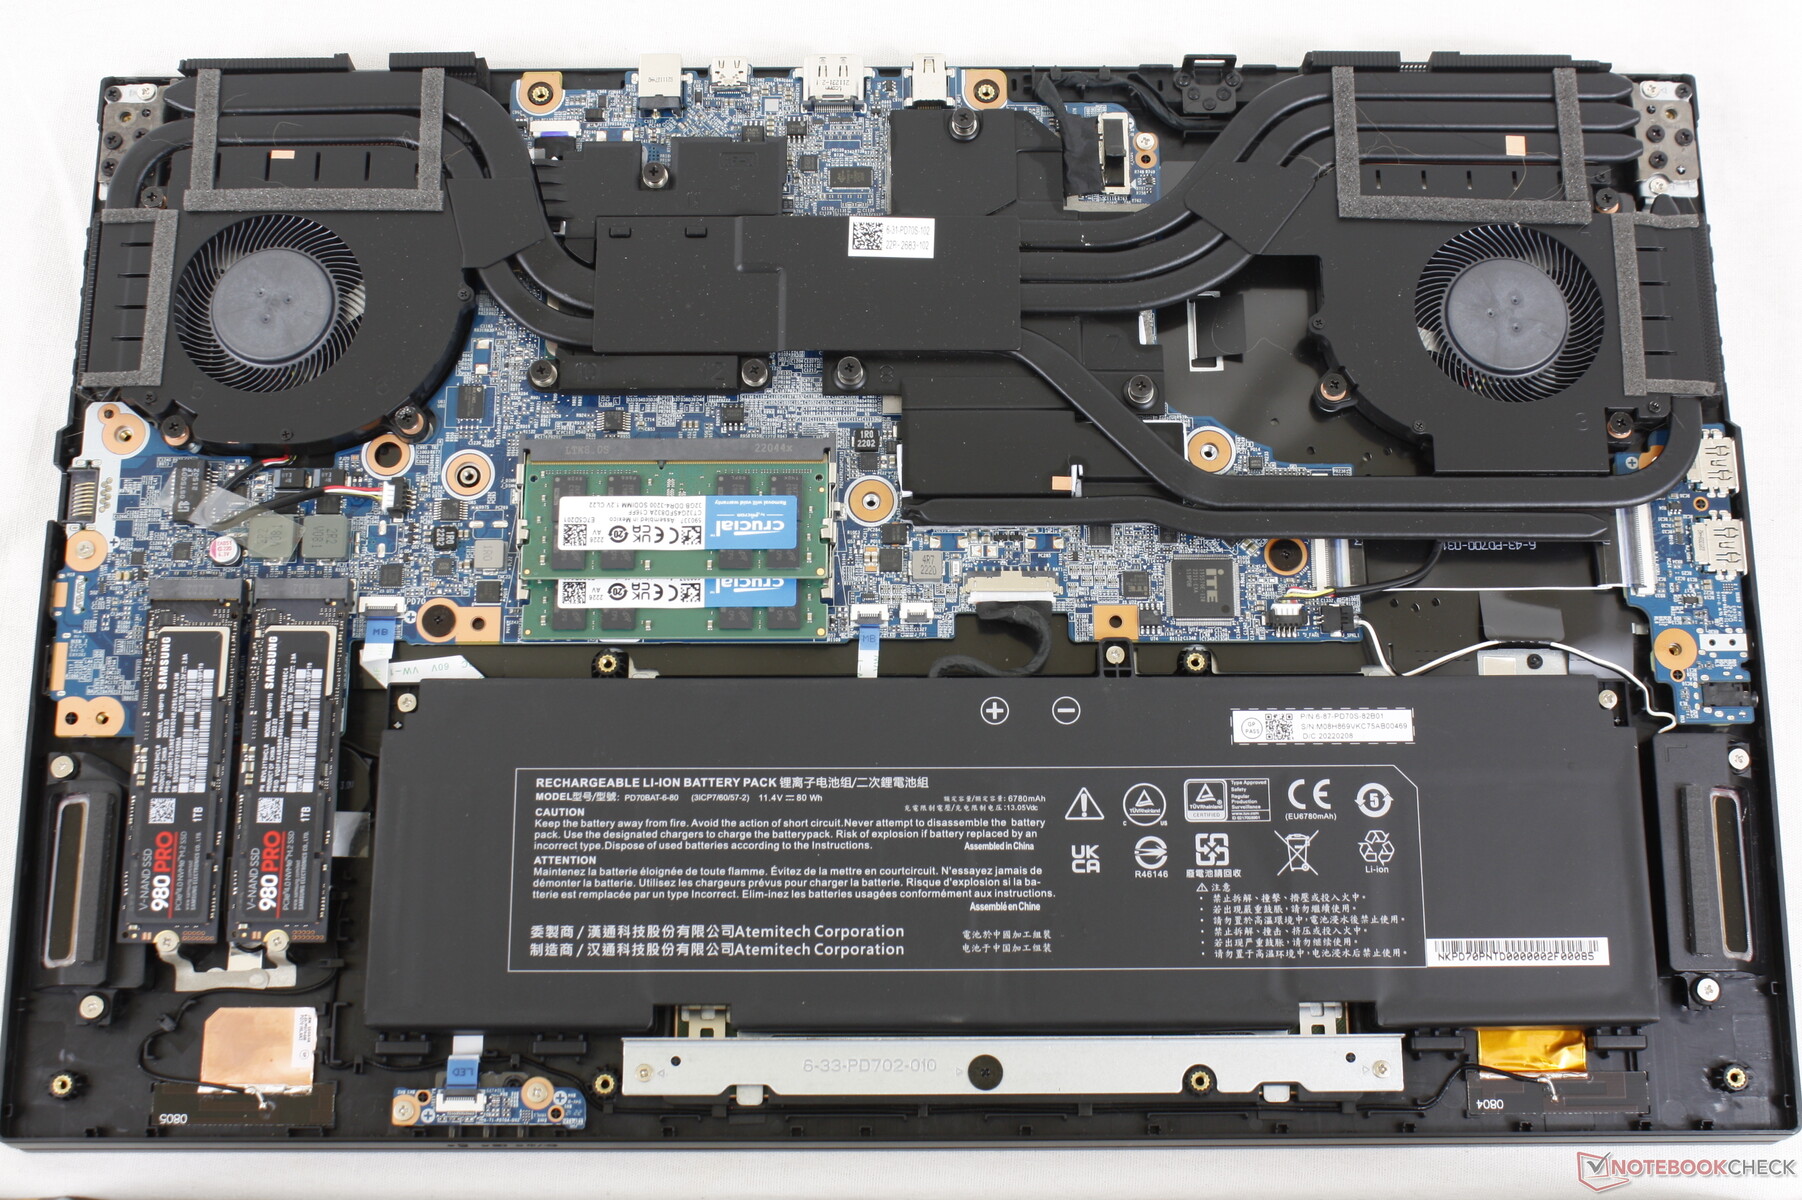
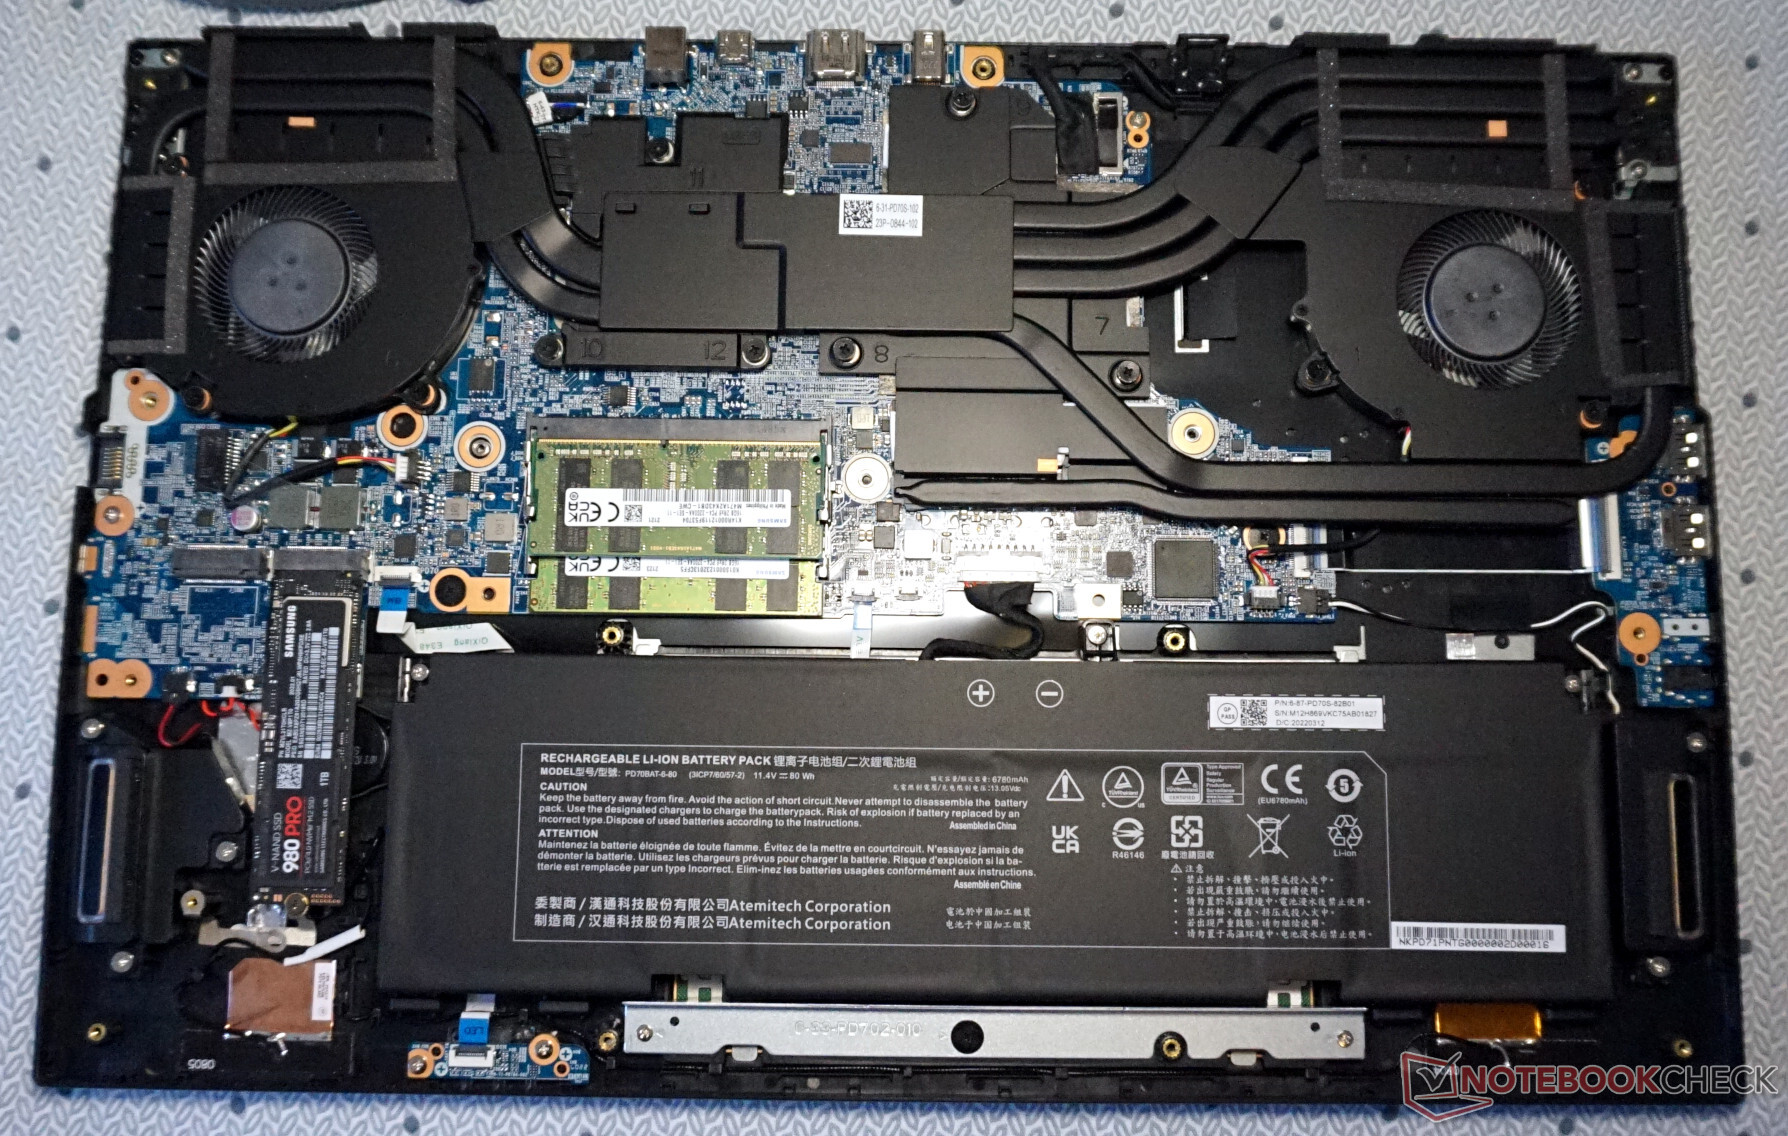
Nightsky TXi317是Eurocom最新的17.3英寸游戏笔记本电脑,利用英特尔的第12代Alder Lake-H CPU和高达155 W的TGPGeForce RTX 3080 Ti GPU,成为目前最快的游戏笔记本电脑之一。它与Schenker XMG Pro 17 E22共享相同的同方机箱设计,因此我们建议查看我们的 这里的现有评论了解更多关于机箱及其物理特性的细节。
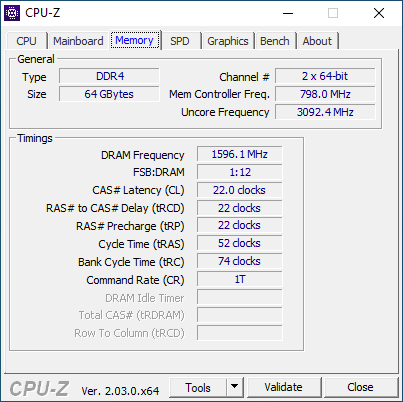
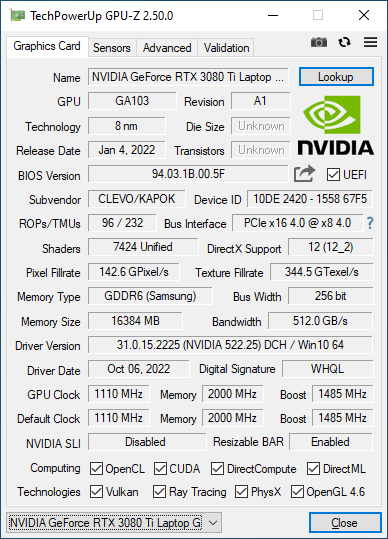
我们的审查配置配备了酷睿i7-12700H CPU,144 Hz 1080p IPS显示屏,GeForce RTX 3080 Ti GPU,以及64 GB内存,价格约为4100美元。最低端的GPU选项是GeForce RTX 3070 Ti,这使Nightsky TXi317完全处于发烧级游戏笔记本电脑市场。
直接竞争对手包括其他高性能的17英寸游戏笔记本电脑,如 Aorus 17X,MSI Raider GE77, 或艾利安华x17 R2.
更多关于Eurocom的评论。
潜在的竞争对手比较
Rating | Date | Model | Weight | Height | Size | Resolution | Price |
|---|---|---|---|---|---|---|---|
| 85.3 % v7 (old) | 10 / 2022 | Eurocom Nightsky TXi317 i7-12700H, GeForce RTX 3080 Ti Laptop GPU | 2.9 kg | 27 mm | 17.30" | 1920x1080 | |
| 85.4 % v7 (old) | 07 / 2022 | Schenker XMG Pro 17 E22 i9-12900H, GeForce RTX 3080 Ti Laptop GPU | 2.8 kg | 27 mm | 17.30" | 2560x1440 | |
| 83.7 % v7 (old) | 08 / 2022 | Aorus 17X XES i9-12900HX, GeForce RTX 3070 Ti Laptop GPU | 2.7 kg | 30 mm | 17.30" | 1920x1080 | |
| 86.8 % v7 (old) | 07 / 2022 | MSI Raider GE77 HX 12UHS i9-12900HX, GeForce RTX 3080 Ti Laptop GPU | 3.1 kg | 25.9 mm | 17.30" | 3840x2160 | |
| 89.9 % v7 (old) | 07 / 2022 | Razer Blade 17 Early 2022 i9-12900H, GeForce RTX 3080 Ti Laptop GPU | 2.8 kg | 19.9 mm | 17.30" | 3840x2160 | |
| 89.2 % v7 (old) | 05 / 2022 | Alienware x17 R2 P48E i9-12900HK, GeForce RTX 3080 Ti Laptop GPU | 3.1 kg | 20.9 mm | 17.30" | 1920x1080 |
案例
Nightsky TXi317和XMG Pro 17 E22之间有一个表面上的区别:Eurocom设计的后角加入了光亮的青铜色装饰,而Schenker设计则没有。除此之外,它们的底盘设计是相同的。
SD卡阅读器
| SD Card Reader | |
| average JPG Copy Test (av. of 3 runs) | |
| Alienware x17 R2 P48E (AV Pro V60) | |
| Razer Blade 17 Early 2022 (AV PRO microSD 128 GB V60) | |
| Schenker XMG Pro 17 E22 (AV PRO microSD 128 GB V60) | |
| MSI Raider GE77 HX 12UHS (AV PRO microSD 128 GB V60) | |
| Eurocom Nightsky TXi317 (AV Pro V60) | |
| maximum AS SSD Seq Read Test (1GB) | |
| Alienware x17 R2 P48E (AV Pro V60) | |
| Eurocom Nightsky TXi317 (AV Pro V60) | |
| Schenker XMG Pro 17 E22 (AV PRO microSD 128 GB V60) | |
沟通
Wi-Fi 6是标准配置,尽管该型号的价格范围很高,但制造商没有提供Wi-Fi 6E选项。尽管如此,传输率还是很稳定,没有连接问题。
| Networking | |
| iperf3 transmit AX12 | |
| Alienware x17 R2 P48E | |
| iperf3 receive AX12 | |
| Alienware x17 R2 P48E | |
| iperf3 receive AXE11000 6GHz | |
| Aorus 17X XES | |
| MSI Raider GE77 HX 12UHS | |
| iperf3 receive AXE11000 | |
| Schenker XMG Pro 17 E22 | |
| Razer Blade 17 Early 2022 | |
| Eurocom Nightsky TXi317 | |
| iperf3 transmit AXE11000 6GHz | |
| Aorus 17X XES | |
| iperf3 transmit AXE11000 | |
| Eurocom Nightsky TXi317 | |
网络摄像头
相机只有100万像素,没有200万像素的选择,考虑到该型号的高价格范围,这又是令人失望的。


维护
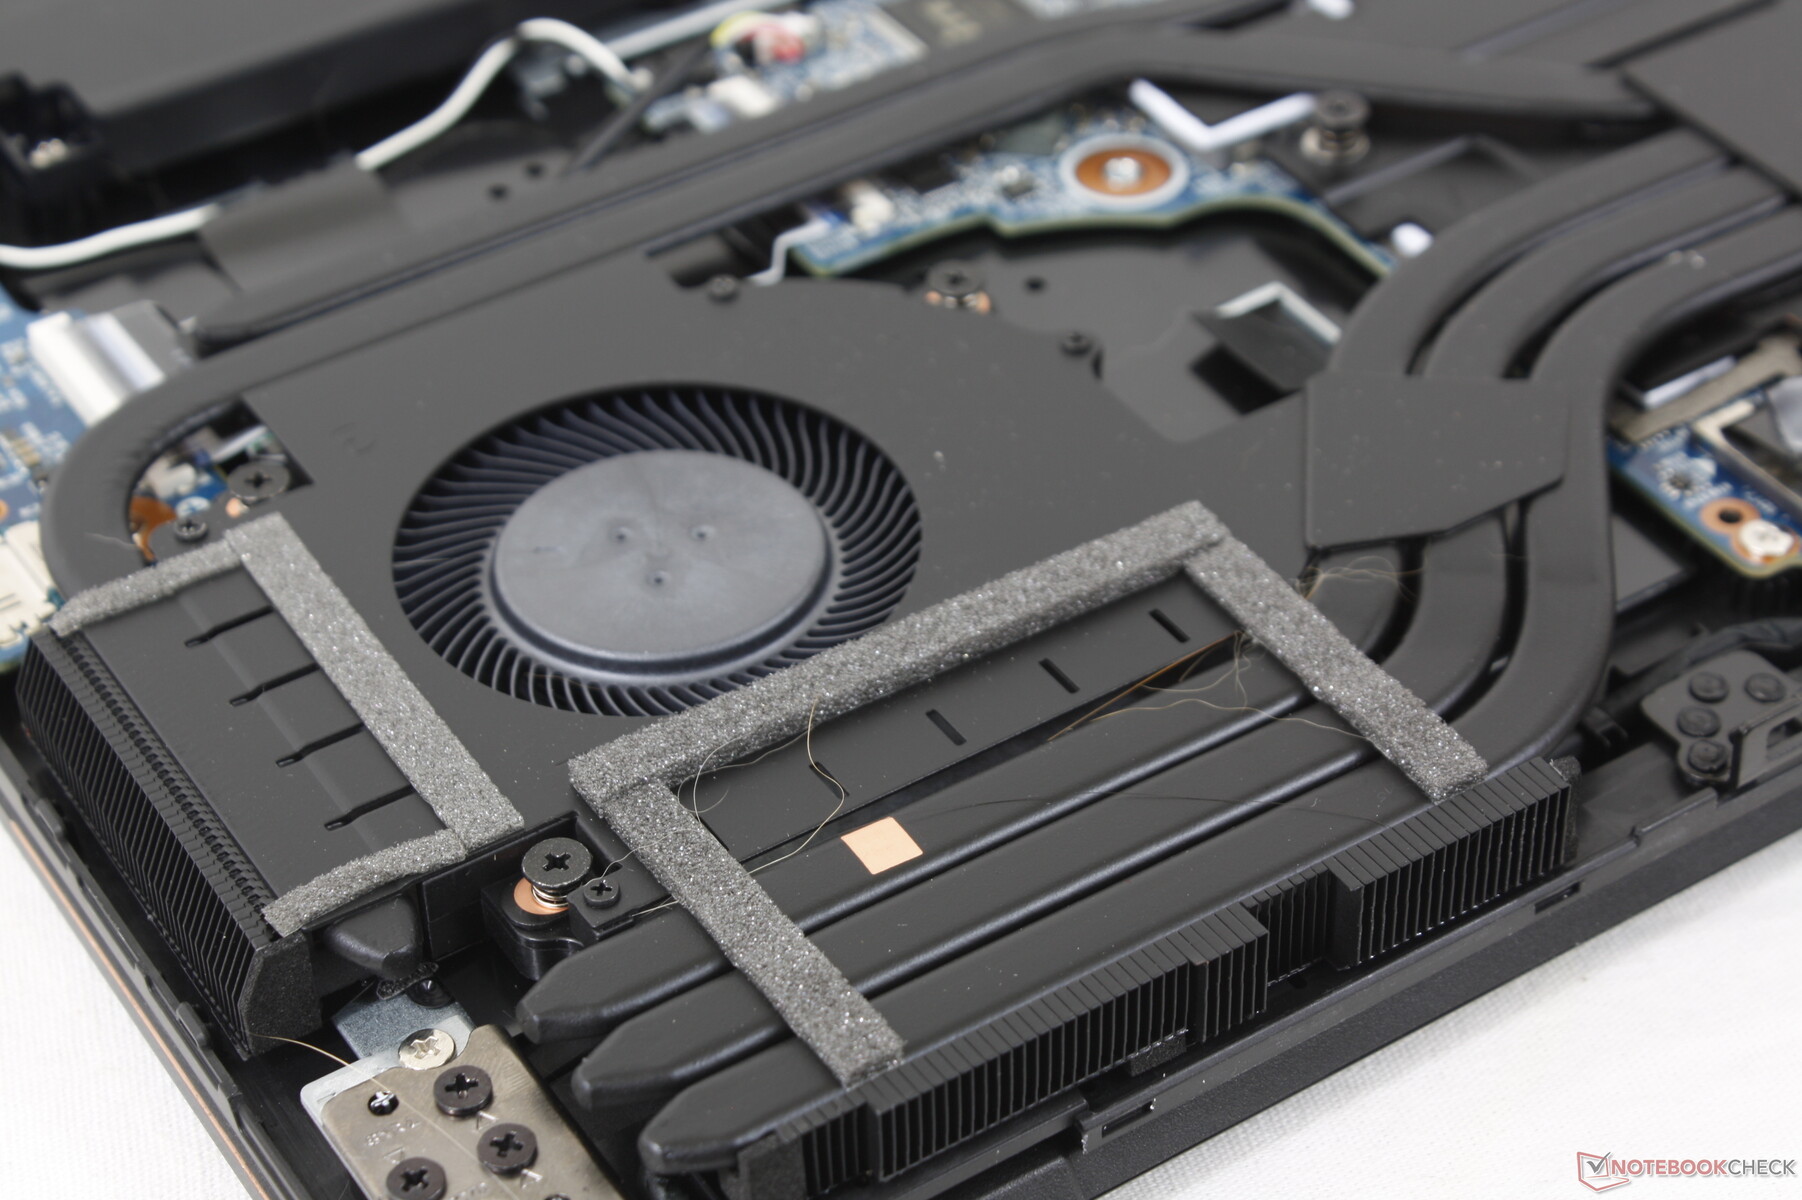
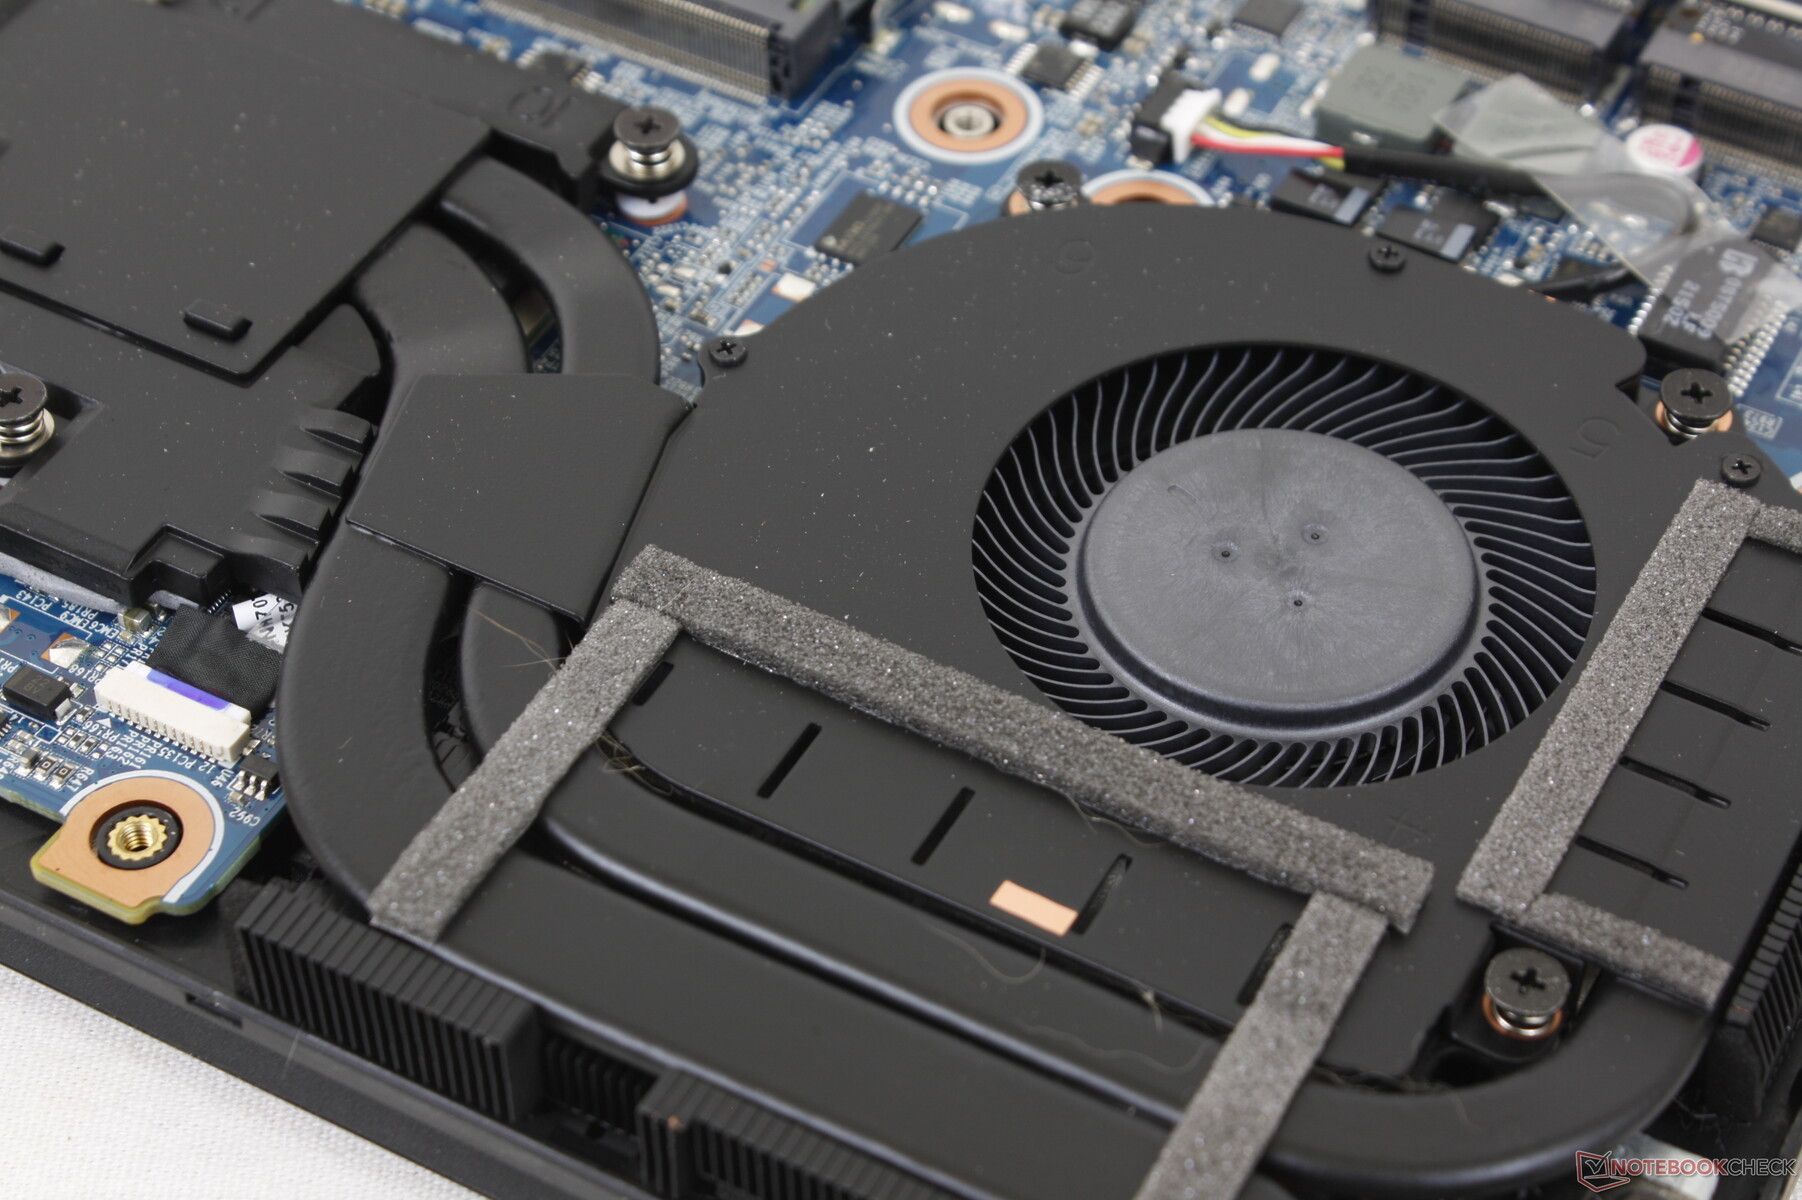
底部面板由16颗飞利浦螺钉固定,便于维修。然而,大多数其他游戏笔记本电脑的螺丝要少得多,因此需要更多的耐心来打开Eurocom。
配件和保修
除了交流电适配器和文件外,零售盒中没有任何额外的东西。如果在美国购买,则适用标准的一年有限制造商保修。
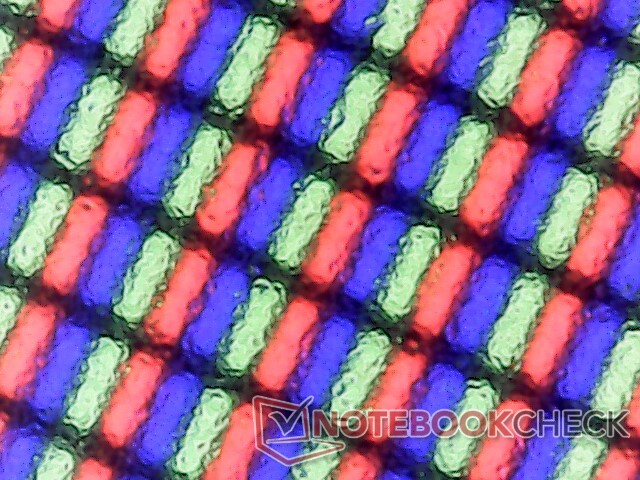
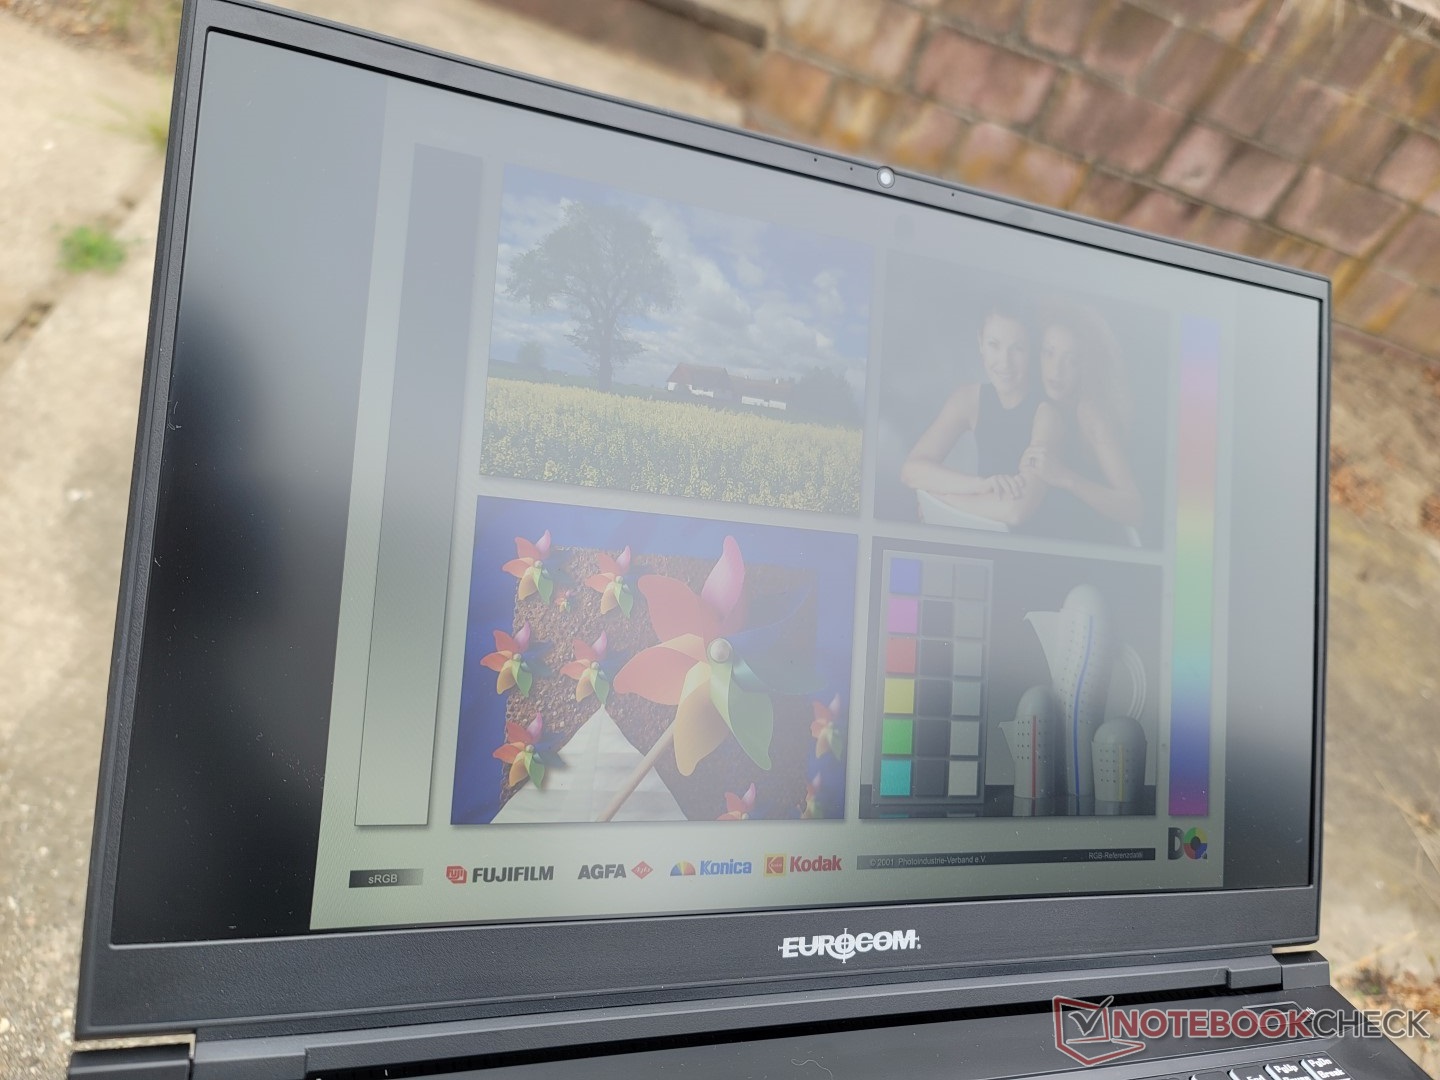
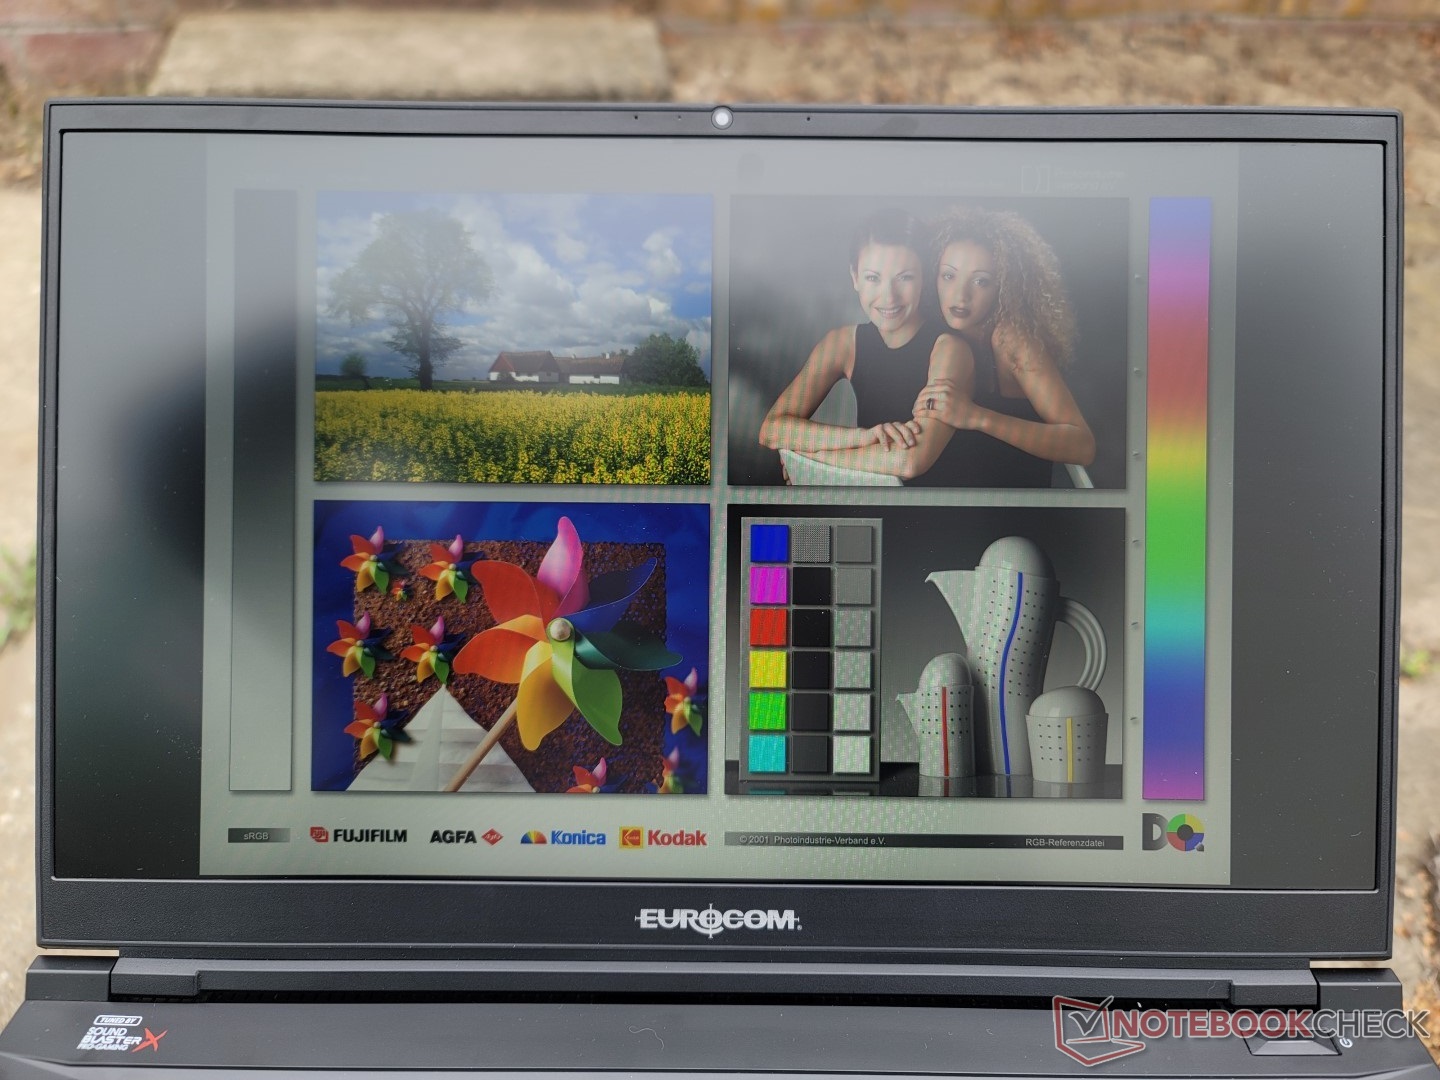
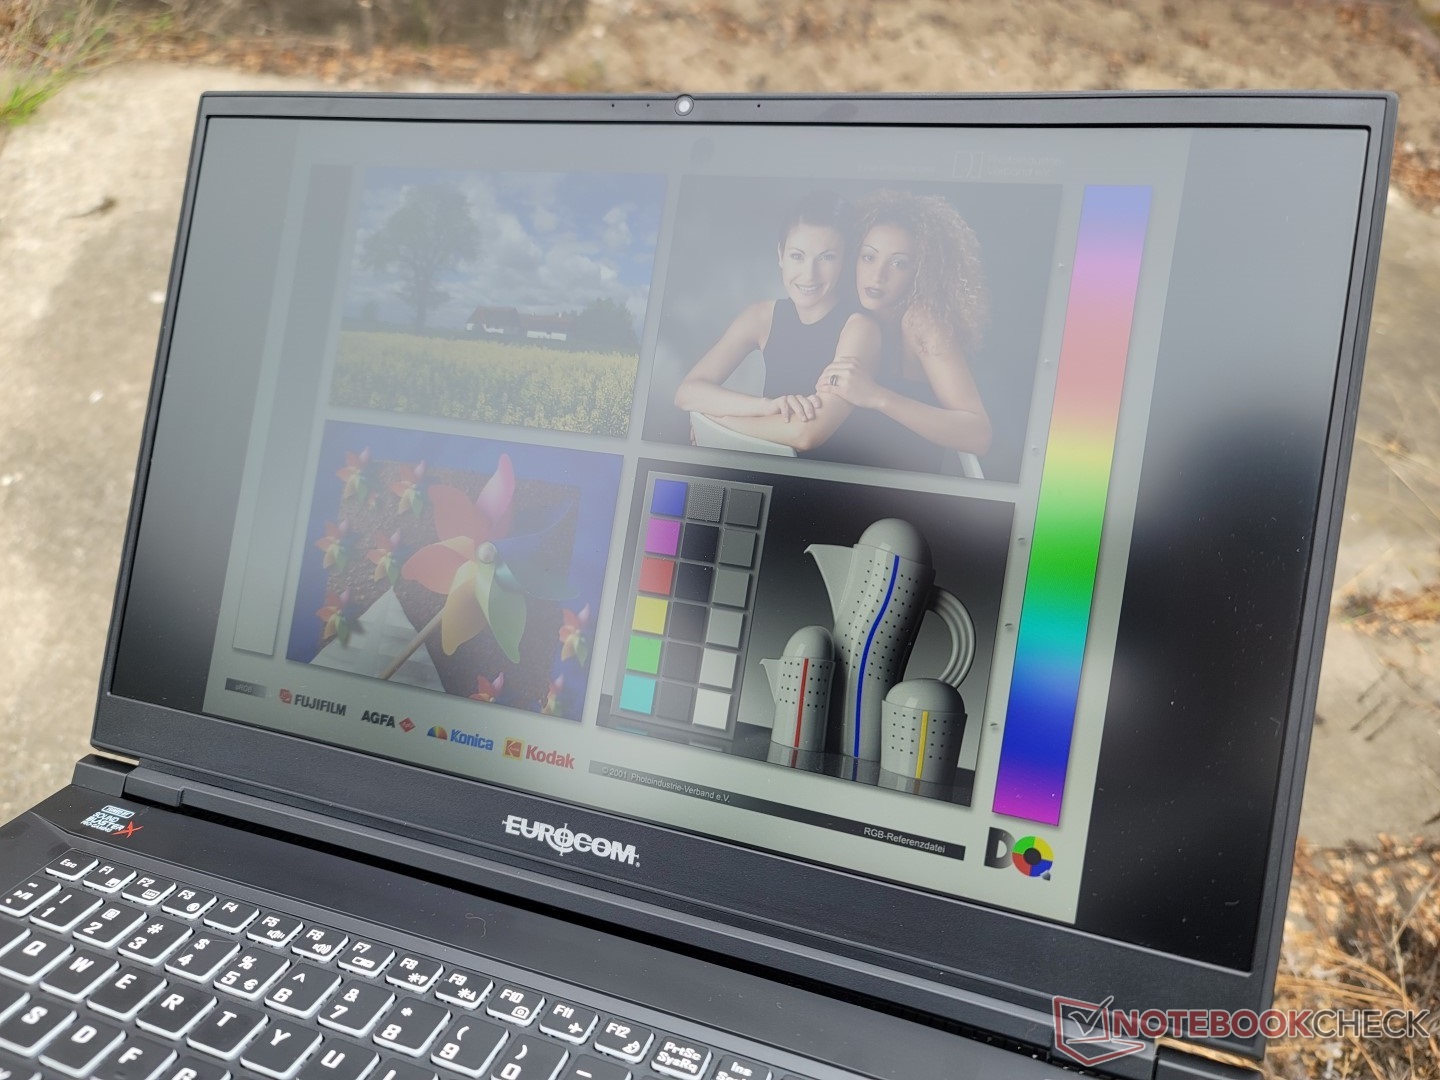
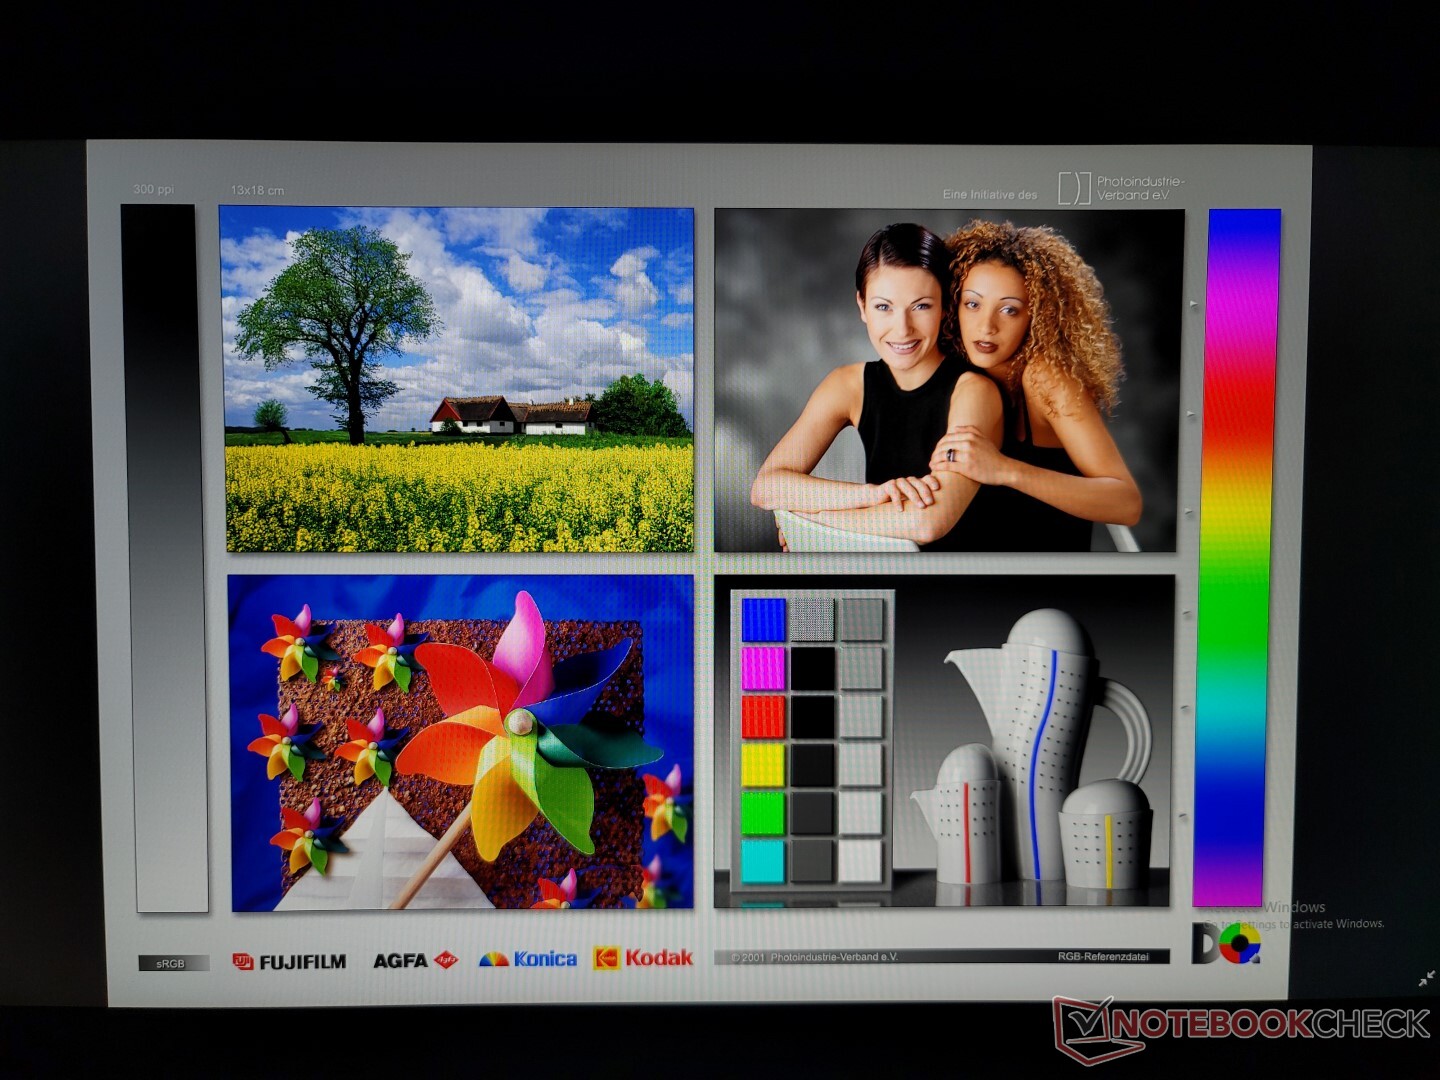
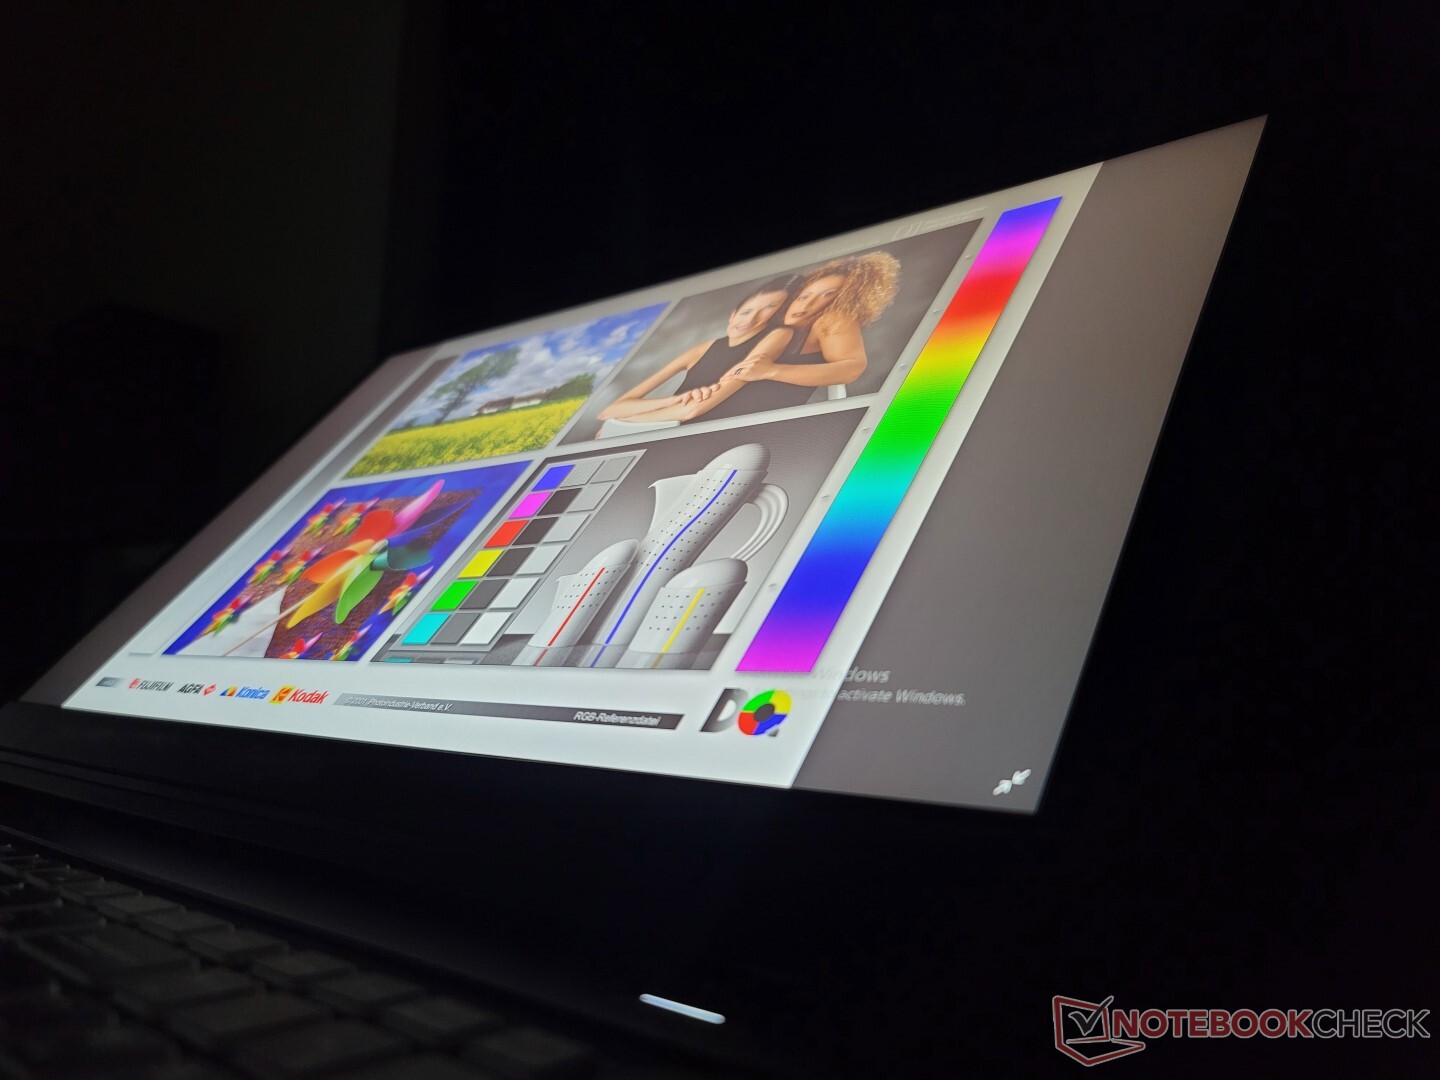
显示
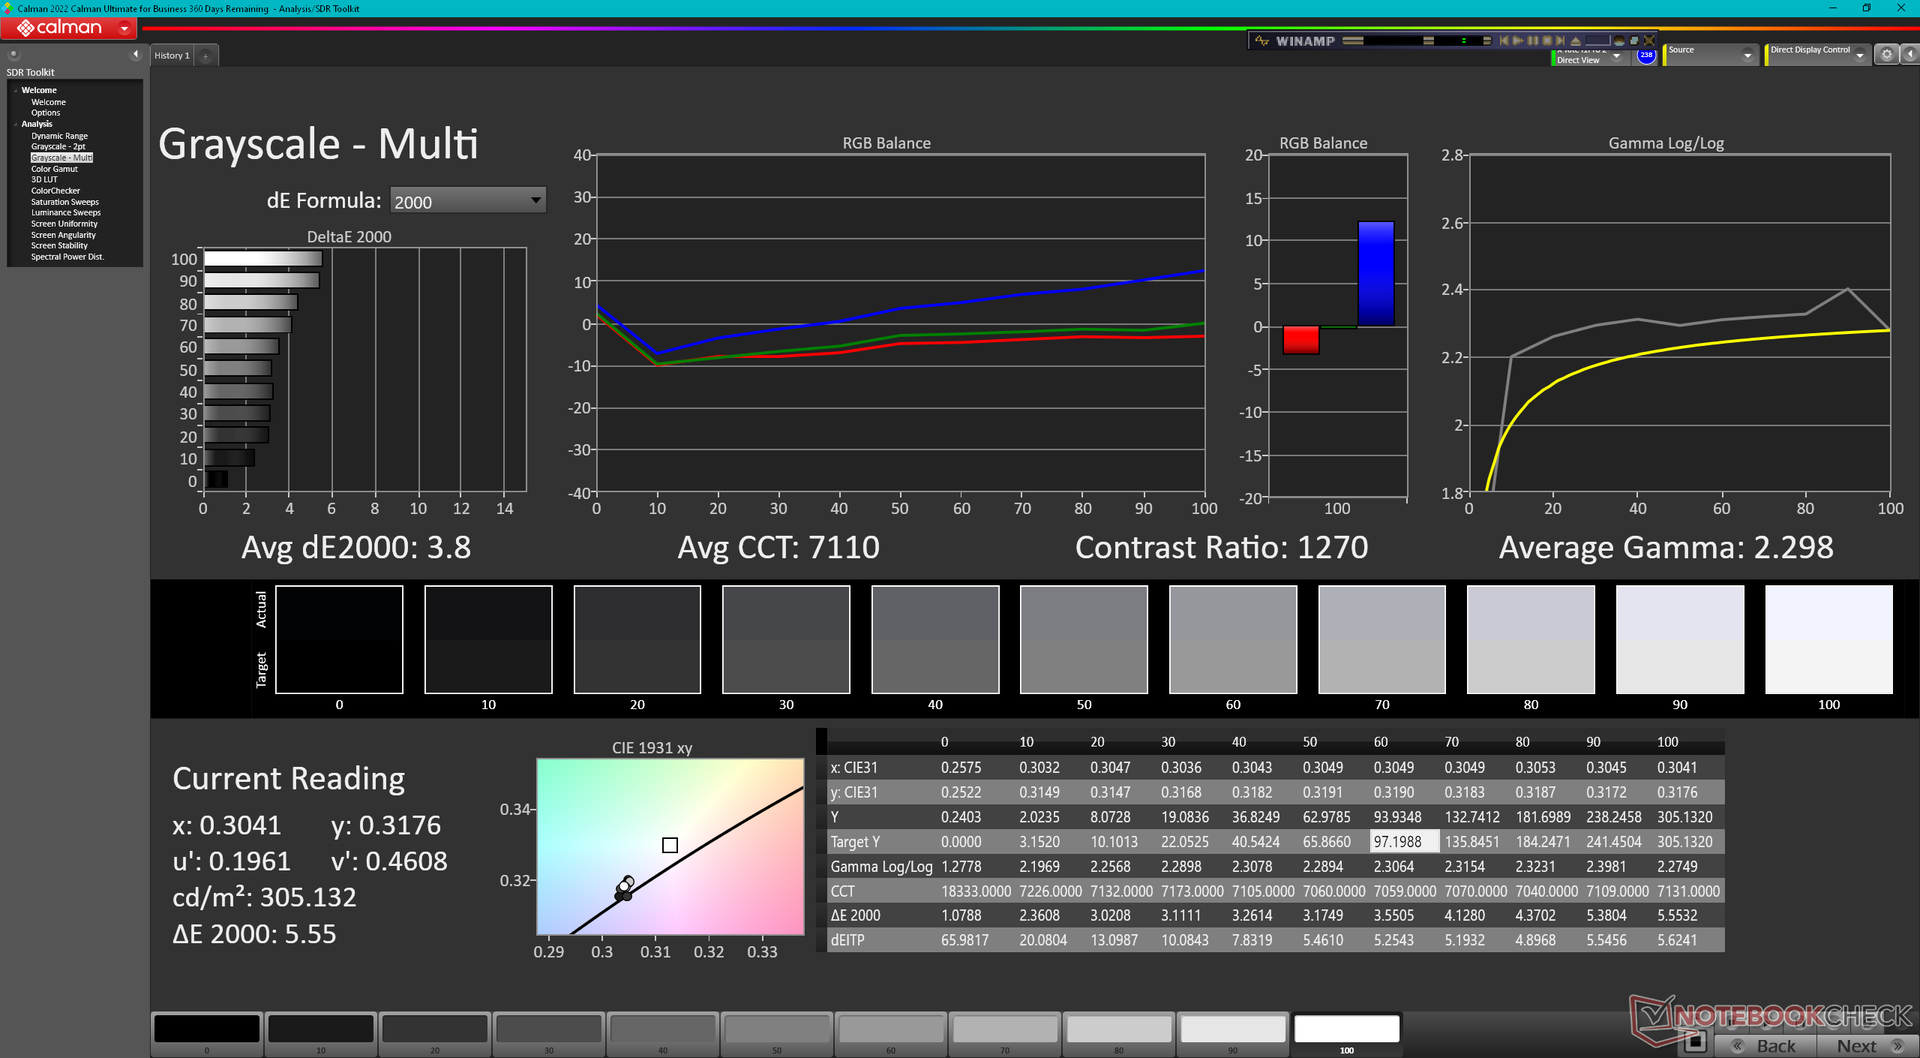
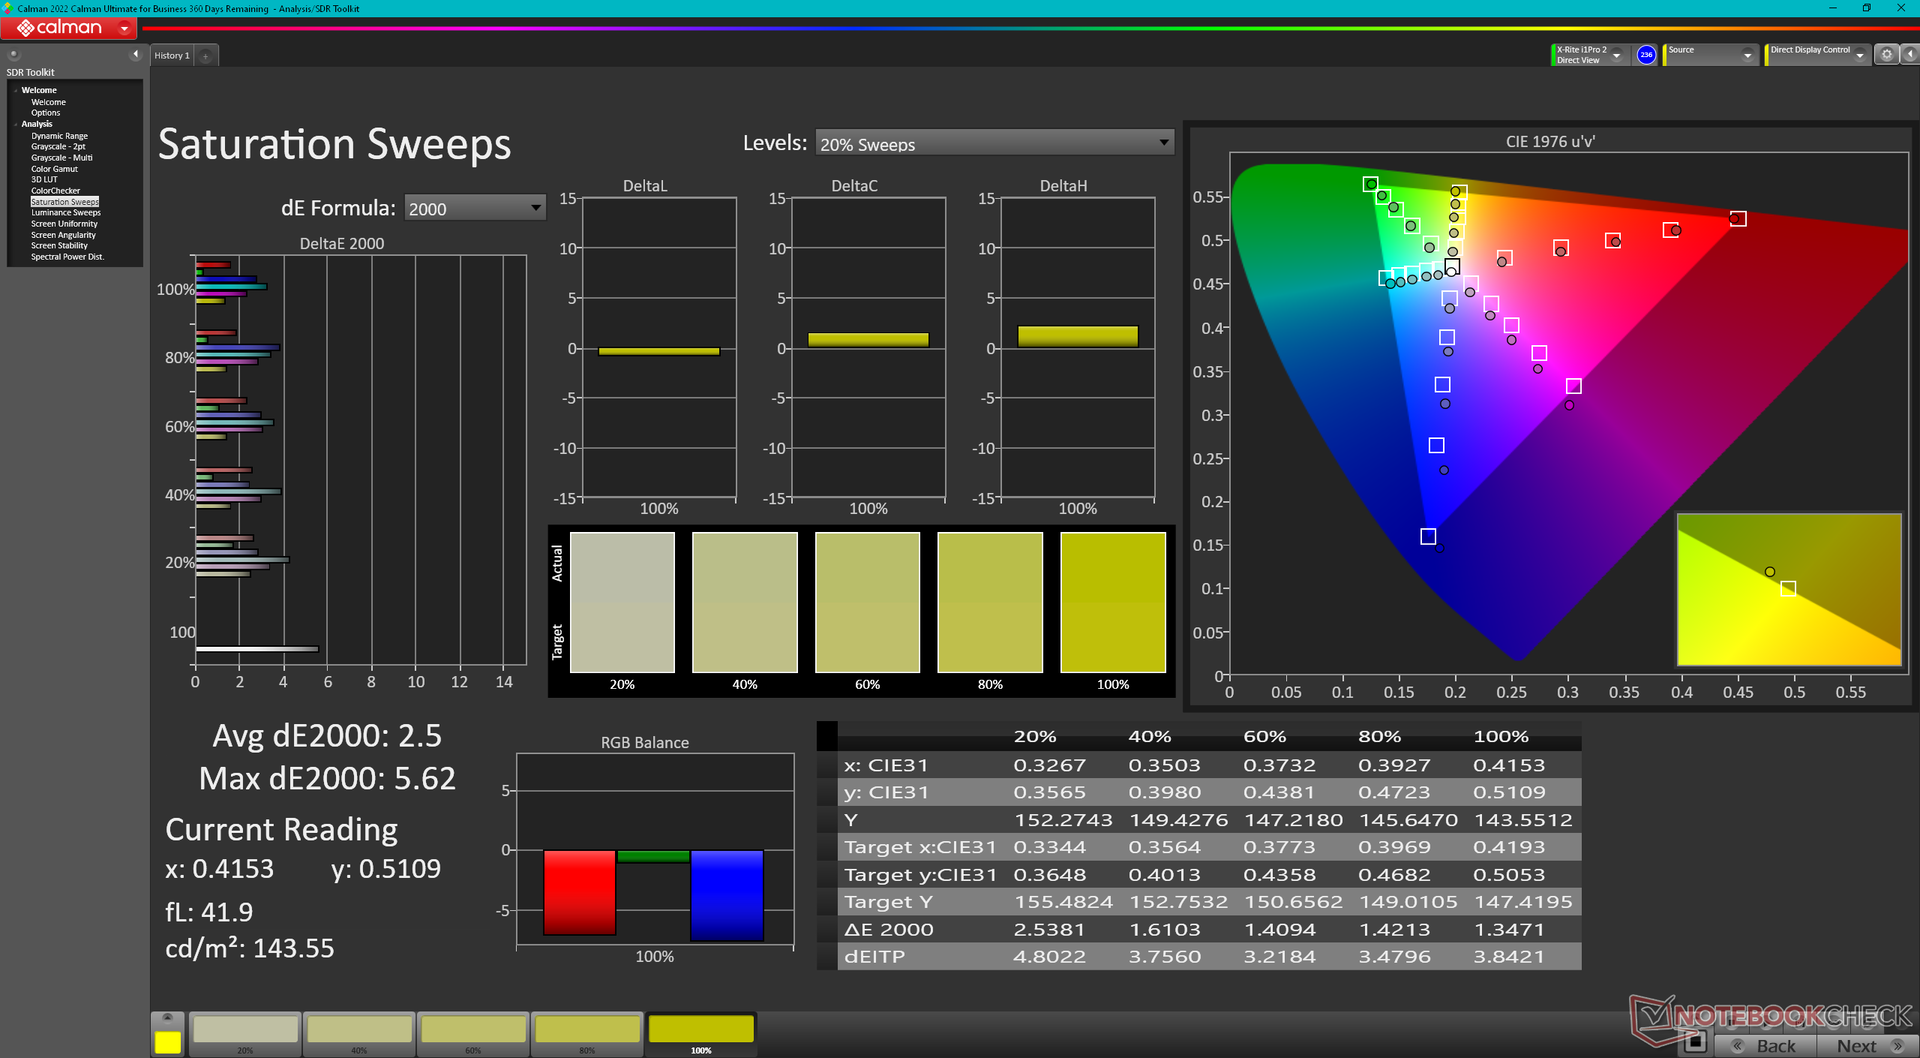
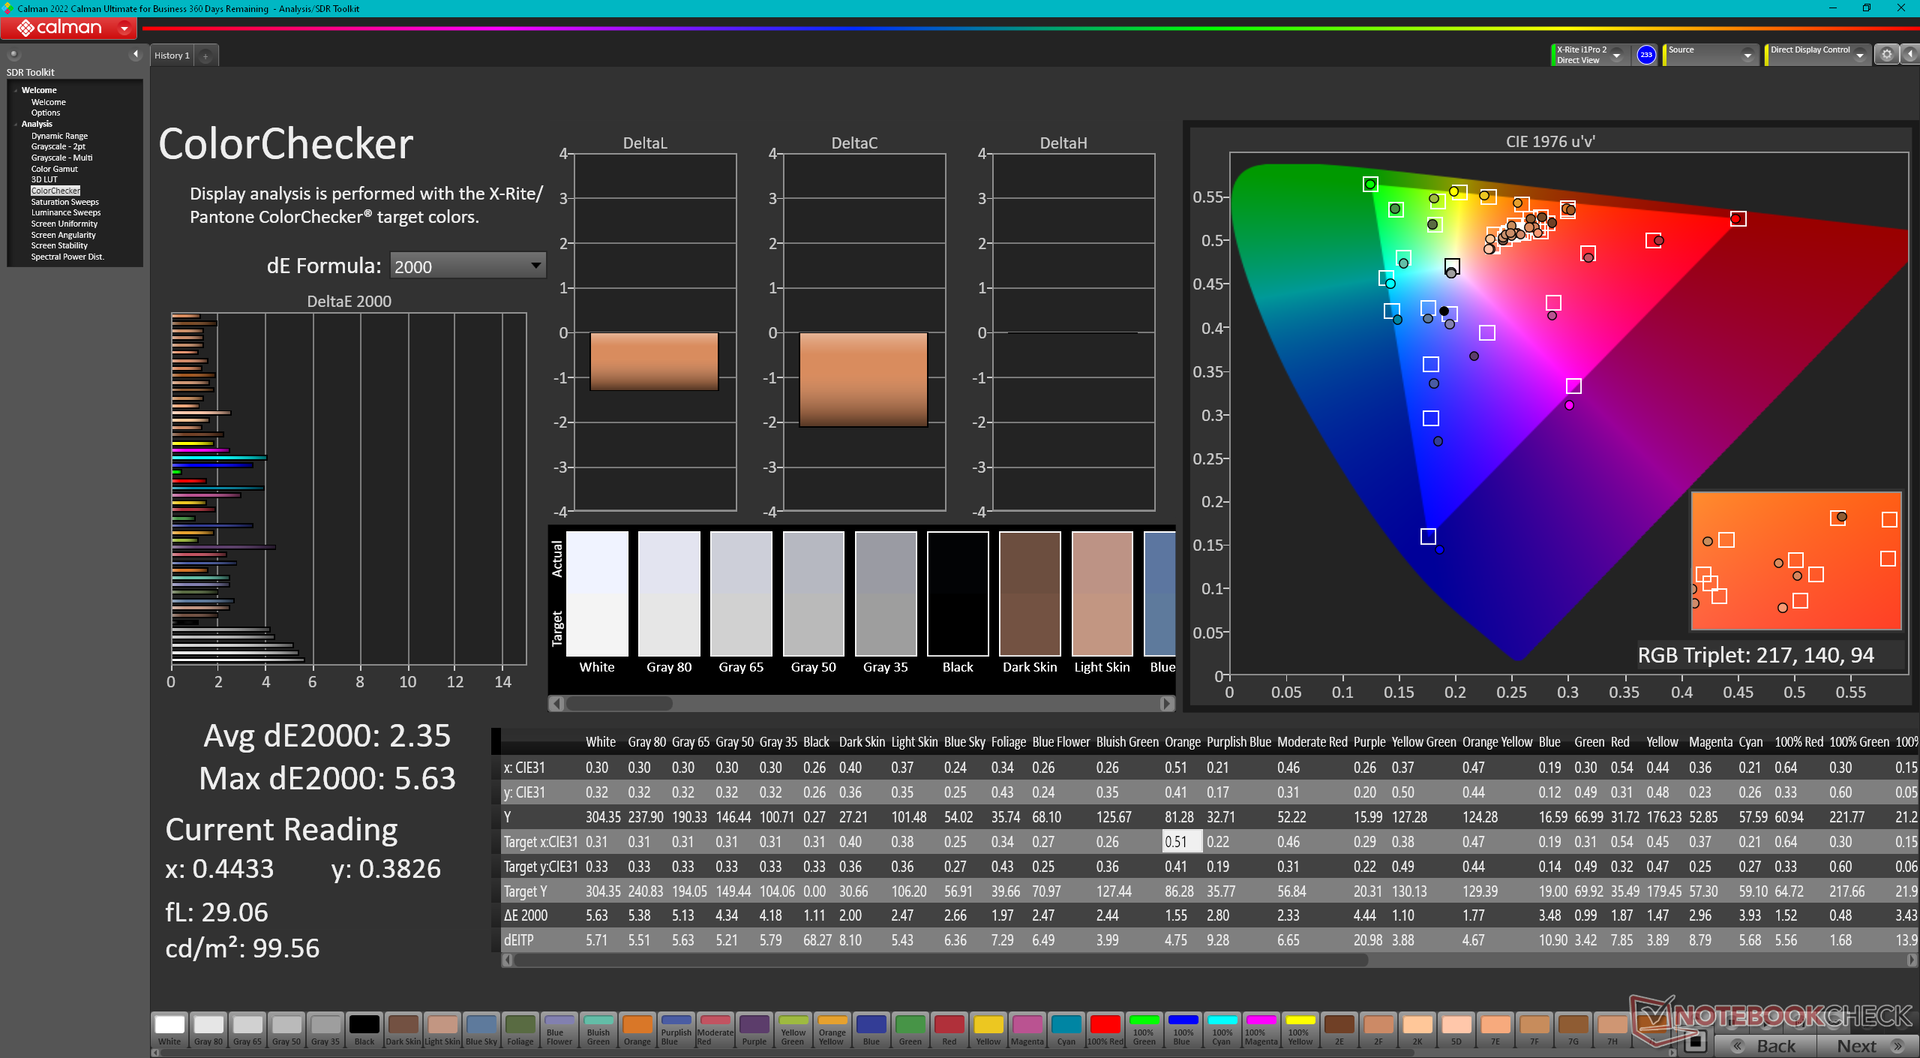
我们的测试装置采用了LG飞利浦LP173WFG-SPB3 IPS面板,这与在 申克XMG Focus 17.与XMG Pro 17 E22上的1440p京东方面板相比,我们的1080p LG飞利浦面板提供了更窄的色彩、更慢的刷新率和更慢的黑白响应时间,更像是一个中端显示器,而不是一个高端。然而,它仍然非常好,但对于在GeForce RTX 3080 Ti GPU上运行的笔记本电脑来说,1440p绝对比1080p更合适。
幸运的是,TXi317有三种面板可供选择,从1080p到4K。请记住,没有一个是OLED,也不能提供完整的AdobeRGB覆盖。
- 1080p, 144 Hz, 100% sRGB, IPS
- 1440p, 165 Hz, 100% sRGB, IPS
- 2160p, 60 Hz, 100% sRGB, IPS
| |||||||||||||||||||||||||
Brightness Distribution: 88 %
Center on Battery: 303.9 cd/m²
Contrast: 1013:1 (Black: 0.3 cd/m²)
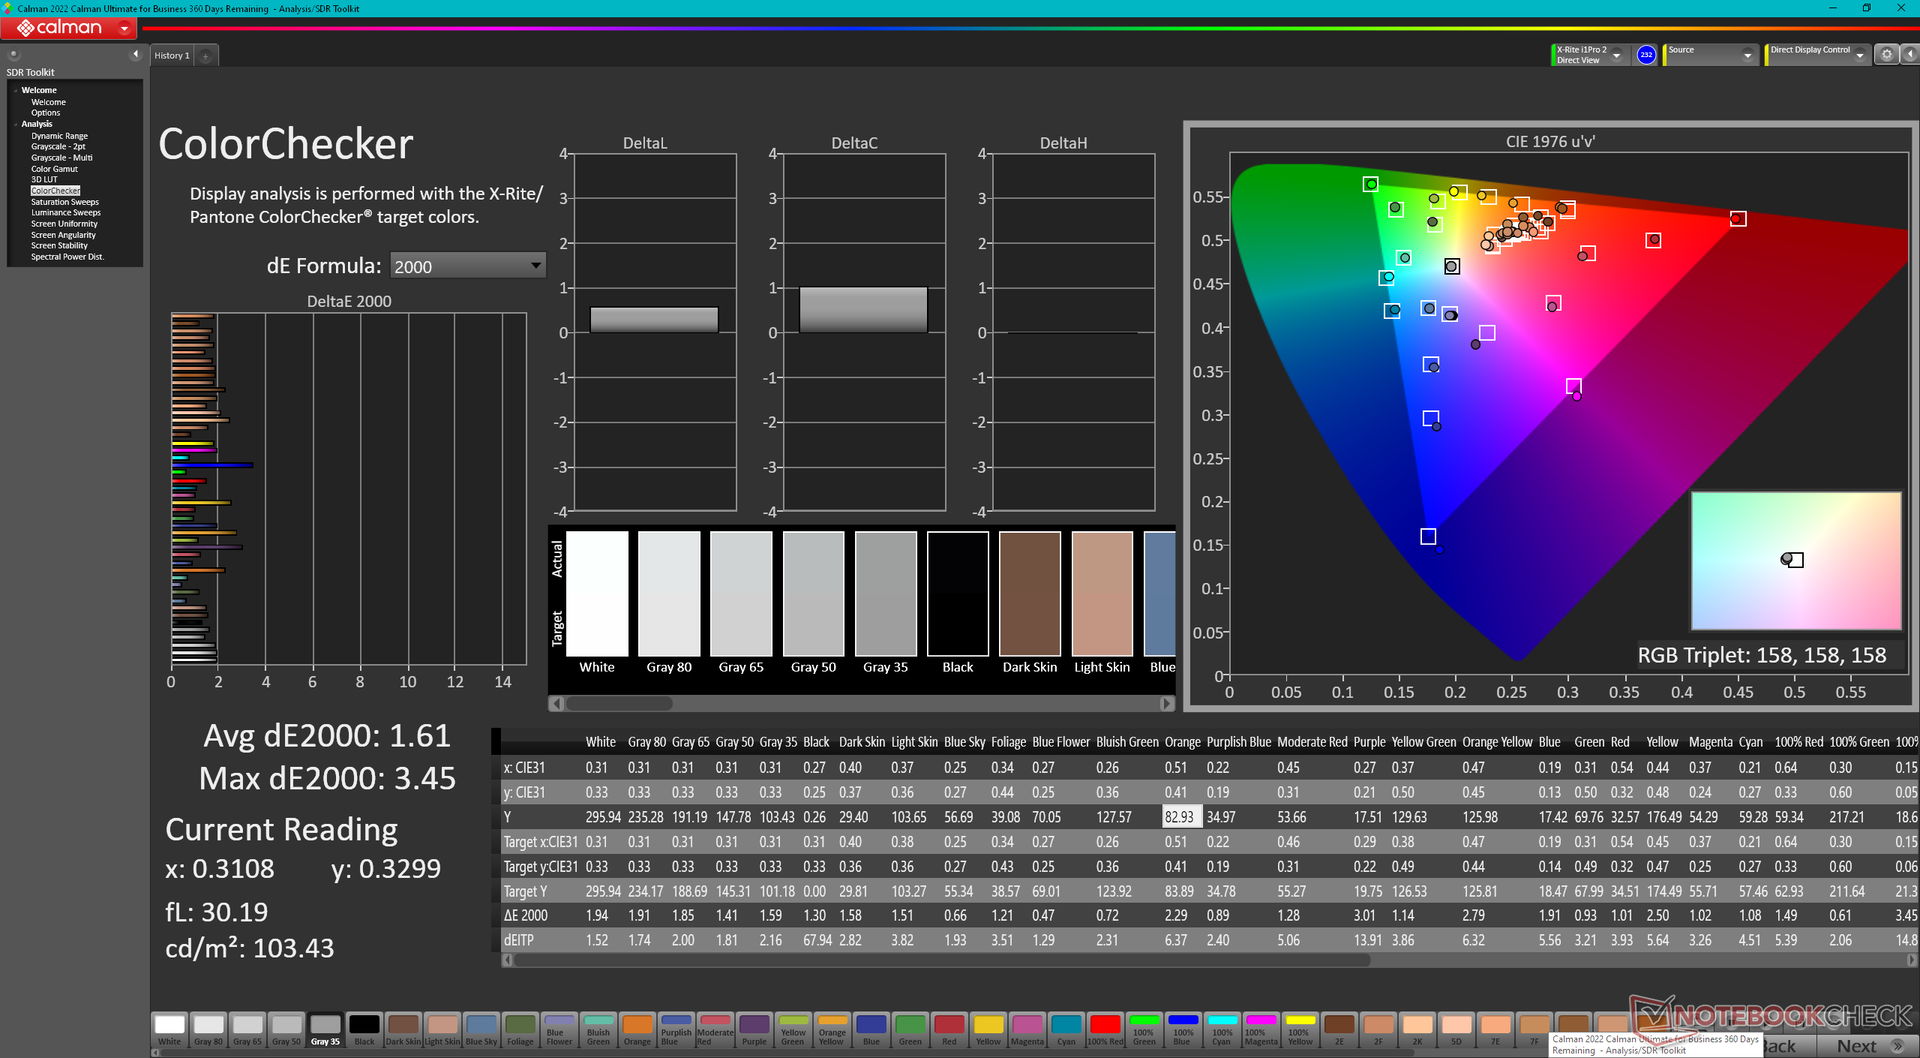
ΔE ColorChecker Calman: 2.35 | ∀{0.5-29.43 Ø4.73}
calibrated: 1.61
ΔE Greyscale Calman: 3.8 | ∀{0.09-98 Ø4.97}
65.4% AdobeRGB 1998 (Argyll 3D)
95.2% sRGB (Argyll 3D)
64.5% Display P3 (Argyll 3D)
Gamma: 2.3
CCT: 7110 K
| Eurocom Nightsky TXi317 LG Philips LP173WFG-SPB3, IPS, 1920x1080, 17.3" | Schenker XMG Pro 17 E22 BOE099D, IPS, 2560x1440, 17.3" | Aorus 17X XES Sharp SHP1563, IPS, 1920x1080, 17.3" | MSI Raider GE77 HX 12UHS AU Optronics B173ZAN06.1, IPS, 3840x2160, 17.3" | Razer Blade 17 Early 2022 AU Optronics B173ZAN06.9, IPS, 3840x2160, 17.3" | Alienware x17 R2 P48E AU Optronics B173HAN, IPS, 1920x1080, 17.3" | |
|---|---|---|---|---|---|---|
| Display | 29% | 8% | 29% | 31% | 17% | |
| Display P3 Coverage (%) | 64.5 | 97.5 51% | 70.1 9% | 96.6 50% | 99.4 54% | 79.2 23% |
| sRGB Coverage (%) | 95.2 | 99.9 5% | 99.9 5% | 99.8 5% | 100 5% | 99.8 5% |
| AdobeRGB 1998 Coverage (%) | 65.4 | 85.2 30% | 71.9 10% | 85.8 31% | 87.3 33% | 79.6 22% |
| Response Times | 44% | 58% | 47% | 39% | -1% | |
| Response Time Grey 50% / Grey 80% * (ms) | 10.4 ? | 5.4 ? 48% | 3.4 ? 67% | 5.8 ? 44% | 7.5 ? 28% | 12.4 ? -19% |
| Response Time Black / White * (ms) | 11.2 ? | 6.8 ? 39% | 5.8 ? 48% | 5.6 ? 50% | 5.6 ? 50% | 9.2 ? 18% |
| PWM Frequency (Hz) | ||||||
| Screen | 5% | -24% | -19% | 33% | 2% | |
| Brightness middle (cd/m²) | 303.9 | 349 15% | 278 -9% | 381 25% | 503 66% | 365.4 20% |
| Brightness (cd/m²) | 292 | 319 9% | 273 -7% | 371 27% | 486 66% | 344 18% |
| Brightness Distribution (%) | 88 | 83 -6% | 79 -10% | 84 -5% | 84 -5% | 85 -3% |
| Black Level * (cd/m²) | 0.3 | 0.32 -7% | 0.26 13% | 0.52 -73% | 0.44 -47% | 0.29 3% |
| Contrast (:1) | 1013 | 1091 8% | 1069 6% | 733 -28% | 1143 13% | 1260 24% |
| Colorchecker dE 2000 * | 2.35 | 2.5 -6% | 3.96 -69% | 1.08 54% | 3.17 -35% | |
| Colorchecker dE 2000 max. * | 5.63 | 6.87 -22% | 10.78 -91% | 4.54 19% | 7.69 -37% | |
| Colorchecker dE 2000 calibrated * | 1.61 | 0.64 60% | 1.07 34% | 2.53 -57% | 0.6 63% | 0.51 68% |
| Greyscale dE 2000 * | 3.8 | 3.9 -3% | 6.8 -79% | 1.3 66% | 5.3 -39% | |
| Gamma | 2.3 96% | 2.09 105% | 2.224 99% | 2.151 102% | 2.18 101% | |
| CCT | 7110 91% | 7192 90% | 7651 85% | 6541 99% | 5879 111% | |
| Total Average (Program / Settings) | 26% /
16% | 14% /
-5% | 19% /
6% | 34% /
33% | 6% /
5% |
* ... smaller is better
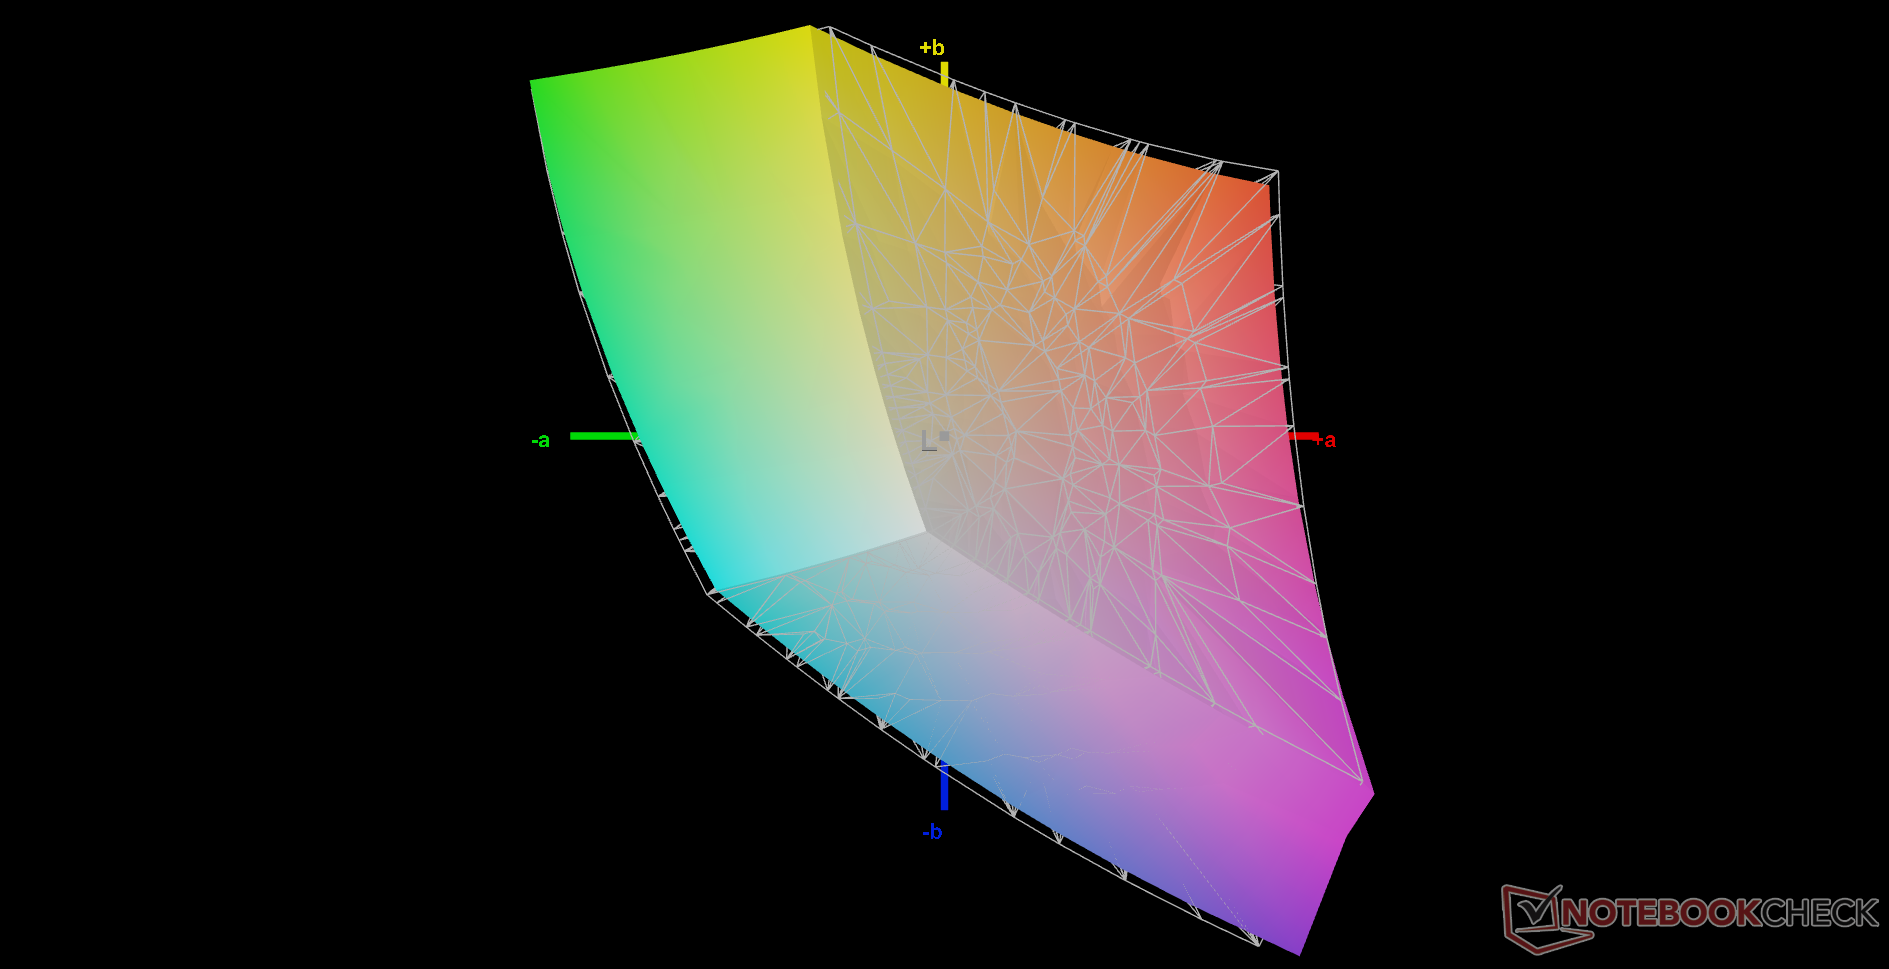
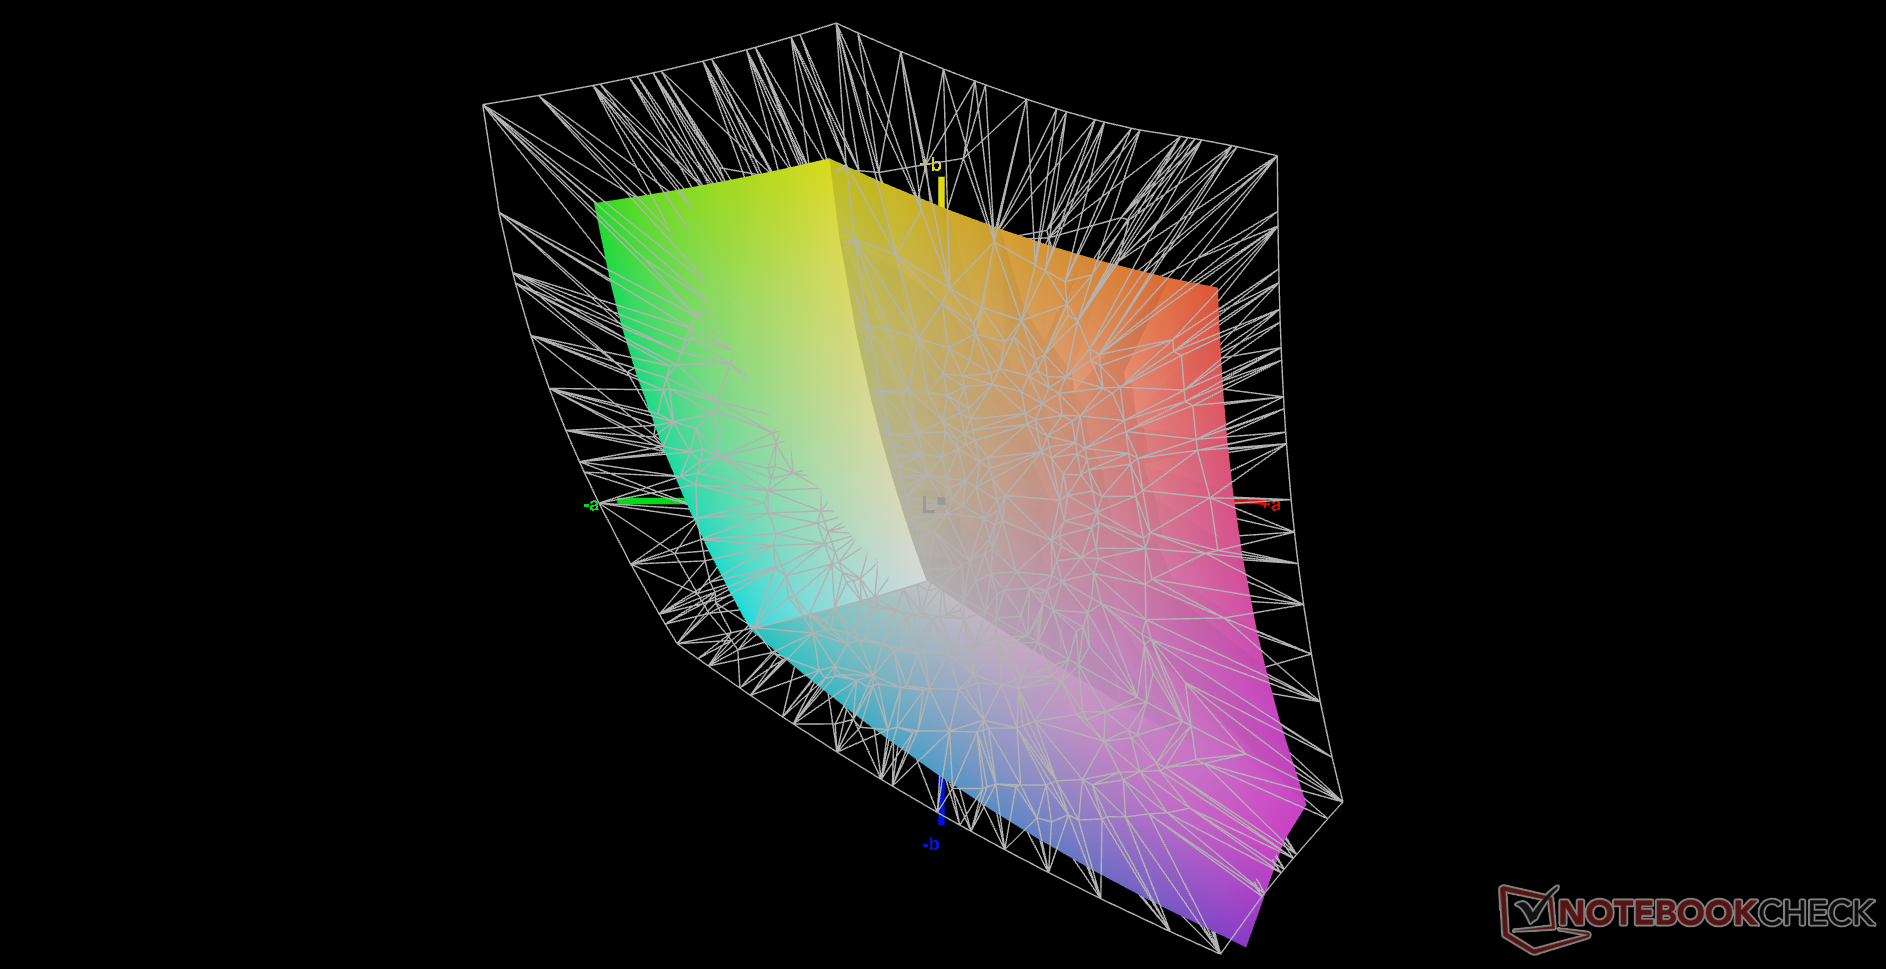
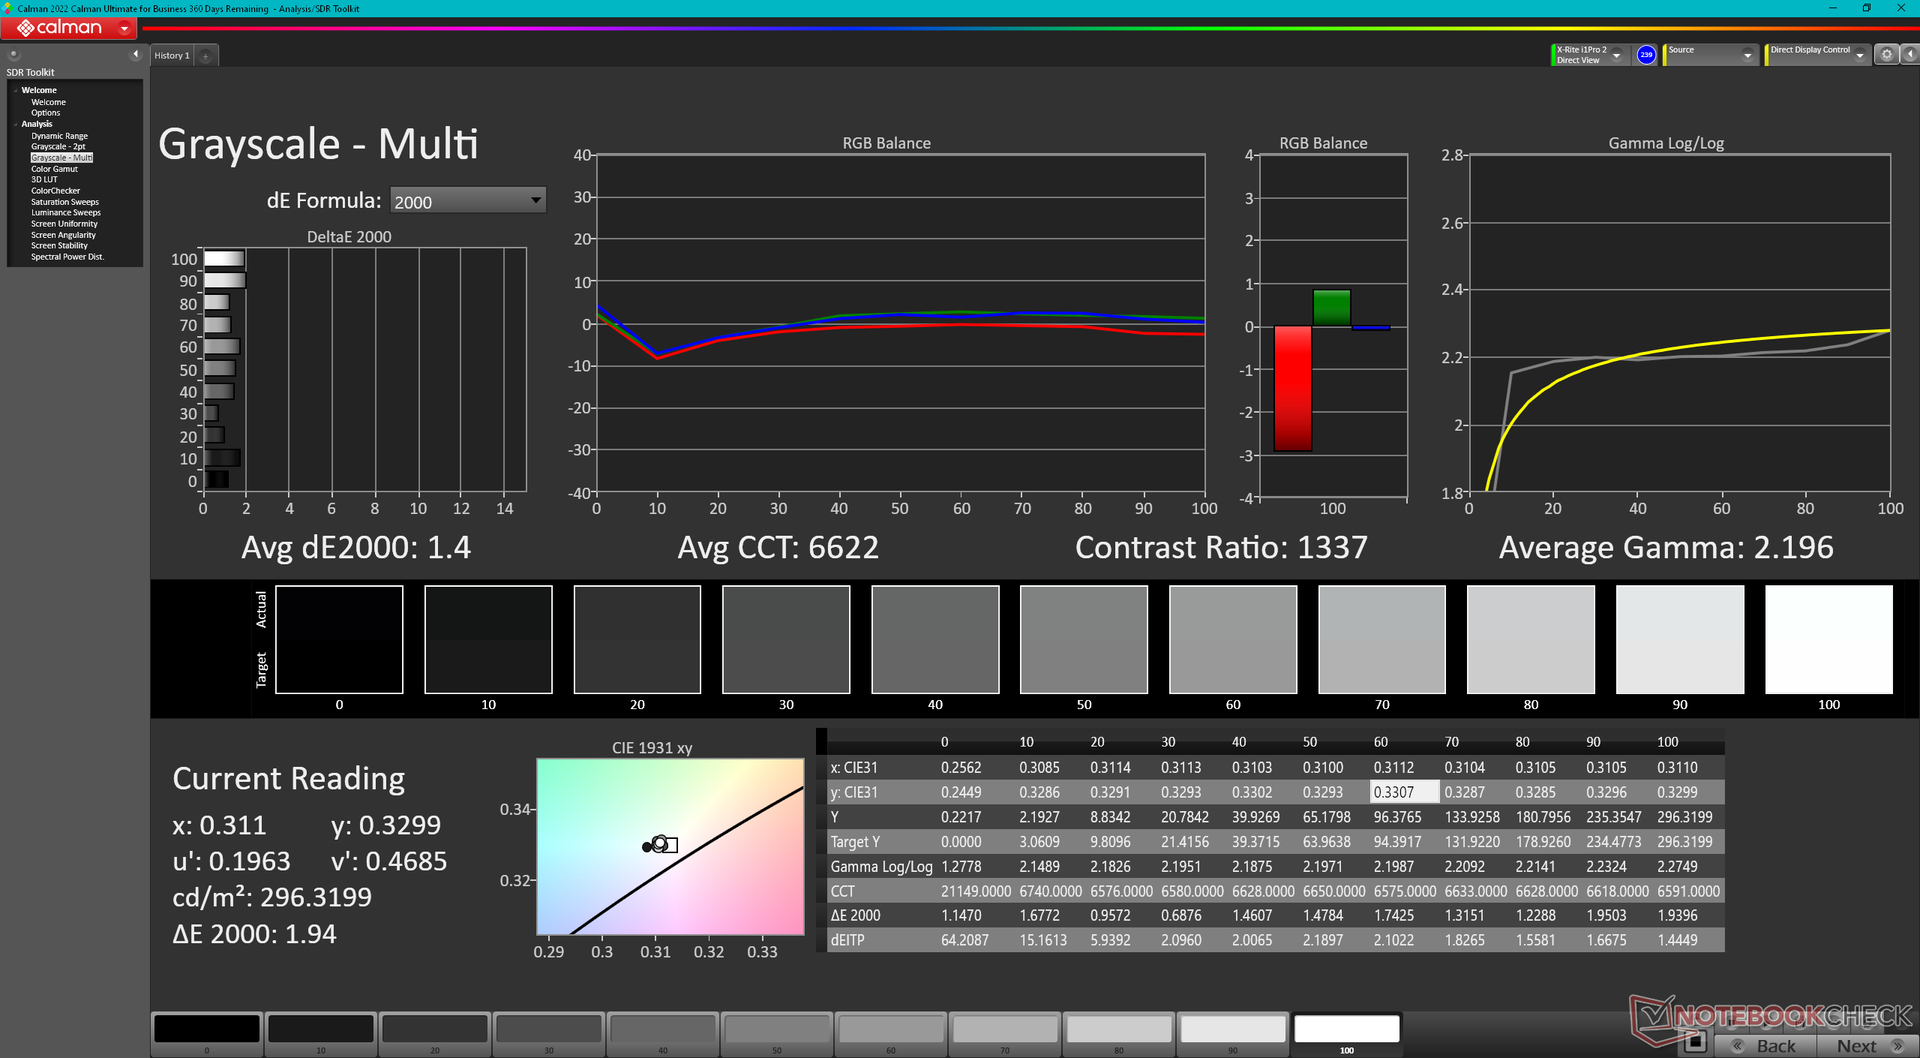
Eurocom将为你校准显示器,并收取费用。我们的测试装置未经校准,其平均灰度和彩色deltaE值分别为3.8和2.35,这实际上并不坏。自己校准面板将进一步改善这些平均值,达到1.4和1.61。我们校准过的配置文件可在上面免费下载。

Display Response Times
| ↔ Response Time Black to White | ||
|---|---|---|
| 11.2 ms ... rise ↗ and fall ↘ combined | ↗ 6 ms rise | 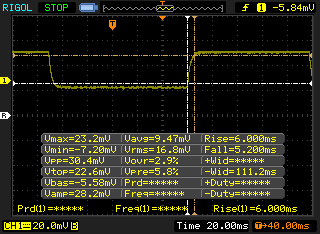 |
| ↘ 5.2 ms fall | ||
| The screen shows good response rates in our tests, but may be too slow for competitive gamers. In comparison, all tested devices range from 0.1 (minimum) to 240 (maximum) ms. » 30 % of all devices are better. This means that the measured response time is better than the average of all tested devices (19.9 ms). | ||
| ↔ Response Time 50% Grey to 80% Grey | ||
| 10.4 ms ... rise ↗ and fall ↘ combined | ↗ 6 ms rise | 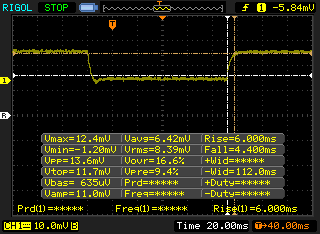 |
| ↘ 4.4 ms fall | ||
| The screen shows good response rates in our tests, but may be too slow for competitive gamers. In comparison, all tested devices range from 0.165 (minimum) to 636 (maximum) ms. » 24 % of all devices are better. This means that the measured response time is better than the average of all tested devices (31.1 ms). | ||
Screen Flickering / PWM (Pulse-Width Modulation)
| Screen flickering / PWM not detected | 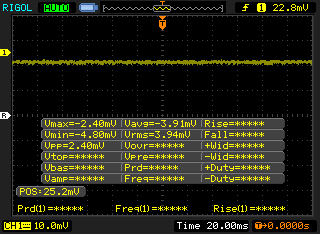 | ||
In comparison: 52 % of all tested devices do not use PWM to dim the display. If PWM was detected, an average of 7784 (minimum: 5 - maximum: 343500) Hz was measured. | |||
最大300尼特,与其他17英寸游戏笔记本电脑相比,该显示器的户外能见度约为平均水平。一些替代品,如Razer Blade 17有更明亮的显示屏,超过500尼特,在户外更容易阅读。
业绩
测试条件
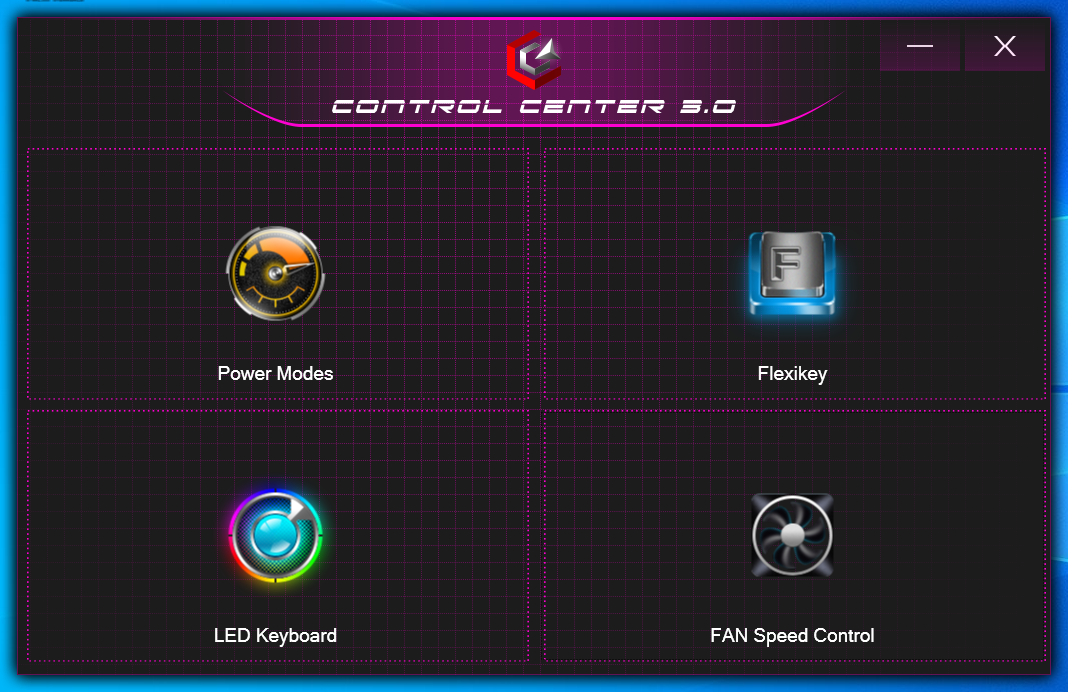
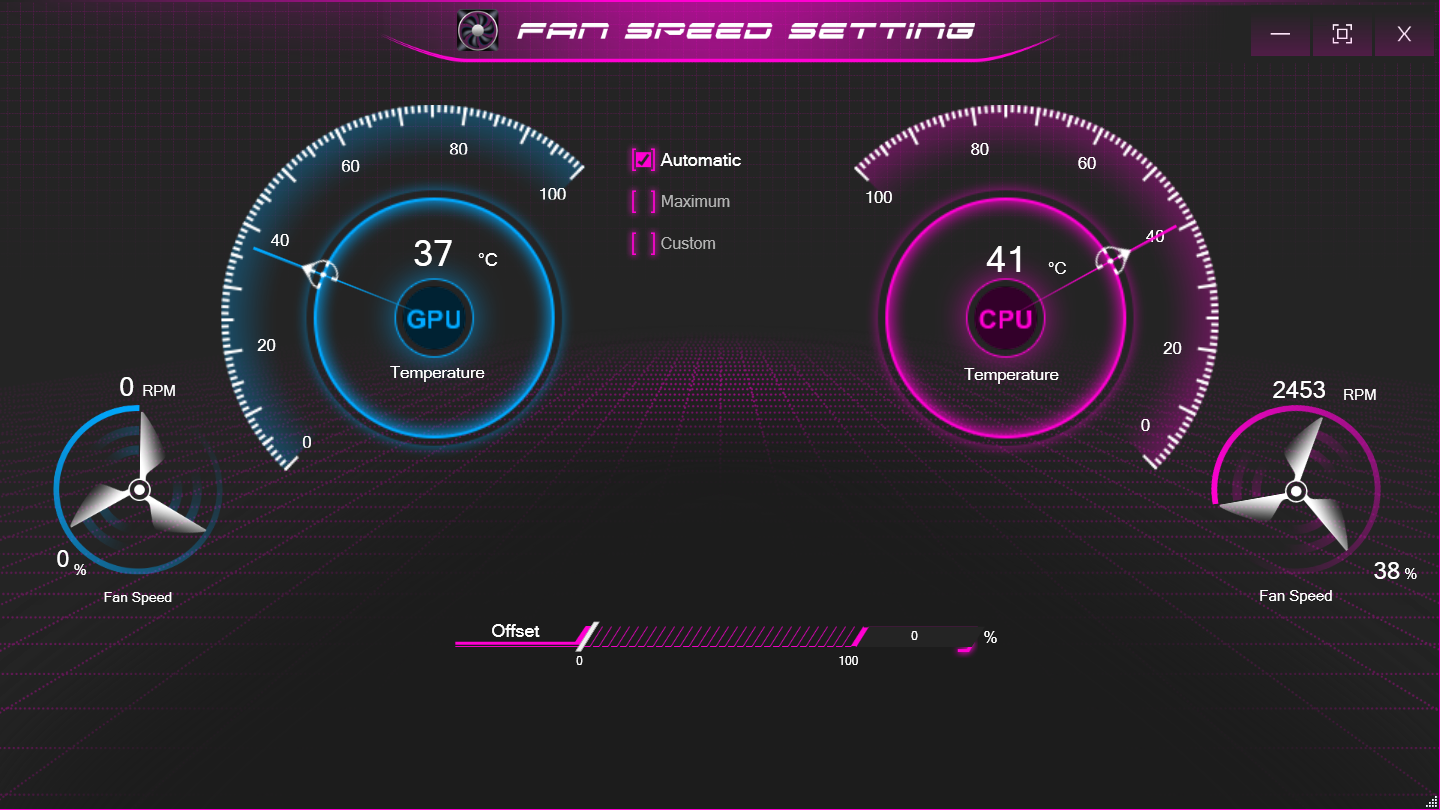
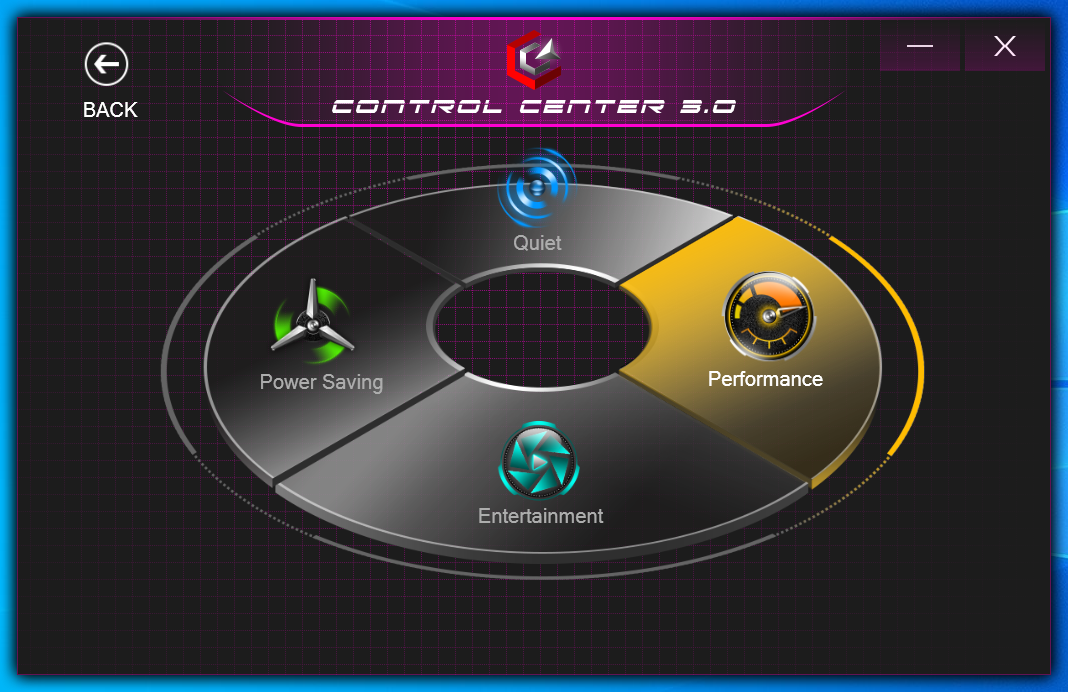
在运行以下任何基准测试之前,我们的设备通过Windows和预装的控制中心3.0软件被设置为性能模式,以获得尽可能高的分数。我们还确保将Nvidia Optimus设置为独立显卡;遗憾的是这里不支持MUX。
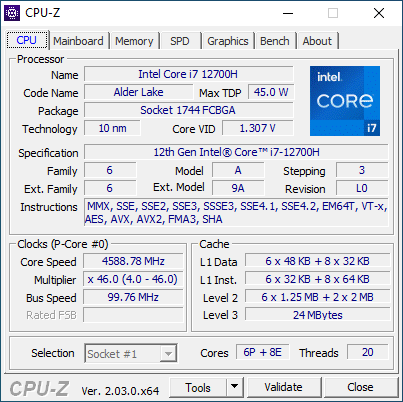
处理器
原始多线程性能比我们数据库中配备相同的笔记本电脑快约10%。 酷睿i7-12700H.惠普Envy 16中的处理器HP Envy 16例如,即使考虑到任何性能节流,它也比我们的Eurocom慢得多。
升级到 酷睿i9-12900H根据我们在Alienware x15 R2上的经验,升级到酷睿i9-12900H后,处理器的性能有望略微提高5%到10%左右。 Alienware x15 R2和Schenker XMG Pro 17 E22。
CineBench R15无法在我们的设备上正确运行,就像我们今年早些时候评测的上一个Eurocom系统一样。我们已经与制造商取得联系,他们能够证实我们的发现。在这次审查中,该基准被省略了。
Cinebench R23 Multi Loop
Cinebench R23: Multi Core | Single Core
Cinebench R15: CPU Multi 64Bit | CPU Single 64Bit
Blender: v2.79 BMW27 CPU
7-Zip 18.03: 7z b 4 | 7z b 4 -mmt1
Geekbench 5.5: Multi-Core | Single-Core
HWBOT x265 Benchmark v2.2: 4k Preset
LibreOffice : 20 Documents To PDF
R Benchmark 2.5: Overall mean
| Cinebench R20 / CPU (Multi Core) | |
| MSI Raider GE77 HX 12UHS | |
| Alienware x17 R2 P48E | |
| Schenker XMG Pro 17 E22 | |
| Eurocom Nightsky TXi317 | |
| Average Intel Core i7-12700H (1576 - 7407, n=64) | |
| Schenker XMG Neo 17 M22 | |
| Alienware x17 RTX 3080 P48E | |
| Razer Blade 17 (i7-12800H, RTX 3070 Ti) | |
| Asus Strix Scar 17 G733QSA-XS99 | |
| Schenker XMG Apex 17 M21 | |
| Razer Blade 17 Early 2022 | |
| Razer Blade Pro 17 2021 (QHD Touch) | |
| Schenker XMG Core 17 (Early 2021) | |
| Cinebench R20 / CPU (Single Core) | |
| MSI Raider GE77 HX 12UHS | |
| Schenker XMG Pro 17 E22 | |
| Alienware x17 R2 P48E | |
| Razer Blade 17 (i7-12800H, RTX 3070 Ti) | |
| Razer Blade 17 Early 2022 | |
| Eurocom Nightsky TXi317 | |
| Average Intel Core i7-12700H (300 - 704, n=64) | |
| Schenker XMG Neo 17 M22 | |
| Alienware x17 RTX 3080 P48E | |
| Asus Strix Scar 17 G733QSA-XS99 | |
| Schenker XMG Apex 17 M21 | |
| Razer Blade Pro 17 2021 (QHD Touch) | |
| Schenker XMG Core 17 (Early 2021) | |
| Cinebench R23 / Multi Core | |
| MSI Raider GE77 HX 12UHS | |
| Alienware x17 R2 P48E | |
| Eurocom Nightsky TXi317 | |
| Schenker XMG Pro 17 E22 | |
| Average Intel Core i7-12700H (4032 - 19330, n=64) | |
| Razer Blade 17 (i7-12800H, RTX 3070 Ti) | |
| Schenker XMG Neo 17 M22 | |
| Alienware x17 RTX 3080 P48E | |
| Asus Strix Scar 17 G733QSA-XS99 | |
| Schenker XMG Apex 17 M21 | |
| Razer Blade 17 Early 2022 | |
| Razer Blade Pro 17 2021 (QHD Touch) | |
| Schenker XMG Core 17 (Early 2021) | |
| Cinebench R23 / Single Core | |
| Schenker XMG Pro 17 E22 | |
| Razer Blade 17 Early 2022 | |
| MSI Raider GE77 HX 12UHS | |
| Alienware x17 R2 P48E | |
| Razer Blade 17 (i7-12800H, RTX 3070 Ti) | |
| Eurocom Nightsky TXi317 | |
| Average Intel Core i7-12700H (778 - 1826, n=63) | |
| Schenker XMG Neo 17 M22 | |
| Alienware x17 RTX 3080 P48E | |
| Asus Strix Scar 17 G733QSA-XS99 | |
| Schenker XMG Apex 17 M21 | |
| Razer Blade Pro 17 2021 (QHD Touch) | |
| Schenker XMG Core 17 (Early 2021) | |
| Cinebench R15 / CPU Multi 64Bit | |
| MSI Raider GE77 HX 12UHS | |
| Alienware x17 R2 P48E | |
| Schenker XMG Pro 17 E22 | |
| Razer Blade 17 (i7-12800H, RTX 3070 Ti) | |
| Average Intel Core i7-12700H (1379 - 2916, n=70) | |
| Schenker XMG Neo 17 M22 | |
| Asus Strix Scar 17 G733QSA-XS99 | |
| Alienware x17 RTX 3080 P48E | |
| Schenker XMG Apex 17 M21 | |
| Razer Blade 17 Early 2022 | |
| Razer Blade Pro 17 2021 (QHD Touch) | |
| Schenker XMG Core 17 (Early 2021) | |
| Cinebench R15 / CPU Single 64Bit | |
| MSI Raider GE77 HX 12UHS | |
| Schenker XMG Pro 17 E22 | |
| Alienware x17 R2 P48E | |
| Razer Blade 17 (i7-12800H, RTX 3070 Ti) | |
| Razer Blade 17 Early 2022 | |
| Average Intel Core i7-12700H (113 - 263, n=65) | |
| Schenker XMG Neo 17 M22 | |
| Asus Strix Scar 17 G733QSA-XS99 | |
| Schenker XMG Apex 17 M21 | |
| Alienware x17 RTX 3080 P48E | |
| Razer Blade Pro 17 2021 (QHD Touch) | |
| Schenker XMG Core 17 (Early 2021) | |
| Blender / v2.79 BMW27 CPU | |
| Schenker XMG Core 17 (Early 2021) | |
| Razer Blade 17 Early 2022 | |
| Razer Blade Pro 17 2021 (QHD Touch) | |
| Schenker XMG Apex 17 M21 | |
| Asus Strix Scar 17 G733QSA-XS99 | |
| Average Intel Core i7-12700H (168 - 732, n=63) | |
| Razer Blade 17 (i7-12800H, RTX 3070 Ti) | |
| Alienware x17 RTX 3080 P48E | |
| Schenker XMG Neo 17 M22 | |
| Schenker XMG Pro 17 E22 | |
| Eurocom Nightsky TXi317 | |
| Alienware x17 R2 P48E | |
| MSI Raider GE77 HX 12UHS | |
| 7-Zip 18.03 / 7z b 4 | |
| MSI Raider GE77 HX 12UHS | |
| Alienware x17 R2 P48E | |
| Eurocom Nightsky TXi317 | |
| Schenker XMG Pro 17 E22 | |
| Schenker XMG Neo 17 M22 | |
| Razer Blade 17 (i7-12800H, RTX 3070 Ti) | |
| Asus Strix Scar 17 G733QSA-XS99 | |
| Average Intel Core i7-12700H (22844 - 73067, n=63) | |
| Schenker XMG Apex 17 M21 | |
| Alienware x17 RTX 3080 P48E | |
| Razer Blade 17 Early 2022 | |
| Razer Blade Pro 17 2021 (QHD Touch) | |
| Schenker XMG Core 17 (Early 2021) | |
| 7-Zip 18.03 / 7z b 4 -mmt1 | |
| MSI Raider GE77 HX 12UHS | |
| Schenker XMG Pro 17 E22 | |
| Razer Blade 17 Early 2022 | |
| Eurocom Nightsky TXi317 | |
| Schenker XMG Neo 17 M22 | |
| Alienware x17 R2 P48E | |
| Razer Blade 17 (i7-12800H, RTX 3070 Ti) | |
| Asus Strix Scar 17 G733QSA-XS99 | |
| Average Intel Core i7-12700H (2743 - 5972, n=63) | |
| Schenker XMG Apex 17 M21 | |
| Schenker XMG Core 17 (Early 2021) | |
| Alienware x17 RTX 3080 P48E | |
| Razer Blade Pro 17 2021 (QHD Touch) | |
| Geekbench 5.5 / Multi-Core | |
| MSI Raider GE77 HX 12UHS | |
| Alienware x17 R2 P48E | |
| Schenker XMG Pro 17 E22 | |
| Eurocom Nightsky TXi317 | |
| Razer Blade 17 (i7-12800H, RTX 3070 Ti) | |
| Average Intel Core i7-12700H (5144 - 13745, n=64) | |
| Schenker XMG Neo 17 M22 | |
| Razer Blade 17 Early 2022 | |
| Schenker XMG Apex 17 M21 | |
| Asus Strix Scar 17 G733QSA-XS99 | |
| Razer Blade Pro 17 2021 (QHD Touch) | |
| Schenker XMG Core 17 (Early 2021) | |
| Geekbench 5.5 / Single-Core | |
| MSI Raider GE77 HX 12UHS | |
| Alienware x17 R2 P48E | |
| Schenker XMG Pro 17 E22 | |
| Razer Blade 17 Early 2022 | |
| Eurocom Nightsky TXi317 | |
| Razer Blade 17 (i7-12800H, RTX 3070 Ti) | |
| Average Intel Core i7-12700H (803 - 1851, n=64) | |
| Schenker XMG Neo 17 M22 | |
| Asus Strix Scar 17 G733QSA-XS99 | |
| Schenker XMG Apex 17 M21 | |
| Razer Blade Pro 17 2021 (QHD Touch) | |
| Schenker XMG Core 17 (Early 2021) | |
| HWBOT x265 Benchmark v2.2 / 4k Preset | |
| MSI Raider GE77 HX 12UHS | |
| Alienware x17 R2 P48E | |
| Schenker XMG Pro 17 E22 | |
| Schenker XMG Neo 17 M22 | |
| Alienware x17 RTX 3080 P48E | |
| Asus Strix Scar 17 G733QSA-XS99 | |
| Average Intel Core i7-12700H (4.67 - 21.8, n=64) | |
| Eurocom Nightsky TXi317 | |
| Razer Blade 17 (i7-12800H, RTX 3070 Ti) | |
| Schenker XMG Apex 17 M21 | |
| Razer Blade 17 Early 2022 | |
| Razer Blade Pro 17 2021 (QHD Touch) | |
| Schenker XMG Core 17 (Early 2021) | |
| LibreOffice / 20 Documents To PDF | |
| Schenker XMG Core 17 (Early 2021) | |
| Schenker XMG Neo 17 M22 | |
| Schenker XMG Apex 17 M21 | |
| Alienware x17 RTX 3080 P48E | |
| Average Intel Core i7-12700H (34.2 - 95.3, n=63) | |
| Asus Strix Scar 17 G733QSA-XS99 | |
| Razer Blade Pro 17 2021 (QHD Touch) | |
| MSI Raider GE77 HX 12UHS | |
| Razer Blade 17 (i7-12800H, RTX 3070 Ti) | |
| Alienware x17 R2 P48E | |
| Eurocom Nightsky TXi317 | |
| Razer Blade 17 Early 2022 | |
| Schenker XMG Pro 17 E22 | |
| R Benchmark 2.5 / Overall mean | |
| Razer Blade Pro 17 2021 (QHD Touch) | |
| Schenker XMG Core 17 (Early 2021) | |
| Alienware x17 RTX 3080 P48E | |
| Schenker XMG Apex 17 M21 | |
| Asus Strix Scar 17 G733QSA-XS99 | |
| Schenker XMG Neo 17 M22 | |
| Average Intel Core i7-12700H (0.4441 - 1.052, n=63) | |
| Razer Blade 17 (i7-12800H, RTX 3070 Ti) | |
| Eurocom Nightsky TXi317 | |
| Razer Blade 17 Early 2022 | |
| Schenker XMG Pro 17 E22 | |
| Alienware x17 R2 P48E | |
| MSI Raider GE77 HX 12UHS | |
Cinebench R23: Multi Core | Single Core
Cinebench R15: CPU Multi 64Bit | CPU Single 64Bit
Blender: v2.79 BMW27 CPU
7-Zip 18.03: 7z b 4 | 7z b 4 -mmt1
Geekbench 5.5: Multi-Core | Single-Core
HWBOT x265 Benchmark v2.2: 4k Preset
LibreOffice : 20 Documents To PDF
R Benchmark 2.5: Overall mean
* ... smaller is better
AIDA64: FP32 Ray-Trace | FPU Julia | CPU SHA3 | CPU Queen | FPU SinJulia | FPU Mandel | CPU AES | CPU ZLib | FP64 Ray-Trace | CPU PhotoWorxx
| Performance rating | |
| MSI Raider GE77 HX 12UHS | |
| Aorus 17X XES | |
| Eurocom Nightsky TXi317 | |
| Alienware x17 R2 P48E | |
| Average Intel Core i7-12700H | |
| Schenker XMG Pro 17 E22 | |
| Razer Blade 17 Early 2022 | |
| AIDA64 / FP32 Ray-Trace | |
| MSI Raider GE77 HX 12UHS | |
| Eurocom Nightsky TXi317 | |
| Aorus 17X XES | |
| Average Intel Core i7-12700H (2585 - 17957, n=64) | |
| Alienware x17 R2 P48E | |
| Schenker XMG Pro 17 E22 | |
| Razer Blade 17 Early 2022 | |
| AIDA64 / FPU Julia | |
| MSI Raider GE77 HX 12UHS | |
| Eurocom Nightsky TXi317 | |
| Aorus 17X XES | |
| Average Intel Core i7-12700H (12439 - 90760, n=64) | |
| Alienware x17 R2 P48E | |
| Schenker XMG Pro 17 E22 | |
| Razer Blade 17 Early 2022 | |
| AIDA64 / CPU SHA3 | |
| MSI Raider GE77 HX 12UHS | |
| Eurocom Nightsky TXi317 | |
| Aorus 17X XES | |
| Alienware x17 R2 P48E | |
| Average Intel Core i7-12700H (833 - 4242, n=64) | |
| Schenker XMG Pro 17 E22 | |
| Razer Blade 17 Early 2022 | |
| AIDA64 / CPU Queen | |
| Alienware x17 R2 P48E | |
| Schenker XMG Pro 17 E22 | |
| Aorus 17X XES | |
| Eurocom Nightsky TXi317 | |
| MSI Raider GE77 HX 12UHS | |
| Average Intel Core i7-12700H (57923 - 103202, n=63) | |
| Razer Blade 17 Early 2022 | |
| AIDA64 / FPU SinJulia | |
| MSI Raider GE77 HX 12UHS | |
| Aorus 17X XES | |
| Alienware x17 R2 P48E | |
| Eurocom Nightsky TXi317 | |
| Schenker XMG Pro 17 E22 | |
| Average Intel Core i7-12700H (3249 - 9939, n=64) | |
| Razer Blade 17 Early 2022 | |
| AIDA64 / FPU Mandel | |
| MSI Raider GE77 HX 12UHS | |
| Aorus 17X XES | |
| Eurocom Nightsky TXi317 | |
| Average Intel Core i7-12700H (7135 - 44760, n=64) | |
| Alienware x17 R2 P48E | |
| Schenker XMG Pro 17 E22 | |
| Razer Blade 17 Early 2022 | |
| AIDA64 / CPU AES | |
| MSI Raider GE77 HX 12UHS | |
| Eurocom Nightsky TXi317 | |
| Aorus 17X XES | |
| Alienware x17 R2 P48E | |
| Schenker XMG Pro 17 E22 | |
| Average Intel Core i7-12700H (31839 - 144360, n=64) | |
| Razer Blade 17 Early 2022 | |
| AIDA64 / CPU ZLib | |
| MSI Raider GE77 HX 12UHS | |
| Alienware x17 R2 P48E | |
| Eurocom Nightsky TXi317 | |
| Schenker XMG Pro 17 E22 | |
| Aorus 17X XES | |
| Average Intel Core i7-12700H (305 - 1171, n=64) | |
| Razer Blade 17 Early 2022 | |
| AIDA64 / FP64 Ray-Trace | |
| MSI Raider GE77 HX 12UHS | |
| Aorus 17X XES | |
| Eurocom Nightsky TXi317 | |
| Average Intel Core i7-12700H (1437 - 9692, n=64) | |
| Alienware x17 R2 P48E | |
| Schenker XMG Pro 17 E22 | |
| Razer Blade 17 Early 2022 | |
| AIDA64 / CPU PhotoWorxx | |
| MSI Raider GE77 HX 12UHS | |
| Aorus 17X XES | |
| Razer Blade 17 Early 2022 | |
| Alienware x17 R2 P48E | |
| Average Intel Core i7-12700H (12863 - 52207, n=64) | |
| Eurocom Nightsky TXi317 | |
| Schenker XMG Pro 17 E22 | |
系统性能
CrossMark: Overall | Productivity | Creativity | Responsiveness
| PCMark 10 / Score | |
| Alienware x17 R2 P48E | |
| Aorus 17X XES | |
| Schenker XMG Pro 17 E22 | |
| Eurocom Nightsky TXi317 | |
| Average Intel Core i7-12700H, NVIDIA GeForce RTX 3080 Ti Laptop GPU (6868 - 7638, n=7) | |
| Razer Blade 17 Early 2022 | |
| MSI Raider GE77 HX 12UHS | |
| PCMark 10 / Essentials | |
| Eurocom Nightsky TXi317 | |
| Alienware x17 R2 P48E | |
| Schenker XMG Pro 17 E22 | |
| Aorus 17X XES | |
| Average Intel Core i7-12700H, NVIDIA GeForce RTX 3080 Ti Laptop GPU (9987 - 11318, n=7) | |
| Razer Blade 17 Early 2022 | |
| MSI Raider GE77 HX 12UHS | |
| PCMark 10 / Productivity | |
| Eurocom Nightsky TXi317 | |
| Aorus 17X XES | |
| Schenker XMG Pro 17 E22 | |
| Alienware x17 R2 P48E | |
| MSI Raider GE77 HX 12UHS | |
| Average Intel Core i7-12700H, NVIDIA GeForce RTX 3080 Ti Laptop GPU (8944 - 10726, n=7) | |
| Razer Blade 17 Early 2022 | |
| PCMark 10 / Digital Content Creation | |
| Alienware x17 R2 P48E | |
| Aorus 17X XES | |
| Schenker XMG Pro 17 E22 | |
| Average Intel Core i7-12700H, NVIDIA GeForce RTX 3080 Ti Laptop GPU (8956 - 12249, n=7) | |
| Razer Blade 17 Early 2022 | |
| Eurocom Nightsky TXi317 | |
| MSI Raider GE77 HX 12UHS | |
| CrossMark / Overall | |
| MSI Raider GE77 HX 12UHS | |
| Aorus 17X XES | |
| Alienware x17 R2 P48E | |
| Eurocom Nightsky TXi317 | |
| Average Intel Core i7-12700H, NVIDIA GeForce RTX 3080 Ti Laptop GPU (1761 - 1861, n=4) | |
| Razer Blade 17 Early 2022 | |
| CrossMark / Productivity | |
| MSI Raider GE77 HX 12UHS | |
| Aorus 17X XES | |
| Alienware x17 R2 P48E | |
| Eurocom Nightsky TXi317 | |
| Razer Blade 17 Early 2022 | |
| Average Intel Core i7-12700H, NVIDIA GeForce RTX 3080 Ti Laptop GPU (1645 - 1800, n=4) | |
| CrossMark / Creativity | |
| MSI Raider GE77 HX 12UHS | |
| Aorus 17X XES | |
| Alienware x17 R2 P48E | |
| Average Intel Core i7-12700H, NVIDIA GeForce RTX 3080 Ti Laptop GPU (1936 - 2041, n=4) | |
| Eurocom Nightsky TXi317 | |
| Razer Blade 17 Early 2022 | |
| CrossMark / Responsiveness | |
| Aorus 17X XES | |
| MSI Raider GE77 HX 12UHS | |
| Eurocom Nightsky TXi317 | |
| Alienware x17 R2 P48E | |
| Average Intel Core i7-12700H, NVIDIA GeForce RTX 3080 Ti Laptop GPU (1461 - 1868, n=4) | |
| Razer Blade 17 Early 2022 | |
| PCMark 10 Score | 7638 points | |
Help | ||
| AIDA64 / Memory Copy | |
| MSI Raider GE77 HX 12UHS | |
| Aorus 17X XES | |
| Razer Blade 17 Early 2022 | |
| Alienware x17 R2 P48E | |
| Average Intel Core i7-12700H (25615 - 80511, n=64) | |
| Eurocom Nightsky TXi317 | |
| Schenker XMG Pro 17 E22 | |
| AIDA64 / Memory Read | |
| MSI Raider GE77 HX 12UHS | |
| Aorus 17X XES | |
| Razer Blade 17 Early 2022 | |
| Alienware x17 R2 P48E | |
| Average Intel Core i7-12700H (25586 - 79442, n=64) | |
| Eurocom Nightsky TXi317 | |
| Schenker XMG Pro 17 E22 | |
| AIDA64 / Memory Write | |
| MSI Raider GE77 HX 12UHS | |
| Aorus 17X XES | |
| Razer Blade 17 Early 2022 | |
| Average Intel Core i7-12700H (23679 - 88660, n=64) | |
| Alienware x17 R2 P48E | |
| Eurocom Nightsky TXi317 | |
| Schenker XMG Pro 17 E22 | |
| AIDA64 / Memory Latency | |
| Alienware x17 R2 P48E | |
| Schenker XMG Pro 17 E22 | |
| Eurocom Nightsky TXi317 | |
| Aorus 17X XES | |
| MSI Raider GE77 HX 12UHS | |
| Average Intel Core i7-12700H (76.2 - 133.9, n=62) | |
* ... smaller is better
DPC延时
LatencyMon显示了在我们的主页上打开多个浏览器标签时的DPC问题。在60 FPS的情况下,4K视频播放是完美的,没有丢帧。
| DPC Latencies / LatencyMon - interrupt to process latency (max), Web, Youtube, Prime95 | |
| MSI Raider GE77 HX 12UHS | |
| Eurocom Nightsky TXi317 | |
| Aorus 17X XES | |
| Alienware x17 R2 P48E | |
| Schenker XMG Pro 17 E22 | |
| Razer Blade 17 Early 2022 | |
* ... smaller is better
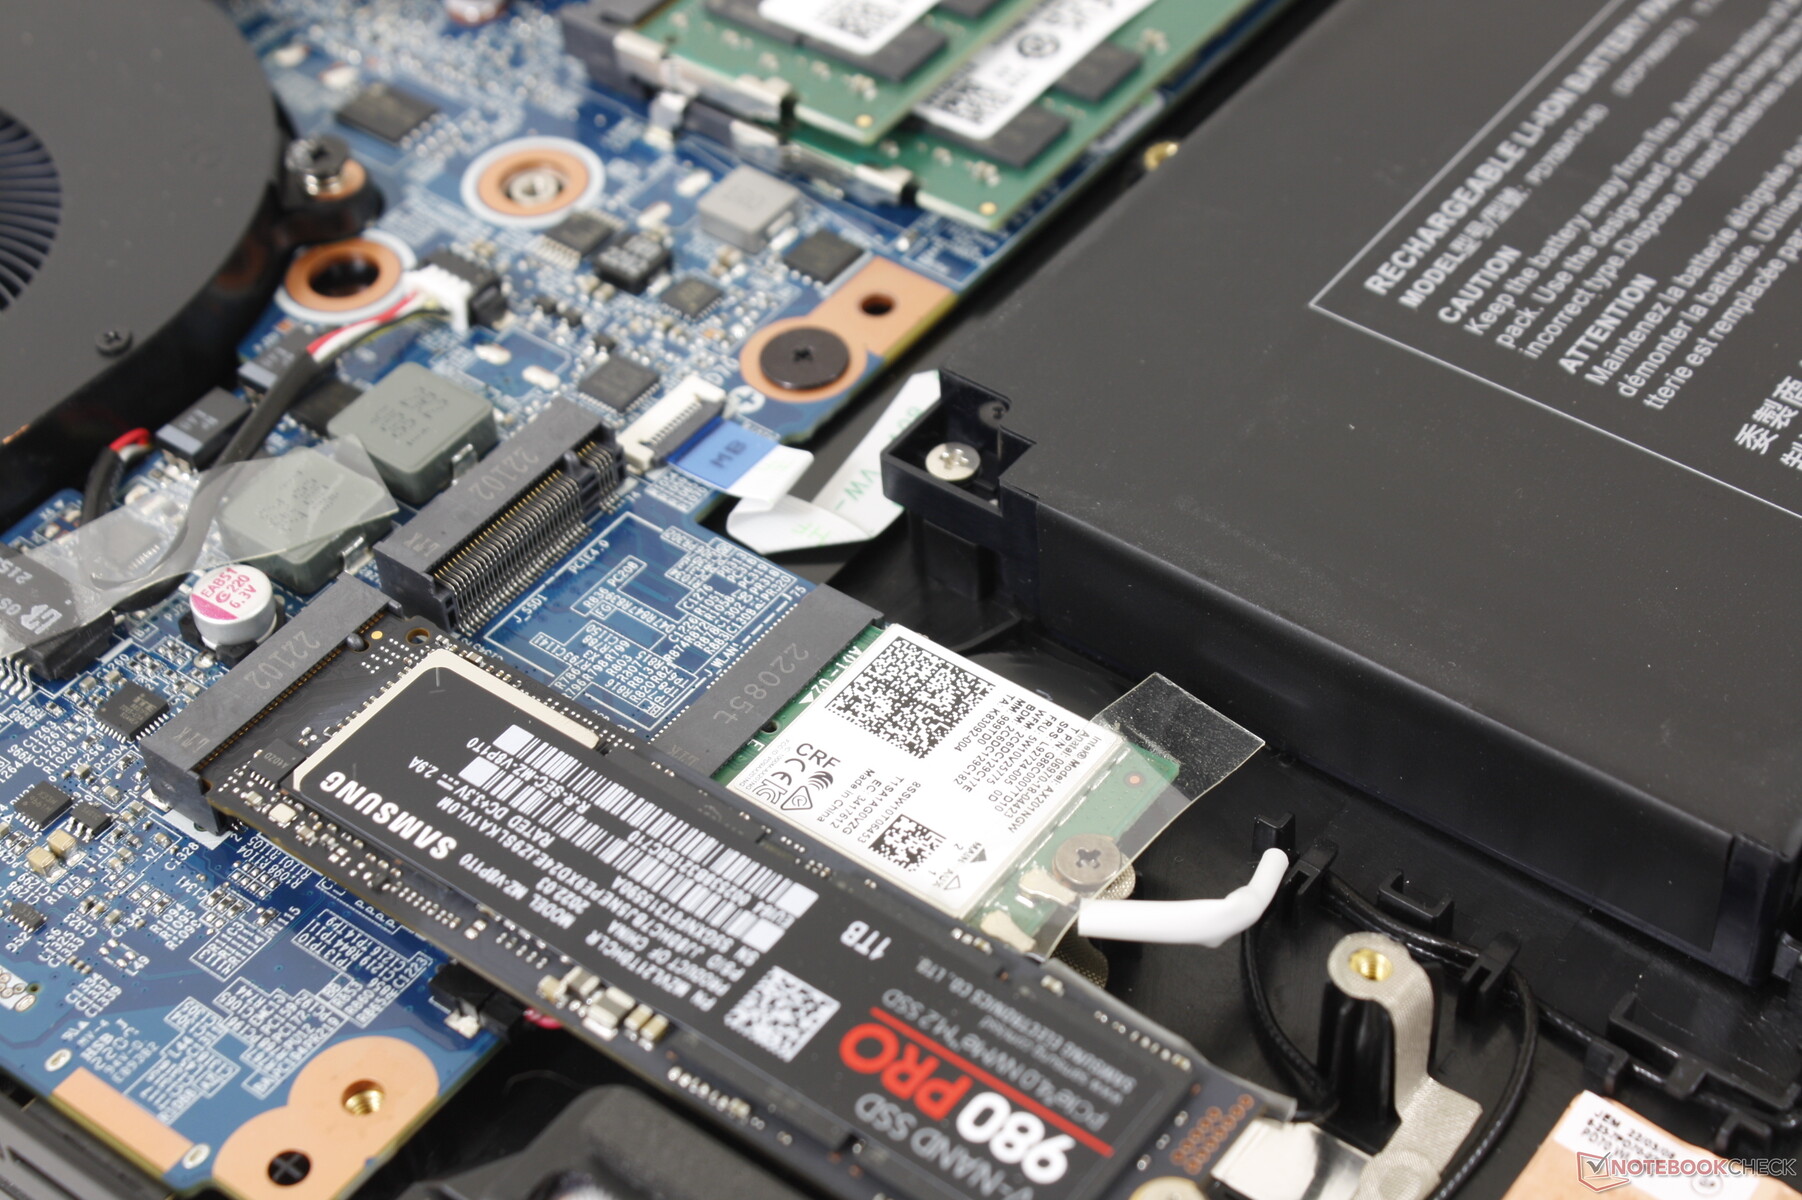
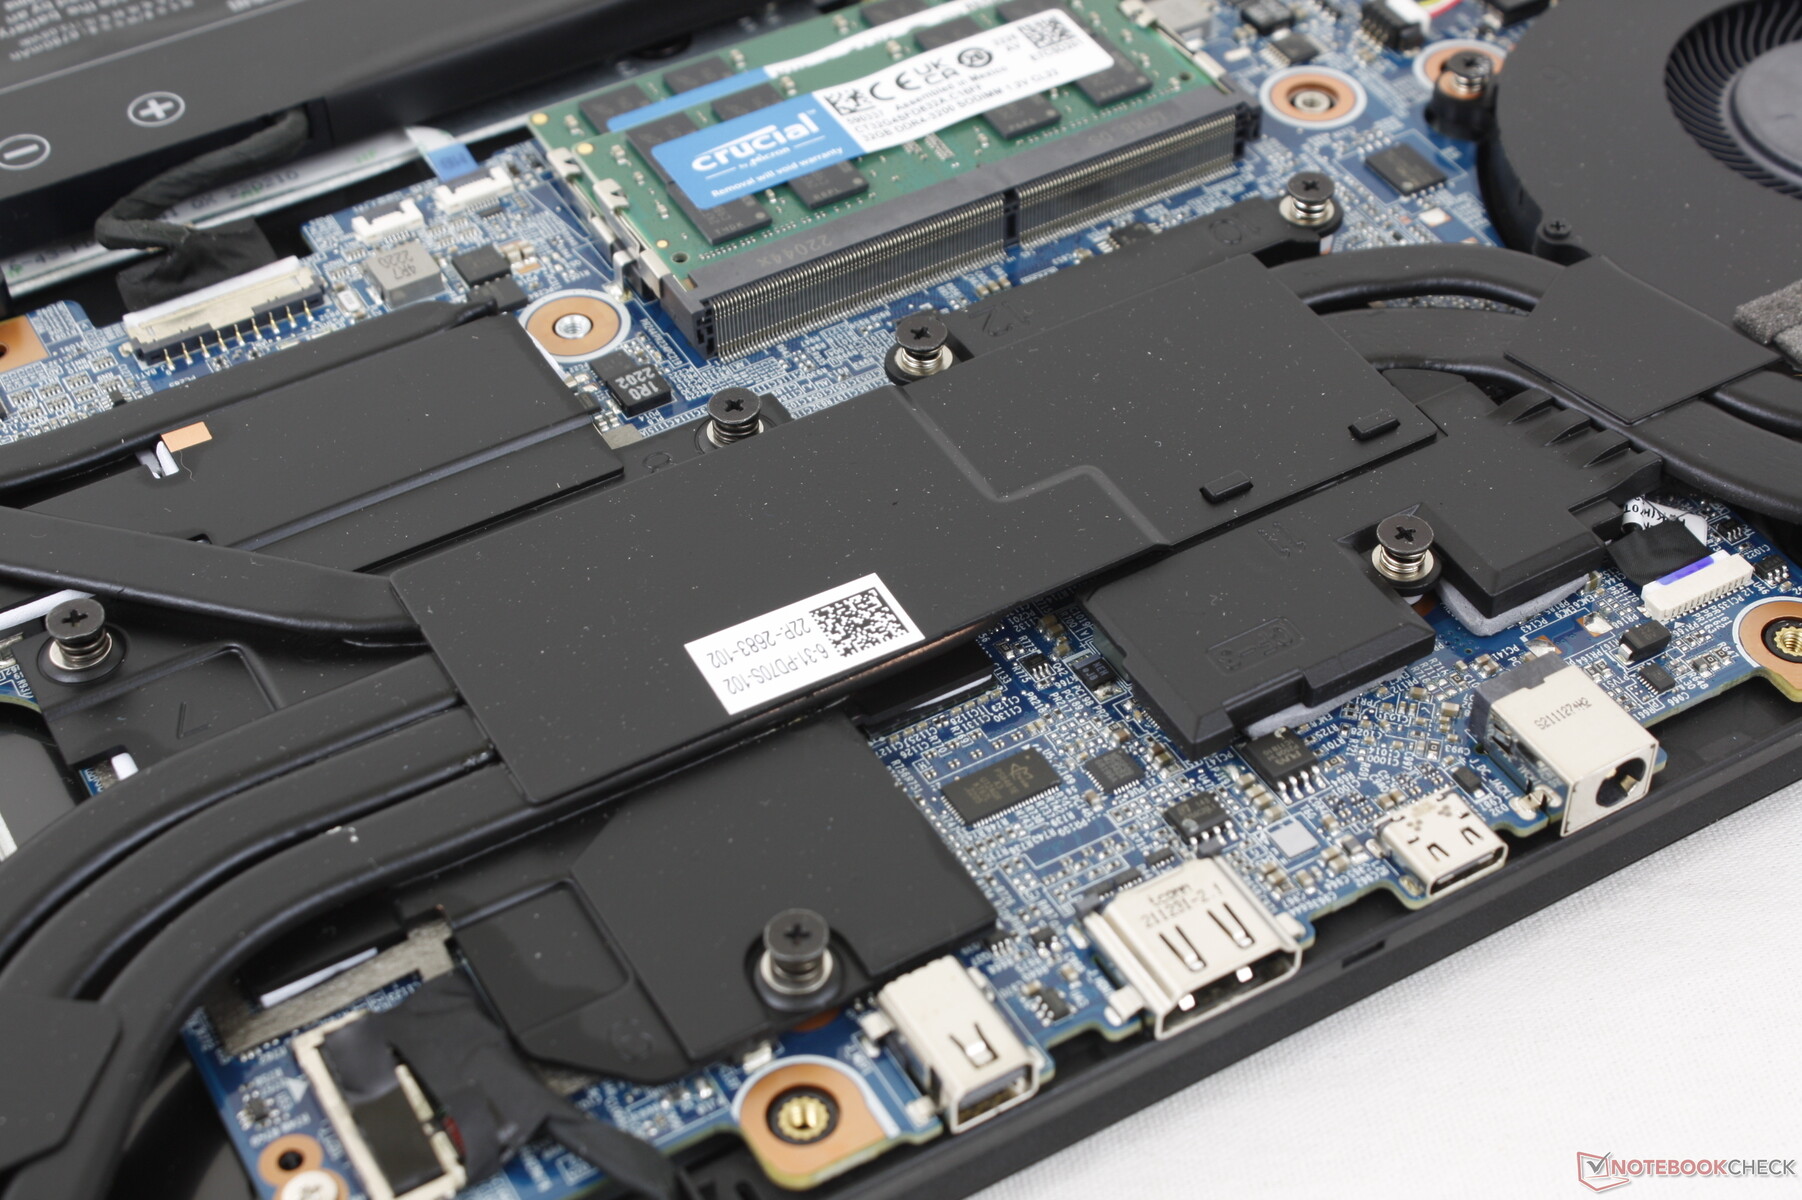
存储设备
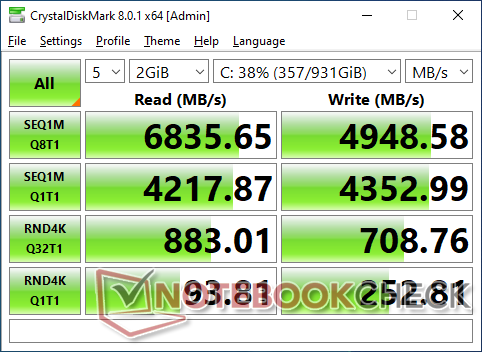
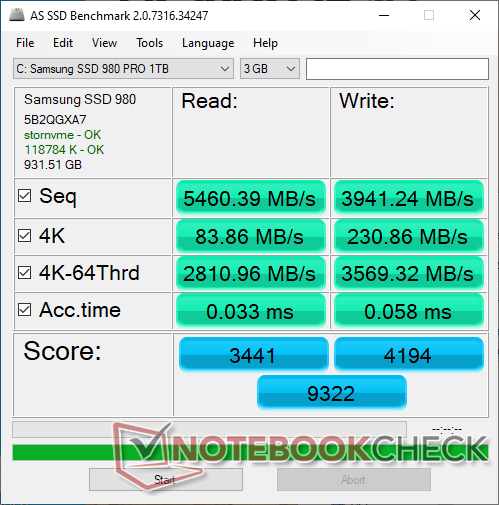
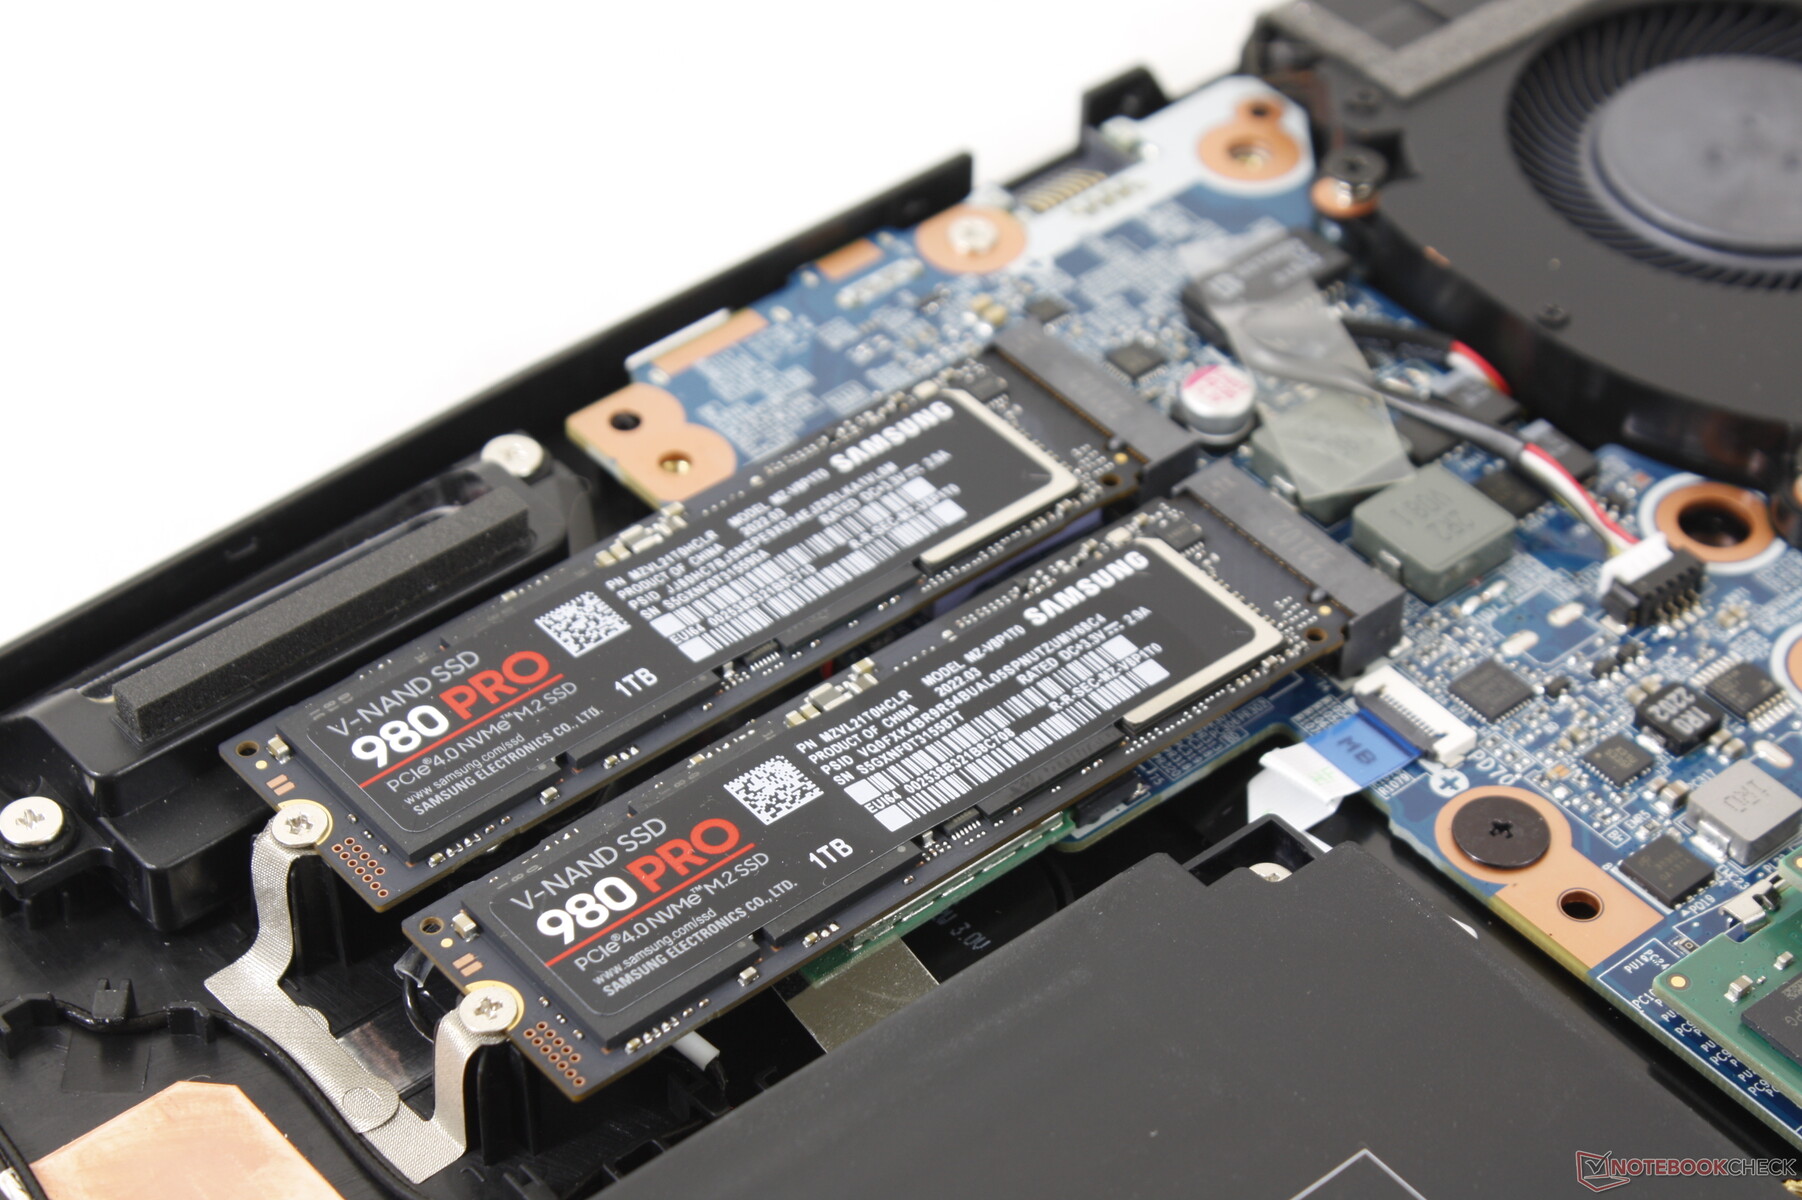
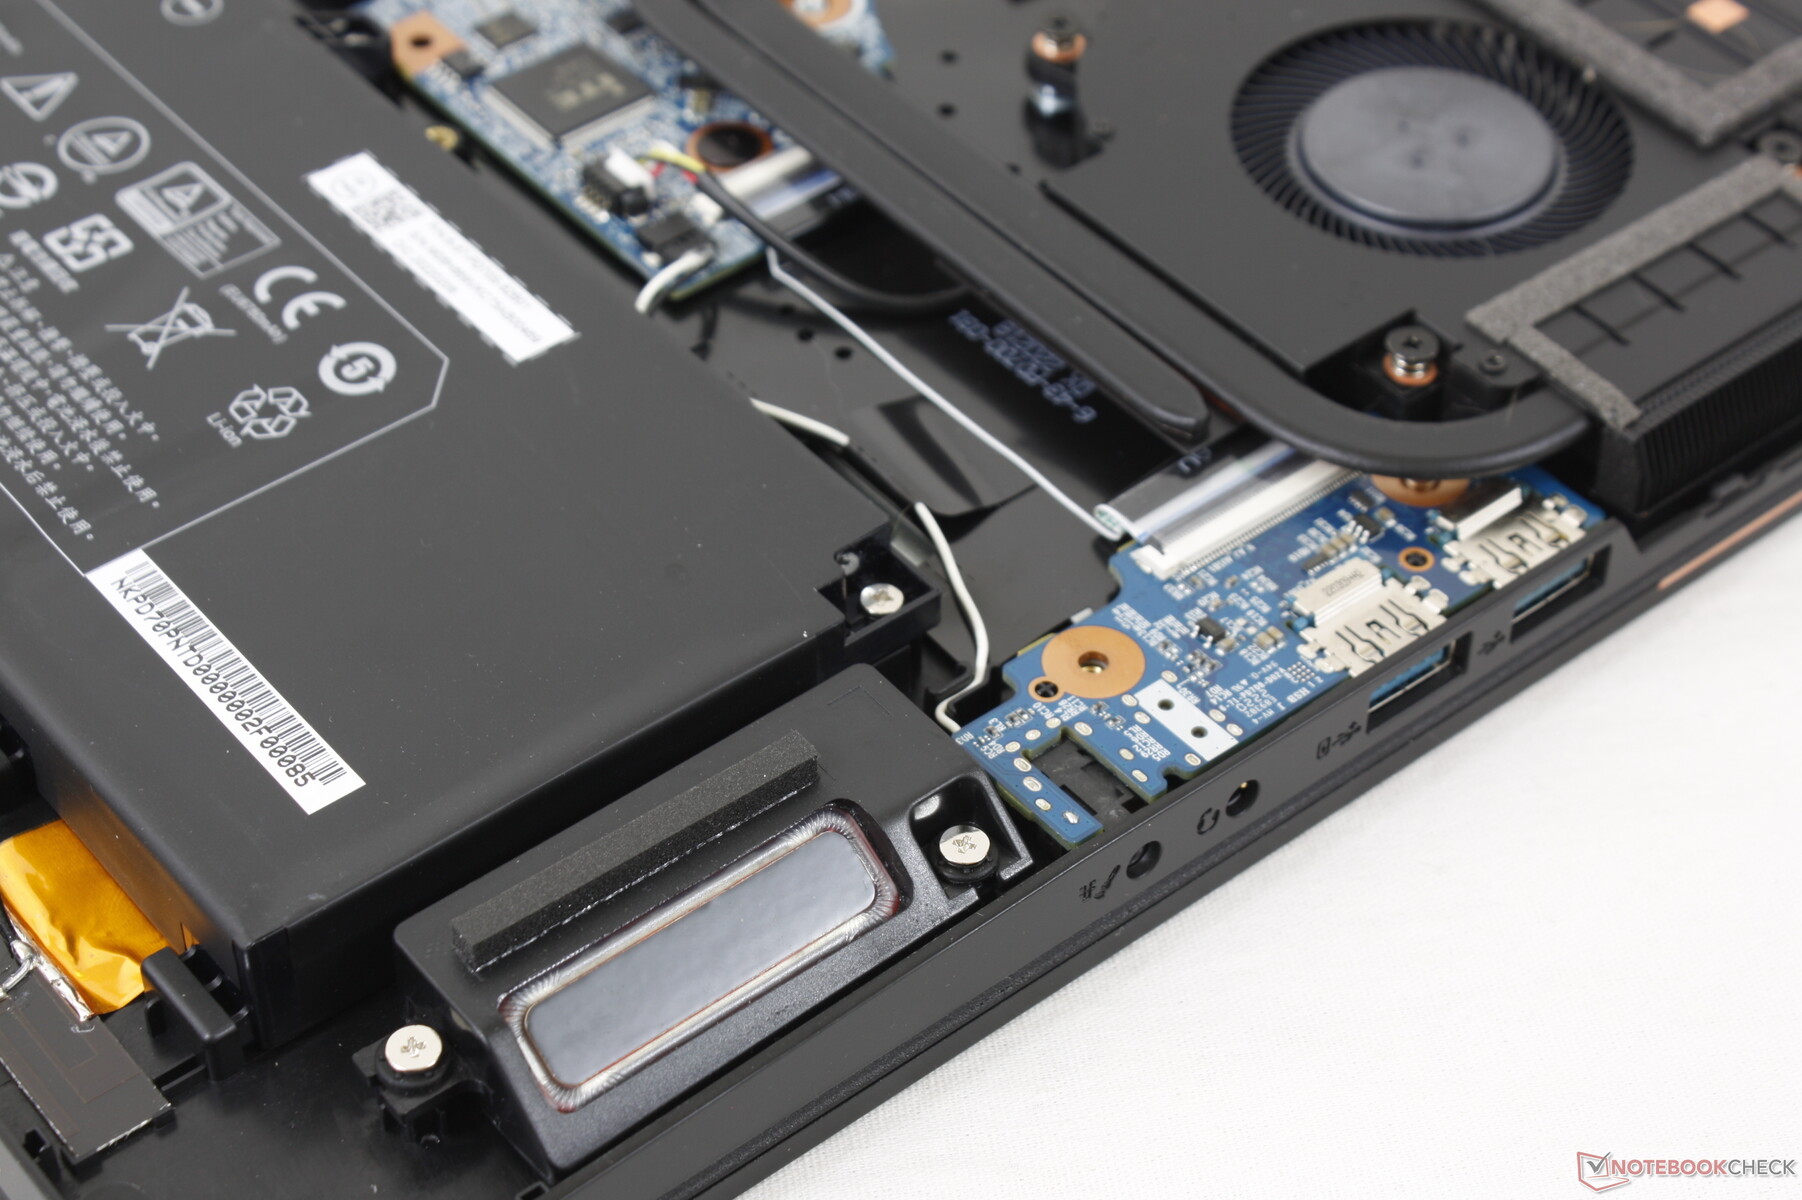
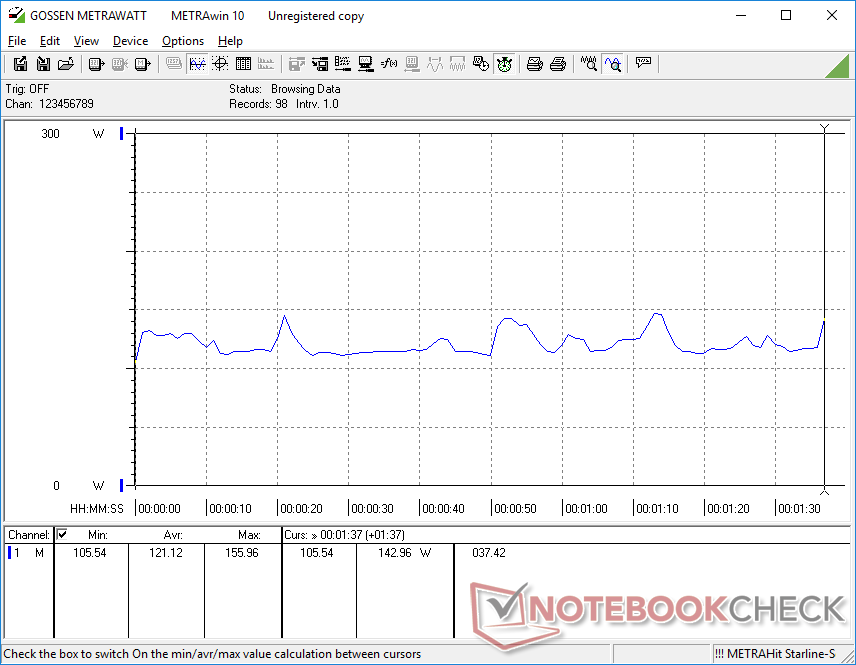
两个内部的M.2 2280插槽可以分别支持PCIe4 x4固态硬盘的疯狂速度,至少在理论上如此。然而,在现实中,由于机箱没有为固态硬盘提供内置的散热器,所以驱动器很可能会被扼杀。1TB的 三星980 ProPCIe4 x4 NVMe固态硬盘在我们的测试装置中,在循环运行DiskSpd时,会从最初的6800 MB/s的高速度下降到1400 MB/s,如下图所示。这样的结果对于经济型游戏笔记本电脑来说通常是可以接受的,但在这样的高端机器上看到这些结果是令人失望的。

| Drive Performance rating - Percent | |
| MSI Raider GE77 HX 12UHS | |
| Eurocom Nightsky TXi317 | |
| Aorus 17X XES | |
| Schenker XMG Pro 17 E22 | |
| Razer Blade 17 Early 2022 | |
| Alienware x17 R2 P48E | |
* ... smaller is better
Disk Throttling: DiskSpd Read Loop, Queue Depth 8
GPU性能
图形性能非常好,其结果略微领先于其他大多数具有相同功能的笔记本电脑。 GeForce RTX 3080 TiGPU。125W的TGP并不是最高的,因为 Alienware x17 R2甚至是 Razer Blade 17有更高的目标,但它至少高于许多超薄笔记本电脑,如MSI GS系列。
有趣的是,Nvidia控制面板声称TGP为155W,而Eurocom声称TGP为125W。后者的数字似乎是更准确的目标,我们下面的压力测试部分将显示。
降级到 GeForce RTX 3070 Ti只会对图形性能产生约10%的影响。总体性能比我们的参考数据慢大约20%至30%。 桌面GeForce RTX 3080.
| 3DMark 11 - 1280x720 Performance GPU | |
| ASUS GeForce RTX 3080 ROG STRIX OC GAMING | |
| Schenker XMG Neo 17 M22 | |
| Alienware x17 RTX 3080 P48E | |
| Eurocom Nightsky TXi317 | |
| Schenker XMG Pro 17 E22 | |
| Average NVIDIA GeForce RTX 3080 Ti Laptop GPU (13920 - 45841, n=45) | |
| Razer Blade 17 (i7-12800H, RTX 3070 Ti) | |
| Schenker XMG Apex 17 M21 | |
| Razer Blade Pro 17 2021 (QHD Touch) | |
| Schenker XMG Core 17 (Early 2021) | |
| MSI GF75 Thin 10SDR | |
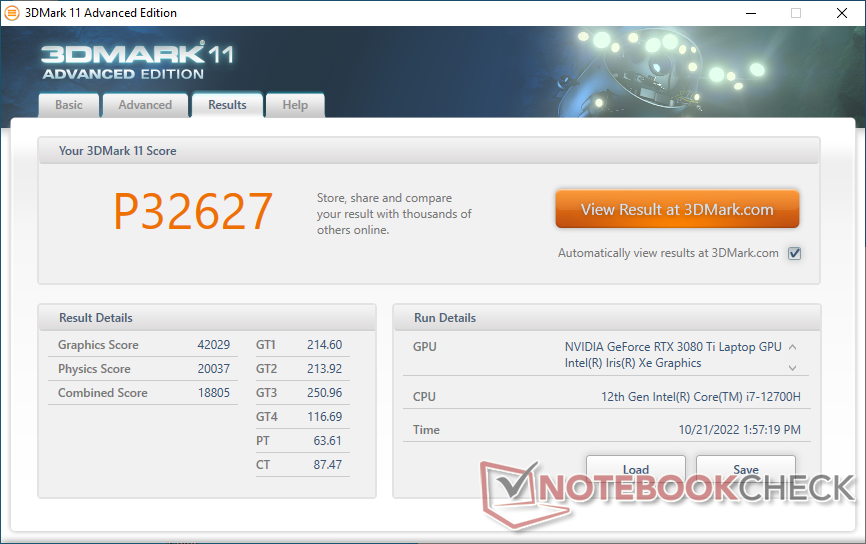
| 3DMark 11 Performance | 32627 points | |
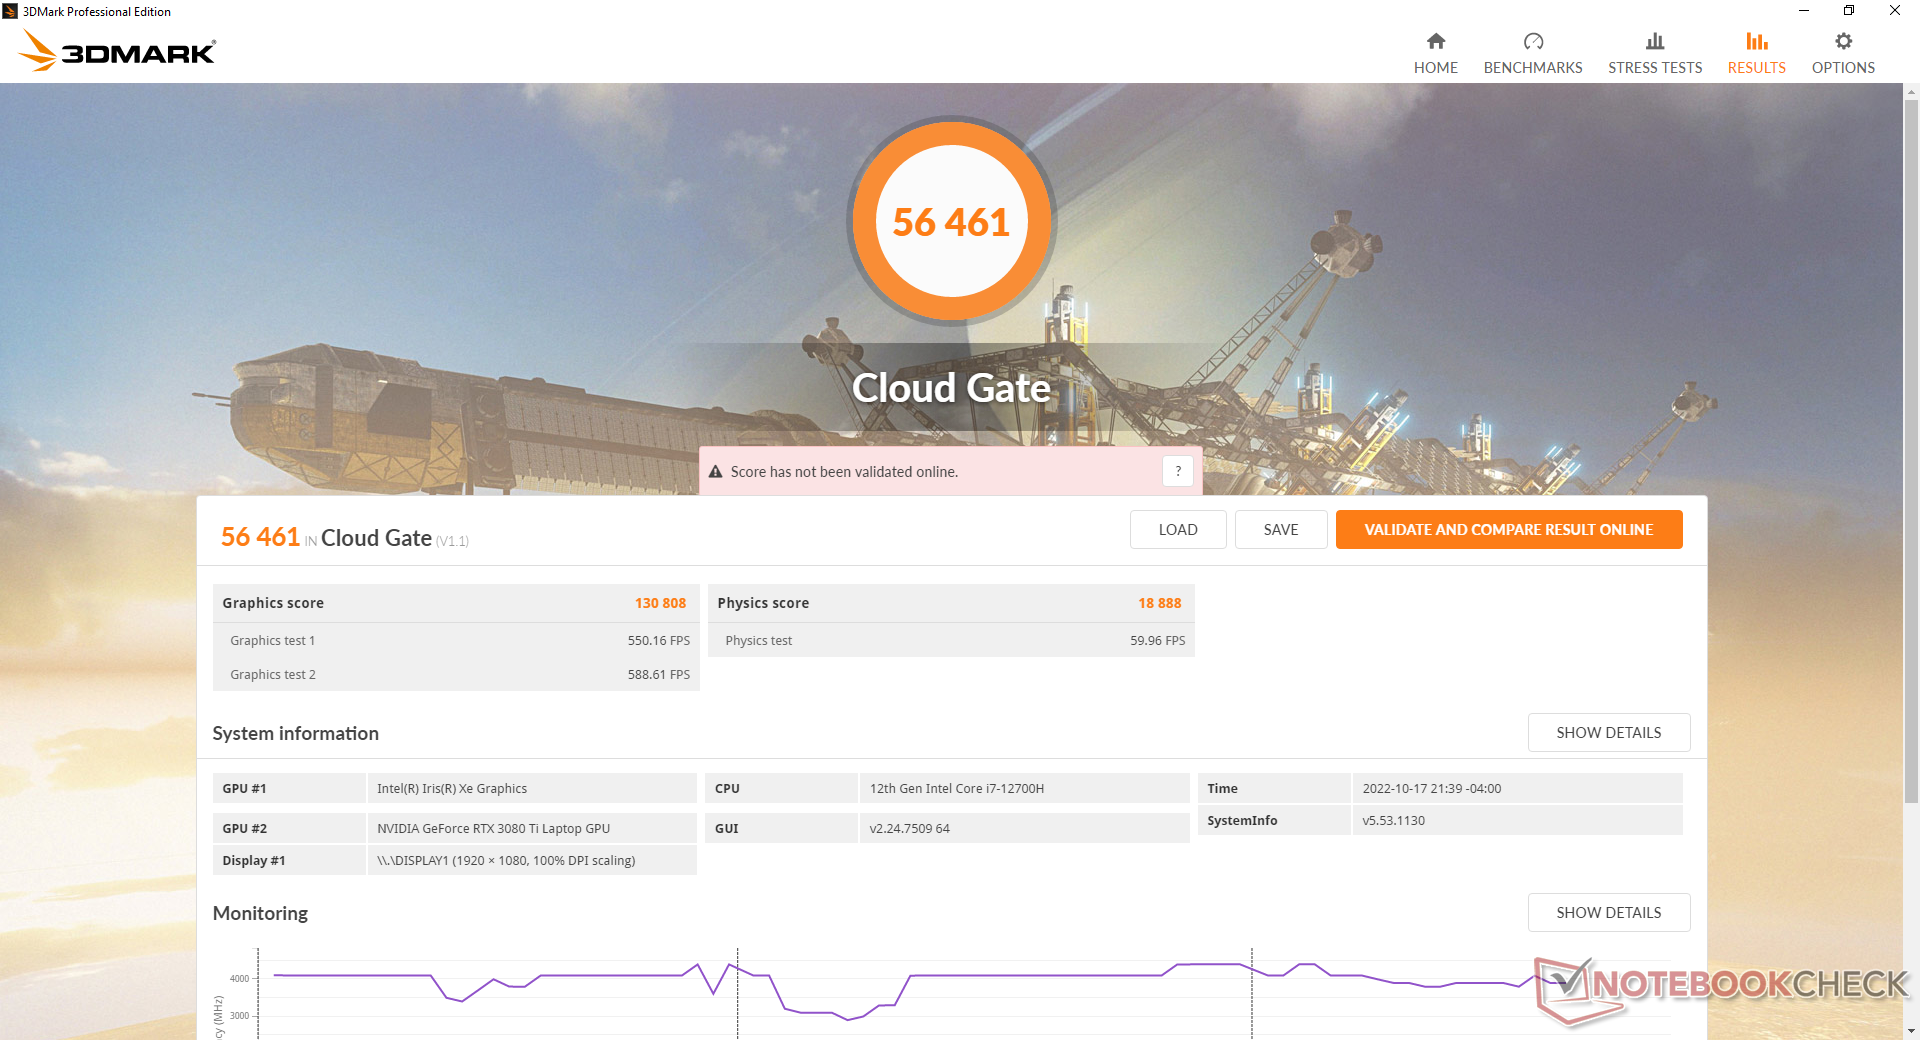
| 3DMark Cloud Gate Standard Score | 56461 points | |
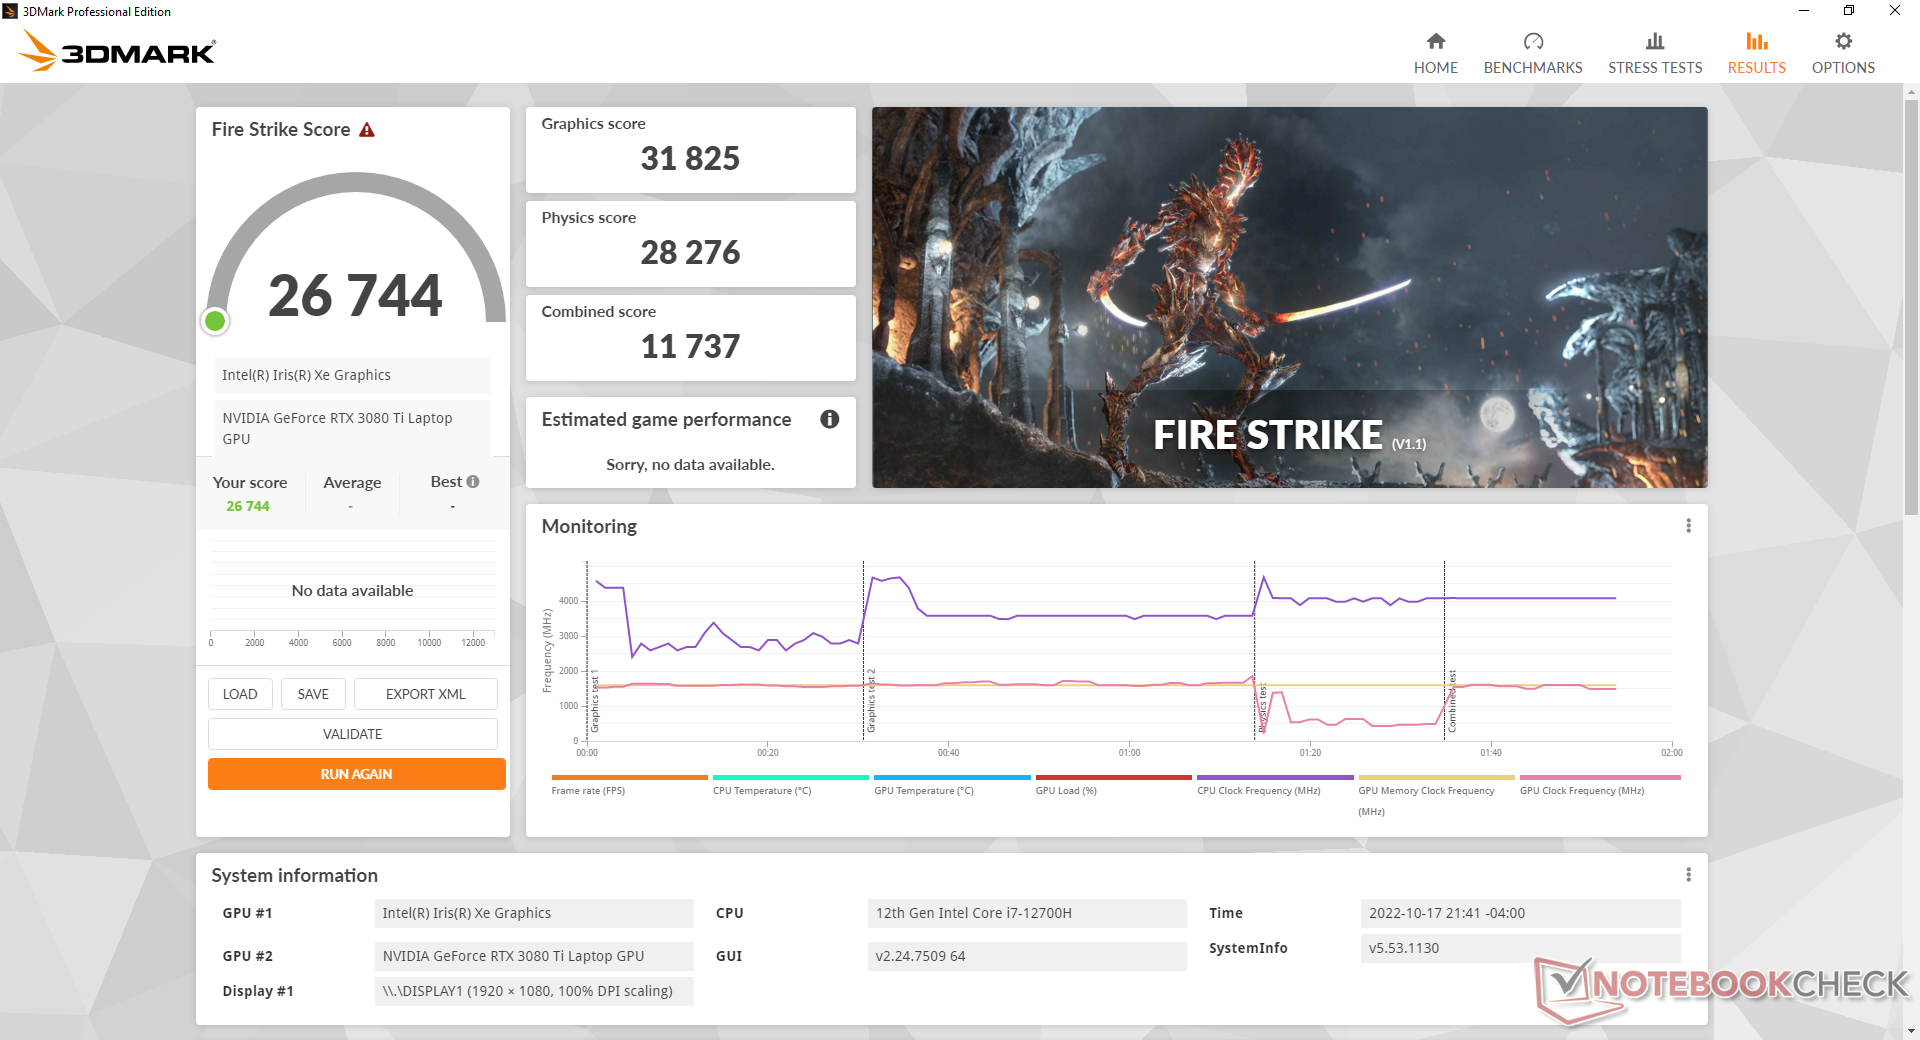
| 3DMark Fire Strike Score | 26744 points | |
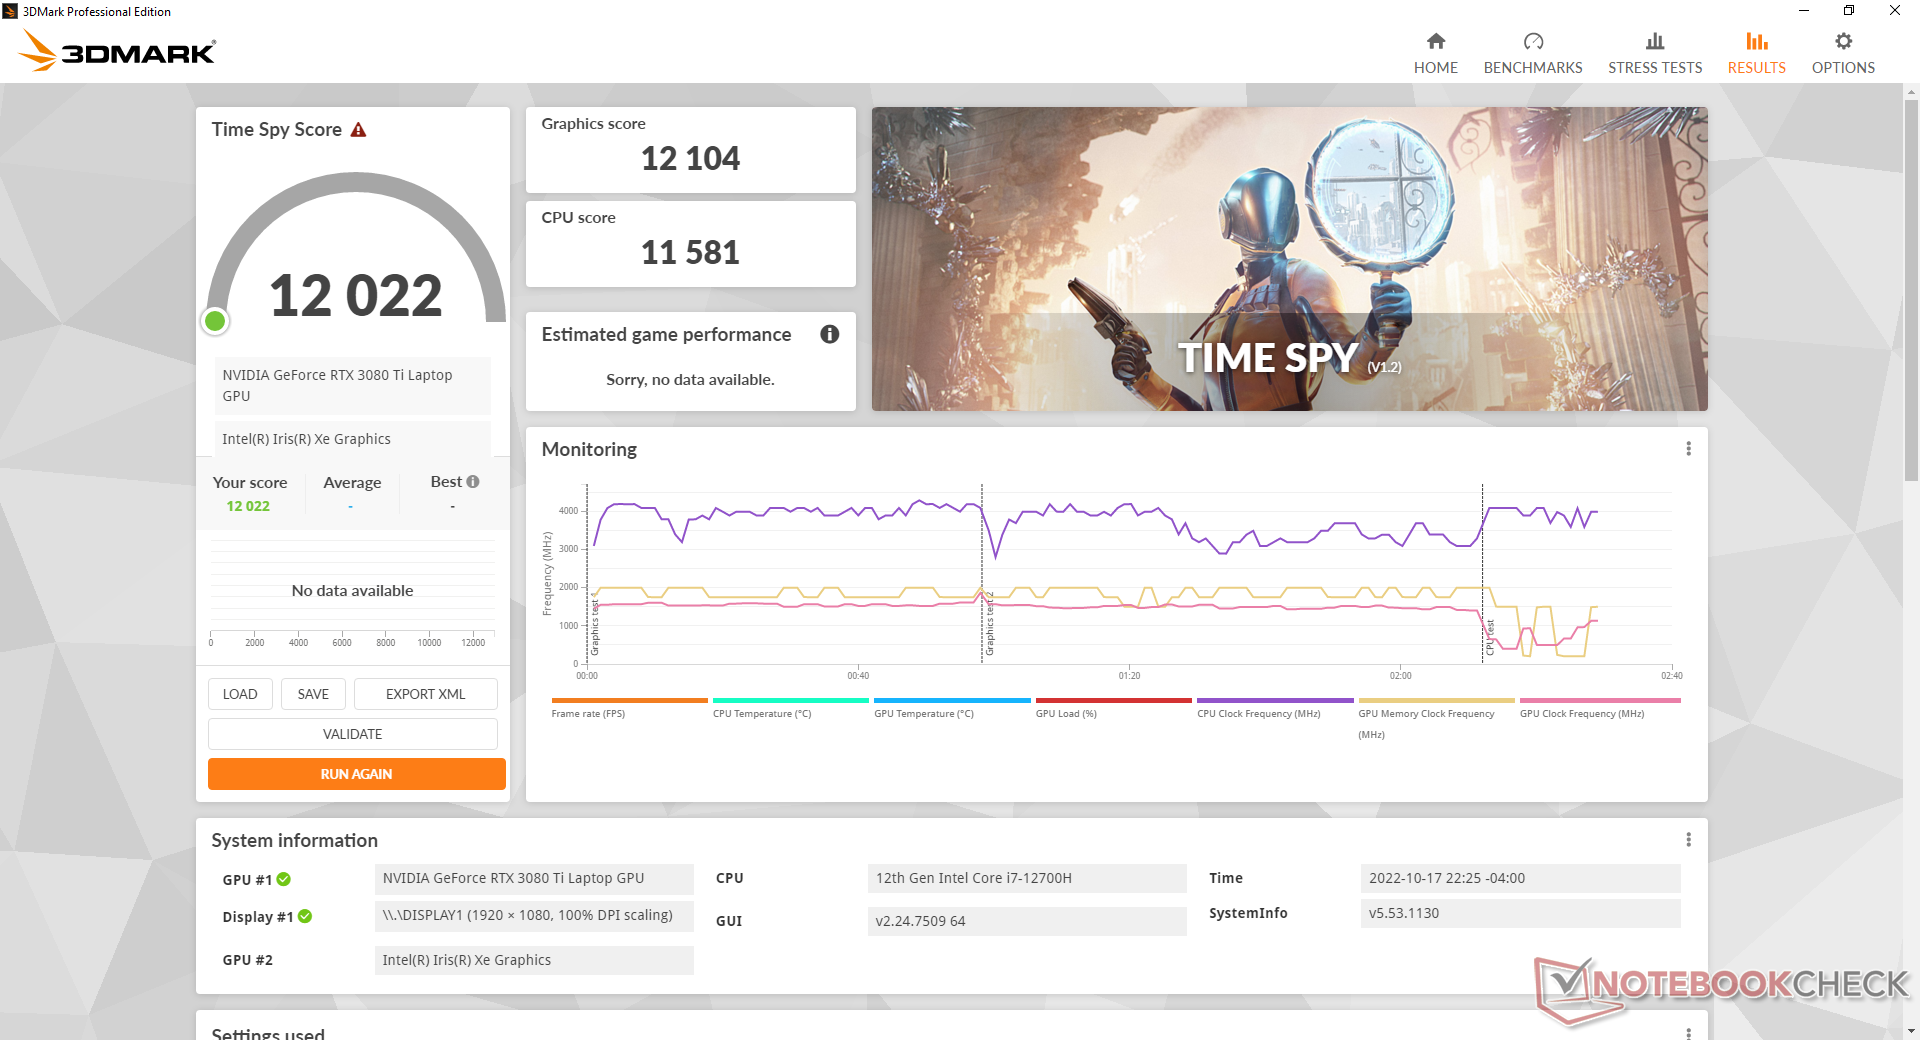
| 3DMark Time Spy Score | 12022 points | |
Help | ||
* ... smaller is better
Witcher 3 FPS Chart
| low | med. | high | ultra | |
|---|---|---|---|---|
| GTA V (2015) | 186.2 | 181.3 | 169.5 | 107.4 |
| The Witcher 3 (2015) | 391.9 | 313.9 | 212.5 | 109.4 |
| Dota 2 Reborn (2015) | 176.1 | 157.9 | 148.6 | 140.8 |
| Final Fantasy XV Benchmark (2018) | 200 | 147.4 | 115.1 | |
| X-Plane 11.11 (2018) | 124.3 | 106.6 | 96.4 | |
| Strange Brigade (2018) | 416 | 273 | 226 | 199.8 |
| Cyberpunk 2077 1.6 (2022) | 135.4 | 123.2 | 96.2 | 80 |
排放
系统噪音
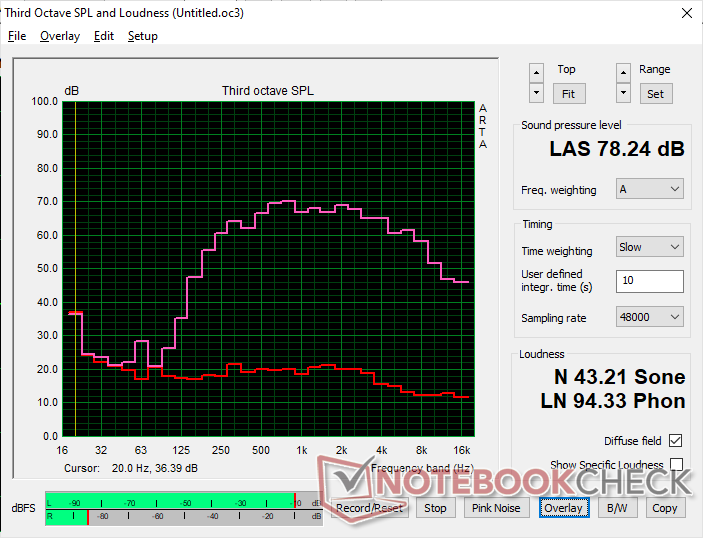
这台机器几乎总是有一些风扇噪音。如果在桌面上空转,风扇往往会空转,但即使是最轻微的负载,如网页浏览,也会引起30 dB(A)的风扇噪音,而安静的背景为23 dB(A)。当运行要求更高的负载如3DMark 06或游戏时,即使设置为平衡电源配置文件,风扇噪音也会迅速达到最大的56 dB(A)。这是一台不怕吵闹的游戏笔记本,无论电源配置文件设置如何。
大多数其他17英寸游戏笔记本在类似条件下也达到了50dB(A)或更大的噪音范围,因此这个问题并不是Eurocom独有的。尽管如此,Eurocom的机器往往会突然变得更吵,而且速度更快。
Noise level
| Idle |
| 23.3 / 30.7 / 30.7 dB(A) |
| Load |
| 56.2 / 55.9 dB(A) |
 | ||
30 dB silent 40 dB(A) audible 50 dB(A) loud |
||
min: | ||
| Eurocom Nightsky TXi317 GeForce RTX 3080 Ti Laptop GPU, i7-12700H, Samsung SSD 980 Pro 1TB MZ-V8P1T0BW | Schenker XMG Pro 17 E22 GeForce RTX 3080 Ti Laptop GPU, i9-12900H, Samsung SSD 980 Pro 1TB MZ-V8P1T0BW | Aorus 17X XES GeForce RTX 3070 Ti Laptop GPU, i9-12900HX, Gigabyte AG470S1TB-SI B10 | MSI Raider GE77 HX 12UHS GeForce RTX 3080 Ti Laptop GPU, i9-12900HX, Samsung PM9A1 MZVL22T0HBLB | Razer Blade 17 Early 2022 GeForce RTX 3080 Ti Laptop GPU, i9-12900H, Samsung PM9A1 MZVL21T0HCLR | Alienware x17 R2 P48E GeForce RTX 3080 Ti Laptop GPU, i9-12900HK, 2x Samsung PM9A1 1TB (RAID 0) | |
|---|---|---|---|---|---|---|
| Noise | -12% | -7% | -11% | 2% | 16% | |
| off / environment * (dB) | 23.3 | 26 -12% | 26 -12% | 26 -12% | 26 -12% | 22.7 3% |
| Idle Minimum * (dB) | 23.3 | 26 -12% | 28 -20% | 26 -12% | 26 -12% | 23.1 1% |
| Idle Average * (dB) | 30.7 | 34 -11% | 32 -4% | 34 -11% | 27 12% | 23.1 25% |
| Idle Maximum * (dB) | 30.7 | 42 -37% | 38 -24% | 46 -50% | 32 -4% | 23.1 25% |
| Load Average * (dB) | 56.2 | 58 -3% | 53 6% | 50 11% | 50 11% | 31.9 43% |
| Witcher 3 ultra * (dB) | 56.1 | 57 -2% | 54 4% | 55 2% | 51 9% | 52.5 6% |
| Load Maximum * (dB) | 55.9 | 58 -4% | 55 2% | 57 -2% | 51 9% | 52.5 6% |
* ... smaller is better
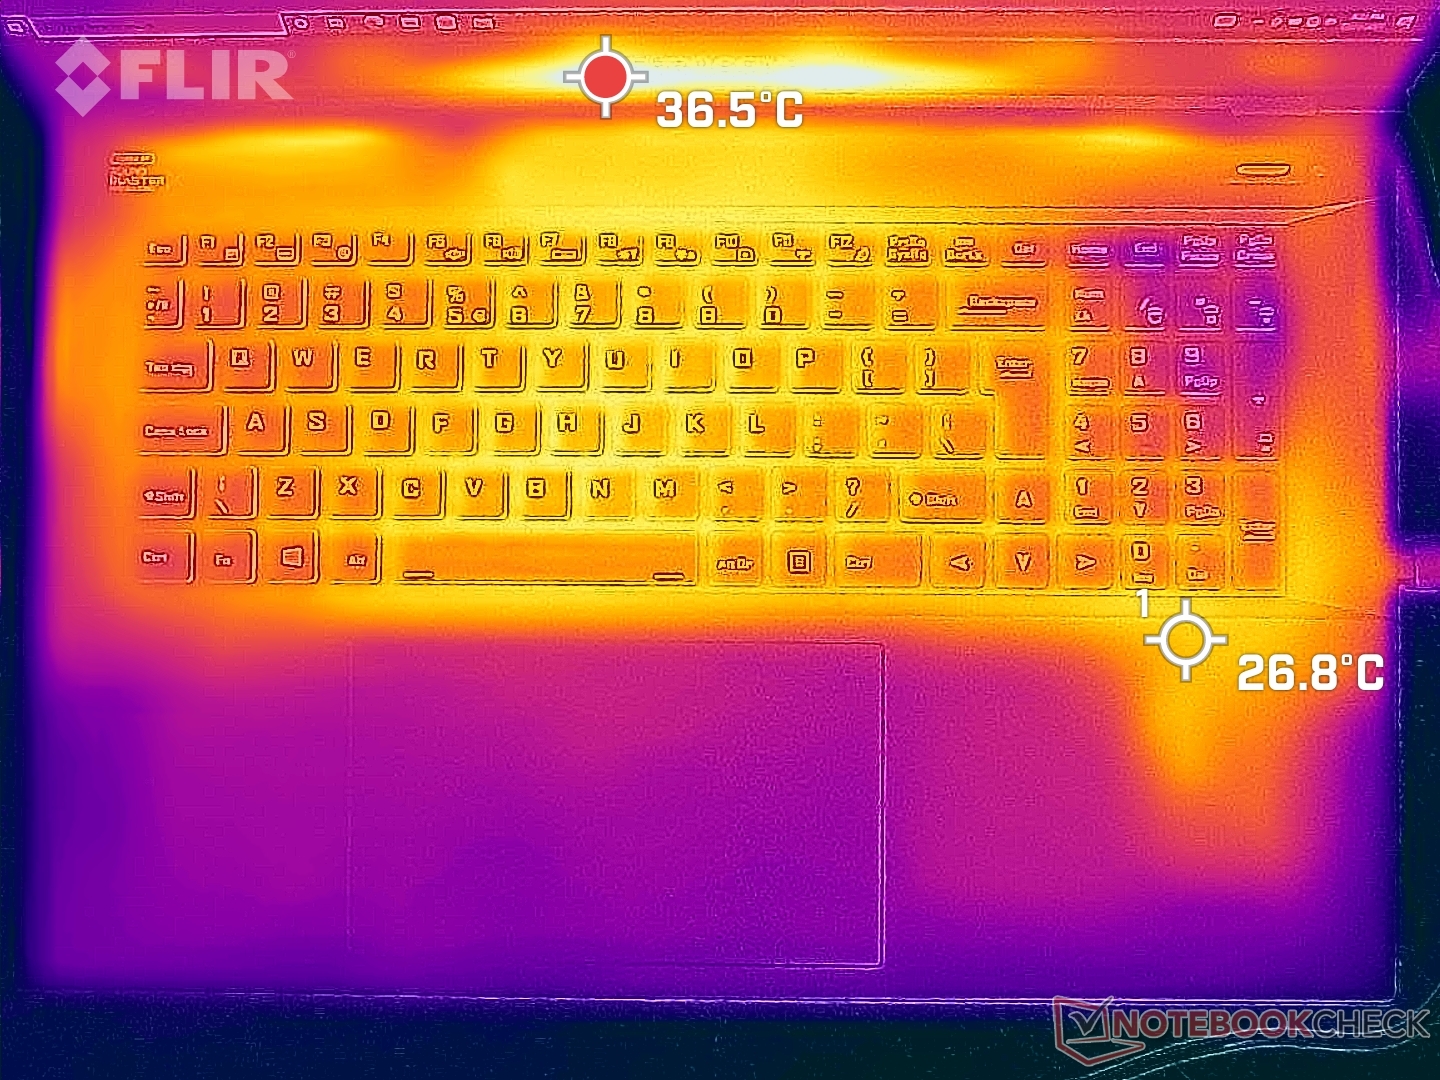
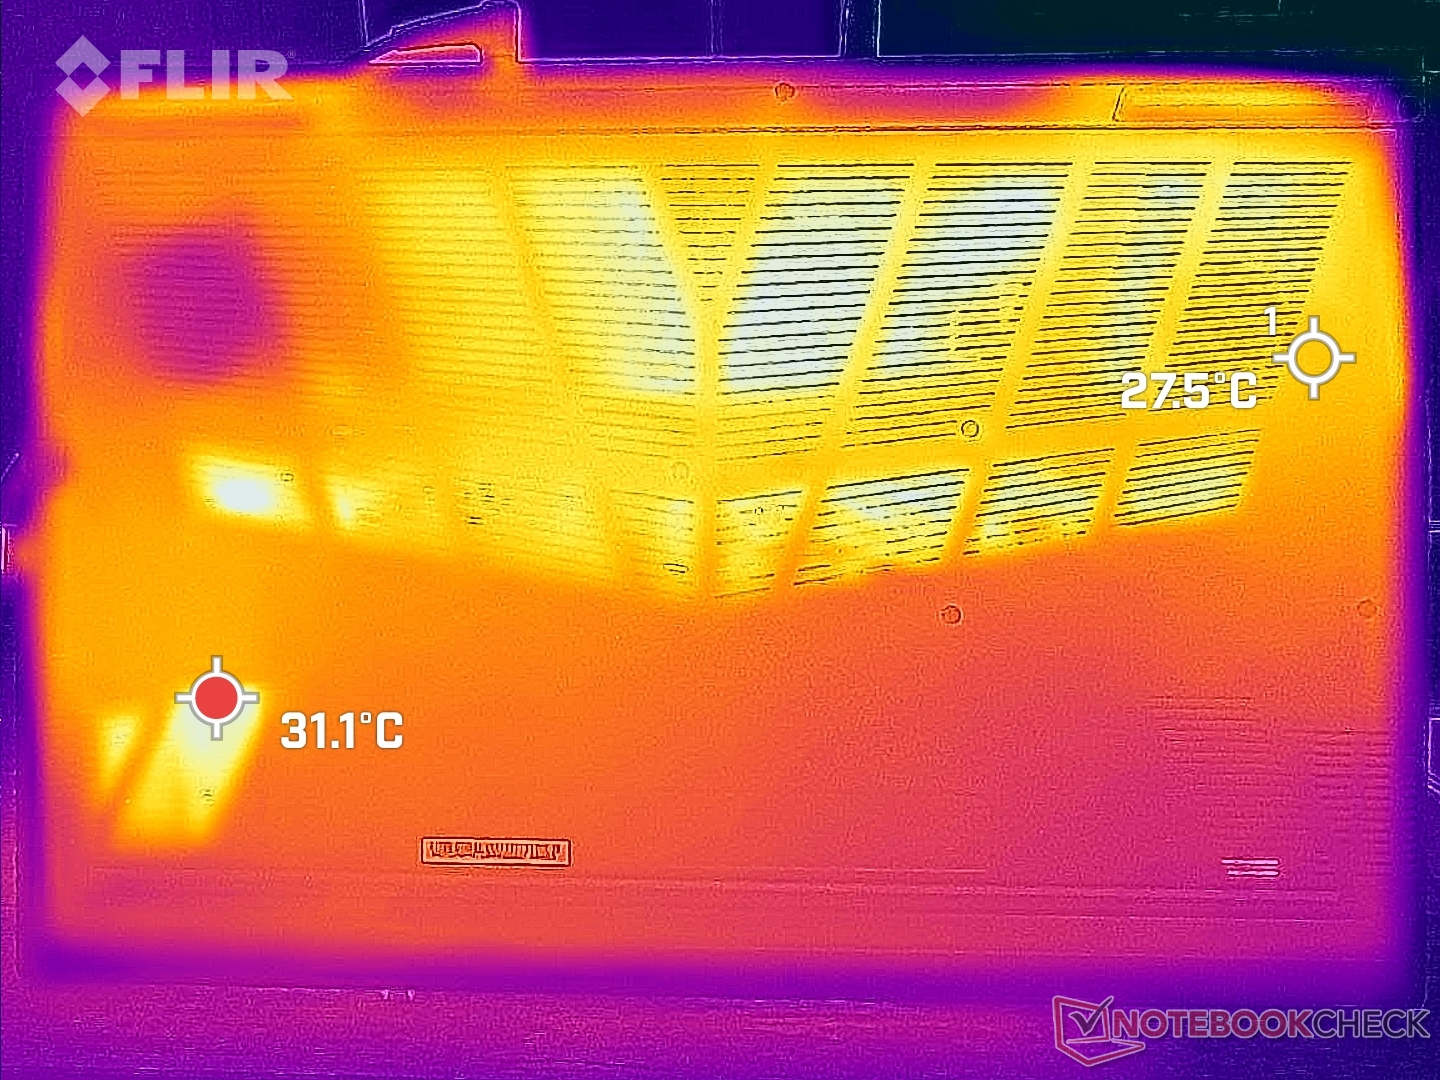
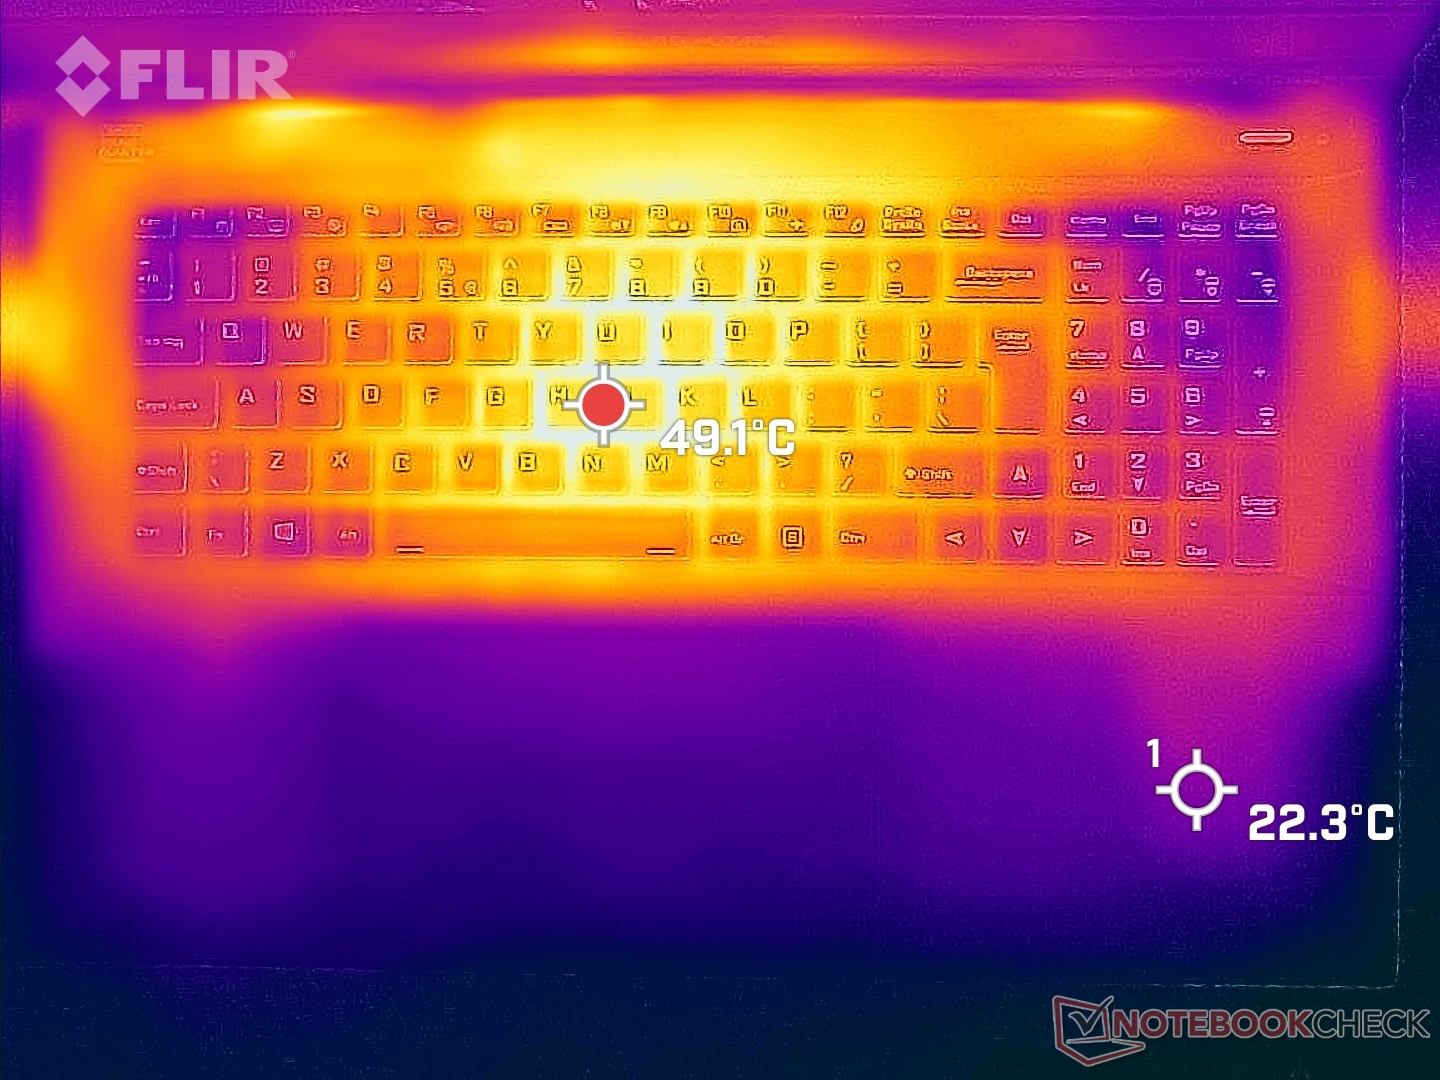
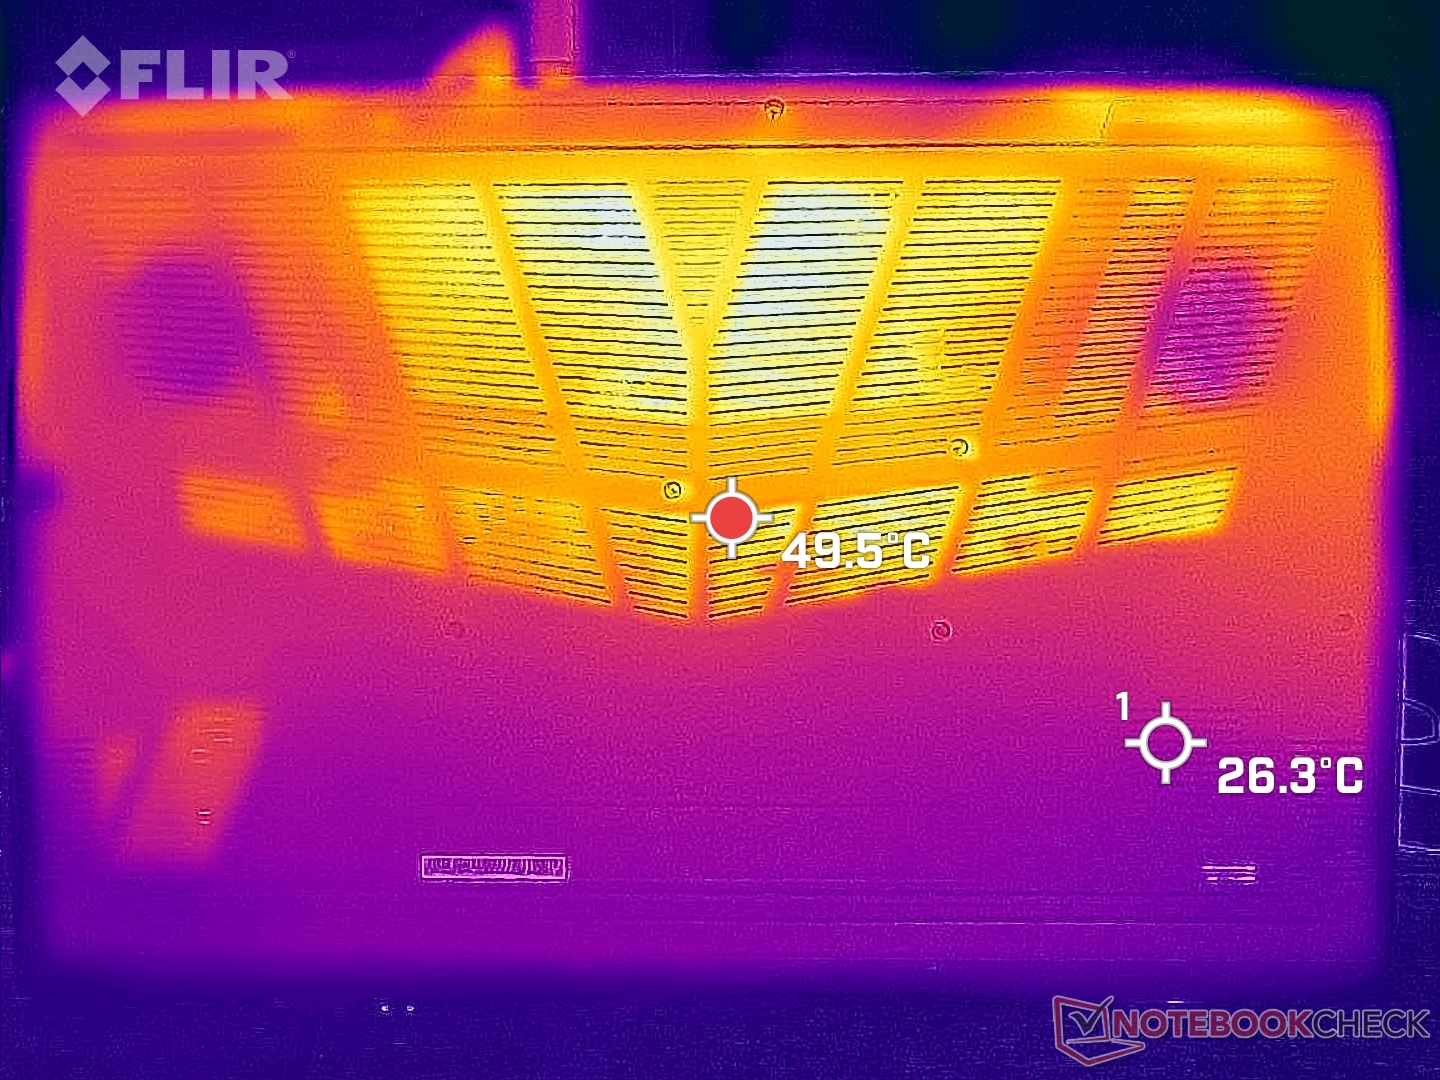
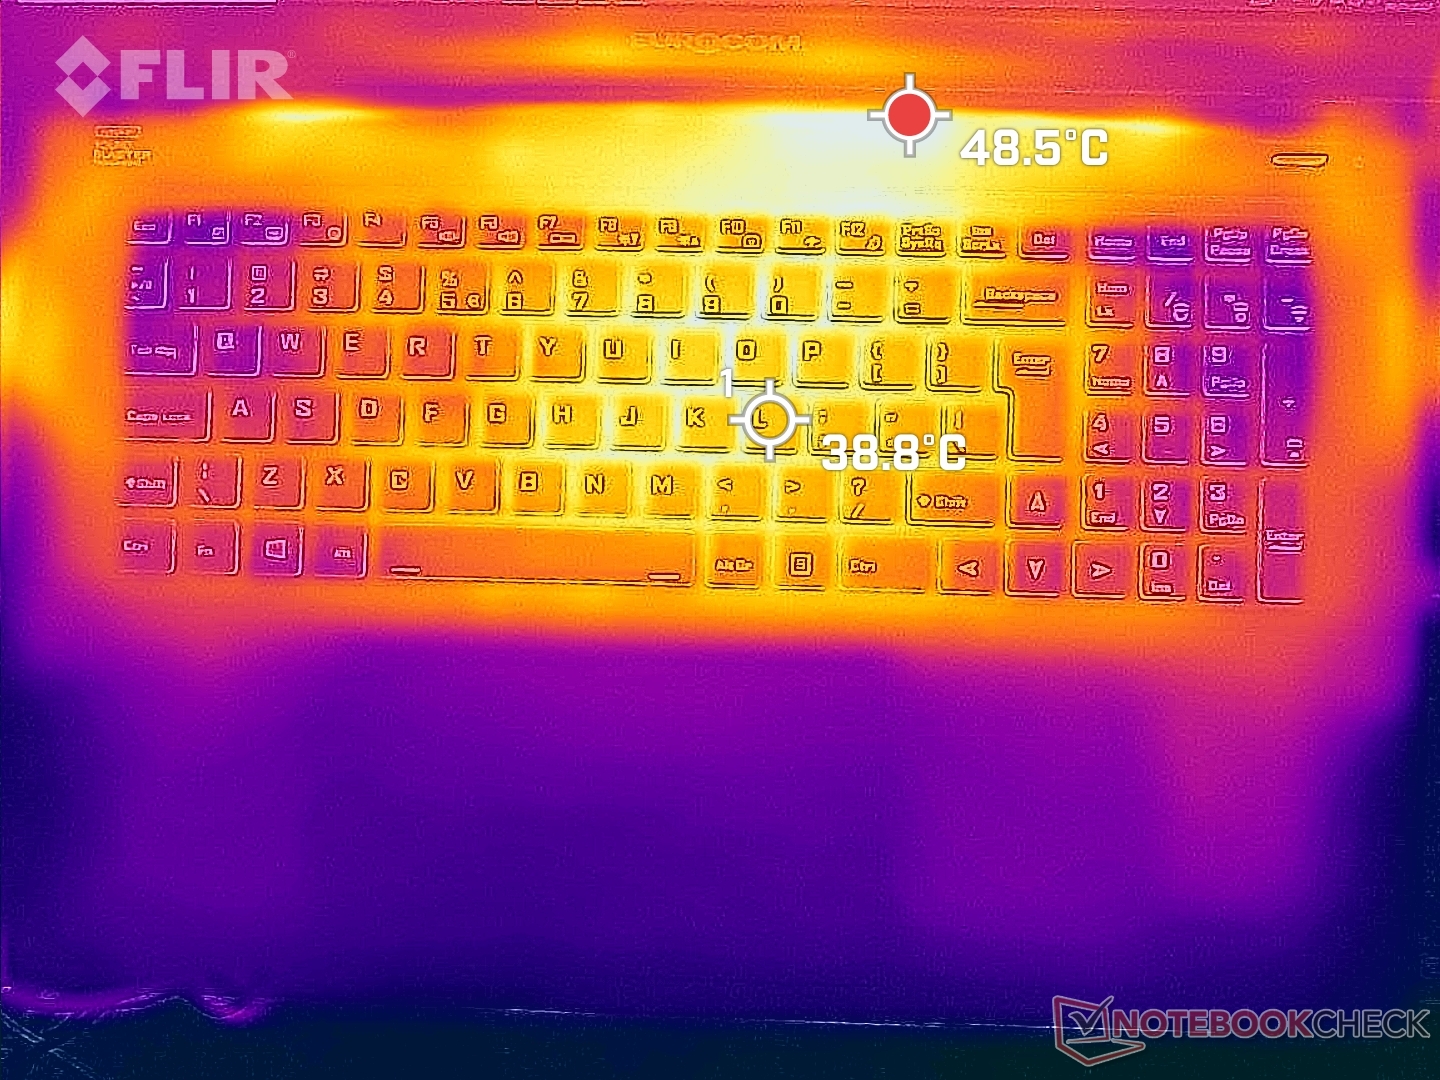
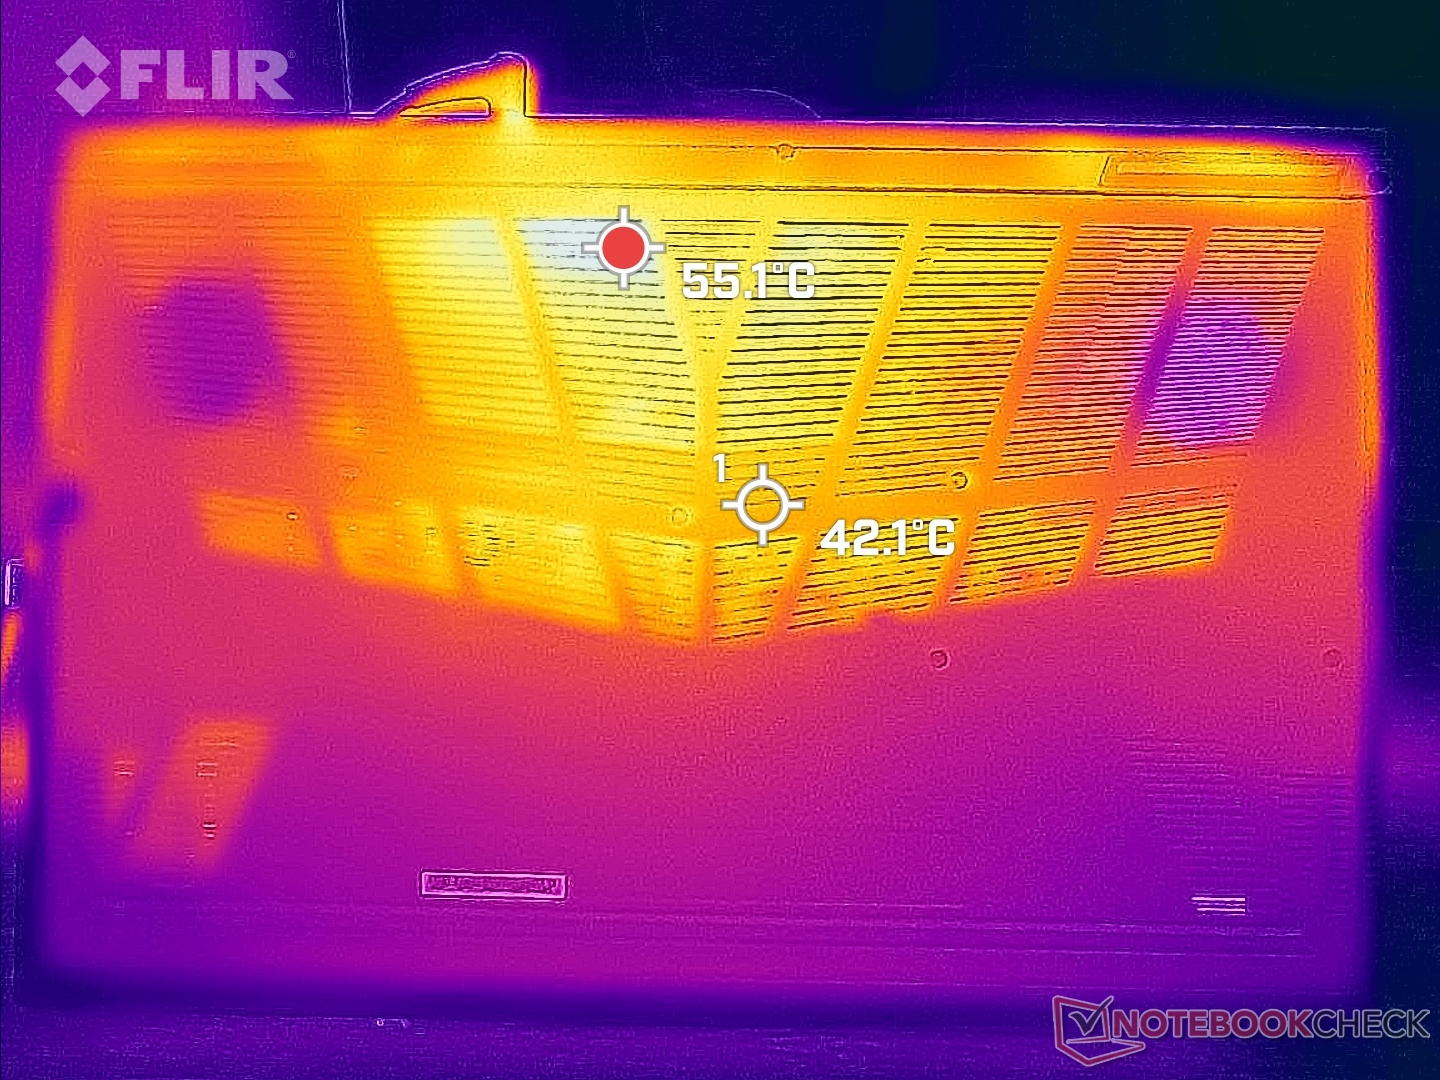
温度
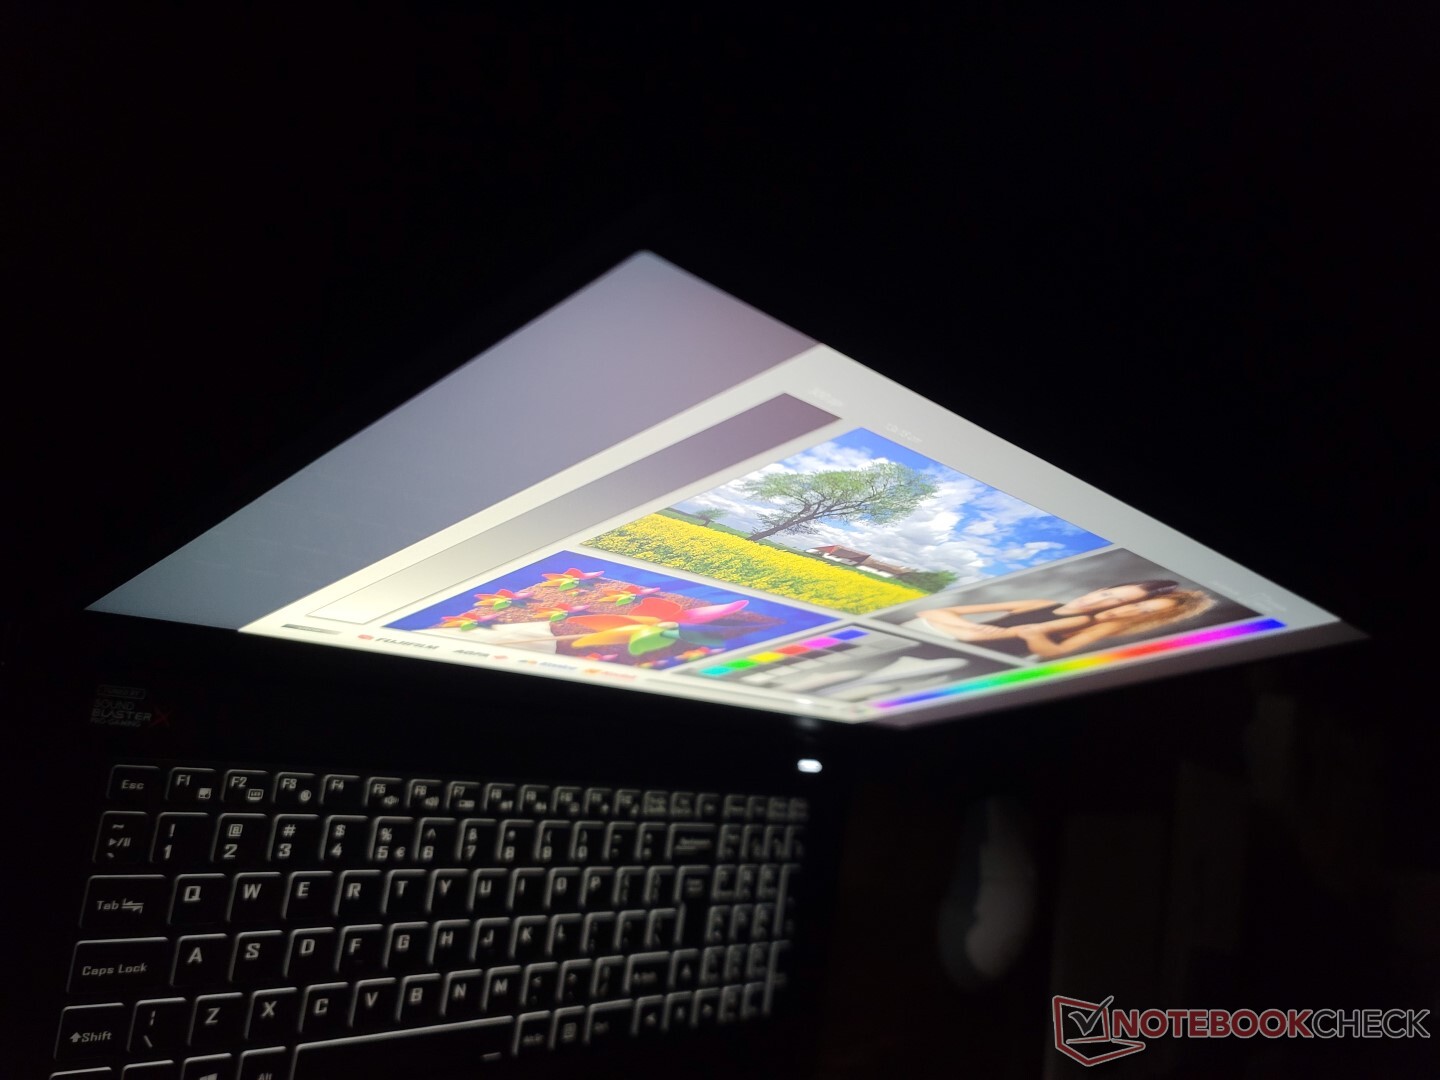
键盘中心的表面温度最高,而掌托的温度要低得多,可以使游戏更加舒适。更薄的笔记本电脑,如 Razer Blade 17等较薄的笔记本电脑,其掌托温度明显较高,对手部来说比较不舒服。
请注意,Nightsky TXi317的右掌托总是比左掌托要热一点,因为M.2固态硬盘位于右掌托下面。
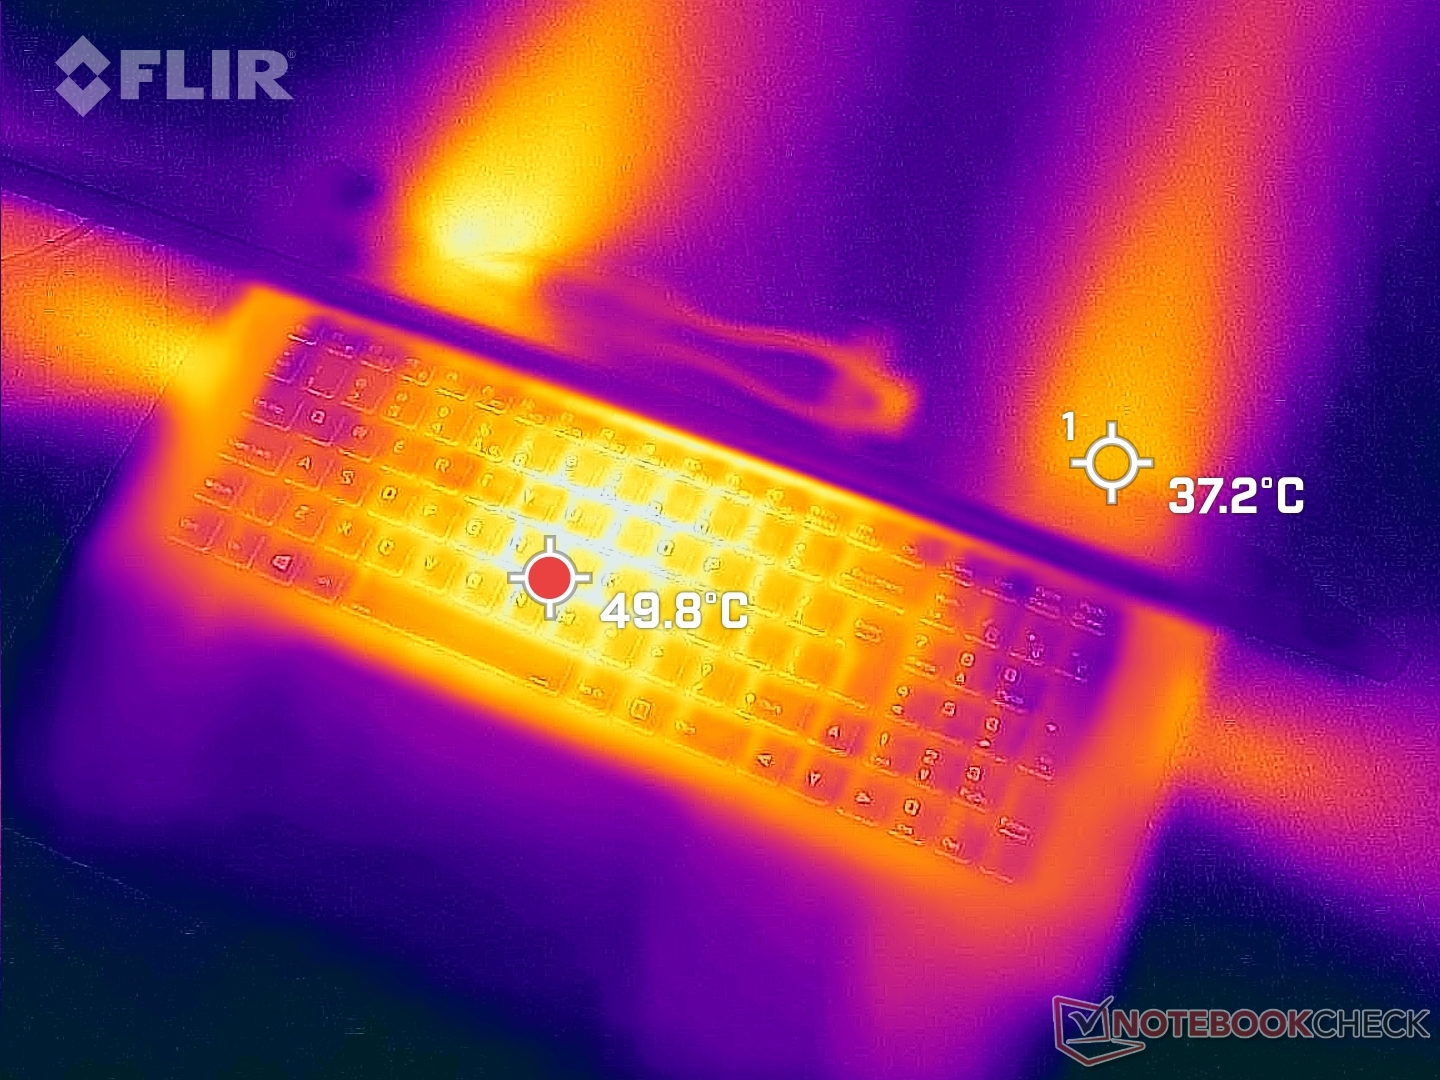
(-) The maximum temperature on the upper side is 50.4 °C / 123 F, compared to the average of 40.4 °C / 105 F, ranging from 21.2 to 68.8 °C for the class Gaming.
(-) The bottom heats up to a maximum of 47.6 °C / 118 F, compared to the average of 43.2 °C / 110 F
(+) In idle usage, the average temperature for the upper side is 29.4 °C / 85 F, compared to the device average of 33.9 °C / 93 F.
(-) Playing The Witcher 3, the average temperature for the upper side is 39.2 °C / 103 F, compared to the device average of 33.9 °C / 93 F.
(+) The palmrests and touchpad are cooler than skin temperature with a maximum of 31.2 °C / 88.2 F and are therefore cool to the touch.
(-) The average temperature of the palmrest area of similar devices was 28.8 °C / 83.8 F (-2.4 °C / -4.4 F).
| Eurocom Nightsky TXi317 Intel Core i7-12700H, NVIDIA GeForce RTX 3080 Ti Laptop GPU | Schenker XMG Pro 17 E22 Intel Core i9-12900H, NVIDIA GeForce RTX 3080 Ti Laptop GPU | Aorus 17X XES Intel Core i9-12900HX, NVIDIA GeForce RTX 3070 Ti Laptop GPU | MSI Raider GE77 HX 12UHS Intel Core i9-12900HX, NVIDIA GeForce RTX 3080 Ti Laptop GPU | Razer Blade 17 Early 2022 Intel Core i9-12900H, NVIDIA GeForce RTX 3080 Ti Laptop GPU | Alienware x17 R2 P48E Intel Core i9-12900HK, NVIDIA GeForce RTX 3080 Ti Laptop GPU | |
|---|---|---|---|---|---|---|
| Heat | -12% | -15% | -19% | -10% | 7% | |
| Maximum Upper Side * (°C) | 50.4 | 56 -11% | 54 -7% | 53 -5% | 50 1% | 49.6 2% |
| Maximum Bottom * (°C) | 47.6 | 60 -26% | 58 -22% | 58 -22% | 56 -18% | 42.4 11% |
| Idle Upper Side * (°C) | 32.6 | 34 -4% | 37 -13% | 38 -17% | 36 -10% | 29.2 10% |
| Idle Bottom * (°C) | 33.2 | 36 -8% | 39 -17% | 43 -30% | 38 -14% | 32 4% |
* ... smaller is better
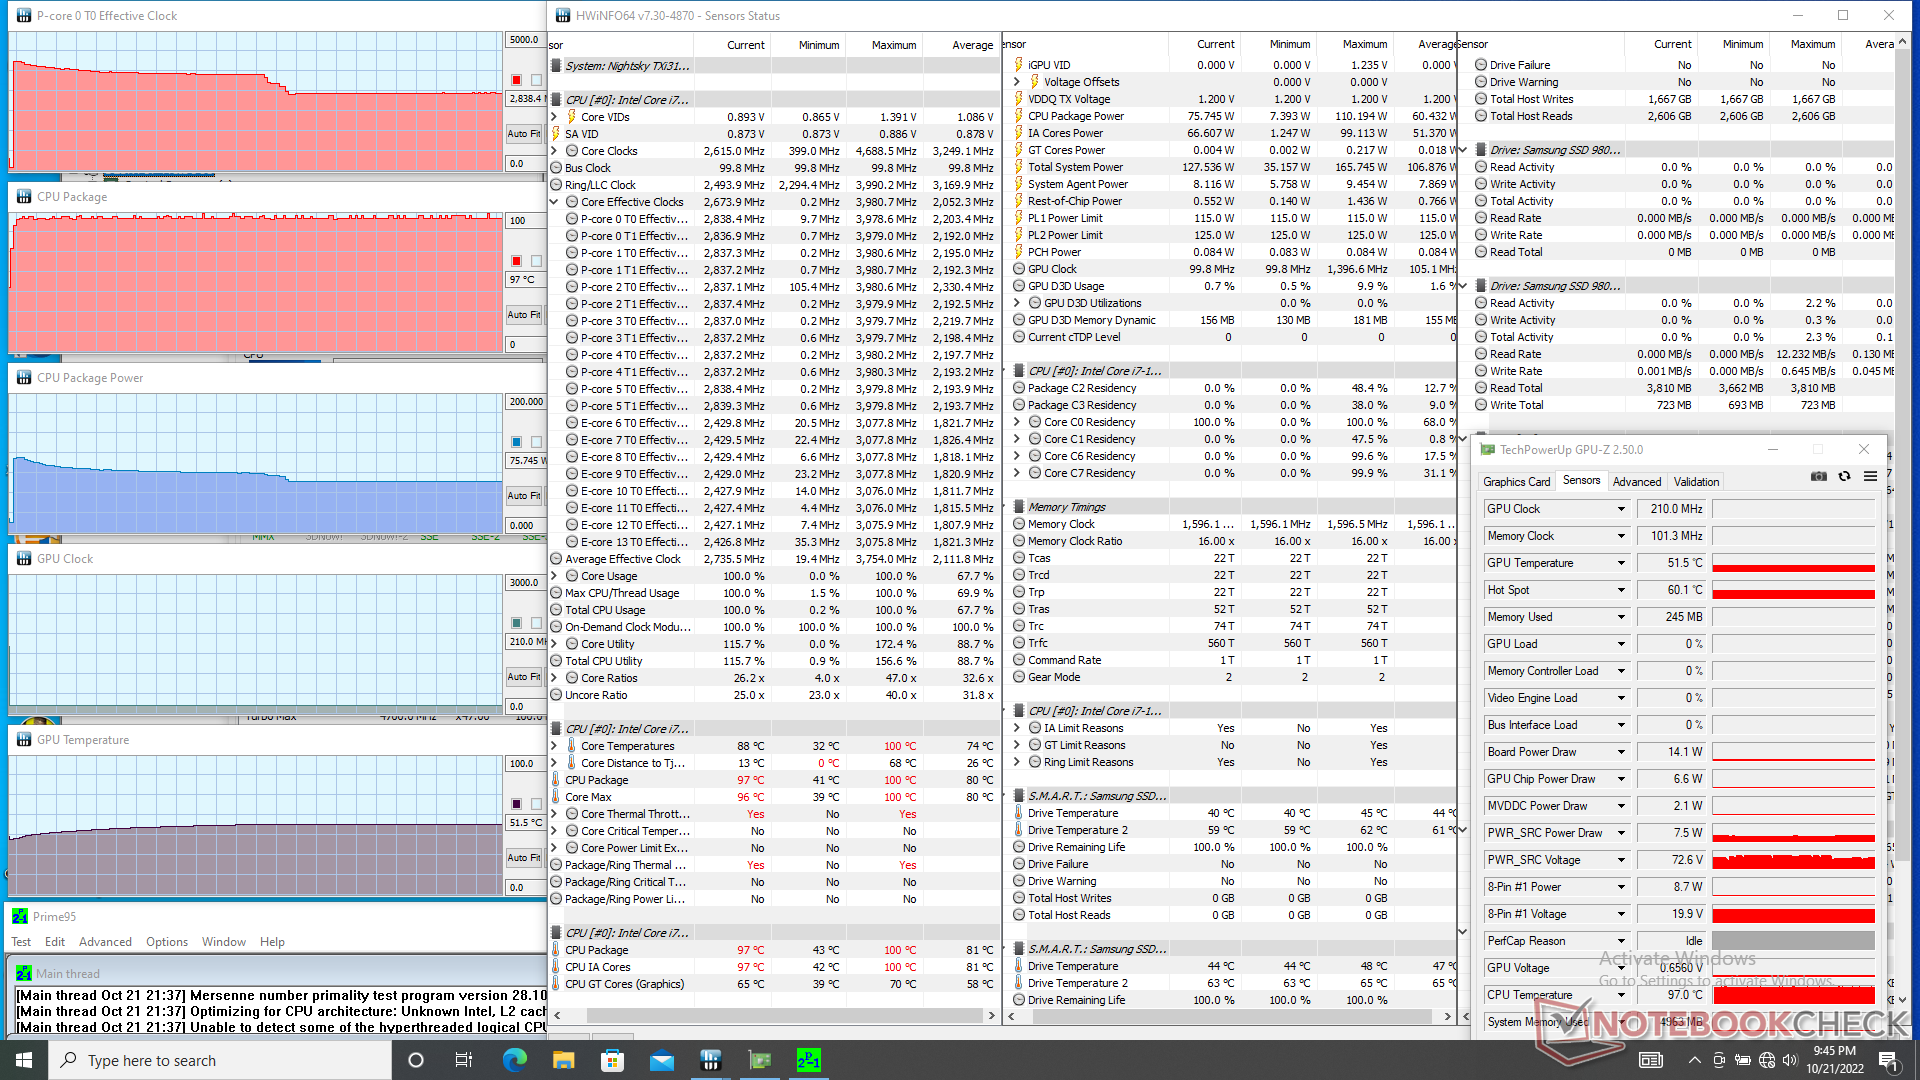
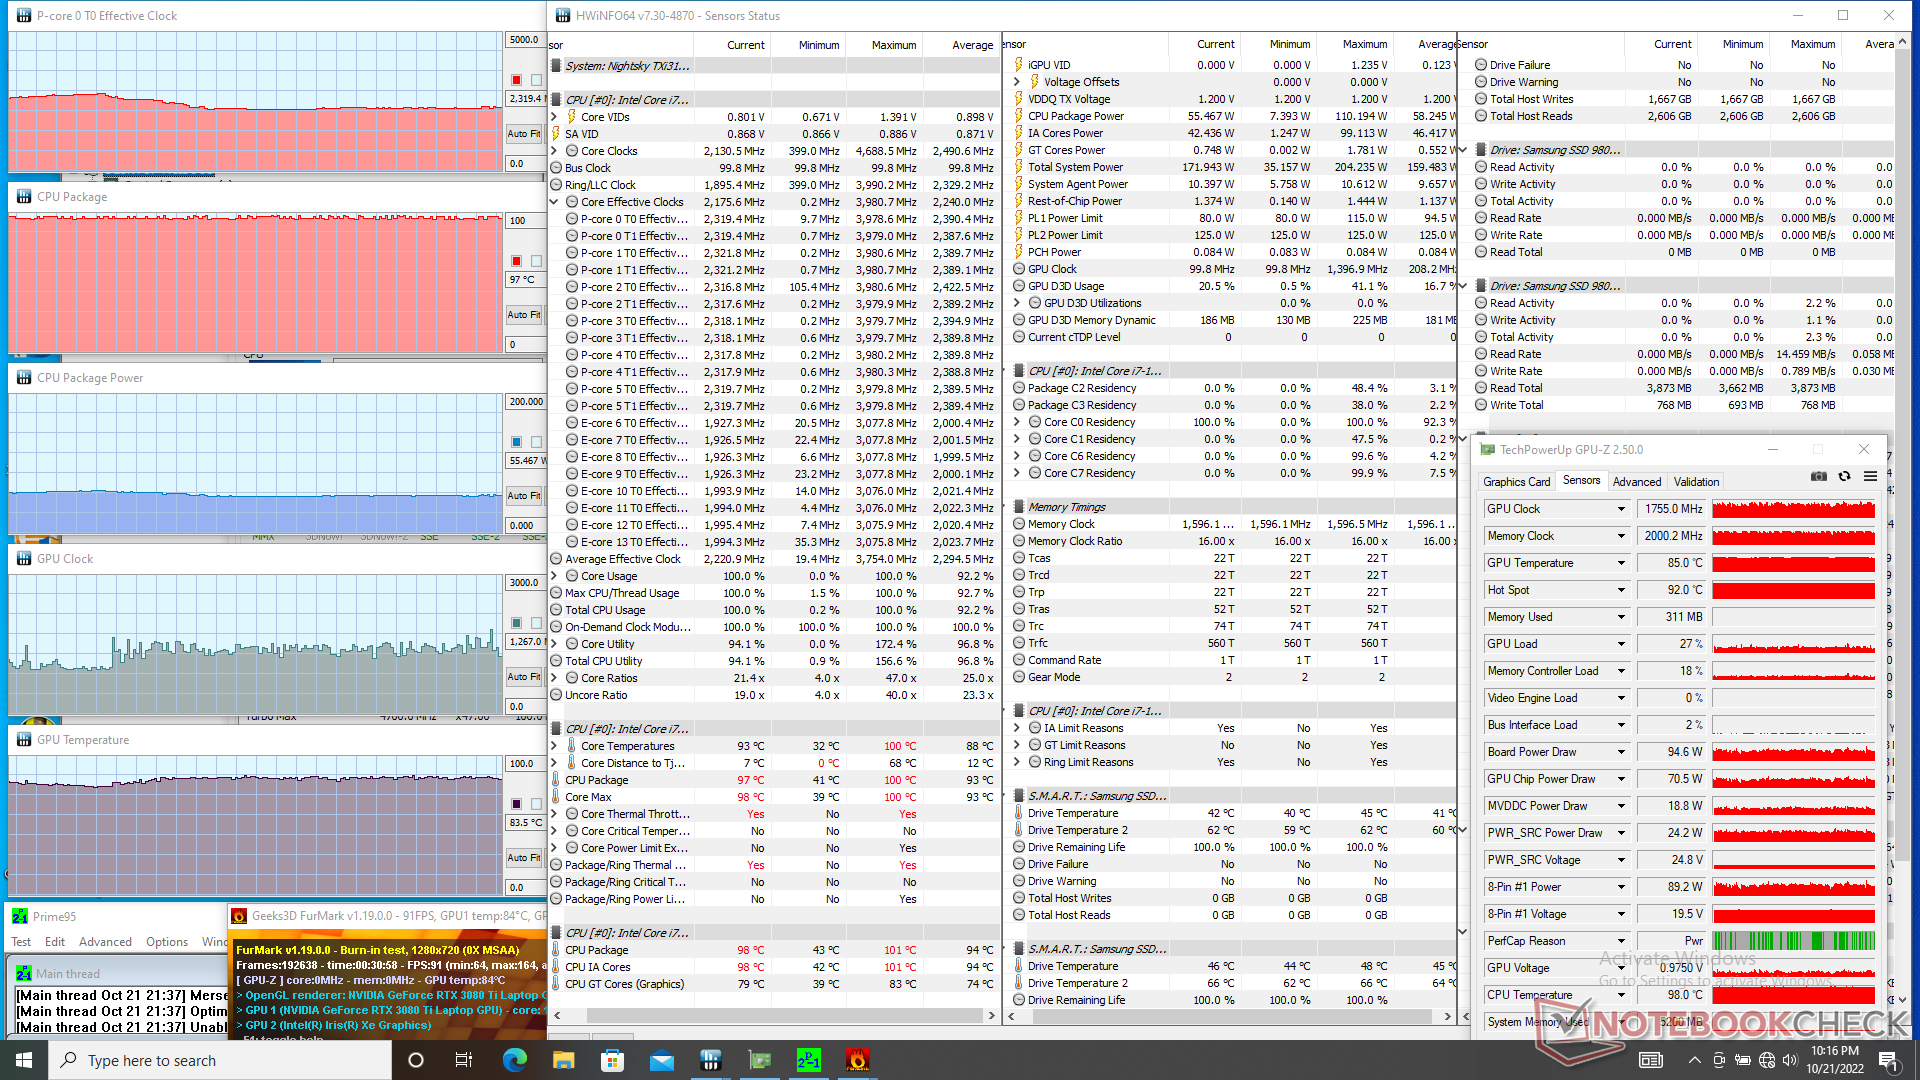
压力测试
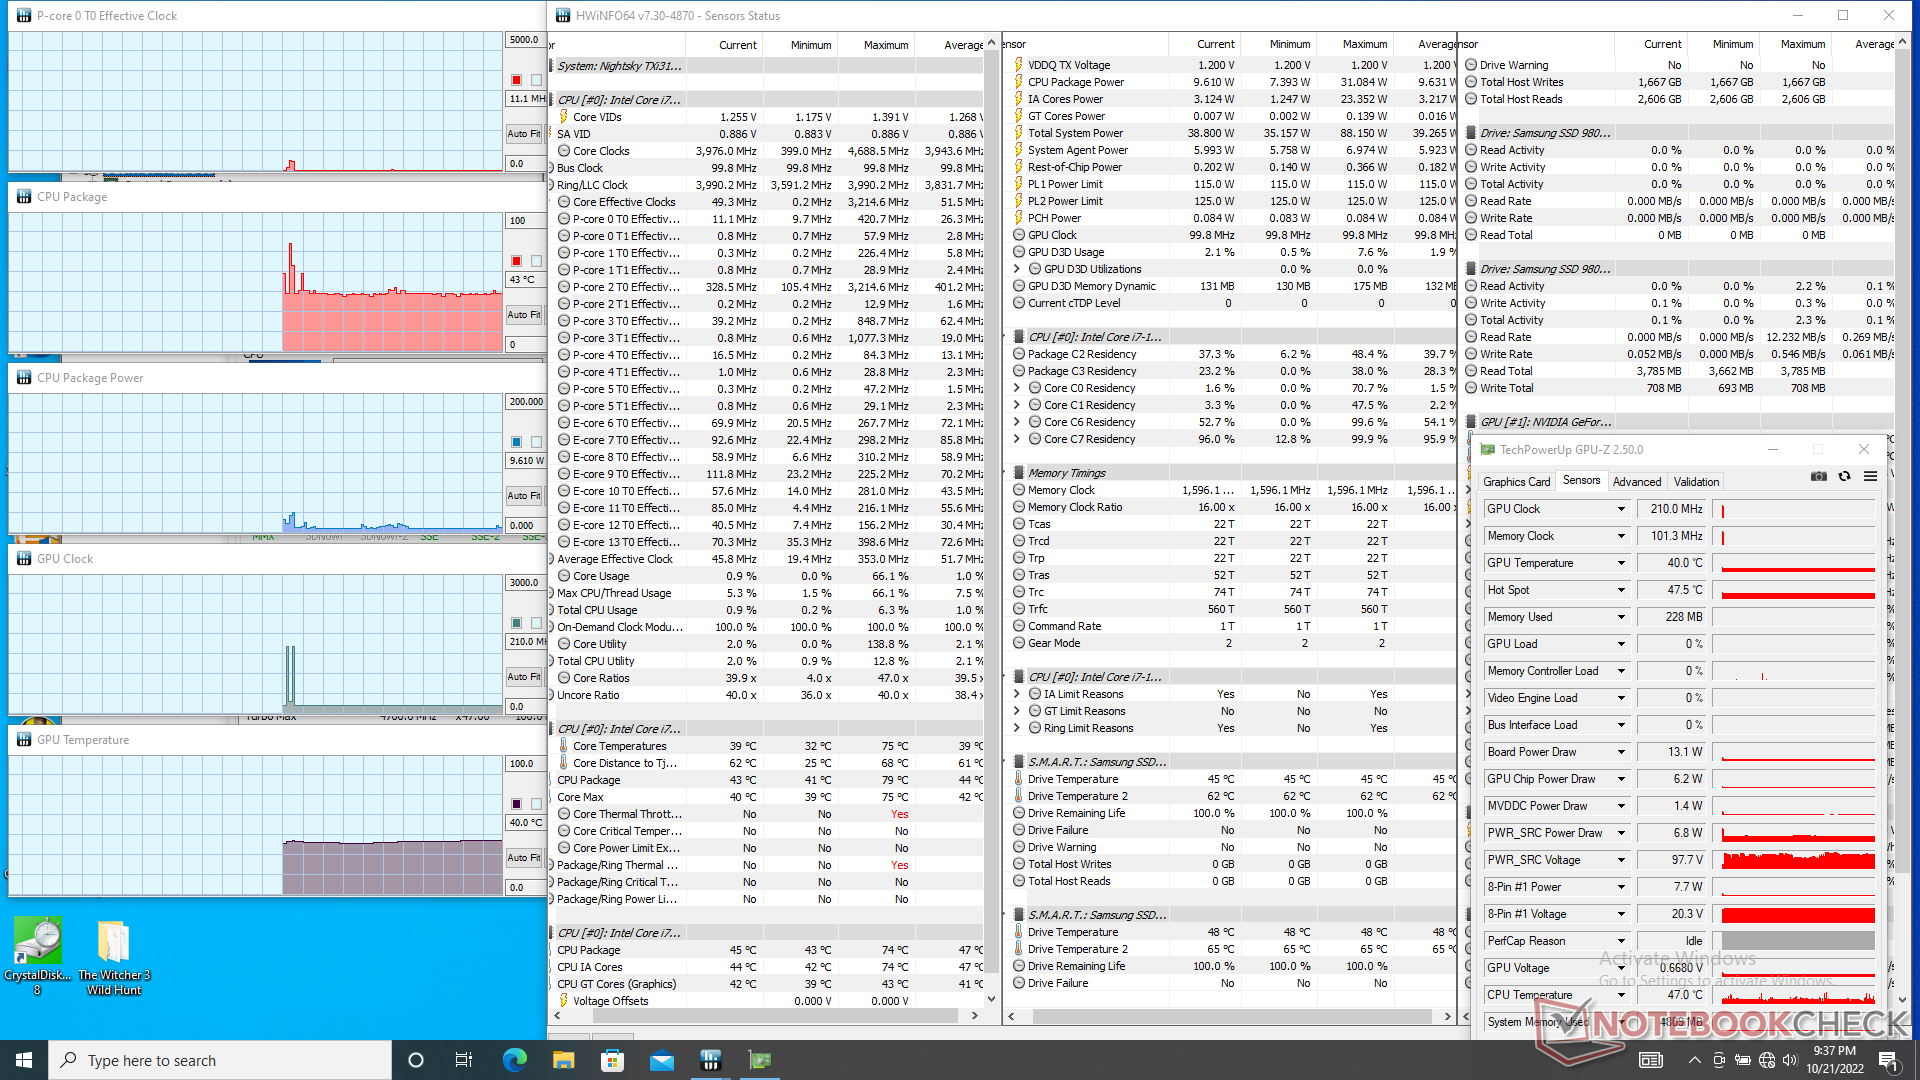
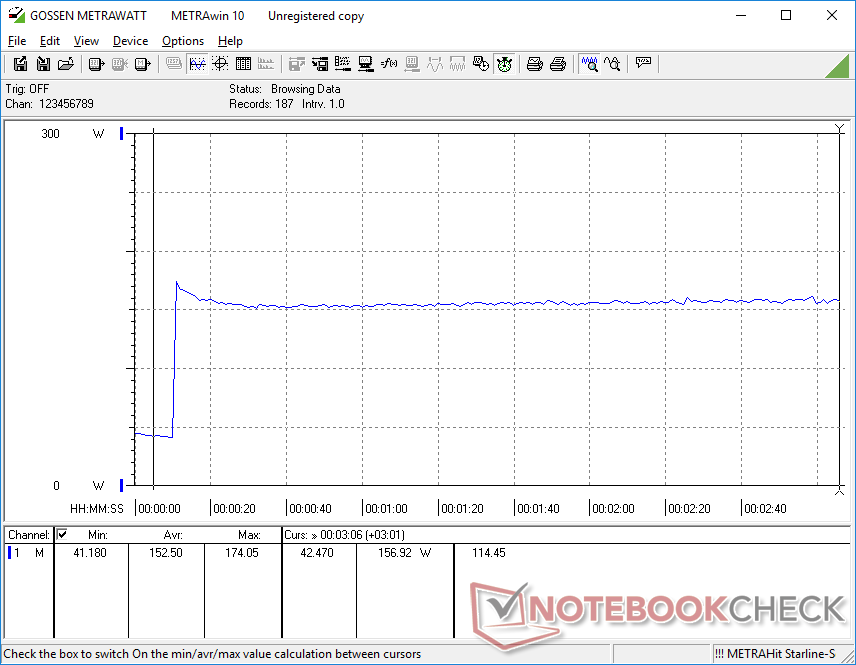
在启动Prime95压力时,CPU的时钟频率、温度和电路板的功耗将分别飙升到4GHz、97C和110W。然后,时钟频率和功耗将稳步下降,然后分别稳定在2.8 GHz和76 W,而核心温度没有变化。在戴尔G16 7620上重复这个相同的测试戴尔G16 7620用相同的处理器重复同样的测试,将导致稍快的稳定时钟频率约为3.3 GHz,但类似的核心温度几乎为100 C。
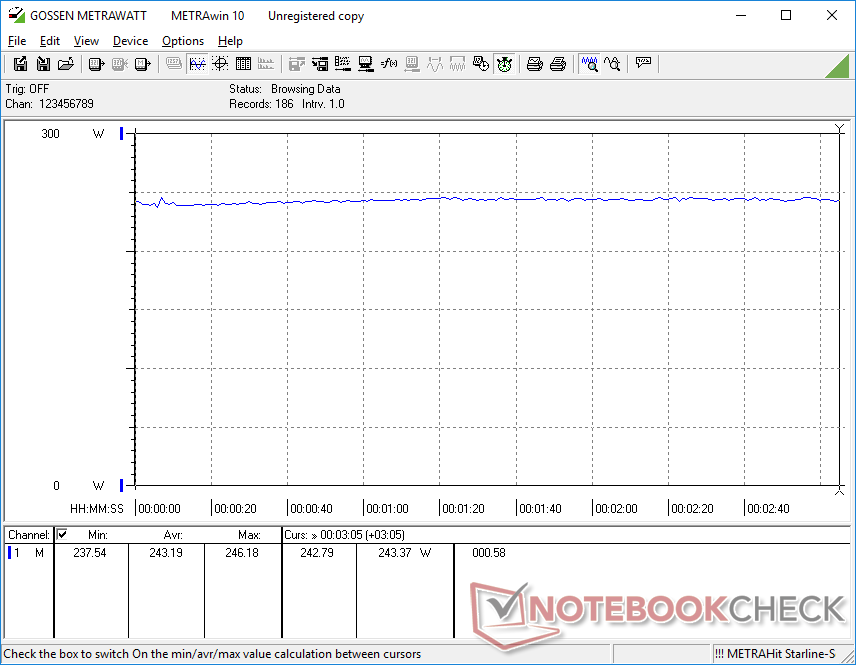
当运行时,GPU时钟速率、温度和板卡功耗将分别稳定在1432 MHz、87 C和121 W。 Witcher 3.在 "娱乐 "电源配置文件上重复这一测试将导致GPU性能略有下降:时钟速率和功耗将分别下降到1327 MHz和110 W,温度没有变化。不幸的是,我们无法接近声称的125 W至155 W的TGP目标。
运行 Witcher 3在 微星GS77与我们的Eurocom相比,使用相同的RTX 3080 Ti GPU将导致更慢的GPU时钟速率,更冷的核心温度,以及更低的电路板功耗,分别为1432 MHz、75 C和105 W。
如果用电池运行,性能是有限的。在电池供电的情况下,Fire Strike ,物理学和图形学的分数分别为12300和5071分,而在电源供电的情况下则为28276和31825分。
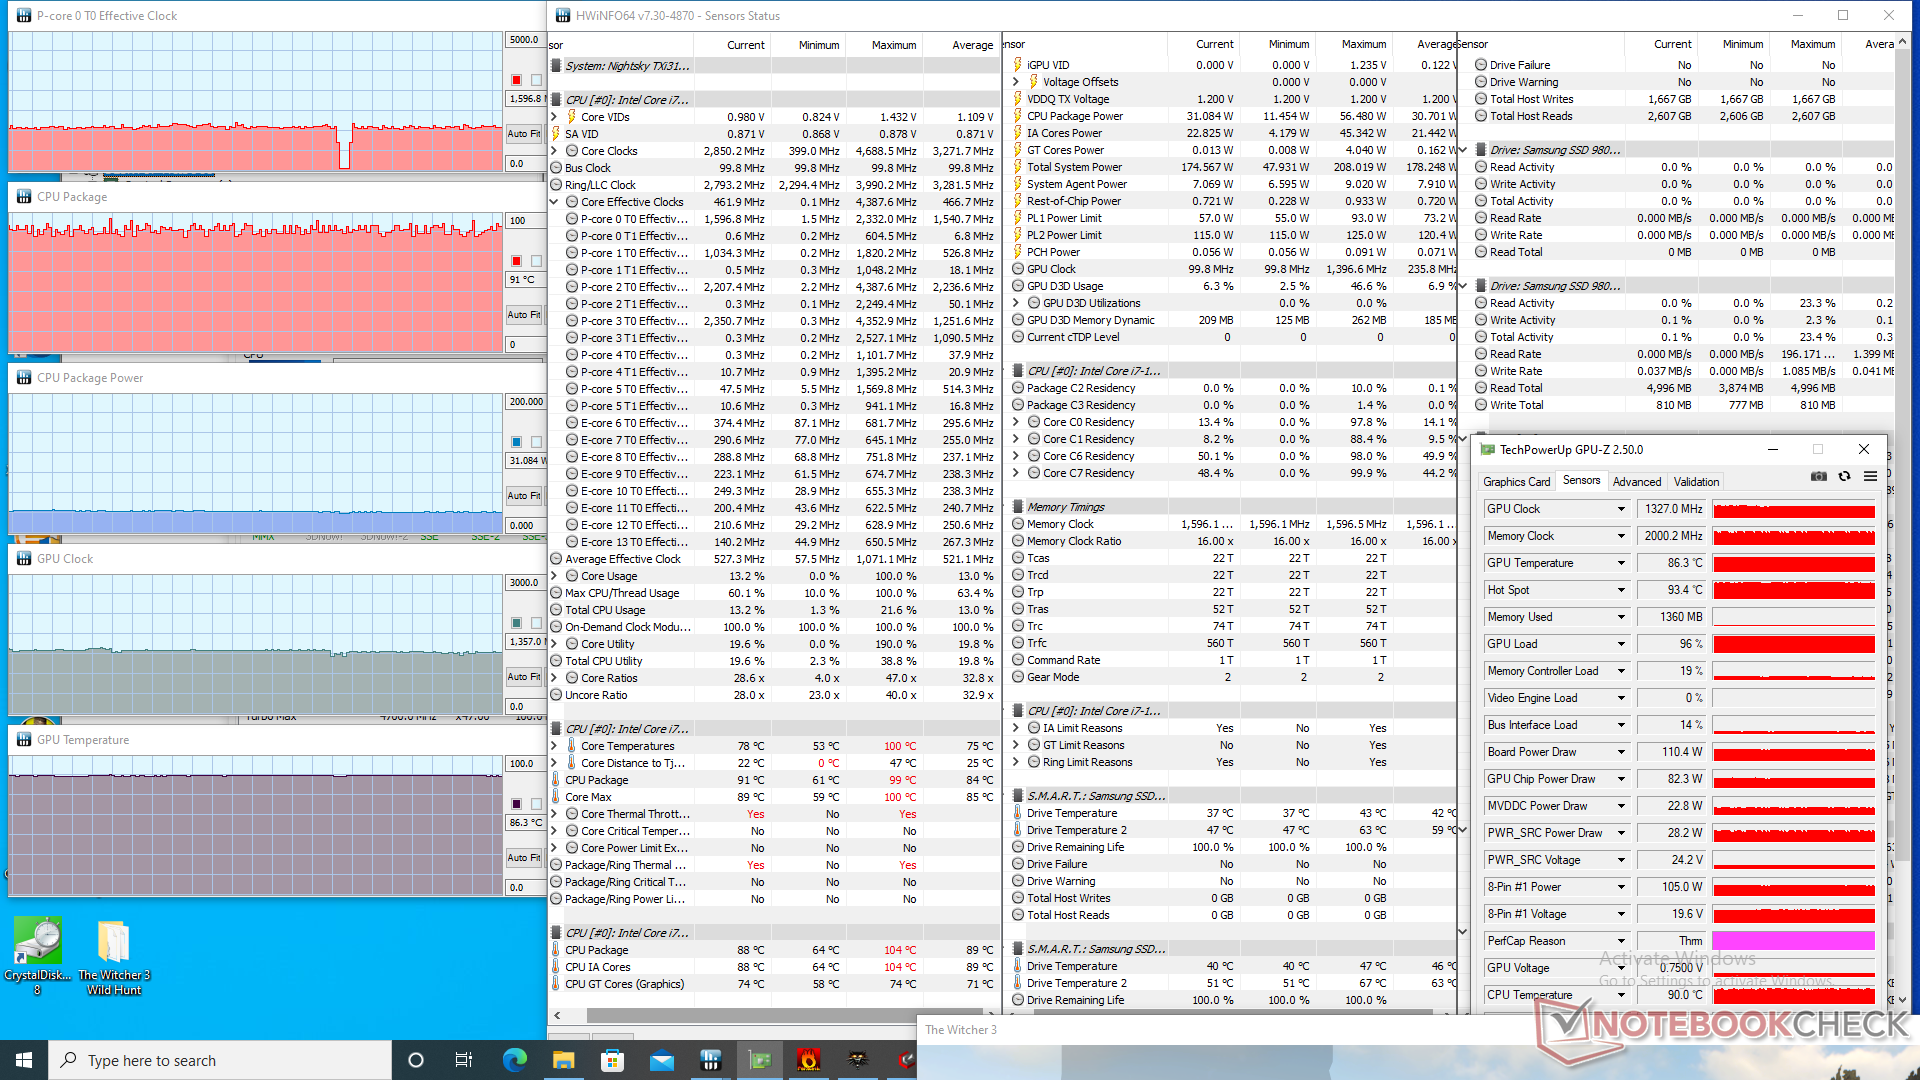
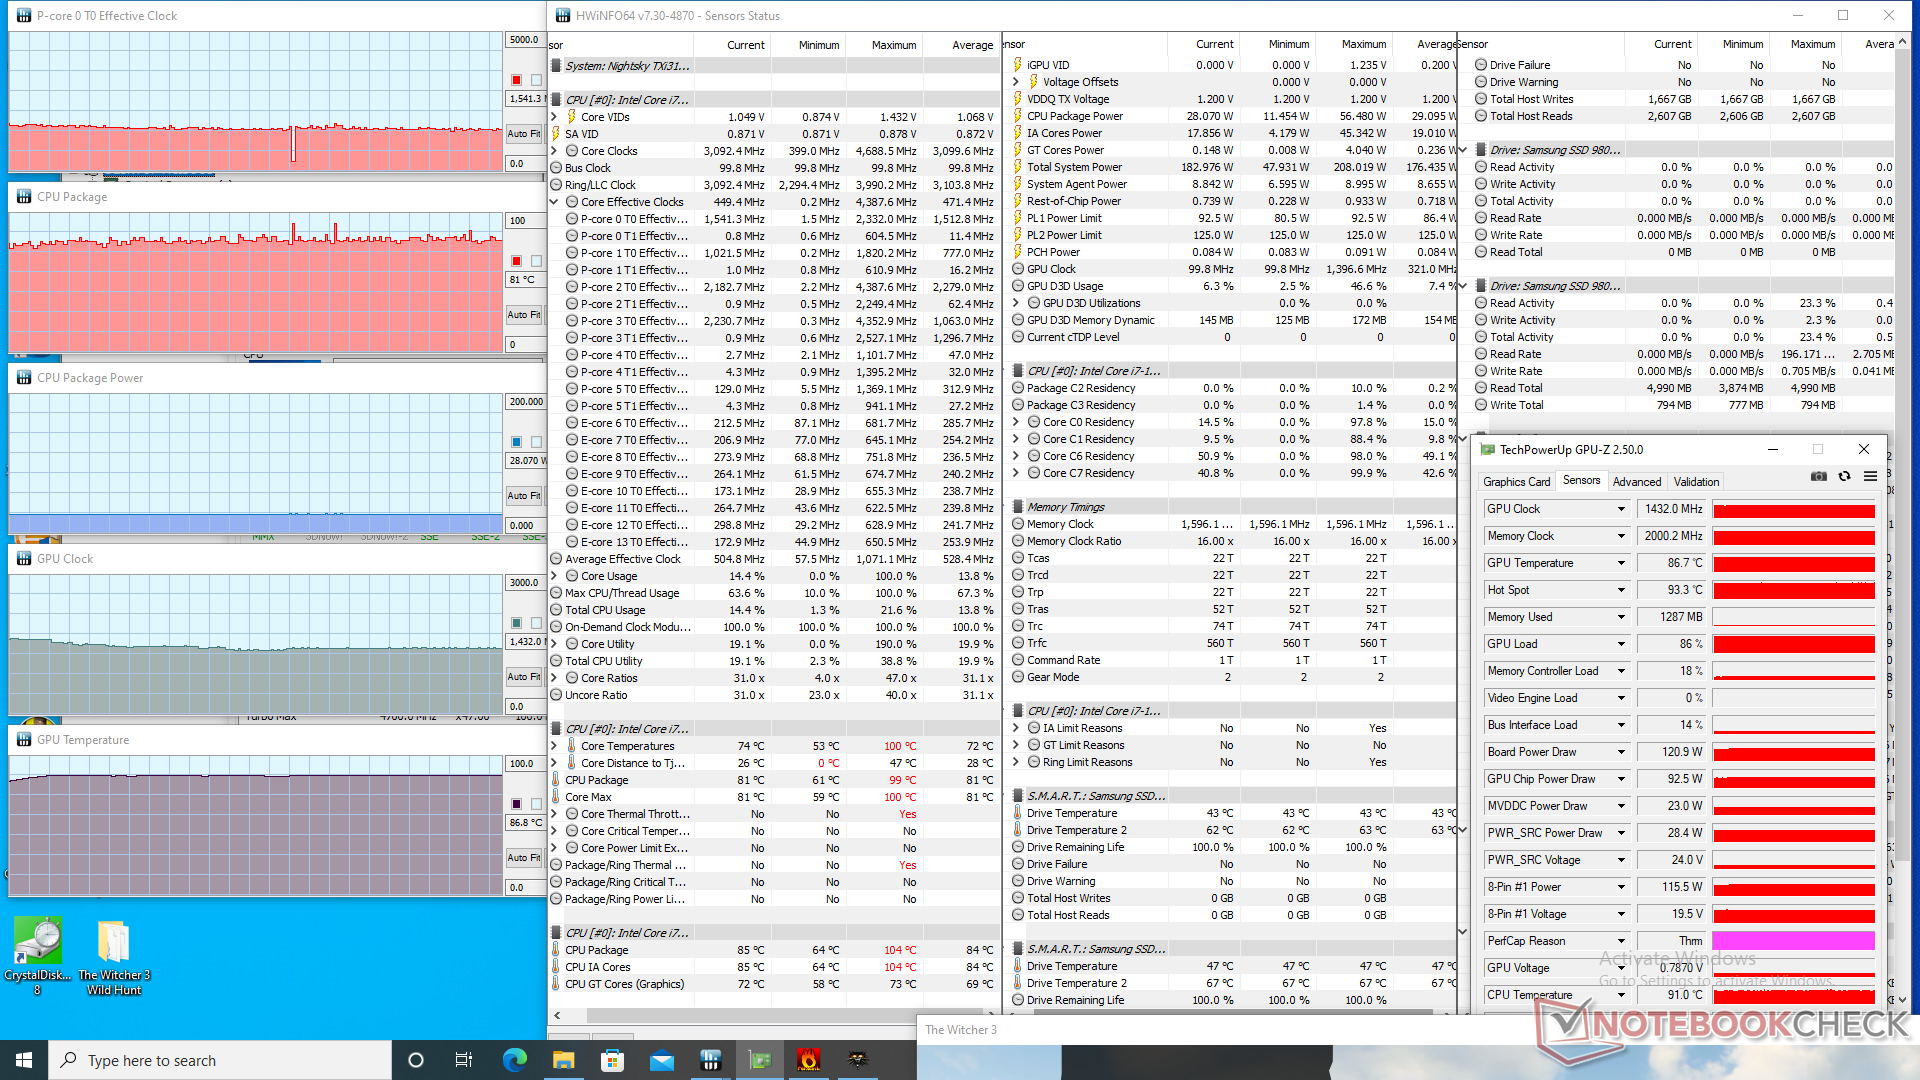
| CPU时钟(GHz) | GPU时钟(MHz) | CPU平均温度(℃) | GPU平均温度(℃) | |
| 系统空闲 | -- | -- | 43 | 40 |
| Prime95压力 | 2.8 | -- | 97 | 52 |
| Prime95 + FurMark 压力 | 2.3 - 2.8 | 1267 - 1755 | 97 | 84 |
| Witcher 3 应力 | 1.5 | 1432 | 81 | 87 |
发言人
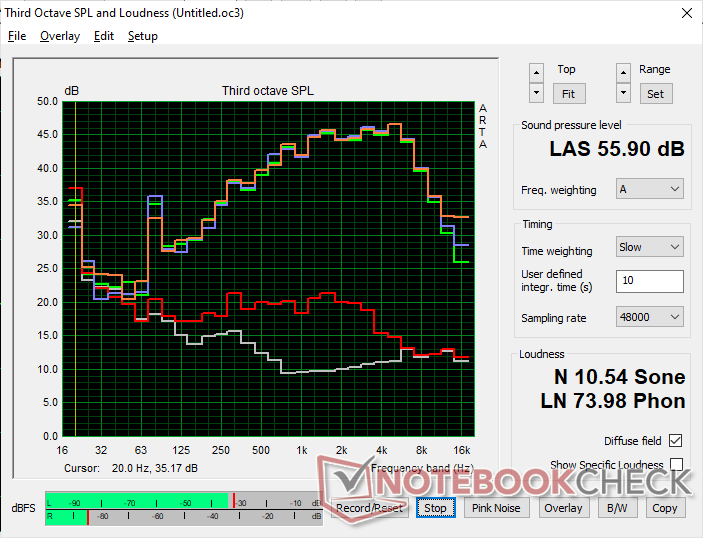
Eurocom Nightsky TXi317 audio analysis
(±) | speaker loudness is average but good (78.2 dB)
Bass 100 - 315 Hz
(±) | reduced bass - on average 14.6% lower than median
(-) | bass is not linear (16.5% delta to prev. frequency)
Mids 400 - 2000 Hz
(±) | higher mids - on average 5.1% higher than median
(+) | mids are linear (5% delta to prev. frequency)
Highs 2 - 16 kHz
(+) | balanced highs - only 4% away from median
(+) | highs are linear (6.2% delta to prev. frequency)
Overall 100 - 16.000 Hz
(±) | linearity of overall sound is average (20.4% difference to median)
Compared to same class
» 72% of all tested devices in this class were better, 6% similar, 22% worse
» The best had a delta of 6%, average was 18%, worst was 132%
Compared to all devices tested
» 53% of all tested devices were better, 8% similar, 39% worse
» The best had a delta of 4%, average was 24%, worst was 134%
Apple MacBook Pro 16 2021 M1 Pro audio analysis
(+) | speakers can play relatively loud (84.7 dB)
Bass 100 - 315 Hz
(+) | good bass - only 3.8% away from median
(+) | bass is linear (5.2% delta to prev. frequency)
Mids 400 - 2000 Hz
(+) | balanced mids - only 1.3% away from median
(+) | mids are linear (2.1% delta to prev. frequency)
Highs 2 - 16 kHz
(+) | balanced highs - only 1.9% away from median
(+) | highs are linear (2.7% delta to prev. frequency)
Overall 100 - 16.000 Hz
(+) | overall sound is linear (4.6% difference to median)
Compared to same class
» 0% of all tested devices in this class were better, 0% similar, 100% worse
» The best had a delta of 5%, average was 17%, worst was 45%
Compared to all devices tested
» 0% of all tested devices were better, 0% similar, 100% worse
» The best had a delta of 4%, average was 24%, worst was 134%
能源管理
消耗功率
在桌面上以最低的亮度设置和电源配置文件进行空转,需要不到13W的功率才能与XMG Pro 17 E22相媲美。然而,如果在最大亮度设置和高性能电源配置下,在独立的Nvidia GPU激活的情况下,这可能会跳到高达40W。如果不需要额外的性能,建议在较低的功率设置下运行,因为可以大大节省能源。
运行时的耗电量 Witcher 3几乎与我们在微星Raider GE77上记录的相同。MSI Raider GE77配备了相同的GPU。该系统比运行在GeForce RTX 2080上的旧游戏笔记本要求更高,如联想Legion 7 15超过80瓦。
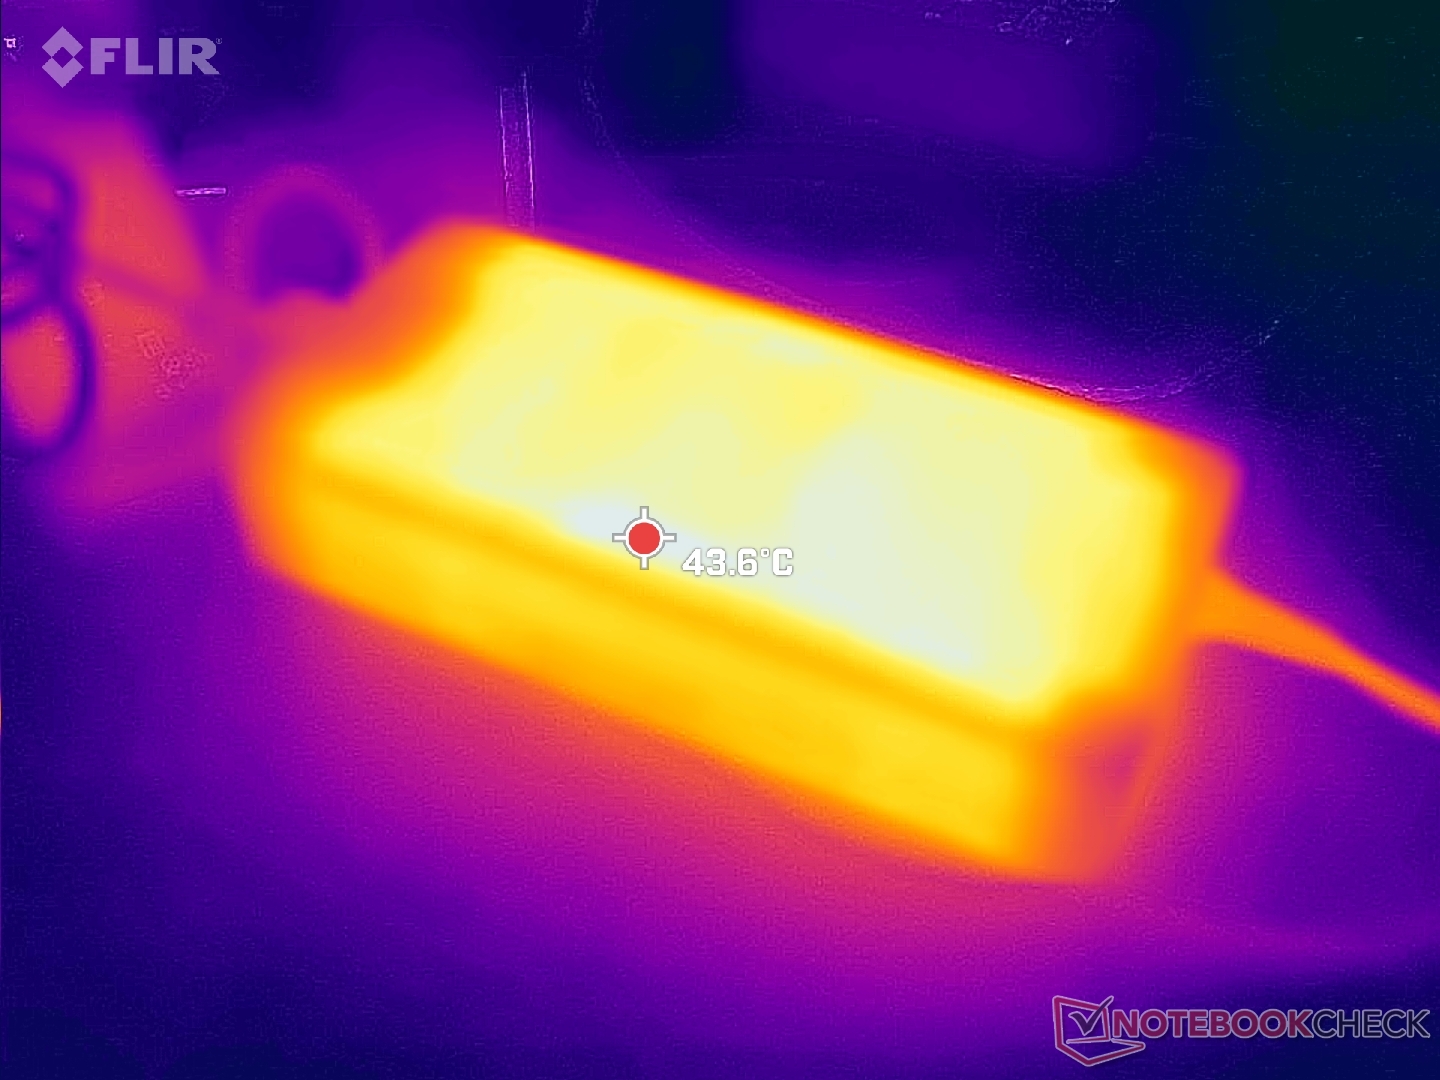
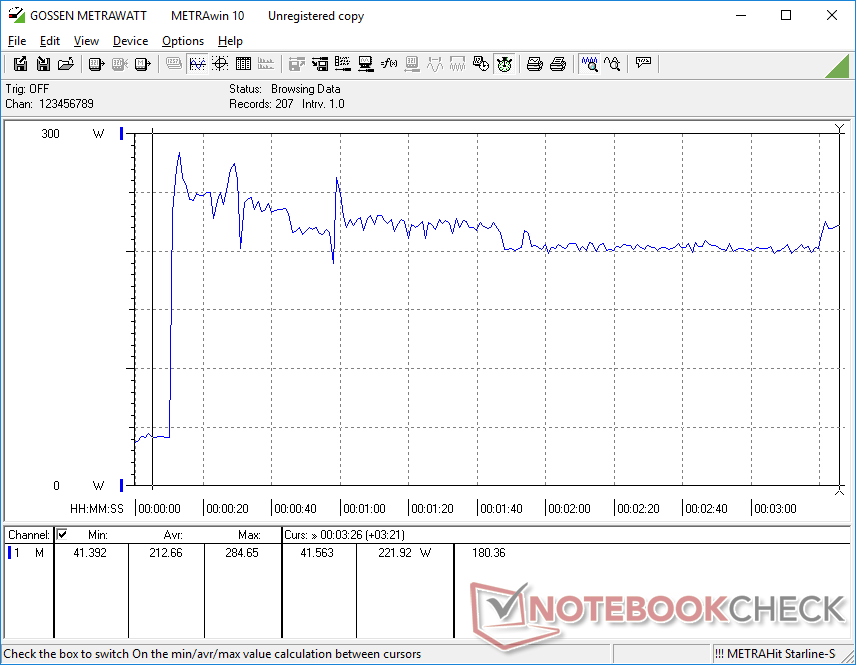
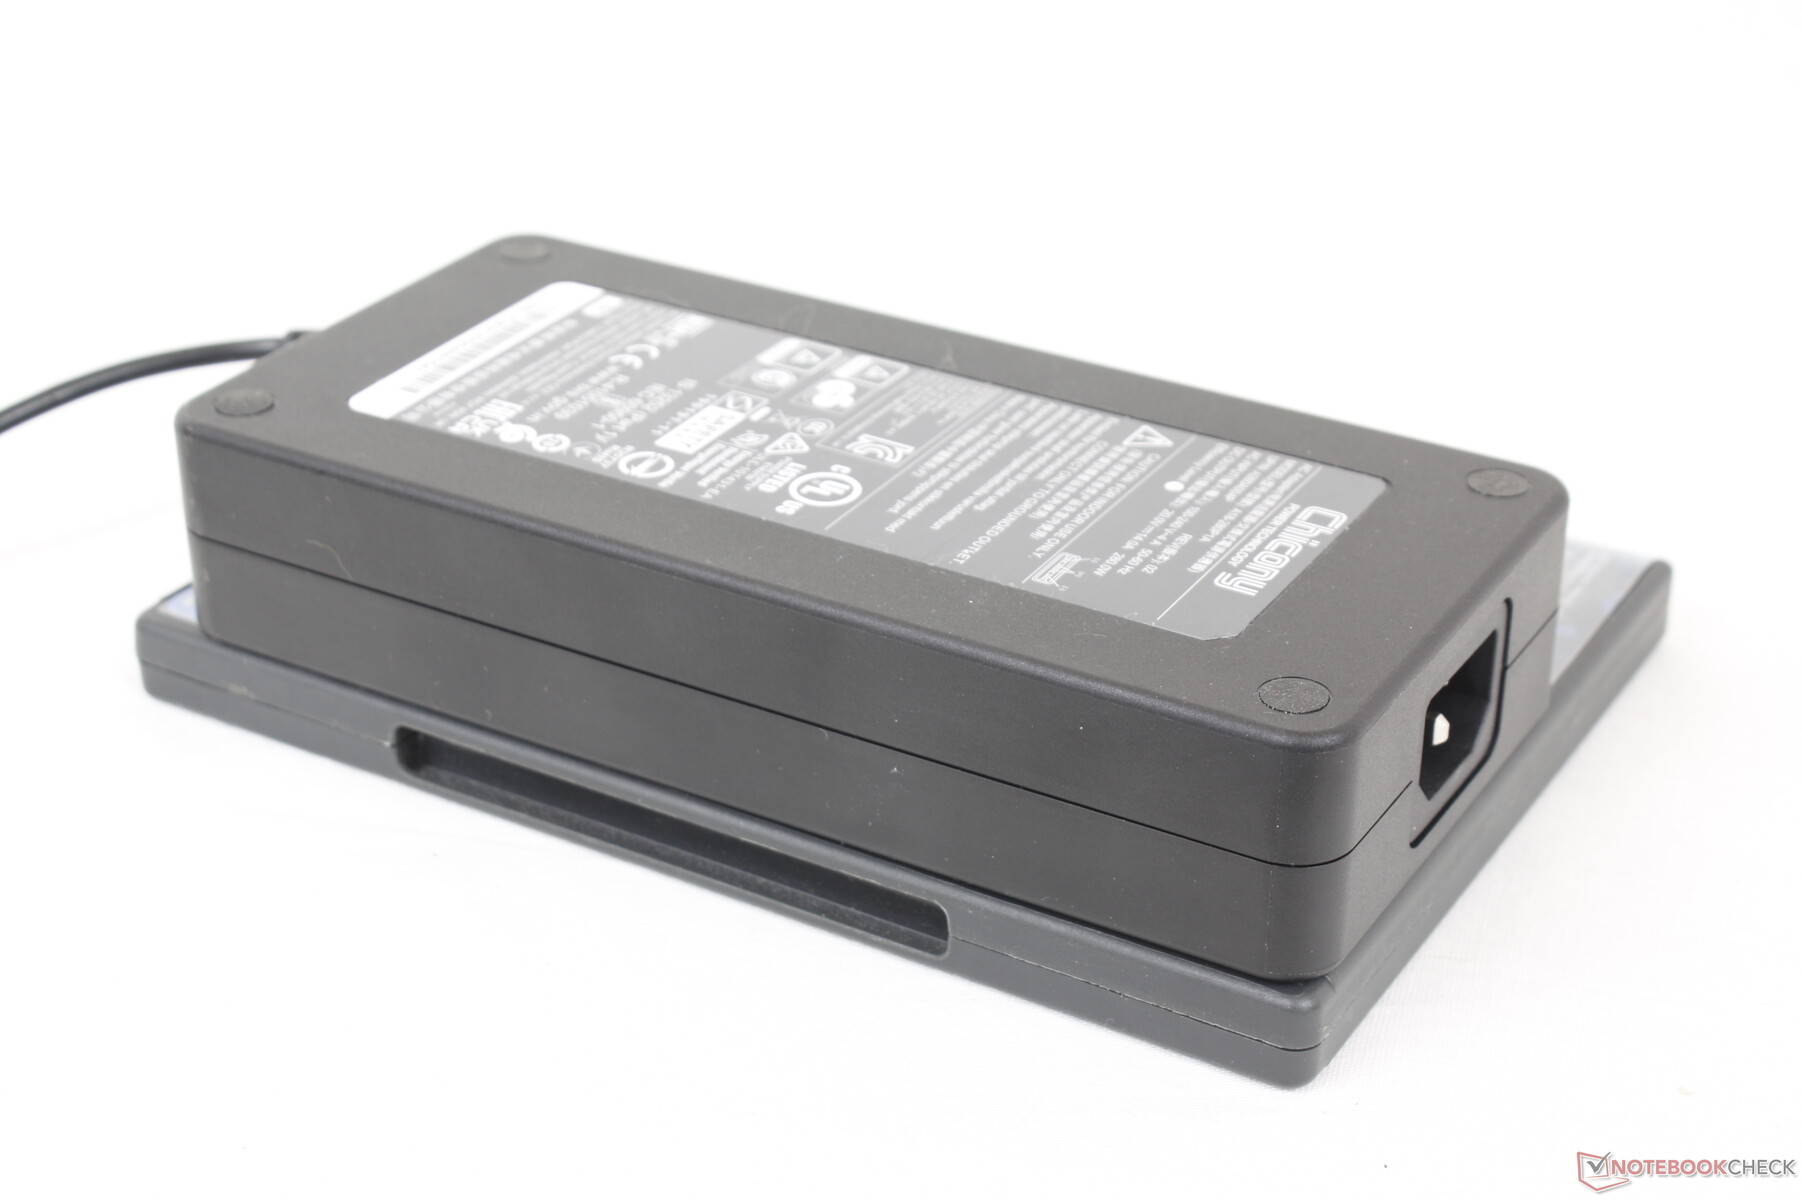
当CPU和GPU都处于100%的利用率时,我们能够从大型(约18 x 8.5 x 3.5厘米)280 W交流适配器中记录到285 W的最大功耗。如我们下面的图表所示,由于散热限制,这一比率只是暂时的。该系统仍然可以同时以合理的速度运行游戏和充电。
| Off / Standby | |
| Idle | |
| Load |
|
Key:
min: | |
| Eurocom Nightsky TXi317 i7-12700H, GeForce RTX 3080 Ti Laptop GPU, Samsung SSD 980 Pro 1TB MZ-V8P1T0BW, IPS, 1920x1080, 17.3" | Schenker XMG Pro 17 E22 i9-12900H, GeForce RTX 3080 Ti Laptop GPU, Samsung SSD 980 Pro 1TB MZ-V8P1T0BW, IPS, 2560x1440, 17.3" | Aorus 17X XES i9-12900HX, GeForce RTX 3070 Ti Laptop GPU, Gigabyte AG470S1TB-SI B10, IPS, 1920x1080, 17.3" | MSI Raider GE77 HX 12UHS i9-12900HX, GeForce RTX 3080 Ti Laptop GPU, Samsung PM9A1 MZVL22T0HBLB, IPS, 3840x2160, 17.3" | Razer Blade 17 Early 2022 i9-12900H, GeForce RTX 3080 Ti Laptop GPU, Samsung PM9A1 MZVL21T0HCLR, IPS, 3840x2160, 17.3" | Alienware x17 R2 P48E i9-12900HK, GeForce RTX 3080 Ti Laptop GPU, 2x Samsung PM9A1 1TB (RAID 0), IPS, 1920x1080, 17.3" | |
|---|---|---|---|---|---|---|
| Power Consumption | 17% | -6% | 4% | 6% | -25% | |
| Idle Minimum * (Watt) | 12.8 | 13 -2% | 18 -41% | 13 -2% | 17 -33% | 24.1 -88% |
| Idle Average * (Watt) | 33.9 | 17 50% | 28 17% | 19 44% | 23 32% | 28.5 16% |
| Idle Maximum * (Watt) | 39.1 | 26 34% | 36 8% | 29 26% | 34 13% | 60 -53% |
| Load Average * (Watt) | 121.1 | 120 1% | 153 -26% | 143 -18% | 120 1% | 128.7 -6% |
| Witcher 3 ultra * (Watt) | 243 | 221 9% | 221 9% | 247 -2% | 229 6% | 254 -5% |
| Load Maximum * (Watt) | 284.7 | 266 7% | 290 -2% | 352 -24% | 243 15% | 323 -13% |
* ... smaller is better
Power Consumption Witcher 3 / Stresstest
Power Consumption external Monitor
电池寿命
WLAN的运行时间很短,在需要充电之前,实际浏览的时间只有4个多小时。在进行电池寿命测试之前,我们的设备被设置为平衡电源配置文件,iGPU处于激活状态。结果类似于Razer Blade 17或 Aorus 17X但仍比Schenker XMG Pro 17 E22短了两个多小时。
从空电到满电的充电速度非常慢,大约2.5小时。相比之下,大多数游戏笔记本电脑只需要1.5至2小时。该系统不能通过USB-C充电。
| Eurocom Nightsky TXi317 i7-12700H, GeForce RTX 3080 Ti Laptop GPU, 80 Wh | Schenker XMG Pro 17 E22 i9-12900H, GeForce RTX 3080 Ti Laptop GPU, 80 Wh | Aorus 17X XES i9-12900HX, GeForce RTX 3070 Ti Laptop GPU, 99 Wh | MSI Raider GE77 HX 12UHS i9-12900HX, GeForce RTX 3080 Ti Laptop GPU, 99.99 Wh | Razer Blade 17 Early 2022 i9-12900H, GeForce RTX 3080 Ti Laptop GPU, 82 Wh | Alienware x17 R2 P48E i9-12900HK, GeForce RTX 3080 Ti Laptop GPU, 87 Wh | |
|---|---|---|---|---|---|---|
| Battery runtime | 62% | 5% | 29% | -10% | -52% | |
| WiFi v1.3 (h) | 4.2 | 6.8 62% | 4.4 5% | 5.4 29% | 3.8 -10% | 2 -52% |
| H.264 (h) | 4.6 | 3.8 | 6.5 | 4.8 | ||
| Load (h) | 1.5 | 1.4 | 2 | 1.7 | 0.8 | |
| Reader / Idle (h) | 9.8 | 7.1 | 3.9 |
Pros
Cons
结论 - 需要更新底盘
Eurocom Nightsky TXi317具有大型旗舰游戏笔记本电脑的CPU和GPU性能,但没有许多我们期待的中型设计的辅助功能。最明显的是,该机型无法在不需要节制传输速率的情况下长时间运行SSD。性能用户的目标受众更可能对他们不能完全利用新的PCIe4 x4驱动器而感到失望。替代产品如 Alienware x17或 微星GE66系列通常在其内部固态硬盘上有散热器,正是出于这个原因。
Eurocom Nightsky TXi317具有昂贵的游戏笔记本电脑的性能,但它缺乏许多基本和先进的辅助功能。
更多的小缺点包括分辨率很低的网络摄像头,没有隐私快门,缺乏USB-C PD支持,没有高级优化,没有Wi-Fi 6E选项,以及游戏时非常温暖的核心温度达到近90℃。机箱在维修方面甚至落后,因为底部面板的拆卸时间比现在大多数其他游戏笔记本都要长。对于3000美元以上的产品,Nightsky TXi317只是没有像其他高端竞争对手那样提供很多东西。
价格和可用性
Nightsky TXi317可以直接从Eurocom这里购买。 各种配置,起价为3000美元。
Eurocom Nightsky TXi317
- 10/26/2022 v7 (old)
Allen Ngo
Price comparison

