Notebookcheck Logo

Apple Mac Studio 2023 评测:M2 Max 也是令人印象深刻的桌面设备

安静而昂贵。 Apple 苹果公司更新了其台式电脑 Mac Studio,现在配备了速度更快的 M2 Max 或 M2 Ultra SoC。我们测试了配备 M2 Max 和 30 核 GPU 以及 32 GB 内存的基本型号。
ARM Apple Desktop Thunderbolt

除了小巧的 Mac Mini(599 美元起,按此处评测这里Apple 还提供功能更强大的 Mac Studio 台式电脑。该设备只使用制造商生产的最快的 SoC,从M2 Max我们已经从当前的 MacBook Pro 型号中了解到了它。今天,我们将近距离观察配备 M2 Max SoC 的 Mac Studio 基本机型,它拥有 30 核 GPU、32 GB 内存和 512 GB 固态硬盘。该配置的最高售价为 1,999 美元。如果你选择所有选项(M2 Ultra 配备 76 核 GPU、192 GB 内存和 8 TB SSD),那么你最多需要花费 8799 美元。

Apple Mac Studio 2023 M2 Max
Processor
Apple M2 Max 12 x 2.4 - 3.7 GHz, 36 W PL1 / Sustained
Graphics adapter
Memory
32 GB 
, LPDDR5-6400, Dual-Channel, onboard
Storage
Apple SSD AP0512Z, 512 GB 
, 470 GB free
Connections
2 USB 3.0 / 3.1 Gen1, 2 USB 3.1 Gen2, 4 USB 4.0 40 Gbps, 4 Thunderbolt, 1 HDMI, 4 DisplayPort, Audio Connections: 3.5 mm Stereo, Card Reader: SDXC (UHS-II)
Networking
Broadcom 0x14E4, 0x4388 WiFi 6E AirPort (a/b/g/n = Wi-Fi 4/ac = Wi-Fi 5/ax = Wi-Fi 6/ Wi-Fi 6E 6 GHz), Bluetooth 5.3
Size
height x width x depth (in mm): 95 x 197 x 197
Operating System
Apple macOS 13 Ventura
Additional features
Speakers: Mono, 12 Months Warranty
Weight
2.76 kg
Price
2399 Euro
Note: The manufacturer may use components from different suppliers including display panels, drives or memory sticks with similar specifications.


案例 - 知名铝材

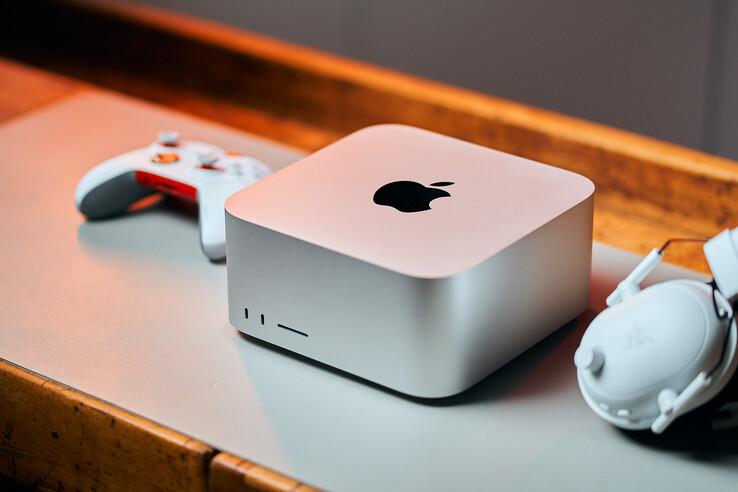
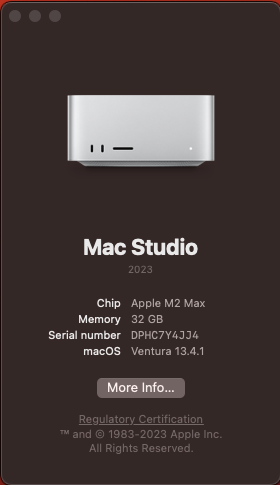
Mac Studio 的设计没有任何变化,这意味着你将继续获得一台相对紧凑的台式电脑,并配备高品质的铝合金外壳。四角采用圆角设计,小巧的立方体相当沉重,重量接近 2.8 千克(M2 Ultra 甚至重达 3.6 千克),因此给人一种高品质的感觉。其占地面积与Mac Mini但 Mac Studio 当然要高得多。这台电脑可以放在办公桌上大多数显示器的下方。电源已集成到设备中,电源线又长又漂亮,长度超过 180 厘米。

正如预期的那样,它的构造非常出色,这个小巧的立方体也非常稳定。Mac 依然没有维护选项,这在台式电脑上是一个巨大的缺点。基本型号的 32 GB 内存还算可以,但其内部固态硬盘容量只能在购买后通过外置硬盘进行扩展。

尺寸比较

197 mm 197 mm 95 mm 2.8 kg197 mm 197 mm 95 mm 2.7 kg197 mm 197 mm 36 mm 1.2 kg297 mm 210 mm 1 mm 5.7 g

连接性 - Thunderbolt 4 和 Wi-Fi 6E

Mac Studio 提供一系列连接选项,包括四个配备 Thunderbolt 4 的现代 USB-C 端口。根据所选配置,正面的两个 USB-C 端口均支持 USB 3.2 Gen.2 (M2 Max) 或 USB 4.0/Thunderbolt 4 (M2 Ultra)。正面的连接选项消除了我们对 Mac Mini 的诟病,因为你现在可以快速、轻松地连接配件。配备 M2 Max 的 Mac Studio 最多可支持五台外接显示器;配备 M2 Ultra 的机型甚至可支持多达八台显示器。
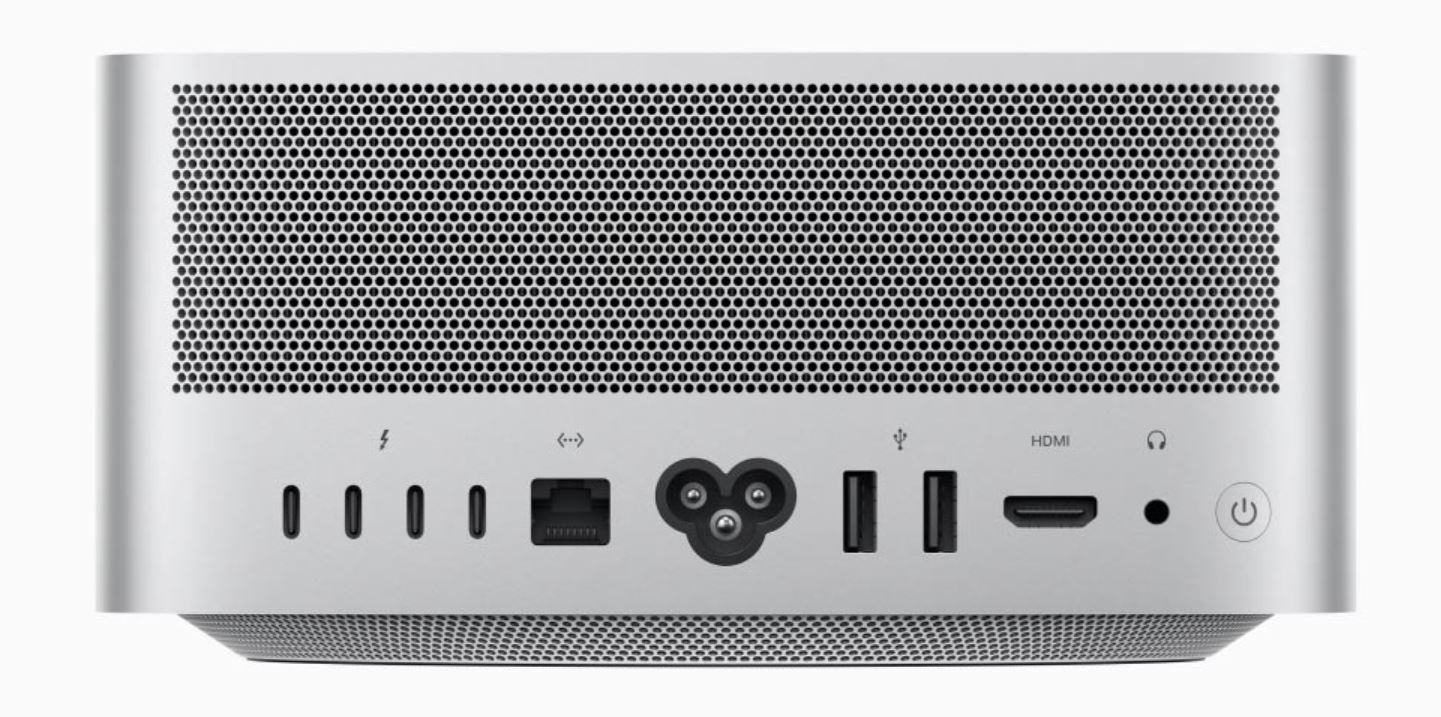
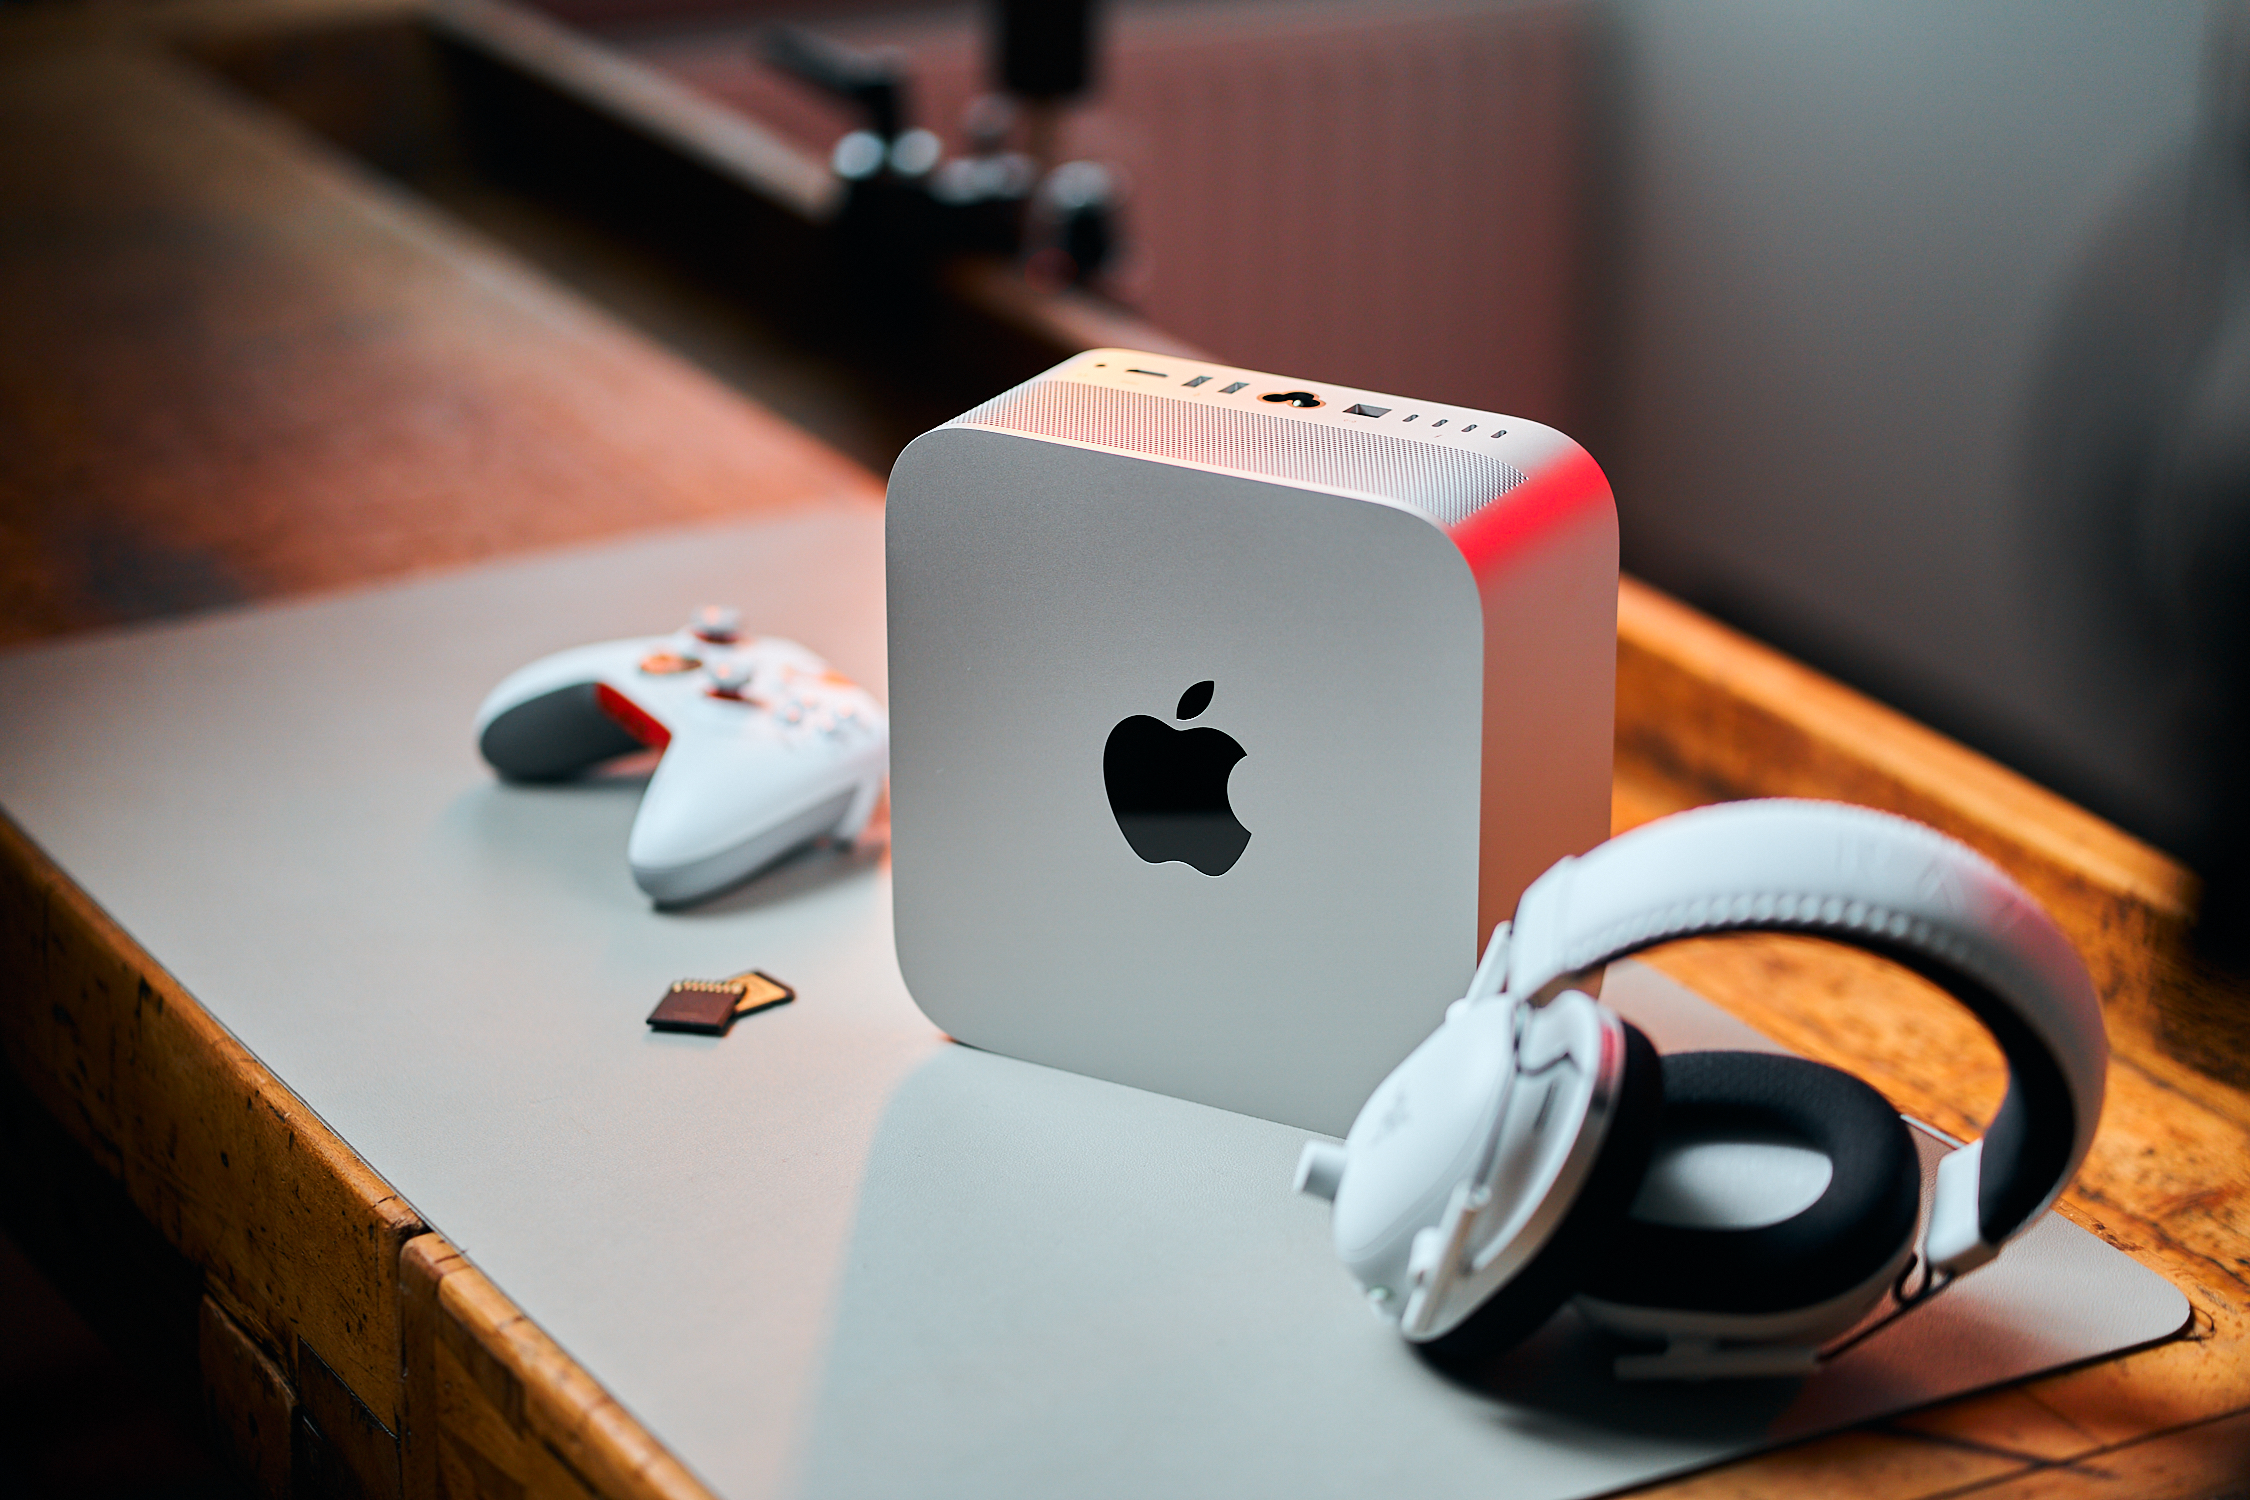
正面:2 个 USB-C 3.2 Gen.2(10 Gbit/s)、SDXC 读卡器(来源:Apple)
背面:4 个 USB-C 4.0,带 Thunderbolt 4(40 Gbit/s,DisplayPort ALT 模式)、以太网(10 Gbit/s)、电源、USB-A 3.2 Gen.1(5 Gbit/s)、HDMI 2.1、3.5 mm 音频、电源按钮

SD 读卡器

正面的 SD 读卡器几乎可以完全读取 SD 卡,在我们使用参考卡(Angelbird AV Pro V60)进行的测试中,可以达到很好的传输速率,与当前的平均传输速率差不多。MacBook Pro 16 M2 Max.我们测得的峰值速度超过 200 MB/s。

SD Card Reader
average JPG Copy Test (av. of 3 runs)
Apple MacBook Pro 16 2023 M2 Max
Apple M2 Max (Angelbird AV Pro V60)
196 MB/s +5%
Apple Mac Studio 2023 M2 Max
Apple M2 Max (Angelbird AV Pro V60)
187 MB/s
Apple Mac Studio 2022 M1 Max
Apple M1 Max (Angelbird AV Pro V60)
121 MB/s -35%
Average of class Desktop
  (19.9 - 187, n=6, last 2 years)
82.2 MB/s -56%
maximum AS SSD Seq Read Test (1GB)
Apple MacBook Pro 16 2023 M2 Max
Apple M2 Max (Angelbird AV Pro V60)
222 MB/s +3%
Apple Mac Studio 2023 M2 Max
Apple M2 Max (Angelbird AV Pro V60)
215.1 MB/s
Average of class Desktop
  (20.6 - 215, n=5, last 2 years)
86.4 MB/s -60%

交流

Apple Mac Studio 配备了标准的 10 Gbit/s 以太网连接。此外,电脑还使用了当前 MacBook Pro 16 的 WLAN 模块。MacBook Pro 16的 WLAN 模块,该模块除了支持现代 WiFi 6E 标准外,还支持蓝牙 5.3。结合华硕的参考路由器,我们测得了很高且稳定的传输速率。在测试中,我们也从未遇到过任何无线连接问题。

Networking
Apple Mac Studio 2023 M2 Max
Broadcom 0x14E4, 0x4388 WiFi 6E AirPort
iperf3 receive AXE11000
1478 (min: 1427) MBit/s ∼82%
iperf3 transmit AXE11000 6GHz
1734 (min: 1713) MBit/s ∼98%
Apple MacBook Pro 16 2023 M2 Max
Broadcom 0x14E4, 0x4388 WiFi 6E AirPort
iperf3 transmit AXE11000 6GHz
1730 (min: 1700) MBit/s ∼97%
iperf3 receive AXE11000 6GHz
1803 (min: 1749) MBit/s ∼100%
Apple Mac Studio 2022 M1 Max
802.11 a/b/g/n/ac/ax
iperf3 transmit AXE11000
864 (min: 825) MBit/s ∼49%
iperf3 receive AXE11000
957 (min: 935) MBit/s ∼53%
Apple Mac Mini M2
Broadcom 0x14E4, 0x4388 WiFi 6E AirPort
iperf3 transmit AXE11000
1776 (min: 1740) MBit/s ∼100%
iperf3 receive AXE11000
1796 (min: 1738) MBit/s ∼100%
Apple MacBook Pro 14 2023 M2 Pro
Broadcom 0x14E4, 0x4388 WiFi 6E AirPort
iperf3 transmit AXE11000 6GHz
1777 (min: 1685) MBit/s ∼100%
iperf3 receive AXE11000 6GHz
1741 (min: 1650) MBit/s ∼97%
0501001502002503003504004505005506006507007508008509009501000105011001150120012501300135014001450150015501600165017001750Tooltip
Apple Mac Studio 2023 M2 Max; iperf3 transmit AXE11000 6GHz: Ø1734 (1713-1757)
Apple Mac Studio 2023 M2 Max; iperf3 receive AXE11000: Ø1478 (1427-1530)

性能 - 配备 30 个 GPU 内核的Apple M2 Max

处理器

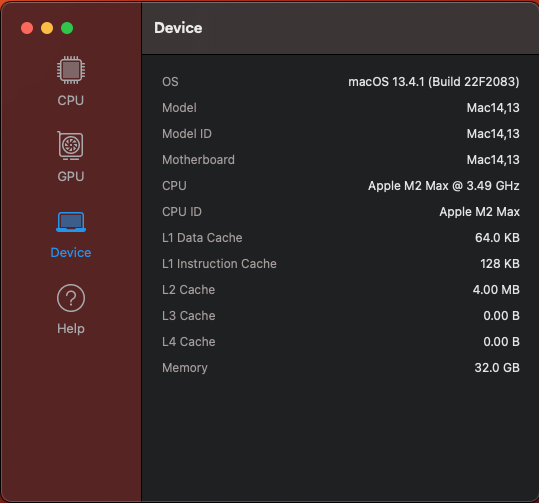
处理器部分M2 Max的处理器部分与较小的M2 Pro- 只是其更大的缓存在某些用途上略有优势。它共有 12 个 CPU 内核,分为三个集群。高效核心集群由四个核心组成,最高主频可达 2.4 GHz,两个高性能集群各有四个核心,最高主频可达 3.7 GHz。与其他Apple 产品类似,它的最大 TDP 为 36 瓦,我们测得的结果与 MacBook Pro 16 M2 Max 相同。MacBook Pro 16 M2 MaxMacBook Pro 14 M2 Pro.我们的 Cinebench R15 多循环测试表明,它的性能完全保持稳定。与旧版Mac Studio 与 M1 Max相比,它的优势为 8%(单核)和 20%(多核),这除了得益于更高的时钟频率外,还得益于两个额外的 E 核。

Cinebench R15 Multi continuous test

01052103154205256307358409451050115512601365147015751680178518901995Tooltip
Apple Mac Studio 2023 M2 Max Apple M2 Max: Ø2094 (2084.53-2099.63)
Apple MacBook Pro 16 2023 M2 Max Apple M2 Max: Ø2074 (2068.47-2081.27)
Apple Mac Studio 2022 M1 Max Apple M1 Max: Ø1691 (1678.91-1695.2)
Apple Mac Mini M2 Apple M2: Ø1241 (1235.48-1243.47)
Apple MacBook Pro 14 2023 M2 Pro Apple M2 Pro: Ø2069 (2052.12-2075.23)

AMD 和英特尔的竞争产品在总体上提供了更好的 CPU 性能,但功耗也更高一些。我们谈论的是移动处理器,它们也用于迷你 PC。当然,真正的台式电脑性能完全不同,但它们的 TDP 值也更高。

CPU Performance Rating: Percent
Cinebench R23: Multi Core | Single Core
Cinebench R20: CPU (Multi Core) | CPU (Single Core)
Cinebench R15: CPU Multi 64Bit | CPU Single 64Bit
Geekbench 5.5: Multi-Core | Single-Core
CPU Performance Rating
Beelink SER7
AMD Ryzen 7 7840HS
95.1 pt
Intel NUC 13 Pro Desk Edition Kit
Intel Core i7-1360P
84.6 pt
Average of class Desktop
 
83.9 pt
Apple Mac Studio 2023 M2 Max
Apple M2 Max
83.4 pt
Apple MacBook Pro 16 2023 M2 Max
Apple M2 Max
83.4 pt
Average Apple M2 Max
 
83.4 pt
Apple MacBook Pro 14 2023 M2 Pro
Apple M2 Pro
82.4 pt
Apple Mac Studio 2022 M1 Max
Apple M1 Max
70.4 pt
Apple Mac Mini M2
Apple M2
65.7 pt
Cinebench R23 / Multi Core
Beelink SER7
AMD Ryzen 7 7840HS
16105 (15785.6min - 16105.2max) Points +9%
Apple MacBook Pro 14 2023 M2 Pro
Apple M2 Pro
14787 Points 0%
Apple MacBook Pro 16 2023 M2 Max
Apple M2 Max
14767 Points 0%
Average Apple M2 Max
  (14738 - 14767, n=2)
14753 Points 0%
Apple Mac Studio 2023 M2 Max
Apple M2 Max
14738 Points
Average of class Desktop
  (277 - 38314, n=29, last 2 years)
14020 Points -5%
Apple Mac Studio 2022 M1 Max
Apple M1 Max
12396 Points -16%
Intel NUC 13 Pro Desk Edition Kit
Intel Core i7-1360P
12155 Points -18%
Apple Mac Mini M2
Apple M2
8772 Points -40%
Cinebench R23 / Single Core
Intel NUC 13 Pro Desk Edition Kit
Intel Core i7-1360P
1878 Points +13%
Beelink SER7
AMD Ryzen 7 7840HS
1774 Points +7%
Apple Mac Studio 2023 M2 Max
Apple M2 Max
1662 Points
Apple MacBook Pro 14 2023 M2 Pro
Apple M2 Pro
1647 Points -1%
Average Apple M2 Max
  (1625 - 1662, n=2)
1644 Points -1%
Apple Mac Mini M2
Apple M2
1638 Points -1%
Apple MacBook Pro 16 2023 M2 Max
Apple M2 Max
1625 Points -2%
Apple Mac Studio 2022 M1 Max
Apple M1 Max
1536 Points -8%
Average of class Desktop
  (439 - 2210, n=27, last 2 years)
1521 Points -8%
Cinebench R20 / CPU (Multi Core)
Beelink SER7
AMD Ryzen 7 7840HS
6344 Points +55%
Average of class Desktop
  (285 - 14891, n=27, last 2 years)
5572 Points +36%
Intel NUC 13 Pro Desk Edition Kit
Intel Core i7-1360P
4687 Points +15%
Apple Mac Studio 2023 M2 Max
Apple M2 Max
4085 Points
Average Apple M2 Max
  (4044 - 4085, n=2)
4065 Points 0%
Apple MacBook Pro 14 2023 M2 Pro
Apple M2 Pro
4044 Points -1%
Apple MacBook Pro 16 2023 M2 Max
Apple M2 Max
4044 Points -1%
Apple Mac Studio 2022 M1 Max
Apple M1 Max
2753 Points -33%
Apple Mac Mini M2
Apple M2
2416 Points -41%
Cinebench R20 / CPU (Single Core)
Intel NUC 13 Pro Desk Edition Kit
Intel Core i7-1360P
723 Points +60%
Beelink SER7
AMD Ryzen 7 7840HS
698 Points +55%
Average of class Desktop
  (174 - 853, n=27, last 2 years)
574 Points +27%
Apple MacBook Pro 16 2023 M2 Max
Apple M2 Max
460 Points +2%
Average Apple M2 Max
  (451 - 460, n=2)
456 Points +1%
Apple Mac Studio 2023 M2 Max
Apple M2 Max
451 Points
Apple MacBook Pro 14 2023 M2 Pro
Apple M2 Pro
447 Points -1%
Apple Mac Mini M2
Apple M2
446 Points -1%
Apple Mac Studio 2022 M1 Max
Apple M1 Max
395 Points -12%
Cinebench R15 / CPU Multi 64Bit
Average of class Desktop
  (128 - 6236, n=31, last 2 years)
2667 Points +27%
Beelink SER7
AMD Ryzen 7 7840HS
2565 (2511.62min - 2564.76max) Points +22%
Apple Mac Studio 2023 M2 Max
Apple M2 Max
2094 (2084.53min, 2085.55P1 - 2099.63max) Points
Average Apple M2 Max
  (2074 - 2094, n=2)
2084 Points 0%
Apple MacBook Pro 16 2023 M2 Max
Apple M2 Max
2074 (2068.47min, 2068.57P1 - 2081.27max) Points -1%
Apple MacBook Pro 14 2023 M2 Pro
Apple M2 Pro
2069 (2052.12min, 2054.58P1 - 2075.23max) Points -1%
Intel NUC 13 Pro Desk Edition Kit
Intel Core i7-1360P
1990 Points -5%
Apple Mac Studio 2022 M1 Max
Apple M1 Max
1691 (1678.91min, 1679.66P1 - 1695.2max) Points -19%
Apple Mac Mini M2
Apple M2
1243 (1221min - 1243max) Points -41%
Cinebench R15 / CPU Single 64Bit
Beelink SER7
AMD Ryzen 7 7840HS
283 Points +21%
Intel NUC 13 Pro Desk Edition Kit
Intel Core i7-1360P
267 Points +15%
Apple MacBook Pro 16 2023 M2 Max
Apple M2 Max
239 Points +3%
Average of class Desktop
  (76 - 319, n=31, last 2 years)
239 Points +3%
Average Apple M2 Max
  (233 - 239, n=2)
236 Points +1%
Apple Mac Studio 2023 M2 Max
Apple M2 Max
233 Points
Apple MacBook Pro 14 2023 M2 Pro
Apple M2 Pro
230 Points -1%
Apple Mac Mini M2
Apple M2
229 Points -2%
Apple Mac Studio 2022 M1 Max
Apple M1 Max
200 Points -14%
Geekbench 5.5 / Multi-Core
Apple Mac Studio 2023 M2 Max
Apple M2 Max
15444 Points
Average Apple M2 Max
  (15348 - 15444, n=3)
15388 Points 0%
Apple MacBook Pro 16 2023 M2 Max
Apple M2 Max
15348 Points -1%
Apple MacBook Pro 14 2023 M2 Pro
Apple M2 Pro
14859 Points -4%
Apple Mac Studio 2022 M1 Max
Apple M1 Max
12697 Points -18%
Beelink SER7
AMD Ryzen 7 7840HS
11423 Points -26%
Average of class Desktop
  (844 - 24033, n=26, last 2 years)
10803 Points -30%
Intel NUC 13 Pro Desk Edition Kit
Intel Core i7-1360P
10269 Points -34%
Apple Mac Mini M2
Apple M2
8994 Points -42%
Geekbench 5.5 / Single-Core
Beelink SER7
AMD Ryzen 7 7840HS
1983 Points +1%
Apple MacBook Pro 16 2023 M2 Max
Apple M2 Max
1978 Points +1%
Average Apple M2 Max
  (1965 - 1978, n=3)
1970 Points 0%
Apple Mac Studio 2023 M2 Max
Apple M2 Max
1967 Points
Apple MacBook Pro 14 2023 M2 Pro
Apple M2 Pro
1961 Points 0%
Apple Mac Mini M2
Apple M2
1953 Points -1%
Intel NUC 13 Pro Desk Edition Kit
Intel Core i7-1360P
1832 Points -7%
Apple Mac Studio 2022 M1 Max
Apple M1 Max
1795 Points -9%
Average of class Desktop
  (556 - 2241, n=26, last 2 years)
1612 Points -18%
Cinebench R15 CPU Multi 64Bit
2094 Points
Cinebench R15 CPU Single 64Bit
233 Points
Cinebench R15 OpenGL 64Bit
145.7 fps
Cinebench R15 Ref. Match 64Bit
99.5 %
Help

系统性能

Mac 的系统性能在日常使用中表现出色,输入立即执行。即使是复杂的程序,如 DaVinci Resolve 或 Adobe Photoshop(针对 ARM 芯片进行了优化),在当前的Apple 产品上也能运行得非常快速流畅。英特尔 Mac 的旧版应用程序可以通过 Rosetta 2 进行仿真,同样运行良好。与运行原生应用程序相比,其性能稍逊一筹。

CrossMark: Overall | Productivity | Creativity | Responsiveness
Jetstream 2: Total Score
WebXPRT 3: Overall
WebXPRT 4: Overall
Speedometer 2.0: Result
Blackmagic RAW Speed Test: 12:1 8K Metal | 12:1 8K CPU
CrossMark / Overall
Apple MacBook Pro 16 2023 M2 Max
M2 Max 38-Core GPU, M2 Max, Apple SSD AP2048Z
1910 Points +9%
Apple MacBook Pro 14 2023 M2 Pro
M2 Pro 19-Core GPU, M2 Pro, Apple SSD AP2048Z
1812 Points +3%
Apple Mac Studio 2023 M2 Max
M2 Max 30-Core GPU, M2 Max, Apple SSD AP0512Z
1759 Points
Average Apple M2 Max, Apple M2 Max 30-Core GPU
  ()
1759 Points 0%
Average of class Desktop
  (481 - 2495, n=21, last 2 years)
1711 Points -3%
Apple Mac Studio 2022 M1 Max
M1 Max 32-Core GPU, M1 Max, Apple SSD AP2048R
1621 Points -8%
Apple Mac Mini M2
M2 10-Core GPU, M2, Apple SSD AP0512Z
1538 Points -13%
CrossMark / Productivity
Average of class Desktop
  (518 - 2292, n=21, last 2 years)
1631 Points +6%
Apple MacBook Pro 16 2023 M2 Max
M2 Max 38-Core GPU, M2 Max, Apple SSD AP2048Z
1618 Points +5%
Apple MacBook Pro 14 2023 M2 Pro
M2 Pro 19-Core GPU, M2 Pro, Apple SSD AP2048Z
1562 Points +1%
Apple Mac Studio 2023 M2 Max
M2 Max 30-Core GPU, M2 Max, Apple SSD AP0512Z
1544 Points
Average Apple M2 Max, Apple M2 Max 30-Core GPU
  ()
1544 Points 0%
Apple Mac Mini M2
M2 10-Core GPU, M2, Apple SSD AP0512Z
1441 Points -7%
Apple Mac Studio 2022 M1 Max
M1 Max 32-Core GPU, M1 Max, Apple SSD AP2048R
1385 Points -10%
CrossMark / Creativity
Apple MacBook Pro 16 2023 M2 Max
M2 Max 38-Core GPU, M2 Max, Apple SSD AP2048Z
2505 Points +13%
Apple MacBook Pro 14 2023 M2 Pro
M2 Pro 19-Core GPU, M2 Pro, Apple SSD AP2048Z
2330 Points +5%
Apple Mac Studio 2023 M2 Max
M2 Max 30-Core GPU, M2 Max, Apple SSD AP0512Z
2218 Points
Average Apple M2 Max, Apple M2 Max 30-Core GPU
  ()
2218 Points 0%
Apple Mac Studio 2022 M1 Max
M1 Max 32-Core GPU, M1 Max, Apple SSD AP2048R
2153 Points -3%
Average of class Desktop
  (434 - 2793, n=21, last 2 years)
1879 Points -15%
Apple Mac Mini M2
M2 10-Core GPU, M2, Apple SSD AP0512Z
1793 Points -19%
CrossMark / Responsiveness
Average of class Desktop
  (469 - 2297, n=21, last 2 years)
1516 Points +17%
Apple MacBook Pro 16 2023 M2 Max
M2 Max 38-Core GPU, M2 Max, Apple SSD AP2048Z
1395 Points +8%
Apple MacBook Pro 14 2023 M2 Pro
M2 Pro 19-Core GPU, M2 Pro, Apple SSD AP2048Z
1333 Points +3%
Apple Mac Studio 2023 M2 Max
M2 Max 30-Core GPU, M2 Max, Apple SSD AP0512Z
1296 Points
Average Apple M2 Max, Apple M2 Max 30-Core GPU
  ()
1296 Points 0%
Apple Mac Mini M2
M2 10-Core GPU, M2, Apple SSD AP0512Z
1182 Points -9%
Apple Mac Studio 2022 M1 Max
M1 Max 32-Core GPU, M1 Max, Apple SSD AP2048R
1107 Points -15%
Jetstream 2 / Total Score
Average Apple M2 Max, Apple M2 Max 30-Core GPU
  ()
247 Points 0%
Apple Mac Studio 2023 M2 Max
M2 Max 30-Core GPU, M2 Max, Apple SSD AP0512Z
246.5 Points
Apple MacBook Pro 16 2023 M2 Max
M2 Max 38-Core GPU, M2 Max, Apple SSD AP2048Z
246.4 Points 0%
Apple MacBook Pro 14 2023 M2 Pro
M2 Pro 19-Core GPU, M2 Pro, Apple SSD AP2048Z
239 Points -3%
Apple Mac Mini M2
M2 10-Core GPU, M2, Apple SSD AP0512Z
238.8 Points -3%
Apple Mac Studio 2022 M1 Max
M1 Max 32-Core GPU, M1 Max, Apple SSD AP2048R
215 Points -13%
Average of class Desktop
  (102.1 - 295, n=4, last 2 years)
215 Points -13%
WebXPRT 3 / Overall
Apple MacBook Pro 16 2023 M2 Max
M2 Max 38-Core GPU, M2 Max, Apple SSD AP2048Z
407 Points +1%
Apple Mac Studio 2023 M2 Max
M2 Max 30-Core GPU, M2 Max, Apple SSD AP0512Z
402 Points
Average Apple M2 Max, Apple M2 Max 30-Core GPU
  ()
402 Points 0%
Apple Mac Mini M2
M2 10-Core GPU, M2, Apple SSD AP0512Z
387 Points -4%
Apple MacBook Pro 14 2023 M2 Pro
M2 Pro 19-Core GPU, M2 Pro, Apple SSD AP2048Z
386 Points -4%
Apple Mac Studio 2022 M1 Max
M1 Max 32-Core GPU, M1 Max, Apple SSD AP2048R
366 Points -9%
Average of class Desktop
  (89.2 - 402, n=27, last 2 years)
273 Points -32%
WebXPRT 4 / Overall
Apple Mac Studio 2023 M2 Max
M2 Max 30-Core GPU, M2 Max, Apple SSD AP0512Z
260 Points
Average Apple M2 Max, Apple M2 Max 30-Core GPU
  ()
260 Points 0%
Apple MacBook Pro 16 2023 M2 Max
M2 Max 38-Core GPU, M2 Max, Apple SSD AP2048Z
258 Points -1%
Apple Mac Mini M2
M2 10-Core GPU, M2, Apple SSD AP0512Z
256 Points -2%
Average of class Desktop
  (63.2 - 335, n=13, last 2 years)
256 Points -2%
Apple MacBook Pro 14 2023 M2 Pro
M2 Pro 19-Core GPU, M2 Pro, Apple SSD AP2048Z
253 Points -3%
Speedometer 2.0 / Result
Apple MacBook Pro 16 2023 M2 Max
M2 Max 38-Core GPU, M2 Max, Apple SSD AP2048Z
424 runs/min 0%
Apple Mac Mini M2
M2 10-Core GPU, M2, Apple SSD AP0512Z
424 runs/min 0%
Apple Mac Studio 2023 M2 Max
M2 Max 30-Core GPU, M2 Max, Apple SSD AP0512Z
422 runs/min
Average Apple M2 Max, Apple M2 Max 30-Core GPU
  ()
422 runs/min 0%
Apple MacBook Pro 14 2023 M2 Pro
M2 Pro 19-Core GPU, M2 Pro, Apple SSD AP2048Z
403 runs/min -5%
Average of class Desktop
  (349 - 422, n=2, last 2 years)
386 runs/min -9%
Apple Mac Studio 2022 M1 Max
M1 Max 32-Core GPU, M1 Max, Apple SSD AP2048R
349 runs/min -17%
Blackmagic RAW Speed Test / 12:1 8K Metal
Apple MacBook Pro 16 2023 M2 Max
M2 Max 38-Core GPU, M2 Max, Apple SSD AP2048Z
222 fps +3%
Apple Mac Studio 2023 M2 Max
M2 Max 30-Core GPU, M2 Max, Apple SSD AP0512Z
215 fps
Average Apple M2 Max, Apple M2 Max 30-Core GPU
  ()
215 fps 0%
Average of class Desktop
  (200 - 215, n=2, last 2 years)
208 fps -3%
Apple Mac Studio 2022 M1 Max
M1 Max 32-Core GPU, M1 Max, Apple SSD AP2048R
200 fps -7%
Apple MacBook Pro 14 2023 M2 Pro
M2 Pro 19-Core GPU, M2 Pro, Apple SSD AP2048Z
169 fps -21%
Apple Mac Mini M2
M2 10-Core GPU, M2, Apple SSD AP0512Z
59 fps -73%
Blackmagic RAW Speed Test / 12:1 8K CPU
Apple Mac Studio 2023 M2 Max
M2 Max 30-Core GPU, M2 Max, Apple SSD AP0512Z
46 fps
Average Apple M2 Max, Apple M2 Max 30-Core GPU
  ()
46 fps 0%
Apple MacBook Pro 14 2023 M2 Pro
M2 Pro 19-Core GPU, M2 Pro, Apple SSD AP2048Z
43 fps -7%
Apple MacBook Pro 16 2023 M2 Max
M2 Max 38-Core GPU, M2 Max, Apple SSD AP2048Z
43 fps -7%
Average of class Desktop
  (30 - 46, n=2, last 2 years)
38 fps -17%
Apple Mac Studio 2022 M1 Max
M1 Max 32-Core GPU, M1 Max, Apple SSD AP2048R
30 fps -35%
Apple Mac Mini M2
M2 10-Core GPU, M2, Apple SSD AP0512Z
26 fps -43%

存储设备

非晶磁盘标记
非晶磁盘标记

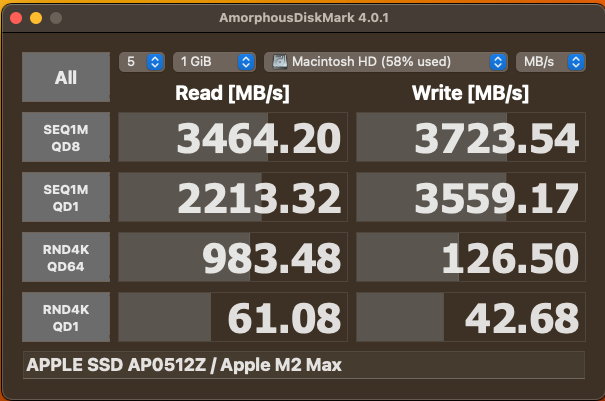
固态硬盘是我们基本配置的弱点之一,因为尽管入门价格不菲,Apple ,Mac Studio 却只配备了 512GB 的固态硬盘。除了容量有限外,该硬盘的传输速率也不高,仅为 3-3.5 GB/s,只能达到 PCIe 3.0 标准的上限。只有 1 TB 以上的大容量固态硬盘才能正常使用 PCIe 4.0 连接。更多固态硬盘基准测试这里。

Drive Performance Rating - Percent
Apple MacBook Pro 16 2023 M2 Max
Apple SSD AP2048Z
98.9 pt
Apple MacBook Pro 14 2023 M2 Pro
Apple SSD AP2048Z
97.1 pt
Apple MacBook Pro 16 2021 M1 Max
Apple SSD AP2048R
95.8 pt
Apple Mac Studio 2022 M1 Max
Apple SSD AP2048R
94 pt
Average of class Desktop
 
72 pt
Average Apple SSD AP0512Z
 
57.8 pt
Apple Mac Mini M2
Apple SSD AP0512Z
50.3 pt
Apple Mac Studio 2023 M2 Max
Apple SSD AP0512Z
50 pt
Blackmagic Disk Speed Test
5GB Read
Apple Mac Studio 2022 M1 Max
Apple SSD AP2048R
5498.6 MB/s +90%
Apple MacBook Pro 16 2023 M2 Max
Apple SSD AP2048Z
5379 MB/s +86%
Apple MacBook Pro 14 2023 M2 Pro
Apple SSD AP2048Z
5359.8 MB/s +85%
Apple MacBook Pro 16 2021 M1 Max
Apple SSD AP2048R
5340 MB/s +84%
Average of class Desktop
  (2896 - 5499, n=2, last 2 years)
4197 MB/s +45%
Average Apple SSD AP0512Z
  (2896 - 4756, n=7)
3422 MB/s +18%
Apple Mac Mini M2
Apple SSD AP0512Z
2902.4 MB/s 0%
Apple Mac Studio 2023 M2 Max
Apple SSD AP0512Z
2895.6 MB/s
5GB Write
Apple MacBook Pro 16 2023 M2 Max
Apple SSD AP2048Z
6602 MB/s +111%
Apple MacBook Pro 14 2023 M2 Pro
Apple SSD AP2048Z
6388.9 MB/s +105%
Apple MacBook Pro 16 2021 M1 Max
Apple SSD AP2048R
6243 MB/s +100%
Apple Mac Studio 2022 M1 Max
Apple SSD AP2048R
5808.3 MB/s +86%
Average of class Desktop
  (3123 - 5808, n=2, last 2 years)
4466 MB/s +43%
Average Apple SSD AP0512Z
  (3123 - 4199, n=7)
3517 MB/s +13%
Apple Mac Mini M2
Apple SSD AP0512Z
3152.1 MB/s +1%
Apple Mac Studio 2023 M2 Max
Apple SSD AP0512Z
3123.3 MB/s

图形卡

Mac Studio 的基本型号使用M2 Max SoC虽然 30 核 GPU 性能较弱,但与旧版的 24 核 M1 Max GPU 相比,性能仍有可观的提升。M1 Max 24 核 GPU 相比,性能仍有相当大的提升。在合成测试中,新的 30 核 GPU 只比旧的 24 核机型高出约 30%,与旧的 32 核机型相差无几。 旧的 32 核版本相当。可选的38 核版本仍快约 20%。

我们不得不继续依靠模拟游戏来进行游戏基准测试,因为它们提供了一个综合基准。对于原生游戏,如《生化危机村》(该游戏在 1080p 下以最大细节完全流畅运行),我们仍然没有办法记录 FPS 数值来进行评估。模拟游戏的结果可以让我们对两台 Mac 进行比较,但并不能代表电脑运行本机游戏时的全部性能。在游戏基准测试中,30 核版的 M2 Max 比旧版 M1 Max 的 32 核 GPU 性能更好,而且更接近目前配备 36 个 GPU 内核的顶级机型。

3DMark Performance Rating - Percent
Apple MacBook Pro 16 2023 M2 Max
Apple M2 Max 38-Core GPU, Apple M2 Max
88.4 pt
Apple Mac Studio 2023 M2 Max
Apple M2 Max 30-Core GPU, Apple M2 Max
78.4 pt
Average Apple M2 Max 30-Core GPU
 
78.4 pt
Average of class Desktop
 
74.9 pt
Apple MacBook Pro 16 2021 M1 Max
Apple M1 Max 32-Core GPU, Apple M1 Max
69.1 pt
Apple Mac Studio 2022 M1 Max -2!
Apple M1 Max 32-Core GPU, Apple M1 Max
66.3 pt
Apple MacBook Pro 14 2021 M1 Max 24-Core GPU -1!
Apple M1 Max 24-Core GPU, Apple M1 Max
57.5 pt
Apple MacBook Pro 14 2023 M2 Pro
Apple M2 Pro 19-Core GPU, Apple M2 Pro
52.4 pt
Apple Mac Mini M2
Apple M2 10-Core GPU, Apple M2
28.4 pt
3DMark - Wild Life Extreme Unlimited
Average of class Desktop
  (2553 - 86227, n=15, last 2 years)
39619 Points +91%
Apple MacBook Pro 16 2023 M2 Max
Apple M2 Max 38-Core GPU, Apple M2 Max
25103 Points +21%
Apple Mac Studio 2023 M2 Max
Apple M2 Max 30-Core GPU, Apple M2 Max
20692 Points
Average Apple M2 Max 30-Core GPU
  ()
20692 Points 0%
Apple Mac Studio 2022 M1 Max
Apple M1 Max 32-Core GPU, Apple M1 Max
20293 Points -2%
Apple MacBook Pro 16 2021 M1 Max
Apple M1 Max 32-Core GPU, Apple M1 Max
20228 Points -2%
Apple MacBook Pro 14 2021 M1 Max 24-Core GPU
Apple M1 Max 24-Core GPU, Apple M1 Max
15730 Points -24%
Apple MacBook Pro 14 2023 M2 Pro
Apple M2 Pro 19-Core GPU, Apple M2 Pro
12968 Points -37%
Apple Mac Mini M2
Apple M2 10-Core GPU, Apple M2
6987 Points -66%
GFXBench
3840x2160 4K Aztec Ruins High Tier Offscreen
Apple MacBook Pro 16 2023 M2 Max
Apple M2 Max 38-Core GPU, Apple M2 Max
179.9 fps +24%
Apple Mac Studio 2023 M2 Max
Apple M2 Max 30-Core GPU, Apple M2 Max
145.3 fps
Average Apple M2 Max 30-Core GPU
  ()
145.3 fps 0%
Apple MacBook Pro 16 2021 M1 Max
Apple M1 Max 32-Core GPU, Apple M1 Max
139.6 fps -4%
Apple MacBook Pro 14 2023 M2 Pro
Apple M2 Pro 19-Core GPU, Apple M2 Pro
92.1 fps -37%
Average of class Desktop
  (28.7 - 145.3, n=2, last 2 years)
87 fps -40%
Apple Mac Mini M2
Apple M2 10-Core GPU, Apple M2
48 fps -67%
2560x1440 Aztec Ruins High Tier Offscreen
Apple MacBook Pro 16 2023 M2 Max
Apple M2 Max 38-Core GPU, Apple M2 Max
397.6 fps +22%
Apple Mac Studio 2023 M2 Max
Apple M2 Max 30-Core GPU, Apple M2 Max
326.1 fps
Average Apple M2 Max 30-Core GPU
  ()
326 fps 0%
Apple MacBook Pro 16 2021 M1 Max
Apple M1 Max 32-Core GPU, Apple M1 Max
310.3 fps -5%
Apple Mac Studio 2022 M1 Max
Apple M1 Max 32-Core GPU, Apple M1 Max
308.5 fps -5%
Apple MacBook Pro 14 2021 M1 Max 24-Core GPU
Apple M1 Max 24-Core GPU, Apple M1 Max
240 fps -26%
Average of class Desktop
  (62.7 - 326, n=3, last 2 years)
232 fps -29%
Apple MacBook Pro 14 2023 M2 Pro
Apple M2 Pro 19-Core GPU, Apple M2 Pro
210.4 fps -35%
Apple Mac Mini M2
Apple M2 10-Core GPU, Apple M2
107.9 fps -67%
1920x1080 Aztec Ruins Normal Tier Offscreen
Apple MacBook Pro 16 2023 M2 Max
Apple M2 Max 38-Core GPU, Apple M2 Max
950 fps +11%
Average Apple M2 Max 30-Core GPU
  ()
853 fps 0%
Apple Mac Studio 2023 M2 Max
Apple M2 Max 30-Core GPU, Apple M2 Max
852.9 fps
Apple MacBook Pro 16 2021 M1 Max
Apple M1 Max 32-Core GPU, Apple M1 Max
752 fps -12%
Apple Mac Studio 2022 M1 Max
Apple M1 Max 32-Core GPU, Apple M1 Max
718.4 fps -16%
Apple MacBook Pro 14 2021 M1 Max 24-Core GPU
Apple M1 Max 24-Core GPU, Apple M1 Max
636 fps -25%
Average of class Desktop
  (155.2 - 853, n=3, last 2 years)
576 fps -32%
Apple MacBook Pro 14 2023 M2 Pro
Apple M2 Pro 19-Core GPU, Apple M2 Pro
565.3 fps -34%
Apple Mac Mini M2
Apple M2 10-Core GPU, Apple M2
289.5 fps -66%
1920x1080 Car Chase Offscreen
Apple MacBook Pro 16 2023 M2 Max
Apple M2 Max 38-Core GPU, Apple M2 Max
585.2 fps 0%
Apple Mac Studio 2023 M2 Max
Apple M2 Max 30-Core GPU, Apple M2 Max
585 fps
Average Apple M2 Max 30-Core GPU
  ()
585 fps 0%
Apple Mac Studio 2022 M1 Max
Apple M1 Max 32-Core GPU, Apple M1 Max
450.7 fps -23%
Apple MacBook Pro 14 2023 M2 Pro
Apple M2 Pro 19-Core GPU, Apple M2 Pro
434.4 fps -26%
Apple MacBook Pro 16 2021 M1 Max
Apple M1 Max 32-Core GPU, Apple M1 Max
424.2 fps -27%
Apple MacBook Pro 14 2021 M1 Max 24-Core GPU
Apple M1 Max 24-Core GPU, Apple M1 Max
416 fps -29%
Average of class Desktop
  (153.9 - 585, n=3, last 2 years)
397 fps -32%
Apple Mac Mini M2
Apple M2 10-Core GPU, Apple M2
232 fps -60%
Geekbench 5.5
OpenCL Score
Average of class Desktop
  (1233 - 350353, n=29, last 2 years)
128924 Points +82%
Apple MacBook Pro 16 2023 M2 Max
Apple M2 Max 38-Core GPU, Apple M2 Max
71726 Points +1%
Apple Mac Studio 2023 M2 Max
Apple M2 Max 30-Core GPU, Apple M2 Max
70890 Points
Average Apple M2 Max 30-Core GPU
  ()
70890 Points 0%
Apple Mac Studio 2022 M1 Max
Apple M1 Max 32-Core GPU, Apple M1 Max
64407 Points -9%
Apple MacBook Pro 16 2021 M1 Max
Apple M1 Max 32-Core GPU, Apple M1 Max
60482 Points -15%
Apple MacBook Pro 14 2021 M1 Max 24-Core GPU
Apple M1 Max 24-Core GPU, Apple M1 Max
51568 Points -27%
Apple MacBook Pro 14 2023 M2 Pro
Apple M2 Pro 19-Core GPU, Apple M2 Pro
46941 Points -34%
Apple Mac Mini M2
Apple M2 10-Core GPU, Apple M2
27965 Points -61%
Metal Score
Apple MacBook Pro 16 2023 M2 Max
Apple M2 Max 38-Core GPU, Apple M2 Max
86678 Points +12%
Apple Mac Studio 2023 M2 Max
Apple M2 Max 30-Core GPU, Apple M2 Max
77213 Points
Average Apple M2 Max 30-Core GPU
  ()
77213 Points 0%
Average of class Desktop
  (last 2 years)
77213 Points 0%
Apple MacBook Pro 16 2021 M1 Max
Apple M1 Max 32-Core GPU, Apple M1 Max
67868 Points -12%
Apple MacBook Pro 14 2021 M1 Max 24-Core GPU
Apple M1 Max 24-Core GPU, Apple M1 Max
58191 Points -25%
Apple MacBook Pro 14 2023 M2 Pro
Apple M2 Pro 19-Core GPU, Apple M2 Pro
52054 Points -33%
Apple Mac Mini M2
Apple M2 10-Core GPU, Apple M2
30556 Points -60%
Blender / v3.3 Classroom METAL
Apple MacBook Pro 14 2023 M2 Pro
Apple M2 Pro 19-Core GPU, Apple M2 Pro
97 Seconds * -17%
Apple Mac Studio 2023 M2 Max
Apple M2 Max 30-Core GPU, Apple M2 Max
83 Seconds *
Average Apple M2 Max 30-Core GPU
  ()
83 Seconds * -0%
Average of class Desktop
  (last 2 years)
83 Seconds * -0%
Apple MacBook Pro 16 2023 M2 Max
Apple M2 Max 38-Core GPU, Apple M2 Max
51.2 Seconds * +38%
Blender / v3.3 Classroom CPU
Average of class Desktop
  (128 - 2940, n=16, last 2 years)
399 Seconds * -22%
Apple MacBook Pro 14 2023 M2 Pro
Apple M2 Pro 19-Core GPU, Apple M2 Pro
331 Seconds * -2%
Apple MacBook Pro 16 2023 M2 Max
Apple M2 Max 38-Core GPU, Apple M2 Max
326 Seconds * -0%
Apple Mac Studio 2023 M2 Max
Apple M2 Max 30-Core GPU, Apple M2 Max
326 Seconds *
Average Apple M2 Max 30-Core GPU
  ()
326 Seconds * -0%

* ... smaller is better

Shadow of the Tomb Raider
1920x1080 High Preset AA:SM
Average of class Desktop
  (12.6 - 315, n=25, last 2 years)
189.2 fps +65%
Apple MacBook Pro 16 2023 M2 Max
Apple M2 Max, Apple M2 Max 38-Core GPU
122 fps +6%
Apple Mac Studio 2023 M2 Max
Apple M2 Max, Apple M2 Max 30-Core GPU
115 fps
Average Apple M2 Max 30-Core GPU
  ()
115 fps 0%
Apple MacBook Pro 16 2021 M1 Max
Apple M1 Max, Apple M1 Max 32-Core GPU
97 fps -16%
Apple Mac Studio 2022 M1 Max
Apple M1 Max, Apple M1 Max 32-Core GPU
97 fps -16%
Apple MacBook Pro 14 2021 M1 Max 24-Core GPU
Apple M1 Max, Apple M1 Max 24-Core GPU
79 fps -31%
Apple MacBook Pro 14 2023 M2 Pro
Apple M2 Pro, Apple M2 Pro 19-Core GPU
72 fps -37%
Apple Mac Mini M2
Apple M2, Apple M2 10-Core GPU
36 fps -69%
1920x1080 Highest Preset AA:T
Average of class Desktop
  (10.5 - 306, n=24, last 2 years)
194.9 fps +91%
Apple MacBook Pro 16 2023 M2 Max
Apple M2 Max, Apple M2 Max 38-Core GPU
109 fps +7%
Apple Mac Studio 2023 M2 Max
Apple M2 Max, Apple M2 Max 30-Core GPU
102 fps
Average Apple M2 Max 30-Core GPU
  ()
102 fps 0%
Apple Mac Studio 2022 M1 Max
Apple M1 Max, Apple M1 Max 32-Core GPU
88 fps -14%
Apple MacBook Pro 16 2021 M1 Max
Apple M1 Max, Apple M1 Max 32-Core GPU
87 fps -15%
Apple MacBook Pro 14 2021 M1 Max 24-Core GPU
Apple M1 Max, Apple M1 Max 24-Core GPU
77 fps -25%
Apple MacBook Pro 14 2023 M2 Pro
Apple M2 Pro, Apple M2 Pro 19-Core GPU
63 fps -38%
Apple Mac Mini M2
Apple M2, Apple M2 10-Core GPU
32 fps -69%
Total War: Three Kingdoms
1920x1080 High (incl textures)
Average of class Desktop
  (83 - 332, n=6, last 2 years)
221 fps +143%
Apple MacBook Pro 16 2023 M2 Max
Apple M2 Max, Apple M2 Max 38-Core GPU
96 fps +5%
Apple Mac Studio 2023 M2 Max
Apple M2 Max, Apple M2 Max 30-Core GPU
91 fps
Average Apple M2 Max 30-Core GPU
  ()
91 fps 0%
Apple Mac Studio 2022 M1 Max
Apple M1 Max, Apple M1 Max 32-Core GPU
83 fps -9%
Apple MacBook Pro 16 2021 M1 Max
Apple M1 Max, Apple M1 Max 32-Core GPU
80 fps -12%
Apple MacBook Pro 14 2021 M1 Max 24-Core GPU
Apple M1 Max, Apple M1 Max 24-Core GPU
62 fps -32%
Apple MacBook Pro 14 2023 M2 Pro
Apple M2 Pro, Apple M2 Pro 19-Core GPU
54 fps -41%
Apple Mac Mini M2
Apple M2, Apple M2 10-Core GPU
29.5 fps -68%
1920x1080 Ultra (incl textures)
Average of class Desktop
  (60 - 268, n=6, last 2 years)
163.5 fps +152%
Apple MacBook Pro 16 2023 M2 Max
Apple M2 Max, Apple M2 Max 38-Core GPU
71 fps +9%
Apple Mac Studio 2023 M2 Max
Apple M2 Max, Apple M2 Max 30-Core GPU
65 fps
Average Apple M2 Max 30-Core GPU
  ()
65 fps 0%
Apple Mac Studio 2022 M1 Max
Apple M1 Max, Apple M1 Max 32-Core GPU
60 fps -8%
Apple MacBook Pro 16 2021 M1 Max
Apple M1 Max, Apple M1 Max 32-Core GPU
59 fps -9%
Apple MacBook Pro 14 2021 M1 Max 24-Core GPU
Apple M1 Max, Apple M1 Max 24-Core GPU
46 fps -29%
Apple MacBook Pro 14 2023 M2 Pro
Apple M2 Pro, Apple M2 Pro 19-Core GPU
40 fps -38%
Apple Mac Mini M2
Apple M2, Apple M2 10-Core GPU
21.3 fps -67%
Borderlands 3
1920x1080 High Overall Quality (DX11)
Average of class Desktop
  (4.99 - 231, n=26, last 2 years)
136.6 fps +157%
Apple MacBook Pro 16 2023 M2 Max
Apple M2 Max, Apple M2 Max 38-Core GPU
60.2 fps +13%
Apple Mac Studio 2023 M2 Max
Apple M2 Max, Apple M2 Max 30-Core GPU
53.2 fps
Average Apple M2 Max 30-Core GPU
  ()
53.2 fps 0%
Apple MacBook Pro 16 2021 M1 Max
Apple M1 Max, Apple M1 Max 32-Core GPU
47.6 fps -11%
Apple Mac Studio 2022 M1 Max
Apple M1 Max, Apple M1 Max 32-Core GPU
46.1 fps -13%
Apple MacBook Pro 14 2021 M1 Max 24-Core GPU
Apple M1 Max, Apple M1 Max 24-Core GPU
40.7 fps -23%
Apple MacBook Pro 14 2023 M2 Pro
Apple M2 Pro, Apple M2 Pro 19-Core GPU
40 fps -25%
Apple Mac Mini M2
Apple M2, Apple M2 10-Core GPU
28 fps -47%
1920x1080 Badass Overall Quality (DX11)
Average of class Desktop
  (6.48 - 201, n=26, last 2 years)
129.9 fps +187%
Apple MacBook Pro 16 2023 M2 Max
Apple M2 Max, Apple M2 Max 38-Core GPU
48.6 fps +8%
Apple Mac Studio 2023 M2 Max
Apple M2 Max, Apple M2 Max 30-Core GPU
45.2 fps
Average Apple M2 Max 30-Core GPU
  ()
45.2 fps 0%
Apple MacBook Pro 16 2021 M1 Max
Apple M1 Max, Apple M1 Max 32-Core GPU
40.7 fps -10%
Apple Mac Studio 2022 M1 Max
Apple M1 Max, Apple M1 Max 32-Core GPU
39.6 fps -12%
Apple MacBook Pro 14 2021 M1 Max 24-Core GPU
Apple M1 Max, Apple M1 Max 24-Core GPU
34.6 fps -23%
Apple MacBook Pro 14 2023 M2 Pro
Apple M2 Pro, Apple M2 Pro 19-Core GPU
29 fps -36%
Apple Mac Mini M2
Apple M2, Apple M2 10-Core GPU
17.6 fps -61%
low med. high ultraQHD
Shadow of the Tomb Raider (2018) 115 102 69
Total War: Three Kingdoms (2019) 91 65 41.4
Borderlands 3 (2019) 53.2 45.2 35.1

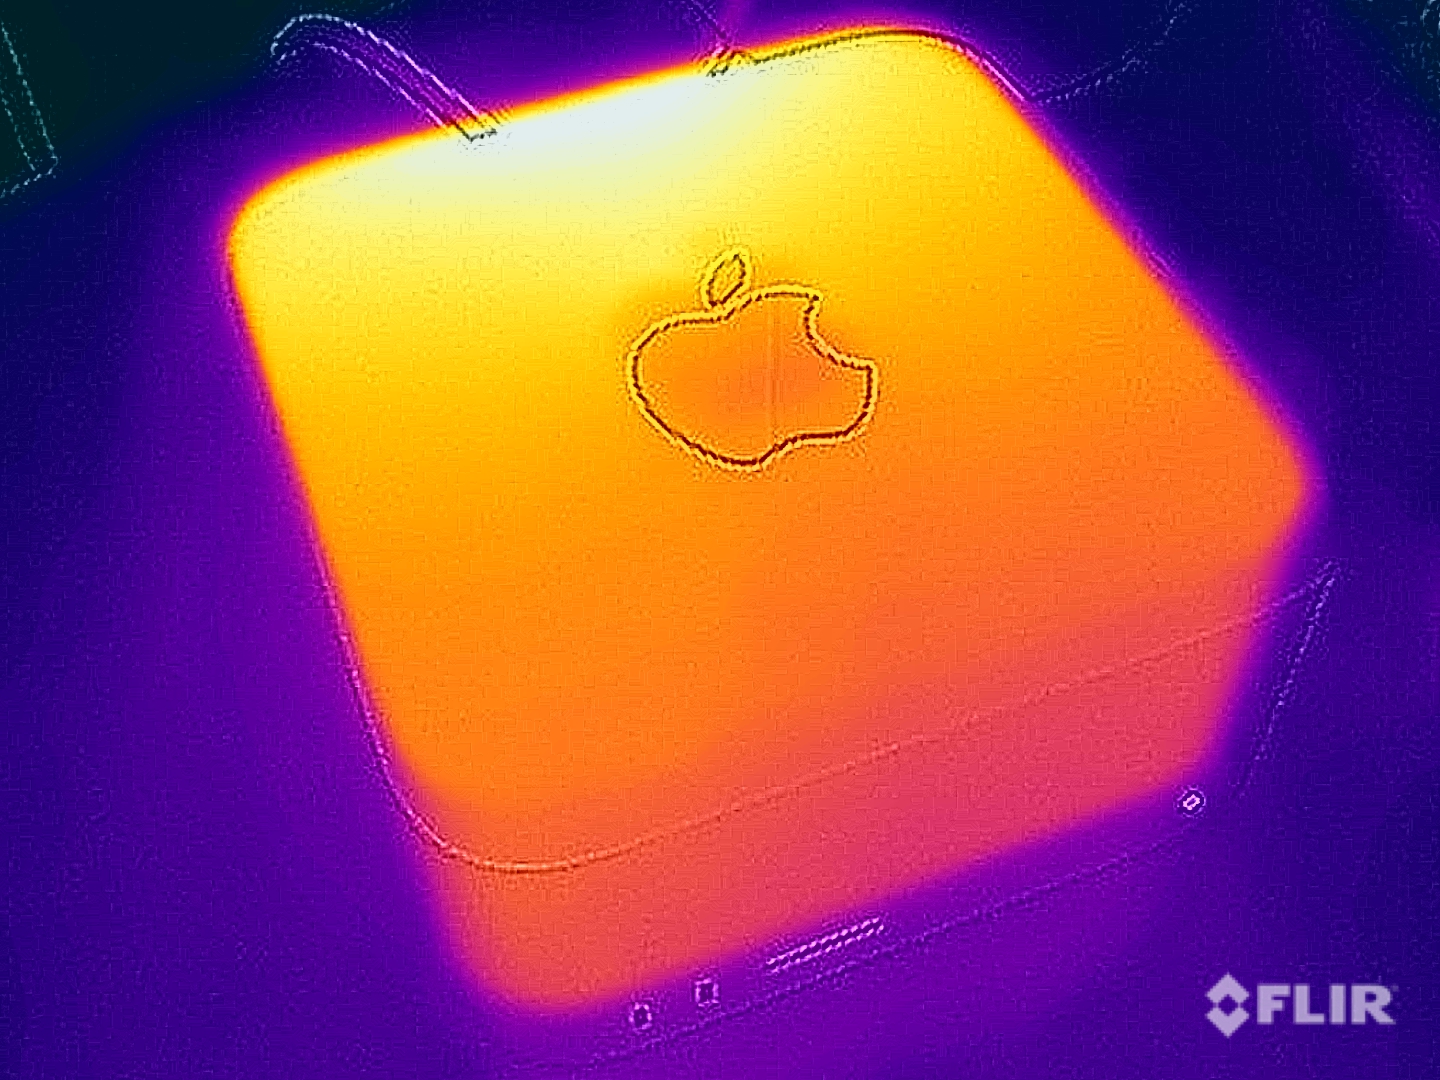
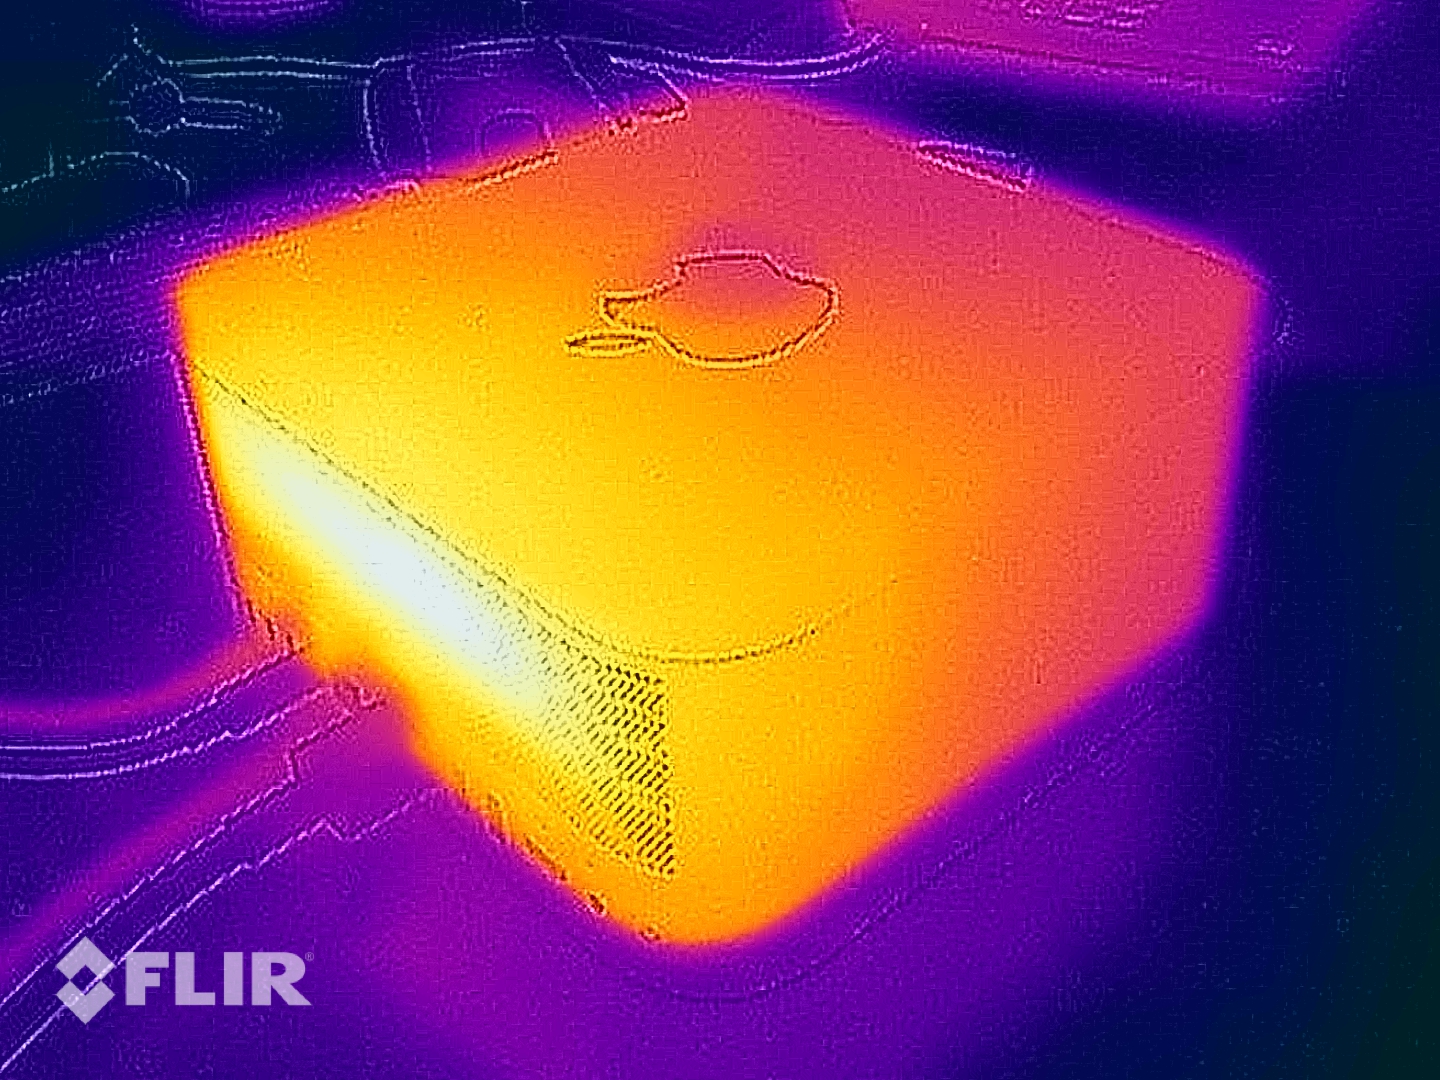
排放 - Mac Studio 几乎总是保持沉默

噪音排放

Mac Studio 使用两个风扇将热空气送出机箱。这些风扇的声音几乎听不到,因为即使在 CPU/GPU 满载的情况下,我们也只能测得安静的呼呼声(25 dB(A)),略高于环境噪音水平。只有在极其安静的房间里才能听到这种呼呼声。在以最高细节运行《生化危机村》时,我们实际上只测到了 24 dB(A),而且在导出 YouTube 评测视频时,Mac Studio 仍然保持安静。我们没有注意到任何其他电气噪音。

Noise Level

Idle
23.1 / 23.1 / 23.1 dB(A)
DVD
0 / dB(A)
Load
23.1 / 25 dB(A)
  red to green bar
 
 
30 dB
silent
40 dB(A)
audible
50 dB(A)
loud
 
min: dark, med: mid, max: light   Earthworks M23R, Arta (15 cm distance)   environment noise: 23.1 dB(A)
dB(A) 0102030405060708090Deep BassMiddle BassHigh BassLower RangeMidsHigher MidsLower HighsMid HighsUpper HighsSuper Highs2035.333.841.338.42527.830.631.929.33124.727.526.226.14027.627.426.629.9502523.523.423.26323.923.521.622.98021.120.119.220.610020.519.719.320.61252118.318.220.216019.516.717.21820021.319.617.420.325021.919.815.819.931522.115.514.719.140021.215.114.117.450015.912.212.814.763014.910.512.713.48001511.412.413.8100013.910.811.312.6125013.910.210.915.3160010.49.29.110.6200010.29.68.910.525009.811.19.310.7315010.110.39.811.4400010.911.910.41250001112.410.511.1630011.413.110.511.5800011.412.810.411.41000011.313.410.611.41250012.41410.512.11600011.914.69.712.7SPL25.724.123.125.2N0.70.60.50.7median 13.9median 12.8median 10.9median 12.7Delta4.52.52.22.9hearing rangehide median Fan NoiseApple Mac Studio 2023 M2 Max
Apple Mac Studio 2023 M2 Max
M2 Max 30-Core GPU, M2 Max, Apple SSD AP0512Z
Apple MacBook Pro 16 2023 M2 Max
M2 Max 38-Core GPU, M2 Max, Apple SSD AP2048Z
Apple Mac Studio 2022 M1 Max
M1 Max 32-Core GPU, M1 Max, Apple SSD AP2048R
Apple Mac Mini M2
M2 10-Core GPU, M2, Apple SSD AP0512Z
Apple MacBook Pro 14 2023 M2 Pro
M2 Pro 19-Core GPU, M2 Pro, Apple SSD AP2048Z
Intel NUC 13 Pro Desk Edition Kit
Iris Xe G7 96EUs, i7-1360P, Samsung PM9A1 MZVL2512HCJQ
Beelink SER7
Radeon 780M, R7 7840HS, Crucial P3 Plus CT1000P3PSSD8
Noise
-24%
-20%
-9%
-16%
-38%
-28%
off / environment *
23.1
23.9
-3%
23.8
-3%
24.7
-7%
23.9
-3%
25.2
-9%
24.5
-6%
Idle Minimum *
23.1
23.9
-3%
28.8
-25%
24.7
-7%
23.9
-3%
28.1
-22%
25.1
-9%
Idle Average *
23.1
23.9
-3%
28.8
-25%
24.7
-7%
23.9
-3%
28.2
-22%
25.1
-9%
Idle Maximum *
23.1
23.9
-3%
28.8
-25%
24.7
-7%
23.9
-3%
28.3
-23%
25.1
-9%
Load Average *
23.1
36.6
-58%
28.8
-25%
24.7
-7%
26
-13%
42
-82%
35.9
-55%
Load Maximum *
25
43.2
-73%
28.8
-15%
29.4
-18%
43.2
-73%
42.1
-68%
45.4
-82%
Witcher 3 ultra *
35.1
28.8
35.6

* ... smaller is better

温度

当然,与笔记本电脑相比,台式电脑的表面温度并不太重要,但即便如此,Mac Studio 也无需担心。在日常使用中,机箱温度几乎保持不变,即使在一小时的压力测试后,我们测得机箱顶部最高温度为 38 °C,风扇出口处最高温度为 42 °C。这些温度完全没有问题。

应力测试表面温度(顶部)
应力测试表面温度(顶部)
压力测试表面温度(背面)
压力测试表面温度(背面)

发言人

Mac Mini,Apple 在 Mac Studio 中安装了一个扬声器,听起来还不错。如果你对音效的要求不高,那么这个扬声器就完全够用了--不过,与优秀的笔记本电脑音响系统相比,Mac Studio 并不占优势。我们始终建议你连接外置扬声器。

dB(A) 0102030405060708090Deep BassMiddle BassHigh BassLower RangeMidsHigher MidsLower HighsMid HighsUpper HighsSuper Highs2041.3362531.935.43126.229.54026.629.35023.427.16321.627.98019.22710019.334.312518.247.416017.247.620017.448.825015.850.231514.753.940014.156.750012.85863012.75480012.463.6100011.364.6125010.966.816009.164.920008.968.125009.366.131509.862400010.468.1500010.568.2630010.565.6800010.461.51000010.659.81250010.559.6160009.760.2SPL23.177.3N0.539.4median 10.9median 60.2Delta2.26.626.325.821.422.12624.925.127.622.532.523.448.72655.818.860.922.167.2267019.372.317.674.217.774.319.575.31571.711.871.311.27410.574.21072.710.17210.67210.97511.374.811.671.71269.71269.612.371.112.669.61270.111.269.824.784.70.666.6median 12median 71.73.42.2hearing rangehide median Pink NoiseApple Mac Studio 2023 M2 MaxApple MacBook Pro 16 2021 M1 Pro
Frequency diagram (checkboxes can be checked and unchecked to compare devices)
Apple Mac Studio 2023 M2 Max audio analysis

(±) | speaker loudness is average but good (77.3 dB)
Bass 100 - 315 Hz
(±) | reduced bass - on average 13.1% lower than median
(±) | linearity of bass is average (9.1% delta to prev. frequency)
Mids 400 - 2000 Hz
(+) | balanced mids - only 4.9% away from median
(+) | mids are linear (6.6% delta to prev. frequency)
Highs 2 - 16 kHz
(+) | balanced highs - only 4.4% away from median
(+) | highs are linear (6% delta to prev. frequency)
Overall 100 - 16.000 Hz
(±) | linearity of overall sound is average (15.2% difference to median)
Compared to same class
» 50% of all tested devices in this class were better, 13% similar, 38% worse
» The best had a delta of 6%, average was 17%, worst was 46%
Compared to all devices tested
» 18% of all tested devices were better, 4% similar, 79% worse
» The best had a delta of 4%, average was 25%, worst was 134%

Apple MacBook Pro 16 2021 M1 Pro audio analysis

(+) | speakers can play relatively loud (84.7 dB)
Bass 100 - 315 Hz
(+) | good bass - only 3.8% away from median
(+) | bass is linear (5.2% delta to prev. frequency)
Mids 400 - 2000 Hz
(+) | balanced mids - only 1.3% away from median
(+) | mids are linear (2.1% delta to prev. frequency)
Highs 2 - 16 kHz
(+) | balanced highs - only 1.9% away from median
(+) | highs are linear (2.7% delta to prev. frequency)
Overall 100 - 16.000 Hz
(+) | overall sound is linear (4.6% difference to median)
Compared to same class
» 0% of all tested devices in this class were better, 0% similar, 100% worse
» The best had a delta of 5%, average was 18%, worst was 45%
Compared to all devices tested
» 0% of all tested devices were better, 0% similar, 100% worse
» The best had a delta of 4%, average was 25%, worst was 134%

电源管理 - 待机功耗高

耗电量

在我们的耗电量测量中,全新 Mac Studio 在空闲模式下变得更加节俭,但其 1.5 瓦的待机耗电量还是有点高。即使在关机状态下,电脑的耗电量仍为 0.63 瓦。在负载情况下,游戏时的耗电量为 85-90 瓦,极端情况下约为 110 瓦。

Power Consumption
Off / Standbydarklight 0.63 / 1.5 Watt
Idledarkmidlight 7.2 / / 9.2 Watt
Load midlight 63.5 / 111.5 Watt
 color bar
Key: min: dark, med: mid, max: light        Metrahit Energy
Currently we use the Metrahit Energy, a professional single phase power quality and energy measurement digital multimeter, for our measurements. Find out more about it here. All of our test methods can be found here.
Apple Mac Studio 2023 M2 Max
M2 Max, M2 Max 30-Core GPU, Apple SSD AP0512Z, , x,
Apple MacBook Pro 16 2023 M2 Max
M2 Max, M2 Max 38-Core GPU, Apple SSD AP2048Z, Mini-LED, 3456x2234, 16.20
Apple Mac Studio 2022 M1 Max
M1 Max, M1 Max 32-Core GPU, Apple SSD AP2048R, , x,
Apple Mac Mini M2
M2, M2 10-Core GPU, Apple SSD AP0512Z, , x,
Apple MacBook Pro 14 2023 M2 Pro
M2 Pro, M2 Pro 19-Core GPU, Apple SSD AP2048Z, Mini-LED, 3024x1964, 14.20
Intel NUC 13 Pro Desk Edition Kit
i7-1360P, Iris Xe G7 96EUs, Samsung PM9A1 MZVL2512HCJQ, , x,
Beelink SER7
R7 7840HS, Radeon 780M, Crucial P3 Plus CT1000P3PSSD8, , x,
Average Apple M2 Max 30-Core GPU
 
Average of class Desktop
 
Power Consumption
-41%
-17%
63%
15%
4%
-1%
0%
-121%
Idle Minimum *
7.2
5.2
28%
2.2
69%
2.4
67%
7
3%
6.7
7%
7.2 ?()
-0%
Idle Maximum *
9.2
16.8
-83%
11.6
-26%
2.6
72%
11.5
-25%
11.8
-28%
11.6
-26%
9.2 ?()
-0%
Load Average *
63.5
113
-78%
78.6
-24%
28.7
55%
59.6
6%
45
29%
64.1
-1%
63.5 ?()
-0%
Load Maximum *
111.5
145
-30%
114
-2%
51.5
54%
100
10%
97.2
13%
94.8
15%
111.5 ?()
-0%
Idle Average *
16.5
11.3
9.2
7.3
Witcher 3 ultra *
92
55.9
75.8

* ... smaller is better

Power consumption with external monitor

0510152025303540455055606570758085Tooltip
Apple Mac Studio 2023 M2 Max; Cinebench R23 Single (external Monitor): Ø19.4 (15.6-22.9)
Apple Mac Studio 2023 M2 Max; Cinebench R23 Multi (external Monitor): Ø50.7 (49-53.4)
Apple Mac Studio 2023 M2 Max; 1920x1080 The Witcher 3 ultra (external Monitor): Ø83.7 (79-86.4)
Apple Mac Studio 2023 M2 Max; Idle 1min (external Monitor): Ø9.23 (7.67-10.5)

Pros

+ 快速高效的 M2 Max SoC
+ 雷电 4 和 Wi-Fi 6E
+ 即使在高负载情况下也几乎听不到声音
+ 丰富的软件功能
+ 高品质外壳
+ 正面的连接选项
+ 集成电源

Cons

- 没有维护选项
- 内存和固态硬盘升级费用高昂
- 保修期仅为 1 年

评价:Mac Studio 速度快、噪音低,但价格昂贵

Apple Mac Studio 评论。测试设备由提供:

AppleMac Studio 的 M2 Max SoC 也给我们留下了深刻的印象。这款小巧的台式电脑即使用于复杂的任务,如视频编辑和针对Apple 的 ARM SoC 进行了优化的本地应用,也能提供出色的性能。同时,这款小巧的设备在任何情况下都非常安静,即使在负载情况下,两个风扇也只会发出几乎听不到的呼呼声。对于它的连接选项,我们也没有什么负面意见--它配备了多个 Thunderbolt 4 端口以及标准的 10 Gbit/s 以太网连接。与小型 Mac Mini 不同的是,这款设备还配备了两个 USB-C 端口,正面还有一个快速读卡器。

Mac Studio 的核心可能是台式电脑,但其M2 Max是与 MacBook Pro 型号相同的移动处理器。MacBook Pro 的移动处理器。你还可以选择配备 M2 Ultra 的 Mac,它结合了两个 M2 Max SoC,再次大大提高了性能水平。即便如此,英特尔、AMD 或 Nvidia 的真正台式机部件在纯粹的性能方面要好得多,但在如此小巧的设备中也找不到这样的部件。

现代化的连接选项、出色的性能和几乎无声的运行:Apple Mac Studio 确实是一款出色的紧凑型台式电脑,但这也是有代价的。此外,该设备没有任何维护选项。

与 MacBook Pro 机型类似,我们对 Mac Studio 只有两点主要的批评意见。它虽然是台式电脑,但却没有任何维护选项。同样,我们也不得不提到基本机型的功能。32 GB 内存可能足够了,但 512 GB 的小型固态硬盘却不够用,速度也无法与大型固态硬盘相提并论。我们认为,基本型号应该配备 1 TB 的固态硬盘。

这就引出了第二个问题,即升级及其高昂的附加费用。当然,这台小巧的电脑可以升级到8 TB的固态硬盘存储空间是件好事,但Apple ,从512 GB升级到1 TB的价格却高得离谱。比较一下:1 TB 版本的超高速三星 980 Pro 目前售价约为 75 美元。

Download your licensed rating image as SVG / PNG

价格和供应情况

我们的测试版Apple Mac Studio 在亚马逊上的售价为 1,999 美元。

Apple Mac Studio 2023 M2 Max - 09/19/2023 v7
Andreas Osthoff

Chassis
84 / 98 → 86%
Connectivity
64 / 81 → 79%
Weight
58%
Games Performance
99%
Application Performance
98%
Temperature
80%
Noise
100%
Audio
79%
Average
83%
92%
Desktop - Weighted Average

Transparency

The present review sample was made available to the author as a loan by the manufacturer or a shop for the purposes of review. The lender had no influence on this review, nor did the manufacturer receive a copy of this review before publication. There was no obligation to publish this review.

Pricecompare

Please share our article, every link counts!
> Notebookcheck中文版(NBC中国) > 评测 > Apple Mac Studio 2023 评测:M2 Max 也是令人印象深刻的桌面设备
Andreas Osthoff, 2023-09-21 (Update: 2023-09-21)