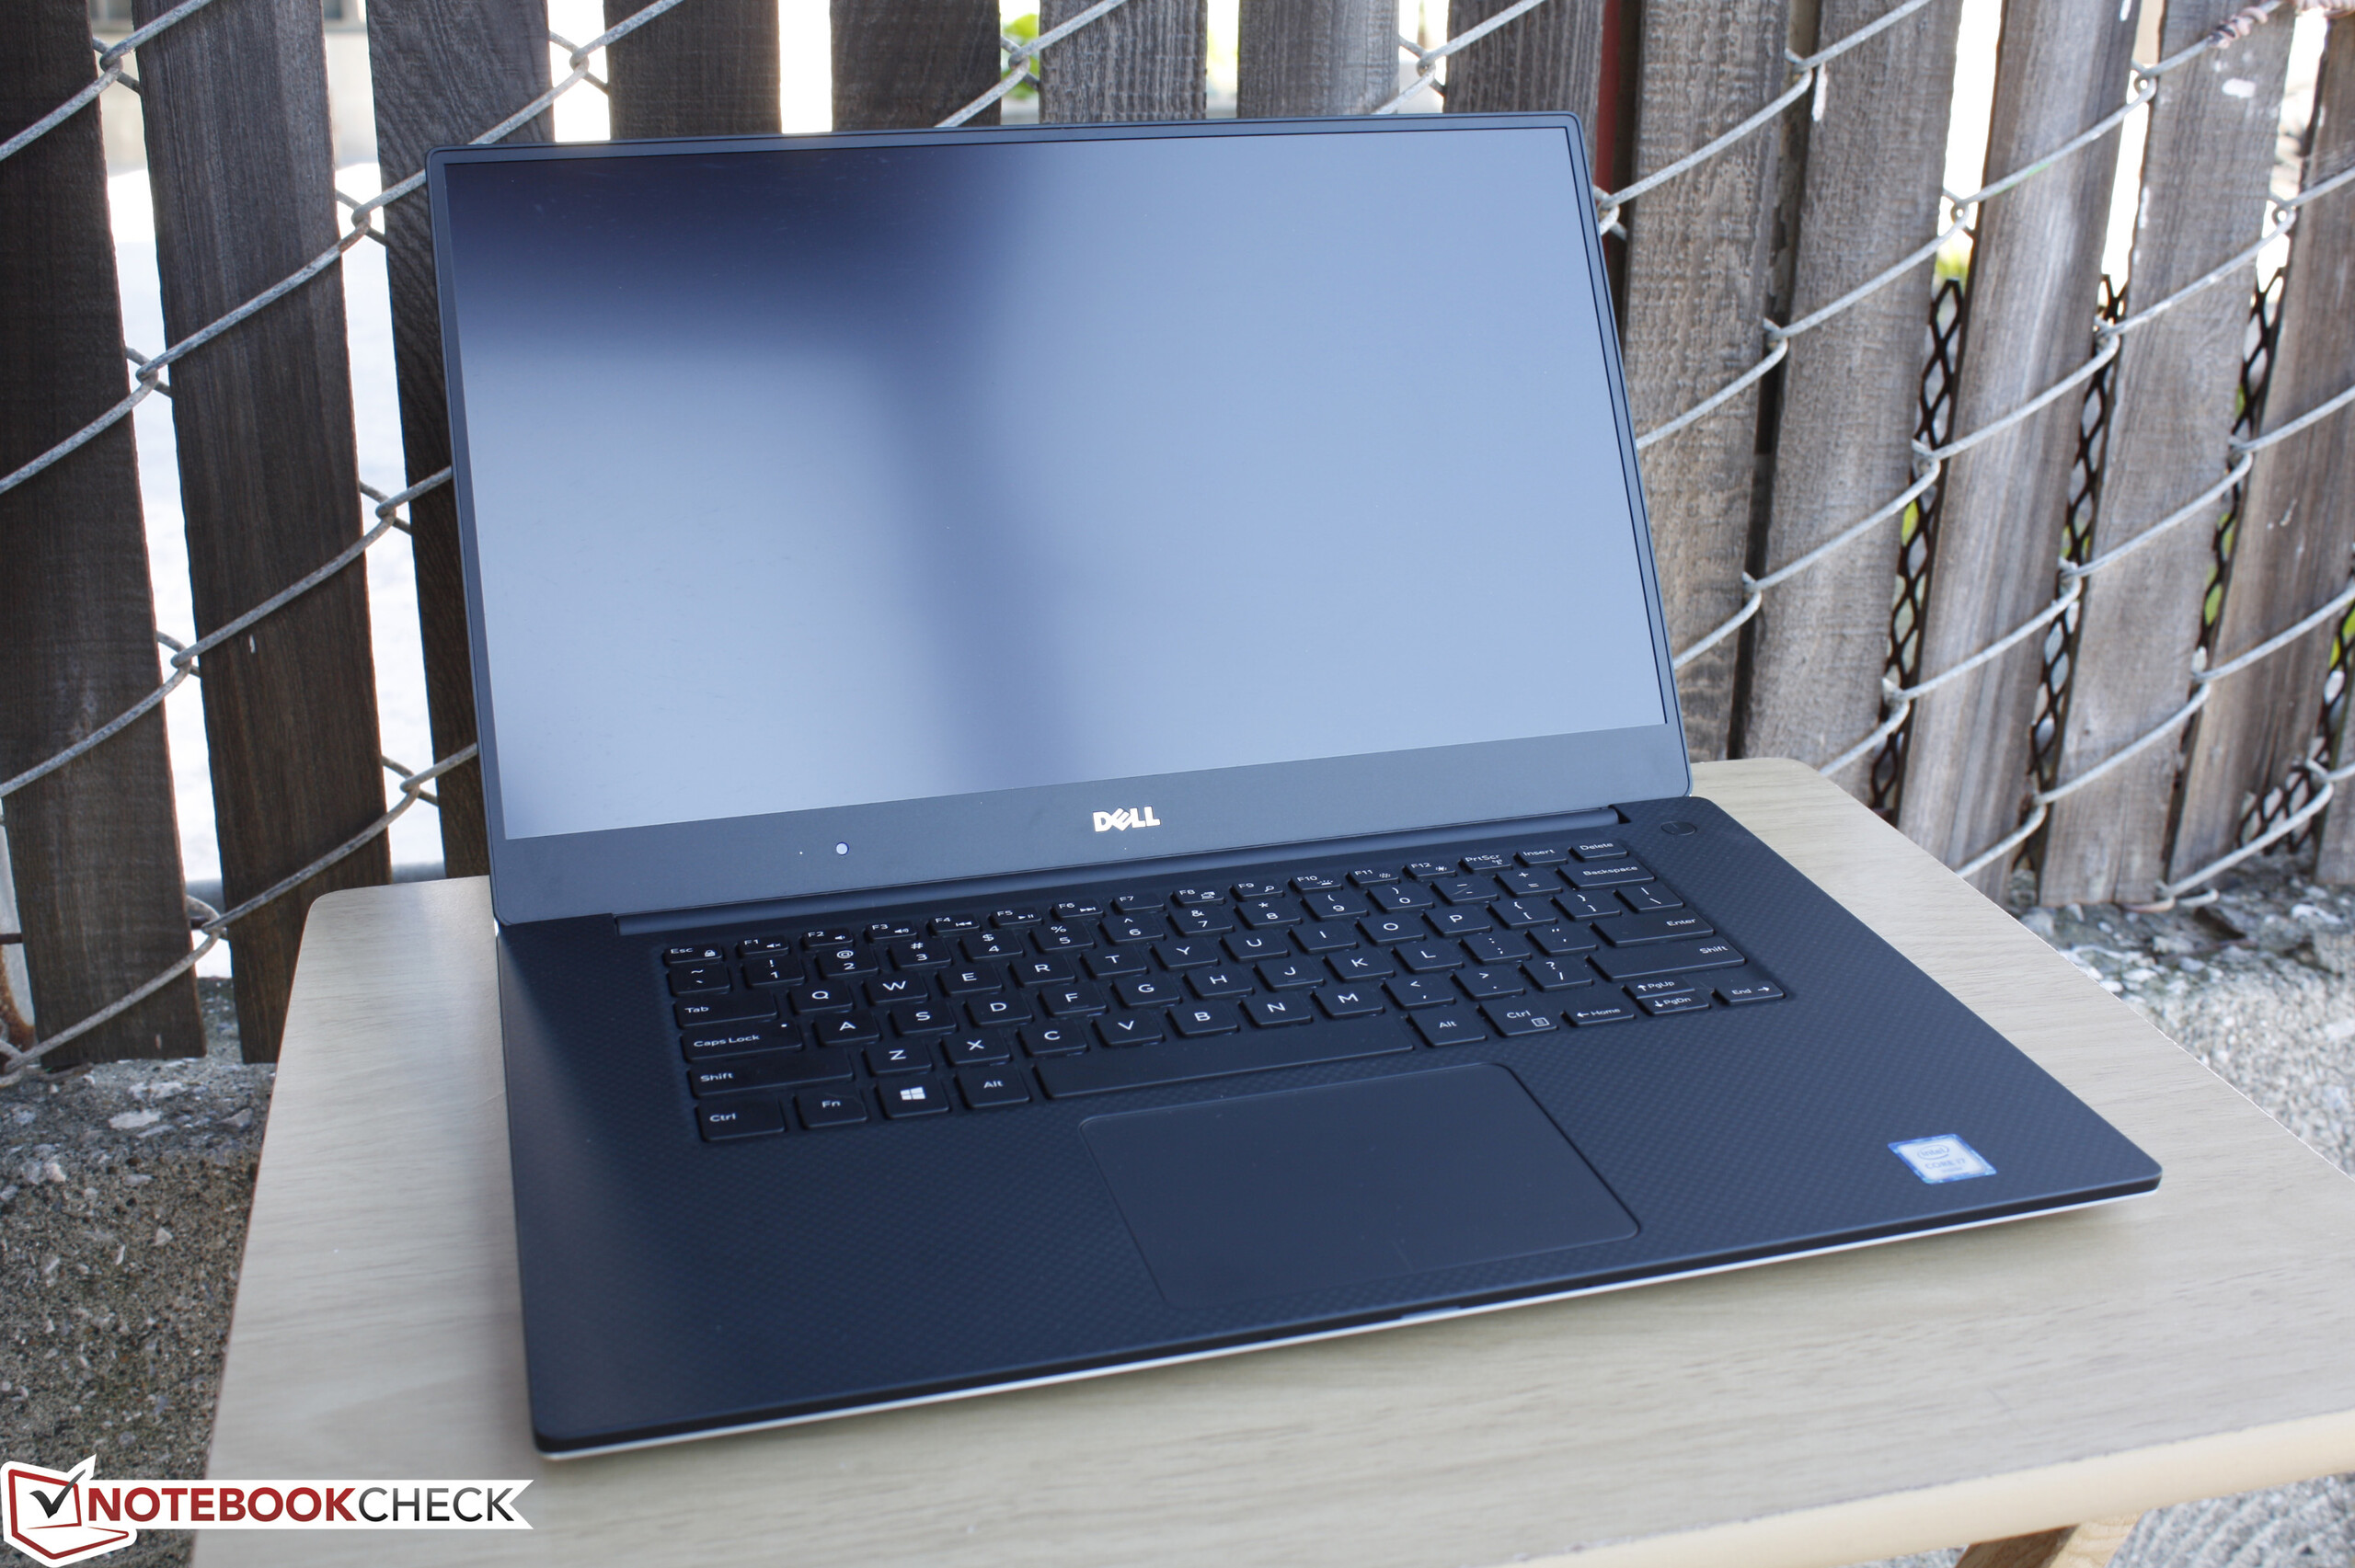
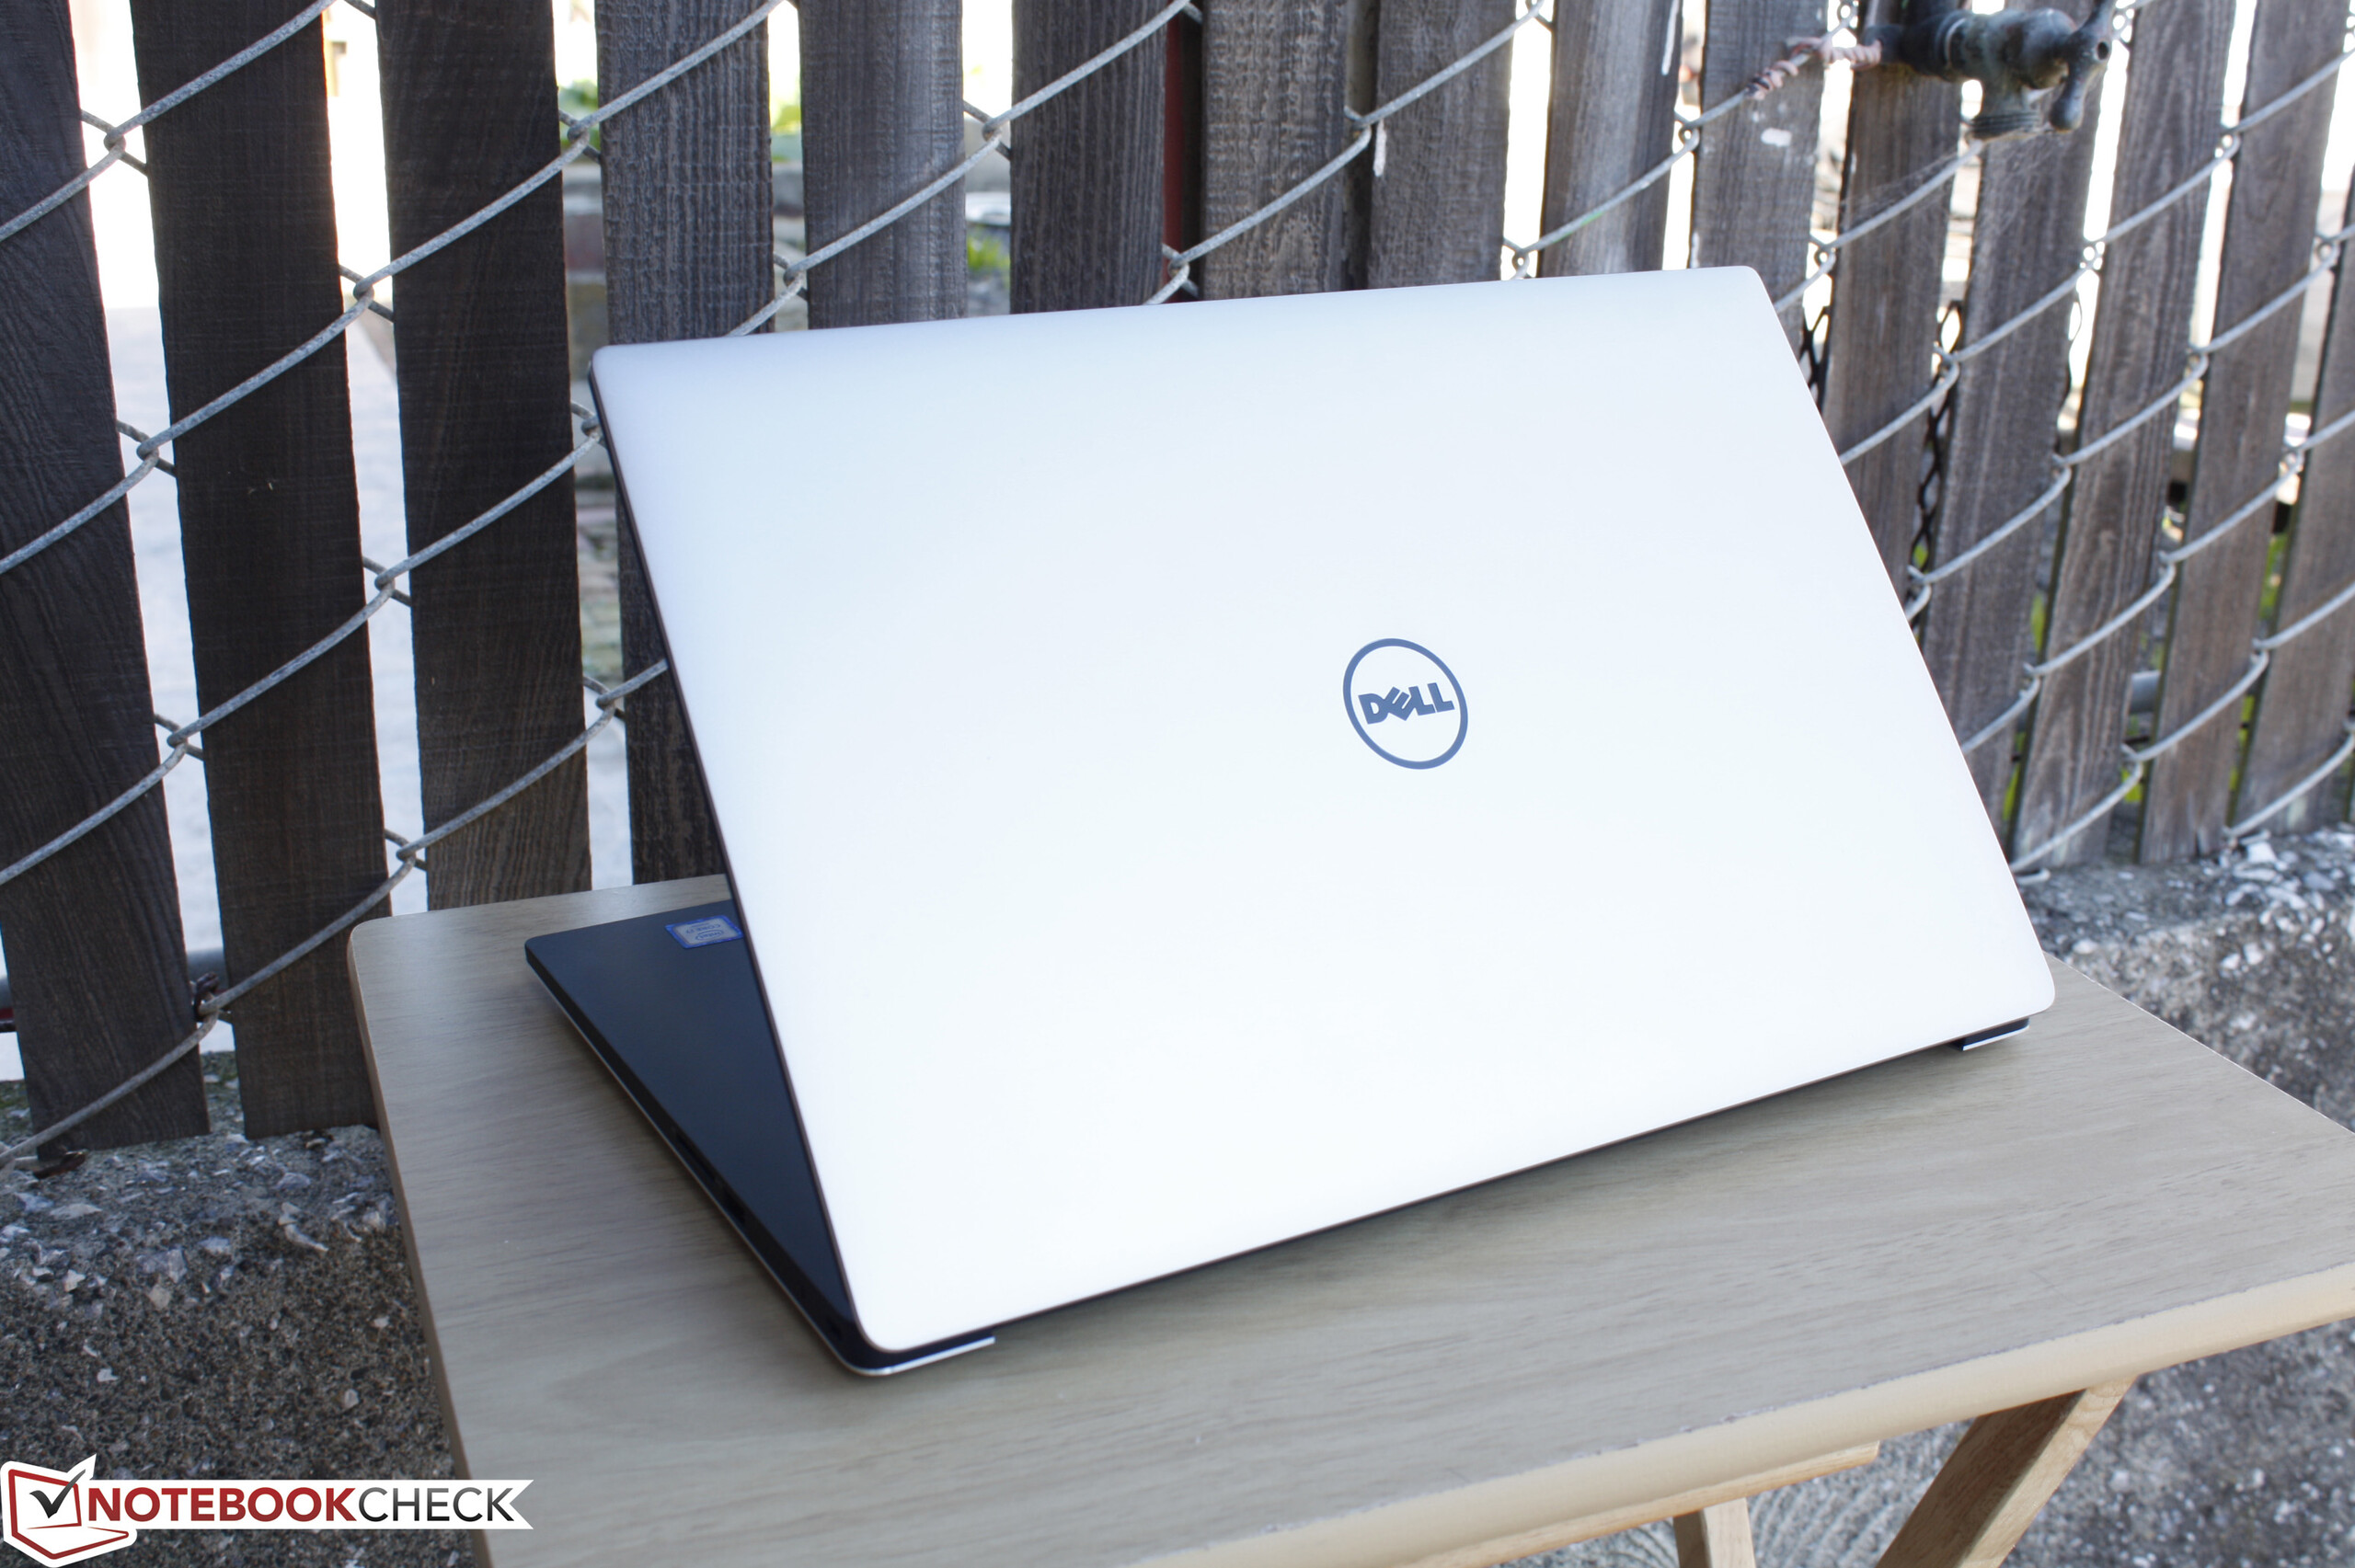
戴尔 XPS 15 9550 (Core i7, FHD) 笔记本电脑简短评测
Dell XPS 15 9550 i7 FHD (XPS 15 Series)
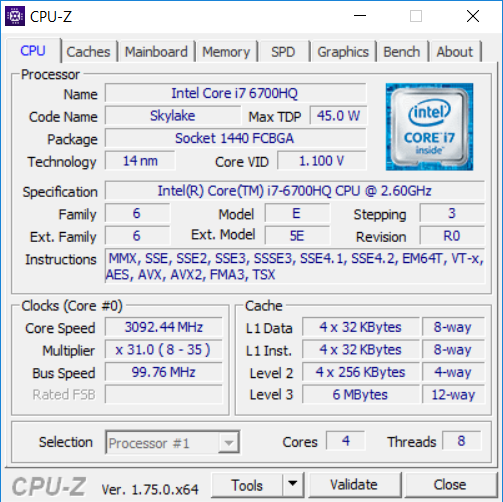
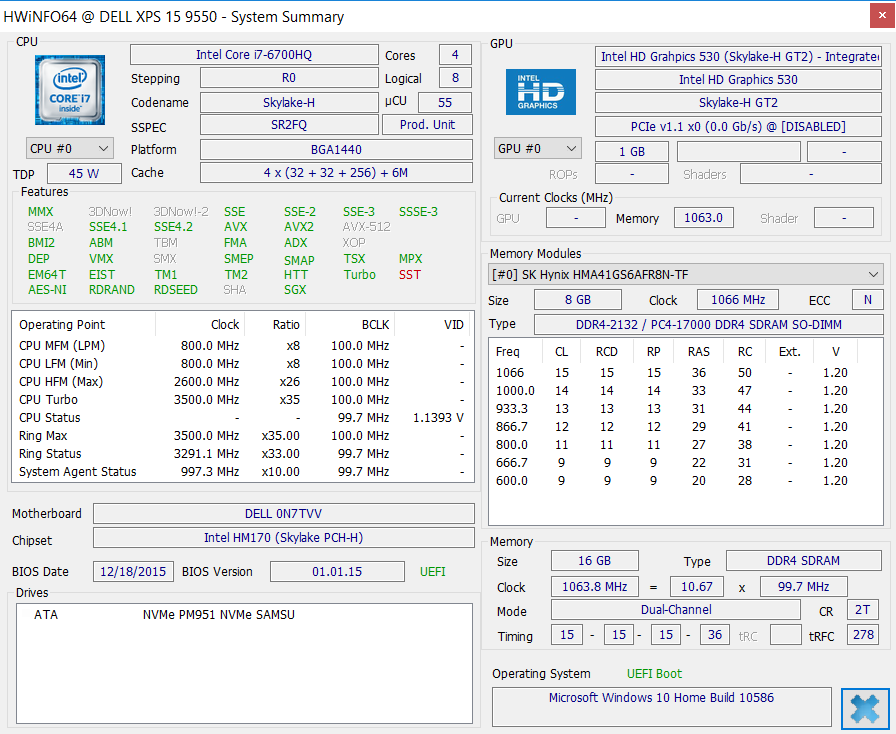
Processor
Intel Core i7-6700HQ 4c/8t 4 x 2.6 - 3.5 GHz, Skylake
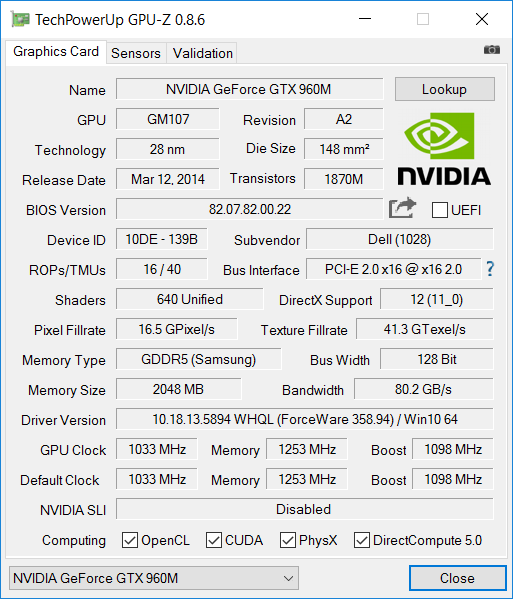
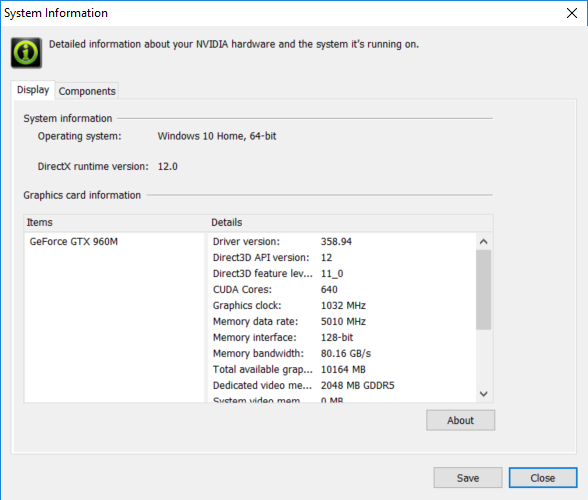
Graphics adapter
NVIDIA GeForce GTX 960M - 2048 MB VRAM, Core: 1032 MHz, RAM: 5010 MHz, 358.94, Optimus
Memory
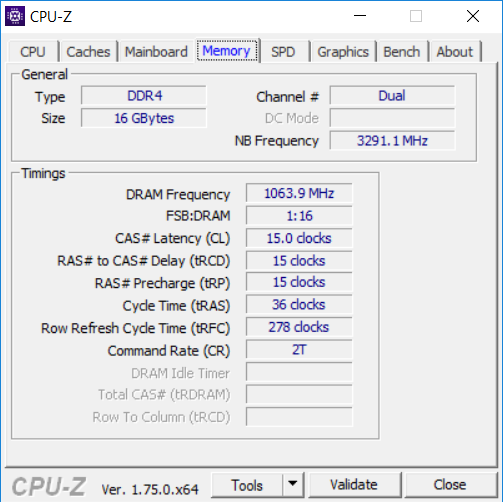
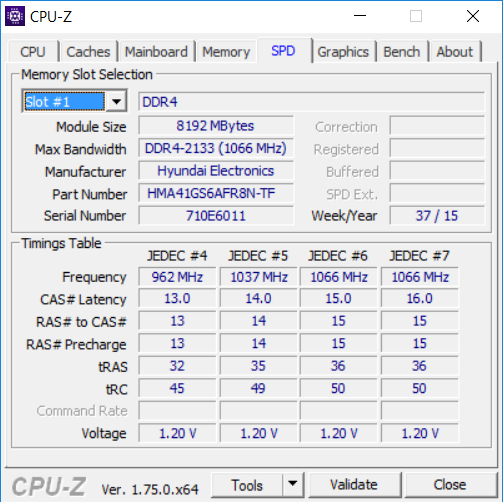
16 GB
, DDR4, 1066.1 MHz, 双通道, 15-15-15-36
Display
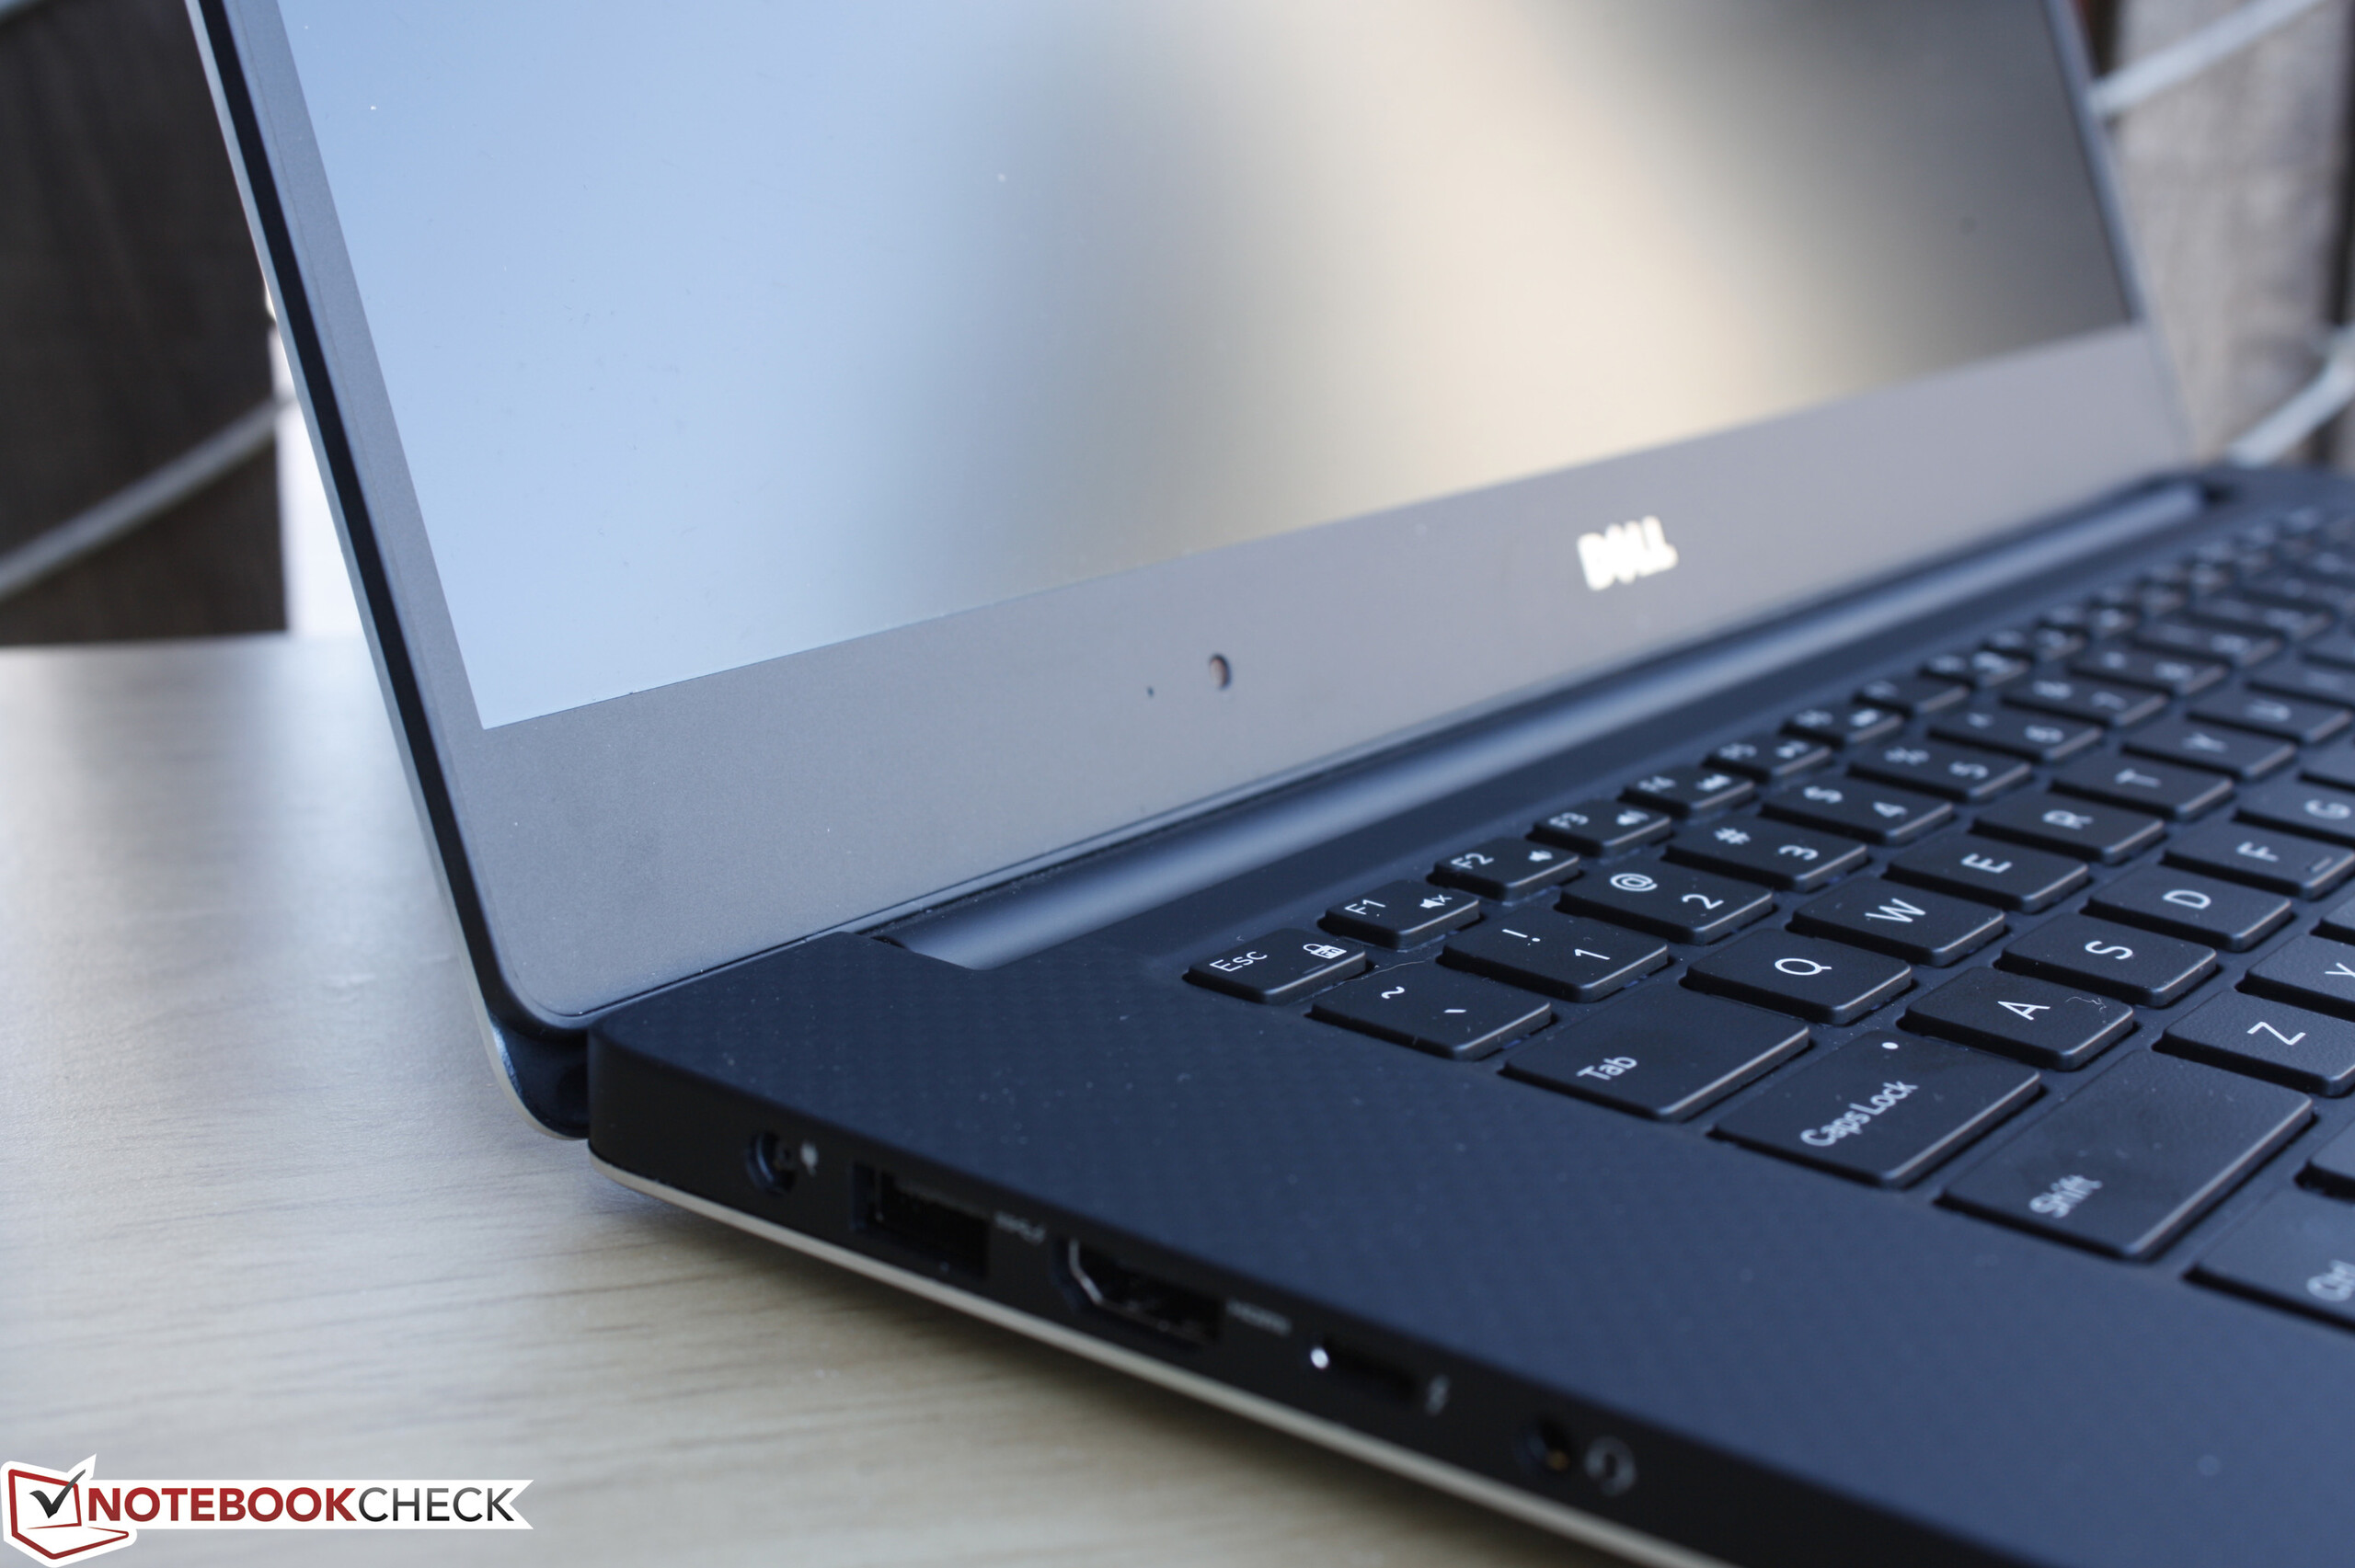
15.60 inch 16:9, 1920 x 1080 pixel, IPS, 显示器 ID: 夏普 SHP1453, 型号: LQ156M1, 戴尔 P/N: 1203M, glossy: no
Mainboard
Intel HM170 (Skylake PCH-H)
Storage
Samsung PM951 NVMe 512 GB, 512 GB
Weight
1.963 kg, Power Supply: 458 g
Price
1800 USD
Note: The manufacturer may use components from different suppliers including display panels, drives or memory sticks with similar specifications.
| |||||||||||||||||||||||||
tested with X-Rite i1Pro Basic 2
Maximum: 371.5 cd/m² (Nits) Average: 356.5 cd/m² Minimum: 15.1 cd/m²Brightness Distribution: 92 %
Center on Battery: 371.5 cd/m²
Contrast: 1474:1 (Black: 0.252 cd/m²)
ΔE ColorChecker Calman: 5.55 | ∀{0.5-29.43 Ø4.72}
ΔE Greyscale Calman: 7.1 | ∀{0.09-98 Ø4.97}
97.9% sRGB (Argyll 1.6.3 3D)
63.4% AdobeRGB 1998 (Argyll 1.6.3 3D)
70.4% AdobeRGB 1998 (Argyll 3D)
97.2% sRGB (Argyll 3D)
68.5% Display P3 (Argyll 3D)
Gamma: 2.1
| Dell XPS 15 9550 i7 FHD 15.6", 1920x1080 | Dell XPS 15-9550 i7 15.6", 3840x2160 | Dell XPS 15 2016 9550 15.6", 1920x1080 | Dell XPS 15 (9530-0538) 15.6", 3840x2160 | Dell XPS 15 (Late 2013) 15.6", 3200x1800 | Dell XPS 13 2016 i7 256GB QHD 13.3", 3200x1800 | |
|---|---|---|---|---|---|---|
| Display | 24% | 0% | -4% | 3% | -6% | |
| Display P3 Coverage (%) | 68.5 | 87.8 28% | 68.8 0% | 64.9 -5% | 72.6 6% | 63.6 -7% |
| sRGB Coverage (%) | 97.2 | 100 3% | 97.9 1% | 96.1 -1% | 96.1 -1% | 93.6 -4% |
| AdobeRGB 1998 Coverage (%) | 70.4 | 99.4 41% | 70.7 0% | 66.9 -5% | 72.9 4% | 65.5 -7% |
| Response Times | 20% | 12% | 39% | |||
| Response Time Grey 50% / Grey 80% * (ms) | 64 ? | 58 ? 9% | 62 ? 3% | 40 ? 37% | ||
| Response Time Black / White * (ms) | 50 ? | 35 ? 30% | 40 ? 20% | 30 ? 40% | ||
| PWM Frequency (Hz) | 362 ? | 4900 ? | ||||
| Screen | -2% | 1% | 6% | -6% | 2% | |
| Brightness middle (cd/m²) | 371.5 | 361 -3% | 399 7% | 349 -6% | 349 -6% | 285 -23% |
| Brightness (cd/m²) | 356 | 344 -3% | 394 11% | 365 3% | 322 -10% | 281 -21% |
| Brightness Distribution (%) | 92 | 90 -2% | 89 -3% | 87 -5% | 83 -10% | 90 -2% |
| Black Level * (cd/m²) | 0.252 | 0.38 -51% | 0.24 5% | 0.282 -12% | 0.21 17% | 0.18 29% |
| Contrast (:1) | 1474 | 950 -36% | 1663 13% | 1238 -16% | 1662 13% | 1583 7% |
| Colorchecker dE 2000 * | 5.55 | 5.34 4% | 5.95 -7% | 2.65 52% | 8.27 -49% | 4.89 12% |
| Colorchecker dE 2000 max. * | 10.95 | |||||
| Greyscale dE 2000 * | 7.1 | 4.84 32% | 8.41 -18% | 3.77 47% | 7.99 -13% | 5.16 27% |
| Gamma | 2.1 105% | 2.21 100% | 2.35 94% | 2.41 91% | 3.42 64% | 2.15 102% |
| Color Space (Percent of AdobeRGB 1998) (%) | 63.4 | 89 40% | 64 1% | 61.02 -4% | 69.08 9% | 59 -7% |
| Color Space (Percent of sRGB) (%) | 97.9 | 100 2% | 98 0% | 96.1 -2% | 93 -5% | |
| CCT | 7395 88% | 7010 93% | 6786 96% | 8117 80% | 7106 91% | |
| Total Average (Program / Settings) | 14% /
7% | 4% /
2% | 1% /
4% | -2% /
-4% | 12% /
5% |
* ... smaller is better
Display Response Times
ℹ
Display response times show how fast the screen is able to change from one color to the next. Slow response times can lead to afterimages and can cause moving objects to appear blurry (ghosting). Gamers of fast-paced 3D titles should pay special attention to fast response times.| ↔ Response Time Black to White | ||
|---|---|---|
| 50 ms ... rise ↗ and fall ↘ combined | ↗ 12 ms rise | 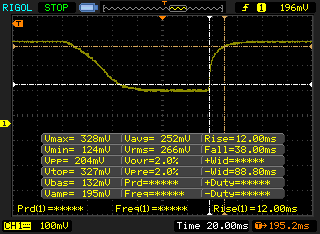 |
| ↘ 38 ms fall | ||
| The screen shows slow response rates in our tests and will be unsatisfactory for gamers. In comparison, all tested devices range from 0.1 (minimum) to 240 (maximum) ms. » 99 % of all devices are better. This means that the measured response time is worse than the average of all tested devices (19.8 ms). | ||
| ↔ Response Time 50% Grey to 80% Grey | ||
| 64 ms ... rise ↗ and fall ↘ combined | ↗ 27 ms rise | 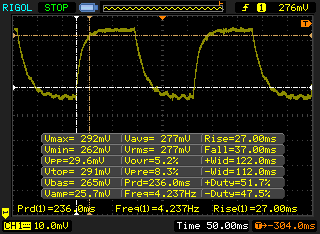 |
| ↘ 37 ms fall | ||
| The screen shows slow response rates in our tests and will be unsatisfactory for gamers. In comparison, all tested devices range from 0.165 (minimum) to 636 (maximum) ms. » 97 % of all devices are better. This means that the measured response time is worse than the average of all tested devices (31 ms). | ||
| Cinebench R11.5 | |
| CPU Single 64Bit (sort by value) | |
| Dell XPS 15 9550 i7 FHD | |
| Dell XPS 15-9550 i7 | |
| Dell XPS 15 (9530-0538) | |
| Dell XPS 15 (L521x) PL | |
| Dell XPS 15 2016 9550 | |
| CPU Multi 64Bit (sort by value) | |
| Dell XPS 15 9550 i7 FHD | |
| Dell XPS 15-9550 i7 | |
| Dell XPS 15 (9530-0538) | |
| Dell XPS 15 (L521x) PL | |
| Dell XPS 15 2016 9550 | |
| Cinebench R10 | |
| Rendering Single CPUs 64Bit (sort by value) | |
| Dell XPS 15-9550 i7 | |
| Dell XPS 15 (9530-0538) | |
| Dell XPS 15 (L521x) PL | |
| Dell XPS 15 2016 9550 | |
| Rendering Multiple CPUs 64Bit (sort by value) | |
| Dell XPS 15-9550 i7 | |
| Dell XPS 15 (9530-0538) | |
| Dell XPS 15 (L521x) PL | |
| Dell XPS 15 2016 9550 | |
| Super Pi Mod 1.5 XS 32M - 32M (sort by value) | |
| Dell XPS 15 9550 i7 FHD | |
| Dell XPS 15 (L521x) PL | |
| wPrime 2.10 - 1024m (sort by value) | |
| Dell XPS 15 9550 i7 FHD | |
* ... smaller is better
| PCMark 7 - Score (sort by value) | |
| Dell XPS 15 9550 i7 FHD | |
| Dell XPS 15 (9530-0538) | |
| Dell XPS 15-9550 i7 | |
| Dell XPS 15 2016 9550 | |
| PCMark 8 | |
| Home Score Accelerated v2 (sort by value) | |
| Dell XPS 15 9550 i7 FHD | |
| Dell XPS 15-9550 i7 | |
| Dell XPS 15 2016 9550 | |
| Work Score Accelerated v2 (sort by value) | |
| Dell XPS 15 9550 i7 FHD | |
| Dell XPS 15-9550 i7 | |
| Creative Score Accelerated v2 (sort by value) | |
| Dell XPS 15 9550 i7 FHD | |
| Dell XPS 15-9550 i7 | |
| Dell XPS 15 2016 9550 | |
| PCMark 7 Score | 5739 points | |
| PCMark 8 Home Score Accelerated v2 | 3753 points | |
| PCMark 8 Creative Score Accelerated v2 | 4659 points | |
| PCMark 8 Work Score Accelerated v2 | 4696 points | |
Help | ||
| Dell XPS 15 9550 i7 FHD GeForce GTX 960M, 6700HQ, Samsung PM951 NVMe 512 GB | Dell XPS 15-9550 i7 GeForce GTX 960M, 6700HQ, Samsung PM951 NVMe 512 GB | Dell XPS 15 2016 9550 GeForce GTX 960M, 6300HQ, WDC WD10SPCX-75KHST0 + LiteON CS1-SP32-11 M.2 2242 32GB | Dell XPS 15 (9530-0538) GeForce GT 750M, 4712HQ, Lite-On LMT-512L9M | Dell XPS 15 (Late 2013) GeForce GT 750M, 4702HQ, Samsung SSD SM841 512GB | Dell XPS 13 2016 i7 256GB QHD HD Graphics 520, 6500U, Samsung PM951 NVMe MZ-VLV256D | |
|---|---|---|---|---|---|---|
| AS SSD | -5% | -7397% | -51% | -67% | -32% | |
| Copy Game MB/s (MB/s) | 805 | 785 -2% | 66.4 -92% | 292.6 -64% | 148.9 -82% | |
| Copy Program MB/s (MB/s) | 325.3 | 318.4 -2% | 42.24 -87% | 238.5 -27% | 46.64 -86% | |
| Copy ISO MB/s (MB/s) | 1127 | 716 -36% | 15.75 -99% | 468.2 -58% | 397.7 -65% | |
| Score Total (Points) | 2410 | 2410 0% | 44 -98% | 1021 -58% | 1070 -56% | 1603 -33% |
| Score Write (Points) | 675 | 694 3% | 10 -99% | 352 -48% | 391 -42% | 391 -42% |
| Score Read (Points) | 1180 | 1166 -1% | 24 -98% | 440 -63% | 448 -62% | 809 -31% |
| Access Time Write * (ms) | 0.035 | 0.036 -3% | 17.31 -49357% | 0.058 -66% | 0.061 -74% | 0.034 3% |
| Access Time Read * (ms) | 0.038 | 0.053 -39% | 20.2 -53058% | 0.065 -71% | 0.114 -200% | 0.071 -87% |
| 4K-64 Write (MB/s) | 513 | 532 4% | 0.91 -100% | 253.1 -51% | 290.5 -43% | 263.7 -49% |
| 4K-64 Read (MB/s) | 990 | 975 -2% | 10.11 -99% | 361.5 -63% | 374.5 -62% | 698 -29% |
| 4K Write (MB/s) | 105.4 | 105.6 0% | 0.98 -99% | 62 -41% | 59.6 -43% | 97.6 -7% |
| 4K Read (MB/s) | 31.86 | 34.63 9% | 1.53 -95% | 29.65 -7% | 23.83 -25% | 38.21 20% |
| Seq Write (MB/s) | 570 | 562 -1% | 77.6 -86% | 373.5 -34% | 404.9 -29% | 301.2 -47% |
| Seq Read (MB/s) | 1579 | 1569 -1% | 122.2 -92% | 486.2 -69% | 498.5 -68% | 735 -53% |
* ... smaller is better
| 3DMark 11 | |
| 1280x720 Performance (sort by value) | |
| Dell XPS 15-9550 i7 | |
| Dell XPS 15 2016 9550 | |
| Dell XPS 15 (9530-0538) | |
| Dell XPS 15 (Late 2013) | |
| Dell XPS 15 (L521x) PL | |
| 1280x720 Performance GPU (sort by value) | |
| Dell XPS 15-9550 i7 | |
| Dell XPS 15 2016 9550 | |
| Dell XPS 15 (9530-0538) | |
| Dell XPS 15 (Late 2013) | |
| Dell XPS 15 (L521x) PL | |
| 1280x720 Performance Physics (sort by value) | |
| Dell XPS 15-9550 i7 | |
| Dell XPS 15 2016 9550 | |
| Dell XPS 15 (9530-0538) | |
| Dell XPS 15 (Late 2013) | |
| Dell XPS 15 (L521x) PL | |
| 3DMark Ice Storm Standard Score | 77565 points | |
| 3DMark Cloud Gate Standard Score | 17140 points | |
| 3DMark Fire Strike Score | 3939 points | |
| 3DMark Fire Strike Extreme Score | 1981 points | |
Help | ||
| BioShock Infinite | |
| 1366x768 High Preset (sort by value) | |
| Dell XPS 15 9550 i7 FHD | |
| Dell XPS 15 2016 9550 | |
| Dell XPS 15 (9530-0538) | |
| Dell XPS 15 (Late 2013) | |
| Dell XPS 13 2016 i7 256GB QHD | |
| 1920x1080 Ultra Preset, DX11 (DDOF) (sort by value) | |
| Dell XPS 15 9550 i7 FHD | |
| Dell XPS 15-9550 i7 | |
| Dell XPS 15 2016 9550 | |
| Dell XPS 15 (9530-0538) | |
| Dell XPS 15 (Late 2013) | |
| Dell XPS 13 2016 i7 256GB QHD | |
| low | med. | high | ultra | |
|---|---|---|---|---|
| Sleeping Dogs (2012) | 89.2 | 23.4 | ||
| Guild Wars 2 (2012) | 52.5 | 28.6 | ||
| Tomb Raider (2013) | 112 | 52.4 | ||
| StarCraft II: Heart of the Swarm (2013) | 140.3 | 71.1 | ||
| BioShock Infinite (2013) | 106.9 | 44.1 | ||
| Metro: Last Light (2013) | 55.7 | 30.9 | ||
| Thief (2014) | 51.2 | 26.6 | ||
| Middle-earth: Shadow of Mordor (2014) | 39.9 | 30.5 | ||
| Batman: Arkham Knight (2015) | 39 | 19 | ||
| Metal Gear Solid V (2015) | 55 | 37.5 | ||
| Fallout 4 (2015) | 31 | 24.2 | ||
| Rise of the Tomb Raider (2016) | 23.8 | 21.2 |
| Dell XPS 15 9550 i7 FHD GeForce GTX 960M, 6700HQ, Samsung PM951 NVMe 512 GB | Dell XPS 15 2016 9550 GeForce GTX 960M, 6300HQ, WDC WD10SPCX-75KHST0 + LiteON CS1-SP32-11 M.2 2242 32GB | Dell XPS 15 (9530-0538) GeForce GT 750M, 4712HQ, Lite-On LMT-512L9M | Dell XPS 13 2016 i7 256GB QHD HD Graphics 520, 6500U, Samsung PM951 NVMe MZ-VLV256D | Asus ZenBook Pro UX501VW-DS71T GeForce GTX 960M, 6700HQ, Samsung SM951 MZVPV512HDGL m.2 PCI-e | Lenovo Ideapad Y700 15ISK 80NW GeForce GTX 960M, 6700HQ, Samsung MZNLN128HCGR-000L2 | |
|---|---|---|---|---|---|---|
| Noise | -9% | -7% | -1% | -1% | -7% | |
| Idle Minimum * (dB) | 29.2 | 32.6 -12% | 29.6 -1% | 31.8 -9% | 28.9 1% | 30.4 -4% |
| Idle Average * (dB) | 29.3 | 33.6 -15% | 31.6 -8% | 31.8 -9% | 28.9 1% | 30.5 -4% |
| Idle Maximum * (dB) | 29.5 | 33.6 -14% | 31.6 -7% | 34.8 -18% | 30.2 -2% | 33.3 -13% |
| Load Average * (dB) | 36.5 | 37.1 -2% | 45.4 -24% | 34.8 5% | 41.8 -15% | 41.4 -13% |
| Load Maximum * (dB) | 47.7 | 47.5 -0% | 45.4 5% | 34.8 27% | 43.9 8% | 47 1% |
* ... smaller is better
Noise level
| Idle |
| 29.2 / 29.3 / 29.5 dB(A) |
| Load |
| 36.5 / 47.7 dB(A) |
 | ||
30 dB silent 40 dB(A) audible 50 dB(A) loud |
||
min: | ||
(±) The average temperature for the upper side under maximal load is 34.6 °C / 94 F, compared to the average of 31.3 °C / 88 F for the devices in the class Multimedia.
(-) The maximum temperature on the upper side is 56.6 °C / 134 F, compared to the average of 36.8 °C / 98 F, ranging from 21 to 71 °C for the class Multimedia.
(-) The bottom heats up to a maximum of 46.9 °C / 116 F, compared to the average of 39.1 °C / 102 F
(+) In idle usage, the average temperature for the upper side is 23.9 °C / 75 F, compared to the device average of 31.3 °C / 88 F.
(+) The palmrests and touchpad are cooler than skin temperature with a maximum of 26.6 °C / 79.9 F and are therefore cool to the touch.
(+) The average temperature of the palmrest area of similar devices was 28.7 °C / 83.7 F (+2.1 °C / 3.8 F).
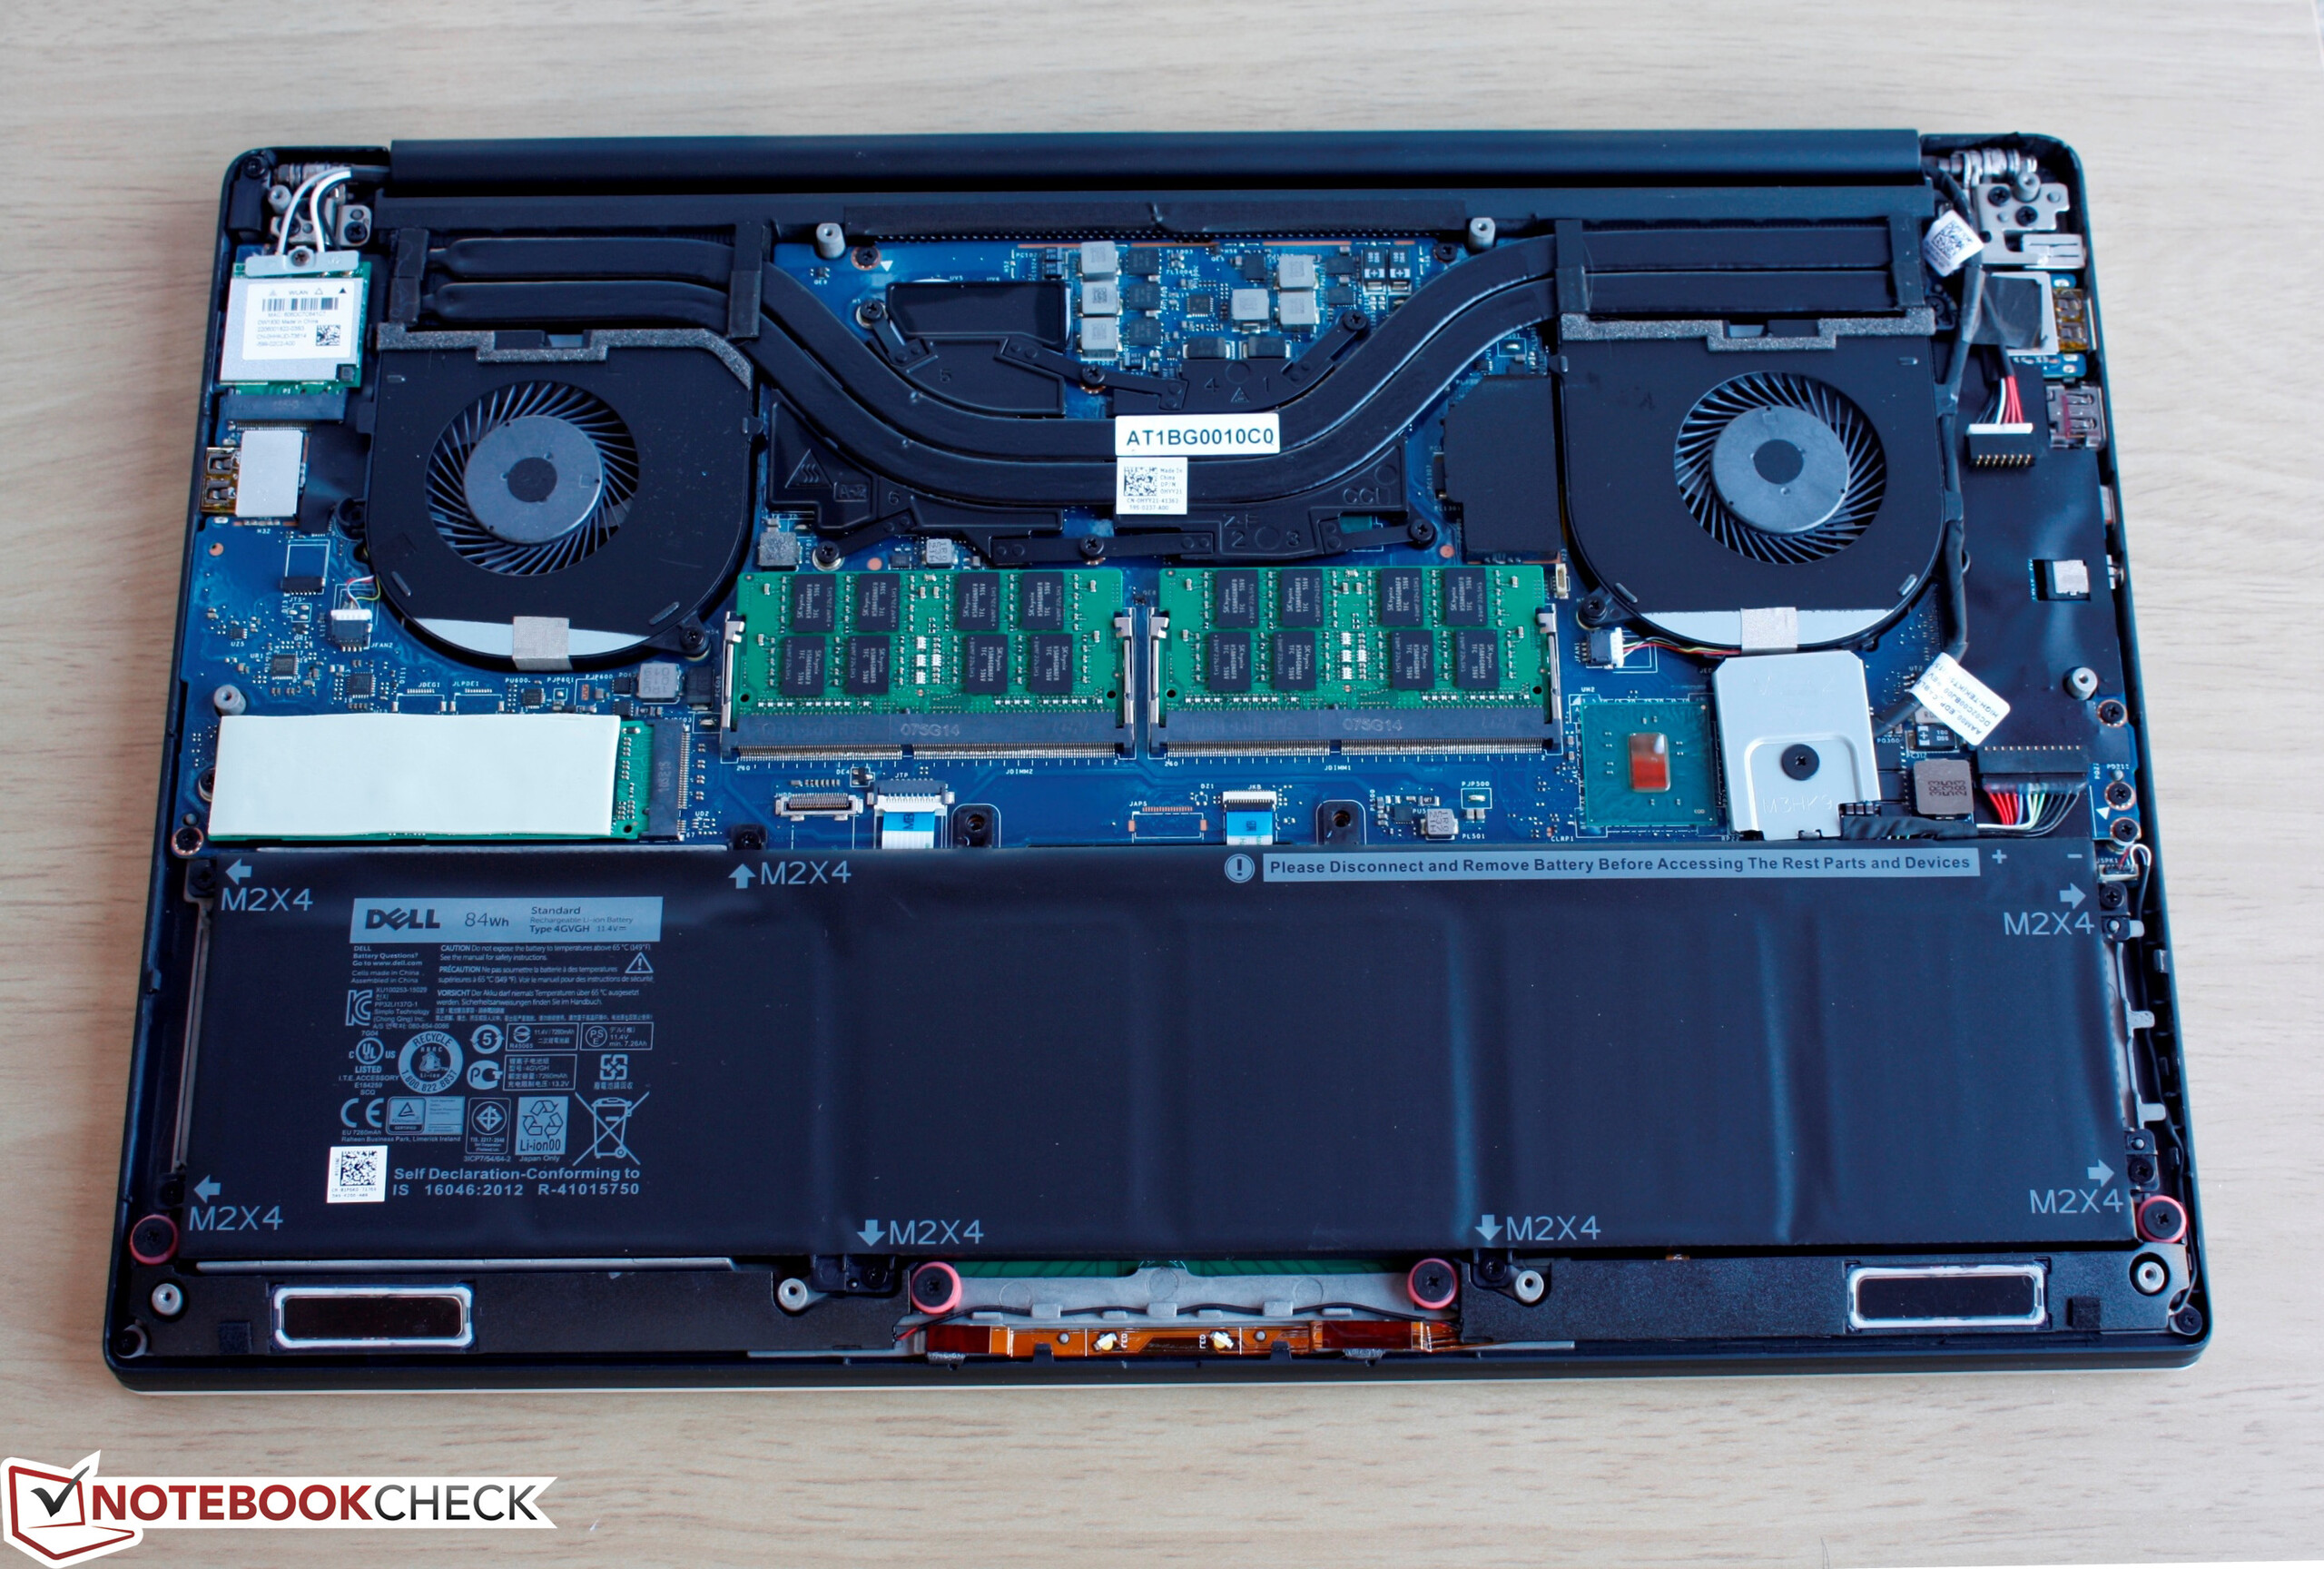
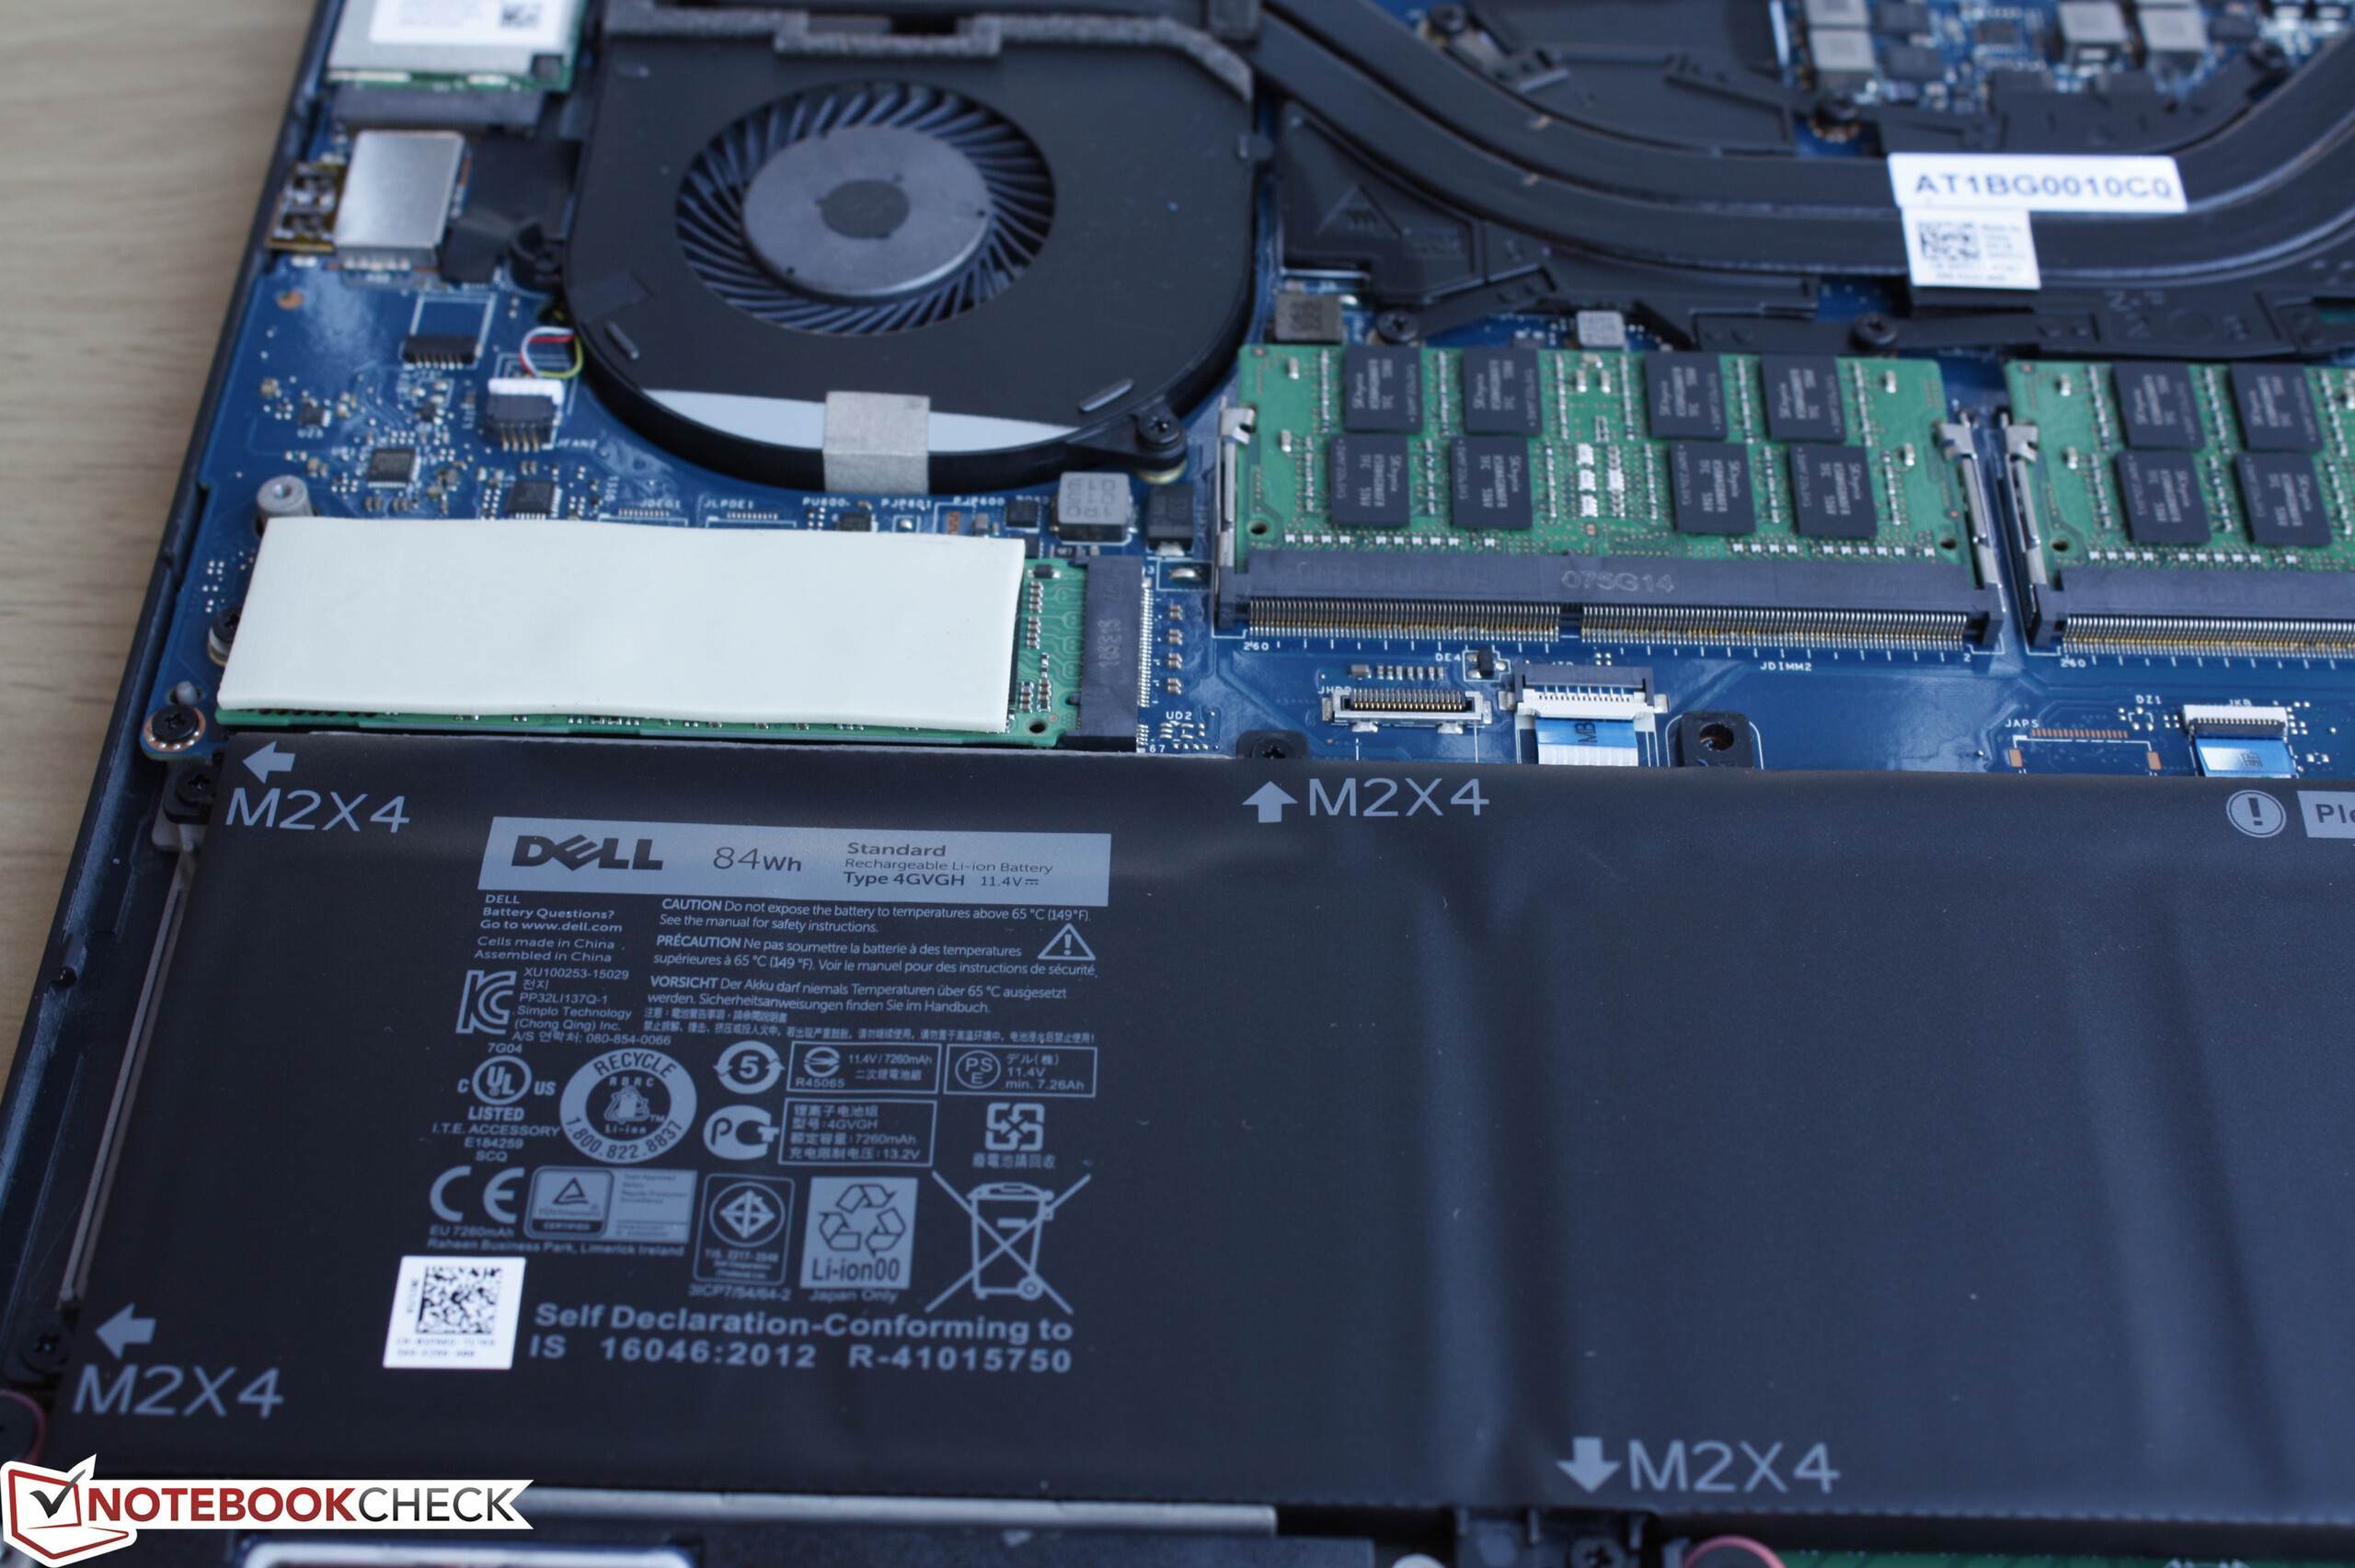
| Dell XPS 15 9550 i7 FHD 84 Wh | Dell XPS 15-9550 i7 84 Wh | Dell XPS 15 2016 9550 56 Wh | Dell XPS 15 (9530-0538) 88 Wh | Dell XPS 13-9350 56 Wh | |
|---|---|---|---|---|---|
| Battery runtime | -24% | -19% | -43% | 0% | |
| Reader / Idle (h) | 16.3 | 8.8 -46% | 9.1 -44% | 13 -20% | |
| WiFi v1.3 (h) | 9.1 | 5.2 -43% | 5.5 -40% | 5.2 -43% | 7.5 -18% |
| Load (h) | 1.8 | 2.1 17% | 2.3 28% | 2.5 39% |
Pros
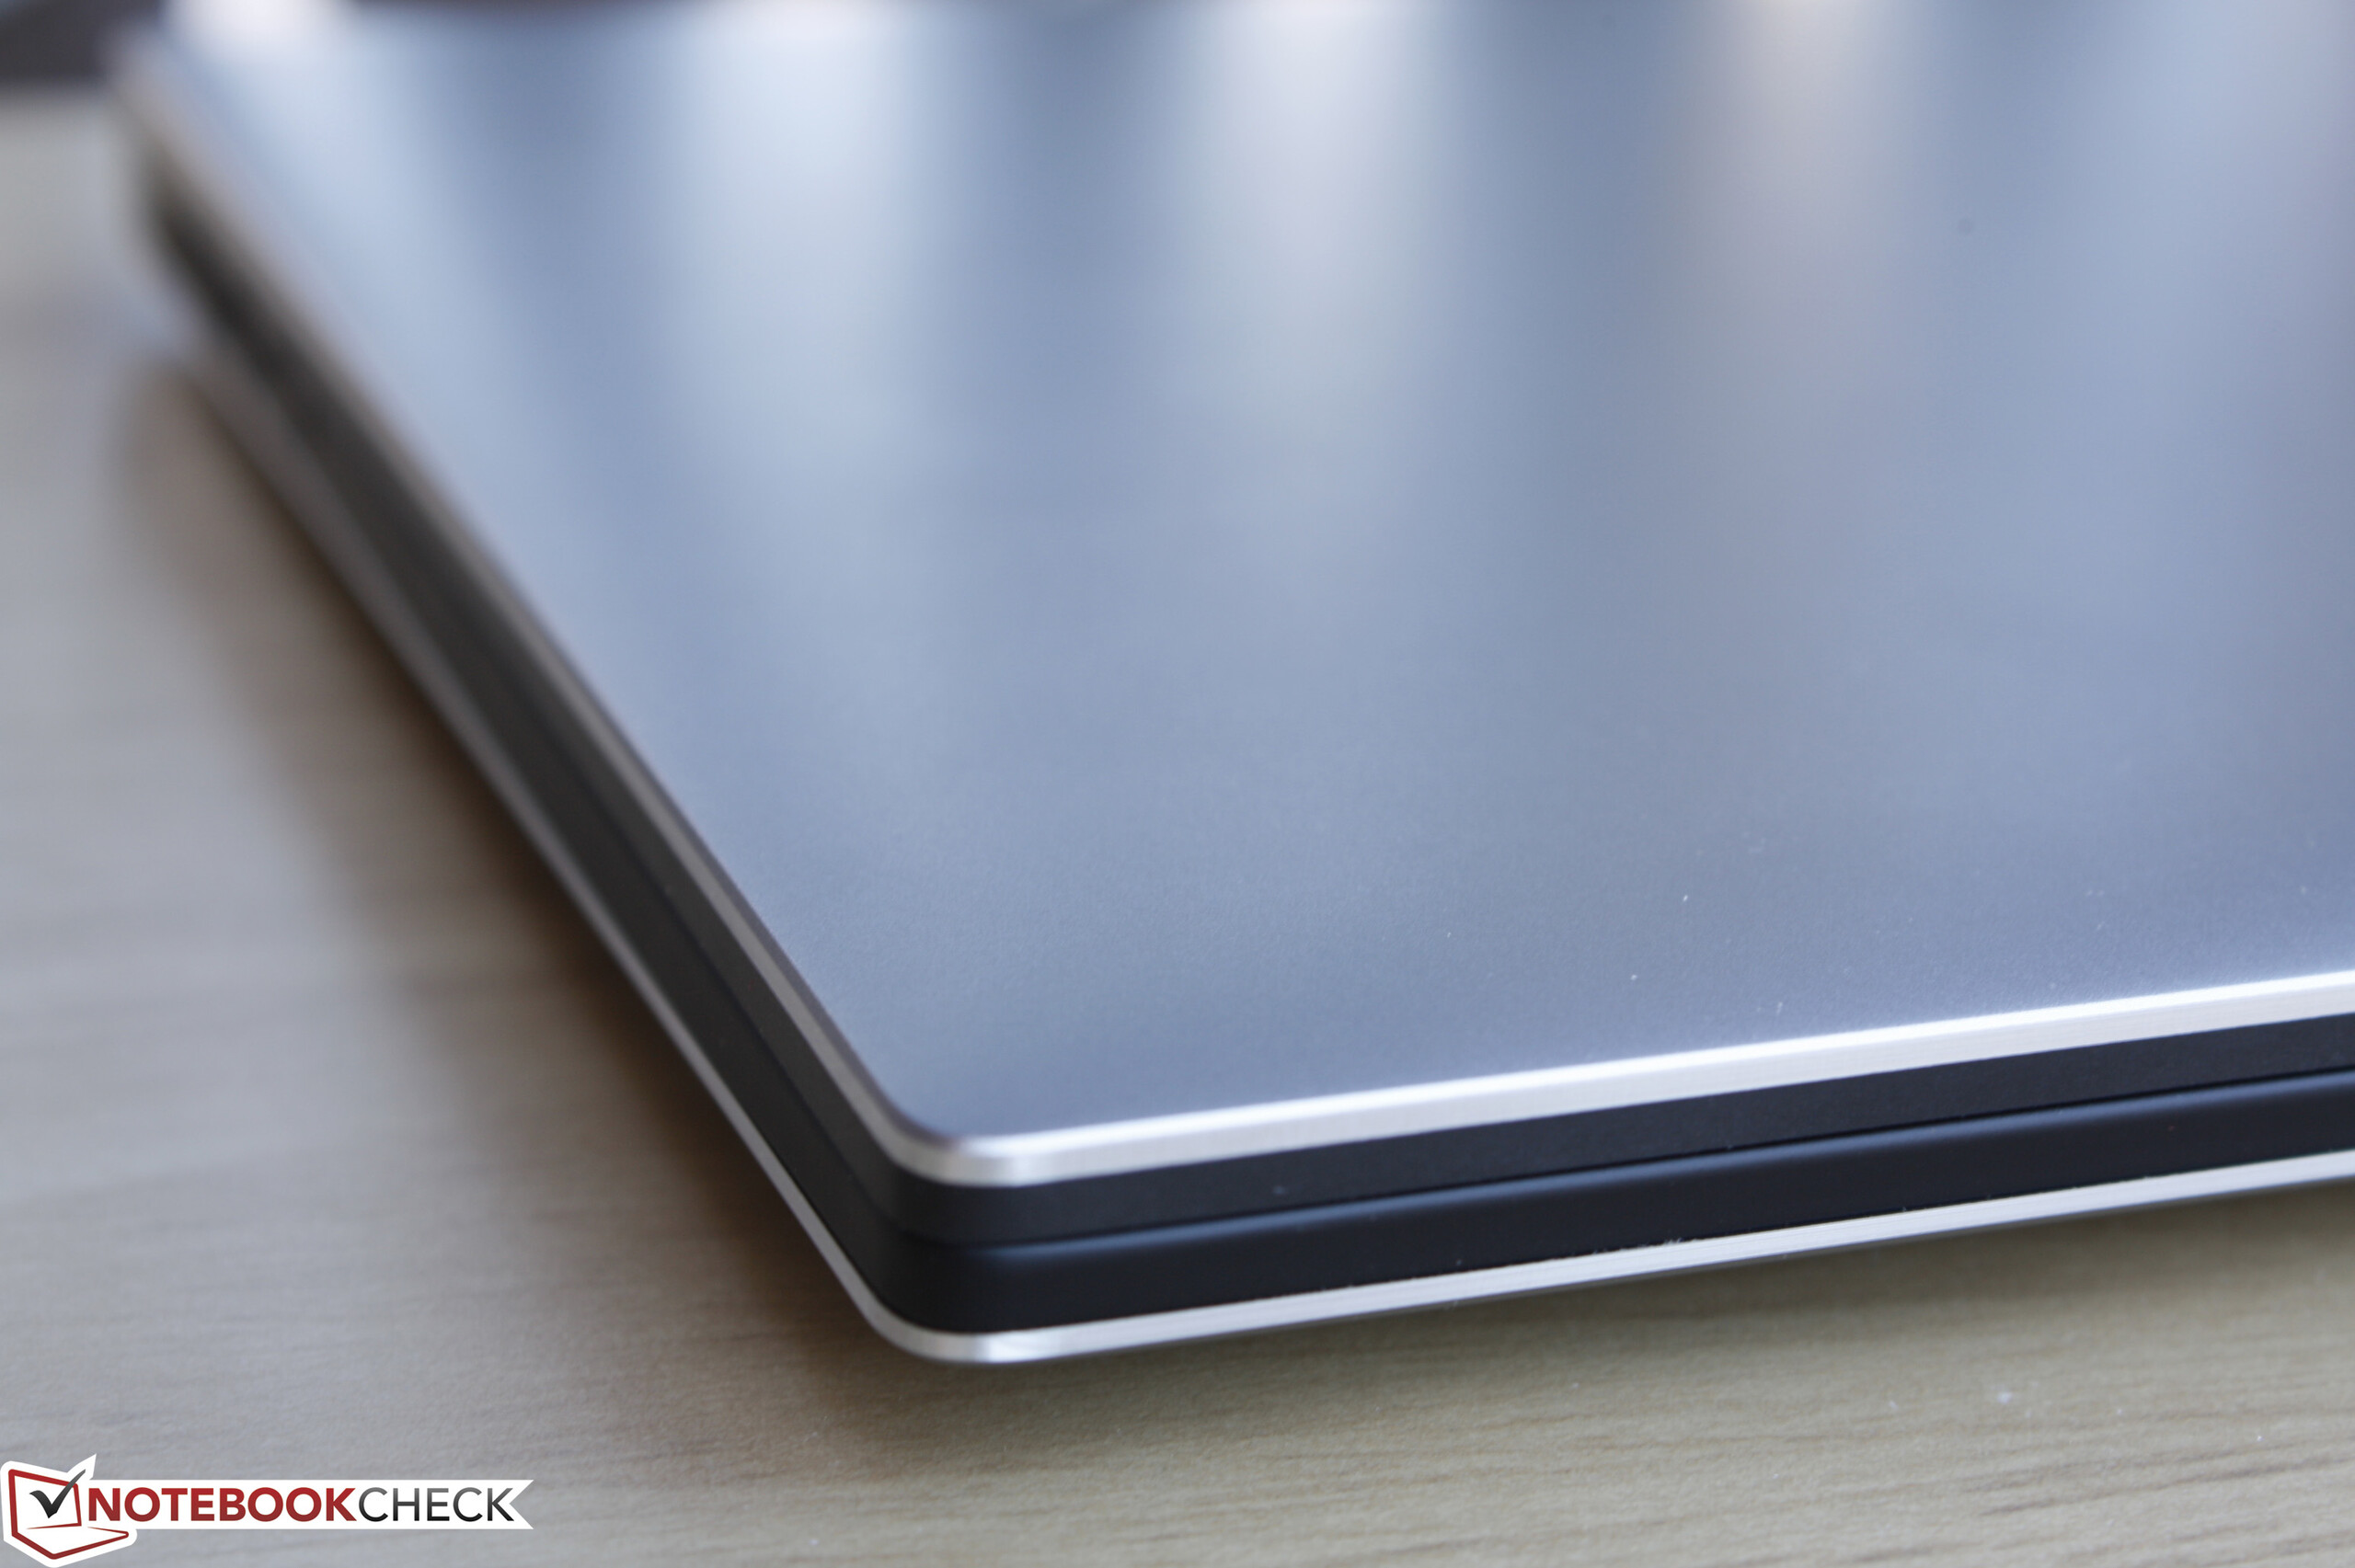
+ 轻盈小巧
+ 高品质全高清屏幕;98% sRGB色域覆盖
+ 惊人的续航时间
+ 处理器显卡性能高;无严重降频问题
+ NVMe M.2支持
+ USB 3.1第2代C型接口,支持Thunderbolt 3
Cons
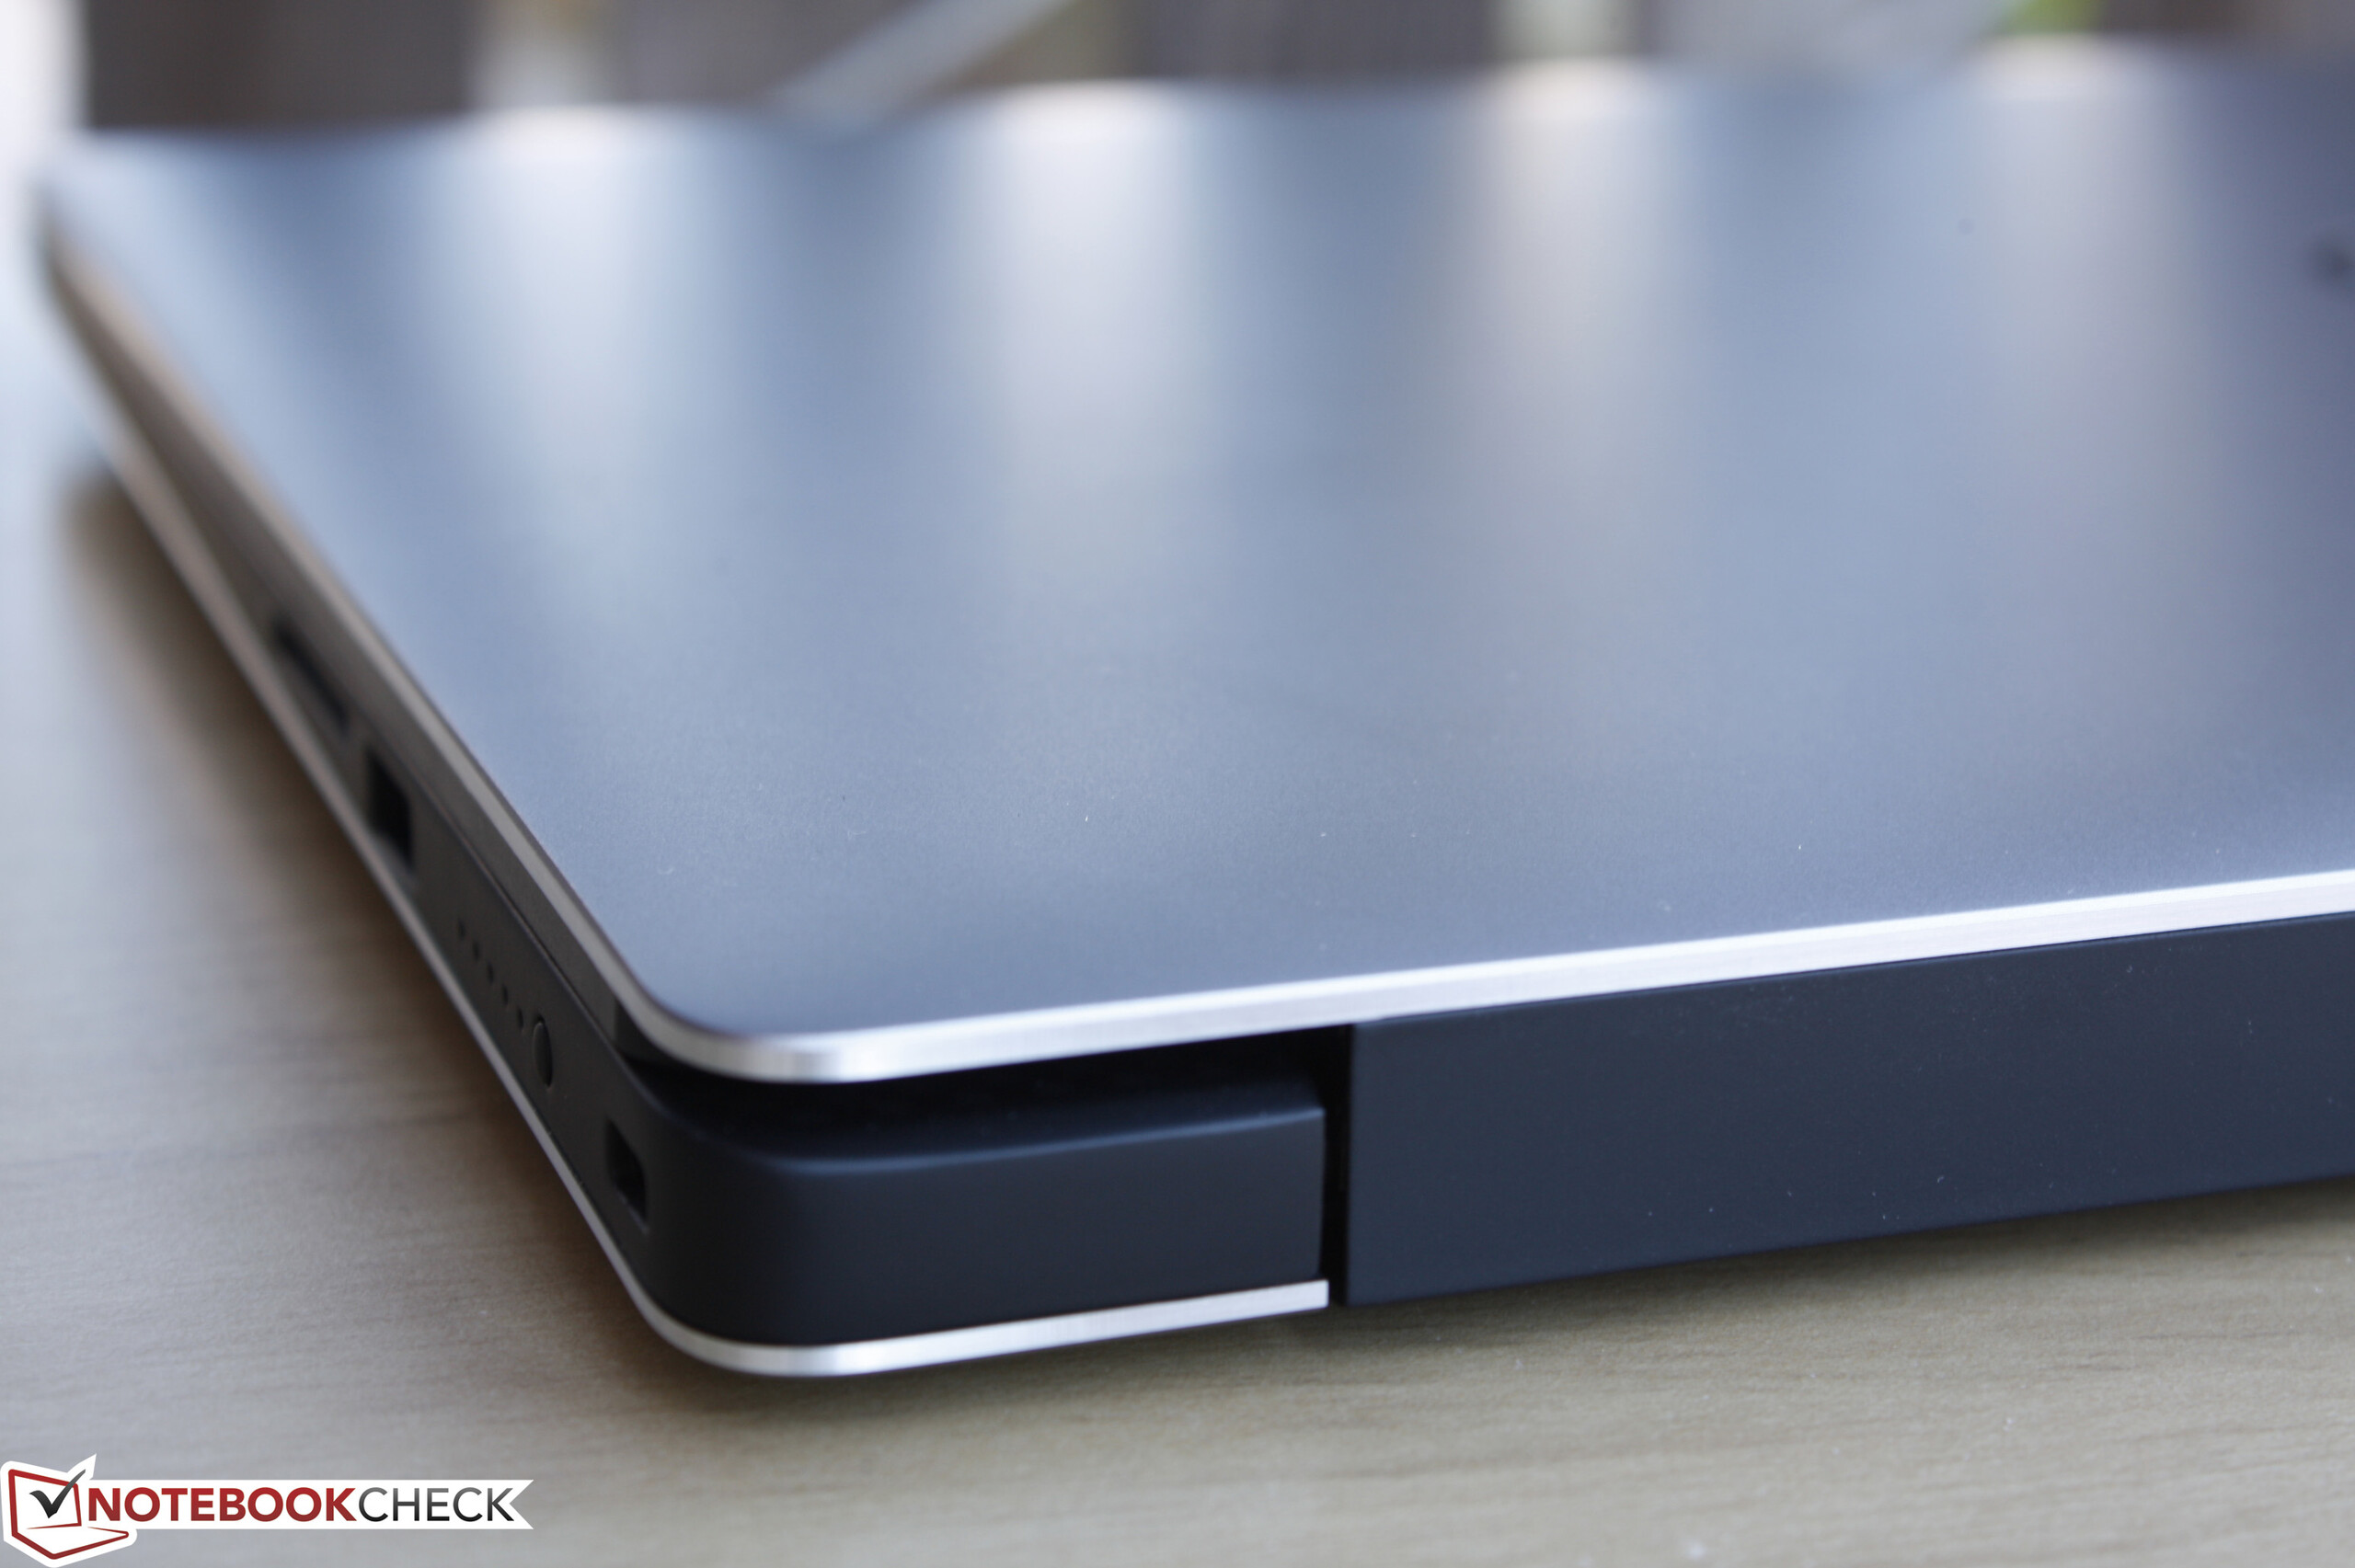
- 仅一个硬盘槽
- 无数字键盘
- 低亮度下屏幕闪烁
- 不可更换电池
- 接口较少
尽管它在推出之时给我们带来了不小的麻烦,XPS 15 2016更新在各方面都有所进步,特别是在显卡、尺寸、重量等方面。它的84瓦时电池在测试中表现惊人,而系统也可以在使用中保持安静清凉。
它的屏幕在低亮度(30%-40%以下)时通过闪烁调节背光亮度,这仍然是全高清屏幕机型的一个问题。另外,这块全高清屏幕几乎完全覆盖了sRGB色域,而4K屏幕型号提供了对AdobeRGB色域的覆盖。这两点应该可以说服创作艺术家选择4K屏幕机型,即使是对高分辨率不感兴趣。
它的更大电池容量占用了第二块硬盘的空间,不过不一定所有地区都会销售这样的机型。电池容量较小的机型可能会对希望把XPS 15用做多媒体和游戏笔记本的用户更有意义。
更大的屏幕,更小的尺寸,显卡的强劲性能让最新的XPS 15成为旅行、游戏、工作的理想选择。它侧重于家用,尽管屏幕色彩还原优秀,但缺少商务功能和一些接口。
注:本文是基于完整评测的缩减版本,阅读完整的英文评测,请点击这里。
Dell XPS 15 9550 i7 FHD
- 02/08/2016 v4.1 (old)
Allen Ngo
Multimedia - Weighted Average
Price comparison
