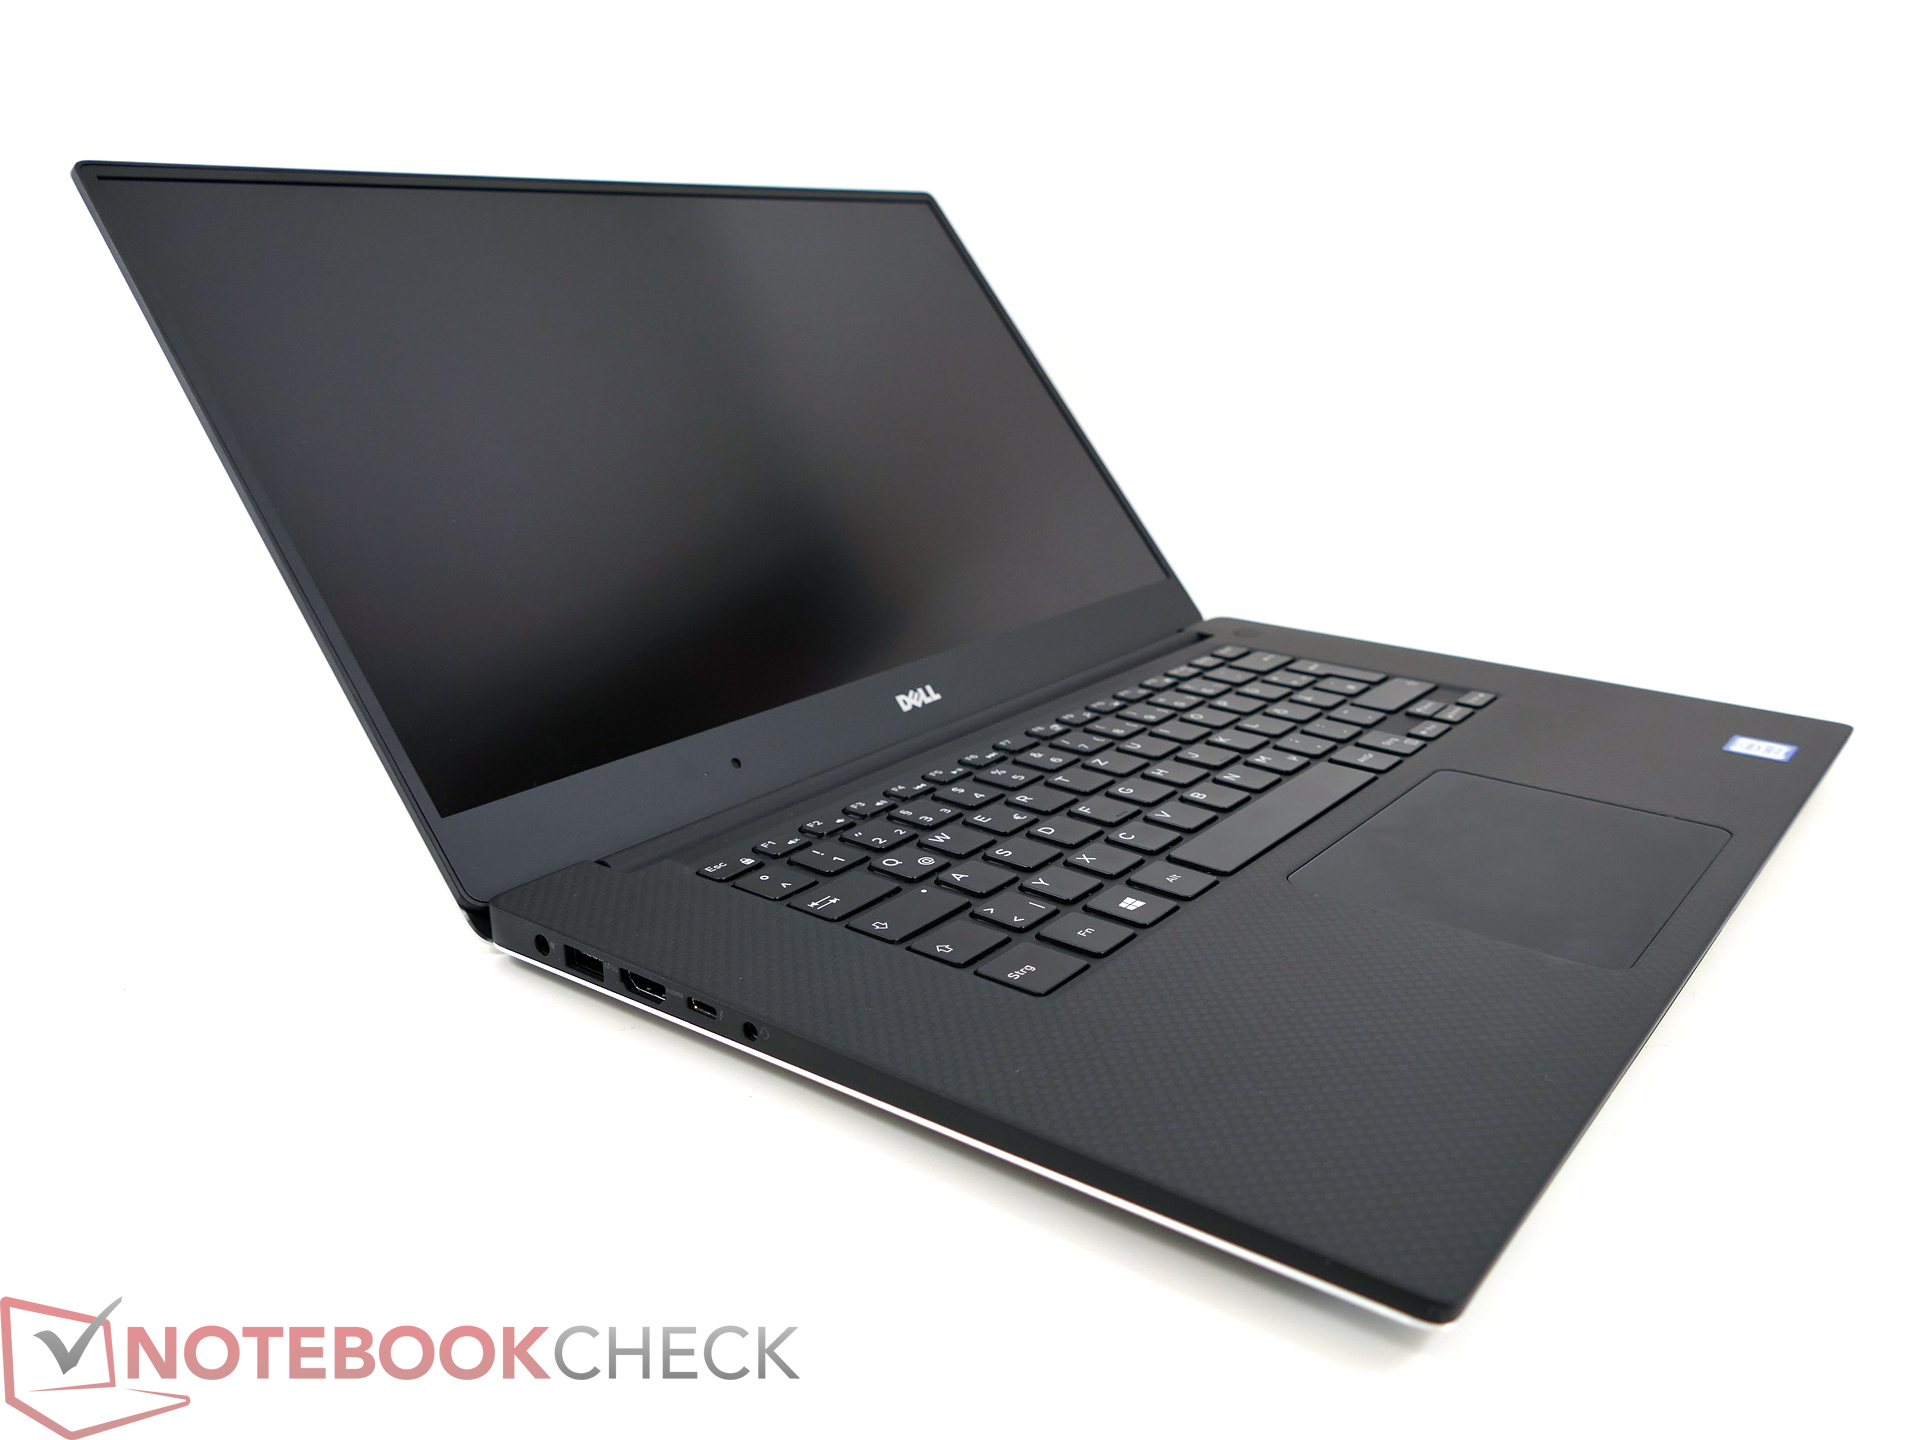
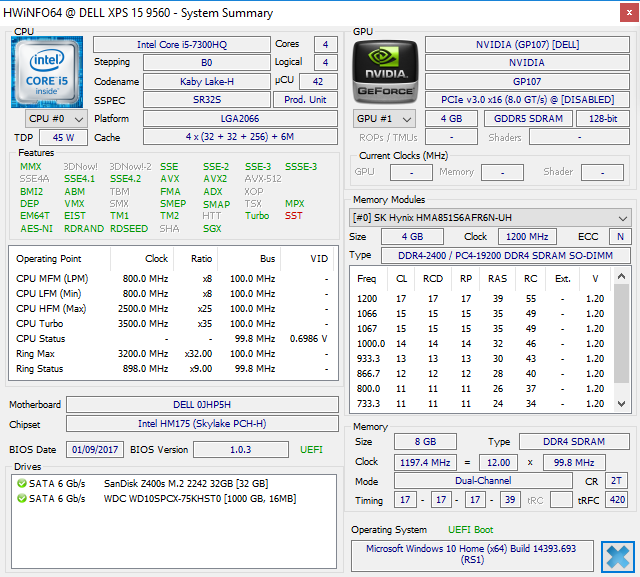
戴尔 XPS 15 2017 9560 (7300HQ, 全高清) 笔记本电脑简短评测

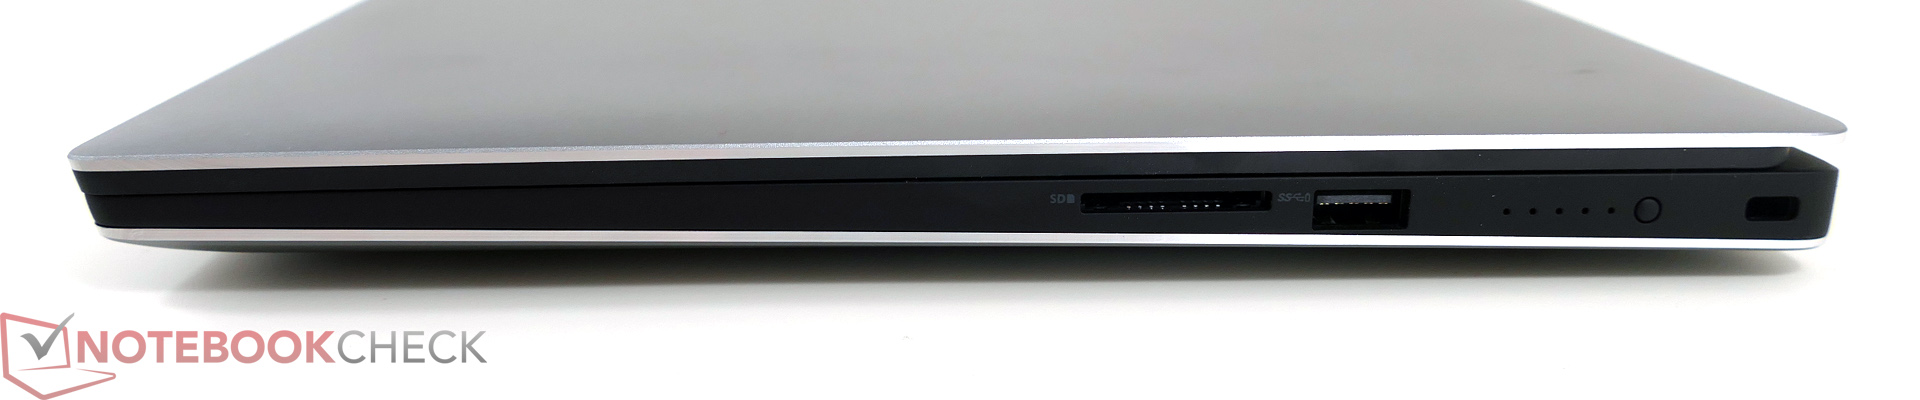
| SD Card Reader | |
| average JPG Copy Test (av. of 3 runs) | |
| Dell XPS 13 9360 QHD+ i7 | |
| Dell XPS 15-9550 i7 | |
| Dell XPS 13 9360 FHD i5 | |
| Dell XPS 15 2017 9560 (7300HQ, Full-HD) | |
| maximum AS SSD Seq Read Test (1GB) | |
| Dell XPS 13 9360 FHD i5 | |
| Dell XPS 13 9360 QHD+ i7 | |
| Dell XPS 15-9550 i7 | |
| Dell XPS 15 2017 9560 (7300HQ, Full-HD) | |
| Networking | |
| iperf3 transmit AX12 | |
| Apple MacBook Pro 15 2016 (2.6 GHz, 450) (Klaus I211) | |
| Apple MacBook Pro 13 2016 (2.9 GHz) | |
| Dell XPS 15 2017 9560 (7300HQ, Full-HD) | |
| Dell XPS 13 9360 FHD i5 | |
| Dell Inspiron 15 7000 7567 (jseb) | |
| iperf3 receive AX12 | |
| Apple MacBook Pro 13 2016 (2.9 GHz) | |
| Apple MacBook Pro 15 2016 (2.6 GHz, 450) (Klaus I211) | |
| Dell XPS 15 2017 9560 (7300HQ, Full-HD) | |
| Dell XPS 13 9360 FHD i5 | |
| Dell Inspiron 15 7000 7567 (jseb) | |
| |||||||||||||||||||||||||
Brightness Distribution: 89 %
Center on Battery: 400 cd/m²
Contrast: 1538:1 (Black: 0.26 cd/m²)
ΔE ColorChecker Calman: 4.9 | ∀{0.5-29.43 Ø4.71}
ΔE Greyscale Calman: 7.2 | ∀{0.09-98 Ø4.96}
98.9% sRGB (Argyll 1.6.3 3D)
64.2% AdobeRGB 1998 (Argyll 1.6.3 3D)
70.9% AdobeRGB 1998 (Argyll 3D)
98.9% sRGB (Argyll 3D)
68.9% Display P3 (Argyll 3D)
Gamma: 2.11
CCT: 6911 K
| Dell XPS 15 2017 9560 (7300HQ, Full-HD) Sharp SHP1453 LQ156M1, , 1920x1080, 15.6" | Dell XPS 15 9550 i7 FHD 1920x1080, 15.6" | Dell XPS 15-9550 i7 SHARP LQ156D1JX01 Dell PN: 7PHPT, , 3840x2160, 15.6" | Apple MacBook Pro 15 2016 (2.9 GHz, 460) Apple APPA030, , 2880x1800, 15.4" | Asus Zenbook UX510UW-CN044T LG Philips LP156WF6-SPB6, , 1920x1080, 15.6" | Dell XPS 13 9360 FHD i5 Sharp SHP1449 LQ133M1, , 1920x1080, 13.3" | Asus ZenBook Pro UX501VW-DS71T 3840x2160, 15.6" | |
|---|---|---|---|---|---|---|---|
| Display | -1% | 23% | 23% | -16% | -28% | -8% | |
| Display P3 Coverage (%) | 68.9 | 68.5 -1% | 87.8 27% | 99 44% | 61.5 -11% | 48.94 -29% | 64.3 -7% |
| sRGB Coverage (%) | 98.9 | 97.2 -2% | 100 1% | 100 1% | 80.4 -19% | 73.3 -26% | 89.9 -9% |
| AdobeRGB 1998 Coverage (%) | 70.9 | 70.4 -1% | 99.4 40% | 87.3 23% | 58.8 -17% | 50.5 -29% | 65.4 -8% |
| Response Times | -7% | 13% | 4% | 38% | 38% | 34% | |
| Response Time Grey 50% / Grey 80% * (ms) | 54 ? | 64 ? -19% | 58 ? -7% | 46 ? 15% | 40 ? 26% | 32.8 ? 39% | 43.2 ? 20% |
| Response Time Black / White * (ms) | 52.4 ? | 50 ? 5% | 35 ? 33% | 56 ? -7% | 26 ? 50% | 33.2 ? 37% | 27.2 ? 48% |
| PWM Frequency (Hz) | 119000 ? | ||||||
| Screen | -3% | -5% | 16% | -14% | -6% | -23% | |
| Brightness middle (cd/m²) | 400 | 371.5 -7% | 361 -10% | 420 5% | 326 -18% | 351.2 -12% | 252.9 -37% |
| Brightness (cd/m²) | 392 | 356 -9% | 344 -12% | 401 2% | 316 -19% | 325 -17% | 250 -36% |
| Brightness Distribution (%) | 89 | 92 3% | 90 1% | 90 1% | 80 -10% | 89 0% | 89 0% |
| Black Level * (cd/m²) | 0.26 | 0.252 3% | 0.38 -46% | 0.3 -15% | 0.35 -35% | 0.195 25% | 0.5 -92% |
| Contrast (:1) | 1538 | 1474 -4% | 950 -38% | 1400 -9% | 931 -39% | 1801 17% | 506 -67% |
| Colorchecker dE 2000 * | 4.9 | 5.55 -13% | 5.34 -9% | 3.33 32% | 5.49 -12% | 7.4 -51% | 5.22 -7% |
| Colorchecker dE 2000 max. * | 11 | 10.95 -0% | 5.11 54% | 11.36 -3% | 9.08 17% | 8.33 24% | |
| Greyscale dE 2000 * | 7.2 | 7.1 1% | 4.84 33% | 2.73 62% | 4.84 33% | 6.71 7% | 6.74 6% |
| Gamma | 2.11 104% | 2.1 105% | 2.21 100% | 2.48 89% | 2.23 99% | 2.74 80% | 2.45 90% |
| CCT | 6911 94% | 7395 88% | 6457 101% | 5971 109% | 7222 90% | 6026 108% | |
| Color Space (Percent of AdobeRGB 1998) (%) | 64.2 | 63.4 -1% | 89 39% | 78.09 22% | 53 -17% | 50.48 -21% | 58.4 -9% |
| Color Space (Percent of sRGB) (%) | 98.9 | 97.9 -1% | 100 1% | 99.97 1% | 80 -19% | 73.31 -26% | 89.7 -9% |
| Total Average (Program / Settings) | -4% /
-3% | 10% /
4% | 14% /
15% | 3% /
-7% | 1% /
-5% | 1% /
-12% |
* ... smaller is better
Display Response Times
| ↔ Response Time Black to White | ||
|---|---|---|
| 52.4 ms ... rise ↗ and fall ↘ combined | ↗ 33.2 ms rise |  |
| ↘ 19.2 ms fall | ||
| The screen shows slow response rates in our tests and will be unsatisfactory for gamers. In comparison, all tested devices range from 0.1 (minimum) to 240 (maximum) ms. » 99 % of all devices are better. This means that the measured response time is worse than the average of all tested devices (19.8 ms). | ||
| ↔ Response Time 50% Grey to 80% Grey | ||
| 54 ms ... rise ↗ and fall ↘ combined | ↗ 33.2 ms rise |  |
| ↘ 20 ms fall | ||
| The screen shows slow response rates in our tests and will be unsatisfactory for gamers. In comparison, all tested devices range from 0.165 (minimum) to 636 (maximum) ms. » 91 % of all devices are better. This means that the measured response time is worse than the average of all tested devices (30.9 ms). | ||
Screen Flickering / PWM (Pulse-Width Modulation)
| Screen flickering / PWM not detected |  | ||
In comparison: 52 % of all tested devices do not use PWM to dim the display. If PWM was detected, an average of 7744 (minimum: 5 - maximum: 343500) Hz was measured. | |||
| PCMark 8 Home Score Accelerated v2 | 3659 points | |
| PCMark 8 Work Score Accelerated v2 | 4884 points | |
Help | ||
| Dell XPS 15 2017 9560 (7300HQ, Full-HD) WDC WD10SPCX-75KHST0 + SanDisk Z400s M.2 2242 32 GB Cache | Dell XPS 13 9360 FHD i5 Toshiba NVMe THNSN5256GPUK | Apple MacBook Pro 15 2016 (2.9 GHz, 460) Apple SSD SM1024L | Asus Zenbook UX510UW-CN044T SanDisk SD8SNAT256G1002 | Dell XPS 15 9550 i7 FHD Samsung PM951 NVMe 512 GB | Dell XPS 15-9550 i7 Samsung PM951 NVMe 512 GB | |
|---|---|---|---|---|---|---|
| CrystalDiskMark 3.0 | 4538% | 7627% | 3855% | 6213% | 4766% | |
| Read Seq (MB/s) | 123 | 1233 902% | 1458 1085% | 459.3 273% | 1291 950% | 1274 936% |
| Write Seq (MB/s) | 74.2 | 733 888% | 1440 1841% | 325.5 339% | 590 695% | 594 701% |
| Read 512 (MB/s) | 101.7 | 1036 919% | 914 799% | 279.2 175% | 632 521% | 674 563% |
| Write 512 (MB/s) | 42.51 | 439.9 935% | 1058 2389% | 280.1 559% | 588 1283% | 596 1302% |
| Read 4k (MB/s) | 10.84 | 29.31 170% | 9.786 -10% | 22.43 107% | 41.4 282% | 37.02 242% |
| Write 4k (MB/s) | 1.021 | 116.9 11350% | 10.9 968% | 74.9 7236% | 132.4 12868% | 129.7 12603% |
| Read 4k QD32 (MB/s) | 69.8 | 479.2 587% | 679 873% | 149 113% | 542 677% | 457.9 556% |
| Write 4k QD32 (MB/s) | 1.057 | 218.3 20553% | 562 53069% | 234 22038% | 343.8 32426% | 225.4 21225% |

| 3DMark 11 Performance | 7504 points | |
| 3DMark Cloud Gate Standard Score | 14758 points | |
| 3DMark Fire Strike Score | 5458 points | |
| 3DMark Fire Strike Extreme Score | 2715 points | |
Help | ||
| The Witcher 3 | |
| 1920x1080 High Graphics & Postprocessing (Nvidia HairWorks Off) | |
| Razer Blade (2016) | |
| MSI GE72 7RE-046 | |
| Dell XPS 15 2017 9560 (7300HQ, Full-HD) | |
| Apple MacBook Pro 15 2016 (2.9 GHz, 460) | |
| Schenker XMG A505 | |
| Asus GL552VW-DK725T | |
| 1920x1080 Ultra Graphics & Postprocessing (HBAO+) | |
| Razer Blade (2016) | |
| MSI GE72 7RE-046 | |
| Dell XPS 15 2017 9560 (7300HQ, Full-HD) | |
| Apple MacBook Pro 15 2016 (2.9 GHz, 460) | |
| Asus GL552VW-DK725T | |
| Schenker XMG A505 | |
| Battlefield 1 | |
| 1920x1080 High Preset AA:T | |
| Razer Blade (2016) | |
| Dell Inspiron 15 7000 7567 | |
| MSI GE72 7RE-046 | |
| Dell XPS 15 2017 9560 (7300HQ, Full-HD) | |
| Apple MacBook Pro 15 2016 (2.9 GHz, 460) | |
| Schenker XMG A505 | |
| 1920x1080 Ultra Preset AA:T | |
| Razer Blade (2016) | |
| Dell Inspiron 15 7000 7567 | |
| MSI GE72 7RE-046 | |
| Dell XPS 15 2017 9560 (7300HQ, Full-HD) | |
| Apple MacBook Pro 15 2016 (2.9 GHz, 460) | |
| Schenker XMG A505 | |
| Titanfall 2 | |
| 1920x1080 High / Enabled AA:TS AF:8x | |
| Dell Inspiron 15 7000 7567 | |
| MSI GE72 7RE-046 | |
| Dell XPS 15 2017 9560 (7300HQ, Full-HD) | |
| Schenker XMG A505 | |
| Apple MacBook Pro 15 2016 (2.9 GHz, 460) | |
| 1920x1080 Very High (Insane Texture Quality) / Enabled AA:TS AF:16x | |
| Dell Inspiron 15 7000 7567 | |
| MSI GE72 7RE-046 | |
| Dell XPS 15 2017 9560 (7300HQ, Full-HD) | |
| Apple MacBook Pro 15 2016 (2.9 GHz, 460) | |
| Schenker XMG A505 | |
| FIFA 17 | |
| 1920x1080 High Preset | |
| Apple MacBook Pro 15 2016 (2.9 GHz, 460) | |
| Dell XPS 15 2017 9560 (7300HQ, Full-HD) | |
| MSI GE72 7RE-046 | |
| Schenker XMG A505 | |
| 1920x1080 Ultra Preset AA:4xMS | |
| Apple MacBook Pro 15 2016 (2.9 GHz, 460) | |
| Dell XPS 15 2017 9560 (7300HQ, Full-HD) | |
| MSI GE72 7RE-046 | |
| Schenker XMG A505 | |
| low | med. | high | ultra | |
|---|---|---|---|---|
| The Witcher 3 (2015) | 125.5 | 77.3 | 34.6 | 24.9 |
| FIFA 17 (2016) | 184.3 | 183.7 | 146.2 | 146 |
| Battlefield 1 (2016) | 121.4 | 103.2 | 50.1 | 47 |
| Titanfall 2 (2016) | 141.3 | 110.5 | 52.8 | 48.4 |
Noise level
| Idle |
| 31.6 / 31.6 / 33.4 dB(A) |
| HDD |
| 31.6 dB(A) |
| Load |
| 47.8 / 47.8 dB(A) |
 | ||
30 dB silent 40 dB(A) audible 50 dB(A) loud |
||
min: | ||
(-) The maximum temperature on the upper side is 47.6 °C / 118 F, compared to the average of 36.8 °C / 98 F, ranging from 21 to 71 °C for the class Multimedia.
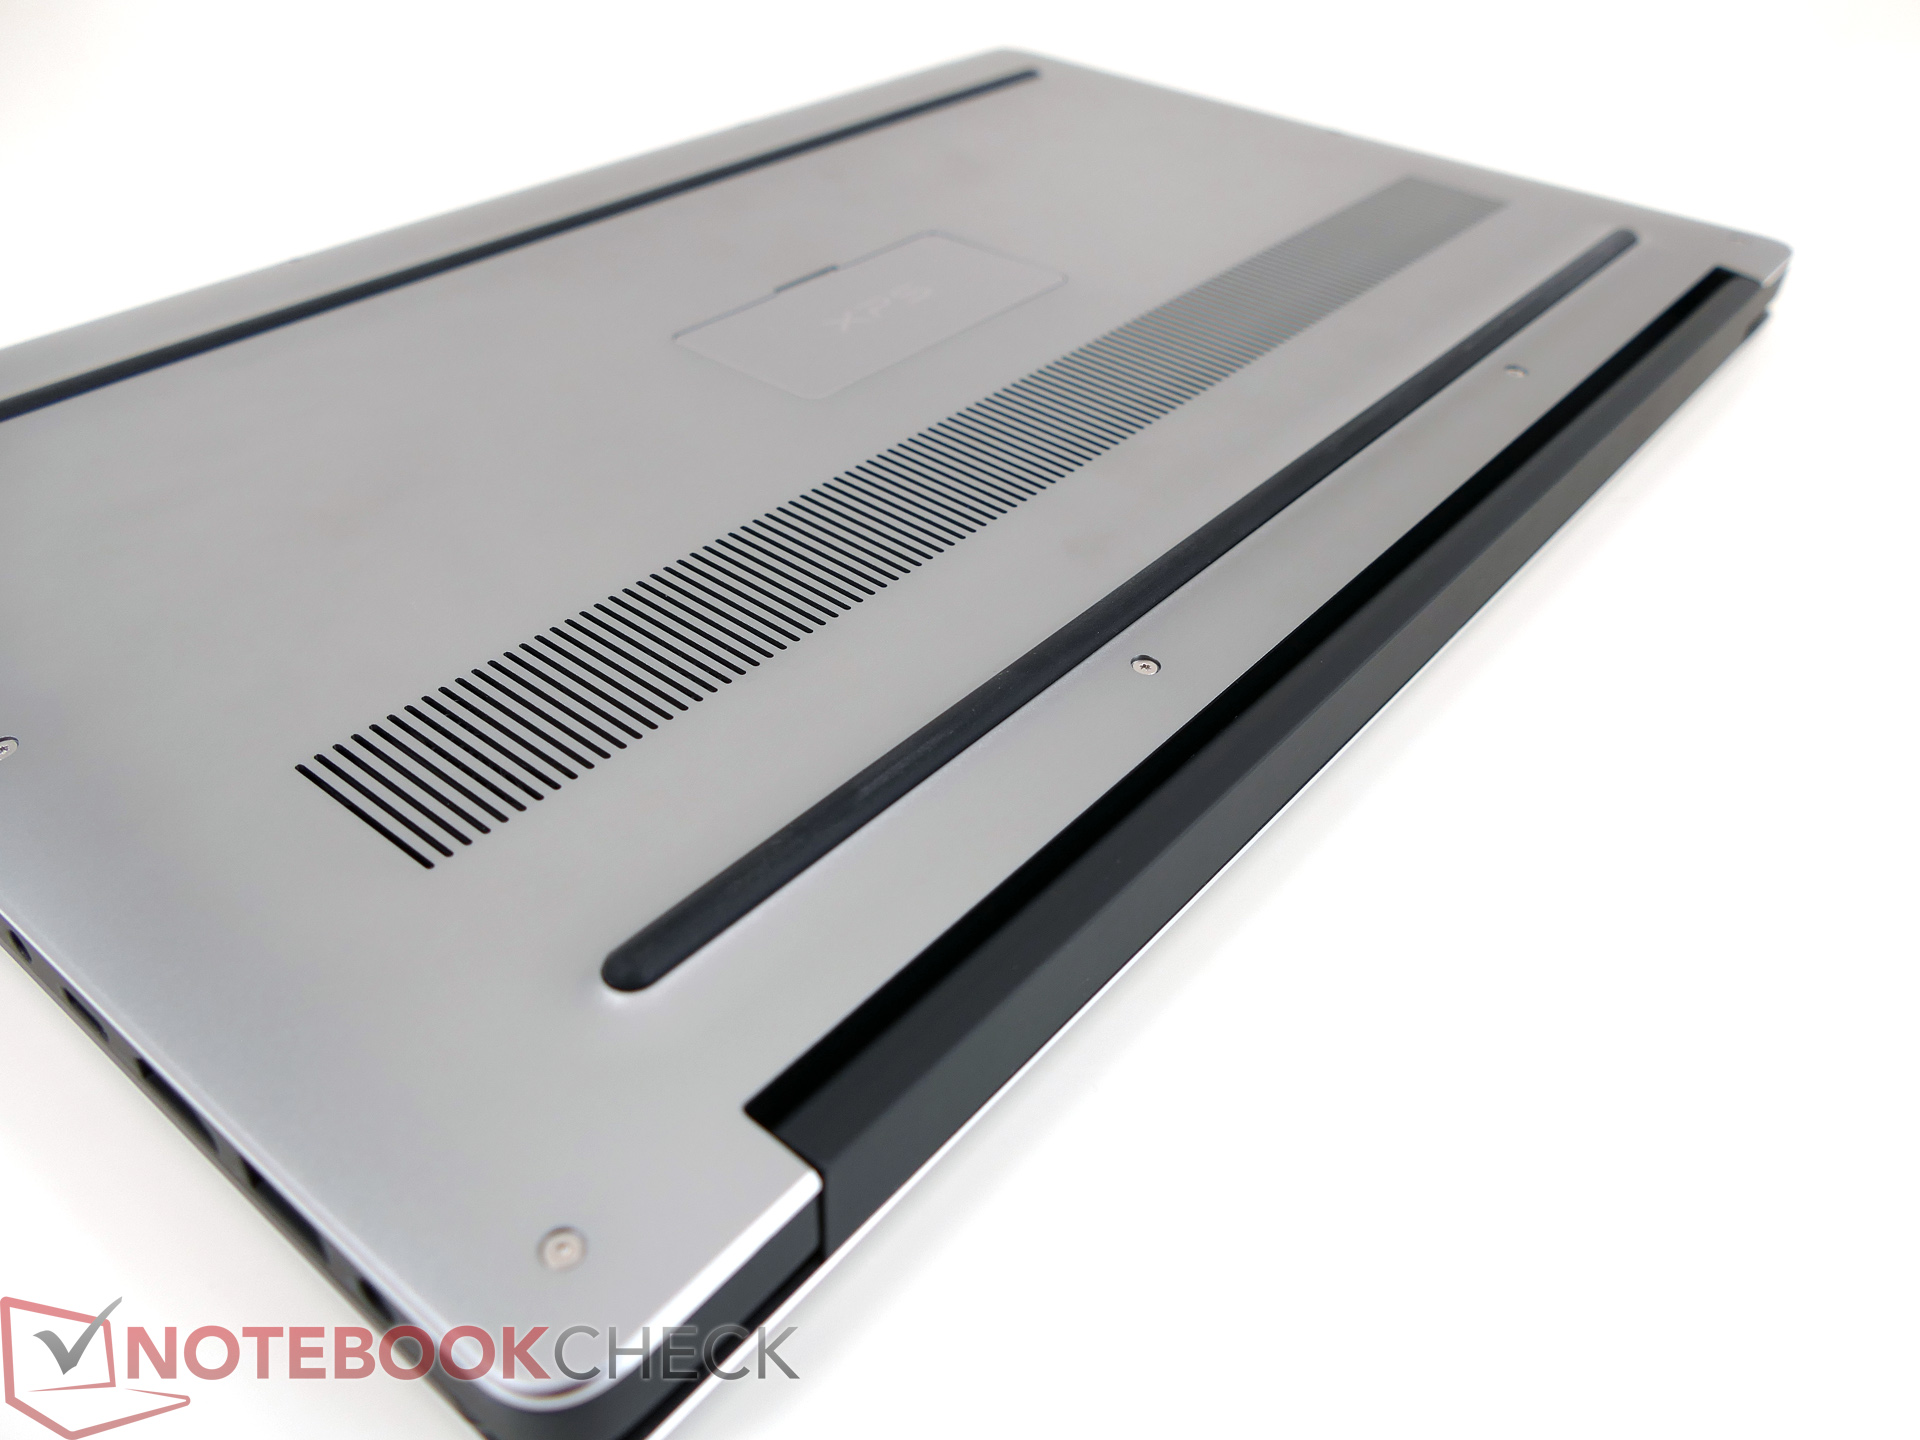
(±) The bottom heats up to a maximum of 42.1 °C / 108 F, compared to the average of 39.1 °C / 102 F
(+) In idle usage, the average temperature for the upper side is 28.4 °C / 83 F, compared to the device average of 31.3 °C / 88 F.
(-) Playing The Witcher 3, the average temperature for the upper side is 38.1 °C / 101 F, compared to the device average of 31.3 °C / 88 F.
(+) The palmrests and touchpad are reaching skin temperature as a maximum (32.2 °C / 90 F) and are therefore not hot.
(-) The average temperature of the palmrest area of similar devices was 28.7 °C / 83.7 F (-3.5 °C / -6.3 F).
Dell XPS 15 2017 9560 (7300HQ, Full-HD) audio analysis
(+) | speakers can play relatively loud (87 dB)
Bass 100 - 315 Hz
(-) | nearly no bass - on average 15.8% lower than median
(±) | linearity of bass is average (13.9% delta to prev. frequency)
Mids 400 - 2000 Hz
(+) | balanced mids - only 4.3% away from median
(±) | linearity of mids is average (7.1% delta to prev. frequency)
Highs 2 - 16 kHz
(+) | balanced highs - only 3.1% away from median
(±) | linearity of highs is average (7.9% delta to prev. frequency)
Overall 100 - 16.000 Hz
(+) | overall sound is linear (13.5% difference to median)
Compared to same class
» 29% of all tested devices in this class were better, 4% similar, 67% worse
» The best had a delta of 5%, average was 17%, worst was 45%
Compared to all devices tested
» 14% of all tested devices were better, 4% similar, 82% worse
» The best had a delta of 4%, average was 23%, worst was 134%
Apple MacBook Pro 15 2016 (2.6 GHz, 450) audio analysis
(+) | speakers can play relatively loud (86 dB)
Bass 100 - 315 Hz
(±) | reduced bass - on average 6.9% lower than median
(±) | linearity of bass is average (12.7% delta to prev. frequency)
Mids 400 - 2000 Hz
(±) | higher mids - on average 5% higher than median
(±) | linearity of mids is average (9.5% delta to prev. frequency)
Highs 2 - 16 kHz
(+) | balanced highs - only 2% away from median
(+) | highs are linear (4.3% delta to prev. frequency)
Overall 100 - 16.000 Hz
(+) | overall sound is linear (9.7% difference to median)
Compared to same class
» 13% of all tested devices in this class were better, 1% similar, 85% worse
» The best had a delta of 5%, average was 17%, worst was 45%
Compared to all devices tested
» 4% of all tested devices were better, 1% similar, 95% worse
» The best had a delta of 4%, average was 23%, worst was 134%
| Off / Standby | |
| Idle | |
| Load |
|
Key:
min: | |
| Dell XPS 15 2017 9560 (7300HQ, Full-HD) | Dell XPS 15 2016 9550 | Dell XPS 15-9550 i7 | Apple MacBook Pro 15 2016 (2.9 GHz, 460) | Dell XPS 13 9360 FHD i5 | Asus Zenbook UX510UW-CN044T | Razer Blade (2016) FHD | |
|---|---|---|---|---|---|---|---|
| Power Consumption | -25% | -67% | 13% | 58% | 14% | -62% | |
| Idle Minimum * (Watt) | 6.6 | 9.9 -50% | 12.5 -89% | 3 55% | 4.1 38% | 5 24% | 14 -112% |
| Idle Average * (Watt) | 9 | 12.6 -40% | 19.6 -118% | 9.9 -10% | 4.2 53% | 8.9 1% | 18 -100% |
| Idle Maximum * (Watt) | 10.7 | 16.8 -57% | 22.8 -113% | 12.5 -17% | 5.1 52% | 11.8 -10% | 21 -96% |
| Load Average * (Watt) | 77.5 | 70 10% | 102 -32% | 70.6 9% | 22.1 71% | 55 29% | 70 10% |
| Load Maximum * (Watt) | 130 | 114 12% | 107 18% | 90.8 30% | 29.4 77% | 93 28% | 146 -12% |
* ... smaller is better
| Dell XPS 15 2017 9560 (7300HQ, Full-HD) i5-7300HQ, GeForce GTX 1050 Mobile, 56 Wh | Dell XPS 15 2016 9550 6300HQ, GeForce GTX 960M, 56 Wh | Dell XPS 15-9550 i7 6700HQ, GeForce GTX 960M, 84 Wh | Apple MacBook Pro 15 2016 (2.9 GHz, 460) 6920HQ, Radeon Pro 460, 76 Wh | Asus ZenBook Pro UX501VW-DS71T 6700HQ, GeForce GTX 960M, 96 Wh | Asus Zenbook UX510UW-CN044T 6500U, GeForce GTX 960M, 48 Wh | Dell Inspiron 15 7000 7567 i7-7700HQ, GeForce GTX 1050 Ti Mobile, 74 Wh | Razer Blade (2016) FHD 6700HQ, GeForce GTX 1060 Mobile, 70 Wh | Dell XPS 13 9360 FHD i5 i5-7200U, HD Graphics 620, 60 Wh | |
|---|---|---|---|---|---|---|---|---|---|
| Battery runtime | 20% | 12% | 24% | 26% | 29% | 65% | 11% | 106% | |
| Reader / Idle (h) | 9.4 | 9.1 -3% | 8.8 -6% | 11.5 22% | 13.6 45% | 19.6 109% | 12.7 35% | 21.6 130% | |
| WiFi v1.3 (h) | 5.6 | 5.5 -2% | 5.2 -7% | 10.3 84% | 6.3 13% | 7.2 29% | 10.4 86% | 7.1 27% | 11.3 102% |
| Load (h) | 1.4 | 2.3 64% | 2.1 50% | 0.9 -36% | 2 43% | 1.6 14% | 1.4 0% | 1 -29% | 2.6 86% |
| H.264 (h) | 6 | 5.3 | 9.1 | 7.1 | 7.6 | 5.2 |
Coming soon!
Price comparison
