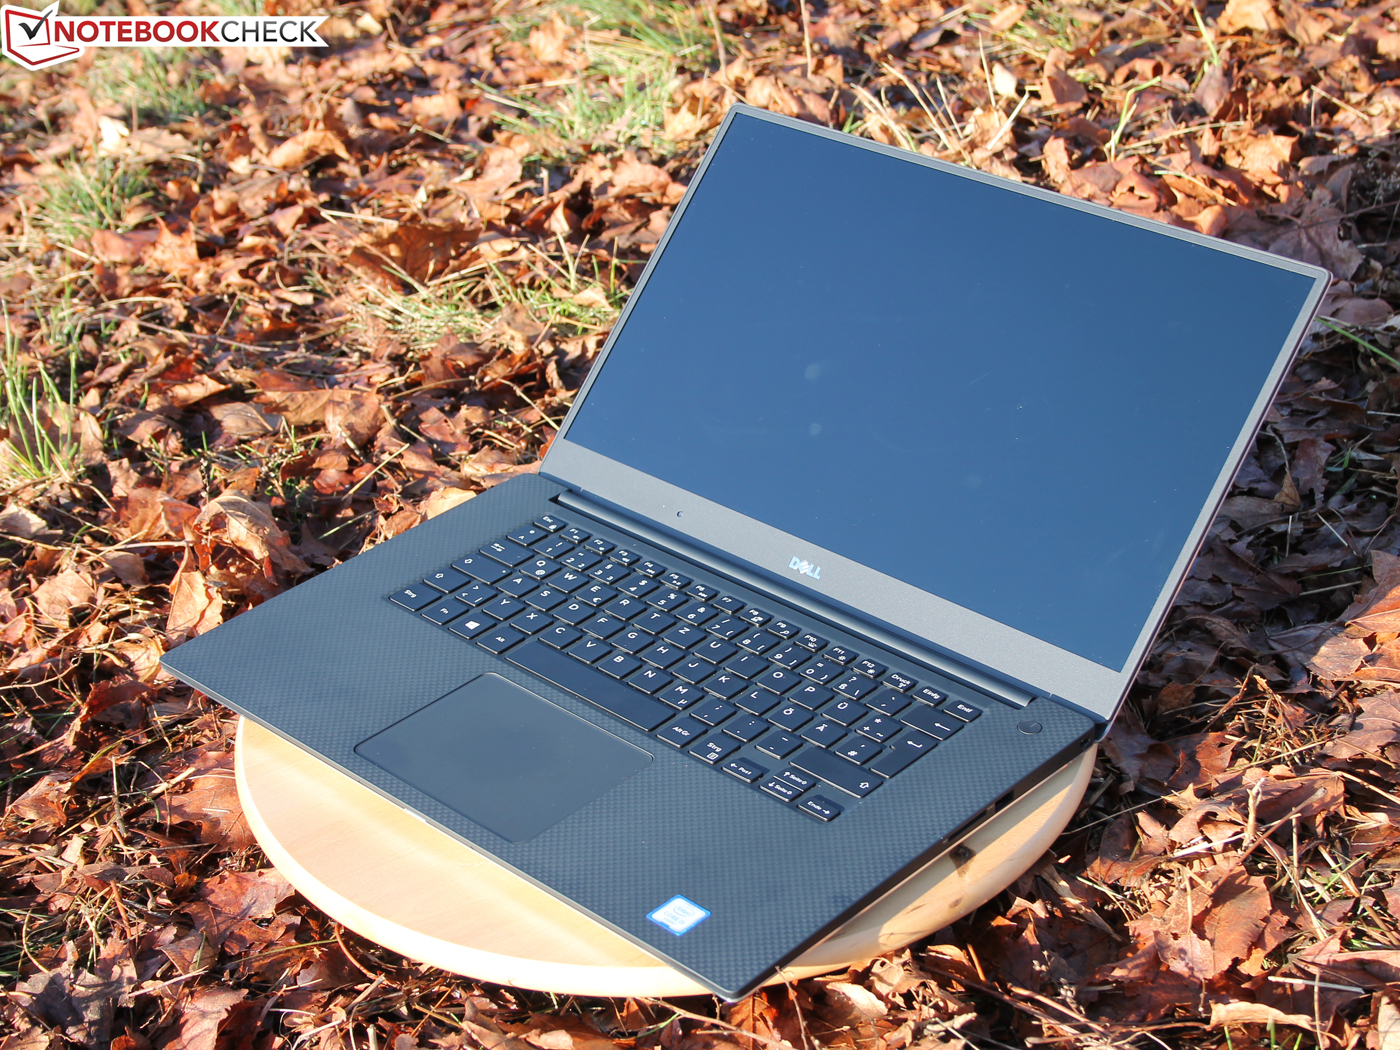
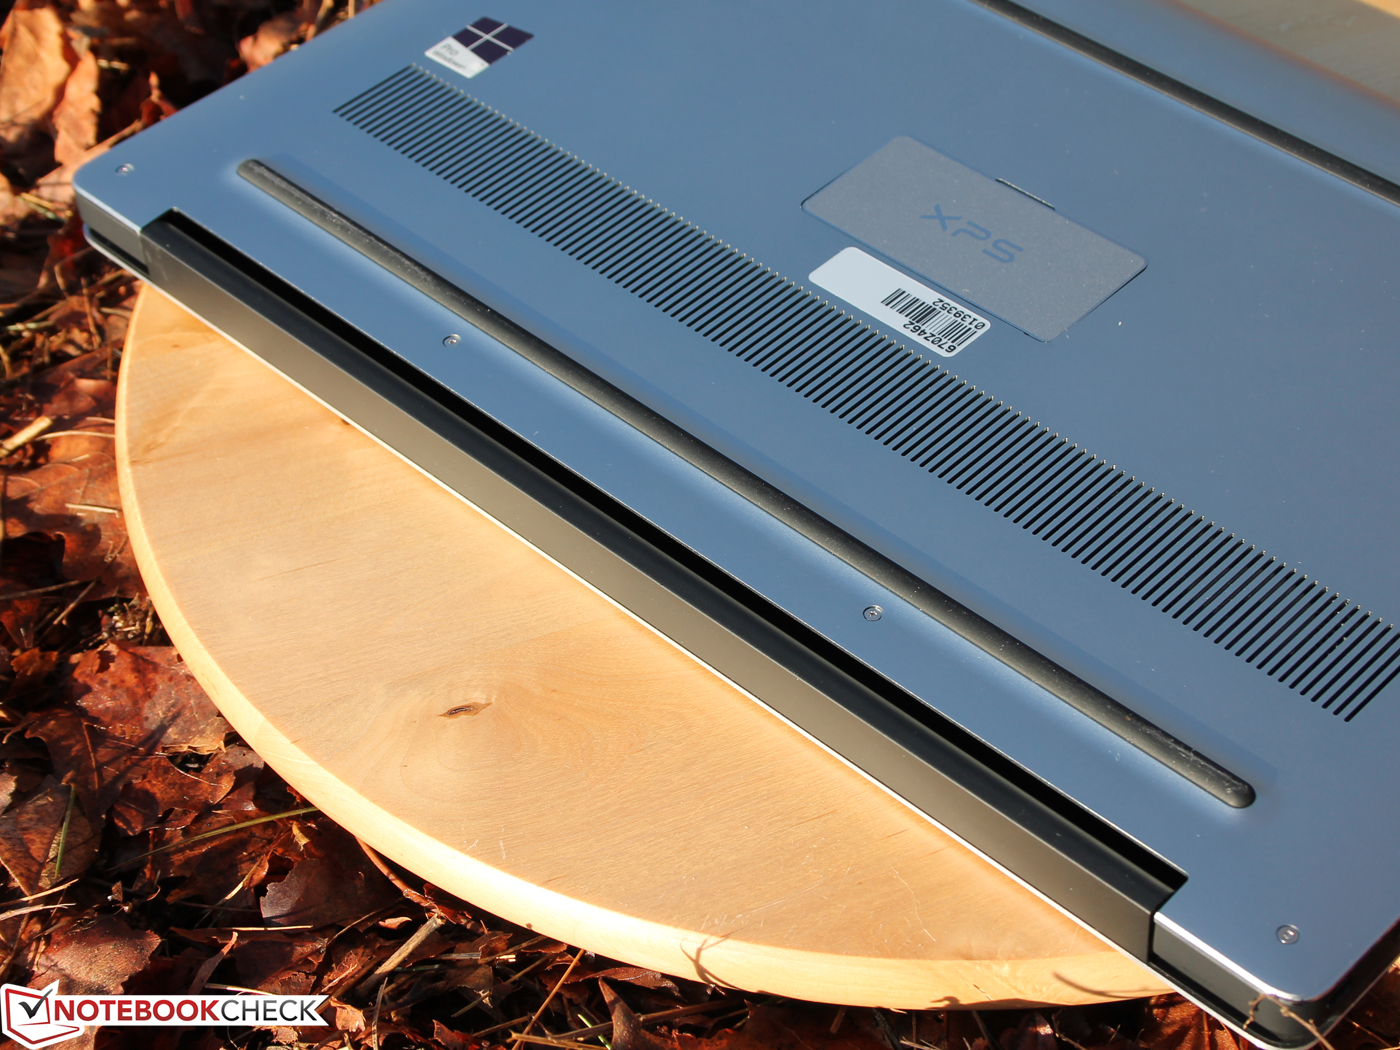
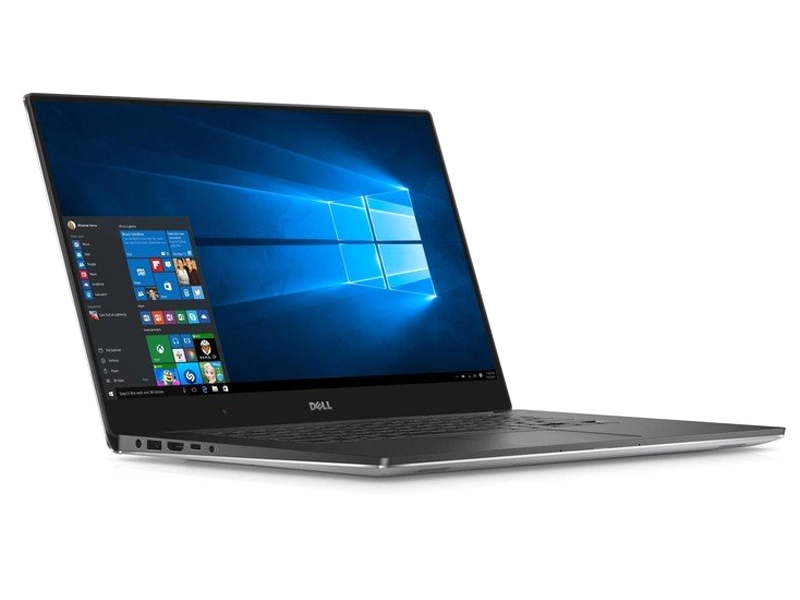
戴尔 XPS 15 2016 (9550) InfinityEdge 笔记本电脑简短评测
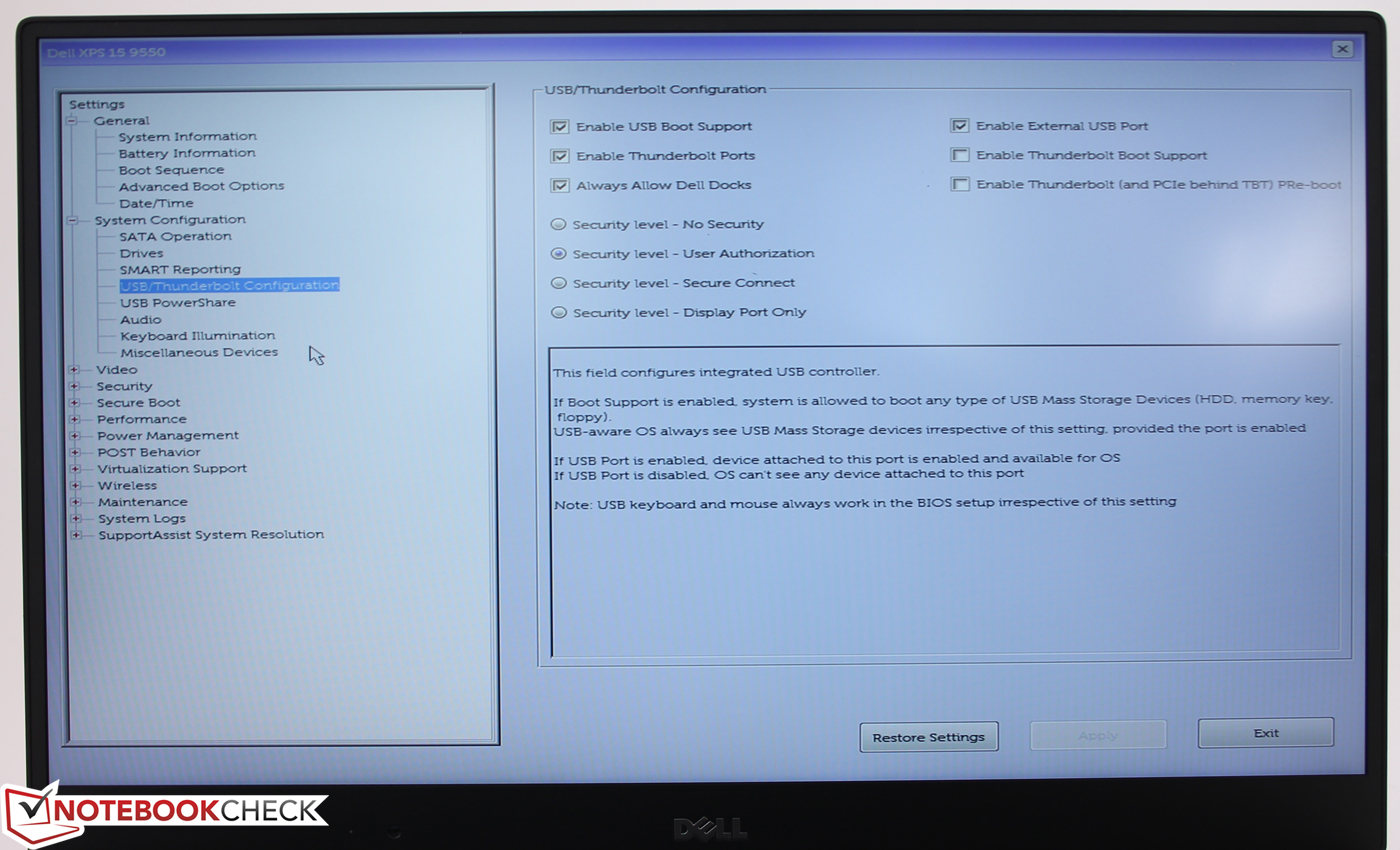
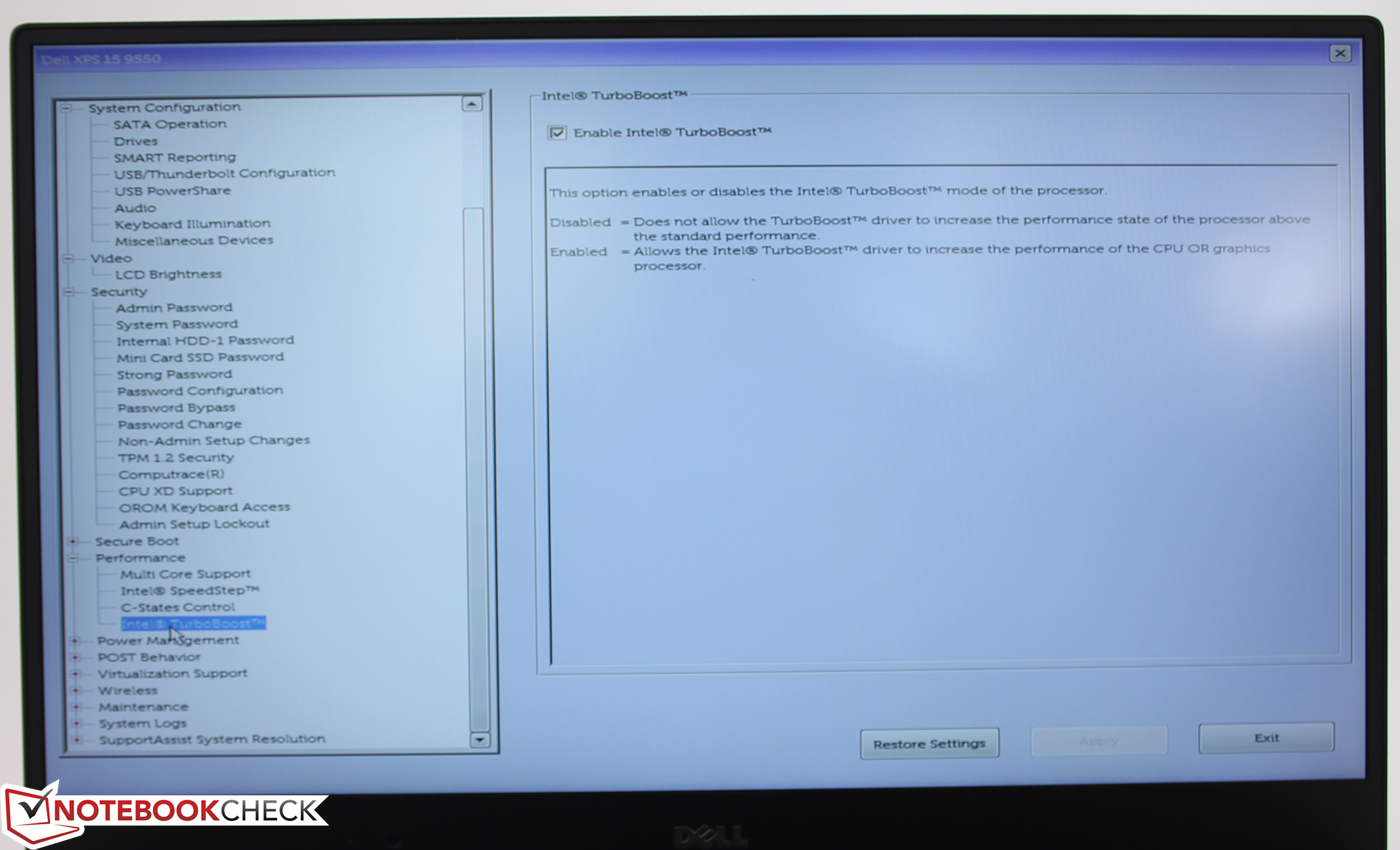
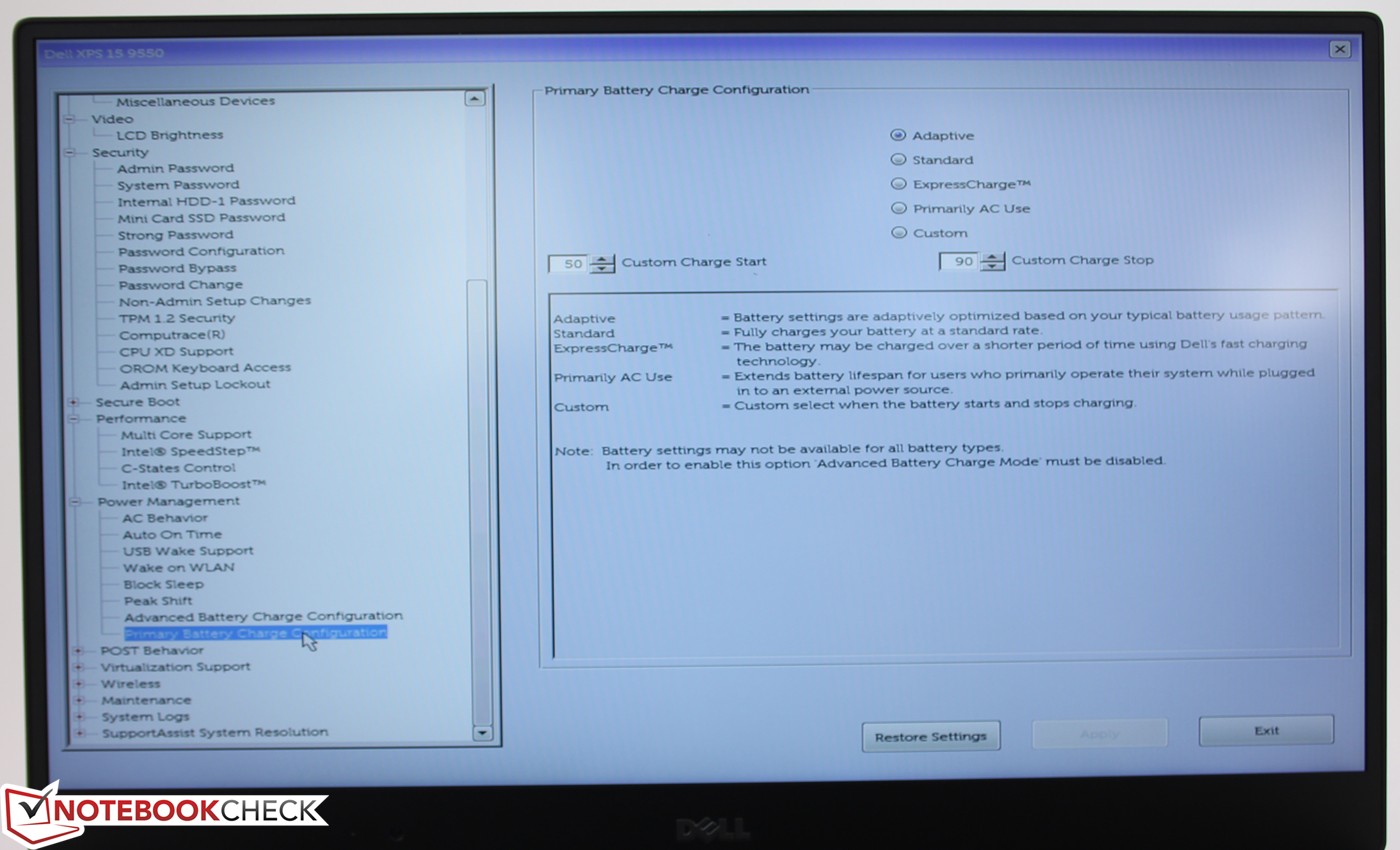
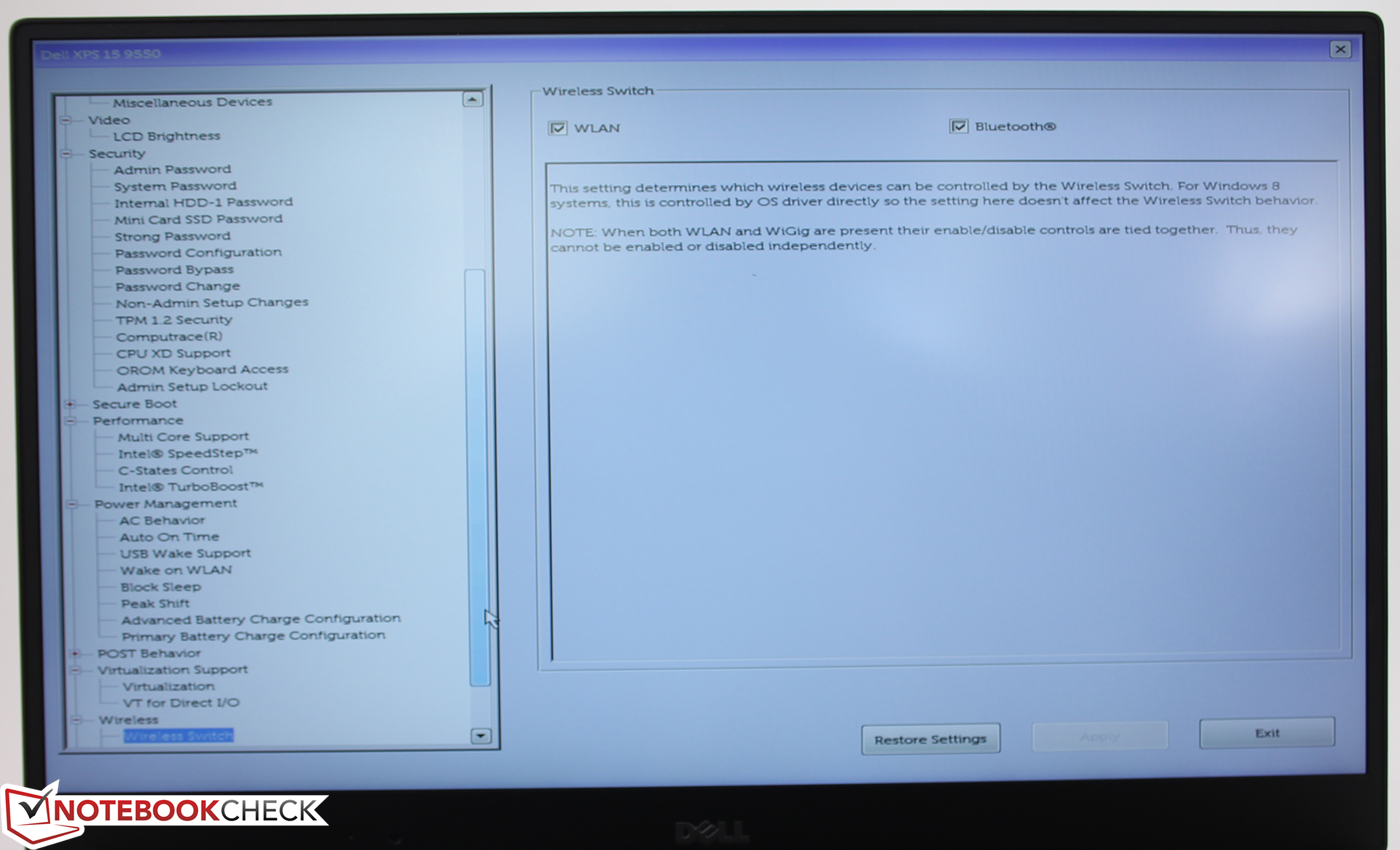
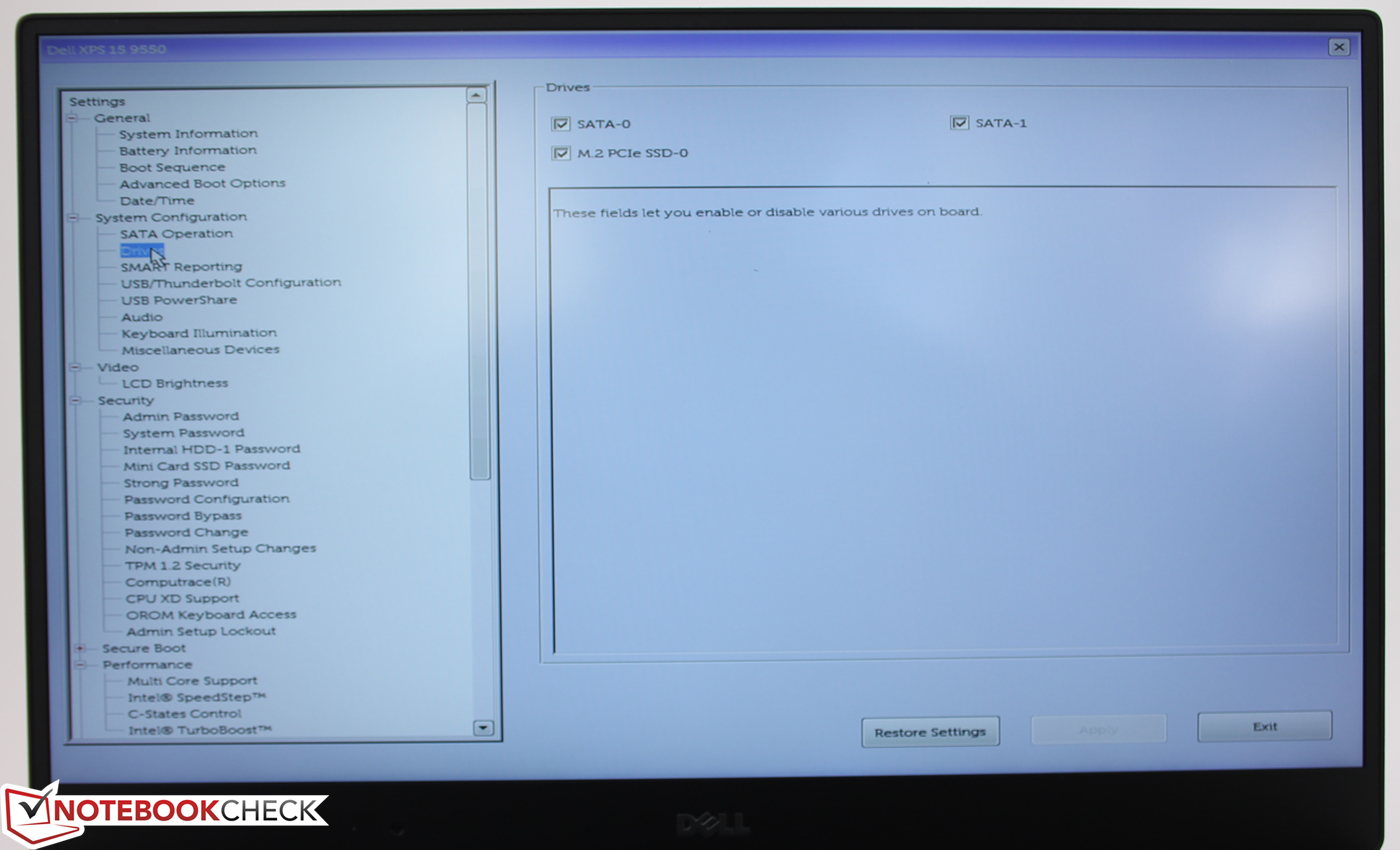
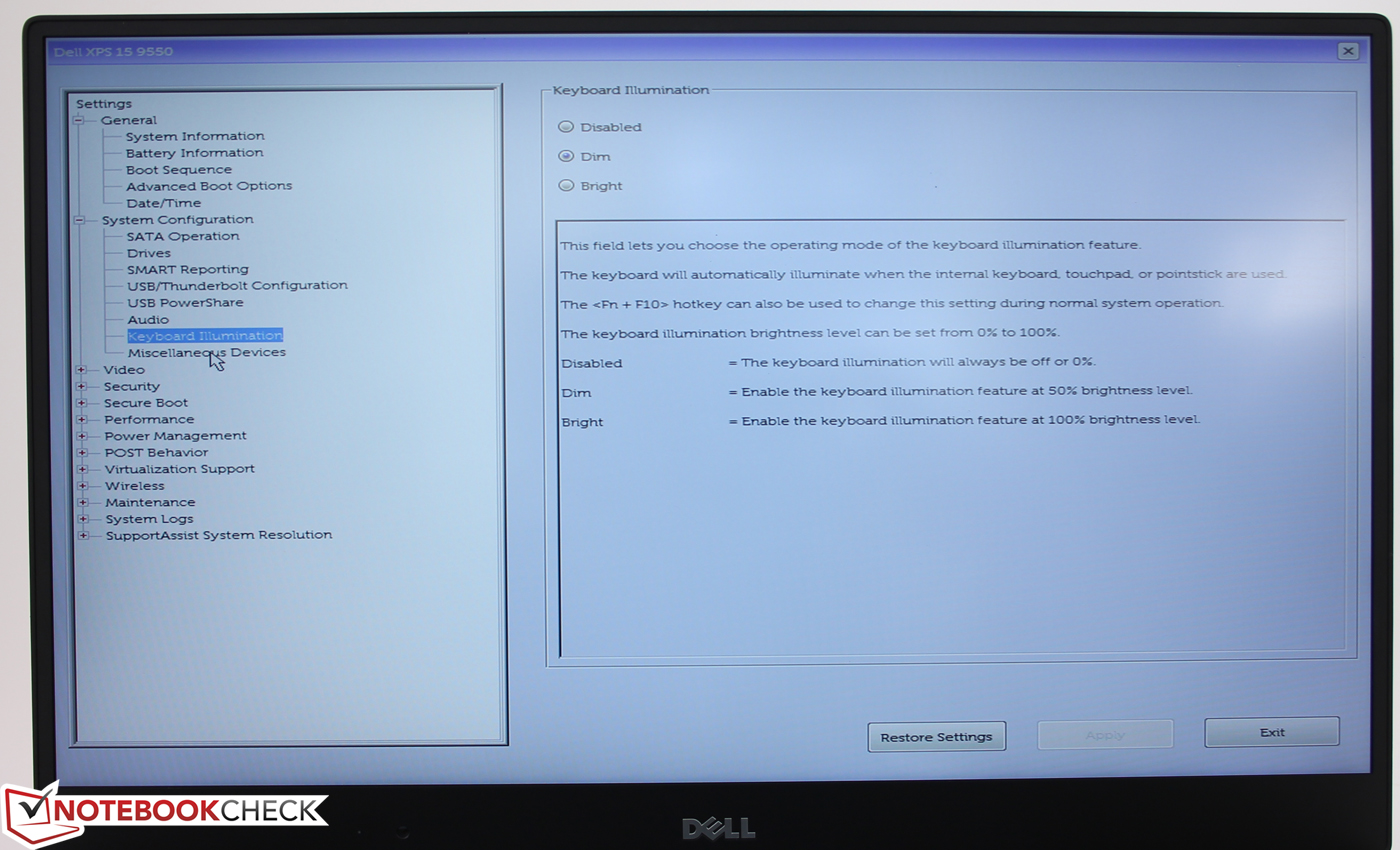
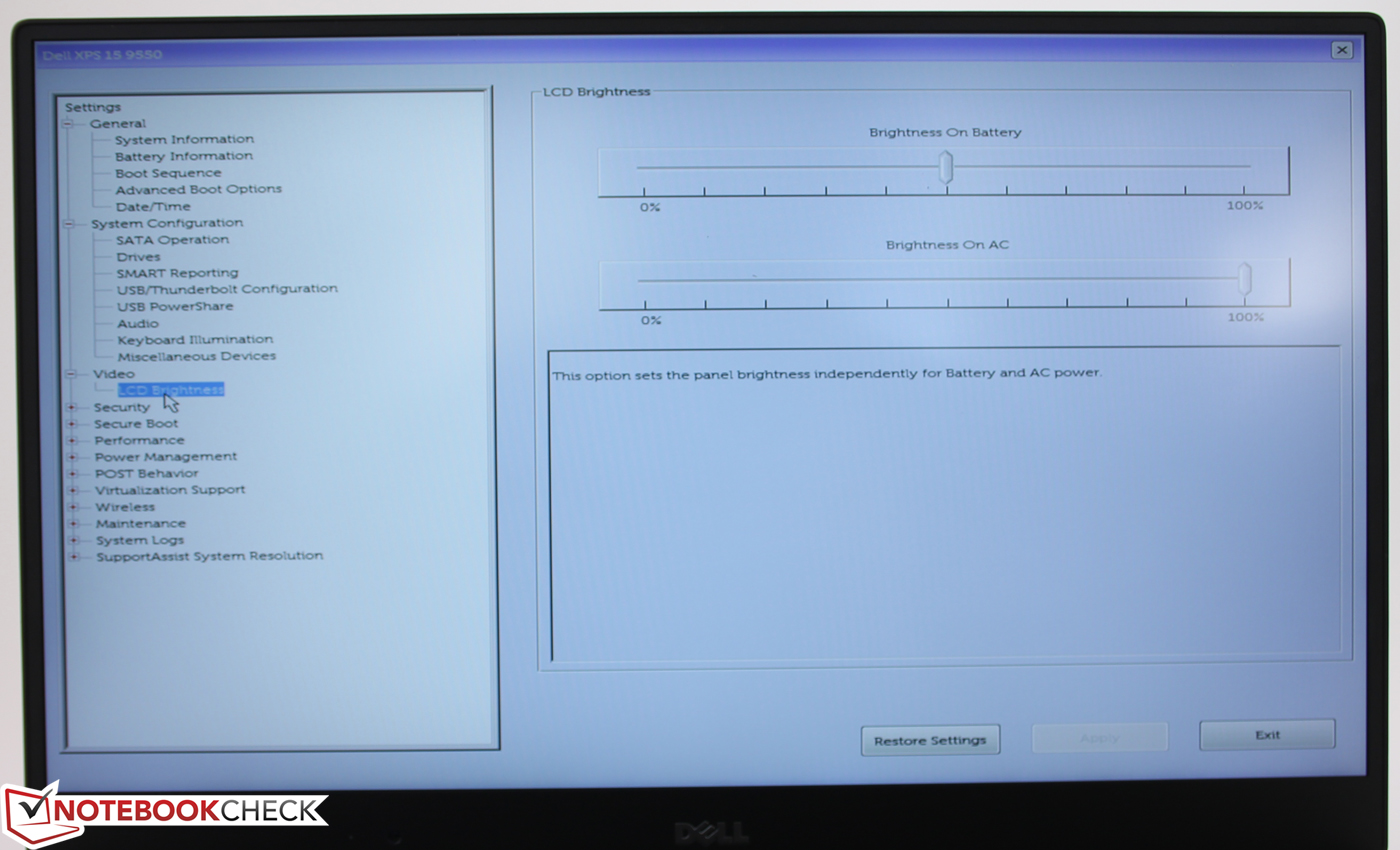
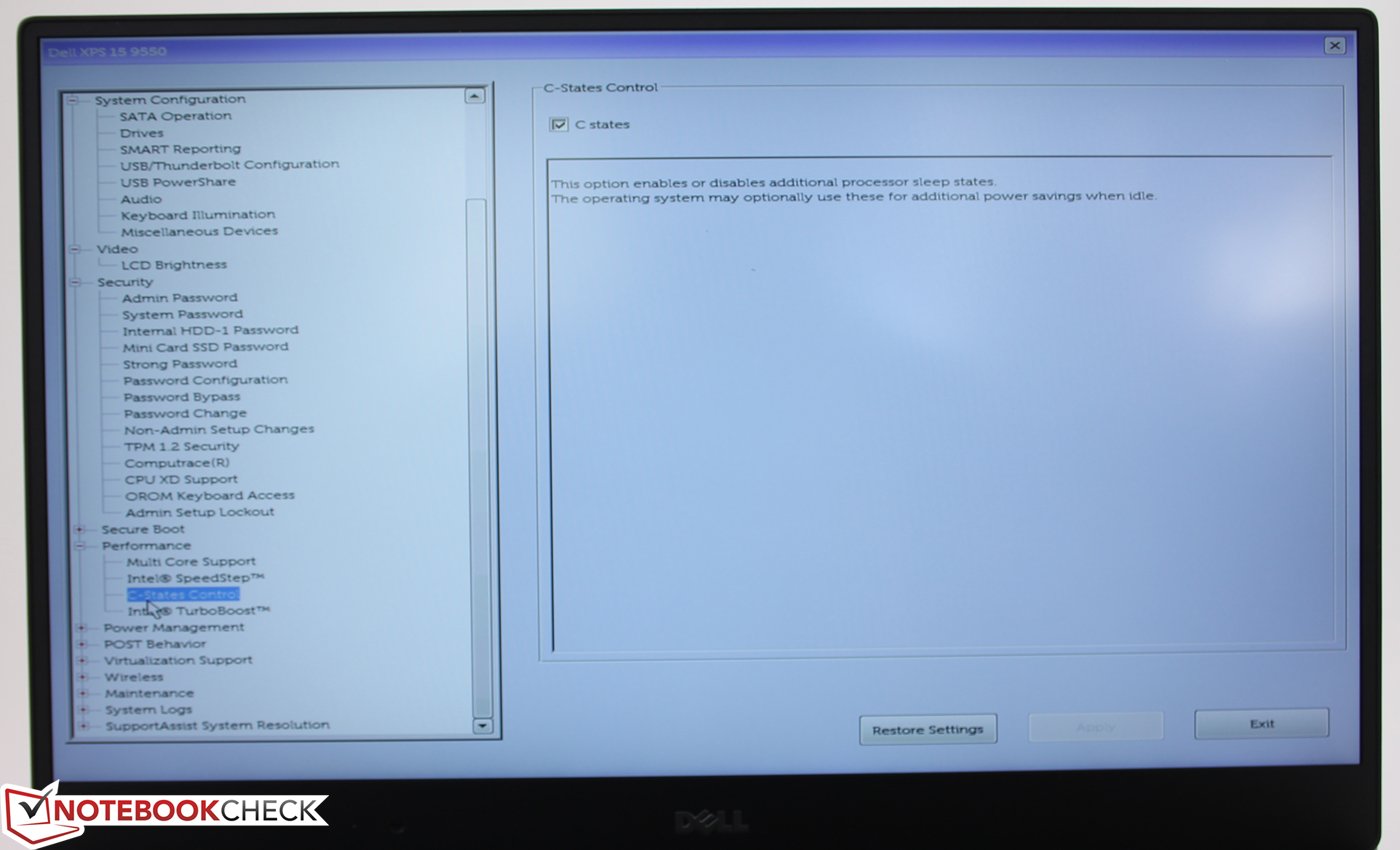
BIOS Settings
| |||||||||||||||||||||||||
Brightness Distribution: 89 %
Center on Battery: 399 cd/m²
Contrast: 1663:1 (Black: 0.24 cd/m²)
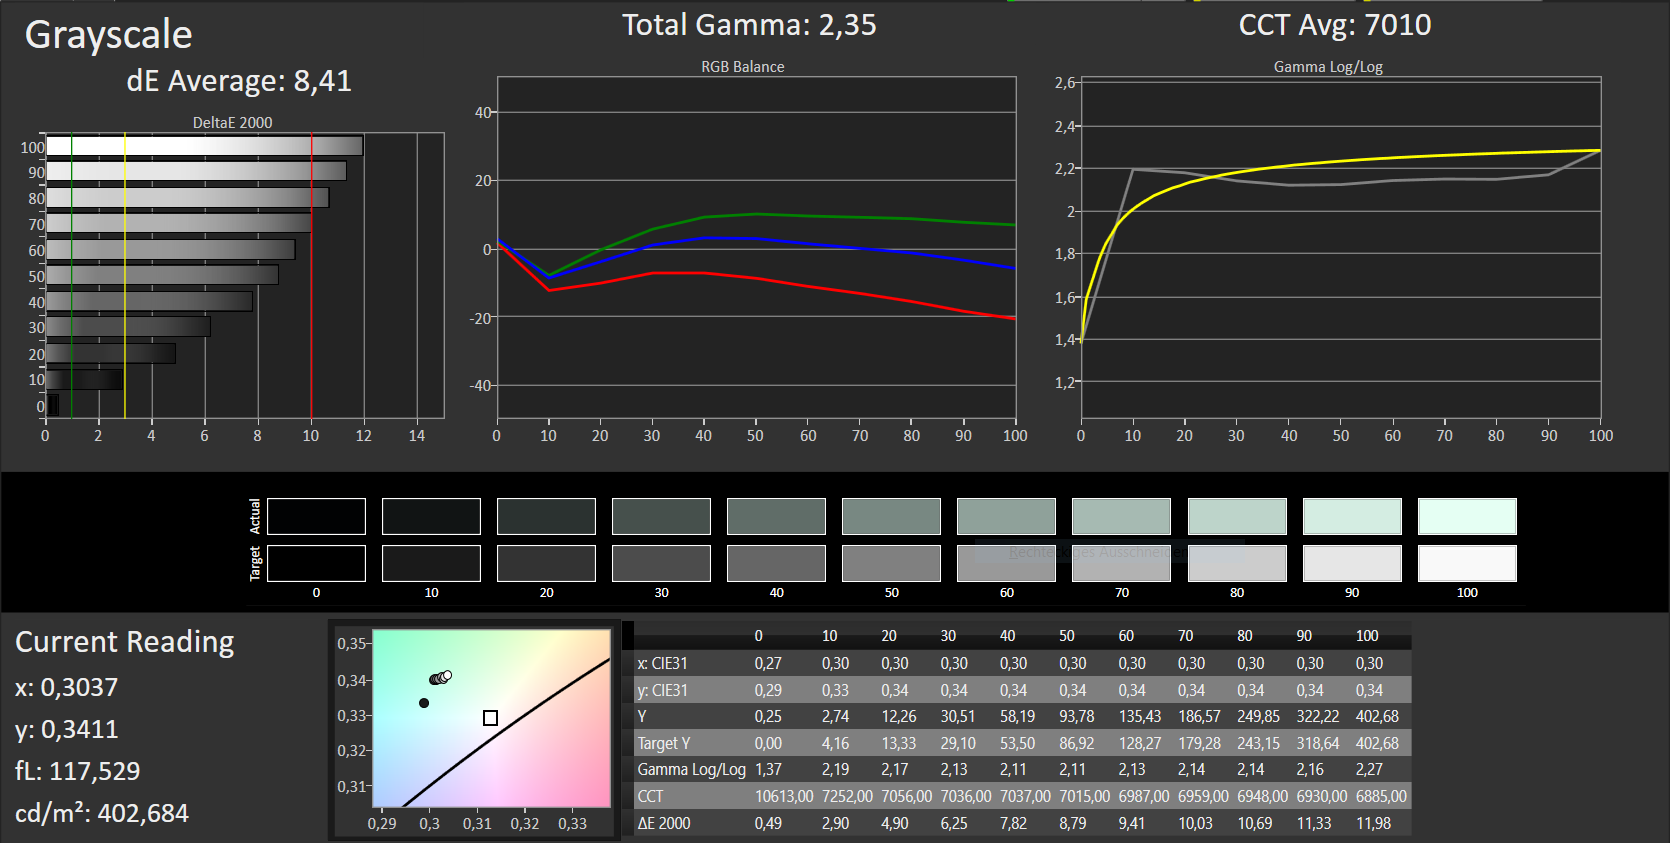
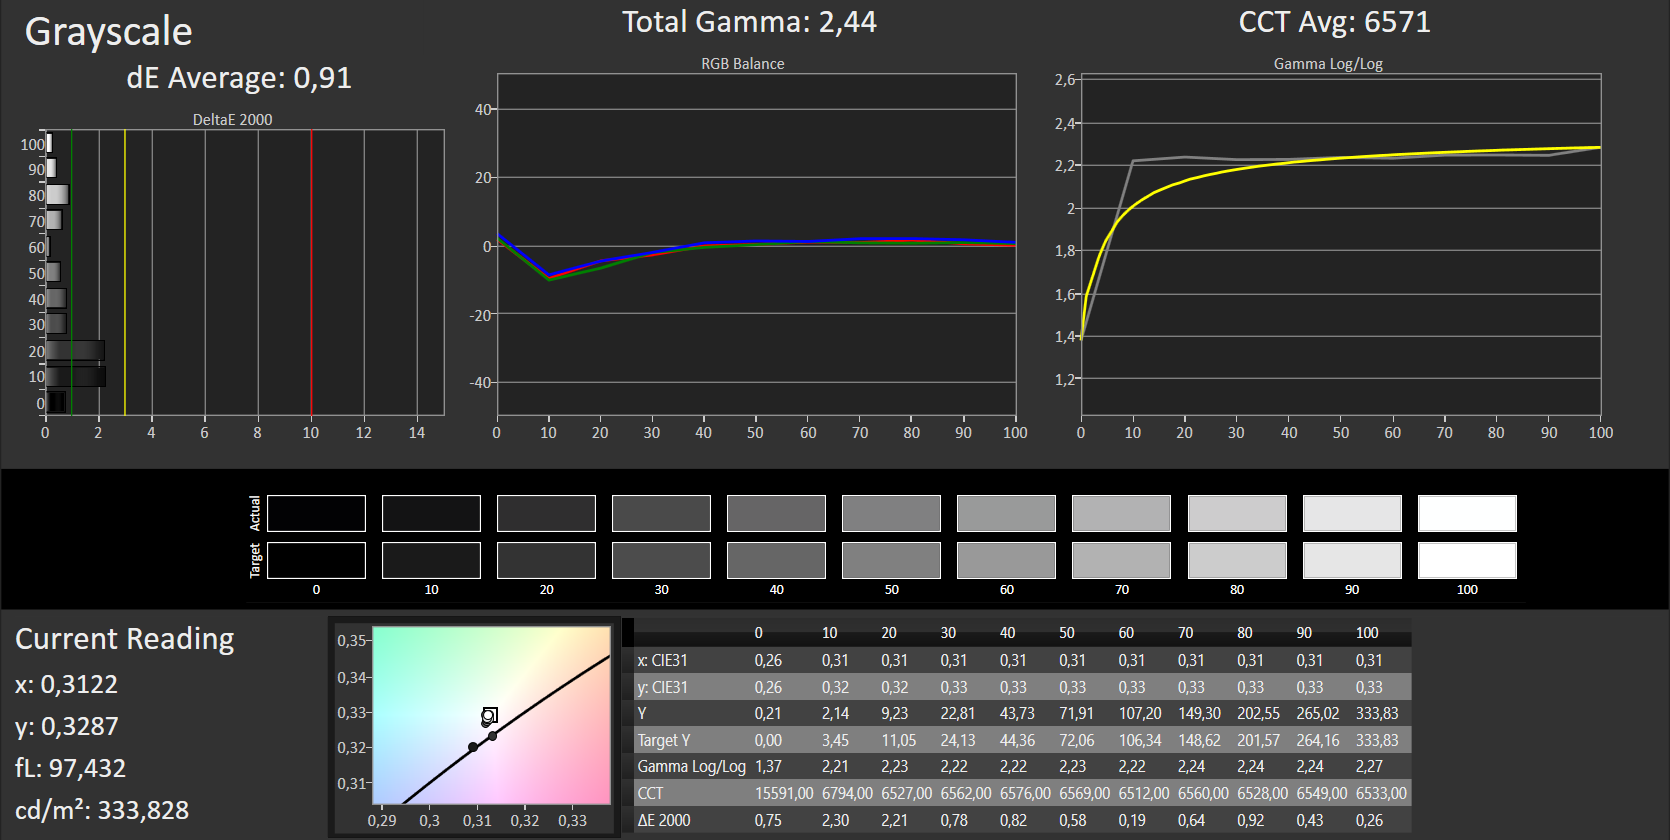
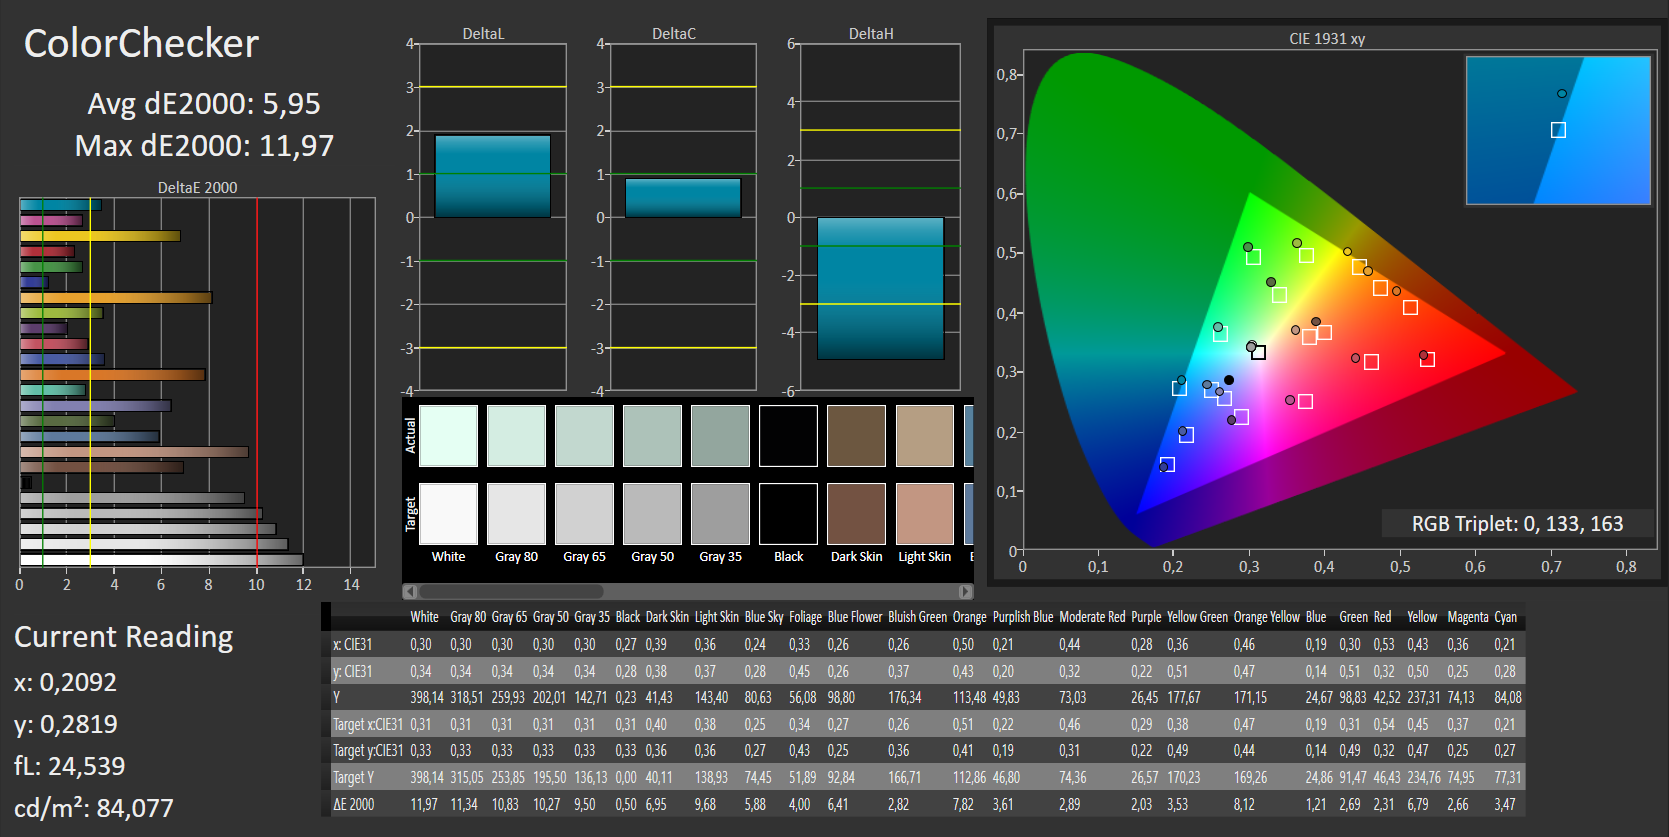
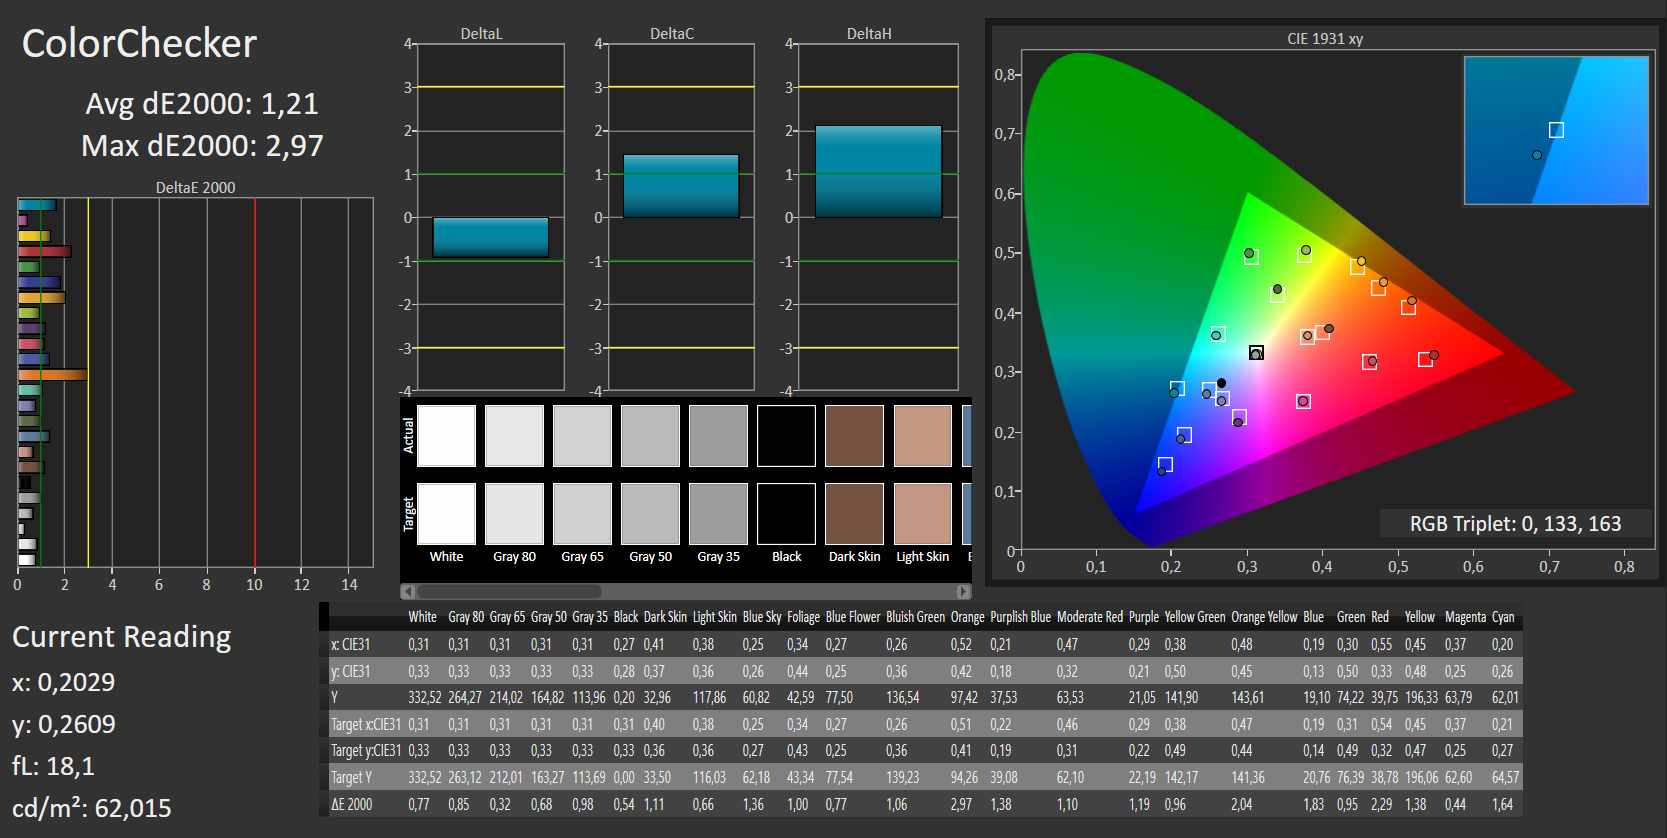
ΔE ColorChecker Calman: 5.95 | ∀{0.5-29.43 Ø4.72}
ΔE Greyscale Calman: 8.41 | ∀{0.09-98 Ø4.97}
98% sRGB (Argyll 1.6.3 3D)
64% AdobeRGB 1998 (Argyll 1.6.3 3D)
70.7% AdobeRGB 1998 (Argyll 3D)
97.9% sRGB (Argyll 3D)
68.8% Display P3 (Argyll 3D)
Gamma: 2.35
CCT: 7010 K
| Dell XPS 15 9550 1920x1080 Sharp SHP1453 LQ156M1 IPS | Apple MB Pro Retina 15 2015 2880x1800 APPA02E IPS | Asus Zenbook Pro UX501JW 3840x2160 Samsung SDC434B FL156FL02-101 IPS | XPS 13 2016 i7 QHD 3200x1800 SHP1421 LQ133Y1 IGZO | XPS 15 9530 3840x2160 Sharp SHP1431 LQ156D1 IPS | MSI PE60 1920x1080 SAMSUNG LTN156HL01 IPS True Color | Acer AS V Nitro VN7-792G 1920x1080 AUO B173HAN01 IPS | |
|---|---|---|---|---|---|---|---|
| Display | -10% | -30% | -6% | -4% | -1% | -5% | |
| Display P3 Coverage (%) | 68.8 | 61.4 -11% | 47.47 -31% | 63.6 -8% | 64.9 -6% | 67.6 -2% | 67 -3% |
| sRGB Coverage (%) | 97.9 | 90.8 -7% | 71.5 -27% | 93.6 -4% | 96.1 -2% | 97 -1% | 91.3 -7% |
| AdobeRGB 1998 Coverage (%) | 70.7 | 62.9 -11% | 49.05 -31% | 65.5 -7% | 66.9 -5% | 69.8 -1% | 66.7 -6% |
| Response Times | 31% | 30% | 18% | ||||
| Response Time Grey 50% / Grey 80% * (ms) | 62 ? | 43.2 ? 30% | 40 ? 35% | 58 ? 6% | |||
| Response Time Black / White * (ms) | 40 ? | 27.2 ? 32% | 30 ? 25% | 28 ? 30% | |||
| PWM Frequency (Hz) | 362 ? | 4900 ? | |||||
| Screen | 0% | -42% | 1% | 4% | -0% | -1% | |
| Brightness middle (cd/m²) | 399 | 341 -15% | 302 -24% | 285 -29% | 349 -13% | 300 -25% | 346 -13% |
| Brightness (cd/m²) | 394 | 315 -20% | 307 -22% | 281 -29% | 365 -7% | 282 -28% | 326 -17% |
| Brightness Distribution (%) | 89 | 82 -8% | 87 -2% | 90 1% | 87 -2% | 90 1% | 88 -1% |
| Black Level * (cd/m²) | 0.24 | 0.34 -42% | 0.79 -229% | 0.18 25% | 0.282 -17% | 0.35 -46% | 0.32 -33% |
| Contrast (:1) | 1663 | 1003 -40% | 382 -77% | 1583 -5% | 1238 -26% | 857 -48% | 1081 -35% |
| Colorchecker dE 2000 * | 5.95 | 2.07 65% | 5.4 9% | 4.89 18% | 2.65 55% | 1.8 70% | 4.01 33% |
| Greyscale dE 2000 * | 8.41 | 1.9 77% | 5.99 29% | 5.16 39% | 3.77 55% | 2.18 74% | 3.58 57% |
| Gamma | 2.35 94% | 2.62 84% | 2.32 95% | 2.15 102% | 2.41 91% | 2.37 93% | 2.23 99% |
| CCT | 7010 93% | 6514 100% | 6670 97% | 7106 91% | 6786 96% | 6837 95% | 6426 101% |
| Color Space (Percent of AdobeRGB 1998) (%) | 64 | 58 -9% | 45 -30% | 59 -8% | 61.02 -5% | 64 0% | |
| Color Space (Percent of sRGB) (%) | 98 | 91 -7% | 71 -28% | 93 -5% | 96.1 -2% | 97 -1% | |
| Colorchecker dE 2000 max. * | 3.27 | ||||||
| Total Average (Program / Settings) | -5% /
-2% | -14% /
-29% | 8% /
3% | 0% /
2% | -1% /
-1% | 4% /
1% |
* ... smaller is better
Display Response Times
| ↔ Response Time Black to White | ||
|---|---|---|
| 40 ms ... rise ↗ and fall ↘ combined | ↗ 13 ms rise | 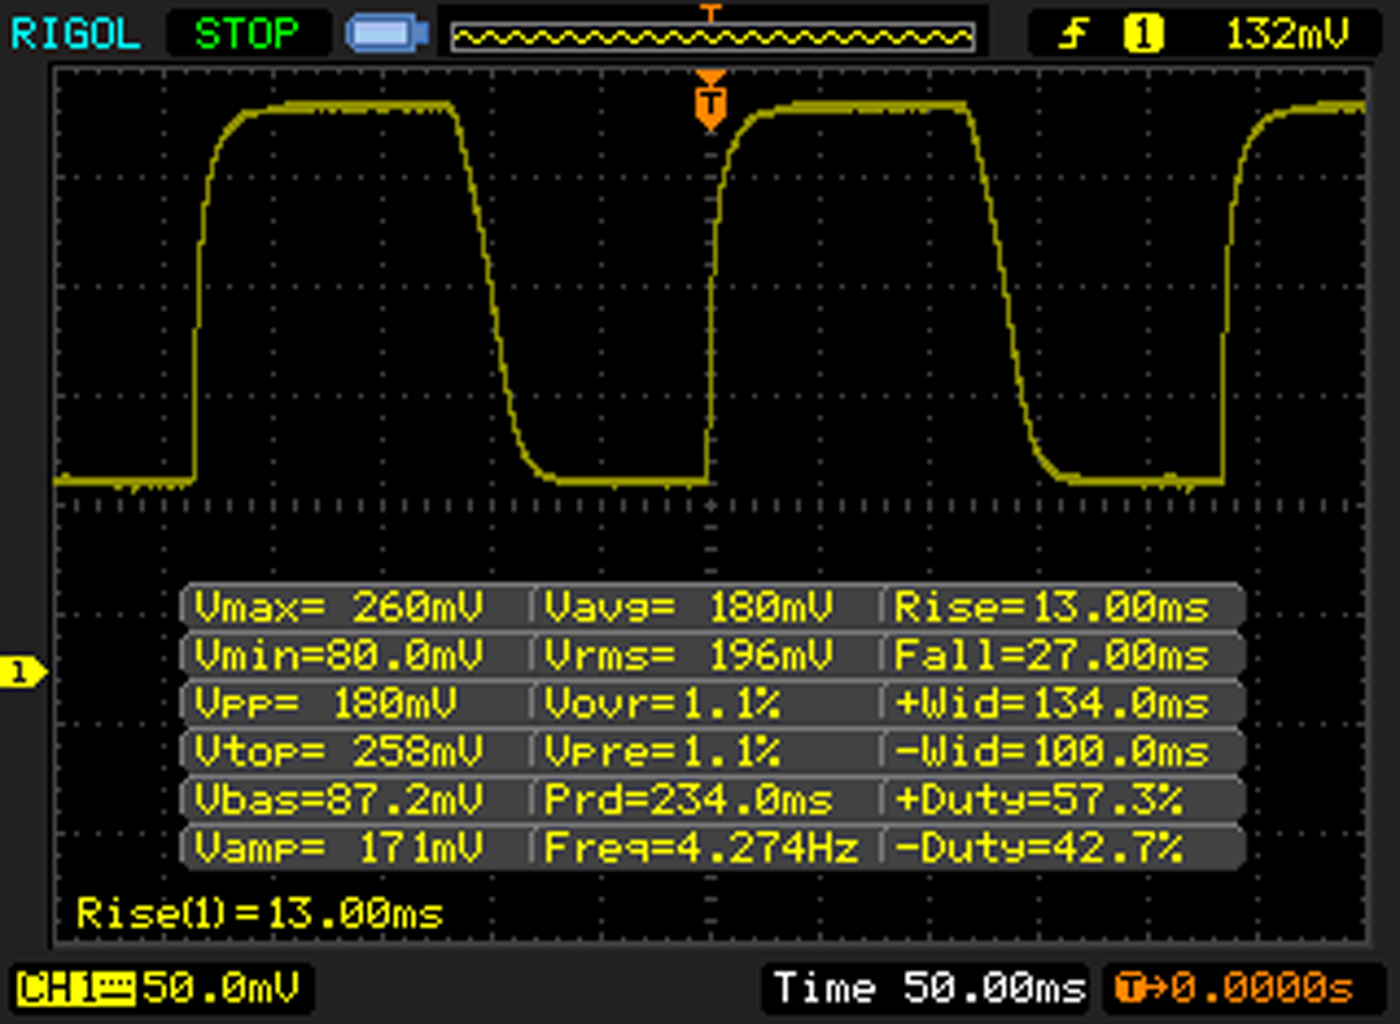 |
| ↘ 27 ms fall | ||
| The screen shows slow response rates in our tests and will be unsatisfactory for gamers. In comparison, all tested devices range from 0.1 (minimum) to 240 (maximum) ms. » 97 % of all devices are better. This means that the measured response time is worse than the average of all tested devices (19.8 ms). | ||
| ↔ Response Time 50% Grey to 80% Grey | ||
| 62 ms ... rise ↗ and fall ↘ combined | ↗ 25 ms rise | 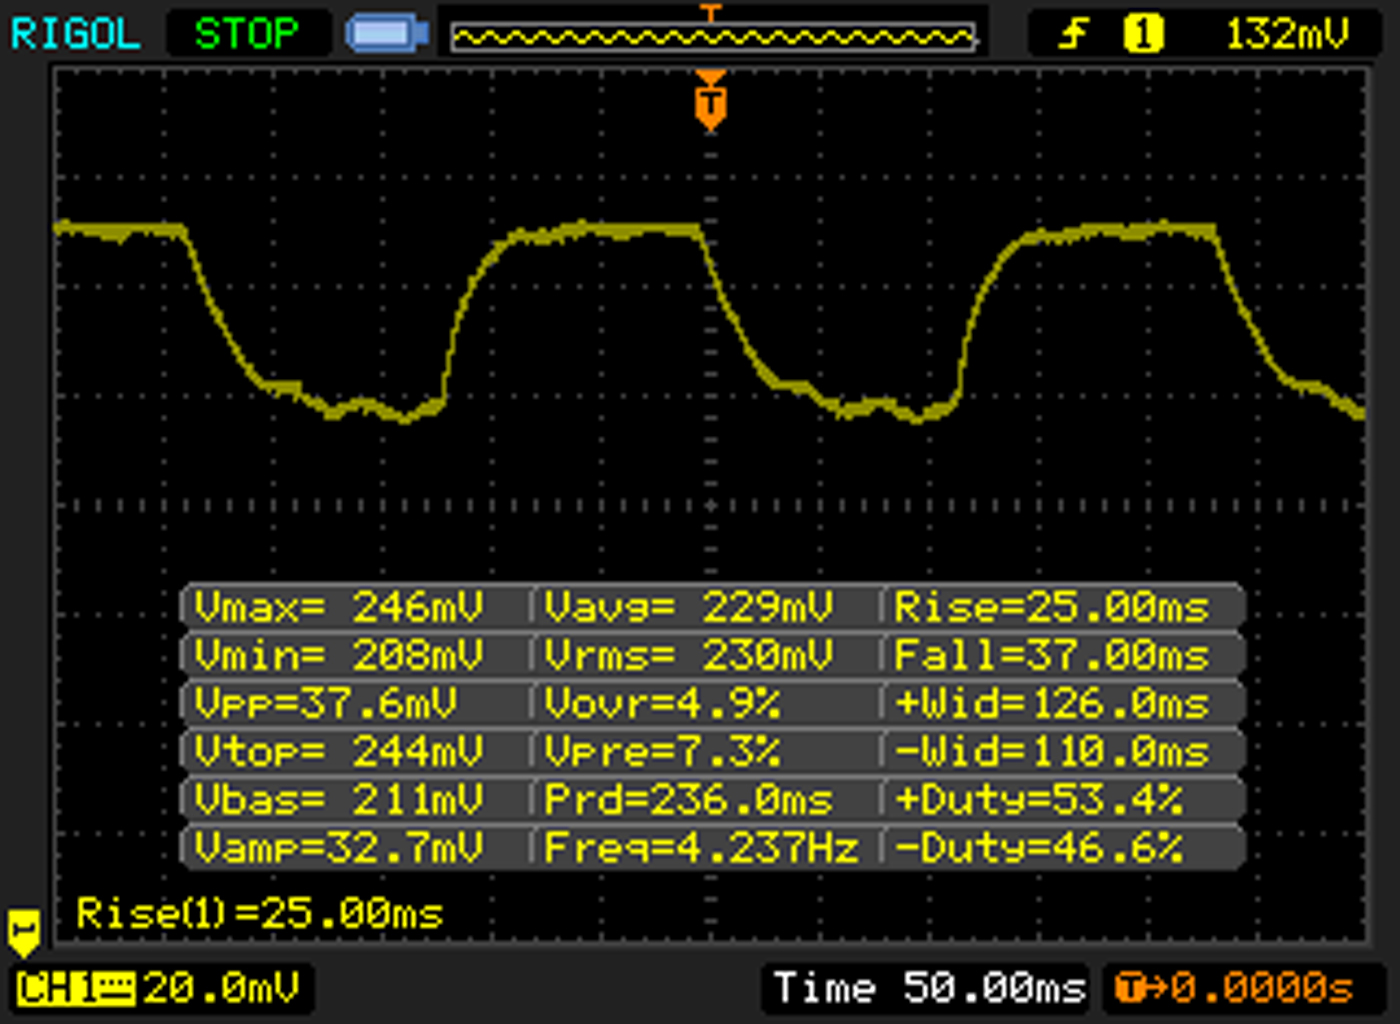 |
| ↘ 37 ms fall | ||
| The screen shows slow response rates in our tests and will be unsatisfactory for gamers. In comparison, all tested devices range from 0.165 (minimum) to 636 (maximum) ms. » 97 % of all devices are better. This means that the measured response time is worse than the average of all tested devices (31 ms). | ||
Screen Flickering / PWM (Pulse-Width Modulation)
| Screen flickering / PWM detected | 362 Hz | ≤ 10 % brightness setting | 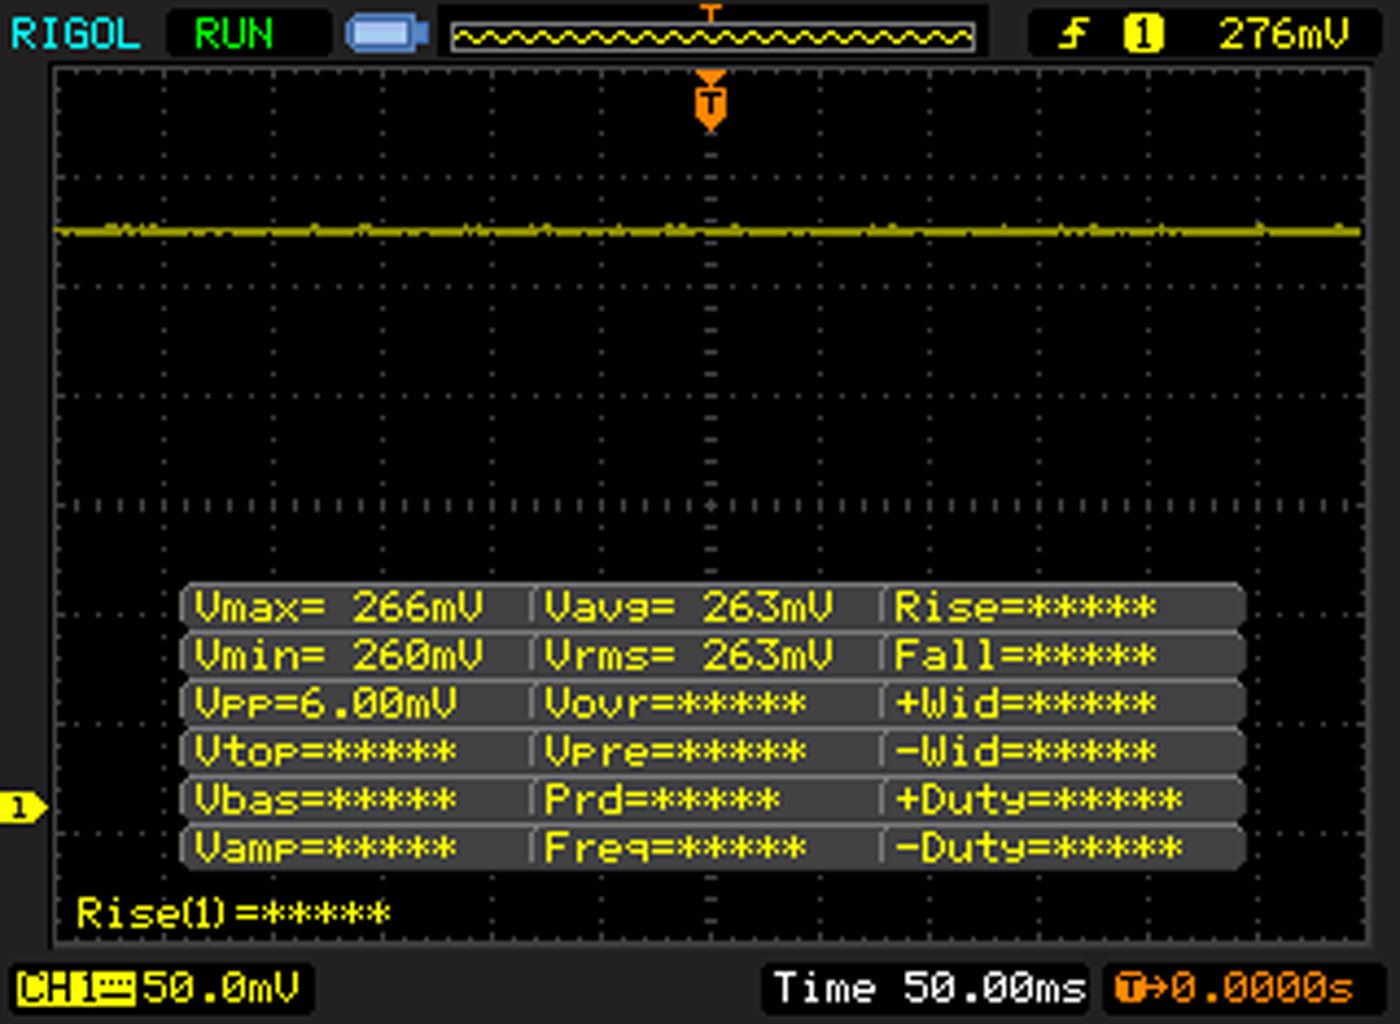 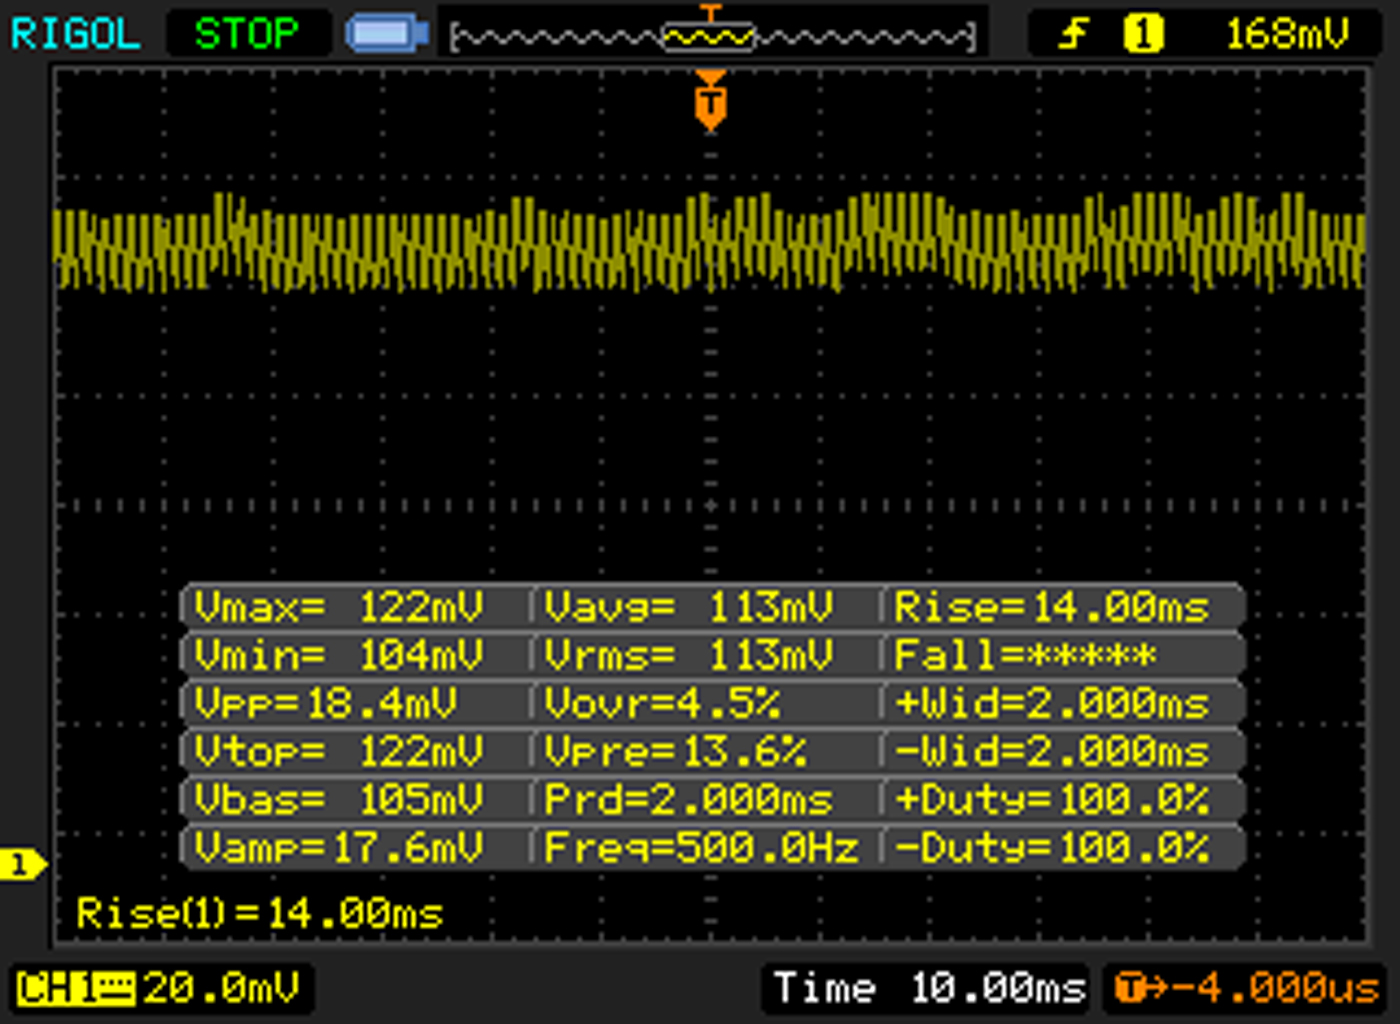 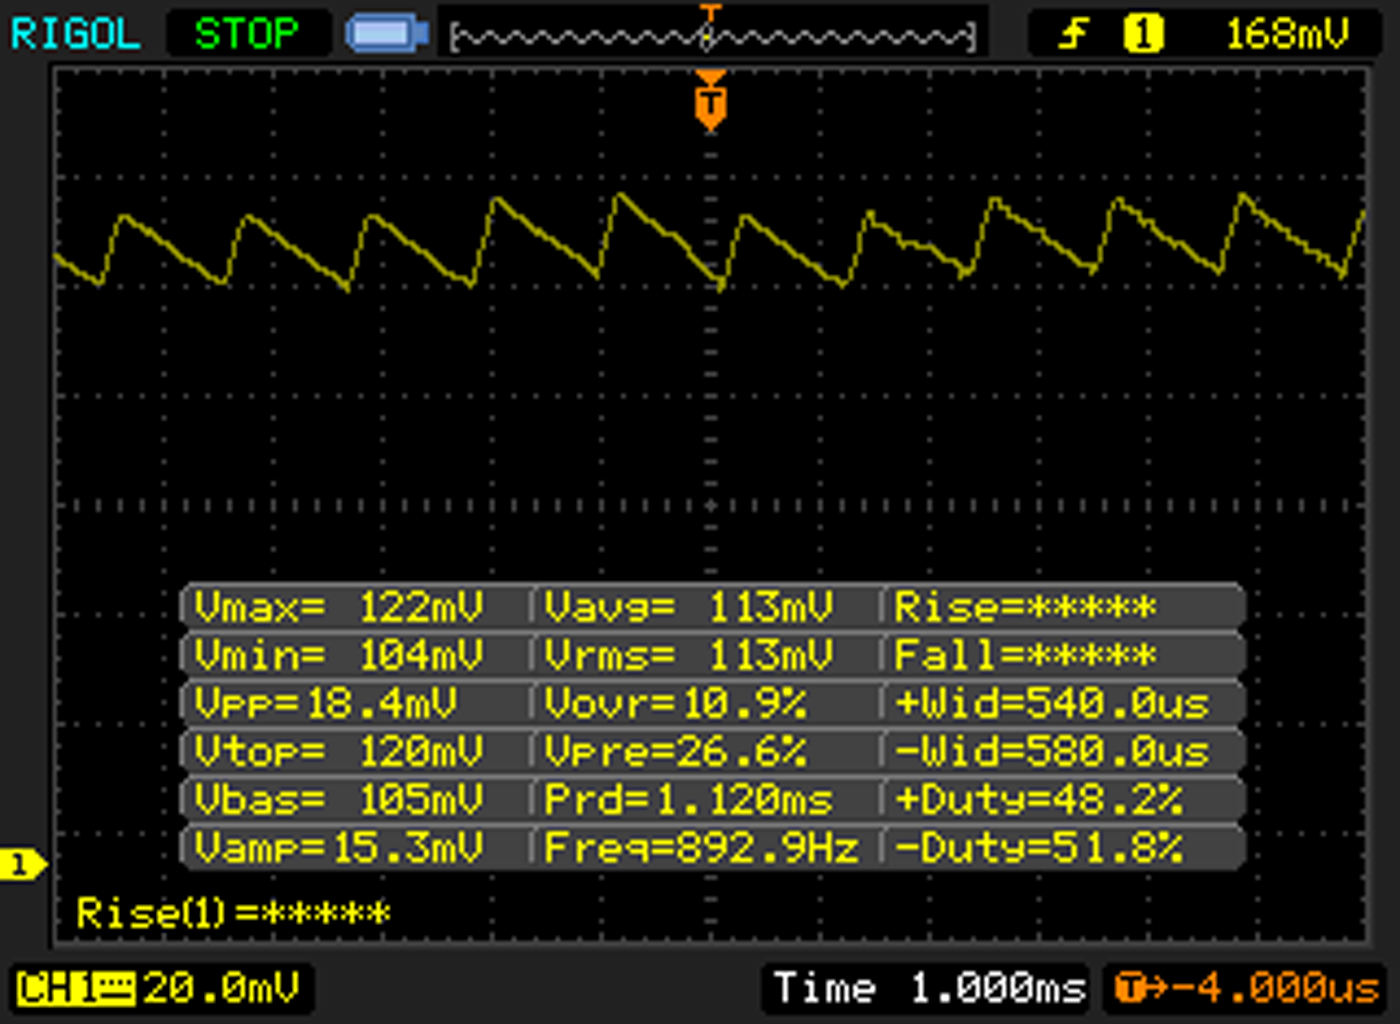 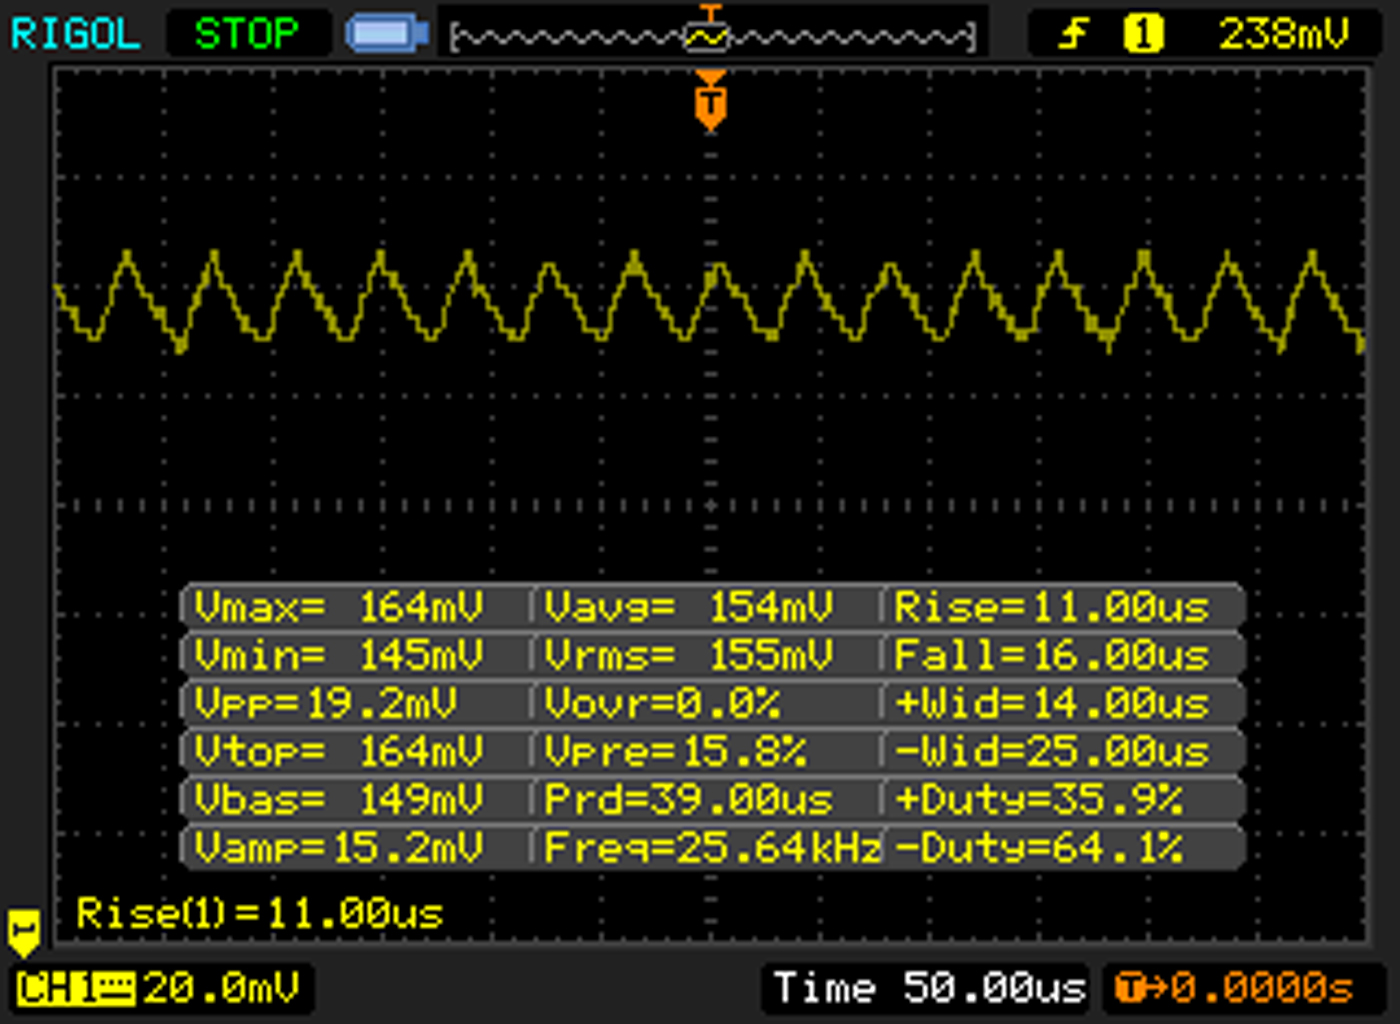 |
The display backlight flickers at 362 Hz (worst case, e.g., utilizing PWM) Flickering detected at a brightness setting of 10 % and below. There should be no flickering or PWM above this brightness setting. The frequency of 362 Hz is relatively high, so most users sensitive to PWM should not notice any flickering. However, there are reports that some users are still sensitive to PWM at 500 Hz and above, so be aware. In comparison: 52 % of all tested devices do not use PWM to dim the display. If PWM was detected, an average of 7747 (minimum: 5 - maximum: 343500) Hz was measured. | |||
| Cinebench R15 | |
| CPU Single 64Bit (sort by value) | |
| Dell XPS 15 2016 9550 | |
| Acer Aspire V Nitro VN7-792G-55SF | |
| Apple MacBook Pro Retina 15 inch 2015-05 | |
| Apple MacBook Pro Retina 15 inch 2015-05 | |
| Asus Zenbook Pro UX501JW-FI218H | |
| Acer Aspire V Nitro Black Edition VN7-792G-74Q4 | |
| Dell XPS 15 (9530-0538) | |
| Dell XPS 13 2016 i7 256GB QHD | |
| Lenovo IdeaPad Y50-70-59441229 | |
| CPU Multi 64Bit (sort by value) | |
| Dell XPS 15 2016 9550 | |
| Acer Aspire V Nitro VN7-792G-55SF | |
| Apple MacBook Pro Retina 15 inch 2015-05 | |
| Apple MacBook Pro Retina 15 inch 2015-05 | |
| Asus Zenbook Pro UX501JW-FI218H | |
| Acer Aspire V Nitro Black Edition VN7-792G-74Q4 | |
| Dell XPS 15 (9530-0538) | |
| Dell XPS 13 2016 i7 256GB QHD | |
| Lenovo IdeaPad Y50-70-59441229 | |
| Cinebench R11.5 | |
| CPU Single 64Bit (sort by value) | |
| Dell XPS 15 2016 9550 | |
| Acer Aspire V Nitro VN7-792G-55SF | |
| Apple MacBook Pro Retina 15 inch 2015-05 | |
| Apple MacBook Pro Retina 15 inch 2015-05 | |
| Asus Zenbook Pro UX501JW-FI218H | |
| Acer Aspire V Nitro Black Edition VN7-792G-74Q4 | |
| Dell XPS 15 (9530-0538) | |
| Dell XPS 13 2016 i7 256GB QHD | |
| Lenovo IdeaPad Y50-70-59441229 | |
| CPU Multi 64Bit (sort by value) | |
| Dell XPS 15 2016 9550 | |
| Acer Aspire V Nitro VN7-792G-55SF | |
| Apple MacBook Pro Retina 15 inch 2015-05 | |
| Apple MacBook Pro Retina 15 inch 2015-05 | |
| Asus Zenbook Pro UX501JW-FI218H | |
| Acer Aspire V Nitro Black Edition VN7-792G-74Q4 | |
| Dell XPS 15 (9530-0538) | |
| Dell XPS 13 2016 i7 256GB QHD | |
| Lenovo IdeaPad Y50-70-59441229 | |
| Cinebench R10 | |
| Rendering Single CPUs 64Bit (sort by value) | |
| Dell XPS 15 2016 9550 | |
| Acer Aspire V Nitro VN7-792G-55SF | |
| Apple MacBook Pro Retina 15 inch 2015-05 | |
| Acer Aspire V Nitro Black Edition VN7-792G-74Q4 | |
| Dell XPS 15 (9530-0538) | |
| Lenovo IdeaPad Y50-70-59441229 | |
| Rendering Multiple CPUs 64Bit (sort by value) | |
| Dell XPS 15 2016 9550 | |
| Acer Aspire V Nitro VN7-792G-55SF | |
| Apple MacBook Pro Retina 15 inch 2015-05 | |
| Acer Aspire V Nitro Black Edition VN7-792G-74Q4 | |
| Dell XPS 15 (9530-0538) | |
| Lenovo IdeaPad Y50-70-59441229 | |
| PCMark 8 | |
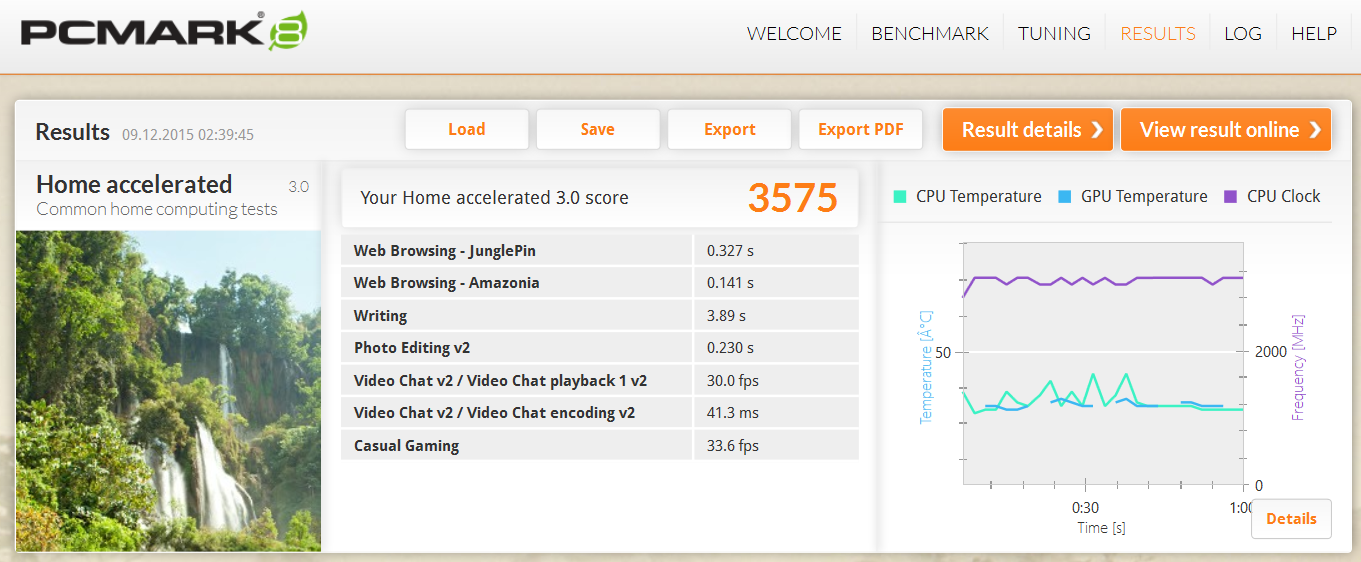
| Home Score Accelerated v2 (sort by value) | |
| Dell XPS 15 2016 9550 | |
| Apple MacBook Pro Retina 15 inch 2015-05 | |
| Acer Aspire V Nitro Black Edition VN7-792G-74Q4 | |
| Dell XPS 13 2016 i7 256GB QHD | |
| Acer Aspire V Nitro VN7-792G-55SF | |
| HP Omen Pro 15 M2T37AA-ABD | |
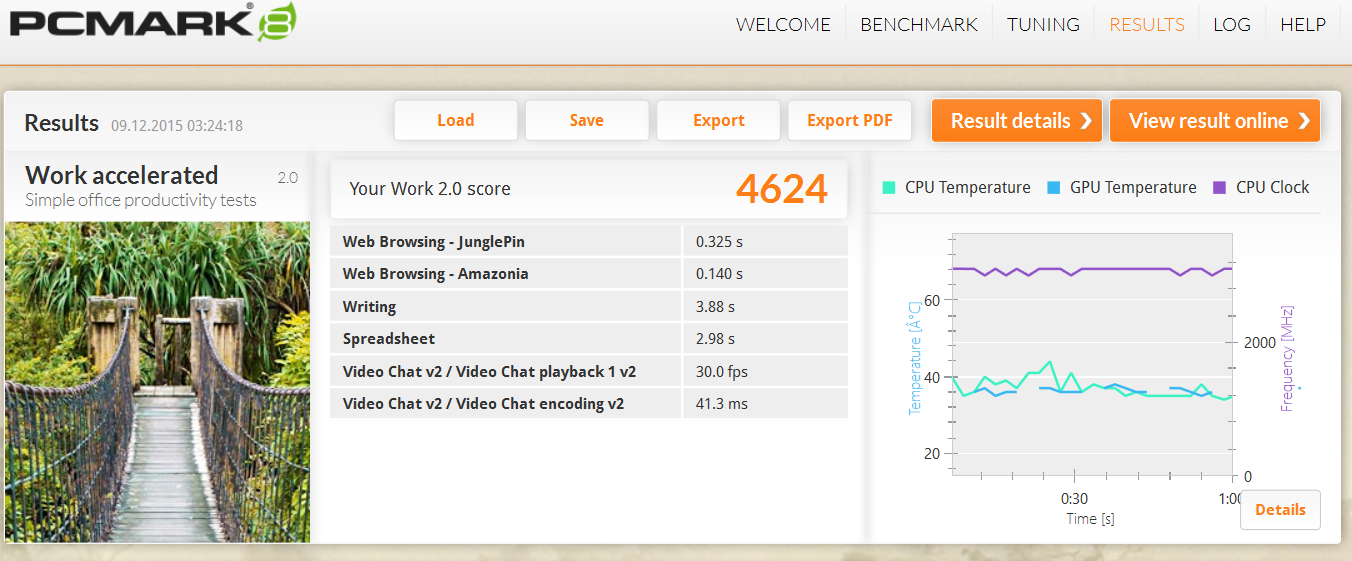
| Work Score Accelerated v2 (sort by value) | |
| Apple MacBook Pro Retina 15 inch 2015-05 | |
| Acer Aspire V Nitro Black Edition VN7-792G-74Q4 | |
| Dell XPS 13 2016 i7 256GB QHD | |
| Acer Aspire V Nitro VN7-792G-55SF | |
| HP Omen Pro 15 M2T37AA-ABD | |
| PCMark 7 Score | 5128 points | |
| PCMark 8 Home Score Accelerated v2 | 3575 points | |
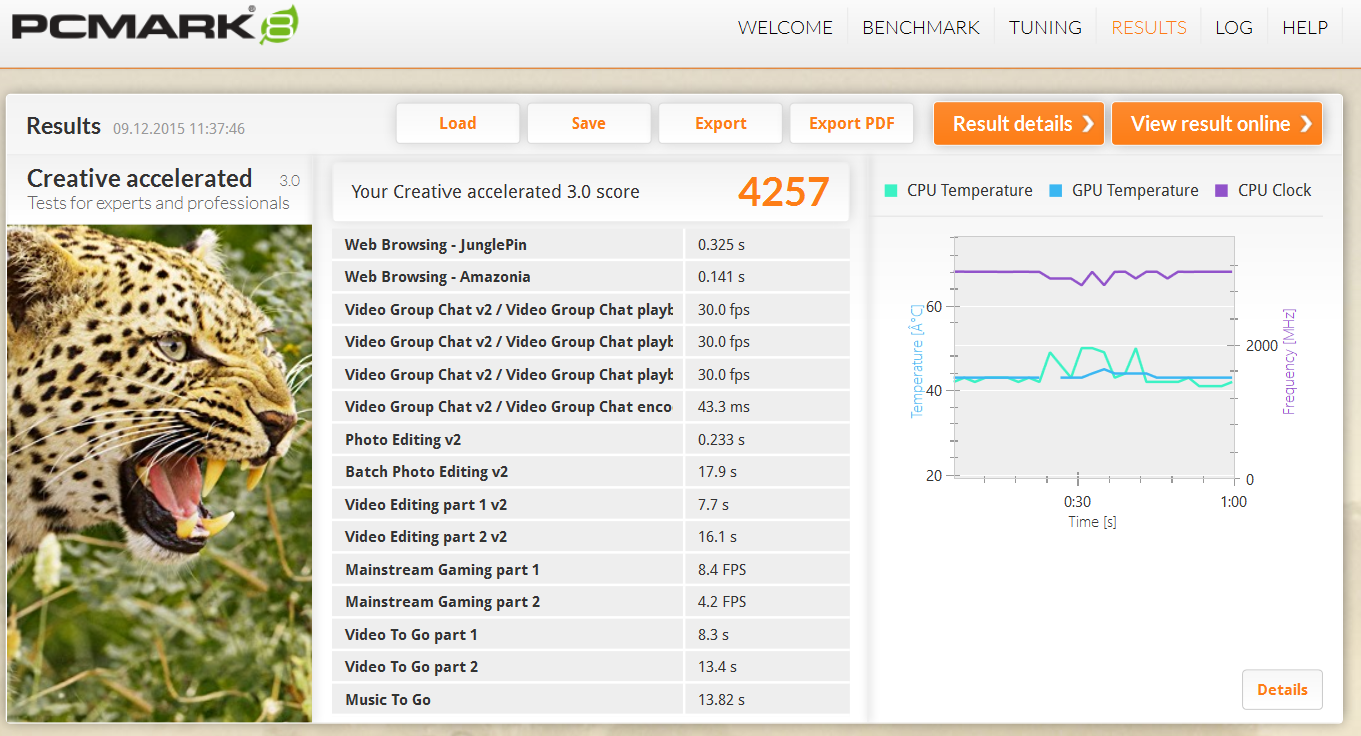
| PCMark 8 Creative Score Accelerated v2 | 4257 points | |
Help | ||
| Dell XPS 15 2016 9550 GeForce GTX 960M, 6300HQ, WDC WD10SPCX-75KHST0 + LiteON CS1-SP32-11 M.2 2242 32GB | Apple MacBook Pro Retina 15 inch 2015-05 Radeon R9 M370X, 4870HQ, Apple SSD SM0512G | Asus Zenbook Pro UX501JW-FI218H GeForce GTX 960M, 4720HQ, SanDisk SD7SN3Q128G1002 | Lenovo IdeaPad Y50-70-59441229 GeForce GTX 960M, 4710HQ, Samsung SSD PM851 256 GB MZ7TE256HMHP | HP ProBook 470 G2 G6W52EA Radeon R5 M255, 4210U, Hitachi Travelstar Z5K500 HTS545050A7E680 | MSI PE70 2QE GeForce GTX 960M, 4720HQ, HGST Travelstar 7K1000 HTS721010A9E630 | |
|---|---|---|---|---|---|---|
| CrystalDiskMark 3.0 | 725% | 151% | 126% | -54% | -38% | |
| Read Seq (MB/s) | 238.6 | 1442 504% | 471.9 98% | 518 117% | 93.1 -61% | 129.3 -46% |
| Write Seq (MB/s) | 64 | 1558 2334% | 347 442% | 264.8 314% | 92.3 44% | 124.3 94% |
| Read 4k (MB/s) | 31.36 | 19.27 -39% | 31.19 -1% | 32.29 3% | 0.288 -99% | 0.478 -98% |
| Read 4k QD32 (MB/s) | 199.5 | 403.1 102% | 331.8 66% | 341.2 71% | 0.743 -100% | 0.899 -100% |
| AS SSD | 2971% | 1868% | 1657% | -36% | -6% | |
| Score Read (Points) | 24 | 793 3204% | 388 1517% | 420 1650% | 10 -58% | 14 -42% |
| Score Write (Points) | 10 | 517 5070% | 294 2840% | 185 1750% | 8 -20% | 14 40% |
| 4K Read (MB/s) | 1.53 | 19.3 1161% | 29.14 1805% | 28.36 1754% | 0.48 -69% | 0.45 -71% |
| 4K Write (MB/s) | 0.98 | 29 2859% | 67.6 6798% | 64.5 6482% | 0.7 -29% | 0.72 -27% |
| Seq Read (MB/s) | 122.2 | 1550 1168% | 485.9 298% | 501 310% | 89.1 -27% | 128.9 5% |
| Seq Write (MB/s) | 77.6 | 1441 1757% | 325.6 320% | 249.4 221% | 69.8 -10% | 121.8 57% |
| Copy ISO MB/s (MB/s) | 15.75 | 1395 8757% | 374.3 2277% | 329.1 1990% | ||
| Copy Program MB/s (MB/s) | 42.24 | 608 1339% | 249.8 491% | 200.6 375% | ||
| Copy Game MB/s (MB/s) | 66.4 | 1014 1427% | 375 465% | 316.5 377% | ||
| Total Average (Program / Settings) | 1848% /
2280% | 1010% /
1340% | 892% /
1186% | -45% /
-43% | -22% /
-19% |

| 3DMark 11 | |
| 1280x720 Performance (sort by value) | |
| Dell XPS 15 9550 | |
| Apple MB Pro Retina 15 2015 | |
| Asus Zenbook Pro UX501JW | |
| XPS 13 2016 i7 QHD | |
| XPS 15 9530 | |
| Acer AS V Nitro VN7-792G | |
| Ideapad Y50-70 | |
| MSI PE60 | |
| 1280x720 Performance GPU (sort by value) | |
| Dell XPS 15 9550 | |
| Apple MB Pro Retina 15 2015 | |
| Asus Zenbook Pro UX501JW | |
| XPS 13 2016 i7 QHD | |
| XPS 15 9530 | |
| Acer AS V Nitro VN7-792G | |
| Ideapad Y50-70 | |
| MSI PE60 | |
| 1280x720 Performance Physics (sort by value) | |
| Dell XPS 15 9550 | |
| Apple MB Pro Retina 15 2015 | |
| Asus Zenbook Pro UX501JW | |
| XPS 13 2016 i7 QHD | |
| XPS 15 9530 | |
| Acer AS V Nitro VN7-792G | |
| Ideapad Y50-70 | |
| MSI PE60 | |
| 1280x720 Performance Combined (sort by value) | |
| Dell XPS 15 9550 | |
| Apple MB Pro Retina 15 2015 | |
| Asus Zenbook Pro UX501JW | |
| XPS 13 2016 i7 QHD | |
| XPS 15 9530 | |
| Acer AS V Nitro VN7-792G | |
| Ideapad Y50-70 | |
| MSI PE60 | |
| 3DMark 11 Performance | 5375 points | |
| 3DMark Ice Storm Standard Score | 80910 points | |
| 3DMark Cloud Gate Standard Score | 12993 points | |
| 3DMark Fire Strike Score | 3907 points | |
Help | ||
| Dirt Rally - 1920x1080 Ultra Preset AA:4x MS (sort by value) | |
| Dell XPS 15 9550 | |
| Apple MB Pro Retina 15 2015 | |
| Schenker XMG A706 | |
| Schenker XMG A505 | |
| BioShock Infinite - 1920x1080 Ultra Preset, DX11 (DDOF) (sort by value) | |
| Dell XPS 15 9550 | |
| Apple MB Pro Retina 15 2015 | |
| XPS 13 2016 i7 QHD | |
| XPS 15 9530 | |
| Thief - 1920x1080 Very High Preset AA:FXAA & High SS AF:8x (sort by value) | |
| Dell XPS 15 9550 | |
| Apple MB Pro Retina 15 2015 | |
| Acer AS V Nitro VN7-792G | |
| Schenker XMG A706 | |
| Alien: Isolation - 1920x1080 Ultra, On, Shadow Map 2048, HDAO AA:2x SM AF:16x (sort by value) | |
| Dell XPS 15 9550 | |
| Apple MB Pro Retina 15 2015 | |
| MSI PE60 | |
| Metal Gear Solid V - 1920x1080 Extra High / On (sort by value) | |
| Dell XPS 15 9550 | |
| Schenker XMG A706 | |
| Schenker XMG A505 | |
| FIFA 16 - 1920x1080 High Preset AA:4x MS (sort by value) | |
| Dell XPS 15 9550 | |
| Schenker XMG A505 | |
| Star Wars Battlefront - 1920x1080 Ultra Preset AA:FX (sort by value) | |
| Dell XPS 15 9550 | |
| Schenker XMG A505 | |
| low | med. | high | ultra | |
|---|---|---|---|---|
| BioShock Infinite (2013) | 108 | 40.8 | ||
| Battlefield 4 (2013) | 80.8 | 33.8 | ||
| Thief (2014) | 52.5 | 27.8 | ||
| Middle-earth: Shadow of Mordor (2014) | 41.2 | 25.9 | ||
| Alien: Isolation (2014) | 58.6 | 52.4 | ||
| Evolve (2015) | 36.8 | 32.2 | ||
| Battlefield Hardline (2015) | 50.8 | 32.2 | ||
| Dirt Rally (2015) | 33.4 | |||
| Metal Gear Solid V (2015) | 55.3 | 35.6 | ||
| FIFA 16 (2015) | 95.7 | |||
| Star Wars Battlefront (2015) | 37.9 | 32.3 |
| Dell XPS 15 2016 9550 GTX 960M 6300HQ RAID HDD-SSD | Acer Aspire V Nitro VN7-792G-55SF 945M 6300HQ HDD | Apple MacBook Pro Retina 15 inch 2015-05 Radeon R9 M370X 4870HQ SSD | Asus Zenbook Pro UX501JW-FI218H GTX 960M 4720HQ SSD | Dell XPS 15 (9530-0538) GT 750M 4712HQ SSD | Lenovo IdeaPad Y50-70-59441229 GTX 960M 4710HQ SSD | MSI PE60-2QEi581 GTX 960M 4210H HDD | |
|---|---|---|---|---|---|---|---|
| Noise | 11% | 4% | 2% | 1% | 2% | -4% | |
| Idle Minimum * (dB) | 32.6 | 30.1 8% | 28.9 11% | 32.2 1% | 29.6 9% | 29.6 9% | 32.8 -1% |
| Idle Average * (dB) | 33.6 | 30.1 10% | 28.9 14% | 32.3 4% | 31.6 6% | 30.7 9% | 32.8 2% |
| Idle Maximum * (dB) | 33.6 | 30.9 8% | 28.9 14% | 32.3 4% | 31.6 6% | 31.3 7% | 35.4 -5% |
| Load Average * (dB) | 37.1 | 33.6 9% | 46 -24% | 41.7 -12% | 45.4 -22% | 43.1 -16% | 42.3 -14% |
| Load Maximum * (dB) | 47.5 | 38.6 19% | 46 3% | 42 12% | 45.4 4% | 47.6 -0% | 47.4 -0% |
* ... smaller is better
Noise level
| Idle |
| 32.6 / 33.6 / 33.6 dB(A) |
| HDD |
| 32.6 dB(A) |
| Load |
| 37.1 / 47.5 dB(A) |
 | ||
30 dB silent 40 dB(A) audible 50 dB(A) loud |
||
min: | ||
| Dell XPS 15 2016 9550 GTX 960M 6300HQ RAID HDD-SSD | Acer Aspire V Nitro VN7-792G-55SF 945M 6300HQ HDD | Apple MacBook Pro Retina 15 inch 2015-05 Radeon R9 M370X 4870HQ SSD | Asus Zenbook Pro UX501JW-FI218H GTX 960M 4720HQ SSD | Dell XPS 15 (9530-0538) GT 750M 4712HQ SSD | Lenovo IdeaPad Y50-70-59441229 GTX 960M 4710HQ SSD | MSI PE60-2QEi581 GTX 960M 4210H HDD | |
|---|---|---|---|---|---|---|---|
| Heat | 18% | 22% | 11% | -10% | 19% | 12% | |
| Maximum Upper Side * (°C) | 62.5 | 42.1 33% | 43.2 31% | 46.2 26% | 51.8 17% | 52.5 16% | 45.5 27% |
| Maximum Bottom * (°C) | 54.4 | 42 23% | 39 28% | 52.5 3% | 64.6 -19% | 47 14% | 37.5 31% |
| Idle Upper Side * (°C) | 33.5 | 31.2 7% | 30 10% | 32 4% | 38.4 -15% | 27.1 19% | 35.8 -7% |
| Idle Bottom * (°C) | 36.7 | 34 7% | 29.3 20% | 32.7 11% | 44.4 -21% | 27 26% | 38.7 -5% |
* ... smaller is better
(-) The maximum temperature on the upper side is 62.5 °C / 145 F, compared to the average of 36.8 °C / 98 F, ranging from 21 to 71 °C for the class Multimedia.
(-) The bottom heats up to a maximum of 54.4 °C / 130 F, compared to the average of 39.1 °C / 102 F
(+) In idle usage, the average temperature for the upper side is 31.7 °C / 89 F, compared to the device average of 31.3 °C / 88 F.
(±) The palmrests and touchpad can get very hot to the touch with a maximum of 39 °C / 102.2 F.
(-) The average temperature of the palmrest area of similar devices was 28.7 °C / 83.7 F (-10.3 °C / -18.5 F).
| Dell XPS 15 2016 9550 GTX 960M 6300HQ RAID HDD-SSD | Acer Aspire V Nitro VN7-792G-55SF 945M 6300HQ HDD | Apple MacBook Pro Retina 15 inch 2015-05 Radeon R9 M370X 4870HQ SSD | Asus Zenbook Pro UX501JW-FI218H GTX 960M 4720HQ SSD | Dell XPS 15 (9530-0538) GT 750M 4712HQ SSD | Lenovo IdeaPad Y50-70-59441229 GTX 960M 4710HQ SSD | MSI PE60-2QEi581 GTX 960M 4210H HDD | |
|---|---|---|---|---|---|---|---|
| Power Consumption | 19% | 12% | -24% | -25% | 18% | -63% | |
| Idle Minimum * (Watt) | 9.9 | 6.4 35% | 6 39% | 15.6 -58% | 14.6 -47% | 4.3 57% | 21.8 -120% |
| Idle Average * (Watt) | 12.6 | 10.9 13% | 12.8 -2% | 20.5 -63% | 19.6 -56% | 7.8 38% | 26.1 -107% |
| Idle Maximum * (Watt) | 16.8 | 14.1 16% | 13.3 21% | 21.2 -26% | 19.8 -18% | 10.6 37% | 26.6 -58% |
| Load Average * (Watt) | 70 | 67.1 4% | 82.4 -18% | 75.8 -8% | 92 -31% | 99.7 -42% | 88.5 -26% |
| Load Maximum * (Watt) | 114 | 84.9 26% | 91.8 19% | 72.9 36% | 85.8 25% | 112.3 1% | 119.7 -5% |
* ... smaller is better
| Off / Standby | |
| Idle | |
| Load |
|
Key:
min: | |
| XPS 15 9550 i5 6300HQ, GeForce GTX 960M, 56 Wh | XPS 15 9550 i7 SSD 6700HQ, GeForce GTX 960M, 84 Wh | XPS 15 9530 4712HQ, GeForce GT 750M, 88 Wh | XPS 13 2016 i7 QHD 6500U, HD Graphics 520, 56 Wh | Apple MB Pro Retina 15 2015 4870HQ, Radeon R9 M370X, 100 Wh | Asus Zenbook Pro UX501JW 4720HQ, GeForce GTX 960M, 60 Wh | Acer AS V Nitro VN7-792G 6300HQ, GeForce 945M, 52 Wh | V Nitro Black Edition VN7-792G 6700HQ, GeForce GTX 960M, 53 Wh | MSI PE60 4210H, GeForce GTX 960M, 42 Wh | |
|---|---|---|---|---|---|---|---|---|---|
| Battery runtime | -7% | -5% | 16% | 29% | -51% | -14% | -20% | -41% | |
| Reader / Idle (h) | 9.1 | 8.8 -3% | 13.1 44% | 17.3 90% | 10.2 12% | 6.8 -25% | 5.8 -36% | ||
| H.264 (h) | 6 | 5.3 -12% | 6.9 15% | 3.9 -35% | 5.9 -2% | ||||
| WiFi v1.3 (h) | 5.5 | 5.2 -5% | 5.2 -5% | 7.2 31% | 7.2 31% | 2.7 -51% | 4.6 -16% | 4.2 -24% | 2.8 -49% |
| Load (h) | 2.3 | 2.1 -9% | 1.7 -26% | 1.8 -22% | 1.9 -17% | 1.6 -30% | 1.4 -39% |
Pros
Cons
如果你期待XPS 15是一款无论何时何地都能提供高端性能的话,大概会以失望告终。XPS 15不仅在使用电池时处理器频率会降低到1.6 GHz,同时有些卡顿,这显然难以让需要性能的用户满意。在多项测试软件中系统无法及时识别连接上了电源适配器,因而处理器无法运行在2.8 GHz的频率,让人十分郁闷。我们因此在它的总分里减去了一分。遗憾的是,i5-6300HQ无法完全利用它的性能,至少是在单线程的模式下。
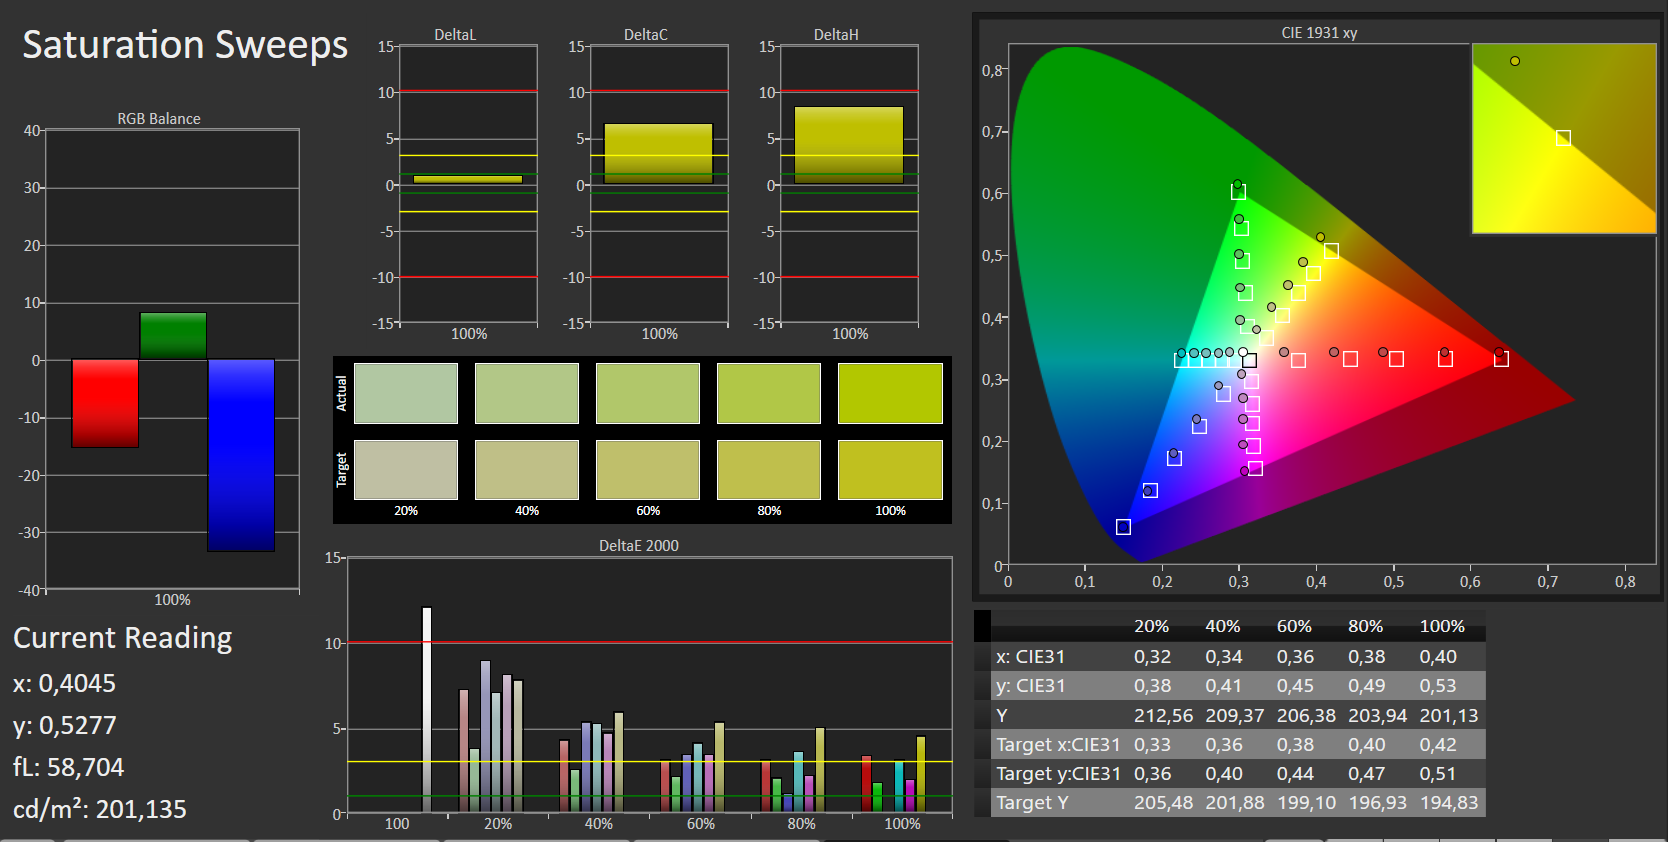
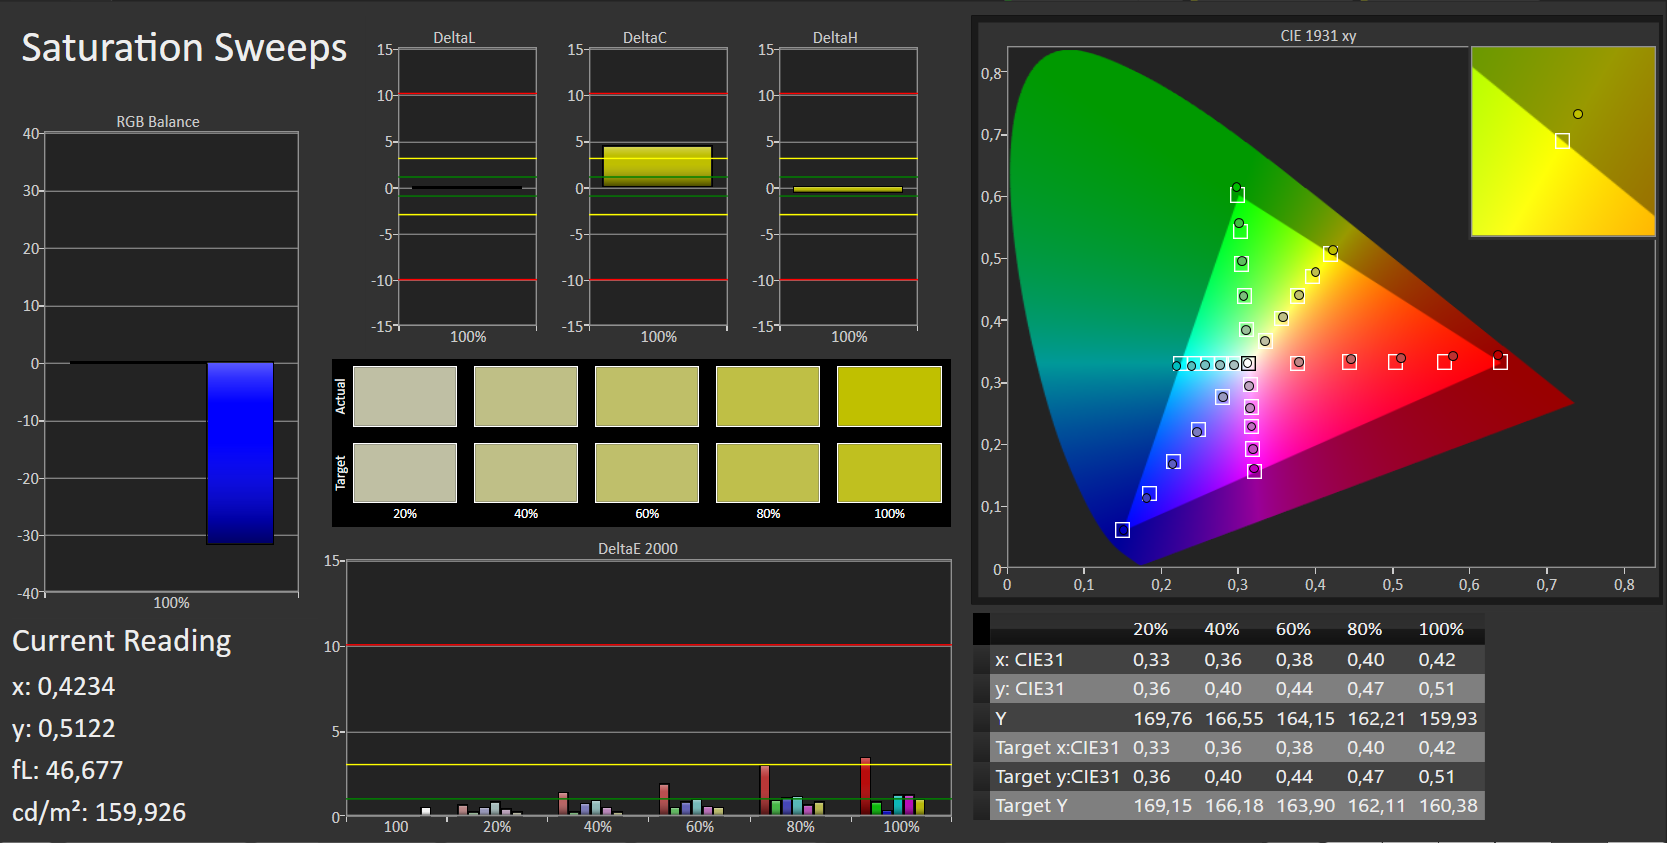
我们测试机型的磨砂全高清屏幕在亮度和对比度方面表现优秀。对sRGB色域近100%的覆盖也是一大优势。不过我们并不太喜欢它出场状态(对于专业用户)不太准确的色彩。这让我们感到十分遗憾,因为只需校对一下它就可以得到改观。屏幕闪烁只会在最低亮度下出现,因此不会造成太大问题。
我们之前提到了它的电池续航时间。9小时的续航——在最低亮度待机状态下——也并不算特别惊艳。这款笔记本电脑在上网浏览测试中实现了5.5小时的续航,属于中规中矩,可以满足大部分情况的需要。相比之下,Apple的MacBook Pro 15 Retina在(Mac OS)同样的测试中可以多坚持约两个小时。
如果你想要更长的电池续航时间,那么或者是必须购买售价更高、采用固态硬盘并搭配84 Wh电池的机型,或者单独购买一块84 Wh的电池。售价相对“较低”的非传统硬盘型号(例如全高清+i5+128 GB固态硬盘)很遗憾无法在戴尔网站购买;而高容量的机型则搭配了4K触控屏幕和酷睿i7处理器。
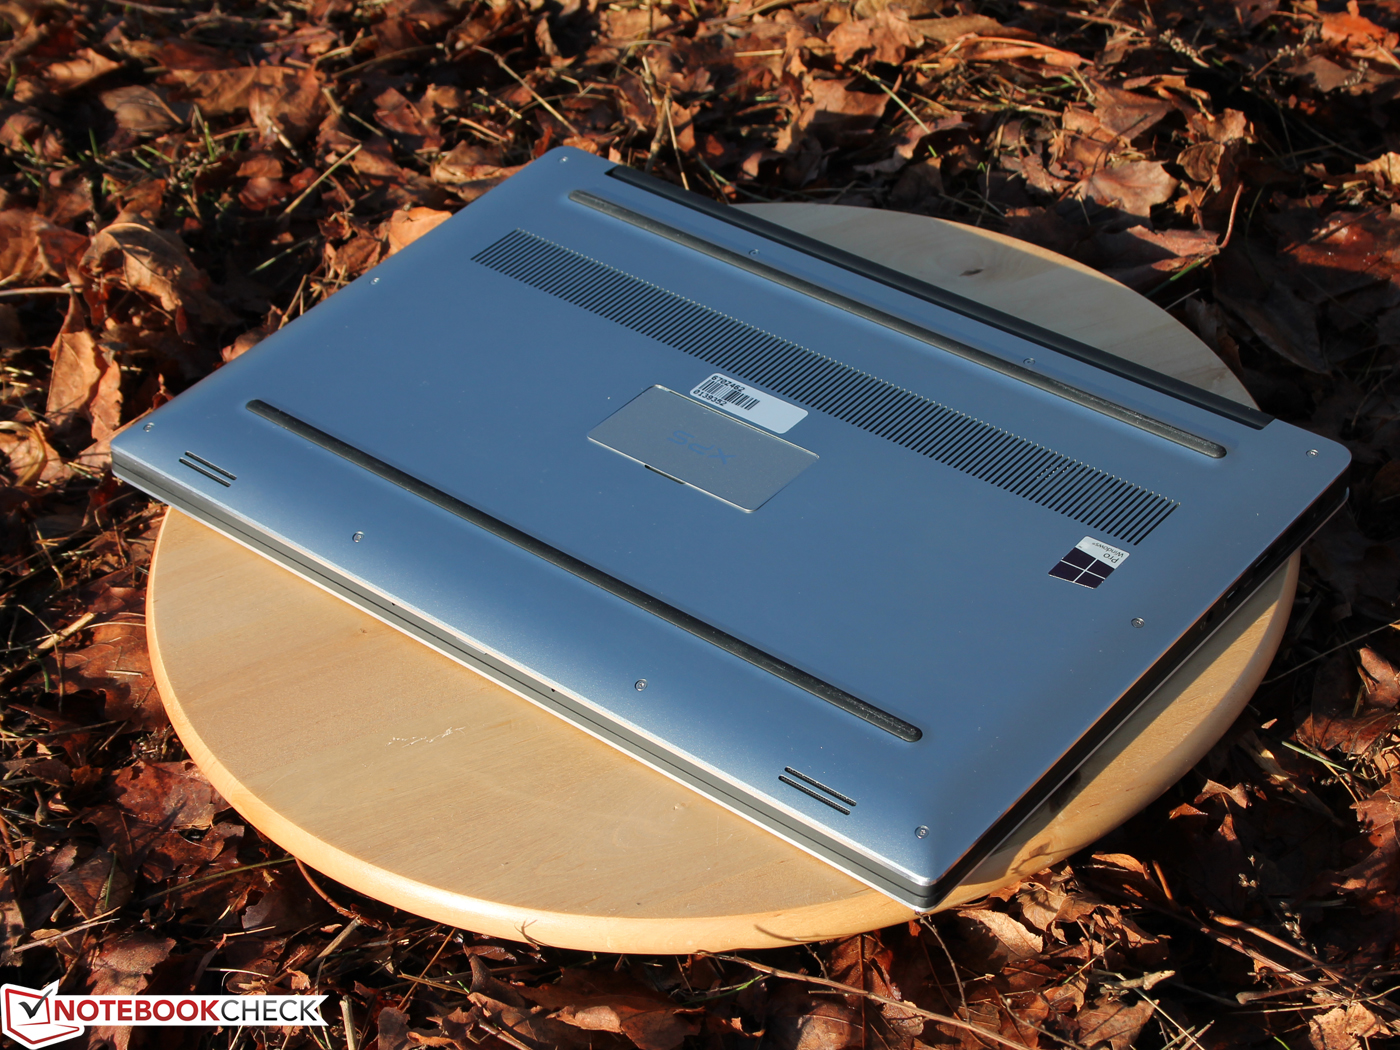
它的散热噪音控制不算是优势,因为XPS 15需要大幅降低显卡和处理器频率来控制压力测试时产生的热量,不过它的机身仍然变得很热。我们的测试接近于极限情况,并不代表实际使用状态,不过对于需要高性能的用户有一点是很明确的:在处理器和显卡的同时高负载下,它们都会降频,而我们所说的不是在使用电池的情况下。这个问题不是来自电源适配器而是95度的温度限制。不过我们可以让游戏玩家稍微安心:GTX 960M的性能在游戏测试中与其它采用同型号显卡的笔记本电脑区别不大。
是的,戴尔XPS 15(9550)是一台精致的多媒体笔记本电脑。不过,对它一些技术细节的仔细审视影响了这台XPS给我们的整体印象。
我们喜欢它十分平衡的扬声器,不过它的麦克风很难满足我们的期待。录音的效果受到或强或弱的噪音的影响。
混合式的硬盘是在性能和存储容量之间的成功取舍。他的读取速度无法和真正的固态硬盘相比,不过明显高于迟缓的传统硬盘。戴尔的“Raid array”技术在应用程序性能上十分出色,甚至可以和真正的固态硬盘系统相媲美。普通的缓冲式混合硬盘还无法做到这一点。
注:本文是基于完整评测的缩减版本,阅读完整的英文评测,请点击这里。
Dell XPS 15 2016 9550
- 02/24/2016 v5 (old)
J. Simon Leitner / Sebastian Jentsch
Price comparison
