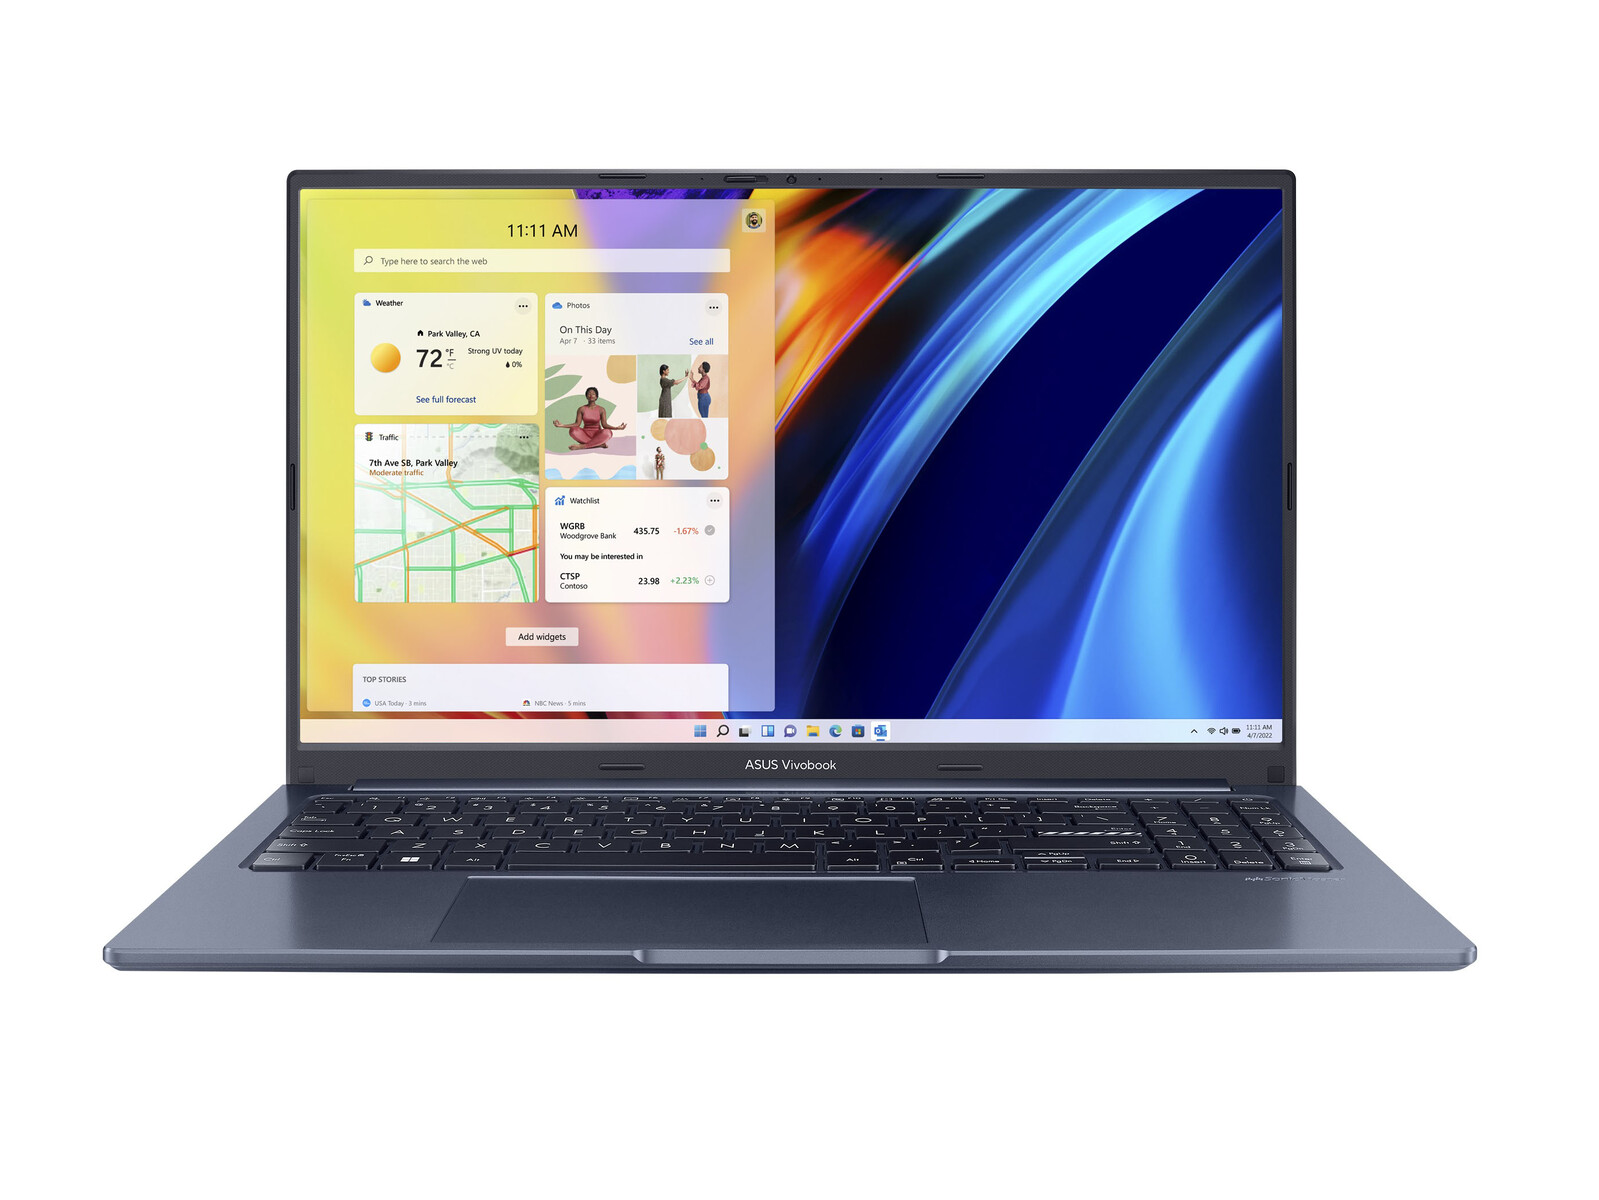
面向大众的1080p OLED。华硕VivoBook 15X M1503QA笔记本评测
不要与 维沃本15, VivoBook 15 OLED, 维梧书15 Pro, 或 vivoBook S15VivoBook 15 X OLED是另一款15.6英寸的产品,是令人困惑的广泛的VivoBook家族的成员。它采用了不同的机箱,与前述机型相比,有一组不同的端口,同时仍然共享许多类似的功能。与全金属和更豪华的ZenBook系列相比,VivoBook机型往往更实惠。
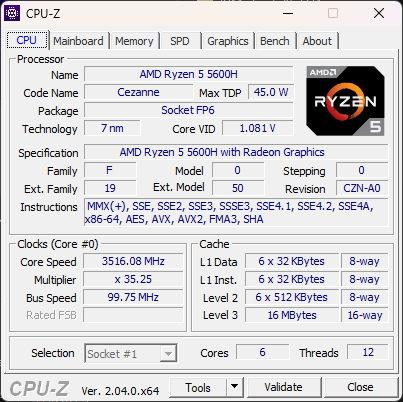
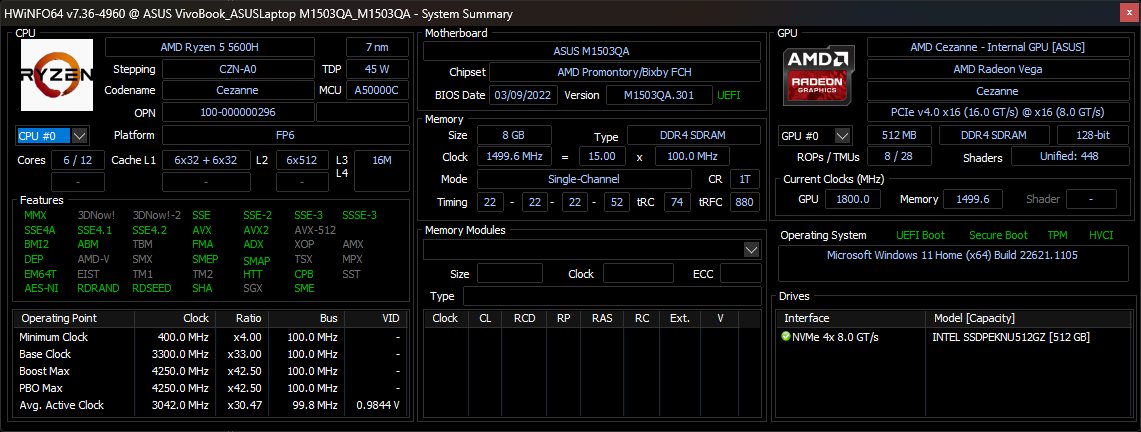
我们的评测单位是低端配置,配备Ryzen 5 5600H处理器、8GB内存、512GB固态硬盘和15.6英寸1080p OLED显示屏,零售价约为700美元,或者在销售时更低。更高端的SKU有更快的Ryzen 7 5800H和更密集的2.8K(1620p)OLED显示屏,售价900美元。相比之下,标准的VivoBook 15型号采用了较慢的U系列CPU。
VivoBook 15 X OLED的竞争者包括其他预算到中档的多媒体蛤壳,如 戴尔Inspiron 15 3501, 联想IdeaPad 3 15, 微星现代15, 或 HPPavilion 15.
更多华硕评论。
潜在的竞争对手比较
Rating | Date | Model | Weight | Height | Size | Resolution | Price |
|---|---|---|---|---|---|---|---|
| 83.1 % v7 (old) | 02 / 2023 | Asus VivoBook 15 X M1503QA R5 5600H, Vega 7 | 1.7 kg | 19.9 mm | 15.60" | 1920x1080 | |
| 80.6 % v7 (old) | 11 / 2021 | Asus Vivobook 15 K513EQ i7-1165G7, GeForce MX350 | 1.6 kg | 17.9 mm | 15.60" | 1920x1080 | |
| 82.1 % v7 (old) | Asus VivoBook S15 D533UA R7 5700U, Vega 8 | 1.8 kg | 16.1 mm | 15.60" | 1920x1080 | ||
| 87 % v7 (old) | Asus ZenBook UX535-M01440 i7-10750H, GeForce GTX 1650 Ti Max-Q | 2 kg | 20 mm | 15.60" | 3840x2160 | ||
| 85.1 % v7 (old) | 12 / 2022 | Lenovo ThinkBook 15 G3 ACL 21A400B2GE R5 5500U, Vega 7 | 1.7 kg | 18.9 mm | 15.60" | 1920x1080 | |
| 80.5 % v7 (old) | 10 / 2021 | Dell Inspiron 15 3501 i7-1165G7, Iris Xe G7 96EUs | 2 kg | 19.9 mm | 15.60" | 1920x1080 |
案例--几处外观变化
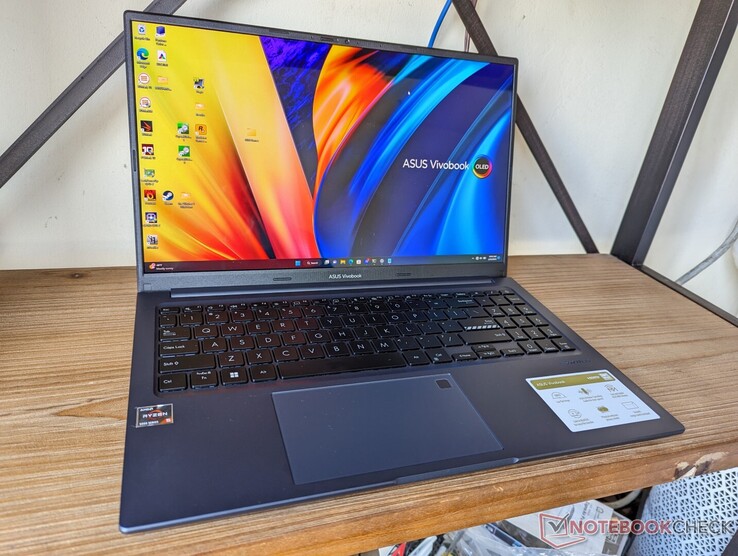
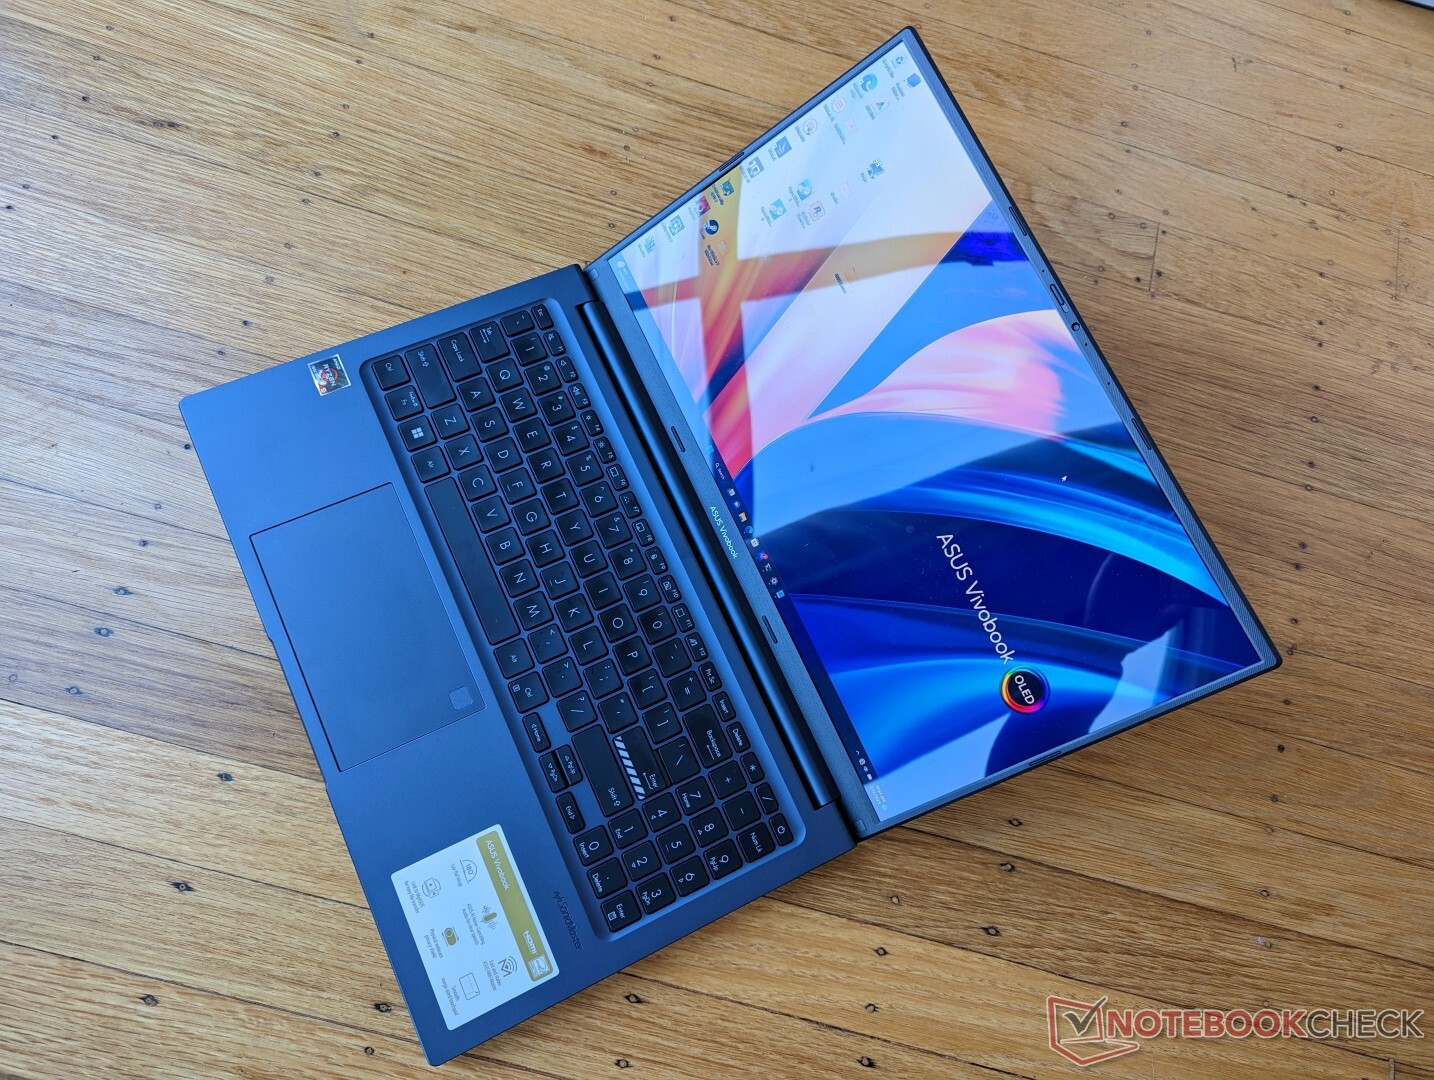
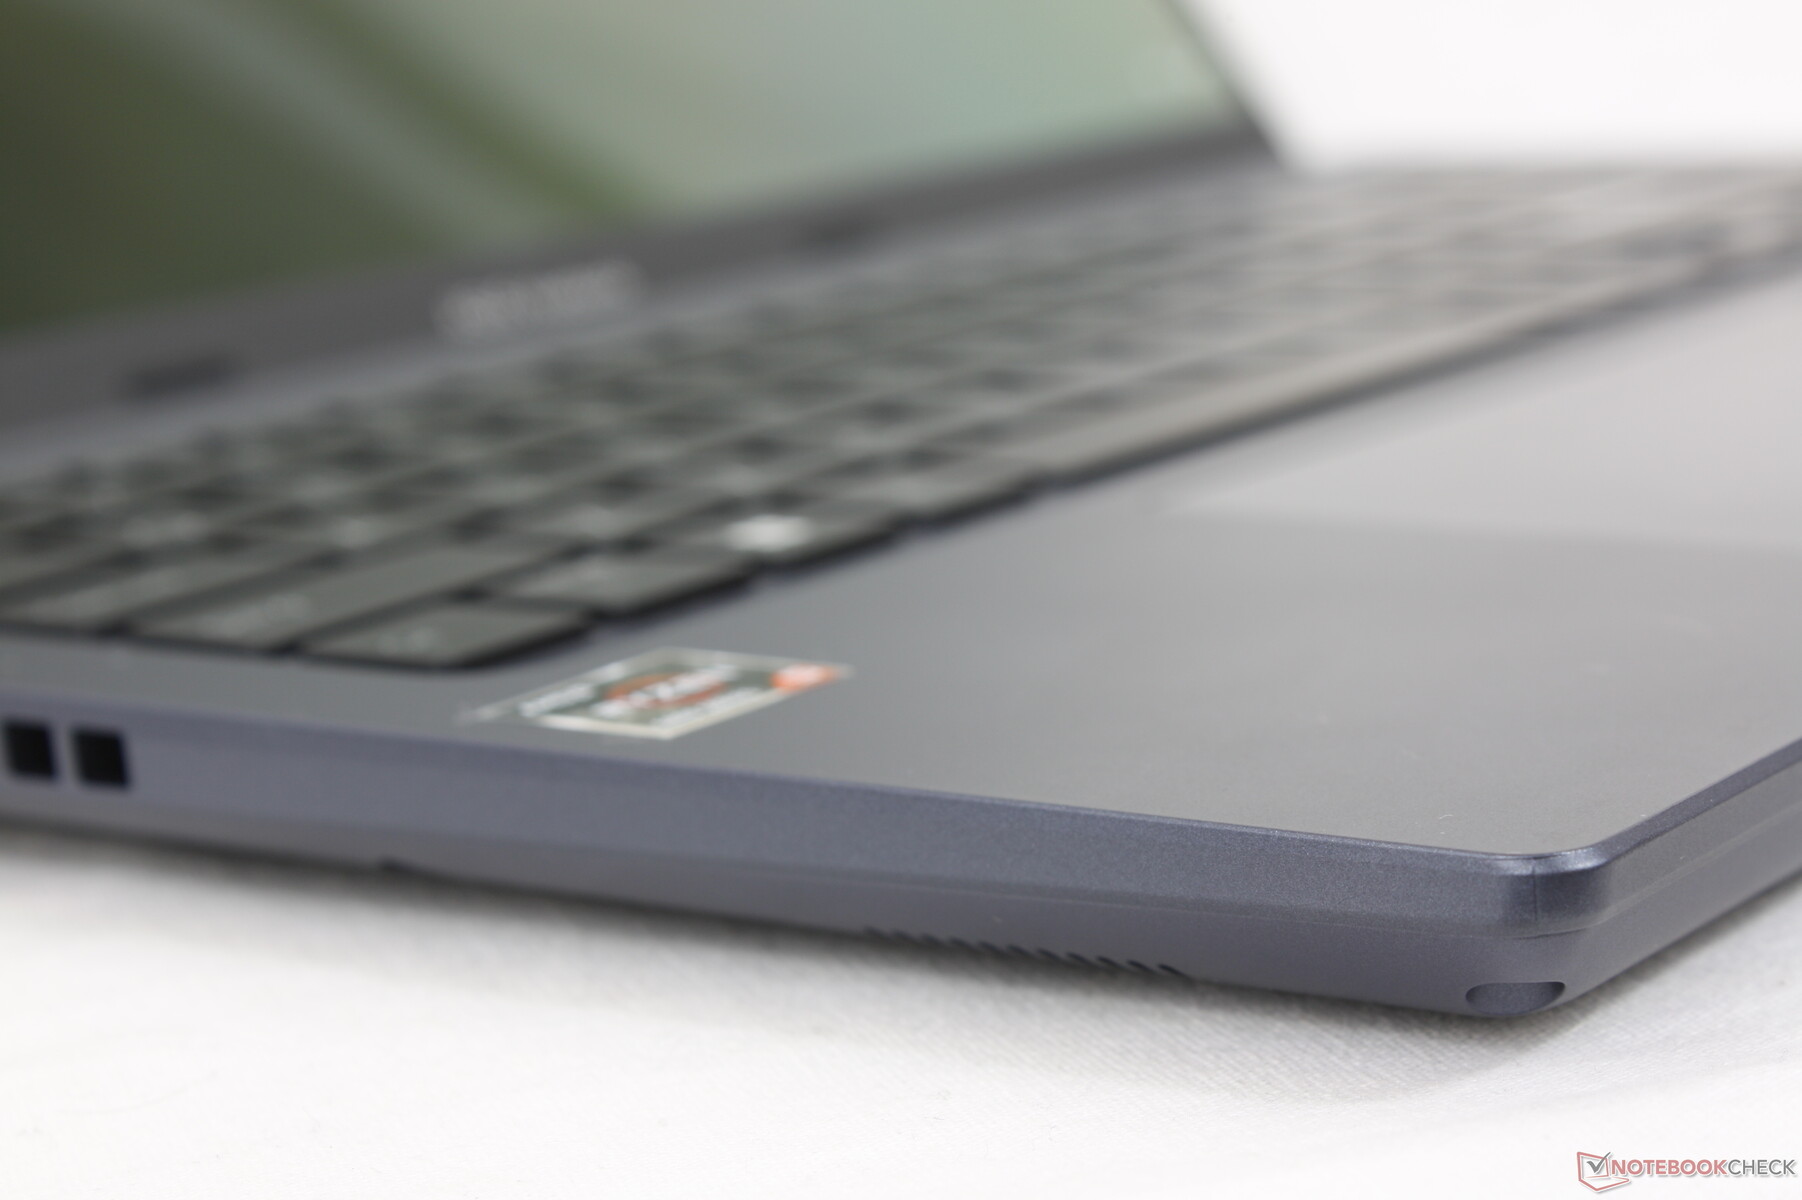
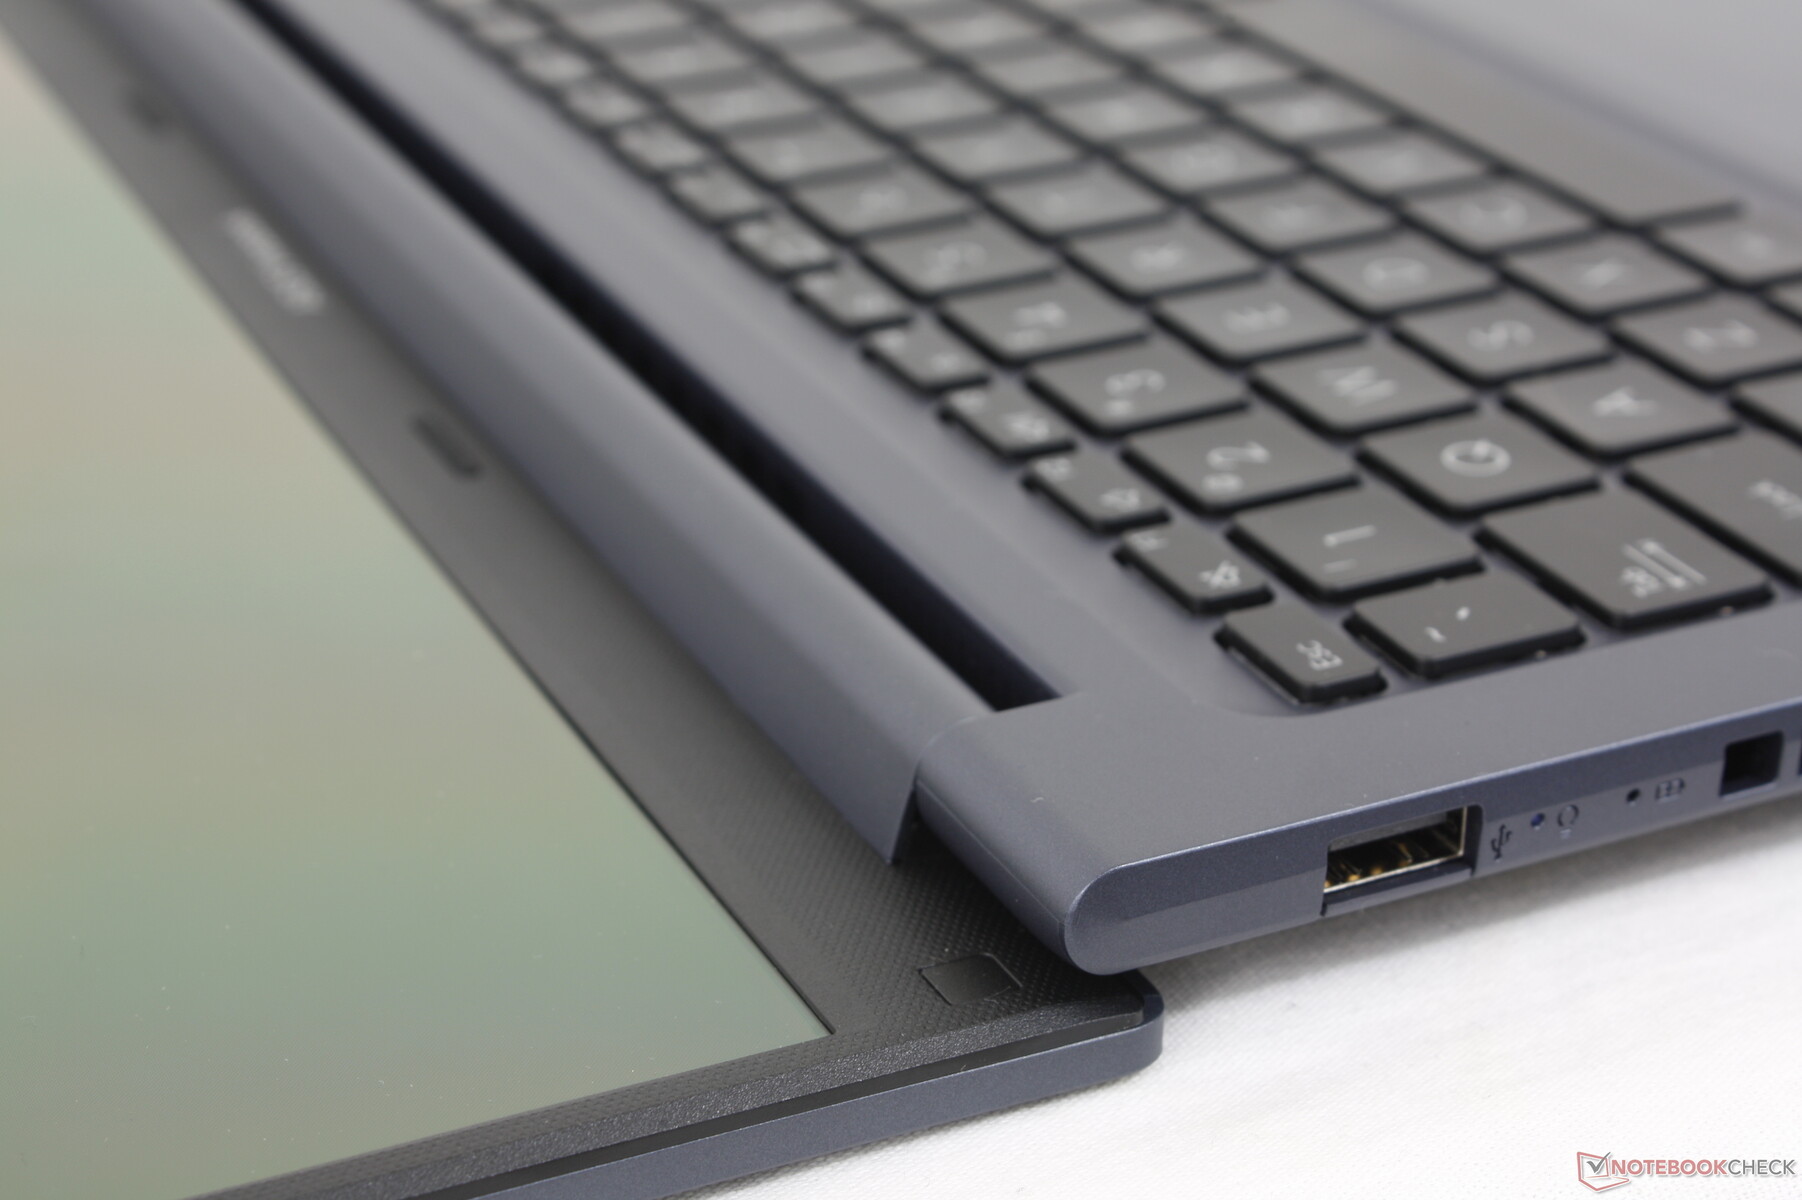
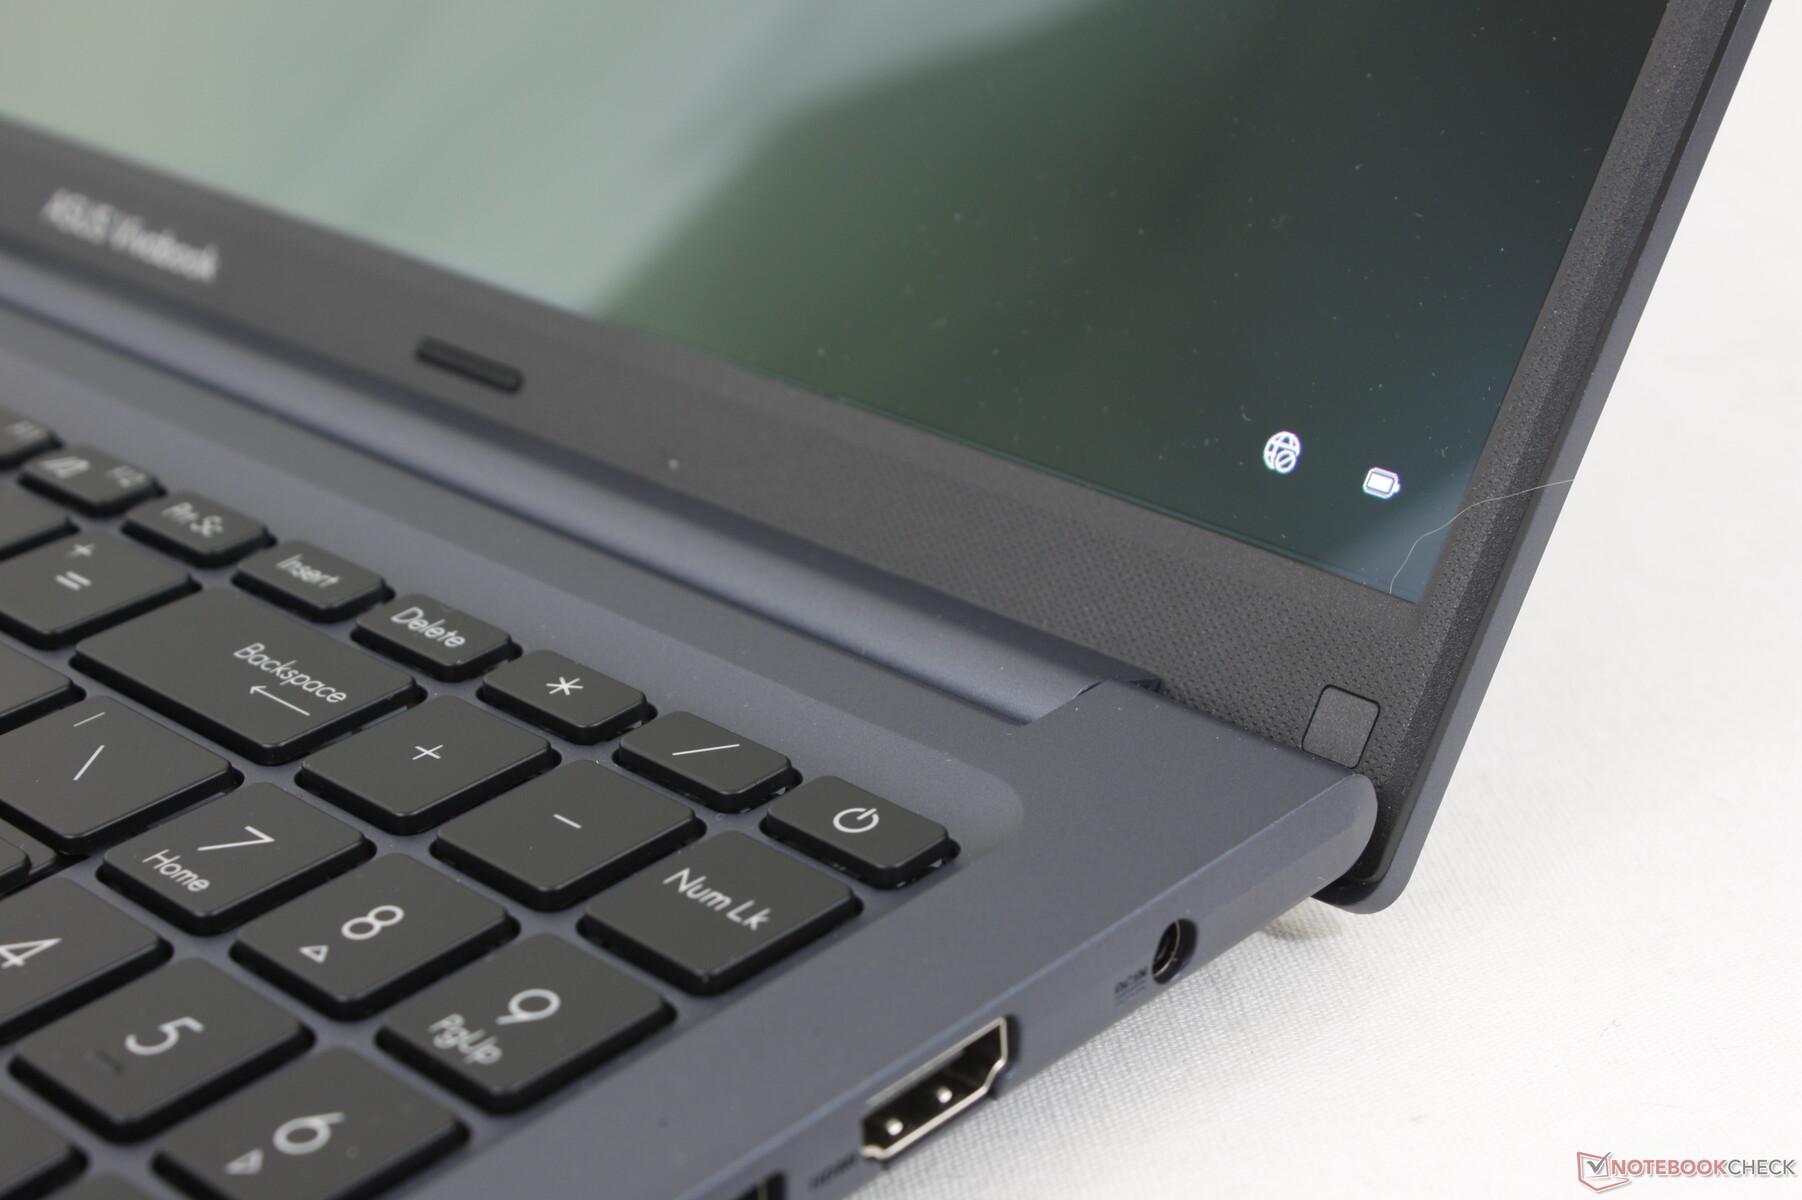
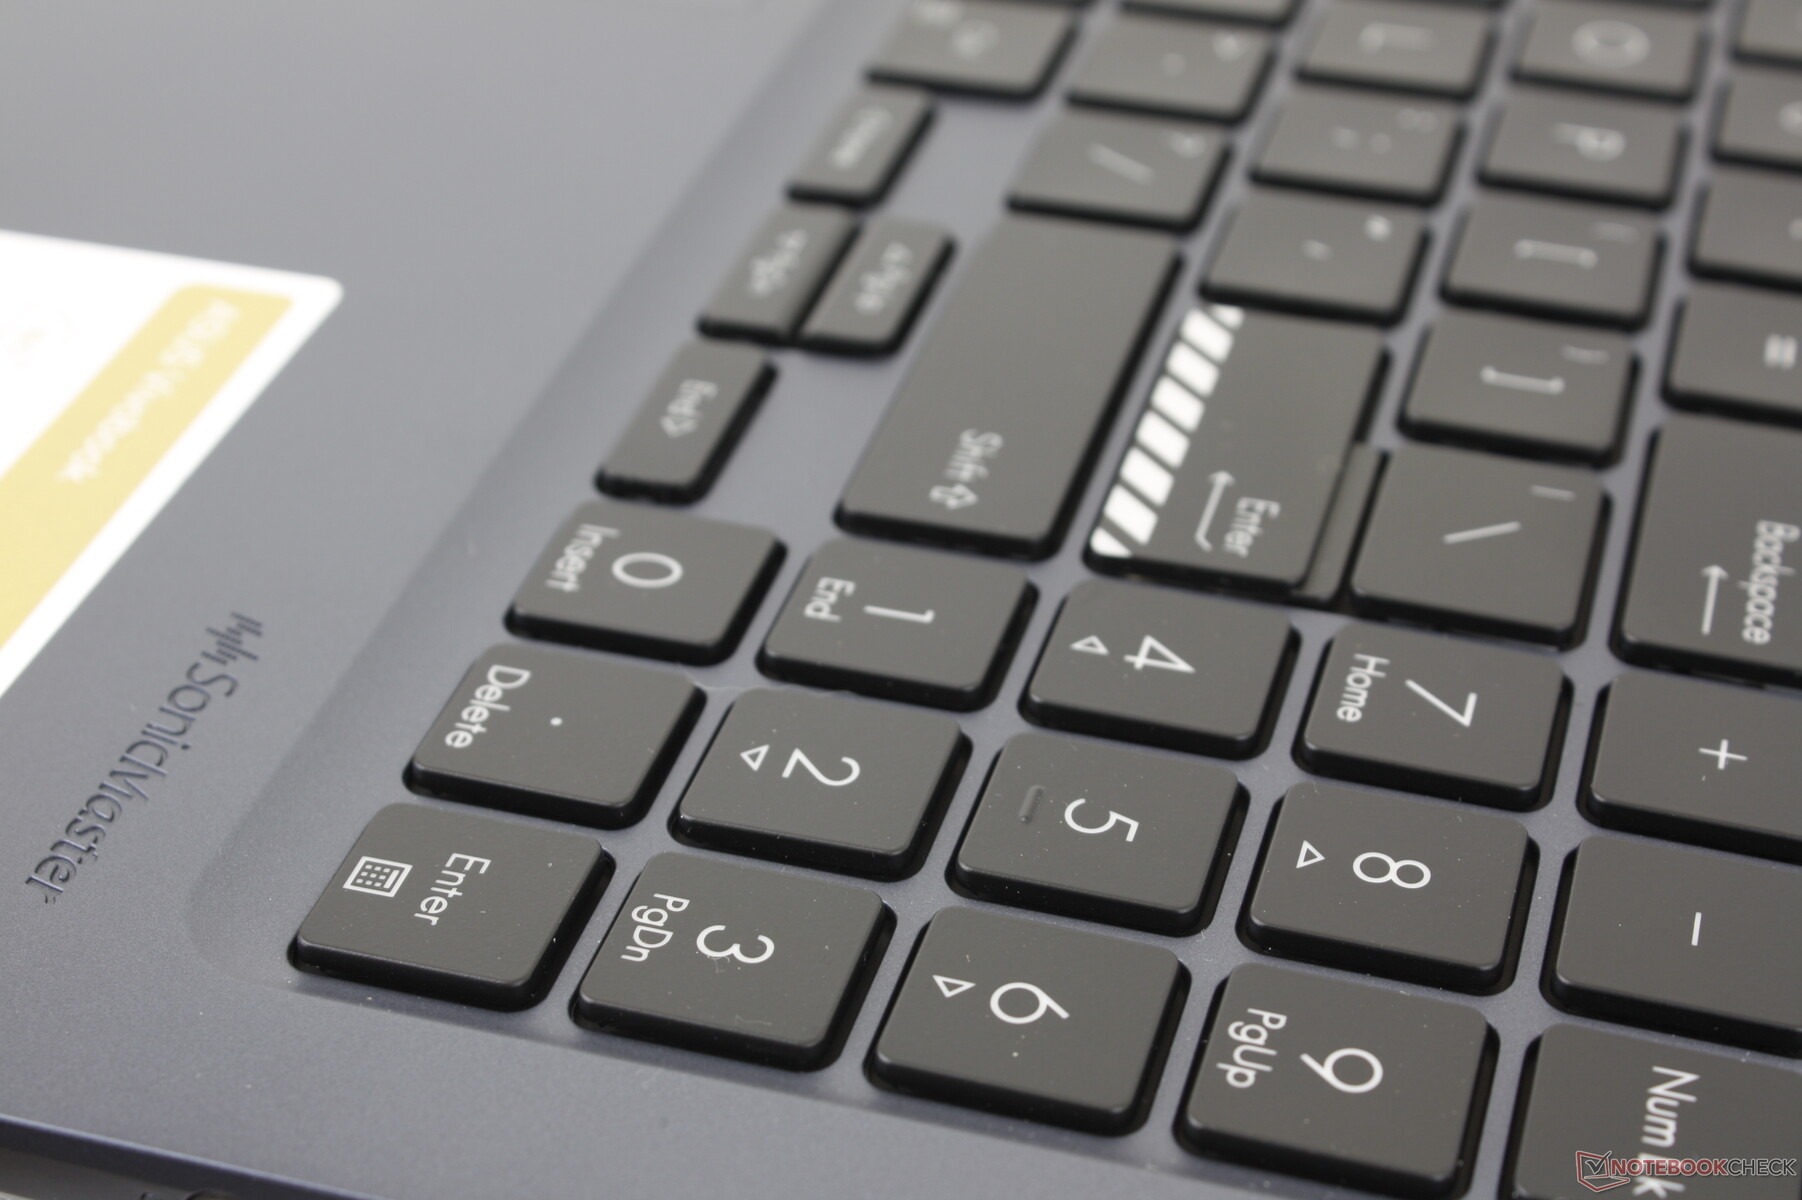
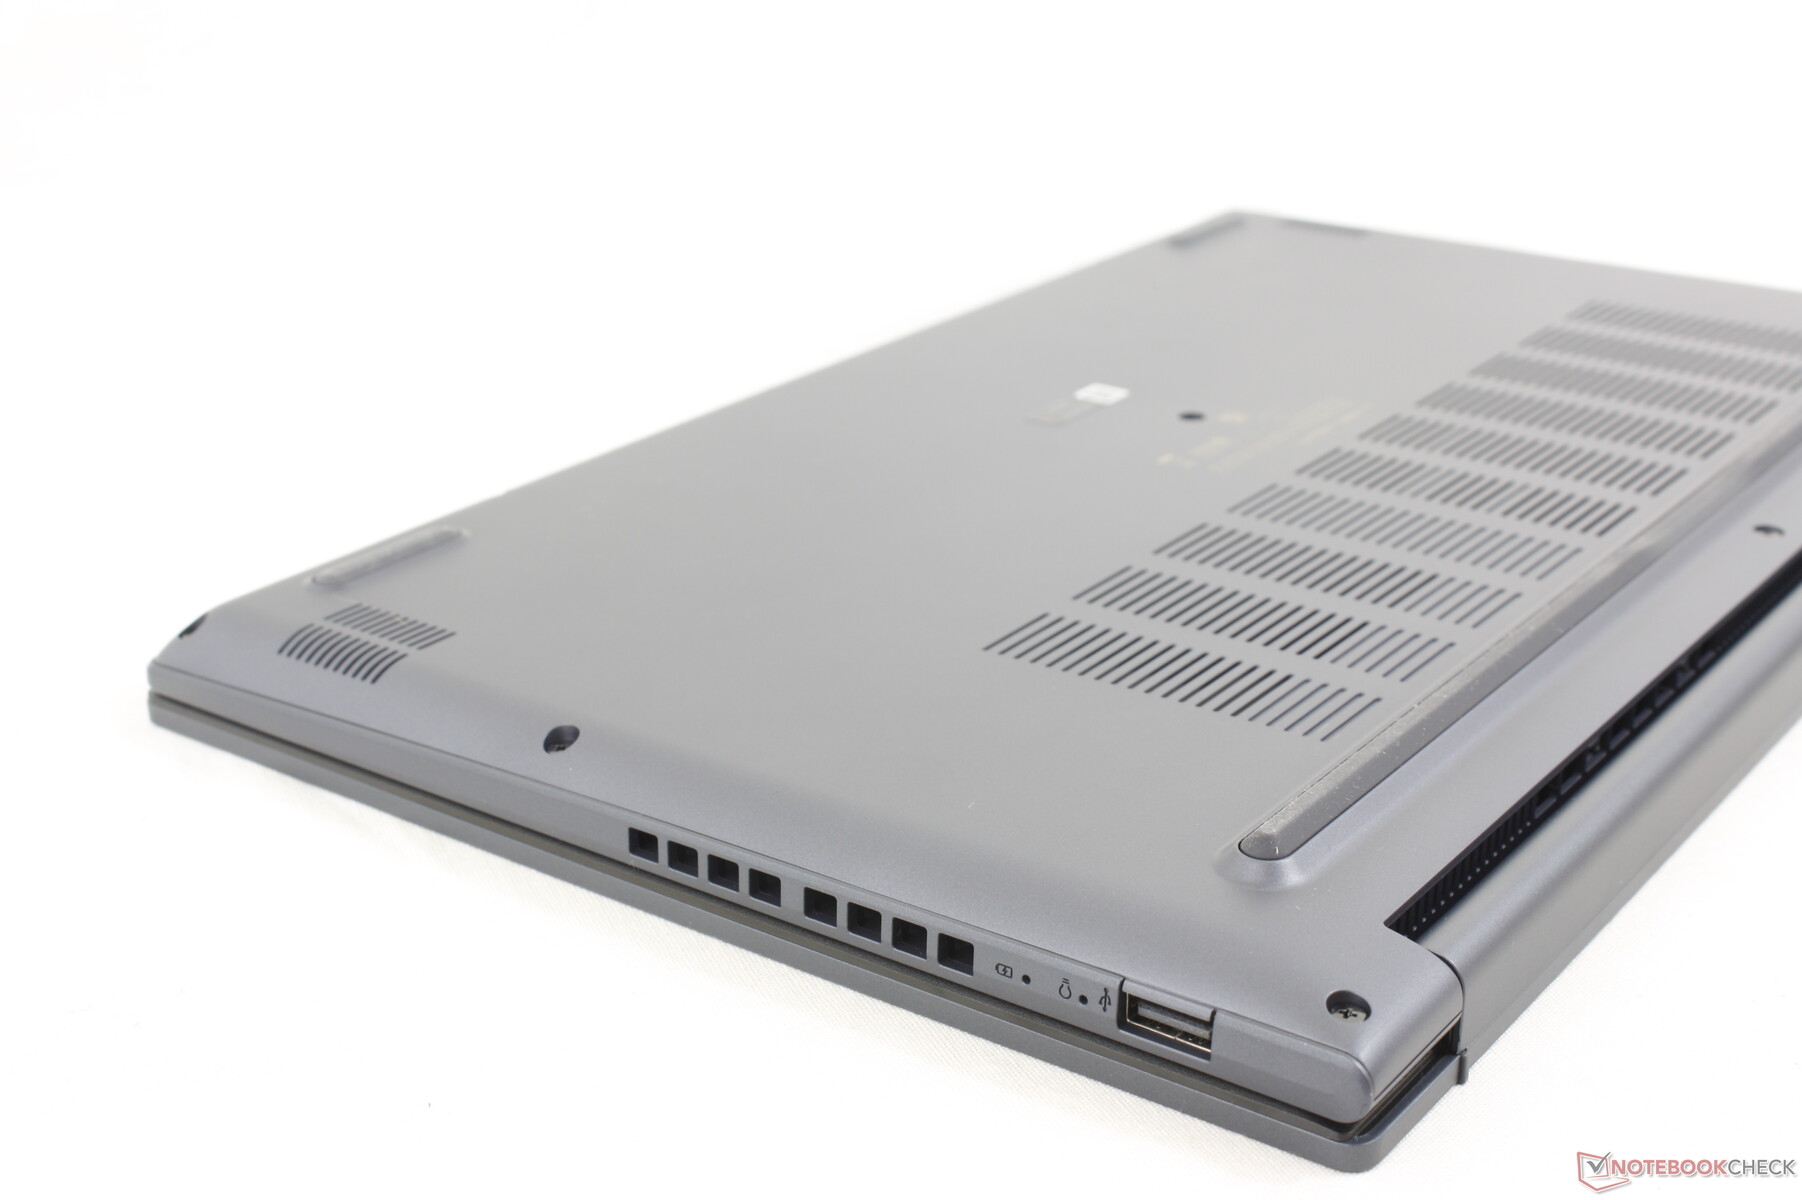
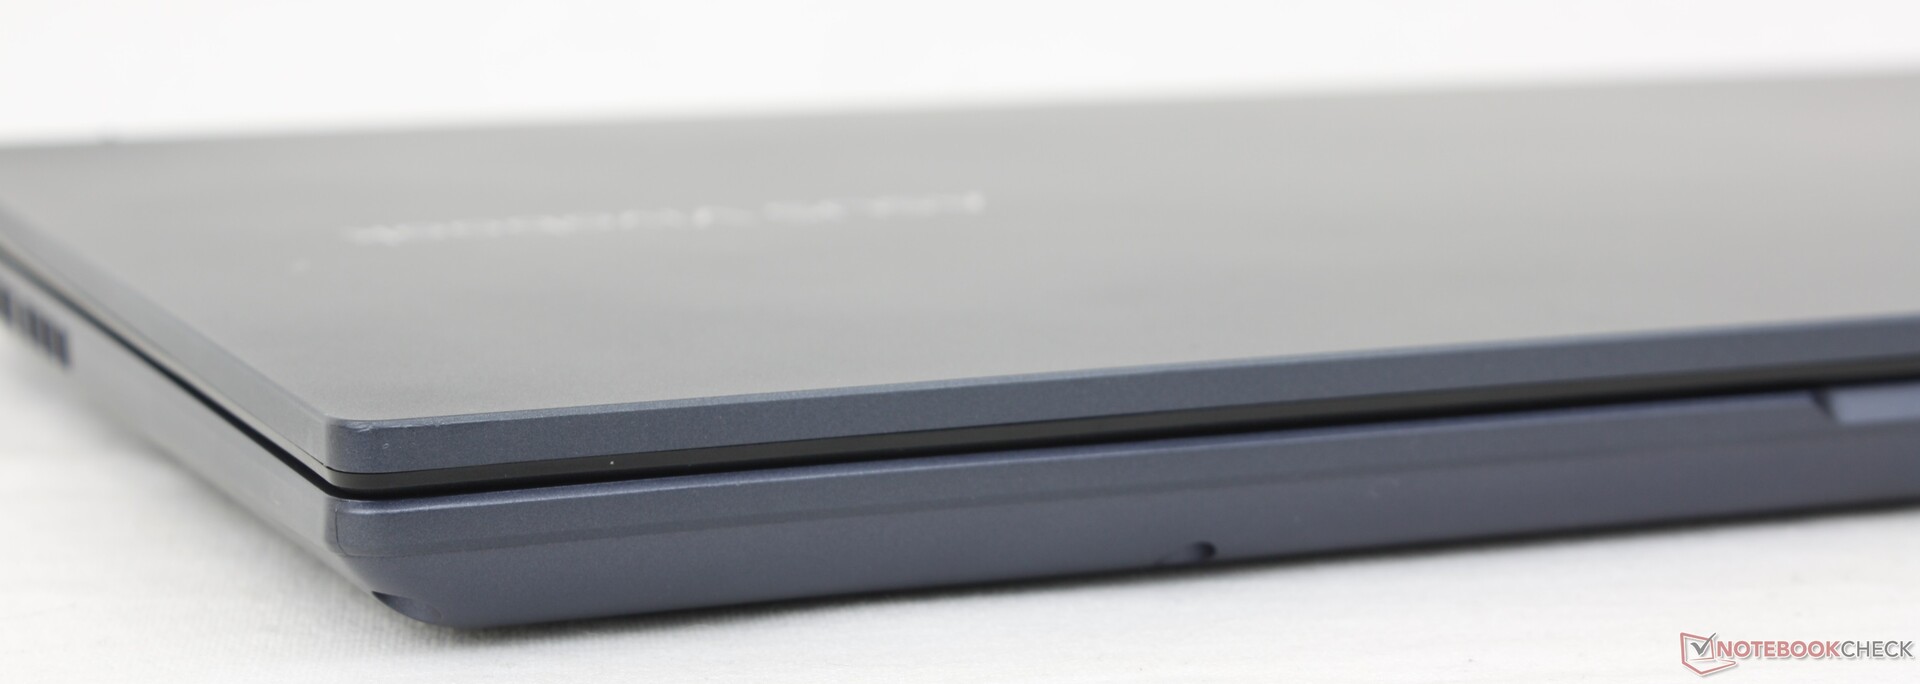
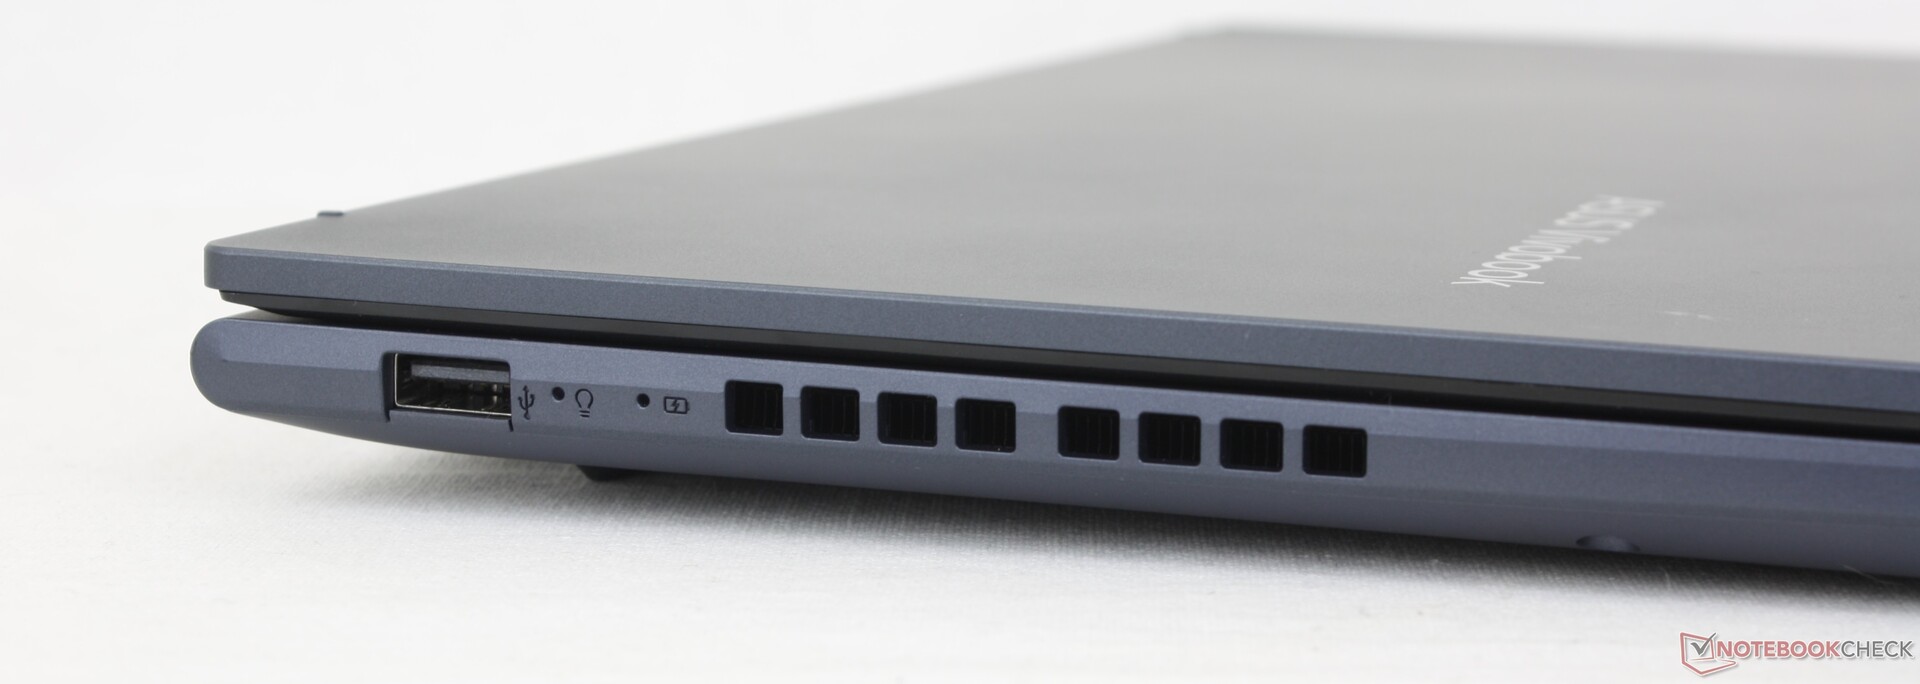
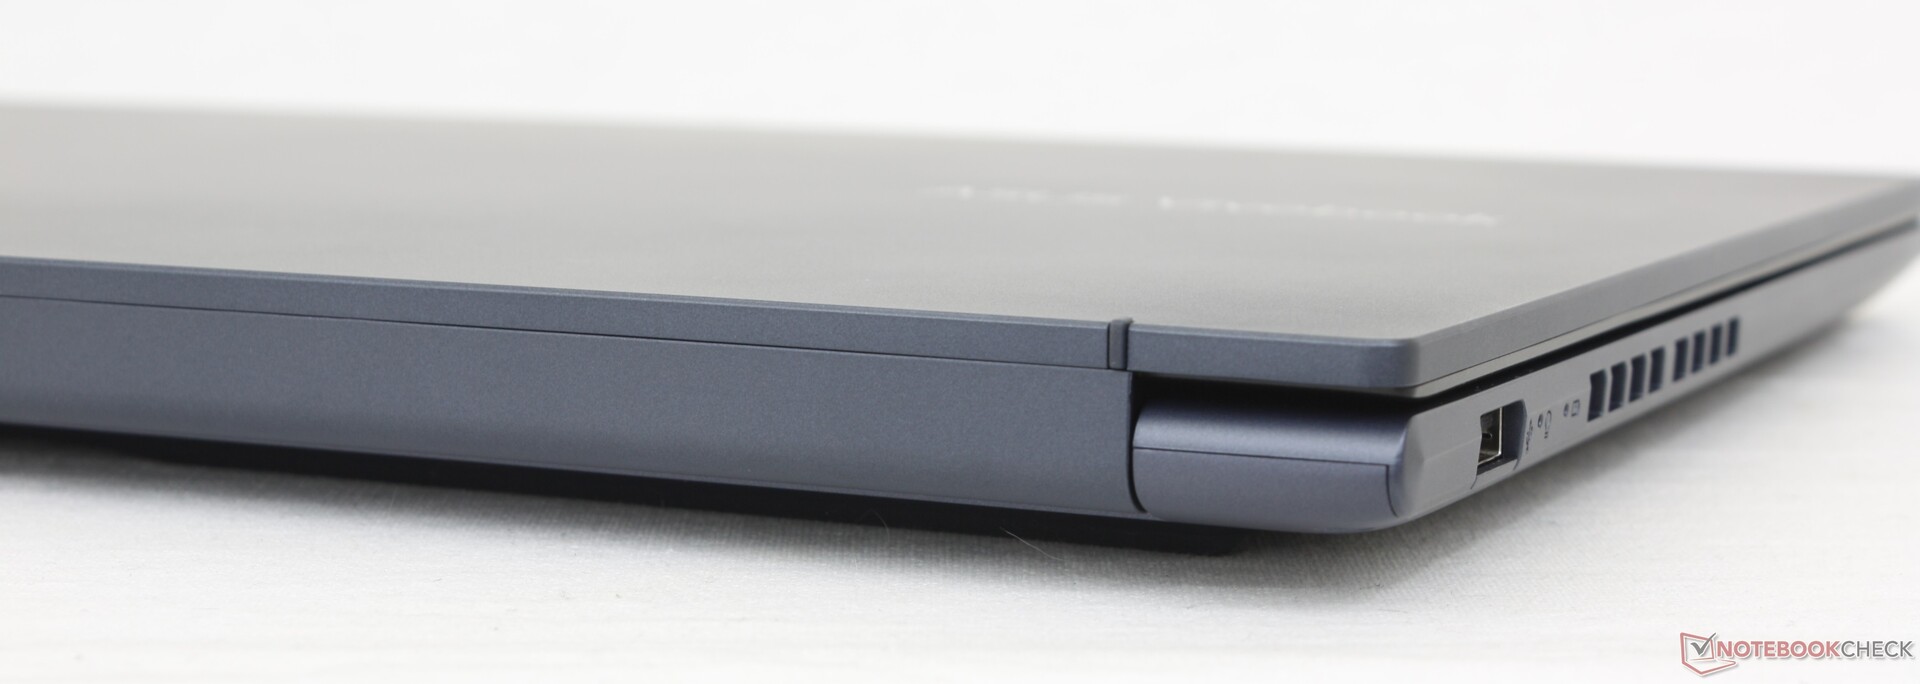
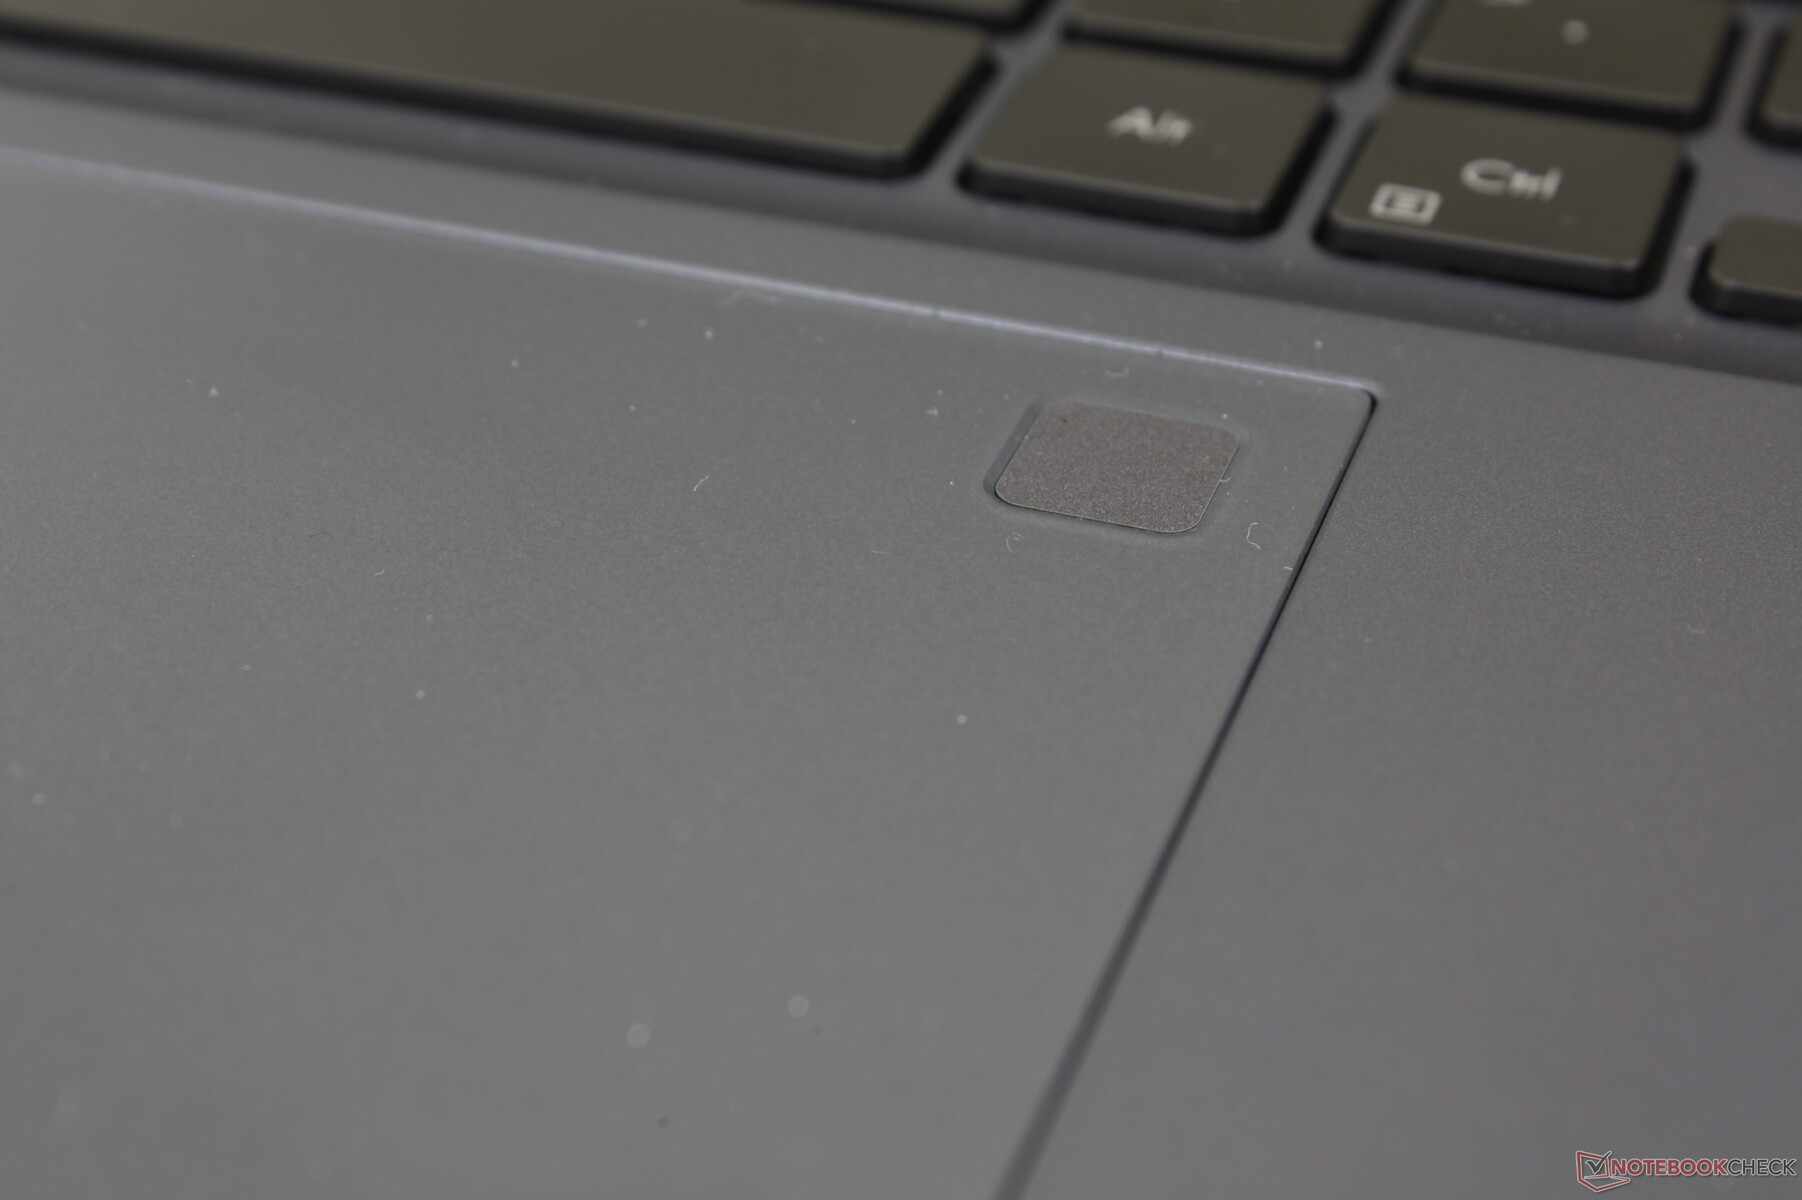
VivoBook 15X OLED采用了与普通VivoBook 15相同的金属外盖和塑料底座材料,但有几个设计更新。首先,右侧掌托上的Harman/Kardon标志已被SonicMaster取代。第二,点击板和键盘甲板分别变得更大和更清晰。第三,尽管我们的机型采用了更快的Ryzen H系列CPU,但所有四边的边框都被缩小了,占地面积略小。最后,左侧边缘包括新的通风格栅和重新排列的端口。这两款机型乍一看可能很相似,但一旦你仔细观察,变化就不小了。
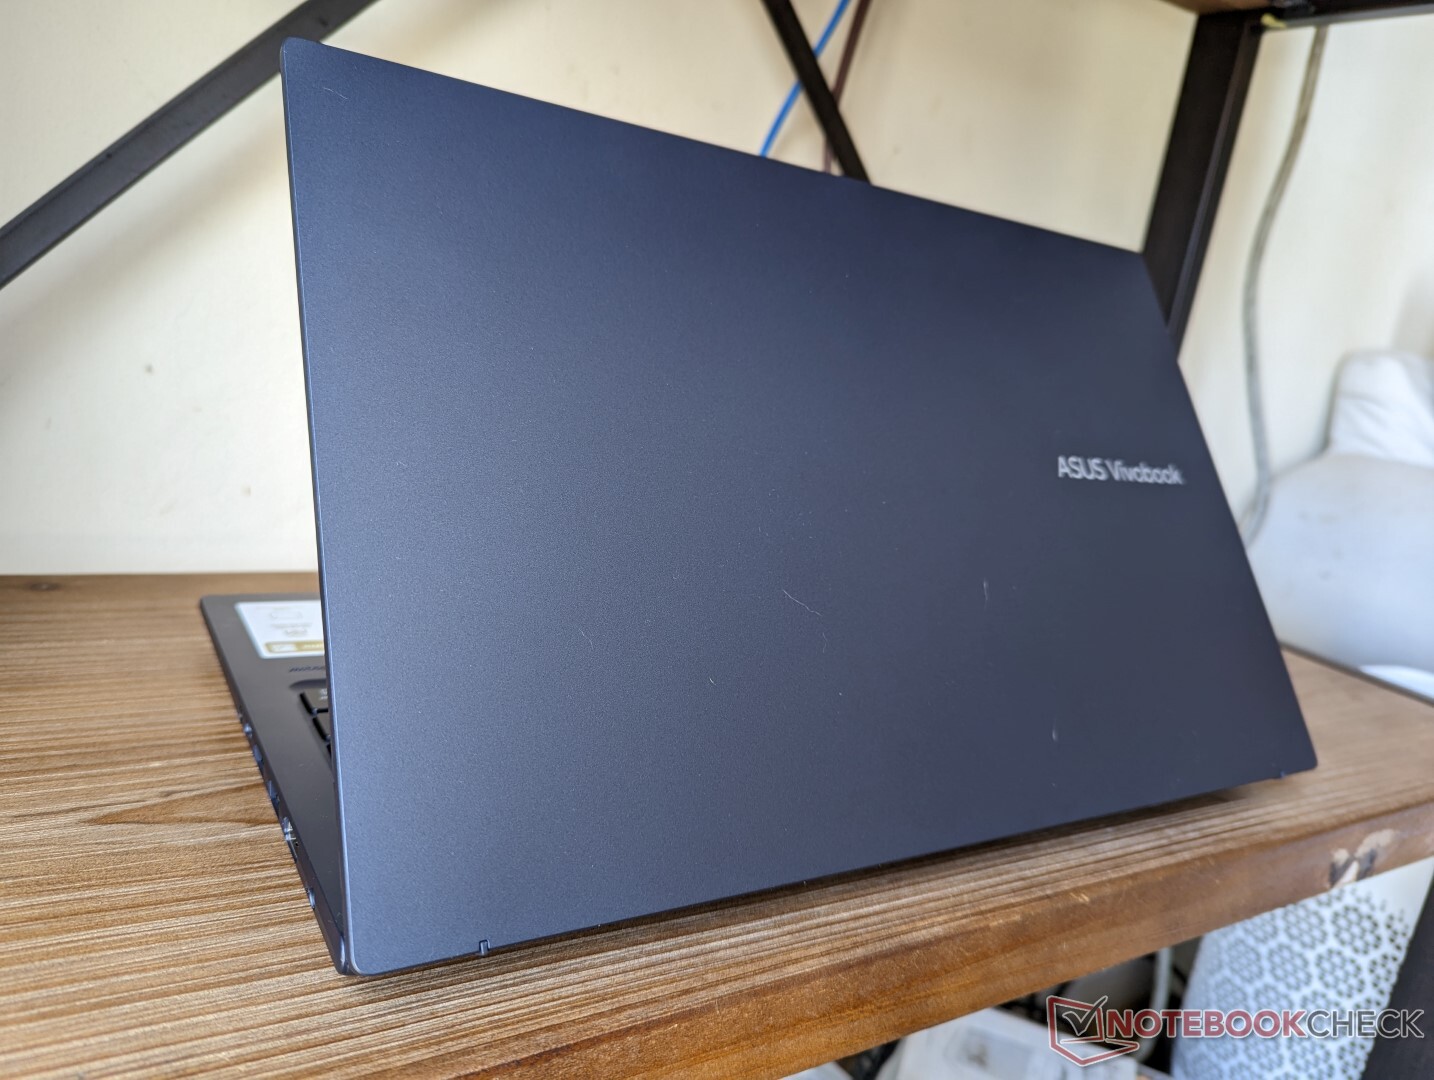
底盘刚性在其他方面与标准的VivoBook 15保持一致。底座比价格较高的 ZenBook 或 戴尔XPS系列。OLED屏幕和盖子特别容易弯曲,因为没有大猩猩玻璃加固。这毕竟是一台预算的华硕笔记本电脑。
总体尺寸和重量并不令人兴奋,因为对于15英寸超极本来说,它们是平均水平。一些型号可能更大更重,如戴尔Inspiron 15 3501,而其他型号如 LG Gram 15则更小、更轻。然而,当考虑到其可承受的价格时,VivoBook 15X比预期的更轻、更便携。
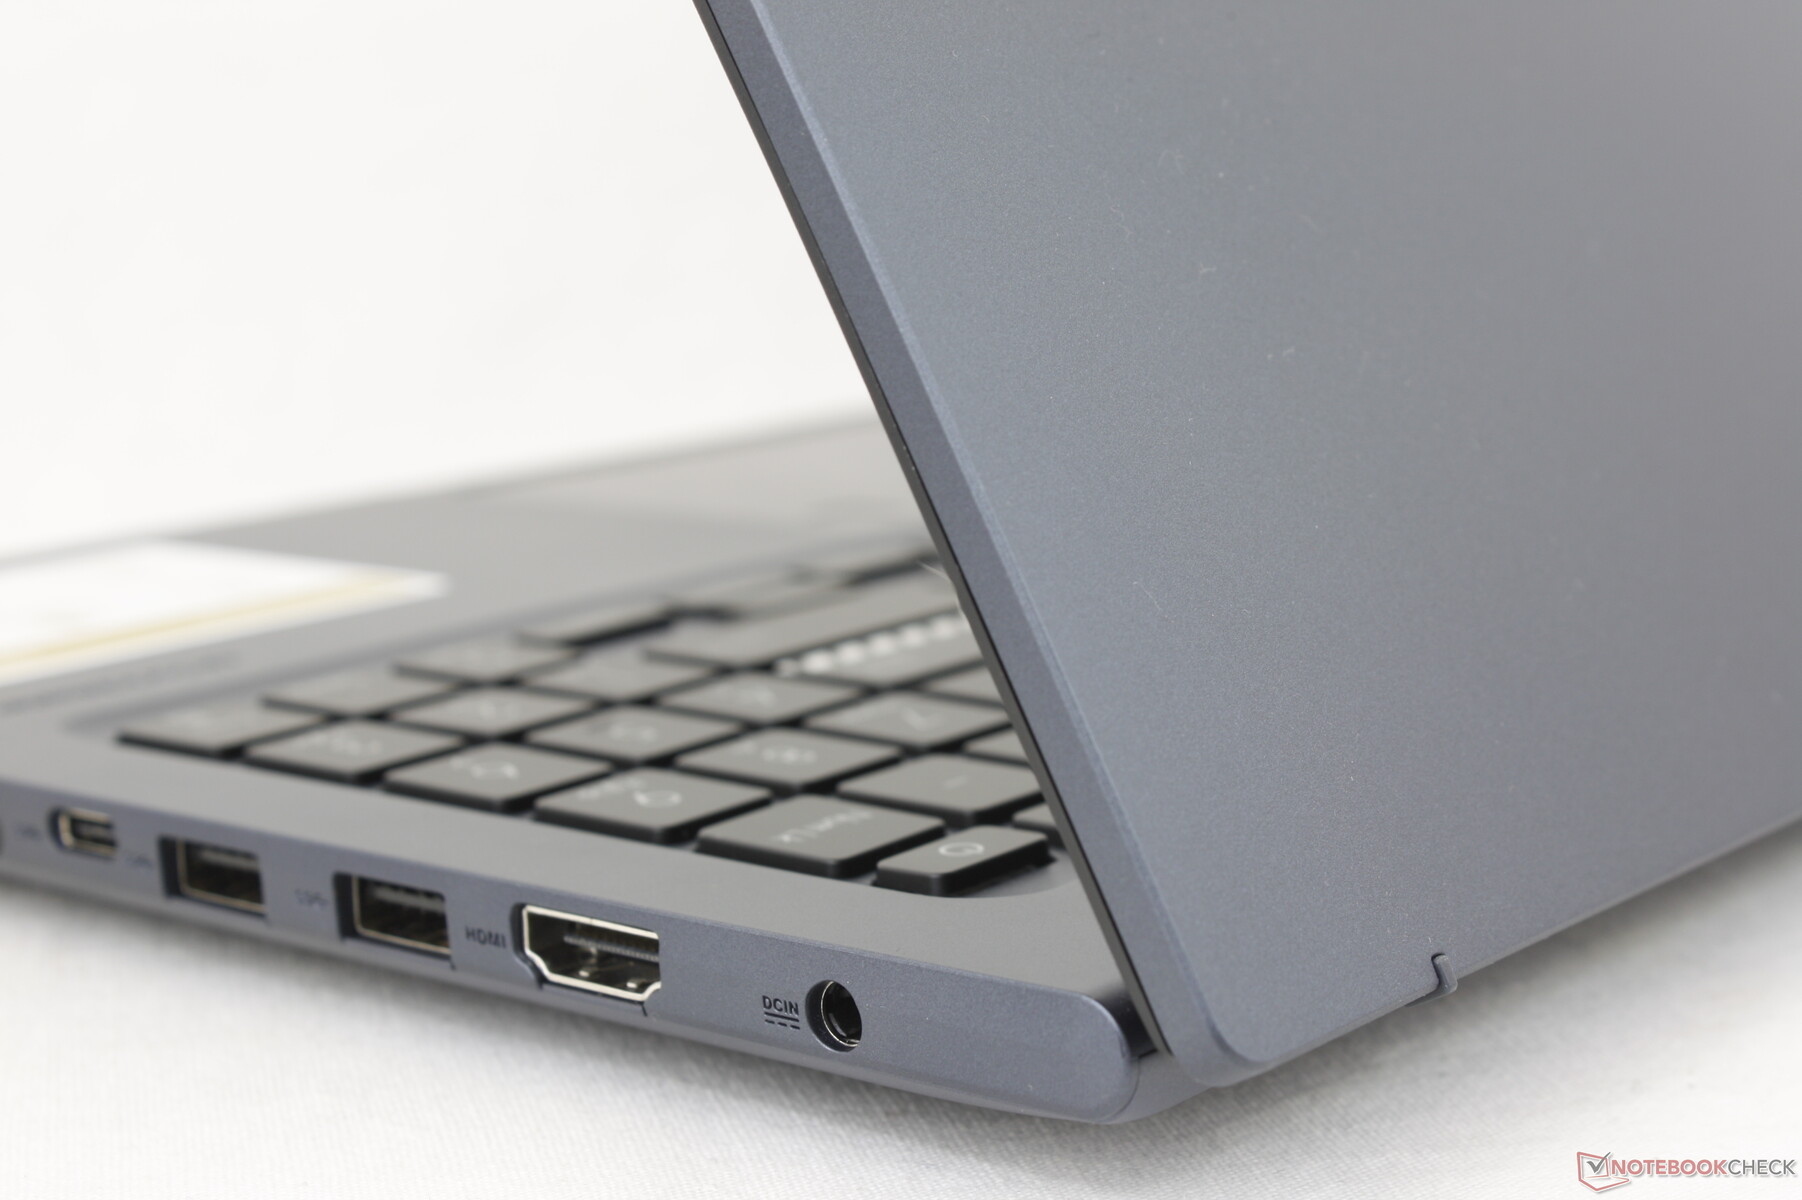
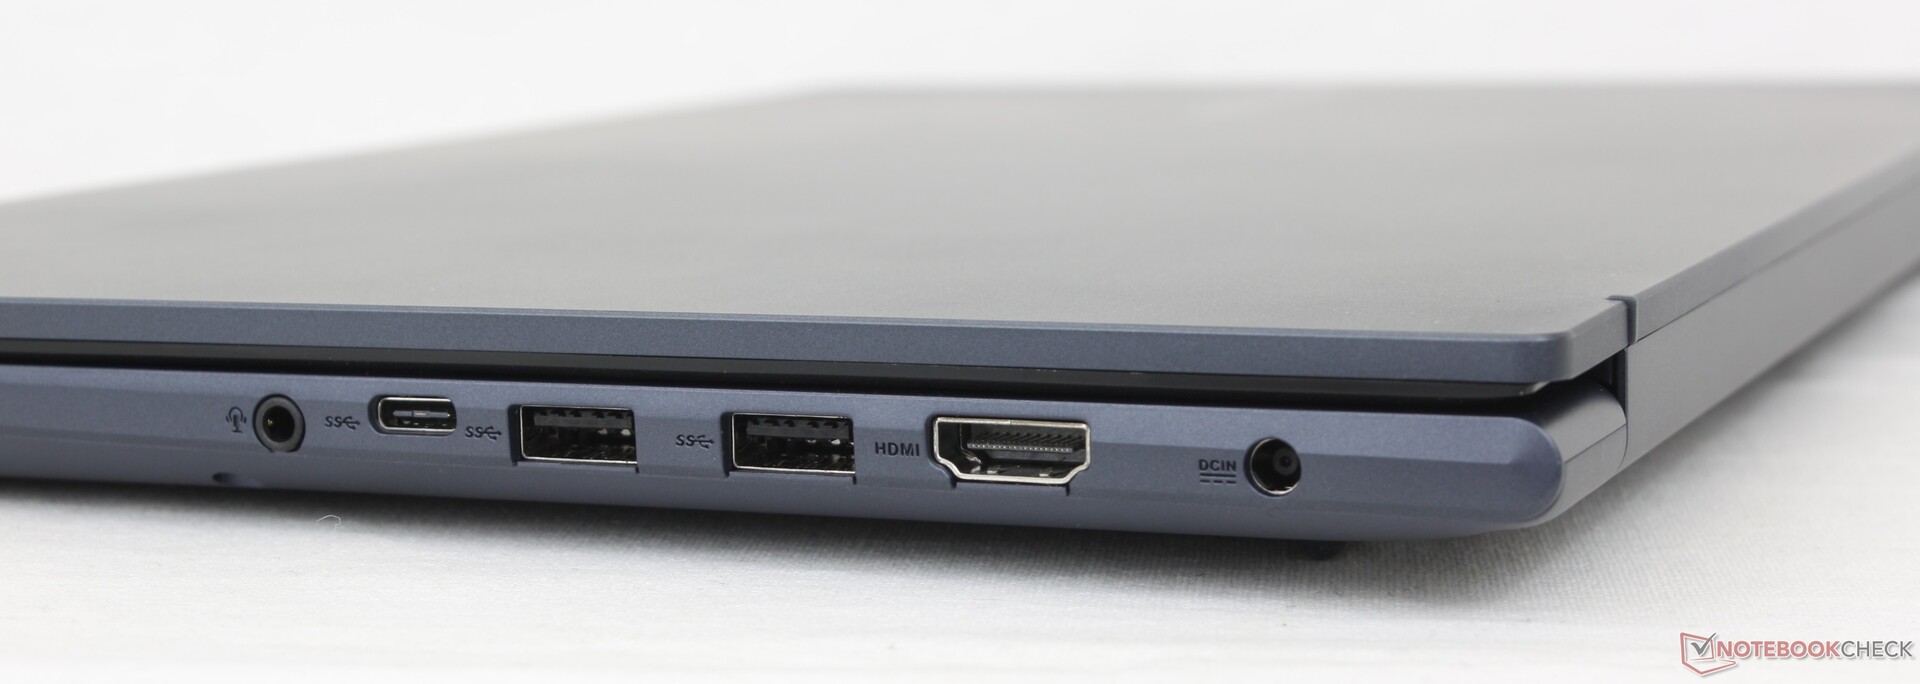
连接性 - 有限的USB-C功能
端口选项在所有众多的VivoBook型号之间略有不同。在这种情况下,我们的VivoBook 15X M1503QA的端口是最类似于14英寸的VivoBook S 14X S5402Z除了有一个额外的USB-A端口和一个较少的USB-C端口。请记住,这里的USB-C端口不支持Thunderbolt、Power Delivery,甚至不支持DisplayPort,而其他大多数带有USB-C的超极本往往至少支持这三种中的一种。
外部显示器只支持30赫兹的4K分辨率。
沟通
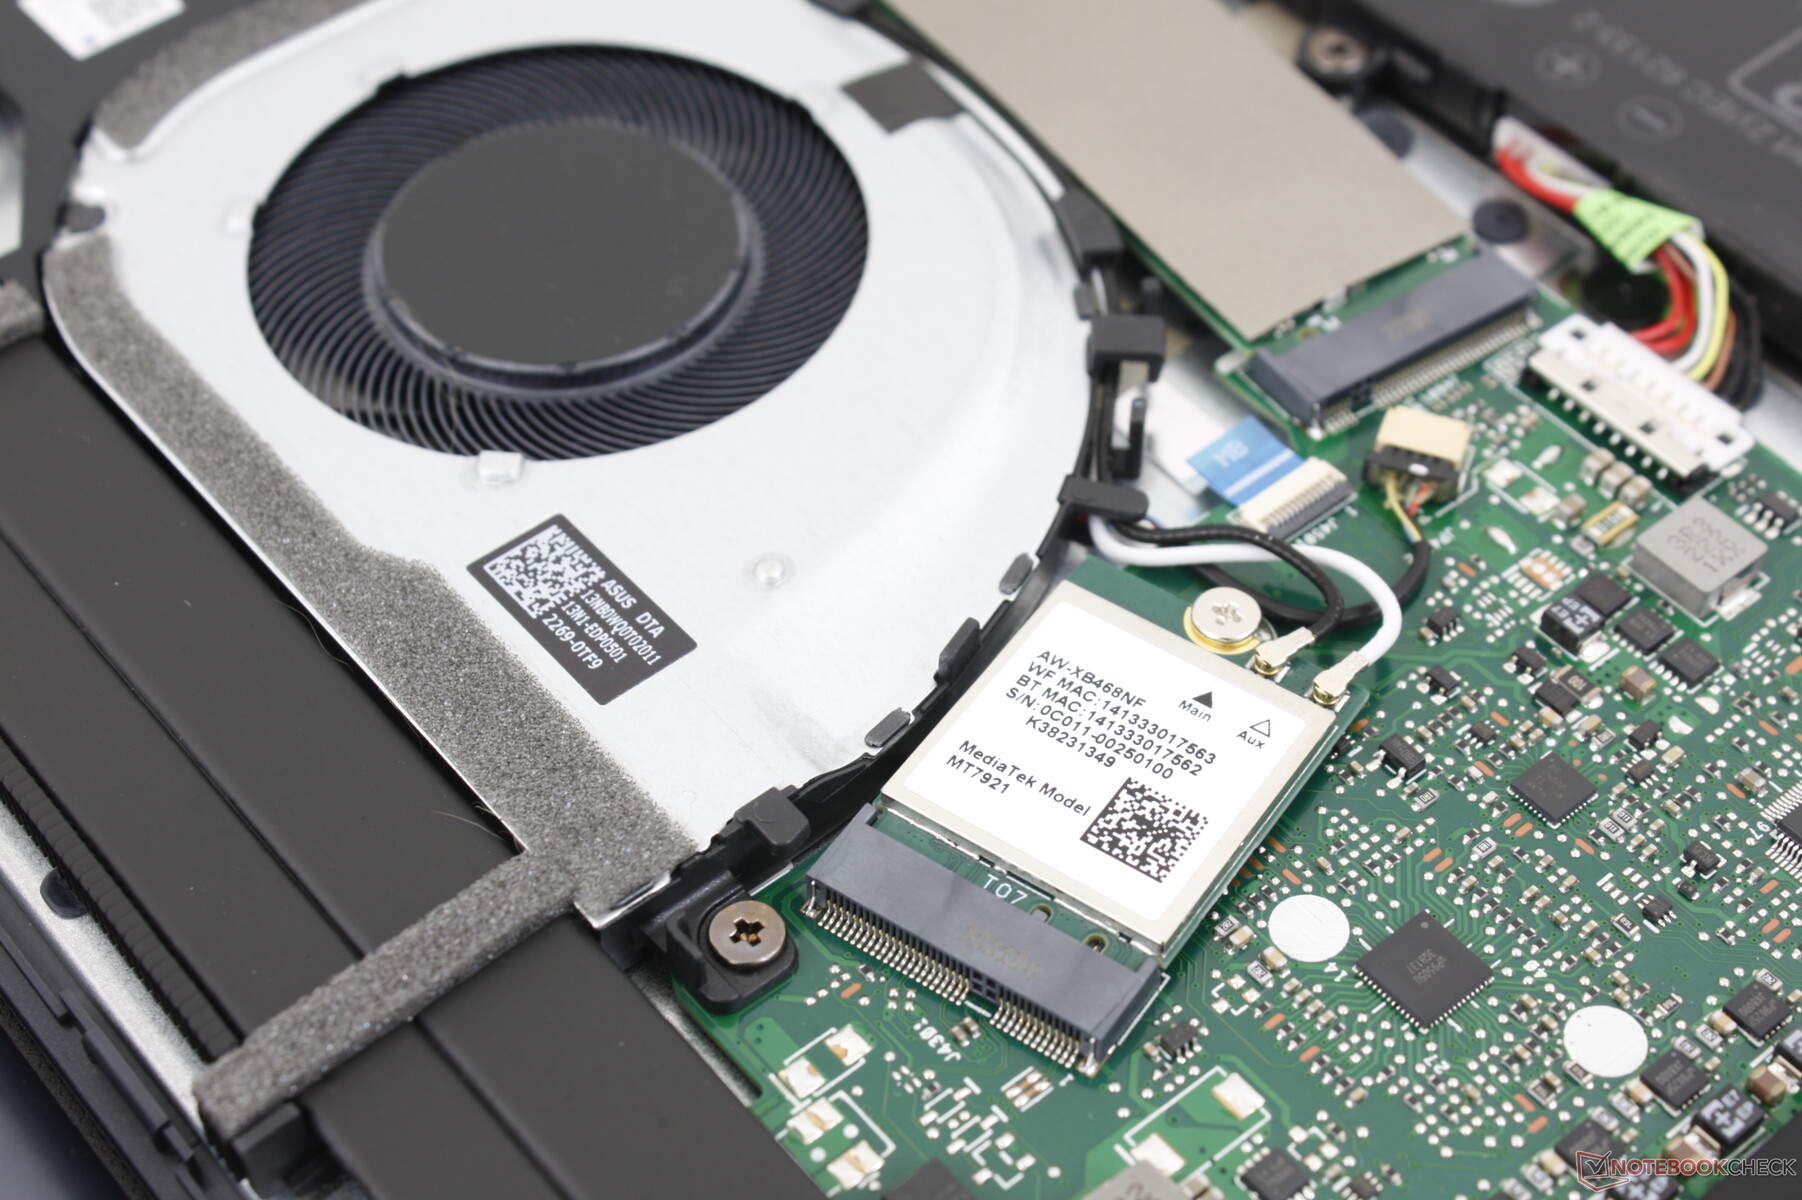
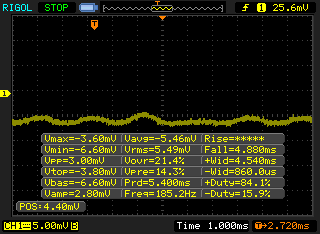
Wi-Fi 6和蓝牙5是由联发科MT7921提供的。虽然发射率是我们所期望的,但接收率往往是波动的,如下图所示。这个问题在日常使用或流媒体期间并不明显,但它比由英特尔AX系列驱动的笔记本电脑低了一个档次,那里的性能更稳定。
Wi-Fi 6E不包括在配置中,可能是为了节省成本。
| Networking | |
| iperf3 transmit AX12 | |
| Asus ZenBook UX535-M01440 | |
| Asus VivoBook S15 D533UA | |
| Asus Vivobook 15 K513EQ | |
| Dell Inspiron 15 3501 | |
| iperf3 receive AX12 | |
| Asus Vivobook 15 K513EQ | |
| Asus VivoBook S15 D533UA | |
| Asus ZenBook UX535-M01440 | |
| Dell Inspiron 15 3501 | |
| iperf3 receive AXE11000 | |
| Lenovo ThinkBook 15 G3 ACL 21A400B2GE | |
| Asus VivoBook 15 X M1503QA | |
| iperf3 transmit AXE11000 | |
| Lenovo ThinkBook 15 G3 ACL 21A400B2GE | |
| Asus VivoBook 15 X M1503QA | |
网络摄像头
一个720p或100万像素的网络摄像头是标准配置,这可能是你在分辨率方面能得到的最底层的东西。至少有一个内置的物理快门以保护隐私,而标准的 VivoBook 15 没有快门。
没有红外传感器或Hello支持。


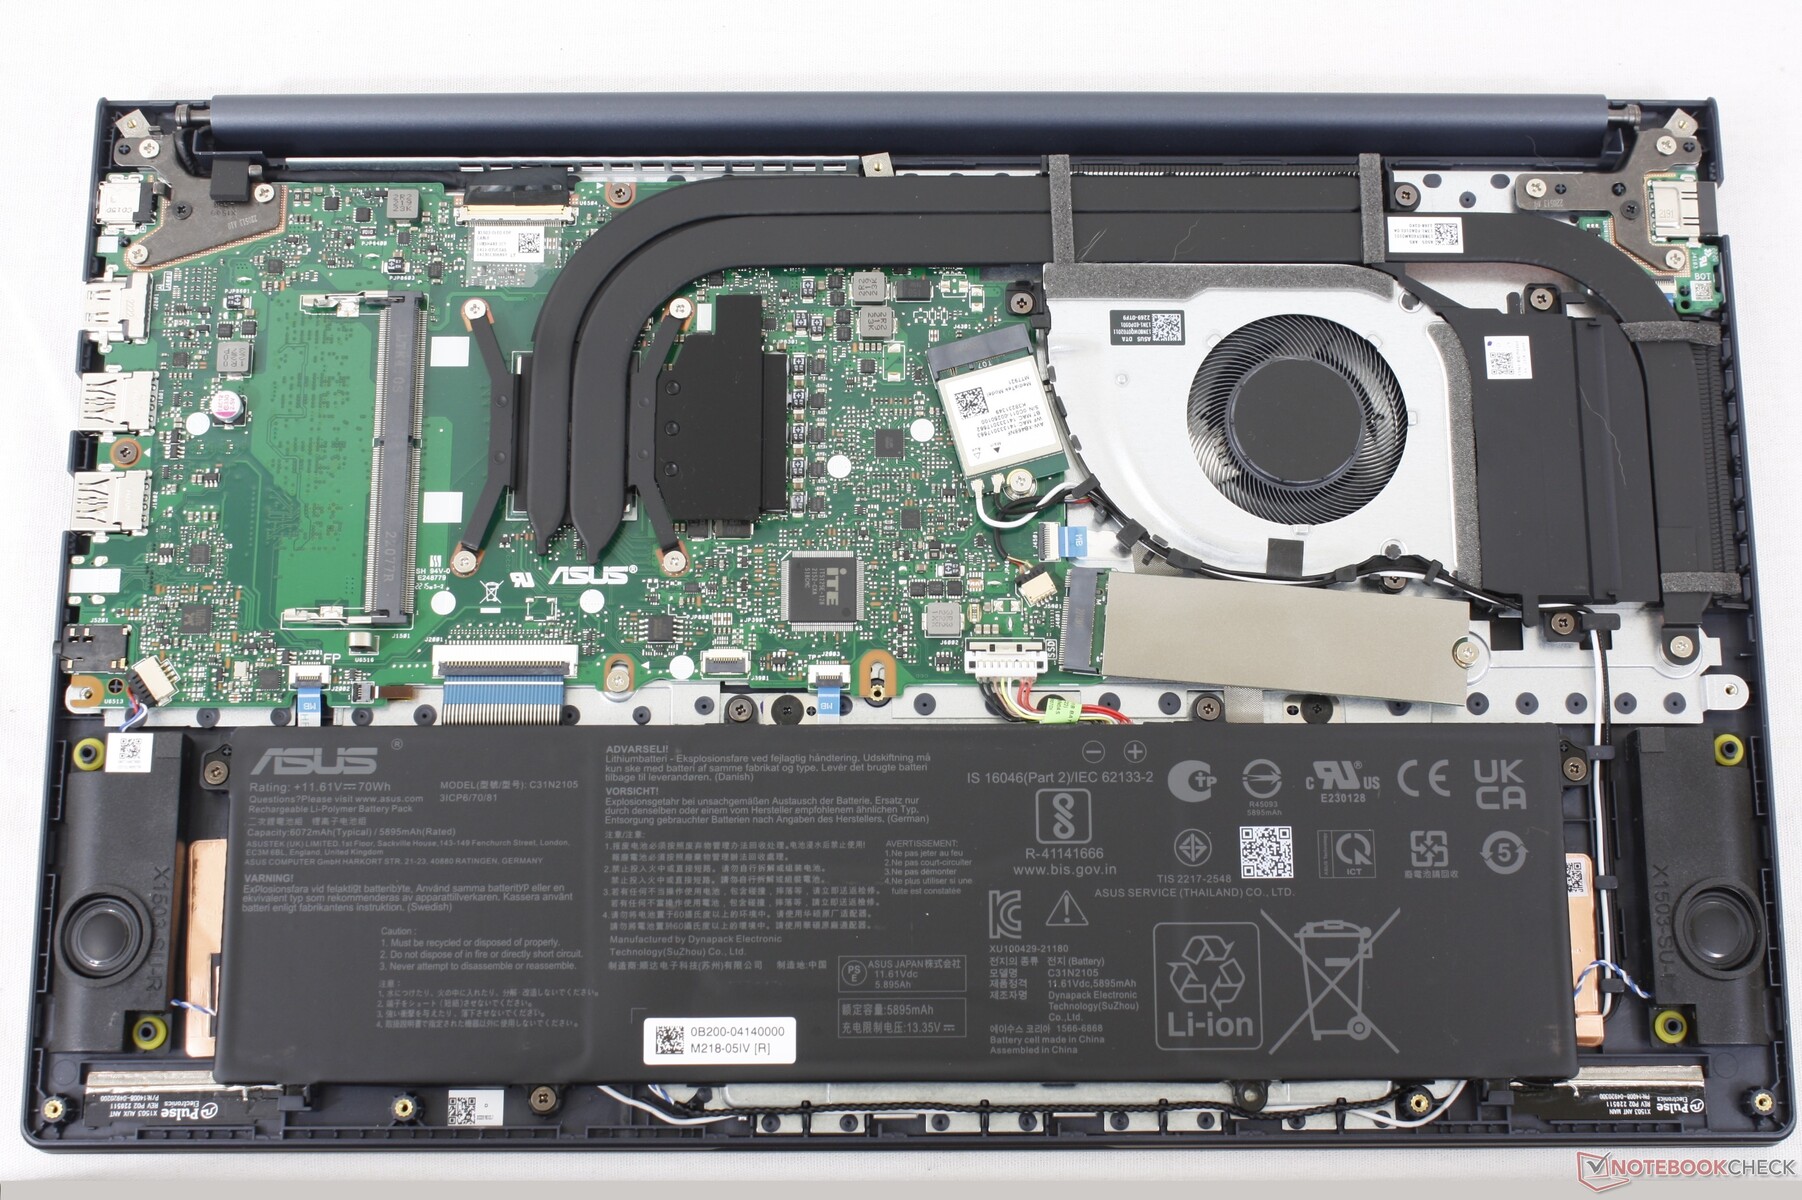
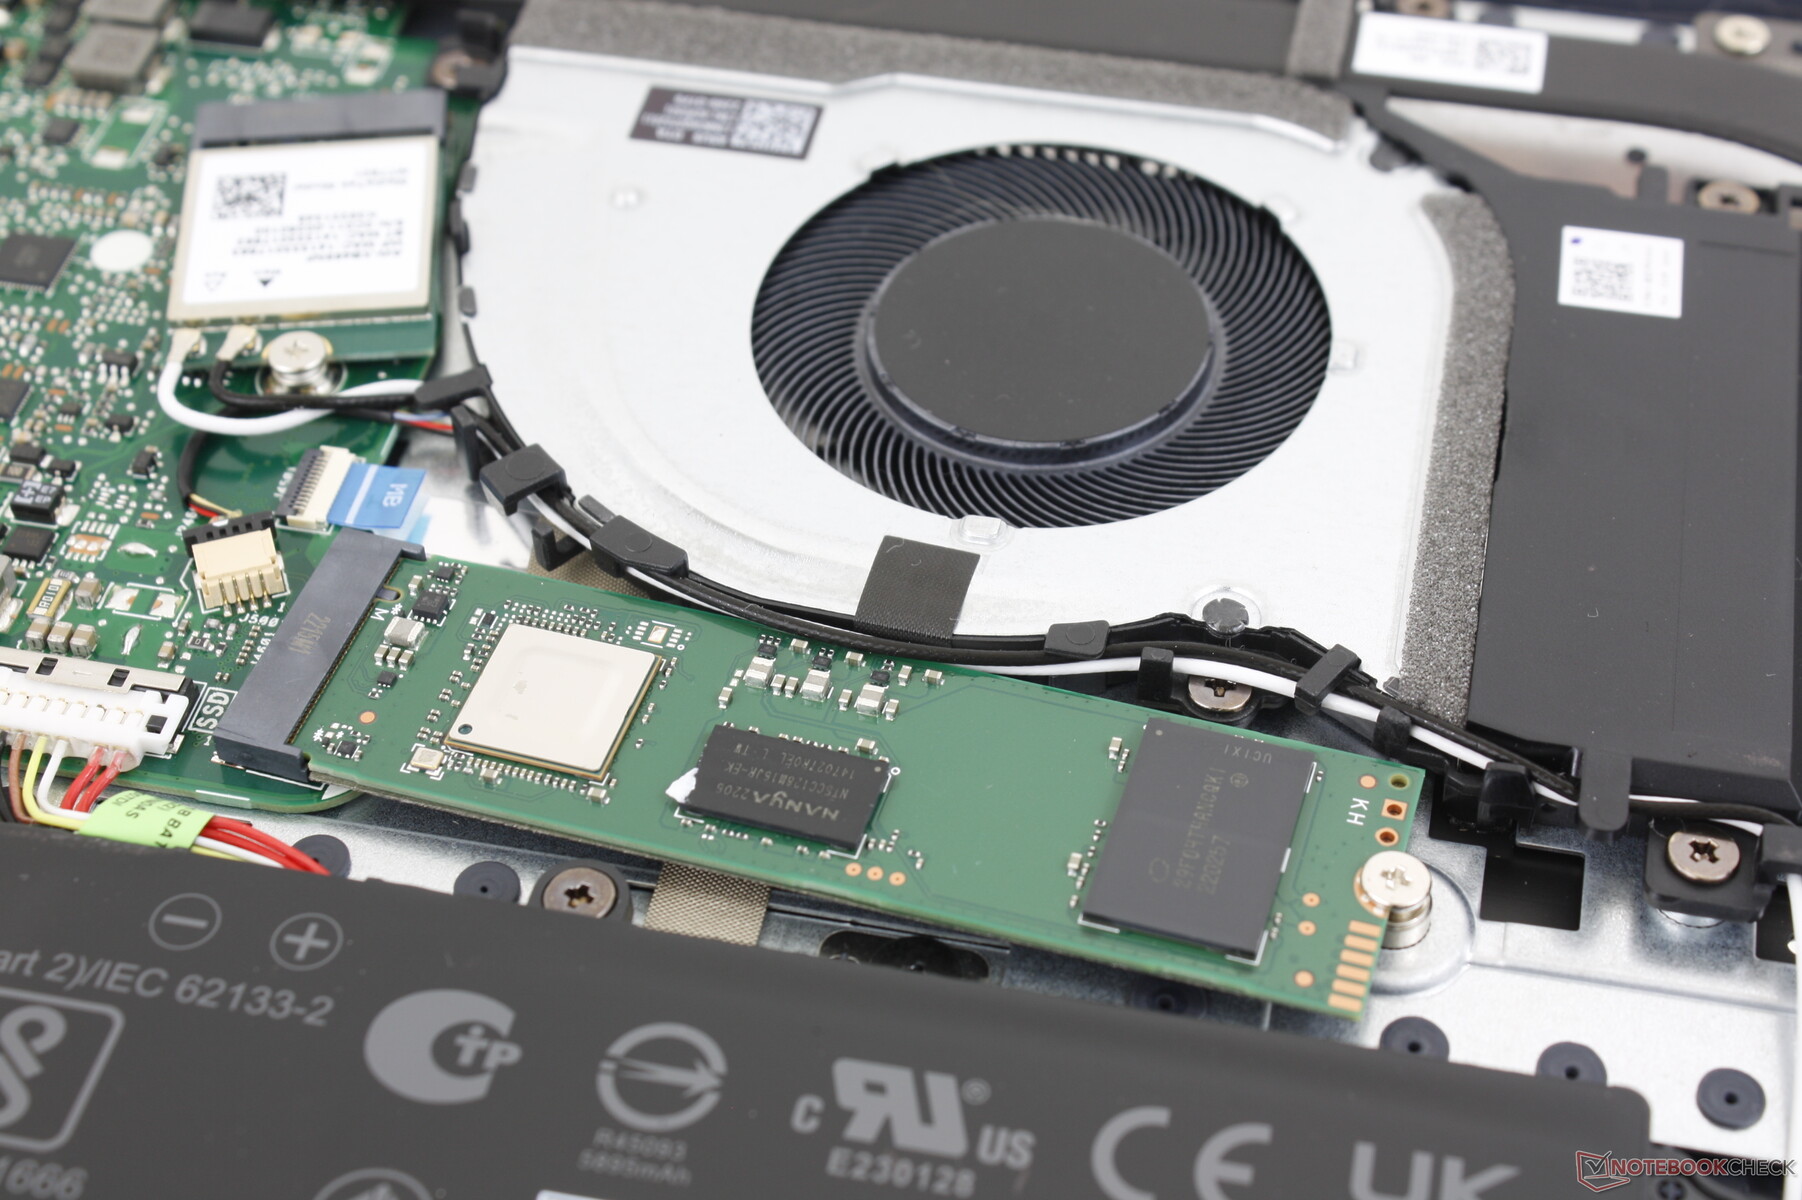
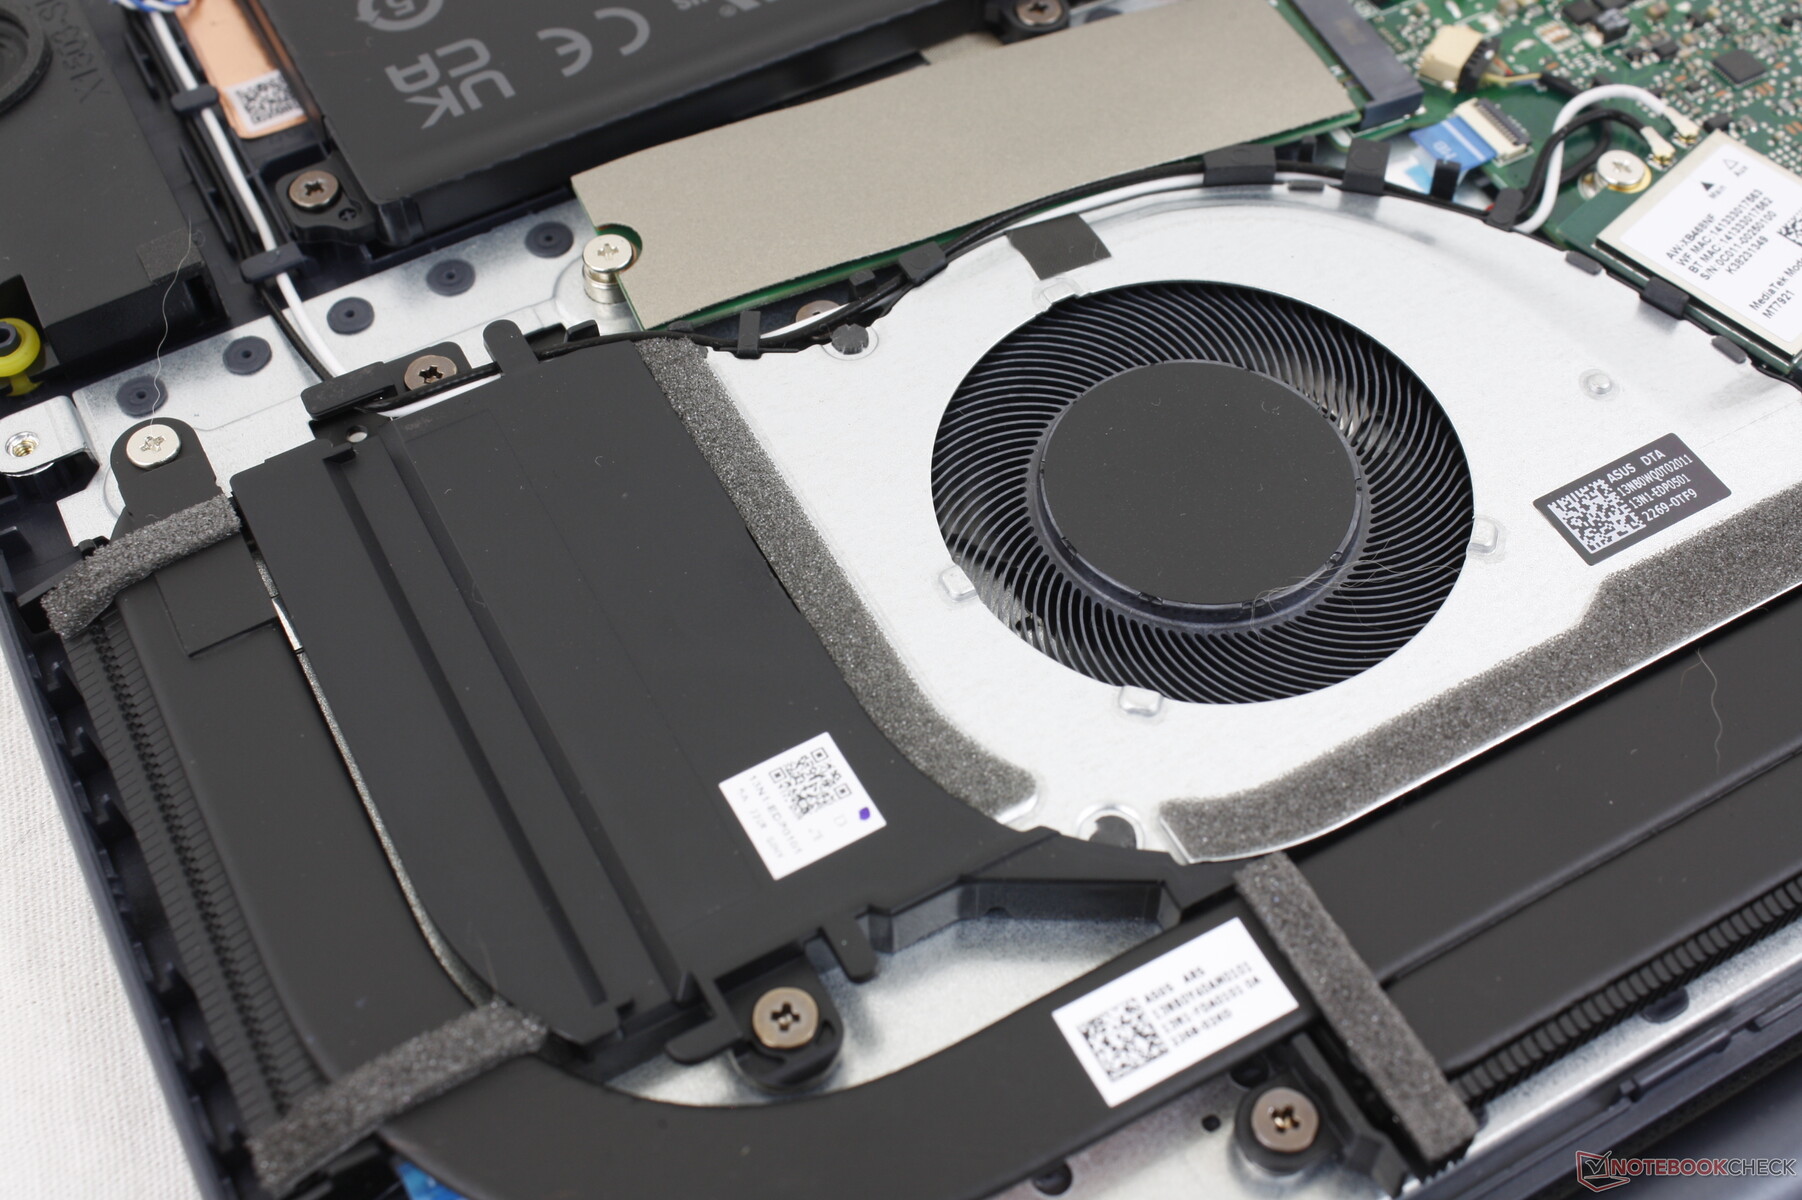
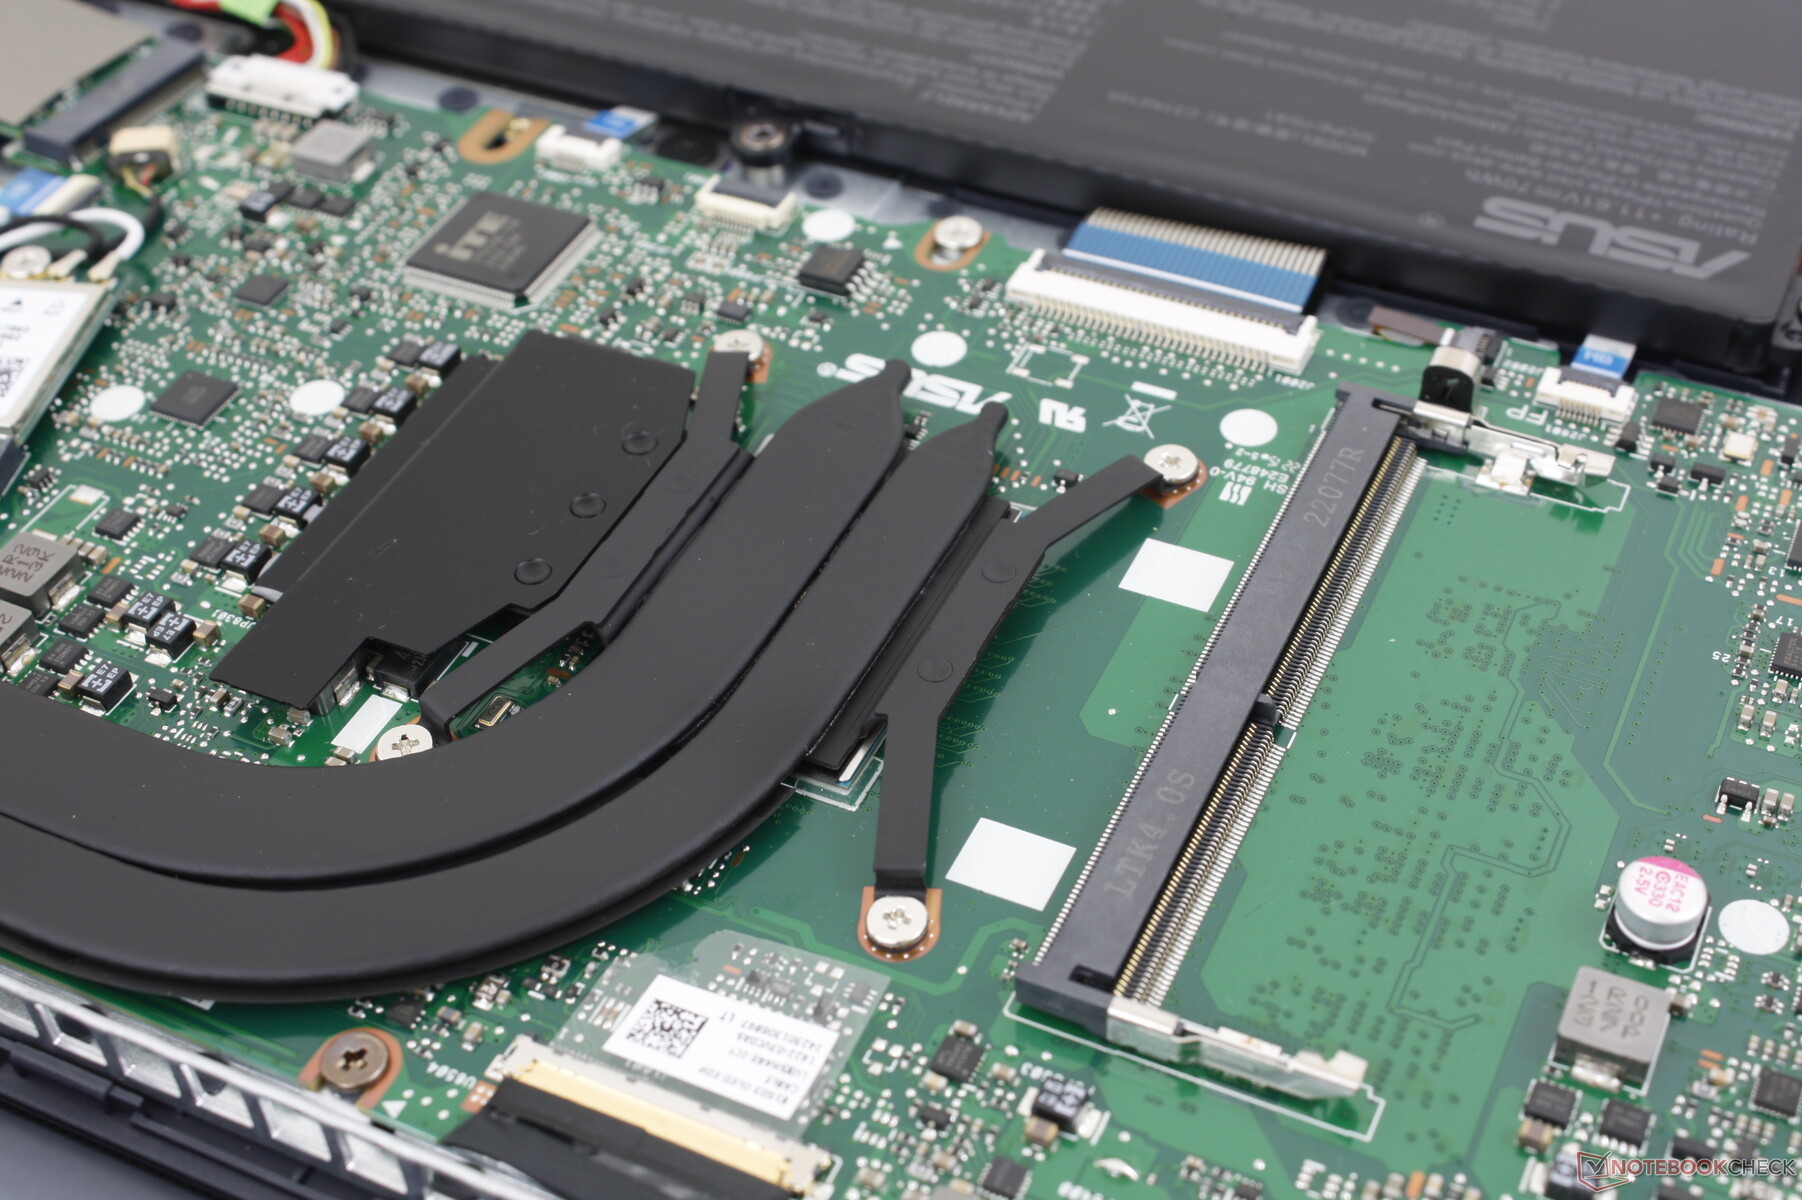
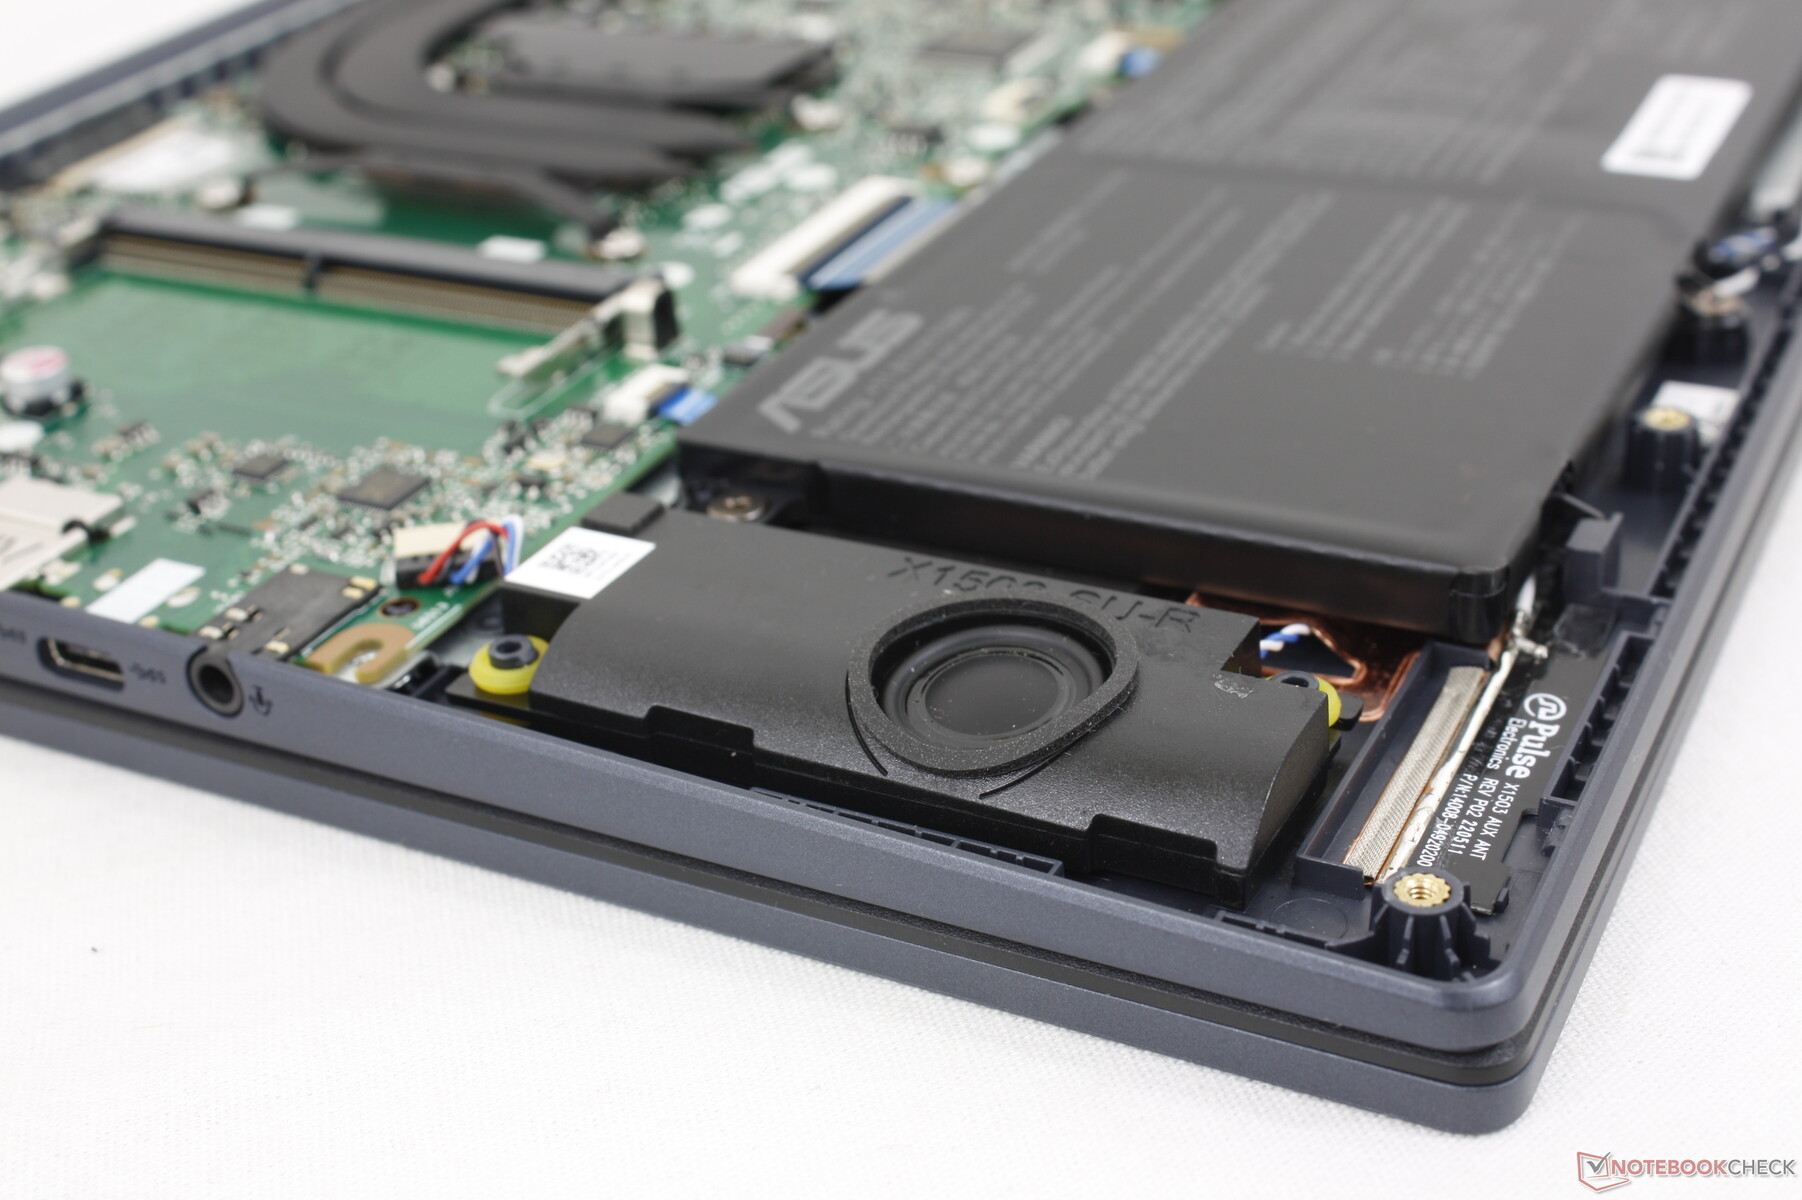
维护
底部面板上有10个飞利浦螺丝,没有一个隐藏在任何橡胶脚下,方便维修。用户可以直接接触到单个M.2 2280 PCIe3 x4插槽、单个DDR4 SODIMM插槽、WLAN模块和电池。如果SODIMM插槽被占用,8GB焊接的单通道RAM无论如何都是固定的,综合容量为16GB。
配件和保修
除了交流电适配器或文件外,盒子里没有其他额外的东西。如果在美国购买,则适用标准的一年有限制造商保修。
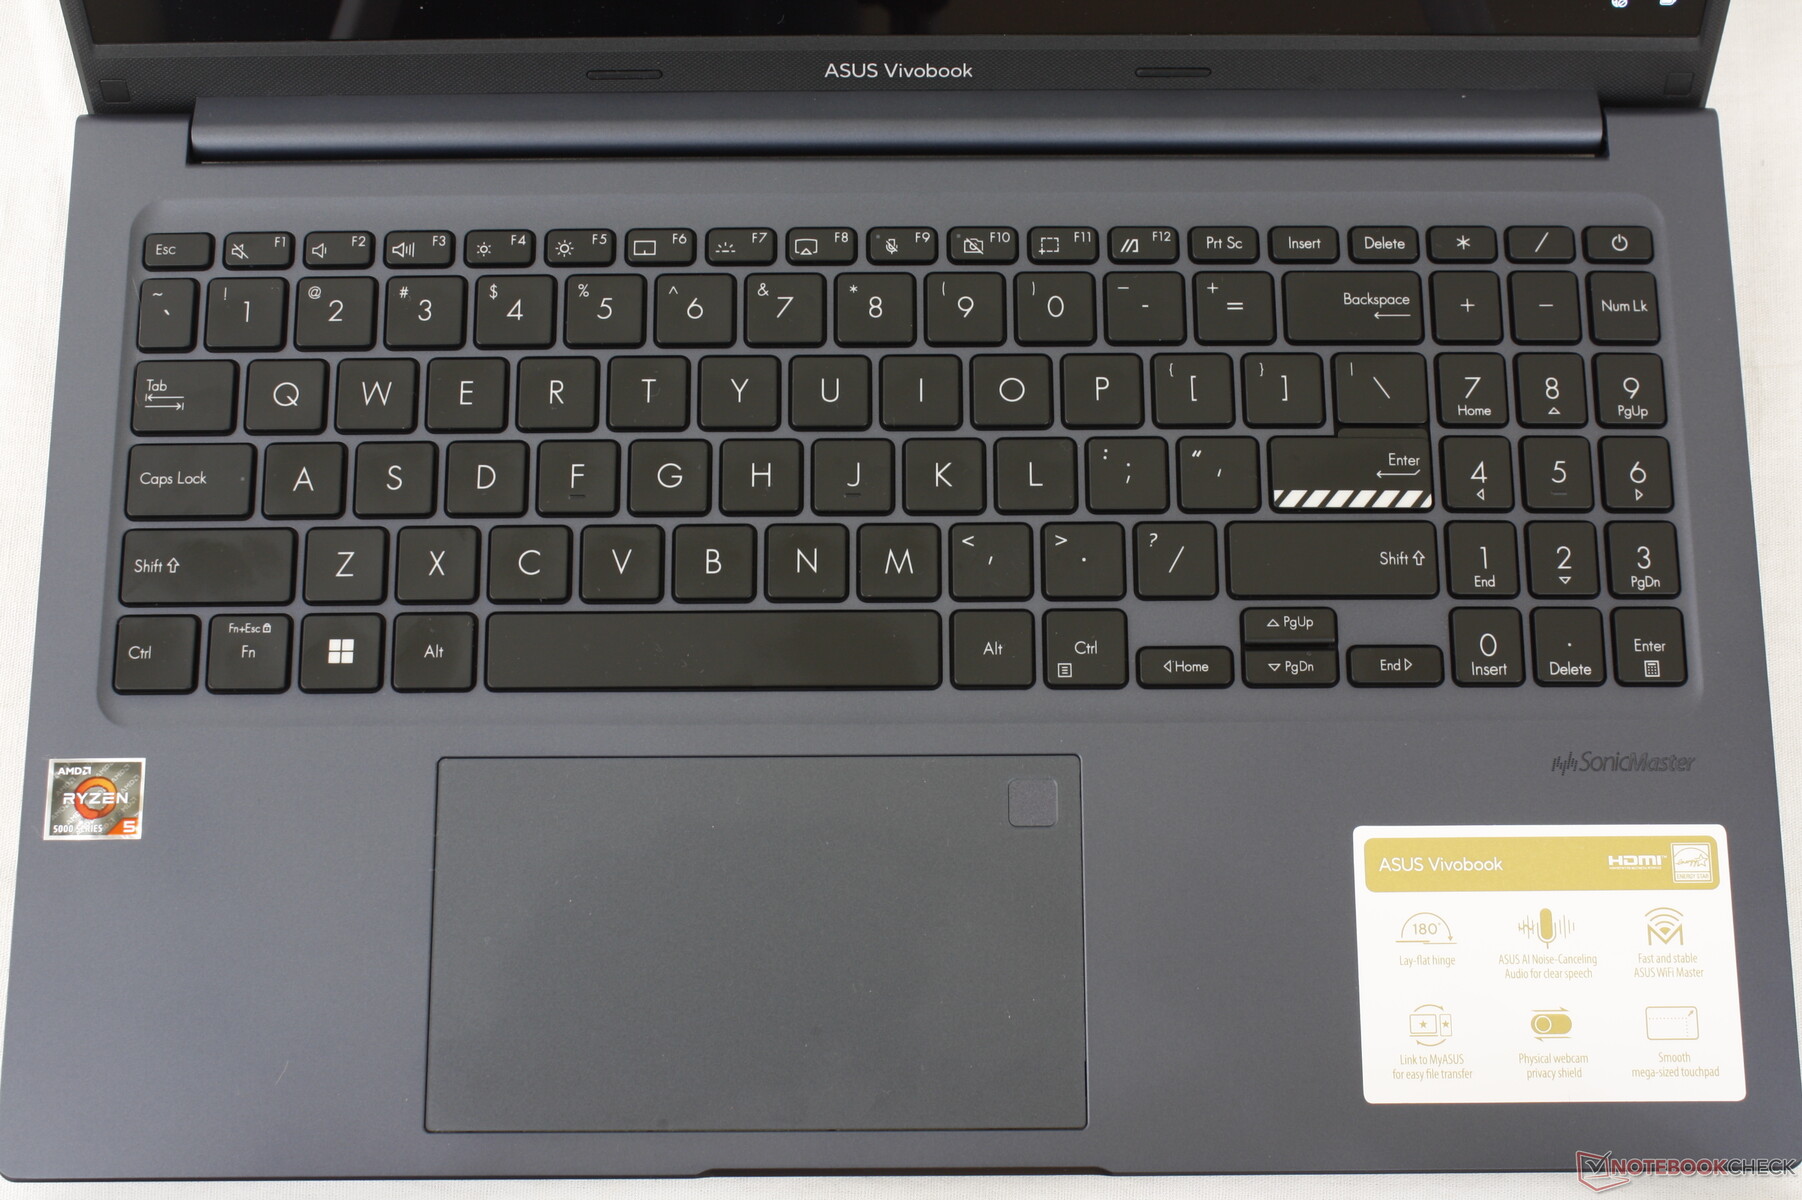
输入设备--点击率很高,而且大多很舒适
键盘
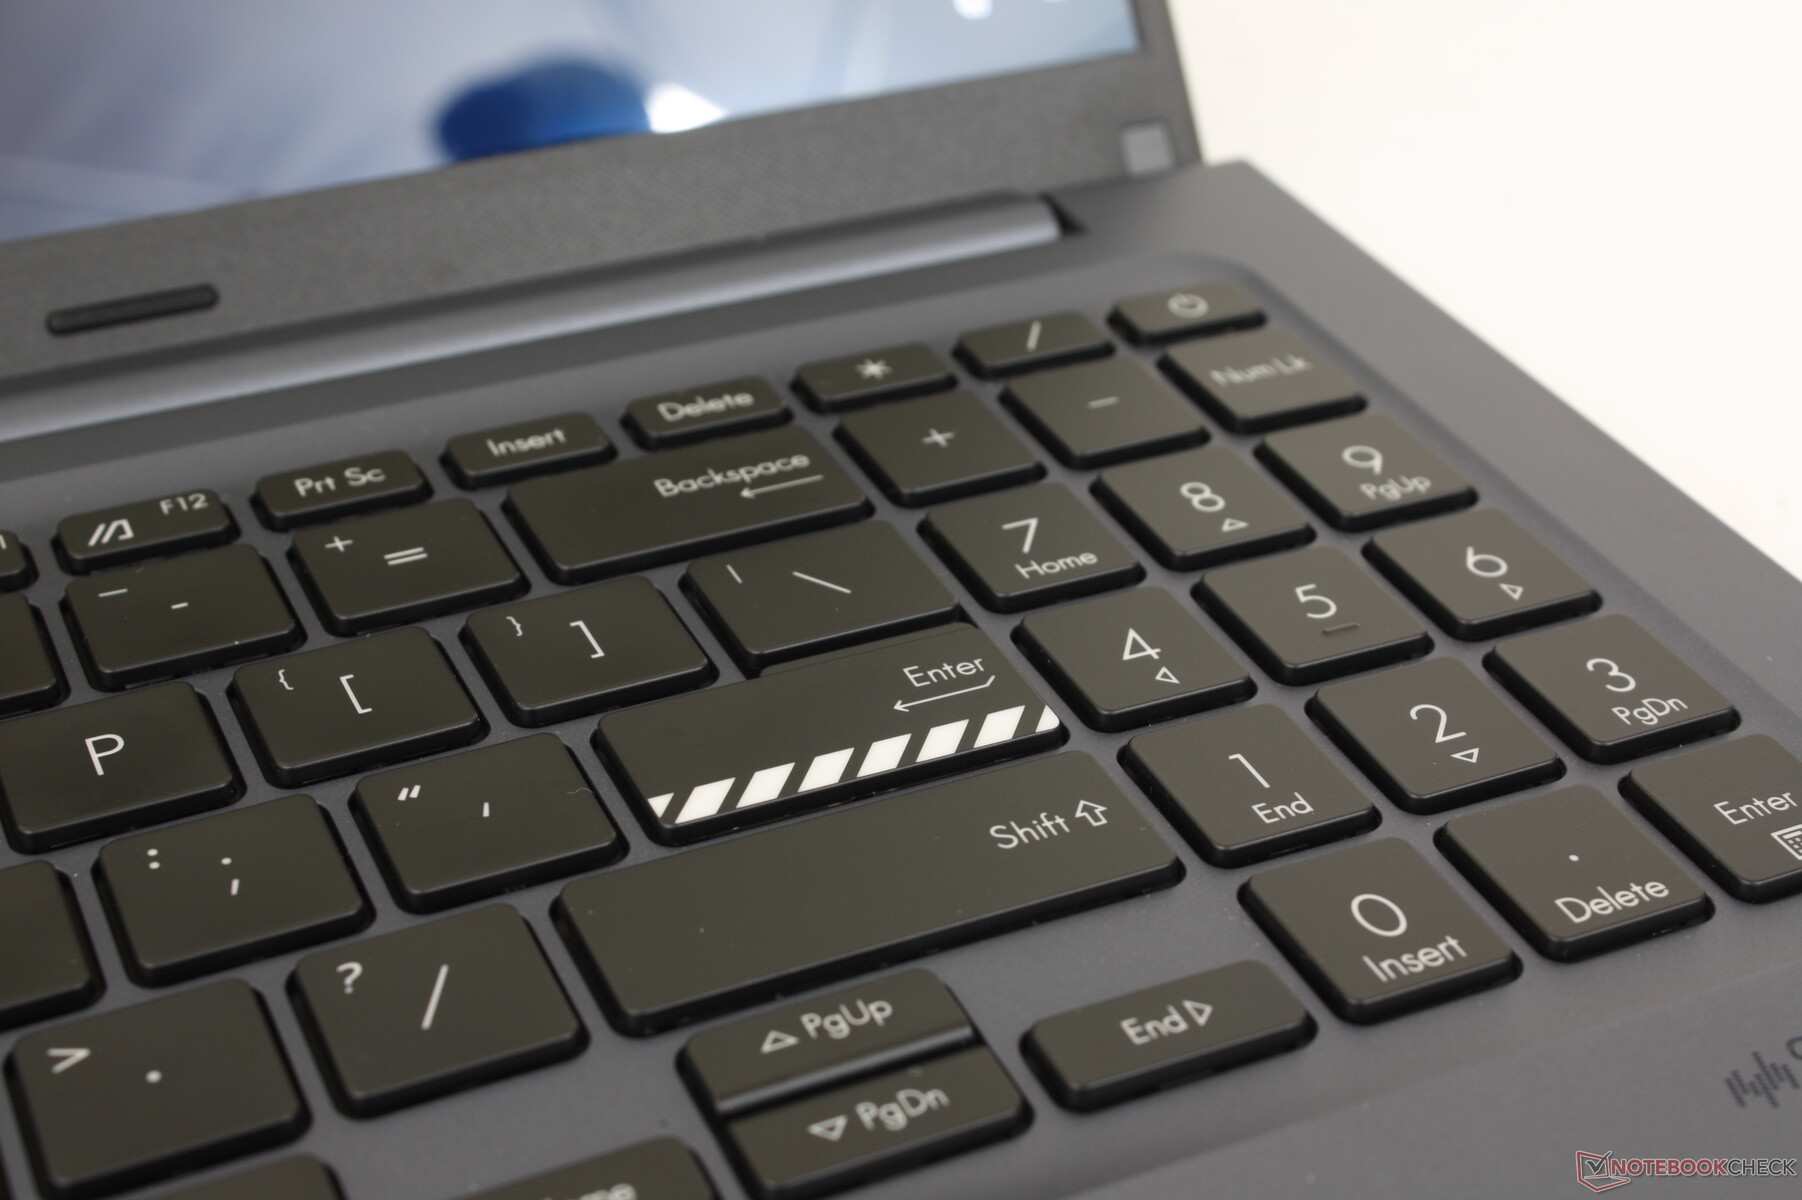
考虑到价格合理的范围,键盘反馈是坚定的,比预期的更清晰。例如,空格键和回车键并不像在联想IdeaPad 3系列上那样松软。 联想IdeaPad 3系列.不幸的是,箭头或小键盘也是如此,它们比主要的QWERTY键更小、更软。
与大多数其他超极本相比,按键的咔哒声略大且音调较高,可能是由于尖锐的反馈。它的声音不大,不至于让人感到困扰,但还是值得一提的。
触摸板
点击板比2021年VivoBook 15上的点击板大(13 x 7.5厘米对10.5 x 7.3厘米),更容易控制光标和多点触摸输入。滑动很顺畅,在较慢的速度下有一点粘性,可以更准确地拖动和删除。不幸的是,点击时的反馈比我们所希望的要浅,而且更有弹性,所以你肯定会希望有一个鼠标来进行长时间的操作。

显示屏 - 仅限OLED

华硕提供了两种分辨率的选择,都是光面OLED和潘通验证的。
- 1920 x 1080, 100% DCI-P3, HDR600, 60 Hz
- 2880 x 1620, 100% DCI-P3, HDR600, 120 Hz
我们的测试装置配备了上面的粗体选项。事实上,华硕为VivoBook 15X和标准的VivoBook 15采用了相同的三星ATNA56YX03-0 OLED面板,这意味着这两款机型提供了类似的观看体验。
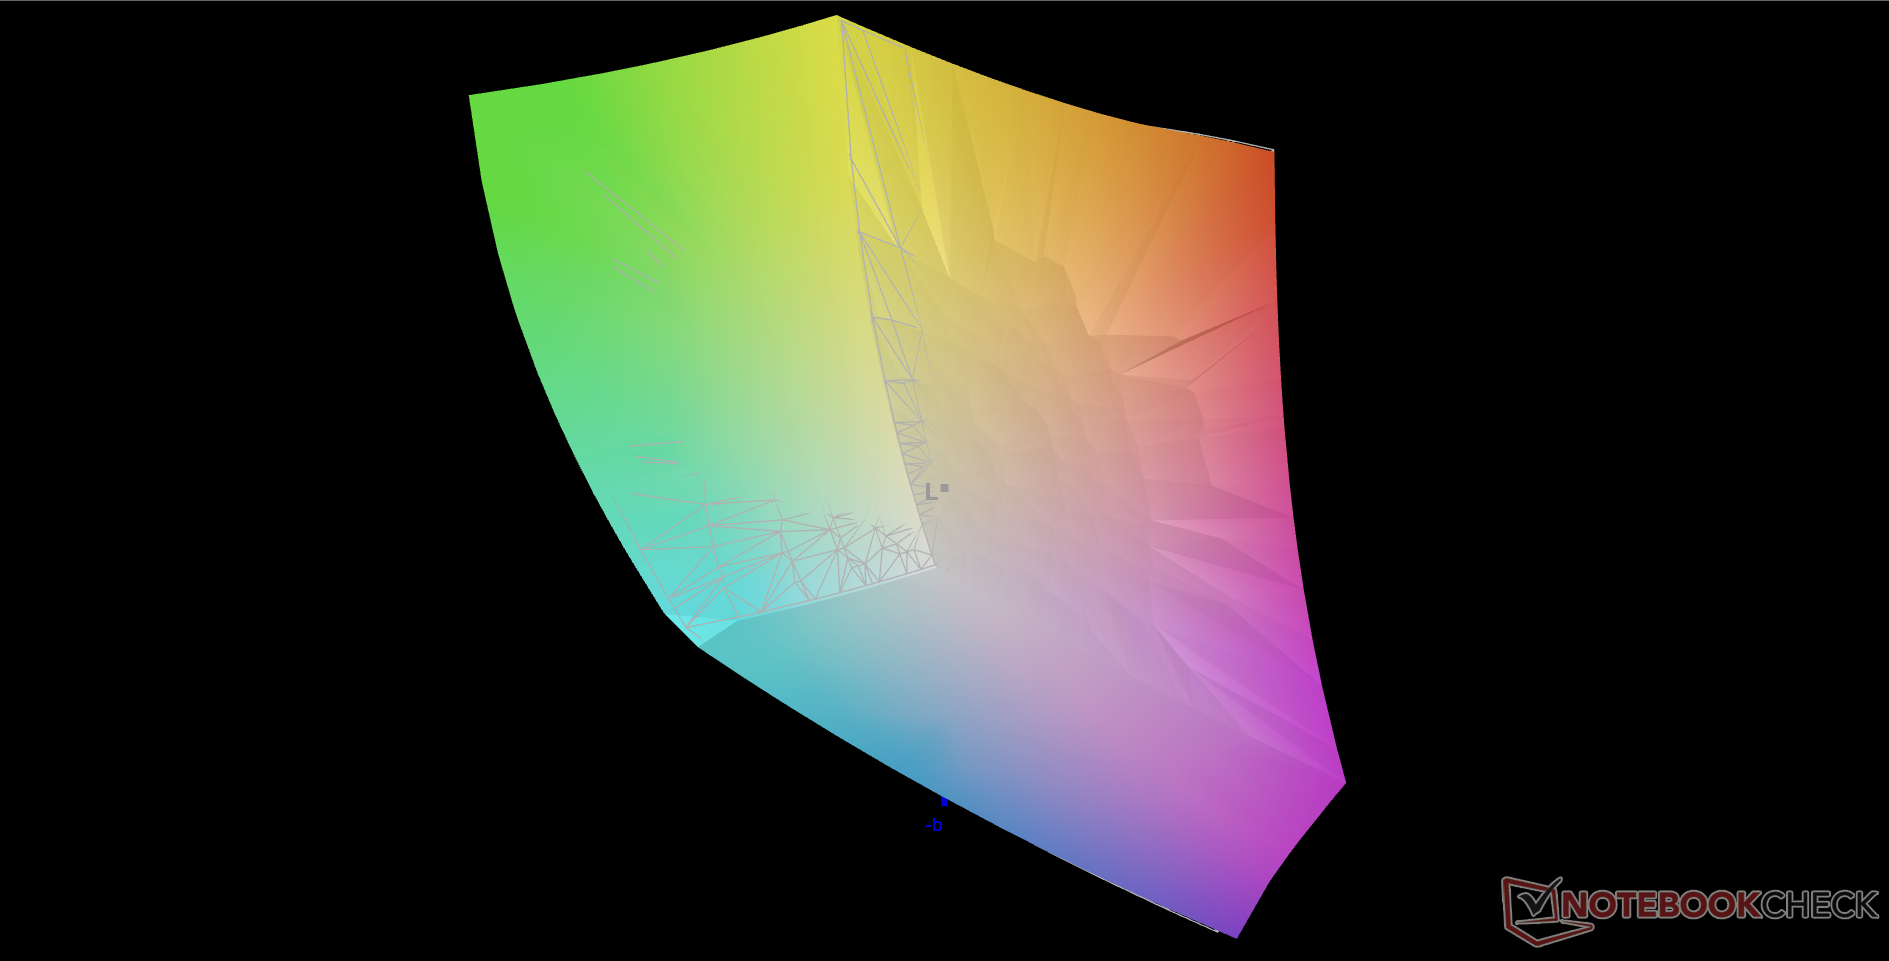
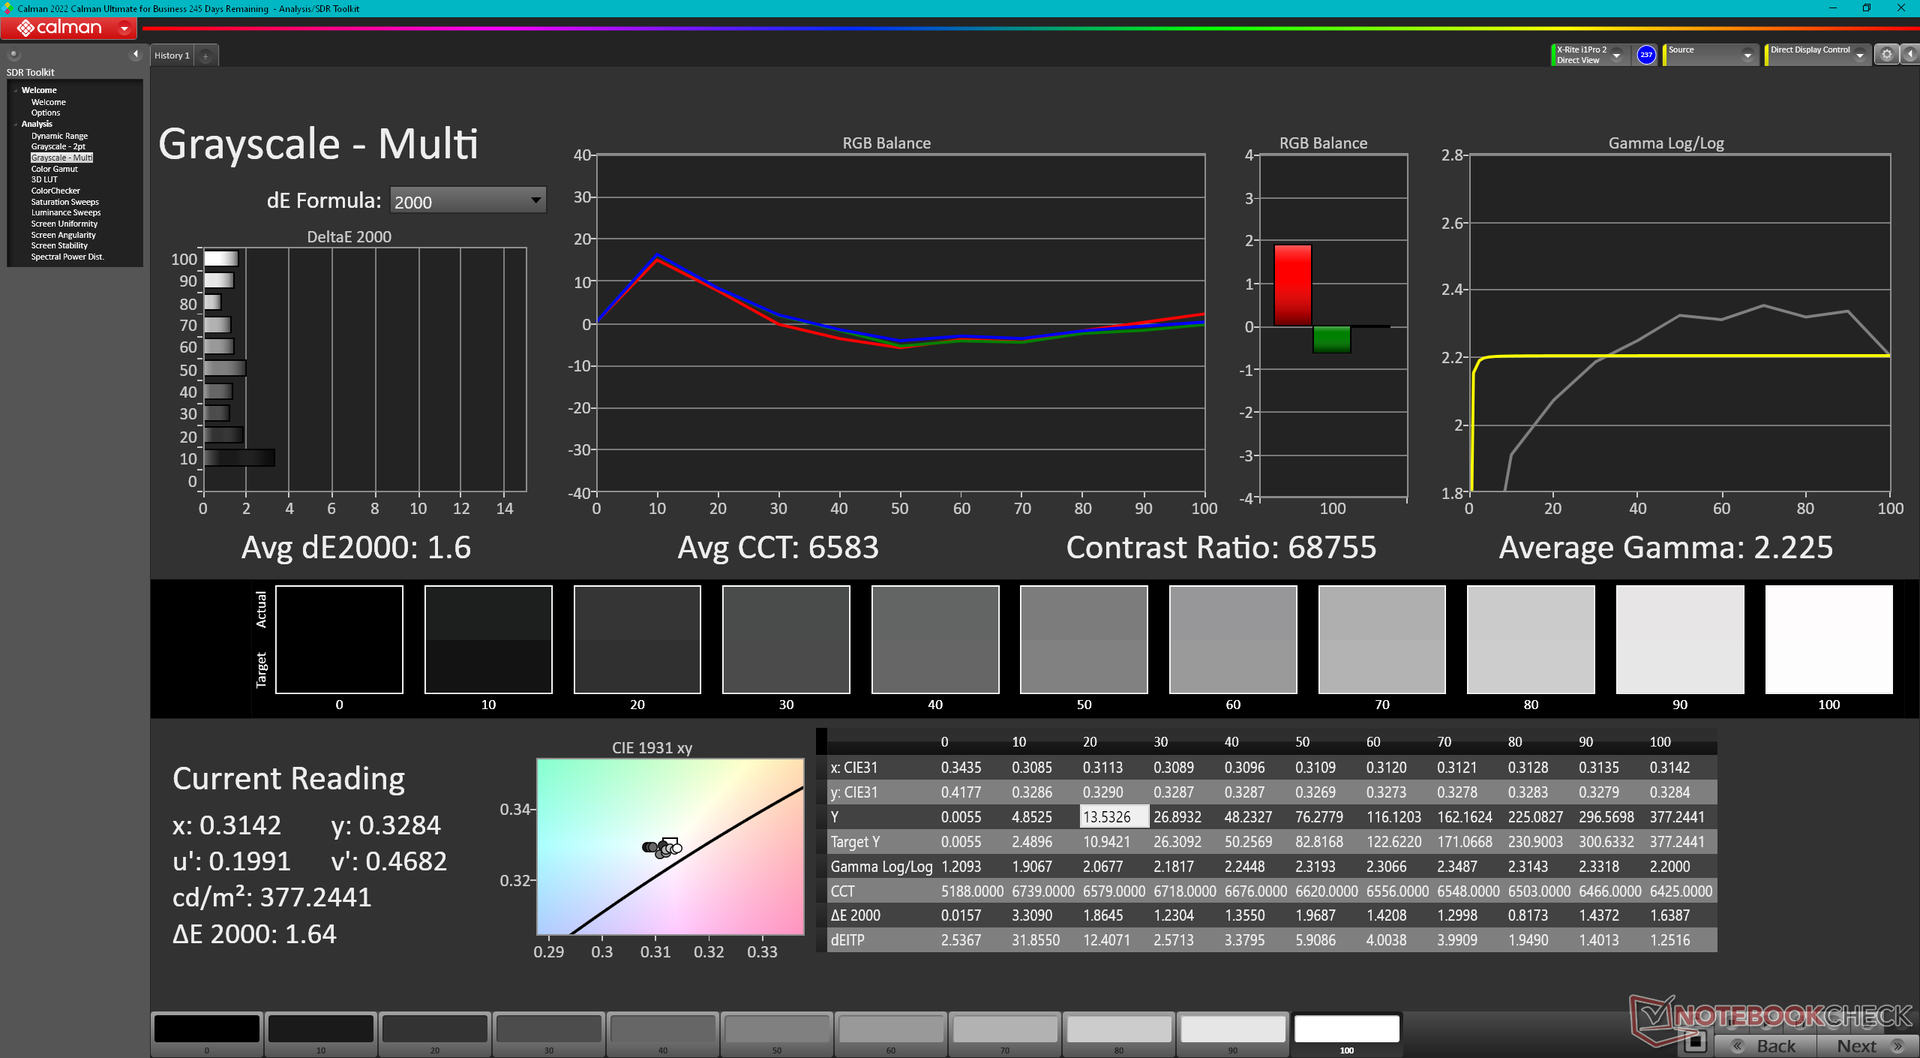
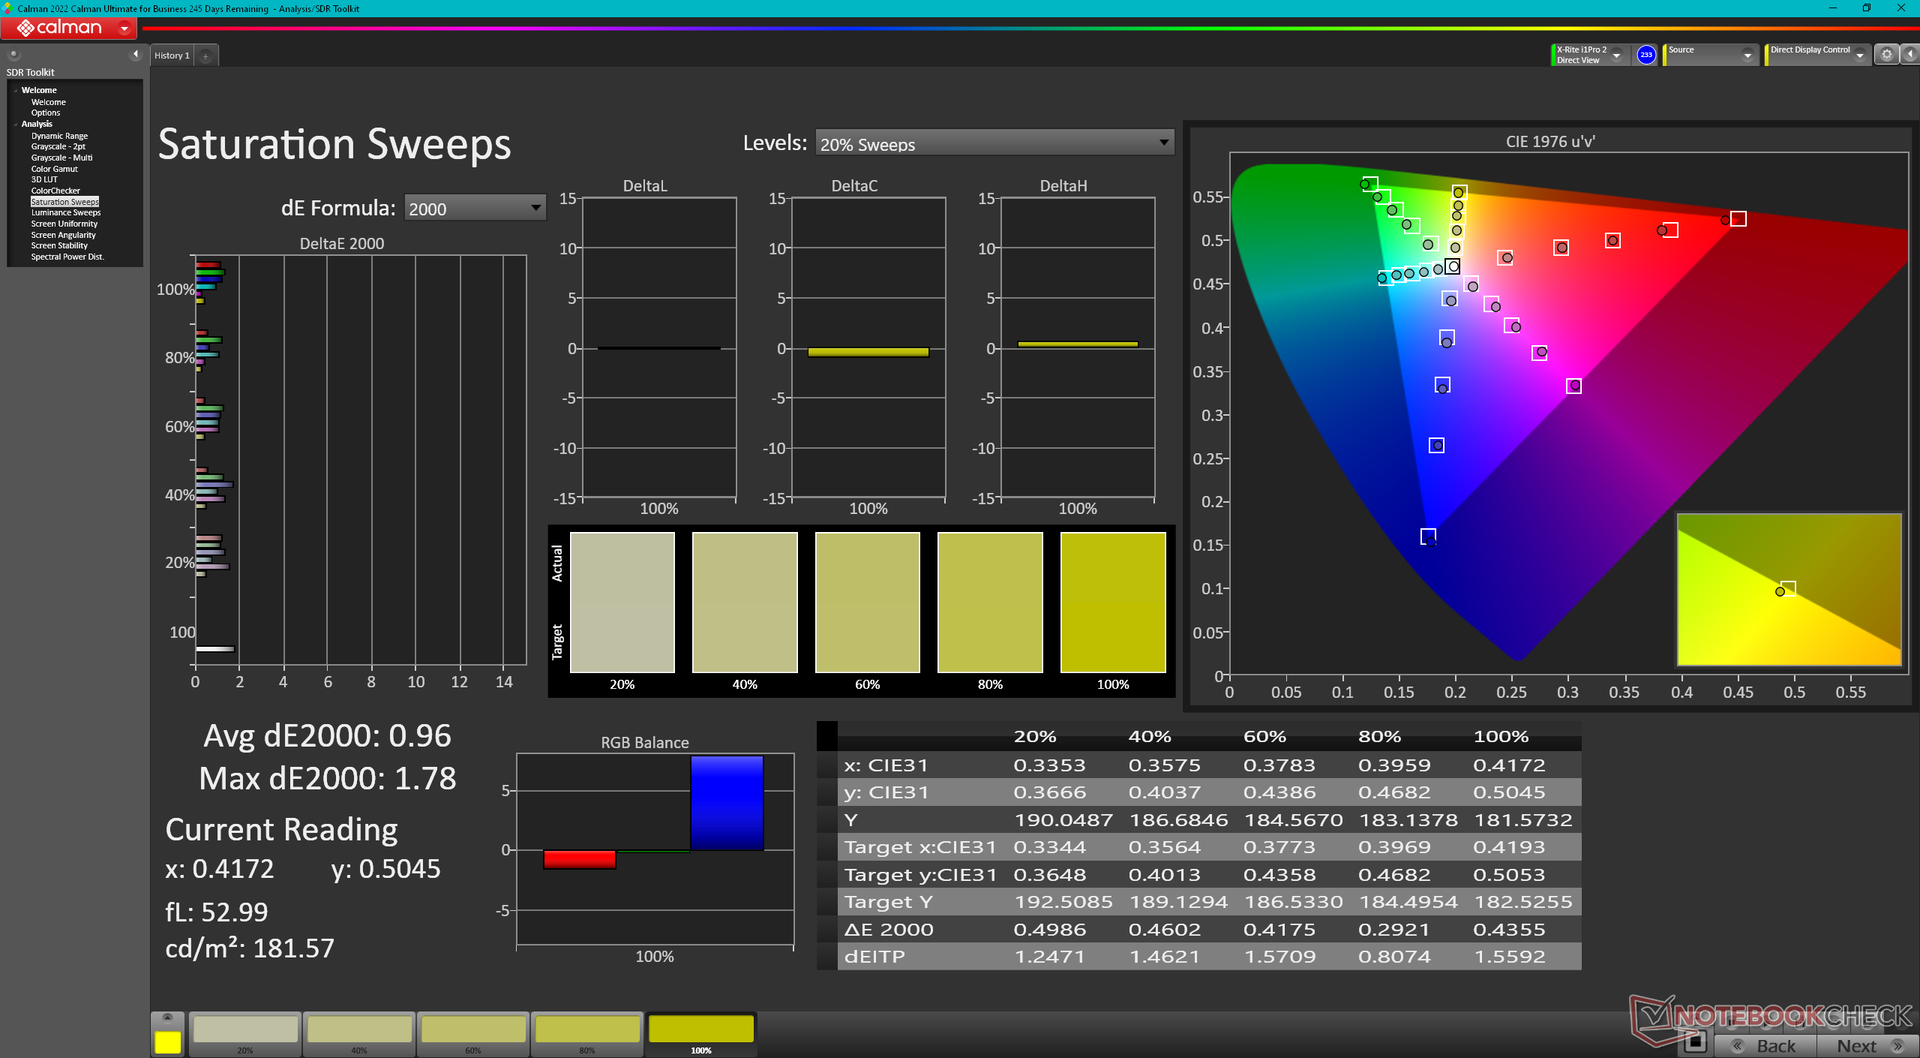
我们能够确认DCI-P3的全面覆盖,而600尼特的最大值只有在播放HDR内容时才能实现,比如这个HDR测试视频.否则,对于所有其他内容,显示器的最大亮度峰值仅为380尼特。

| |||||||||||||||||||||||||
Brightness Distribution: 98 %
Center on Battery: 379 cd/m²
Contrast: ∞:1 (Black: 0 cd/m²)
ΔE ColorChecker Calman: 1.13 | ∀{0.5-29.43 Ø4.71}
ΔE Greyscale Calman: 1.6 | ∀{0.09-98 Ø4.96}
89.7% AdobeRGB 1998 (Argyll 3D)
99.9% sRGB (Argyll 3D)
99.6% Display P3 (Argyll 3D)
Gamma: 2.23
CCT: 6583 K
| Asus VivoBook 15 X M1503QA Samsung ATNA56YX03-0, OLED, 1920x1080, 15.6" | Asus Vivobook 15 K513EQ Samsung ATNA56YX03-0, OLED, 1920x1080, 15.6" | Asus VivoBook S15 D533UA Chi Mei N156HCA-EAB, IPS, 1920x1080, 15.6" | Asus ZenBook UX535-M01440 BOE0866, IPS, 3840x2160, 15.6" | Lenovo ThinkBook 15 G3 ACL 21A400B2GE Chi Mei N156HCA-EAC, IPS, 1920x1080, 15.6" | Dell Inspiron 15 3501 BOE NV15N3D (Dell P/N: N39X1), IPS, 1920x1080, 15.6" | |
|---|---|---|---|---|---|---|
| Display | 4% | -47% | -18% | -46% | -52% | |
| Display P3 Coverage (%) | 99.6 | 99.9 0% | 43.6 -56% | 68.8 -31% | 43.8 -56% | 39.4 -60% |
| sRGB Coverage (%) | 99.9 | 100 0% | 65.2 -35% | 99.5 0% | 65.5 -34% | 58.7 -41% |
| AdobeRGB 1998 Coverage (%) | 89.7 | 99.9 11% | 45 -50% | 70.1 -22% | 45.4 -49% | 40.7 -55% |
| Response Times | -27% | -832% | -1390% | -1211% | -1822% | |
| Response Time Grey 50% / Grey 80% * (ms) | 1.8 ? | 2.2 ? -22% | 18 ? -900% | 34 ? -1789% | 30 ? -1567% | 43 ? -2289% |
| Response Time Black / White * (ms) | 2.2 ? | 2.9 ? -32% | 19 ? -764% | 24 ? -991% | 21 ? -855% | 32 ? -1355% |
| PWM Frequency (Hz) | 59.52 | 59.5 ? | 1000 ? | |||
| Screen | -36% | -91% | -34% | -95% | -104% | |
| Brightness middle (cd/m²) | 379 | 384.5 1% | 289 -24% | 402 6% | 291 -23% | 271 -28% |
| Brightness (cd/m²) | 379 | 388 2% | 267 -30% | 375 -1% | 271 -28% | 263 -31% |
| Brightness Distribution (%) | 98 | 98 0% | 85 -13% | 84 -14% | 86 -12% | 92 -6% |
| Black Level * (cd/m²) | 0.56 | 0.35 | 0.375 | 0.15 | ||
| Colorchecker dE 2000 * | 1.13 | 2.53 -124% | 3.96 -250% | 2.47 -119% | 4.17 -269% | 4.83 -327% |
| Colorchecker dE 2000 max. * | 3.15 | 6.16 -96% | 6.76 -115% | 4.32 -37% | 7.18 -128% | 7 -122% |
| Greyscale dE 2000 * | 1.6 | 1.6 -0% | 3.43 -114% | 2.26 -41% | 3.31 -107% | 3.36 -110% |
| Gamma | 2.23 99% | 2.24 98% | 2.28 96% | 2.49 88% | 2.23 99% | 2.56 86% |
| CCT | 6583 99% | 6464 101% | 7191 90% | 6285 103% | 6457 101% | 6764 96% |
| Contrast (:1) | 516 | 1149 | 776 | 1807 | ||
| Color Space (Percent of AdobeRGB 1998) (%) | 42 | 99 | ||||
| Color Space (Percent of sRGB) (%) | 65 | |||||
| Colorchecker dE 2000 calibrated * | 2.36 | |||||
| Total Average (Program / Settings) | -20% /
-24% | -323% /
-214% | -481% /
-276% | -451% /
-284% | -659% /
-402% |
* ... smaller is better

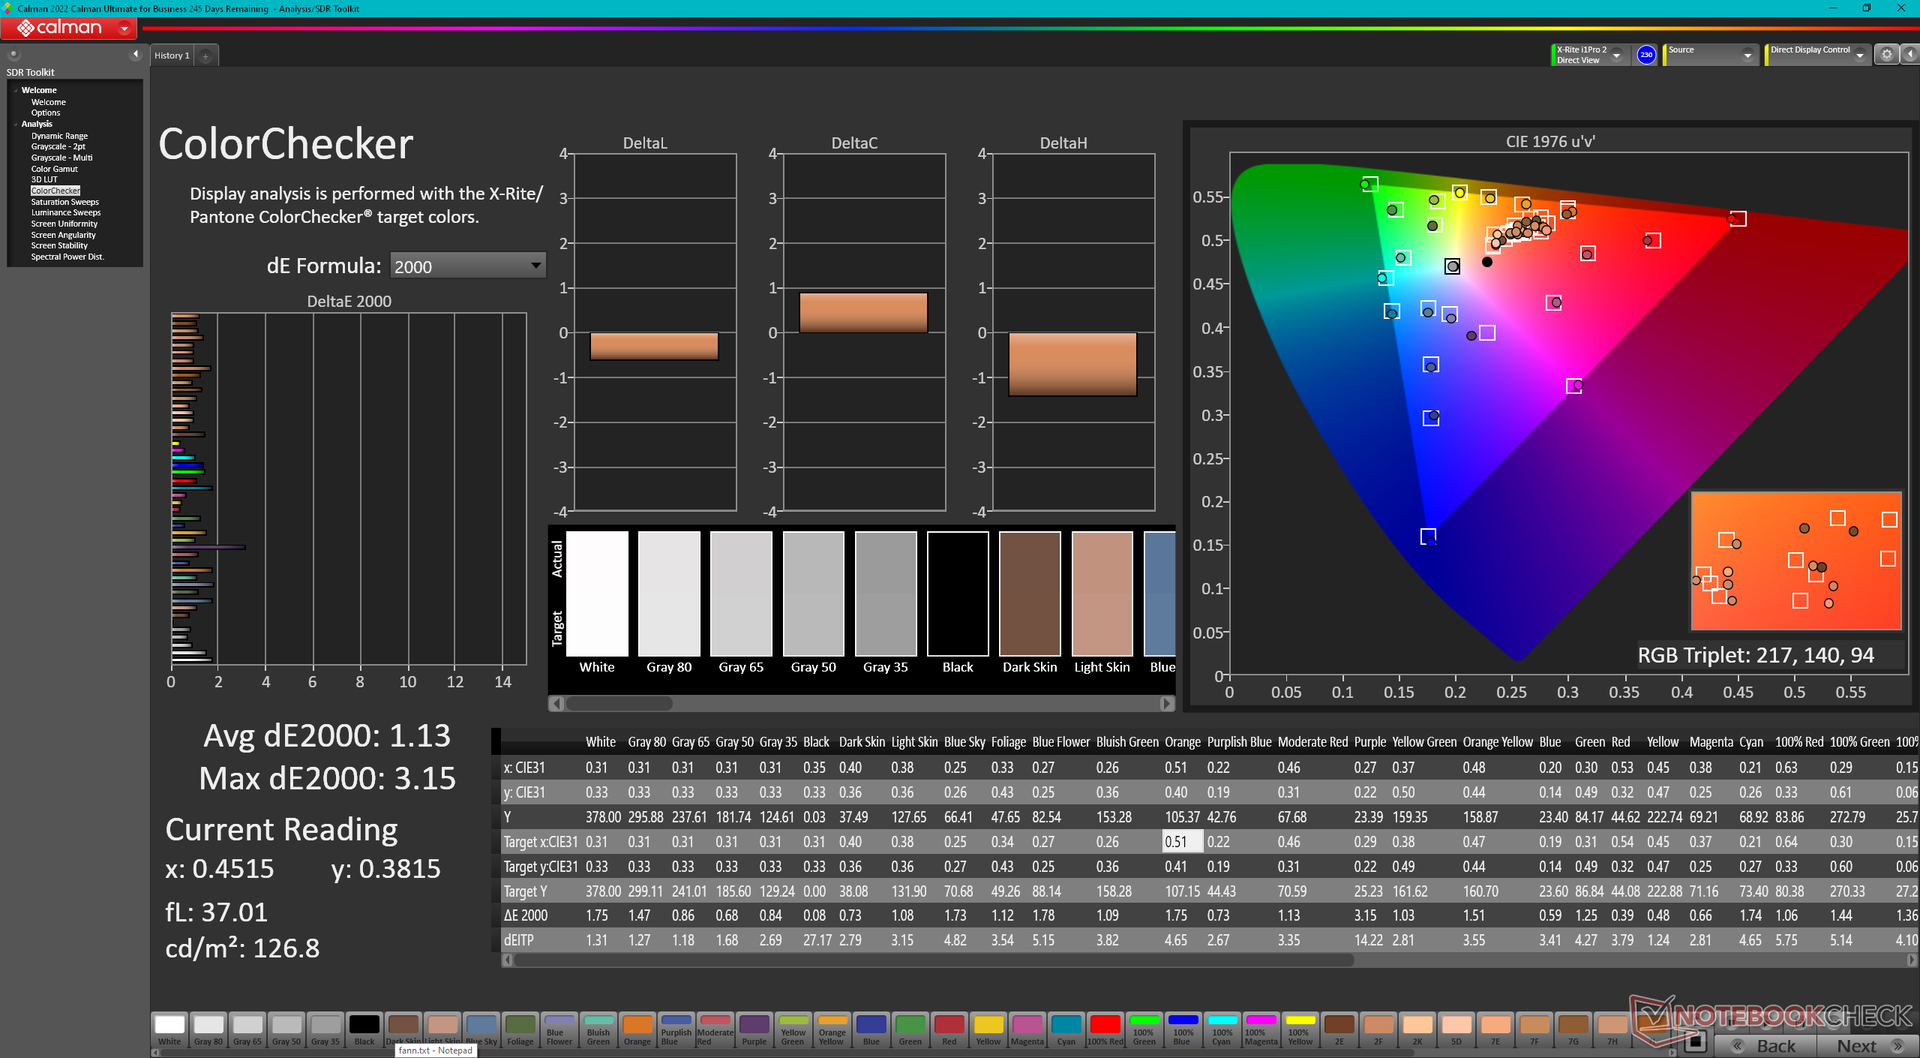
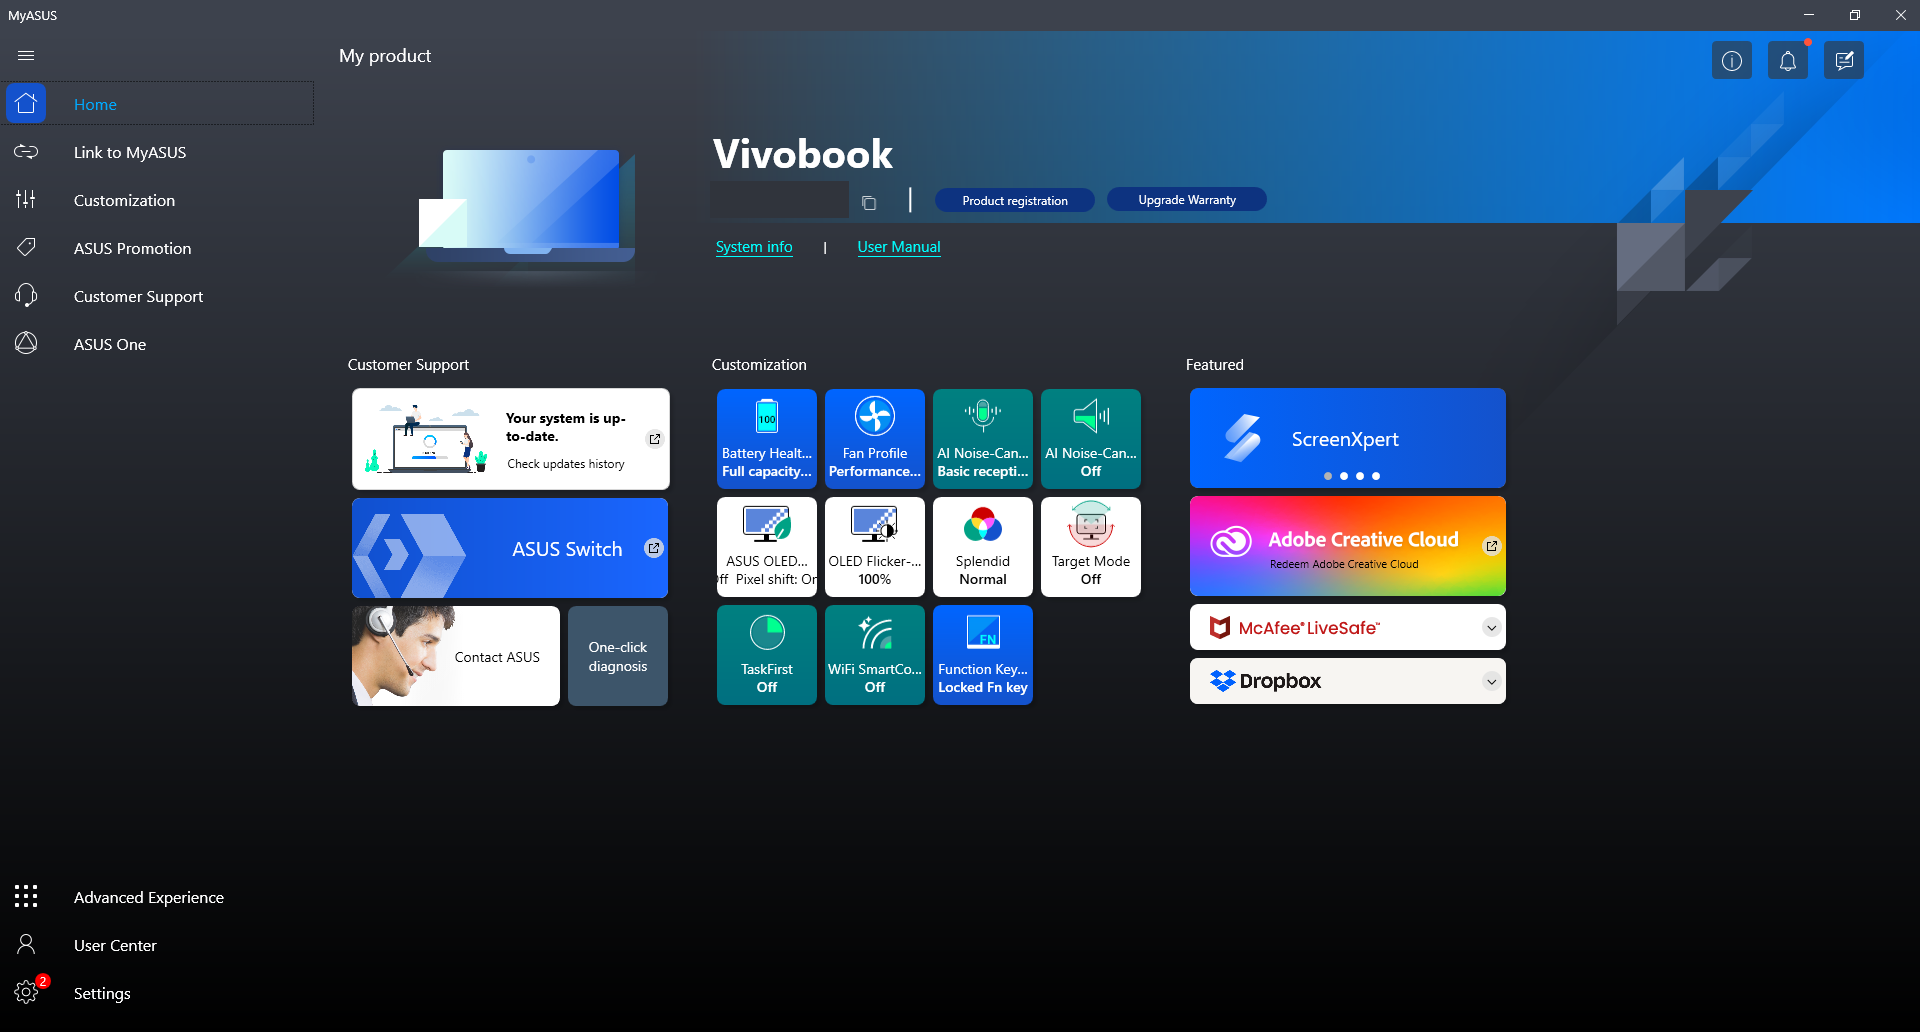
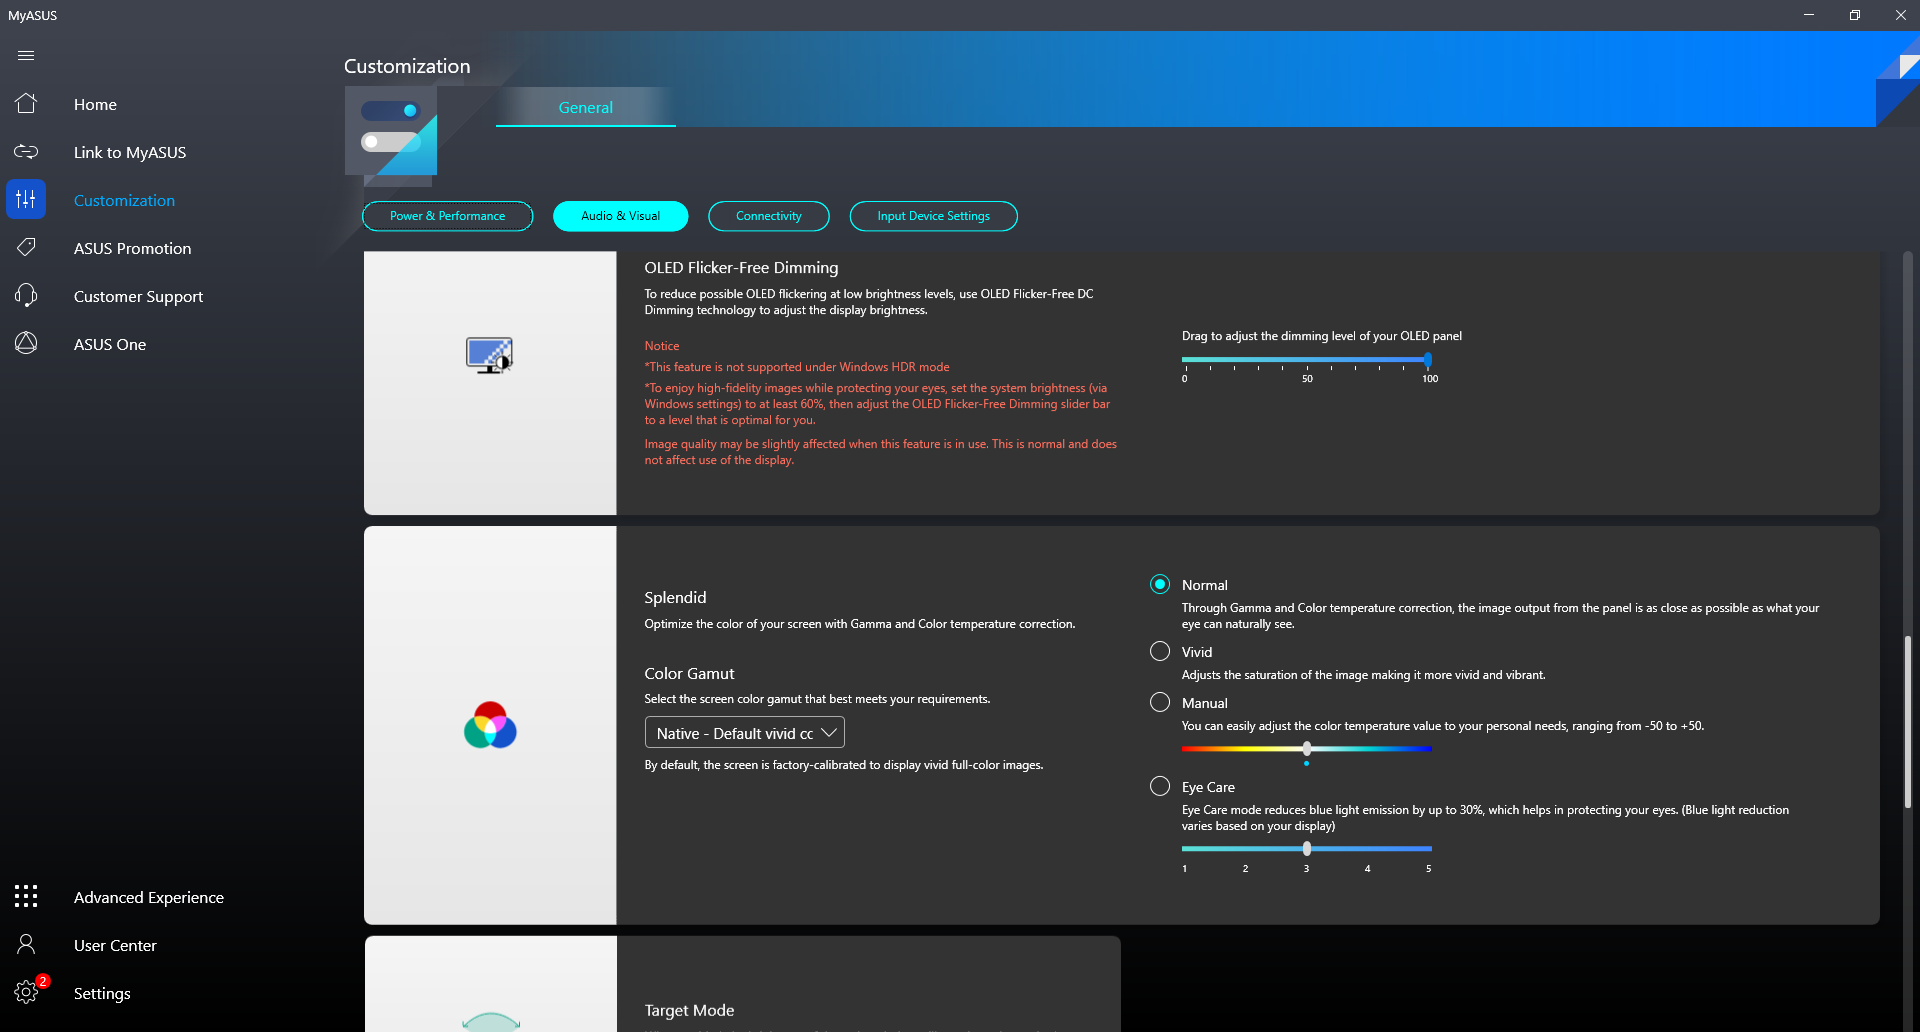
我们可以用我们的X-Rite色度计确认,颜色已经按照制造商的宣传进行了开箱校准。平均灰度和色彩deltaE值分别只有1.6和1.13,这意味着任何终端用户的校准对改善显示效果的作用都不大。然而,用预装的MyAsus软件在色彩配置文件之间进行切换可能会有一点问题,因为任何变化都与内置的Windows色彩配置文件不相关。
Display Response Times
| ↔ Response Time Black to White | ||
|---|---|---|
| 2.2 ms ... rise ↗ and fall ↘ combined | ↗ 0.96 ms rise | 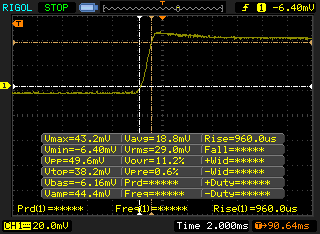 |
| ↘ 1.2 ms fall | ||
| The screen shows very fast response rates in our tests and should be very well suited for fast-paced gaming. In comparison, all tested devices range from 0.1 (minimum) to 240 (maximum) ms. » 12 % of all devices are better. This means that the measured response time is better than the average of all tested devices (19.8 ms). | ||
| ↔ Response Time 50% Grey to 80% Grey | ||
| 1.8 ms ... rise ↗ and fall ↘ combined | ↗ 0.92 ms rise | 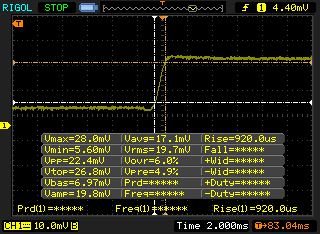 |
| ↘ 0.88 ms fall | ||
| The screen shows very fast response rates in our tests and should be very well suited for fast-paced gaming. In comparison, all tested devices range from 0.165 (minimum) to 636 (maximum) ms. » 9 % of all devices are better. This means that the measured response time is better than the average of all tested devices (30.9 ms). | ||
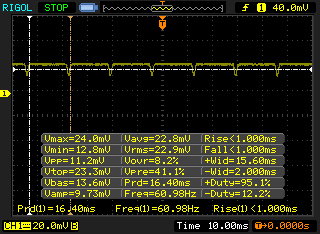
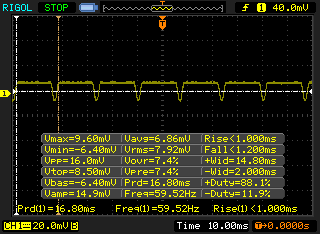
Screen Flickering / PWM (Pulse-Width Modulation)
| Screen flickering / PWM detected | 59.52 Hz | 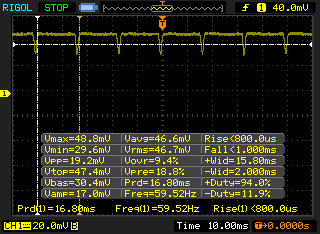 | |
The display backlight flickers at 59.52 Hz (worst case, e.g., utilizing PWM) . The frequency of 59.52 Hz is very low, so the flickering may cause eyestrain and headaches after extended use. In comparison: 52 % of all tested devices do not use PWM to dim the display. If PWM was detected, an average of 7748 (minimum: 5 - maximum: 343500) Hz was measured. | |||
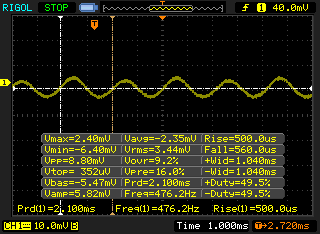
脉宽调制存在于所有亮度水平上,与大多数其他笔记本电脑用OLED面板一样。我们能够记录到从51%到100%亮度的50赫兹的频率,以及从0到49%亮度的476赫兹。

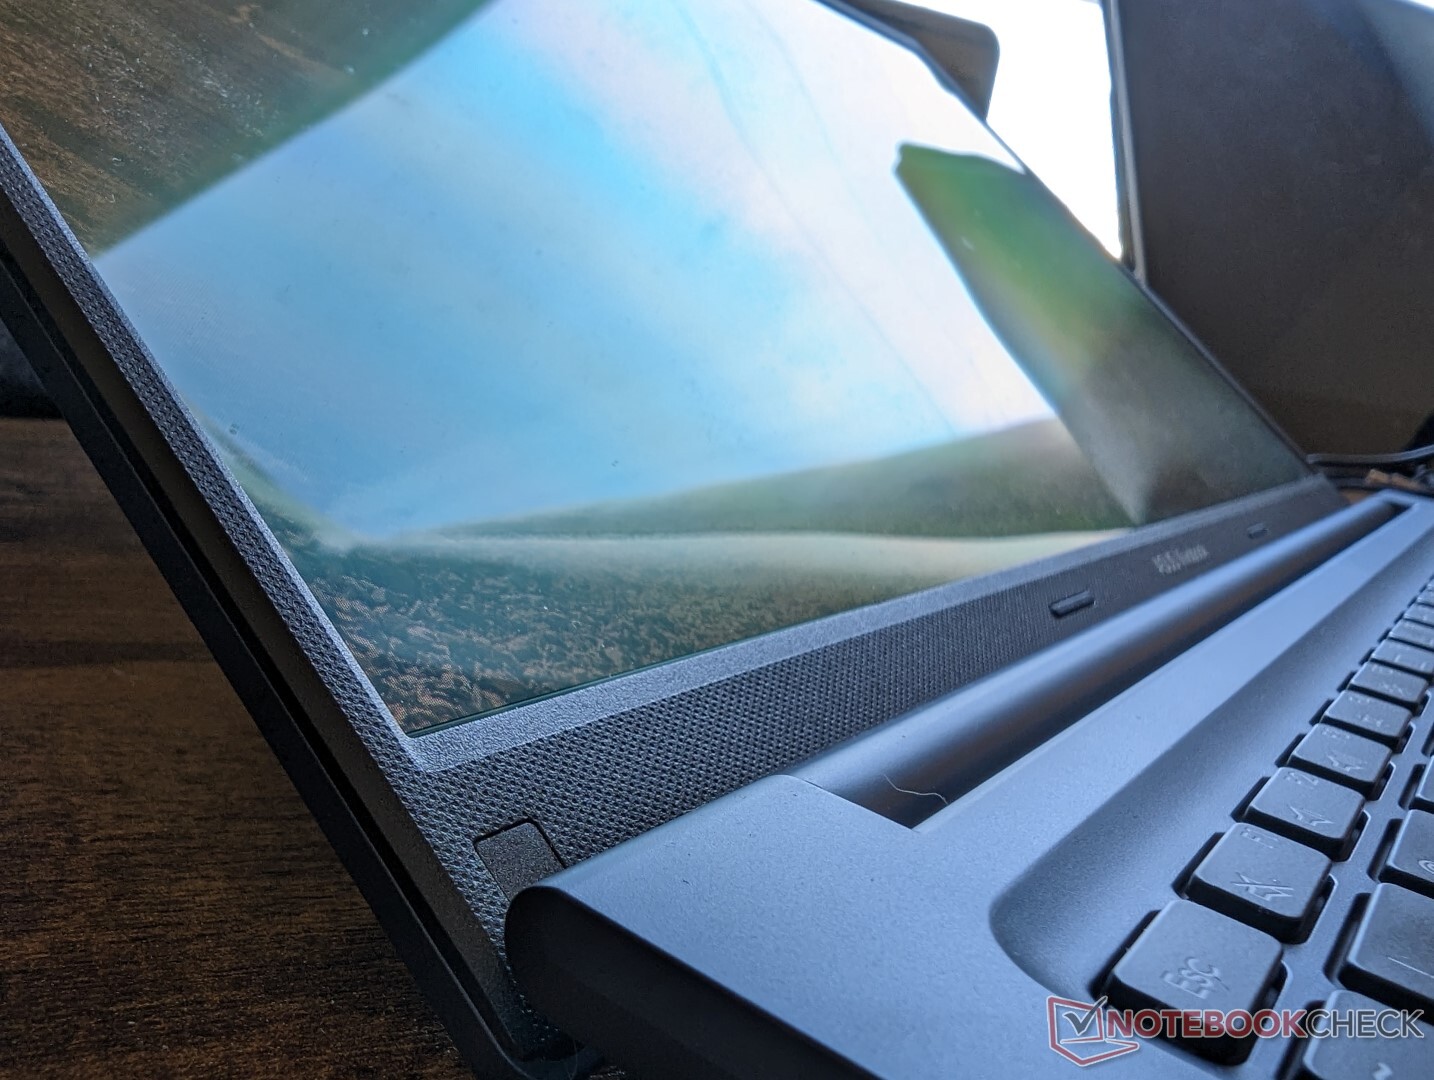
户外能见度是一个混合的袋子。虽然OLED在户外条件下往往比IPS表现更好,但Vivobook的面板根本不够亮,无法克服光面覆盖层上的眩光。此外,眩光将屏幕洗成蓝色,影响了可见度和色彩,如下图所示。
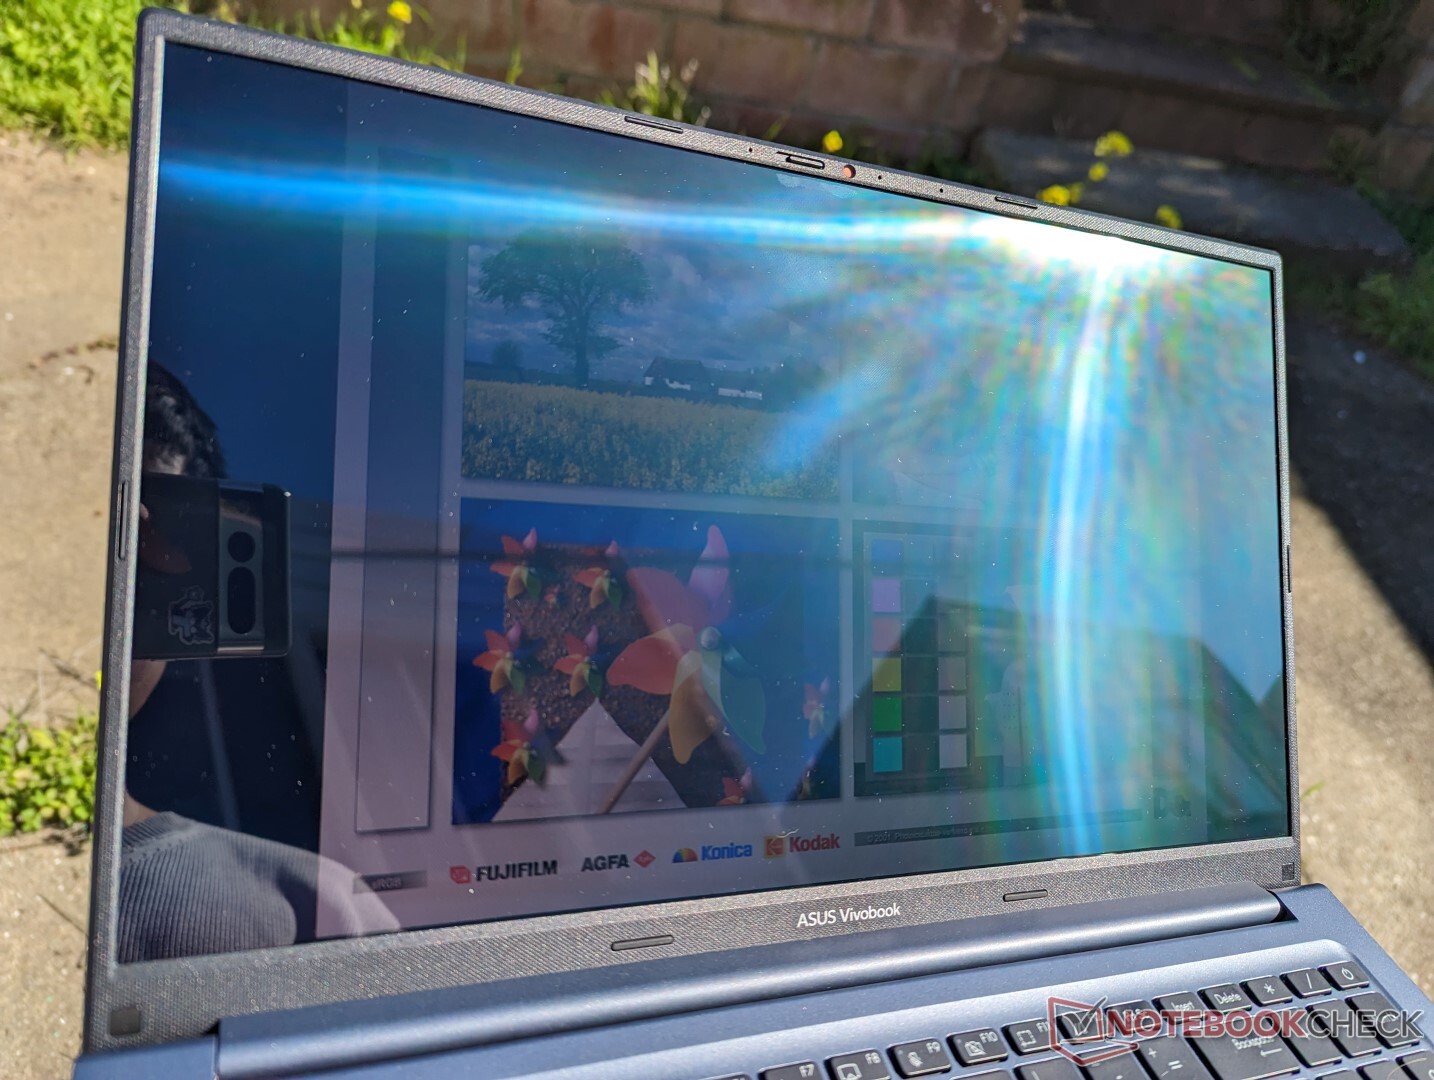

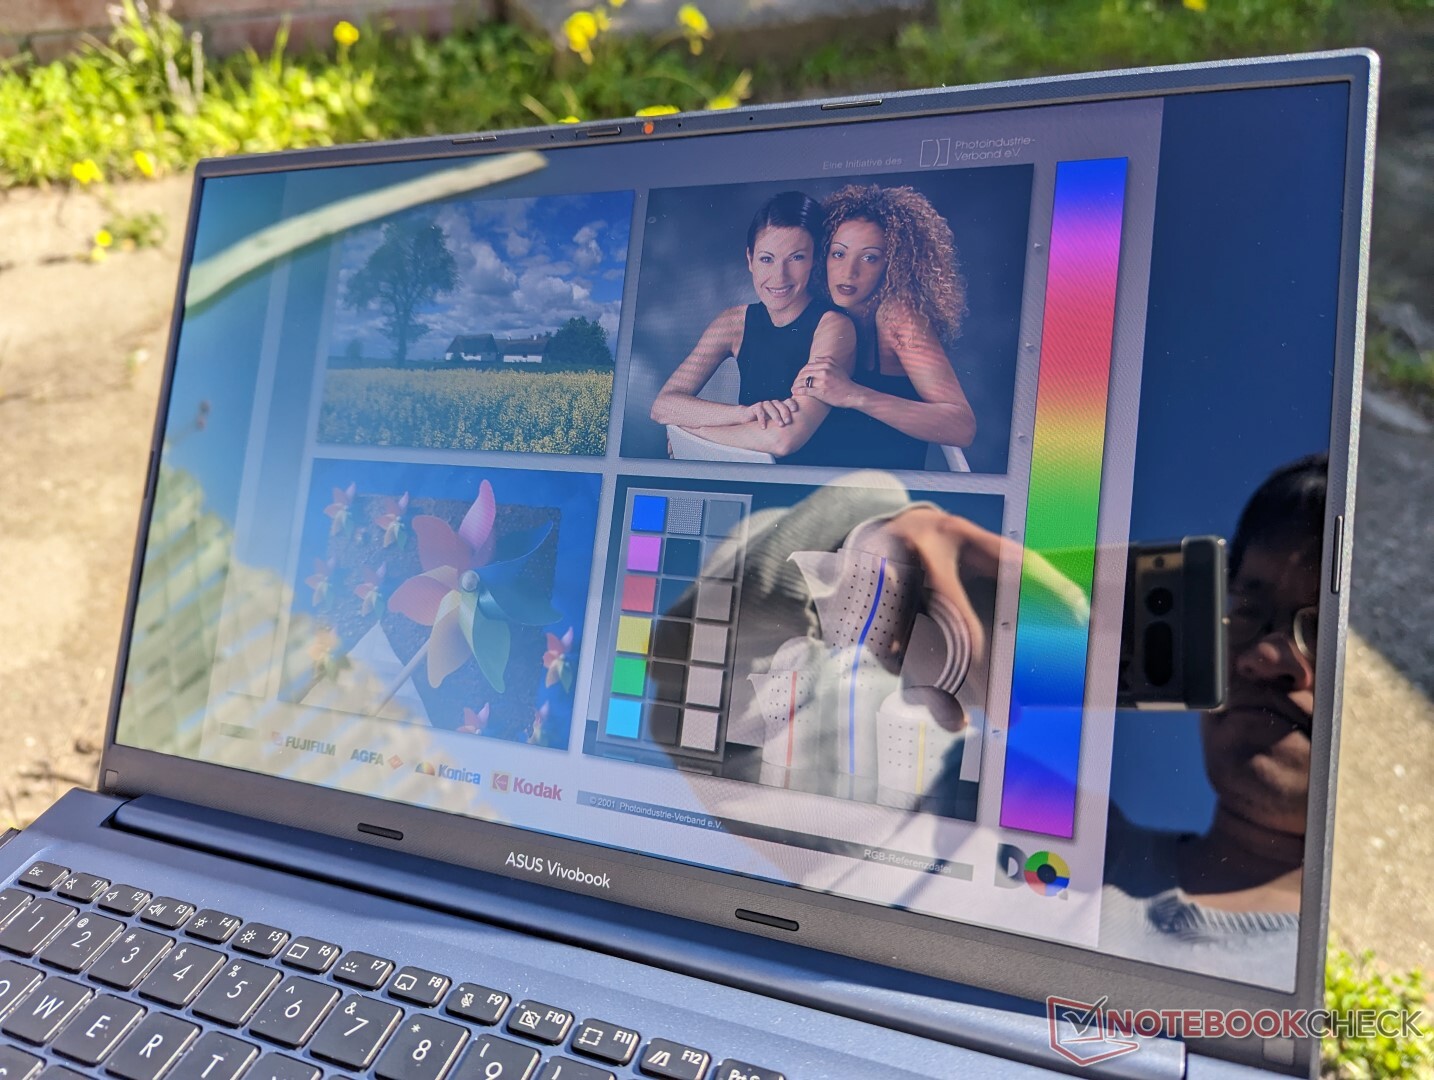
与任何OLED面板一样,可视角度都很好。与IPS不同的是,OLED面板在广角下表现出一种蓝色的彩虹效果,而IPS面板的颜色会变得更灰暗。

性能 - Ryzen H系列处理器
测试条件
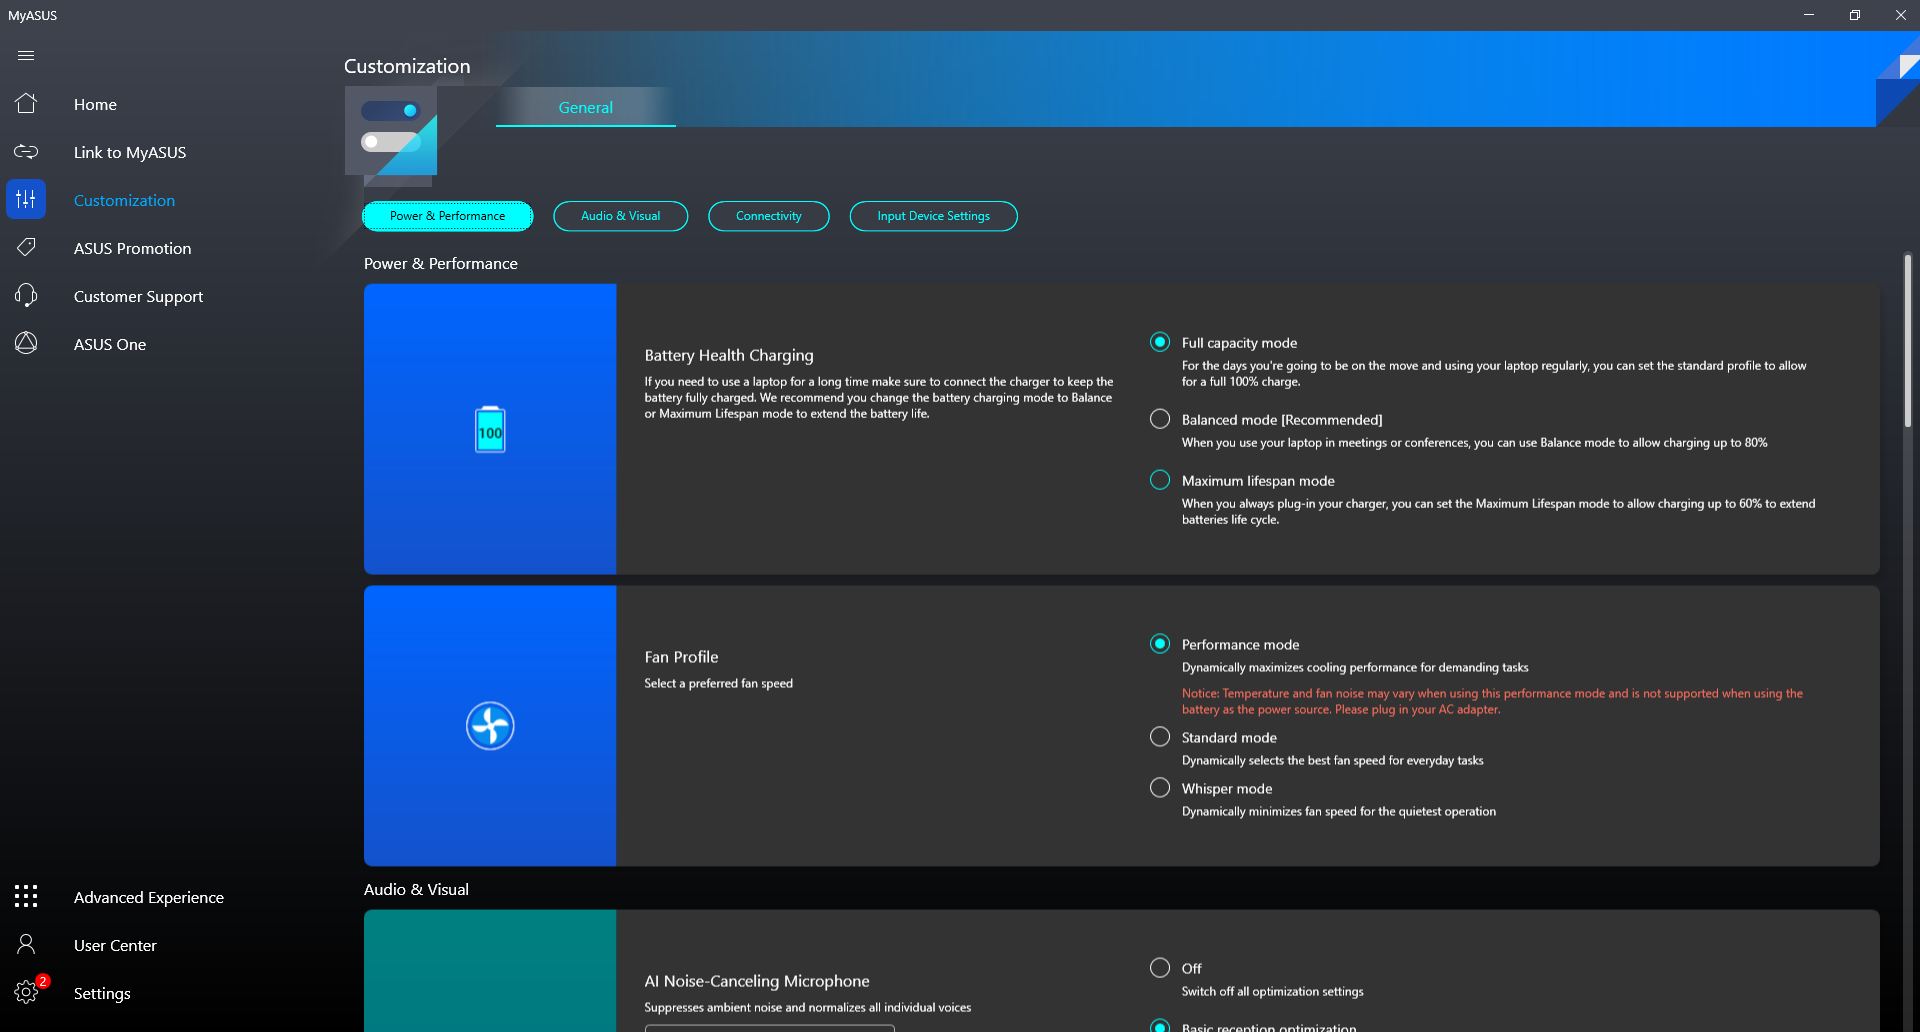
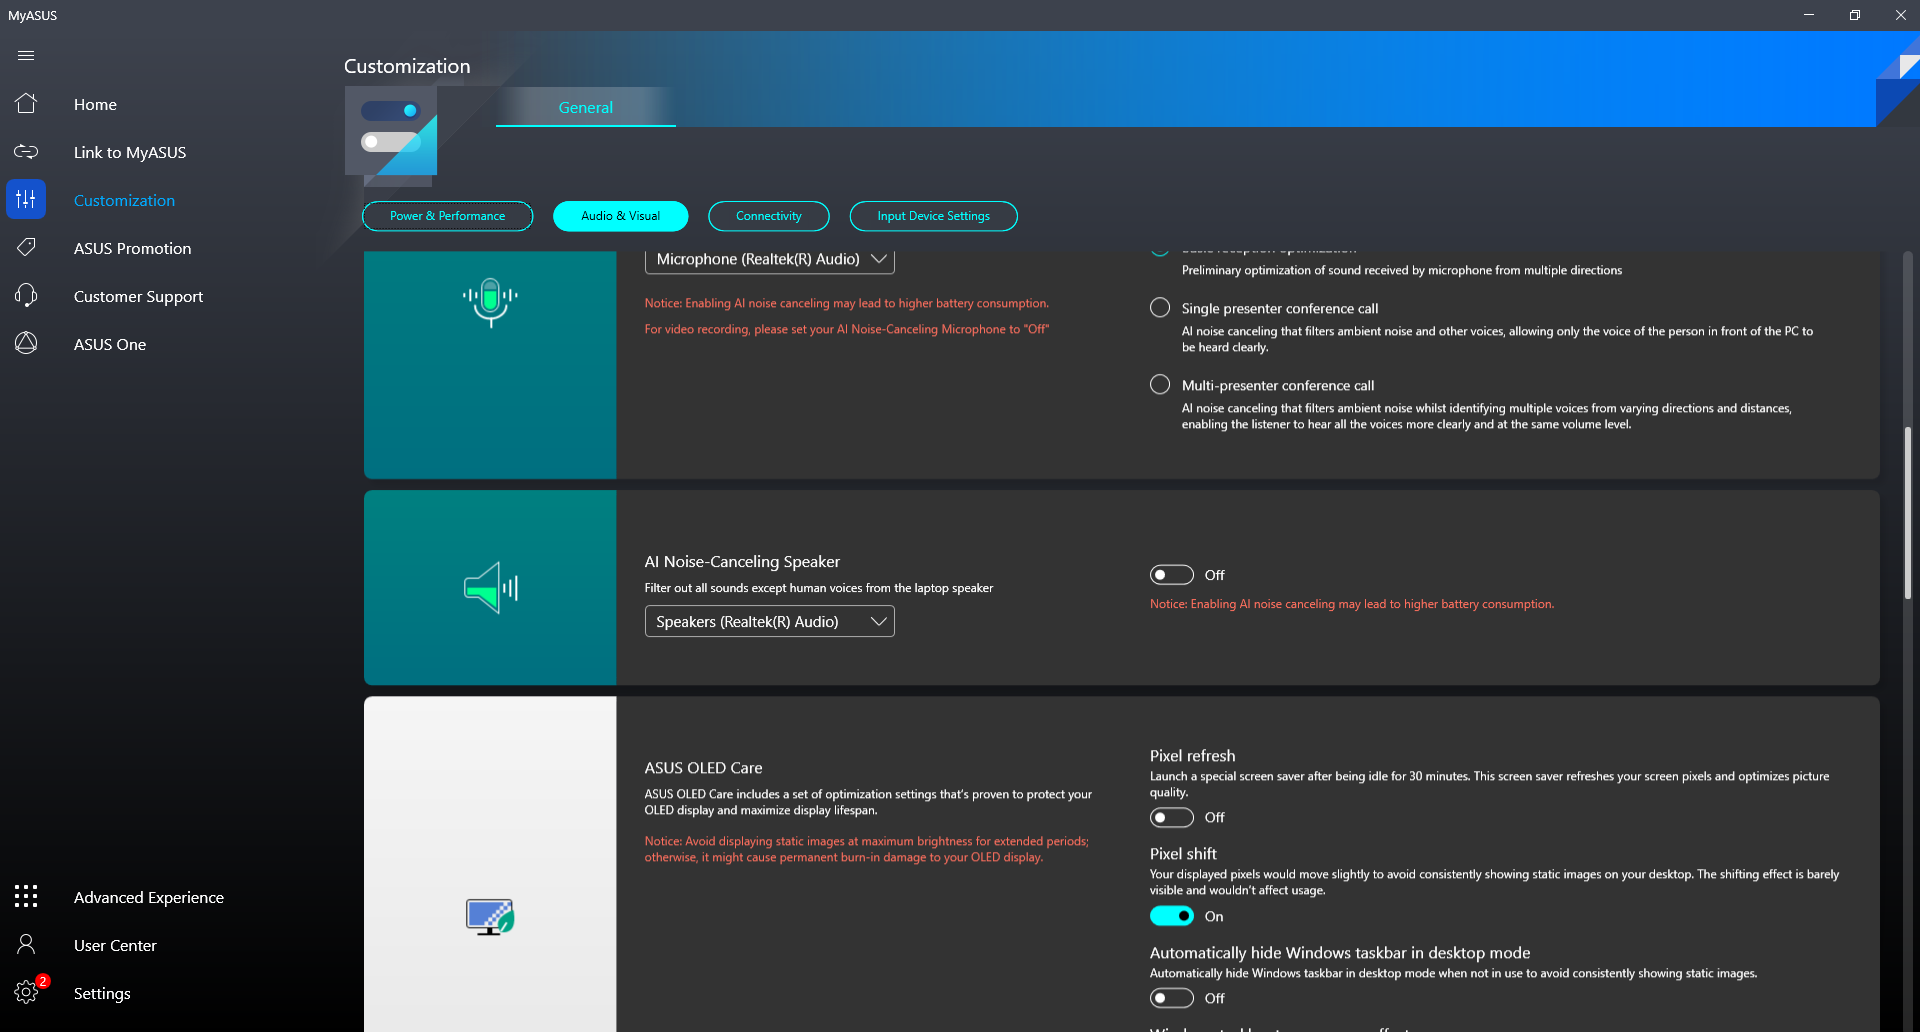
在运行以下任何基准测试之前,我们通过MyAsus软件将我们的设备设置为性能模式,并通过Windows设置为性能模式。令人讨厌的是,通过华硕改变电源配置文件不会自动改变Windows上的电源配置文件,反之亦然。建议用户熟悉MyAsus软件,因为它是任何关键更新、改变颜色配置文件和其他华硕特定功能的枢纽,如下图所示。
处理器
CPU的性能非常好,其结果是在我们数据库中配备相同的笔记本电脑的平均几个百分点之内。 Ryzen 5 5600HCPU。它的表现几乎与低功率的 Ryzen 7 5700U和较低功率的Ryzen 7 5700U几乎相同,只比较新的Zen 3+落后5到10个百分点。 Ryzen 5 6600H.性能的可持续性尤其出色,下面稳定的CineBench R15 xT循环结果就是例证。
Ryzen 5 5600H直接与第11代英特尔 酷睿i5-11300H它在多线程工作负载中的表现明显优于后者近2倍。然而,英特尔在一年后推出了改进很多的第12代 酷睿i5-12500H它的性能比我们的Ryzen CPU高出约30%。
升级到 Ryzen 7 5800H配置,预计将比我们的Ryzen 5600H配置提高30%的性能。
Cinebench R15 Multi Loop
Cinebench R20: CPU (Multi Core) | CPU (Single Core)
Cinebench R23: Multi Core | Single Core
Cinebench R15: CPU Multi 64Bit | CPU Single 64Bit
Blender: v2.79 BMW27 CPU
7-Zip 18.03: 7z b 4 | 7z b 4 -mmt1
Geekbench 5.5: Multi-Core | Single-Core
HWBOT x265 Benchmark v2.2: 4k Preset
LibreOffice : 20 Documents To PDF
R Benchmark 2.5: Overall mean
| CPU Performance rating | |
| Acer Nitro 5 AN515-46-R1A1 | |
| MSI Prestige 15 A12UD-093 -1! | |
| Acer Swift 3 SF314-71-56U3 | |
| MSI Alpha 15 B5EEK-008 | |
| Samsung Galaxy Book2 15 | |
| Lenovo IdeaPad Gaming 3 15ARH7 | |
| Average AMD Ryzen 5 5600H | |
| Asus VivoBook 15 X M1503QA | |
| Asus VivoBook S15 D533UA | |
| Asus ZenBook UX535-M01440 | |
| Asus Vivobook 15 K513EQ -2! | |
| Lenovo ThinkBook 15 G3 ACL 21A400B2GE | |
| Dell Inspiron 15 3501 | |
| Dell Inspiron 15 5518-2X3JR | |
| Cinebench R20 / CPU (Multi Core) | |
| Acer Nitro 5 AN515-46-R1A1 | |
| Acer Swift 3 SF314-71-56U3 | |
| MSI Alpha 15 B5EEK-008 | |
| MSI Prestige 15 A12UD-093 | |
| Lenovo IdeaPad Gaming 3 15ARH7 | |
| Samsung Galaxy Book2 15 | |
| Average AMD Ryzen 5 5600H (3074 - 4059, n=16) | |
| Asus VivoBook 15 X M1503QA | |
| Asus VivoBook S15 D533UA | |
| Asus ZenBook UX535-M01440 | |
| Lenovo ThinkBook 15 G3 ACL 21A400B2GE | |
| Asus Vivobook 15 K513EQ | |
| Dell Inspiron 15 3501 | |
| Dell Inspiron 15 5518-2X3JR | |
| Cinebench R20 / CPU (Single Core) | |
| Samsung Galaxy Book2 15 | |
| MSI Prestige 15 A12UD-093 | |
| Acer Swift 3 SF314-71-56U3 | |
| Acer Nitro 5 AN515-46-R1A1 | |
| Asus Vivobook 15 K513EQ | |
| Lenovo IdeaPad Gaming 3 15ARH7 | |
| MSI Alpha 15 B5EEK-008 | |
| Dell Inspiron 15 3501 | |
| Asus VivoBook 15 X M1503QA | |
| Average AMD Ryzen 5 5600H (527 - 538, n=15) | |
| Dell Inspiron 15 5518-2X3JR | |
| Asus VivoBook S15 D533UA | |
| Asus ZenBook UX535-M01440 | |
| Lenovo ThinkBook 15 G3 ACL 21A400B2GE | |
| Cinebench R23 / Multi Core | |
| Acer Nitro 5 AN515-46-R1A1 | |
| MSI Alpha 15 B5EEK-008 | |
| MSI Prestige 15 A12UD-093 | |
| Acer Swift 3 SF314-71-56U3 | |
| Samsung Galaxy Book2 15 | |
| Lenovo IdeaPad Gaming 3 15ARH7 | |
| Average AMD Ryzen 5 5600H (7945 - 10416, n=13) | |
| Asus VivoBook 15 X M1503QA | |
| Asus VivoBook S15 D533UA | |
| Lenovo ThinkBook 15 G3 ACL 21A400B2GE | |
| Asus ZenBook UX535-M01440 | |
| Asus Vivobook 15 K513EQ | |
| Dell Inspiron 15 3501 | |
| Dell Inspiron 15 5518-2X3JR | |
| Cinebench R23 / Single Core | |
| Samsung Galaxy Book2 15 | |
| Acer Swift 3 SF314-71-56U3 | |
| MSI Prestige 15 A12UD-093 | |
| Acer Nitro 5 AN515-46-R1A1 | |
| Asus Vivobook 15 K513EQ | |
| Lenovo IdeaPad Gaming 3 15ARH7 | |
| MSI Alpha 15 B5EEK-008 | |
| Dell Inspiron 15 3501 | |
| Dell Inspiron 15 5518-2X3JR | |
| Average AMD Ryzen 5 5600H (1316 - 1381, n=13) | |
| Asus VivoBook 15 X M1503QA | |
| Asus VivoBook S15 D533UA | |
| Asus ZenBook UX535-M01440 | |
| Lenovo ThinkBook 15 G3 ACL 21A400B2GE | |
| Cinebench R15 / CPU Multi 64Bit | |
| MSI Prestige 15 A12UD-093 | |
| Acer Nitro 5 AN515-46-R1A1 | |
| Acer Swift 3 SF314-71-56U3 | |
| MSI Alpha 15 B5EEK-008 | |
| Lenovo IdeaPad Gaming 3 15ARH7 | |
| Average AMD Ryzen 5 5600H (1319 - 1723, n=16) | |
| Asus VivoBook 15 X M1503QA | |
| Asus VivoBook S15 D533UA | |
| Asus ZenBook UX535-M01440 | |
| Samsung Galaxy Book2 15 | |
| Lenovo ThinkBook 15 G3 ACL 21A400B2GE | |
| Asus Vivobook 15 K513EQ | |
| Dell Inspiron 15 3501 | |
| Dell Inspiron 15 5518-2X3JR | |
| Cinebench R15 / CPU Single 64Bit | |
| Acer Nitro 5 AN515-46-R1A1 | |
| Samsung Galaxy Book2 15 | |
| Acer Swift 3 SF314-71-56U3 | |
| Lenovo IdeaPad Gaming 3 15ARH7 | |
| MSI Alpha 15 B5EEK-008 | |
| Asus Vivobook 15 K513EQ | |
| Asus VivoBook 15 X M1503QA | |
| Average AMD Ryzen 5 5600H (218 - 225, n=14) | |
| MSI Prestige 15 A12UD-093 | |
| Asus ZenBook UX535-M01440 | |
| Asus VivoBook S15 D533UA | |
| Lenovo ThinkBook 15 G3 ACL 21A400B2GE | |
| Dell Inspiron 15 3501 | |
| Dell Inspiron 15 5518-2X3JR | |
| Blender / v2.79 BMW27 CPU | |
| Dell Inspiron 15 5518-2X3JR | |
| Dell Inspiron 15 3501 | |
| Asus Vivobook 15 K513EQ | |
| Lenovo ThinkBook 15 G3 ACL 21A400B2GE | |
| Asus ZenBook UX535-M01440 | |
| Samsung Galaxy Book2 15 | |
| Asus VivoBook 15 X M1503QA | |
| Average AMD Ryzen 5 5600H (300 - 384, n=14) | |
| Asus VivoBook S15 D533UA | |
| Lenovo IdeaPad Gaming 3 15ARH7 | |
| MSI Prestige 15 A12UD-093 | |
| Acer Swift 3 SF314-71-56U3 | |
| MSI Alpha 15 B5EEK-008 | |
| Acer Nitro 5 AN515-46-R1A1 | |
| 7-Zip 18.03 / 7z b 4 | |
| Acer Nitro 5 AN515-46-R1A1 | |
| MSI Alpha 15 B5EEK-008 | |
| MSI Prestige 15 A12UD-093 | |
| Acer Swift 3 SF314-71-56U3 | |
| Average AMD Ryzen 5 5600H (36315 - 46562, n=14) | |
| Asus VivoBook S15 D533UA | |
| Samsung Galaxy Book2 15 | |
| Lenovo IdeaPad Gaming 3 15ARH7 | |
| Asus VivoBook 15 X M1503QA | |
| Asus ZenBook UX535-M01440 | |
| Lenovo ThinkBook 15 G3 ACL 21A400B2GE | |
| Asus Vivobook 15 K513EQ | |
| Dell Inspiron 15 3501 | |
| Dell Inspiron 15 5518-2X3JR | |
| 7-Zip 18.03 / 7z b 4 -mmt1 | |
| Acer Nitro 5 AN515-46-R1A1 | |
| MSI Prestige 15 A12UD-093 | |
| MSI Alpha 15 B5EEK-008 | |
| Lenovo IdeaPad Gaming 3 15ARH7 | |
| Samsung Galaxy Book2 15 | |
| Acer Swift 3 SF314-71-56U3 | |
| Average AMD Ryzen 5 5600H (5213 - 5446, n=14) | |
| Asus Vivobook 15 K513EQ | |
| Asus VivoBook 15 X M1503QA | |
| Asus ZenBook UX535-M01440 | |
| Dell Inspiron 15 5518-2X3JR | |
| Dell Inspiron 15 3501 | |
| Asus VivoBook S15 D533UA | |
| Lenovo ThinkBook 15 G3 ACL 21A400B2GE | |
| Geekbench 5.5 / Multi-Core | |
| MSI Prestige 15 A12UD-093 | |
| Acer Swift 3 SF314-71-56U3 | |
| Acer Nitro 5 AN515-46-R1A1 | |
| MSI Alpha 15 B5EEK-008 | |
| Samsung Galaxy Book2 15 | |
| Average AMD Ryzen 5 5600H (4990 - 7253, n=14) | |
| Lenovo IdeaPad Gaming 3 15ARH7 | |
| Asus VivoBook S15 D533UA | |
| Asus ZenBook UX535-M01440 | |
| Asus VivoBook 15 X M1503QA | |
| Dell Inspiron 15 3501 | |
| Lenovo ThinkBook 15 G3 ACL 21A400B2GE | |
| Dell Inspiron 15 5518-2X3JR | |
| Geekbench 5.5 / Single-Core | |
| Samsung Galaxy Book2 15 | |
| Acer Swift 3 SF314-71-56U3 | |
| MSI Prestige 15 A12UD-093 | |
| Acer Nitro 5 AN515-46-R1A1 | |
| MSI Alpha 15 B5EEK-008 | |
| Dell Inspiron 15 3501 | |
| Lenovo IdeaPad Gaming 3 15ARH7 | |
| Average AMD Ryzen 5 5600H (1365 - 1445, n=14) | |
| Asus VivoBook 15 X M1503QA | |
| Dell Inspiron 15 5518-2X3JR | |
| Asus ZenBook UX535-M01440 | |
| Asus VivoBook S15 D533UA | |
| Lenovo ThinkBook 15 G3 ACL 21A400B2GE | |
| HWBOT x265 Benchmark v2.2 / 4k Preset | |
| Acer Nitro 5 AN515-46-R1A1 | |
| MSI Alpha 15 B5EEK-008 | |
| Acer Swift 3 SF314-71-56U3 | |
| Average AMD Ryzen 5 5600H (9.92 - 13.3, n=14) | |
| Samsung Galaxy Book2 15 | |
| Lenovo IdeaPad Gaming 3 15ARH7 | |
| Asus VivoBook S15 D533UA | |
| Asus VivoBook 15 X M1503QA | |
| Asus ZenBook UX535-M01440 | |
| Lenovo ThinkBook 15 G3 ACL 21A400B2GE | |
| Asus Vivobook 15 K513EQ | |
| Dell Inspiron 15 3501 | |
| Dell Inspiron 15 5518-2X3JR | |
| LibreOffice / 20 Documents To PDF | |
| Asus ZenBook UX535-M01440 | |
| Lenovo ThinkBook 15 G3 ACL 21A400B2GE | |
| MSI Prestige 15 A12UD-093 | |
| MSI Prestige 15 A12UD-093 | |
| Average AMD Ryzen 5 5600H (52.2 - 81.5, n=14) | |
| Lenovo IdeaPad Gaming 3 15ARH7 | |
| Asus VivoBook S15 D533UA | |
| MSI Alpha 15 B5EEK-008 | |
| Asus VivoBook 15 X M1503QA | |
| Acer Nitro 5 AN515-46-R1A1 | |
| Dell Inspiron 15 3501 | |
| Dell Inspiron 15 5518-2X3JR | |
| Asus Vivobook 15 K513EQ | |
| Samsung Galaxy Book2 15 | |
| Acer Swift 3 SF314-71-56U3 | |
| R Benchmark 2.5 / Overall mean | |
| Lenovo ThinkBook 15 G3 ACL 21A400B2GE | |
| Dell Inspiron 15 5518-2X3JR | |
| Asus ZenBook UX535-M01440 | |
| Dell Inspiron 15 3501 | |
| Asus VivoBook S15 D533UA | |
| Asus Vivobook 15 K513EQ | |
| Asus VivoBook 15 X M1503QA | |
| Average AMD Ryzen 5 5600H (0.526 - 0.596, n=14) | |
| Lenovo IdeaPad Gaming 3 15ARH7 | |
| MSI Alpha 15 B5EEK-008 | |
| Acer Swift 3 SF314-71-56U3 | |
| Acer Nitro 5 AN515-46-R1A1 | |
| Samsung Galaxy Book2 15 | |
| MSI Prestige 15 A12UD-093 | |
Cinebench R20: CPU (Multi Core) | CPU (Single Core)
Cinebench R23: Multi Core | Single Core
Cinebench R15: CPU Multi 64Bit | CPU Single 64Bit
Blender: v2.79 BMW27 CPU
7-Zip 18.03: 7z b 4 | 7z b 4 -mmt1
Geekbench 5.5: Multi-Core | Single-Core
HWBOT x265 Benchmark v2.2: 4k Preset
LibreOffice : 20 Documents To PDF
R Benchmark 2.5: Overall mean
* ... smaller is better
* ... smaller is better
AIDA64: FP32 Ray-Trace | FPU Julia | CPU SHA3 | CPU Queen | FPU SinJulia | FPU Mandel | CPU AES | CPU ZLib | FP64 Ray-Trace | CPU PhotoWorxx
| Performance rating | |
| Asus VivoBook S15 D533UA | |
| Average AMD Ryzen 5 5600H | |
| Asus VivoBook 15 X M1503QA | |
| Lenovo ThinkBook 15 G3 ACL 21A400B2GE | |
| Asus Vivobook 15 K513EQ | |
| Dell Inspiron 15 3501 | |
| AIDA64 / FP32 Ray-Trace | |
| Average AMD Ryzen 5 5600H (9181 - 12636, n=14) | |
| Asus VivoBook S15 D533UA | |
| Asus VivoBook 15 X M1503QA | |
| Lenovo ThinkBook 15 G3 ACL 21A400B2GE | |
| Asus Vivobook 15 K513EQ | |
| Dell Inspiron 15 3501 | |
| AIDA64 / FPU Julia | |
| Average AMD Ryzen 5 5600H (51994 - 78250, n=14) | |
| Asus VivoBook 15 X M1503QA | |
| Asus VivoBook S15 D533UA | |
| Lenovo ThinkBook 15 G3 ACL 21A400B2GE | |
| Asus Vivobook 15 K513EQ | |
| Dell Inspiron 15 3501 | |
| AIDA64 / CPU SHA3 | |
| Average AMD Ryzen 5 5600H (1587 - 2675, n=14) | |
| Asus VivoBook 15 X M1503QA | |
| Asus Vivobook 15 K513EQ | |
| Asus VivoBook S15 D533UA | |
| Dell Inspiron 15 3501 | |
| Lenovo ThinkBook 15 G3 ACL 21A400B2GE | |
| AIDA64 / CPU Queen | |
| Asus VivoBook S15 D533UA | |
| Average AMD Ryzen 5 5600H (66699 - 77213, n=14) | |
| Asus VivoBook 15 X M1503QA | |
| Lenovo ThinkBook 15 G3 ACL 21A400B2GE | |
| Asus Vivobook 15 K513EQ | |
| Dell Inspiron 15 3501 | |
| AIDA64 / FPU SinJulia | |
| Asus VivoBook S15 D533UA | |
| Lenovo ThinkBook 15 G3 ACL 21A400B2GE | |
| Average AMD Ryzen 5 5600H (8340 - 9159, n=14) | |
| Asus VivoBook 15 X M1503QA | |
| Asus Vivobook 15 K513EQ | |
| Dell Inspiron 15 3501 | |
| AIDA64 / FPU Mandel | |
| Asus VivoBook 15 X M1503QA | |
| Average AMD Ryzen 5 5600H (28268 - 43274, n=14) | |
| Asus VivoBook S15 D533UA | |
| Lenovo ThinkBook 15 G3 ACL 21A400B2GE | |
| Asus Vivobook 15 K513EQ | |
| Dell Inspiron 15 3501 | |
| AIDA64 / CPU AES | |
| Average AMD Ryzen 5 5600H (39852 - 98939, n=14) | |
| Asus Vivobook 15 K513EQ | |
| Dell Inspiron 15 3501 | |
| Asus VivoBook S15 D533UA | |
| Lenovo ThinkBook 15 G3 ACL 21A400B2GE | |
| Asus VivoBook 15 X M1503QA | |
| AIDA64 / CPU ZLib | |
| Asus VivoBook S15 D533UA | |
| Average AMD Ryzen 5 5600H (507 - 649, n=14) | |
| Asus VivoBook 15 X M1503QA | |
| Lenovo ThinkBook 15 G3 ACL 21A400B2GE | |
| Asus Vivobook 15 K513EQ | |
| Dell Inspiron 15 3501 | |
| AIDA64 / FP64 Ray-Trace | |
| Asus VivoBook S15 D533UA | |
| Average AMD Ryzen 5 5600H (4811 - 6652, n=14) | |
| Asus VivoBook 15 X M1503QA | |
| Lenovo ThinkBook 15 G3 ACL 21A400B2GE | |
| Asus Vivobook 15 K513EQ | |
| Dell Inspiron 15 3501 | |
| AIDA64 / CPU PhotoWorxx | |
| Asus Vivobook 15 K513EQ | |
| Average AMD Ryzen 5 5600H (7419 - 24746, n=14) | |
| Dell Inspiron 15 3501 | |
| Asus VivoBook S15 D533UA | |
| Lenovo ThinkBook 15 G3 ACL 21A400B2GE | |
| Asus VivoBook 15 X M1503QA | |
系统性能
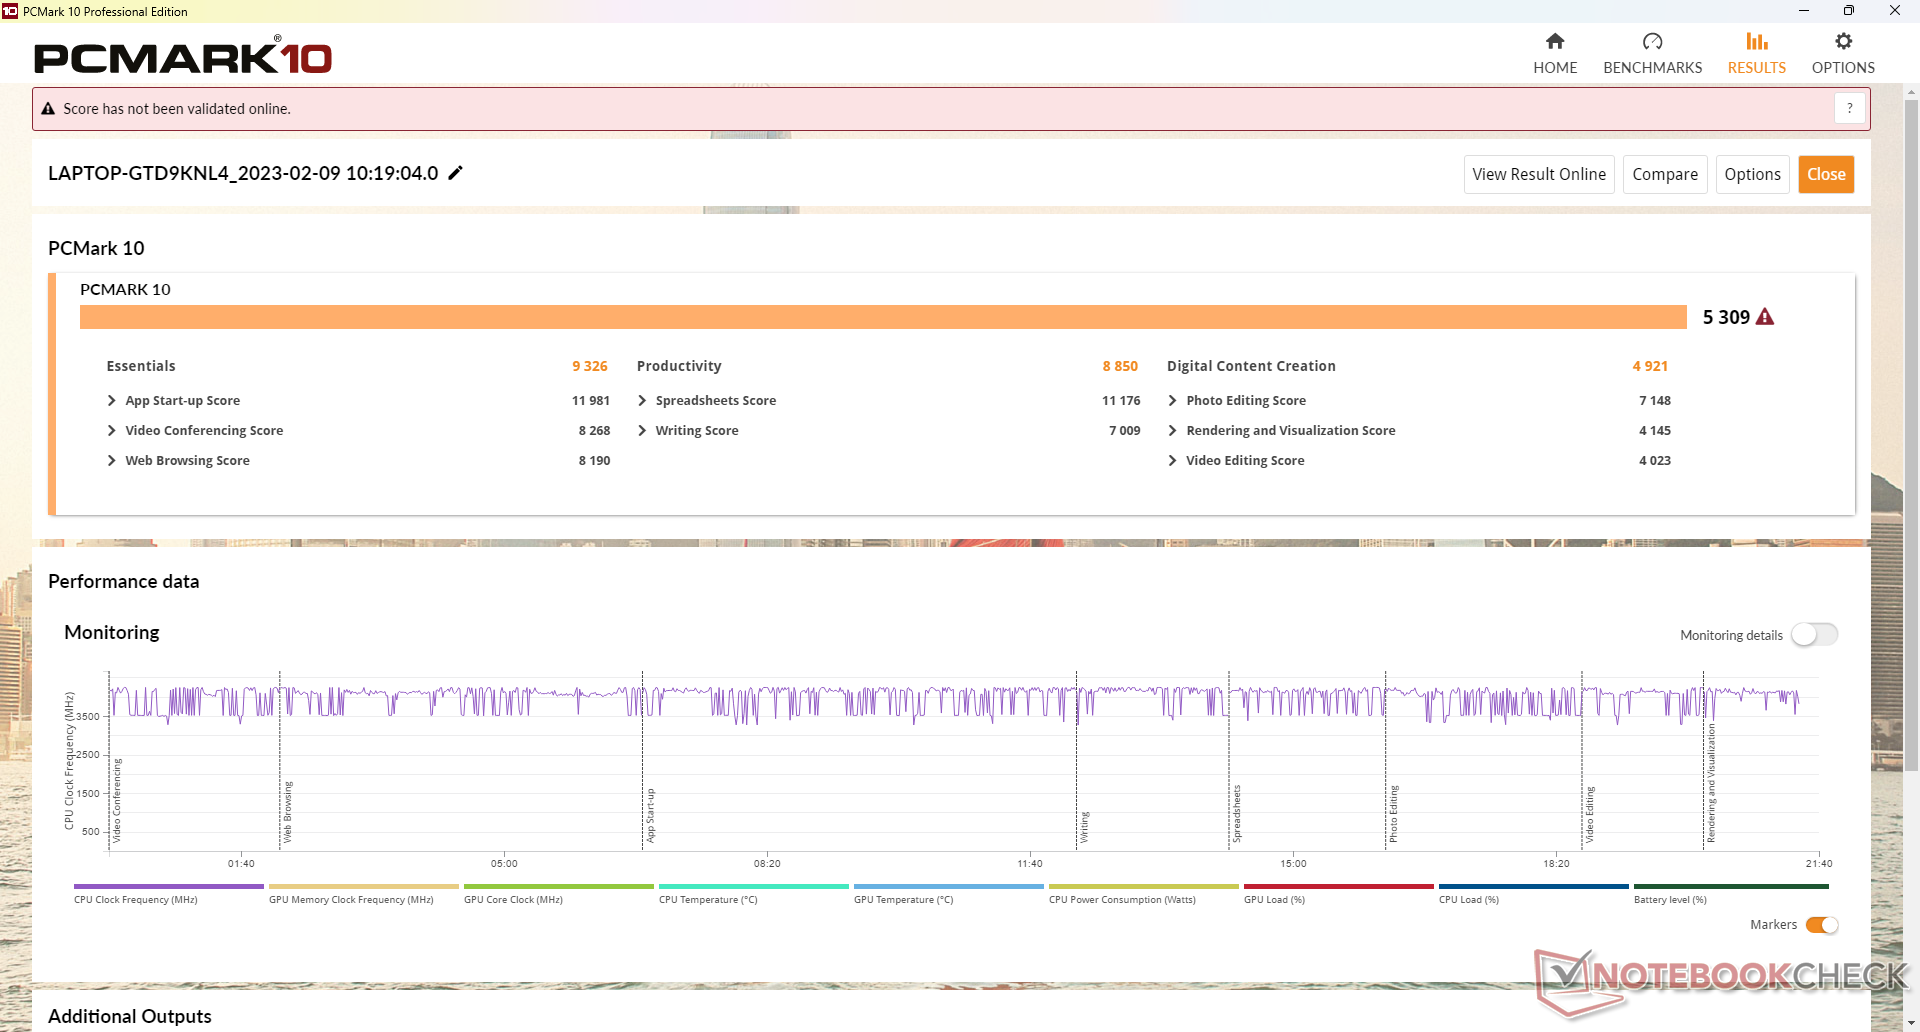
PCMark 10的得分与其他U系列的超极本相当,如果不是因为我们的H系列CPU而略高的话。因此,尽管令人失望的单内存配置,该系统在日常负载中仍然感觉很敏捷。
CrossMark: Overall | Productivity | Creativity | Responsiveness
| PCMark 10 / Score | |
| Average AMD Ryzen 5 5600H, AMD Radeon RX Vega 7 (5309 - 6189, n=4) | |
| Acer Swift 3 SF314-71-56U3 | |
| Asus VivoBook S15 D533UA | |
| Asus VivoBook 15 X M1503QA | |
| Asus Vivobook 15 K513EQ | |
| Dell Inspiron 15 5518-2X3JR | |
| Dell Inspiron 15 3501 | |
| Asus ZenBook UX535-M01440 | |
| Lenovo ThinkBook 15 G3 ACL 21A400B2GE | |
| PCMark 10 / Essentials | |
| Acer Swift 3 SF314-71-56U3 | |
| Average AMD Ryzen 5 5600H, AMD Radeon RX Vega 7 (9326 - 10503, n=4) | |
| Dell Inspiron 15 3501 | |
| Asus Vivobook 15 K513EQ | |
| Asus VivoBook 15 X M1503QA | |
| Asus VivoBook S15 D533UA | |
| Asus ZenBook UX535-M01440 | |
| Lenovo ThinkBook 15 G3 ACL 21A400B2GE | |
| Dell Inspiron 15 5518-2X3JR | |
| PCMark 10 / Productivity | |
| Average AMD Ryzen 5 5600H, AMD Radeon RX Vega 7 (8850 - 9642, n=4) | |
| Asus VivoBook 15 X M1503QA | |
| Asus Vivobook 15 K513EQ | |
| Dell Inspiron 15 5518-2X3JR | |
| Asus VivoBook S15 D533UA | |
| Lenovo ThinkBook 15 G3 ACL 21A400B2GE | |
| Acer Swift 3 SF314-71-56U3 | |
| Asus ZenBook UX535-M01440 | |
| Dell Inspiron 15 3501 | |
| PCMark 10 / Digital Content Creation | |
| Acer Swift 3 SF314-71-56U3 | |
| Average AMD Ryzen 5 5600H, AMD Radeon RX Vega 7 (4921 - 6352, n=4) | |
| Asus VivoBook S15 D533UA | |
| Asus ZenBook UX535-M01440 | |
| Asus VivoBook 15 X M1503QA | |
| Dell Inspiron 15 3501 | |
| Dell Inspiron 15 5518-2X3JR | |
| Lenovo ThinkBook 15 G3 ACL 21A400B2GE | |
| Asus Vivobook 15 K513EQ | |
| CrossMark / Overall | |
| Acer Swift 3 SF314-71-56U3 | |
| Average AMD Ryzen 5 5600H, AMD Radeon RX Vega 7 (1157 - 1353, n=4) | |
| Asus VivoBook 15 X M1503QA | |
| Lenovo ThinkBook 15 G3 ACL 21A400B2GE | |
| CrossMark / Productivity | |
| Acer Swift 3 SF314-71-56U3 | |
| Average AMD Ryzen 5 5600H, AMD Radeon RX Vega 7 (1217 - 1384, n=4) | |
| Asus VivoBook 15 X M1503QA | |
| Lenovo ThinkBook 15 G3 ACL 21A400B2GE | |
| CrossMark / Creativity | |
| Acer Swift 3 SF314-71-56U3 | |
| Average AMD Ryzen 5 5600H, AMD Radeon RX Vega 7 (1184 - 1377, n=4) | |
| Asus VivoBook 15 X M1503QA | |
| Lenovo ThinkBook 15 G3 ACL 21A400B2GE | |
| CrossMark / Responsiveness | |
| Acer Swift 3 SF314-71-56U3 | |
| Average AMD Ryzen 5 5600H, AMD Radeon RX Vega 7 (926 - 1225, n=4) | |
| Asus VivoBook 15 X M1503QA | |
| Lenovo ThinkBook 15 G3 ACL 21A400B2GE | |
| PCMark 10 Score | 5309 points | |
Help | ||
| AIDA64 / Memory Copy | |
| Average AMD Ryzen 5 5600H (20549 - 42141, n=14) | |
| Asus Vivobook 15 K513EQ | |
| Asus VivoBook S15 D533UA | |
| Dell Inspiron 15 3501 | |
| Asus VivoBook 15 X M1503QA | |
| Lenovo ThinkBook 15 G3 ACL 21A400B2GE | |
| AIDA64 / Memory Read | |
| Asus Vivobook 15 K513EQ | |
| Asus VivoBook S15 D533UA | |
| Average AMD Ryzen 5 5600H (22917 - 47595, n=14) | |
| Dell Inspiron 15 3501 | |
| Lenovo ThinkBook 15 G3 ACL 21A400B2GE | |
| Asus VivoBook 15 X M1503QA | |
| AIDA64 / Memory Write | |
| Asus Vivobook 15 K513EQ | |
| Asus VivoBook S15 D533UA | |
| Average AMD Ryzen 5 5600H (20226 - 44872, n=14) | |
| Dell Inspiron 15 3501 | |
| Lenovo ThinkBook 15 G3 ACL 21A400B2GE | |
| Asus VivoBook 15 X M1503QA | |
| AIDA64 / Memory Latency | |
| Asus VivoBook S15 D533UA | |
| Dell Inspiron 15 3501 | |
| Lenovo ThinkBook 15 G3 ACL 21A400B2GE | |
| Asus Vivobook 15 K513EQ | |
| Average AMD Ryzen 5 5600H (75 - 89.1, n=14) | |
| Asus VivoBook 15 X M1503QA | |
* ... smaller is better
DPC延时
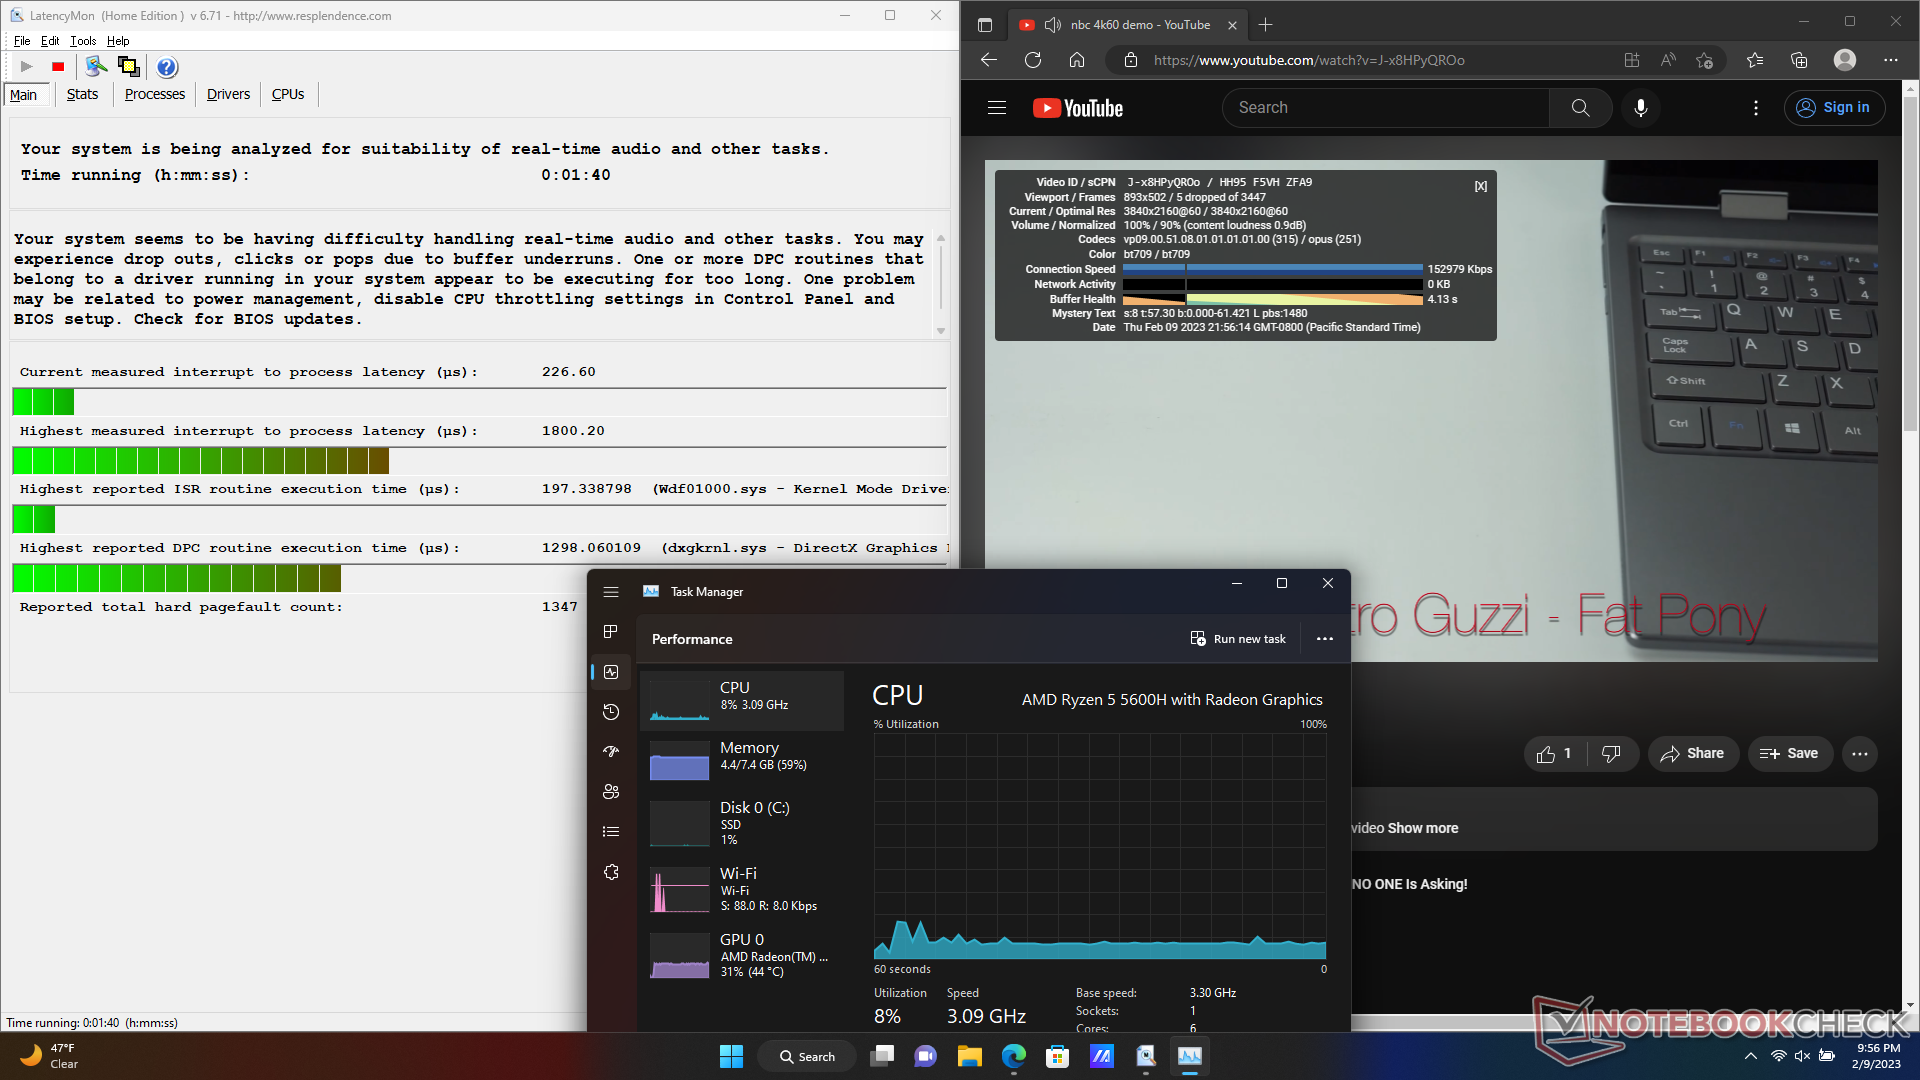
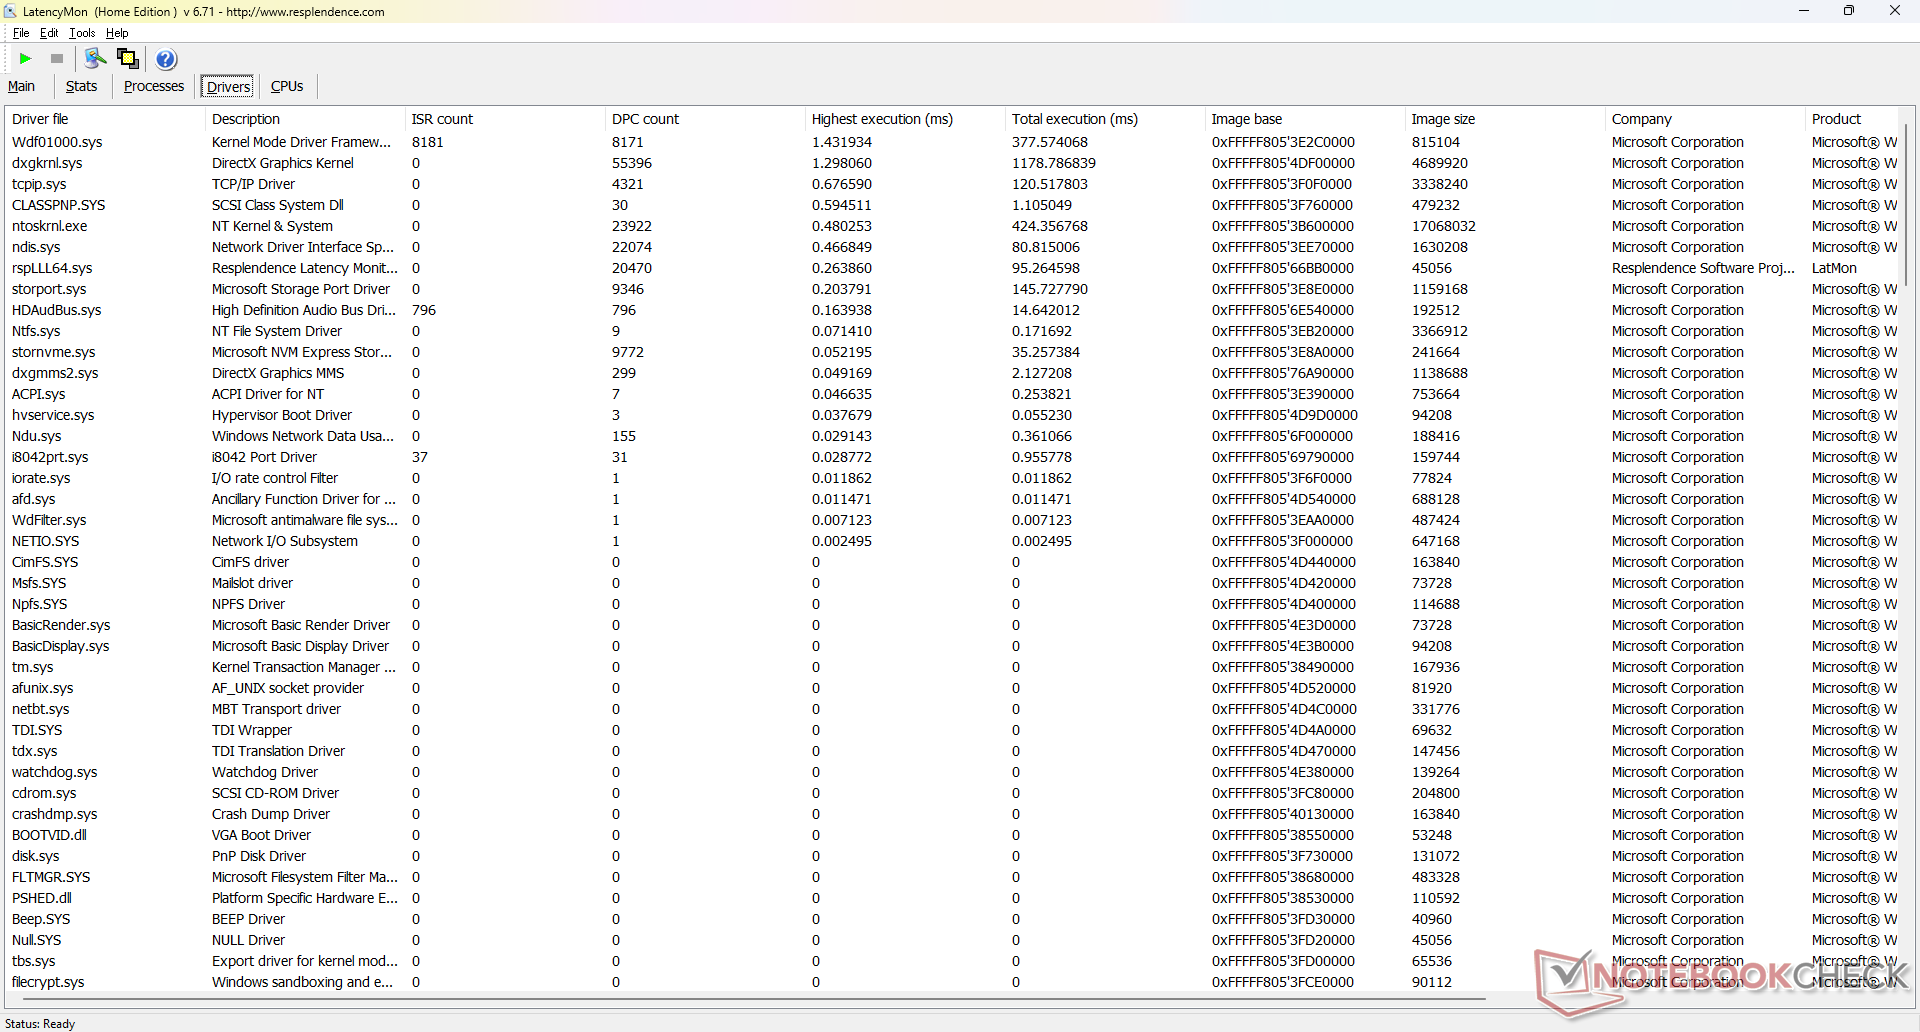
LatencyMon显示,在打开我们主页的多个浏览器标签时存在DPC问题。在60FPS的4K视频播放也不完美,在我们长达1分钟的测试视频中出现了5个丢帧。然而,这不应该是一个巨大的问题,因为笔记本电脑不能以60赫兹的速度输出到4K显示器,无论如何。
| DPC Latencies / LatencyMon - interrupt to process latency (max), Web, Youtube, Prime95 | |
| Asus Vivobook 15 K513EQ | |
| Asus VivoBook 15 X M1503QA | |
| Lenovo ThinkBook 15 G3 ACL 21A400B2GE | |
| Dell Inspiron 15 3501 | |
| Asus ZenBook UX535-M01440 | |
| Asus VivoBook S15 D533UA | |
* ... smaller is better
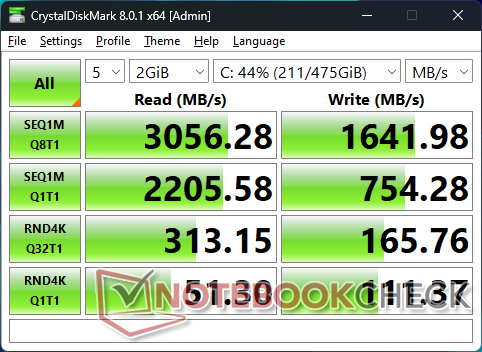
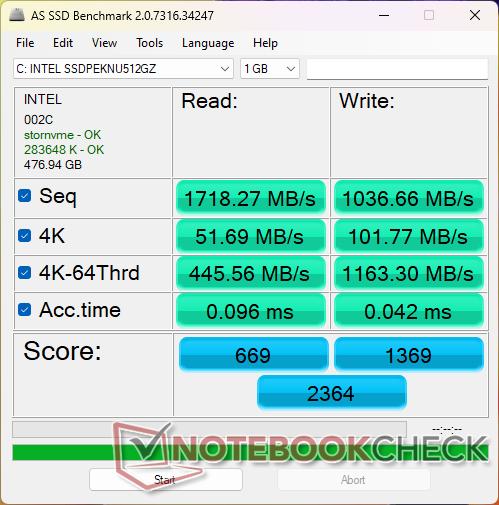
存储设备 - 仅支持一个固态硬盘
该系统支持PCIe3驱动器而不是PCIe4可能是为了节省成本。512GB的 英特尔670p是一款中端PCIe3 x4 NVMe硬盘,连续读取和写入速度分别为3000MB/s和1600MB/s左右。在压力下,性能似乎略有波动,这意味着它在长时间保持高传输率方面会有问题。然而,当考虑到笔记本电脑的价格范围和性能水平时,这对大多数工作负荷来说不会有太大影响。

| Drive Performance rating - Percent | |
| Asus VivoBook S15 D533UA | |
| Dell Inspiron 15 3501 | |
| Asus ZenBook UX535-M01440 | |
| Lenovo ThinkBook 15 G3 ACL 21A400B2GE | |
| Asus VivoBook 15 X M1503QA | |
| Asus Vivobook 15 K513EQ | |
* ... smaller is better
Disk Throttling: DiskSpd Read Loop, Queue Depth 8
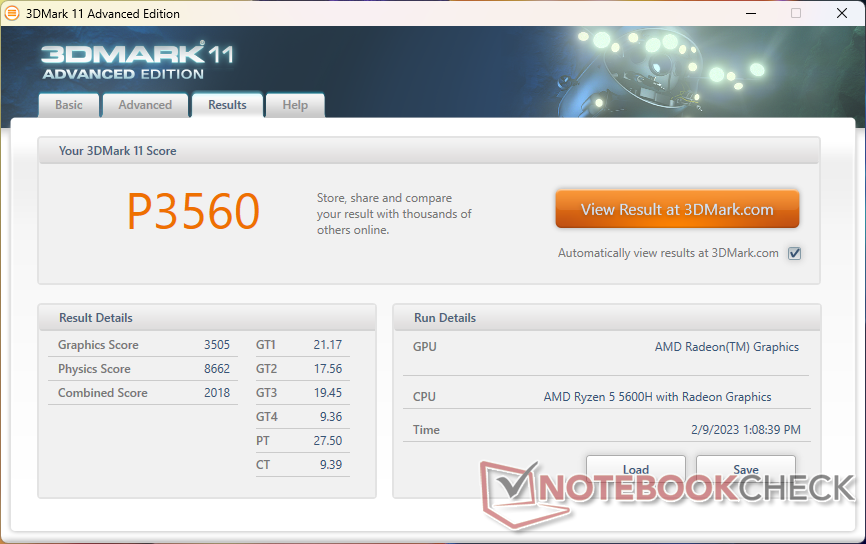
GPU性能 - 尽可能升级到双通道内存
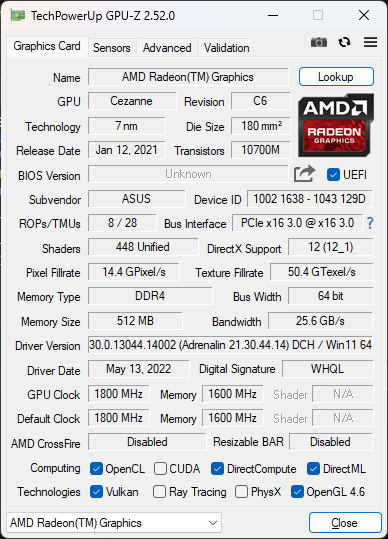
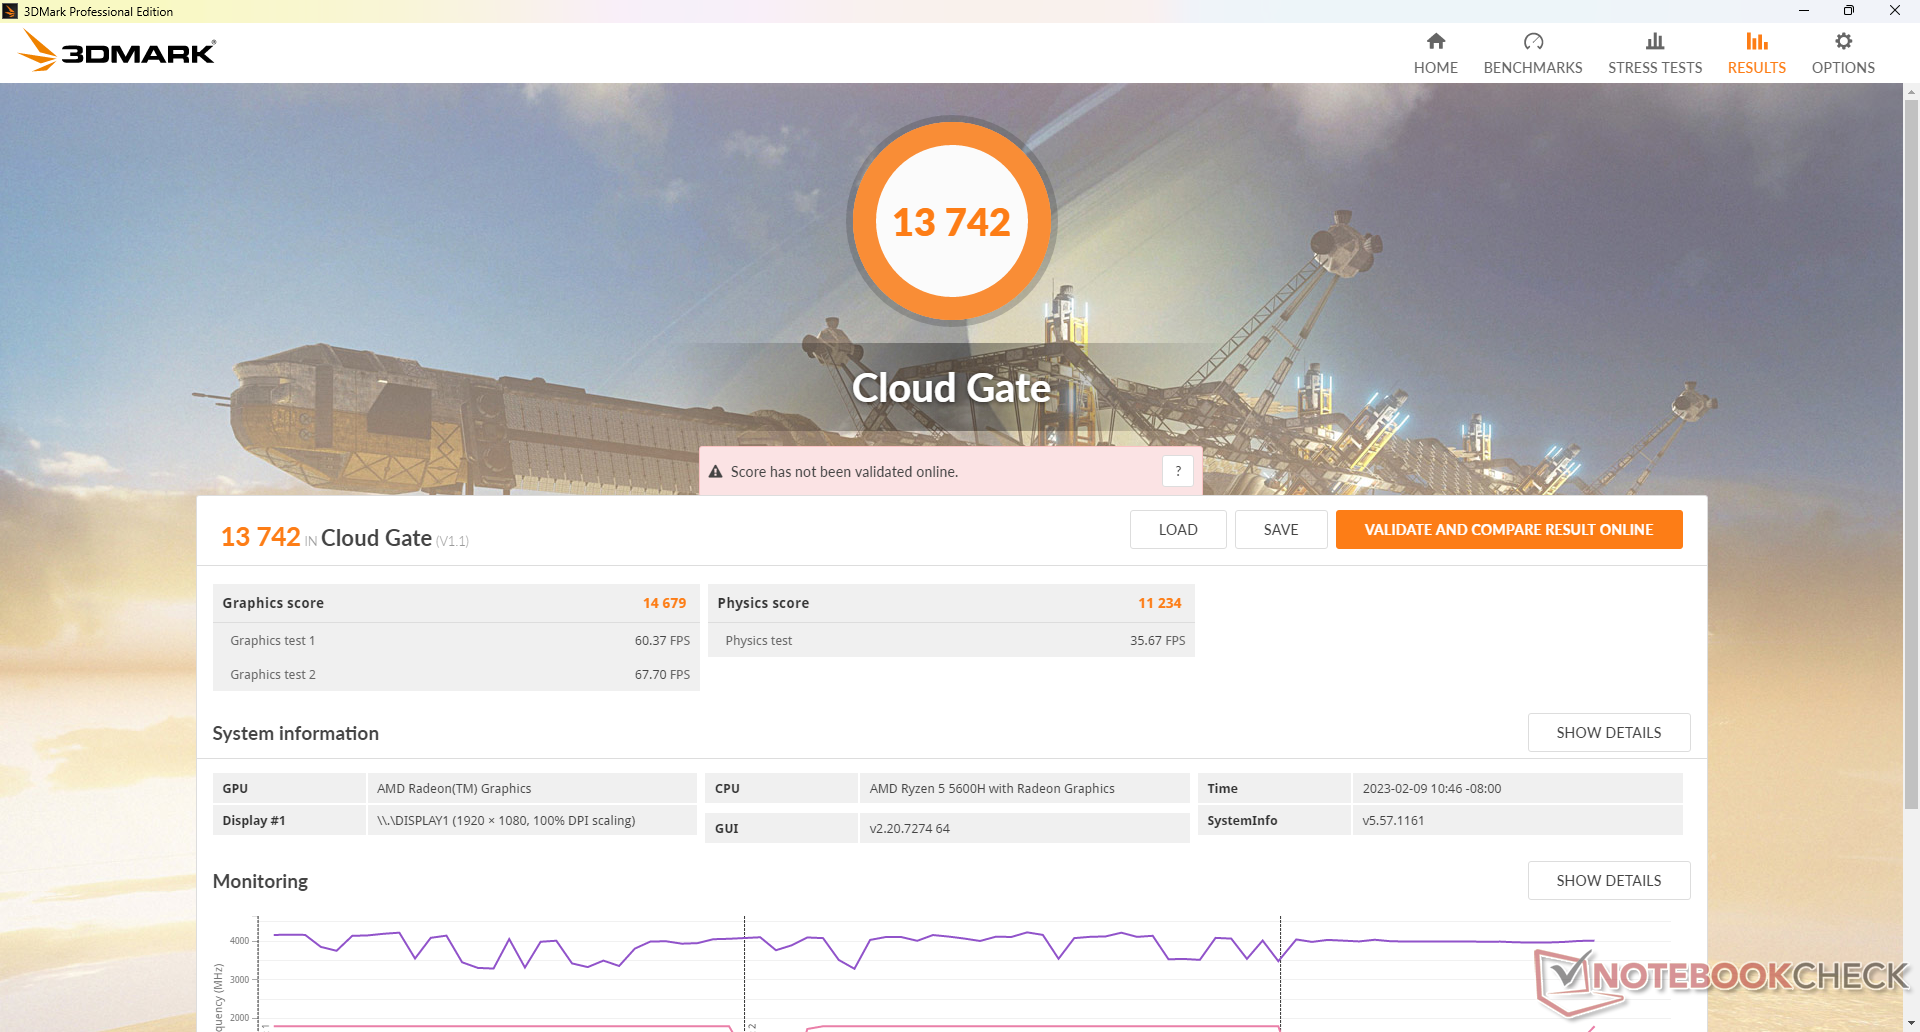
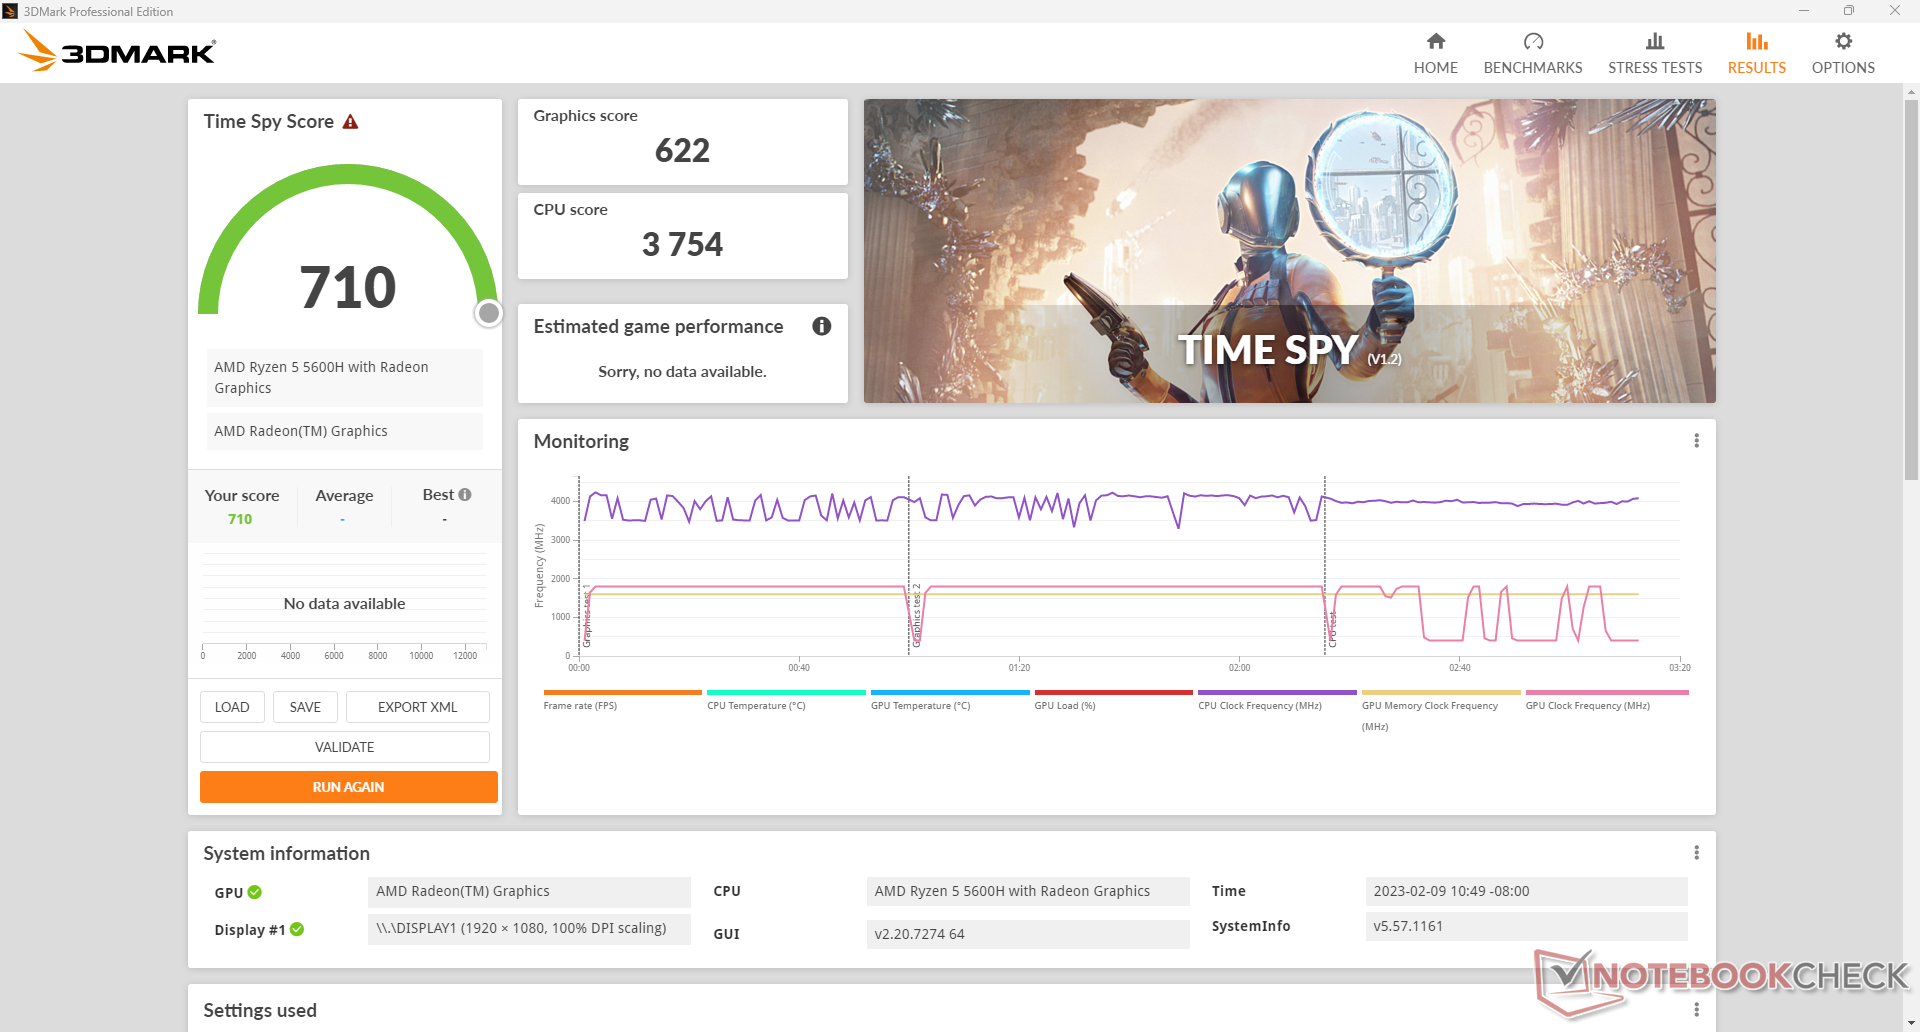
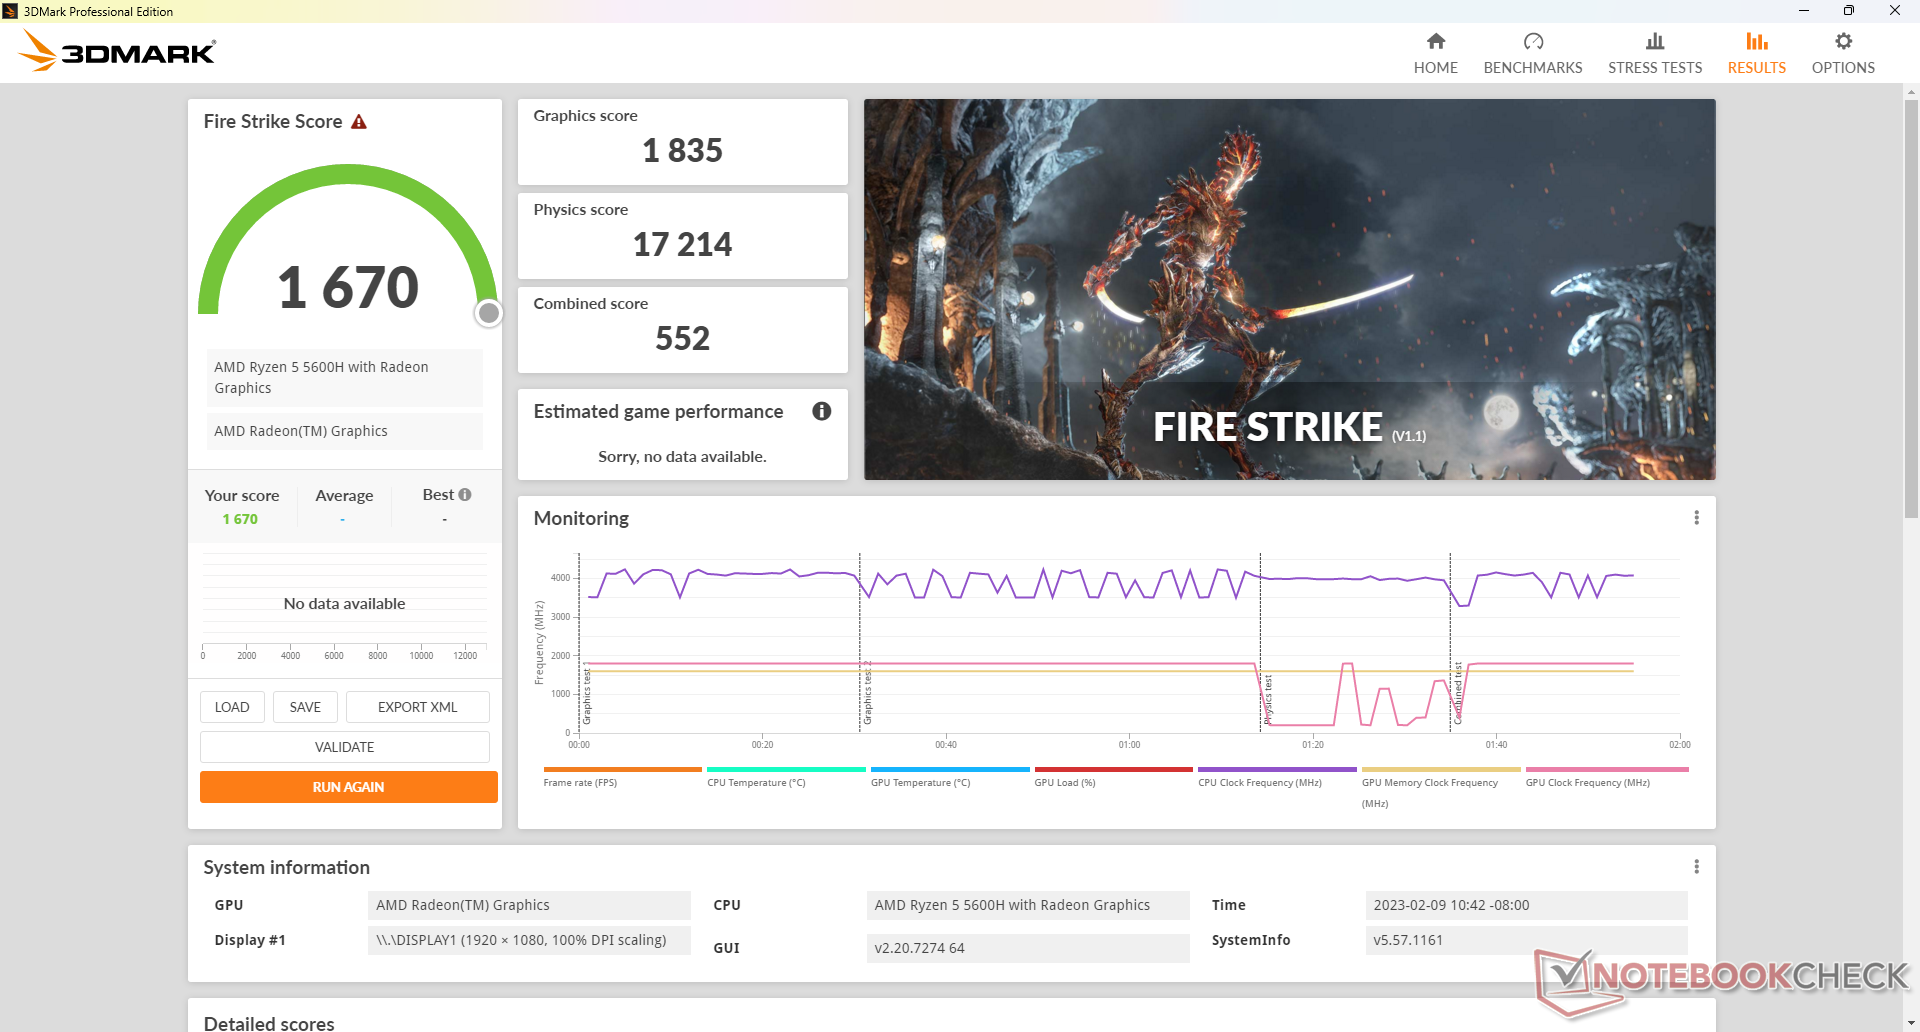
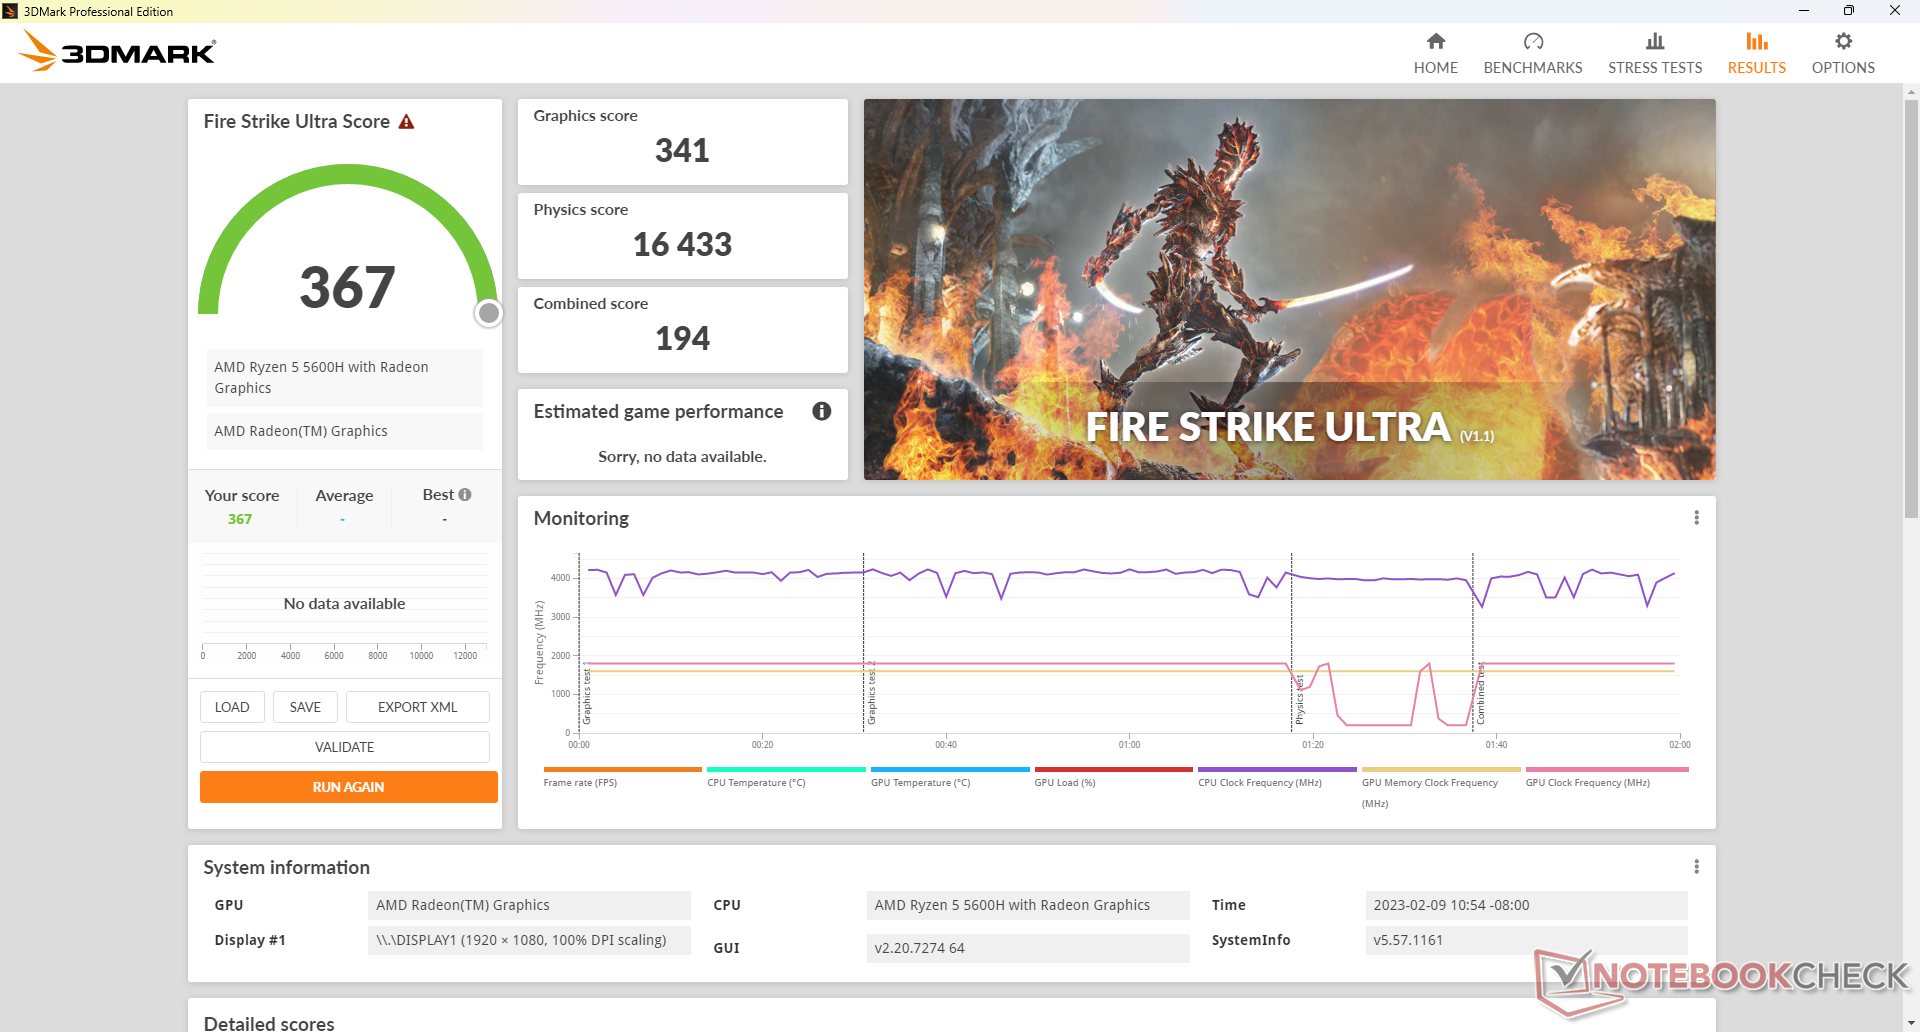
图形性能令人失望,比我们数据库中具有相同集成度的AMD笔记本电脑平均慢35%至40%左右。 Radeon RX Vega 7 GPU。差距是如此之大,以至于 Vega 8或竞争者Iris Xe 96 EUs可以提供比我们的华硕1.5倍到2倍的图形性能。尽管如此,从旧的 UHD Graphics 620仍将提高大约50%的图形性能。
我们表现不佳的GPU可以归因于我们测试设备的单通道内存配置。增加另一条双通道配置的内存,应该可以显著提高图形性能,与其他RX Vega 7笔记本电脑更加一致。
| 3DMark Performance rating - Percent | |
| Lenovo IdeaPad Gaming 3 15ARH7 | |
| MSI Prestige 15 A12UD-093 | |
| Asus ZenBook UX535-M01440 | |
| Samsung Galaxy Book2 15 | |
| Asus Vivobook 15 K513EQ | |
| Dell Inspiron 15 3501 | |
| Asus VivoBook S15 D533UA | |
| Average AMD Radeon RX Vega 7 | |
| Lenovo ThinkBook 15 G3 ACL 21A400B2GE | |
| Asus VivoBook 15 X M1503QA | |
| Dell Latitude 9510 2-in-1 | |
| 3DMark 11 - 1280x720 Performance GPU | |
| Lenovo IdeaPad Gaming 3 15ARH7 | |
| Asus ZenBook UX535-M01440 | |
| Samsung Galaxy Book2 15 | |
| MSI Prestige 15 A12UD-093 | |
| Asus Vivobook 15 K513EQ | |
| Dell Inspiron 15 3501 | |
| Asus VivoBook S15 D533UA | |
| Average AMD Radeon RX Vega 7 (3353 - 6249, n=62) | |
| Asus VivoBook 15 X M1503QA | |
| Lenovo ThinkBook 15 G3 ACL 21A400B2GE | |
| Dell Latitude 9510 2-in-1 | |
| 3DMark 11 Performance | 3560 points | |
| 3DMark Cloud Gate Standard Score | 13742 points | |
| 3DMark Fire Strike Score | 1670 points | |
| 3DMark Time Spy Score | 710 points | |
Help | ||
| X-Plane 11.11 | |
| 1280x720 low (fps_test=1) | |
| MSI Prestige 15 A12UD-093 | |
| Asus ZenBook UX535-M01440 | |
| Lenovo IdeaPad Gaming 3 15ARH7 | |
| Asus Vivobook 15 K513EQ | |
| Asus VivoBook S15 D533UA | |
| Average AMD Radeon RX Vega 7 (24.7 - 53.4, n=60) | |
| Samsung Galaxy Book2 15 | |
| Asus VivoBook 15 X M1503QA | |
| Dell Inspiron 15 3501 | |
| Lenovo ThinkBook 15 G3 ACL 21A400B2GE | |
| 1920x1080 med (fps_test=2) | |
| Asus ZenBook UX535-M01440 | |
| Lenovo IdeaPad Gaming 3 15ARH7 | |
| MSI Prestige 15 A12UD-093 | |
| Asus Vivobook 15 K513EQ | |
| Asus VivoBook S15 D533UA | |
| Average AMD Radeon RX Vega 7 (19.3 - 40.3, n=60) | |
| Samsung Galaxy Book2 15 | |
| Asus VivoBook 15 X M1503QA | |
| Lenovo ThinkBook 15 G3 ACL 21A400B2GE | |
| Dell Inspiron 15 3501 | |
| 1920x1080 high (fps_test=3) | |
| Asus ZenBook UX535-M01440 | |
| Lenovo IdeaPad Gaming 3 15ARH7 | |
| MSI Prestige 15 A12UD-093 | |
| Asus Vivobook 15 K513EQ | |
| Asus VivoBook S15 D533UA | |
| Average AMD Radeon RX Vega 7 (17.4 - 35.7, n=60) | |
| Samsung Galaxy Book2 15 | |
| Asus VivoBook 15 X M1503QA | |
| Lenovo ThinkBook 15 G3 ACL 21A400B2GE | |
| Dell Inspiron 15 3501 | |
| Final Fantasy XV Benchmark | |
| 1280x720 Lite Quality | |
| Lenovo IdeaPad Gaming 3 15ARH7 | |
| Samsung Galaxy Book2 15 | |
| MSI Prestige 15 A12UD-093 | |
| Asus Vivobook 15 K513EQ | |
| Asus VivoBook S15 D533UA | |
| Dell Inspiron 15 3501 | |
| Average AMD Radeon RX Vega 7 (17.1 - 41.1, n=44) | |
| Asus VivoBook 15 X M1503QA | |
| Lenovo ThinkBook 15 G3 ACL 21A400B2GE | |
| 1920x1080 Standard Quality | |
| Lenovo IdeaPad Gaming 3 15ARH7 | |
| MSI Prestige 15 A12UD-093 | |
| Samsung Galaxy Book2 15 | |
| Asus Vivobook 15 K513EQ | |
| Dell Inspiron 15 3501 | |
| Asus VivoBook S15 D533UA | |
| Average AMD Radeon RX Vega 7 (8.9 - 20.3, n=44) | |
| Asus VivoBook 15 X M1503QA | |
| Lenovo ThinkBook 15 G3 ACL 21A400B2GE | |
| 1920x1080 High Quality | |
| Lenovo IdeaPad Gaming 3 15ARH7 | |
| MSI Prestige 15 A12UD-093 | |
| Samsung Galaxy Book2 15 | |
| Asus Vivobook 15 K513EQ | |
| Dell Inspiron 15 3501 | |
| Asus VivoBook S15 D533UA | |
| Average AMD Radeon RX Vega 7 (5.85 - 14.3, n=41) | |
| Asus VivoBook 15 X M1503QA | |
| Lenovo ThinkBook 15 G3 ACL 21A400B2GE | |
| Cyberpunk 2077 1.6 | |
| 1280x720 Low Preset | |
| Average AMD Radeon RX Vega 7 (18.1 - 35.8, n=5) | |
| Asus VivoBook 15 X M1503QA | |
| 1920x1080 Low Preset | |
| Lenovo IdeaPad Gaming 3 15ARH7 | |
| Samsung Galaxy Book2 15 | |
| Average AMD Radeon RX Vega 7 (10 - 20.9, n=4) | |
| Asus VivoBook 15 X M1503QA | |
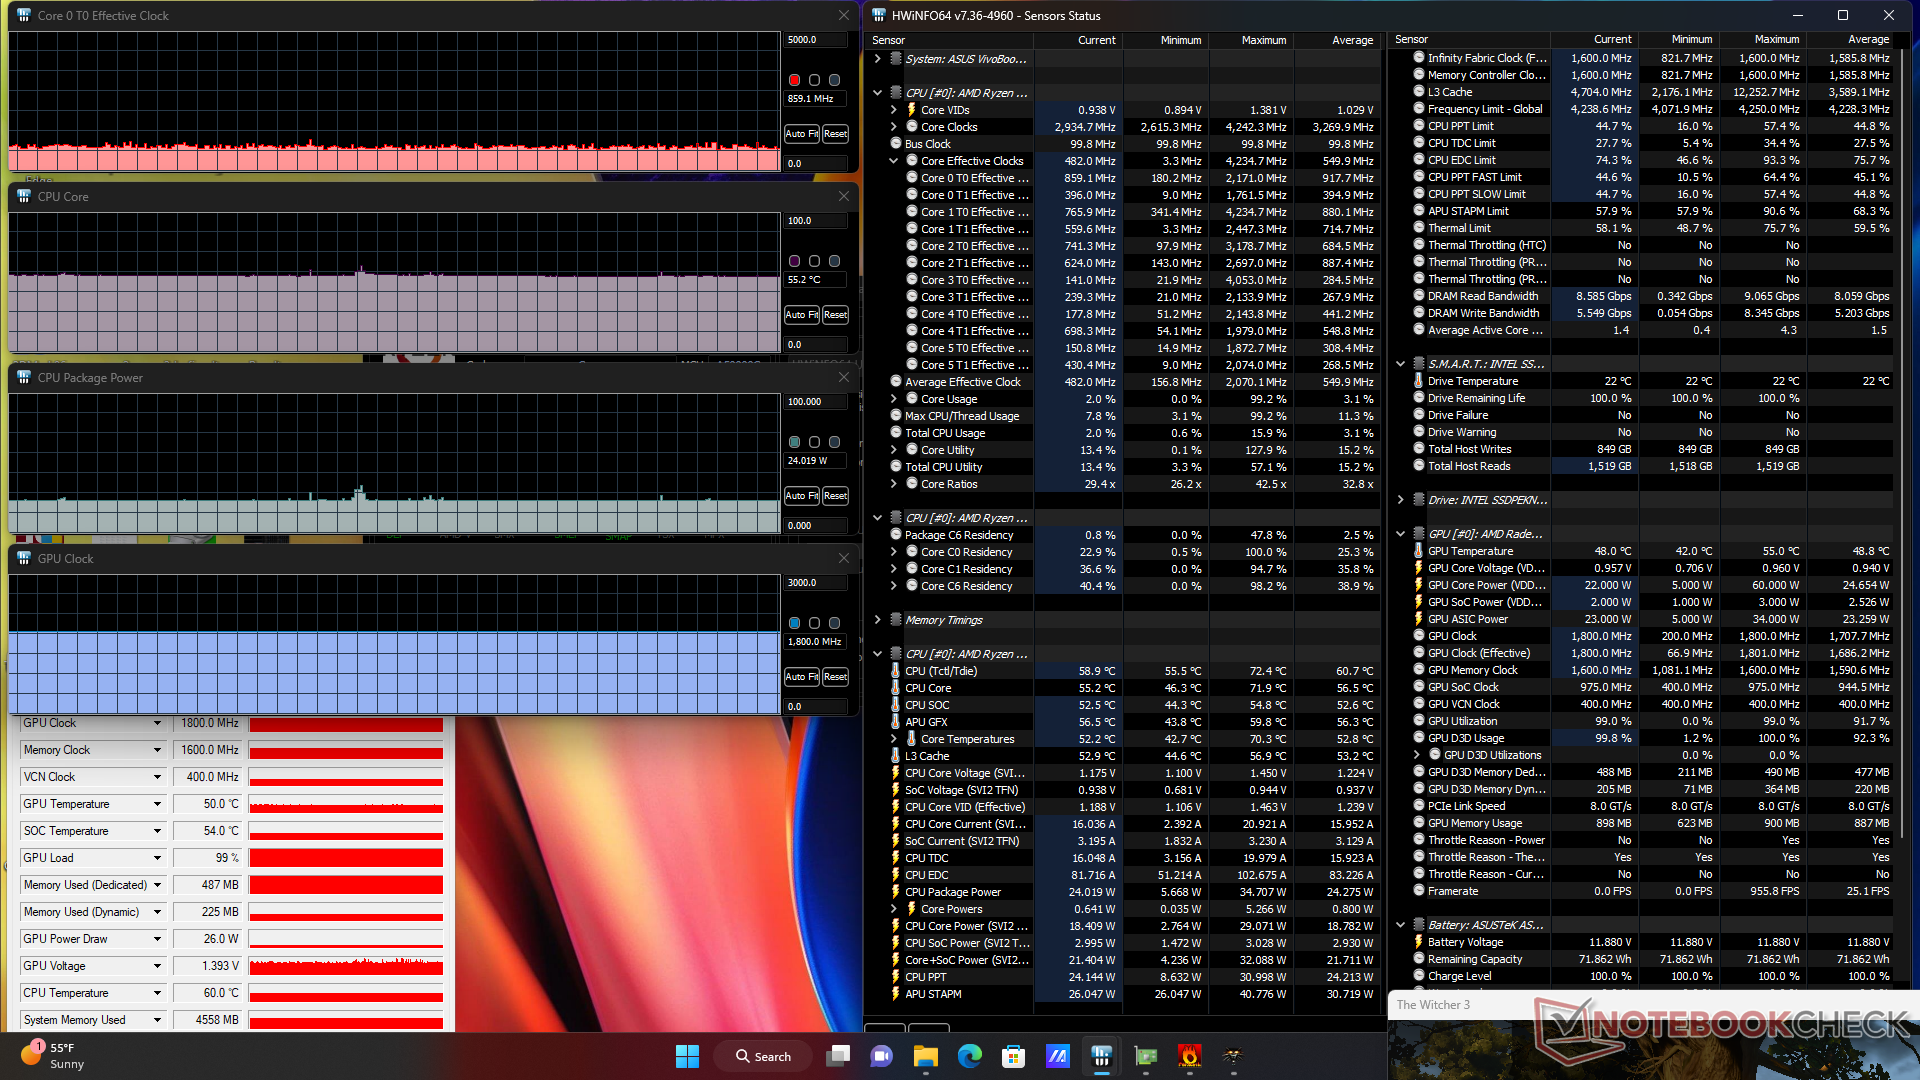
怠速时 Witcher 3揭示了性能稳定性问题,因为帧率会周期性地下降到15FPS,然后立即恢复,如下图所示。这通常归因于后台程序的资源管理不善,这些程序可能会打断正在聚焦的主程序。像Vivobook这样价格低廉的笔记本电脑往往有比平常更多的臃肿软件。
Witcher 3 FPS Chart
| low | med. | high | ultra | |
|---|---|---|---|---|
| GTA V (2015) | 52.4 | 45.6 | 11.9 | 5.09 |
| The Witcher 3 (2015) | 36 | 23 | 11.2 | 8 |
| Dota 2 Reborn (2015) | 94.3 | 59 | 28 | 26.3 |
| Final Fantasy XV Benchmark (2018) | 19 | 9.75 | 6.53 | |
| X-Plane 11.11 (2018) | 32.9 | 26.1 | 23.4 | |
| Strange Brigade (2018) | 39.7 | 15.2 | 12.8 | 11 |
| Cyberpunk 2077 1.6 (2022) | 10 |
排放
系统噪音 - 大部分时间都很安静
该系统在长时间的压力下保持安静方面表现出色。例如,当运行3DMark 06的第一个基准场景时,测试必须重复三次,风扇噪音才会明显增加。即使如此,在23.8dB(A)的无声背景下,风扇的噪音也只是可以听到27.3dB(A),而戴尔Inspiron 15 3501的噪音为35dB(A)甚至是45dB(A)。戴尔Inspiron 15 3501或 VivoBook S15分别。
我们怀疑上述比平均水平更安静的风扇噪音可能与我们的单通道配置比平均水平更慢的图形性能有关。例如,当运行Prime95和FurMark以进一步强调处理器时,风扇噪音将达到41dB(A)的更大上限。否则,对于大多数日常工作负荷,包括浏览或视频流,期望系统能安静地运行。
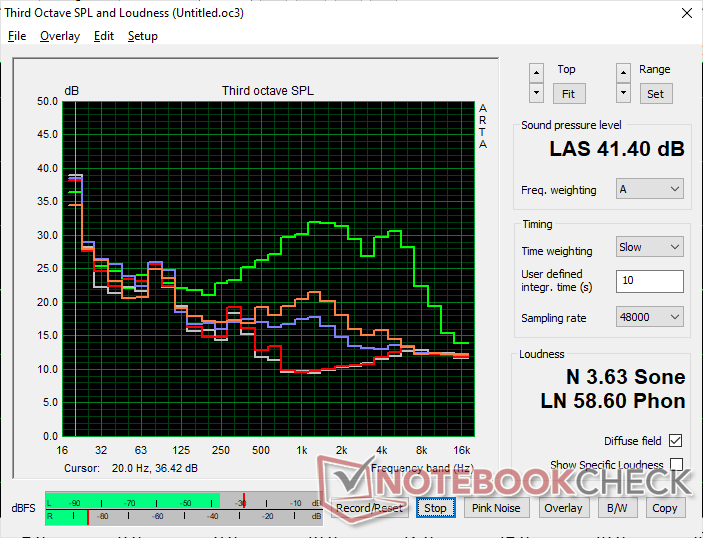
Noise level
| Idle |
| 24.1 / 24.1 / 24.1 dB(A) |
| Load |
| 27.3 / 41.4 dB(A) |
 | ||
30 dB silent 40 dB(A) audible 50 dB(A) loud |
||
min: | ||
| Asus VivoBook 15 X M1503QA Vega 7, R5 5600H, Intel SSD 670p SSDPEKNU512GZ | Asus Vivobook 15 K513EQ GeForce MX350, i7-1165G7, Intel SSD 660p SSDPEKNW512G8 | Asus VivoBook S15 D533UA Vega 8, R7 5700U, WDC PC SN530 SDBPNPZ-1T00 | Asus ZenBook UX535-M01440 GeForce GTX 1650 Ti Max-Q, i7-10750H, WDC PC SN730 SDBPNTY-1T00 | Lenovo ThinkBook 15 G3 ACL 21A400B2GE Vega 7, R5 5500U, Samsung PM991A MZALQ256HBJD | Dell Inspiron 15 3501 Iris Xe G7 96EUs, i7-1165G7, Samsung PM991a MZ9LQ512HBLU-00BD1 | |
|---|---|---|---|---|---|---|
| Noise | -14% | -20% | -14% | -7% | -9% | |
| off / environment * (dB) | 23.8 | 23.4 2% | 26 -9% | 24.6 -3% | 25.5 -7% | 26 -9% |
| Idle Minimum * (dB) | 24.1 | 23.6 2% | 26 -8% | 24.6 -2% | 25.5 -6% | 26 -8% |
| Idle Average * (dB) | 24.1 | 23.6 2% | 26 -8% | 24.6 -2% | 25.5 -6% | 26 -8% |
| Idle Maximum * (dB) | 24.1 | 23.6 2% | 28.8 -20% | 24.6 -2% | 25.5 -6% | 26 -8% |
| Load Average * (dB) | 27.3 | 41 -50% | 45 -65% | 41.3 -51% | 28.5 -4% | 35.9 -32% |
| Witcher 3 ultra * (dB) | 29.7 | 42.9 -44% | 42 -41% | |||
| Load Maximum * (dB) | 41.4 | 47 -14% | 45 -9% | 41.4 -0% | 45.6 -10% | 35.8 14% |
* ... smaller is better
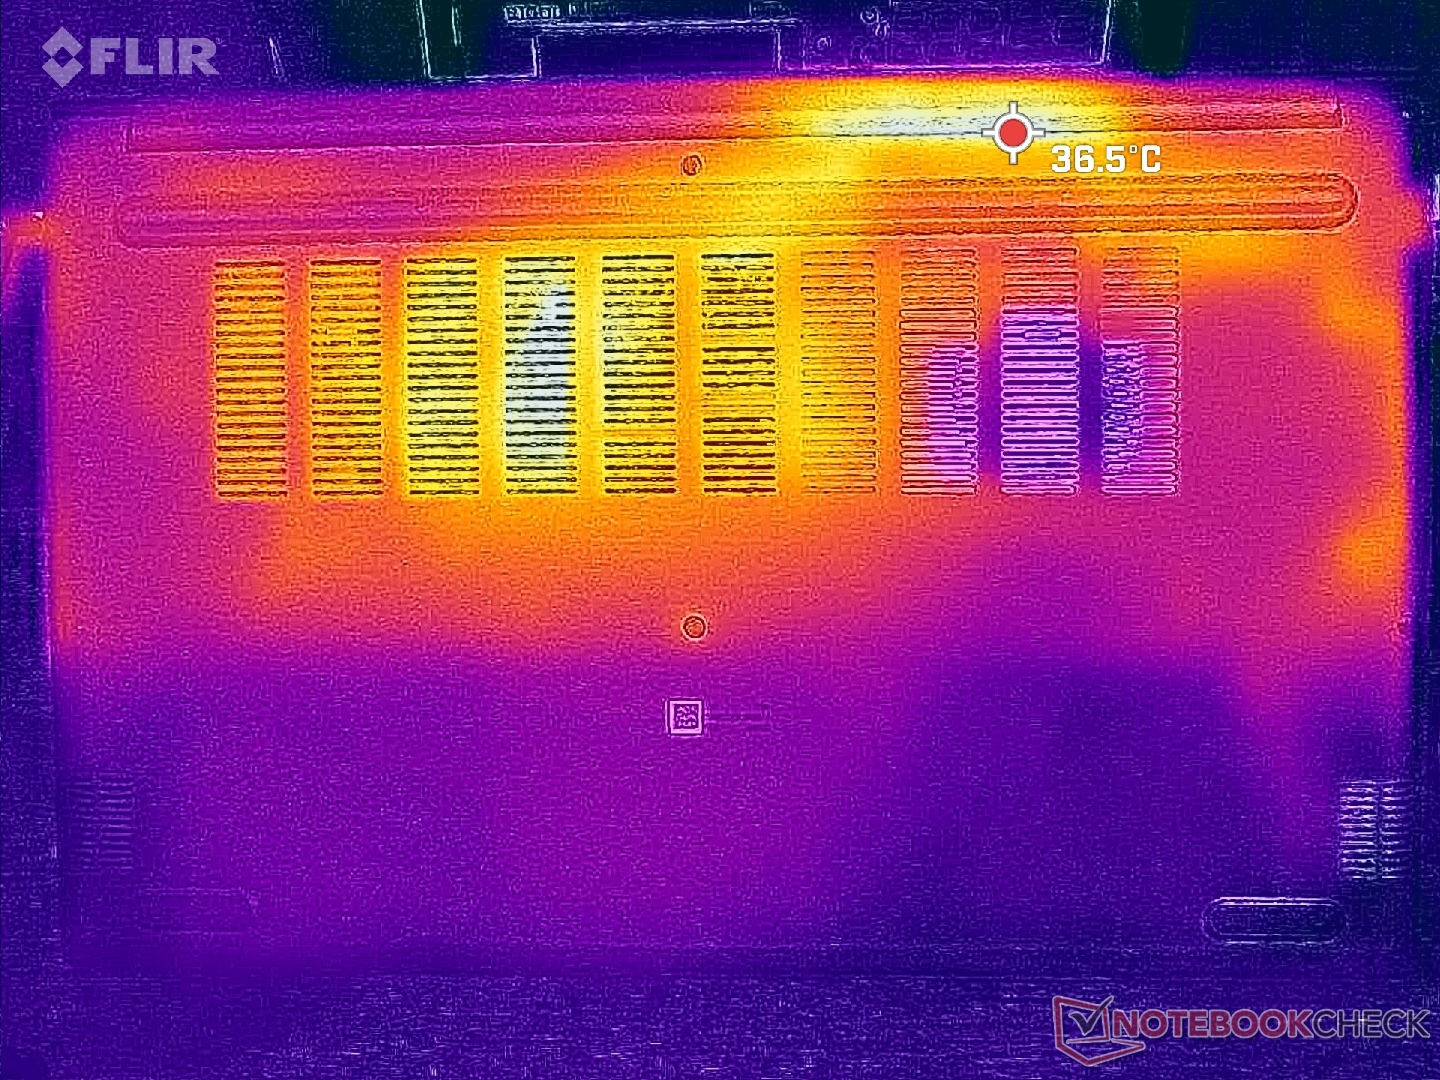
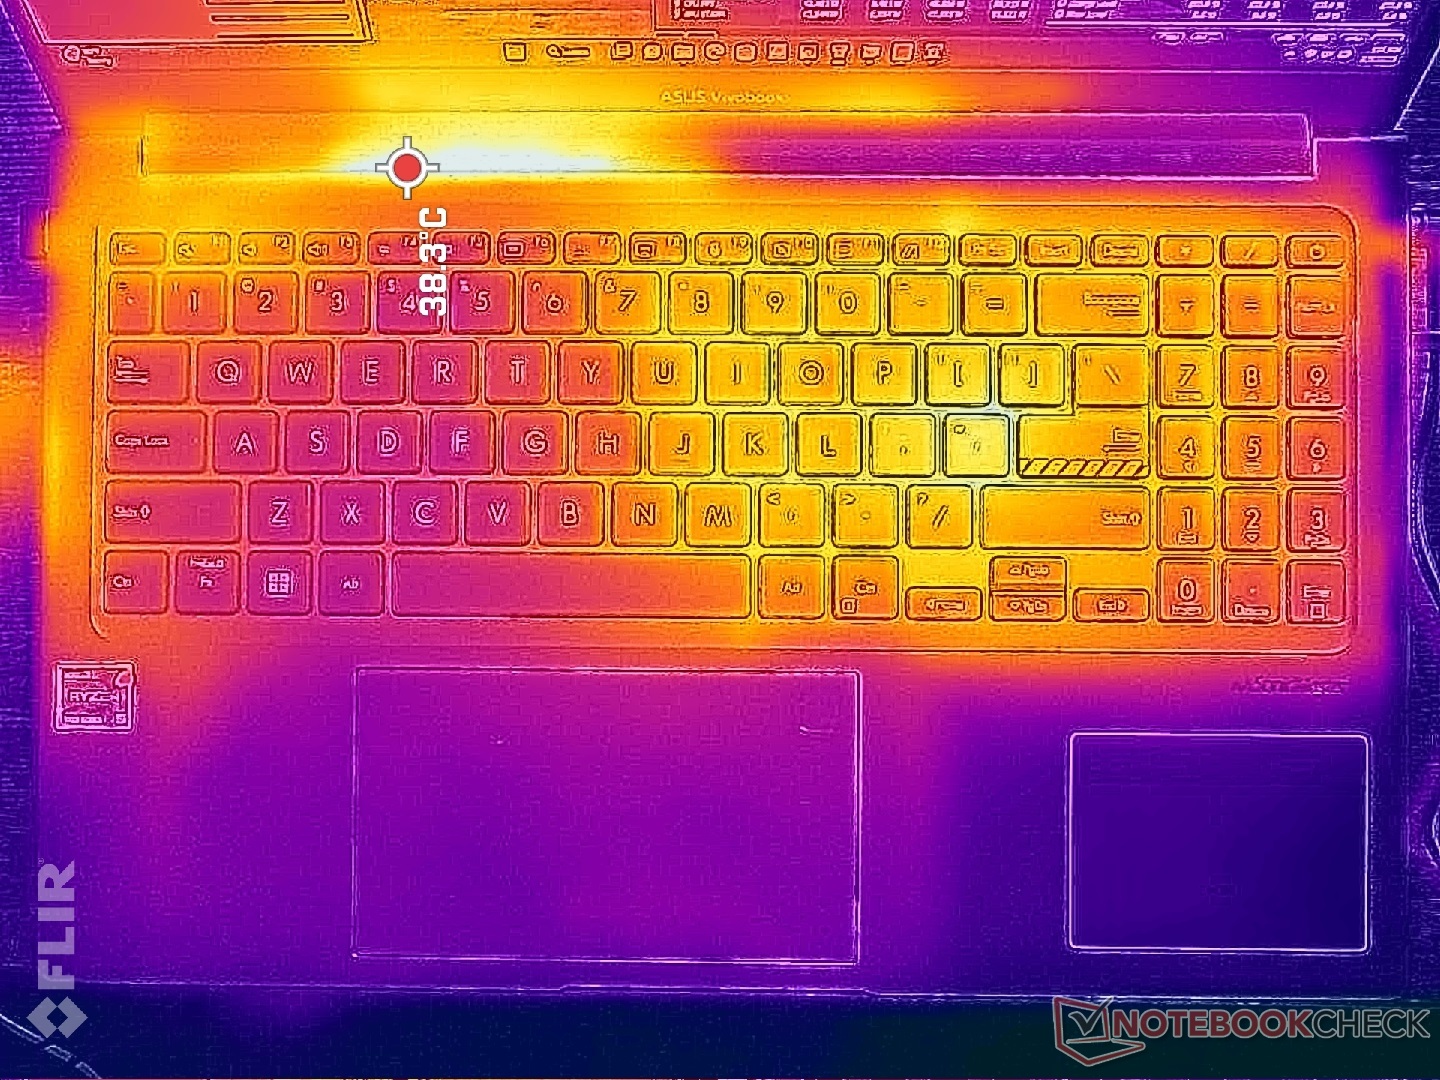
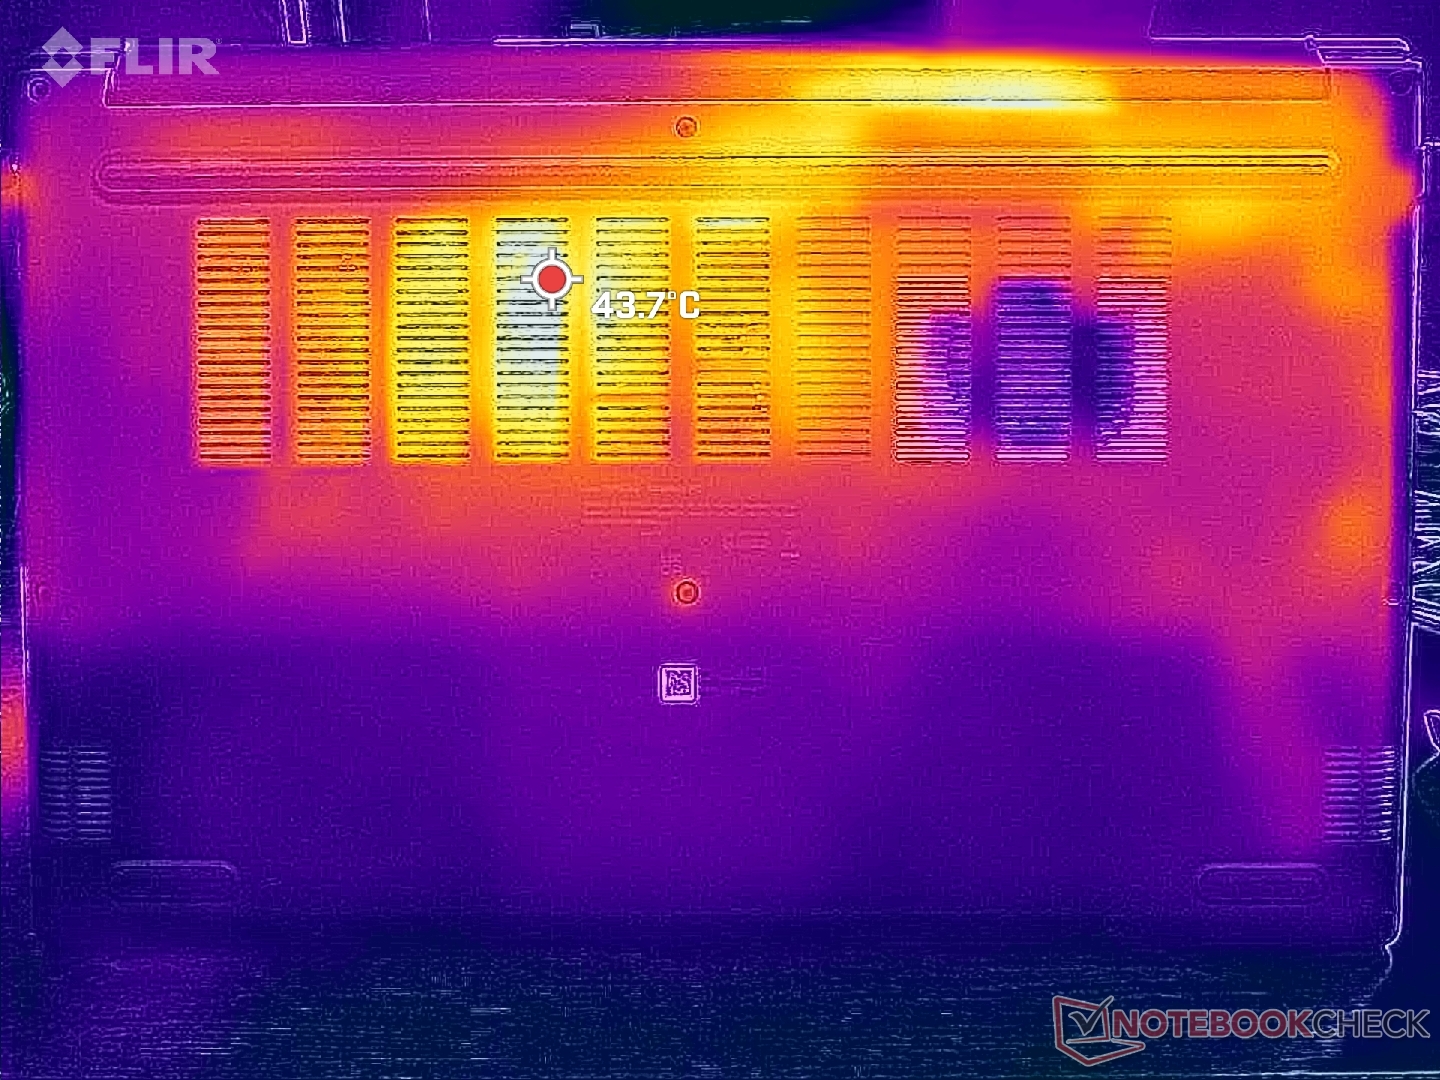
温度
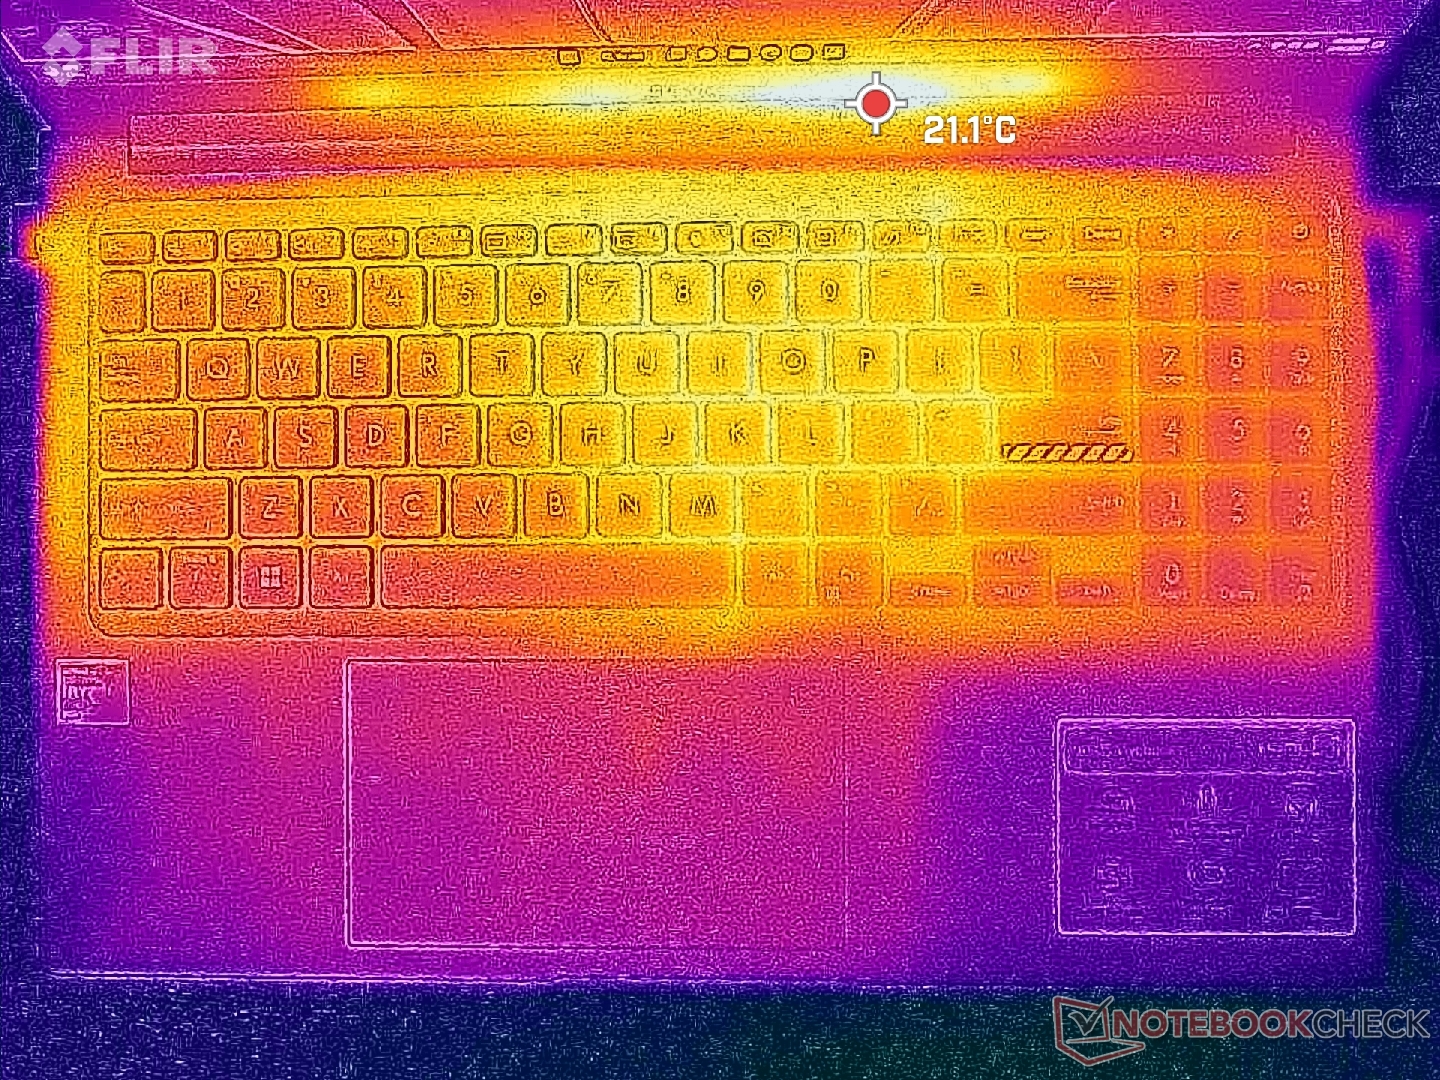
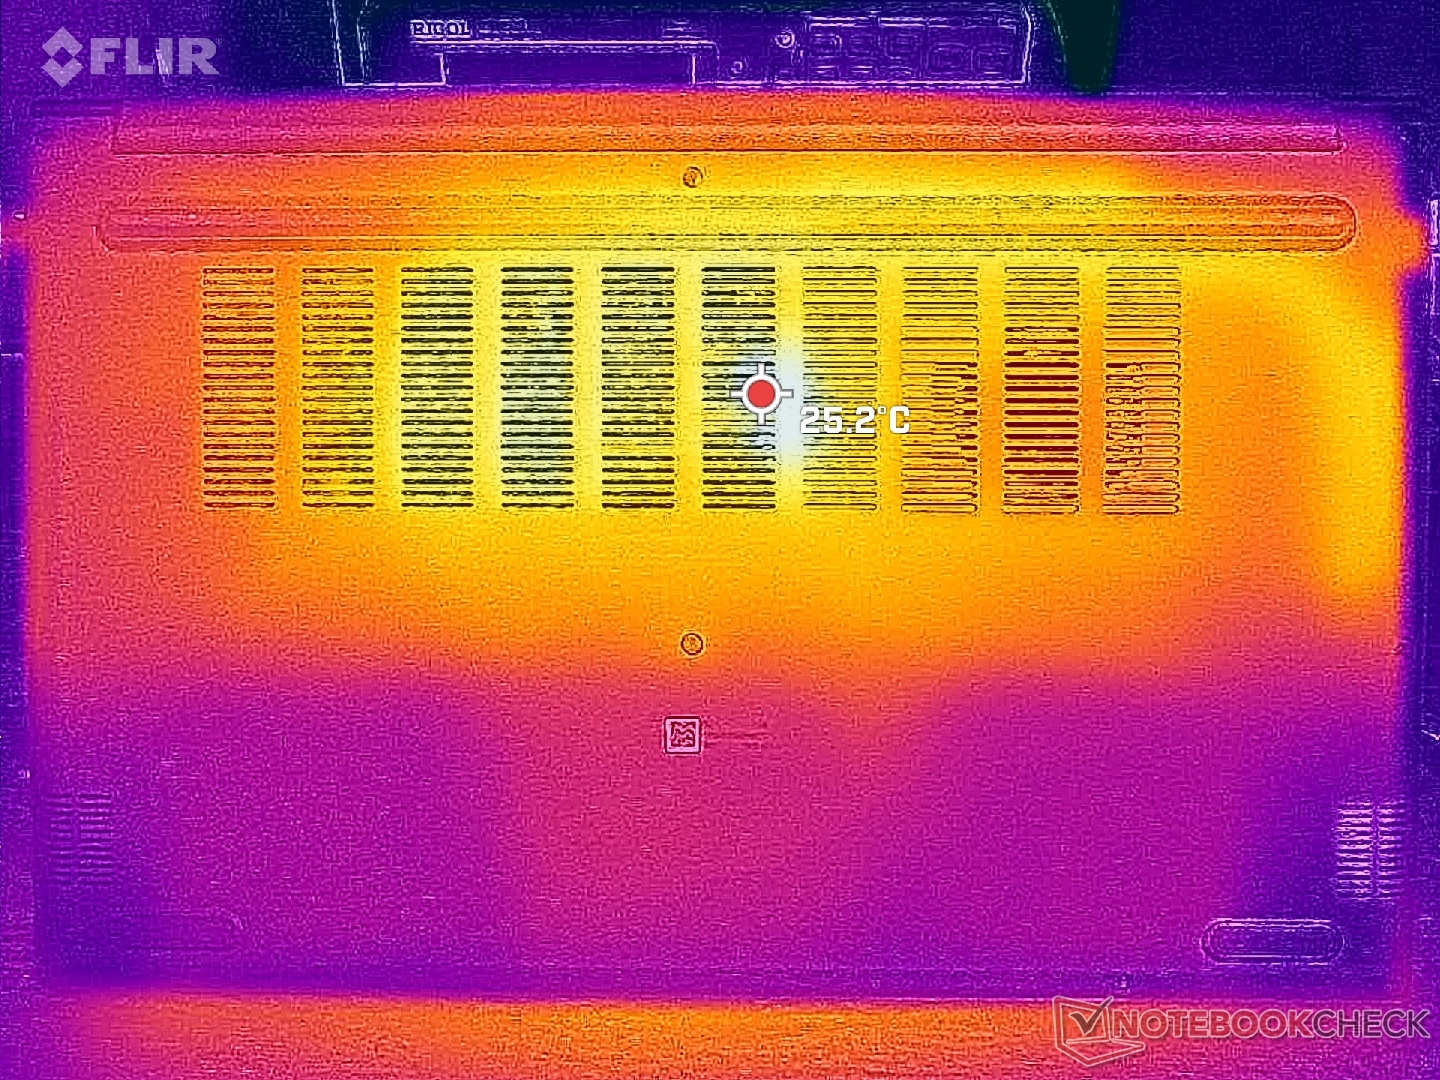
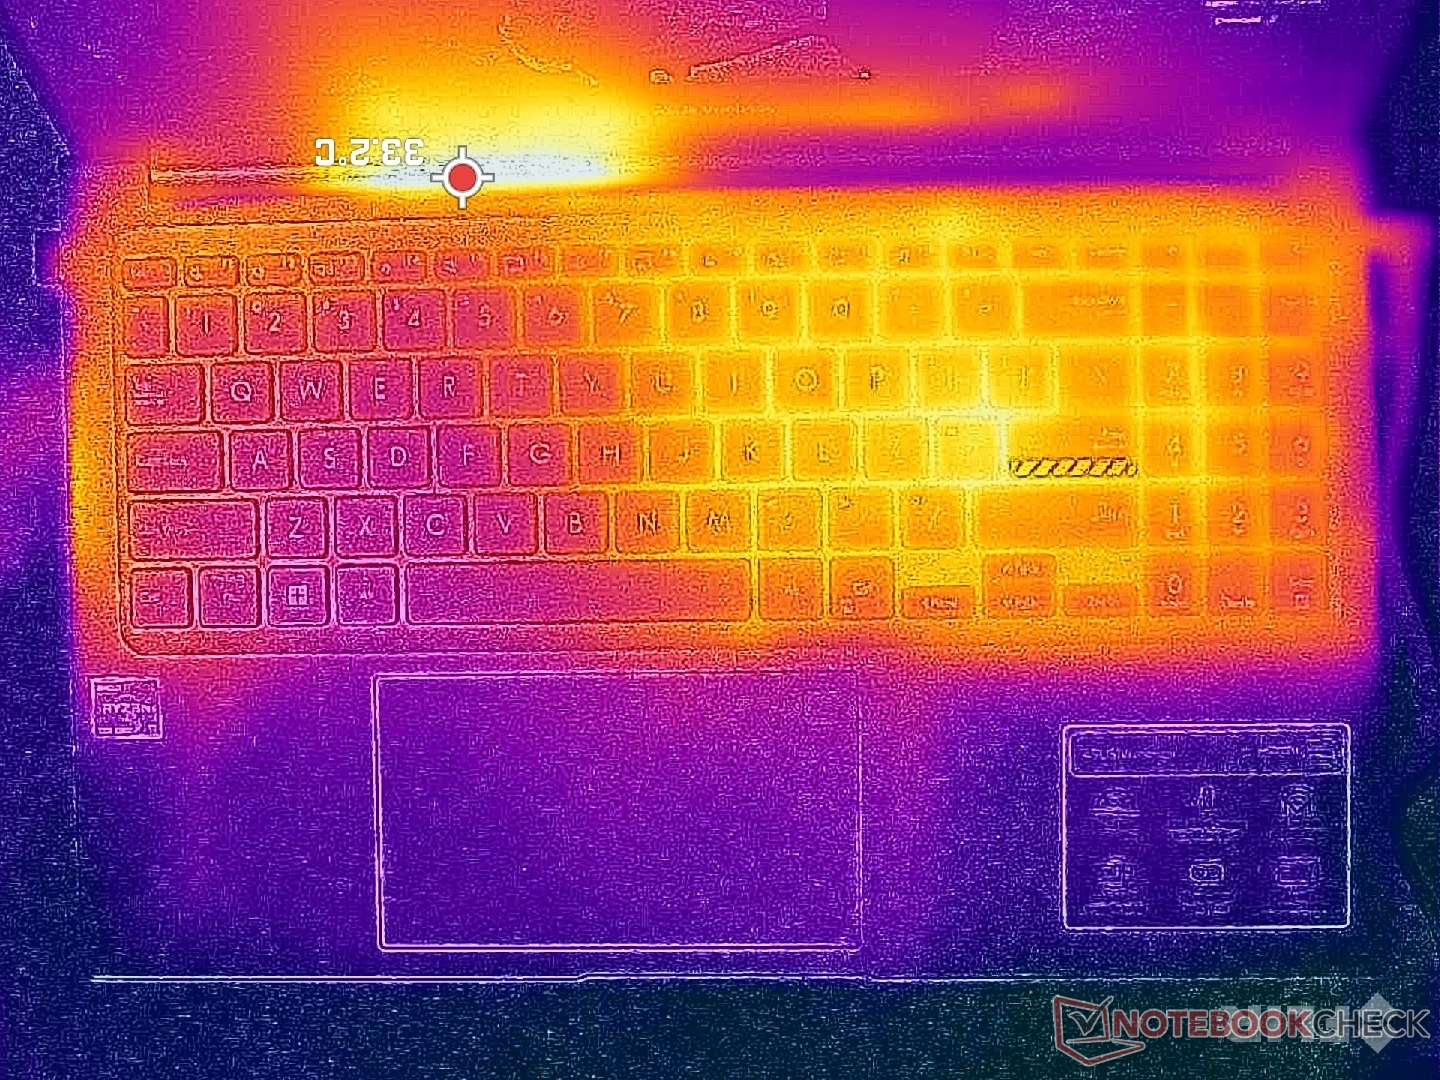
由于机箱内部冷却方案的定位,机箱右半部分的表面温度总是比较高。键盘最冷和最热的一侧之间的差异可高达10摄氏度。无论屏幕上的负载如何,表面都不会变得令人不舒服。
竞争者戴尔 Inspiron 15 3501在顶部和底部的温度甚至可以达到50摄氏度,而我们的华硕最高温度在35摄氏度左右。
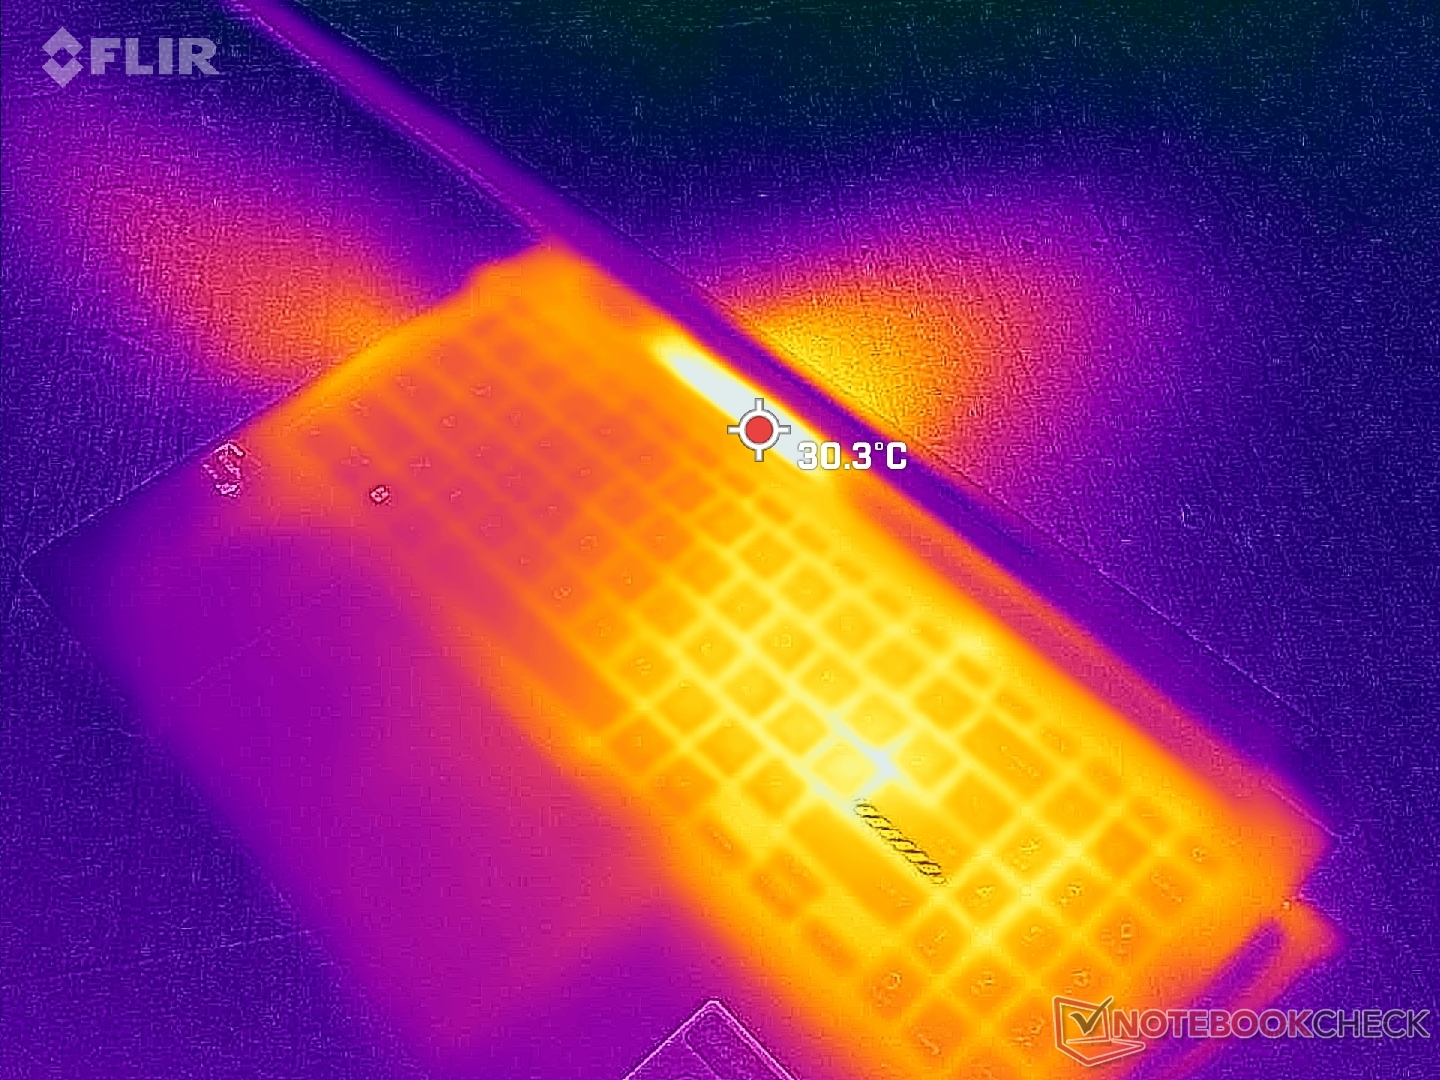
(+) The maximum temperature on the upper side is 33.4 °C / 92 F, compared to the average of 36.8 °C / 98 F, ranging from 21 to 71 °C for the class Multimedia.
(+) The bottom heats up to a maximum of 35.6 °C / 96 F, compared to the average of 39.1 °C / 102 F
(+) In idle usage, the average temperature for the upper side is 22.4 °C / 72 F, compared to the device average of 31.3 °C / 88 F.
(+) Playing The Witcher 3, the average temperature for the upper side is 24.6 °C / 76 F, compared to the device average of 31.3 °C / 88 F.
(+) The palmrests and touchpad are cooler than skin temperature with a maximum of 20.8 °C / 69.4 F and are therefore cool to the touch.
(+) The average temperature of the palmrest area of similar devices was 28.7 °C / 83.7 F (+7.9 °C / 14.3 F).
| Asus VivoBook 15 X M1503QA AMD Ryzen 5 5600H, AMD Radeon RX Vega 7 | Asus Vivobook 15 K513EQ Intel Core i7-1165G7, NVIDIA GeForce MX350 | Asus VivoBook S15 D533UA AMD Ryzen 7 5700U, AMD Radeon RX Vega 8 (Ryzen 4000/5000) | Asus ZenBook UX535-M01440 Intel Core i7-10750H, NVIDIA GeForce GTX 1650 Ti Max-Q | Lenovo ThinkBook 15 G3 ACL 21A400B2GE AMD Ryzen 5 5500U, AMD Radeon RX Vega 7 | Dell Inspiron 15 3501 Intel Core i7-1165G7, Intel Iris Xe Graphics G7 96EUs | |
|---|---|---|---|---|---|---|
| Heat | -30% | -22% | -15% | -25% | -20% | |
| Maximum Upper Side * (°C) | 33.4 | 48.8 -46% | 46.1 -38% | 37.8 -13% | 42.2 -26% | 45.6 -37% |
| Maximum Bottom * (°C) | 35.6 | 42 -18% | 46.6 -31% | 44.2 -24% | 48.8 -37% | 41 -15% |
| Idle Upper Side * (°C) | 24.6 | 30 -22% | 27.4 -11% | 28.1 -14% | 27.8 -13% | 28.2 -15% |
| Idle Bottom * (°C) | 26 | 35 -35% | 28.2 -8% | 27.7 -7% | 32.3 -24% | 29.1 -12% |
* ... smaller is better
压力测试
CPU的时钟频率、温度和电路板功耗将分别提升到并稳定在4GHz、78C和41W,没有明显的下降或循环行为。相比之下,许多由U系列CPU驱动的超极本在保持温度的情况下,只在短短的几秒钟内飙升到高时钟速率,然后就会扼杀性能。
GPU时钟速率和温度将稳定在1800 MHz和相对凉爽的55 C,而较小的14英寸的GPU则为78 C。VivoBook S 14X.然而,后者提供的图形性能比我们的审查单位更快。
用电池供电运行会影响性能。在电池上进行的3DMark 11测试将分别返回物理和图形分数8132和3391分,而在主电源上则为8662和3505分。
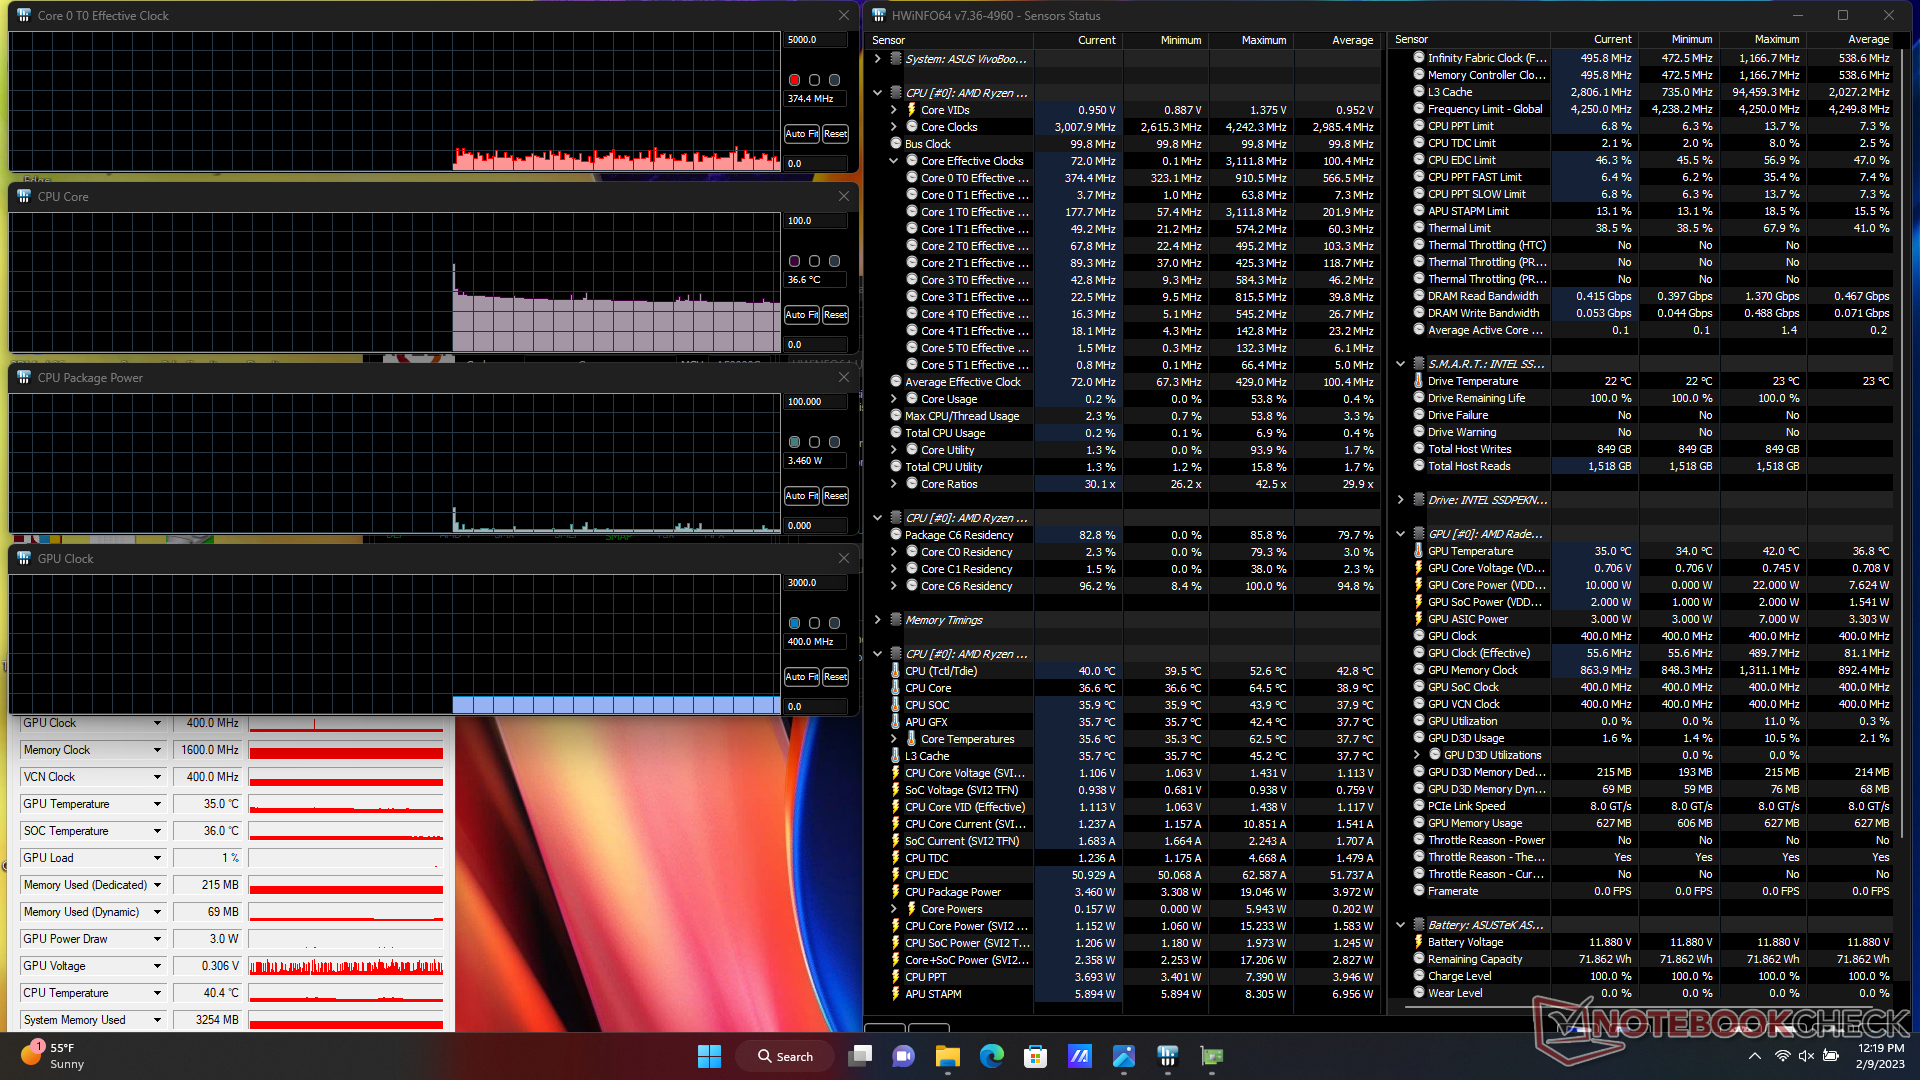
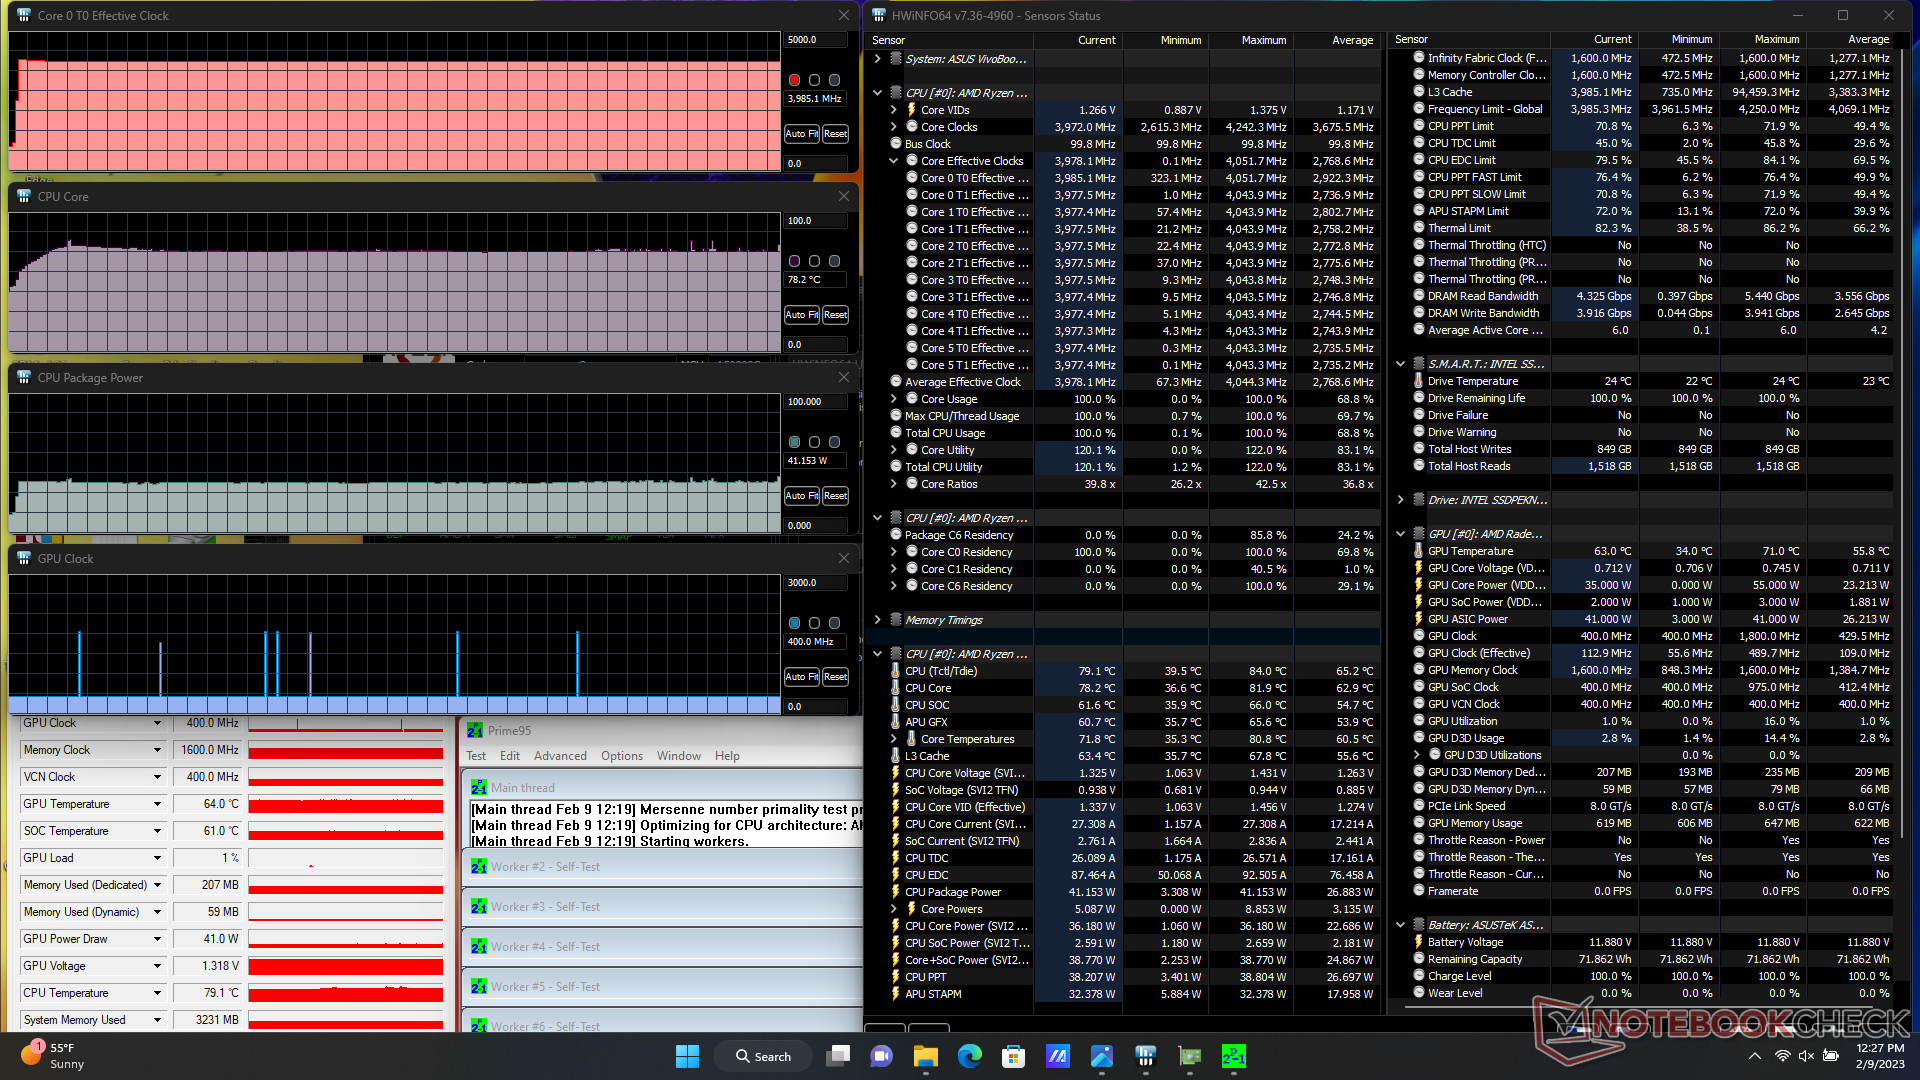
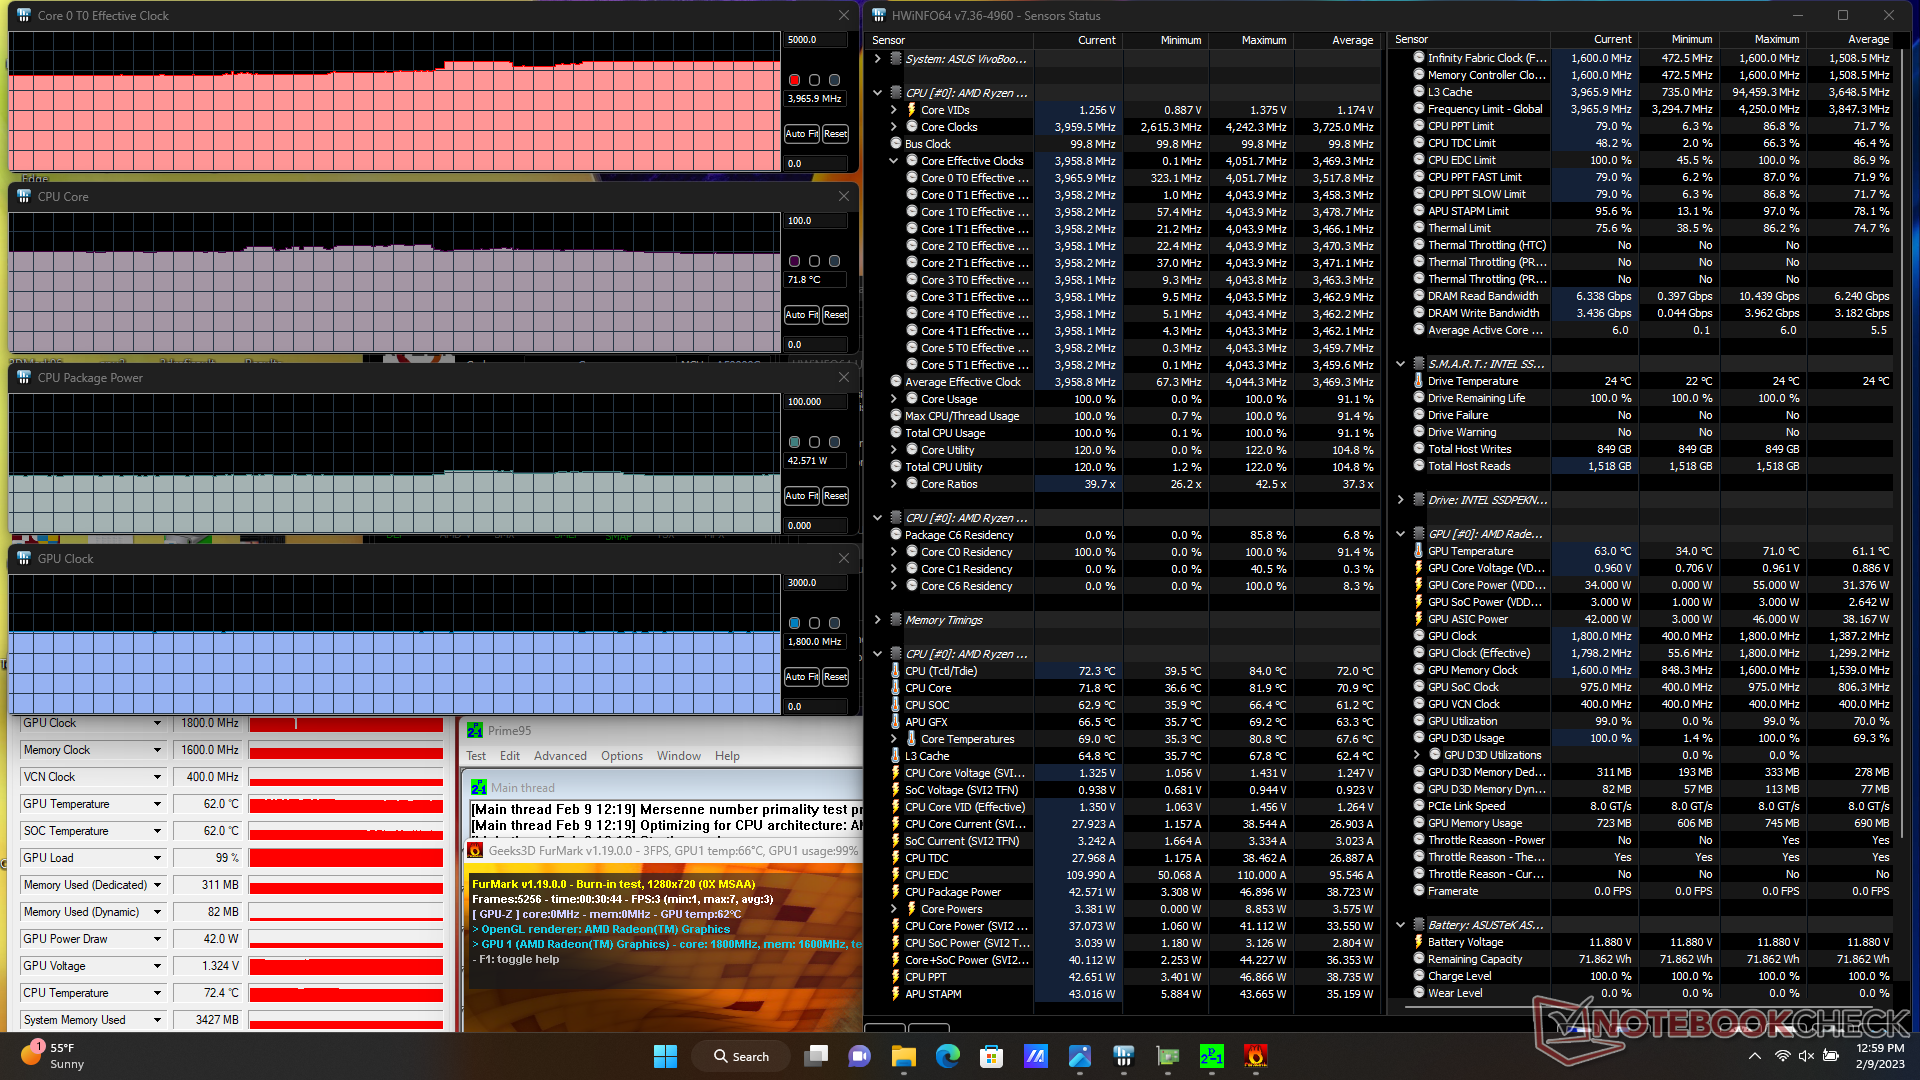
| CPU时钟(GHz) | GPU时钟(MHz) | CPU平均温度(°C) | |
| 系统空闲 | -- | -- | 37 |
| Prime95压力 | 4.0 | -- | 78 |
| Prime95 + FurMark 压力 | ~4.0 | 1800 | 72 |
| Witcher 3 应力 | ~0.9 | 1800 | 55 |
发言人
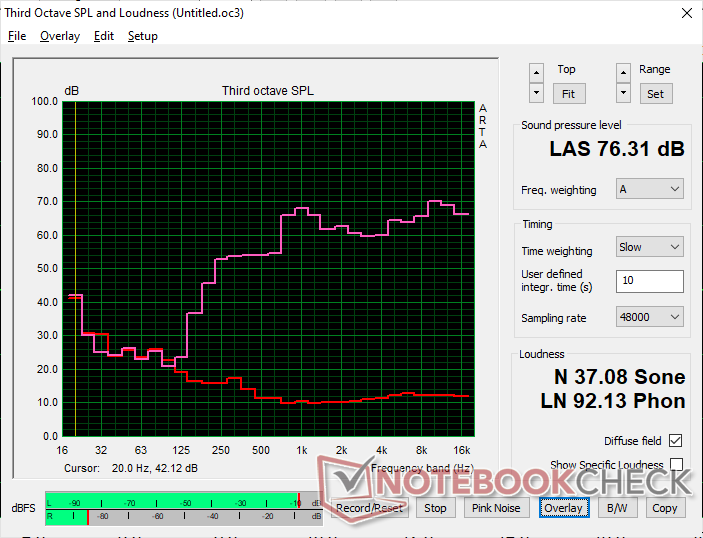
Asus VivoBook 15 X M1503QA audio analysis
(±) | speaker loudness is average but good (76.3 dB)
Bass 100 - 315 Hz
(-) | nearly no bass - on average 21.9% lower than median
(±) | linearity of bass is average (12.8% delta to prev. frequency)
Mids 400 - 2000 Hz
(±) | higher mids - on average 5% higher than median
(+) | mids are linear (5.6% delta to prev. frequency)
Highs 2 - 16 kHz
(+) | balanced highs - only 3.2% away from median
(+) | highs are linear (4.1% delta to prev. frequency)
Overall 100 - 16.000 Hz
(±) | linearity of overall sound is average (20.3% difference to median)
Compared to same class
» 68% of all tested devices in this class were better, 9% similar, 24% worse
» The best had a delta of 5%, average was 17%, worst was 45%
Compared to all devices tested
» 53% of all tested devices were better, 8% similar, 39% worse
» The best had a delta of 4%, average was 23%, worst was 134%
Apple MacBook Pro 16 2021 M1 Pro audio analysis
(+) | speakers can play relatively loud (84.7 dB)
Bass 100 - 315 Hz
(+) | good bass - only 3.8% away from median
(+) | bass is linear (5.2% delta to prev. frequency)
Mids 400 - 2000 Hz
(+) | balanced mids - only 1.3% away from median
(+) | mids are linear (2.1% delta to prev. frequency)
Highs 2 - 16 kHz
(+) | balanced highs - only 1.9% away from median
(+) | highs are linear (2.7% delta to prev. frequency)
Overall 100 - 16.000 Hz
(+) | overall sound is linear (4.6% difference to median)
Compared to same class
» 0% of all tested devices in this class were better, 0% similar, 100% worse
» The best had a delta of 5%, average was 17%, worst was 45%
Compared to all devices tested
» 0% of all tested devices were better, 0% similar, 100% worse
» The best had a delta of 4%, average was 23%, worst was 134%
能源管理
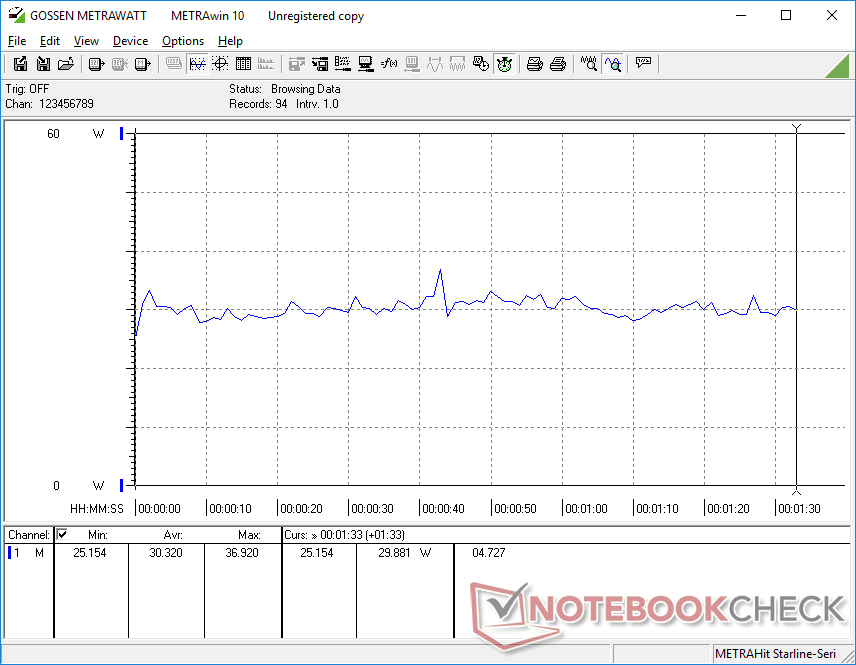
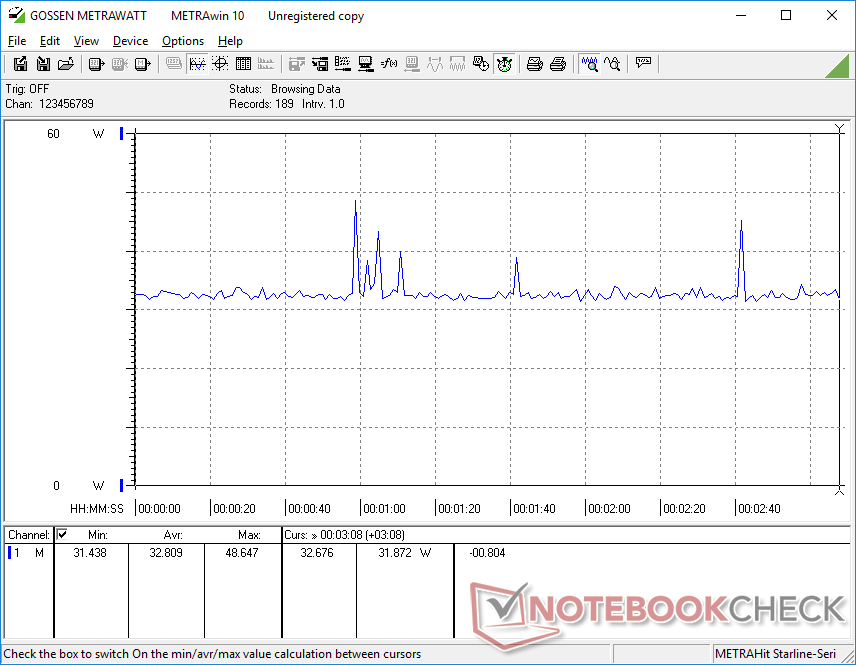
消耗功率
在桌面上空转需要5瓦到14瓦,这取决于亮度设置和电源配置文件,这比大多数基于IPS的替代品,如戴尔Inspiron 15 3501或联想ThinkBook 15 G3多出几瓦。 联想ThinkBook 15 G3.由于OLED在显示白色时消耗更多的电力,建议使用较暗的壁纸或背景来延长电池寿命。
运行更高的负载,如3DMark 或 Witcher 3将平均消耗约33W,而VivoBook S15 D533的功耗为40W或更高。VivoBook S15 D533UA或联想ThinkBook 15 G3。然而,由于前面提到的单通道内存,我们的评测设备上的图形性能较弱。将我们的设备升级为双通道会相应提高性能和功耗。
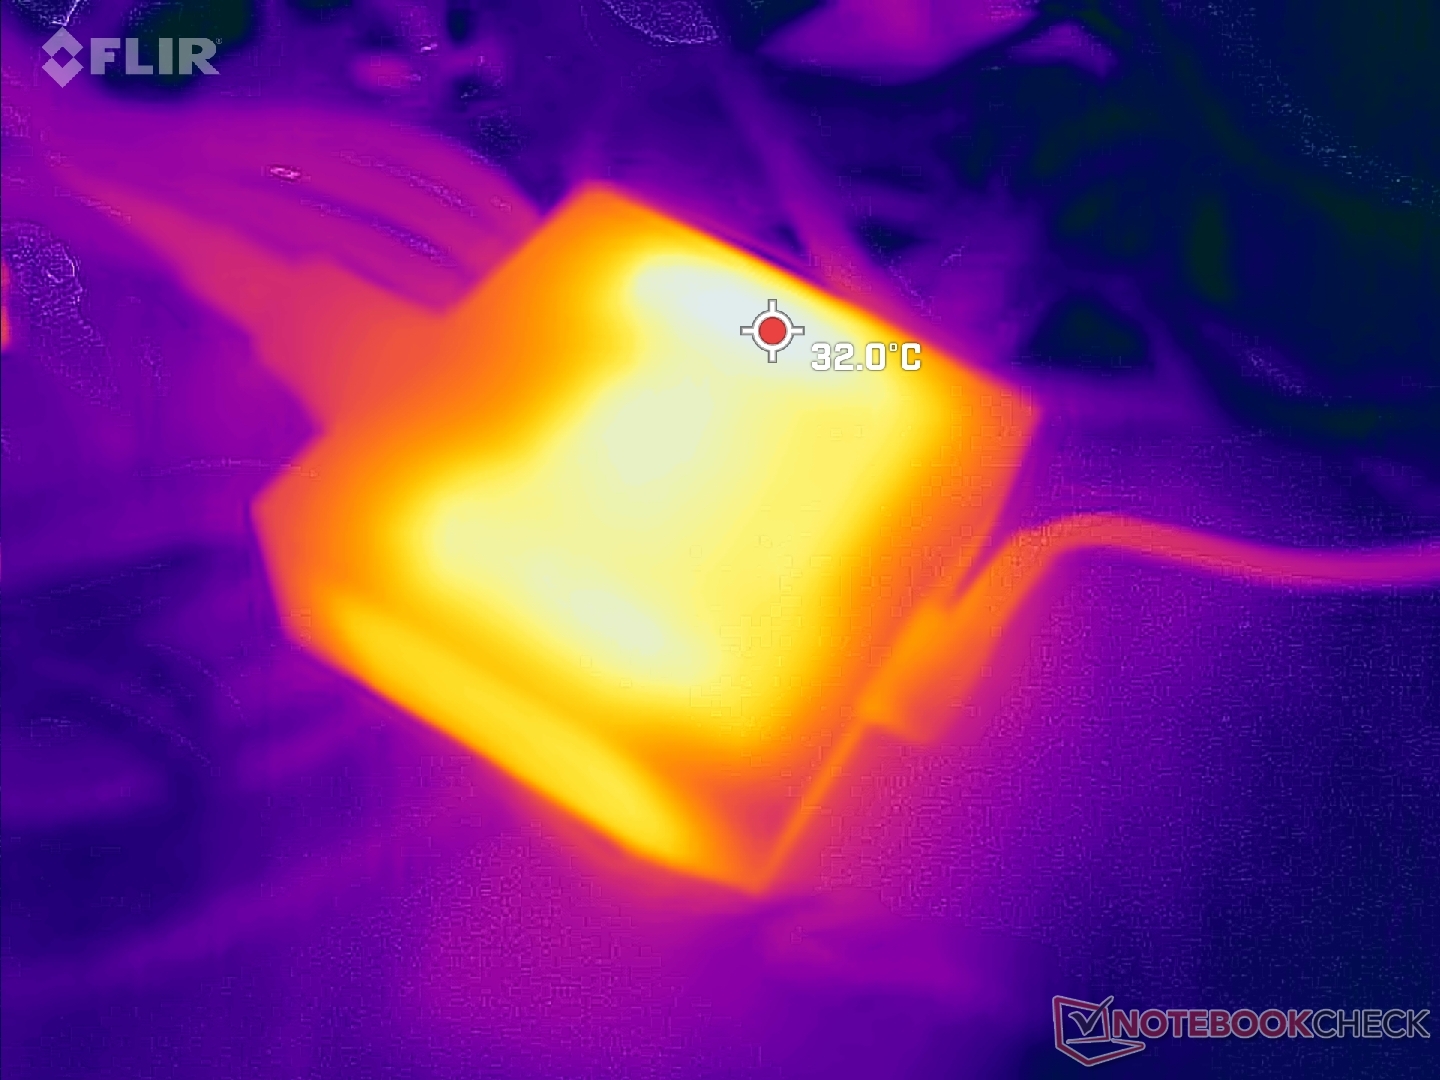
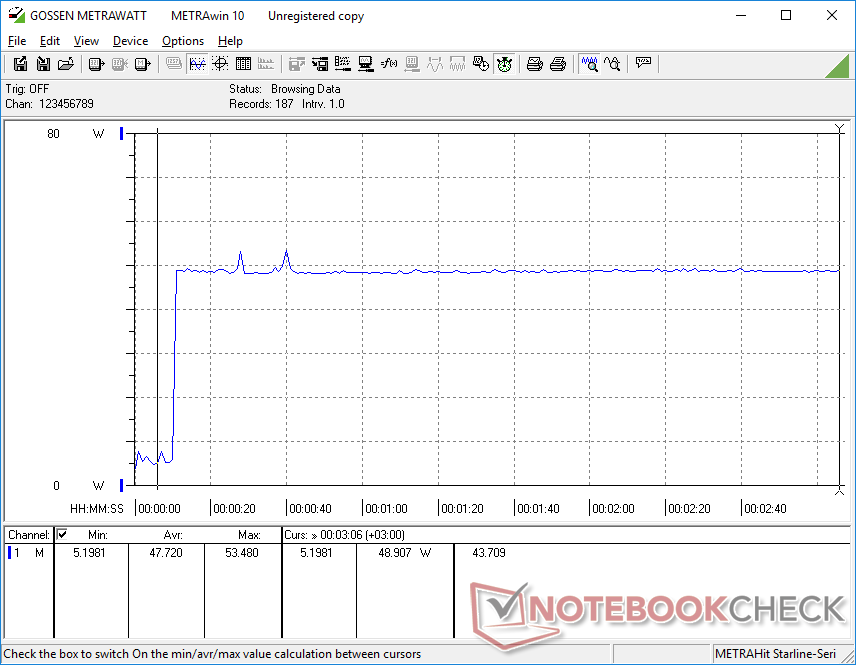
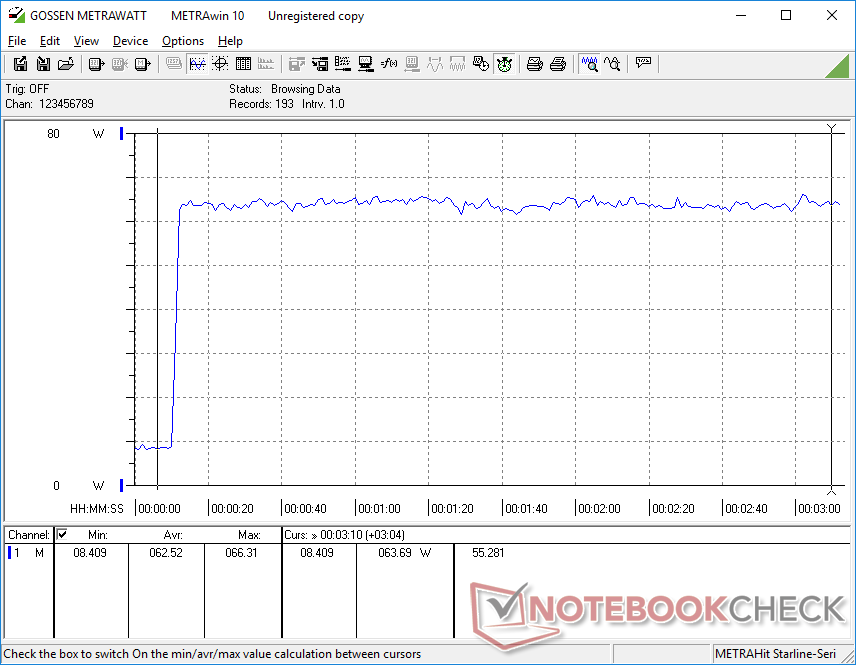
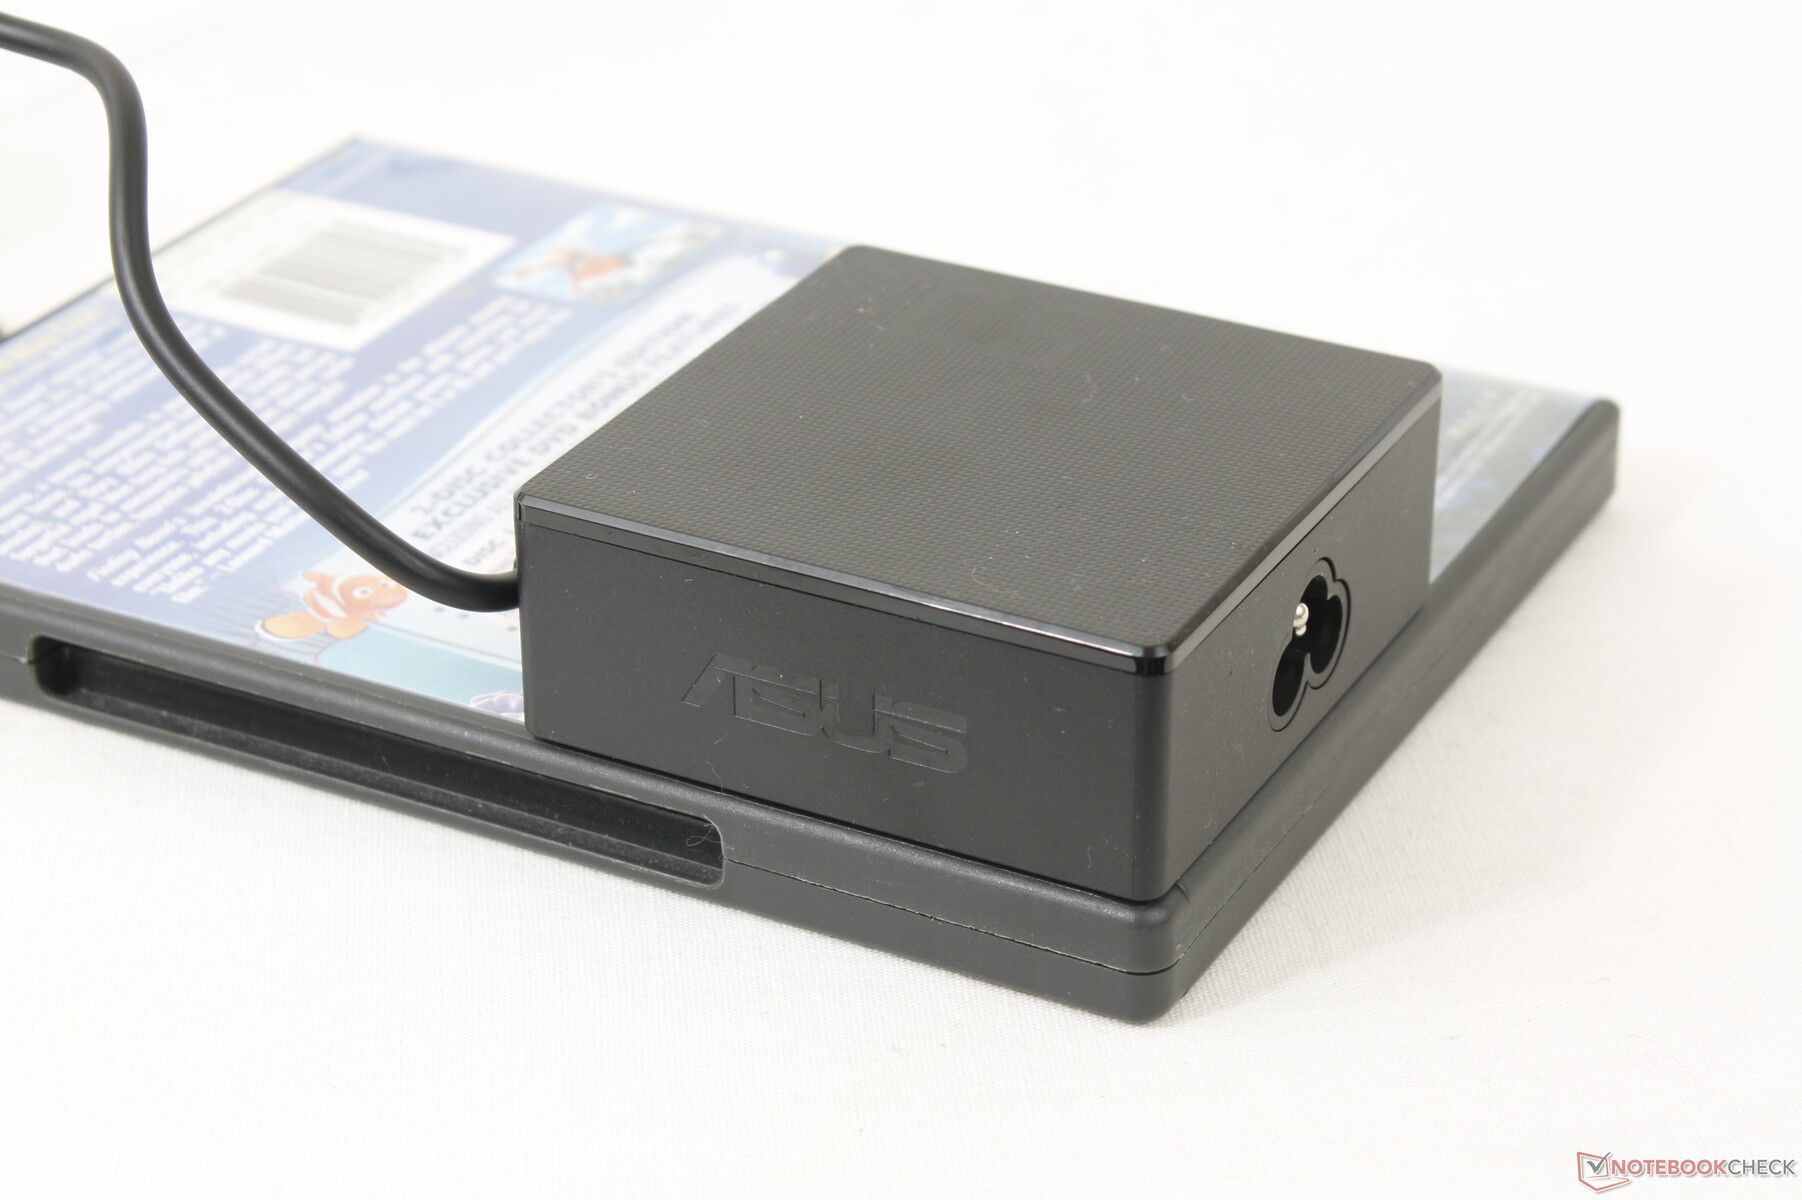
当同时运行Prime95和FurMark时,我们能够从小型(7.5 x 7.5 x 2.9厘米)的90瓦交流适配器中记录到63瓦的最大功耗。该适配器有足够的空间为系统供电并以合理的速度为电池充电。
| Off / Standby | |
| Idle | |
| Load |
|
Key:
min: | |
| Asus VivoBook 15 X M1503QA R5 5600H, Vega 7, Intel SSD 670p SSDPEKNU512GZ, OLED, 1920x1080, 15.6" | Asus Vivobook 15 K513EQ i7-1165G7, GeForce MX350, Intel SSD 660p SSDPEKNW512G8, OLED, 1920x1080, 15.6" | Asus VivoBook S15 D533UA R7 5700U, Vega 8, WDC PC SN530 SDBPNPZ-1T00, IPS, 1920x1080, 15.6" | Asus ZenBook UX535-M01440 i7-10750H, GeForce GTX 1650 Ti Max-Q, WDC PC SN730 SDBPNTY-1T00, IPS, 3840x2160, 15.6" | Lenovo ThinkBook 15 G3 ACL 21A400B2GE R5 5500U, Vega 7, Samsung PM991A MZALQ256HBJD, IPS, 1920x1080, 15.6" | Dell Inspiron 15 3501 i7-1165G7, Iris Xe G7 96EUs, Samsung PM991a MZ9LQ512HBLU-00BD1, IPS, 1920x1080, 15.6" | |
|---|---|---|---|---|---|---|
| Power Consumption | -14% | -9% | -65% | -4% | 13% | |
| Idle Minimum * (Watt) | 5.4 | 3.7 31% | 5 7% | 4.4 19% | 4.2 22% | 3.6 33% |
| Idle Average * (Watt) | 7.4 | 6.3 15% | 7.7 -4% | 9.8 -32% | 8.3 -12% | 6.4 14% |
| Idle Maximum * (Watt) | 13.8 | 9.7 30% | 12.2 12% | 14.5 -5% | 10.4 25% | 7.9 43% |
| Load Average * (Watt) | 30.3 | 59 -95% | 41 -35% | 83 -174% | 49 -62% | 39 -29% |
| Witcher 3 ultra * (Watt) | 32.8 | 51.4 -57% | 43 -31% | 67 -104% | 39.7 -21% | 37.6 -15% |
| Load Maximum * (Watt) | 63 | 67.7 -7% | 65 -3% | 123 -95% | 49.3 22% | 41.8 34% |
* ... smaller is better
Power Consumption Witcher 3 / Stresstest
Power Consumption external Monitor
电池寿命 - 长寿命机器
相对于其他Vivobook机型,电池容量很大,为70Wh,其中~40Wh是典型的。这一增加足以抵消OLED面板和H系列CPU的更高功率需求。我们能够记录下超过11小时的实际浏览时间,而VivoBook S15为9小时。
从空电到满电的充电速度相对较快,约为90分钟。不幸的是,该系统不能通过USB-C充电。
| Asus VivoBook 15 X M1503QA R5 5600H, Vega 7, 70 Wh | Asus Vivobook 15 K513EQ i7-1165G7, GeForce MX350, 42 Wh | Asus VivoBook S15 D533UA R7 5700U, Vega 8, 50 Wh | Asus ZenBook UX535-M01440 i7-10750H, GeForce GTX 1650 Ti Max-Q, 96 Wh | Lenovo ThinkBook 15 G3 ACL 21A400B2GE R5 5500U, Vega 7, 45 Wh | Dell Inspiron 15 3501 i7-1165G7, Iris Xe G7 96EUs, 42 Wh | |
|---|---|---|---|---|---|---|
| Battery runtime | -35% | -20% | -1% | -28% | -39% | |
| Reader / Idle (h) | 18.9 | 13.3 -30% | 18.3 -3% | |||
| WiFi v1.3 (h) | 11.2 | 6 -46% | 9 -20% | 10.1 -10% | 8.1 -28% | 6.8 -39% |
| Load (h) | 1.8 | 1.3 -28% | 2 11% | |||
| H.264 (h) | 11.9 |
Pros
Cons
结论 - 对于这个价格来说,显示和处理器都很棒
VivoBook 15X OLED在提供长的电池寿命、快速的处理器性能和经过Pantone校准的OLED显示屏方面表现出色,而且价格合理。在同一价格范围内的大多数其他超极本通常提供较慢的U系列处理器和/或颜色较差的IPS显示屏。因此,VivoBook 15X OLED更适合于偶尔的随身图形编辑,而不是人们所期望的15.6英寸预算笔记本电脑。
该机型的一个明显的挫折是其有限的8GB焊接的单通道内存,这大大影响了图形性能。幸运的是,底部面板相对容易脱落,用户可以添加额外的内存,我们强烈推荐。升级到16GB的双通道内存基本上可以解锁GPU的性能,同时提高整个笔记本电脑的多任务处理能力。
另一个需要记住的限制是缺乏对DisplayPort或HDMI 2.0的支持。60赫兹的4K显示器完全不兼容。用户可能想看看VivoBook Pro 16X系列,或任何其他英特尔驱动的替代 ,它应该比我们的AMD设备提供更好的对接能力。但是,如果你经常从A点到B点,同时在中间编辑照片,那么经济实惠的VivoBook 15X OLED很好地填补了这一空白。
在电池寿命、处理器性能和显示色彩方面,VivoBook 15X OLED在其重量和价格类别上都很出色。
Asus VivoBook 15 X M1503QA
- 02/13/2023 v7 (old)
Allen Ngo
Transparency
The selection of devices to be reviewed is made by our editorial team. The test sample was provided to the author as a loan by the manufacturer or retailer for the purpose of this review. The lender had no influence on this review, nor did the manufacturer receive a copy of this review before publication. There was no obligation to publish this review. As an independent media company, Notebookcheck is not subjected to the authority of manufacturers, retailers or publishers.
This is how Notebookcheck is testing
Every year, Notebookcheck independently reviews hundreds of laptops and smartphones using standardized procedures to ensure that all results are comparable. We have continuously developed our test methods for around 20 years and set industry standards in the process. In our test labs, high-quality measuring equipment is utilized by experienced technicians and editors. These tests involve a multi-stage validation process. Our complex rating system is based on hundreds of well-founded measurements and benchmarks, which maintains objectivity. Further information on our test methods can be found here.
Price comparison

