戴尔Inspiron 15 5518笔记本电脑在审查。CPU的速度变慢了

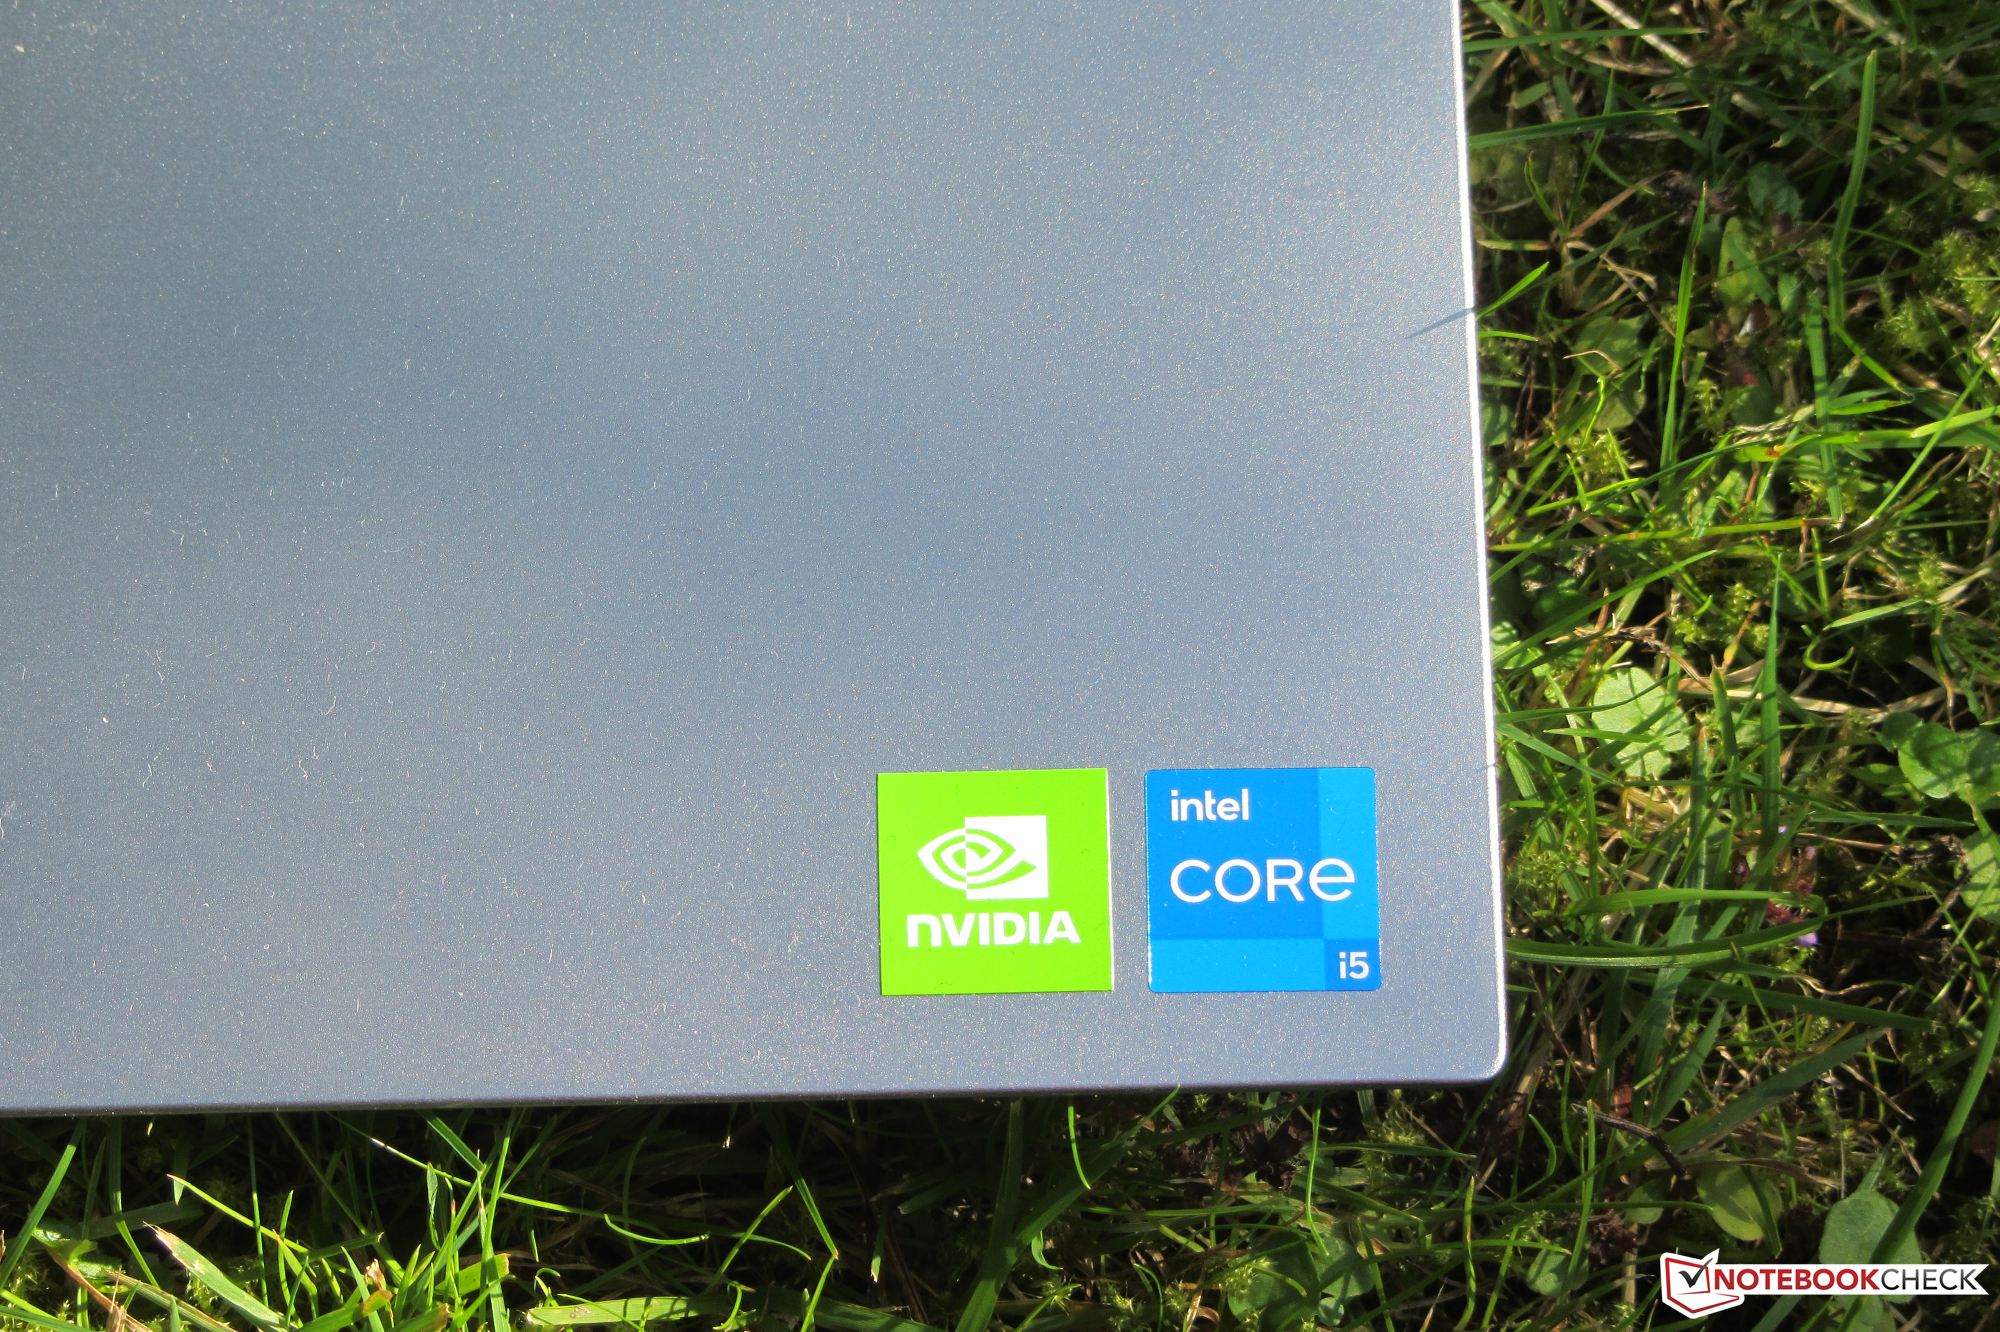
戴尔在其产品线中推出了一款15.6英寸的全能型产品Inspiron 15 5518,它采用了 酷睿i5-11300H-CPU和一个 GeForce-MX450-GPU。竞争对手包括以下设备 小米红米书Pro 15,以及 惠普Pavilion 15,以及 联想IdeaPad 5 Pro 16IHU6和 华硕VivoBook S15 D533UA.
Possible competitors in comparison
Rating | Date | Model | Weight | Height | Size | Resolution | Price |
|---|---|---|---|---|---|---|---|
| 82.3 % v7 (old) | 09 / 2021 | Dell Inspiron 15 5518-2X3JR i5-11300H, GeForce MX450 | 1.8 kg | 18 mm | 15.60" | 1920x1080 | |
| 81.2 % v7 (old) | 07 / 2021 | HP Pavilion 15-eg i7-1165G7, GeForce MX450 | 1.7 kg | 17.9 mm | 15.60" | 1920x1080 | |
| 83.2 % v7 (old) | Xiaomi RedmiBook Pro 15 i7-11370H, GeForce MX450 | 1.7 kg | 16 mm | 15.60" | 3200x2000 | ||
| 86 % v7 (old) | 08 / 2021 | Lenovo IdeaPad 5 Pro 16IHU6 i5-11300H, GeForce MX450 | 1.9 kg | 18.4 mm | 16.00" | 2560x1600 | |
| 82.1 % v7 (old) | Asus VivoBook S15 D533UA R7 5700U, Vega 8 | 1.8 kg | 16.1 mm | 15.60" | 1920x1080 | ||
| 83.5 % v7 (old) | 08 / 2021 | Lenovo IdeaPad 5 15ALC05 R5 5500U, Vega 7 | 1.7 kg | 19.1 mm | 15.60" | 1920x1080 |
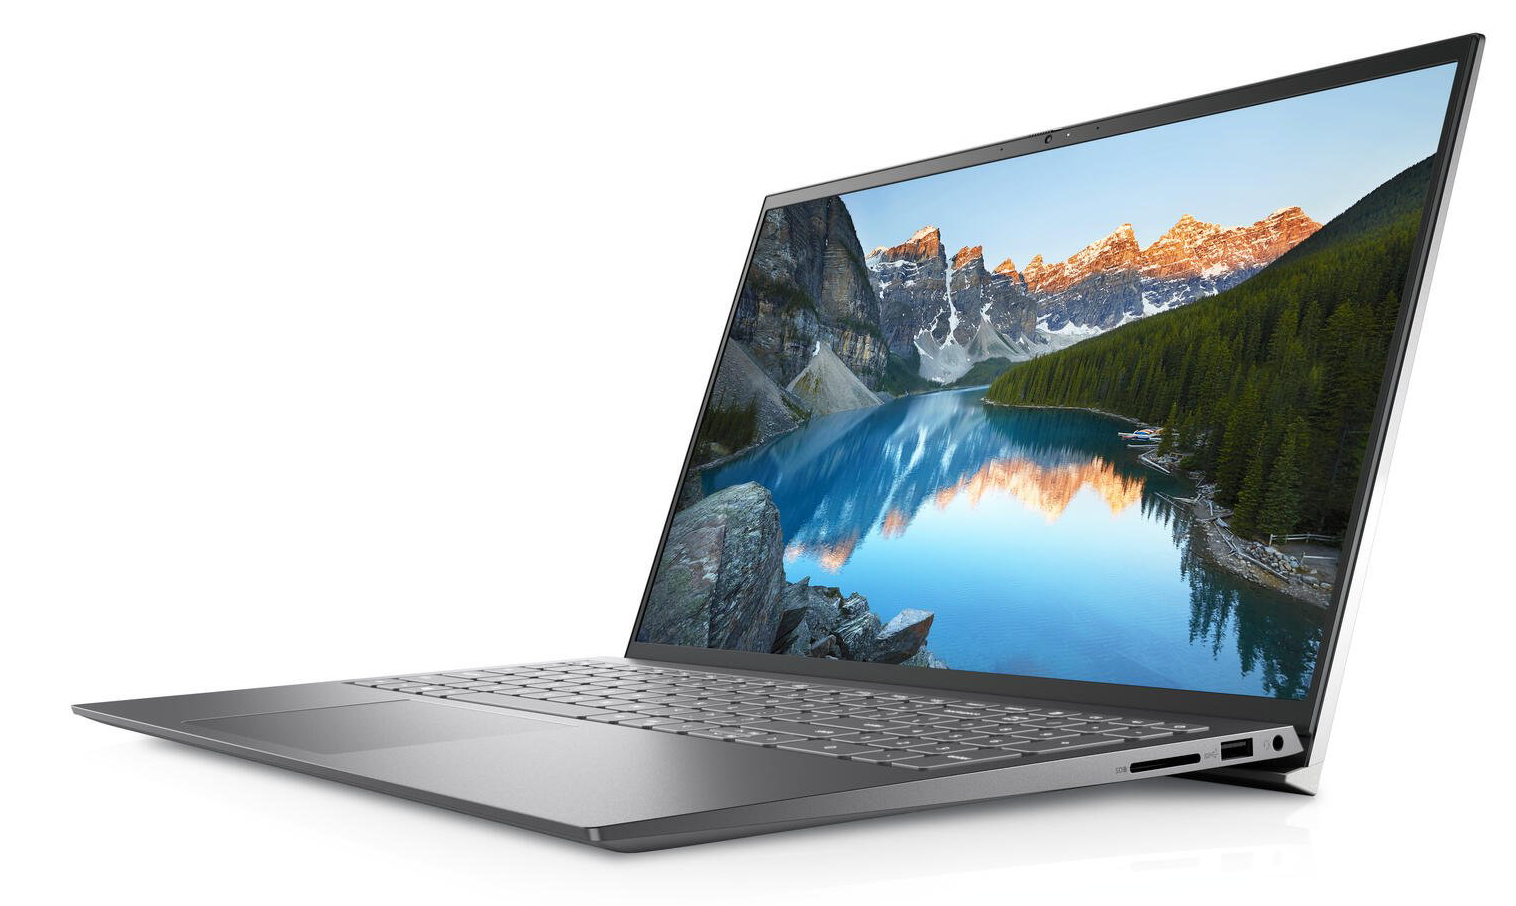
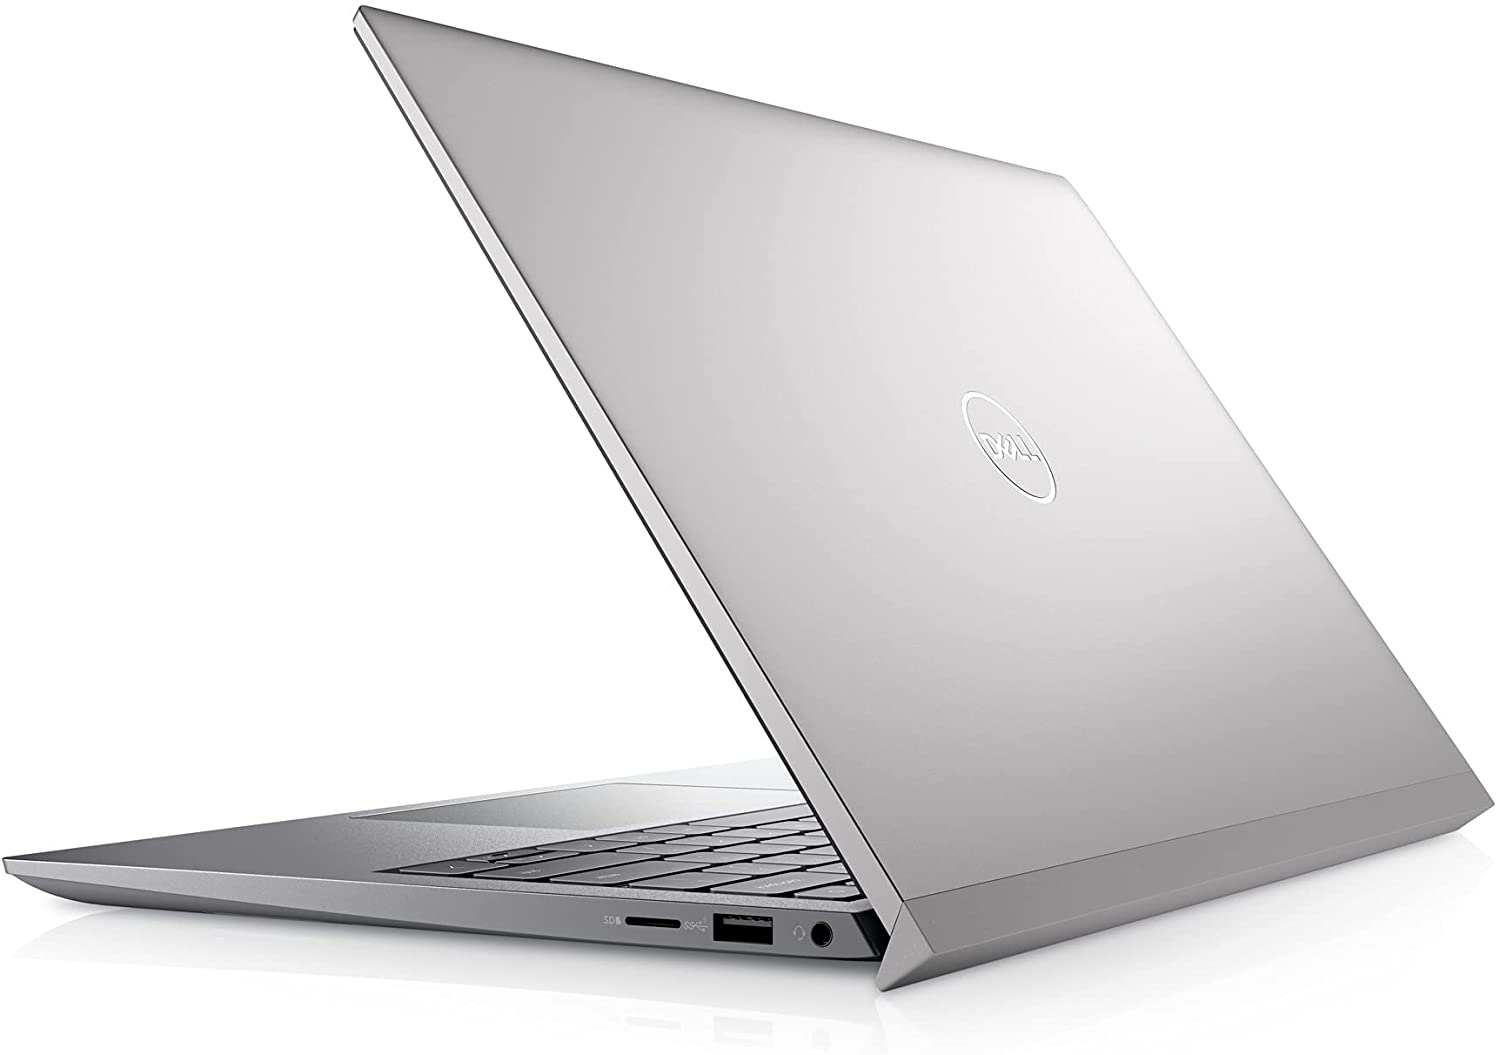
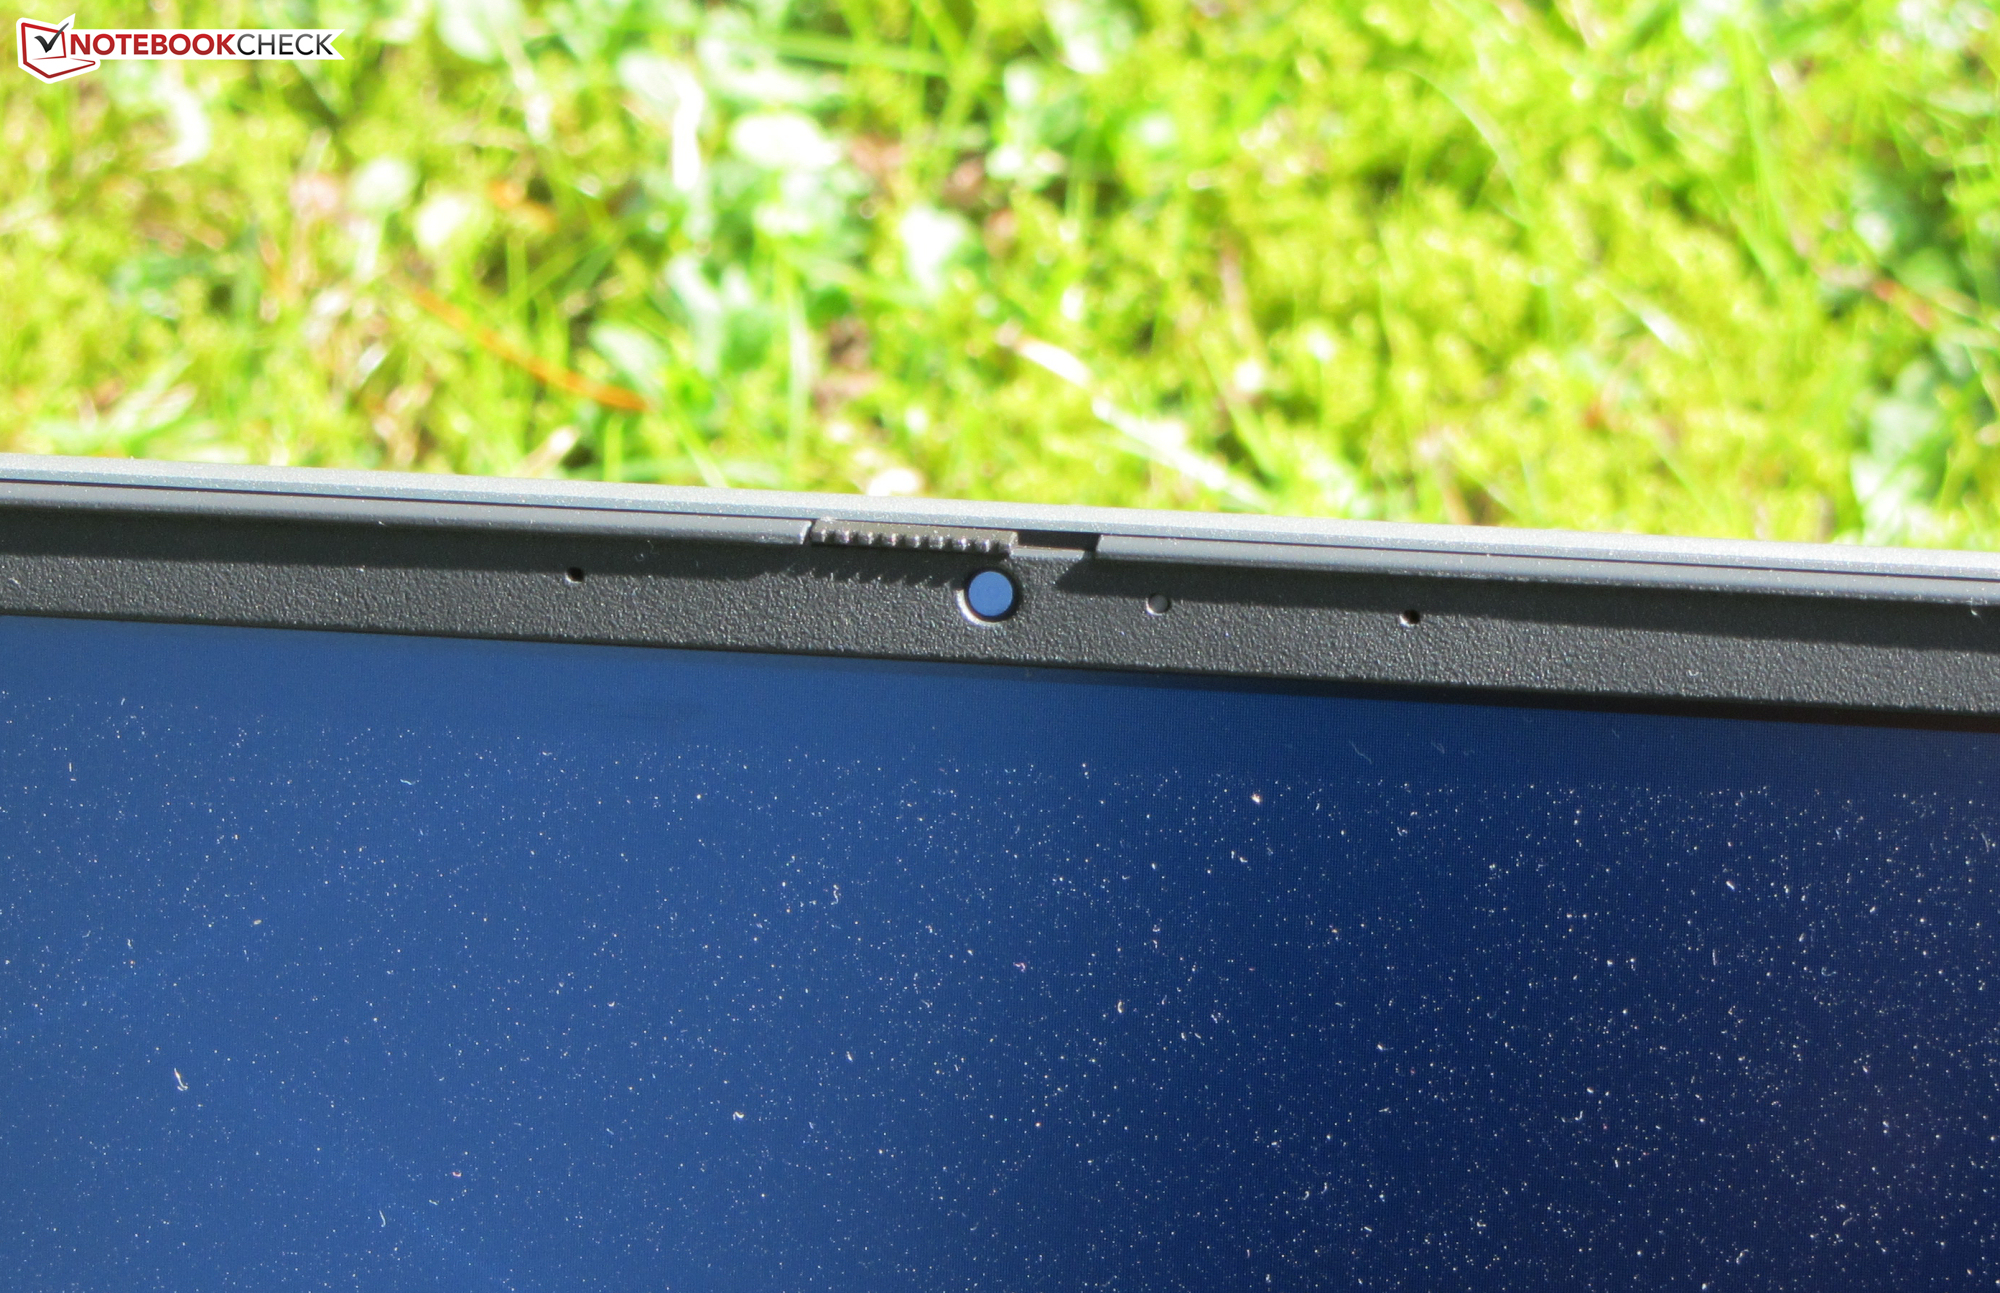
外壳和功能 - Inspiron配备了一个别致的金属外壳
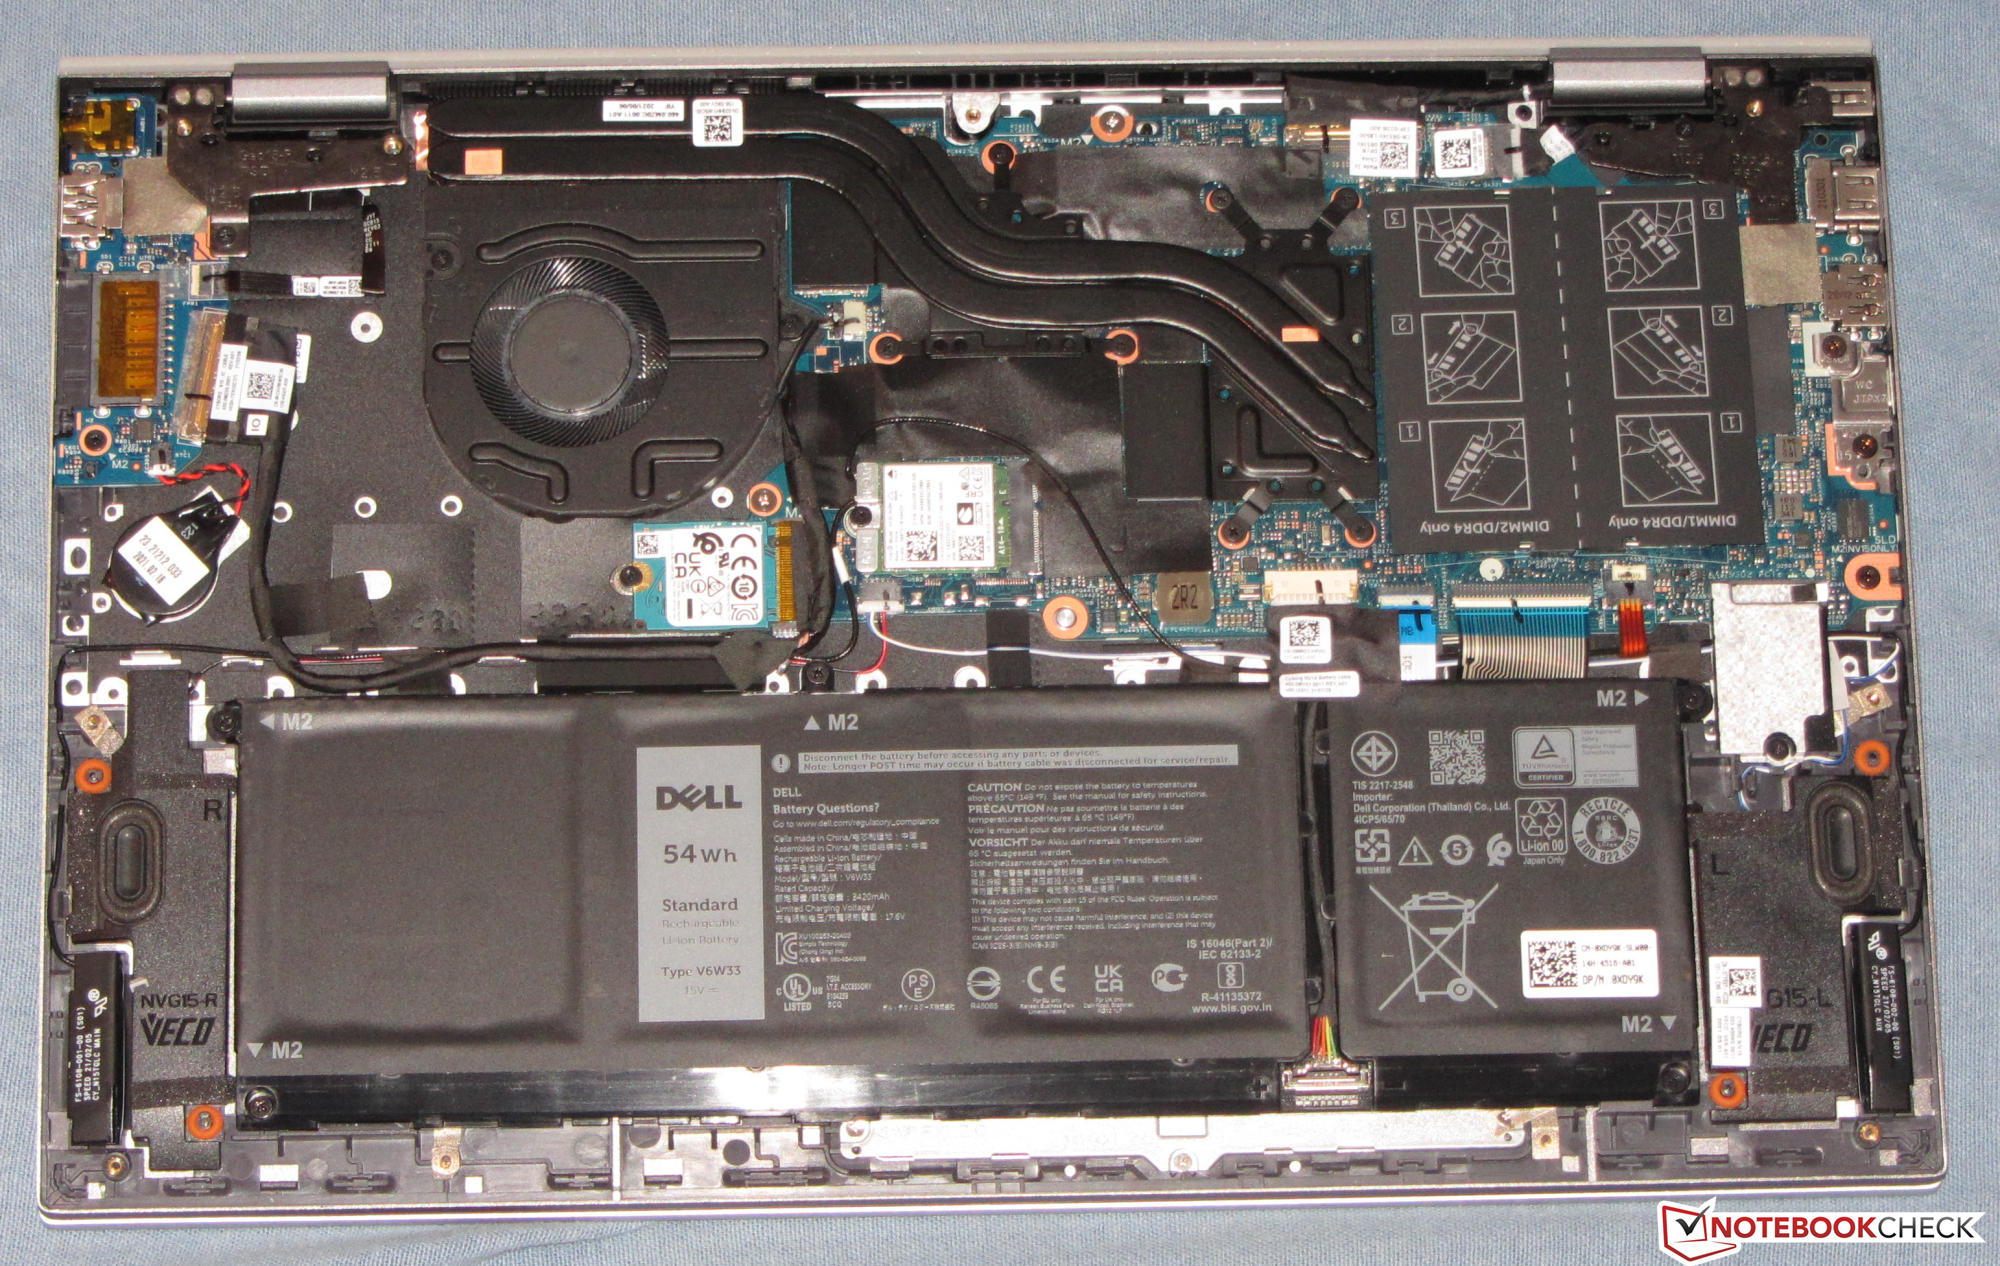
戴尔依靠光滑别致的设计,为Inspiron超薄的哑光银灰色金属外壳提供了光滑的表面。笔记本电脑没有发现任何制造缺陷,但整体上应该更硬。底座和盖子可以扭动得太厉害。电池安装牢固。拆除底壳后,可以接触到内件。
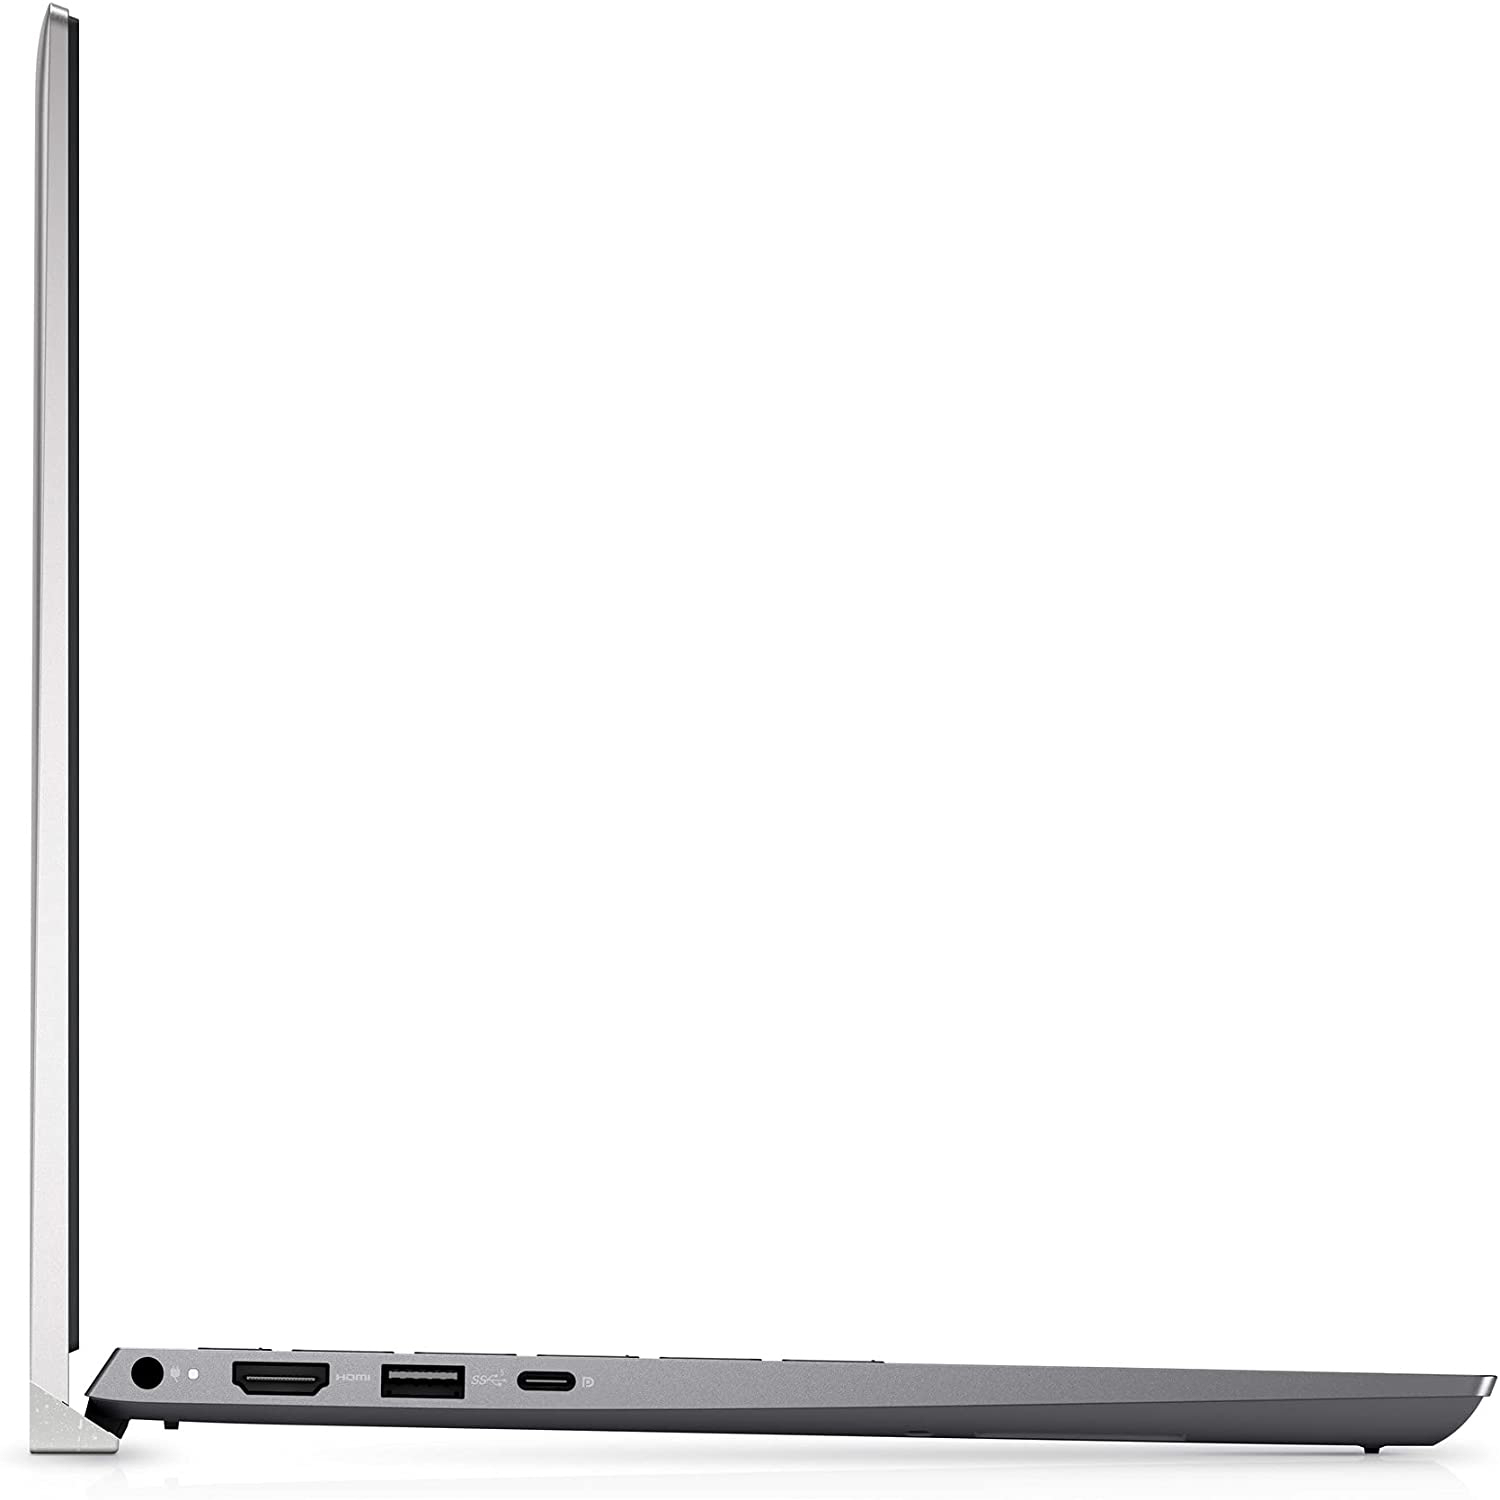
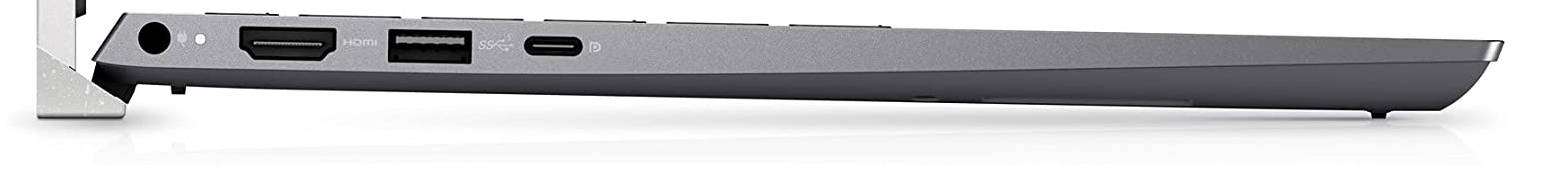
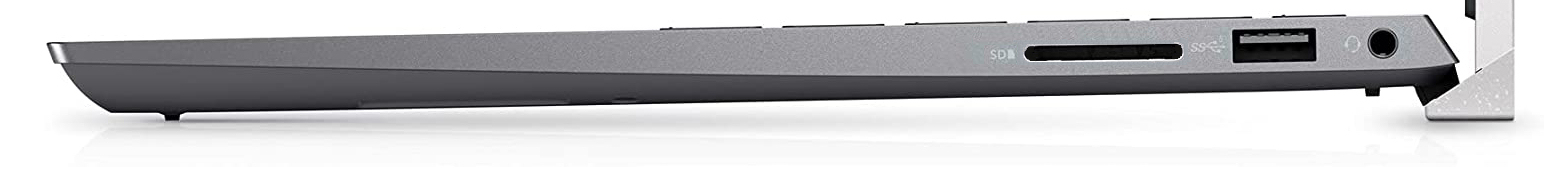
Inspiron有两个USB-A端口(USB 3.2 Gen 1)和一个USB-C端口(USB 3.2 Gen 2x2;Core i7型号:Thunderbolt 4)。后者支持Power Delivery和Displayport-per-USB-C。因此,5518有两个视频输出,加上HDMI插槽。SD存储卡阅读器(参考卡:AV PRO SD 128 GB V60)属于慢速型号。
在最佳条件下确定的WLAN数据速率(附近没有其他WLAN设备,笔记本和服务器PC之间距离较短;路由器。Netgear Nighthawk AX12)结果不错,但仍然略低于所安装的英特尔AX201芯片的能力。

连接设备
| SD Card Reader | |
| average JPG Copy Test (av. of 3 runs) | |
| HP Pavilion 15-eg (AV PRO microSD 128 GB V60) | |
| Average of class Office (19.8 - 198.5, n=22, last 2 years) | |
| Asus VivoBook S15 D533UA (AV PRO microSD 128 GB V60) | |
| Lenovo IdeaPad 5 15ALC05 (Toshiba Exceria Pro SDXC 64 GB UHS-II) | |
| Dell Inspiron 15 5518-2X3JR (AV Pro SD 128 GB V60) | |
| maximum AS SSD Seq Read Test (1GB) | |
| Lenovo IdeaPad 5 Pro 16IHU6 (AV PRO microSD 128 GB V60) | |
| Average of class Office (27.4 - 249, n=21, last 2 years) | |
| HP Pavilion 15-eg (AV PRO microSD 128 GB V60) | |
| Asus VivoBook S15 D533UA (AV PRO microSD 128 GB V60) | |
| Lenovo IdeaPad 5 15ALC05 (Toshiba Exceria Pro SDXC 64 GB UHS-II) | |
| Dell Inspiron 15 5518-2X3JR (AV Pro SD 128 GB V60) | |
| Networking | |
| iperf3 transmit AX12 | |
| Xiaomi RedmiBook Pro 15 | |
| Lenovo IdeaPad 5 Pro 16IHU6 | |
| HP Pavilion 15-eg | |
| Average Intel Wi-Fi 6 AX201 (49.8 - 1775, n=324) | |
| Asus VivoBook S15 D533UA | |
| Dell Inspiron 15 5518-2X3JR | |
| iperf3 receive AX12 | |
| HP Pavilion 15-eg | |
| Xiaomi RedmiBook Pro 15 | |
| Lenovo IdeaPad 5 Pro 16IHU6 | |
| Dell Inspiron 15 5518-2X3JR | |
| Asus VivoBook S15 D533UA | |
| Average Intel Wi-Fi 6 AX201 (136 - 1743, n=324) | |


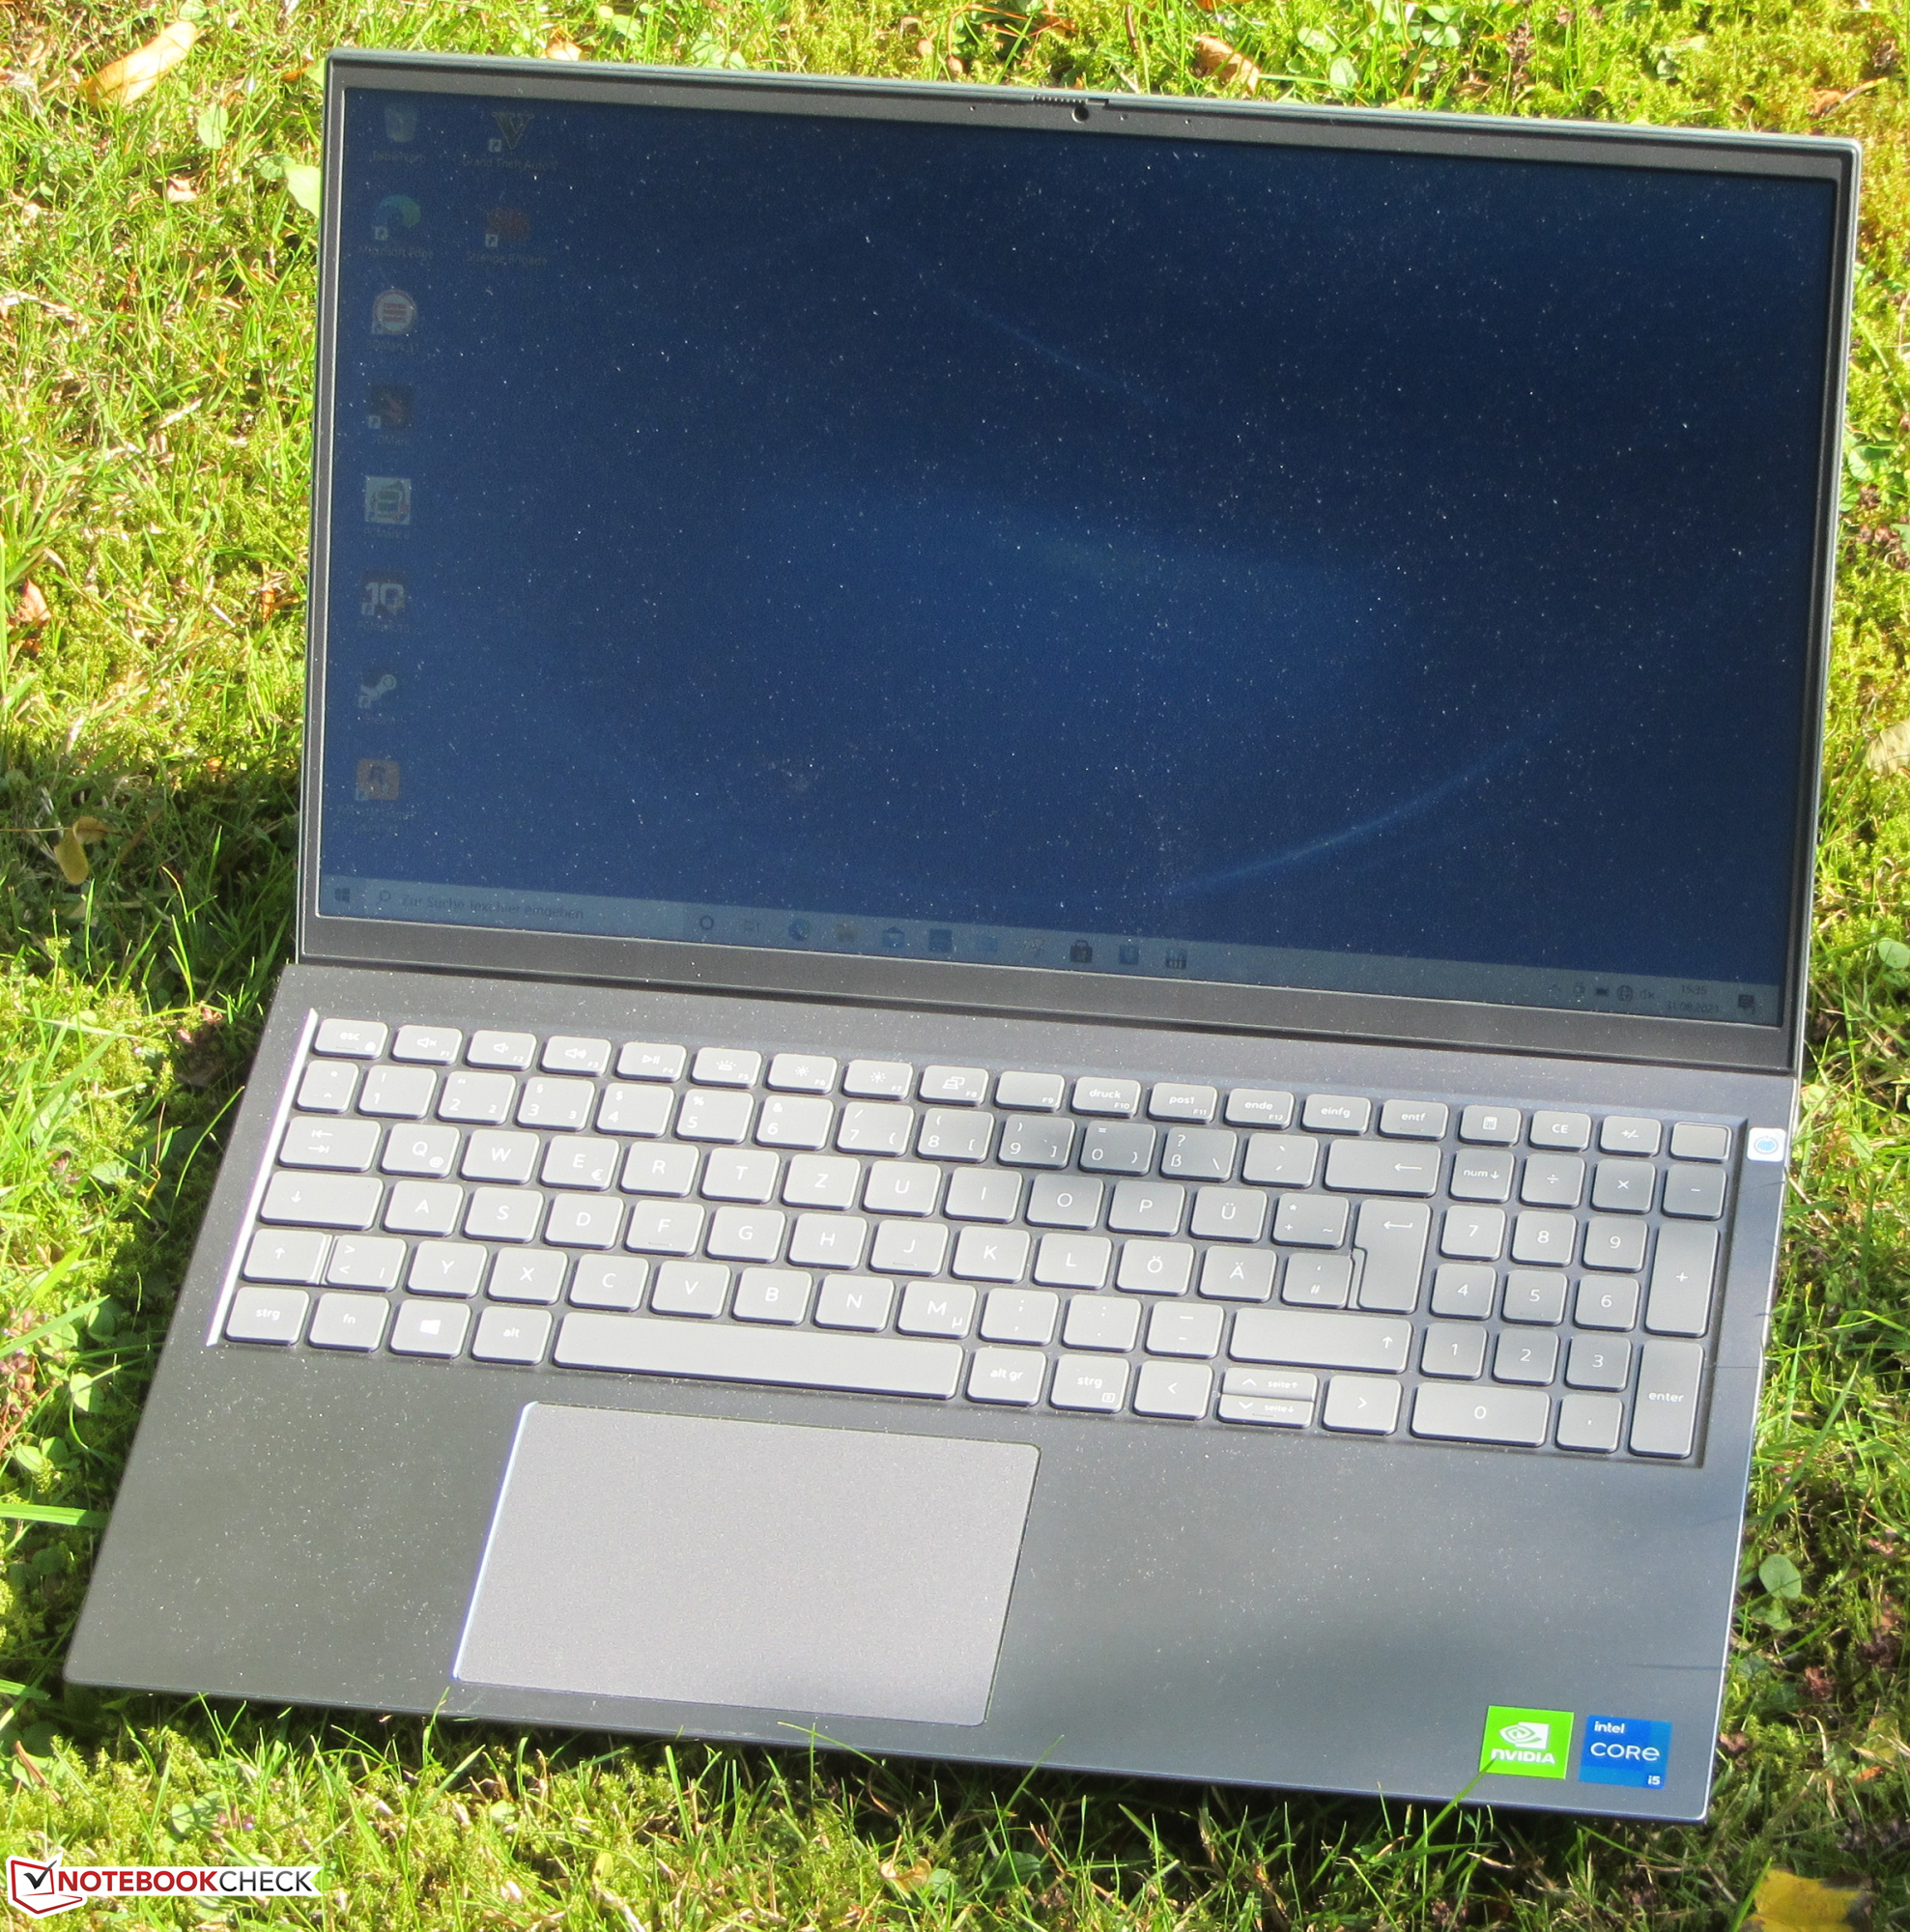
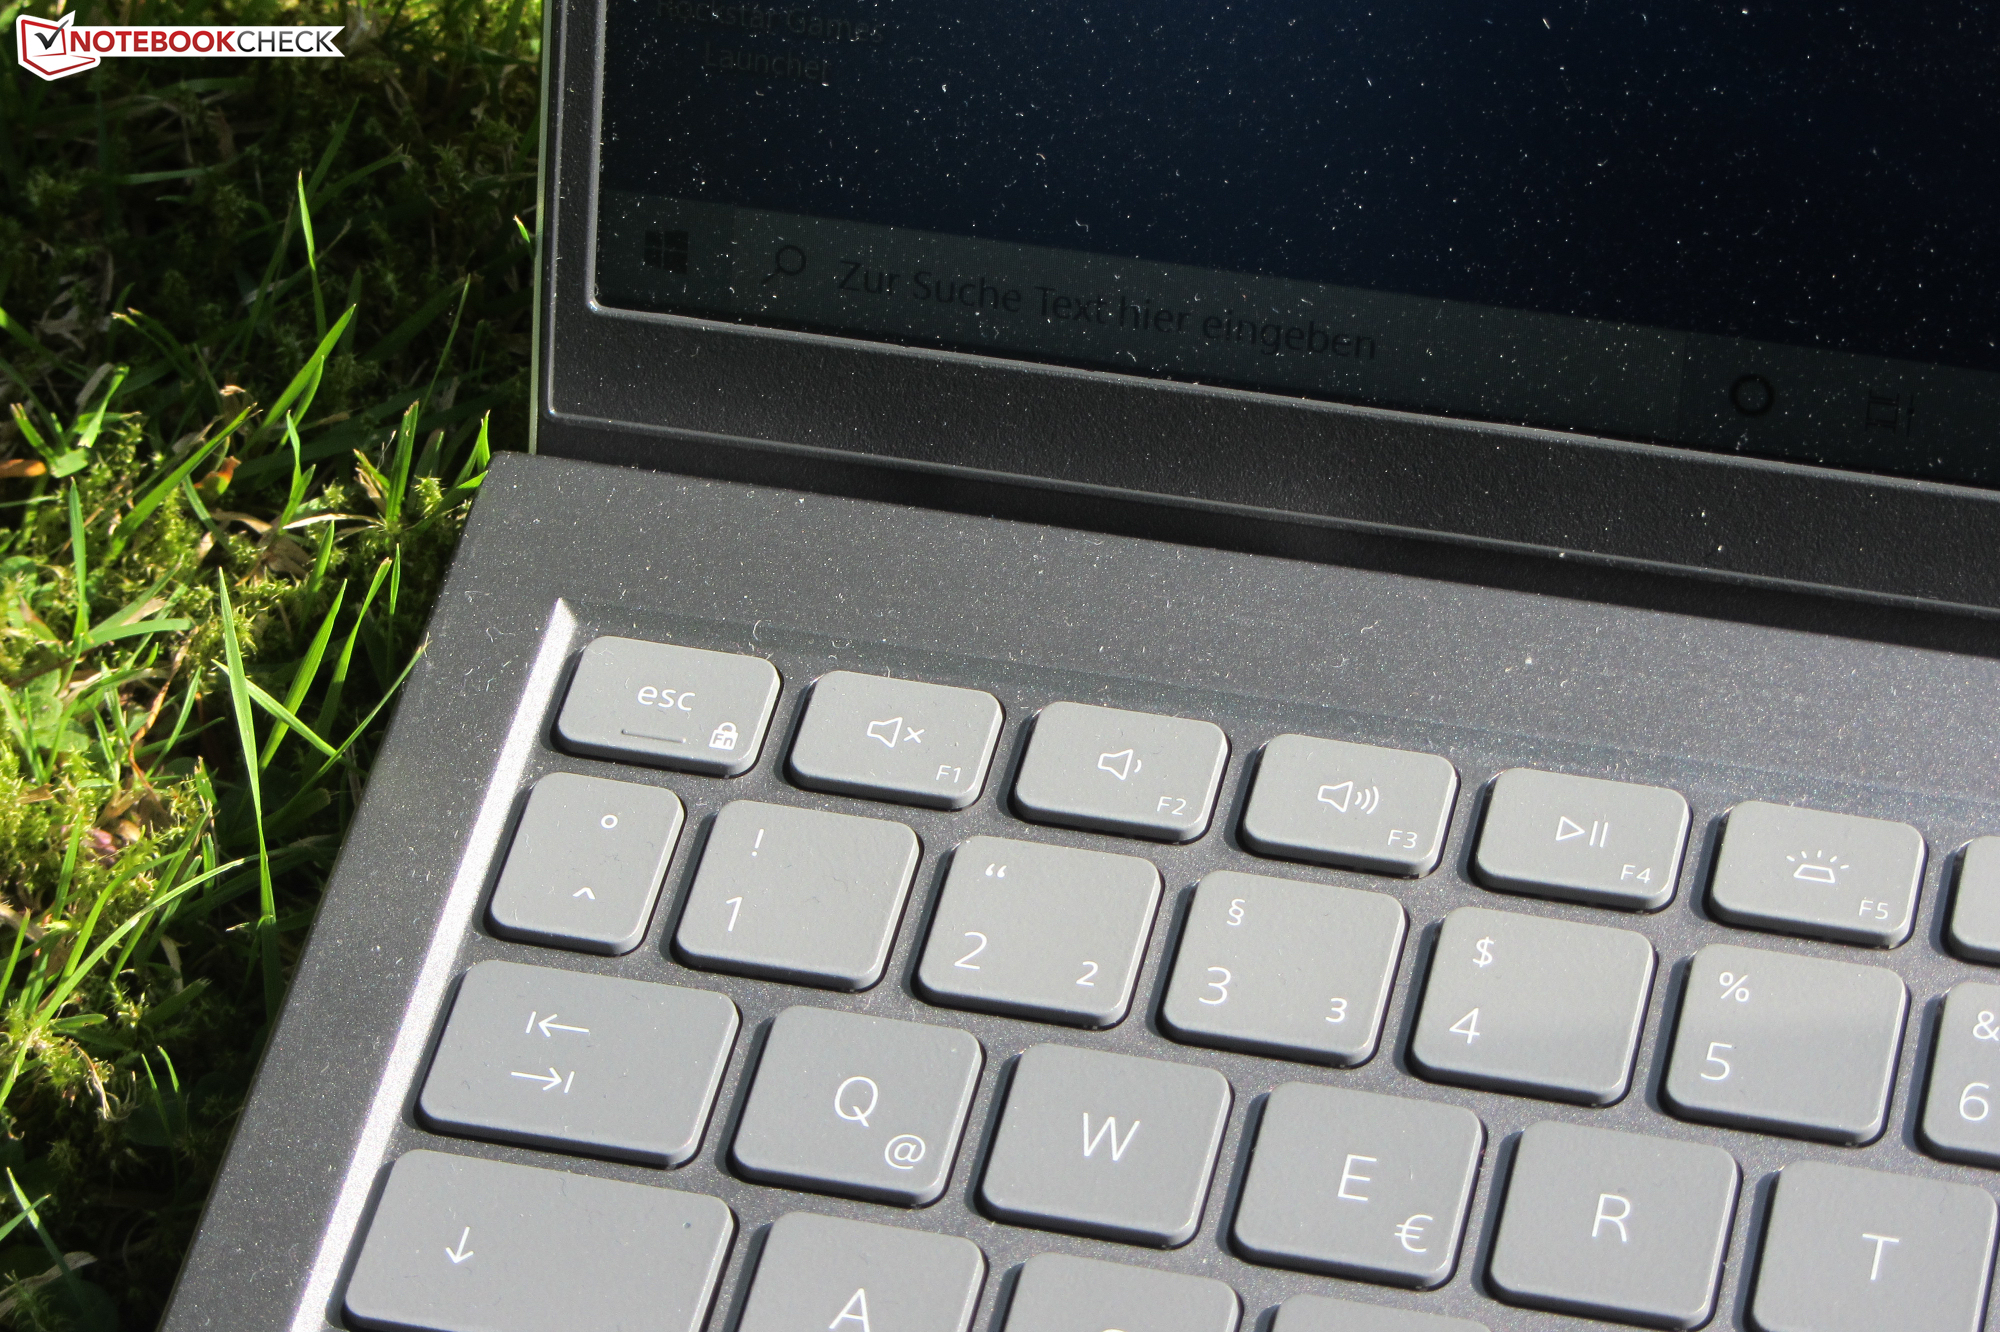
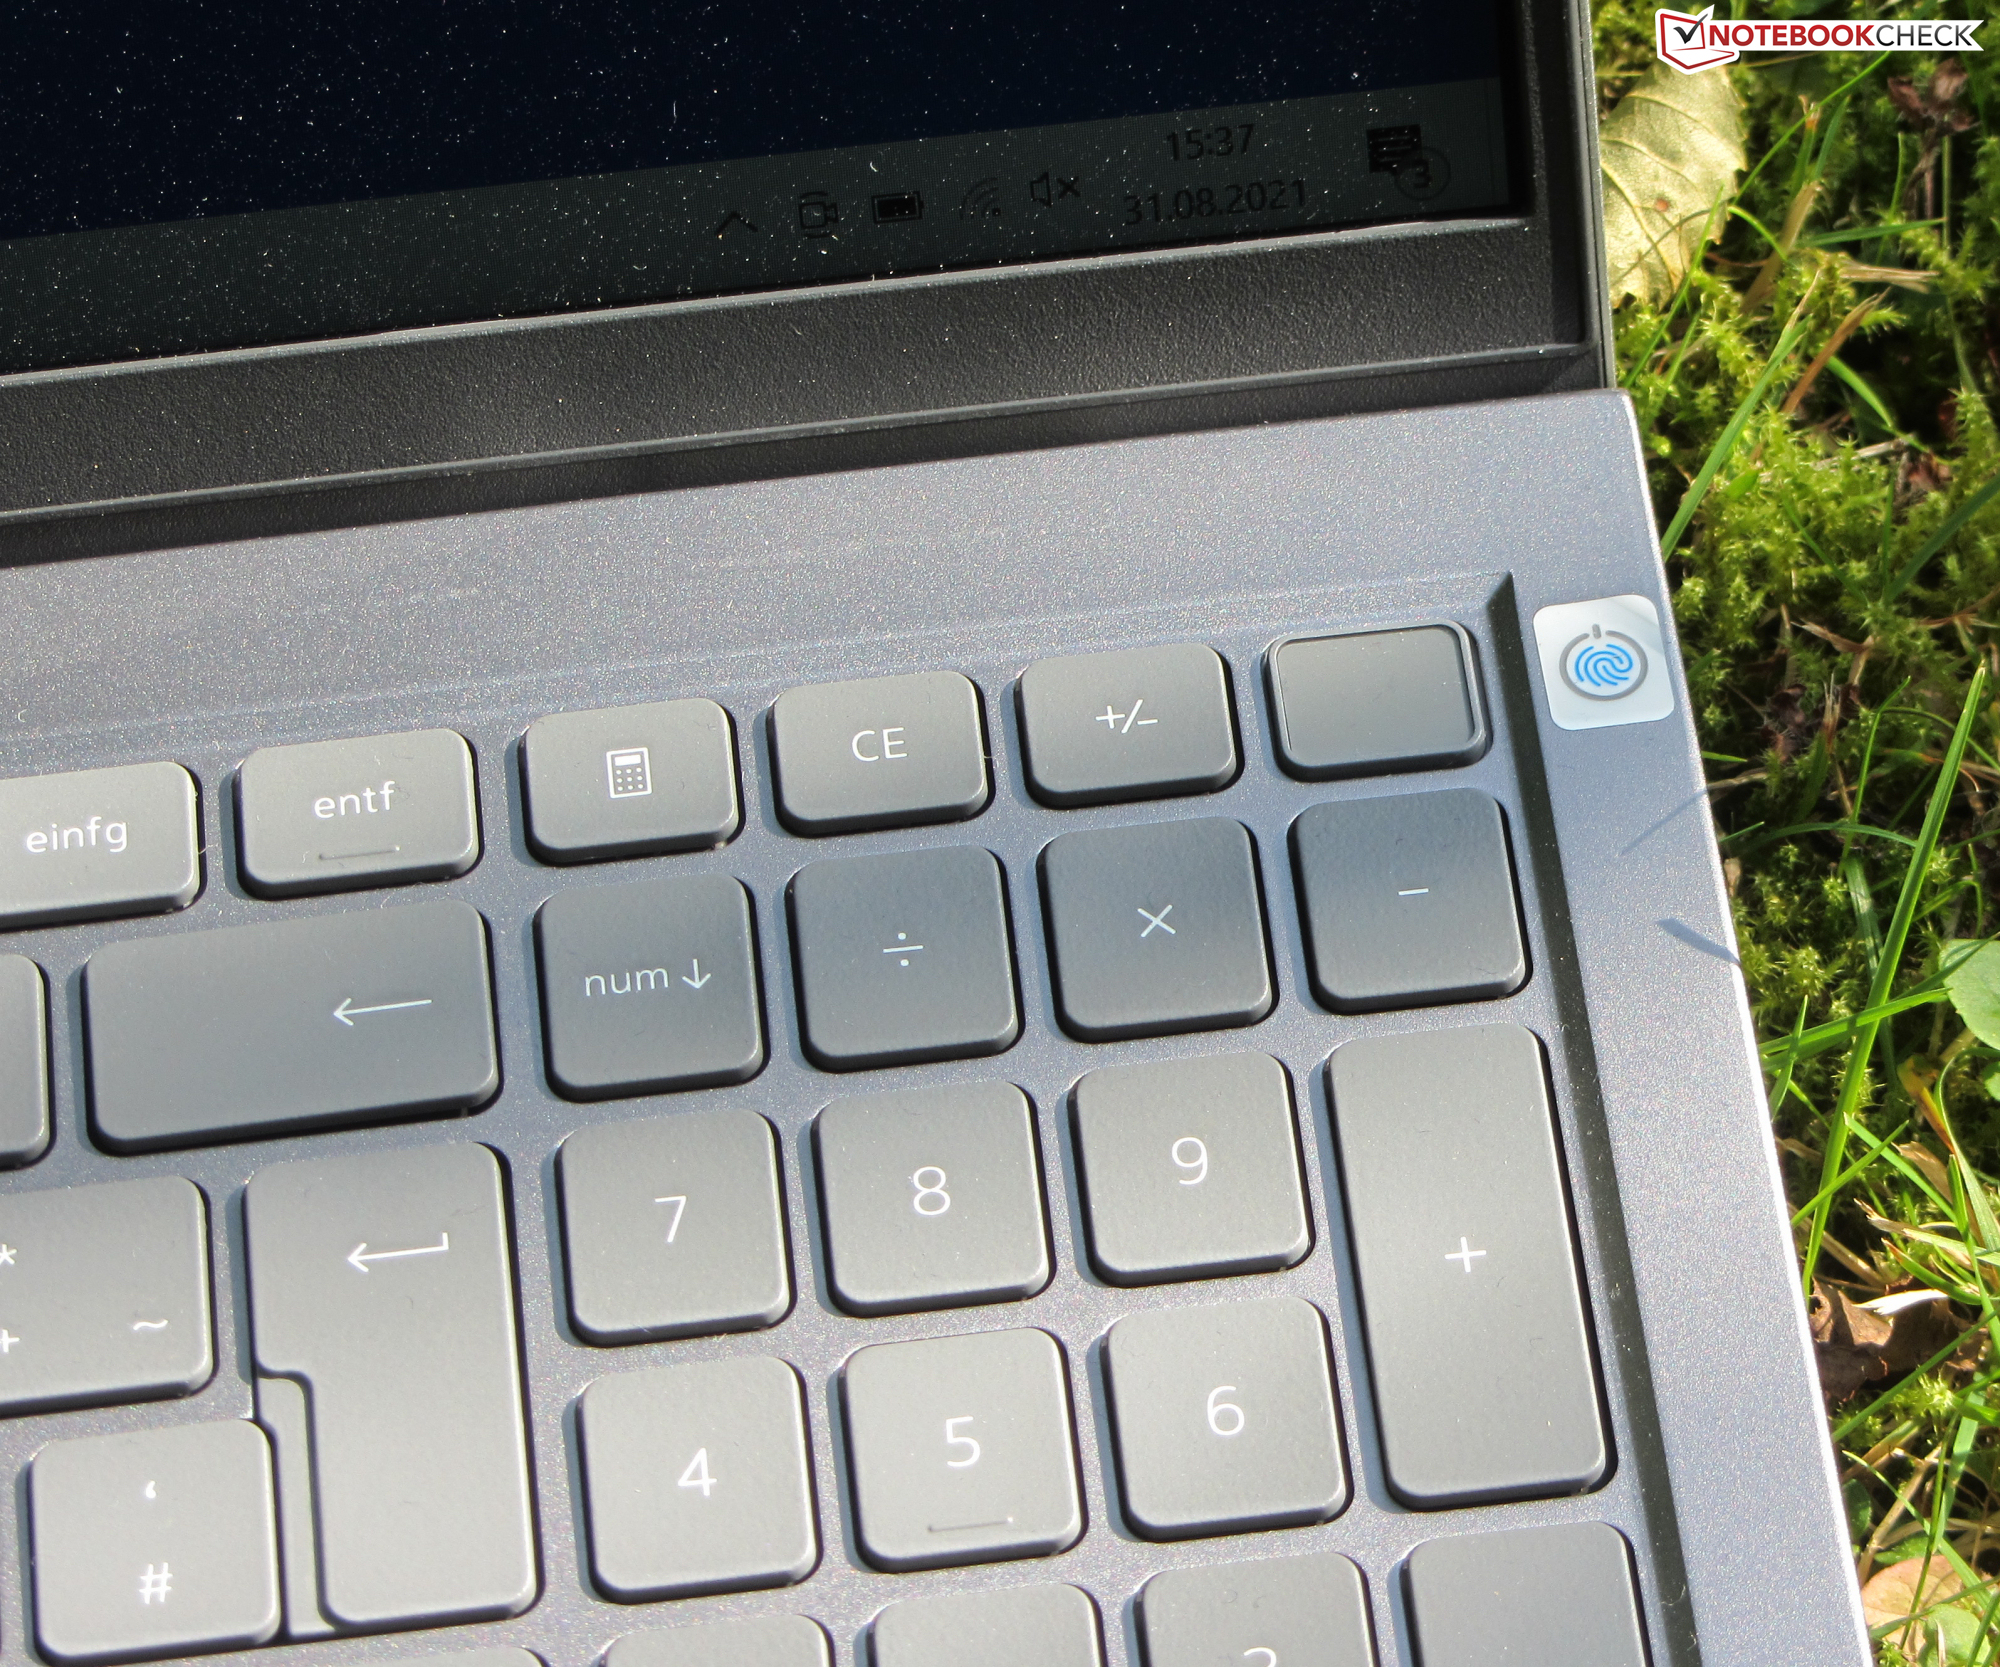
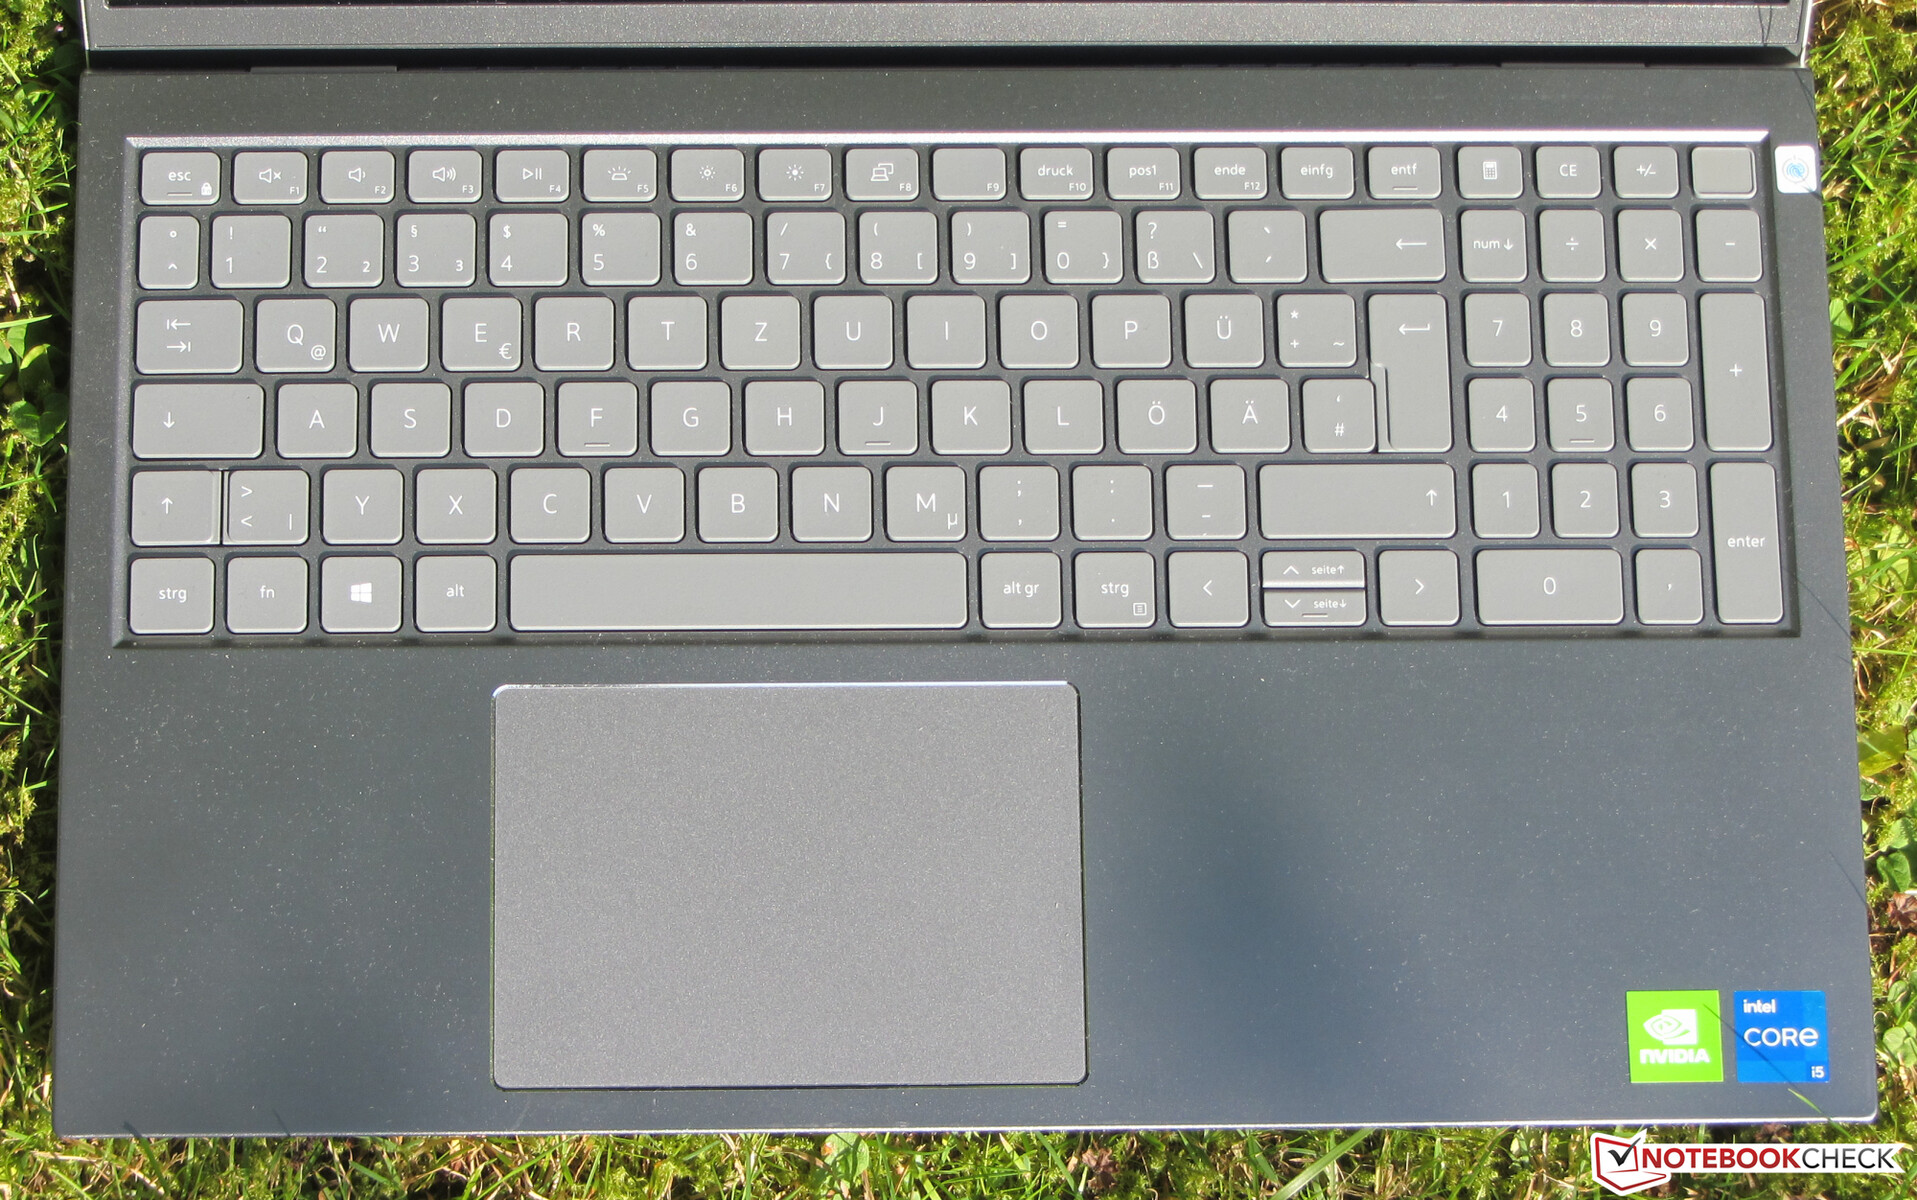
输入设备 - 戴尔5518提供按键照明
发光木制键盘上略显粗糙的按键行程较短,压力点清晰。键的阻力是令人愉快的。键盘在打字过程中会有一点弯曲--在中间比在边缘更多。照明(两个亮度级别)是通过一个功能键控制的。总而言之,戴尔在这里提供了一个适合日常使用的键盘。
具有多点触摸功能的ClickPad(约11.5 x 8厘米/~4.5 x 3.2英寸)即使在角落里也能对输入做出反应。光滑的表面使手指很容易滑行。垫子的行程很短,有一个清晰的压力点。
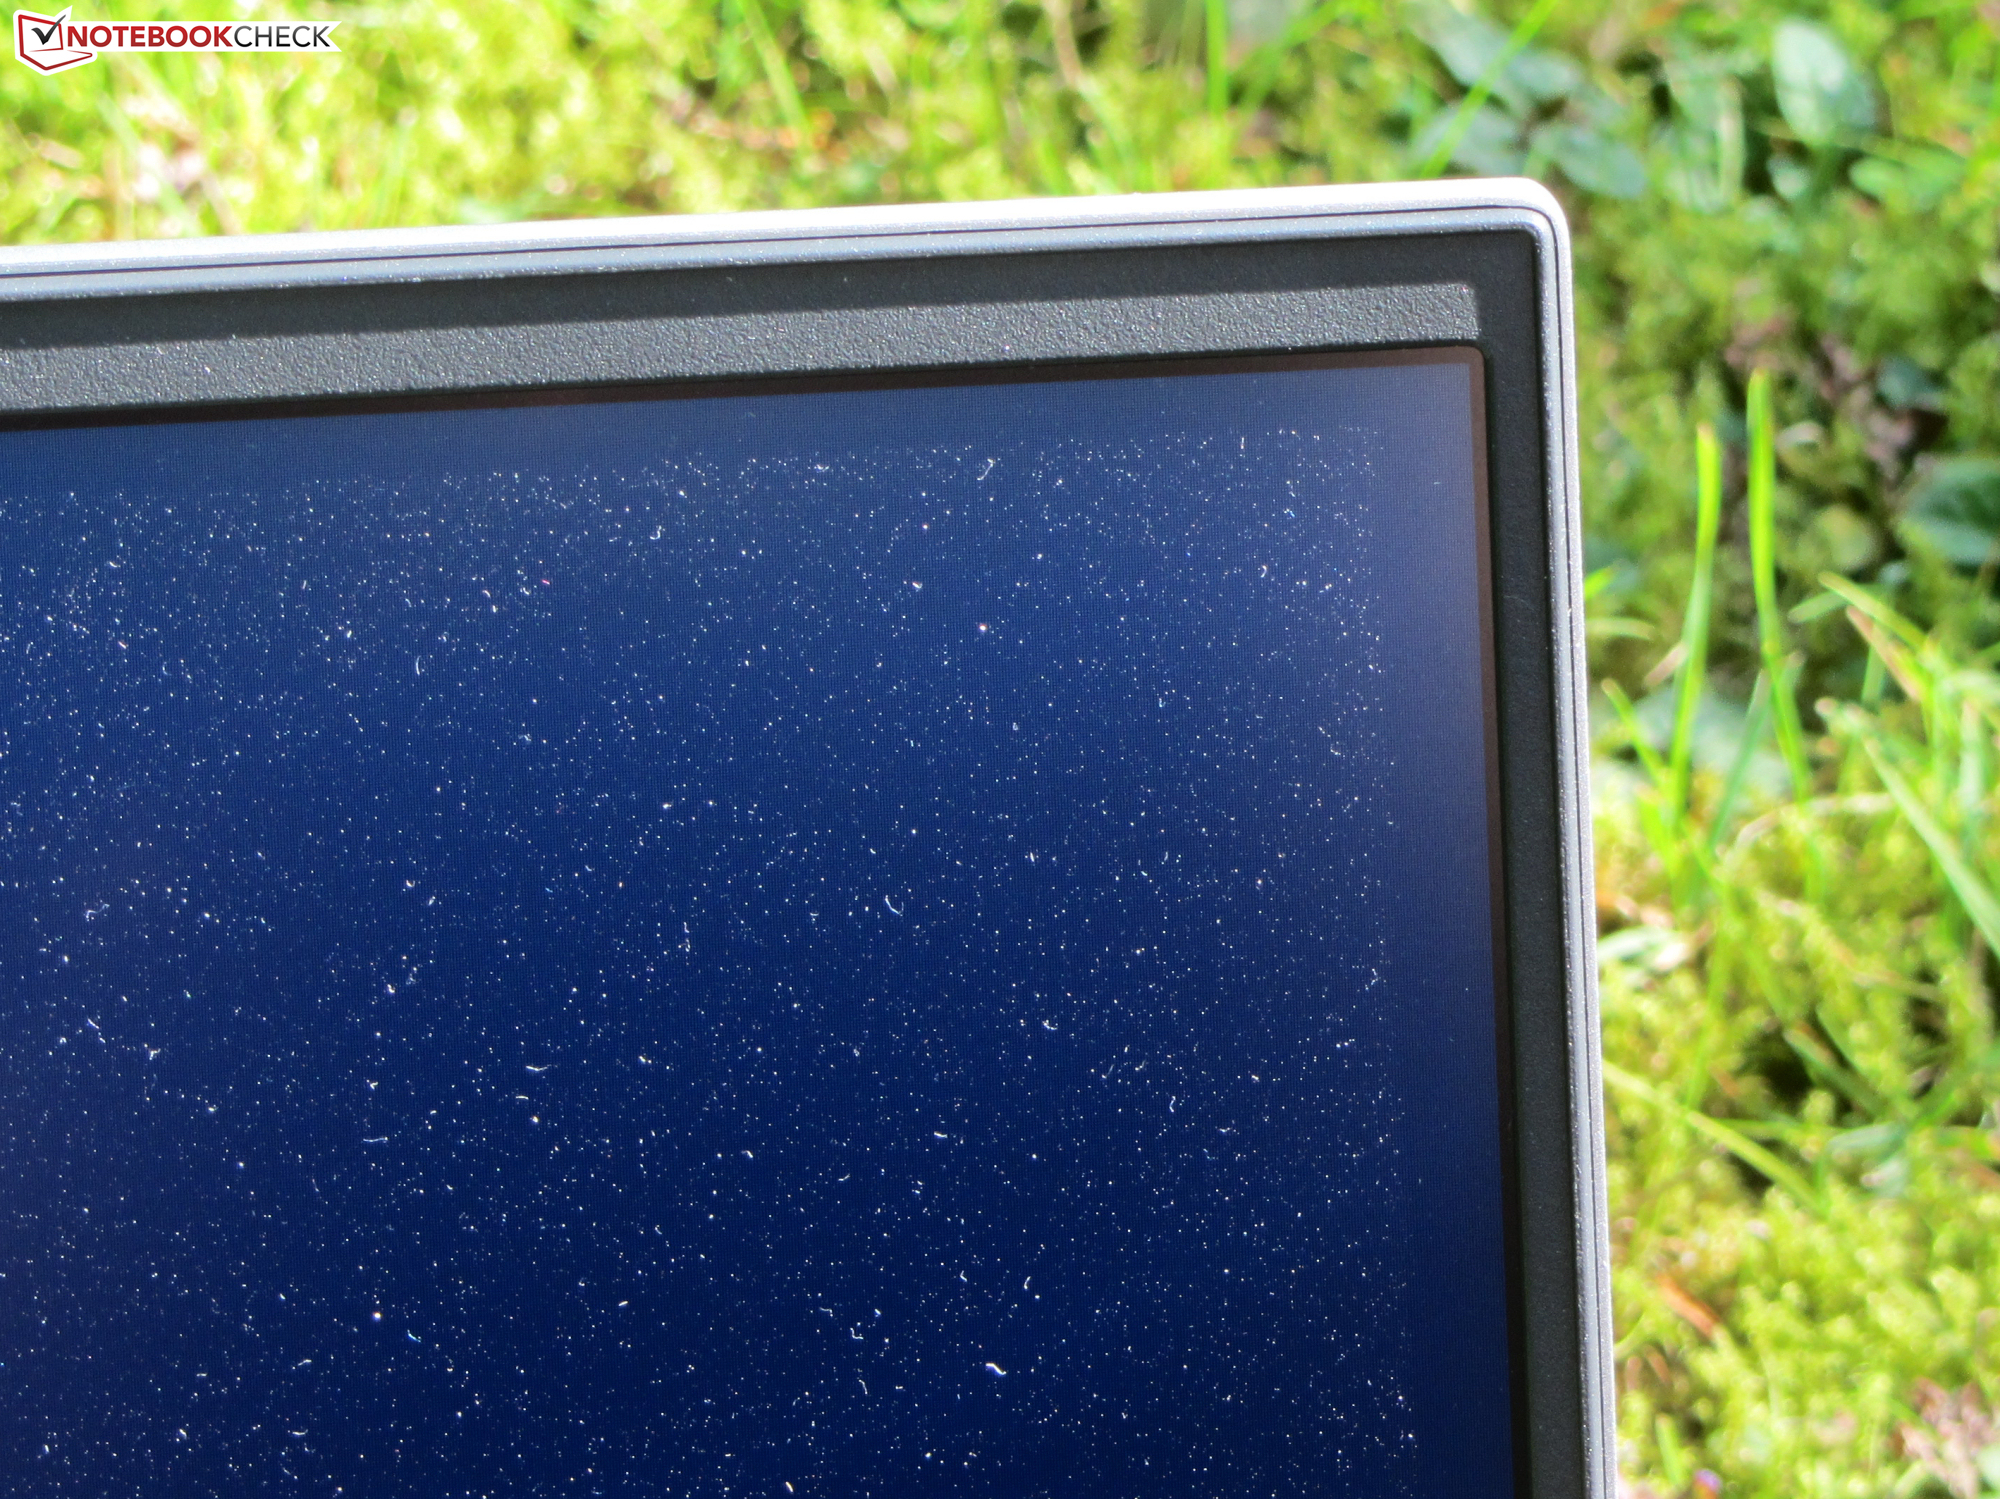
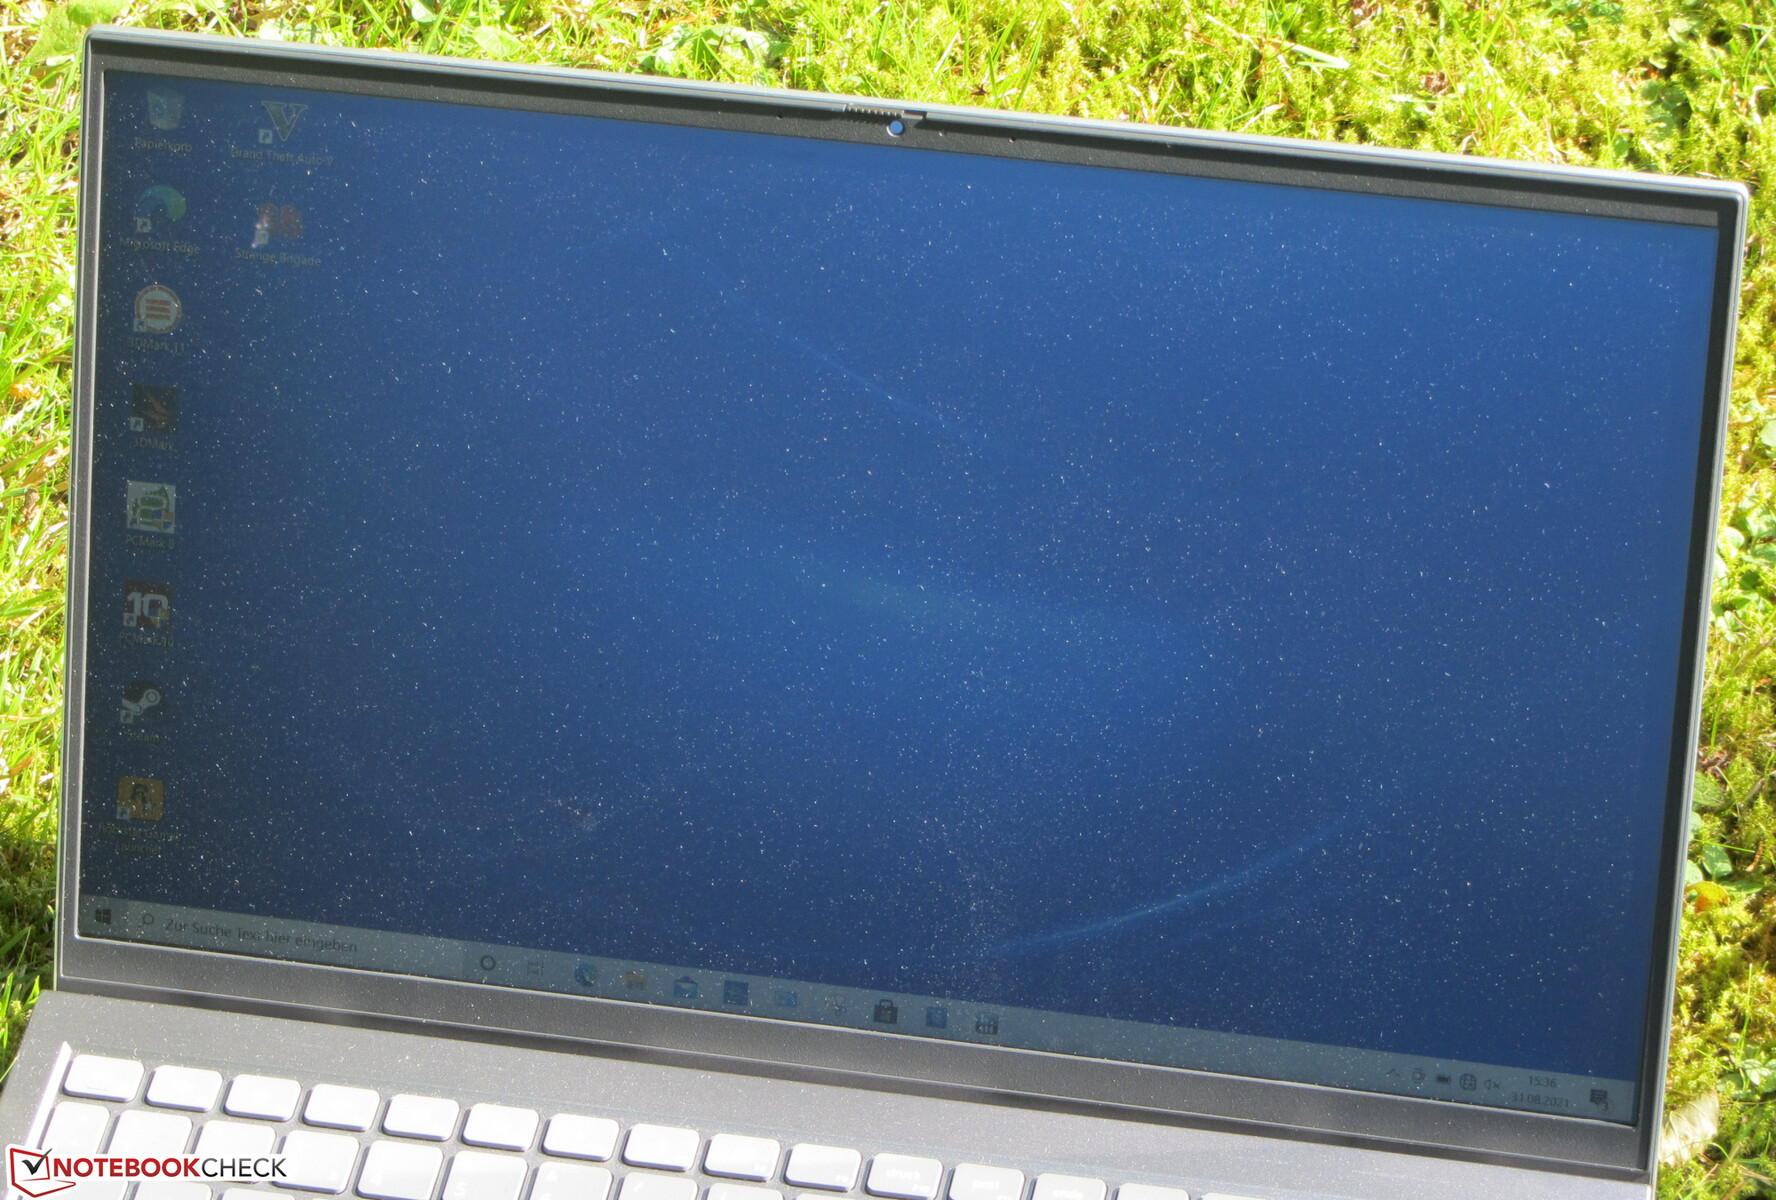
显示器 - 板载IPS
虽然15.6英寸的哑光显示屏(1,920 x 1,080像素)提供了良好的对比度(1,040:1),但亮度(267.8 cd/m²)太低。在电池模式下,该值进一步下降。我们认为超过300cd/m²的数值是好的。
在90%及以下的亮度水平下,屏幕显示频率为1000赫兹的闪烁。由于频率相当高,敏感的人应该可以免于头痛和/或眼睛问题。
| |||||||||||||||||||||||||
Brightness Distribution: 87 %
Center on Battery: 257 cd/m²
Contrast: 1040:1 (Black: 0.275 cd/m²)
ΔE ColorChecker Calman: 4.74 | ∀{0.5-29.43 Ø4.71}
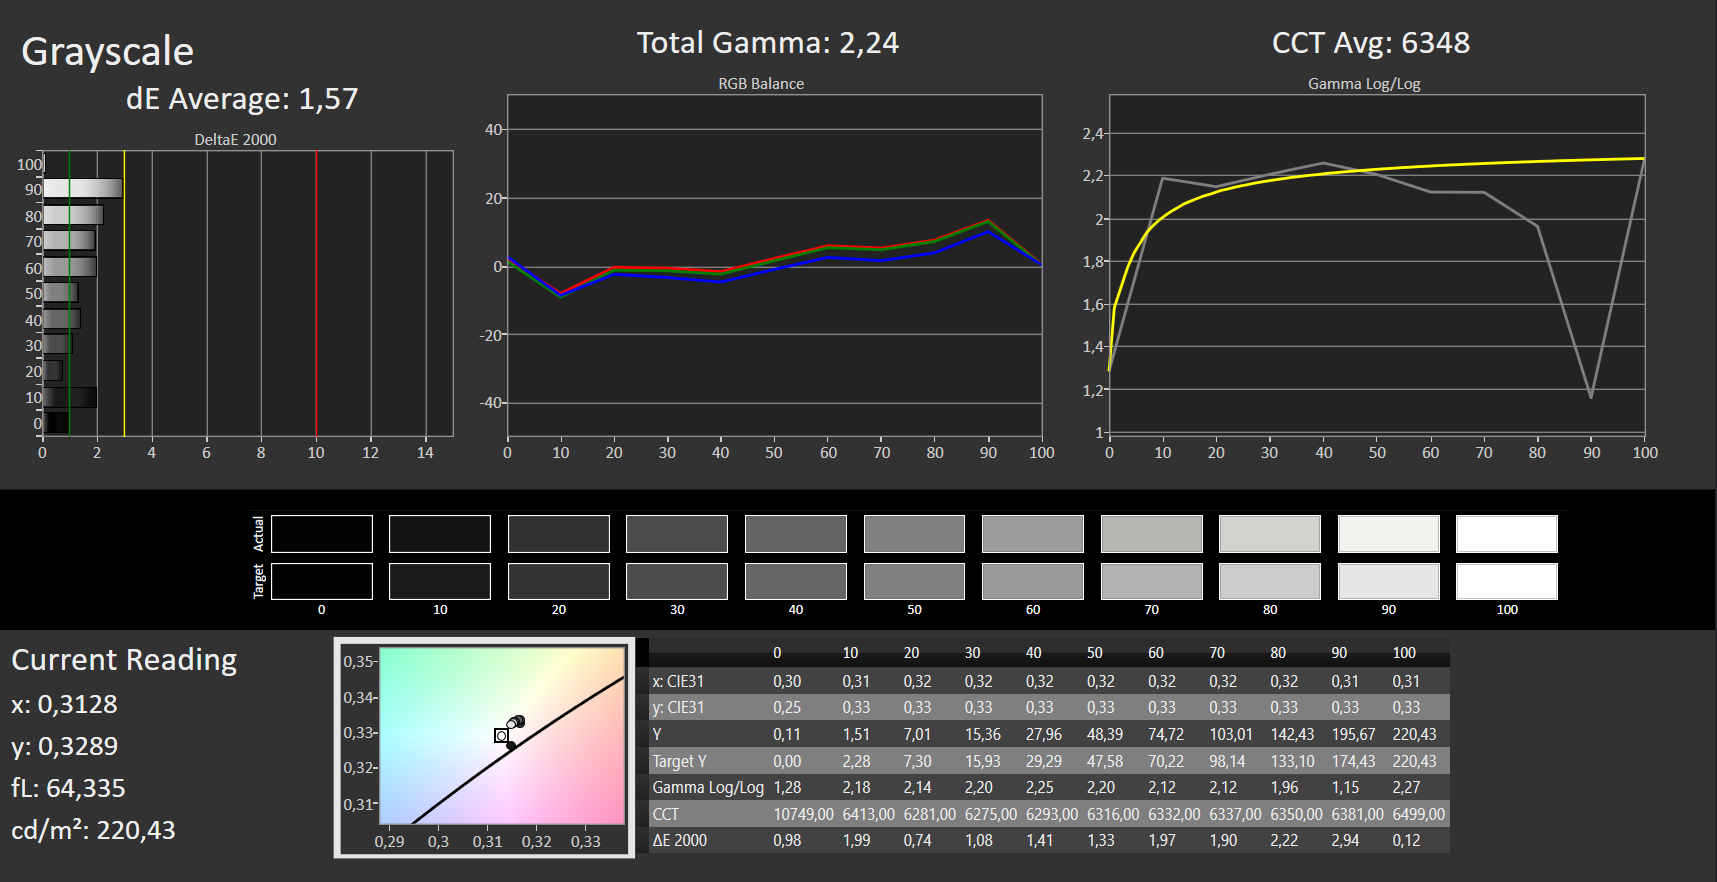
ΔE Greyscale Calman: 1.57 | ∀{0.09-98 Ø4.96}
41.24% AdobeRGB 1998 (Argyll 3D)
58.8% sRGB (Argyll 3D)
39.92% Display P3 (Argyll 3D)
Gamma: 2.24
CCT: 6348 K
| Dell Inspiron 15 5518-2X3JR BOE NV15N4V, IPS, 1920x1080, 15.6" | HP Pavilion 15-eg Chi Mei CMN1523, IPS, 1920x1080, 15.6" | Xiaomi RedmiBook Pro 15 IPS, 3200x2000, 15.6" | Lenovo IdeaPad 5 Pro 16IHU6 Lenovo LEN160WQXGA, IPS, 2560x1600, 16" | Asus VivoBook S15 D533UA Chi Mei N156HCA-EAB, IPS, 1920x1080, 15.6" | Lenovo IdeaPad 5 15ALC05 Lenovo LEN156FHD, IPS, 1920x1080, 15.6" | |
|---|---|---|---|---|---|---|
| Display | 8% | 66% | 78% | 10% | -4% | |
| Display P3 Coverage (%) | 39.92 | 42.9 7% | 66.7 67% | 74 85% | 43.6 9% | |
| sRGB Coverage (%) | 58.8 | 64 9% | 96.3 64% | 98.7 68% | 65.2 11% | 59 0% |
| AdobeRGB 1998 Coverage (%) | 41.24 | 44.4 8% | 68.5 66% | 74.5 81% | 45 9% | 38 -8% |
| Response Times | 34% | 19% | 71% | 48% | 36% | |
| Response Time Grey 50% / Grey 80% * (ms) | 41 ? | 22.8 ? 44% | 34.8 ? 15% | 13 ? 68% | 18 ? 56% | 29 ? 29% |
| Response Time Black / White * (ms) | 31 ? | 23.6 ? 24% | 24 ? 23% | 8 ? 74% | 19 ? 39% | 18 ? 42% |
| PWM Frequency (Hz) | 1000 ? | 26320 ? | ||||
| Screen | -27% | -27% | 10% | -30% | -64% | |
| Brightness middle (cd/m²) | 286 | 294.3 3% | 312 9% | 356 24% | 289 1% | 376 31% |
| Brightness (cd/m²) | 268 | 251 -6% | 298 11% | 322 20% | 267 0% | 341 27% |
| Brightness Distribution (%) | 87 | 76 -13% | 87 0% | 80 -8% | 85 -2% | 78 -10% |
| Black Level * (cd/m²) | 0.275 | 0.26 5% | 0.18 35% | 0.27 2% | 0.56 -104% | 0.66 -140% |
| Contrast (:1) | 1040 | 1132 9% | 1733 67% | 1319 27% | 516 -50% | 570 -45% |
| Colorchecker dE 2000 * | 4.74 | 4.08 14% | 5.39 -14% | 2.4 49% | 3.96 16% | 6.4 -35% |
| Colorchecker dE 2000 max. * | 8.27 | 19.49 -136% | 9.95 -20% | 4.42 47% | 6.76 18% | 20.45 -147% |
| Greyscale dE 2000 * | 1.57 | 3 -91% | 6.3 -301% | 2.81 -79% | 3.43 -118% | 4.59 -192% |
| Gamma | 2.24 98% | 2.21 100% | 2.192 100% | 2.4 92% | 2.28 96% | 2.26 97% |
| CCT | 6348 102% | 6616 98% | 7473 87% | 6294 103% | 7191 90% | 6819 95% |
| Colorchecker dE 2000 calibrated * | 3.7 | 3.15 | ||||
| Color Space (Percent of AdobeRGB 1998) (%) | 69 | 42 | 38 | |||
| Color Space (Percent of sRGB) (%) | 96 | 65 | 59 | |||
| Total Average (Program / Settings) | 5% /
-9% | 19% /
2% | 53% /
35% | 9% /
-9% | -11% /
-37% |
* ... smaller is better
Display Response Times
| ↔ Response Time Black to White | ||
|---|---|---|
| 31 ms ... rise ↗ and fall ↘ combined | ↗ 17 ms rise |  |
| ↘ 14 ms fall | ||
| The screen shows slow response rates in our tests and will be unsatisfactory for gamers. In comparison, all tested devices range from 0.1 (minimum) to 240 (maximum) ms. » 84 % of all devices are better. This means that the measured response time is worse than the average of all tested devices (19.8 ms). | ||
| ↔ Response Time 50% Grey to 80% Grey | ||
| 41 ms ... rise ↗ and fall ↘ combined | ↗ 21 ms rise |  |
| ↘ 20 ms fall | ||
| The screen shows slow response rates in our tests and will be unsatisfactory for gamers. In comparison, all tested devices range from 0.165 (minimum) to 636 (maximum) ms. » 65 % of all devices are better. This means that the measured response time is worse than the average of all tested devices (31 ms). | ||
Screen Flickering / PWM (Pulse-Width Modulation)
| Screen flickering / PWM detected | 1000 Hz | ≤ 90 % brightness setting |  |
The display backlight flickers at 1000 Hz (worst case, e.g., utilizing PWM) Flickering detected at a brightness setting of 90 % and below. There should be no flickering or PWM above this brightness setting. The frequency of 1000 Hz is quite high, so most users sensitive to PWM should not notice any flickering. In comparison: 52 % of all tested devices do not use PWM to dim the display. If PWM was detected, an average of 7754 (minimum: 5 - maximum: 343500) Hz was measured. | |||
在交付状态下,屏幕有一个体面的颜色再现,但颜色有点偏离目标--整体仍在可接受范围内。它不存在偏蓝的问题。该显示器不能再现AdobeRGB(41%)、sRGB(59%)和DCI-P3(40%)色彩空间。
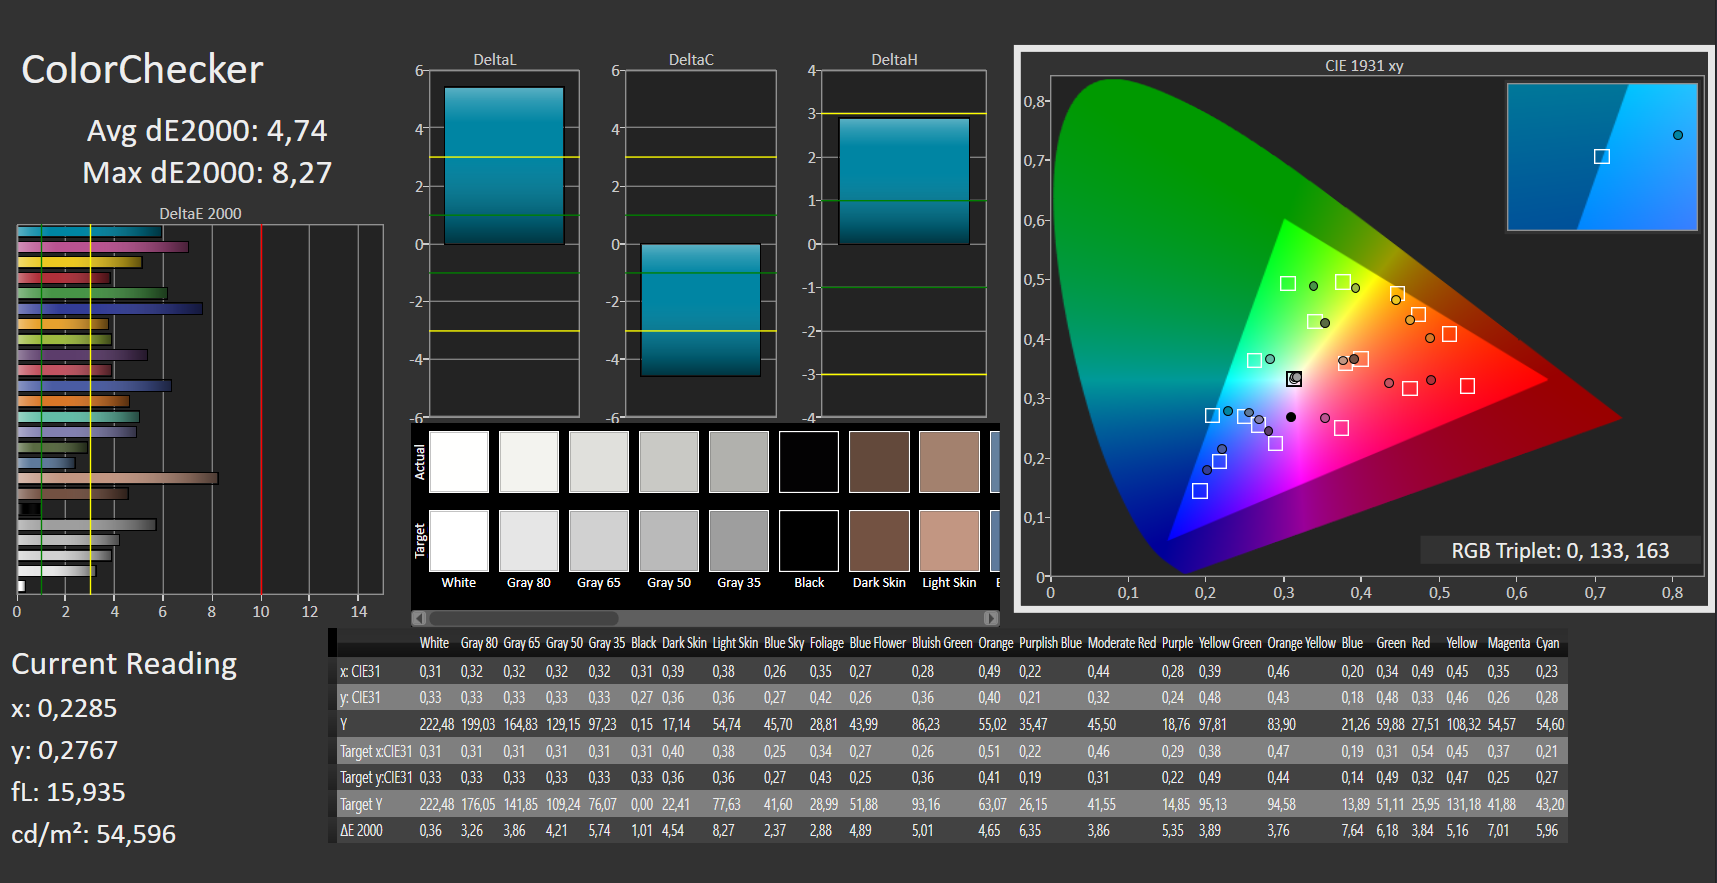
视角稳定的IPS面板可以从任何位置阅读。在阳光不太强烈的情况下,也可以在户外阅读屏幕。
性能 - 戴尔电脑的CPU仍然低于其能力
戴尔的15.6英寸全能型产品为办公和互联网应用提供足够的性能,并允许使用电脑游戏。
测试条件
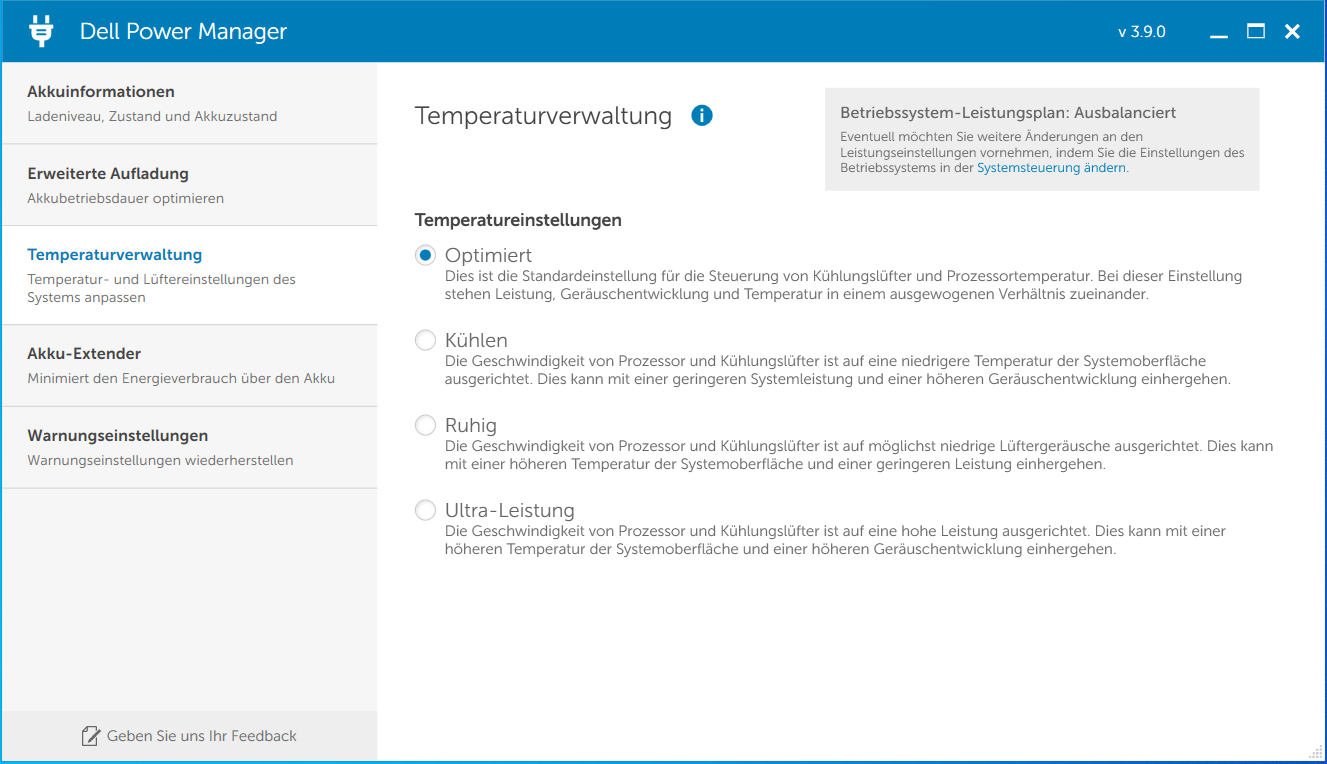
戴尔电源管理器提供影响笔记本温度和功率发展的配置文件。我们使用了 "优化 "配置文件。一些基准测试还在 "超性能 "配置文件中运行。
| 优化的 | 凉爽的 | 安静的 | 超强的性能 | |
|---|---|---|---|---|
| PL1 | 25瓦特 | 15瓦特 | 30瓦特 | |
| PL2 | 51瓦特 | 51瓦特 | 51瓦特 | 51瓦特 |
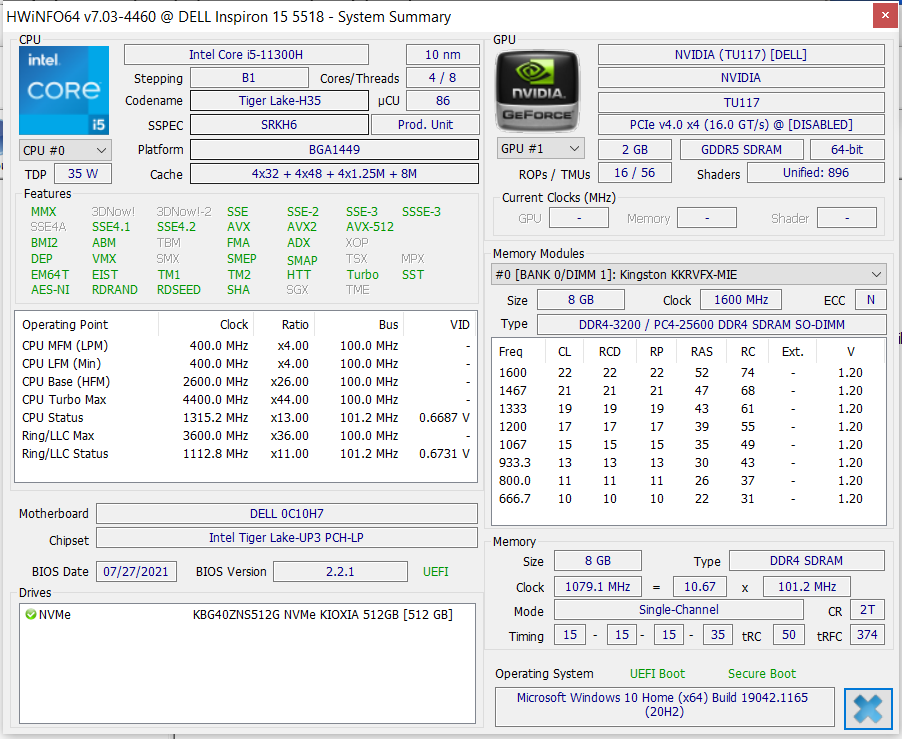
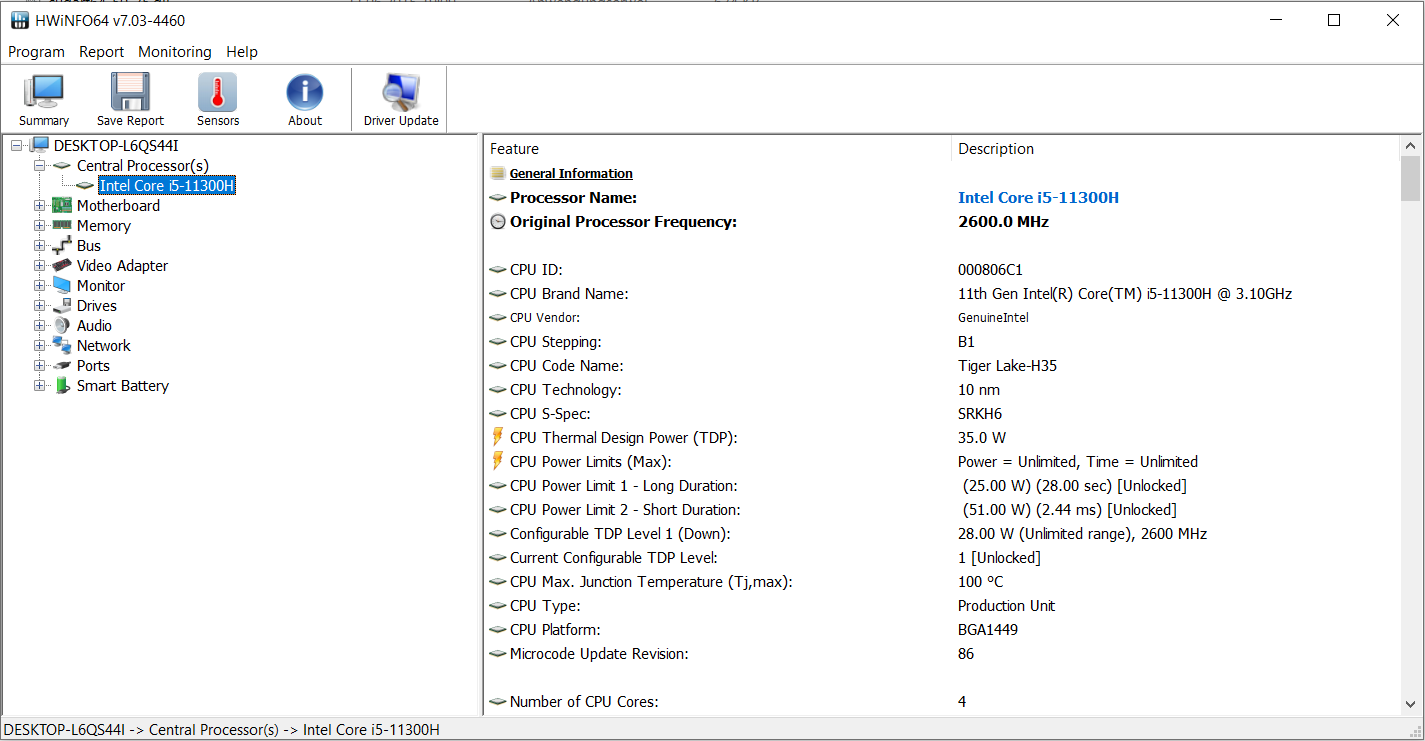
处理器
该 酷睿i7-11300H-四核处理器(Tiger Lake)以3.1 GHz的基础时钟工作。通过Turbo可以提高到4GHz(四个核心),最高4.4GHz(一个核心)。支持超线程(每个核心两个线程)。
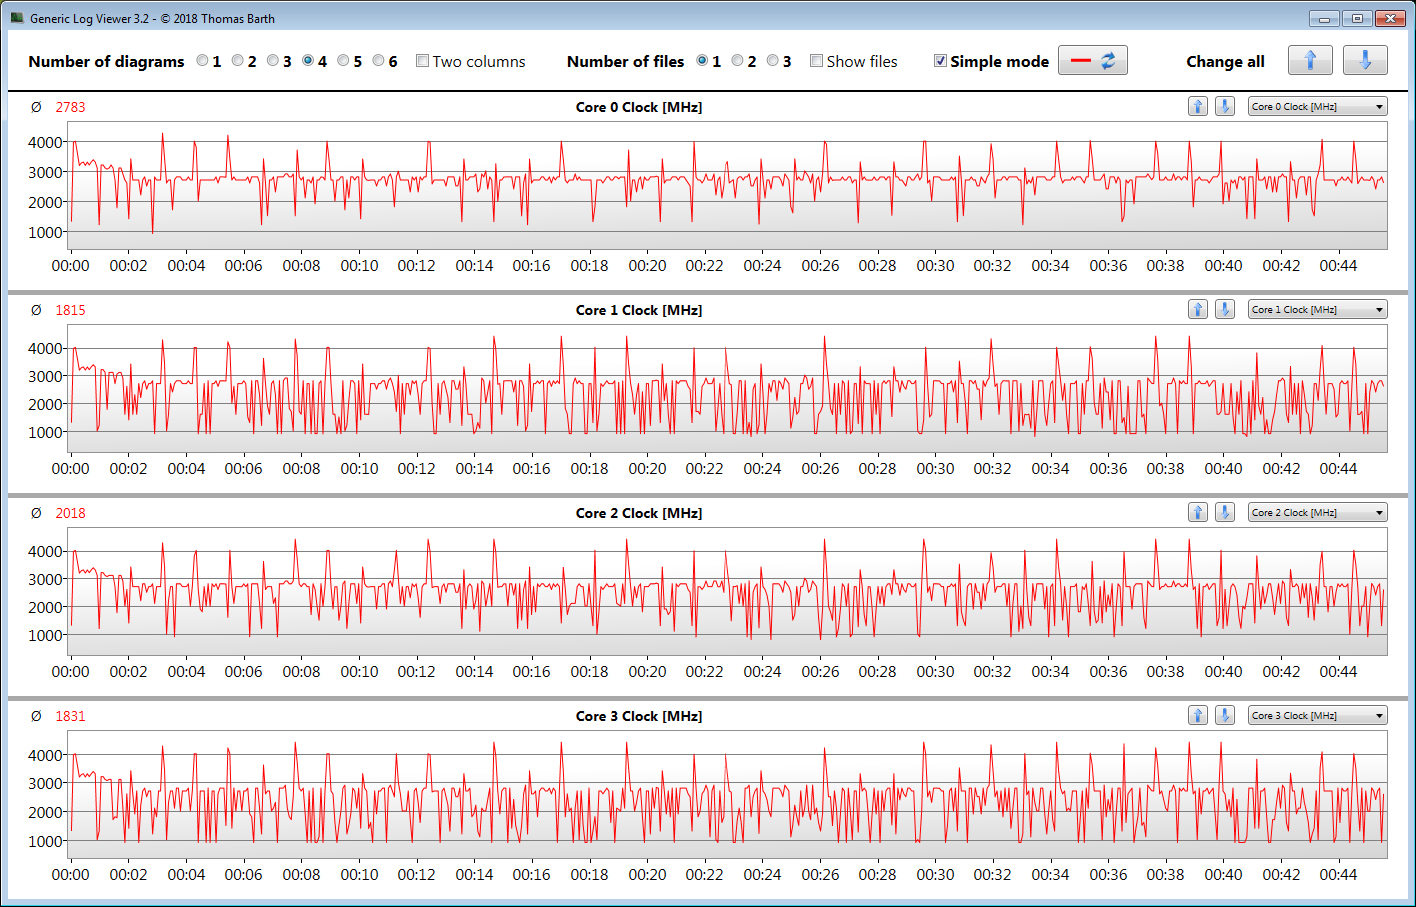
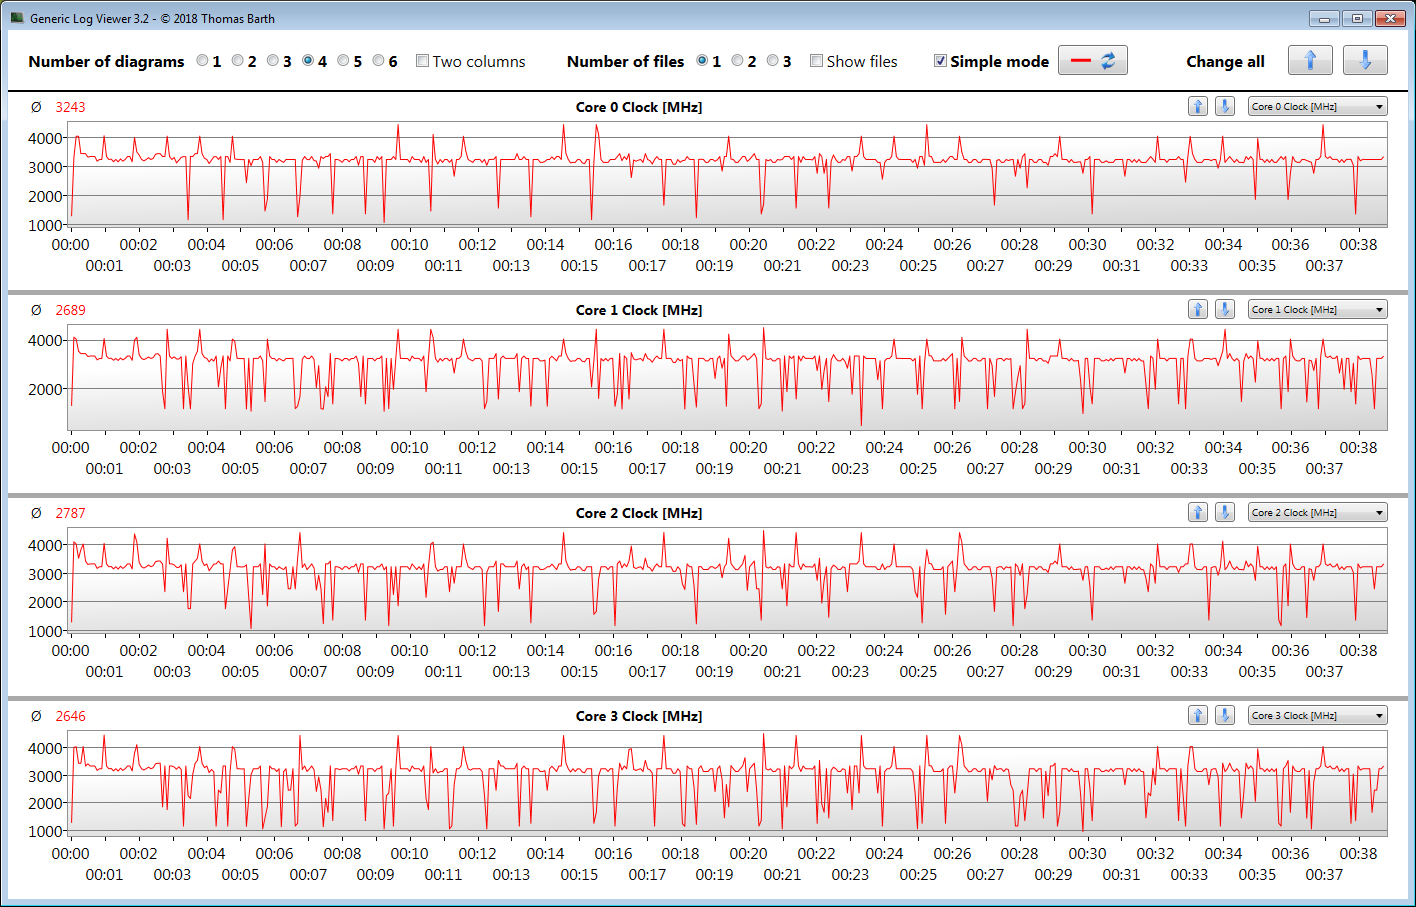
Cinebench R15基准的多线程测试在3.3至4GHz下运行了很短的时间,然后时钟在600MHz和3GHz之间波动。单线程测试以1.6至4.4GHz运行。在电池模式下,时钟速率较低。
戴尔为CPU选择了相对较低的功率限制。因此,11300H仍然低于其能力,因为与Ideapad 5 Pro 16IH的基准结果相比 Ideapad 5 Pro 16IHU6显示。多线程测试中的差距明显大于单线程测试。

我们通过循环运行Cinebench R15基准的多线程测试至少30分钟来检查CPU Turbo是否也在主电源运行中被永久使用。Turbo只在开始时使用,通常基础时钟被压低。超性能 "配置文件让CPU以更高的速度运行。
Cinebench R15 Multi Endurance test
| Cinebench R23 | |
| Single Core | |
| Average of class Office (708 - 2130, n=76, last 2 years) | |
| Xiaomi RedmiBook Pro 15 | |
| HP Pavilion 15-eg | |
| Lenovo IdeaPad 5 Pro 16IHU6 | |
| Dell Inspiron 15 5518-2X3JR (Ultra-Leistung) | |
| Average Intel Core i5-11300H (1218 - 1431, n=11) | |
| Dell Inspiron 15 5518-2X3JR | |
| Asus VivoBook S15 D533UA | |
| Lenovo IdeaPad 5 15ALC05 | |
| Multi Core | |
| Average of class Office (1673 - 22808, n=76, last 2 years) | |
| Asus VivoBook S15 D533UA | |
| Lenovo IdeaPad 5 15ALC05 | |
| Lenovo IdeaPad 5 Pro 16IHU6 | |
| Xiaomi RedmiBook Pro 15 | |
| Xiaomi RedmiBook Pro 15 | |
| Average Intel Core i5-11300H (3313 - 6581, n=10) | |
| HP Pavilion 15-eg | |
| Dell Inspiron 15 5518-2X3JR (Ultra-Leistung) | |
| Dell Inspiron 15 5518-2X3JR | |
| Cinebench R20 | |
| CPU (Single Core) | |
| Average of class Office (345 - 816, n=75, last 2 years) | |
| Xiaomi RedmiBook Pro 15 | |
| HP Pavilion 15-eg | |
| Lenovo IdeaPad 5 Pro 16IHU6 | |
| Dell Inspiron 15 5518-2X3JR (Ultra-Leistung) | |
| Dell Inspiron 15 5518-2X3JR | |
| Average Intel Core i5-11300H (431 - 548, n=11) | |
| Asus VivoBook S15 D533UA | |
| Lenovo IdeaPad 5 15ALC05 | |
| CPU (Multi Core) | |
| Average of class Office (648 - 8840, n=75, last 2 years) | |
| Asus VivoBook S15 D533UA | |
| Lenovo IdeaPad 5 15ALC05 | |
| Lenovo IdeaPad 5 Pro 16IHU6 | |
| Xiaomi RedmiBook Pro 15 | |
| Average Intel Core i5-11300H (1300 - 2533, n=10) | |
| Dell Inspiron 15 5518-2X3JR | |
| HP Pavilion 15-eg | |
| Dell Inspiron 15 5518-2X3JR (Ultra-Leistung) | |
| Cinebench R15 | |
| CPU Single 64Bit | |
| Average of class Office (99.5 - 316, n=77, last 2 years) | |
| Xiaomi RedmiBook Pro 15 | |
| Xiaomi RedmiBook Pro 15 | |
| HP Pavilion 15-eg | |
| Asus VivoBook S15 D533UA | |
| Lenovo IdeaPad 5 15ALC05 | |
| Lenovo IdeaPad 5 Pro 16IHU6 | |
| Average Intel Core i5-11300H (123 - 211, n=8) | |
| Dell Inspiron 15 5518-2X3JR | |
| CPU Multi 64Bit | |
| Average of class Office (250 - 3380, n=77, last 2 years) | |
| Asus VivoBook S15 D533UA | |
| Lenovo IdeaPad 5 15ALC05 | |
| Xiaomi RedmiBook Pro 15 (Variable PL1 ) | |
| Xiaomi RedmiBook Pro 15 (Pl1 @ 25W) | |
| Xiaomi RedmiBook Pro 15 (PL1 fixed @ 28W) | |
| Lenovo IdeaPad 5 Pro 16IHU6 | |
| Average Intel Core i5-11300H (632 - 990, n=11) | |
| Dell Inspiron 15 5518-2X3JR (Ultra-Leistung) | |
| Dell Inspiron 15 5518-2X3JR | |
| HP Pavilion 15-eg | |
| Blender - v2.79 BMW27 CPU | |
| Dell Inspiron 15 5518-2X3JR | |
| Dell Inspiron 15 5518-2X3JR (Ultra-Leistung) | |
| HP Pavilion 15-eg | |
| Average Intel Core i5-11300H (466 - 862, n=10) | |
| Lenovo IdeaPad 5 Pro 16IHU6 | |
| Xiaomi RedmiBook Pro 15 | |
| Lenovo IdeaPad 5 15ALC05 | |
| Average of class Office (158 - 1940, n=76, last 2 years) | |
| Asus VivoBook S15 D533UA | |
| 7-Zip 18.03 | |
| 7z b 4 -mmt1 | |
| Average of class Office (3387 - 6469, n=77, last 2 years) | |
| HP Pavilion 15-eg | |
| Xiaomi RedmiBook Pro 15 | |
| Lenovo IdeaPad 5 Pro 16IHU6 | |
| Dell Inspiron 15 5518-2X3JR | |
| Dell Inspiron 15 5518-2X3JR (Ultra-Leistung) | |
| Average Intel Core i5-11300H (4603 - 4969, n=10) | |
| Asus VivoBook S15 D533UA | |
| Lenovo IdeaPad 5 15ALC05 | |
| 7z b 4 | |
| Average of class Office (7098 - 76886, n=77, last 2 years) | |
| Asus VivoBook S15 D533UA | |
| Lenovo IdeaPad 5 15ALC05 | |
| Xiaomi RedmiBook Pro 15 | |
| Lenovo IdeaPad 5 Pro 16IHU6 | |
| Average Intel Core i5-11300H (17573 - 26001, n=10) | |
| HP Pavilion 15-eg | |
| Dell Inspiron 15 5518-2X3JR (Ultra-Leistung) | |
| Dell Inspiron 15 5518-2X3JR | |
| Geekbench 5.5 | |
| Single-Core | |
| Average of class Office (811 - 2175, n=73, last 2 years) | |
| Xiaomi RedmiBook Pro 15 | |
| Lenovo IdeaPad 5 Pro 16IHU6 | |
| Average Intel Core i5-11300H (1342 - 1462, n=10) | |
| Dell Inspiron 15 5518-2X3JR (Ultra-Leistung) | |
| Dell Inspiron 15 5518-2X3JR | |
| Asus VivoBook S15 D533UA | |
| Lenovo IdeaPad 5 15ALC05 | |
| Multi-Core | |
| Average of class Office (1483 - 16999, n=73, last 2 years) | |
| Asus VivoBook S15 D533UA | |
| Lenovo IdeaPad 5 15ALC05 | |
| Xiaomi RedmiBook Pro 15 | |
| Lenovo IdeaPad 5 Pro 16IHU6 | |
| Average Intel Core i5-11300H (3631 - 5499, n=10) | |
| Dell Inspiron 15 5518-2X3JR (Ultra-Leistung) | |
| Dell Inspiron 15 5518-2X3JR | |
| HWBOT x265 Benchmark v2.2 - 4k Preset | |
| Average of class Office (2.21 - 26, n=76, last 2 years) | |
| Asus VivoBook S15 D533UA | |
| Lenovo IdeaPad 5 15ALC05 | |
| Lenovo IdeaPad 5 Pro 16IHU6 | |
| Average Intel Core i5-11300H (4.32 - 8.38, n=10) | |
| Xiaomi RedmiBook Pro 15 | |
| HP Pavilion 15-eg | |
| Dell Inspiron 15 5518-2X3JR (Ultra-Leistung) | |
| Dell Inspiron 15 5518-2X3JR | |
| LibreOffice - 20 Documents To PDF | |
| Lenovo IdeaPad 5 15ALC05 | |
| Asus VivoBook S15 D533UA | |
| Average of class Office (39.9 - 102.3, n=76, last 2 years) | |
| Lenovo IdeaPad 5 Pro 16IHU6 | |
| Average Intel Core i5-11300H (43.6 - 59.4, n=10) | |
| Xiaomi RedmiBook Pro 15 | |
| Dell Inspiron 15 5518-2X3JR | |
| HP Pavilion 15-eg | |
| Dell Inspiron 15 5518-2X3JR (Ultra-Leistung) | |
| R Benchmark 2.5 - Overall mean | |
| Lenovo IdeaPad 5 15ALC05 | |
| Dell Inspiron 15 5518-2X3JR (Ultra-Leistung) | |
| Dell Inspiron 15 5518-2X3JR | |
| Average Intel Core i5-11300H (0.6 - 0.644, n=10) | |
| Lenovo IdeaPad 5 Pro 16IHU6 | |
| Asus VivoBook S15 D533UA | |
| HP Pavilion 15-eg | |
| Xiaomi RedmiBook Pro 15 | |
| Average of class Office (0.393 - 0.888, n=76, last 2 years) | |
* ... smaller is better
系统性能
灵活而流畅的工作系统为所有常见的应用领域提供了足够的性能。基本上良好的PCMark结果有点落后于竞争对手。
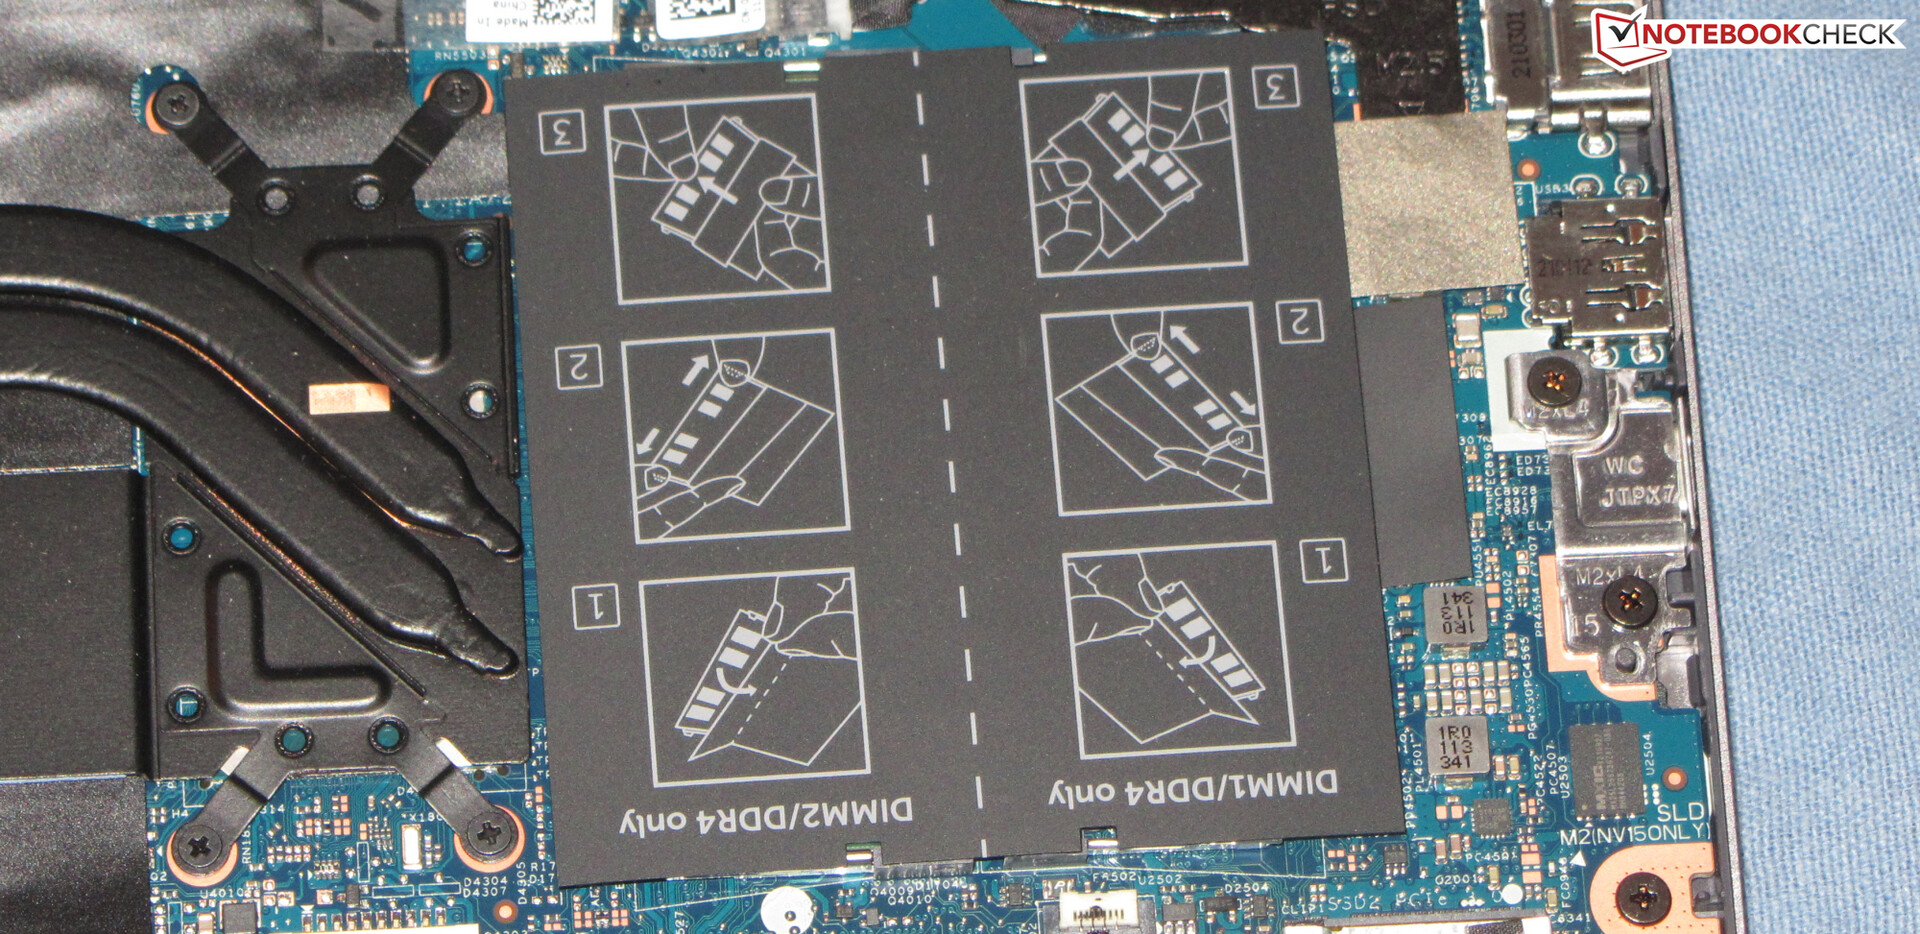
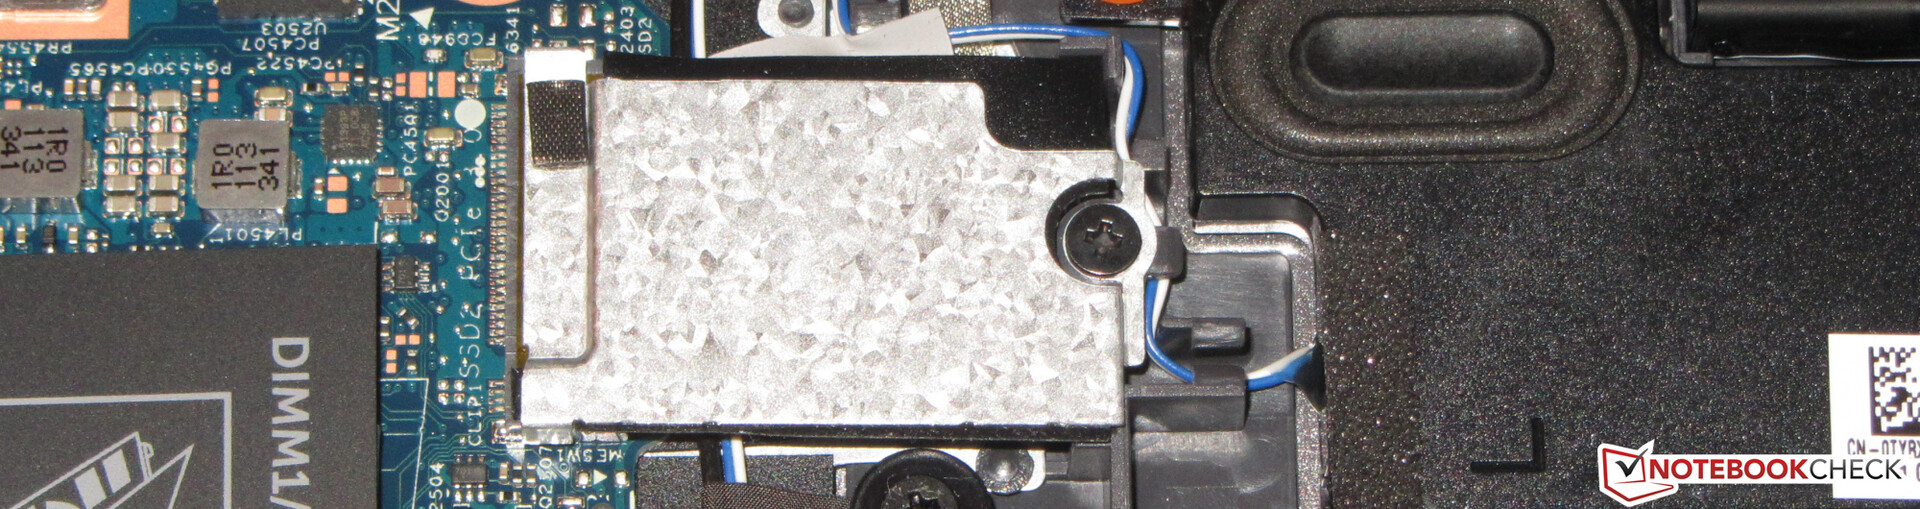
由于工作内存在单通道模式下运行,部分性能仍 未使用。双通道模式可以通过安装第二个内存模块激活。
| PCMark 10 Score | 4899 points | |
Help | ||
| PCMark 10 / Score | |
| Average of class Office (2601 - 9298, n=68, last 2 years) | |
| HP Pavilion 15-eg | |
| Xiaomi RedmiBook Pro 15 | |
| Asus VivoBook S15 D533UA | |
| Lenovo IdeaPad 5 Pro 16IHU6 | |
| Lenovo IdeaPad 5 15ALC05 | |
| Average Intel Core i5-11300H, NVIDIA GeForce MX450 (4899 - 5391, n=3) | |
| Dell Inspiron 15 5518-2X3JR | |
| PCMark 10 / Essentials | |
| Average of class Office (3245 - 11594, n=68, last 2 years) | |
| HP Pavilion 15-eg | |
| Asus VivoBook S15 D533UA | |
| Lenovo IdeaPad 5 15ALC05 | |
| Lenovo IdeaPad 5 Pro 16IHU6 | |
| Average Intel Core i5-11300H, NVIDIA GeForce MX450 (8366 - 8931, n=3) | |
| Xiaomi RedmiBook Pro 15 | |
| Dell Inspiron 15 5518-2X3JR | |
| PCMark 10 / Productivity | |
| Average of class Office (5336 - 17243, n=68, last 2 years) | |
| Xiaomi RedmiBook Pro 15 | |
| HP Pavilion 15-eg | |
| Average Intel Core i5-11300H, NVIDIA GeForce MX450 (8292 - 9188, n=3) | |
| Lenovo IdeaPad 5 Pro 16IHU6 | |
| Dell Inspiron 15 5518-2X3JR | |
| Asus VivoBook S15 D533UA | |
| Lenovo IdeaPad 5 15ALC05 | |
| PCMark 10 / Digital Content Creation | |
| Average of class Office (2049 - 13541, n=68, last 2 years) | |
| Xiaomi RedmiBook Pro 15 | |
| HP Pavilion 15-eg | |
| Asus VivoBook S15 D533UA | |
| Lenovo IdeaPad 5 Pro 16IHU6 | |
| Lenovo IdeaPad 5 15ALC05 | |
| Average Intel Core i5-11300H, NVIDIA GeForce MX450 (4600 - 5388, n=3) | |
| Dell Inspiron 15 5518-2X3JR | |
DPC延迟
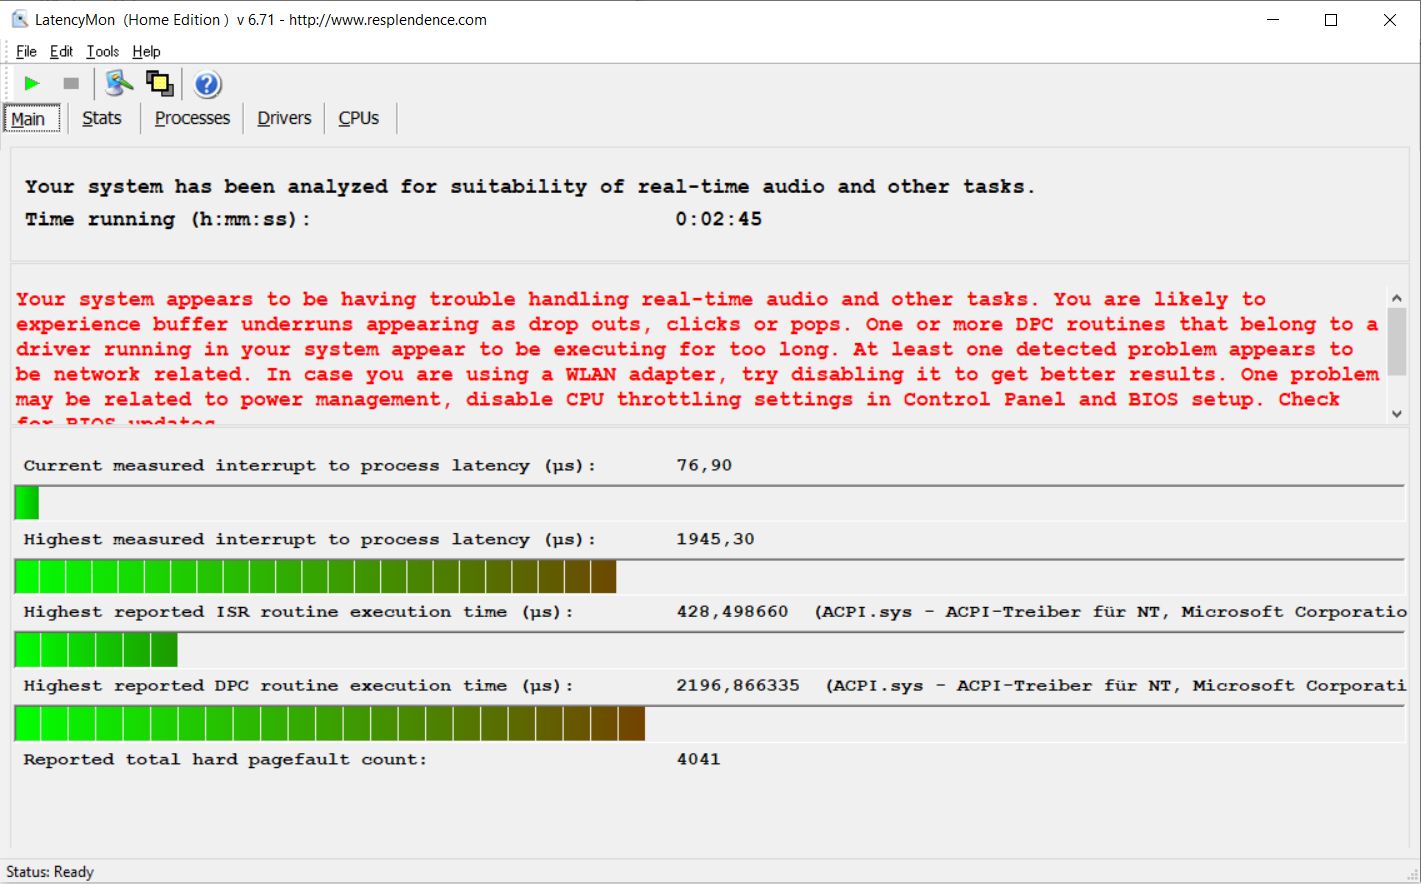
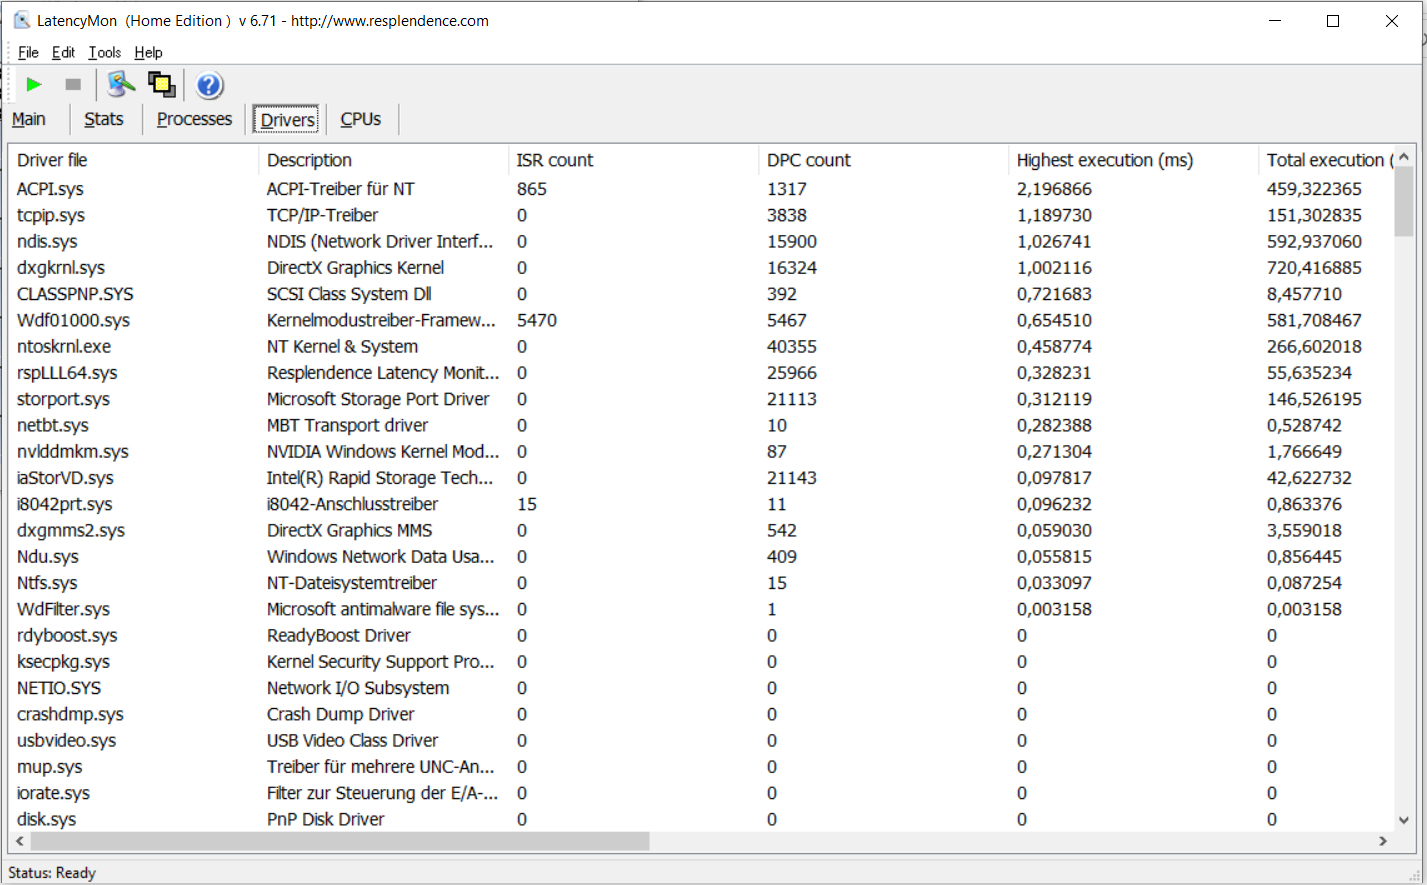
| DPC Latencies / LatencyMon - interrupt to process latency (max), Web, Youtube, Prime95 | |
| Xiaomi RedmiBook Pro 15 | |
| HP Pavilion 15-eg | |
| Dell Inspiron 15 5518-2X3JR | |
| Lenovo IdeaPad 5 15ALC05 | |
| Lenovo IdeaPad 5 Pro 16IHU6 | |
| Asus VivoBook S15 D533UA | |
* ... smaller is better
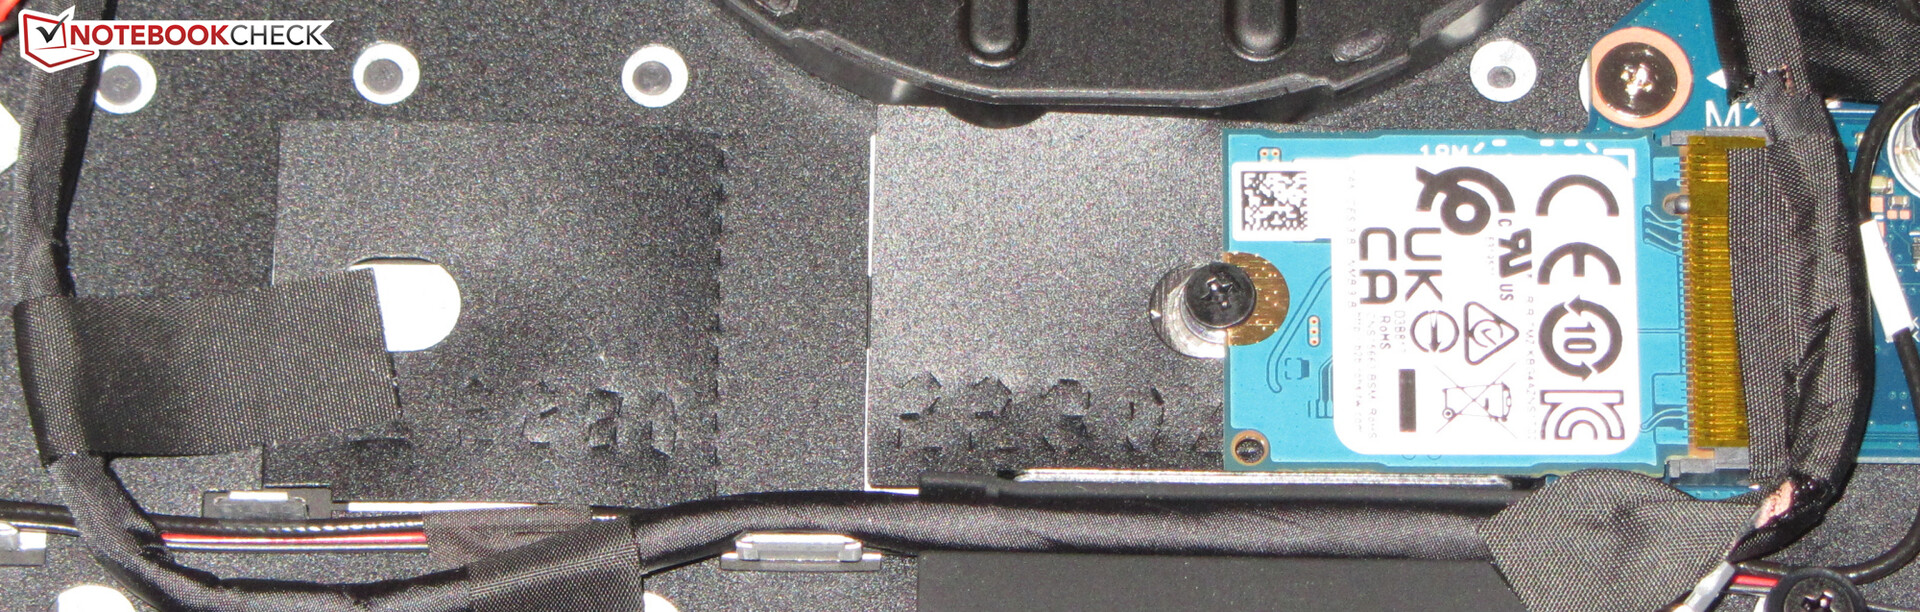
大容量存储
512GB NVMe固态硬盘(M.2-2230)的传输率很好,但它不是顶级固态硬盘之一。使用2280格式的固态硬盘需要重新定位安装支架。第二个第二个M.2插槽只能容纳2230格式的型号。

| Dell Inspiron 15 5518-2X3JR Toshiba KBG40ZNS512G NVMe | HP Pavilion 15-eg Samsung PM991 MZVLQ1T0HALB | Xiaomi RedmiBook Pro 15 Toshiba KBG40ZNV512G | Lenovo IdeaPad 5 Pro 16IHU6 Samsung SSD PM981a MZVLB512HBJQ | Asus VivoBook S15 D533UA WDC PC SN530 SDBPNPZ-1T00 | Lenovo IdeaPad 5 15ALC05 | Average Toshiba KBG40ZNS512G NVMe | Average of class Office | |
|---|---|---|---|---|---|---|---|---|
| CrystalDiskMark 5.2 / 6 | -16% | -12% | 27% | -5% | -21% | -23% | 55% | |
| Write 4K (MB/s) | 207.3 | 141.6 -32% | 136 -34% | 203 -2% | 116.8 -44% | 82.7 -60% | 126.4 ? -39% | 153.2 ? -26% |
| Read 4K (MB/s) | 61.3 | 42.61 -30% | 60.4 -1% | 52.3 -15% | 43.92 -28% | 39.96 -35% | 50 ? -18% | 73.4 ? 20% |
| Write Seq (MB/s) | 1499 | 1337 -11% | 1447 -3% | 2138 43% | 1990 33% | 1273 -15% | 1207 ? -19% | 2531 ? 69% |
| Read Seq (MB/s) | 1858 | 1575 -15% | 1507 -19% | 1974 6% | 1959 5% | 1601 -14% | 1567 ? -16% | 3292 ? 77% |
| Write 4K Q32T1 (MB/s) | 510 | 397.8 -22% | 235.6 -54% | 640 25% | 373.3 -27% | 360.4 -29% | 347 ? -32% | 431 ? -15% |
| Read 4K Q32T1 (MB/s) | 640 | 454.2 -29% | 737 15% | 707 10% | 524 -18% | 410.4 -36% | 425 ? -34% | 516 ? -19% |
| Write Seq Q32T1 (MB/s) | 1521 | 1648 8% | 1529 1% | 2973 95% | 1985 31% | 1589 4% | 1224 ? -20% | 4178 ? 175% |
| Read Seq Q32T1 (MB/s) | 2316 | 2388 3% | 2357 2% | 3559 54% | 2456 6% | 2652 15% | 2278 ? -2% | 6043 ? 161% |
| AS SSD | 35% | -7% | 86% | 43% | 30% | -10% | 85% | |
| Seq Read (MB/s) | 2086 | 2030 -3% | 1972 -5% | 2541 22% | 2082 0% | 2549 22% | 1871 ? -10% | 4326 ? 107% |
| Seq Write (MB/s) | 1124 | 1003 -11% | 981 -13% | 2555 127% | 1844 64% | 1571 40% | 810 ? -28% | 2771 ? 147% |
| 4K Read (MB/s) | 54.1 | 46.74 -14% | 55.8 3% | 56 4% | 44.33 -18% | 41.92 -23% | 45.8 ? -15% | 58.1 ? 7% |
| 4K Write (MB/s) | 138.1 | 164.2 19% | 133.5 -3% | 129.6 -6% | 157.5 14% | 110.3 -20% | 110.9 ? -20% | 162.6 ? 18% |
| 4K-64 Read (MB/s) | 1295 | 1098 -15% | 1277 -1% | 1633 26% | 1039 -20% | 1086 -16% | 997 ? -23% | 958 ? -26% |
| 4K-64 Write (MB/s) | 750 | 891 19% | 313.9 -58% | 1863 148% | 1556 107% | 1083 44% | 452 ? -40% | 1643 ? 119% |
| Access Time Read * (ms) | 0.141 | 0.053 62% | 0.15 -6% | 0.077 45% | 0.05 65% | 0.119 16% | 0.1024 ? 27% | 0.08448 ? 40% |
| Access Time Write * (ms) | 0.169 | 0.062 63% | 0.513 -204% | 0.029 83% | 0.065 62% | 0.034 80% | 0.4026 ? -138% | 0.05931 ? 65% |
| Score Read (Points) | 1558 | 1348 -13% | 1530 -2% | 1944 25% | 1292 -17% | 1383 -11% | 1232 ? -21% | 1449 ? -7% |
| Score Write (Points) | 1001 | 1155 15% | 546 -45% | 2248 125% | 1898 90% | 1351 35% | 644 ? -36% | 2083 ? 108% |
| Score Total (Points) | 3316 | 3149 -5% | 2819 -15% | 5192 57% | 3845 16% | 3398 2% | 2461 ? -26% | 4207 ? 27% |
| Copy ISO MB/s (MB/s) | 678 | 1583 133% | 1105 63% | 2246 231% | 1441 113% | 1286 90% | 1785 ? 163% | 2541 ? 275% |
| Copy Program MB/s (MB/s) | 364.8 | 682 87% | 799 119% | 861 136% | 484.9 33% | 574 57% | 388 ? 6% | 790 ? 117% |
| Copy Game MB/s (MB/s) | 557 | 1428 156% | 957 72% | 1552 179% | 1098 97% | 1133 103% | 715 ? 28% | 1627 ? 192% |
| Total Average (Program / Settings) | 10% /
17% | -10% /
-9% | 57% /
64% | 19% /
26% | 5% /
11% | -17% /
-14% | 70% /
74% |
* ... smaller is better
Continuous load read: DiskSpd Read Loop, Queue Depth 8
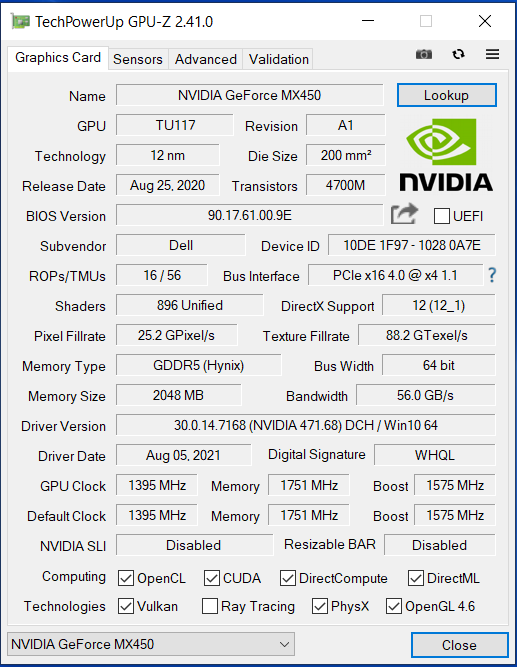
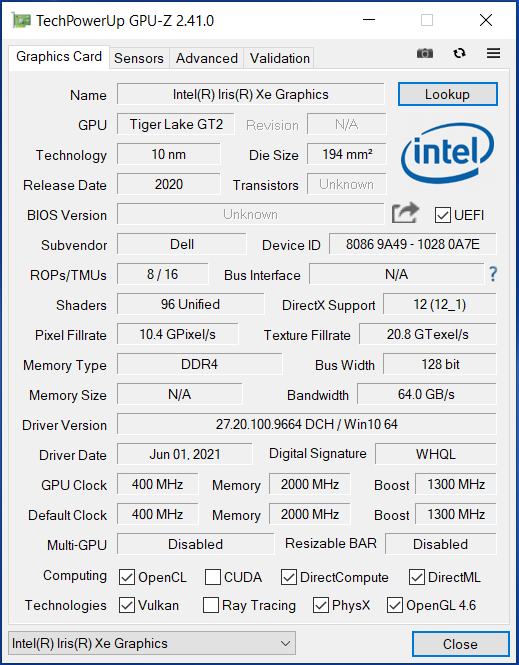
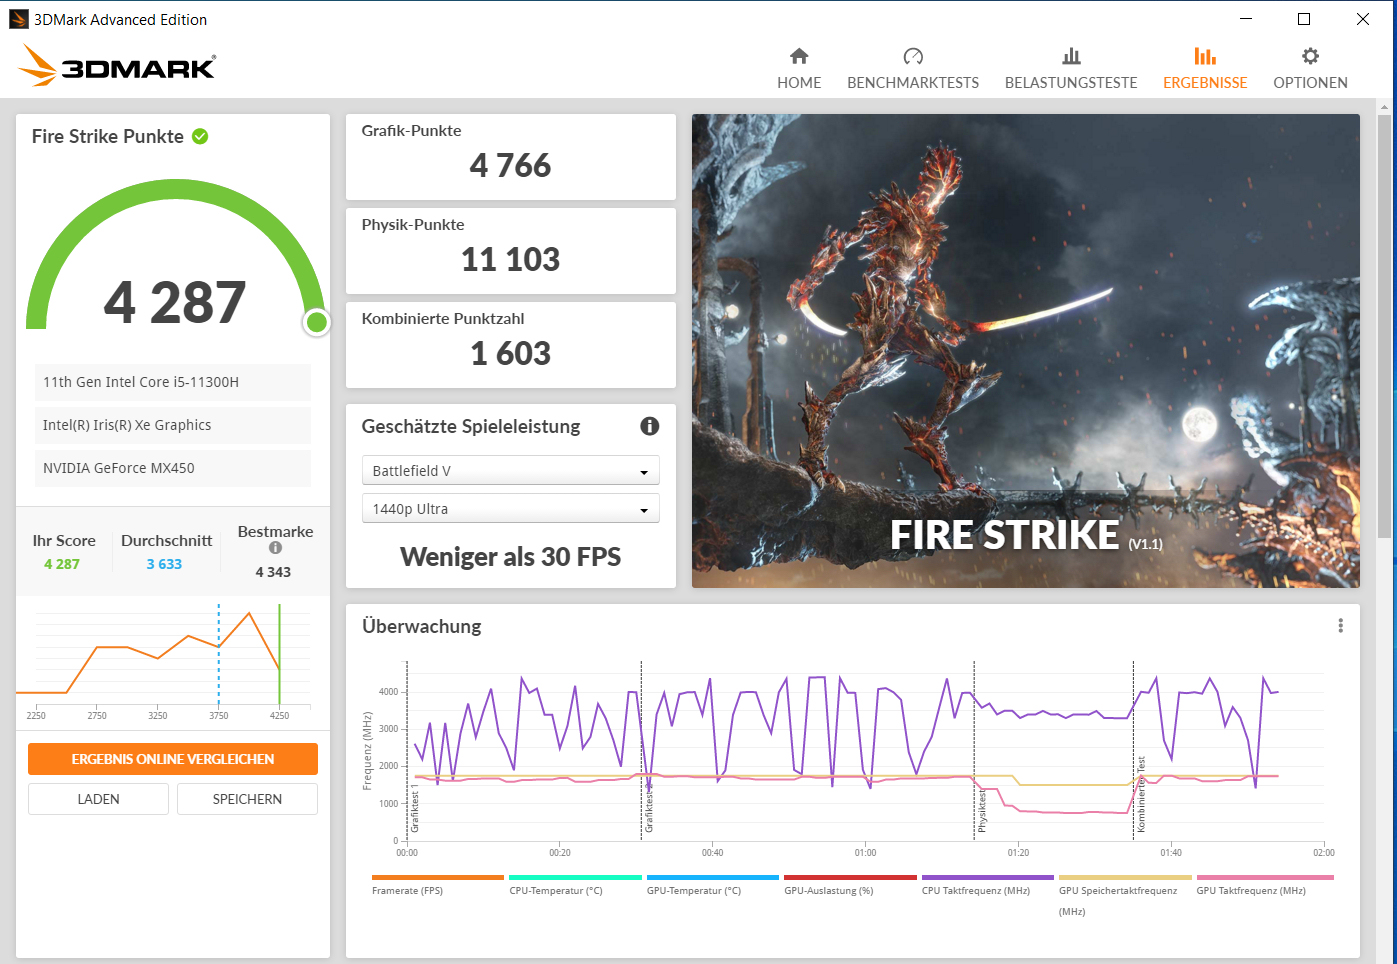
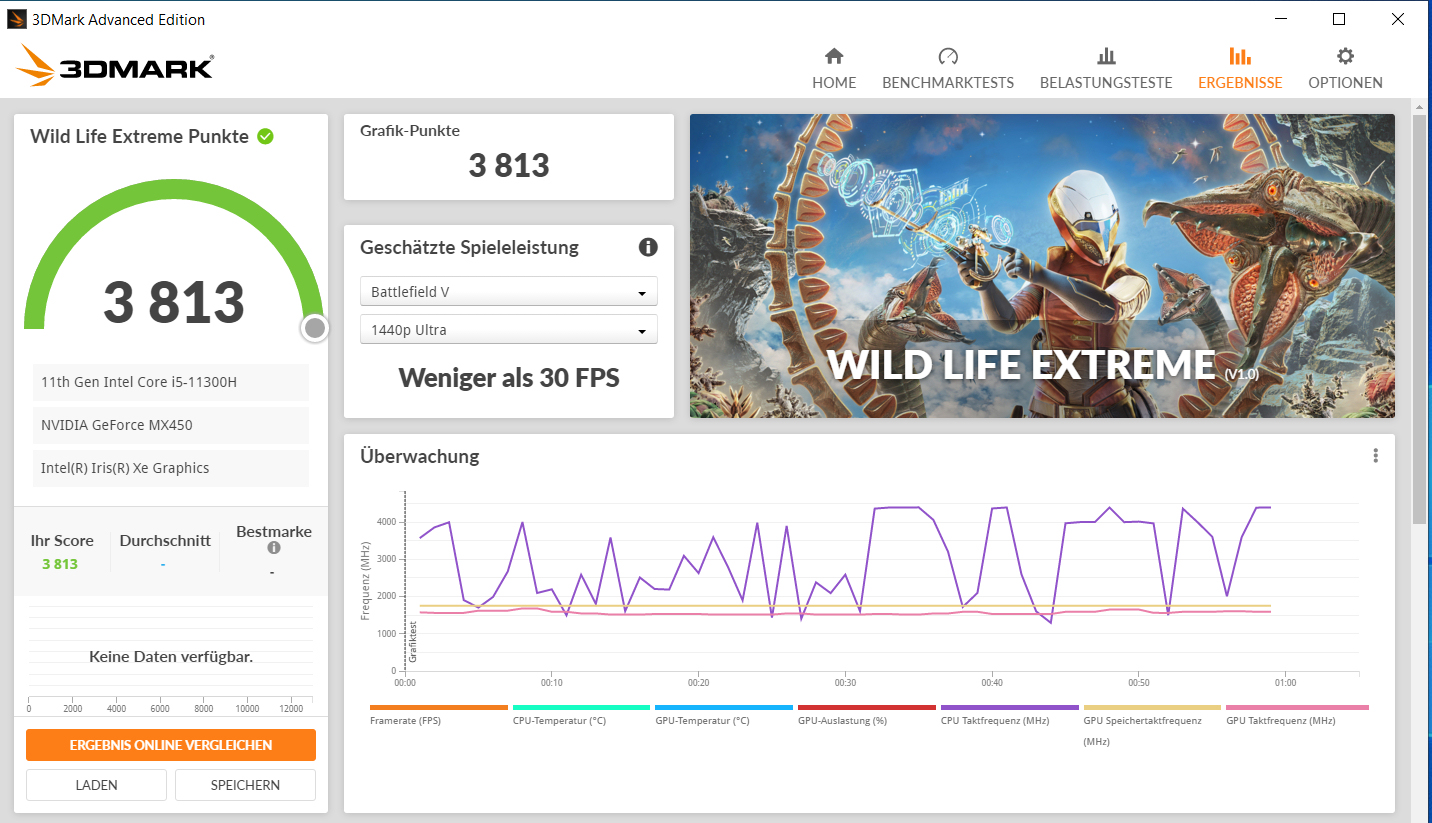
图形卡
的。GeForce-MX450GPU(图灵)是Nvidia目前的中档型号。它由快速的GDDR5内存(2,048 MB)支持,通过64位线连接。3DMark的结果与我们迄今为止确定的MX450平均水平相当。超性能 "配置文件并不影响图形性能。
| 3DMark 11 Performance | 7524 points | |
| 3DMark Ice Storm Standard Score | 55566 points | |
| 3DMark Cloud Gate Standard Score | 14683 points | |
| 3DMark Fire Strike Score | 4287 points | |
| 3DMark Time Spy Score | 2030 points | |
Help | ||
| 3DMark 11 - 1280x720 Performance GPU | |
| Lenovo IdeaPad 5 Pro 16IHU6 | |
| Dell Inspiron 15 5518-2X3JR (Ultra-Leistung) | |
| Dell Inspiron 15 5518-2X3JR | |
| Average of class Office (2551 - 18313, n=72, last 2 years) | |
| HP Pavilion 15-eg | |
| Average NVIDIA GeForce MX450 (6341 - 9580, n=16) | |
| Xiaomi RedmiBook Pro 15 | |
| Asus VivoBook S15 D533UA | |
| Lenovo IdeaPad 5 15ALC05 | |
| 3DMark | |
| 1920x1080 Fire Strike Graphics | |
| Average of class Office (736 - 21871, n=75, last 2 years) | |
| Lenovo IdeaPad 5 Pro 16IHU6 | |
| Average NVIDIA GeForce MX450 (4336 - 5753, n=17) | |
| Dell Inspiron 15 5518-2X3JR | |
| HP Pavilion 15-eg | |
| Dell Inspiron 15 5518-2X3JR (Ultra-Leistung) | |
| Xiaomi RedmiBook Pro 15 | |
| Asus VivoBook S15 D533UA | |
| Lenovo IdeaPad 5 15ALC05 | |
| 1280x720 Cloud Gate Standard Graphics | |
| Average of class Office (11640 - 118515, n=38, last 2 years) | |
| Lenovo IdeaPad 5 Pro 16IHU6 | |
| Average NVIDIA GeForce MX450 (25467 - 33806, n=13) | |
| Dell Inspiron 15 5518-2X3JR (Ultra-Leistung) | |
| HP Pavilion 15-eg | |
| Dell Inspiron 15 5518-2X3JR | |
| Xiaomi RedmiBook Pro 15 | |
| Lenovo IdeaPad 5 15ALC05 | |
| 2560x1440 Time Spy Graphics | |
| Average of class Office (493 - 6679, n=70, last 2 years) | |
| Lenovo IdeaPad 5 Pro 16IHU6 | |
| Dell Inspiron 15 5518-2X3JR (Ultra-Leistung) | |
| HP Pavilion 15-eg | |
| Dell Inspiron 15 5518-2X3JR | |
| Average NVIDIA GeForce MX450 (1086 - 2300, n=16) | |
| Lenovo IdeaPad 5 15ALC05 | |
| Asus VivoBook S15 D533UA | |
游戏性能
| The Witcher 3 - 1366x768 Medium Graphics & Postprocessing | |
| Lenovo IdeaPad 5 Pro 16IHU6 | |
| HP Pavilion 15-eg | |
| Average of class Office (44.7 - 90.4, n=3, last 2 years) | |
| Average NVIDIA GeForce MX450 (34 - 81.4, n=14) | |
| MSI Modern 14 B11SB-085 | |
| Xiaomi RedmiBook Pro 15 | |
| Dell Inspiron 15 5518-2X3JR | |
| Lenovo IdeaPad 5 15ALC05 | |
| Asus VivoBook S15 D533UA | |
| Dota 2 Reborn - 1920x1080 ultra (3/3) best looking | |
| Lenovo IdeaPad 5 Pro 16IHU6 | |
| HP Pavilion 15-eg | |
| MSI Modern 14 B11SB-085 | |
| Average NVIDIA GeForce MX450 (34.9 - 104.6, n=20) | |
| Xiaomi RedmiBook Pro 15 | |
| Dell Inspiron 15 5518-2X3JR (Ultra-Leistung) | |
| Dell Inspiron 15 5518-2X3JR | |
| Average of class Office (14.6 - 135, n=77, last 2 years) | |
| Asus VivoBook S15 D533UA | |
| Lenovo IdeaPad 5 15ALC05 | |
| X-Plane 11.11 - 1920x1080 high (fps_test=3) | |
| HP Pavilion 15-eg | |
| Lenovo IdeaPad 5 Pro 16IHU6 | |
| Xiaomi RedmiBook Pro 15 | |
| MSI Modern 14 B11SB-085 | |
| Average NVIDIA GeForce MX450 (35.4 - 71.4, n=20) | |
| Dell Inspiron 15 5518-2X3JR | |
| Dell Inspiron 15 5518-2X3JR (Ultra-Leistung) | |
| Average of class Office (12 - 82.4, n=69, last 2 years) | |
| Lenovo IdeaPad 5 15ALC05 | |
| Asus VivoBook S15 D533UA | |
| Final Fantasy XV Benchmark - 1280x720 Lite Quality | |
| Lenovo IdeaPad 5 Pro 16IHU6 (1.3) | |
| Average of class Office (16.5 - 171.2, n=73, last 2 years) | |
| Average NVIDIA GeForce MX450 (27.6 - 72.2, n=16) | |
| MSI Modern 14 B11SB-085 (1.3) | |
| Dell Inspiron 15 5518-2X3JR (1.3, Ultra-Leistung) | |
| Xiaomi RedmiBook Pro 15 (1.3) | |
| Dell Inspiron 15 5518-2X3JR (1.3) | |
| HP Pavilion 15-eg (1.3) | |
| Asus VivoBook S15 D533UA (1.3) | |
| GTA V - 1920x1080 High/On (Advanced Graphics Off) AA:2xMSAA + FX AF:8x | |
| Lenovo IdeaPad 5 Pro 16IHU6 | |
| Average NVIDIA GeForce MX450 (30.6 - 68.3, n=11) | |
| Dell Inspiron 15 5518-2X3JR (Ultra-Leistung) | |
| Dell Inspiron 15 5518-2X3JR | |
| MSI Modern 14 B11SB-085 | |
| HP Pavilion 15-eg | |
| Average of class Office (11.4 - 163.1, n=70, last 2 years) | |
| Asus VivoBook S15 D533UA | |
| Strange Brigade - 1280x720 lowest AF:1 | |
| Average of class Office (19.4 - 388, n=53, last 2 years) | |
| Lenovo IdeaPad 5 Pro 16IHU6 (1.47.22.14 D3D12) | |
| Average NVIDIA GeForce MX450 (61.4 - 137.7, n=12) | |
| MSI Modern 14 B11SB-085 (1.47.22.14 D3D12) | |
| Dell Inspiron 15 5518-2X3JR (1.47.22.14 D3D12) | |
| Dell Inspiron 15 5518-2X3JR (1.47.22.14 D3D12, Ultra-Leistung) | |
| Xiaomi RedmiBook Pro 15 (1.47.22.14 D3D12) | |
| Asus VivoBook S15 D533UA (1.47.22.14 D3D12) | |
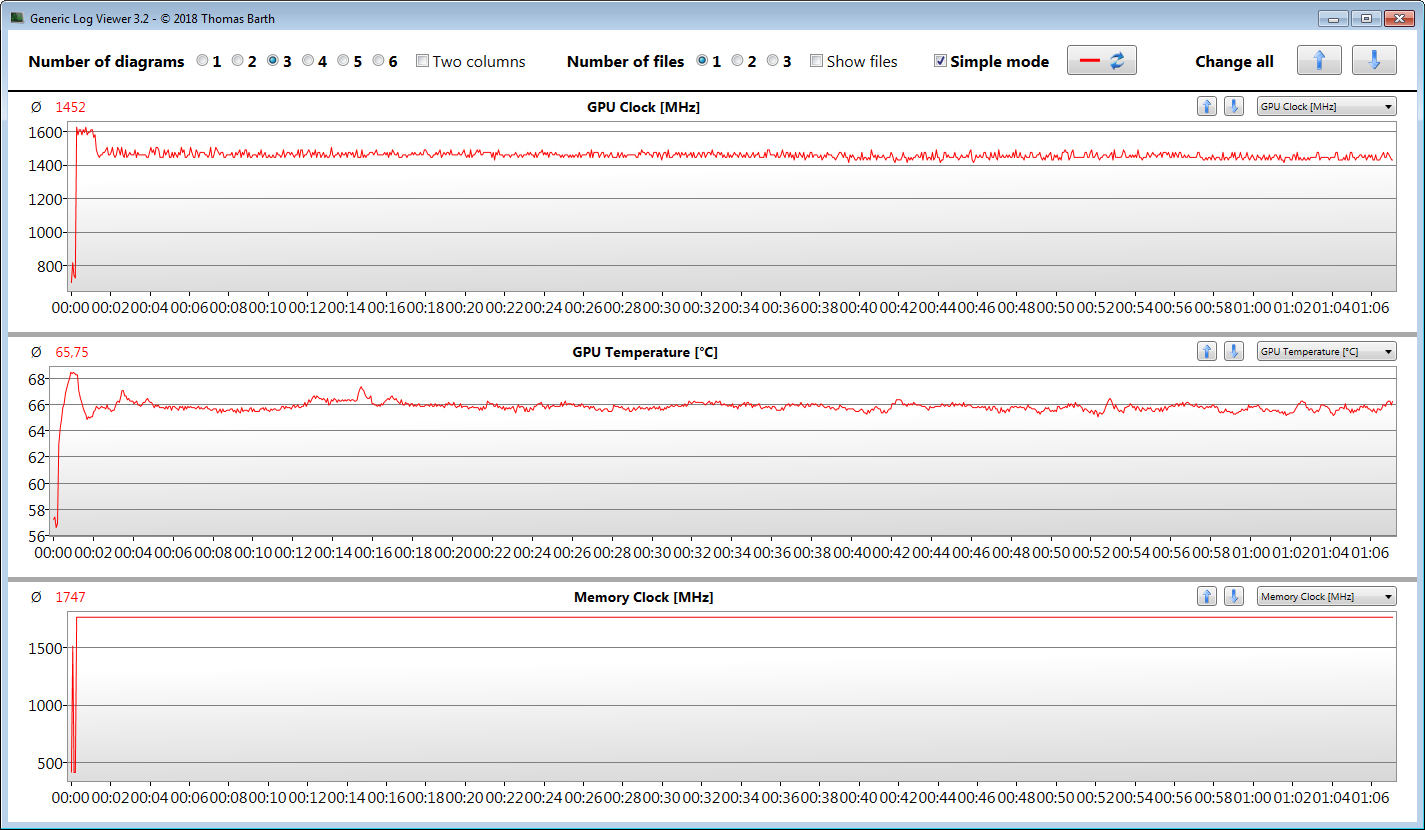
为了检查帧率是否在较长时间内基本保持不变,我们在全高清分辨率和最高质量设置下运行游戏"TheWitcher 3" 约60分钟。游戏角色没有移动。在不到两分钟后,GPU时钟略微降低,但这并不影响帧率。
Witcher 3 FPS-Diagram
| low | med. | high | ultra | |
|---|---|---|---|---|
| GTA V (2015) | 115 | 95.8 | 51.8 | 23.8 |
| The Witcher 3 (2015) | 99.3 | 57.8 | 30.7 | 17.7 |
| Dota 2 Reborn (2015) | 104 | 90.5 | 80.7 | 75.3 |
| Final Fantasy XV Benchmark (2018) | 54.1 | 25.3 | 13.8 | |
| X-Plane 11.11 (2018) | 68.8 | 53.7 | 47 | |
| Strange Brigade (2018) | 106 | 40.6 | 35.4 | 25 |
| Control (2019) | 74.8 | 24.7 | 15.7 | |
| Flight Simulator 2020 (2020) | 61 | 22.7 | 14.8 | 7.86 |
| Deathloop (2021) | 27.7 | 13.5 | 11 | |
| Alan Wake Remastered (2021) | 25.5 | 16.2 | 13.4 | |
| Back 4 Blood (2021) | 128.3 | 46.9 | 29.4 | 26.7 |
| Riders Republic (2021) | 62 | 28 | 23 | 20 |
| Forza Horizon 5 (2021) | 72 | 28 | 23 | 13 |
| Halo Infinite (2021) | 8.6 | |||
| God of War (2022) | 25.8 | 18.4 | 8.66 | 3.09 |
| Rainbow Six Extraction (2022) | 54 | 28 | 26 | 16 |
| Dying Light 2 (2022) | 22 | 16.7 | 11.8 | |
| GRID Legends (2022) | 67.7 | 45.8 | 39.7 | 24.9 |
| Elden Ring (2022) | 31 | 19 | 17.2 | 15.1 |
| Elex 2 (2022) | 23.1 | 10.7 | 6.62 | |
| Ghostwire Tokyo (2022) | 38.2 | 25.8 | 25.8 | 24.9 |
| Tiny Tina's Wonderlands (2022) | 37.2 | 22.7 | 14 | 10.5 |
| Vampire Bloodhunt (2022) | 96.5 | 59.3 | 50.7 | 33.4 |
| F1 22 (2022) | 54.7 | 49.2 | 36 | 22.2 |
| The Quarry (2022) | 30 | 21.1 | 14.9 | 9.31 |
| FIFA 23 (2022) | 57.4 | 42.1 | 37.8 | 33.9 |
| A Plague Tale Requiem (2022) | 22.6 | 18.3 | 12.4 | 8.51 |
| Uncharted Legacy of Thieves Collection (2022) | 9.73 | 8.41 | 5.83 | 5.51 |
| Call of Duty Modern Warfare 2 2022 (2022) | 37 | 33 | 15 | 17 |
| Spider-Man Miles Morales (2022) | 22.9 | 21 | 17.6 | 11.2 |
| The Callisto Protocol (2022) | 34.2 | 15 | 8 | 7.4 |
| Need for Speed Unbound (2022) | 28.7 | 21.4 | 13.5 | |
| High On Life (2023) | 29.4 | 15.8 | 14 | 12.4 |
| The Witcher 3 v4 (2023) | 45.8 | 32.4 | 24.9 | 14.1 |
| Dead Space Remake (2023) | 17.1 | 15.7 | 6.37 | |
| Baldur's Gate 3 (2023) | 11.3 | 5.94 | ||
| Cyberpunk 2077 (2023) | 22.6 | 14 | 8.12 | 7.09 |
| Counter-Strike 2 (2023) | 87.5 | 67 | 34.8 | 21.7 |
| EA Sports FC 24 (2023) | 58 | 57.3 | 56.4 | 55.9 |
| Assassin's Creed Mirage (2023) | 18 | 15 | ||
| Skull & Bones (2024) | 21 | 21 | 13 | |
| Horizon Forbidden West (2024) | 11.6 | |||
| F1 24 (2024) | 31.9 | 25.7 | 20.4 | 13.4 |
Emissions & energy - Dell laptop with good battery runtimes
噪声排放
在日常使用中(办公室、互联网),笔记本几乎不产生任何噪音--风扇经常静止不动。在较重的负载下,达到的声压级要比装备相当的笔记本,如RedmiBook Pro 15 和Ideapad 5 Pro 16IHU6 。通过使用 "静音 "配置,可以实现较低的噪音水平--以牺牲计算性能为代价。
Noise level
| Idle |
| 26 / 26 / 26 dB(A) |
| Load |
| 47.4 / 48.4 dB(A) |
 | ||
30 dB silent 40 dB(A) audible 50 dB(A) loud |
||
min: | ||
| Dell Inspiron 15 5518-2X3JR Intel Core i5-11300H, NVIDIA GeForce MX450 | HP Pavilion 15-eg Intel Core i7-1165G7, NVIDIA GeForce MX450 | Xiaomi RedmiBook Pro 15 Intel Core i7-11370H, NVIDIA GeForce MX450 | Lenovo IdeaPad 5 Pro 16IHU6 Intel Core i5-11300H, NVIDIA GeForce MX450 | Asus VivoBook S15 D533UA AMD Ryzen 7 5700U, AMD Radeon RX Vega 8 (Ryzen 4000/5000) | Lenovo IdeaPad 5 15ALC05 AMD Ryzen 5 5500U, AMD Radeon RX Vega 7 | |
|---|---|---|---|---|---|---|
| Noise | 7% | 4% | 8% | 0% | 6% | |
| off / environment * (dB) | 26 | 25.4 2% | 25 4% | 25 4% | 26 -0% | 26 -0% |
| Idle Minimum * (dB) | 26 | 25.6 2% | 25 4% | 25 4% | 26 -0% | 26 -0% |
| Idle Average * (dB) | 26 | 25.6 2% | 26 -0% | 25 4% | 26 -0% | 26 -0% |
| Idle Maximum * (dB) | 26 | 25.6 2% | 27 -4% | 25 4% | 28.8 -11% | 26 -0% |
| Load Average * (dB) | 47.4 | 39.2 17% | 43 9% | 44.5 6% | 45 5% | 42.6 10% |
| Load Maximum * (dB) | 48.4 | 41.5 14% | 44 9% | 36.5 25% | 45 7% | 37.4 23% |
| Witcher 3 ultra * (dB) | 39.1 | 42 |
* ... smaller is better
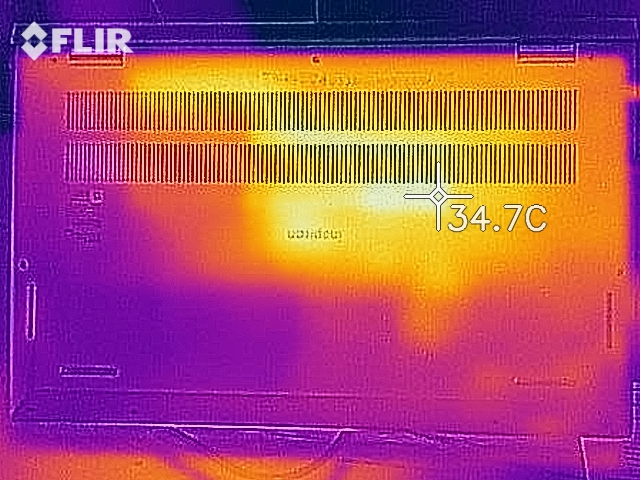
温度
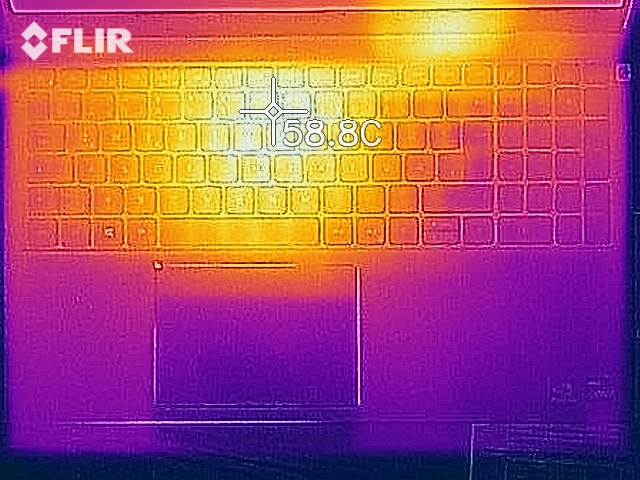
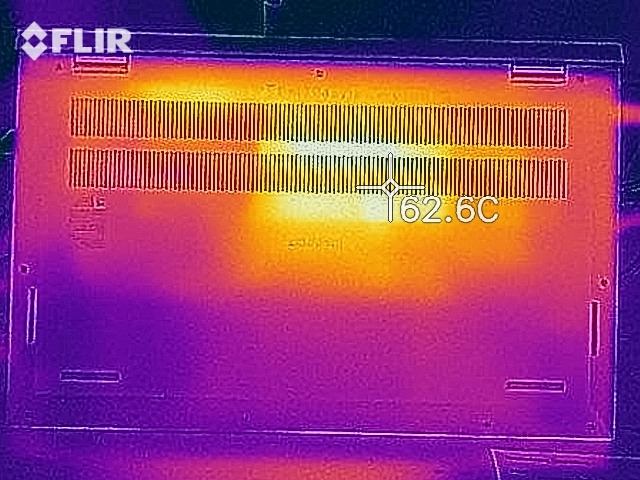
在日常使用中(办公室、互联网),机箱温度处于绿色区域内。在硬件满负荷的情况下,散热器的区域会达到超过50或60℃(122或140°F)的数值。竞争者通常不那么有选择地发热。但总的来说,他们的发热程度更高。
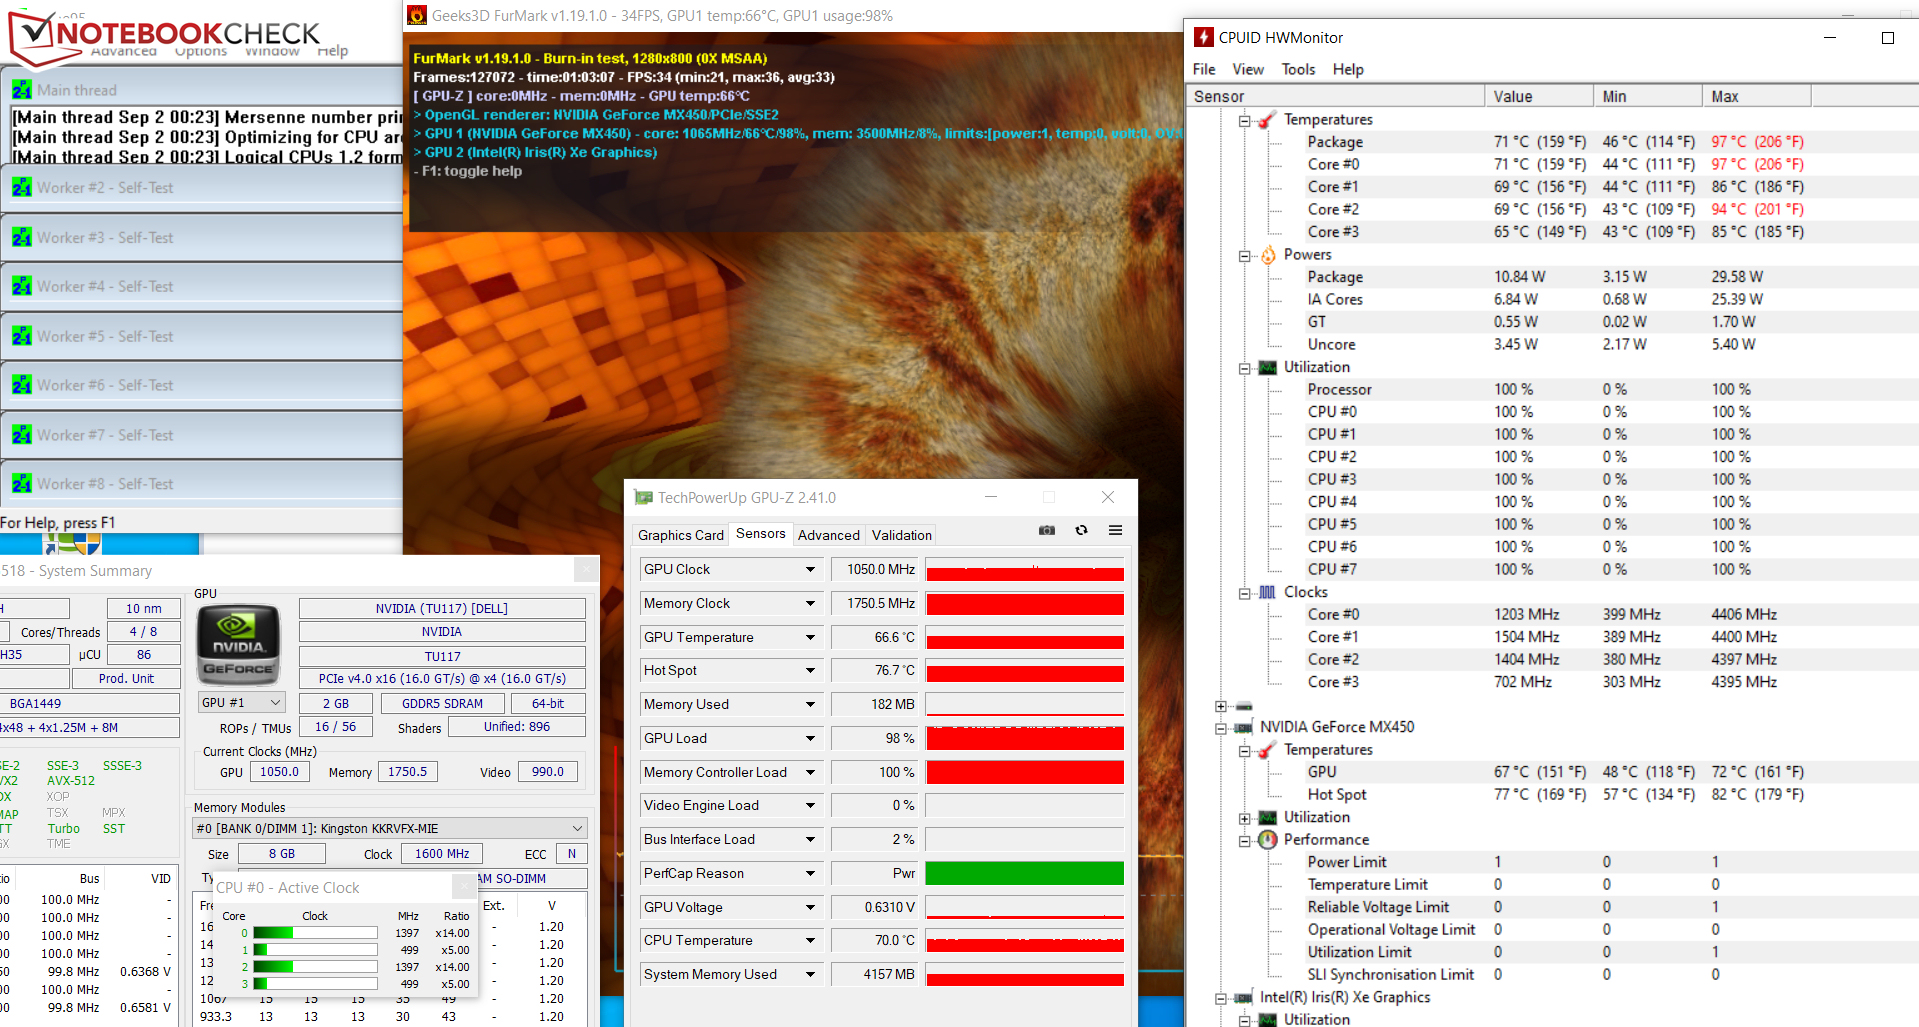
CPU和GPU以相对较高的速度开始进行压力测试(Prime95和FurMark至少运行一个小时)。超过这个时期,速率下降到400 MHz至1.4 GHz或大约1050 MHz。压力测试代表了一种极端情况。我们用这个测试来检查系统是否在全负荷下稳定运行。
(-) The maximum temperature on the upper side is 55.1 °C / 131 F, compared to the average of 34.3 °C / 94 F, ranging from 21.2 to 62.5 °C for the class Office.
(-) The bottom heats up to a maximum of 62.4 °C / 144 F, compared to the average of 36.8 °C / 98 F
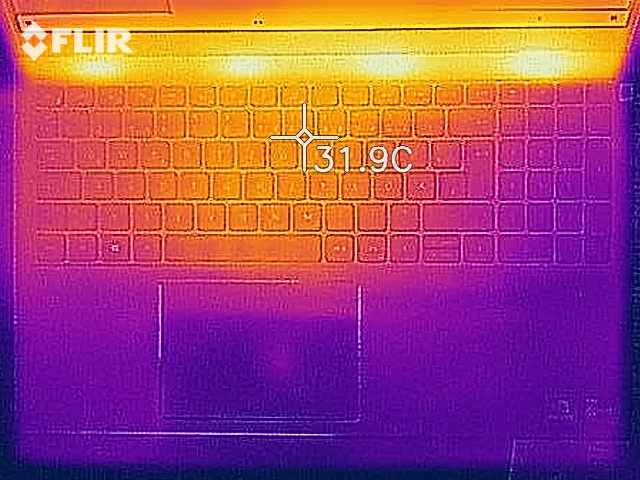
(+) In idle usage, the average temperature for the upper side is 26.3 °C / 79 F, compared to the device average of 29.5 °C / 85 F.
(+) The palmrests and touchpad are cooler than skin temperature with a maximum of 28.3 °C / 82.9 F and are therefore cool to the touch.
(±) The average temperature of the palmrest area of similar devices was 27.5 °C / 81.5 F (-0.8 °C / -1.4 F).
| Dell Inspiron 15 5518-2X3JR Intel Core i5-11300H, NVIDIA GeForce MX450 | HP Pavilion 15-eg Intel Core i7-1165G7, NVIDIA GeForce MX450 | Xiaomi RedmiBook Pro 15 Intel Core i7-11370H, NVIDIA GeForce MX450 | Lenovo IdeaPad 5 Pro 16IHU6 Intel Core i5-11300H, NVIDIA GeForce MX450 | Asus VivoBook S15 D533UA AMD Ryzen 7 5700U, AMD Radeon RX Vega 8 (Ryzen 4000/5000) | Lenovo IdeaPad 5 15ALC05 AMD Ryzen 5 5500U, AMD Radeon RX Vega 7 | |
|---|---|---|---|---|---|---|
| Heat | 13% | 6% | 6% | 16% | 20% | |
| Maximum Upper Side * (°C) | 55.1 | 44 20% | 54 2% | 65.3 -19% | 46.1 16% | 40.5 26% |
| Maximum Bottom * (°C) | 62.4 | 53.4 14% | 52 17% | 55.4 11% | 46.6 25% | 42 33% |
| Idle Upper Side * (°C) | 29.8 | 27.4 8% | 33 -11% | 25.4 15% | 27.4 8% | 26.5 11% |
| Idle Bottom * (°C) | 32.5 | 28.8 11% | 28 14% | 26.8 18% | 28.2 13% | 29 11% |
* ... smaller is better
演讲者
立体声扬声器产生了一个体面的声音,其中几乎没有任何低音。
Dell Inspiron 15 5518-2X3JR audio analysis
(+) | speakers can play relatively loud (88.4 dB)
Bass 100 - 315 Hz
(-) | nearly no bass - on average 21.3% lower than median
(+) | bass is linear (5.8% delta to prev. frequency)
Mids 400 - 2000 Hz
(+) | balanced mids - only 3.1% away from median
(+) | mids are linear (4.2% delta to prev. frequency)
Highs 2 - 16 kHz
(±) | higher highs - on average 5.5% higher than median
(+) | highs are linear (6.4% delta to prev. frequency)
Overall 100 - 16.000 Hz
(±) | linearity of overall sound is average (17% difference to median)
Compared to same class
» 24% of all tested devices in this class were better, 7% similar, 68% worse
» The best had a delta of 7%, average was 21%, worst was 53%
Compared to all devices tested
» 31% of all tested devices were better, 8% similar, 61% worse
» The best had a delta of 4%, average was 23%, worst was 134%
HP Pavilion 15-eg audio analysis
(±) | speaker loudness is average but good (81.3 dB)
Bass 100 - 315 Hz
(-) | nearly no bass - on average 18% lower than median
(±) | linearity of bass is average (12.8% delta to prev. frequency)
Mids 400 - 2000 Hz
(+) | balanced mids - only 2.8% away from median
(+) | mids are linear (4% delta to prev. frequency)
Highs 2 - 16 kHz
(+) | balanced highs - only 1% away from median
(+) | highs are linear (3% delta to prev. frequency)
Overall 100 - 16.000 Hz
(+) | overall sound is linear (13.2% difference to median)
Compared to same class
» 27% of all tested devices in this class were better, 5% similar, 68% worse
» The best had a delta of 5%, average was 17%, worst was 45%
Compared to all devices tested
» 13% of all tested devices were better, 3% similar, 84% worse
» The best had a delta of 4%, average was 23%, worst was 134%
消耗功率
在空闲和低负载的情况下,戴尔电脑的能耗与Ideapad 5 Pro和RedmiBook Pro的数值基本持平。Ideapad 5 Pro和红米书Pro 15.在高负荷下,它的能耗要低得多。一方面,CPU的低功率限制在这里很明显,另一方面,戴尔只包括一个65瓦的电源(联想:95瓦,小米:100瓦)。因此,Inspiron在计算能力方面无法跟上竞争对手的步伐。
在压力测试和测试期间,CPU和GPU的功耗图很好地描述了它们的行为。 Witcher 3 测试很好地描述了它们的行为。在测试过程中,时钟速率下降。
| Off / Standby | |
| Idle | |
| Load |
|
Key:
min: | |
Power consumption Witcher 3 / Stress test
| Dell Inspiron 15 5518-2X3JR Intel Core i5-11300H, NVIDIA GeForce MX450 | HP Pavilion 15-eg Intel Core i7-1165G7, NVIDIA GeForce MX450 | Xiaomi RedmiBook Pro 15 Intel Core i7-11370H, NVIDIA GeForce MX450 | Lenovo IdeaPad 5 Pro 16IHU6 Intel Core i5-11300H, NVIDIA GeForce MX450 | Asus VivoBook S15 D533UA AMD Ryzen 7 5700U, AMD Radeon RX Vega 8 (Ryzen 4000/5000) | Lenovo IdeaPad 5 15ALC05 AMD Ryzen 5 5500U, AMD Radeon RX Vega 7 | |
|---|---|---|---|---|---|---|
| Power Consumption | -19% | -37% | -30% | -3% | 11% | |
| Idle Minimum * (Watt) | 4 | 4.9 -23% | 6 -50% | 5 -25% | 5 -25% | 3.7 7% |
| Idle Average * (Watt) | 7.6 | 7.9 -4% | 9 -18% | 9 -18% | 7.7 -1% | 7.9 -4% |
| Idle Maximum * (Watt) | 10.2 | 14.2 -39% | 12 -18% | 9.4 8% | 12.2 -20% | 9.3 9% |
| Load Average * (Watt) | 49.4 | 64.3 -30% | 74 -50% | 71 -44% | 41 17% | 41 17% |
| Witcher 3 ultra * (Watt) | 49.4 | 55.6 -13% | 70.7 -43% | 72.4 -47% | 43 13% | 41 17% |
| Load Maximum * (Watt) | 63.4 | 65.4 -3% | 91 -44% | 99 -56% | 65 -3% | 52.2 18% |
* ... smaller is better
电池寿命
在我们的实际WLAN测试中,Inspiron 5518的运行时间达到了9:24小时。网页加载期间的负载是通过一个脚本来映射的。
| Battery Runtime - WiFi Websurfing | |
| Lenovo IdeaPad 5 15ALC05 | |
| Average of class Office (3.83 - 31.5, n=77, last 2 years) | |
| Dell Inspiron 15 5518-2X3JR | |
| Lenovo IdeaPad 5 Pro 16IHU6 | |
| Asus VivoBook S15 D533UA | |
| Xiaomi RedmiBook Pro 15 | |
| HP Pavilion 15-eg | |
Pros
Cons
结论 - Inspiron 15 5518有改进的潜力
安装的 酷睿i5-11300HCPU为办公和互联网应用提供了足够的性能。 GeForce-MX450图形核心允许使用计算机游戏或GPU重的应用程序。这些硬件被安置在一个别致的铝制外壳中。
Thunderbolt 4是为Inspiron的Core i7型号保留的。
近9.5小时的WLAN运行时间应该可以让你在没有电源适配器的情况下度过一天。可以通过附带的戴尔专有电源适配器或USB-C电源适配器进行充电--5518的USB-C端口根据USB 3.2 Gen 2x2标准工作。
笔记本电脑在日常使用中(办公室、互联网)不会产生太多的噪音,热量的发展也处于可接受的水平。哑光屏幕(FHD,IPS)提供稳定的可视角度,良好的对比度和体面的色彩再现。亮度和色彩空间覆盖率太低。
由于功率限制较低,处理器没有达到其能力。在单通道模式下运行的工作内存(1x 8 GB,DDR4-3200)进一步降低了性能。这可以通过安装第二个内存模块来改善。铝制外壳缺乏硬度。
在800欧元(约939美元)的细分市场中,Inspiron的一个替代品是联想IdeaPad 5 15ALC05 。它的优点是多线程CPU性能高,屏幕明亮,排放低,以及电池运行时间长。缺点是。工作存储器是焊接的,屏幕的对比度很低。
价格和可用性
戴尔的Inspiron 15 5518(Core i5-11300H,GeForce MX450, 8 GB RAM, 512 GB SSD)目前在Cyberport.de有售。以不到800欧元(约合939美元)的价格出售。
Dell Inspiron 15 5518-2X3JR
- 09/14/2021 v7 (old)
Sascha Mölck
Price comparison

