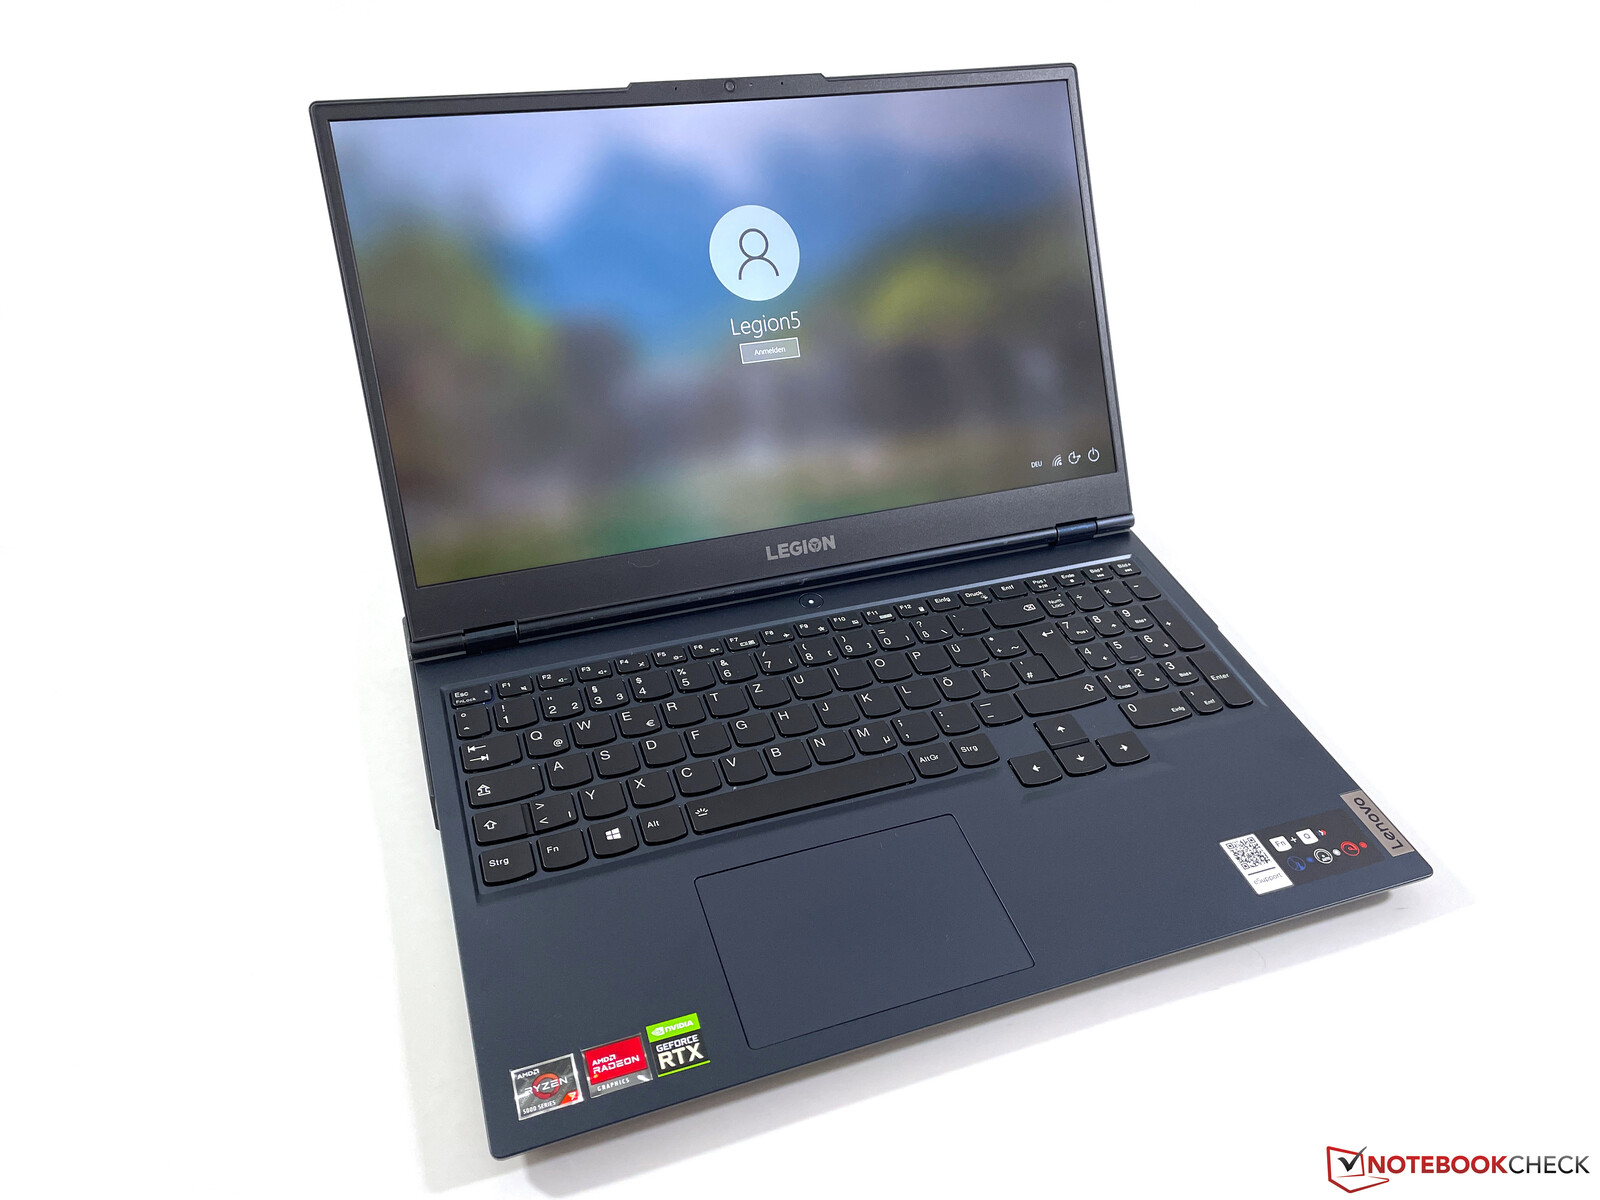
联想Legion 5 15 G6 AMD评论。经济实惠的游戏笔记本,动力十足
联想的Legion 机型系列是为游戏爱好者设计的,第六代Legion 5 15再次提供英特尔和AMD处理器以及NvidiaGeForce RTX GPU(RTX 3060或RTX 3070)之间的选择。我们的测试装置结合了现代AMD处理器Ryzen 7 5800H和快速的NvidiaGeForce RTX 3060。显示屏是哑光的1080p屏幕,刷新率为165赫兹,所以整体包装应该很好。进入联想校园计划的用户可以以1120欧元的价格获得这个型号(无操作系统),配备16GB内存和512GB PCI-SSD存储;普通客户应该期待1400-1500欧元。
Possible Competitors
Rating | Date | Model | Weight | Height | Size | Resolution | Price |
|---|---|---|---|---|---|---|---|
| 83.4 % v7 (old) | 09 / 2021 | Lenovo Legion 5 15ACH-82JU00C6GE-FL R7 5800H, GeForce RTX 3060 Laptop GPU | 2.5 kg | 26 mm | 15.60" | 1920x1080 | |
| 82.2 % v7 (old) | 08 / 2021 | Acer Nitro 5 AN515-45-R1JH R7 5800H, GeForce RTX 3070 Laptop GPU | 2.3 kg | 23.9 mm | 15.60" | 2560x1440 | |
| 85.9 % v7 (old) | 10 / 2021 | Asus TUF Gaming F15 FX506HM i7-11800H, GeForce RTX 3060 Laptop GPU | 2.3 kg | 24.9 mm | 15.60" | 1920x1080 | |
| 84.7 % v7 (old) | 08 / 2025 | Alienware m15 R5 Ryzen Edition R7 5800H, GeForce RTX 3060 Laptop GPU | 2.5 kg | 22.85 mm | 15.60" | 1920x1080 | |
| 84.9 % v7 (old) | Schenker XMG Core 15 Ampere R7 4800H, GeForce RTX 3060 Laptop GPU | 2 kg | 22.9 mm | 15.60" | 2560x1440 |
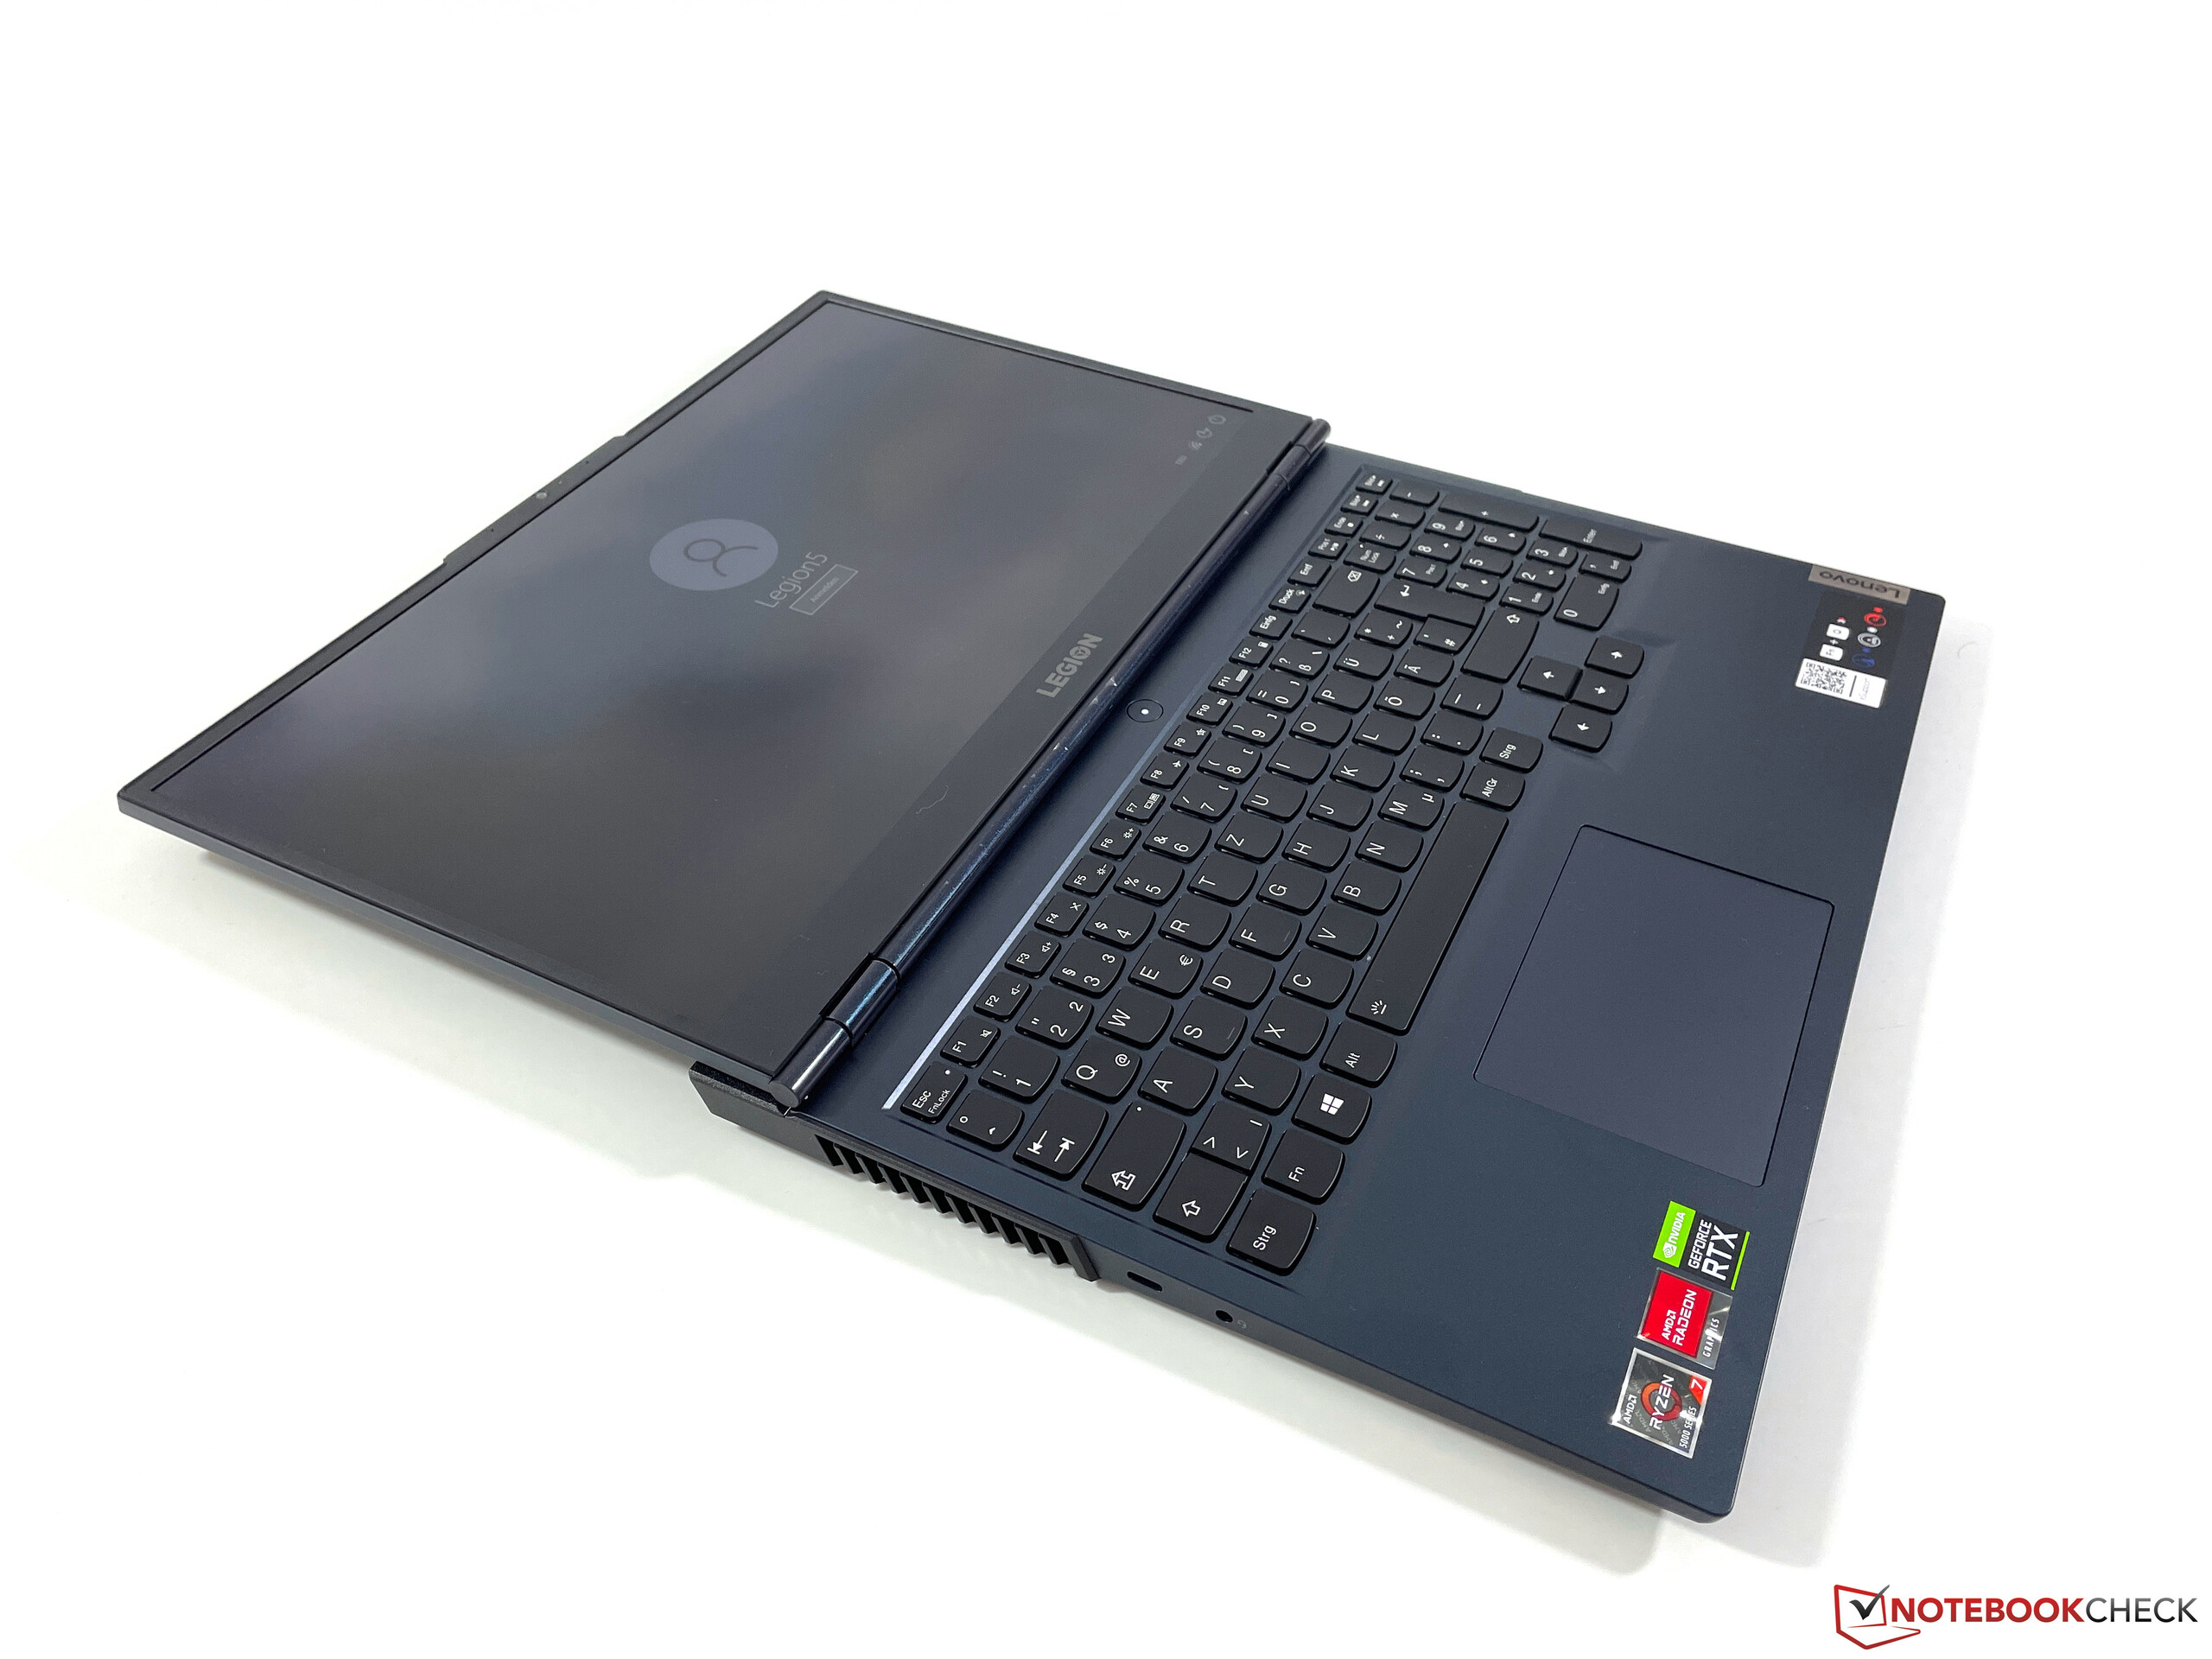
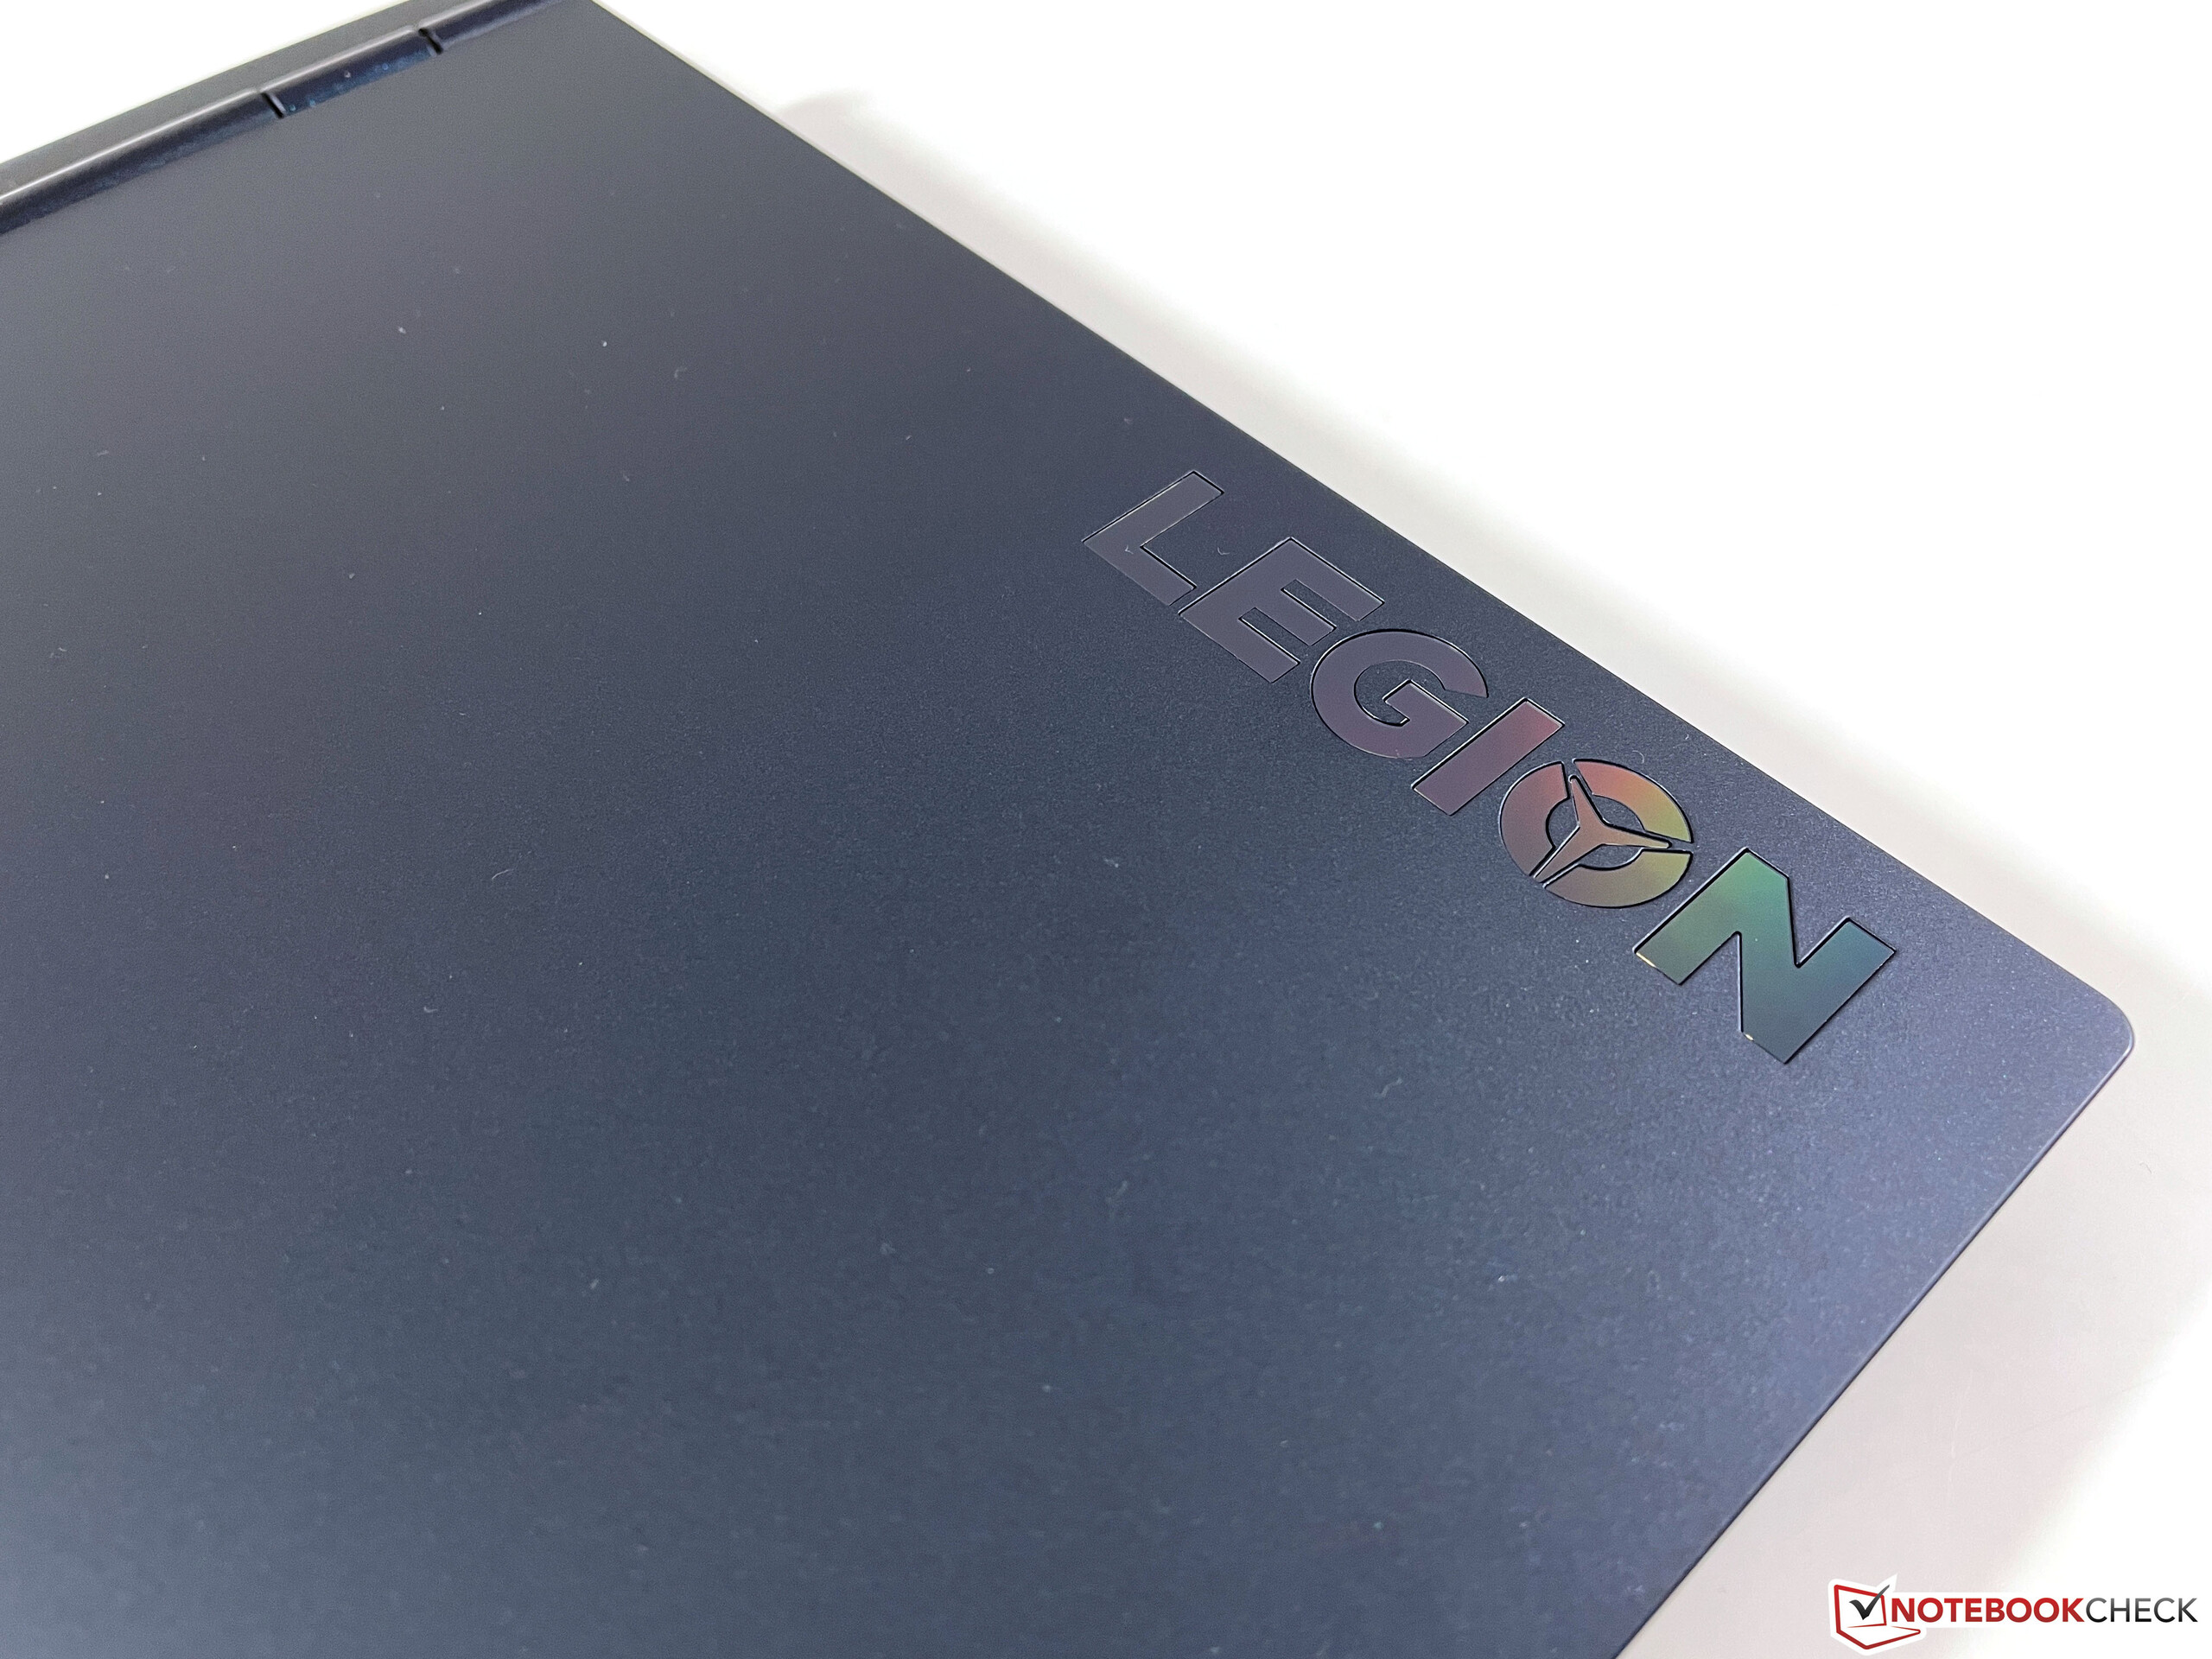
外壳 -Legion ,深蓝色塑料
底盘与上一型号基本相同。 之前的型号但我们的测试设备现在使用深蓝色塑料代替黑色表面,用于大部分的底座和盖子。光滑的表面不会受到灰尘或指纹的影响,我们喜欢这种新颜色。
底座的质量可能是笔记本电脑最薄弱的地方之一,你只是注意到了低价位。建造质量本身很好,但是当你扭动底座时有一些吱吱嘎嘎的声音。在日常情况下,更大的问题是当你调整屏幕的打开角度(最大180度)时,铰链发出的吱吱声。铰链不能完全避免一些弹跳。当你玩游戏时,这些几乎没有限制,但你不应该期待一个高端机箱。联想并没有故意实施全面的照明选项。
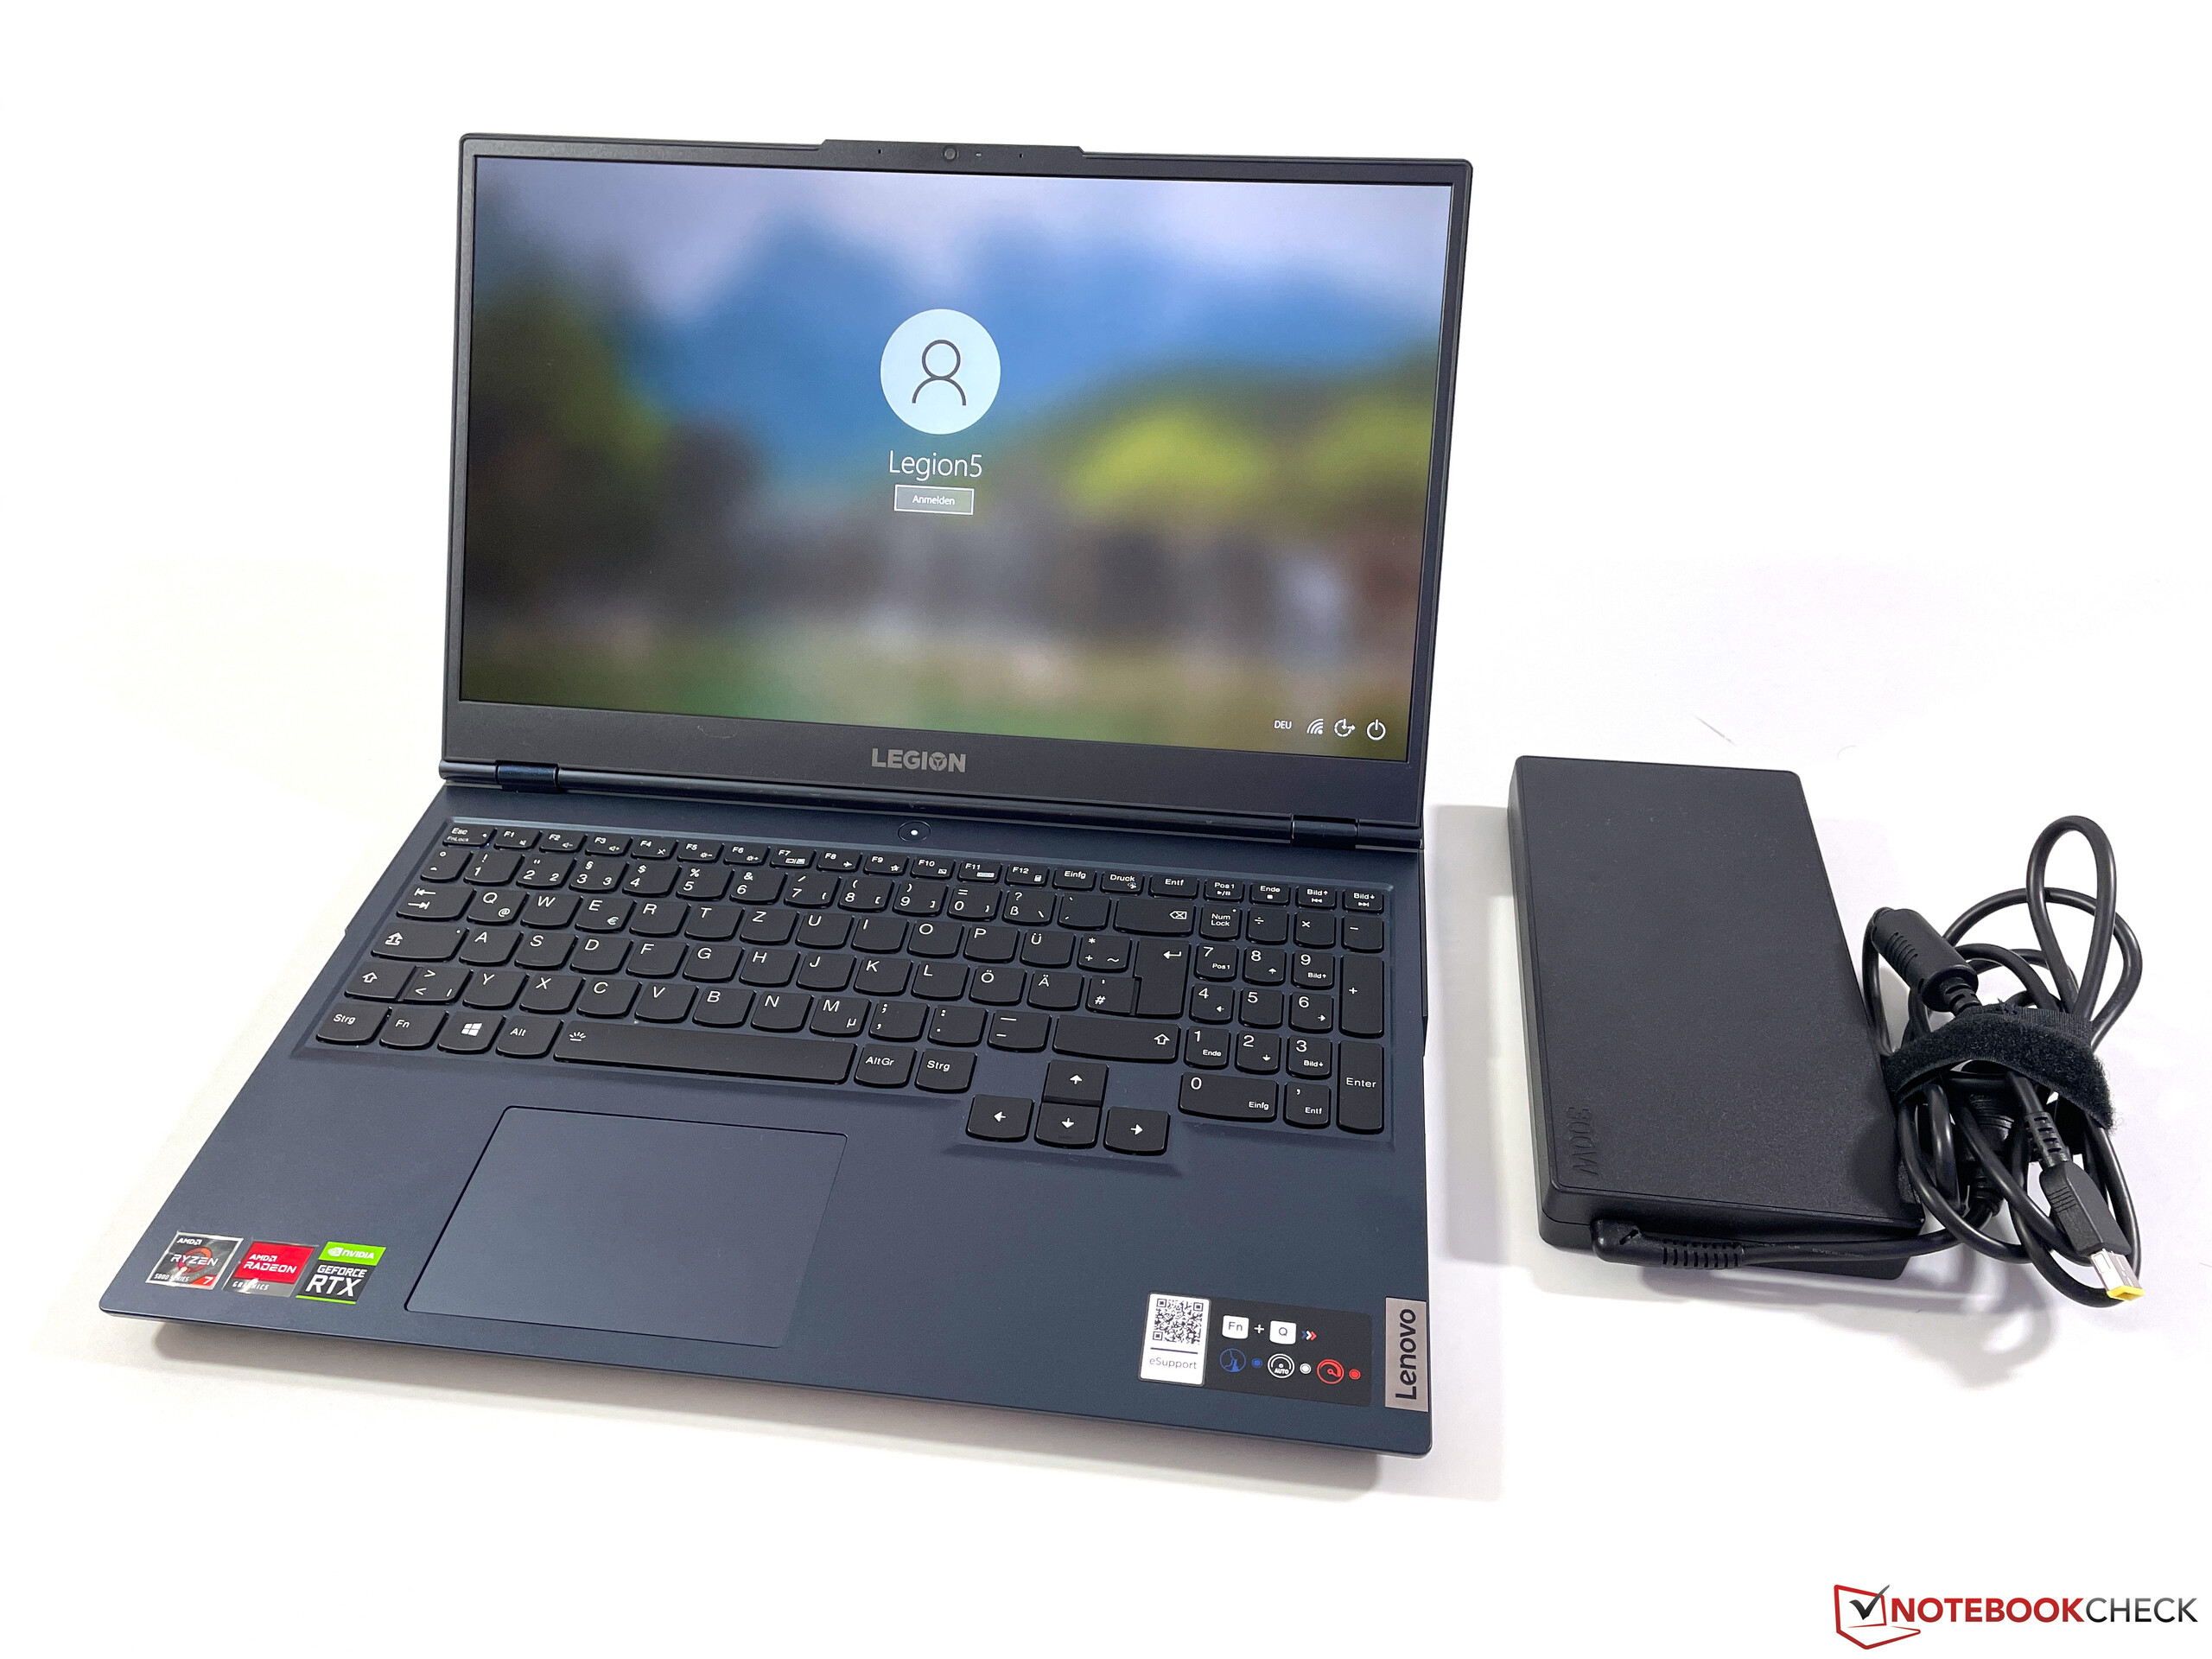
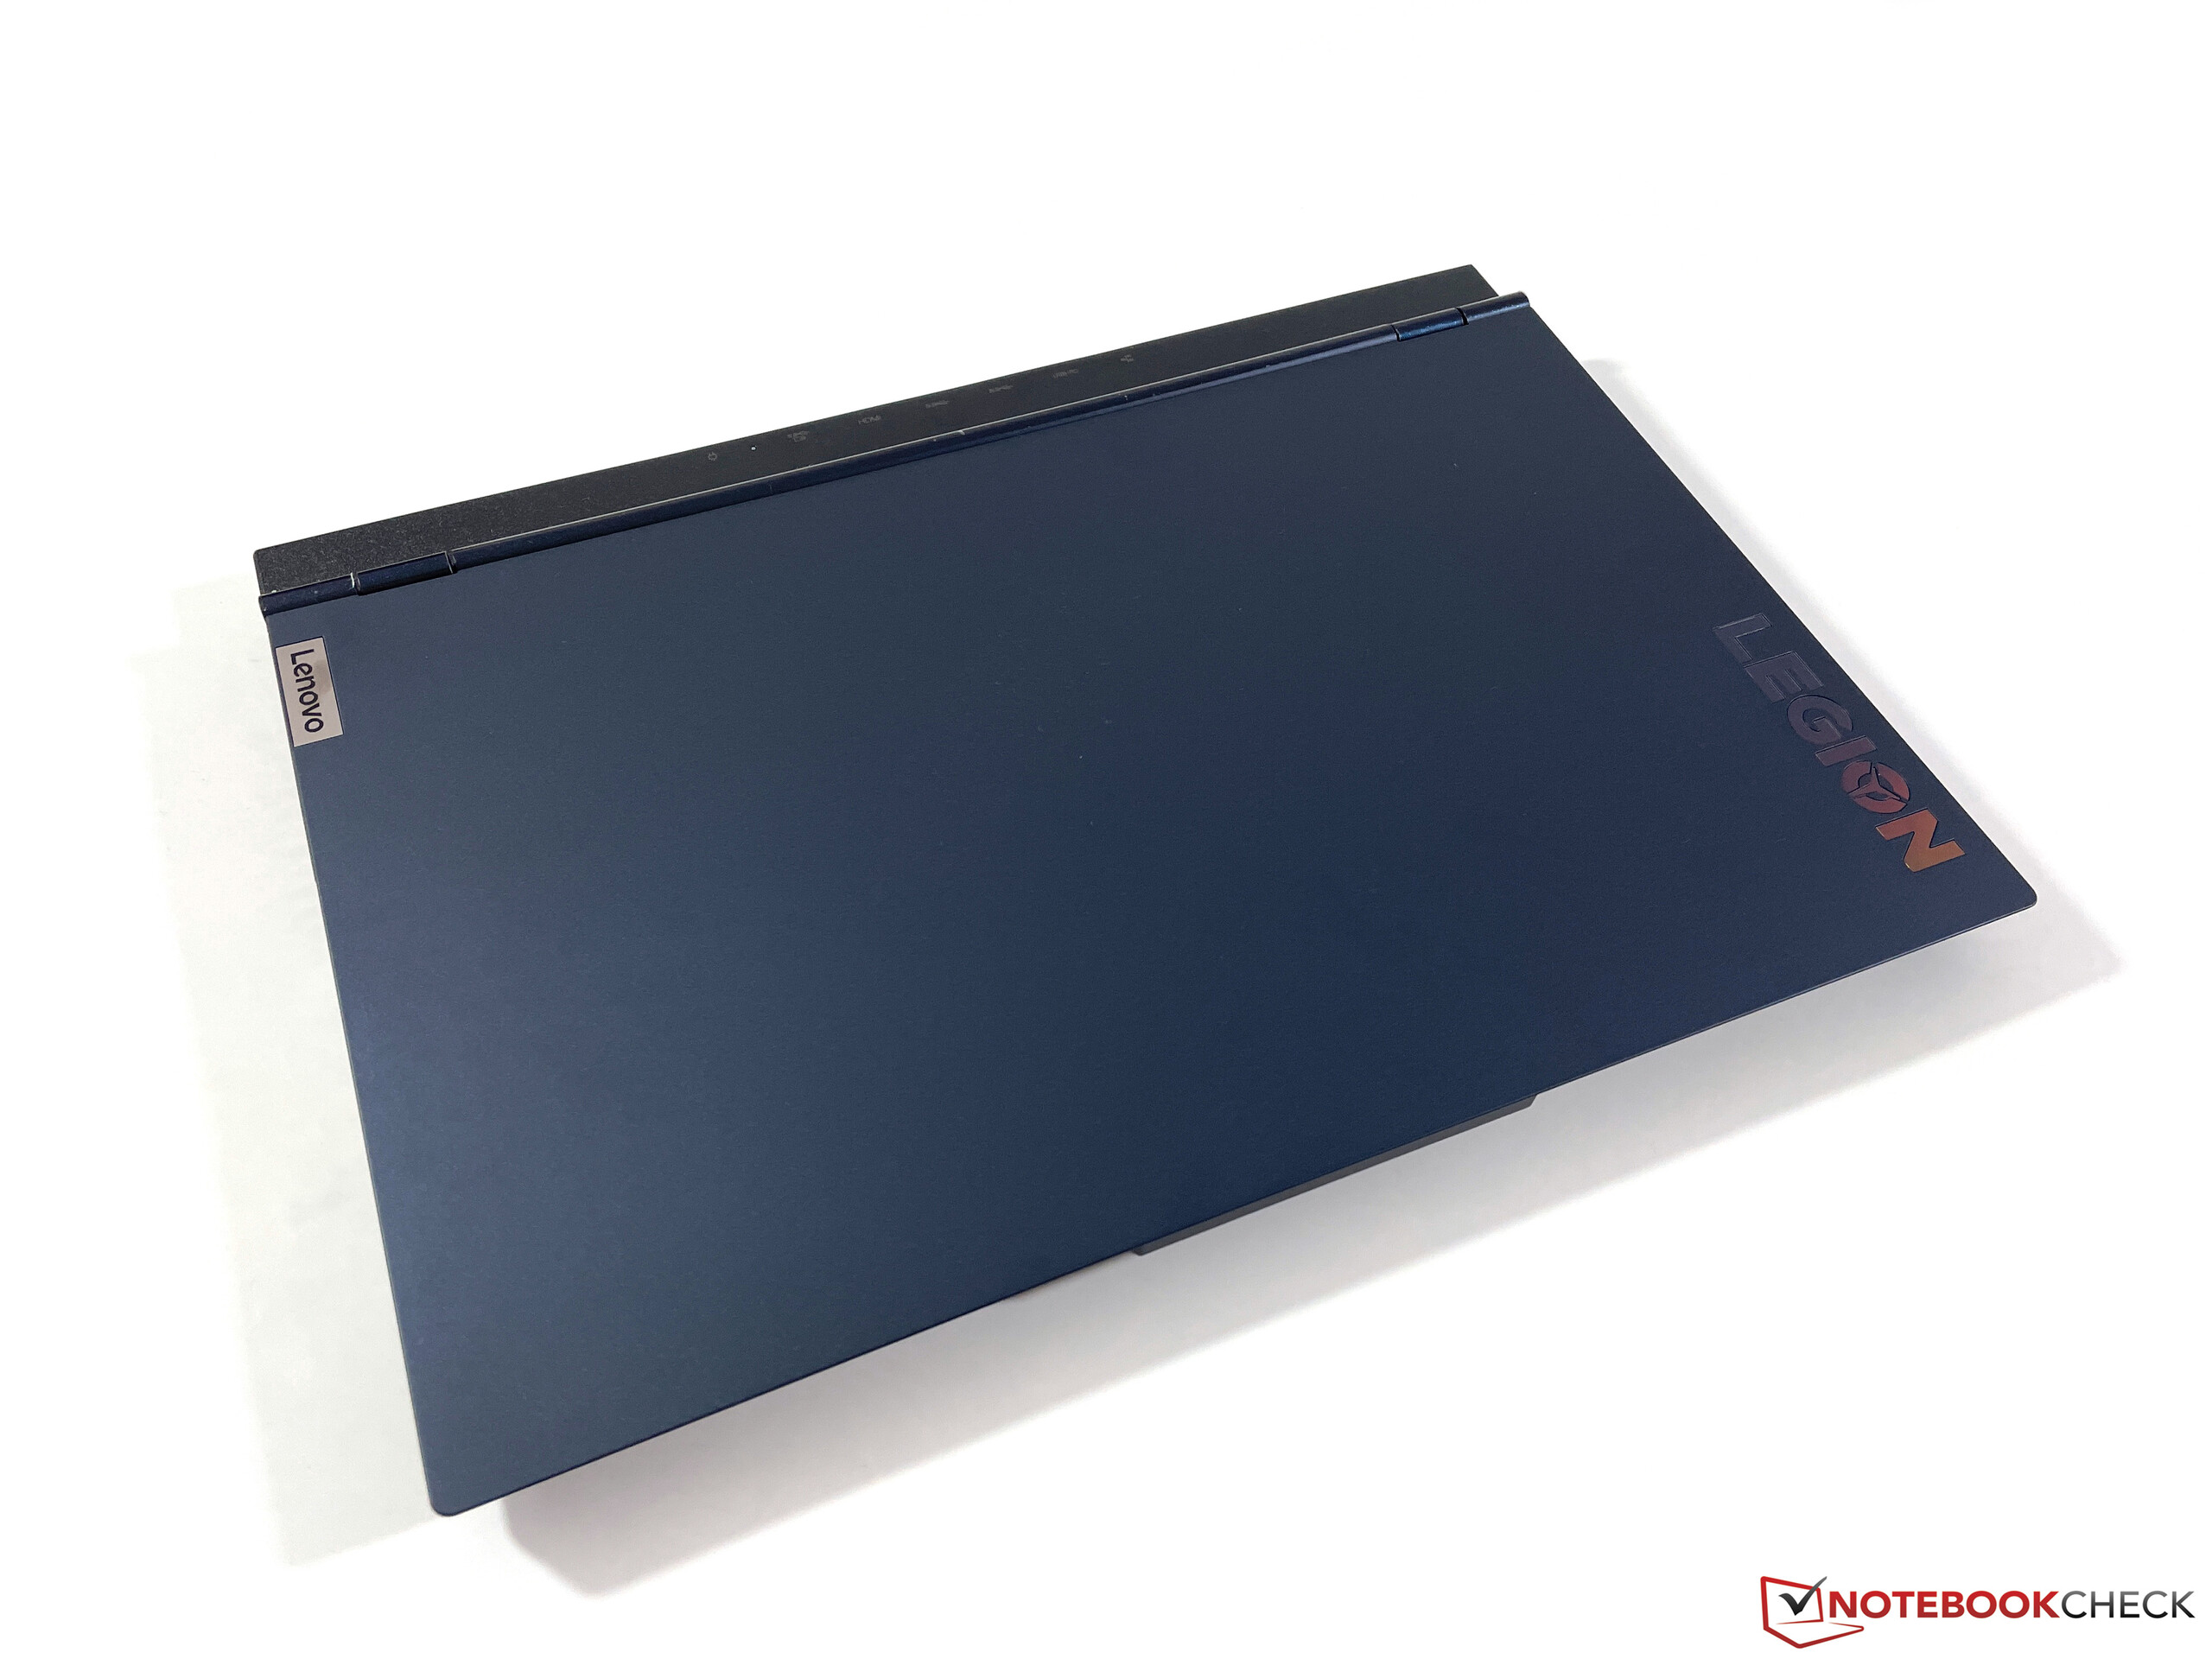
我们的测试单位Legion 5 15的重量为2.5公斤,这意味着它是我们比较组中最重的一个,当你运输笔记本电脑时,你还应该考虑到巨大的电源适配器(几乎1.1公斤)。另一方面,所有设备的占地面积都非常相似。
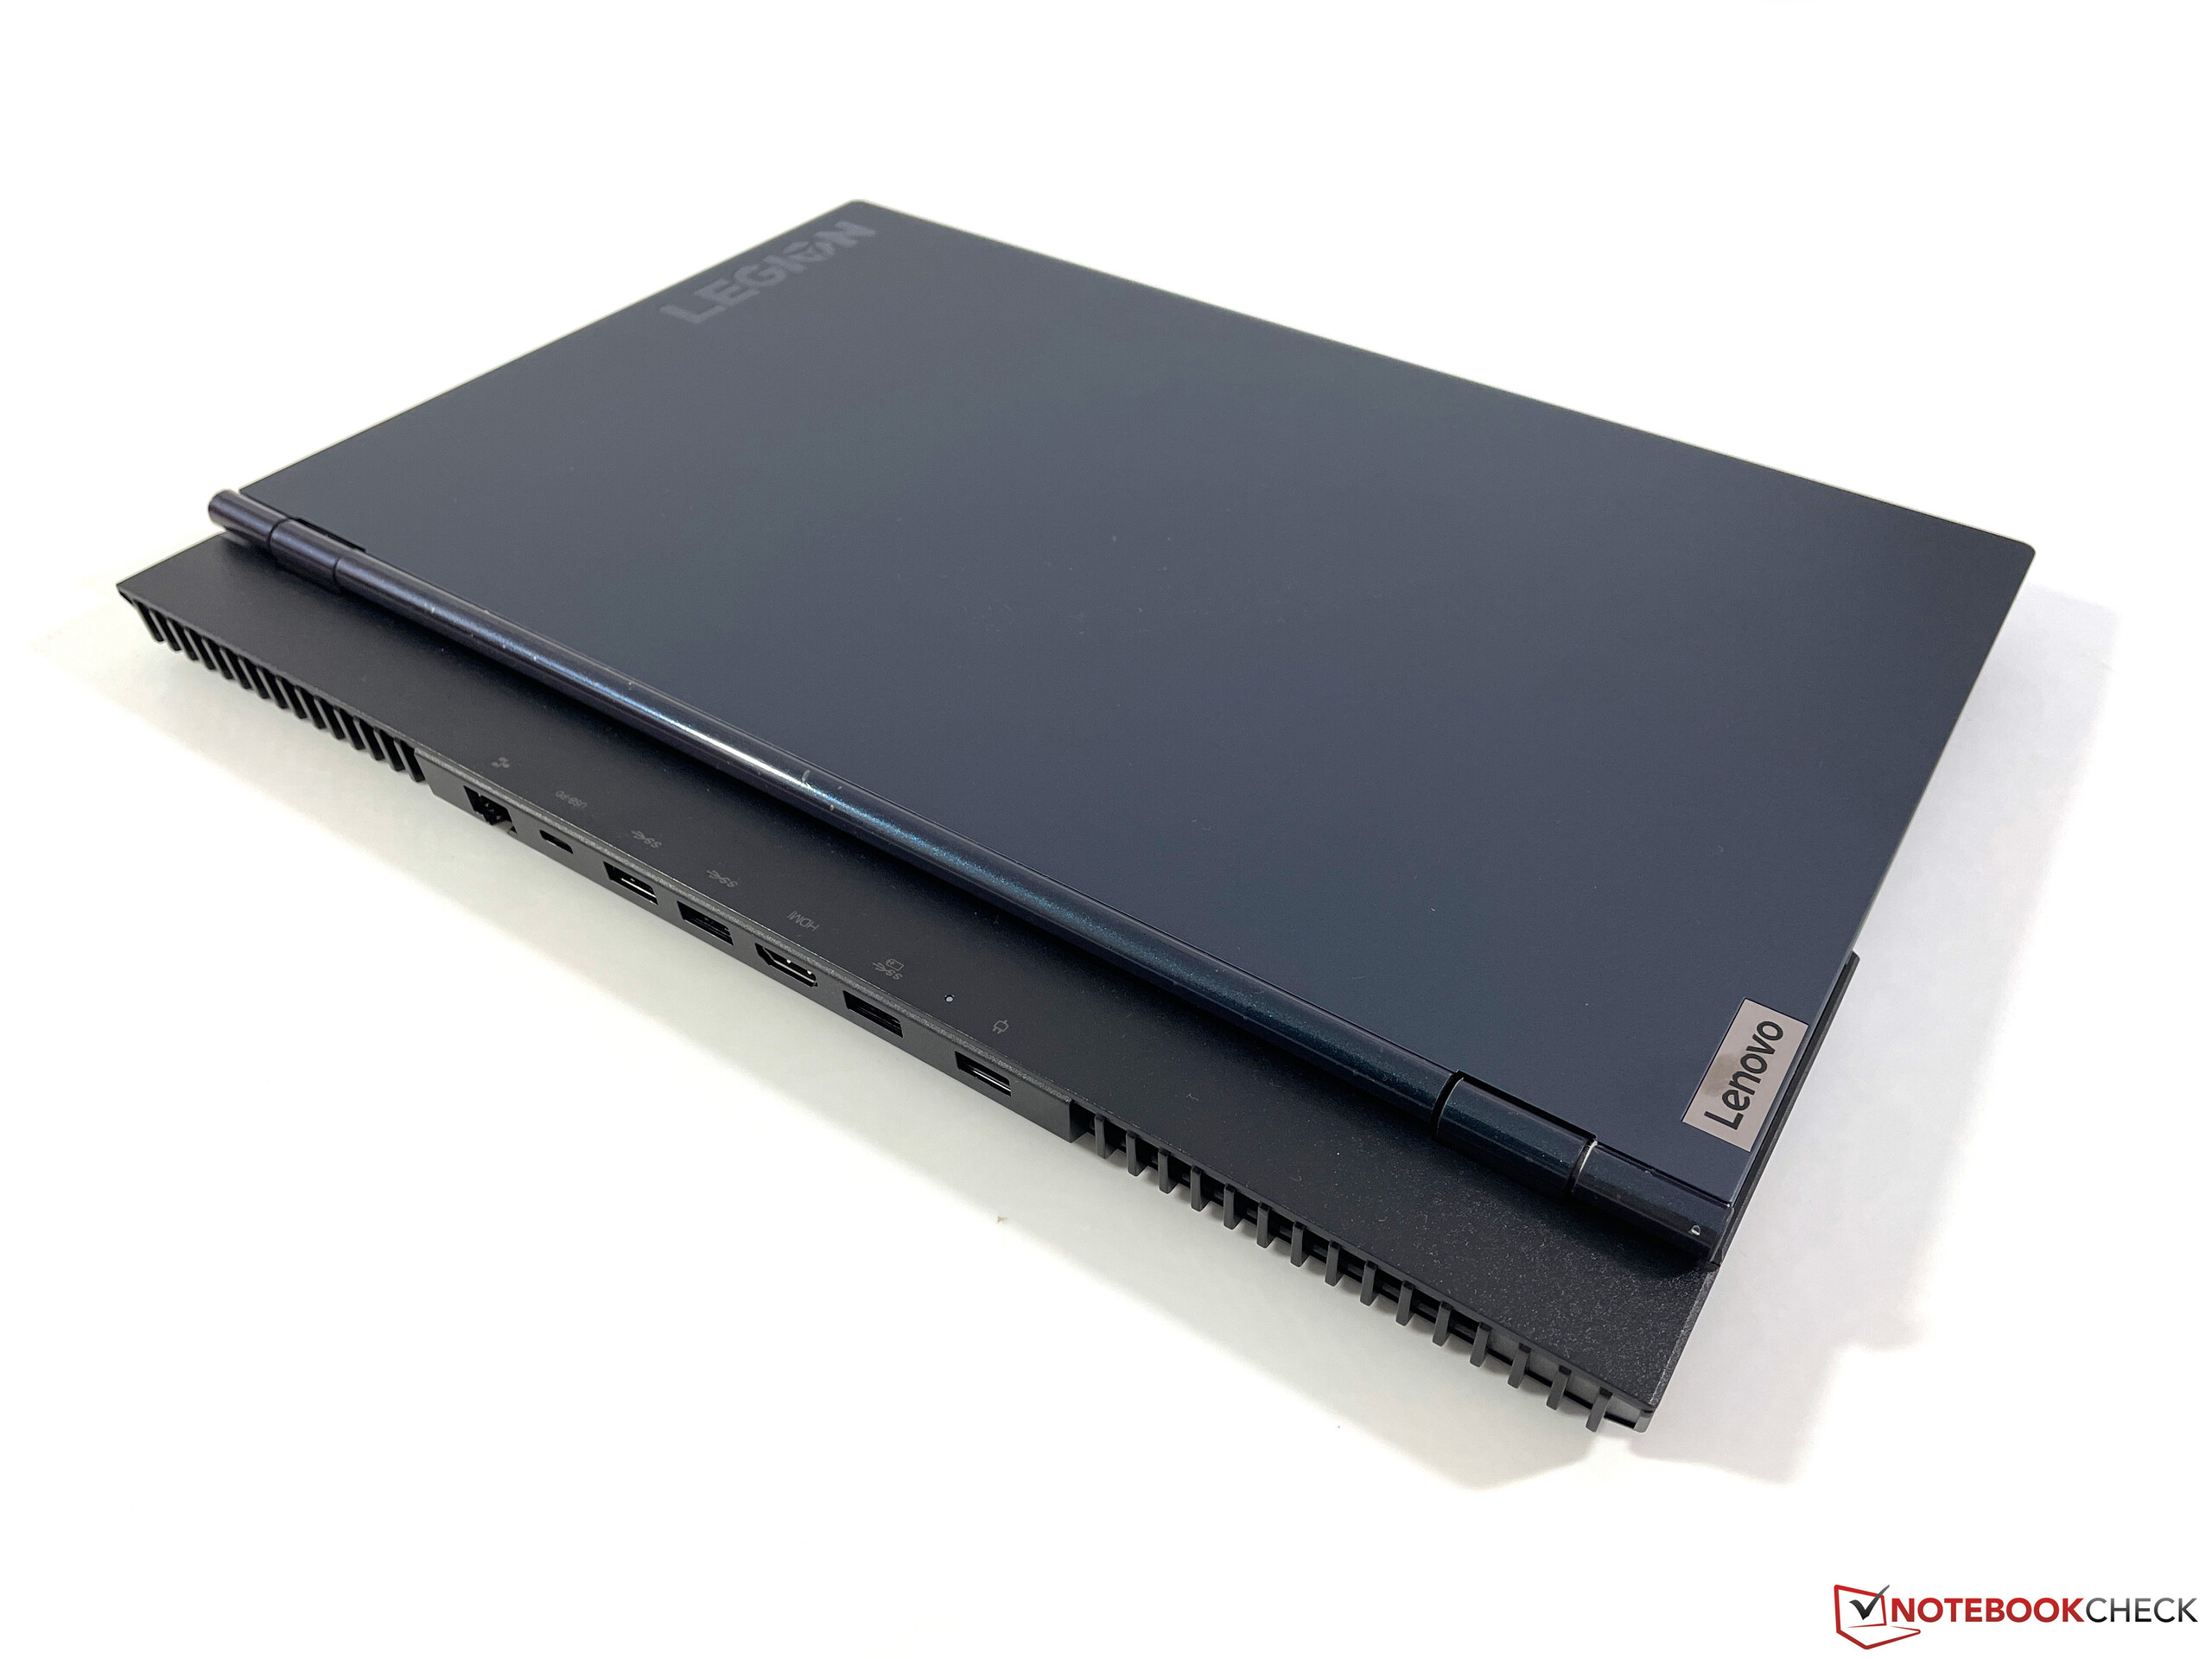
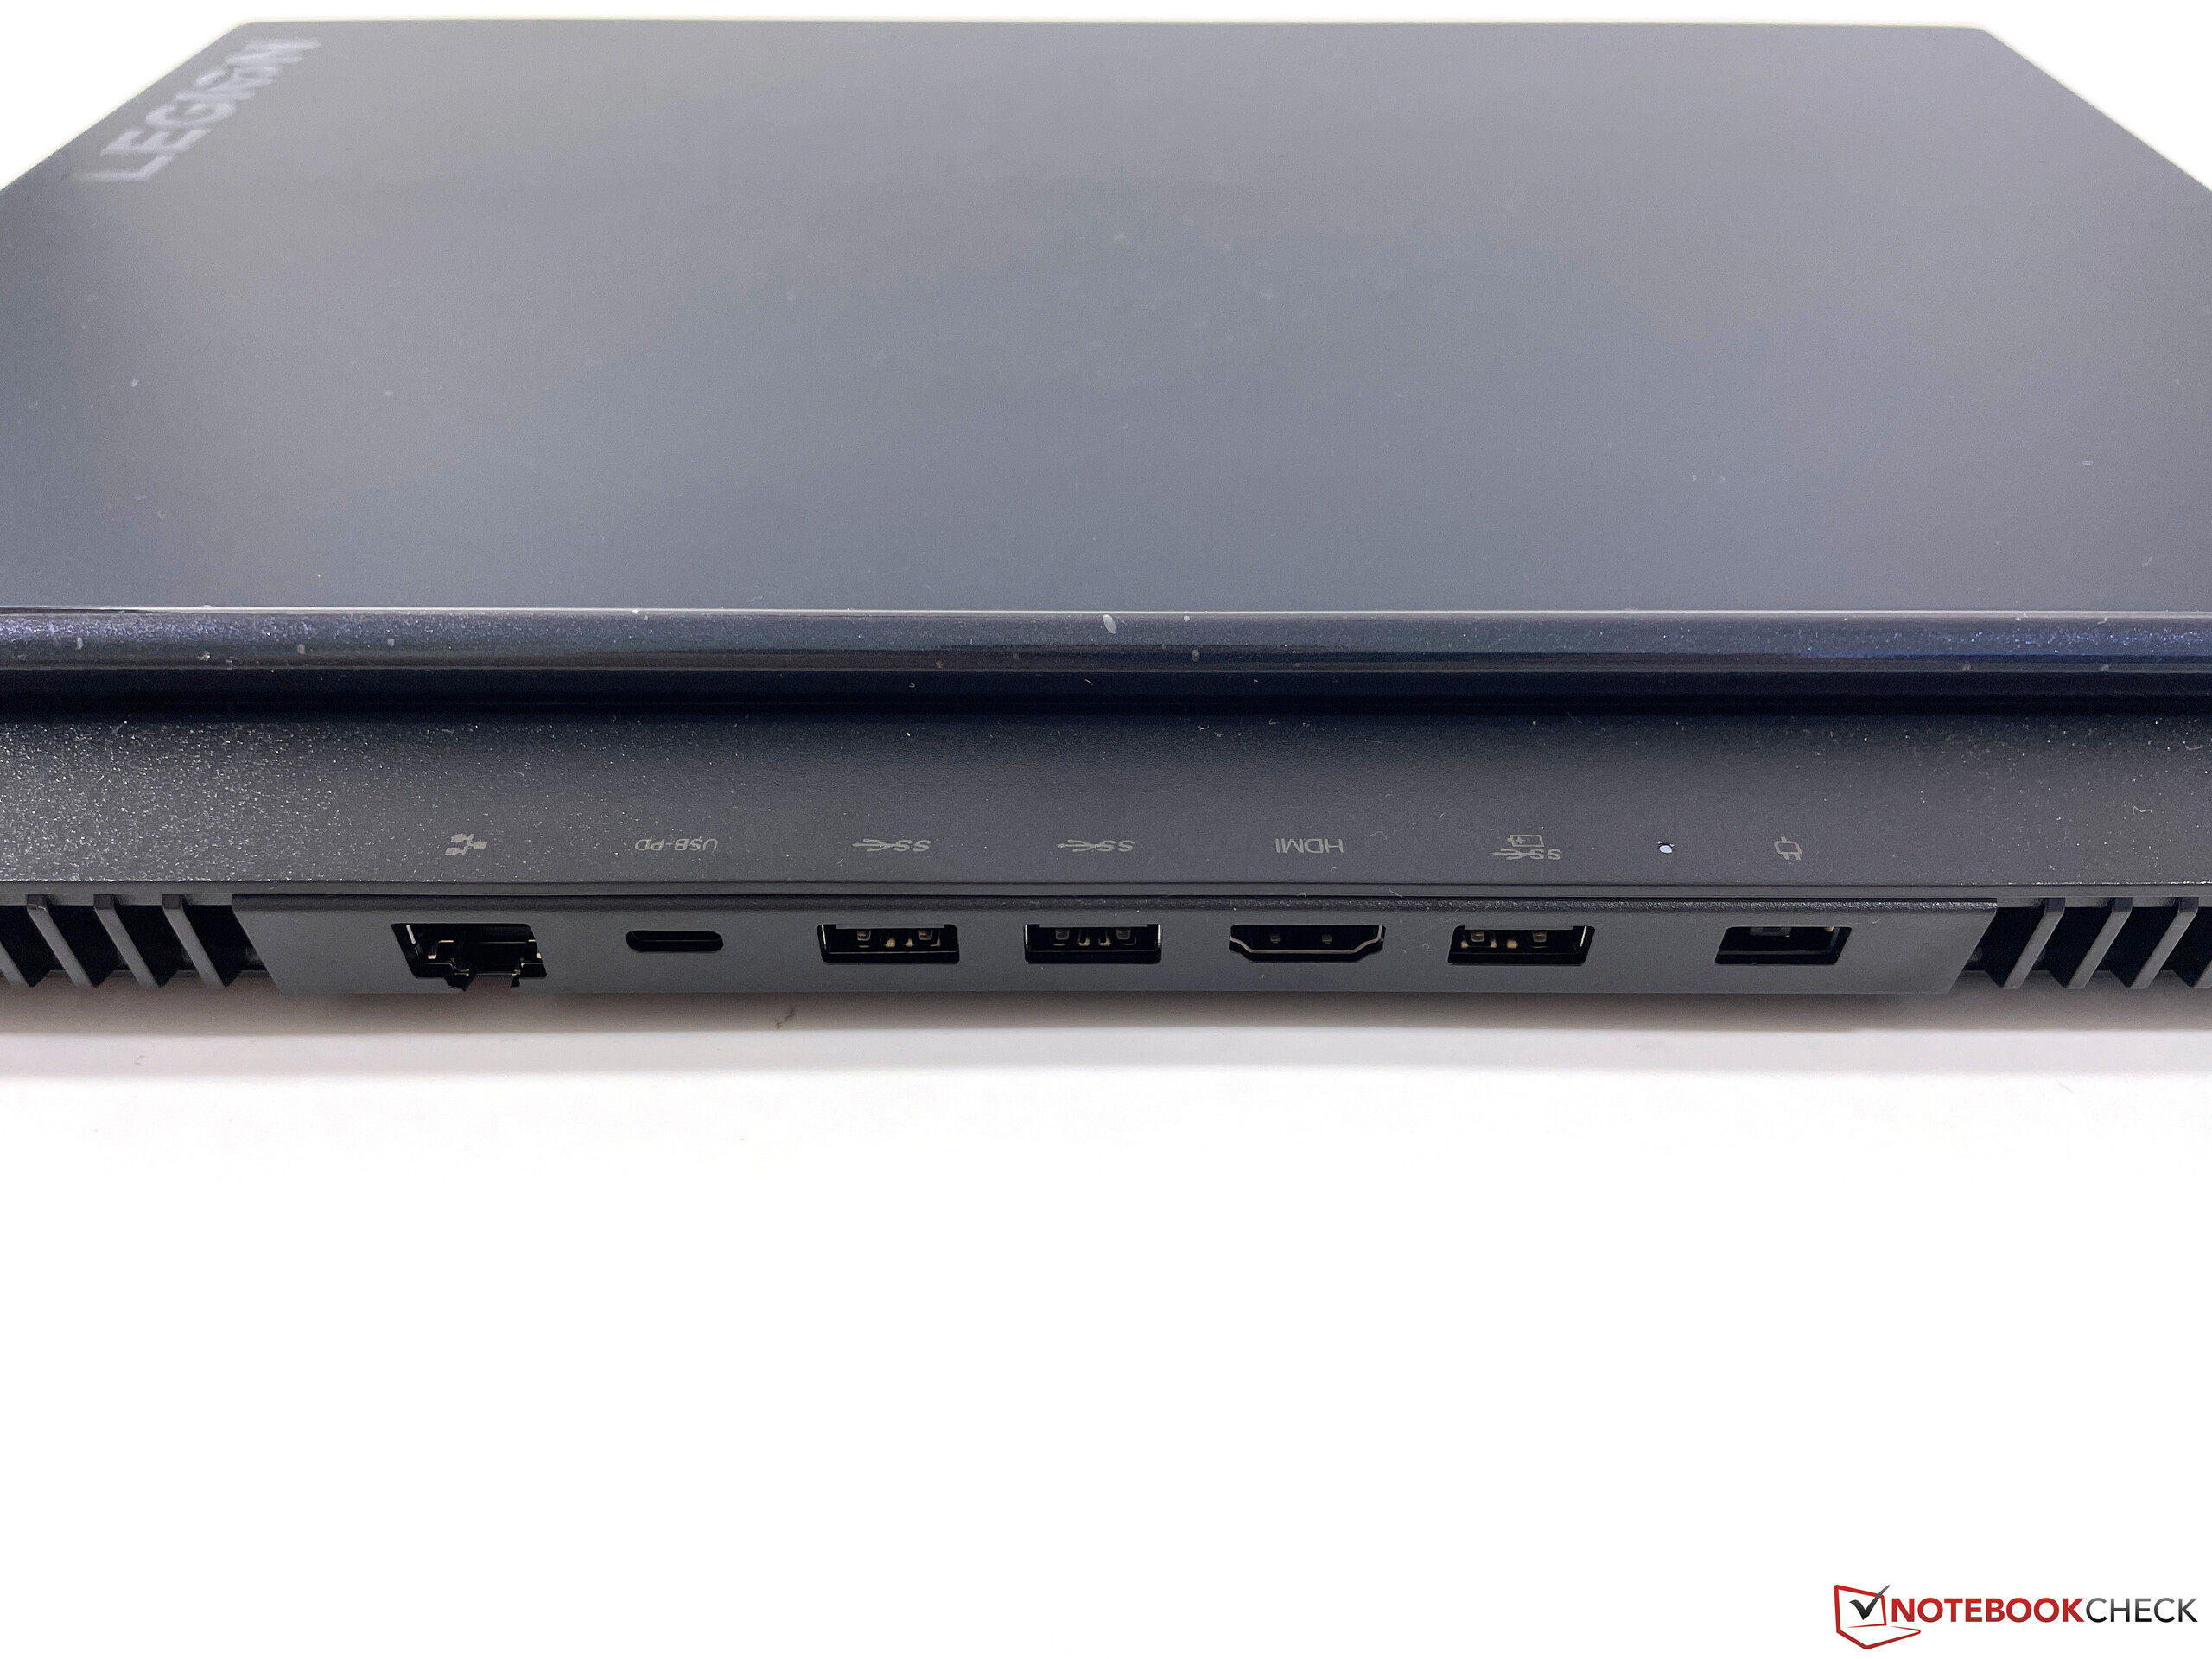
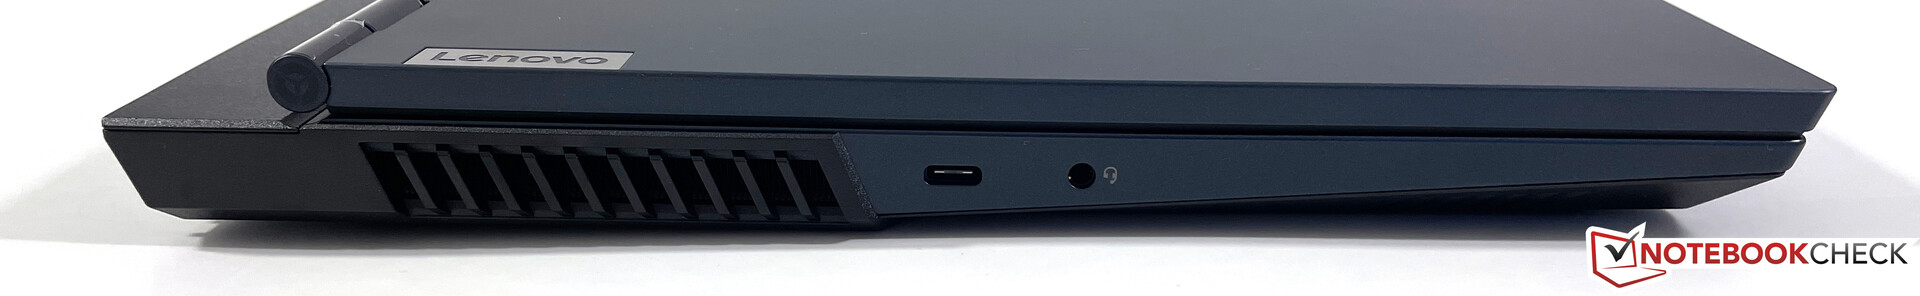
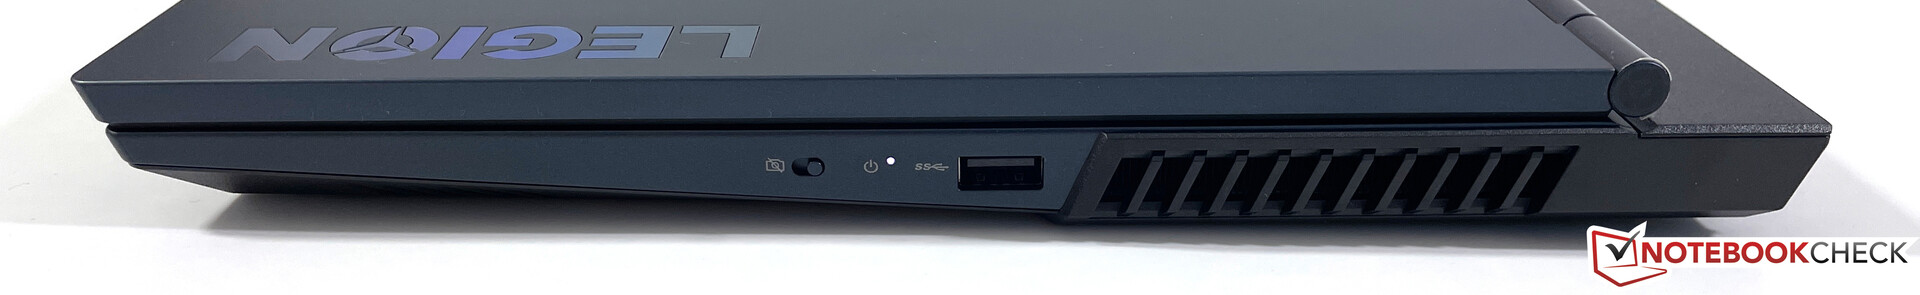
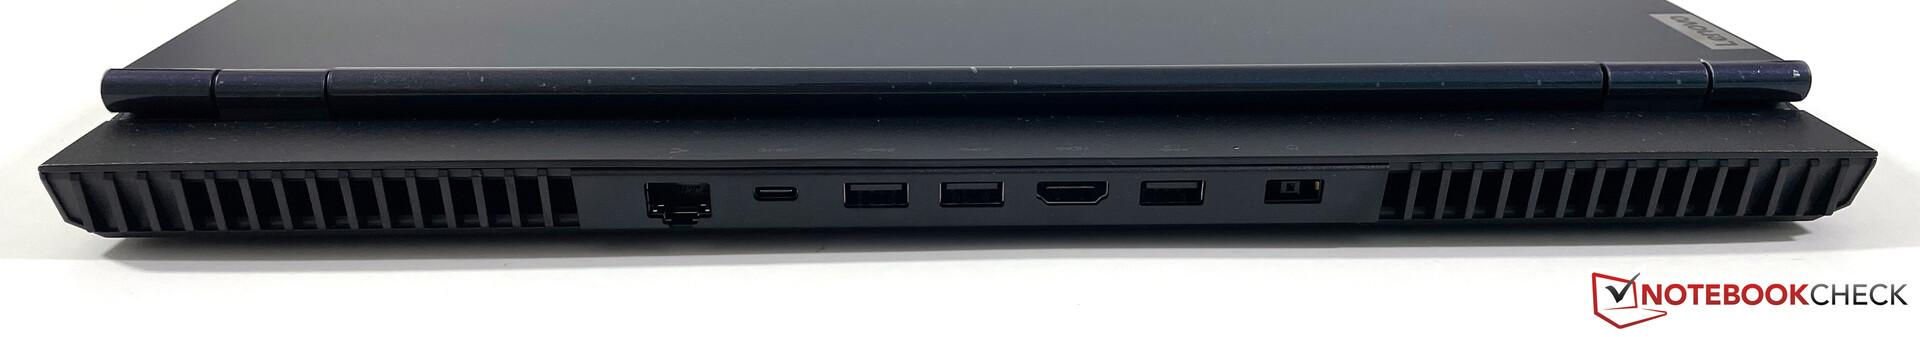
连接性--AMDLegion ,不含Thunderbolt
正如预期的那样,Legion 5 15不支持Thunderbolt,但你可以得到所有其他重要的端口。大多数连接器位于后部,但你在每一侧至少有一个USB端口(1个USB-C,1个USB-A)以及耳机端口。
沟通
Wi-Fi模块是该笔记本低价位的一个指标。你得到一个来自RealTek(RTL8852AE)的现代Wi-Fi 6模块,但最大传输率如果限制在866 Mbps,而且也没有针对游戏的特殊功能(比如在线游戏的优先级)。我们用路由器Netgear Nighthawk RAX120进行的标准化Wi-Fi测试也显示了波动的传输速率。然而,我们在实践中没有遇到任何问题,下载速度也不明显。
| Networking | |
| iperf3 transmit AX12 | |
| Schenker XMG Core 15 Ampere | |
| Alienware m15 R5 Ryzen Edition | |
| Acer Nitro 5 AN515-45-R1JH | |
| Asus TUF Gaming F15 FX506HM | |
| Average RealTek Semiconductor RTL8852AE (424 - 928, n=20) | |
| Lenovo Legion 5 15ACH-82JU00C6GE-FL | |
| iperf3 receive AX12 | |
| Schenker XMG Core 15 Ampere | |
| Alienware m15 R5 Ryzen Edition | |
| Asus TUF Gaming F15 FX506HM | |
| Lenovo Legion 5 15ACH-82JU00C6GE-FL | |
| Average RealTek Semiconductor RTL8852AE (621 - 877, n=20) | |
| Acer Nitro 5 AN515-45-R1JH | |
网络摄像头
720P提供电子快门,但即使在良好的照明条件下,画质也不理想。没有额外的红外摄像头用于Windows Hello。


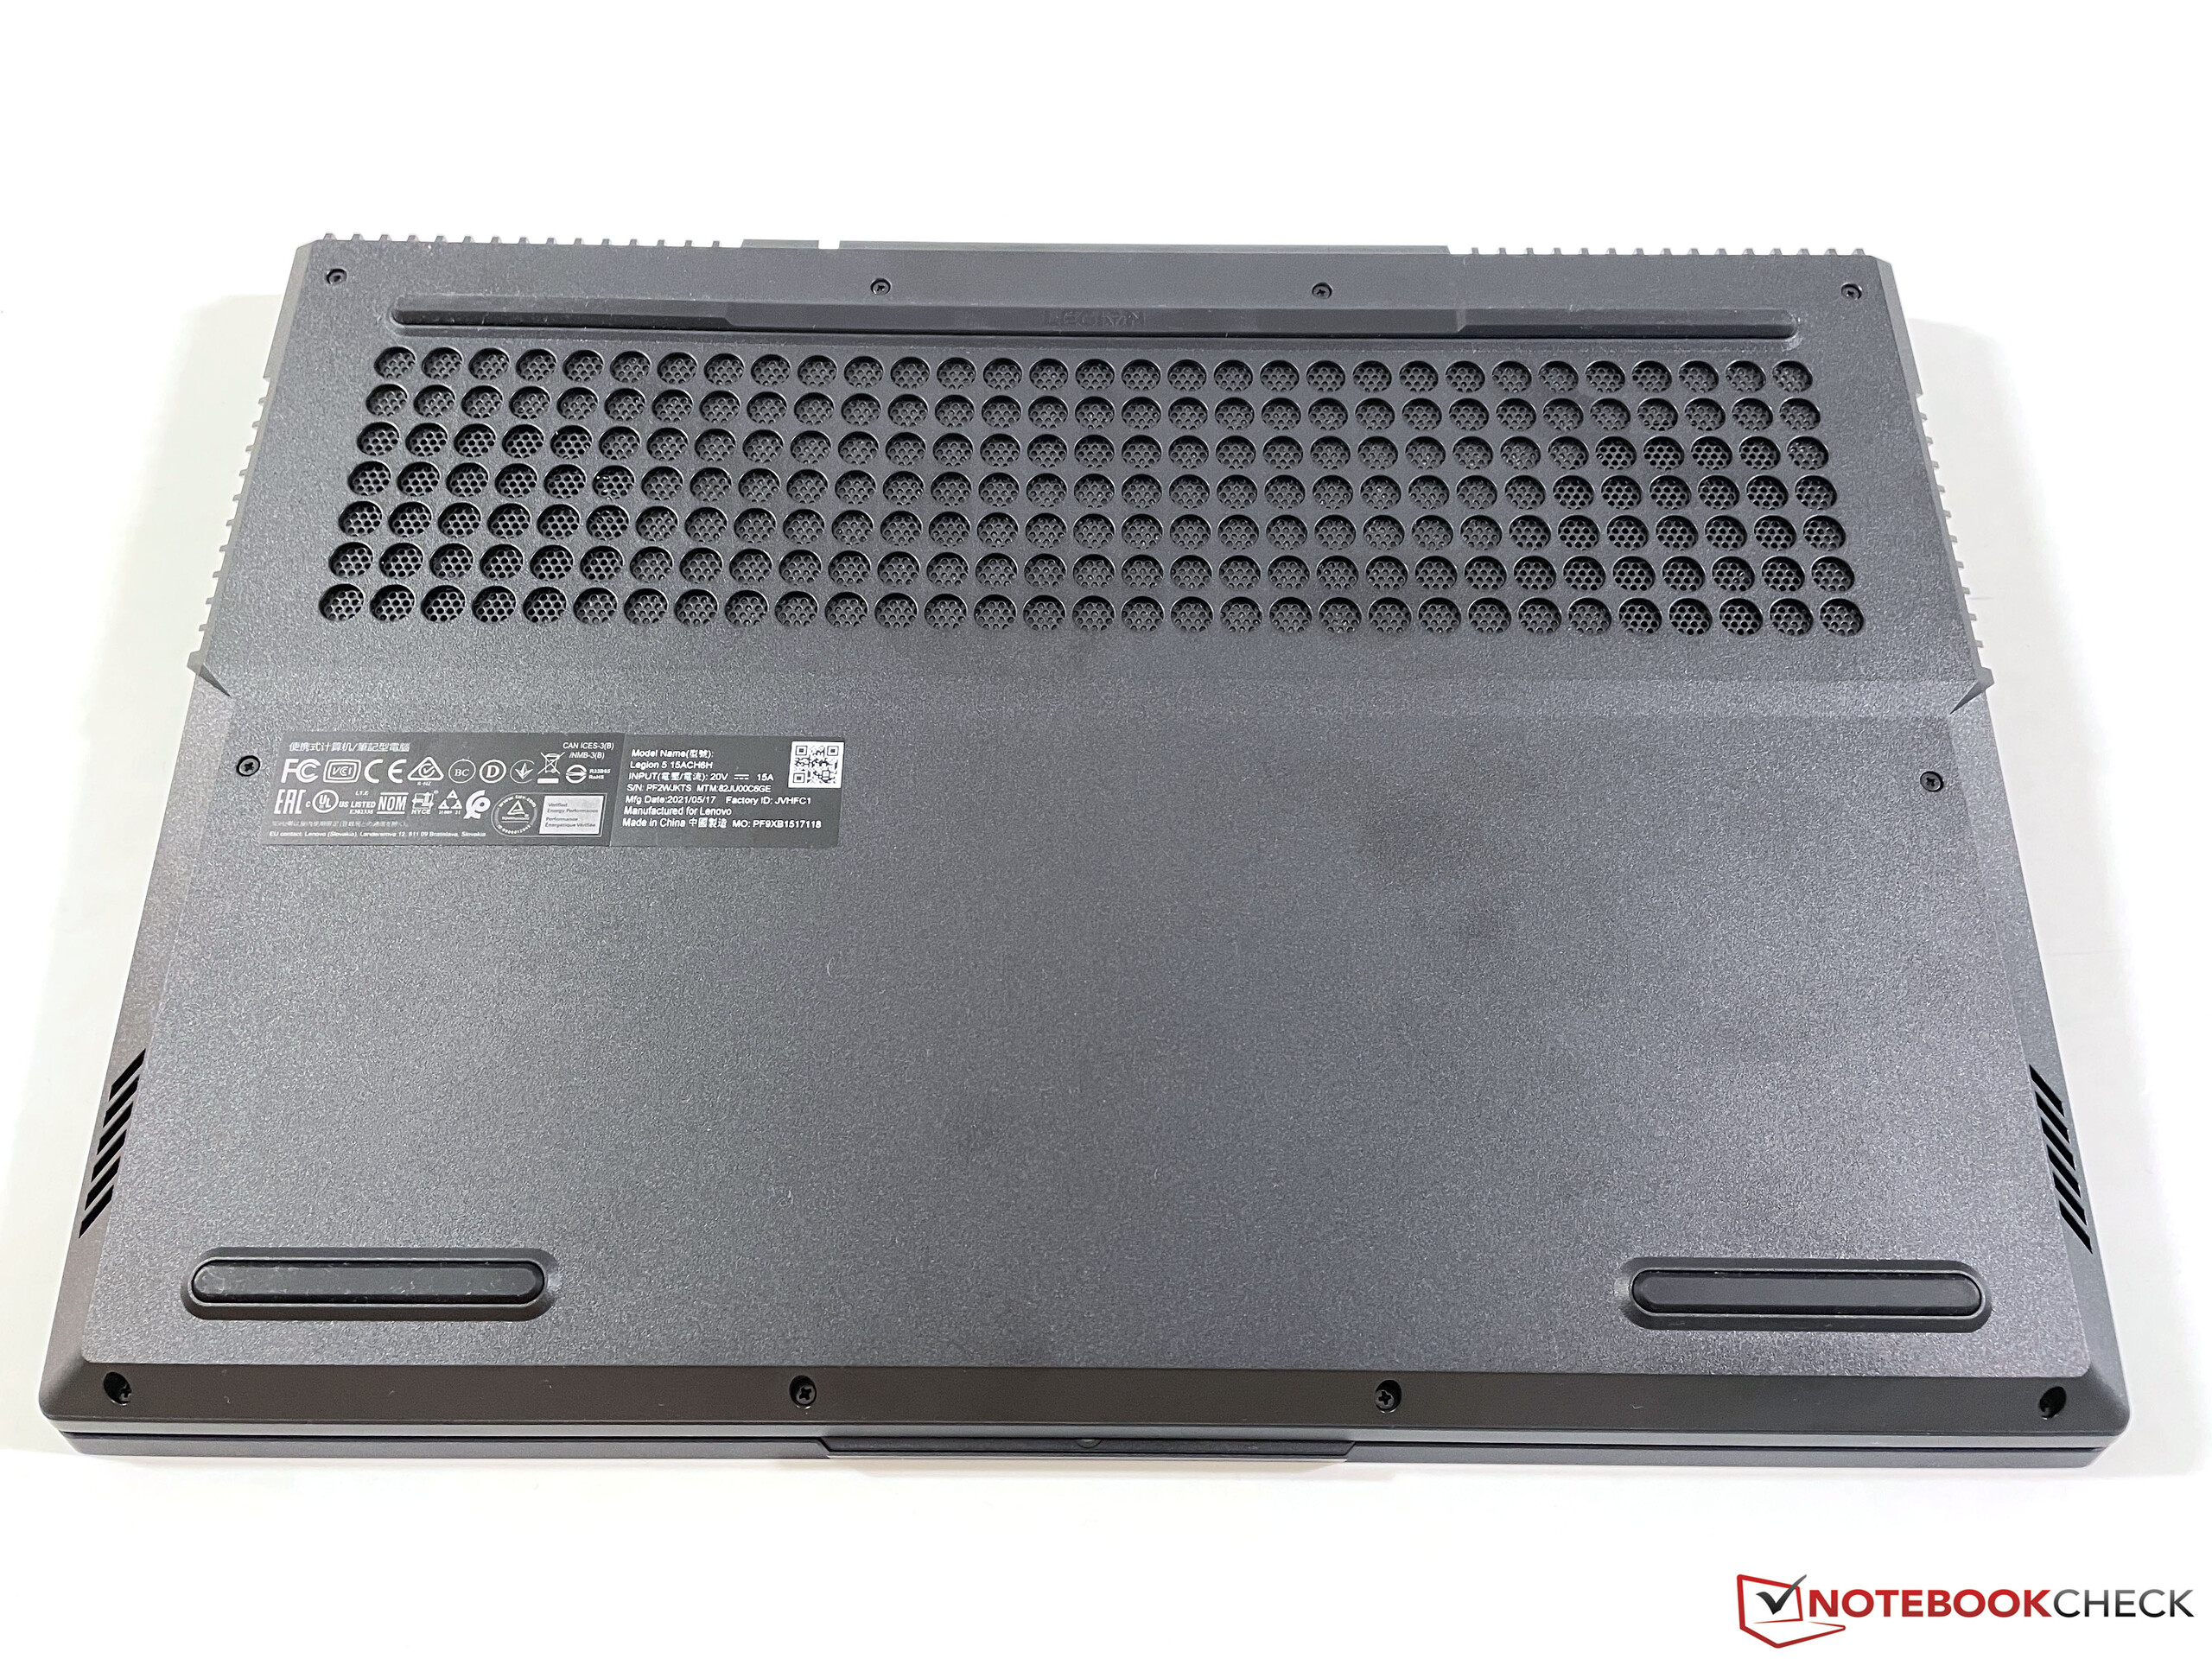
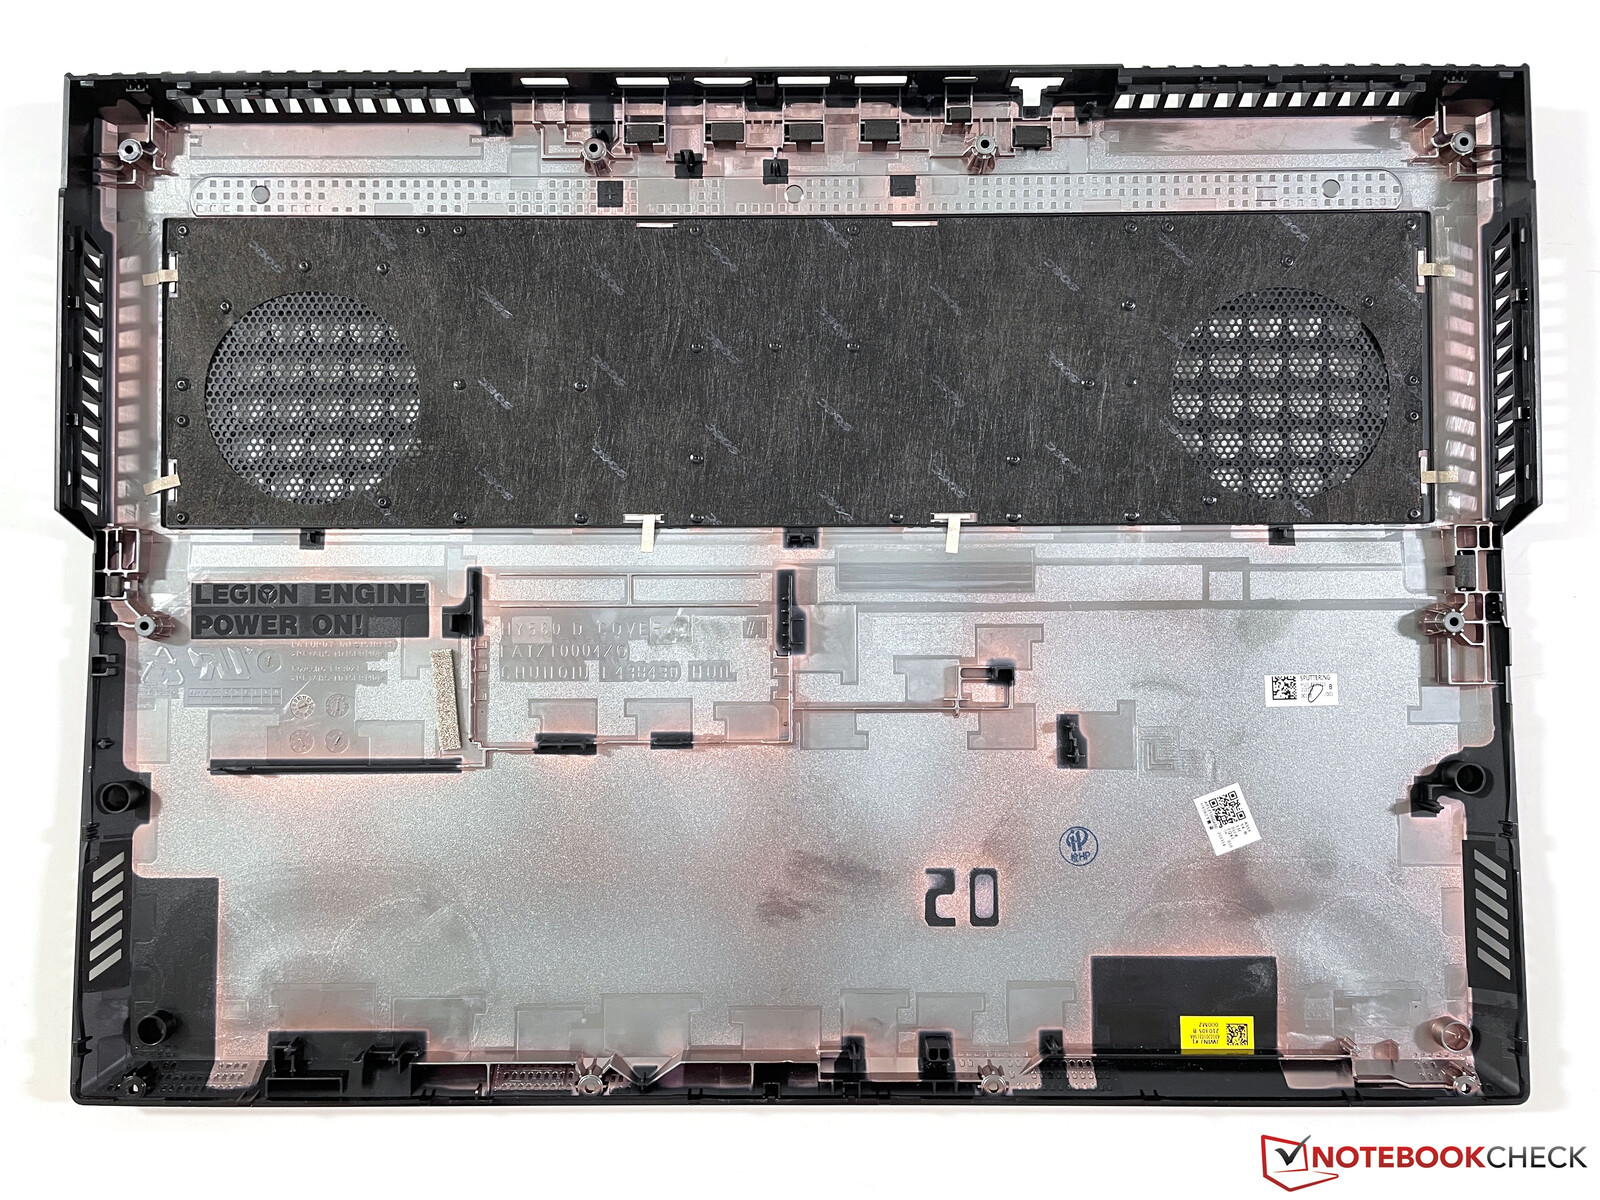
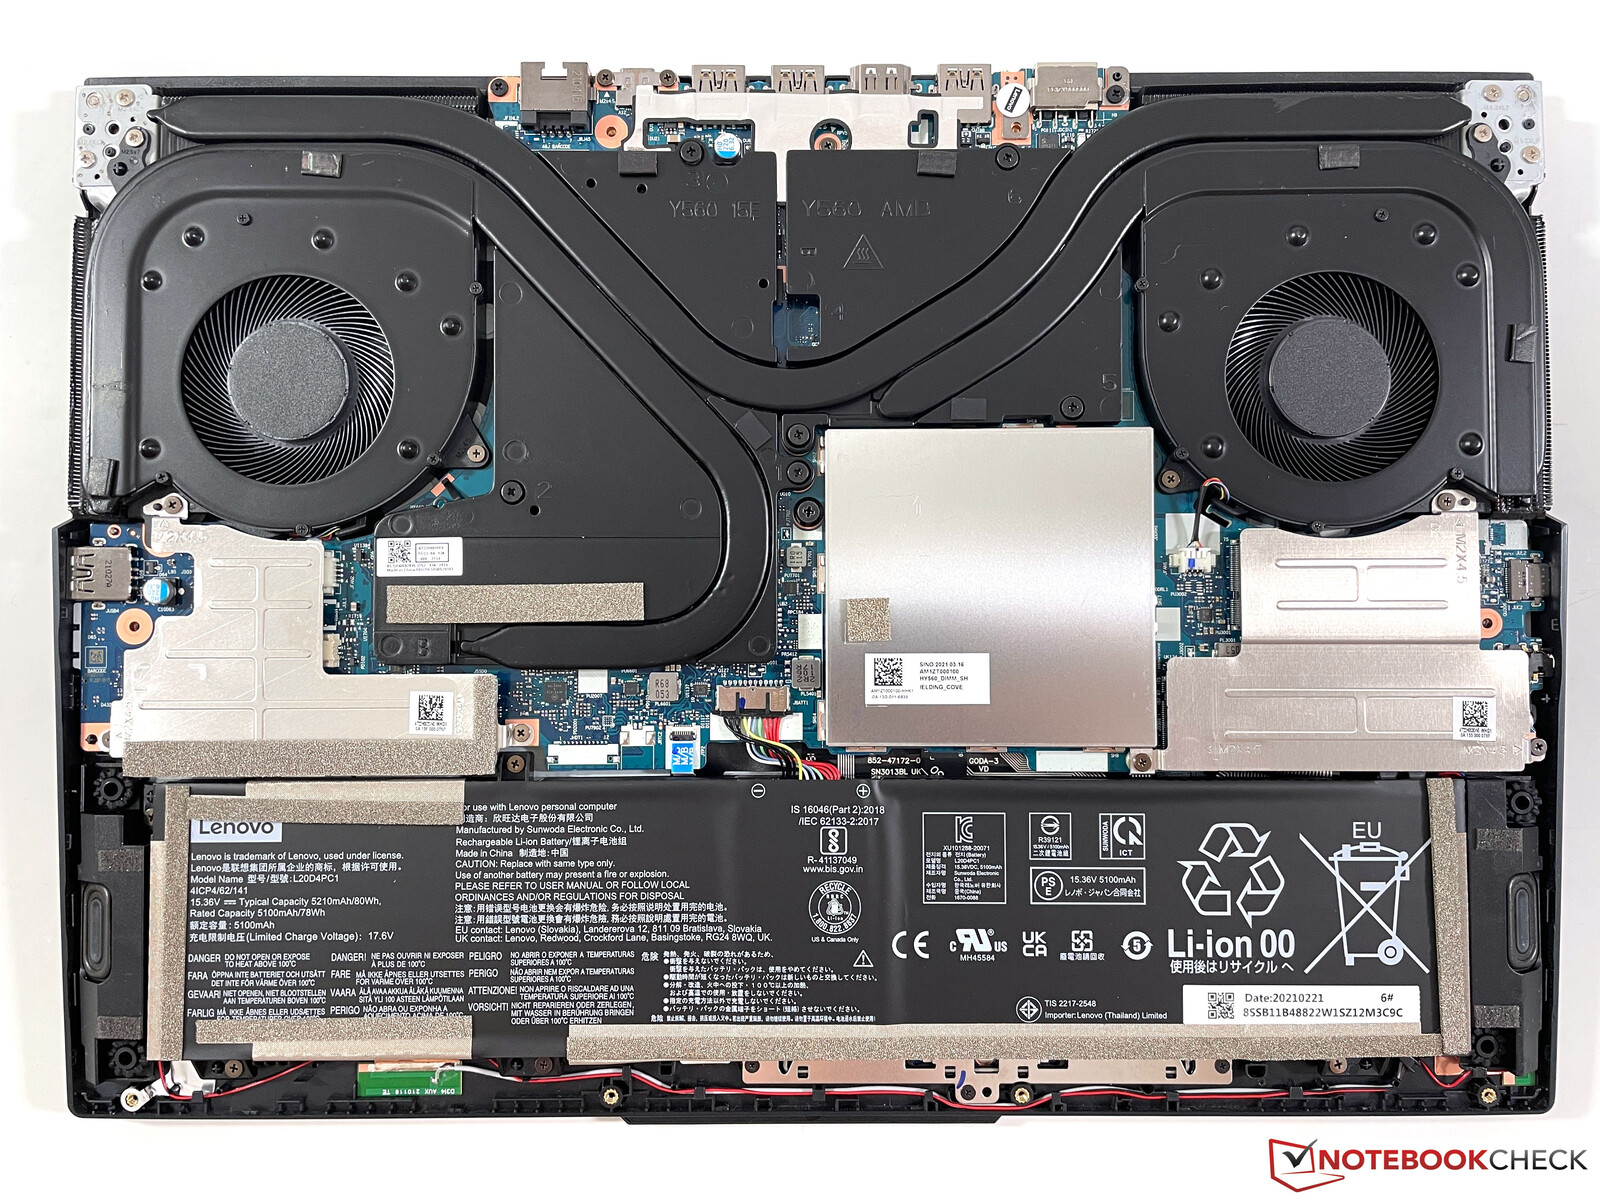
维护
底部的盖子可以被拆掉,但过程并不简单。拆除螺丝后,面板仍然非常紧,你在拆除时必须小心。两个内存插槽以及两个M.2-2280插槽都被额外的面板所覆盖,但它们很容易拆除。也可以更换Wi-Fi模块。
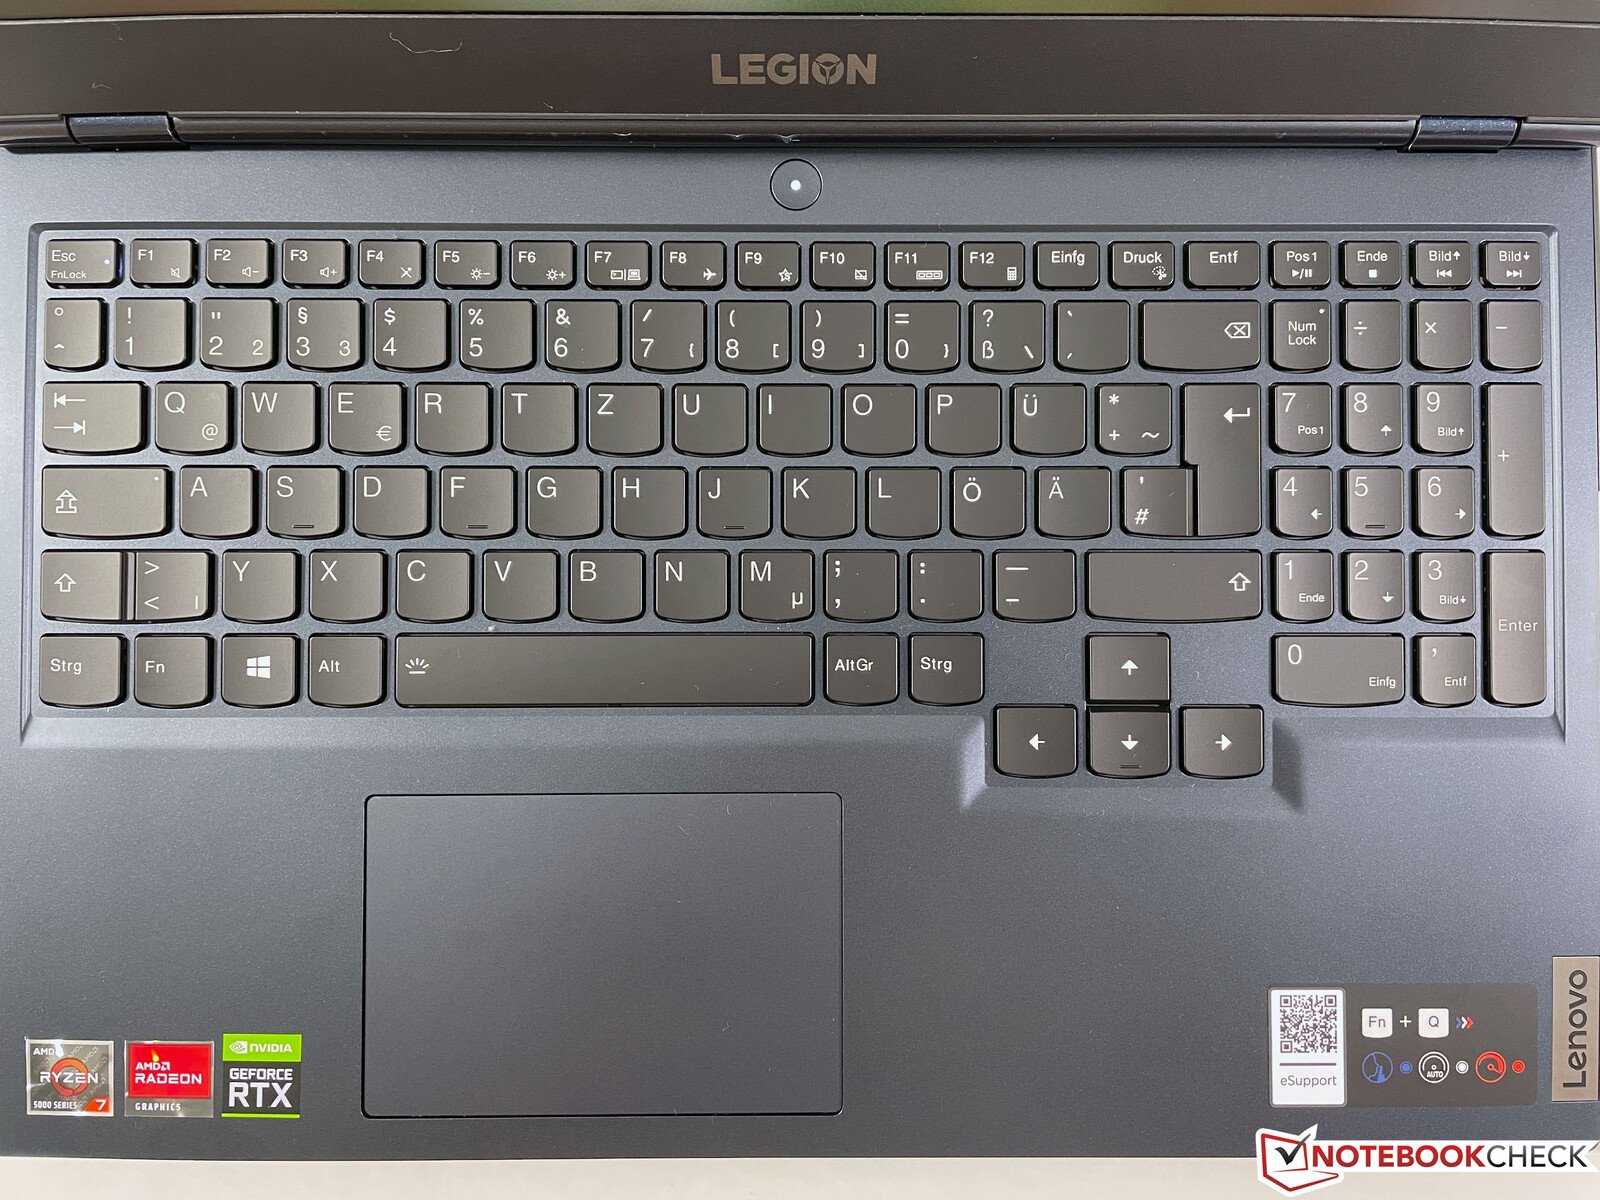
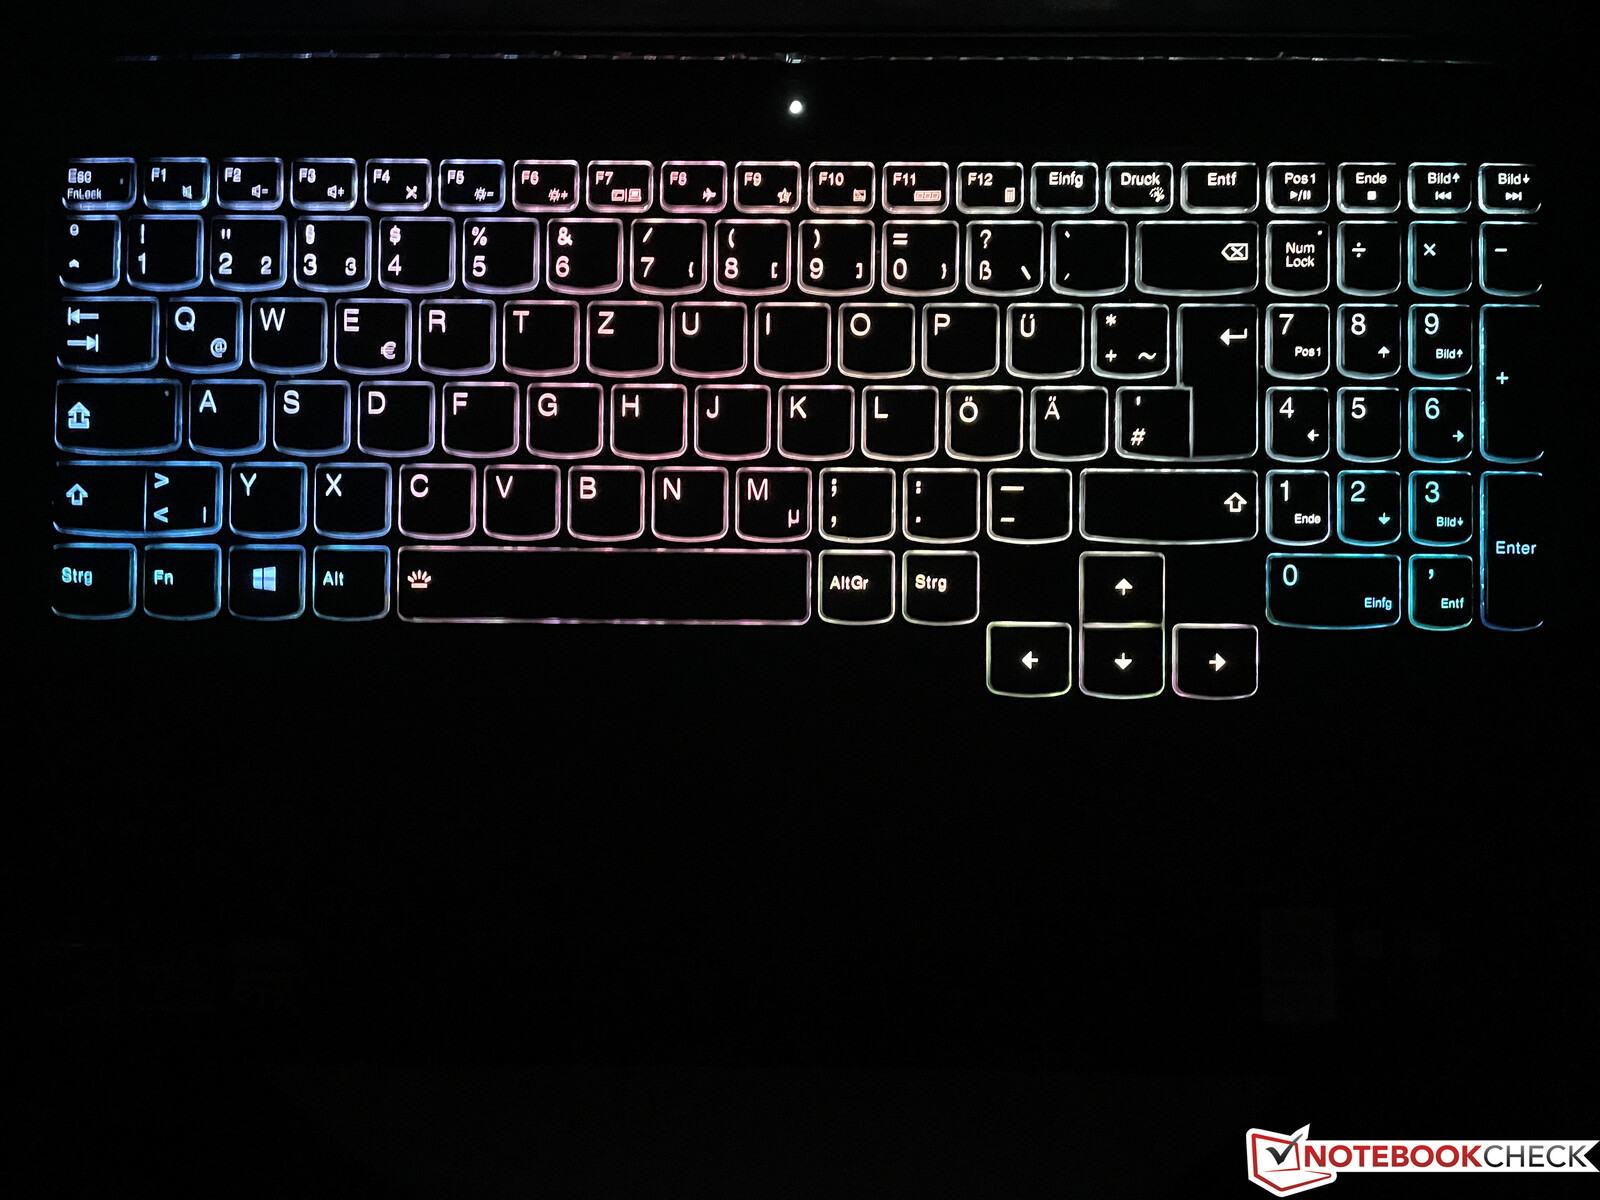
输入设备 -Legion ,多区照明。
与上一代产品相比,联想并没有改变输入设备。 之前的型号.你可以在按键上舒适地打字,而且在右侧有一个专用的小键盘,尽管按键有点窄。然而,方向键略微向底部移动,而且它们的大小相同,所以不用看也很容易找到。背景照明被分为四个区域,可以分别调整。你可以通过组合键(Fn+空格键)在三个配置文件之间切换,你可以通过联想的Vantage应用来调整它们(亮度、颜色、图案)。光标移动在大点击板上是没有问题的,但大多数游戏者可能会使用外部鼠标。
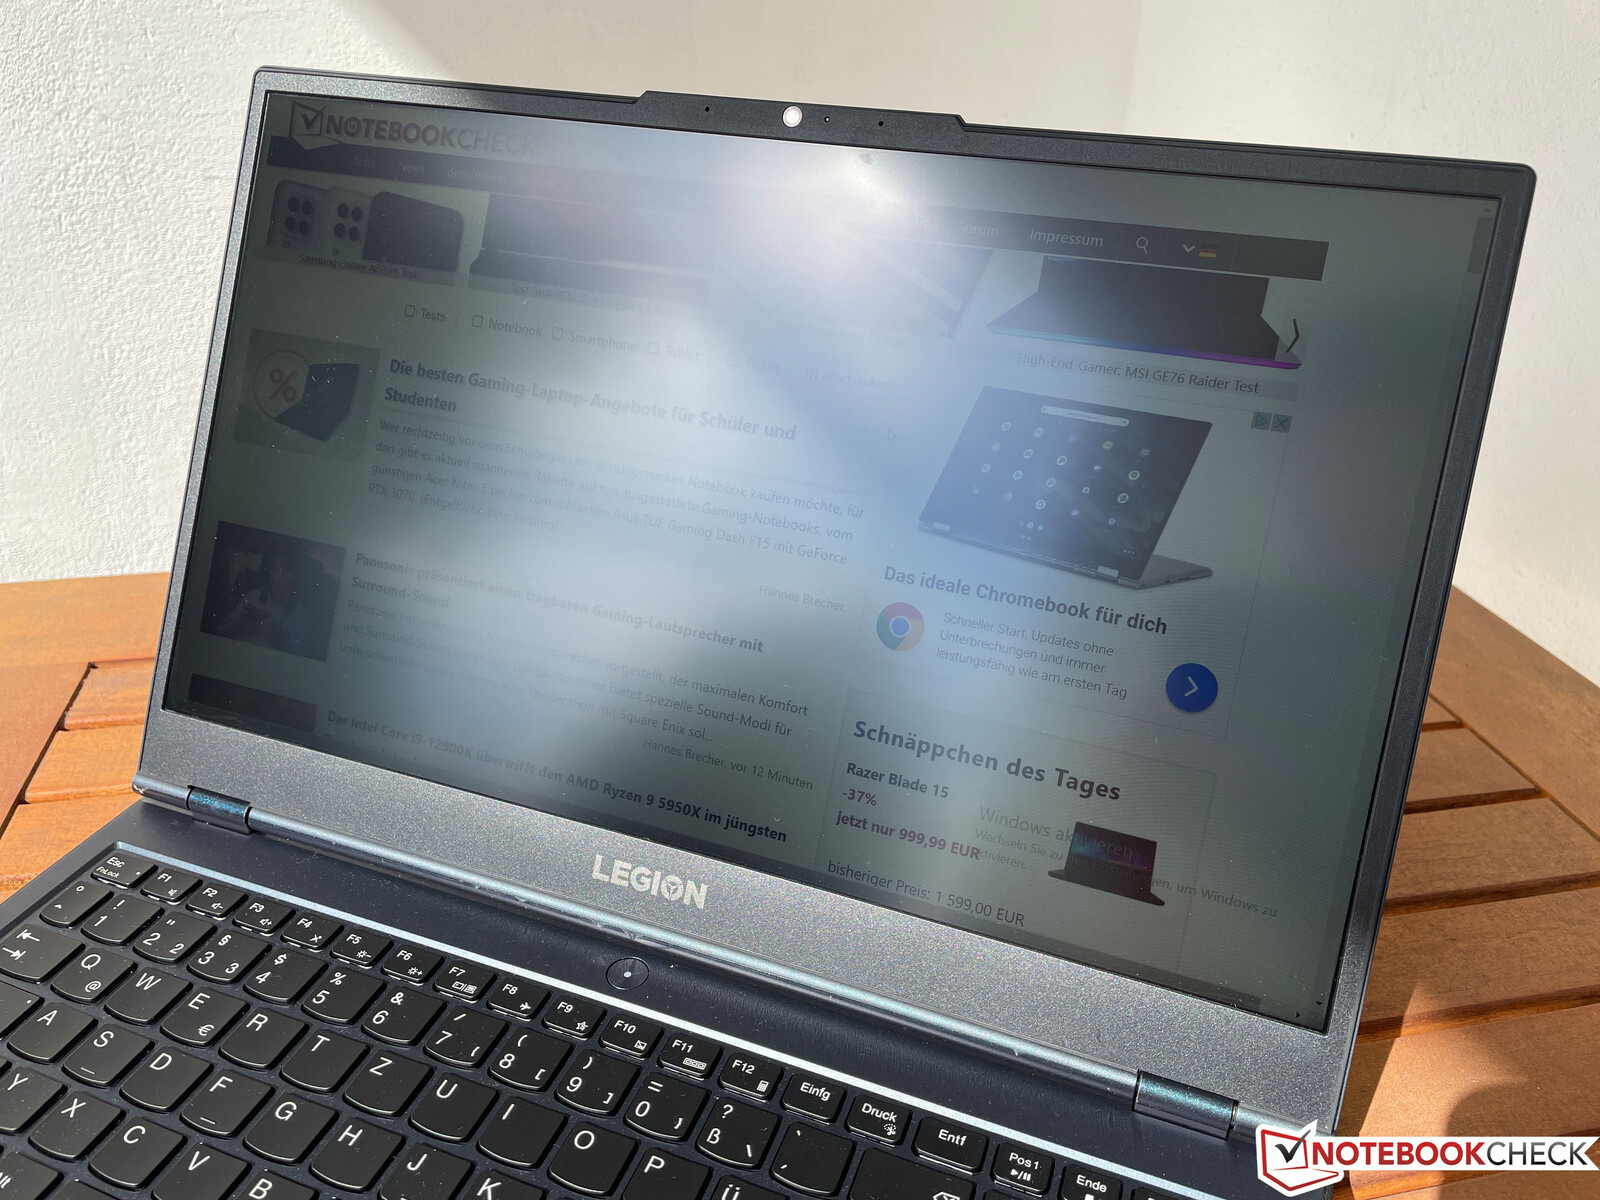
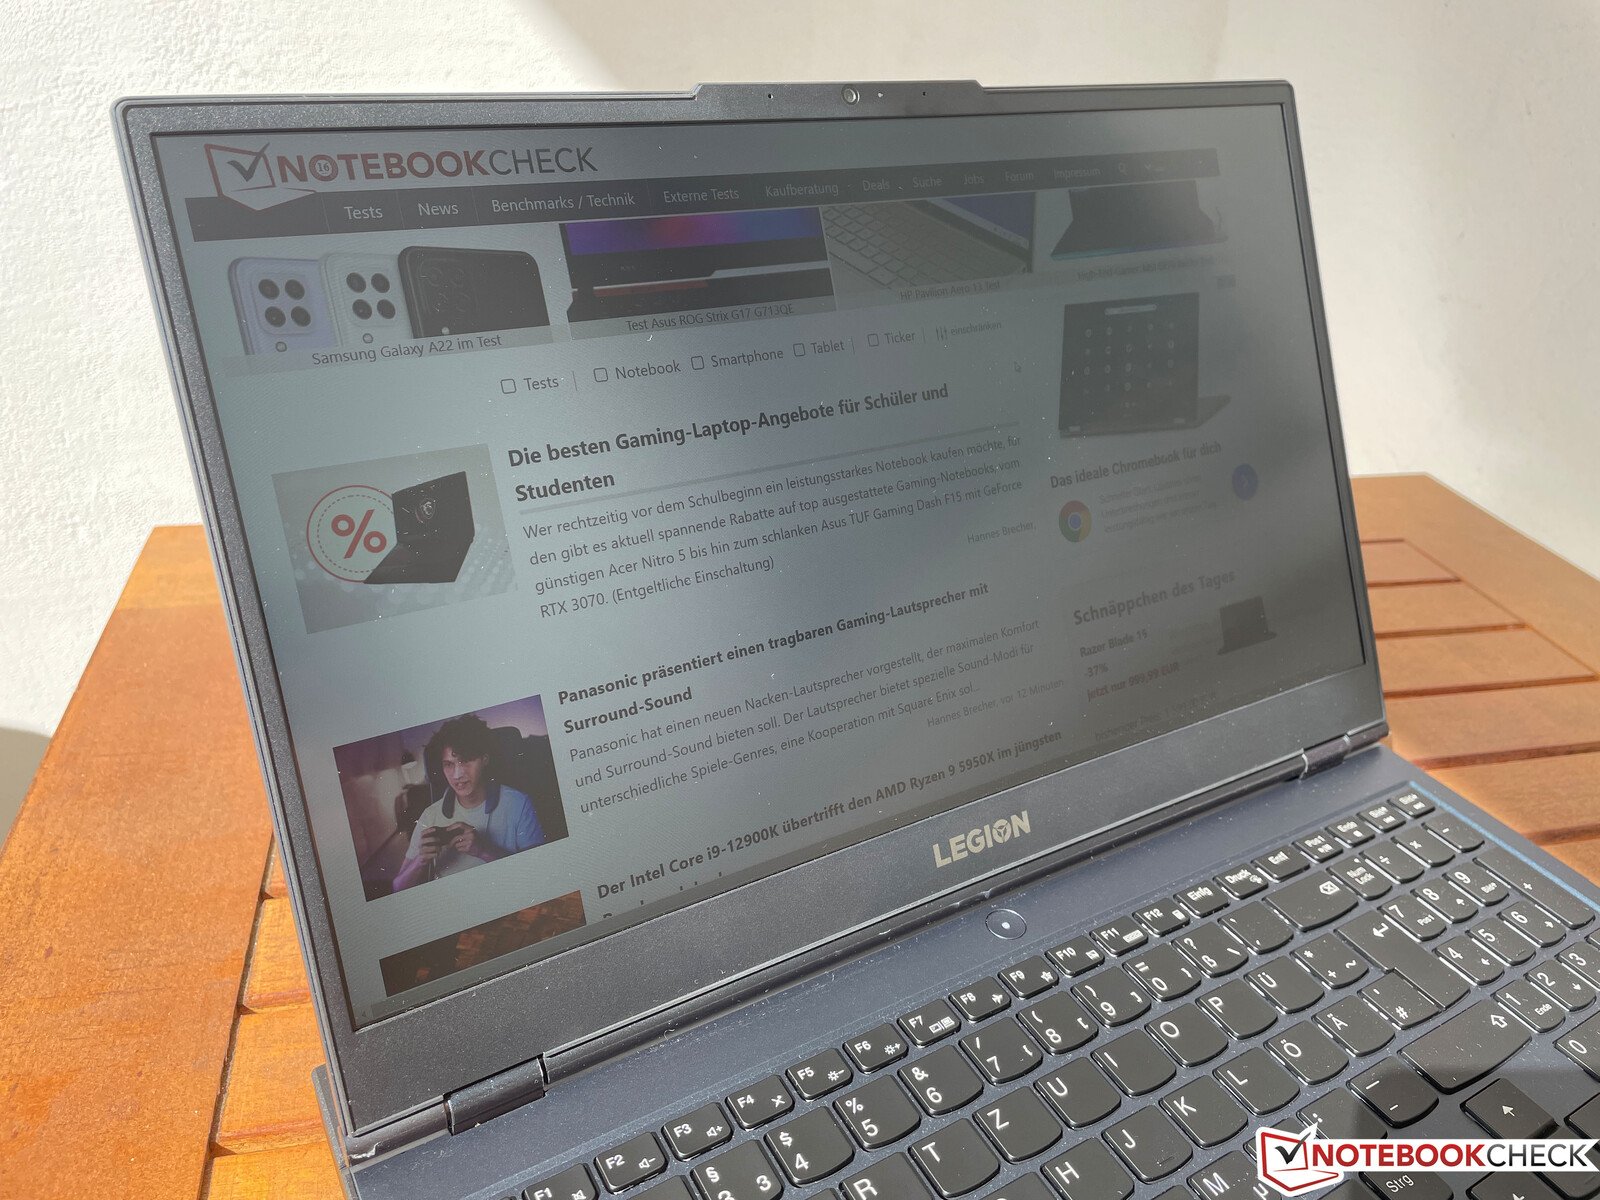
显示器 - 1080p mit 165 Hz & G-Sync

联想提供不同的显示屏,从 1080p屏幕和120赫兹(250尼特),60赫兹(300尼特)的1080p屏幕,165赫兹(300尼特)的1080p面板,一直到165赫兹(300尼特)的WQHD面板。我们的测试设备配备的是165赫兹和G-Sync的快速FHD面板,这给人留下了非常好的主观画面印象。颜色鲜艳,即使是明亮的表面也不显得有颗粒感,尽管屏幕表面是哑光的。高刷新率也导致了一个非常流畅的印象。
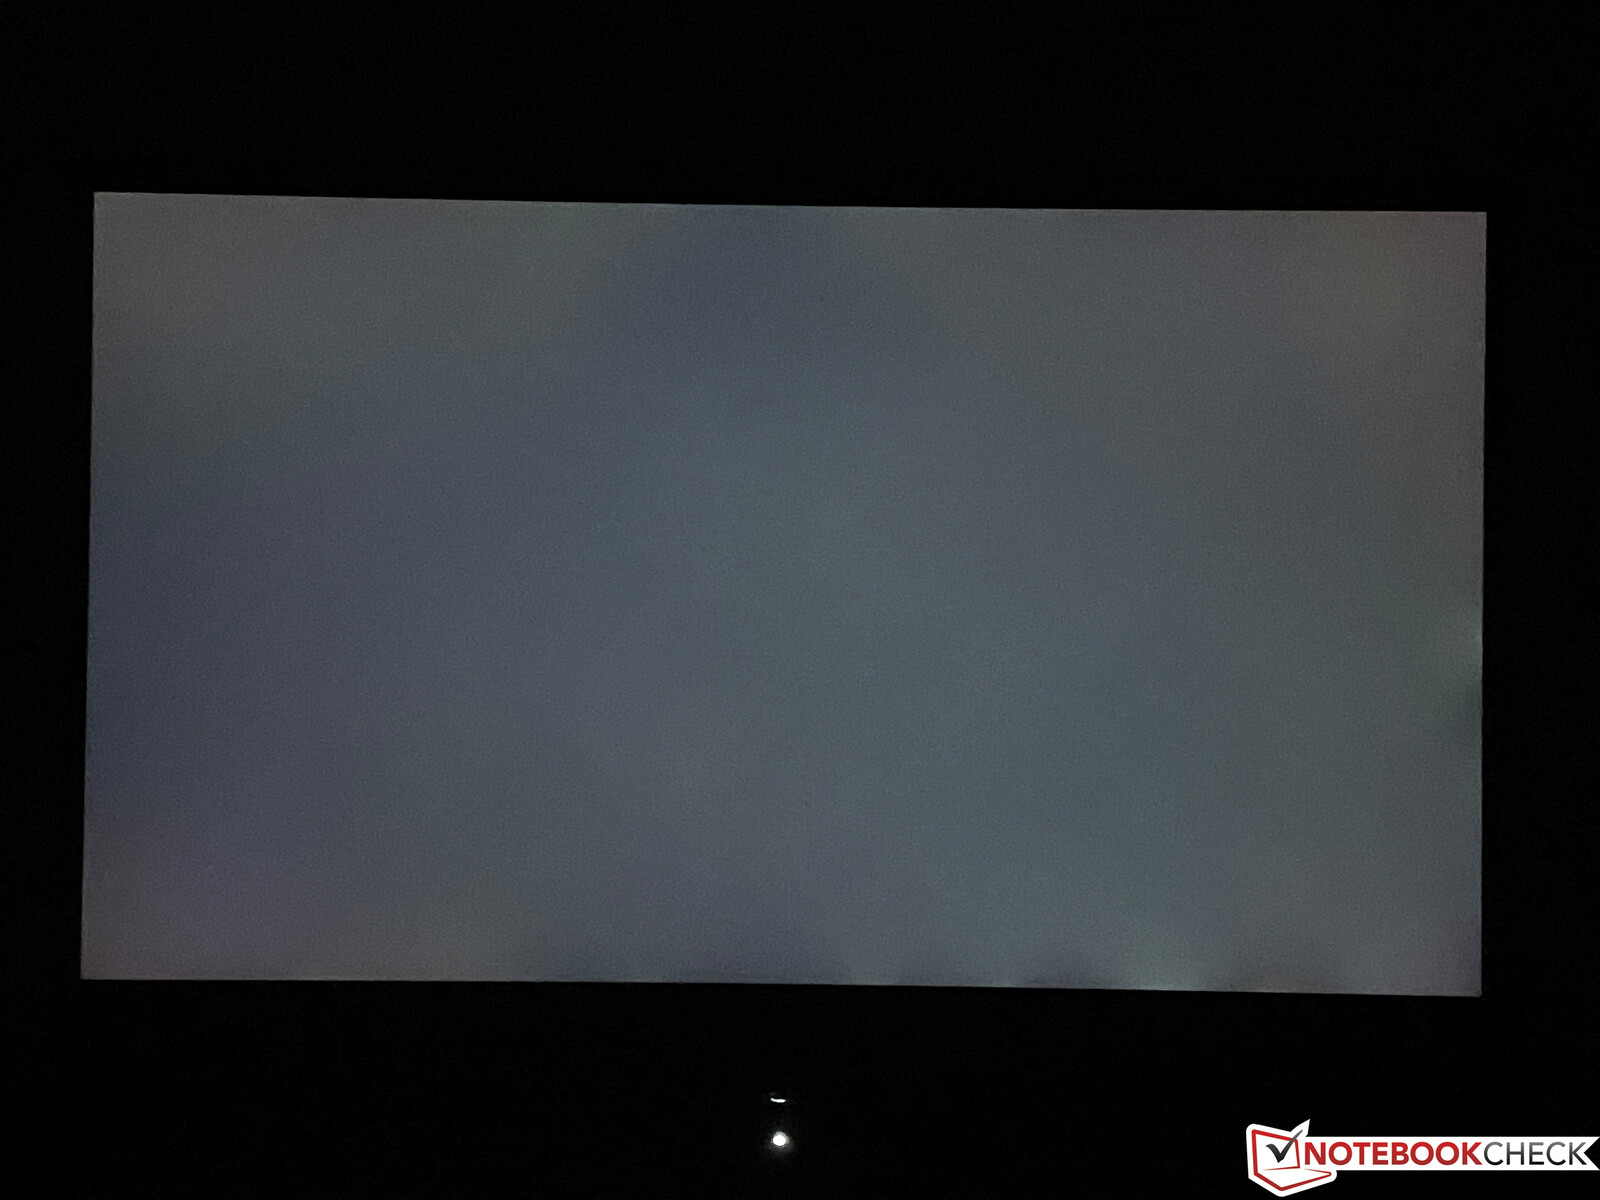
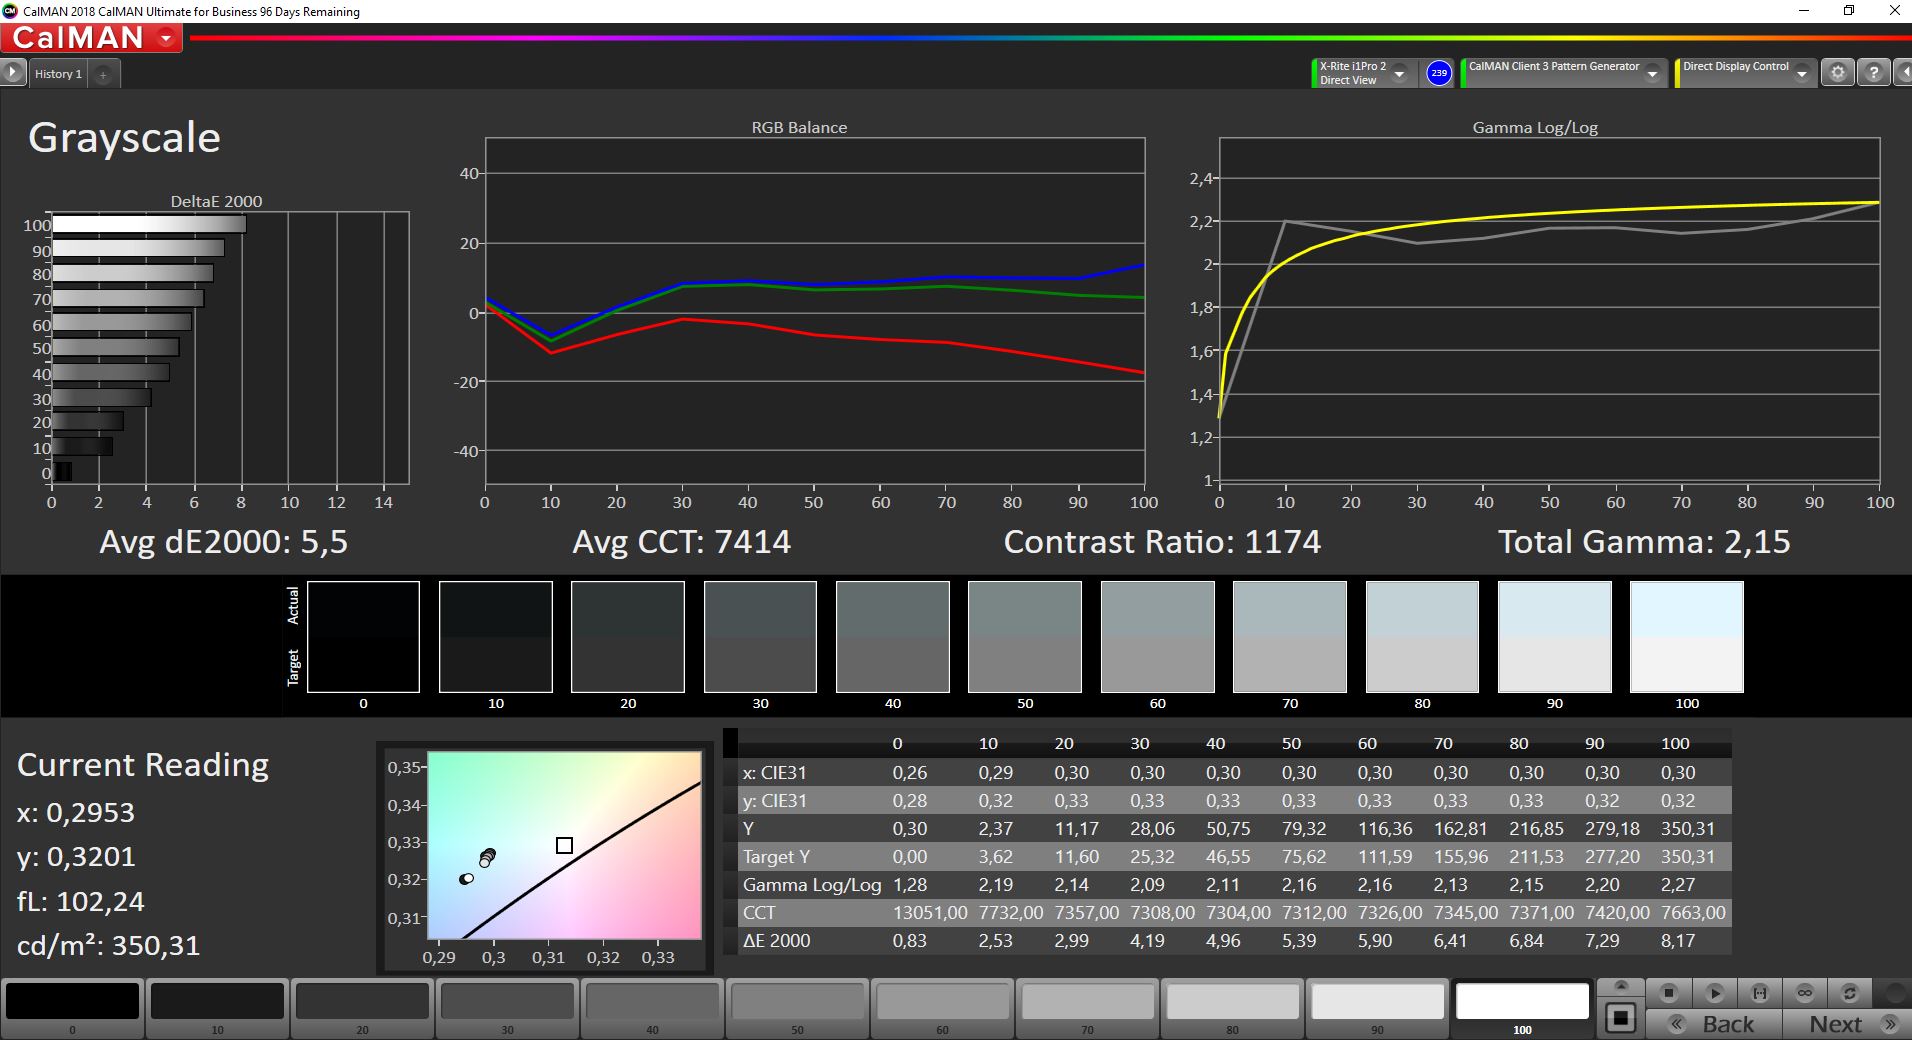
我们的测试设备很容易就超过了宣传的300尼特的亮度,平均结果为350尼特,对比度为1200:1。只是在下边缘有轻微的背光渗漏,但在实践中几乎看不出来。我们没有检测到PWM,而且响应时间非常快,所以Legion 5 15没有重影的问题。
| |||||||||||||||||||||||||
Brightness Distribution: 96 %
Center on Battery: 350 cd/m²
Contrast: 1167:1 (Black: 0.3 cd/m²)
ΔE ColorChecker Calman: 3.9 | ∀{0.5-29.43 Ø4.71}
calibrated: 1.6
ΔE Greyscale Calman: 5.5 | ∀{0.09-98 Ø4.96}
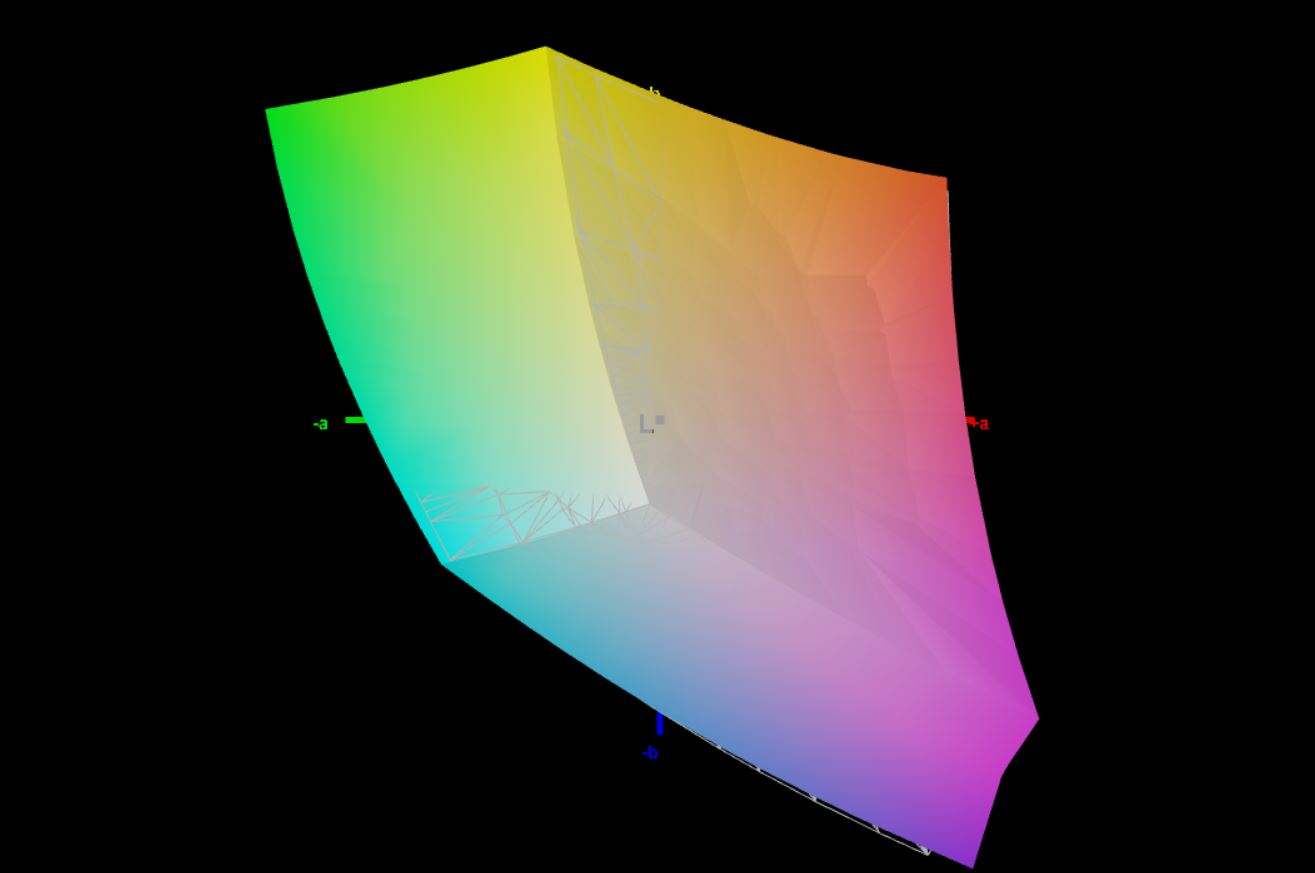
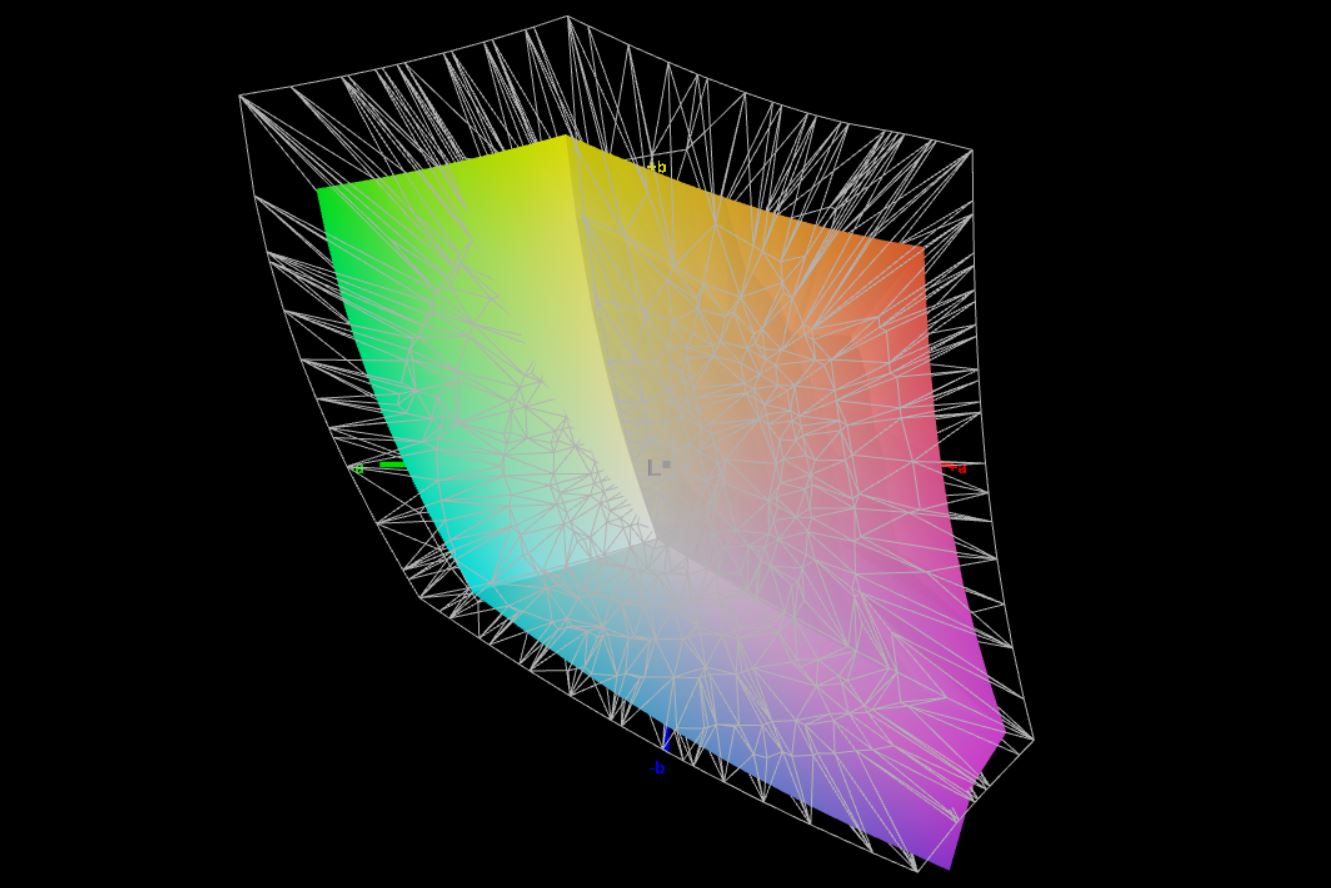
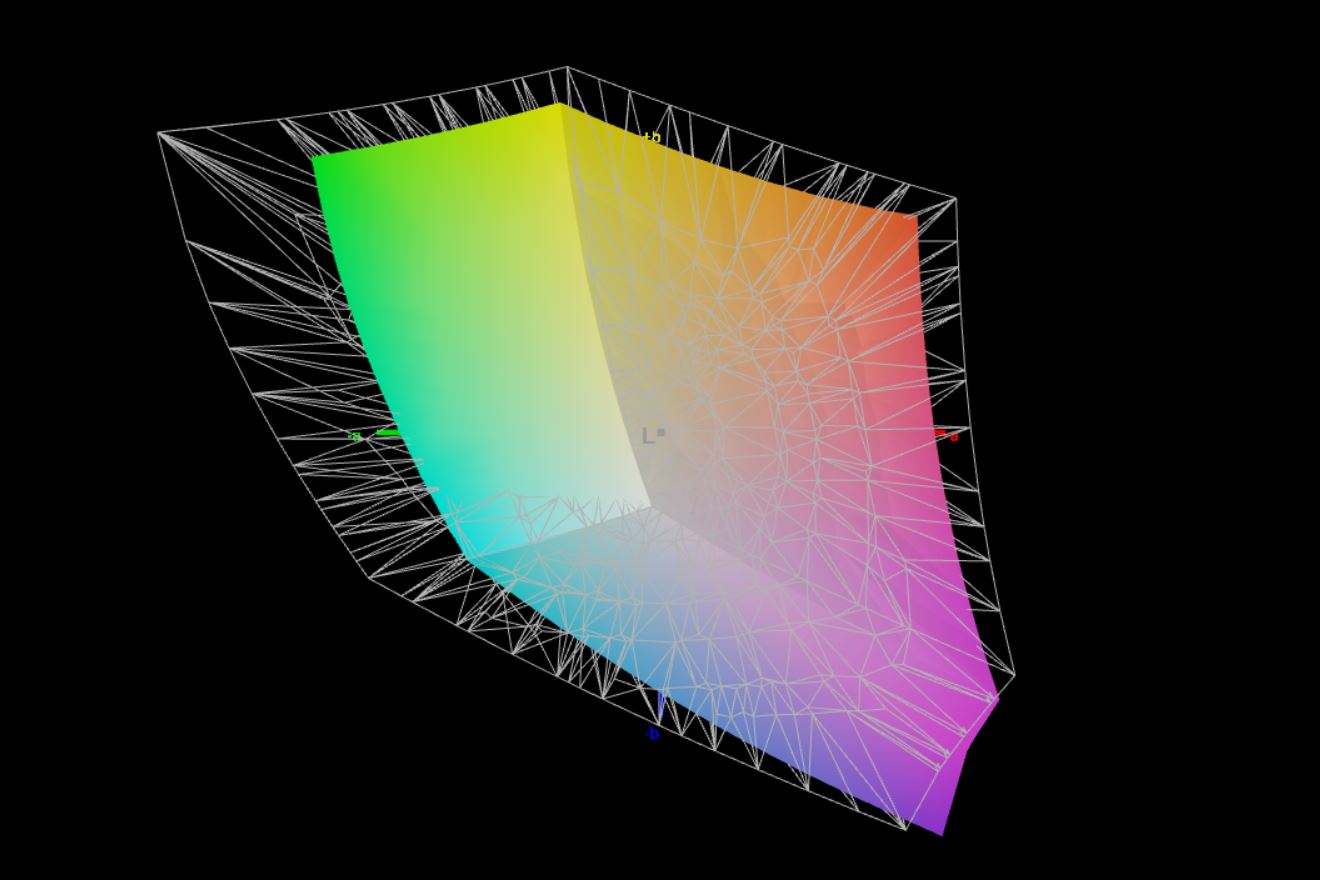
67.5% AdobeRGB 1998 (Argyll 3D)
96.3% sRGB (Argyll 3D)
65.4% Display P3 (Argyll 3D)
Gamma: 2.15
CCT: 7414 K
| Lenovo Legion 5 15ACH-82JU00C6GE-FL B156HAN12.H, , 1920x1080, 15.6" | Acer Nitro 5 AN515-45-R1JH BOE BOE09B8, IPS, 2560x1440, 15.6" | Asus TUF Gaming F15 FX506HM Chi Mei N156HRA-EA1, IPS, 1920x1080, 15.6" | Alienware m15 R5 Ryzen Edition B156HAN, IPS, 1920x1080, 15.6" | Schenker XMG Core 15 Ampere BOE CQ NE156QHM-NY2, IPS, 2560x1440, 15.6" | |
|---|---|---|---|---|---|
| Display | 0% | -36% | 5% | ||
| Display P3 Coverage (%) | 65.4 | 66.2 1% | 41.9 -36% | 69.8 7% | |
| sRGB Coverage (%) | 96.3 | 96.3 0% | 62.9 -35% | 98.8 3% | |
| AdobeRGB 1998 Coverage (%) | 67.5 | 67.1 -1% | 43.3 -36% | 70.7 5% | |
| Response Times | 5% | -122% | 40% | -11% | |
| Response Time Grey 50% / Grey 80% * (ms) | 13.6 ? | 14 ? -3% | 28.4 ? -109% | 4 ? 71% | 14.8 ? -9% |
| Response Time Black / White * (ms) | 9.2 ? | 8 ? 13% | 21.6 ? -135% | 8.4 ? 9% | 10.4 ? -13% |
| PWM Frequency (Hz) | |||||
| Screen | -18% | -36% | 13% | 24% | |
| Brightness middle (cd/m²) | 350 | 349 0% | 268.3 -23% | 329 -6% | 347 -1% |
| Brightness (cd/m²) | 350 | 304 -13% | 257 -27% | 321 -8% | 328 -6% |
| Brightness Distribution (%) | 96 | 79 -18% | 84 -12% | 92 -4% | 89 -7% |
| Black Level * (cd/m²) | 0.3 | 0.535 -78% | 0.34 -13% | 0.27 10% | 0.27 10% |
| Contrast (:1) | 1167 | 652 -44% | 789 -32% | 1219 4% | 1285 10% |
| Colorchecker dE 2000 * | 3.9 | 3.11 20% | 5.05 -29% | 2.78 29% | 1.66 57% |
| Colorchecker dE 2000 max. * | 8.2 | 9.57 -17% | 15.43 -88% | 4.88 40% | 3.03 63% |
| Colorchecker dE 2000 calibrated * | 1.6 | 3.21 -101% | 1.63 -2% | 1.23 23% | |
| Greyscale dE 2000 * | 5.5 | 5 9% | 5.5 -0% | 2.5 55% | 1.6 71% |
| Gamma | 2.15 102% | 2.36 93% | 2.35 94% | 2.106 104% | 2.278 97% |
| CCT | 7414 88% | 6976 93% | 7392 88% | 6201 105% | 6430 101% |
| Color Space (Percent of AdobeRGB 1998) (%) | 76 | 71 | |||
| Color Space (Percent of sRGB) (%) | 99 | 94 | |||
| Total Average (Program / Settings) | -4% /
-10% | -65% /
-48% | 27% /
18% | 6% /
15% |
* ... smaller is better
我们的分析(CalMAN和X-Rite i1 Pro 2)显示,结合冷色温,对绿色/蓝色有轻微偏色。这改善了最大亮度,在我们自己的校准后,最大亮度降至约300尼特。
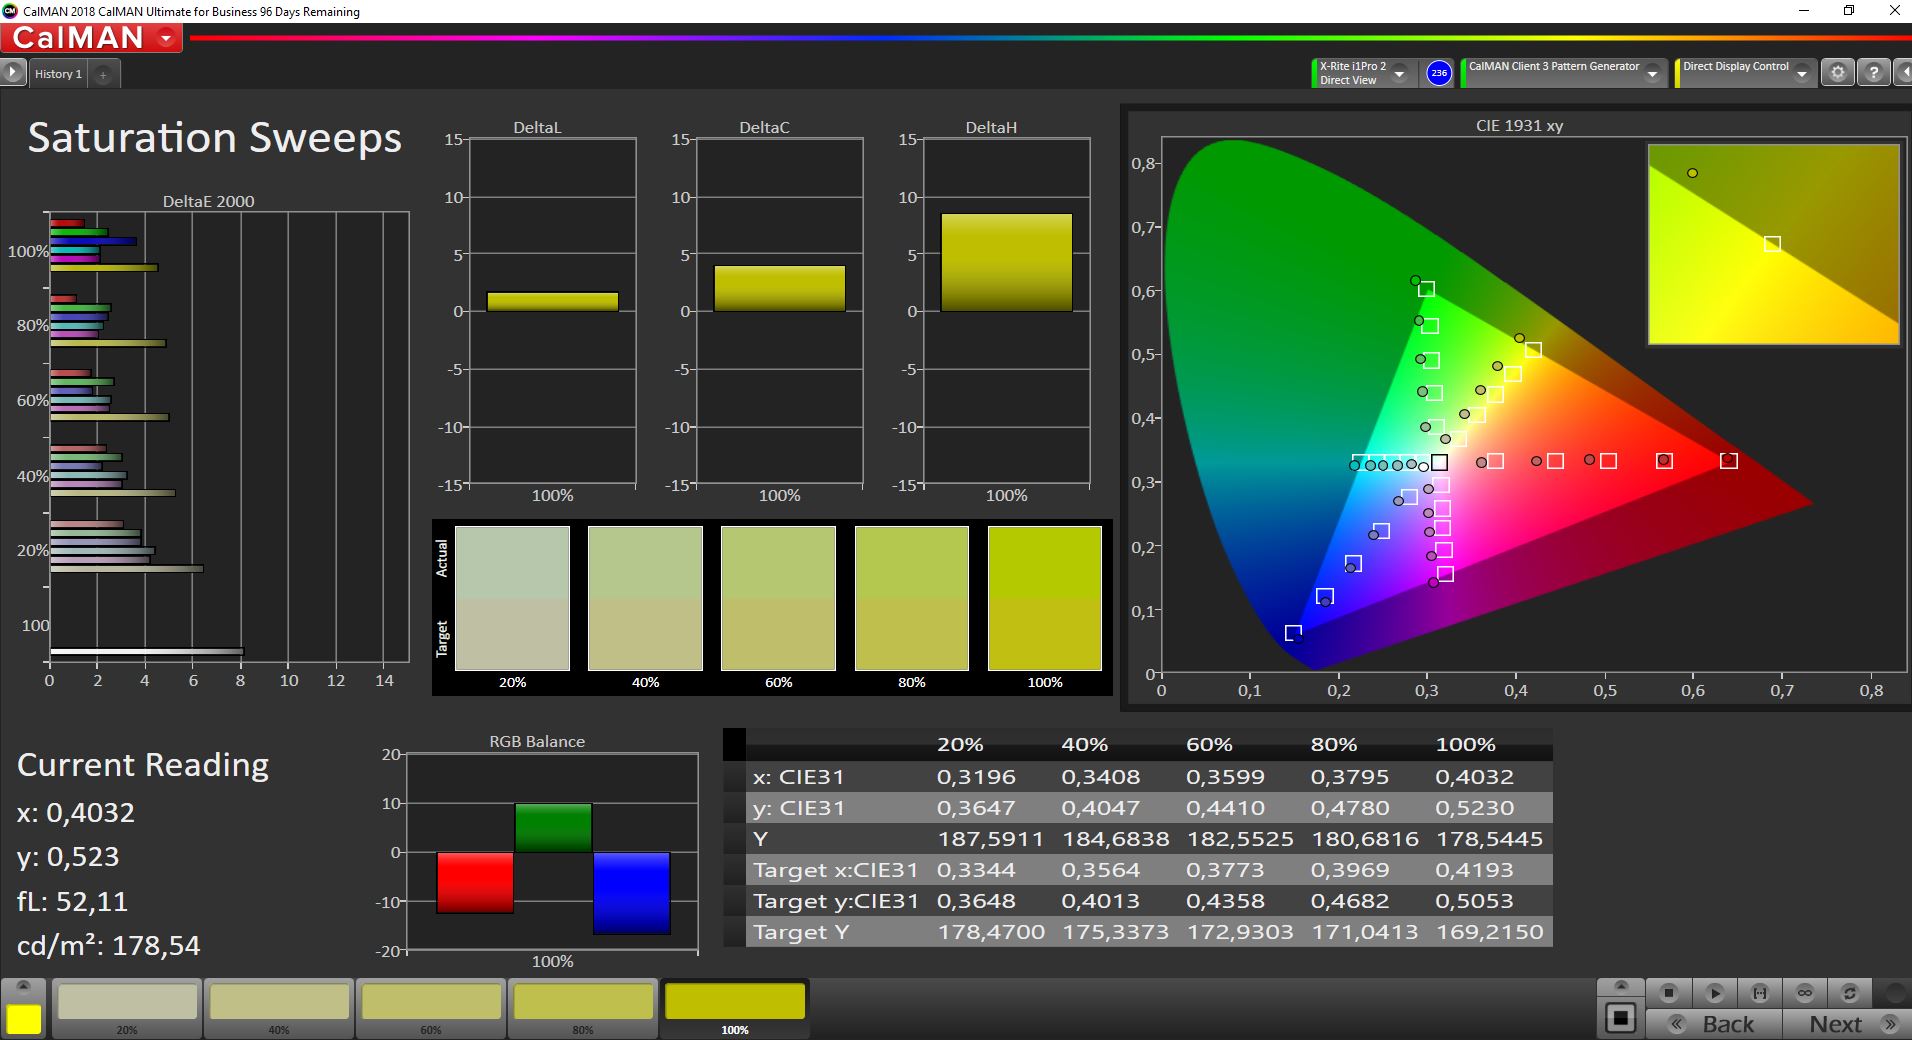
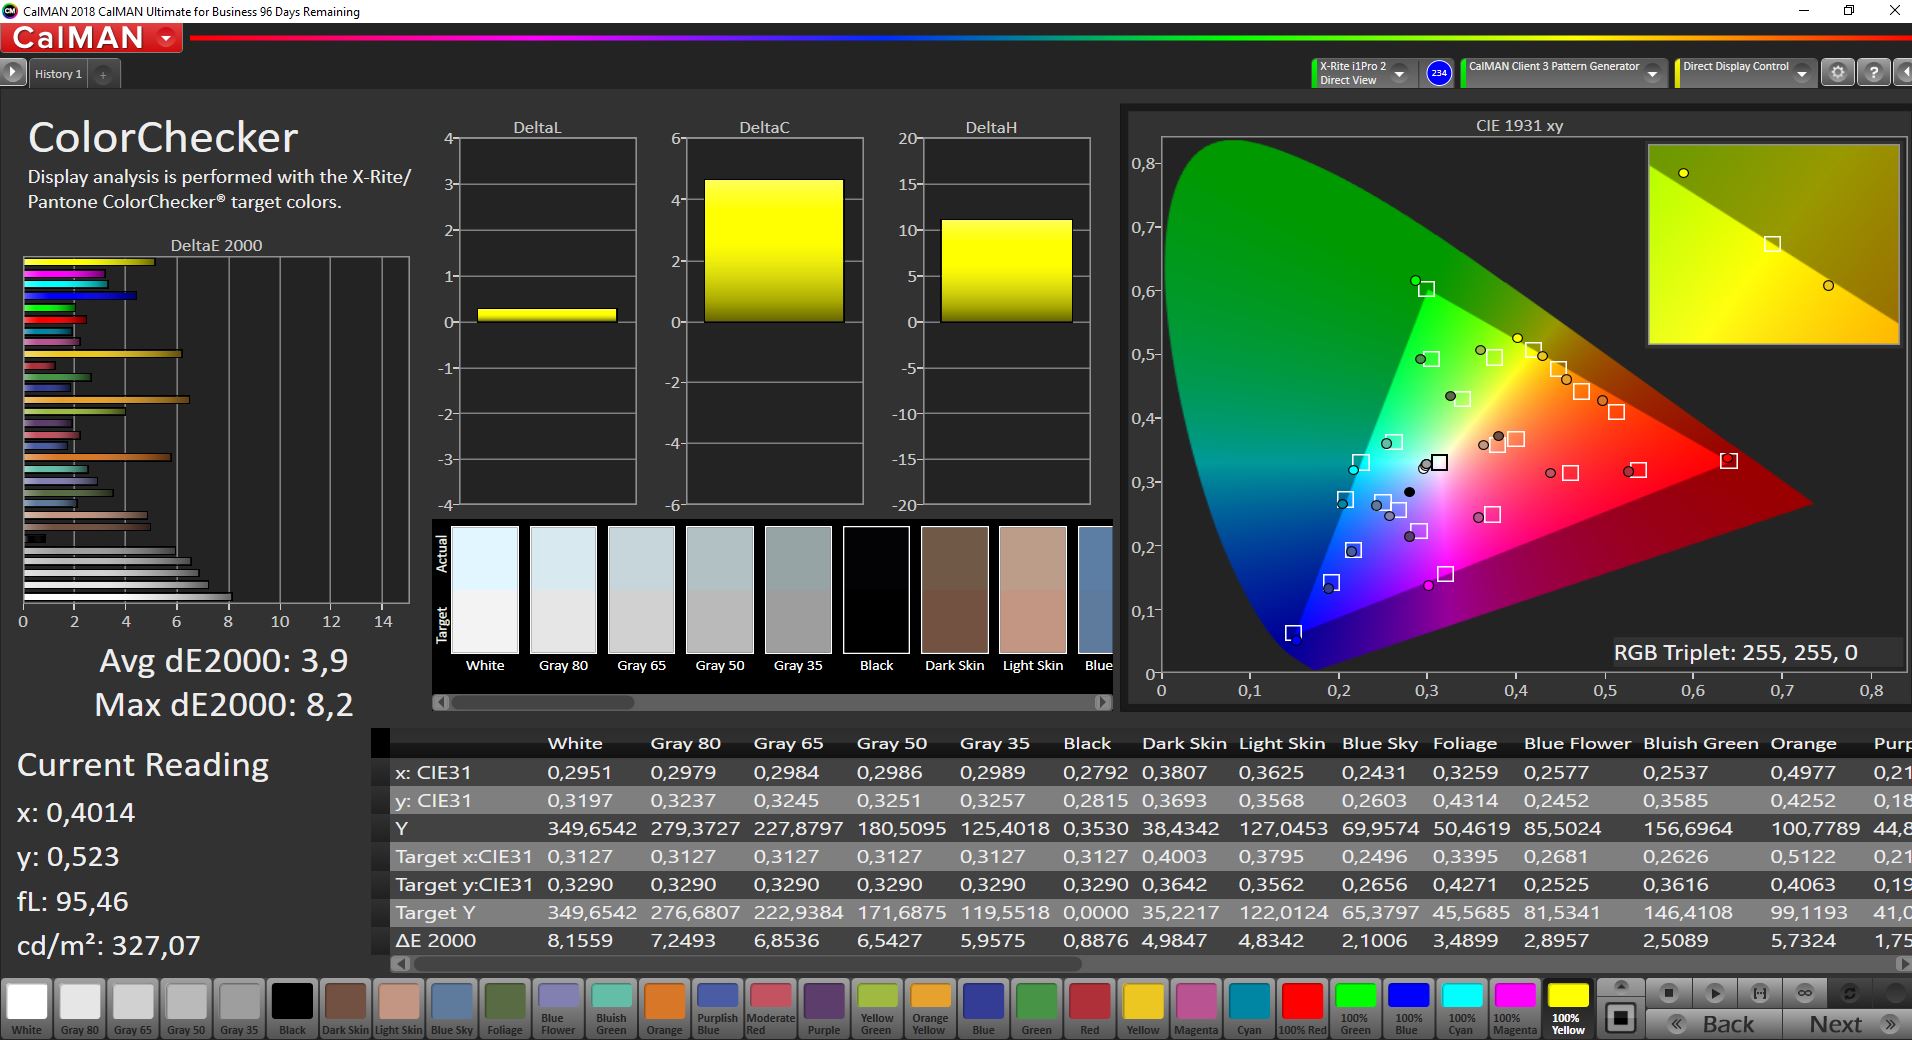
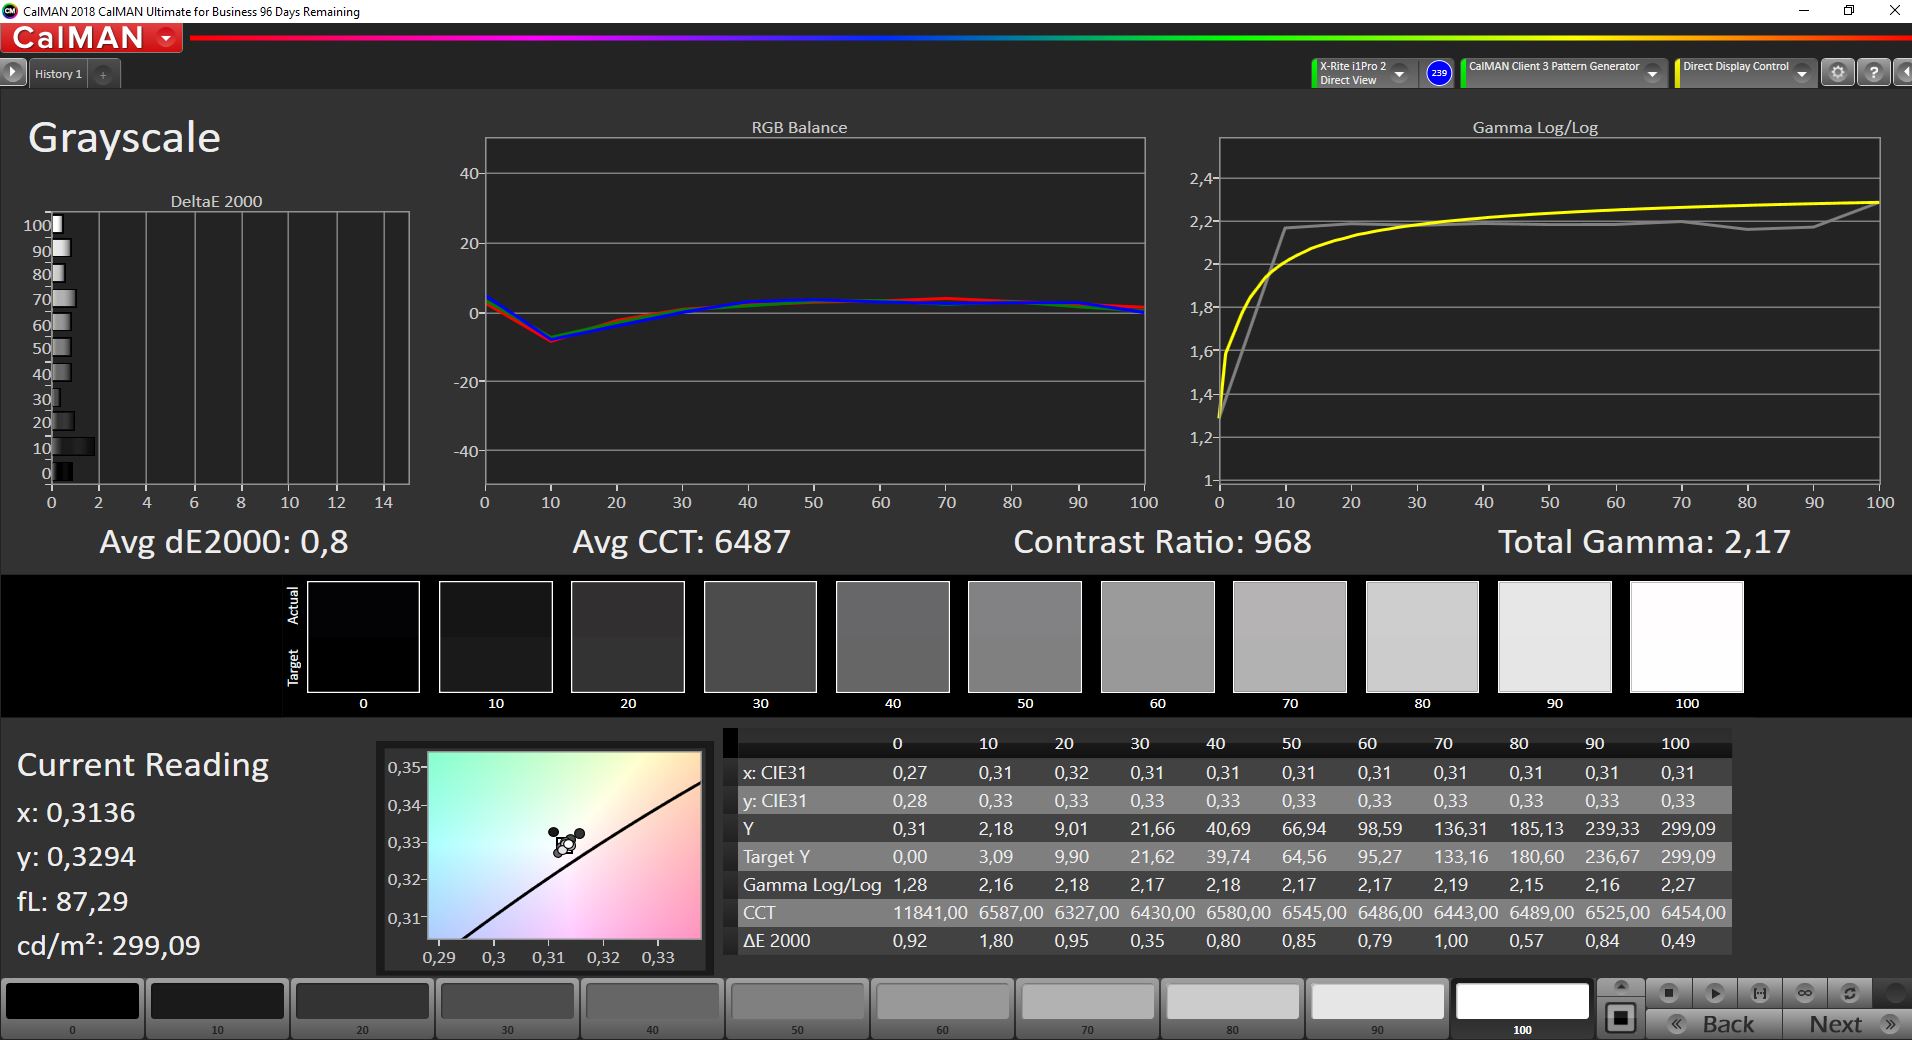
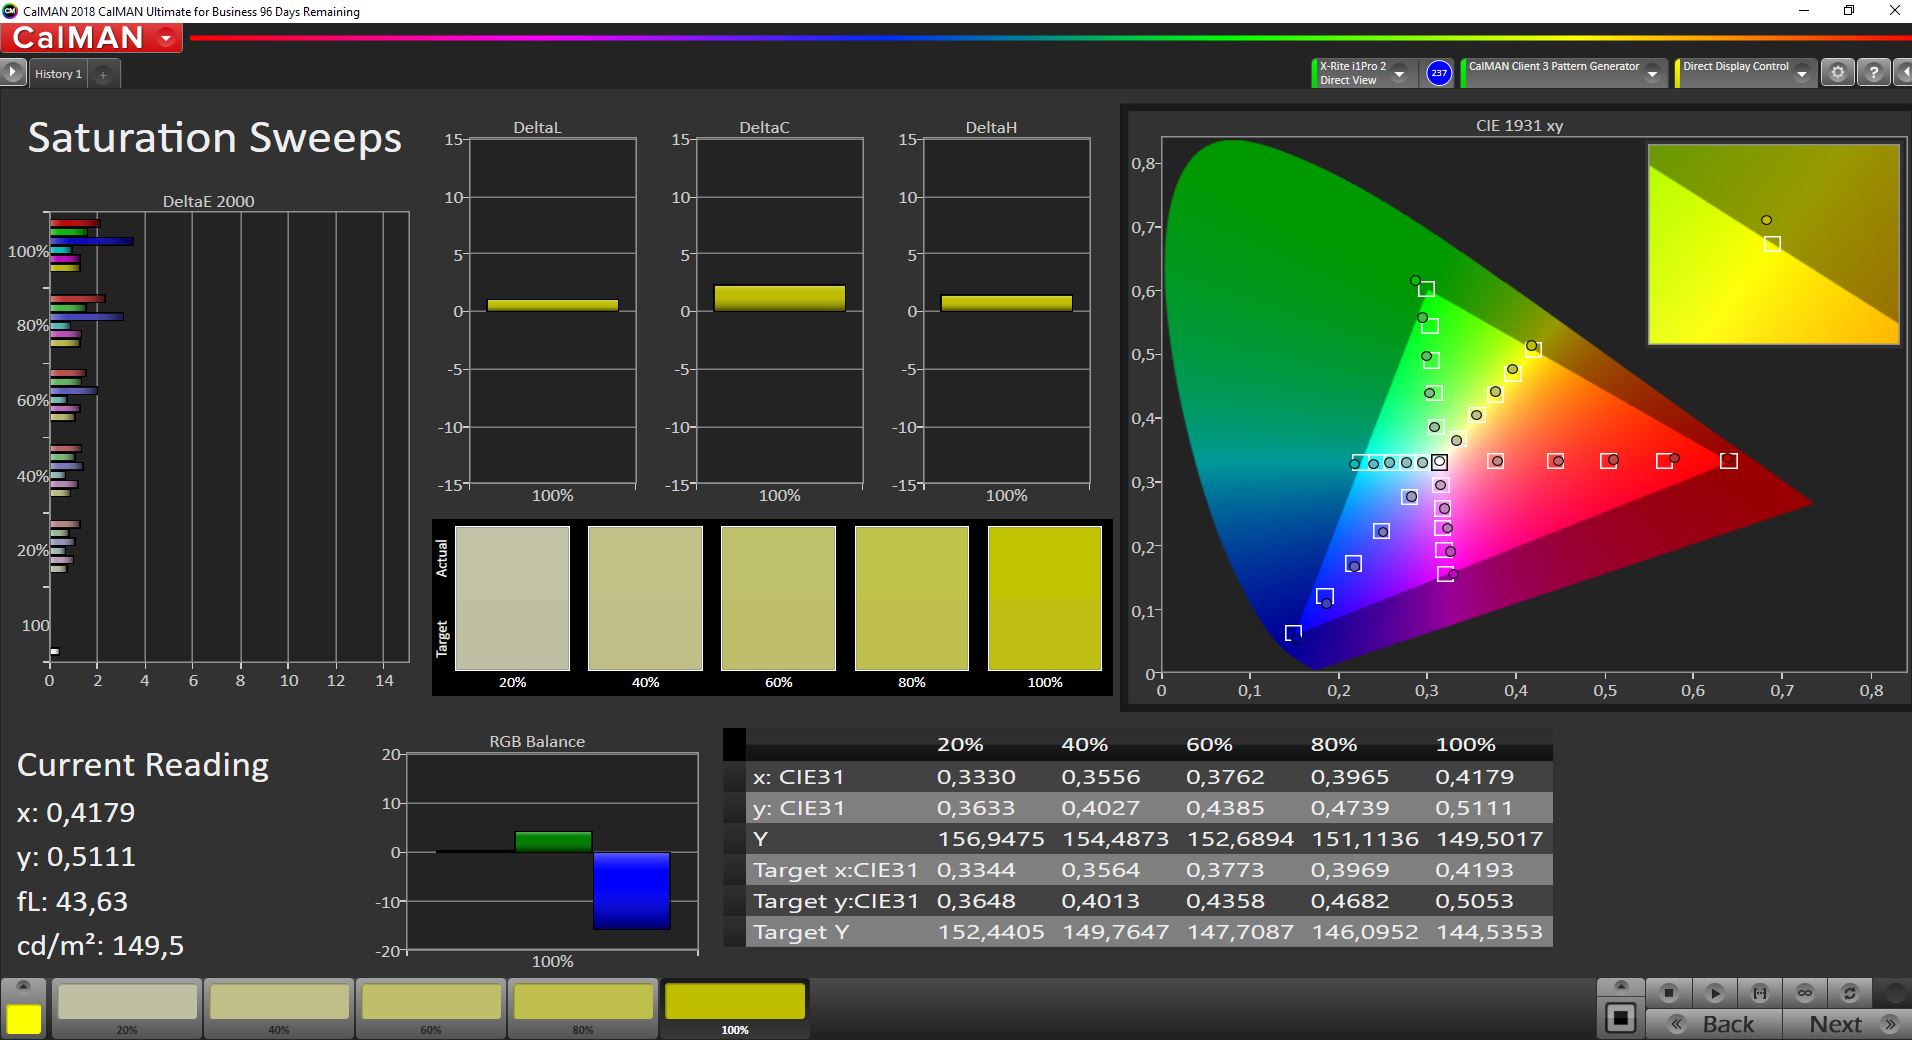
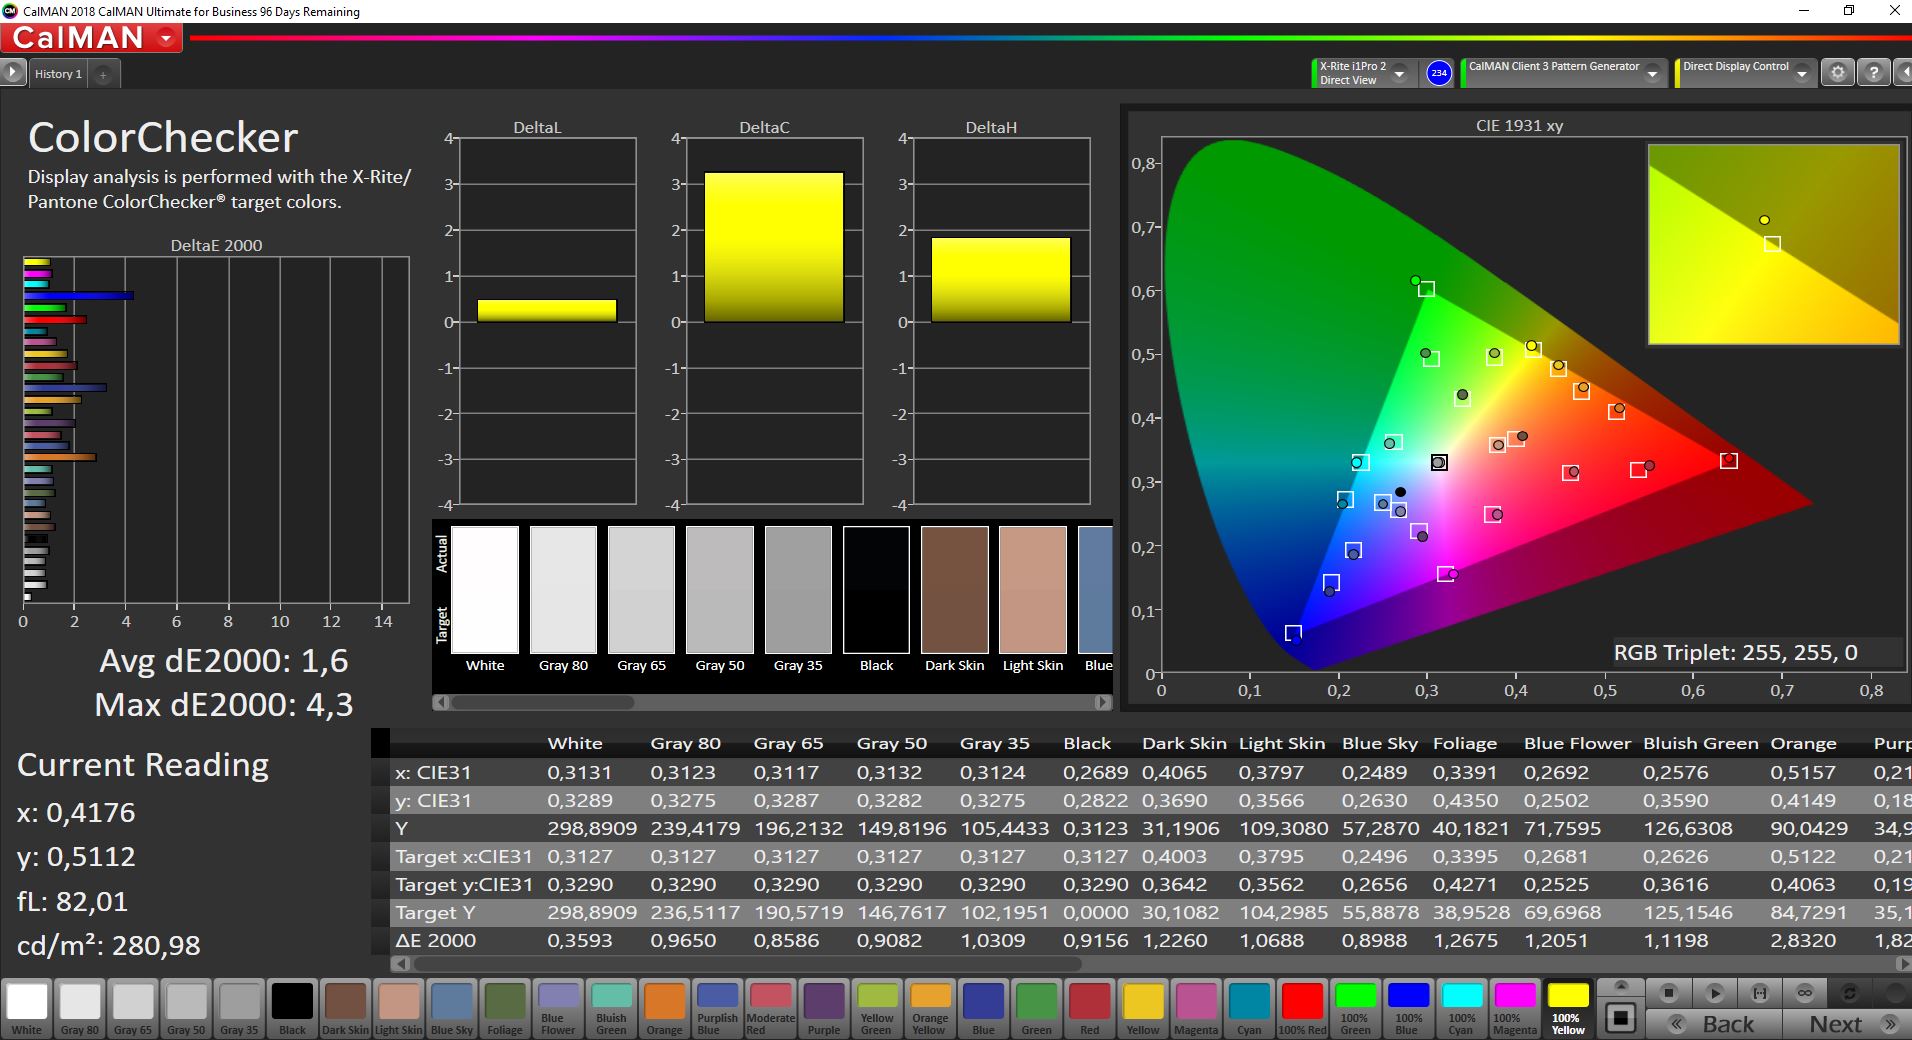
校准的优势在于,与sRGB参考色彩空间相比,灰度和色彩的偏差明显降低。由于几乎完全覆盖sRGB,该面板也适用于图片/视频编辑。
Display Response Times
| ↔ Response Time Black to White | ||
|---|---|---|
| 9.2 ms ... rise ↗ and fall ↘ combined | ↗ 4.4 ms rise | 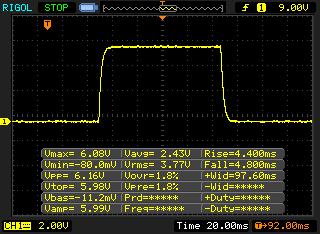 |
| ↘ 4.8 ms fall | ||
| The screen shows fast response rates in our tests and should be suited for gaming. In comparison, all tested devices range from 0.1 (minimum) to 240 (maximum) ms. » 26 % of all devices are better. This means that the measured response time is better than the average of all tested devices (19.8 ms). | ||
| ↔ Response Time 50% Grey to 80% Grey | ||
| 13.6 ms ... rise ↗ and fall ↘ combined | ↗ 6.8 ms rise | 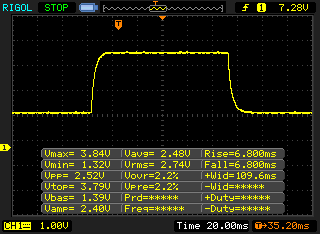 |
| ↘ 6.8 ms fall | ||
| The screen shows good response rates in our tests, but may be too slow for competitive gamers. In comparison, all tested devices range from 0.165 (minimum) to 636 (maximum) ms. » 27 % of all devices are better. This means that the measured response time is better than the average of all tested devices (30.9 ms). | ||
Screen Flickering / PWM (Pulse-Width Modulation)
| Screen flickering / PWM not detected | 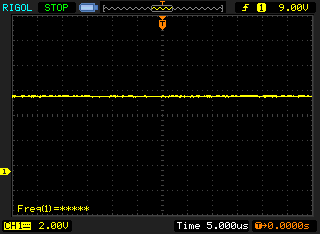 | ||
In comparison: 52 % of all tested devices do not use PWM to dim the display. If PWM was detected, an average of 7741 (minimum: 5 - maximum: 343500) Hz was measured. | |||
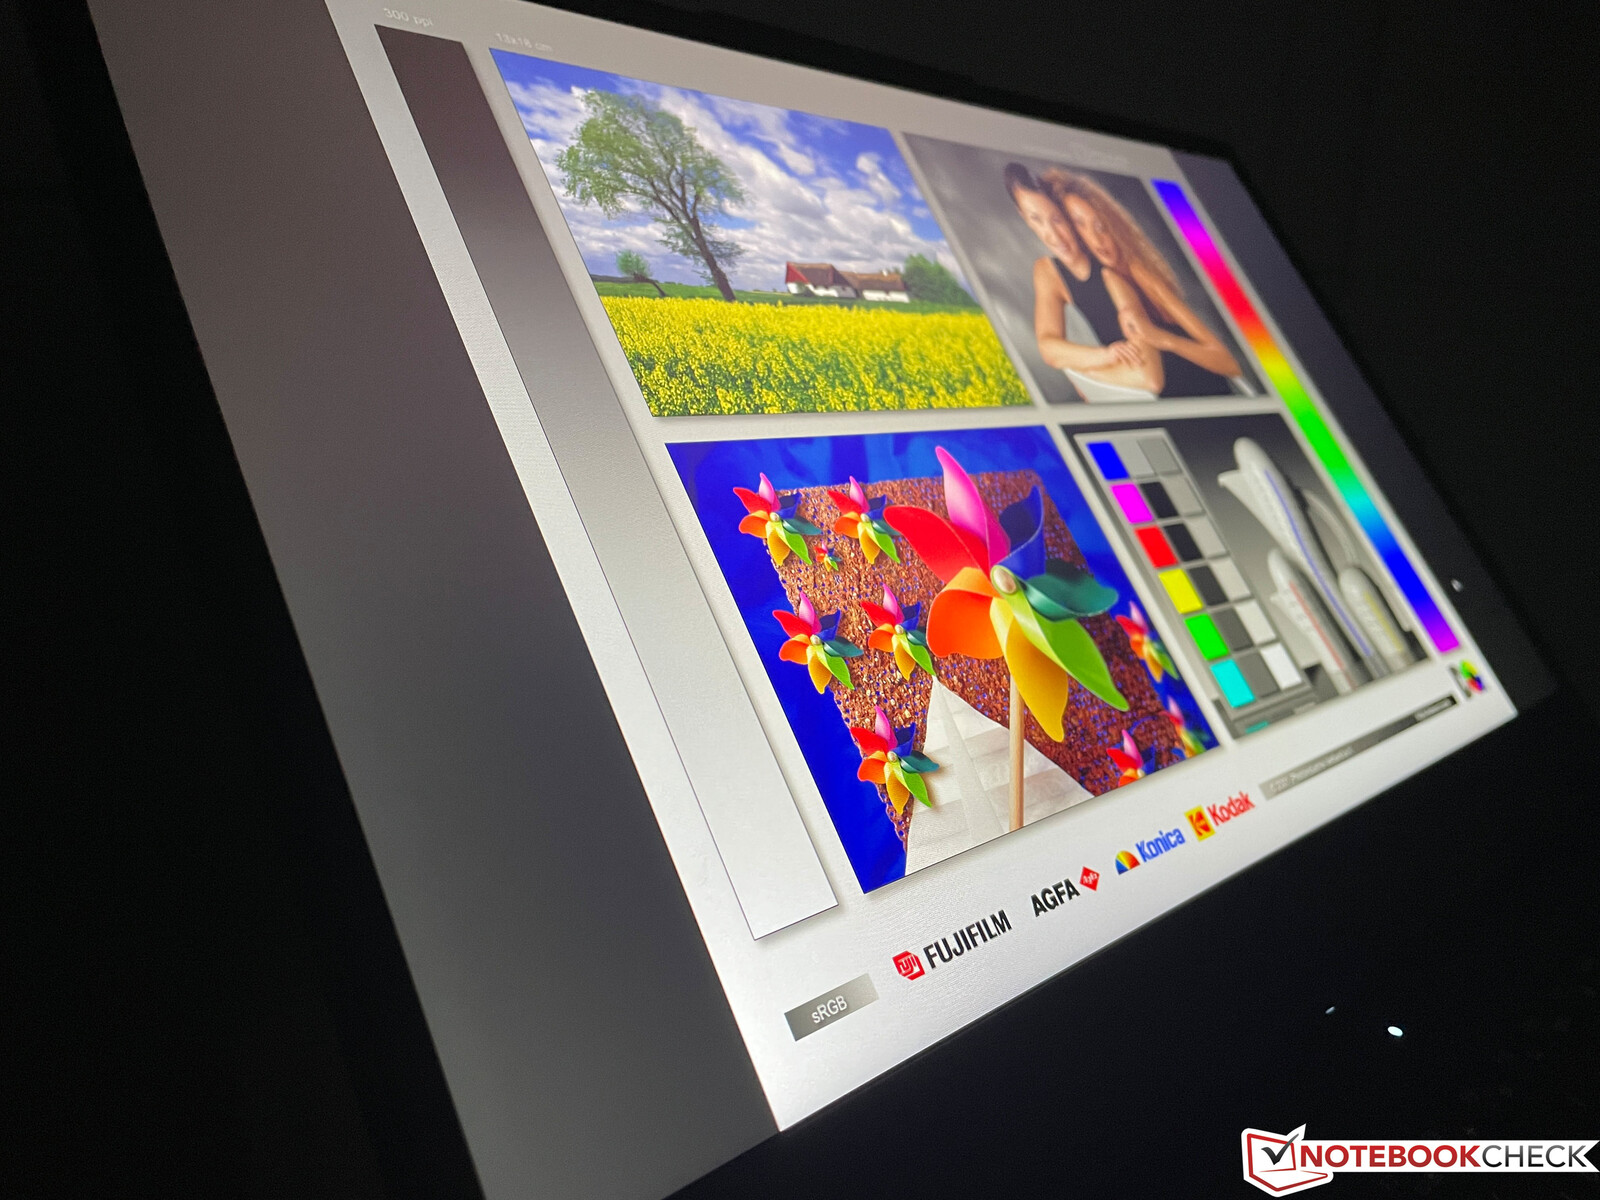
由于采用了哑光显示屏,你也可以在户外使用Legion 5 15。非常明亮的环境可能太有挑战性,但当你避免阳光直射时,你至少还能看到内容。不过我们建议在阴凉处,以获得舒适的工作/游戏体验。IPS屏幕的可视角度稳定性非常好。
性能 - 联想使用快速的AMD Ryzen 7
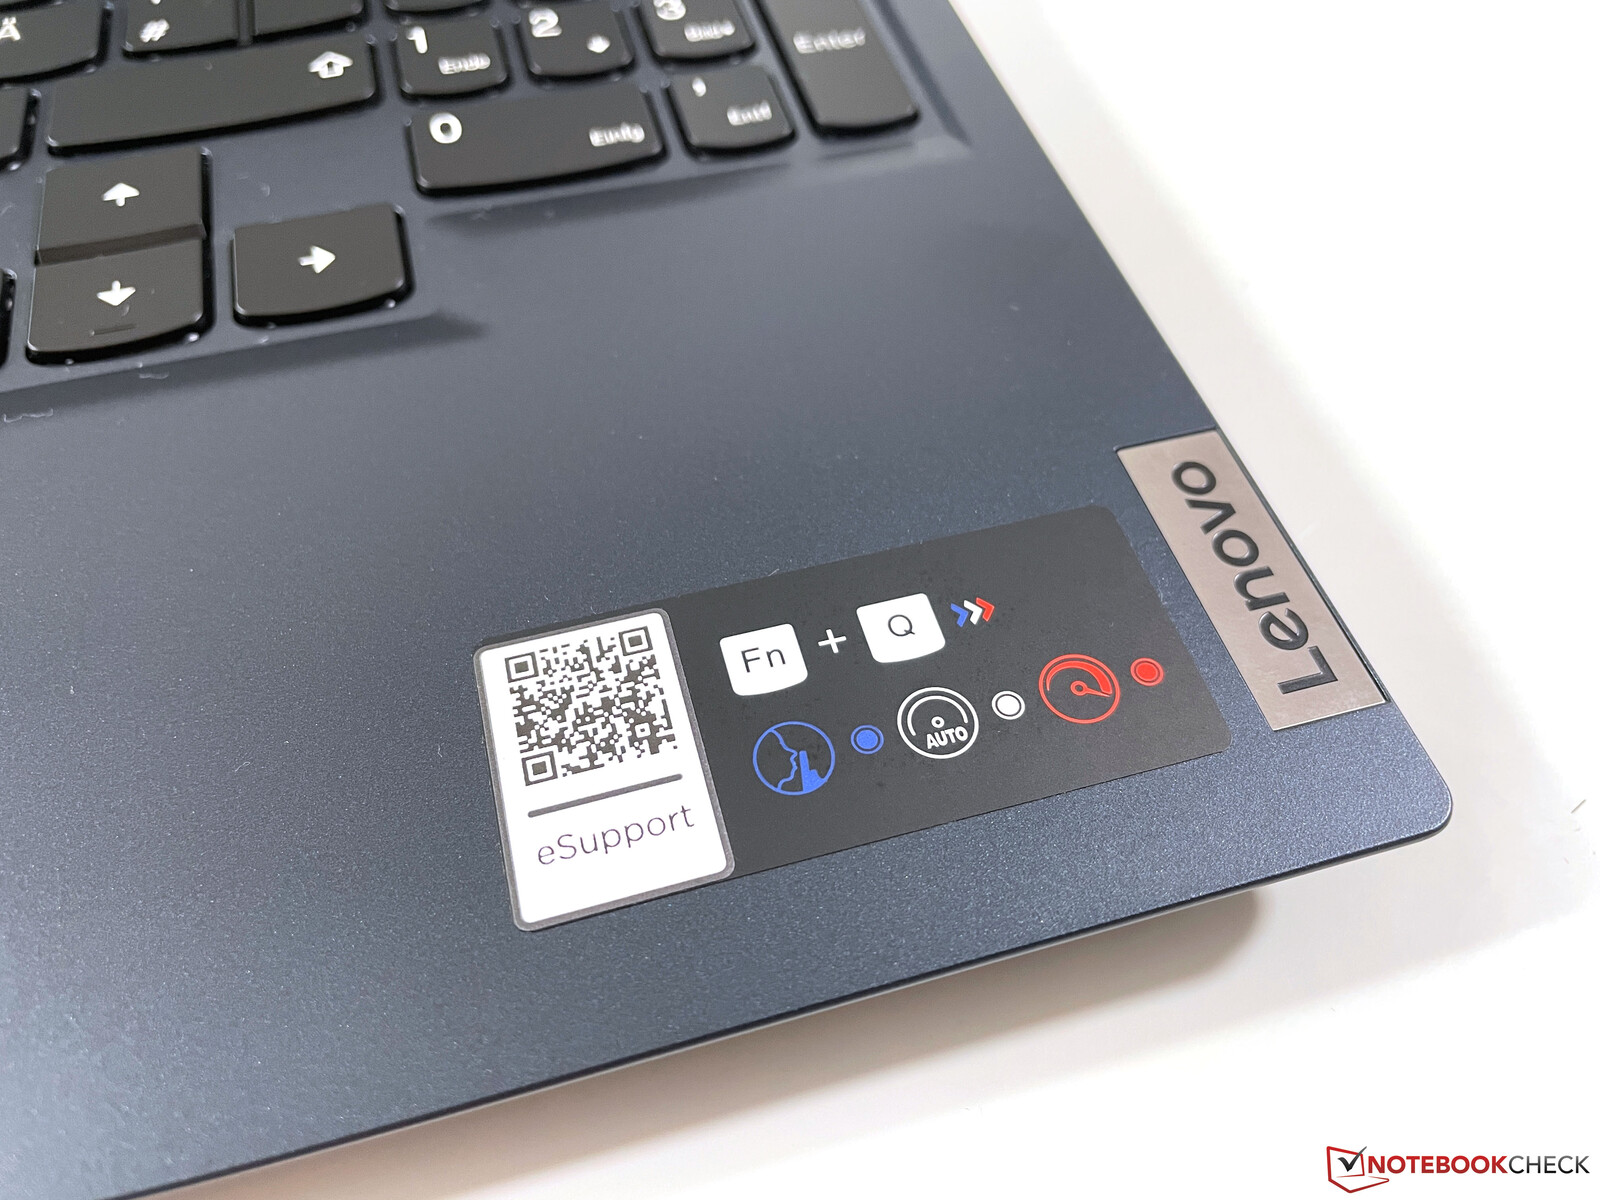
联想实现了三种独立于常规Windows设置的性能模式。它们既可以在制造商自己的Vantage应用程序中切换,也可以通过组合键(Fn+Q)舒适地切换。当前的模式由电源按钮内的状态LED的颜色显示(蓝色:生态,白色:自动,红色:超)。我们在下面的表格中列出了每种模式的TDP配置。我们在所有的基准测试中使用了Ultra性能模式。你只能在使用电池供电时使用自动和生态模式。
| 性能模式 | CPU负载 | GPU负载 | CPU/GPU综合负载 |
|---|---|---|---|
| 超级 | 80->75 | 130 | 62->45(CPU)&115(GPU)。 |
| 自动 | 65->54->45 | 95 | 54->45(CPU)和80(GPU) |
| 经济型 | 38->25 | 80 | 36->25(CPU)&80(GPU)。 |
Vantage应用程序还提供了混合模式选项,它可以在iGPU和dGPU之间进行图形切换。然而,这在我们的审查中引起了问题(后面会有更多的介绍),所以我们在基准测试和测量中停用了混合模式。
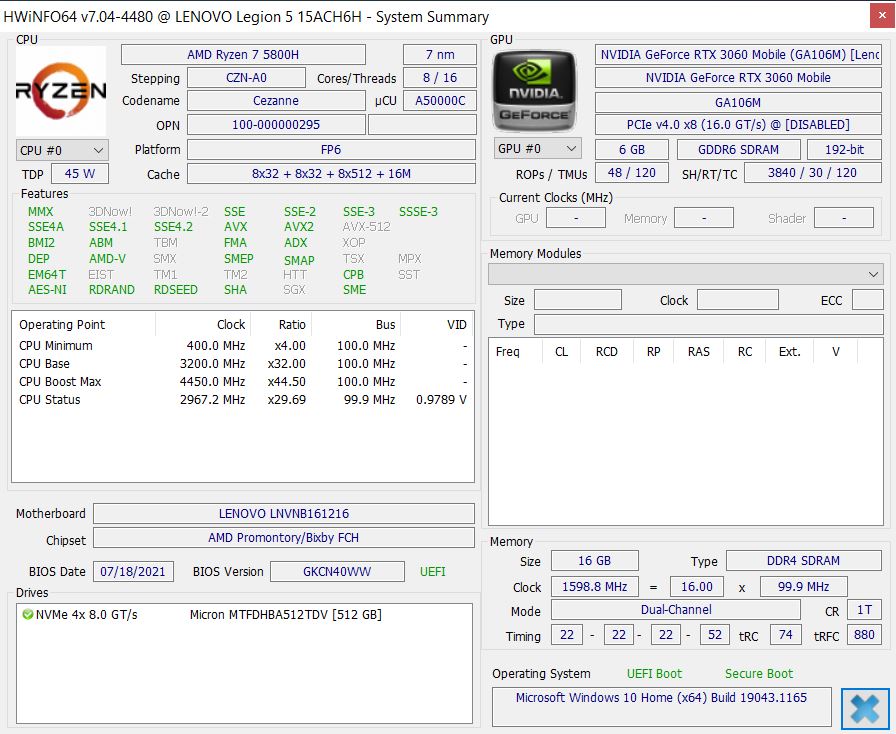
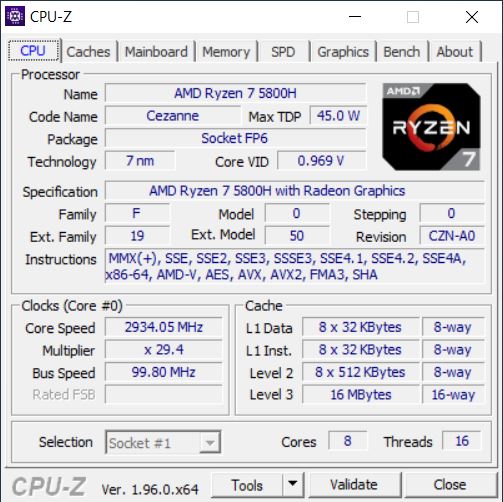
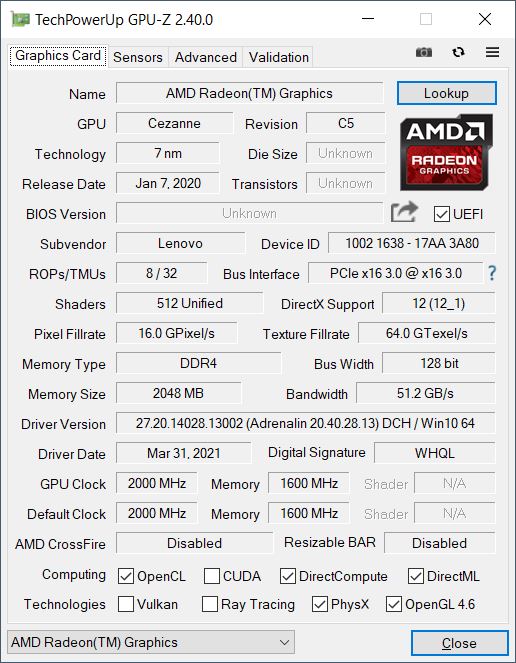
处理器 - Ryzen 7 5800H
我们的测试装置采用的是目前的AMD处理器Ryzen 7 5800H,它的8个核心(16个线程)提供了非常高的性能,它是一个非常好的游戏芯片。即使在持续的工作负荷下,其性能也很稳定,总体而言,它略微领先于竞争对手的酷睿i7-11800H,尽管你在实践中不会注意到任何差异。然而,在相同的性能下,Ryzen芯片的效率更高一些。
在电池供电的情况下,CPU的功耗降低了,你必须期望分别有~19%(自动@35W TDP)或~38%(生态@19W TDP)的赤字。更多的CPU基准测试可在我们的 技术部分.
Cinebench R15 Multi Loop
Cinebench R20: CPU (Single Core) | CPU (Multi Core)
Cinebench R15: CPU Single 64Bit | CPU Multi 64Bit
Blender: v2.79 BMW27 CPU
7-Zip 18.03: 7z b 4 -mmt1 | 7z b 4
Geekbench 5.5: Single-Core | Multi-Core
HWBOT x265 Benchmark v2.2: 4k Preset
LibreOffice : 20 Documents To PDF
R Benchmark 2.5: Overall mean
| Cinebench R23 / Single Core | |
| Average of class Gaming (1601 - 2415, n=104, last 2 years) | |
| Asus TUF Gaming F15 FX506HM | |
| Acer Nitro 5 AN515-45-R1JH | |
| Alienware m15 R5 Ryzen Edition | |
| Lenovo Legion 5 15ACH-82JU00C6GE-FL | |
| Average AMD Ryzen 7 5800H (1294 - 1441, n=29) | |
| Schenker XMG Core 15 Ampere | |
| Cinebench R23 / Multi Core | |
| Average of class Gaming (10488 - 42661, n=104, last 2 years) | |
| Asus TUF Gaming F15 FX506HM | |
| Lenovo Legion 5 15ACH-82JU00C6GE-FL | |
| Alienware m15 R5 Ryzen Edition | |
| Acer Nitro 5 AN515-45-R1JH | |
| Average AMD Ryzen 7 5800H (8812 - 13214, n=29) | |
| Schenker XMG Core 15 Ampere | |
| Cinebench R20 / CPU (Single Core) | |
| Average of class Gaming (622 - 913, n=103, last 2 years) | |
| Asus TUF Gaming F15 FX506HM | |
| Alienware m15 R5 Ryzen Edition | |
| Acer Nitro 5 AN515-45-R1JH | |
| Lenovo Legion 5 15ACH-82JU00C6GE-FL | |
| Average AMD Ryzen 7 5800H (502 - 560, n=30) | |
| Schenker XMG Core 15 Ampere | |
| Cinebench R20 / CPU (Multi Core) | |
| Average of class Gaming (4029 - 16433, n=103, last 2 years) | |
| Asus TUF Gaming F15 FX506HM | |
| Lenovo Legion 5 15ACH-82JU00C6GE-FL | |
| Alienware m15 R5 Ryzen Edition | |
| Acer Nitro 5 AN515-45-R1JH | |
| Average AMD Ryzen 7 5800H (3430 - 5020, n=31) | |
| Schenker XMG Core 15 Ampere | |
| Cinebench R15 / CPU Single 64Bit | |
| Average of class Gaming (188.8 - 350, n=103, last 2 years) | |
| Alienware m15 R5 Ryzen Edition | |
| Acer Nitro 5 AN515-45-R1JH | |
| Asus TUF Gaming F15 FX506HM | |
| Average AMD Ryzen 7 5800H (209 - 234, n=29) | |
| Lenovo Legion 5 15ACH-82JU00C6GE-FL | |
| Schenker XMG Core 15 Ampere | |
| Cinebench R15 / CPU Multi 64Bit | |
| Average of class Gaming (1578 - 6330, n=102, last 2 years) | |
| Lenovo Legion 5 15ACH-82JU00C6GE-FL | |
| Asus TUF Gaming F15 FX506HM | |
| Alienware m15 R5 Ryzen Edition | |
| Acer Nitro 5 AN515-45-R1JH | |
| Average AMD Ryzen 7 5800H (1487 - 2119, n=28) | |
| Schenker XMG Core 15 Ampere | |
| Blender / v2.79 BMW27 CPU | |
| Average AMD Ryzen 7 5800H (237 - 340, n=29) | |
| Acer Nitro 5 AN515-45-R1JH | |
| Alienware m15 R5 Ryzen Edition | |
| Schenker XMG Core 15 Ampere | |
| Lenovo Legion 5 15ACH-82JU00C6GE-FL | |
| Asus TUF Gaming F15 FX506HM | |
| Average of class Gaming (79 - 330, n=101, last 2 years) | |
| 7-Zip 18.03 / 7z b 4 -mmt1 | |
| Average of class Gaming (4824 - 7436, n=102, last 2 years) | |
| Asus TUF Gaming F15 FX506HM | |
| Alienware m15 R5 Ryzen Edition | |
| Acer Nitro 5 AN515-45-R1JH | |
| Average AMD Ryzen 7 5800H (5038 - 5632, n=29) | |
| Lenovo Legion 5 15ACH-82JU00C6GE-FL | |
| Schenker XMG Core 15 Ampere | |
| 7-Zip 18.03 / 7z b 4 | |
| Average of class Gaming (33491 - 148086, n=102, last 2 years) | |
| Average AMD Ryzen 7 5800H (45773 - 59986, n=28) | |
| Acer Nitro 5 AN515-45-R1JH | |
| Alienware m15 R5 Ryzen Edition | |
| Lenovo Legion 5 15ACH-82JU00C6GE-FL | |
| Schenker XMG Core 15 Ampere | |
| Asus TUF Gaming F15 FX506HM | |
| Geekbench 5.5 / Single-Core | |
| Average of class Gaming (1403 - 2474, n=102, last 2 years) | |
| Alienware m15 R5 Ryzen Edition | |
| Lenovo Legion 5 15ACH-82JU00C6GE-FL | |
| Acer Nitro 5 AN515-45-R1JH | |
| Average AMD Ryzen 7 5800H (1336 - 1505, n=28) | |
| Schenker XMG Core 15 Ampere | |
| Geekbench 5.5 / Multi-Core | |
| Average of class Gaming (6460 - 28263, n=102, last 2 years) | |
| Schenker XMG Core 15 Ampere | |
| Average AMD Ryzen 7 5800H (6551 - 9062, n=28) | |
| Alienware m15 R5 Ryzen Edition | |
| Lenovo Legion 5 15ACH-82JU00C6GE-FL | |
| Acer Nitro 5 AN515-45-R1JH | |
| HWBOT x265 Benchmark v2.2 / 4k Preset | |
| Average of class Gaming (11.5 - 44.4, n=102, last 2 years) | |
| Asus TUF Gaming F15 FX506HM | |
| Lenovo Legion 5 15ACH-82JU00C6GE-FL | |
| Alienware m15 R5 Ryzen Edition | |
| Acer Nitro 5 AN515-45-R1JH | |
| Average AMD Ryzen 7 5800H (11.6 - 16.1, n=29) | |
| Schenker XMG Core 15 Ampere | |
| LibreOffice / 20 Documents To PDF | |
| Lenovo Legion 5 15ACH-82JU00C6GE-FL | |
| Acer Nitro 5 AN515-45-R1JH | |
| Average AMD Ryzen 7 5800H (47.4 - 113, n=29) | |
| Schenker XMG Core 15 Ampere | |
| Alienware m15 R5 Ryzen Edition | |
| Average of class Gaming (33.2 - 88.8, n=102, last 2 years) | |
| Asus TUF Gaming F15 FX506HM | |
| R Benchmark 2.5 / Overall mean | |
| Schenker XMG Core 15 Ampere | |
| Asus TUF Gaming F15 FX506HM | |
| Lenovo Legion 5 15ACH-82JU00C6GE-FL | |
| Average AMD Ryzen 7 5800H (0.511 - 0.559, n=28) | |
| Alienware m15 R5 Ryzen Edition | |
| Acer Nitro 5 AN515-45-R1JH | |
| Average of class Gaming (0.3439 - 0.59, n=102, last 2 years) | |
* ... smaller is better
系统性能
我们在评测过程中注意到,当系统在集成显卡和专用显卡之间切换时出现了停顿。大约需要一秒钟,系统才会做出反应,而且你还可以听到切换图形适配器的Windows通知声。这种行为非常恼人,只能通过停用联想Vantage应用程序中的混合模式来防止,从而避免使用AMD的集成iGPU。你会失去效率,但现在系统运行非常顺畅,没有卡顿现象。联想希望能提供一个更新来解决这个问题。
| PCMark 10 / Score | |
| Average of class Gaming (5828 - 12414, n=93, last 2 years) | |
| Asus TUF Gaming F15 FX506HM | |
| Acer Nitro 5 AN515-45-R1JH | |
| Average AMD Ryzen 7 5800H, NVIDIA GeForce RTX 3060 Laptop GPU (6465 - 6855, n=6) | |
| Lenovo Legion 5 15ACH-82JU00C6GE-FL | |
| Alienware m15 R5 Ryzen Edition | |
| Schenker XMG Core 15 Ampere | |
| PCMark 10 / Essentials | |
| Average of class Gaming (8810 - 11935, n=97, last 2 years) | |
| Asus TUF Gaming F15 FX506HM | |
| Lenovo Legion 5 15ACH-82JU00C6GE-FL | |
| Average AMD Ryzen 7 5800H, NVIDIA GeForce RTX 3060 Laptop GPU (9589 - 10414, n=6) | |
| Acer Nitro 5 AN515-45-R1JH | |
| Alienware m15 R5 Ryzen Edition | |
| Schenker XMG Core 15 Ampere | |
| PCMark 10 / Productivity | |
| Average of class Gaming (6845 - 25323, n=95, last 2 years) | |
| Lenovo Legion 5 15ACH-82JU00C6GE-FL | |
| Acer Nitro 5 AN515-45-R1JH | |
| Average AMD Ryzen 7 5800H, NVIDIA GeForce RTX 3060 Laptop GPU (8798 - 9728, n=6) | |
| Alienware m15 R5 Ryzen Edition | |
| Asus TUF Gaming F15 FX506HM | |
| Schenker XMG Core 15 Ampere | |
| PCMark 10 / Digital Content Creation | |
| Average of class Gaming (7602 - 19954, n=95, last 2 years) | |
| Asus TUF Gaming F15 FX506HM | |
| Acer Nitro 5 AN515-45-R1JH | |
| Average AMD Ryzen 7 5800H, NVIDIA GeForce RTX 3060 Laptop GPU (7884 - 9497, n=6) | |
| Alienware m15 R5 Ryzen Edition | |
| Schenker XMG Core 15 Ampere | |
| Lenovo Legion 5 15ACH-82JU00C6GE-FL | |
| PCMark 10 Score | 6648 points | |
Help | ||
DPC延时
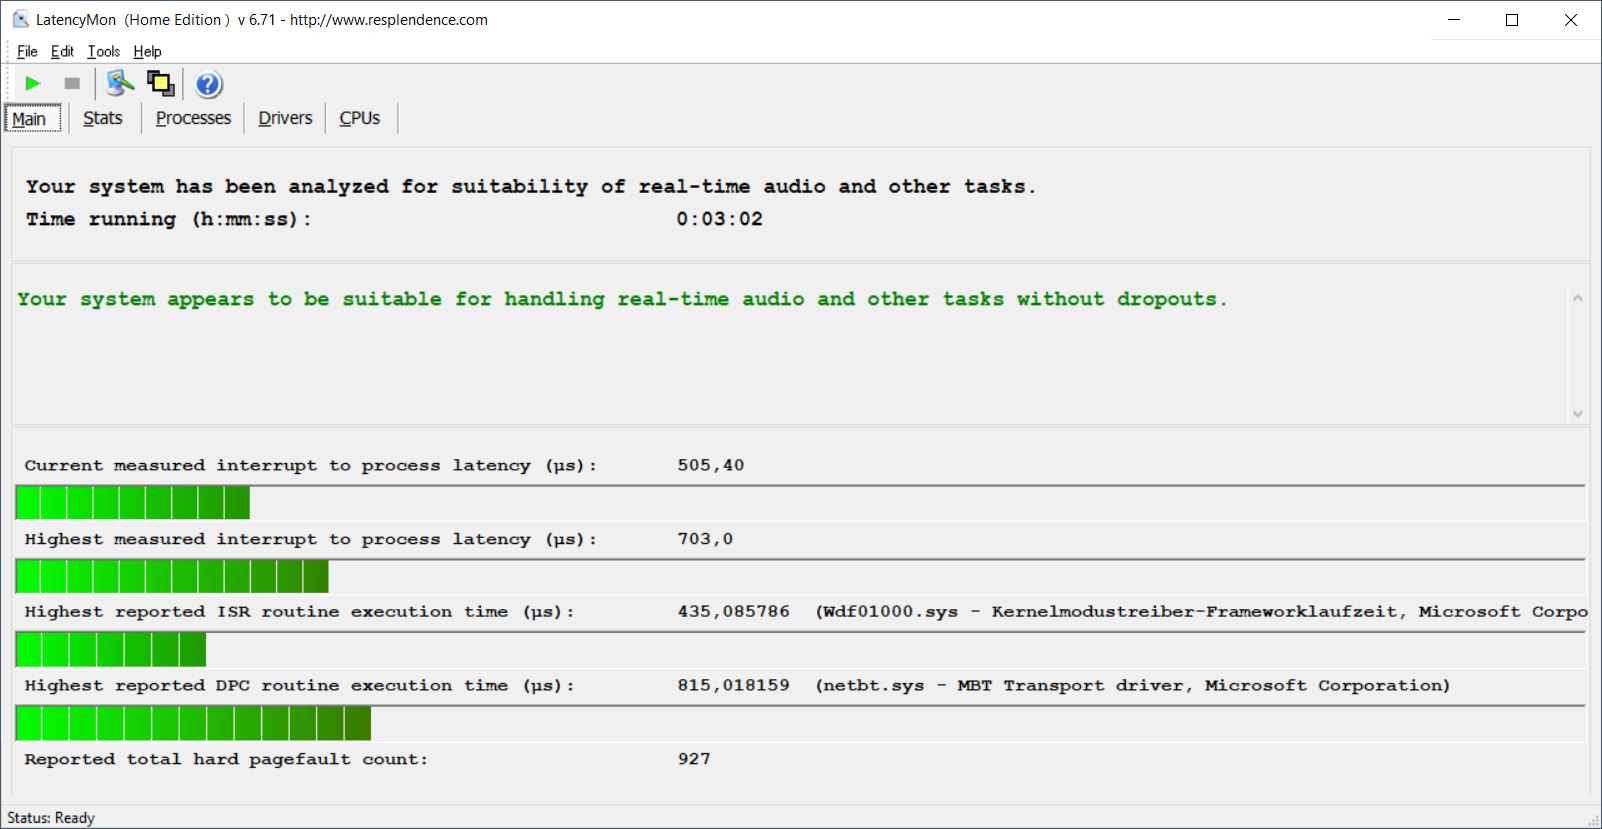
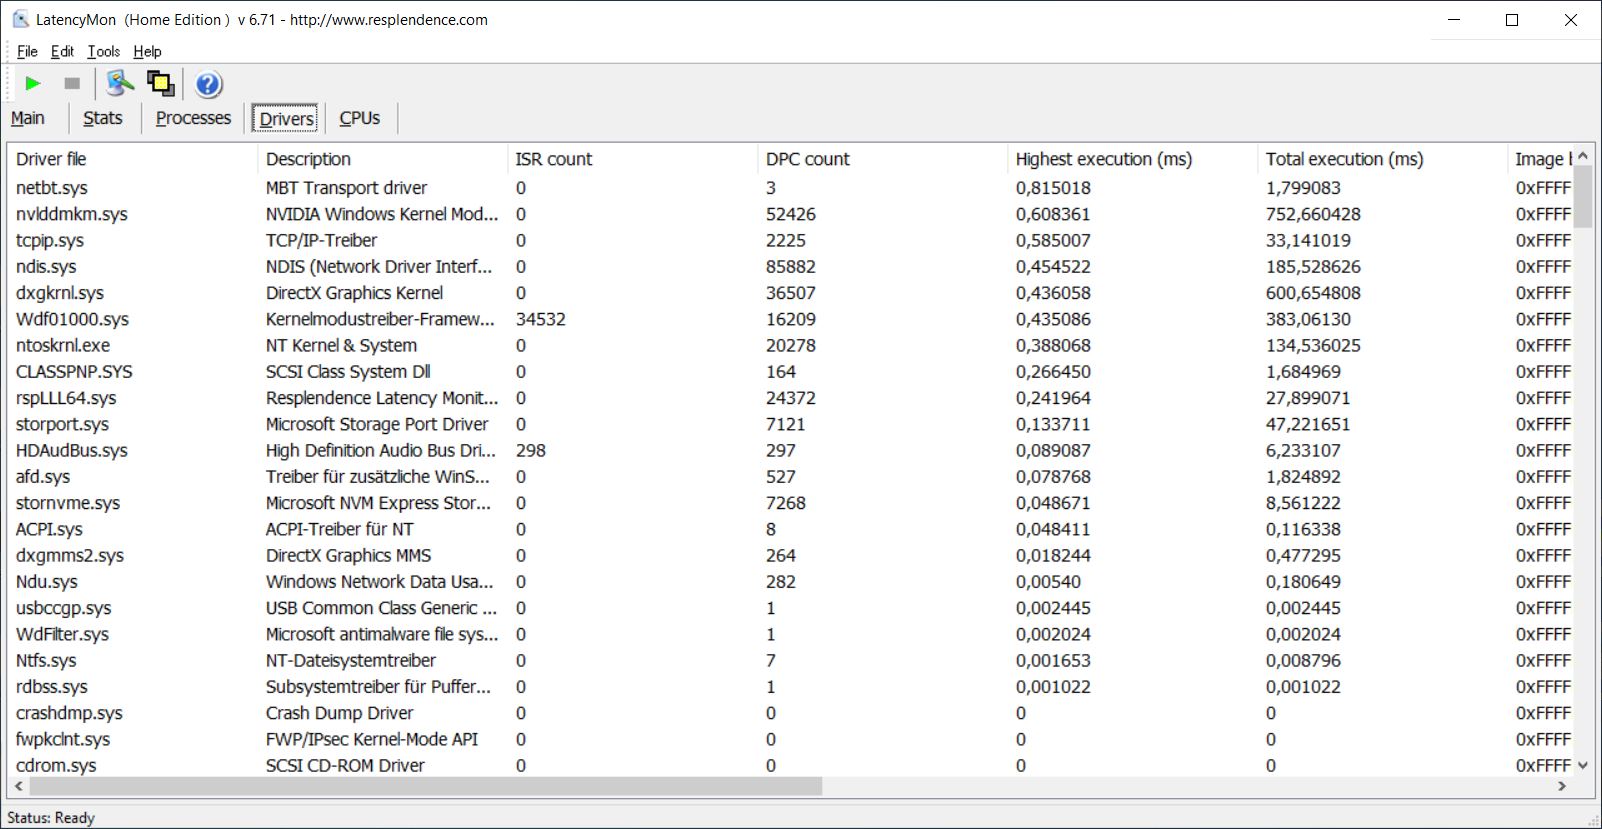
Legion 5在我们的标准化DPC延迟测试中没有显示任何问题(网页浏览、YouTube 4K播放、CPU负载),因此它适合实时音频应用。当我们使用Nvidia GPU时,我们注意到一些丢帧,视频解码器也不是很有效(~60%的GPU负载)。作为比较。Ryzen处理器的iGPU对于同样的任务只显示9%的负载,并且没有掉帧的问题。
| DPC Latencies / LatencyMon - interrupt to process latency (max), Web, Youtube, Prime95 | |
| Asus TUF Gaming F15 FX506HM | |
| Lenovo Legion 5 15ACH-82JU00C6GE-FL | |
| Schenker XMG Core 15 Ampere | |
| Alienware m15 R5 Ryzen Edition | |
| Acer Nitro 5 AN515-45-R1JH | |
* ... smaller is better
存储设备
联想为我们的评测设备配备了美光公司的快速NVM-SSD(PCIe 3.0 x4),存储容量为512GB,在初始设置后,你可以使用约436GB的文件。传输速率非常好,除了容量问题,当你有一个全面的游戏库时,容量很快就会成为一个限制因素,没有理由更换驱动器。更多的SSD基准测试可在我们的 技术部分.
| Lenovo Legion 5 15ACH-82JU00C6GE-FL Micron 2300 512GB MTFDHBA512TDV | Acer Nitro 5 AN515-45-R1JH WDC PC SN530 SDBPNPZ-1T00 | Asus TUF Gaming F15 FX506HM SK Hynix HFM001TD3JX013N | Alienware m15 R5 Ryzen Edition Toshiba KBG40ZNS512G NVMe | Schenker XMG Core 15 Ampere Samsung SSD 970 EVO Plus 1TB | Average Micron 2300 512GB MTFDHBA512TDV | |
|---|---|---|---|---|---|---|
| CrystalDiskMark 5.2 / 6 | -13% | 0% | -25% | 4% | -12% | |
| Write 4K (MB/s) | 124.6 | 161.3 29% | 168.1 35% | 116.9 -6% | 139.1 12% | 105.5 ? -15% |
| Read 4K (MB/s) | 54.2 | 49.49 -9% | 65.1 20% | 44.56 -18% | 47.59 -12% | 51.2 ? -6% |
| Write Seq (MB/s) | 2706 | 1970 -27% | 2124 -22% | 1552 -43% | 2917 8% | 2041 ? -25% |
| Read Seq (MB/s) | 2298 | 2007 -13% | 2204 -4% | 1682 -27% | 2586 13% | 1845 ? -20% |
| Write 4K Q32T1 (MB/s) | 499.7 | 416.8 -17% | 455.3 -9% | 497.8 0% | 511 2% | 494 ? -1% |
| Read 4K Q32T1 (MB/s) | 570 | 554 -3% | 465.6 -18% | 436.8 -23% | 571 0% | 445 ? -22% |
| Write Seq Q32T1 (MB/s) | 2999 | 1965 -34% | 2911 -3% | 1461 -51% | 3263 9% | 2867 ? -4% |
| Read Seq Q32T1 (MB/s) | 3461 | 2369 -32% | 3519 2% | 2364 -32% | 3567 3% | 3272 ? -5% |
| AS SSD | -35% | 9% | -34% | 28% | -21% | |
| Seq Read (MB/s) | 2960 | 2217 -25% | 2873 -3% | 2082 -30% | 2829 -4% | 2300 ? -22% |
| Seq Write (MB/s) | 2586 | 1929 -25% | 1619 -37% | 825 -68% | 2646 2% | 1550 ? -40% |
| 4K Read (MB/s) | 46.84 | 28.71 -39% | 57.5 23% | 42.41 -9% | 54.8 17% | 45 ? -4% |
| 4K Write (MB/s) | 96.1 | 146.3 52% | 149.6 56% | 98.3 2% | 179.1 86% | 106.6 ? 11% |
| 4K-64 Read (MB/s) | 854 | 215.9 -75% | 1252 47% | 1255 47% | 1734 103% | 676 ? -21% |
| 4K-64 Write (MB/s) | 2015 | 1475 -27% | 2196 9% | 738 -63% | 2396 19% | 1616 ? -20% |
| Access Time Read * (ms) | 0.048 | 0.04 17% | 0.109 -127% | 0.033 31% | 0.059 ? -23% | |
| Access Time Write * (ms) | 0.094 | 0.105 -12% | 0.082 13% | 0.17 -81% | 0.021 78% | 0.1807 ? -92% |
| Score Read (Points) | 1197 | 466 -61% | 1597 33% | 1506 26% | 2072 73% | 952 ? -20% |
| Score Write (Points) | 2370 | 814 -66% | 2508 6% | 918 -61% | 2839 20% | 1877 ? -21% |
| Score Total (Points) | 4170 | 2513 -40% | 4869 17% | 3136 -25% | 5965 43% | 3290 ? -21% |
| Copy ISO MB/s (MB/s) | 2064 | 1698 -18% | 1583 -23% | 1391 -33% | 2119 3% | 1603 ? -22% |
| Copy Program MB/s (MB/s) | 873 | 284.7 -67% | 964 10% | 645 -26% | 406.1 -53% | 843 ? -3% |
| Copy Game MB/s (MB/s) | 1503 | 786 -48% | 943 -37% | 1101 -27% | 1086 -28% | 1570 ? 4% |
| Total Average (Program / Settings) | -24% /
-27% | 5% /
6% | -30% /
-31% | 16% /
19% | -17% /
-18% |
* ... smaller is better

Disk Throttling: DiskSpd Read Loop, Queue Depth 8
GPU性能 - RTX 3060,功率130瓦
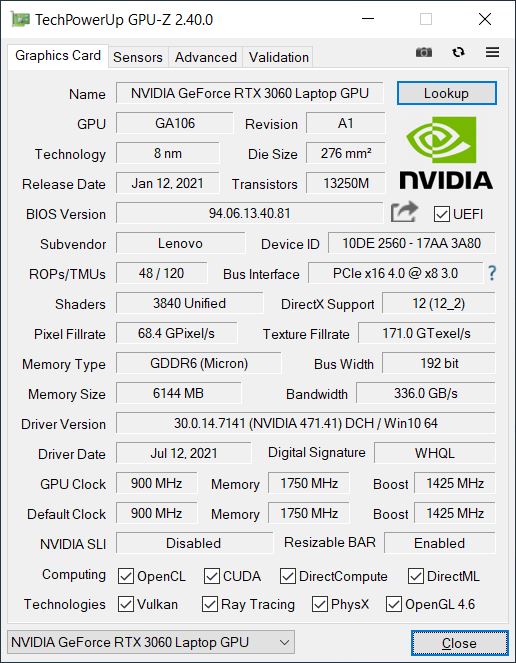
Nvidia的 GeForce RTX 3060是一个强大的显卡,联想使用最快的型号,其TGP高达130瓦,最大核心时钟为1935兆赫。由于高TGP,合成基准测试的结果非常好,有时甚至领先于采用较慢版本的 RTX 3070.与配备RTX 2060移动版的老款Legion 5 15相比,其优势约为30-40%,具体取决于基准测试。
在持续的工作负载下,性能是稳定的(在所有的性能模式下),但GPU在电池电量上有很大的节流(见下表)。更多的GPU基准测试可在 这里.
| 性能模式 | Time Spy 图形 | 差异 |
|---|---|---|
| 超级模式 | 8844点 | // |
| 自动模式 | 7708分 | -13%。 |
| 生态模式 | 7171分 | -19%。 |
| 自动(电池) | 2076分 | -76%。 |
| 生态(电池) | 734点 | -92%。 |
| 3DMark 11 - 1280x720 Performance GPU | |
| Average of class Gaming (21841 - 80022, n=103, last 2 years) | |
| Acer Nitro 5 AN515-45-R1JH | |
| Lenovo Legion 5 15ACH-82JU00C6GE-FL | |
| Asus TUF Gaming F15 FX506HM | |
| Schenker XMG Core 15 Ampere | |
| Alienware m15 R5 Ryzen Edition | |
| Average NVIDIA GeForce RTX 3060 Laptop GPU (13799 - 30772, n=43) | |
| Lenovo Legion 5 15IMH05H | |
| 3DMark | |
| 1280x720 Cloud Gate Standard Graphics | |
| Average of class Gaming (86886 - 223650, n=60, last 2 years) | |
| Schenker XMG Core 15 Ampere | |
| Lenovo Legion 5 15ACH-82JU00C6GE-FL | |
| Asus TUF Gaming F15 FX506HM | |
| Average NVIDIA GeForce RTX 3060 Laptop GPU (33126 - 136826, n=38) | |
| Lenovo Legion 5 15IMH05H | |
| Alienware m15 R5 Ryzen Edition | |
| Acer Nitro 5 AN515-45-R1JH | |
| 1920x1080 Fire Strike Graphics | |
| Average of class Gaming (18629 - 62849, n=112, last 2 years) | |
| Lenovo Legion 5 15ACH-82JU00C6GE-FL | |
| Asus TUF Gaming F15 FX506HM | |
| Acer Nitro 5 AN515-45-R1JH | |
| Average NVIDIA GeForce RTX 3060 Laptop GPU (16354 - 23109, n=49) | |
| Alienware m15 R5 Ryzen Edition | |
| Schenker XMG Core 15 Ampere | |
| Lenovo Legion 5 15IMH05H | |
| 2560x1440 Time Spy Graphics | |
| Average of class Gaming (6387 - 26212, n=112, last 2 years) | |
| Lenovo Legion 5 15ACH-82JU00C6GE-FL | |
| Schenker XMG Core 15 Ampere | |
| Alienware m15 R5 Ryzen Edition | |
| Acer Nitro 5 AN515-45-R1JH | |
| Average NVIDIA GeForce RTX 3060 Laptop GPU (6285 - 9235, n=49) | |
| Asus TUF Gaming F15 FX506HM | |
| Lenovo Legion 5 15IMH05H | |
| 3DMark 11 Performance | 23146 points | |
| 3DMark Cloud Gate Standard Score | 53687 points | |
| 3DMark Fire Strike Score | 19980 points | |
| 3DMark Time Spy Score | 8863 points | |
Help | ||
游戏性能
| F1 2020 | |
| 1920x1080 Ultra High Preset AA:T AF:16x | |
| Lenovo Legion 5 15ACH-82JU00C6GE-FL | |
| Alienware m15 R5 Ryzen Edition | |
| Average NVIDIA GeForce RTX 3060 Laptop GPU (97.6 - 142, n=7) | |
| 1920x1080 High Preset AA:T AF:16x | |
| Lenovo Legion 5 15ACH-82JU00C6GE-FL | |
| Average NVIDIA GeForce RTX 3060 Laptop GPU (138 - 193, n=7) | |
| Alienware m15 R5 Ryzen Edition | |
| 1920x1080 Medium Preset AF:16x | |
| Lenovo Legion 5 15ACH-82JU00C6GE-FL | |
| Average NVIDIA GeForce RTX 3060 Laptop GPU (150 - 204, n=6) | |
| Alienware m15 R5 Ryzen Edition | |
| 1280x720 Ultra Low Preset | |
| Lenovo Legion 5 15ACH-82JU00C6GE-FL | |
| Average NVIDIA GeForce RTX 3060 Laptop GPU (215 - 260, n=6) | |
| Alienware m15 R5 Ryzen Edition | |
Witcher 3 FPS Diagram
| low | med. | high | ultra | |
|---|---|---|---|---|
| GTA V (2015) | 170 | 164 | 142 | 81.3 |
| The Witcher 3 (2015) | 280 | 216 | 146 | 67 |
| Dota 2 Reborn (2015) | 124 | 128 | 106 | 102 |
| Final Fantasy XV Benchmark (2018) | 151 | 106 | 78.9 | |
| X-Plane 11.11 (2018) | 87.1 | 80.7 | 66.2 | |
| Far Cry 5 (2018) | 102 | 88 | 85 | 80 |
| F1 2020 (2020) | 243 | 200 | 183 | 131 |
| Cyberpunk 2077 1.0 (2020) | 101 | 81 | 68 | 58 |
| F1 2021 (2021) | 236 | 210 | 179 | 67 |
排放 - 冷却效果好,但风扇声音大
系统噪音
这两个风扇一直在运行,与电源设置无关(也是在电池供电的情况下),在安静的环境中你可以听到杂音。我们希望看到停用的风扇,特别是在Eco模式下。在Eco模式下,它们至少是相当安静的,即使在负载下也是如此;纯粹的CPU负载不会导致更大声的风扇,在GPU负载两分钟后,我们可以测量到约43 dB(A)。在自动模式下的游戏将导致48-53.5 dB(A),这也是你在超级模式下达到的噪音水平。自动以及超性能模式都会导致非常响亮的风扇,我们绝对建议使用耳机,否则你将听不到游戏的声音。我们没有发现任何电子噪音。
Noise level
| Idle |
| 29 / 29 / 29 dB(A) |
| Load |
| 53.5 / 53.5 dB(A) |
 | ||
30 dB silent 40 dB(A) audible 50 dB(A) loud |
||
min: | ||
| Lenovo Legion 5 15ACH-82JU00C6GE-FL GeForce RTX 3060 Laptop GPU, R7 5800H, Micron 2300 512GB MTFDHBA512TDV | Acer Nitro 5 AN515-45-R1JH GeForce RTX 3070 Laptop GPU, R7 5800H, WDC PC SN530 SDBPNPZ-1T00 | Asus TUF Gaming F15 FX506HM GeForce RTX 3060 Laptop GPU, i7-11800H, SK Hynix HFM001TD3JX013N | Alienware m15 R5 Ryzen Edition GeForce RTX 3060 Laptop GPU, R7 5800H, Toshiba KBG40ZNS512G NVMe | Schenker XMG Core 15 Ampere GeForce RTX 3060 Laptop GPU, R7 4800H, Samsung SSD 970 EVO Plus 1TB | |
|---|---|---|---|---|---|
| Noise | 6% | 16% | 7% | 6% | |
| off / environment * (dB) | 24.2 | 25 -3% | 24.8 -2% | 24 1% | 24 1% |
| Idle Minimum * (dB) | 29 | 25 14% | 24.6 15% | 24 17% | 26 10% |
| Idle Average * (dB) | 29 | 25 14% | 24.9 14% | 25 14% | 28 3% |
| Idle Maximum * (dB) | 29 | 32.2 -11% | 24.9 14% | 35 -21% | 30 -3% |
| Load Average * (dB) | 53.5 | 45.8 14% | 27.1 49% | 44 18% | 42 21% |
| Witcher 3 ultra * (dB) | 53.5 | 46.4 13% | 48 10% | 50 7% | |
| Load Maximum * (dB) | 53.5 | 49.1 8% | 49 8% | 50 7% | 52 3% |
* ... smaller is better
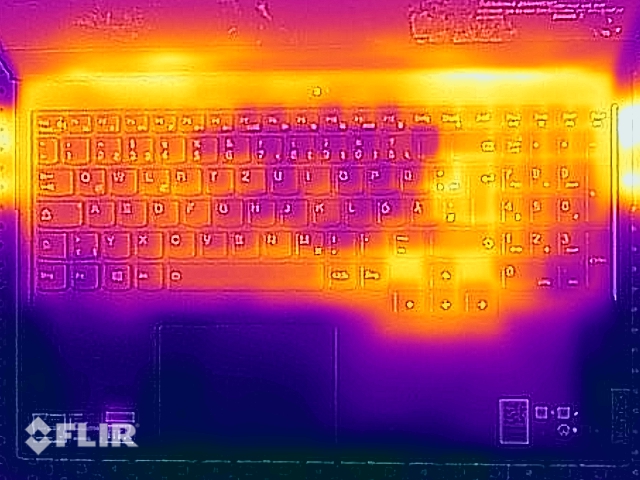
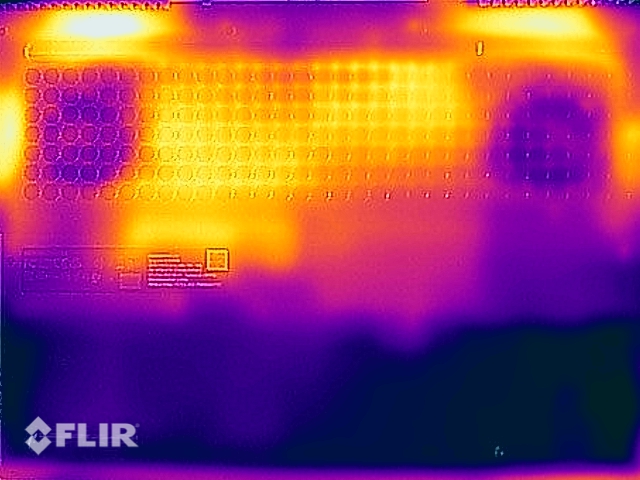
温度
冷却解决方案正在相当努力地工作,但没有温度问题的回报。在游戏过程中,只有一个地方(左下角)我们测量到大约50℃。这意味着你不应该把它放在你的腿上,但无论如何,对于这样一个大的笔记本电脑来说,这是不太可能的。基本单元的顶部是相当酷的,当你使用键盘时没有任何限制。
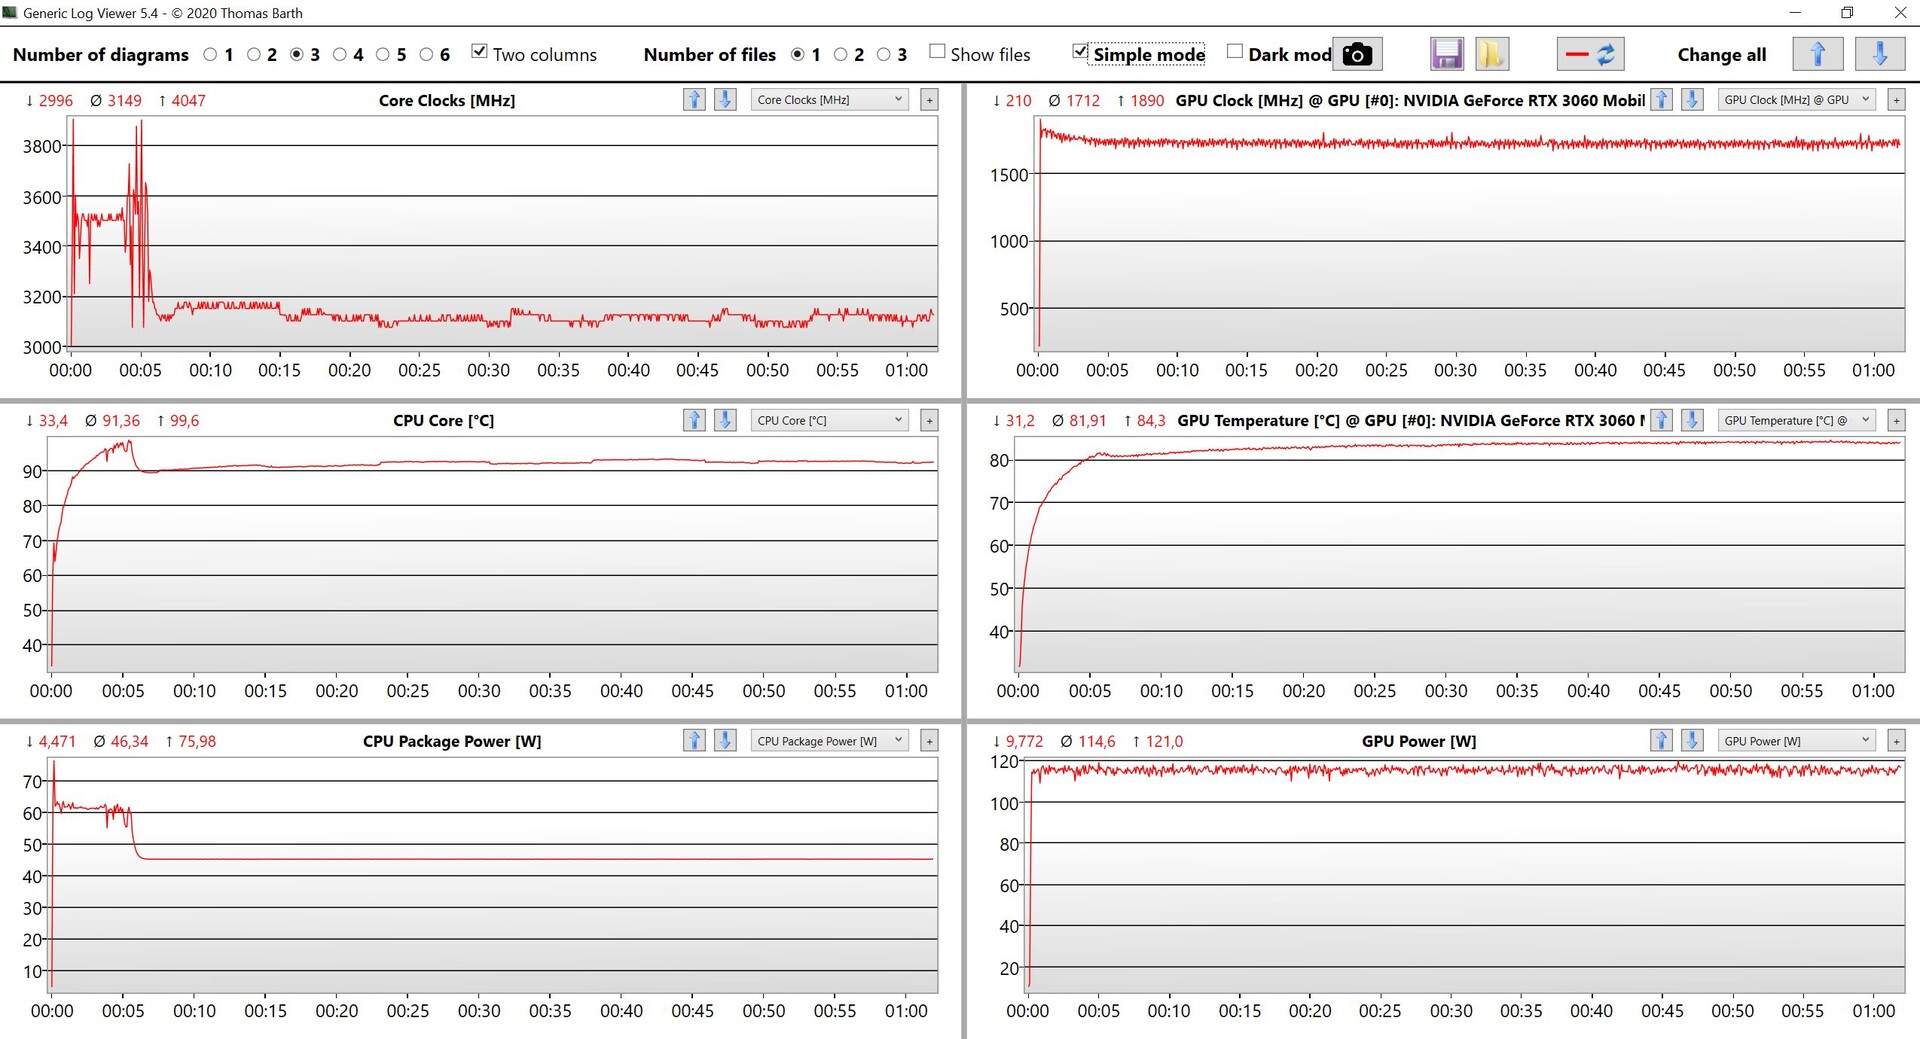
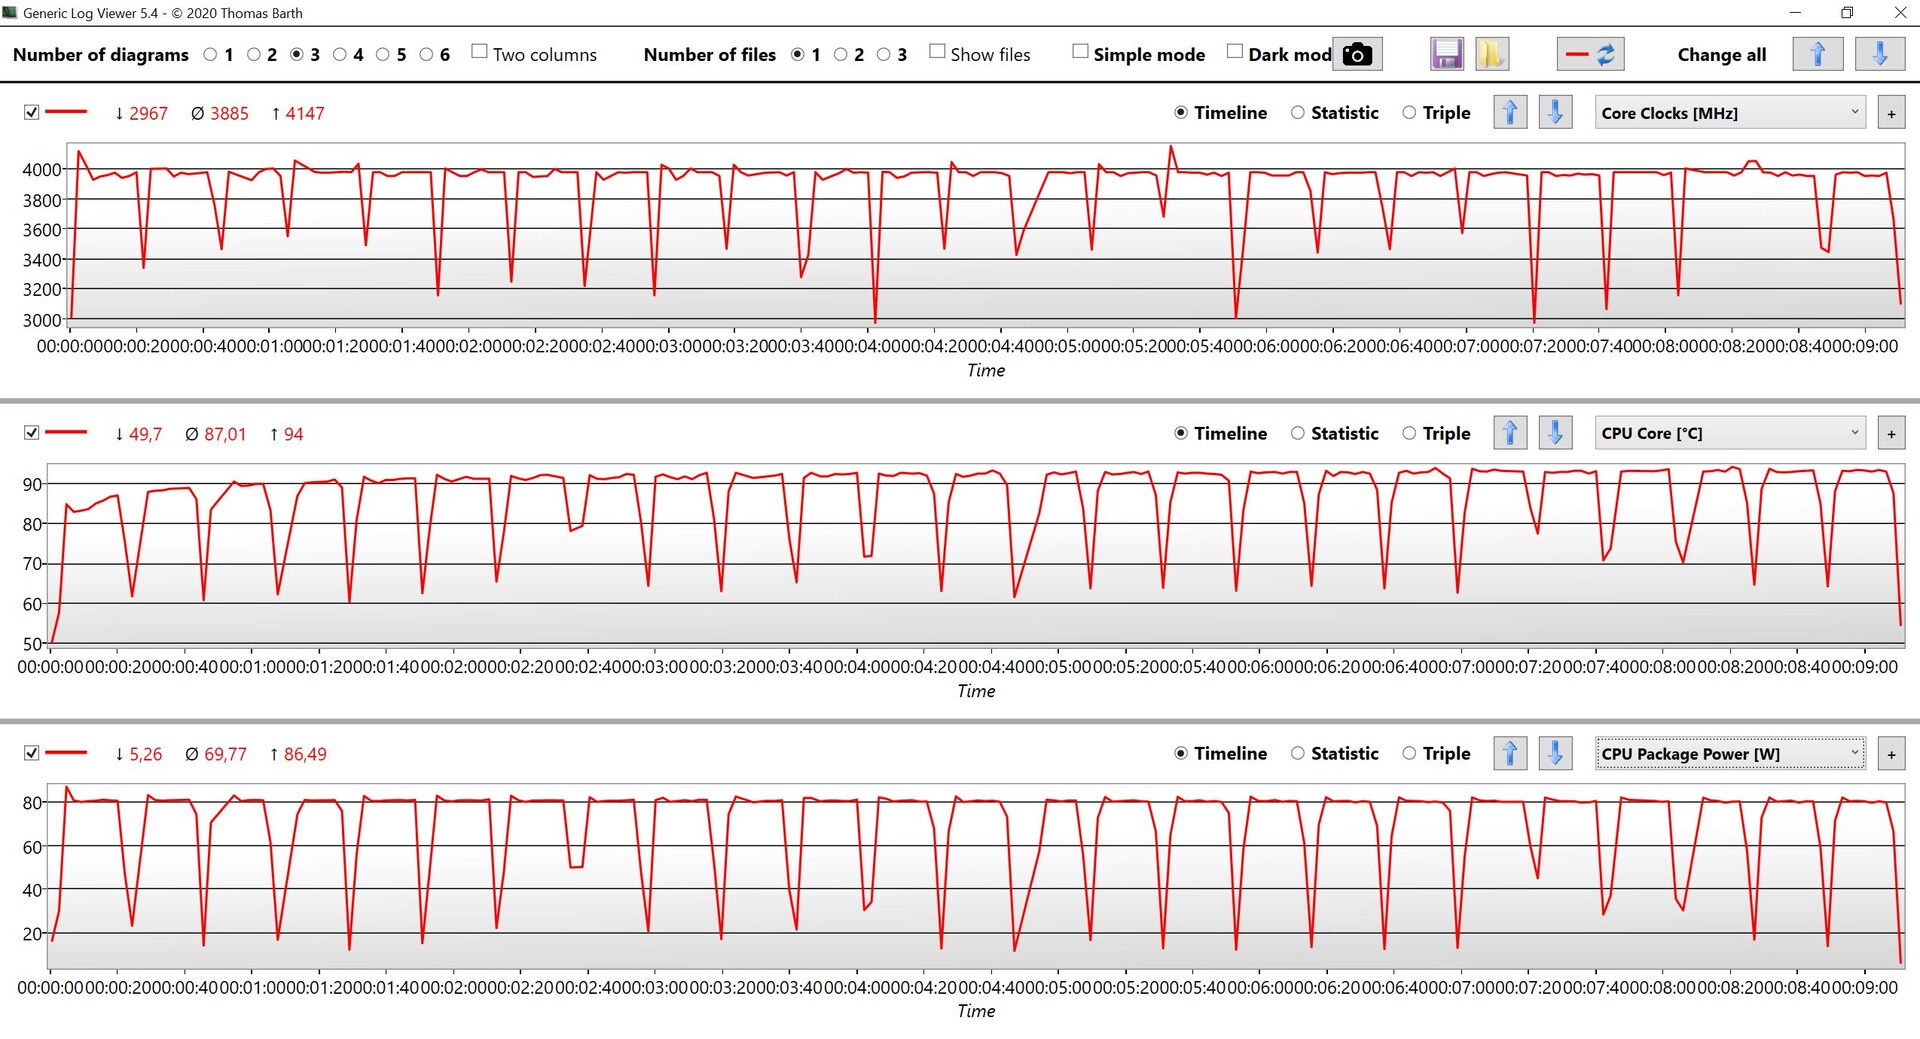
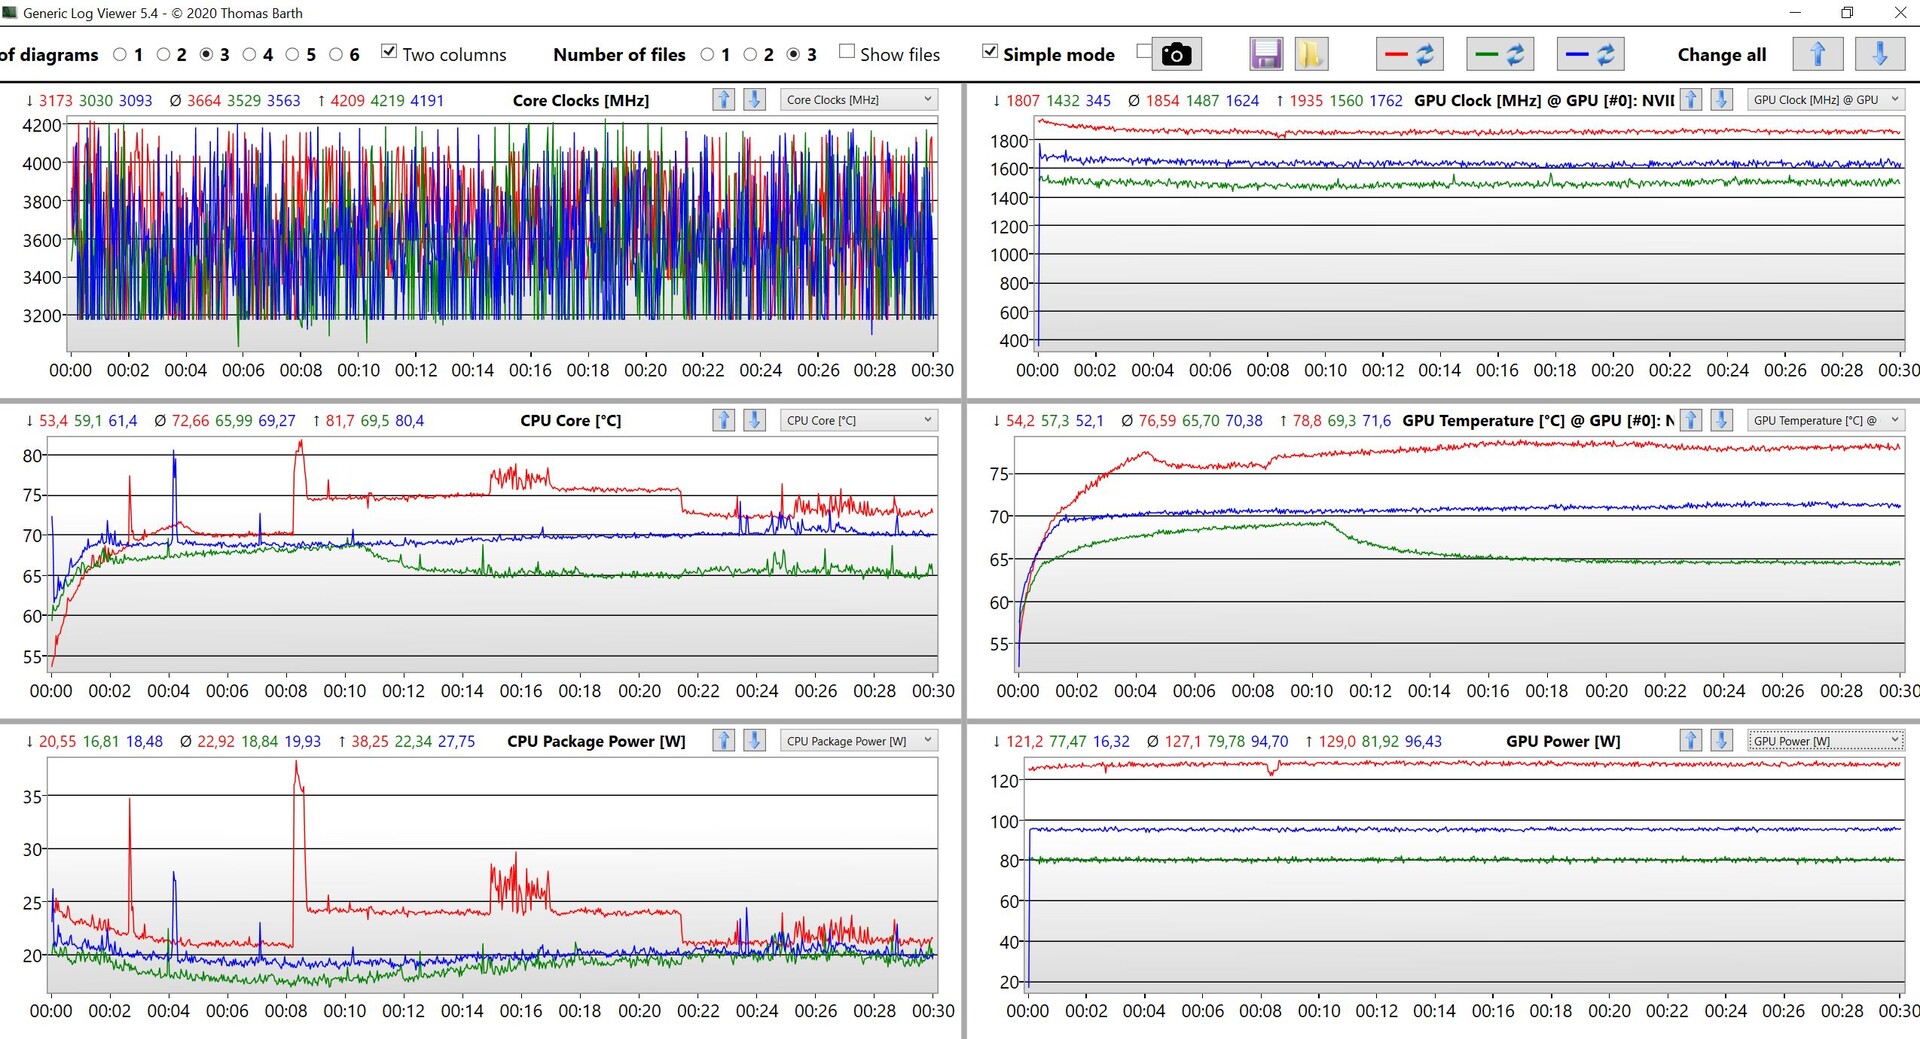
在Prime95和FurMark的压力测试中,Legion 5 15不能保持高性能的数据,但系统仍然处理得很好。处理器在大约5分钟后从60瓦下降到45瓦,显卡被限制在115瓦,而且在测试过程中没有进一步下降。这意味着即使在非常苛刻的情况下也不会出现性能问题。
(±) The maximum temperature on the upper side is 42.6 °C / 109 F, compared to the average of 40.4 °C / 105 F, ranging from 21.2 to 68.8 °C for the class Gaming.
(-) The bottom heats up to a maximum of 52.2 °C / 126 F, compared to the average of 43.2 °C / 110 F
(+) In idle usage, the average temperature for the upper side is 24.2 °C / 76 F, compared to the device average of 33.9 °C / 93 F.
(±) Playing The Witcher 3, the average temperature for the upper side is 34.8 °C / 95 F, compared to the device average of 33.9 °C / 93 F.
(+) The palmrests and touchpad are reaching skin temperature as a maximum (34.8 °C / 94.6 F) and are therefore not hot.
(-) The average temperature of the palmrest area of similar devices was 28.8 °C / 83.8 F (-6 °C / -10.8 F).
发言人
扬声器系统(2x 2W)本来可以做得更好;几乎没有任何低音,整体音质只是一般。它们对于视频和一些背景音乐来说是足够的,但我们绝对建议使用外部扬声器或耳机观看大片。在游戏过程中,扬声器也很无用,因为风扇的声音太大。
Lenovo Legion 5 15ACH-82JU00C6GE-FL audio analysis
(±) | speaker loudness is average but good (81 dB)
Bass 100 - 315 Hz
(-) | nearly no bass - on average 22.1% lower than median
(±) | linearity of bass is average (11.4% delta to prev. frequency)
Mids 400 - 2000 Hz
(+) | balanced mids - only 4.5% away from median
(+) | mids are linear (5% delta to prev. frequency)
Highs 2 - 16 kHz
(+) | balanced highs - only 2.9% away from median
(+) | highs are linear (4.5% delta to prev. frequency)
Overall 100 - 16.000 Hz
(±) | linearity of overall sound is average (17.8% difference to median)
Compared to same class
» 53% of all tested devices in this class were better, 10% similar, 37% worse
» The best had a delta of 6%, average was 18%, worst was 132%
Compared to all devices tested
» 36% of all tested devices were better, 8% similar, 56% worse
» The best had a delta of 4%, average was 23%, worst was 134%
Acer Nitro 5 AN515-45-R1JH audio analysis
(±) | speaker loudness is average but good (75.5 dB)
Bass 100 - 315 Hz
(-) | nearly no bass - on average 33.4% lower than median
(±) | linearity of bass is average (12.8% delta to prev. frequency)
Mids 400 - 2000 Hz
(+) | balanced mids - only 3.4% away from median
(±) | linearity of mids is average (8.6% delta to prev. frequency)
Highs 2 - 16 kHz
(±) | higher highs - on average 5% higher than median
(±) | linearity of highs is average (7.3% delta to prev. frequency)
Overall 100 - 16.000 Hz
(±) | linearity of overall sound is average (25.1% difference to median)
Compared to same class
» 90% of all tested devices in this class were better, 3% similar, 7% worse
» The best had a delta of 6%, average was 18%, worst was 132%
Compared to all devices tested
» 77% of all tested devices were better, 5% similar, 18% worse
» The best had a delta of 4%, average was 23%, worst was 134%
Asus TUF Gaming F15 FX506HM audio analysis
(±) | speaker loudness is average but good (77.1 dB)
Bass 100 - 315 Hz
(±) | reduced bass - on average 13.8% lower than median
(±) | linearity of bass is average (7.9% delta to prev. frequency)
Mids 400 - 2000 Hz
(+) | balanced mids - only 2.9% away from median
(+) | mids are linear (5.9% delta to prev. frequency)
Highs 2 - 16 kHz
(+) | balanced highs - only 1.8% away from median
(+) | highs are linear (2.7% delta to prev. frequency)
Overall 100 - 16.000 Hz
(+) | overall sound is linear (13.1% difference to median)
Compared to same class
» 18% of all tested devices in this class were better, 4% similar, 78% worse
» The best had a delta of 6%, average was 18%, worst was 132%
Compared to all devices tested
» 13% of all tested devices were better, 3% similar, 84% worse
» The best had a delta of 4%, average was 23%, worst was 134%
能源管理 - 电池运行时间取决于GPU
消耗功率
Legion 5 15的整体功耗并不明显。负载下的最大消耗在短暂的时间内是~230W,很快就在200W左右趋于平稳。300W的电源适配器几乎太强大了,但它有一个优势。联想的Vantage应用程序提供了一个名为快速充电的功能,这大大改善了充电性能。整体充电时间减少了40分钟,设备开启20分钟后可使用50%的电池容量(44分钟后为80%)。
| Off / Standby | |
| Idle | |
| Load |
|
Key:
min: | |
| Lenovo Legion 5 15ACH-82JU00C6GE-FL R7 5800H, GeForce RTX 3060 Laptop GPU, Micron 2300 512GB MTFDHBA512TDV, , 1920x1080, 15.6" | Acer Nitro 5 AN515-45-R1JH R7 5800H, GeForce RTX 3070 Laptop GPU, WDC PC SN530 SDBPNPZ-1T00, IPS, 2560x1440, 15.6" | Asus TUF Gaming F15 FX506HM i7-11800H, GeForce RTX 3060 Laptop GPU, SK Hynix HFM001TD3JX013N, IPS, 1920x1080, 15.6" | Alienware m15 R5 Ryzen Edition R7 5800H, GeForce RTX 3060 Laptop GPU, Toshiba KBG40ZNS512G NVMe, IPS, 1920x1080, 15.6" | Schenker XMG Core 15 Ampere R7 4800H, GeForce RTX 3060 Laptop GPU, Samsung SSD 970 EVO Plus 1TB, IPS, 2560x1440, 15.6" | Average NVIDIA GeForce RTX 3060 Laptop GPU | Average of class Gaming | |
|---|---|---|---|---|---|---|---|
| Power Consumption | -2% | -8% | -26% | -17% | -21% | -47% | |
| Idle Minimum * (Watt) | 7.3 | 8.8 -21% | 9.5 -30% | 11 -51% | 11 -51% | 10.4 ? -42% | 13.1 ? -79% |
| Idle Average * (Watt) | 10.5 | 13 -24% | 12.1 -15% | 14 -33% | 14 -33% | 14.5 ? -38% | 19 ? -81% |
| Idle Maximum * (Watt) | 15.7 | 14.6 7% | 22.5 -43% | 25 -59% | 20 -27% | 21.4 ? -36% | 24.6 ? -57% |
| Load Average * (Watt) | 108 | 133 -23% | 99.5 8% | 123 -14% | 94 13% | 109.3 ? -1% | 111.3 ? -3% |
| Witcher 3 ultra * (Watt) | 175 | 134 23% | 157 10% | 176 -1% | 167 5% | ||
| Load Maximum * (Watt) | 228 | 164 28% | 173.5 24% | 226 1% | 251 -10% | 206 ? 10% | 260 ? -14% |
* ... smaller is better
Power Consumption Witcher 3 / Stress test
电池运行时间
80Wh的电池可以管理体面的电池运行时间,但这取决于GPU。当Nvidia GPU运行并停用混合模式时,我们在Wi-Fi测试中记录了长达5小时的时间,在最大负荷下记录了1:45小时。拥有工作图形切换的竞争者在这方面显然有优势。
如果你需要更长的电池运行时间,你肯定应该激活混合模式。在某些情况下,运行时间甚至可以翻倍。
| 场景 | 混合模式激活 | 混合模式停用 |
|---|---|---|
| Wi-Fi测试最大亮度 | 396分钟 | 262分钟 |
| Wi-Fi测试150cd/m² | 477分钟 | 290分钟 |
| 视频测试150cd/m² | 537分钟 | 259分钟 |
| Lenovo Legion 5 15ACH-82JU00C6GE-FL R7 5800H, GeForce RTX 3060 Laptop GPU, 80 Wh | Acer Nitro 5 AN515-45-R1JH R7 5800H, GeForce RTX 3070 Laptop GPU, 57.5 Wh | Asus TUF Gaming F15 FX506HM i7-11800H, GeForce RTX 3060 Laptop GPU, 90 Wh | Alienware m15 R5 Ryzen Edition R7 5800H, GeForce RTX 3060 Laptop GPU, 86 Wh | Schenker XMG Core 15 Ampere R7 4800H, GeForce RTX 3060 Laptop GPU, 62 Wh | Average of class Gaming | |
|---|---|---|---|---|---|---|
| Battery runtime | 12% | 38% | 20% | 9% | 41% | |
| H.264 (h) | 4.3 | 6.9 60% | 8.8 105% | 6 40% | 8.27 ? 92% | |
| WiFi v1.3 (h) | 4.8 | 5.7 19% | 7.9 65% | 5.1 6% | 5.8 21% | 7.08 ? 48% |
| Load (h) | 1.8 | 1 -44% | 2 11% | 0.9 -50% | 1.2 -33% | 1.496 ? -17% |
| Reader / Idle (h) | 9.2 | 11 | 14.7 | 7.8 | 7.84 ? | |
| Witcher 3 ultra (h) | 1.6 |
Pros
Cons
结论 -Legion 5 15以显示和高性能而令人信服
新的Legion 5 15 Gen.6再次成为一个好的游戏笔记本电脑,其价格相对较低,组件功能强大。新的AMD处理器Ryzen 7 5800H提供了充足的性能,它也非常高效。与快速的130W版本的GeForce RTX 3060相结合,确保了高游戏性能。我们也喜欢1080p分辨率的快速165Hz显示屏。
自动图形切换会导致一些卡顿的问题,这非常令人讨厌。如果你不需要长的电池运行时间,你肯定应该在联想的Vantage应用程序中停用混合图形模式。联想的额外电源设置是有意义的,你可以在它们之间快速切换,但我们希望看到停用的风扇,至少在你使用Eco模式的时候。Legion 5 15从来都是安静的。
Legion
5 15 Gen.6专注于游戏笔记本电脑的核心部件,并通过快速的165赫兹显示屏提供了足够的性能。不过,自动图形切换的问题很烦人,应该尽快解决。
与其接近的对手相比,如Acer Nitro 5或华硕TUF游戏机F15 Legion ,主要是凭借强大的显卡脱颖而出。没有全面的照明你得到与Alienware m15但是,联想的笔记本在价格上更实惠。
价格和可用性
你可以在联想的网上商店配置Legion 5 15 AMD目前起价949美元,配备Ryzen 5 600H,GeForce RTX 3050和1080p 120 Hz显示器。与我们的评测设备类似的配置,价格约为1800美元。
Lenovo Legion 5 15ACH-82JU00C6GE-FL
- 09/06/2021 v7 (old)
Andreas Osthoff
Price comparison

