初步的XMG Neo 15 E22 with RTX 3080 Ti (Tongfang GM5AG8W)评论。水冷是游戏笔记本电脑的一个临时但可行的解决方案吗?
注意事项:Neo 15和Oasis都是明确的预生产设备。在发布之前,很多东西仍可能发生变化,生产缺陷仍可能存在。我们建议读者在考虑下面的基准时注意这一点。完成的系统可能会有不同的表现。
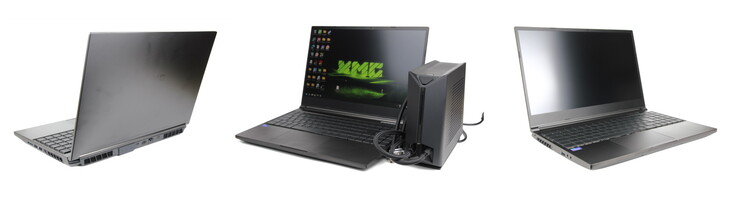
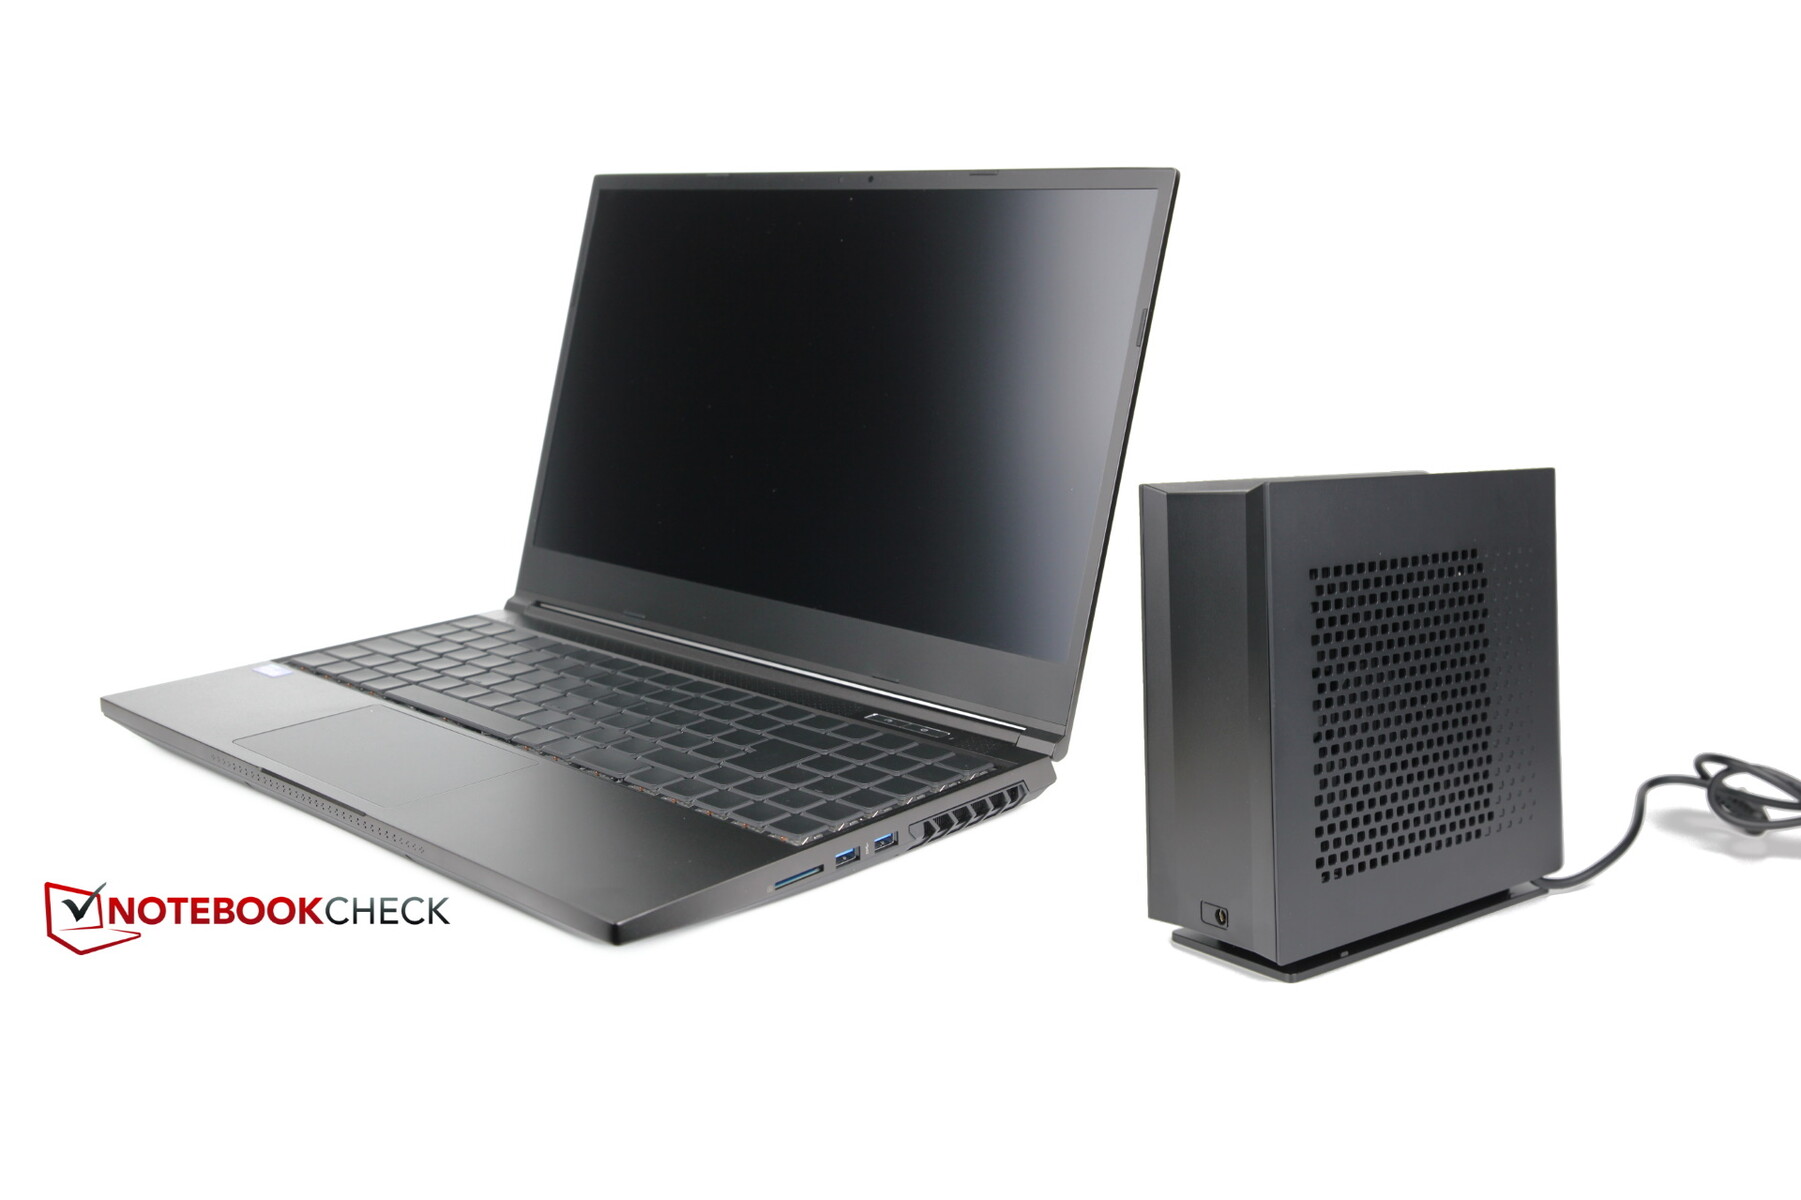
Schenker敢于通过新的XMG Neo 15 E22进入未知领域。制造商现在为该笔记本电脑配备了一个新的端口,可以选择水冷系统。当你购买Neo时,你还可以以199欧元的价格订购XMG Oasis。这应该可以在游戏或其他压力下大幅降低温度和噪音水平。但是客户会接受购买和操作这样一个额外的设备吗?配备热刺RTX 3080 Ti的XMG Neo在没有水冷的情况下表现如何?我们在测试中研究了这些方面。
Schenker在几个方面升级了XMG Neo。全新的 RTX 3080 Ti 笔记本GPU而不是RTX 3080,使用Alder Lake-H CPU而不是Tiger Lake ,然后还有这个用于水冷的新端口。我们的配置价格约为3,442欧元,不含XMG Oasis(外部水冷),选择它又增加了199欧元。
我们将新的Neo 15 E22与去年同样强大的前辈(87%的评分)进行比较。我们还创建了一个名为 "XMG Neo加XMG Oasis "的比较元素,并将其加入到基准比较中。此外,我们还考虑其他高端游戏笔记本电脑进行比较。这些包括 华硕ROG Strix Scar 15 G533QS,以及Razer Blade 15 Advanced ModelWWW.STEELT.CN刀片15高级模型,Alienware m15 R6, 还有17英寸微星Raider GE76 ,由于缺乏新一代的CPU/GPU比较,所以采用Alder Lake和RTX 3080 Ti。
潜在的竞争对手比较
Rating | Date | Model | Weight | Height | Size | Resolution | Price |
|---|---|---|---|---|---|---|---|
v (old) | 03 / 2022 | Schenker XMG Neo 15 E22 (Early 2022, RTX 3080 Ti) i7-12700H, GeForce RTX 3080 Ti Laptop GPU | 2.2 kg | 26.6 mm | 15.60" | 2560x1440 | |
| 87 % v7 (old) | Schenker XMG Neo 15 Tiger Lake i7-11800H, GeForce RTX 3080 Laptop GPU | 2.2 kg | 26 mm | 15.60" | 2560x1440 | ||
| 88.9 % v7 (old) | 10 / 2021 | Razer Blade 15 Advanced (Mid 2021) i7-11800H, GeForce RTX 3080 Laptop GPU | 2 kg | 16.99 mm | 15.60" | 1920x1080 | |
| 86.3 % v7 (old) | 09 / 2021 | Asus ROG Strix Scar 15 G533QS R9 5900HX, GeForce RTX 3080 Laptop GPU | 2.3 kg | 27.2 mm | 15.60" | 2560x1440 | |
| 86.1 % v7 (old) | 11 / 2021 | Alienware m15 R6, i7-11800H RTX 3080 i7-11800H, GeForce RTX 3080 Laptop GPU | 2.5 kg | 22.85 mm | 15.60" | 1920x1080 | |
| 87.5 % v7 (old) | 01 / 2022 | MSI GE76 Raider i9-12900HK, GeForce RTX 3080 Ti Laptop GPU | 3 kg | 26 mm | 17.30" | 1920x1080 |
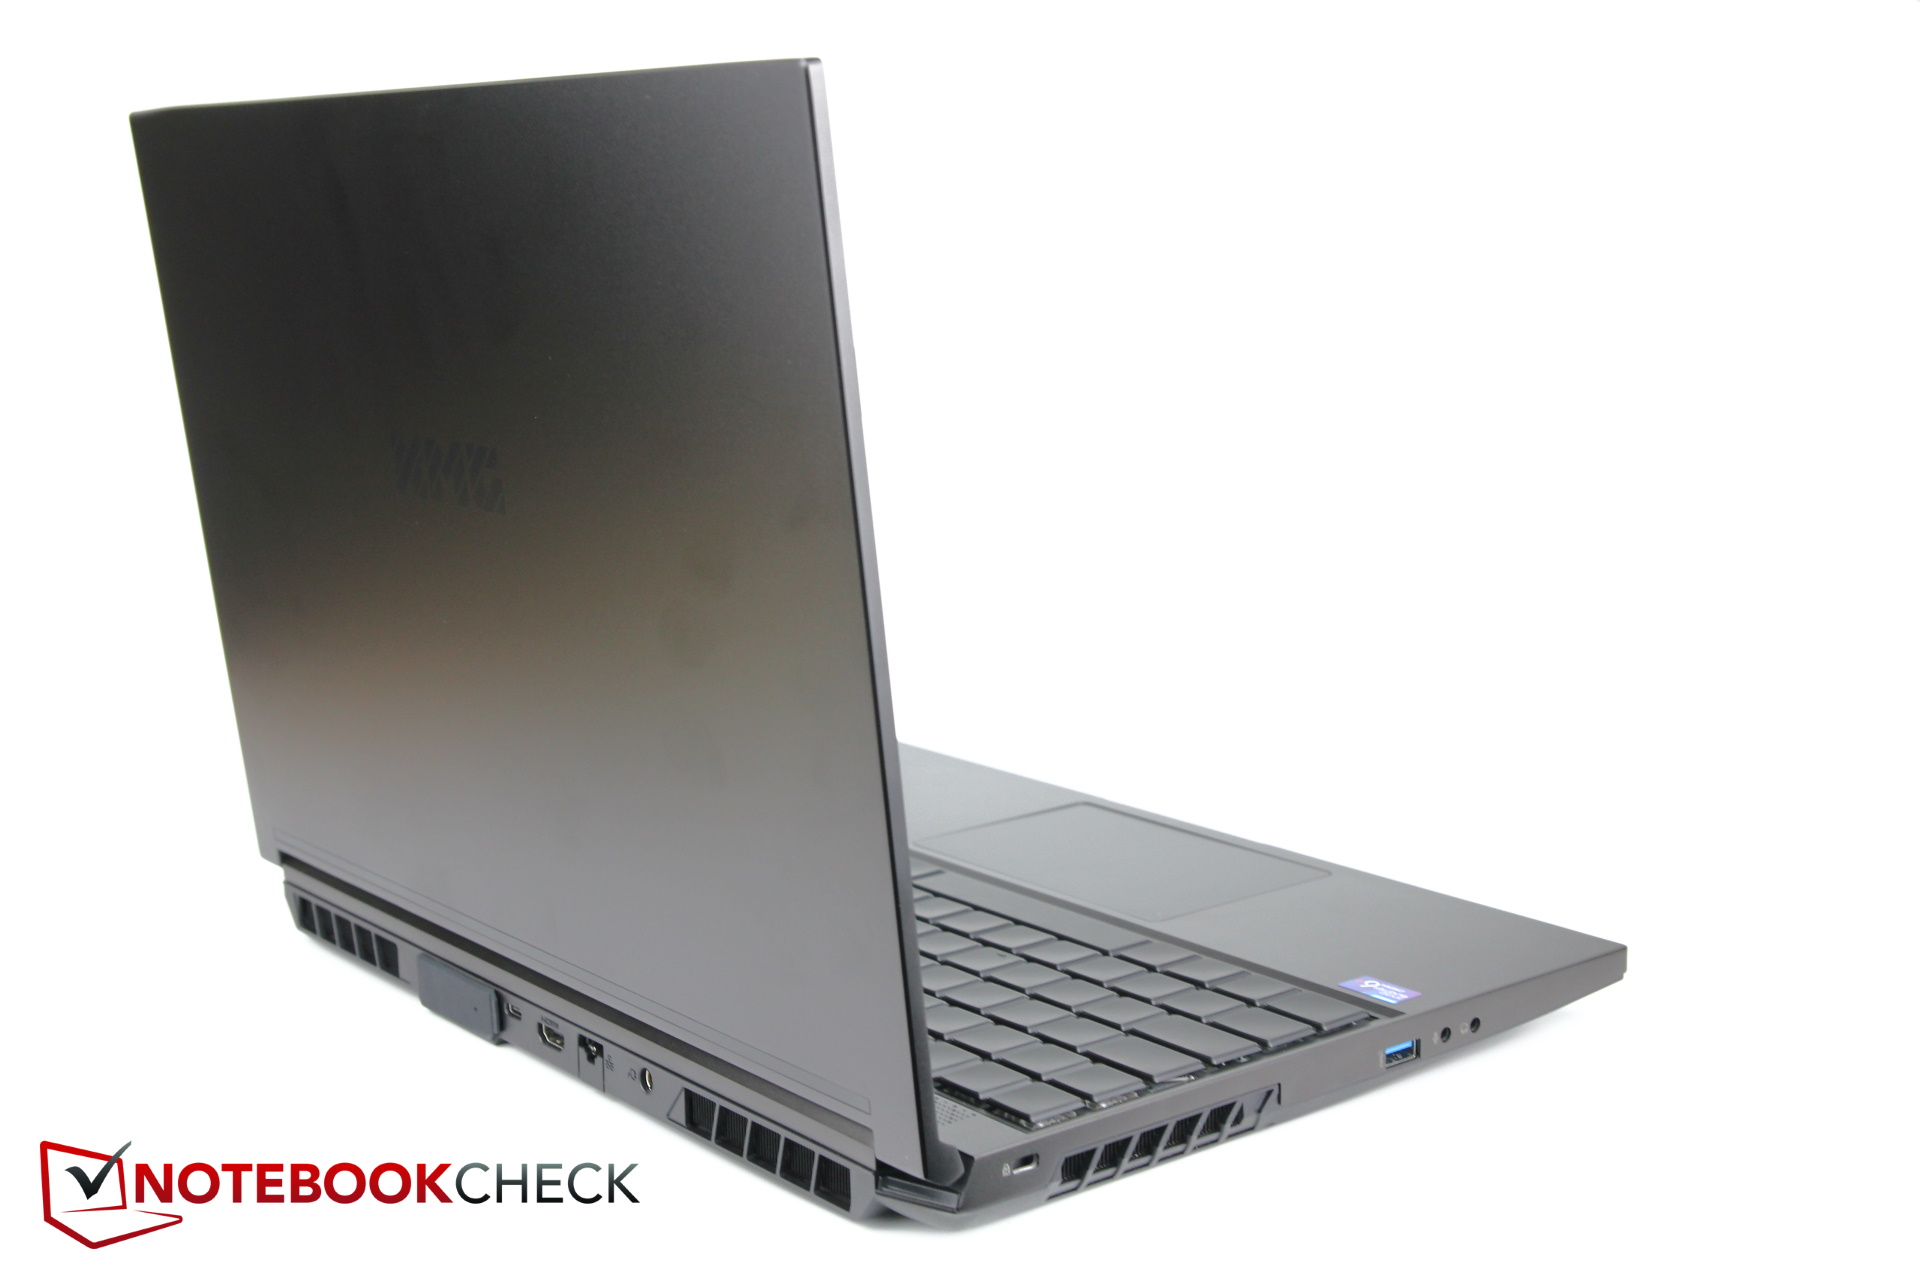
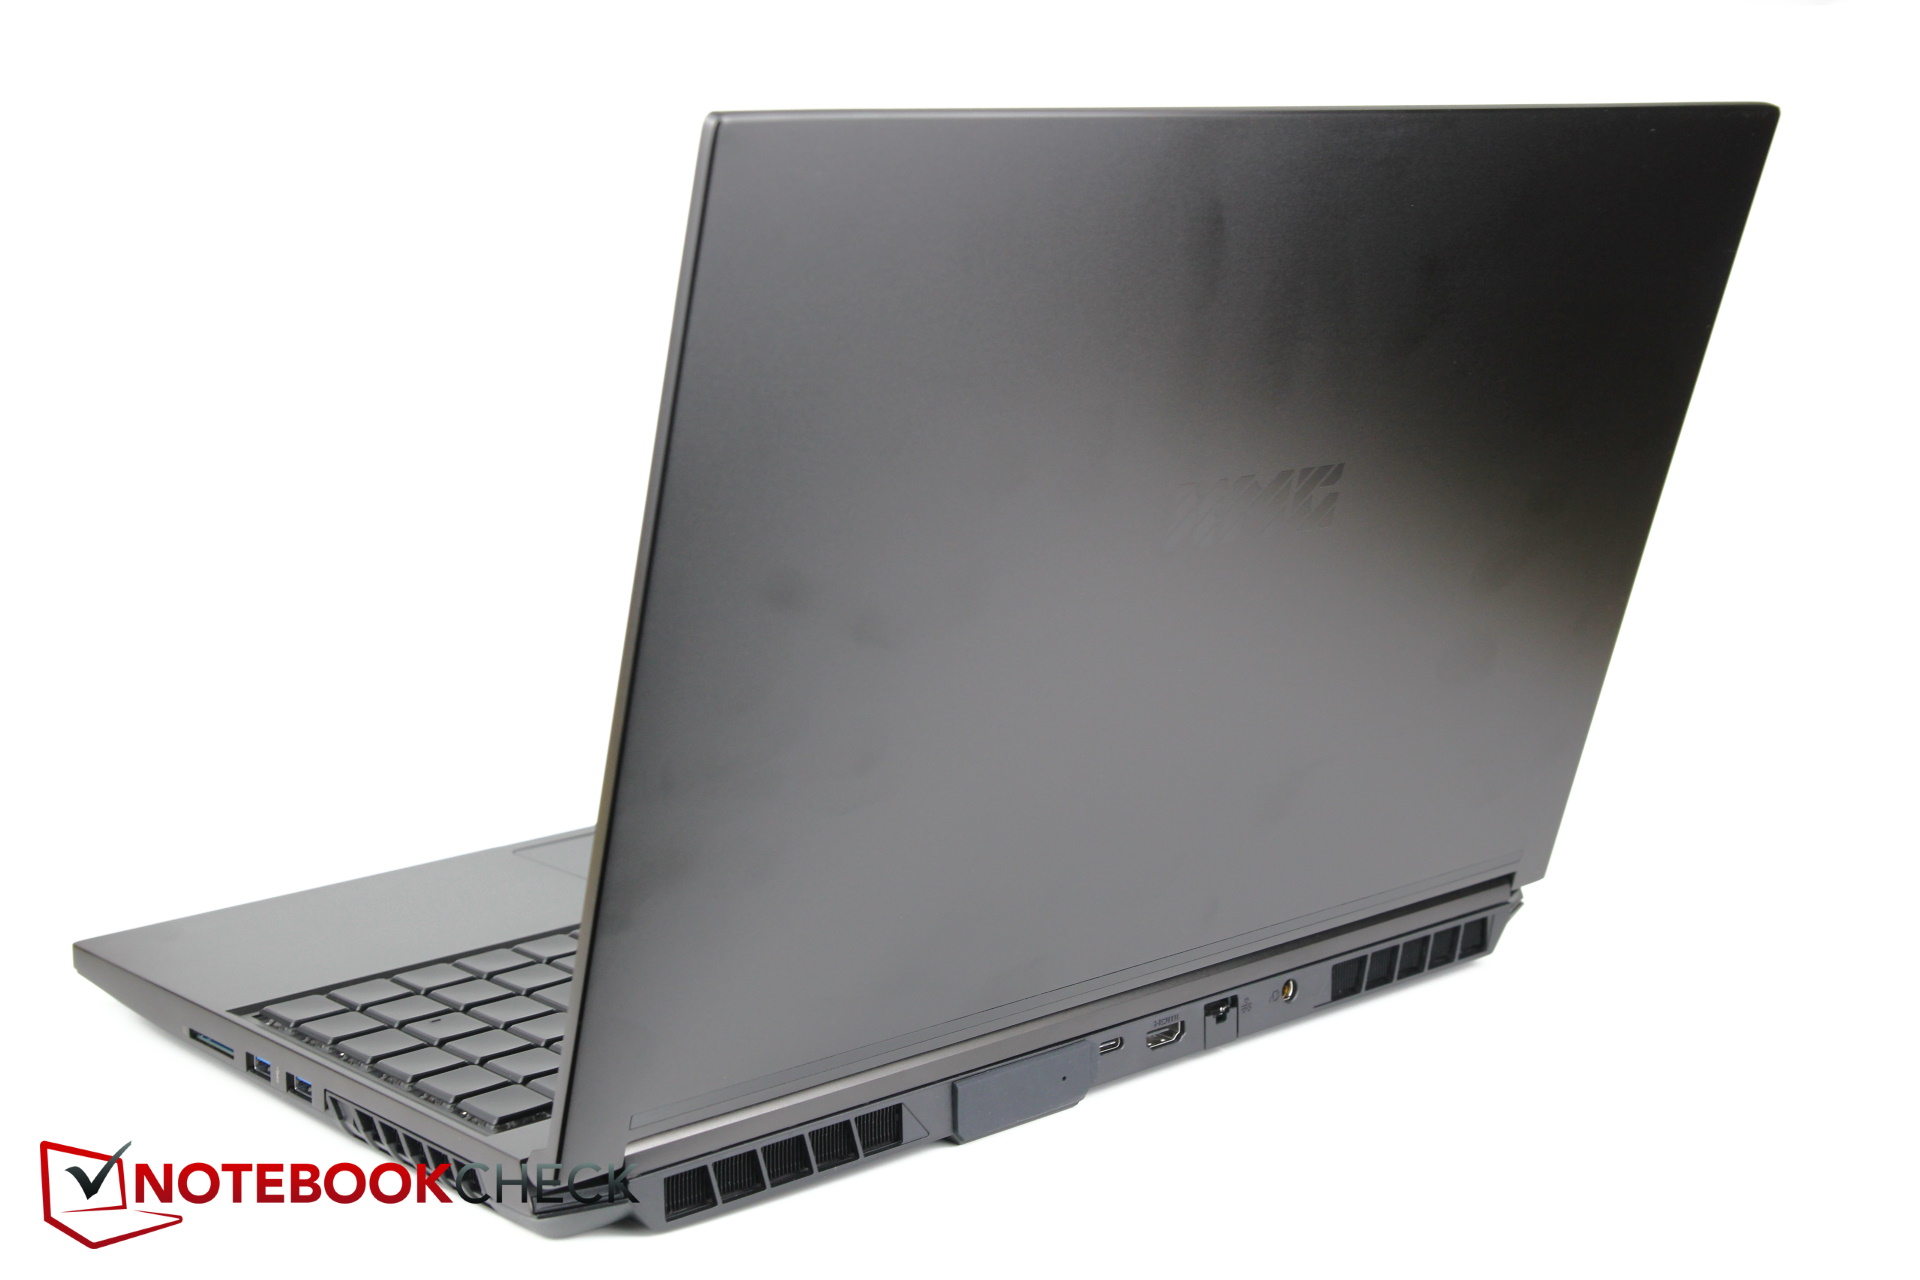
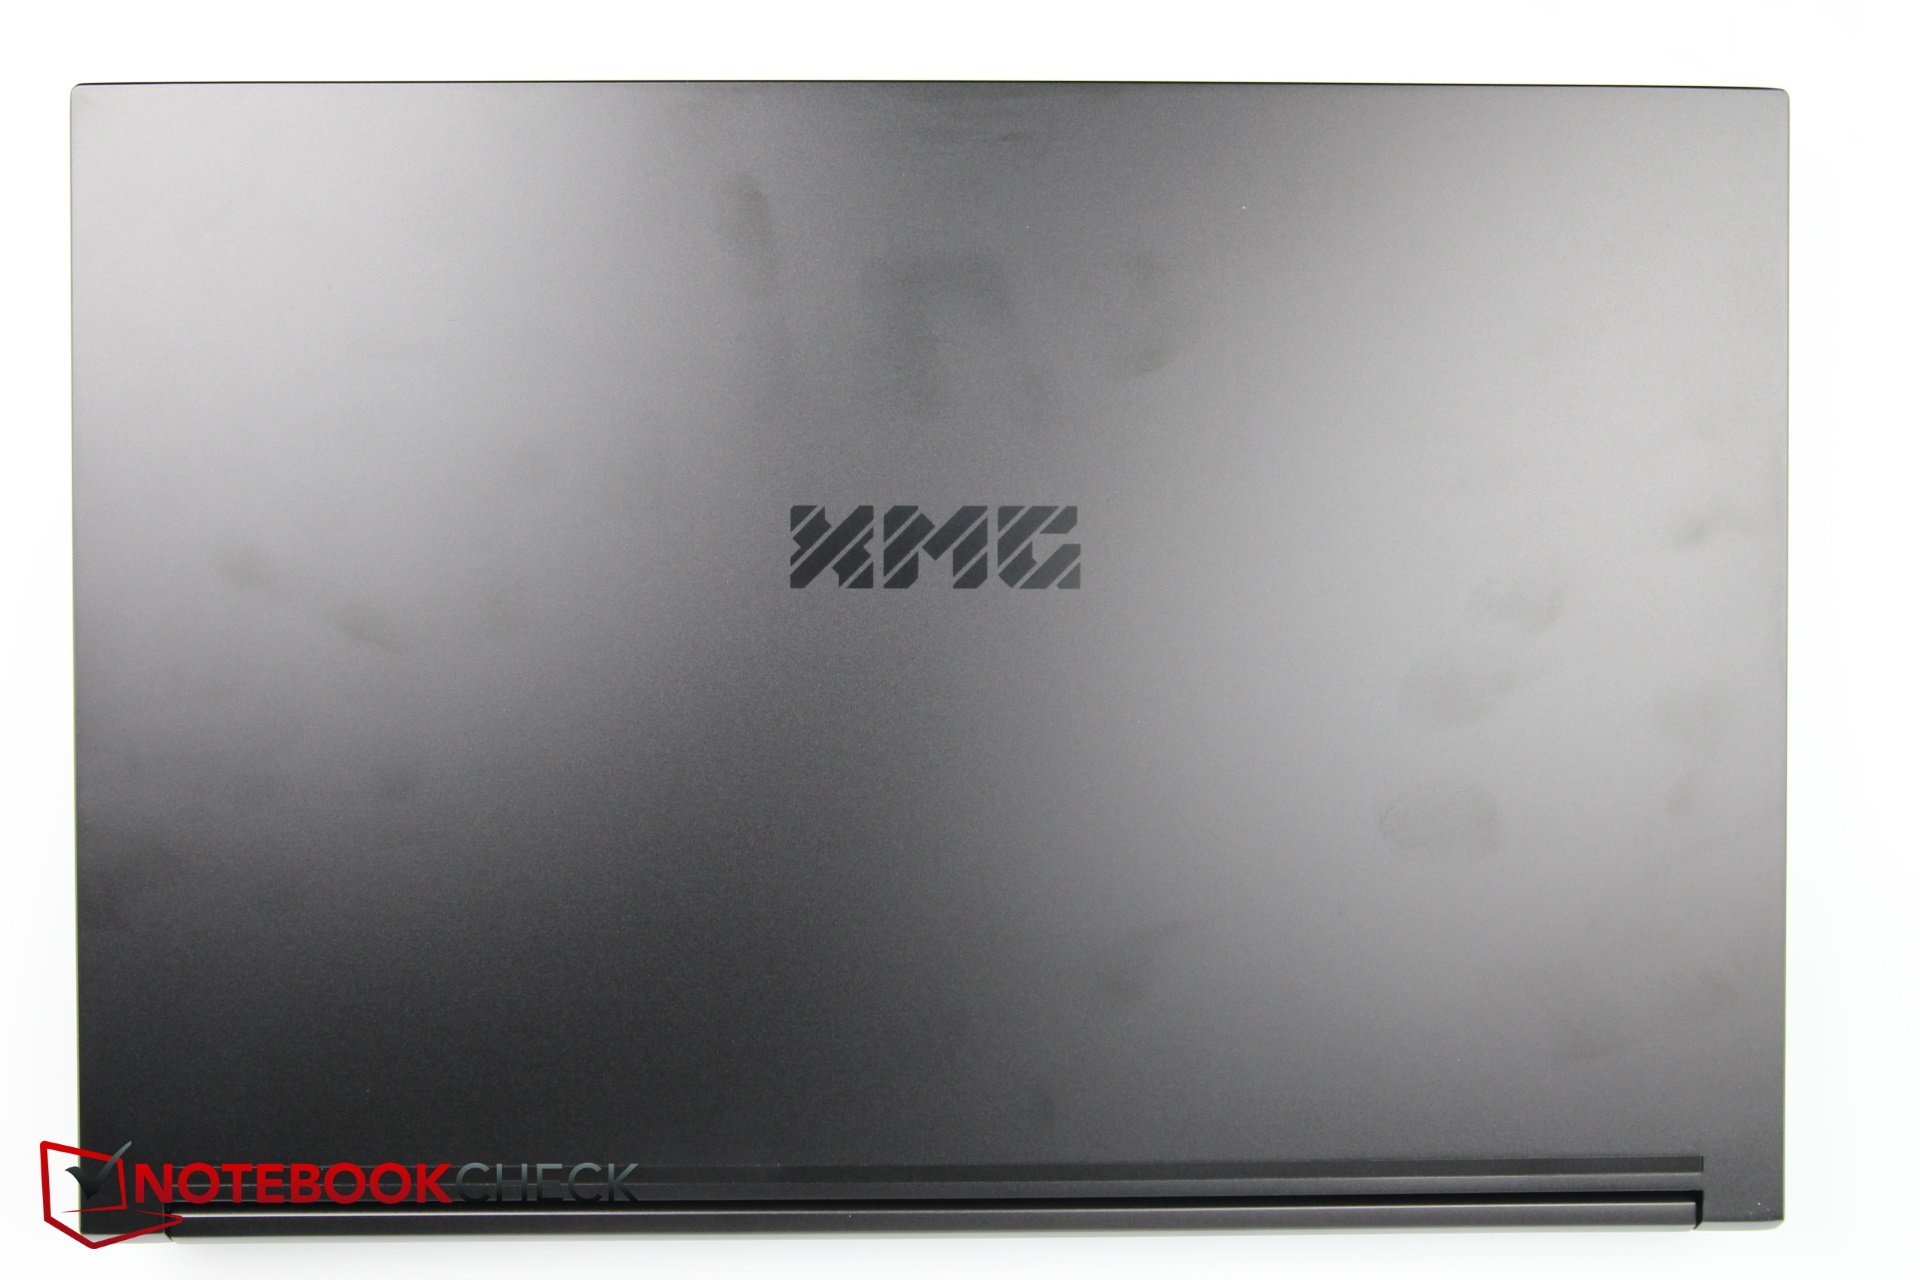
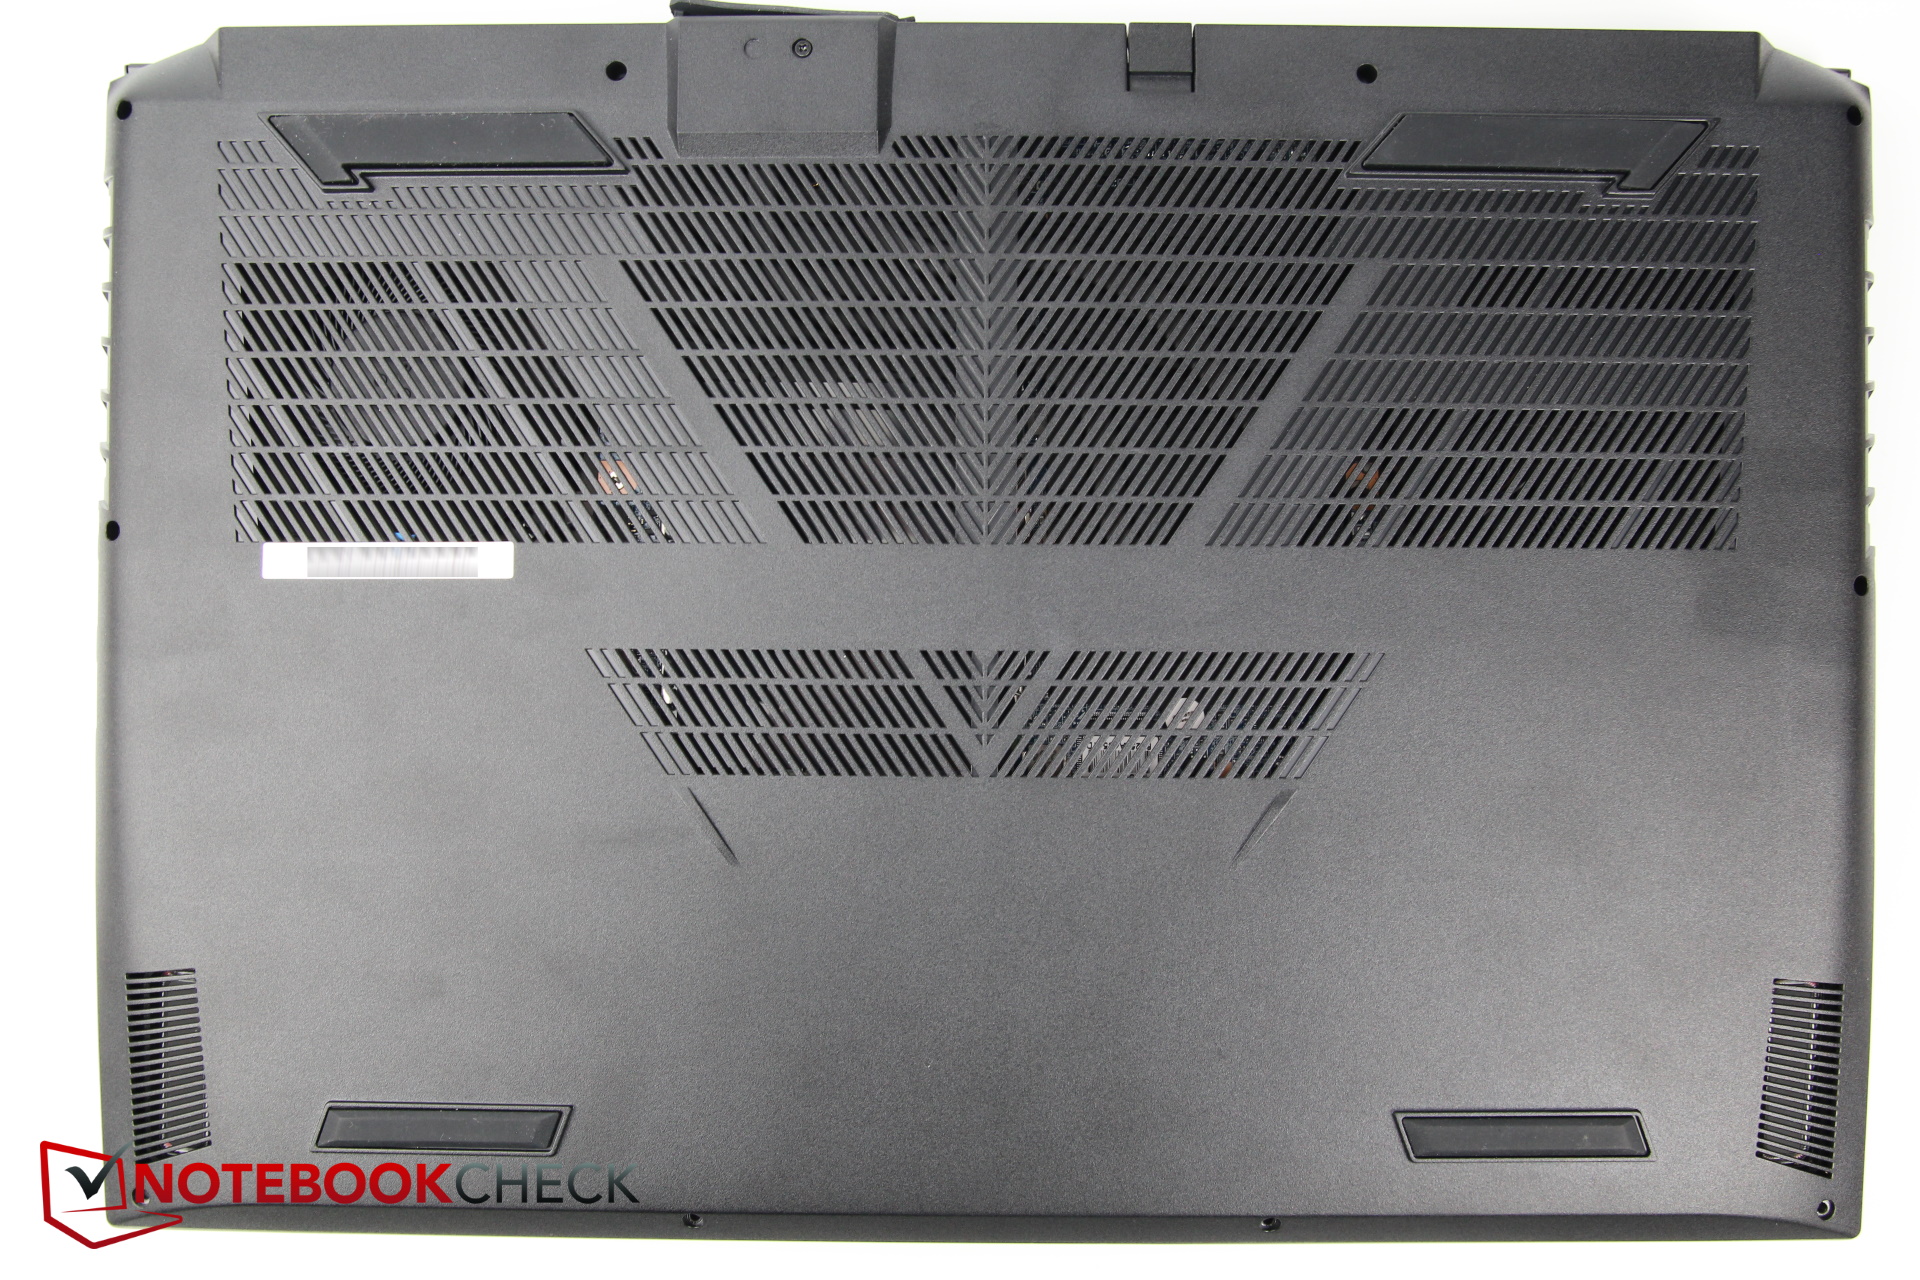
案例。一个用于水冷的端口!
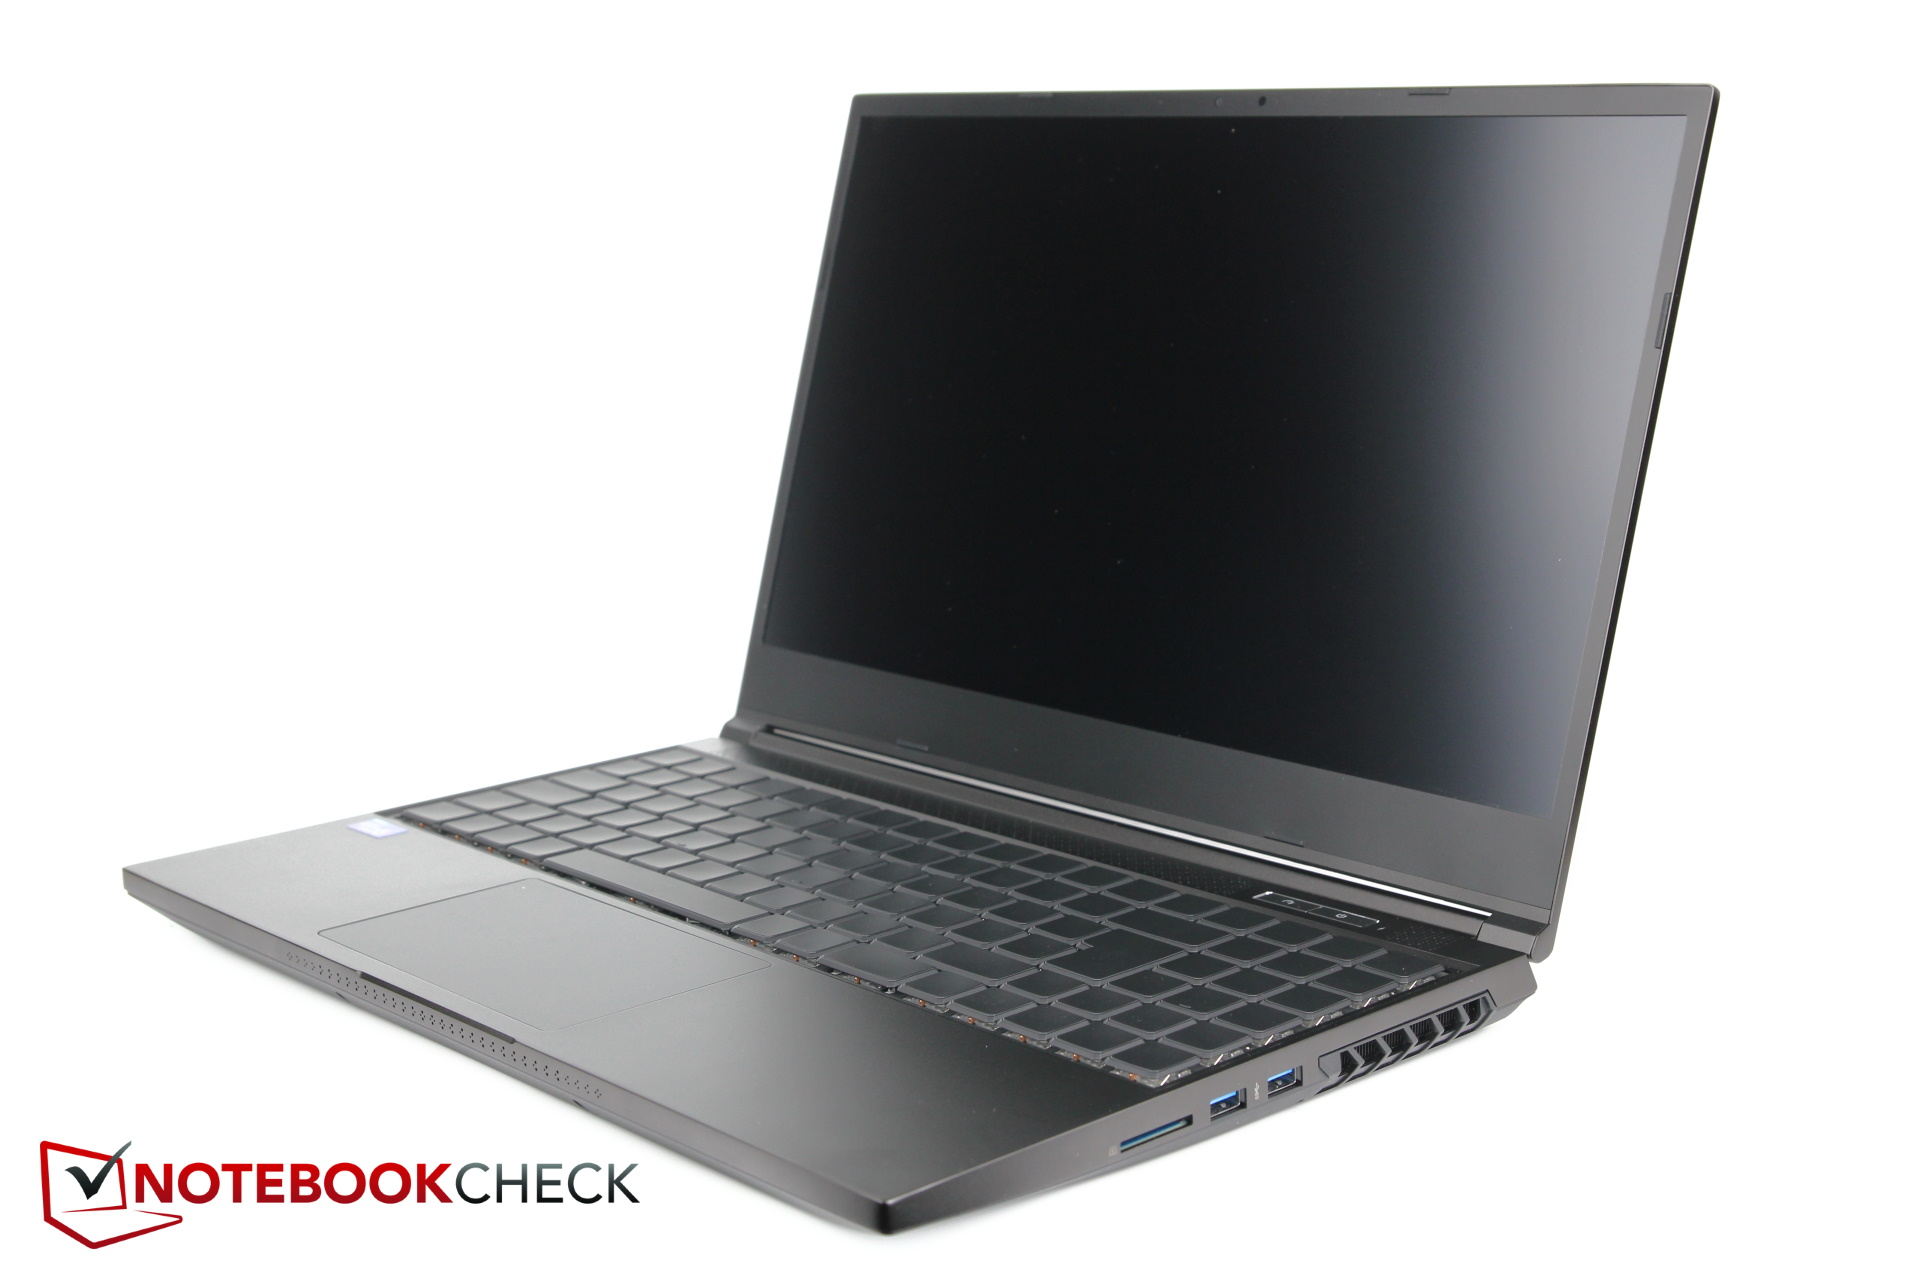
外壳与前代产品基本相同--只有背面的水接口是新增加的。此外,电源插头也变得更加坚固。底部由塑料制成,而机箱的其余部分,包括盖子,甚至显示器的边缘都是由哑光黑铝制成。特别是底座看起来非常坚固,但显示屏盖子也相对抗扭,尽管其表面强烈吸引指纹。整体建造质量非常好。
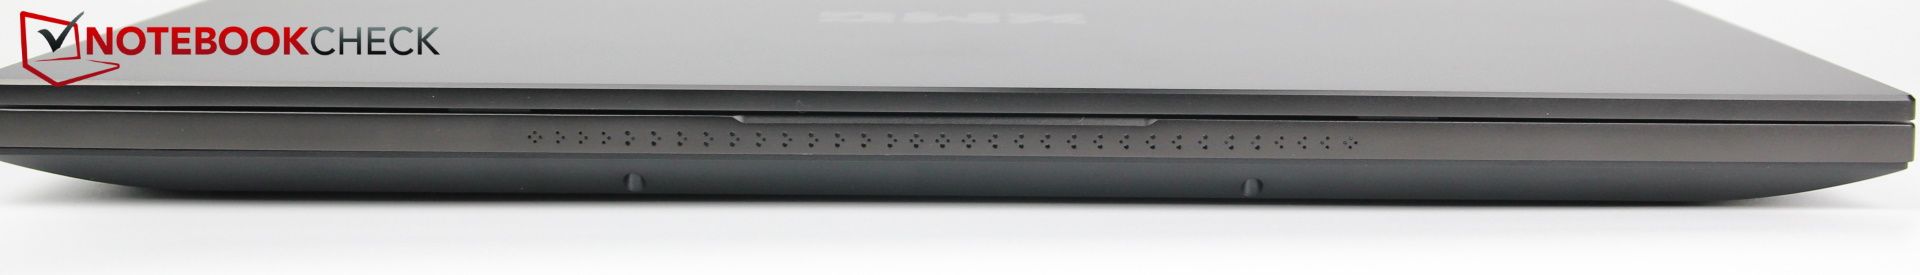
设计相当朴素,因此,这台笔记本电脑不仅在桌面上看起来适合游戏玩家,而且也适合创意和专业用户。在机箱前缘有一个带小孔的条状物,这意味着键盘照明作为一个 "LED条 "微弱地照到前面。
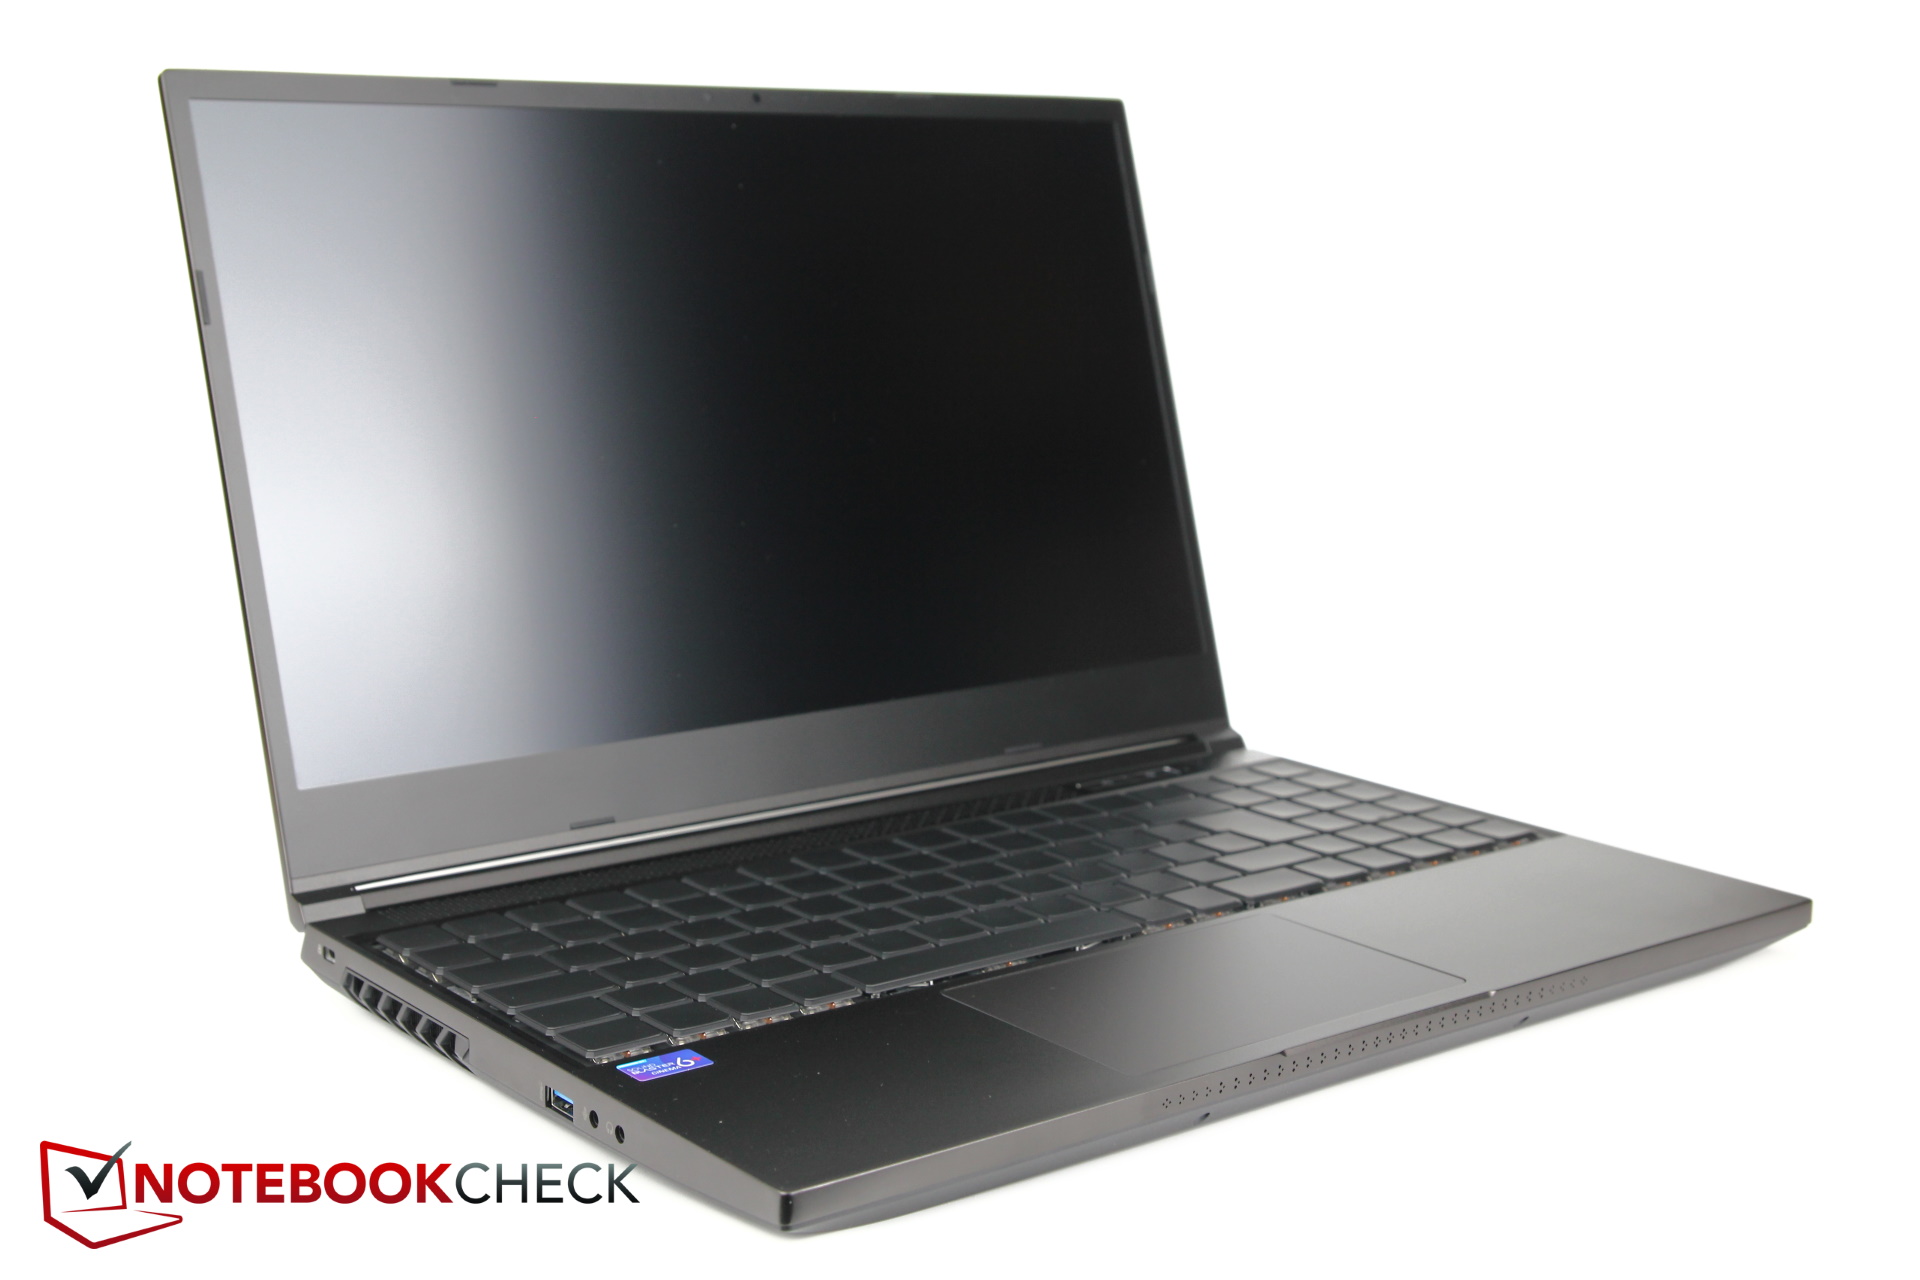
尽管增加了水路,但笔记本电脑并没有变得更厚。它绝对不属于苗条的人群,但考虑到极其强大的硬件,它也不是特别厚。然而,Razer Blade和Alienware M15都明显更薄。
考虑到硬件,2.2公斤的重量也是适中的。Razer Blade要轻200克,而Alienware要重300克。
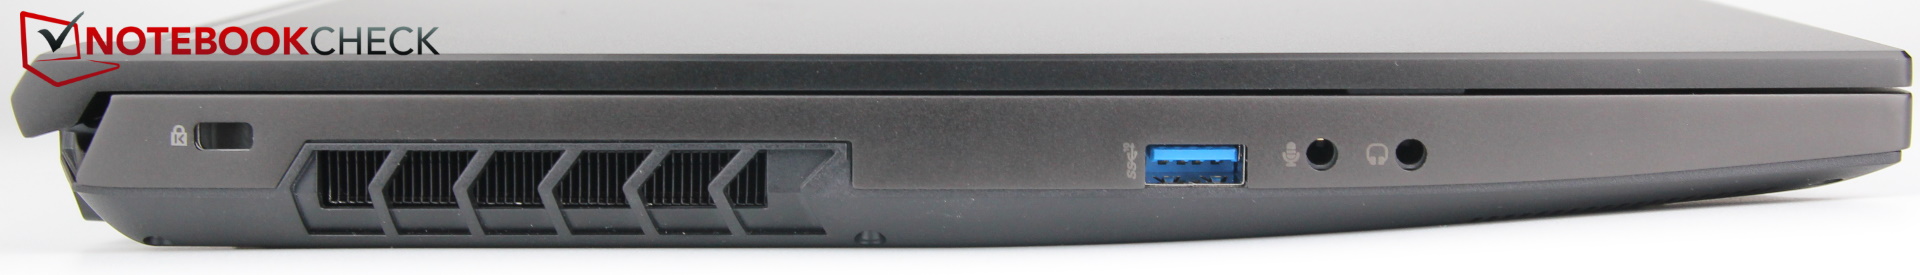
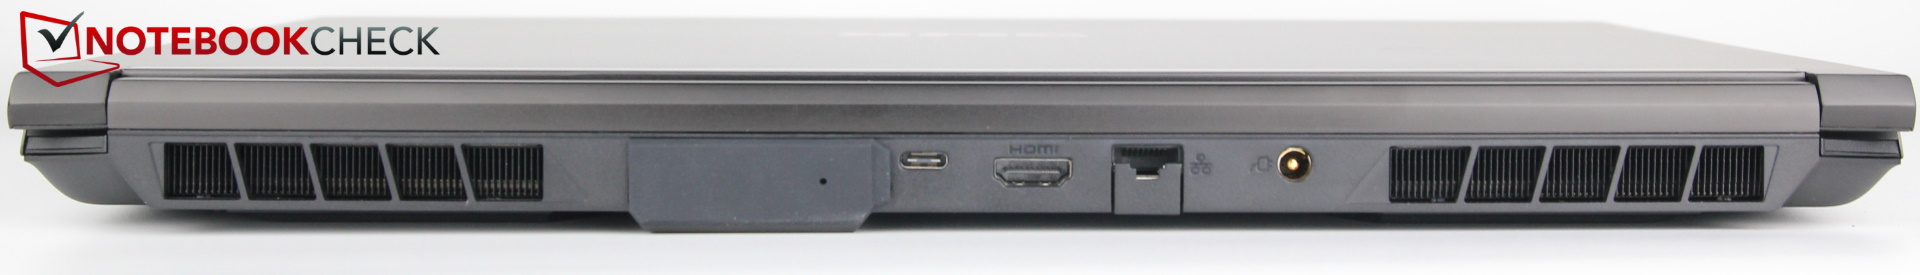
设备。Thunderbolt 4和水的连接!
虽然水口确实占用了一些空间,但申克公司并没有放弃其他的端口。从SD读卡器到带Thunderbolt 4的USB-C和两个音频插孔,一切都在船上。笔记本电脑不能通过USB-C充电。另外,带有Thunderbolt 4的Alder Lake笔记本电脑本身并不是VR就绪的,因为DisplayPort信号不再直接发送到dGPU,而是通过iGPU。只有当有第二个USB-C端口与dGPU或专用DisplayPort连接时,它们才是VR就绪的。
这些端口之间的距离相当近,但这只是在某些情况下令人讨厌。相当便宜的微星GP66 Leopard 11UH显示了端口的位置可以做得更好。
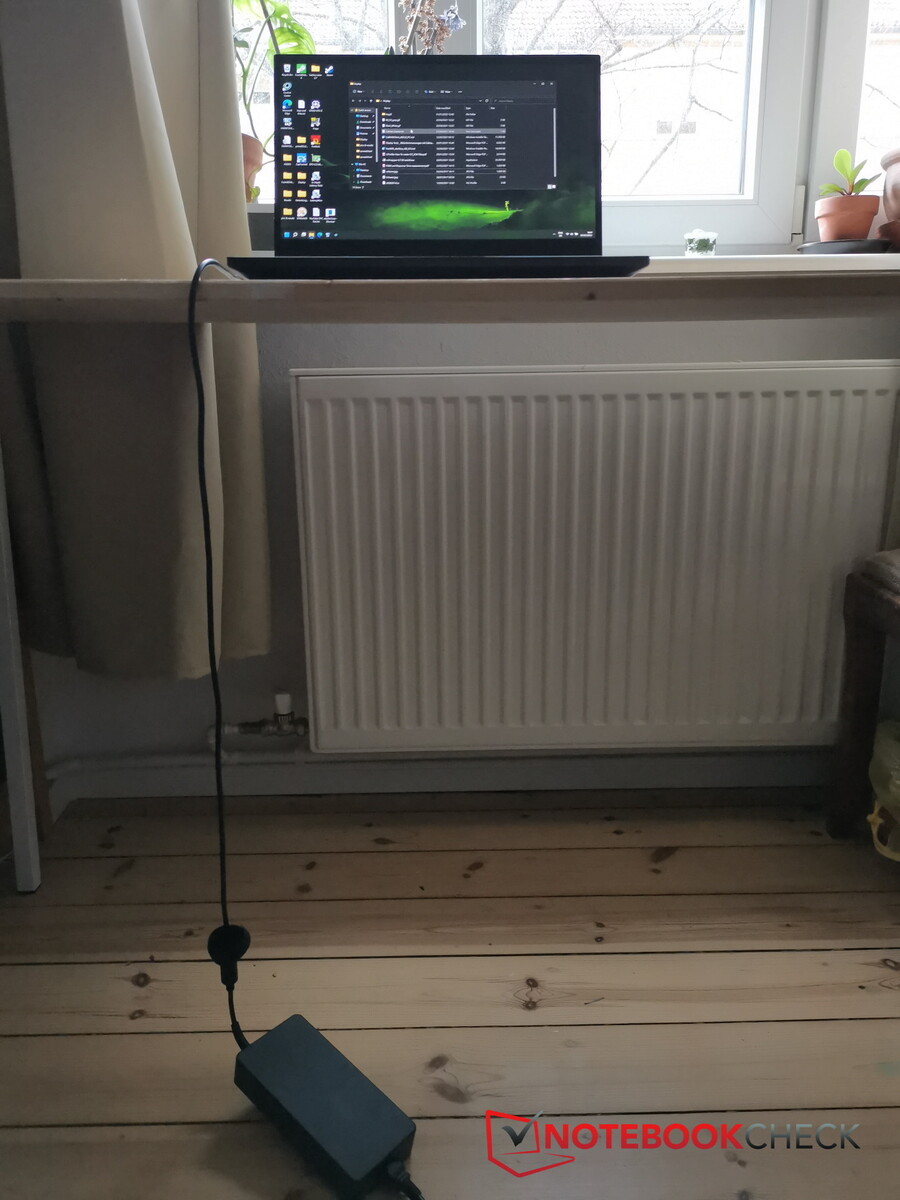
关于电源的问题。从电源到笔记本电脑的电缆非常短,因此很烦人。如果你有一张稍高的桌子,并且不得不把电缆从桌子前面拉到笔记本端口的后面,那么电源就会悬在空中,紧得非常恼人。如果能有一条稍长的电缆就更好了。
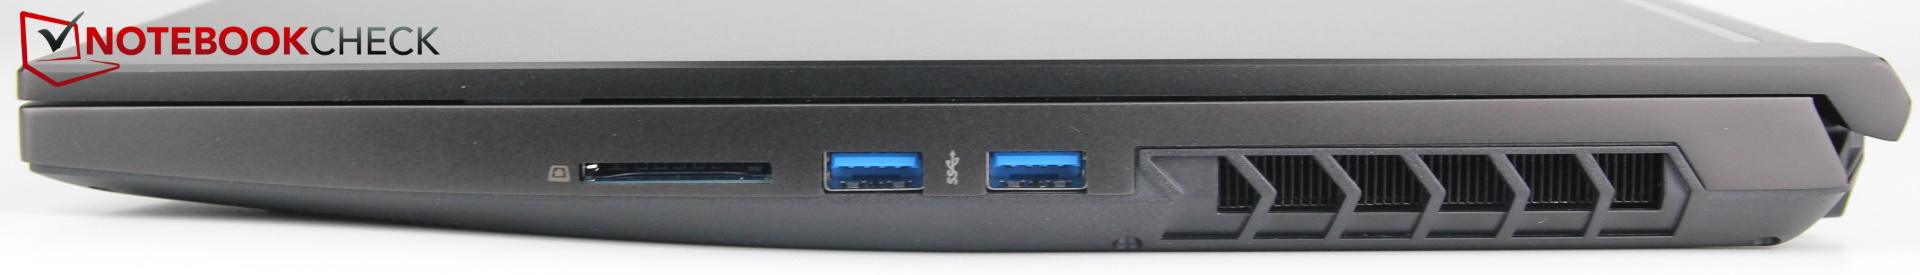
SD卡阅读器
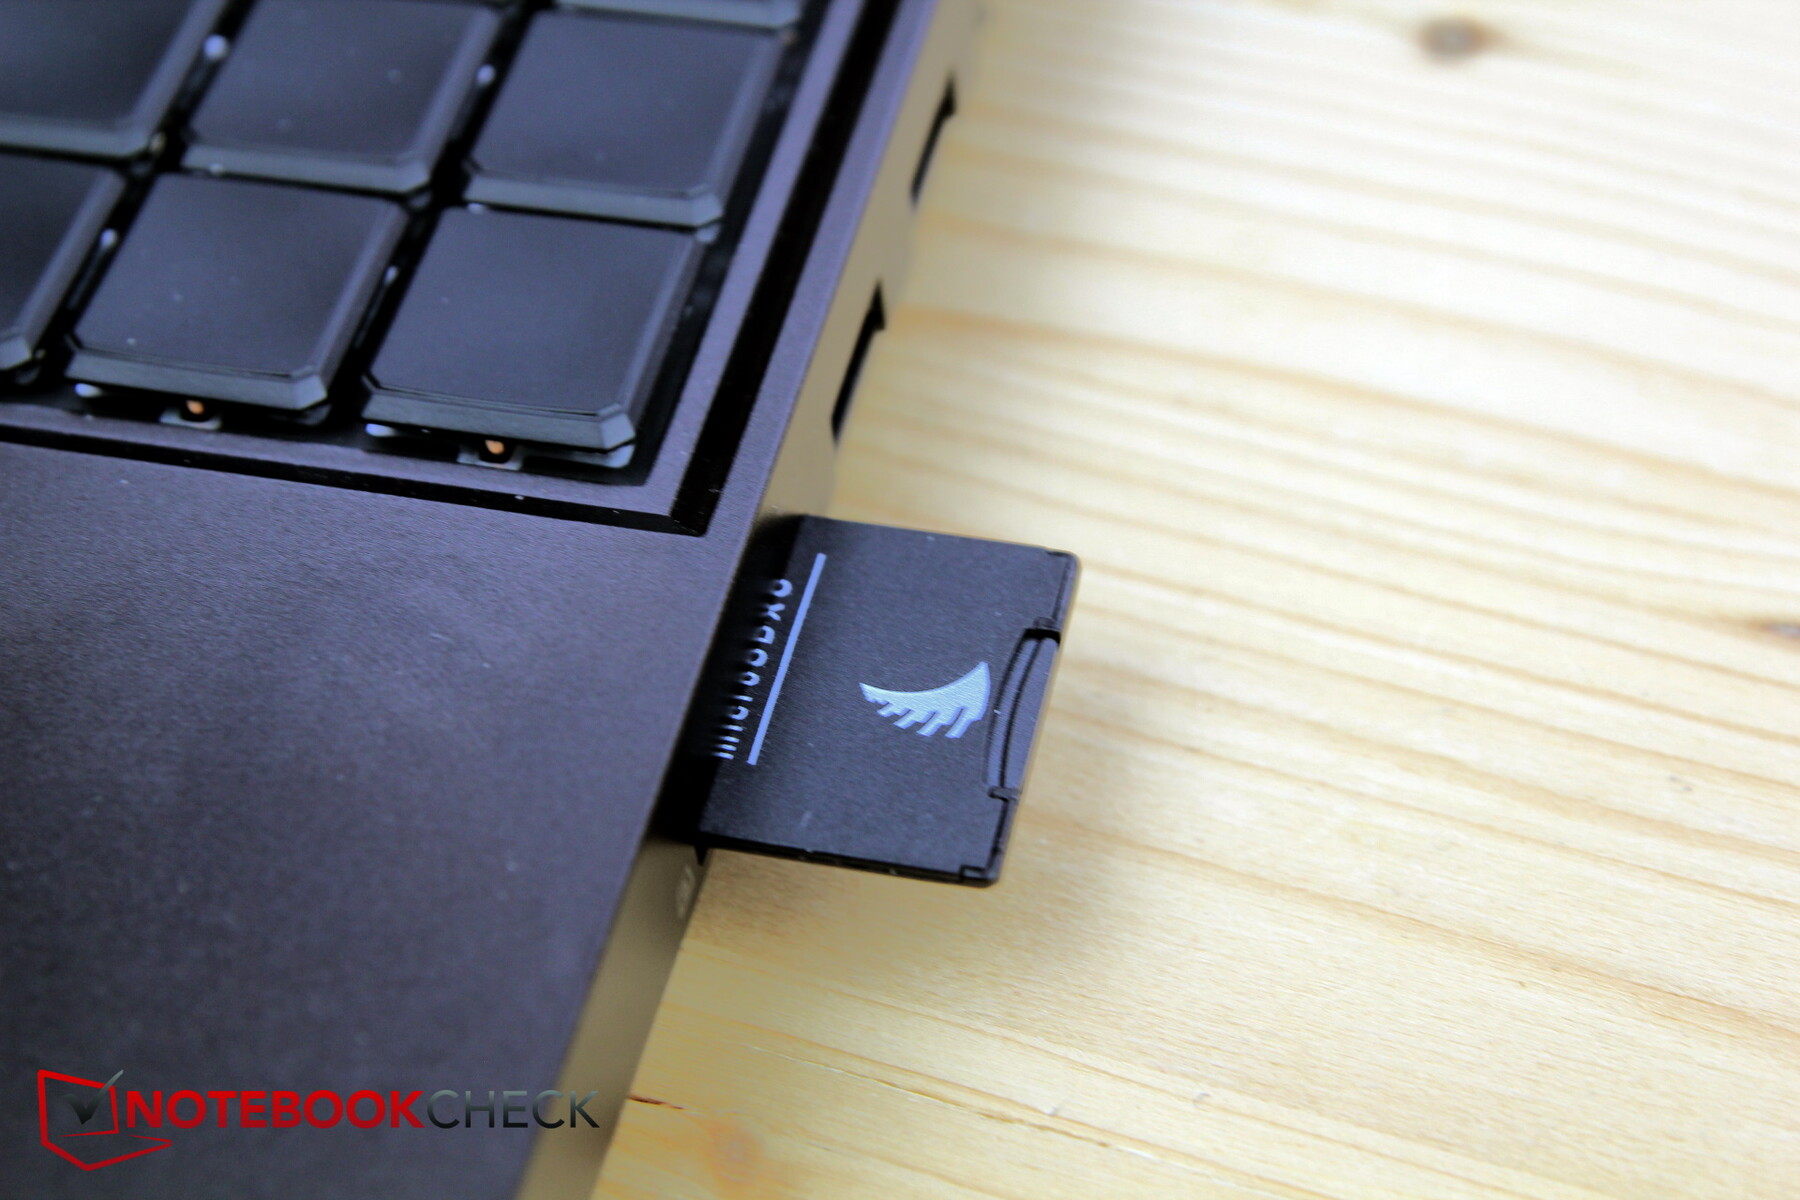
所安装的SD读卡器至少在两代中是较慢的型号之一。该级别的平均速度约为两倍--如果根本没有安装的话,因为许多竞争厂商甚至不再安装SD读卡器了。
我们的测试卡AV PRO microSD 128 GB V60并没有卡住,而只是插入,并且有一半的卡突出在插槽外。
| SD Card Reader | |
| average JPG Copy Test (av. of 3 runs) | |
| Average of class Gaming (20.9 - 210, n=54, last 2 years) | |
| MSI GE76 Raider (AV PRO microSD 128 GB V60) | |
| Schenker XMG Neo 15 Tiger Lake (AV PRO microSD 128 GB V60) | |
| Schenker XMG Neo 15 E22 (Early 2022, RTX 3080 Ti) | |
| maximum AS SSD Seq Read Test (1GB) | |
| Average of class Gaming (25.5 - 261, n=51, last 2 years) | |
| Schenker XMG Neo 15 Tiger Lake (AV PRO microSD 128 GB V60) | |
| Schenker XMG Neo 15 E22 (Early 2022, RTX 3080 Ti) | |
沟通
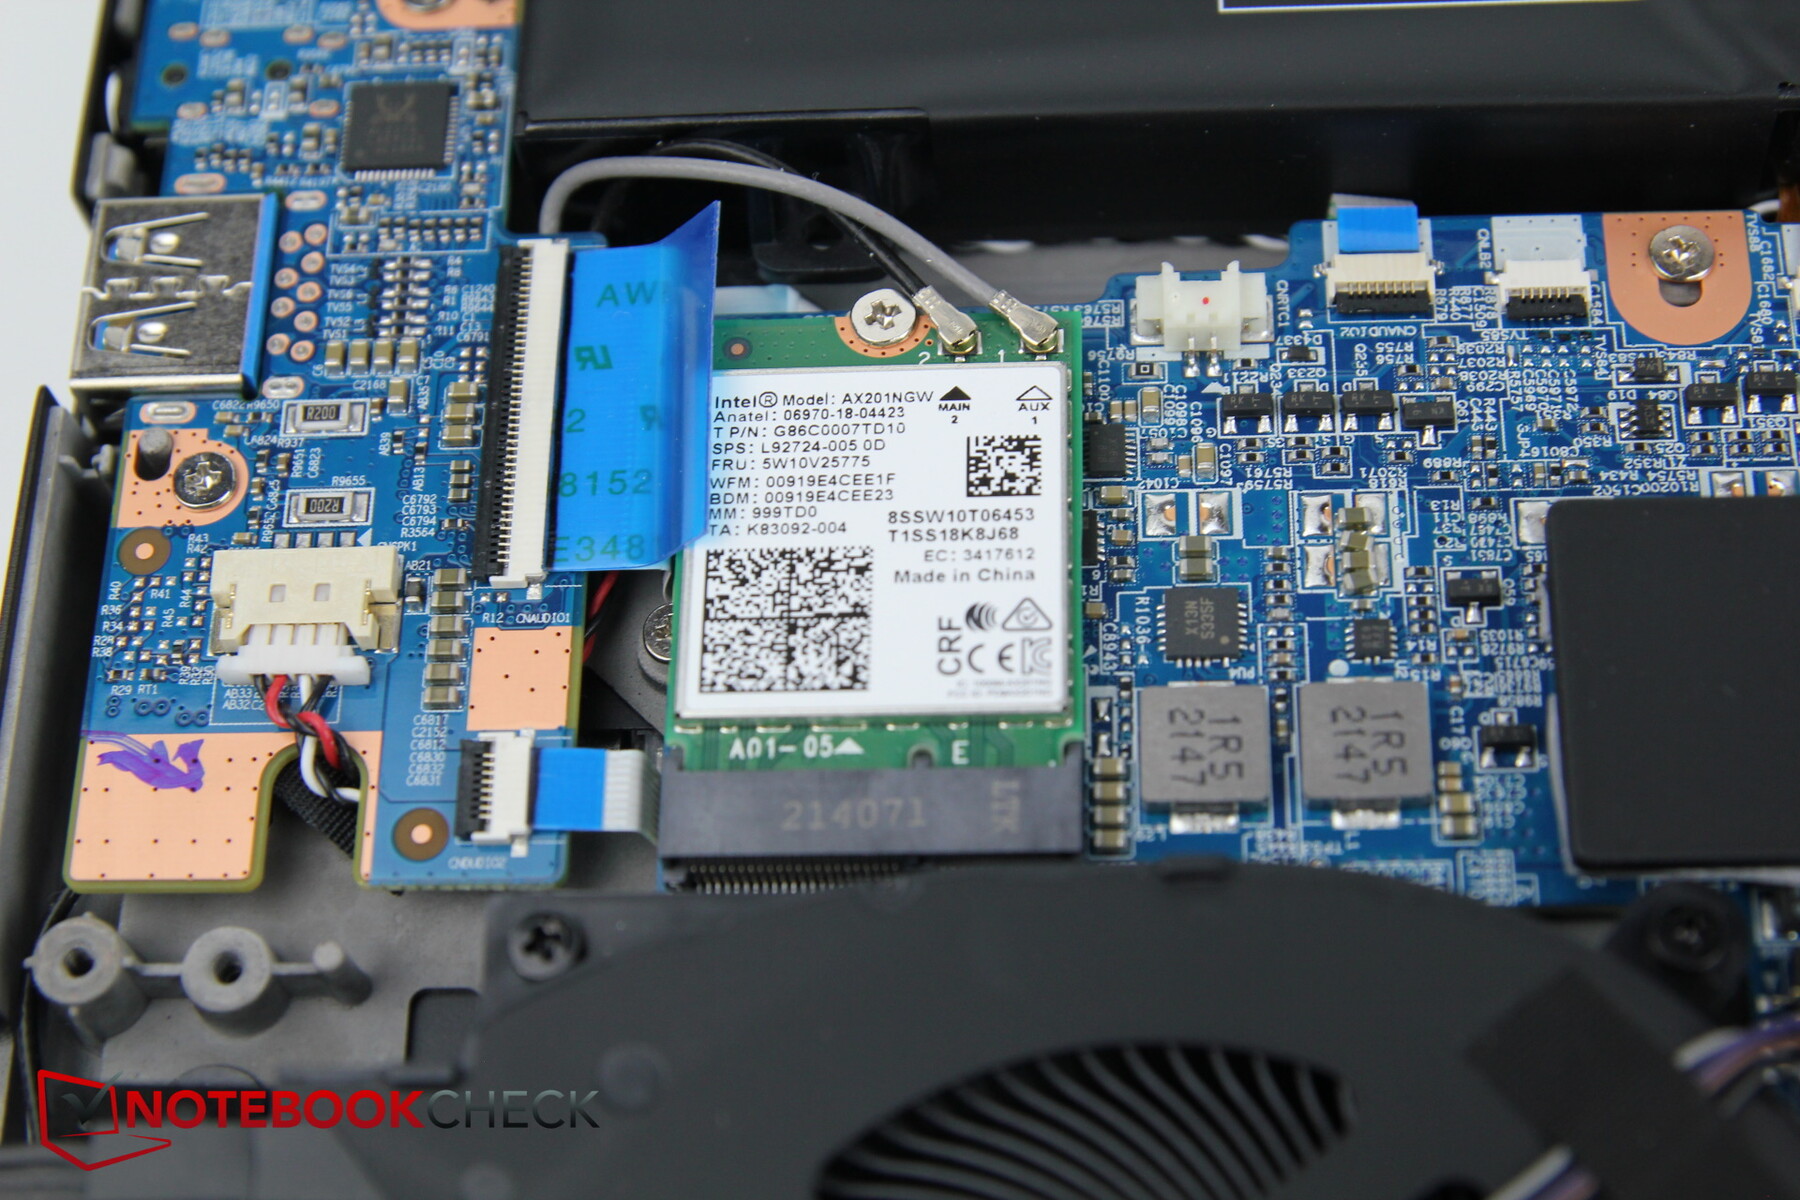
英特尔AX201是与前代产品相同的WLAN模块,需要时可以换掉。
然而,我们测得的传输速率略低于1GBit/s,而前代产品达到了1.5GBit/s以上。这是否可以通过驱动更新进行优化,还有待观察。
| Networking | |
| iperf3 transmit AX12 | |
| Schenker XMG Neo 15 Tiger Lake | |
| MSI GE76 Raider | |
| Average Intel Wi-Fi 6 AX201 (49.8 - 1775, n=324) | |
| Razer Blade 15 Advanced (Mid 2021) | |
| Schenker XMG Neo 15 E22 (Early 2022, RTX 3080 Ti) | |
| Alienware m15 R6, i7-11800H RTX 3080 | |
| Asus ROG Strix Scar 15 G533QS | |
| iperf3 receive AX12 | |
| Schenker XMG Neo 15 Tiger Lake | |
| Razer Blade 15 Advanced (Mid 2021) | |
| Average Intel Wi-Fi 6 AX201 (136 - 1743, n=324) | |
| MSI GE76 Raider | |
| Alienware m15 R6, i7-11800H RTX 3080 | |
| Schenker XMG Neo 15 E22 (Early 2022, RTX 3080 Ti) | |
| Asus ROG Strix Scar 15 G533QS | |
网络摄像头
申克公司安装了一个全高清摄像头。色彩偏差还可以,但即使在中等光照条件下,画面仍然非常嘈杂,看起来很冲。

 GeForce RTX 3080 Ti Laptop GPU, i7-12700H, Samsung SSD 980 Pro 250GB MZ-V8P250BW")
 GeForce RTX 3080 Ti Laptop GPU, i7-12700H, Samsung SSD 980 Pro 250GB MZ-V8P250BW")
安全问题
一个Kensington锁端口和一个TPM 2.0芯片都是可用的。然而,缺少一个指纹传感器。
辅料
由于这是一个预生产的模型,所以还不能对配件做出任何声明。按照Schenker的典型做法,应该包括驱动光盘和U盘。在评论中经常提到的XMG Oasis,可以额外购买199欧元(约199美元)。
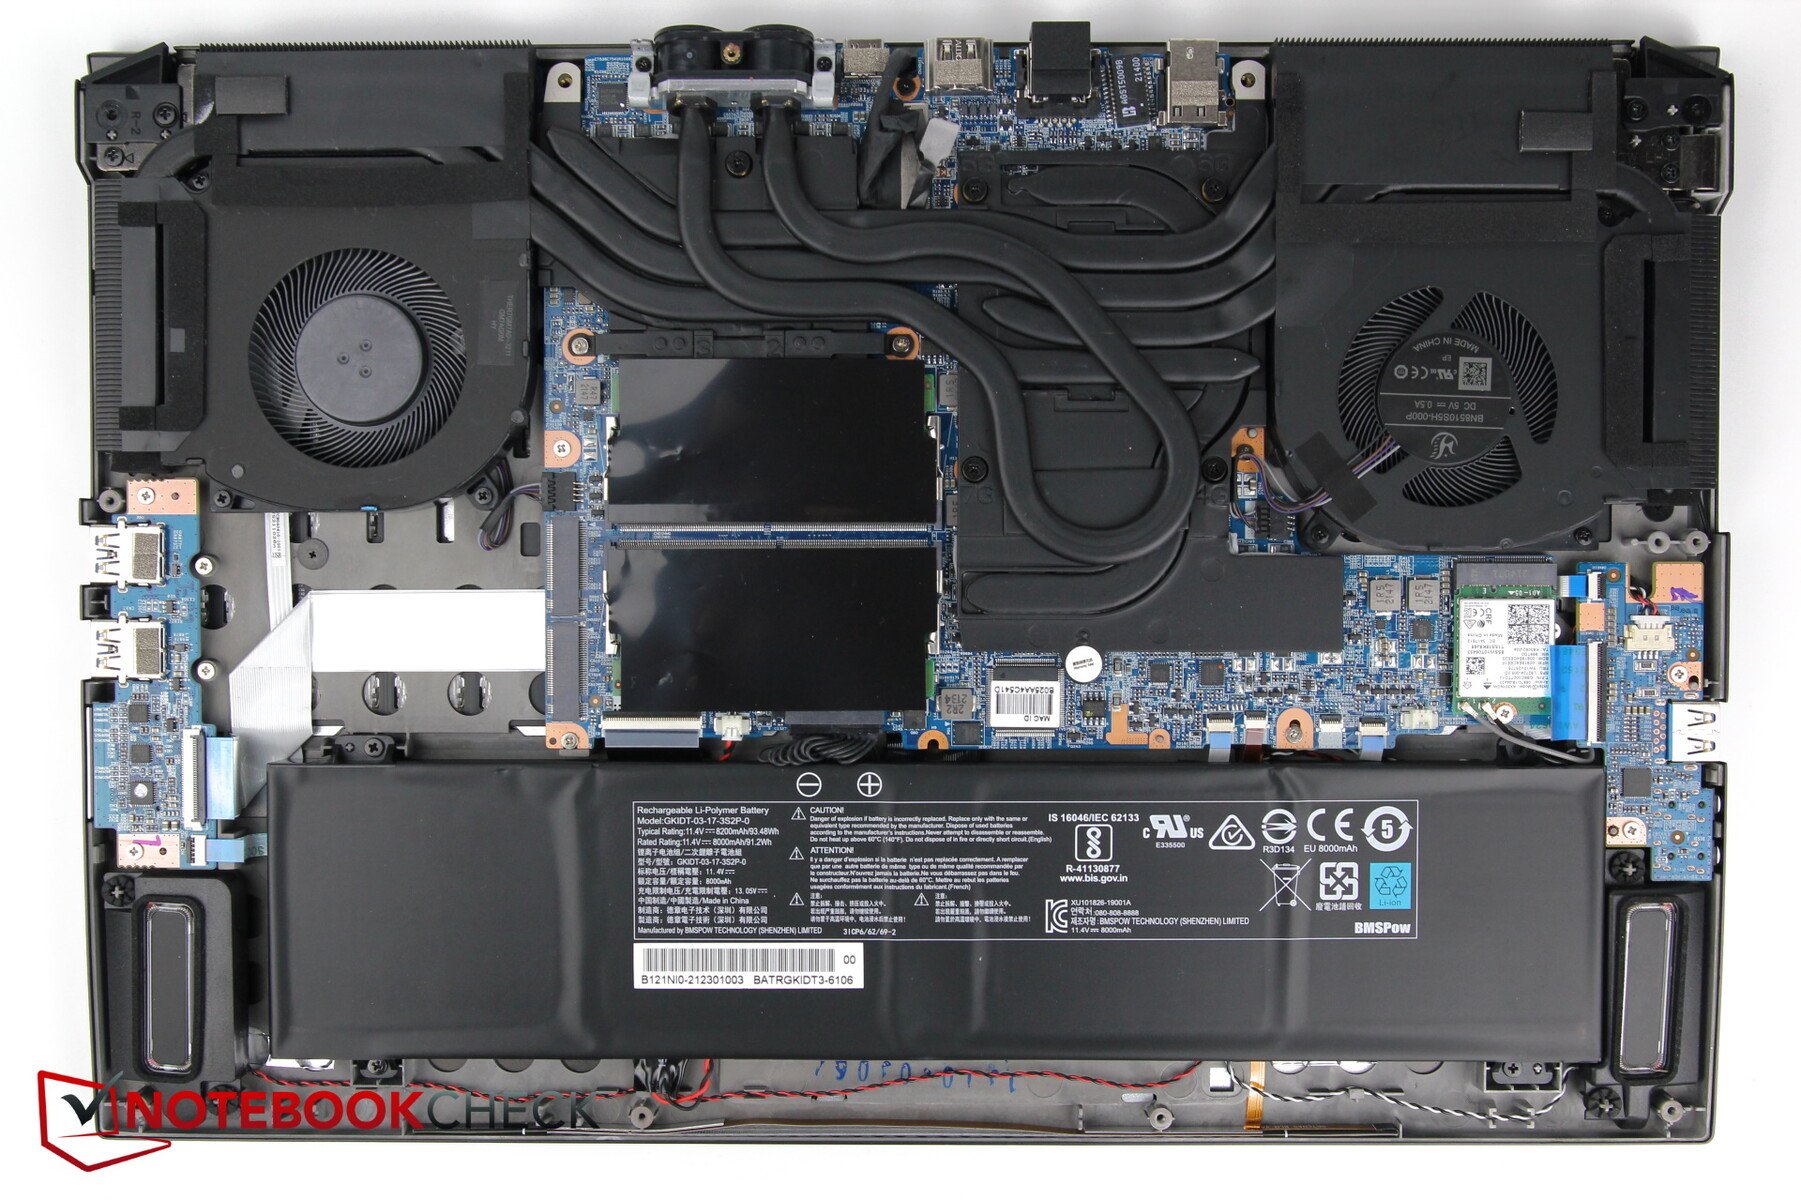
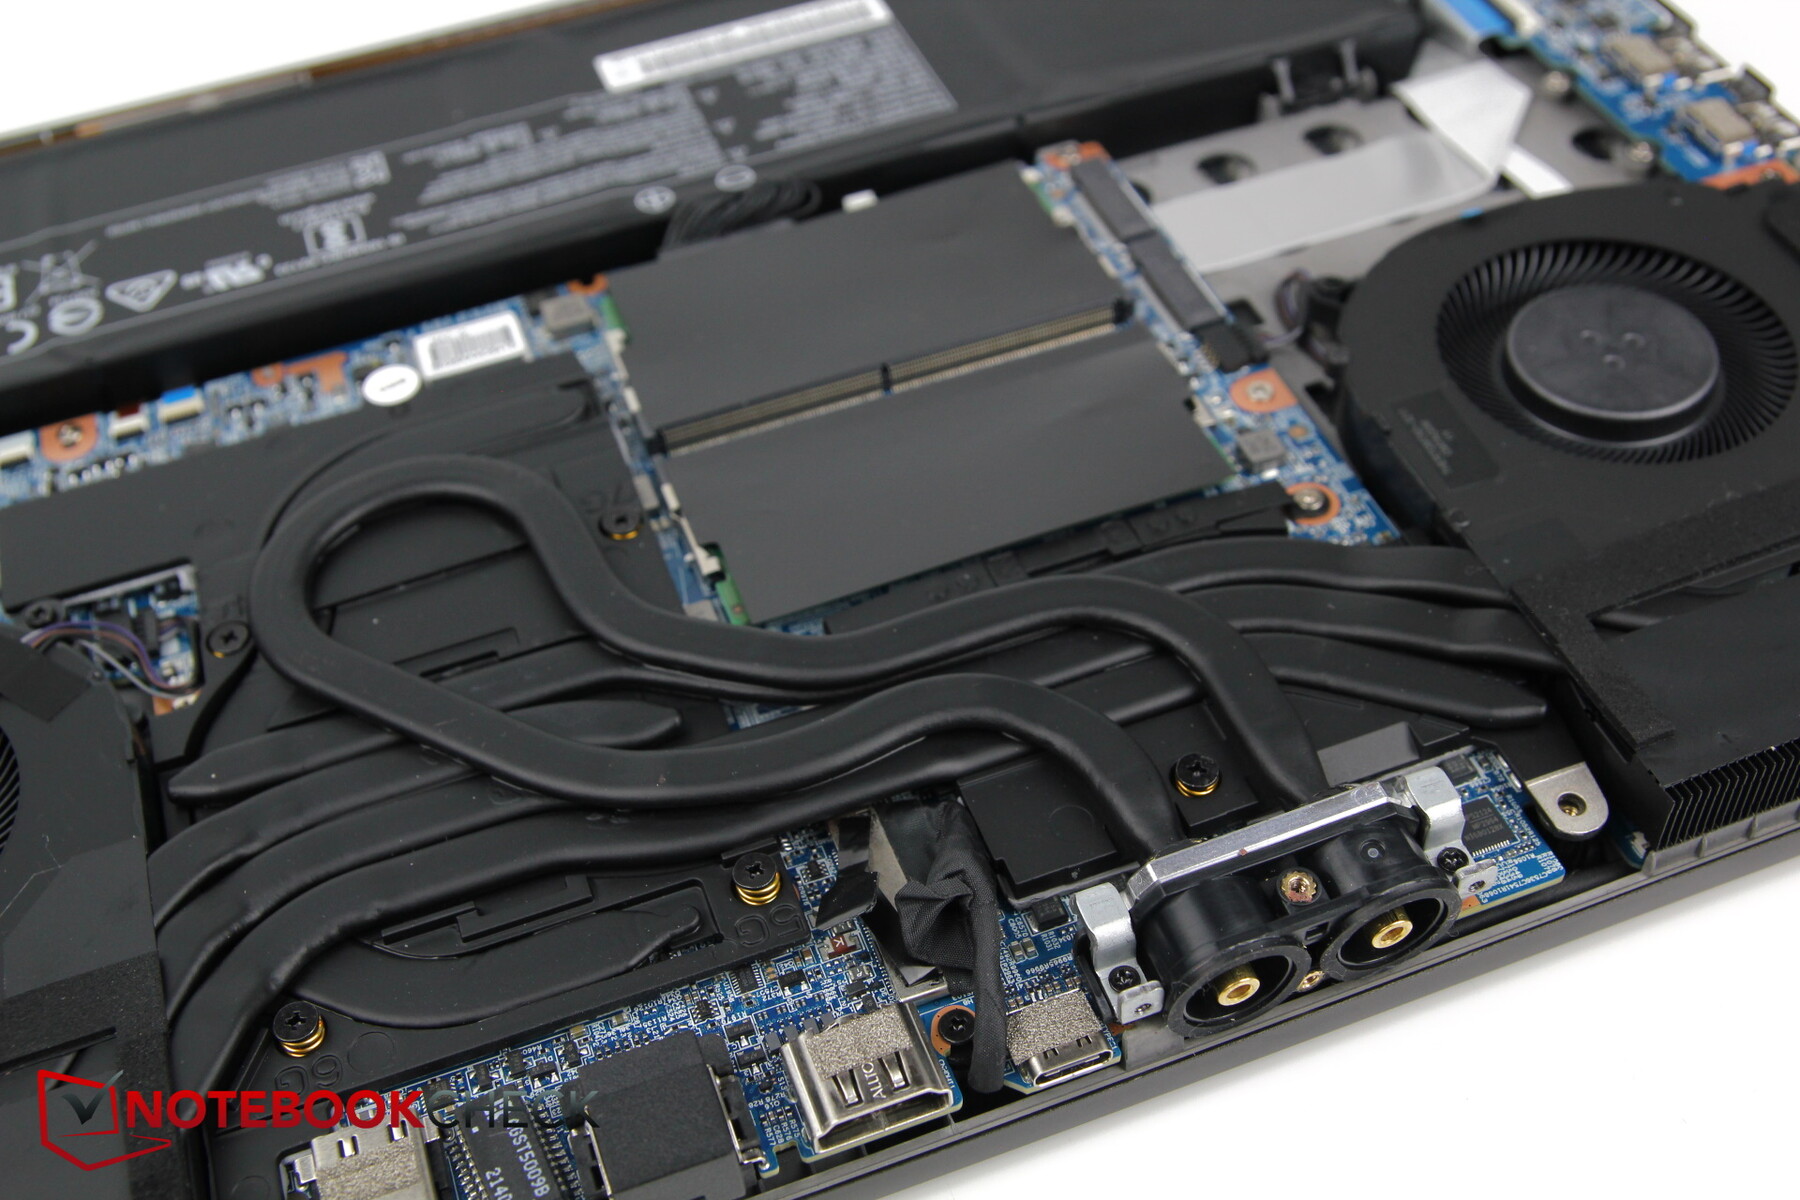
维护
整体维护相当简单。水冷系统只需要再卸下四个十字螺丝(共14个)。之后,机箱可以比较容易地被撬开。
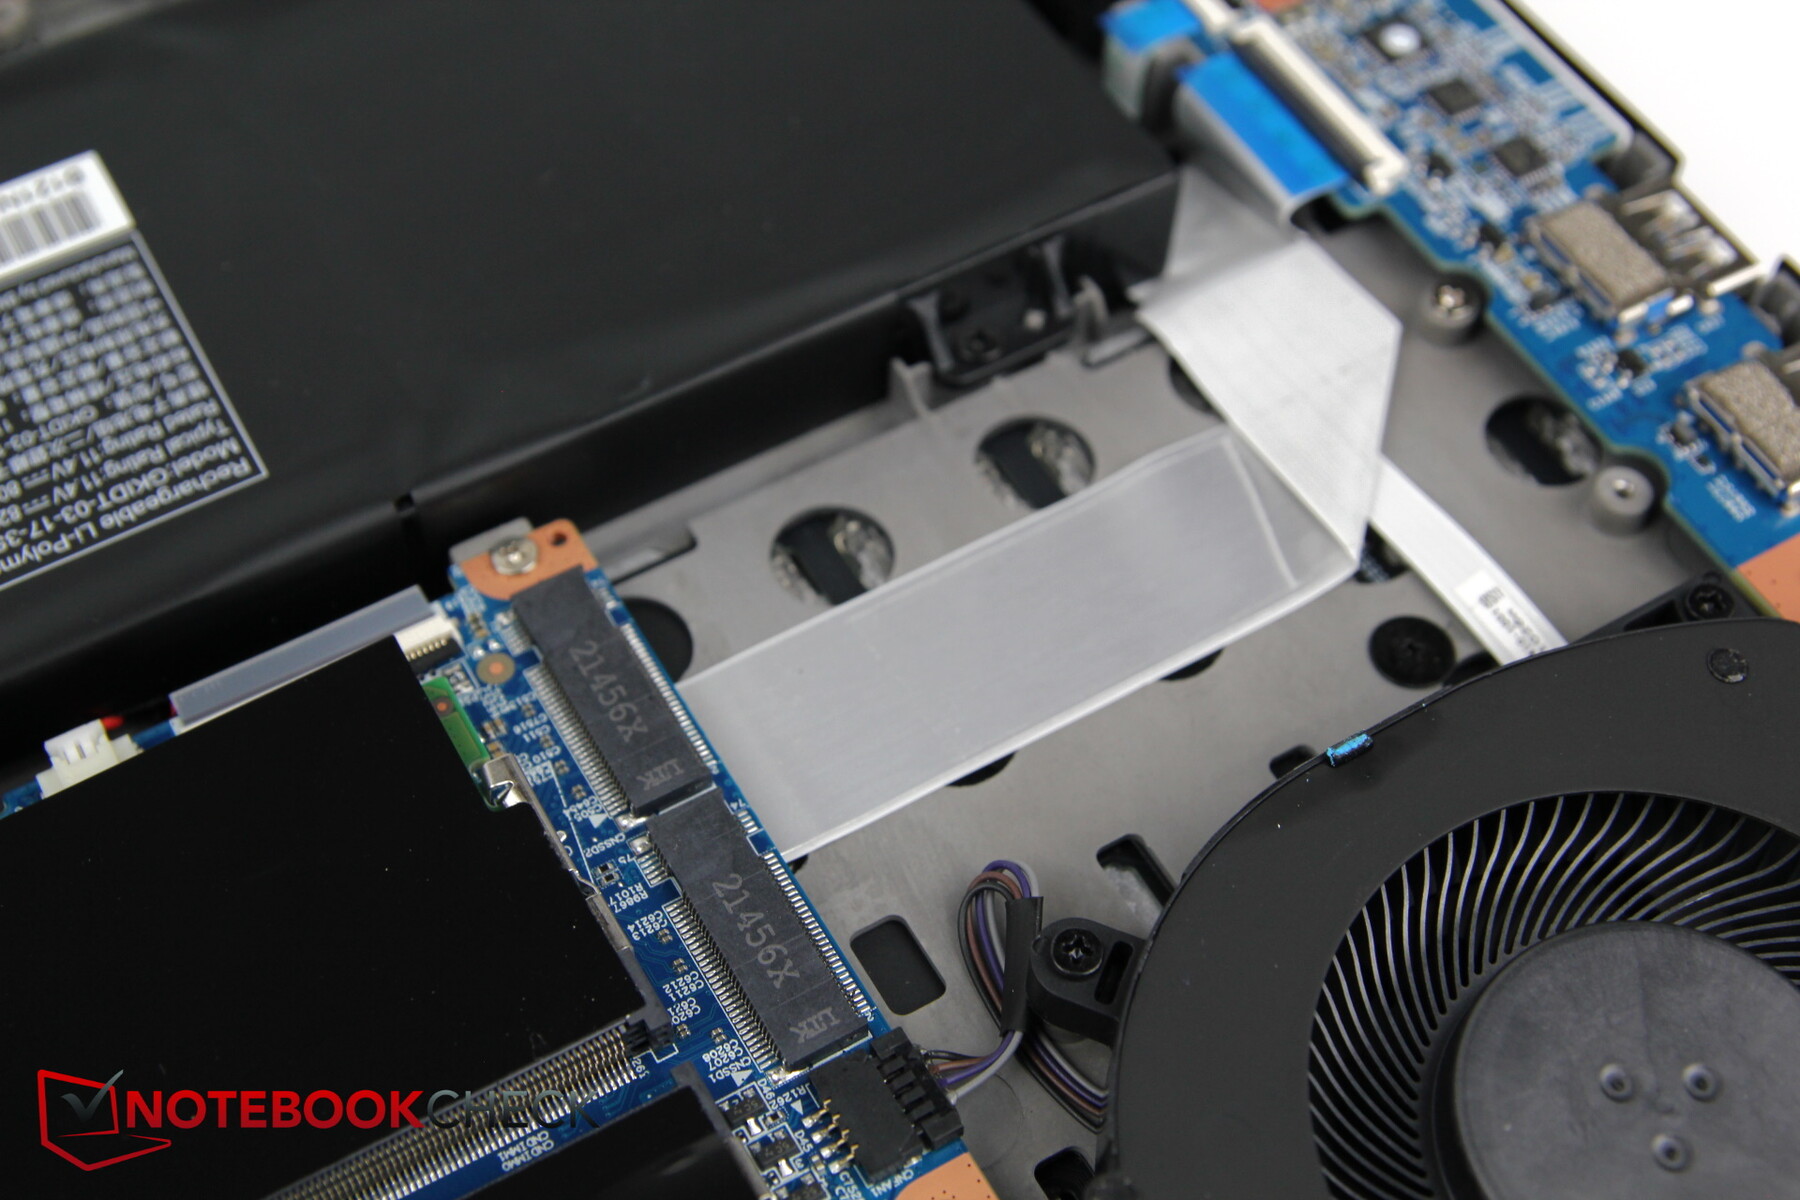
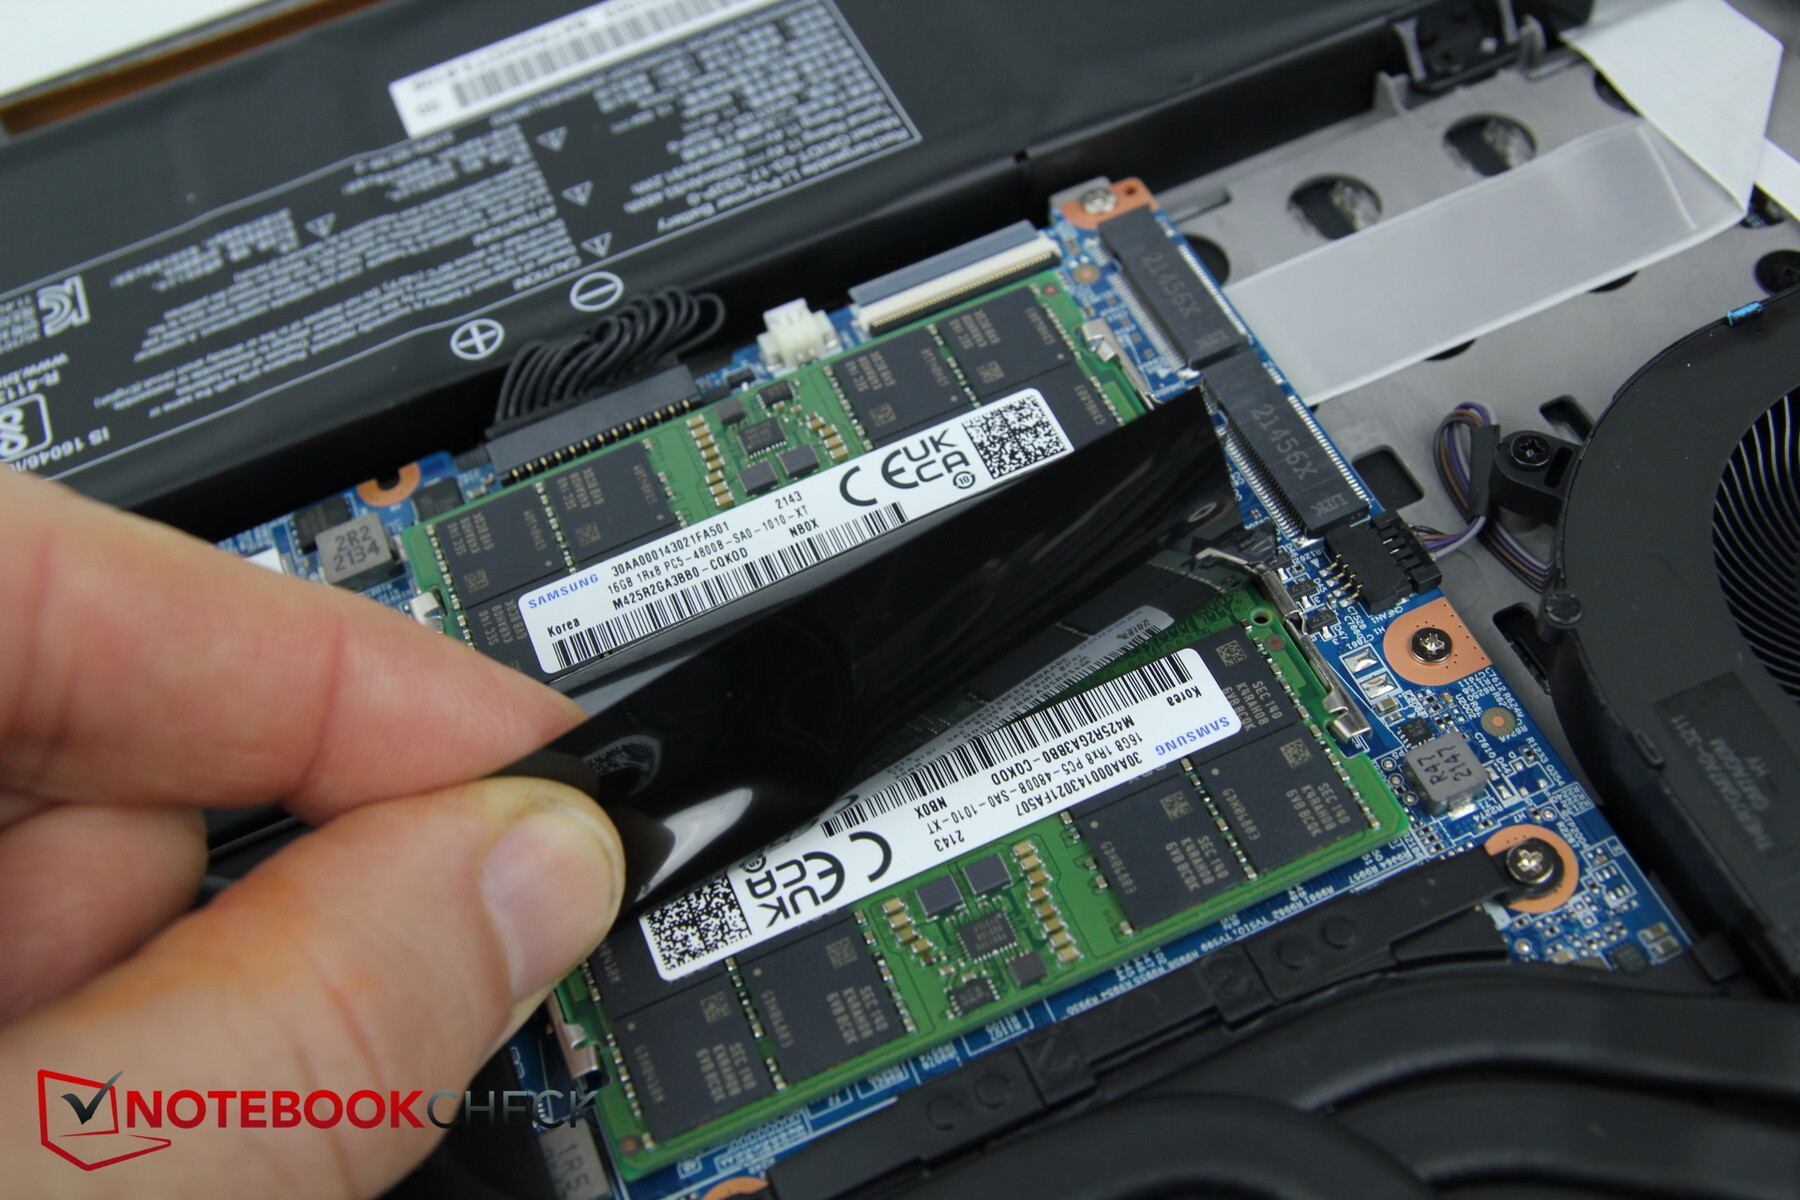
风扇、包括水路在内的热管、两条内存和M.2固态硬盘插槽以及Wi-Fi模块都可以接触到。这也表明,如果该型号变得流行,为制造商实施有效的、额外的水路是多么容易。
担保
Schenker通常对其笔记本电脑提供两年的保修。
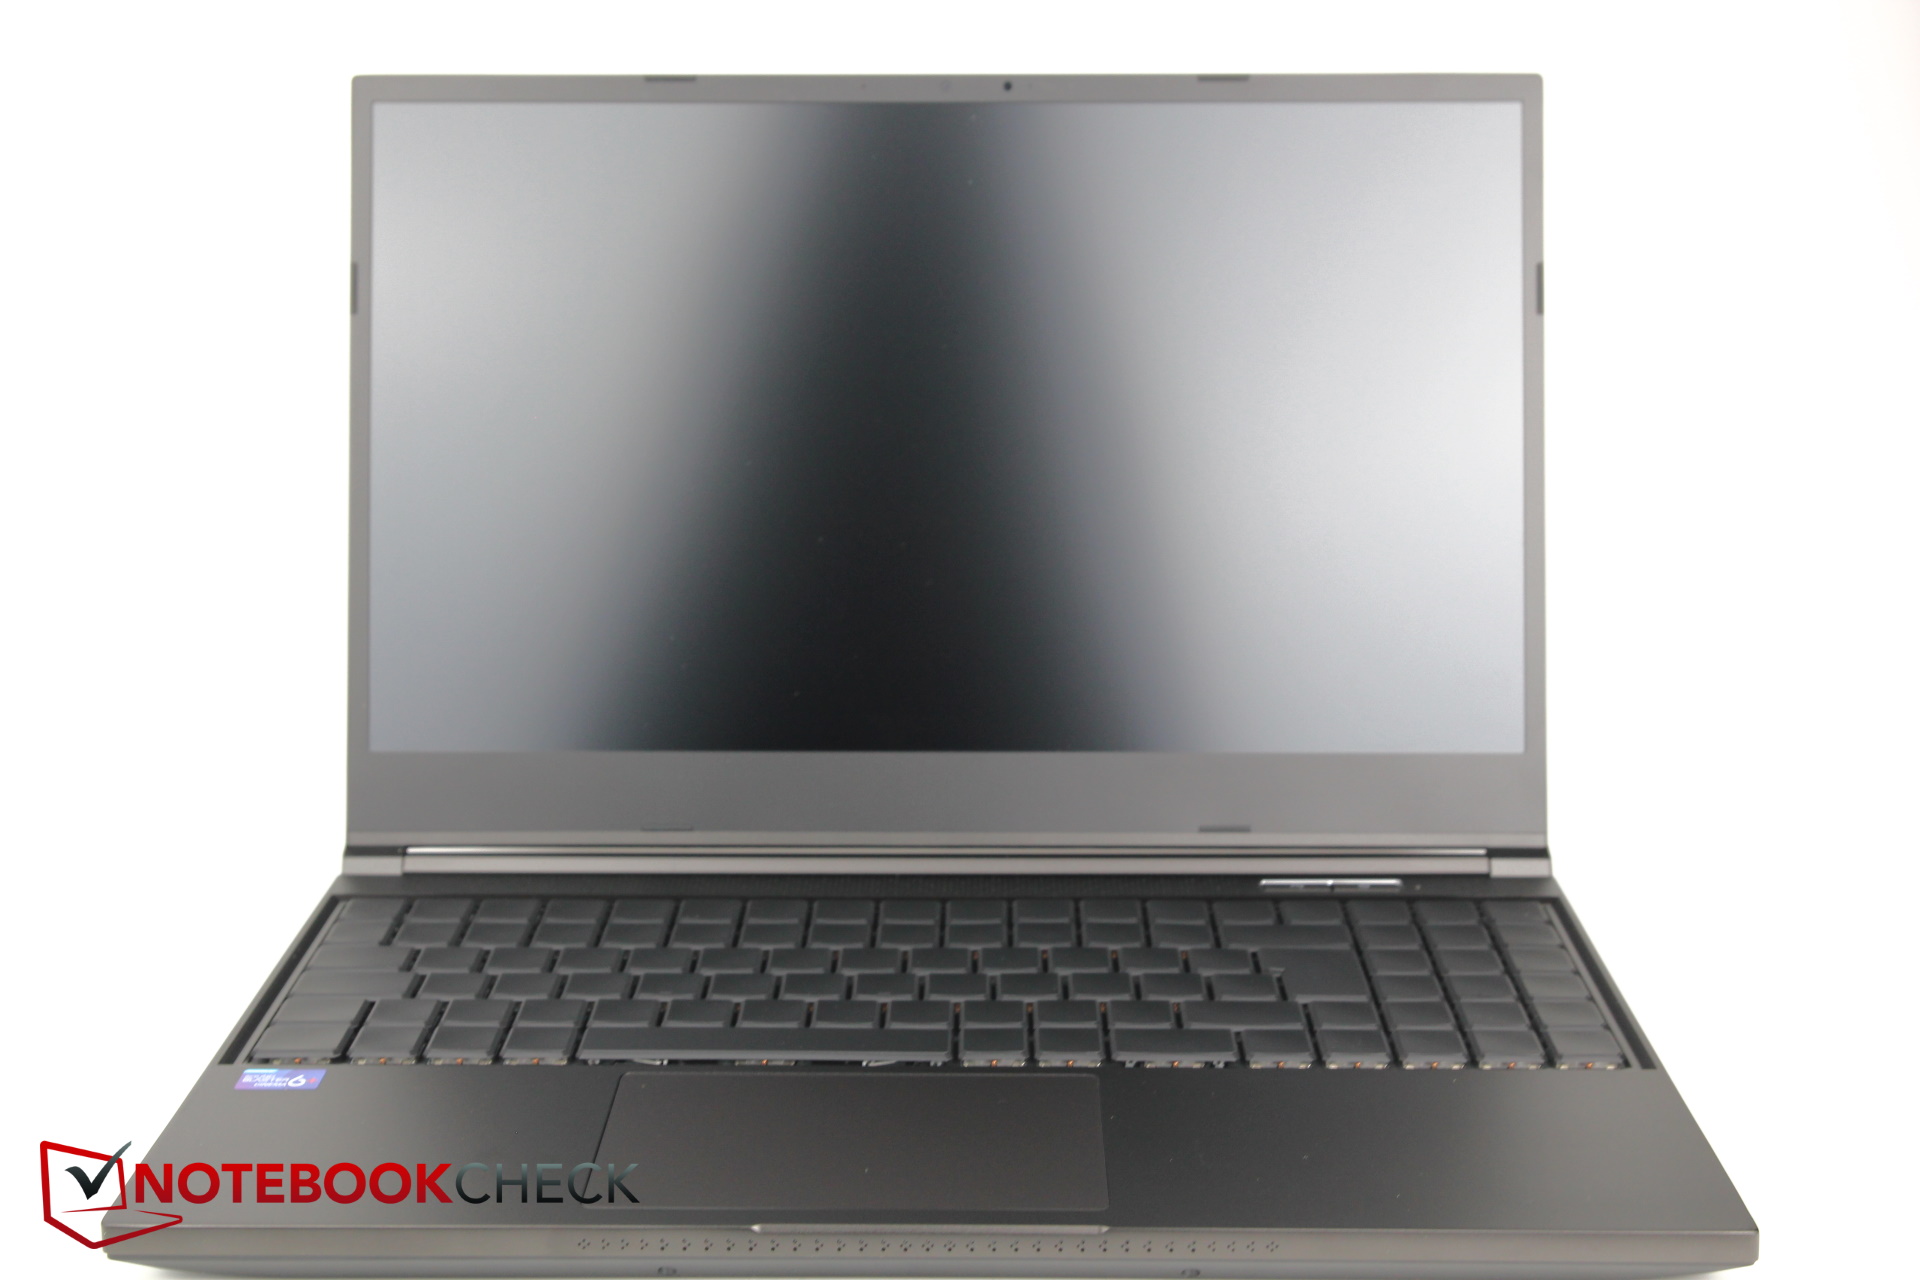
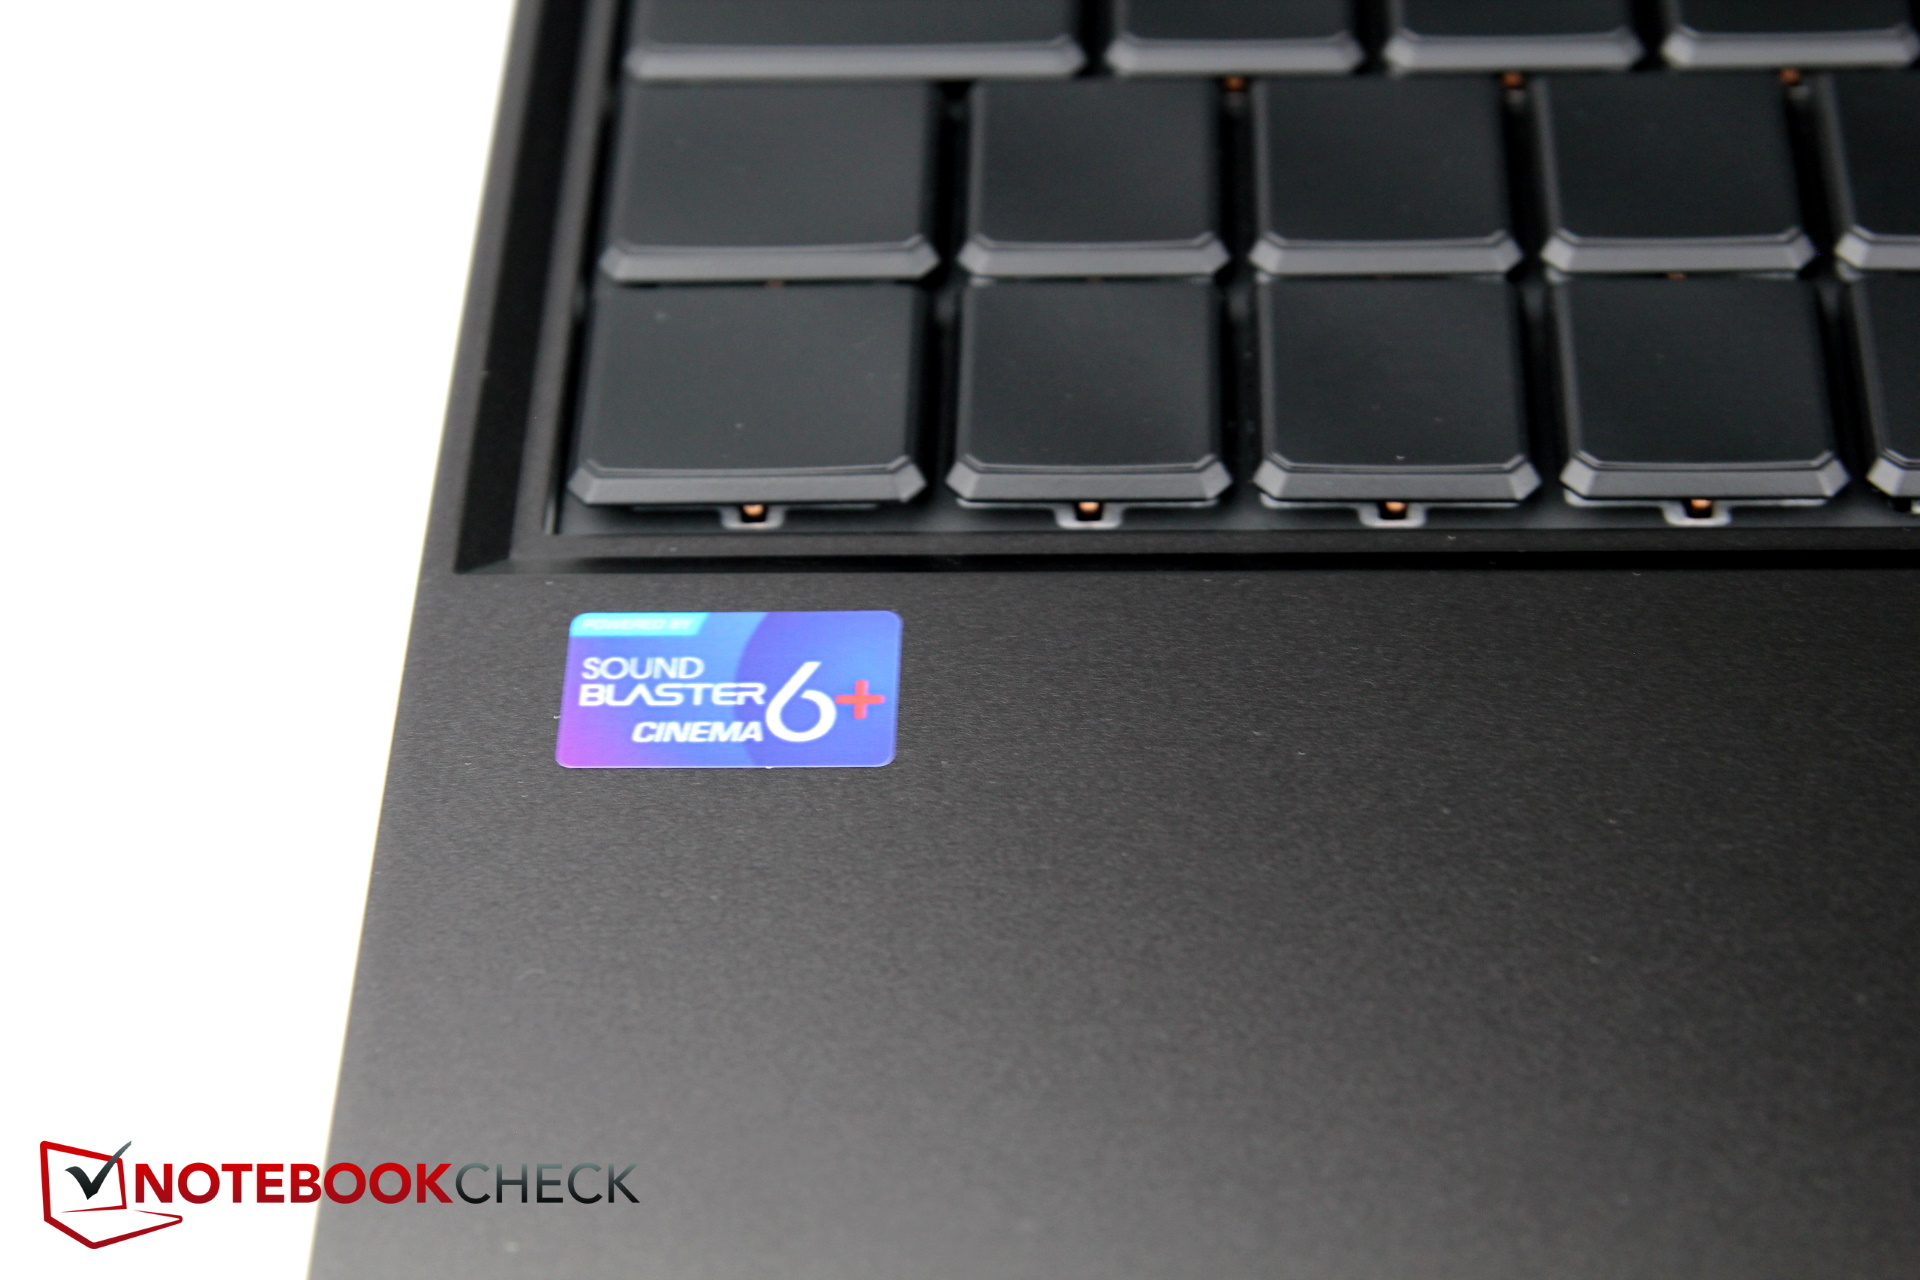
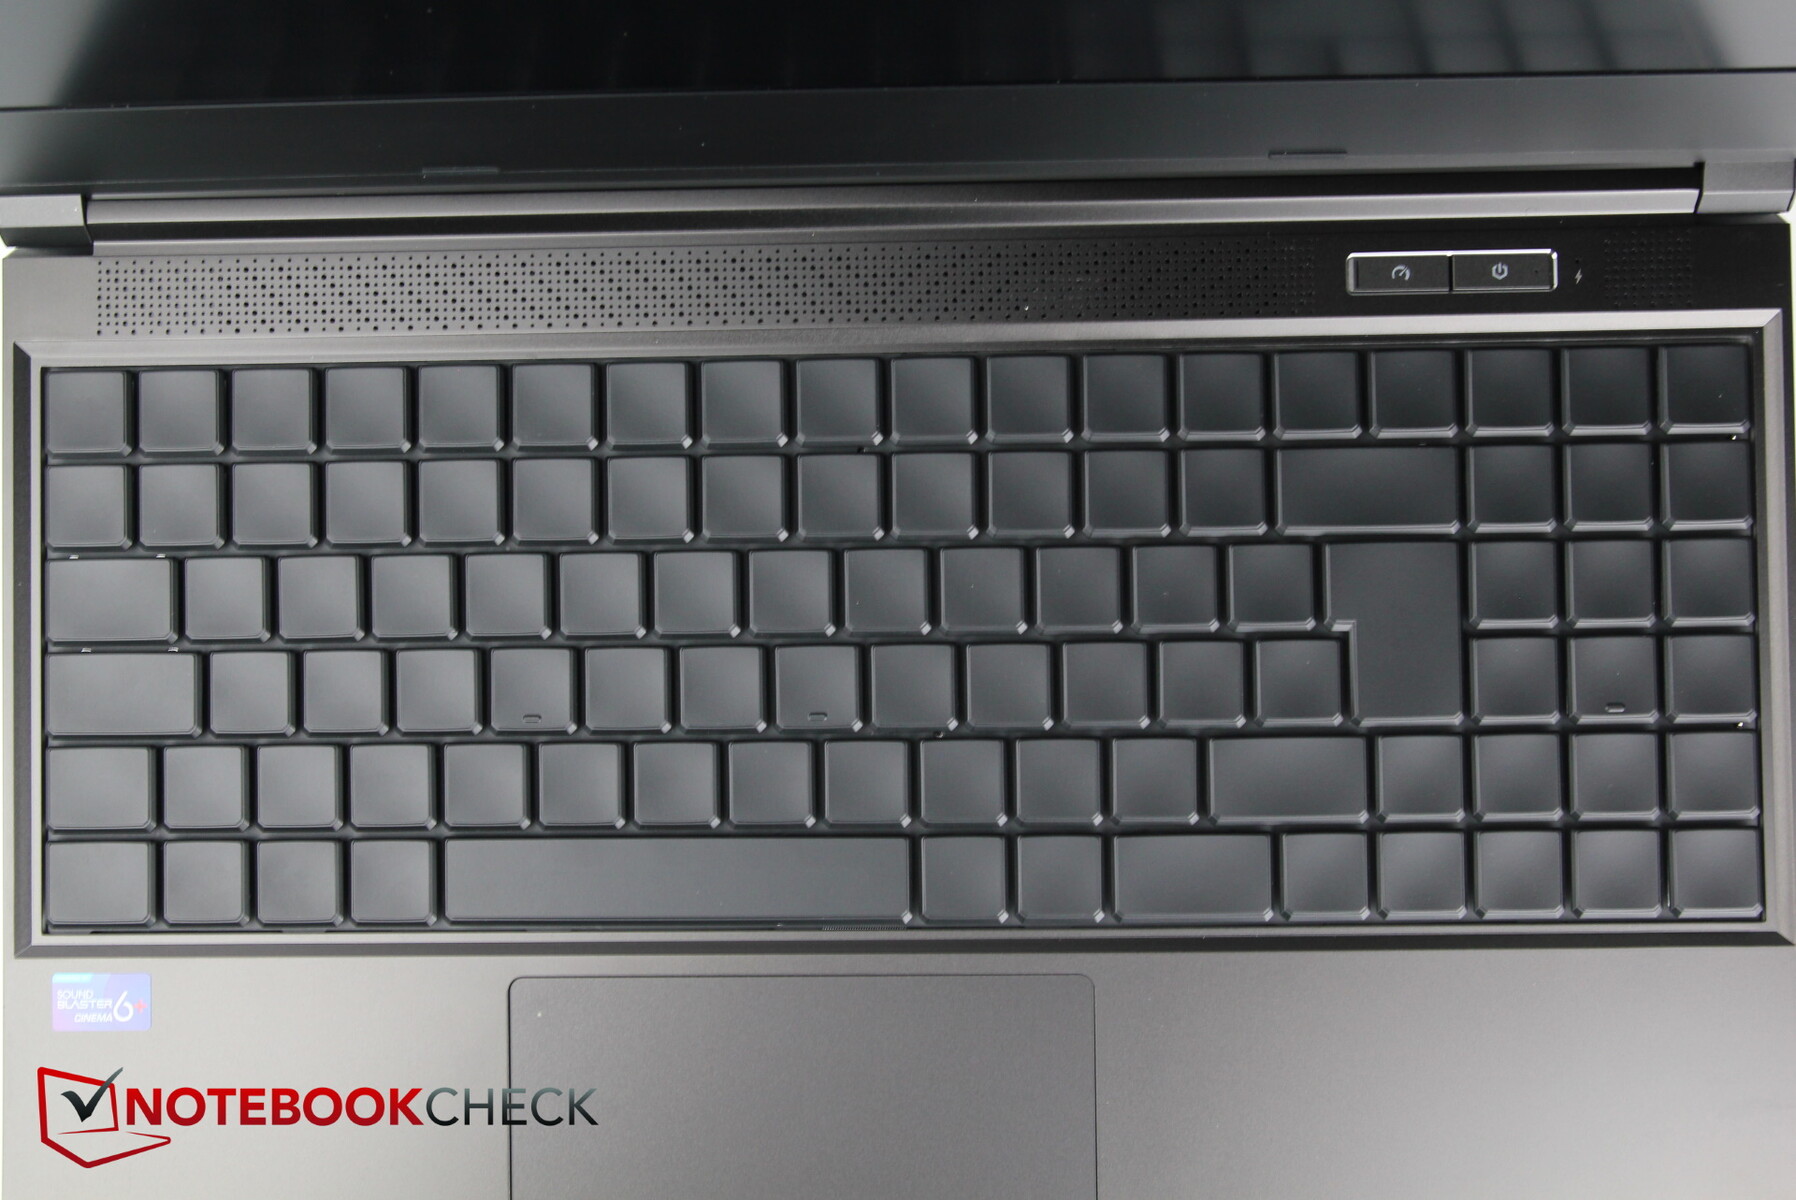
输入设备。光学机械键盘
键盘
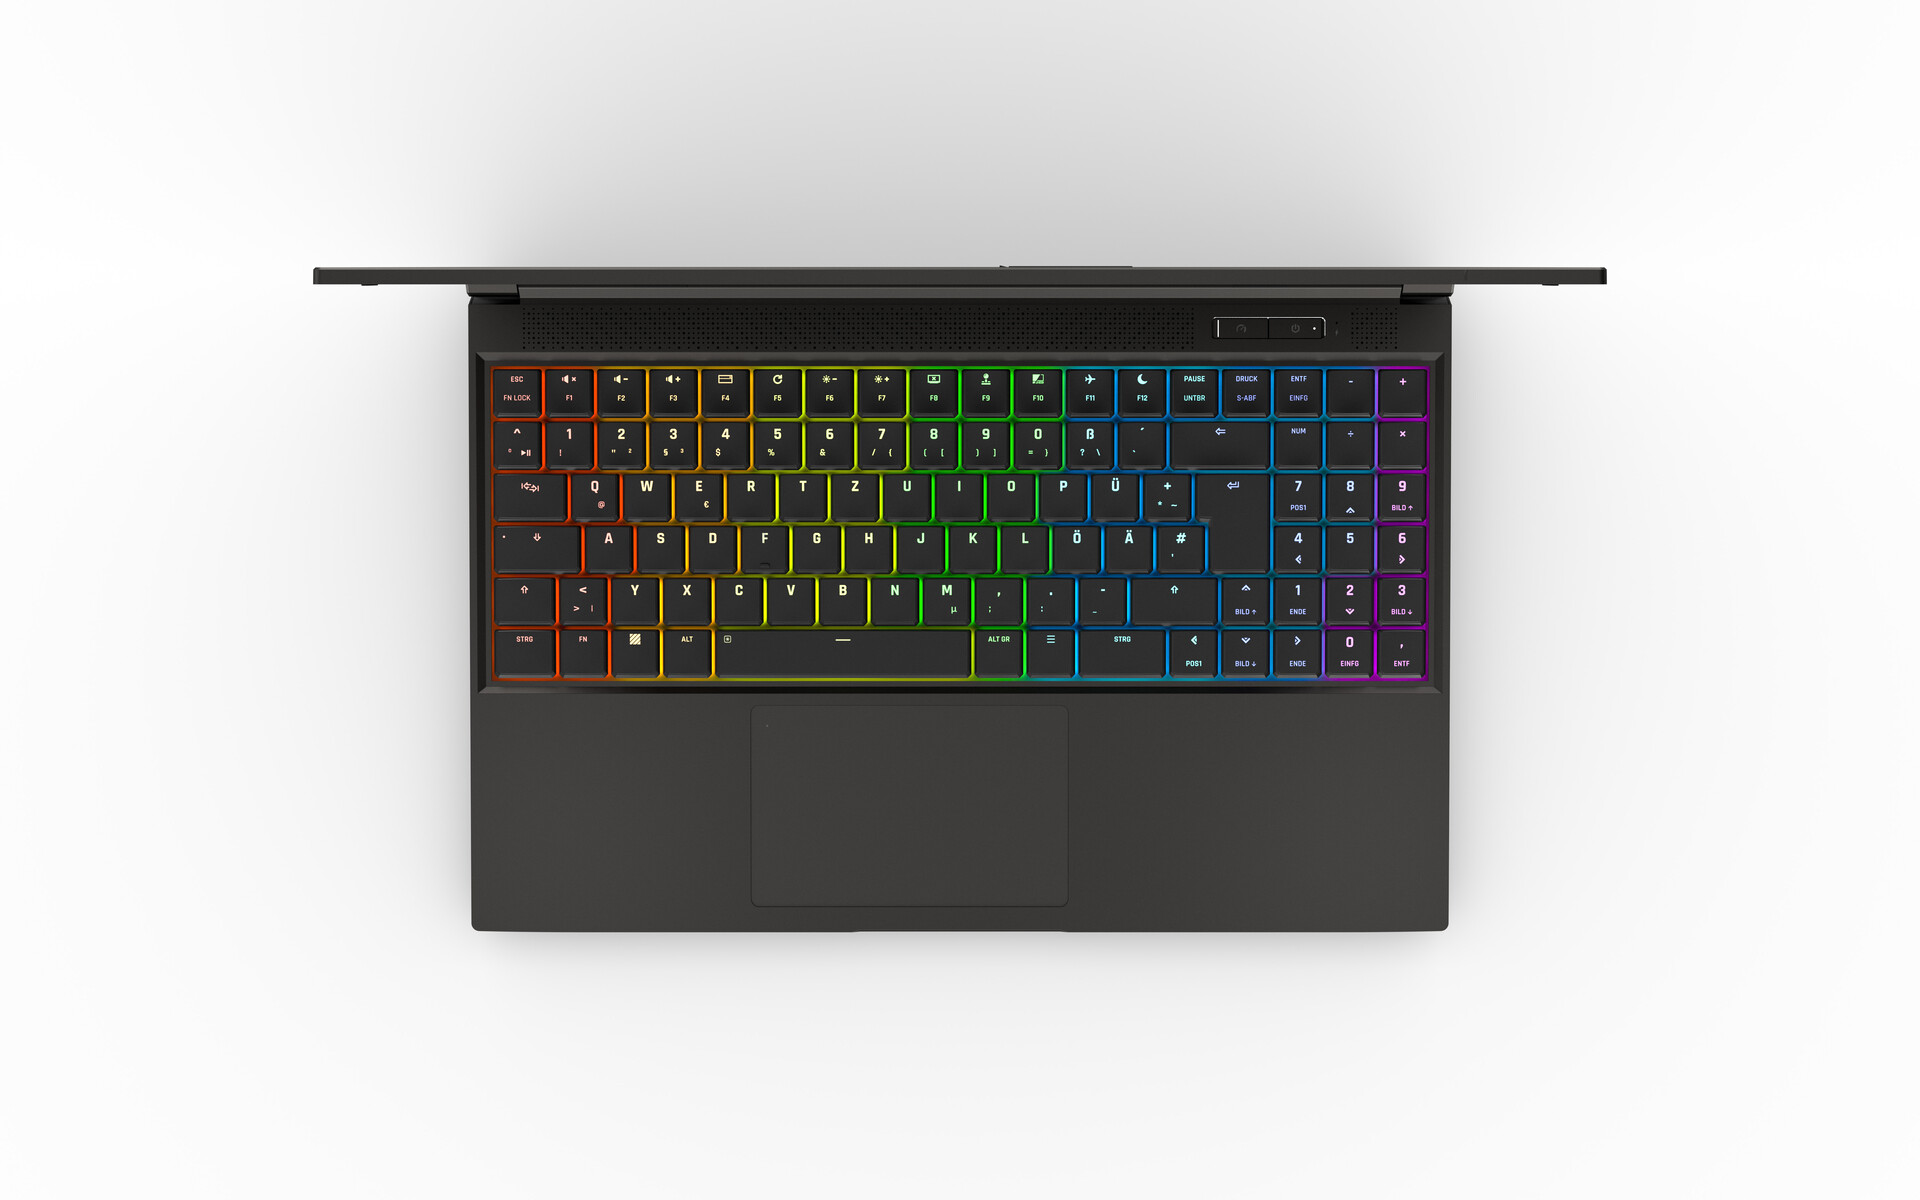
制造商采用了带有RGB单键照明、数字键盘、N键翻转和防鬼怪功能的光学机械键盘。触觉无声开关的行程为2毫米,行程为1毫米。
键的触发在行程开始时有清晰的反馈;打字的感觉很好,速度也很快。
我们的预生产模型带有空白键,所以我们还不能对字体说什么。没有标记的小键盘在右边看起来非常拥挤,而且与键盘的其他部分没有间隙。尽管如此,方向键的大小是正常的,尽管它们在某种程度上被挤在键盘和小键盘之间。
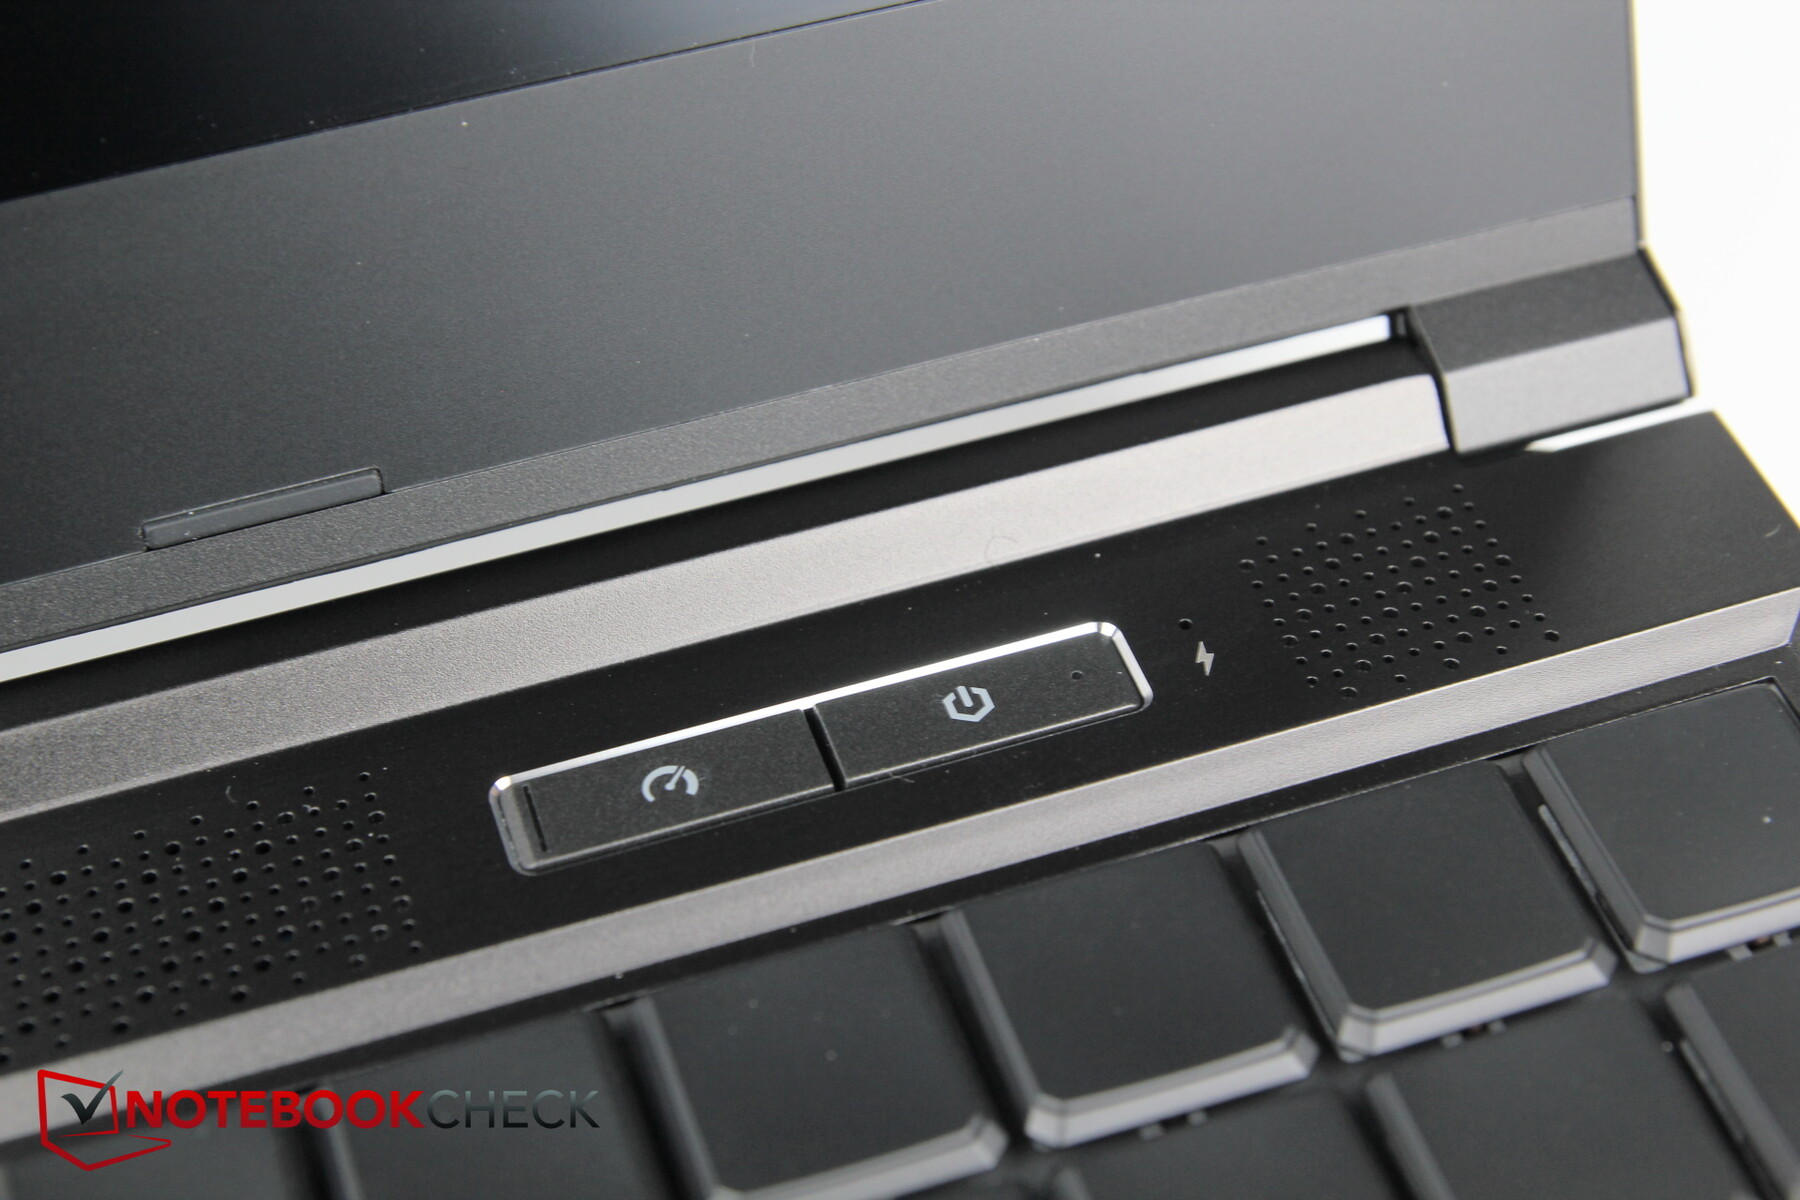
电源开关以及切换各种性能模式的专用开关被整合在键盘的右侧上方。
由于采用了光学机械式开关,噪音比一些比较安静的小键盘略大。然而,它比全尺寸的机械键盘要安静得多。
触摸板
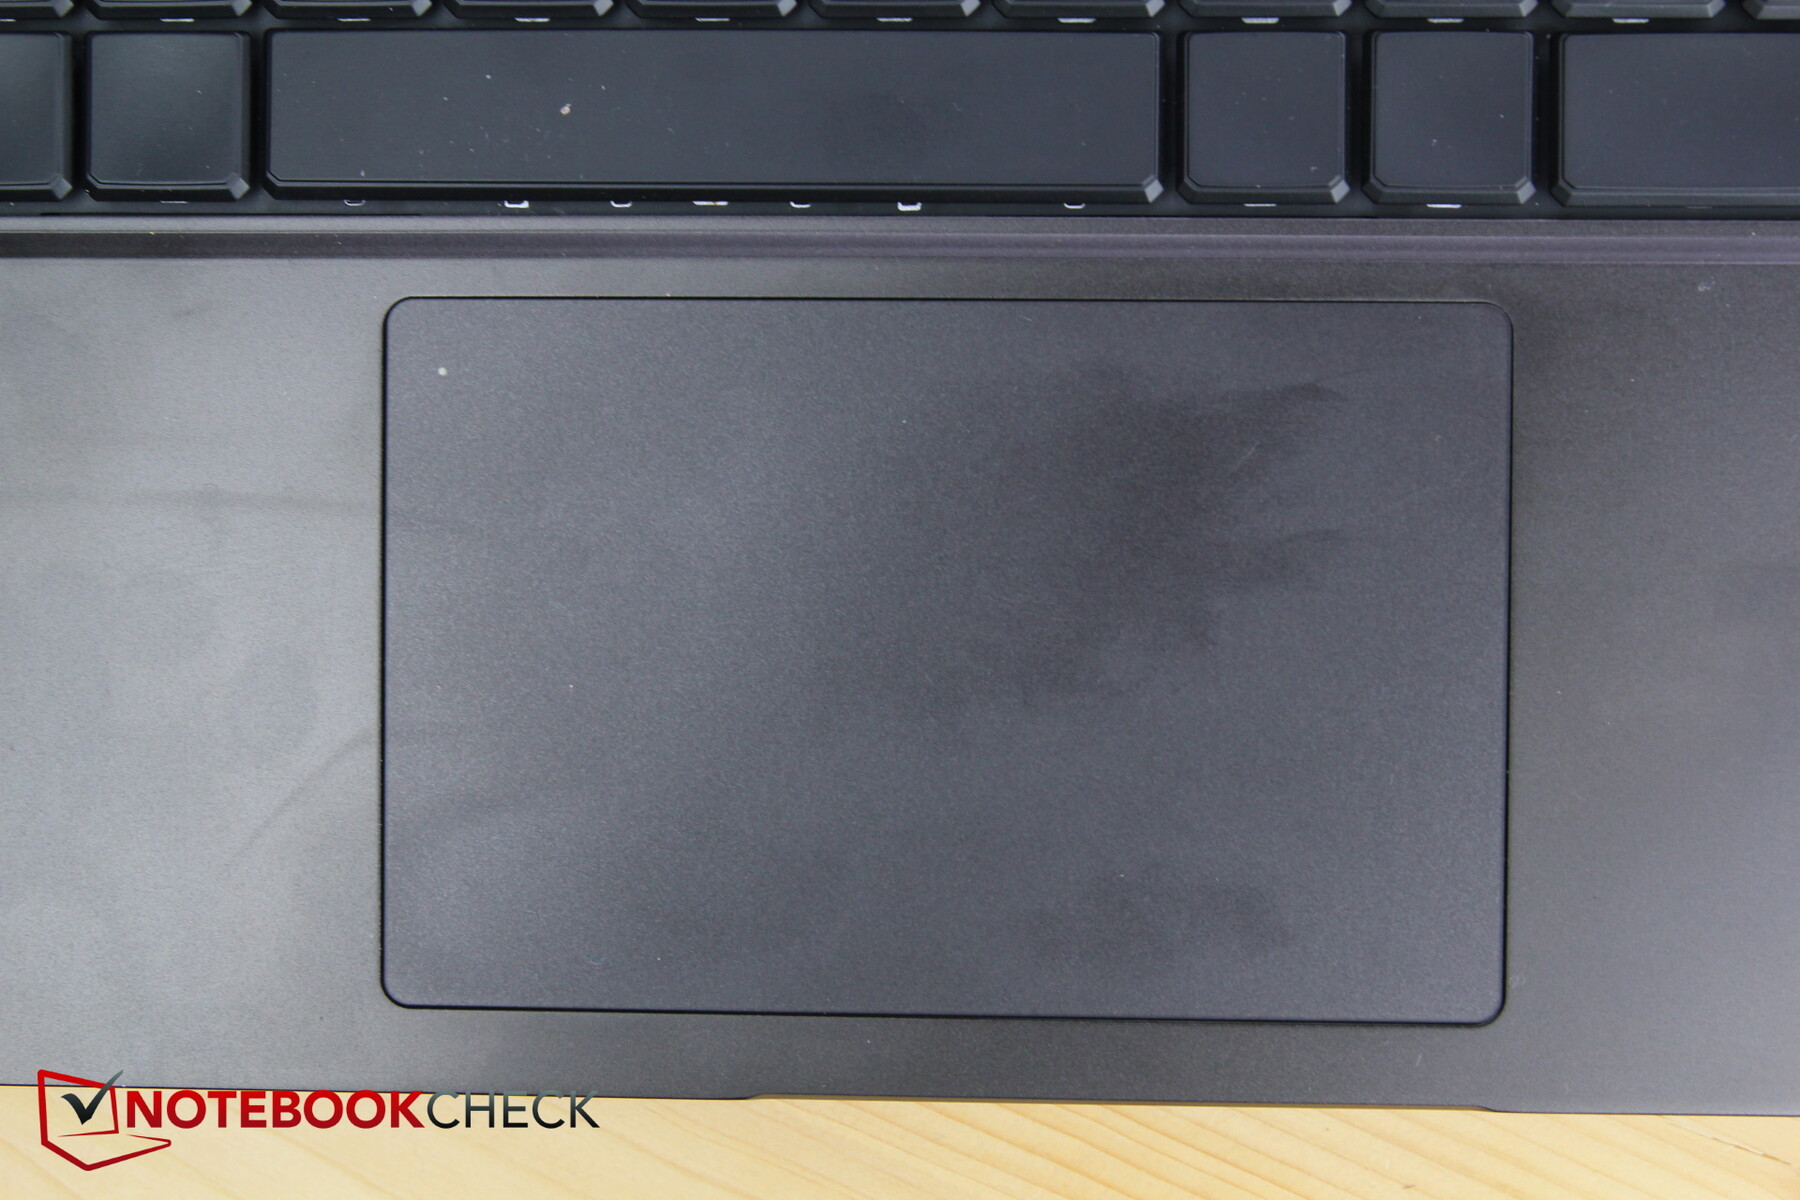
相当大的触摸板尺寸约为11.6厘米×7.4厘米,有一个非常光滑的表面,即使在缓慢移动时也几乎没有动摇。
轻击左上角两次可停用触摸板,并以同样的方式再次激活它,这很方便。
集成的按钮相当清晰,给人留下了可靠的印象。 我们在使用触摸板时没有遇到任何问题。
显示。要整理的预生产模型
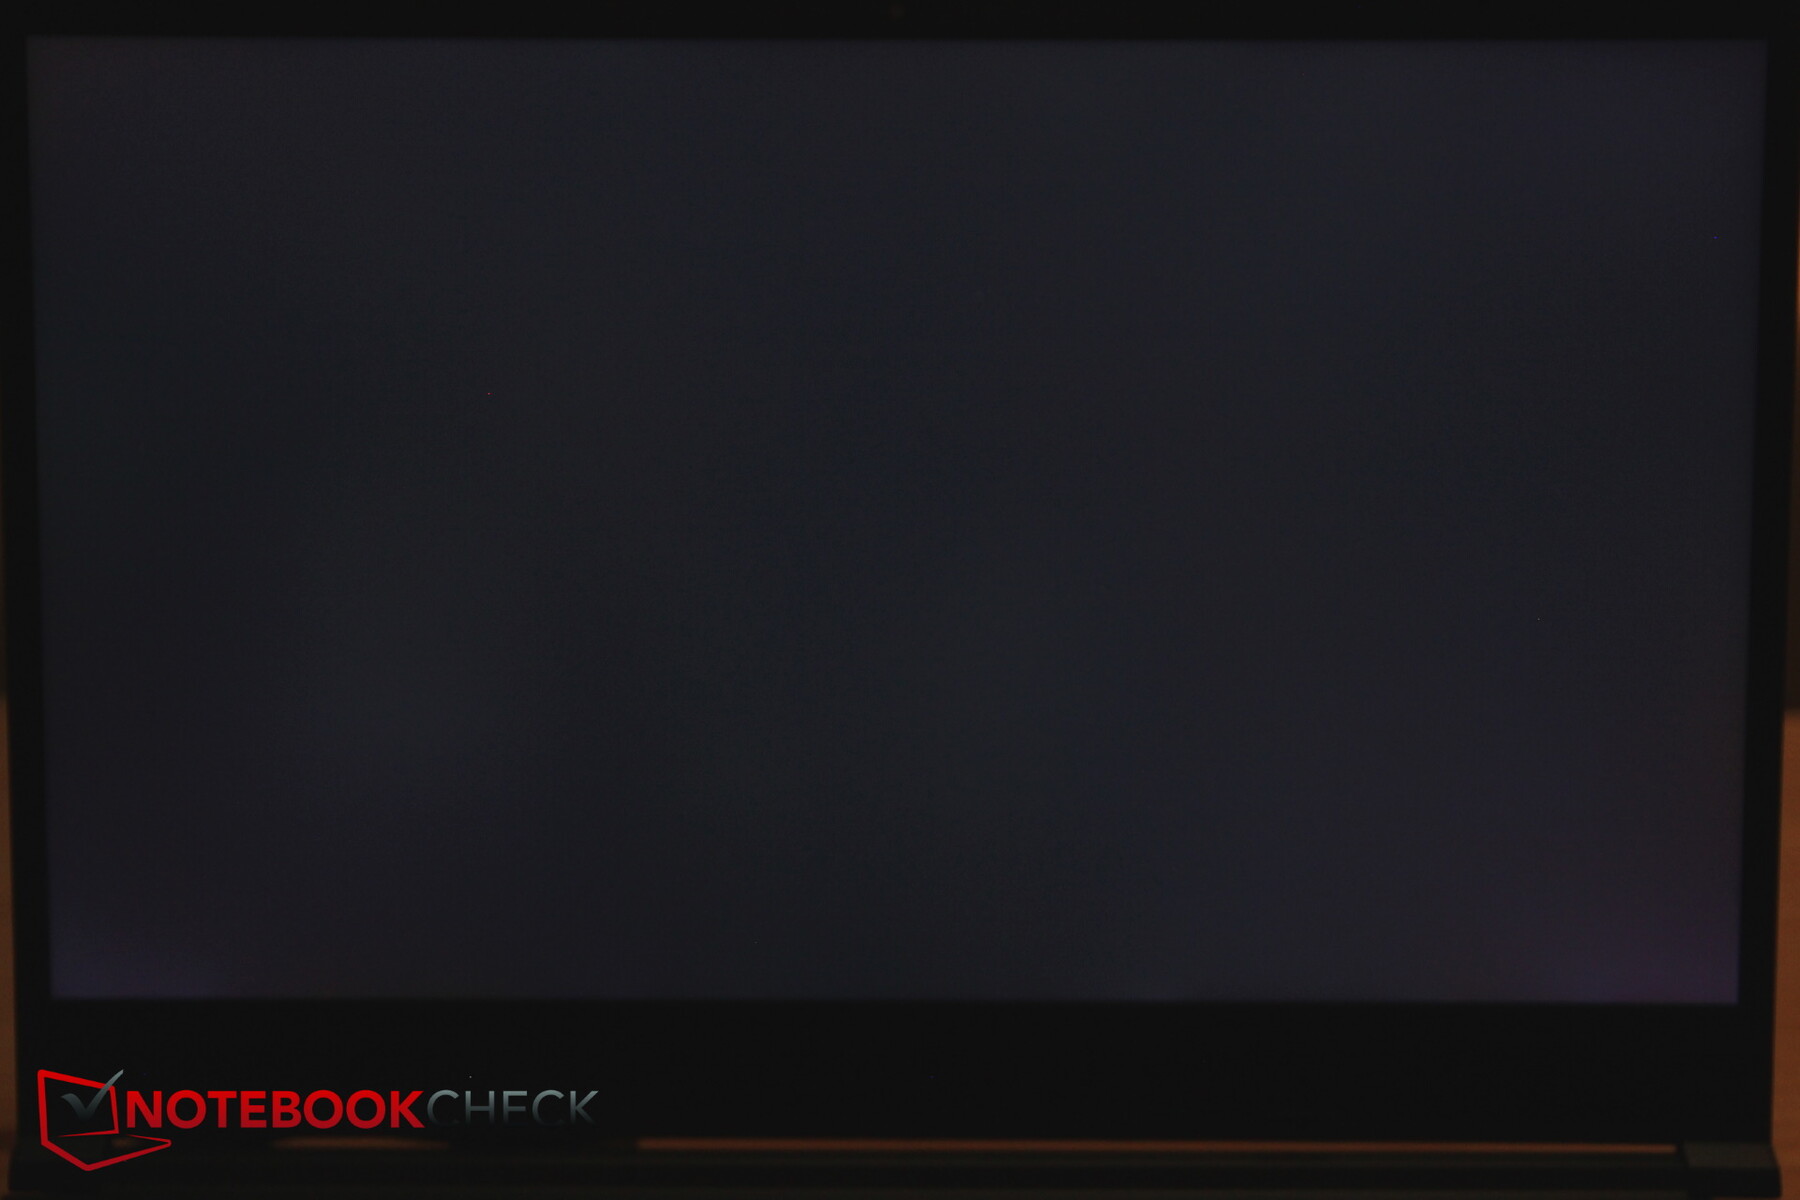
和它的前辈一样,Schenker使用京东方的哑光IPS显示屏,分辨率为WQHD(2560×1440像素)。然而,这些型号略有不同。现在没有165赫兹,而是采用了240赫兹的面板。然而,与前一型号一样,目前的型号没有达到制造商宣传的350尼特;我们平均只测量到273尼特。
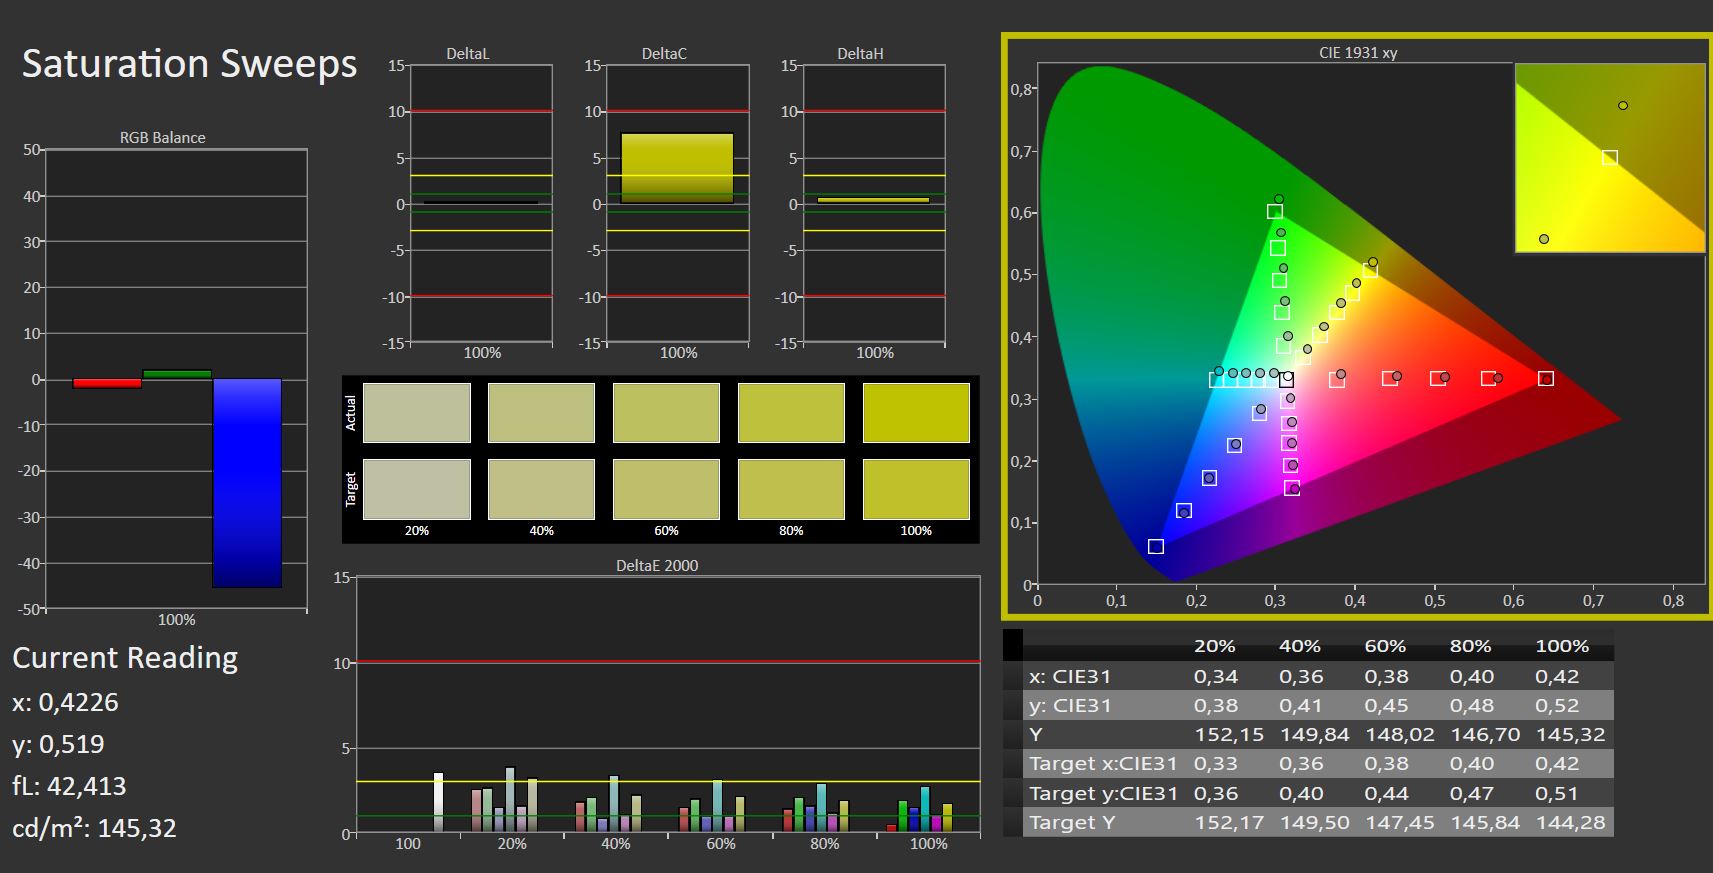
预生产型号的亮度分布也是如此糟糕,只有62%。申克公司向我们保证,这样的面板将不会出售。因此,在发布之前仍会有一些变化。因此,我们将暂时不测量色彩空间
| |||||||||||||||||||||||||
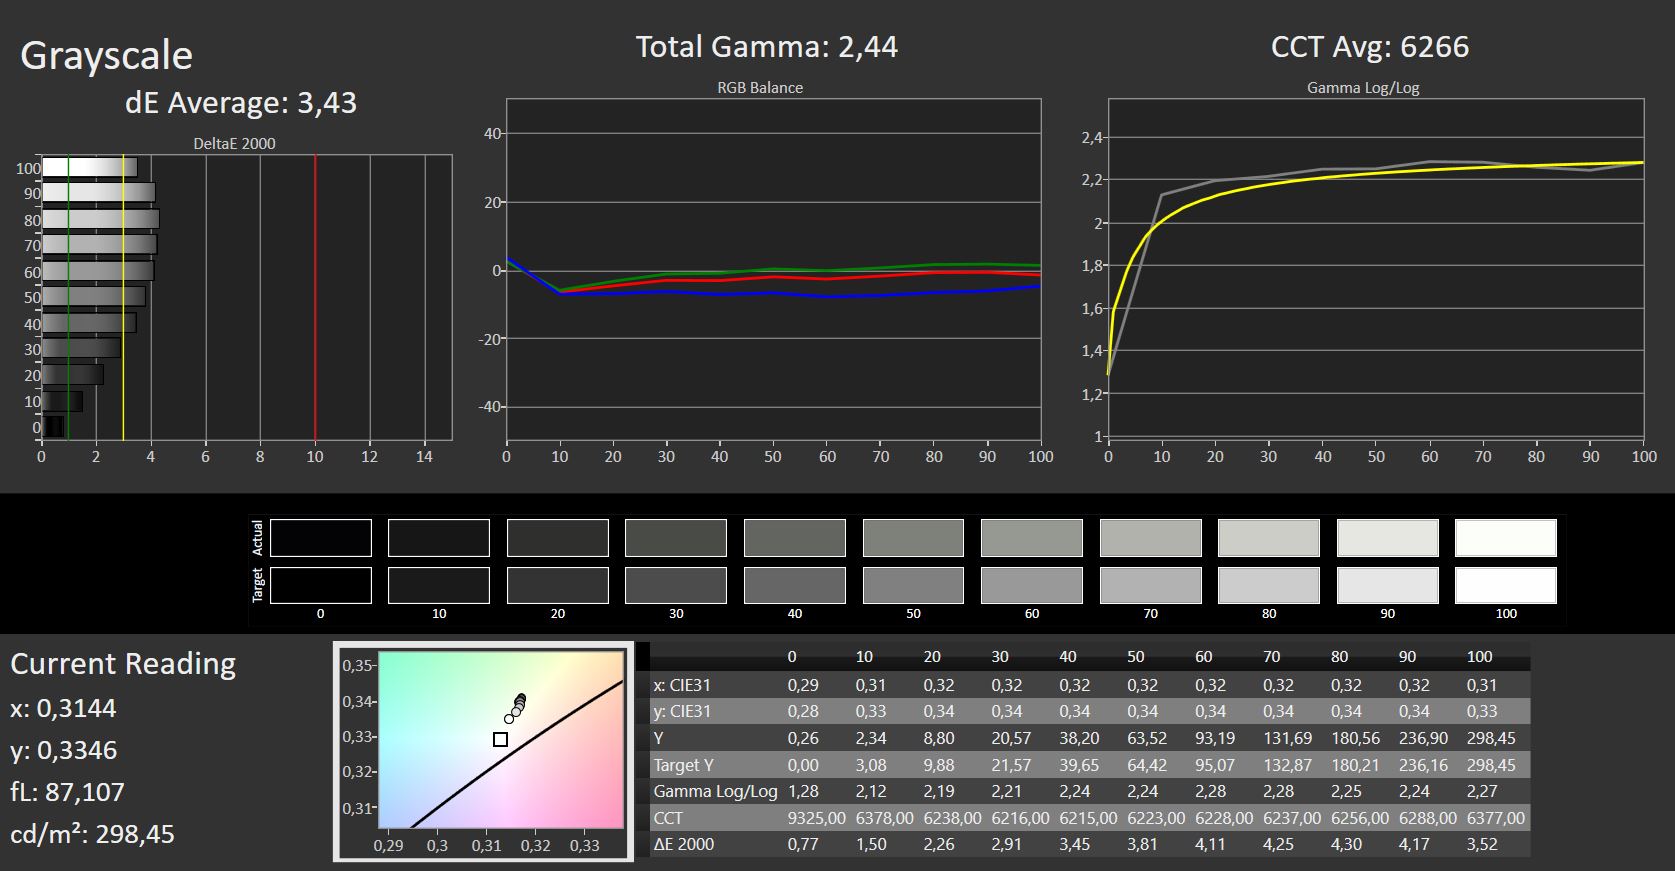
Brightness Distribution: 62 %
Center on Battery: 293 cd/m²
Contrast: 1054:1 (Black: 0.28 cd/m²)
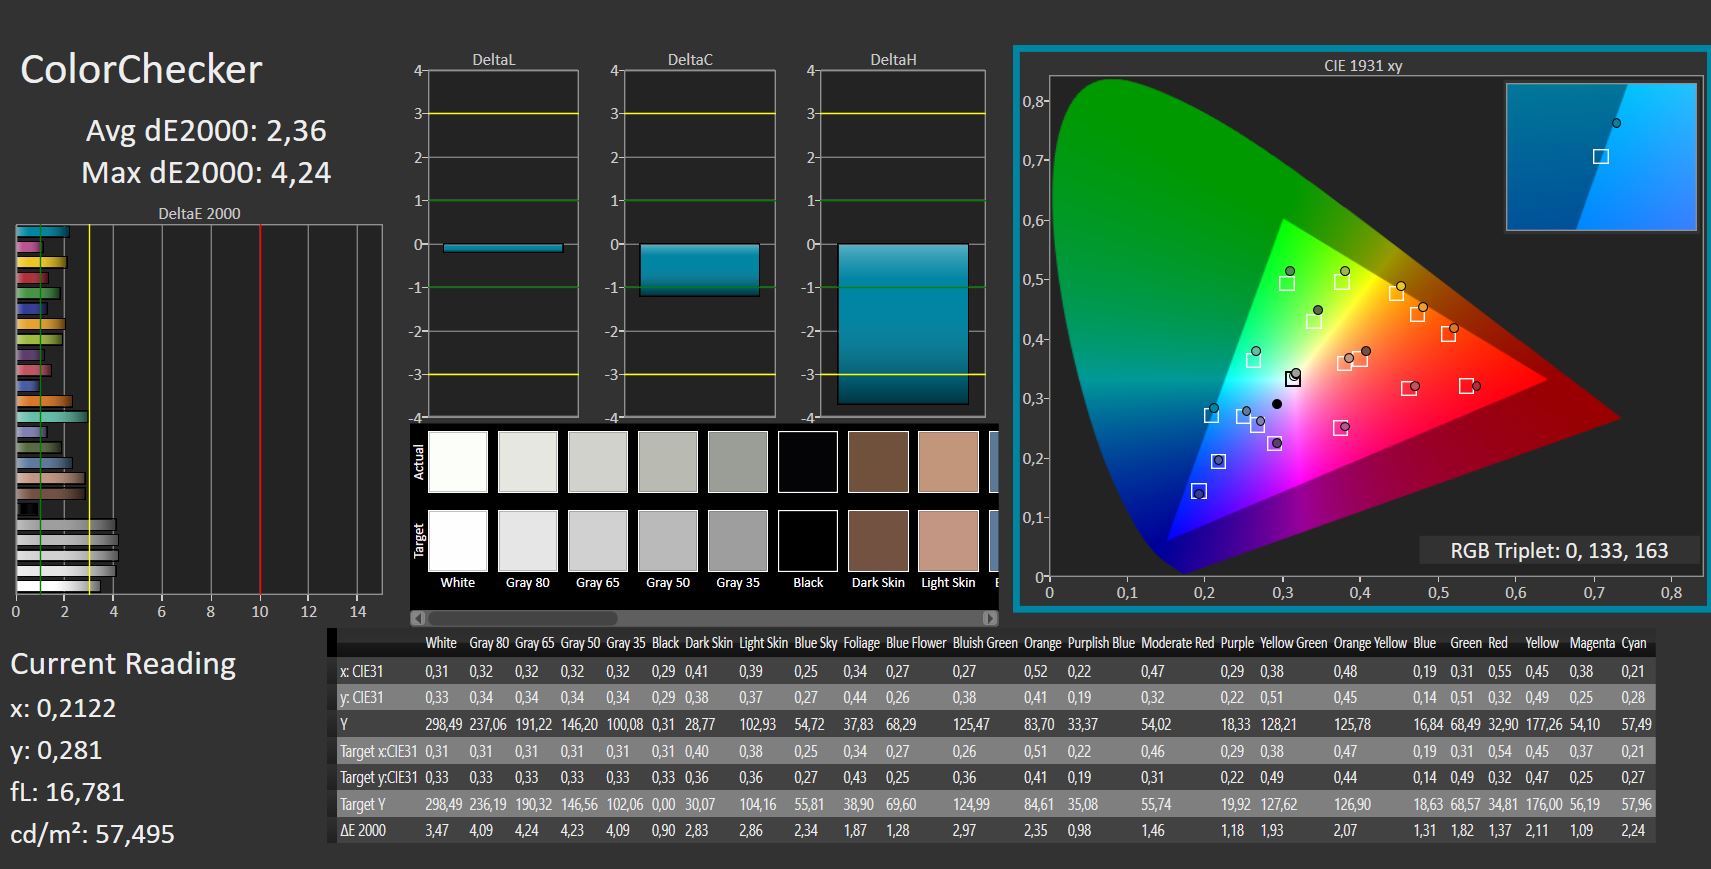
ΔE ColorChecker Calman: 2.36 | ∀{0.5-29.43 Ø4.71}
ΔE Greyscale Calman: 3.43 | ∀{0.09-98 Ø4.96}
Gamma: 2.44
CCT: 6266 K
| Schenker XMG Neo 15 E22 (Early 2022, RTX 3080 Ti) BOE0A67 (BOE CQ NE156QHM-NZ1), IPS, 2560x1440, 15.6" | Schenker XMG Neo 15 Tiger Lake BOE CQ NE156QHM-NY2, IPS, 2560x1440, 15.6" | Razer Blade 15 Advanced (Mid 2021) TL156VDXP02-0, IPS, 1920x1080, 15.6" | Asus ROG Strix Scar 15 G533QS BOE CQ NE156QHM-NY1, IPS, 2560x1440, 15.6" | Alienware m15 R6, i7-11800H RTX 3080 AU Optronics AUO9092 (B156HAN), IPS, 1920x1080, 15.6" | MSI GE76 Raider AU Optronics B173HAN05.4 (AUOE295), IPS-Level, 1920x1080, 17.3" | |
|---|---|---|---|---|---|---|
| Display | ||||||
| Display P3 Coverage (%) | 68.6 | 66.9 | 97.6 | 74.1 | 63.1 | |
| sRGB Coverage (%) | 98.6 | 97.1 | 99.9 | 99.5 | 94 | |
| AdobeRGB 1998 Coverage (%) | 69.3 | 69 | 85.3 | 75.7 | 65.2 | |
| Response Times | -11% | 39% | -6% | 65% | 36% | |
| Response Time Grey 50% / Grey 80% * (ms) | 14.4 ? | 16 ? -11% | 4.2 ? 71% | 14 ? 3% | 2.8 81% | 5.6 ? 61% |
| Response Time Black / White * (ms) | 10.8 ? | 12 ? -11% | 10 ? 7% | 12.4 ? -15% | 5.6 48% | 9.6 ? 11% |
| PWM Frequency (Hz) | ||||||
| Screen | -20% | 8% | -8% | -1% | 23% | |
| Brightness middle (cd/m²) | 295 | 324 10% | 353.4 20% | 304.3 3% | 359 22% | 290 -2% |
| Brightness (cd/m²) | 277 | 307 11% | 340 23% | 286 3% | 344 24% | 290 5% |
| Brightness Distribution (%) | 62 | 91 47% | 92 48% | 76 23% | 85 37% | 96 55% |
| Black Level * (cd/m²) | 0.28 | 0.27 4% | 0.31 -11% | 0.33 -18% | 0.35 -25% | 0.23 18% |
| Contrast (:1) | 1054 | 1200 14% | 1140 8% | 922 -13% | 1026 -3% | 1261 20% |
| Colorchecker dE 2000 * | 2.36 | 3.36 -42% | 2.17 8% | 2.76 -17% | 3.3 -40% | 1.59 33% |
| Colorchecker dE 2000 max. * | 4.24 | 9.87 -133% | 5.69 -34% | 5.57 -31% | 4.84 -14% | 3.17 25% |
| Greyscale dE 2000 * | 3.43 | 5.8 -69% | 3.4 1% | 4 -17% | 3.66 -7% | 2.5 27% |
| Gamma | 2.44 90% | 2.311 95% | 2.2 100% | 2.14 103% | 2.43 91% | 2.253 98% |
| CCT | 6266 104% | 7087 92% | 6830 95% | 6844 95% | 5896 110% | 6640 98% |
| Colorchecker dE 2000 calibrated * | 1.23 | 1.05 | 2.38 | 3.28 | 0.87 | |
| Color Space (Percent of AdobeRGB 1998) (%) | 69 | |||||
| Color Space (Percent of sRGB) (%) | 93 | |||||
| Total Average (Program / Settings) | -16% /
-18% | 24% /
14% | -7% /
-8% | 32% /
12% | 30% /
25% |
* ... smaller is better
也就是说,显示器在出厂时就已经被校准得很好,Delta E值很低。黑色水平和对比度都远远高于平均水平。
Display Response Times
| ↔ Response Time Black to White | ||
|---|---|---|
| 10.8 ms ... rise ↗ and fall ↘ combined | ↗ 5.4 ms rise | 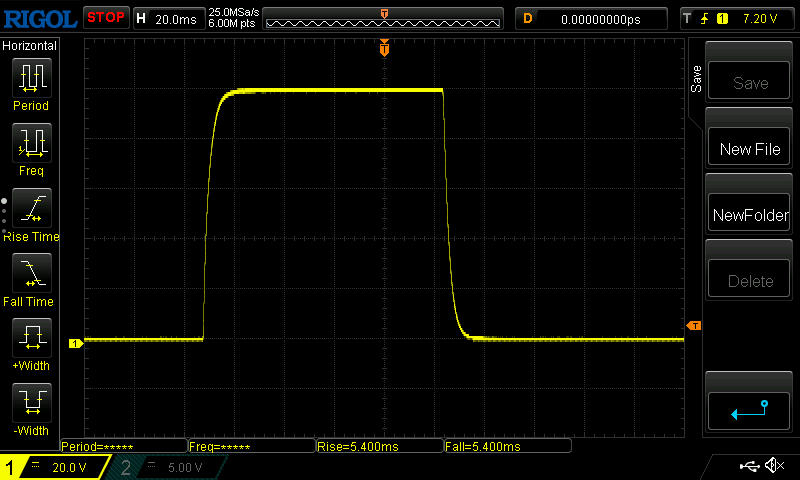 |
| ↘ 5.4 ms fall | ||
| The screen shows good response rates in our tests, but may be too slow for competitive gamers. In comparison, all tested devices range from 0.1 (minimum) to 240 (maximum) ms. » 29 % of all devices are better. This means that the measured response time is better than the average of all tested devices (19.8 ms). | ||
| ↔ Response Time 50% Grey to 80% Grey | ||
| 14.4 ms ... rise ↗ and fall ↘ combined | ↗ 6.6 ms rise | 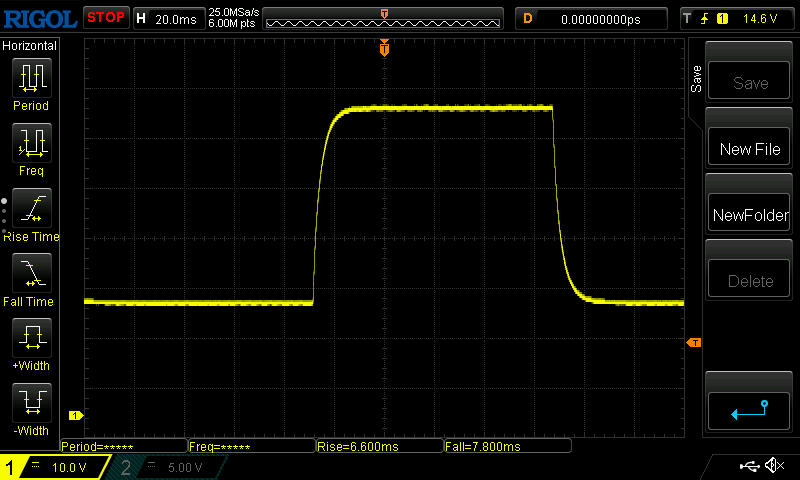 |
| ↘ 7.8 ms fall | ||
| The screen shows good response rates in our tests, but may be too slow for competitive gamers. In comparison, all tested devices range from 0.165 (minimum) to 636 (maximum) ms. » 28 % of all devices are better. This means that the measured response time is better than the average of all tested devices (31 ms). | ||
Screen Flickering / PWM (Pulse-Width Modulation)
| Screen flickering / PWM not detected | 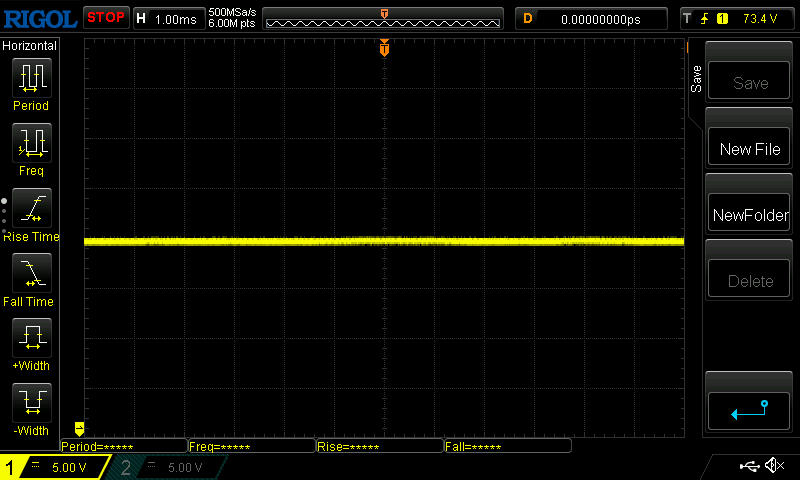 | ||
In comparison: 52 % of all tested devices do not use PWM to dim the display. If PWM was detected, an average of 7754 (minimum: 5 - maximum: 343500) Hz was measured. | |||
响应时间对于游戏来说有些偏低。该面板不使用PWM。
在户外,哑光涂层消除了大部分反射。黑色水平和对比度也足够好,至少在阴天和阴暗处仍能很好地看到屏幕的内容。
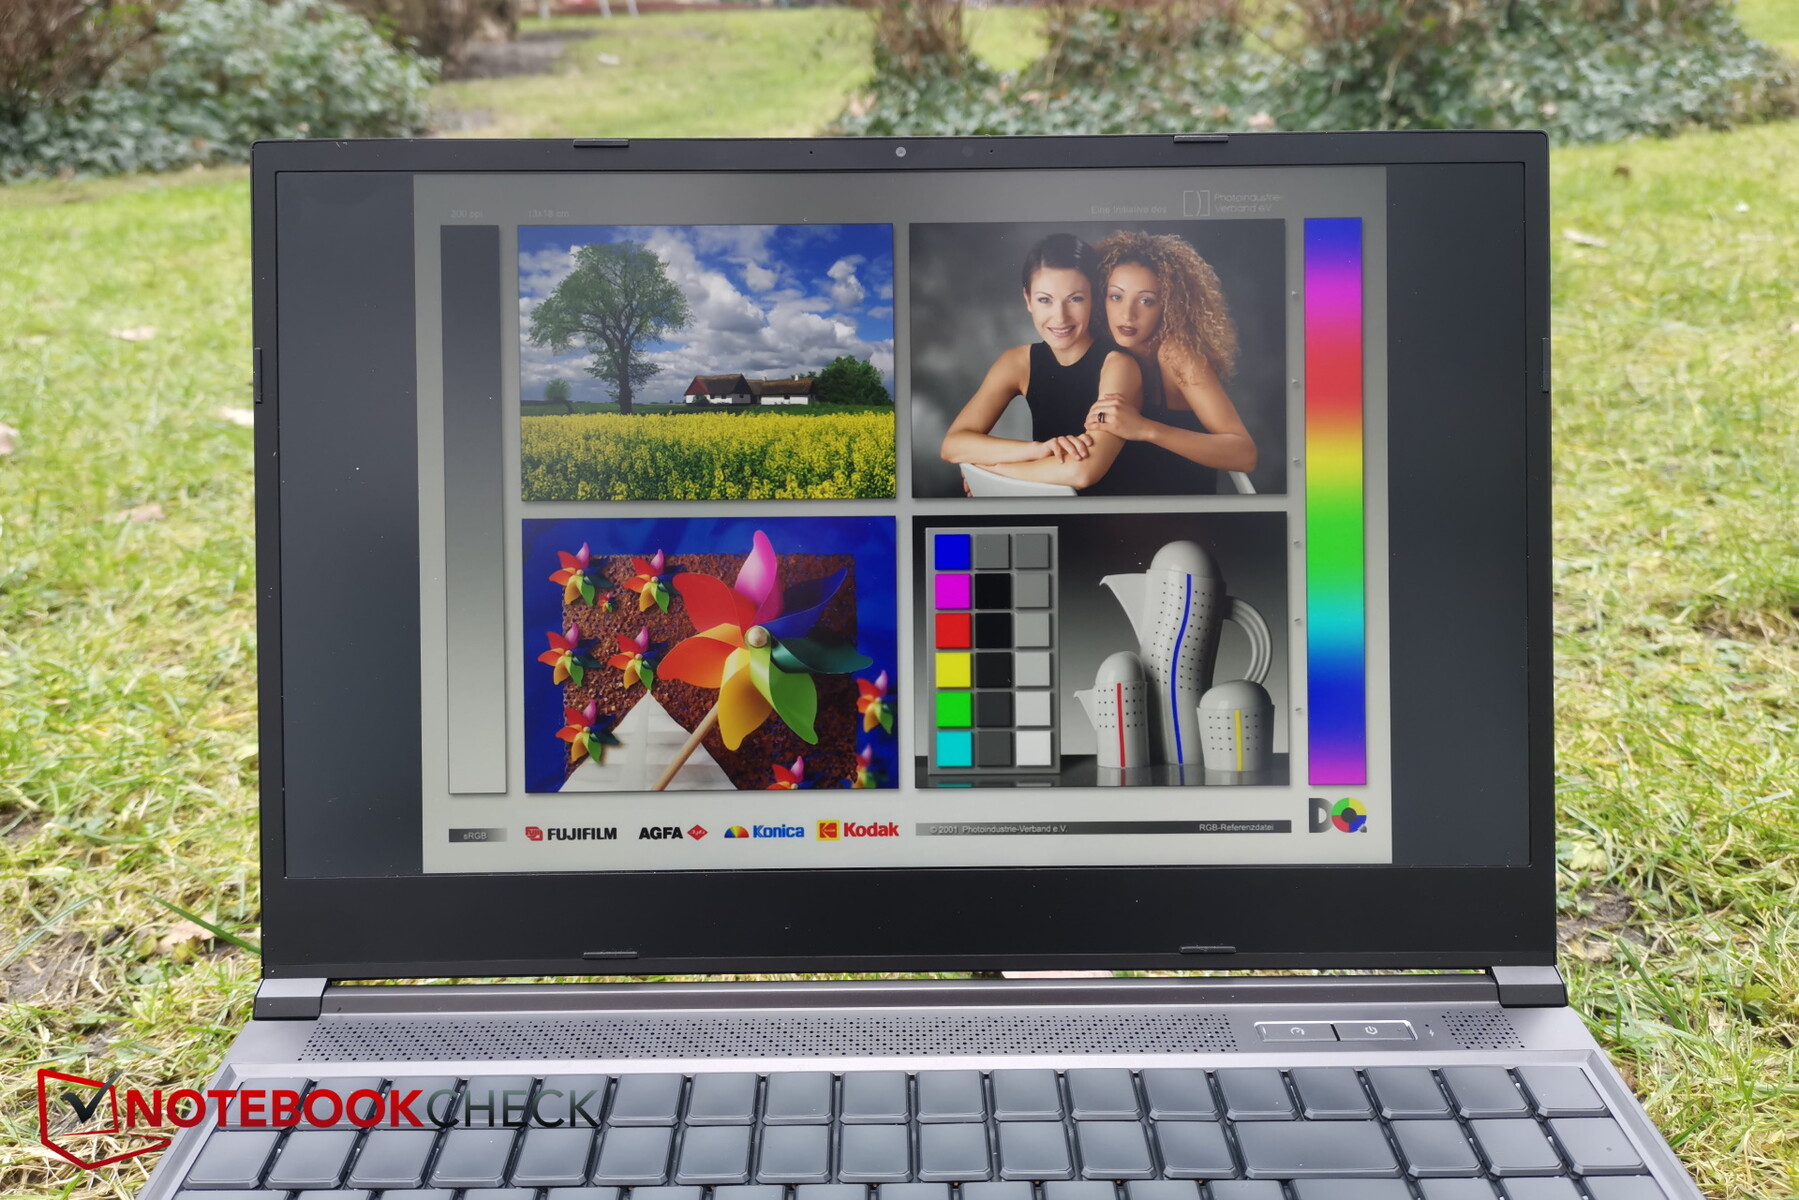
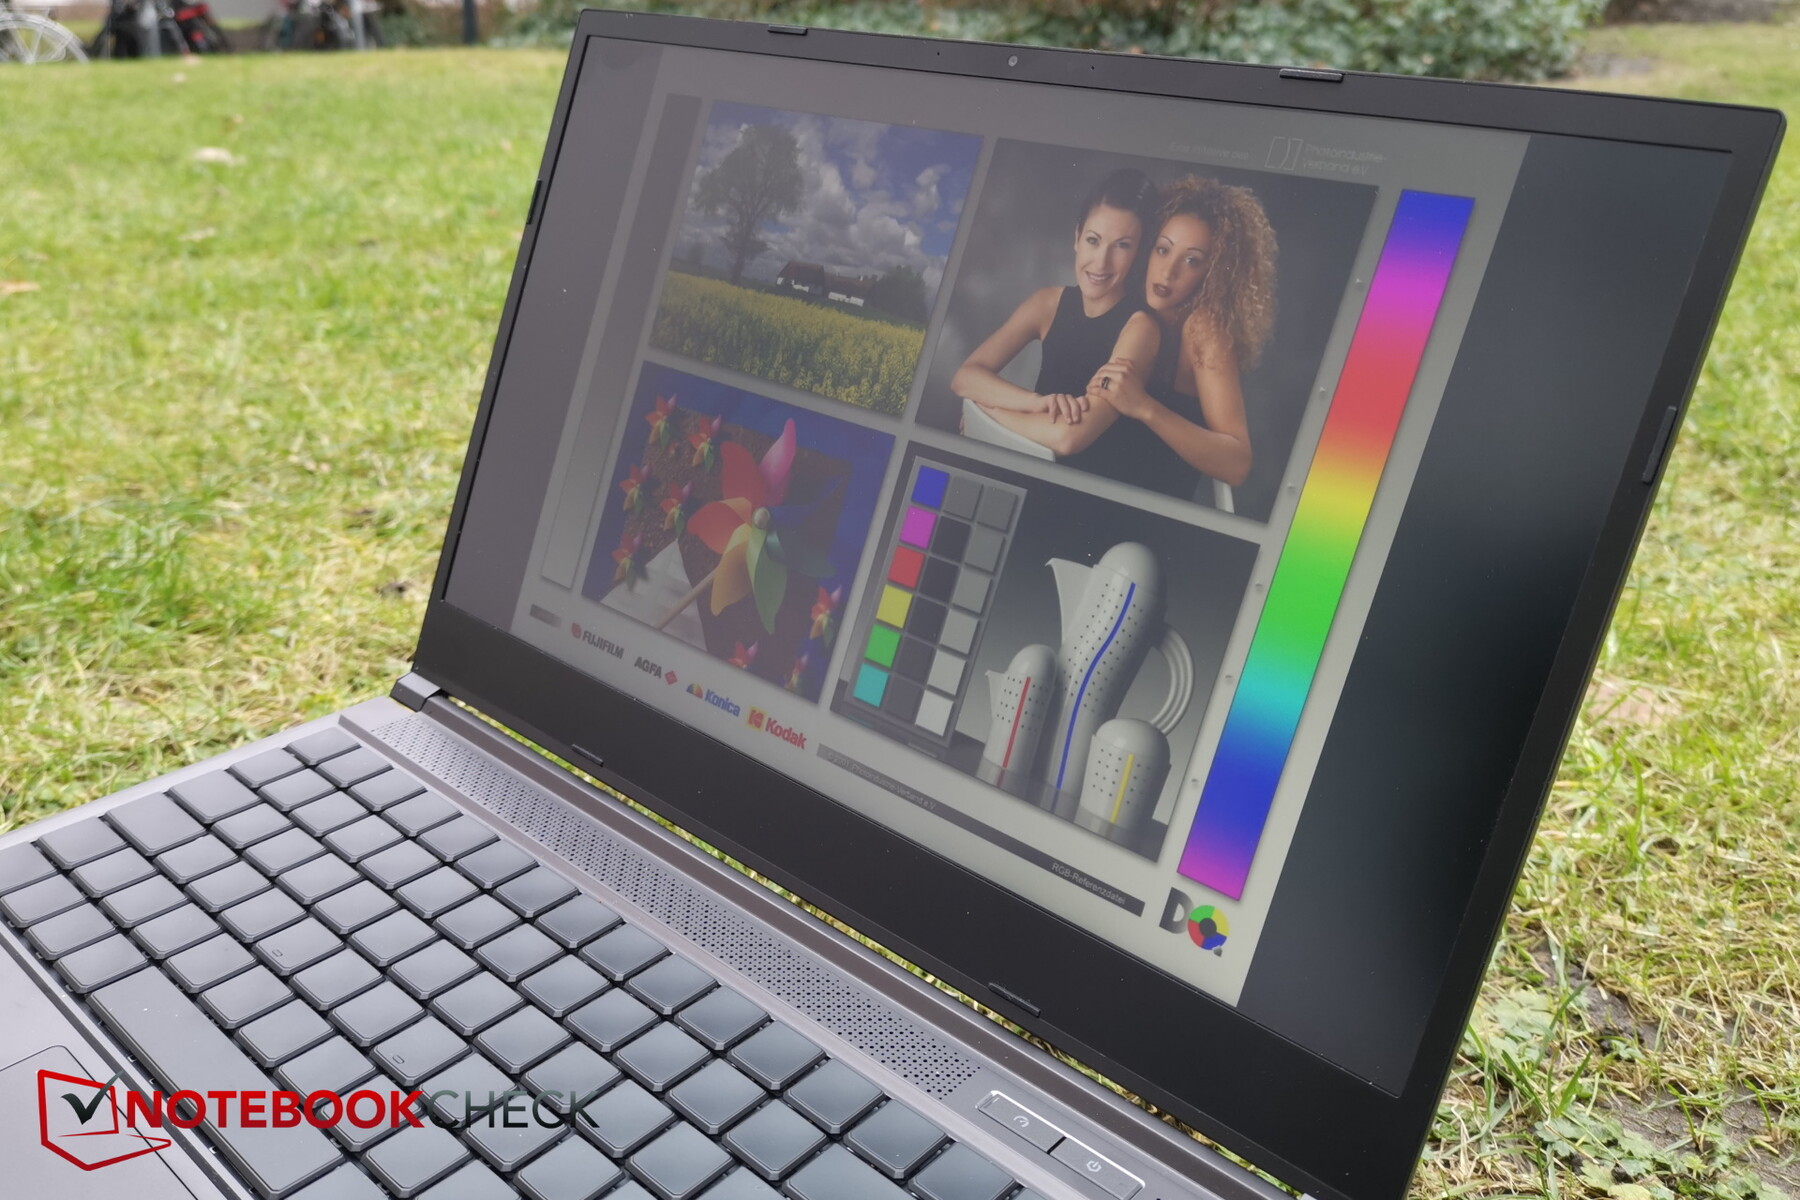
视角的稳定性很好。即使在极端角度下,画质的下降也相当低。

性能。高!
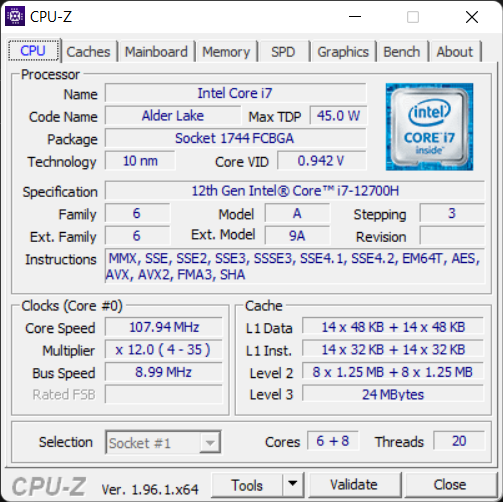
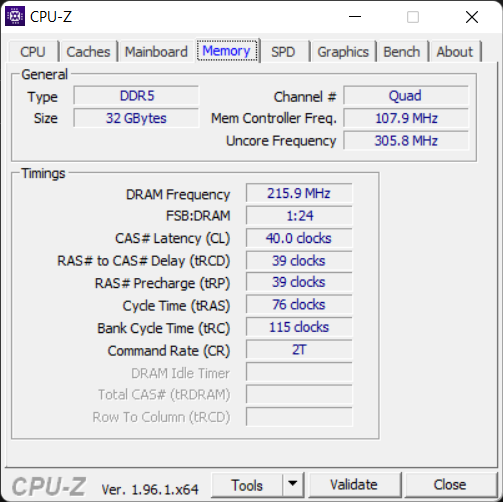
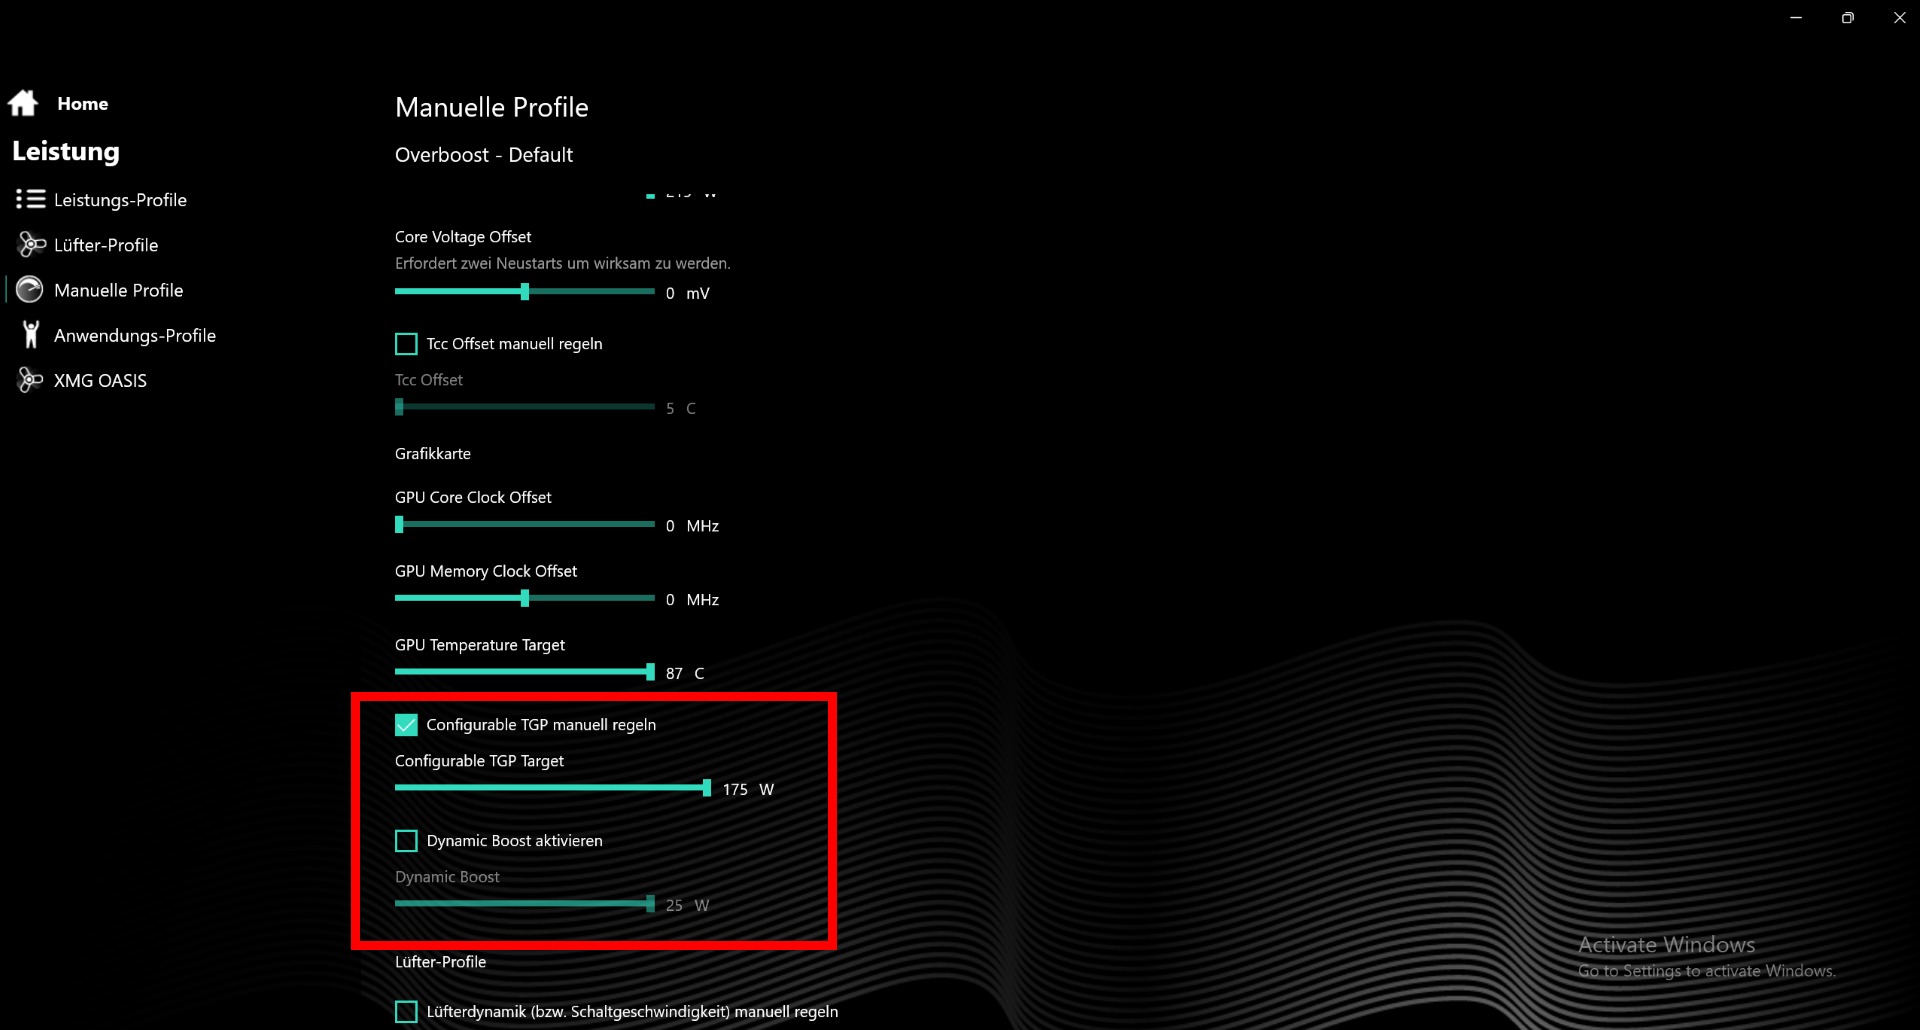
我们在这里处理的是绝对高端的硬件,特别是新的RTX 3080 Ti,它可以通过控制中心以175W的最大TGP运行。新的桤木湖 英特尔酷睿i7-12700H处理器,以及首次采用的32GB DDR5内存,使 "新Neo "成为真正的高性能游戏笔记本电脑。
测试条件
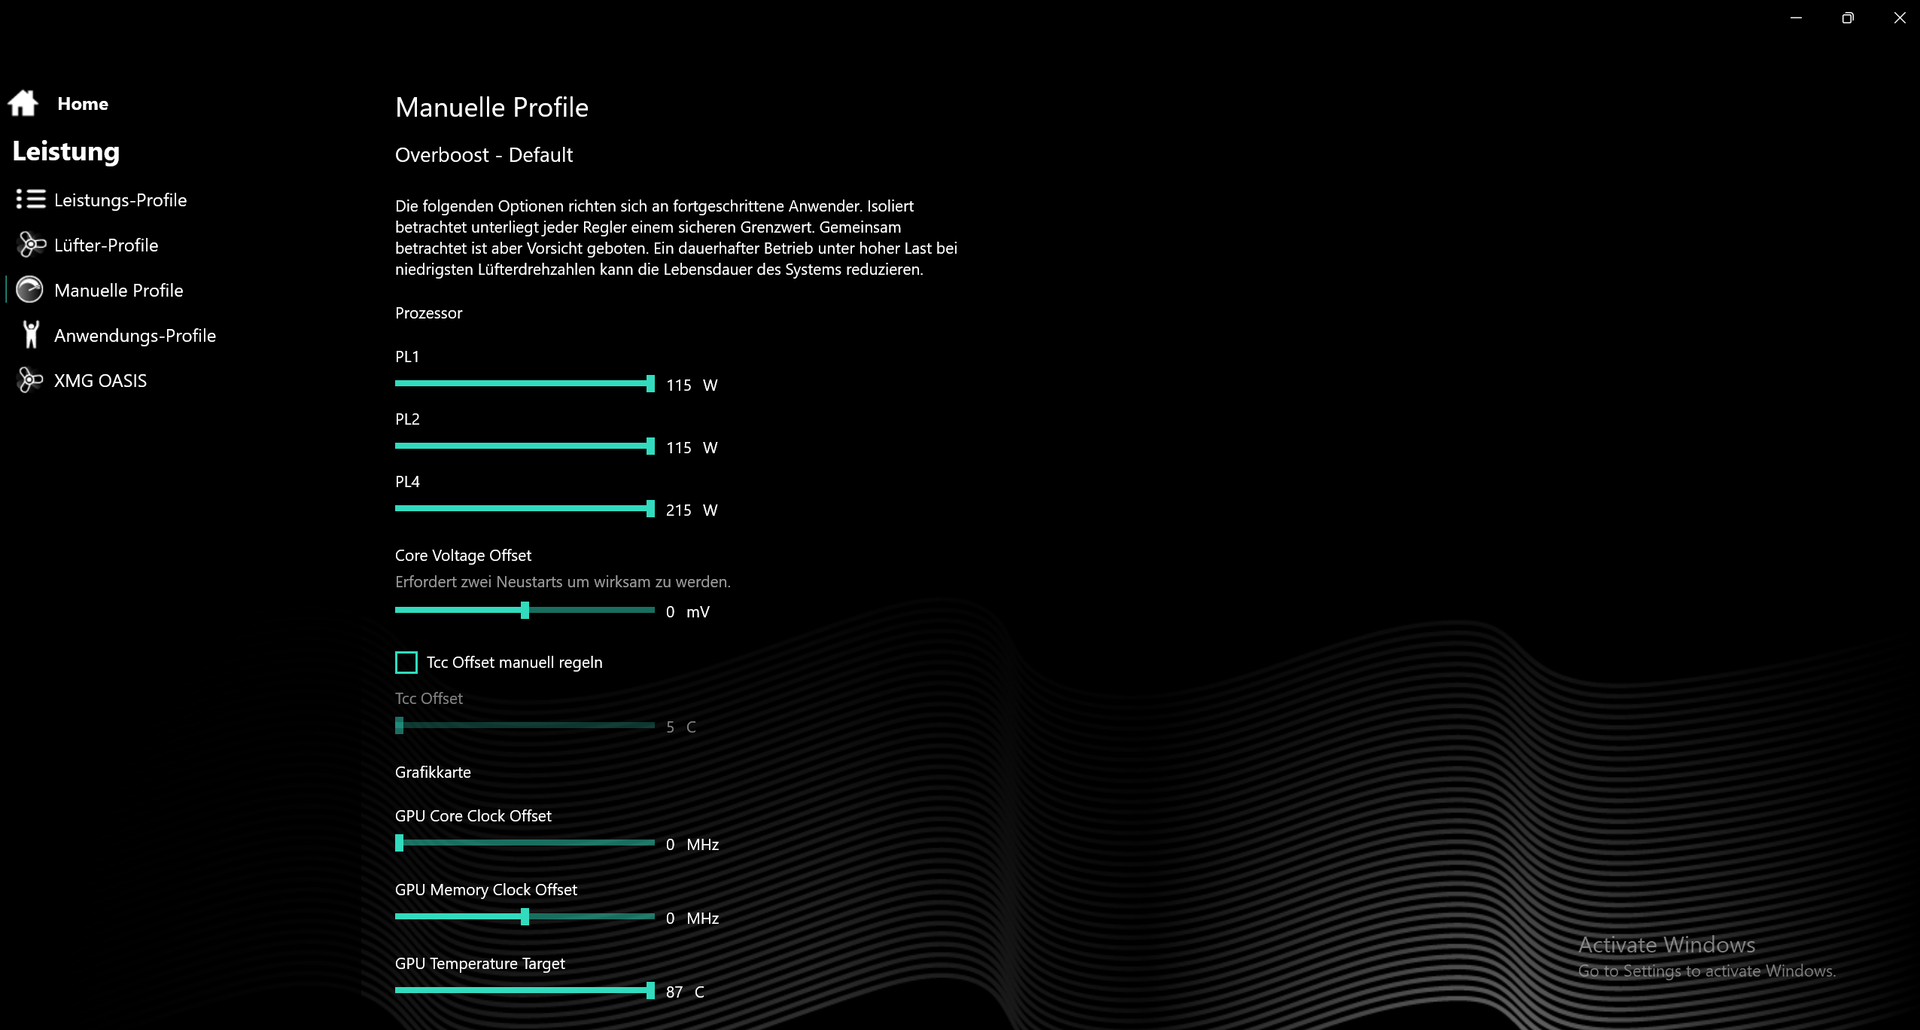
为了获得最佳的基准测试结果,我们在控制中心启用了超增压模式,还在手动性能设置中最大化了CPU的PL值。
对于GPU,我们将动态提升设置为25W。设置了动态提升后,你就不能再自己设置GPU的TGP了。该选项是灰色的,被固定在150W,因此,最大的175W总共是最大的。
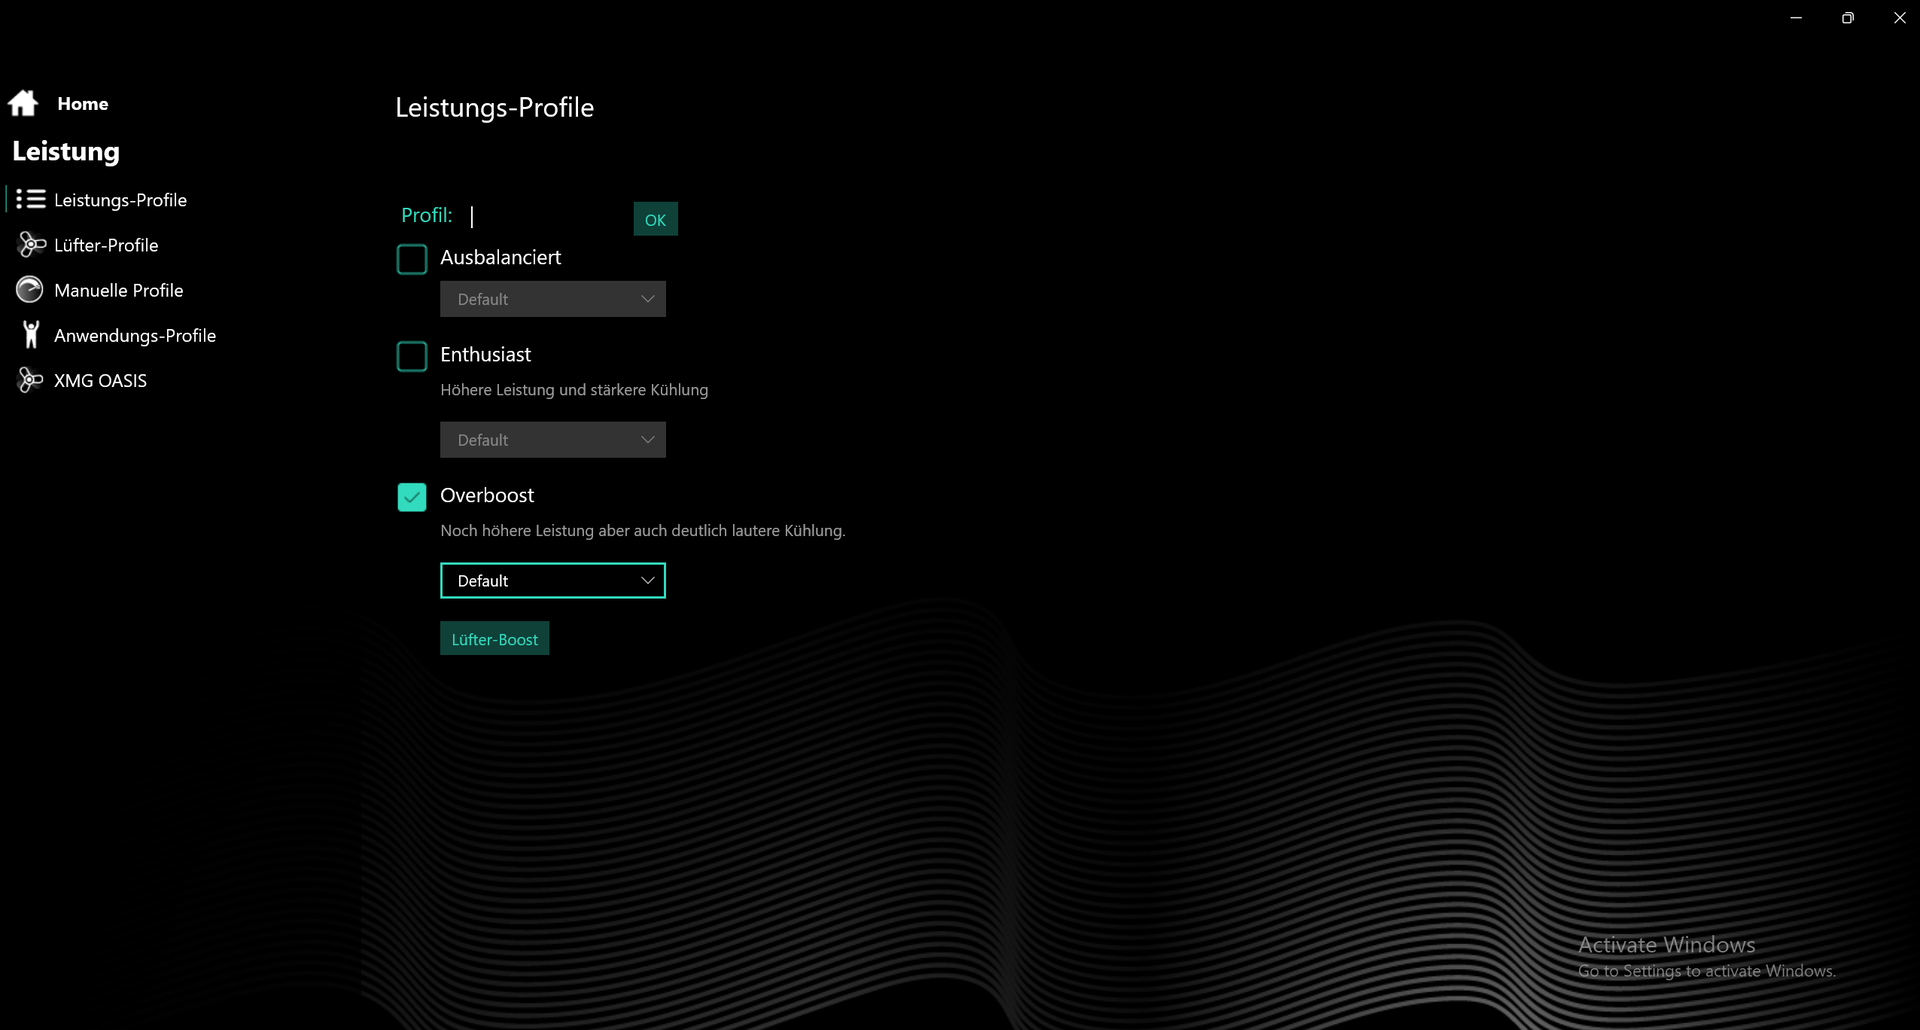
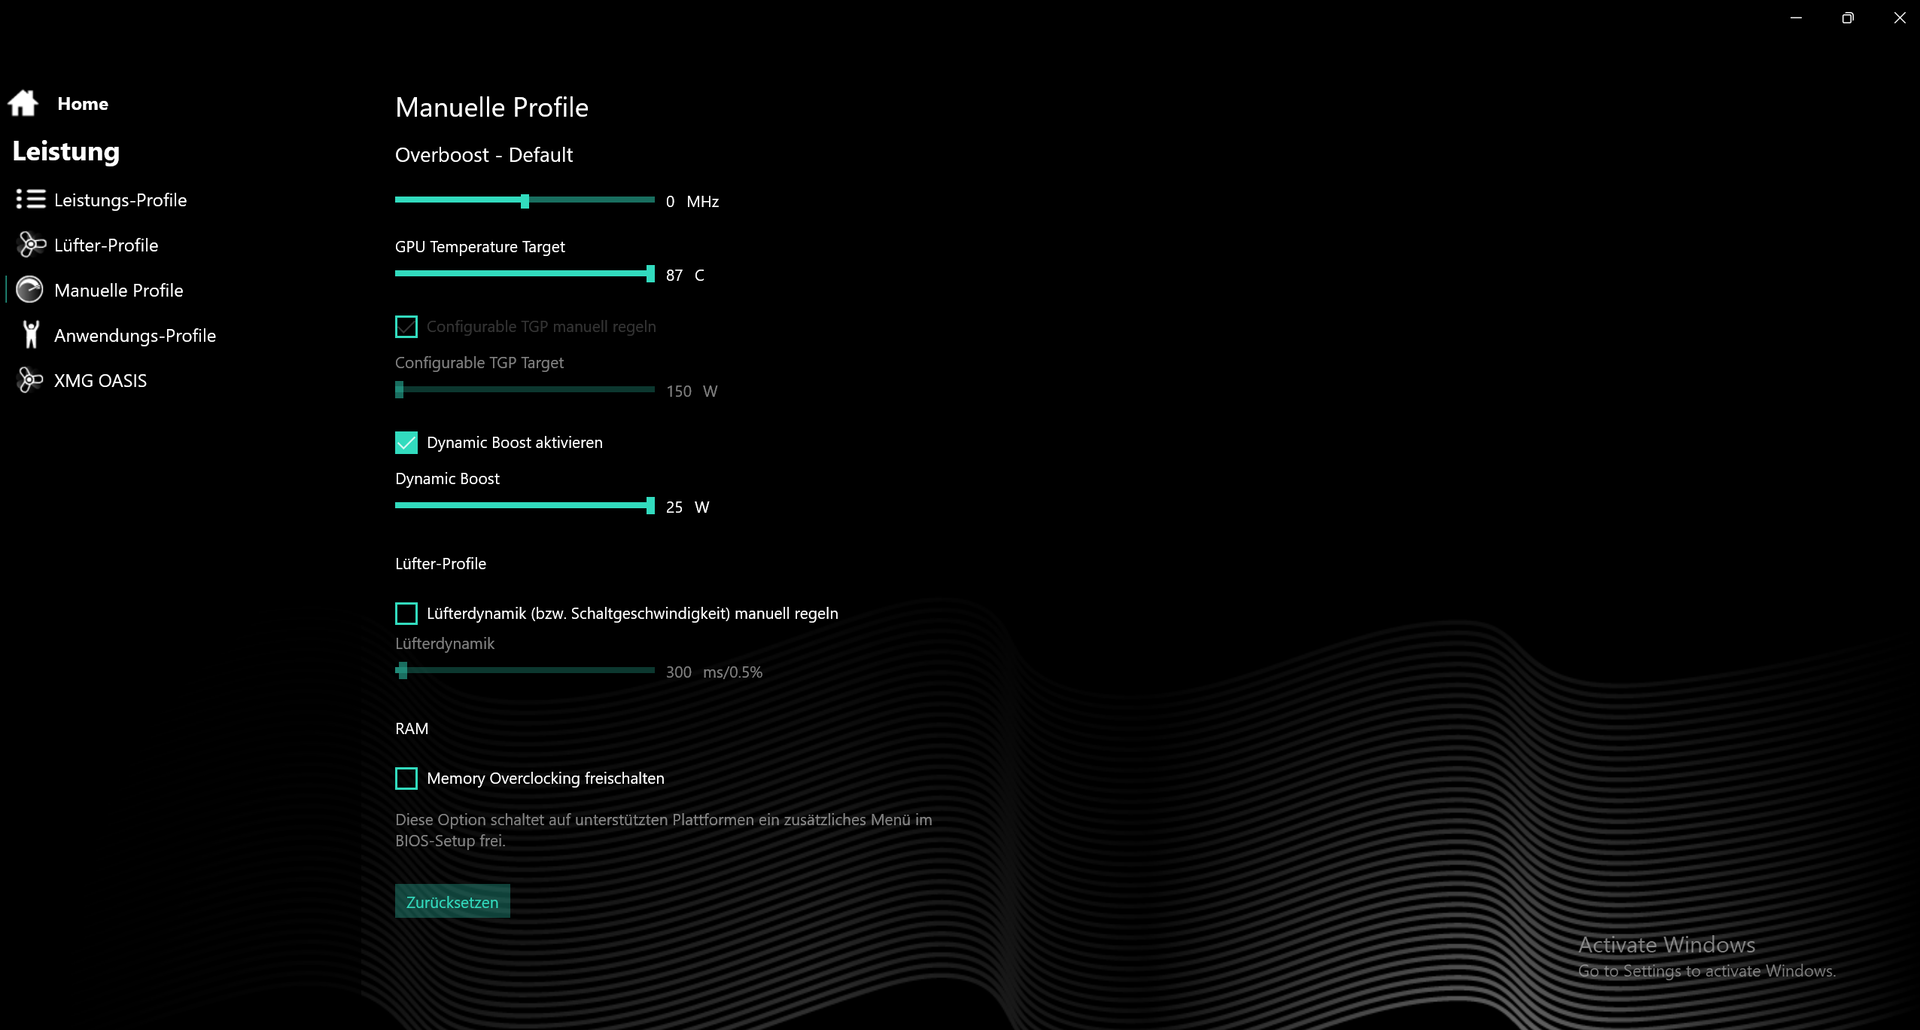
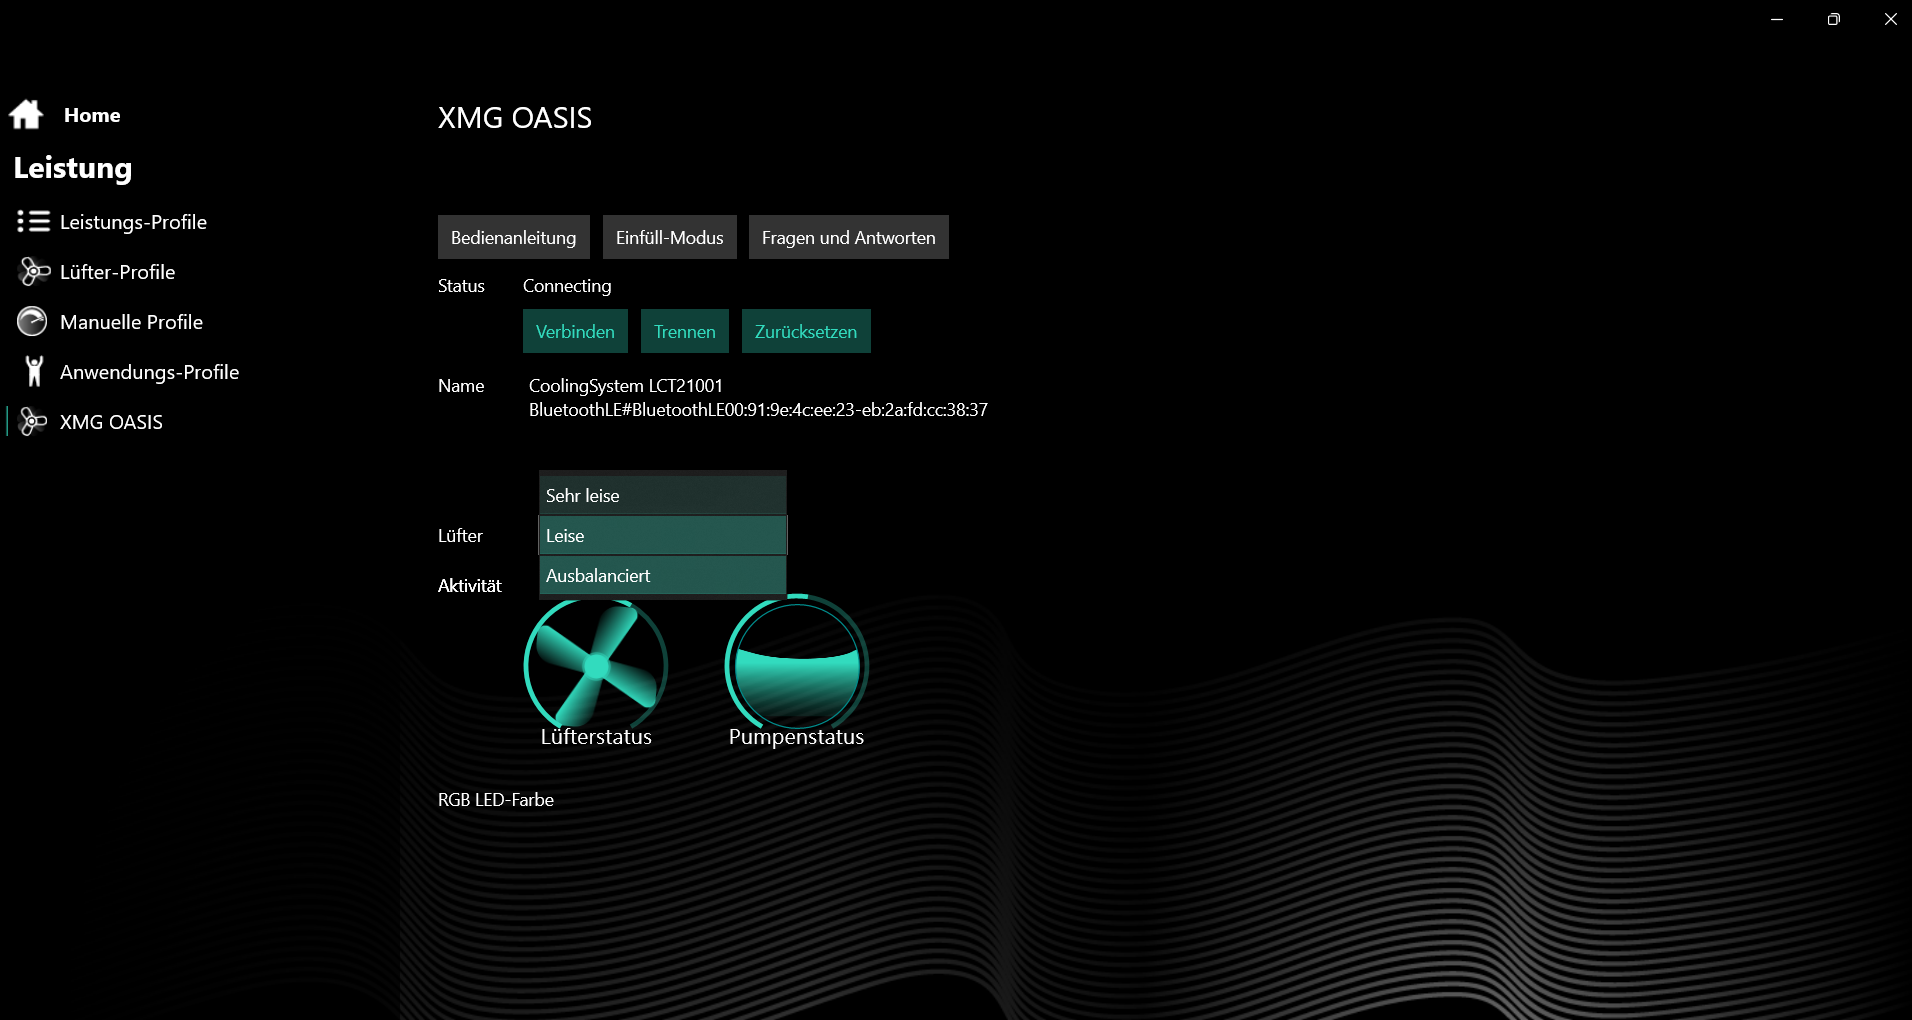
XMG Oasis还提供几种风扇模式(非常安静、安静和平衡)。除非指定,否则我们使用平衡模式,以获得最佳的冷却性能。
处理器
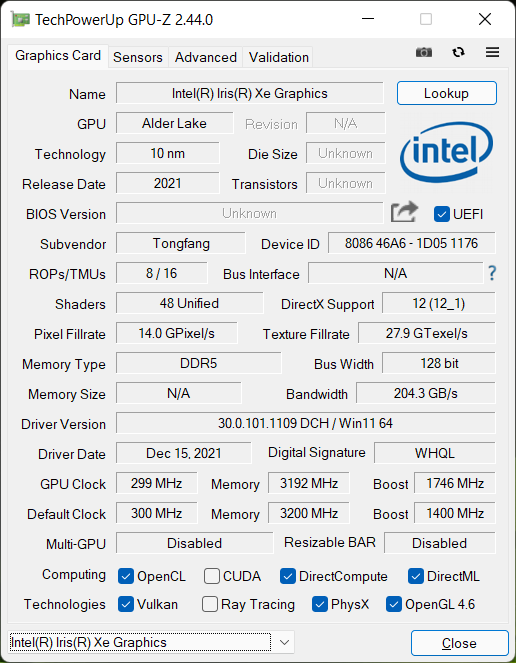
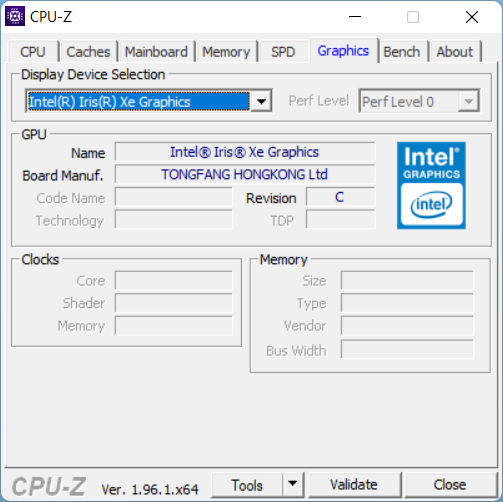
该英特尔酷睿i7-12700H是一款基于新Alder Lake架构的高端CPU。它总共有14个内核,首次像ARM处理器那样被分为性能内核(6个P内核)和效率内核(8个E内核)。只有P核支持超线程,所以你总共有20个线程。一个具有96个EU和高达1.4GHz时钟的英特尔Xe图形单元被集成到CPU中。
在一小时的Cinebench循环测试中,该CPU与其稍高时钟的姐妹型号进行了正面交锋 酷睿i9-12900HK而且随着时间的推移,甚至以微弱的优势获胜。只有酷睿i9-12900HK的输出功率更高。
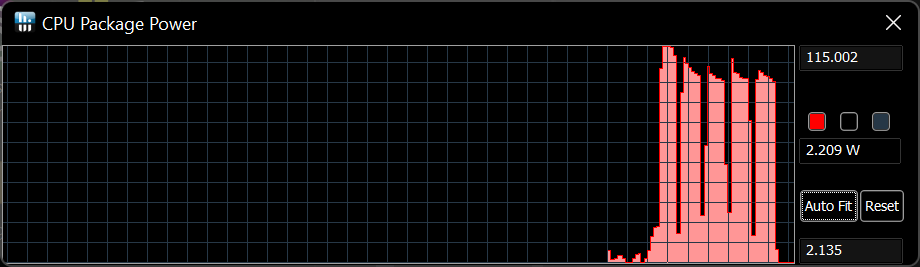
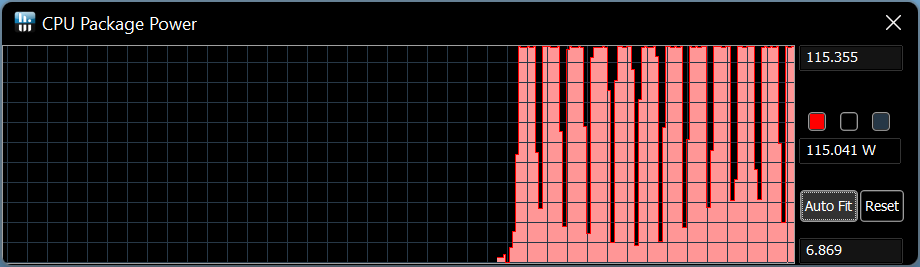
使用 "绿洲 "的性能比不使用 "绿洲 "的性能要高得多,在开始时看到的性能小幅下降的情况没有发生。然而,短期性能没有差别。
在第一次运行时,封装功率最大为115W,后来只有100W。使用Oasis,封装功率没有下降到100W,而是相当稳定地保持在115W。
在多线程测试中,酷睿i7-12700H比其Tiger Lake 的前辈整整高出30%!同样的情况也适用于AMD Ryzen 9 5900HX华硕ROG Strix Scar 15中。这两颗桤木湖CPU在其他基准测试中也几乎不相上下,并在排行榜上领先。
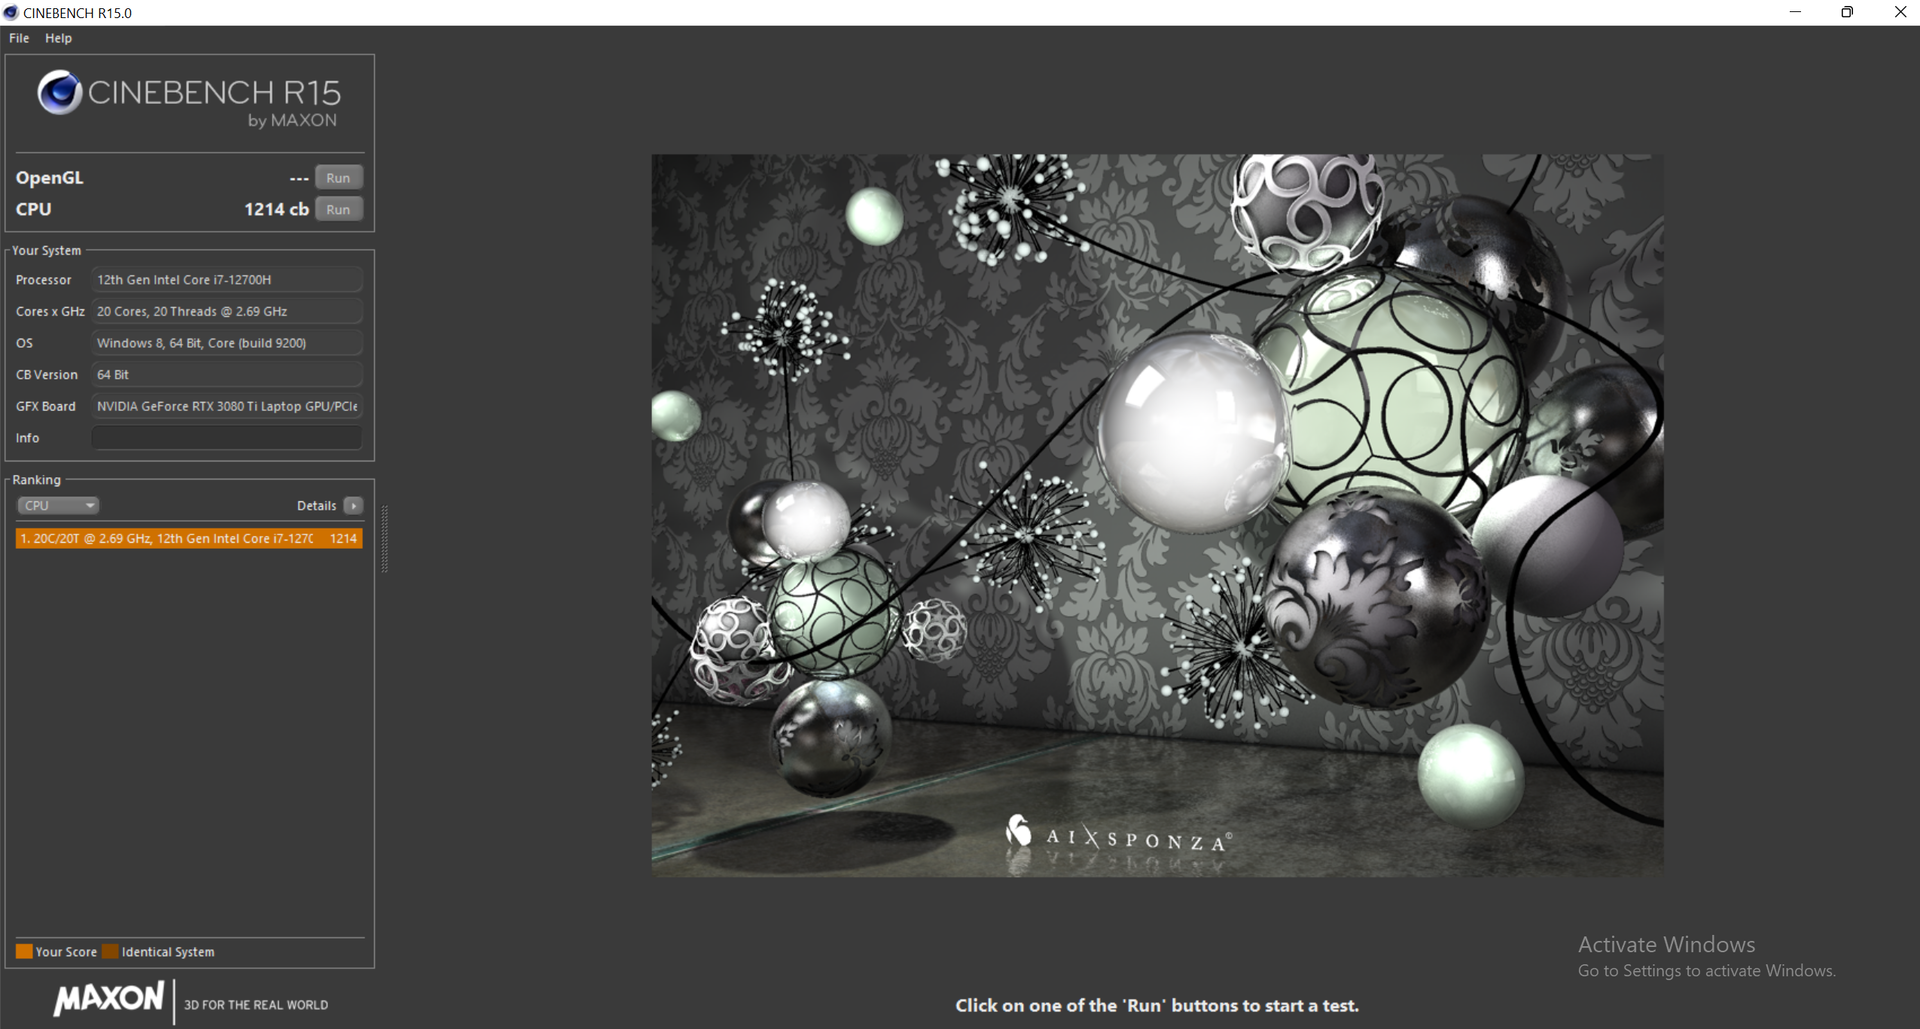
在电池模式下,CPU的性能损失超过50%。在Cinebench R15 Multi中只达到1214分,而在直流电上则达到2824分。

Cinebench R15 Multi Dauertest
Cinebench R23: Multi Core | Single Core
Cinebench R20: CPU (Multi Core) | CPU (Single Core)
Cinebench R15: CPU Multi 64Bit | CPU Single 64Bit
Blender: v2.79 BMW27 CPU
7-Zip 18.03: 7z b 4 | 7z b 4 -mmt1
Geekbench 5.5: Multi-Core | Single-Core
HWBOT x265 Benchmark v2.2: 4k Preset
LibreOffice : 20 Documents To PDF
R Benchmark 2.5: Overall mean
| CPU Performance rating | |
| Average of class Gaming | |
| MSI GE76 Raider | |
| Schenker XMG Neo 15 E22 (Early 2022, RTX 3080 Ti) | |
| Schenker XMG Oasis | |
| Average Intel Core i7-12700H | |
| Schenker XMG Neo 15 Tiger Lake | |
| Asus ROG Strix Scar 15 G533QS -2! | |
| Alienware m15 R6, i7-11800H RTX 3080 | |
| Razer Blade 15 Advanced (Mid 2021) -2! | |
| Cinebench R23 / Multi Core | |
| Average of class Gaming (10488 - 42661, n=107, last 2 years) | |
| Schenker XMG Neo 15 E22 (Early 2022, RTX 3080 Ti) | |
| Schenker XMG Oasis | |
| MSI GE76 Raider | |
| Average Intel Core i7-12700H (4032 - 19330, n=64) | |
| Schenker XMG Neo 15 Tiger Lake | |
| Asus ROG Strix Scar 15 G533QS | |
| Alienware m15 R6, i7-11800H RTX 3080 | |
| Razer Blade 15 Advanced (Mid 2021) | |
| Cinebench R23 / Single Core | |
| Average of class Gaming (1166 - 2415, n=107, last 2 years) | |
| MSI GE76 Raider | |
| Schenker XMG Oasis | |
| Schenker XMG Neo 15 E22 (Early 2022, RTX 3080 Ti) | |
| Average Intel Core i7-12700H (778 - 1826, n=63) | |
| Schenker XMG Neo 15 Tiger Lake | |
| Razer Blade 15 Advanced (Mid 2021) | |
| Alienware m15 R6, i7-11800H RTX 3080 | |
| Asus ROG Strix Scar 15 G533QS | |
| Cinebench R20 / CPU (Multi Core) | |
| Average of class Gaming (4029 - 16433, n=106, last 2 years) | |
| Schenker XMG Oasis | |
| Schenker XMG Neo 15 E22 (Early 2022, RTX 3080 Ti) | |
| MSI GE76 Raider | |
| Average Intel Core i7-12700H (1576 - 7407, n=64) | |
| Schenker XMG Neo 15 Tiger Lake | |
| Asus ROG Strix Scar 15 G533QS | |
| Razer Blade 15 Advanced (Mid 2021) | |
| Alienware m15 R6, i7-11800H RTX 3080 | |
| Cinebench R20 / CPU (Single Core) | |
| Average of class Gaming (442 - 913, n=106, last 2 years) | |
| MSI GE76 Raider | |
| Schenker XMG Neo 15 E22 (Early 2022, RTX 3080 Ti) | |
| Schenker XMG Oasis | |
| Average Intel Core i7-12700H (300 - 704, n=64) | |
| Razer Blade 15 Advanced (Mid 2021) | |
| Schenker XMG Neo 15 Tiger Lake | |
| Alienware m15 R6, i7-11800H RTX 3080 | |
| Asus ROG Strix Scar 15 G533QS | |
| Cinebench R15 / CPU Multi 64Bit | |
| Average of class Gaming (1578 - 6330, n=105, last 2 years) | |
| MSI GE76 Raider | |
| Schenker XMG Oasis | |
| Schenker XMG Neo 15 E22 (Early 2022, RTX 3080 Ti) | |
| Average Intel Core i7-12700H (1379 - 2916, n=70) | |
| Asus ROG Strix Scar 15 G533QS | |
| Schenker XMG Neo 15 Tiger Lake | |
| Alienware m15 R6, i7-11800H RTX 3080 | |
| Razer Blade 15 Advanced (Mid 2021) | |
| Cinebench R15 / CPU Single 64Bit | |
| Average of class Gaming (188.8 - 350, n=106, last 2 years) | |
| MSI GE76 Raider | |
| Schenker XMG Neo 15 E22 (Early 2022, RTX 3080 Ti) | |
| Schenker XMG Oasis | |
| Average Intel Core i7-12700H (113 - 263, n=65) | |
| Asus ROG Strix Scar 15 G533QS | |
| Schenker XMG Neo 15 Tiger Lake | |
| Razer Blade 15 Advanced (Mid 2021) | |
| Alienware m15 R6, i7-11800H RTX 3080 | |
| Blender / v2.79 BMW27 CPU | |
| Alienware m15 R6, i7-11800H RTX 3080 | |
| Razer Blade 15 Advanced (Mid 2021) | |
| Asus ROG Strix Scar 15 G533QS | |
| Average Intel Core i7-12700H (168 - 732, n=63) | |
| Schenker XMG Neo 15 Tiger Lake | |
| MSI GE76 Raider | |
| Schenker XMG Neo 15 E22 (Early 2022, RTX 3080 Ti) | |
| Schenker XMG Oasis | |
| Average of class Gaming (79 - 330, n=104, last 2 years) | |
| 7-Zip 18.03 / 7z b 4 | |
| Average of class Gaming (33491 - 148086, n=105, last 2 years) | |
| Schenker XMG Oasis | |
| Schenker XMG Neo 15 E22 (Early 2022, RTX 3080 Ti) | |
| MSI GE76 Raider | |
| Asus ROG Strix Scar 15 G533QS | |
| Average Intel Core i7-12700H (22844 - 73067, n=63) | |
| Schenker XMG Neo 15 Tiger Lake | |
| Razer Blade 15 Advanced (Mid 2021) | |
| Alienware m15 R6, i7-11800H RTX 3080 | |
| 7-Zip 18.03 / 7z b 4 -mmt1 | |
| Average of class Gaming (4199 - 7436, n=105, last 2 years) | |
| MSI GE76 Raider | |
| Schenker XMG Oasis | |
| Schenker XMG Neo 15 E22 (Early 2022, RTX 3080 Ti) | |
| Schenker XMG Neo 15 Tiger Lake | |
| Average Intel Core i7-12700H (2743 - 5972, n=63) | |
| Asus ROG Strix Scar 15 G533QS | |
| Razer Blade 15 Advanced (Mid 2021) | |
| Alienware m15 R6, i7-11800H RTX 3080 | |
| Geekbench 5.5 / Multi-Core | |
| Average of class Gaming (6460 - 28263, n=105, last 2 years) | |
| Schenker XMG Neo 15 E22 (Early 2022, RTX 3080 Ti) | |
| MSI GE76 Raider | |
| Schenker XMG Oasis | |
| Average Intel Core i7-12700H (5144 - 13745, n=64) | |
| Schenker XMG Neo 15 Tiger Lake | |
| Alienware m15 R6, i7-11800H RTX 3080 | |
| Geekbench 5.5 / Single-Core | |
| Average of class Gaming (986 - 2474, n=105, last 2 years) | |
| MSI GE76 Raider | |
| Schenker XMG Neo 15 E22 (Early 2022, RTX 3080 Ti) | |
| Schenker XMG Oasis | |
| Average Intel Core i7-12700H (803 - 1851, n=64) | |
| Schenker XMG Neo 15 Tiger Lake | |
| Alienware m15 R6, i7-11800H RTX 3080 | |
| HWBOT x265 Benchmark v2.2 / 4k Preset | |
| Average of class Gaming (11.5 - 44.4, n=105, last 2 years) | |
| Schenker XMG Oasis | |
| Schenker XMG Neo 15 E22 (Early 2022, RTX 3080 Ti) | |
| MSI GE76 Raider | |
| Schenker XMG Neo 15 Tiger Lake | |
| Average Intel Core i7-12700H (4.67 - 21.8, n=64) | |
| Asus ROG Strix Scar 15 G533QS | |
| Razer Blade 15 Advanced (Mid 2021) | |
| Alienware m15 R6, i7-11800H RTX 3080 | |
| LibreOffice / 20 Documents To PDF | |
| Asus ROG Strix Scar 15 G533QS | |
| Average of class Gaming (33.2 - 88.8, n=105, last 2 years) | |
| Schenker XMG Oasis | |
| Schenker XMG Neo 15 Tiger Lake | |
| Average Intel Core i7-12700H (34.2 - 95.3, n=63) | |
| Razer Blade 15 Advanced (Mid 2021) | |
| Alienware m15 R6, i7-11800H RTX 3080 | |
| Schenker XMG Neo 15 E22 (Early 2022, RTX 3080 Ti) | |
| MSI GE76 Raider | |
| R Benchmark 2.5 / Overall mean | |
| Alienware m15 R6, i7-11800H RTX 3080 | |
| Schenker XMG Neo 15 Tiger Lake | |
| Razer Blade 15 Advanced (Mid 2021) | |
| Asus ROG Strix Scar 15 G533QS | |
| Average Intel Core i7-12700H (0.4441 - 1.052, n=63) | |
| Schenker XMG Neo 15 E22 (Early 2022, RTX 3080 Ti) | |
| Schenker XMG Oasis | |
| Average of class Gaming (0.3439 - 0.759, n=106, last 2 years) | |
| MSI GE76 Raider | |
* ... smaller is better
AIDA64: FP32 Ray-Trace | FPU Julia | CPU SHA3 | CPU Queen | FPU SinJulia | FPU Mandel | CPU AES | CPU ZLib | FP64 Ray-Trace | CPU PhotoWorxx
| Performance rating | |
| Average of class Gaming | |
| Asus ROG Strix Scar 15 G533QS | |
| Alienware m15 R6, i7-11800H RTX 3080 | |
| MSI GE76 Raider | |
| Schenker XMG Oasis | |
| Schenker XMG Neo 15 E22 (Early 2022, RTX 3080 Ti) | |
| Average Intel Core i7-12700H | |
| AIDA64 / FP32 Ray-Trace | |
| Average of class Gaming (10227 - 85542, n=105, last 2 years) | |
| Alienware m15 R6, i7-11800H RTX 3080 | |
| Asus ROG Strix Scar 15 G533QS | |
| Average Intel Core i7-12700H (2585 - 17957, n=64) | |
| Schenker XMG Oasis | |
| Schenker XMG Neo 15 E22 (Early 2022, RTX 3080 Ti) | |
| MSI GE76 Raider | |
| AIDA64 / FPU Julia | |
| Average of class Gaming (51376 - 238426, n=105, last 2 years) | |
| Asus ROG Strix Scar 15 G533QS | |
| Alienware m15 R6, i7-11800H RTX 3080 | |
| Average Intel Core i7-12700H (12439 - 90760, n=64) | |
| Schenker XMG Neo 15 E22 (Early 2022, RTX 3080 Ti) | |
| Schenker XMG Oasis | |
| MSI GE76 Raider | |
| AIDA64 / CPU SHA3 | |
| Average of class Gaming (2180 - 10115, n=105, last 2 years) | |
| Alienware m15 R6, i7-11800H RTX 3080 | |
| Asus ROG Strix Scar 15 G533QS | |
| Schenker XMG Oasis | |
| Schenker XMG Neo 15 E22 (Early 2022, RTX 3080 Ti) | |
| MSI GE76 Raider | |
| Average Intel Core i7-12700H (833 - 4242, n=64) | |
| AIDA64 / CPU Queen | |
| Average of class Gaming (49785 - 173351, n=90, last 2 years) | |
| MSI GE76 Raider | |
| Asus ROG Strix Scar 15 G533QS | |
| Schenker XMG Oasis | |
| Schenker XMG Neo 15 E22 (Early 2022, RTX 3080 Ti) | |
| Average Intel Core i7-12700H (57923 - 103202, n=63) | |
| Alienware m15 R6, i7-11800H RTX 3080 | |
| AIDA64 / FPU SinJulia | |
| Average of class Gaming (4424 - 33636, n=105, last 2 years) | |
| Asus ROG Strix Scar 15 G533QS | |
| MSI GE76 Raider | |
| Schenker XMG Oasis | |
| Schenker XMG Neo 15 E22 (Early 2022, RTX 3080 Ti) | |
| Alienware m15 R6, i7-11800H RTX 3080 | |
| Average Intel Core i7-12700H (3249 - 9939, n=64) | |
| AIDA64 / FPU Mandel | |
| Average of class Gaming (25115 - 128721, n=105, last 2 years) | |
| Asus ROG Strix Scar 15 G533QS | |
| Alienware m15 R6, i7-11800H RTX 3080 | |
| Average Intel Core i7-12700H (7135 - 44760, n=64) | |
| Schenker XMG Oasis | |
| Schenker XMG Neo 15 E22 (Early 2022, RTX 3080 Ti) | |
| MSI GE76 Raider | |
| AIDA64 / CPU AES | |
| Alienware m15 R6, i7-11800H RTX 3080 | |
| Asus ROG Strix Scar 15 G533QS | |
| Average of class Gaming (39258 - 247074, n=105, last 2 years) | |
| MSI GE76 Raider | |
| Average Intel Core i7-12700H (31839 - 144360, n=64) | |
| Schenker XMG Neo 15 E22 (Early 2022, RTX 3080 Ti) | |
| Schenker XMG Oasis | |
| AIDA64 / CPU ZLib | |
| Average of class Gaming (574 - 2531, n=105, last 2 years) | |
| Schenker XMG Neo 15 E22 (Early 2022, RTX 3080 Ti) | |
| Schenker XMG Oasis | |
| MSI GE76 Raider | |
| Average Intel Core i7-12700H (305 - 1171, n=64) | |
| Asus ROG Strix Scar 15 G533QS | |
| Alienware m15 R6, i7-11800H RTX 3080 | |
| AIDA64 / FP64 Ray-Trace | |
| Average of class Gaming (5509 - 45446, n=105, last 2 years) | |
| Alienware m15 R6, i7-11800H RTX 3080 | |
| Asus ROG Strix Scar 15 G533QS | |
| Average Intel Core i7-12700H (1437 - 9692, n=64) | |
| Schenker XMG Oasis | |
| Schenker XMG Neo 15 E22 (Early 2022, RTX 3080 Ti) | |
| MSI GE76 Raider | |
| AIDA64 / CPU PhotoWorxx | |
| Average of class Gaming (12271 - 89891, n=105, last 2 years) | |
| Schenker XMG Oasis | |
| Schenker XMG Neo 15 E22 (Early 2022, RTX 3080 Ti) | |
| MSI GE76 Raider | |
| Average Intel Core i7-12700H (12863 - 52207, n=64) | |
| Asus ROG Strix Scar 15 G533QS | |
| Alienware m15 R6, i7-11800H RTX 3080 | |
系统性能
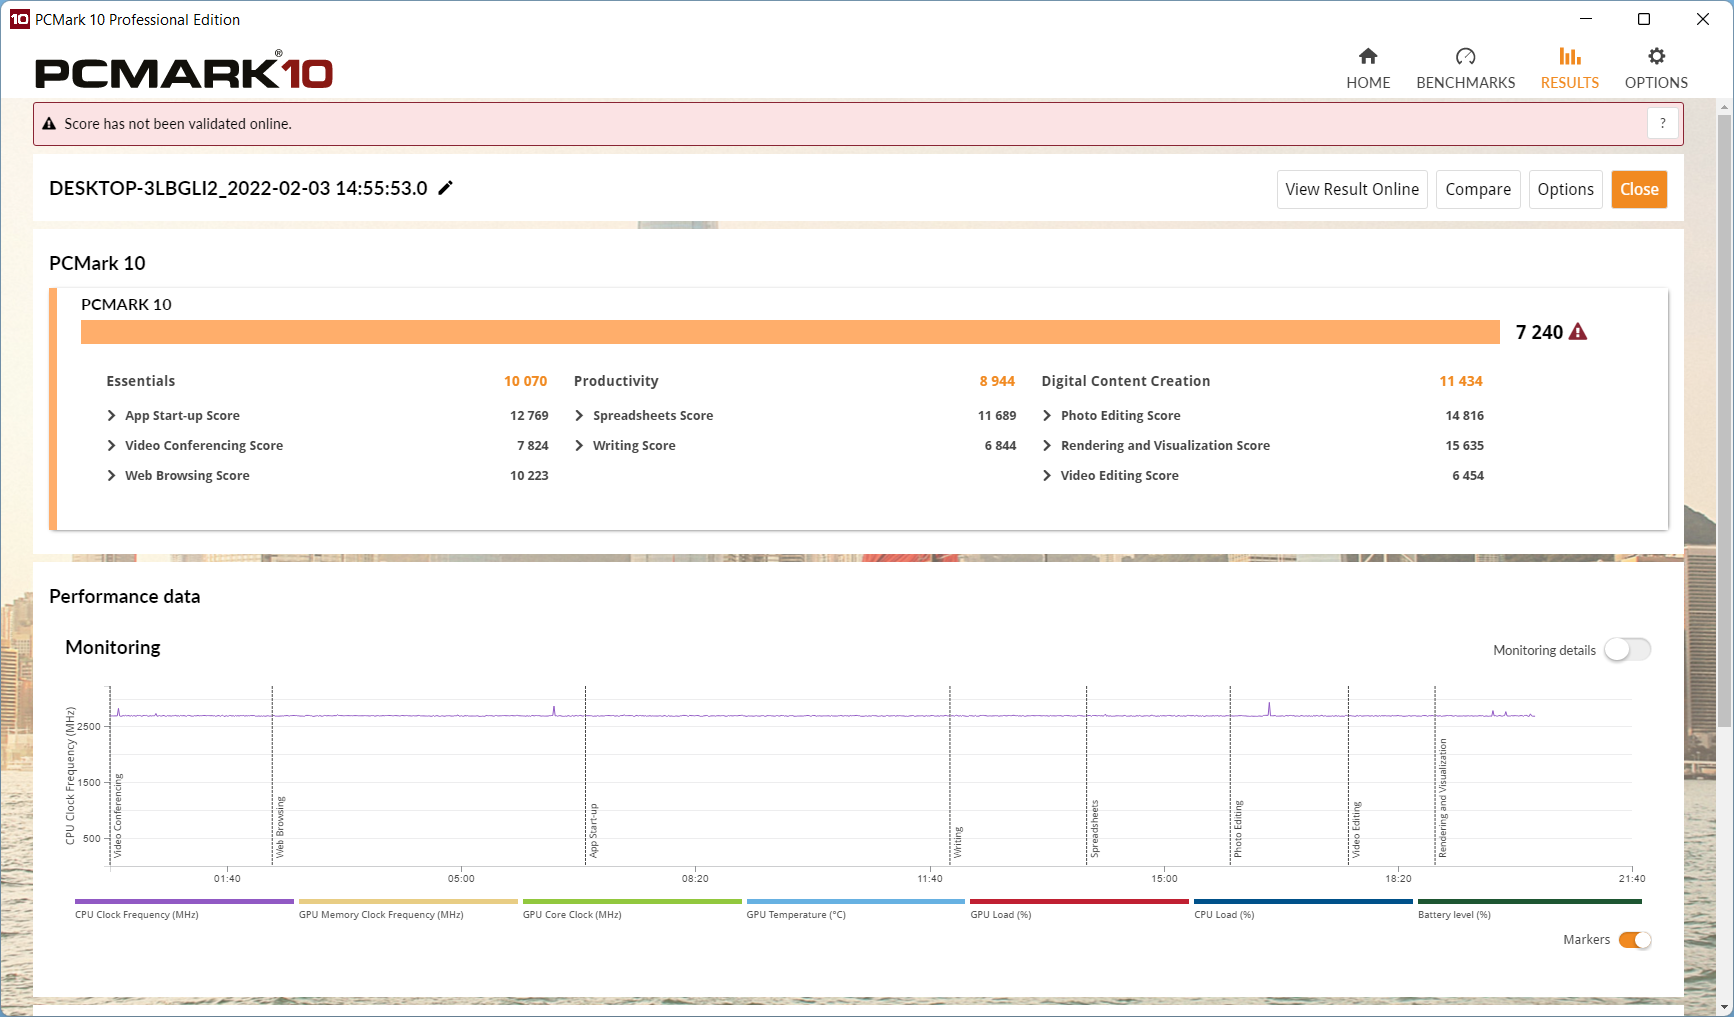
在PCMark 10中的得分并不具有全面的说服力。Razer Blade 15在总分上超过了Neo 15。另一方面,在数字内容创作测试中,Neo 15仅次于硬件相似的微星GE76 Raider,但在基本要素和生产力测试中,该笔记本略微落后。在后者中,带有Oasis附件的Neo的表现要好10%左右。
| PCMark 10 / Score | |
| Average of class Gaming (5828 - 12414, n=93, last 2 years) | |
| MSI GE76 Raider | |
| Schenker XMG Oasis | |
| Average Intel Core i7-12700H, NVIDIA GeForce RTX 3080 Ti Laptop GPU (6868 - 7638, n=7) | |
| Razer Blade 15 Advanced (Mid 2021) | |
| Schenker XMG Neo 15 E22 (Early 2022, RTX 3080 Ti) | |
| Asus ROG Strix Scar 15 G533QS | |
| Schenker XMG Neo 15 Tiger Lake | |
| Alienware m15 R6, i7-11800H RTX 3080 | |
| PCMark 10 / Essentials | |
| Razer Blade 15 Advanced (Mid 2021) | |
| MSI GE76 Raider | |
| Average of class Gaming (8810 - 11935, n=97, last 2 years) | |
| Average Intel Core i7-12700H, NVIDIA GeForce RTX 3080 Ti Laptop GPU (9987 - 11318, n=7) | |
| Schenker XMG Neo 15 Tiger Lake | |
| Asus ROG Strix Scar 15 G533QS | |
| Schenker XMG Neo 15 E22 (Early 2022, RTX 3080 Ti) | |
| Alienware m15 R6, i7-11800H RTX 3080 | |
| Schenker XMG Oasis | |
| PCMark 10 / Productivity | |
| Average of class Gaming (6845 - 25323, n=95, last 2 years) | |
| MSI GE76 Raider | |
| Asus ROG Strix Scar 15 G533QS | |
| Schenker XMG Oasis | |
| Average Intel Core i7-12700H, NVIDIA GeForce RTX 3080 Ti Laptop GPU (8944 - 10726, n=7) | |
| Alienware m15 R6, i7-11800H RTX 3080 | |
| Razer Blade 15 Advanced (Mid 2021) | |
| Schenker XMG Neo 15 Tiger Lake | |
| Schenker XMG Neo 15 E22 (Early 2022, RTX 3080 Ti) | |
| PCMark 10 / Digital Content Creation | |
| Average of class Gaming (7602 - 19954, n=95, last 2 years) | |
| MSI GE76 Raider | |
| Schenker XMG Oasis | |
| Schenker XMG Neo 15 E22 (Early 2022, RTX 3080 Ti) | |
| Average Intel Core i7-12700H, NVIDIA GeForce RTX 3080 Ti Laptop GPU (8956 - 12249, n=7) | |
| Schenker XMG Neo 15 Tiger Lake | |
| Razer Blade 15 Advanced (Mid 2021) | |
| Alienware m15 R6, i7-11800H RTX 3080 | |
| Asus ROG Strix Scar 15 G533QS | |
| PCMark 10 Score | 7240 points | |
Help | ||
| AIDA64 / Memory Copy | |
| Average of class Gaming (21750 - 129946, n=105, last 2 years) | |
| Schenker XMG Neo 15 E22 (Early 2022, RTX 3080 Ti) | |
| MSI GE76 Raider | |
| Schenker XMG Oasis | |
| Average Intel Core i7-12700H (25615 - 80511, n=64) | |
| Alienware m15 R6, i7-11800H RTX 3080 | |
| Asus ROG Strix Scar 15 G533QS | |
| AIDA64 / Memory Read | |
| Average of class Gaming (22956 - 118858, n=105, last 2 years) | |
| Schenker XMG Oasis | |
| Schenker XMG Neo 15 E22 (Early 2022, RTX 3080 Ti) | |
| MSI GE76 Raider | |
| Average Intel Core i7-12700H (25586 - 79442, n=64) | |
| Alienware m15 R6, i7-11800H RTX 3080 | |
| Asus ROG Strix Scar 15 G533QS | |
| AIDA64 / Memory Write | |
| Average of class Gaming (22297 - 135096, n=105, last 2 years) | |
| Schenker XMG Oasis | |
| Schenker XMG Neo 15 E22 (Early 2022, RTX 3080 Ti) | |
| MSI GE76 Raider | |
| Average Intel Core i7-12700H (23679 - 88660, n=64) | |
| Asus ROG Strix Scar 15 G533QS | |
| Alienware m15 R6, i7-11800H RTX 3080 | |
| AIDA64 / Memory Latency | |
| Average of class Gaming (75.3 - 259, n=105, last 2 years) | |
| Alienware m15 R6, i7-11800H RTX 3080 | |
| MSI GE76 Raider | |
| Asus ROG Strix Scar 15 G533QS | |
| Average Intel Core i7-12700H (76.2 - 133.9, n=62) | |
| Schenker XMG Neo 15 Tiger Lake | |
| Razer Blade 15 Advanced (Mid 2021) | |
| Schenker XMG Neo 15 E22 (Early 2022, RTX 3080 Ti) | |
| Schenker XMG Oasis | |
* ... smaller is better
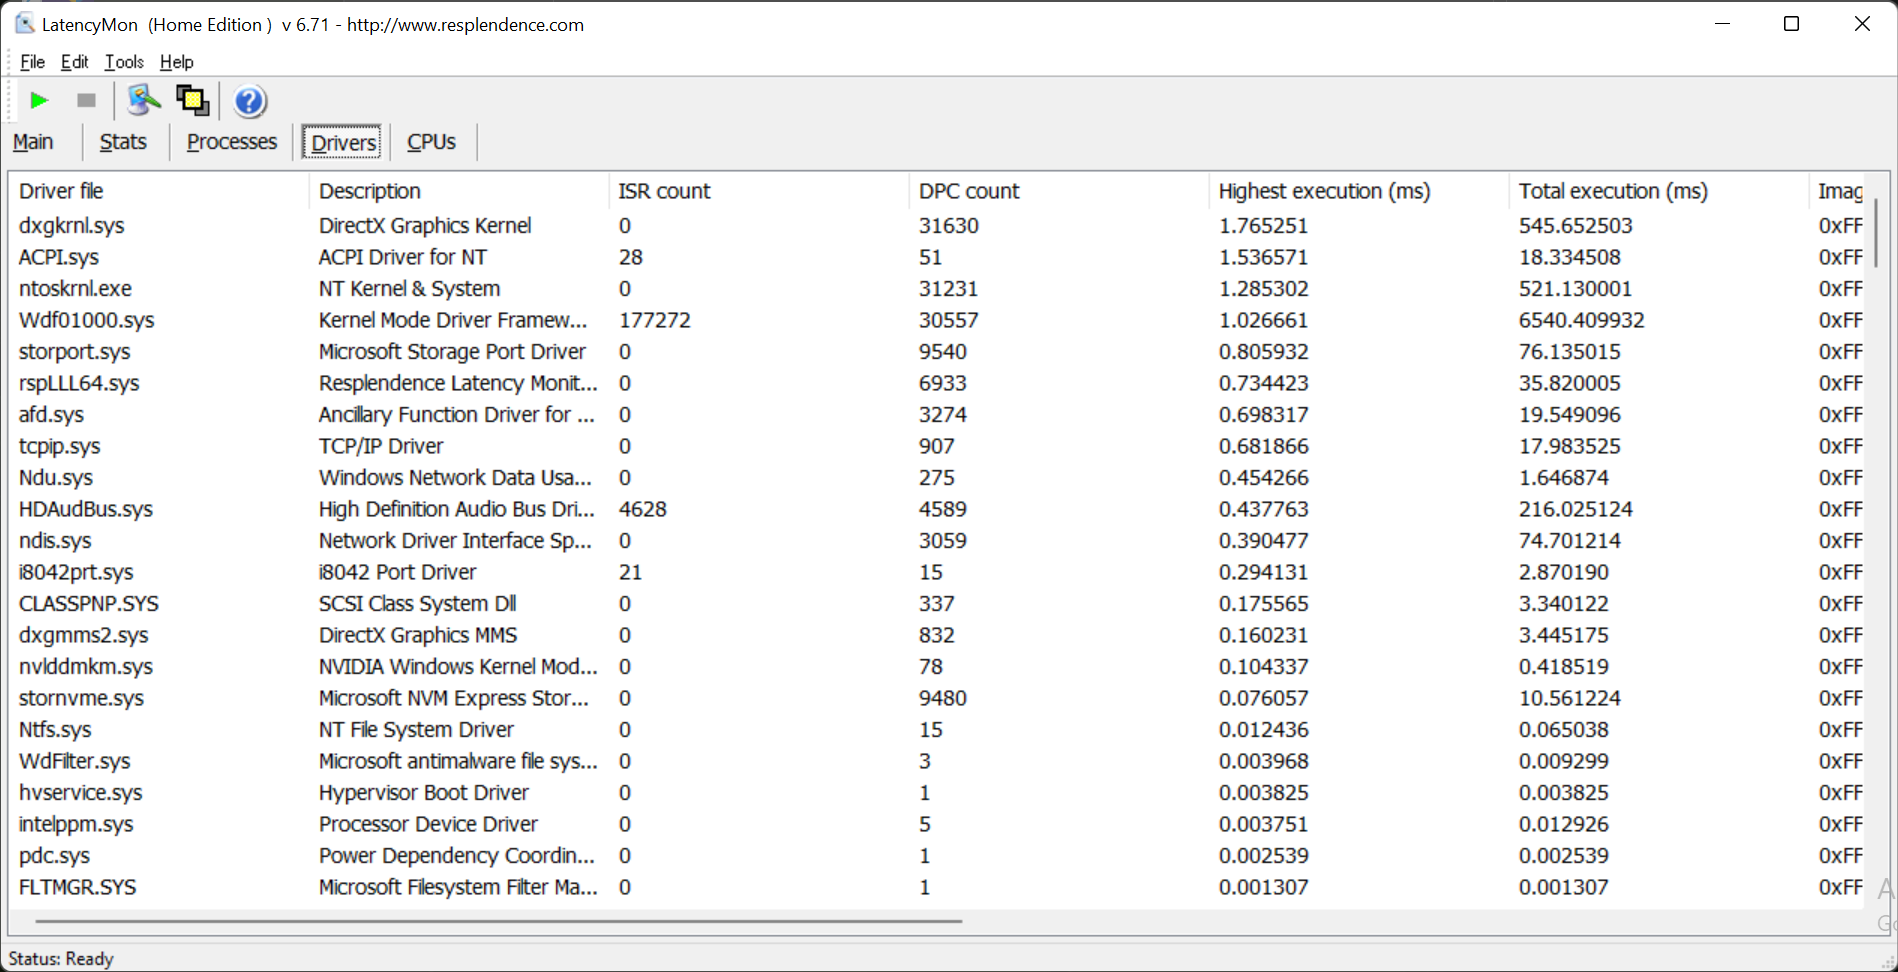
DPC延迟
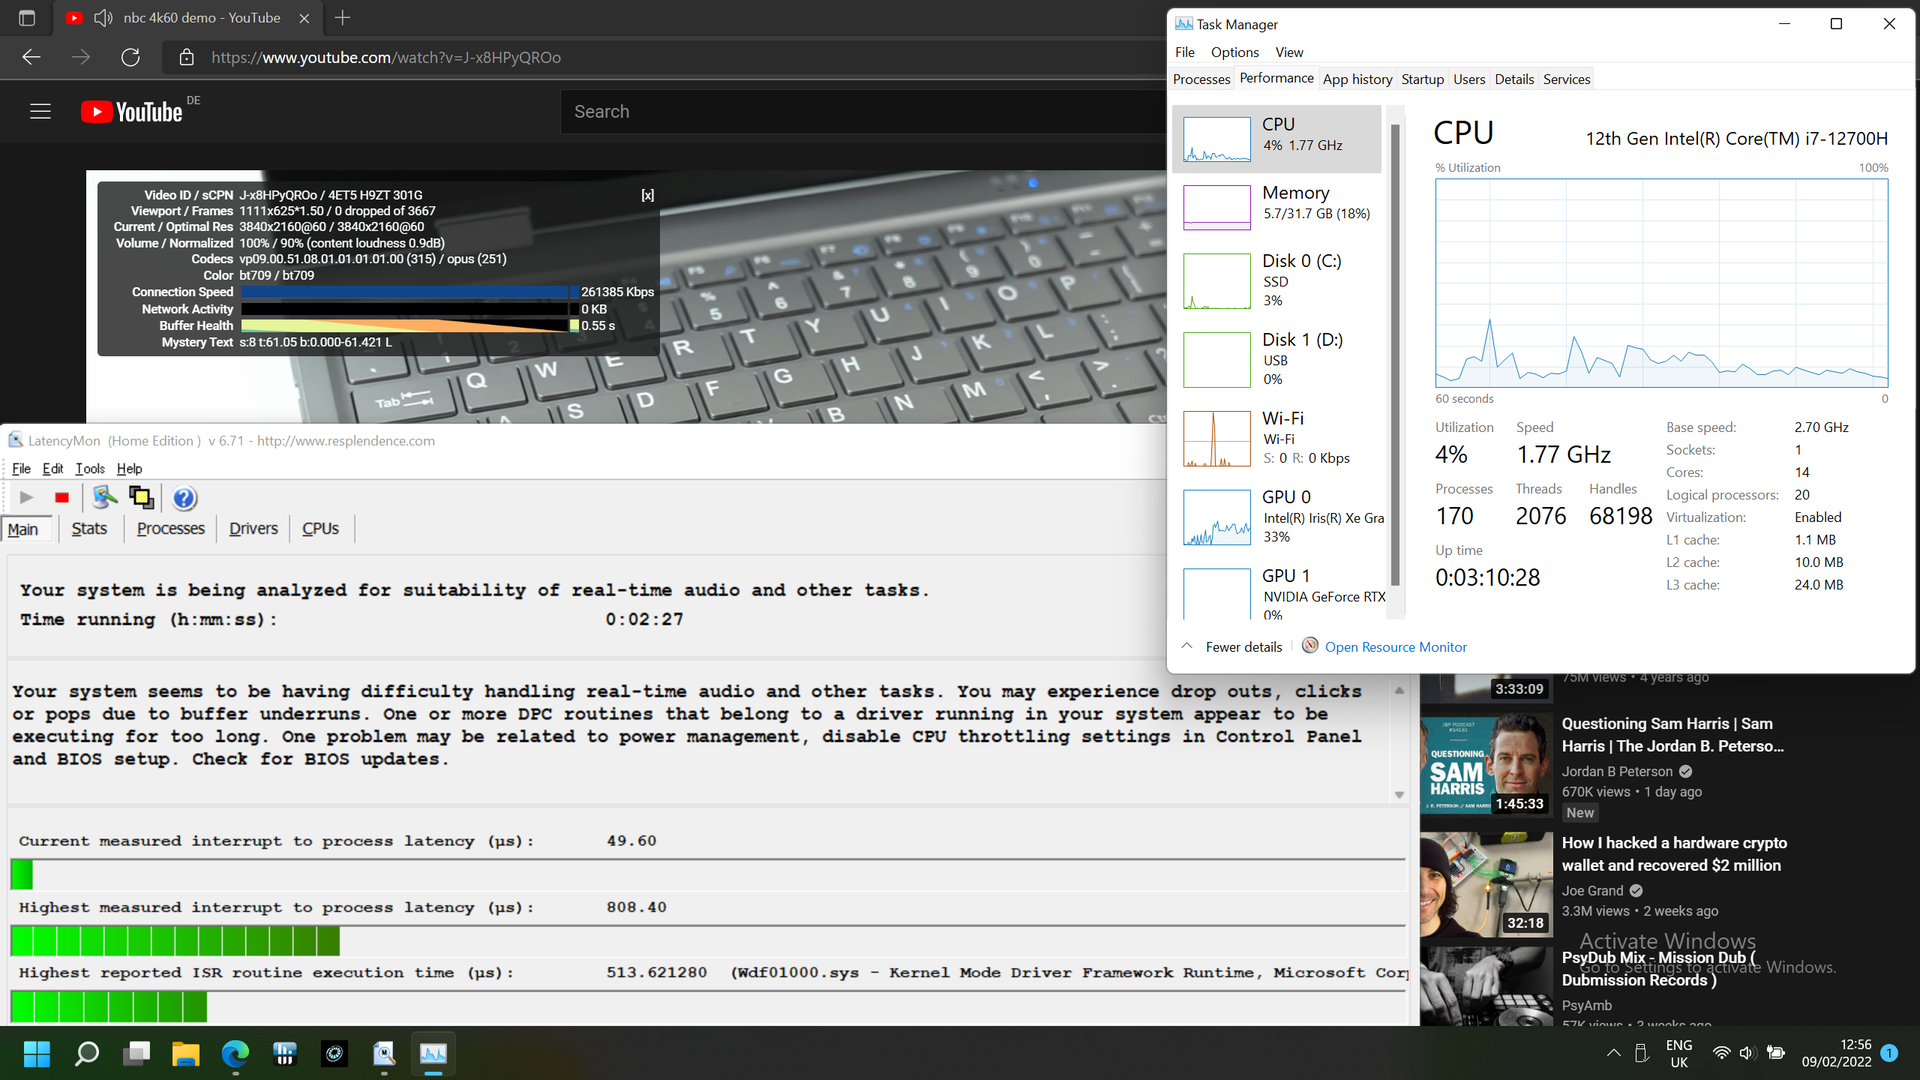
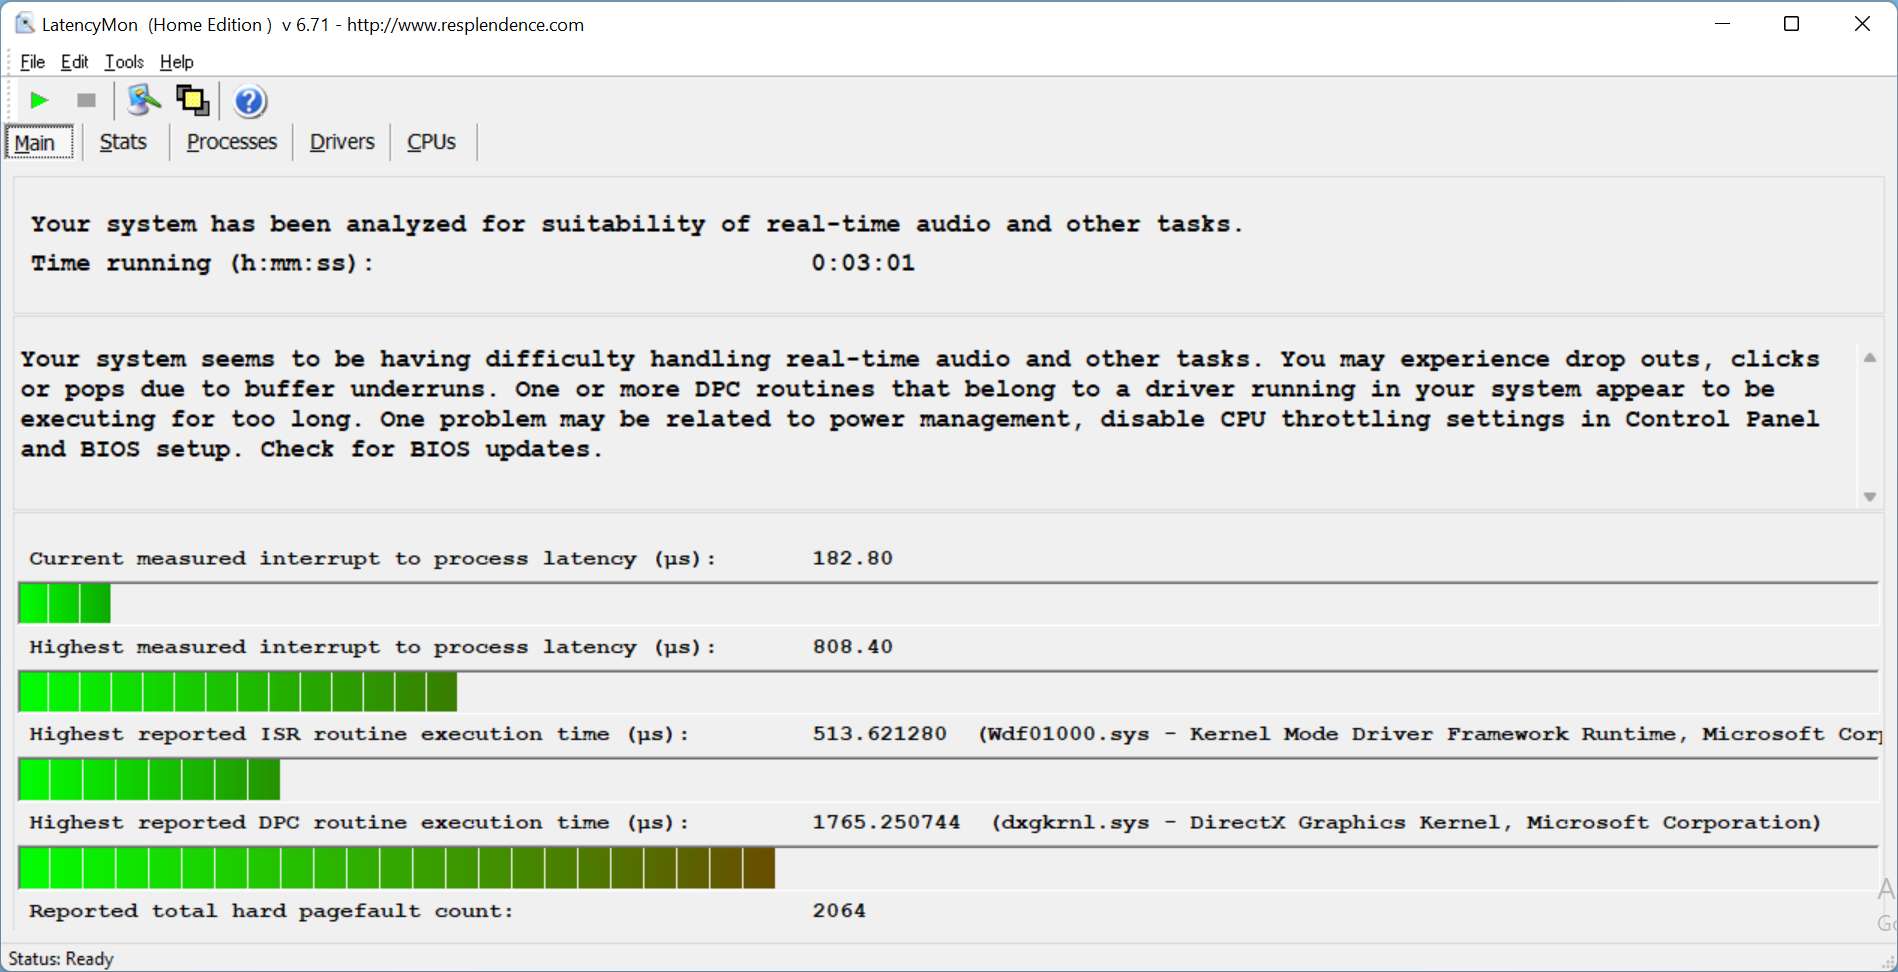
LatencyMon已经显示在打开Edge浏览器时延迟增加。当打开多个标签并播放我们的4K/60帧YouTube视频时,情况变得更糟。不过,视频播放时没有掉帧。
| DPC Latencies / LatencyMon - interrupt to process latency (max), Web, Youtube, Prime95 | |
| Razer Blade 15 Advanced (Mid 2021) | |
| MSI GE76 Raider | |
| Asus ROG Strix Scar 15 G533QS | |
| Alienware m15 R6, i7-11800H RTX 3080 | |
| Schenker XMG Neo 15 E22 (Early 2022, RTX 3080 Ti) | |
| Schenker XMG Neo 15 Tiger Lake | |
* ... smaller is better
大容量存储
我们来自中国的预生产模型最初并没有固态硬盘。Schenker给我们送来了一个快速的三星980 Pro,可惜只有250GB用于测试,由于其体积小,几乎不会被安装,甚至没有出现在我们的固态硬盘最佳列表到目前为止。
在安装了Windows 11 Home之后,只剩下大约60到80GB用于其他程序。生产模型可能会有至少512GB。

| Drive Performance rating - Percent | |
| MSI GE76 Raider | |
| Razer Blade 15 Advanced (Mid 2021) | |
| Average of class Gaming | |
| Schenker XMG Neo 15 E22 (Early 2022, RTX 3080 Ti) | |
| Average Samsung SSD 980 Pro 250GB MZ-V8P250BW | |
| Schenker XMG Neo 15 Tiger Lake | |
| Alienware m15 R6, i7-11800H RTX 3080 | |
| Asus ROG Strix Scar 15 G533QS | |
* ... smaller is better
Continuous load read: DiskSpd Read Loop, Queue Depth 8
图形卡
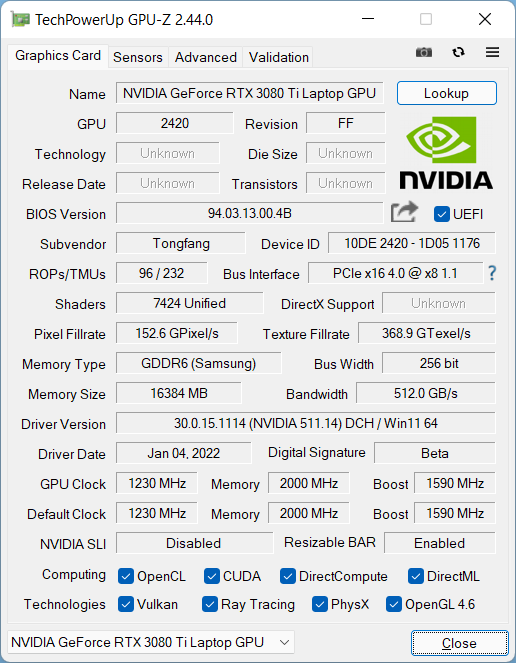
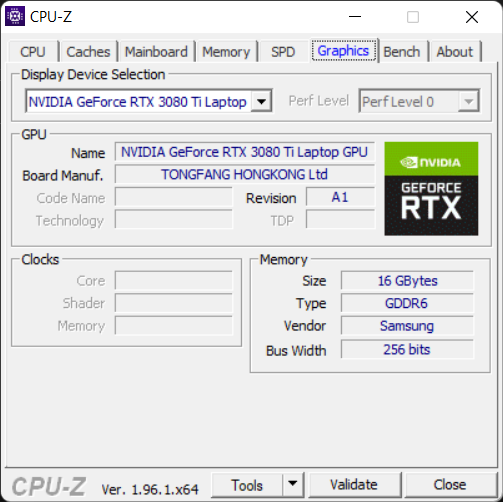
全新的NvidiaGeForce RTX 3080 Ti Laptop GPU是目前笔记本电脑中最快的显卡。Max-Q和Whisper模式可用,但在Neo 15中没有Advanced Optimus。该卡的GDDR6显存为16GB。
Nvidia再次让制造商决定耗电量,从而决定性能。Schenker通过控制中心将这一决定传递给客户。
在3DMark测试中,Neo 15的排名通常仅次于微星GE76 Raider,后者也以175W的全功率运行RTX 3080 Ti。然而,Neo 15的前辈在许多3DMark测试中只落后几个百分点,在整体性能评级中落后约12%。
与Oasis几乎没有任何值得注意的差异,而且该组合通常甚至落后于仅有Neo的比率。
离开了电源插座,3D性能就大大下降了。在3DMark 11中,笔记本的性能整整下降了87%。在TheWitcher 3WQHD中,帧率从略低于100帧下降到只有约10至11帧--也损失了近90%!不幸的是,考虑到当前GPU的高功耗,这是标准的。
| 3DMark Performance rating - Percent | |
| Average of class Gaming | |
| MSI GE76 Raider | |
| Schenker XMG Neo 15 E22 (Early 2022, RTX 3080 Ti) | |
| Schenker XMG Oasis | |
| Average NVIDIA GeForce RTX 3080 Ti Laptop GPU | |
| Razer Blade 15 Advanced (Mid 2021) | |
| Schenker XMG Neo 15 Tiger Lake | |
| Alienware m15 R6, i7-11800H RTX 3080 | |
| Asus ROG Strix Scar 15 G533QS | |
| 3DMark 11 - 1280x720 Performance GPU | |
| Average of class Gaming (21841 - 80022, n=104, last 2 years) | |
| MSI GE76 Raider | |
| Schenker XMG Oasis | |
| Schenker XMG Neo 15 E22 (Early 2022, RTX 3080 Ti) | |
| Schenker XMG Neo 15 Tiger Lake | |
| Asus ROG Strix Scar 15 G533QS | |
| Average NVIDIA GeForce RTX 3080 Ti Laptop GPU (13920 - 45841, n=45) | |
| Alienware m15 R6, i7-11800H RTX 3080 | |
| Razer Blade 15 Advanced (Mid 2021) | |
| 3DMark 11 Performance | 35910 points | |
| 3DMark Cloud Gate Standard Score | 63903 points | |
| 3DMark Fire Strike Score | 27983 points | |
| 3DMark Time Spy Score | 12480 points | |
Help | ||
游戏性能
使用 RTX 3080 Ti的情况下,Neo 15可以在原生WQHD分辨率下流畅地玩所有当前游戏。大多数时候也应该有足够的储备用于4K。
Witcher 3,在2,560 x 1,440像素的超分辨率下运行约95帧,在全高清下运行120帧。Far Cry 5,在原生分辨率下也能运行超过100帧。
笔记本电脑配备RTX 3080滞后约10%,而微星GE76 Raider的速度则微乎其微。我们无法安装 GTA V因为SSD容量太小,而Windows 11又太耗费空间。希望我们能在生产模型中弥补这一点。
使用绿洲冷却,《Witcher 3》和《Far Cry 5》的运行速度约为3-5%,这在实践中通常不明显,但会导致较大的温度差异。
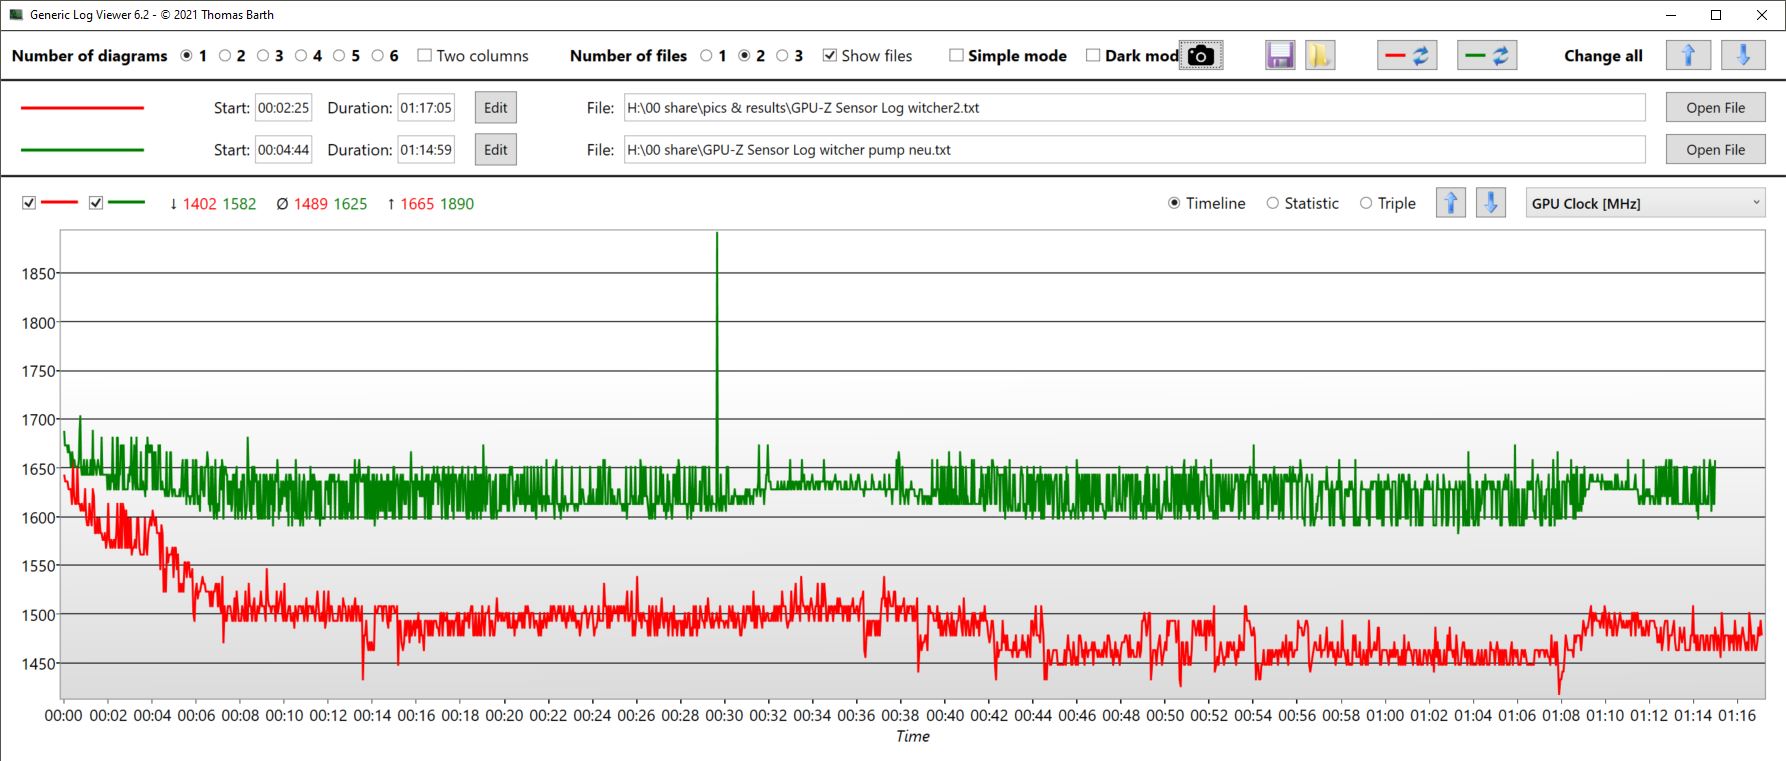
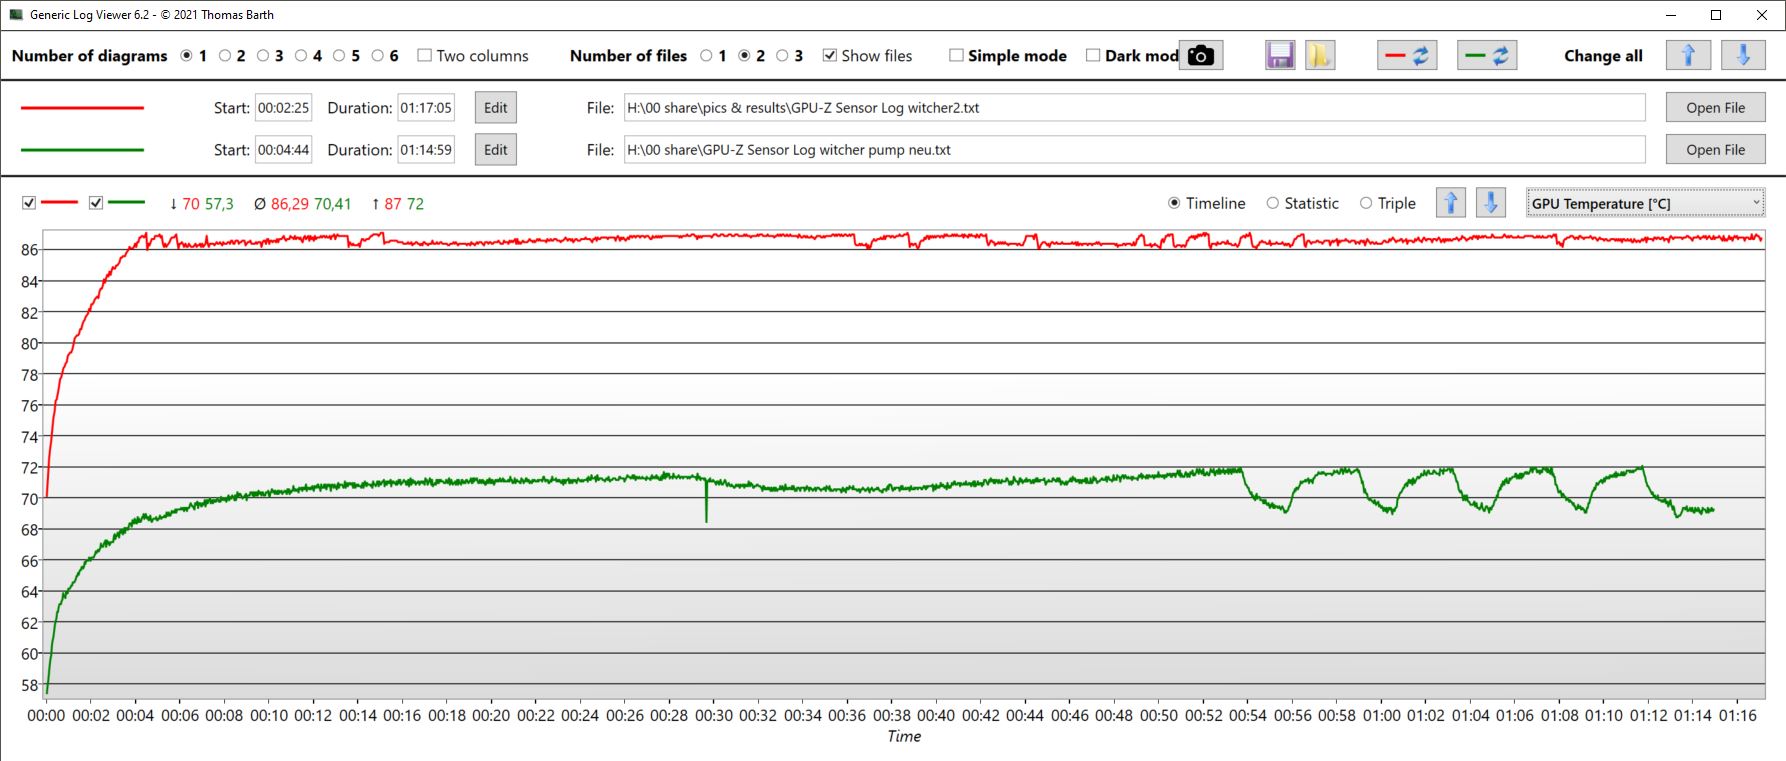
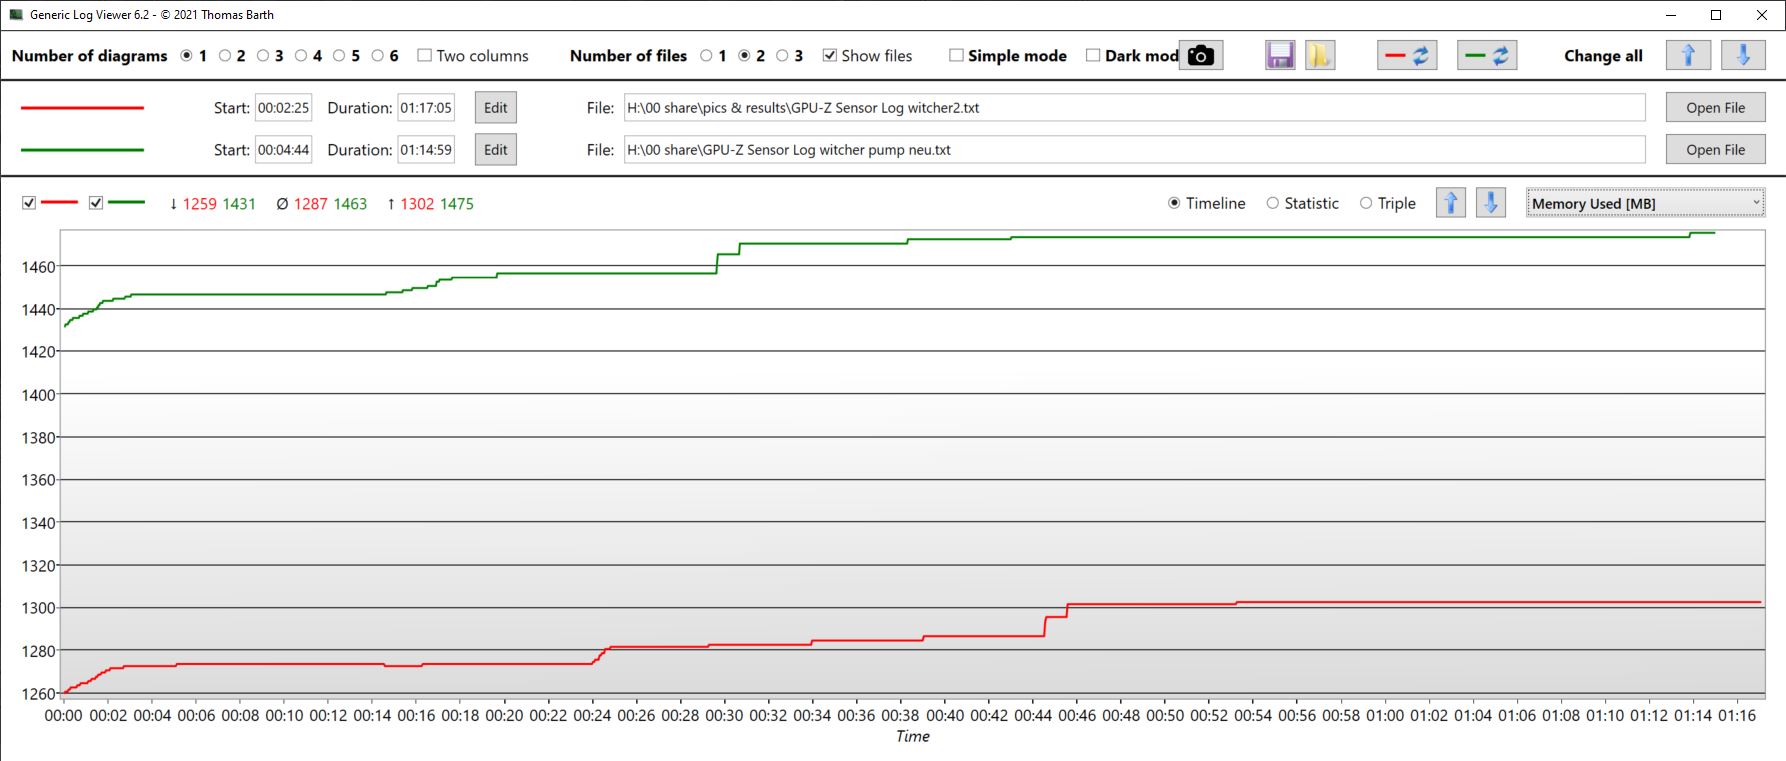
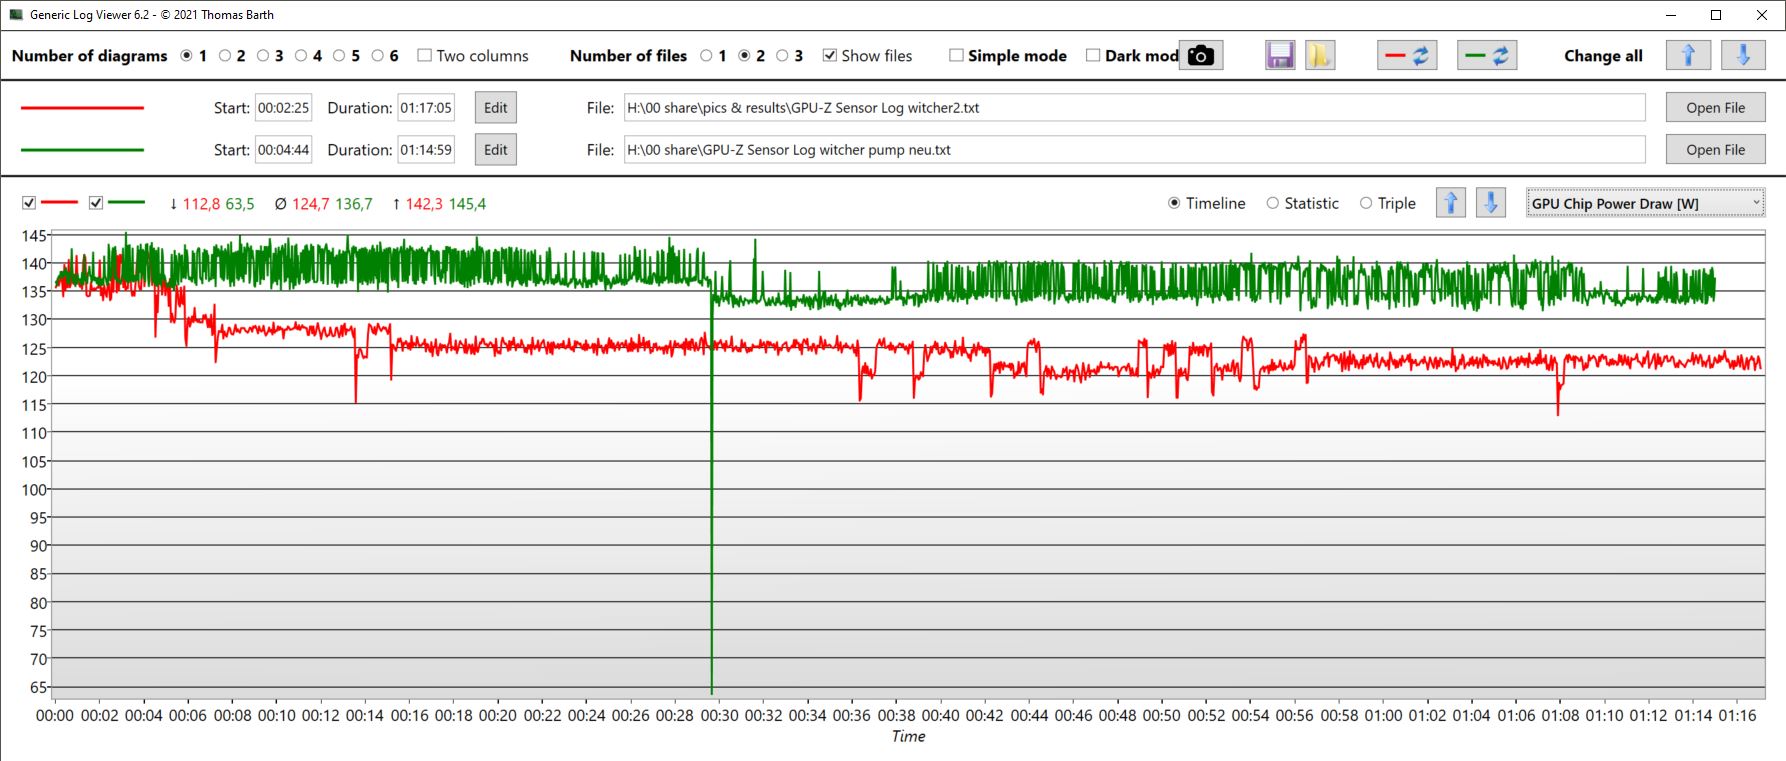
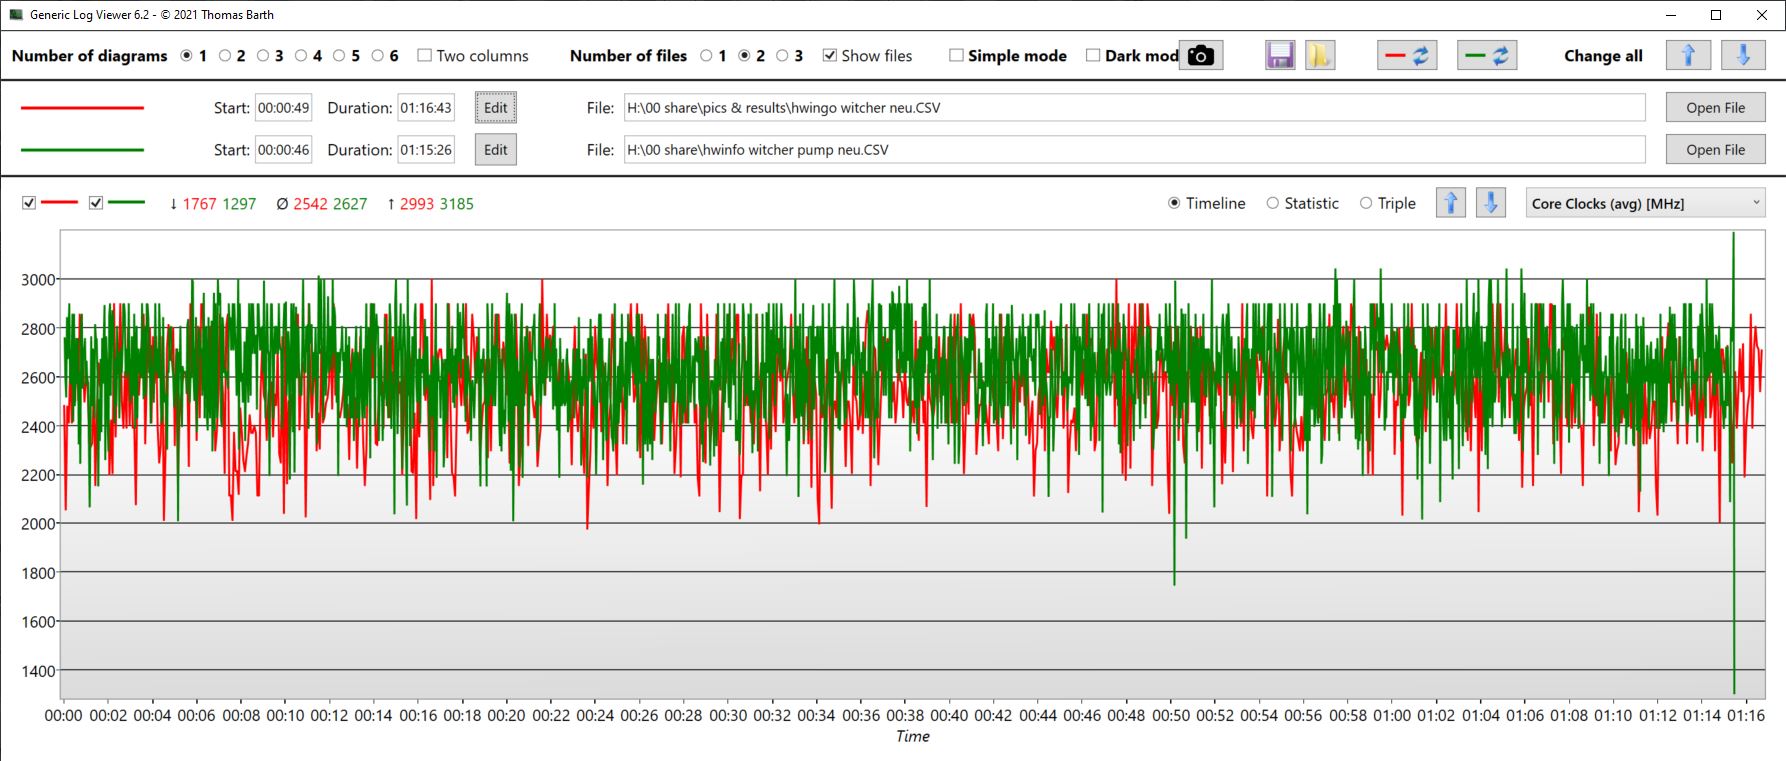
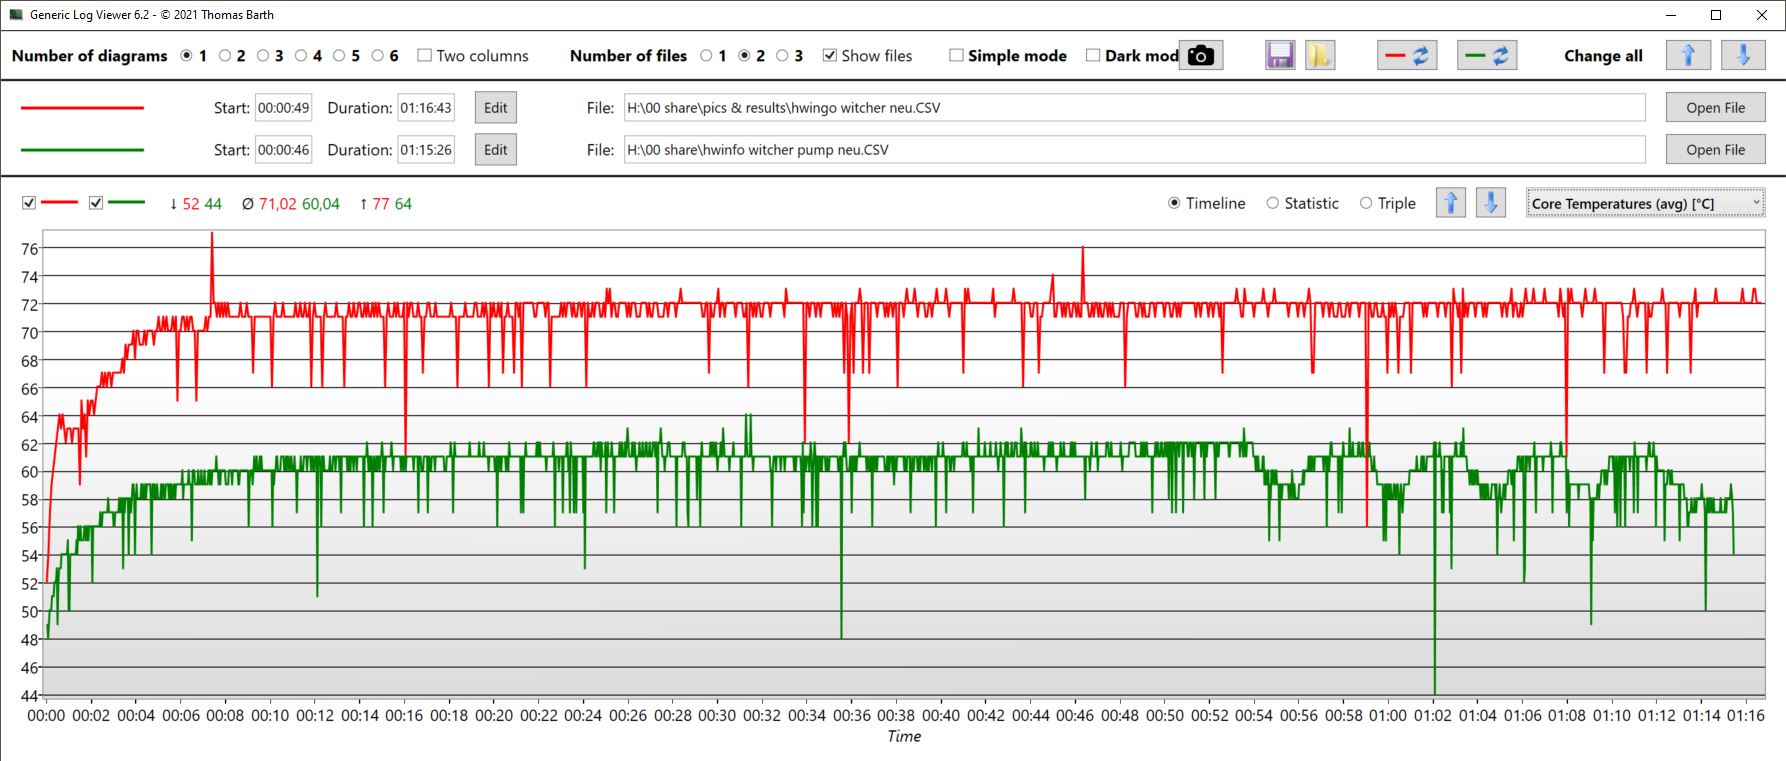
对《Witcher 3》一小时的压力评估表明,Neo 15的GPU在Oasis的作用下平均能够提高150MHz的频率,保持整整16℃的温度,消耗更多的电力,并能使用更多的内存。
在《Witcher 3》中,对CPU的影响要小一些。时钟频率几乎相同,即使没有Oasis,CPU也没有明显的热节流现象。然而,连接Oasis后,CPU的温度要低11℃左右。
| Dota 2 Reborn | |
| 1920x1080 high (2/3) | |
| Average of class Gaming (82.8 - 275, n=106, last 2 years) | |
| MSI GE76 Raider | |
| Schenker XMG Oasis | |
| Schenker XMG Neo 15 Tiger Lake | |
| Schenker XMG Neo 15 E22 (Early 2022, RTX 3080 Ti) | |
| Razer Blade 15 Advanced (Mid 2021) | |
| Average NVIDIA GeForce RTX 3080 Ti Laptop GPU (29.9 - 180.8, n=45) | |
| Alienware m15 R6, i7-11800H RTX 3080 | |
| Asus ROG Strix Scar 15 G533QS | |
| 1920x1080 ultra (3/3) best looking | |
| MSI GE76 Raider | |
| Average of class Gaming (84.8 - 248, n=107, last 2 years) | |
| Schenker XMG Neo 15 E22 (Early 2022, RTX 3080 Ti) | |
| Schenker XMG Oasis | |
| Schenker XMG Neo 15 Tiger Lake | |
| Razer Blade 15 Advanced (Mid 2021) | |
| Average NVIDIA GeForce RTX 3080 Ti Laptop GPU (29.9 - 170.5, n=45) | |
| Alienware m15 R6, i7-11800H RTX 3080 | |
| Asus ROG Strix Scar 15 G533QS | |
| Final Fantasy XV Benchmark | |
| 1920x1080 Standard Quality | |
| Average of class Gaming (85.7 - 236, n=82, last 2 years) | |
| MSI GE76 Raider | |
| Schenker XMG Oasis | |
| Average NVIDIA GeForce RTX 3080 Ti Laptop GPU (110 - 189.3, n=27) | |
| Schenker XMG Neo 15 E22 (Early 2022, RTX 3080 Ti) | |
| Schenker XMG Neo 15 Tiger Lake | |
| Asus ROG Strix Scar 15 G533QS | |
| Razer Blade 15 Advanced (Mid 2021) | |
| 1920x1080 High Quality | |
| Average of class Gaming (41 - 215, n=95, last 2 years) | |
| MSI GE76 Raider | |
| Schenker XMG Oasis | |
| Schenker XMG Neo 15 E22 (Early 2022, RTX 3080 Ti) | |
| Average NVIDIA GeForce RTX 3080 Ti Laptop GPU (30.7 - 140.6, n=42) | |
| Schenker XMG Neo 15 Tiger Lake | |
| Asus ROG Strix Scar 15 G533QS | |
| Razer Blade 15 Advanced (Mid 2021) | |
| 2560x1440 High Quality | |
| Average of class Gaming (32.5 - 184.3, n=87, last 2 years) | |
| Schenker XMG Oasis | |
| Schenker XMG Neo 15 E22 (Early 2022, RTX 3080 Ti) | |
| Average NVIDIA GeForce RTX 3080 Ti Laptop GPU (30.8 - 105.8, n=34) | |
| Schenker XMG Neo 15 Tiger Lake | |
Witcher 3》中的帧率在一小时内只略有下降,但表现也不太稳定。使用 "绿洲",帧率类似,但总是比我们在没有水冷的情况下看到的高7%左右。因此,长期性能的提高是微乎其微的。
The Witcher 3 - FPS Diagram
| low | med. | high | ultra | QHD | |
|---|---|---|---|---|---|
| The Witcher 3 (2015) | 388.4 | 325.6 | 212.4 | 121 | |
| Dota 2 Reborn (2015) | 175 | 162 | 153 | 147 | |
| Final Fantasy XV Benchmark (2018) | 151 | 115 | 87.4 | ||
| X-Plane 11.11 (2018) | 142 | 124 | 101 | ||
| Far Cry 5 (2018) | 164 | 145 | 140 | 131 | 116 |
排放。我们有没有提到水冷?
噪声排放
我们使用的手动最大化TDP/TGP值的过度增压模式肯定不是通常的使用情况。该硬件提供了足够的功率,也可以在更安静的 "爱好者 "或 "平衡 "模式下运行(带耳语模式)。
即使在过载模式下,该设备至少也不会比配备RTX 3080的前代产品更吵。比较设备运行时也只是稍微安静一些。
遗憾的是,使用Oasis,噪音排放只略有下降(Oasis Balanced)--从54分贝到53分贝,在 Witcher 3 。在压力测试中,噪音水平的下降也很低。绿洲不一定安静的风扇将其音量增加到内部风扇的音量,然后以较低的速度旋转。总的来说,这种差异比我们希望的要小。
然而,这些数值是在一个小时的游戏和压力测试后测量的。在短时负载期间,如3DMark06分项测试,我们注意到由于Oasis的原因,内部风扇根本没有启动。从这个角度来看,理论上噪音排放已经大大降低。此外,可以为Oasis设置三种风扇配置文件(平衡、安静、非常安静)。在安静状态下, Witcher 3,只产生49分贝,而不是53或54分贝(在15-20厘米的距离测量)。
在负载情况下,我们听到Neo机箱发出呼呼的声音,但由于整个风扇的声音,它逐渐消失在背景中。
Noise level
| Idle |
| 24 / 24 / 27.76 dB(A) |
| Load |
| 38.81 / 54.18 dB(A) |
 | ||
30 dB silent 40 dB(A) audible 50 dB(A) loud |
||
min: | ||
| Schenker XMG Neo 15 E22 (Early 2022, RTX 3080 Ti) GeForce RTX 3080 Ti Laptop GPU, i7-12700H, Samsung SSD 980 Pro 250GB MZ-V8P250BW | Schenker XMG Neo 15 Tiger Lake GeForce RTX 3080 Laptop GPU, i7-11800H, Samsung SSD 980 Pro 1TB MZ-V8P1T0BW | Razer Blade 15 Advanced (Mid 2021) GeForce RTX 3080 Laptop GPU, i7-11800H, SSSTC CA6-8D1024 | Asus ROG Strix Scar 15 G533QS GeForce RTX 3080 Laptop GPU, R9 5900HX, ADATA Swordfish 2 TB | Alienware m15 R6, i7-11800H RTX 3080 GeForce RTX 3080 Laptop GPU, i7-11800H, Samsung PM9A1 MZVL21T0HCLR | MSI GE76 Raider GeForce RTX 3080 Ti Laptop GPU, i9-12900HK, Samsung PM9A1 MZVL22T0HBLB | |
|---|---|---|---|---|---|---|
| Noise | -11% | 1% | -6% | 0% | -14% | |
| off / environment * (dB) | 24 | 25 -4% | 25.1 -5% | 25.5 -6% | 23 4% | 26 -8% |
| Idle Minimum * (dB) | 24 | 27 -13% | 25.3 -5% | 25.5 -6% | 23 4% | 26 -8% |
| Idle Average * (dB) | 24 | 30 -25% | 25.3 -5% | 25.5 -6% | 23 4% | 27 -13% |
| Idle Maximum * (dB) | 27.76 | 32 -15% | 25.3 9% | 37.1 -34% | 30 -8% | 40 -44% |
| Load Average * (dB) | 38.81 | 46 -19% | 42 -8% | 39.2 -1% | 41.26 -6% | 50 -29% |
| Witcher 3 ultra * (dB) | 54.2 | 52 4% | 45.6 16% | 50.5 7% | 53.4 1% | 53 2% |
| Load Maximum * (dB) | 54.18 | 55 -2% | 51.6 5% | 51.8 4% | 53.37 1% | 53 2% |
* ... smaller is better
温度
Oasis终于可以显示其在温度排放方面的优势。我们看到上面的GPU和CPU温度明显降低,而这至少部分延续到了表面温度。
由于RTX 3080 Ti不受阻碍,我们在一小时的压力测试后,在底部测得的温度高达68℃。然而,Schenker也怀疑这里是预发布模型的缺陷。有了Oasis,这个数值降低到了更容易容忍的51℃。
(-) The maximum temperature on the upper side is 52 °C / 126 F, compared to the average of 40.4 °C / 105 F, ranging from 21.2 to 68.8 °C for the class Gaming.
(-) The bottom heats up to a maximum of 68 °C / 154 F, compared to the average of 43.2 °C / 110 F
(+) In idle usage, the average temperature for the upper side is 29 °C / 84 F, compared to the device average of 33.9 °C / 93 F.
(-) Playing The Witcher 3, the average temperature for the upper side is 39 °C / 102 F, compared to the device average of 33.9 °C / 93 F.
(±) The palmrests and touchpad can get very hot to the touch with a maximum of 36 °C / 96.8 F.
(-) The average temperature of the palmrest area of similar devices was 28.8 °C / 83.8 F (-7.2 °C / -13 F).
| Schenker XMG Neo 15 E22 (Early 2022, RTX 3080 Ti) Intel Core i7-12700H, NVIDIA GeForce RTX 3080 Ti Laptop GPU | Schenker XMG Oasis | Schenker XMG Neo 15 Tiger Lake Intel Core i7-11800H, NVIDIA GeForce RTX 3080 Laptop GPU | Razer Blade 15 Advanced (Mid 2021) Intel Core i7-11800H, NVIDIA GeForce RTX 3080 Laptop GPU | Asus ROG Strix Scar 15 G533QS AMD Ryzen 9 5900HX, NVIDIA GeForce RTX 3080 Laptop GPU | Alienware m15 R6, i7-11800H RTX 3080 Intel Core i7-11800H, NVIDIA GeForce RTX 3080 Laptop GPU | MSI GE76 Raider Intel Core i9-12900HK, NVIDIA GeForce RTX 3080 Ti Laptop GPU | |
|---|---|---|---|---|---|---|---|
| Heat | 22% | 11% | 3% | 8% | -5% | 11% | |
| Maximum Upper Side * (°C) | 52 | 42 19% | 39 25% | 51 2% | 43.4 17% | 61 -17% | 43 17% |
| Maximum Bottom * (°C) | 68 | 51 25% | 50 26% | 52 24% | 48.2 29% | 58 15% | 47 31% |
| Idle Upper Side * (°C) | 32 | 34 -6% | 35.2 -10% | 35.2 -10% | 38 -19% | 33 -3% | |
| Idle Bottom * (°C) | 36 | 37 -3% | 37.8 -5% | 37 -3% | 36 -0% | 37 -3% |
* ... smaller is better
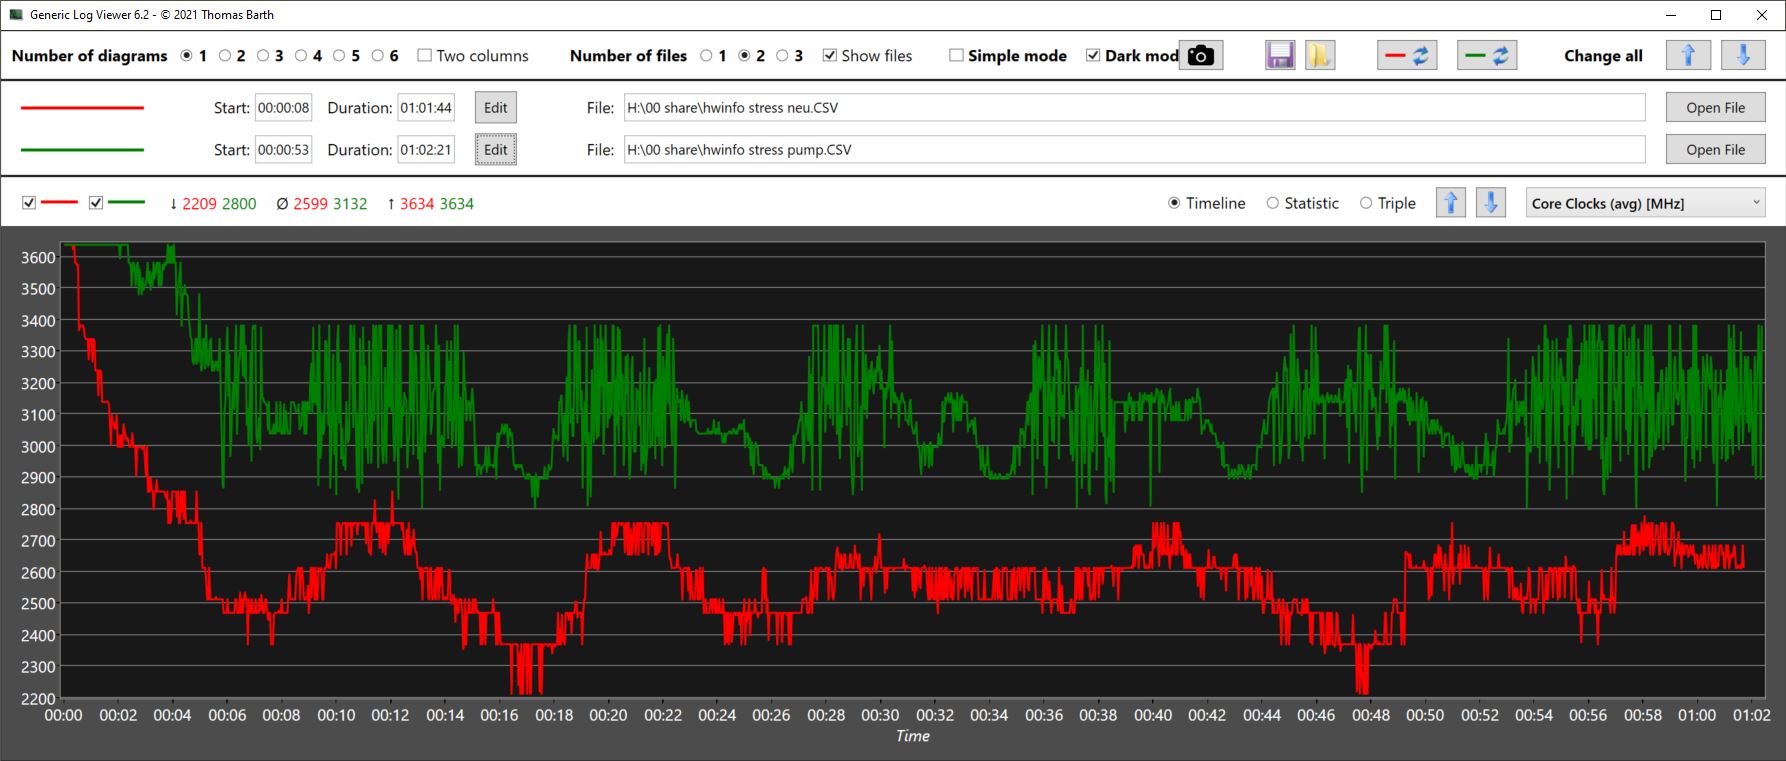
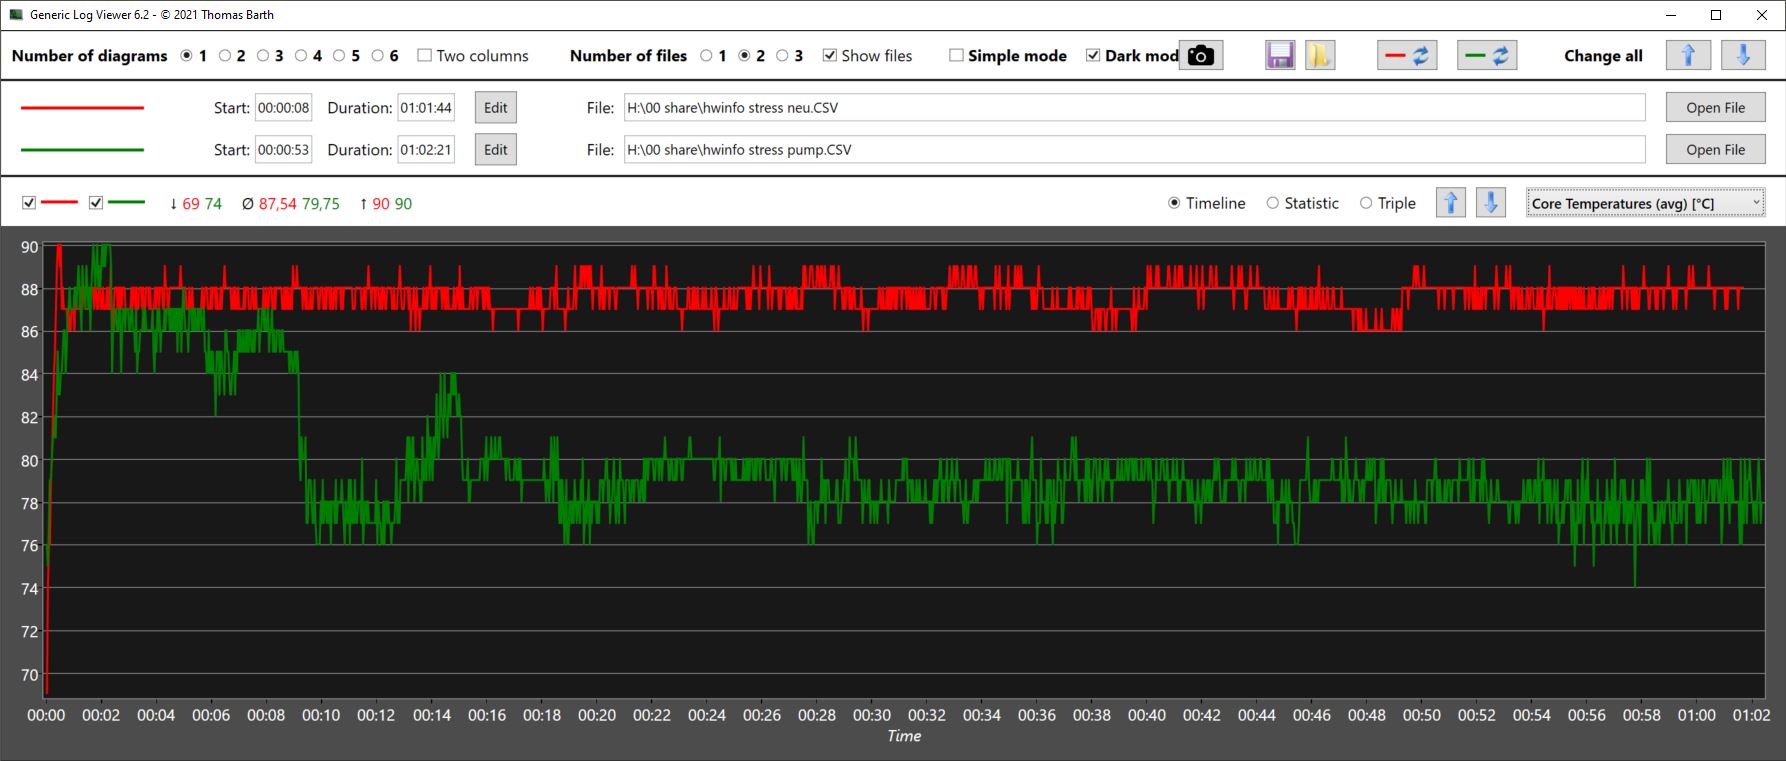
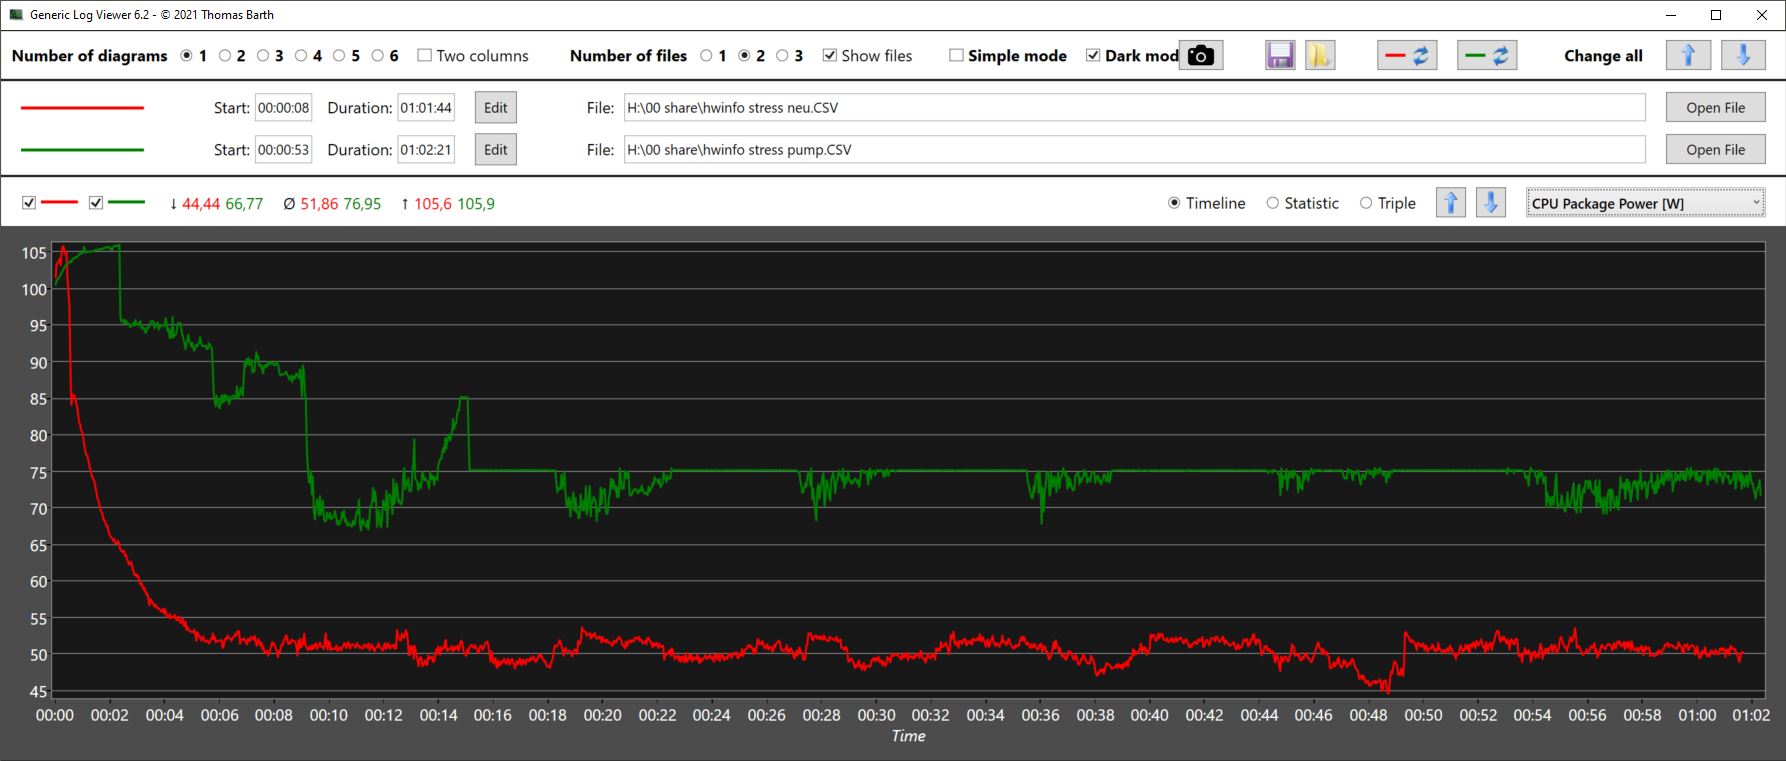
压力测试
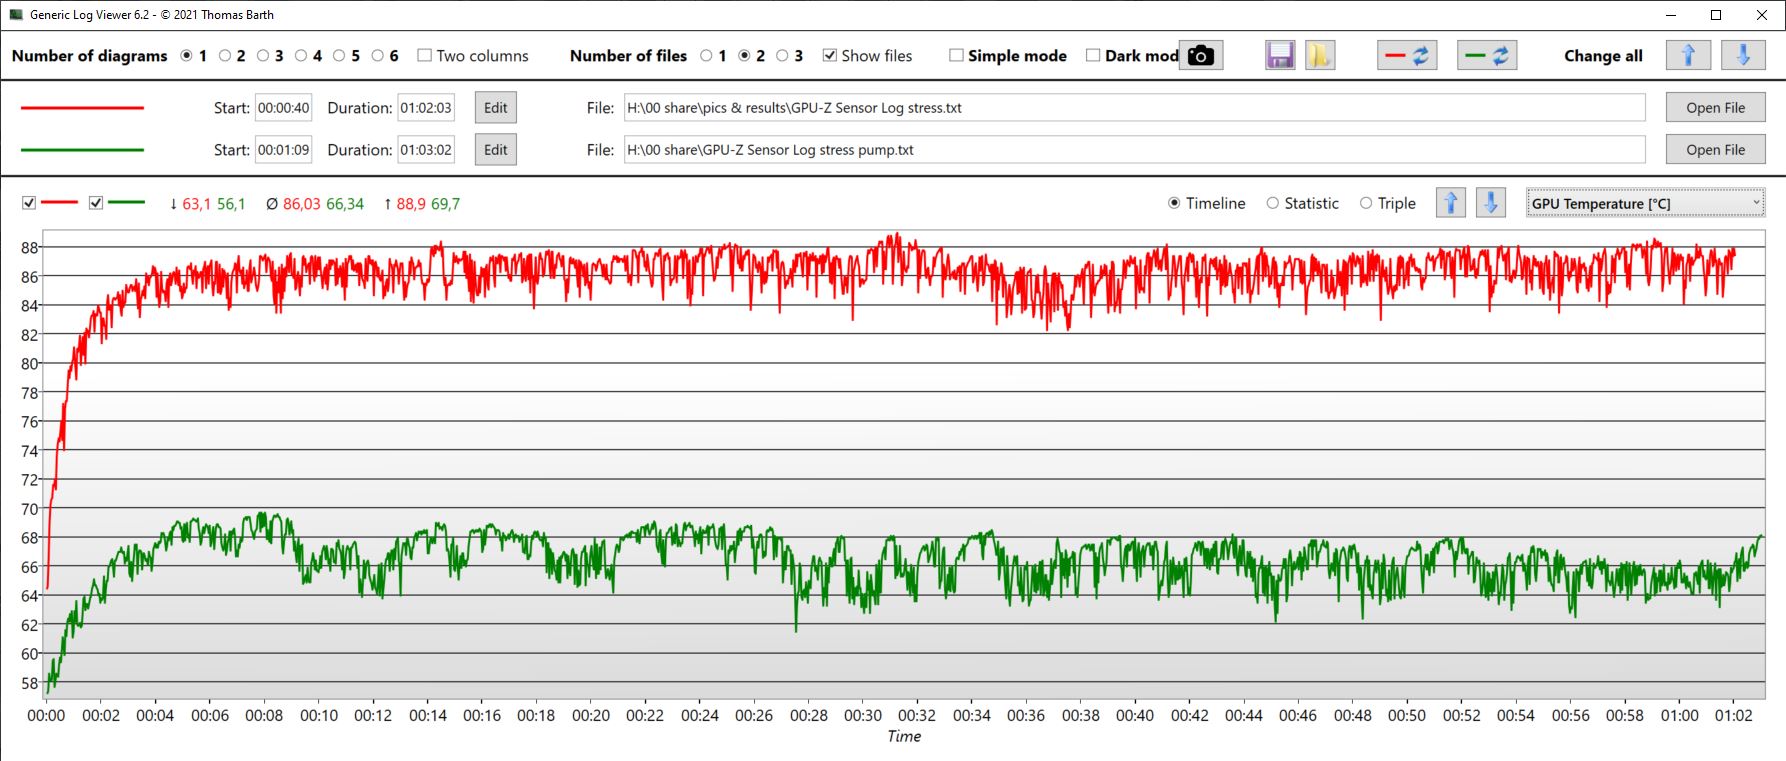
核心在大约3.6GHz的频率下开始我们的压力测试。在一小时的过程中,时钟下降,然后在2.2和3GHz之间波动。平均时钟约为2.6 GHz。使用Oasis,平均时钟在更高的3.1 GHz,同时核心温度降低了8℃,而封装功率提高了25W!
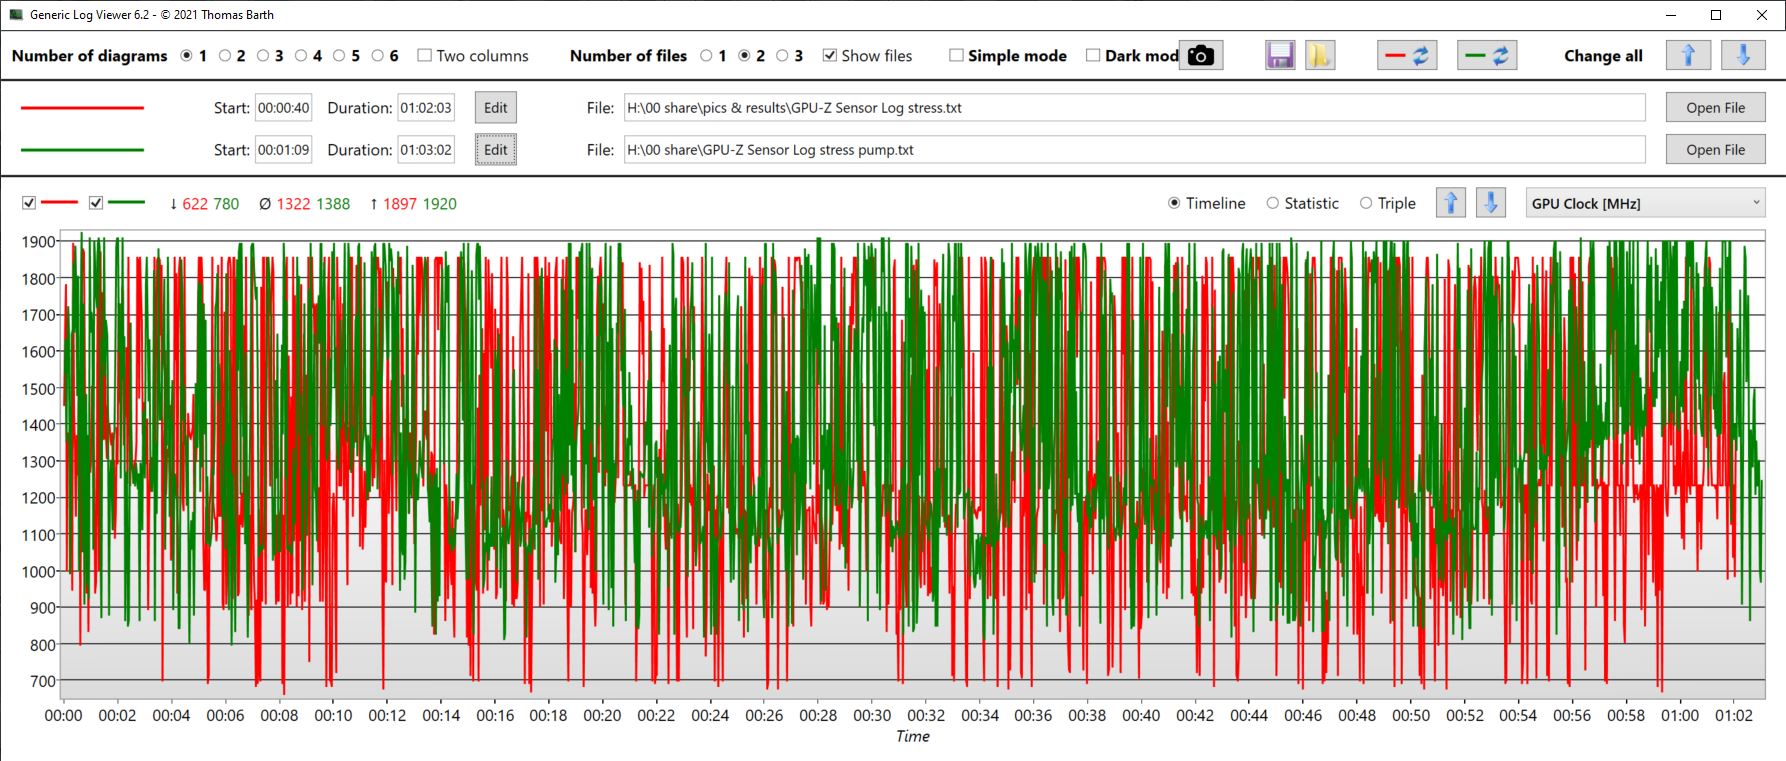
GPU时钟似乎是相同的,但内存时钟显然在没有Oasis的情况下下降得更频繁。同时,Oasis提供了平均20°C的GPU温度!
在压力之后直接运行新的3DMark 11,产生的分数与没有事先压力的运行相同。
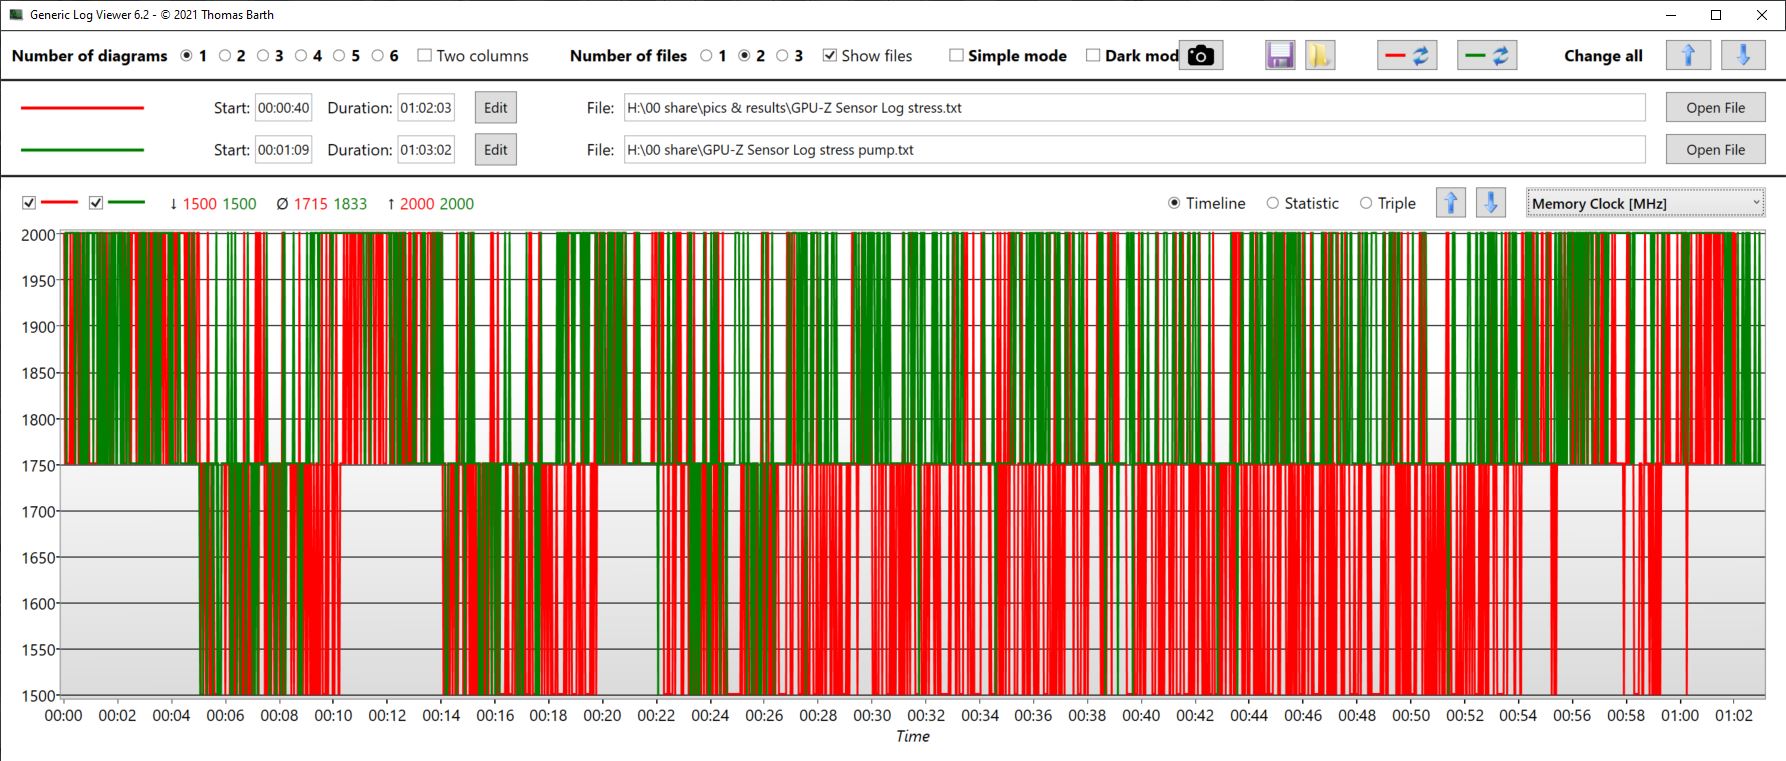
| 空气冷却/绿洲 | |||
| CPU时钟(GHz) | GPU时钟(MHz) | CPU平均温度(℃) | GPU平均温度(℃) |
| Prime95 + FurMark压力 | 2.6/3.1 | 1.3 | 88/80 |
| Witcher 3 压力 | 2.5/2.6 | 1.5/1.6 | 71/60 |
扬声器
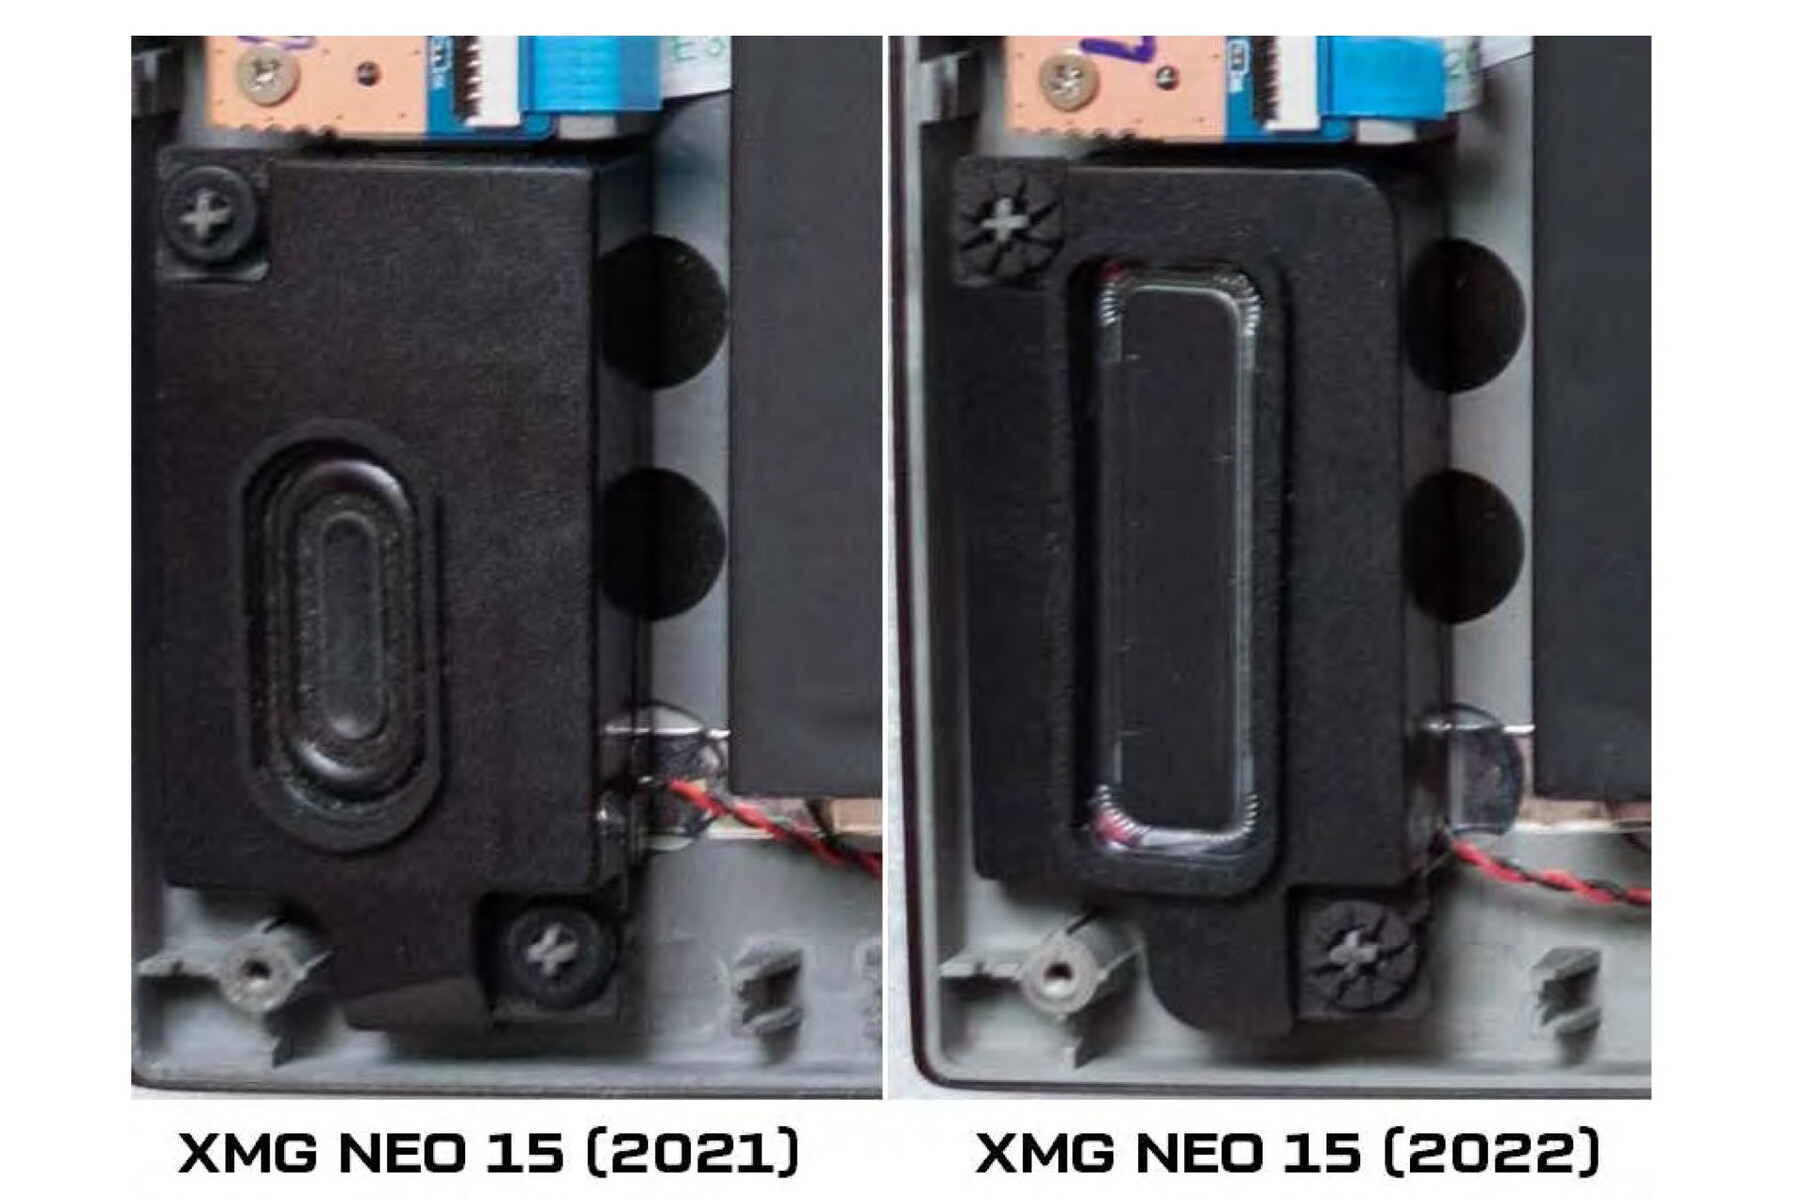
Schenker扩大了新Neo的扬声器。它们现在的音量最小,提供的低音也最小,但显然还是太低。
一个麦克风/线路输入和一个耳机端口可用于模拟第三方设备。
Schenker XMG Neo 15 E22 (Early 2022, RTX 3080 Ti) audio analysis
(±) | speaker loudness is average but good (80.8 dB)
Bass 100 - 315 Hz
(-) | nearly no bass - on average 16.5% lower than median
(±) | linearity of bass is average (7.6% delta to prev. frequency)
Mids 400 - 2000 Hz
(±) | higher mids - on average 6.7% higher than median
(±) | linearity of mids is average (7.5% delta to prev. frequency)
Highs 2 - 16 kHz
(+) | balanced highs - only 2.8% away from median
(+) | highs are linear (5.2% delta to prev. frequency)
Overall 100 - 16.000 Hz
(±) | linearity of overall sound is average (17% difference to median)
Compared to same class
» 45% of all tested devices in this class were better, 12% similar, 43% worse
» The best had a delta of 6%, average was 18%, worst was 132%
Compared to all devices tested
» 31% of all tested devices were better, 8% similar, 61% worse
» The best had a delta of 4%, average was 23%, worst was 134%
Schenker XMG Neo 15 Tiger Lake audio analysis
(±) | speaker loudness is average but good (79 dB)
Bass 100 - 315 Hz
(-) | nearly no bass - on average 22.6% lower than median
(±) | linearity of bass is average (9.5% delta to prev. frequency)
Mids 400 - 2000 Hz
(+) | balanced mids - only 4.7% away from median
(±) | linearity of mids is average (9.1% delta to prev. frequency)
Highs 2 - 16 kHz
(+) | balanced highs - only 4.1% away from median
(+) | highs are linear (5.3% delta to prev. frequency)
Overall 100 - 16.000 Hz
(±) | linearity of overall sound is average (19.4% difference to median)
Compared to same class
» 67% of all tested devices in this class were better, 7% similar, 26% worse
» The best had a delta of 6%, average was 18%, worst was 132%
Compared to all devices tested
» 48% of all tested devices were better, 7% similar, 45% worse
» The best had a delta of 4%, average was 23%, worst was 134%
能源管理。高消耗,良好的电池性能
消耗功率
RTX 3080 Ti自然对电源有一定的要求。 Witcher 3
,该系统从插座中平均吸取228瓦,使用XMG Oasis后,这一数值增加了约10瓦。然而,特别是在开始的时候,消耗量也可以达到280瓦。在压力测试期间,消耗的功率甚至更大。我们测量了平均242瓦和高达330瓦的负载峰值,此外还有一个波动的消耗,在长期运行中总是跳到280瓦左右。总的来说,耗电量和性能一样高。
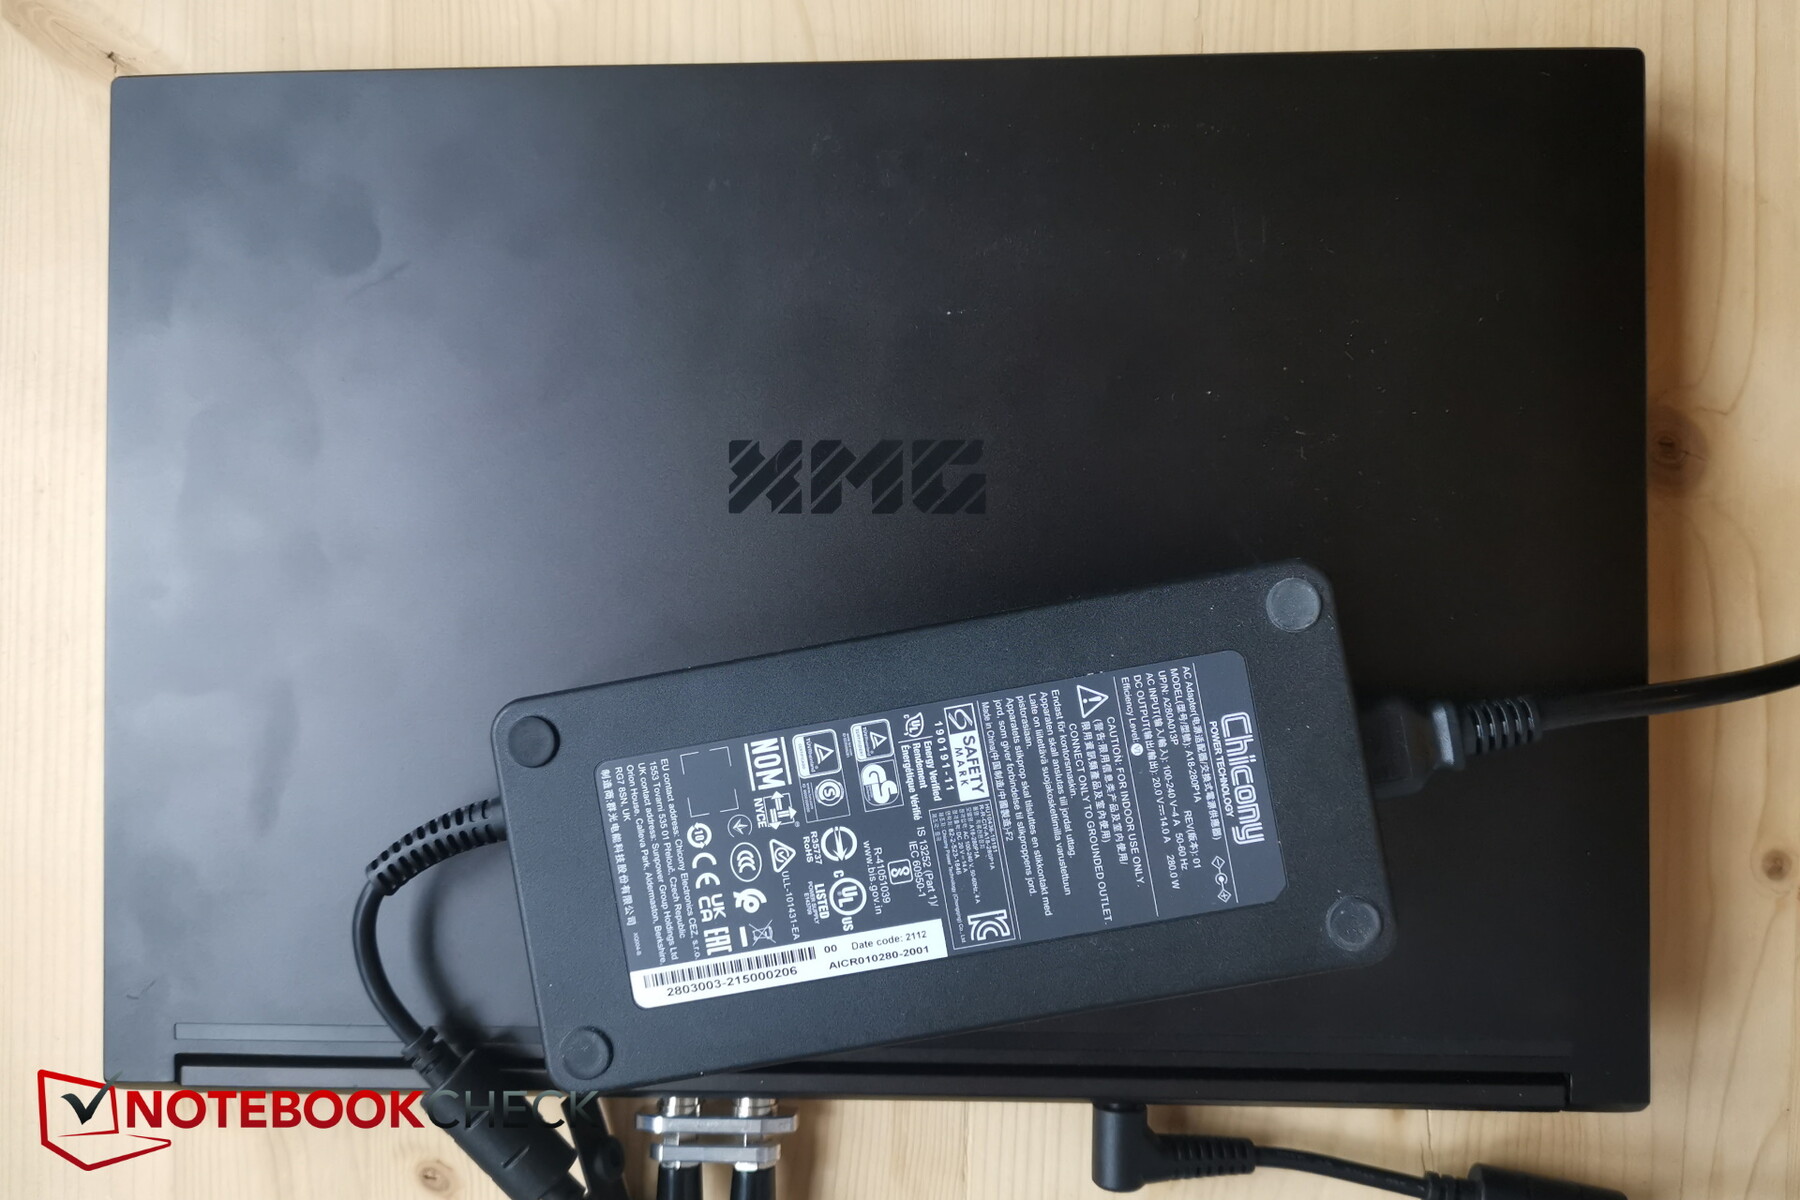
短连接的大型电源(约18 x 8.5 x 3.4厘米)是为280 W的输出功率设计的,实际上应该能够适应开始时测量的数值,但在所有情况下的可靠充电可能不是一种可能性。有计划设计一个330W的电源。
| Idle | |
| Load |
|
Key:
min: | |
| Schenker XMG Neo 15 E22 (Early 2022, RTX 3080 Ti) i7-12700H, GeForce RTX 3080 Ti Laptop GPU, Samsung SSD 980 Pro 250GB MZ-V8P250BW, IPS, 2560x1440, 15.6" | Schenker XMG Neo 15 Tiger Lake i7-11800H, GeForce RTX 3080 Laptop GPU, Samsung SSD 980 Pro 1TB MZ-V8P1T0BW, IPS, 2560x1440, 15.6" | Razer Blade 15 Advanced (Mid 2021) i7-11800H, GeForce RTX 3080 Laptop GPU, SSSTC CA6-8D1024, IPS, 1920x1080, 15.6" | Asus ROG Strix Scar 15 G533QS R9 5900HX, GeForce RTX 3080 Laptop GPU, ADATA Swordfish 2 TB, IPS, 2560x1440, 15.6" | Alienware m15 R6, i7-11800H RTX 3080 i7-11800H, GeForce RTX 3080 Laptop GPU, Samsung PM9A1 MZVL21T0HCLR, IPS, 1920x1080, 15.6" | MSI GE76 Raider i9-12900HK, GeForce RTX 3080 Ti Laptop GPU, Samsung PM9A1 MZVL22T0HBLB, IPS-Level, 1920x1080, 17.3" | Average NVIDIA GeForce RTX 3080 Ti Laptop GPU | Average of class Gaming | |
|---|---|---|---|---|---|---|---|---|
| Power Consumption | 6% | -19% | 5% | 3% | -5% | -22% | -2% | |
| Idle Minimum * (Watt) | 14 | 15 -7% | 19.5 -39% | 11.2 20% | 14 -0% | 12 14% | 17.2 ? -23% | 13 ? 7% |
| Idle Average * (Watt) | 18 | 17 6% | 23.3 -29% | 16.4 9% | 18 -0% | 17 6% | 23.3 ? -29% | 19 ? -6% |
| Idle Maximum * (Watt) | 19 | 22 -16% | 40.1 -111% | 29.4 -55% | 29 -53% | 28 -47% | 30.8 ? -62% | 24.6 ? -29% |
| Load Average * (Watt) | 115 | 101 12% | 98.9 14% | 106.2 8% | 93 19% | 118 -3% | 121.2 ? -5% | 110.7 ? 4% |
| Witcher 3 ultra * (Watt) | 228 | 195 14% | 174 24% | 189 17% | 190 17% | 252 -11% | ||
| Load Maximum * (Watt) | 307 | 230 25% | 214 30% | 213.6 30% | 203 34% | 272 11% | 276 ? 10% | 259 ? 16% |
* ... smaller is better
Power consumption - The Witcher 3 / Stress test
Power consumption with external monitor
电池寿命
93瓦时的电池表现良好。显然,可以通过提供的性能配置文件对省电机制进行一些改进。前代产品在同样大小的电池下持续时间较短。在我们的Wi-Fi和视频测试中,我们测量了大约6到7小时。
| Schenker XMG Neo 15 E22 (Early 2022, RTX 3080 Ti) i7-12700H, GeForce RTX 3080 Ti Laptop GPU, 93 Wh | Schenker XMG Neo 15 Tiger Lake i7-11800H, GeForce RTX 3080 Laptop GPU, 93 Wh | Razer Blade 15 Advanced (Mid 2021) i7-11800H, GeForce RTX 3080 Laptop GPU, 80 Wh | Asus ROG Strix Scar 15 G533QS R9 5900HX, GeForce RTX 3080 Laptop GPU, 90 Wh | Alienware m15 R6, i7-11800H RTX 3080 i7-11800H, GeForce RTX 3080 Laptop GPU, 84 Wh | MSI GE76 Raider i9-12900HK, GeForce RTX 3080 Ti Laptop GPU, 99.99 Wh | Average of class Gaming | |
|---|---|---|---|---|---|---|---|
| Battery runtime | -20% | -12% | -27% | -34% | -24% | -11% | |
| H.264 (h) | 6.9 | 5.9 -14% | 5.6 -19% | 8.32 ? 21% | |||
| WiFi v1.3 (h) | 6.7 | 5.6 -16% | 5.9 -12% | 7.3 9% | 5 -25% | 5.1 -24% | 7.11 ? 6% |
| Load (h) | 3.8 | 2.7 -29% | 1.4 -63% | 1.6 -58% | 1.502 ? -60% | ||
| Reader / Idle (h) | 11.1 | 8.27 ? |
判决。通过 "绿洲 "获得真正的附加值
XMG Neo 15是一款优秀的游戏笔记本电脑,它有一个独特的增值卖点--水口。即使在风冷的情况下,热节流也不会过度干扰,这不仅导致了非常高的游戏性能,也导致了非常高的表面温度。
使用200欧元的外部水冷系统--XMG Oasis,温度明显下降。因此,噪音也减少了,而且根据应用,只要避免因温度下降而导致的热节流,性能也可以更高。总的来说,Oasis的声效仍可优化,也许在泵或尽管有通风的情况下出现的潺潺声。也就是说,从整体上看,这些优点说服了我们。对于有高性能要求的玩家来说,这种组合肯定能得到回报,而且在系统的寿命方面也是如此。
细节,如显示屏,将首先在我们对生产模型的测试中得到澄清。但是预生产型号已经做了很多正确的事情。
XMG Neo 15具有极高的性能,并且有一个真正独特的增值卖点,那就是XMG Oasis,不过,它需要额外支付199欧元。在没有水冷的情况下,预生产的模型会变得非常热。
价格和可用性
目前,预生产的模型还没有上市。然而,它已经可以在bestware上预购了。预计将于4月初开始交付。我们的测试配置是512GB固态硬盘,而不是250GB,价格为3,427.00欧元。
Price comparison
