联想ThinkBook Plus Gen2的评论。带触摸屏的电子墨水笔记本电脑

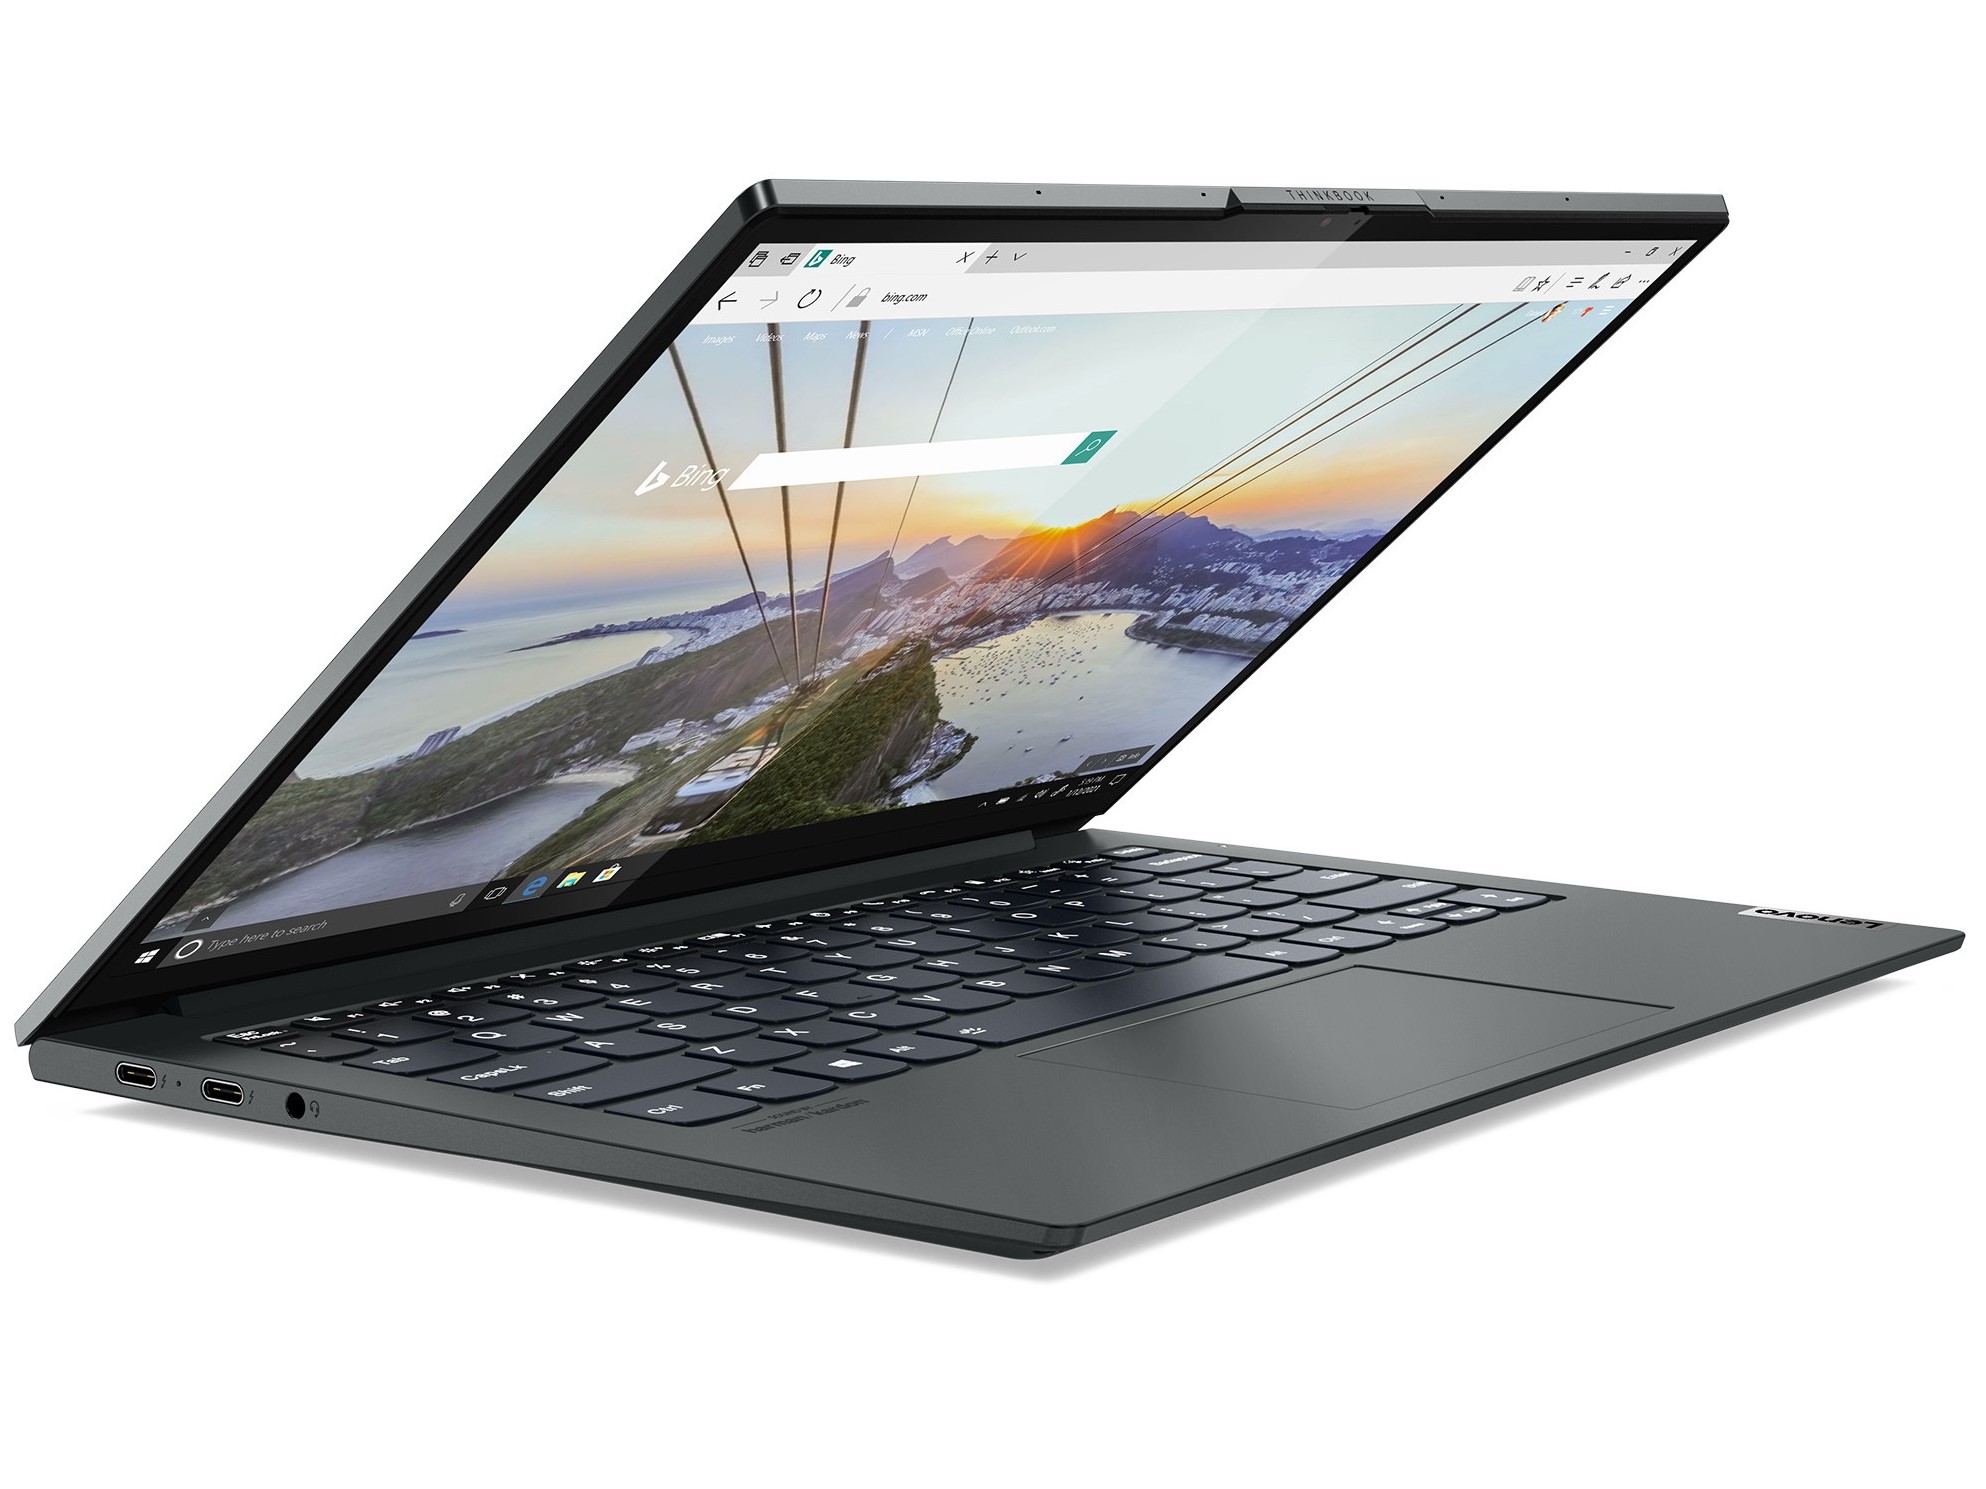
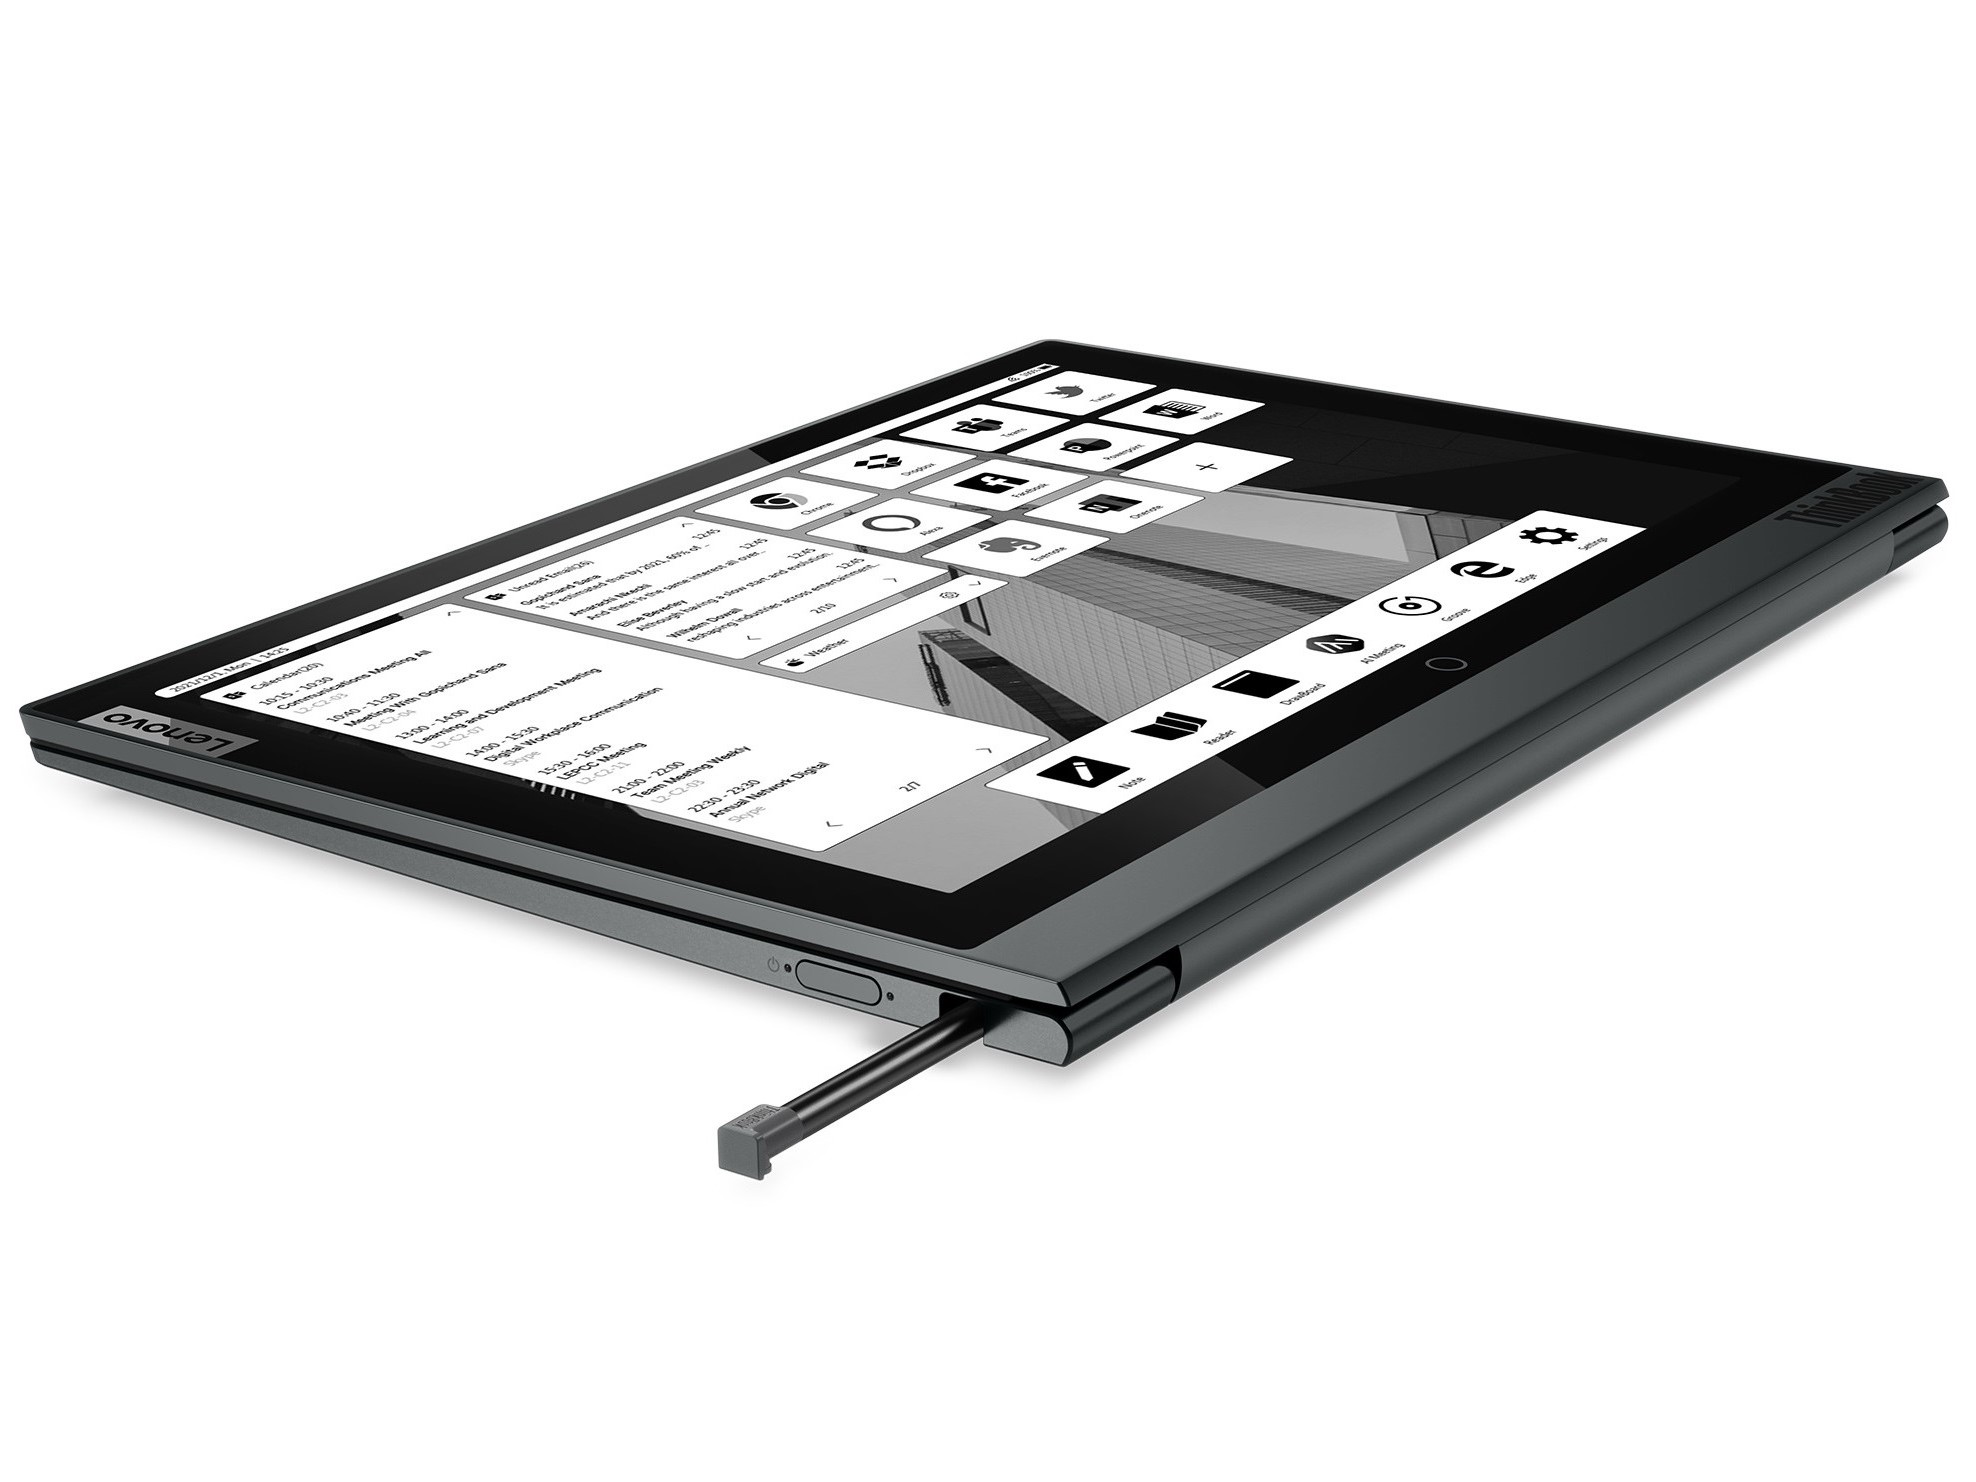
虽然 第一代ThinkBook Plus第一代的ThinkBook Plus基本上是一台普通的笔记本电脑,配有触摸式电子墨水显示屏,而现在联想在ThinkBook Plus Gen2上增加了触摸式IPS面板。然而,这款笔记本电脑不是真正的可转换产品,因为屏幕不能360度转动。因此,只有外面的E-ink显示屏可以在封闭状态下使用。
然而,不仅两个显示屏的价格约为1400欧元(约1621美元),而且还有一个 英特尔酷睿i5-1130G7,它由16GB的内存支持。安装的固态硬盘大小为512GB,内部Intel Iris Xe Graphics G7 80EUs ,用于显示图像内容。
Possible competitors in comparison
Rating | Date | Model | Weight | Height | Size | Resolution | Price |
|---|---|---|---|---|---|---|---|
| 86.1 % v7 (old) | 10 / 2021 | Lenovo ThinkBook Plus Gen2 Core i5 i5-1130G7, Iris Xe G7 80EUs | 1.2 kg | 13.9 mm | 13.30" | 2560x1600 | |
| 86.9 % v7 (old) | 03 / 2020 | Lenovo ThinkBook Plus 13 i7 i7-10510U, UHD Graphics 620 | 1.4 kg | 17.4 mm | 13.30" | 1920x1080 | |
| 84.4 % v7 (old) | 08 / 2021 | HP Pavilion Aero 13 be0097nr R7 5800U, Vega 8 | 953 g | 17 mm | 13.30" | 1920x1200 | |
| 85.7 % v7 (old) | Acer Spin 3 SP313-51N-56YV i5-1135G7, Iris Xe G7 80EUs | 1.4 kg | 16 mm | 13.30" | 2560x1600 | ||
| 85.4 % v7 (old) | 06 / 2021 | Samsung Galaxy Book Pro 360 13 i5-1135G7, Iris Xe G7 80EUs | 1.1 kg | 13 mm | 13.20" | 1920x1080 |
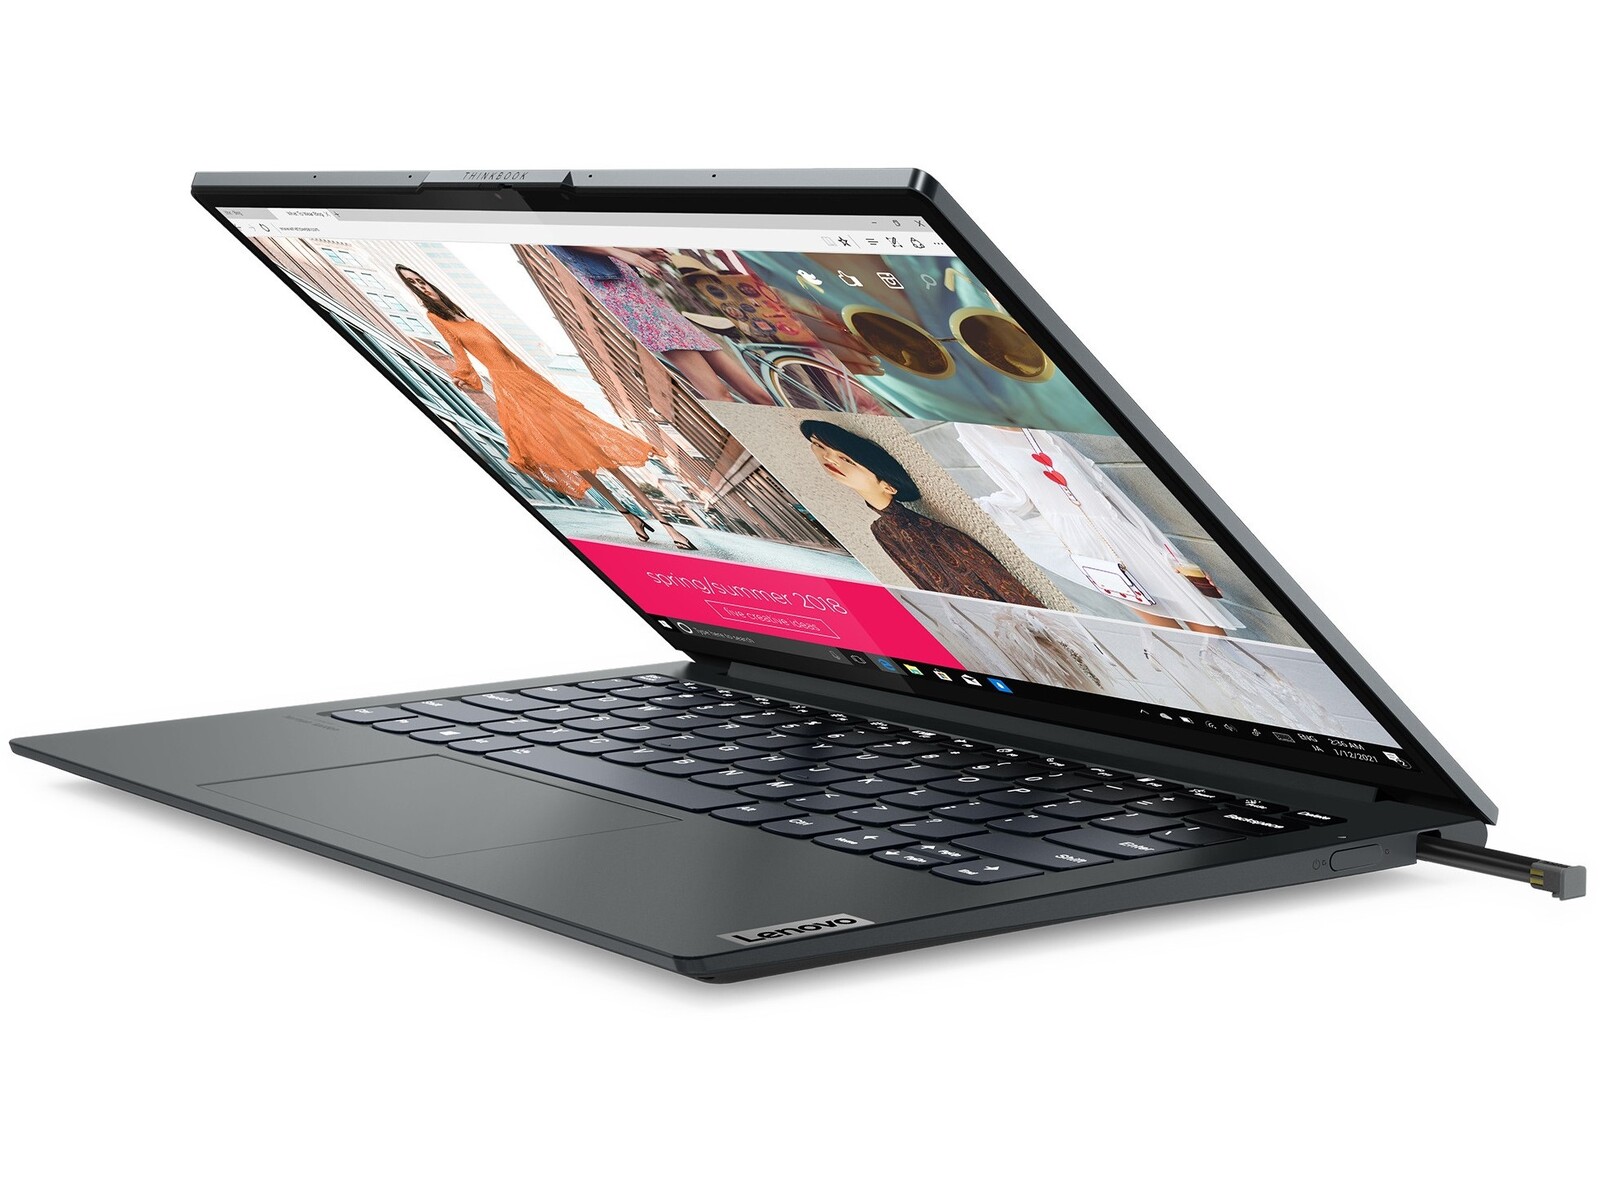
机箱及特点 - 铝制超薄笔记本
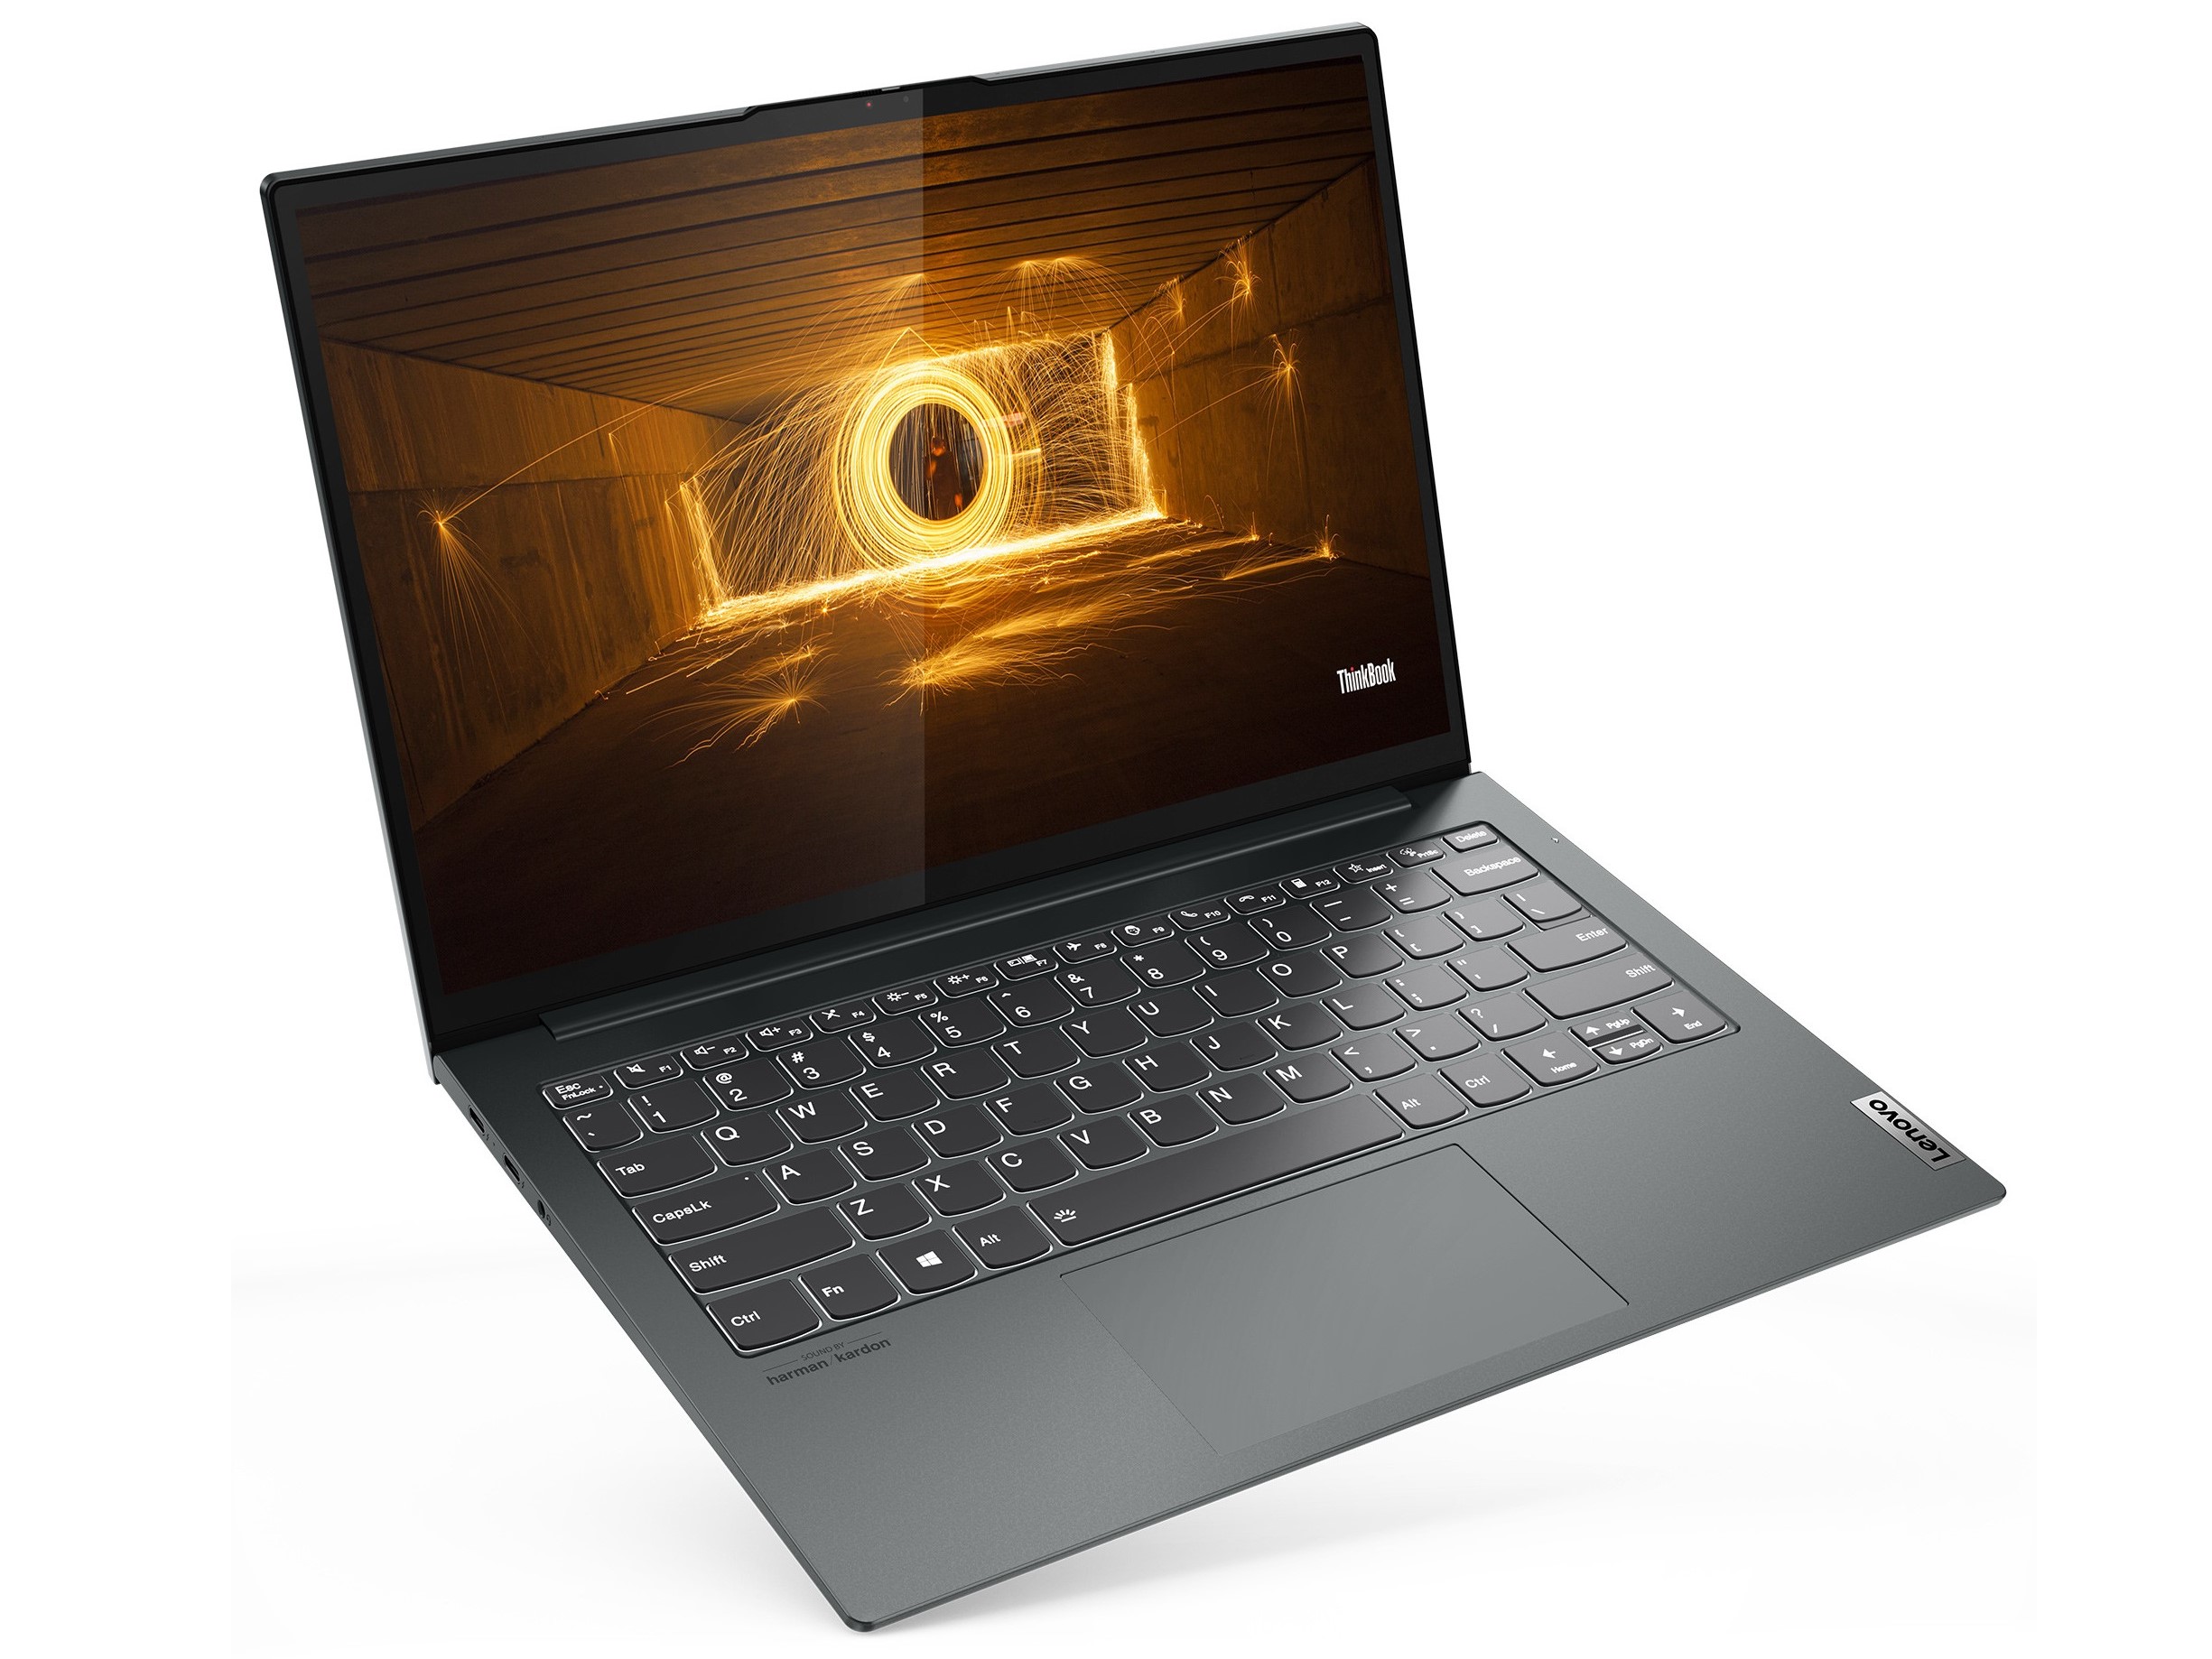
联想用铝制造ThinkBook Plus Gen2。这使得它非常结实,给人以高质量的印象。这款笔记本也非常纤细,相当轻,只有1.2公斤(约2.65磅),其他尺寸比其他13英寸设备更紧凑一些。
底板理论上是可以拆下来的,但它被钩得很紧。为了不损坏设备,我们因此放弃了打开的尝试。
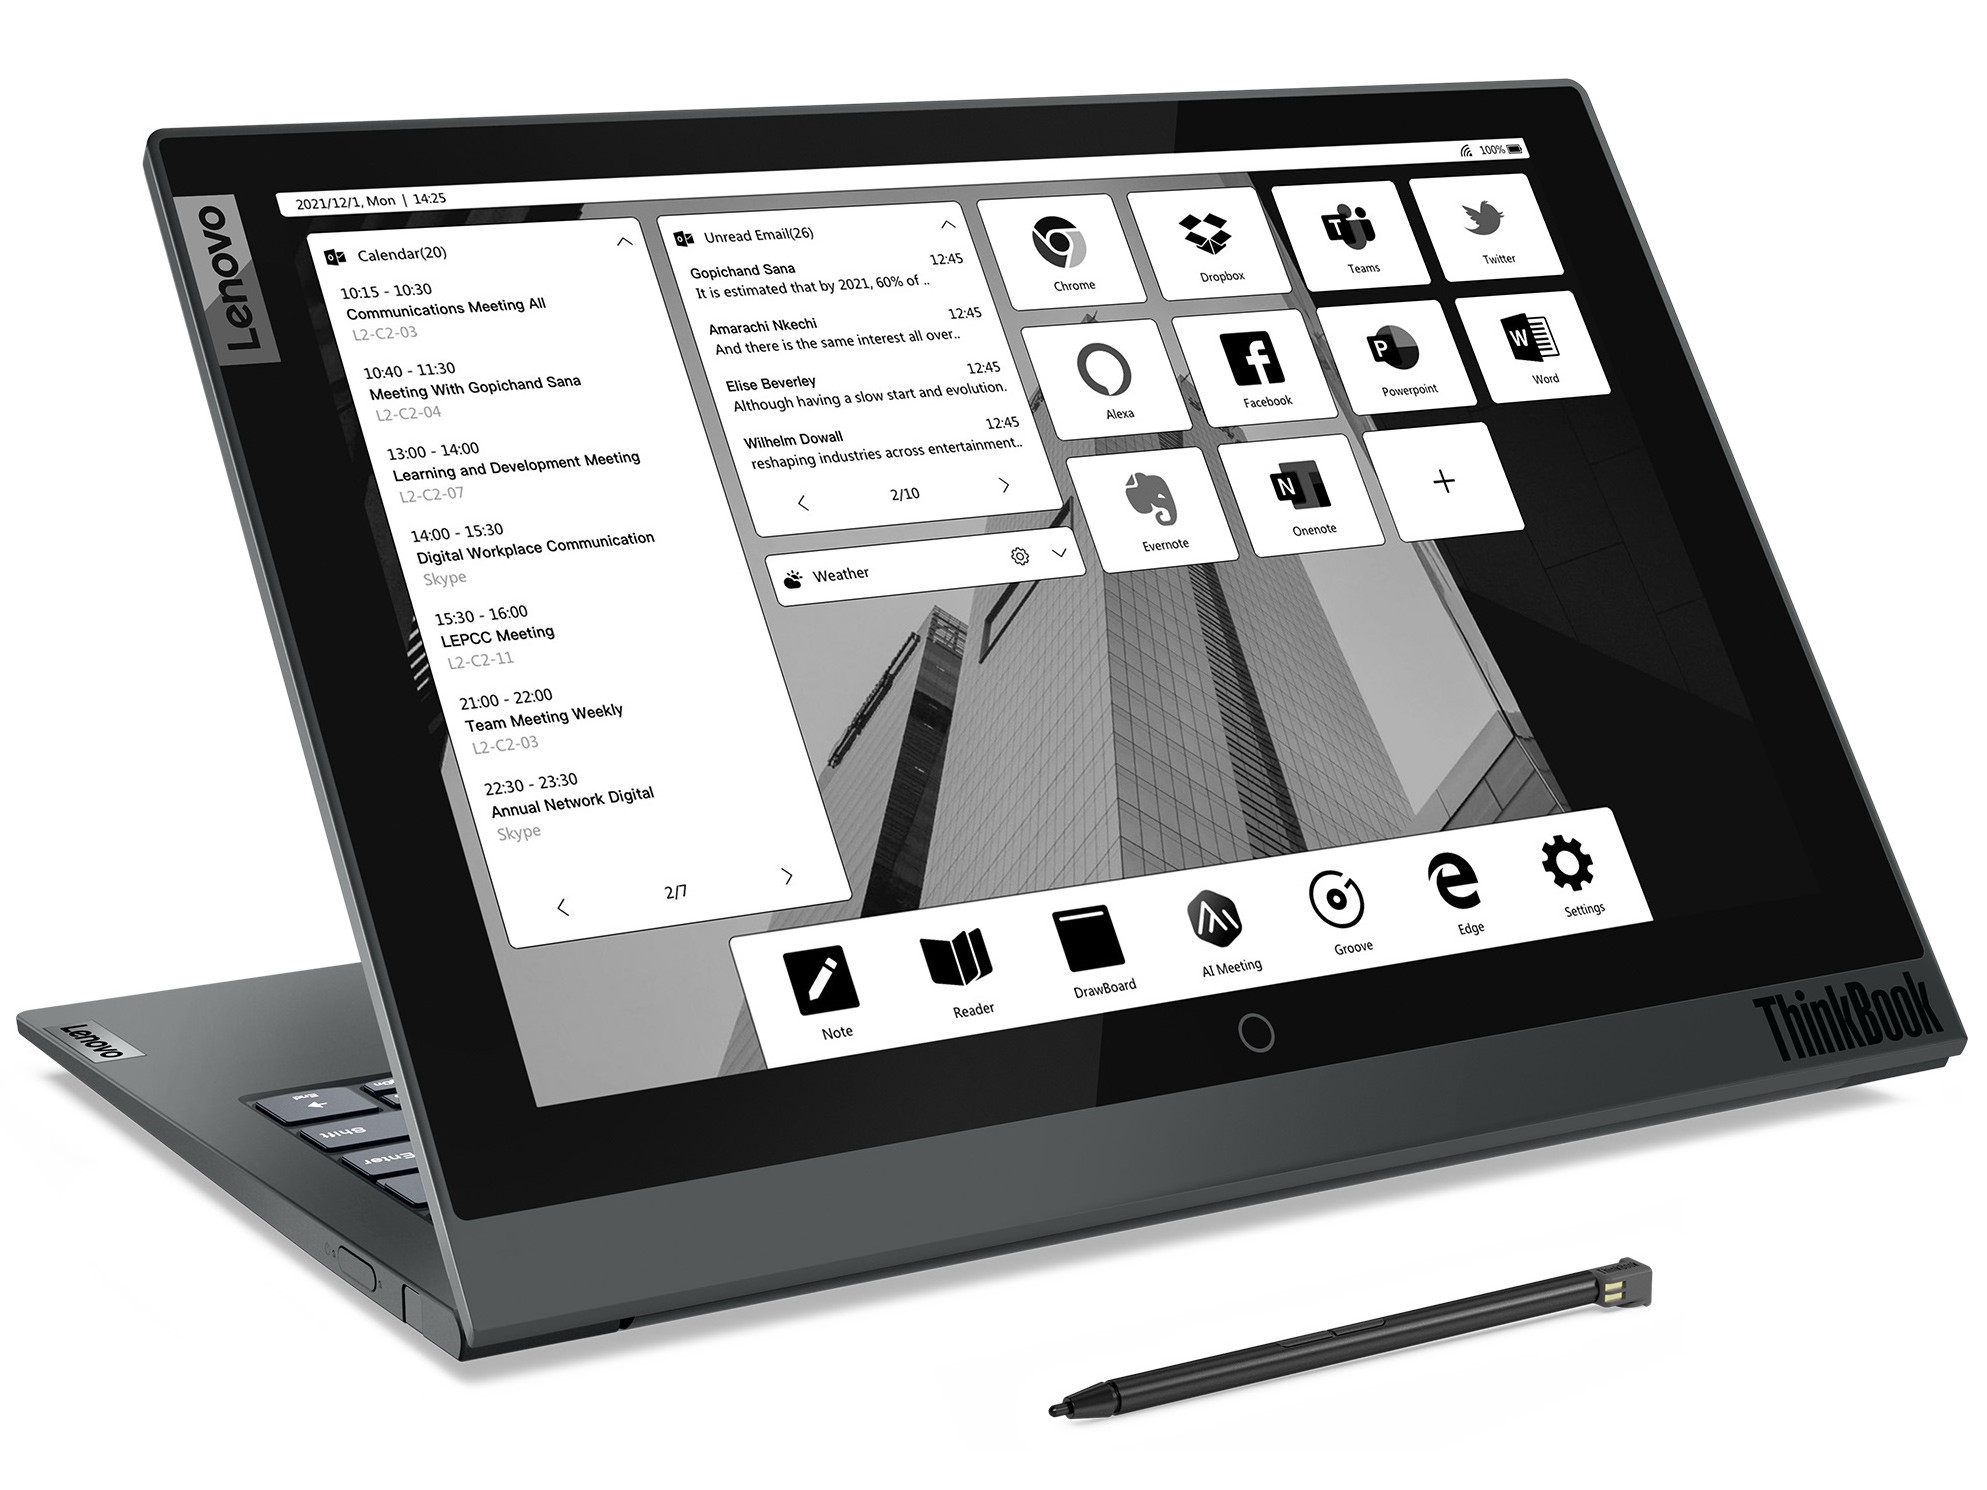
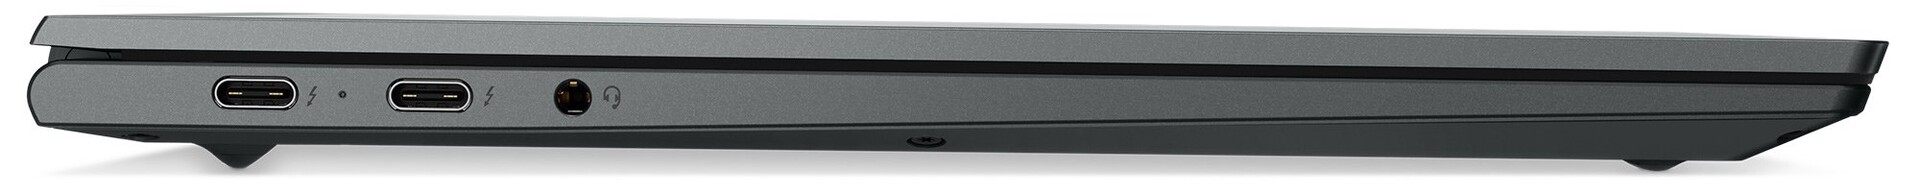
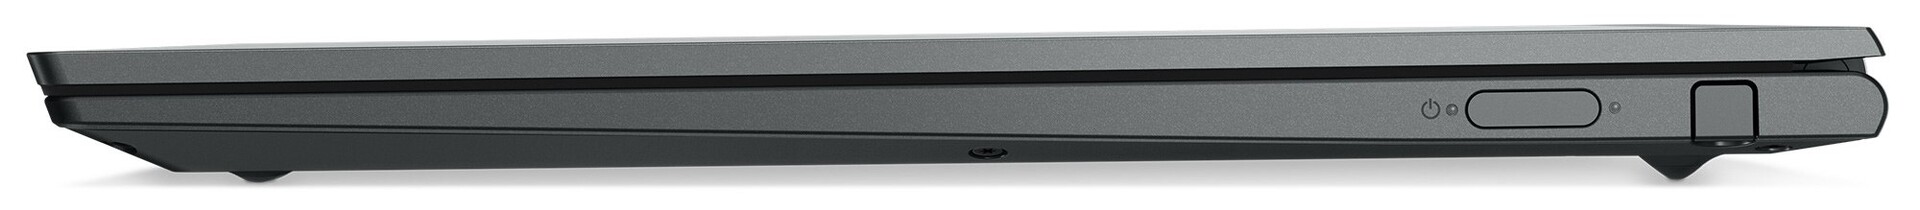
ThinkBook Plus Gen2的端口选择非常清晰,但由于有两个Thunderbolt 4端口,可以进行多功能的扩展。非常好的是,附带的输入笔可以直接存放在电源按钮旁边的插槽中。
联想的笔记本可以通过蓝牙5.2和WiFi 6建立无线连接。与我们的参考路由器Netgear Nighthawk AX12结合使用,我们的WLAN速度在传输时平均为1.293 MBit/s,在接收数据时为1.403 MBit/s。
与目前许多笔记本一样,一个低分辨率的90万像素的摄像头被用作网络摄像头。即使在良好的光线条件下,它也只能提供一个平庸的图像质量,在清晰度和对比度方面有明显的弱点。

连接设备
| Networking | |
| iperf3 transmit AX12 | |
| Lenovo ThinkBook Plus Gen2 Core i5 | |
| Average Intel Wi-Fi 6 AX201 (49.8 - 1775, n=324) | |
| Samsung Galaxy Book Pro 360 13 | |
| Lenovo ThinkBook Plus 13 i7 | |
| Acer Spin 3 SP313-51N-56YV | |
| HP Pavilion Aero 13 be0097nr | |
| iperf3 receive AX12 | |
| Lenovo ThinkBook Plus Gen2 Core i5 | |
| Samsung Galaxy Book Pro 360 13 | |
| Average Intel Wi-Fi 6 AX201 (136 - 1743, n=324) | |
| Acer Spin 3 SP313-51N-56YV | |
| HP Pavilion Aero 13 be0097nr | |
| Lenovo ThinkBook Plus 13 i7 | |


输入设备--包括手写笔
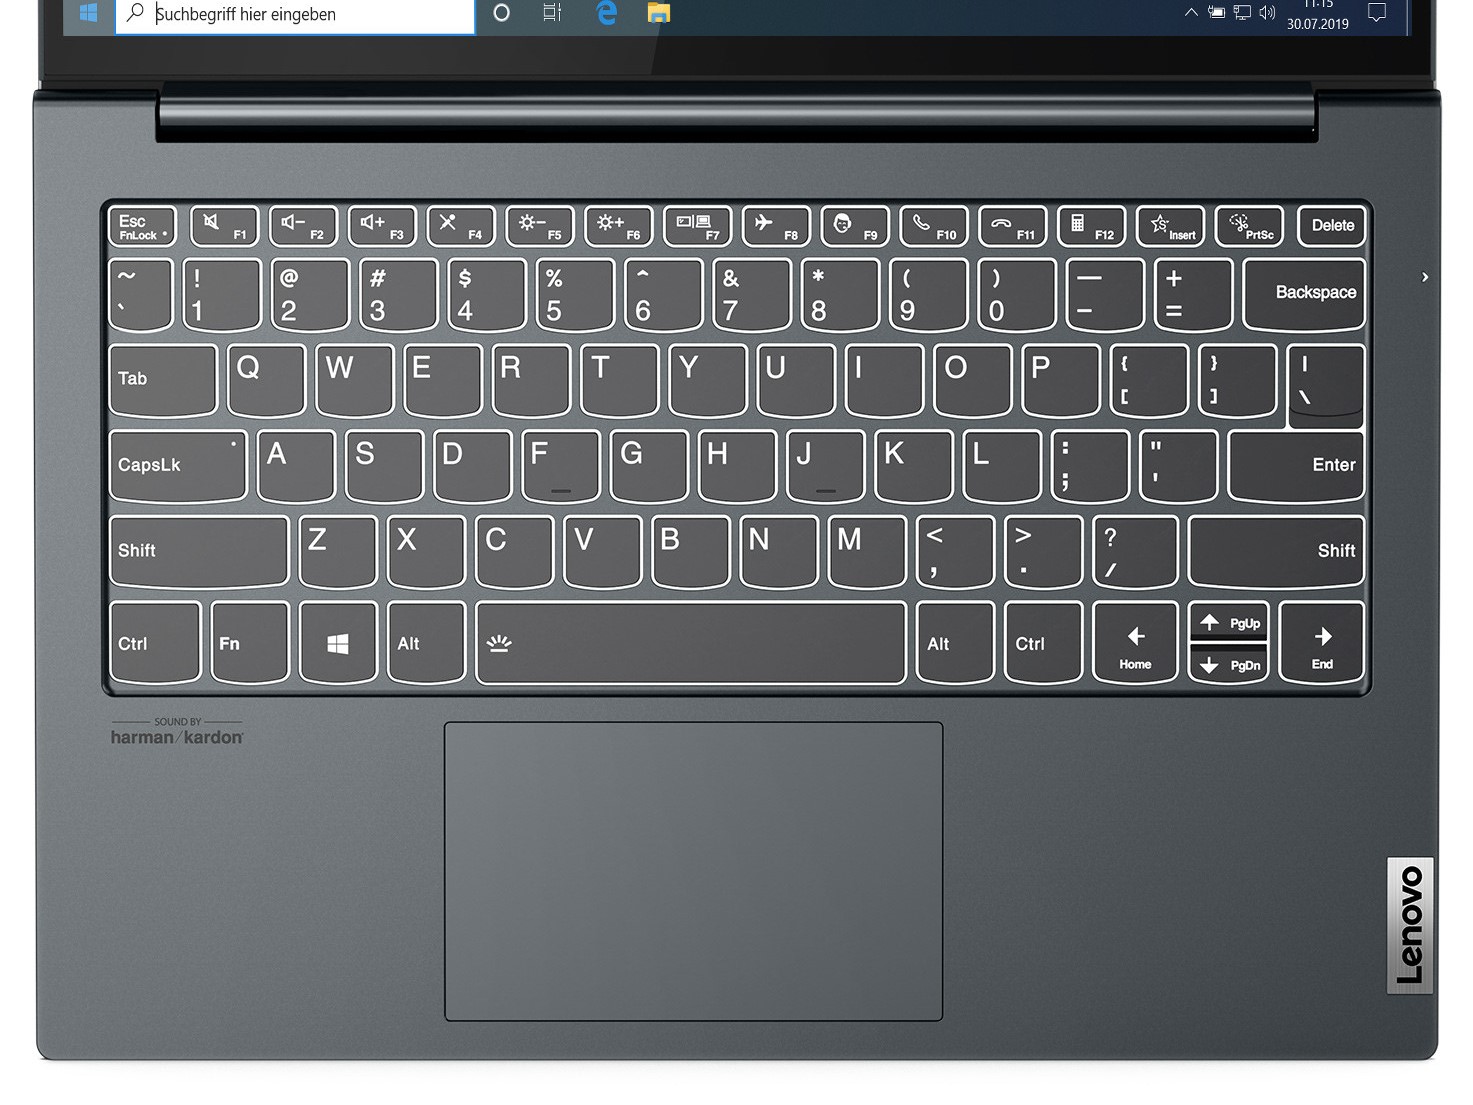
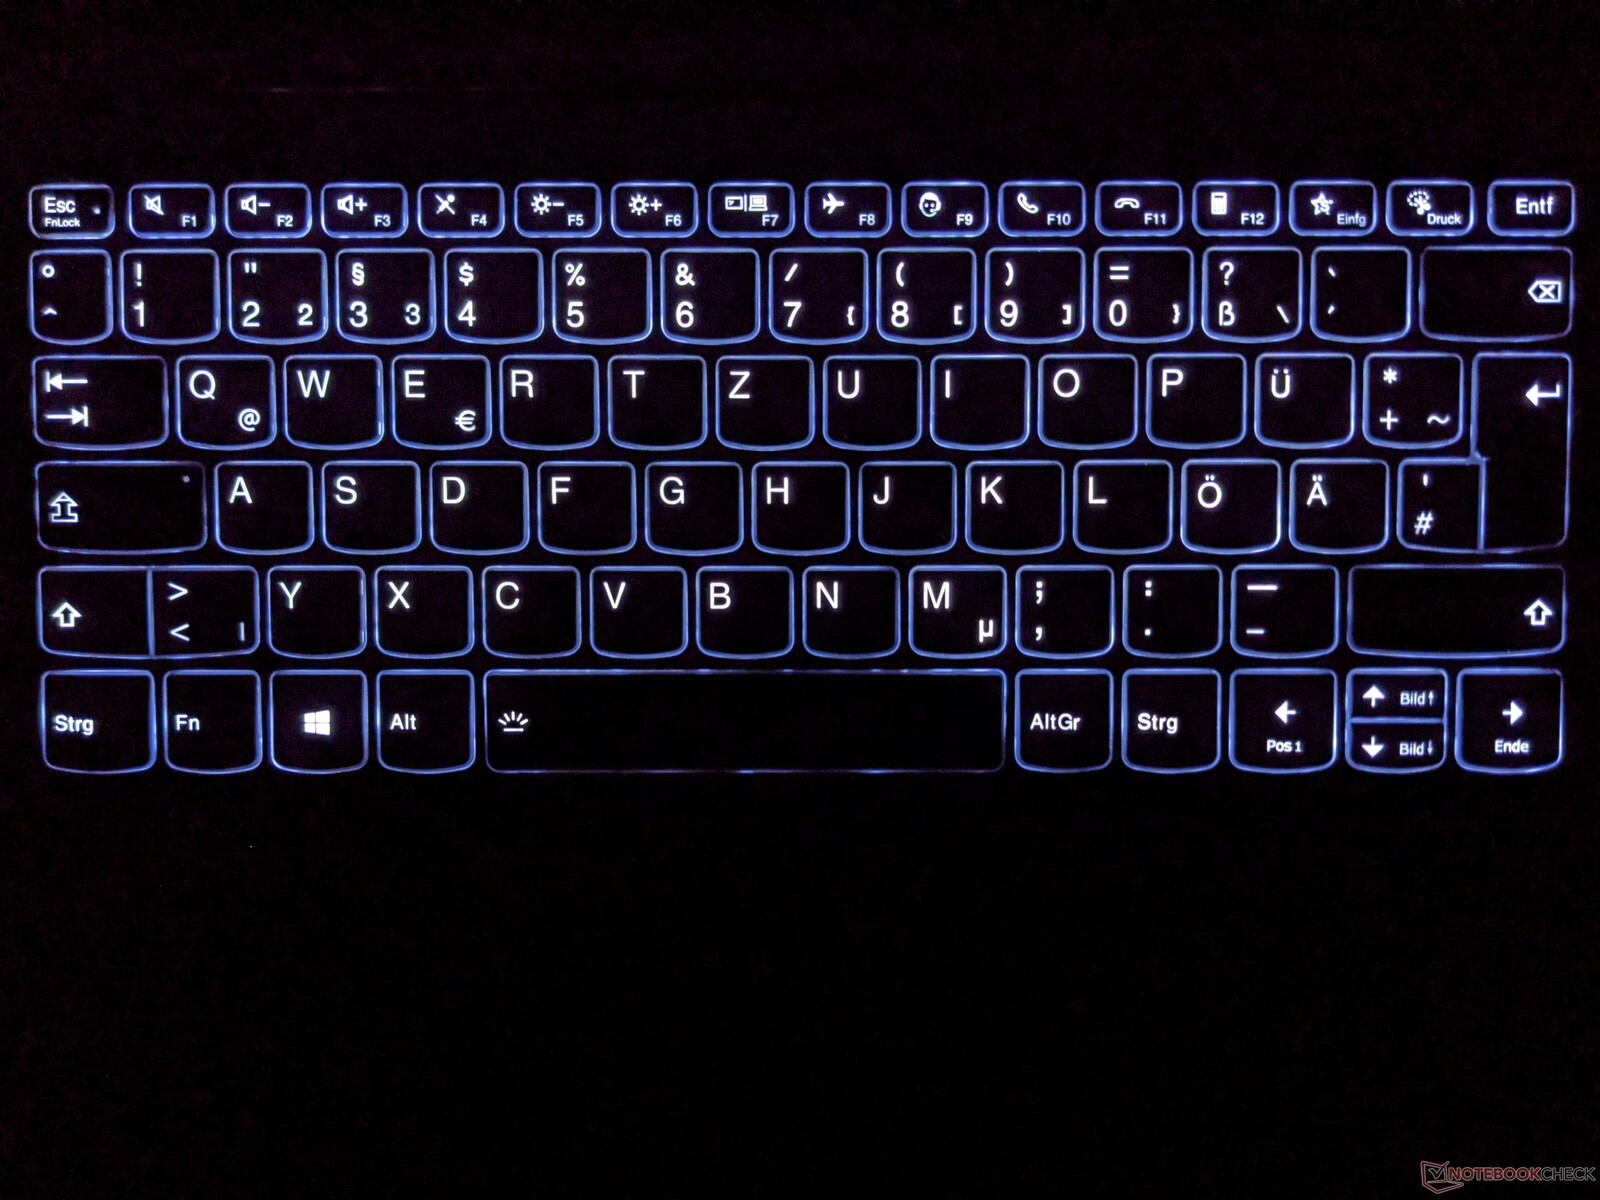
ThinkBook Plus的键盘提供了一个精心设计的布局和清晰的反馈。行程相对较短,但即使是较长的打字任务在短暂的熟悉期后也能顺利完成。一个点击板被用作鼠标的替代品,这对导航鼠标指针很有好处。
联想笔记本电脑的主屏幕支持触摸功能,对触摸也有可靠的反应。还可以通过附带的输入笔进行精确的输入。这些也可以在电子墨水屏幕上实现,尽管屏幕本身的反应非常迟钝。
因此,触摸和例如绘图或书写的文字都能被系统可靠地接收,但在电子墨水屏幕上的实施总是会有很大的延迟。这是由于底层技术的原因,但它非常节能,对眼睛也很舒适。
显示屏 - ThinkPad Plus with QHD
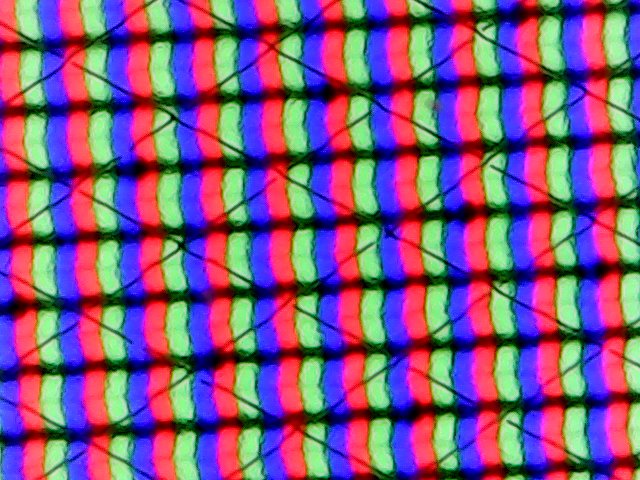

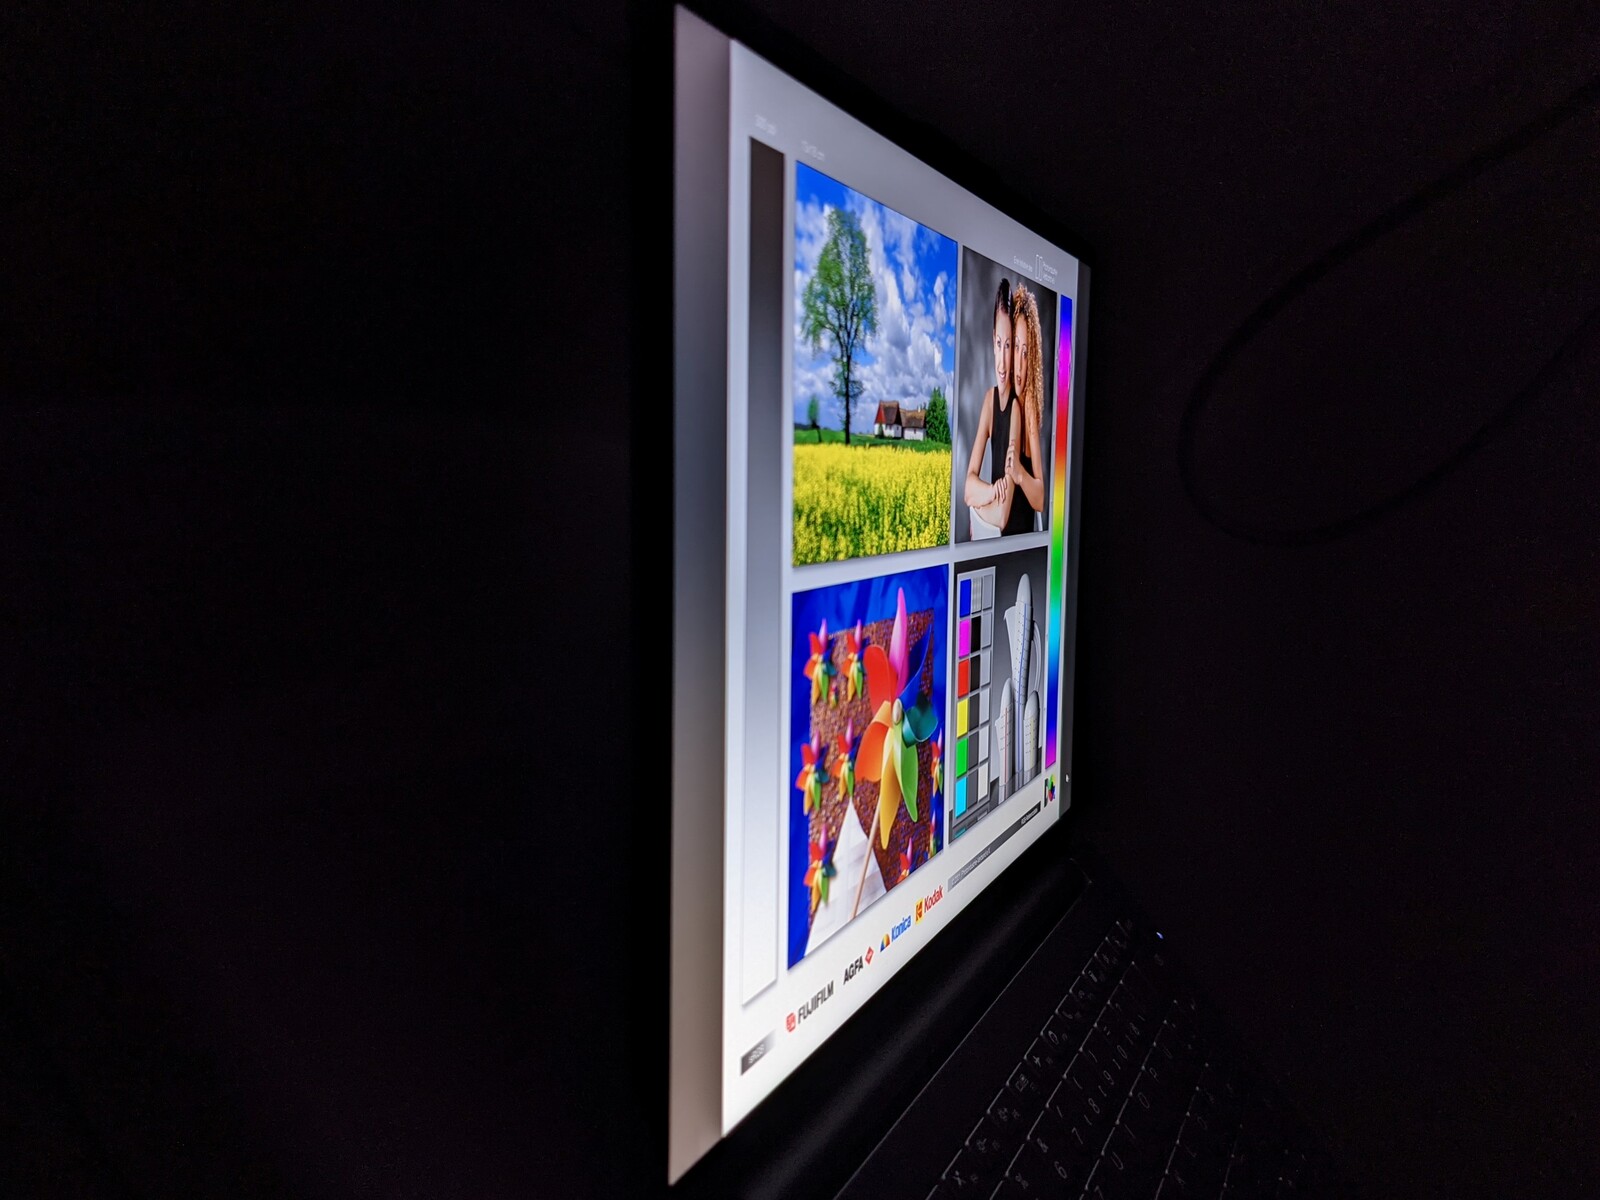
联想ThinkBook Plus Gen2的主屏幕由13.3英寸IPS面板组成,长宽比为16:10,分辨率为2,560 x 1,600像素。最大亮度平均为388 cd/m²,照度为94%。因此,在我们的测试领域,它是拥有第二好的比率的显示器。
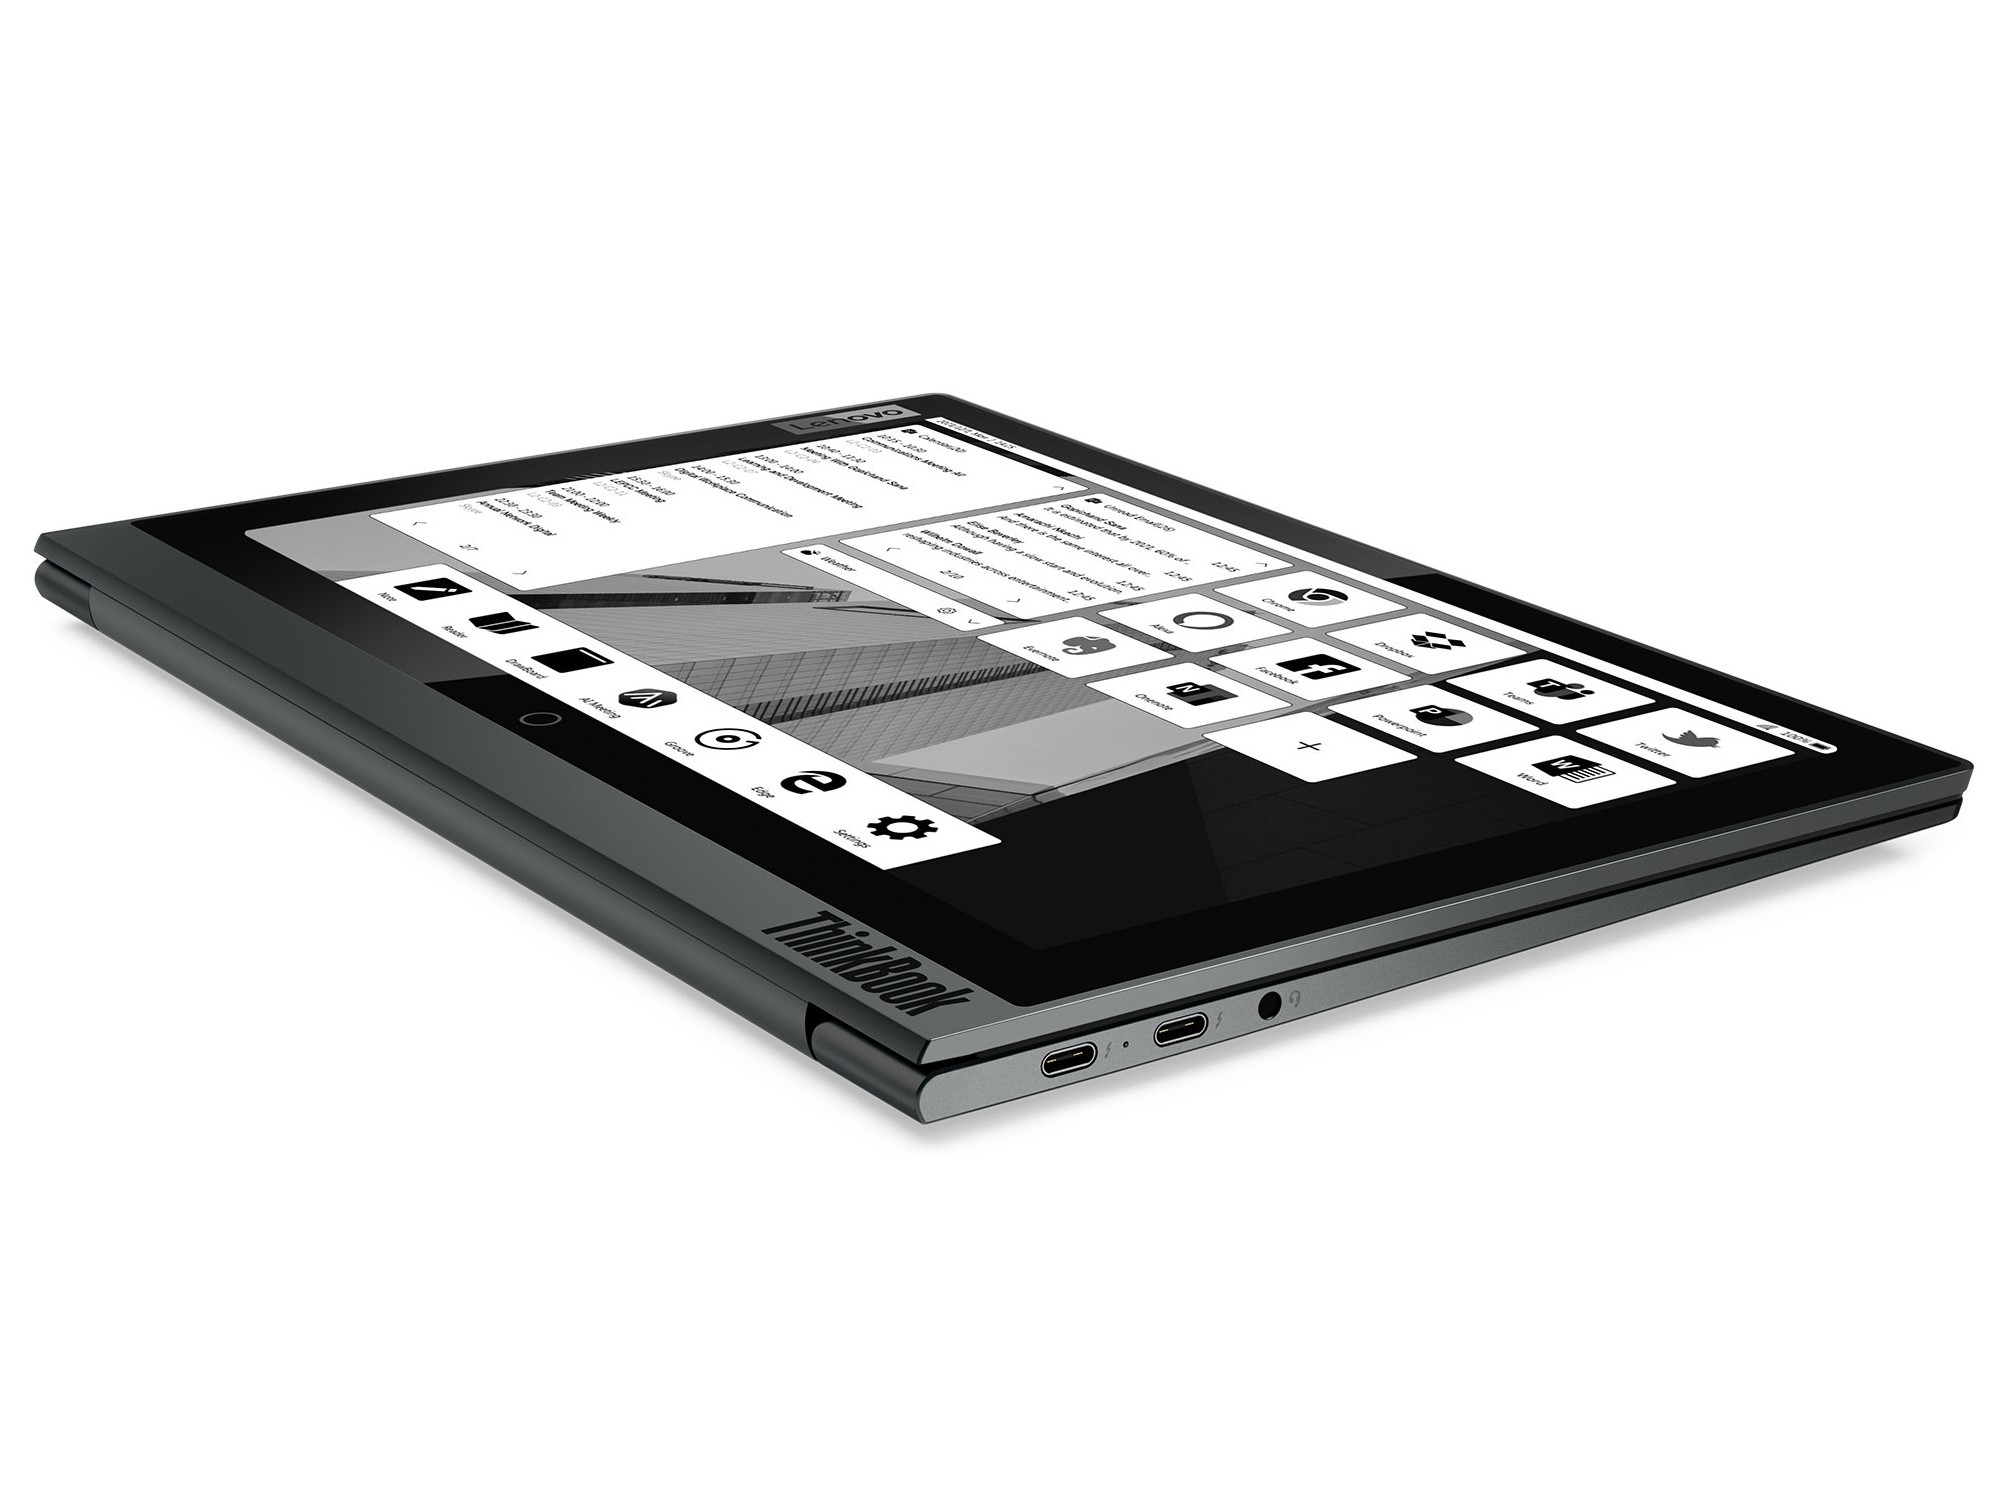
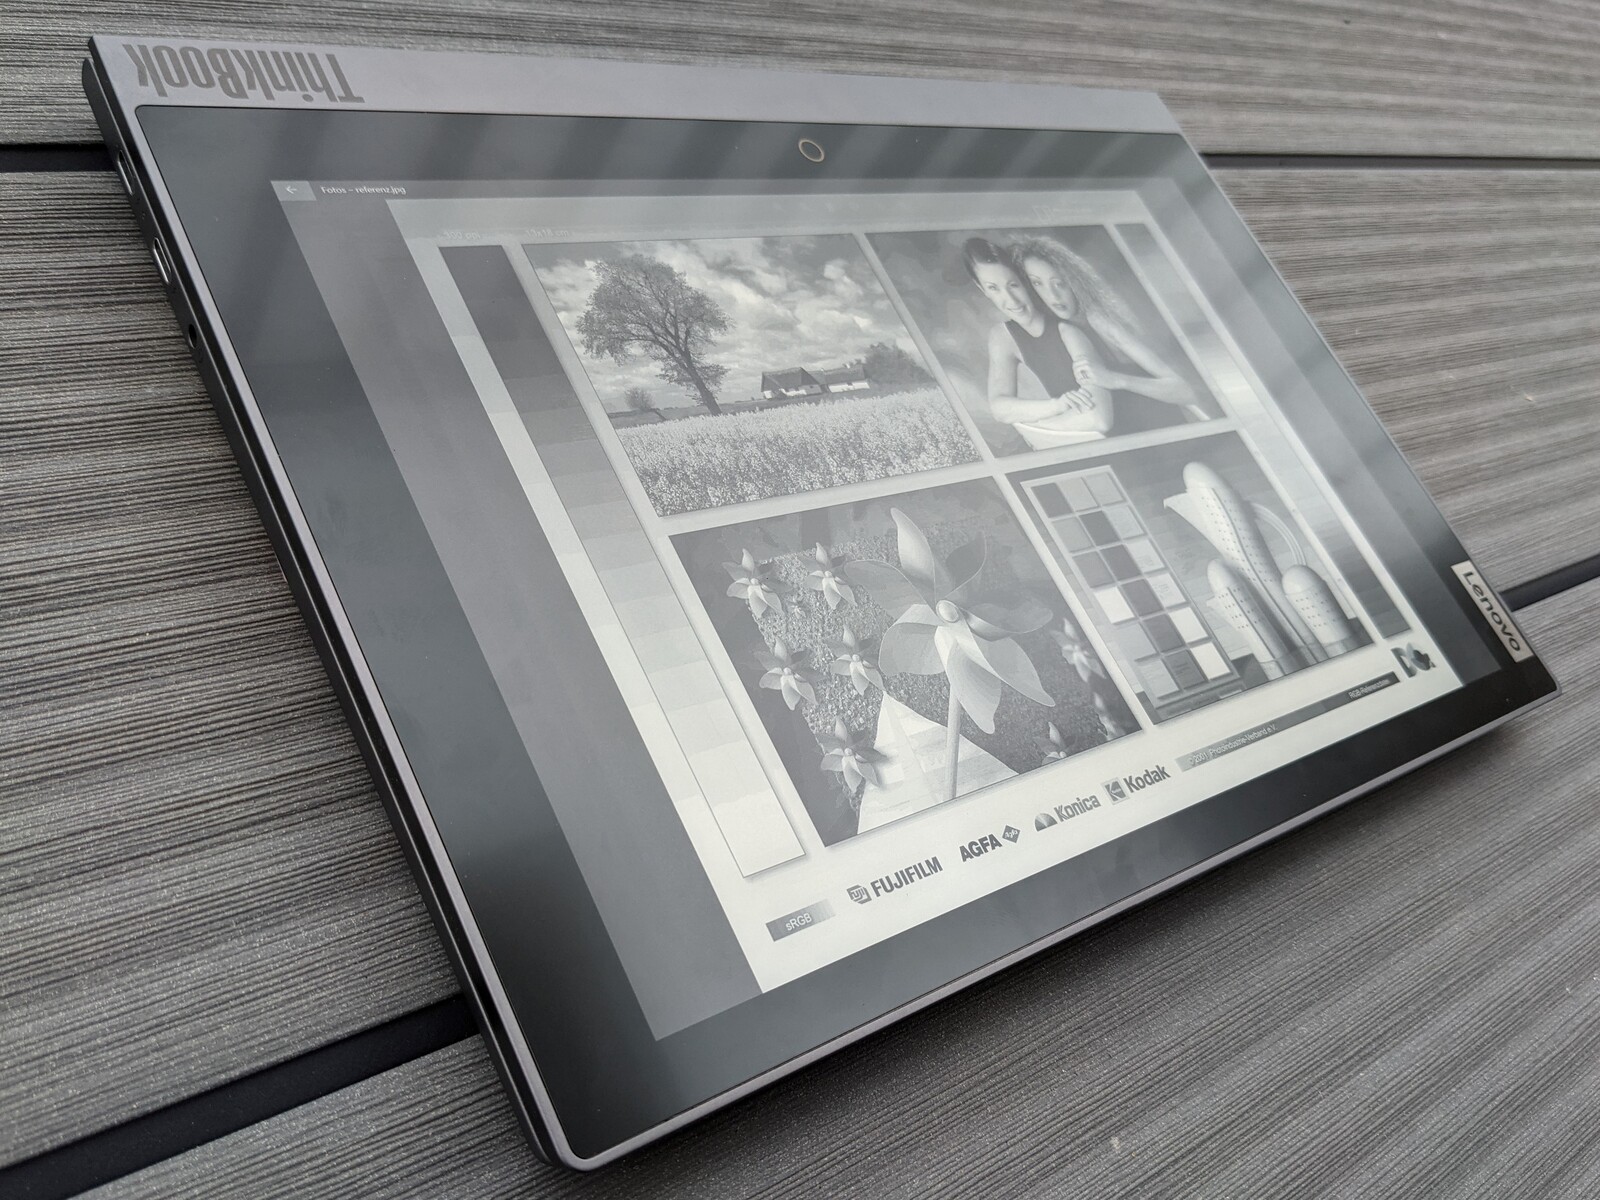
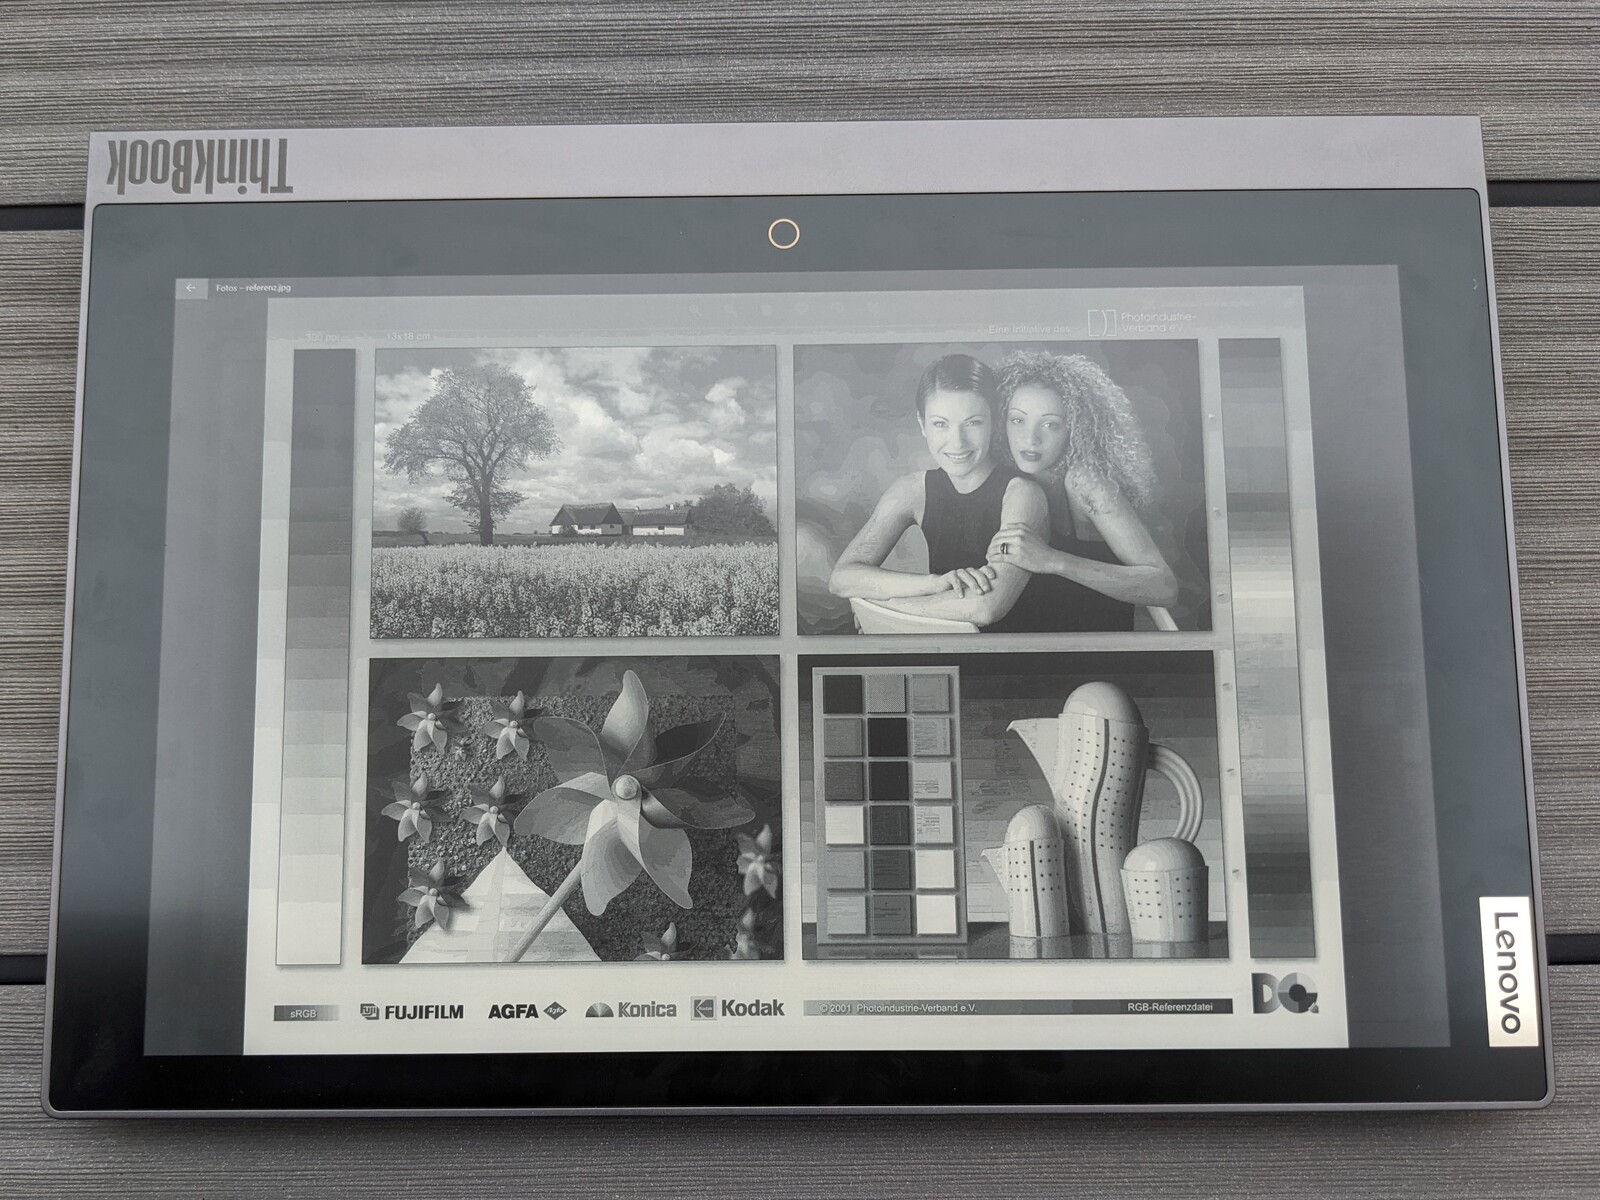
由于E-ink屏幕安装在盖子的上侧,ThinkBook有第二个显示屏,适合显示静态内容。这块黑白面板的分辨率也是2,560 x 1,600像素,但尺寸为12英寸。电子墨水显示屏没有背光灯,这就是为什么在环境光线不好的情况下需要外部照明。
根据我们的测量,没有 PWM是使用的。也可以操作外部显示器,但 "仅外部显示器 "选项不起作用。这可能是由于二级电子墨水显示器的原因。
| |||||||||||||||||||||||||
Brightness Distribution: 94 %
Center on Battery: 403 cd/m²
Contrast: 1683:1 (Black: 0.24 cd/m²)
ΔE ColorChecker Calman: 3.1 | ∀{0.5-29.43 Ø4.71}
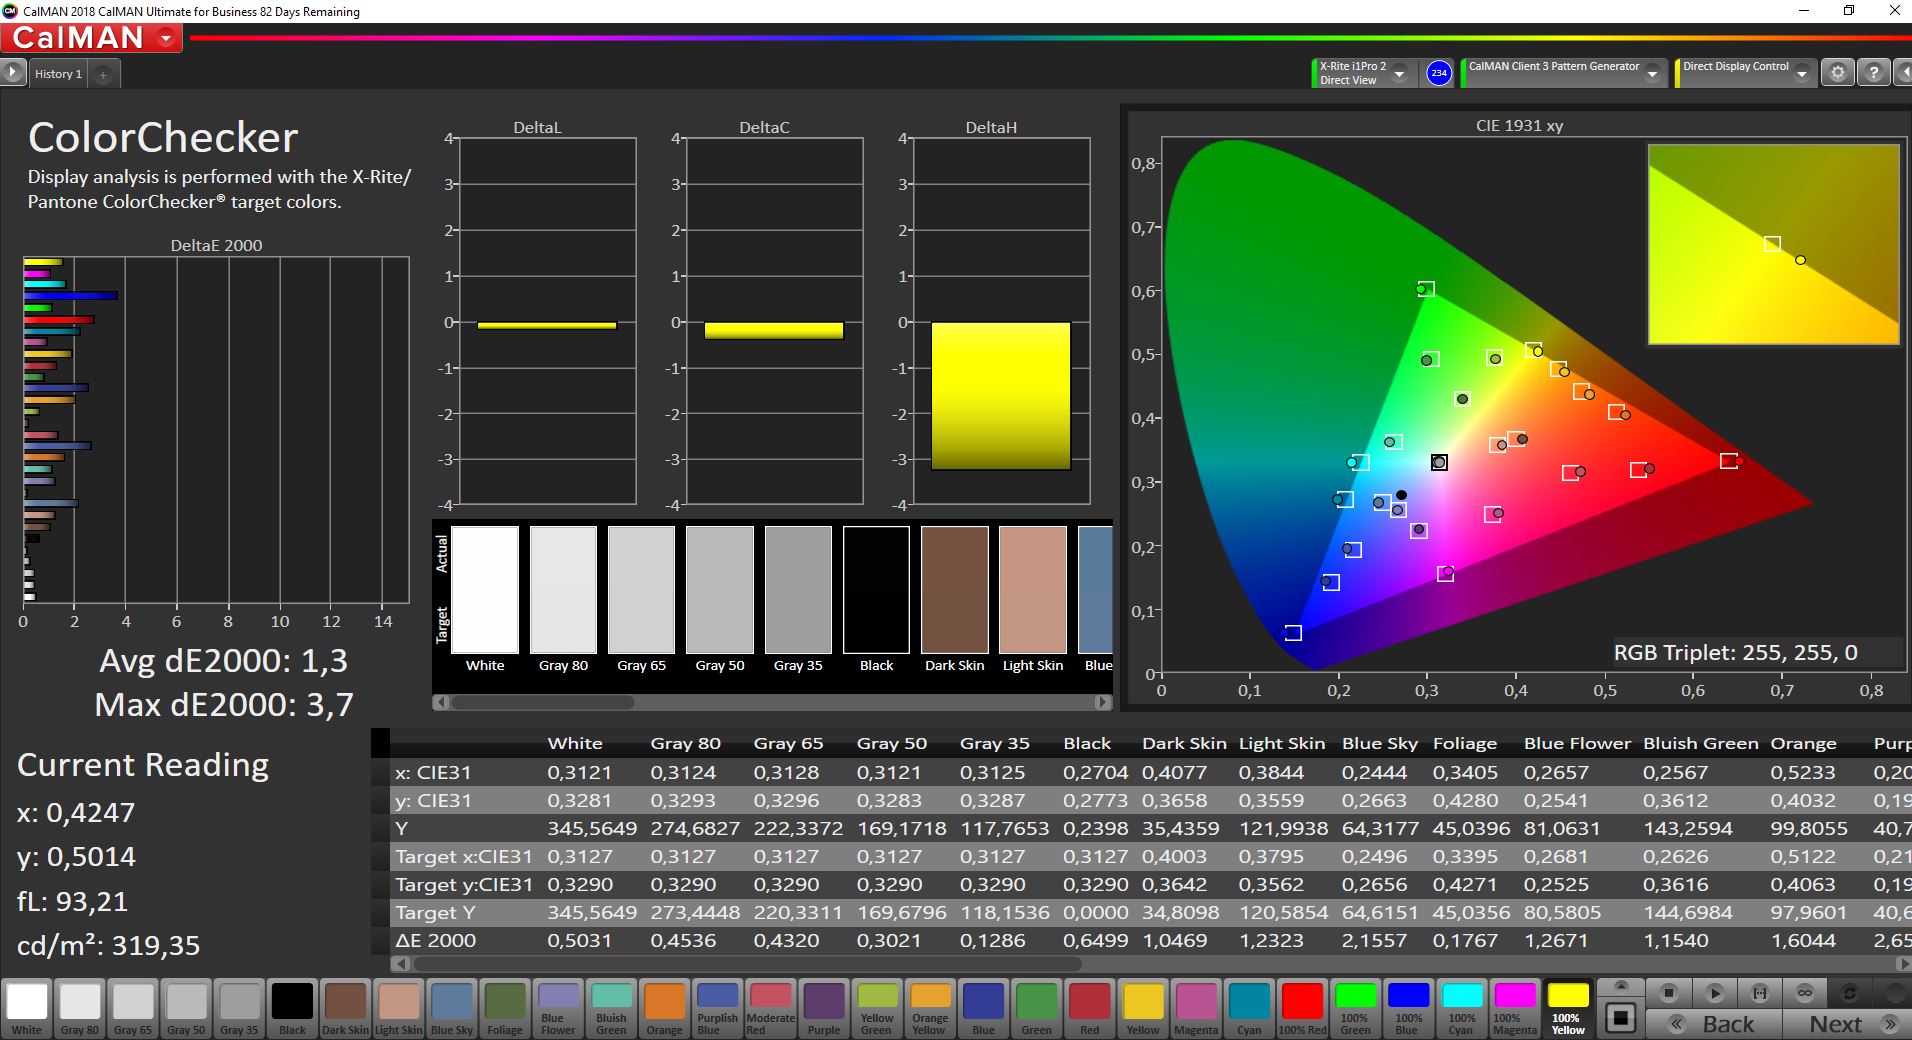
calibrated: 1.3
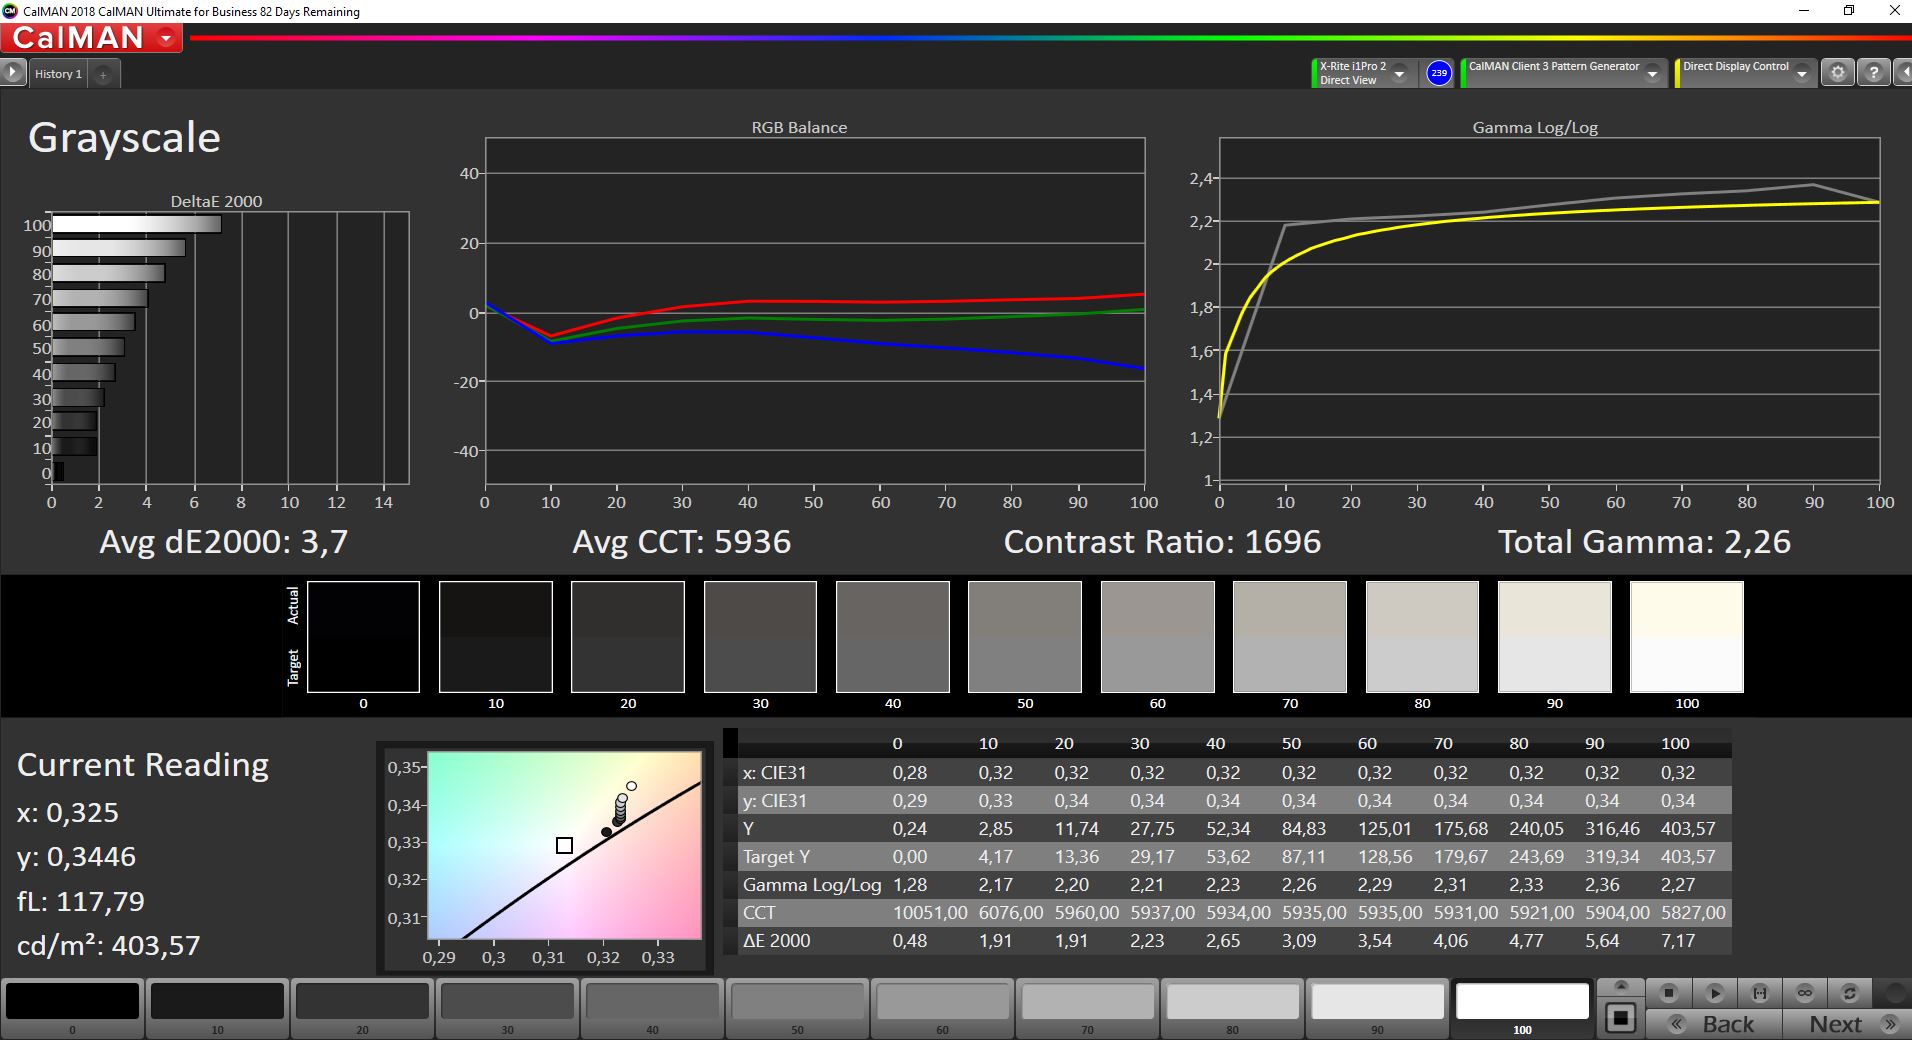
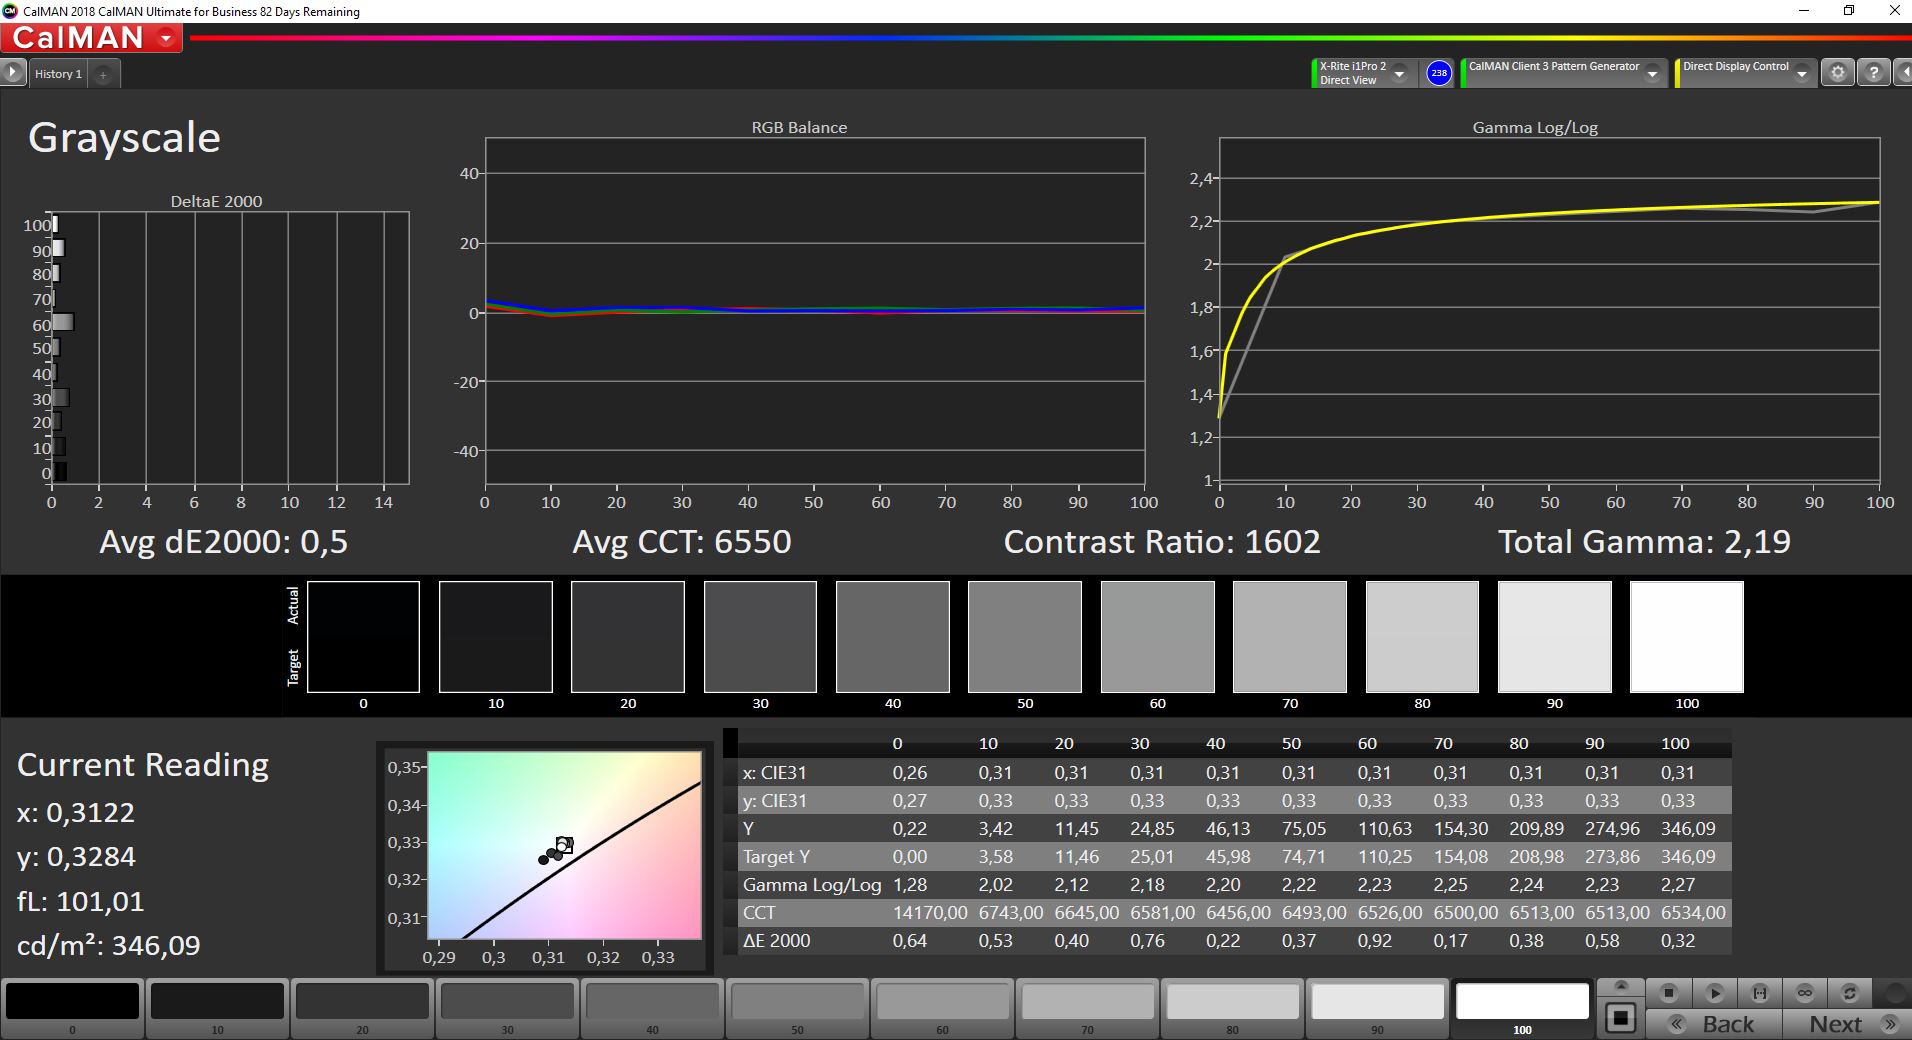
ΔE Greyscale Calman: 3.7 | ∀{0.09-98 Ø4.96}
72.2% AdobeRGB 1998 (Argyll 3D)
98% sRGB (Argyll 3D)
70.1% Display P3 (Argyll 3D)
Gamma: 2.26
CCT: 5936 K
| Lenovo ThinkBook Plus Gen2 Core i5 CSOT T3 MND307DA1-5 (LCD), IPS, E-Ink, 2560x1600, 13.3" | Lenovo ThinkBook Plus 13 i7 LP133WF7-SPB1, IPS LED, 1920x1080, 13.3" | HP Pavilion Aero 13 be0097nr AU Optronics AUO6496, IPS, 1920x1200, 13.3" | Acer Spin 3 SP313-51N-56YV AU Optronics AUOB493, IPS, 2560x1600, 13.3" | Samsung Galaxy Book Pro 360 13 AMOLED, 1920x1080, 13.2" | |
|---|---|---|---|---|---|
| Display | -5% | 4% | 7% | 26% | |
| Display P3 Coverage (%) | 70.1 | 66 -6% | 73.4 5% | 78.8 12% | 99.4 42% |
| sRGB Coverage (%) | 98 | 96.1 -2% | 99.8 2% | 99.8 2% | 100 2% |
| AdobeRGB 1998 Coverage (%) | 72.2 | 67 -7% | 74.8 4% | 77.6 7% | 96 33% |
| Response Times | -20% | -6% | -25% | 94% | |
| Response Time Grey 50% / Grey 80% * (ms) | 42.8 ? | 53.6 ? -25% | 42.4 ? 1% | 52 ? -21% | 2 ? 95% |
| Response Time Black / White * (ms) | 28 ? | 32 ? -14% | 31.6 ? -13% | 36 ? -29% | 2 ? 93% |
| PWM Frequency (Hz) | 60 ? | ||||
| Screen | -30% | 1% | -32% | 219% | |
| Brightness middle (cd/m²) | 404 | 328 -19% | 473.9 17% | 338 -16% | 287 -29% |
| Brightness (cd/m²) | 388 | 329 -15% | 458 18% | 307 -21% | 289 -26% |
| Brightness Distribution (%) | 94 | 89 -5% | 91 -3% | 83 -12% | 96 2% |
| Black Level * (cd/m²) | 0.24 | 0.21 12% | 0.36 -50% | 0.27 -13% | 0.01 96% |
| Contrast (:1) | 1683 | 1562 -7% | 1316 -22% | 1252 -26% | 28700 1605% |
| Colorchecker dE 2000 * | 3.1 | 6.4 -106% | 2.99 4% | 4.63 -49% | 2.24 28% |
| Colorchecker dE 2000 max. * | 6.9 | 11.2 -62% | 4.35 37% | 9.99 -45% | 3.69 47% |
| Colorchecker dE 2000 calibrated * | 1.3 | 1.2 8% | 1.1 15% | 1.64 -26% | |
| Greyscale dE 2000 * | 3.7 | 6.5 -76% | 4 -8% | 6.76 -83% | 2.73 26% |
| Gamma | 2.26 97% | 2.87 77% | 2.35 94% | 2.37 93% | 2.46 89% |
| CCT | 5936 110% | 6428 101% | 6269 104% | 5934 110% | 6523 100% |
| Color Space (Percent of AdobeRGB 1998) (%) | 61.6 | 68 | |||
| Color Space (Percent of sRGB) (%) | 95.9 | 98 | |||
| Total Average (Program / Settings) | -18% /
-23% | -0% /
1% | -17% /
-23% | 113% /
155% |
* ... smaller is better
Display Response Times
| ↔ Response Time Black to White | ||
|---|---|---|
| 28 ms ... rise ↗ and fall ↘ combined | ↗ 14 ms rise | 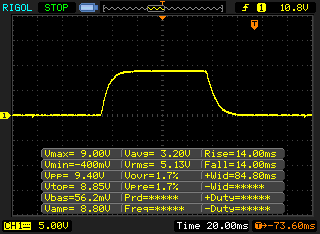 |
| ↘ 14 ms fall | ||
| The screen shows relatively slow response rates in our tests and may be too slow for gamers. In comparison, all tested devices range from 0.1 (minimum) to 240 (maximum) ms. » 71 % of all devices are better. This means that the measured response time is worse than the average of all tested devices (19.8 ms). | ||
| ↔ Response Time 50% Grey to 80% Grey | ||
| 42.8 ms ... rise ↗ and fall ↘ combined | ↗ 21.6 ms rise | 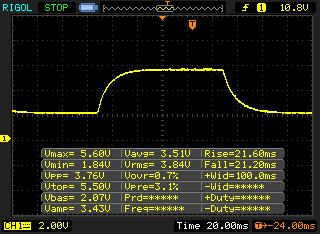 |
| ↘ 21.2 ms fall | ||
| The screen shows slow response rates in our tests and will be unsatisfactory for gamers. In comparison, all tested devices range from 0.165 (minimum) to 636 (maximum) ms. » 70 % of all devices are better. This means that the measured response time is worse than the average of all tested devices (31 ms). | ||
Screen Flickering / PWM (Pulse-Width Modulation)
| Screen flickering / PWM not detected | 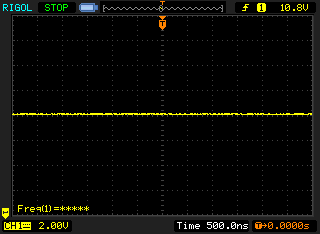 | ||
In comparison: 52 % of all tested devices do not use PWM to dim the display. If PWM was detected, an average of 7757 (minimum: 5 - maximum: 343500) Hz was measured. | |||
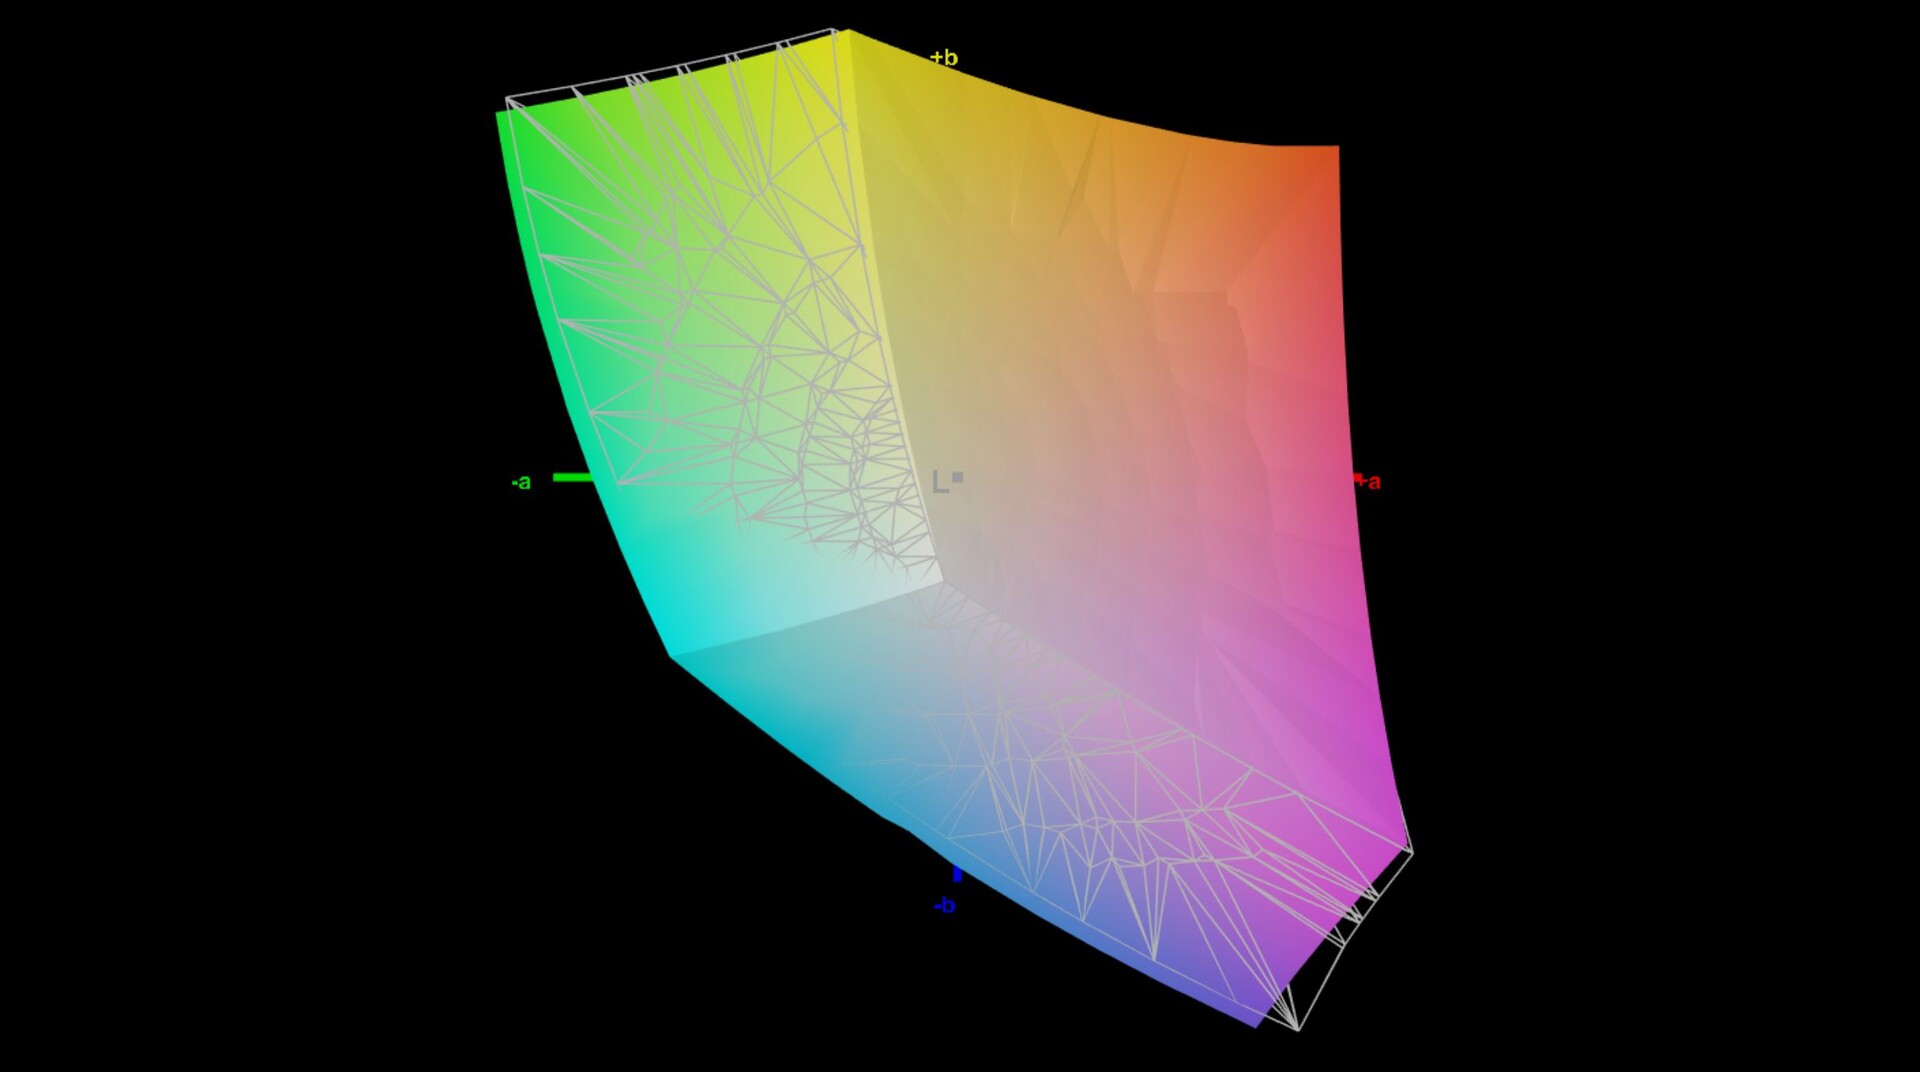
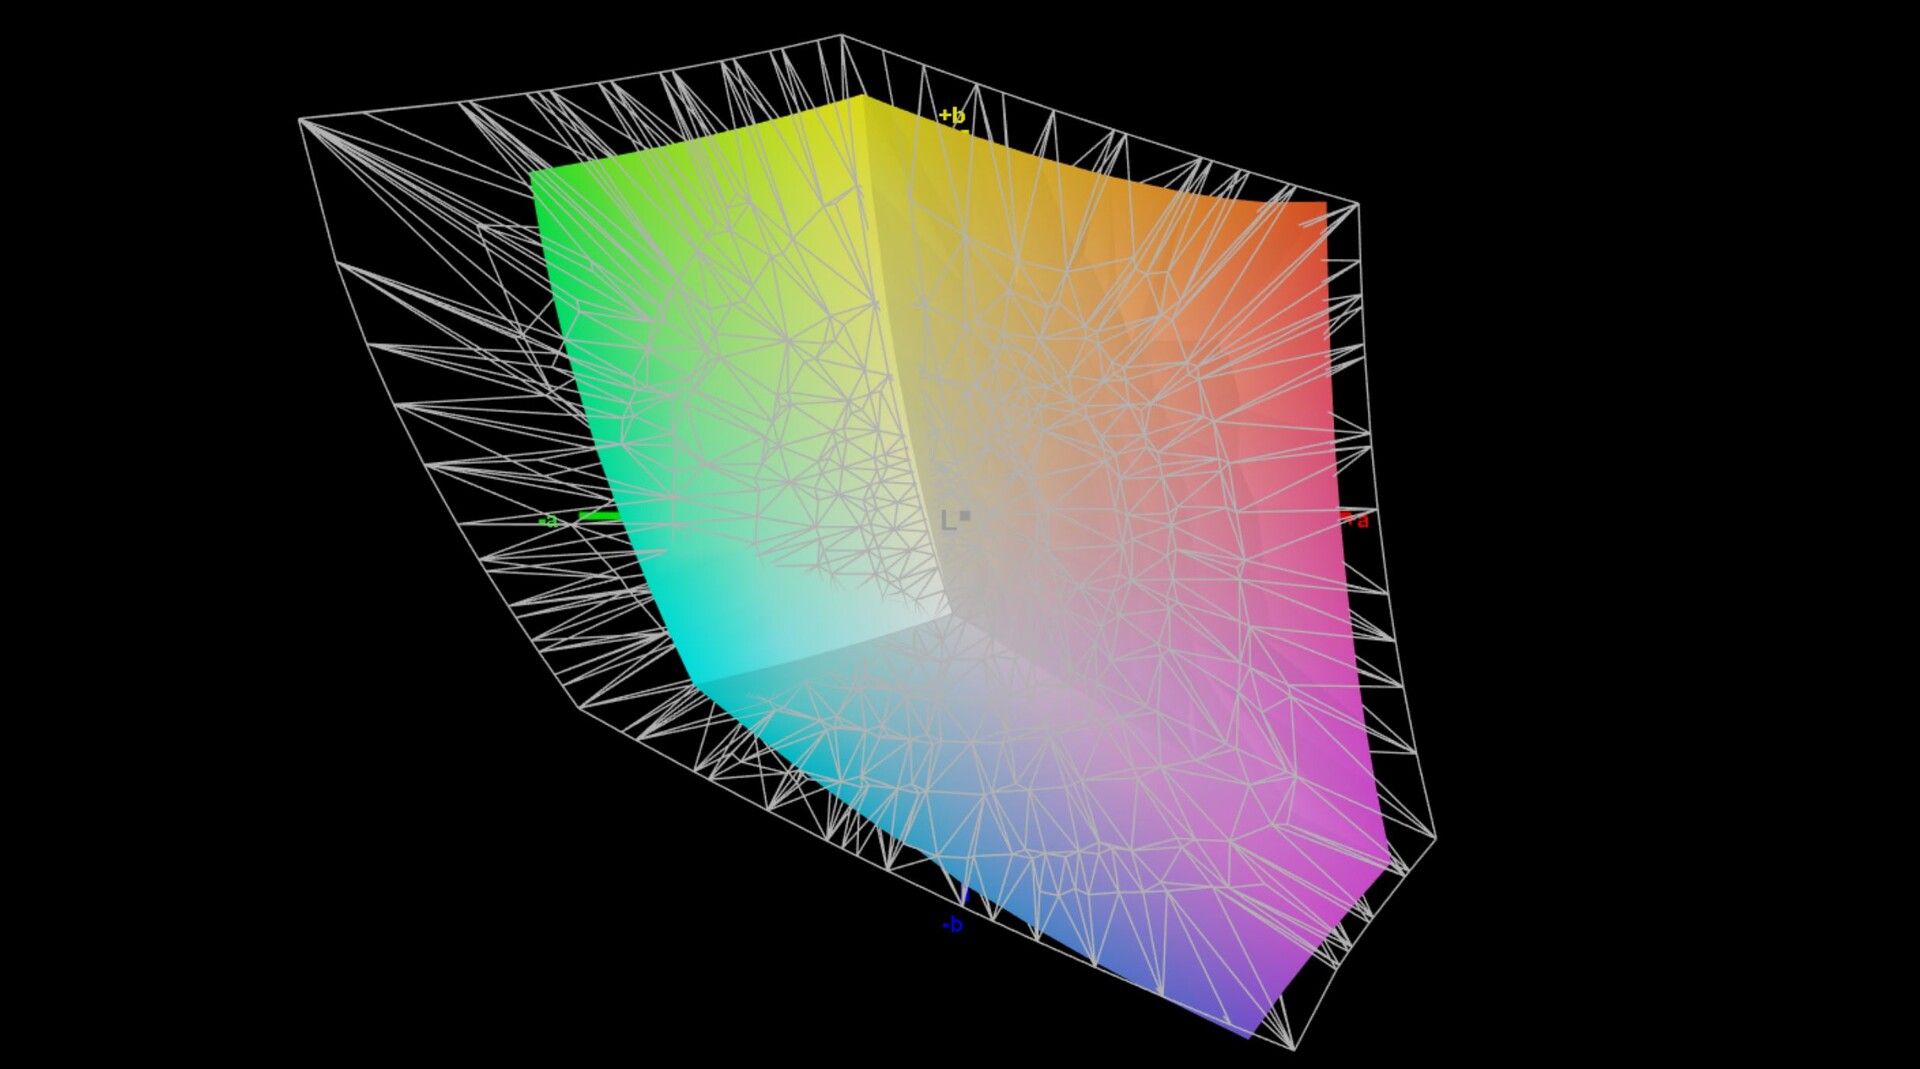
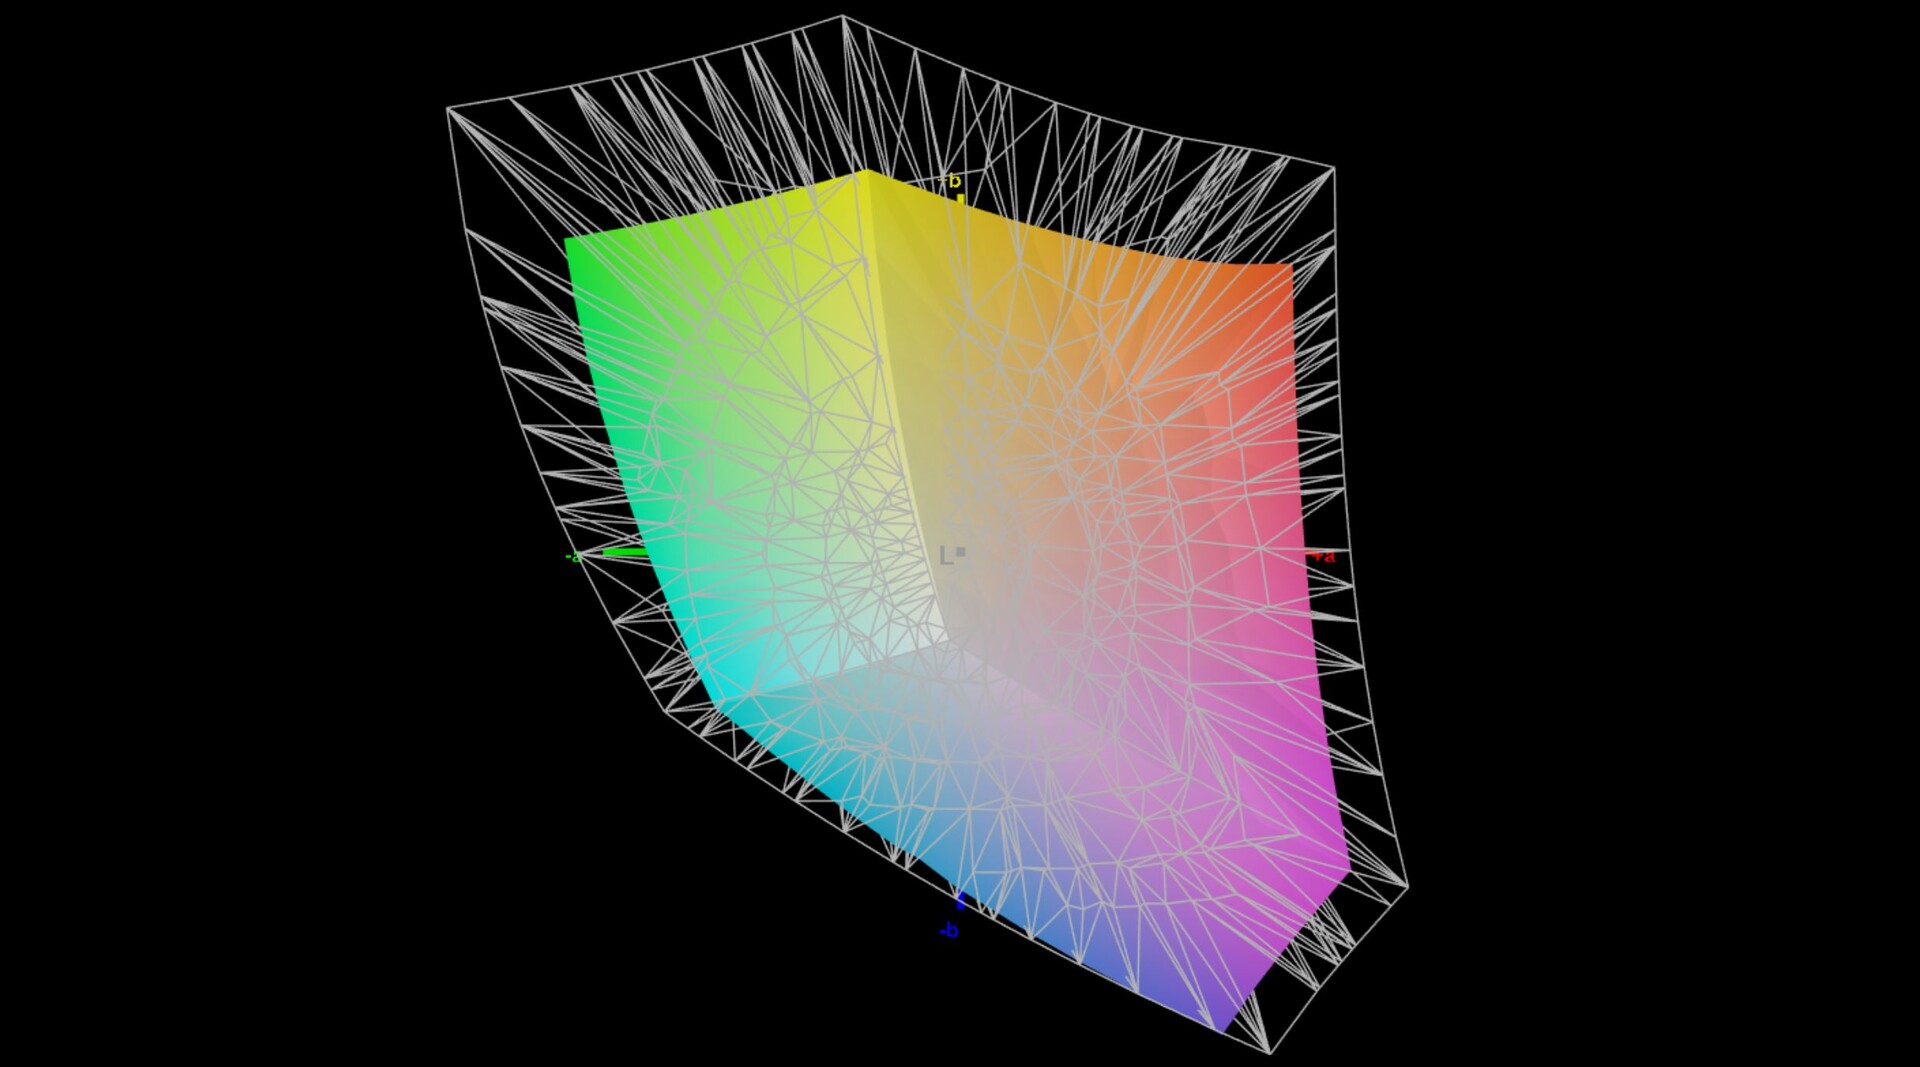
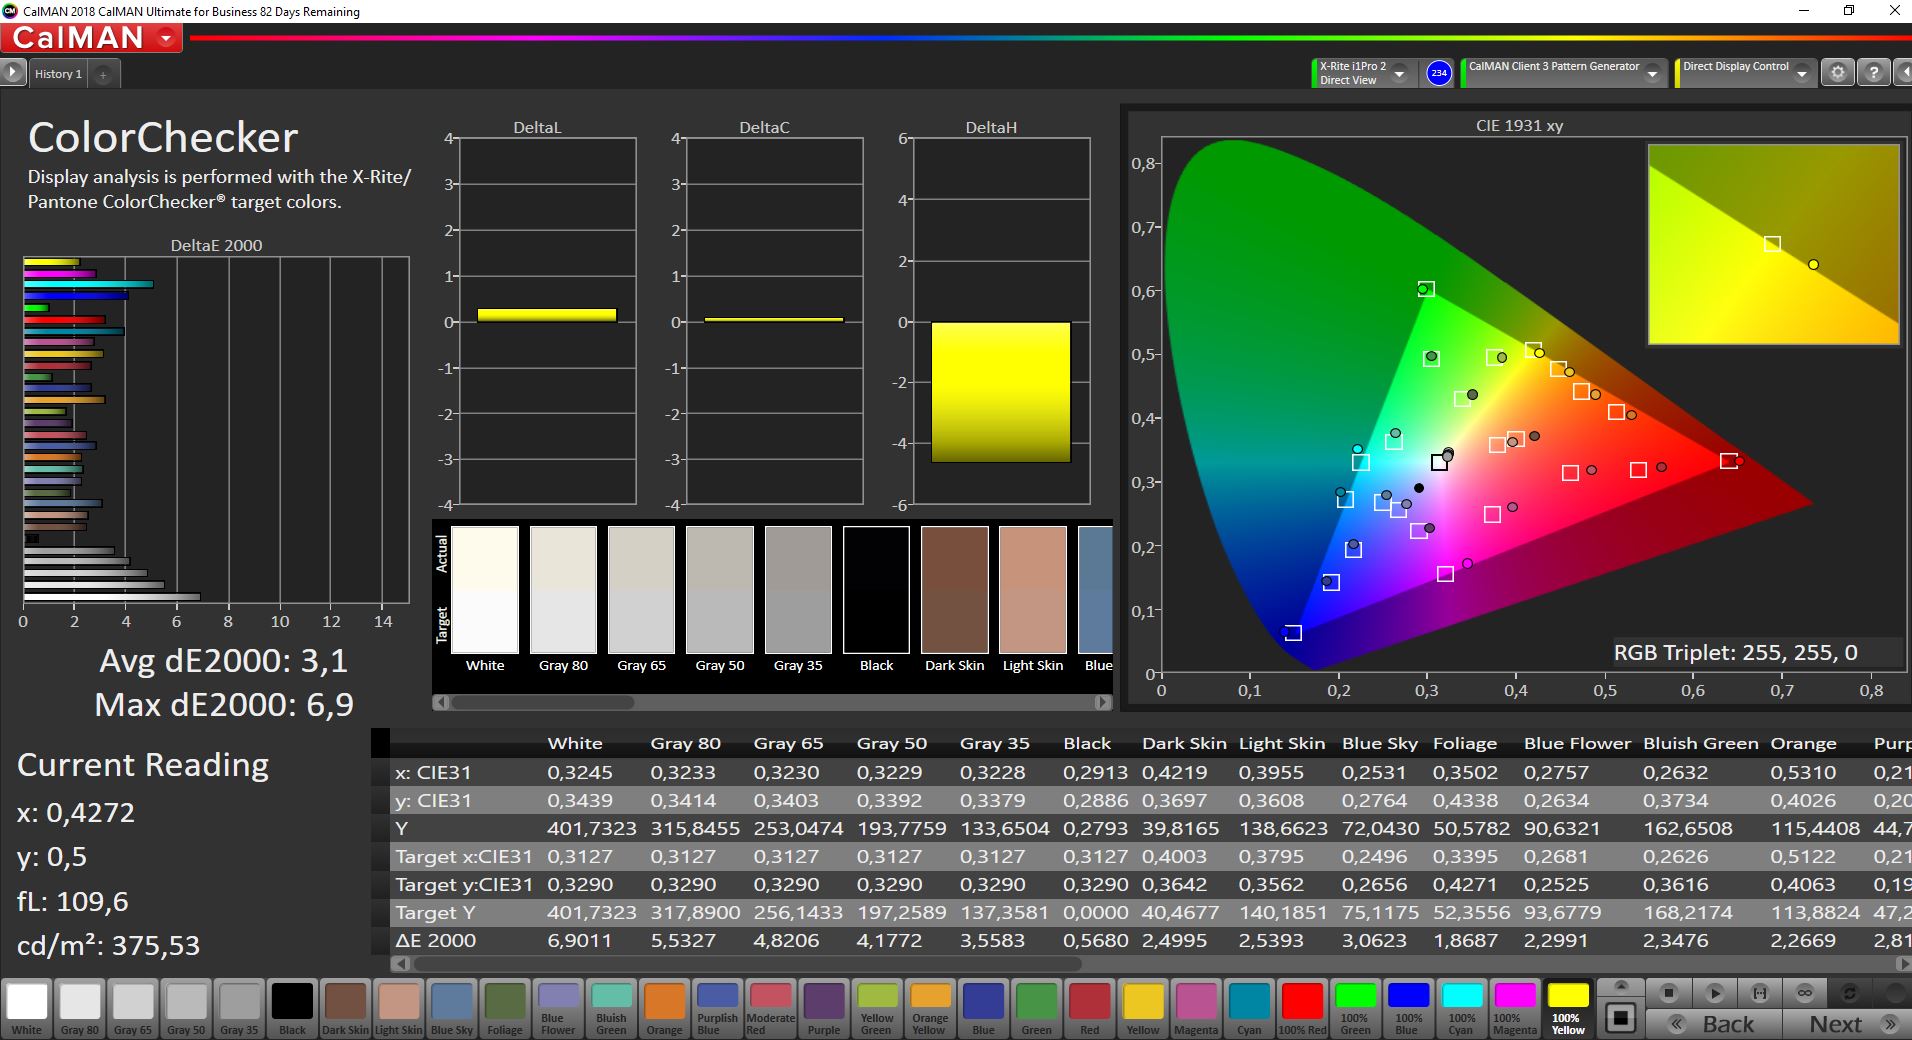

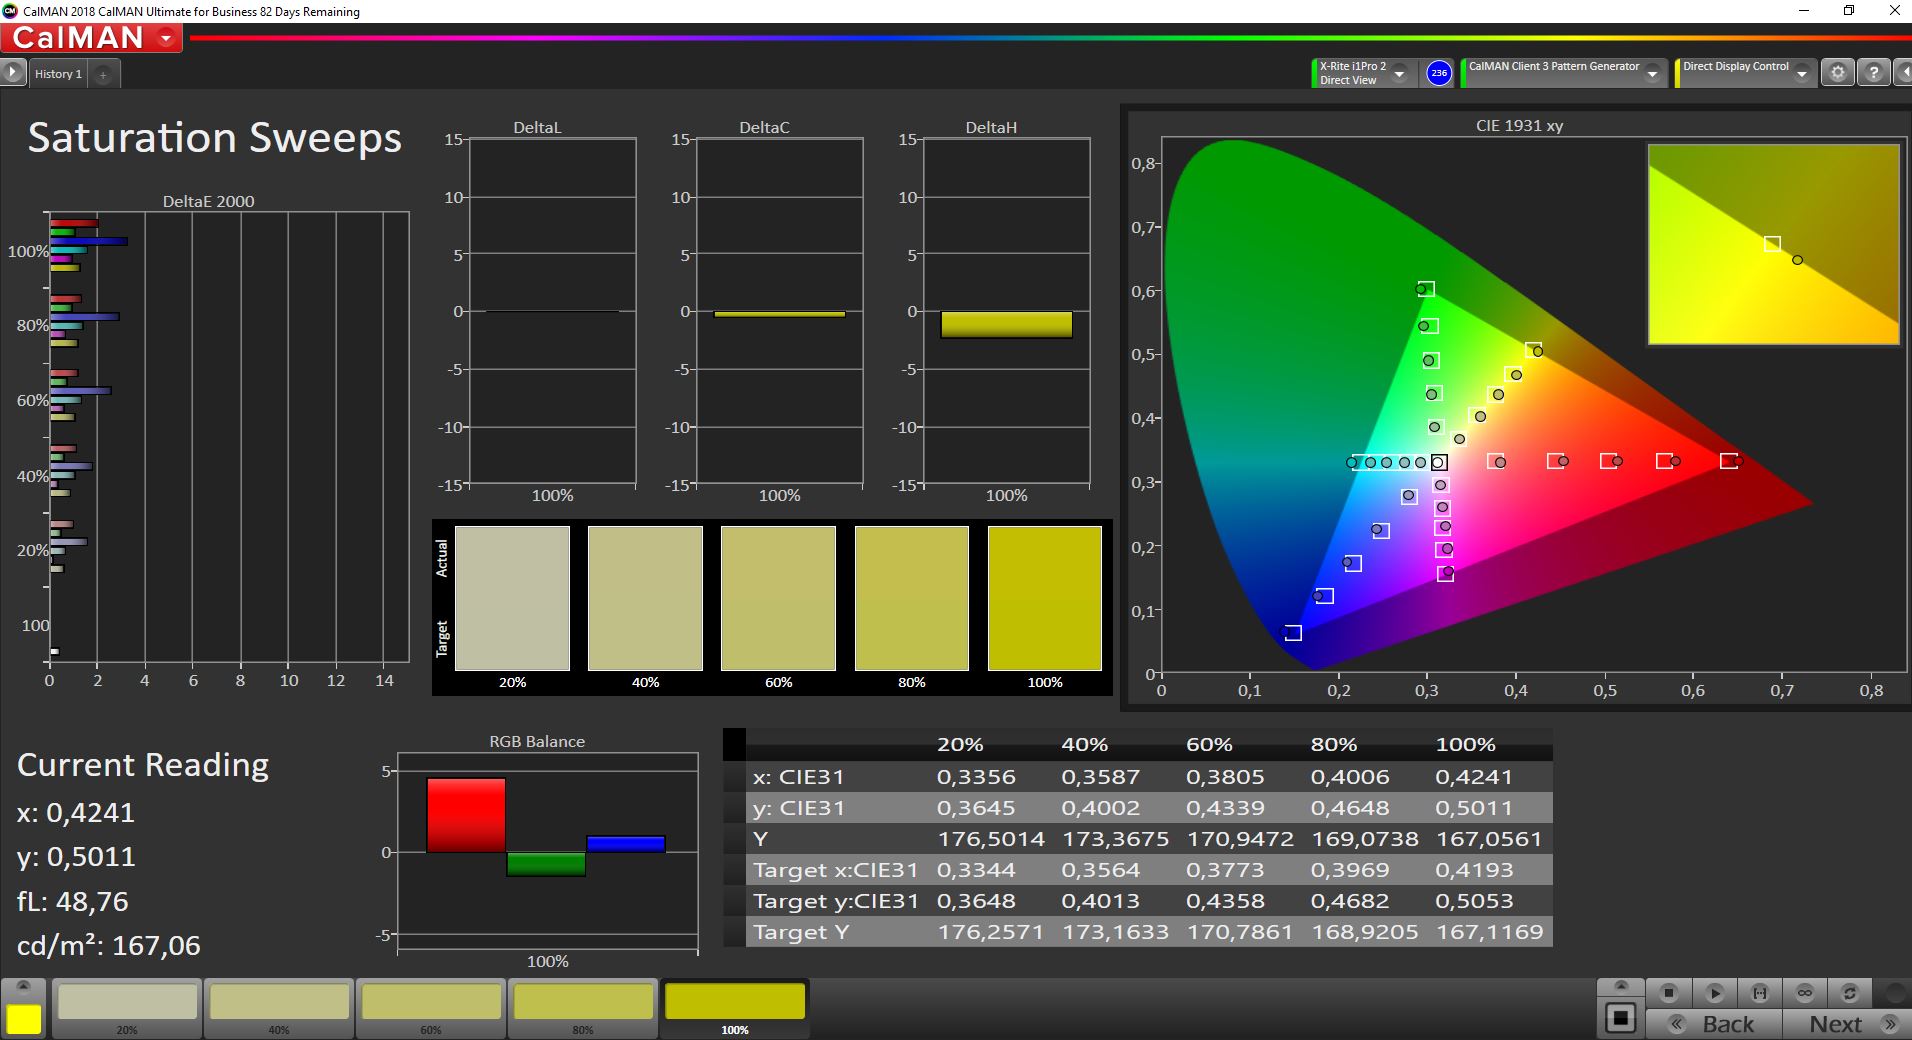
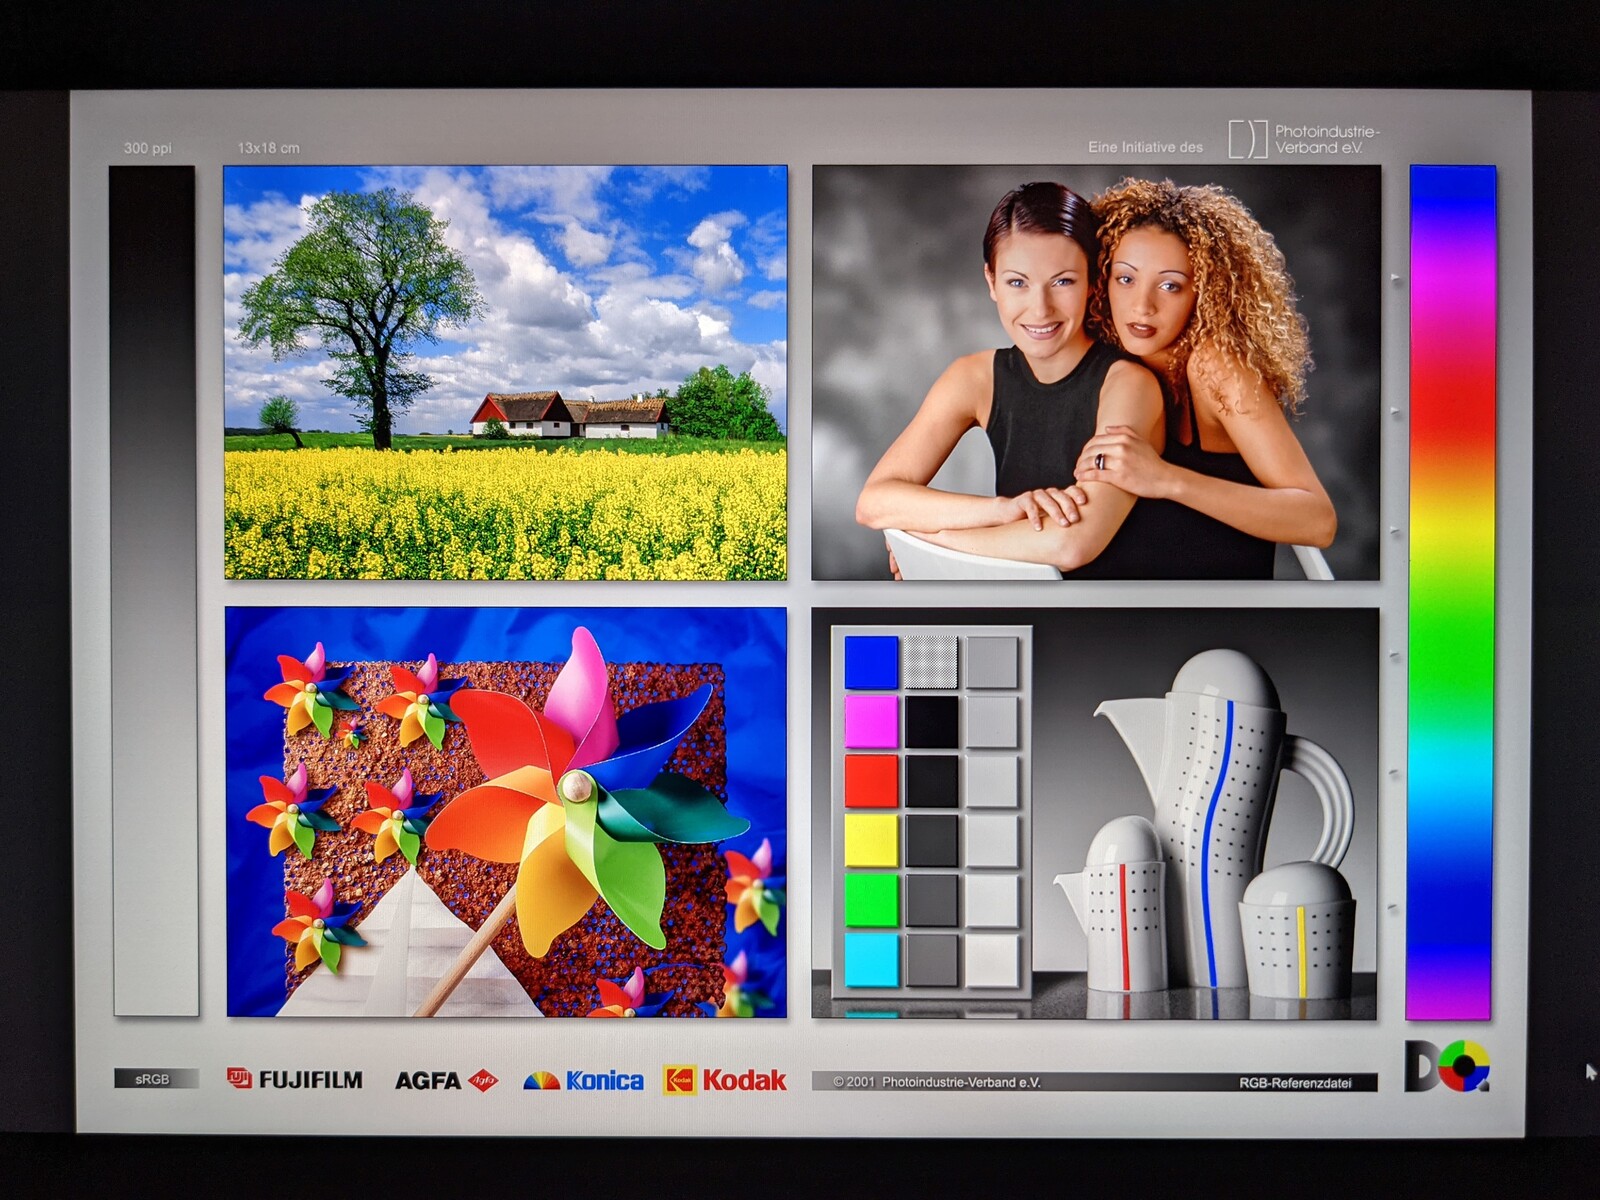
我们的测量证明,ThinkBook Plus Gen2的主屏幕的色彩空间覆盖率非常高,达到98%(sRGB)。1,683:1的对比度是我们测试领域中最高的之一,0.24 cd/m²的黑值也只是略高。
CalMAN分析还显示,颜色的显示仅有出厂时3.1的低DeltaE-2000偏差。通过校准,这个值可以降低到1.3。相应的ICC文件可以在屏幕照度图形旁边的右上方窗口下载。
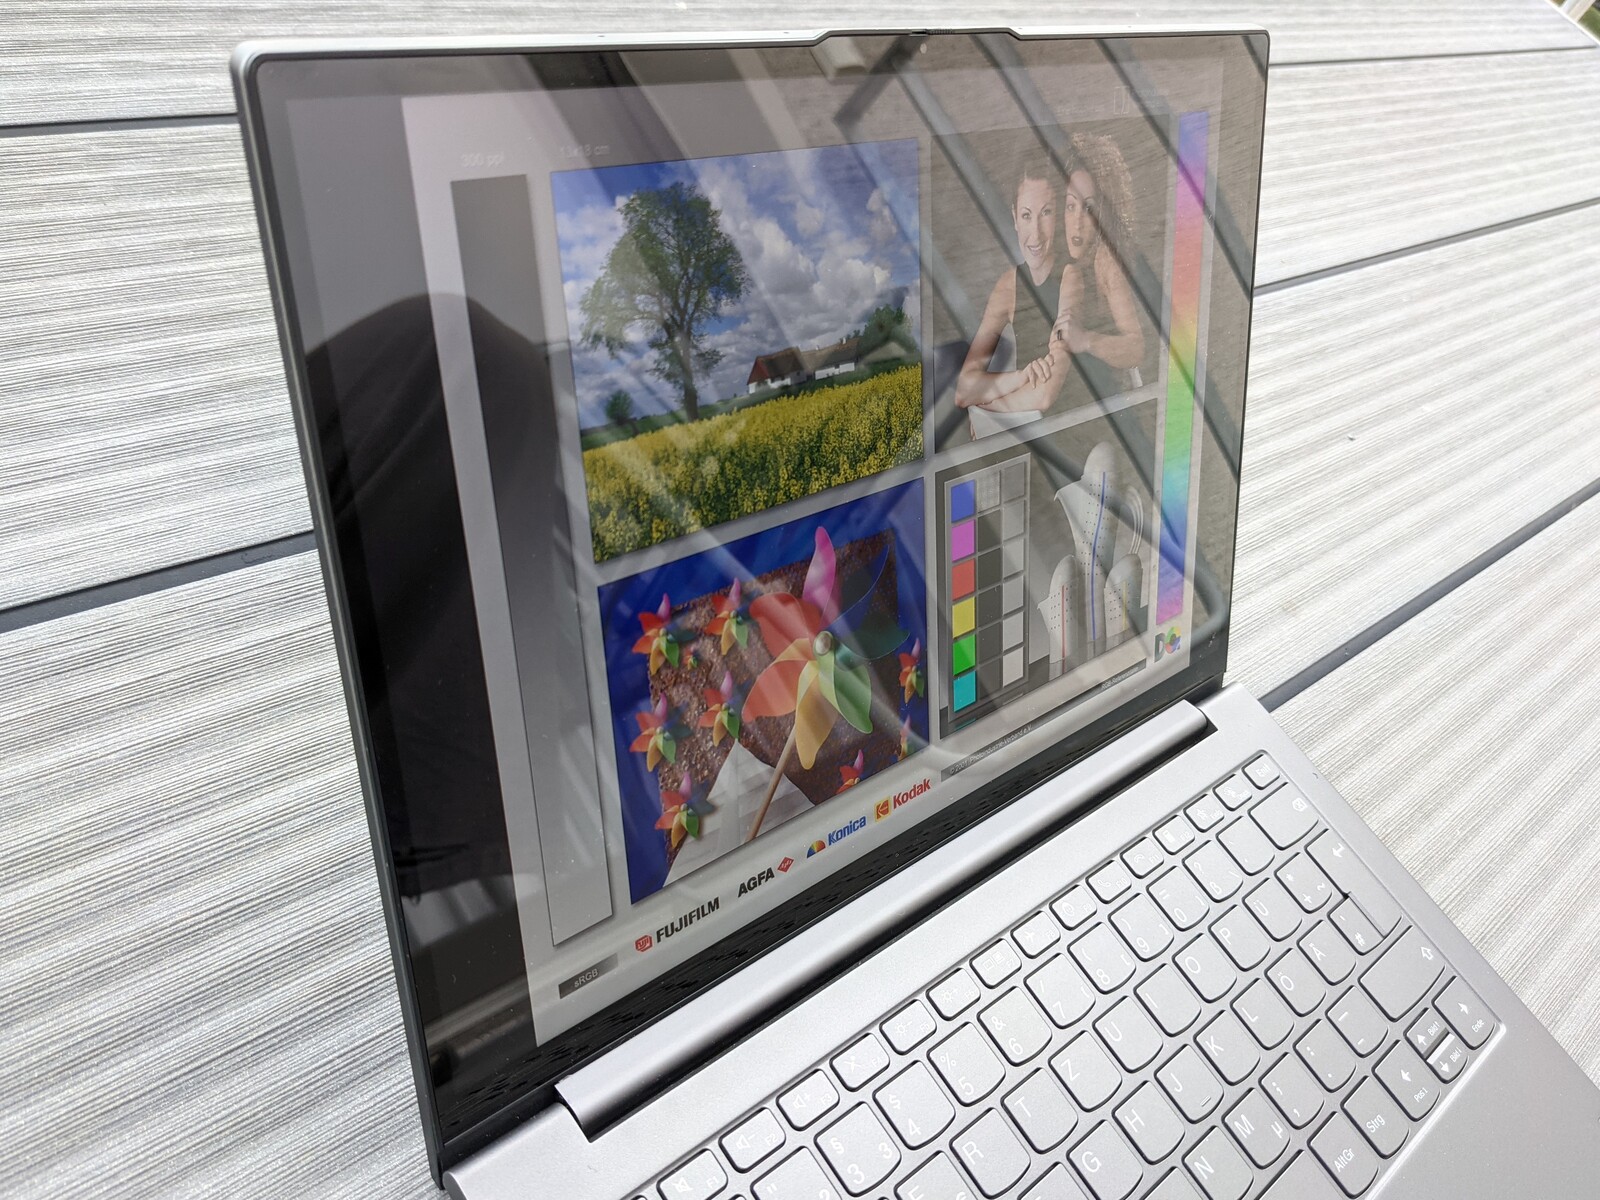
IPS和E-ink显示屏的可视角度都非常稳定。在户外可以很好地从主显示屏上读取图像内容。然而,其光亮的表面会引起恼人的反射。这种影响在外部E-ink屏幕上就不那么明显了,这就是为什么它非常适合在户外消费内容。

性能--CPU在前代水平上的性能
联想将ThinkBook Plus Gen2的目标用户定位在需要足够性能的日常工作以及办公应用的办公室用户。除了这里测试的配置,没有提供其他选项,这意味着只有处理器的内部图形单元可用于图形要求更高的任务,例如。联想在预装的Vantage应用程序中提供了不同的性能模式。我们在 "智能冷却 "的预设下进行了以下基准测试和测量。
处理器
这里安装的是 英特尔酷睿i5-1130G7是一个具有四个核心的处理器,可以同时处理多达八个任务。然而,与 "普通 "酷睿i5-1135G7相比,它是一个性能较低的UP4芯片,这在较低的时钟(1.8-4 GHz)和较低的TDP(7-15瓦)中都很明显。
联想使用i5-1130G7的PL1 i5-1130G7在ThinkBook Plus Gen2中为12瓦,PL2为25瓦。因此,在我们的Cinebench R15永久负载测试中,一个与 英特尔酷睿i7-10510U在前代的 思考本Plus达到。在ThinkBook Plus Gen2中,性能下降的速度稍慢,但已经恢复到了ThinkBook Plus Gen2的水平。 笔记本但从长远来看,又回到了ThinkBook Plus的水平。
在个别测试中,其结果通常只够在我们的测试领域中获得较低的名次。的水平 英特尔酷睿i5-1135G7的水平略微偏低,而 英特尔酷睿i7-10510U只有在单一的多核测试中才超过了ThinkPad Plus的前辈。通过可选的高性能模式,多核性能可提高约25%,但总体上仍处于相当低的水平。
Cinebench R15 Multi Endurance test
Cinebench R20: CPU (Multi Core) | CPU (Single Core)
Cinebench R15: CPU Multi 64Bit | CPU Single 64Bit
Blender: v2.79 BMW27 CPU
7-Zip 18.03: 7z b 4 | 7z b 4 -mmt1
Geekbench 5.5: Multi-Core | Single-Core
HWBOT x265 Benchmark v2.2: 4k Preset
LibreOffice : 20 Documents To PDF
R Benchmark 2.5: Overall mean
| Cinebench R23 / Multi Core | |
| Average of class Subnotebook (1555 - 21812, n=60, last 2 years) | |
| HP Pavilion Aero 13 be0097nr | |
| Acer Spin 3 SP313-51N-56YV | |
| Samsung Galaxy Book Pro 360 13 | |
| Samsung Galaxy Book Pro 360 13 | |
| Lenovo ThinkBook Plus Gen2 Core i5 | |
| Average Intel Core i5-1130G7 (2237 - 3240, n=2) | |
| Cinebench R23 / Single Core | |
| Average of class Subnotebook (358 - 2213, n=61, last 2 years) | |
| HP Pavilion Aero 13 be0097nr | |
| Acer Spin 3 SP313-51N-56YV | |
| Samsung Galaxy Book Pro 360 13 | |
| Samsung Galaxy Book Pro 360 13 | |
| Lenovo ThinkBook Plus Gen2 Core i5 | |
| Average Intel Core i5-1130G7 (1077 - 1226, n=2) | |
| Cinebench R20 / CPU (Multi Core) | |
| Average of class Subnotebook (579 - 8541, n=57, last 2 years) | |
| HP Pavilion Aero 13 be0097nr | |
| Acer Spin 3 SP313-51N-56YV | |
| Lenovo ThinkBook Plus 13 i7 | |
| Lenovo ThinkBook Plus 13 i7 | |
| Samsung Galaxy Book Pro 360 13 | |
| Samsung Galaxy Book Pro 360 13 | |
| Lenovo ThinkBook Plus Gen2 Core i5 | |
| Average Intel Core i5-1130G7 (870 - 1251, n=2) | |
| Cinebench R20 / CPU (Single Core) | |
| Average of class Subnotebook (128 - 832, n=57, last 2 years) | |
| HP Pavilion Aero 13 be0097nr | |
| Acer Spin 3 SP313-51N-56YV | |
| Samsung Galaxy Book Pro 360 13 | |
| Samsung Galaxy Book Pro 360 13 | |
| Lenovo ThinkBook Plus Gen2 Core i5 | |
| Average Intel Core i5-1130G7 (418 - 478, n=2) | |
| Lenovo ThinkBook Plus 13 i7 | |
| Cinebench R15 / CPU Multi 64Bit | |
| Average of class Subnotebook (327 - 3345, n=57, last 2 years) | |
| HP Pavilion Aero 13 be0097nr | |
| Acer Spin 3 SP313-51N-56YV | |
| Lenovo ThinkBook Plus 13 i7 | |
| Lenovo ThinkBook Plus 13 i7 | |
| Samsung Galaxy Book Pro 360 13 | |
| Samsung Galaxy Book Pro 360 13 | |
| Lenovo ThinkBook Plus Gen2 Core i5 | |
| Lenovo ThinkBook Plus Gen2 Core i5 | |
| Average Intel Core i5-1130G7 (564 - 700, n=4) | |
| Cinebench R15 / CPU Single 64Bit | |
| Average of class Subnotebook (72.4 - 322, n=57, last 2 years) | |
| HP Pavilion Aero 13 be0097nr | |
| Acer Spin 3 SP313-51N-56YV | |
| Samsung Galaxy Book Pro 360 13 | |
| Samsung Galaxy Book Pro 360 13 | |
| Lenovo ThinkBook Plus Gen2 Core i5 | |
| Lenovo ThinkBook Plus Gen2 Core i5 | |
| Average Intel Core i5-1130G7 (114 - 189.7, n=3) | |
| Lenovo ThinkBook Plus 13 i7 | |
| Blender / v2.79 BMW27 CPU | |
| Average Intel Core i5-1130G7 (1124 - 1255, n=2) | |
| Lenovo ThinkBook Plus Gen2 Core i5 | |
| Samsung Galaxy Book Pro 360 13 | |
| Lenovo ThinkBook Plus 13 i7 | |
| Acer Spin 3 SP313-51N-56YV | |
| Average of class Subnotebook (159 - 2271, n=58, last 2 years) | |
| HP Pavilion Aero 13 be0097nr | |
| 7-Zip 18.03 / 7z b 4 | |
| Average of class Subnotebook (11668 - 77867, n=57, last 2 years) | |
| HP Pavilion Aero 13 be0097nr | |
| Samsung Galaxy Book Pro 360 13 | |
| Samsung Galaxy Book Pro 360 13 | |
| Acer Spin 3 SP313-51N-56YV | |
| Lenovo ThinkBook Plus 13 i7 | |
| Average Intel Core i5-1130G7 (14453 - 14999, n=2) | |
| Lenovo ThinkBook Plus Gen2 Core i5 | |
| 7-Zip 18.03 / 7z b 4 -mmt1 | |
| Average of class Subnotebook (2643 - 6699, n=59, last 2 years) | |
| HP Pavilion Aero 13 be0097nr | |
| Acer Spin 3 SP313-51N-56YV | |
| Samsung Galaxy Book Pro 360 13 | |
| Samsung Galaxy Book Pro 360 13 | |
| Lenovo ThinkBook Plus 13 i7 | |
| Lenovo ThinkBook Plus Gen2 Core i5 | |
| Average Intel Core i5-1130G7 (4094 - 4256, n=2) | |
| Geekbench 5.5 / Multi-Core | |
| Average of class Subnotebook (2557 - 17218, n=48, last 2 years) | |
| Acer Spin 3 SP313-51N-56YV | |
| Lenovo ThinkBook Plus Gen2 Core i5 | |
| Average Intel Core i5-1130G7 (4710 - 4894, n=2) | |
| Lenovo ThinkBook Plus 13 i7 | |
| Geekbench 5.5 / Single-Core | |
| Average of class Subnotebook (726 - 2224, n=48, last 2 years) | |
| Acer Spin 3 SP313-51N-56YV | |
| Average Intel Core i5-1130G7 (1306 - 1337, n=2) | |
| Lenovo ThinkBook Plus Gen2 Core i5 | |
| Lenovo ThinkBook Plus 13 i7 | |
| HWBOT x265 Benchmark v2.2 / 4k Preset | |
| Average of class Subnotebook (0.97 - 25.1, n=57, last 2 years) | |
| HP Pavilion Aero 13 be0097nr | |
| Acer Spin 3 SP313-51N-56YV | |
| Lenovo ThinkBook Plus 13 i7 | |
| Samsung Galaxy Book Pro 360 13 | |
| Average Intel Core i5-1130G7 (n=1) | |
| LibreOffice / 20 Documents To PDF | |
| Lenovo ThinkBook Plus 13 i7 | |
| Lenovo ThinkBook Plus Gen2 Core i5 | |
| Average Intel Core i5-1130G7 (57.7 - 58.9, n=2) | |
| Average of class Subnotebook (39.9 - 220, n=56, last 2 years) | |
| Samsung Galaxy Book Pro 360 13 | |
| Samsung Galaxy Book Pro 360 13 | |
| HP Pavilion Aero 13 be0097nr | |
| Acer Spin 3 SP313-51N-56YV | |
| R Benchmark 2.5 / Overall mean | |
| Average Intel Core i5-1130G7 (0.714 - 0.753, n=2) | |
| Lenovo ThinkBook Plus Gen2 Core i5 | |
| Lenovo ThinkBook Plus 13 i7 | |
| Samsung Galaxy Book Pro 360 13 | |
| Acer Spin 3 SP313-51N-56YV | |
| HP Pavilion Aero 13 be0097nr | |
| Average of class Subnotebook (0.4024 - 1.456, n=58, last 2 years) | |
* ... smaller is better
系统性能
在用于评估系统性能的PCMark 10测试中, 笔记本在评估系统性能的PCMark 10测试中,ThinkBook Plus Gen2取得了比前代产品高出10%的成绩 ThinkBook Plus.尤其是非常好的Essentials得分在这里很突出,可以在我们的测试领域中领先。
在日常使用中,联想的笔记本总是能提供流畅的系统性能,启动程序和访问文件都很迅速。
| PCMark 10 / Score | |
| Average of class Subnotebook (4920 - 9939, n=45, last 2 years) | |
| HP Pavilion Aero 13 be0097nr | |
| Acer Spin 3 SP313-51N-56YV | |
| Samsung Galaxy Book Pro 360 13 | |
| Lenovo ThinkBook Plus Gen2 Core i5 | |
| Average Intel Core i5-1130G7, Intel Iris Xe Graphics G7 80EUs (4082 - 4482, n=2) | |
| Lenovo ThinkBook Plus 13 i7 | |
| PCMark 10 / Essentials | |
| Average of class Subnotebook (8552 - 11646, n=45, last 2 years) | |
| Lenovo ThinkBook Plus Gen2 Core i5 | |
| HP Pavilion Aero 13 be0097nr | |
| Acer Spin 3 SP313-51N-56YV | |
| Average Intel Core i5-1130G7, Intel Iris Xe Graphics G7 80EUs (8873 - 10226, n=2) | |
| Samsung Galaxy Book Pro 360 13 | |
| Lenovo ThinkBook Plus 13 i7 | |
| PCMark 10 / Productivity | |
| Average of class Subnotebook (5435 - 16606, n=45, last 2 years) | |
| HP Pavilion Aero 13 be0097nr | |
| Lenovo ThinkBook Plus 13 i7 | |
| Samsung Galaxy Book Pro 360 13 | |
| Acer Spin 3 SP313-51N-56YV | |
| Lenovo ThinkBook Plus Gen2 Core i5 | |
| Average Intel Core i5-1130G7, Intel Iris Xe Graphics G7 80EUs (5875 - 6004, n=2) | |
| PCMark 10 / Digital Content Creation | |
| Average of class Subnotebook (5722 - 13779, n=45, last 2 years) | |
| HP Pavilion Aero 13 be0097nr | |
| Acer Spin 3 SP313-51N-56YV | |
| Samsung Galaxy Book Pro 360 13 | |
| Lenovo ThinkBook Plus Gen2 Core i5 | |
| Average Intel Core i5-1130G7, Intel Iris Xe Graphics G7 80EUs (3543 - 3982, n=2) | |
| Lenovo ThinkBook Plus 13 i7 | |
| PCMark 10 Score | 4482 points | |
Help | ||
DPC延迟
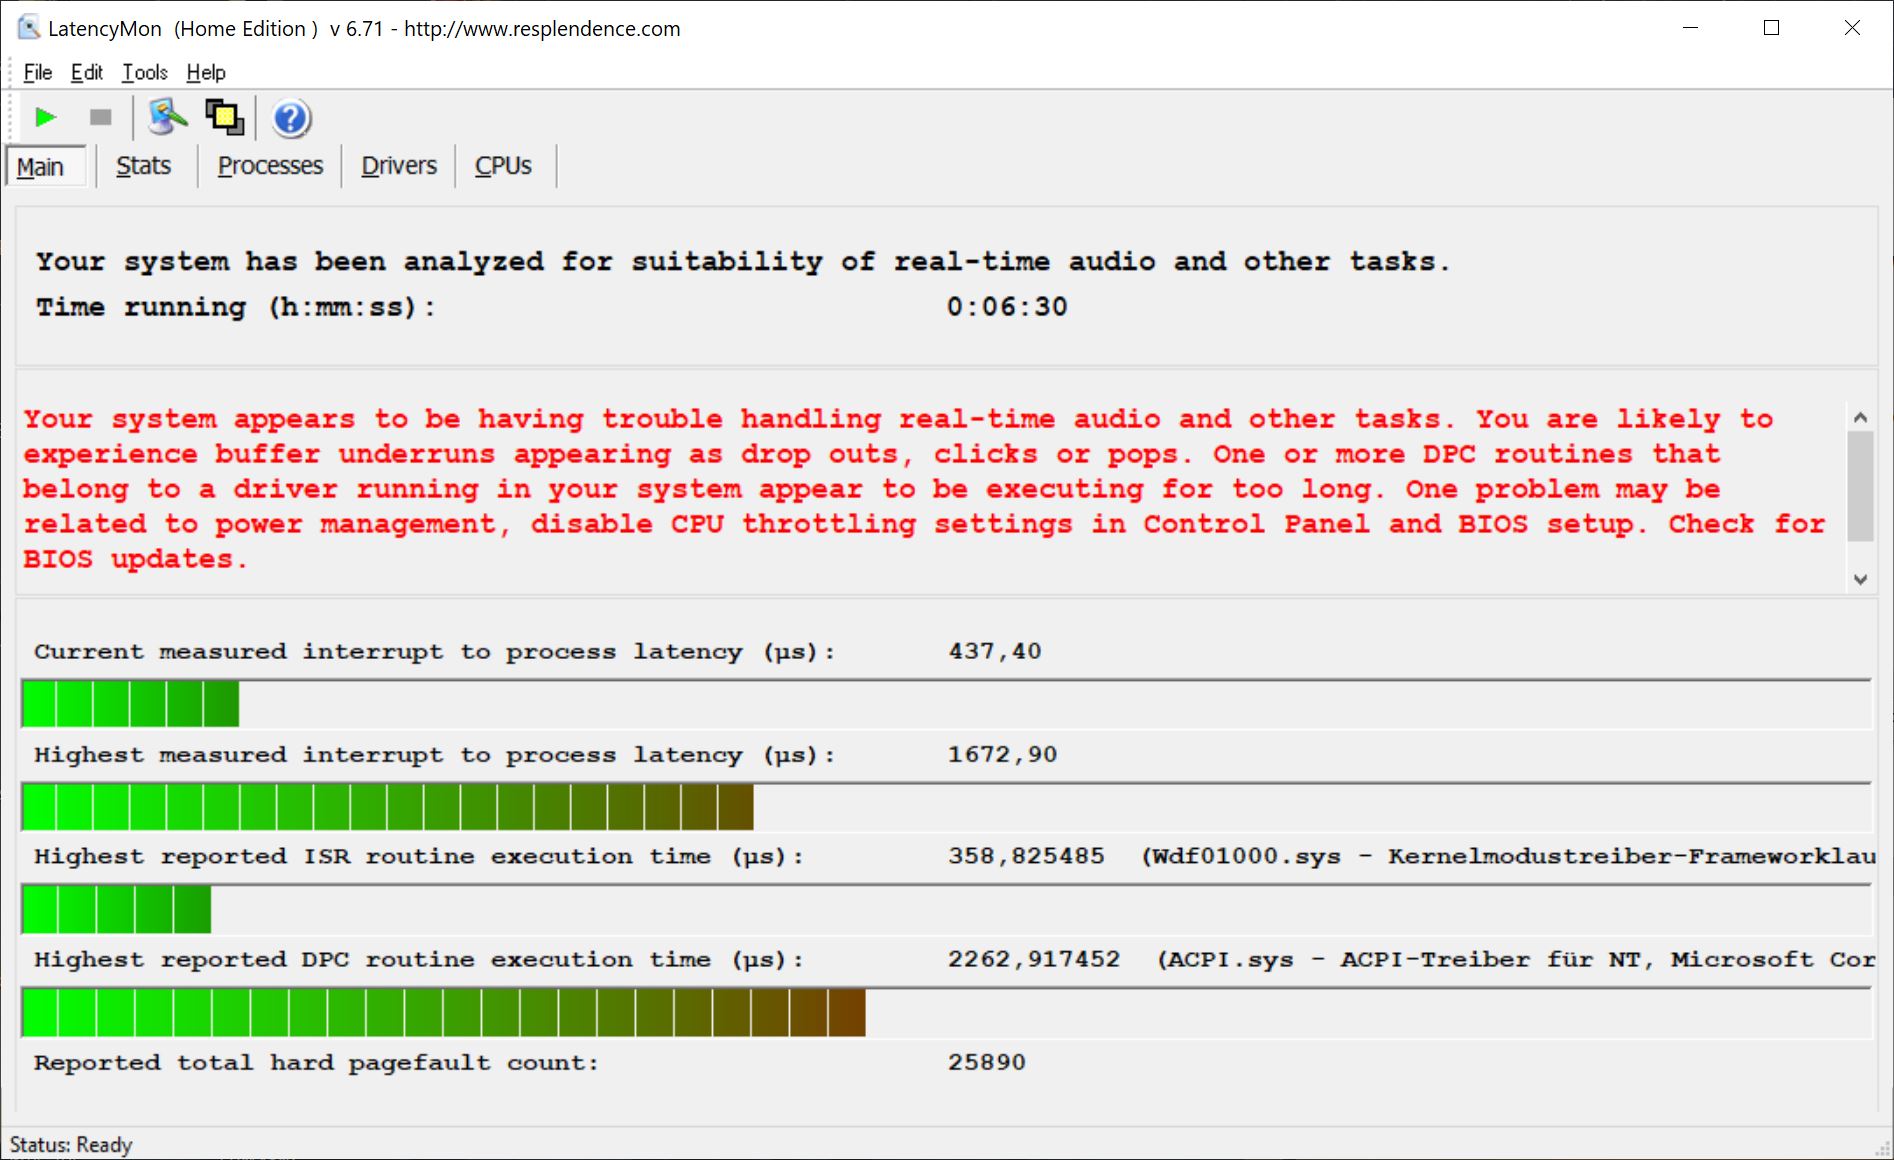
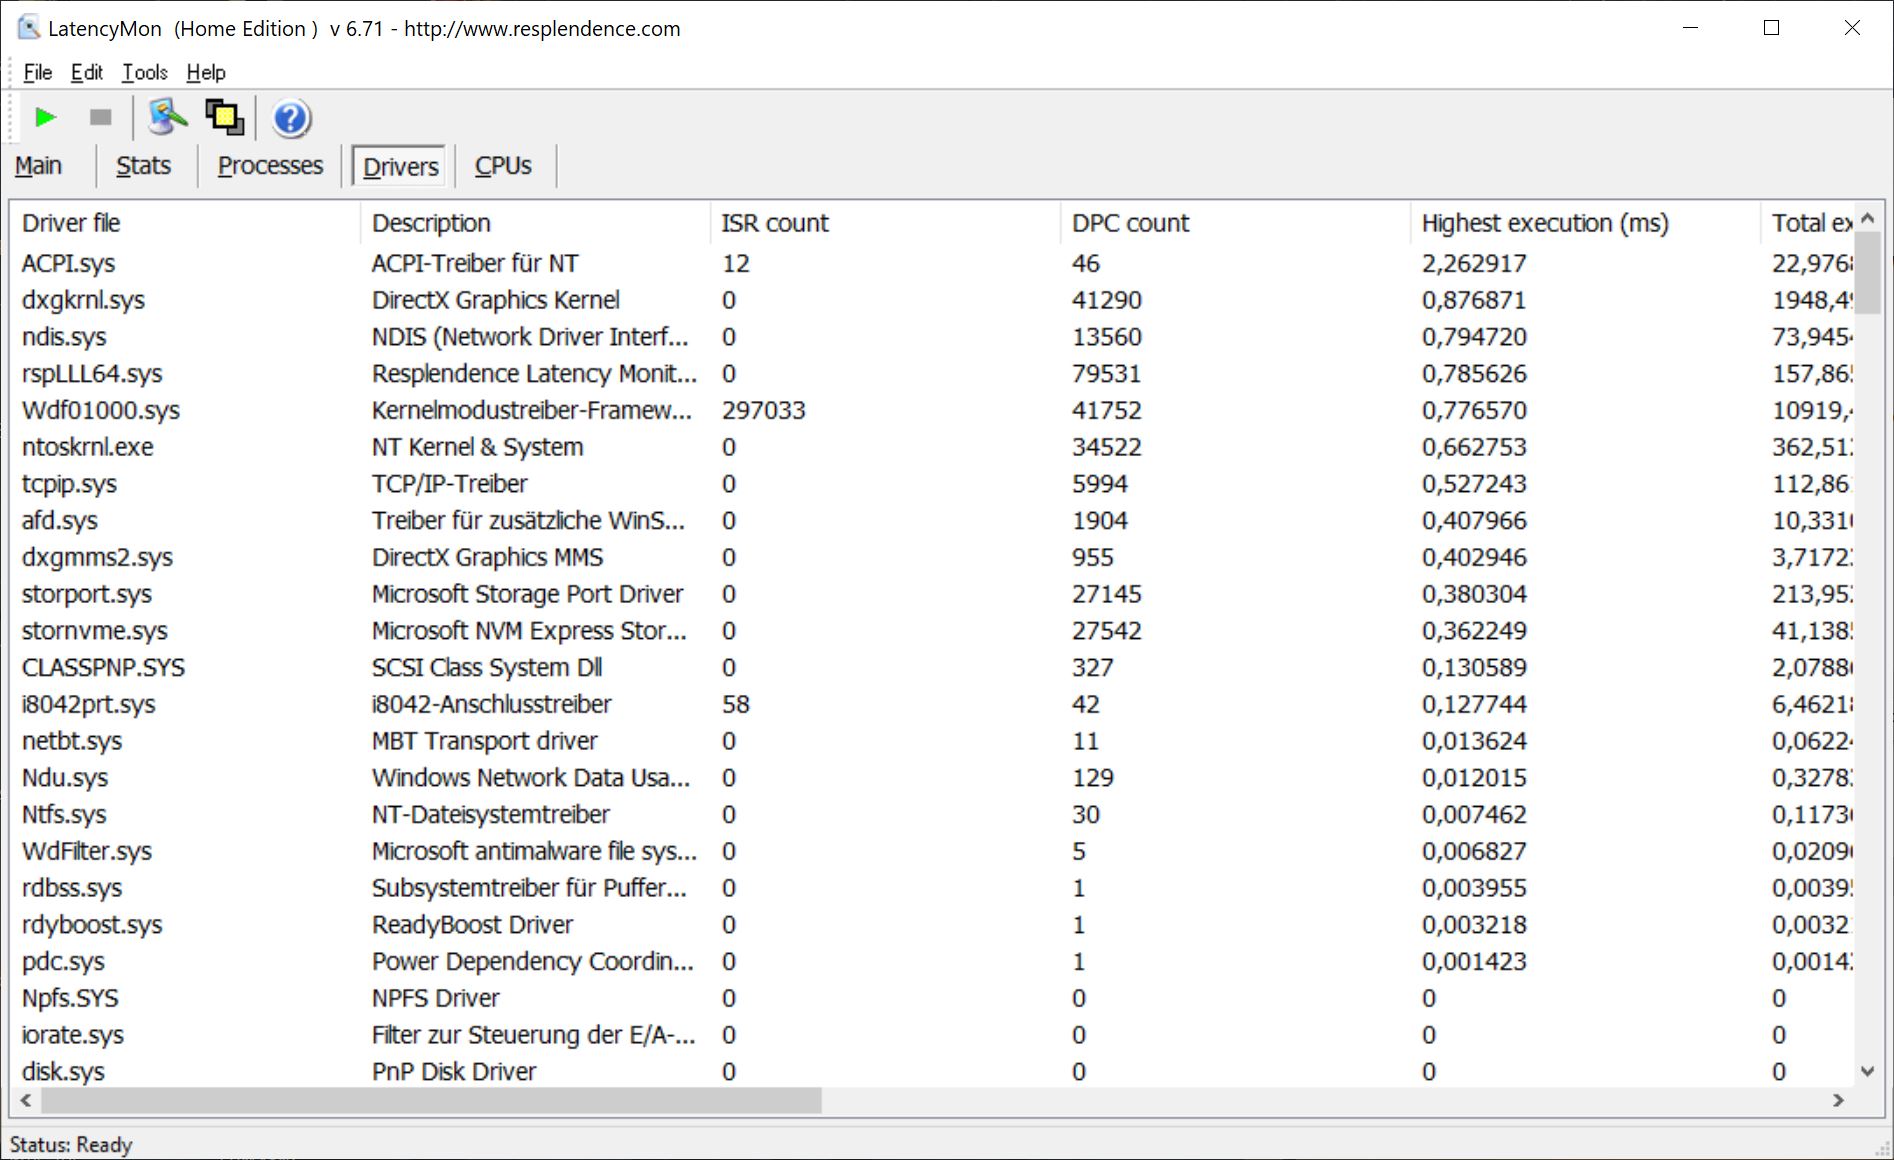
在用LatencyMon进行的测试中,联想ThinkBook Plus Gen2在我们的测试配置中显示出中断时间增加。因此,在目前的BIOS版本下,它不适合于实时应用或类似的应用。
| DPC Latencies / LatencyMon - interrupt to process latency (max), Web, Youtube, Prime95 | |
| Samsung Galaxy Book Pro 360 13 | |
| Lenovo ThinkBook Plus Gen2 Core i5 | |
| Acer Spin 3 SP313-51N-56YV | |
| HP Pavilion Aero 13 be0097nr | |
| Lenovo ThinkBook Plus 13 i7 | |
* ... smaller is better
大容量存储
联想在ThinkBook Plus Gen2中安装了一块三星的512GB PCIe 4.0固态硬盘。它在存储基准中实现了非常好的读写速率(大于6GB/s),这足以在我们的测试领域中获得第一名。
与其他大容量存储设备的比较结果如何,可以在我们的 硬盘/SSD基准测试列表可以找到。
| Lenovo ThinkBook Plus Gen2 Core i5 Samsung PM9A1 MZVL2512HCJQ | Lenovo ThinkBook Plus 13 i7 WDC PC SN730 SDBPNTY-512G | HP Pavilion Aero 13 be0097nr Intel SSD 660p SSDPEKNW512G8 | Acer Spin 3 SP313-51N-56YV Kingston OM8PCP3512F-AB | Samsung Galaxy Book Pro 360 13 Samsung PM991 MZVLQ256HAJD | Average Samsung PM9A1 MZVL2512HCJQ | Average of class Subnotebook | |
|---|---|---|---|---|---|---|---|
| CrystalDiskMark 5.2 / 6 | -43% | -51% | -42% | -54% | -15% | -21% | |
| Write 4K (MB/s) | 222.8 | 135.4 -39% | 128.3 -42% | 286.1 28% | 170.6 -23% | 179.1 ? -20% | 150.3 ? -33% |
| Read 4K (MB/s) | 88.8 | 48.83 -45% | 50.9 -43% | 48.89 -45% | 44.51 -50% | 75.6 ? -15% | 63.8 ? -28% |
| Write Seq (MB/s) | 4096 | 2036 -50% | 971 -76% | 982 -76% | 872 -79% | 3016 ? -26% | 2795 ? -32% |
| Read Seq (MB/s) | 4439 | 2127 -52% | 1540 -65% | 1301 -71% | 1188 -73% | 3350 ? -25% | 3303 ? -26% |
| Write 4K Q32T1 (MB/s) | 467.1 | 394.1 -16% | 538 15% | 625 34% | 483.1 3% | 459 ? -2% | 433 ? -7% |
| Read 4K Q32T1 (MB/s) | 628 | 345.2 -45% | 344.4 -45% | 301 -52% | 284.3 -55% | 554 ? -12% | 498 ? -21% |
| Write Seq Q32T1 (MB/s) | 5023 | 2700 -46% | 980 -80% | 981 -80% | 950 -81% | 4346 ? -13% | 4677 ? -7% |
| Read Seq Q32T1 (MB/s) | 6822 | 3331 -51% | 1829 -73% | 1631 -76% | 1872 -73% | 6346 ? -7% | 5850 ? -14% |
| AS SSD | -58% | -111% | -100% | -79% | -14% | -41% | |
| Seq Read (MB/s) | 5403 | 2341 -57% | 1616 -70% | 1748 -68% | 1771 -67% | 4656 ? -14% | 4491 ? -17% |
| Seq Write (MB/s) | 3792 | 993 -74% | 761 -80% | 941 -75% | 894 -76% | 2742 ? -28% | 2933 ? -23% |
| 4K Read (MB/s) | 80.4 | 45.76 -43% | 46.87 -42% | 44.06 -45% | 53.5 -33% | 67 ? -17% | 59 ? -27% |
| 4K Write (MB/s) | 195.1 | 141.8 -27% | 126.6 -35% | 77.7 -60% | 157.8 -19% | 173.8 ? -11% | 165.1 ? -15% |
| 4K-64 Read (MB/s) | 1687 | 615 -64% | 324.6 -81% | 451.1 -73% | 478.1 -72% | 1514 ? -10% | 854 ? -49% |
| 4K-64 Write (MB/s) | 1797 | 1295 -28% | 815 -55% | 926 -48% | 741 -59% | 2355 ? 31% | 1694 ? -6% |
| Access Time Read * (ms) | 0.035 | 0.096 -174% | 0.074 -111% | 0.188 -437% | 0.156 -346% | 0.04867 ? -39% | 0.06636 ? -90% |
| Access Time Write * (ms) | 0.021 | 0.026 -24% | 0.135 -543% | 0.043 -105% | 0.023 -10% | 0.03605 ? -72% | 0.05079 ? -142% |
| Score Read (Points) | 2307 | 895 -61% | 533 -77% | 670 -71% | 709 -69% | 2047 ? -11% | 1360 ? -41% |
| Score Write (Points) | 2371 | 1536 -35% | 1018 -57% | 1098 -54% | 988 -58% | 2778 ? 17% | 2153 ? -9% |
| Score Total (Points) | 5792 | 2834 -51% | 1798 -69% | 2084 -64% | 2034 -65% | 5812 ? 0% | 4146 ? -28% |
| Total Average (Program / Settings) | -51% /
-52% | -81% /
-86% | -71% /
-76% | -67% /
-69% | -15% /
-14% | -31% /
-32% |
* ... smaller is better

Continuous reading: DiskSpd Read Loop, Queue Depth 8
图形卡
ThinkBook Plus Gen2的内部图形单元用于显示图像内容。该Intel Iris Xe Graphics G7 80EUs负责。这适用于对GPU性能要求不高的应用,如简单的照片编辑。
在3DMark基准测试中,GPU显示的结果略低于平均水平,但可以明显领先于前代联想ThinkBook Plus的IntelUHD Graphics 620。与其他图形单元相比,取得了哪些性能,可以在我们的 GPU基准测试列表.
| 3DMark 11 - 1280x720 Performance GPU | |
| Average of class Subnotebook (995 - 18489, n=55, last 2 years) | |
| Samsung Galaxy Book Pro 360 13 | |
| Acer Spin 3 SP313-51N-56YV | |
| HP Pavilion Aero 13 be0097nr | |
| Average Intel Iris Xe Graphics G7 80EUs (2246 - 6579, n=112) | |
| Lenovo ThinkBook Plus Gen2 Core i5 | |
| Lenovo ThinkBook Plus 13 i7 | |
| 3DMark | |
| 1920x1080 Fire Strike Graphics | |
| Average of class Subnotebook (832 - 16347, n=56, last 2 years) | |
| Acer Spin 3 SP313-51N-56YV | |
| Average Intel Iris Xe Graphics G7 80EUs (1560 - 5398, n=114) | |
| Lenovo ThinkBook Plus Gen2 Core i5 | |
| Samsung Galaxy Book Pro 360 13 | |
| HP Pavilion Aero 13 be0097nr | |
| Lenovo ThinkBook Plus 13 i7 | |
| 1280x720 Cloud Gate Standard Graphics | |
| Average of class Subnotebook (5577 - 61591, n=28, last 2 years) | |
| Acer Spin 3 SP313-51N-56YV | |
| HP Pavilion Aero 13 be0097nr | |
| Average Intel Iris Xe Graphics G7 80EUs (6361 - 30894, n=96) | |
| Lenovo ThinkBook Plus Gen2 Core i5 | |
| Samsung Galaxy Book Pro 360 13 | |
| Lenovo ThinkBook Plus 13 i7 | |
| 2560x1440 Time Spy Graphics | |
| Average of class Subnotebook (804 - 6288, n=55, last 2 years) | |
| Average Intel Iris Xe Graphics G7 80EUs (561 - 1576, n=111) | |
| HP Pavilion Aero 13 be0097nr | |
| Lenovo ThinkBook Plus Gen2 Core i5 | |
| Lenovo ThinkBook Plus 13 i7 | |
| 3DMark 11 Performance | 4466 points | |
| 3DMark Cloud Gate Standard Score | 12148 points | |
| 3DMark Fire Strike Score | 3116 points | |
| 3DMark Time Spy Score | 1160 points | |
Help | ||
游戏性能
这里安装的是 Intel Iris Xe Graphics G7 80EUs只适用于非常简单或较老的游戏。因此,在我们测试的游戏中,只有在降低分辨率和降低图形设置的情况下,才能实现流畅的帧率。
我们已经列出了在其他游戏中可以预期的性能,在我们的 GPU游戏列表.
Witcher 3 FPS-Diagram
| The Witcher 3 - 1366x768 Medium Graphics & Postprocessing | |
| Average of class Subnotebook (71 - 115, n=8, last 2 years) | |
| Acer Spin 3 SP313-51N-56YV | |
| Average Intel Iris Xe Graphics G7 80EUs (21.8 - 56.9, n=103) | |
| Samsung Galaxy Book Pro 360 13 | |
| Lenovo ThinkBook Plus Gen2 Core i5 | |
| Dota 2 Reborn - 1366x768 med (1/3) | |
| Average of class Subnotebook (25 - 149.1, n=61, last 2 years) | |
| HP Pavilion Aero 13 be0097nr | |
| Samsung Galaxy Book Pro 360 13 | |
| Average Intel Iris Xe Graphics G7 80EUs (10.9 - 119.5, n=113) | |
| Lenovo ThinkBook Plus Gen2 Core i5 | |
| Acer Spin 3 SP313-51N-56YV | |
| Lenovo ThinkBook Plus 13 i7 | |
| GTA V - 1366x768 Normal/Off AF:4x | |
| Average of class Subnotebook (81.2 - 176.9, n=54, last 2 years) | |
| Acer Spin 3 SP313-51N-56YV | |
| Samsung Galaxy Book Pro 360 13 | |
| Average Intel Iris Xe Graphics G7 80EUs (28.9 - 133.8, n=87) | |
| Lenovo ThinkBook Plus Gen2 Core i5 | |
| Strange Brigade - 1920x1080 medium AA:medium AF:4 | |
| Average of class Subnotebook (29.8 - 137.5, n=50, last 2 years) | |
| Samsung Galaxy Book Pro 360 13 | |
| Acer Spin 3 SP313-51N-56YV | |
| HP Pavilion Aero 13 be0097nr | |
| Average Intel Iris Xe Graphics G7 80EUs (6 - 48.8, n=86) | |
| Lenovo ThinkBook Plus Gen2 Core i5 | |
| low | med. | high | ultra | |
|---|---|---|---|---|
| GTA V (2015) | 59.9 | 54.6 | 19.3 | 8.84 |
| The Witcher 3 (2015) | 66 | 39.5 | 20.7 | 9.65 |
| Dota 2 Reborn (2015) | 81.5 | 63.7 | 39.5 | 34.8 |
| X-Plane 11.11 (2018) | 36.8 | 24.6 | 21.5 | |
| Far Cry 5 (2018) | 29 | 16 | 15 | 14 |
| Strange Brigade (2018) | 60.4 | 27.1 | 21.7 | 18.2 |
Emissions & Energy - Battery life decreases
噪声排放
联想ThinkBook Plus Gen2在日常使用中非常安静,甚至听不到声音。当使用 "智能冷却 "模式时,我们测得重载下的最大噪音水平为34.5 dB(A)。然而,在 "超性能 "模式下,可以听到明显更响的风扇噪音,大约为42 dB(A)。
我们无法确定任何其他噪音,如线圈啸叫或类似声音。
Noise level
| Idle |
| 25.4 / 27.4 / 32.2 dB(A) |
| Load |
| 32.2 / 34.5 dB(A) |
 | ||
30 dB silent 40 dB(A) audible 50 dB(A) loud |
||
min: | ||
温度
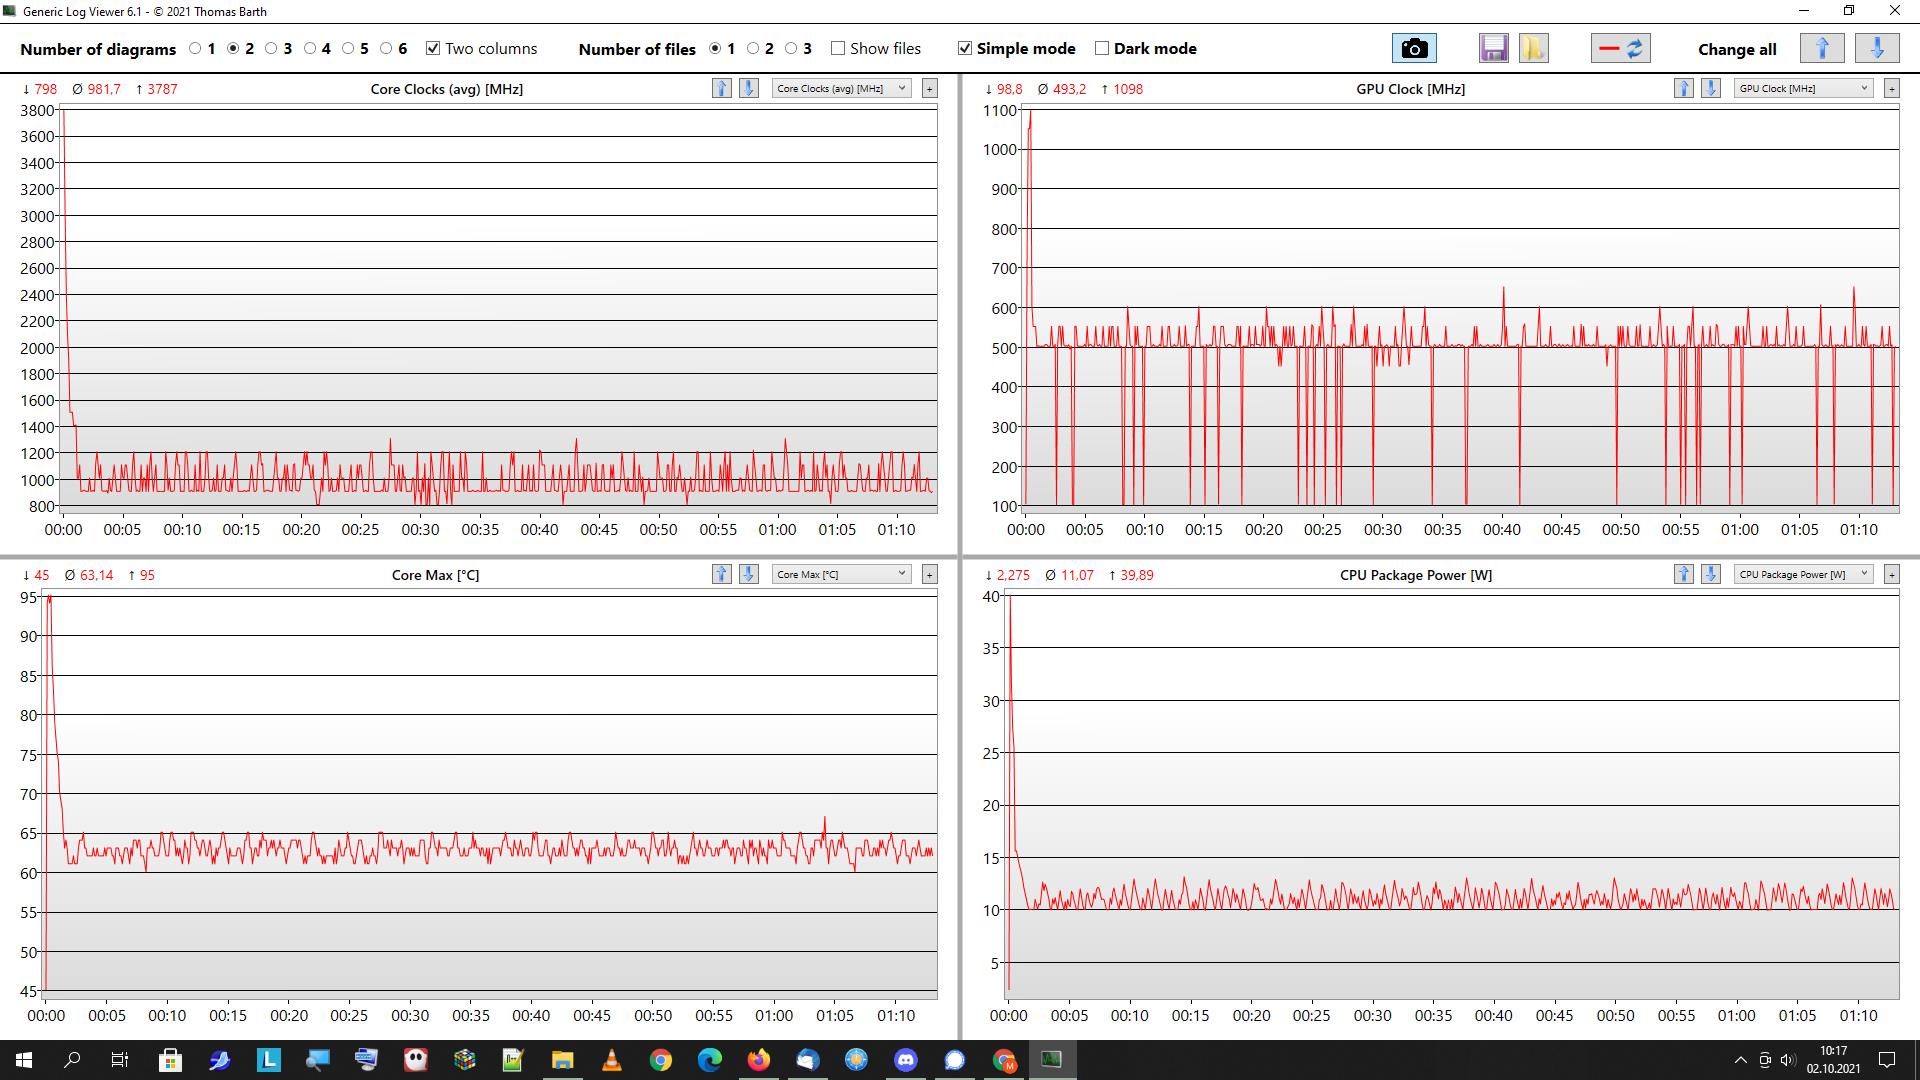
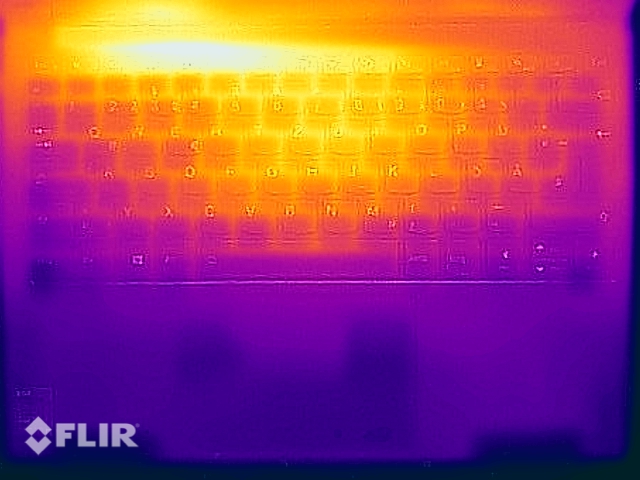
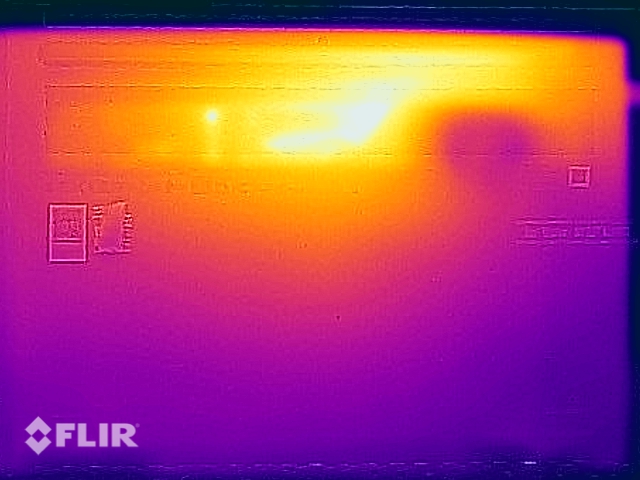
在非常大的负荷下,ThinkBook Plus Gen2的底部发热高达45℃(113°F)。然而,联想的笔记本在日常使用中始终保持低温,因此可以在任何时候顺利使用。
在我们大约一小时的耐久压力测试中,笔记本内部的温度上升到远远超过90°C(194°F),并且时钟速率下降到1.8GHz的基础时钟以下。然而,这样的负载在日常使用中不应该发生,而且测试结束后系统很快又稳定下来,所以不必期待由于温度过高而造成的限制。
(±) The maximum temperature on the upper side is 42 °C / 108 F, compared to the average of 35.9 °C / 97 F, ranging from 21.4 to 59 °C for the class Subnotebook.
(±) The bottom heats up to a maximum of 44.5 °C / 112 F, compared to the average of 39.2 °C / 103 F
(+) In idle usage, the average temperature for the upper side is 27.5 °C / 82 F, compared to the device average of 30.8 °C / 87 F.
(±) Playing The Witcher 3, the average temperature for the upper side is 33.7 °C / 93 F, compared to the device average of 30.8 °C / 87 F.
(+) The palmrests and touchpad are cooler than skin temperature with a maximum of 27.2 °C / 81 F and are therefore cool to the touch.
(±) The average temperature of the palmrest area of similar devices was 28.2 °C / 82.8 F (+1 °C / 1.8 F).
演讲者
E-ink笔记本电脑的扬声器提供中等音量和相对较宽的声谱。因此,它们非常适用于在安静环境中偶尔播放媒体内容。
Lenovo ThinkBook Plus Gen2 Core i5 audio analysis
(±) | speaker loudness is average but good (81.9 dB)
Bass 100 - 315 Hz
(±) | reduced bass - on average 13.5% lower than median
(±) | linearity of bass is average (9.7% delta to prev. frequency)
Mids 400 - 2000 Hz
(+) | balanced mids - only 3.2% away from median
(+) | mids are linear (5.3% delta to prev. frequency)
Highs 2 - 16 kHz
(+) | balanced highs - only 2% away from median
(+) | highs are linear (4.1% delta to prev. frequency)
Overall 100 - 16.000 Hz
(+) | overall sound is linear (10.9% difference to median)
Compared to same class
» 10% of all tested devices in this class were better, 3% similar, 87% worse
» The best had a delta of 5%, average was 18%, worst was 53%
Compared to all devices tested
» 6% of all tested devices were better, 2% similar, 92% worse
» The best had a delta of 4%, average was 23%, worst was 134%
Lenovo ThinkBook Plus 13 i7 audio analysis
(-) | not very loud speakers (71.7 dB)
Bass 100 - 315 Hz
(-) | nearly no bass - on average 15% lower than median
(-) | bass is not linear (16.1% delta to prev. frequency)
Mids 400 - 2000 Hz
(±) | higher mids - on average 5.9% higher than median
(+) | mids are linear (5.6% delta to prev. frequency)
Highs 2 - 16 kHz
(+) | balanced highs - only 3.6% away from median
(±) | linearity of highs is average (9% delta to prev. frequency)
Overall 100 - 16.000 Hz
(±) | linearity of overall sound is average (23.9% difference to median)
Compared to same class
» 81% of all tested devices in this class were better, 4% similar, 15% worse
» The best had a delta of 5%, average was 18%, worst was 53%
Compared to all devices tested
» 72% of all tested devices were better, 6% similar, 22% worse
» The best had a delta of 4%, average was 23%, worst was 134%
能源消耗
我们的测量证明,ThinkBook Plus Gen2在空闲情况下的平均功耗为7.9瓦。在负载情况下,功耗约为30瓦,但峰值可以达到65瓦以上。
附带的电源适配器提供65瓦的输出,因此有足够的尺寸。
| Off / Standby | |
| Idle | |
| Load |
|
Key:
min: | |
Power consumption Witcher 3 / Stress test
电池寿命
在我们的实际WLAN测试中,联想ThinkBook Plus Gen2实现了大约七个半小时的运行时间。因此,尽管有更大的53Wh电池,但它没有提供前代产品的运行时间。使用随附的充电器,大约一个半小时后,电池就能完全充电。
| Battery Runtime - WiFi Websurfing | |
| Average of class Subnotebook (7.25 - 26.4, n=60, last 2 years) | |
| Samsung Galaxy Book Pro 360 13 | |
| HP Pavilion Aero 13 be0097nr | |
| Lenovo ThinkBook Plus 13 i7 | |
| Acer Spin 3 SP313-51N-56YV | |
| Lenovo ThinkBook Plus Gen2 Core i5 | |
Pros
Cons
结论--ThinkBook Plus G2带来更好的显示屏

如果你已经拥有 第一代ThinkBook Plus如果你已经拥有第一代ThinkBook Plus,并能在日常使用中受益于这一概念,那么ThinkBook Plus Gen2将为你带来同样强大的设备,它拥有更大的电子墨水显示屏和主屏幕的触摸功能。分辨率也提高了,屏幕格式现在是16:10而不是16:9。有了两个Thunderbolt端口,就有了现代的传输标准,但USB-A和HDMI现在不得不省去。
联想ThinkBook Plus Gen2是一款高质量的笔记本。然而,只有在日常生活中也使用电子墨水显示屏的情况下才值得购买。
除非你真的能利用12英寸的第二显示屏,否则你可以挥手选择ThinkBook Plus Gen2。电池的容量更大,但不能像前代产品那样持久。CPU性能也大致保持不变,只有内部图形单元变得更强。作为回报,联想的笔记本现在更轻、更薄了。我们也很喜欢主屏幕的质量,它显示的颜色很鲜艳,只有出厂时的轻微偏差。
然而,对ThinkBook Plus Gen2的推荐与E-ink显示屏是否真的用于日常使用的问题息息相关。如果不是这样的话,那么更值得去选择一个可转换的产品,如 三星Galaxy Book Pro 360.如果你基本上可以不使用触摸屏幕和外部显示器,那么传统的笔记本如 惠普Pavilion Aero 13是更好的选择。
价格和可用性
联想ThinkBook Plus Gen2现在已经上市,例如,可以从我们的租赁供应商Campuspoint购买。.
Lenovo ThinkBook Plus Gen2 Core i5
- 10/02/2021 v7 (old)
Mike Wobker
Price comparison

