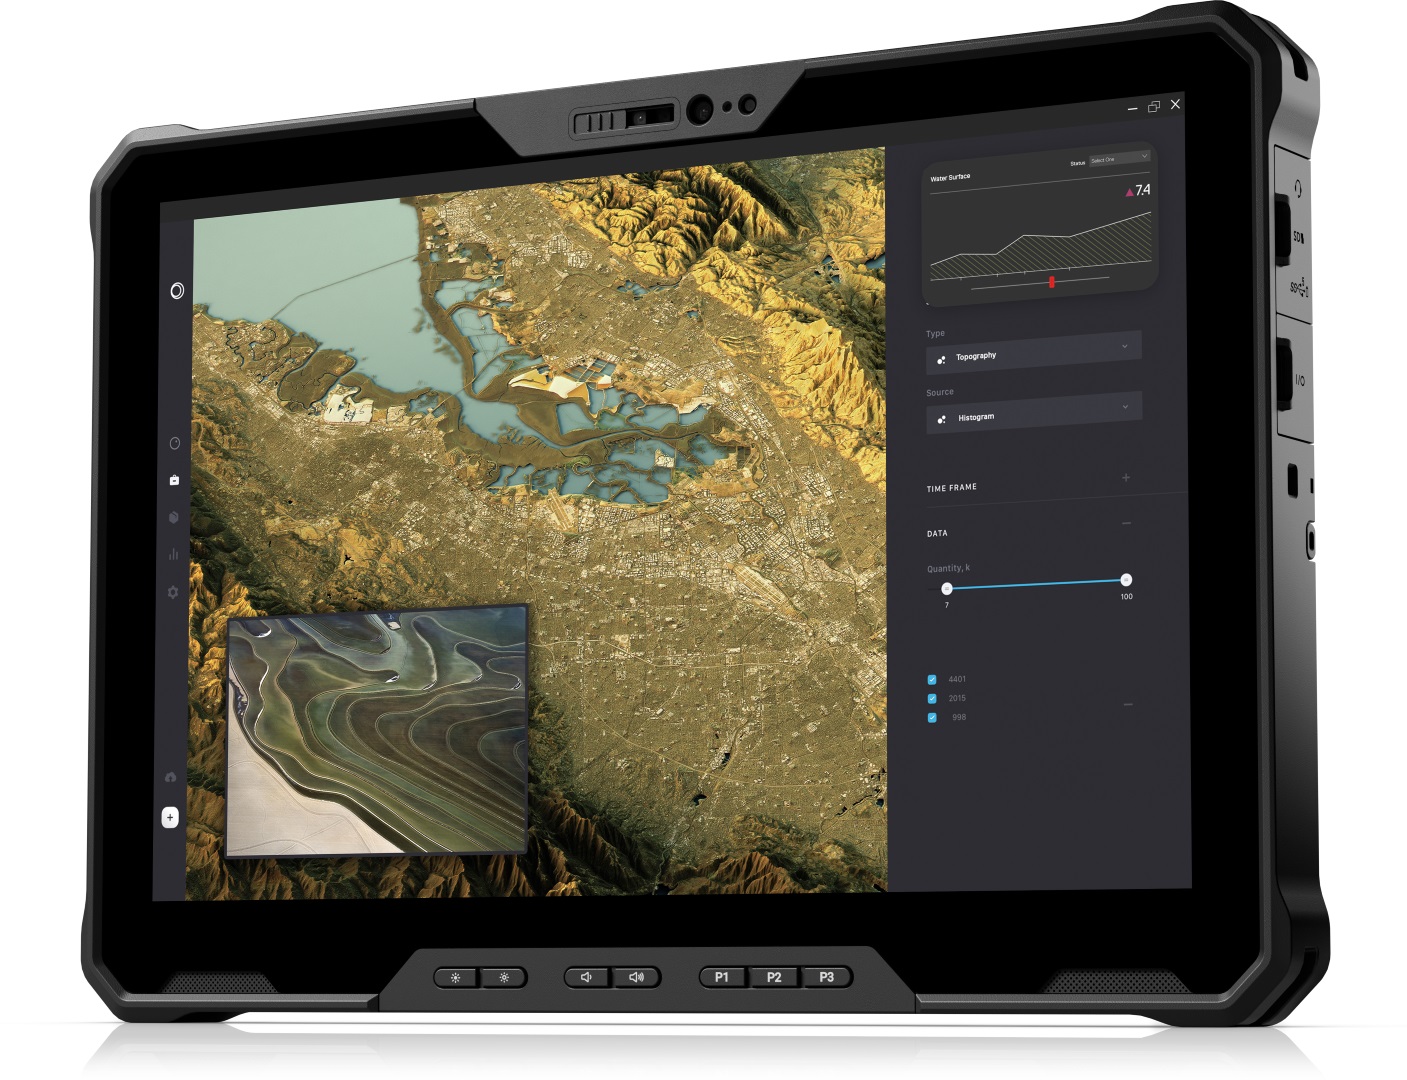
DellLatitude 7230 Rugged Extreme平板电脑评论:同类中最好的显示器之一

Latitude 7230 Rugged Extreme是在去年10月宣布的。 去年10月作为Latitude 7220 Rugged Extreme的继任者。它引入了一个更新的机箱,屏幕尺寸更大(11.6英寸到12英寸),更快的英特尔CPU选项(8代到12代),以及更快的连接选项(Wi-Fi 6到6E,5G)。
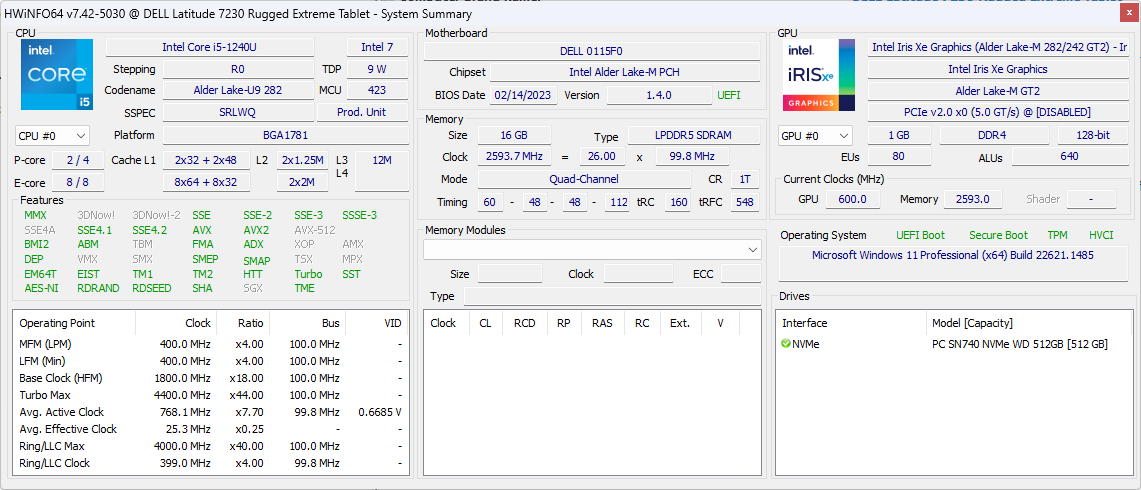
我们审查的单位是一个中档SKU,配备酷睿i5-1240U,16GB内存和512GB NVMe固态硬盘,价格约为3200美元。其他SKU可使用较慢的酷睿i3-1210U,更快的i7-1260U,更多的内存或存储,以及其他扩展。所有配置都配备相同的1920 x 1200 1200-nit IPS触摸屏。Latitude 7230 Rugged Extreme的完整规格表可通过戴尔公开。.
替代产品包括 Acer Enduro T1,以及 三星Galaxy Tab Active系列,或 松下Toughbook FZ-G2系列.
更多戴尔评论:
潜在的竞争对手比较
Rating | Date | Model | Weight | Height | Size | Resolution | Price |
|---|---|---|---|---|---|---|---|
| 83.9 % v7 (old) | 04 / 2023 | Dell Latitude 7230 Rugged Extreme i5-1240U, Iris Xe G7 80EUs | 1.6 kg | 23.9 mm | 12.00" | 1920x1200 | |
v (old) | 05 / 2022 | Dell Latitude 7330 Rugged Extreme i7-1185G7, Iris Xe G7 96EUs | 2.7 kg | 36.5 mm | 13.30" | 1920x1080 | |
v (old) | 07 / 2022 | Panasonic Toughbook 40 i7-1185G7, Iris Xe G7 96EUs | 3.9 kg | 53.4 mm | 14.00" | 1920x1080 | |
| 83.8 % v7 (old) | 01 / 2022 | Getac B360 i7-10710U, UHD Graphics 620 | 2.4 kg | 34.9 mm | 13.30" | 1920x1080 | |
| 82.4 % v7 (old) | 12 / 2021 | Acer Enduro Urban N3 EUN314 i7-1165G7, Iris Xe G7 96EUs | 1.8 kg | 21.95 mm | 14.00" | 1920x1080 | |
v (old) | 09 / 2021 | Durabook S14I i7-1165G7, Iris Xe G7 96EUs | 3 kg | 38.1 mm | 14.00" | 1920x1080 |
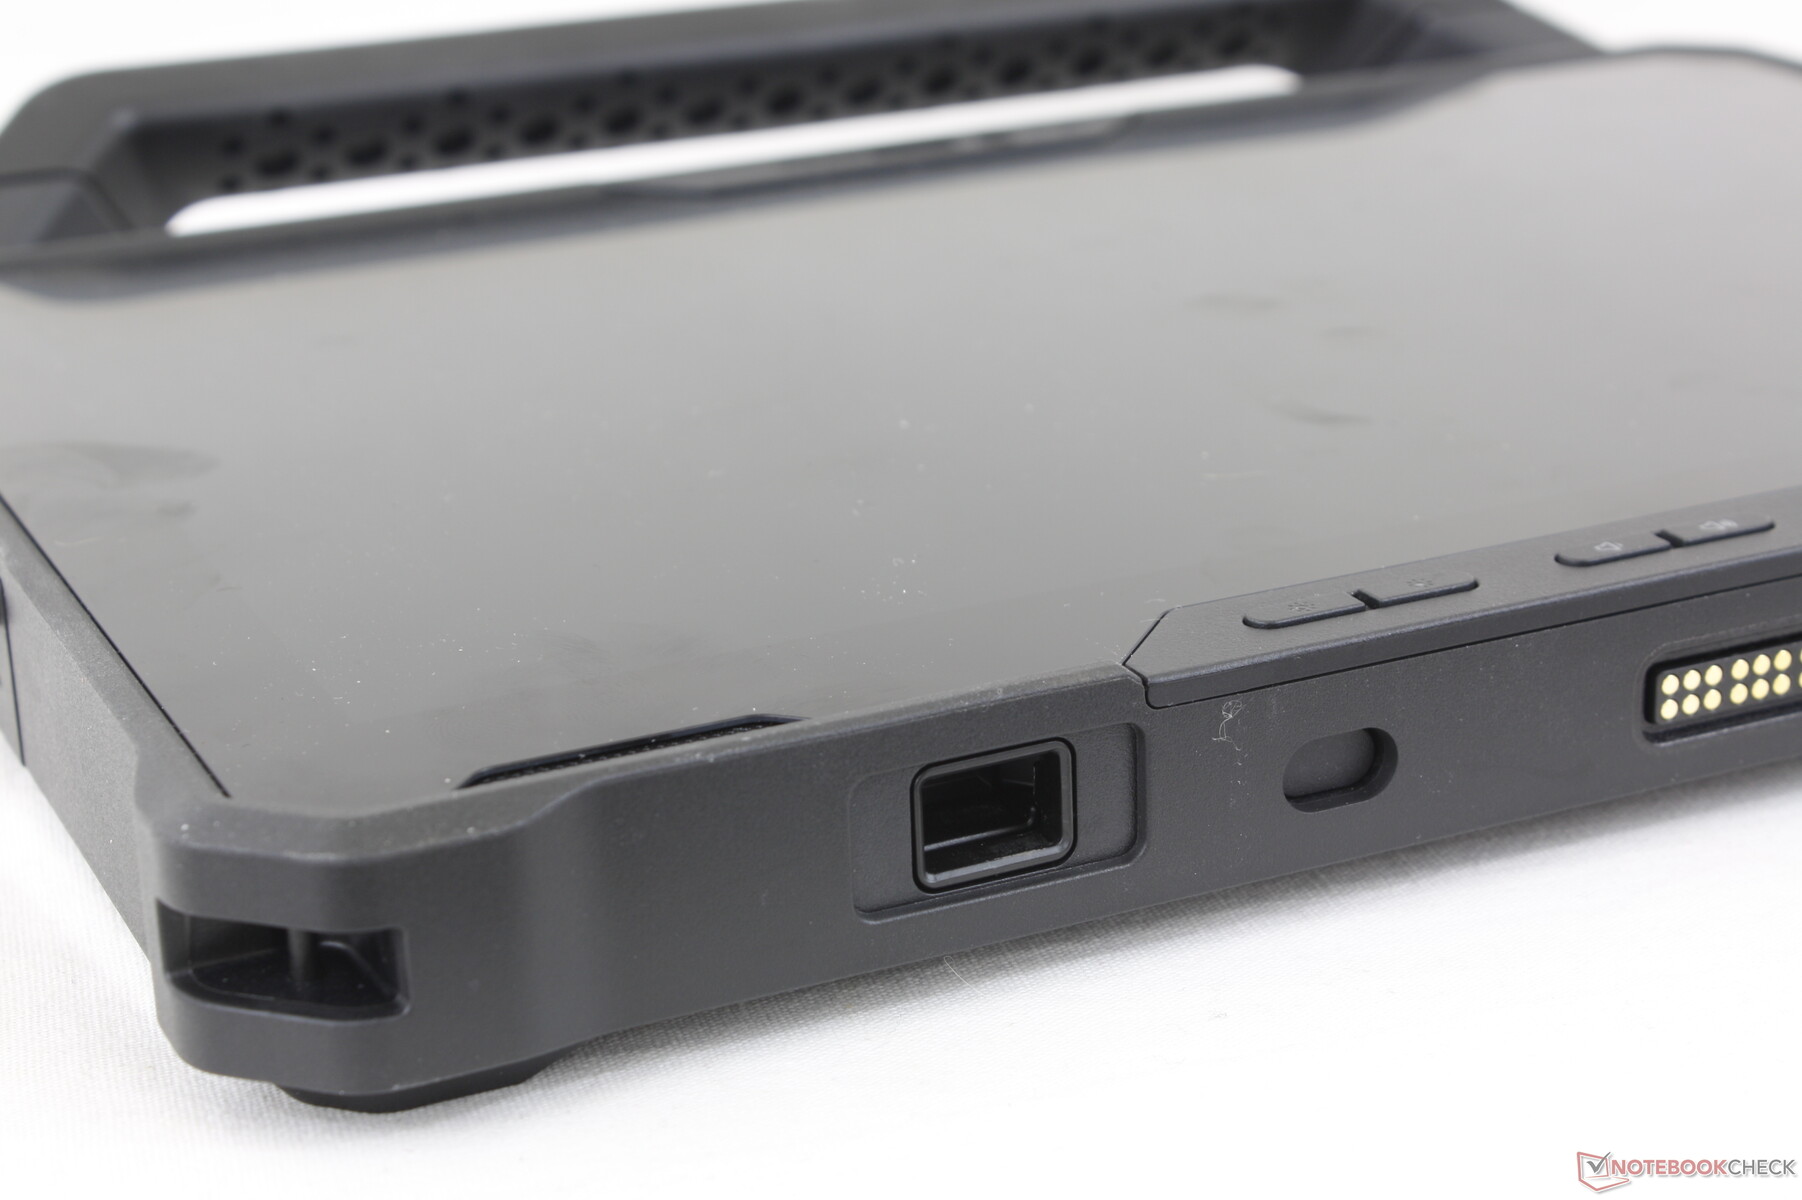
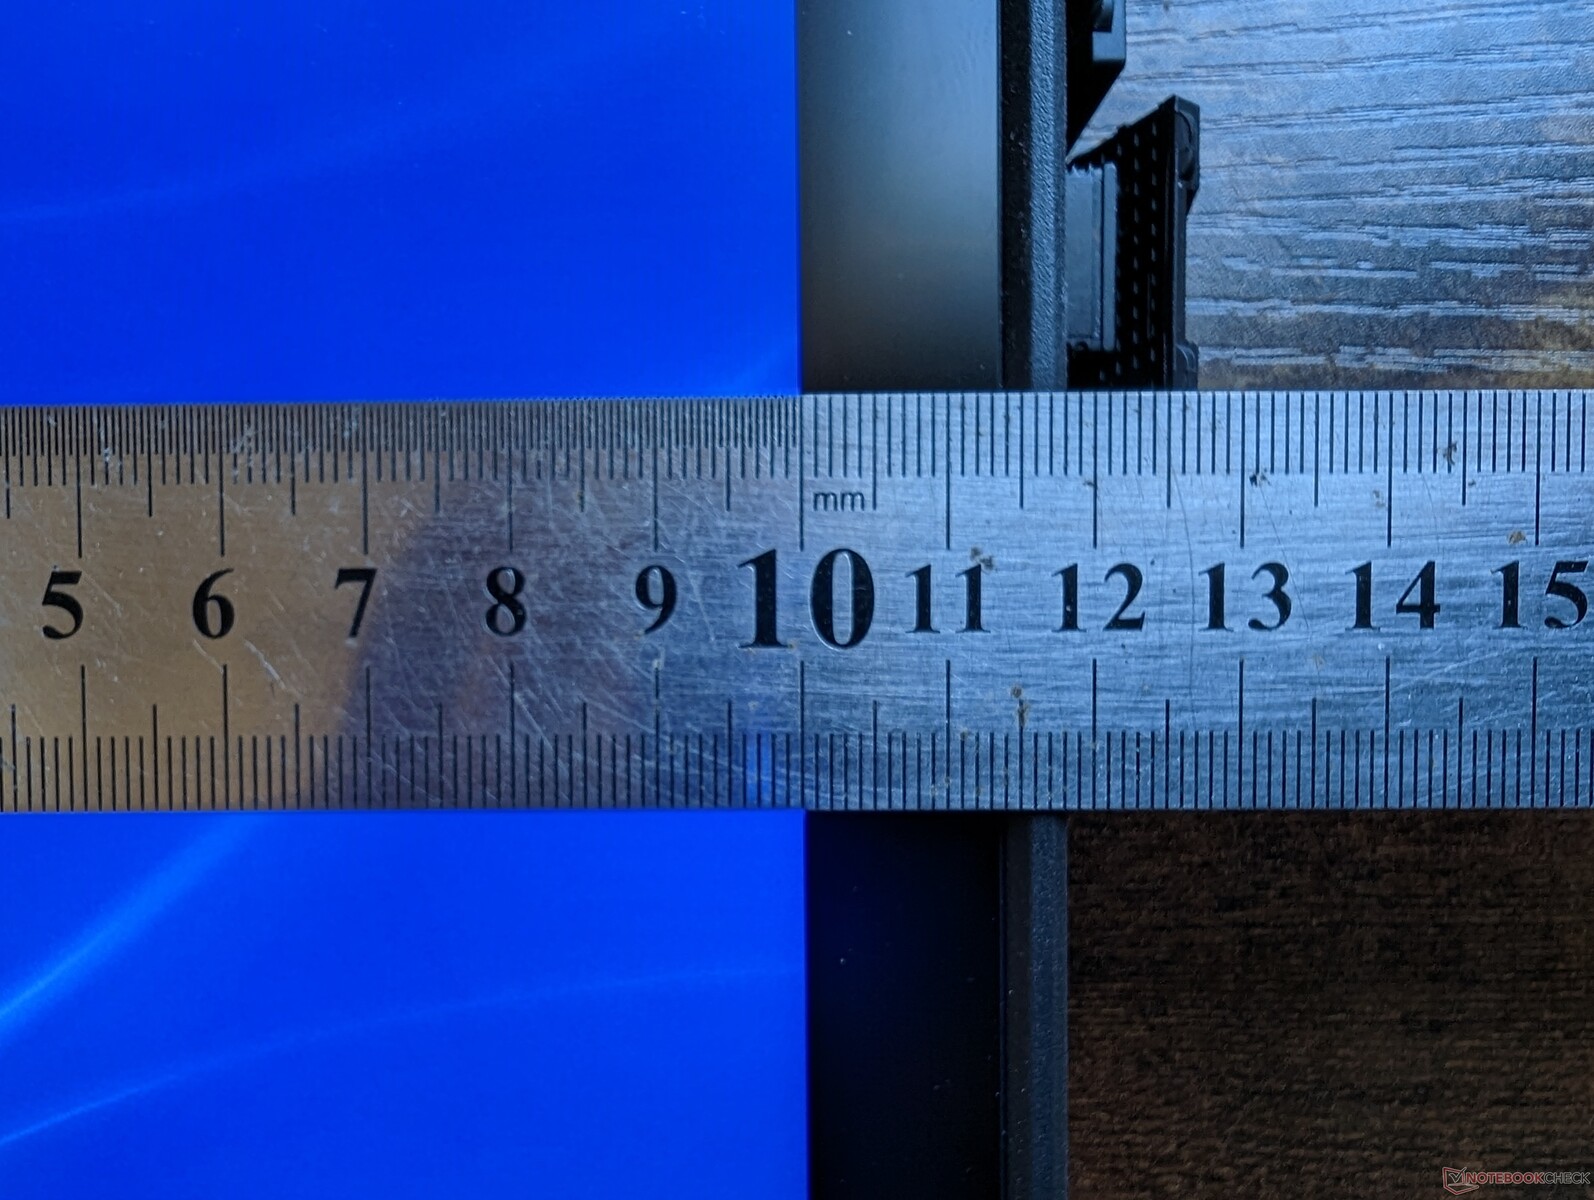
外壳 - 厚,边框相对较窄
从各个角度看,机箱都很坚固,特别是在其橡胶边缘和角落。它最薄弱的地方是触摸屏的中心,当用手指紧紧按住它时,翘曲是明显的。这不是一个巨大的问题,但任何翘曲都值得一提。
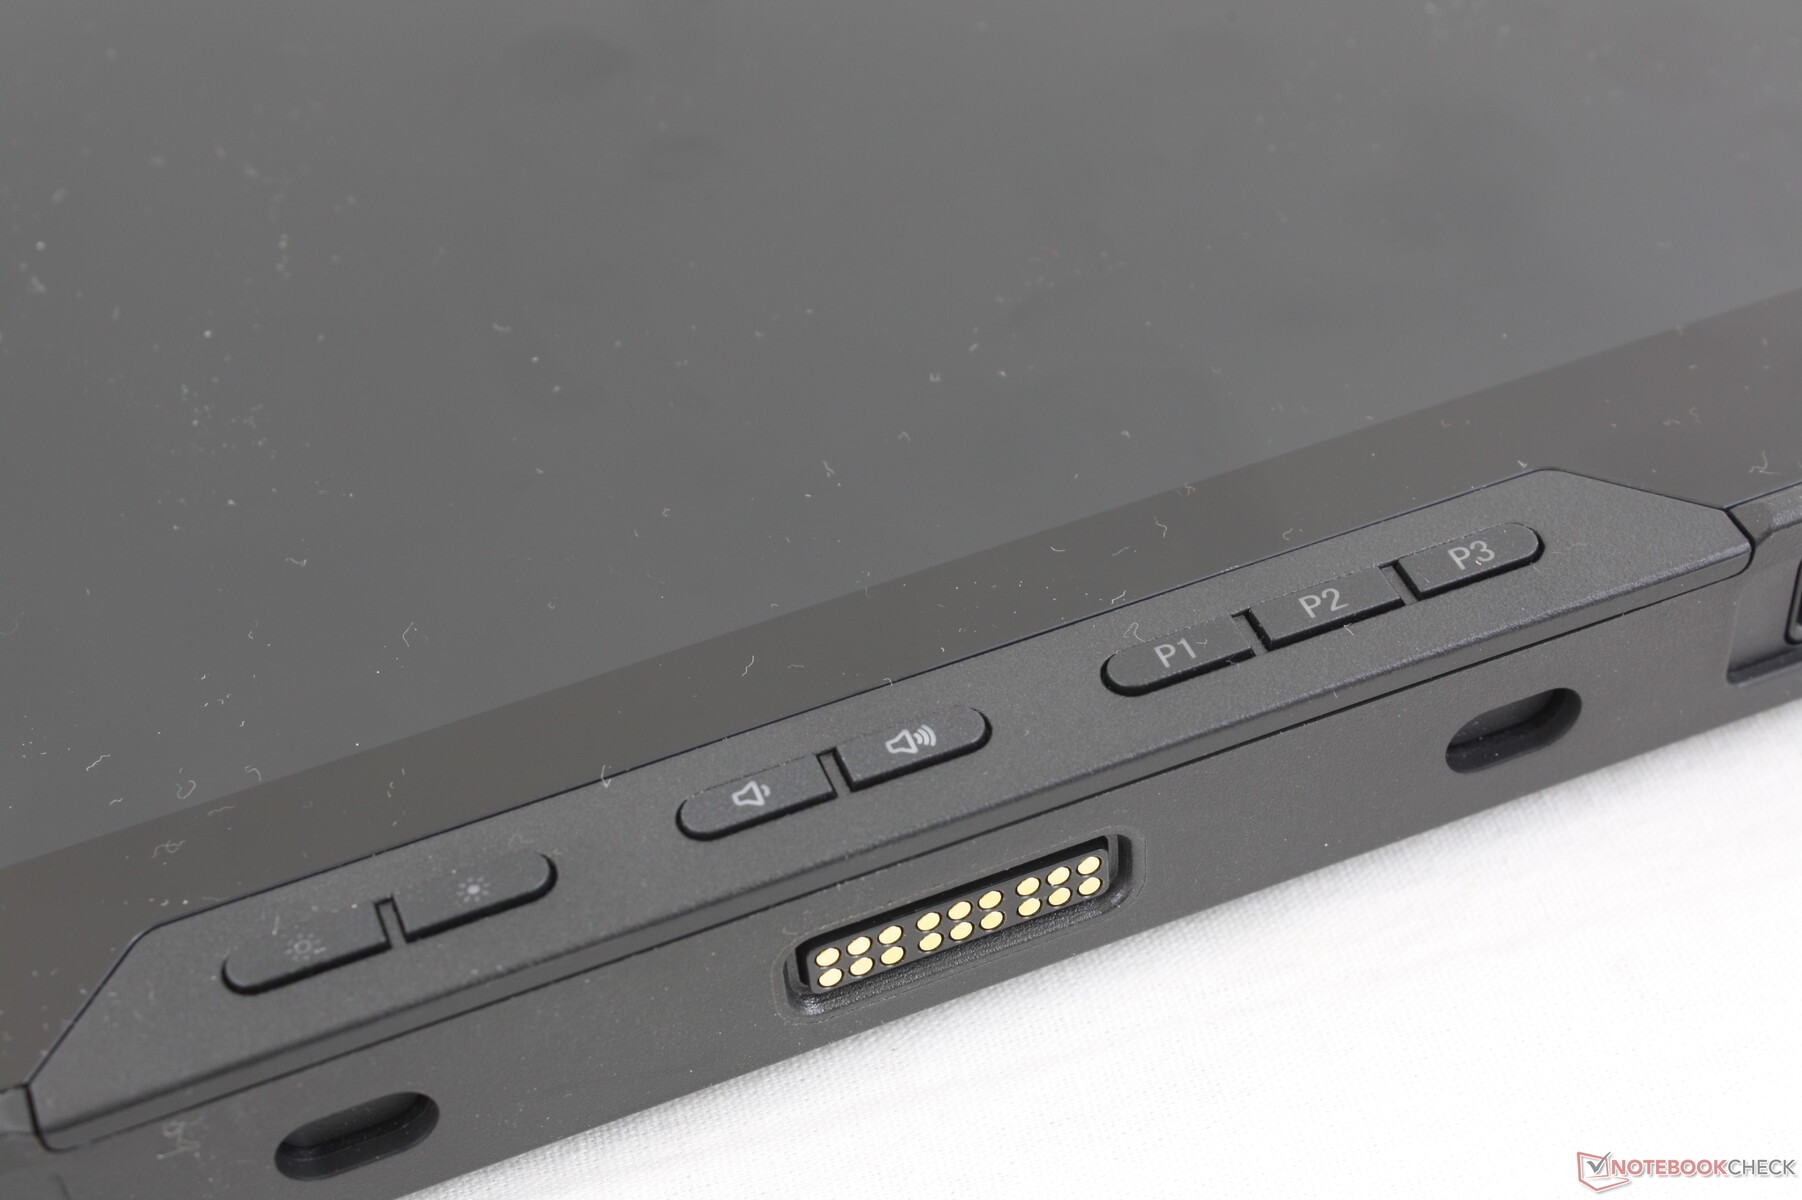
这款手机的一些令人讨厌的方面包括端口的烦躁的盖子和正面的海绵状按钮。端口盖很难握住,而按钮的快捷键在按下时可以使用一些更多的力。竞争者Toughbook FZ-G2在这方面做得更好一些。
包括两块可拆卸电池在内,该设备的重量约为1.6公斤,是同类产品中较轻的坚固型平板电脑之一。如果不考虑可拆卸的提手,长度和宽度很方便地接近DIN A4标准。
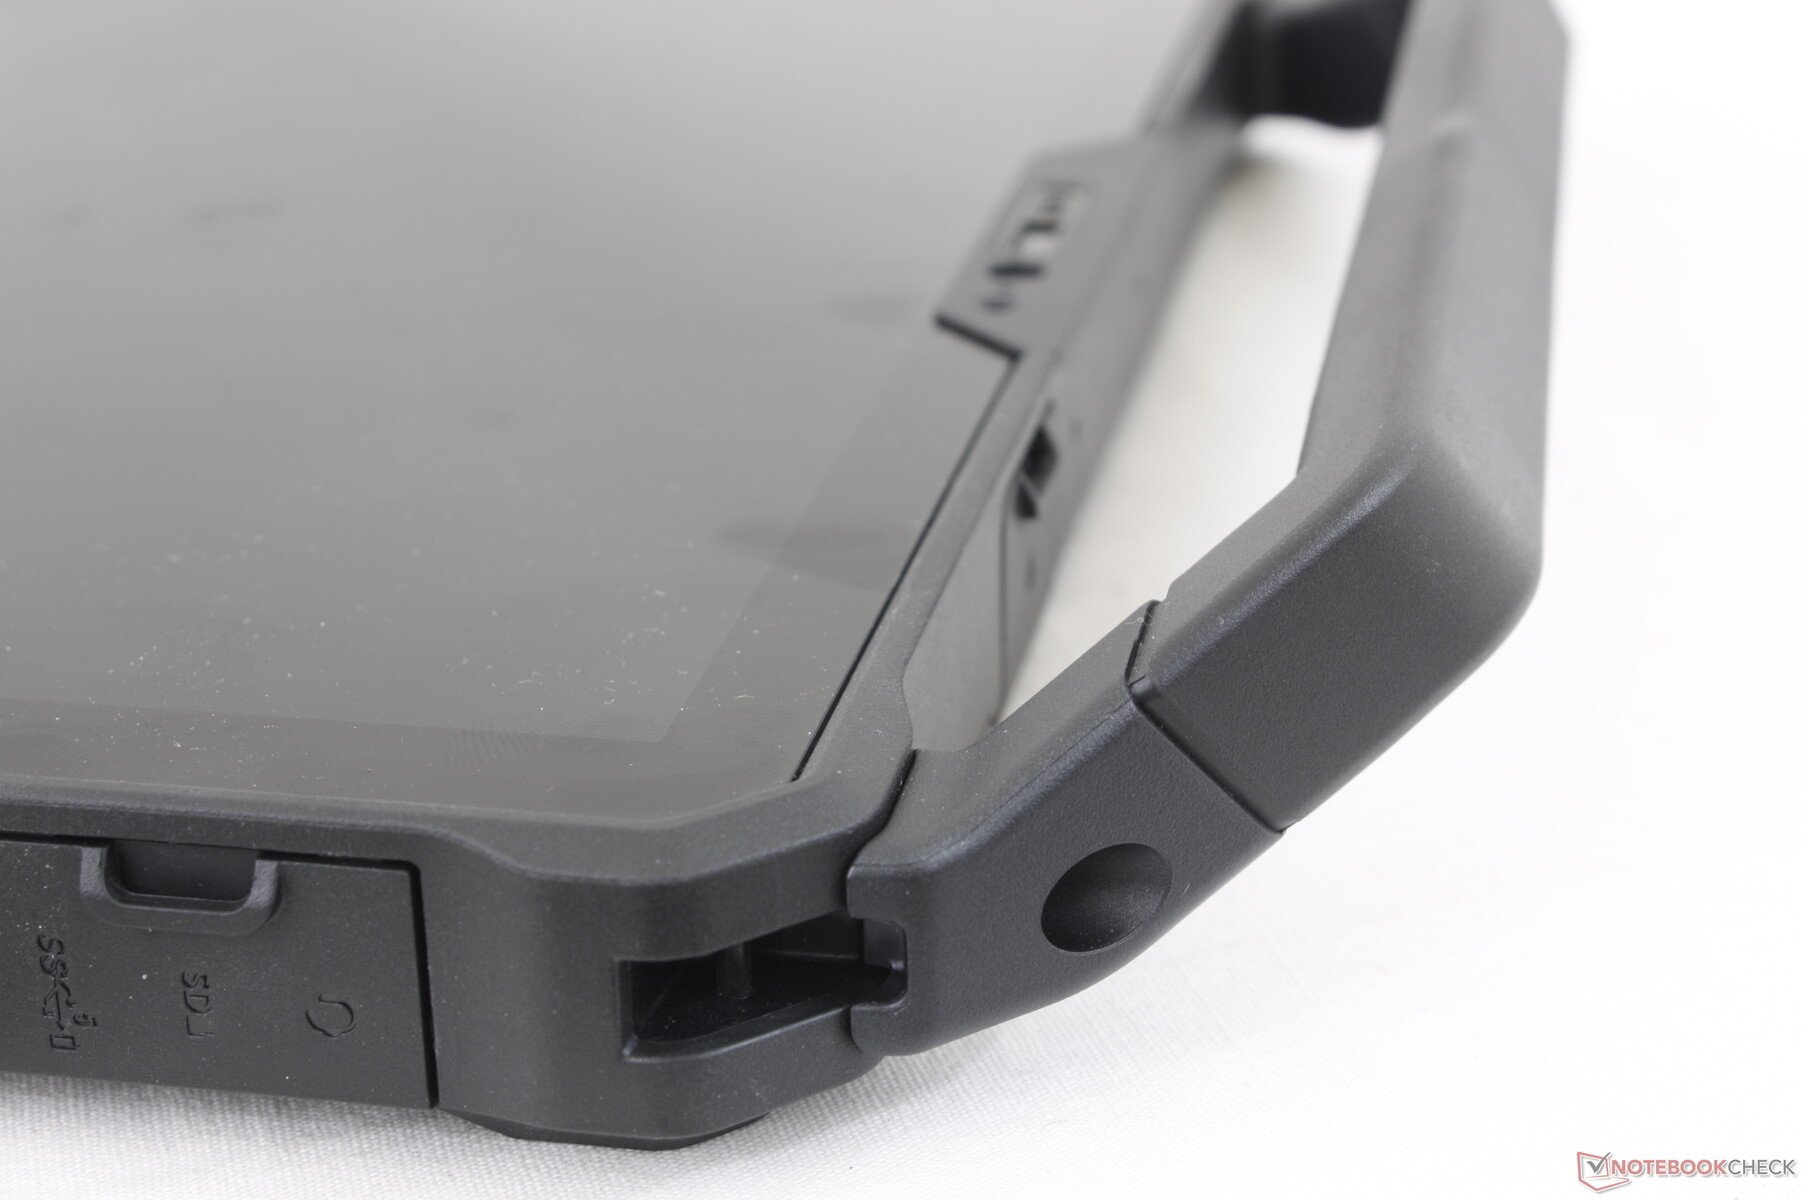
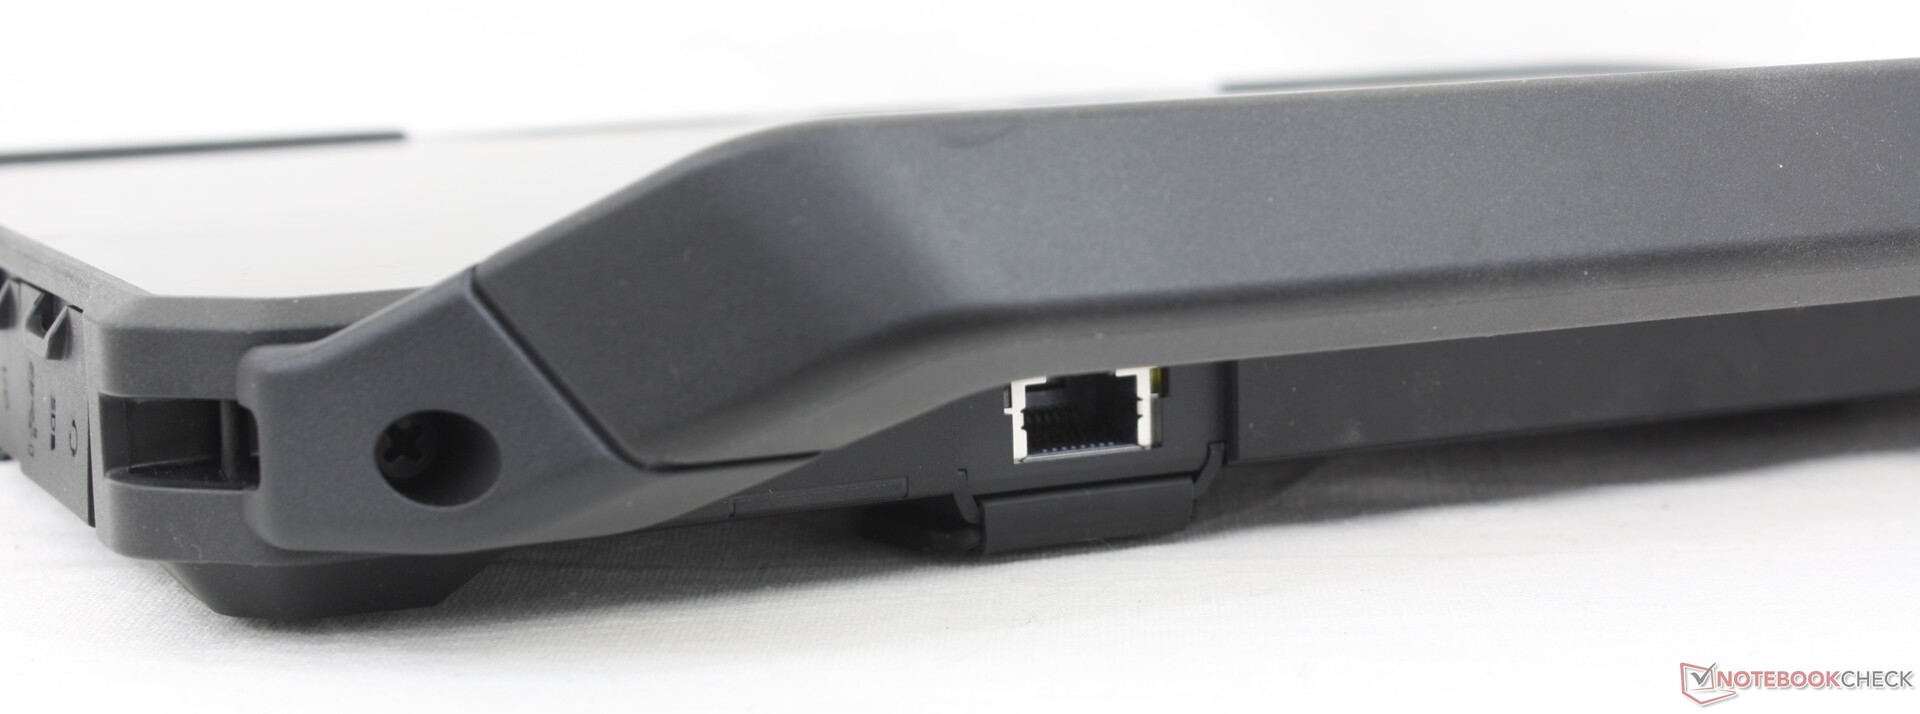
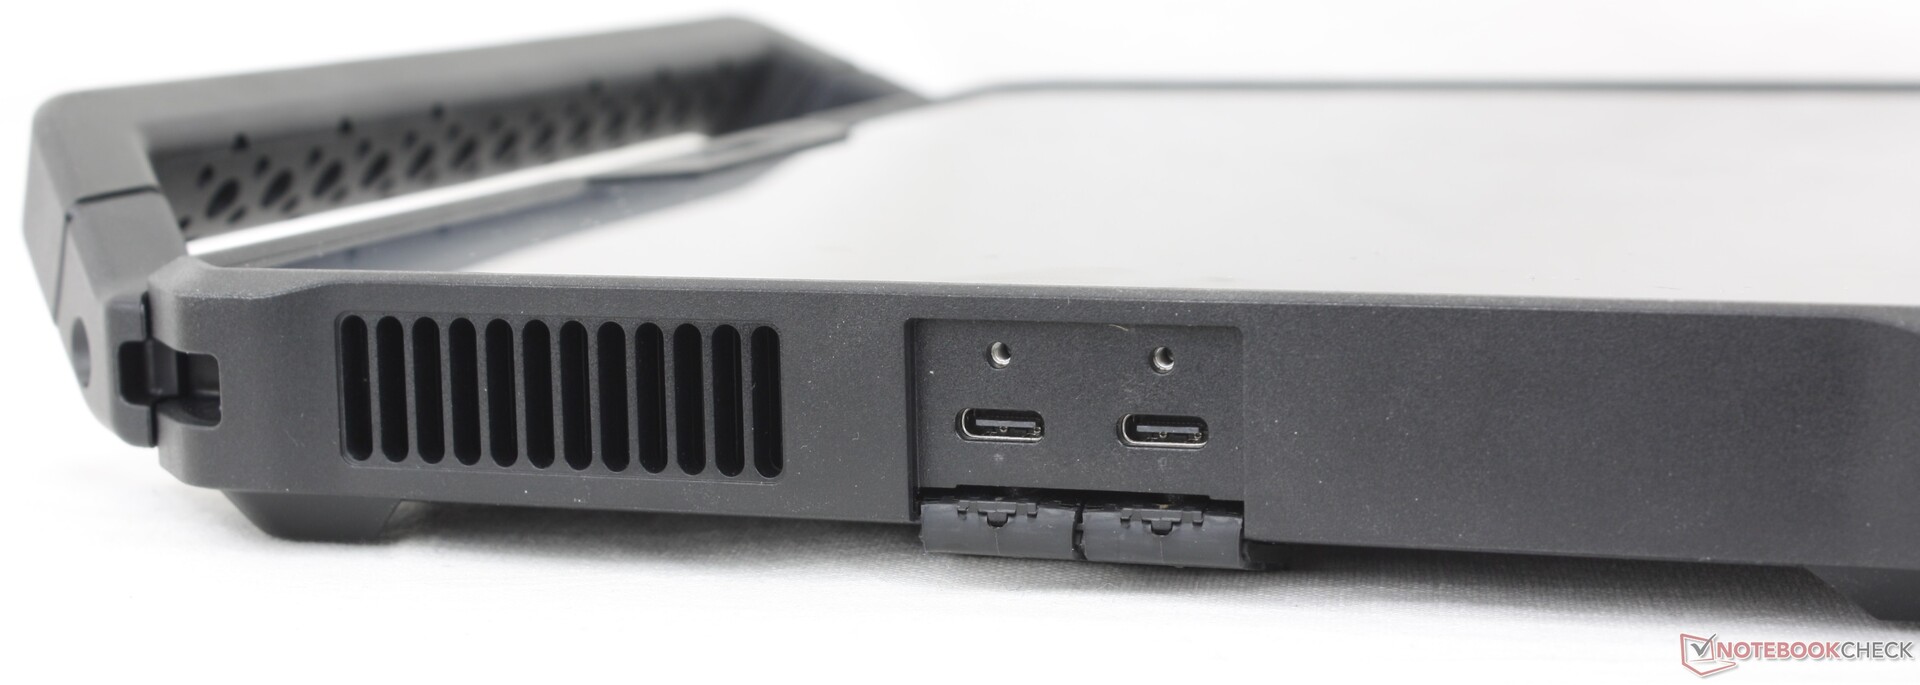
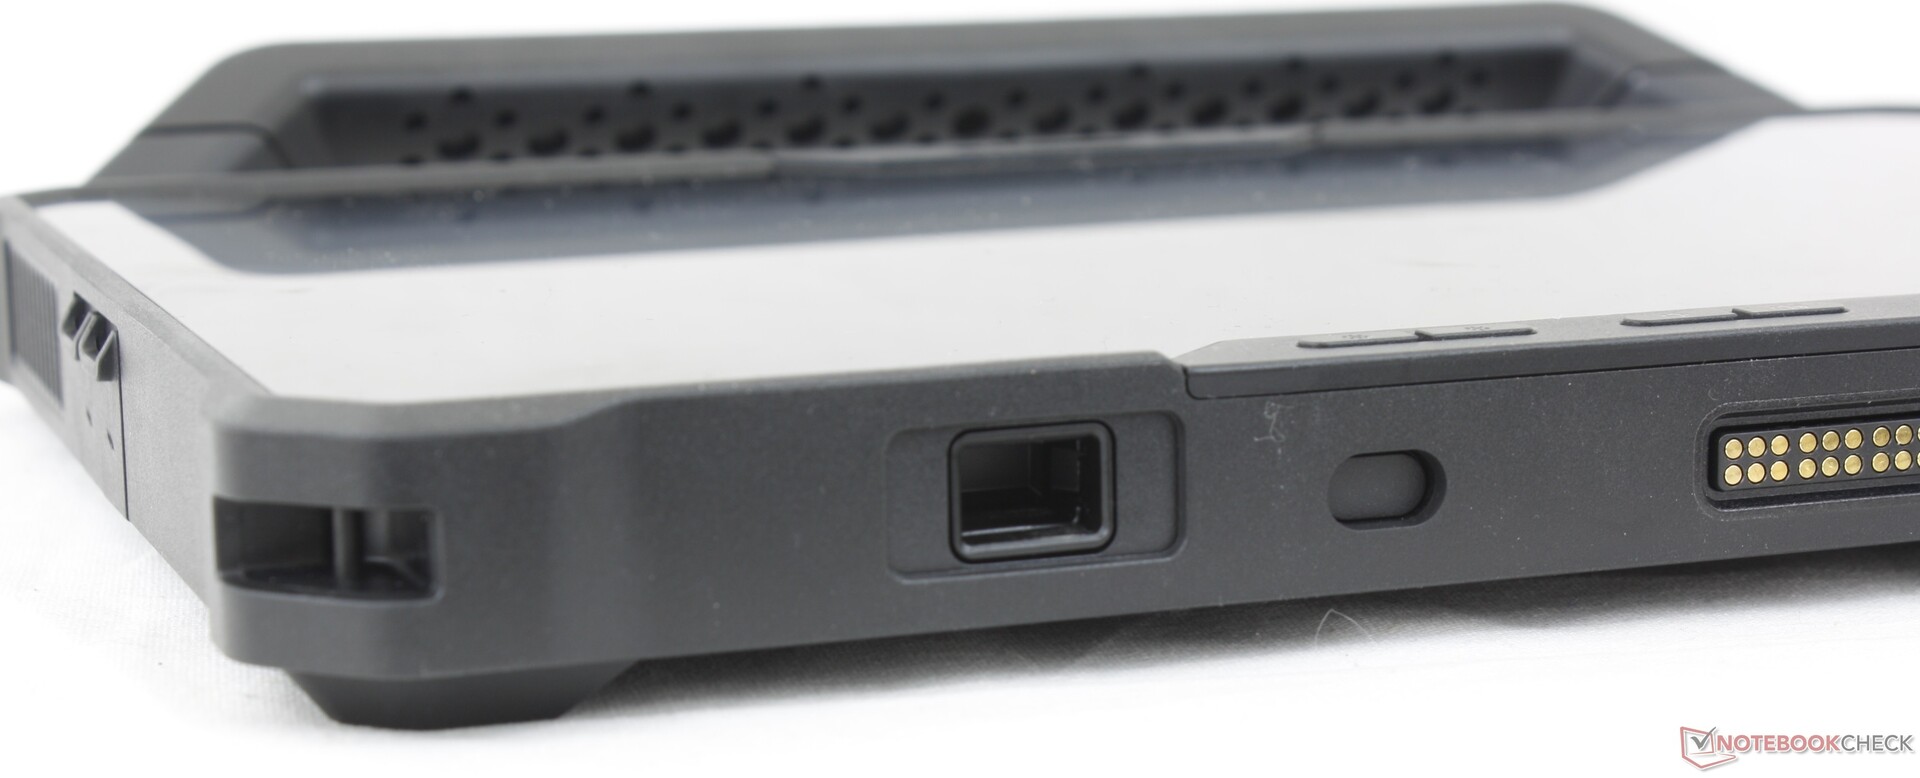
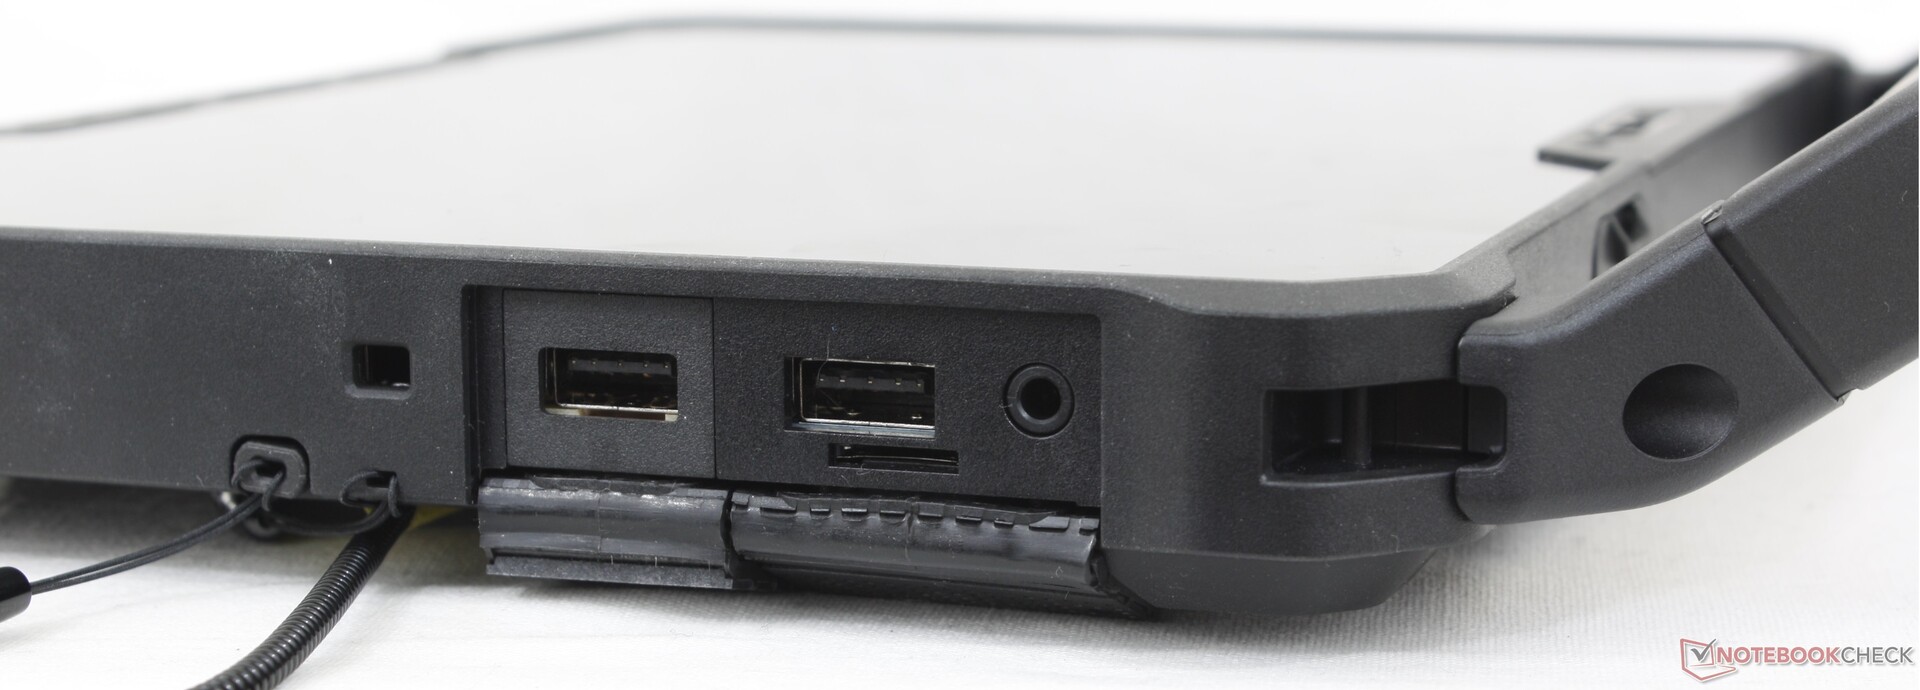
连接性 - 支持2个Thunderbolt 4
有一个健康的集成端口可供选择。两个Thunderbolt 4端口尤其值得注意,因为它们允许与现代消费者超极本一样的对接能力和外部显示器支持。然而,请记住,其中一个将始终被占用用于充电目的。
其他大多数端口是可选的,可以在结账时进行配置,包括HDMI 2.0、USB-A、RJ-45、RS-232或条形码扫描仪。
SD卡阅读器
| SD Card Reader | |
| average JPG Copy Test (av. of 3 runs) | |
| Dell Latitude 7330 Rugged Extreme (AV Pro V60) | |
| Dell Latitude 7230 Rugged Extreme (AV Pro V60) | |
| Panasonic Toughbook 40 (AV Pro V60) | |
| Acer Enduro Urban N3 EUN314 (AV Pro V60) | |
| Durabook S14I (Angelbird 128GB AV Pro UHS-II) | |
| maximum AS SSD Seq Read Test (1GB) | |
| Dell Latitude 7330 Rugged Extreme (AV Pro V60) | |
| Dell Latitude 7230 Rugged Extreme (AV Pro V60) | |
| Panasonic Toughbook 40 (AV Pro V60) | |
| Durabook S14I (Angelbird 128GB AV Pro UHS-II) | |
| Acer Enduro Urban N3 EUN314 (AV Pro V60) | |
沟通
英特尔AX211在与我们支持Wi-Fi 6E的华硕AXE11000测试路由器配对时表现可靠。该模型可以配置为完全没有Wi-Fi,但我们建议谨慎选择,因为在Latitude 7230 Rugged Extreme上的终端用户安装要比典型的超极本复杂得多。
| Networking | |
| iperf3 transmit AX12 | |
| Acer Enduro Urban N3 EUN314 | |
| Durabook S14I | |
| Dell Latitude 7330 Rugged Extreme | |
| Getac B360 | |
| iperf3 receive AX12 | |
| Durabook S14I | |
| Acer Enduro Urban N3 EUN314 | |
| Getac B360 | |
| Dell Latitude 7330 Rugged Extreme | |
| iperf3 transmit AXE11000 | |
| Panasonic Toughbook 40 | |
| Dell Latitude 7230 Rugged Extreme | |
| iperf3 receive AXE11000 | |
| Panasonic Toughbook 40 | |
| Dell Latitude 7230 Rugged Extreme | |
| iperf3 transmit AXE11000 6GHz | |
| Dell Latitude 7230 Rugged Extreme | |
| iperf3 receive AXE11000 6GHz | |
| Dell Latitude 7230 Rugged Extreme | |
网络摄像头
后置1100万像素的网络摄像头和甚至500万像素的前置网络摄像头都比你在消费类蛤壳笔记本上找到的任何东西都要清晰。每个网络摄像头都有自己的物理隐私滑块,而后置网络摄像头有一个内置闪光灯。
前面的网络摄像头支持Windows Hello。


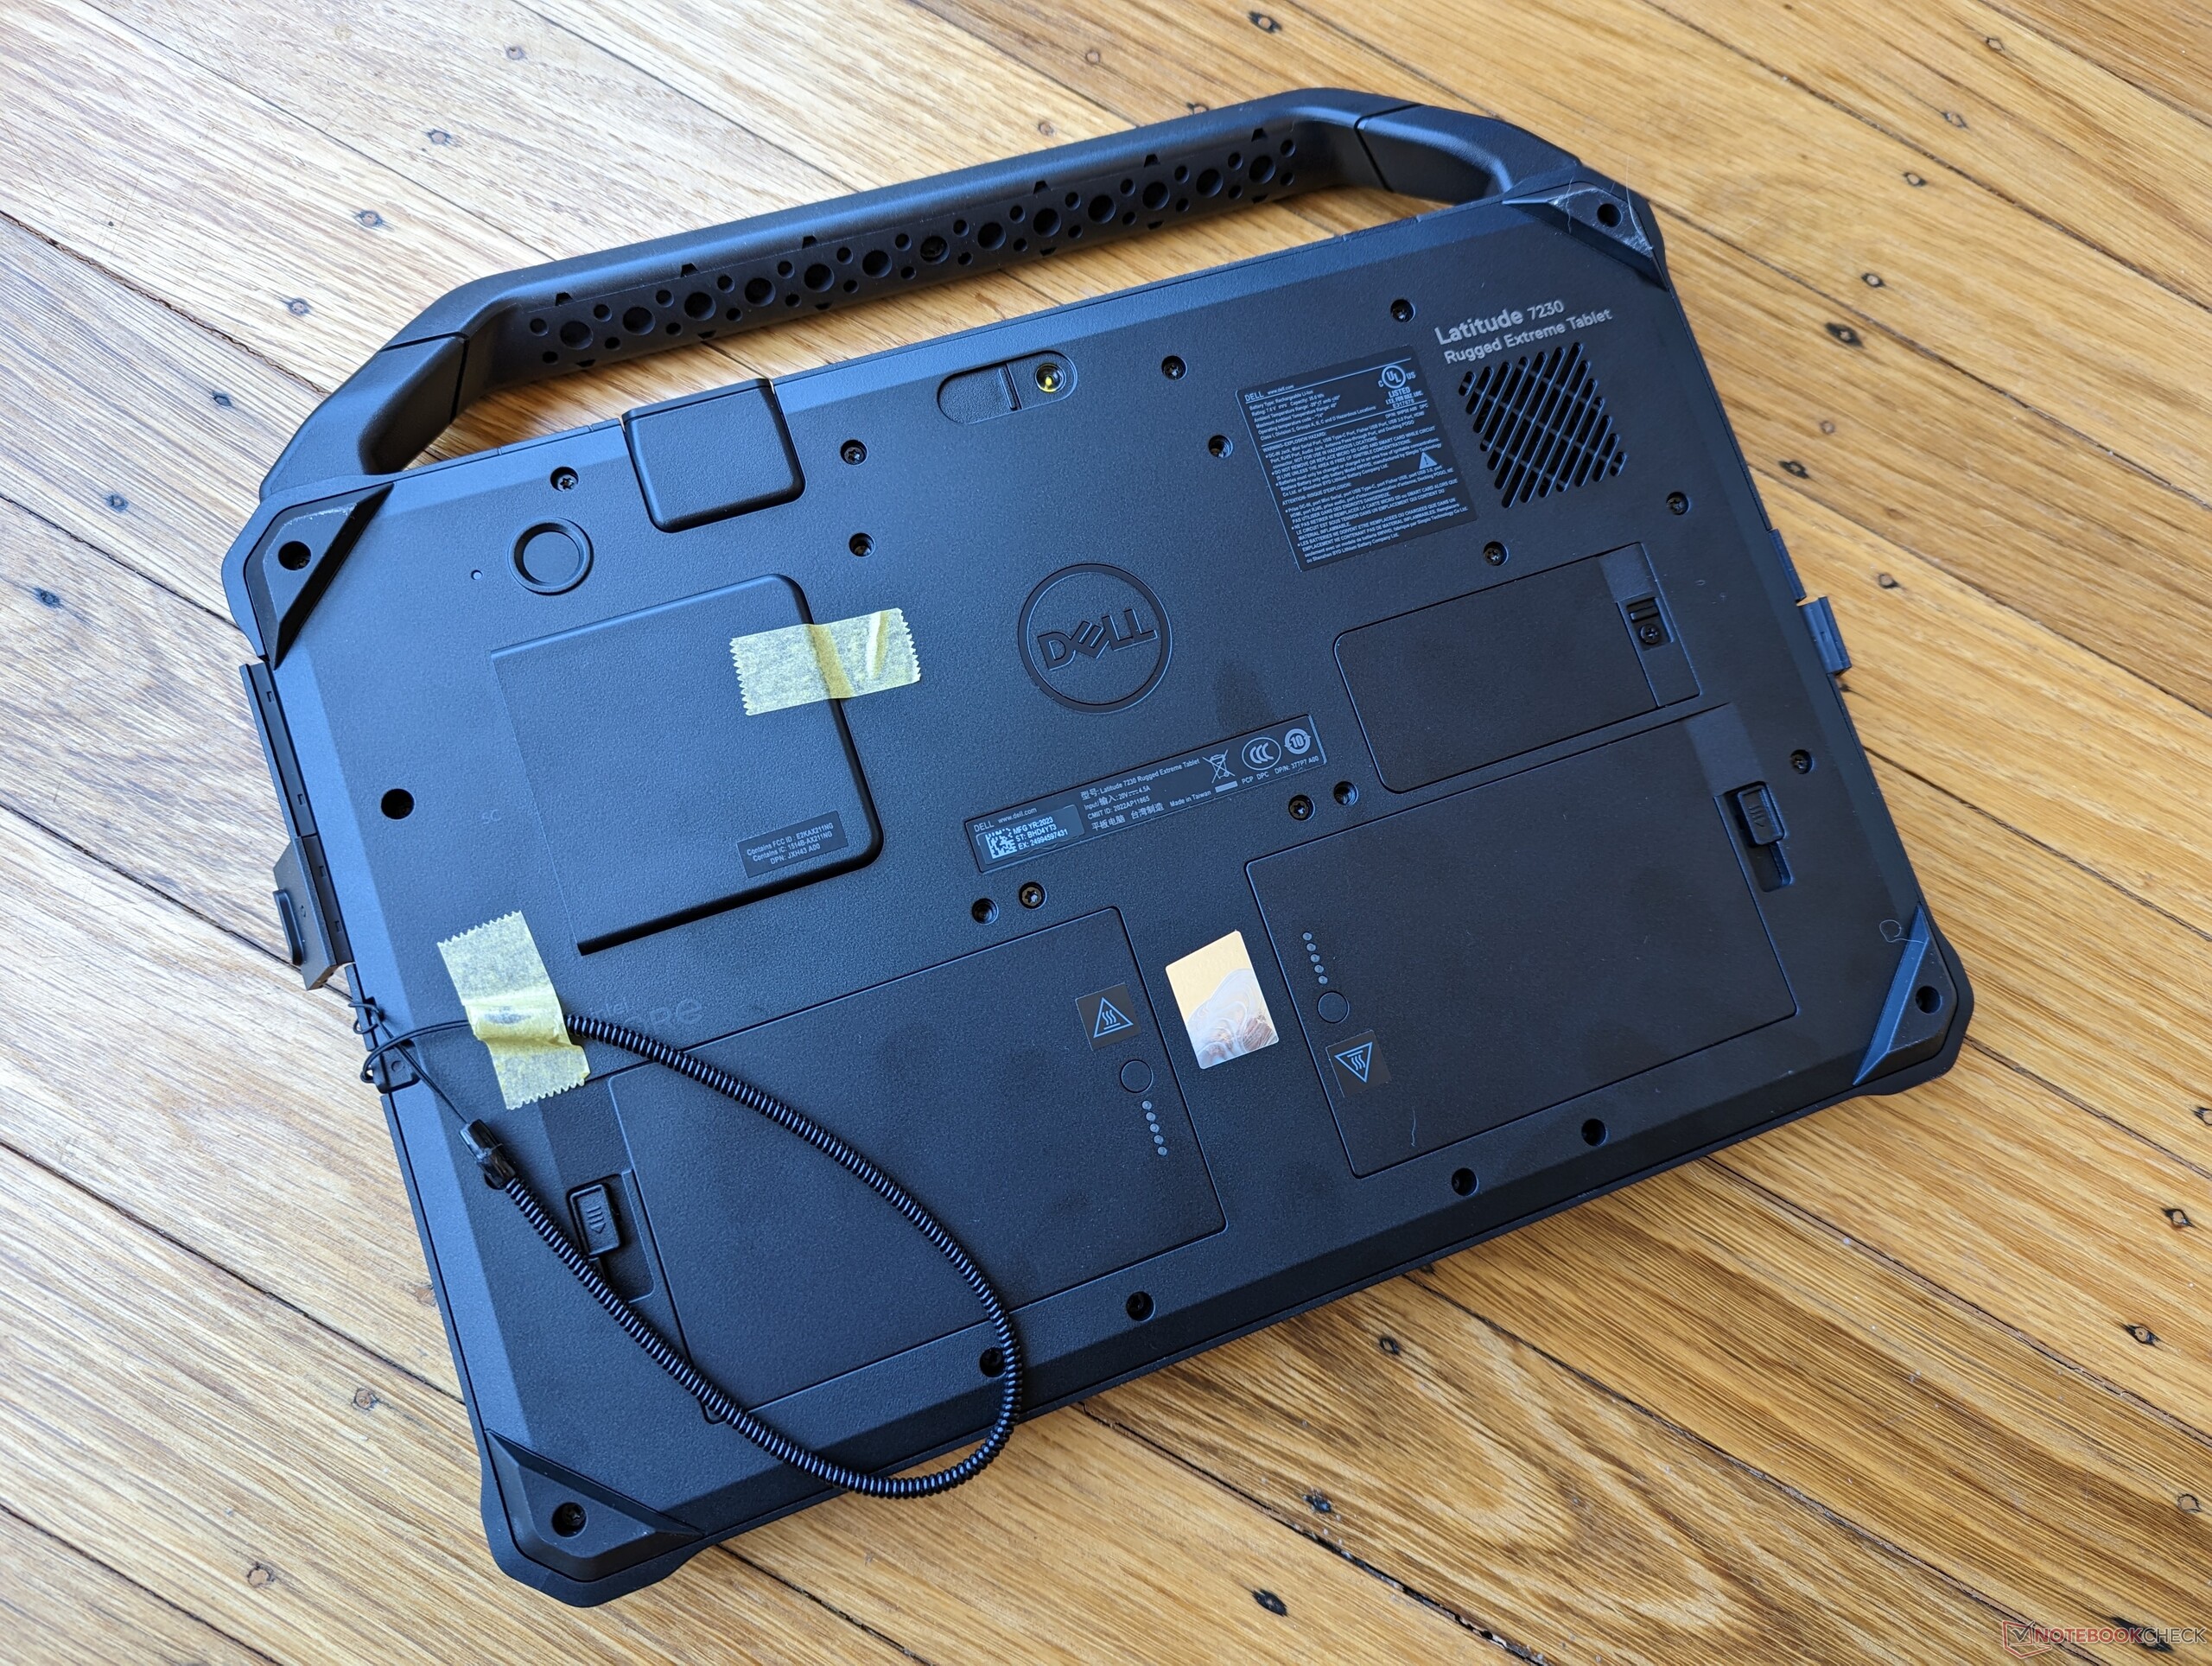
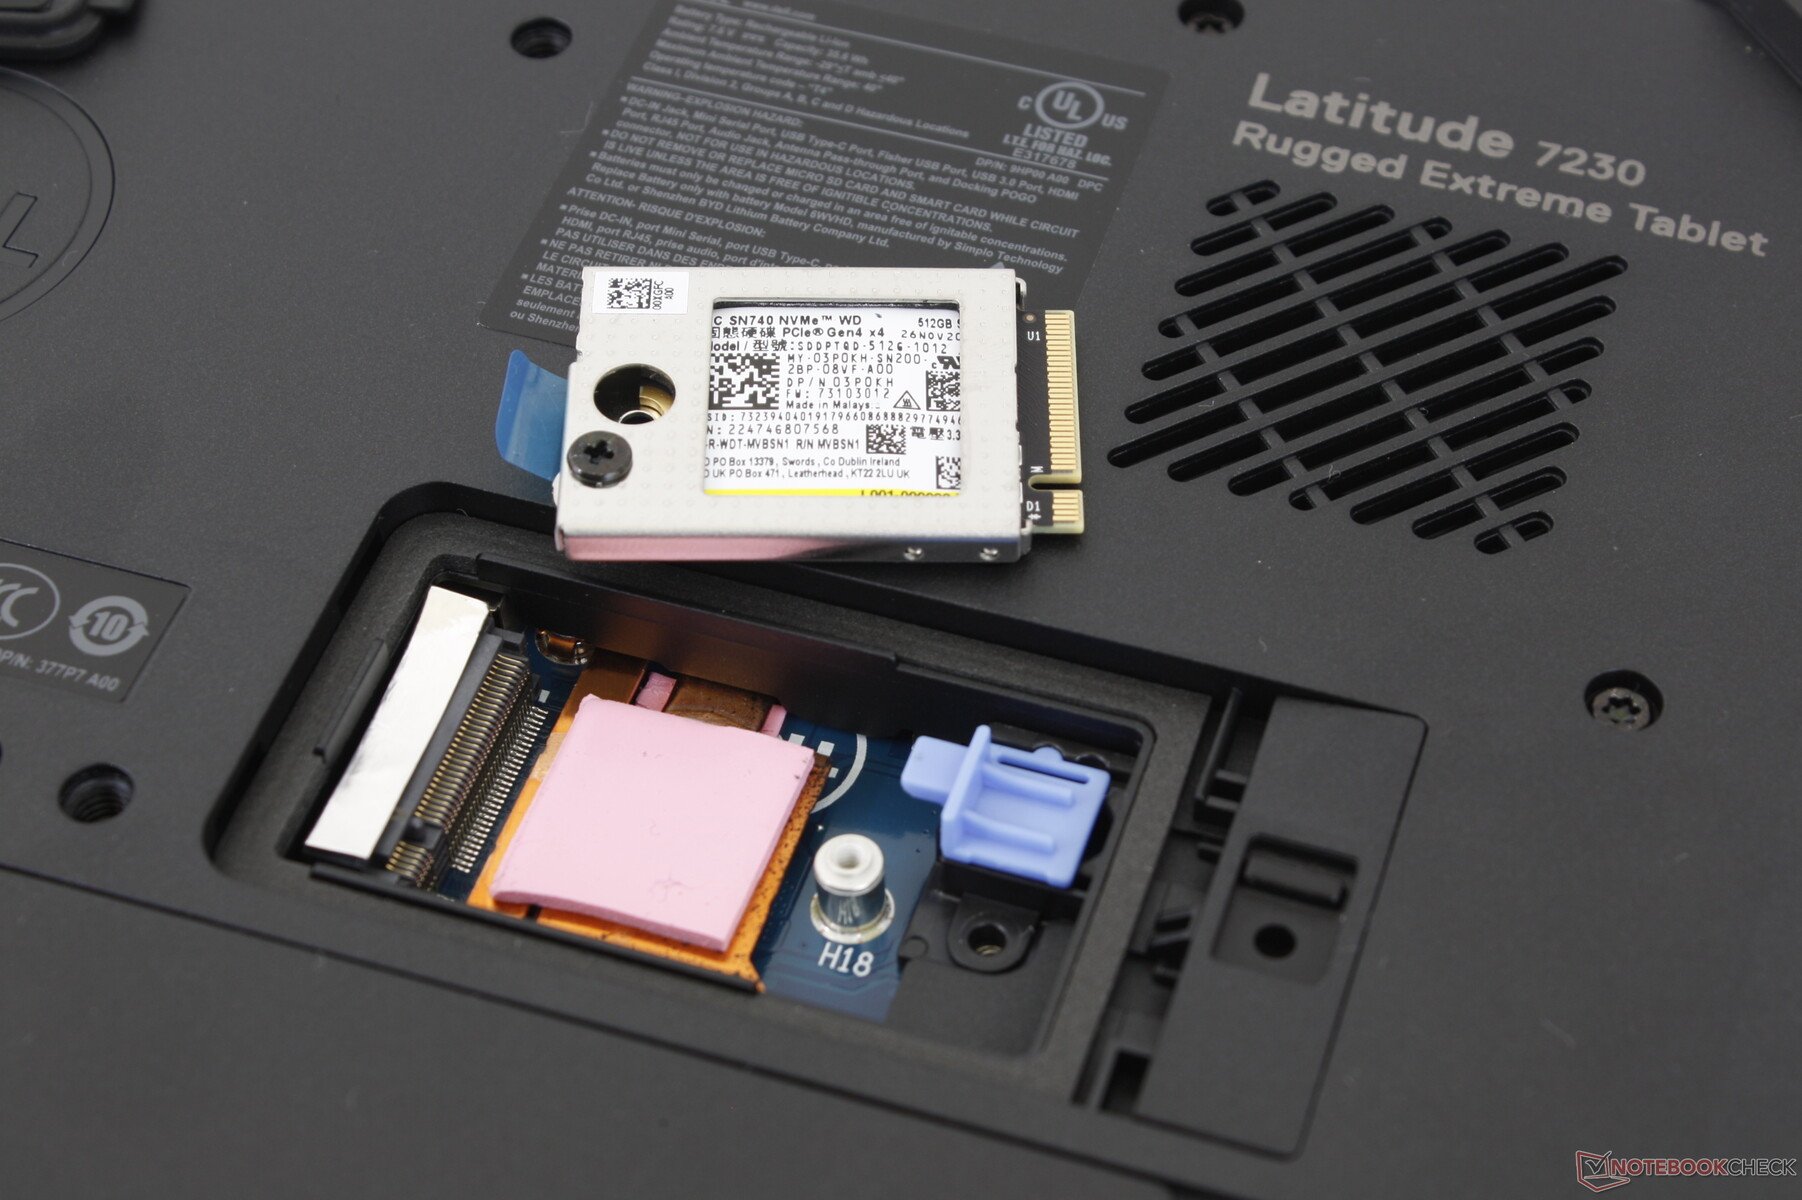
维护
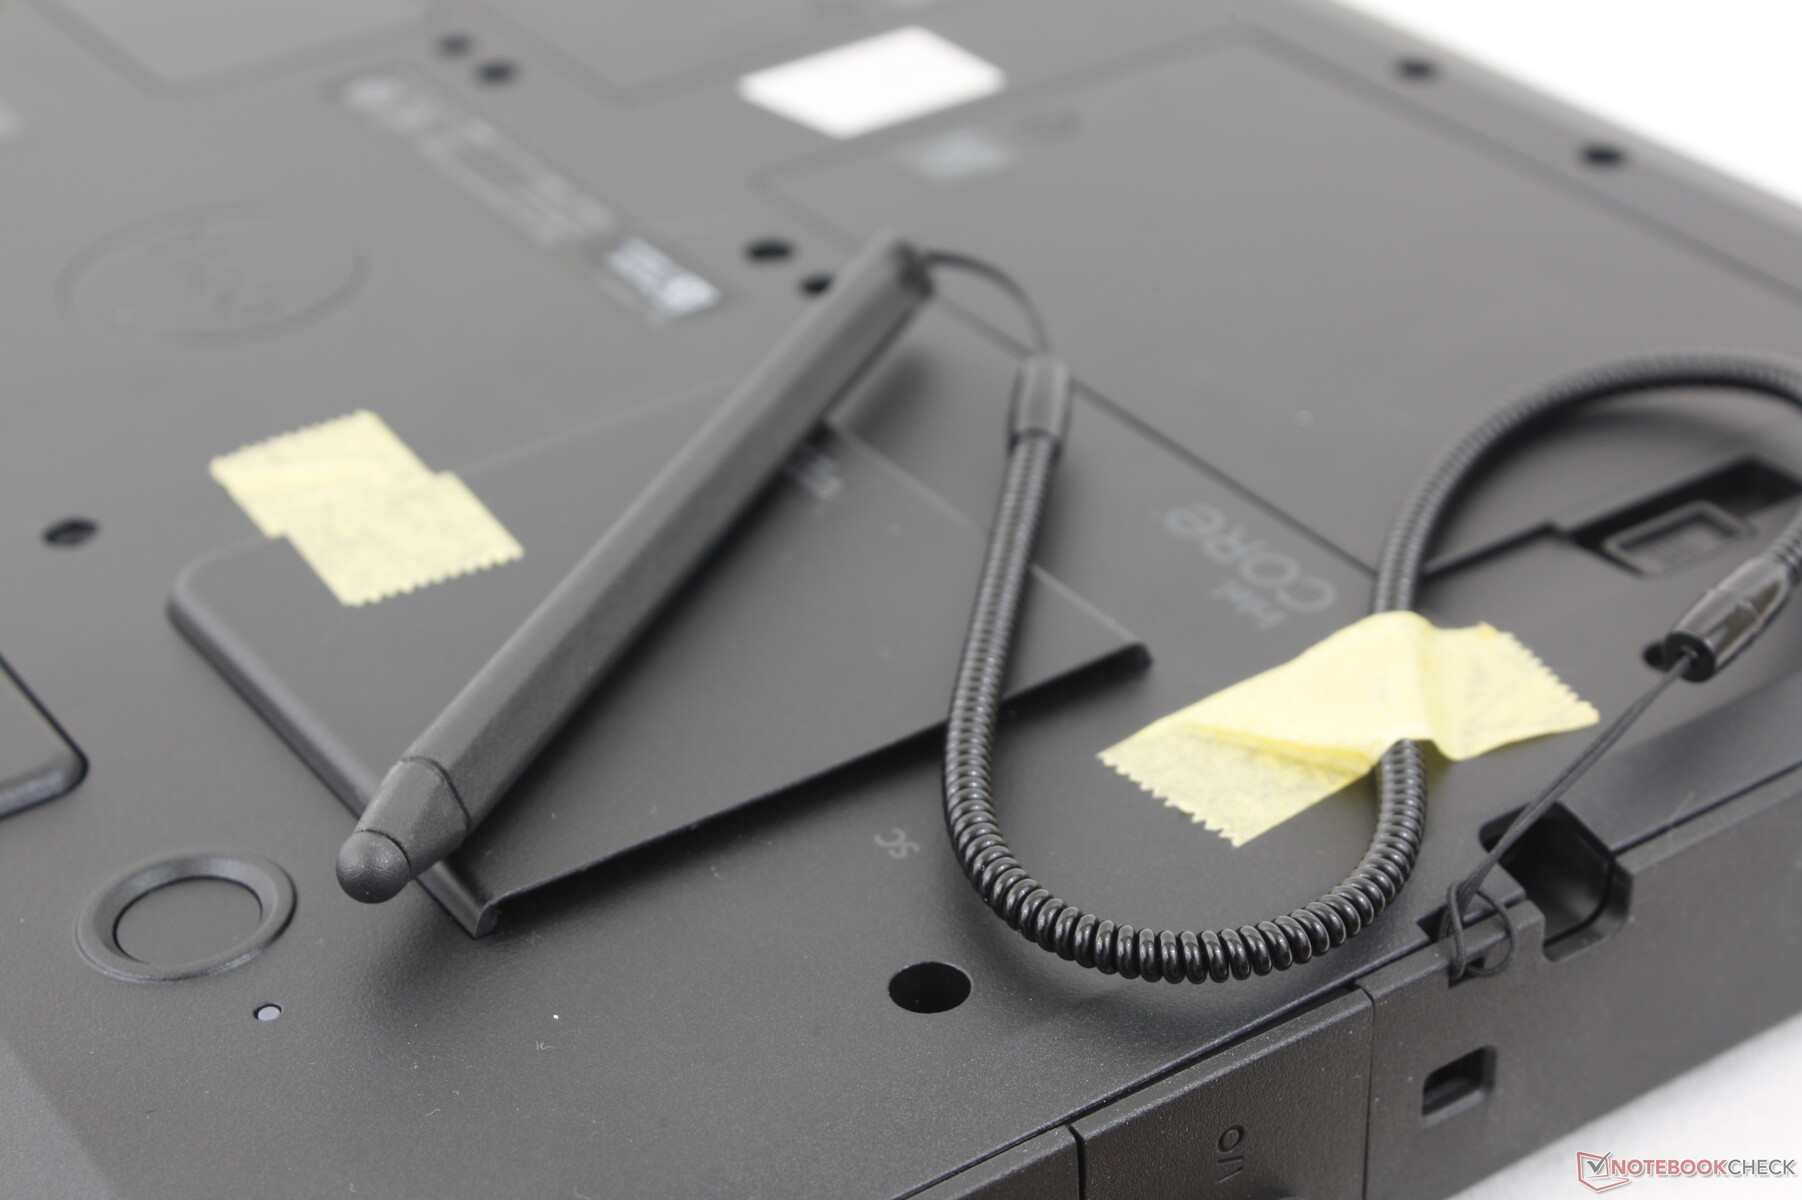
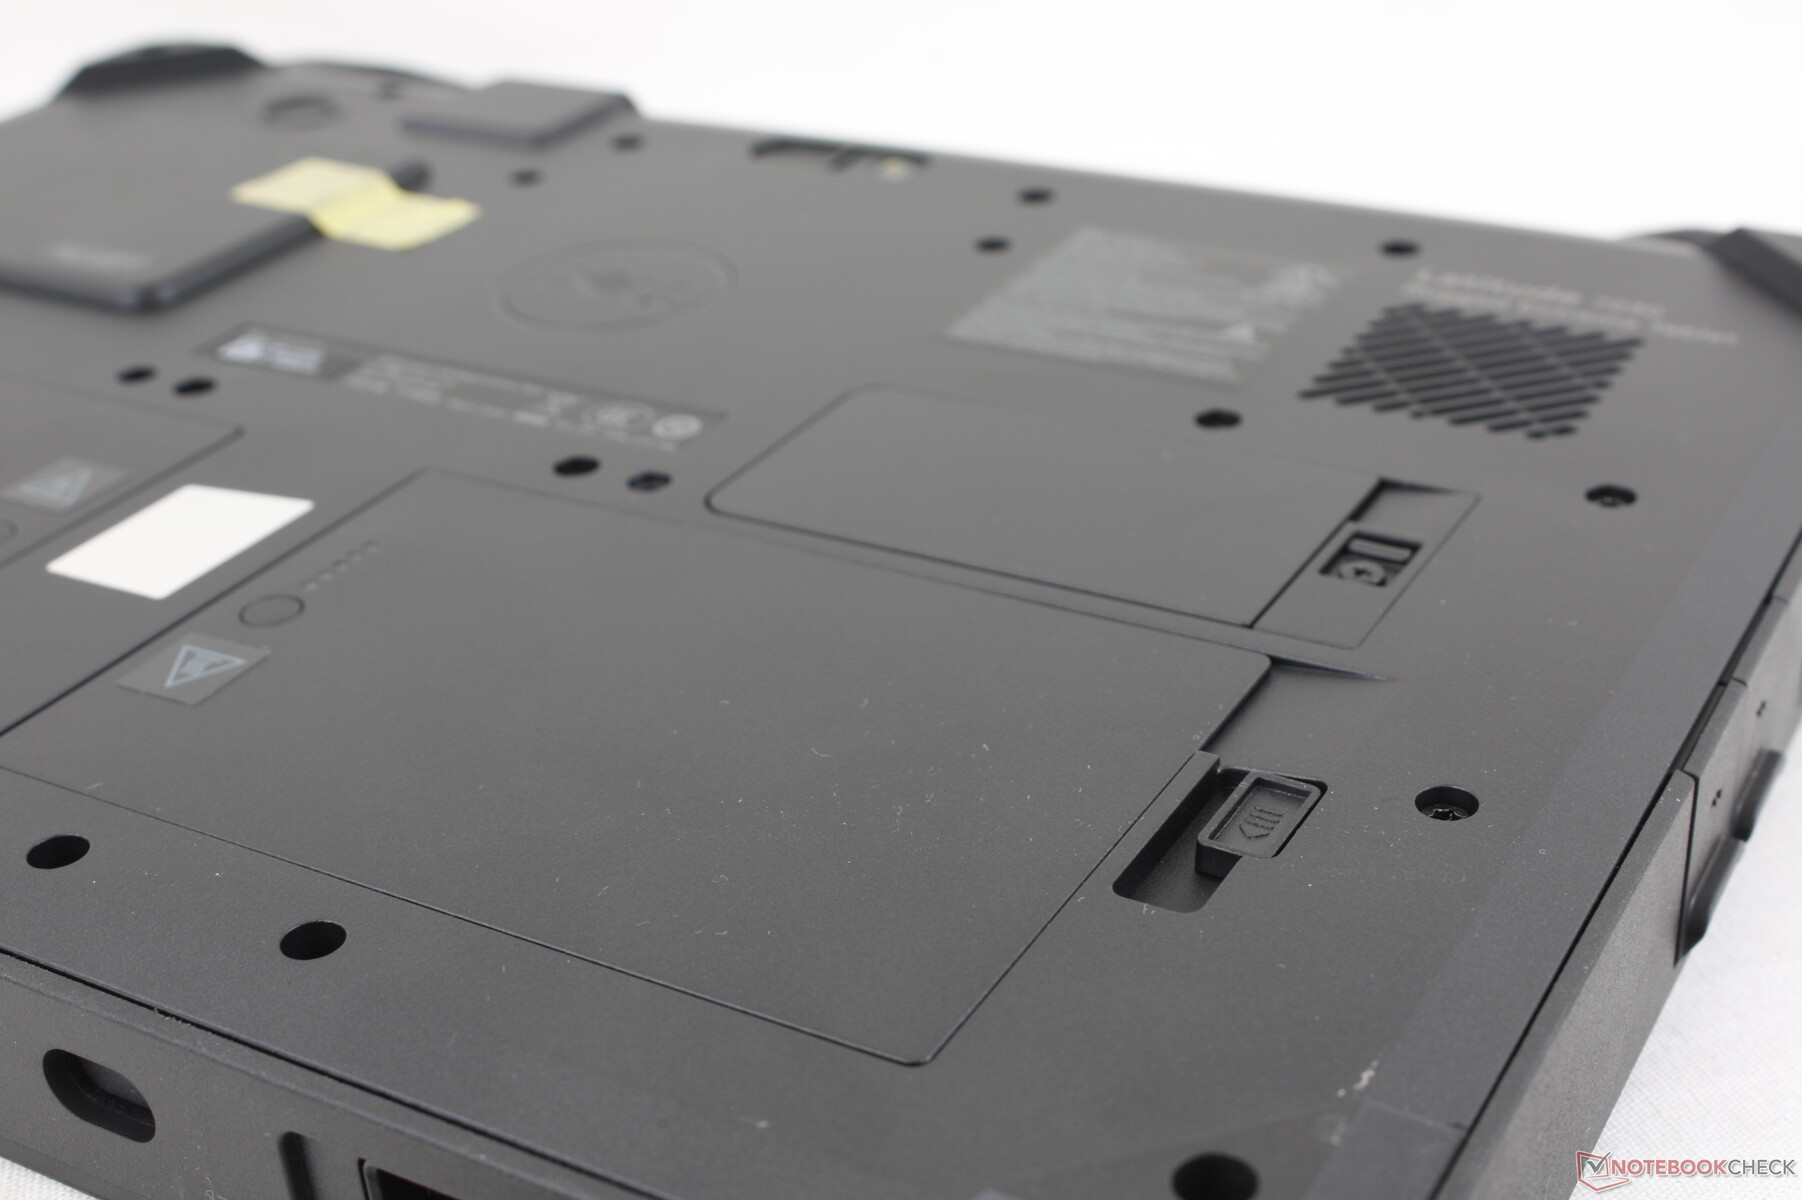
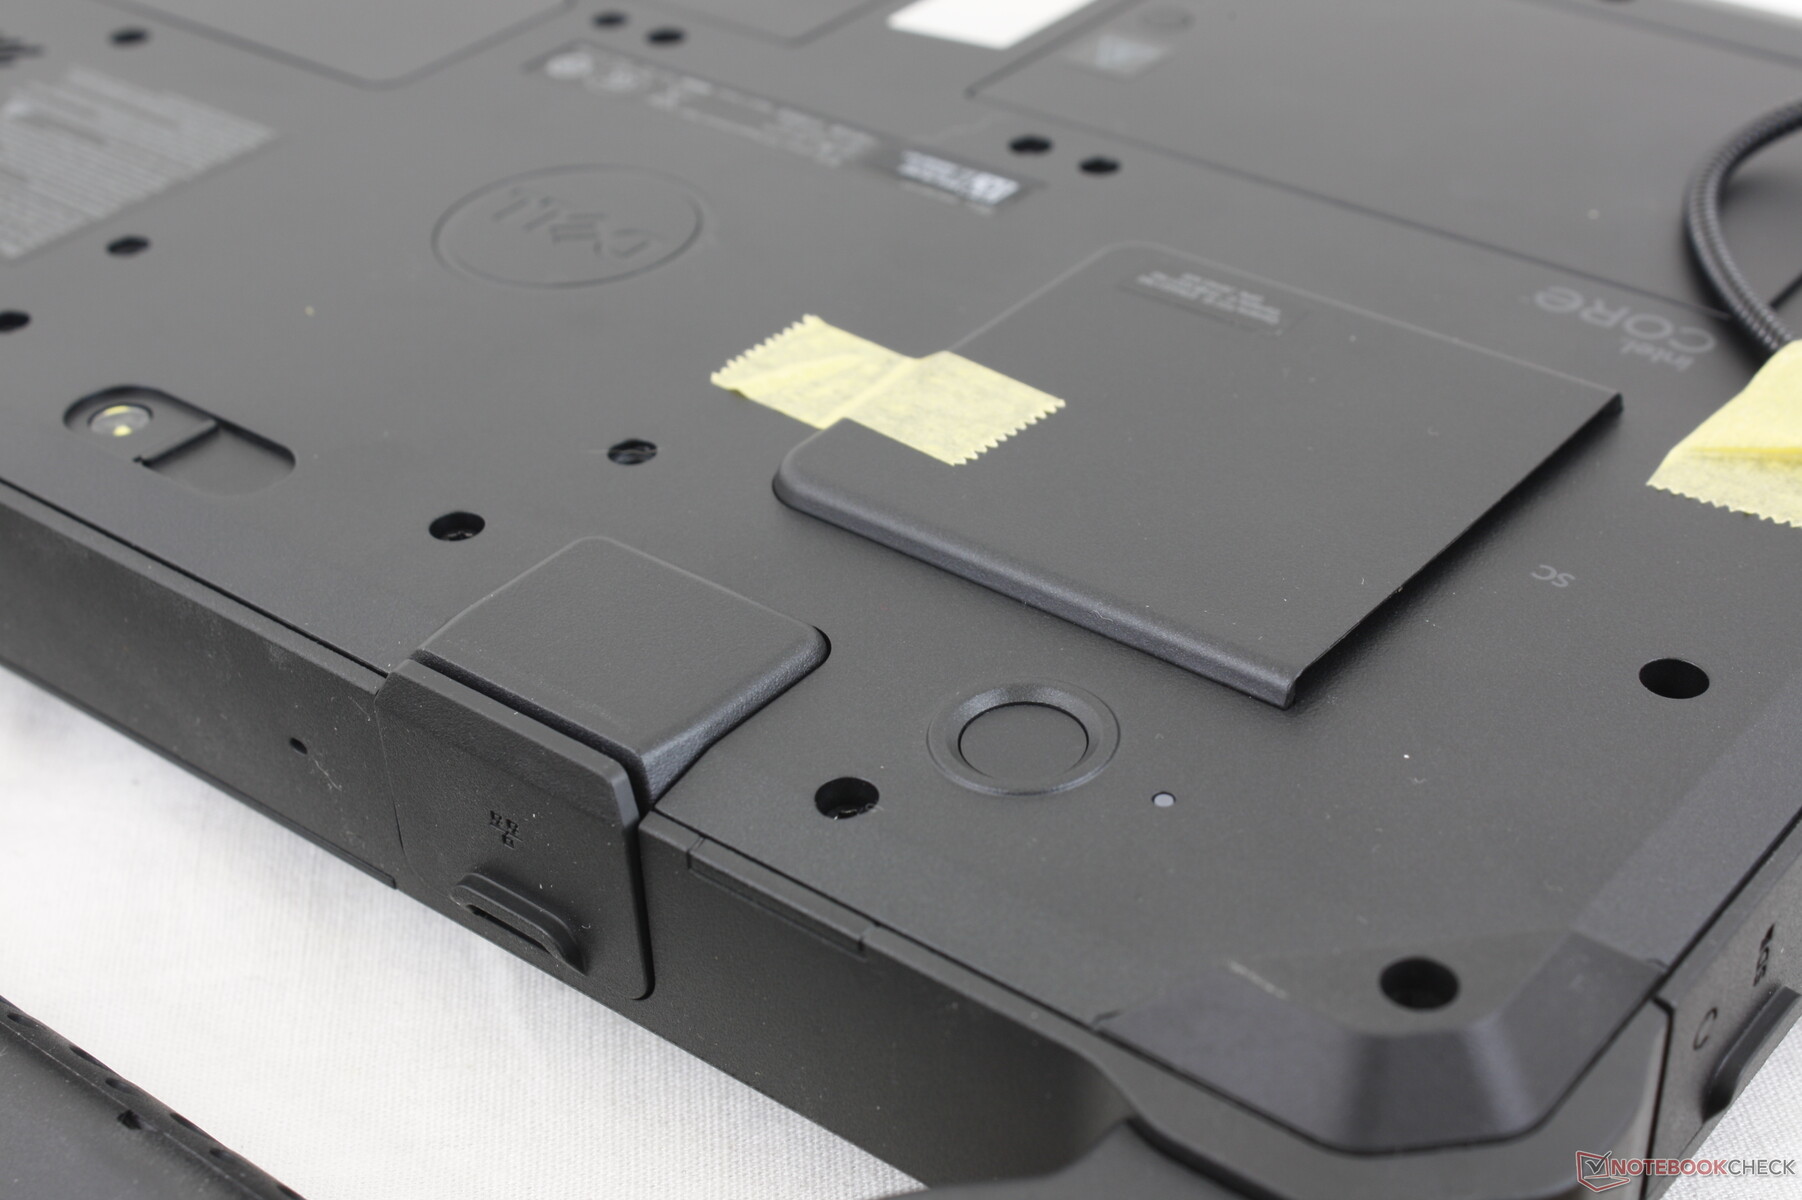
背部面板由不少于二十个Torx螺丝固定。值得庆幸的是,两个电池和单个M.2固态硬盘插槽更容易接近。内存是焊接的,只能在结账时配置。
官方服务手册如果需要进一步拆卸,可以直接从戴尔获得。
配件和保修
可选的附件包括高级键盘、手带、主动笔和其他许多附件。零售包装盒中包括一支无源笔和一个已经连接好的硬质提手。如果在美国购买,有三年的有限保修期。
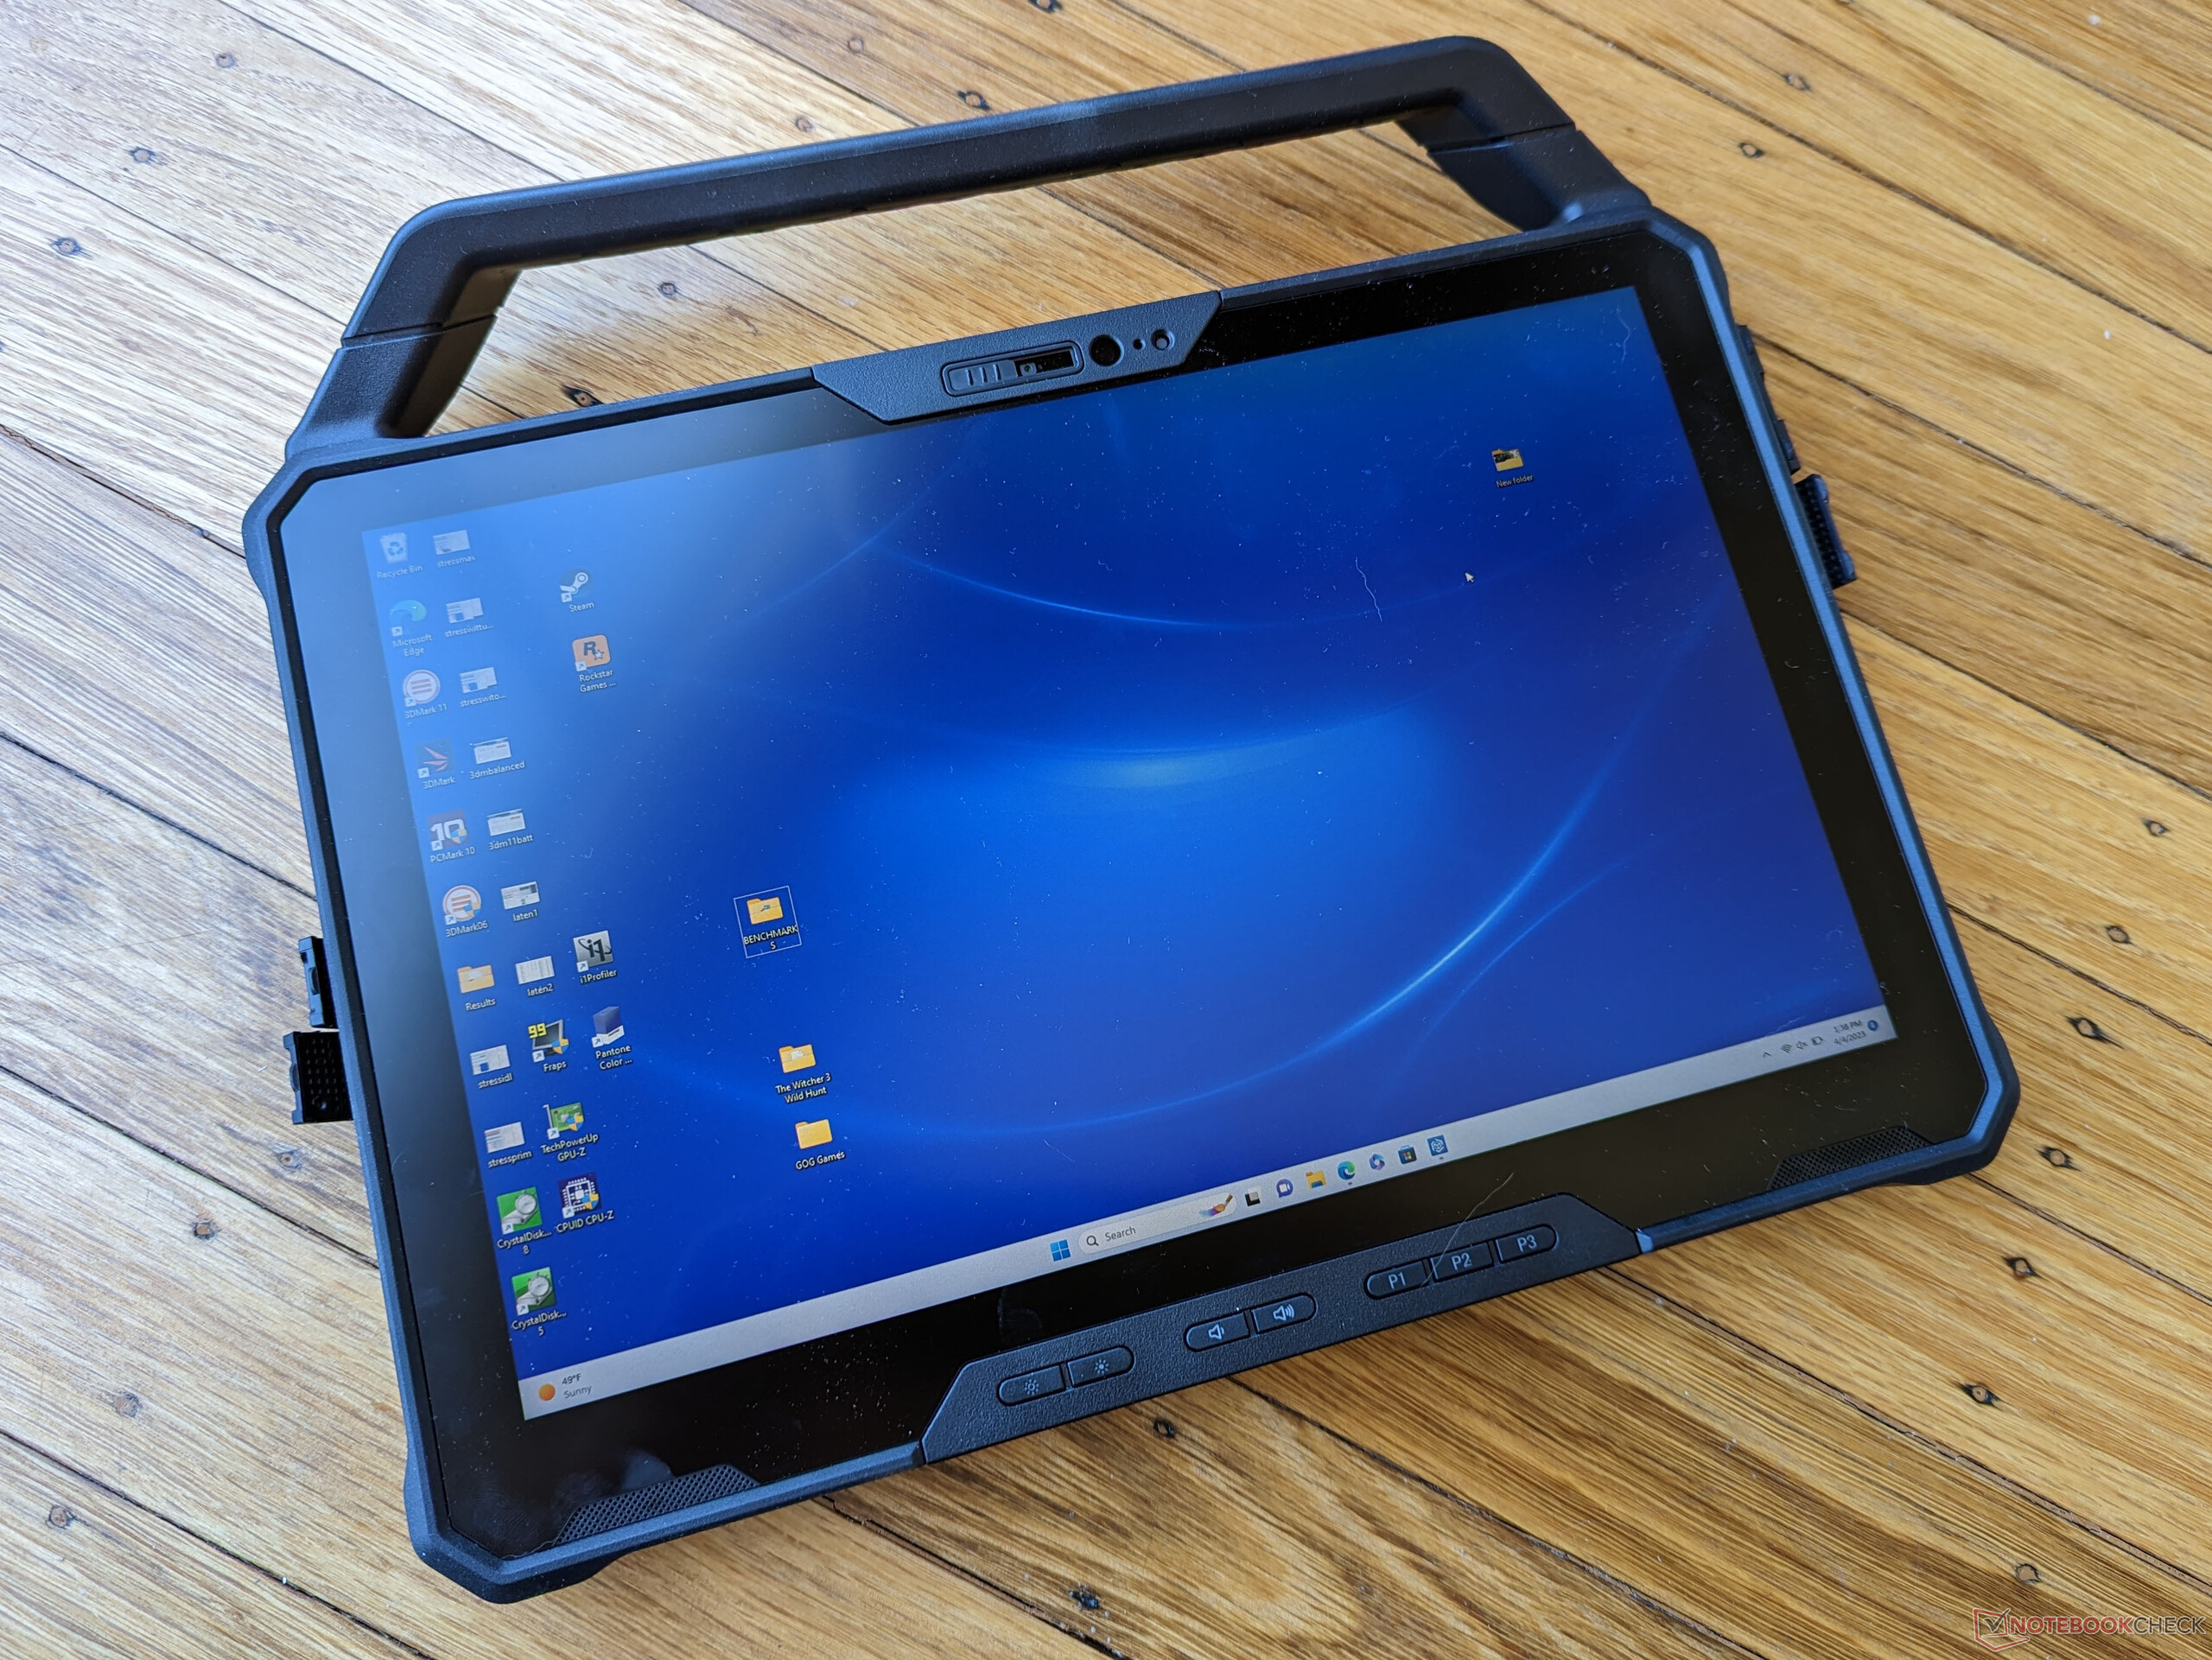
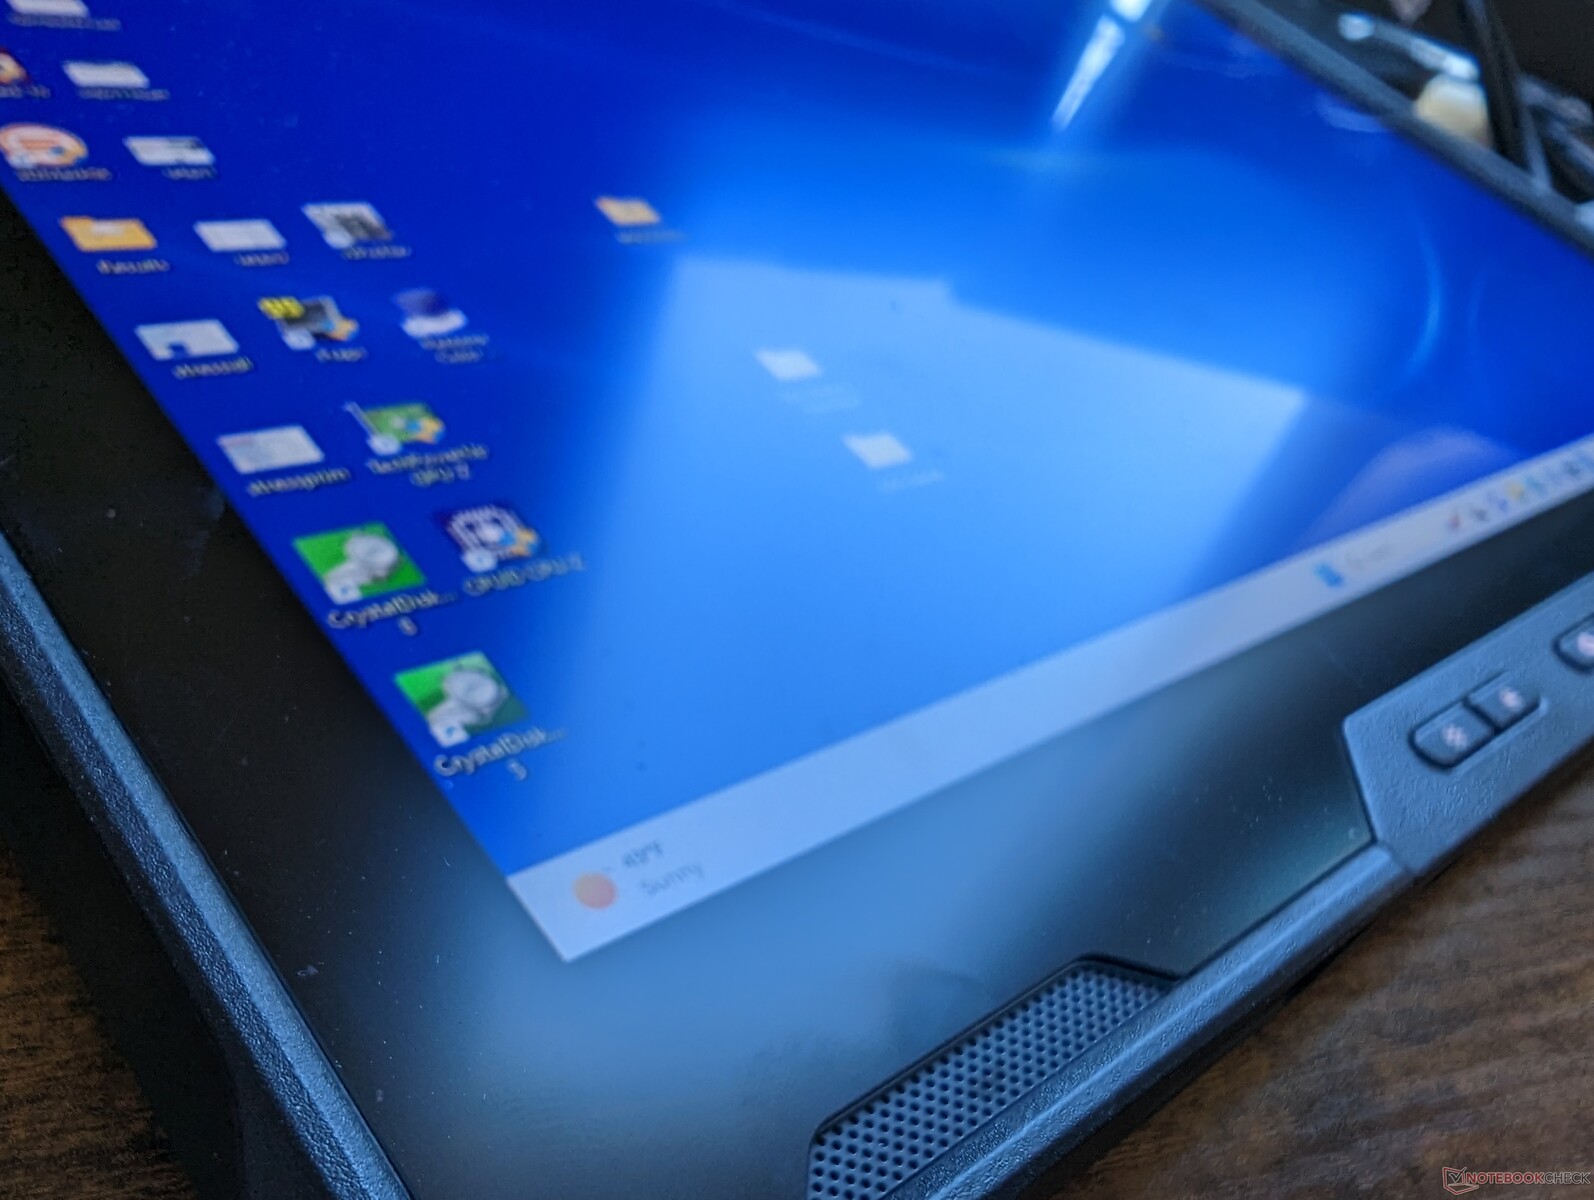
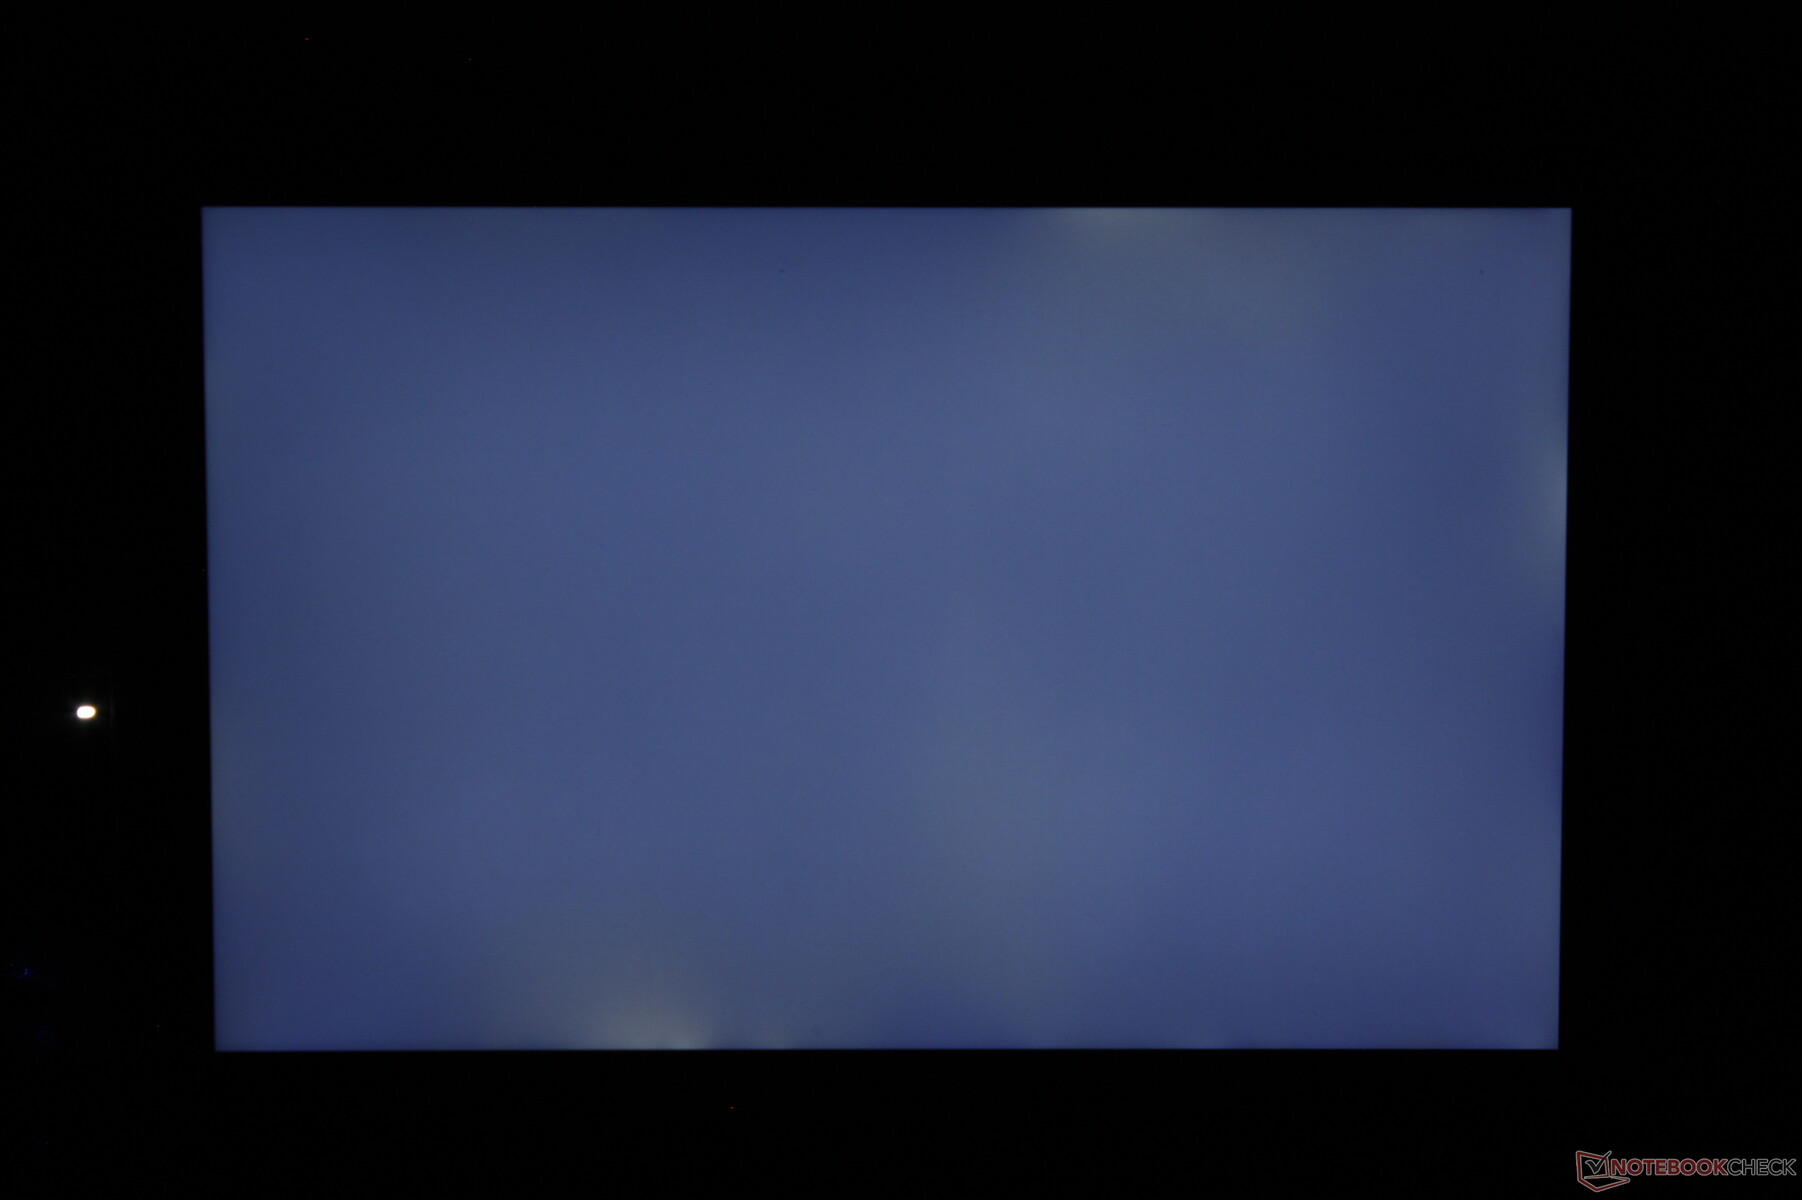
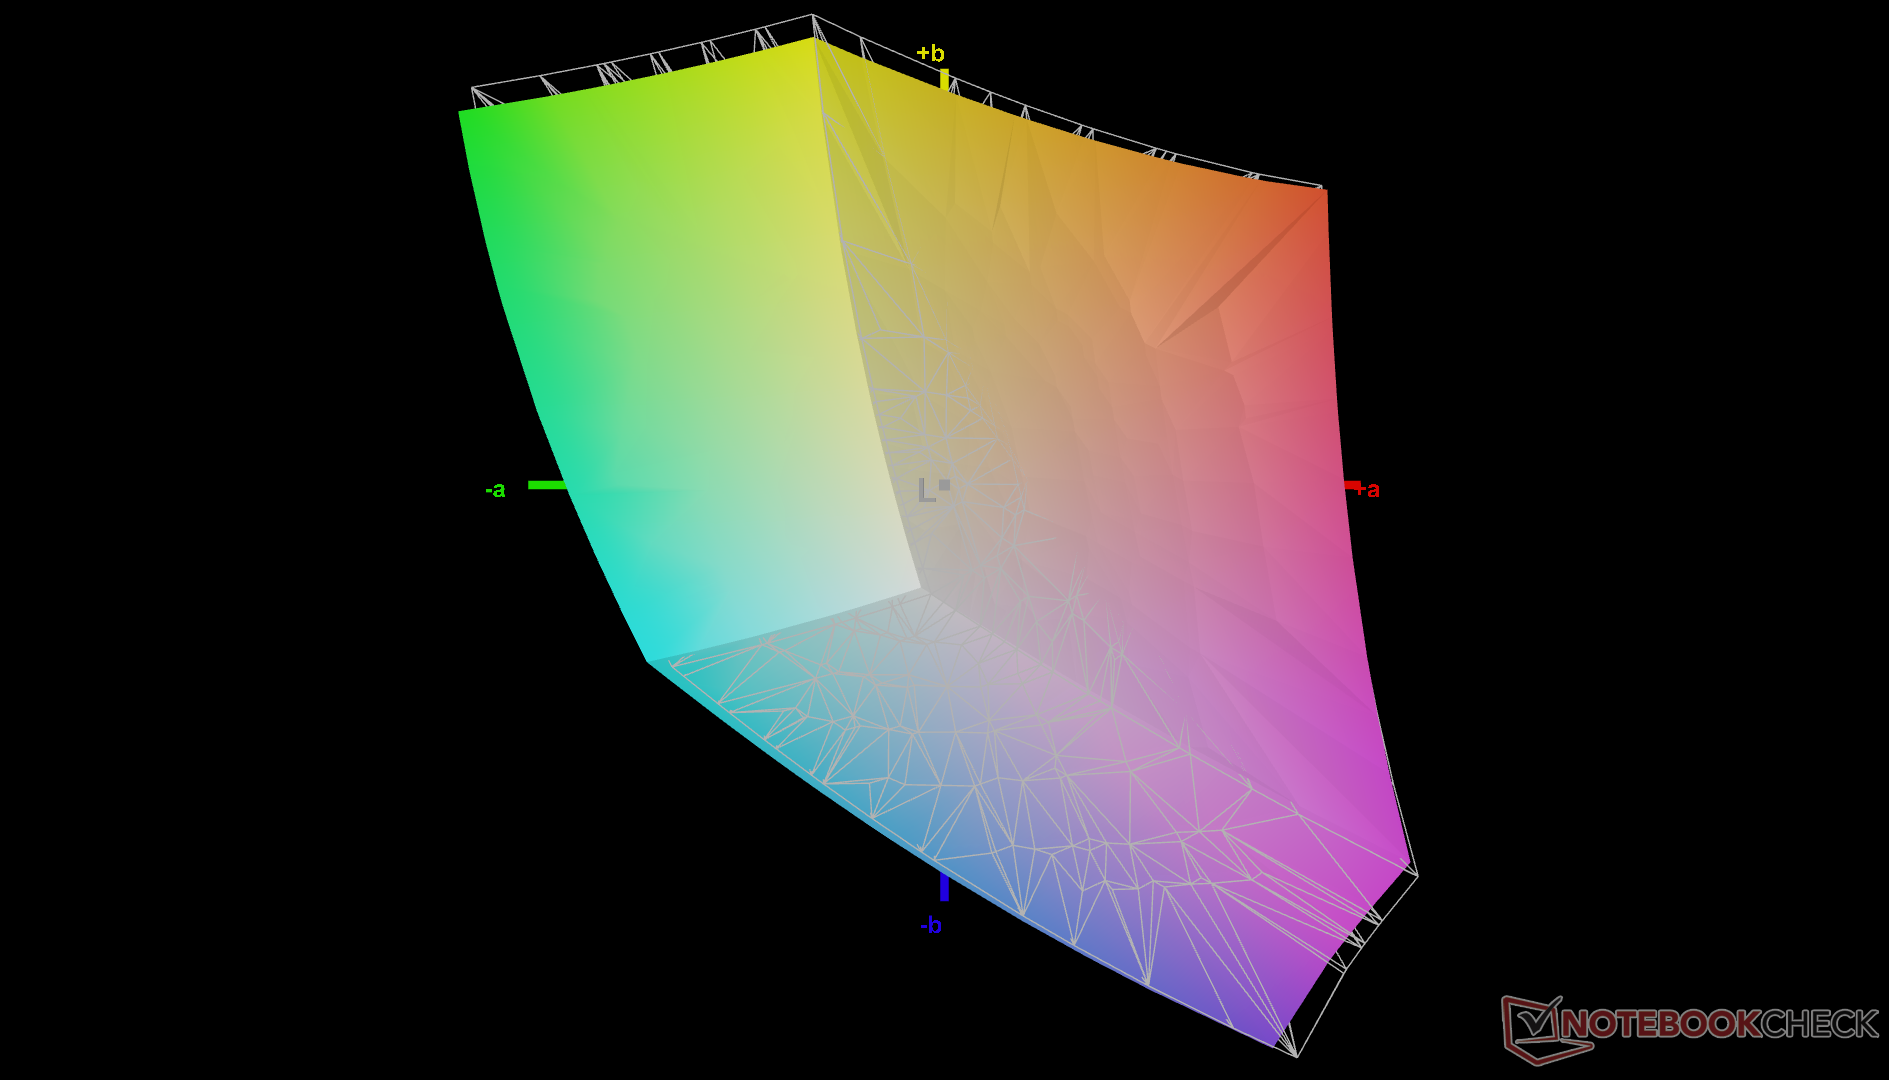
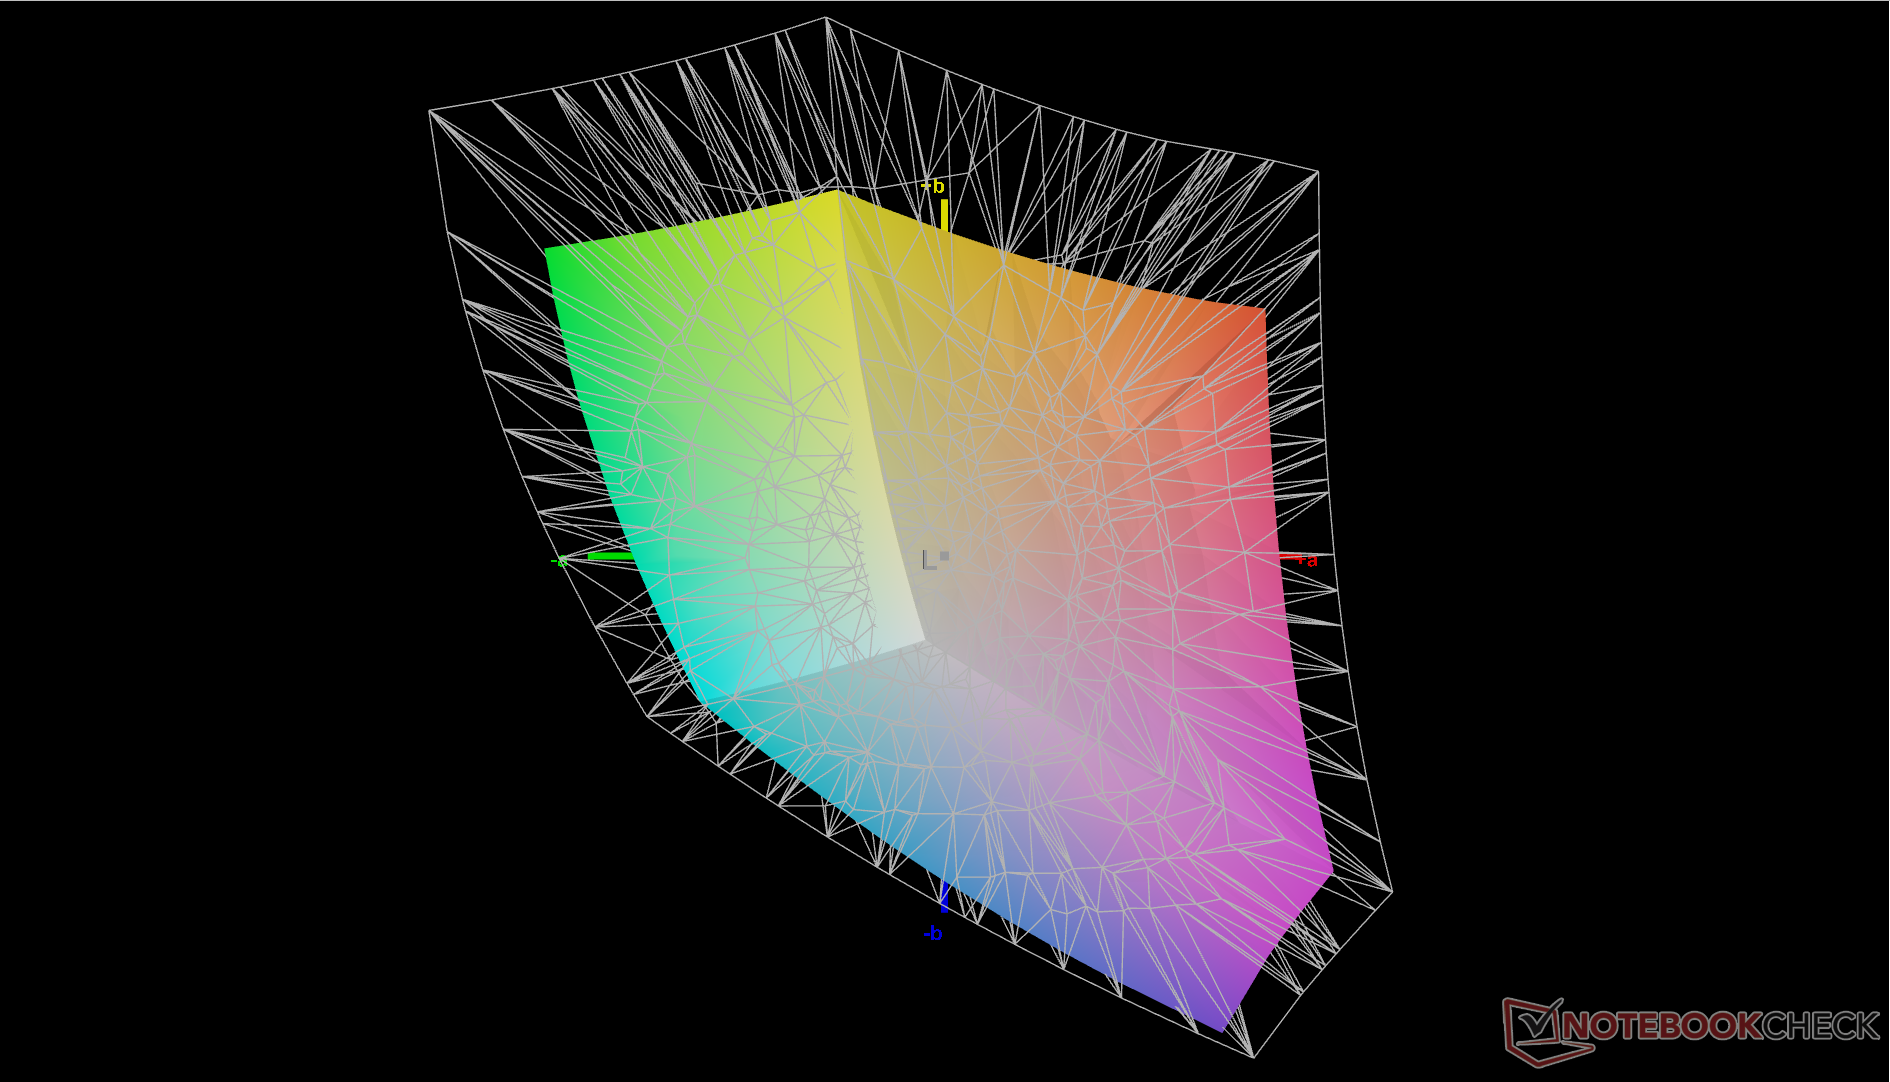
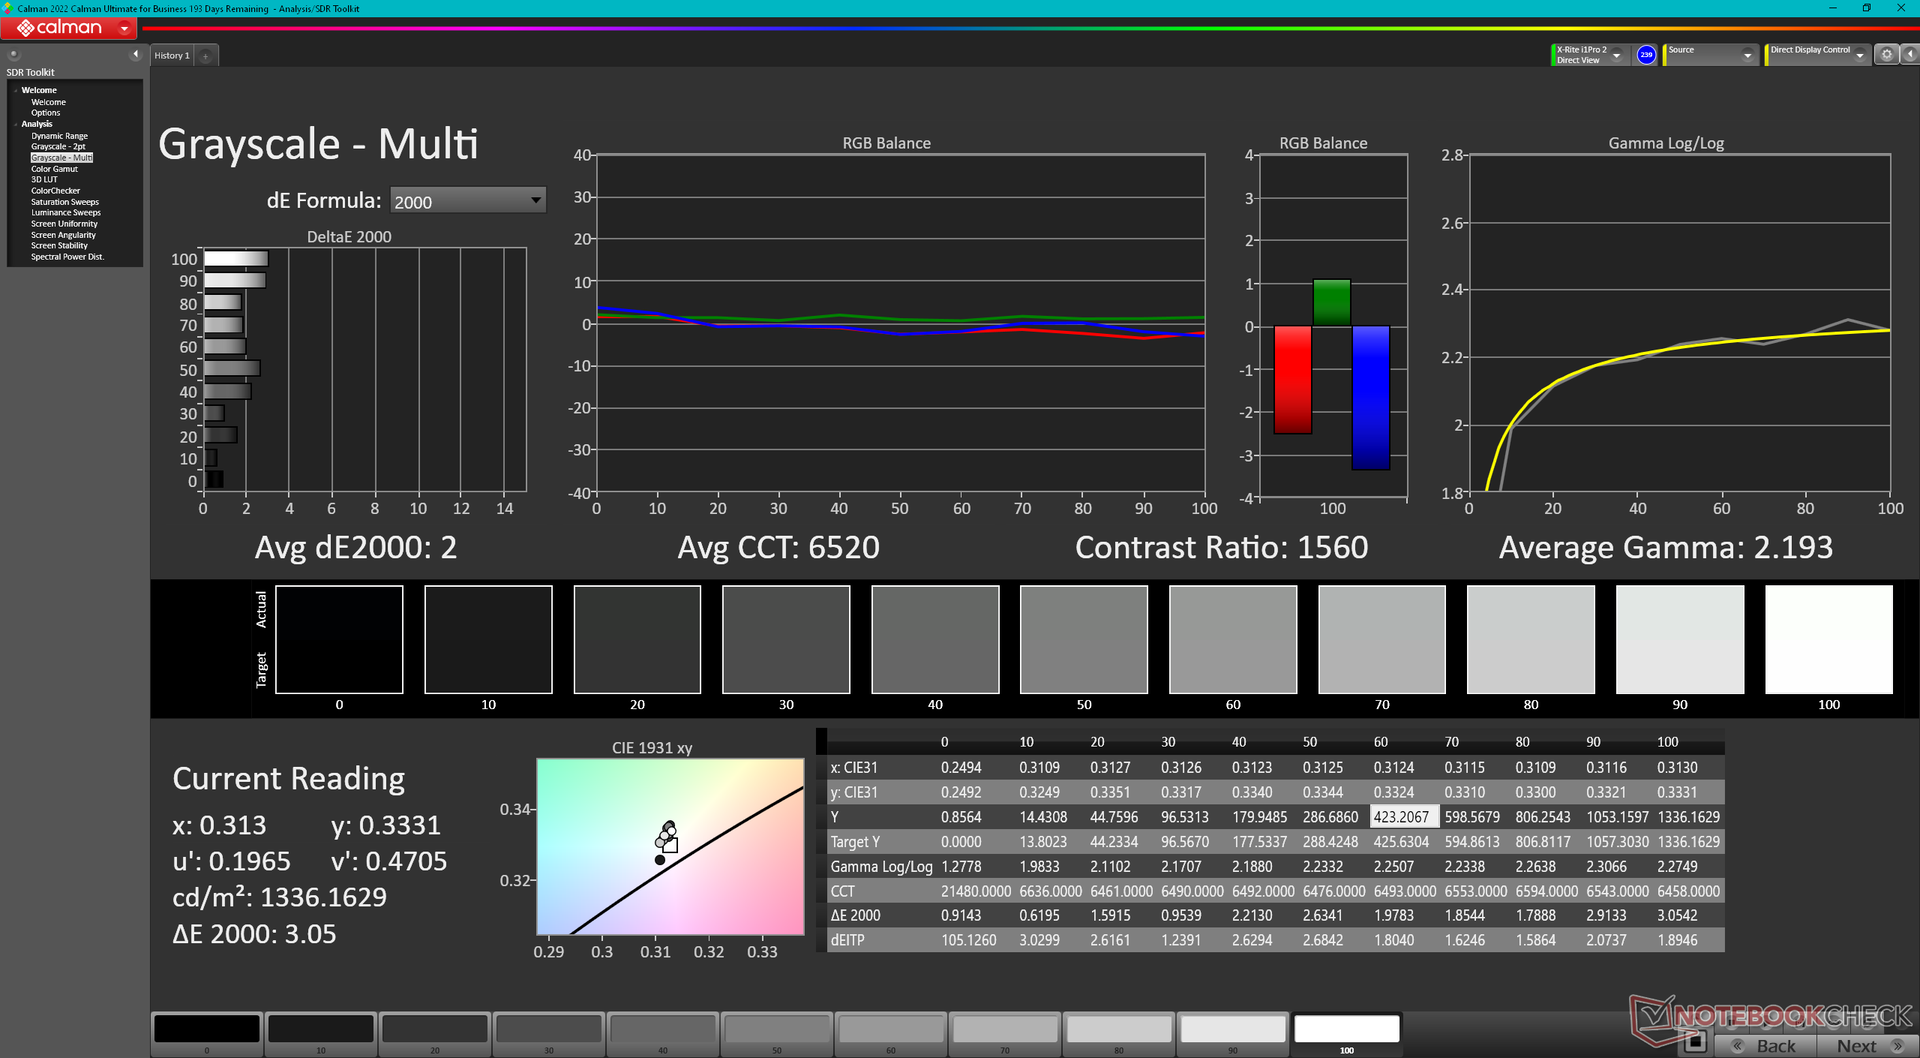
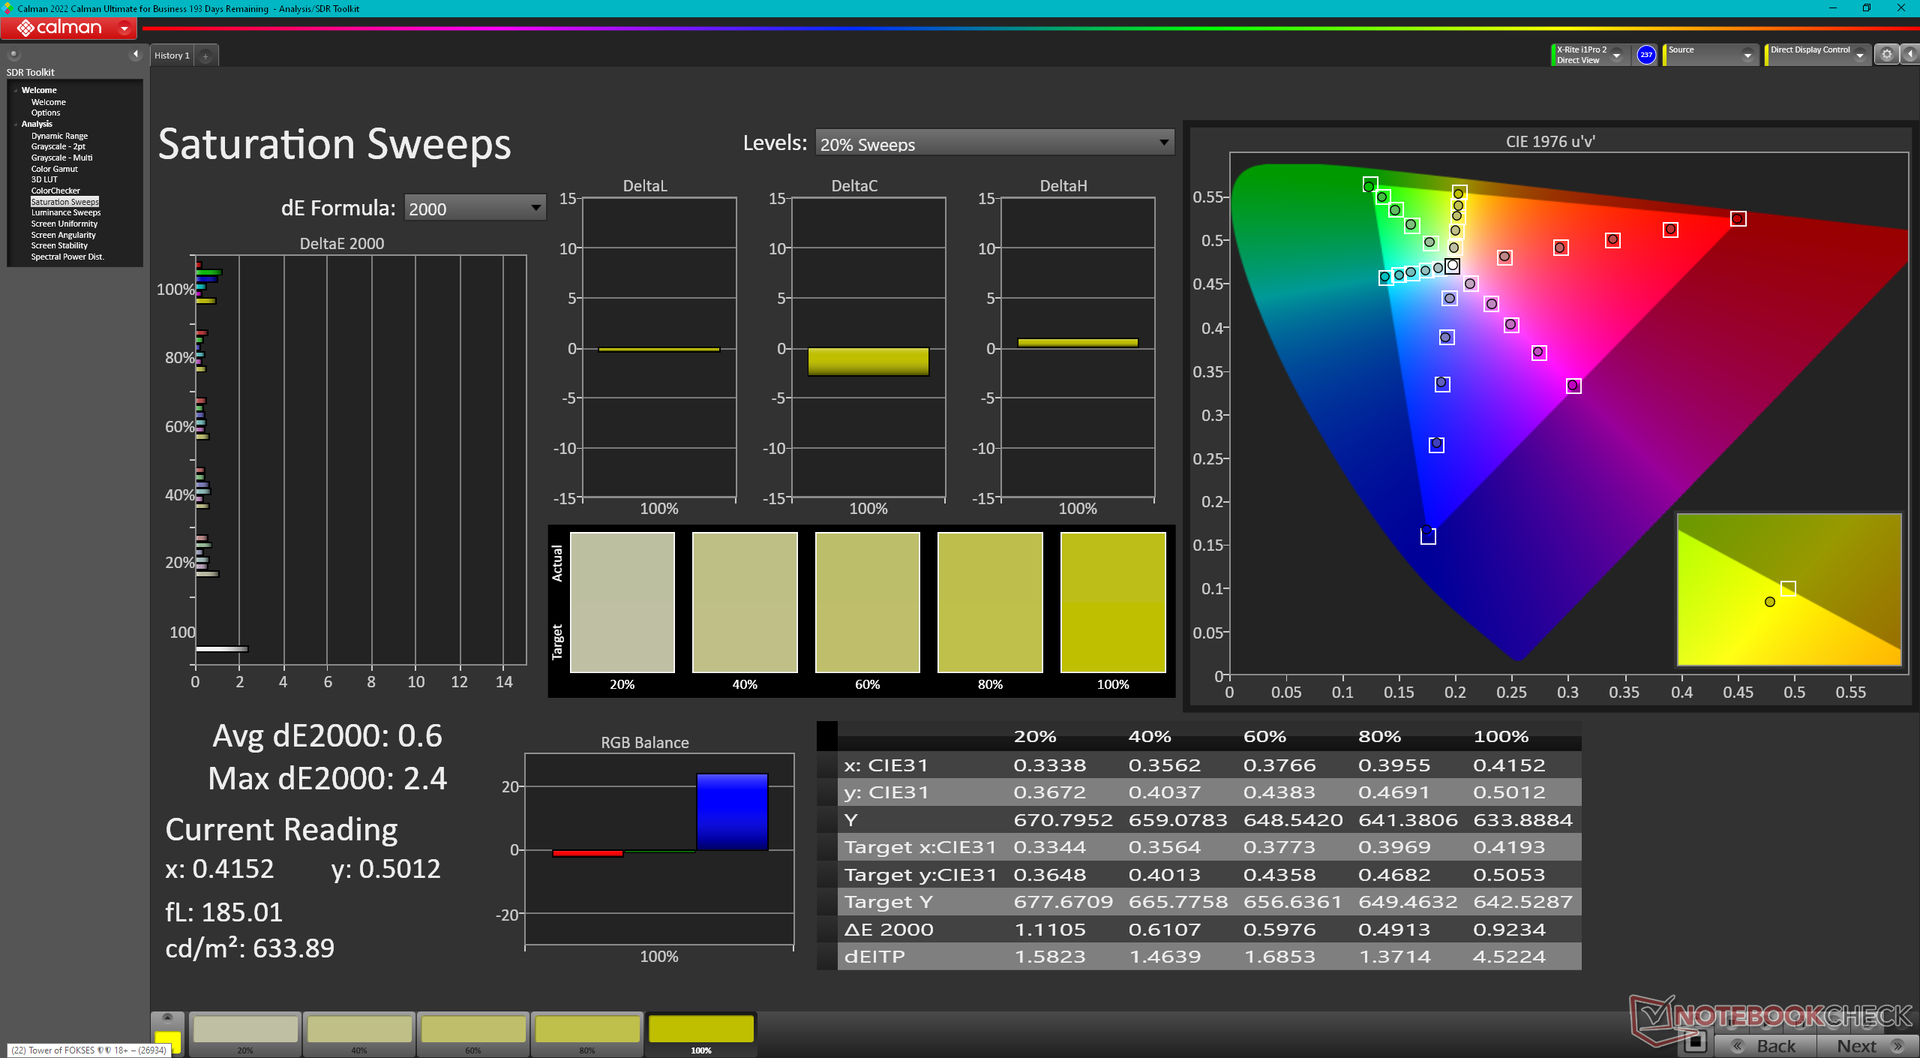
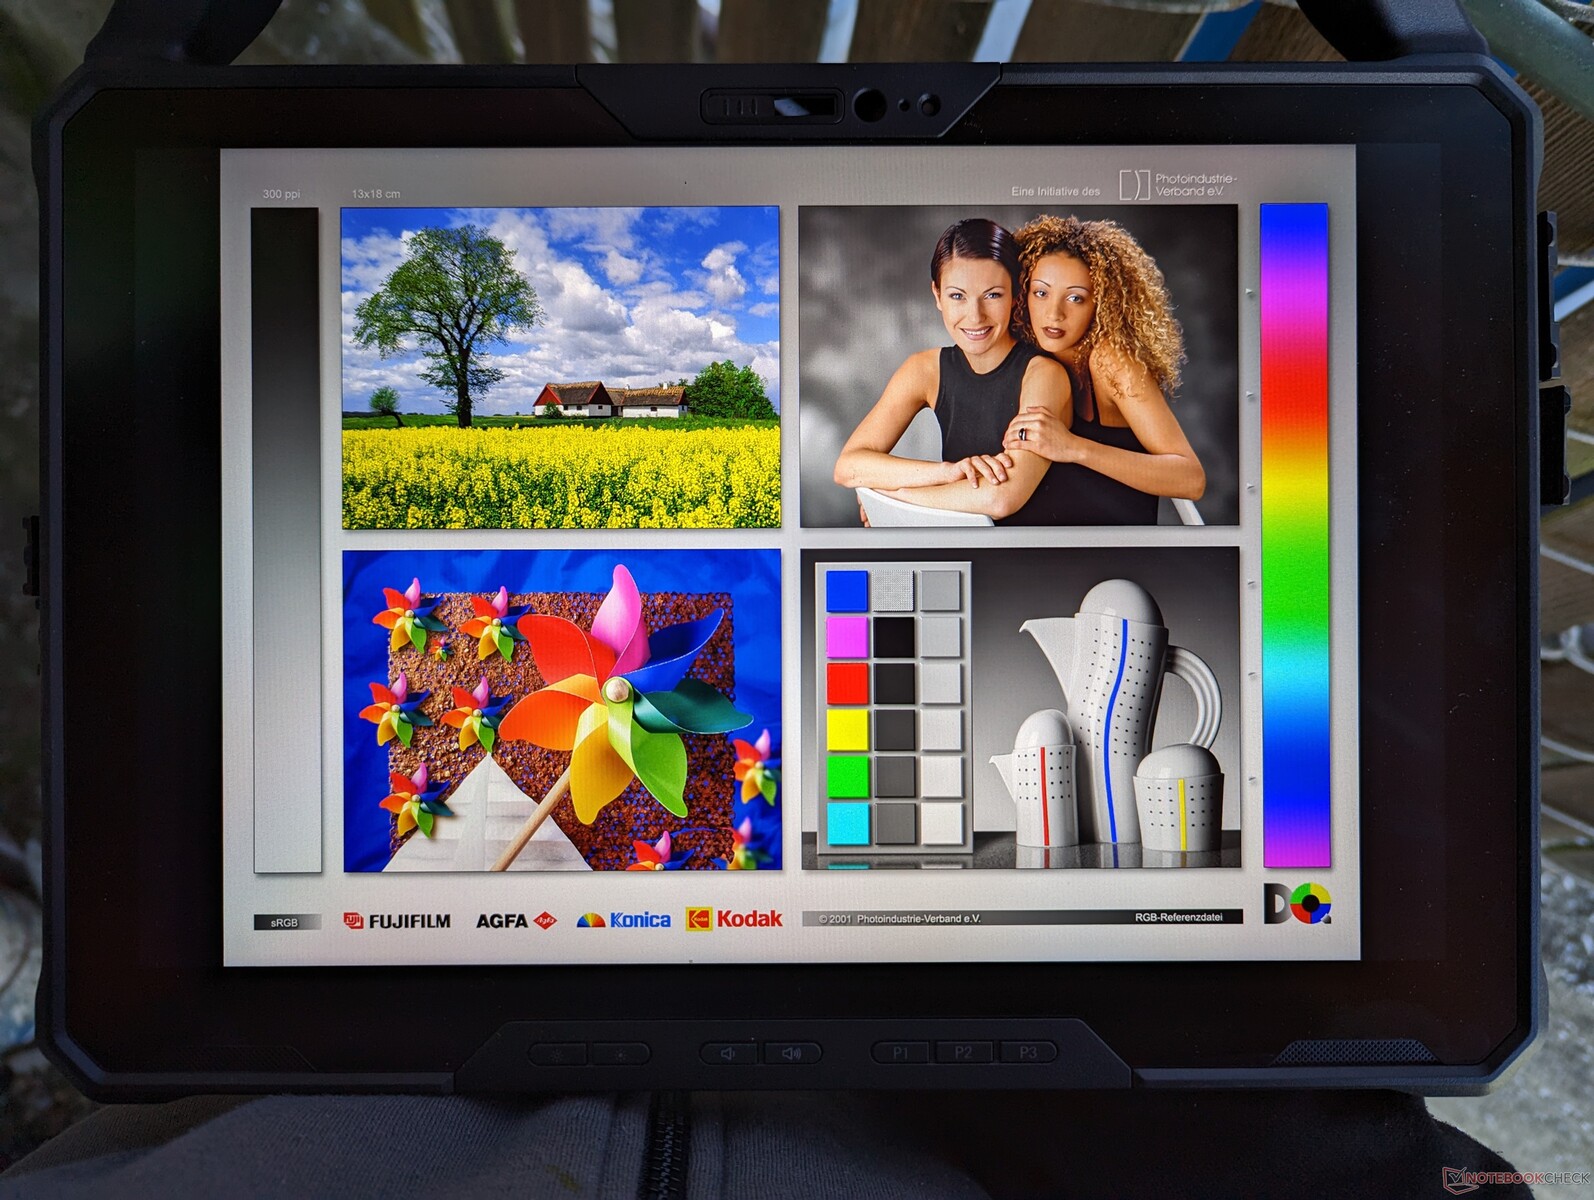
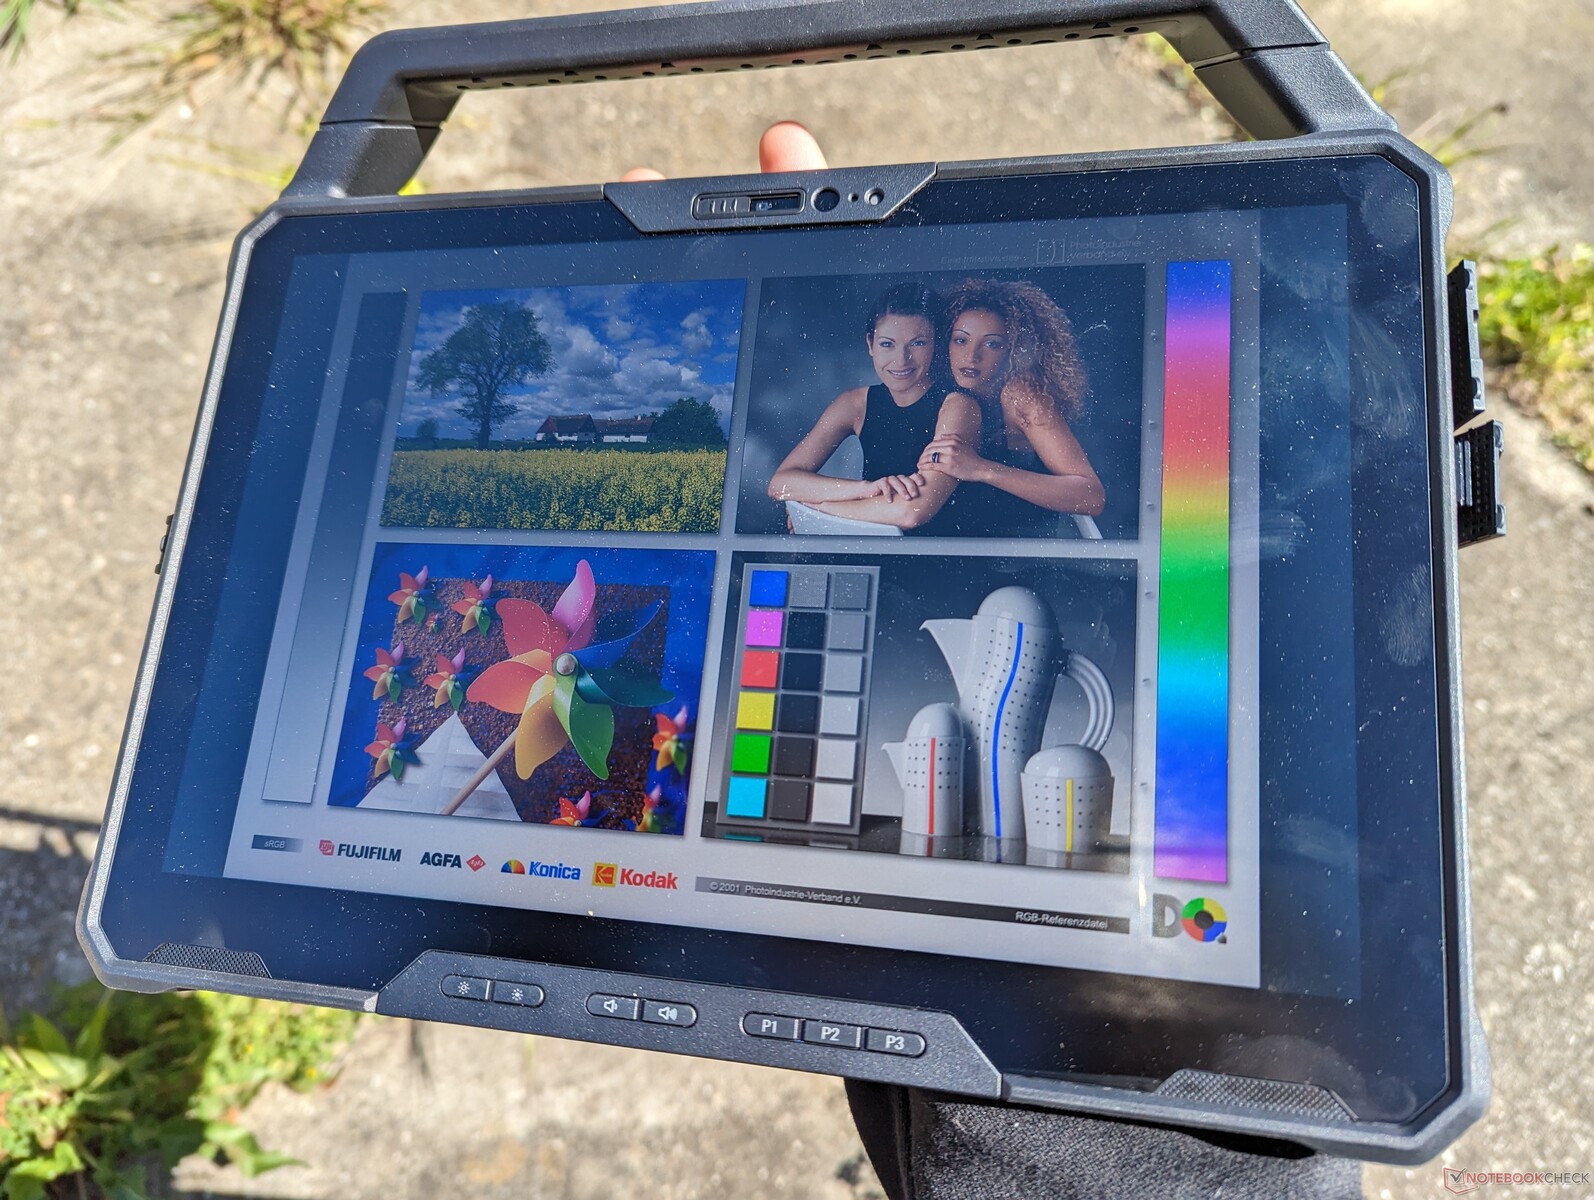
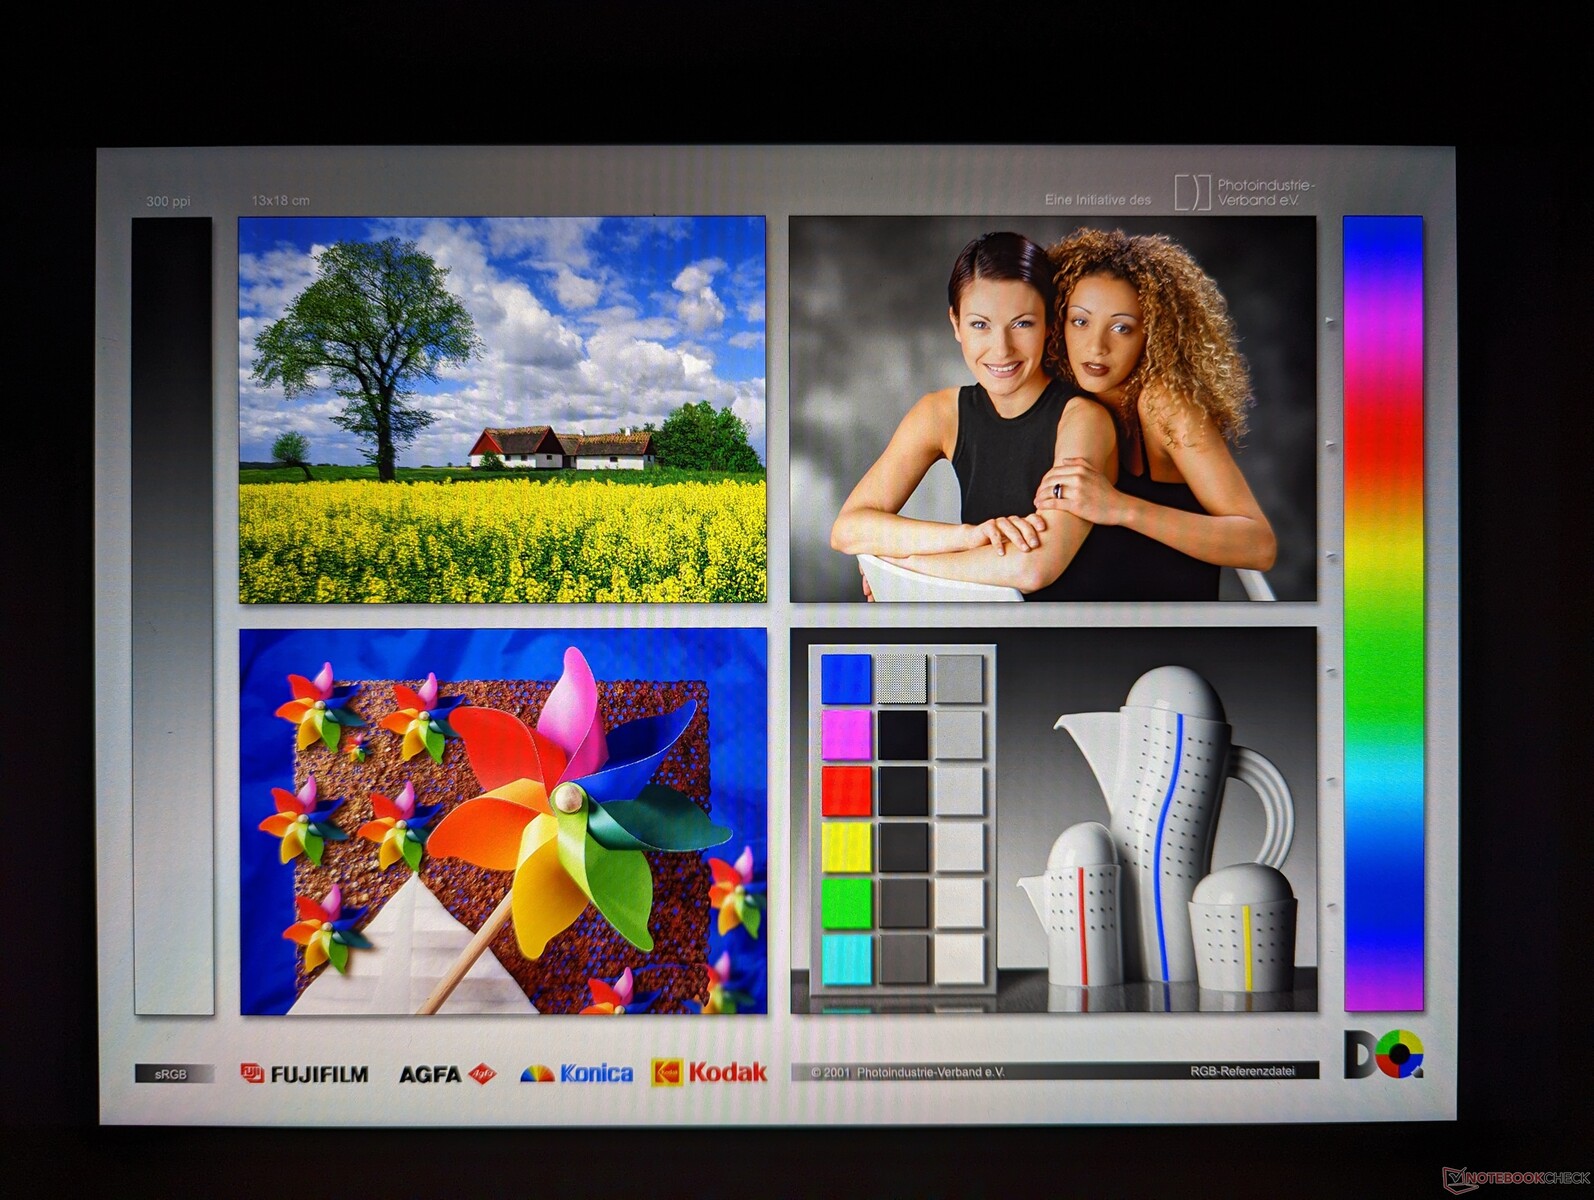
显示器 - 1200尼特和全sRGB覆盖率
Latitude 7230 Rugged是同类产品和尺寸中为数不多的提供>95%sRGB的设备之一,以获得更准确和鲜艳的色彩。黑-白和灰-灰的响应时间也相当快,可以减少明显的重影。亮度控制没有脉宽调制,这意味着你可以在非常低的亮度水平上使用这款平板电脑,而不会出现眼疲劳或明显的闪烁。这是我们在坚固型平板电脑上看到的最好的显示屏之一。
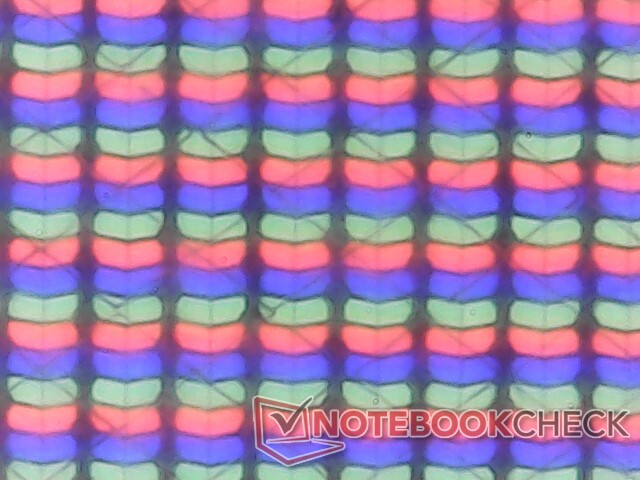
该显示器最大的缺点是它的颗粒感,尽管它有出色的色彩和明亮的背光。与消费者平板电脑或笔记本电脑上的更清晰的屏幕相比,Latitude 7230 Rugged上的触摸屏处于更厚的玻璃和保护层之下,最终影响了图像质量。然而,对于目标受众来说,超级清晰的图片通常不是优先事项。
| |||||||||||||||||||||||||
Brightness Distribution: 82 %
Center on Battery: 1326.7 cd/m²
Contrast: 1561:1 (Black: 0.85 cd/m²)
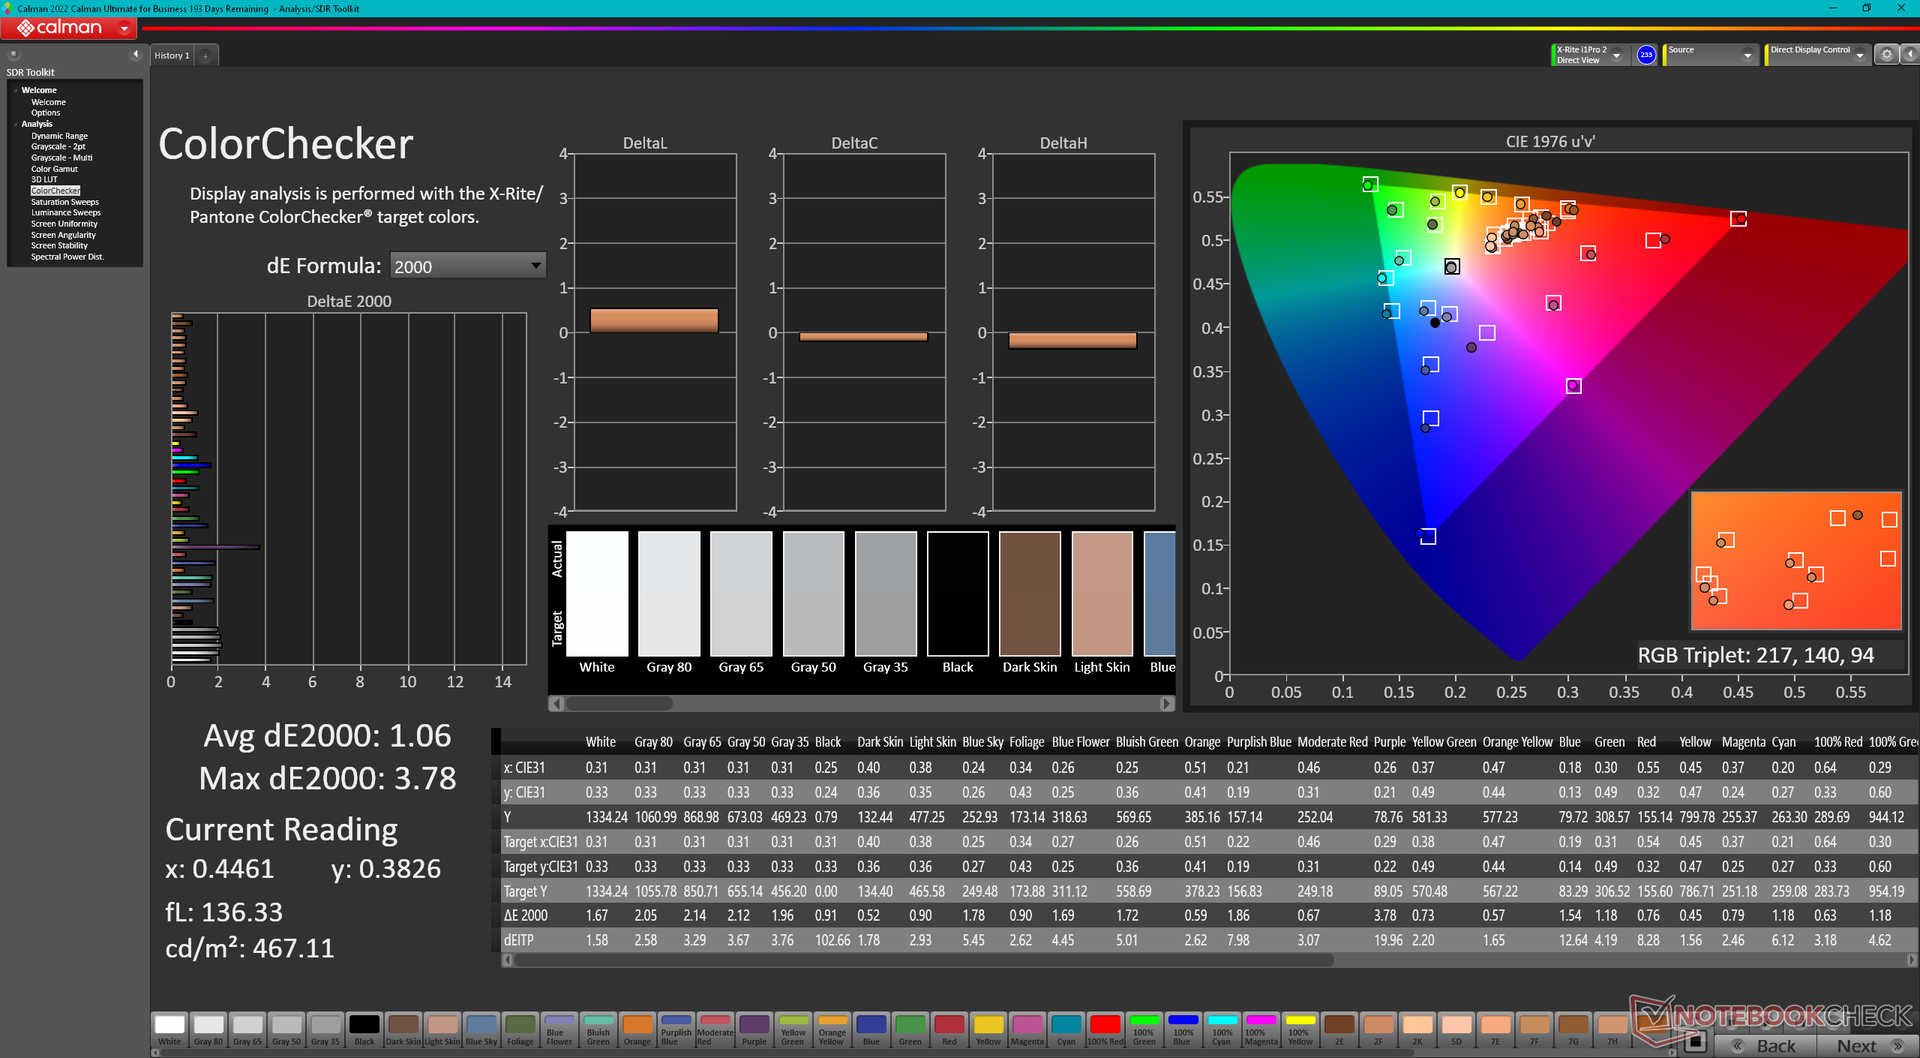
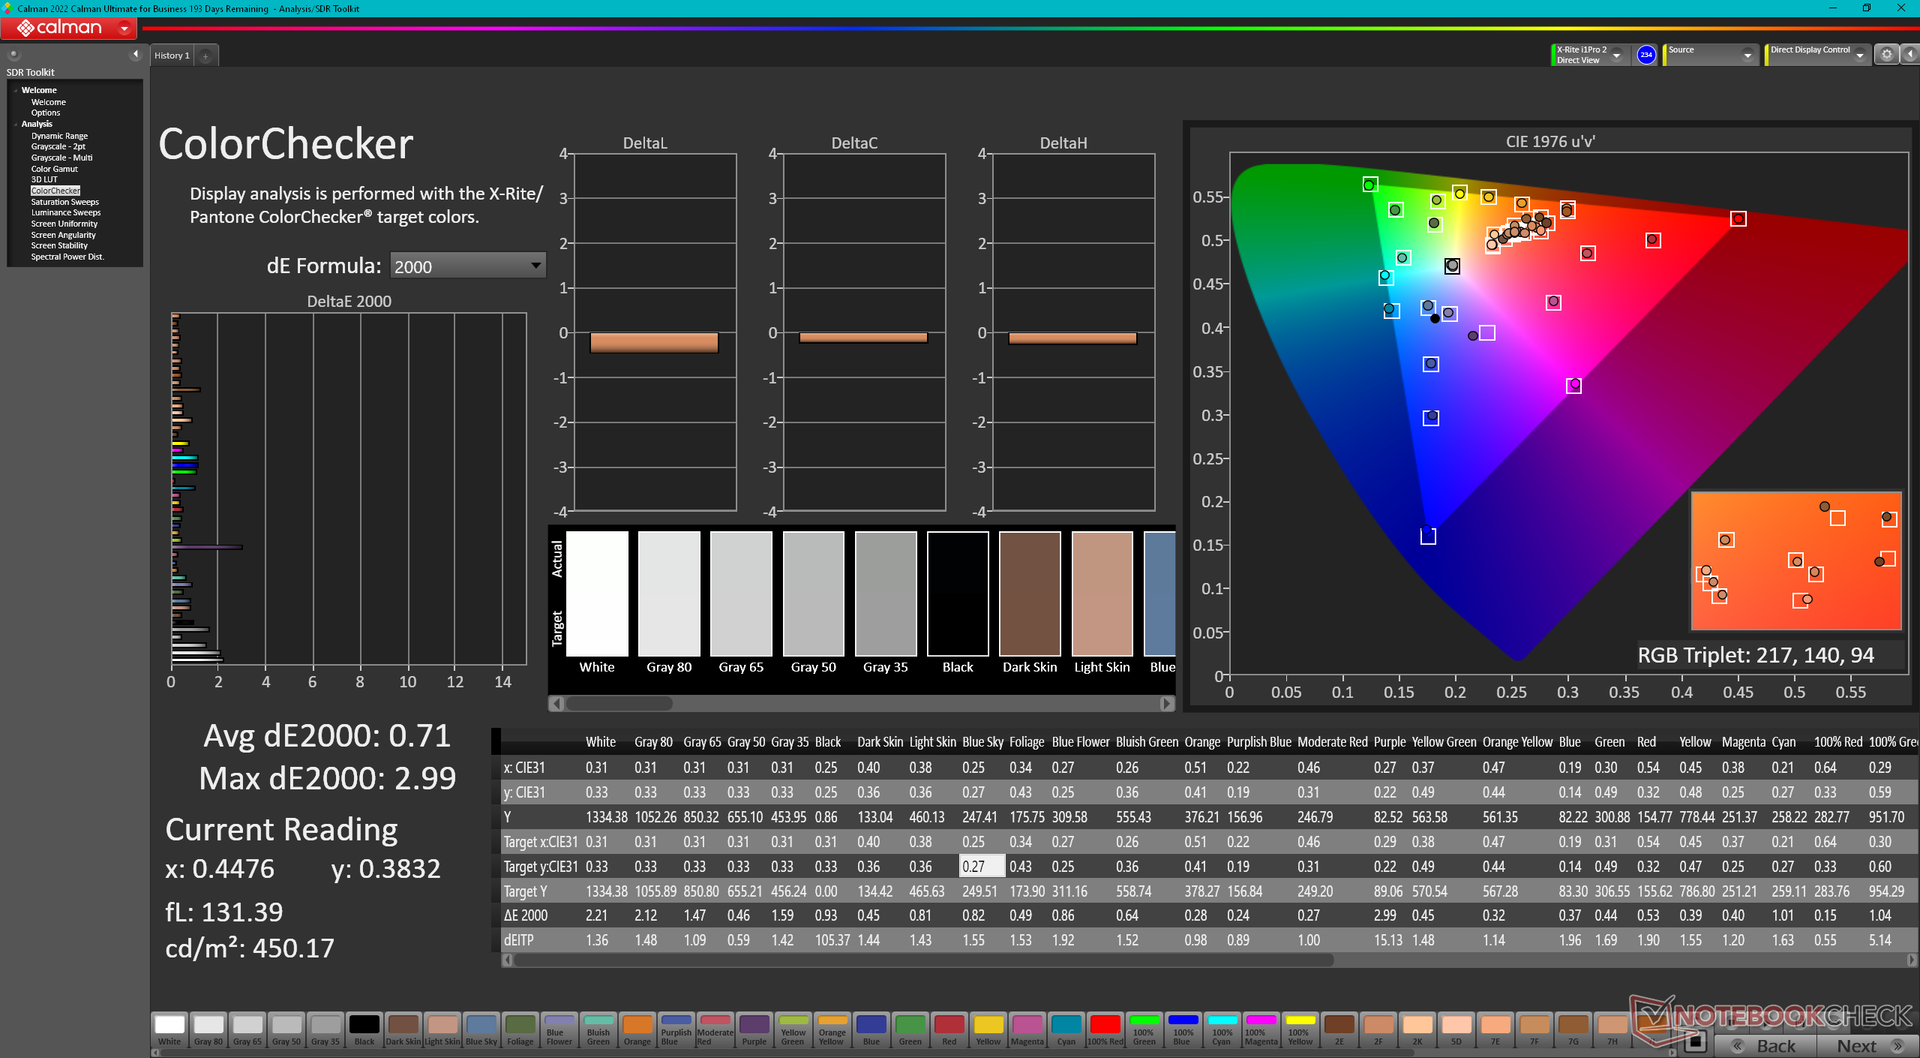
ΔE ColorChecker Calman: 1.06 | ∀{0.5-29.43 Ø4.72}
calibrated: 0.71
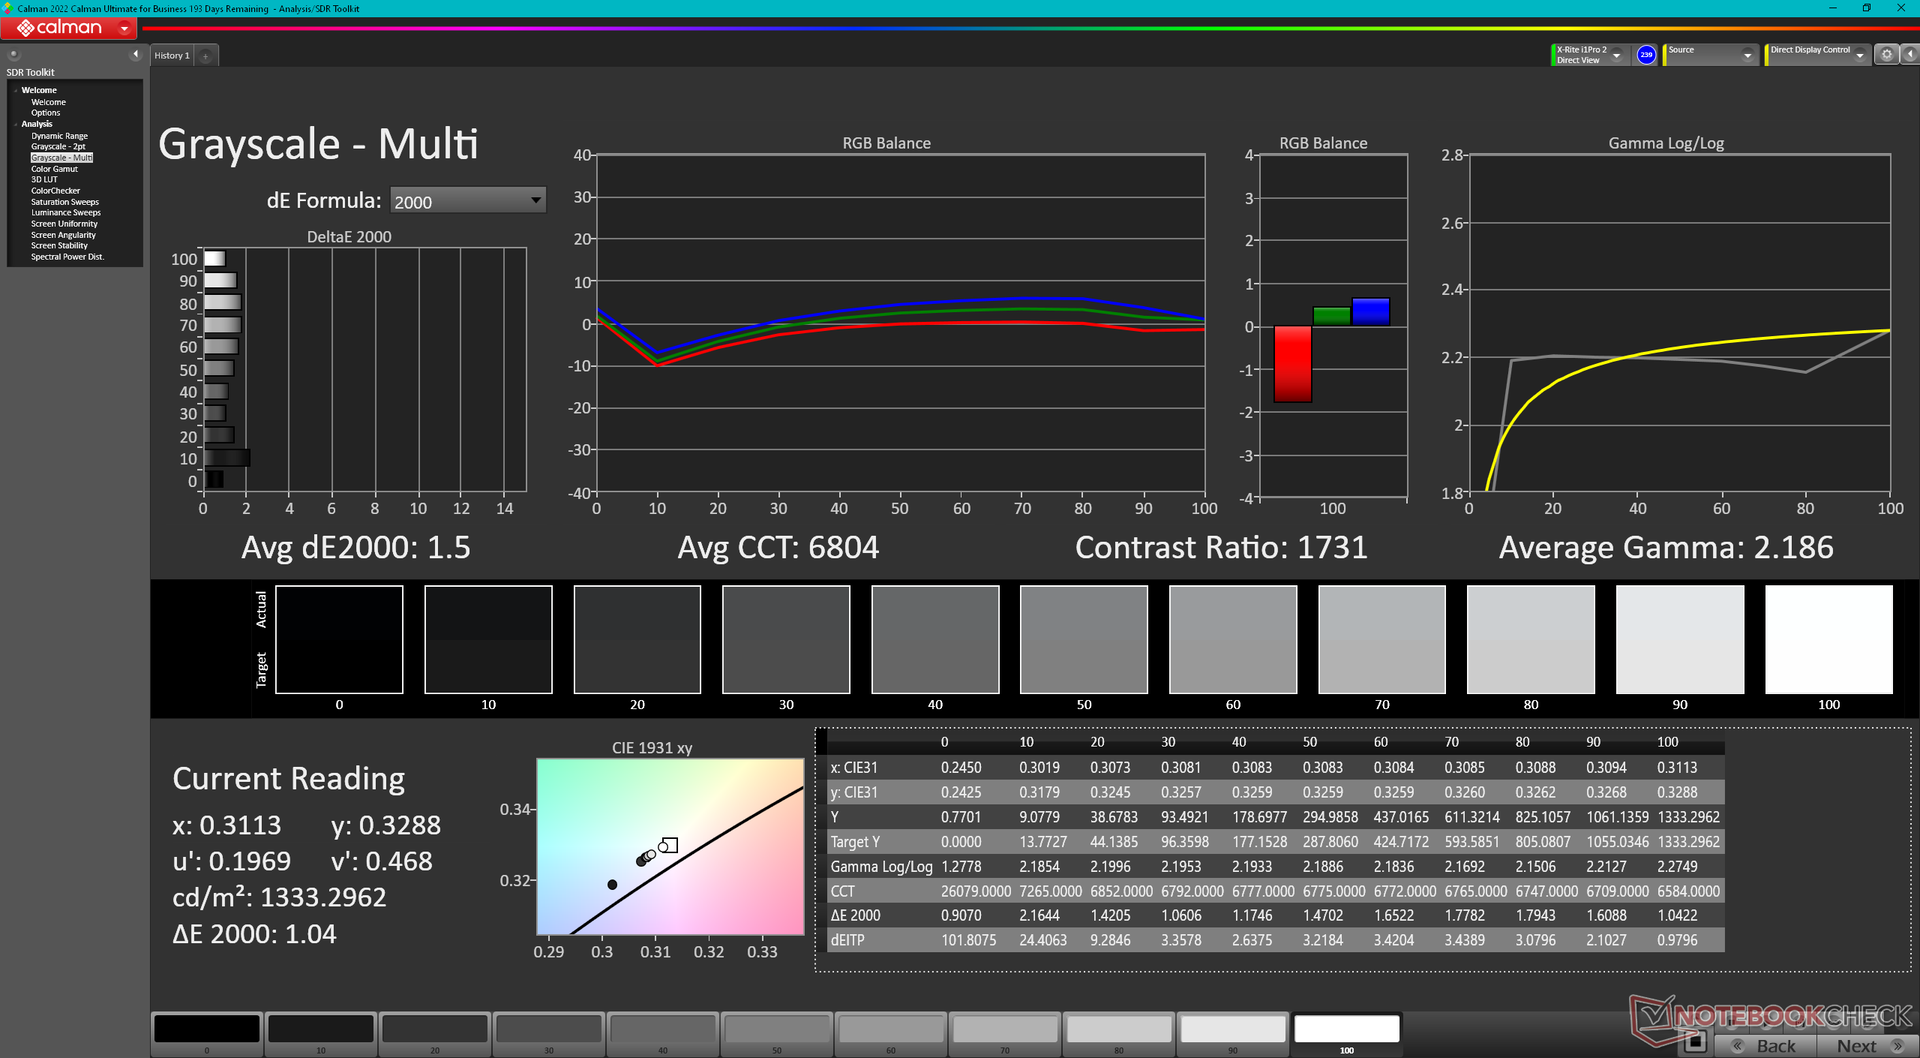
ΔE Greyscale Calman: 1.5 | ∀{0.09-98 Ø4.97}
68.4% AdobeRGB 1998 (Argyll 3D)
96.1% sRGB (Argyll 3D)
66.2% Display P3 (Argyll 3D)
Gamma: 2.19
CCT: 6804 K
| Dell Latitude 7230 Rugged Extreme Sharp LQ120N1, IPS, 1920x1200, 12" | Dell Latitude 7330 Rugged Extreme Sharp LQ133M1, IPS, 1920x1080, 13.3" | Panasonic Toughbook 40 InfoVision M140NWF5 R3, IPS, 1920x1080, 14" | Getac B360 AU Optronics AUO572D, IPS, 1920x1080, 13.3" | Acer Enduro Urban N3 EUN314 XR140EA6T, IPS, 1920x1080, 14" | Durabook S14I KD140N0730A01, TN, 1920x1080, 14" | |
|---|---|---|---|---|---|---|
| Display | 1% | -45% | -24% | -4% | -33% | |
| Display P3 Coverage (%) | 66.2 | 67.1 1% | 35.8 -46% | 51.3 -23% | 63.5 -4% | 43.55 -34% |
| sRGB Coverage (%) | 96.1 | 98.2 2% | 53.8 -44% | 72 -25% | 91.9 -4% | 65.4 -32% |
| AdobeRGB 1998 Coverage (%) | 68.4 | 69 1% | 37 -46% | 52.2 -24% | 65.5 -4% | 45 -34% |
| Response Times | -141% | -60% | -58% | -89% | 16% | |
| Response Time Grey 50% / Grey 80% * (ms) | 28.4 ? | 74.4 ? -162% | 50.4 ? -77% | 33 ? -16% | 56 ? -97% | 30.4 ? -7% |
| Response Time Black / White * (ms) | 19.4 ? | 42.4 ? -119% | 27.6 ? -42% | 38.8 ? -100% | 35.2 ? -81% | 11.8 ? 39% |
| PWM Frequency (Hz) | 694.4 ? | 870 ? | 1000 ? | 304.9 ? | ||
| Screen | -16% | -118% | -216% | -154% | -348% | |
| Brightness middle (cd/m²) | 1326.7 | 1414.1 7% | 1284.3 -3% | 1505.6 13% | 487.8 -63% | 1180.7 -11% |
| Brightness (cd/m²) | 1193 | 1282 7% | 1289 8% | 1383 16% | 464 -61% | 1102 -8% |
| Brightness Distribution (%) | 82 | 84 2% | 82 0% | 86 5% | 89 9% | 89 9% |
| Black Level * (cd/m²) | 0.85 | 0.83 2% | 0.89 -5% | 0.95 -12% | 0.48 44% | 1.91 -125% |
| Contrast (:1) | 1561 | 1704 9% | 1443 -8% | 1585 2% | 1016 -35% | 618 -60% |
| Colorchecker dE 2000 * | 1.06 | 1.99 -88% | 4.67 -341% | 9.81 -825% | 6.51 -514% | 13.45 -1169% |
| Colorchecker dE 2000 max. * | 3.78 | 3.75 1% | 19.85 -425% | 16.64 -340% | 11.36 -201% | 22.52 -496% |
| Colorchecker dE 2000 calibrated * | 0.71 | 0.72 -1% | 2.21 -211% | 1.44 -103% | 1.77 -149% | 3.19 -349% |
| Greyscale dE 2000 * | 1.5 | 2.8 -87% | 2.7 -80% | 12 -700% | 7.8 -420% | 15.4 -927% |
| Gamma | 2.19 100% | 2.06 107% | 1.97 112% | 1.98 111% | 2.28 96% | 1.97 112% |
| CCT | 6804 96% | 6775 96% | 6222 104% | 4838 134% | 8102 80% | 21134 31% |
| Color Space (Percent of AdobeRGB 1998) (%) | 41.6 | |||||
| Color Space (Percent of sRGB) (%) | 65.5 | |||||
| Total Average (Program / Settings) | -52% /
-30% | -74% /
-94% | -99% /
-152% | -82% /
-113% | -122% /
-229% |
* ... smaller is better
该显示器开箱即被很好地校准,平均灰度和彩色deltaE值分别只有1.5和1.06。试图用X-Rite色度计进一步校准它,并不能显著提高精确度,因此没有必要进行最终用户校准。

Display Response Times
| ↔ Response Time Black to White | ||
|---|---|---|
| 19.4 ms ... rise ↗ and fall ↘ combined | ↗ 9.7 ms rise | 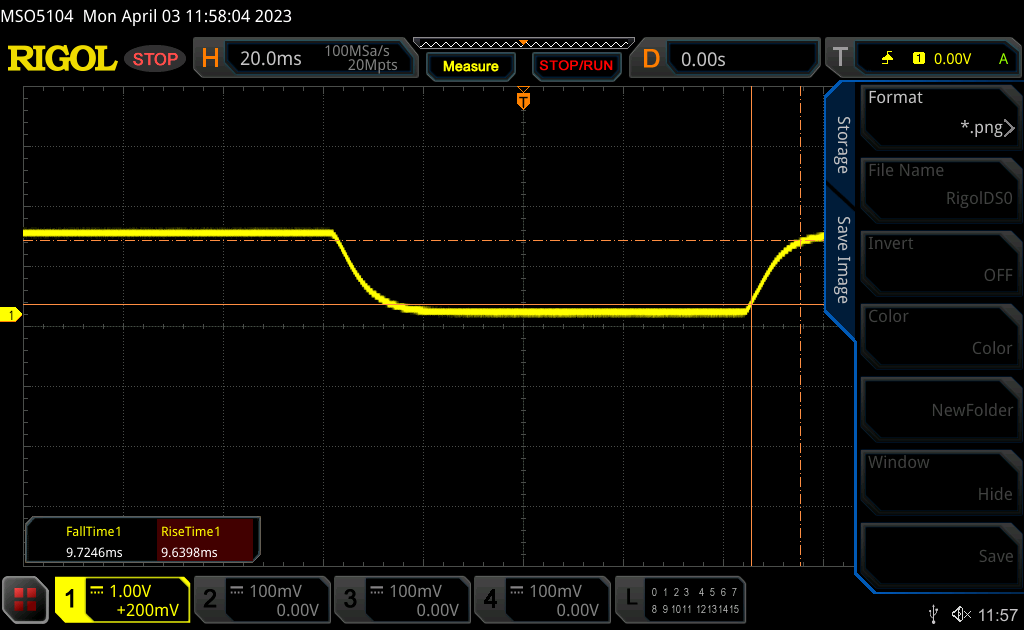 |
| ↘ 9.7 ms fall | ||
| The screen shows good response rates in our tests, but may be too slow for competitive gamers. In comparison, all tested devices range from 0.1 (minimum) to 240 (maximum) ms. » 43 % of all devices are better. This means that the measured response time is similar to the average of all tested devices (19.8 ms). | ||
| ↔ Response Time 50% Grey to 80% Grey | ||
| 28.4 ms ... rise ↗ and fall ↘ combined | ↗ 13.8 ms rise | 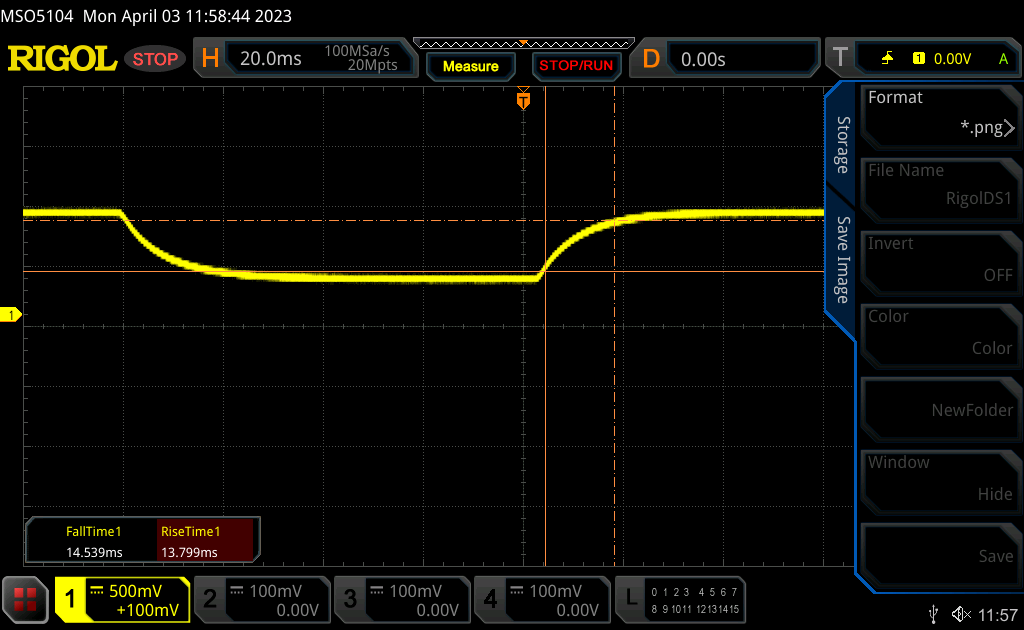 |
| ↘ 14.6 ms fall | ||
| The screen shows relatively slow response rates in our tests and may be too slow for gamers. In comparison, all tested devices range from 0.165 (minimum) to 636 (maximum) ms. » 38 % of all devices are better. This means that the measured response time is similar to the average of all tested devices (31 ms). | ||
Screen Flickering / PWM (Pulse-Width Modulation)
| Screen flickering / PWM not detected | 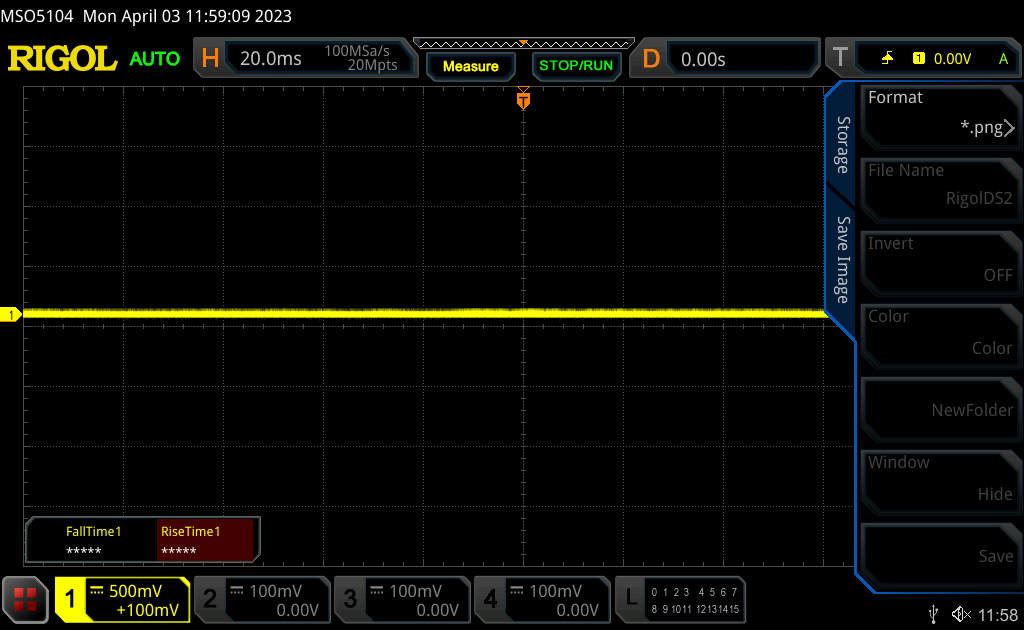 | ||
In comparison: 52 % of all tested devices do not use PWM to dim the display. If PWM was detected, an average of 7778 (minimum: 5 - maximum: 343500) Hz was measured. | |||
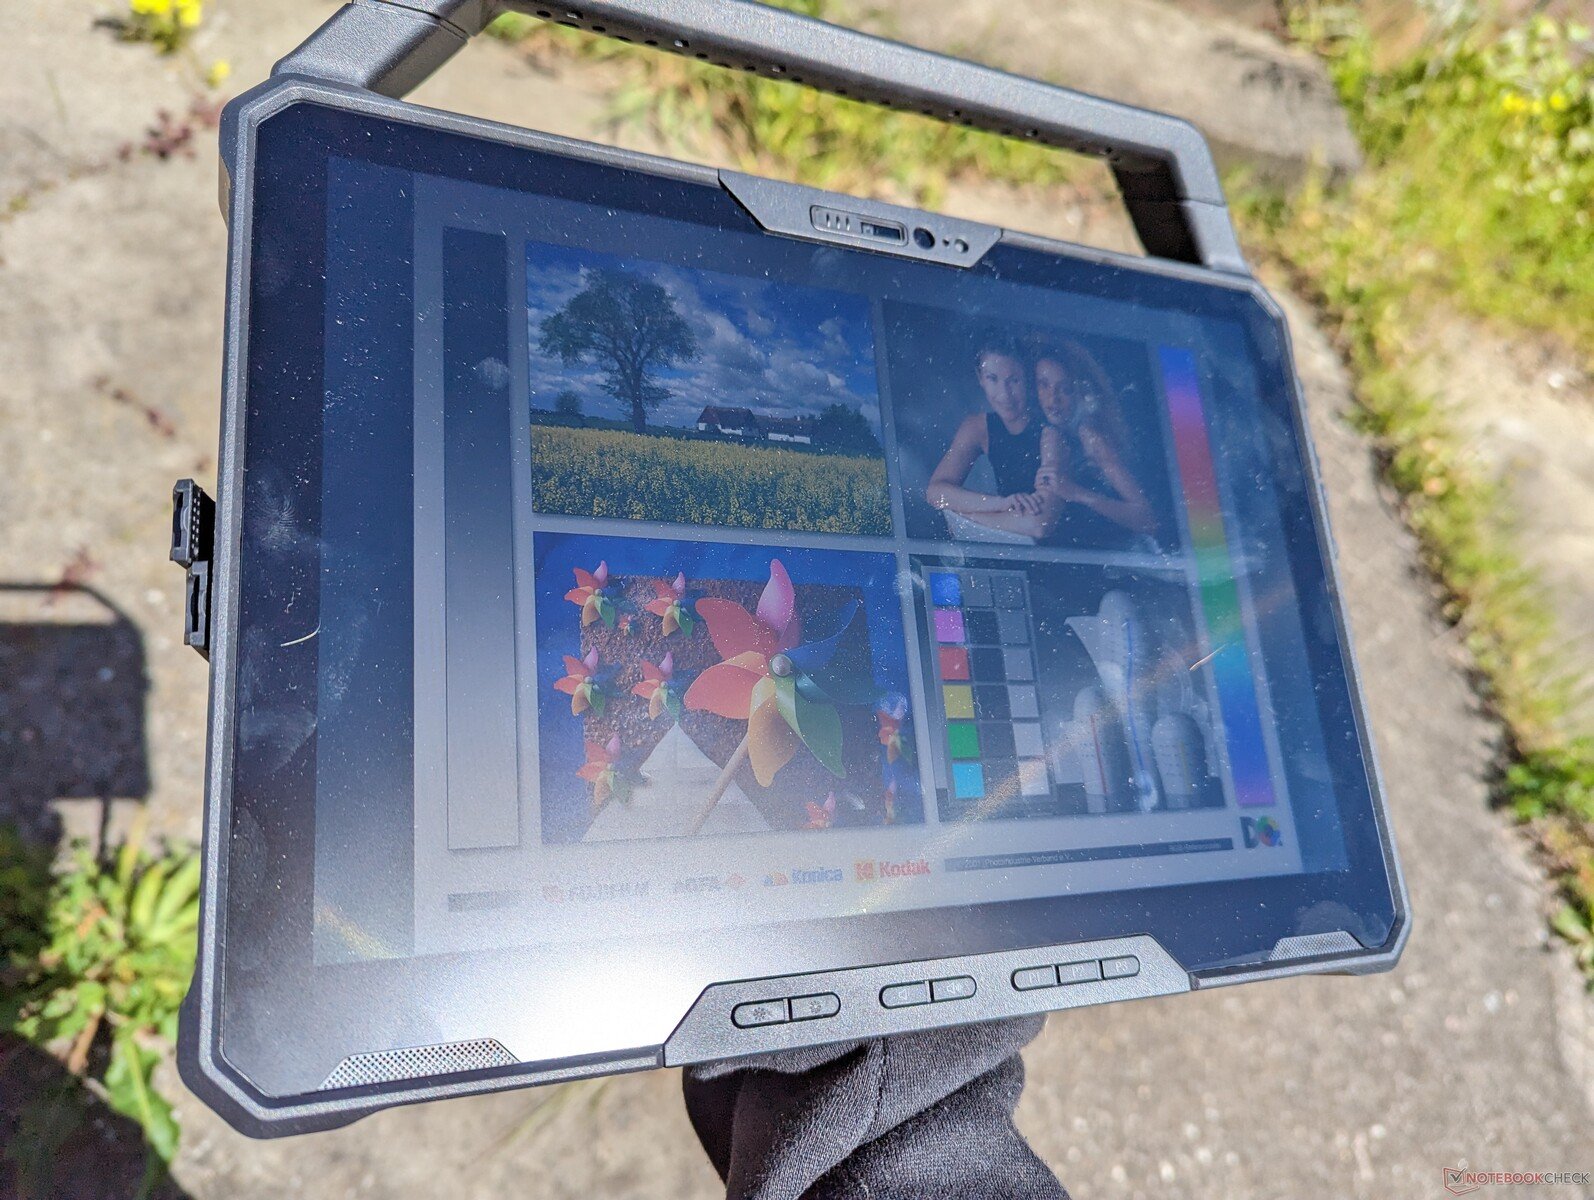
室外能见度非常好,因为显示屏的亮度远远超过1000尼特,或比典型的消费类平板电脑或笔记本电脑的亮度高2倍以上。然而,仍然会出现一些眩光和冲淡的颜色,因此应尽可能避免阳光直射,以最大限度地提高图像质量。
业绩

测试条件
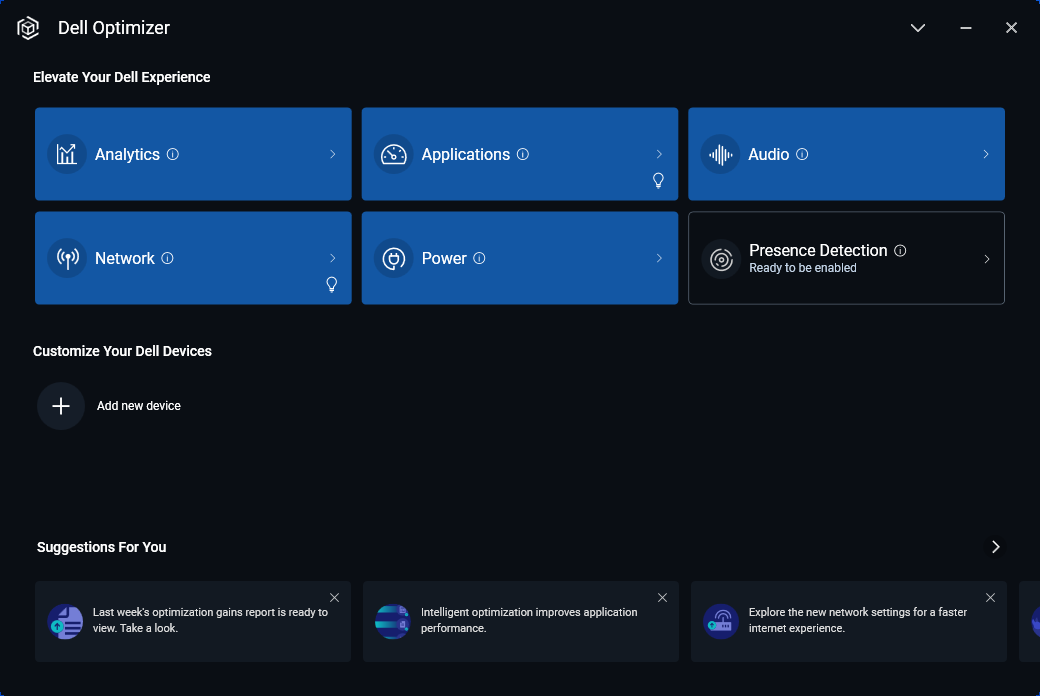
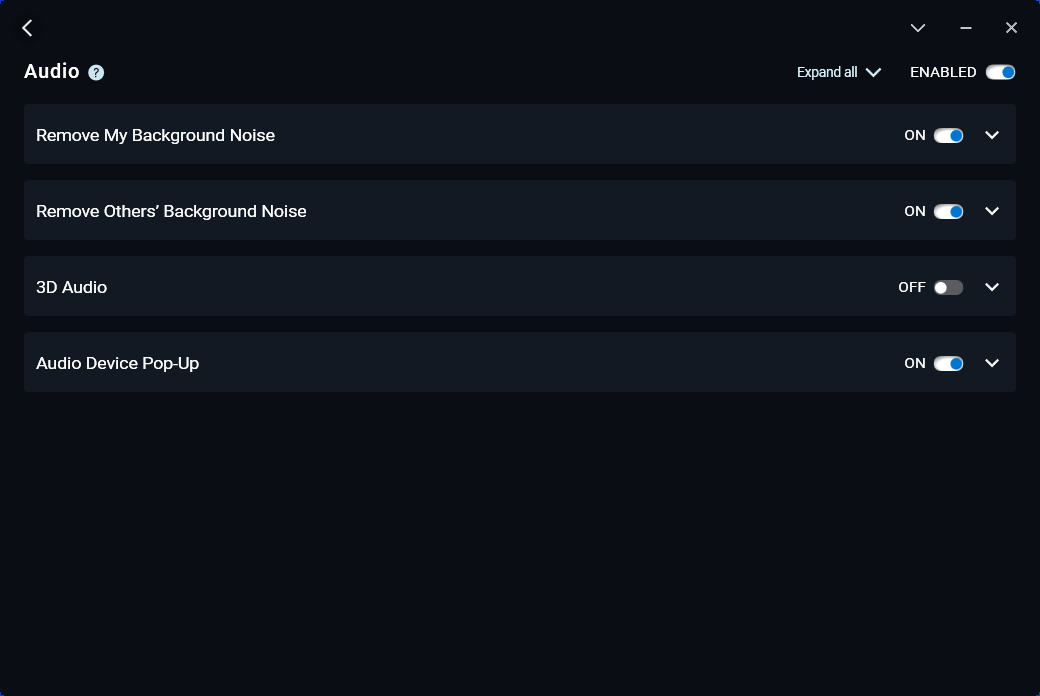
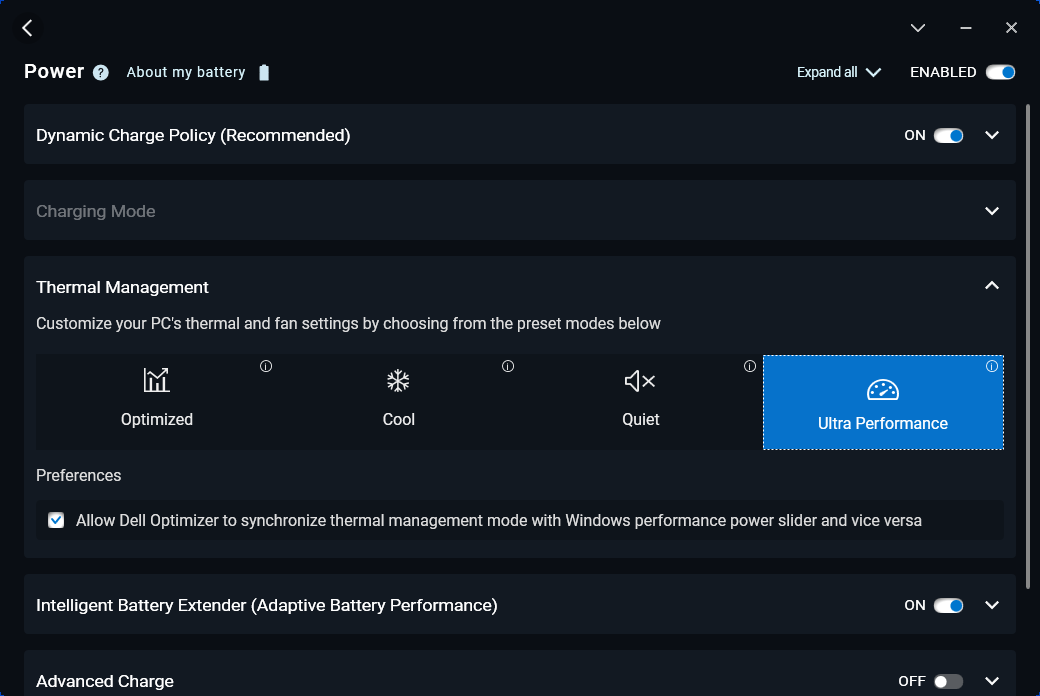
在运行以下任何基准测试之前,我们通过预装的戴尔优化软件将我们的设备设置为超性能模式。用户应该习惯于使用Optimizer,因为它可以控制该机型的关键方面,包括电源配置文件、音频、麦克风和无线连接。
该机型不支持Dell Presence Detection。
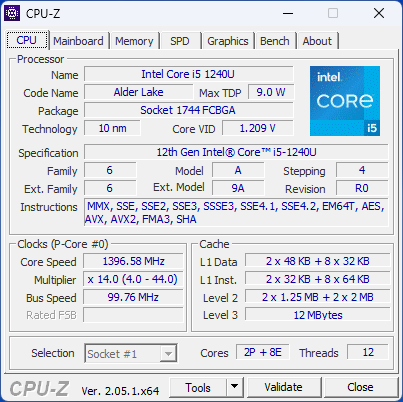
处理器 - 和酷睿i7-1260U一样快
CPU性能非常好,特别是在令人沮丧的 酷睿i7-1260U后,我们曾在 Latitude 7330.多线程性能明显快于流行的 酷睿i7-1165G7或 i7-1185G7昔日为大多数超极本和强固型设备提供动力。
也许在选择酷睿i5-1240U时需要记住的最重要方面是 酷睿i5-1240U或酷睿i7-1260U之间进行选择时,最重要的一点是,它们之间的原始处理器性能几乎是相同的。相反,它们的区别主要在于集成图形性能。如果你需要额外的GPU能力,那么酷睿i7将是最好的选择。否则,当涉及到单线程和多线程的CPU工作负载时,这两款处理器的性能不相上下。
Cinebench R15 Multi Loop
Cinebench R23: Multi Core | Single Core
Cinebench R20: CPU (Multi Core) | CPU (Single Core)
Cinebench R15: CPU Multi 64Bit | CPU Single 64Bit
Blender: v2.79 BMW27 CPU
7-Zip 18.03: 7z b 4 | 7z b 4 -mmt1
Geekbench 5.5: Multi-Core | Single-Core
HWBOT x265 Benchmark v2.2: 4k Preset
LibreOffice : 20 Documents To PDF
R Benchmark 2.5: Overall mean
* ... smaller is better
| Blender | |
| v3.3 Classroom HIP/AMD | |
| Lenovo ThinkPad P14s G3 AMD 21J6S05000 | |
| Lenovo ThinkPad P14s G3 AMD 21J6S05000 | |
| v3.3 Classroom OPTIX/RTX | |
| HP ZBook Firefly 14 G9-6B8A2EA | |
| v3.3 Classroom CUDA | |
| HP ZBook Firefly 14 G9-6B8A2EA | |
| v3.3 Classroom CPU | |
| Dell Latitude 7230 Rugged Extreme | |
| HP ProBook 440 G9-5Y3Z3EA | |
| HP ZBook Firefly 14 G9-6B8A2EA | |
| HP EliteBook 840 G9 | |
| Asus ExpertBook B5 Flip B5602FBN | |
| Lenovo ThinkPad P14s G3 AMD 21J6S05000 | |
* ... smaller is better
AIDA64: FP32 Ray-Trace | FPU Julia | CPU SHA3 | CPU Queen | FPU SinJulia | FPU Mandel | CPU AES | CPU ZLib | FP64 Ray-Trace | CPU PhotoWorxx
| Performance rating | |
| Dell Latitude 7330 Rugged Extreme | |
| Acer Enduro Urban N3 EUN314 | |
| Dell Latitude 7230 Rugged Extreme | |
| Average Intel Core i5-1240U | |
| Panasonic Toughbook 40 | |
| Getac B360 | |
| Durabook S14I | |
| AIDA64 / FP32 Ray-Trace | |
| Dell Latitude 7330 Rugged Extreme | |
| Acer Enduro Urban N3 EUN314 | |
| Dell Latitude 7230 Rugged Extreme | |
| Average Intel Core i5-1240U (n=1) | |
| Panasonic Toughbook 40 | |
| Durabook S14I | |
| Getac B360 | |
| AIDA64 / FPU Julia | |
| Dell Latitude 7230 Rugged Extreme | |
| Average Intel Core i5-1240U (n=1) | |
| Dell Latitude 7330 Rugged Extreme | |
| Acer Enduro Urban N3 EUN314 | |
| Getac B360 | |
| Panasonic Toughbook 40 | |
| Durabook S14I | |
| AIDA64 / CPU SHA3 | |
| Dell Latitude 7330 Rugged Extreme | |
| Acer Enduro Urban N3 EUN314 | |
| Dell Latitude 7230 Rugged Extreme | |
| Average Intel Core i5-1240U (n=1) | |
| Panasonic Toughbook 40 | |
| Durabook S14I | |
| Getac B360 | |
| AIDA64 / CPU Queen | |
| Getac B360 | |
| Dell Latitude 7330 Rugged Extreme | |
| Acer Enduro Urban N3 EUN314 | |
| Durabook S14I | |
| Dell Latitude 7230 Rugged Extreme | |
| Average Intel Core i5-1240U (n=1) | |
| Panasonic Toughbook 40 | |
| AIDA64 / FPU SinJulia | |
| Dell Latitude 7330 Rugged Extreme | |
| Acer Enduro Urban N3 EUN314 | |
| Getac B360 | |
| Panasonic Toughbook 40 | |
| Dell Latitude 7230 Rugged Extreme | |
| Average Intel Core i5-1240U (n=1) | |
| Durabook S14I | |
| AIDA64 / FPU Mandel | |
| Dell Latitude 7330 Rugged Extreme | |
| Acer Enduro Urban N3 EUN314 | |
| Dell Latitude 7230 Rugged Extreme | |
| Average Intel Core i5-1240U (n=1) | |
| Panasonic Toughbook 40 | |
| Durabook S14I | |
| Getac B360 | |
| AIDA64 / CPU AES | |
| Dell Latitude 7330 Rugged Extreme | |
| Acer Enduro Urban N3 EUN314 | |
| Durabook S14I | |
| Dell Latitude 7230 Rugged Extreme | |
| Average Intel Core i5-1240U (n=1) | |
| Panasonic Toughbook 40 | |
| Getac B360 | |
| AIDA64 / CPU ZLib | |
| Dell Latitude 7230 Rugged Extreme | |
| Average Intel Core i5-1240U (n=1) | |
| Dell Latitude 7330 Rugged Extreme | |
| Acer Enduro Urban N3 EUN314 | |
| Panasonic Toughbook 40 | |
| Getac B360 | |
| Durabook S14I | |
| AIDA64 / FP64 Ray-Trace | |
| Dell Latitude 7330 Rugged Extreme | |
| Acer Enduro Urban N3 EUN314 | |
| Dell Latitude 7230 Rugged Extreme | |
| Average Intel Core i5-1240U (n=1) | |
| Panasonic Toughbook 40 | |
| Durabook S14I | |
| Getac B360 | |
| AIDA64 / CPU PhotoWorxx | |
| Dell Latitude 7330 Rugged Extreme | |
| Dell Latitude 7230 Rugged Extreme | |
| Average Intel Core i5-1240U (n=1) | |
| Acer Enduro Urban N3 EUN314 | |
| Panasonic Toughbook 40 | |
| Getac B360 | |
| Durabook S14I | |
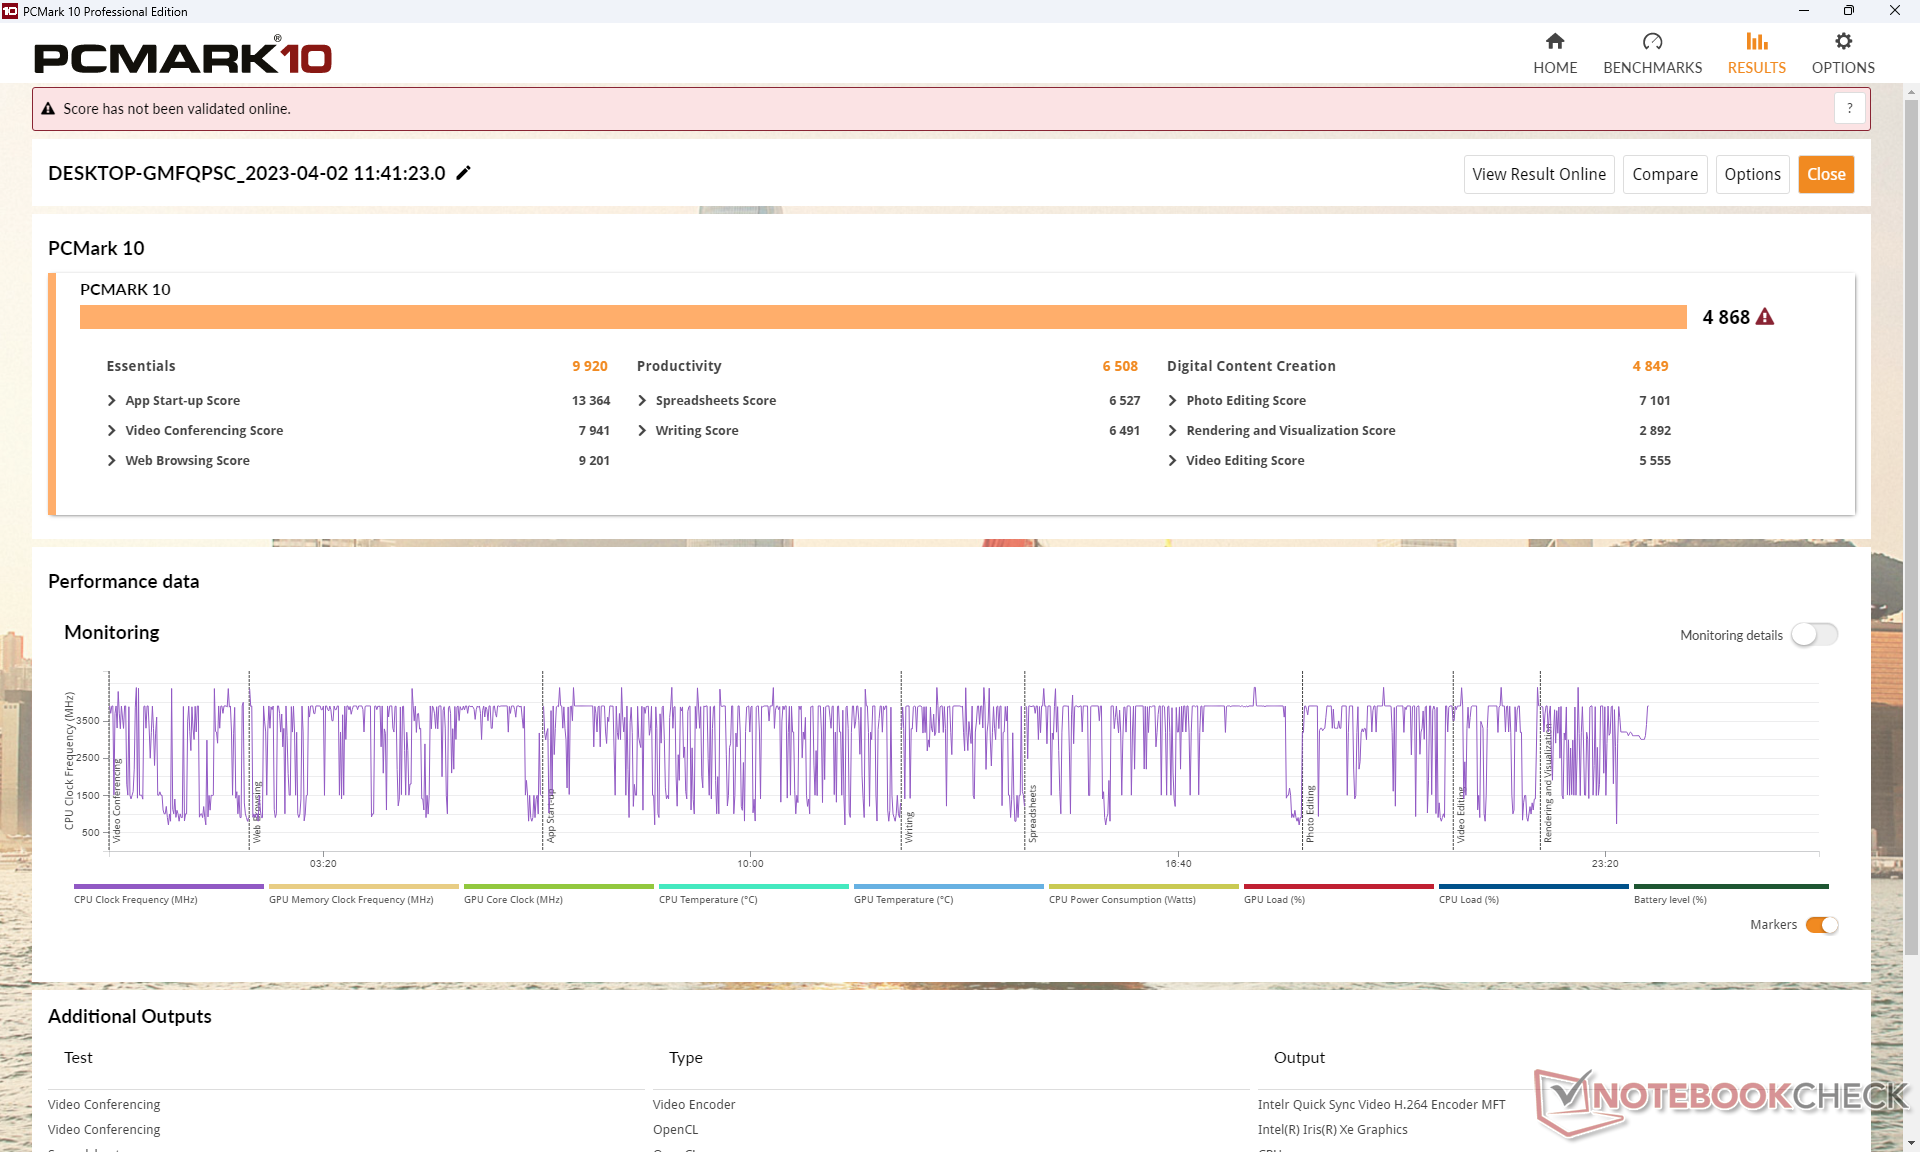
系统性能
CrossMark: Overall | Productivity | Creativity | Responsiveness
| PCMark 10 / Score | |
| Dell Latitude 7330 Rugged Extreme | |
| Panasonic Toughbook 40 | |
| Dell Latitude 7230 Rugged Extreme | |
| Average Intel Core i5-1240U, Intel Iris Xe Graphics G7 80EUs (n=1) | |
| Durabook S14I | |
| Acer Enduro Urban N3 EUN314 | |
| Getac B360 | |
| PCMark 10 / Essentials | |
| Dell Latitude 7330 Rugged Extreme | |
| Durabook S14I | |
| Dell Latitude 7230 Rugged Extreme | |
| Average Intel Core i5-1240U, Intel Iris Xe Graphics G7 80EUs (n=1) | |
| Panasonic Toughbook 40 | |
| Acer Enduro Urban N3 EUN314 | |
| Getac B360 | |
| PCMark 10 / Productivity | |
| Getac B360 | |
| Durabook S14I | |
| Dell Latitude 7330 Rugged Extreme | |
| Panasonic Toughbook 40 | |
| Dell Latitude 7230 Rugged Extreme | |
| Average Intel Core i5-1240U, Intel Iris Xe Graphics G7 80EUs (n=1) | |
| Acer Enduro Urban N3 EUN314 | |
| PCMark 10 / Digital Content Creation | |
| Dell Latitude 7330 Rugged Extreme | |
| Panasonic Toughbook 40 | |
| Acer Enduro Urban N3 EUN314 | |
| Dell Latitude 7230 Rugged Extreme | |
| Average Intel Core i5-1240U, Intel Iris Xe Graphics G7 80EUs (n=1) | |
| Durabook S14I | |
| Getac B360 | |
| CrossMark / Overall | |
| Dell Latitude 7230 Rugged Extreme | |
| Average Intel Core i5-1240U, Intel Iris Xe Graphics G7 80EUs (n=1) | |
| Panasonic Toughbook 40 | |
| CrossMark / Productivity | |
| Dell Latitude 7230 Rugged Extreme | |
| Average Intel Core i5-1240U, Intel Iris Xe Graphics G7 80EUs (n=1) | |
| Panasonic Toughbook 40 | |
| CrossMark / Creativity | |
| Dell Latitude 7230 Rugged Extreme | |
| Average Intel Core i5-1240U, Intel Iris Xe Graphics G7 80EUs (n=1) | |
| Panasonic Toughbook 40 | |
| CrossMark / Responsiveness | |
| Dell Latitude 7230 Rugged Extreme | |
| Average Intel Core i5-1240U, Intel Iris Xe Graphics G7 80EUs (n=1) | |
| Panasonic Toughbook 40 | |
| PCMark 10 Score | 4868 points | |
Help | ||
| AIDA64 / Memory Copy | |
| Dell Latitude 7230 Rugged Extreme | |
| Average Intel Core i5-1240U (n=1) | |
| Dell Latitude 7330 Rugged Extreme | |
| Acer Enduro Urban N3 EUN314 | |
| Panasonic Toughbook 40 | |
| Getac B360 | |
| Durabook S14I | |
| AIDA64 / Memory Read | |
| Dell Latitude 7330 Rugged Extreme | |
| Dell Latitude 7230 Rugged Extreme | |
| Average Intel Core i5-1240U (n=1) | |
| Acer Enduro Urban N3 EUN314 | |
| Panasonic Toughbook 40 | |
| Getac B360 | |
| Durabook S14I | |
| AIDA64 / Memory Write | |
| Dell Latitude 7330 Rugged Extreme | |
| Dell Latitude 7230 Rugged Extreme | |
| Average Intel Core i5-1240U (n=1) | |
| Acer Enduro Urban N3 EUN314 | |
| Getac B360 | |
| Panasonic Toughbook 40 | |
| Durabook S14I | |
| AIDA64 / Memory Latency | |
| Dell Latitude 7230 Rugged Extreme | |
| Average Intel Core i5-1240U (n=1) | |
| Panasonic Toughbook 40 | |
| Dell Latitude 7330 Rugged Extreme | |
| Acer Enduro Urban N3 EUN314 | |
| Durabook S14I | |
| Getac B360 | |
* ... smaller is better
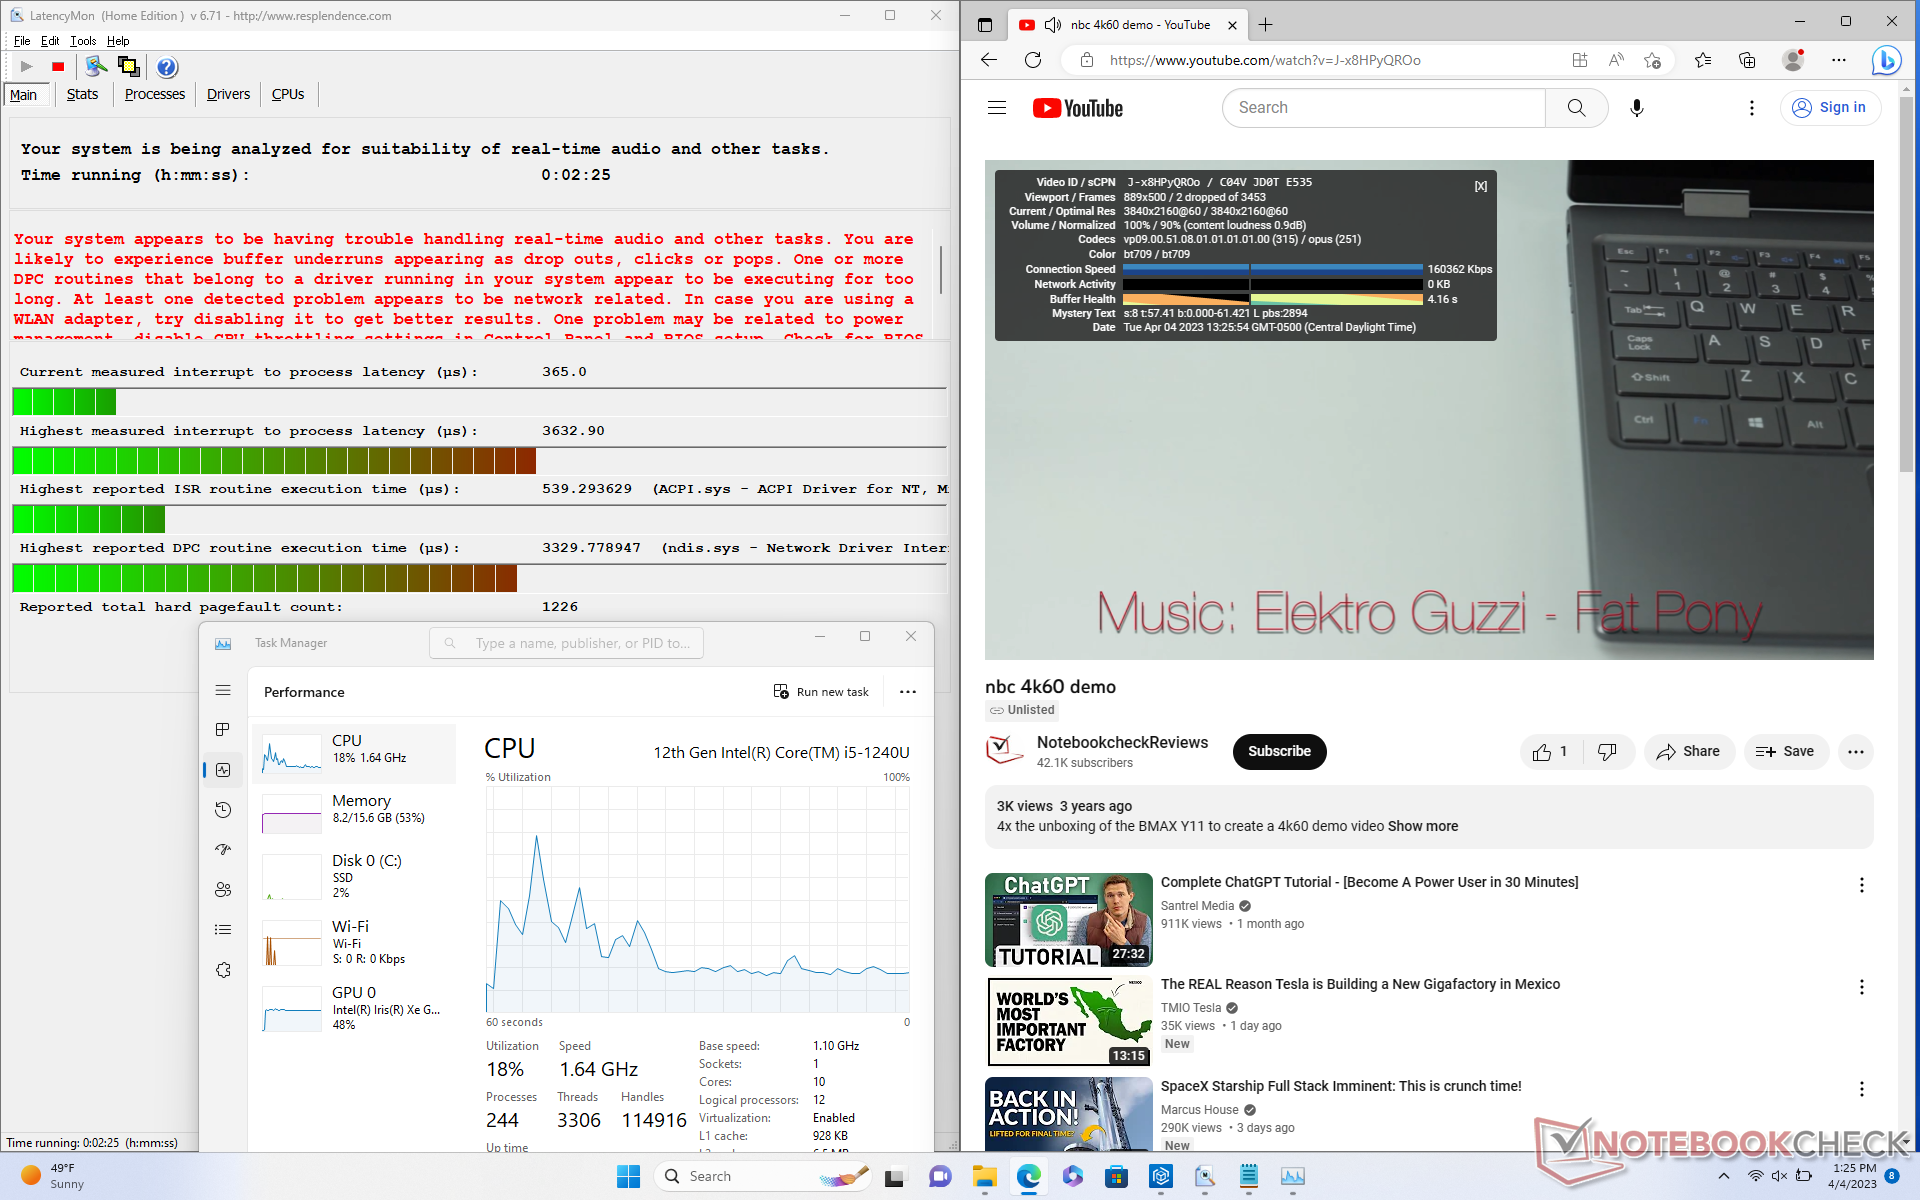
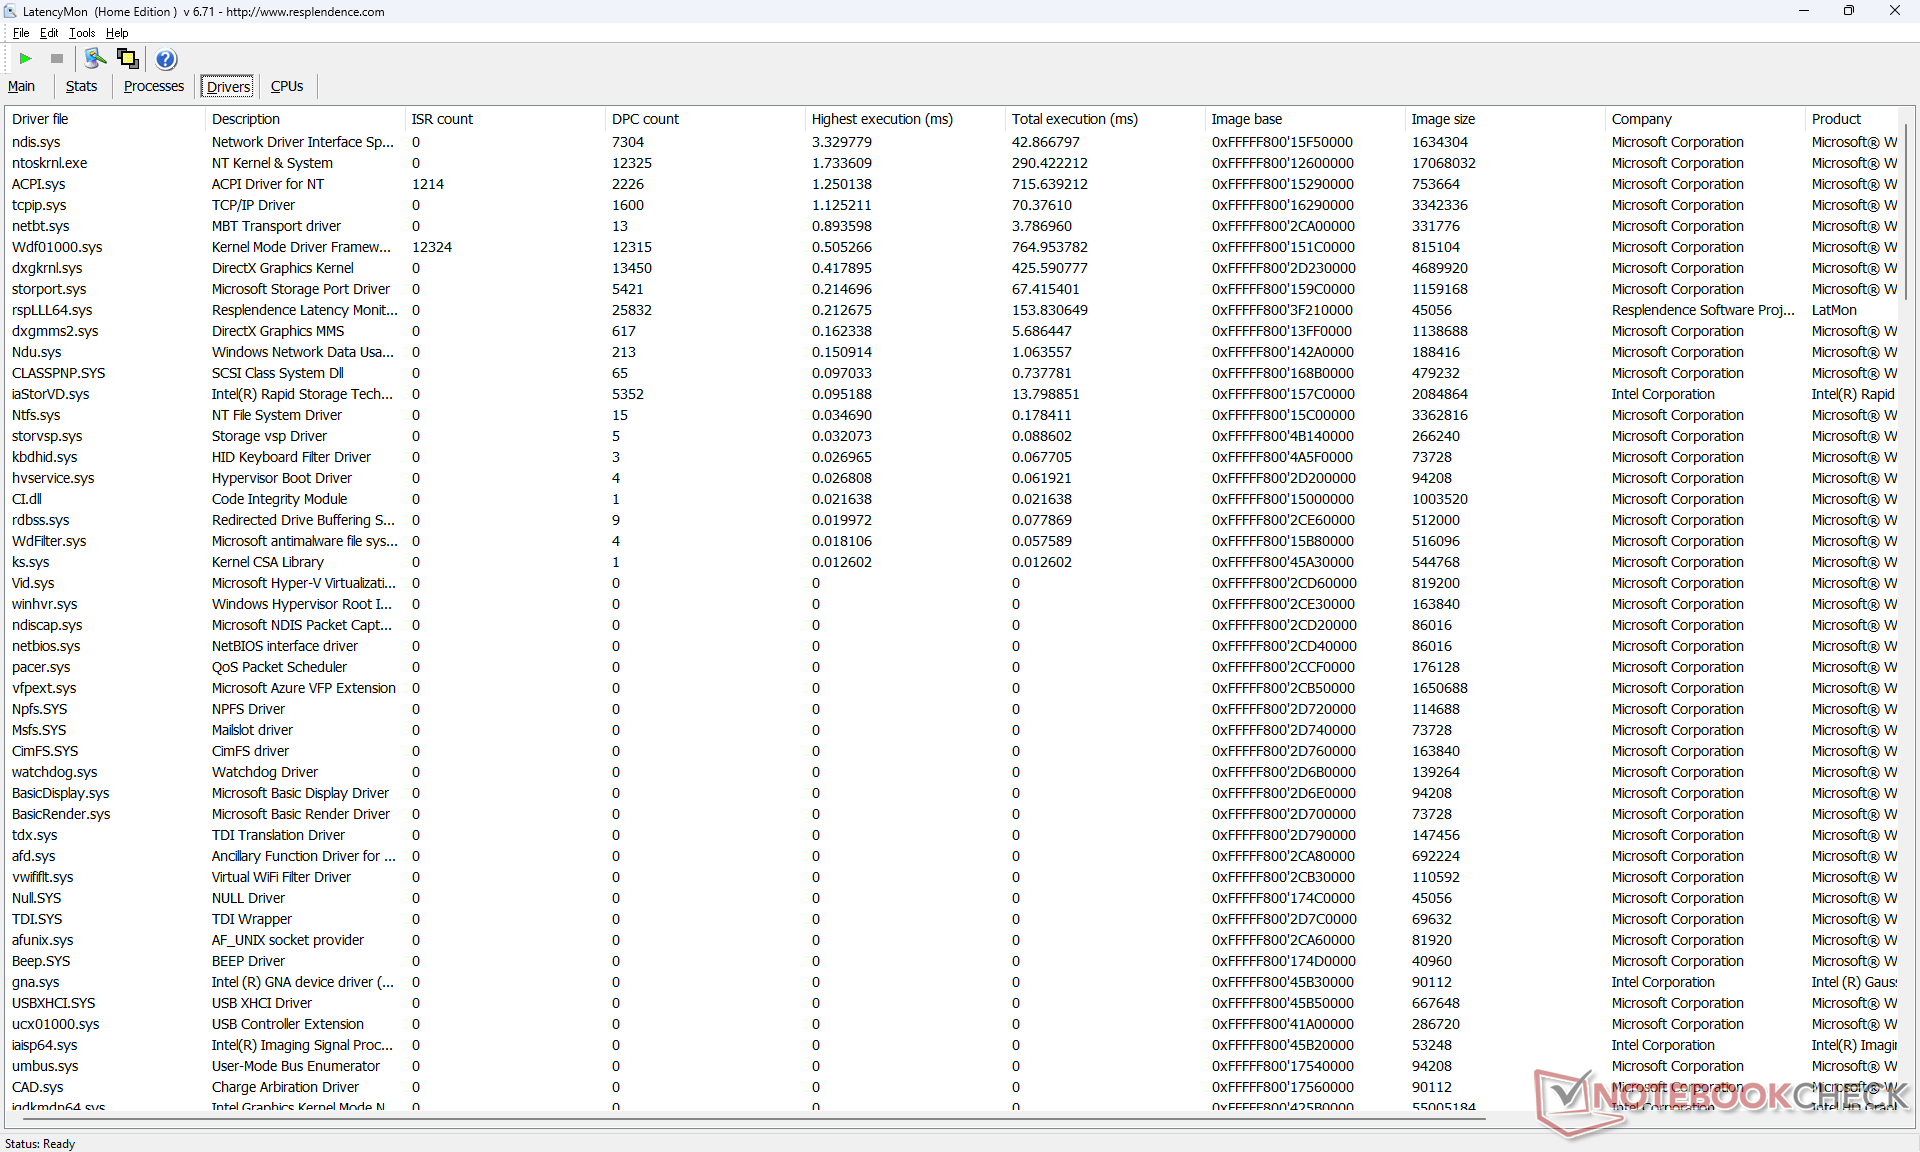
DPC延时
LatencyMon显示,在打开我们的主页的多个浏览器标签时,出现了DPC问题,这对于一个性能稳定性至关重要的坚固设备来说是令人失望的。在60FPS下的4K视频播放也是不完美的,在我们长达1分钟的测试视频中出现了2个丢帧。
| DPC Latencies / LatencyMon - interrupt to process latency (max), Web, Youtube, Prime95 | |
| Acer Enduro Urban N3 EUN314 | |
| Dell Latitude 7230 Rugged Extreme | |
| Durabook S14I | |
| Panasonic Toughbook 40 | |
| Getac B360 | |
| Dell Latitude 7330 Rugged Extreme | |
* ... smaller is better
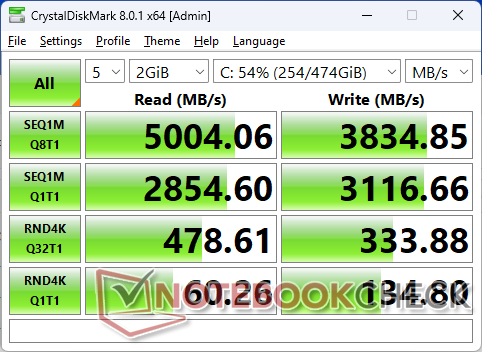
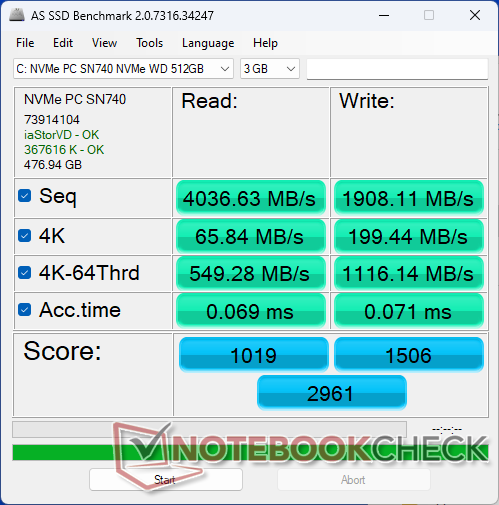
存储设备
我们的测试设备配备了一个可移动的 WD PC SN740 PCIe4 x4 NVMe SSD顺序传输率高达4800 MB/s。然而,最大的性能是不可持续的,因为如下图所示,传输率在短短几分钟后就会节流到2300MB/s的低水平。

| Drive Performance rating - Percent | |
| Dell Latitude 7330 Rugged Extreme | |
| Dell Latitude 7230 Rugged Extreme | |
| Acer Enduro Urban N3 EUN314 | |
| Getac B360 | |
| Durabook S14I | |
| Panasonic Toughbook 40 | |
* ... smaller is better
Disk Throttling: DiskSpd Read Loop, Queue Depth 8
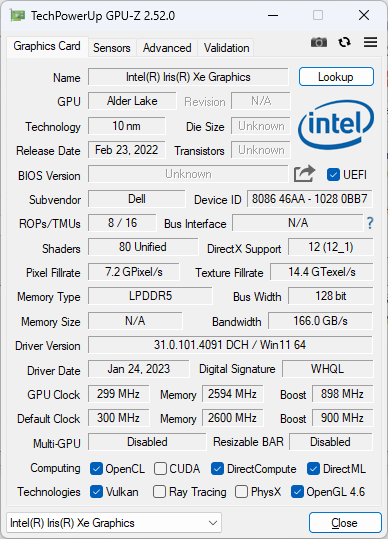
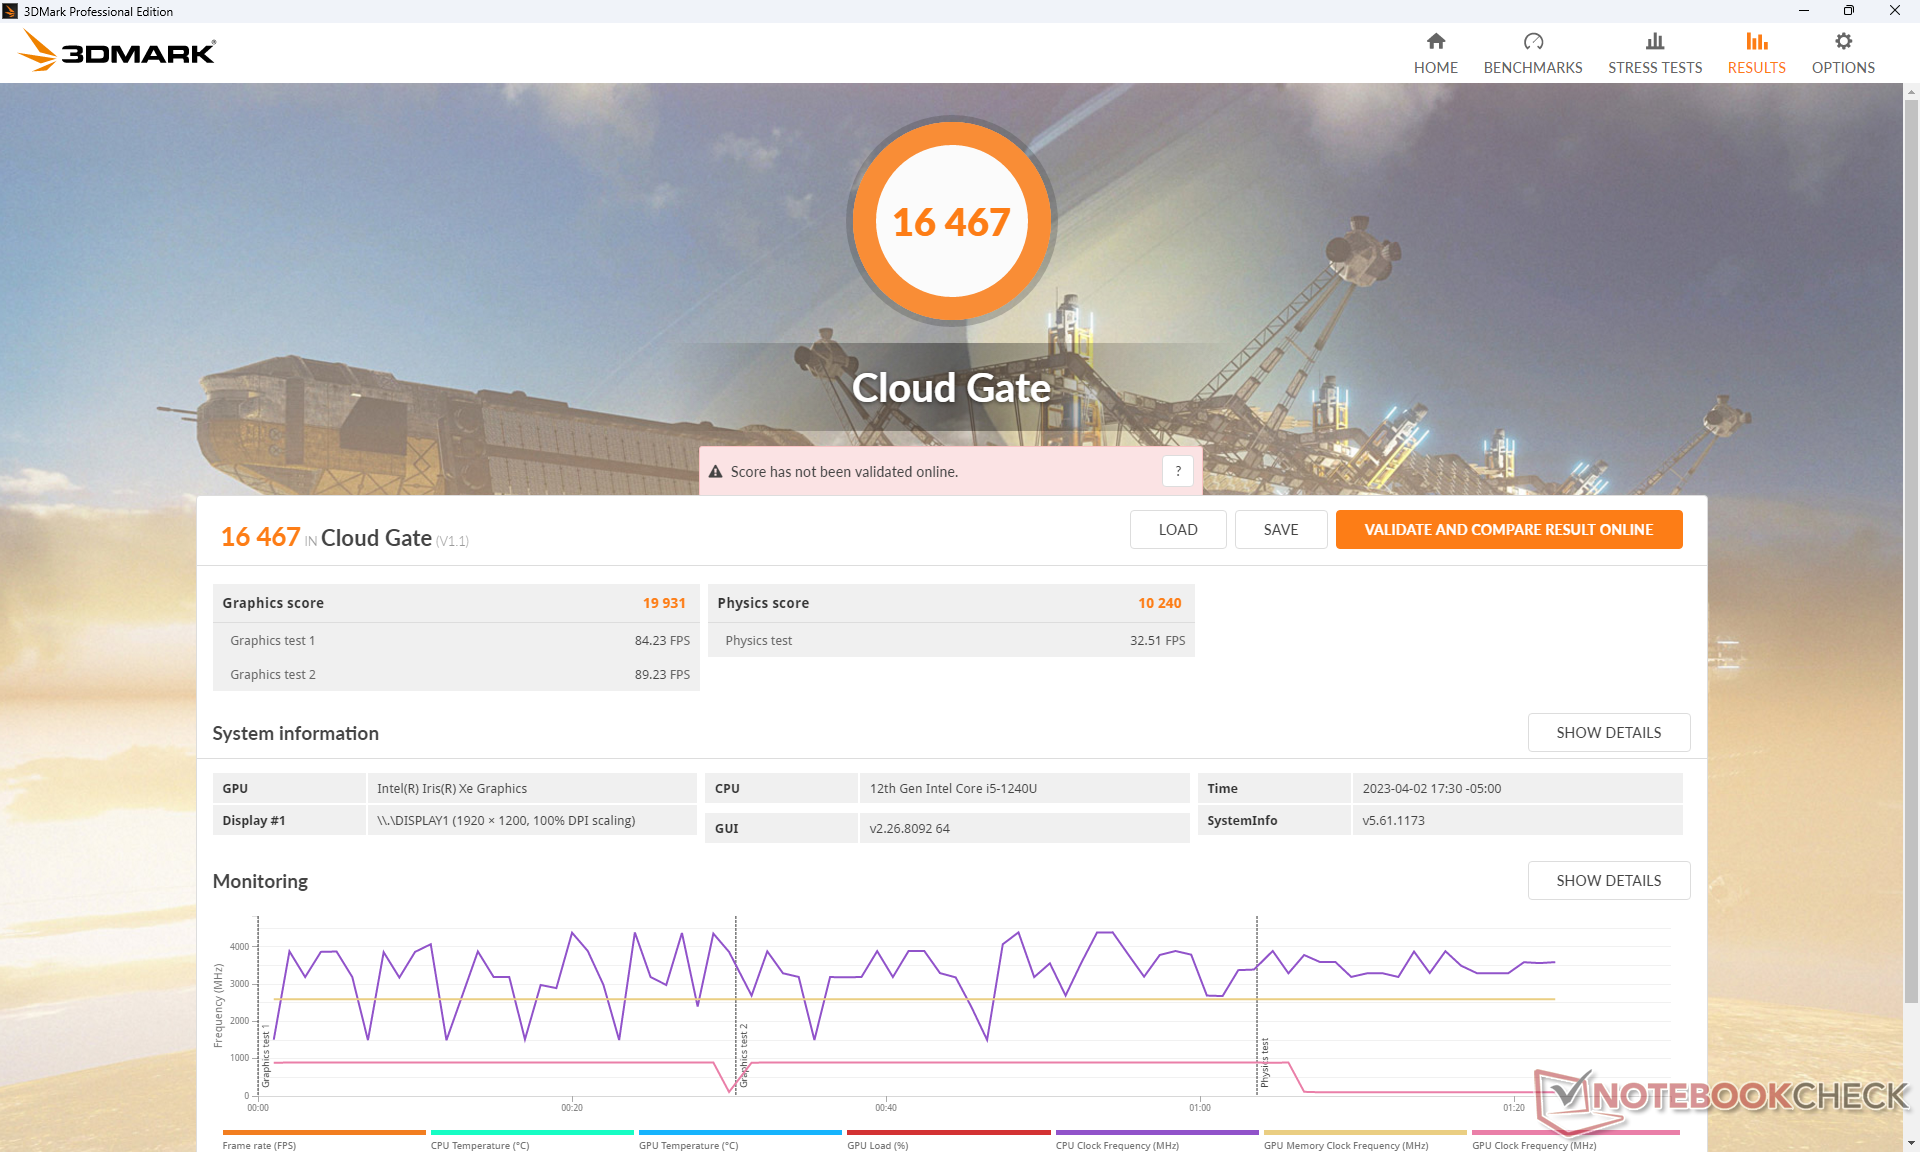
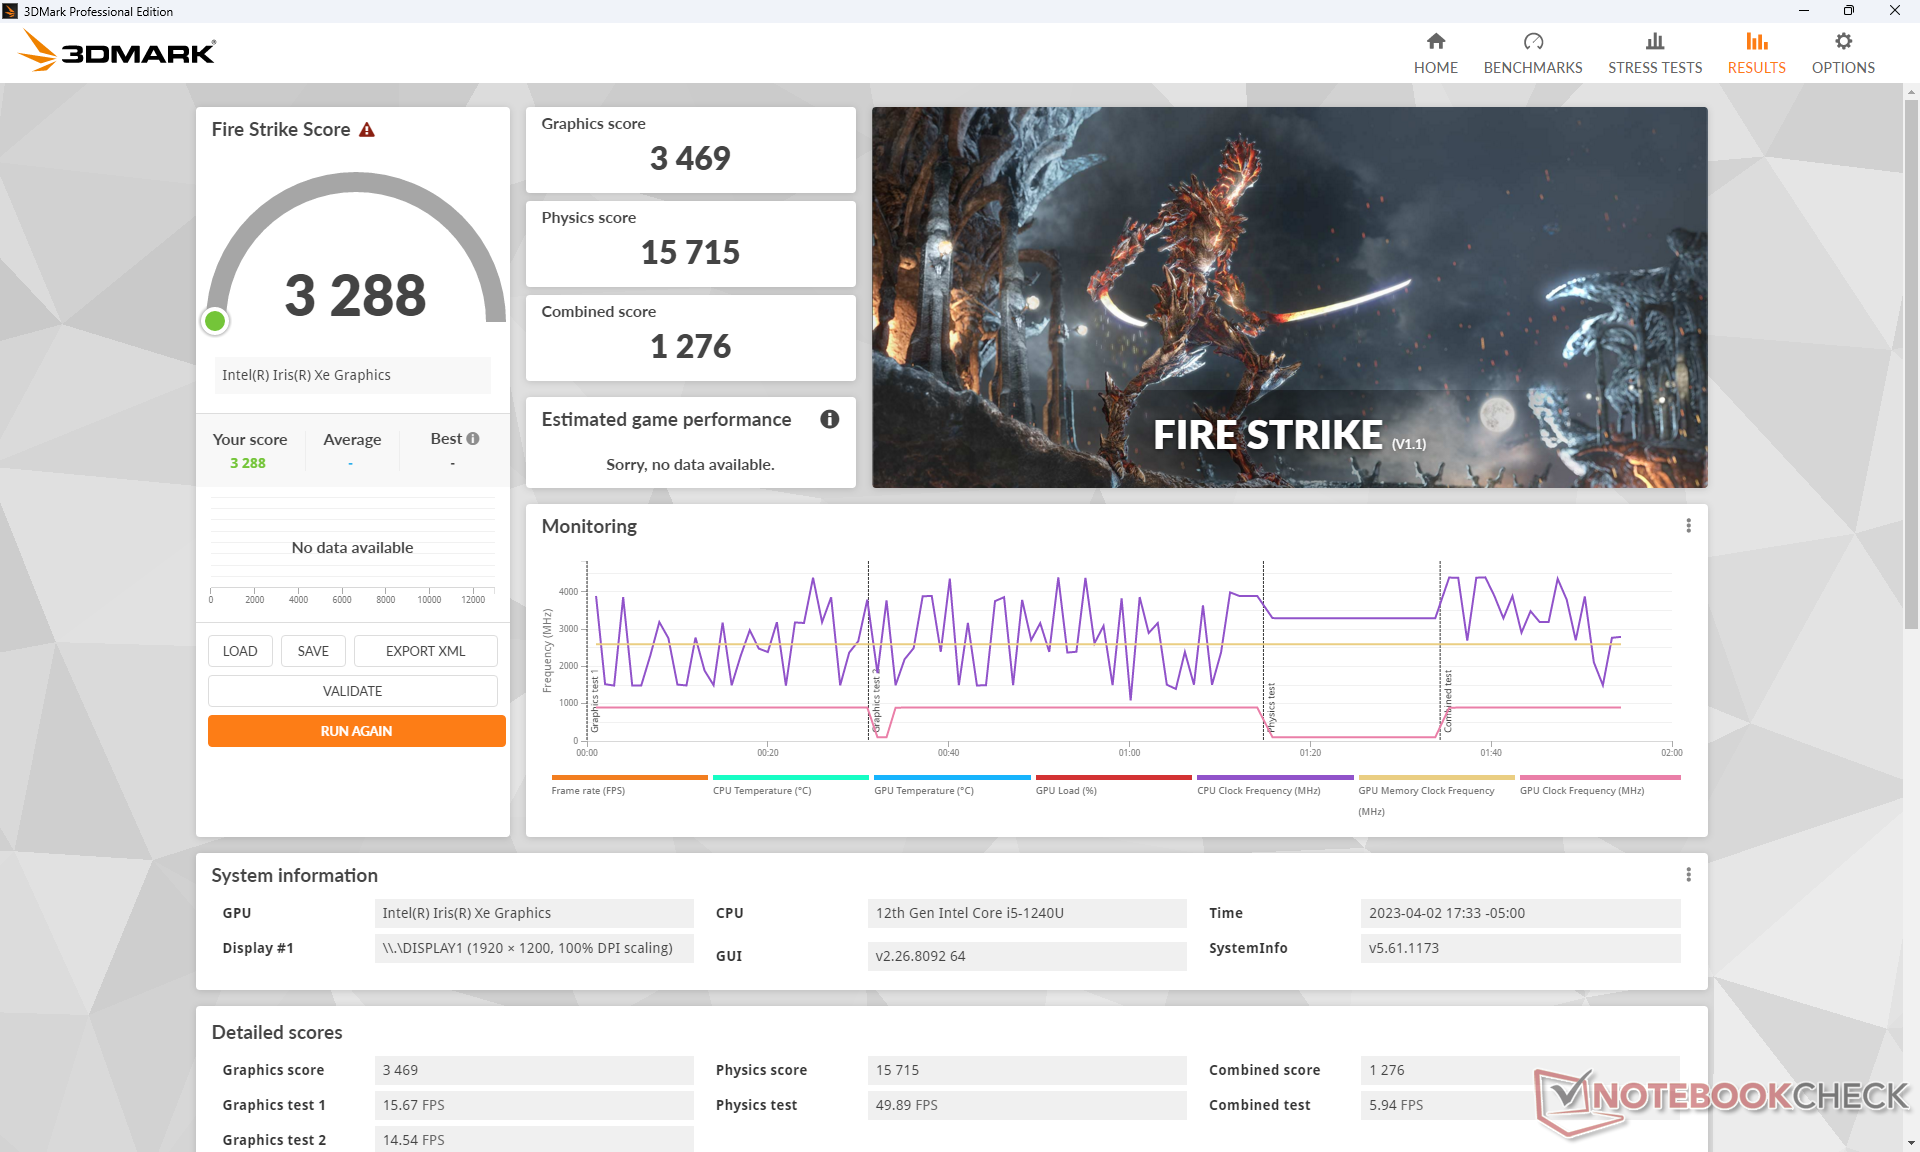
GPU性能 - 平均Iris Xe 80 EUs
与我们数据库中配备同样集成的PC相比,图形性能低了约5%至15%。 Iris Xe 80 EUs GPU.预计整体性能将比普通PC慢30%到40%。 Iris Xe 96 EUs.幸运的是,该模型可以配置酷睿i7-1260U,它为那些需要它的人提供了更快的Iris Xe 96 EUs,如前所述。
系统性能在优化和超强电源配置文件之间似乎是相同的。在这两种电源模式下进行的3DMark 11测试将导致它们之间几乎相同的最终得分。
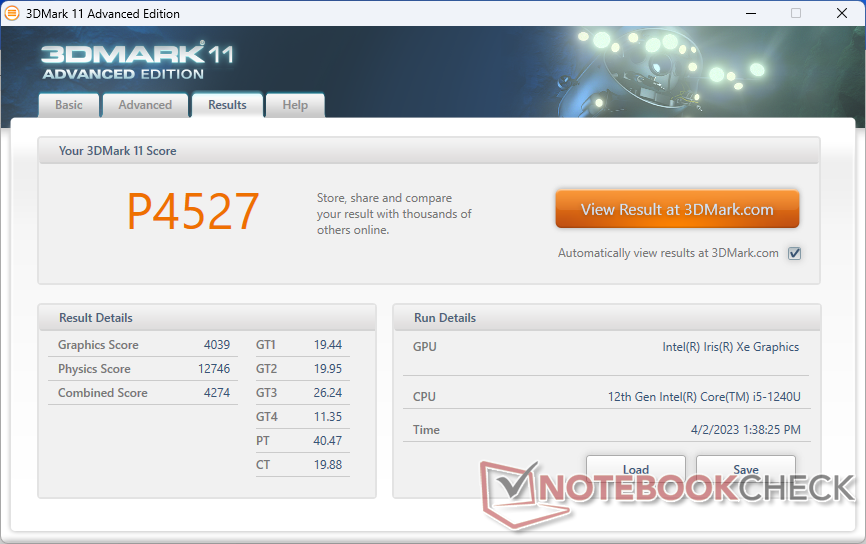
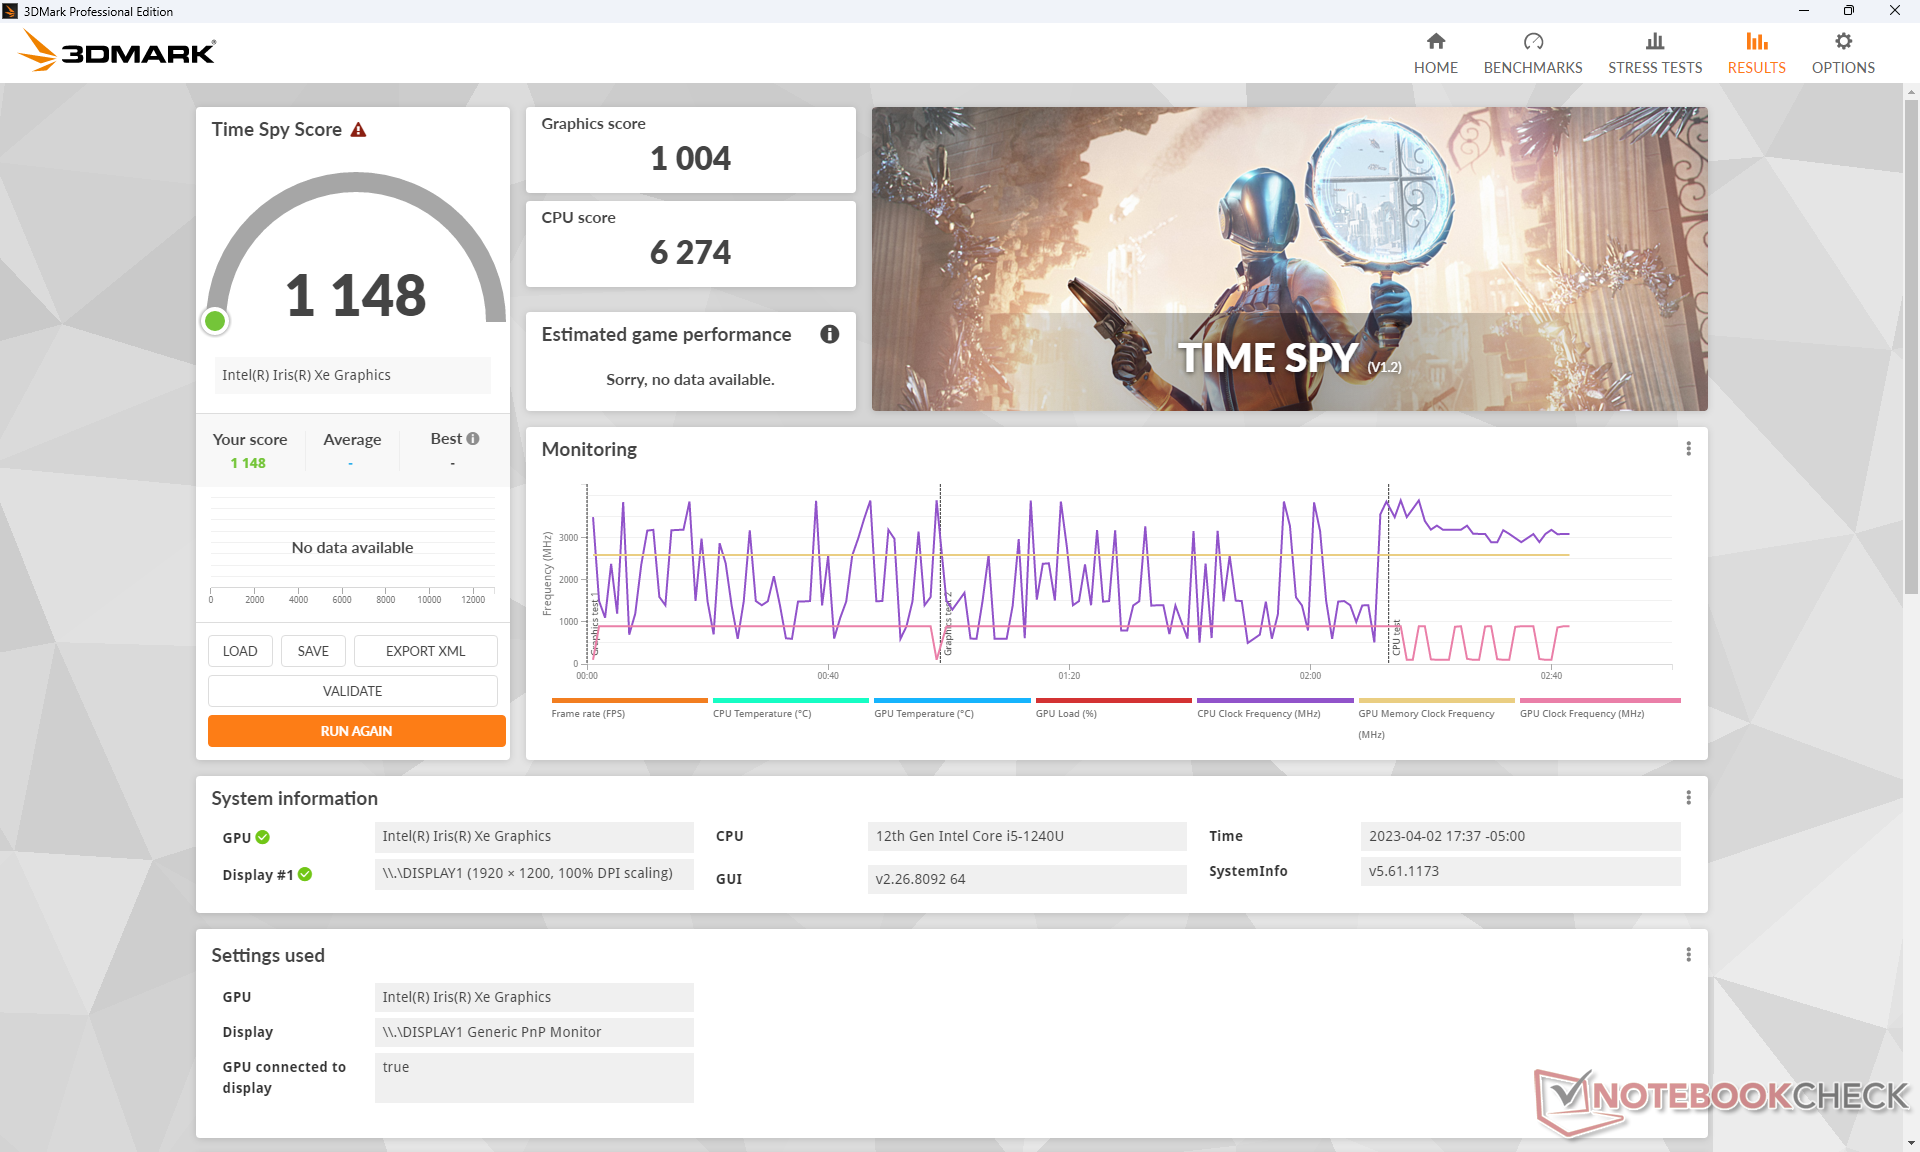
| 3DMark 11 Performance | 4527 points | |
| 3DMark Cloud Gate Standard Score | 16467 points | |
| 3DMark Fire Strike Score | 3288 points | |
| 3DMark Time Spy Score | 1148 points | |
Help | ||
| GTA V - 1920x1080 Highest AA:4xMSAA + FX AF:16x | |
| HP ZBook Firefly 14 G9-6B8A2EA | |
| Lenovo ThinkPad P14s G3 AMD 21J6S05000 | |
| Asus ExpertBook B5 Flip B5602FBN | |
| HP EliteBook 840 G9 | |
| Acer Enduro Urban N3 EUN314 | |
| Dell Latitude 7230 Rugged Extreme | |
| Strange Brigade - 1920x1080 ultra AA:ultra AF:16 | |
| Asus ExpertBook B5 Flip B5602FBN | |
| HP ZBook Firefly 14 G9-6B8A2EA | |
| Lenovo ThinkPad P14s G3 AMD 21J6S05000 | |
| HP EliteBook 840 G9 | |
| Acer Enduro Urban N3 EUN314 | |
| Dell Latitude 7230 Rugged Extreme | |
Witcher 3 FPS Chart
| low | med. | high | ultra | |
|---|---|---|---|---|
| GTA V (2015) | 103.3 | 93.3 | 18.5 | 7.79 |
| The Witcher 3 (2015) | 67.3 | 40.9 | 24.1 | 10.6 |
| Dota 2 Reborn (2015) | 98.9 | 77.8 | 50.7 | 45.7 |
| Final Fantasy XV Benchmark (2018) | 31 | 17.3 | 11.8 | |
| X-Plane 11.11 (2018) | 32.6 | 22.6 | 20.6 | |
| Strange Brigade (2018) | 60.2 | 27.4 | 21.4 | 17.9 |
排放 - 安静到响亮为止
系统噪音
风扇噪音很安静,在低到中度负载期间基本上听不到。例如,运行3DMark 06的第一个基准场景,直到基准结束时才会产生任何风扇噪音。
不幸的是,这个小直径的风扇比大多数笔记本电脑的音调要高。如果运行非常苛刻的应用程序,如游戏或Prime95,风扇噪音可高达43 dB(A),成为我们测试过的最响亮的坚固型平板电脑之一。然而,你必须真正把平板电脑推到它的极限,才能达到如此高的噪音水平。
Noise level
| Idle |
| 22.9 / 22.9 / 22.9 dB(A) |
| Load |
| 24.5 / 43.2 dB(A) |
 | ||
30 dB silent 40 dB(A) audible 50 dB(A) loud |
||
min: | ||
| Dell Latitude 7230 Rugged Extreme Iris Xe G7 80EUs, i5-1240U, WD PC SN740 512GB SDDPMQD-512G-1101 | Dell Latitude 7330 Rugged Extreme Iris Xe G7 96EUs, i7-1185G7 | Panasonic Toughbook 40 Iris Xe G7 96EUs, i7-1185G7, Samsung PM991 MZVLQ1T0HALB | Getac B360 UHD Graphics 620, i7-10710U, Lite-On CA5-8D512 | Acer Enduro Urban N3 EUN314 Iris Xe G7 96EUs, i7-1165G7, Samsung PM991 MZVLQ1T0HALB | Durabook S14I Iris Xe G7 96EUs, i7-1165G7, UDinfo M2P M2P80DE512GBAEP | |
|---|---|---|---|---|---|---|
| Noise | 2% | -13% | 0% | -3% | -18% | |
| off / environment * (dB) | 22.8 | 22.9 -0% | 22.8 -0% | 24.3 -7% | 23.8 -4% | 25.2 -11% |
| Idle Minimum * (dB) | 22.9 | 23.1 -1% | 26 -14% | 24.5 -7% | 24.1 -5% | 25.2 -10% |
| Idle Average * (dB) | 22.9 | 23.1 -1% | 26 -14% | 24.5 -7% | 24.1 -5% | 25.2 -10% |
| Idle Maximum * (dB) | 22.9 | 23.1 -1% | 26 -14% | 24.6 -7% | 24.1 -5% | 34.5 -51% |
| Load Average * (dB) | 24.5 | 28 -14% | 37.6 -53% | 29.8 -22% | 27.9 -14% | 34.5 -41% |
| Witcher 3 ultra * (dB) | 36 | 31.2 13% | 37.8 -5% | 27.3 24% | 35.7 1% | |
| Load Maximum * (dB) | 43.2 | 36.2 16% | 40.3 7% | 30.8 29% | 38.6 11% | 36.2 16% |
* ... smaller is better
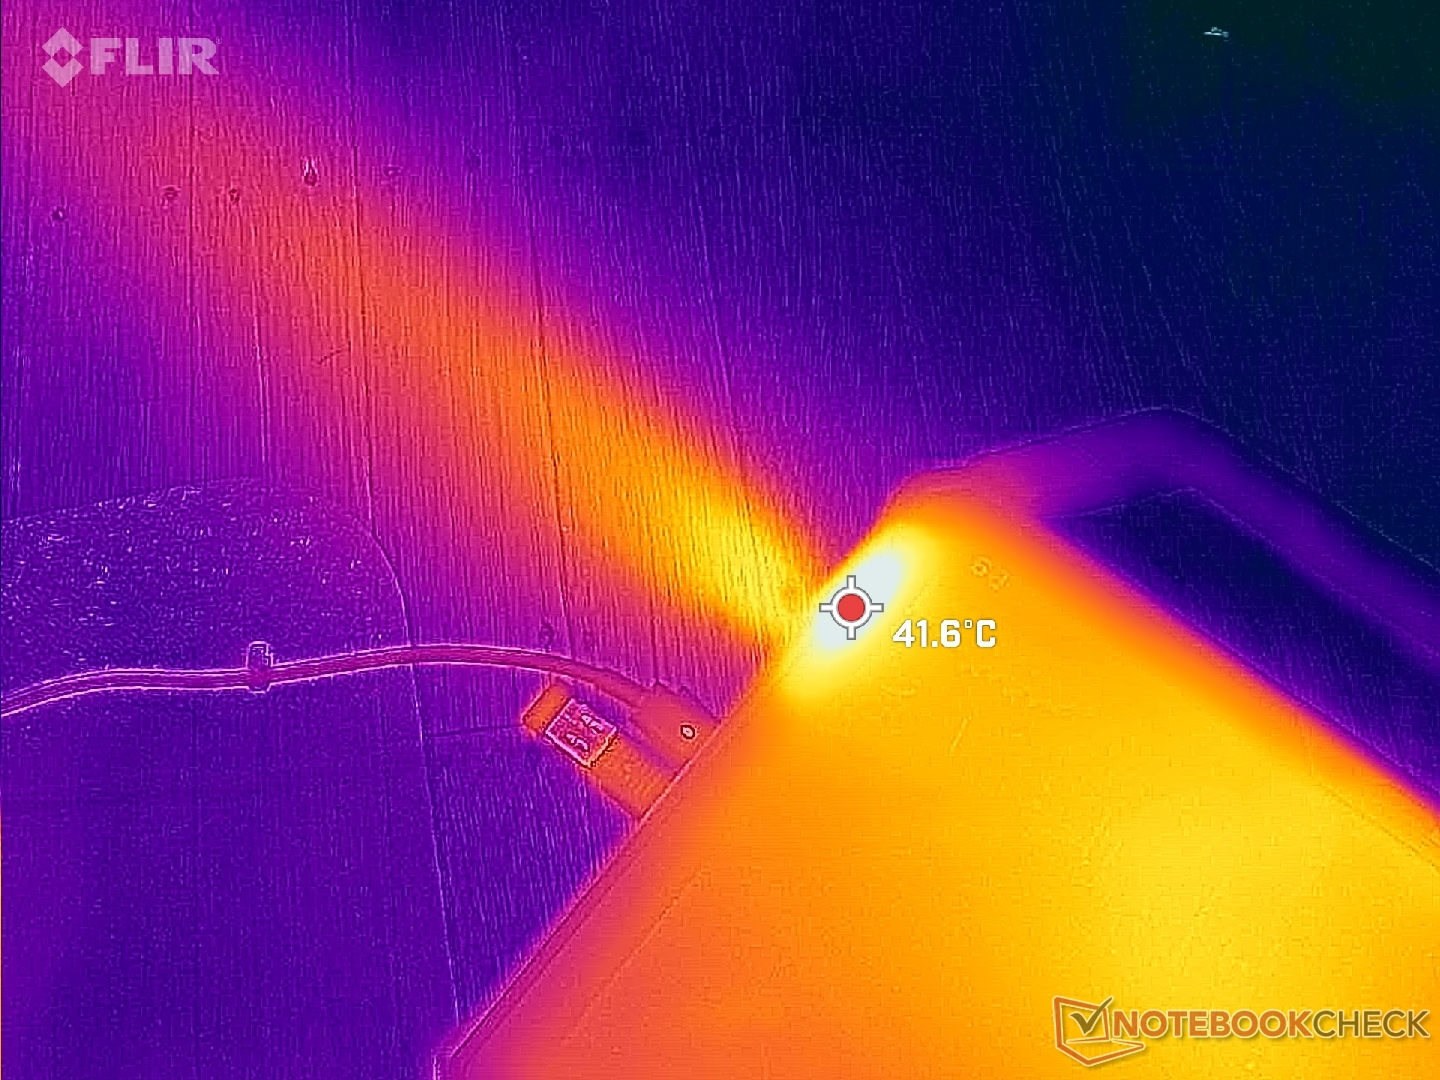
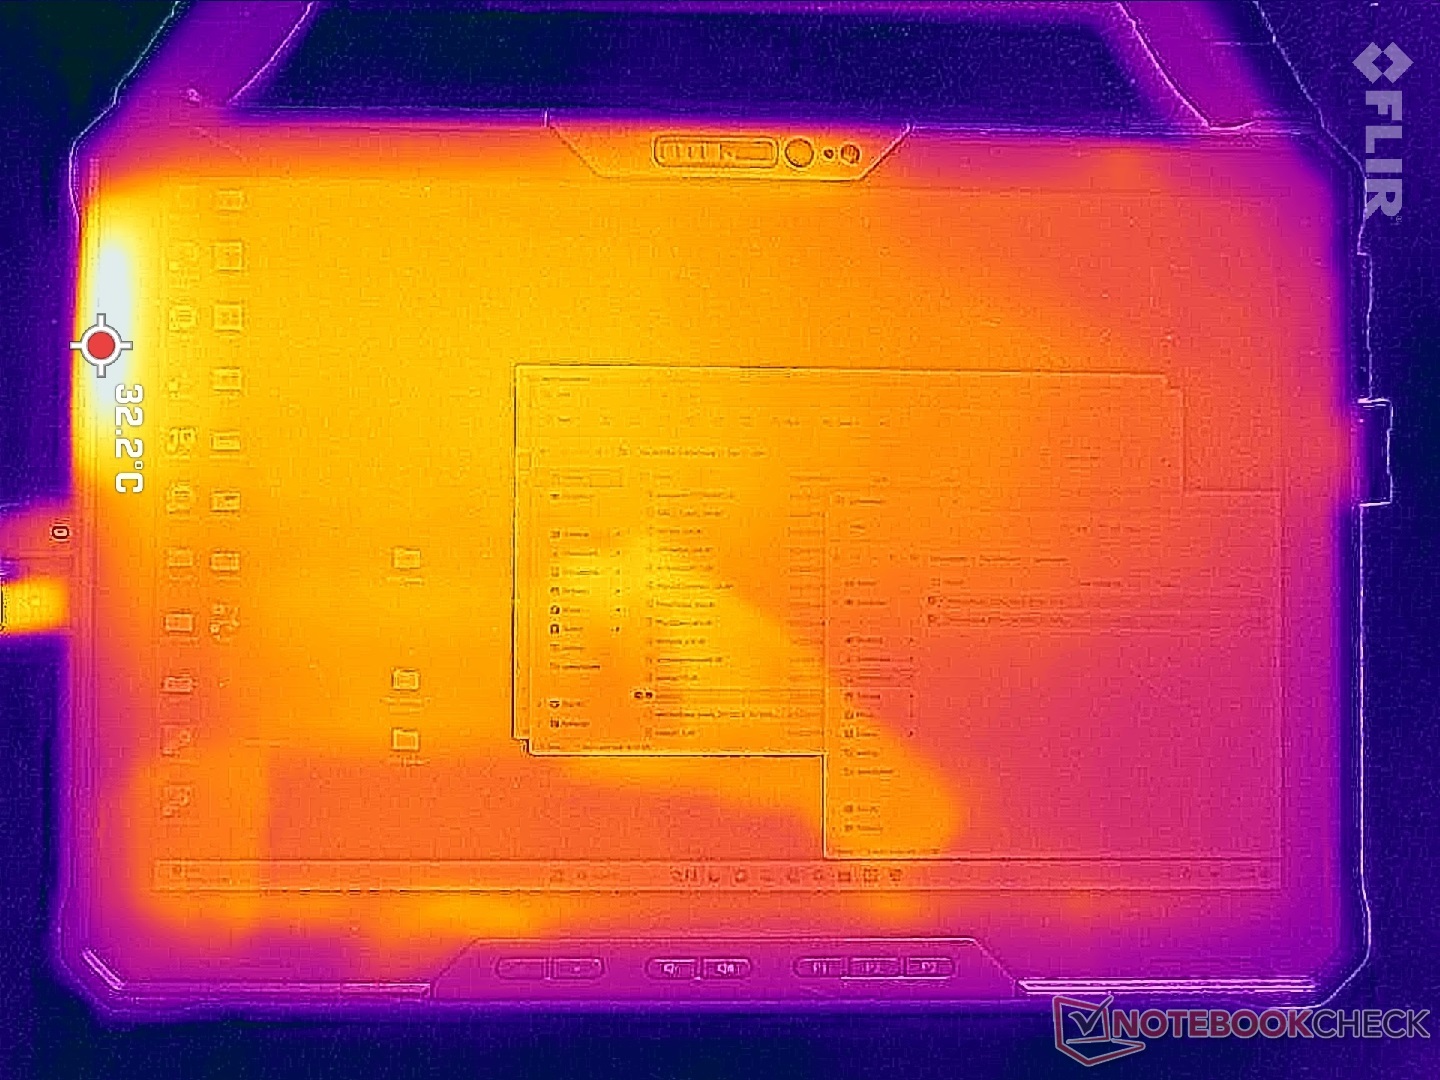
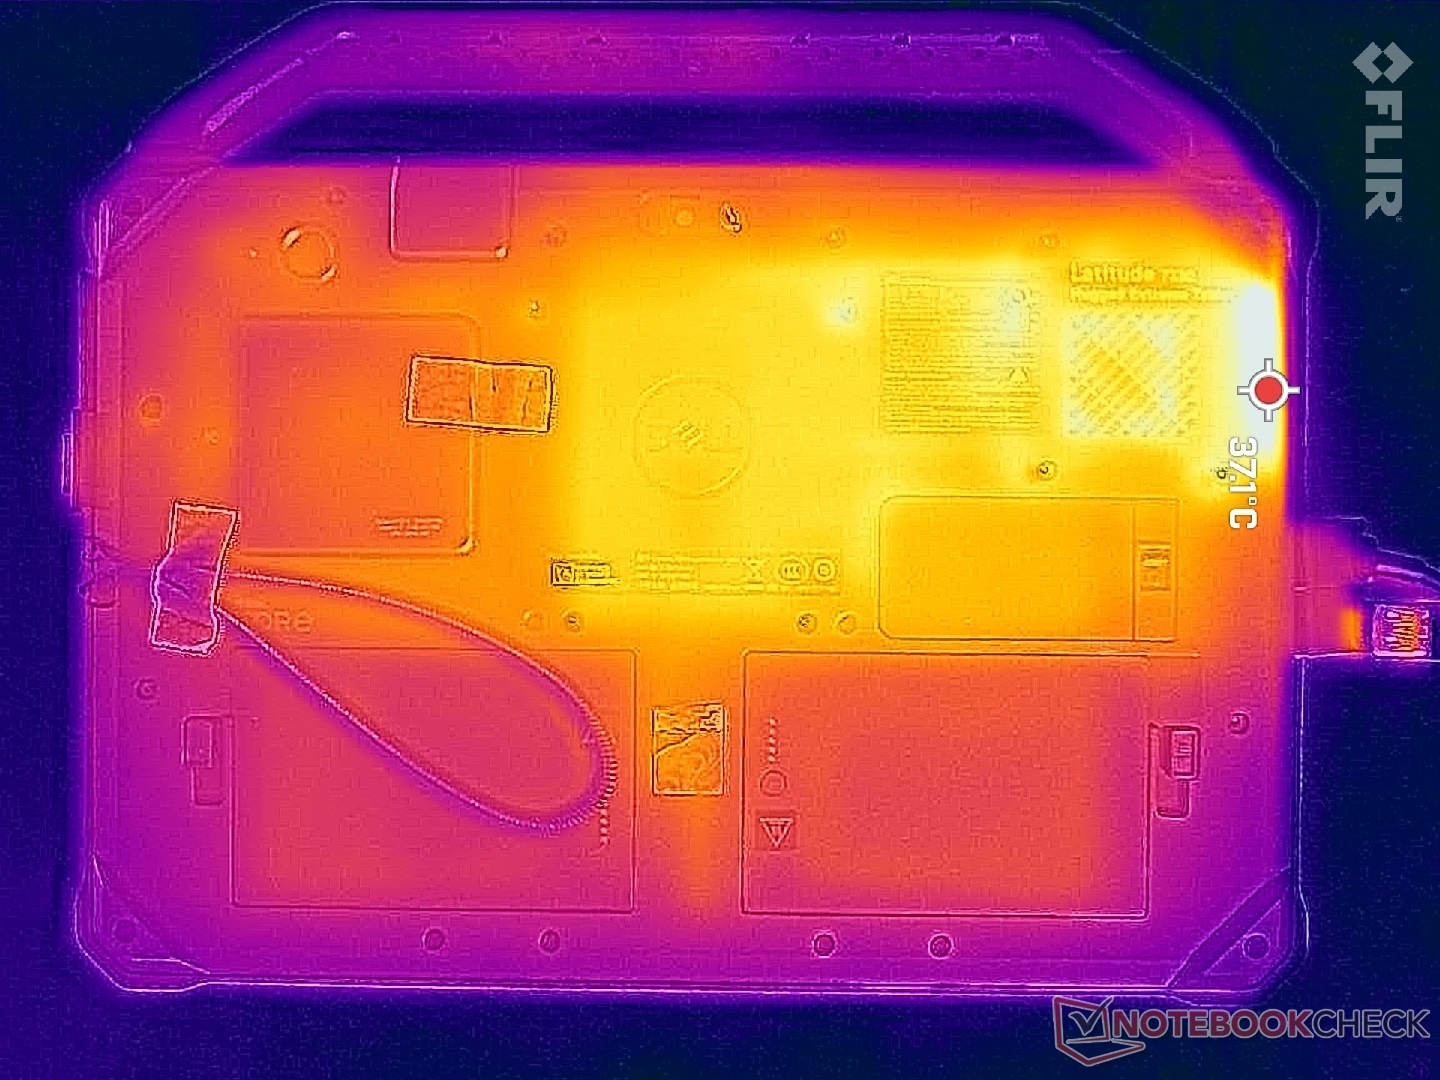
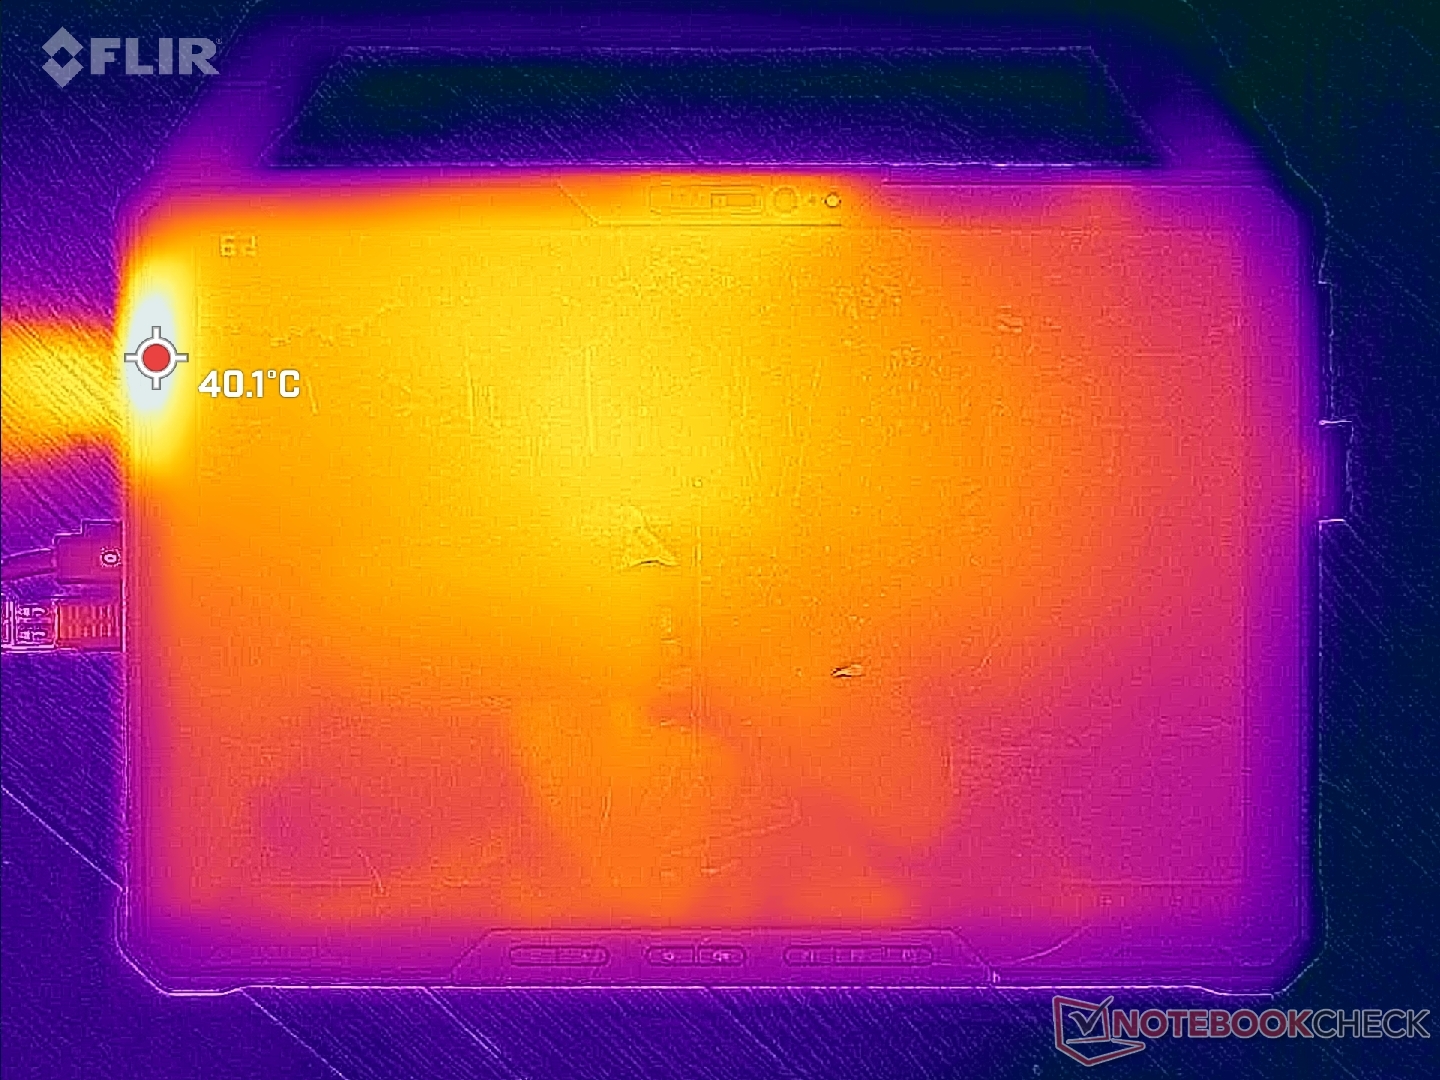
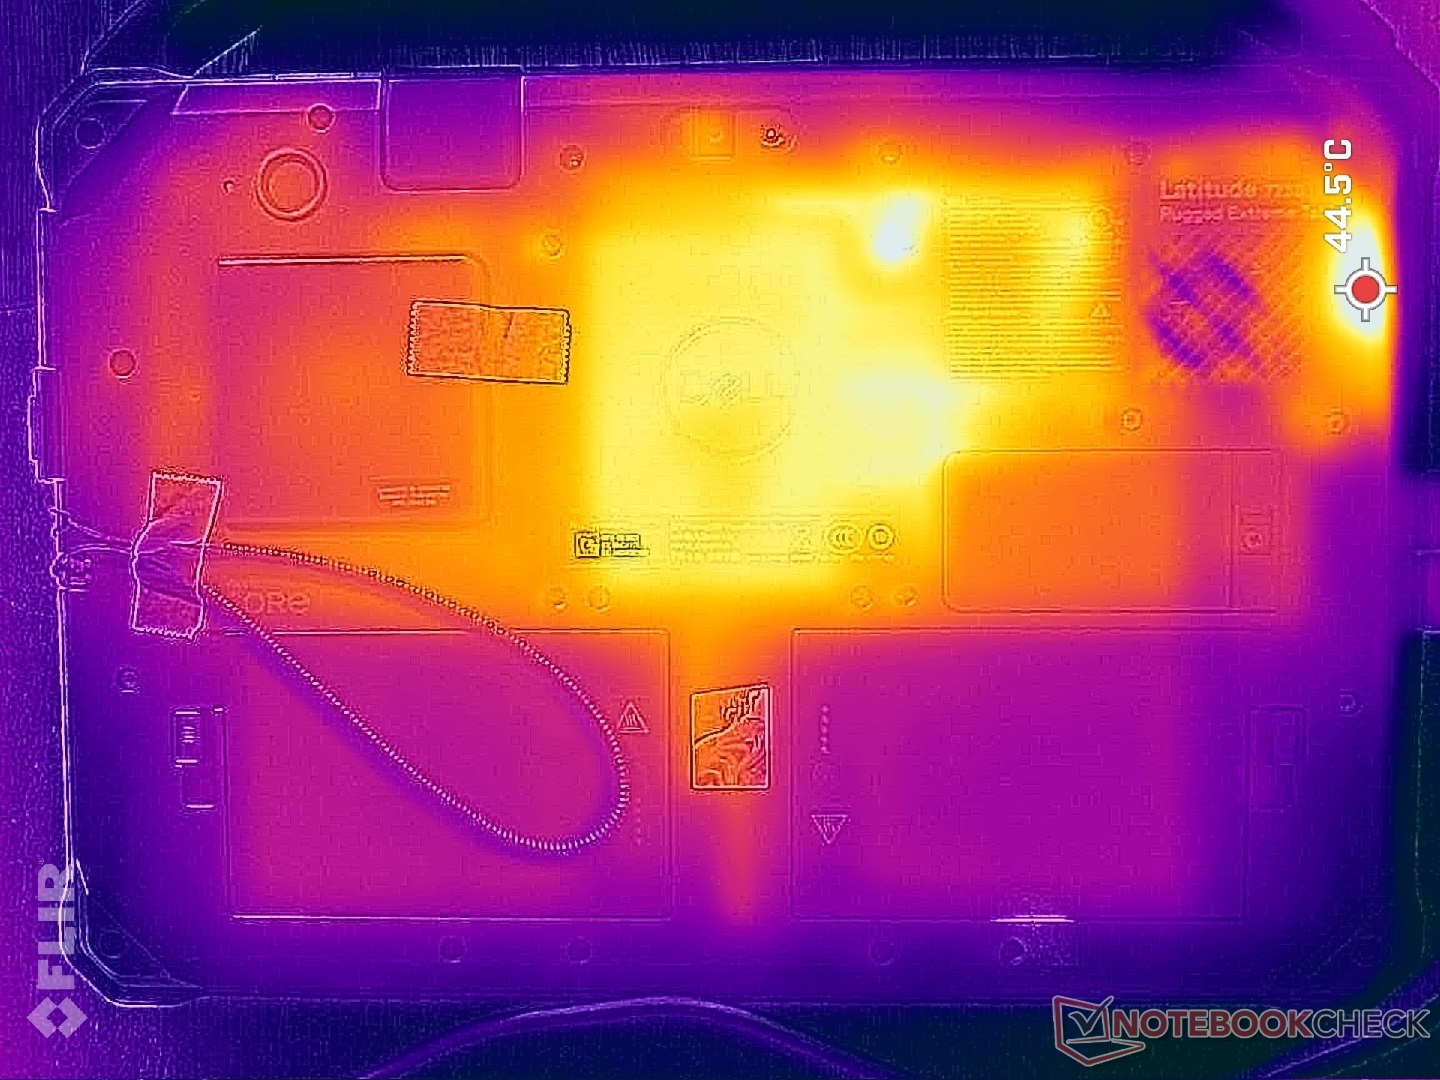
温度
表面温度不是一个问题,因为厚实耐用的外形和其他大多数耐用设备一样。在最坏的情况下,当CPU处于100%的利用率时,我们能够在离通风栅栏最近的设备边缘记录到40℃的高温度。
(+) The maximum temperature on the upper side is 32.6 °C / 91 F, compared to the average of 33.6 °C / 92 F, ranging from 20.7 to 53.2 °C for the class Tablet.
(±) The bottom heats up to a maximum of 40.2 °C / 104 F, compared to the average of 33.2 °C / 92 F
(+) In idle usage, the average temperature for the upper side is 29 °C / 84 F, compared to the device average of 30 °C / 86 F.
| Dell Latitude 7230 Rugged Extreme Intel Core i5-1240U, Intel Iris Xe Graphics G7 80EUs | Dell Latitude 7330 Rugged Extreme Intel Core i7-1185G7, Intel Iris Xe Graphics G7 96EUs | Panasonic Toughbook 40 Intel Core i7-1185G7, Intel Iris Xe Graphics G7 96EUs | Getac B360 Intel Core i7-10710U, Intel UHD Graphics 620 | Acer Enduro Urban N3 EUN314 Intel Core i7-1165G7, Intel Iris Xe Graphics G7 96EUs | Durabook S14I Intel Core i7-1165G7, Intel Iris Xe Graphics G7 96EUs | |
|---|---|---|---|---|---|---|
| Heat | 13% | 4% | 10% | -1% | -3% | |
| Maximum Upper Side * (°C) | 32.6 | 34.6 -6% | 35.6 -9% | 33.4 -2% | 37.8 -16% | 36.4 -12% |
| Maximum Bottom * (°C) | 40.2 | 36.6 9% | 40 -0% | 42.6 -6% | 45.8 -14% | 38.6 4% |
| Idle Upper Side * (°C) | 30.6 | 24.8 19% | 28.6 7% | 24.2 21% | 26.4 14% | 32.6 -7% |
| Idle Bottom * (°C) | 35 | 25.2 28% | 29.4 16% | 26.2 25% | 30.2 14% | 33.8 3% |
* ... smaller is better
压力测试
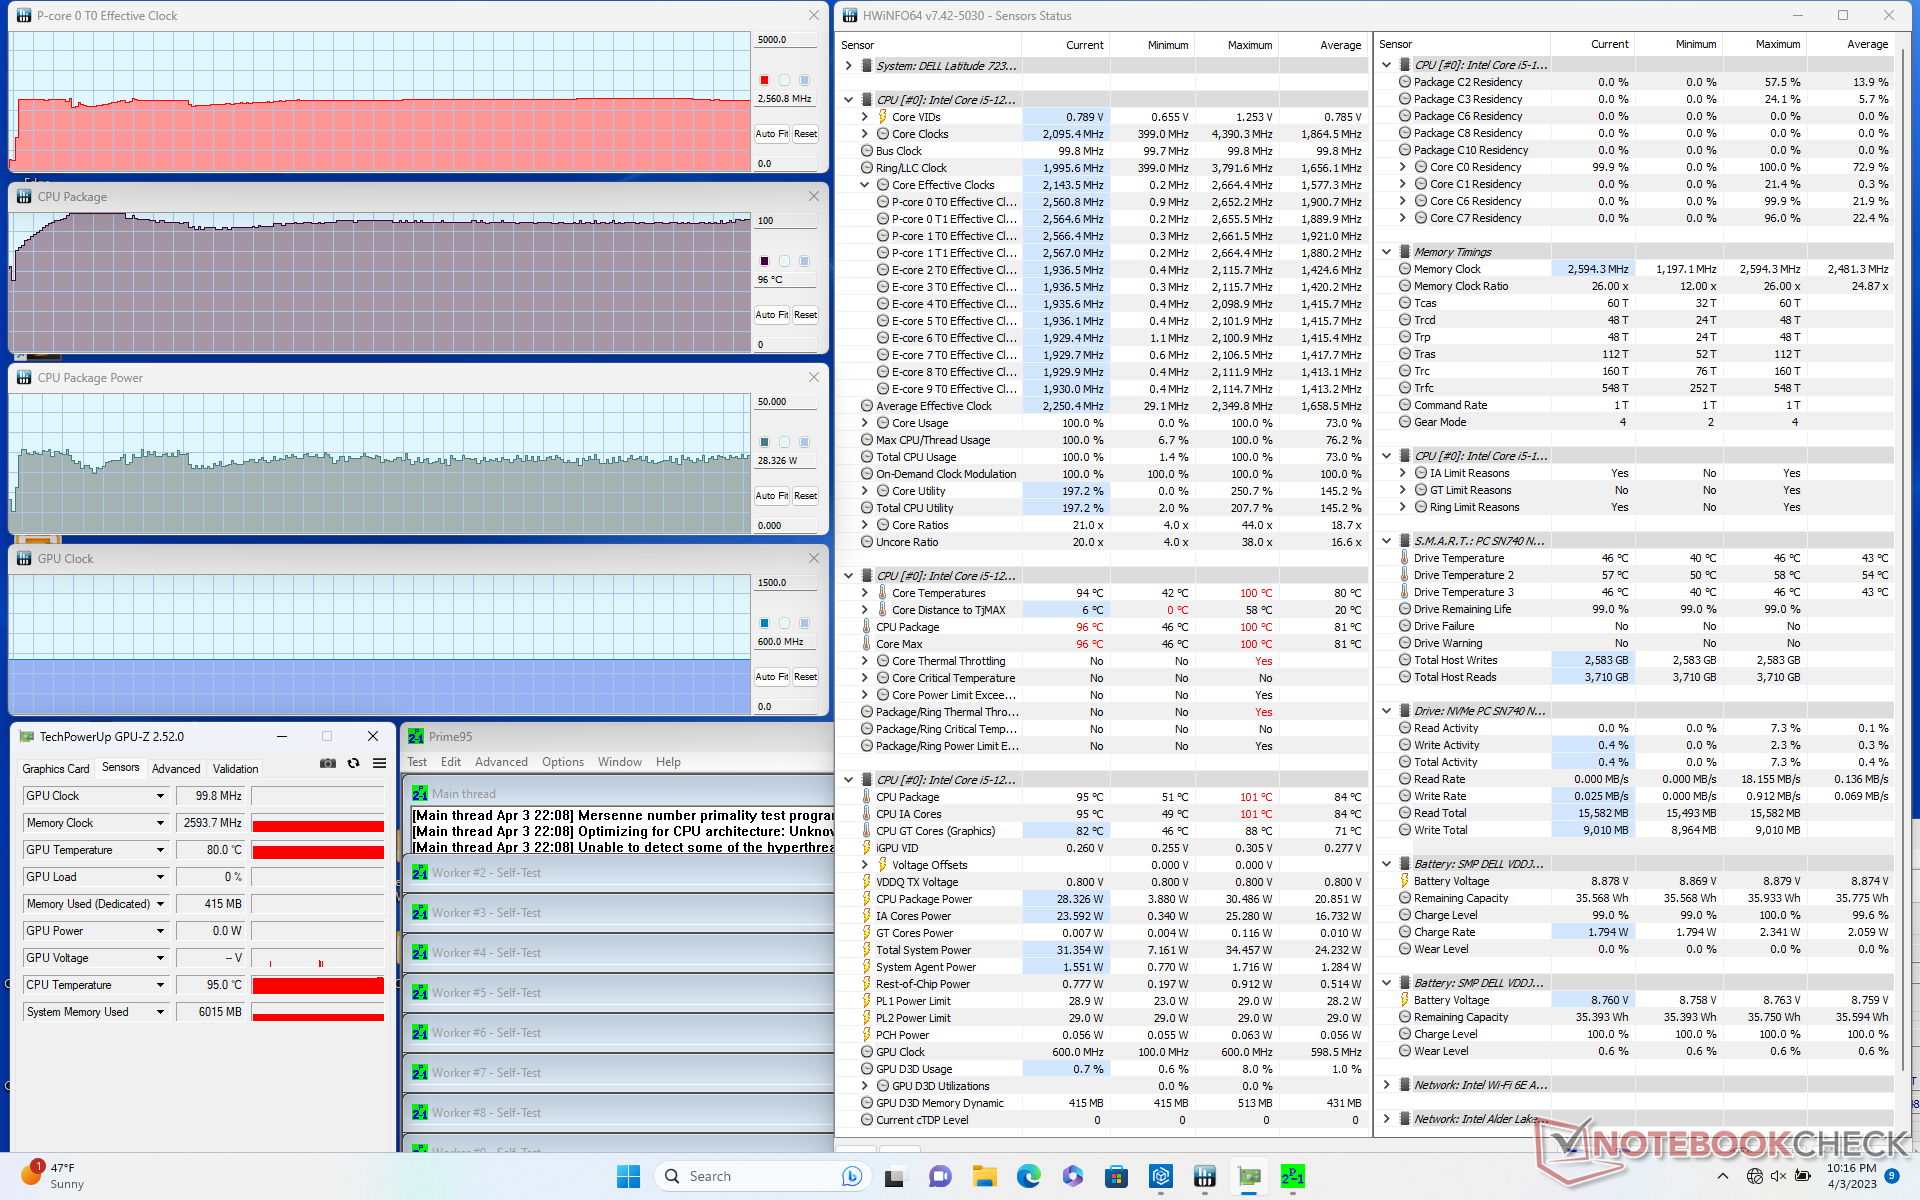
当运行Prime95对CPU施加压力时,时钟频率和主板功耗将分别提升到2.6GHz和30W,几秒钟后再略微下降到2.5GHz和26W。核心温度将稳定在非常高的97摄氏度,比我们希望的要高。在更大的戴尔Latitude 7330 Rugged上重复这一测试,将导致更低的核心温度,只有68℃。
用电池供电运行对CPU性能略有影响。在电池上进行的3DMark 11测试将返回物理和图形分数,分别为10743和4041分,而在电源上则为12765和4053分。

| CPU时钟(GHz) | GPU时钟(MHz) | CPU平均温度(°C) | |
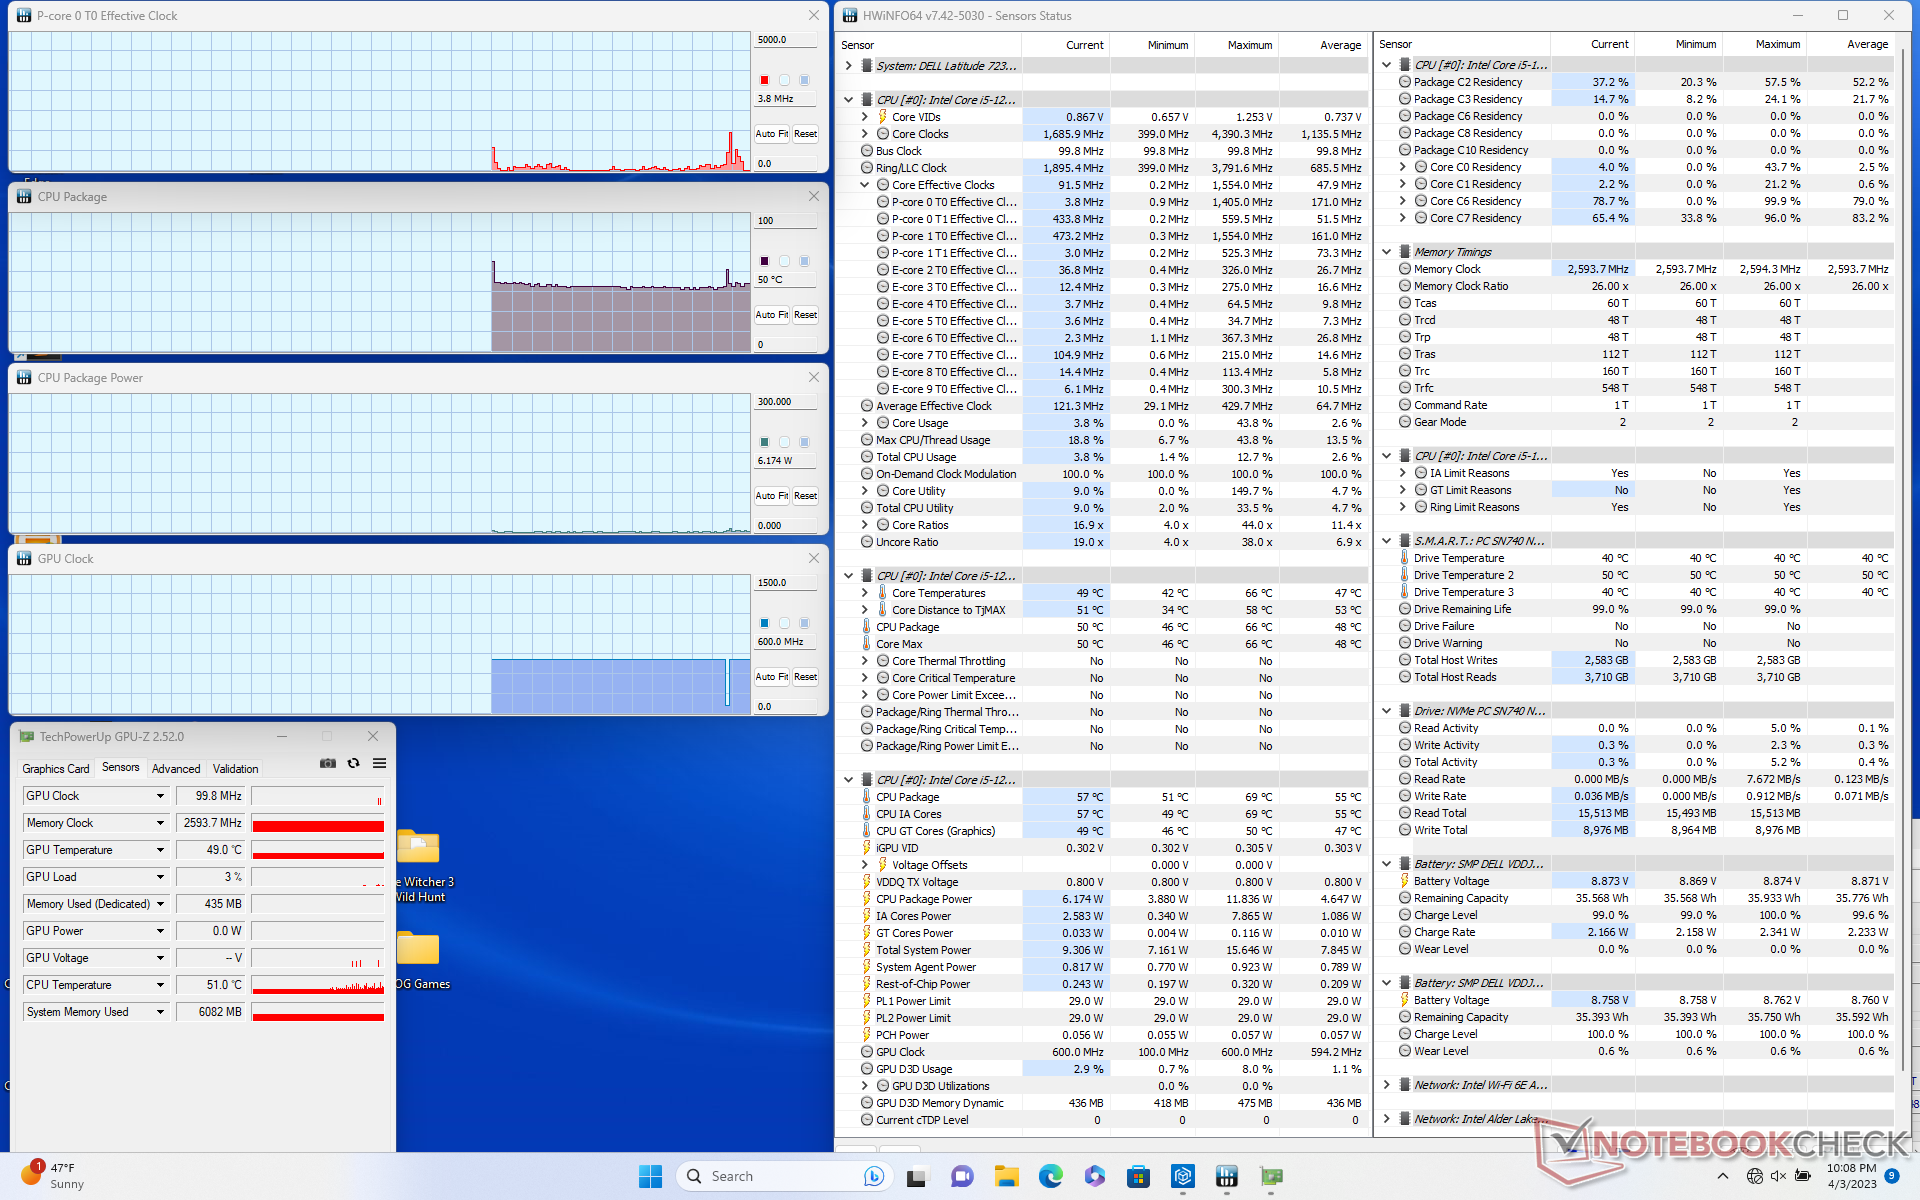
| 系统空闲 | -- | -- | 50 |
| Prime95压力 | 2.6 | -- | 96 |
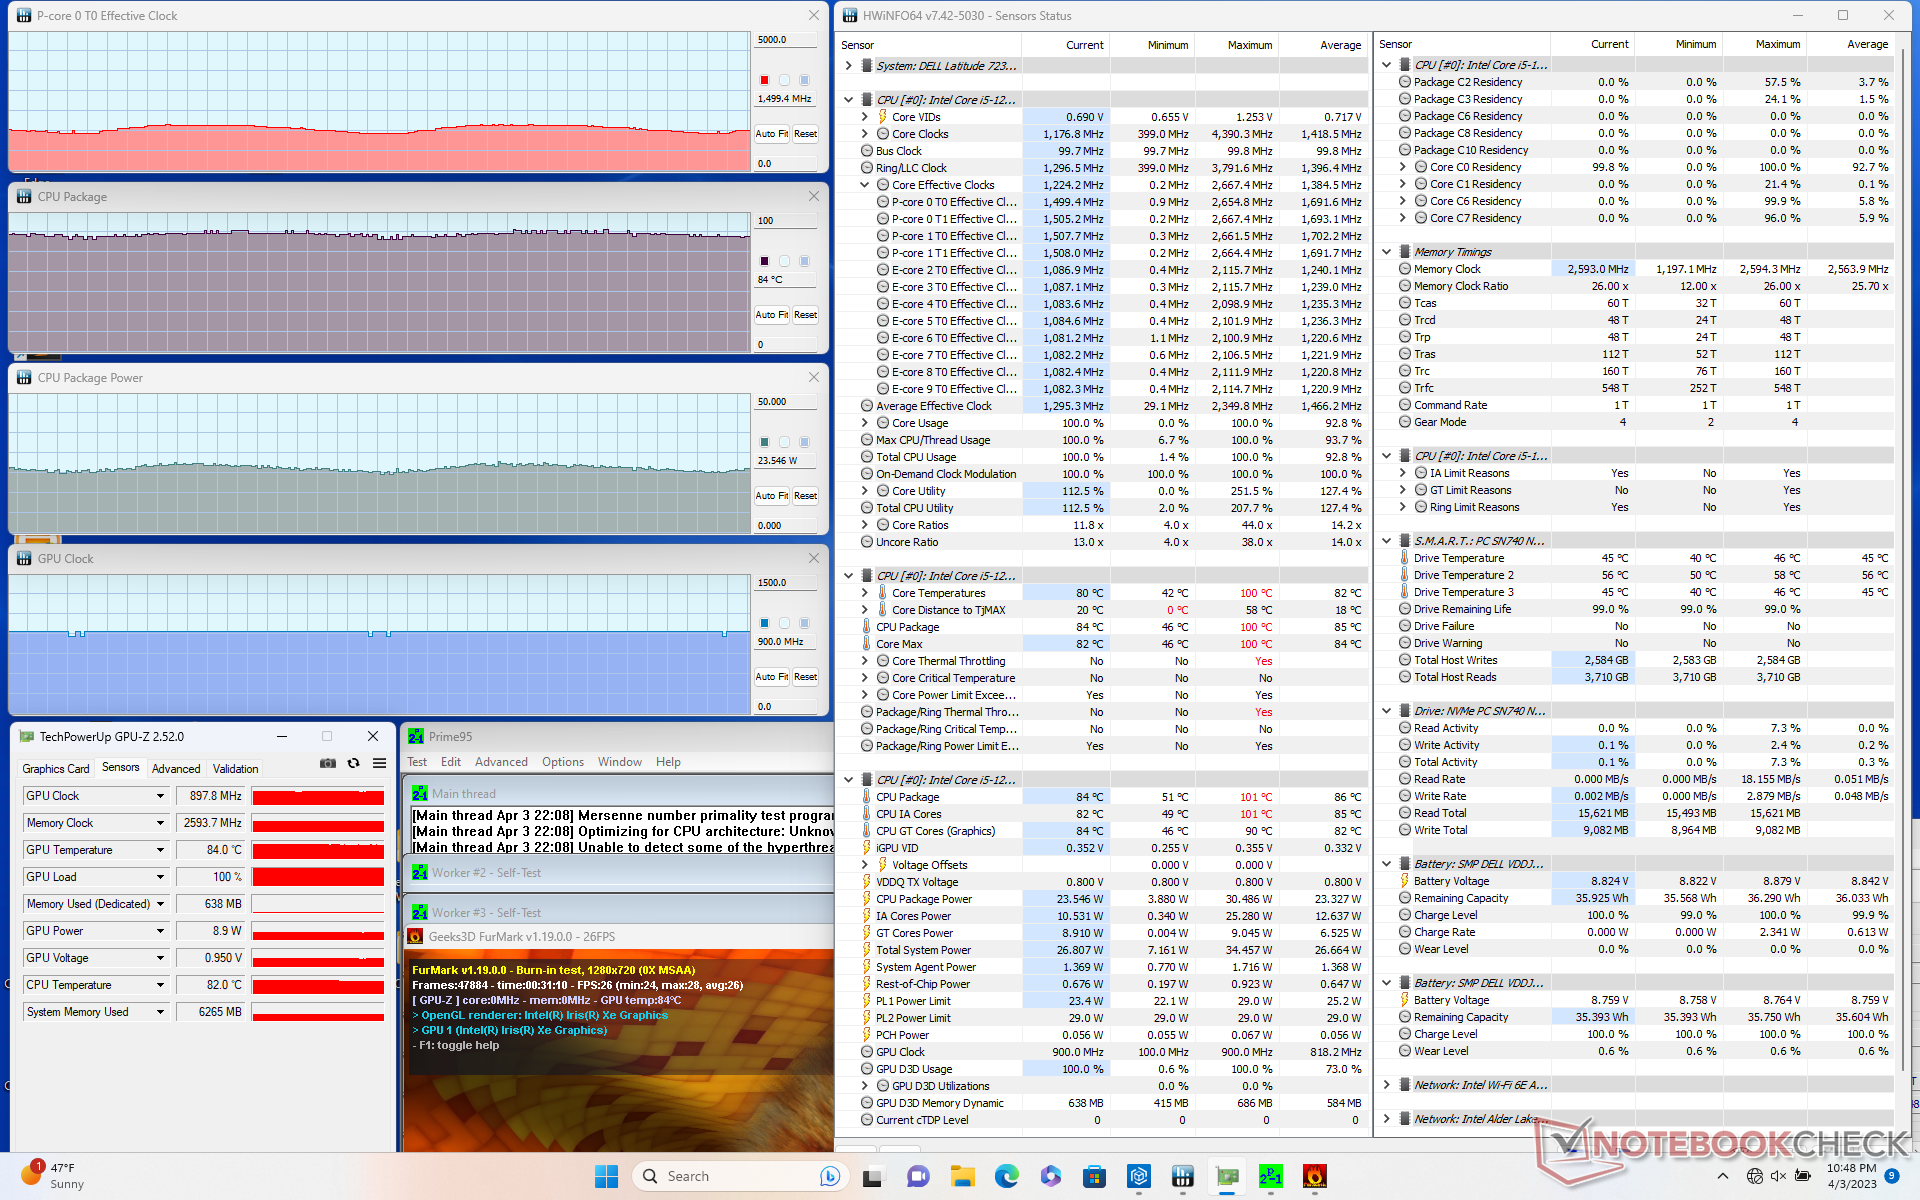
| Prime95 + FurMark 压力 | 1.4 - 1.6 | 898 | 84 |
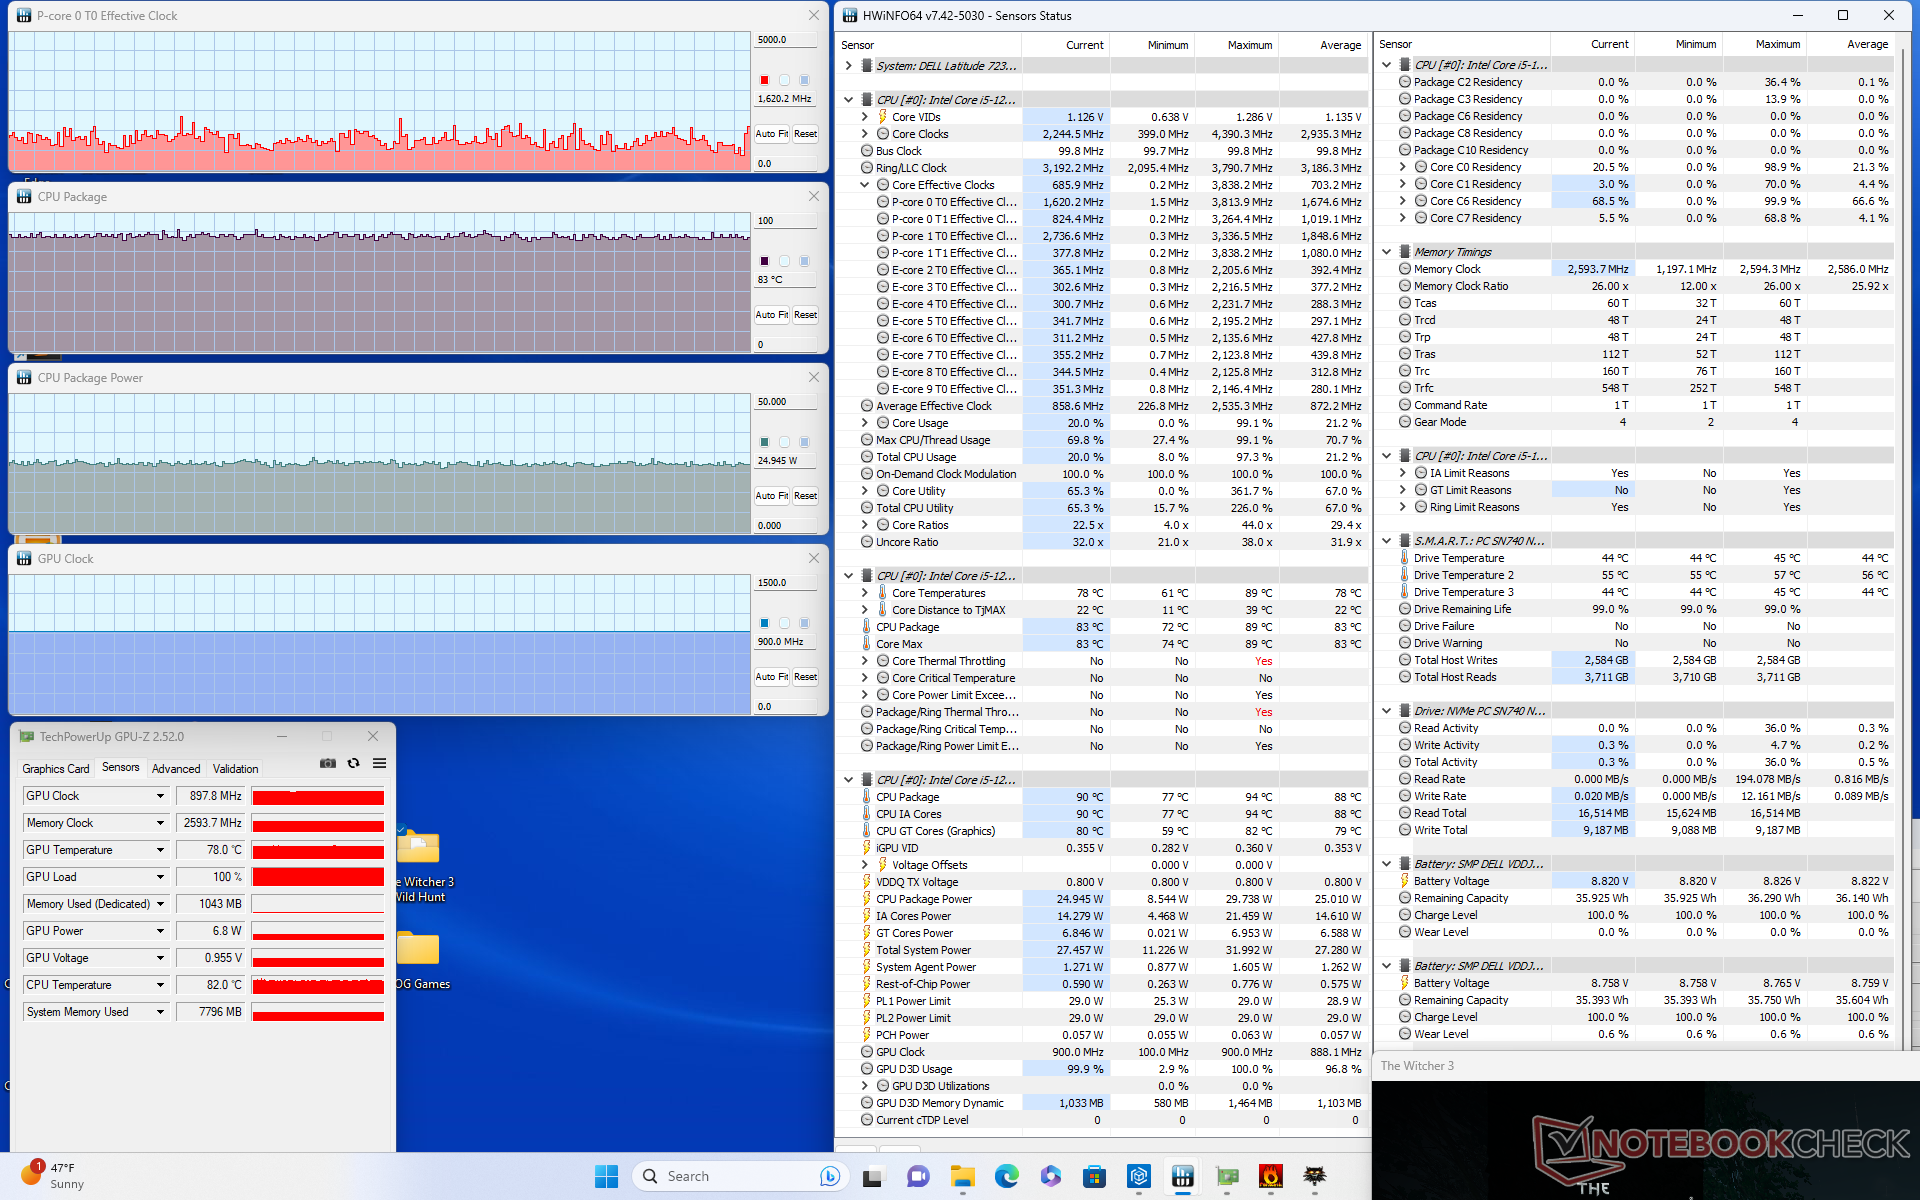
| Witcher 3 应力(超级模式) | ~3.0 | 898 | 85 |
| Witcher 3 应力(优化模式) | ~1.7 | 898 | 83 |
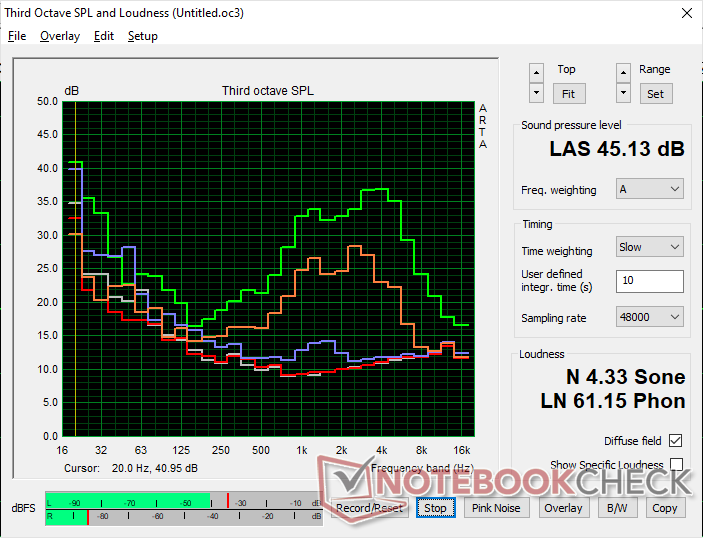
发言人
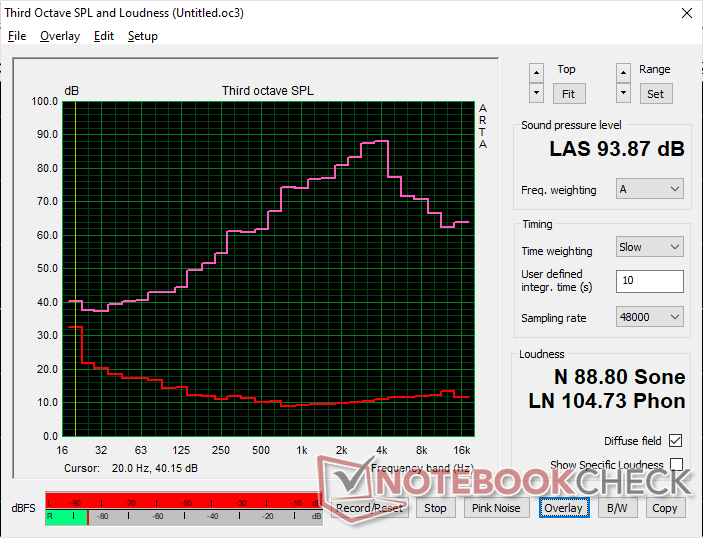
Dell Latitude 7230 Rugged Extreme audio analysis
(+) | speakers can play relatively loud (93.9 dB)
Bass 100 - 315 Hz
(-) | nearly no bass - on average 19.9% lower than median
(+) | bass is linear (5.2% delta to prev. frequency)
Mids 400 - 2000 Hz
(±) | higher mids - on average 6.5% higher than median
(+) | mids are linear (4.5% delta to prev. frequency)
Highs 2 - 16 kHz
(±) | higher highs - on average 8.4% higher than median
(±) | linearity of highs is average (7% delta to prev. frequency)
Overall 100 - 16.000 Hz
(±) | linearity of overall sound is average (19.4% difference to median)
Compared to same class
» 54% of all tested devices in this class were better, 7% similar, 39% worse
» The best had a delta of 7%, average was 20%, worst was 129%
Compared to all devices tested
» 48% of all tested devices were better, 7% similar, 45% worse
» The best had a delta of 4%, average was 24%, worst was 134%
Apple MacBook Pro 16 2021 M1 Pro audio analysis
(+) | speakers can play relatively loud (84.7 dB)
Bass 100 - 315 Hz
(+) | good bass - only 3.8% away from median
(+) | bass is linear (5.2% delta to prev. frequency)
Mids 400 - 2000 Hz
(+) | balanced mids - only 1.3% away from median
(+) | mids are linear (2.1% delta to prev. frequency)
Highs 2 - 16 kHz
(+) | balanced highs - only 1.9% away from median
(+) | highs are linear (2.7% delta to prev. frequency)
Overall 100 - 16.000 Hz
(+) | overall sound is linear (4.6% difference to median)
Compared to same class
» 0% of all tested devices in this class were better, 0% similar, 100% worse
» The best had a delta of 5%, average was 17%, worst was 45%
Compared to all devices tested
» 0% of all tested devices were better, 0% similar, 100% worse
» The best had a delta of 4%, average was 24%, worst was 134%
能源管理
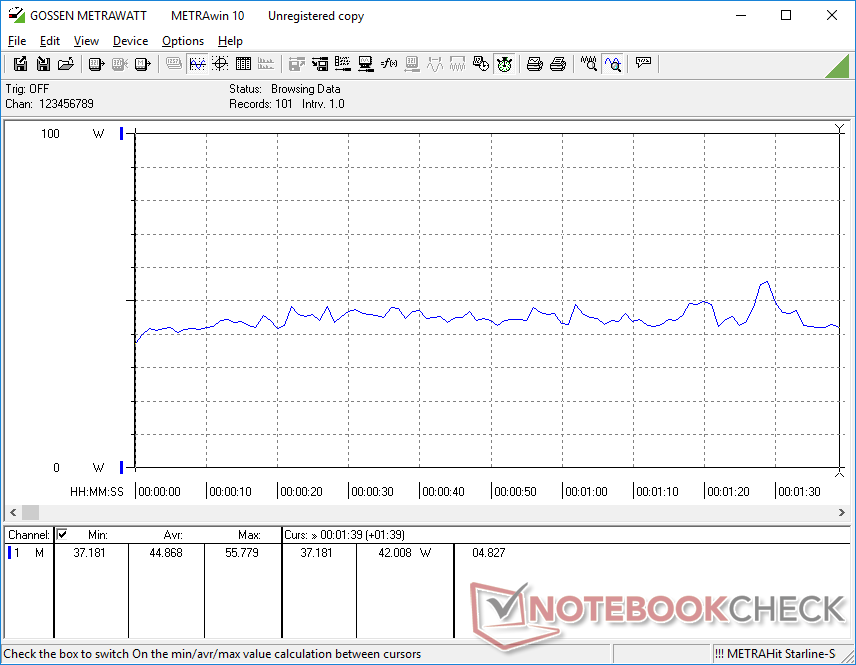
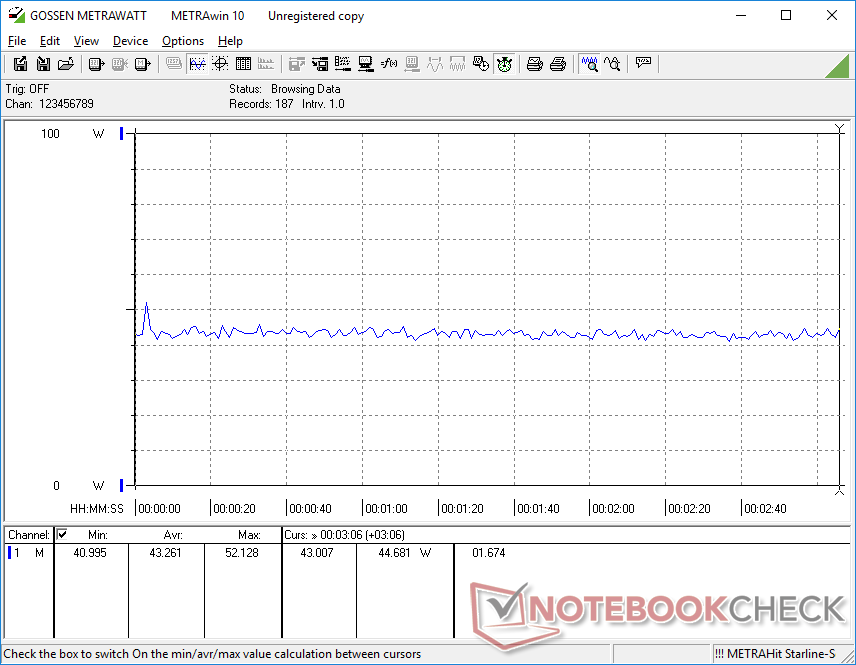
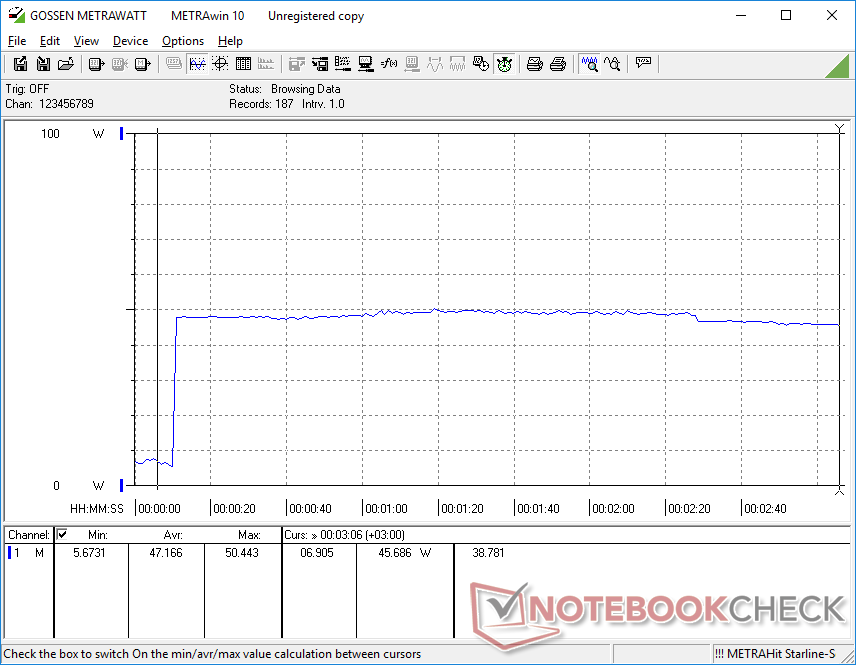
消耗功率
功耗大多与其他运行在旧的第11代CPU上的耐用设备相似,如戴尔Latitude 7330 Rugged Extreme或松下Toughbook 40。然而,每瓦性能可能非常不同。更具体地说,我们的Latitude 7230 Rugged可以提供比Core i7-1185G7更快40%到50%的处理器性能。戴尔Latitude 7330 Rugged而不需要消耗更多的电力。另一方面,GPU性能要慢30%到40%。
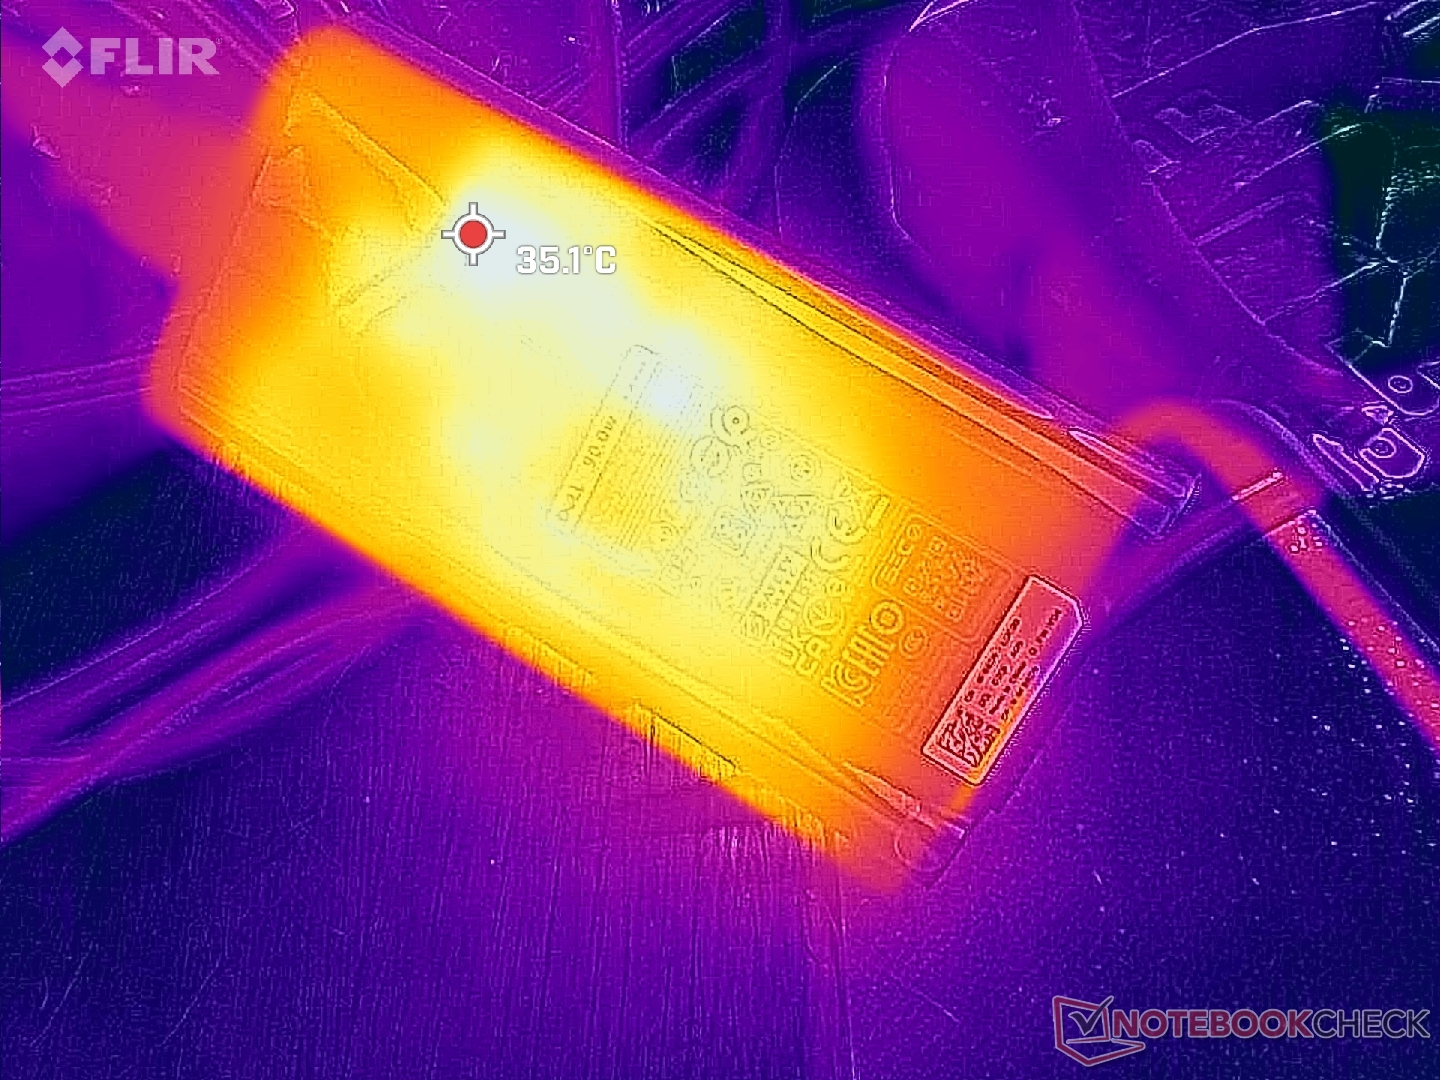
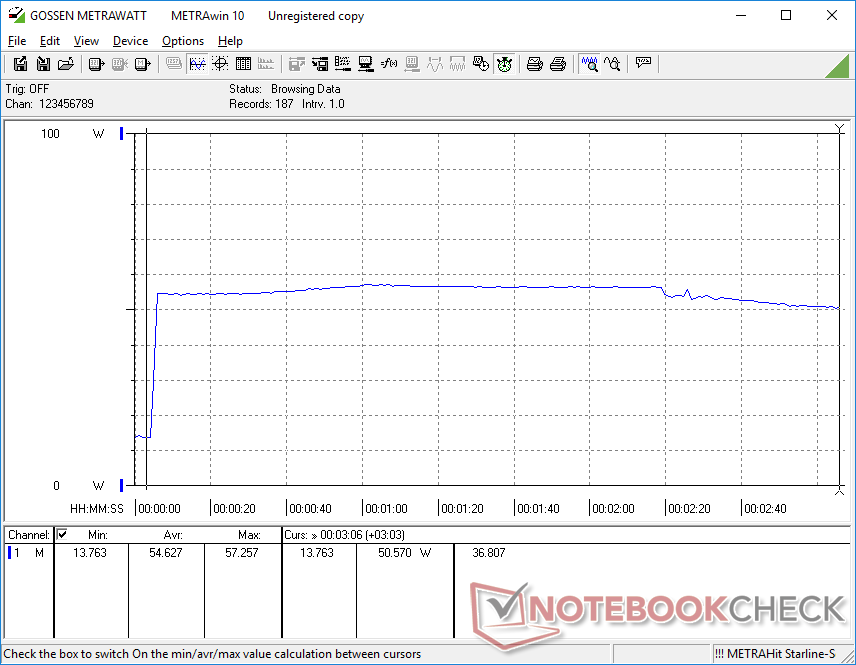
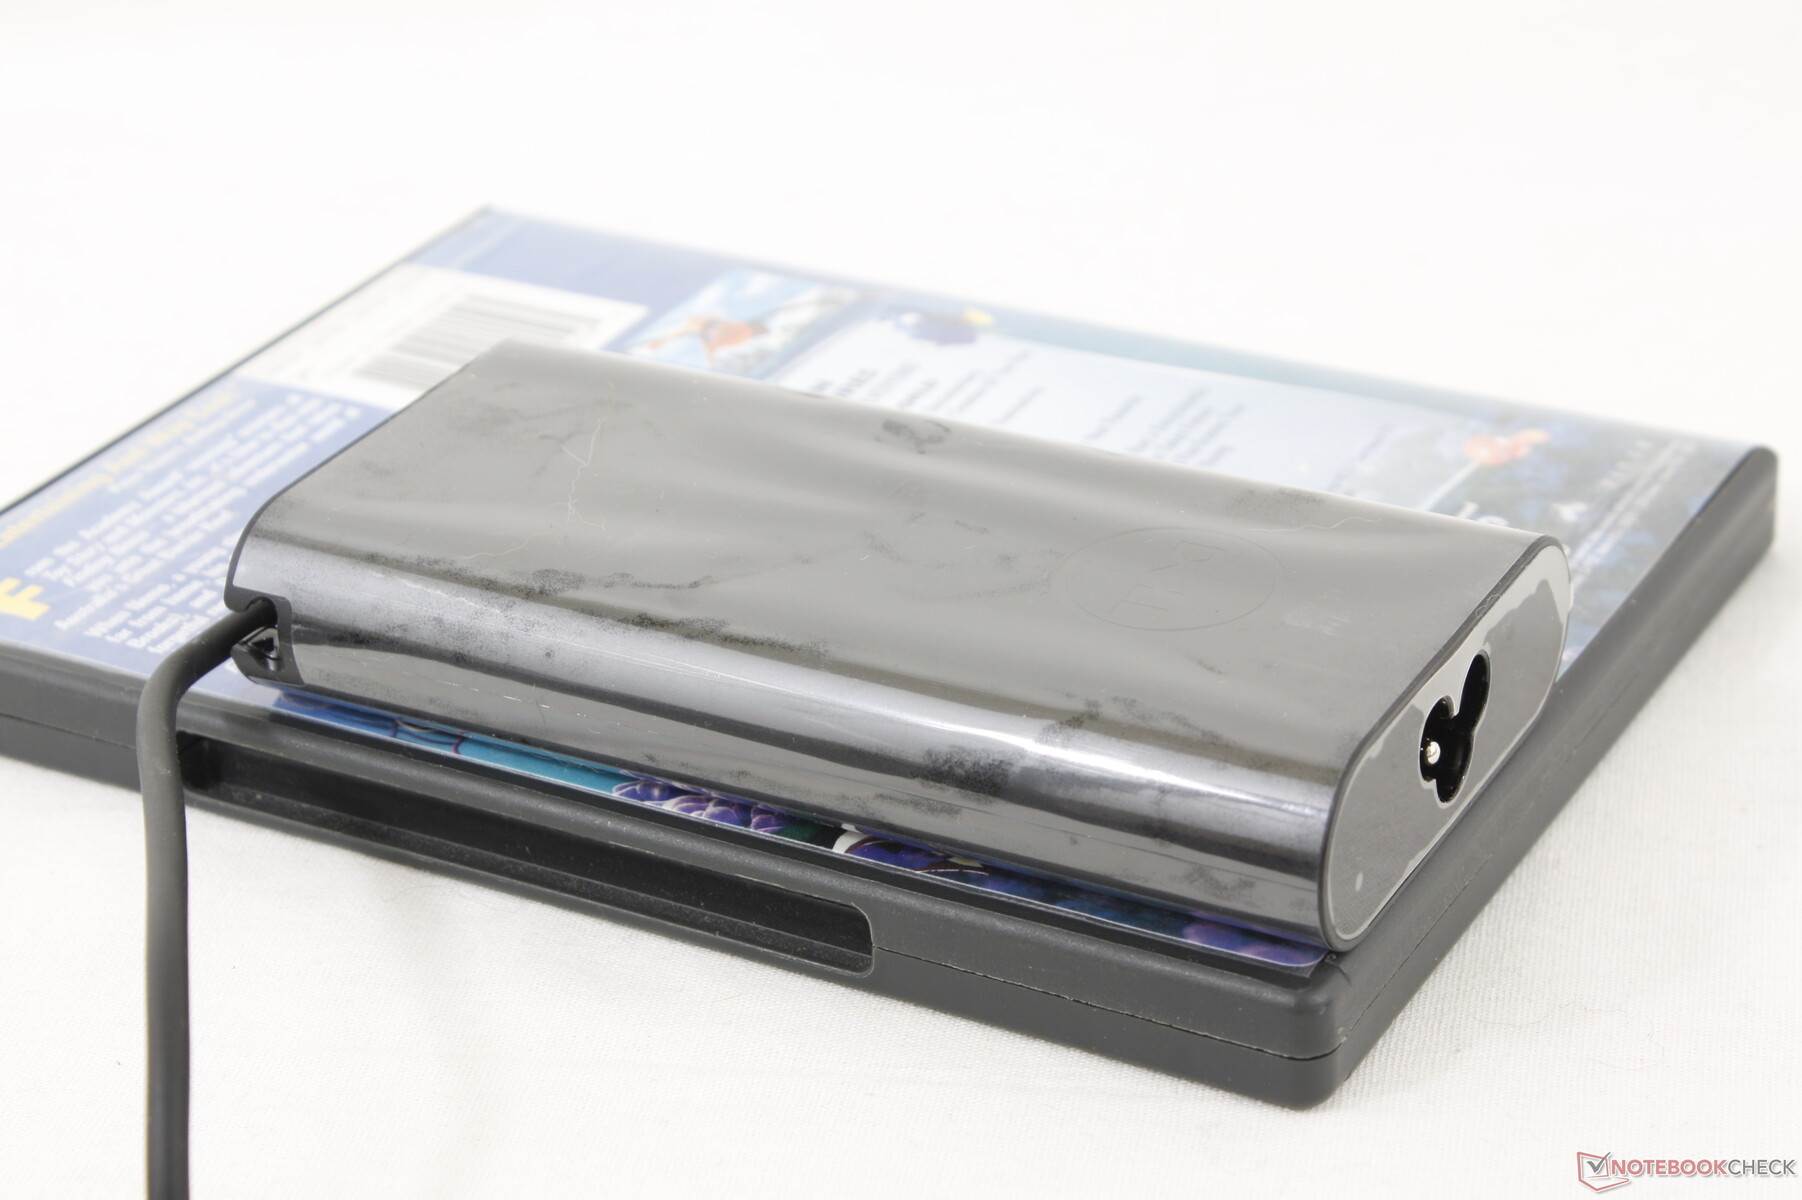
我们能够从中小型(约13 x 6.5 x 2.3厘米)的90瓦USB-C交流适配器上记录到55瓦的最大功耗。与许多酷睿i7替代品相比,这个最大读数相对较低,因为我们的酷睿i5有一个较低的涡轮增压限制。请注意,该机型配备的交流适配器与某些XPS笔记本电脑上的相同。
| Off / Standby | |
| Idle | |
| Load |
|
Key:
min: | |
| Dell Latitude 7230 Rugged Extreme i5-1240U, Iris Xe G7 80EUs, WD PC SN740 512GB SDDPMQD-512G-1101, IPS, 1920x1200, 12" | Dell Latitude 7330 Rugged Extreme i7-1185G7, Iris Xe G7 96EUs, , IPS, 1920x1080, 13.3" | Panasonic Toughbook 40 i7-1185G7, Iris Xe G7 96EUs, Samsung PM991 MZVLQ1T0HALB, IPS, 1920x1080, 14" | Getac B360 i7-10710U, UHD Graphics 620, Lite-On CA5-8D512, IPS, 1920x1080, 13.3" | Acer Enduro Urban N3 EUN314 i7-1165G7, Iris Xe G7 96EUs, Samsung PM991 MZVLQ1T0HALB, IPS, 1920x1080, 14" | Durabook S14I i7-1165G7, Iris Xe G7 96EUs, UDinfo M2P M2P80DE512GBAEP, TN, 1920x1080, 14" | |
|---|---|---|---|---|---|---|
| Power Consumption | -9% | -15% | -5% | 25% | -25% | |
| Idle Minimum * (Watt) | 6.5 | 4.1 37% | 4.9 25% | 5.4 17% | 3.8 42% | 6.8 -5% |
| Idle Average * (Watt) | 8.9 | 11.7 -31% | 12.3 -38% | 12.2 -37% | 8 10% | 16.4 -84% |
| Idle Maximum * (Watt) | 14.3 | 11.8 17% | 14 2% | 12.6 12% | 8.7 39% | 16.9 -18% |
| Load Average * (Watt) | 44.9 | 48.5 -8% | 54 -20% | 39.1 13% | 34.6 23% | 39.2 13% |
| Witcher 3 ultra * (Watt) | 43.2 | 44.3 -3% | 46.3 -7% | 36.5 16% | 35.4 18% | |
| Load Maximum * (Watt) | 54.8 | 91 -66% | 83.6 -53% | 81.8 -49% | 45.4 17% | 73.1 -33% |
* ... smaller is better
Power Consumption Witcher 3 / Stresstest
Power Consumption external Monitor
电池寿命 - 极端使用下3.5小时
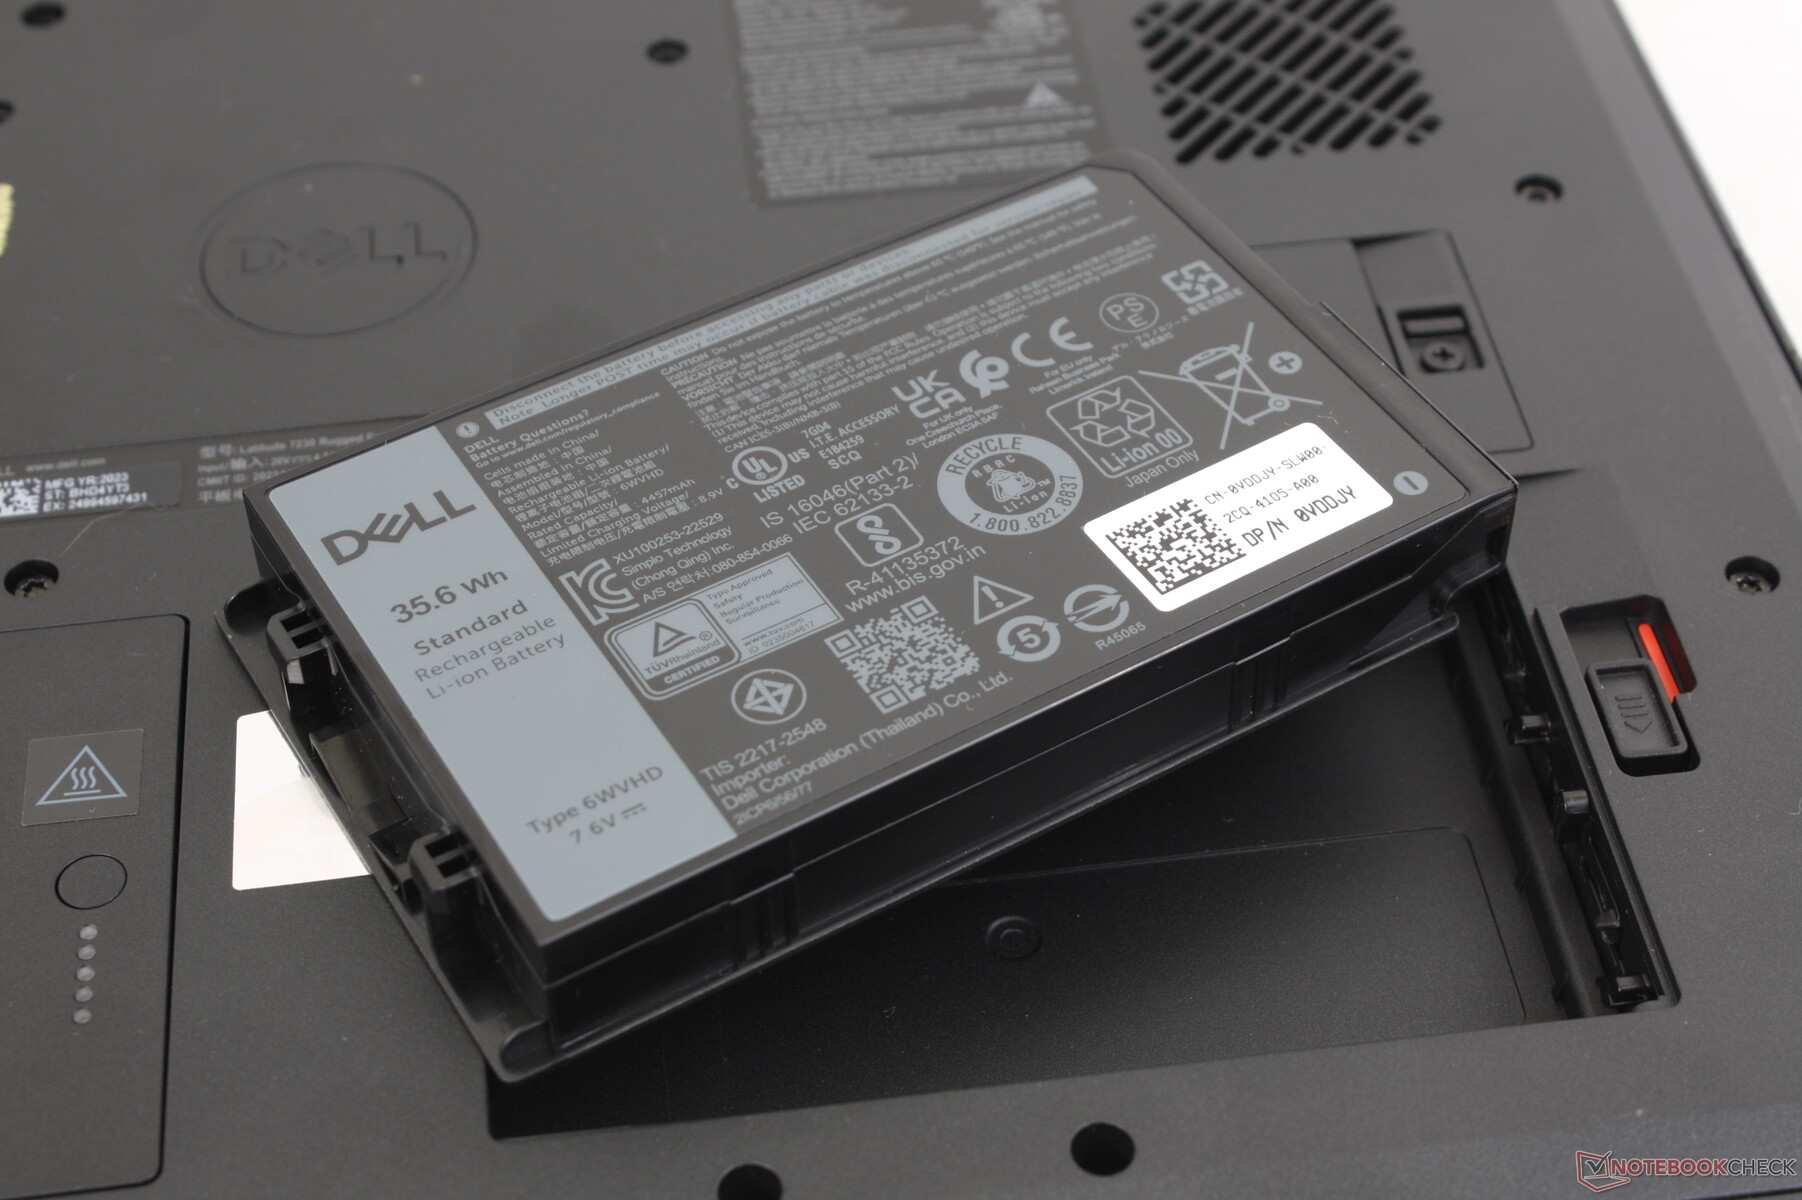
最多支持两块可移动电池。安装两块电池(36Wh x2)时,WLAN运行时间几乎为13小时。另一方面,在最大亮度水平上运行要求较高的负载应持续约3.5小时。
不幸的是,两块电池从空到满的充电时间相当慢,为4至5小时,而大多数超极本为1.5至2小时。
| Dell Latitude 7230 Rugged Extreme i5-1240U, Iris Xe G7 80EUs, 72 Wh | Dell Latitude 7330 Rugged Extreme i7-1185G7, Iris Xe G7 96EUs, 107 Wh | Panasonic Toughbook 40 i7-1185G7, Iris Xe G7 96EUs, 136 Wh | Getac B360 i7-10710U, UHD Graphics 620, 46 Wh | Acer Enduro Urban N3 EUN314 i7-1165G7, Iris Xe G7 96EUs, 50.3 Wh | Durabook S14I i7-1165G7, Iris Xe G7 96EUs, 50 Wh | |
|---|---|---|---|---|---|---|
| Battery runtime | 38% | 46% | -38% | -51% | -58% | |
| WiFi v1.3 (h) | 13 | 18 38% | 19 46% | 8.1 -38% | 6.4 -51% | 5.5 -58% |
| Load (h) | 3.6 |
Pros
Cons
判决--大部分是全垒打
Latitude 7230 Rugged Extreme的突出特点是其全sRGB覆盖率,快速的CPU性能,以及相对于其他耐用平板电脑的低重量。相比之下,大多数替代品的颜色更差,边框更厚。
我们希望看到端口盖和前部按钮的改进,它们分别太滑和小。如果你碰巧戴着手套,这些就更难处理了。
Latitude 7230 Rugged Extreme出色的电池寿命、超亮的显示屏和全sRGB覆盖,为未来的耐用平板电脑设定了标准。
潜在的买家要记住,在CPU性能方面,价格较低的酷睿i5-1240U与酷睿i7-1260U的性能相似。因此,用户只有在需要更快的图形性能时才应选择后者。 如果你打算在该机型上运行更苛刻的任务,预计风扇噪音会比平时大。
价格和可用性
戴尔现在正在运送Latitude 7230 Rugged Extreme,基本配置起价为2700美元,如果配置齐全则超过5000美元。我们的评测设备的售价约为3200美元。
Dell Latitude 7230 Rugged Extreme
- 04/07/2023 v7 (old)
Allen Ngo
Transparency
The selection of devices to be reviewed is made by our editorial team. The test sample was provided to the author as a loan by the manufacturer or retailer for the purpose of this review. The lender had no influence on this review, nor did the manufacturer receive a copy of this review before publication. There was no obligation to publish this review. As an independent media company, Notebookcheck is not subjected to the authority of manufacturers, retailers or publishers.
This is how Notebookcheck is testing
Every year, Notebookcheck independently reviews hundreds of laptops and smartphones using standardized procedures to ensure that all results are comparable. We have continuously developed our test methods for around 20 years and set industry standards in the process. In our test labs, high-quality measuring equipment is utilized by experienced technicians and editors. These tests involve a multi-stage validation process. Our complex rating system is based on hundreds of well-founded measurements and benchmarks, which maintains objectivity. Further information on our test methods can be found here.
Price comparison

