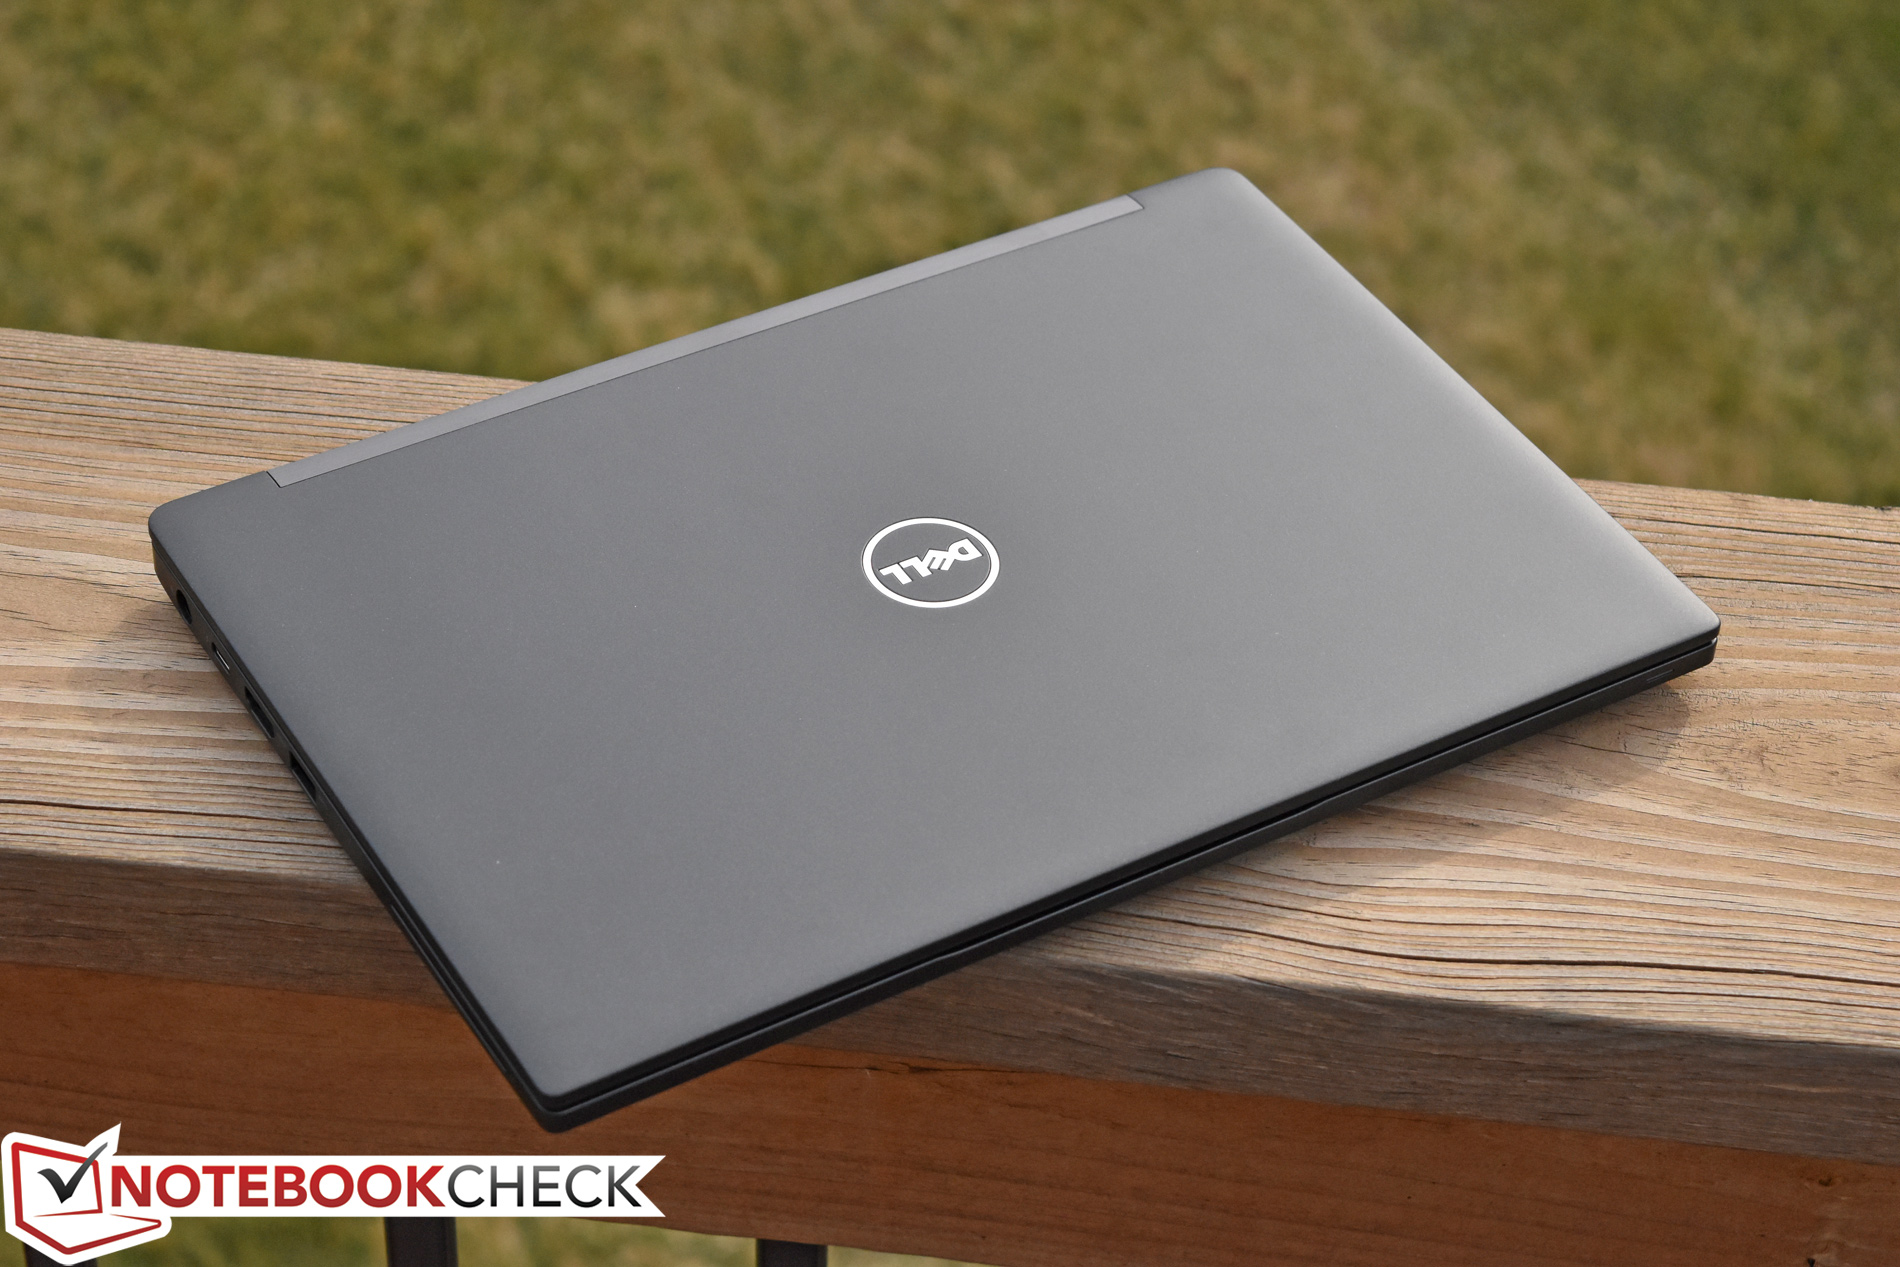
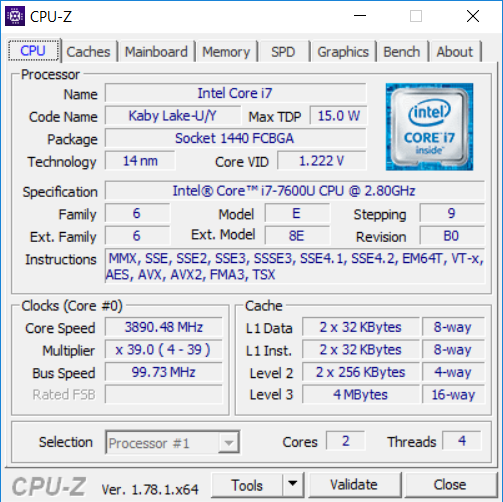
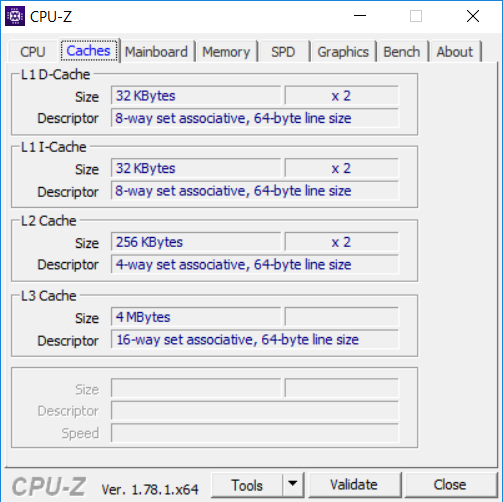
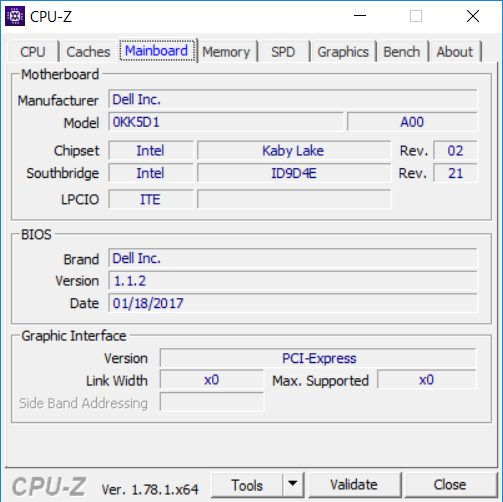
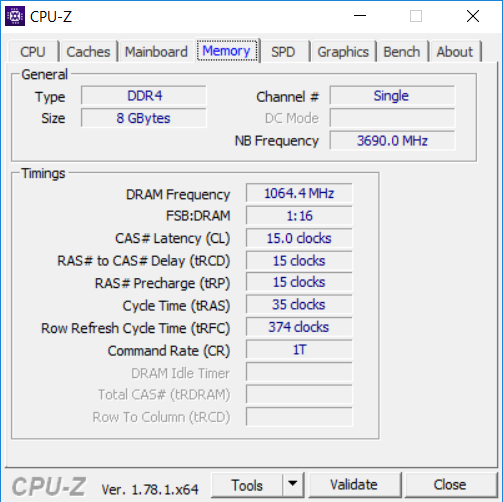
戴尔 Latitude 7280 (7600U, FHD) 笔记本简短评测

| SD Card Reader | |
| average JPG Copy Test (av. of 3 runs) | |
| Dell Latitude 12 E7270 | |
| HP EliteBook 820 G4 Z2V72ET | |
| Dell Latitude 7280 | |
| Lenovo ThinkPad X260-20F6007RGE | |
| maximum AS SSD Seq Read Test (1GB) | |
| Dell Latitude 12 E7270 | |
| Dell Latitude 7280 | |
| HP EliteBook 820 G4 Z2V72ET | |
| Lenovo ThinkPad X260-20F6007RGE | |
| Networking | |
| iperf3 transmit AX12 | |
| Dell Latitude 7280 | |
| HP EliteBook 820 G4 Z2V72ET (jseb) | |
| iperf3 receive AX12 | |
| Dell Latitude 7280 | |
| HP EliteBook 820 G4 Z2V72ET (jseb) | |
| |||||||||||||||||||||||||
Brightness Distribution: 88 %
Center on Battery: 310.4 cd/m²
Contrast: 970:1 (Black: 0.32 cd/m²)
ΔE ColorChecker Calman: 5.9 | ∀{0.5-29.43 Ø4.71}
ΔE Greyscale Calman: 5.1 | ∀{0.09-98 Ø4.96}
65% sRGB (Argyll 1.6.3 3D)
42% AdobeRGB 1998 (Argyll 1.6.3 3D)
45.9% AdobeRGB 1998 (Argyll 3D)
65.4% sRGB (Argyll 3D)
44.41% Display P3 (Argyll 3D)
Gamma: 2.33
CCT: 6816 K
| Dell Latitude 7280 AUO236D , IPS, 12.5", 1920x1080 | Dell Latitude 12 E7270 LG LP125WF4, IPS LED, 12.5", 1920x1080 | HP EliteBook 820 G4 Z2V72ET Chi Mei, IPS, 12.5", 1920x1080 | Razer Blade Stealth QHD i7-7500U Sharp SHP142F (LQ125T1JW02), , 12.5", 2560x1440 | Lenovo ThinkPad X260-20F6007RGE Lenovo N125HCE-GN1, IPS, 12.5", 1920x1080 | |
|---|---|---|---|---|---|
| Display | -10% | 0% | 51% | 1% | |
| Display P3 Coverage (%) | 44.41 | 39.7 -11% | 44.45 0% | 68.7 55% | 44.71 1% |
| sRGB Coverage (%) | 65.4 | 59.2 -9% | 65.5 0% | 95.8 46% | 66.1 1% |
| AdobeRGB 1998 Coverage (%) | 45.9 | 41.07 -11% | 46.04 0% | 69.9 52% | 46.23 1% |
| Response Times | -6% | 5% | -11% | 6% | |
| Response Time Grey 50% / Grey 80% * (ms) | 32.4 ? | 38.4 ? -19% | 35 ? -8% | 37 ? -14% | 32.8 ? -1% |
| Response Time Black / White * (ms) | 31.2 ? | 28.8 ? 8% | 26 ? 17% | 33.4 ? -7% | 27.2 ? 13% |
| PWM Frequency (Hz) | 200 ? | ||||
| Screen | -11% | 2% | 22% | 6% | |
| Brightness middle (cd/m²) | 310.4 | 353 14% | 326 5% | 402 30% | 337 9% |
| Brightness (cd/m²) | 301 | 334 11% | 304 1% | 382 27% | 322 7% |
| Brightness Distribution (%) | 88 | 91 3% | 81 -8% | 88 0% | 91 3% |
| Black Level * (cd/m²) | 0.32 | 0.47 -47% | 0.29 9% | 0.45 -41% | 0.32 -0% |
| Contrast (:1) | 970 | 751 -23% | 1124 16% | 893 -8% | 1053 9% |
| Colorchecker dE 2000 * | 5.9 | 7.79 -32% | 6.49 -10% | 3.6 39% | 5.71 3% |
| Colorchecker dE 2000 max. * | 21 | 15.19 28% | 15.95 24% | 7.5 64% | 15.39 27% |
| Greyscale dE 2000 * | 5.1 | 7.38 -45% | 6.16 -21% | 4.3 16% | 5.15 -1% |
| Gamma | 2.33 94% | 2.43 91% | 2.32 95% | 2.1 105% | 2.38 92% |
| CCT | 6816 95% | 6158 106% | 7575 86% | 6572 99% | 6881 94% |
| Color Space (Percent of AdobeRGB 1998) (%) | 42 | 37.72 -10% | 42 0% | 62.3 48% | 42.38 1% |
| Color Space (Percent of sRGB) (%) | 65 | 58.87 -9% | 65 0% | 95.7 47% | 65.62 1% |
| Total Average (Program / Settings) | -9% /
-10% | 2% /
2% | 21% /
24% | 4% /
5% |
* ... smaller is better
Display Response Times
| ↔ Response Time Black to White | ||
|---|---|---|
| 31.2 ms ... rise ↗ and fall ↘ combined | ↗ 9.2 ms rise | 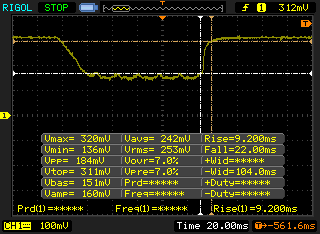 |
| ↘ 22 ms fall | ||
| The screen shows slow response rates in our tests and will be unsatisfactory for gamers. In comparison, all tested devices range from 0.1 (minimum) to 240 (maximum) ms. » 84 % of all devices are better. This means that the measured response time is worse than the average of all tested devices (19.8 ms). | ||
| ↔ Response Time 50% Grey to 80% Grey | ||
| 32.4 ms ... rise ↗ and fall ↘ combined | ↗ 12.4 ms rise | 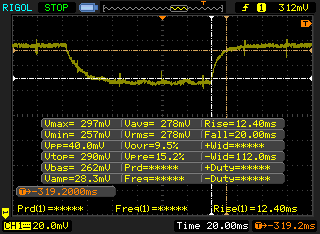 |
| ↘ 20 ms fall | ||
| The screen shows slow response rates in our tests and will be unsatisfactory for gamers. In comparison, all tested devices range from 0.165 (minimum) to 636 (maximum) ms. » 44 % of all devices are better. This means that the measured response time is similar to the average of all tested devices (31 ms). | ||
Screen Flickering / PWM (Pulse-Width Modulation)
| Screen flickering / PWM not detected | 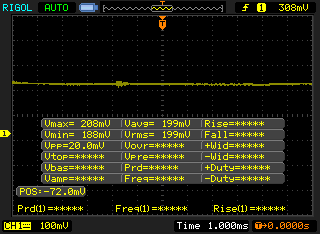 | ||
In comparison: 52 % of all tested devices do not use PWM to dim the display. If PWM was detected, an average of 7754 (minimum: 5 - maximum: 343500) Hz was measured. | |||
| PCMark 8 | |
| Home Score Accelerated v2 | |
| Dell Latitude 7280 | |
| HP EliteBook 820 G4 Z2V72ET | |
| Dell Latitude 12 E7270 | |
| Razer Blade Stealth QHD i7-7500U | |
| Lenovo ThinkPad X260-20F6007RGE | |
| Work Score Accelerated v2 | |
| Dell Latitude 7280 | |
| HP EliteBook 820 G4 Z2V72ET | |
| Dell Latitude 12 E7270 | |
| Lenovo ThinkPad X260-20F6007RGE | |
| Creative Score Accelerated v2 | |
| Dell Latitude 7280 | |
| HP EliteBook 820 G4 Z2V72ET | |
| Lenovo ThinkPad X260-20F6007RGE | |
| PCMark 8 Home Score Accelerated v2 | 3667 points | |
| PCMark 8 Creative Score Accelerated v2 | 4662 points | |
| PCMark 8 Work Score Accelerated v2 | 4957 points | |
Help | ||
| Dell Latitude 7280 SanDisk X400 M.2 2280 256GB | Dell Latitude 12 E7270 Liteon L8H-256V2G | HP EliteBook 820 G4 Z2V72ET Samsung PM951 NVMe MZVLV512 | Razer Blade Stealth QHD i7-7500U Samsung PM951 NVMe MZVLV256 | Lenovo ThinkPad X260-20F6007RGE Liteonit LCH-512V2S | |
|---|---|---|---|---|---|
| CrystalDiskMark 3.0 | 2% | 100% | 64% | 8% | |
| Read Seq (MB/s) | 470.8 | 498.4 6% | 1315 179% | 1178 150% | 499.6 6% |
| Write Seq (MB/s) | 477.4 | 286.7 -40% | 594 24% | 305.4 -36% | 403 -16% |
| Read 512 (MB/s) | 370.1 | 661 79% | 638 72% | 322.9 -13% | |
| Write 512 (MB/s) | 323.2 | 594 84% | 305.7 -5% | 372.4 15% | |
| Read 4k (MB/s) | 30.23 | 24.89 -18% | 42.87 42% | 38.54 27% | 27.22 -10% |
| Write 4k (MB/s) | 59.5 | 88 48% | 151.6 155% | 153.4 158% | 83.6 41% |
| Read 4k QD32 (MB/s) | 344.4 | 280.5 -19% | 568 65% | 614 78% | 316.5 -8% |
| Write 4k QD32 (MB/s) | 183 | 241.9 32% | 491.7 169% | 302.7 65% | 273.1 49% |

| 3DMark | |
| 1280x720 Cloud Gate Standard Graphics | |
| Razer Blade Stealth QHD i7-7500U | |
| HP EliteBook 820 G4 Z2V72ET | |
| Dell Latitude 7280 | |
| Lenovo ThinkPad X260-20F6007RGE | |
| Dell Latitude 12 E7270 | |
| 1920x1080 Fire Strike Graphics | |
| Razer Blade Stealth QHD i7-7500U | |
| HP EliteBook 820 G4 Z2V72ET | |
| Dell Latitude 7280 | |
| Lenovo ThinkPad X260-20F6007RGE | |
| Dell Latitude 12 E7270 | |
| 1920x1080 Ice Storm Extreme Graphics | |
| HP EliteBook 820 G4 Z2V72ET | |
| 3DMark 06 Standard Score | 8030 points | |
| 3DMark 11 Performance | 1538 points | |
| 3DMark Ice Storm Standard Score | 54025 points | |
| 3DMark Cloud Gate Standard Score | 5940 points | |
| 3DMark Fire Strike Score | 772 points | |
Help | ||
| BioShock Infinite | |
| 1280x720 Very Low Preset (sort by value) | |
| Dell Latitude 7280 | |
| Dell Latitude 12 E7270 | |
| HP EliteBook 820 G4 Z2V72ET | |
| Lenovo ThinkPad X260-20F6007RGE | |
| 1366x768 Medium Preset (sort by value) | |
| Dell Latitude 7280 | |
| Dell Latitude 12 E7270 | |
| HP EliteBook 820 G4 Z2V72ET | |
| Lenovo ThinkPad X260-20F6007RGE | |
| 1366x768 High Preset (sort by value) | |
| Dell Latitude 7280 | |
| Dell Latitude 12 E7270 | |
| HP EliteBook 820 G4 Z2V72ET | |
| Lenovo ThinkPad X260-20F6007RGE | |
| 1920x1080 Ultra Preset, DX11 (DDOF) (sort by value) | |
| Dell Latitude 7280 | |
| Dell Latitude 12 E7270 | |
| HP EliteBook 820 G4 Z2V72ET | |
| Lenovo ThinkPad X260-20F6007RGE | |
| low | med. | high | ultra | |
|---|---|---|---|---|
| BioShock Infinite (2013) | 37 | 23 | 19 | 7 |
Noise level
| Idle |
| 29.4 / 29.4 / 30 dB(A) |
| Load |
| 30.6 / 32.7 dB(A) |
 | ||
30 dB silent 40 dB(A) audible 50 dB(A) loud |
||
min: | ||
| Dell Latitude 7280 HD Graphics 620, i7-7600U, SanDisk X400 M.2 2280 256GB | Dell Latitude 12 E7270 HD Graphics 520, 6300U, Liteon L8H-256V2G | HP EliteBook 820 G4 Z2V72ET HD Graphics 620, i7-7500U, Samsung PM951 NVMe MZVLV512 | Razer Blade Stealth QHD i7-7500U HD Graphics 620, i7-7500U, Samsung PM951 NVMe MZVLV256 | Lenovo ThinkPad X260-20F6007RGE HD Graphics 520, 6500U, Liteonit LCH-512V2S | |
|---|---|---|---|---|---|
| Noise | -1% | -5% | -9% | -4% | |
| off / environment * (dB) | 29.4 | 28.9 2% | 30.7 -4% | 31 -5% | 29 1% |
| Idle Minimum * (dB) | 29.4 | 28.9 2% | 30.7 -4% | 31 -5% | 29 1% |
| Idle Average * (dB) | 29.4 | 28.9 2% | 30.7 -4% | 31 -5% | 29 1% |
| Idle Maximum * (dB) | 30 | 28.9 4% | 30.7 -2% | 31 -3% | 29 3% |
| Load Average * (dB) | 30.6 | 31.3 -2% | 35.3 -15% | 35 -14% | 35.1 -15% |
| Load Maximum * (dB) | 32.7 | 37.6 -15% | 33.7 -3% | 40.5 -24% | 37.8 -16% |
* ... smaller is better
(±) The maximum temperature on the upper side is 41.2 °C / 106 F, compared to the average of 34.3 °C / 94 F, ranging from 21.2 to 62.5 °C for the class Office.
(-) The bottom heats up to a maximum of 45.4 °C / 114 F, compared to the average of 36.8 °C / 98 F
(+) In idle usage, the average temperature for the upper side is 25.8 °C / 78 F, compared to the device average of 29.5 °C / 85 F.
(+) The palmrests and touchpad are cooler than skin temperature with a maximum of 27.2 °C / 81 F and are therefore cool to the touch.
(±) The average temperature of the palmrest area of similar devices was 27.5 °C / 81.5 F (+0.3 °C / 0.5 F).
Dell Latitude 7280 audio analysis
(-) | not very loud speakers (71.8 dB)
Bass 100 - 315 Hz
(±) | reduced bass - on average 7.9% lower than median
(±) | linearity of bass is average (8.2% delta to prev. frequency)
Mids 400 - 2000 Hz
(±) | higher mids - on average 5.3% higher than median
(±) | linearity of mids is average (10.5% delta to prev. frequency)
Highs 2 - 16 kHz
(+) | balanced highs - only 2.2% away from median
(+) | highs are linear (6.6% delta to prev. frequency)
Overall 100 - 16.000 Hz
(±) | linearity of overall sound is average (22.4% difference to median)
Compared to same class
» 60% of all tested devices in this class were better, 9% similar, 32% worse
» The best had a delta of 7%, average was 21%, worst was 53%
Compared to all devices tested
» 66% of all tested devices were better, 6% similar, 29% worse
» The best had a delta of 4%, average was 23%, worst was 134%
HP EliteBook 820 G4 Z2V72ET audio analysis
(-) | not very loud speakers (66 dB)
Bass 100 - 315 Hz
(±) | reduced bass - on average 14.6% lower than median
(±) | linearity of bass is average (7.6% delta to prev. frequency)
Mids 400 - 2000 Hz
(+) | balanced mids - only 1.1% away from median
(+) | mids are linear (4.7% delta to prev. frequency)
Highs 2 - 16 kHz
(±) | higher highs - on average 5.8% higher than median
(+) | highs are linear (5% delta to prev. frequency)
Overall 100 - 16.000 Hz
(±) | linearity of overall sound is average (17.6% difference to median)
Compared to same class
» 49% of all tested devices in this class were better, 7% similar, 45% worse
» The best had a delta of 5%, average was 18%, worst was 53%
Compared to all devices tested
» 35% of all tested devices were better, 8% similar, 57% worse
» The best had a delta of 4%, average was 23%, worst was 134%
| Off / Standby | |
| Idle | |
| Load |
|
Key:
min: | |
| Dell Latitude 7280 i7-7600U, HD Graphics 620, SanDisk X400 M.2 2280 256GB, IPS, 1920x1080, 12.5" | Dell Latitude 12 E7270 6300U, HD Graphics 520, Liteon L8H-256V2G, IPS LED, 1920x1080, 12.5" | HP EliteBook 820 G4 Z2V72ET i7-7500U, HD Graphics 620, Samsung PM951 NVMe MZVLV512, IPS, 1920x1080, 12.5" | Razer Blade Stealth QHD i7-7500U i7-7500U, HD Graphics 620, Samsung PM951 NVMe MZVLV256, , 2560x1440, 12.5" | Lenovo ThinkPad X260-20F6007RGE 6500U, HD Graphics 520, Liteonit LCH-512V2S, IPS, 1920x1080, 12.5" | |
|---|---|---|---|---|---|
| Power Consumption | -8% | 6% | -33% | -10% | |
| Idle Minimum * (Watt) | 4.28 | 3.8 11% | 2.7 37% | 4.4 -3% | 3.5 18% |
| Idle Average * (Watt) | 5.11 | 6.7 -31% | 4.8 6% | 5.8 -14% | 5.5 -8% |
| Idle Maximum * (Watt) | 5.49 | 7.2 -31% | 6.6 -20% | 8.6 -57% | 6.7 -22% |
| Load Average * (Watt) | 29.83 | 27.2 9% | 28.5 4% | 35.2 -18% | 28.9 3% |
| Load Maximum * (Watt) | 30.05 | 30.2 -0% | 29 3% | 52 -73% | 42.1 -40% |
* ... smaller is better
| Dell Latitude 7280 i7-7600U, HD Graphics 620, 60 Wh | Dell Latitude 12 E7270 6300U, HD Graphics 520, 55 Wh | HP EliteBook 820 G4 Z2V72ET i7-7500U, HD Graphics 620, 49 Wh | Razer Blade Stealth QHD i7-7500U i7-7500U, HD Graphics 620, 53.6 Wh | Lenovo ThinkPad X260-20F6007RGE 6500U, HD Graphics 520, 46 Wh | |
|---|---|---|---|---|---|
| Battery runtime | -20% | -2% | -36% | -36% | |
| Reader / Idle (h) | 25.9 | 17.5 -32% | 22.4 -14% | 13.6 -47% | 15.9 -39% |
| WiFi v1.3 (h) | 11.4 | 8.5 -25% | 9.4 -18% | 8.3 -27% | 8.4 -26% |
| Load (h) | 2.7 | 2.6 -4% | 3.4 26% | 1.8 -33% | 1.5 -44% |
Pros
Cons
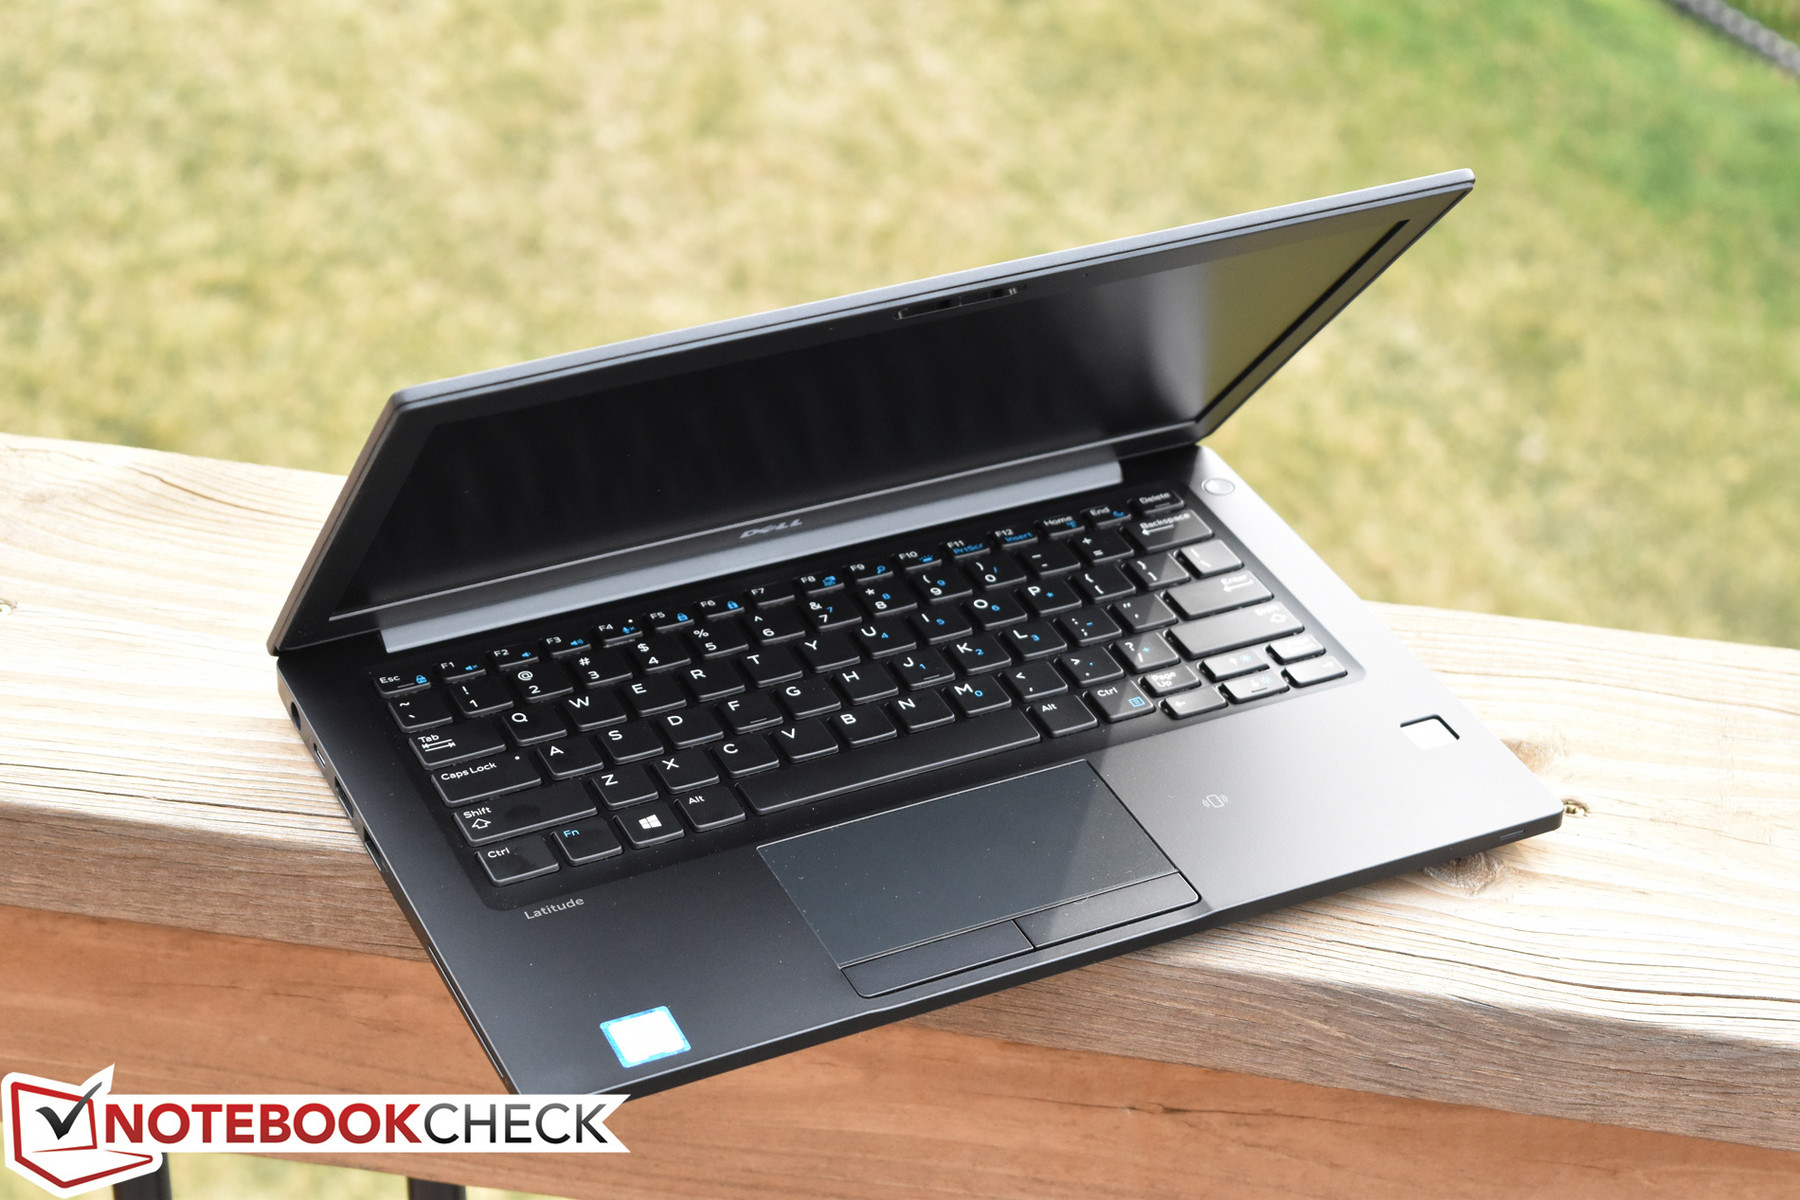
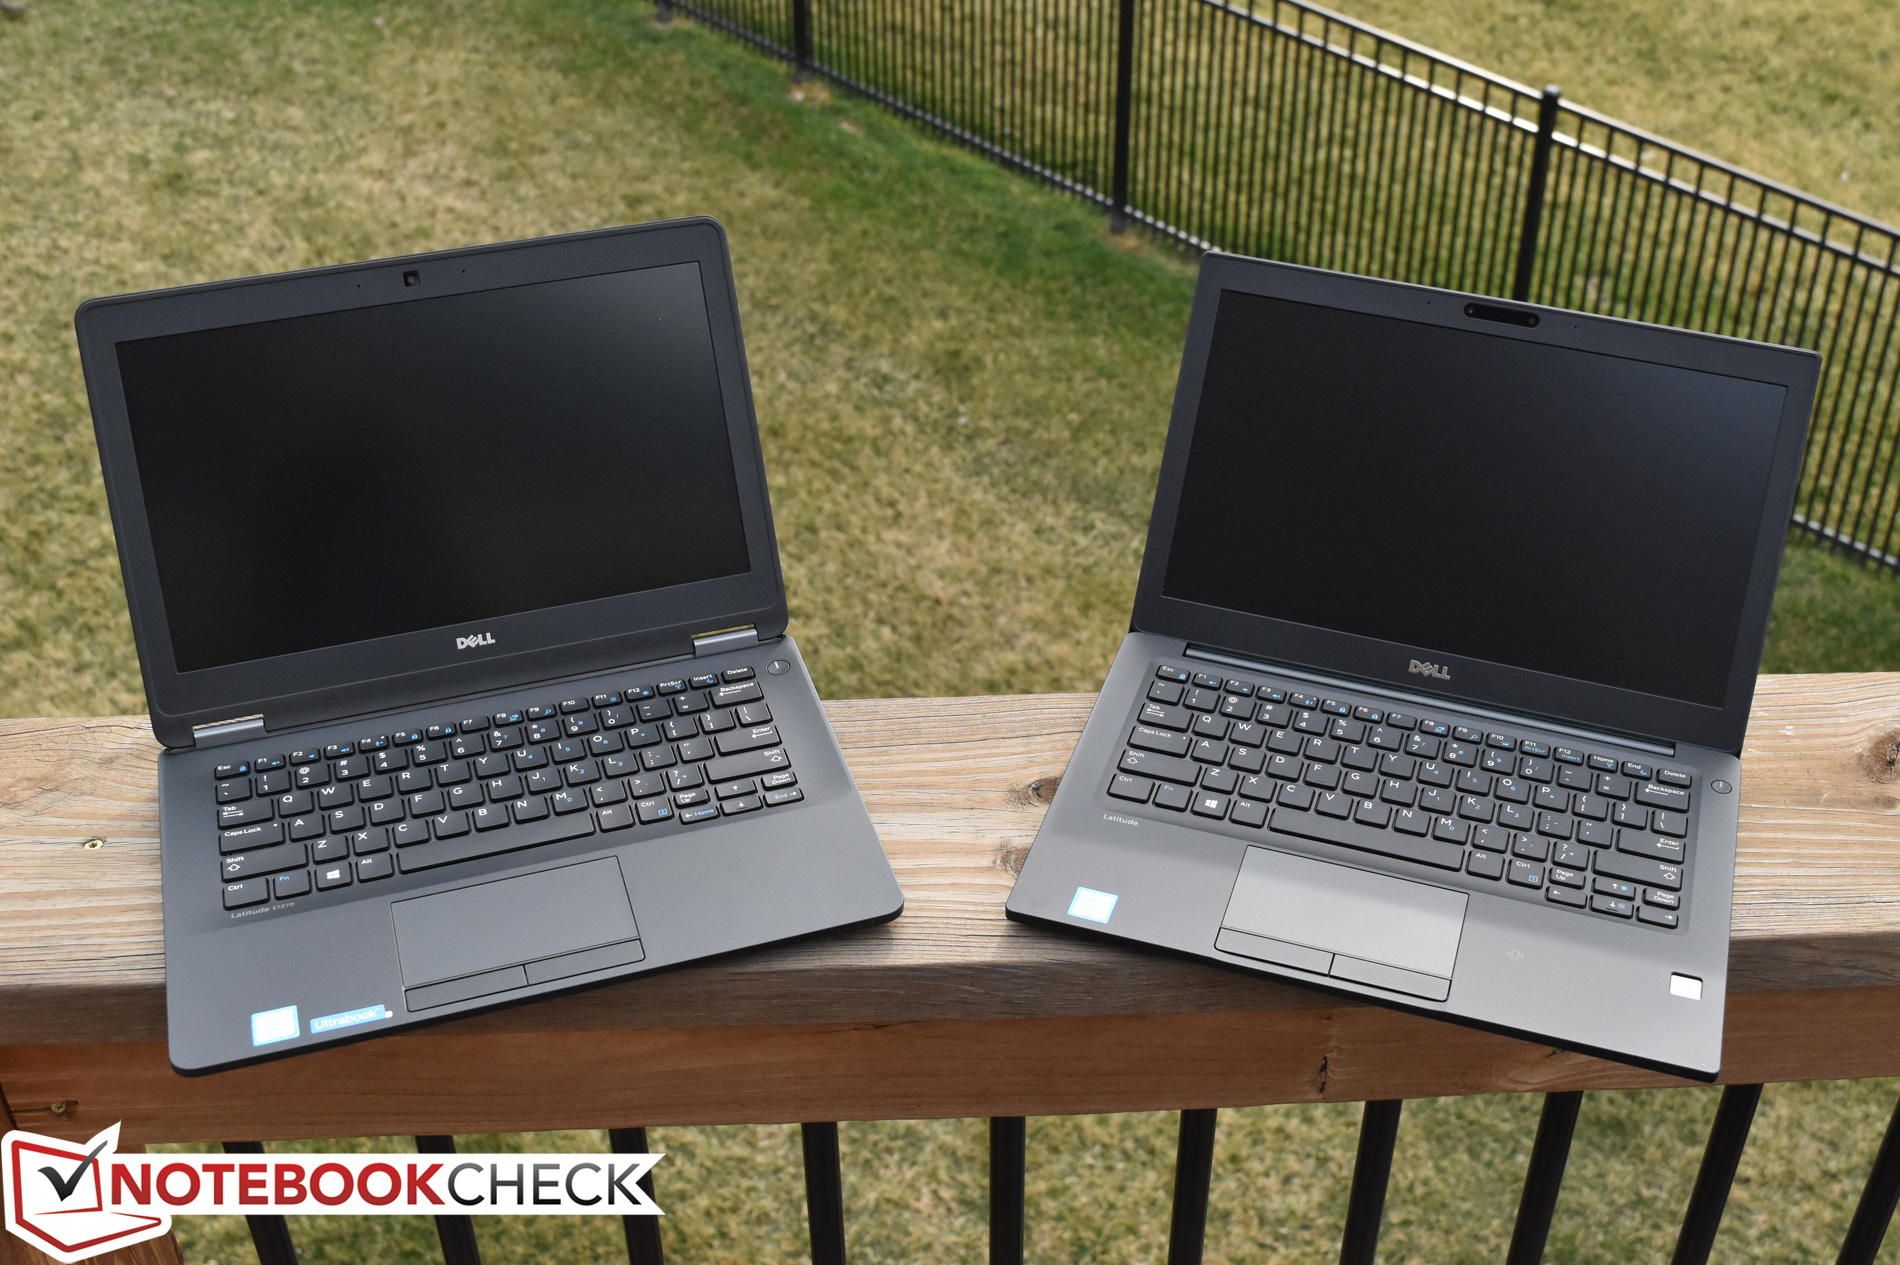
Latitude 7280可能是从几年前Latitude 7000谢列发布以来最大的一次改进。尽管耗费了一些时间,但7280的确是在现有的商务本中引入了更多的消费级奢侈品的元素,这使得它们的知名度和上一代完全不同。其结果就是在保持专业感的同时也带来了一些时尚感,体积上也更有利于携带,但的确是做出了一些妥协。
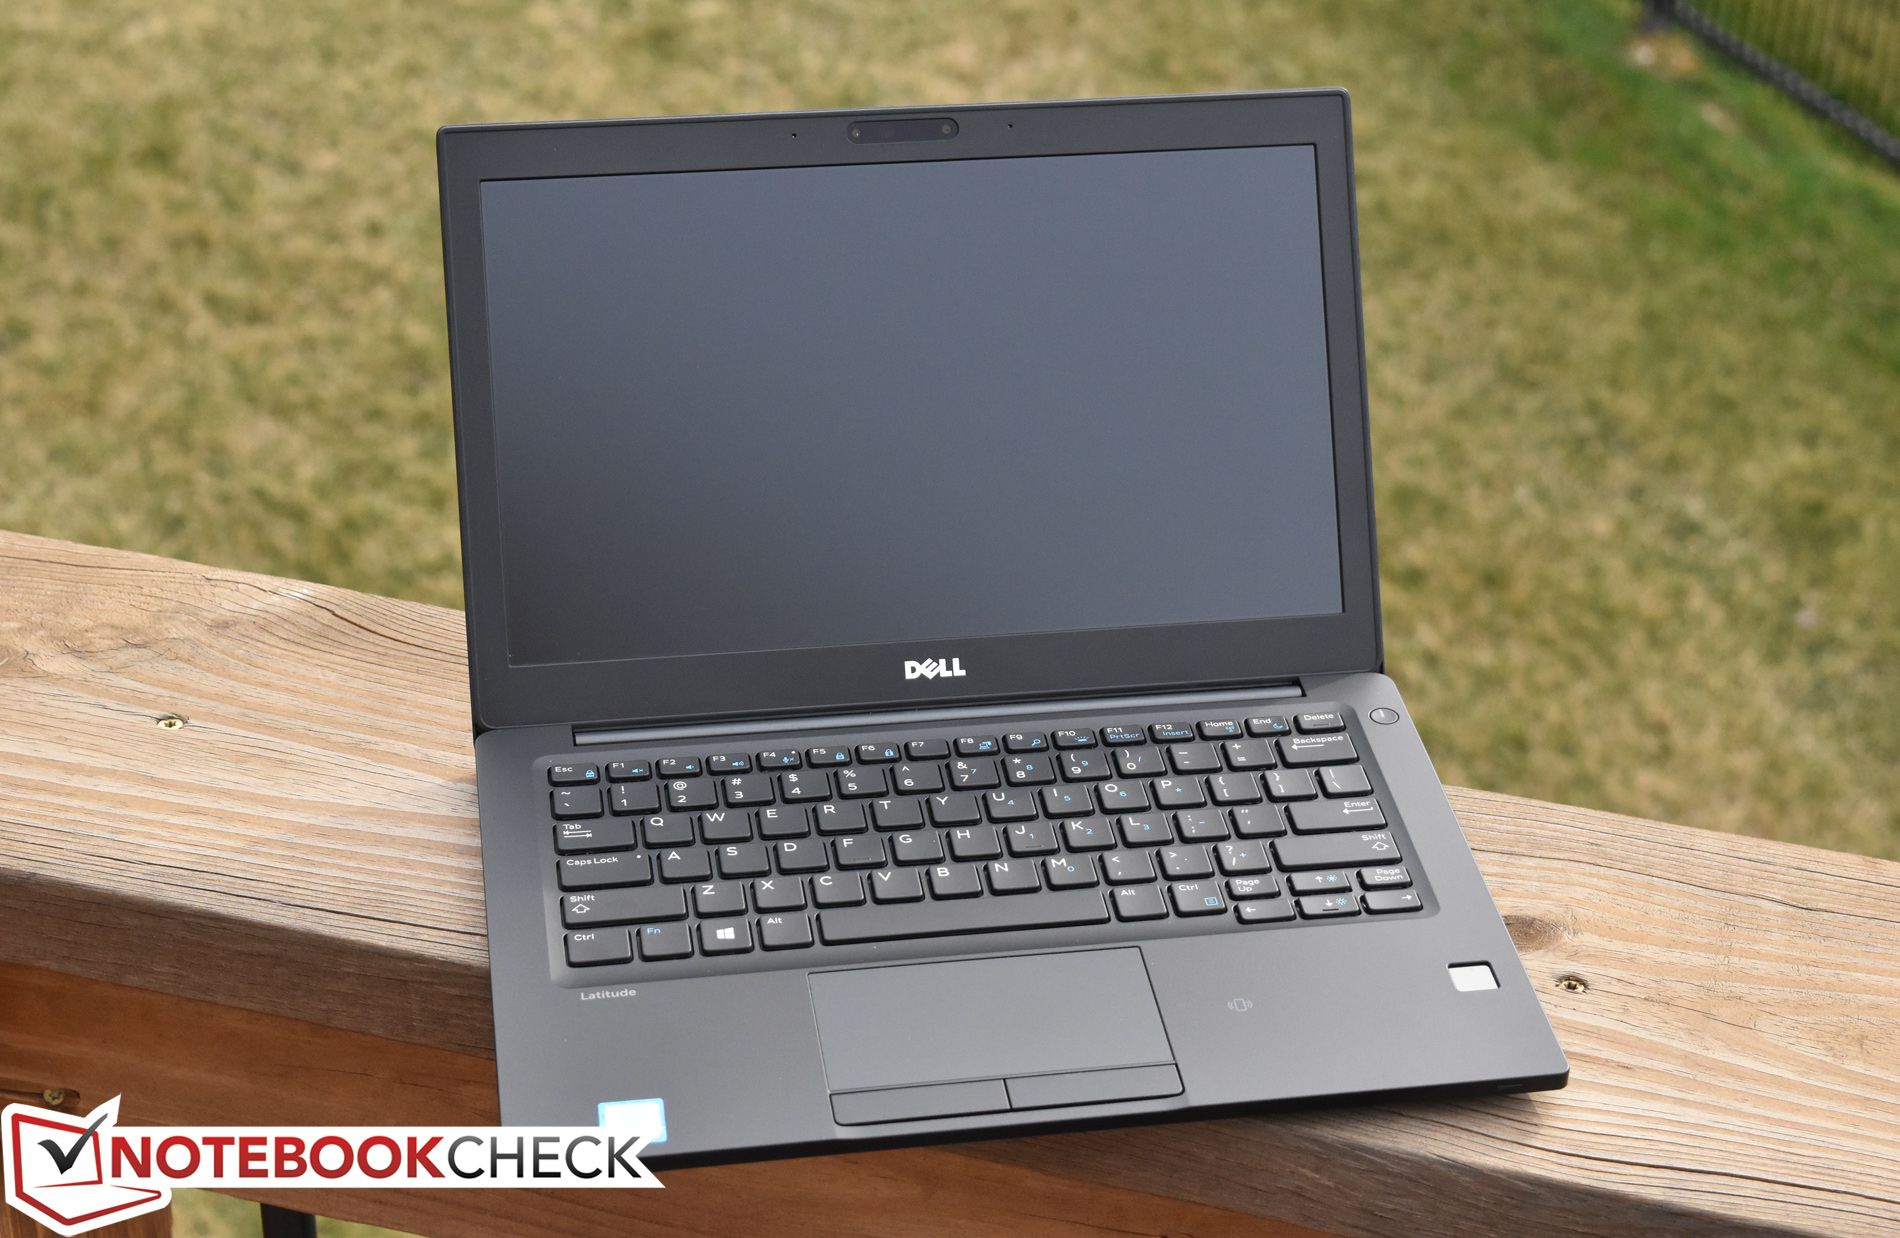
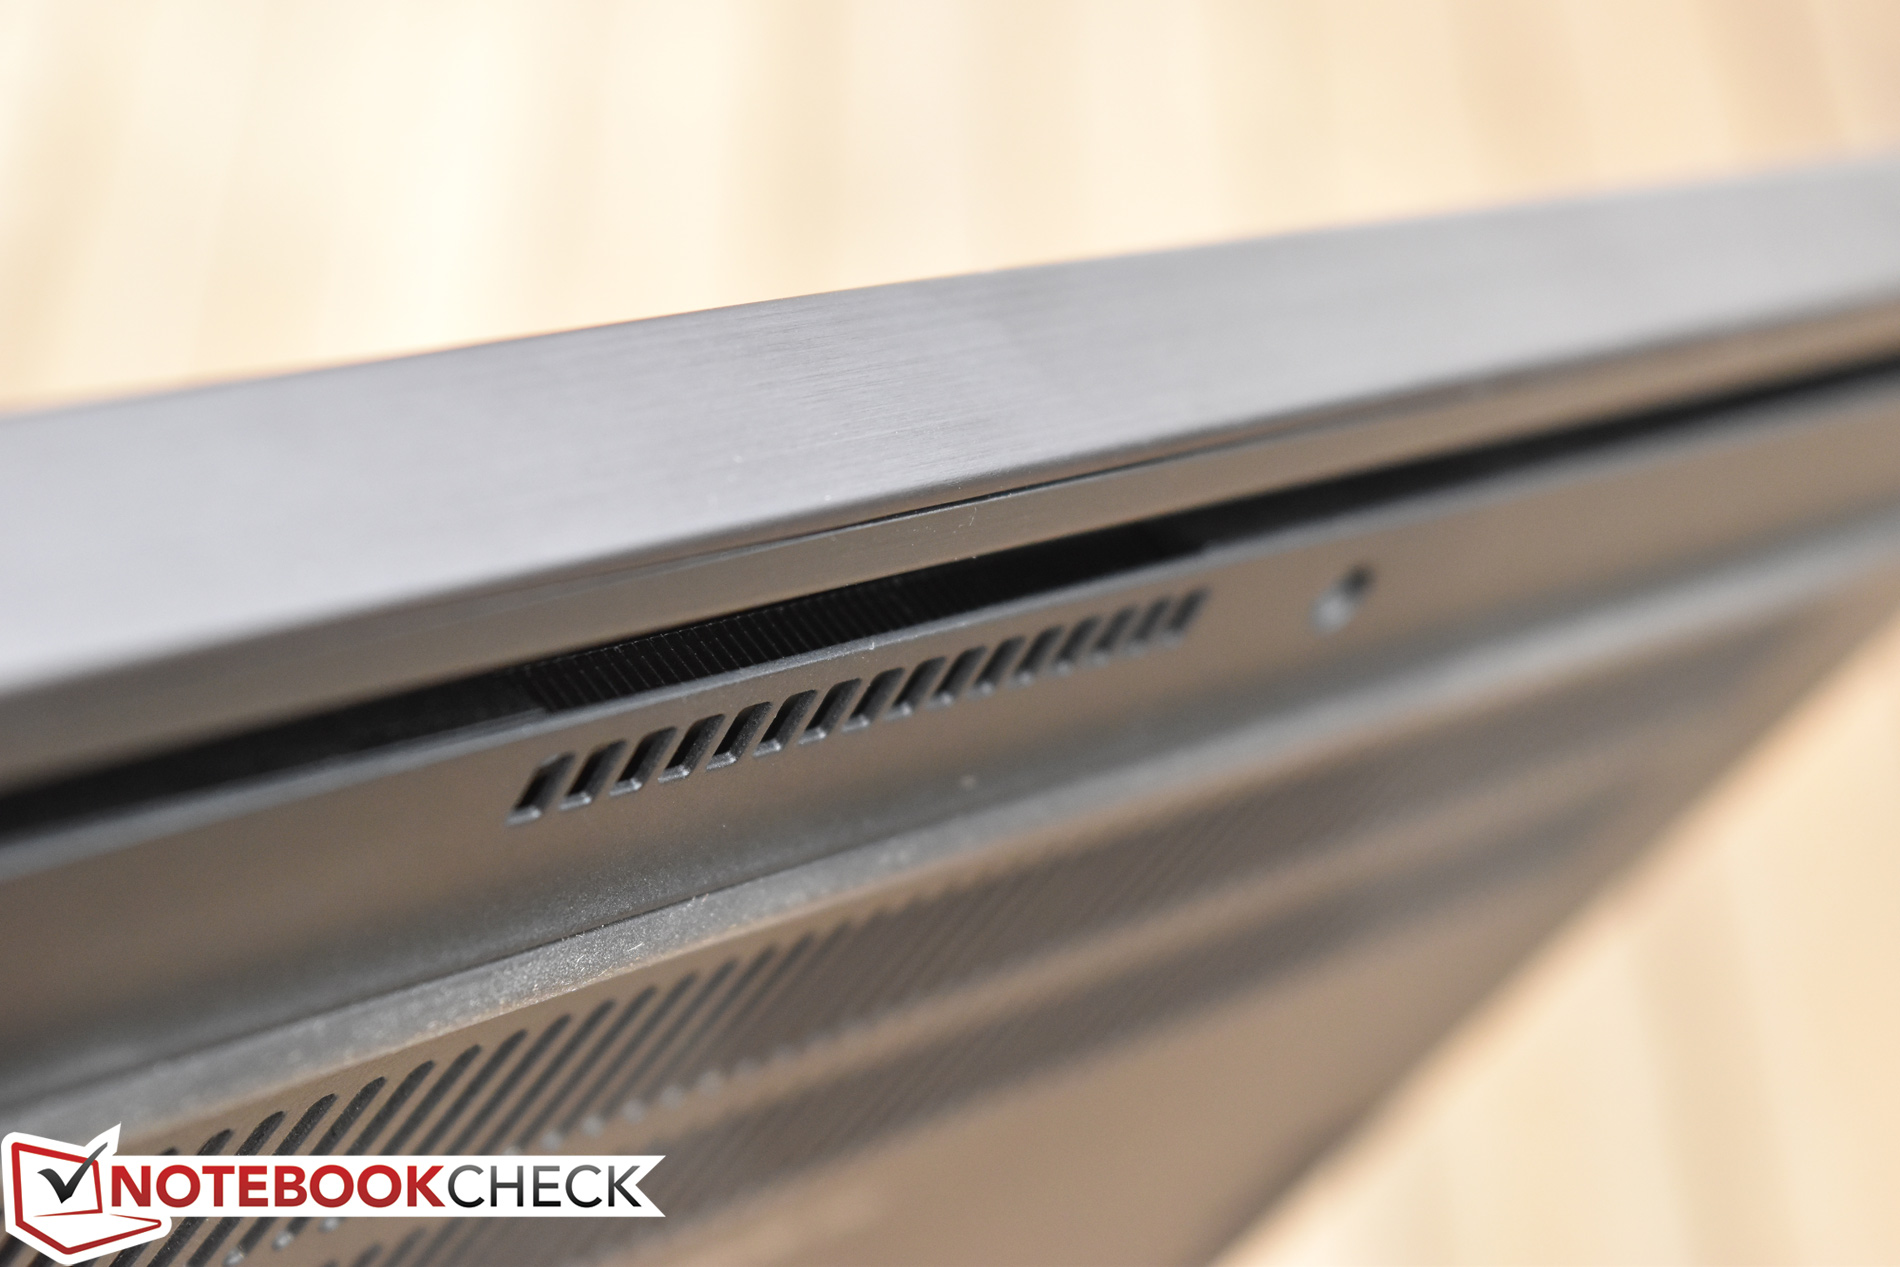
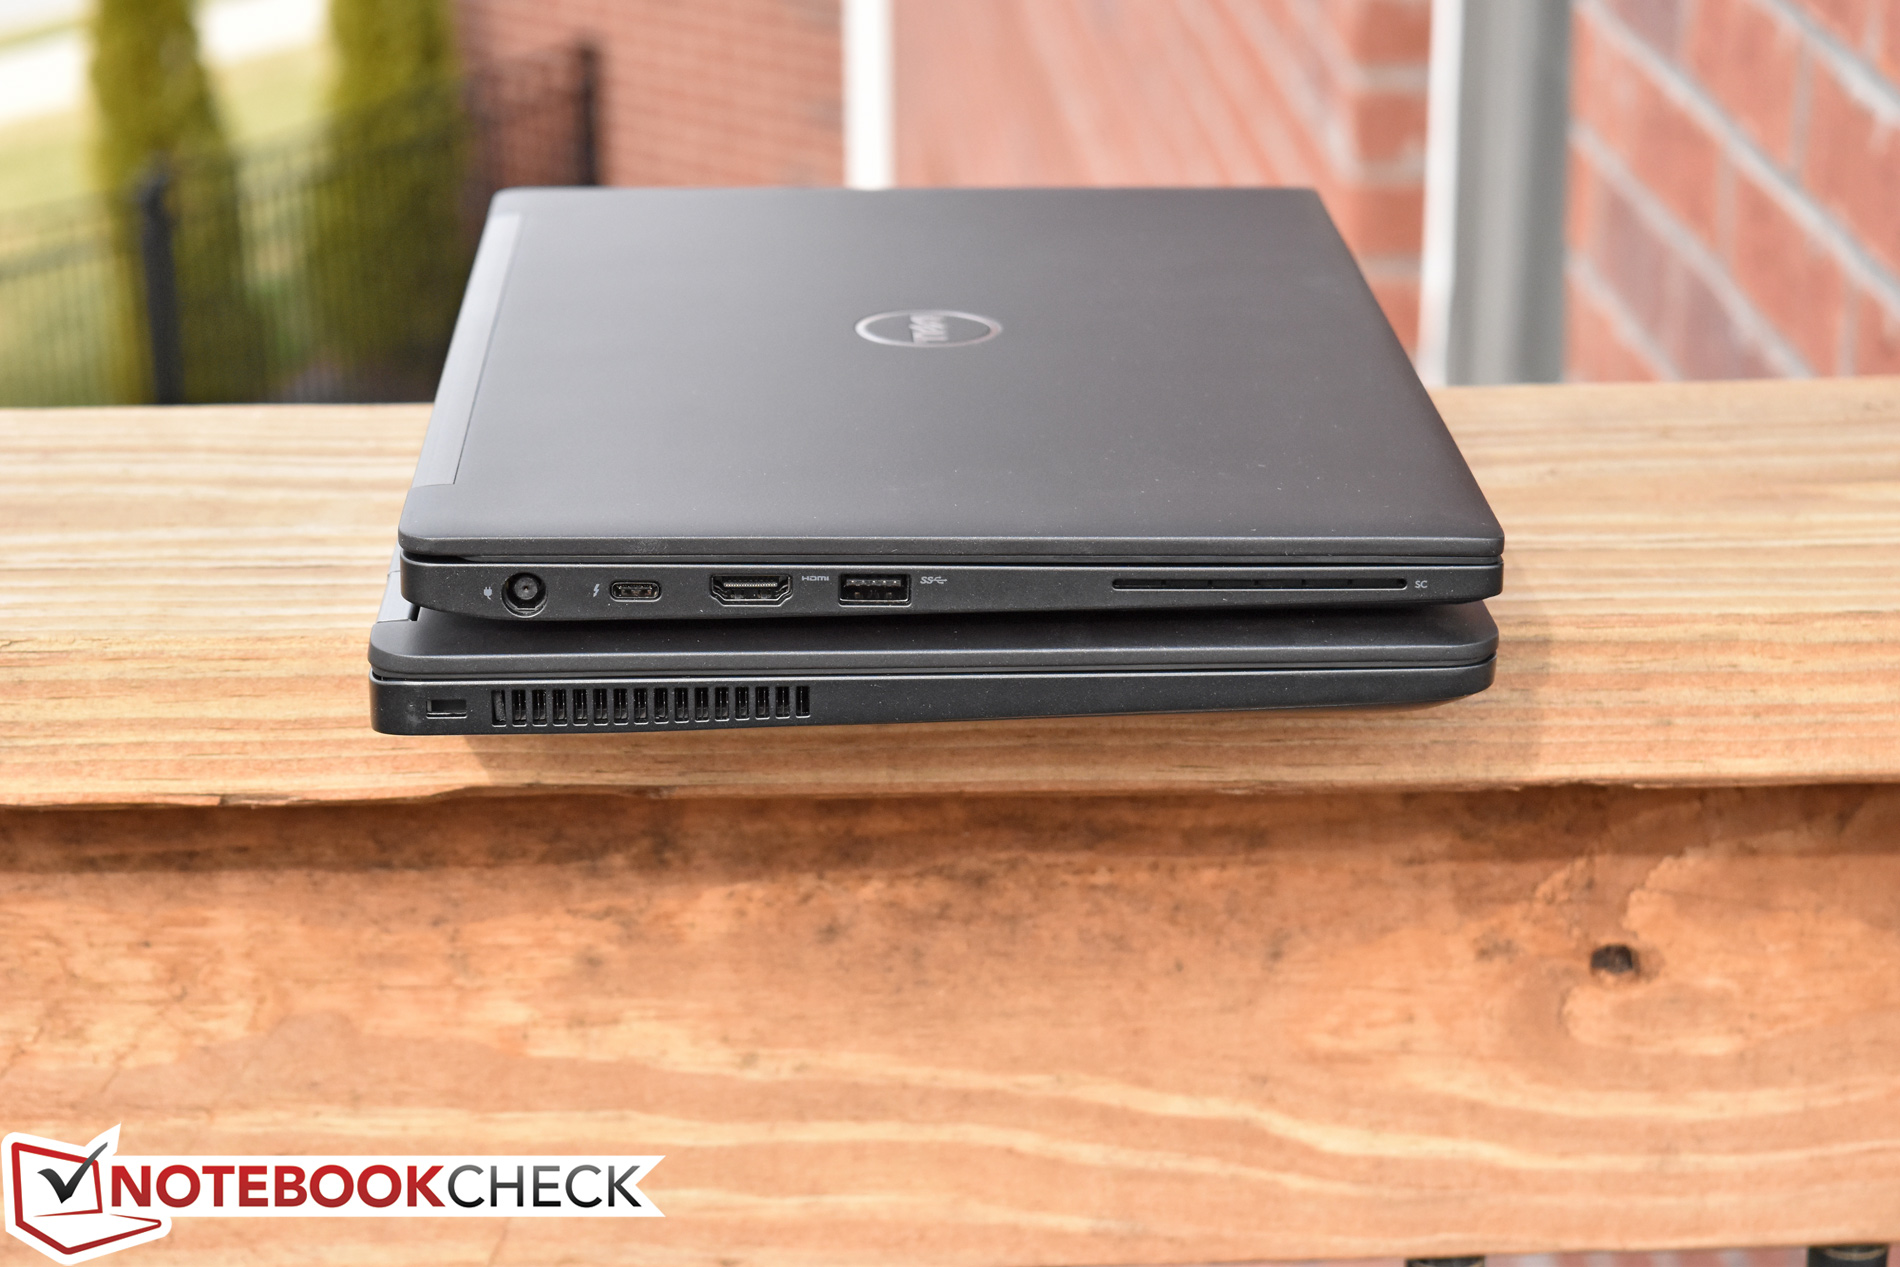
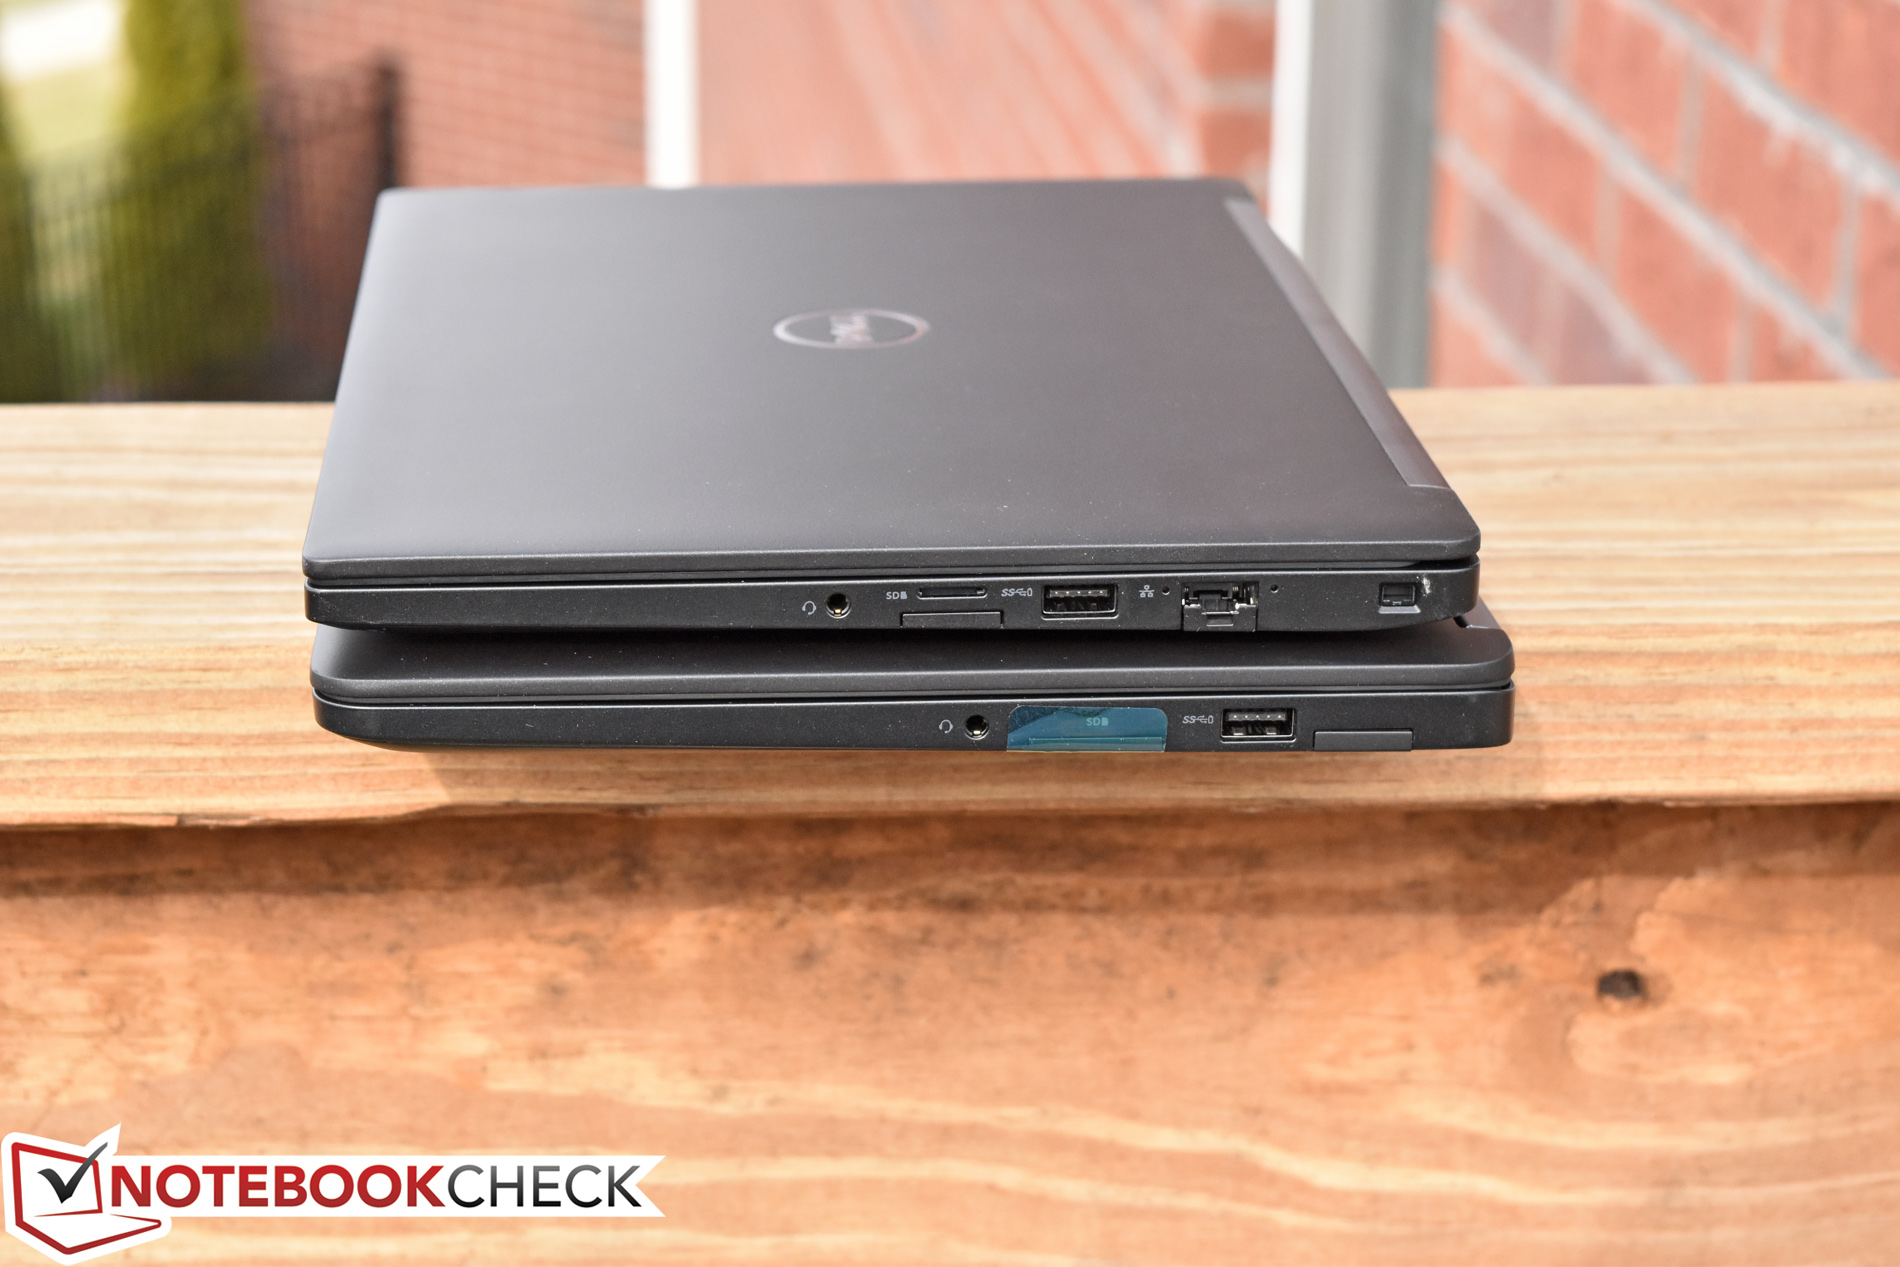
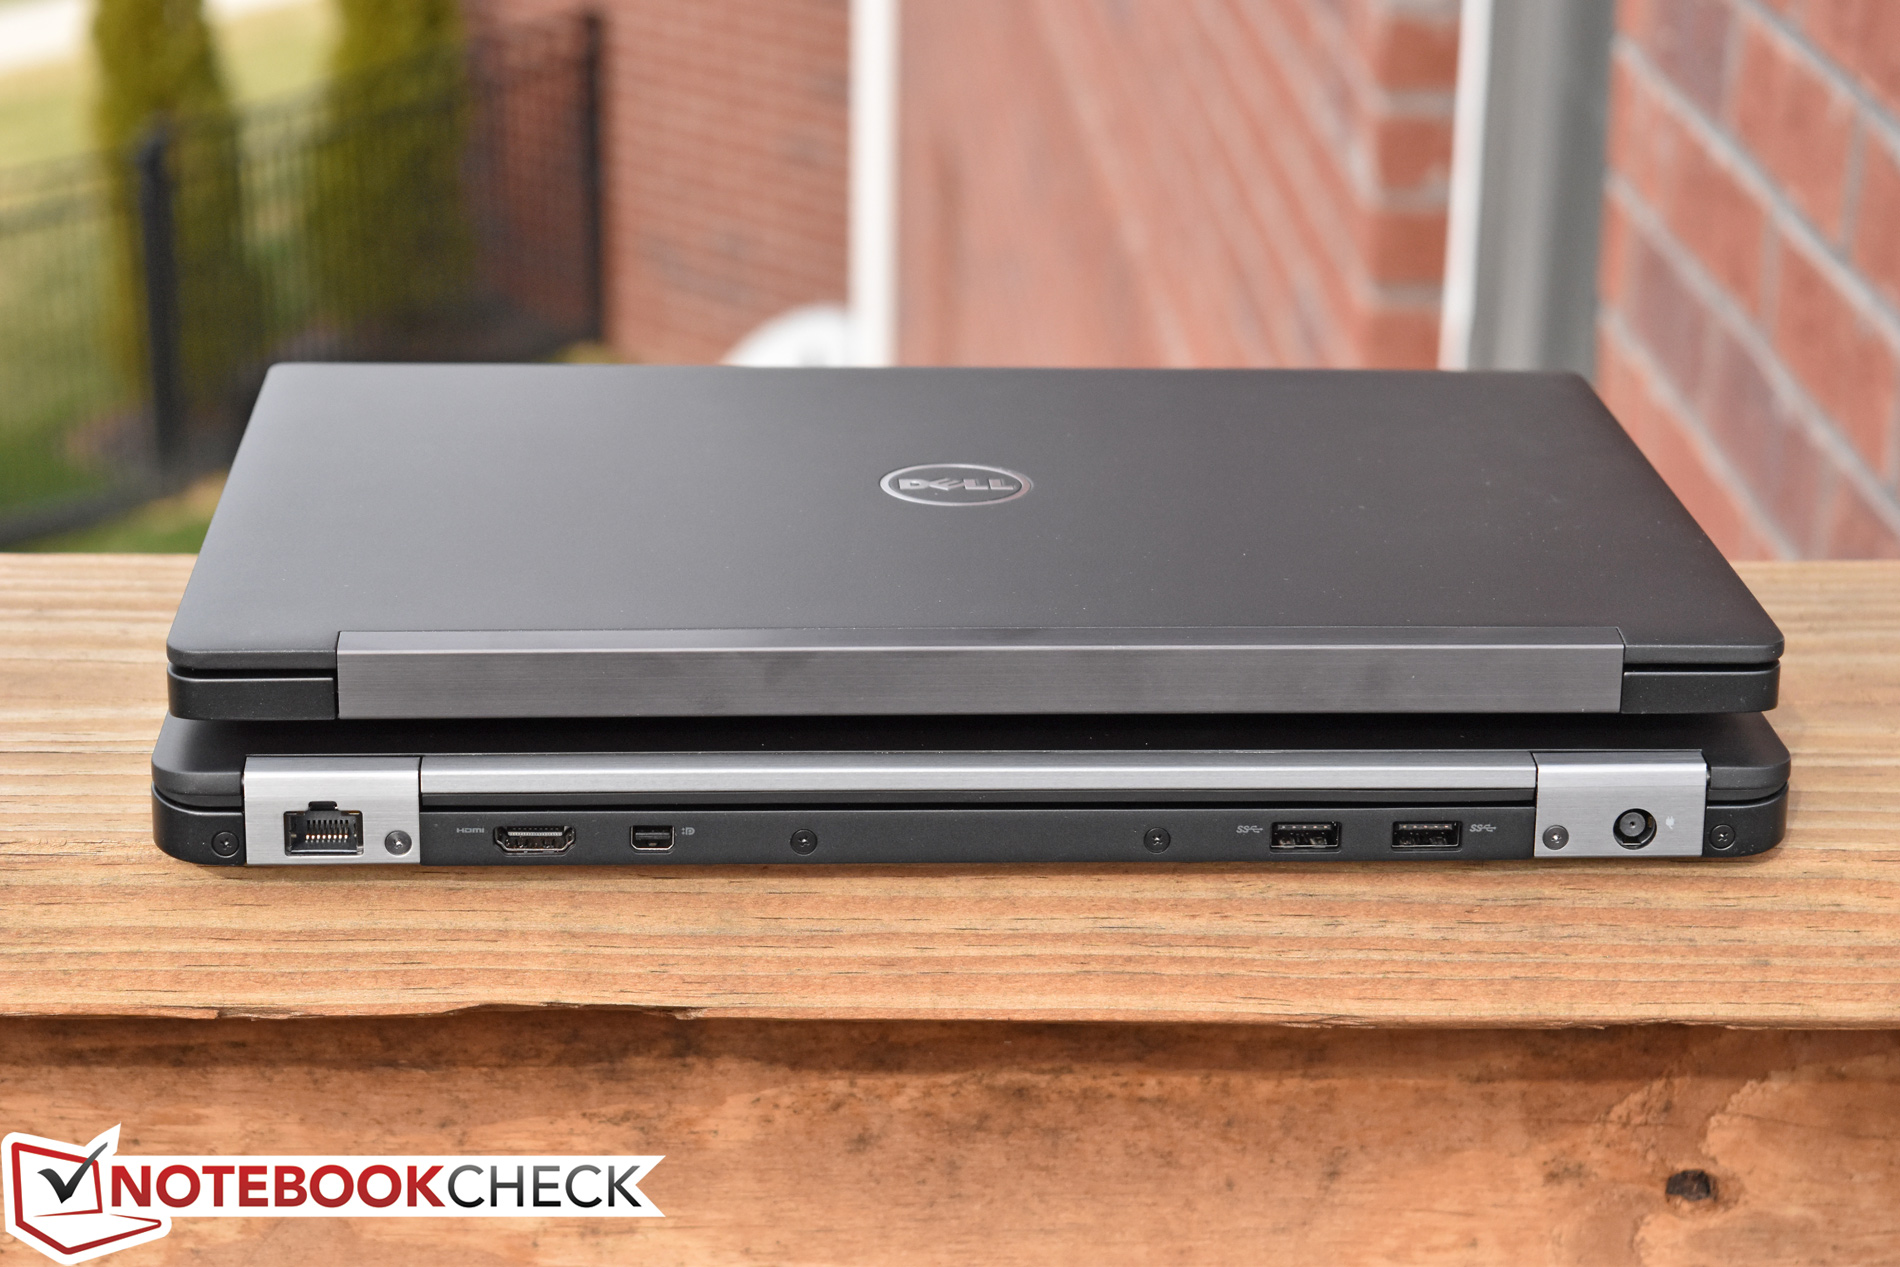
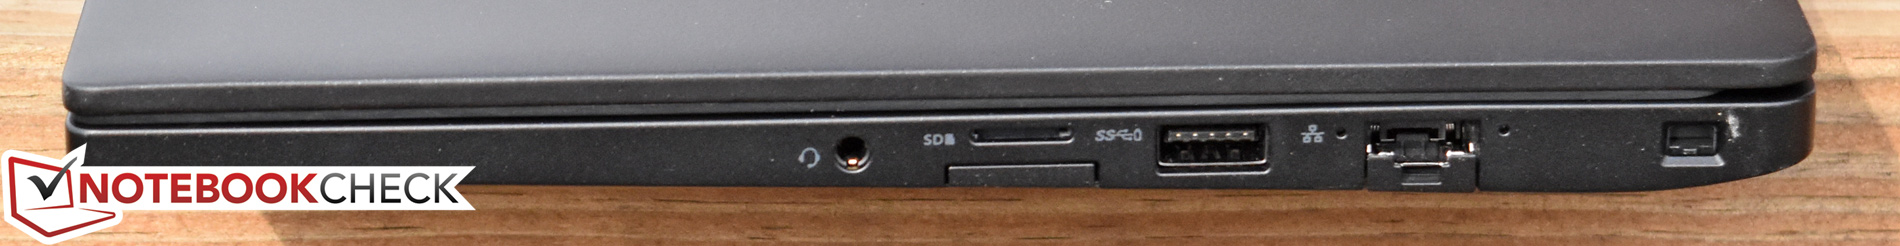
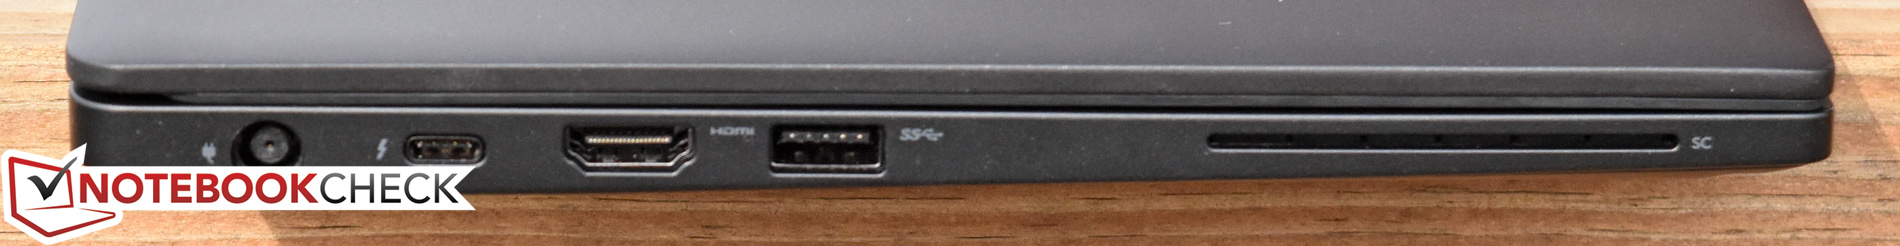
第一点是可维护性,整体上来说还是很好但是不如上一代。由于设计的变更,对于键盘和屏幕的更换操作明显变的更加困难,这对于IT部门来说将会是一个头疼的问题。接下来是接口,7280的接口安排可能是更加合理的,但却缺少了独立的扩展坞接口,mini-DisplayPort,以及第三个Type-A USB接口(转而采用一个USB Type-C/Thunderbolt接口来代替上述三者)并将前代中完整规格的SD读卡器缩减到microSD规格。我们同时发现该台测试样机无法长期维持CPU高负载工作,而是将会很快降低睿频频率,这显然将会抹去其所搭载的双核Core i7 CPU所带来的性能提升。
除了上述的缺点(其中重要性相对主管),7280依旧保留了上一代的一些(相对小的)缺点。屏幕尽管有着高亮度及分辨率,但在色域表现上依旧不尽人意。触摸板也还仅仅是平均水平(尽管它提供两颗物理按键)。我们很遗憾地说,我们的测试样机依旧有之前很多戴尔超极本有的通病:CPU高频电流声。
尽管它有着潜在的重大缺陷(决定于用户及用途),如果你能偶接受它们,依旧有很多人会喜欢Latitude 7280。
尽管有着上述缺点,也应该考虑到它不少的有点。首先,7280的制造质量无可挑剔,十分坚固企鹅人体工程学设计令人惊奇,这一切都在它轻薄的机身中。电池续航时间极佳,拥有同类产品中最好的键盘。在大多数使用状况下,系统能够安静的运行(出了CPU噪声),同时保持合理的温度。综合系统操作表现的极快的,综合应用基准测试使其竞品无地自容。
对于那些不在乎上述缺点的用户来说,这是一台极为坚固而设计出色的超便携商务本。对于其他人来说, E7270 可能更加的诱人, 亦或者说 EliteBook 820 G4 或 ThinkPad X260 可能是更好的选择。
注:本文是基于完整评测的缩减版本,阅读完整的英文评测,请点击这里。
Dell Latitude 7280
- 04/05/2017 v6 (old)
Steve Schardein
Price comparison
