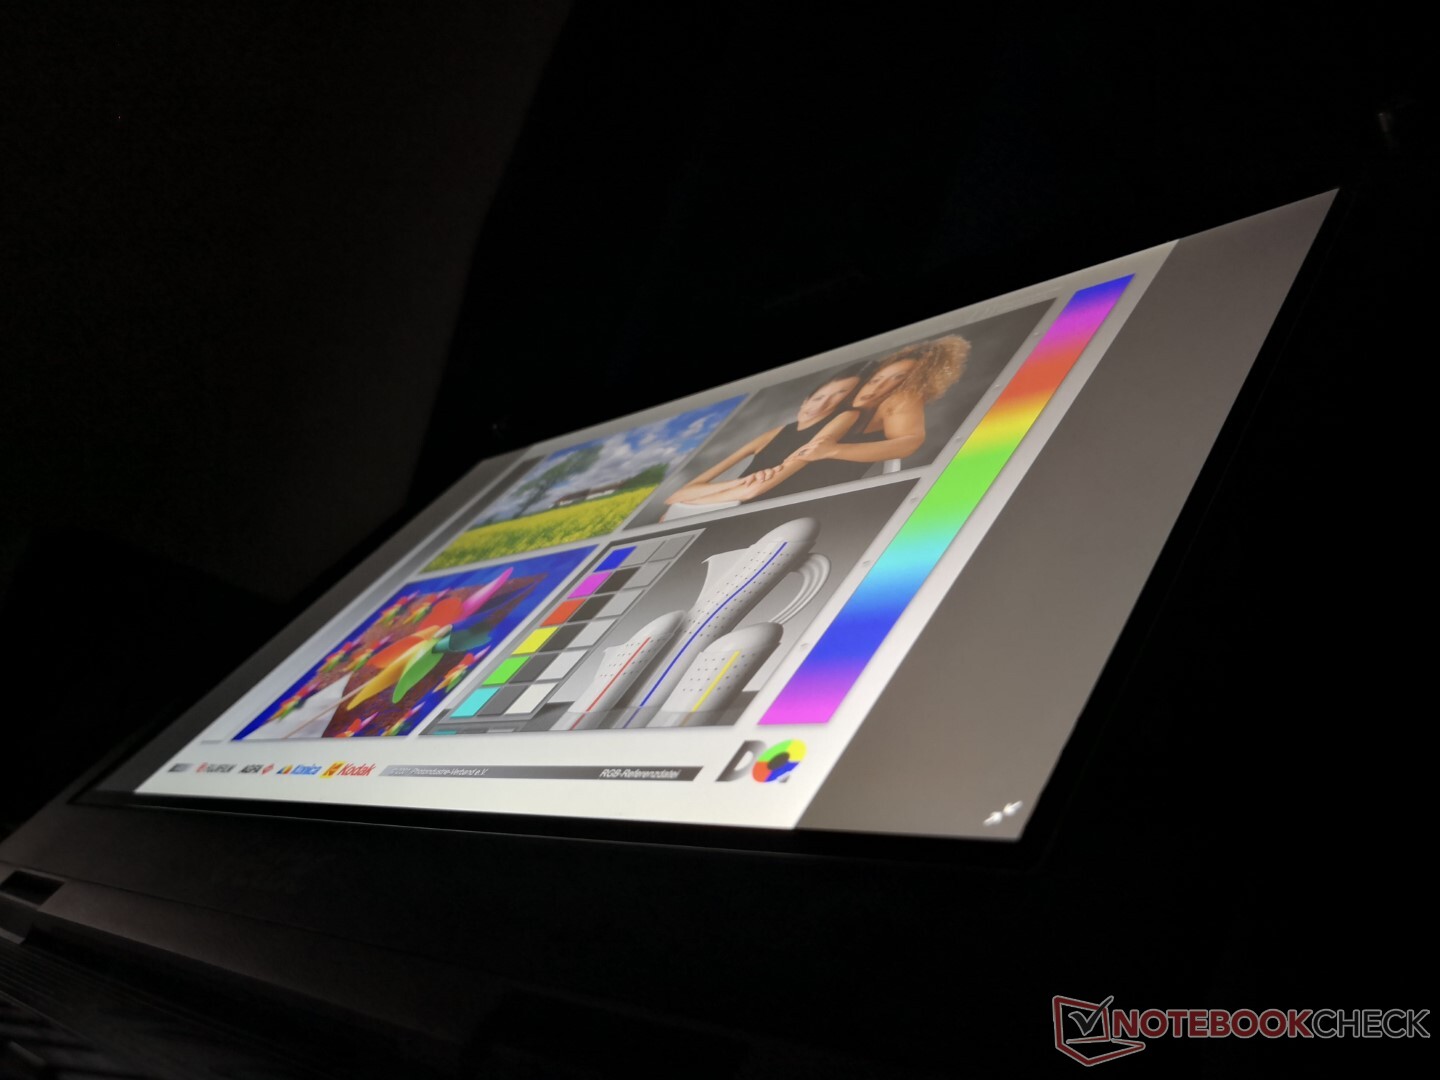
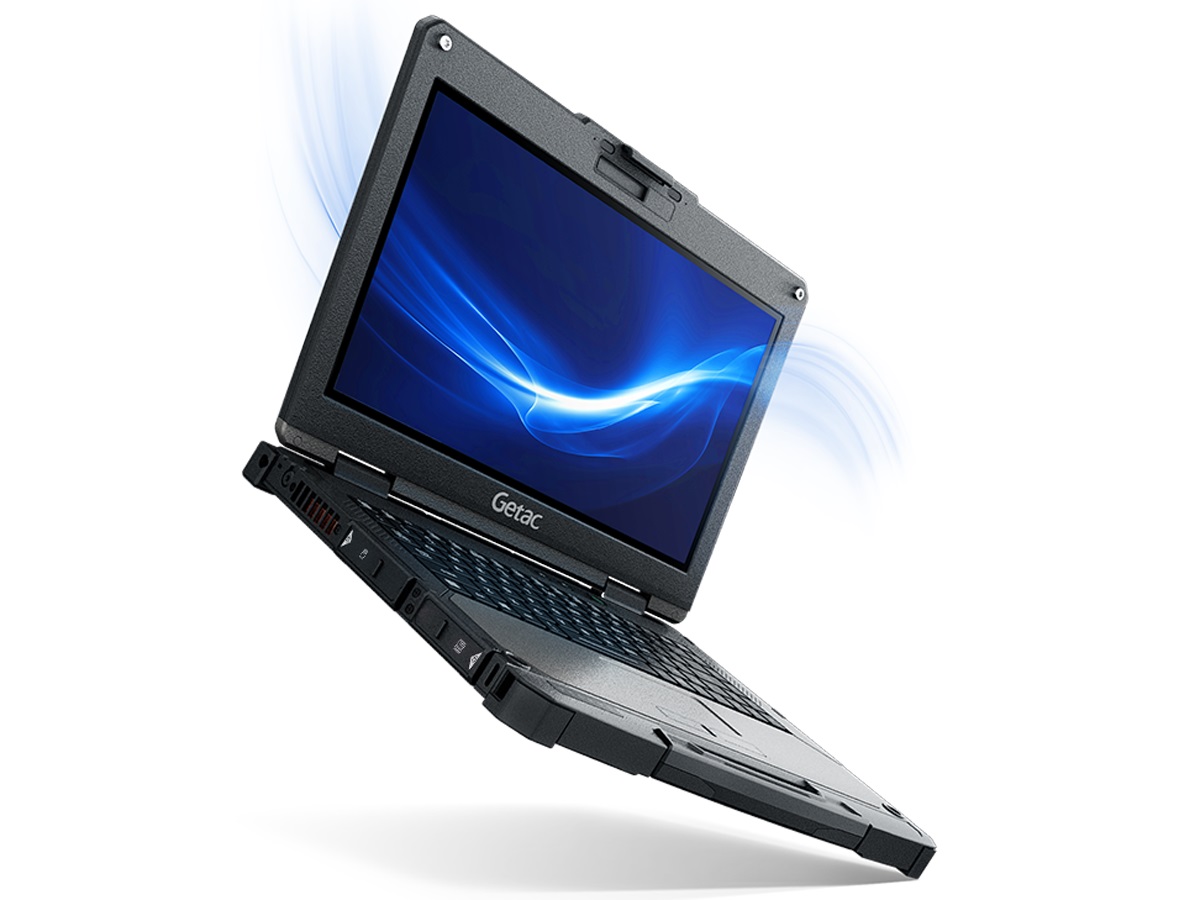
Getac B360强固型笔记本电脑回顾。明亮的1400尼特触摸屏
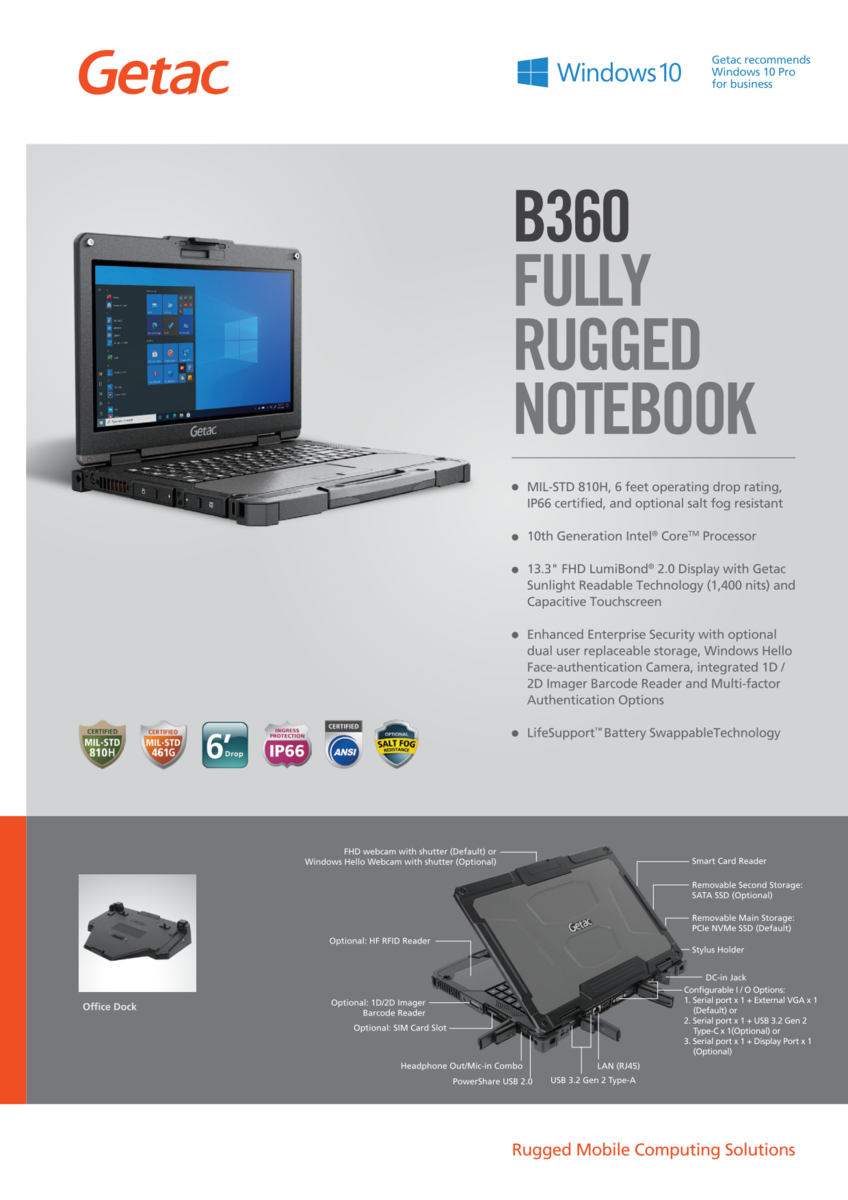
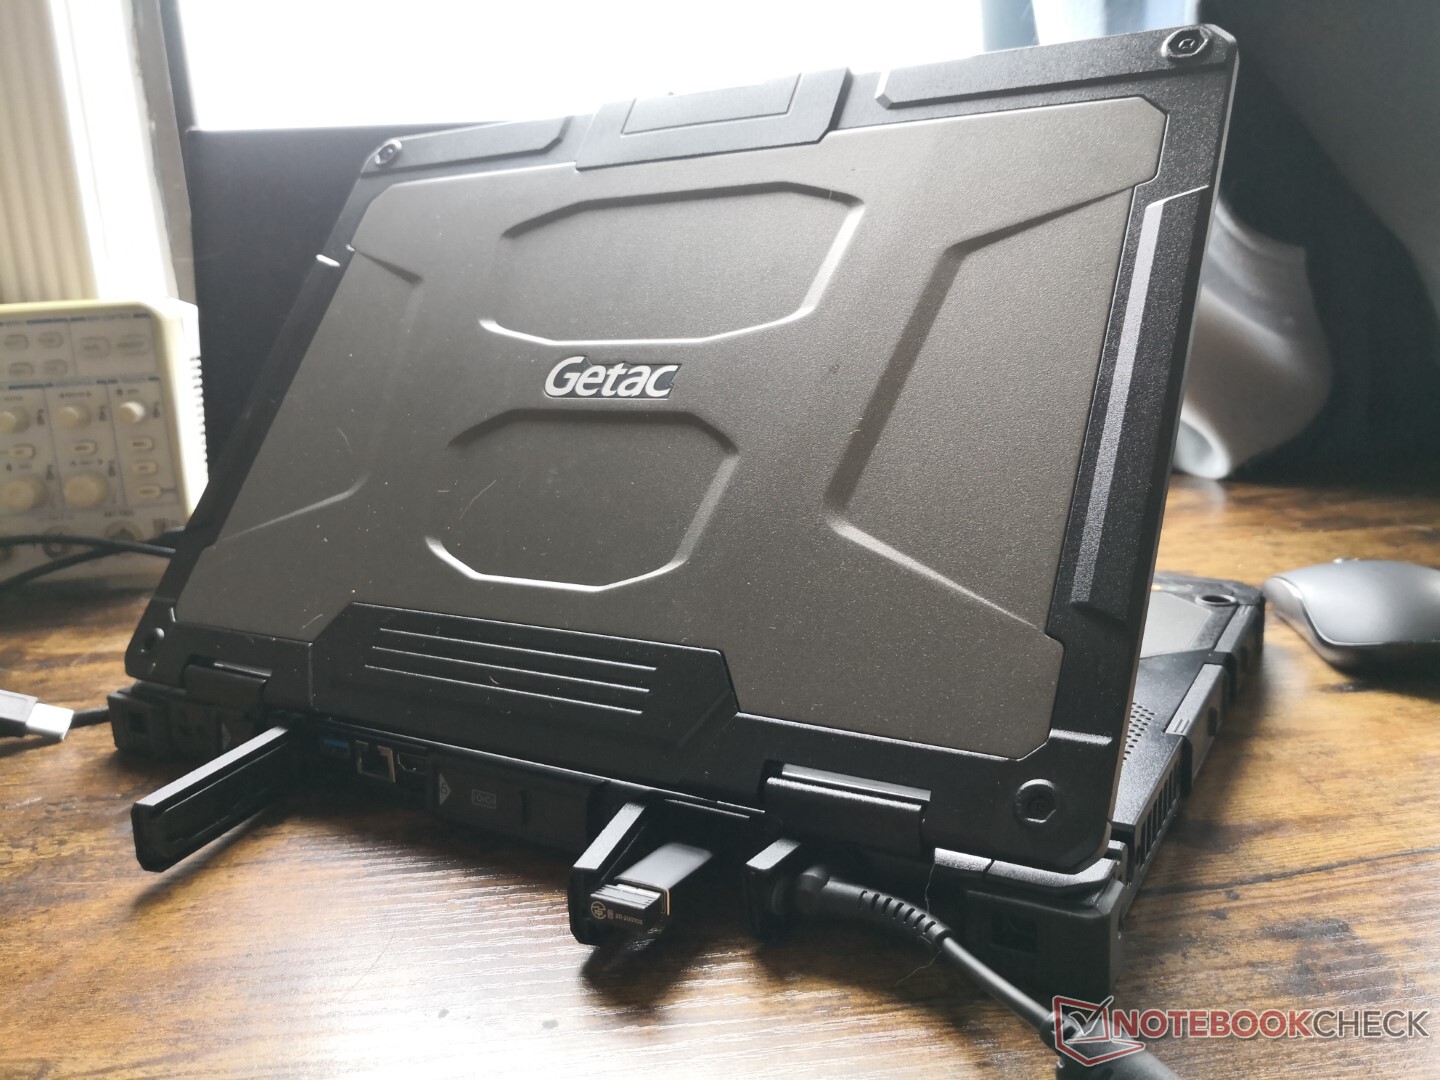
Getac B360是一款全加固的13.3英寸笔记本电脑,集成了许多现代连接功能和升级,我们已经开始期待消费类设备。它是我们数据库中第一款适用于这一特定尺寸级别的耐用型笔记本电脑,因为大多数耐用型通常是14英寸或更大。我们建议在这里查看官方的产品页面或下面的完整规格表,以了解除了我们这里的一个单元之外的所有可用选项。
更多Getac评论。
Potential Competitors in Comparison
Rating | Date | Model | Weight | Height | Size | Resolution | Price |
|---|---|---|---|---|---|---|---|
| 83.8 % v7 (old) | 01 / 2022 | Getac B360 i7-10710U, UHD Graphics 620 | 2.4 kg | 34.9 mm | 13.30" | 1920x1080 | |
| 89.2 % v6 (old) | Dell Latitude 5420 Rugged-P85G i7-8650U, Radeon RX 540 | 2.8 kg | 32.9 mm | 14.00" | 1920x1080 | ||
| 81.9 % v6 (old) | Getac S410 i5-8550U, UHD Graphics 620 | 3.2 kg | 34.9 mm | 14.00" | 1366x768 | ||
| 82.4 % v7 (old) | 12 / 2021 | Acer Enduro Urban N3 EUN314 i7-1165G7, Iris Xe G7 96EUs | 1.8 kg | 21.95 mm | 14.00" | 1920x1080 | |
| 83.9 % v7 (old) | 10 / 2021 | Panasonic Toughbook FZ-55 MK2 i7-1185G7, Iris Xe G7 96EUs | 2.3 kg | 33 mm | 14.00" | 1920x1080 | |
v (old) | 09 / 2021 | Durabook S14I i7-1165G7, Iris Xe G7 96EUs | 3 kg | 38.1 mm | 14.00" | 1920x1080 |
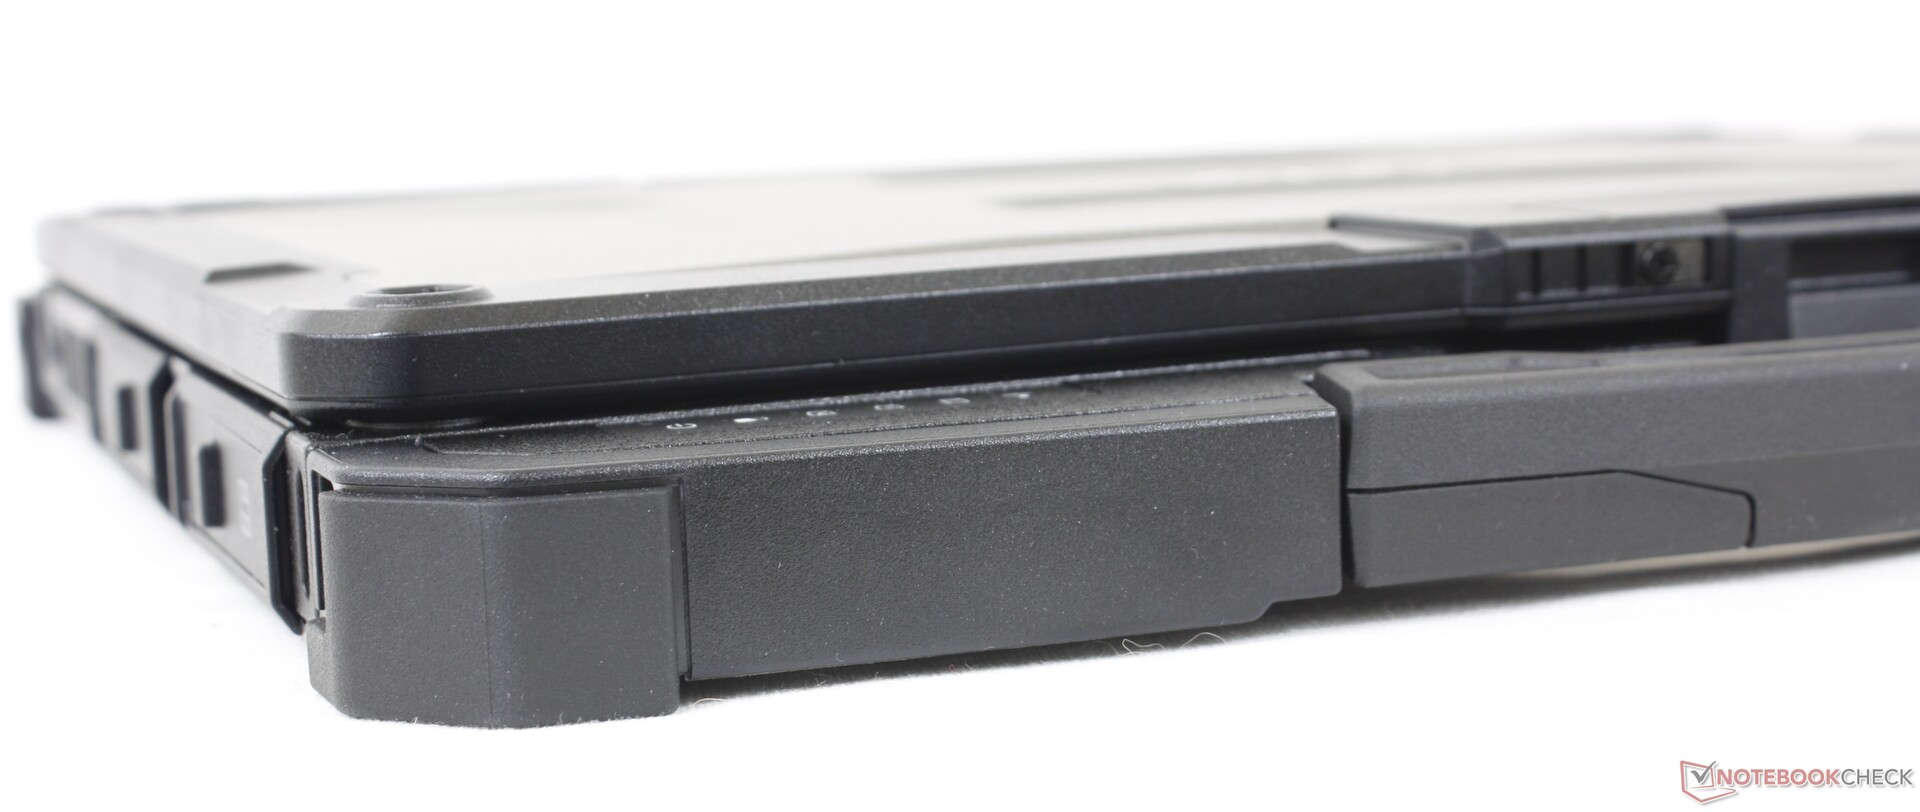
案例
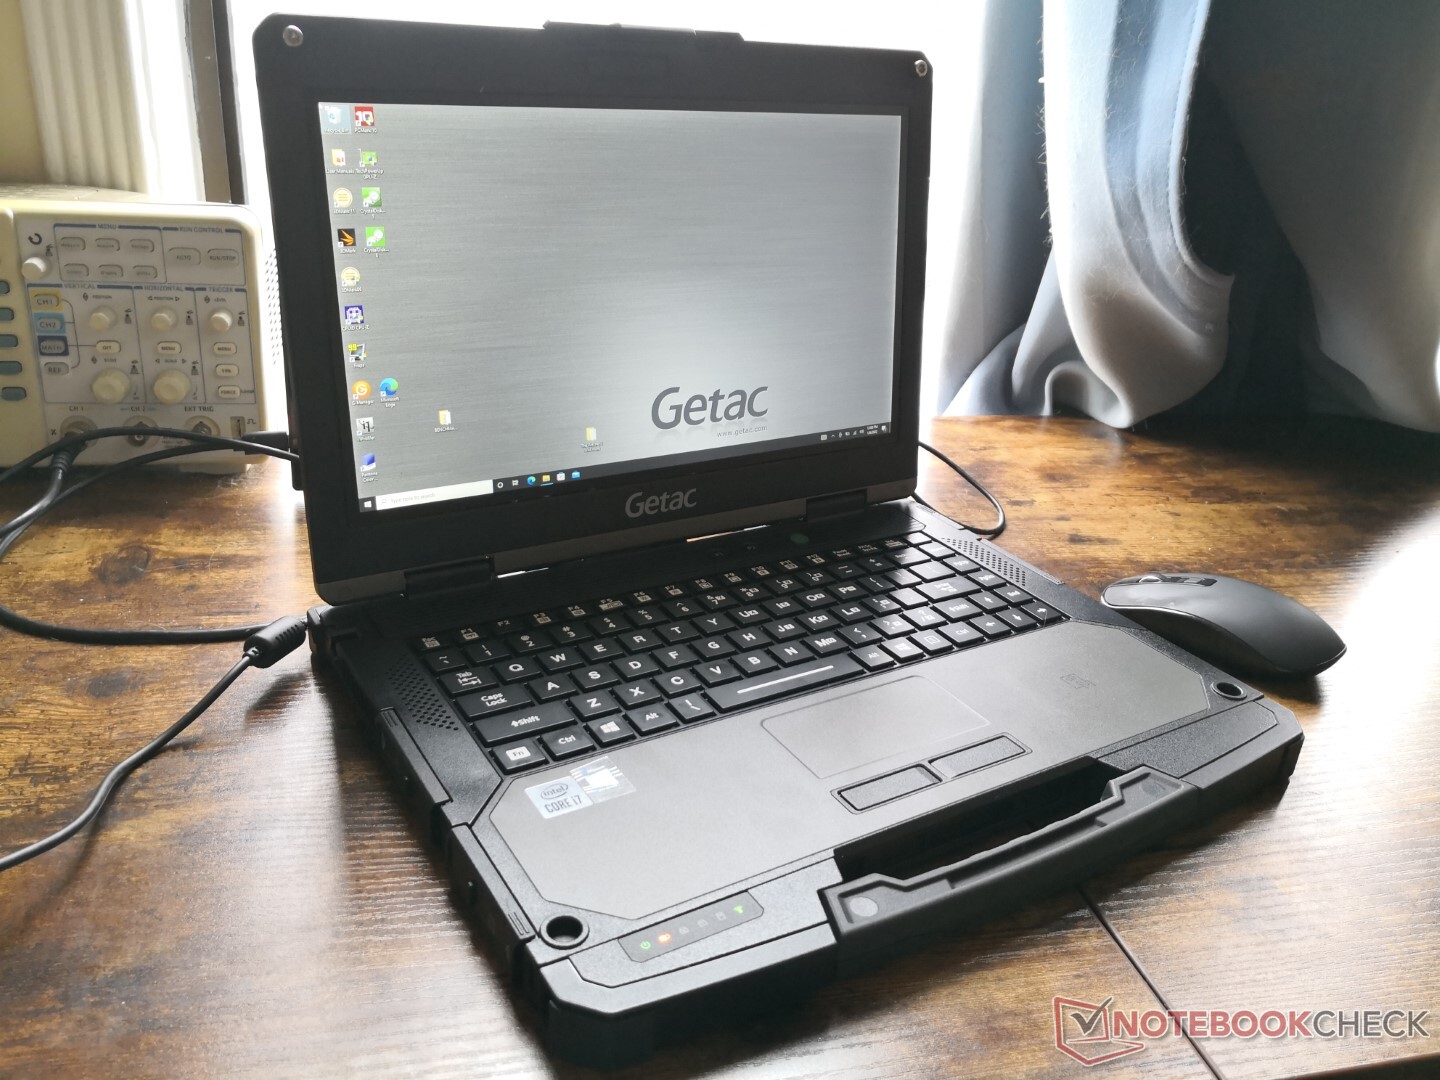
尽管提供的屏幕尺寸比14英寸的松下Toughbook FZ-55或Getac S410小,但B360实际上比这两个型号都要重和厚。该机箱通过了MIL-STD 810H和IP66认证。
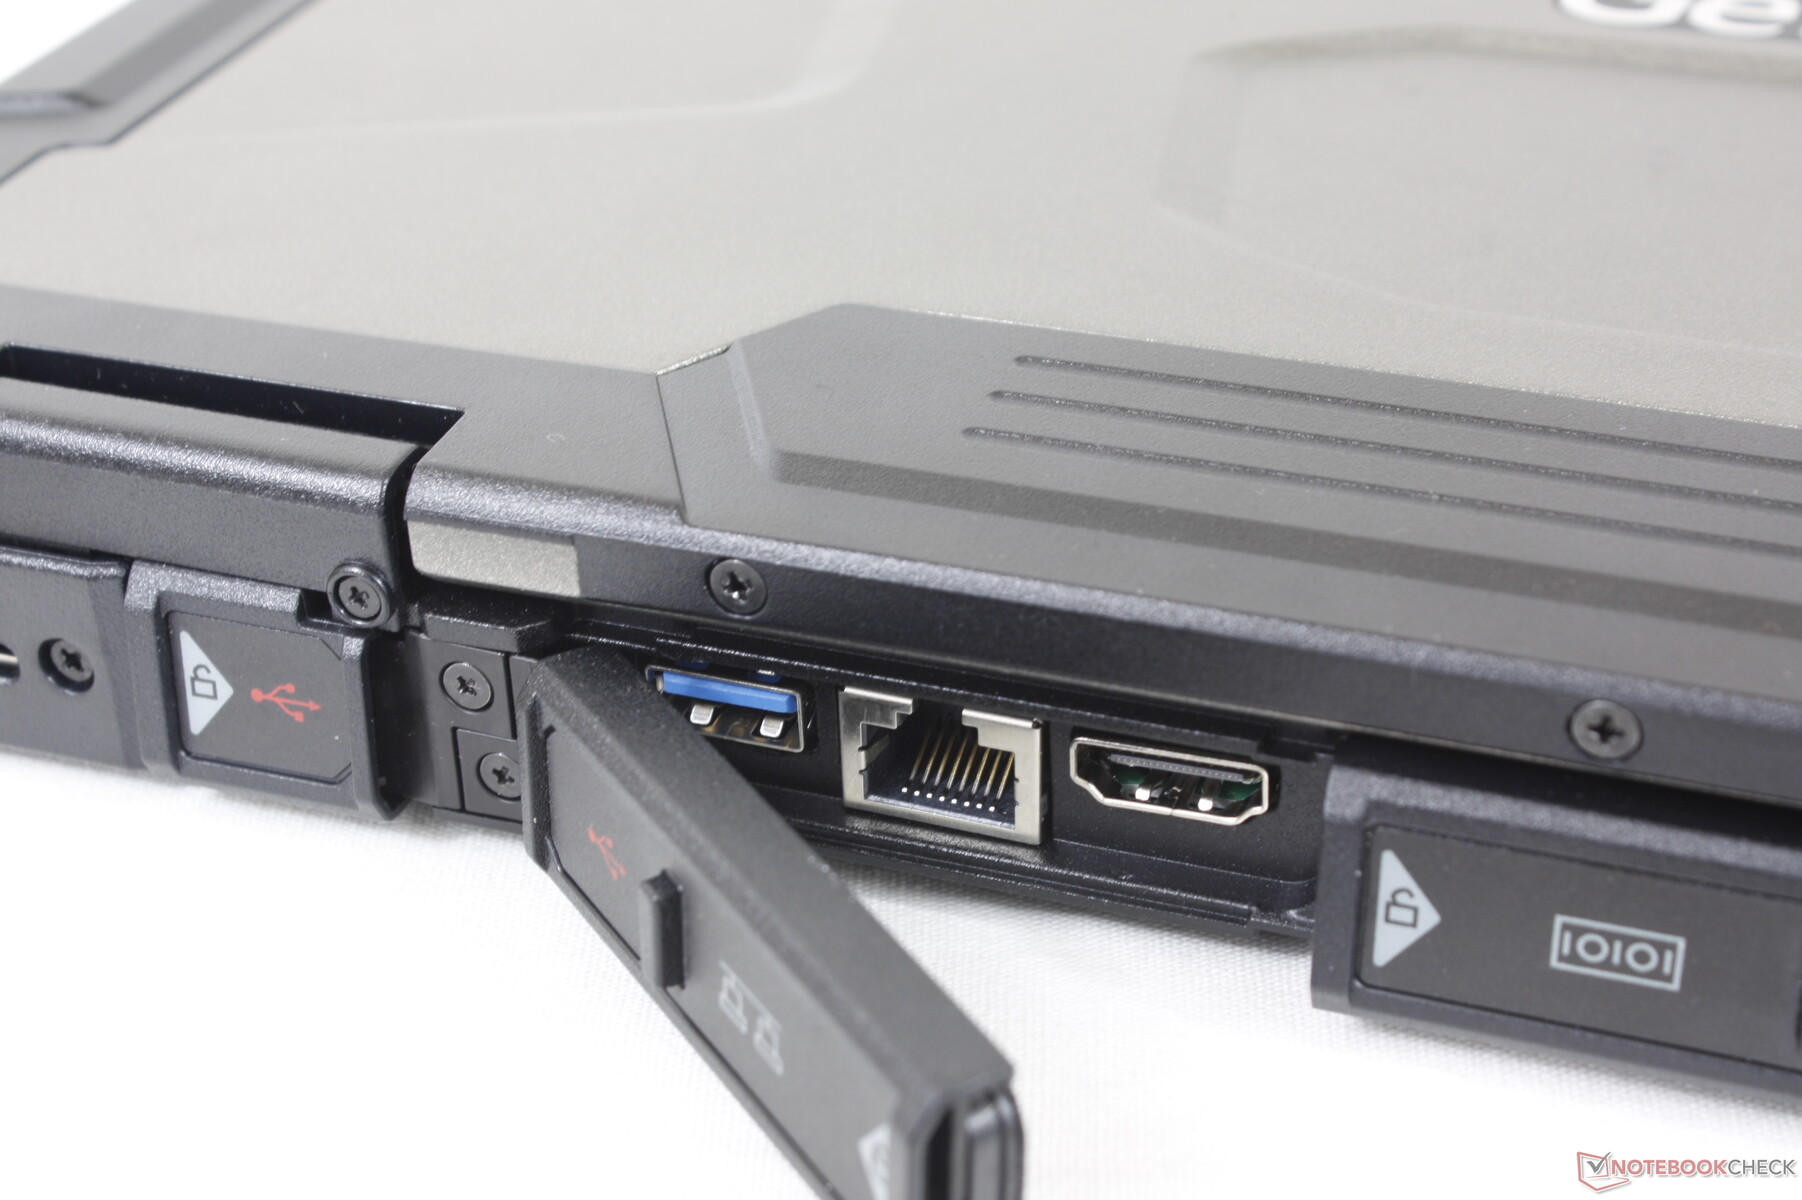
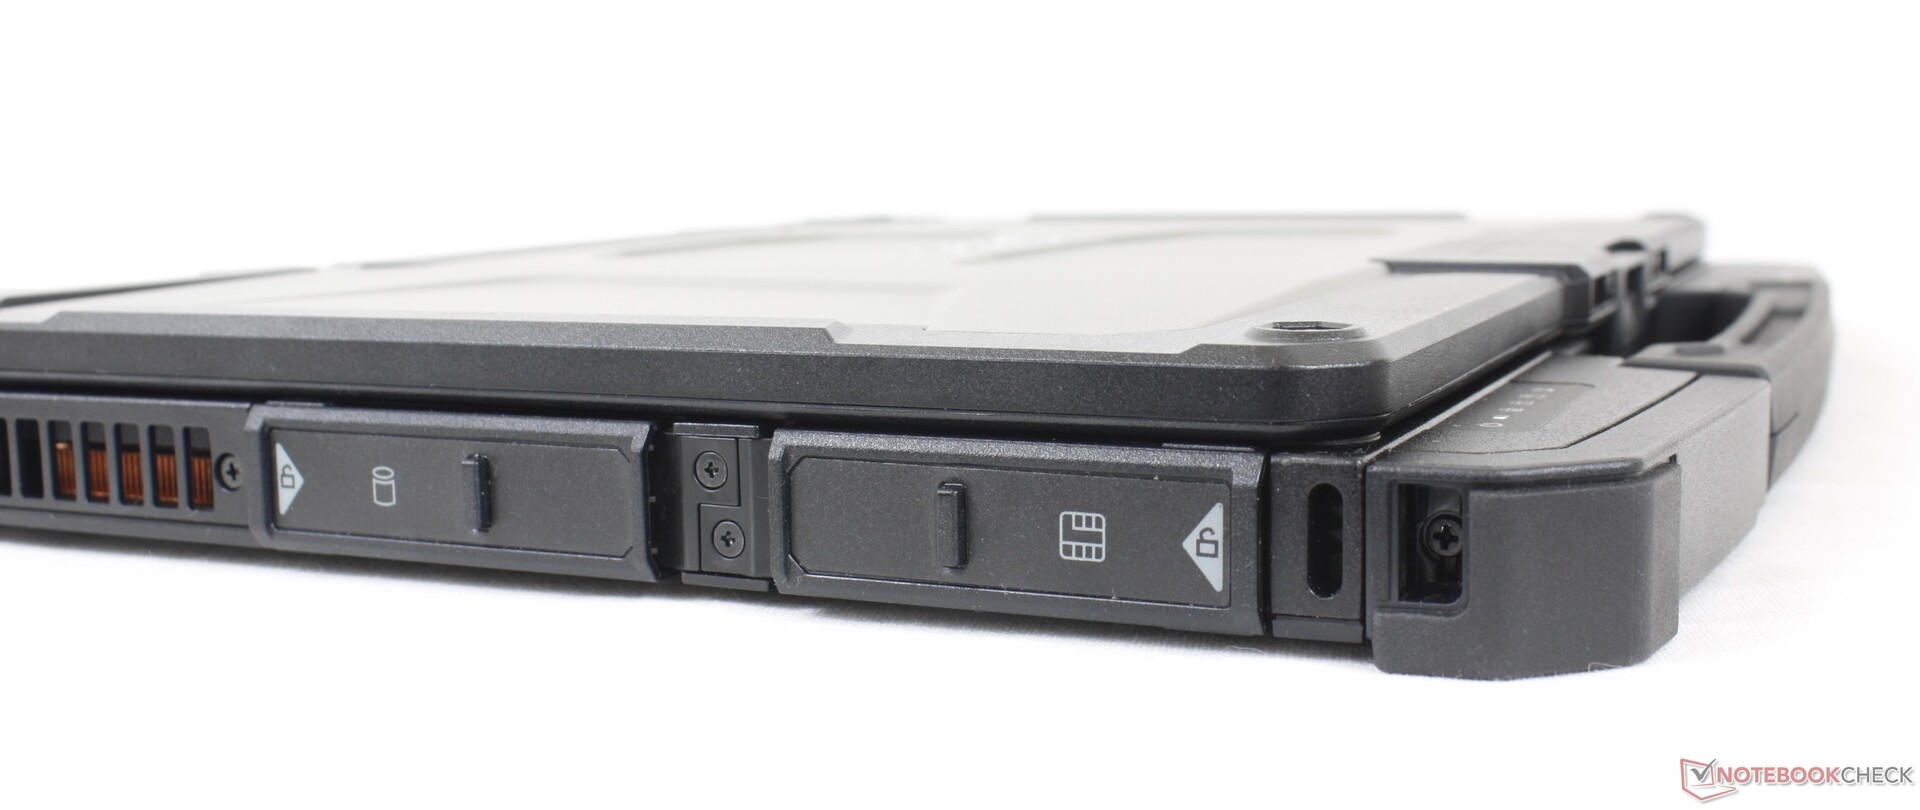
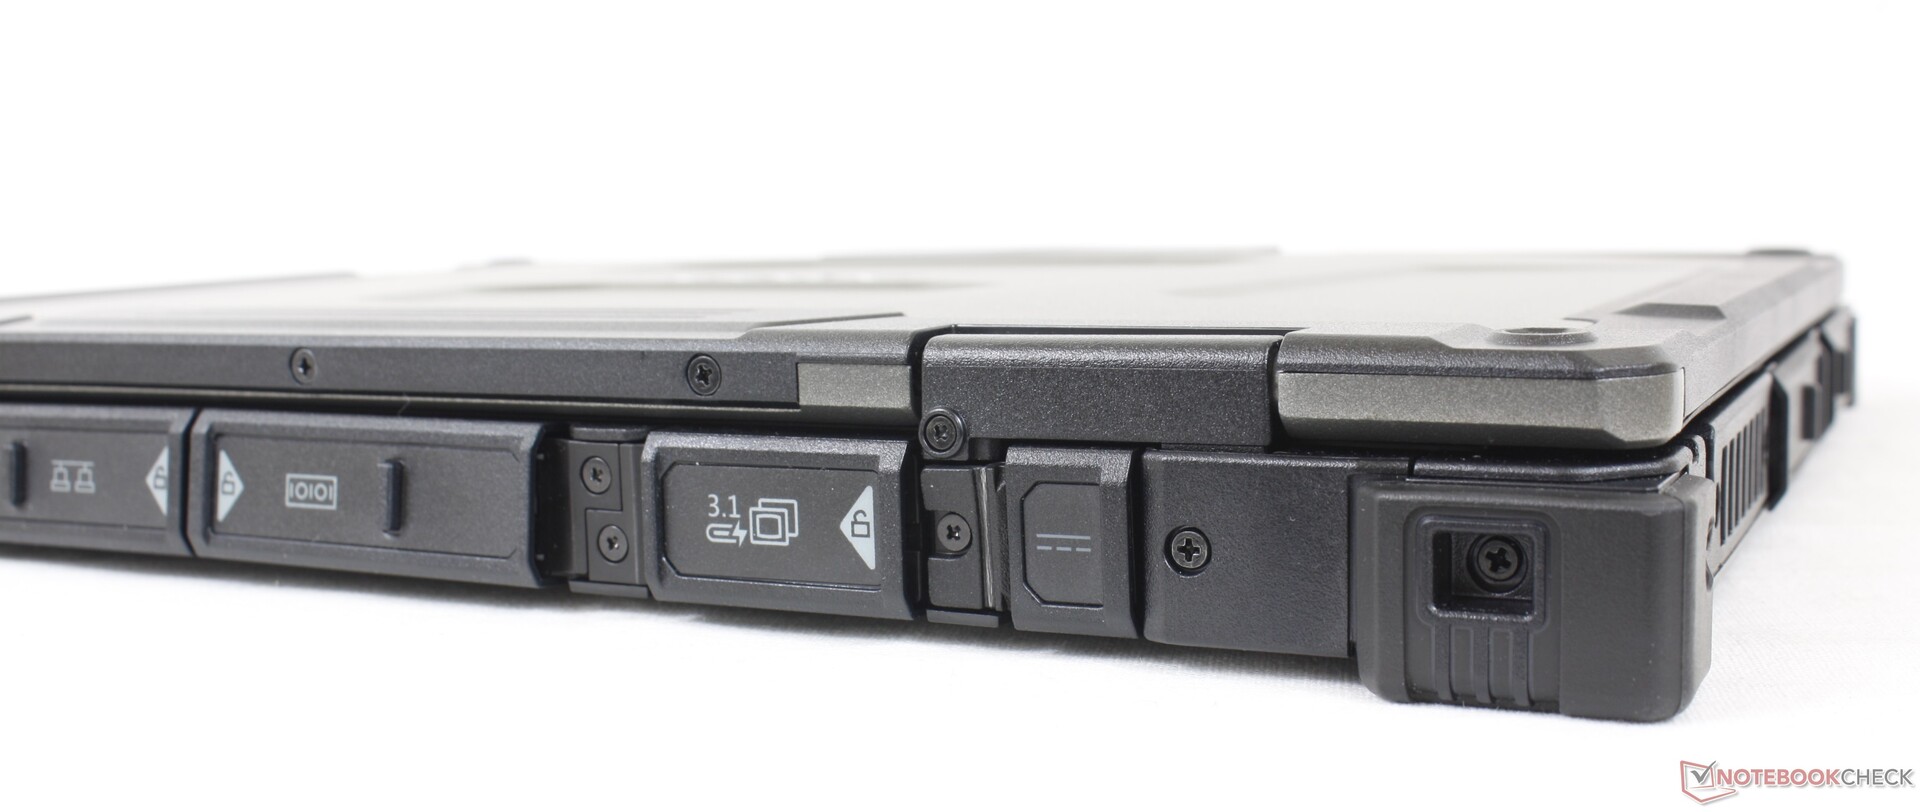
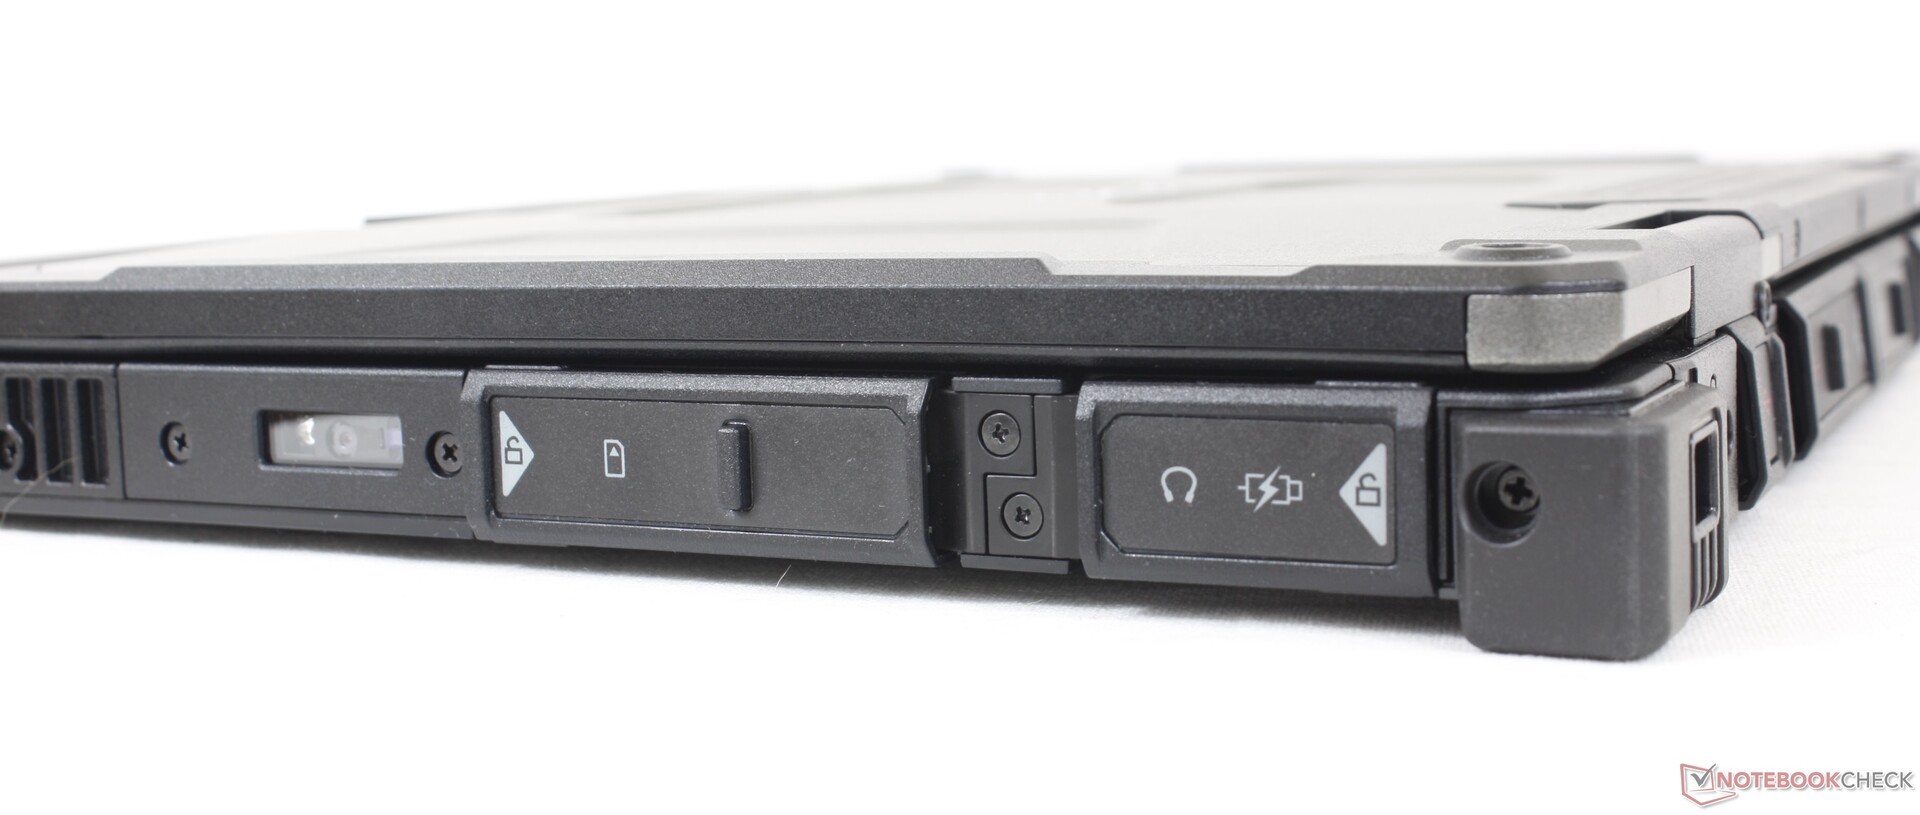
连接性
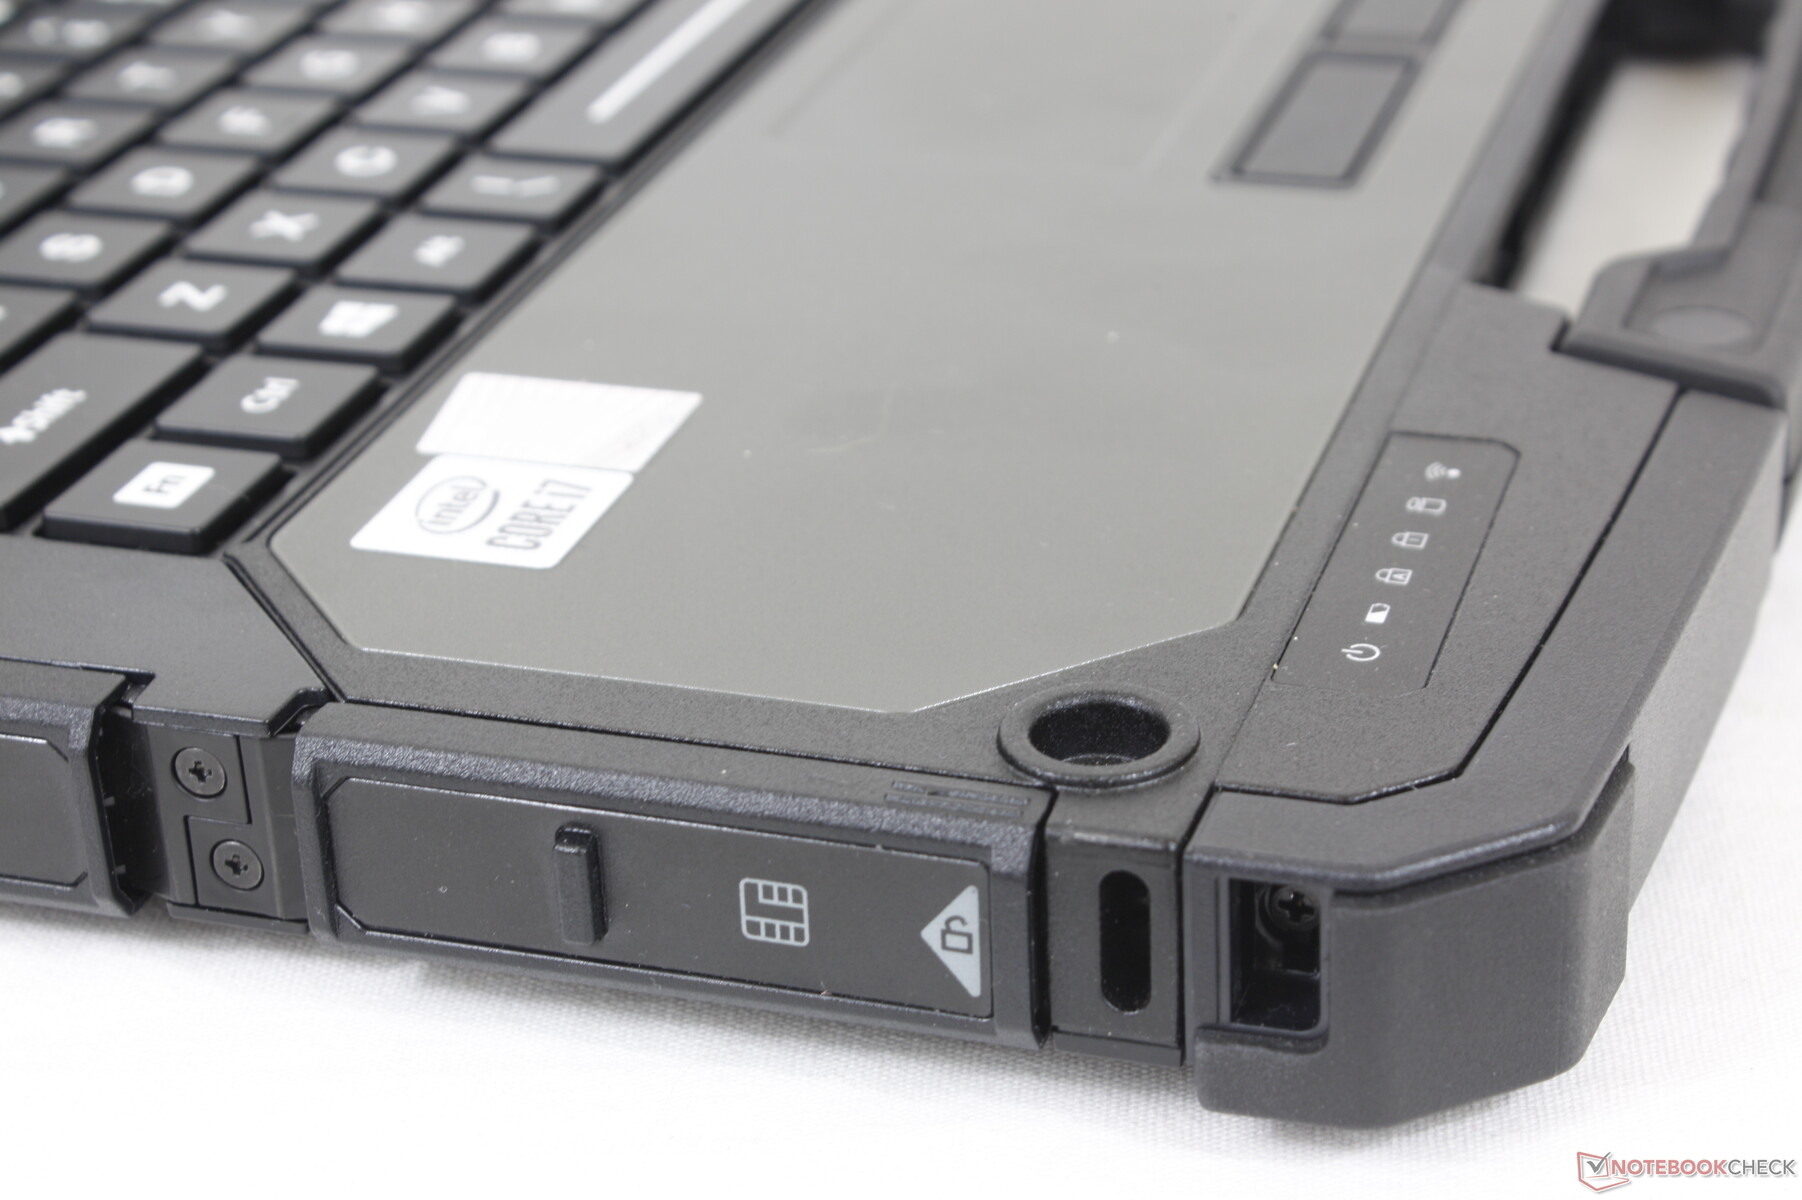
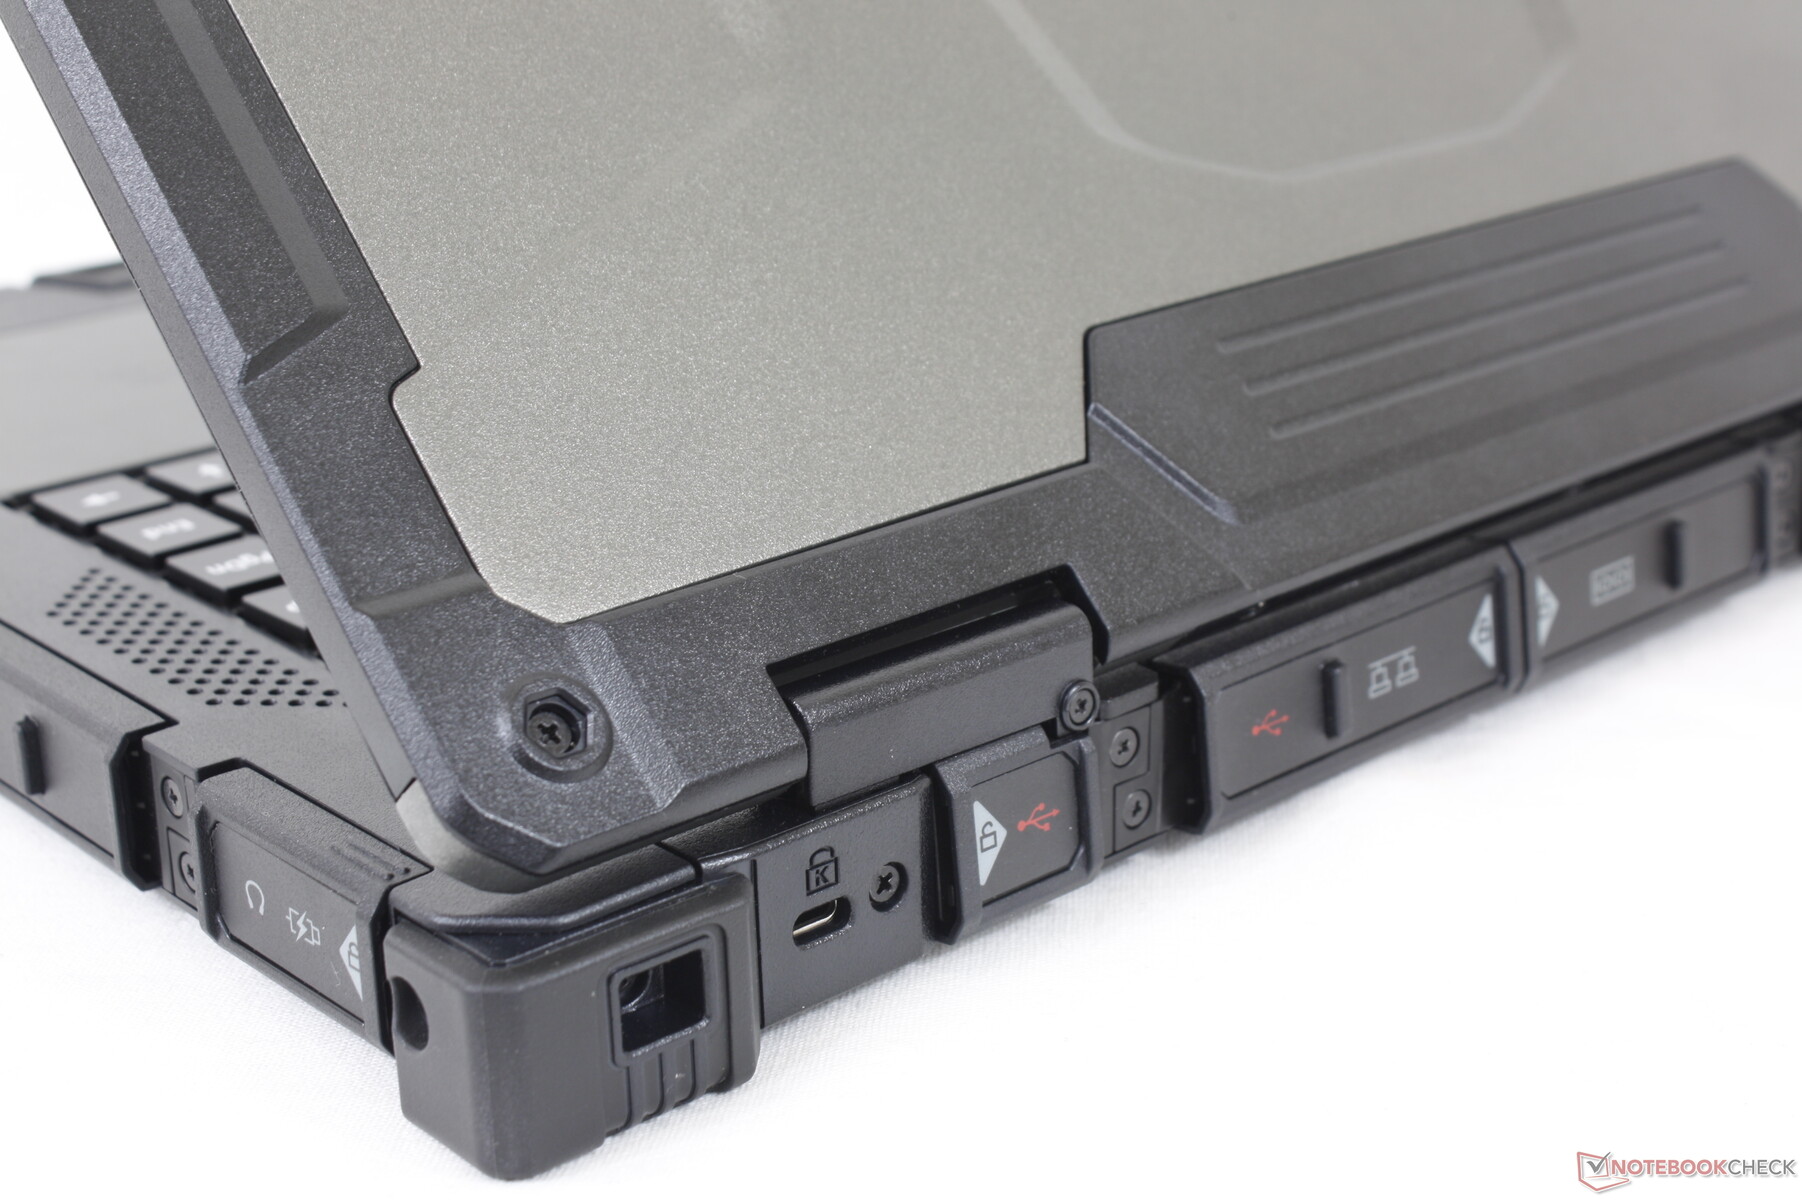
B360的独特之处在于沿着系统的左侧边缘有两个M.2 2280的隔间,取代了较大的S410的2.5英寸隔间。其他大多数端口都在系统的后部,可能难以触及,特别是由于它们受到小盖子的保护,难以抓握。
沟通
| Networking | |
| iperf3 transmit AX12 | |
| Acer Enduro Urban N3 EUN314 | |
| Panasonic Toughbook FZ-55 MK2 | |
| Durabook S14I | |
| Getac B360 | |
| Dell Latitude 5420 Rugged-P85G | |
| Getac S410 | |
| iperf3 receive AX12 | |
| Durabook S14I | |
| Acer Enduro Urban N3 EUN314 | |
| Panasonic Toughbook FZ-55 MK2 | |
| Getac B360 | |
| Dell Latitude 5420 Rugged-P85G | |
| Getac S410 | |
网络摄像头
一个1080p的网络摄像头是标准配置,比大多数其他笔记本电脑上常见的720p网络摄像头分辨率更高。颜色仍然不理想,IR是可选的Windows Hello支持。


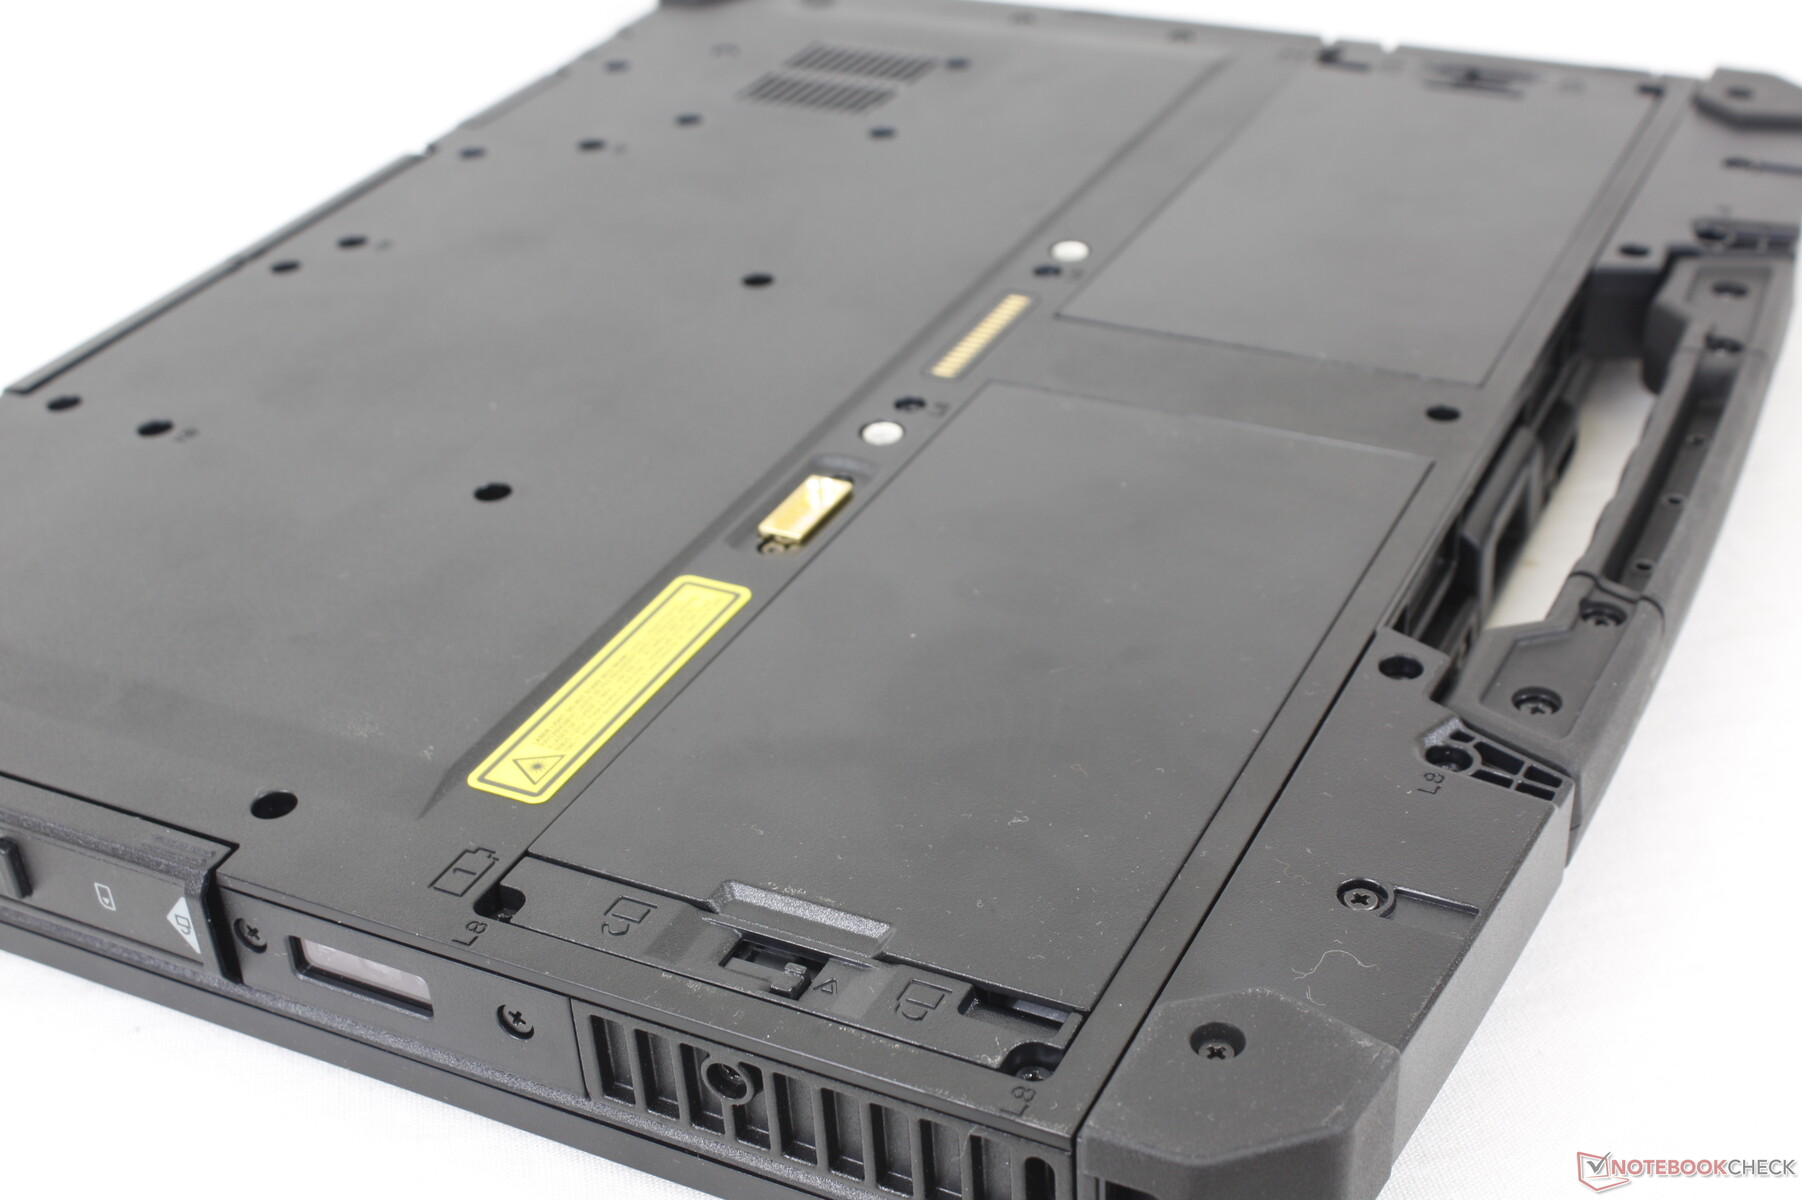
维护
Getac不建议拆除底板进行任何形式的维修或升级。底部由不少于34颗(!)螺丝固定的事实已经暗示了制造方不鼓励最终用户进行修补。
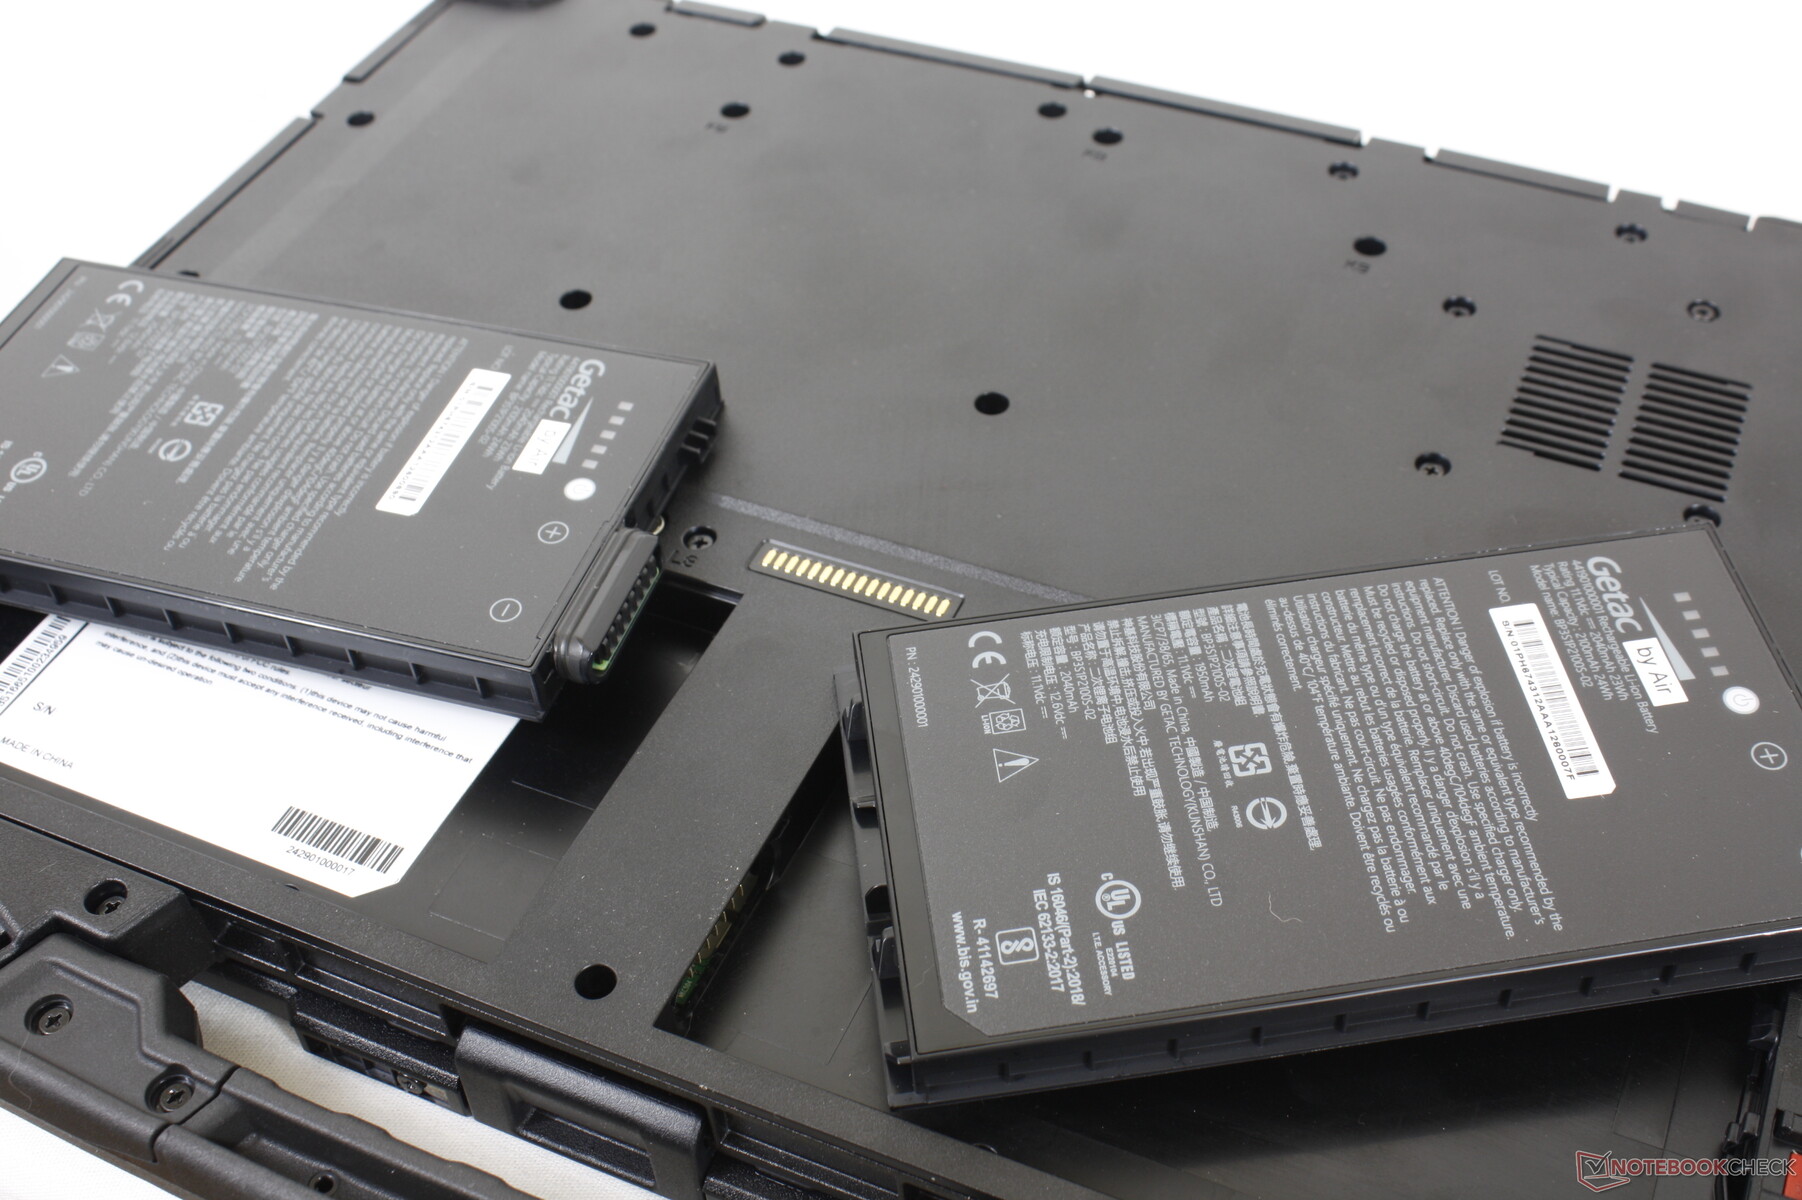
配件和保修
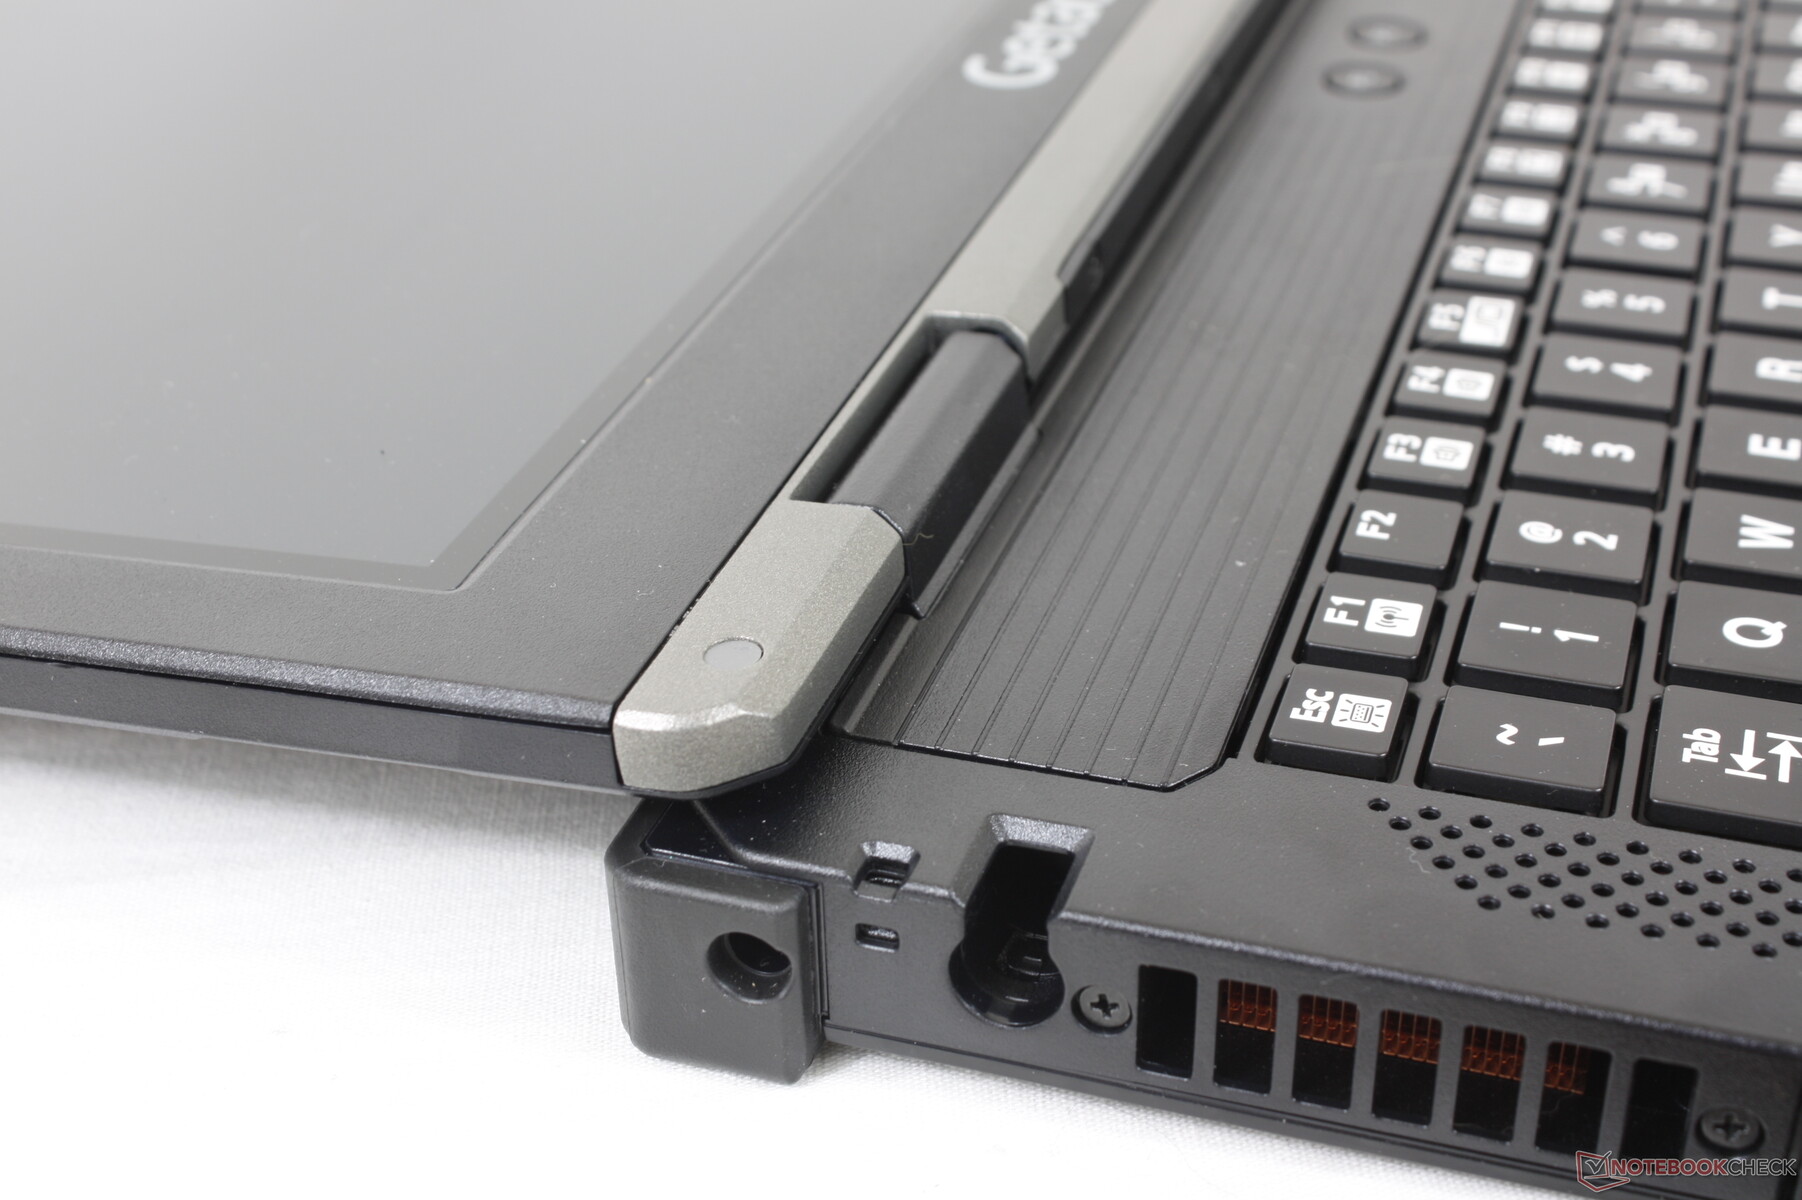
基本包装包括一支无源手写笔、两块可拆卸电池、以及通常的文件和交流适配器。3年有限保修是标准配置。
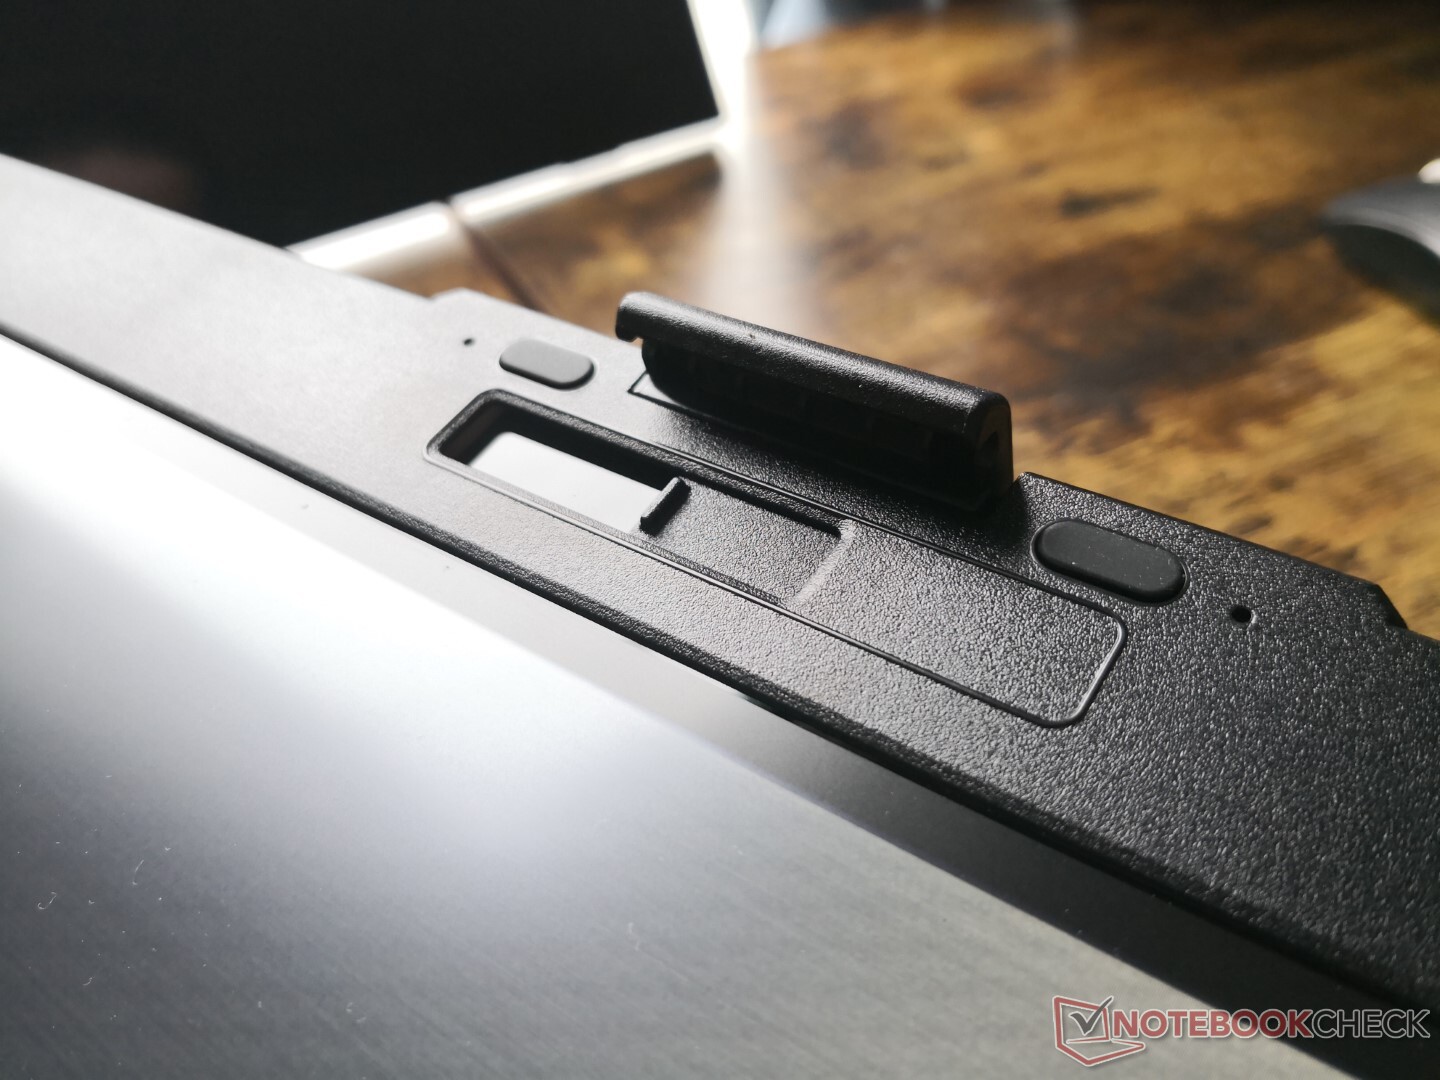
还有其他配件可供选择,这些配件利用了设备底部的专有插销。
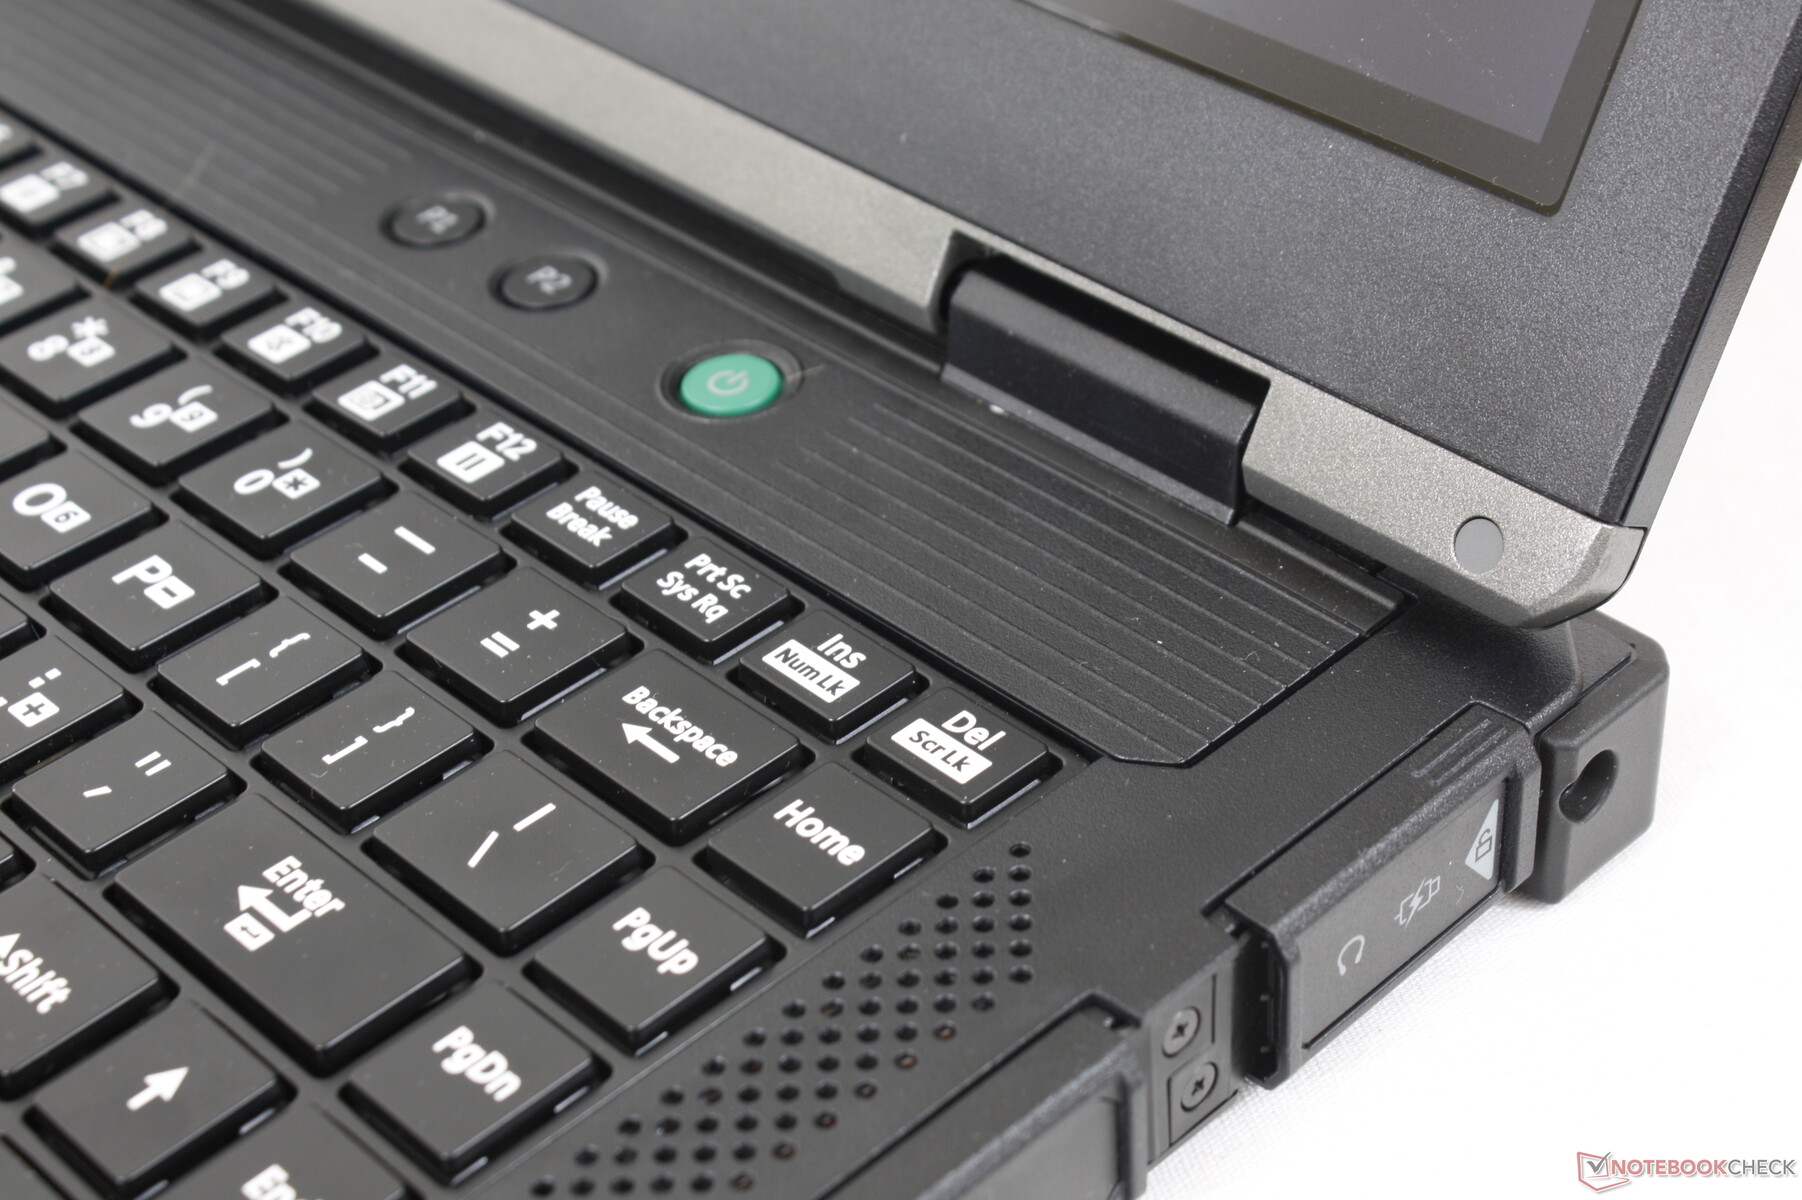
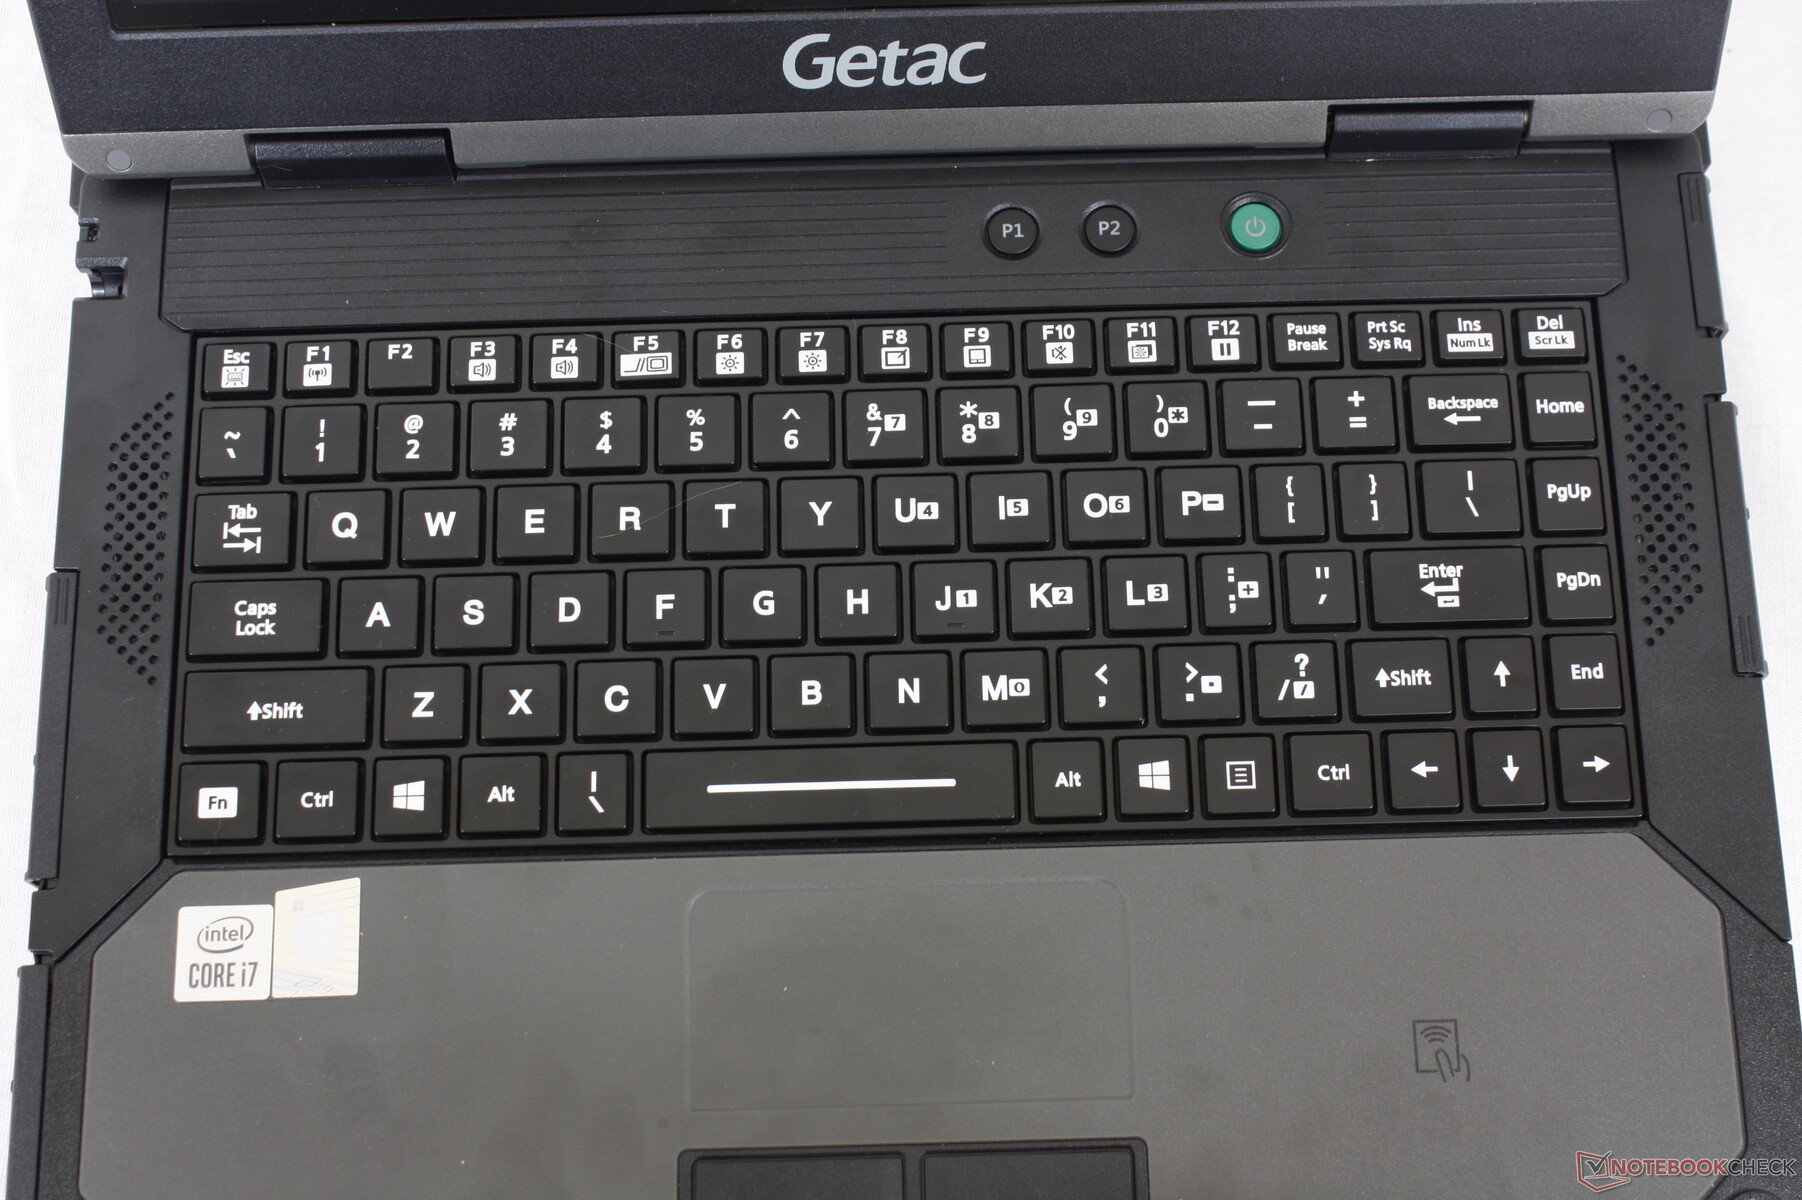
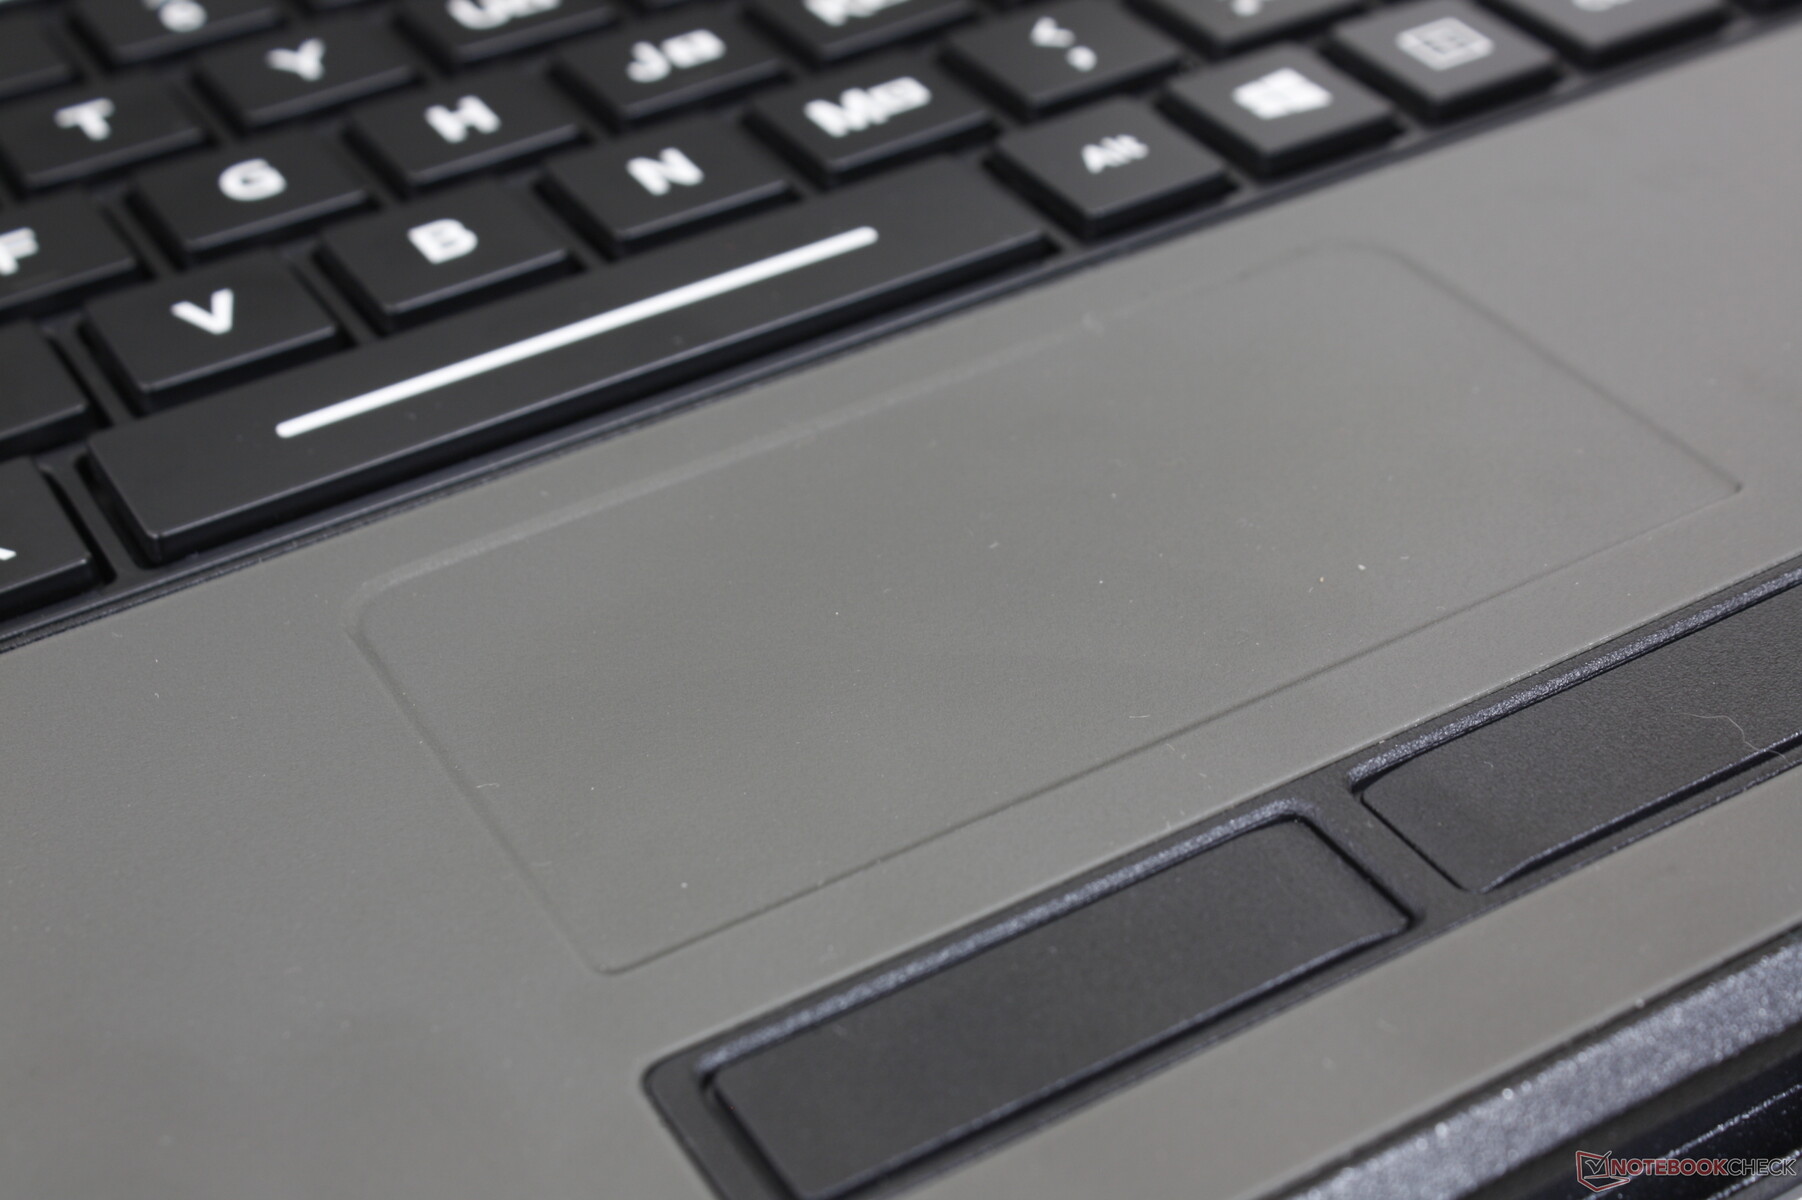
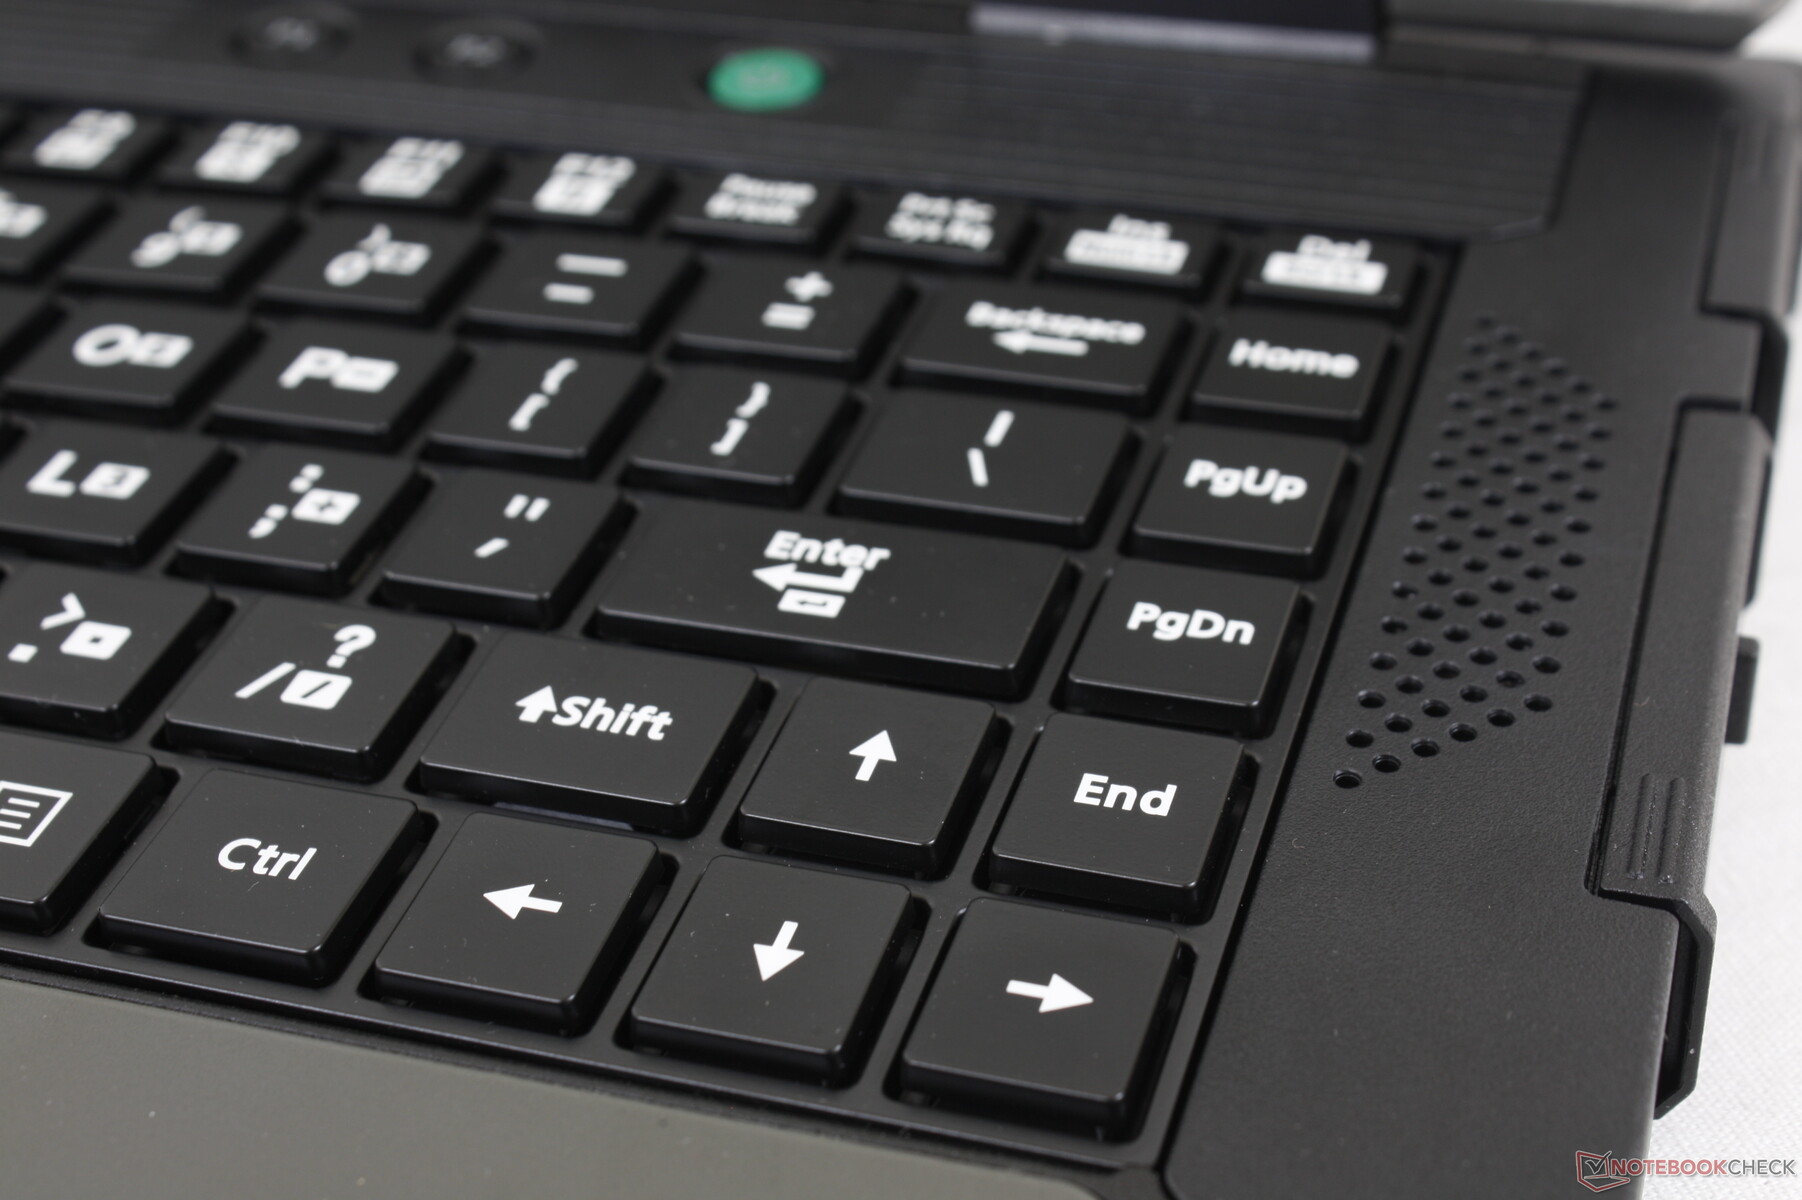
输入设备

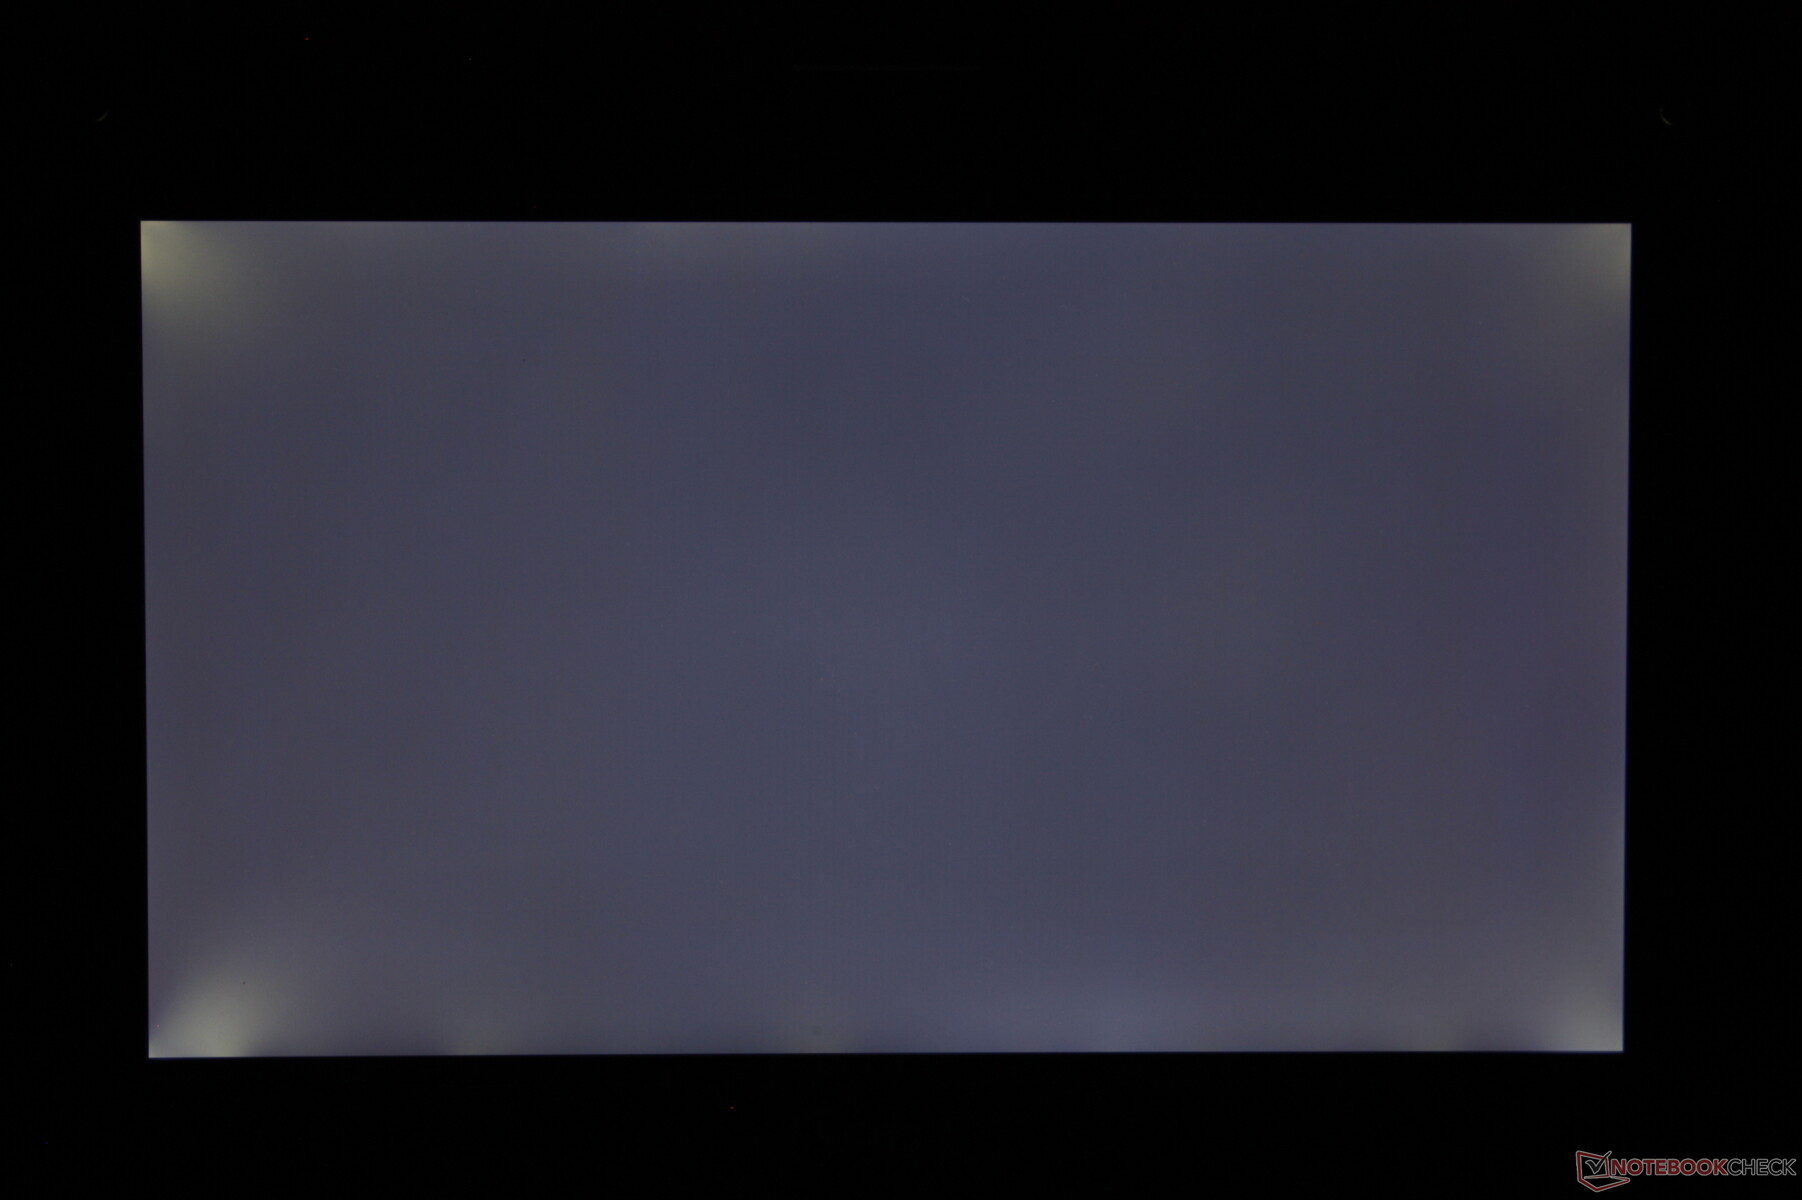
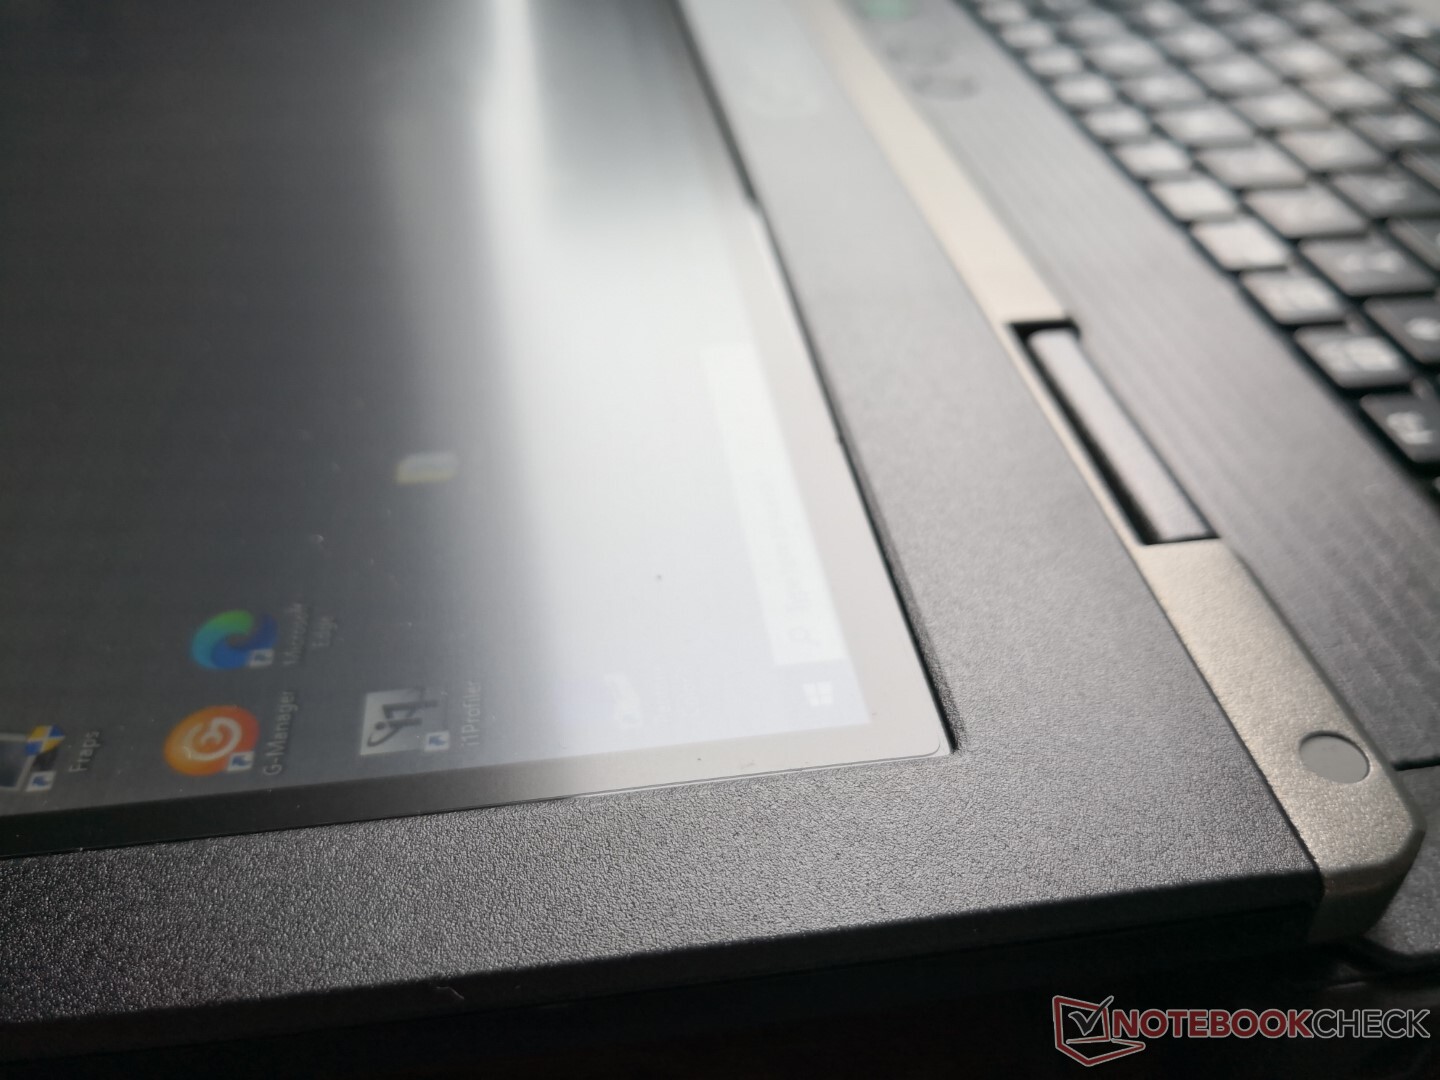
显示
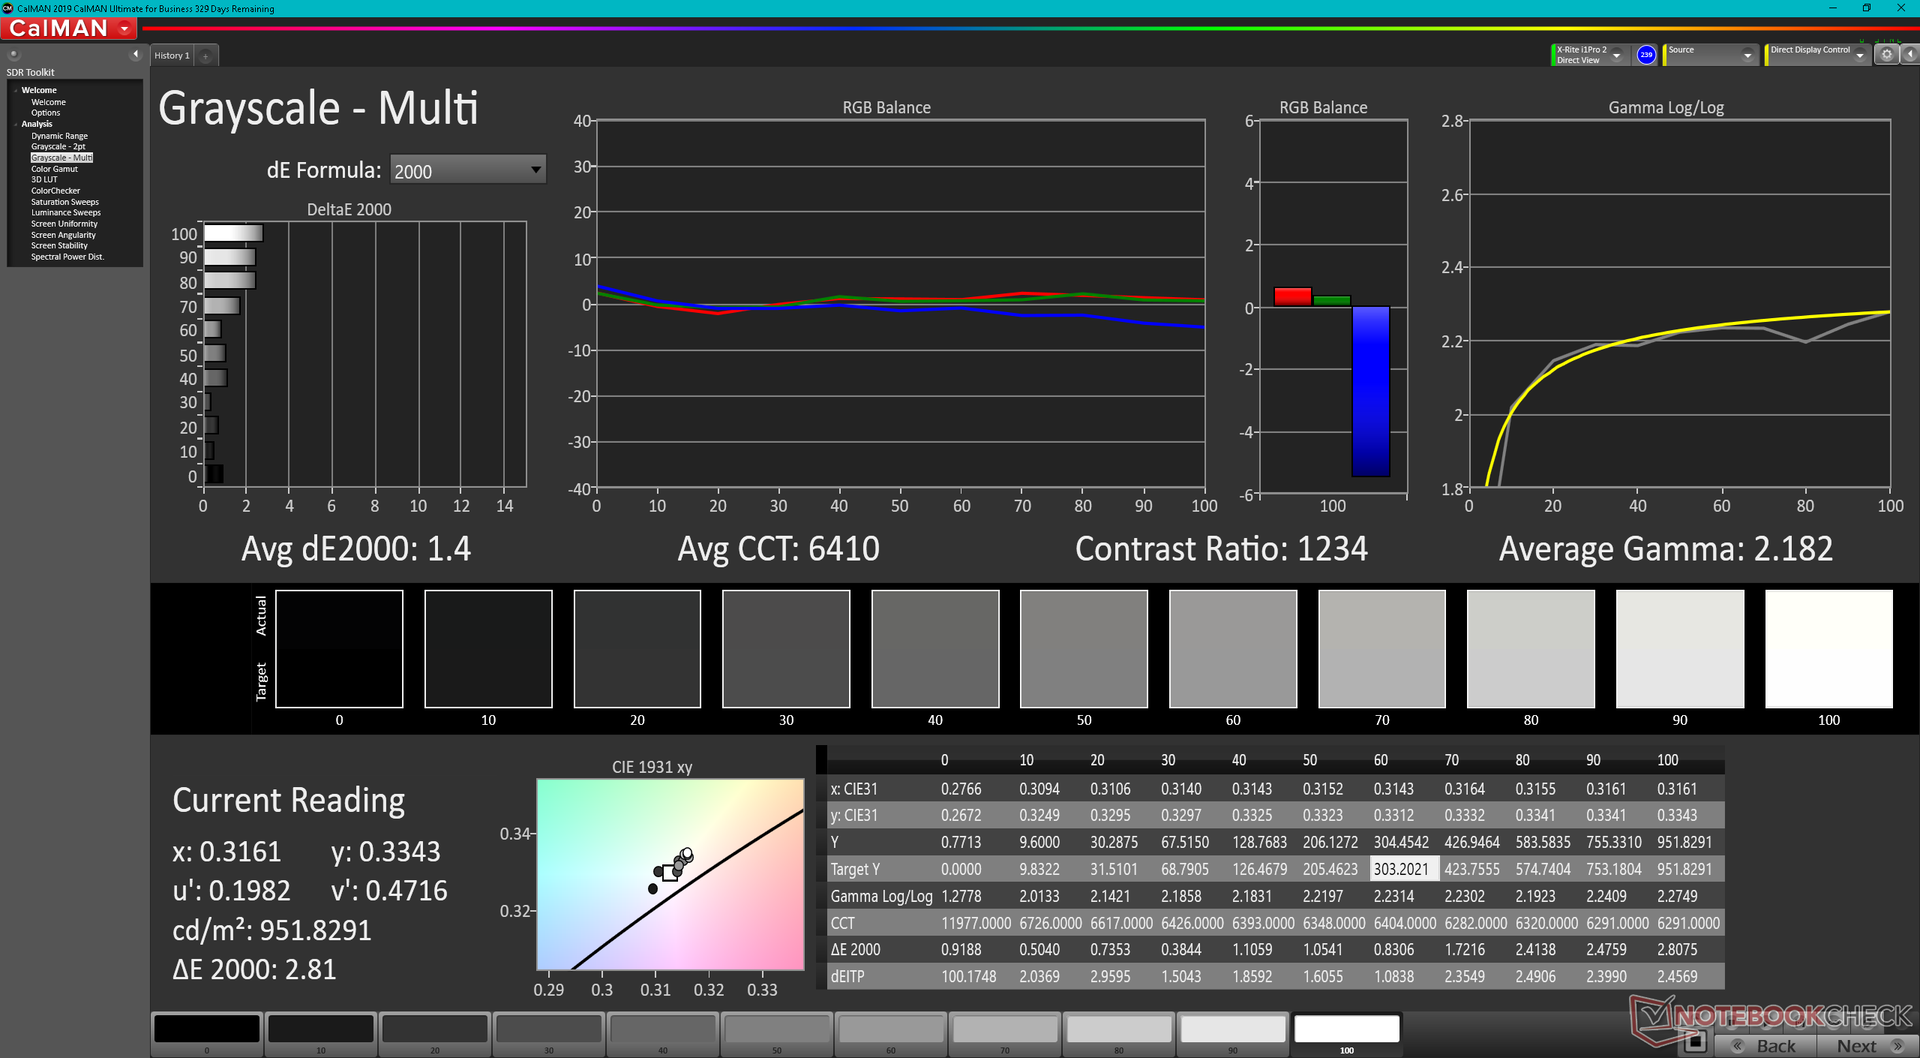
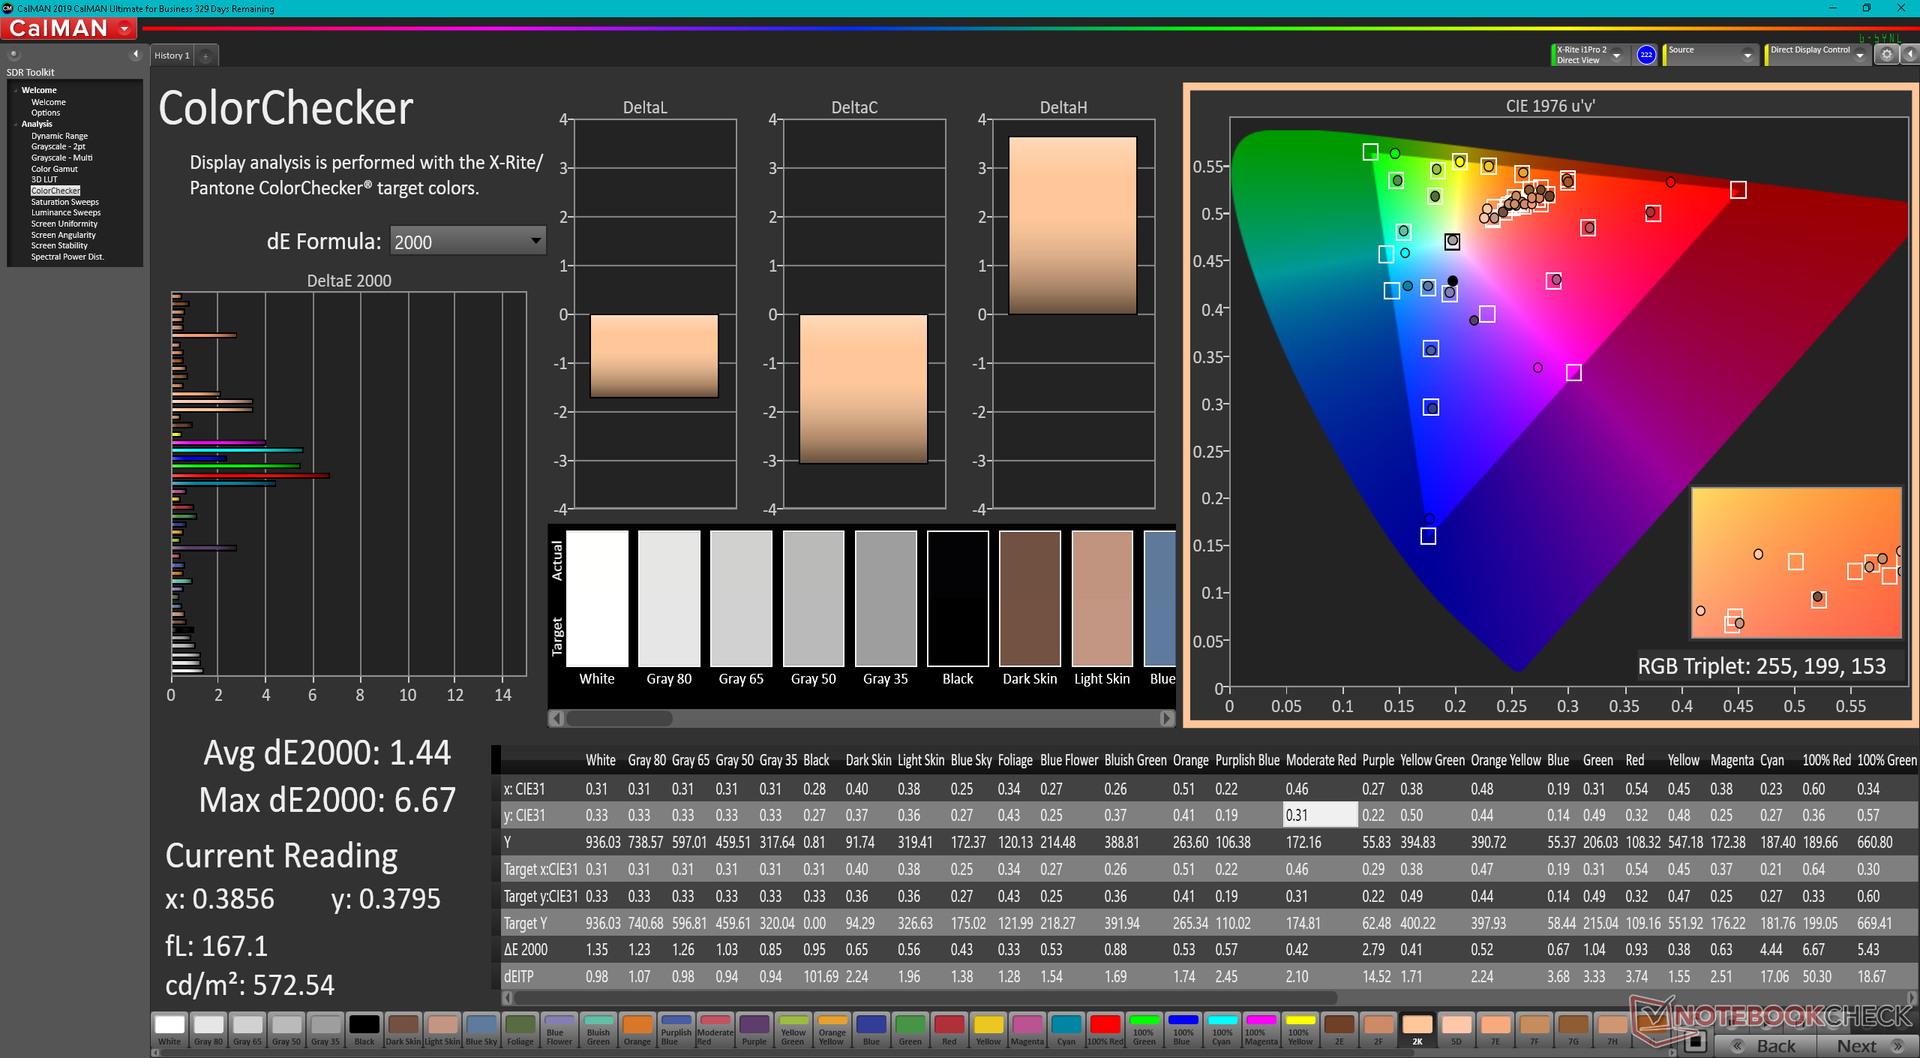
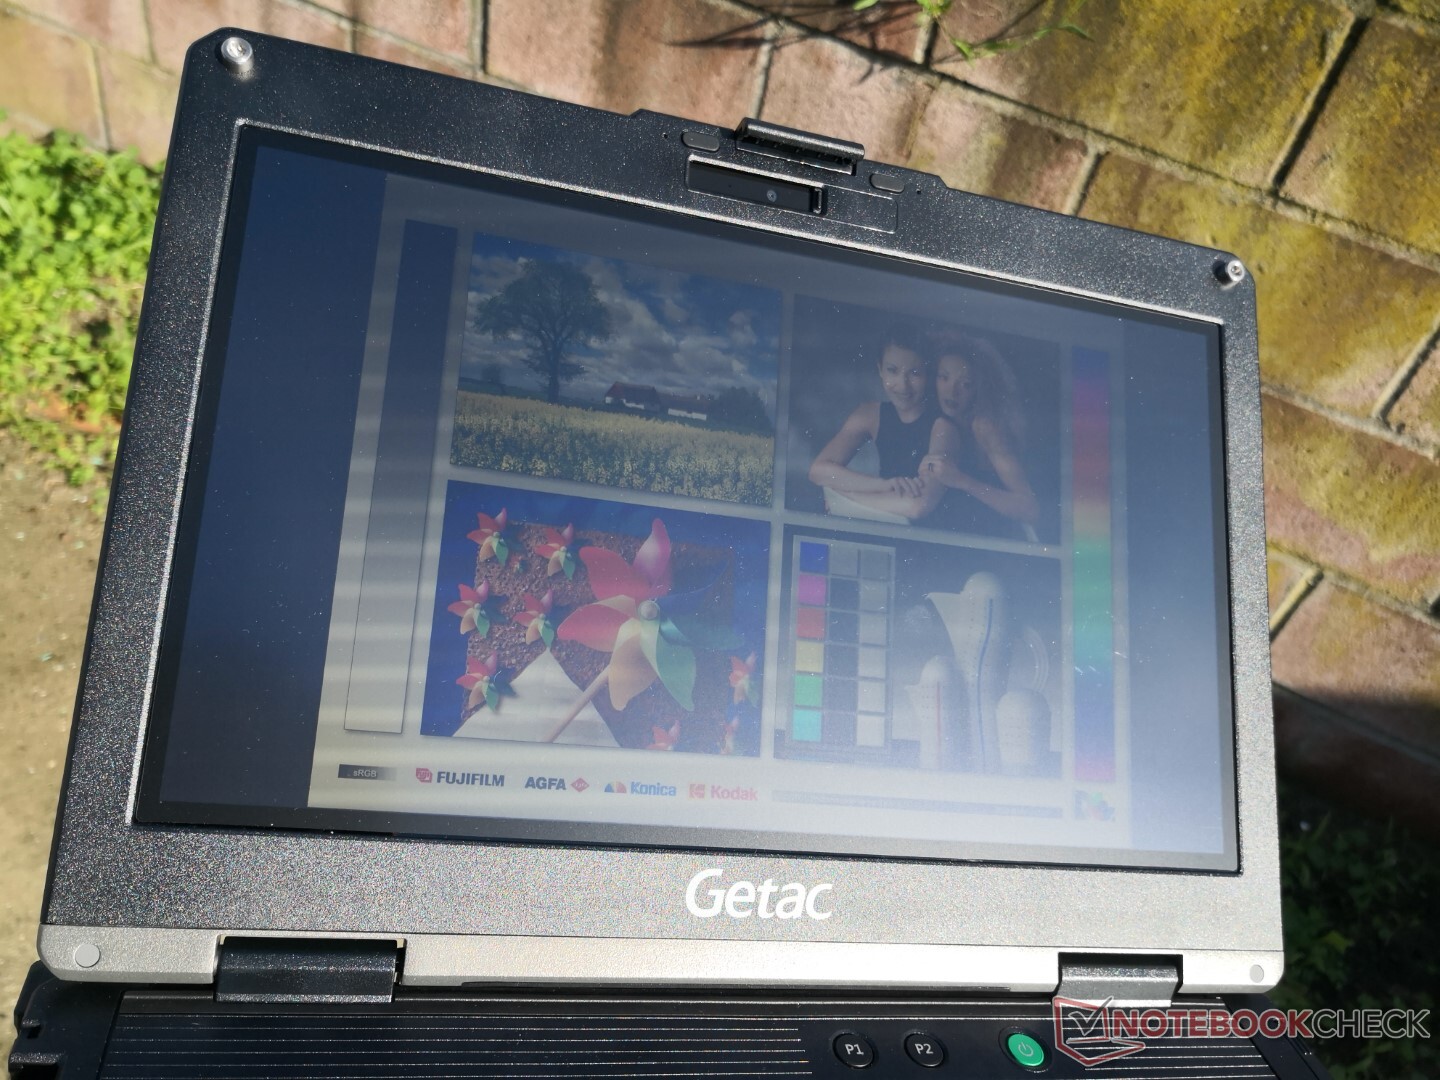
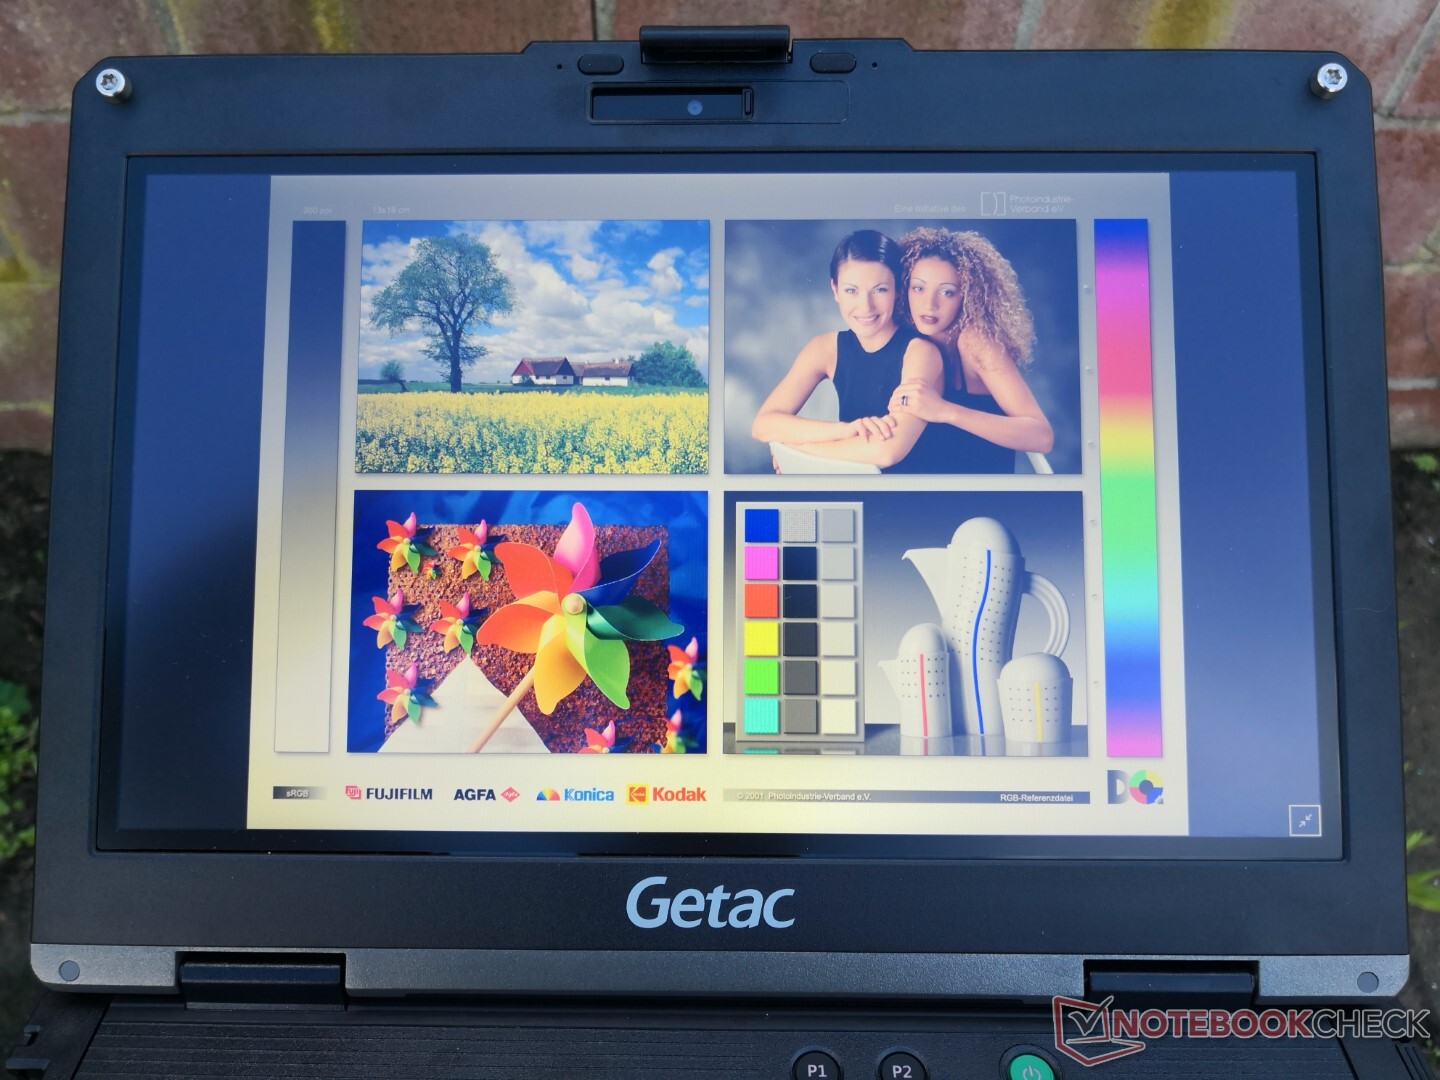
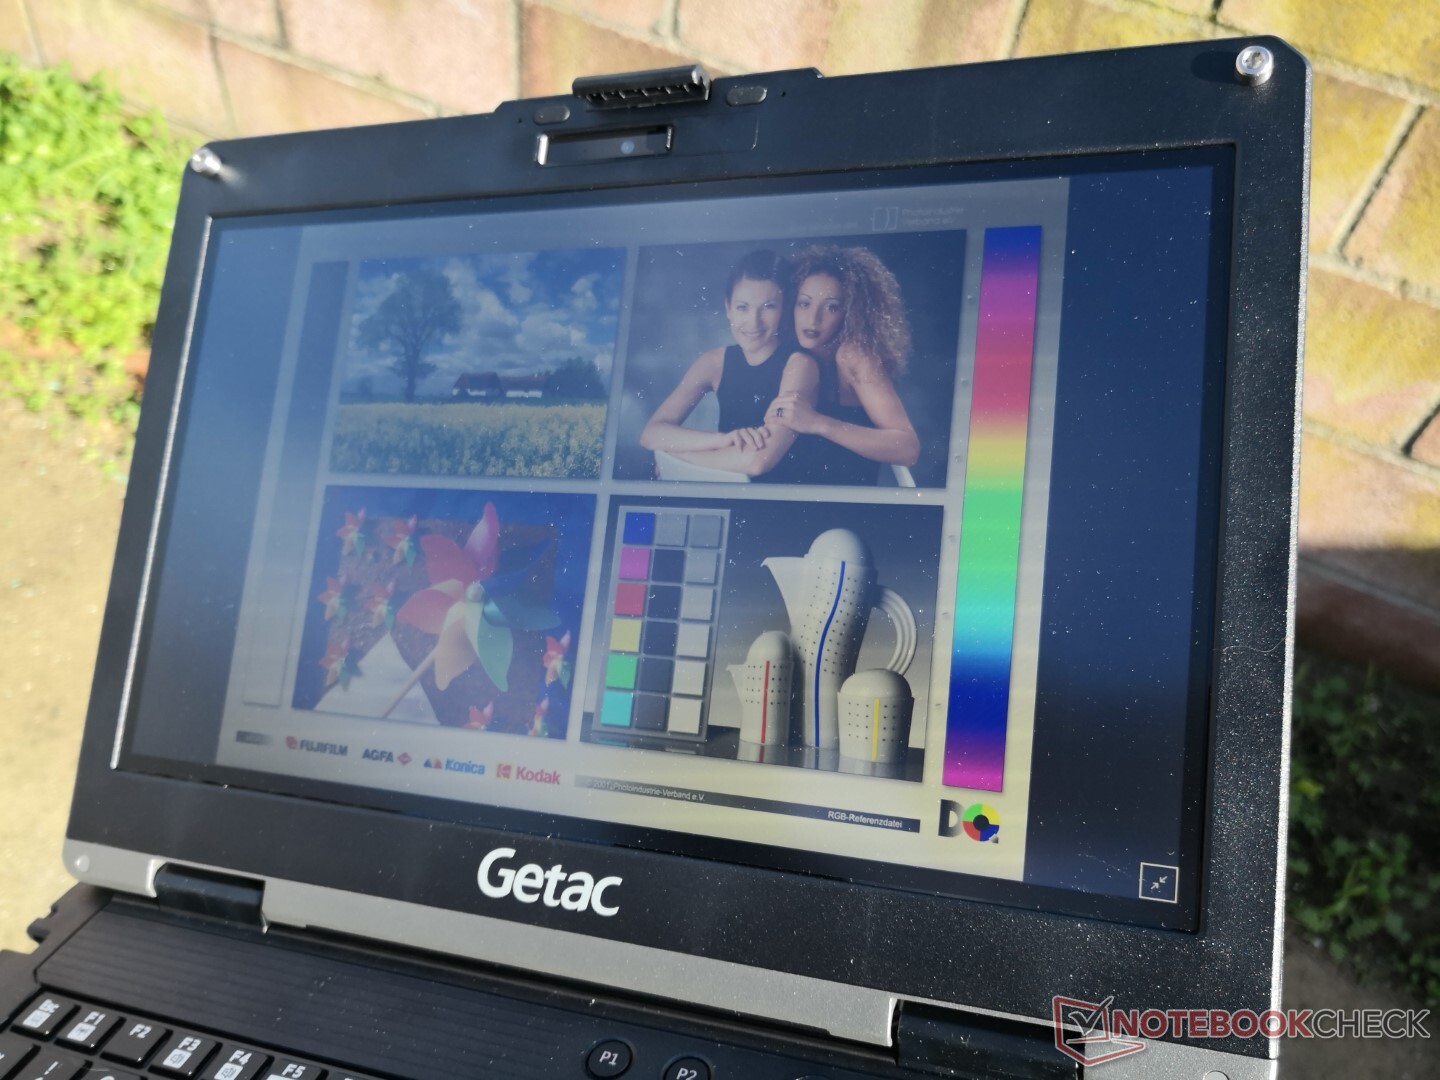
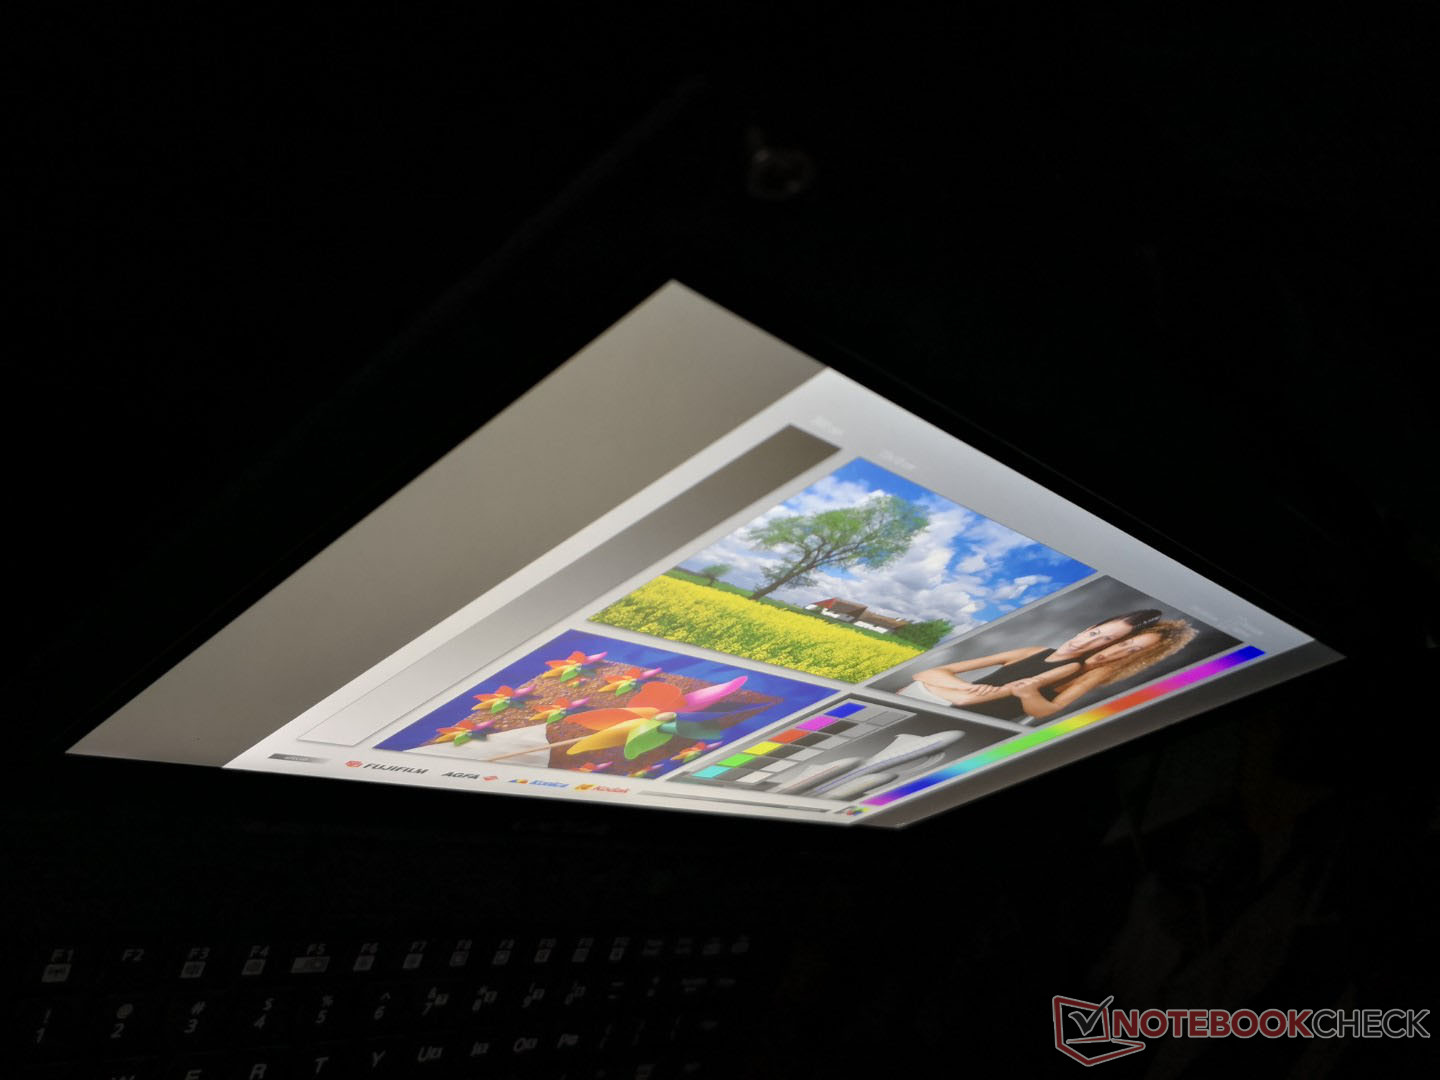
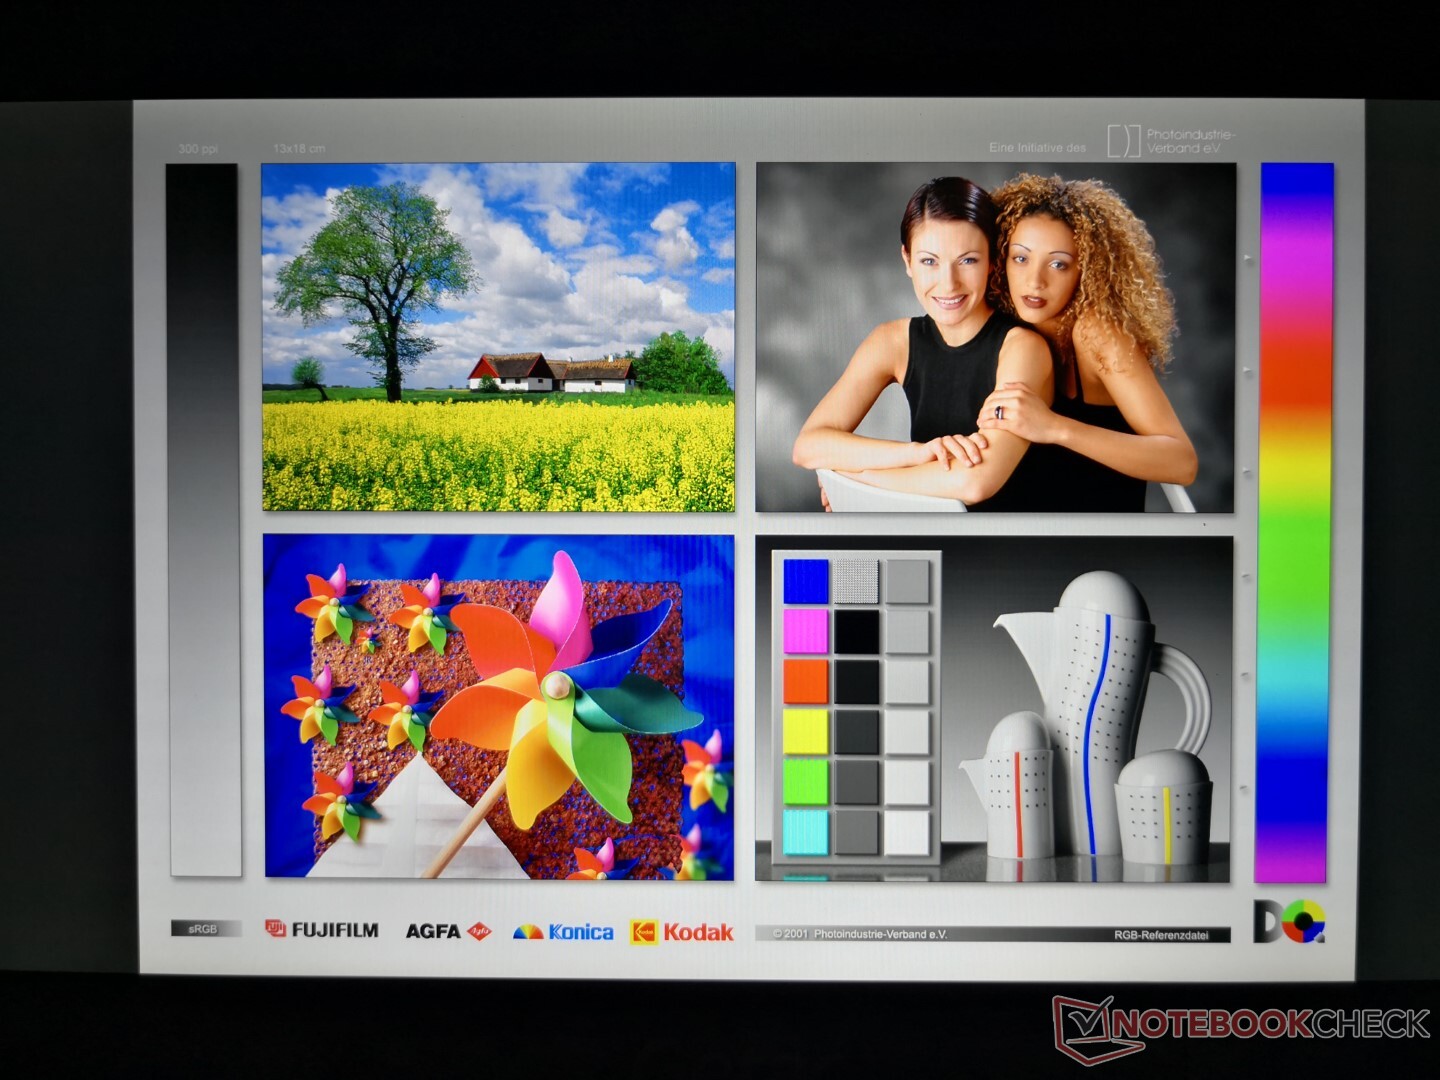
制造商宣称1400尼特的亮度是最亮的笔记本电脑之一,不管是什么类别,我们可以通过自己的独立测量来确认。也许更令人印象深刻的是相对较深的对比度~1500:1,这又比其他大多数坚固耐用的型号好。
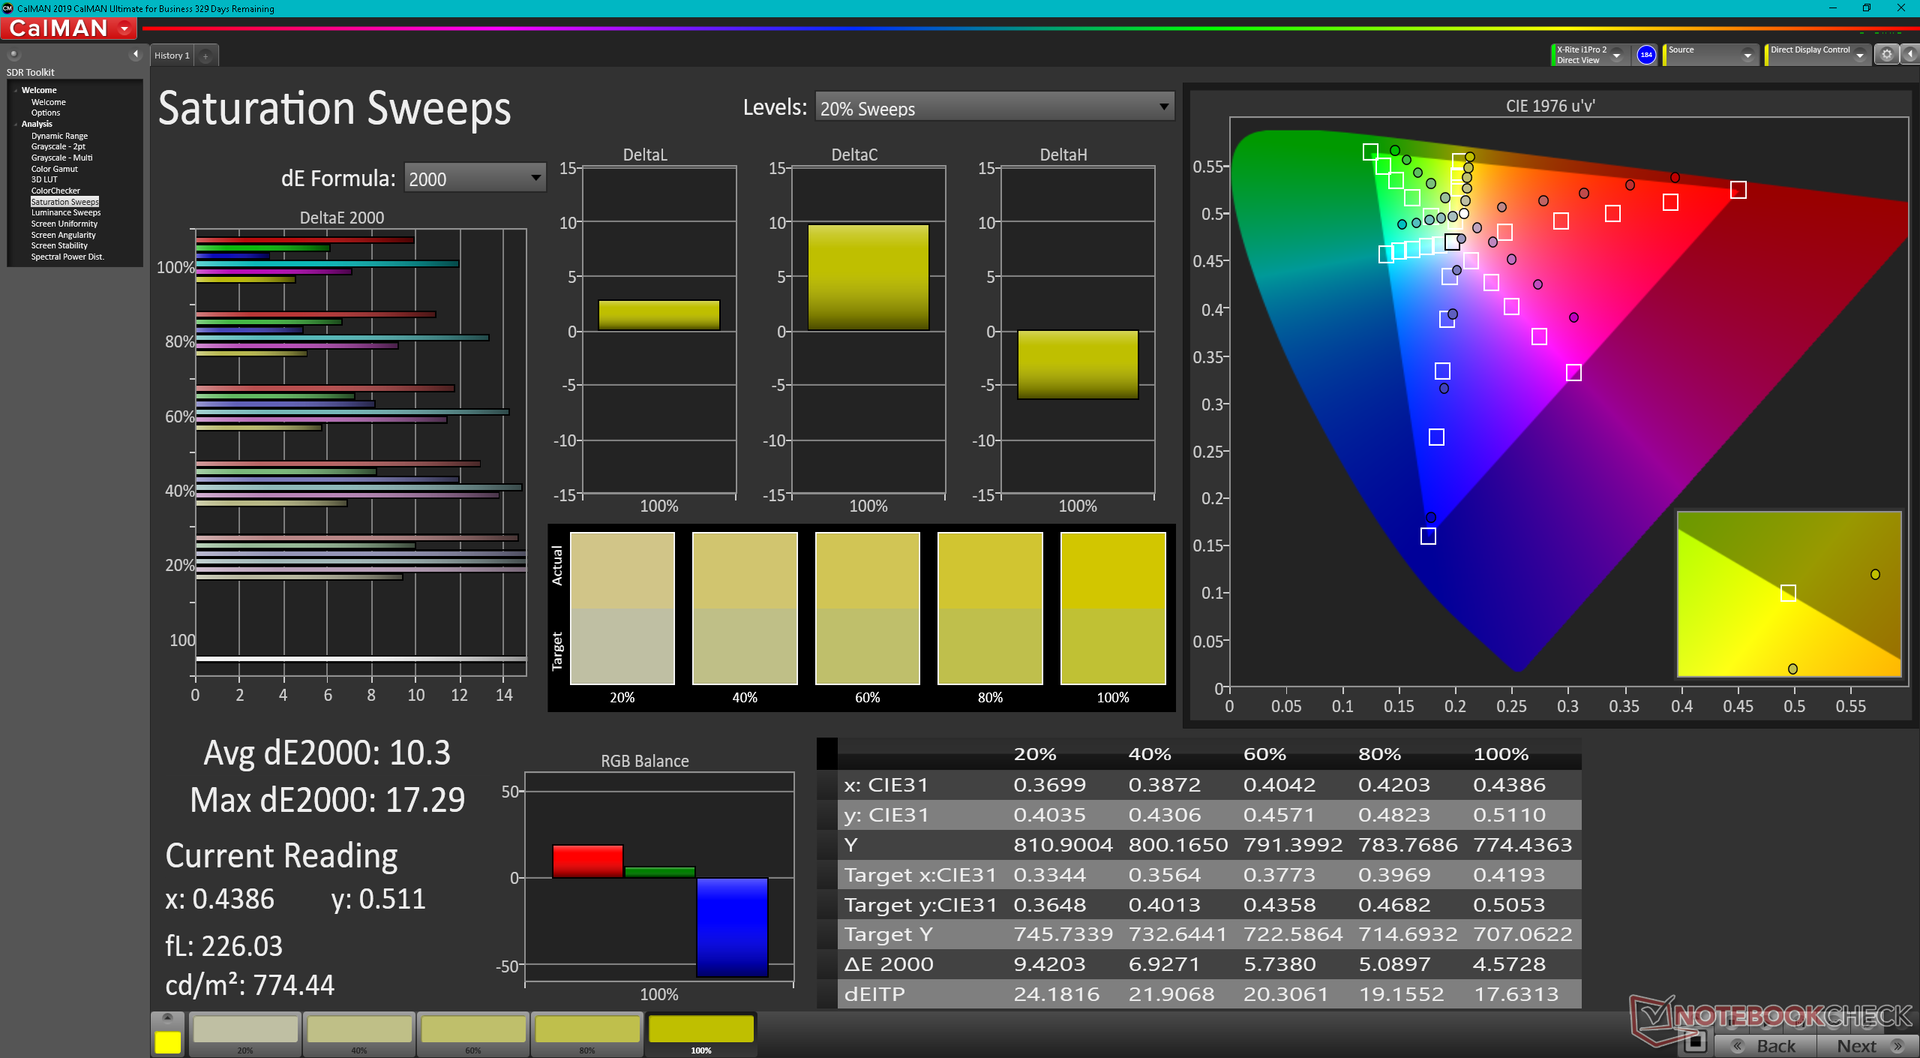
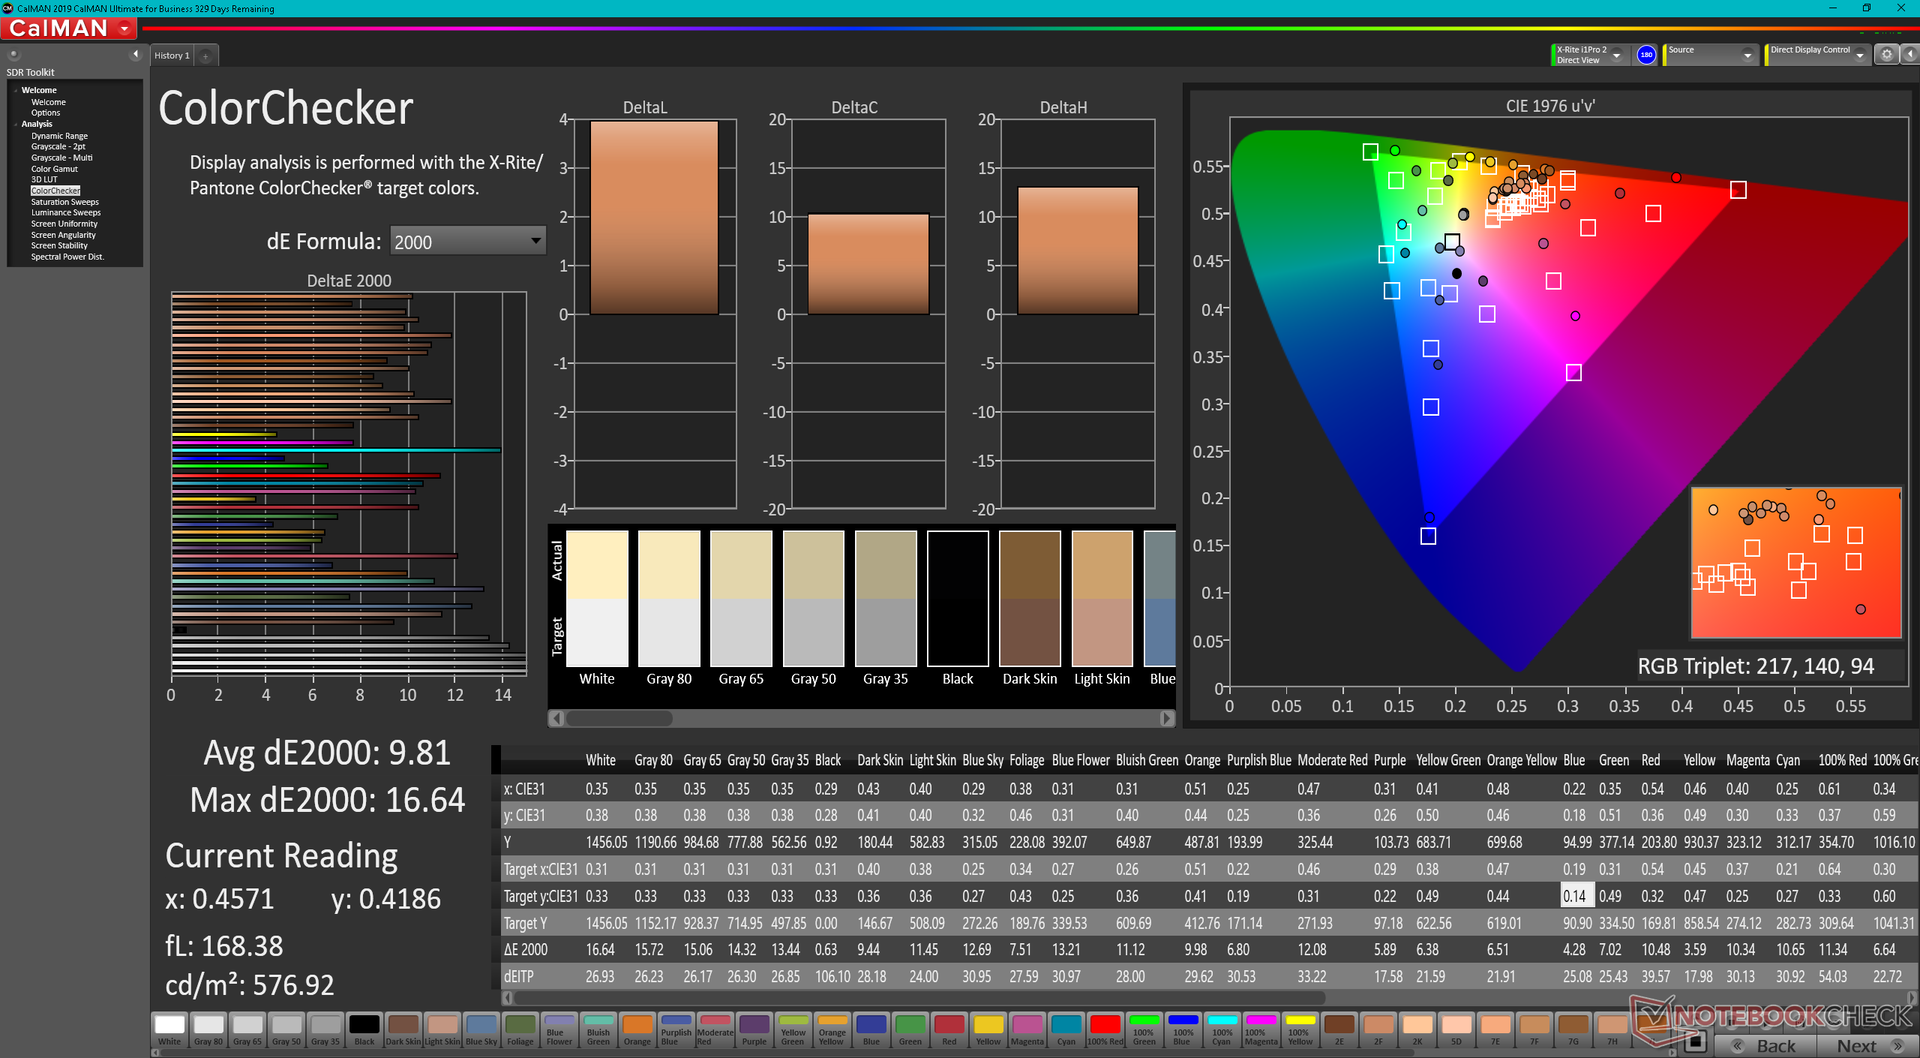
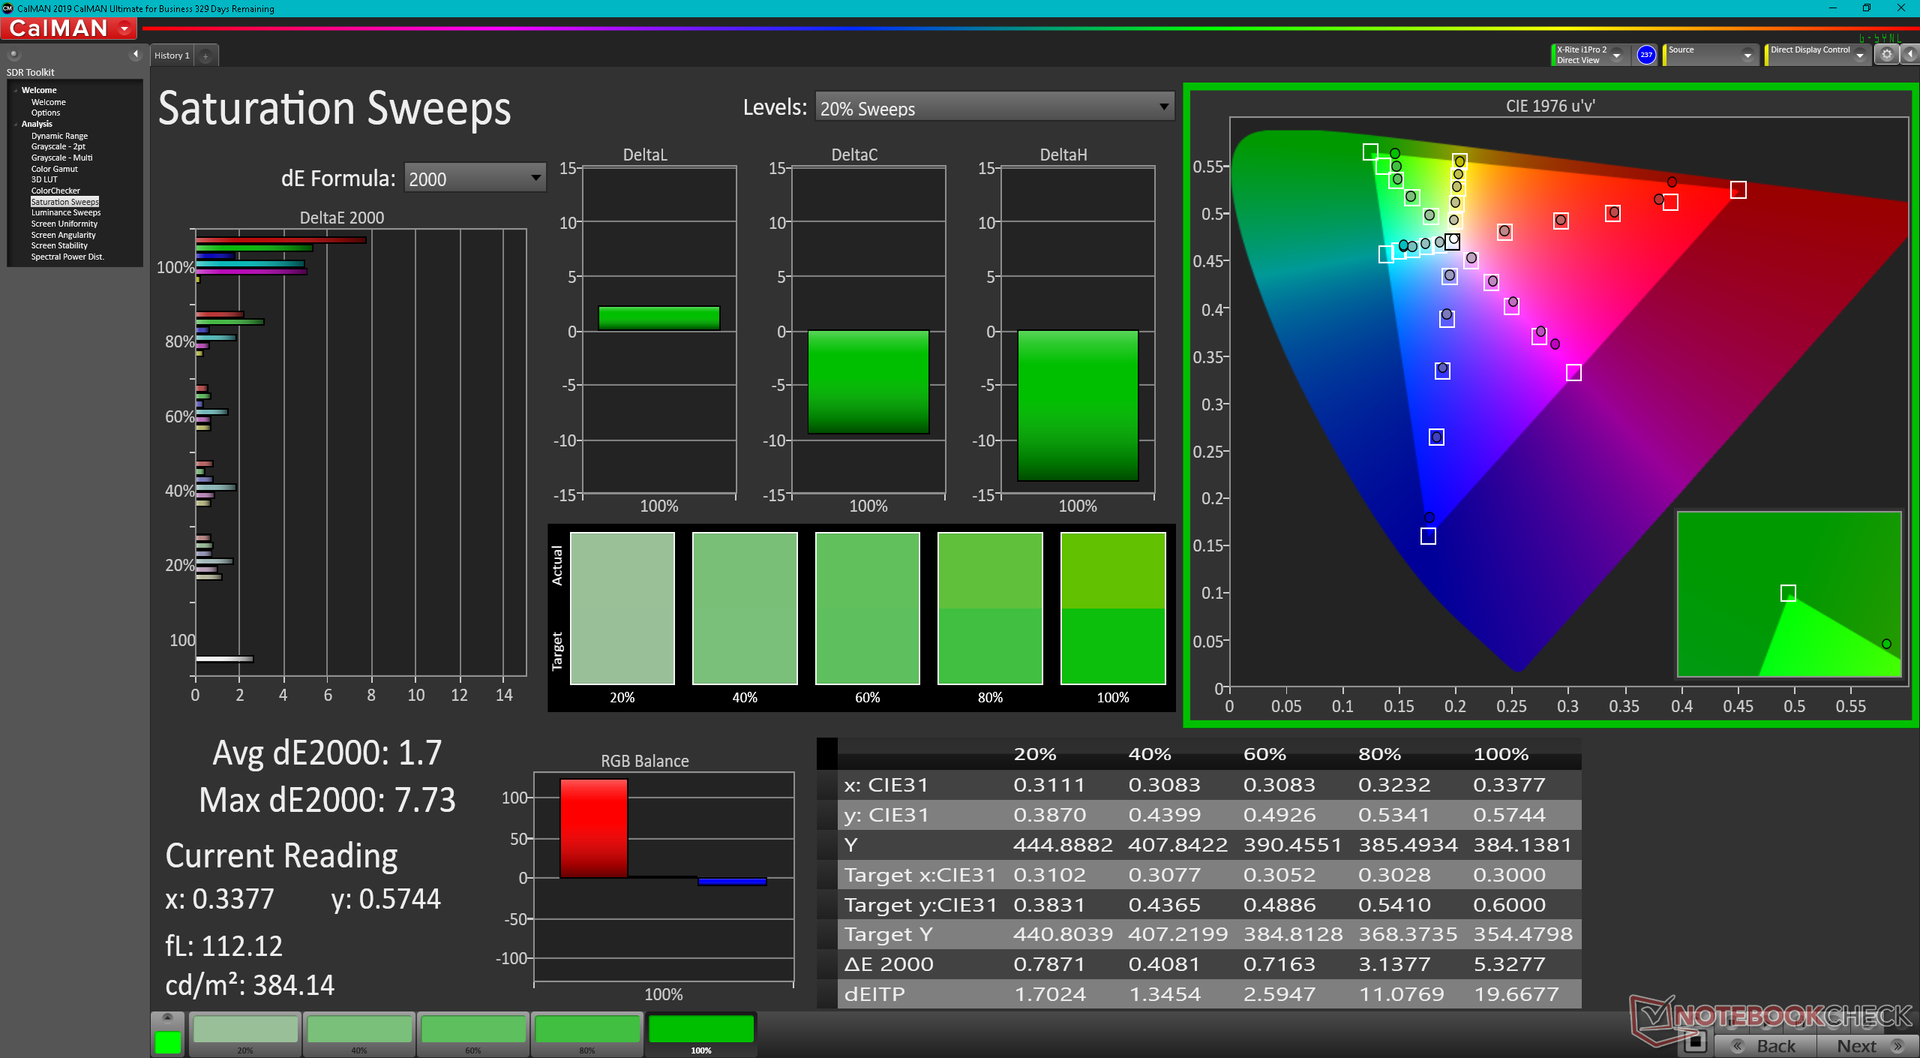
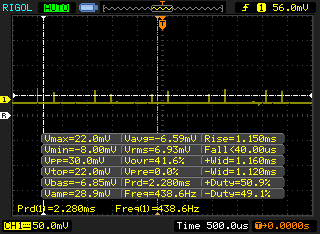
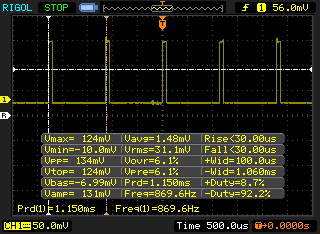
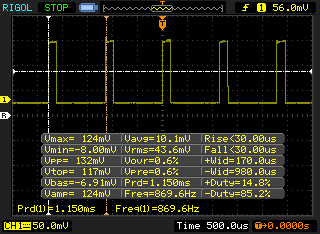
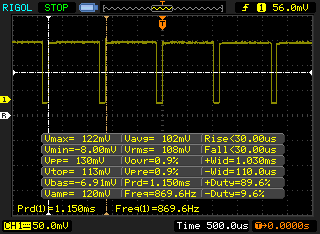
该显示器的三个主要缺点是色彩再现有限,黑白响应时间慢,以及在所有亮度水平上存在脉宽调制。前两个不是问题,因为B360不是用于专业的照片编辑或游戏,但后者对于那些可能对闪烁的灯光敏感的用户来说可能是个麻烦。

| |||||||||||||||||||||||||
Brightness Distribution: 86 %
Center on Battery: 1505.6 cd/m²
Contrast: 1585:1 (Black: 0.95 cd/m²)
ΔE ColorChecker Calman: 9.81 | ∀{0.5-29.43 Ø4.72}
calibrated: 1.44
ΔE Greyscale Calman: 12 | ∀{0.09-98 Ø4.97}
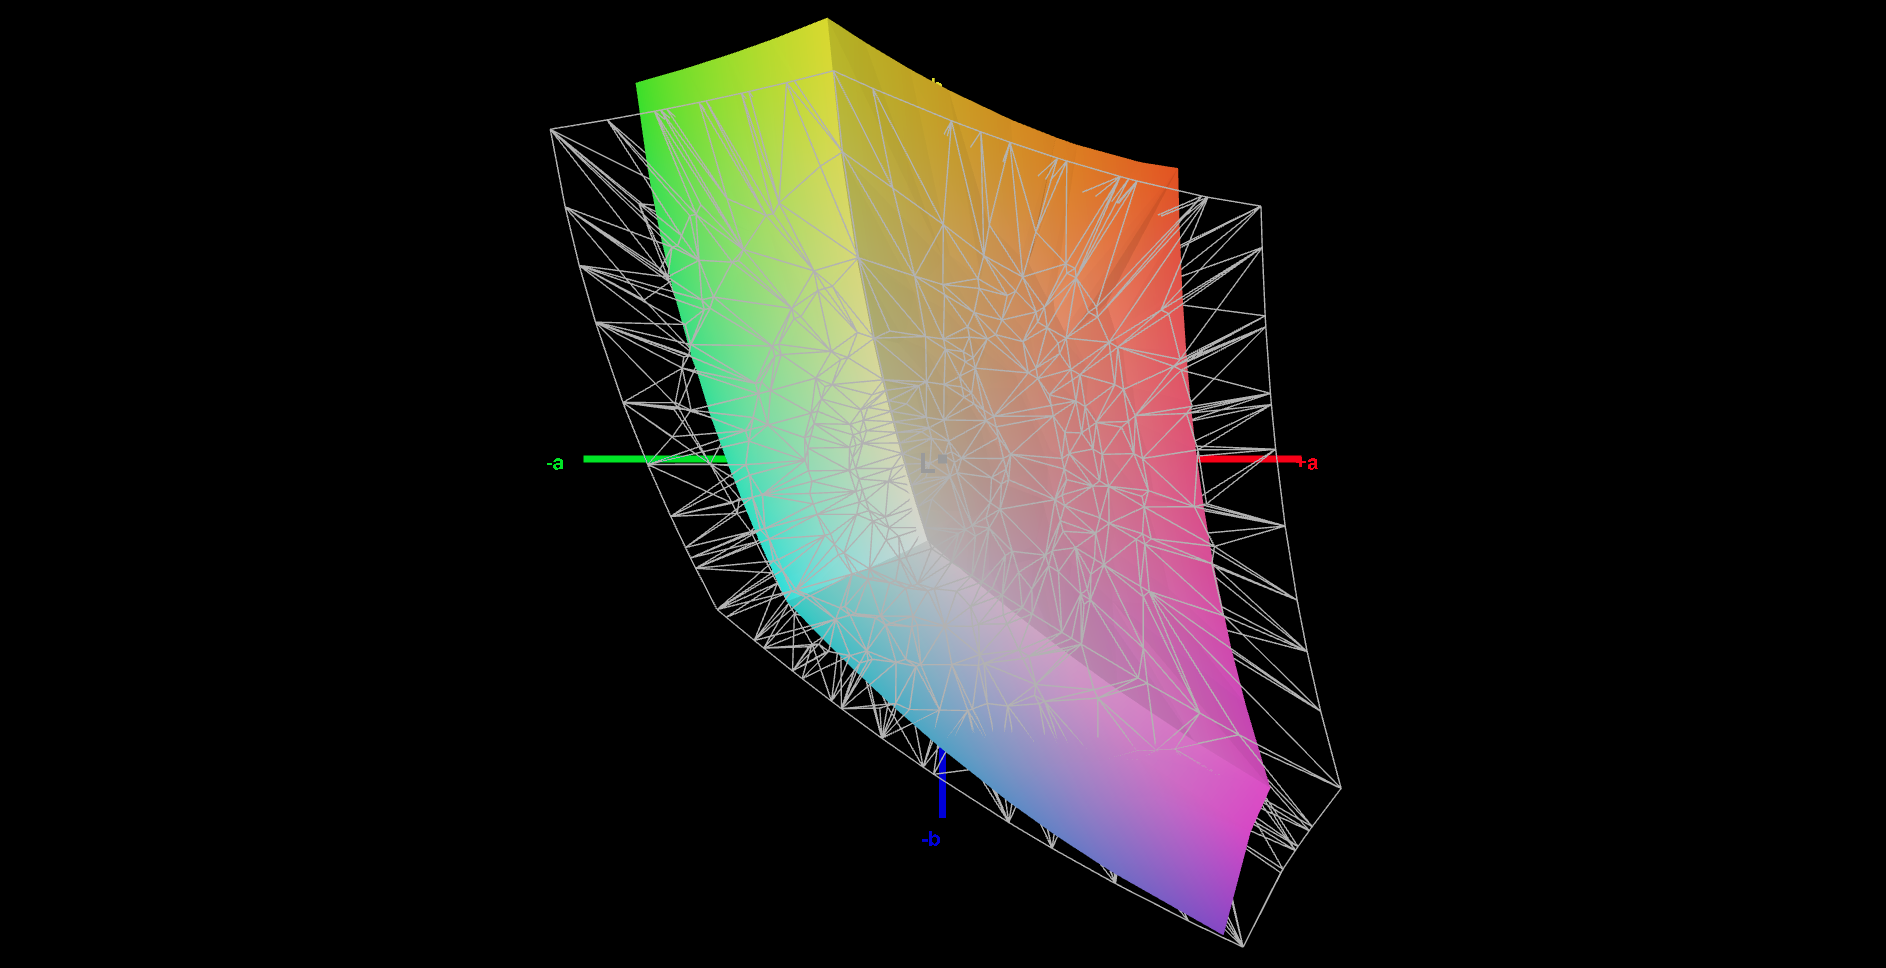
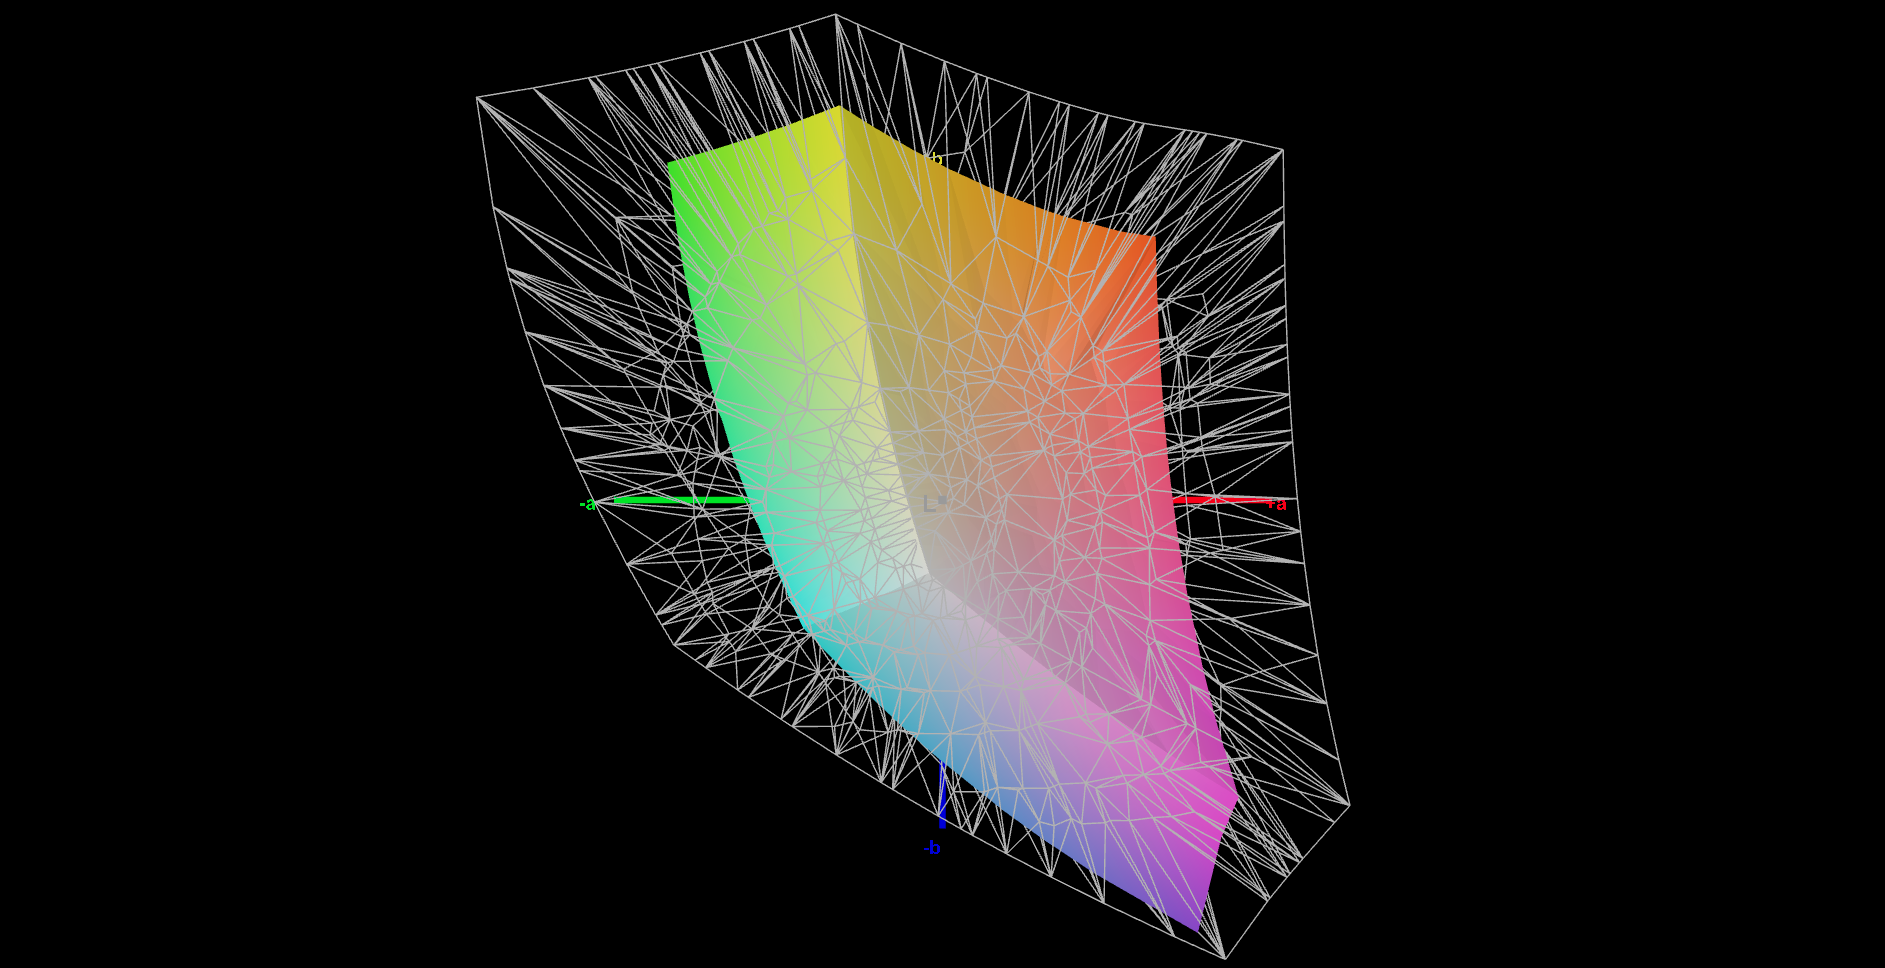
52.2% AdobeRGB 1998 (Argyll 3D)
72% sRGB (Argyll 3D)
51.3% Display P3 (Argyll 3D)
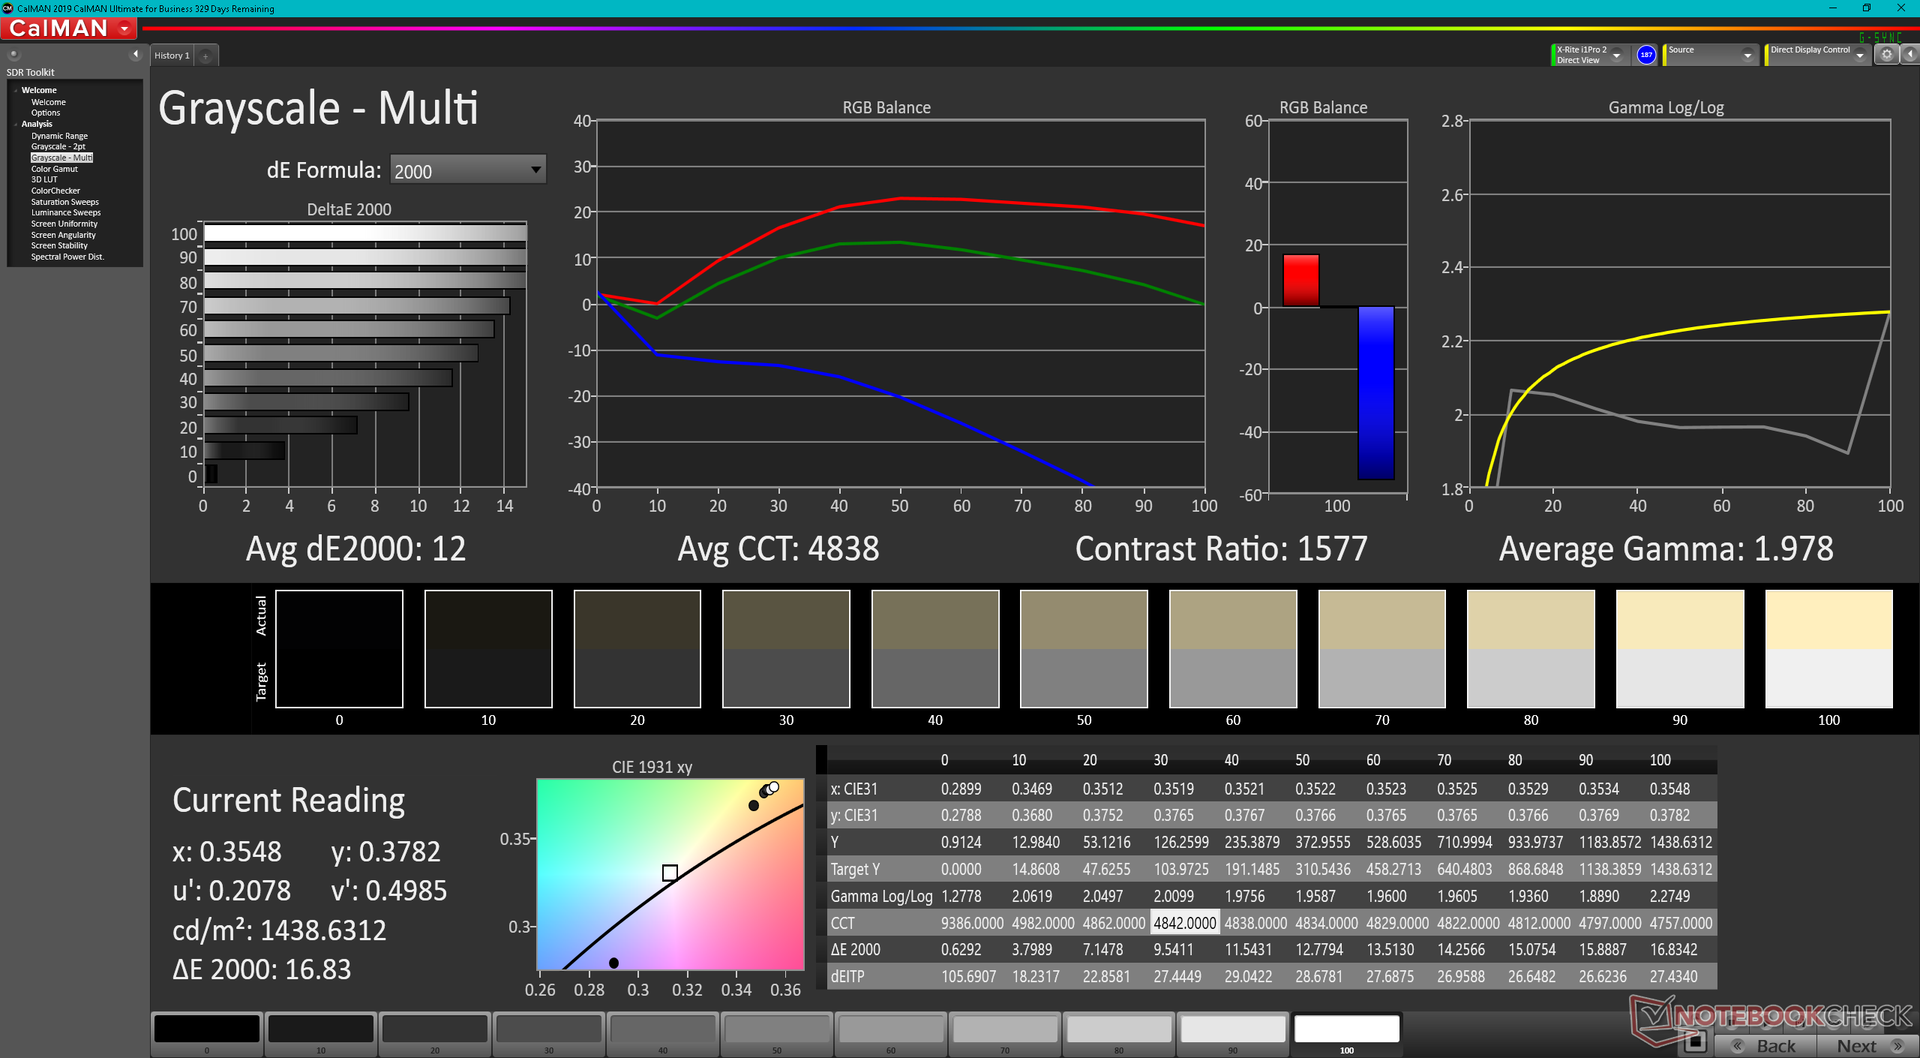
Gamma: 1.98
CCT: 4838 K
| Getac B360 AU Optronics AUO572D, IPS, 1920x1080, 13.3" | Dell Latitude 5420 Rugged-P85G AU Optronics AUO523D, IPS, 1920x1080, 14" | Getac S410 CMN N140BGE-E33, TN PED, 1366x768, 14" | Acer Enduro Urban N3 EUN314 XR140EA6T, IPS, 1920x1080, 14" | Panasonic Toughbook FZ-55 MK2 InfoVision M140NWF5 R3, IPS, 1920x1080, 14" | Durabook S14I KD140N0730A01, TN, 1920x1080, 14" | |
|---|---|---|---|---|---|---|
| Display | 24% | -19% | 26% | -30% | -13% | |
| Display P3 Coverage (%) | 51.3 | 62.5 22% | 40.46 -21% | 63.5 24% | 34.8 -32% | 43.55 -15% |
| sRGB Coverage (%) | 72 | 92.4 28% | 60.9 -15% | 91.9 28% | 52.2 -27% | 65.4 -9% |
| AdobeRGB 1998 Coverage (%) | 52.2 | 64.2 23% | 41.8 -20% | 65.5 25% | 36 -31% | 45 -14% |
| Response Times | -47% | 20% | -31% | 19% | 39% | |
| Response Time Grey 50% / Grey 80% * (ms) | 33 ? | 68 ? -106% | 41.2 ? -25% | 56 ? -70% | 28.4 ? 14% | 30.4 ? 8% |
| Response Time Black / White * (ms) | 38.8 ? | 33.6 ? 13% | 14 ? 64% | 35.2 ? 9% | 30 ? 23% | 11.8 ? 70% |
| PWM Frequency (Hz) | 870 ? | 735 ? | 877 ? | 1000 ? | 685 ? | 304.9 ? |
| Screen | 0% | -55% | -4% | -2% | -47% | |
| Brightness middle (cd/m²) | 1505.6 | 1111.7 -26% | 265.1 -82% | 487.8 -68% | 1061.1 -30% | 1180.7 -22% |
| Brightness (cd/m²) | 1383 | 1026 -26% | 246 -82% | 464 -66% | 997 -28% | 1102 -20% |
| Brightness Distribution (%) | 86 | 80 -7% | 81 -6% | 89 3% | 76 -12% | 89 3% |
| Black Level * (cd/m²) | 0.95 | 0.81 15% | 0.58 39% | 0.48 49% | 0.7 26% | 1.91 -101% |
| Contrast (:1) | 1585 | 1372 -13% | 457 -71% | 1016 -36% | 1516 -4% | 618 -61% |
| Colorchecker dE 2000 * | 9.81 | 3.83 61% | 14.24 -45% | 6.51 34% | 4.64 53% | 13.45 -37% |
| Colorchecker dE 2000 max. * | 16.64 | 7.85 53% | 26.66 -60% | 11.36 32% | 20.92 -26% | 22.52 -35% |
| Colorchecker dE 2000 calibrated * | 1.44 | 2.98 -107% | 3.94 -174% | 1.77 -23% | 2.52 -75% | 3.19 -122% |
| Greyscale dE 2000 * | 12 | 5.6 53% | 14.2 -18% | 7.8 35% | 2.8 77% | 15.4 -28% |
| Gamma | 1.98 111% | 2.306 95% | 2.03 108% | 2.28 96% | 2.08 106% | 1.97 112% |
| CCT | 4838 134% | 7676 85% | 17152 38% | 8102 80% | 6364 102% | 21134 31% |
| Color Space (Percent of AdobeRGB 1998) (%) | 59 | 38.7 | 41.6 | |||
| Color Space (Percent of sRGB) (%) | 93 | 61 | 65.5 | |||
| Total Average (Program / Settings) | -8% /
-1% | -18% /
-37% | -3% /
-2% | -4% /
-5% | -7% /
-27% |
* ... smaller is better
色彩空间狭窄,仅为sRGB的72%,不适合大多数图形编辑。
开箱后的色温非常温暖,平均deltaE值可以接近两位数。校准面板可以解决这个问题,特别是在较低的饱和度水平上,颜色明显更准确。
Display Response Times
| ↔ Response Time Black to White | ||
|---|---|---|
| 38.8 ms ... rise ↗ and fall ↘ combined | ↗ 15.6 ms rise | 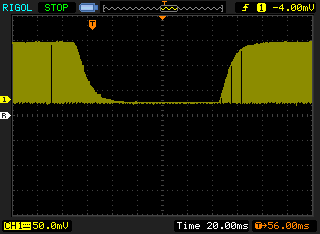 |
| ↘ 23.2 ms fall | ||
| The screen shows slow response rates in our tests and will be unsatisfactory for gamers. In comparison, all tested devices range from 0.1 (minimum) to 240 (maximum) ms. » 96 % of all devices are better. This means that the measured response time is worse than the average of all tested devices (19.8 ms). | ||
| ↔ Response Time 50% Grey to 80% Grey | ||
| 33 ms ... rise ↗ and fall ↘ combined | ↗ 16 ms rise | 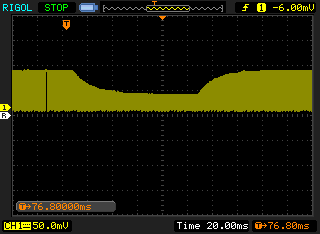 |
| ↘ 17 ms fall | ||
| The screen shows slow response rates in our tests and will be unsatisfactory for gamers. In comparison, all tested devices range from 0.165 (minimum) to 636 (maximum) ms. » 45 % of all devices are better. This means that the measured response time is similar to the average of all tested devices (31 ms). | ||
Screen Flickering / PWM (Pulse-Width Modulation)
| Screen flickering / PWM detected | 870 Hz | ≤ 100 % brightness setting |  |
The display backlight flickers at 870 Hz (worst case, e.g., utilizing PWM) Flickering detected at a brightness setting of 100 % and below. There should be no flickering or PWM above this brightness setting. The frequency of 870 Hz is quite high, so most users sensitive to PWM should not notice any flickering. In comparison: 52 % of all tested devices do not use PWM to dim the display. If PWM was detected, an average of 7775 (minimum: 5 - maximum: 343500) Hz was measured. | |||

该显示屏在大多数户外条件下都可以观看,但用户仍希望避免阳光直射,以限制眩光和冲淡的色彩。
业绩
测试条件
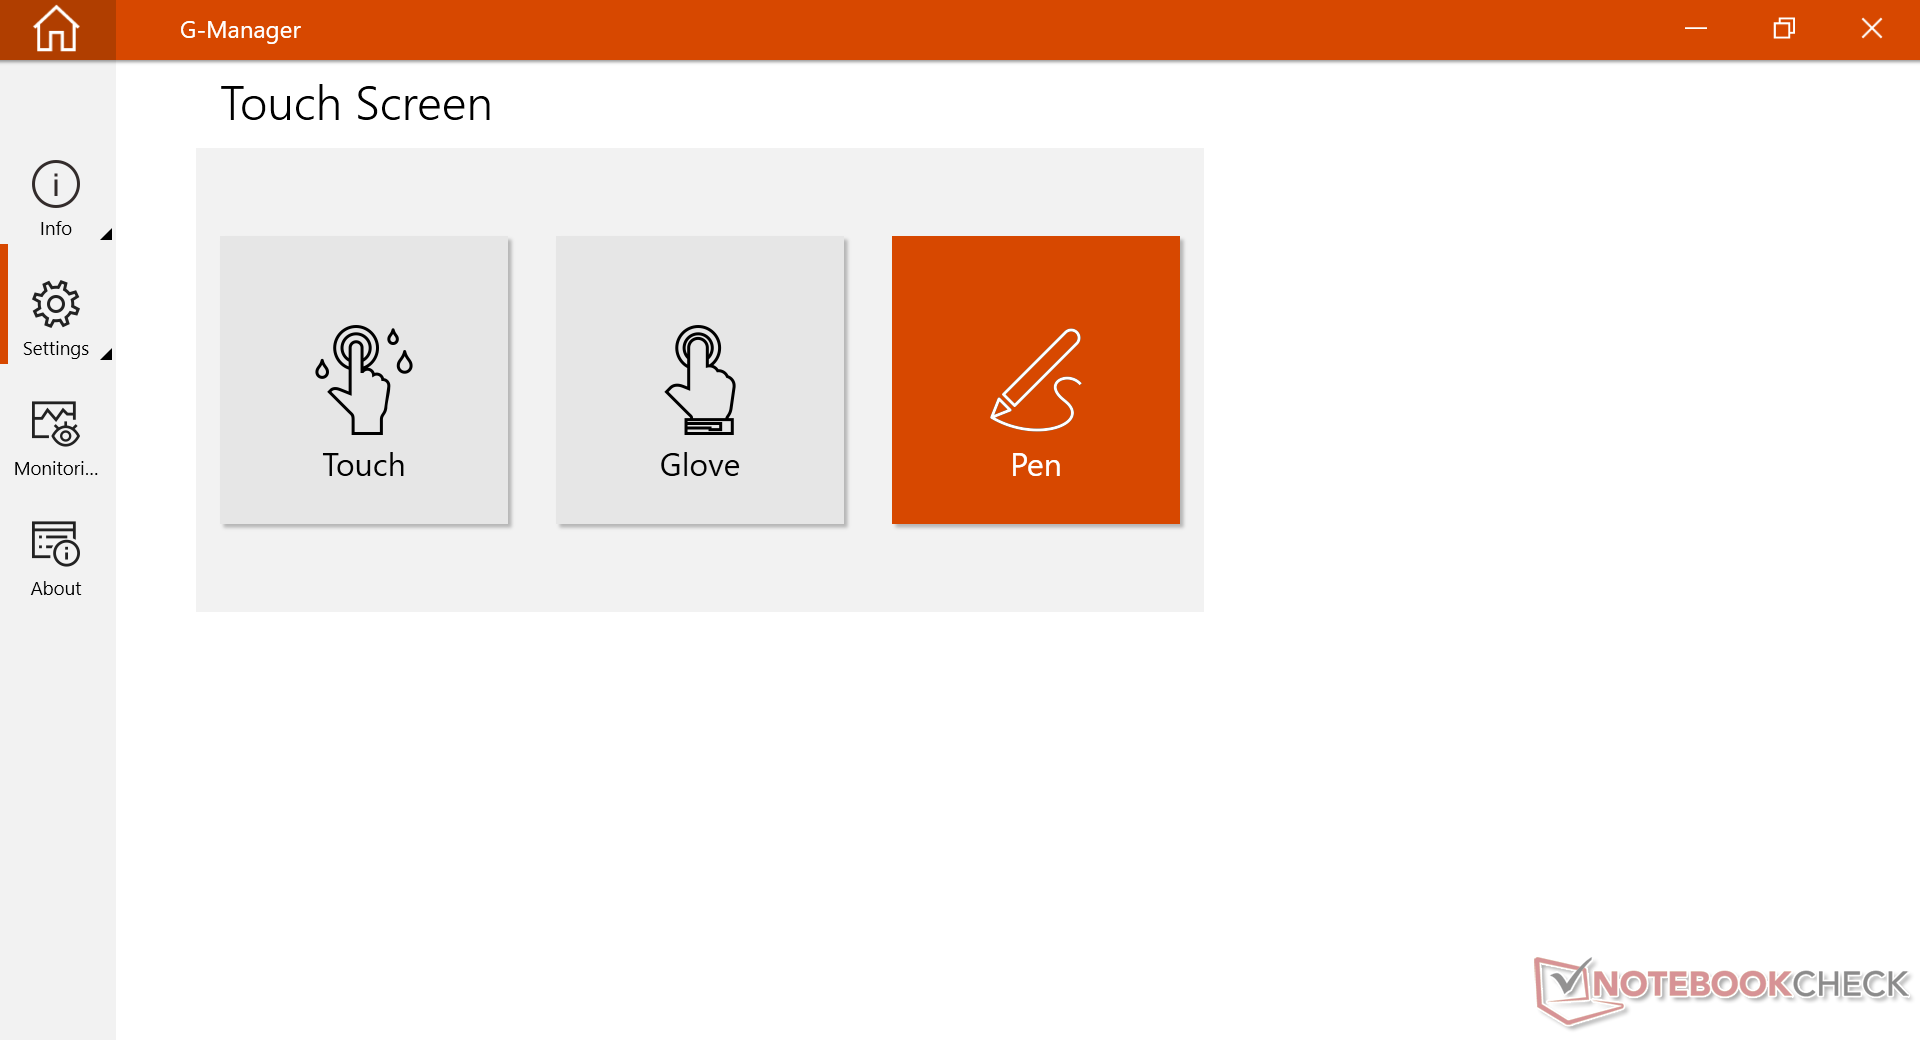
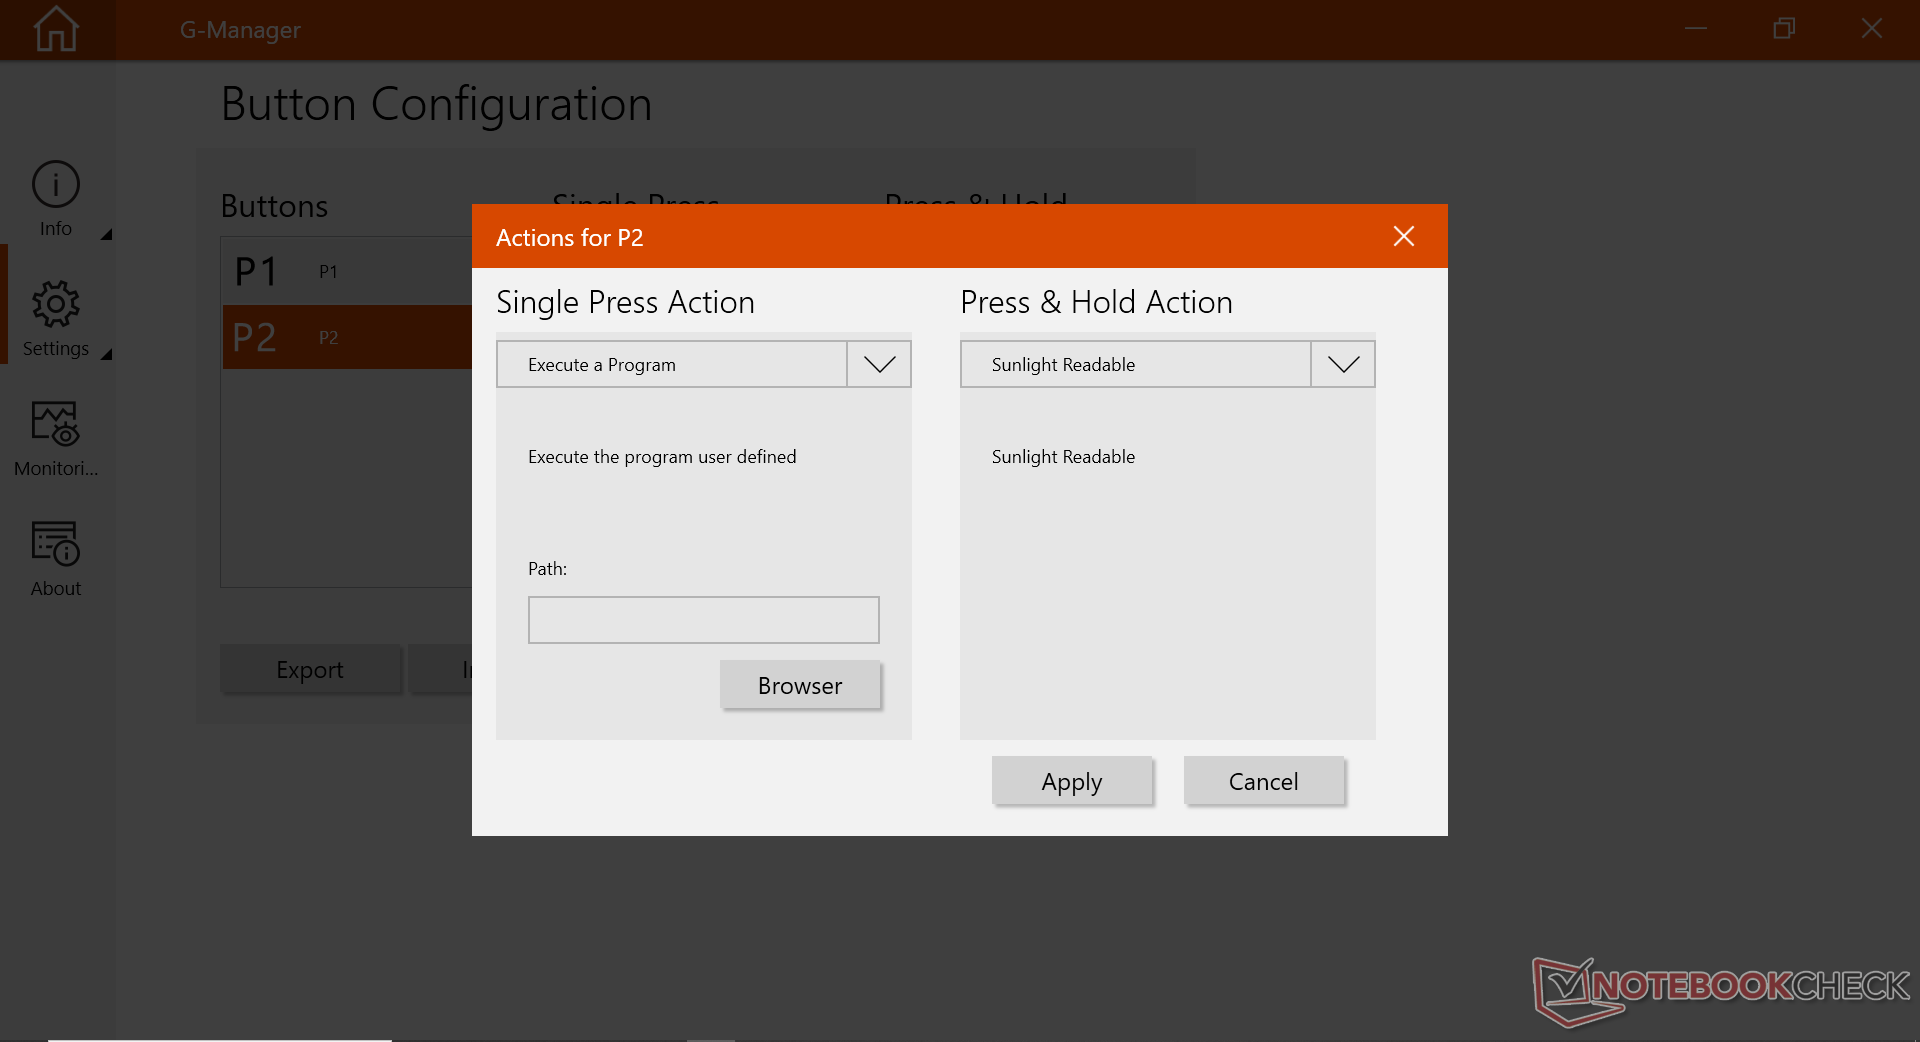
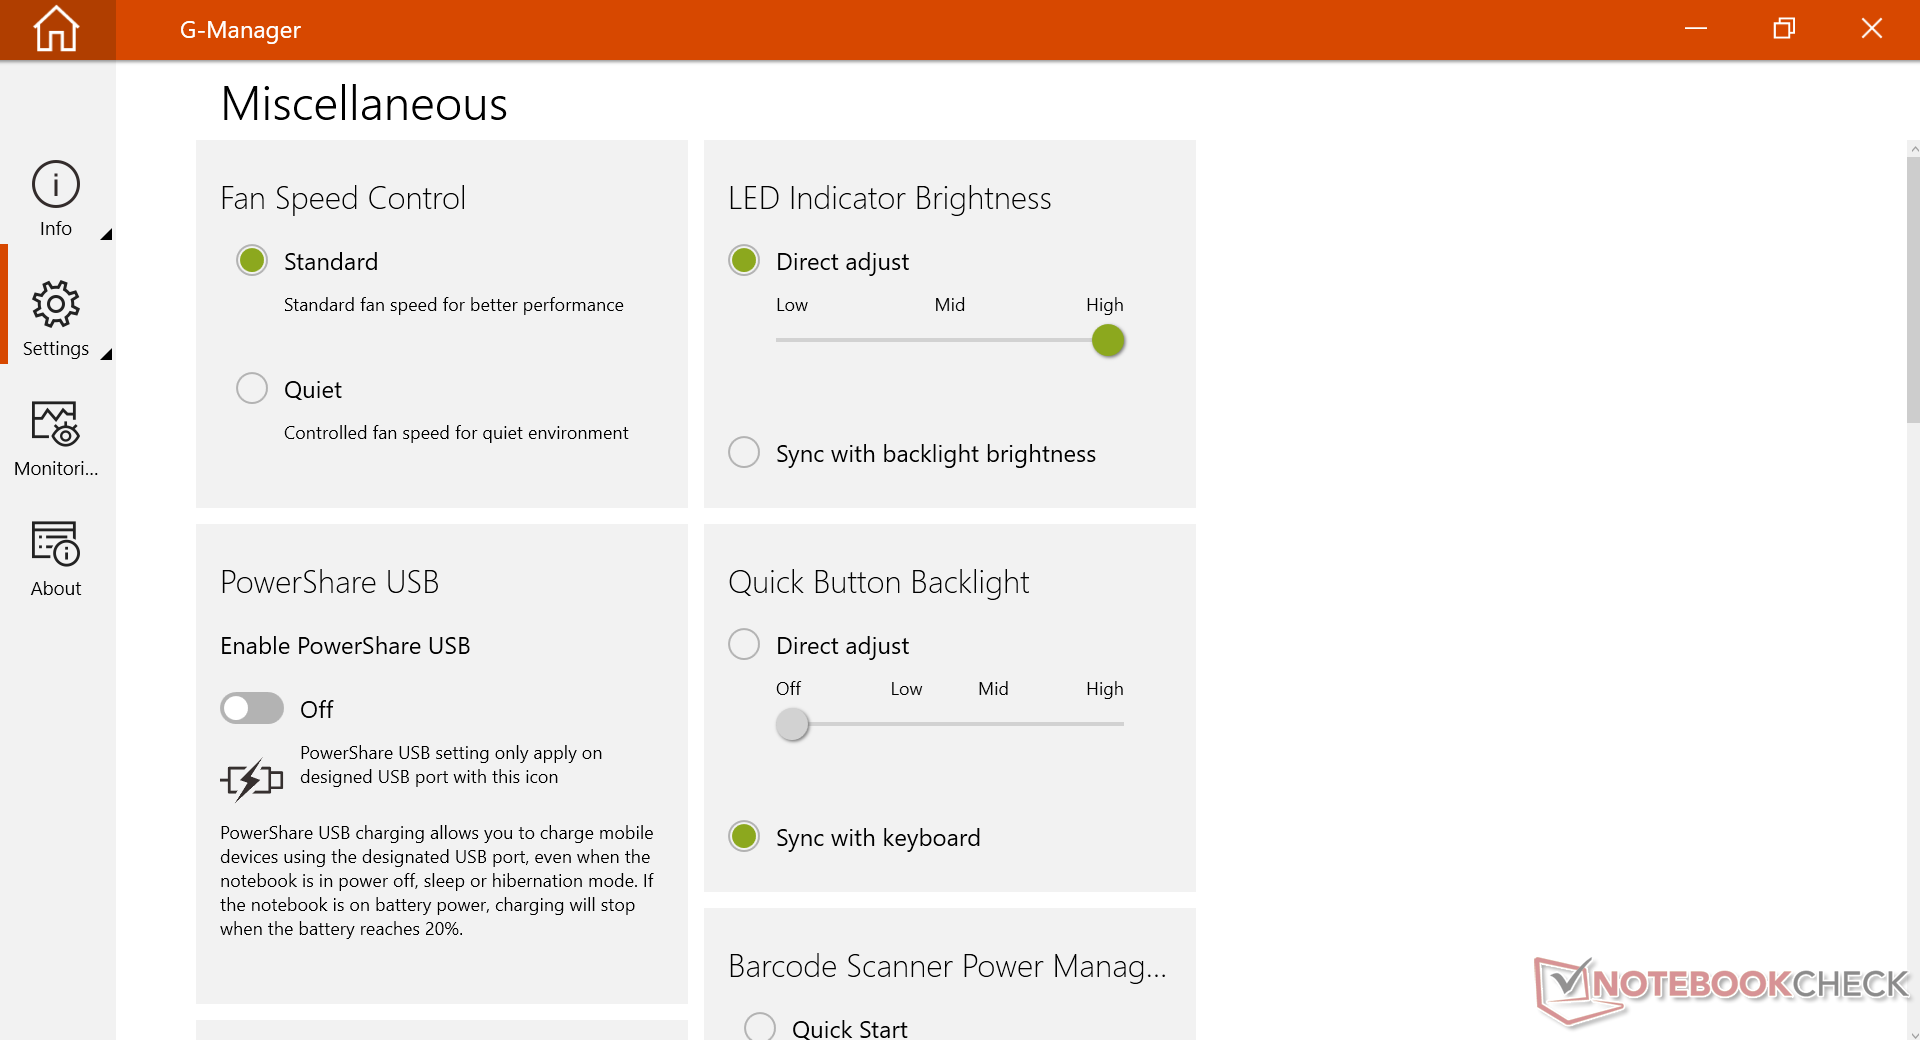
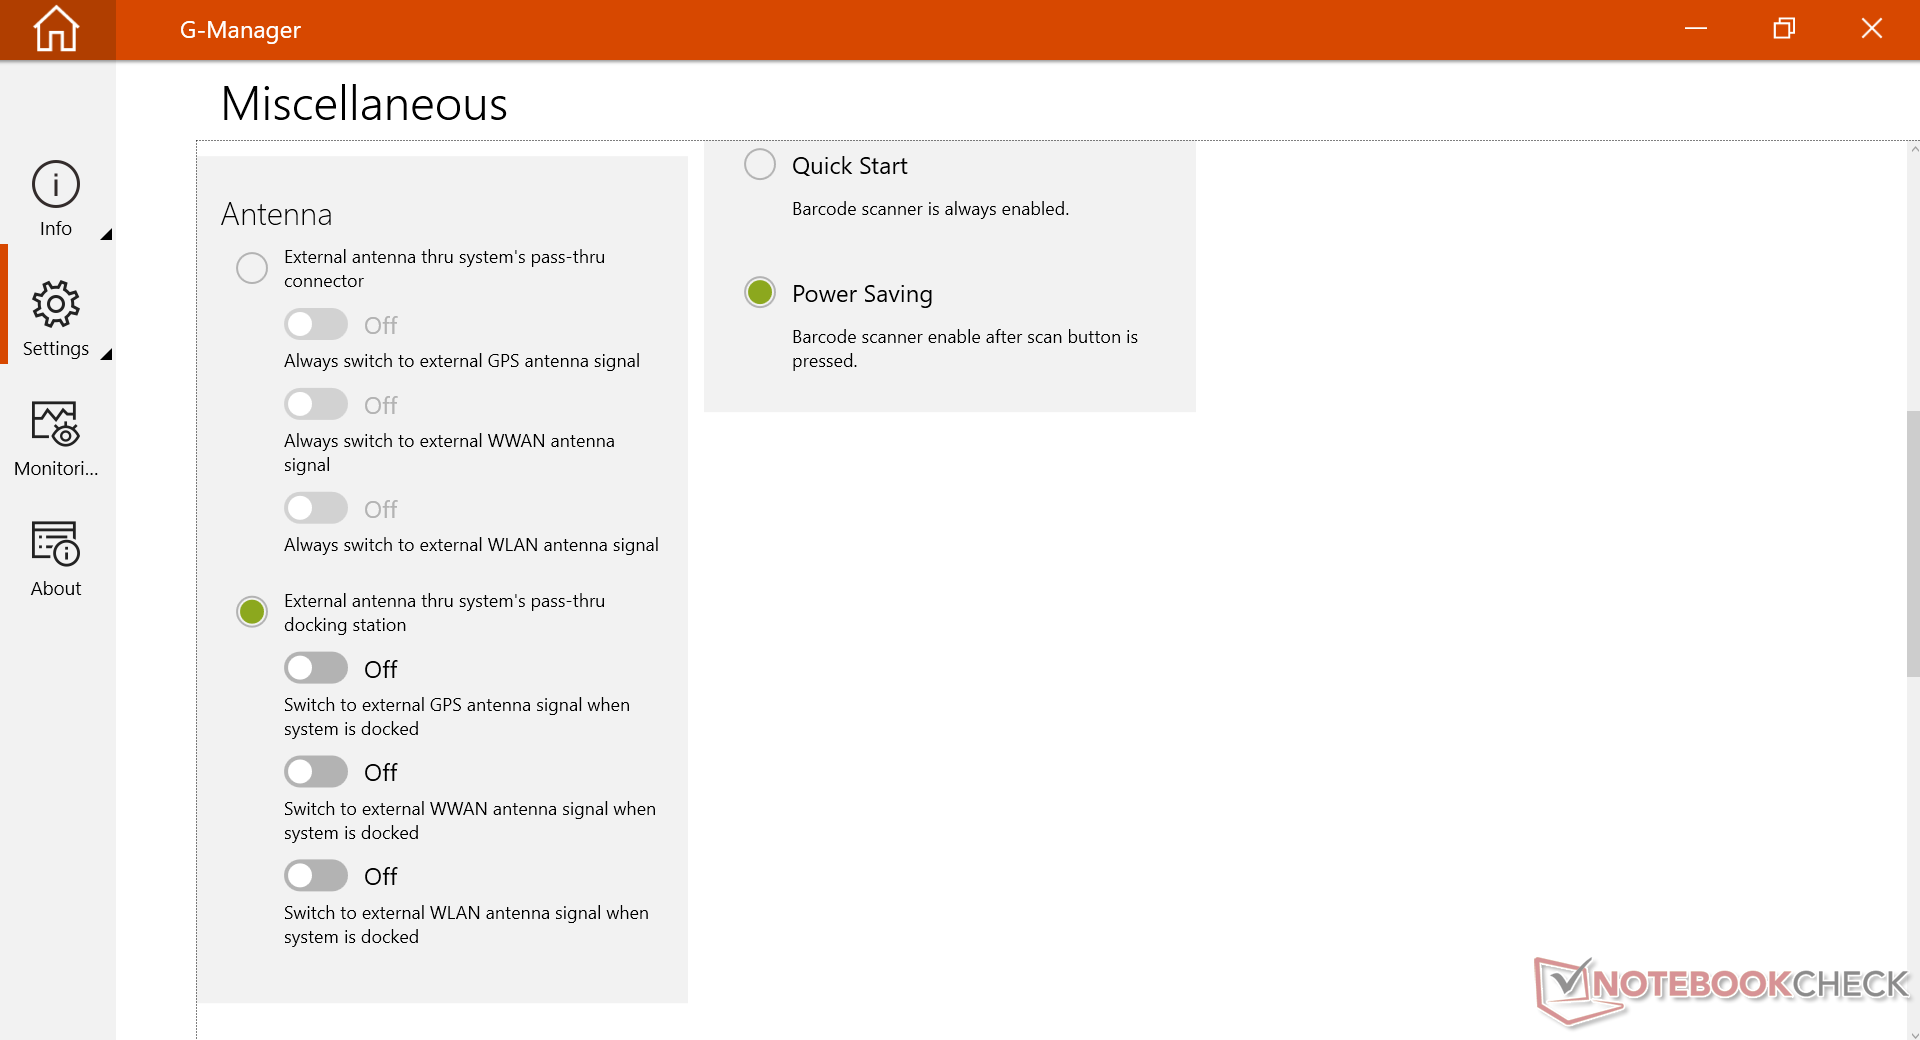
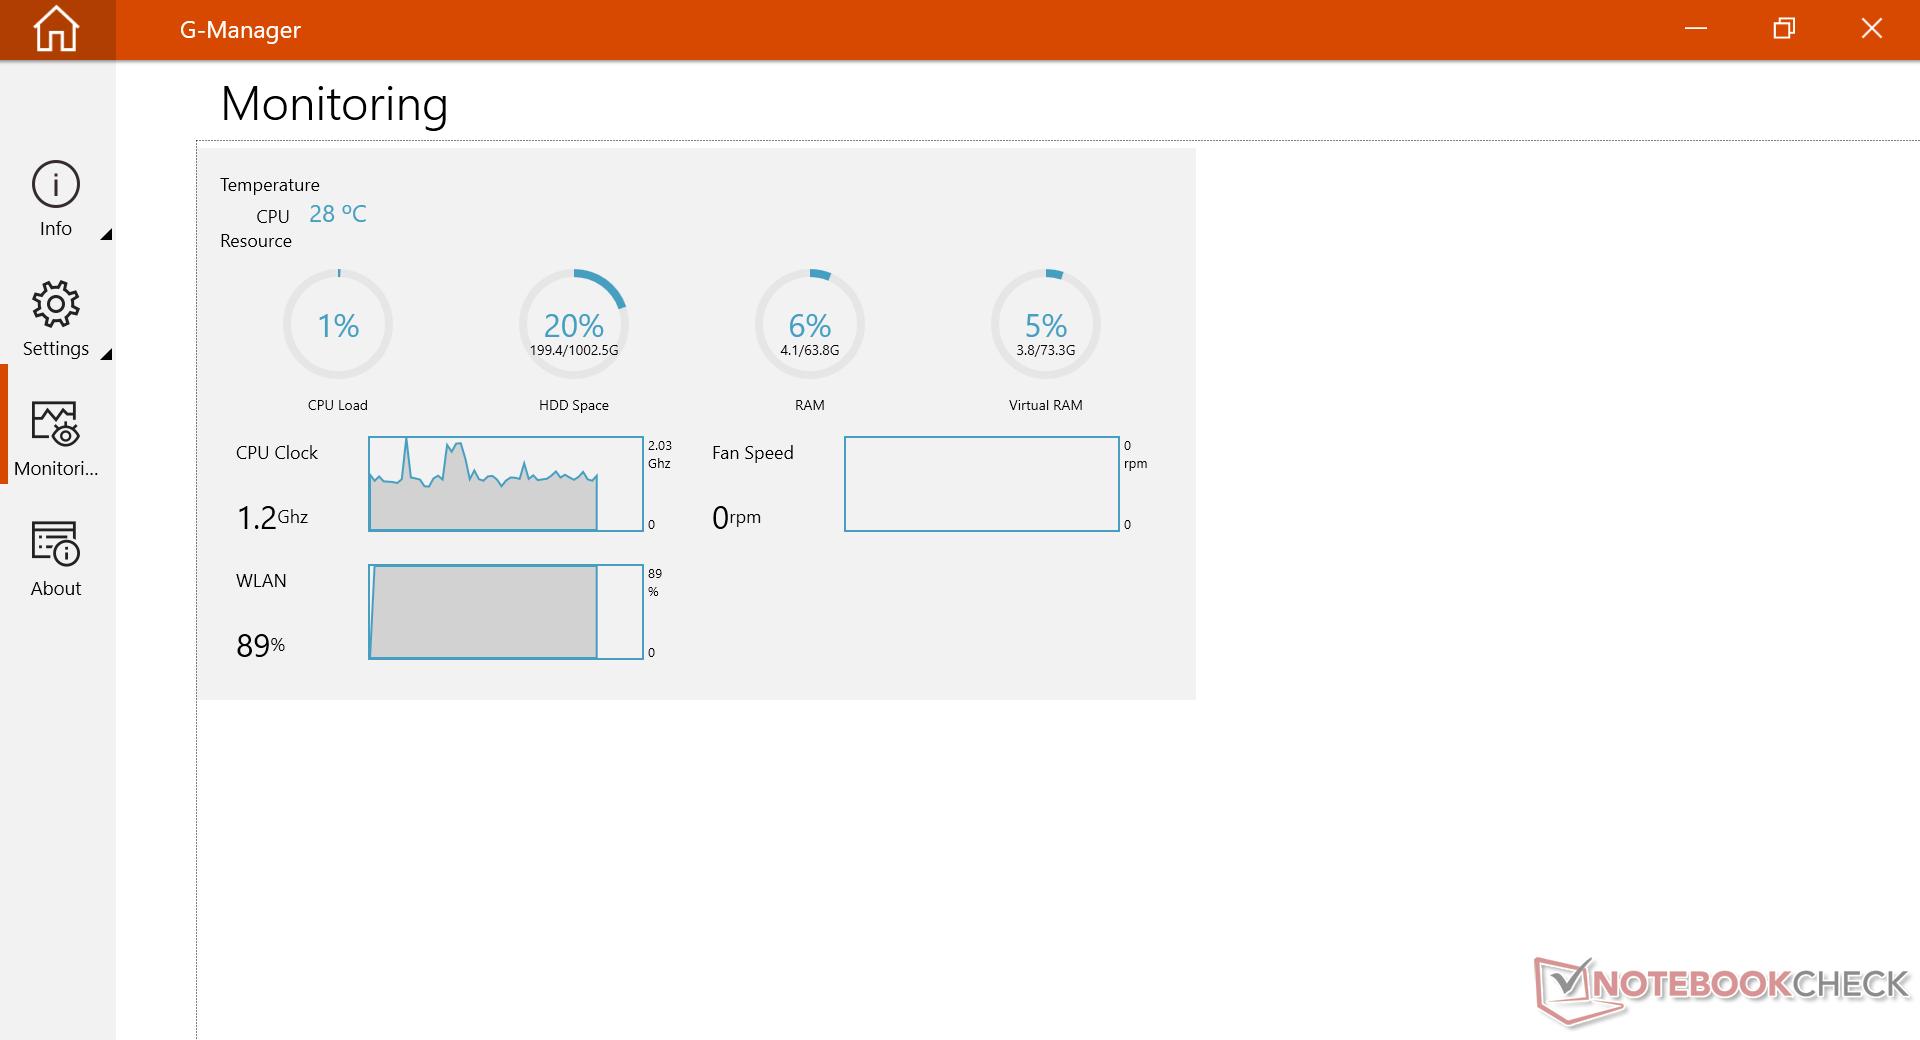
在运行任何基准测试之前,我们的设备被设置为极端模式,以获得尽可能高的分数。用户应该熟悉预装的G-Manager软件,因为许多Getac特有的定制功能在这里被切换。
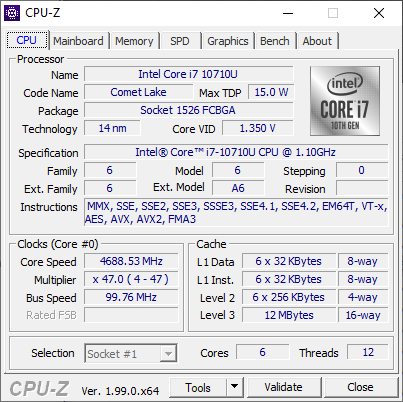
处理器
多线程CPU性能比我们数据库中配备相同的笔记本电脑的平均速度要慢20%至30%。 酷睿i7-10710U处理器。这对于可能以牺牲一些原始性能为代价来提高整体稳定性和可靠性的坚固耐用的笔记本电脑来说并不罕见。
Cinebench R15 Multi Loop
Cinebench R23: Multi Core | Single Core
Cinebench R15: CPU Multi 64Bit | CPU Single 64Bit
Blender: v2.79 BMW27 CPU
7-Zip 18.03: 7z b 4 | 7z b 4 -mmt1
Geekbench 5.5: Multi-Core | Single-Core
HWBOT x265 Benchmark v2.2: 4k Preset
LibreOffice : 20 Documents To PDF
R Benchmark 2.5: Overall mean
| Cinebench R20 / CPU (Multi Core) | |
| Lenovo Yoga 6 13ALC6 | |
| Lenovo IdeaPad 5 15ALC05 | |
| Lenovo ThinkPad L14-20U50003GE | |
| Panasonic Toughbook FZ-55 MK2 | |
| Acer Enduro Urban N3 EUN314 | |
| Average Intel Core i7-10710U (1181 - 2598, n=5) | |
| Lenovo ThinkPad P15s Gen1-20T4000JGE | |
| Honor MagicBook Pro 10210U | |
| Getac B360 | |
| Durabook S14I | |
| Asus ZenBook 14 UX434FL-DB77 | |
| Infinix INBook X2 | |
| Cinebench R20 / CPU (Single Core) | |
| Acer Enduro Urban N3 EUN314 | |
| Panasonic Toughbook FZ-55 MK2 | |
| Durabook S14I | |
| Lenovo Yoga 6 13ALC6 | |
| Lenovo ThinkPad P15s Gen1-20T4000JGE | |
| Average Intel Core i7-10710U (429 - 480, n=4) | |
| Lenovo IdeaPad 5 15ALC05 | |
| Lenovo ThinkPad L14-20U50003GE | |
| Asus ZenBook 14 UX434FL-DB77 | |
| Getac B360 | |
| Honor MagicBook Pro 10210U | |
| Infinix INBook X2 | |
| Cinebench R23 / Multi Core | |
| Lenovo Yoga 6 13ALC6 | |
| Lenovo IdeaPad 5 15ALC05 | |
| Panasonic Toughbook FZ-55 MK2 | |
| Acer Enduro Urban N3 EUN314 | |
| Honor MagicBook Pro 10210U | |
| Getac B360 | |
| Average Intel Core i7-10710U (n=1) | |
| Durabook S14I | |
| Infinix INBook X2 | |
| Cinebench R23 / Single Core | |
| Panasonic Toughbook FZ-55 MK2 | |
| Acer Enduro Urban N3 EUN314 | |
| Durabook S14I | |
| Lenovo Yoga 6 13ALC6 | |
| Lenovo IdeaPad 5 15ALC05 | |
| Honor MagicBook Pro 10210U | |
| Infinix INBook X2 | |
| Getac B360 | |
| Average Intel Core i7-10710U (n=1) | |
| Cinebench R15 / CPU Multi 64Bit | |
| Lenovo IdeaPad 5 15ALC05 | |
| Lenovo Yoga 6 13ALC6 | |
| Average Intel Core i7-10710U (513 - 1113, n=8) | |
| Lenovo ThinkPad L14-20U50003GE | |
| Acer Enduro Urban N3 EUN314 | |
| Panasonic Toughbook FZ-55 MK2 | |
| Honor MagicBook Pro 10210U | |
| Lenovo ThinkPad P15s Gen1-20T4000JGE | |
| Asus ZenBook 14 UX434FL-DB77 | |
| Getac B360 | |
| Durabook S14I | |
| Infinix INBook X2 | |
| Getac S410 | |
| Dell Latitude 5420 Rugged-P85G | |
| Cinebench R15 / CPU Single 64Bit | |
| Panasonic Toughbook FZ-55 MK2 | |
| Acer Enduro Urban N3 EUN314 | |
| Durabook S14I | |
| Lenovo Yoga 6 13ALC6 | |
| Lenovo ThinkPad P15s Gen1-20T4000JGE | |
| Asus ZenBook 14 UX434FL-DB77 | |
| Lenovo IdeaPad 5 15ALC05 | |
| Getac B360 | |
| Average Intel Core i7-10710U (138 - 194, n=8) | |
| Lenovo ThinkPad L14-20U50003GE | |
| Honor MagicBook Pro 10210U | |
| Getac S410 | |
| Infinix INBook X2 | |
| Dell Latitude 5420 Rugged-P85G | |
| Blender / v2.79 BMW27 CPU | |
| Infinix INBook X2 | |
| Durabook S14I | |
| Asus ZenBook 14 UX434FL-DB77 | |
| Lenovo ThinkPad P15s Gen1-20T4000JGE | |
| Honor MagicBook Pro 10210U | |
| Getac B360 | |
| Average Intel Core i7-10710U (468 - 892, n=4) | |
| Panasonic Toughbook FZ-55 MK2 | |
| Acer Enduro Urban N3 EUN314 | |
| Lenovo ThinkPad L14-20U50003GE | |
| Lenovo IdeaPad 5 15ALC05 | |
| Lenovo Yoga 6 13ALC6 | |
| 7-Zip 18.03 / 7z b 4 | |
| Lenovo Yoga 6 13ALC6 | |
| Lenovo IdeaPad 5 15ALC05 | |
| Lenovo ThinkPad L14-20U50003GE | |
| Acer Enduro Urban N3 EUN314 | |
| Average Intel Core i7-10710U (16713 - 29948, n=4) | |
| Panasonic Toughbook FZ-55 MK2 | |
| Getac B360 | |
| Honor MagicBook Pro 10210U | |
| Lenovo ThinkPad P15s Gen1-20T4000JGE | |
| Durabook S14I | |
| Asus ZenBook 14 UX434FL-DB77 | |
| Infinix INBook X2 | |
| 7-Zip 18.03 / 7z b 4 -mmt1 | |
| Acer Enduro Urban N3 EUN314 | |
| Panasonic Toughbook FZ-55 MK2 | |
| Durabook S14I | |
| Lenovo ThinkPad P15s Gen1-20T4000JGE | |
| Getac B360 | |
| Average Intel Core i7-10710U (4425 - 4727, n=4) | |
| Lenovo Yoga 6 13ALC6 | |
| Honor MagicBook Pro 10210U | |
| Lenovo IdeaPad 5 15ALC05 | |
| Lenovo ThinkPad L14-20U50003GE | |
| Asus ZenBook 14 UX434FL-DB77 | |
| Infinix INBook X2 | |
| Geekbench 5.5 / Multi-Core | |
| Lenovo IdeaPad 5 15ALC05 | |
| Acer Enduro Urban N3 EUN314 | |
| Average Intel Core i7-10710U (4575 - 5839, n=2) | |
| Getac B360 | |
| Lenovo ThinkPad P15s Gen1-20T4000JGE | |
| Lenovo ThinkPad L14-20U50003GE | |
| Durabook S14I | |
| Honor MagicBook Pro 10210U | |
| Infinix INBook X2 | |
| Asus ZenBook 14 UX434FL-DB77 | |
| Geekbench 5.5 / Single-Core | |
| Acer Enduro Urban N3 EUN314 | |
| Durabook S14I | |
| Average Intel Core i7-10710U (1225 - 1229, n=2) | |
| Getac B360 | |
| Lenovo ThinkPad P15s Gen1-20T4000JGE | |
| Infinix INBook X2 | |
| Asus ZenBook 14 UX434FL-DB77 | |
| Lenovo IdeaPad 5 15ALC05 | |
| Lenovo ThinkPad L14-20U50003GE | |
| Honor MagicBook Pro 10210U | |
| HWBOT x265 Benchmark v2.2 / 4k Preset | |
| Lenovo Yoga 6 13ALC6 | |
| Lenovo IdeaPad 5 15ALC05 | |
| Lenovo ThinkPad L14-20U50003GE | |
| Panasonic Toughbook FZ-55 MK2 | |
| Acer Enduro Urban N3 EUN314 | |
| Average Intel Core i7-10710U (4.2 - 7.95, n=4) | |
| Honor MagicBook Pro 10210U | |
| Getac B360 | |
| Lenovo ThinkPad P15s Gen1-20T4000JGE | |
| Durabook S14I | |
| Asus ZenBook 14 UX434FL-DB77 | |
| Infinix INBook X2 | |
| LibreOffice / 20 Documents To PDF | |
| Asus ZenBook 14 UX434FL-DB77 | |
| Infinix INBook X2 | |
| Lenovo IdeaPad 5 15ALC05 | |
| Lenovo ThinkPad P15s Gen1-20T4000JGE | |
| Acer Enduro Urban N3 EUN314 | |
| Lenovo Yoga 6 13ALC6 | |
| Lenovo ThinkPad L14-20U50003GE | |
| Honor MagicBook Pro 10210U | |
| Panasonic Toughbook FZ-55 MK2 | |
| Durabook S14I | |
| R Benchmark 2.5 / Overall mean | |
| Asus ZenBook 14 UX434FL-DB77 | |
| Infinix INBook X2 | |
| Honor MagicBook Pro 10210U | |
| Getac B360 | |
| Average Intel Core i7-10710U (0.649 - 0.674, n=2) | |
| Lenovo ThinkPad L14-20U50003GE | |
| Lenovo ThinkPad P15s Gen1-20T4000JGE | |
| Lenovo IdeaPad 5 15ALC05 | |
| Durabook S14I | |
| Lenovo Yoga 6 13ALC6 | |
| Acer Enduro Urban N3 EUN314 | |
| Panasonic Toughbook FZ-55 MK2 | |
Cinebench R23: Multi Core | Single Core
Cinebench R15: CPU Multi 64Bit | CPU Single 64Bit
Blender: v2.79 BMW27 CPU
7-Zip 18.03: 7z b 4 | 7z b 4 -mmt1
Geekbench 5.5: Multi-Core | Single-Core
HWBOT x265 Benchmark v2.2: 4k Preset
LibreOffice : 20 Documents To PDF
R Benchmark 2.5: Overall mean
* ... smaller is better
AIDA64: FP32 Ray-Trace | FPU Julia | CPU SHA3 | CPU Queen | FPU SinJulia | FPU Mandel | CPU AES | CPU ZLib | FP64 Ray-Trace | CPU PhotoWorxx
| Performance rating | |
| Acer Enduro Urban N3 EUN314 | |
| Panasonic Toughbook FZ-55 MK2 | |
| Getac B360 | |
| Durabook S14I | |
| Average Intel Core i7-10710U | |
| AIDA64 / FP32 Ray-Trace | |
| Acer Enduro Urban N3 EUN314 | |
| Panasonic Toughbook FZ-55 MK2 | |
| Durabook S14I | |
| Getac B360 | |
| Average Intel Core i7-10710U (3674 - 4992, n=2) | |
| AIDA64 / FPU Julia | |
| Acer Enduro Urban N3 EUN314 | |
| Panasonic Toughbook FZ-55 MK2 | |
| Getac B360 | |
| Average Intel Core i7-10710U (21776 - 26990, n=2) | |
| Durabook S14I | |
| AIDA64 / CPU SHA3 | |
| Acer Enduro Urban N3 EUN314 | |
| Panasonic Toughbook FZ-55 MK2 | |
| Durabook S14I | |
| Getac B360 | |
| Average Intel Core i7-10710U (883 - 1289, n=2) | |
| AIDA64 / CPU Queen | |
| Getac B360 | |
| Average Intel Core i7-10710U (37935 - 64609, n=2) | |
| Acer Enduro Urban N3 EUN314 | |
| Durabook S14I | |
| Panasonic Toughbook FZ-55 MK2 | |
| AIDA64 / FPU SinJulia | |
| Acer Enduro Urban N3 EUN314 | |
| Getac B360 | |
| Panasonic Toughbook FZ-55 MK2 | |
| Average Intel Core i7-10710U (3580 - 4770, n=2) | |
| Durabook S14I | |
| AIDA64 / FPU Mandel | |
| Acer Enduro Urban N3 EUN314 | |
| Panasonic Toughbook FZ-55 MK2 | |
| Durabook S14I | |
| Getac B360 | |
| Average Intel Core i7-10710U (9533 - 12867, n=2) | |
| AIDA64 / CPU AES | |
| Acer Enduro Urban N3 EUN314 | |
| Durabook S14I | |
| Panasonic Toughbook FZ-55 MK2 | |
| Getac B360 | |
| Average Intel Core i7-10710U (13808 - 18491, n=2) | |
| AIDA64 / CPU ZLib | |
| Acer Enduro Urban N3 EUN314 | |
| Getac B360 | |
| Panasonic Toughbook FZ-55 MK2 | |
| Average Intel Core i7-10710U (242 - 300, n=2) | |
| Durabook S14I | |
| AIDA64 / FP64 Ray-Trace | |
| Acer Enduro Urban N3 EUN314 | |
| Panasonic Toughbook FZ-55 MK2 | |
| Durabook S14I | |
| Getac B360 | |
| Average Intel Core i7-10710U (1994 - 2672, n=2) | |
| AIDA64 / CPU PhotoWorxx | |
| Acer Enduro Urban N3 EUN314 | |
| Panasonic Toughbook FZ-55 MK2 | |
| Getac B360 | |
| Average Intel Core i7-10710U (10842 - 21733, n=2) | |
| Durabook S14I | |
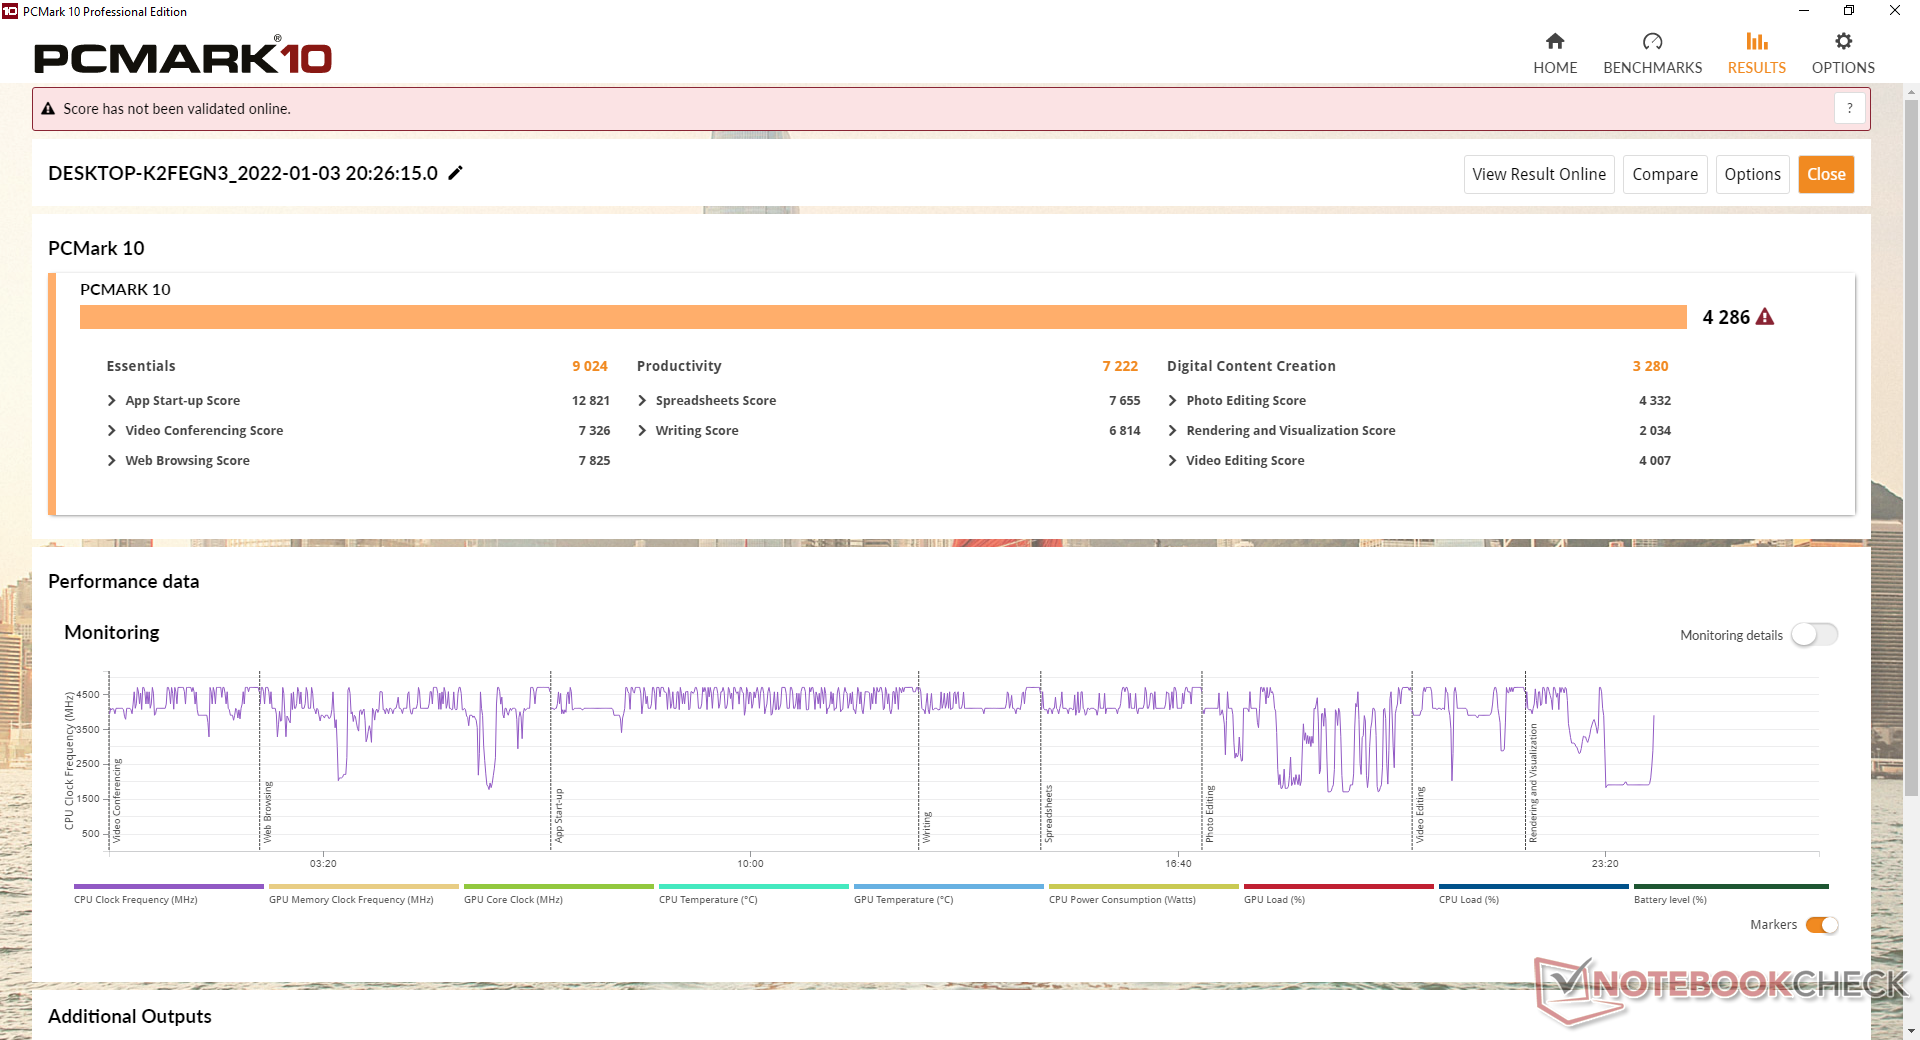
系统性能
| PCMark 10 / Score | |
| Panasonic Toughbook FZ-55 MK2 | |
| Durabook S14I | |
| Average Intel Core i7-10710U (4161 - 5150, n=6) | |
| Acer Enduro Urban N3 EUN314 | |
| Dell Latitude 5420 Rugged-P85G | |
| Getac B360 | |
| Getac S410 | |
| PCMark 10 / Essentials | |
| Panasonic Toughbook FZ-55 MK2 | |
| Durabook S14I | |
| Acer Enduro Urban N3 EUN314 | |
| Getac B360 | |
| Average Intel Core i7-10710U (8785 - 9160, n=6) | |
| Dell Latitude 5420 Rugged-P85G | |
| Getac S410 | |
| PCMark 10 / Productivity | |
| Dell Latitude 5420 Rugged-P85G | |
| Getac B360 | |
| Durabook S14I | |
| Getac S410 | |
| Panasonic Toughbook FZ-55 MK2 | |
| Average Intel Core i7-10710U (5816 - 7222, n=6) | |
| Acer Enduro Urban N3 EUN314 | |
| PCMark 10 / Digital Content Creation | |
| Panasonic Toughbook FZ-55 MK2 | |
| Acer Enduro Urban N3 EUN314 | |
| Average Intel Core i7-10710U (3280 - 6248, n=6) | |
| Durabook S14I | |
| Dell Latitude 5420 Rugged-P85G | |
| Getac B360 | |
| Getac S410 | |
| PCMark 10 Score | 4286 points | |
Help | ||
| AIDA64 / Memory Copy | |
| Acer Enduro Urban N3 EUN314 | |
| Panasonic Toughbook FZ-55 MK2 | |
| Getac B360 | |
| Durabook S14I | |
| AIDA64 / Memory Read | |
| Acer Enduro Urban N3 EUN314 | |
| Panasonic Toughbook FZ-55 MK2 | |
| Getac B360 | |
| Durabook S14I | |
| AIDA64 / Memory Write | |
| Acer Enduro Urban N3 EUN314 | |
| Panasonic Toughbook FZ-55 MK2 | |
| Getac B360 | |
| Durabook S14I | |
| AIDA64 / Memory Latency | |
| Acer Enduro Urban N3 EUN314 | |
| Panasonic Toughbook FZ-55 MK2 | |
| Durabook S14I | |
| Getac B360 | |
* ... smaller is better
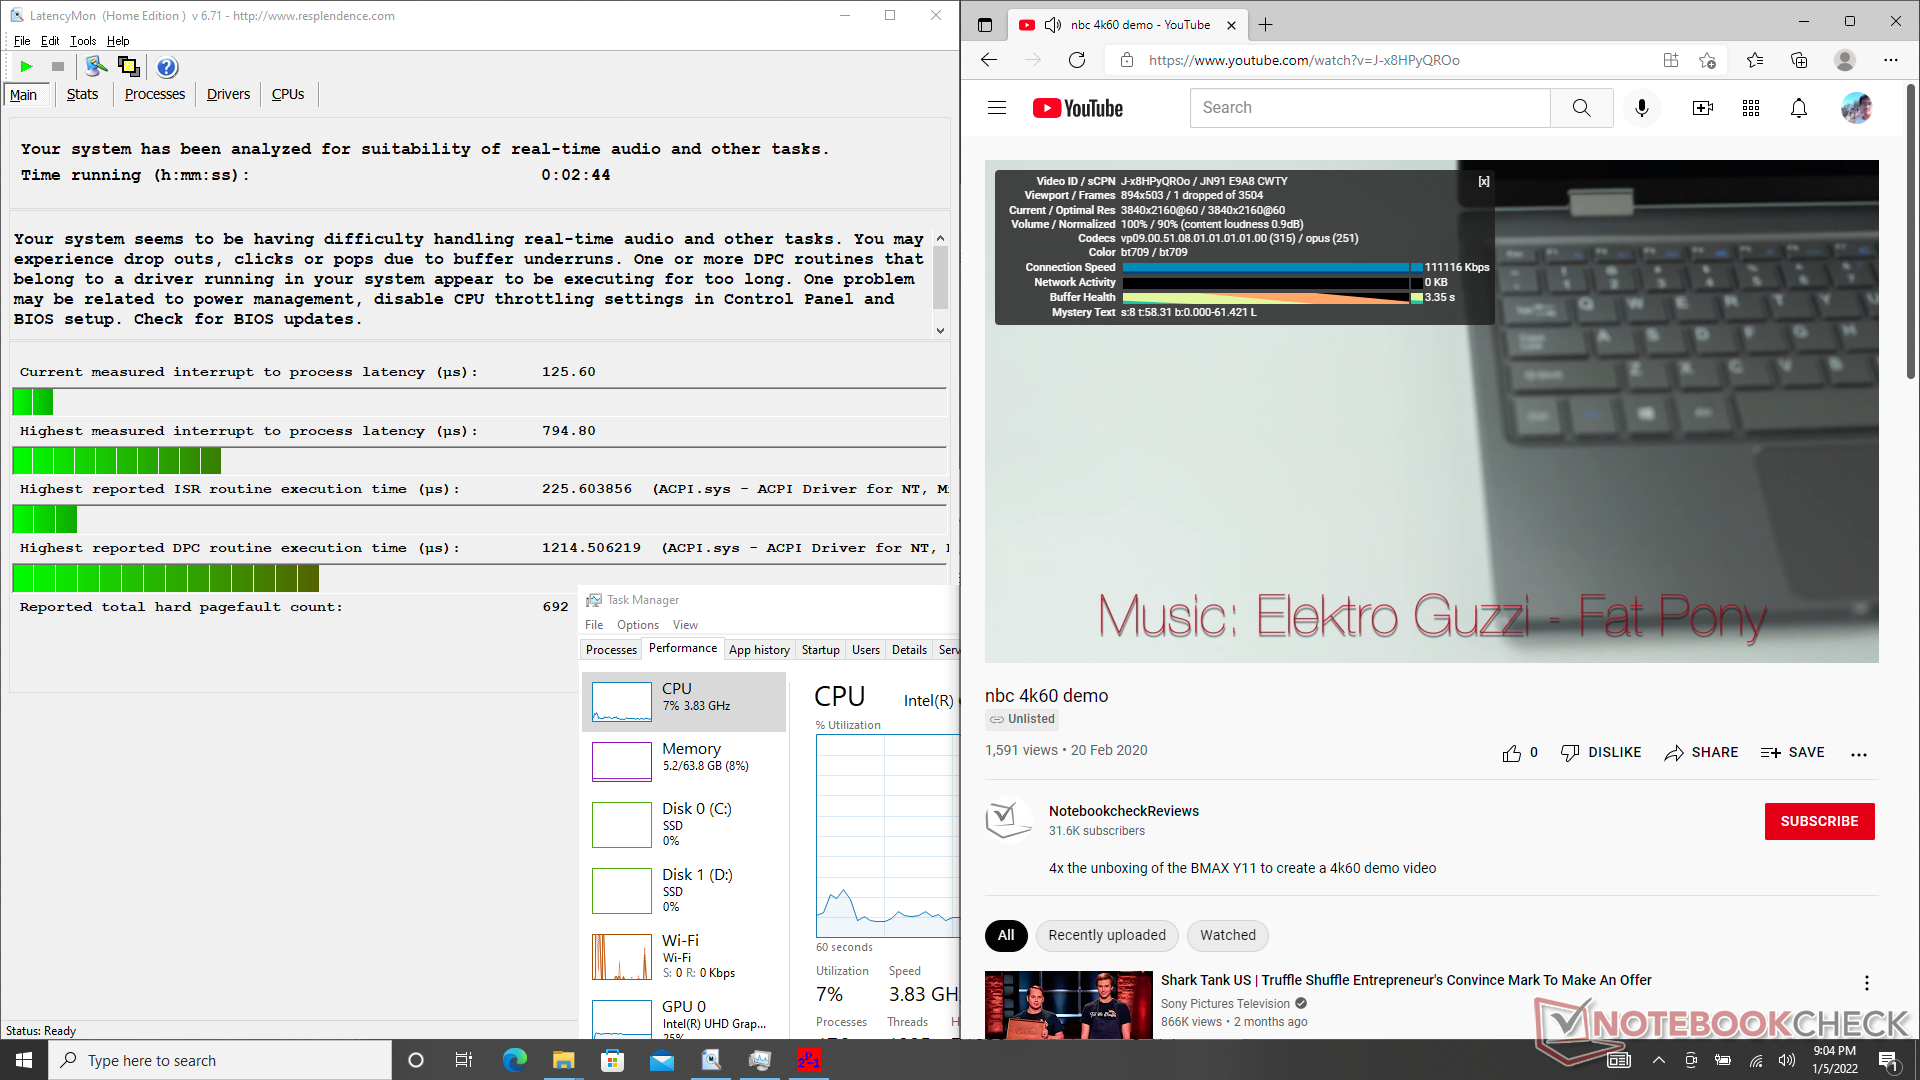
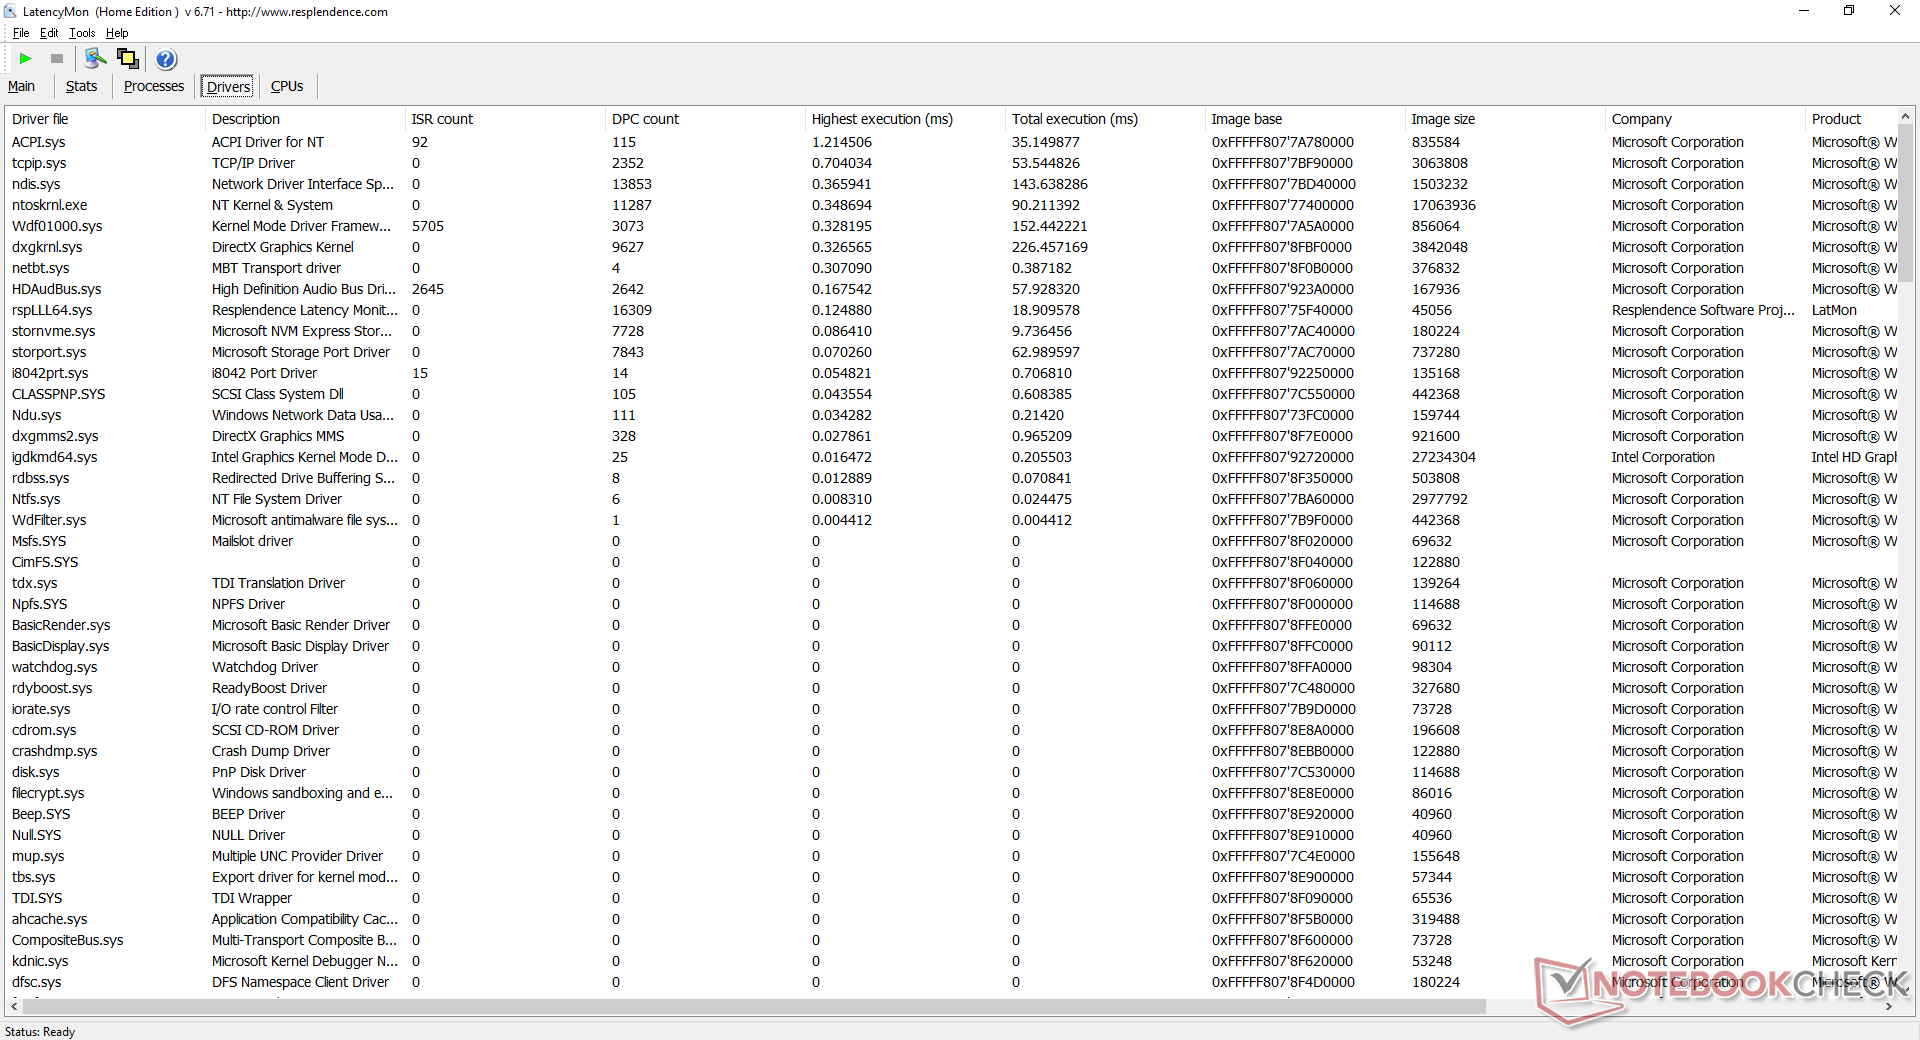
DPC延时
我们的设备在主页上打开多个标签时表现出轻微的延迟问题。在60FPS下的4K视频播放是顺畅的,在我们长达1分钟的视频测试中只有一个掉帧。
| DPC Latencies / LatencyMon - interrupt to process latency (max), Web, Youtube, Prime95 | |
| Acer Enduro Urban N3 EUN314 | |
| Panasonic Toughbook FZ-55 MK2 | |
| Durabook S14I | |
| Getac B360 | |
* ... smaller is better
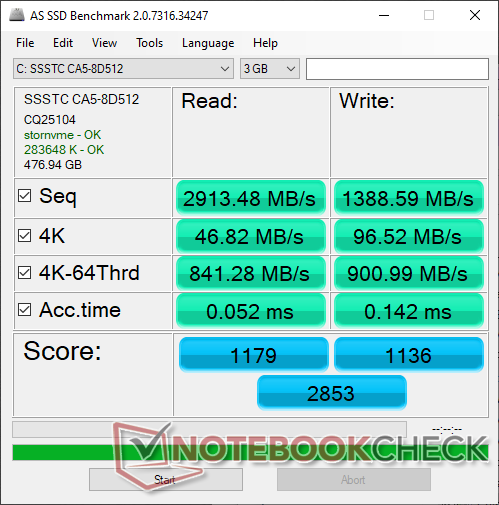
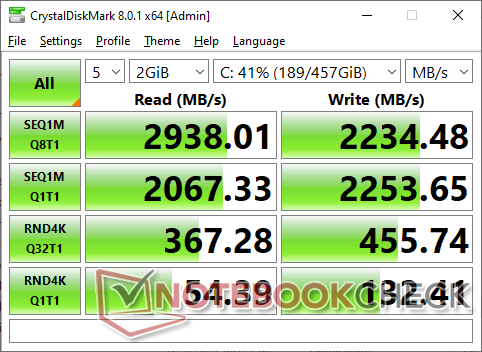
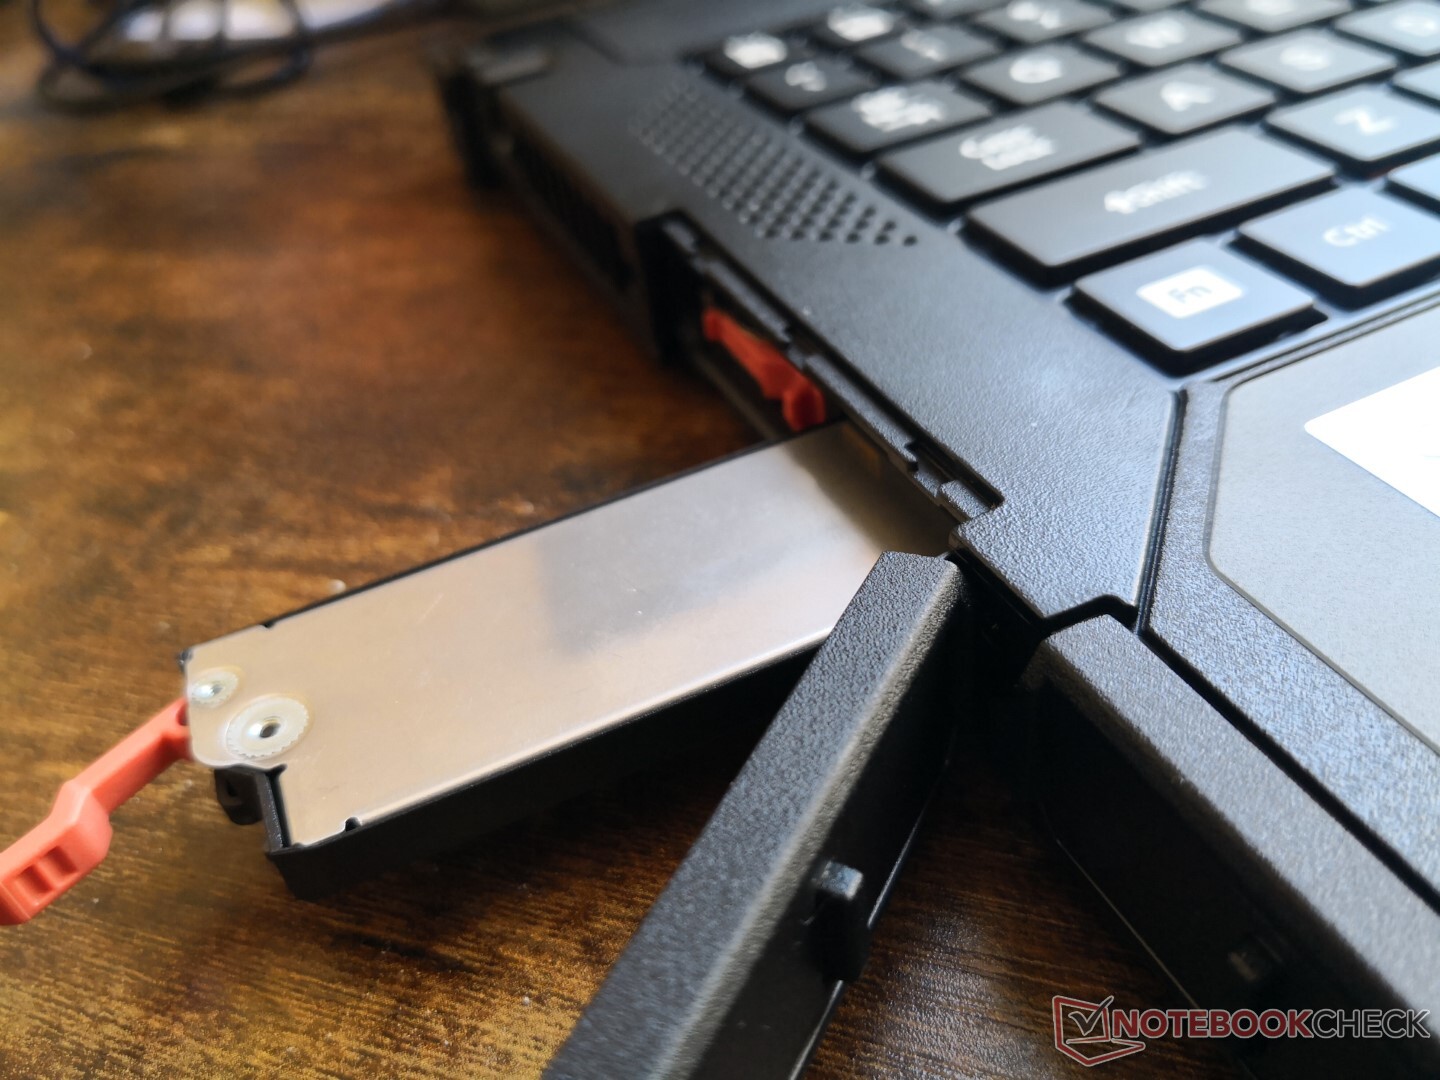
存储设备
最多可支持两个M.2驱动器(1个PCIe + 1个SATA)。然而,第二个驱动器是一个可选的升级。这两个插槽都可以通过机箱左侧边缘的两个橙色锁扣进入。这些可移动模块通过USB-C连接到笔记本电脑,这意味着你在技术上可以将这些模块连接到其他笔记本电脑,但Getac不建议这样做。我们的具体审查单位配备了一个512 GB光宝CA5-8D512PCIe3 x4 NVMe SSD。

| Drive Performance rating - Percent | |
| Getac B360 | |
| Acer Enduro Urban N3 EUN314 | |
| Durabook S14I | |
| Dell Latitude 5420 Rugged-P85G -8! | |
| Panasonic Toughbook FZ-55 MK2 | |
| Getac S410 -8! | |
* ... smaller is better
Disk Throttling: DiskSpd Read Loop, Queue Depth 8
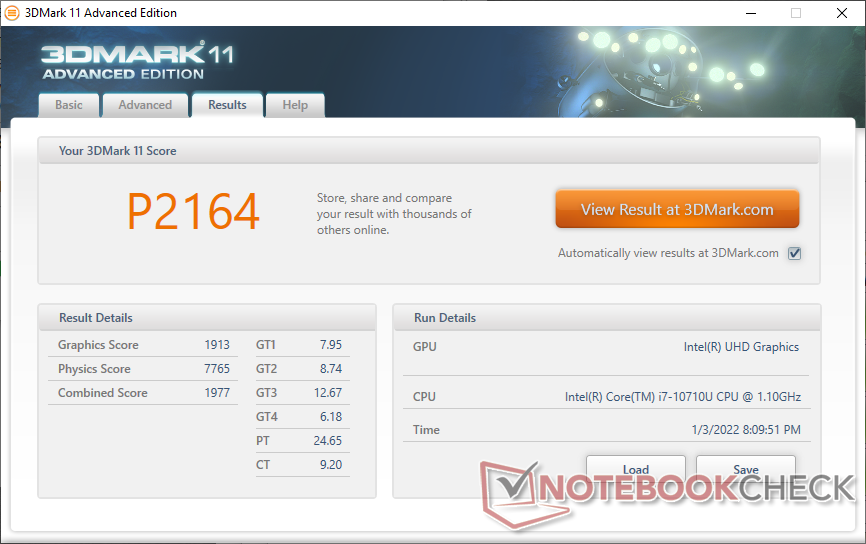
GPU性能
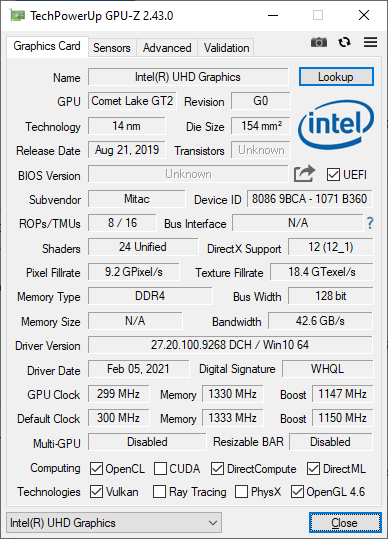
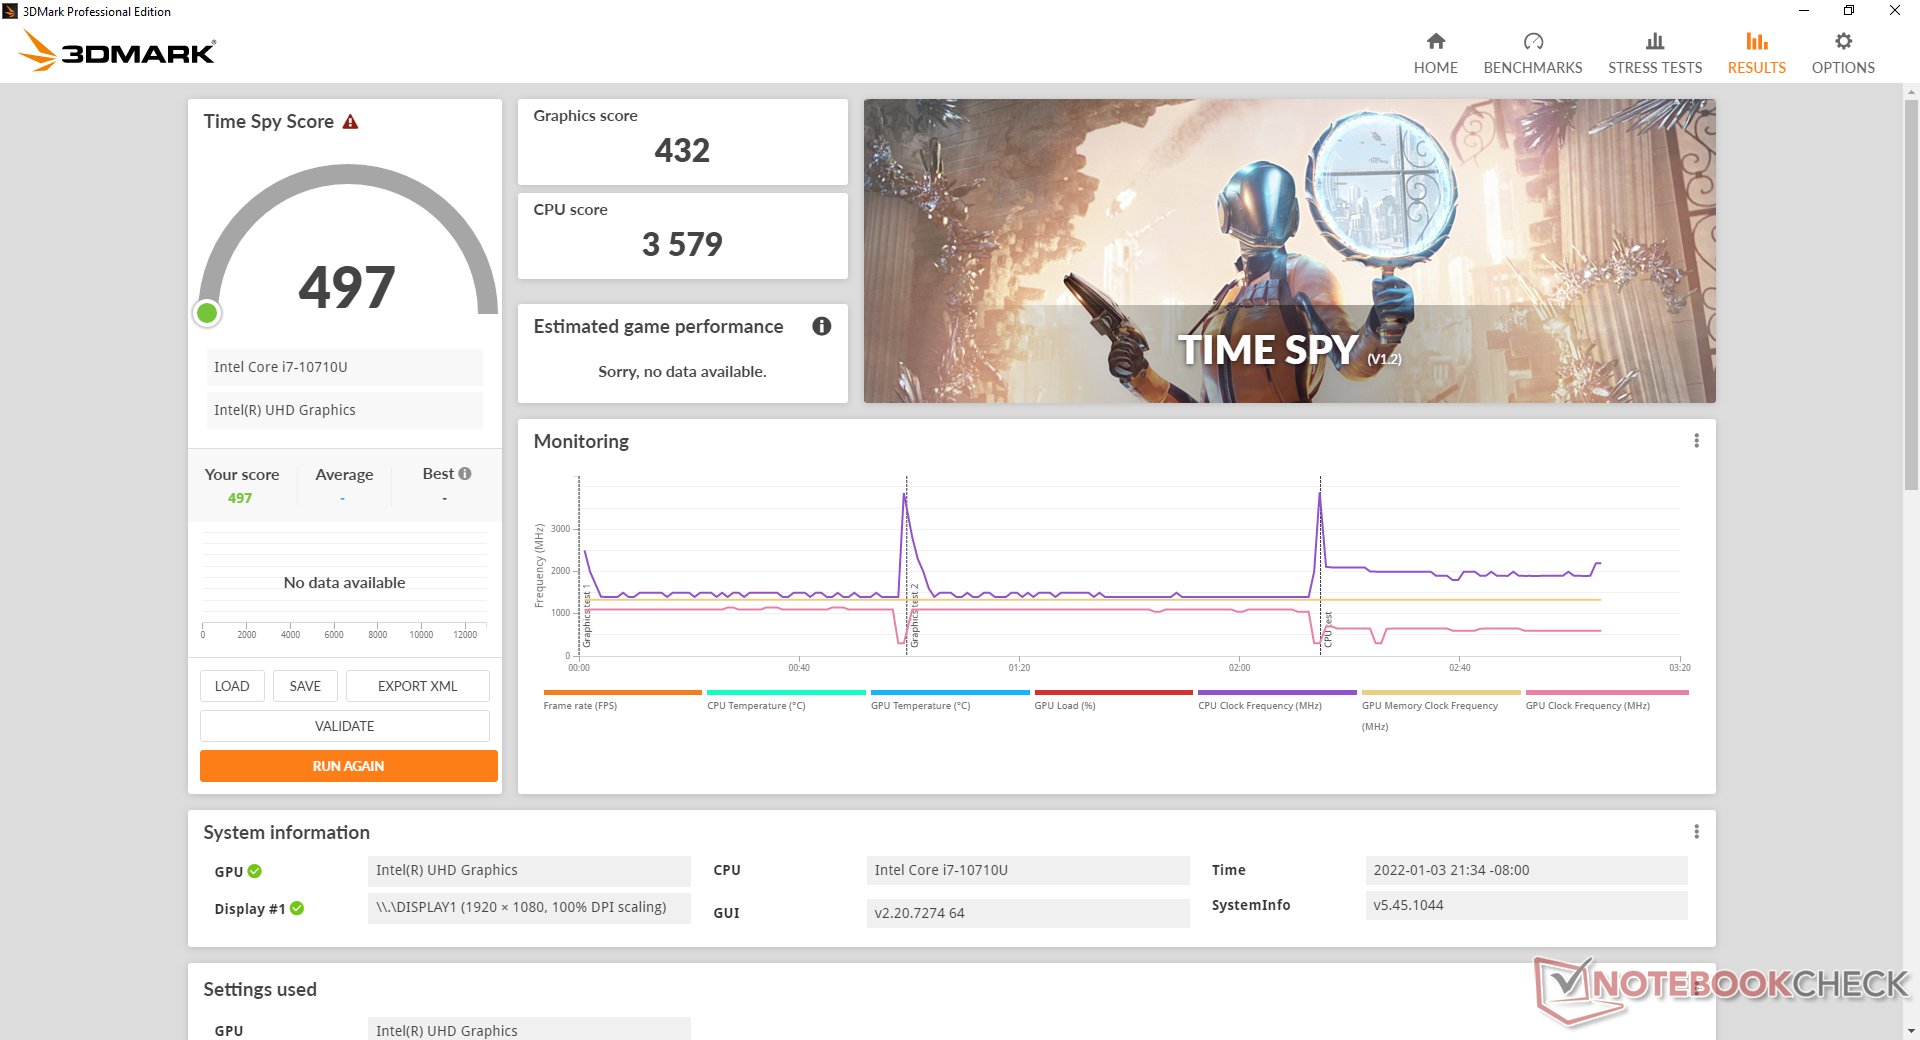
的。 UHD Graphics 620已经过时了。预计性能将远远落后于AMD Zen系列或英特尔Ice Lake 或Tiger Lake 系列的最新集成GPU。
| 3DMark 11 - 1280x720 Performance GPU | |
| Acer Enduro Urban N3 EUN314 | |
| Panasonic Toughbook FZ-55 MK2 | |
| Honor MagicBook Pro 10210U | |
| Lenovo Yoga 6 13ALC6 | |
| Lenovo IdeaPad 5 15ALC05 | |
| Durabook S14I | |
| Dell Latitude 5420 Rugged-P85G | |
| Lenovo ThinkPad P15s Gen1-20T4000JGE | |
| Infinix INBook X2 | |
| Asus ZenBook 14 UX434FL-DB77 | |
| Lenovo ThinkPad L14-20U50003GE | |
| Getac B360 | |
| Getac S410 | |
| Average Intel UHD Graphics 620 (1144 - 3432, n=244) | |
| 3DMark 11 Performance | 2164 points | |
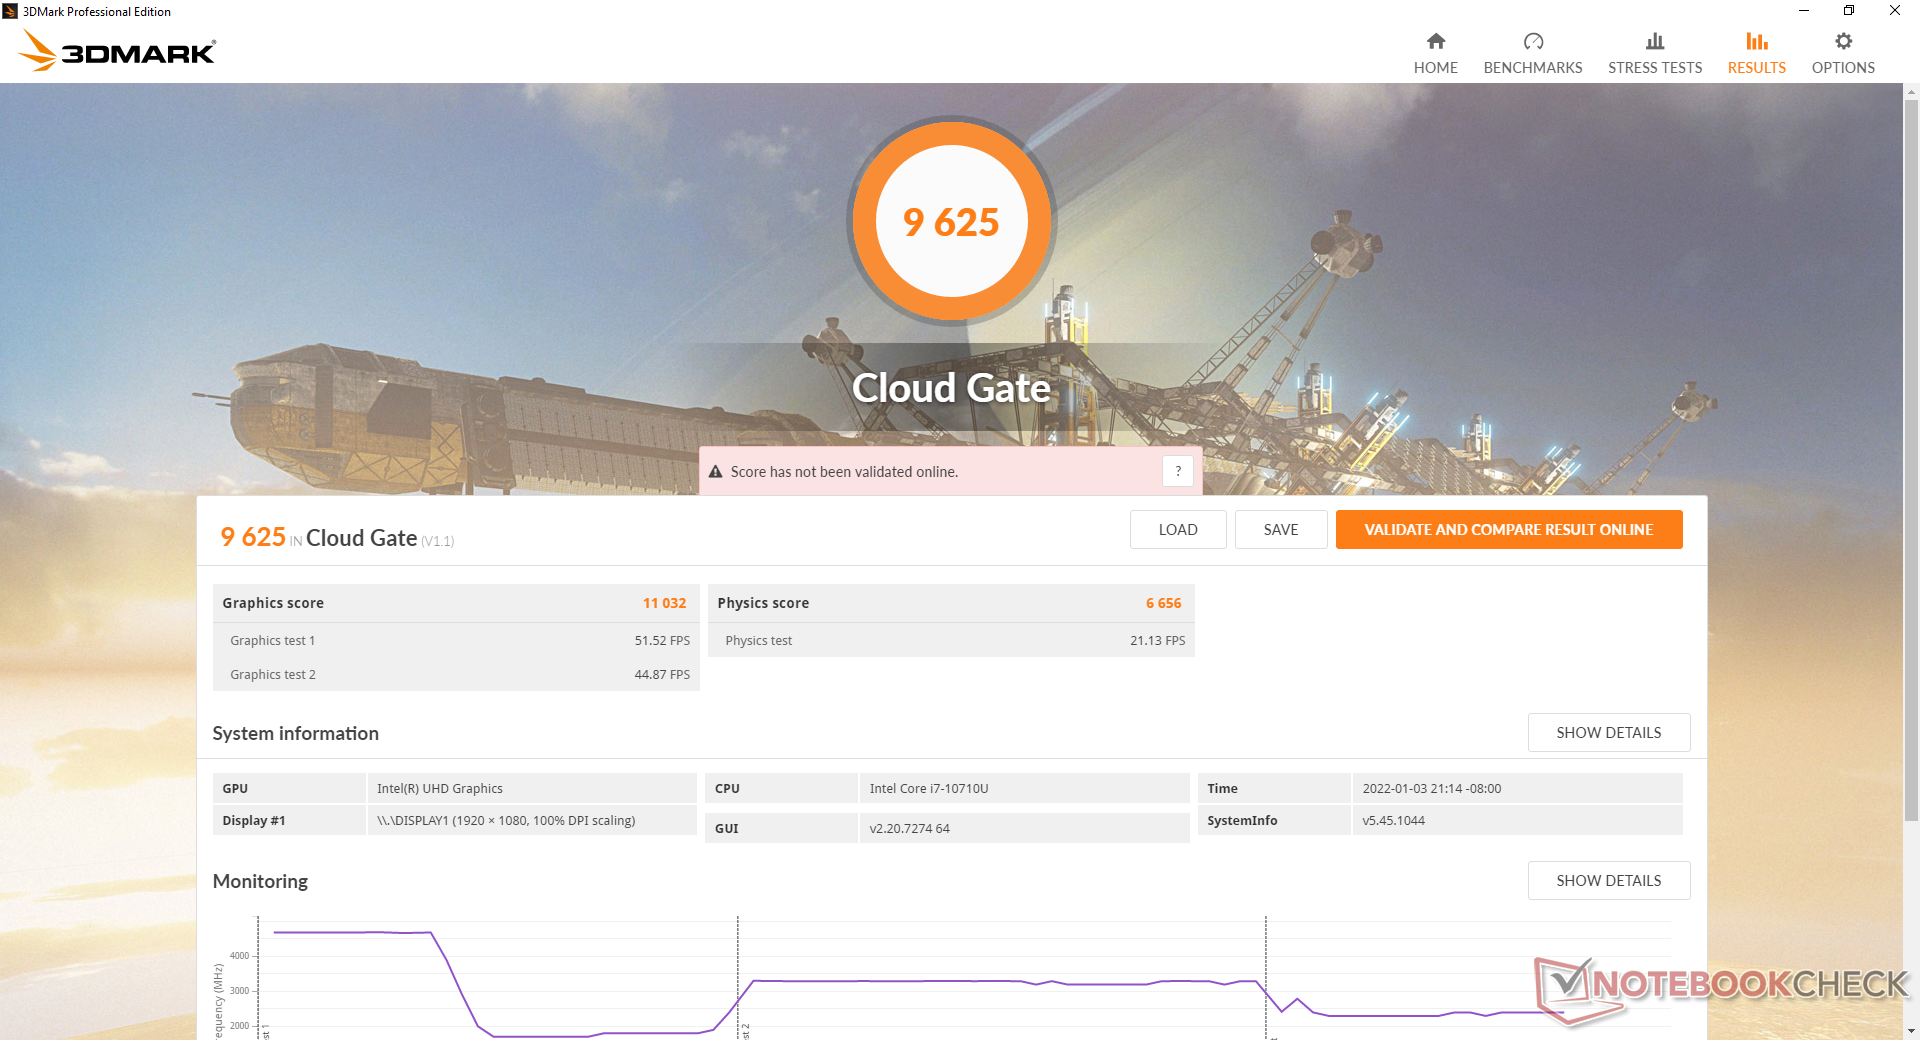
| 3DMark Cloud Gate Standard Score | 9625 points | |
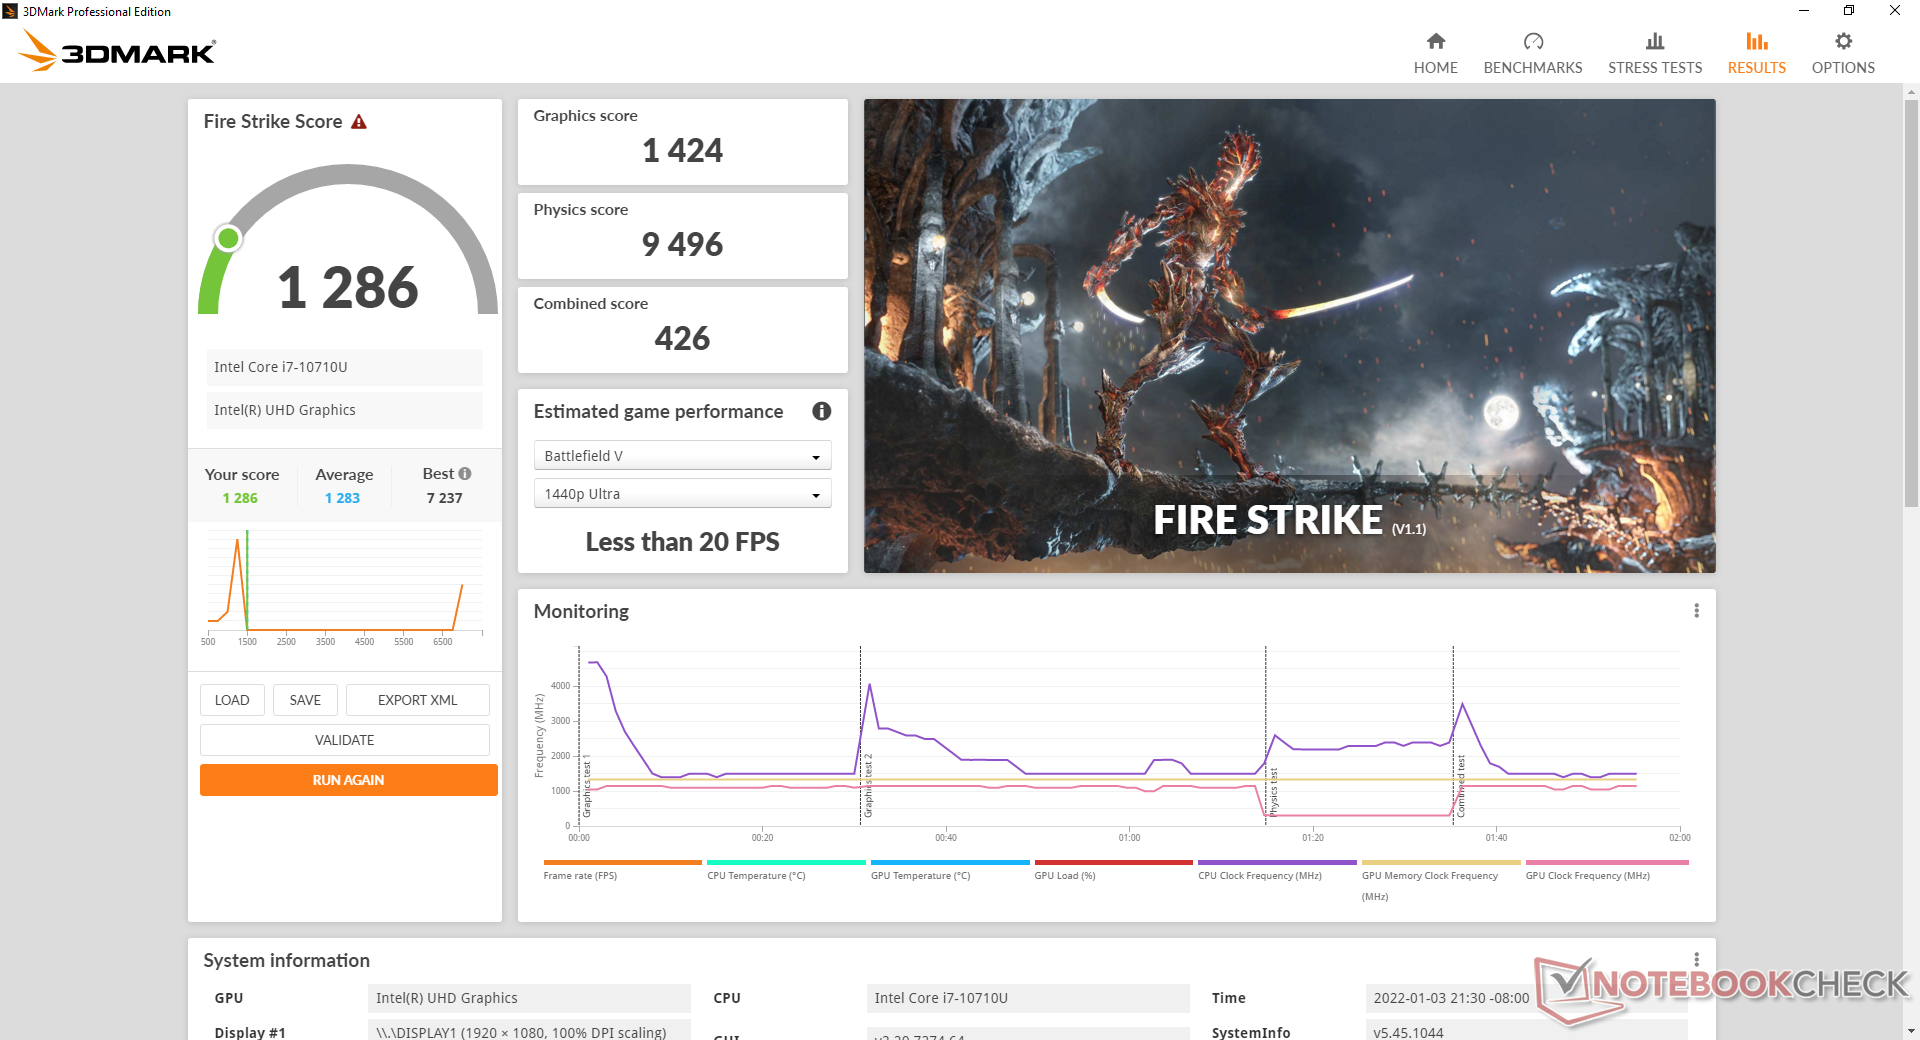
| 3DMark Fire Strike Score | 1286 points | |
| 3DMark Time Spy Score | 497 points | |
Help | ||
Witcher 3 FPS Chart
| low | med. | high | ultra | |
|---|---|---|---|---|
| The Witcher 3 (2015) | 20.7 | 14.3 | 8.4 | 4.8 |
| Dota 2 Reborn (2015) | 85.9 | 56 | 22.8 | 20.3 |
| Final Fantasy XV Benchmark (2018) | 14.2 | 6.77 | 5.05 | |
| X-Plane 11.11 (2018) | 13.2 | 13.8 | 12.4 |
排放
系统噪音
风扇的最大噪音相对较小,只有31 dB(A),但高音调使它在安静的环境中比我们希望的更明显。如果在户外或现场工作,用户可能根本不会注意到风扇的存在。
Noise level
| Idle |
| 24.5 / 24.5 / 24.6 dB(A) |
| Load |
| 29.8 / 30.8 dB(A) |
 | ||
30 dB silent 40 dB(A) audible 50 dB(A) loud |
||
min: | ||
| Getac B360 UHD Graphics 620, i7-10710U, Lite-On CA5-8D512 | Dell Latitude 5420 Rugged-P85G Radeon RX 540, i7-8650U, SK hynix PC401 NVMe 500 GB | Getac S410 UHD Graphics 620, i5-8550U, CUKUSA 1 TB SATA SSD Q0526A | Acer Enduro Urban N3 EUN314 Iris Xe G7 96EUs, i7-1165G7, Samsung PM991 MZVLQ1T0HALB | Panasonic Toughbook FZ-55 MK2 Iris Xe G7 96EUs, i7-1185G7, Toshiba KIOXIA KBG4AZNV512G M.2 2280 OPAL | Durabook S14I Iris Xe G7 96EUs, i7-1165G7, UDinfo M2P M2P80DE512GBAEP | |
|---|---|---|---|---|---|---|
| Noise | -14% | -12% | -6% | -3% | -14% | |
| off / environment * (dB) | 24.3 | 28.3 -16% | 28.4 -17% | 23.8 2% | 23.8 2% | 25.2 -4% |
| Idle Minimum * (dB) | 24.5 | 28.3 -16% | 28.4 -16% | 24.1 2% | 24 2% | 25.2 -3% |
| Idle Average * (dB) | 24.5 | 28.3 -16% | 28.4 -16% | 24.1 2% | 24 2% | 25.2 -3% |
| Idle Maximum * (dB) | 24.6 | 28.3 -15% | 28.4 -15% | 24.1 2% | 24 2% | 34.5 -40% |
| Load Average * (dB) | 29.8 | 29.9 -0% | 30.3 -2% | 27.9 6% | 26.7 10% | 34.5 -16% |
| Witcher 3 ultra * (dB) | 27.3 | 35.7 -31% | ||||
| Load Maximum * (dB) | 30.8 | 38 -23% | 33.3 -8% | 38.6 -25% | 41.7 -35% | 36.2 -18% |
* ... smaller is better
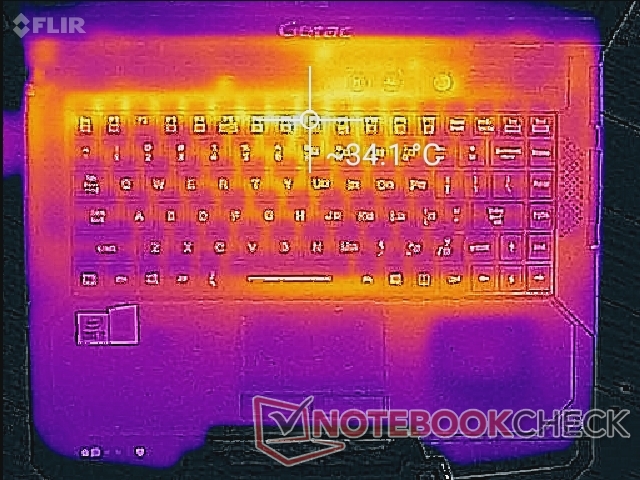
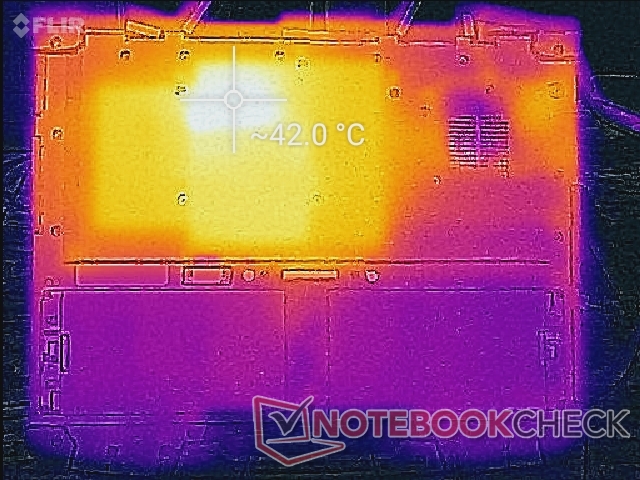
温度
表面温度不是问题,因为你在一个比大多数超极本至少厚2倍或3倍的机箱里有一个ULV CPU。我们能够在运行苛刻的负载时,在顶部和底部表面记录到34℃和42℃的热点。
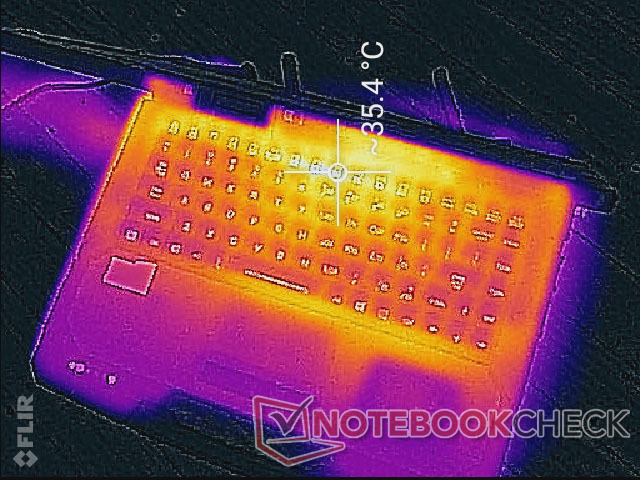
(+) The maximum temperature on the upper side is 33.4 °C / 92 F, compared to the average of 34.3 °C / 94 F, ranging from 21.2 to 62.5 °C for the class Office.
(±) The bottom heats up to a maximum of 42.6 °C / 109 F, compared to the average of 36.8 °C / 98 F
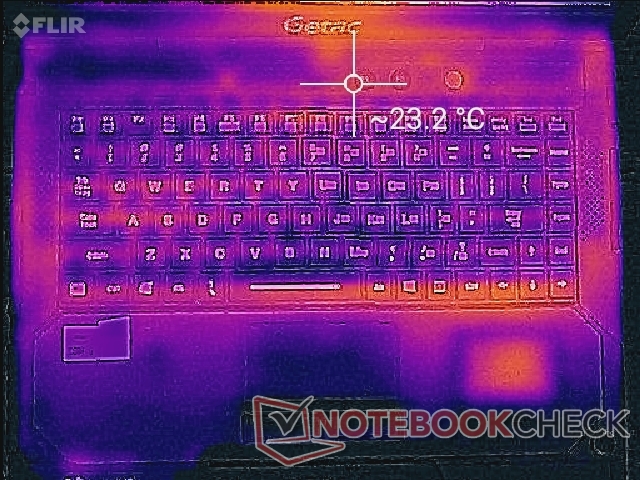
(+) In idle usage, the average temperature for the upper side is 23.2 °C / 74 F, compared to the device average of 29.5 °C / 85 F.
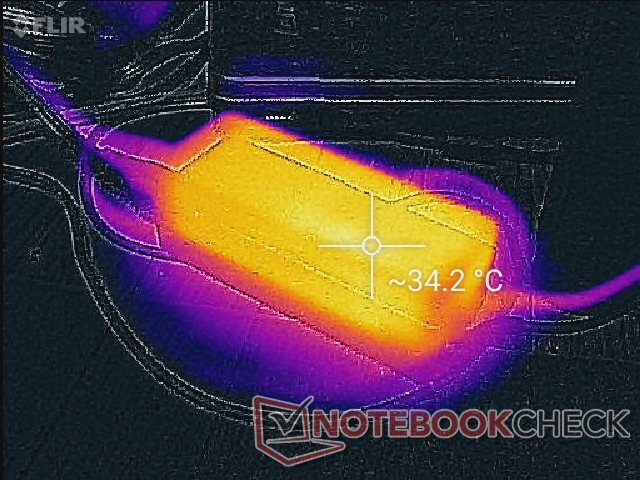
(+) The palmrests and touchpad are cooler than skin temperature with a maximum of 24.2 °C / 75.6 F and are therefore cool to the touch.
(+) The average temperature of the palmrest area of similar devices was 27.5 °C / 81.5 F (+3.3 °C / 5.9 F).
| Getac B360 Intel Core i7-10710U, Intel UHD Graphics 620 | Dell Latitude 5420 Rugged-P85G Intel Core i7-8650U, AMD Radeon RX 540 | Getac S410 Intel Core i7-8550U, Intel UHD Graphics 620 | Acer Enduro Urban N3 EUN314 Intel Core i7-1165G7, Intel Iris Xe Graphics G7 96EUs | Panasonic Toughbook FZ-55 MK2 Intel Core i7-1185G7, Intel Iris Xe Graphics G7 96EUs | Durabook S14I Intel Core i7-1165G7, Intel Iris Xe Graphics G7 96EUs | |
|---|---|---|---|---|---|---|
| Heat | -19% | -25% | -11% | -16% | -16% | |
| Maximum Upper Side * (°C) | 33.4 | 42.2 -26% | 42.6 -28% | 37.8 -13% | 36.2 -8% | 36.4 -9% |
| Maximum Bottom * (°C) | 42.6 | 42 1% | 49 -15% | 45.8 -8% | 42.2 1% | 38.6 9% |
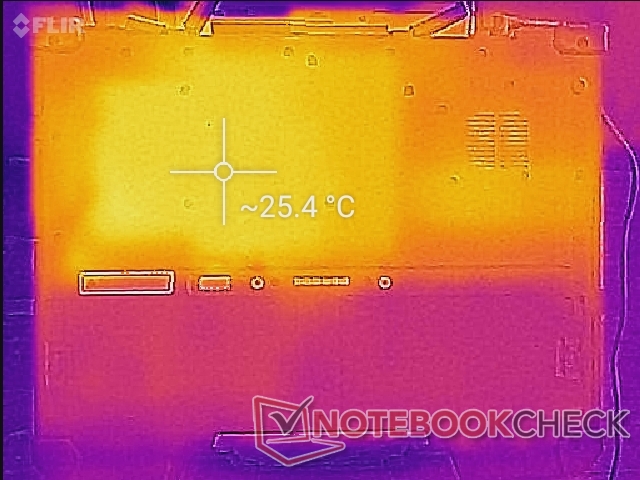
| Idle Upper Side * (°C) | 24.2 | 31.6 -31% | 30.8 -27% | 26.4 -9% | 31 -28% | 32.6 -35% |
| Idle Bottom * (°C) | 26.2 | 31.8 -21% | 34.4 -31% | 30.2 -15% | 34 -30% | 33.8 -29% |
* ... smaller is better
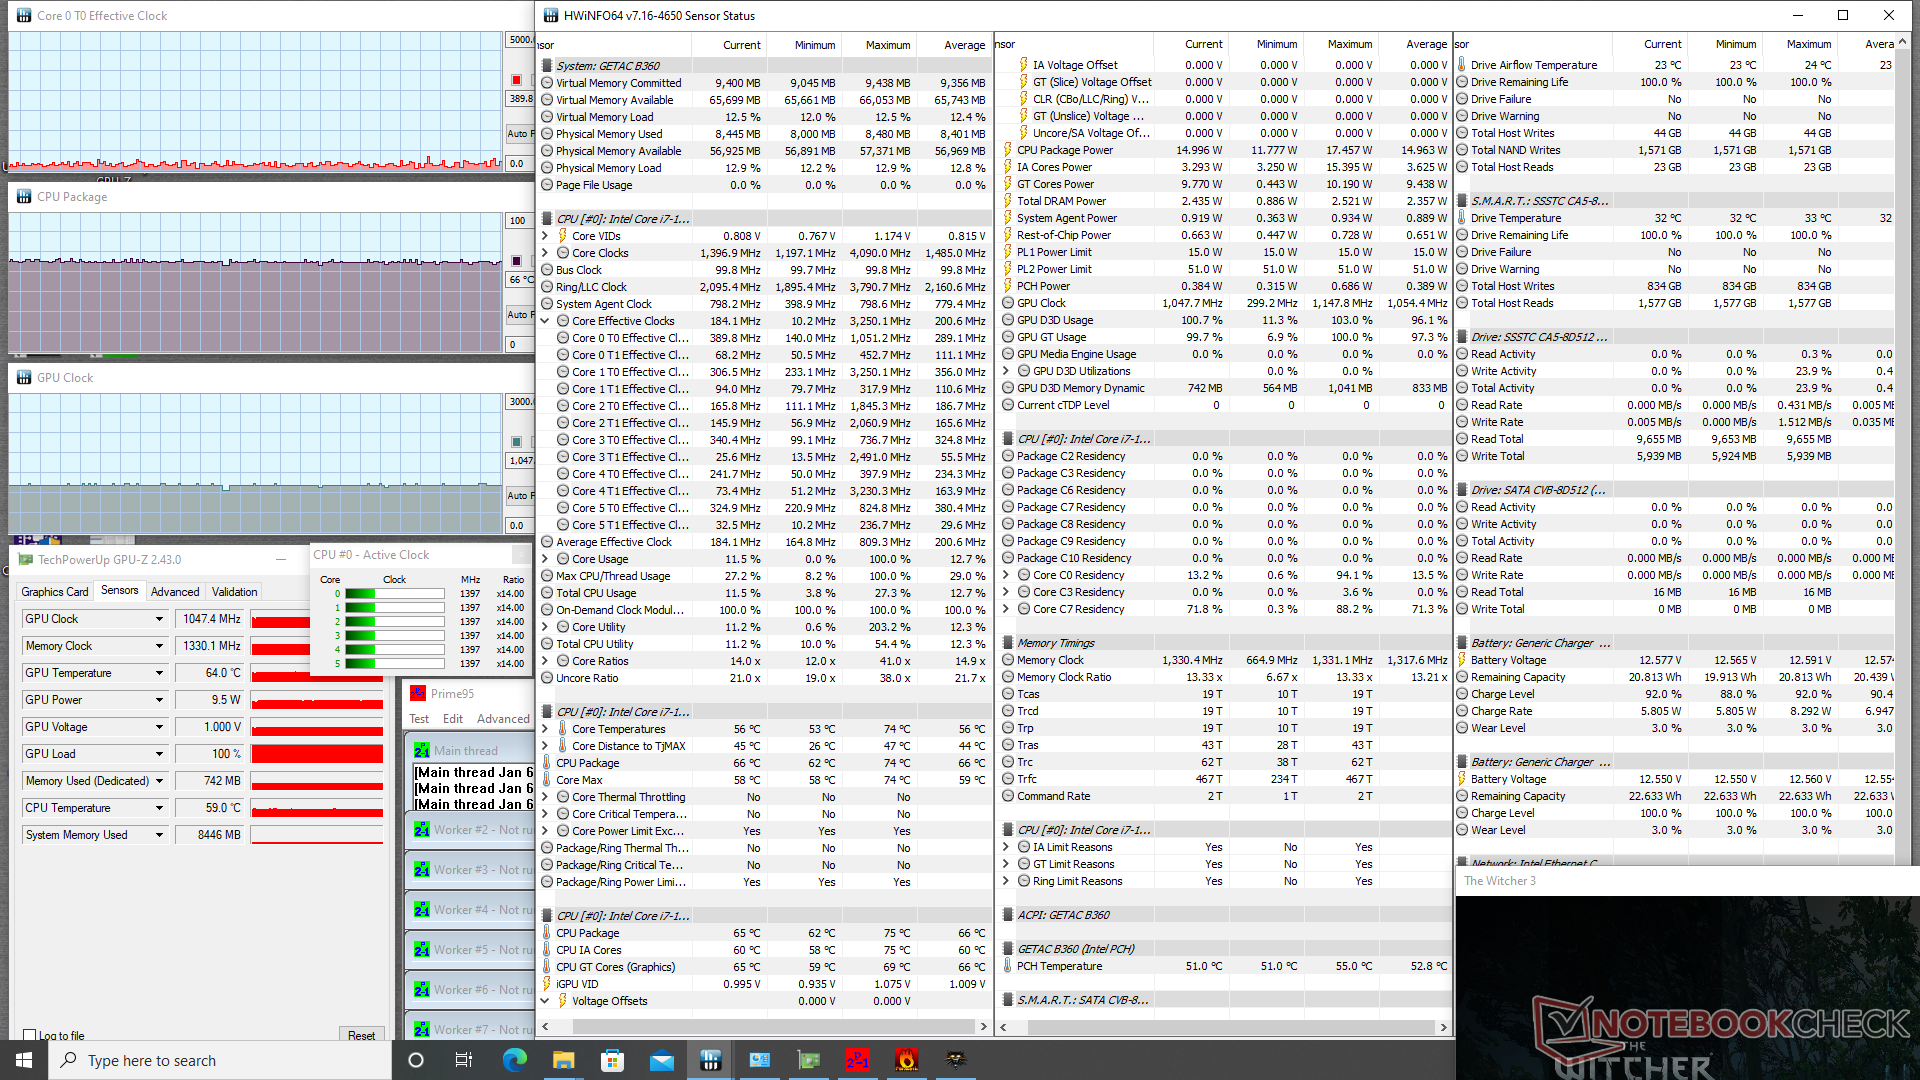
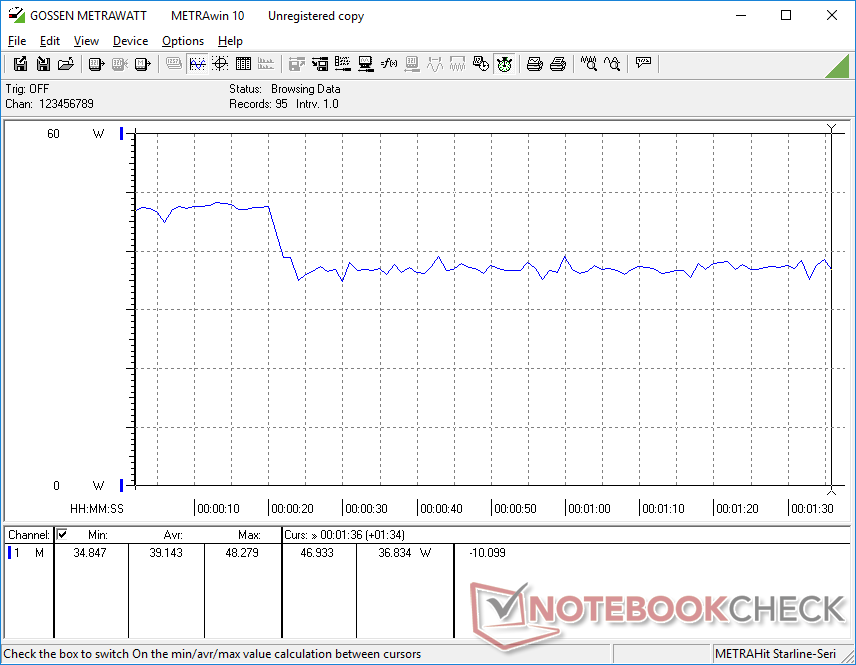
压力测试
当运行Prime95时,CPU的时钟频率在最初的几秒钟内会提升到3GHz,直到达到77℃的核心温度,然后时钟频率会下降并稳定在1.5GHz和62℃。在运行苛刻的负载时,60摄氏度的范围似乎是该系统的甜蜜点。
用电池供电运行不会影响性能。在电池上进行的3DMark 11测试将返回物理和图形分数,分别为7884和1906分,而在主电源上则为7765和1913分。
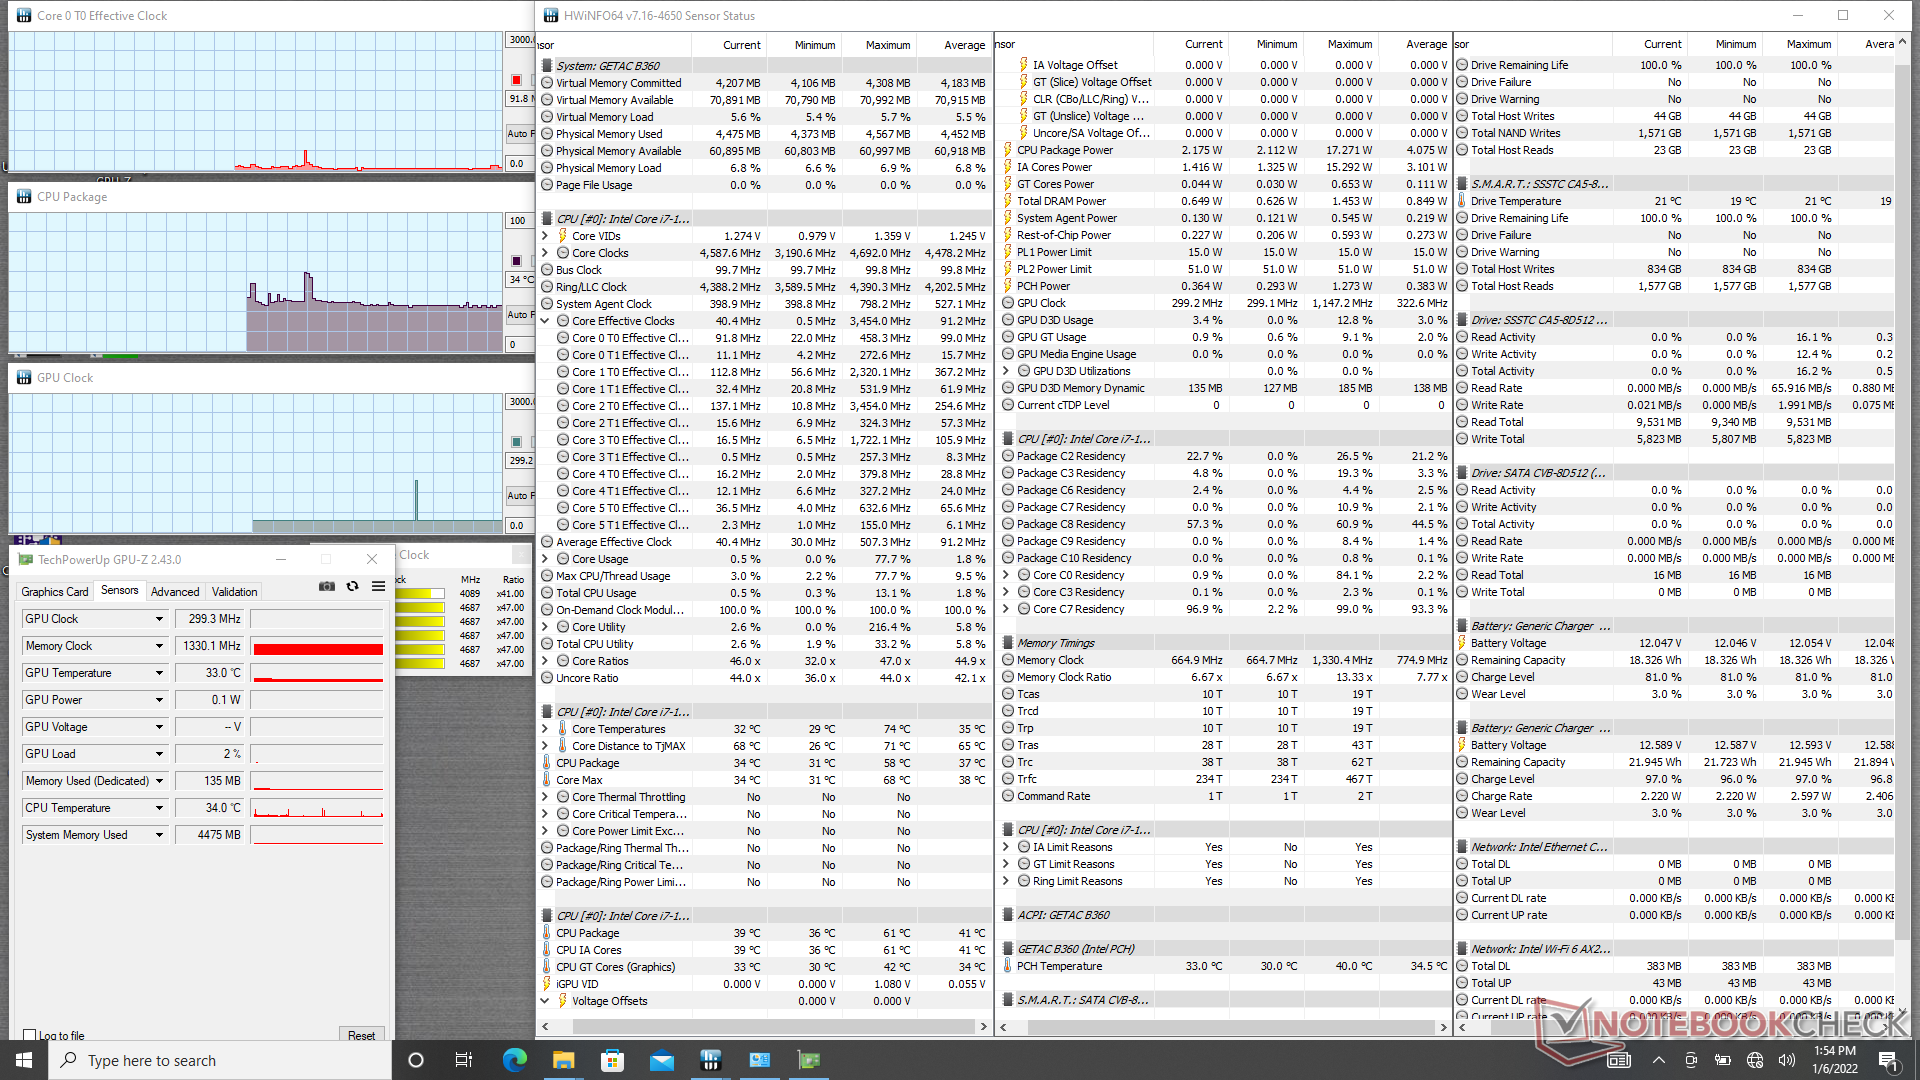
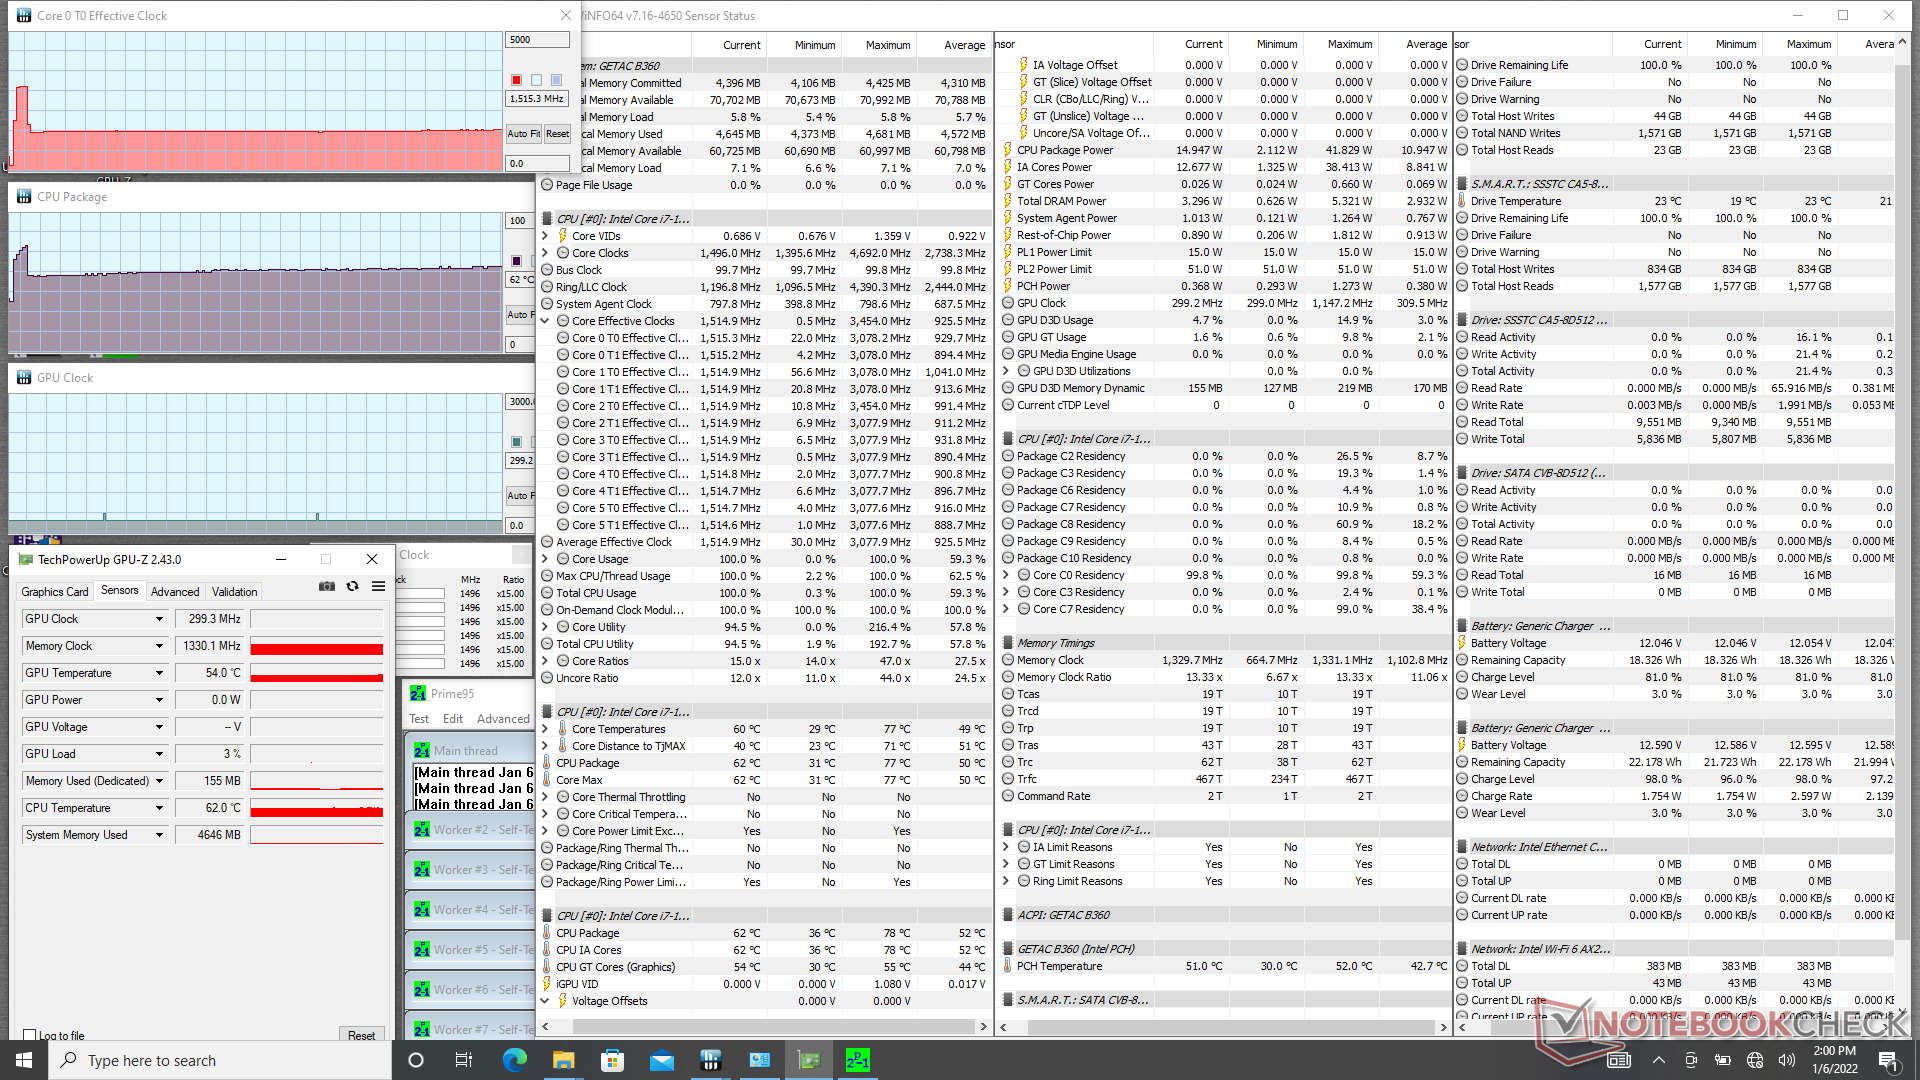
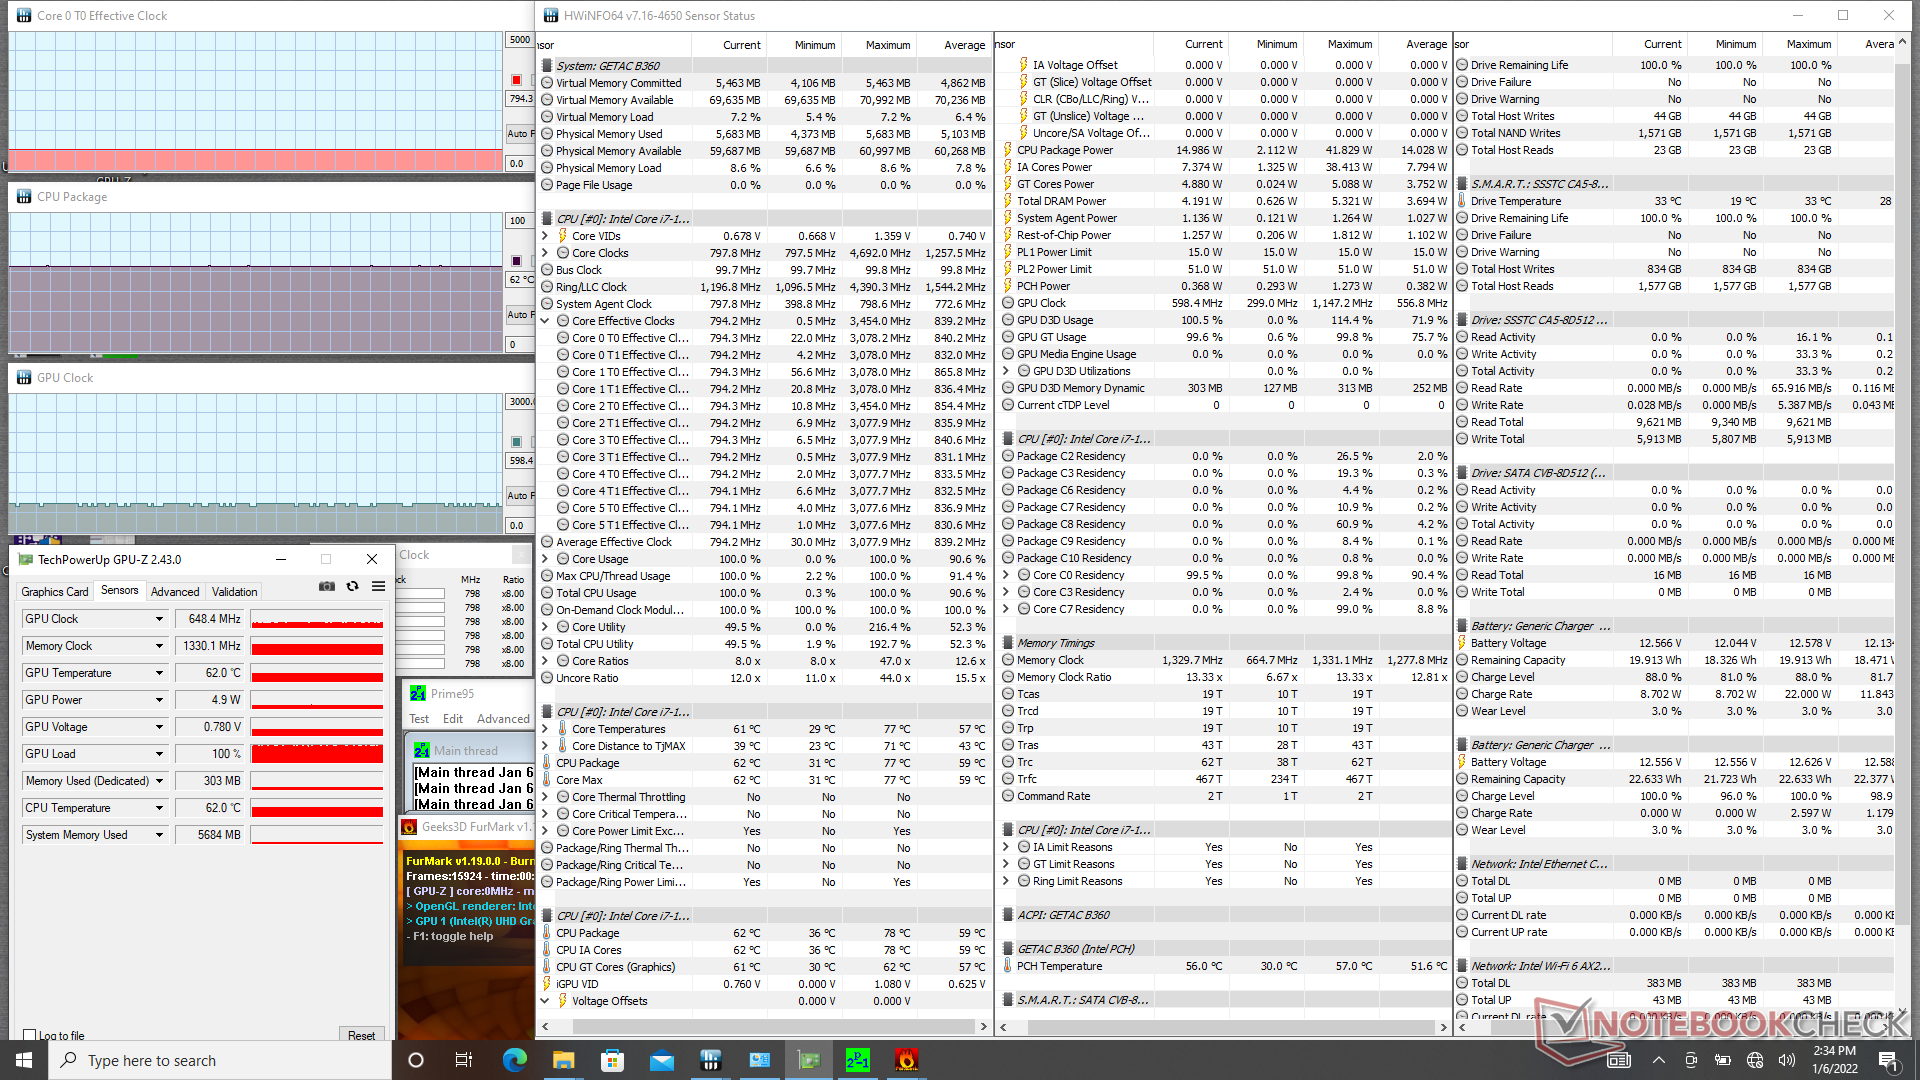
| CPU时钟(GHz) | GPU时钟(MHz) | CPU平均温度(℃) | |
| 系统空闲 | -- | -- | 34 |
| Prime95压力 | 1.5 | -- | 62 |
| Prime95 + FurMark压力 | 0.8 | 598 - 648 | 62 |
| Witcher 3 Stress | ~0.4 | 1047 | 66 |
发言人
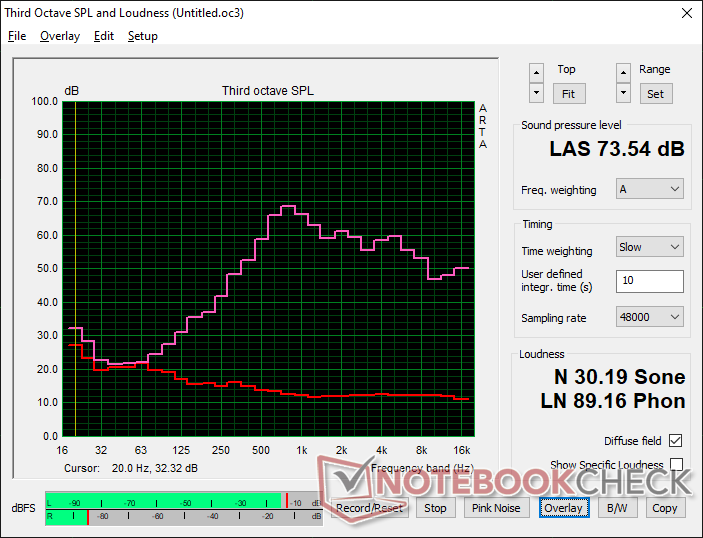
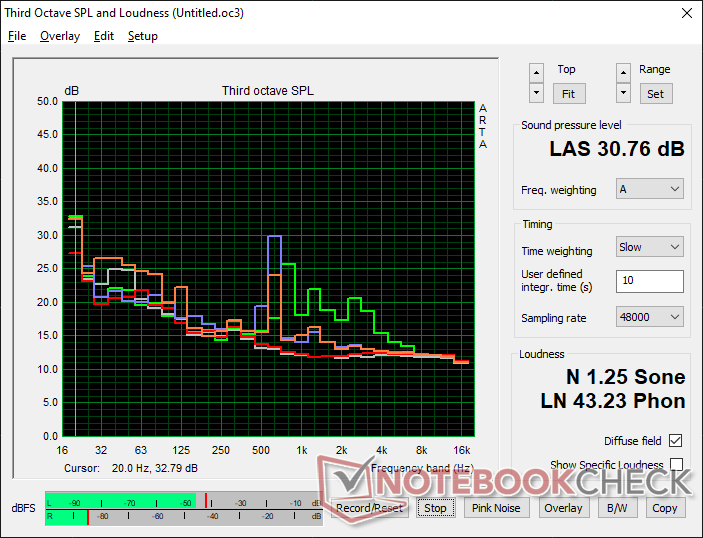
Getac B360 audio analysis
(±) | speaker loudness is average but good (73.5 dB)
Bass 100 - 315 Hz
(-) | nearly no bass - on average 18.6% lower than median
(±) | linearity of bass is average (9.3% delta to prev. frequency)
Mids 400 - 2000 Hz
(±) | higher mids - on average 7.2% higher than median
(±) | linearity of mids is average (9.1% delta to prev. frequency)
Highs 2 - 16 kHz
(+) | balanced highs - only 3.1% away from median
(±) | linearity of highs is average (7.4% delta to prev. frequency)
Overall 100 - 16.000 Hz
(±) | linearity of overall sound is average (22.9% difference to median)
Compared to same class
» 63% of all tested devices in this class were better, 8% similar, 29% worse
» The best had a delta of 7%, average was 21%, worst was 53%
Compared to all devices tested
» 68% of all tested devices were better, 6% similar, 26% worse
» The best had a delta of 4%, average was 24%, worst was 134%
Apple MacBook Pro 16 2021 M1 Pro audio analysis
(+) | speakers can play relatively loud (84.7 dB)
Bass 100 - 315 Hz
(+) | good bass - only 3.8% away from median
(+) | bass is linear (5.2% delta to prev. frequency)
Mids 400 - 2000 Hz
(+) | balanced mids - only 1.3% away from median
(+) | mids are linear (2.1% delta to prev. frequency)
Highs 2 - 16 kHz
(+) | balanced highs - only 1.9% away from median
(+) | highs are linear (2.7% delta to prev. frequency)
Overall 100 - 16.000 Hz
(+) | overall sound is linear (4.6% difference to median)
Compared to same class
» 0% of all tested devices in this class were better, 0% similar, 100% worse
» The best had a delta of 5%, average was 17%, worst was 45%
Compared to all devices tested
» 0% of all tested devices were better, 0% similar, 100% worse
» The best had a delta of 4%, average was 24%, worst was 134%
能源管理
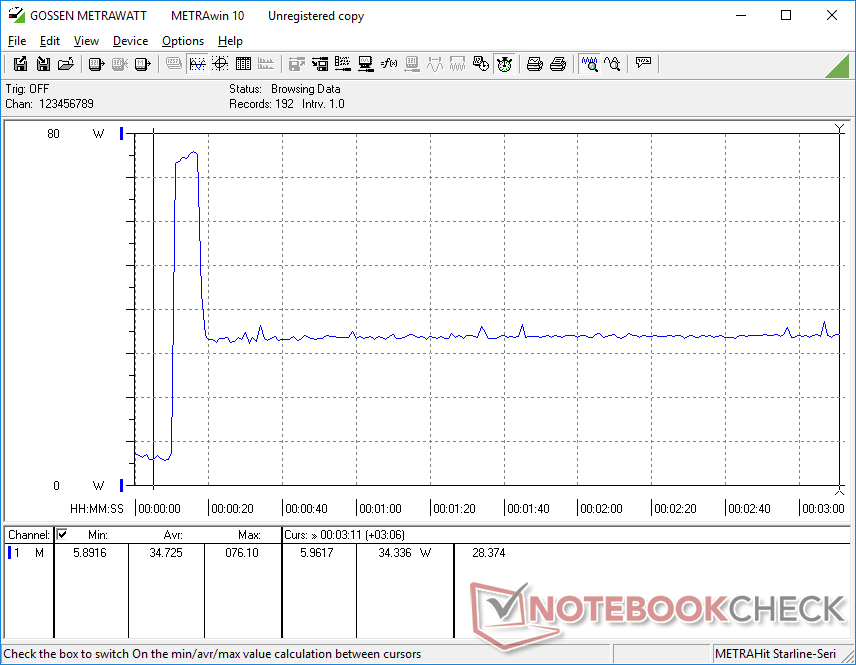
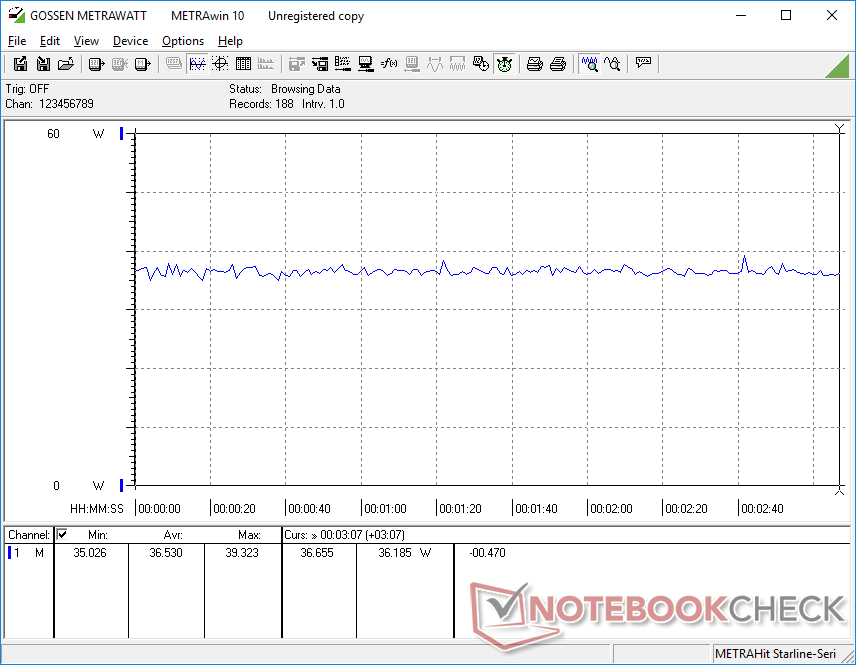
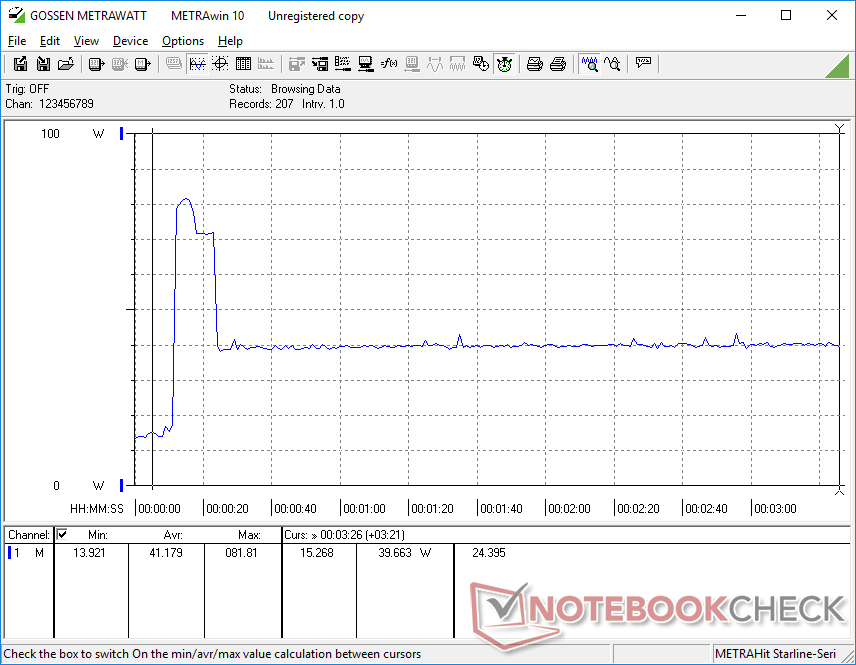
消耗功率
在桌面上空转,在最低亮度设置下会消耗约5W,如果在最高亮度设置下则高达13W。8瓦的差异高于典型的超极本,因为Getac的显示屏可以明显更亮。
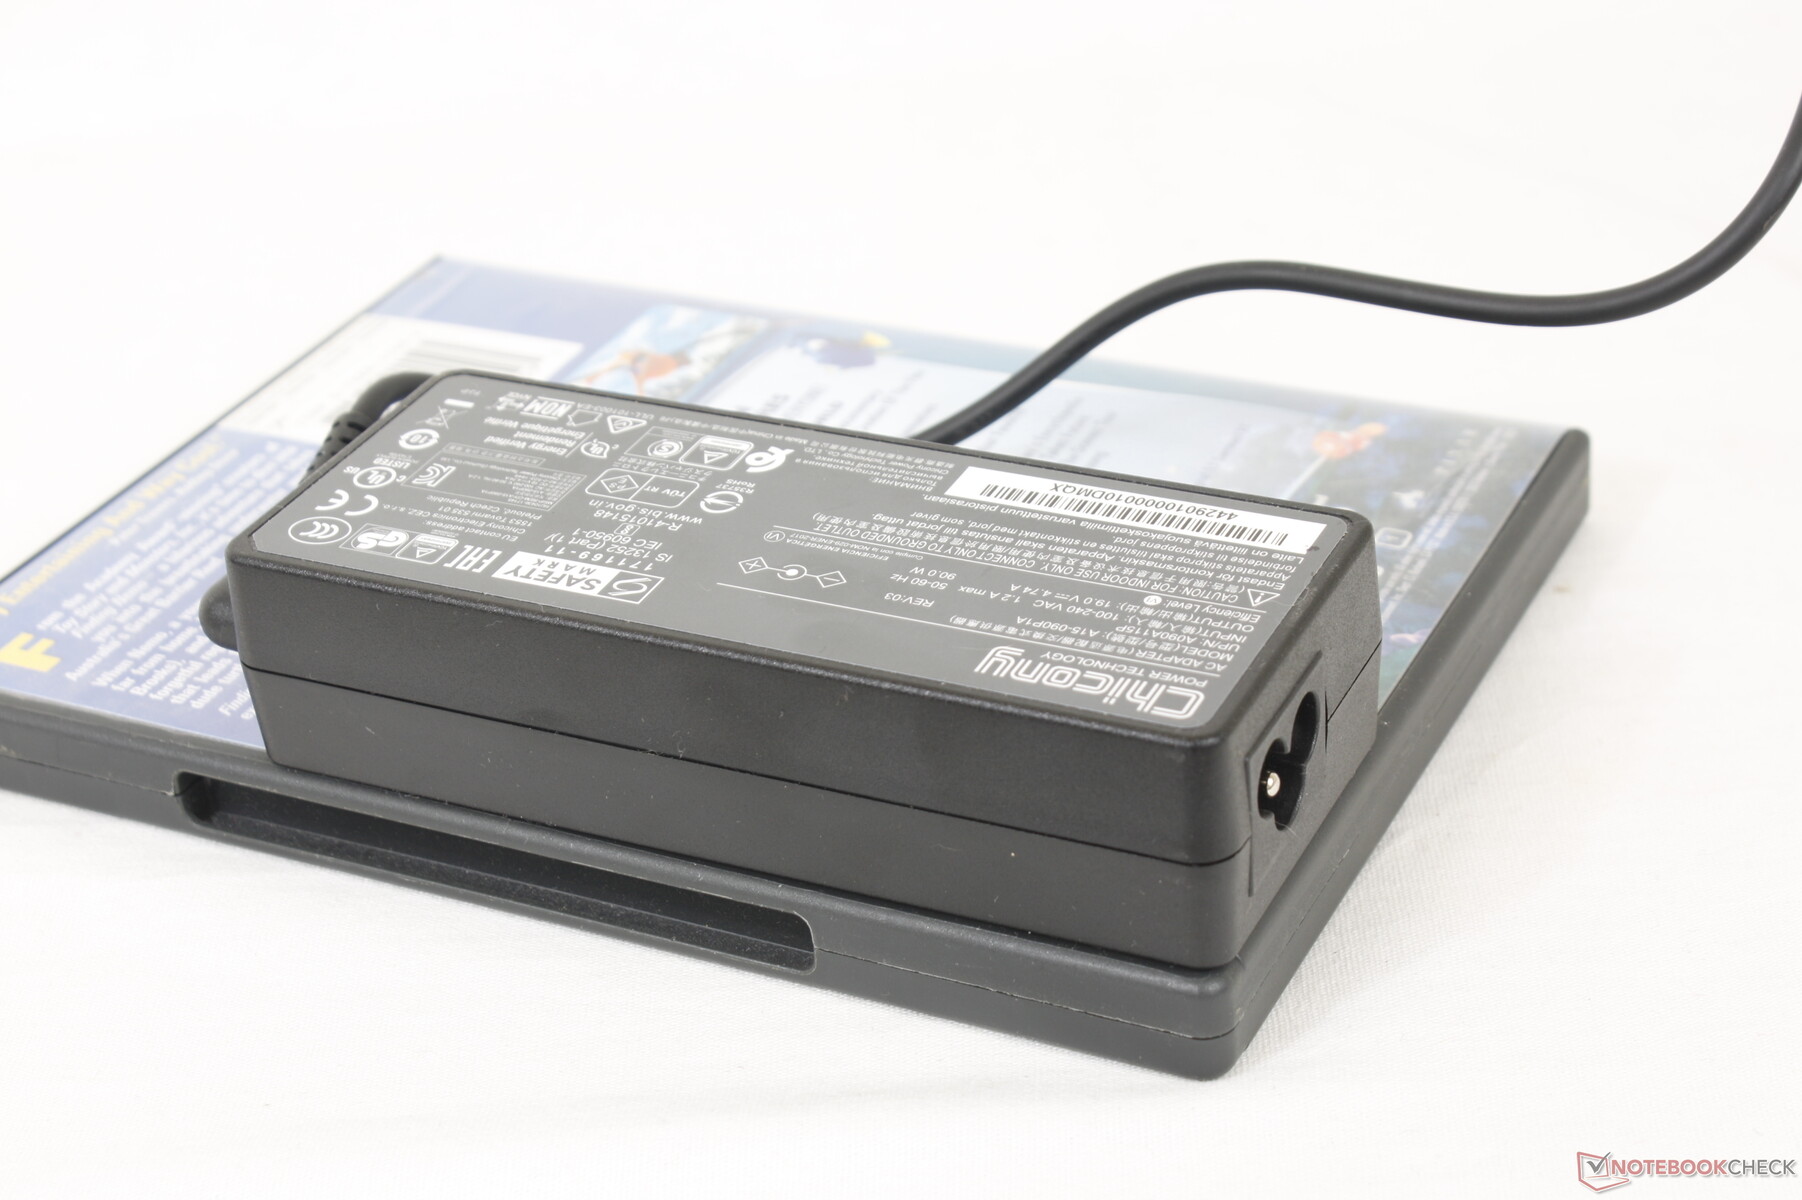
尽管我们的UHD Graphics 620有巨大的GPU劣势,但运行中等或高负载将需要约36 W至40 W,以与大多数运行在较新的第11代酷睿处理器的笔记本电脑相媲美。然而,我们很欣赏该系统配备了一个90瓦(约12.8 x 5.2 x 3厘米)的交流适配器,而许多其他采用超低电压CPU的笔记本电脑通常配备60瓦的适配器或更低。
| Off / Standby | |
| Idle | |
| Load |
|
Key:
min: | |
| Getac B360 i7-10710U, UHD Graphics 620, Lite-On CA5-8D512, IPS, 1920x1080, 13.3" | Dell Latitude 5420 Rugged-P85G i7-8650U, Radeon RX 540, SK hynix PC401 NVMe 500 GB, IPS, 1920x1080, 14" | Getac S410 i5-8550U, UHD Graphics 620, CUKUSA 1 TB SATA SSD Q0526A, TN PED, 1366x768, 14" | Acer Enduro Urban N3 EUN314 i7-1165G7, Iris Xe G7 96EUs, Samsung PM991 MZVLQ1T0HALB, IPS, 1920x1080, 14" | Panasonic Toughbook FZ-55 MK2 i7-1185G7, Iris Xe G7 96EUs, Toshiba KIOXIA KBG4AZNV512G M.2 2280 OPAL, IPS, 1920x1080, 14" | Durabook S14I i7-1165G7, Iris Xe G7 96EUs, UDinfo M2P M2P80DE512GBAEP, TN, 1920x1080, 14" | |
|---|---|---|---|---|---|---|
| Power Consumption | -31% | 28% | 26% | 2% | -17% | |
| Idle Minimum * (Watt) | 5.4 | 4.8 11% | 5.6 -4% | 3.8 30% | 3.5 35% | 6.8 -26% |
| Idle Average * (Watt) | 12.2 | 13.6 -11% | 7.9 35% | 8 34% | 10.4 15% | 16.4 -34% |
| Idle Maximum * (Watt) | 12.6 | 13.8 -10% | 8.4 33% | 8.7 31% | 10.5 17% | 16.9 -34% |
| Load Average * (Watt) | 39.1 | 67.8 -73% | 32.8 16% | 34.6 12% | 45.4 -16% | 39.2 -0% |
| Witcher 3 ultra * (Watt) | 36.5 | 69.1 -89% | 35.4 3% | 43 -18% | ||
| Load Maximum * (Watt) | 81.8 | 93.5 -14% | 34.3 58% | 45.4 44% | 99.3 -21% | 73.1 11% |
* ... smaller is better
Power Consumption Witcher 3 / Stresstest
Power Consumption external Monitor
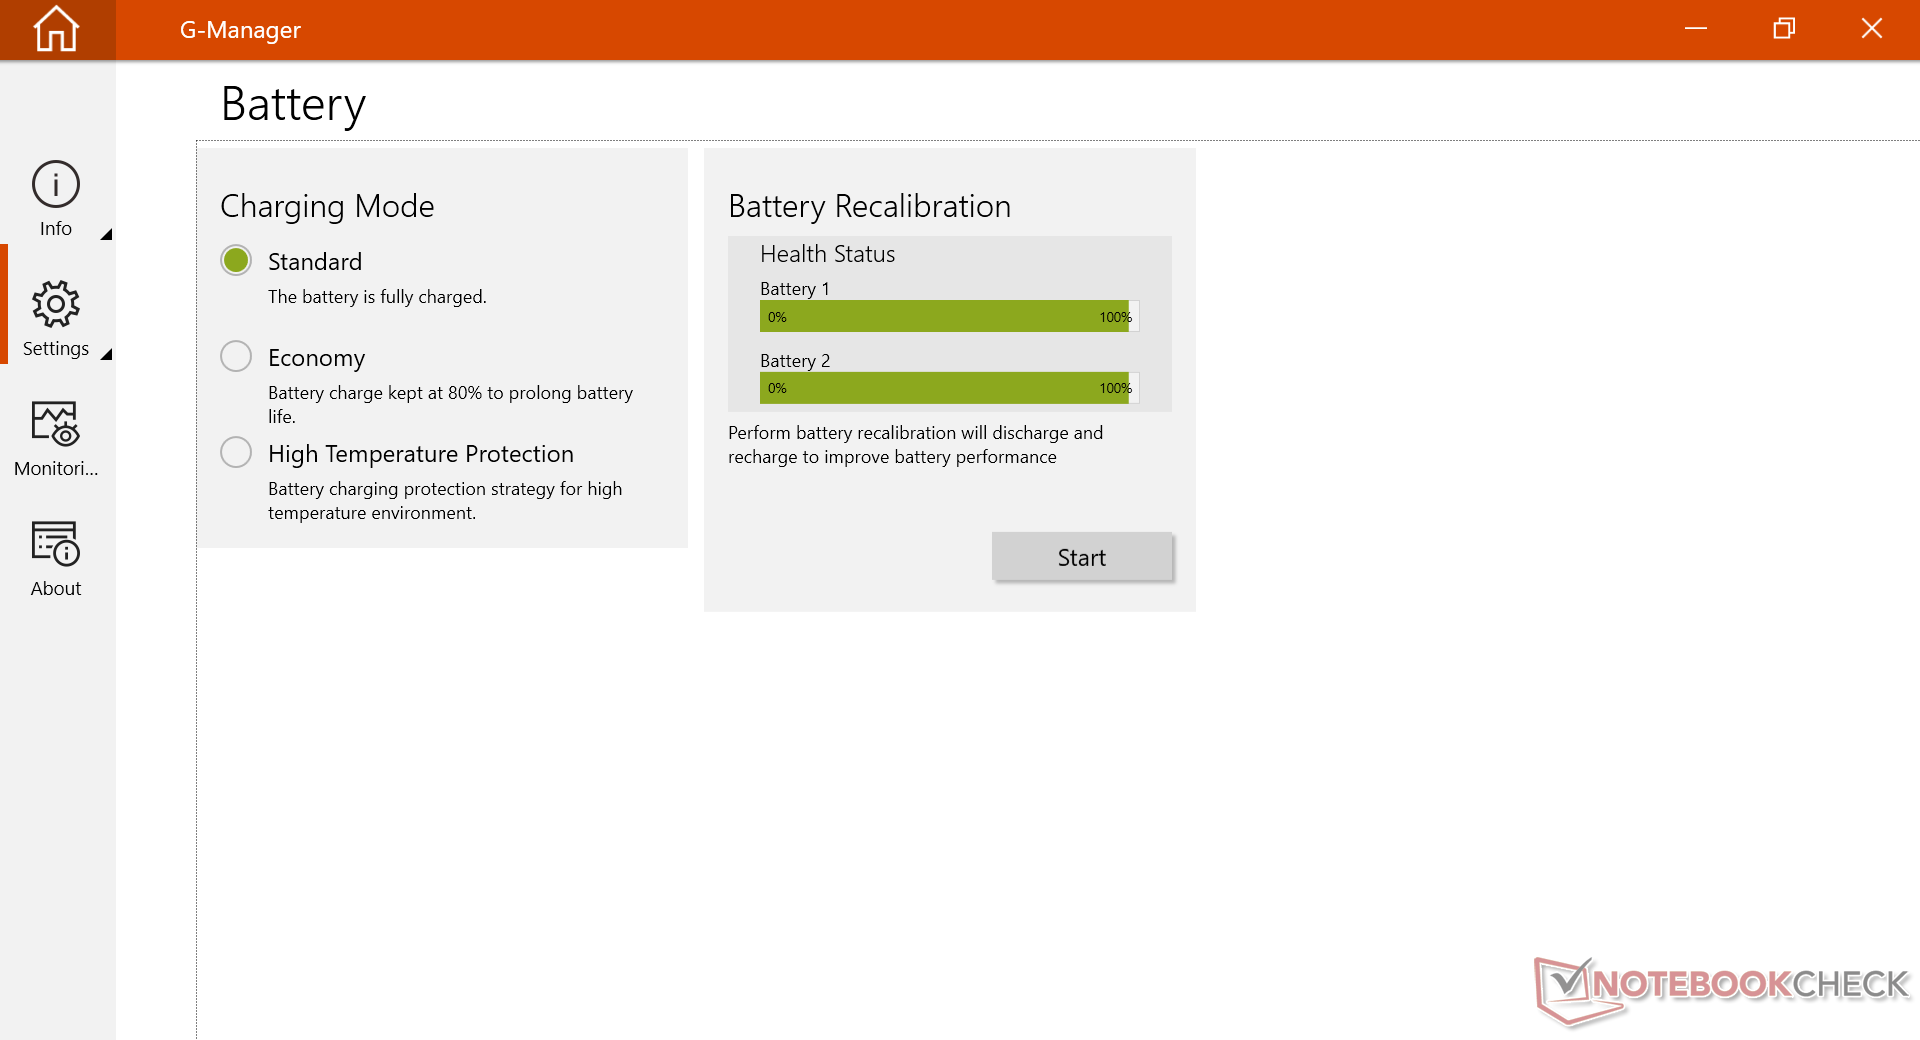
电池寿命
当两个可拆卸电池组(2 x 23 Wh)都安装后,我们能够挤出大约8小时的实际无线网络使用时间。从空电到满电的充电速度有点慢,约为2.5小时,而大多数其他笔记本电脑为1.5小时。用户也可以用第三方USB-C适配器为笔记本电脑充电。
| Getac B360 i7-10710U, UHD Graphics 620, 46 Wh | Dell Latitude 5420 Rugged-P85G i7-8650U, Radeon RX 540, 102 Wh | Getac S410 i5-8550U, UHD Graphics 620, 46.6 Wh | Acer Enduro Urban N3 EUN314 i7-1165G7, Iris Xe G7 96EUs, 50.3 Wh | Panasonic Toughbook FZ-55 MK2 i7-1185G7, Iris Xe G7 96EUs, 71 Wh | Durabook S14I i7-1165G7, Iris Xe G7 96EUs, 50 Wh | |
|---|---|---|---|---|---|---|
| Battery runtime | 100% | -36% | -21% | 68% | -32% | |
| WiFi v1.3 (h) | 8.1 | 16.2 100% | 5.2 -36% | 6.4 -21% | 13.6 68% | 5.5 -32% |
| Reader / Idle (h) | 31.4 | |||||
| Load (h) | 3.2 |
Pros
Cons
判决书
B360在一些值得注意的事情上做得很好,而其他许多坚固耐用的笔记本电脑却忽略了这一点。例如,它的显示屏具有比预期更深的色彩和更高的对比度,以获得更好的视觉体验,尽管该系统并不是为任何类型的图形编辑而设计的。触摸板在不戴手套的情况下也更加灵敏,不像Durabook S14I及其跳跃的触摸板那样。将这些与舒适的、点击式的键盘按键结合起来,你就会有一个令人满意的、无意义的用户体验,这是任何坚固耐用的设备应该追求的目标。
在亮度、色彩和对比度方面,对于一个耐用型的IPS显示屏来说,令人惊讶地好。然而,较老的英特尔第十代CPU已经开始显示其年龄。
有很多改进的余地。脉宽调制存在于所有的亮度水平上,这可能会影响对屏幕闪烁敏感的用户。端口盖的锁定和解锁非常烦人,尤其是它们在锁定后往往会自行弹出。缺乏较新的英特尔第11代CPU选项意味着用户将错过PCIe4、Thunderbolt和明显更高的每瓦性能。内存难以访问,而最大音量比预期的要小。一个更大的风扇有可能缓解运行高要求负载时的高调风扇噪音。我们完全期待最终的下一代机型能够跳到英特尔Tiger Lake ,以实现性能提升,就像在更快的Durabook S14I.或 Acer Enduro Urban N3.
价格和可用性
可直接向Getac公司申请配置和报价https://www.getac.com/intl/b360-police-rugged-laptop/.
Getac B360
- 01/10/2022 v7 (old)
Allen Ngo
Price comparison

