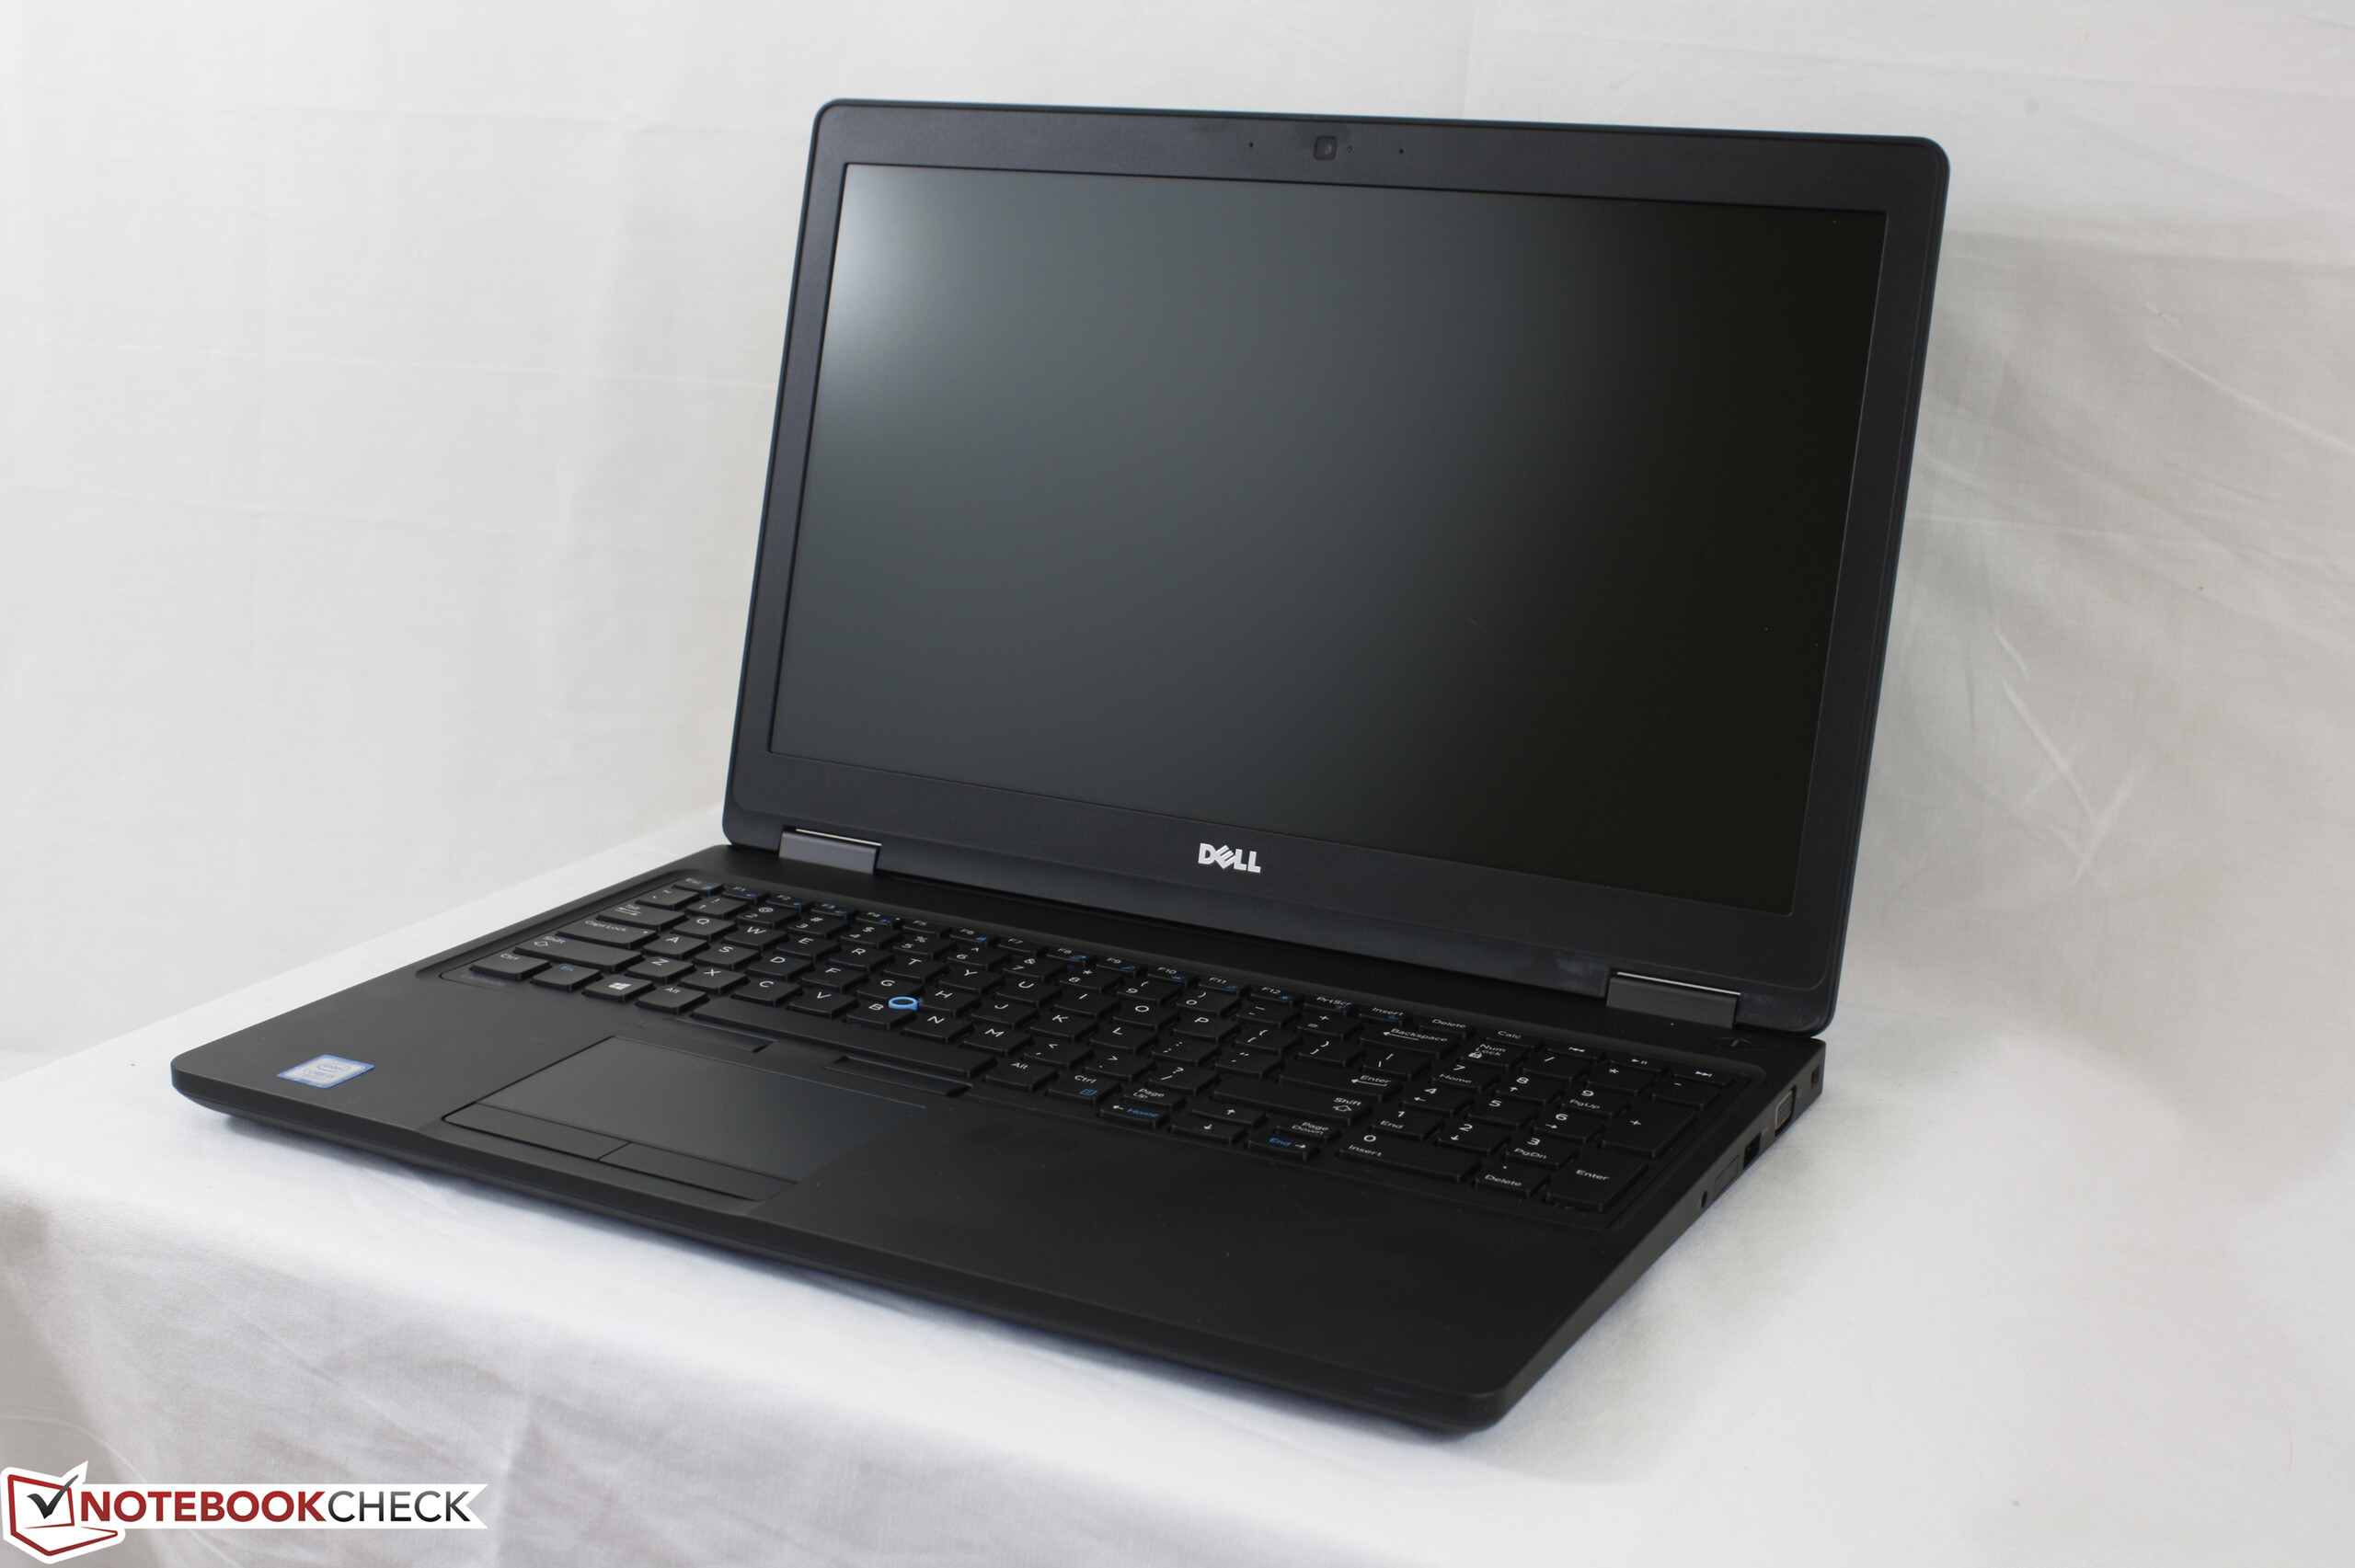
戴尔 Latitude 5580 (i5-7200U, 高清) 笔记本电脑简短评测
| SD Card Reader | |
| average JPG Copy Test (av. of 3 runs) | |
| Dell XPS 15 9560 (i7-7700HQ, UHD) | |
| Dell Latitude 5580 | |
| Lenovo ThinkPad T570-20H90002GE | |
| maximum AS SSD Seq Read Test (1GB) | |
| Dell Latitude 5580 | |
| Dell XPS 15 9560 (i7-7700HQ, UHD) | |
| Lenovo ThinkPad T570-20H90002GE | |
| Networking | |
| iperf3 transmit AX12 | |
| Asus AsusPro P4540UQ-FY0056R | |
| Lenovo ThinkPad T570-20H90002GE | |
| Dell Latitude 5580 | |
| iperf3 receive AX12 | |
| Dell Latitude 5580 | |
| Lenovo ThinkPad T570-20H90002GE | |
| Asus AsusPro P4540UQ-FY0056R | |
| |||||||||||||||||||||||||
Brightness Distribution: 83 %
Center on Battery: 238 cd/m²
Contrast: 449:1 (Black: 0.53 cd/m²)
ΔE ColorChecker Calman: 10.8 | ∀{0.5-29.43 Ø4.71}
ΔE Greyscale Calman: 12.1 | ∀{0.09-98 Ø4.96}
59.9% sRGB (Argyll 1.6.3 3D)
38.3% AdobeRGB 1998 (Argyll 1.6.3 3D)
41.5% AdobeRGB 1998 (Argyll 3D)
60% sRGB (Argyll 3D)
40.13% Display P3 (Argyll 3D)
Gamma: 2.25
CCT: 14344 K
| Dell Latitude 5580 TN LED, 15.6", 1366x768 | Lenovo ThinkPad T570-20H90002GE N156HCA-EAA, IPS, 15.6", 1920x1080 | Asus AsusPro P4540UQ-FY0056R LG Philips LP156WF6-SPB6, IPS, 15.6", 1920x1080 | Toshiba Satellite Pro R50-C-16V Toshiba, TN LED, 15.6", 1366x768 | HP Probook 650 G3 Z2W44ET AU Optronics, TN LED, 15.6", 1920x1080 | |
|---|---|---|---|---|---|
| Display | 10% | 48% | 1% | 37% | |
| Display P3 Coverage (%) | 40.13 | 44.08 10% | 63.3 58% | 40.6 1% | 55.2 38% |
| sRGB Coverage (%) | 60 | 65.6 9% | 83.6 39% | 61.2 2% | 81.1 35% |
| AdobeRGB 1998 Coverage (%) | 41.5 | 45.66 10% | 61.1 47% | 41.95 1% | 57 37% |
| Response Times | -5% | -13% | -58% | -9% | |
| Response Time Grey 50% / Grey 80% * (ms) | 30 ? | 41.6 ? -39% | 38 ? -27% | 68 ? -127% | 38 ? -27% |
| Response Time Black / White * (ms) | 29.6 ? | 20.8 ? 30% | 29 ? 2% | 26 ? 12% | 27 ? 9% |
| PWM Frequency (Hz) | 201.6 ? | 26040 ? | 21000 ? | 217 ? | 200 ? |
| Screen | 44% | 52% | 5% | 22% | |
| Brightness middle (cd/m²) | 238 | 262 10% | 276 16% | 226 -5% | 351 47% |
| Brightness (cd/m²) | 216 | 245 13% | 283 31% | 217 0% | 345 60% |
| Brightness Distribution (%) | 83 | 89 7% | 85 2% | 91 10% | 95 14% |
| Black Level * (cd/m²) | 0.53 | 0.24 55% | 0.27 49% | 0.58 -9% | 0.65 -23% |
| Contrast (:1) | 449 | 1092 143% | 1022 128% | 390 -13% | 540 20% |
| Colorchecker dE 2000 * | 10.8 | 4.5 58% | 3.92 64% | 9.84 9% | 11.02 -2% |
| Colorchecker dE 2000 max. * | 29.3 | 10.5 64% | 9.13 69% | 16.77 43% | 17.68 40% |
| Greyscale dE 2000 * | 12.1 | 3.5 71% | 2.6 79% | 11.1 8% | 13.14 -9% |
| Gamma | 2.25 98% | 2.32 95% | 2.53 87% | 2.35 94% | 2.7 81% |
| CCT | 14344 45% | 6524 100% | 6561 99% | 11979 54% | 16626 39% |
| Color Space (Percent of AdobeRGB 1998) (%) | 38.3 | 42.04 10% | 54.5 42% | 39 2% | 52 36% |
| Color Space (Percent of sRGB) (%) | 59.9 | 65.4 9% | 83.7 40% | 61 2% | 81 35% |
| Total Average (Program / Settings) | 16% /
31% | 29% /
43% | -17% /
-4% | 17% /
21% |
* ... smaller is better
Display Response Times
| ↔ Response Time Black to White | ||
|---|---|---|
| 29.6 ms ... rise ↗ and fall ↘ combined | ↗ 21.2 ms rise | 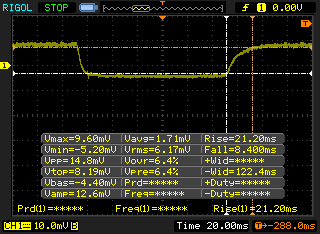 |
| ↘ 8.4 ms fall | ||
| The screen shows relatively slow response rates in our tests and may be too slow for gamers. In comparison, all tested devices range from 0.1 (minimum) to 240 (maximum) ms. » 79 % of all devices are better. This means that the measured response time is worse than the average of all tested devices (19.8 ms). | ||
| ↔ Response Time 50% Grey to 80% Grey | ||
| 30 ms ... rise ↗ and fall ↘ combined | ↗ 19.2 ms rise | 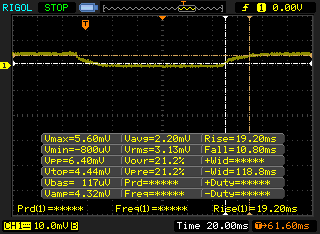 |
| ↘ 10.8 ms fall | ||
| The screen shows slow response rates in our tests and will be unsatisfactory for gamers. In comparison, all tested devices range from 0.165 (minimum) to 636 (maximum) ms. » 40 % of all devices are better. This means that the measured response time is similar to the average of all tested devices (31 ms). | ||
Screen Flickering / PWM (Pulse-Width Modulation)
| Screen flickering / PWM detected | 201.6 Hz | ≤ 99 % brightness setting | 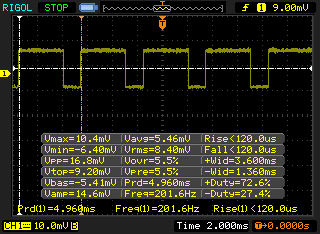 |
The display backlight flickers at 201.6 Hz (worst case, e.g., utilizing PWM) Flickering detected at a brightness setting of 99 % and below. There should be no flickering or PWM above this brightness setting. The frequency of 201.6 Hz is relatively low, so sensitive users will likely notice flickering and experience eyestrain at the stated brightness setting and below. In comparison: 52 % of all tested devices do not use PWM to dim the display. If PWM was detected, an average of 7757 (minimum: 5 - maximum: 343500) Hz was measured. | |||
| wPrime 2.10 - 1024m | |
| Lenovo Thinkpad 13-20J1001BUS | |
| Dell Latitude 7480 | |
| Dell Latitude 5580 | |
| Lenovo ThinkPad T470s-20HF0012US | |
| Apple MacBook Pro 15 2016 (2.7 GHz, 455) | |
* ... smaller is better
| PCMark 8 Home Score Accelerated v2 | 3345 points | |
| PCMark 8 Creative Score Accelerated v2 | 3942 points | |
| PCMark 8 Work Score Accelerated v2 | 4390 points | |
Help | ||
| Dell Latitude 5580 Seagate ST500LM021-1KJ15 | Lenovo ThinkPad T570-20H90002GE Samsung PM961 MZVLW256HEHP | Asus AsusPro P4540UQ-FY0056R SK Hynix HFS256G39TND-N210A | Toshiba Satellite Pro R50-C-16V TOSHIBA MQ01ABD075 | HP ProBook 650 G3 Z2N47EA Samsung SSD 850 EVO 250GB | |
|---|---|---|---|---|---|
| CrystalDiskMark 3.0 | 16541% | 10100% | -30% | 7088% | |
| Read Seq (MB/s) | 132.3 | 1318 896% | 498.4 277% | 96.5 -27% | 506 282% |
| Write Seq (MB/s) | 131.1 | 1166 789% | 257.1 96% | 77.9 -41% | 475.2 262% |
| Read 512 (MB/s) | 27.04 | 933 3350% | 309.3 1044% | 20.82 -23% | 435.9 1512% |
| Write 512 (MB/s) | 56.6 | 860 1419% | 264.2 367% | 19.83 -65% | 367.2 549% |
| Read 4k (MB/s) | 0.459 | 56.6 12231% | 30.6 6567% | 0.342 -25% | 41.78 9002% |
| Write 4k (MB/s) | 0.812 | 130.6 15984% | 77.3 9420% | 0.836 3% | 86.1 10503% |
| Read 4k QD32 (MB/s) | 1.1 | 510 46264% | 357.4 32391% | 0.595 -46% | 263.2 23827% |
| Write 4k QD32 (MB/s) | 0.828 | 426.4 51398% | 254.5 30637% | 0.706 -15% | 90 10770% |

| 3DMark 11 | |
| 1280x720 Performance GPU | |
| Dell Latitude 12 5285 2-in-1 | |
| Lenovo ThinkPad T470s-20HF0012US | |
| Dell Latitude 5480 N005L548014EMEA | |
| Lenovo Miix 510 Pro 80U10006GE | |
| Dell Latitude 5580 | |
| Toshiba Portege Z20t-C-121 | |
| Asus Vivobook F556UQ-XO626D | |
| Asus PU551LA-XO359G | |
| Acer Aspire One Cloudbook 14 AO1-431-C6QM | |
| 1280x720 Performance Combined | |
| Dell Latitude 5480 N005L548014EMEA | |
| Lenovo ThinkPad T470s-20HF0012US | |
| Dell Latitude 12 5285 2-in-1 | |
| Lenovo Miix 510 Pro 80U10006GE | |
| Asus Vivobook F556UQ-XO626D | |
| Dell Latitude 5580 | |
| Asus PU551LA-XO359G | |
| Toshiba Portege Z20t-C-121 | |
| Acer Aspire One Cloudbook 14 AO1-431-C6QM | |
| 3DMark | |
| 1280x720 Cloud Gate Standard Graphics | |
| Dell Latitude 12 5285 2-in-1 | |
| Dell Latitude 5480 N005L548014EMEA | |
| Lenovo ThinkPad T470s-20HF0012US | |
| Lenovo Miix 510 Pro 80U10006GE | |
| Dell Latitude 5580 | |
| Asus Vivobook F556UQ-XO626D | |
| Acer Aspire One Cloudbook 14 AO1-431-C6QM | |
| 1920x1080 Fire Strike Graphics | |
| Dell Latitude 12 5285 2-in-1 | |
| Dell Latitude 5480 N005L548014EMEA | |
| Lenovo ThinkPad T470s-20HF0012US | |
| Dell Latitude 5580 | |
| Asus PU551LA-XO359G | |
| Asus Vivobook F556UQ-XO626D | |
| Acer Aspire One Cloudbook 14 AO1-431-C6QM | |
| 1280x720 Ice Storm Standard Graphics | |
| Dell Latitude 5480 N005L548014EMEA | |
| Lenovo ThinkPad T470s-20HF0012US | |
| Asus Vivobook F556UQ-XO626D | |
| Asus PU551LA-XO359G | |
| Dell Latitude 5580 | |
| Acer Aspire One Cloudbook 14 AO1-431-C6QM | |
| Dell Latitude 12 5285 2-in-1 | |
| 1920x1080 Ice Storm Extreme Graphics | |
| Dell Latitude 5480 N005L548014EMEA | |
| Dell Latitude 12 5285 2-in-1 | |
| Dell Latitude 5580 | |
| Asus PU551LA-XO359G | |
| Asus Vivobook F556UQ-XO626D | |
| 3DMark 11 Performance | 1354 points | |
| 3DMark Ice Storm Standard Score | 47545 points | |
| 3DMark Cloud Gate Standard Score | 5273 points | |
| 3DMark Fire Strike Score | 621 points | |
Help | ||
| low | med. | high | ultra | |
|---|---|---|---|---|
| BioShock Infinite (2013) | 52 | 29 | ||
| Rise of the Tomb Raider (2016) | 19.1 | 11.2 |
Noise level
| Idle |
| 32.6 / 32.6 / 32.8 dB(A) |
| HDD |
| 33.2 dB(A) |
| Load |
| 33.5 / 34.7 dB(A) |
 | ||
30 dB silent 40 dB(A) audible 50 dB(A) loud |
||
min: | ||
| Dell Latitude 5580 HD Graphics 620, i5-7200U, Seagate ST500LM021-1KJ15 | Lenovo ThinkPad T570-20H90002GE HD Graphics 620, i5-7200U, Samsung PM961 MZVLW256HEHP | Asus AsusPro P4540UQ-FY0056R GeForce 940MX, i5-7200U, SK Hynix HFS256G39TND-N210A | Toshiba Satellite Pro R50-C-16V HD Graphics 520, 6006U, TOSHIBA MQ01ABD075 | HP ProBook 650 G3 Z2N47EA HD Graphics 620, i5-7200U, Samsung SSD 850 EVO 250GB | |
|---|---|---|---|---|---|
| Noise | 1% | 0% | 2% | -7% | |
| off / environment * (dB) | 28.2 | 29.3 -4% | 30.3 -7% | 30.4 -8% | |
| Idle Minimum * (dB) | 32.6 | 29.3 10% | 30.3 7% | 31.8 2% | 32.5 -0% |
| Idle Average * (dB) | 32.6 | 29.3 10% | 30.3 7% | 31.8 2% | 33.1 -2% |
| Idle Maximum * (dB) | 32.8 | 31.2 5% | 30.3 8% | 31.8 3% | 33.7 -3% |
| Load Average * (dB) | 33.5 | 35.1 -5% | 35.4 -6% | 31.9 5% | 37 -10% |
| Load Maximum * (dB) | 34.7 | 38.7 -12% | 37.2 -7% | 31.8 8% | 42.5 -22% |
* ... smaller is better
(+) The maximum temperature on the upper side is 36.2 °C / 97 F, compared to the average of 34.3 °C / 94 F, ranging from 21.2 to 62.5 °C for the class Office.
(-) The bottom heats up to a maximum of 45.6 °C / 114 F, compared to the average of 36.8 °C / 98 F
(+) In idle usage, the average temperature for the upper side is 25 °C / 77 F, compared to the device average of 29.5 °C / 85 F.
(+) The palmrests and touchpad are cooler than skin temperature with a maximum of 27.2 °C / 81 F and are therefore cool to the touch.
(±) The average temperature of the palmrest area of similar devices was 27.5 °C / 81.5 F (+0.3 °C / 0.5 F).
Dell Latitude 5580 audio analysis
(-) | not very loud speakers (70.2 dB)
Bass 100 - 315 Hz
(±) | reduced bass - on average 12.5% lower than median
(±) | linearity of bass is average (10.4% delta to prev. frequency)
Mids 400 - 2000 Hz
(+) | balanced mids - only 4.6% away from median
(±) | linearity of mids is average (8.9% delta to prev. frequency)
Highs 2 - 16 kHz
(±) | higher highs - on average 5.1% higher than median
(±) | linearity of highs is average (9.9% delta to prev. frequency)
Overall 100 - 16.000 Hz
(±) | linearity of overall sound is average (24.6% difference to median)
Compared to same class
» 73% of all tested devices in this class were better, 7% similar, 20% worse
» The best had a delta of 7%, average was 21%, worst was 53%
Compared to all devices tested
» 75% of all tested devices were better, 5% similar, 20% worse
» The best had a delta of 4%, average was 23%, worst was 134%
Apple MacBook 12 (Early 2016) 1.1 GHz audio analysis
(+) | speakers can play relatively loud (83.6 dB)
Bass 100 - 315 Hz
(±) | reduced bass - on average 11.3% lower than median
(±) | linearity of bass is average (14.2% delta to prev. frequency)
Mids 400 - 2000 Hz
(+) | balanced mids - only 2.4% away from median
(+) | mids are linear (5.5% delta to prev. frequency)
Highs 2 - 16 kHz
(+) | balanced highs - only 2% away from median
(+) | highs are linear (4.5% delta to prev. frequency)
Overall 100 - 16.000 Hz
(+) | overall sound is linear (10.2% difference to median)
Compared to same class
» 7% of all tested devices in this class were better, 2% similar, 90% worse
» The best had a delta of 5%, average was 18%, worst was 53%
Compared to all devices tested
» 5% of all tested devices were better, 1% similar, 94% worse
» The best had a delta of 4%, average was 23%, worst was 134%
| Off / Standby | |
| Idle | |
| Load |
|
Key:
min: | |
| Dell Latitude 5580 i5-7200U, HD Graphics 620, Seagate ST500LM021-1KJ15, TN LED, 1366x768, 15.6" | Lenovo ThinkPad T570-20H90002GE i5-7200U, HD Graphics 620, Samsung PM961 MZVLW256HEHP, IPS, 1920x1080, 15.6" | Asus AsusPro P4540UQ-FY0056R i5-7200U, GeForce 940MX, SK Hynix HFS256G39TND-N210A, IPS, 1920x1080, 15.6" | Toshiba Satellite Pro R50-C-16V 6006U, HD Graphics 520, TOSHIBA MQ01ABD075, TN LED, 1366x768, 15.6" | HP ProBook 650 G3 Z2N47EA i5-7200U, HD Graphics 620, Samsung SSD 850 EVO 250GB, podświetlanie diodami LED, 1920x1080, 15.6" | |
|---|---|---|---|---|---|
| Power Consumption | -18% | -54% | -16% | -40% | |
| Idle Minimum * (Watt) | 3.5 | 3.6 -3% | 4.9 -40% | 6 -71% | 7 -100% |
| Idle Average * (Watt) | 6 | 7.7 -28% | 8.1 -35% | 8.7 -45% | 9.2 -53% |
| Idle Maximum * (Watt) | 7.3 | 8.2 -12% | 9.4 -29% | 9.2 -26% | 10.3 -41% |
| Load Average * (Watt) | 30.8 | 30.8 -0% | 50 -62% | 18.6 40% | 25.8 16% |
| Load Maximum * (Watt) | 31 | 46.1 -49% | 63.7 -105% | 23.8 23% | 37.5 -21% |
* ... smaller is better
| Dell Latitude 5580 i5-7200U, HD Graphics 620, 68 Wh | Lenovo ThinkPad T570-20H90002GE i5-7200U, HD Graphics 620, 56 Wh | Asus AsusPro P4540UQ-FY0056R i5-7200U, GeForce 940MX, 72 Wh | Toshiba Satellite Pro R50-C-16V 6006U, HD Graphics 520, 44 Wh | HP Probook 650 G3 Z2W44ET i5-7200U, HD Graphics 620, 48 Wh | |
|---|---|---|---|---|---|
| Battery runtime | 9% | -1% | -49% | -9% | |
| Reader / Idle (h) | 18.4 | 19.5 6% | 12.8 -30% | ||
| WiFi v1.3 (h) | 11.6 | 7.6 -34% | 11.5 -1% | 5.9 -49% | 7.8 -33% |
| Load (h) | 2.2 | 3.4 55% | 3 36% |
Pros
Cons
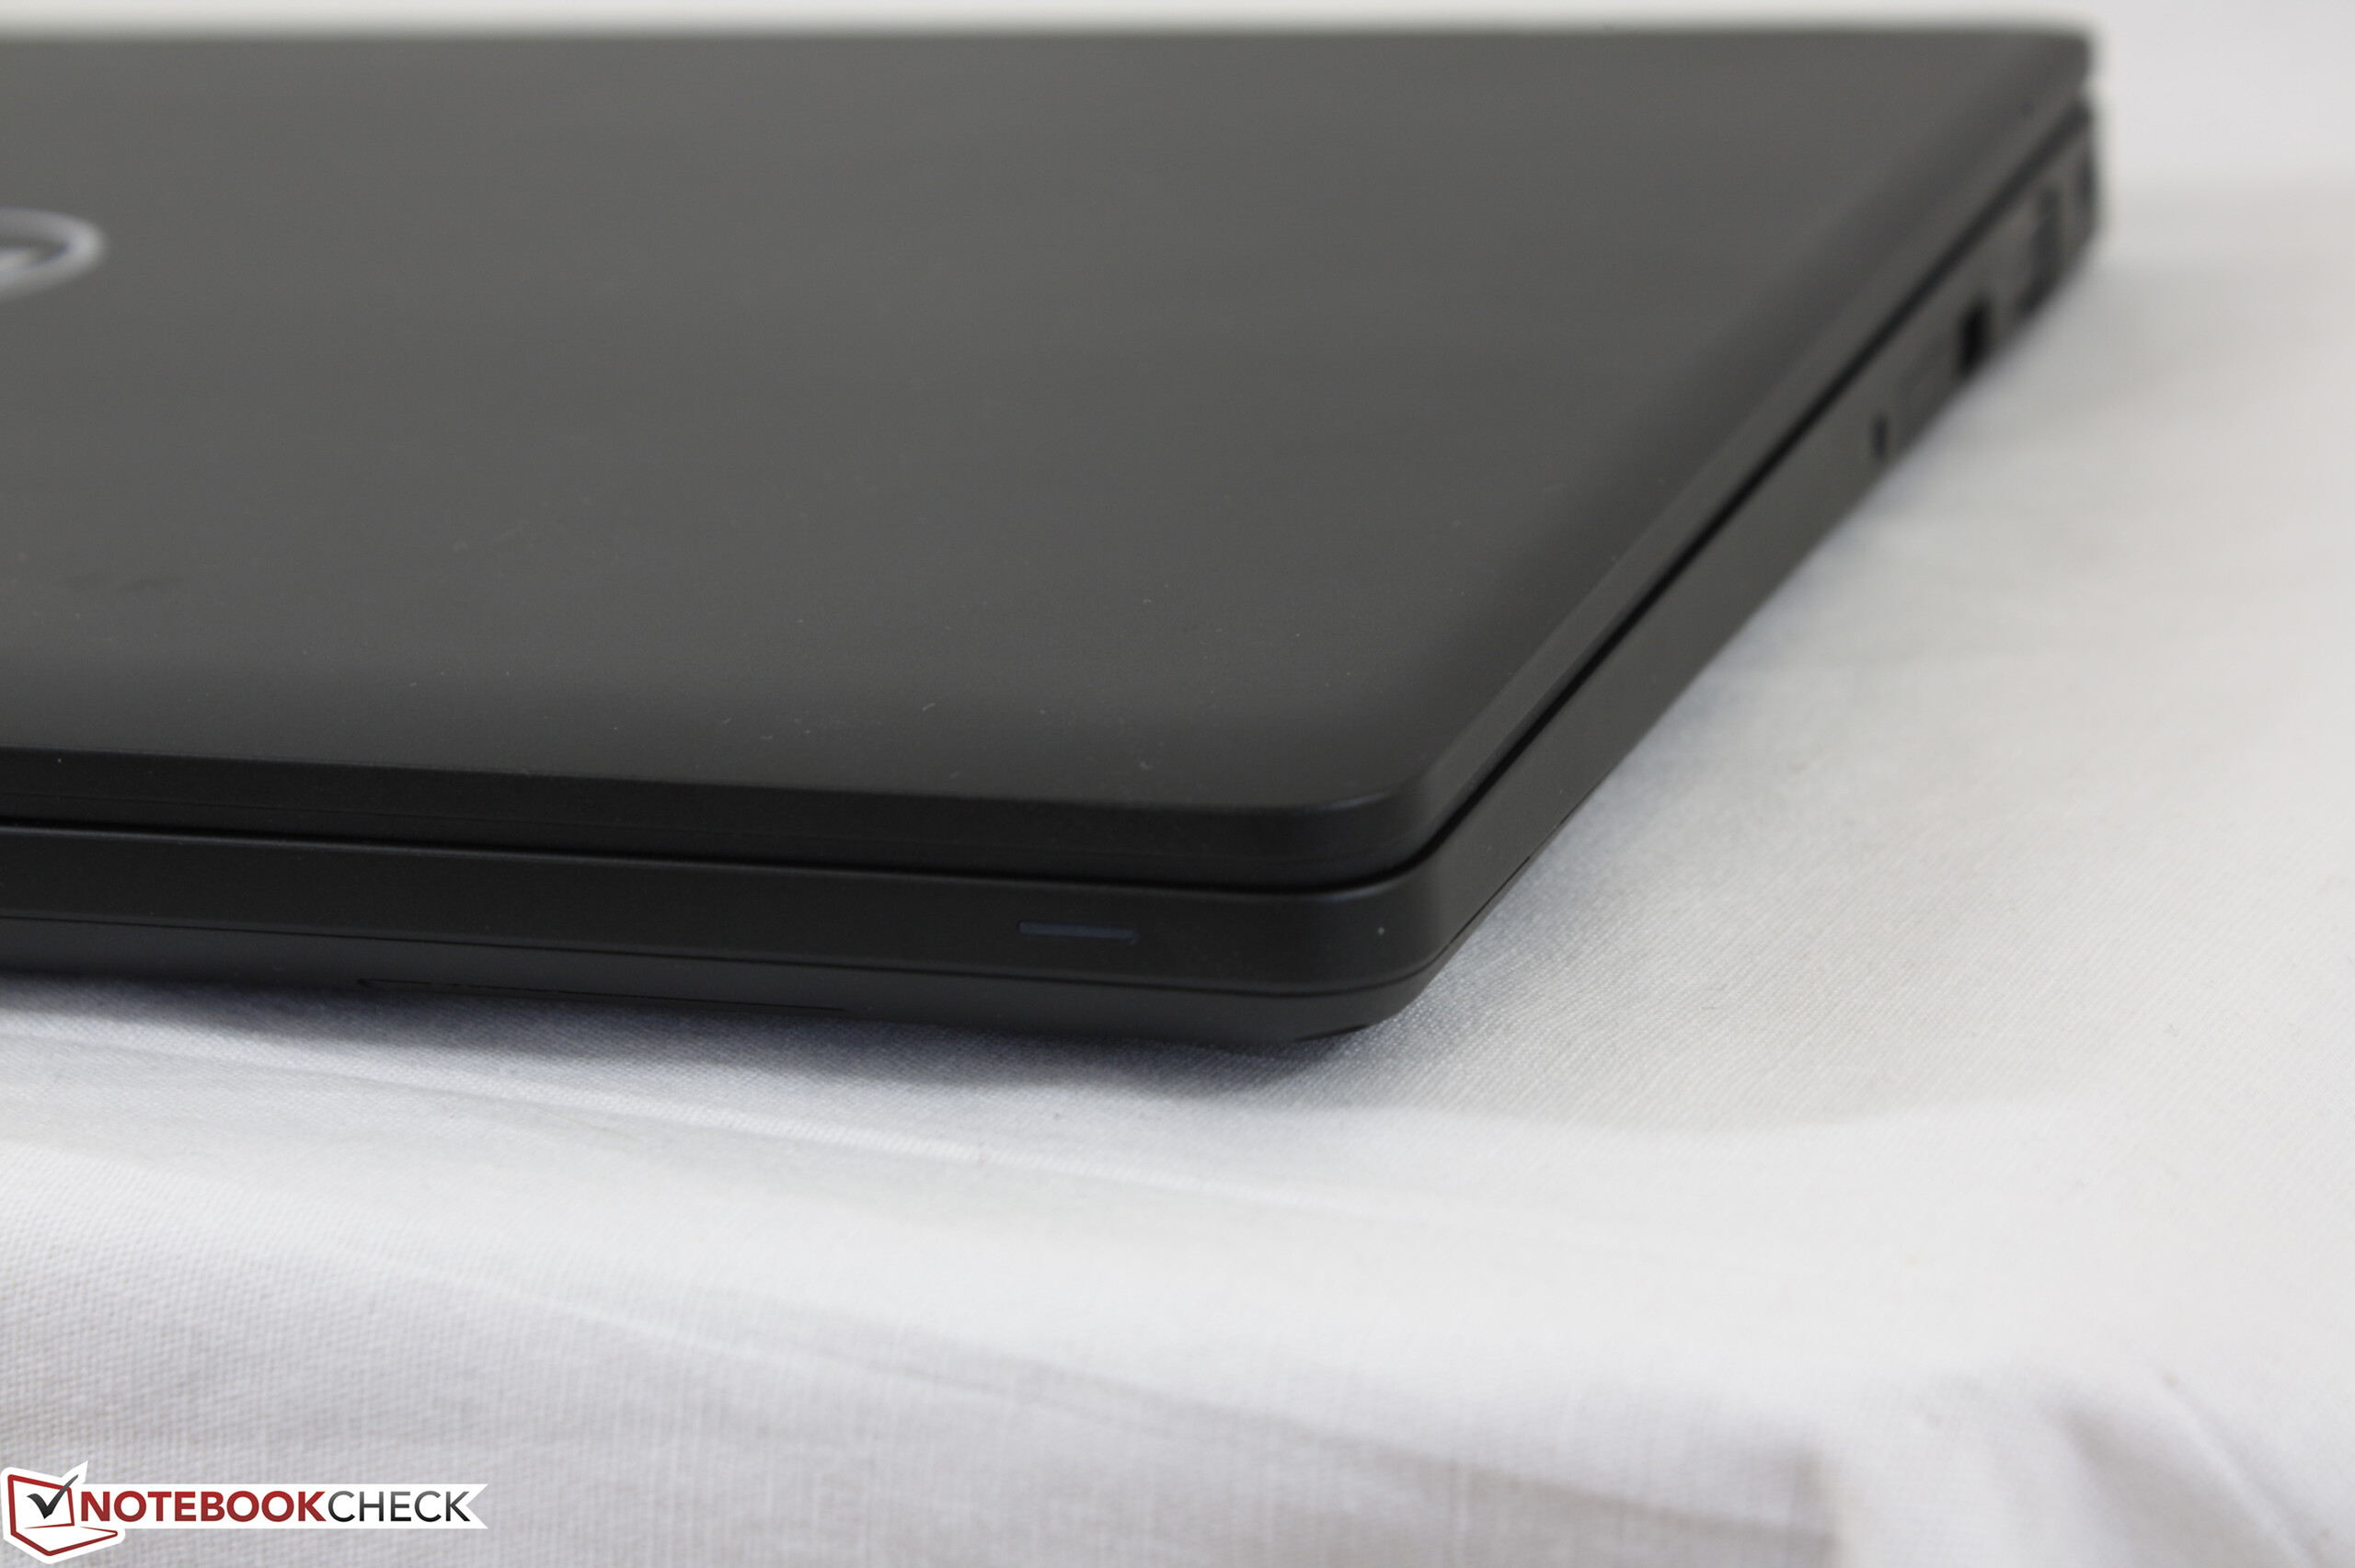
对比我们现有的对于E5550 / E5570的评测,Latitude 5580并没有什么特别之处。其电池续航长,维护方便,配置选择范围广泛,Linux认证且键盘舒适。对于大多数类型的办公工作,该机是一个有吸引力而且多功能的商务笔记本。
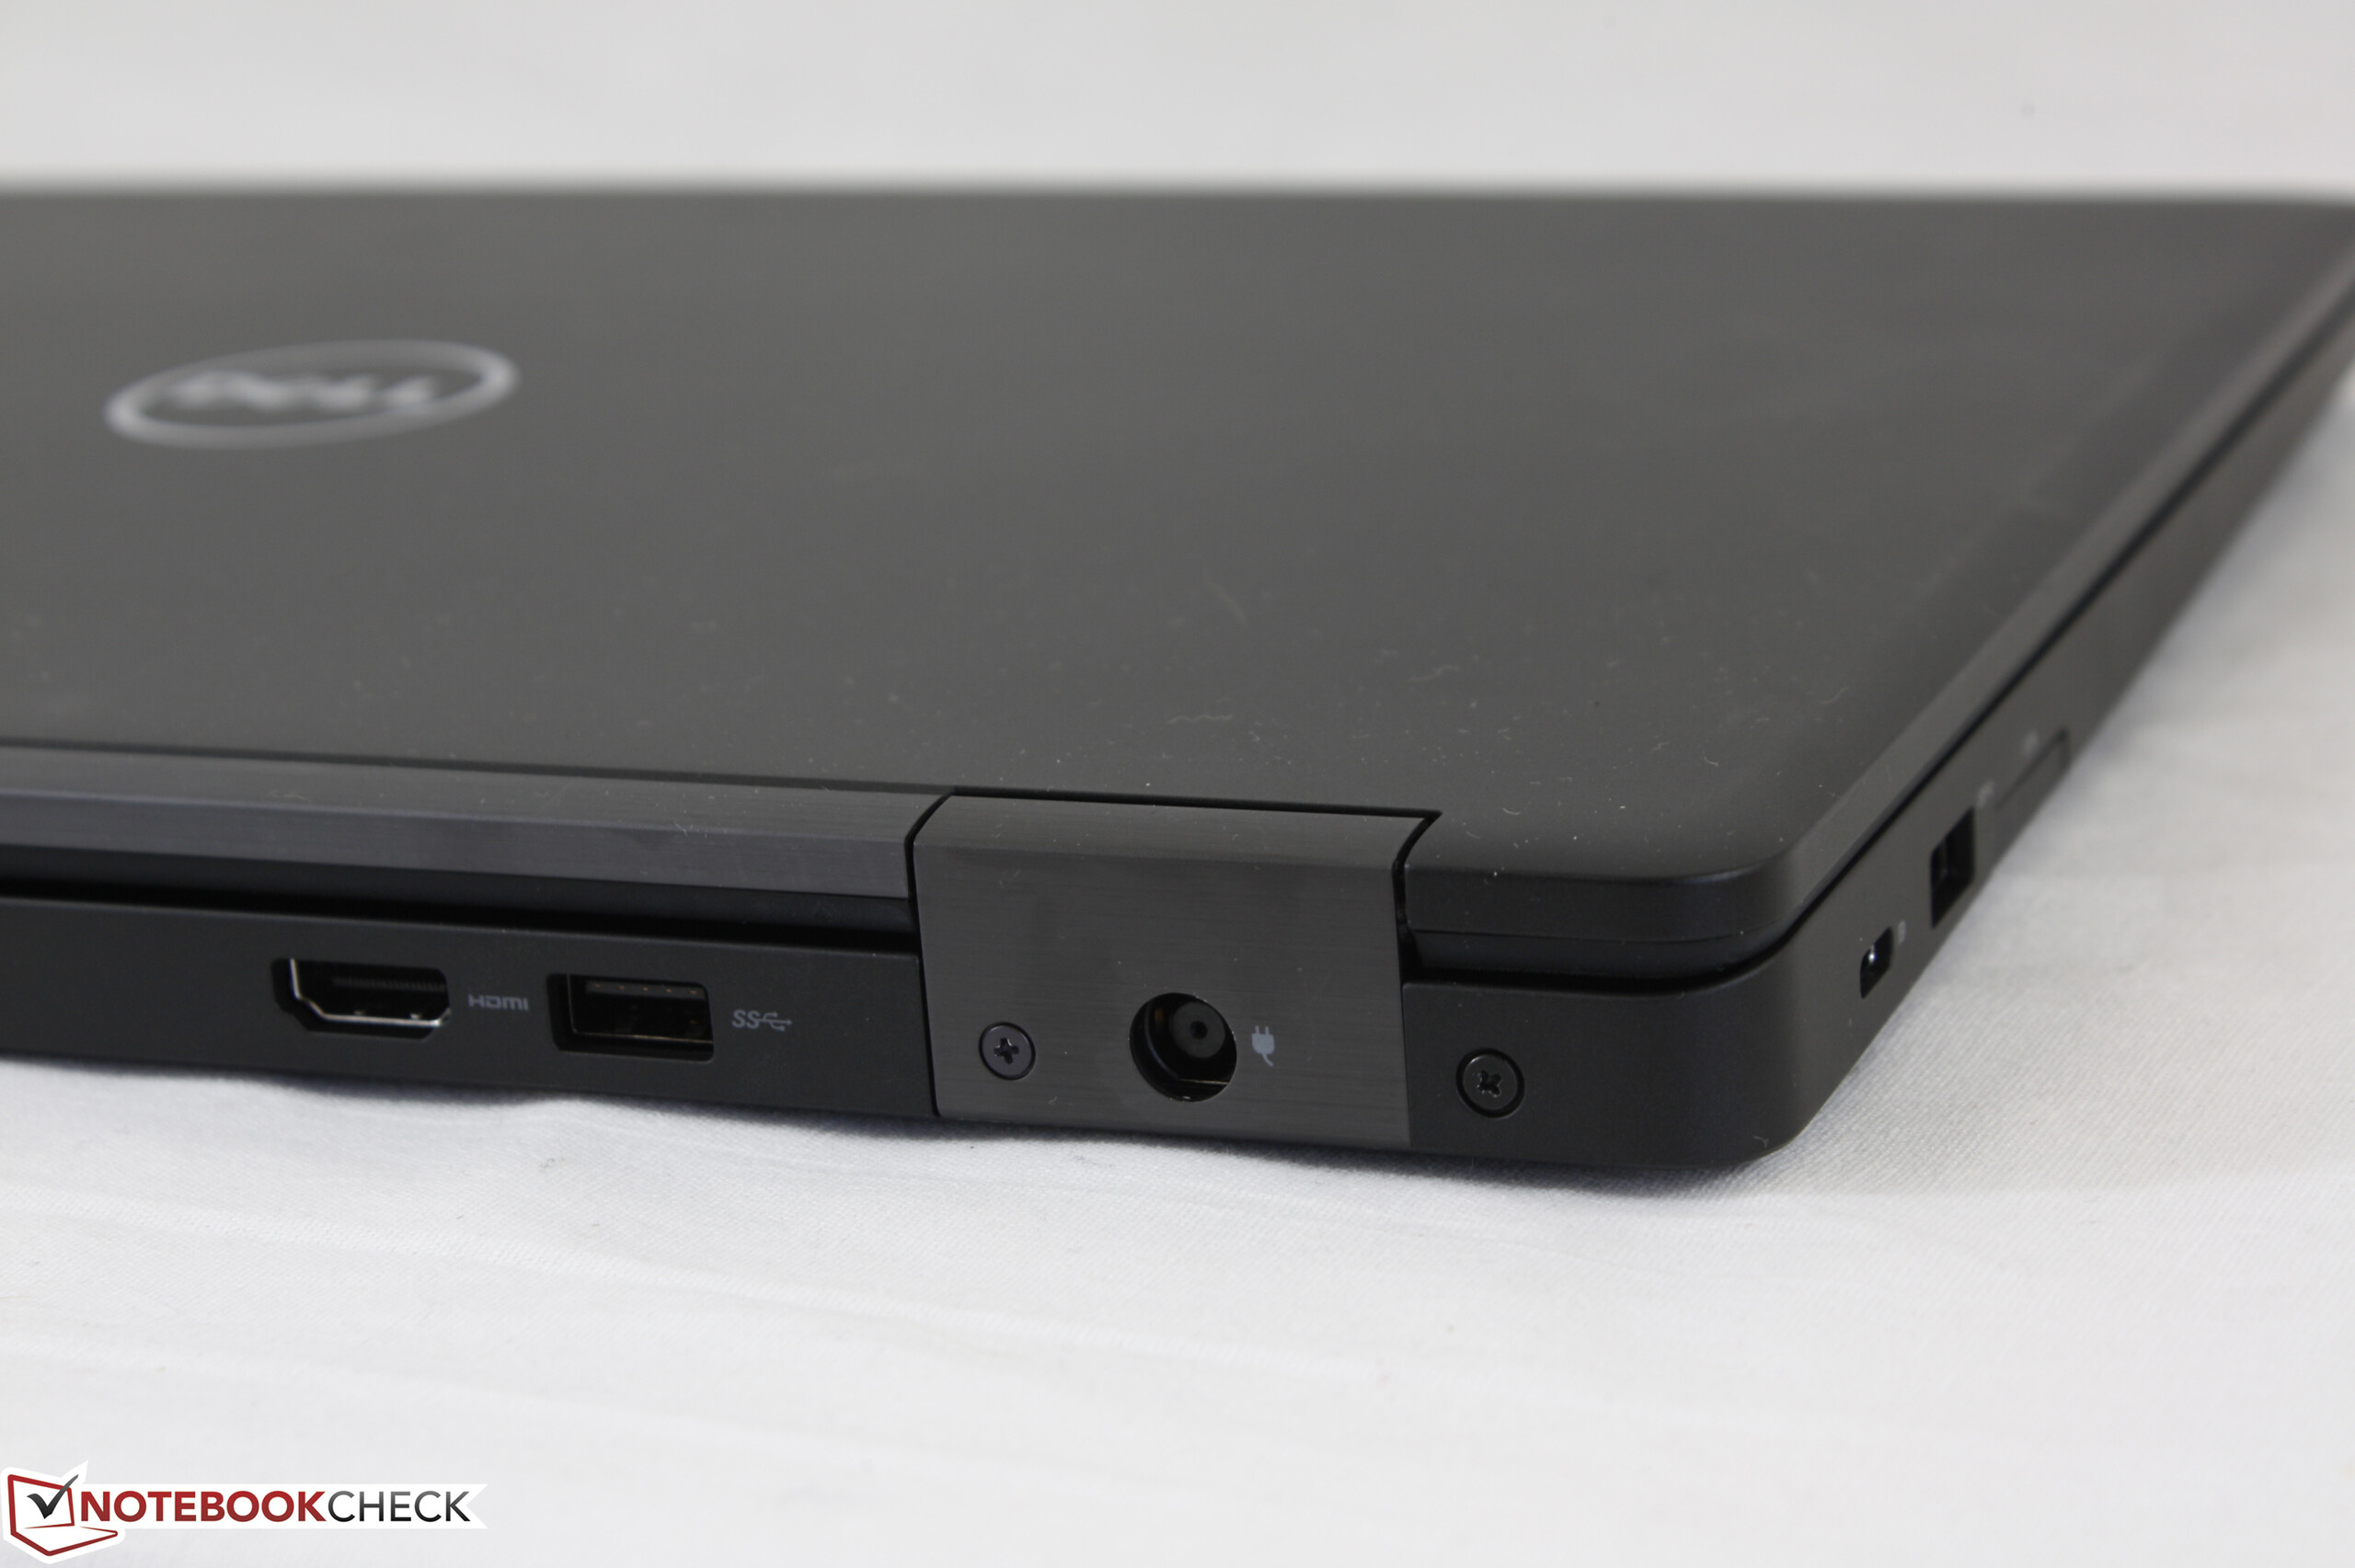
价格是5580的主要考虑因素。虽然像我们这样的入门级配置可以在起步价是700美元左右,但诸如智能卡读卡器,雷电3,WWAN,NFC和指纹识别等可贵功能将使起步价格突破1000美元。此外,我们建议避免可怕的高清显示屏配置,而是选购全高清版本,但是全高清版本的底价是1100美元。配置更快的HQ级处理器起价为1000美元,同时只包括4 GB的运行内存,以及上述的高清显示器,甚至不包括固态硬盘。为了充分利用Latitude 5580所提供的功能,用户需准备支付比阉割的入门级配置机更多的费用。
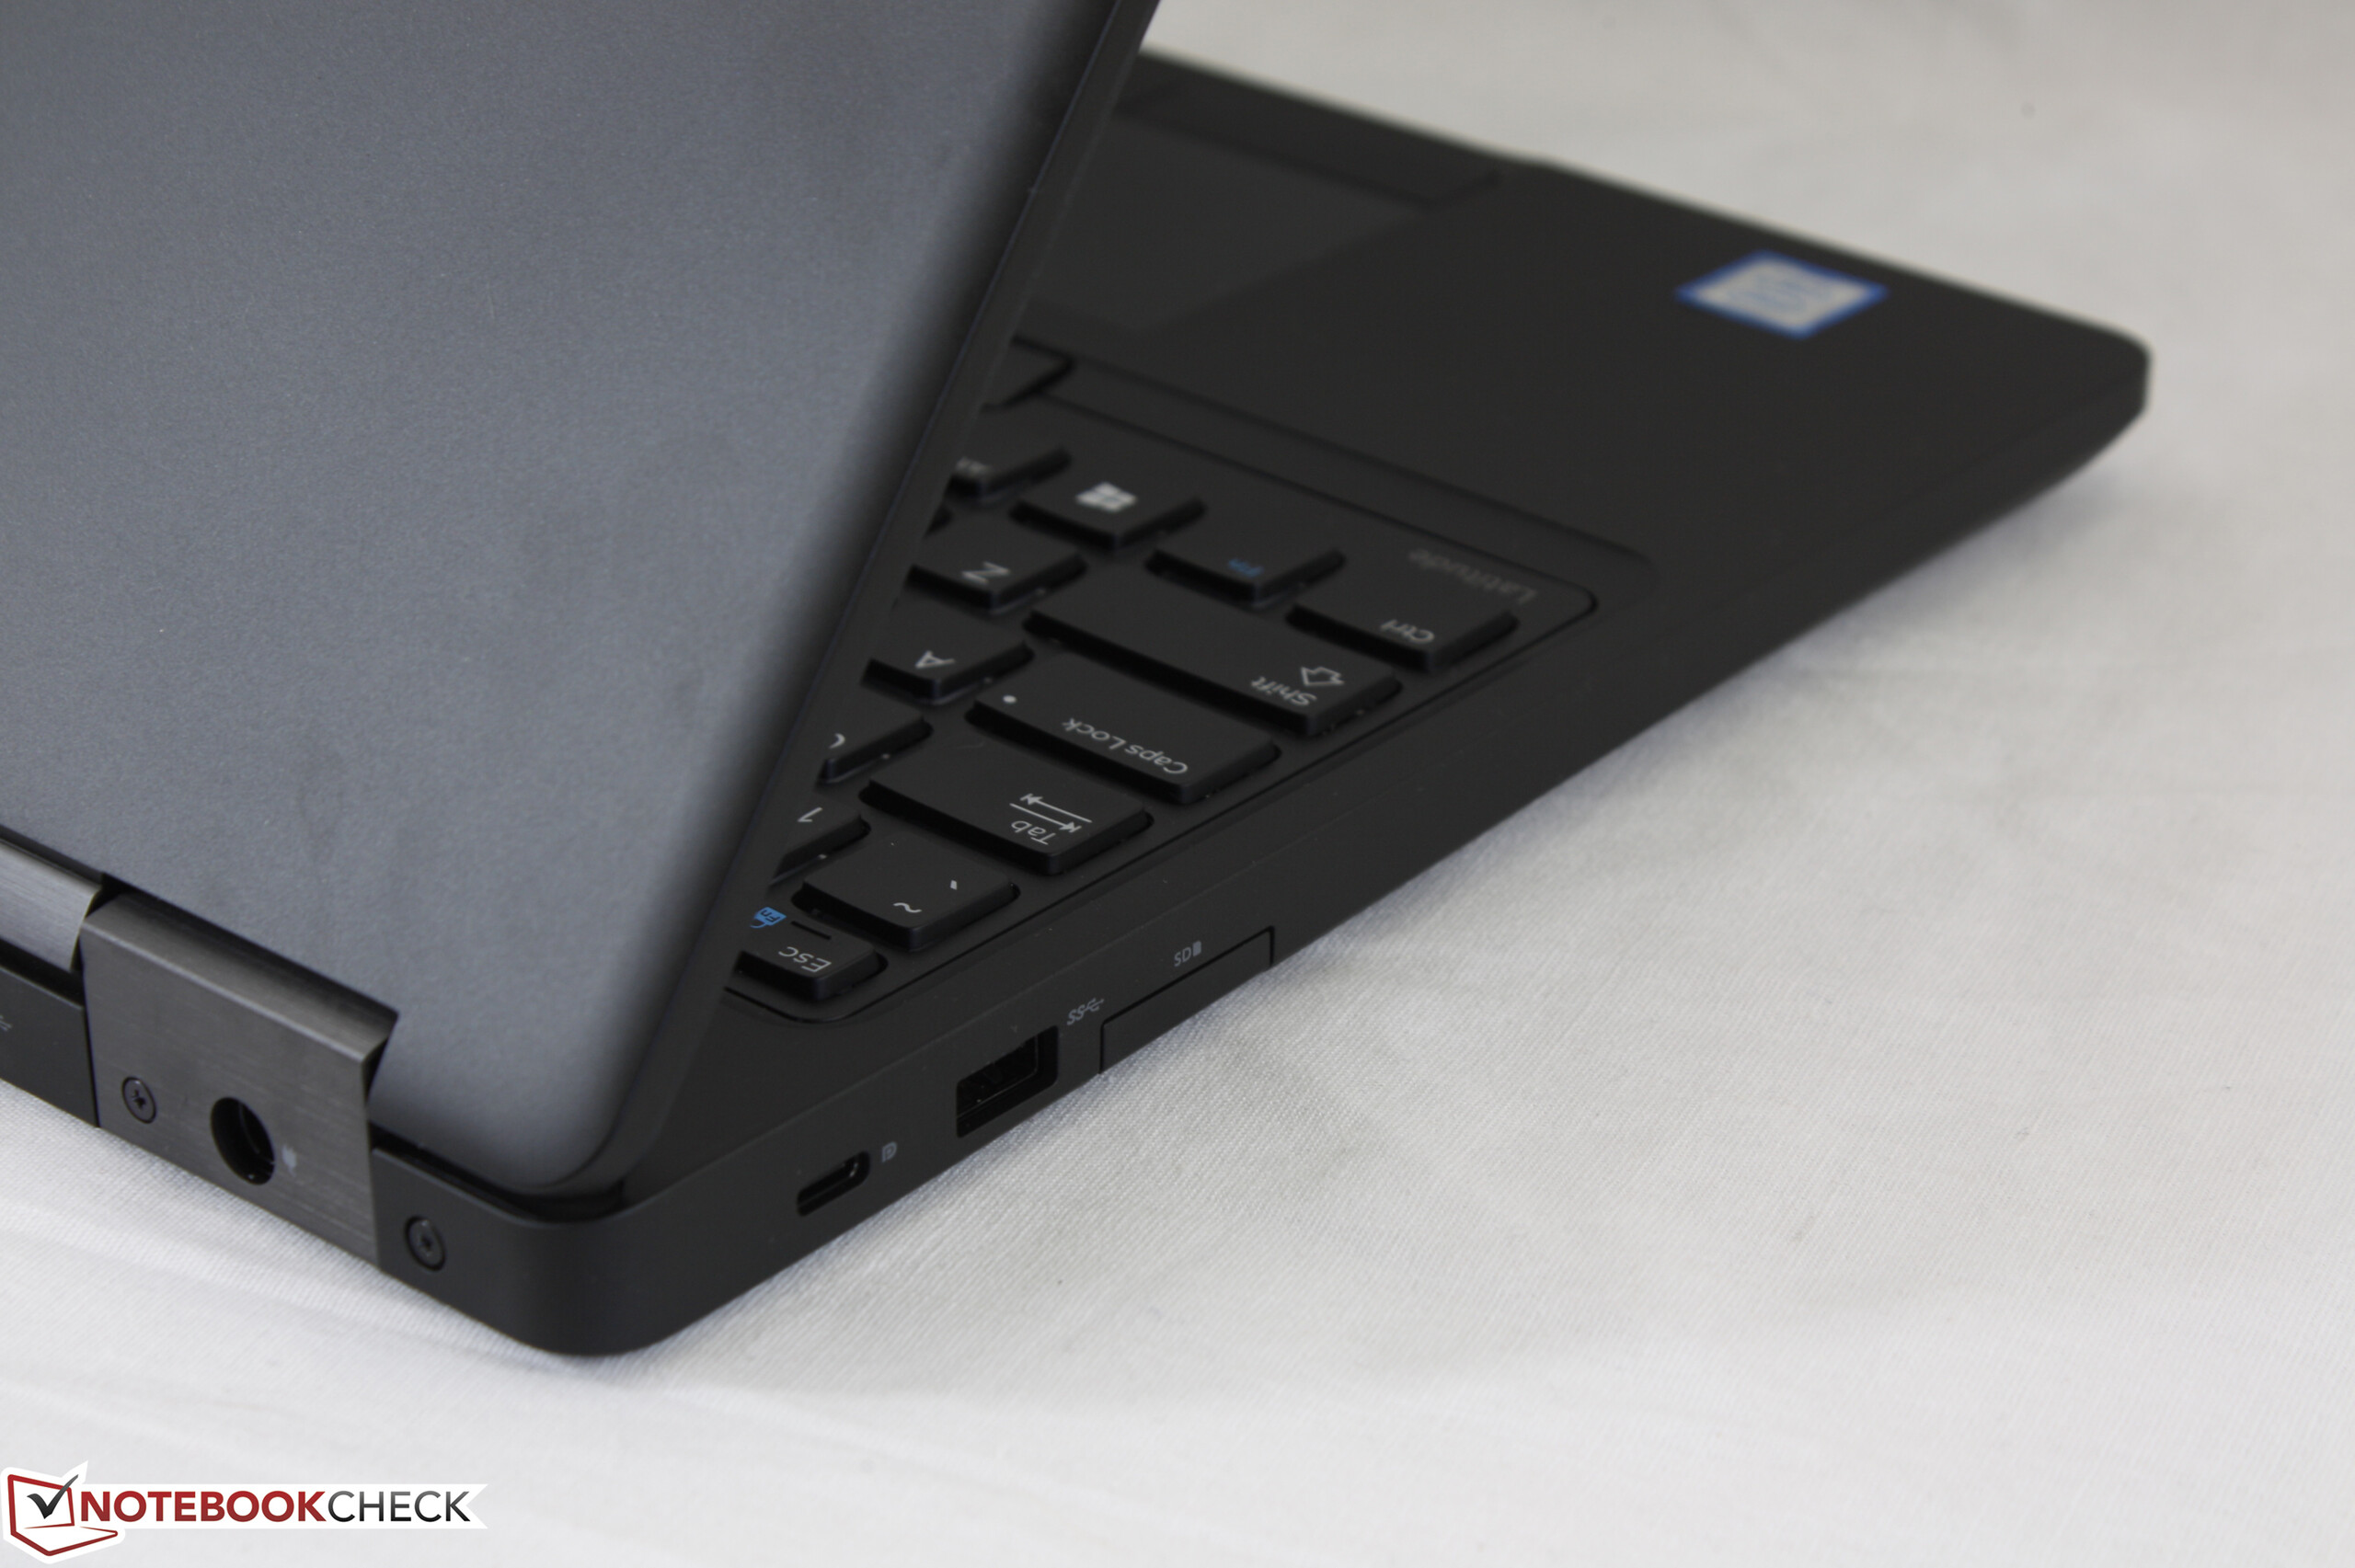
我们可能会在不久的将来查看Latitude 5580的高端配置机,以更好地了解该机型所能提供的一切。一个HQ级处理器的TDP是U级处理器的两倍以上,全高清面板几乎肯定能提供更好的体验。 这些要求更高的组件如何影响电池续航,风扇噪音和性能很值得关注。
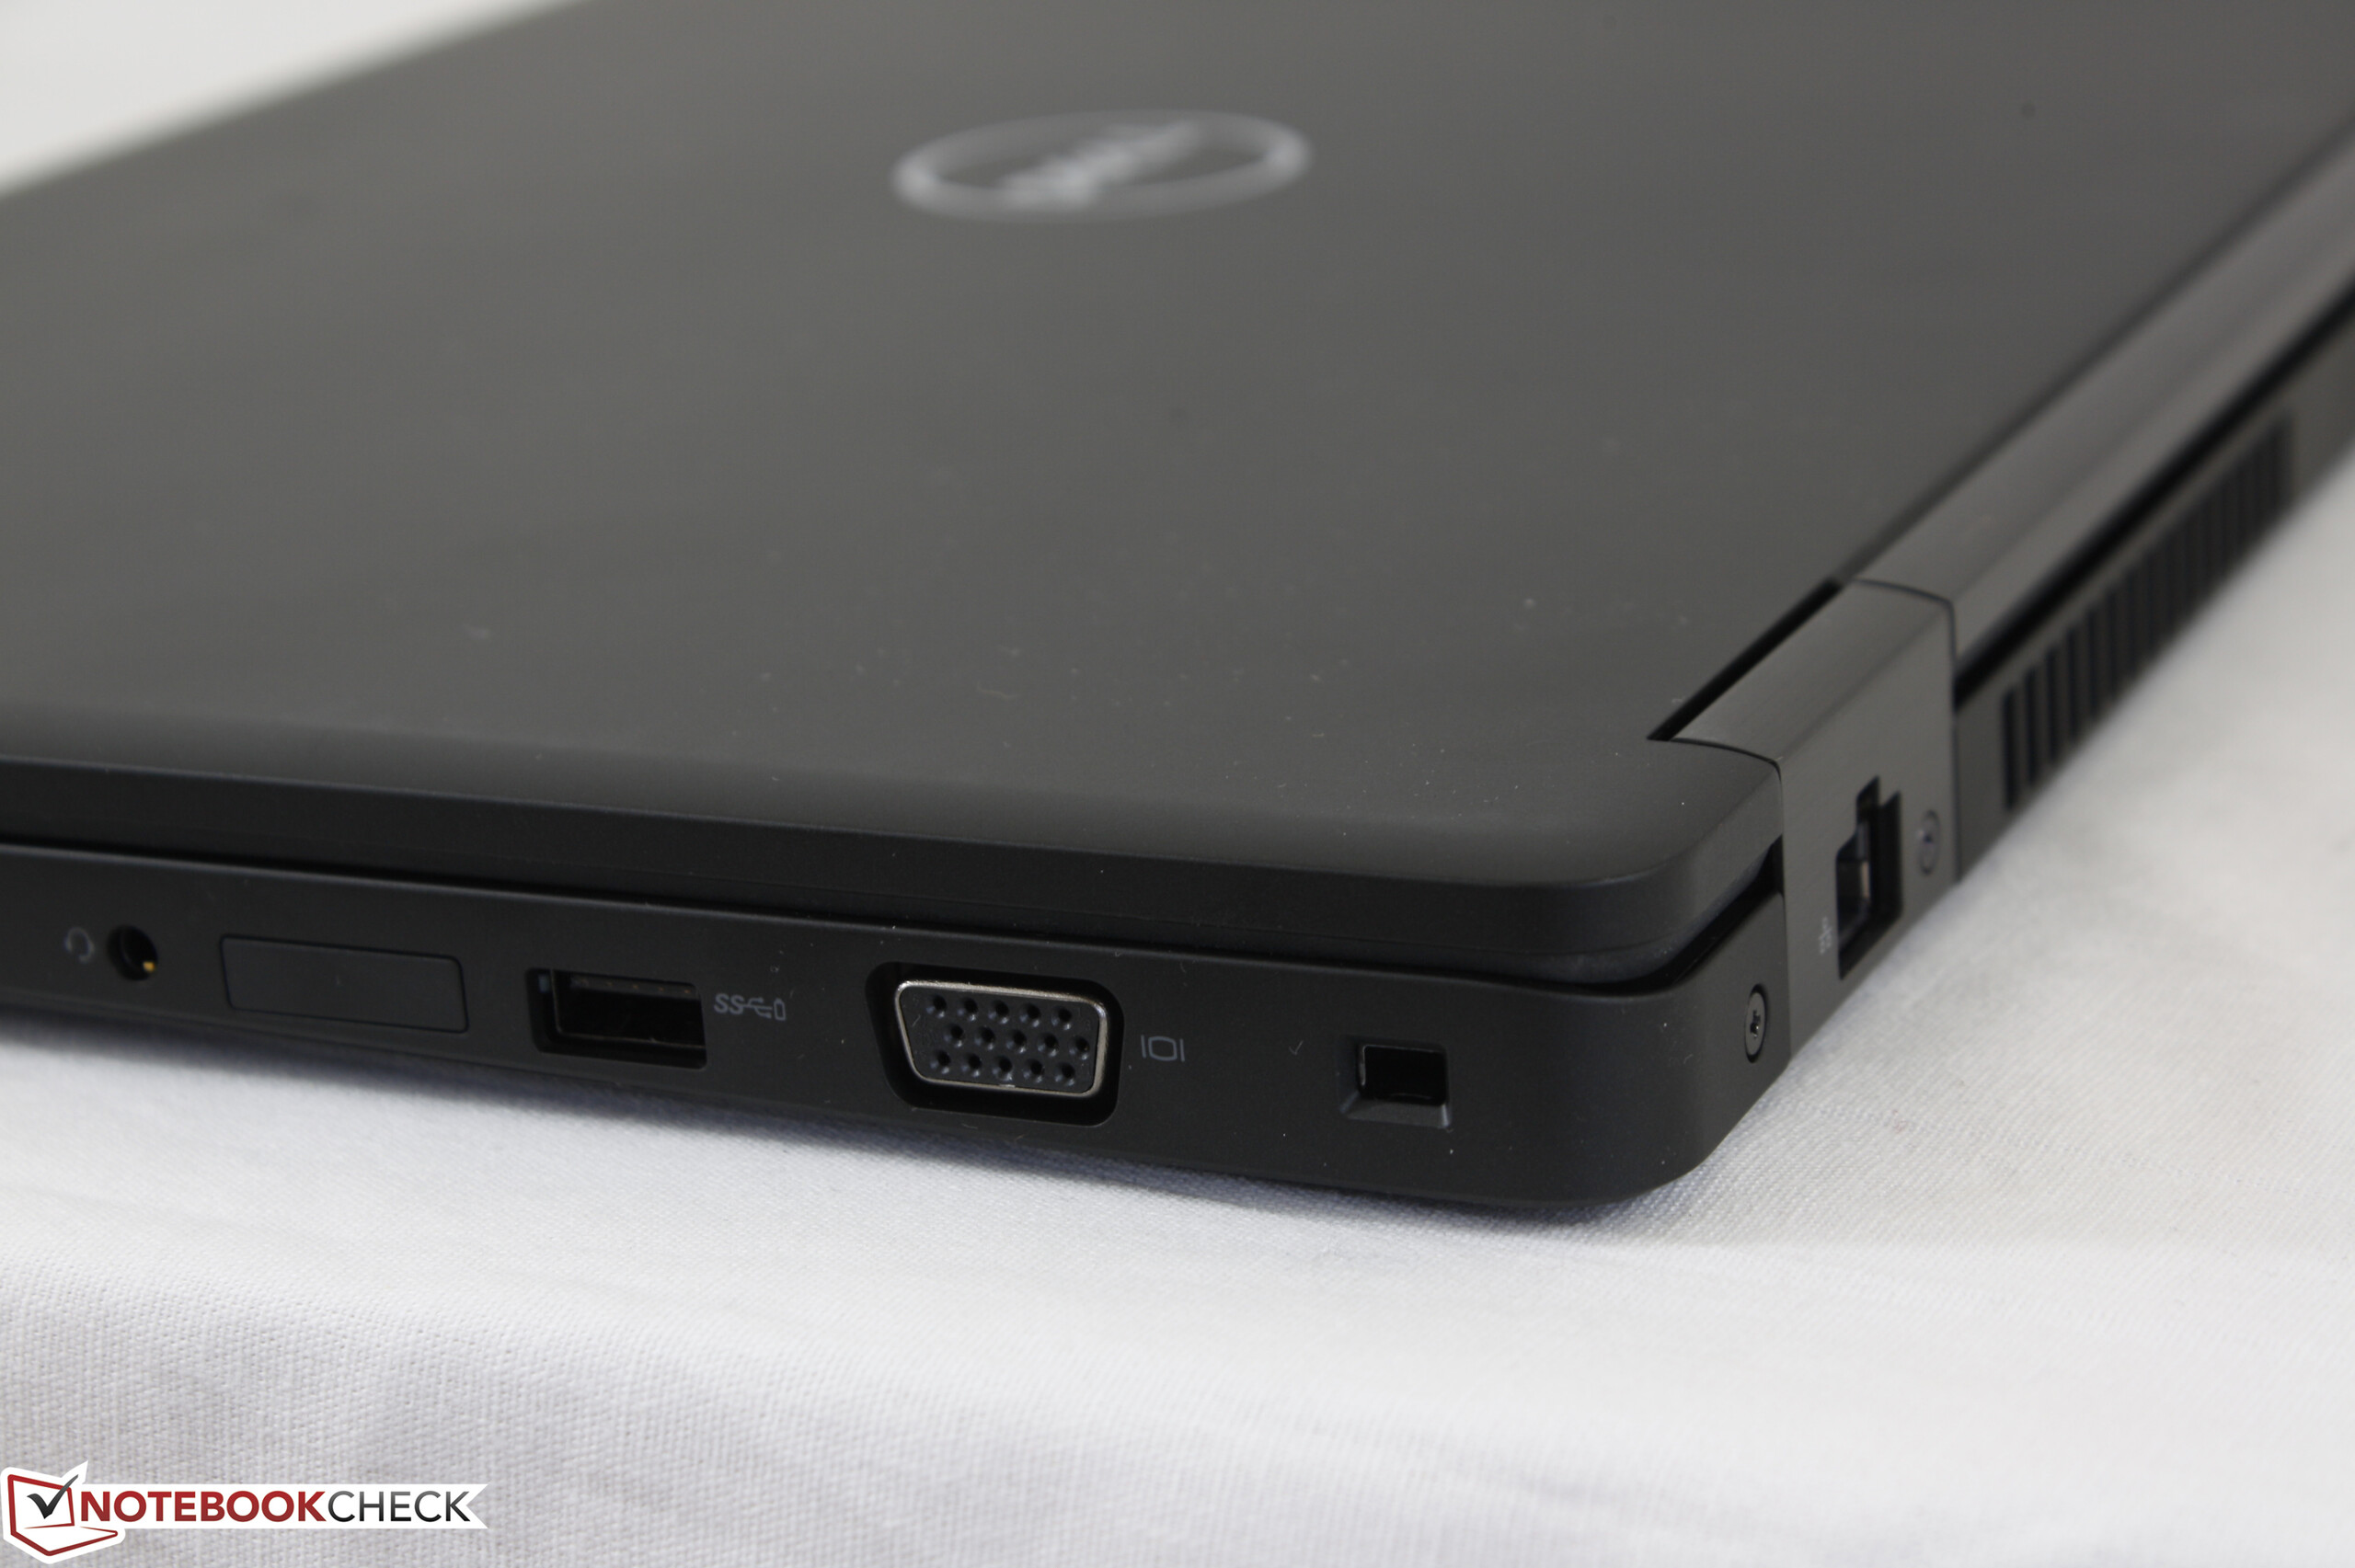
避免使用低于平均水平的高清显示屏,并且功能较少的基准配置。雷电3接口和全高清面板对于更好的体验至关重要,并弥补了拓展坞的缺失。
注:本文是基于完整评测的缩减版本,阅读完整的英文评测,请点击这里。
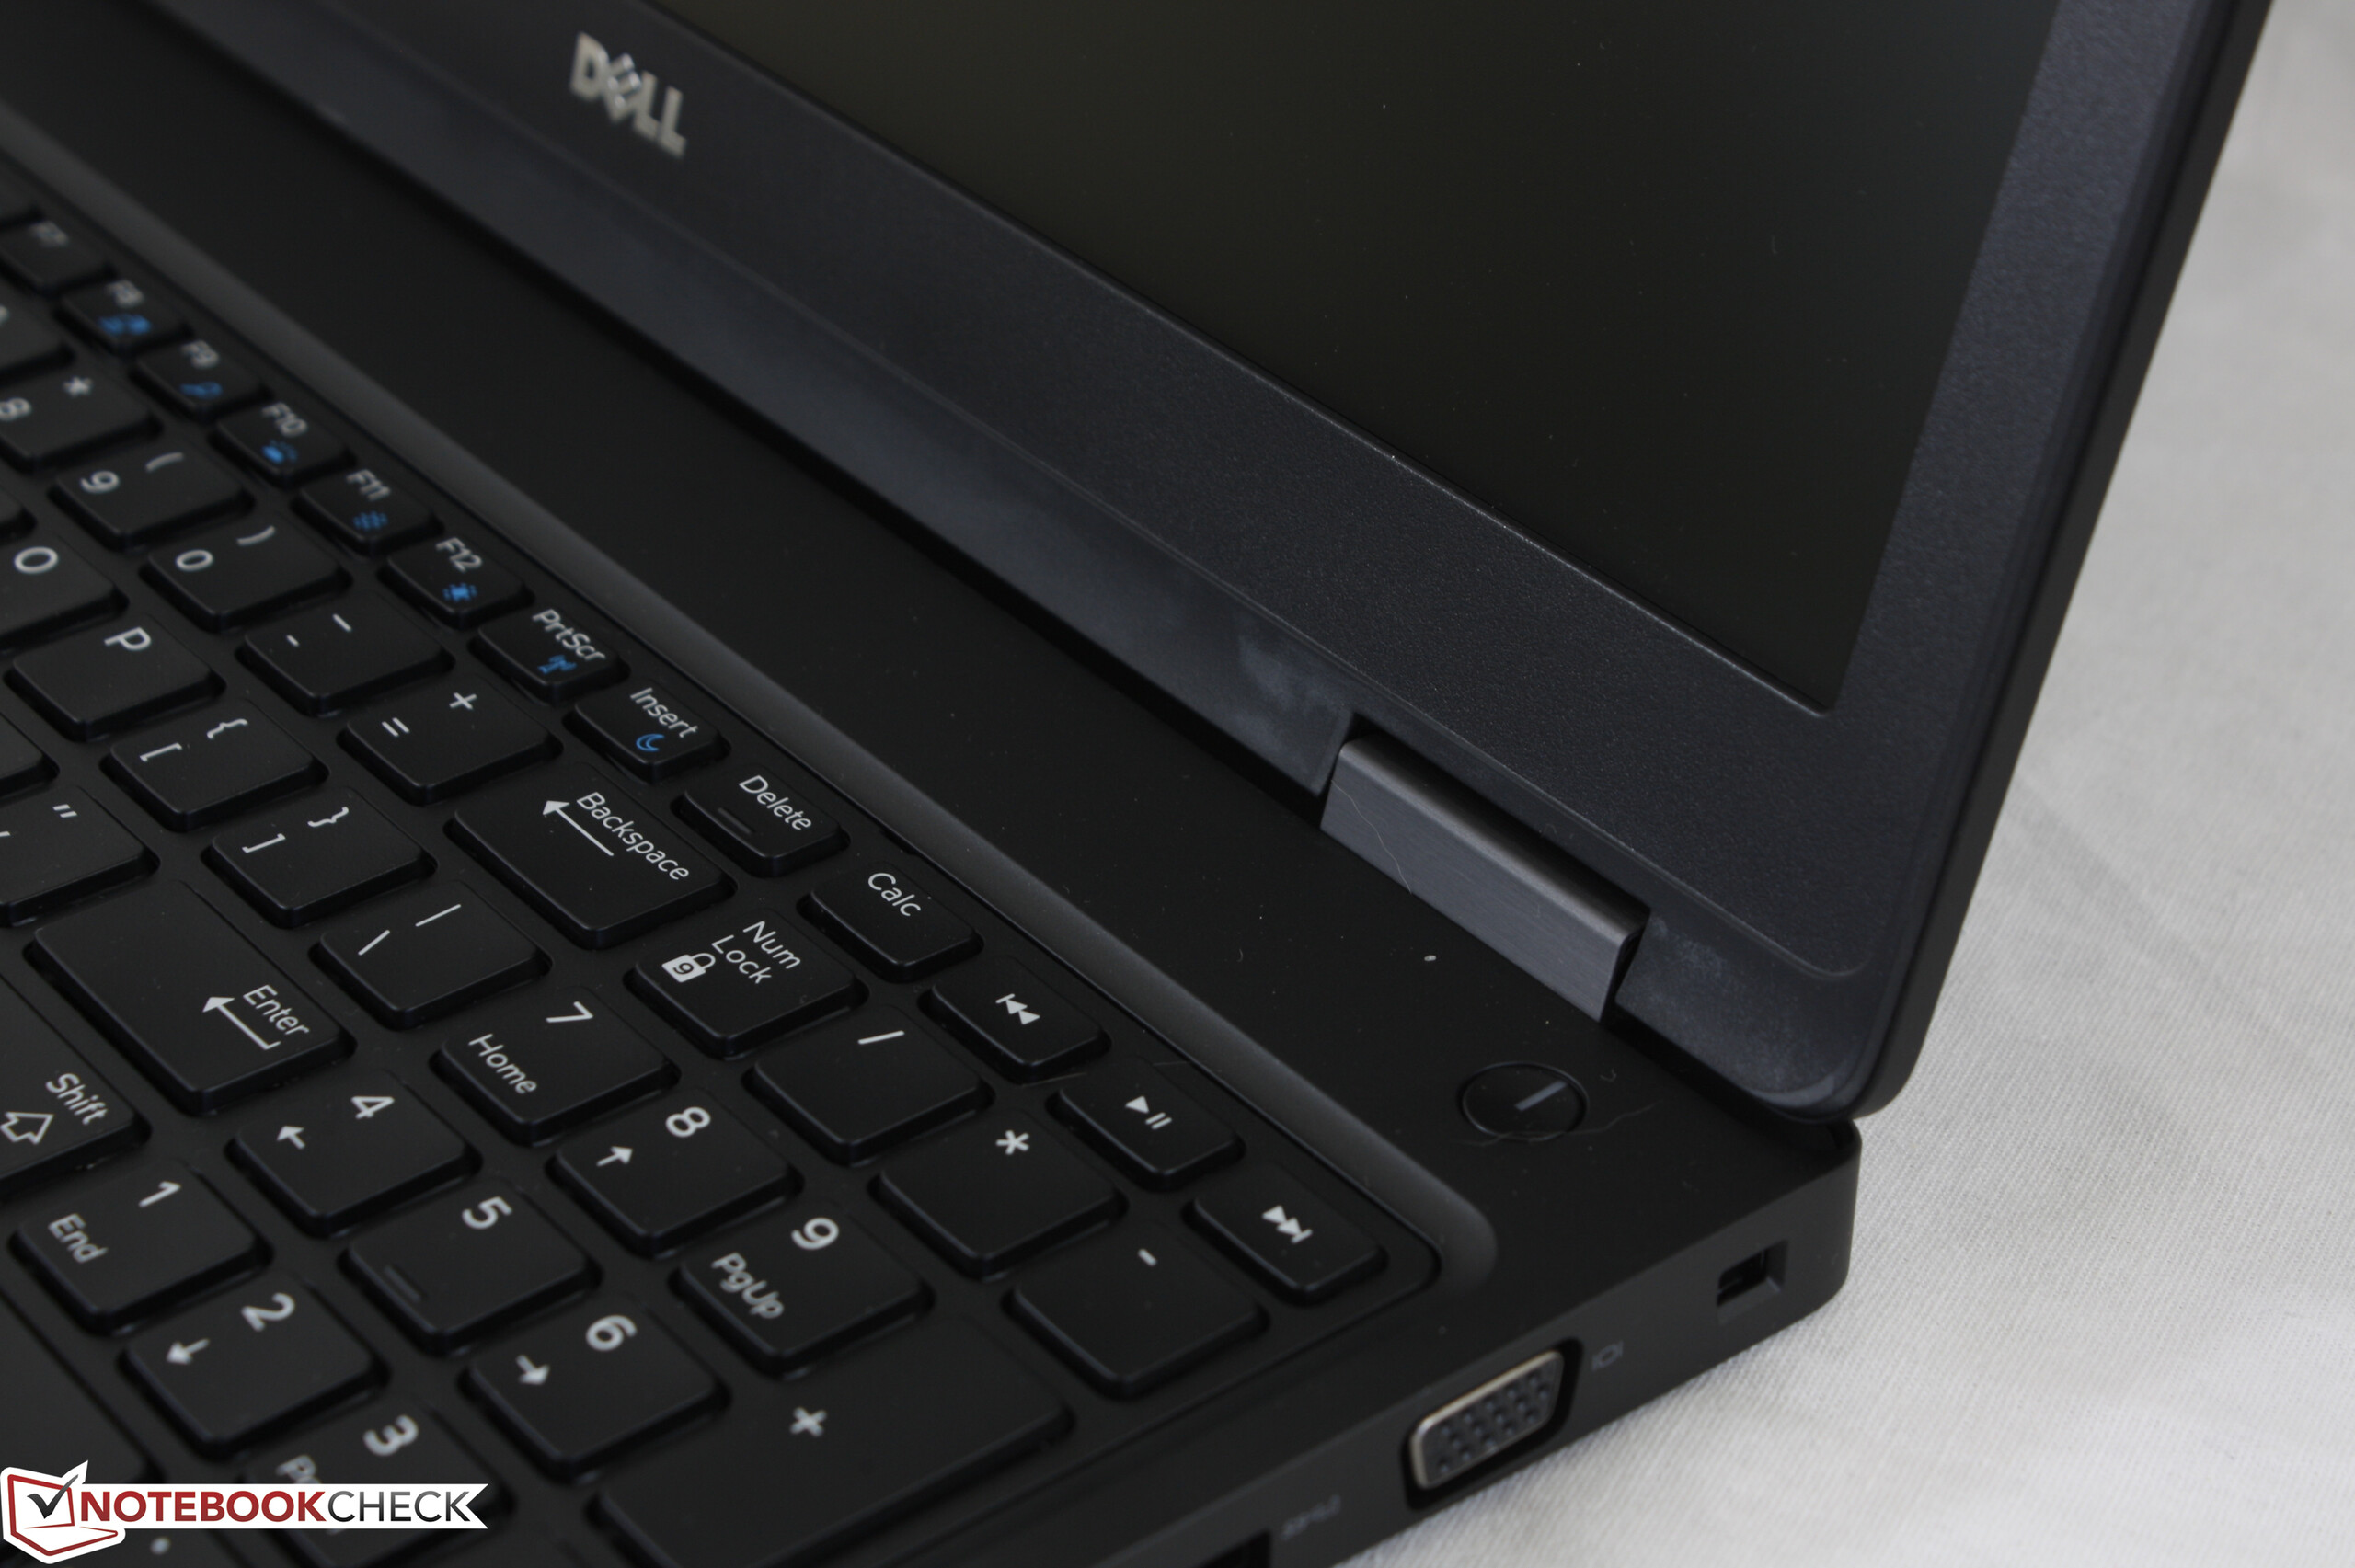
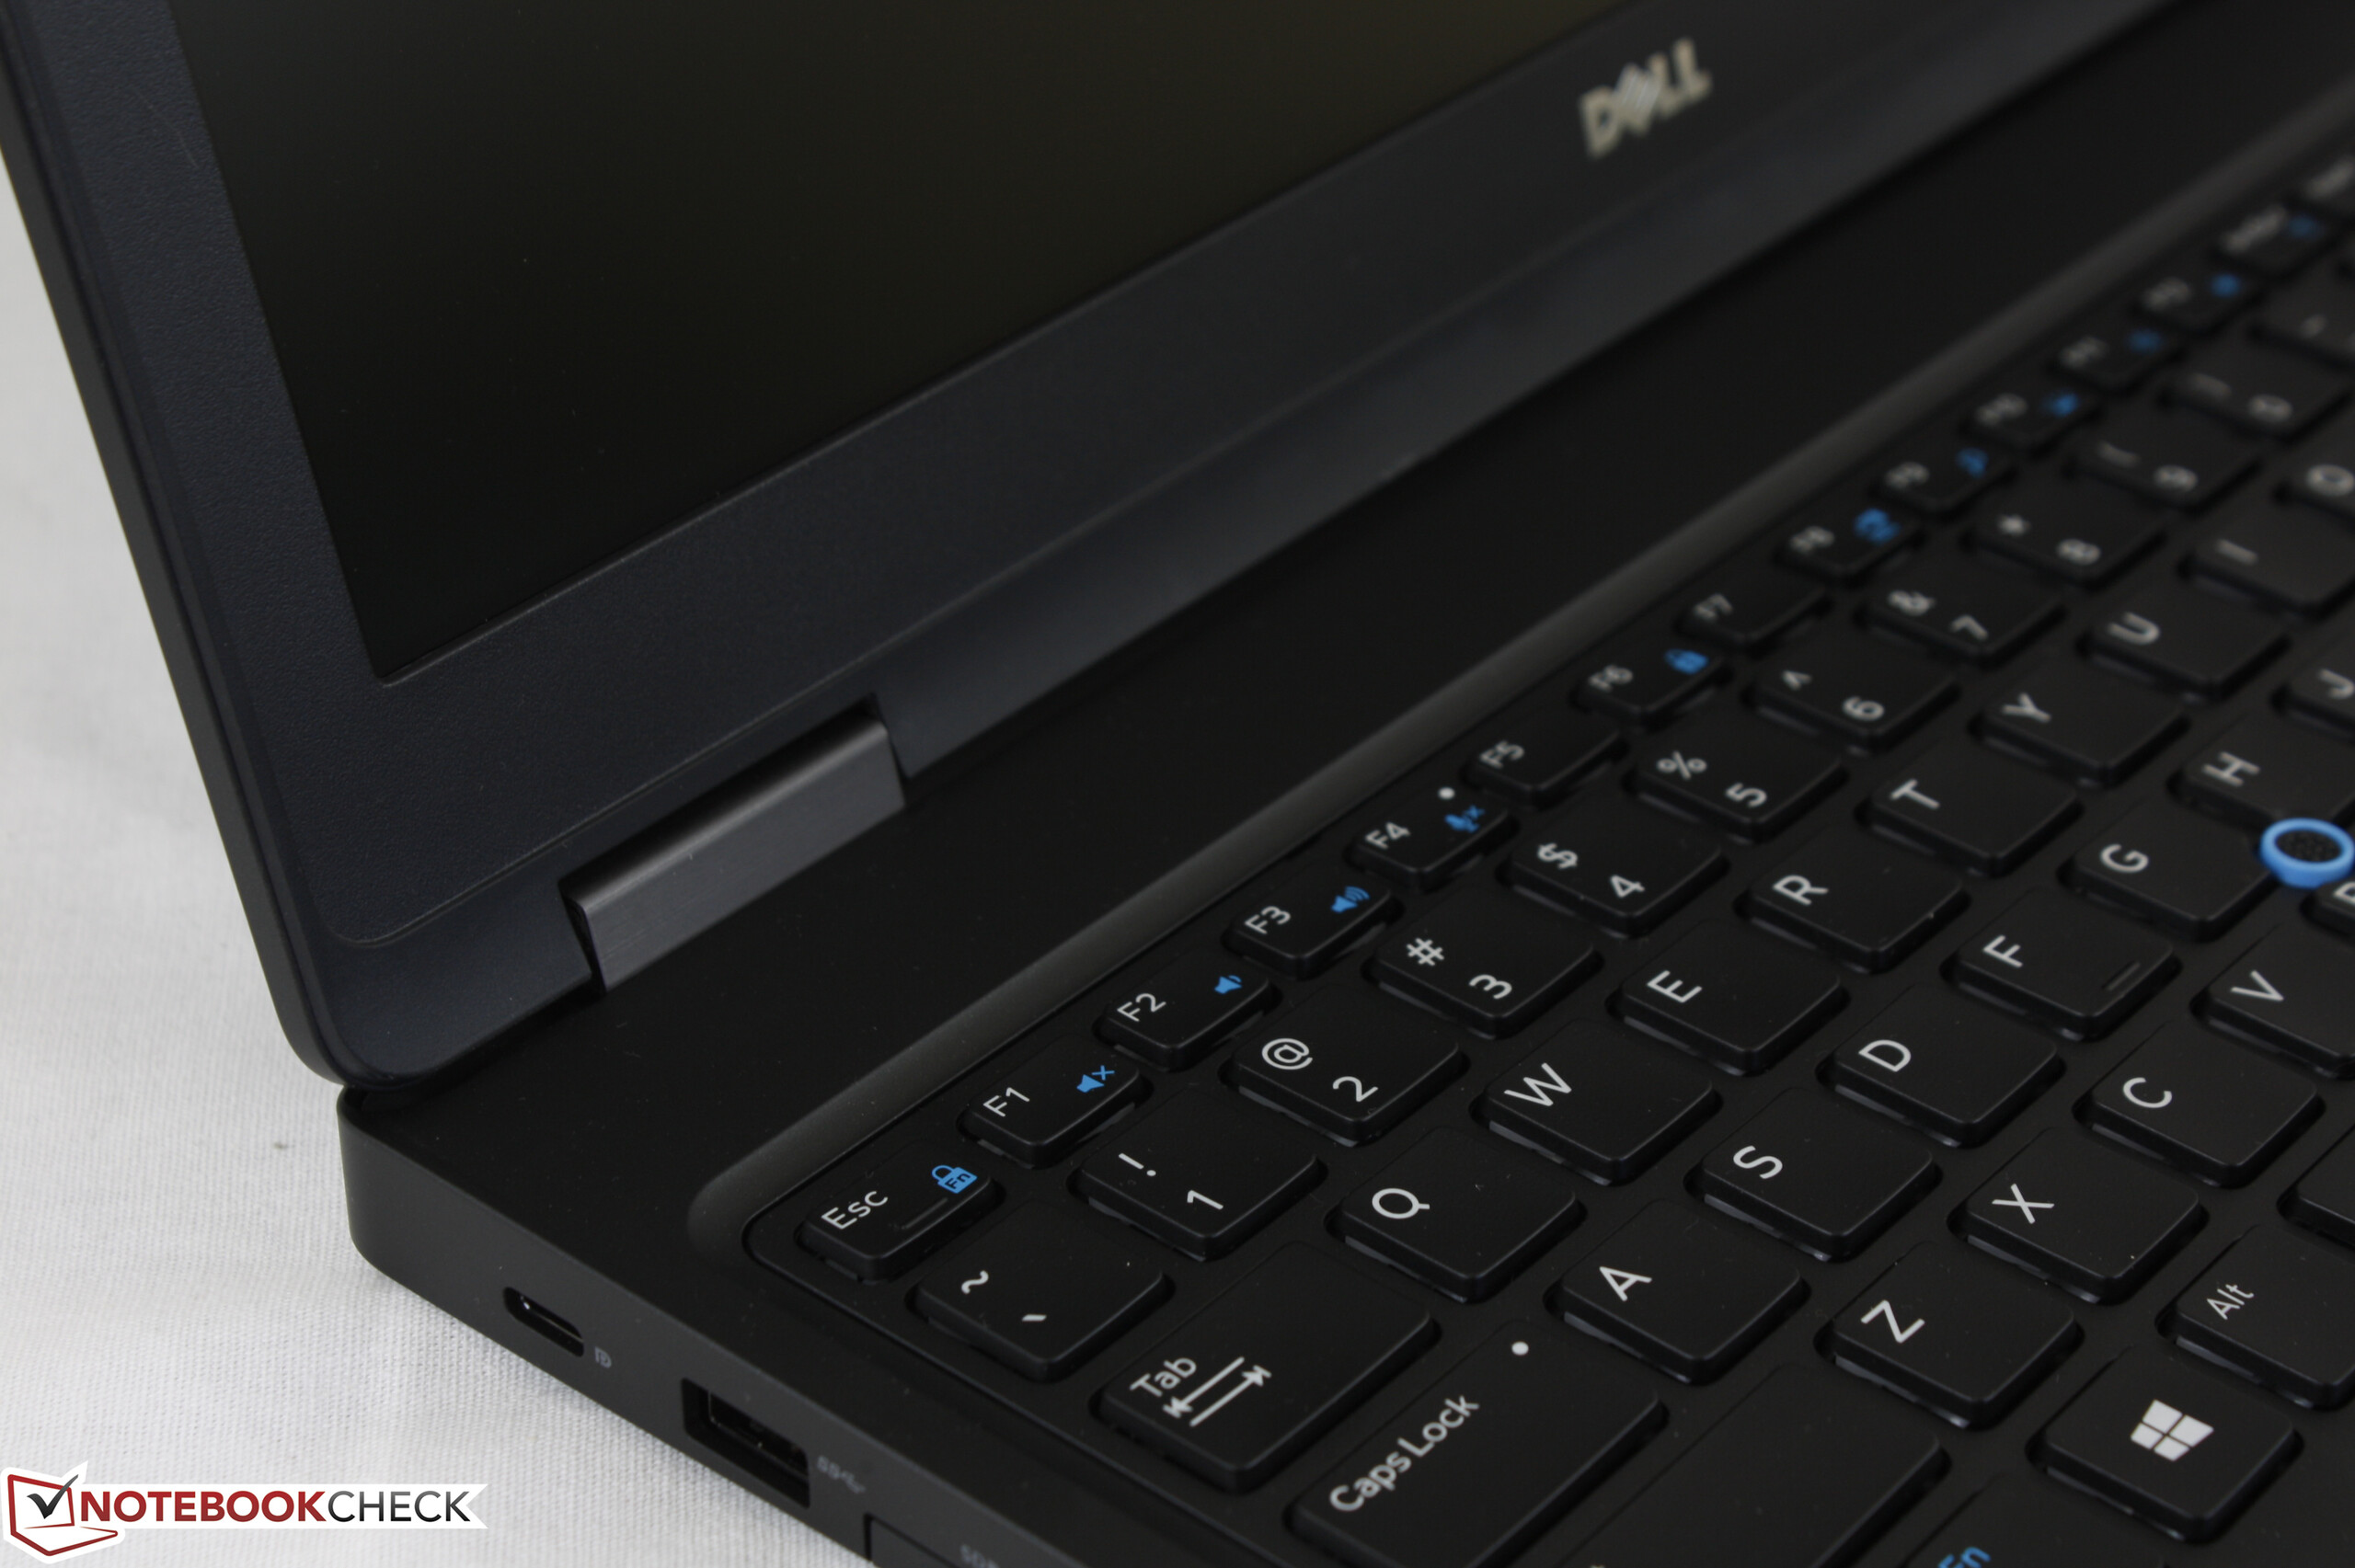
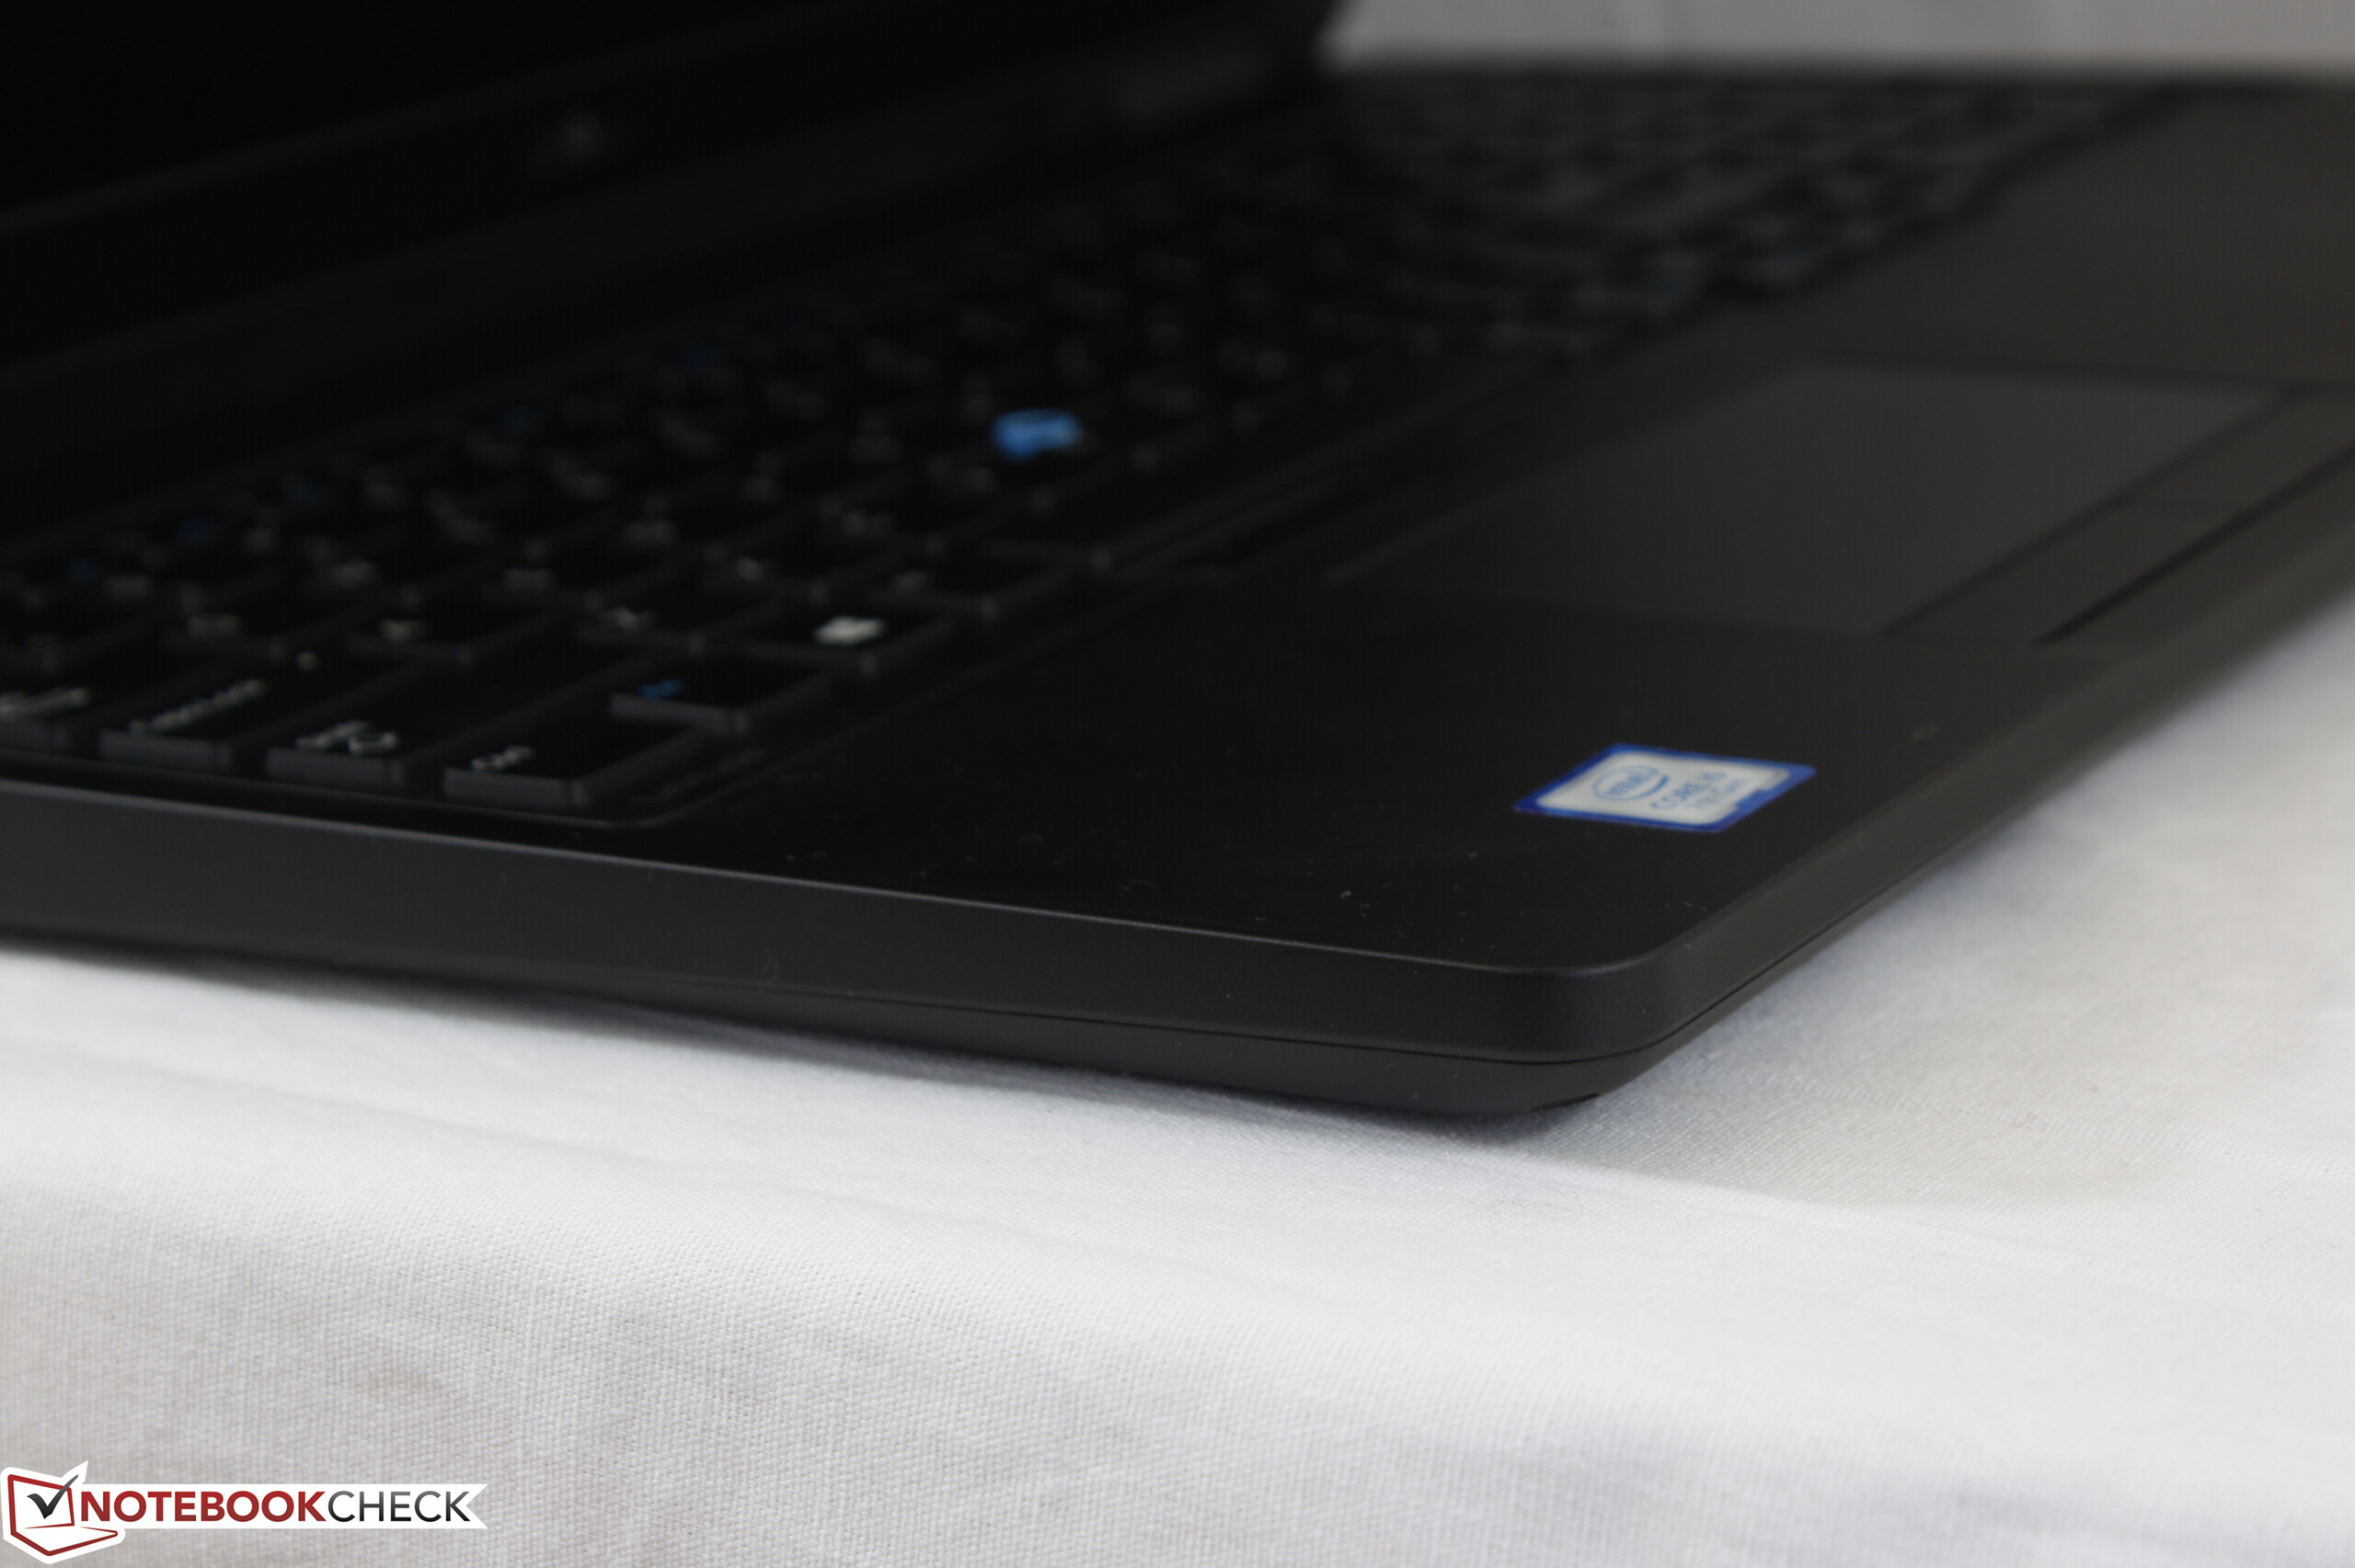
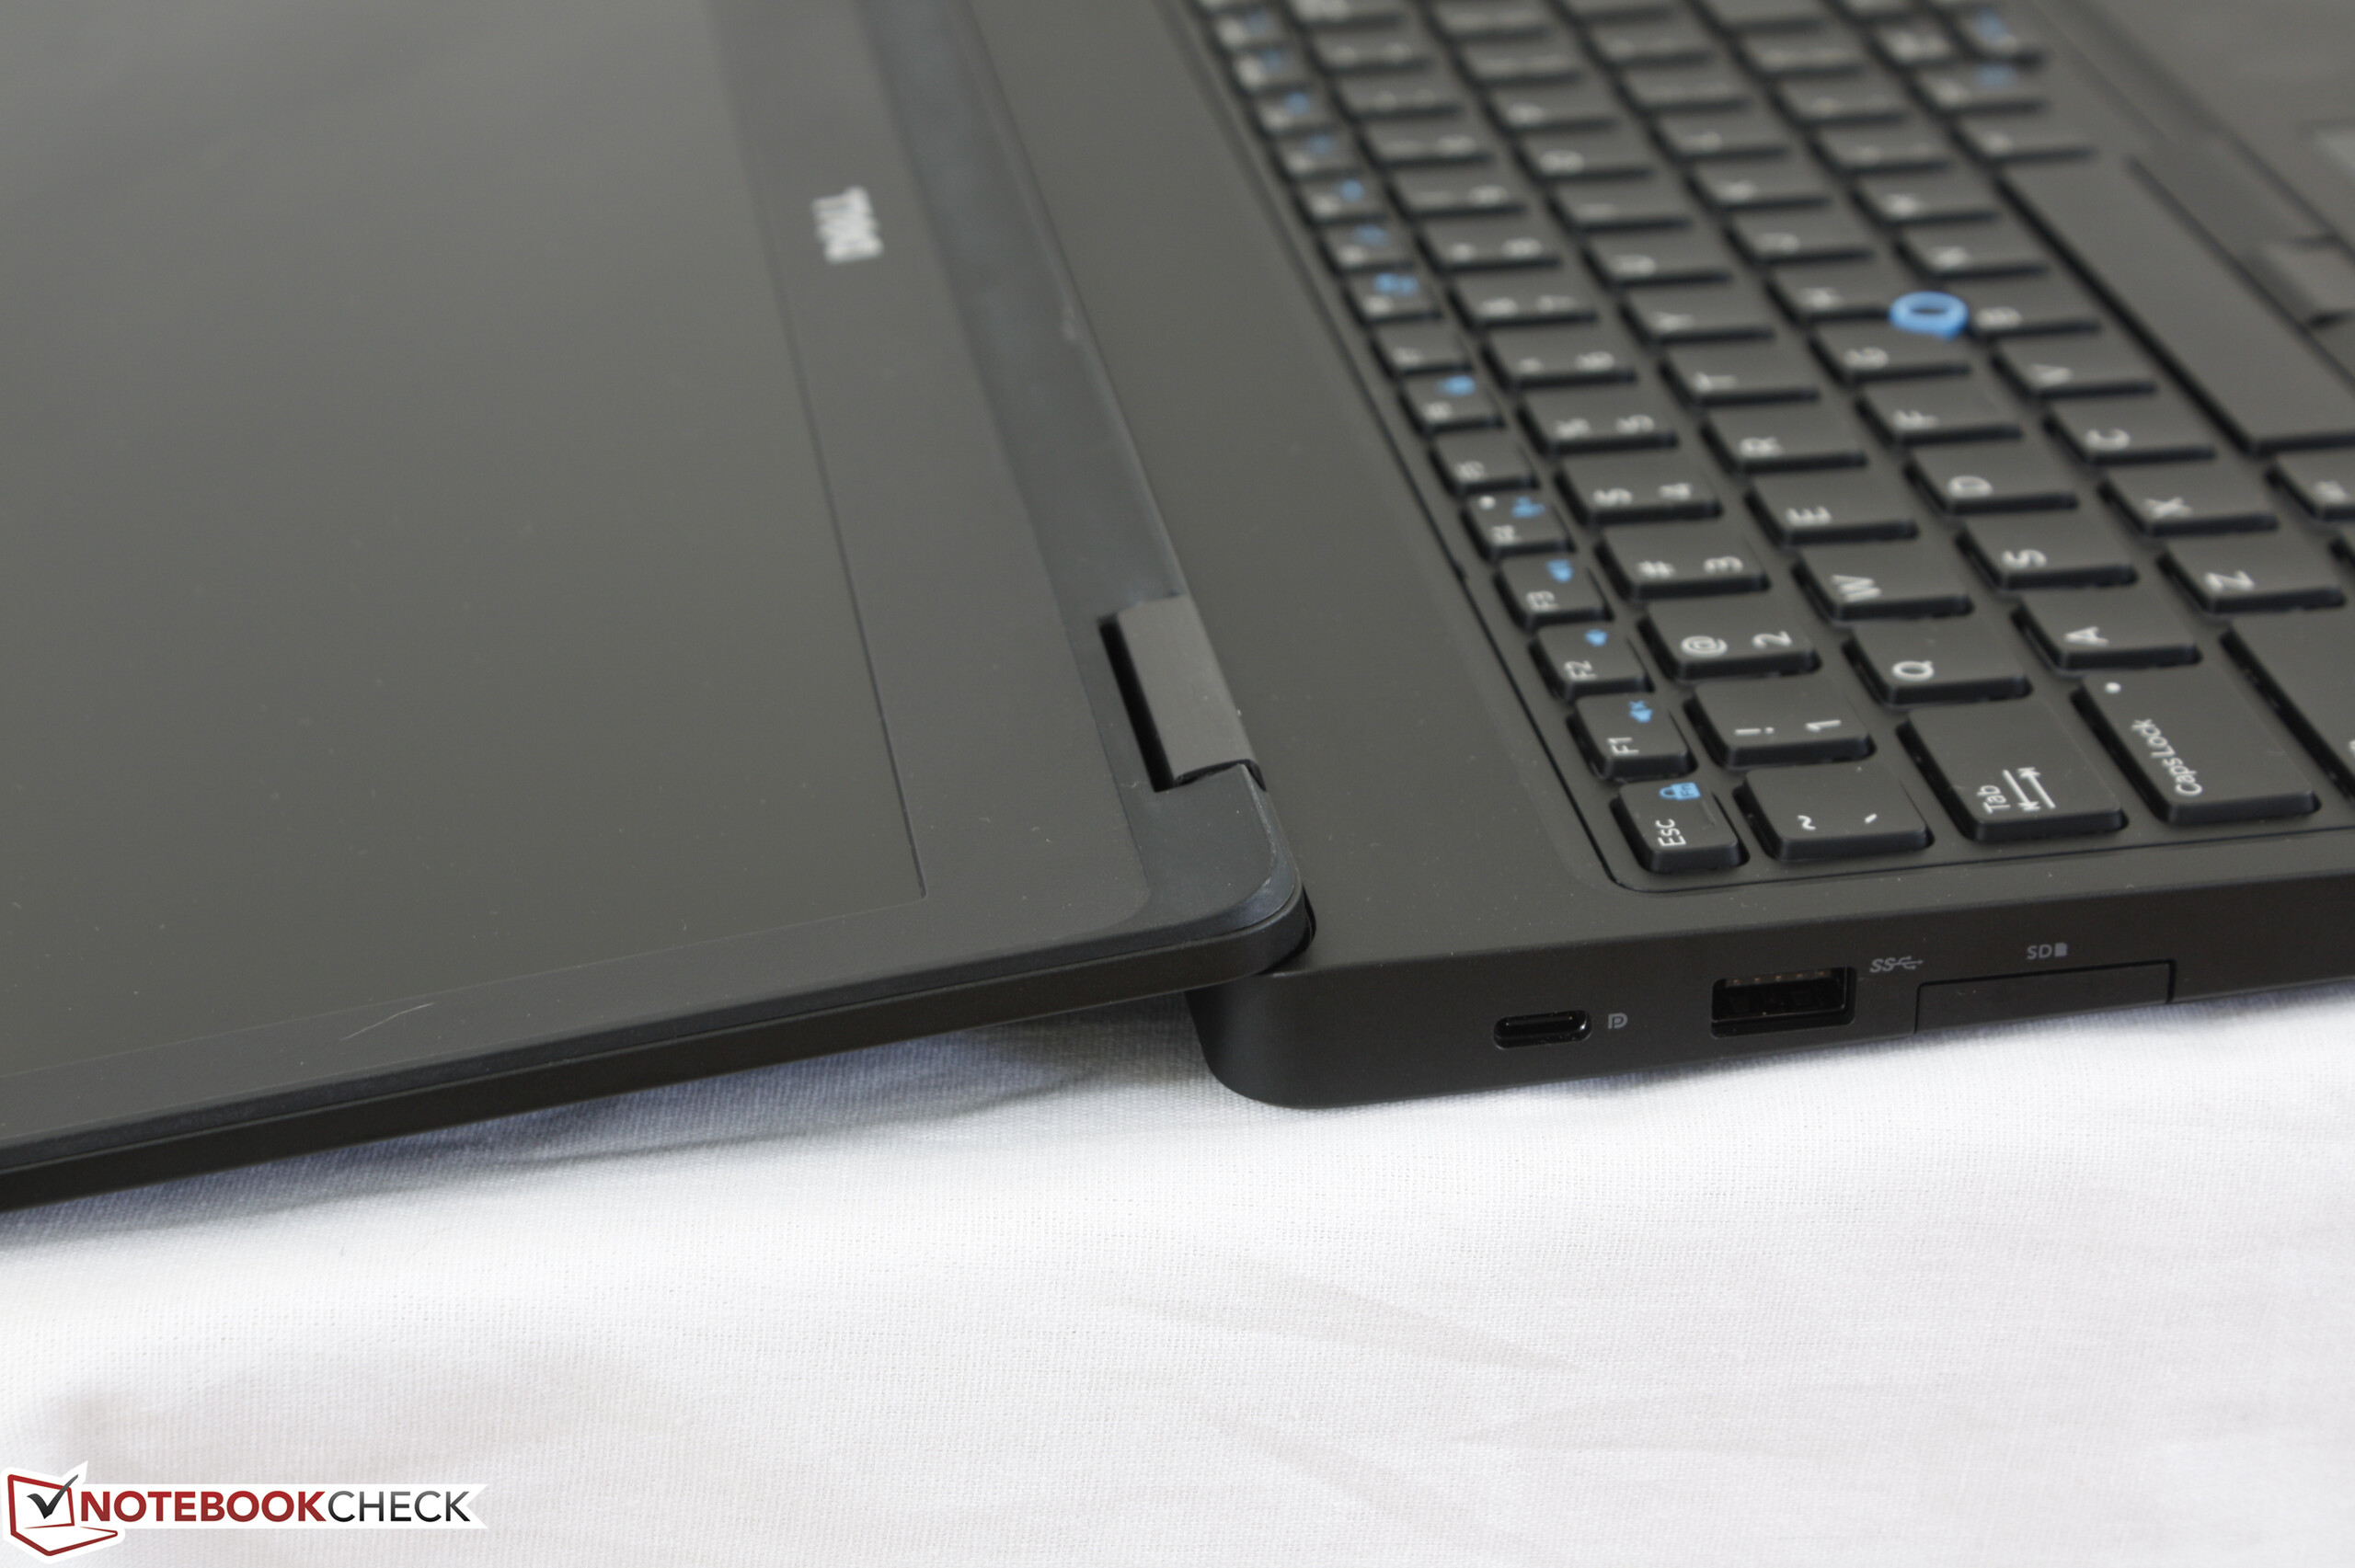
Dell Latitude 5580
- 05/11/2017 v6 (old)
Allen Ngo
Price comparison
