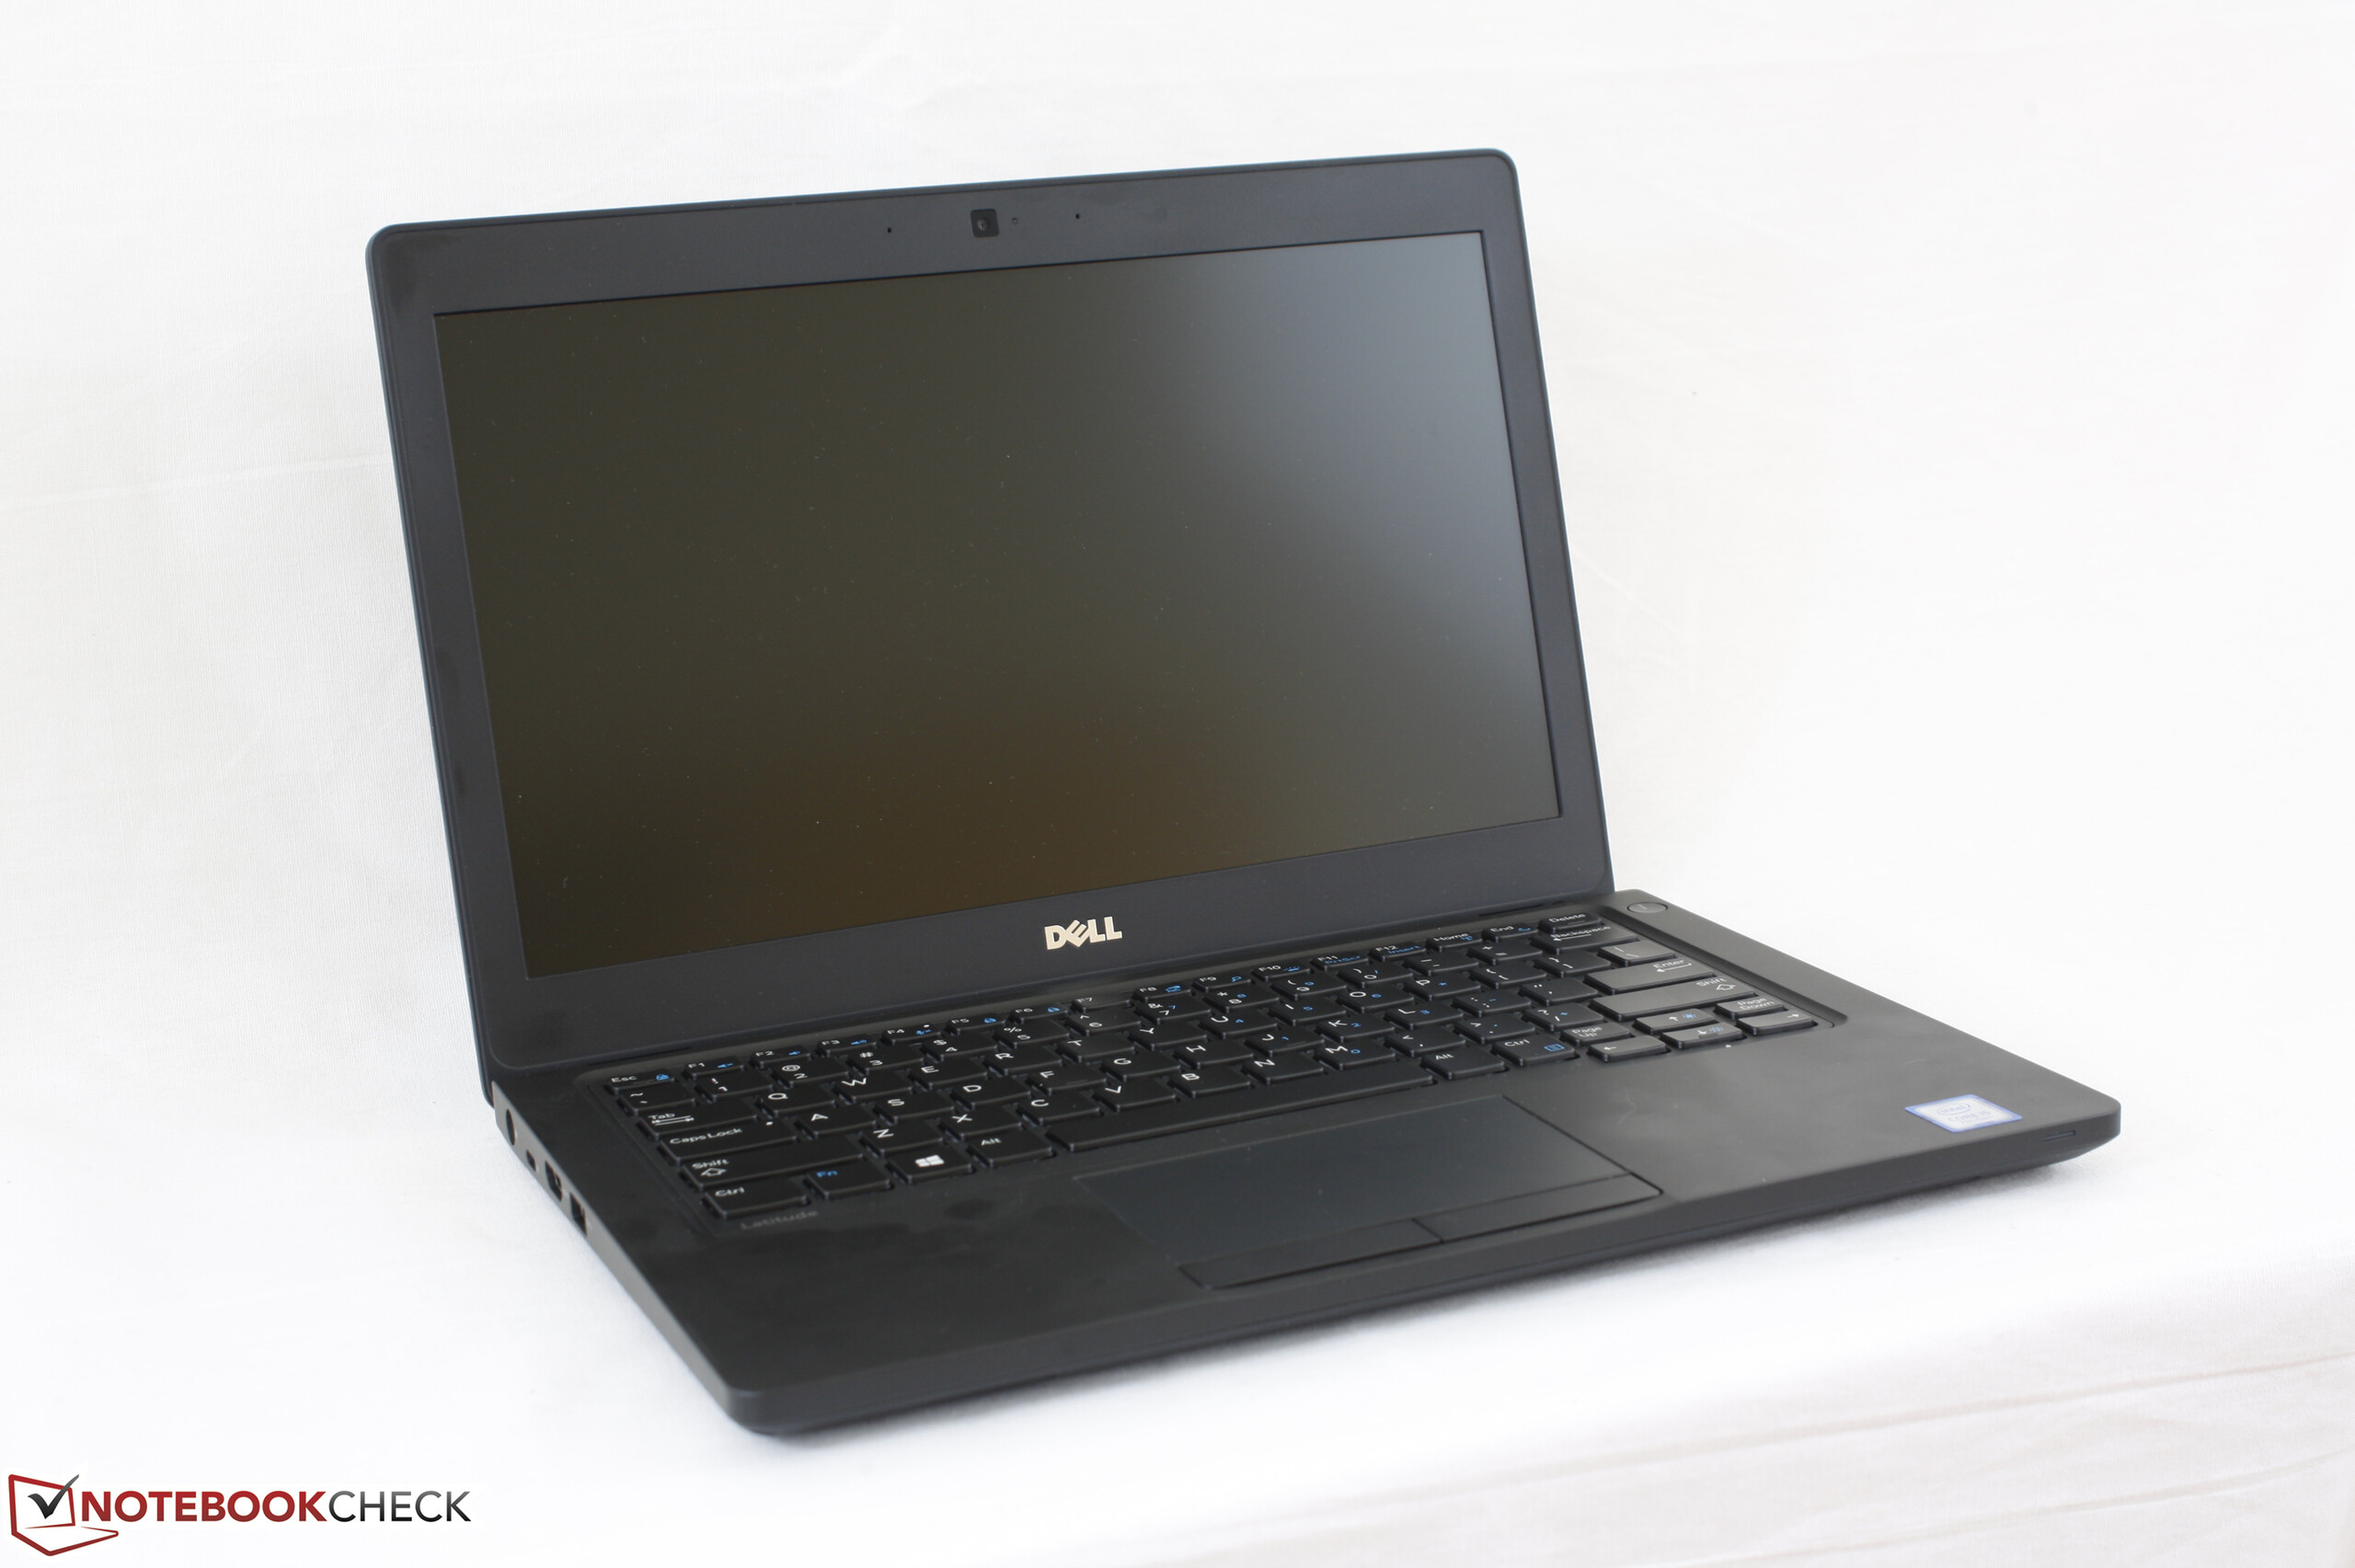
戴尔 Latitude 5280 (7200U, HD) 笔记本电脑简短评测

| SD Card Reader | |
| average JPG Copy Test (av. of 3 runs) | |
| Lenovo ThinkPad X270-20HMS00T00 | |
| HP EliteBook 725 G4 | |
| Dell Latitude 5280 | |
| maximum AS SSD Seq Read Test (1GB) | |
| Dell Latitude 5280 | |
| Lenovo ThinkPad X270-20HMS00T00 | |
| HP EliteBook 725 G4 | |
| Networking | |
| iperf3 transmit AX12 | |
| Lenovo ThinkPad X270-20HMS00T00 | |
| Dell Latitude 5289 | |
| Dell Latitude 5280 | |
| iperf3 receive AX12 | |
| Lenovo ThinkPad X270-20HMS00T00 | |
| Dell Latitude 5280 | |
| Dell Latitude 5289 | |
| |||||||||||||||||||||||||
Brightness Distribution: 90 %
Center on Battery: 251.8 cd/m²
Contrast: 336:1 (Black: 0.75 cd/m²)
ΔE ColorChecker Calman: 11.3 | ∀{0.5-29.43 Ø4.71}
ΔE Greyscale Calman: 13.2 | ∀{0.09-98 Ø4.96}
59.2% sRGB (Argyll 1.6.3 3D)
37.6% AdobeRGB 1998 (Argyll 1.6.3 3D)
40.67% AdobeRGB 1998 (Argyll 3D)
59.2% sRGB (Argyll 3D)
39.34% Display P3 (Argyll 3D)
Gamma: 2.05
CCT: 14912 K
| Dell Latitude 5280 TN LED, 12.5", 1366x768 | Dell Latitude 5289 BOE NV12N51, IPS LED, 12.5", 1920x1080 | Lenovo ThinkPad X270-20HMS00T00 Innolux N125HCE-GN1, IPS LED, 12.5", 1920x1080 | HP EliteBook 725 G4 AU Optronics, IPS, 12.5", 1920x1080 | Dell Latitude 12 E5270 BOE05F4, TN, 12.5", 1366x768 | |
|---|---|---|---|---|---|
| Display | 9% | 12% | 24% | -1% | |
| Display P3 Coverage (%) | 39.34 | 42.79 9% | 44.6 13% 44.6 13% | 49.16 25% | 39.06 -1% |
| sRGB Coverage (%) | 59.2 | 64.3 9% | 65.9 11% 65.9 11% | 72.3 22% | 58.7 -1% |
| AdobeRGB 1998 Coverage (%) | 40.67 | 44.21 9% | 46.11 13% 46.11 13% | 50.8 25% | 40.36 -1% |
| Response Times | -17% | -14% | -8% | -6% | |
| Response Time Grey 50% / Grey 80% * (ms) | 42 ? | 42 ? -0% | 40.8 ? 3% | 47 ? -12% | 45.2 ? -8% |
| Response Time Black / White * (ms) | 23.2 ? | 31 ? -34% | 30.4 ? -31% | 24 ? -3% | 24 ? -3% |
| PWM Frequency (Hz) | 531 ? | 26040 ? | 1000 ? | ||
| Screen | 55% | 49% | 81% | 9% | |
| Brightness middle (cd/m²) | 251.8 | 336 33% | 283 12% | 329 31% | 161 -36% |
| Brightness (cd/m²) | 246 | 320 30% | 281 14% | 310 26% | 152 -38% |
| Brightness Distribution (%) | 90 | 90 0% | 94 4% | 88 -2% | 90 0% |
| Black Level * (cd/m²) | 0.75 | 0.34 55% | 0.25 67% | 0.19 75% | 0.29 61% |
| Contrast (:1) | 336 | 988 194% | 1132 237% | 1732 415% | 555 65% |
| Colorchecker dE 2000 * | 11.3 | 3.45 69% | 6.1 46% | 2.69 76% | 10.31 9% |
| Colorchecker dE 2000 max. * | 23.1 | 7.95 66% | 15.4 33% | 4.47 81% | 18.58 20% |
| Greyscale dE 2000 * | 13.2 | 1.68 87% | 6 55% | 4.23 68% | 11.3 14% |
| Gamma | 2.05 107% | 2.49 88% | 2.05 107% | 2.21 100% | 2.57 86% |
| CCT | 14912 44% | 6782 96% | 6832 95% | 6011 108% | 13574 48% |
| Color Space (Percent of AdobeRGB 1998) (%) | 37.6 | 41 9% | 42.26 12% | 46 22% | 37.32 -1% |
| Color Space (Percent of sRGB) (%) | 59.2 | 64 8% | 65.43 11% | 72 22% | 58.82 -1% |
| Total Average (Program / Settings) | 16% /
36% | 16% /
30% | 32% /
58% | 1% /
5% |
* ... smaller is better
Display Response Times
| ↔ Response Time Black to White | ||
|---|---|---|
| 23.2 ms ... rise ↗ and fall ↘ combined | ↗ 17.2 ms rise | 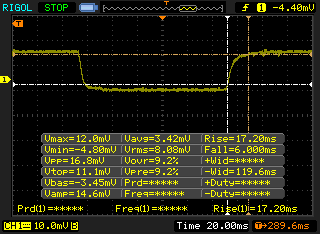 |
| ↘ 6 ms fall | ||
| The screen shows good response rates in our tests, but may be too slow for competitive gamers. In comparison, all tested devices range from 0.1 (minimum) to 240 (maximum) ms. » 53 % of all devices are better. This means that the measured response time is worse than the average of all tested devices (19.8 ms). | ||
| ↔ Response Time 50% Grey to 80% Grey | ||
| 42 ms ... rise ↗ and fall ↘ combined | ↗ 21.2 ms rise | 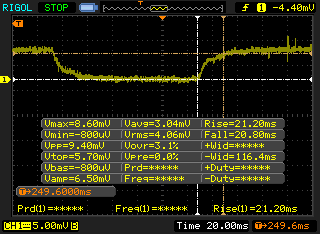 |
| ↘ 20.8 ms fall | ||
| The screen shows slow response rates in our tests and will be unsatisfactory for gamers. In comparison, all tested devices range from 0.165 (minimum) to 636 (maximum) ms. » 67 % of all devices are better. This means that the measured response time is worse than the average of all tested devices (31 ms). | ||
Screen Flickering / PWM (Pulse-Width Modulation)
| Screen flickering / PWM not detected | 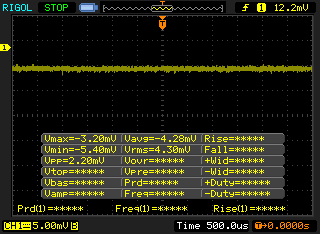 | ||
In comparison: 52 % of all tested devices do not use PWM to dim the display. If PWM was detected, an average of 7754 (minimum: 5 - maximum: 343500) Hz was measured. | |||
| wPrime 2.10 - 1024m | |
| Lenovo Thinkpad 13-20J1001BUS | |
| Dell Latitude E7470 N001LE747014EMEA | |
| Dell Latitude 7280 | |
| HP EliteBook 725 G4 | |
| Dell Latitude 5580 | |
| Dell Latitude 5280 | |
| Lenovo ThinkPad T470s-20HF0012US | |
* ... smaller is better
| PCMark 8 | |
| Home Score Accelerated v2 | |
| Lenovo ThinkPad X270-20HMS00T00 | |
| Dell Latitude 5289 | |
| Dell Latitude 5280 | |
| Dell Latitude 12 E5270 | |
| HP EliteBook 725 G4 | |
| Work Score Accelerated v2 | |
| Dell Latitude 5289 | |
| Lenovo ThinkPad X270-20HMS00T00 | |
| Dell Latitude 5280 | |
| Dell Latitude 12 E5270 | |
| HP EliteBook 725 G4 | |
| Creative Score Accelerated v2 | |
| Dell Latitude 5280 | |
| Dell Latitude 12 E5270 | |
| HP EliteBook 725 G4 | |
| PCMark 8 Home Score Accelerated v2 | 3409 points | |
| PCMark 8 Creative Score Accelerated v2 | 3928 points | |
| PCMark 8 Work Score Accelerated v2 | 4365 points | |
Help | ||
| Dell Latitude 5280 Toshiba MQ01ACF050 | Dell Latitude 5289 SanDisk X400 256GB, SATA (SD8SB8U-256G) | Lenovo ThinkPad X270-20HMS00T00 Toshiba NVMe THNSF5512GPUK | HP EliteBook 725 G4 Samsung PM961 MZVLW256HEHP | Dell Latitude 12 E5270 Seagate ST500LM021-1KJ15 | |
|---|---|---|---|---|---|
| CrystalDiskMark 3.0 | 9086% | 18752% | 6641% | -1% | |
| Read Seq (MB/s) | 107.5 | 423.7 294% | 1190 1007% | 1963 1726% | 113.8 6% |
| Write Seq (MB/s) | 95.3 | 406.4 326% | 985 934% | 1409 1378% | 108.5 14% |
| Read 512 (MB/s) | 31.13 | 260.8 738% | 858 2656% | 949 2949% | 24.9 -20% |
| Write 512 (MB/s) | 45.49 | 255.6 462% | 528 1061% | 890 1856% | 51.9 14% |
| Read 4k (MB/s) | 0.357 | 22.73 6267% | 35.27 9780% | 29.75 8233% | 0.398 11% |
| Write 4k (MB/s) | 0.827 | 27.92 3276% | 124.5 14954% | 47.35 5626% | 0.654 -21% |
| Read 4k QD32 (MB/s) | 0.737 | 306.2 41447% | 495.3 67105% | 139.7 18855% | 0.798 8% |
| Write 4k QD32 (MB/s) | 0.795 | 158.8 19875% | 418.3 52516% | 100.2 12504% | 0.636 -20% |

| 3DMark 11 | |
| 1280x720 Performance GPU | |
| Intel Skull Canyon NUC6i7KYK | |
| Dell Latitude 7480 | |
| Acer Swift 3 SF314-51-731X | |
| Dell Latitude 5280 | |
| Dell Latitude 5580 | |
| Dell XPS 13 9365-4537 2-in-1 | |
| Lenovo Yoga 900S-12ISK-80ML | |
| 1280x720 Performance Combined | |
| Intel Skull Canyon NUC6i7KYK | |
| Dell Latitude 7480 | |
| Acer Swift 3 SF314-51-731X | |
| Dell XPS 13 9365-4537 2-in-1 | |
| Dell Latitude 5280 | |
| Dell Latitude 5580 | |
| Lenovo Yoga 900S-12ISK-80ML | |
| 3DMark | |
| 1280x720 Cloud Gate Standard Graphics | |
| Intel Skull Canyon NUC6i7KYK | |
| Dell Latitude 7480 | |
| Acer Swift 3 SF314-51-731X | |
| Dell Latitude 5280 | |
| Dell Latitude 5580 | |
| Lenovo Yoga 900S-12ISK-80ML | |
| 1920x1080 Fire Strike Graphics | |
| Intel Skull Canyon NUC6i7KYK | |
| Dell Latitude 7480 | |
| Dell Latitude 5280 | |
| Dell Latitude 5580 | |
| Lenovo Yoga 900S-12ISK-80ML | |
| 1920x1080 Ice Storm Extreme Graphics | |
| Intel Skull Canyon NUC6i7KYK | |
| Dell Latitude 7480 | |
| Dell Latitude 5280 | |
| Dell Latitude 5580 | |
| Lenovo Yoga 900S-12ISK-80ML | |
| 3DMark 11 Performance | 1378 points | |
| 3DMark Ice Storm Standard Score | 49846 points | |
| 3DMark Cloud Gate Standard Score | 5281 points | |
| 3DMark Fire Strike Score | 633 points | |
Help | ||
| low | med. | high | ultra | |
|---|---|---|---|---|
| BioShock Infinite (2013) | 29.9 | 20.9 | 18 | |
| Rise of the Tomb Raider (2016) | 14 |
Noise level
| Idle |
| 32.6 / 32.7 / 32.7 dB(A) |
| HDD |
| 33 dB(A) |
| Load |
| 33.4 / 37 dB(A) |
 | ||
30 dB silent 40 dB(A) audible 50 dB(A) loud |
||
min: | ||
| Dell Latitude 5280 HD Graphics 620, i5-7200U, Toshiba MQ01ACF050 | Dell Latitude 5289 HD Graphics 620, i5-7300U, SanDisk X400 256GB, SATA (SD8SB8U-256G) | Lenovo ThinkPad X270-20HMS00T00 HD Graphics 620, i5-7200U, Toshiba NVMe THNSF5512GPUK | HP EliteBook 725 G4 Radeon R7 (Bristol Ridge), PRO A12-9800B, Samsung PM961 MZVLW256HEHP | Dell Latitude 12 E5270 HD Graphics 520, 6300U, Seagate ST500LM021-1KJ15 | |
|---|---|---|---|---|---|
| Noise | 1% | 3% | 4% | -1% | |
| off / environment * (dB) | 27.6 | 30.5 -11% | 29 -5% | 30.4 -10% | 29.2 -6% |
| Idle Minimum * (dB) | 32.6 | 30.5 6% | 29 11% | 30.4 7% | 32.9 -1% |
| Idle Average * (dB) | 32.7 | 30.5 7% | 29 11% | 30.4 7% | 32.9 -1% |
| Idle Maximum * (dB) | 32.7 | 30.5 7% | 30.4 7% | 30.4 7% | 32.9 -1% |
| Load Average * (dB) | 33.4 | 36 -8% | 34.1 -2% | 31.7 5% | 33.7 -1% |
| Load Maximum * (dB) | 37 | 34.6 6% | 37.6 -2% | 34.4 7% | 34.9 6% |
* ... smaller is better
(-) The maximum temperature on the upper side is 48.4 °C / 119 F, compared to the average of 35.9 °C / 97 F, ranging from 21.4 to 59 °C for the class Subnotebook.
(-) The bottom heats up to a maximum of 49.2 °C / 121 F, compared to the average of 39.2 °C / 103 F
(+) In idle usage, the average temperature for the upper side is 25 °C / 77 F, compared to the device average of 30.8 °C / 87 F.
(+) The palmrests and touchpad are cooler than skin temperature with a maximum of 28.4 °C / 83.1 F and are therefore cool to the touch.
(±) The average temperature of the palmrest area of similar devices was 28.2 °C / 82.8 F (-0.2 °C / -0.3 F).
Dell Latitude 5280 audio analysis
(±) | speaker loudness is average but good (81.1 dB)
Bass 100 - 315 Hz
(-) | nearly no bass - on average 20.2% lower than median
(±) | linearity of bass is average (12.4% delta to prev. frequency)
Mids 400 - 2000 Hz
(+) | balanced mids - only 4% away from median
(±) | linearity of mids is average (9.5% delta to prev. frequency)
Highs 2 - 16 kHz
(±) | higher highs - on average 5.8% higher than median
(±) | linearity of highs is average (9.8% delta to prev. frequency)
Overall 100 - 16.000 Hz
(±) | linearity of overall sound is average (25.4% difference to median)
Compared to same class
» 85% of all tested devices in this class were better, 3% similar, 11% worse
» The best had a delta of 5%, average was 18%, worst was 53%
Compared to all devices tested
» 78% of all tested devices were better, 5% similar, 17% worse
» The best had a delta of 4%, average was 23%, worst was 134%
Apple MacBook 12 (Early 2016) 1.1 GHz audio analysis
(+) | speakers can play relatively loud (83.6 dB)
Bass 100 - 315 Hz
(±) | reduced bass - on average 11.3% lower than median
(±) | linearity of bass is average (14.2% delta to prev. frequency)
Mids 400 - 2000 Hz
(+) | balanced mids - only 2.4% away from median
(+) | mids are linear (5.5% delta to prev. frequency)
Highs 2 - 16 kHz
(+) | balanced highs - only 2% away from median
(+) | highs are linear (4.5% delta to prev. frequency)
Overall 100 - 16.000 Hz
(+) | overall sound is linear (10.2% difference to median)
Compared to same class
» 7% of all tested devices in this class were better, 2% similar, 90% worse
» The best had a delta of 5%, average was 18%, worst was 53%
Compared to all devices tested
» 5% of all tested devices were better, 1% similar, 94% worse
» The best had a delta of 4%, average was 23%, worst was 134%
| Off / Standby | |
| Idle | |
| Load |
|
Key:
min: | |
| Dell Latitude 5280 i5-7200U, HD Graphics 620, Toshiba MQ01ACF050, TN LED, 1366x768, 12.5" | Dell Latitude 5289 i5-7300U, HD Graphics 620, SanDisk X400 256GB, SATA (SD8SB8U-256G), IPS LED, 1920x1080, 12.5" | Lenovo ThinkPad X270-20HMS00T00 i5-7200U, HD Graphics 620, Toshiba NVMe THNSF5512GPUK, IPS LED, 1920x1080, 12.5" | HP EliteBook 725 G4 PRO A12-9800B, Radeon R7 (Bristol Ridge), Samsung PM961 MZVLW256HEHP, IPS, 1920x1080, 12.5" | Dell Latitude 12 E5270 6300U, HD Graphics 520, Seagate ST500LM021-1KJ15, TN, 1366x768, 12.5" | |
|---|---|---|---|---|---|
| Power Consumption | 12% | -1% | 0% | 2% | |
| Idle Minimum * (Watt) | 5.7 | 2.7 53% | 3.5 39% | 4.5 21% | 3.9 32% |
| Idle Average * (Watt) | 6.9 | 5.1 26% | 5.8 16% | 6.3 9% | 6 13% |
| Idle Maximum * (Watt) | 7.1 | 7.6 -7% | 7.6 -7% | 8.3 -17% | 6.6 7% |
| Load Average * (Watt) | 28.3 | 33 -17% | 33.2 -17% | 27.6 2% | 28.9 -2% |
| Load Maximum * (Watt) | 30.2 | 29 4% | 40.4 -34% | 34.5 -14% | 41.7 -38% |
* ... smaller is better
| Dell Latitude 5280 i5-7200U, HD Graphics 620, 51 Wh | Dell Latitude 5289 i5-7300U, HD Graphics 620, 60 Wh | Lenovo ThinkPad X270-20HMS00T00 i5-7200U, HD Graphics 620, 46 Wh | HP EliteBook 725 G4 PRO A12-9800B, Radeon R7 (Bristol Ridge), 49 Wh | Dell Latitude 12 E5270 6300U, HD Graphics 520, 47 Wh | |
|---|---|---|---|---|---|
| Battery runtime | 36% | -22% | -22% | -18% | |
| Reader / Idle (h) | 18.5 | 28.8 56% | 17.1 -8% | 11.7 -37% | 12.9 -30% |
| WiFi v1.3 (h) | 7.8 | 11.8 51% | 5.4 -31% | 6.3 -19% | 6.6 -15% |
| Load (h) | 2.3 | 2.3 0% | 1.7 -26% | 2.1 -9% | 2.1 -9% |
Pros
Cons
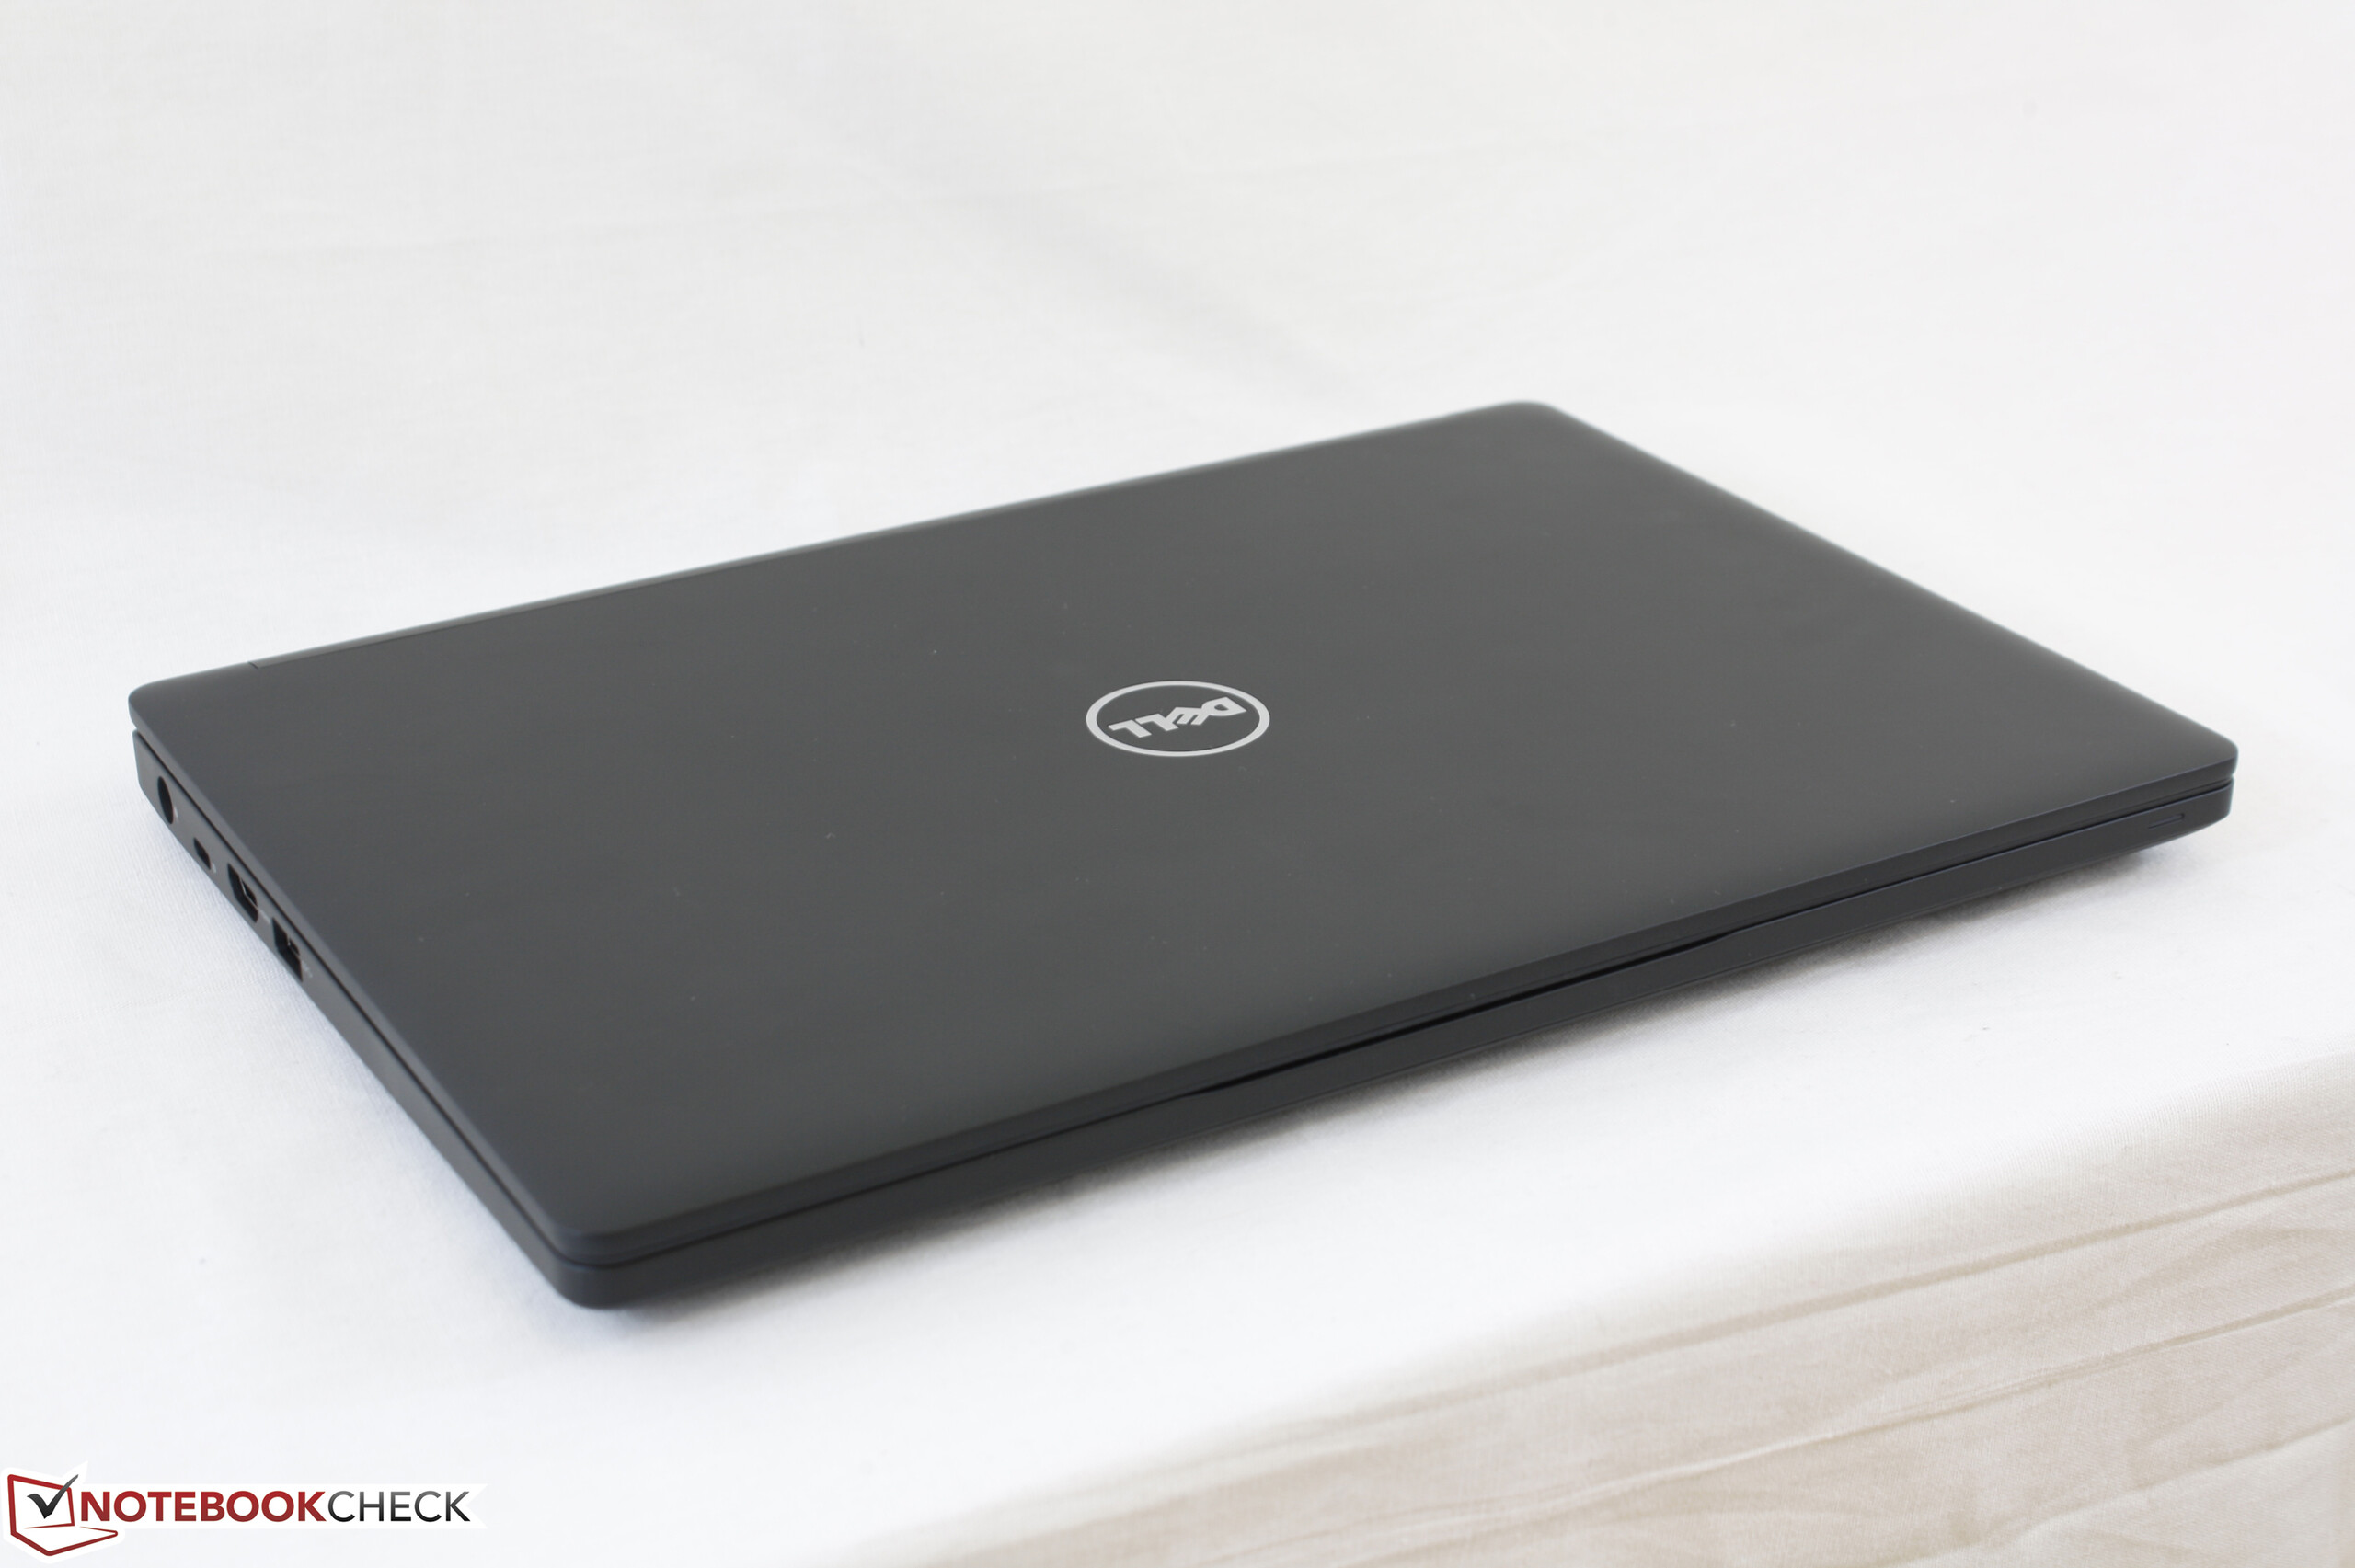
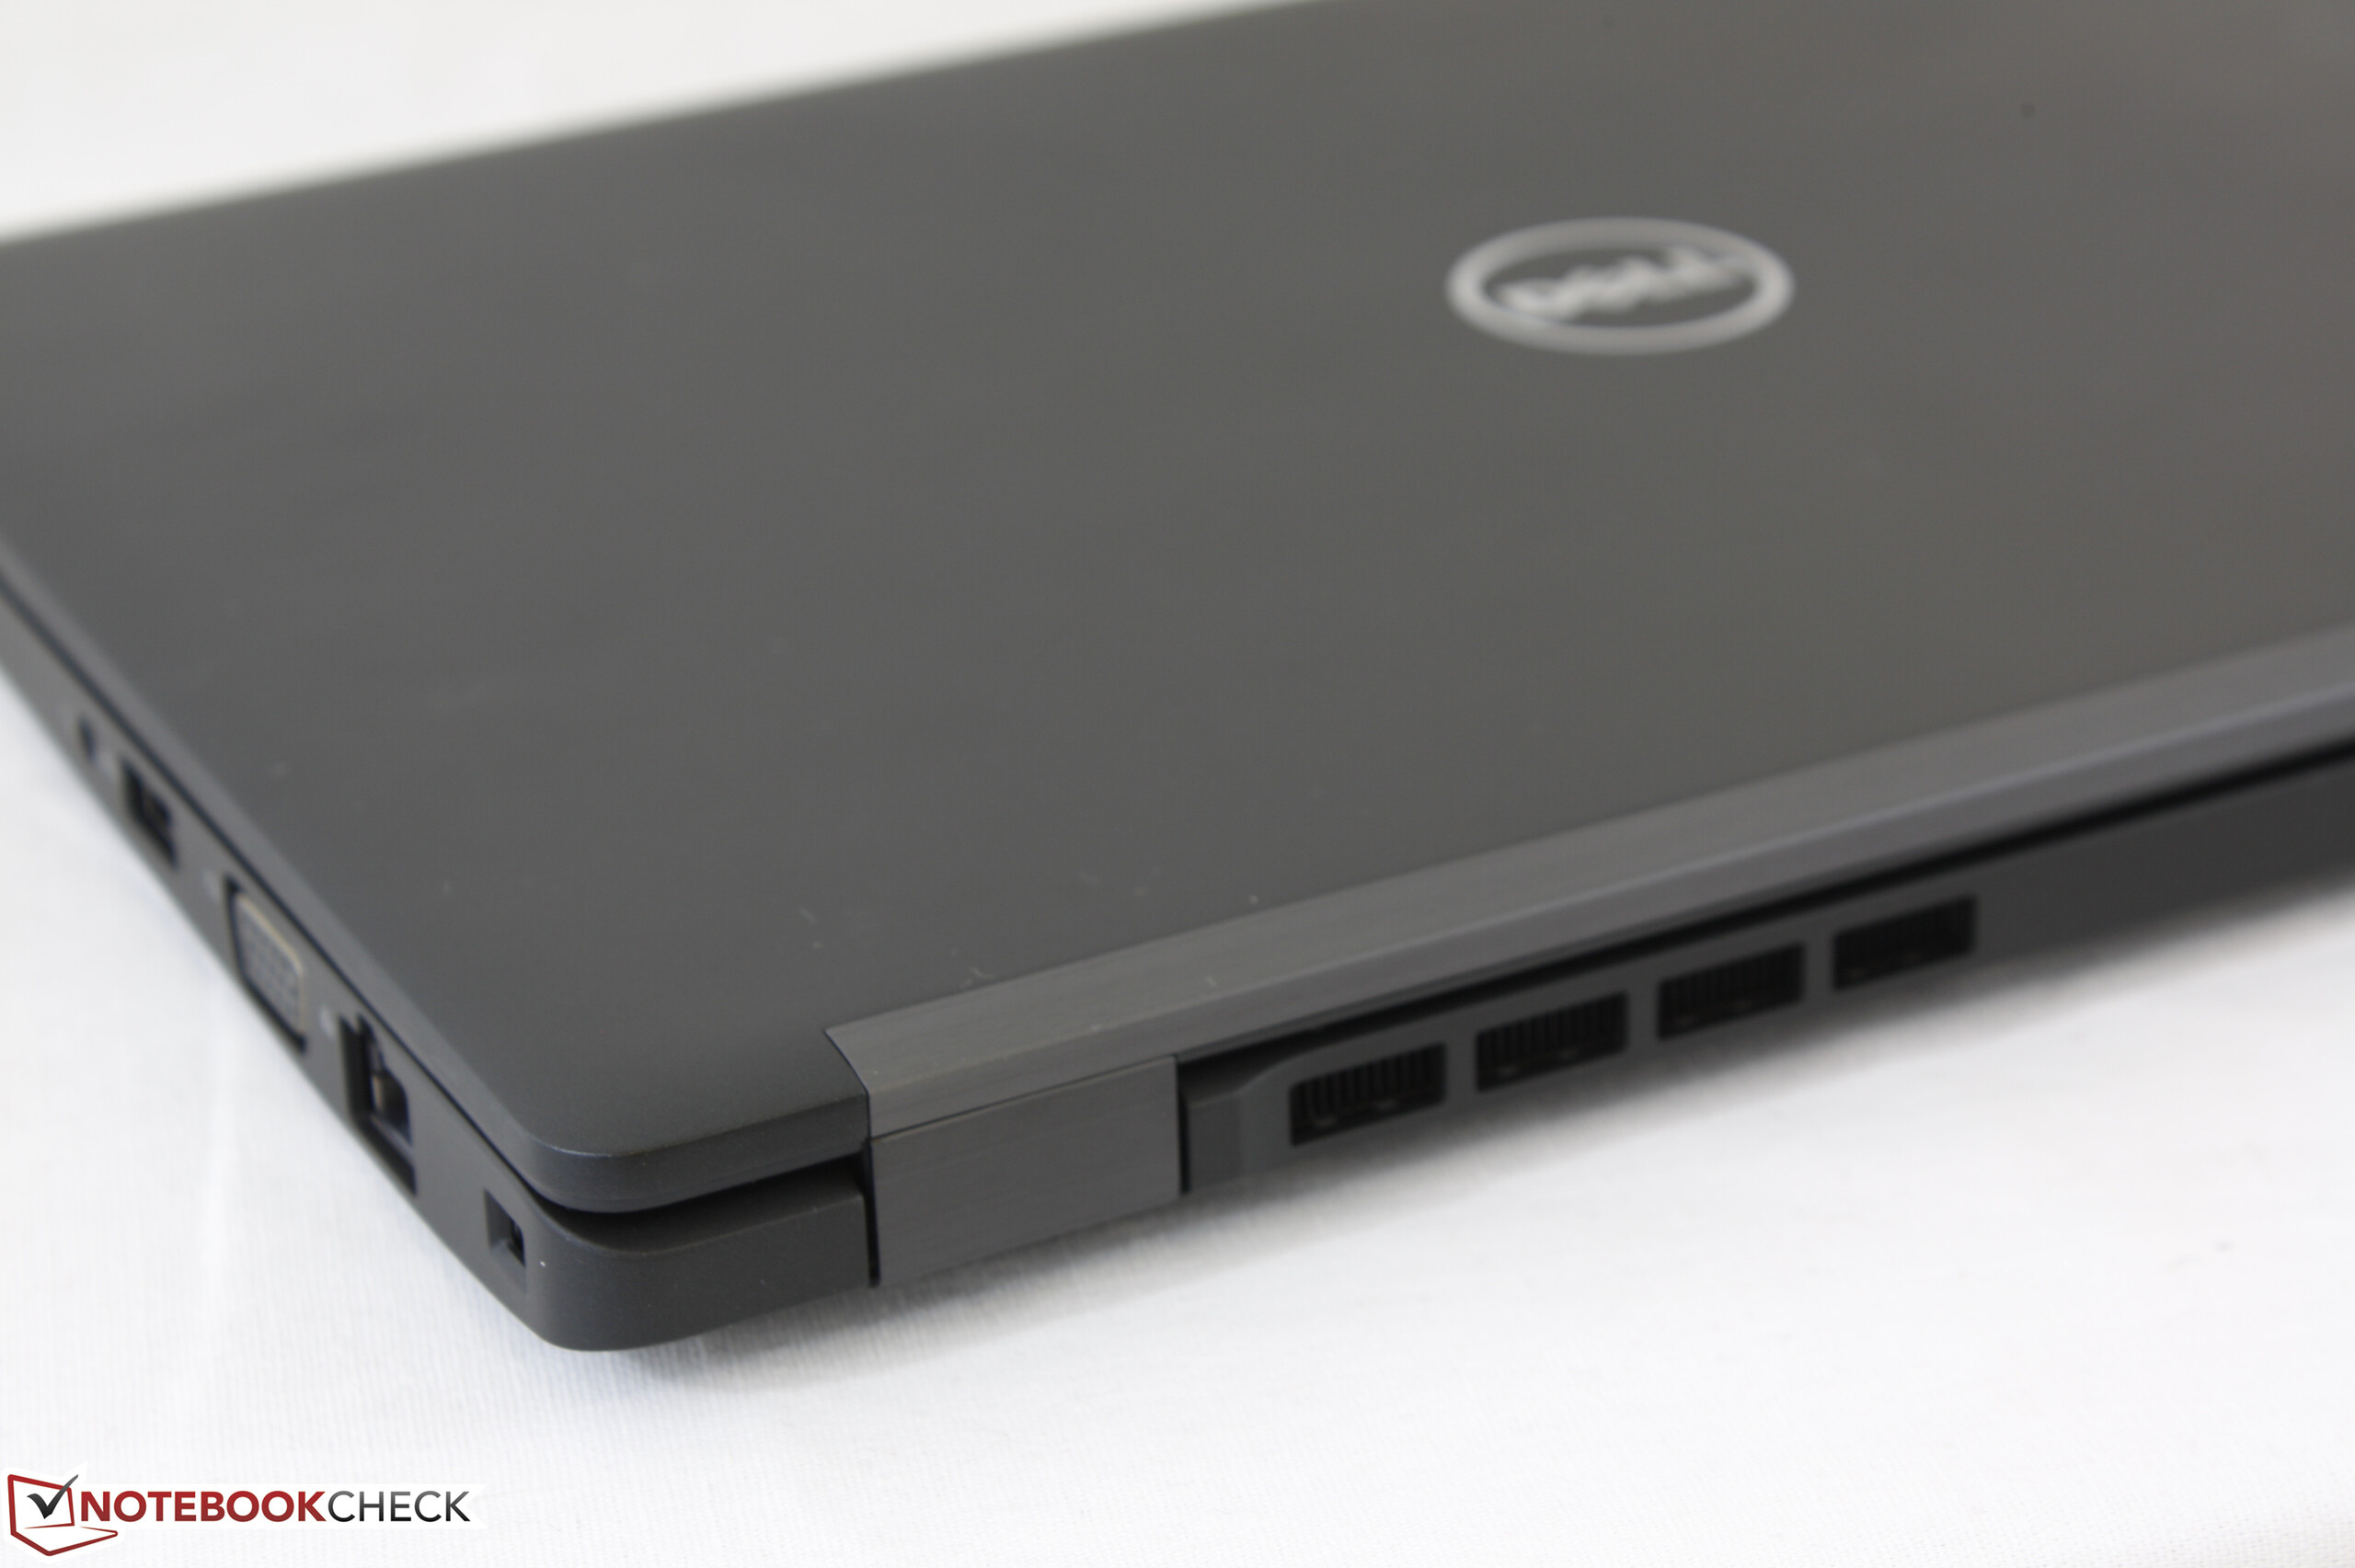
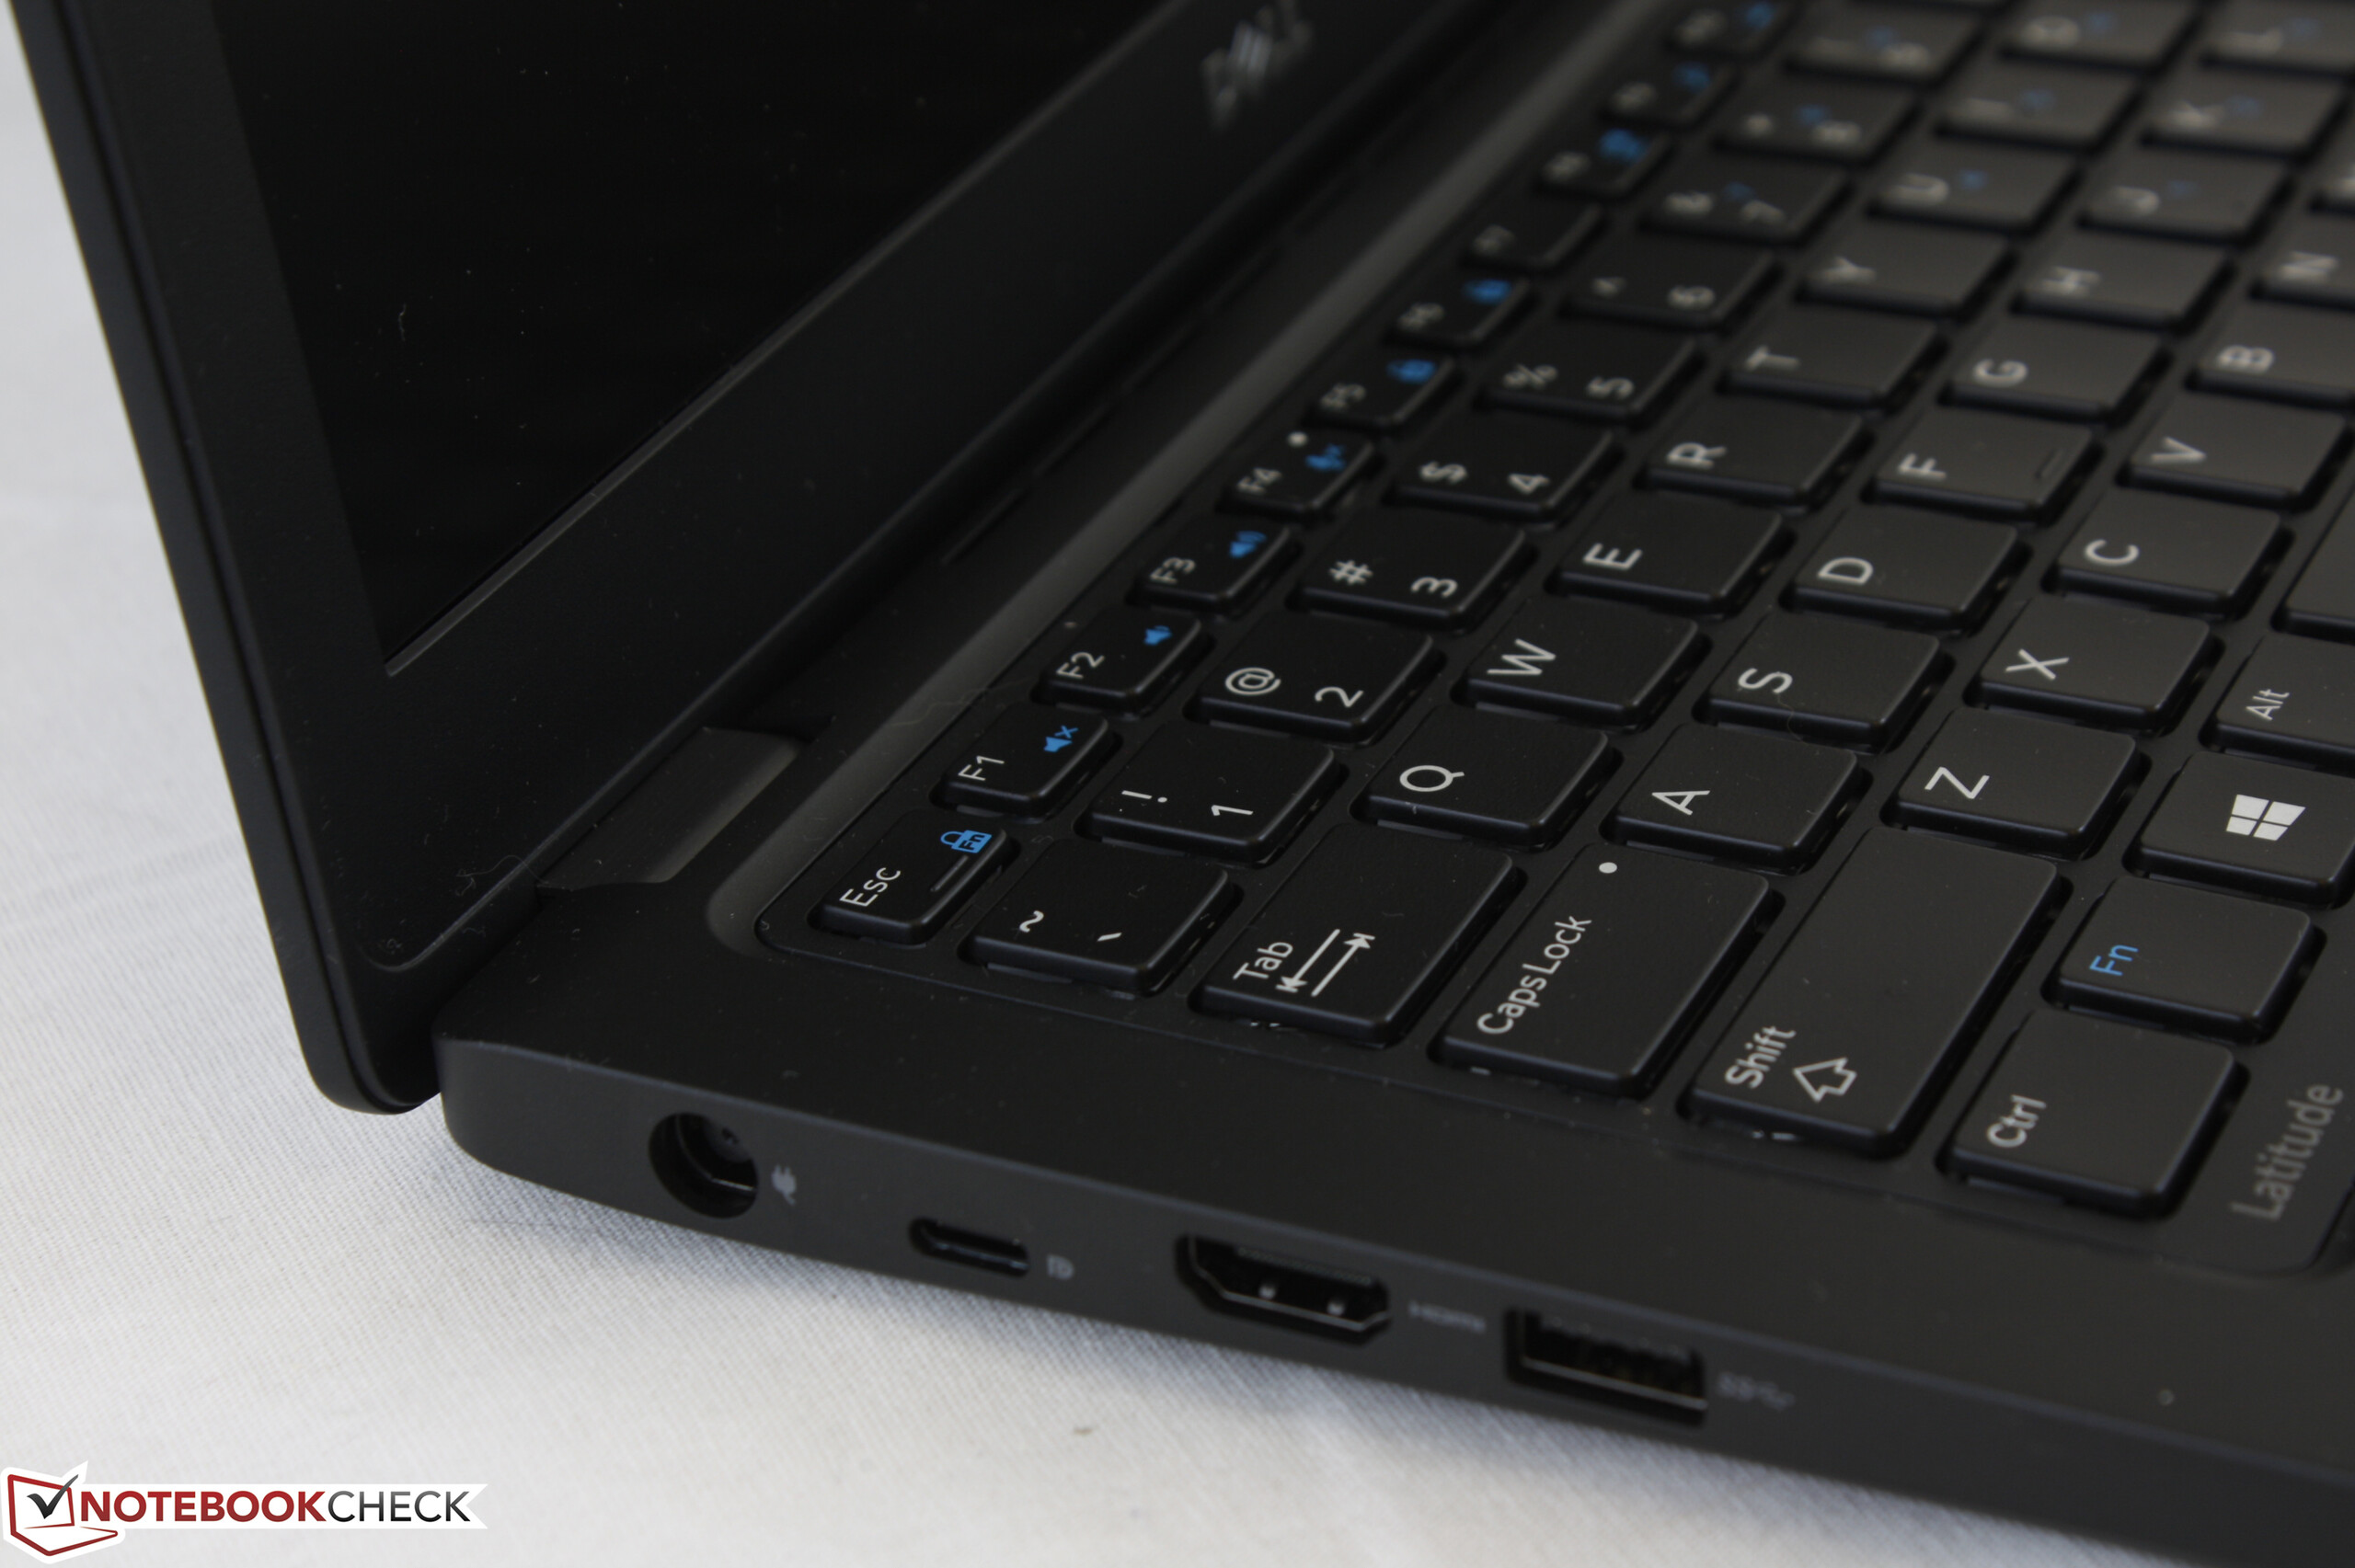
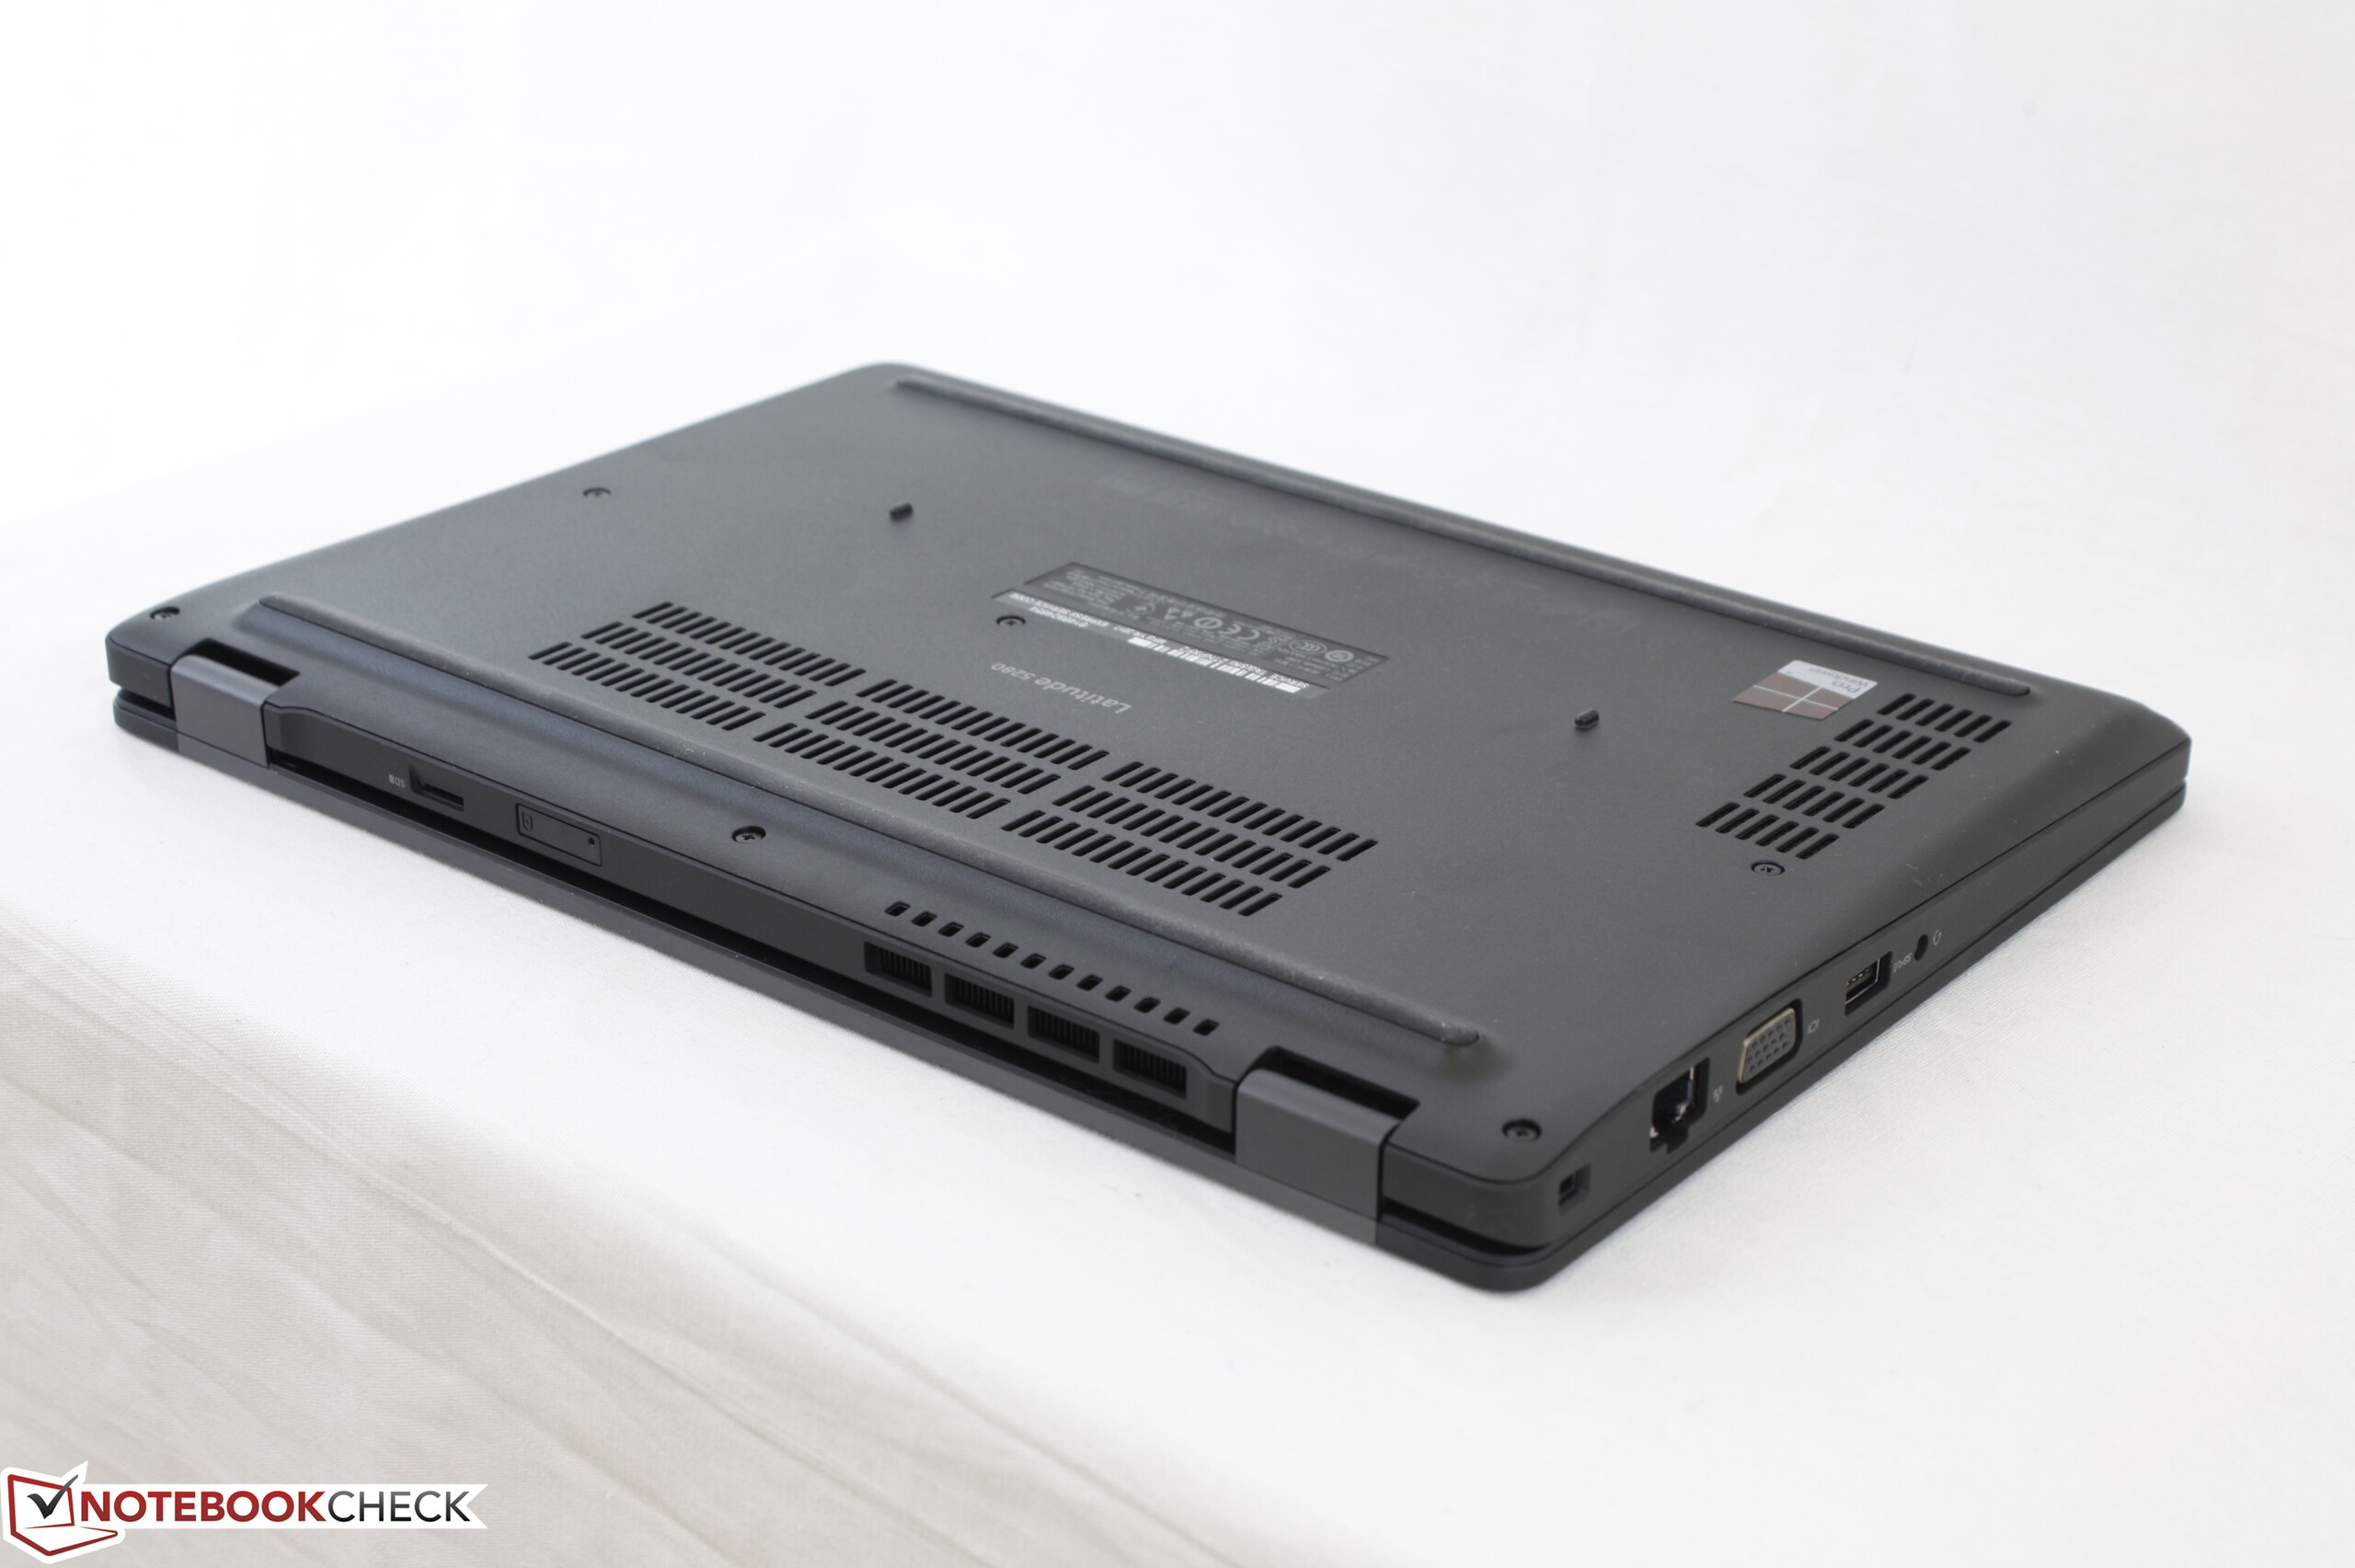
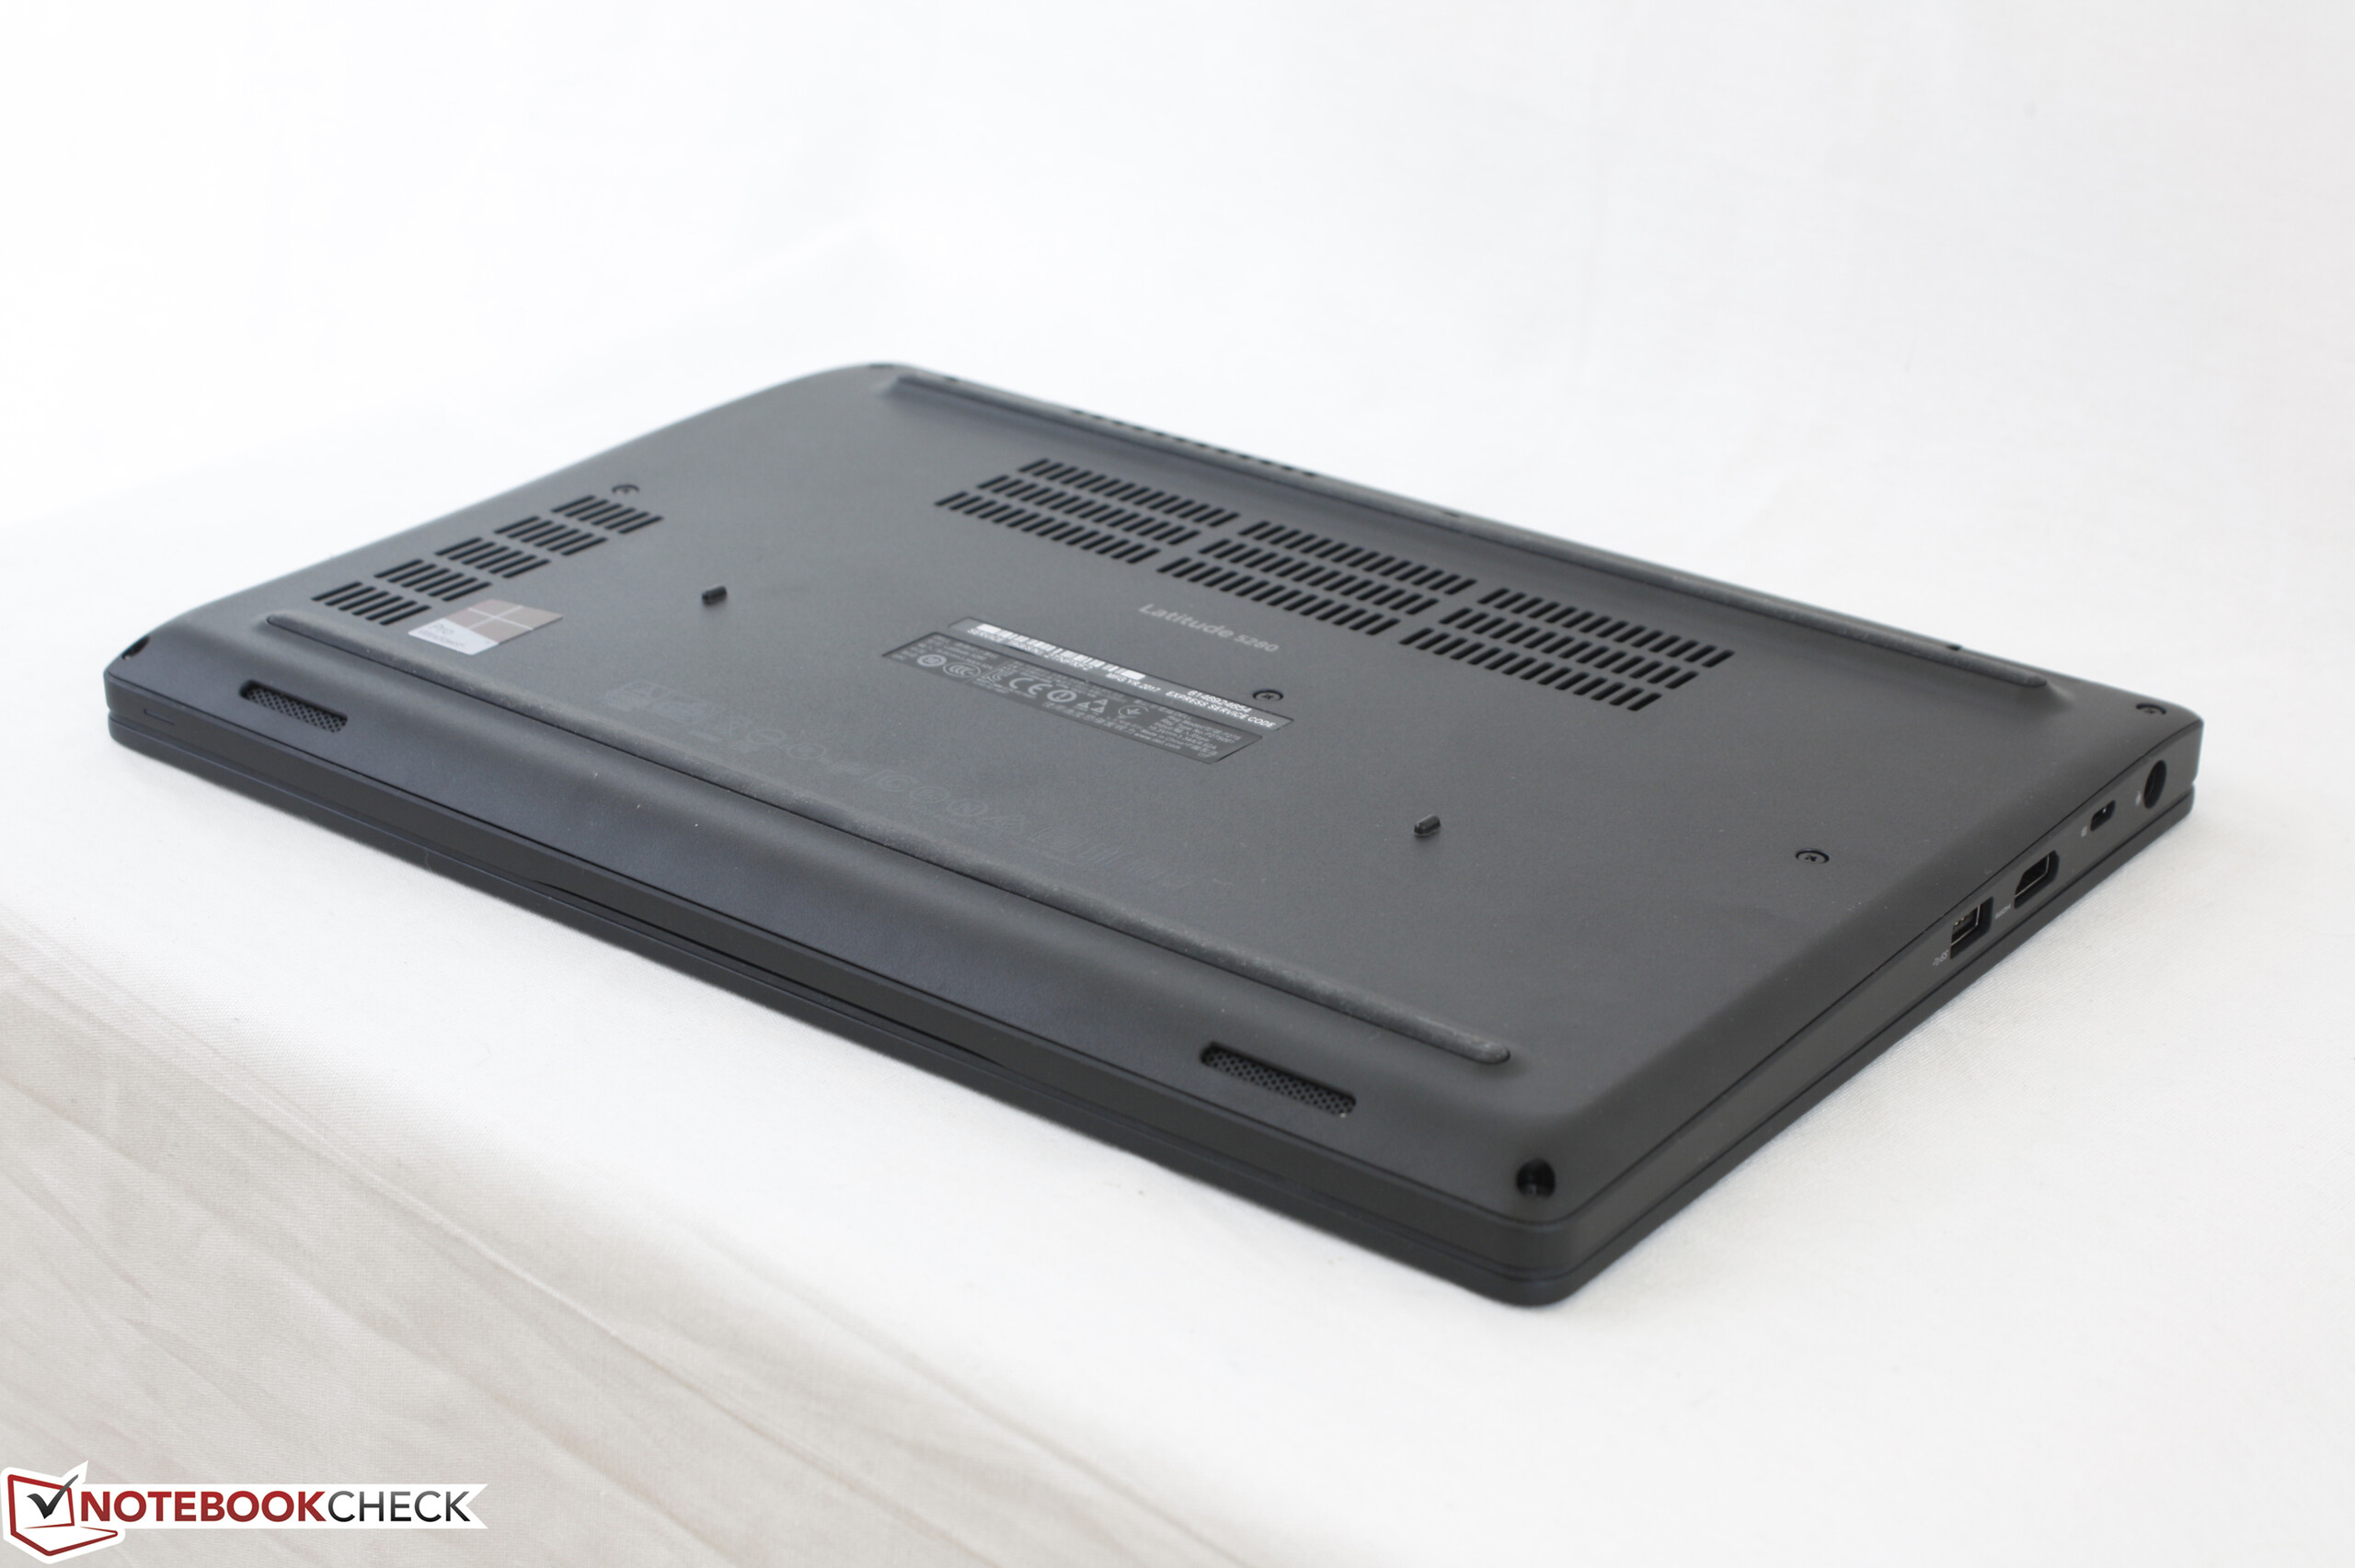
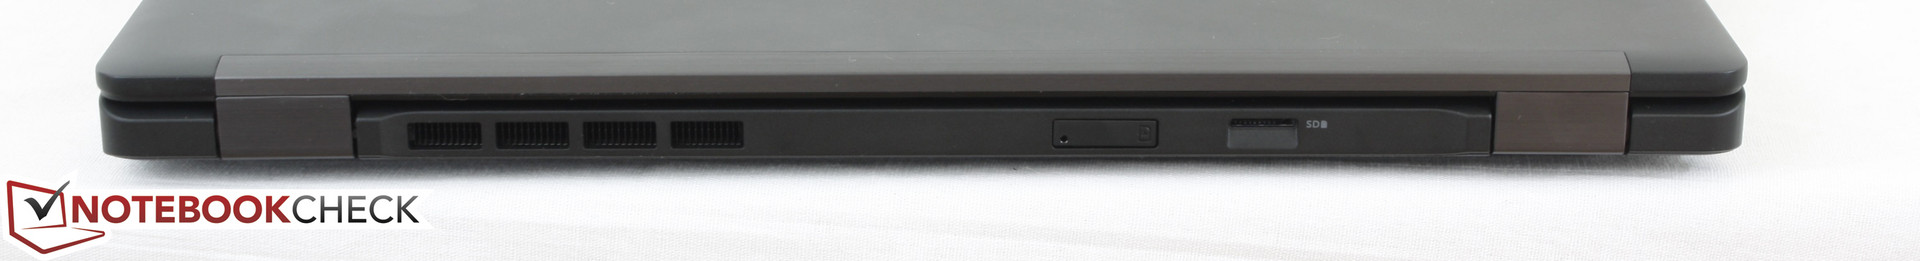
许多商务笔记本电脑的主要卖点都包括了可以方便地连接扩展坞或外置电池。而最新的Latitude 5280/5480/5580系列则放弃了E-Port扩展坞接口,因为Thunderbolt 3正在逐渐成为扩展功能性的核心技术。遗憾的是Latitude 5280对这两者都没有提供支持,因此相比5480或5580灵活度较低,尽管它的尺寸较小也更加便携。另外,它的散热风扇会一直保持开启,我们认为这对于一台采用U系列超低电压处理器的设备来说并没有必要。
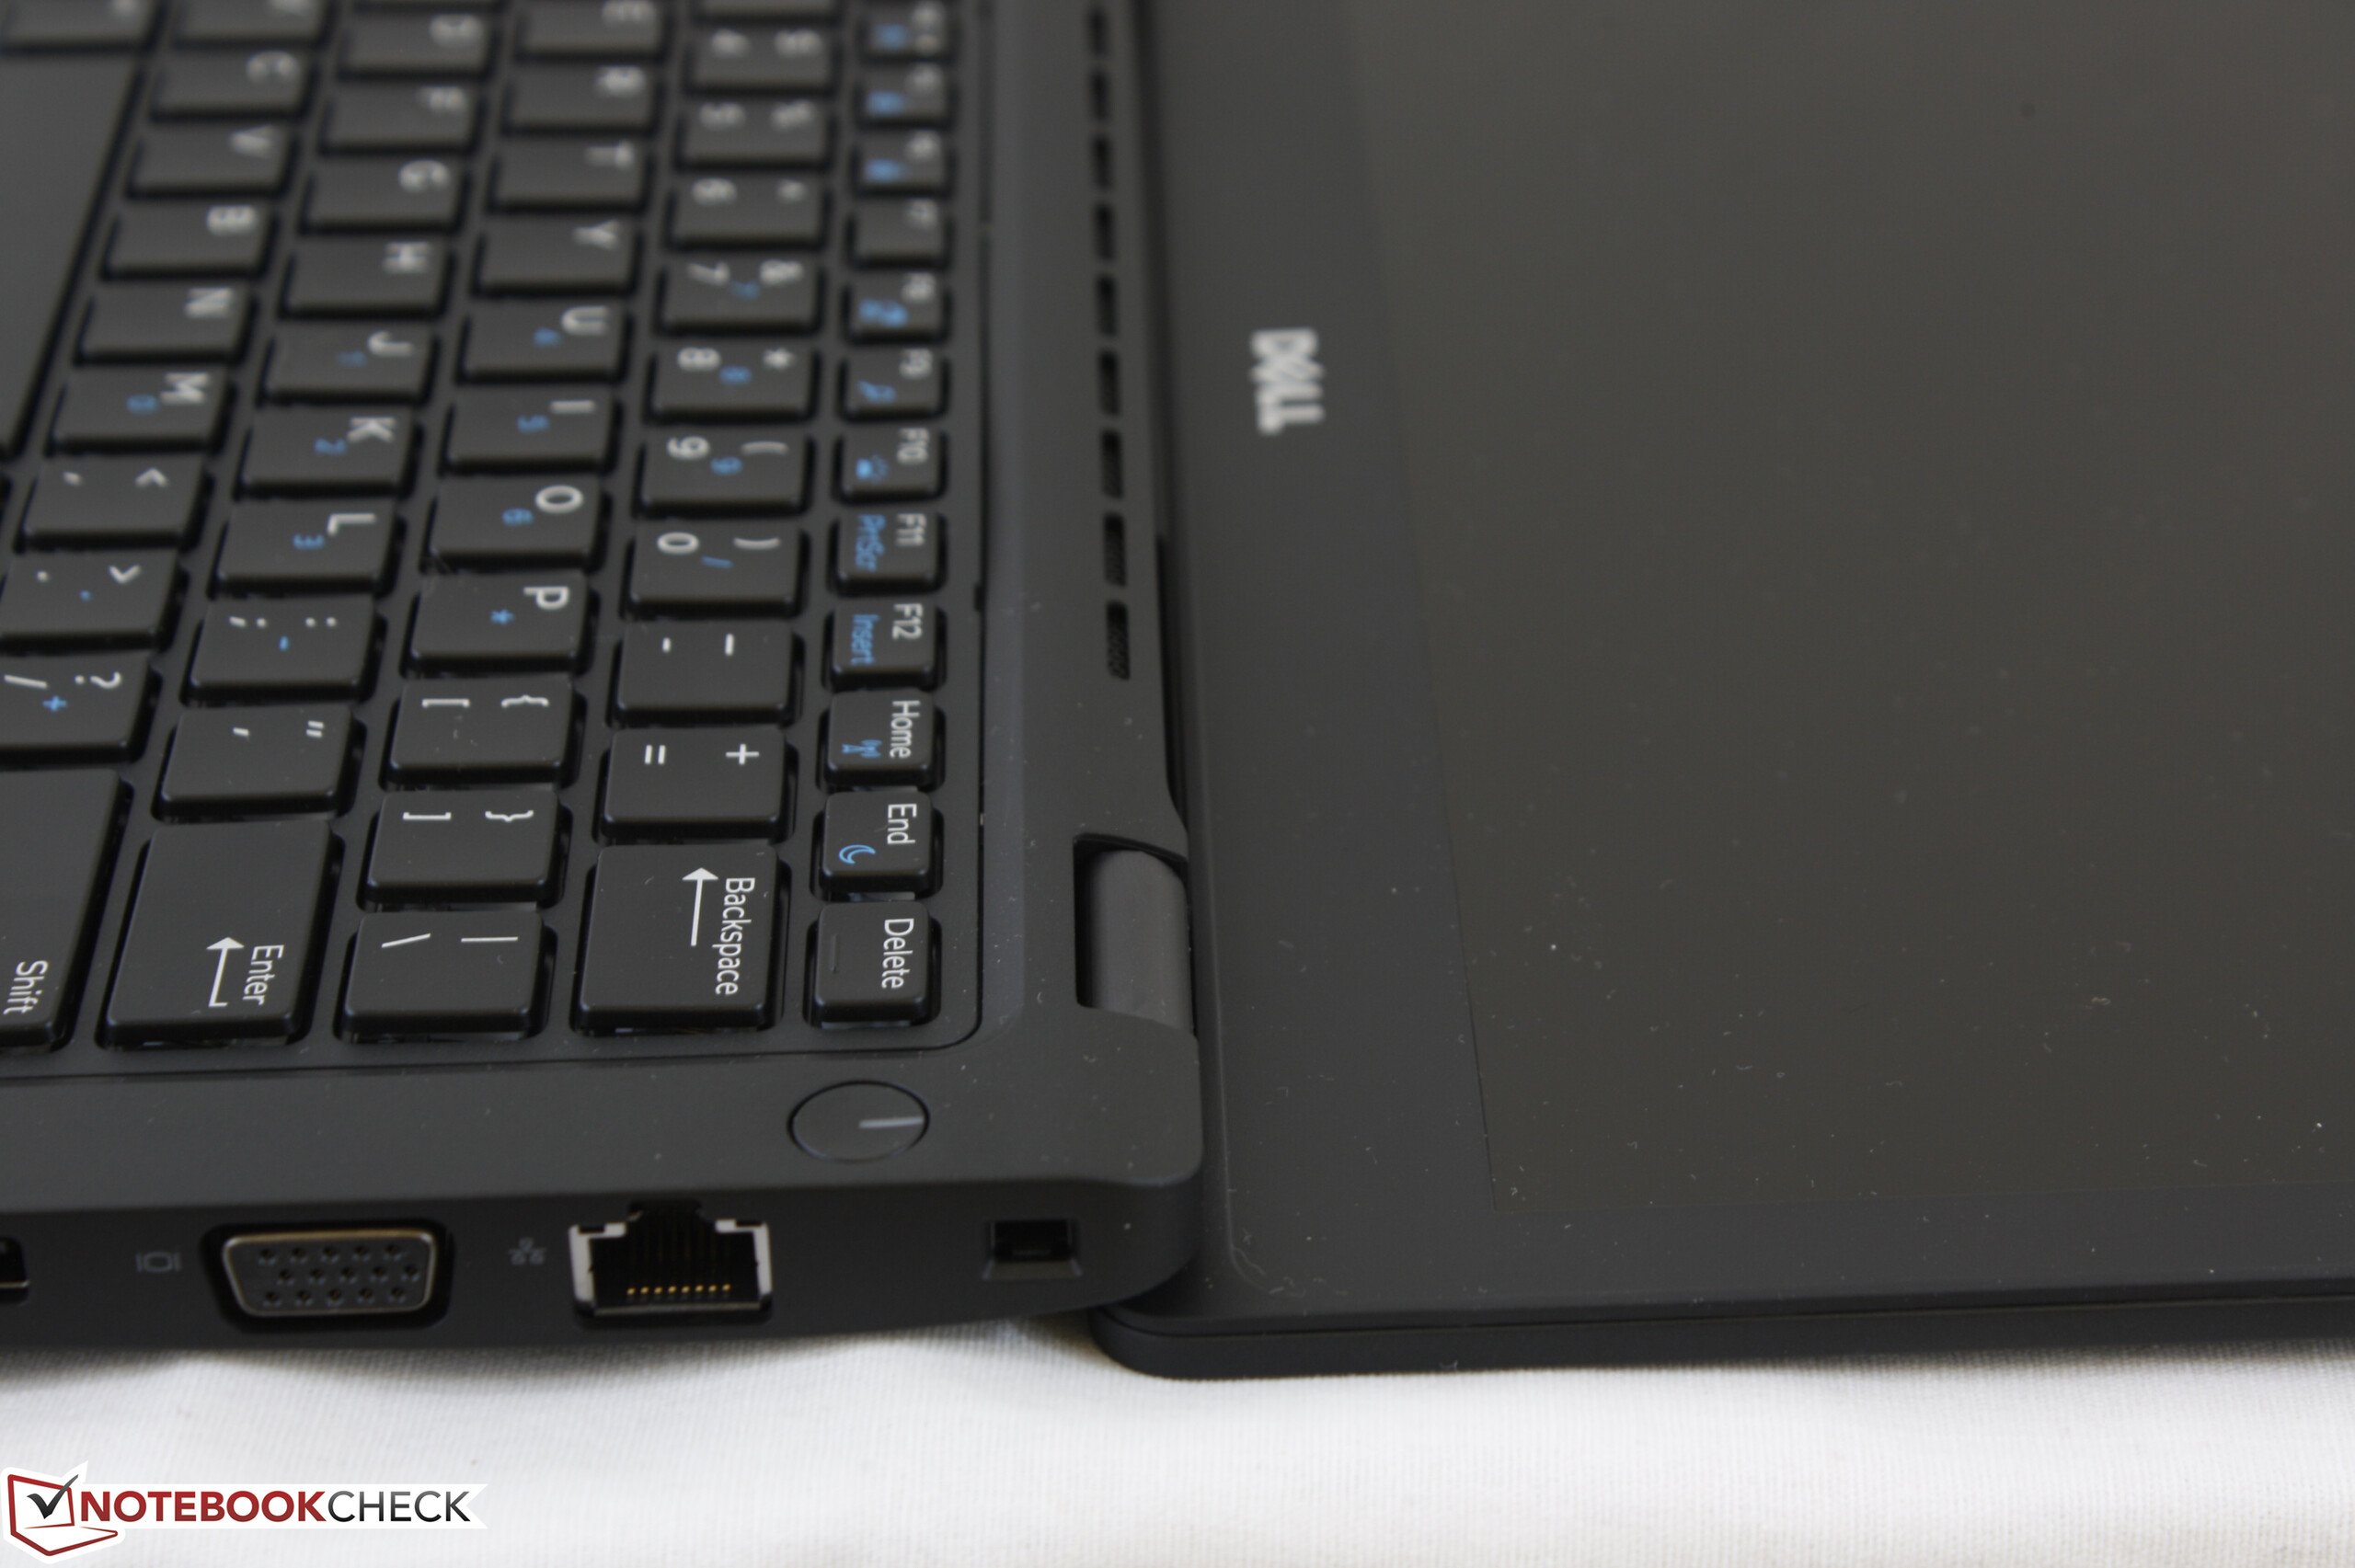
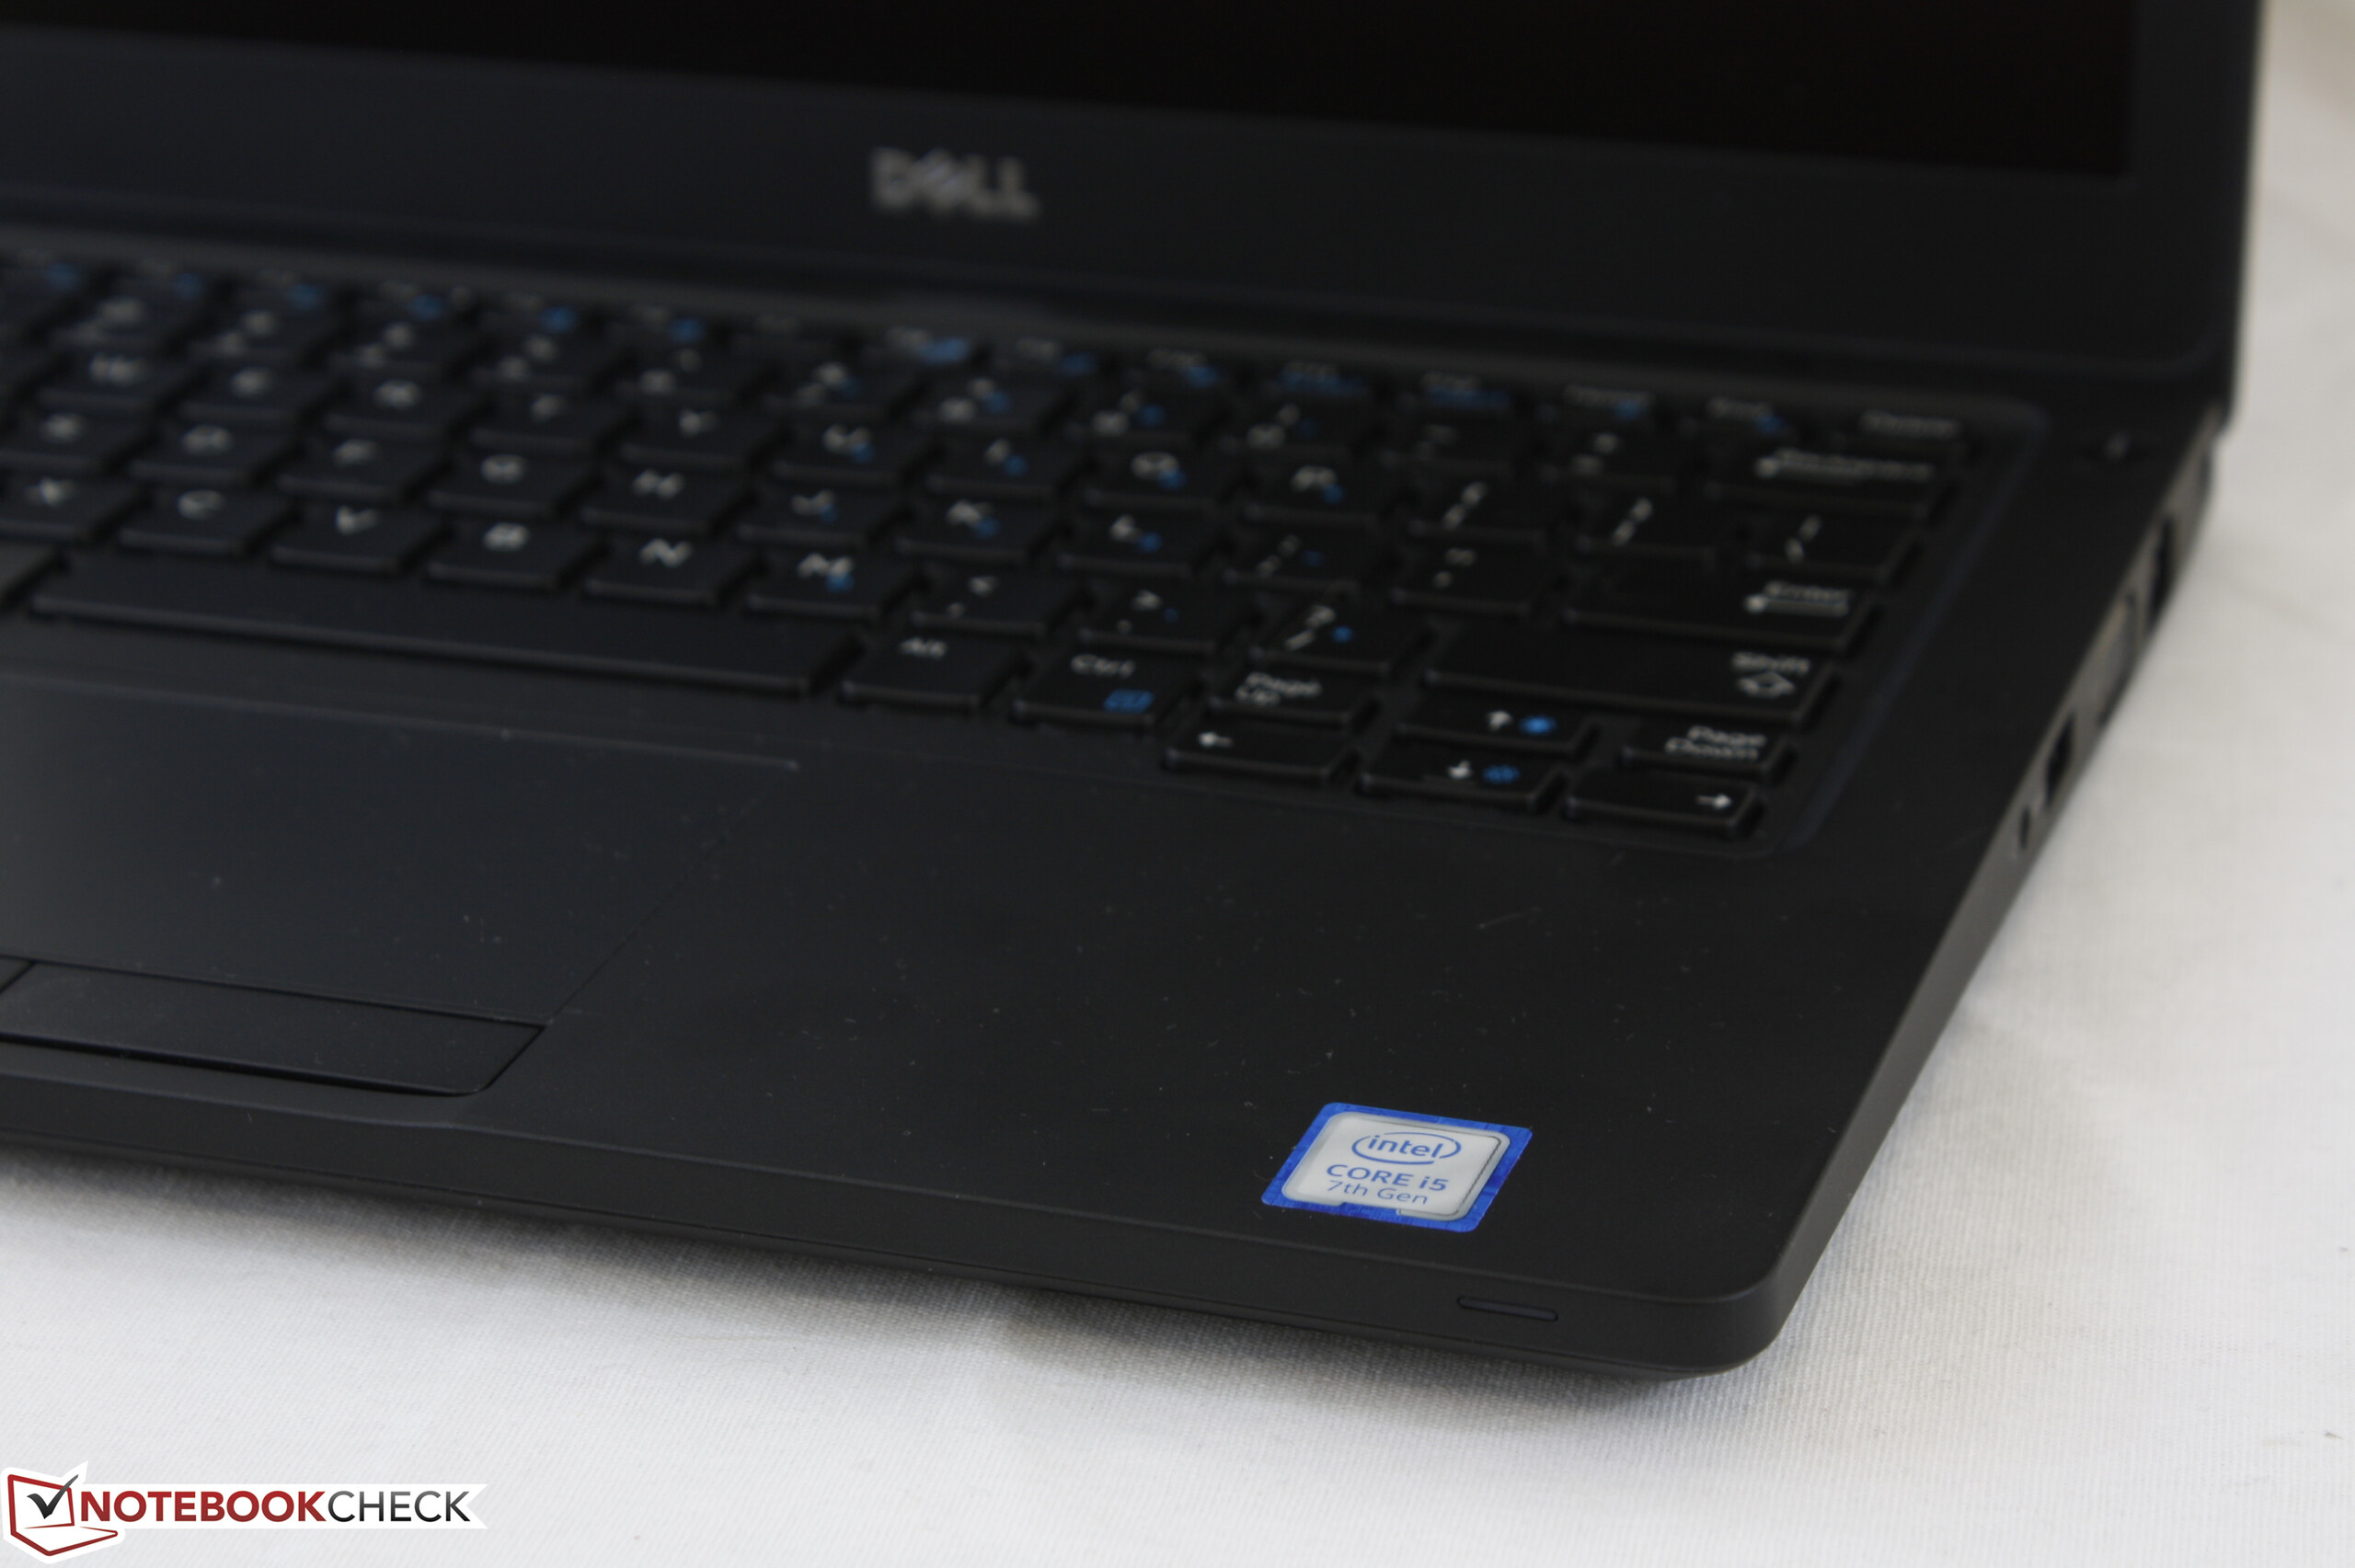
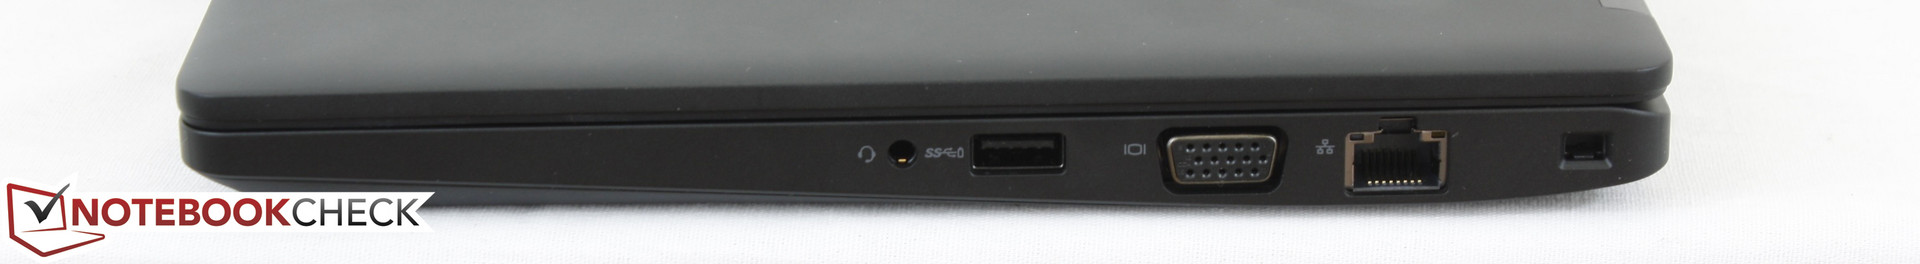
如果我们所提到的缺点并不算严重,5280在其他方面的表现可以说是十分出色。它的USB-C接口可以用于连接DisplayPort外置显示器,而全新设计的机身也在不影响坚固性的前提下相比E5270轻了很多。它的电池续航表现在使用中等容量电池时已经十分出色,保持提供VGA和HDMI接口可能会在大学或会议中提供不小的便利。特别是它的处理器性能十分出色,可以在高负载下保持Turbo Boost频率。
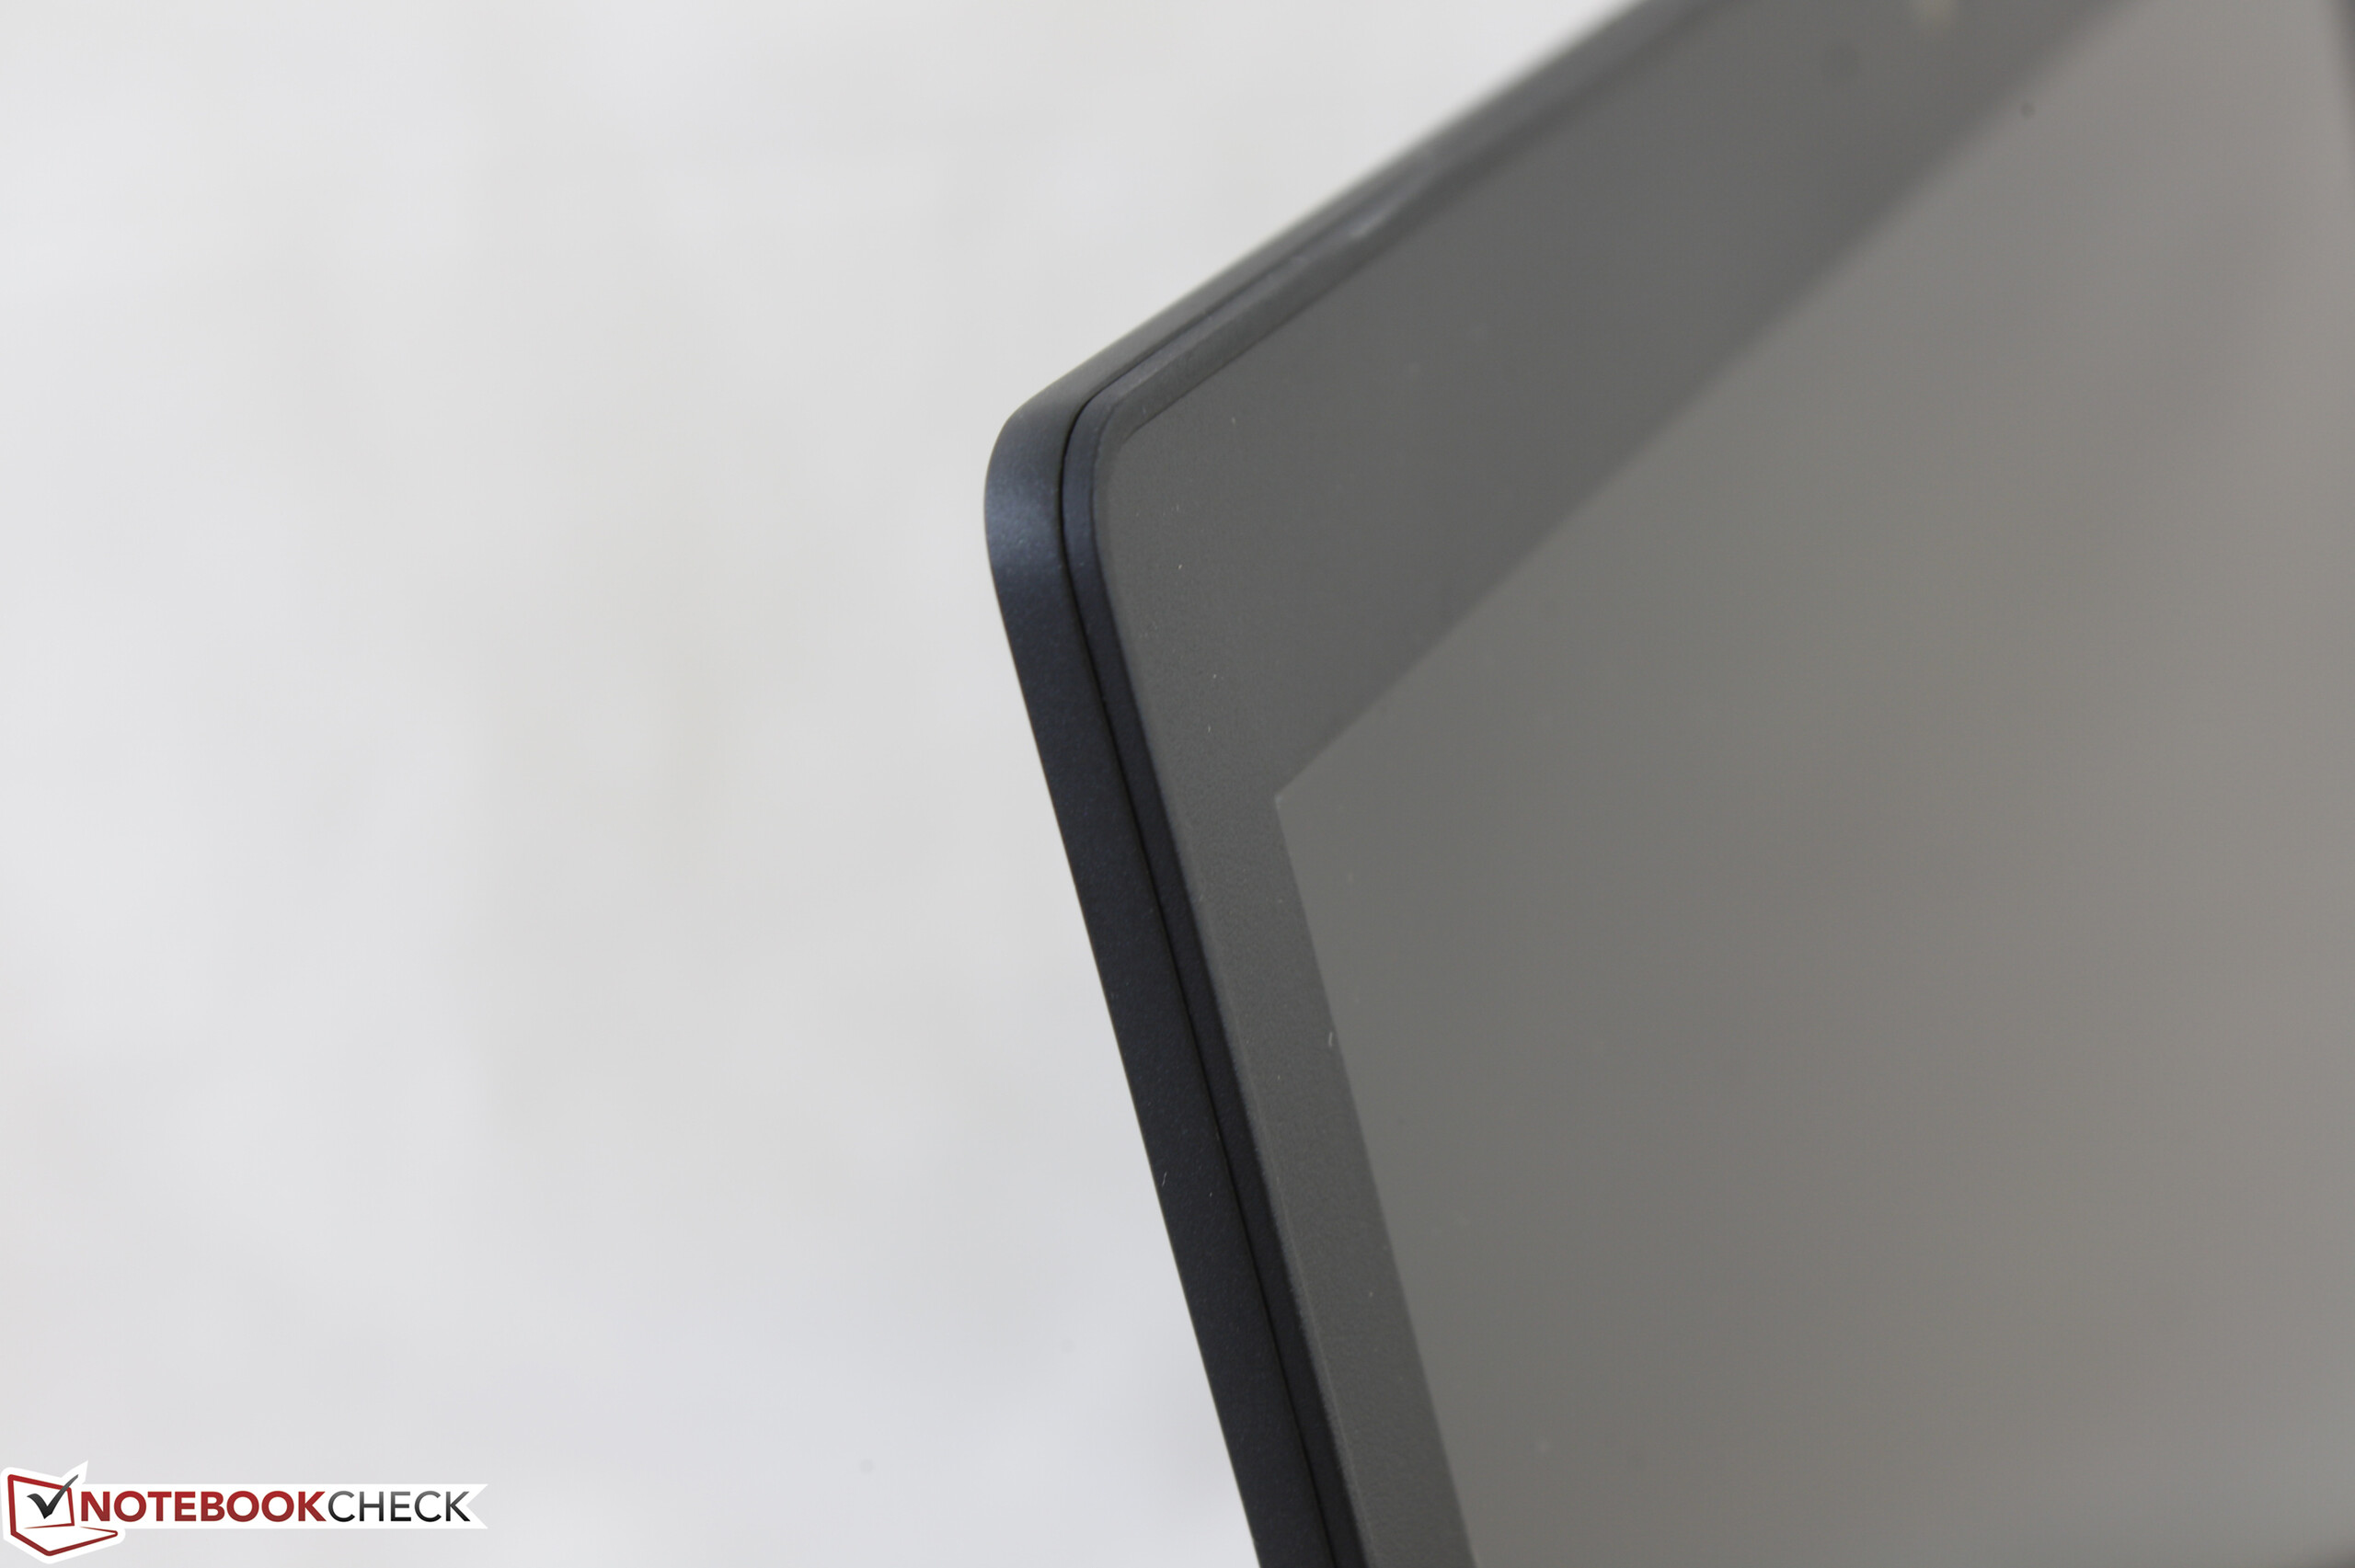
我们建议用户放弃768p屏幕机型,升级到更明亮1080p屏幕搭配固态硬盘的机型。在分辨率和亮度上的提高可以让笔记本电脑的使用更舒适,如果不时常连接外置显示器的话十分值得考虑。
相对绵软的键盘可能需要一些时间适应,而对于手较大的用户可能需要考虑尺寸更大的笔记本电脑。5280十分适合长时间出门在外使用笔记本电脑,而非主要在家中或办公室中使用的用户。
注:本文是基于完整评测的缩减版本,阅读完整的英文评测,请点击这里。
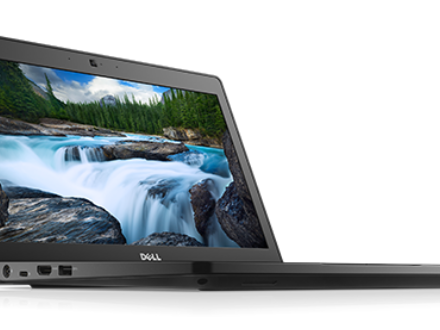
Dell Latitude 5280
- 05/27/2017 v6 (old)
Allen Ngo
Price comparison
