技嘉G5 KC回顾。可升级的游戏笔记本电脑

通过Aero 15 OLED XD 和 Aero 17 HDR YD 等笔记本电脑,技嘉提供了非常高质量,但也相当昂贵的设备。然而,技嘉G5 KC证明了该制造商也可以提供更实惠的机型。在我们的测试配置中,它有一个英特尔酷睿i5-10500H ,一个NvidiaGeForce RTX 3060 ,16GB内存和512GB固态硬盘,价格大约是1000欧元(约1184美元)。
在这种配置下,它必须面对下面列出的竞争,在每个部分下可以添加我们数据库中的其他笔记本电脑。
Possible contenders in comparison
Rating | Date | Model | Weight | Height | Size | Resolution | Price |
|---|---|---|---|---|---|---|---|
| 80.7 % v7 (old) | 09 / 2021 | Gigabyte G5 KC i5-10500H, GeForce RTX 3060 Laptop GPU | 2.1 kg | 28 mm | 15.60" | 1920x1080 | |
| 81.1 % v7 (old) | 08 / 2021 | Acer Nitro 5 AN517-53-54DQ i5-11300H, GeForce RTX 3050 4GB Laptop GPU | 2.6 kg | 25 mm | 17.30" | 1920x1080 | |
| 80.4 % v7 (old) | 05 / 2021 | MSI GF65 Thin 10UE i7-10750H, GeForce RTX 3060 Laptop GPU | 1.9 kg | 21.7 mm | 15.60" | 1920x1080 | |
v (old) | Dell G5 15 5500 09E2 i5-10300H, GeForce GTX 1650 Ti Mobile | 2.3 kg | 21.6 mm | 15.60" | 1920x1080 |
箱子 - 带可更换电池的笔记本电脑
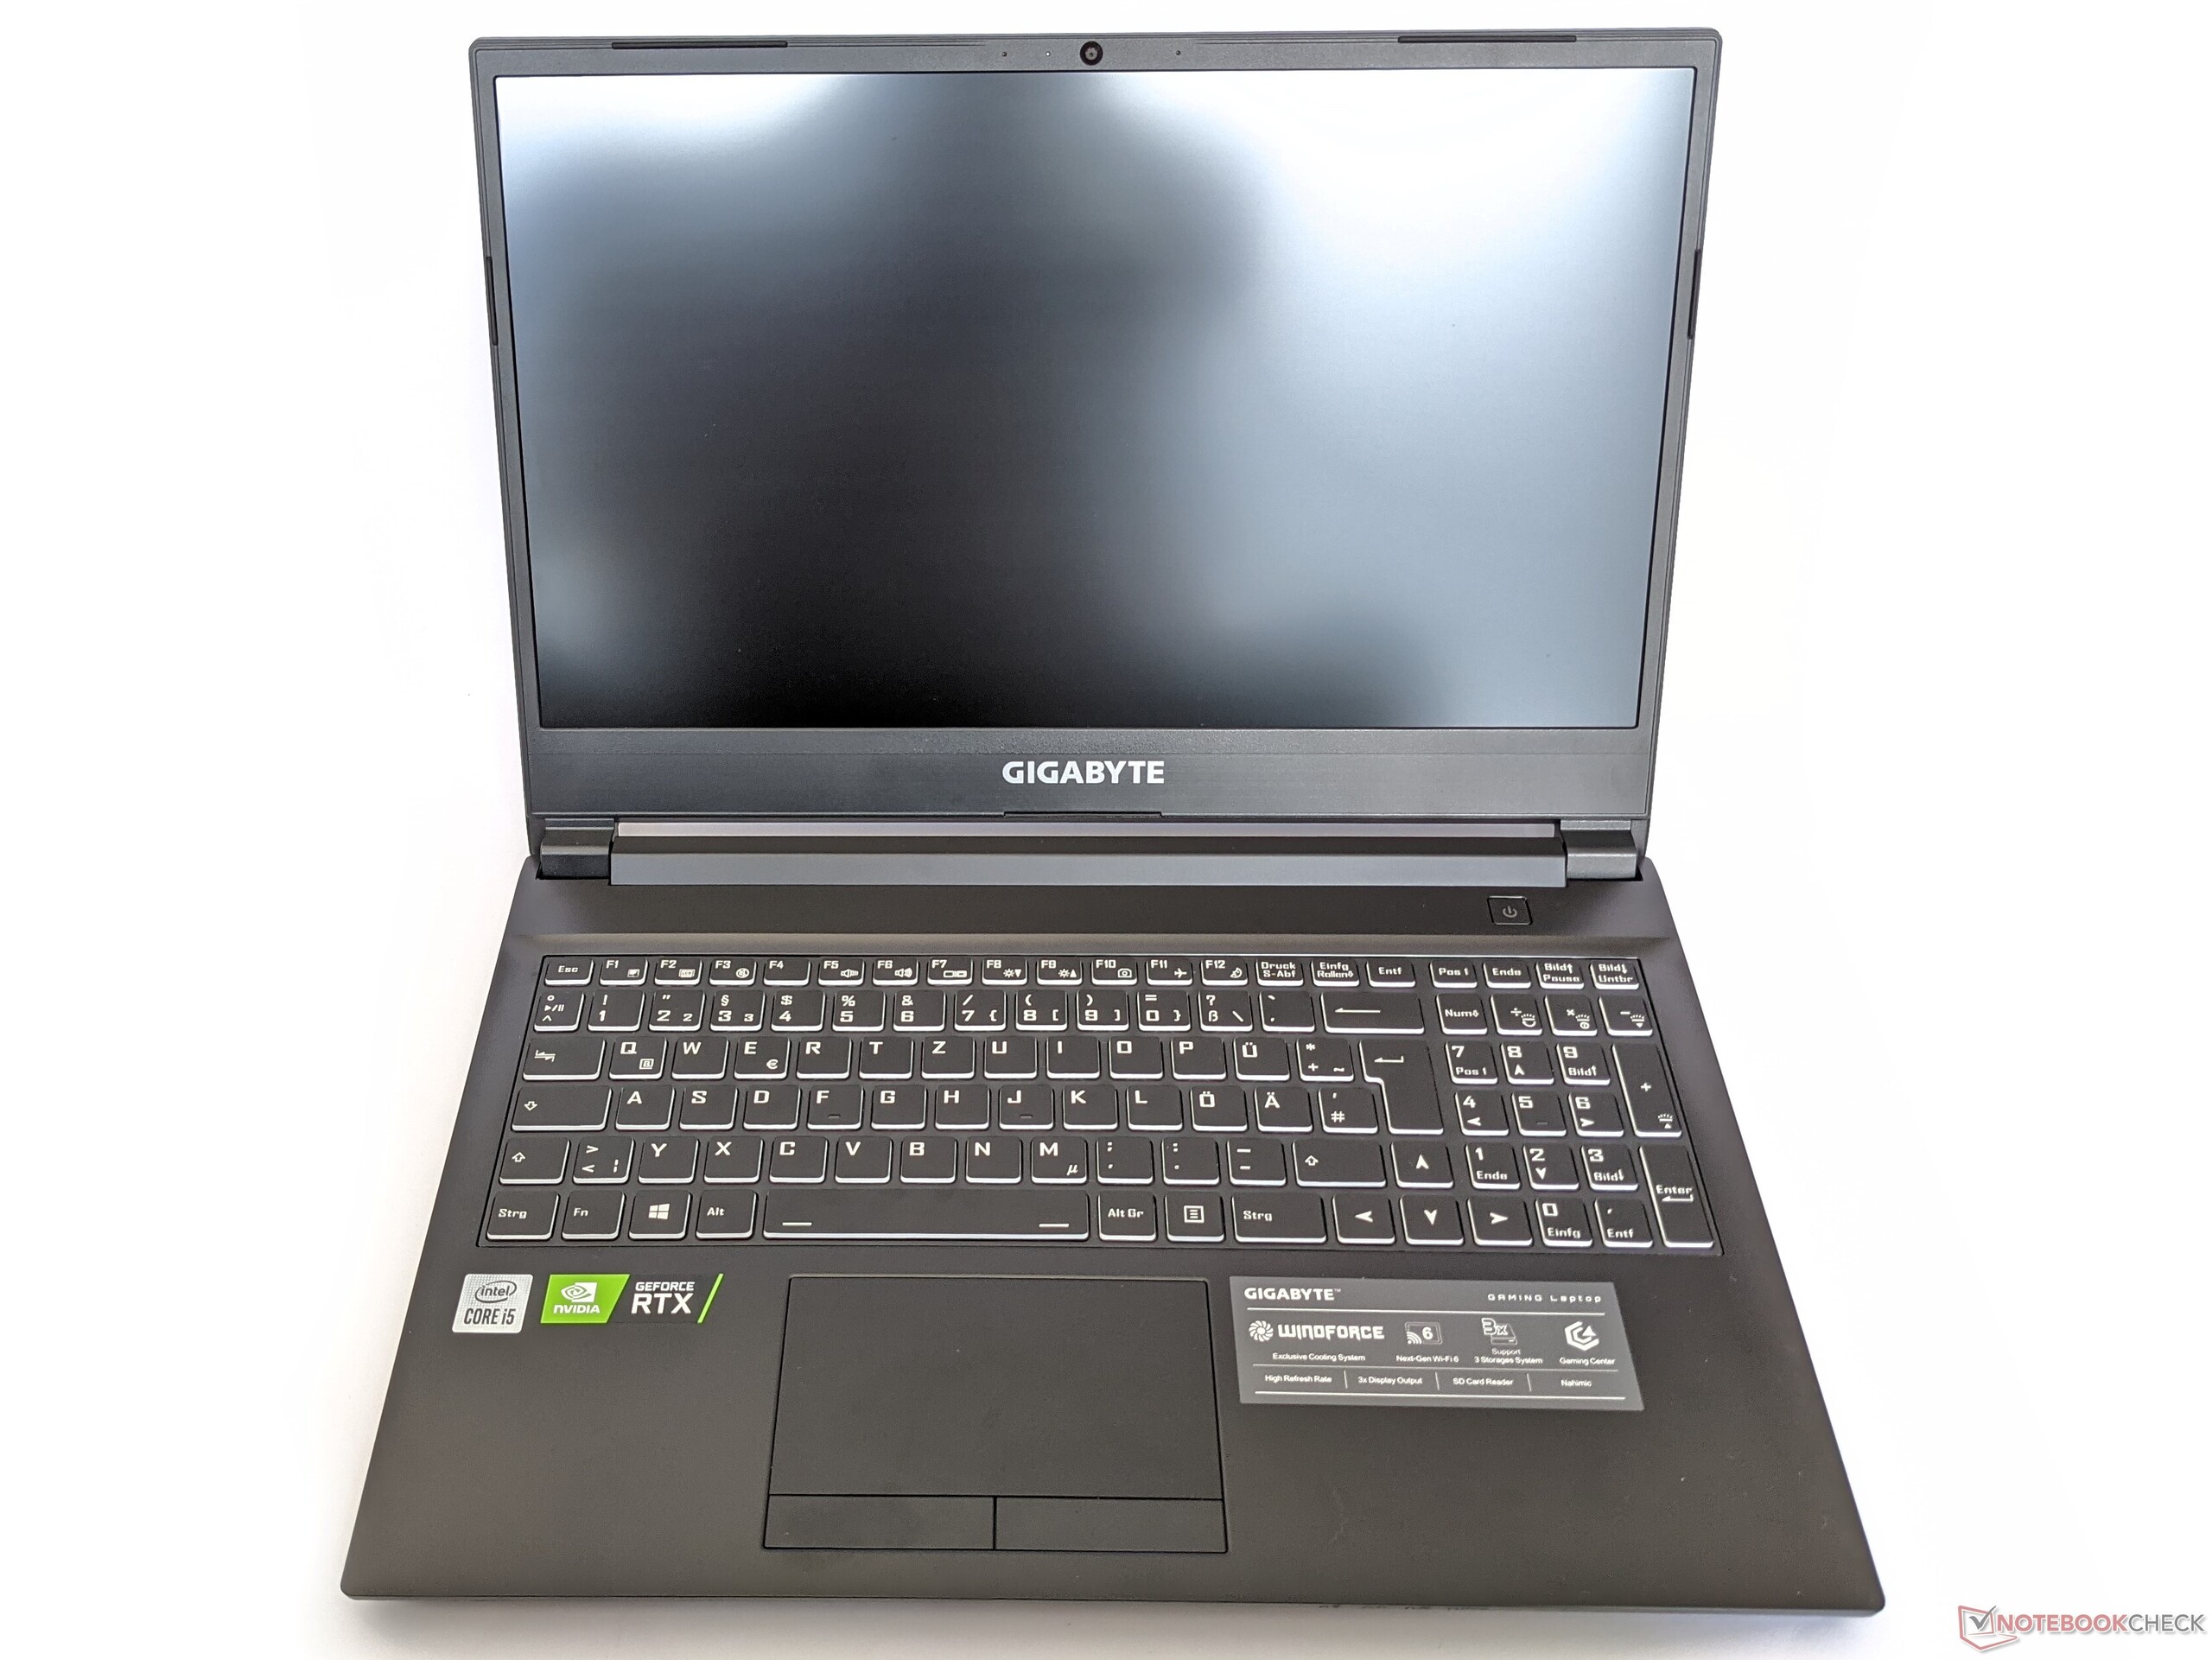
技嘉G5 KC的外壳是由坚固的塑料制成的,它既能保护基本单元,又能保护游戏笔记本的盖子不受扭曲。屏幕可以向后折叠约135度,它被铰链牢牢地保持在各自的位置。建造质量很好,我们无法发现任何不均匀的缝隙尺寸或类似情况。
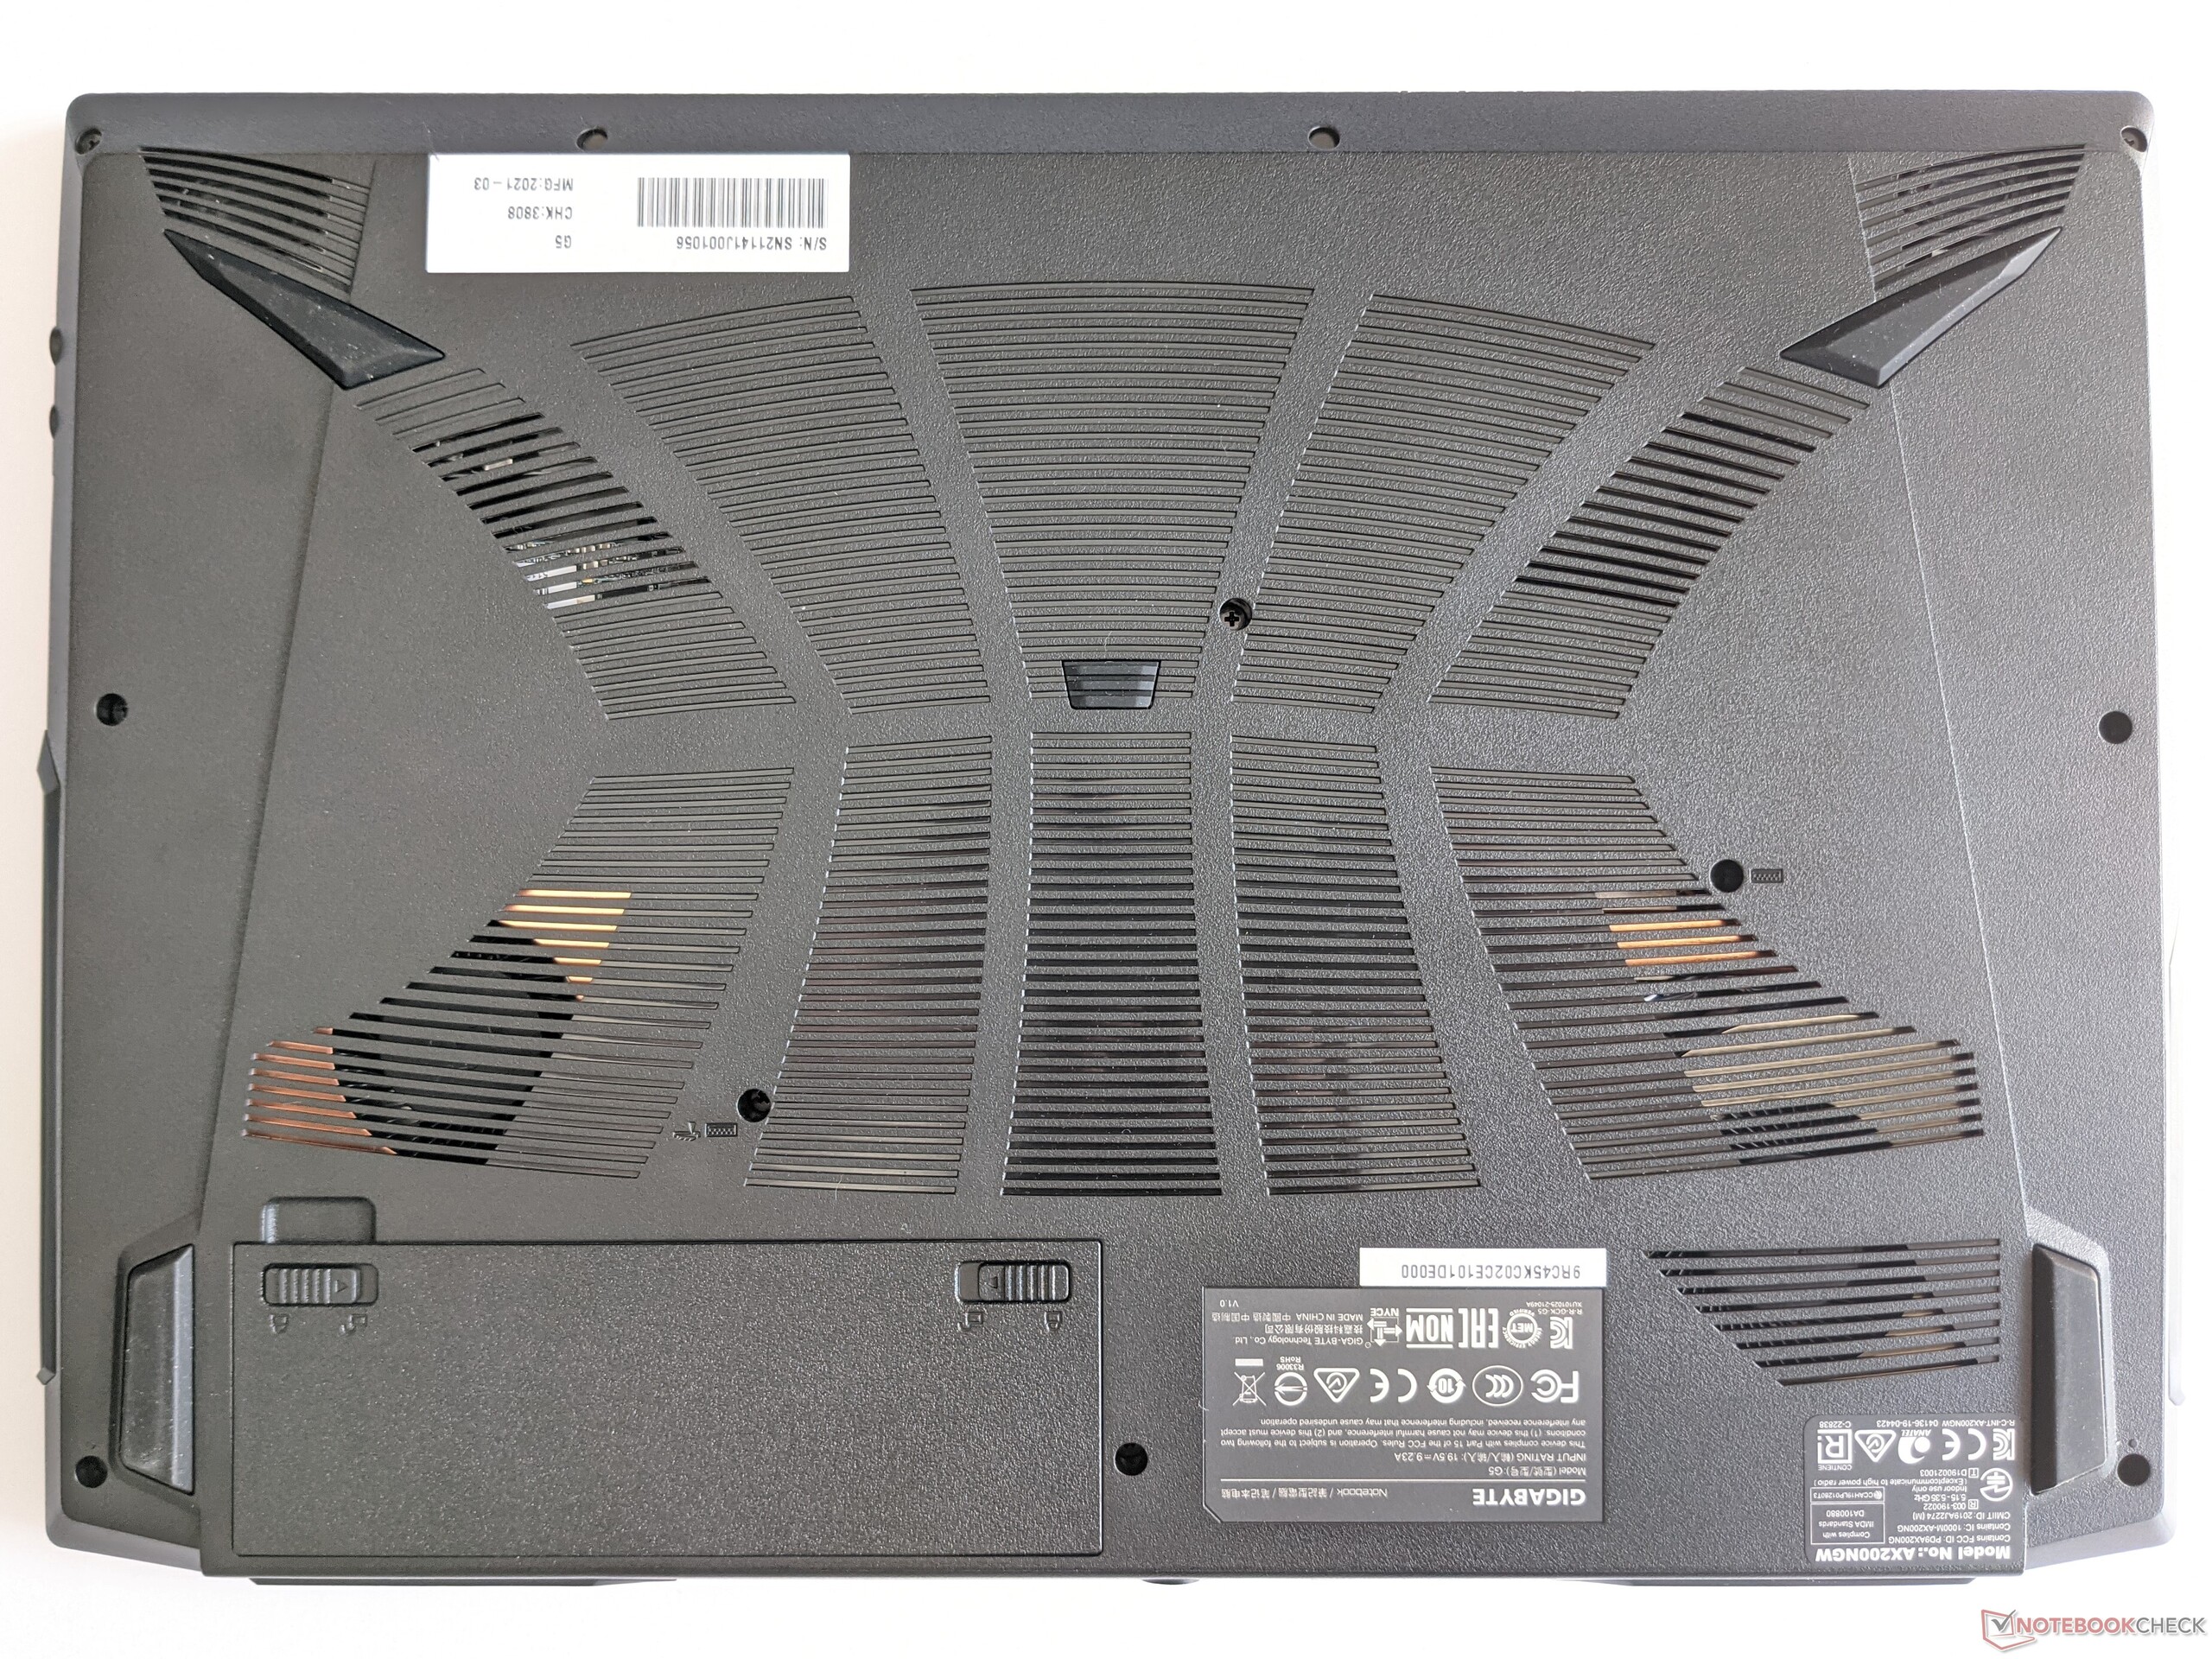
G5的一个独特功能是,电池可以在底部取出,不需要任何工具。你只需要松开锁,然后就可以更换电池。
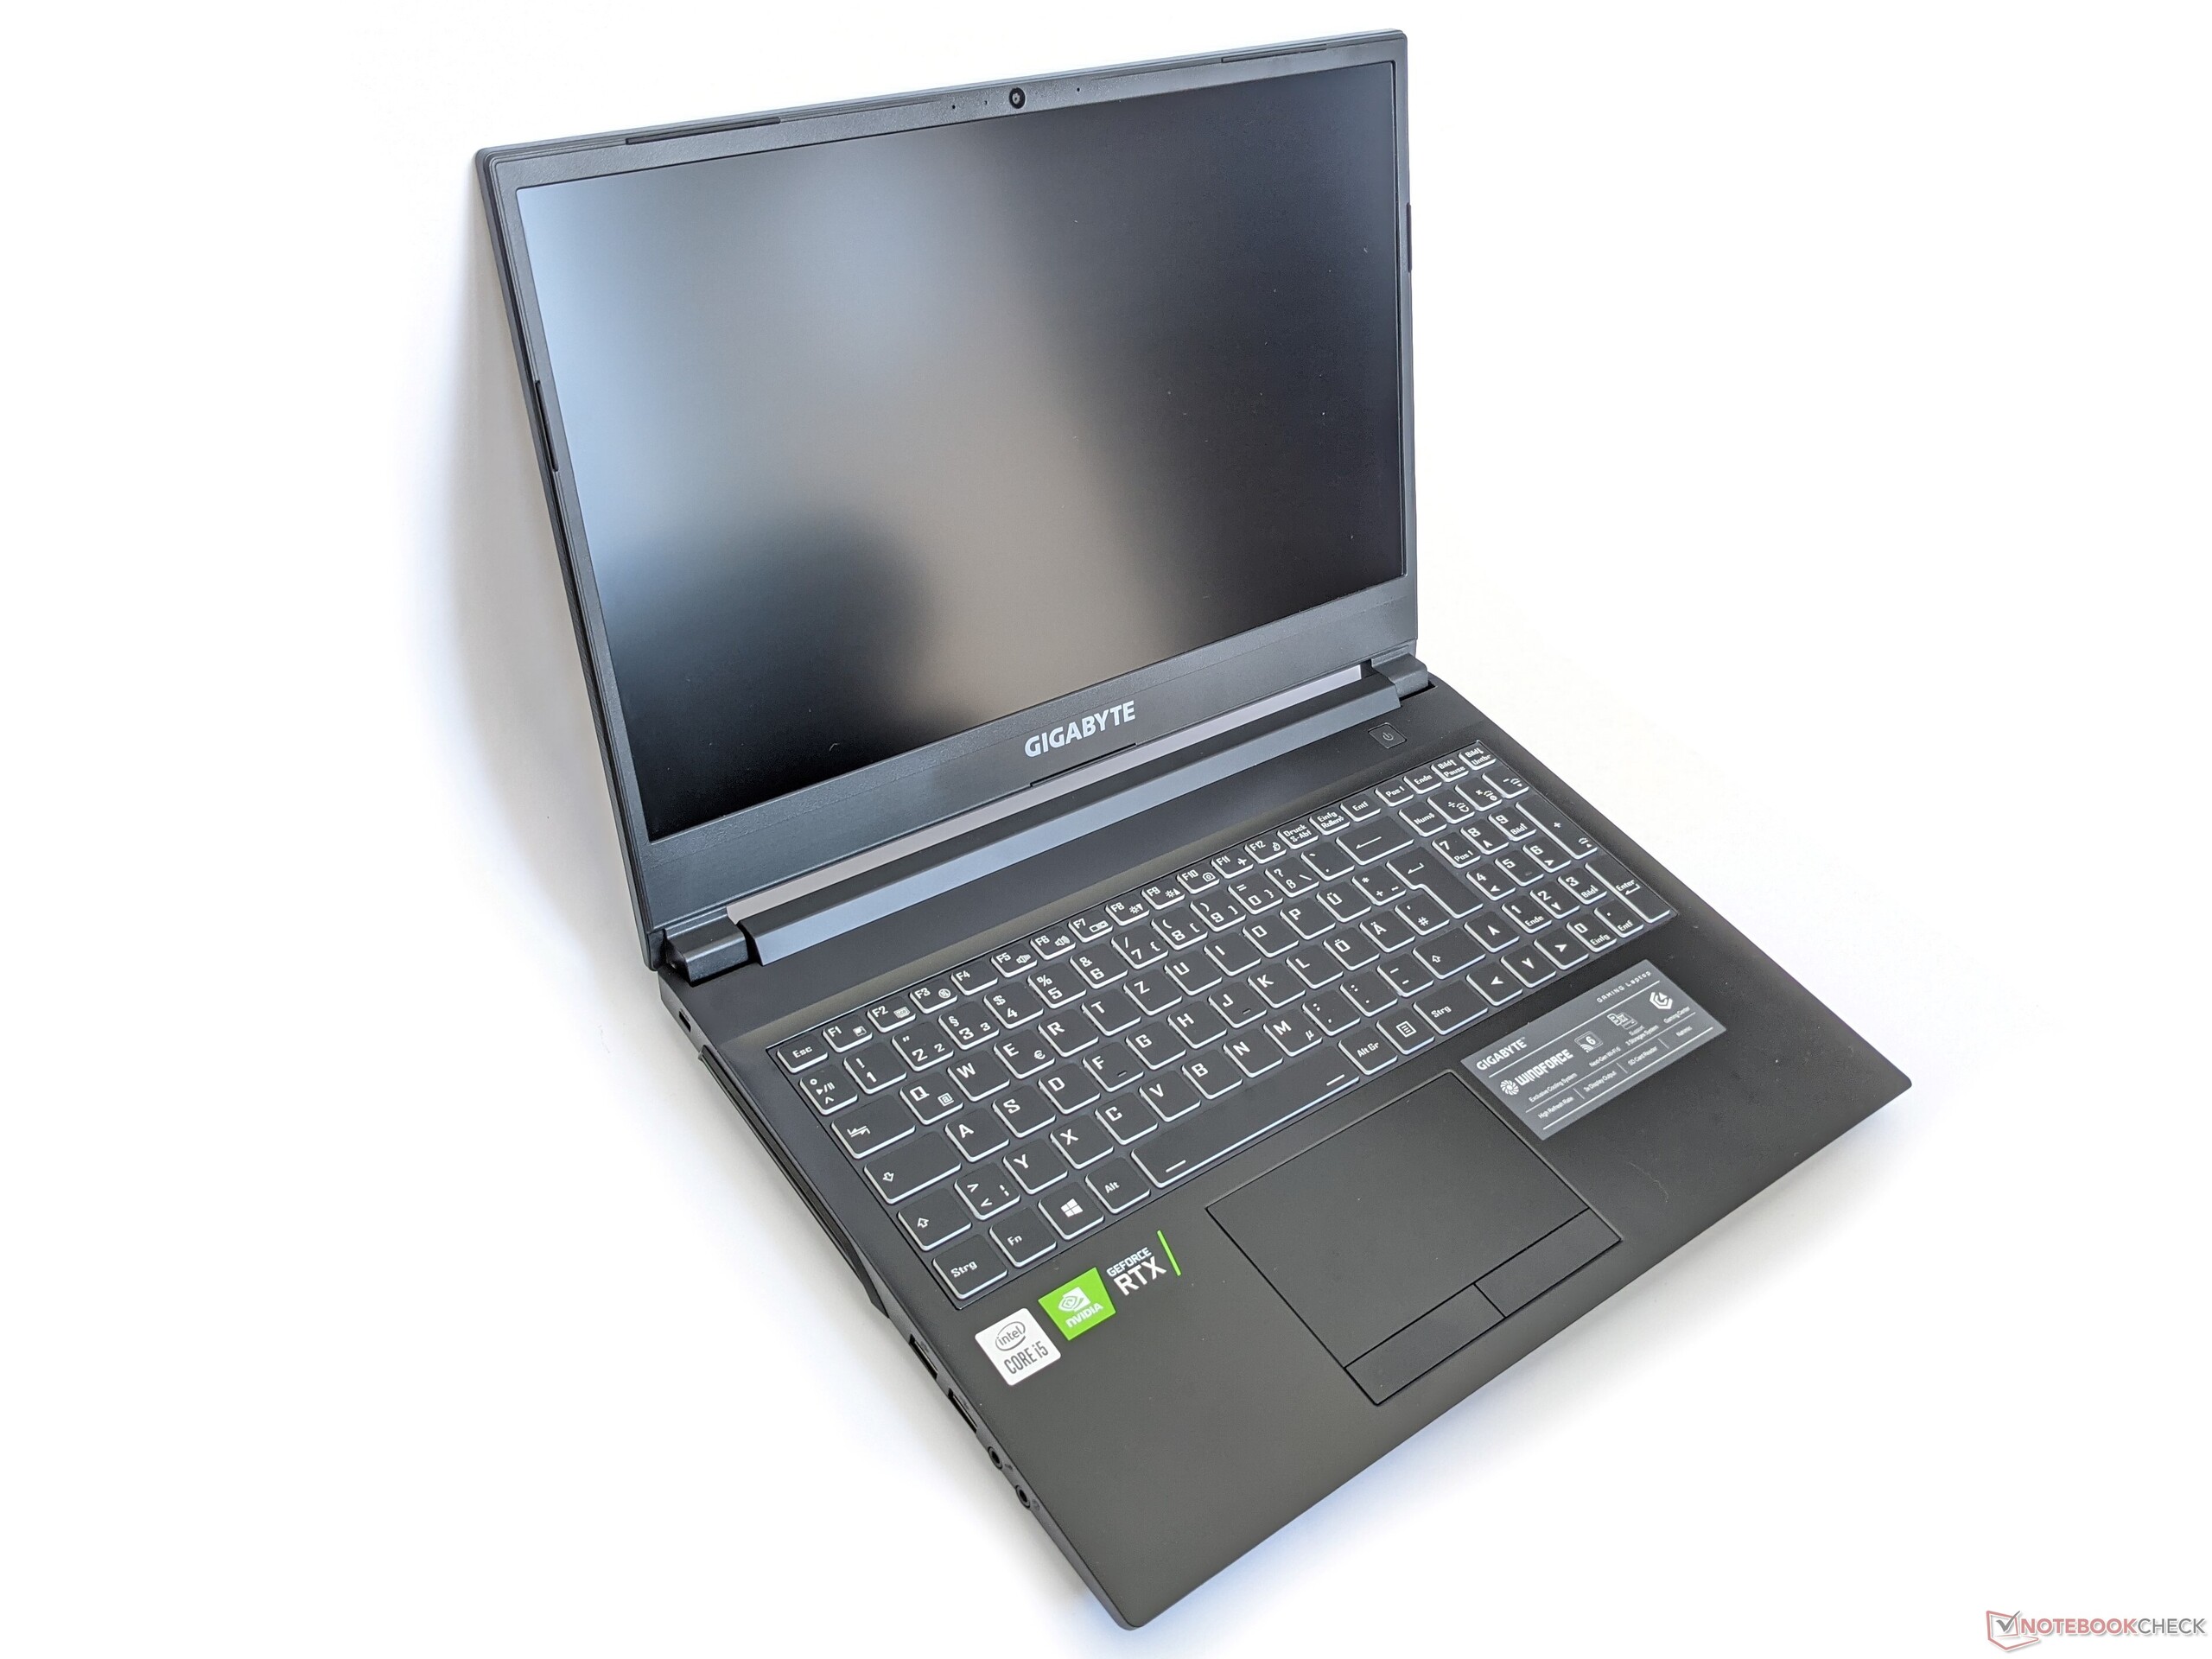
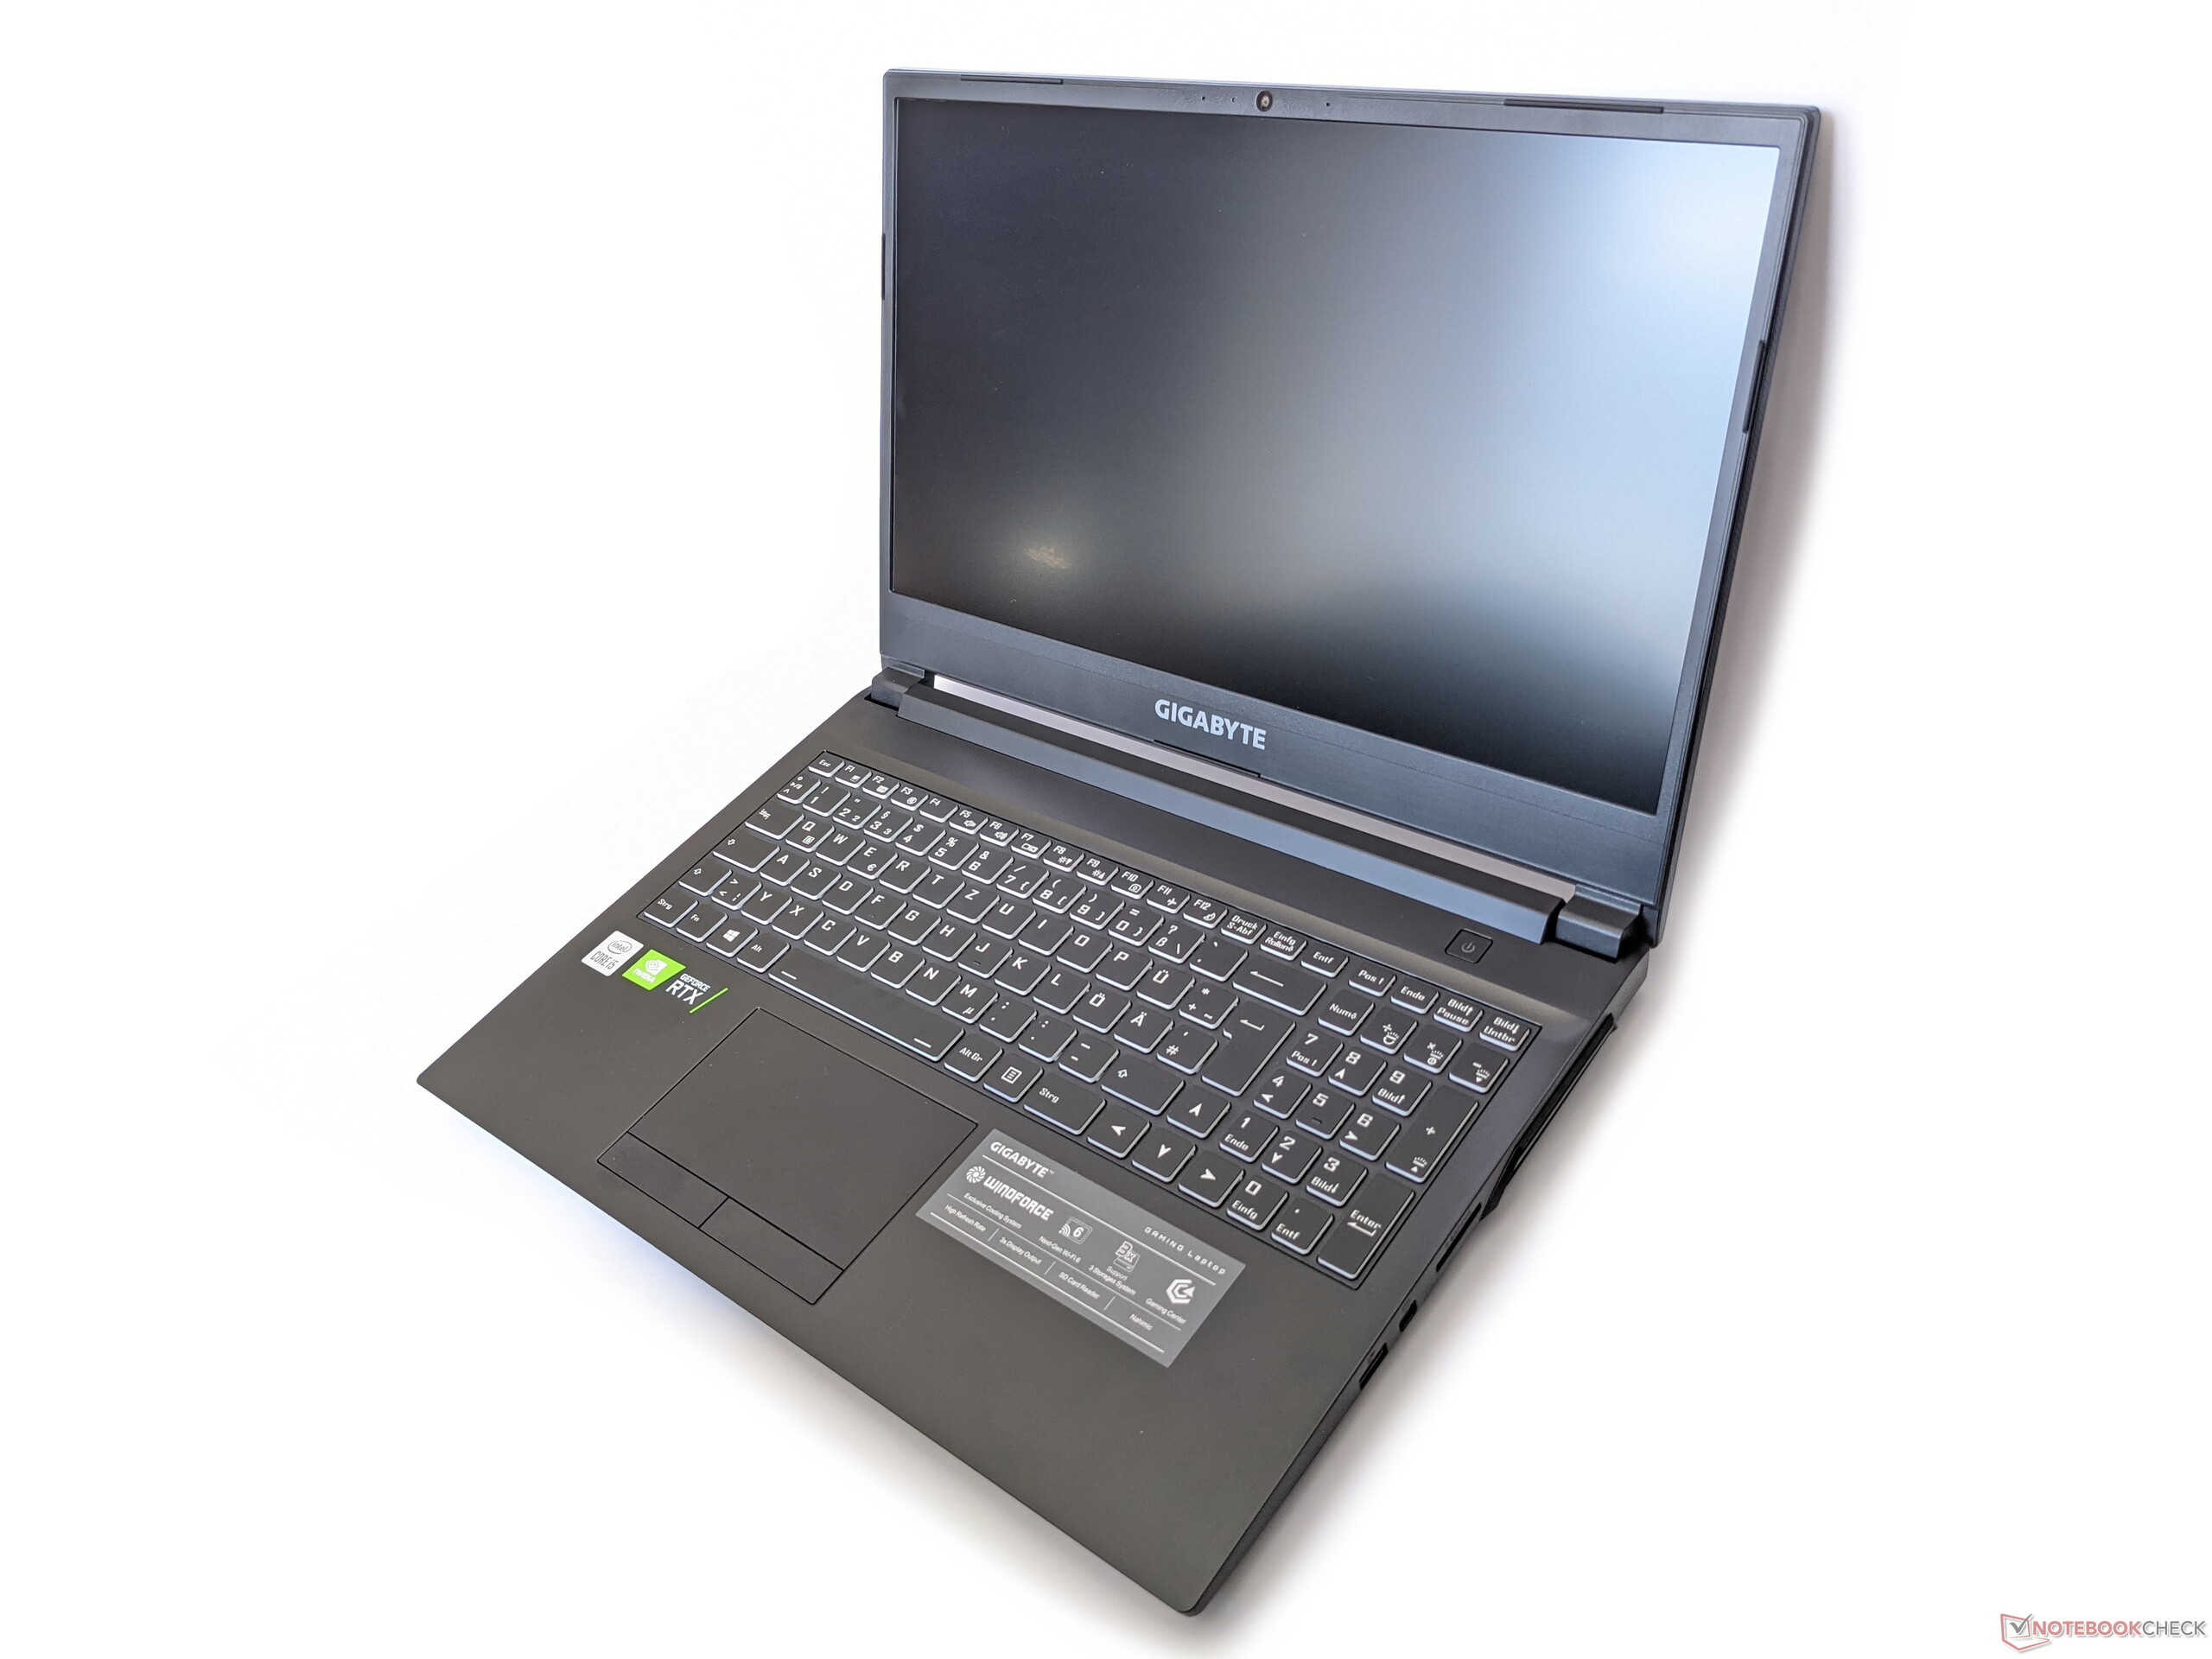
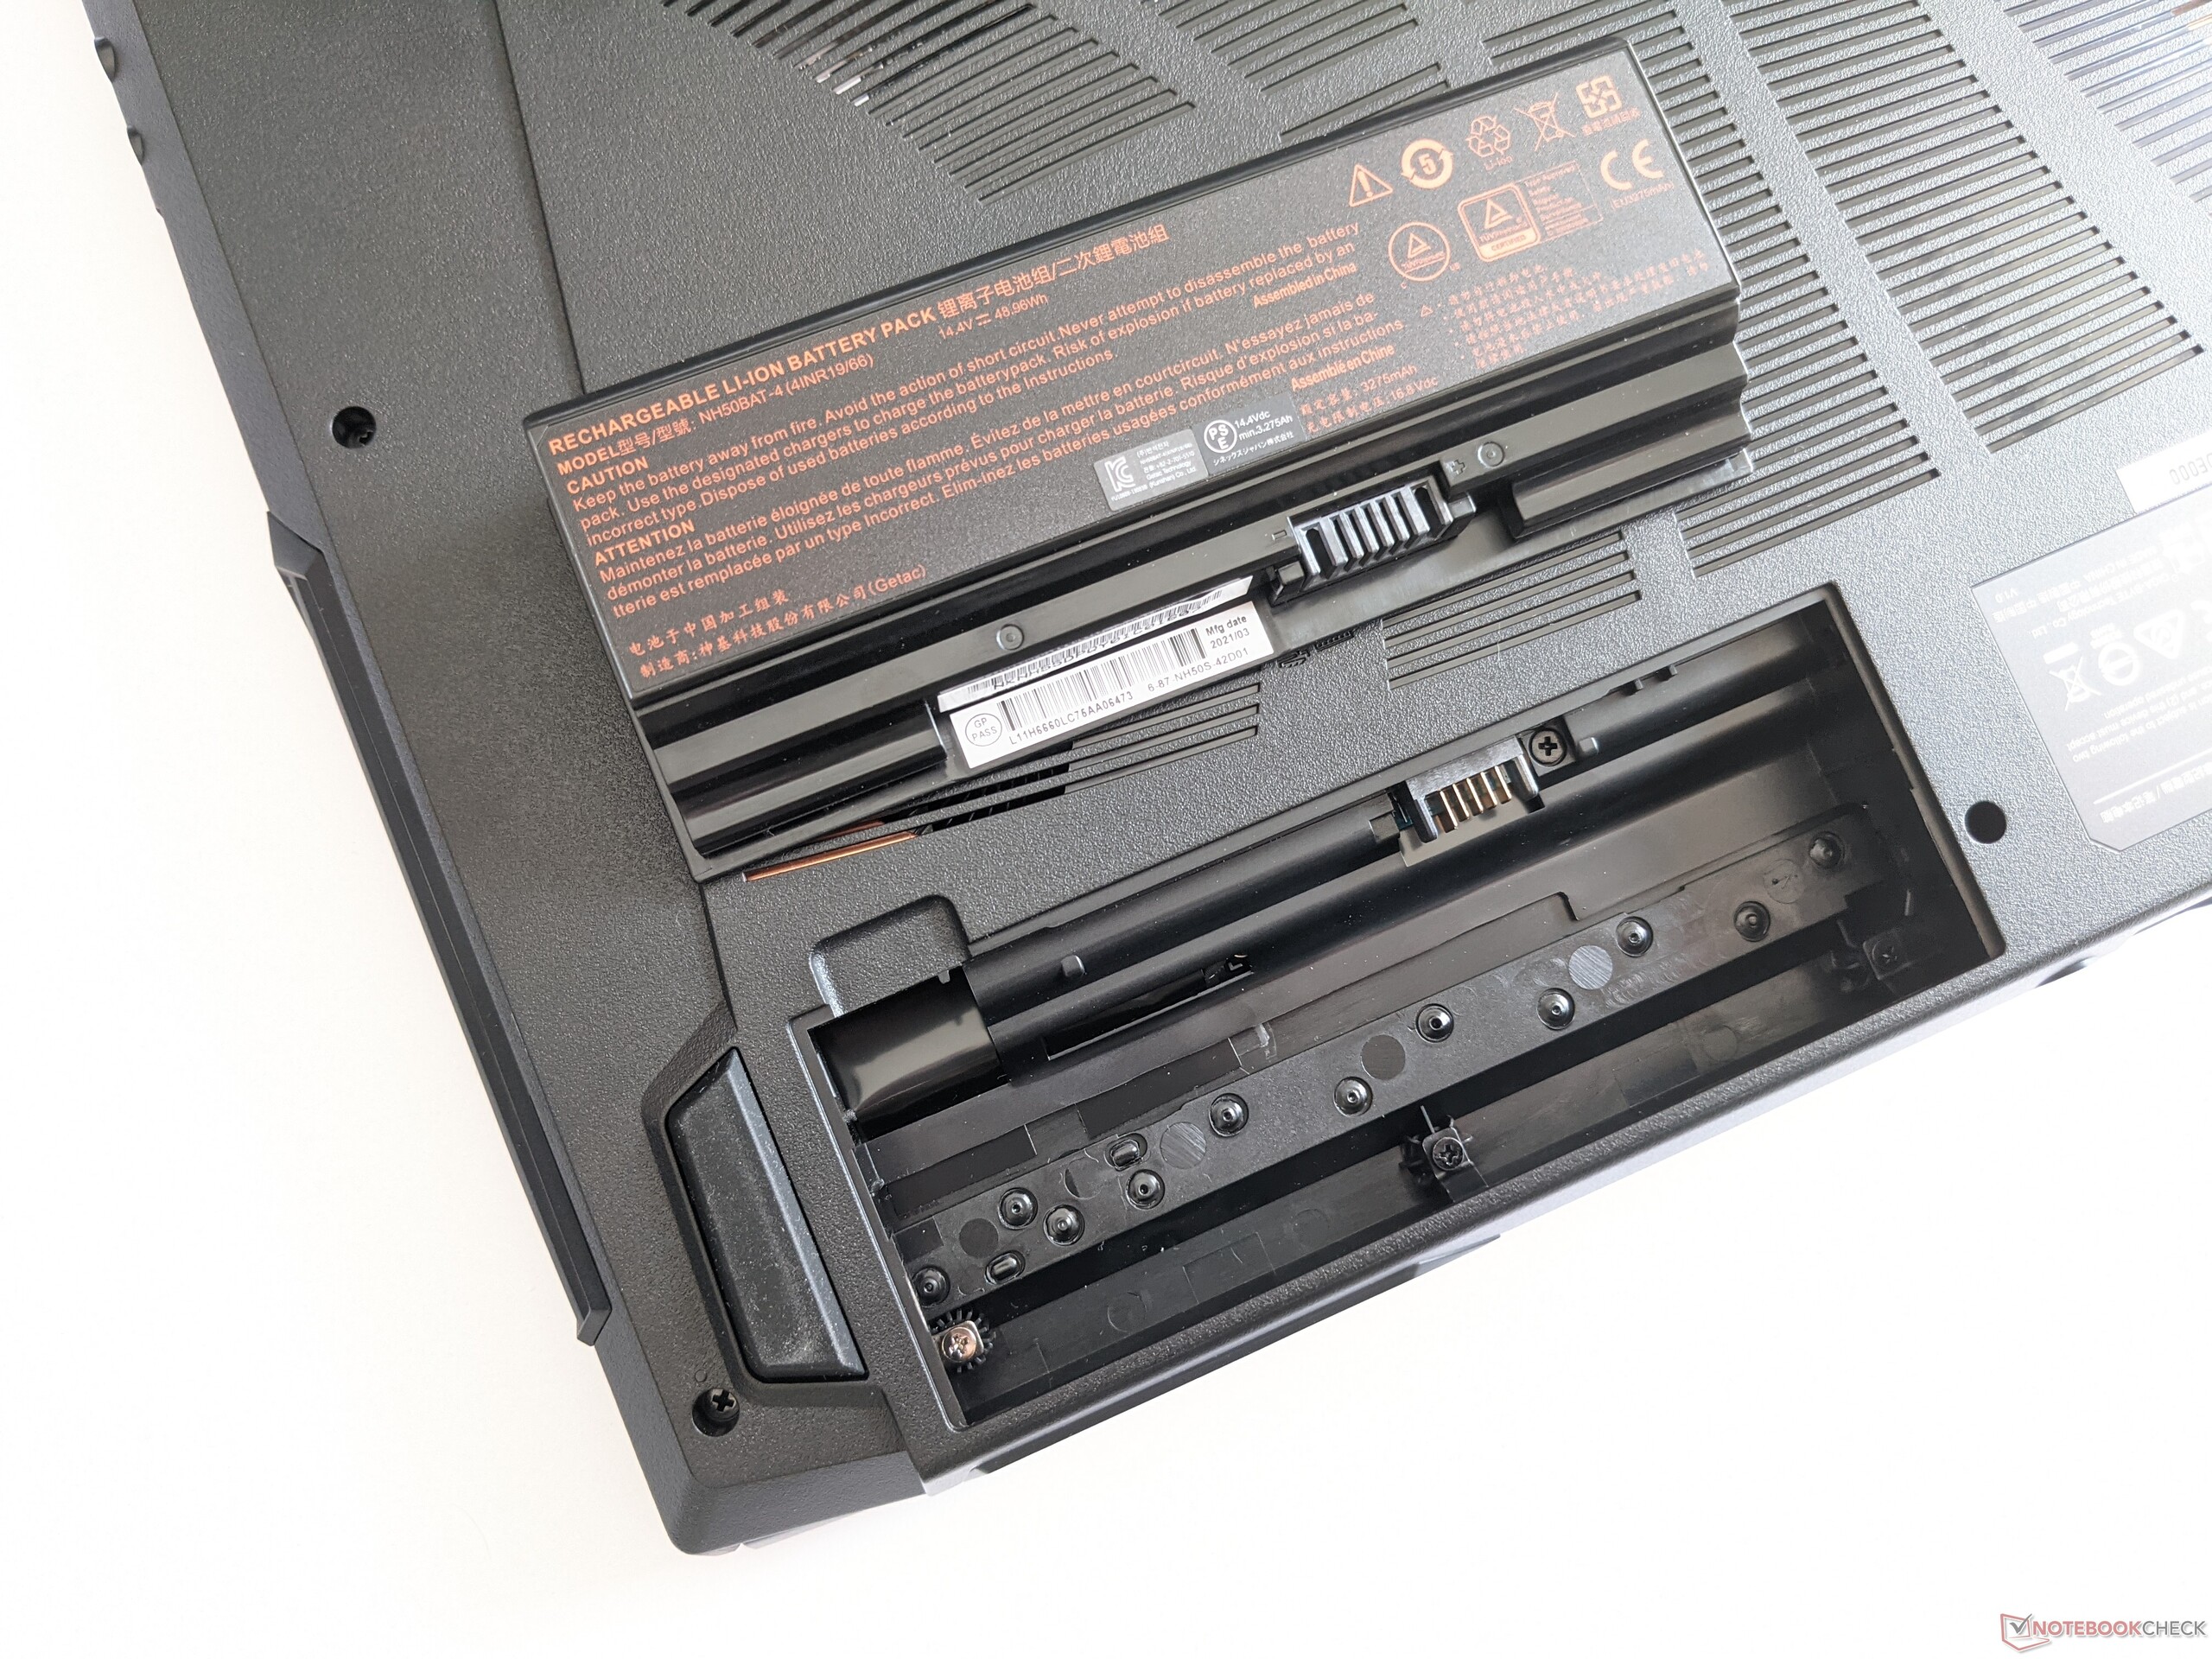
G5的占地面积与其他15英寸笔记本电脑相似。然而,它明显比我们测试领域的其他设备要厚。不过,在大约2.1公斤的重量上,它又一次进入了中场。
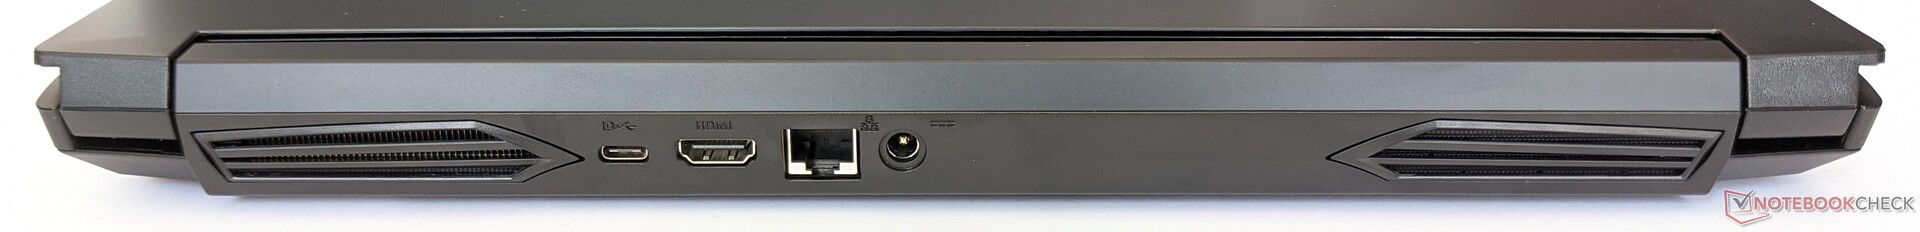
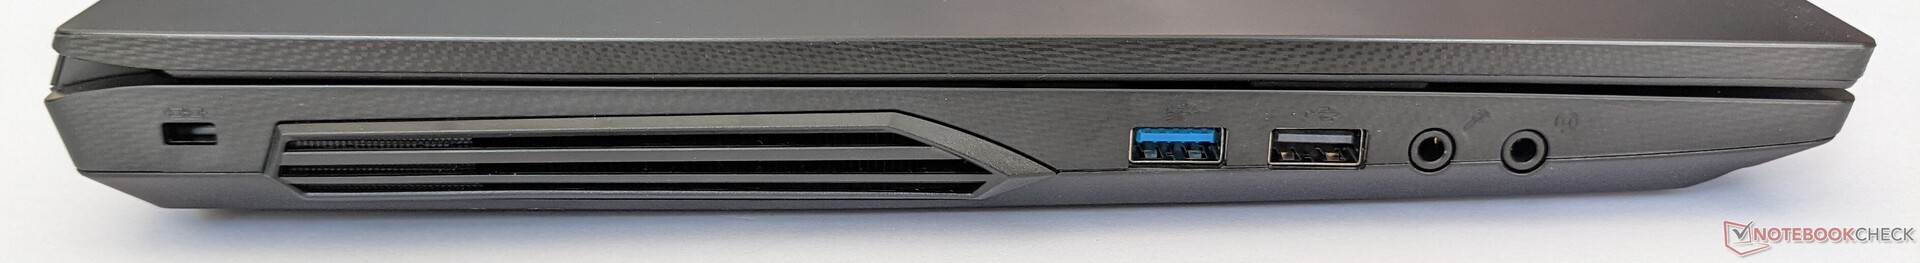
连接性 - 游戏笔记本电脑提供许多端口
Gigabyte G5 KC有一系列令人尊敬的端口。这些端口包括一个千兆LAN端口和一个Mini DisplayPort。由于一些接口,包括电源,被放置在背面,你不应该指望连接的电缆造成太多的拥堵。

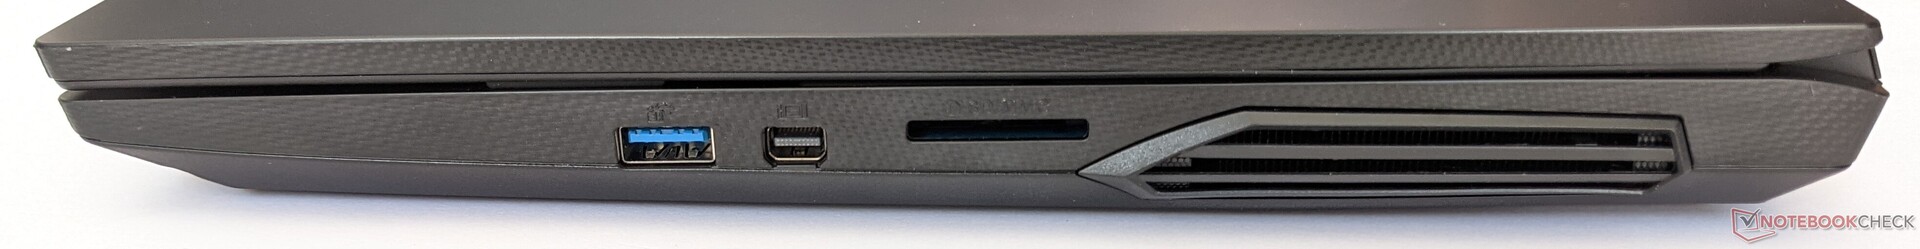
SD卡阅读器
使用我们的128GB AV PRO microSD V60参考存储卡,技嘉G5实现了77MB/s的复制数据和87MB/s的读取数据的合格结果。此外,G5是我们测试领域中唯一带有SD卡读卡器的游戏笔记本电脑。
| SD Card Reader | |
| average JPG Copy Test (av. of 3 runs) | |
| Average of class Gaming (20.9 - 210, n=54, last 2 years) | |
| Gigabyte G5 KC (AV PRO microSD 128 GB V60) | |
| maximum AS SSD Seq Read Test (1GB) | |
| Average of class Gaming (25.5 - 261, n=51, last 2 years) | |
| Gigabyte G5 KC (AV PRO microSD 128 GB V60) | |
沟通
技嘉G5 KC有一个千兆网口,能够通过蓝牙5.2以及Wi-Fi 6建立无线连接。将后者与我们的Netgear Nighthawk AX12参考路由器结合使用,我们接收数据的平均速度为1,388 Mb/s,发送数据的速度为1,520 Mb/s。这使得这款游戏笔记本在我们的测试领域中占据了第一位。
| Networking | |
| iperf3 transmit AX12 | |
| Gigabyte G5 KC | |
| Acer Nitro 5 AN517-53-54DQ | |
| MSI GF65 Thin 10UE | |
| Average Intel Wi-Fi 6 AX200 (447 - 1645, n=127) | |
| iperf3 receive AX12 | |
| Gigabyte G5 KC | |
| Acer Nitro 5 AN517-53-54DQ | |
| MSI GF65 Thin 10UE | |
| Average Intel Wi-Fi 6 AX200 (523 - 1684, n=128) | |
网络摄像头
技嘉G5也像最近的大多数笔记本电脑一样配备了一个低分辨率的90万像素网络摄像头。图像质量也相应地很平庸,即使在良好的照明条件下,主体也会显得模糊不清,颜色也很苍白。


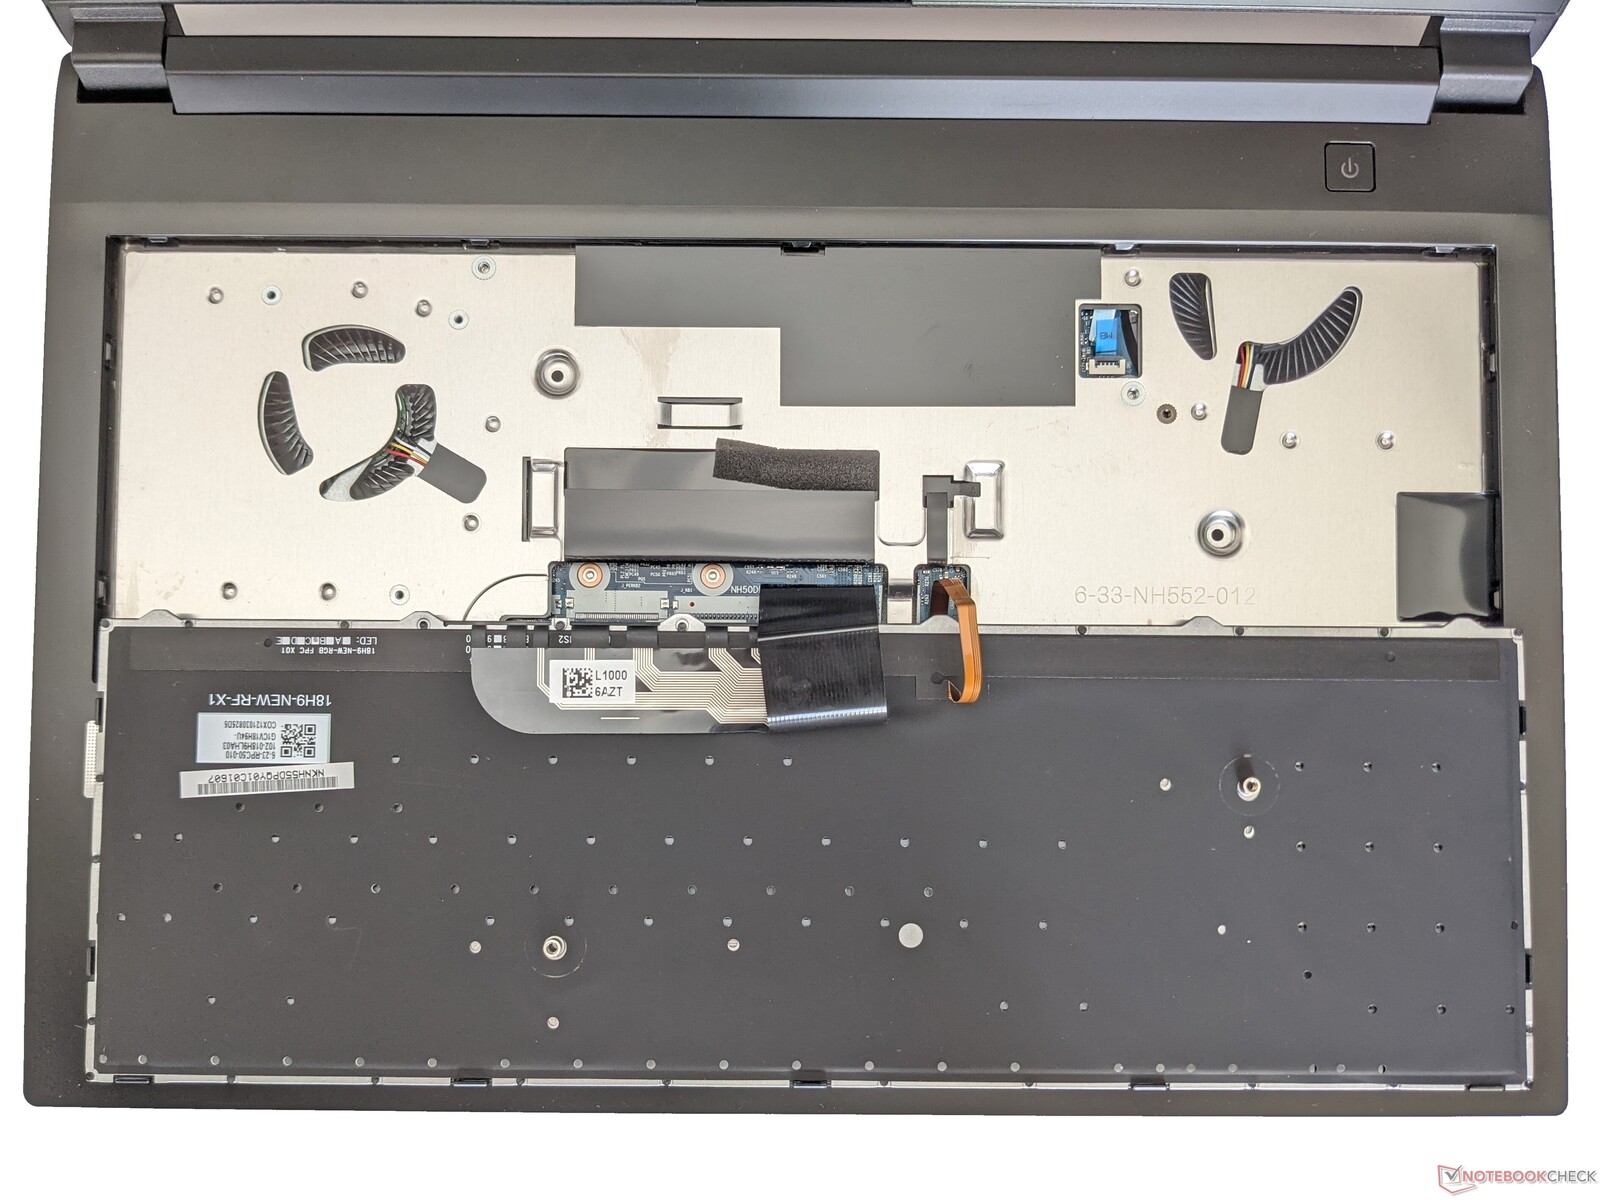
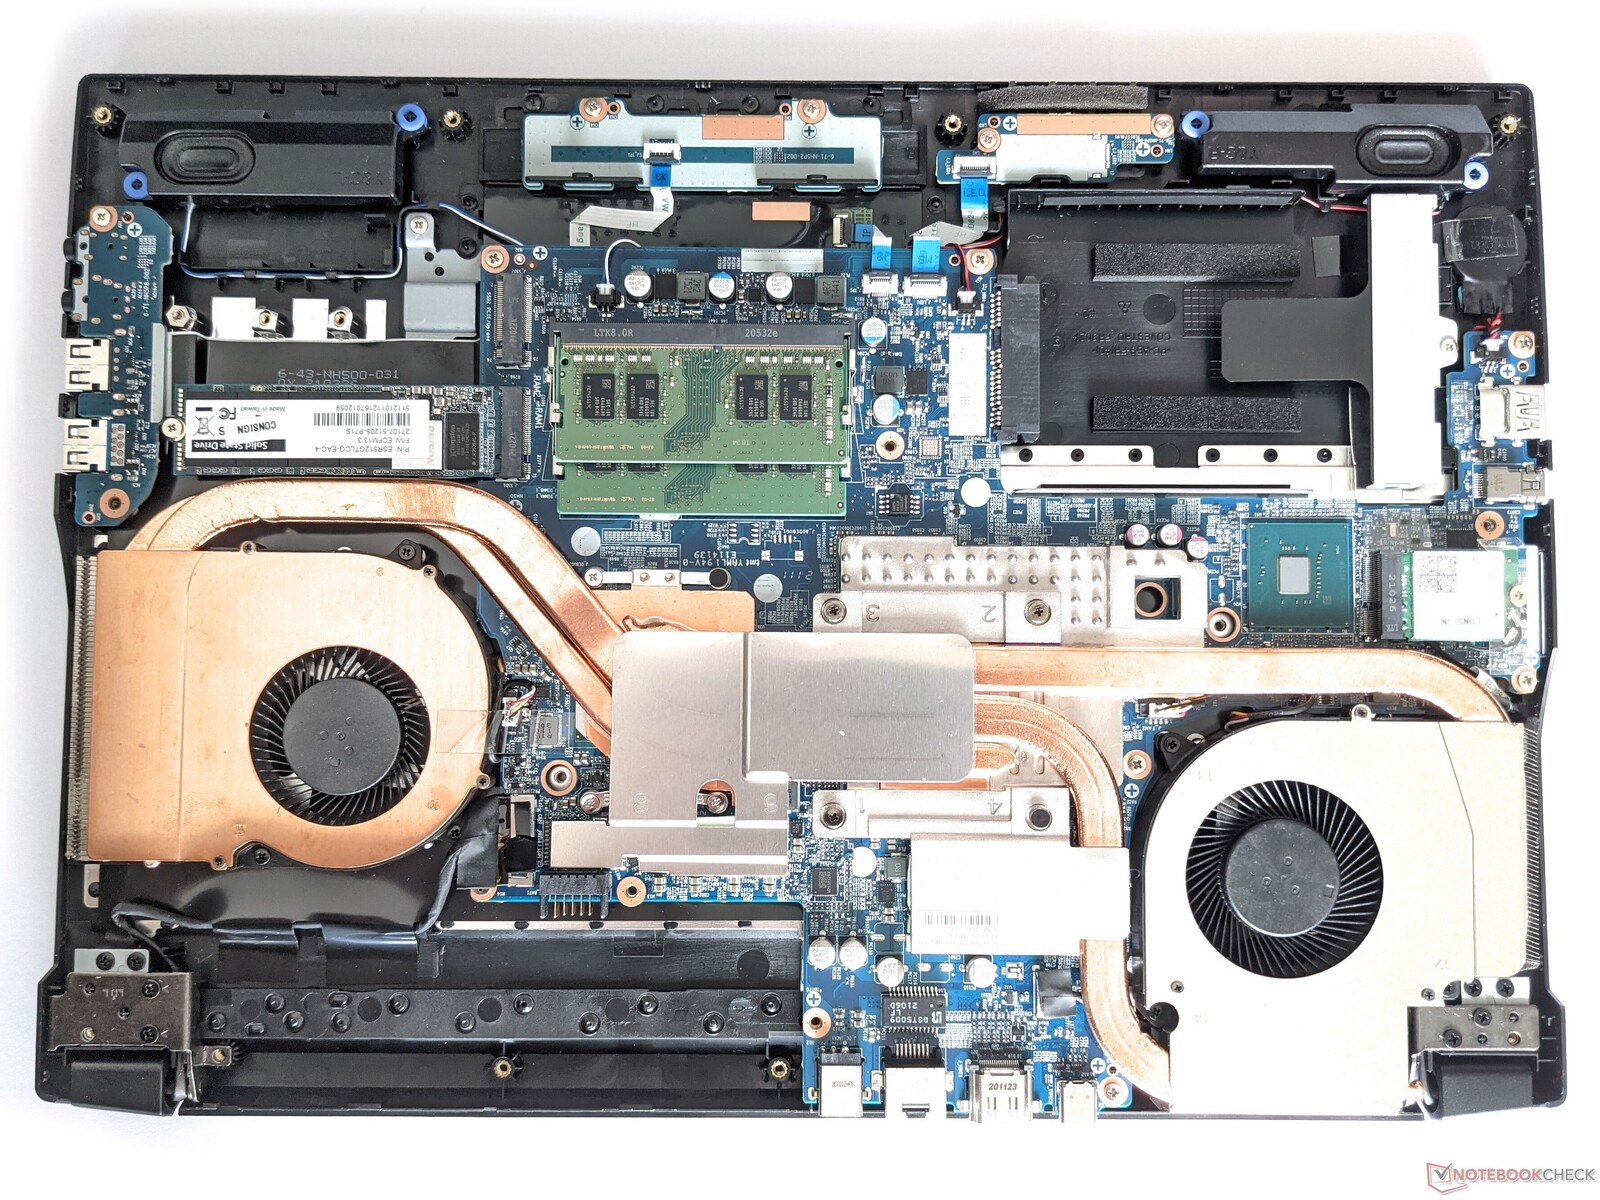
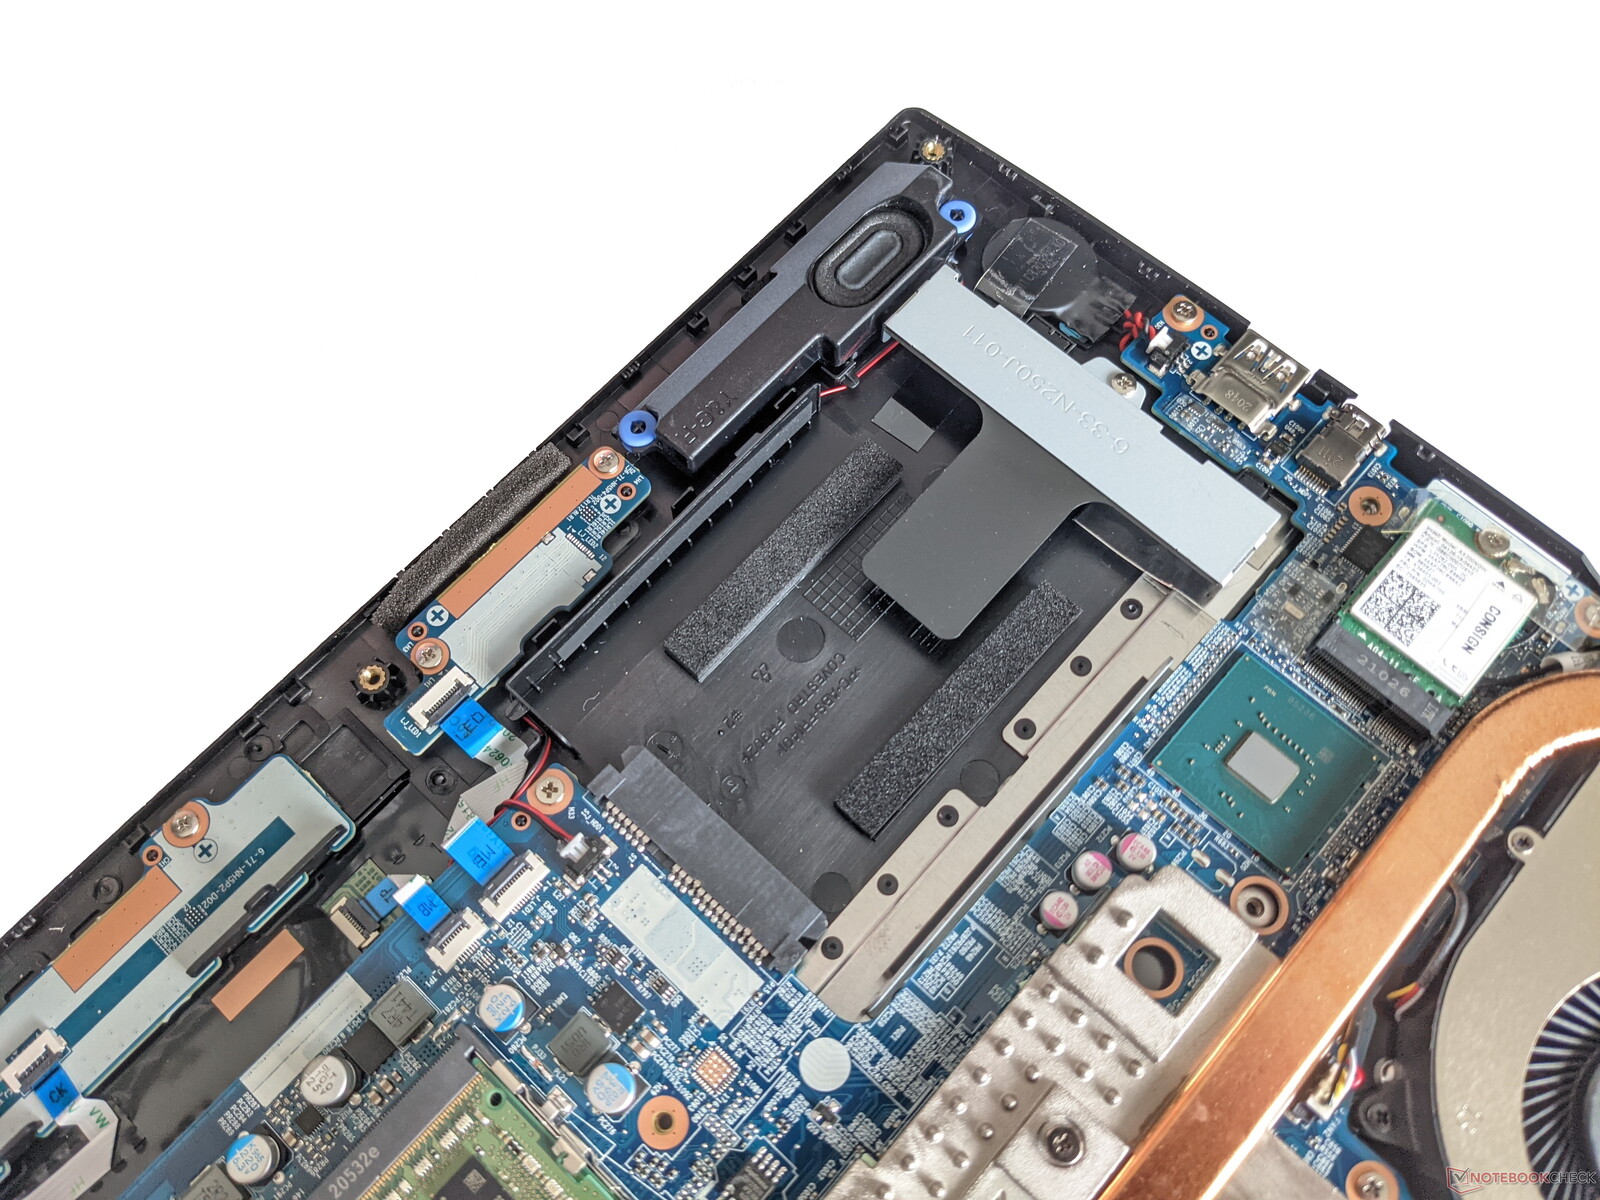
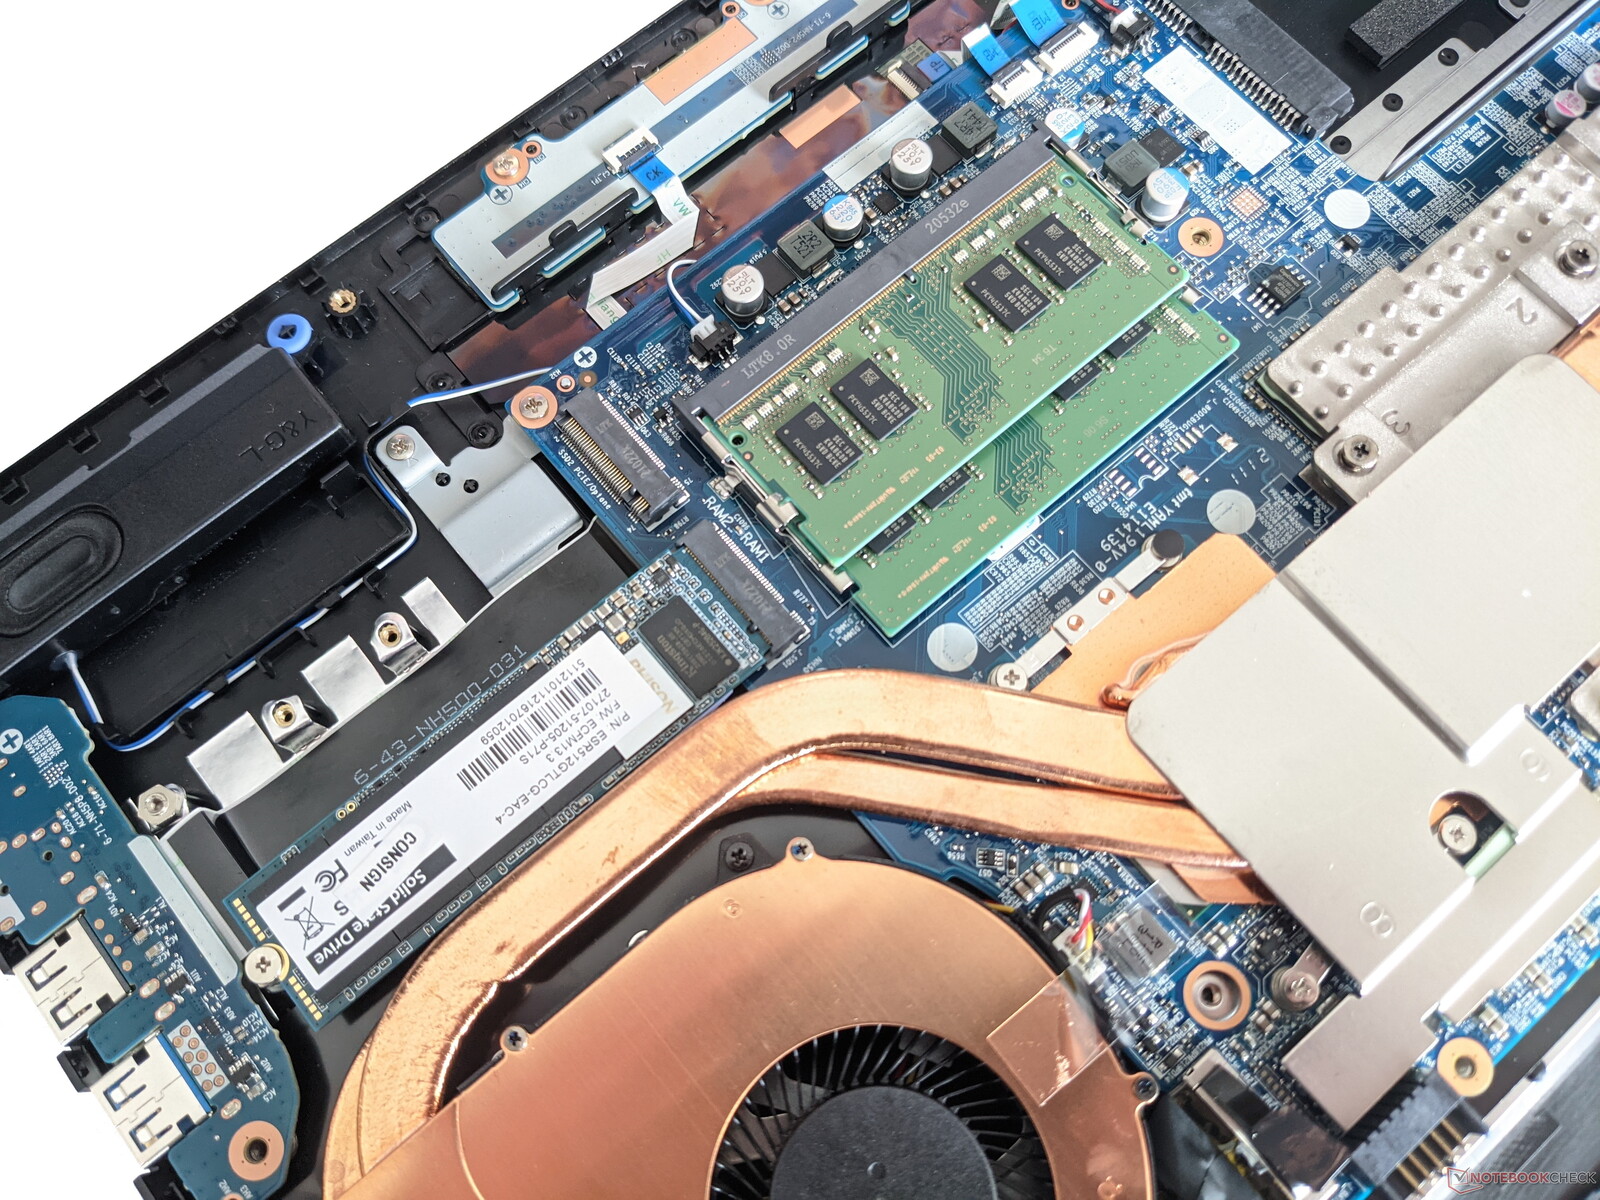
维护
除了电池可以在没有工具的情况下更换外,必要时技嘉G5的键盘也可以更换。卸下底部的众多螺丝,还可以接触到两个内存插槽、两个SSD插槽和一个空闲的2.5英寸驱动器插槽。这里也可以更换WLAN模块。
担保
Gigabyte为G5 KC提供了24个月的保修期。
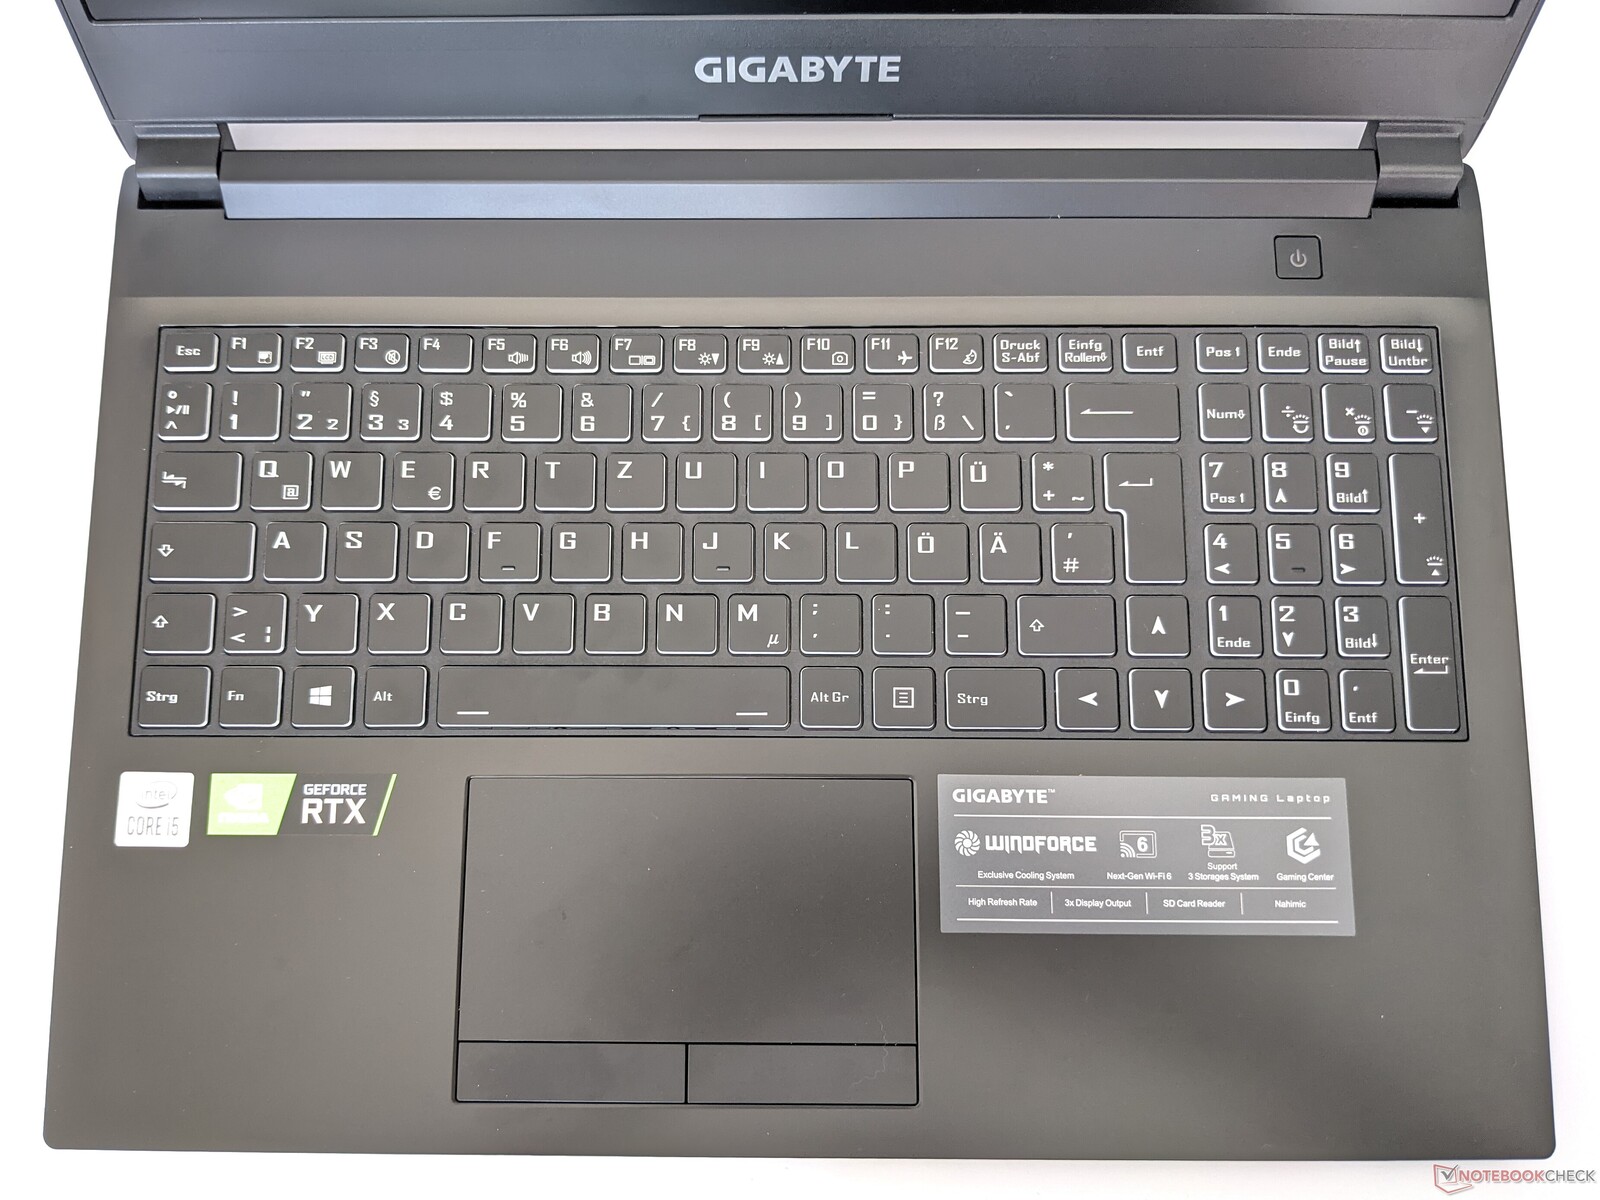
输入设备 - 带有背光的固体键盘
键盘
技嘉G5的键盘提供了清晰的反馈,很适合输入较长的文字。有一个全尺寸的数字键盘,而方向键也是按标准尺寸制作的。此外,大多数特殊键都是以单键形式提供的,这就避免了键盘上有过多的具有辅助功能的按键。
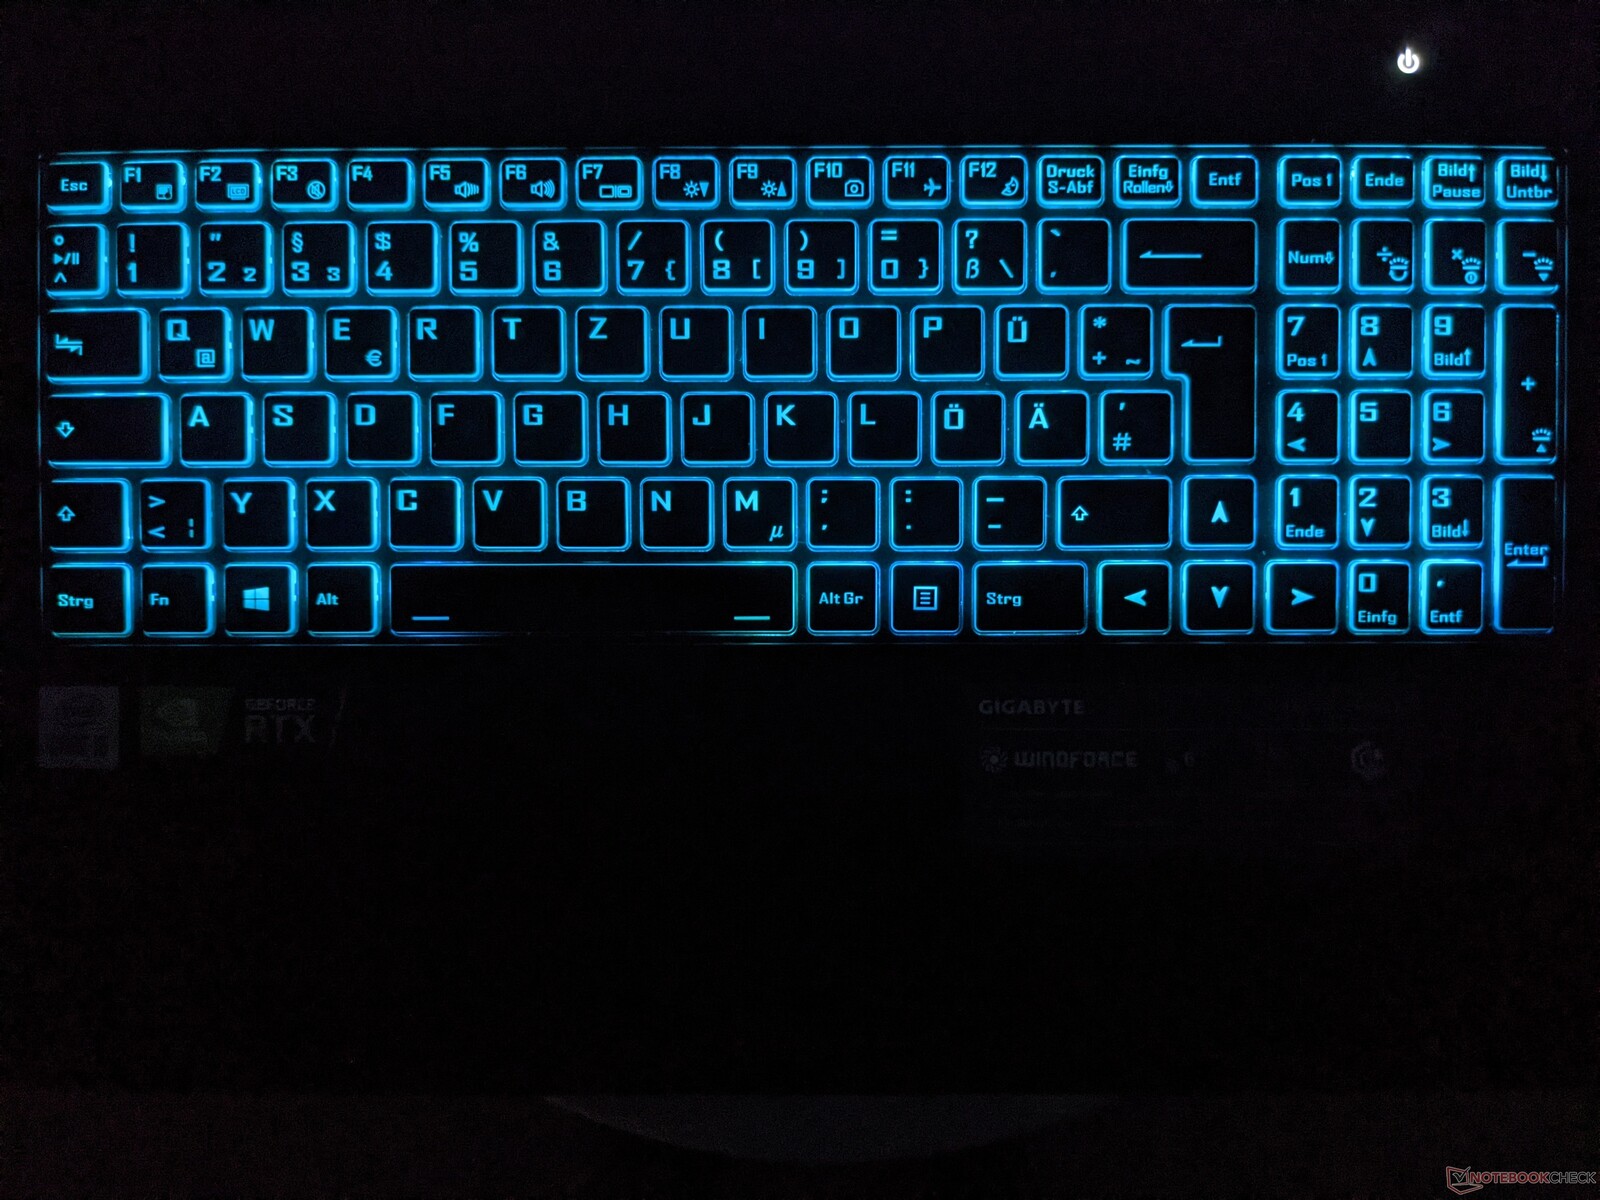
此外,技嘉还集成了一个键盘背光,确保按键上的标签有一个统一的照明。然而,用户不能自己选择颜色,因为他们只能从预定义的调色板中选择颜色,这意味着你不能设置白色背光,例如。
触摸板
在G5 KC中,有一个带有分离式鼠标按钮的经典触摸板可作为鼠标的替代品。它很适合用于导航鼠标指针。然而,当通过触摸来触发鼠标点击时,触摸板的反应有点迟钝。然而,两个鼠标按钮被可靠地触发,并能发出声音,尽管它们的反馈有点软。
显示器 - 144赫兹面板,色彩鲜艳

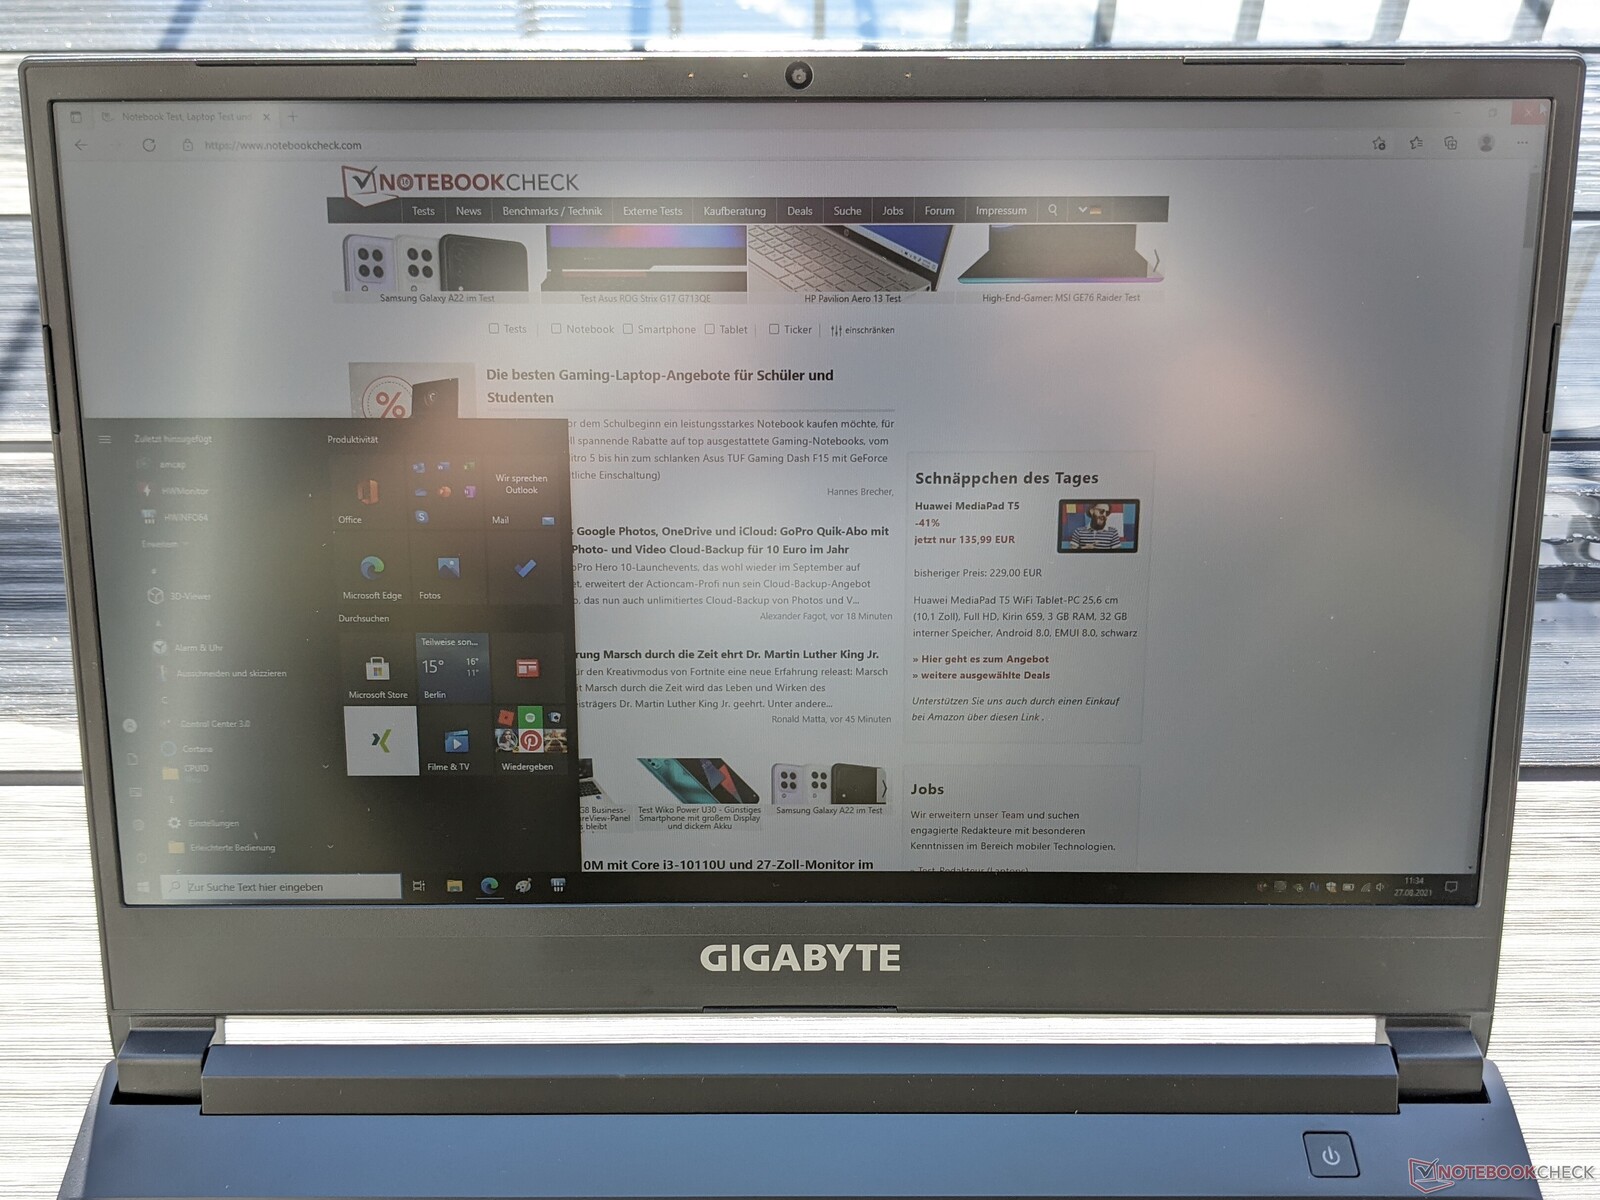
技嘉G5 KC的屏幕由15.6英寸的IPS面板组成,提供1920x1080像素的分辨率和165Hz的刷新率。平均最大亮度为275cd/m²,是我们测试领域中最高的。不过,86%的亮度分布是平均水平。
此外,没有使用PWM进行亮度控制,这意味着眼睛敏感的用户在使用时不必担心任何困难。除了这里使用的显示屏外,还有一个配备240赫兹面板的游戏笔记本版本。
| |||||||||||||||||||||||||
Brightness Distribution: 86 %
Center on Battery: 295 cd/m²
Contrast: 1283:1 (Black: 0.23 cd/m²)
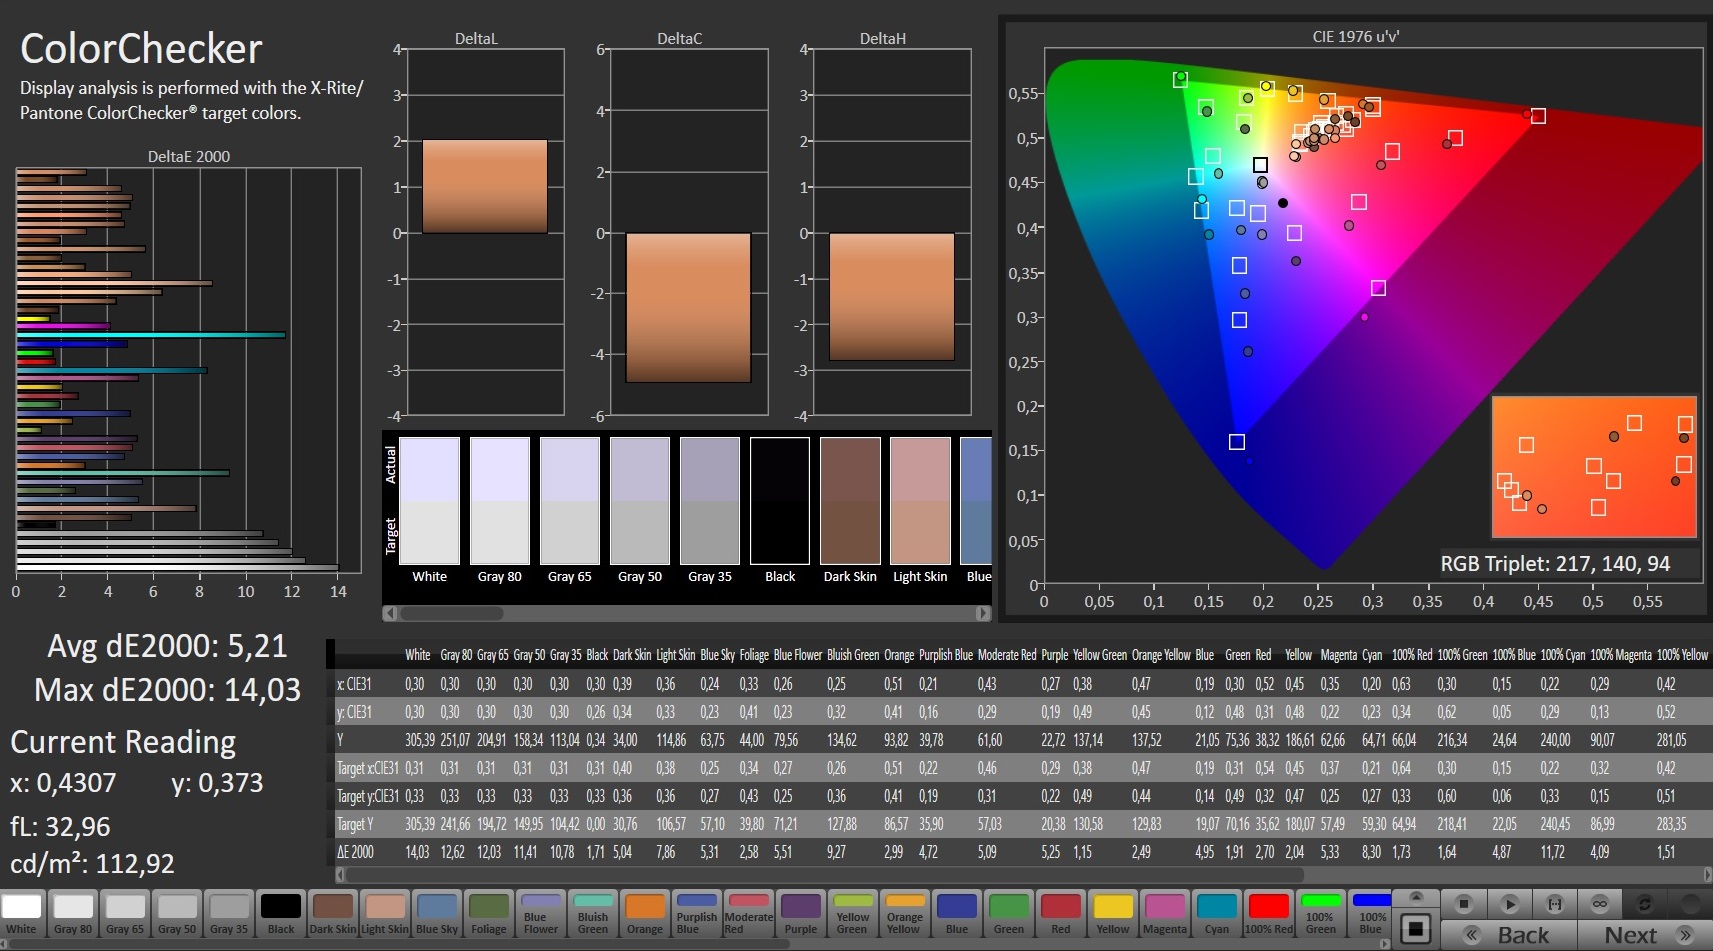
ΔE ColorChecker Calman: 5.21 | ∀{0.5-29.43 Ø4.71}
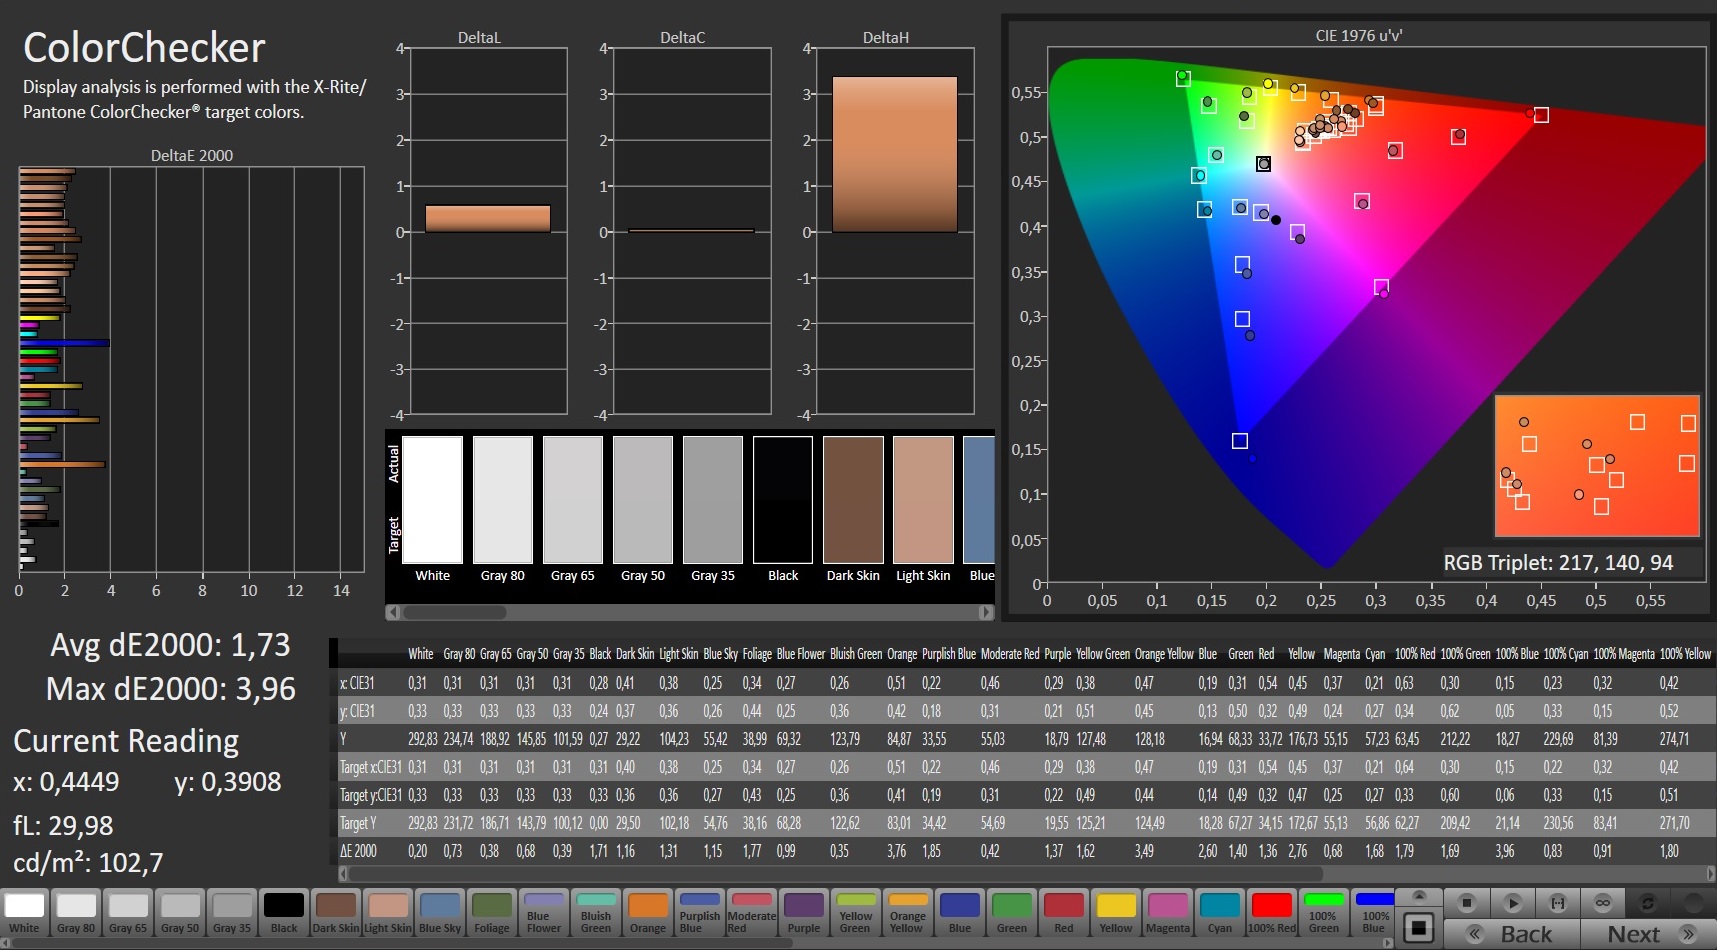
calibrated: 1.73
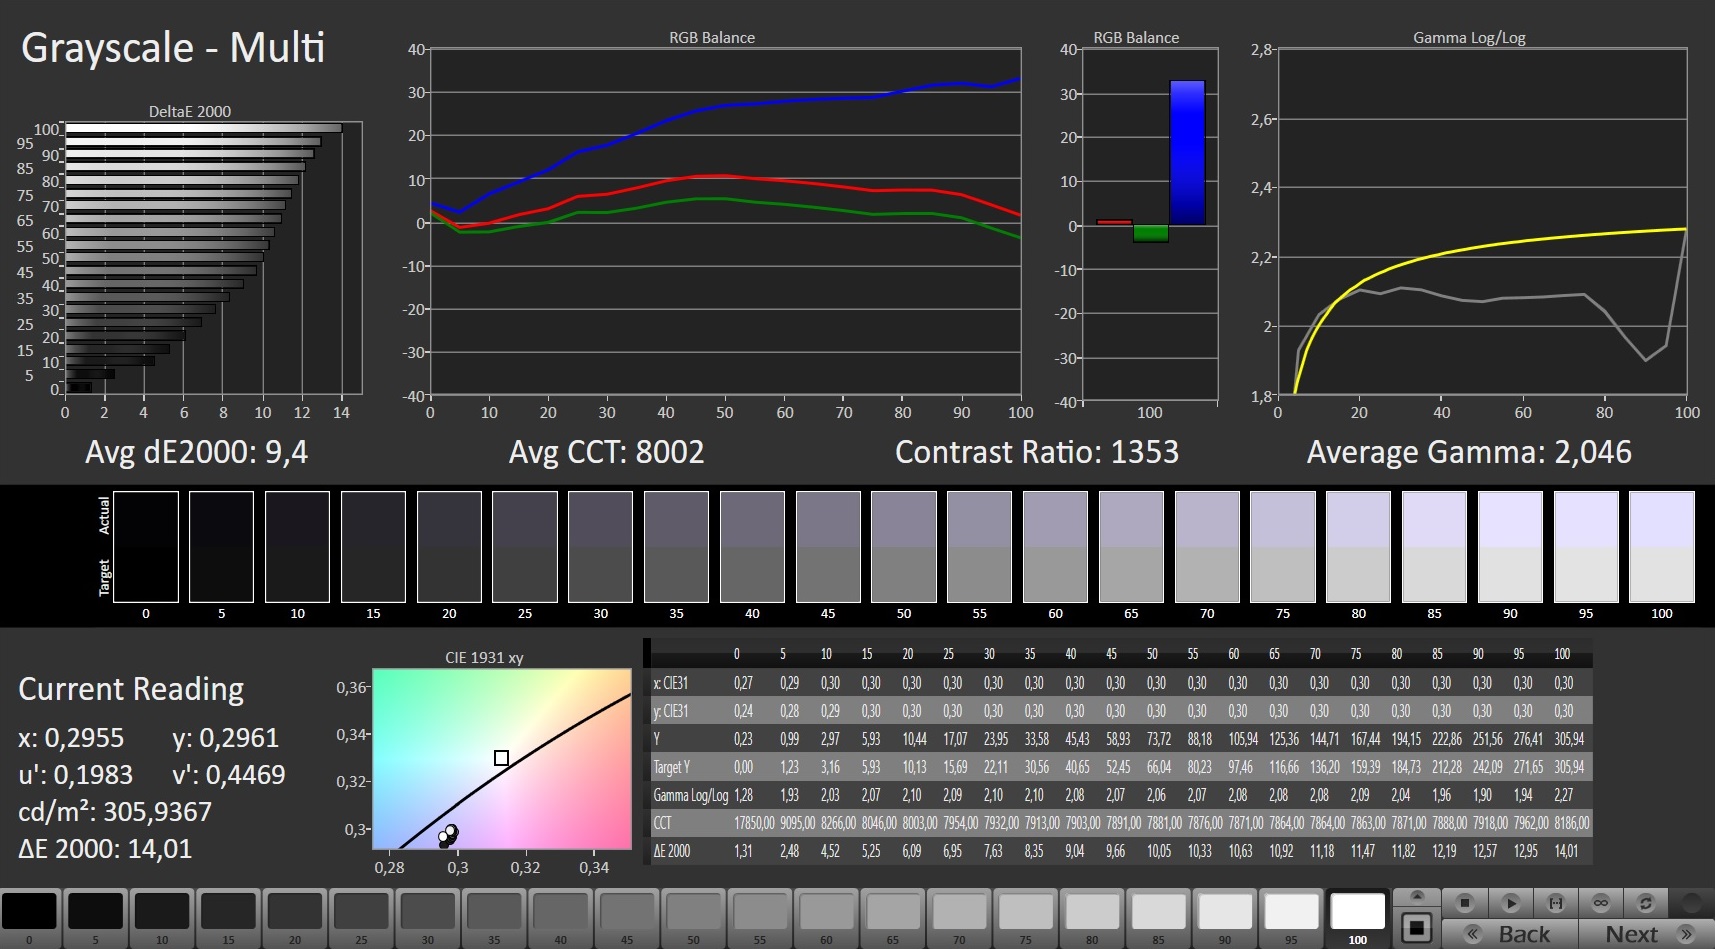
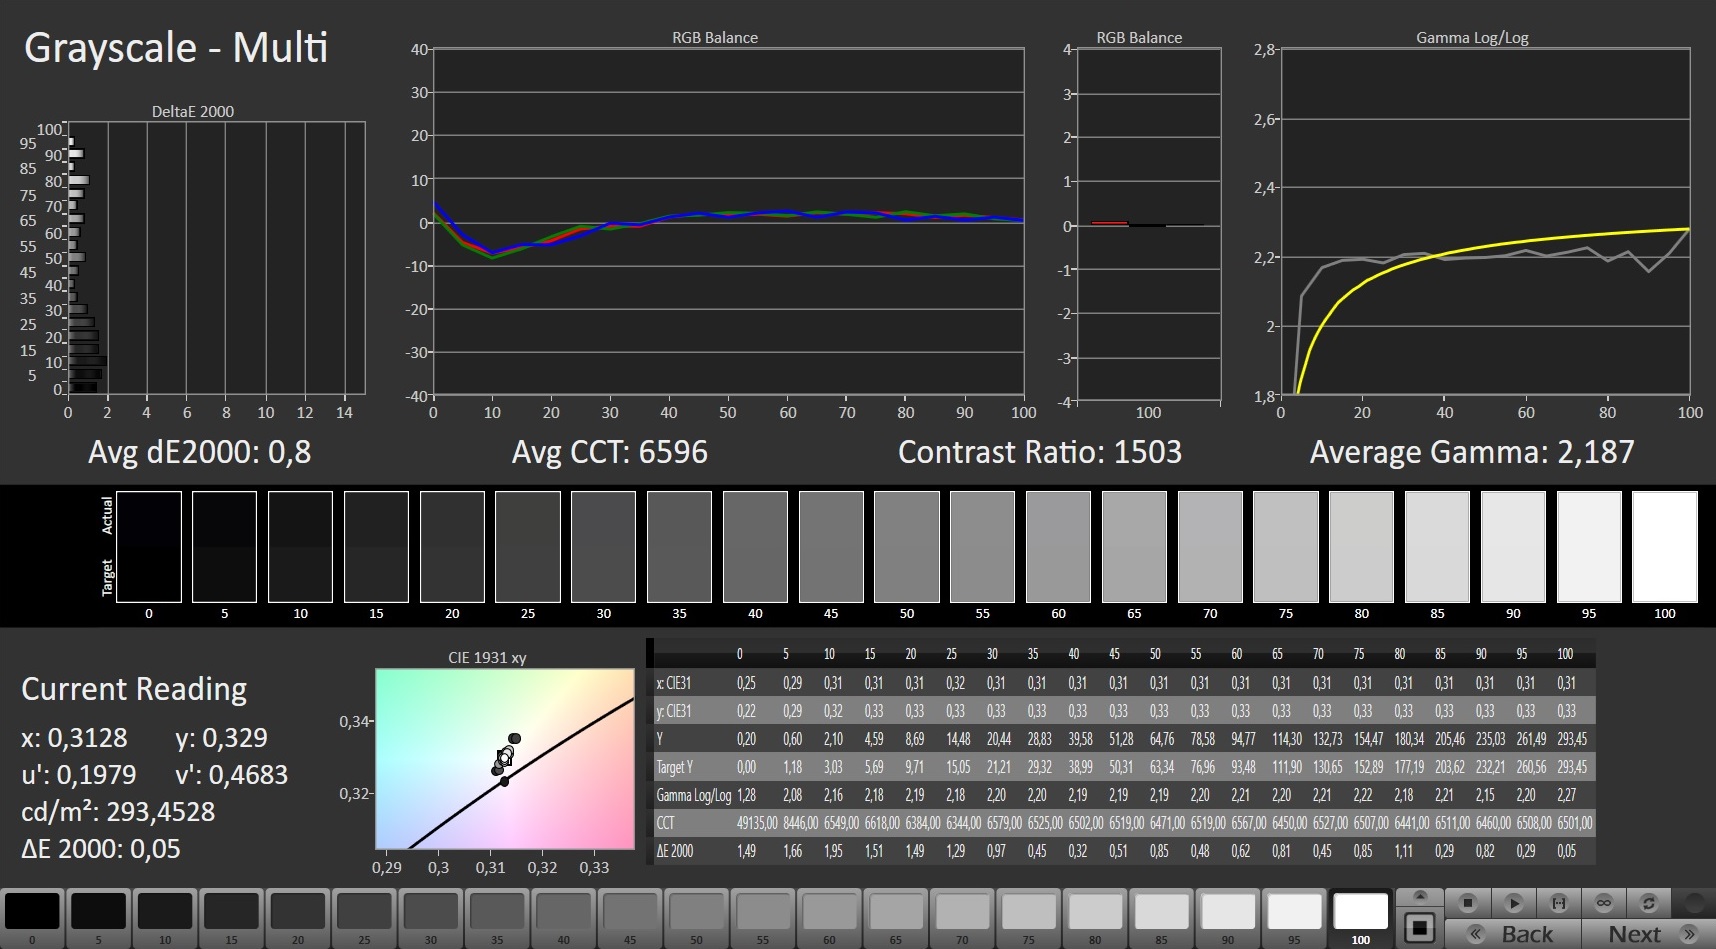
ΔE Greyscale Calman: 9.4 | ∀{0.09-98 Ø4.96}
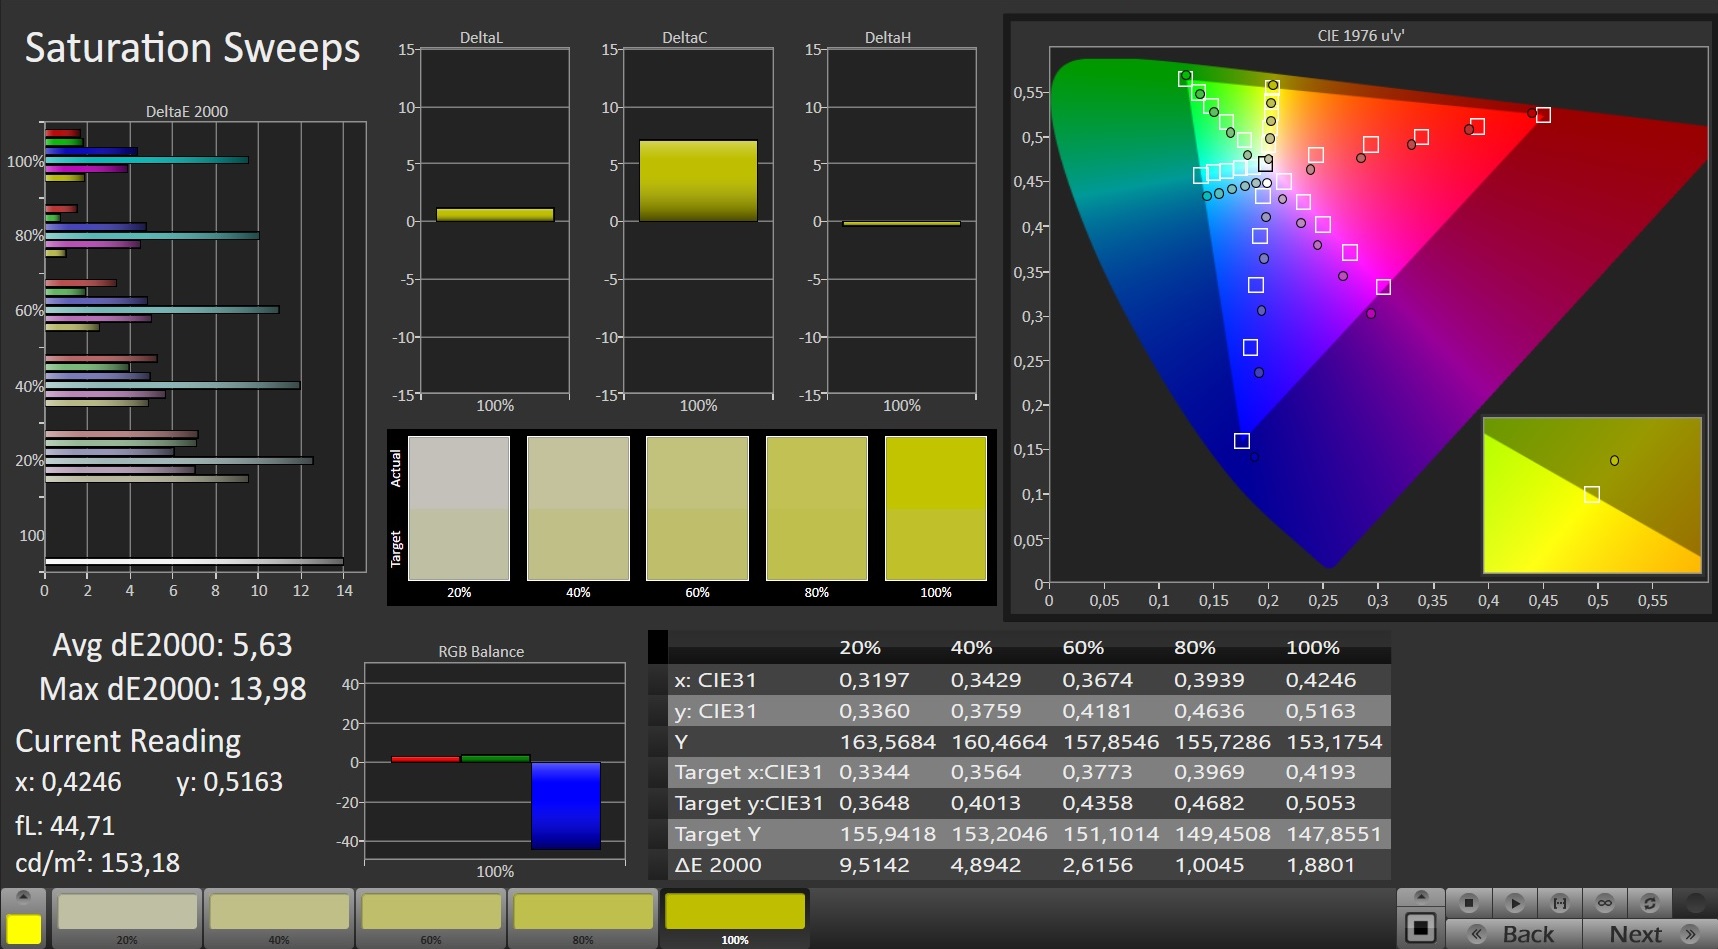
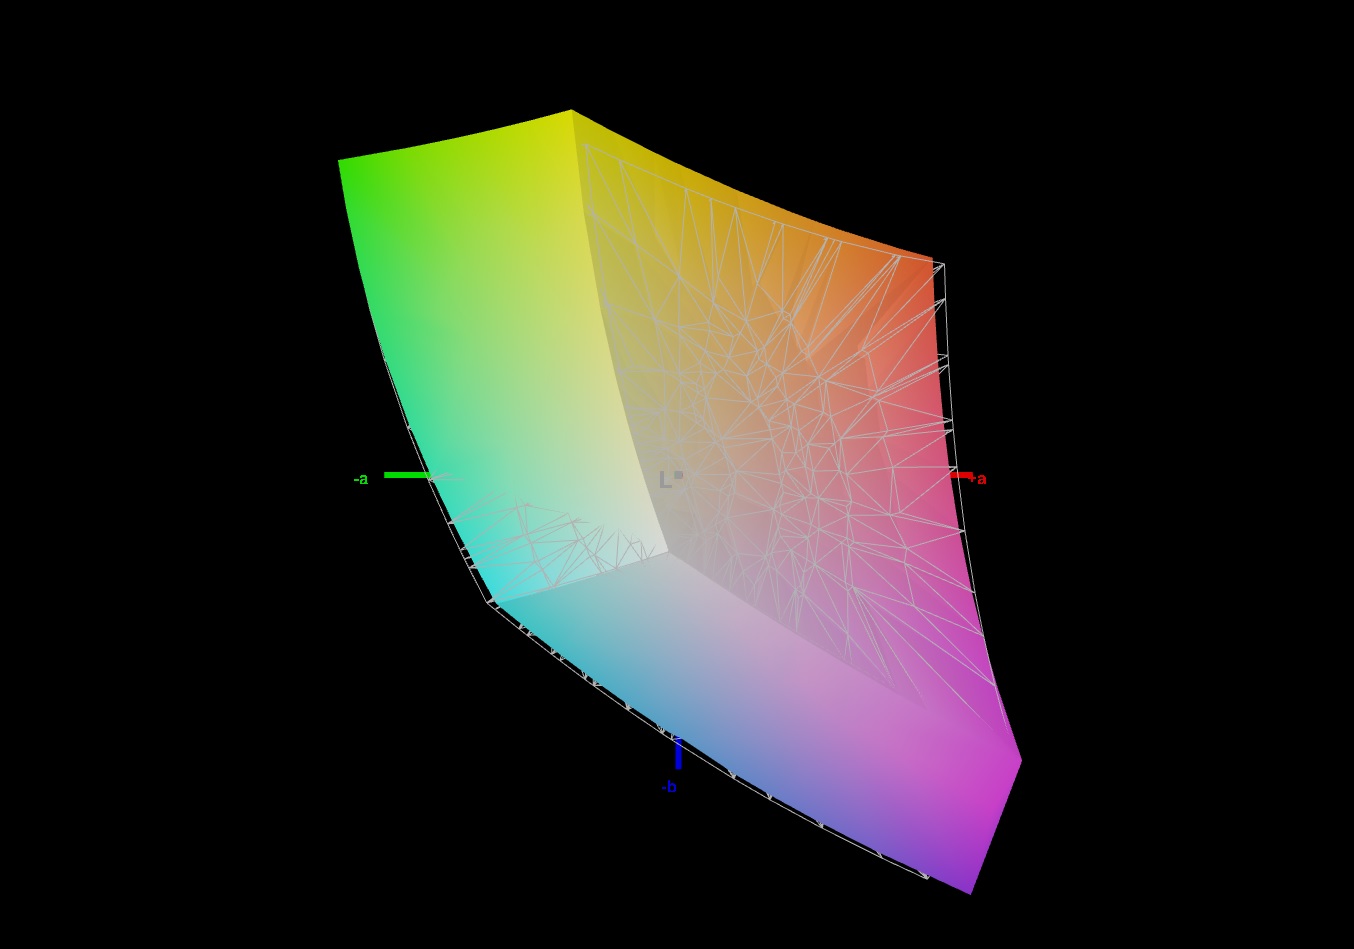
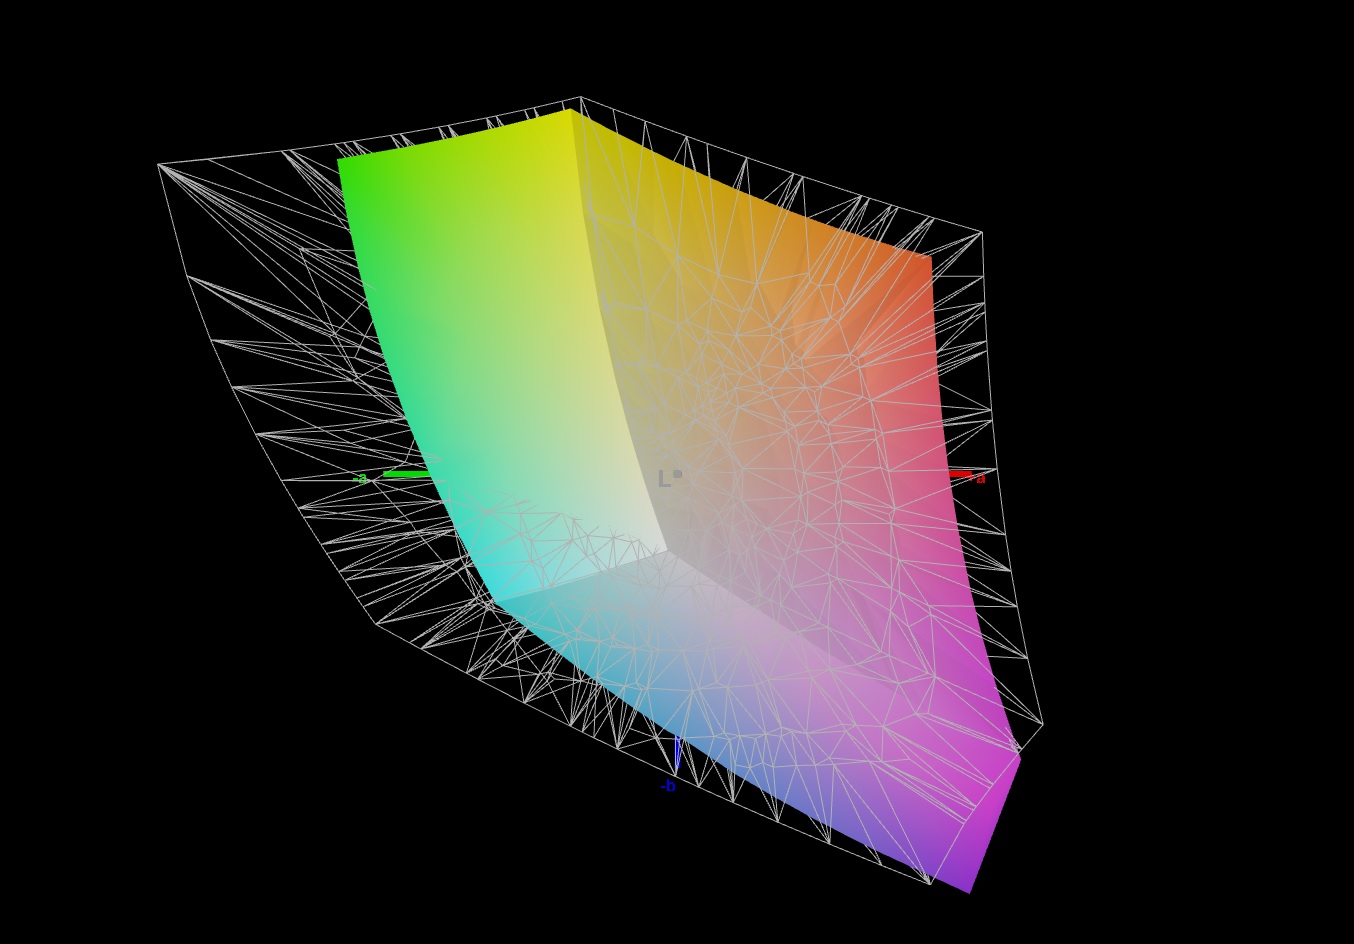
69.6% AdobeRGB 1998 (Argyll 3D)
96.7% sRGB (Argyll 3D)
68.2% Display P3 (Argyll 3D)
Gamma: 2.046
CCT: 8002 K
| Gigabyte G5 KC LM156LF-1F02, IPS, 1920x1080, 15.6" | Acer Nitro 5 AN517-53-54DQ BOE NV173FHM-NX4 (BOE09B4), IPS, 1920x1080, 17.3" | MSI GF65 Thin 10UE AU Optronics B156HAN08.4, IPS, 1920x1080, 15.6" | Dell G5 15 5500 09E2 AU Optronics B156HAN, IPS, 1920x1080, 15.6" | |
|---|---|---|---|---|
| Display | -45% | -44% | -45% | |
| Display P3 Coverage (%) | 68.2 | 36.7 -46% | 37.65 -45% | 36.73 -46% |
| sRGB Coverage (%) | 96.7 | 55 -43% | 56.3 -42% | 55.3 -43% |
| AdobeRGB 1998 Coverage (%) | 69.6 | 37.9 -46% | 38.9 -44% | 37.95 -45% |
| Response Times | -115% | -236% | ||
| Response Time Grey 50% / Grey 80% * (ms) | 10 ? | 24.8 ? -148% | 36.8 ? -268% | |
| Response Time Black / White * (ms) | 10.4 ? | 18.8 ? -81% | 31.6 ? -204% | |
| PWM Frequency (Hz) | ||||
| Screen | -15% | -12% | -18% | |
| Brightness middle (cd/m²) | 295 | 286 -3% | 266.5 -10% | 285.4 -3% |
| Brightness (cd/m²) | 275 | 261 -5% | 262 -5% | 260 -5% |
| Brightness Distribution (%) | 86 | 83 -3% | 91 6% | 86 0% |
| Black Level * (cd/m²) | 0.23 | 0.23 -0% | 0.18 22% | 0.19 17% |
| Contrast (:1) | 1283 | 1243 -3% | 1481 15% | 1502 17% |
| Colorchecker dE 2000 * | 5.21 | 4.92 6% | 5.33 -2% | 5.35 -3% |
| Colorchecker dE 2000 max. * | 14.03 | 19.29 -37% | 18.28 -30% | 18.48 -32% |
| Colorchecker dE 2000 calibrated * | 1.73 | 4.73 -173% | 4.36 -152% | 5.3 -206% |
| Greyscale dE 2000 * | 9.4 | 1.9 80% | 4.5 52% | 4.2 55% |
| Gamma | 2.046 108% | 2.175 101% | 2.35 94% | 2.2 100% |
| CCT | 8002 81% | 6782 96% | 6289 103% | 7627 85% |
| Color Space (Percent of AdobeRGB 1998) (%) | 35.6 | 37.95 | ||
| Color Space (Percent of sRGB) (%) | 55.8 | 55.26 | ||
| Total Average (Program / Settings) | -58% /
-36% | -97% /
-51% | -32% /
-25% |
* ... smaller is better
根据我们的测量,技嘉G5的面板提供了1,283:1的良好对比度和0.23 cd/m²的同样良好的黑色水平。因此,颜色之间有很好的分离,黑色的图像内容只显示最小的灰色面纱。色彩空间覆盖率分别为96.7%(sRGB)和69.6%(AdobeRGB),是我们测试领域中最高的。
CalMAN的分析还显示,在显示色彩时,蓝色的比例过高。然而,这几乎可以通过校准来完全纠正。相应的ICC文件可以在位于顶部的窗口中下载,在显示器亮度分布图的右侧。
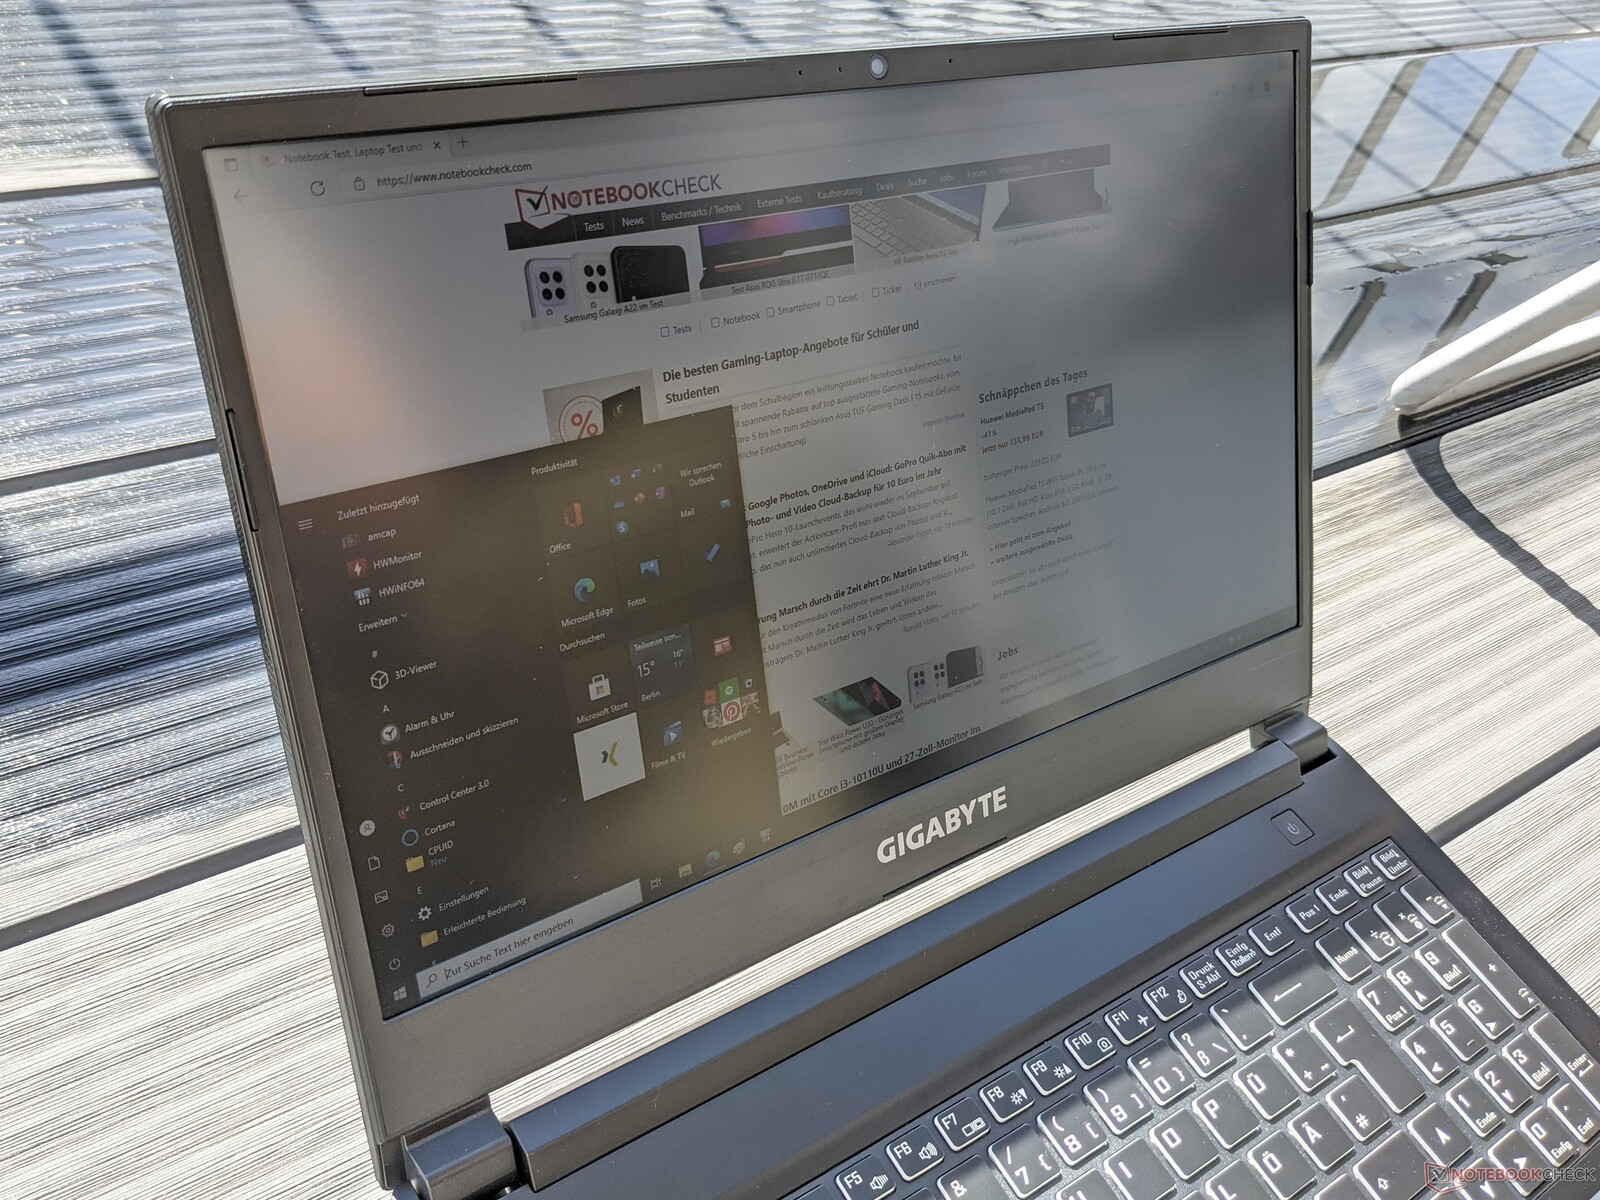
Gigabyte的游戏笔记本电脑只能在户外使用,只要在阴凉处的地方是首选。显示器的亮度不够高,不能在阳光直射下清晰地呈现图像内容。
Display Response Times
| ↔ Response Time Black to White | ||
|---|---|---|
| 10.4 ms ... rise ↗ and fall ↘ combined | ↗ 5.2 ms rise | 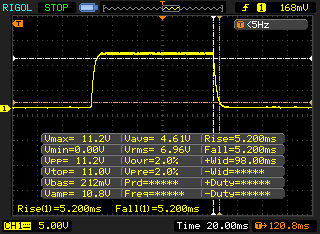 |
| ↘ 5.2 ms fall | ||
| The screen shows good response rates in our tests, but may be too slow for competitive gamers. In comparison, all tested devices range from 0.1 (minimum) to 240 (maximum) ms. » 28 % of all devices are better. This means that the measured response time is better than the average of all tested devices (19.8 ms). | ||
| ↔ Response Time 50% Grey to 80% Grey | ||
| 10 ms ... rise ↗ and fall ↘ combined | ↗ 5.2 ms rise | 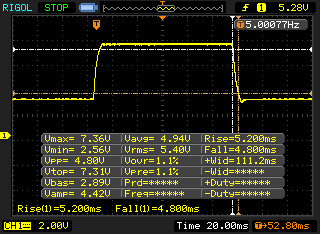 |
| ↘ 4.8 ms fall | ||
| The screen shows good response rates in our tests, but may be too slow for competitive gamers. In comparison, all tested devices range from 0.165 (minimum) to 636 (maximum) ms. » 23 % of all devices are better. This means that the measured response time is better than the average of all tested devices (30.9 ms). | ||
Screen Flickering / PWM (Pulse-Width Modulation)
| Screen flickering / PWM not detected | 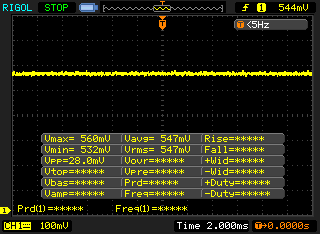 | ||
In comparison: 52 % of all tested devices do not use PWM to dim the display. If PWM was detected, an average of 7741 (minimum: 5 - maximum: 343500) Hz was measured. | |||
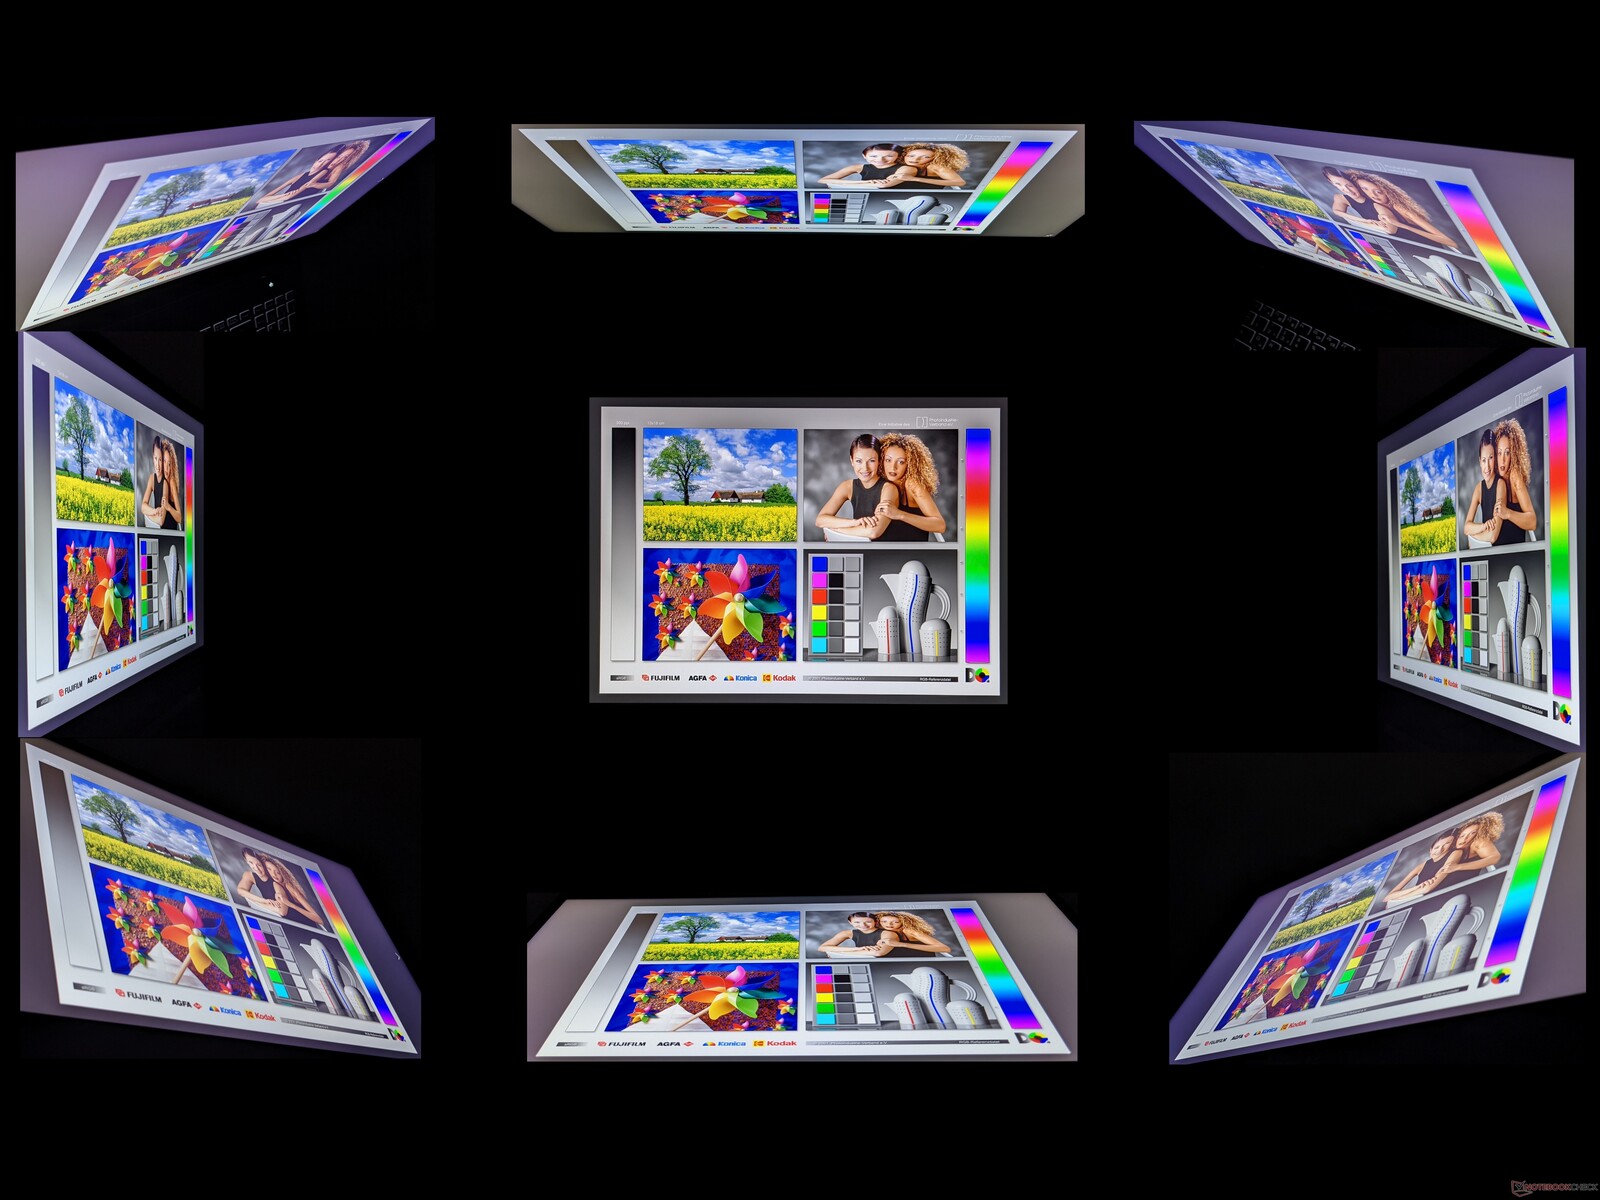
G5 KC的IPS面板具有很好的视角稳定性,即使从平坦的角度观看图像内容也不会出现色彩失真。
性能--技嘉G5的高水平性能
Gigabyte将G5 KC作为预算的入门级游戏笔记本电脑进行销售。然而,他们仍然确保硬件能够顺利地运行所有最新的游戏。除了我们的测试配置外,这款笔记本电脑还有更强的处理器可供选择。这里安装的NvidiaGeForce RTX 3060,一直作为显卡使用。
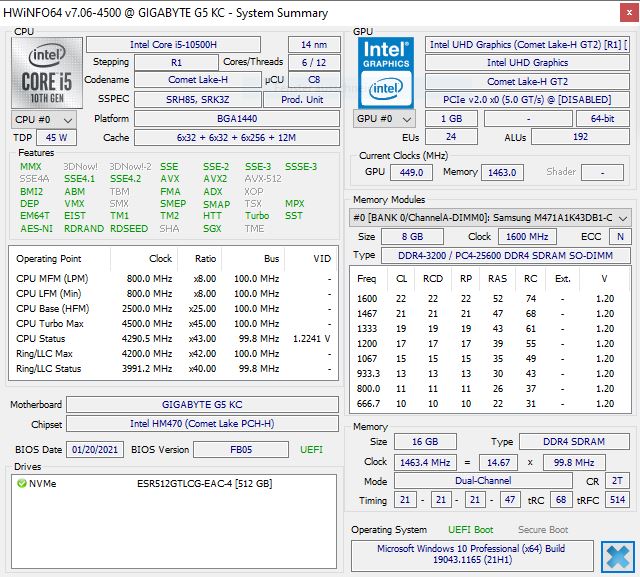
处理器
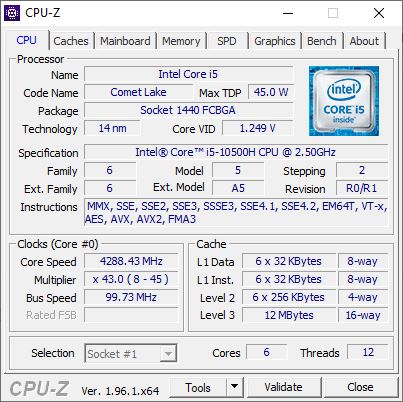
英特尔酷睿i5-10500H在我们测试的技嘉G5 KC的配置中,确保了系统的平稳运行。该处理器有六个核心,因此可以同时处理多达12个任务。时钟频率在2.5和4.5GHz之间。除了冷却系统外,所配置的TDP也决定了时钟速度能在高水平上维持多久。在这种情况下,TDP设置很慷慨,长期PL1为55瓦,短期PL2为135瓦。
我们的Cinebench R15连续循环显示,与Intel Comet Lake i7-10750H 笔记本处理器微星GF65 Thin 10UE 中的酷睿i5-10500H相比,一开始就达到了较高的数值。在逐渐下降之后,i5-10500H的持续性能略高于Intel Core i7-10750H,因此可以在我们的测试领域领先。
单项测试表明,英特尔酷睿i5-10500H的单核性能略高于英特尔酷睿i5-10300H 在戴尔G5 15 5500 。多核性能要好得多,可以再次与英特尔酷睿i7-10750H 竞争或超过。我们的CPU基准测试文章显示了这里提供的性能与其他处理器的比较。
Cinebench R15 Multi endurance test
| Cinebench R15 | |
| CPU Single 64Bit | |
| Average of class Gaming (188.8 - 350, n=103, last 2 years) | |
| Acer Nitro 5 AN517-53-54DQ | |
| MSI GF65 Thin 10UE | |
| Gigabyte G5 KC | |
| Dell G5 15 5500 09E2 | |
| Average Intel Core i5-10500H (184.5 - 188, n=2) | |
| CPU Multi 64Bit | |
| Average of class Gaming (1578 - 6330, n=102, last 2 years) | |
| Gigabyte G5 KC | |
| Average Intel Core i5-10500H (1209 - 1289, n=2) | |
| MSI GF65 Thin 10UE | |
| Acer Nitro 5 AN517-53-54DQ | |
| Dell G5 15 5500 09E2 | |
| Cinebench R23 | |
| Single Core | |
| Average of class Gaming (1601 - 2415, n=104, last 2 years) | |
| Acer Nitro 5 AN517-53-54DQ | |
| MSI GF65 Thin 10UE | |
| Gigabyte G5 KC | |
| Average Intel Core i5-10500H (1158 - 1161, n=2) | |
| Dell G5 15 5500 09E2 | |
| Multi Core | |
| Average of class Gaming (10488 - 42661, n=104, last 2 years) | |
| Average Intel Core i5-10500H (6820 - 7387, n=2) | |
| MSI GF65 Thin 10UE | |
| Gigabyte G5 KC | |
| Acer Nitro 5 AN517-53-54DQ | |
| Dell G5 15 5500 09E2 | |
| Cinebench R20 | |
| CPU (Single Core) | |
| Average of class Gaming (622 - 913, n=103, last 2 years) | |
| Acer Nitro 5 AN517-53-54DQ | |
| MSI GF65 Thin 10UE | |
| Gigabyte G5 KC | |
| Average Intel Core i5-10500H (446 - 450, n=2) | |
| Dell G5 15 5500 09E2 | |
| CPU (Multi Core) | |
| Average of class Gaming (4029 - 16433, n=103, last 2 years) | |
| Gigabyte G5 KC | |
| Average Intel Core i5-10500H (2842 - 2996, n=2) | |
| MSI GF65 Thin 10UE | |
| Acer Nitro 5 AN517-53-54DQ | |
| Dell G5 15 5500 09E2 | |
| Blender - v2.79 BMW27 CPU | |
| Dell G5 15 5500 09E2 | |
| Acer Nitro 5 AN517-53-54DQ | |
| MSI GF65 Thin 10UE | |
| Gigabyte G5 KC | |
| Average Intel Core i5-10500H (382 - 389, n=2) | |
| Average of class Gaming (79 - 330, n=101, last 2 years) | |
| 7-Zip 18.03 | |
| 7z b 4 -mmt1 | |
| Average of class Gaming (4824 - 7436, n=102, last 2 years) | |
| MSI GF65 Thin 10UE | |
| Acer Nitro 5 AN517-53-54DQ | |
| Gigabyte G5 KC | |
| Average Intel Core i5-10500H (4874 - 4897, n=2) | |
| Dell G5 15 5500 09E2 | |
| 7z b 4 | |
| Average of class Gaming (33491 - 148086, n=102, last 2 years) | |
| Average Intel Core i5-10500H (33075 - 33815, n=2) | |
| MSI GF65 Thin 10UE | |
| Gigabyte G5 KC | |
| Acer Nitro 5 AN517-53-54DQ | |
| Dell G5 15 5500 09E2 | |
| Geekbench 5.5 | |
| Single-Core | |
| Average of class Gaming (1403 - 2474, n=102, last 2 years) | |
| Acer Nitro 5 AN517-53-54DQ | |
| MSI GF65 Thin 10UE | |
| Gigabyte G5 KC | |
| Gigabyte G5 KC | |
| Dell G5 15 5500 09E2 | |
| Average Intel Core i5-10500H (1181 - 1214, n=4) | |
| Multi-Core | |
| Average of class Gaming (6460 - 28263, n=102, last 2 years) | |
| MSI GF65 Thin 10UE | |
| Gigabyte G5 KC | |
| Gigabyte G5 KC | |
| Average Intel Core i5-10500H (5550 - 6340, n=4) | |
| Acer Nitro 5 AN517-53-54DQ | |
| Dell G5 15 5500 09E2 | |
| HWBOT x265 Benchmark v2.2 - 4k Preset | |
| Average of class Gaming (11.5 - 44.4, n=102, last 2 years) | |
| Average Intel Core i5-10500H (9.31 - 9.73, n=2) | |
| MSI GF65 Thin 10UE | |
| Gigabyte G5 KC | |
| Acer Nitro 5 AN517-53-54DQ | |
| Dell G5 15 5500 09E2 | |
| LibreOffice - 20 Documents To PDF | |
| Dell G5 15 5500 09E2 | |
| Average Intel Core i5-10500H (50.6 - 61.4, n=2) | |
| Gigabyte G5 KC | |
| Acer Nitro 5 AN517-53-54DQ | |
| Average of class Gaming (33.2 - 88.8, n=102, last 2 years) | |
| MSI GF65 Thin 10UE | |
| R Benchmark 2.5 - Overall mean | |
| Gigabyte G5 KC | |
| Dell G5 15 5500 09E2 | |
| Average Intel Core i5-10500H (0.634 - 0.645, n=2) | |
| Acer Nitro 5 AN517-53-54DQ | |
| MSI GF65 Thin 10UE | |
| Average of class Gaming (0.3439 - 0.59, n=102, last 2 years) | |
* ... smaller is better
系统性能
Gigabyte G5 KC在PCMark 10测试中取得了非常好的总分,它可以在我们的测试领域中领先。虽然数字内容创作和生产力的单项得分相对较高,但Essentials得分只够在测试领域中排名倒数第二。
在测试期间,这台游戏笔记本始终显示出流畅的系统运行,我们没有遇到任何微的停顿或类似情况。程序启动很快,访问文件也没有任何滞后。
| PCMark 10 / Score | |
| Average of class Gaming (5828 - 12414, n=93, last 2 years) | |
| Gigabyte G5 KC | |
| Average Intel Core i5-10500H, NVIDIA GeForce RTX 3060 Laptop GPU (n=1) | |
| Acer Nitro 5 AN517-53-54DQ | |
| MSI GF65 Thin 10UE | |
| Dell G5 15 5500 09E2 | |
| PCMark 10 / Essentials | |
| Average of class Gaming (8810 - 11935, n=97, last 2 years) | |
| Acer Nitro 5 AN517-53-54DQ | |
| MSI GF65 Thin 10UE | |
| Gigabyte G5 KC | |
| Average Intel Core i5-10500H, NVIDIA GeForce RTX 3060 Laptop GPU (n=1) | |
| Dell G5 15 5500 09E2 | |
| PCMark 10 / Productivity | |
| Average of class Gaming (6845 - 25323, n=95, last 2 years) | |
| Acer Nitro 5 AN517-53-54DQ | |
| Gigabyte G5 KC | |
| Average Intel Core i5-10500H, NVIDIA GeForce RTX 3060 Laptop GPU (n=1) | |
| MSI GF65 Thin 10UE | |
| Dell G5 15 5500 09E2 | |
| PCMark 10 / Digital Content Creation | |
| Average of class Gaming (7602 - 19954, n=95, last 2 years) | |
| Gigabyte G5 KC | |
| Average Intel Core i5-10500H, NVIDIA GeForce RTX 3060 Laptop GPU (n=1) | |
| Acer Nitro 5 AN517-53-54DQ | |
| MSI GF65 Thin 10UE | |
| Dell G5 15 5500 09E2 | |
| PCMark 10 Score | 5968 points | |
Help | ||
DPC延迟
在这里使用的硬件中,技嘉G5 KC在LatencyMon的测试中显示出非常低的中断时间。这使得它非常适用于实时应用。
| DPC Latencies / LatencyMon - interrupt to process latency (max), Web, Youtube, Prime95 | |
| Dell G5 15 5500 09E2 | |
| Acer Nitro 5 AN517-53-54DQ | |
| MSI GF65 Thin 10UE | |
| Gigabyte G5 KC | |
* ... smaller is better
储存
技嘉在G5 KC中安装了一块512GB的固态硬盘,在存储基准测试中达到了平均水平。这使该游戏笔记本处于我们测试领域的中间位置。
与其他存储设备的比较可以在我们的HDD/SSD基准测试文章中找到 。
| Gigabyte G5 KC ESR512GTLCG-EAC-4 | Acer Nitro 5 AN517-53-54DQ SK Hynix BC711 HFM512GD3HX015N | MSI GF65 Thin 10UE Samsung SSD PM981 MZVLB1T0HALR | Dell G5 15 5500 09E2 Toshiba KBG40ZNS512G NVMe | Average ESR512GTLCG-EAC-4 | |
|---|---|---|---|---|---|
| CrystalDiskMark 5.2 / 6 | 32% | 2% | -34% | 2% | |
| Write 4K (MB/s) | 133.7 | 206.1 54% | 157.3 18% | 89.3 -33% | 131.6 ? -2% |
| Read 4K (MB/s) | 46.88 | 77.8 66% | 46.69 0% | 41.42 -12% | 45.4 ? -3% |
| Write Seq (MB/s) | 2509 | 2842 13% | 2389 -5% | 1182 -53% | 2303 ? -8% |
| Read Seq (MB/s) | 2209 | 2552 16% | 2196 -1% | 1532 -31% | 1716 ? -22% |
| Write 4K Q32T1 (MB/s) | 373.7 | 583 56% | 407.6 9% | 283.2 -24% | 525 ? 40% |
| Read 4K Q32T1 (MB/s) | 528 | 663 26% | 519 -2% | 353.2 -33% | 581 ? 10% |
| Write Seq Q32T1 (MB/s) | 2511 | 3014 20% | 2401 -4% | 1220 -51% | 2515 ? 0% |
| Read Seq Q32T1 (MB/s) | 3440 | 3556 3% | 3344 -3% | 2329 -32% | 3417 ? -1% |
| AS SSD | 8% | -21% | -231% | -10% | |
| Seq Read (MB/s) | 2972 | 2859 -4% | 3002 1% | 1776 -40% | 2643 ? -11% |
| Seq Write (MB/s) | 2276 | 2693 18% | 2420 6% | 721 -68% | 2134 ? -6% |
| 4K Read (MB/s) | 55.7 | 68.8 24% | 48.46 -13% | 38.58 -31% | 48.3 ? -13% |
| 4K Write (MB/s) | 131.2 | 154.5 18% | 114.3 -13% | 70.9 -46% | 116.4 ? -11% |
| 4K-64 Read (MB/s) | 1775 | 1860 5% | 1873 6% | 945 -47% | 1586 ? -11% |
| 4K-64 Write (MB/s) | 2051 | 1680 -18% | 1882 -8% | 191.8 -91% | 1975 ? -4% |
| Access Time Read * (ms) | 0.091 | 0.043 53% | 0.045 51% | 0.111 -22% | 0.09975 ? -10% |
| Access Time Write * (ms) | 0.028 | 0.028 -0% | 0.101 -261% | 0.588 -2000% | 0.03325 ? -19% |
| Score Read (Points) | 2128 | 2214 4% | 2221 4% | 1161 -45% | 1899 ? -11% |
| Score Write (Points) | 2410 | 2104 -13% | 2238 -7% | 335 -86% | 2305 ? -4% |
| Score Total (Points) | 5595 | 5451 -3% | 5565 -1% | 2043 -63% | 5151 ? -8% |
| Total Average (Program / Settings) | 20% /
18% | -10% /
-12% | -133% /
-148% | -4% /
-5% |
* ... smaller is better

Continuous load read: DiskSpd Read Loop, Queue Depth 8
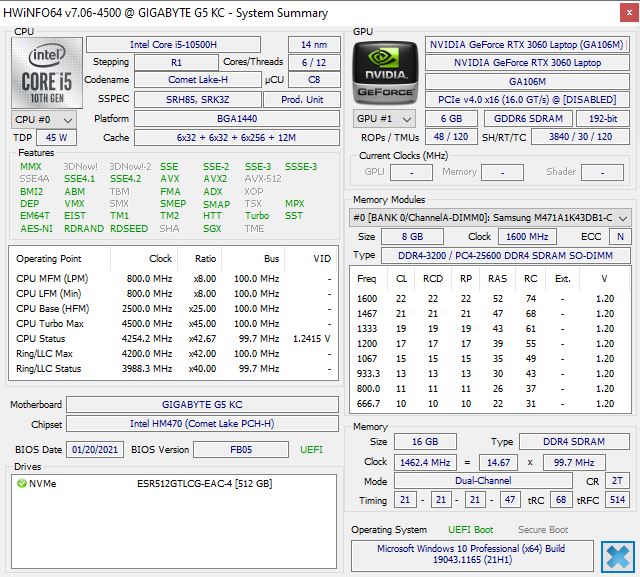
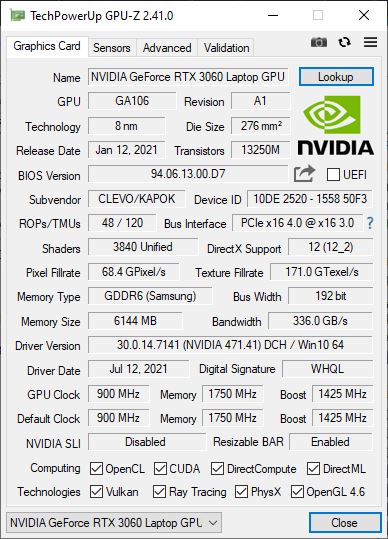
图形卡
一个NvidiaGeForce RTX 3060,负责渲染技嘉G5 KC中对图形要求高的应用。它可以由制造商配置不同的TGP设置,技嘉将其设置为90瓦。然而,Dynamic Boost可以将功耗提高到105瓦。
RTX 3060在我们进行的3DMark基准测试中取得了非常好的成绩,它可以把自己放在我们测试领域的首位。因此,G5 KC也适用于要求严格的3D应用。在我们的GPU基准测试文章 ,RTX 3060,可以与其他显卡进行比较。
| 3DMark 11 - 1280x720 Performance GPU | |
| Average of class Gaming (21841 - 80022, n=103, last 2 years) | |
| Average NVIDIA GeForce RTX 3060 Laptop GPU (13799 - 30772, n=43) | |
| Gigabyte G5 KC | |
| MSI GF65 Thin 10UE | |
| Acer Nitro 5 AN517-53-54DQ | |
| Dell G5 15 5500 09E2 | |
| 3DMark | |
| 1280x720 Cloud Gate Standard Graphics | |
| Average of class Gaming (86886 - 223650, n=60, last 2 years) | |
| Gigabyte G5 KC | |
| MSI GF65 Thin 10UE | |
| Average NVIDIA GeForce RTX 3060 Laptop GPU (33126 - 136826, n=38) | |
| Dell G5 15 5500 09E2 | |
| Acer Nitro 5 AN517-53-54DQ | |
| 1920x1080 Fire Strike Graphics | |
| Average of class Gaming (18629 - 62849, n=112, last 2 years) | |
| Gigabyte G5 KC | |
| Average NVIDIA GeForce RTX 3060 Laptop GPU (16354 - 23109, n=49) | |
| MSI GF65 Thin 10UE | |
| Acer Nitro 5 AN517-53-54DQ | |
| Dell G5 15 5500 09E2 | |
| 2560x1440 Time Spy Graphics | |
| Average of class Gaming (6387 - 26212, n=112, last 2 years) | |
| Average NVIDIA GeForce RTX 3060 Laptop GPU (6285 - 9235, n=49) | |
| Gigabyte G5 KC | |
| MSI GF65 Thin 10UE | |
| Acer Nitro 5 AN517-53-54DQ | |
| Dell G5 15 5500 09E2 | |
| 3DMark 06 Standard Score | 37418 points | |
| 3DMark 11 Performance | 21277 points | |
| 3DMark Cloud Gate Standard Score | 38579 points | |
| 3DMark Fire Strike Score | 17918 points | |
| 3DMark Time Spy Score | 7783 points | |
Help | ||
游戏性能
| F1 2021 - 1920x1080 Ultra High Preset + Raytracing AA:T AF:16x | |
| Average NVIDIA GeForce RTX 3060 Laptop GPU (67 - 112.8, n=9) | |
| Gigabyte G5 KC | |
| Acer Nitro 5 AN517-53-54DQ | |
| Cyberpunk 2077 1.0 - 1920x1080 Ultra Preset | |
| Gigabyte G5 KC | |
| Average NVIDIA GeForce RTX 3060 Laptop GPU (48.9 - 58, n=6) | |
| Acer Nitro 5 AN517-53-54DQ | |
| Dell G5 15 5500 09E2 | |
| Strange Brigade - 1920x1080 ultra AA:ultra AF:16 | |
| Average of class Gaming (113.6 - 458, n=83, last 2 years) | |
| Gigabyte G5 KC | |
| Average NVIDIA GeForce RTX 3060 Laptop GPU (102.2 - 166.3, n=43) | |
| MSI GF65 Thin 10UE | |
| Acer Nitro 5 AN517-53-54DQ | |
| Far Cry 5 - 1920x1080 Ultra Preset AA:T | |
| Average of class Gaming (70 - 151, n=6, last 2 years) | |
| Gigabyte G5 KC | |
| Average NVIDIA GeForce RTX 3060 Laptop GPU (80 - 120, n=31) | |
| MSI GF65 Thin 10UE | |
| Acer Nitro 5 AN517-53-54DQ | |
| X-Plane 11.11 - 1920x1080 high (fps_test=3) | |
| Average of class Gaming (55.5 - 148.5, n=106, last 2 years) | |
| Average NVIDIA GeForce RTX 3060 Laptop GPU (61.9 - 109.3, n=48) | |
| Gigabyte G5 KC | |
| MSI GF65 Thin 10UE | |
| Acer Nitro 5 AN517-53-54DQ | |
| Final Fantasy XV Benchmark - 1920x1080 High Quality | |
| Average of class Gaming (64.2 - 215, n=91, last 2 years) | |
| Average NVIDIA GeForce RTX 3060 Laptop GPU (55 - 100.9, n=42) | |
| Gigabyte G5 KC | |
| MSI GF65 Thin 10UE | |
| Acer Nitro 5 AN517-53-54DQ | |
| Dota 2 Reborn - 1920x1080 ultra (3/3) best looking | |
| Average of class Gaming (84.8 - 252, n=104, last 2 years) | |
| Average NVIDIA GeForce RTX 3060 Laptop GPU (90.7 - 154.8, n=49) | |
| Gigabyte G5 KC | |
| MSI GF65 Thin 10UE | |
| Acer Nitro 5 AN517-53-54DQ | |
| The Witcher 3 - 1920x1080 Ultra Graphics & Postprocessing (HBAO+) | |
| Average of class Gaming (104.7 - 240, n=7, last 2 years) | |
| Gigabyte G5 KC | |
| Average NVIDIA GeForce RTX 3060 Laptop GPU (58.2 - 91.5, n=48) | |
| MSI GF65 Thin 10UE | |
| Acer Nitro 5 AN517-53-54DQ | |
| Dell G5 15 5500 09E2 | |
| GTA V - 1920x1080 Highest AA:4xMSAA + FX AF:16x | |
| Average of class Gaming (67.1 - 186.9, n=90, last 2 years) | |
| Average NVIDIA GeForce RTX 3060 Laptop GPU (69.2 - 109.8, n=46) | |
| Gigabyte G5 KC | |
| MSI GF65 Thin 10UE | |
| Acer Nitro 5 AN517-53-54DQ | |
我们用TheWitcher 3进行的耐力负荷测试表明,来自技嘉的游戏笔记本电脑确实在帧率方面有轻微的波动,但即使在很长一段时间内,它总能再次稳定下来。
The Witcher 3 FPS diagram
| low | med. | high | ultra | |
|---|---|---|---|---|
| GTA V (2015) | 178 | 171 | 151 | 87.4 |
| The Witcher 3 (2015) | 80.8 | |||
| Dota 2 Reborn (2015) | 144 | 129 | 120 | 115 |
| Final Fantasy XV Benchmark (2018) | 146 | 104 | 78.5 | |
| X-Plane 11.11 (2018) | 105 | 93.3 | 78.1 | |
| Far Cry 5 (2018) | 132 | 112 | 109 | 104 |
| Strange Brigade (2018) | 336 | 202 | 162 | 141 |
| Cyberpunk 2077 1.0 (2020) | 106.5 | 76.7 | 65 | 55.6 |
| F1 2021 (2021) | 130 | 120 | 119 | 80.2 |
排放物--3D模式下的响亮风扇
噪声排放
技嘉G5 KC的风扇在负载下发出均匀的噪音,可以明显听到。因此,在游戏或使用高要求的应用程序时,噪音水平非常高。然而,在桌面上使用办公程序和互联网浏览器中的几个打开的标签时,G5基本上是安静或无声的--除了零星的升压阶段。
我们无法确定任何其他背景噪音,如线圈啸叫或类似的声音。
Noise level
| Idle |
| 31 / 32 / 51 dB(A) |
| Load |
| 57 / 58 dB(A) |
 | ||
30 dB silent 40 dB(A) audible 50 dB(A) loud |
||
min: | ||
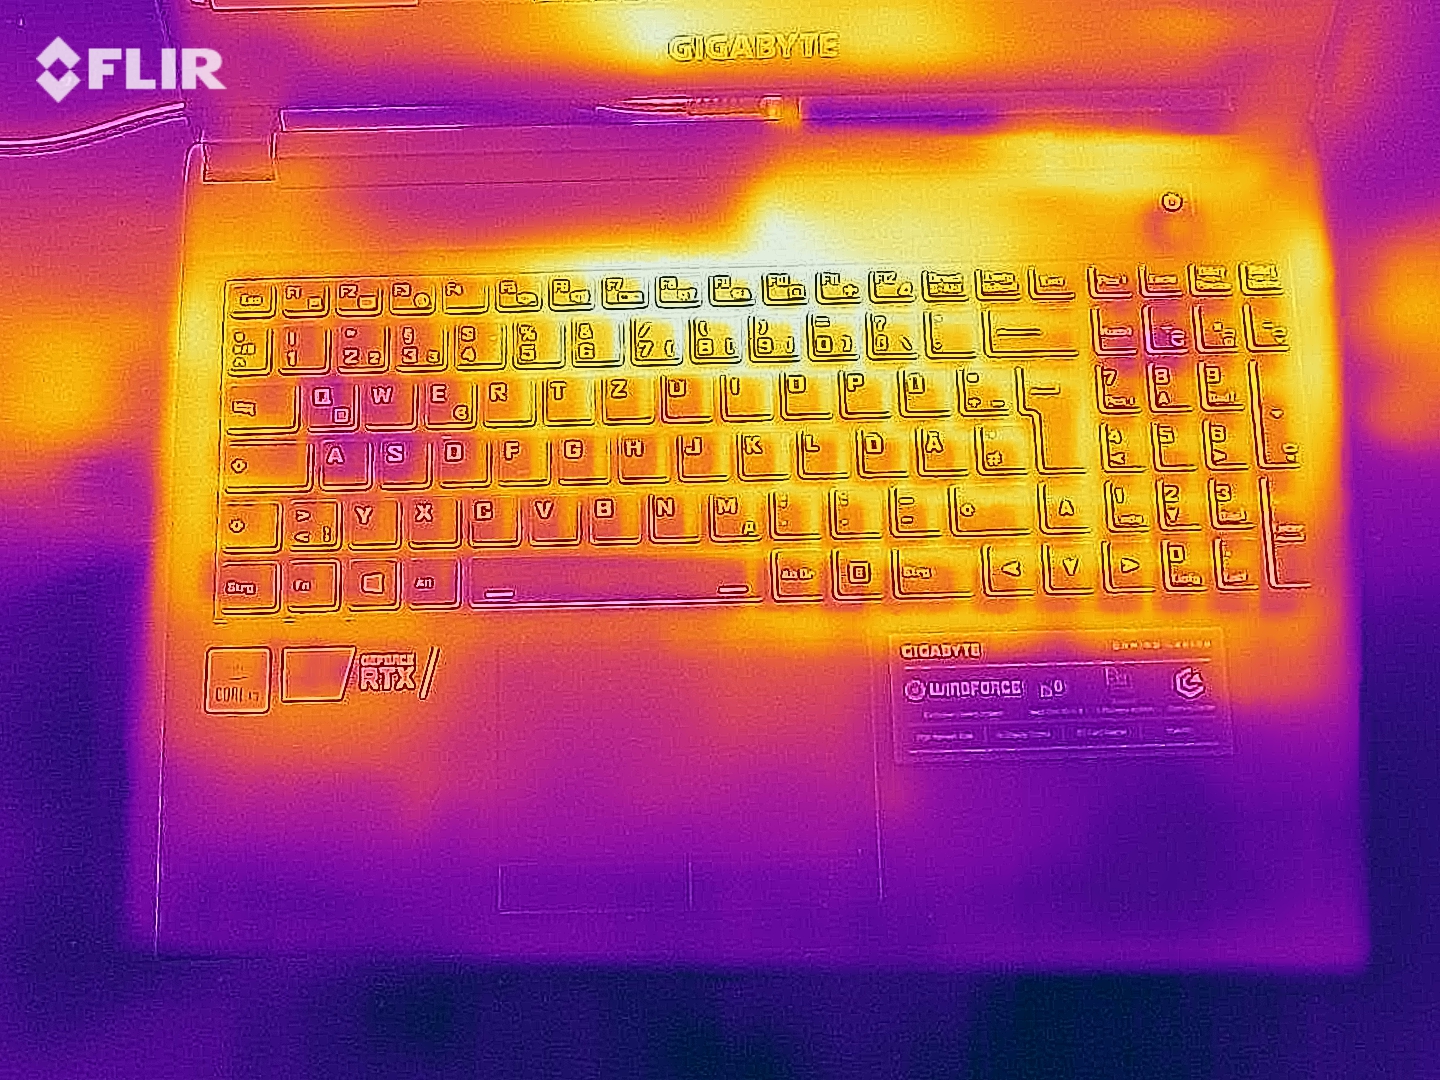
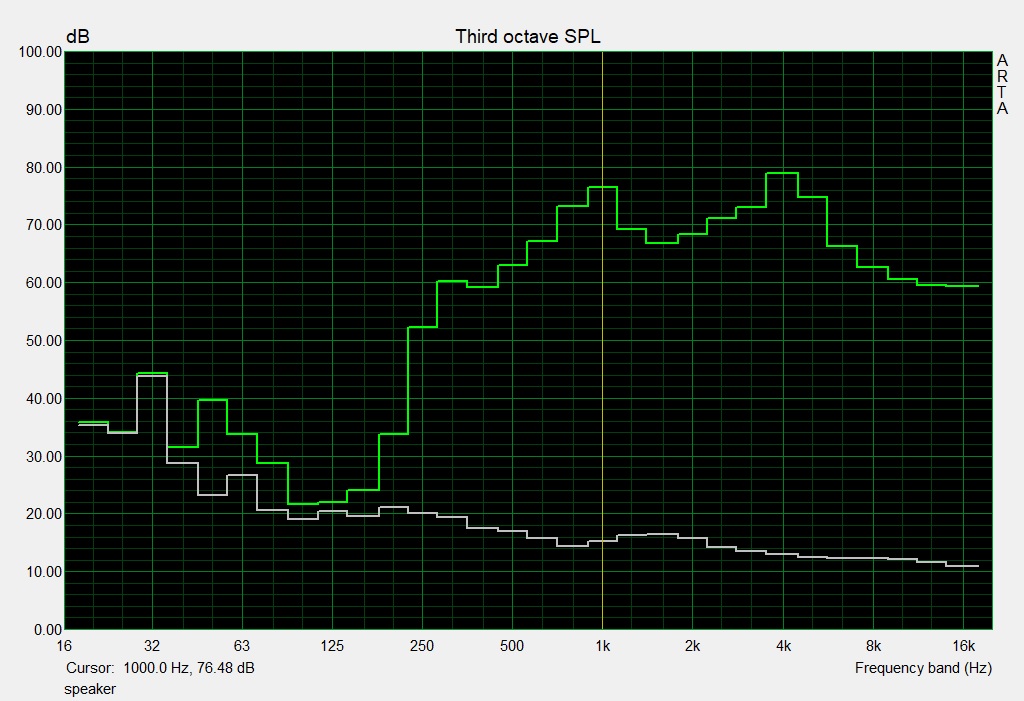
温度
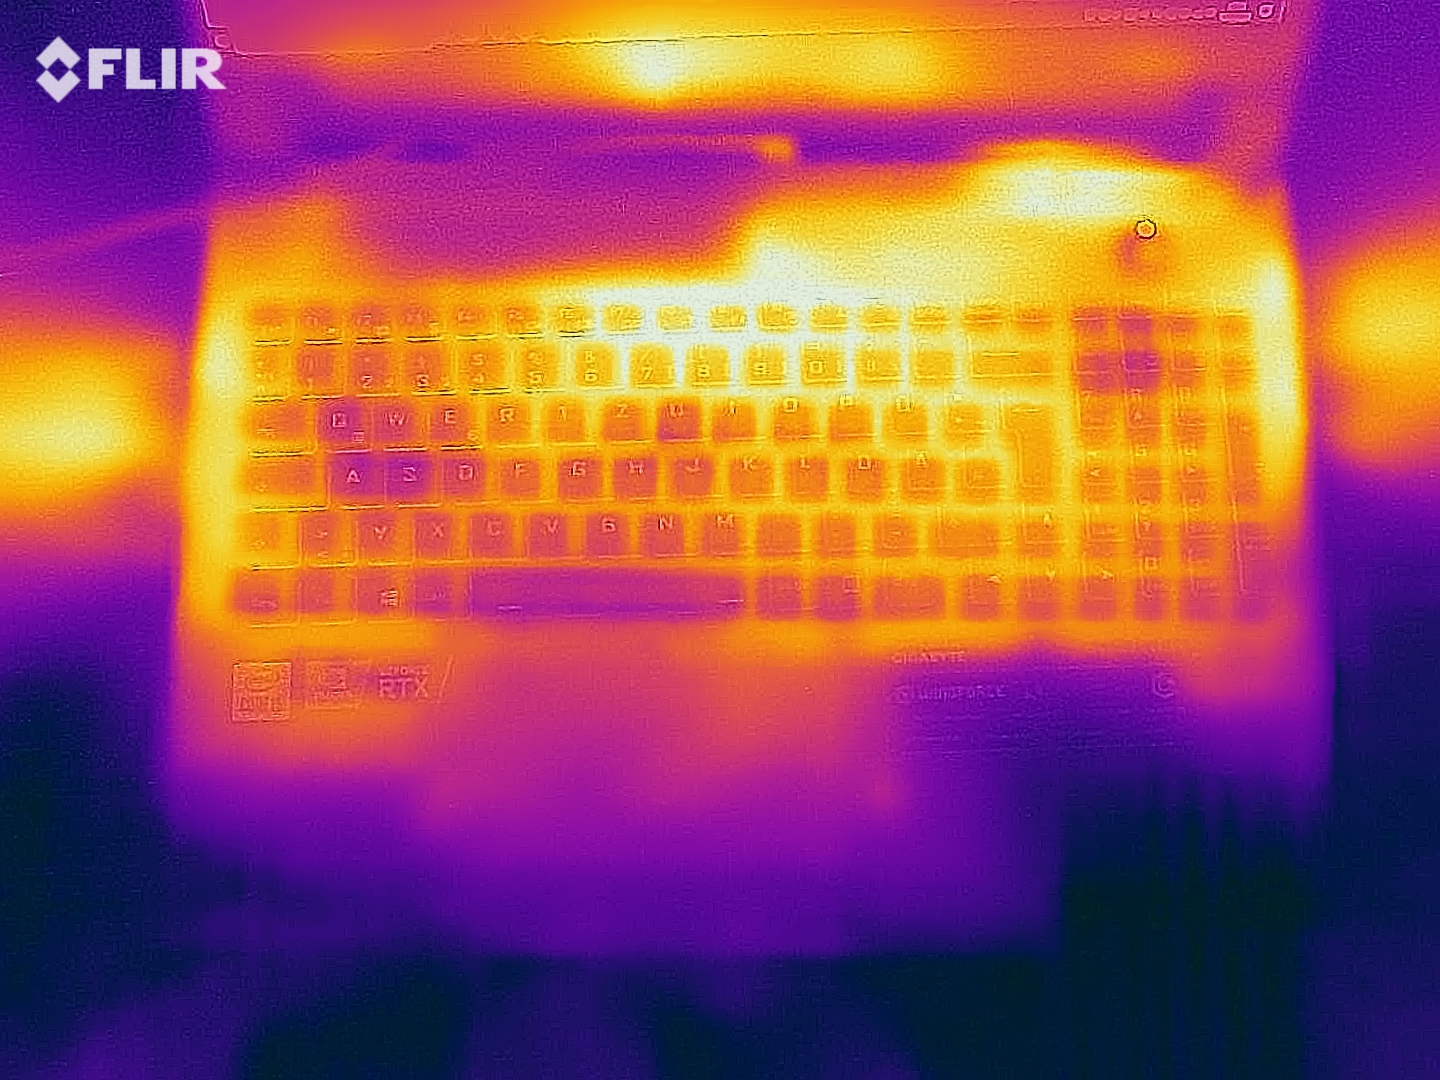
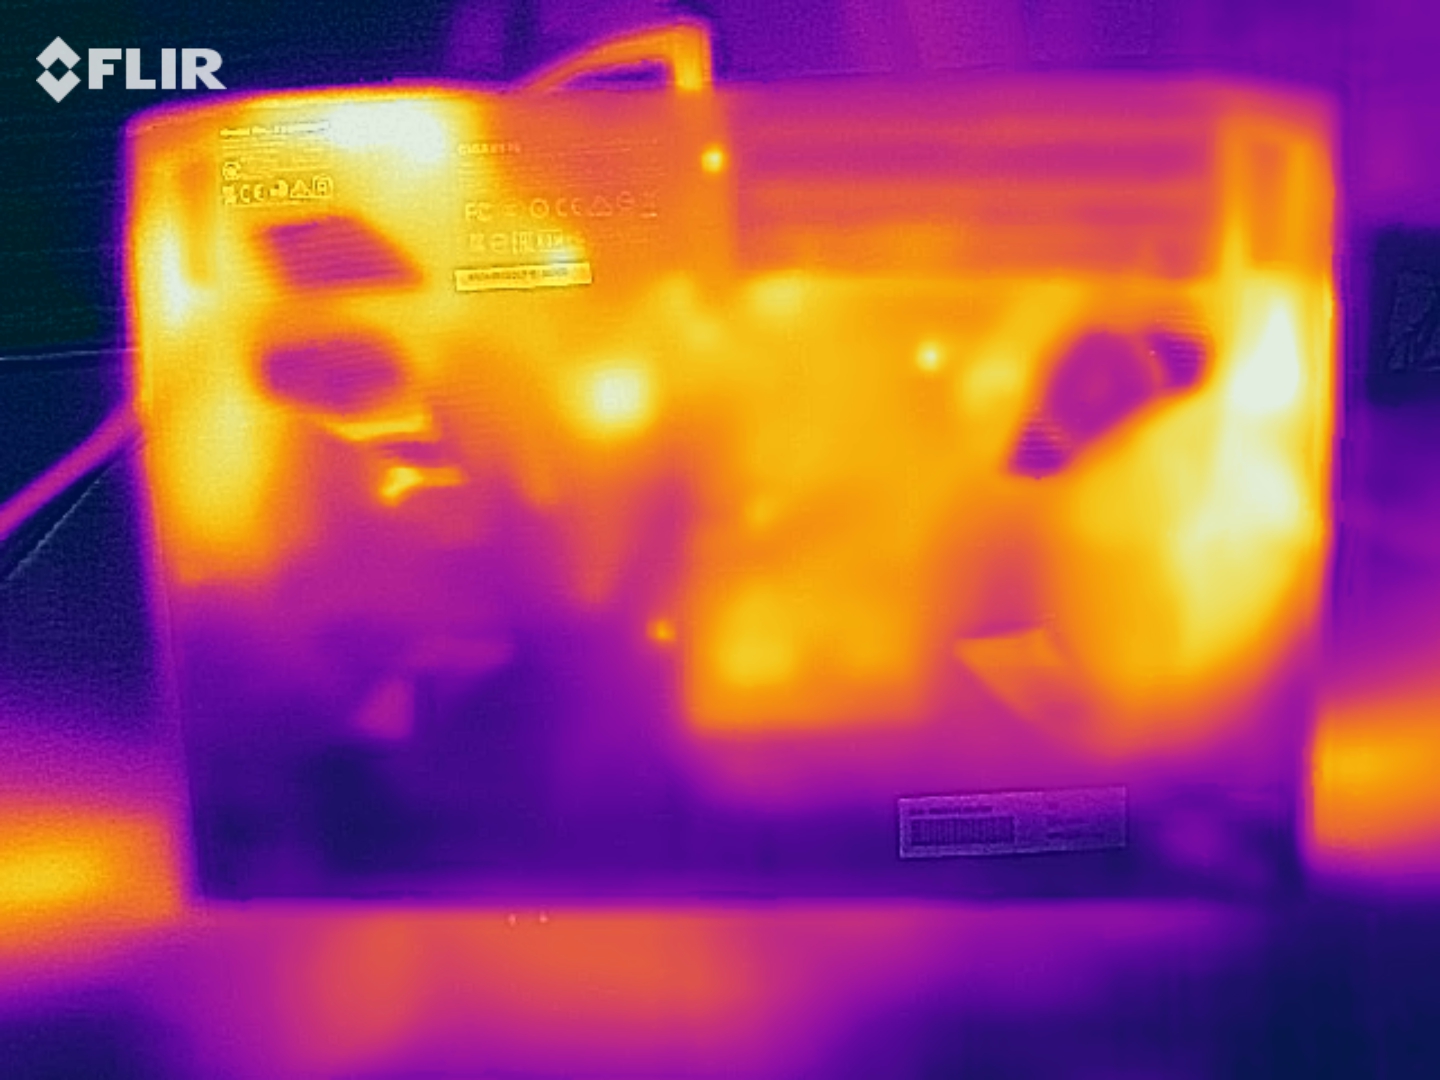
在高达50°C(约122°F)的温度下,技嘉G5的表面温度可以变得相当高。由于这只是在我们非常苛刻的压力测试中出现的情况,但你不应该期望在日常使用甚至游戏时有如此高的温度。此外,掌托的温度始终保持适度。
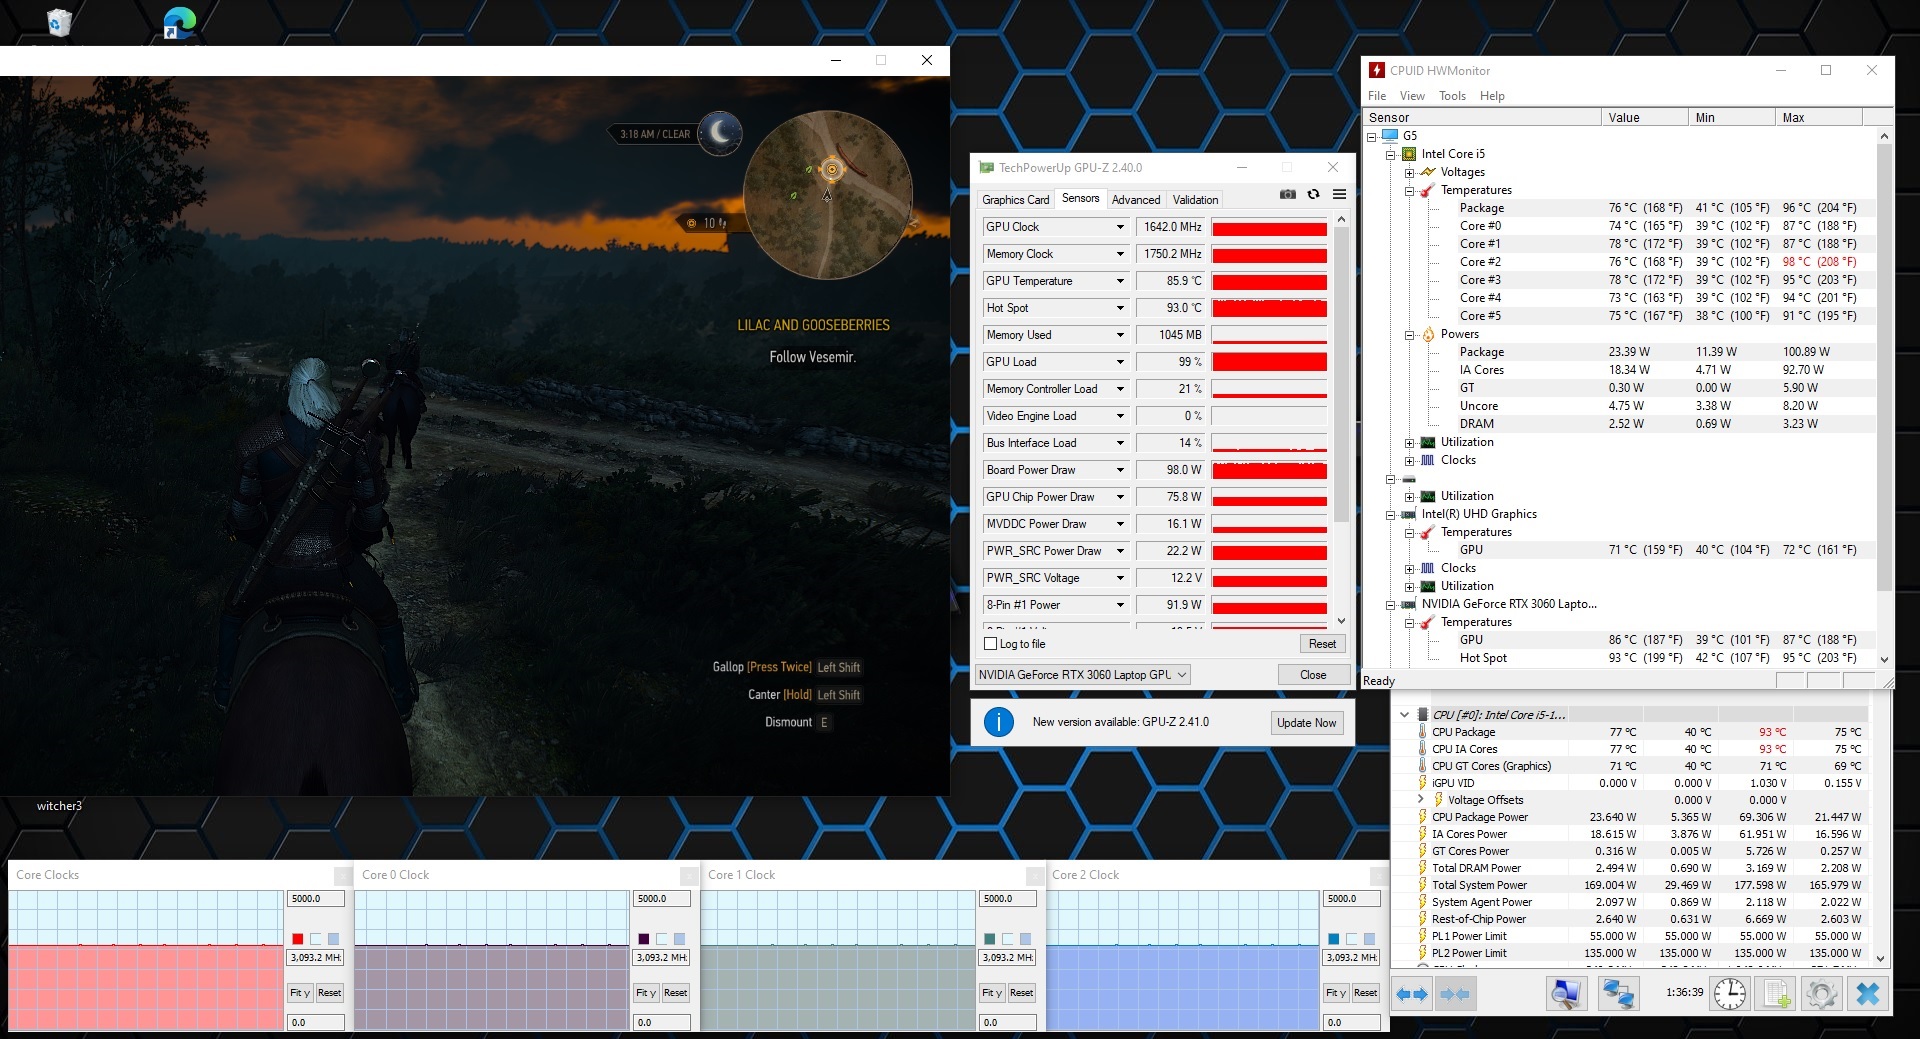
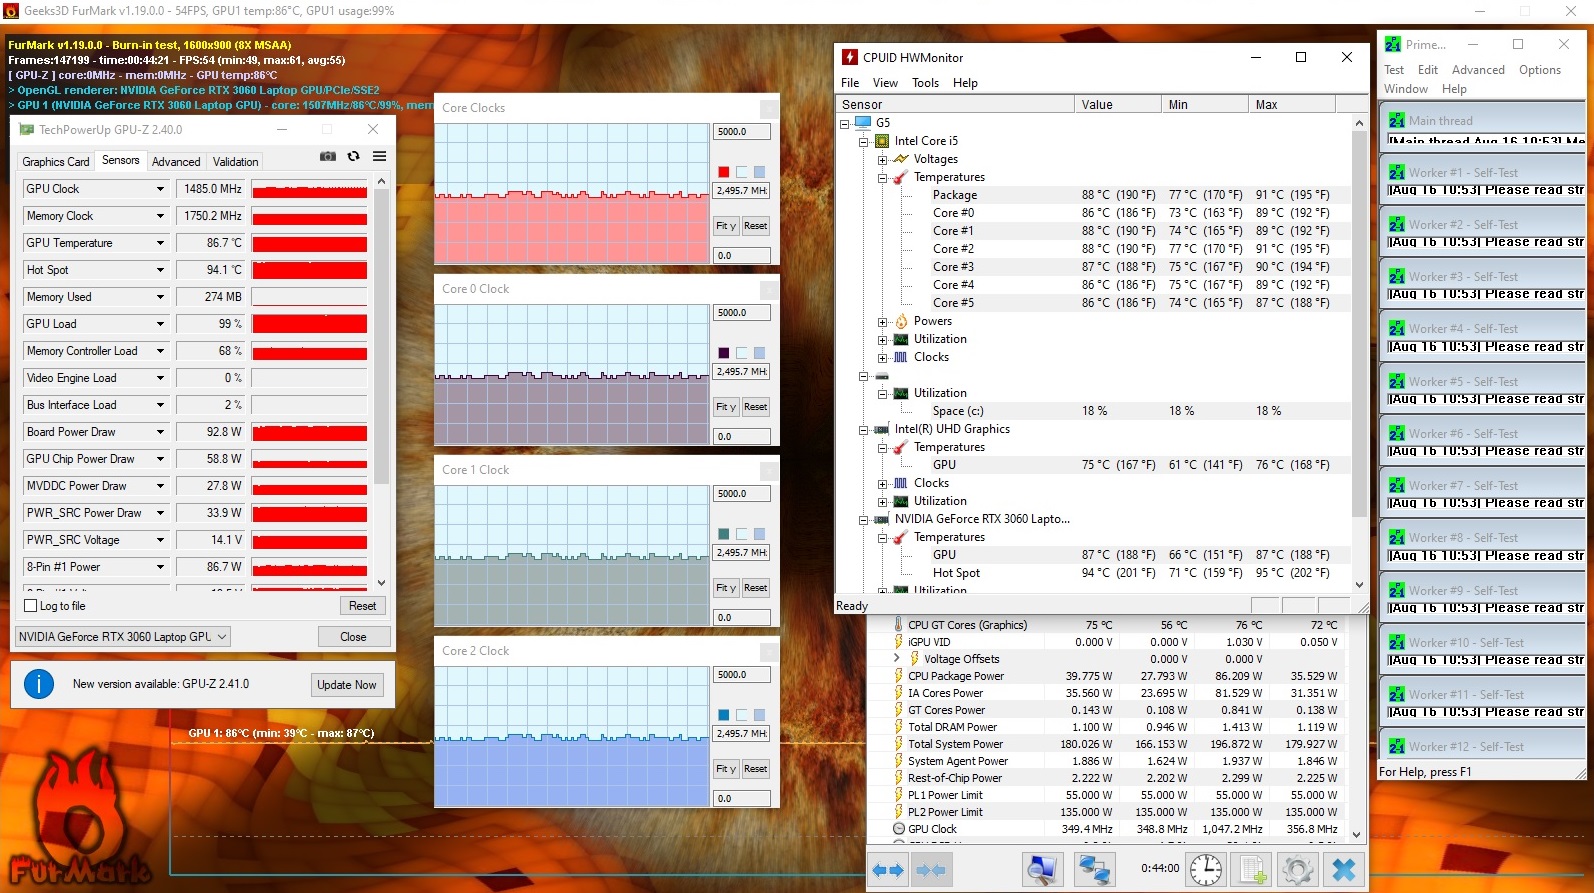
在我们苛刻的耐力压力测试中,笔记本内部的温度攀升至91℃(约196°F)。在此期间,CPU被保持在2.5GHz左右,这意味着它没有低于基本的时钟速度。
在我们的TheWitcher 3 测试中,温度短暂上升到98℃(约208°F)。在整个游戏测试过程中,时钟速率保持在3.1GHz左右。因此,用户不应该期望由于温度过高而受到限制,即使是在重度系统负载下。
(-) The maximum temperature on the upper side is 50 °C / 122 F, compared to the average of 40.4 °C / 105 F, ranging from 21.2 to 68.8 °C for the class Gaming.
(-) The bottom heats up to a maximum of 49 °C / 120 F, compared to the average of 43.2 °C / 110 F
(+) In idle usage, the average temperature for the upper side is 30.9 °C / 88 F, compared to the device average of 33.9 °C / 93 F.
(-) Playing The Witcher 3, the average temperature for the upper side is 42.8 °C / 109 F, compared to the device average of 33.9 °C / 93 F.
(-) The palmrests and touchpad can get very hot to the touch with a maximum of 42 °C / 107.6 F.
(-) The average temperature of the palmrest area of similar devices was 28.8 °C / 83.8 F (-13.2 °C / -23.8 F).
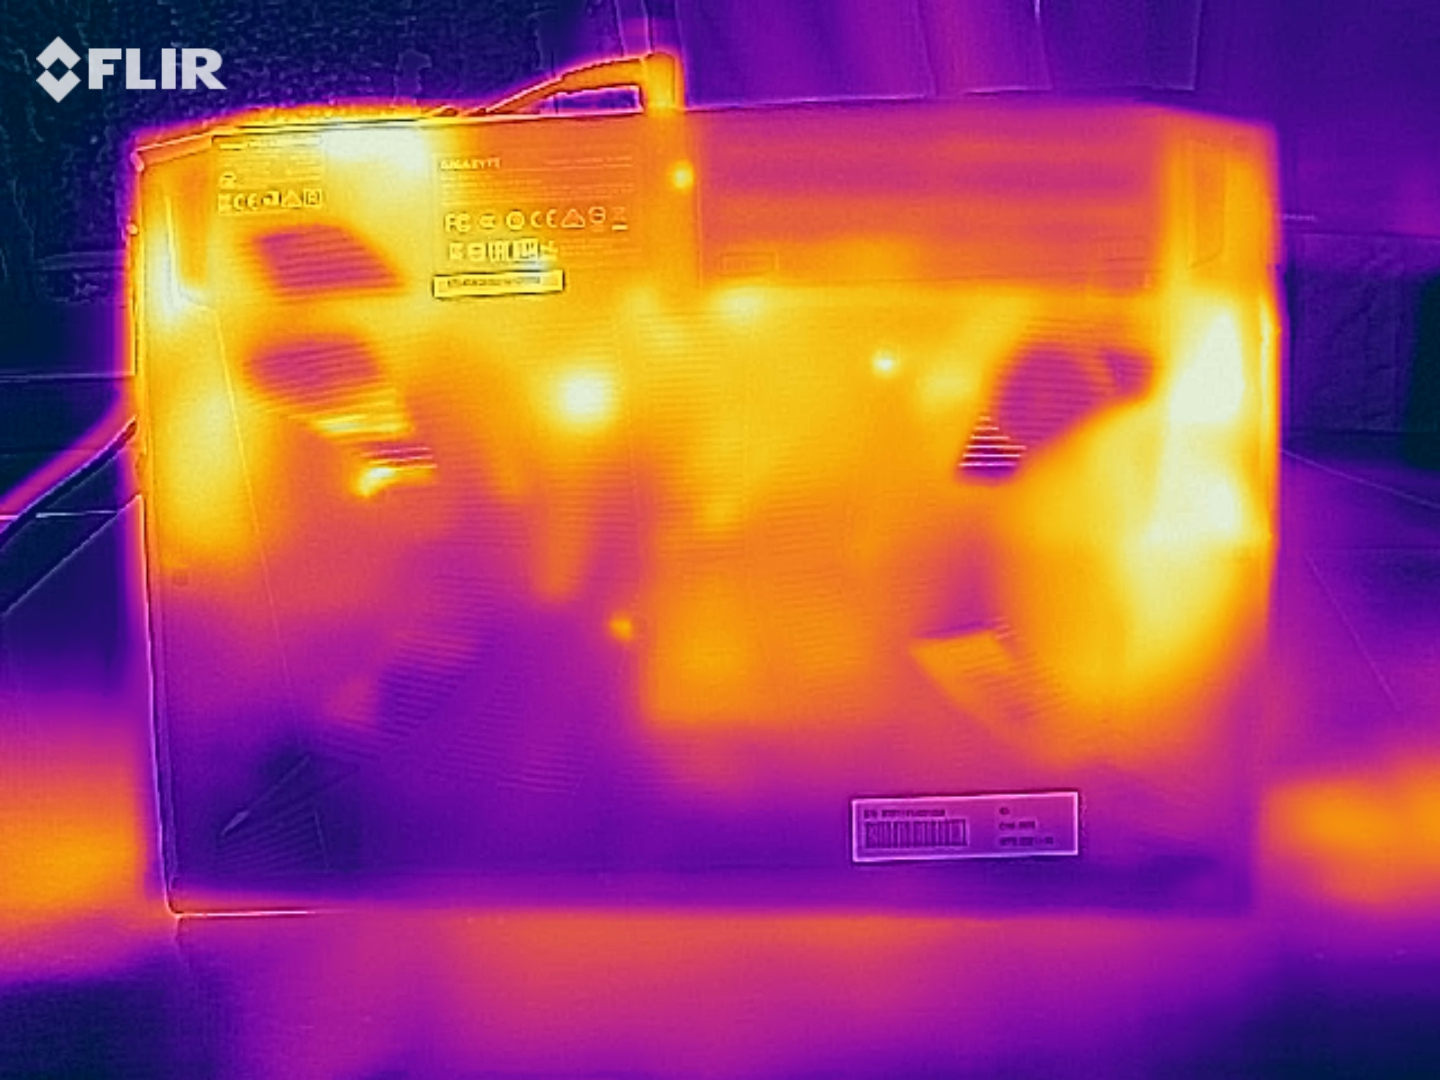
发言人
G5 KC的扬声器提供相对较高的音量和具有明显中、高音的声谱。这使得它们相当适合媒体播放,但在游戏中,例如,应首选耳机或外部扬声器。
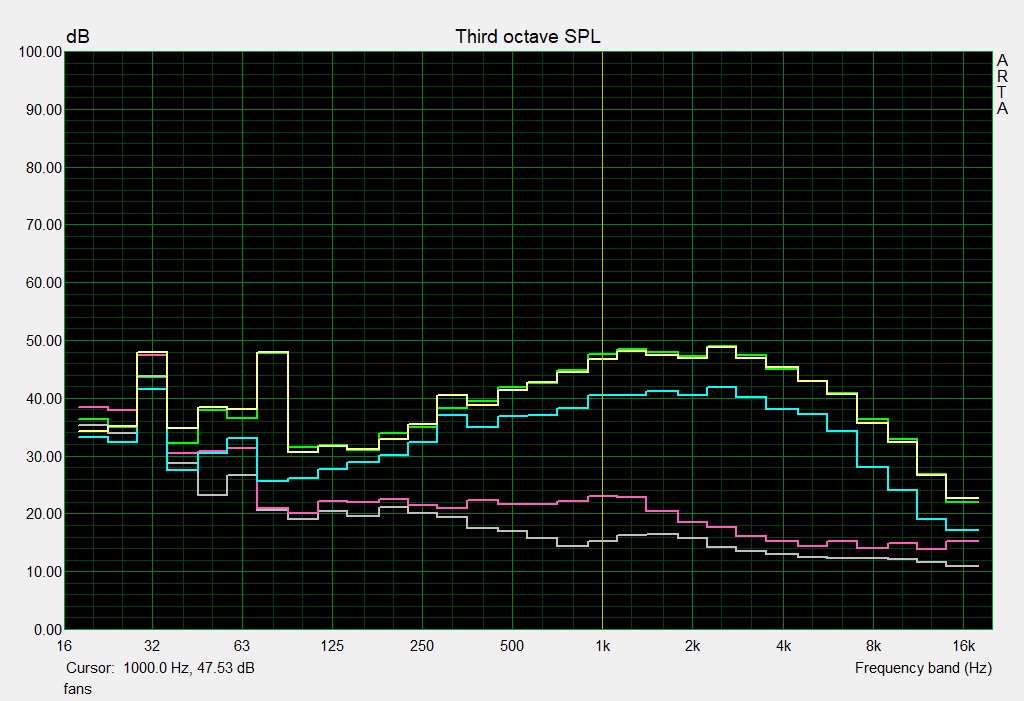
Gigabyte G5 KC audio analysis
(+) | speakers can play relatively loud (85 dB)
Bass 100 - 315 Hz
(-) | nearly no bass - on average 27.4% lower than median
(-) | bass is not linear (16.1% delta to prev. frequency)
Mids 400 - 2000 Hz
(±) | higher mids - on average 5.8% higher than median
(±) | linearity of mids is average (7.8% delta to prev. frequency)
Highs 2 - 16 kHz
(±) | higher highs - on average 7.4% higher than median
(±) | linearity of highs is average (8.8% delta to prev. frequency)
Overall 100 - 16.000 Hz
(±) | linearity of overall sound is average (25.1% difference to median)
Compared to same class
» 90% of all tested devices in this class were better, 3% similar, 7% worse
» The best had a delta of 6%, average was 18%, worst was 132%
Compared to all devices tested
» 77% of all tested devices were better, 5% similar, 18% worse
» The best had a delta of 4%, average was 23%, worst was 134%
MSI GF65 Thin 10UE audio analysis
(±) | speaker loudness is average but good (80.7 dB)
Bass 100 - 315 Hz
(-) | nearly no bass - on average 19.6% lower than median
(-) | bass is not linear (16.1% delta to prev. frequency)
Mids 400 - 2000 Hz
(+) | balanced mids - only 3.2% away from median
(±) | linearity of mids is average (7.6% delta to prev. frequency)
Highs 2 - 16 kHz
(+) | balanced highs - only 3.6% away from median
(±) | linearity of highs is average (8.6% delta to prev. frequency)
Overall 100 - 16.000 Hz
(±) | linearity of overall sound is average (17.9% difference to median)
Compared to same class
» 55% of all tested devices in this class were better, 9% similar, 36% worse
» The best had a delta of 6%, average was 18%, worst was 132%
Compared to all devices tested
» 37% of all tested devices were better, 8% similar, 55% worse
» The best had a delta of 4%, average was 23%, worst was 134%
能源管理 - 电池寿命非常短
能源消耗
根据我们的测量,技嘉G5 KC的最大功耗可以攀升到242瓦。在我们的TheWitcher 3 耐力测试中,功耗相对稳定在166瓦左右,在空闲情况下达到13瓦。虽然负载下的比率高于我们用NvidiaGeForce RTX 3060 测试的其他设备的平均水平,但在空闲情况下,比率较低。
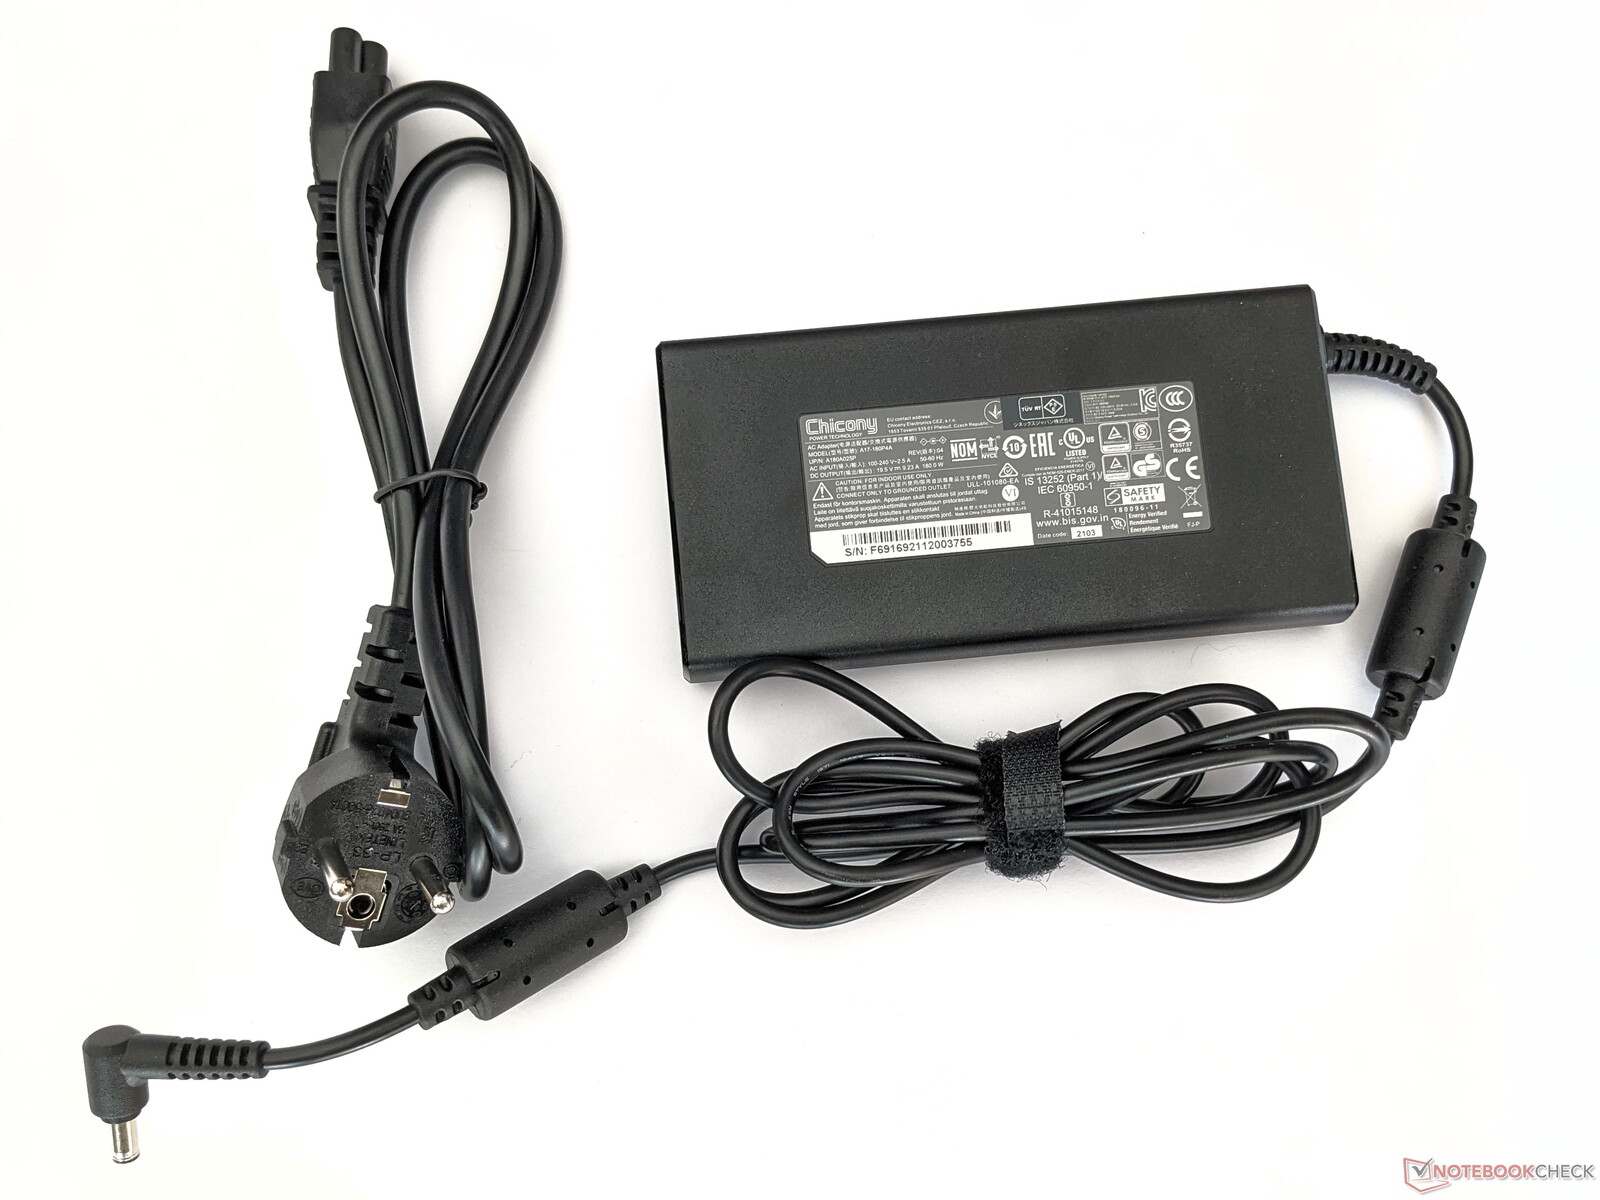
根据标签,附带的电源适配器提供180瓦的输出;因此,当涉及到处理消费高峰时,其容量有点紧张。
| Off / Standby | |
| Idle | |
| Load |
|
Key:
min: | |
| Gigabyte G5 KC i5-10500H, GeForce RTX 3060 Laptop GPU | Acer Nitro 5 AN517-53-54DQ i5-11300H, GeForce RTX 3050 4GB Laptop GPU | MSI GF65 Thin 10UE i7-10750H, GeForce RTX 3060 Laptop GPU | Average NVIDIA GeForce RTX 3060 Laptop GPU | Average of class Gaming | |
|---|---|---|---|---|---|
| Power Consumption | 33% | 18% | -9% | -31% | |
| Idle Minimum * (Watt) | 8 | 4 50% | 5.4 32% | 10.4 ? -30% | 13.1 ? -64% |
| Idle Average * (Watt) | 13 | 9 31% | 12.8 2% | 14.5 ? -12% | 19 ? -46% |
| Idle Maximum * (Watt) | 20 | 15 25% | 19.5 2% | 21.4 ? -7% | 24.6 ? -23% |
| Load Average * (Watt) | 98 | 85 13% | 86.6 12% | 109.3 ? -12% | 111.3 ? -14% |
| Witcher 3 ultra * (Watt) | 166 | 104 37% | 115.7 30% | ||
| Load Maximum * (Watt) | 242 | 135 44% | 175.2 28% | 206 ? 15% | 260 ? -7% |
* ... smaller is better
Energy consumption during The Witcher 3 / Stress test
电池寿命
在我们的实际Wi-Fi测试中,技嘉G5 KC实现了3:35小时的运行时间。这意味着它不像我们测试领域中的其他游戏笔记本电脑那样持续时间长。紧随其后的是微星GF65 Thin 10UE ,不过它的电池容量略大,为51Wh(而不是G5 KC的49Wh)。
| Gigabyte G5 KC i5-10500H, GeForce RTX 3060 Laptop GPU, 48.96 Wh | Acer Nitro 5 AN517-53-54DQ i5-11300H, GeForce RTX 3050 4GB Laptop GPU, 57 Wh | MSI GF65 Thin 10UE i7-10750H, GeForce RTX 3060 Laptop GPU, 51 Wh | Dell G5 15 5500 09E2 i5-10300H, GeForce GTX 1650 Ti Mobile, 51 Wh | Average of class Gaming | |
|---|---|---|---|---|---|
| Battery runtime | 121% | 47% | 107% | 61% | |
| Reader / Idle (h) | 5.2 | 17.4 235% | 11.1 113% | 12.2 135% | 7.84 ? 51% |
| WiFi v1.3 (h) | 3.6 | 7.2 100% | 4.6 28% | 6.4 78% | 7.08 ? 97% |
| Load (h) | 1.1 | 1.4 27% | 1.1 0% | 1.496 ? 36% | |
| Witcher 3 ultra (h) | 1.2 |
Pros
Cons
结论--花小钱买好的游戏笔记本
技嘉G5 KC主要能做一件事:把现代游戏流畅地带到屏幕上。后者以丰富的色彩和144赫兹的刷新率显示出其良好的一面,英特尔酷睿i5-10500H在长时间内也能提供稳定的性能。内置的NvidiaGeForce RTX 3060,没有利用最大可能的TGP,但它也提供了良好的效果,特别是与其他预算游戏笔记本电脑相比,如MSI GF65 Thin 10UE 。
流畅地玩最新的游戏,对于价格低廉的技嘉G5 KC来说不是问题。
在维护选项方面,即使是价格更高的对手也可以从技嘉的书中吸取经验。除了系统固态硬盘外,还有第二个M.2插槽和一个2.5英寸驱动器的空闲插槽。你甚至可以在不需要工具的情况下更换电池,尽管它只能提供中等的运行时间。
这款游戏笔记本的低价在箱子的尺寸上也很明显。但如果你只是在寻找一个具有强大硬件的预算设备,你肯定不会选择技嘉G5 KC。
价格和可用性
在撰写本文时,你目前可以在亚马逊上找到我们相同配置的技嘉G5 KC以及newegg售价为1199美元。
Gigabyte G5 KC
- 09/02/2021 v7 (old)
Mike Wobker
Price comparison

