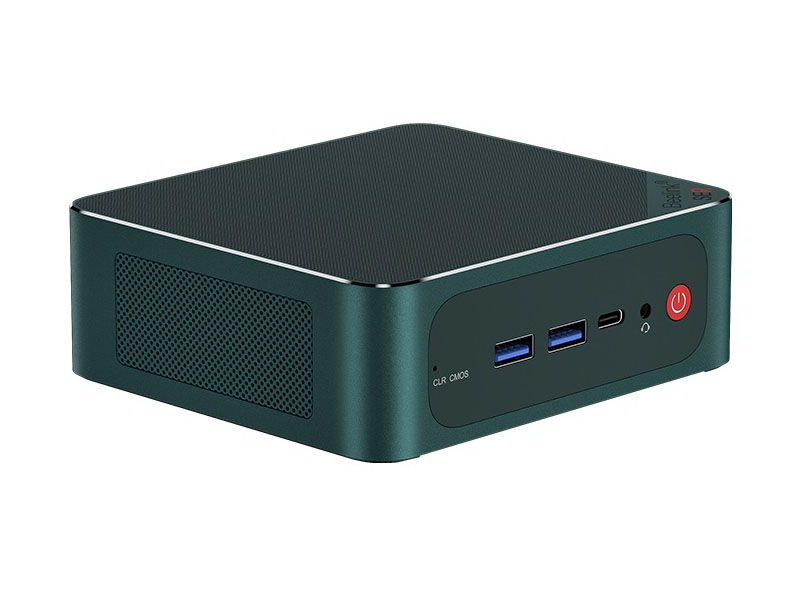
Beelink SER6 Pro回顾。AMD Radeon 680M在迷你电脑上的表现令人惊叹
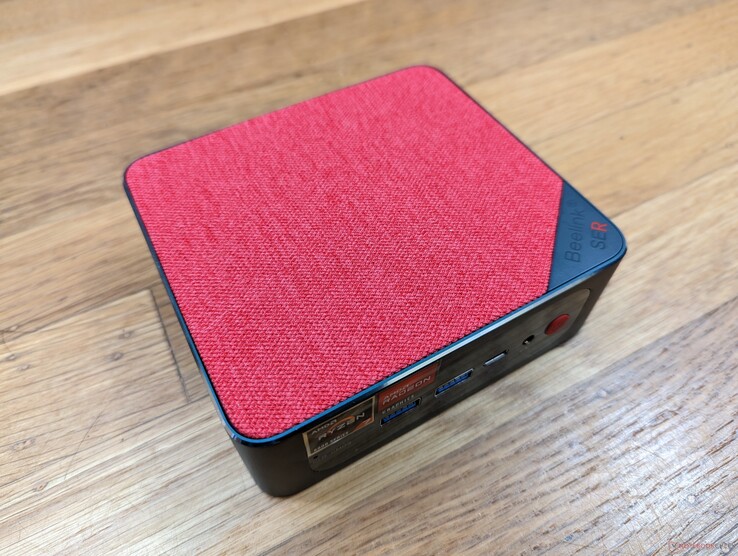
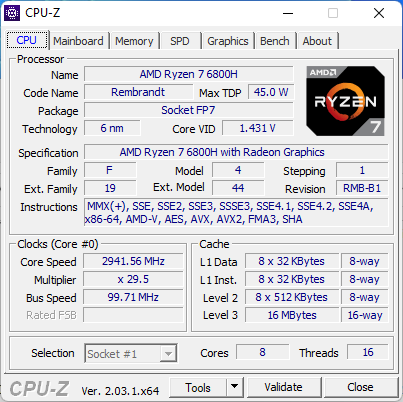
Beelink SER6 Pro接替了老一代的产品。 Beelink SER5 Pro.它引入了新的外部变化和升级的Zen 3+ Ryzen 7 6800H CPU,以取代Zen 3 Ryzen 7 5800H替换即将淘汰的机型上的Zen 3 Ryzen 7 5800H。目前,SER6 Pro没有其他CPU选项。
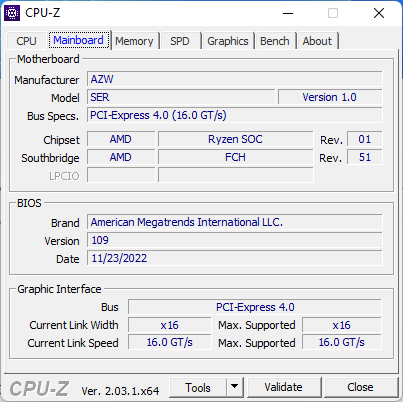
SER6 Pro与许多Intel NUC解决方案 ,以及Zotac ZBox或MSI Cubi系列 。我们来自Beelink的具体配置的售价在600美元到700美元之间。
更多Beelink的评论。
潜在的竞争对手比较
Rating | Date | Model | Weight | Height | Size | Resolution | Price |
|---|---|---|---|---|---|---|---|
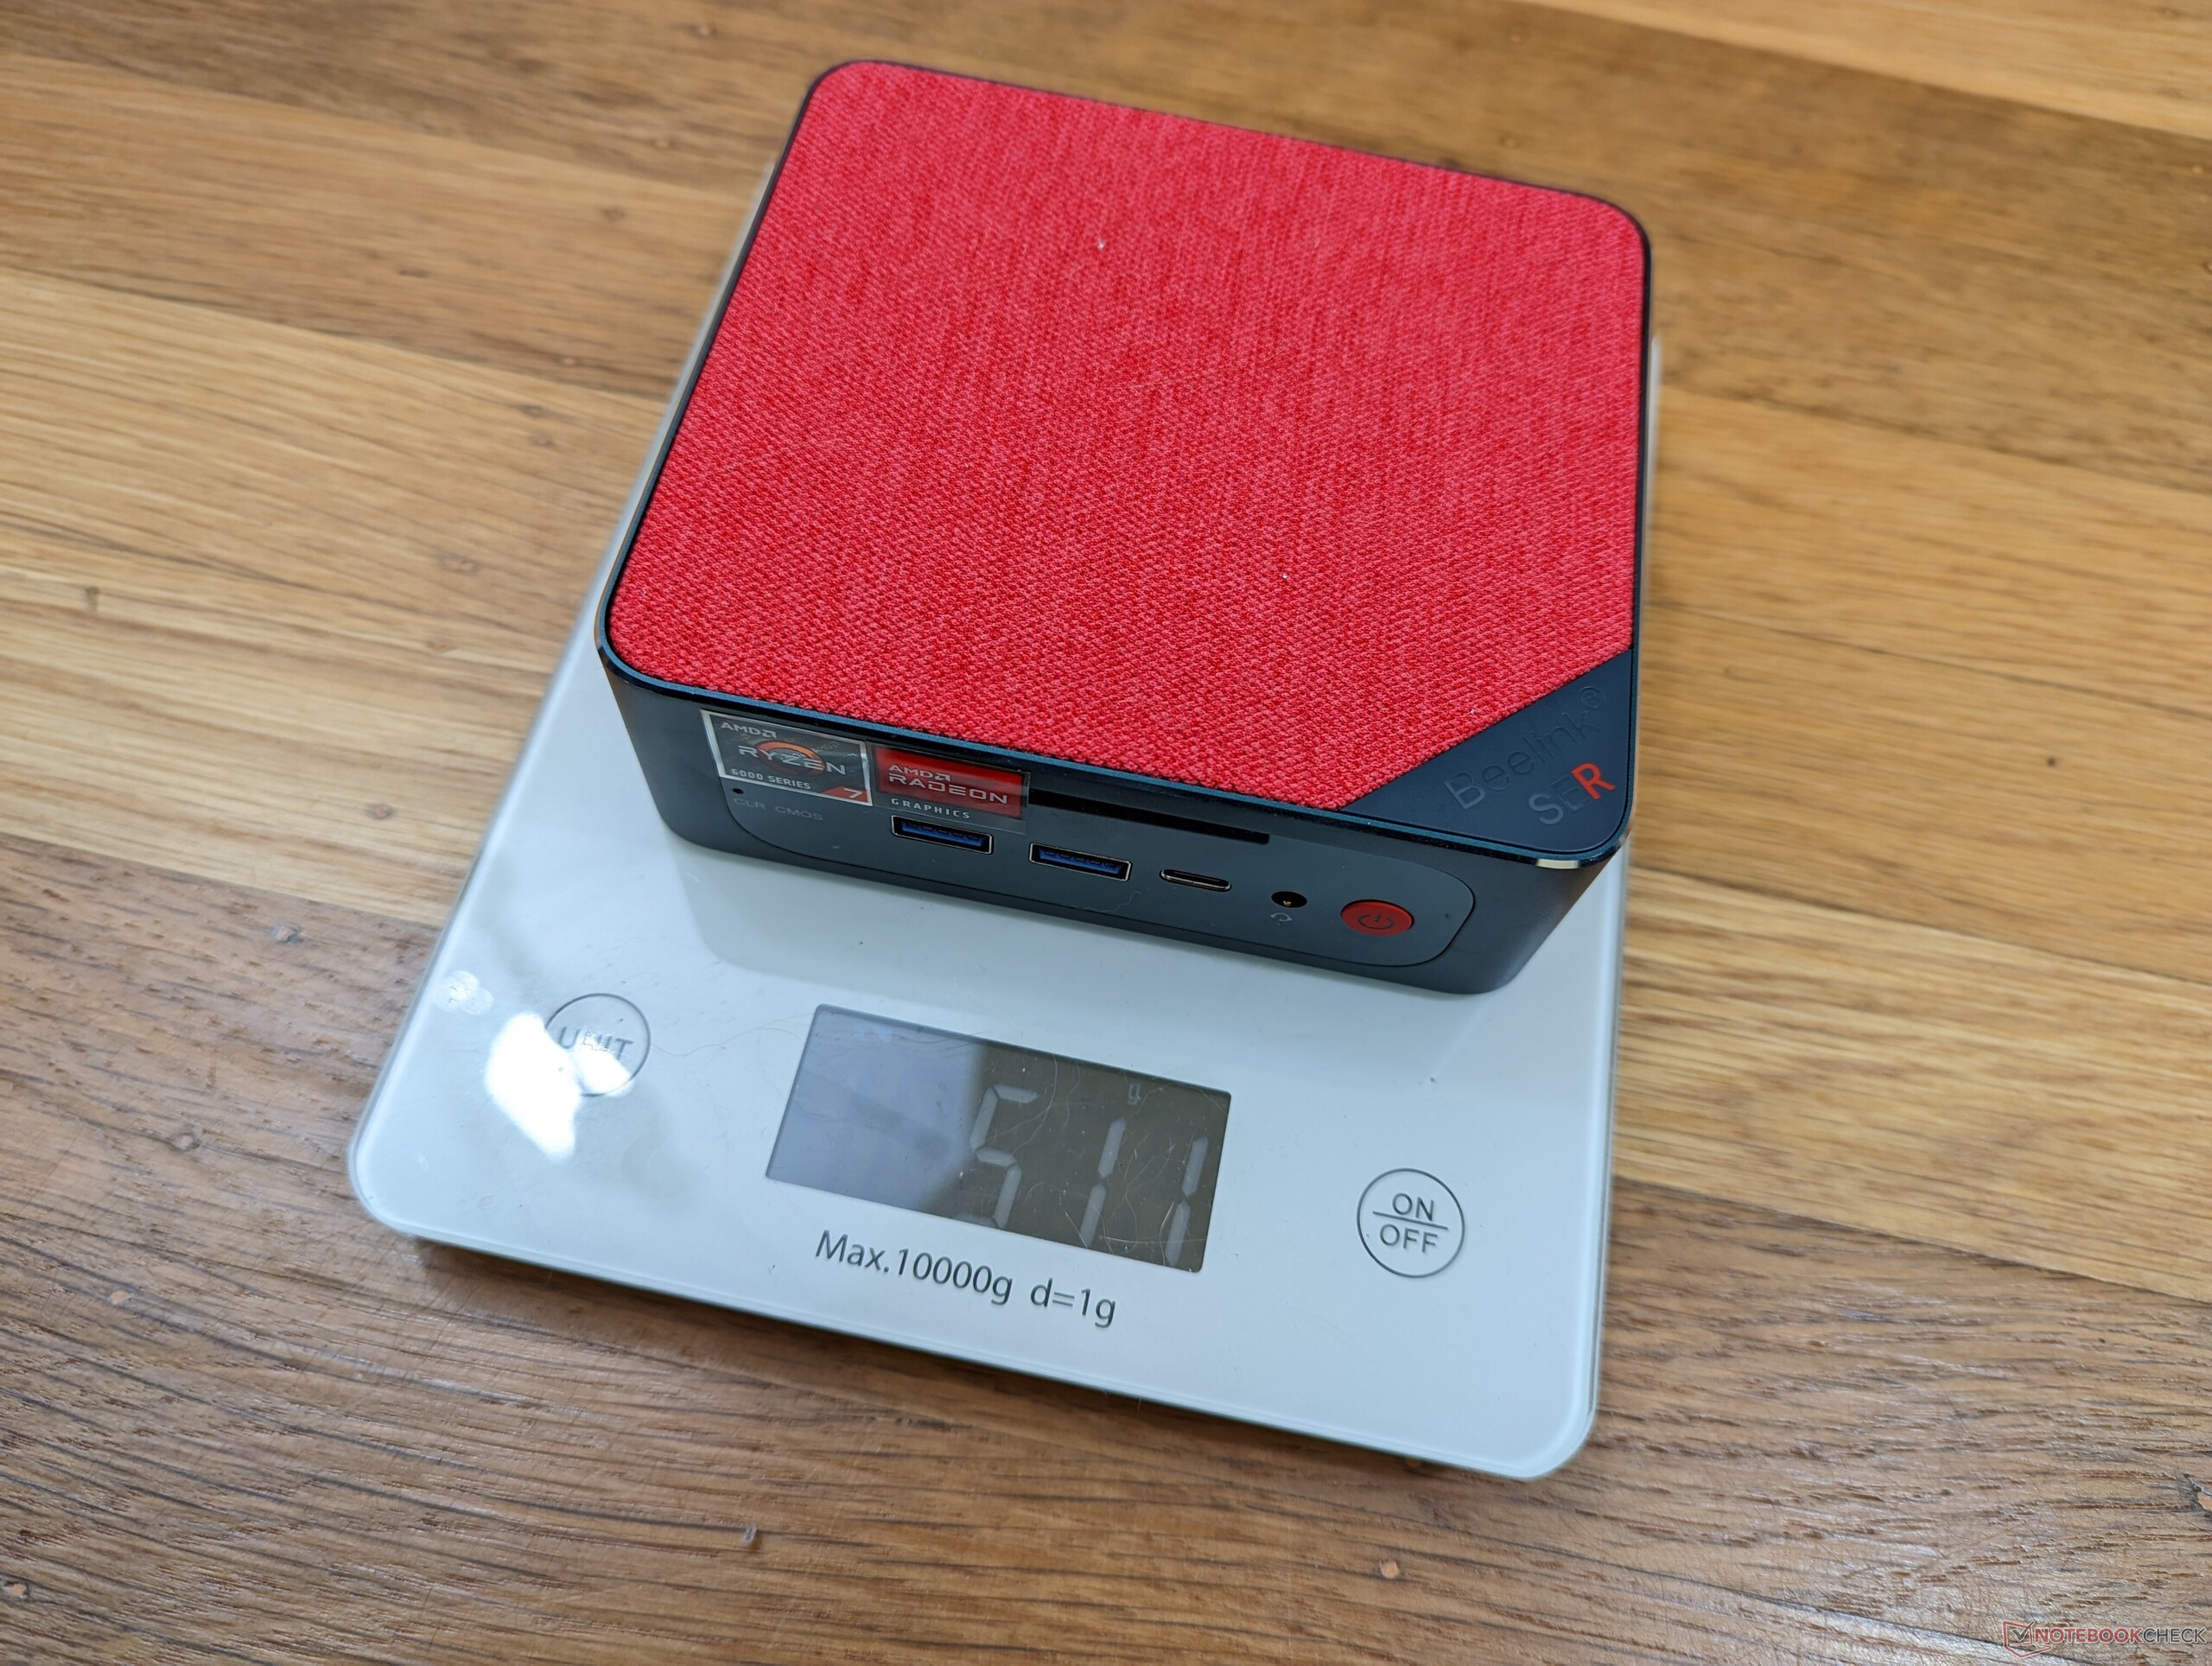
v (old) | 01 / 2023 | Beelink SER6 Pro R7 6800H, Radeon 680M | 511 g | 42 mm | x | ||
v (old) | 11 / 2022 | Beelink GTR6 R9 6900HX, Radeon 680M | 815 g | 43 mm | x | ||
v (old) | 09 / 2022 | Beelink SEi11 Pro i5-11320H, Iris Xe G7 96EUs | 440 g | 40 mm | x | ||
| 78.9 % v7 (old) | 11 / 2022 | Intel NUC 12 Pro Kit NUC12WSKi7 i7-1260P, Iris Xe G7 96EUs | 511 g | 37 mm | x | ||
v (old) | Intel NUC11PHKi7C i7-1165G7, GeForce RTX 2060 Mobile | 1.4 kg | 42 mm | x | |||
v (old) | Intel Hades Canyon NUC8i7HVK i7-8809G, Vega M GH | 1.3 kg | 39 mm | x |
连接性
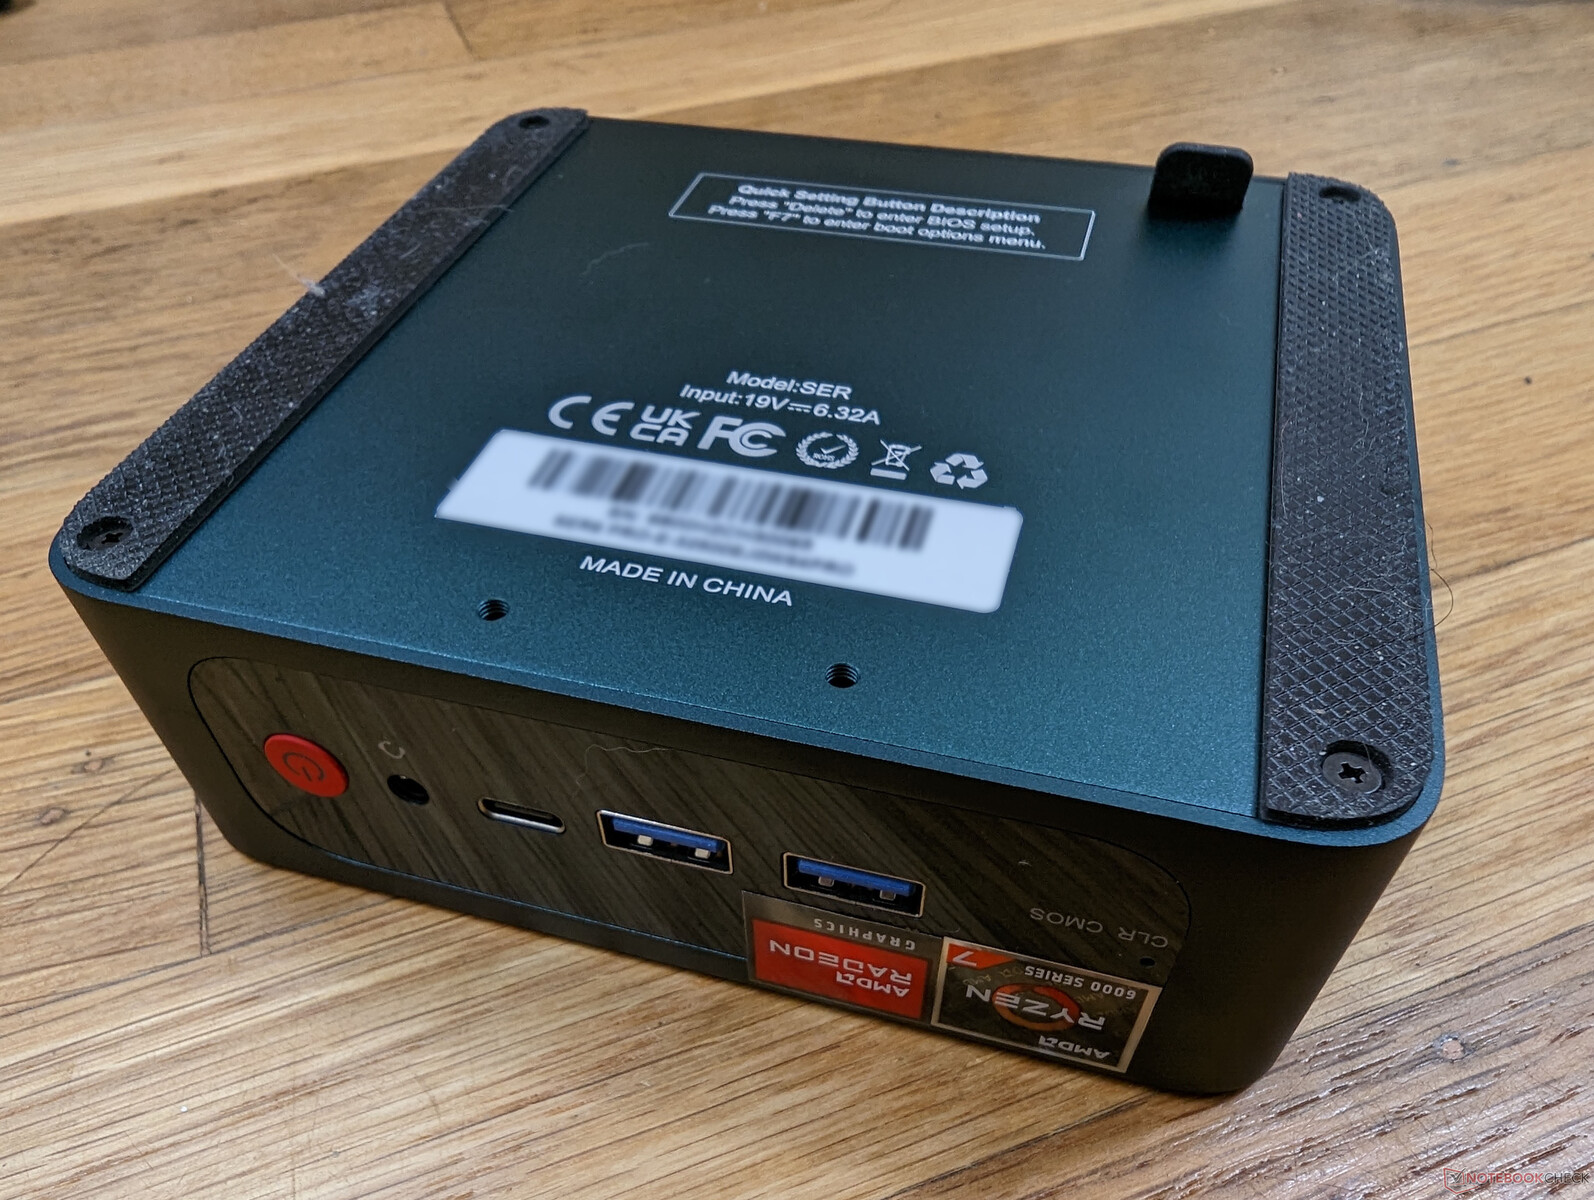
端口选项和定位与SER5 Pro相同,但有一个明显的升级:RJ-45端口现在支持2.5Gbps的速度,而不是只有1Gbps。如果你丢失了零售盒中的专有适配器,该系统还可以由第三方USB-C交流适配器供电。我们的130瓦交流适配器与 戴尔XPS 17例如,可以为我们的SER6 Pro供电,没有任何问题。
沟通
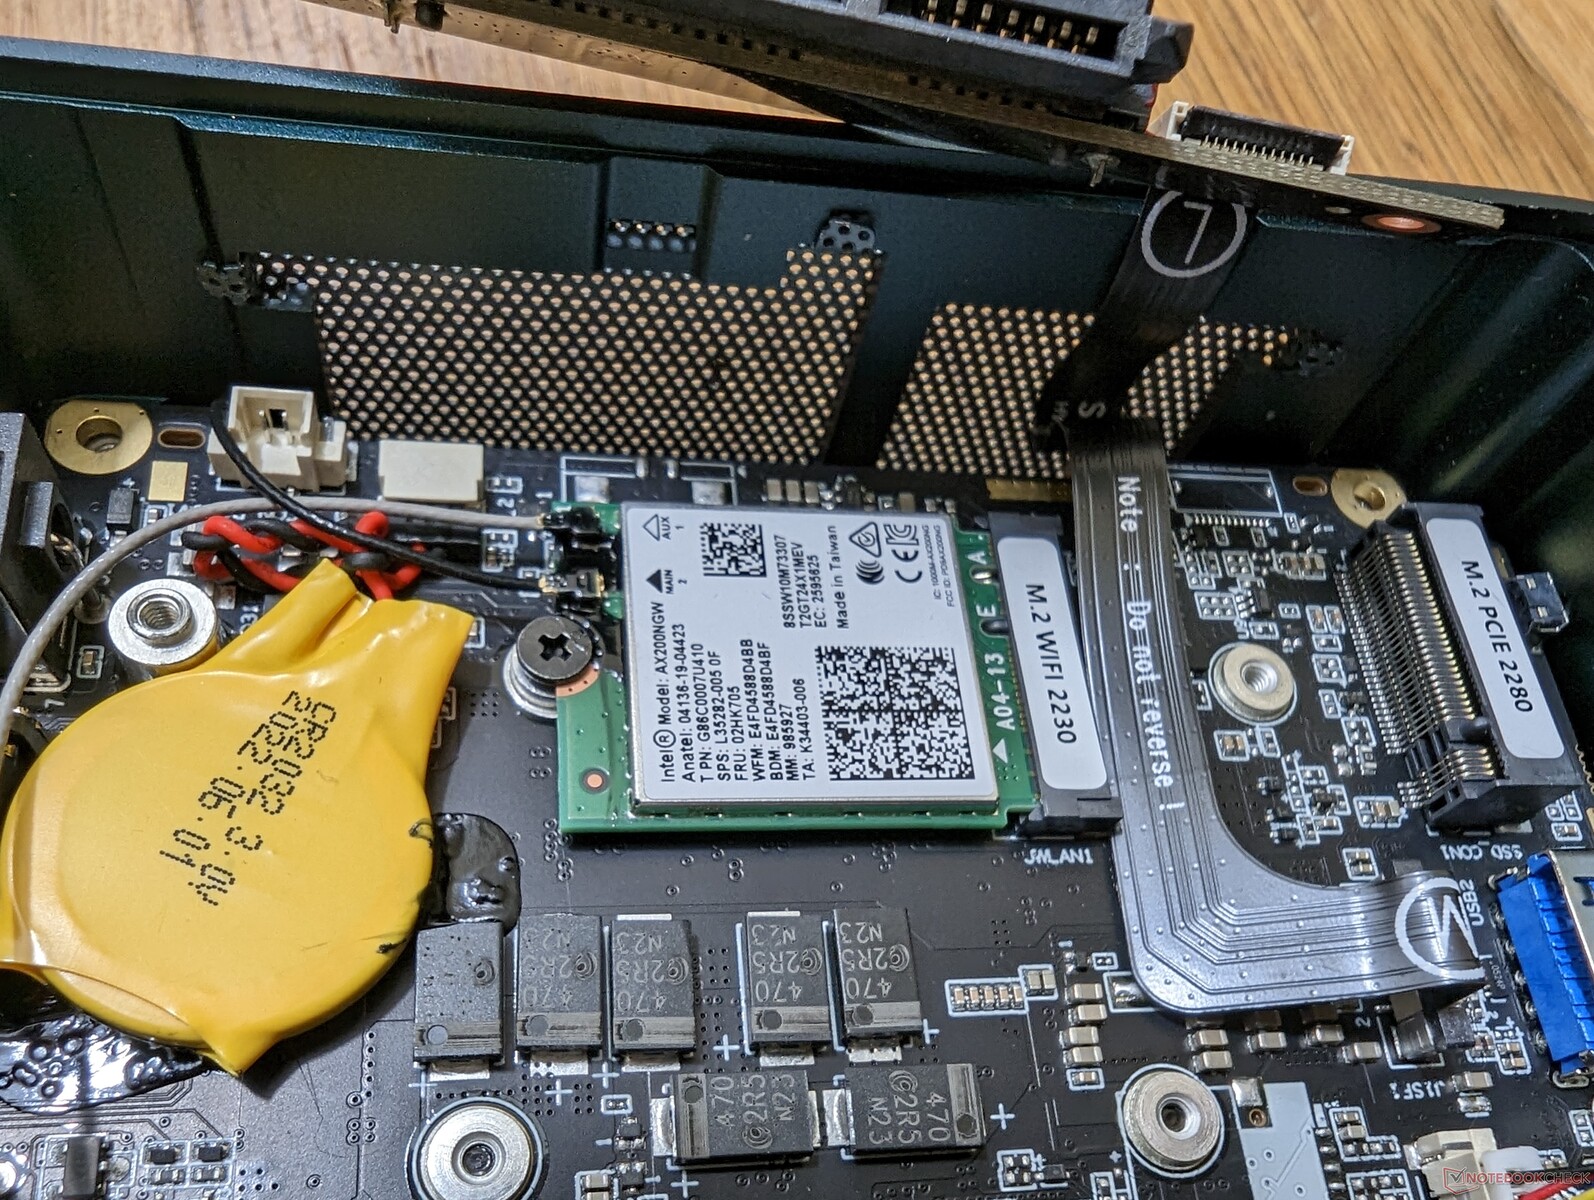
Beelink已经将SER5 Pro中的联发科RZ608换成了更常见的英特尔AX200模块。这个特殊的英特尔模块没有Wi-Fi 6E功能,但当与我们的华硕AXE11000测试路由器配对时,传输速率还是很快,平均约为1200Mbps。
| Networking | |
| iperf3 transmit AX12 | |
| Intel NUC11PHKi7C | |
| Intel Hades Canyon NUC8i7HVK | |
| iperf3 receive AX12 | |
| Intel NUC11PHKi7C | |
| Intel Hades Canyon NUC8i7HVK | |
| iperf3 receive AXE11000 6GHz | |
| Intel NUC 12 Pro Kit NUC12WSKi7 | |
| Beelink GTR6 | |
| Beelink SEi11 Pro | |
| iperf3 receive AXE11000 | |
| Beelink SER6 Pro | |
| Beelink GTR6 | |
| iperf3 transmit AXE11000 | |
| Beelink SER6 Pro | |
| Beelink GTR6 | |
| iperf3 transmit AXE11000 6GHz | |
| Beelink GTR6 | |
| Intel NUC 12 Pro Kit NUC12WSKi7 | |
| Beelink SEi11 Pro | |
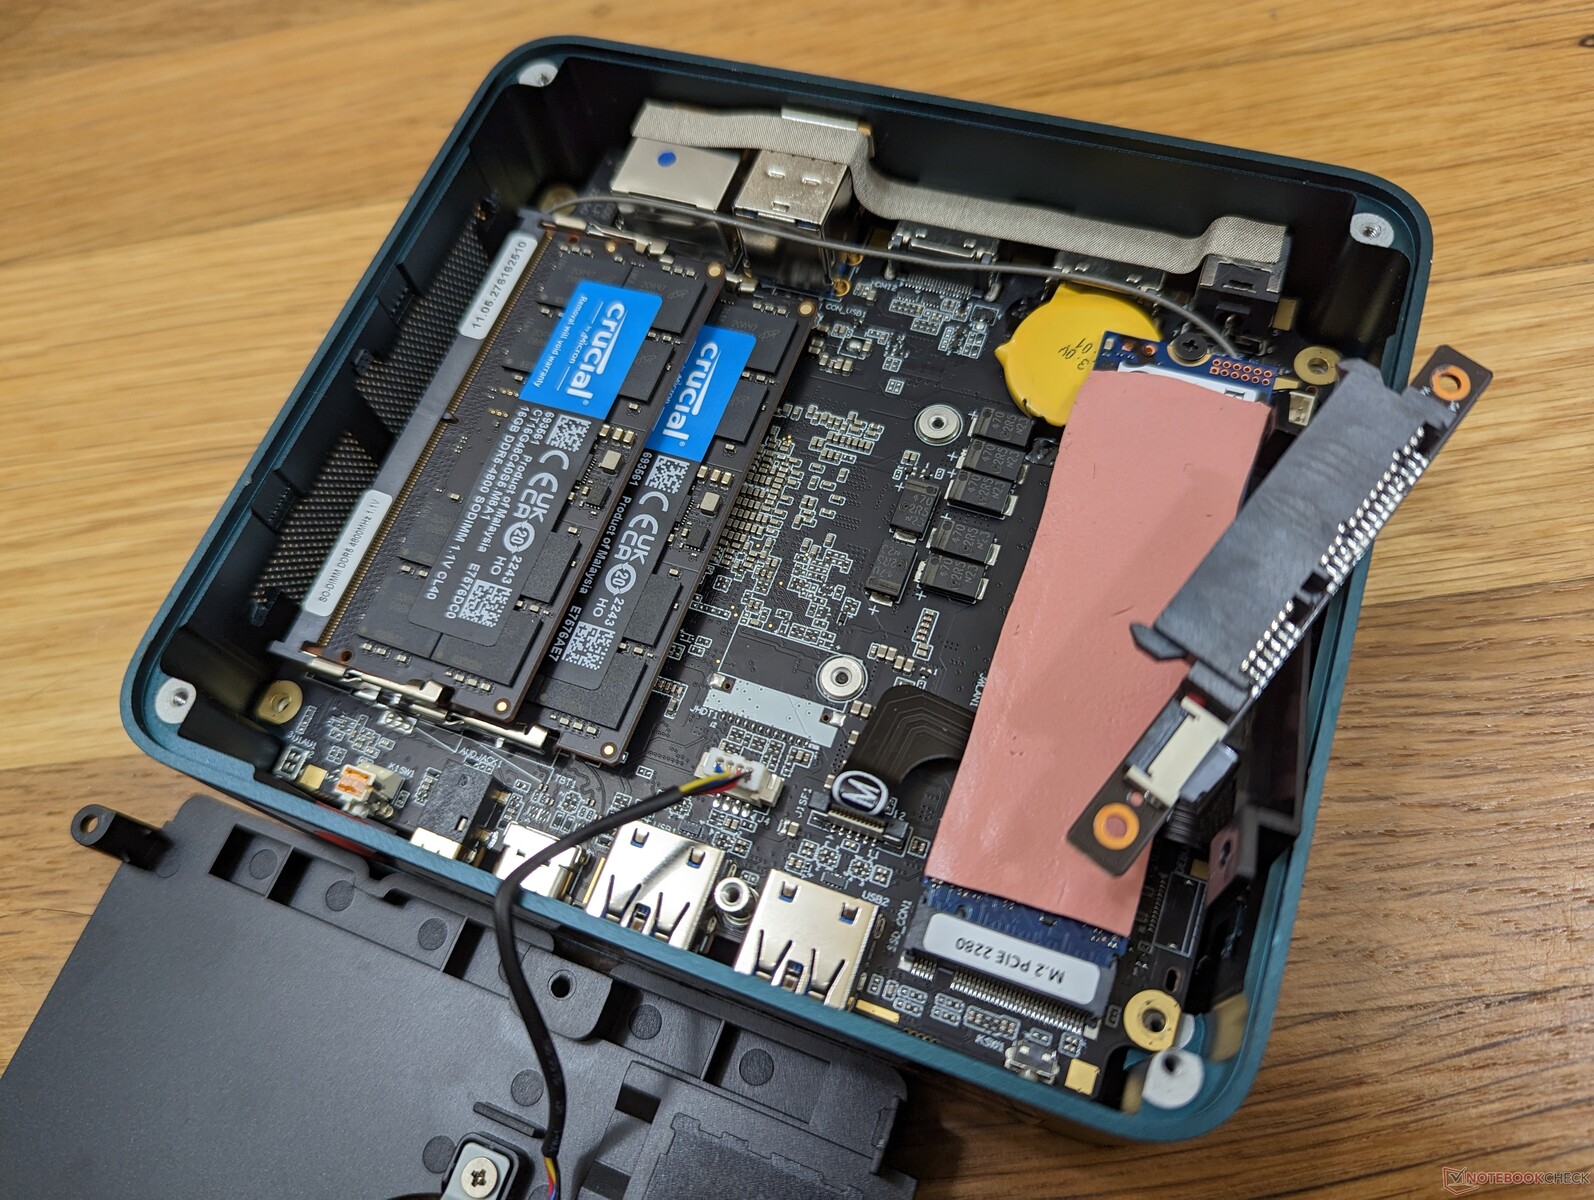
维护
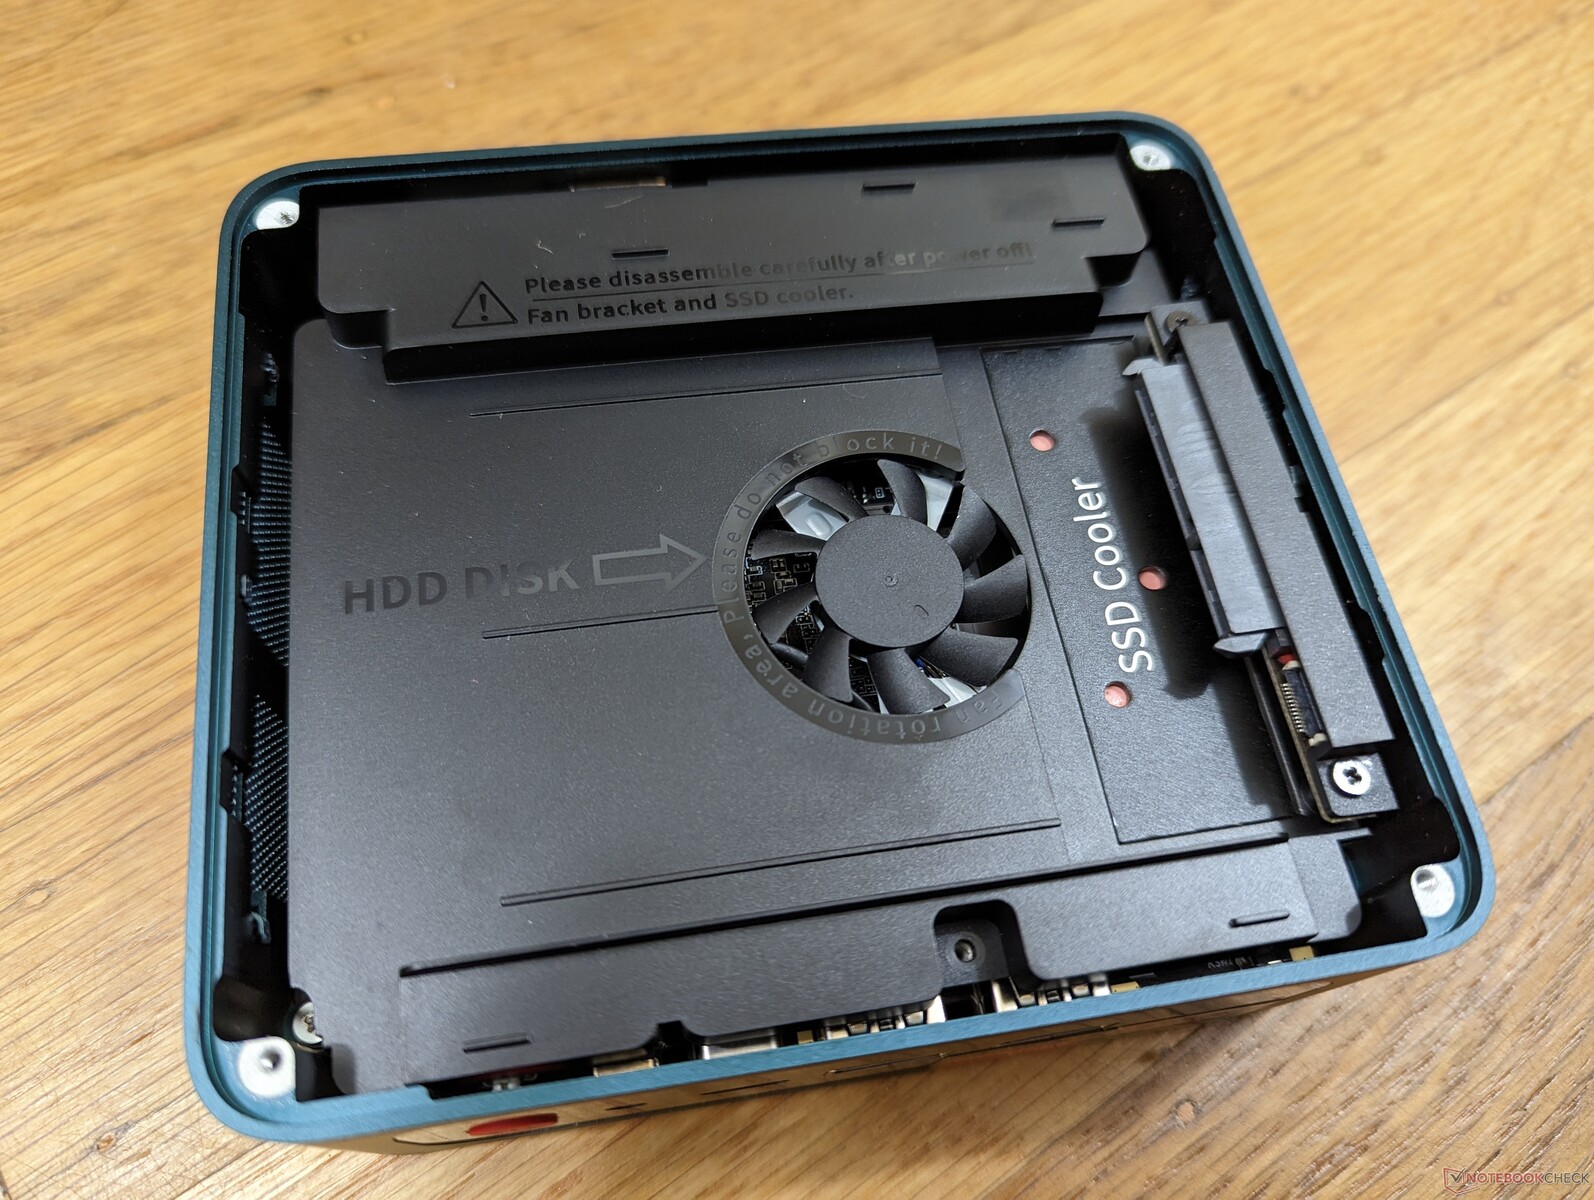
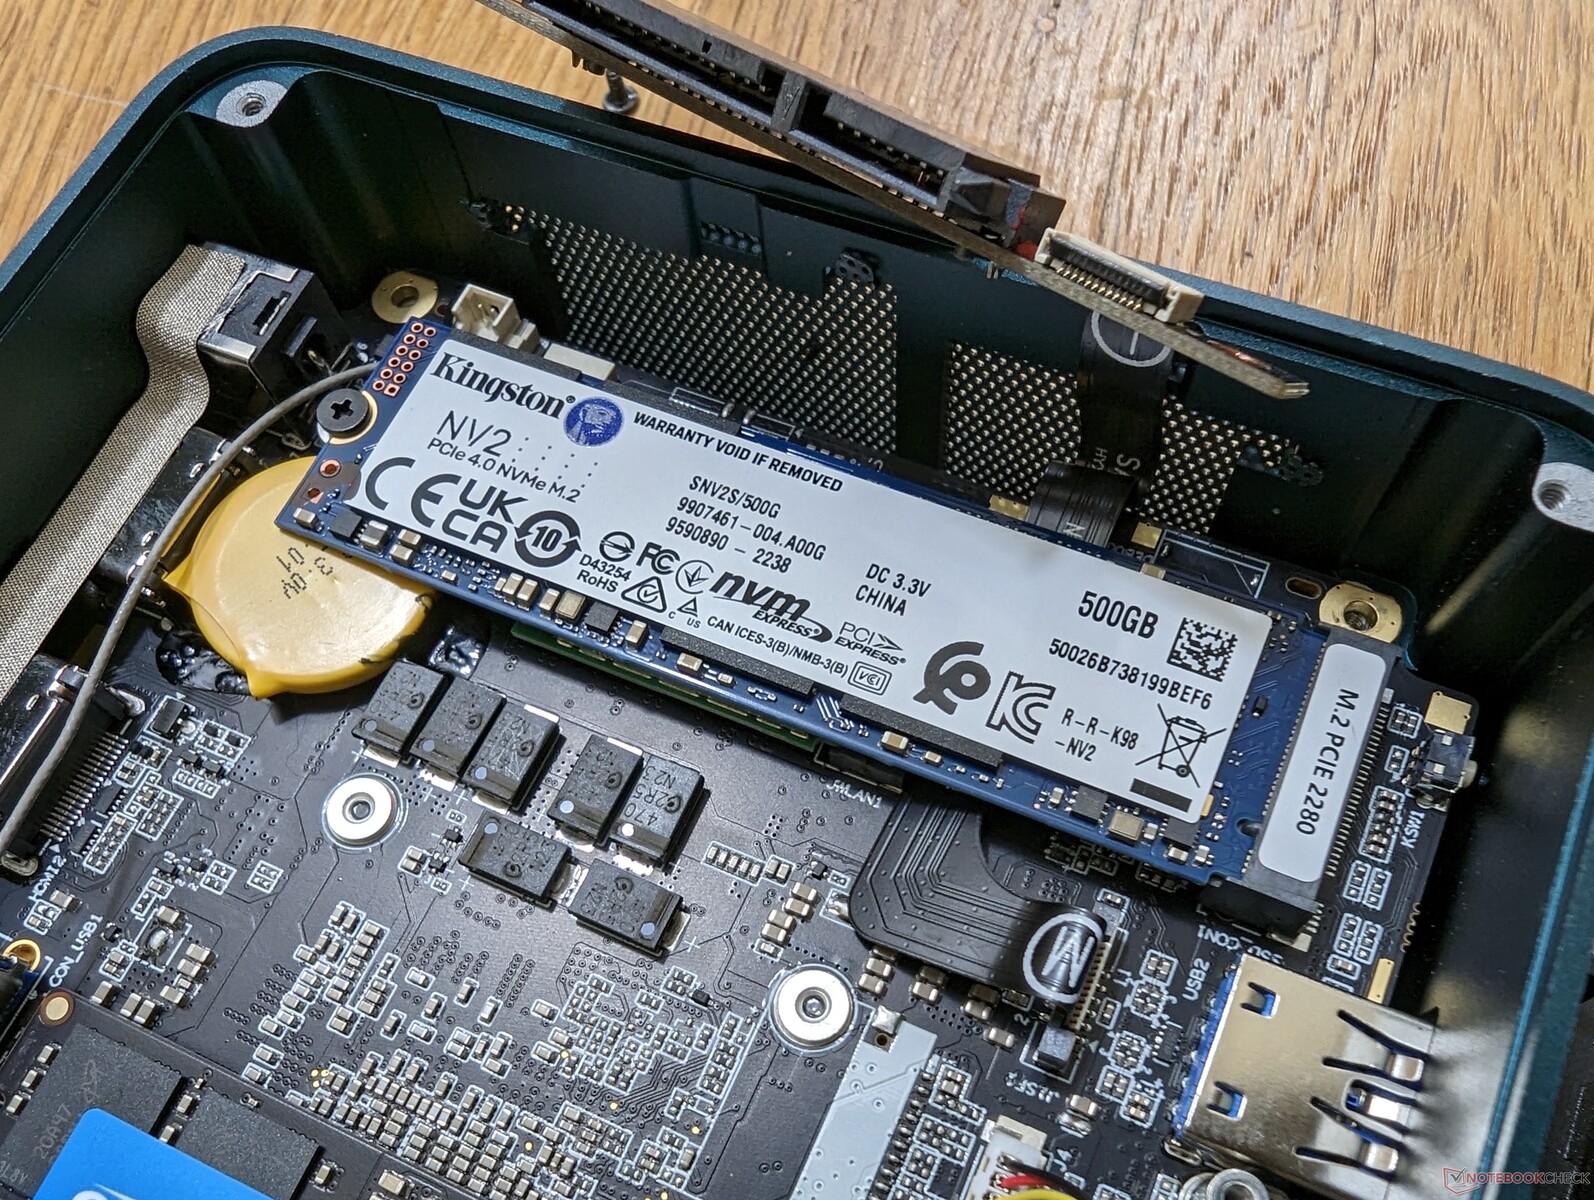
内存和存储的升级很容易,只需要一把飞利浦螺丝刀。用户最多可以安装两个SODIMM内存模块和两个驱动器(1个M.2 PCIe4 x4 + 1个2.5英寸SATA III)。
配件和保修
零售包装盒包括两条HDMI线、一个可拆卸的VESA安装支架、黑色和红色织物顶盖、AC适配器和文件。如果在美国购买,通常有一年的制造商有限保修。
业绩
测试条件
在运行以下任何基准测试之前,我们将我们的设备设置为性能模式。没有预装的控制中心类型的应用程序。
处理器
原始处理器的性能与上一代几乎相同 Ryzen 7 5800H.单线程性能可能会快5%,但任何差异充其量都是微不足道的。相反,这两款CPU之间最大的改进与它们的集成GPU有关,我们下面的GPU部分将展示。
Cinebench R15 Multi Loop
Cinebench R23: Multi Core | Single Core
Cinebench R15: CPU Multi 64Bit | CPU Single 64Bit
Blender: v2.79 BMW27 CPU
7-Zip 18.03: 7z b 4 | 7z b 4 -mmt1
Geekbench 5.5: Multi-Core | Single-Core
HWBOT x265 Benchmark v2.2: 4k Preset
LibreOffice : 20 Documents To PDF
R Benchmark 2.5: Overall mean
| Cinebench R20 / CPU (Multi Core) | |
| Minisforum Neptune Series HX90G | |
| Average AMD Ryzen 7 6800H (4460 - 5661, n=9) | |
| Beelink GTR6 | |
| Dell G15 5515 | |
| Intel NUC 12 Pro Kit NUC12WSKi7 | |
| Beelink SER6 Pro | |
| Beelink SEi12 Core i5-1235U | |
| Beelink SER Pro Ryzen 5 5600H | |
| Minipc Union Ace Magician AMR5 | |
| Beelink SEi11 Pro | |
| Intel Hades Canyon NUC8i7HVK | |
| Intel NUC11PHKi7C | |
| Minipc Union NiPoGi CK10 - 10810U | |
| BMAX B5 Pro G7H8 | |
| Trigkey S3 | |
| Cinebench R20 / CPU (Single Core) | |
| Intel NUC 12 Pro Kit NUC12WSKi7 | |
| Beelink GTR6 | |
| Beelink SEi12 Core i5-1235U | |
| Average AMD Ryzen 7 6800H (580 - 605, n=9) | |
| Beelink SER6 Pro | |
| Intel NUC11PHKi7C | |
| Minisforum Neptune Series HX90G | |
| Beelink SEi11 Pro | |
| Dell G15 5515 | |
| Minipc Union Ace Magician AMR5 | |
| Beelink SER Pro Ryzen 5 5600H | |
| Minipc Union NiPoGi CK10 - 10810U | |
| Intel Hades Canyon NUC8i7HVK | |
| BMAX B5 Pro G7H8 | |
| Trigkey S3 | |
| Cinebench R23 / Multi Core | |
| Minisforum Neptune Series HX90G | |
| Average AMD Ryzen 7 6800H (11481 - 14660, n=11) | |
| Dell G15 5515 | |
| Beelink GTR6 | |
| Intel NUC 12 Pro Kit NUC12WSKi7 | |
| Beelink SER6 Pro | |
| Beelink SEi12 Core i5-1235U | |
| Beelink SER Pro Ryzen 5 5600H | |
| Minipc Union Ace Magician AMR5 | |
| Intel NUC11PHKi7C | |
| Beelink SEi11 Pro | |
| Minipc Union NiPoGi CK10 - 10810U | |
| Trigkey S3 | |
| BMAX B5 Pro G7H8 | |
| Cinebench R23 / Single Core | |
| Intel NUC 12 Pro Kit NUC12WSKi7 | |
| Beelink SEi12 Core i5-1235U | |
| Beelink GTR6 | |
| Intel NUC11PHKi7C | |
| Average AMD Ryzen 7 6800H (1500 - 1552, n=9) | |
| Beelink SER6 Pro | |
| Minisforum Neptune Series HX90G | |
| Beelink SEi11 Pro | |
| Dell G15 5515 | |
| Minipc Union Ace Magician AMR5 | |
| Beelink SER Pro Ryzen 5 5600H | |
| Minipc Union NiPoGi CK10 - 10810U | |
| Trigkey S3 | |
| BMAX B5 Pro G7H8 | |
| Cinebench R15 / CPU Multi 64Bit | |
| Minisforum Neptune Series HX90G | |
| Average AMD Ryzen 7 6800H (1585 - 2366, n=10) | |
| Beelink GTR6 | |
| Dell G15 5515 | |
| Beelink SER6 Pro | |
| Intel NUC 12 Pro Kit NUC12WSKi7 | |
| Beelink SEi12 Core i5-1235U | |
| Beelink SER Pro Ryzen 5 5600H | |
| Minipc Union Ace Magician AMR5 | |
| Intel NUC11PHKi7C | |
| Intel Hades Canyon NUC8i7HVK | |
| Beelink SEi11 Pro | |
| Trigkey S3 | |
| BMAX B5 Pro G7H8 | |
| Minipc Union NiPoGi CK10 - 10810U | |
| Cinebench R15 / CPU Single 64Bit | |
| Intel NUC 12 Pro Kit NUC12WSKi7 | |
| Beelink GTR6 | |
| Minisforum Neptune Series HX90G | |
| Beelink SER6 Pro | |
| Average AMD Ryzen 7 6800H (182.7 - 250, n=10) | |
| Beelink SEi12 Core i5-1235U | |
| Intel NUC11PHKi7C | |
| Dell G15 5515 | |
| Minipc Union Ace Magician AMR5 | |
| Beelink SER Pro Ryzen 5 5600H | |
| Beelink SEi11 Pro | |
| Intel Hades Canyon NUC8i7HVK | |
| Minipc Union NiPoGi CK10 - 10810U | |
| BMAX B5 Pro G7H8 | |
| Trigkey S3 | |
| Blender / v2.79 BMW27 CPU | |
| BMAX B5 Pro G7H8 | |
| Trigkey S3 | |
| Minipc Union NiPoGi CK10 - 10810U | |
| Intel NUC11PHKi7C | |
| Beelink SEi11 Pro | |
| Intel Hades Canyon NUC8i7HVK | |
| Minipc Union Ace Magician AMR5 | |
| Beelink SEi12 Core i5-1235U | |
| Beelink SER Pro Ryzen 5 5600H | |
| Intel NUC 12 Pro Kit NUC12WSKi7 | |
| Beelink SER6 Pro | |
| Dell G15 5515 | |
| Beelink GTR6 | |
| Average AMD Ryzen 7 6800H (213 - 268, n=8) | |
| Minisforum Neptune Series HX90G | |
| 7-Zip 18.03 / 7z b 4 | |
| Minisforum Neptune Series HX90G | |
| Average AMD Ryzen 7 6800H (55067 - 64817, n=8) | |
| Beelink GTR6 | |
| Beelink SER6 Pro | |
| Dell G15 5515 | |
| Intel NUC 12 Pro Kit NUC12WSKi7 | |
| Beelink SER Pro Ryzen 5 5600H | |
| Minipc Union Ace Magician AMR5 | |
| Beelink SEi12 Core i5-1235U | |
| Beelink SEi11 Pro | |
| Intel NUC11PHKi7C | |
| Minipc Union NiPoGi CK10 - 10810U | |
| Intel Hades Canyon NUC8i7HVK | |
| BMAX B5 Pro G7H8 | |
| Trigkey S3 | |
| 7-Zip 18.03 / 7z b 4 -mmt1 | |
| Beelink GTR6 | |
| Minisforum Neptune Series HX90G | |
| Beelink SER6 Pro | |
| Intel NUC 12 Pro Kit NUC12WSKi7 | |
| Average AMD Ryzen 7 6800H (5521 - 5803, n=8) | |
| Dell G15 5515 | |
| Beelink SER Pro Ryzen 5 5600H | |
| Intel NUC11PHKi7C | |
| Minipc Union Ace Magician AMR5 | |
| Beelink SEi12 Core i5-1235U | |
| Beelink SEi11 Pro | |
| Minipc Union NiPoGi CK10 - 10810U | |
| Intel Hades Canyon NUC8i7HVK | |
| BMAX B5 Pro G7H8 | |
| Trigkey S3 | |
| Geekbench 5.5 / Multi-Core | |
| Intel NUC 12 Pro Kit NUC12WSKi7 | |
| Average AMD Ryzen 7 6800H (8898 - 10355, n=10) | |
| Beelink GTR6 | |
| Beelink SER6 Pro | |
| Minisforum Neptune Series HX90G | |
| Beelink SEi12 Core i5-1235U | |
| Dell G15 5515 | |
| Minipc Union Ace Magician AMR5 | |
| Beelink SER Pro Ryzen 5 5600H | |
| Intel NUC11PHKi7C | |
| Beelink SEi11 Pro | |
| Minipc Union NiPoGi CK10 - 10810U | |
| Trigkey S3 | |
| BMAX B5 Pro G7H8 | |
| Geekbench 5.5 / Single-Core | |
| Intel NUC 12 Pro Kit NUC12WSKi7 | |
| Beelink GTR6 | |
| Beelink SEi12 Core i5-1235U | |
| Minisforum Neptune Series HX90G | |
| Beelink SER6 Pro | |
| Average AMD Ryzen 7 6800H (1518 - 1568, n=10) | |
| Intel NUC11PHKi7C | |
| Beelink SEi11 Pro | |
| Dell G15 5515 | |
| Beelink SER Pro Ryzen 5 5600H | |
| Minipc Union Ace Magician AMR5 | |
| Minipc Union NiPoGi CK10 - 10810U | |
| Trigkey S3 | |
| BMAX B5 Pro G7H8 | |
| HWBOT x265 Benchmark v2.2 / 4k Preset | |
| Average AMD Ryzen 7 6800H (14.9 - 18.5, n=9) | |
| Minisforum Neptune Series HX90G | |
| Beelink GTR6 | |
| Beelink SER6 Pro | |
| Dell G15 5515 | |
| Intel NUC 12 Pro Kit NUC12WSKi7 | |
| Beelink SER Pro Ryzen 5 5600H | |
| Minipc Union Ace Magician AMR5 | |
| Beelink SEi12 Core i5-1235U | |
| Beelink SEi11 Pro | |
| Intel NUC11PHKi7C | |
| Intel Hades Canyon NUC8i7HVK | |
| Minipc Union NiPoGi CK10 - 10810U | |
| Trigkey S3 | |
| BMAX B5 Pro G7H8 | |
| LibreOffice / 20 Documents To PDF | |
| BMAX B5 Pro G7H8 | |
| Dell G15 5515 | |
| Trigkey S3 | |
| Minipc Union NiPoGi CK10 - 10810U | |
| Minisforum Neptune Series HX90G | |
| Average AMD Ryzen 7 6800H (48.7 - 79.5, n=8) | |
| Beelink SER Pro Ryzen 5 5600H | |
| Minipc Union Ace Magician AMR5 | |
| Beelink SEi11 Pro | |
| Beelink SER6 Pro | |
| Beelink SEi12 Core i5-1235U | |
| Intel NUC11PHKi7C | |
| Beelink GTR6 | |
| Intel NUC 12 Pro Kit NUC12WSKi7 | |
| R Benchmark 2.5 / Overall mean | |
| BMAX B5 Pro G7H8 | |
| Trigkey S3 | |
| Minipc Union NiPoGi CK10 - 10810U | |
| Beelink SEi11 Pro | |
| Intel NUC11PHKi7C | |
| Minipc Union Ace Magician AMR5 | |
| Beelink SER Pro Ryzen 5 5600H | |
| Dell G15 5515 | |
| Beelink SEi12 Core i5-1235U | |
| Beelink SER6 Pro | |
| Average AMD Ryzen 7 6800H (0.4783 - 0.515, n=8) | |
| Minisforum Neptune Series HX90G | |
| Intel NUC 12 Pro Kit NUC12WSKi7 | |
| Beelink GTR6 | |
Cinebench R23: Multi Core | Single Core
Cinebench R15: CPU Multi 64Bit | CPU Single 64Bit
Blender: v2.79 BMW27 CPU
7-Zip 18.03: 7z b 4 | 7z b 4 -mmt1
Geekbench 5.5: Multi-Core | Single-Core
HWBOT x265 Benchmark v2.2: 4k Preset
LibreOffice : 20 Documents To PDF
R Benchmark 2.5: Overall mean
* ... smaller is better
AIDA64: FP32 Ray-Trace | FPU Julia | CPU SHA3 | CPU Queen | FPU SinJulia | FPU Mandel | CPU AES | CPU ZLib | FP64 Ray-Trace | CPU PhotoWorxx
| Performance rating | |
| Average AMD Ryzen 7 6800H | |
| Beelink GTR6 | |
| Beelink SER6 Pro | |
| Intel NUC 12 Pro Kit NUC12WSKi7 | |
| Intel NUC11PHKi7C | |
| Beelink SEi11 Pro | |
| AIDA64 / FP32 Ray-Trace | |
| Average AMD Ryzen 7 6800H (12876 - 17031, n=8) | |
| Beelink GTR6 | |
| Beelink SER6 Pro | |
| Intel NUC 12 Pro Kit NUC12WSKi7 | |
| Intel NUC11PHKi7C | |
| Beelink SEi11 Pro | |
| AIDA64 / FPU Julia | |
| Average AMD Ryzen 7 6800H (82673 - 105987, n=8) | |
| Beelink GTR6 | |
| Beelink SER6 Pro | |
| Intel NUC 12 Pro Kit NUC12WSKi7 | |
| Intel NUC11PHKi7C | |
| Beelink SEi11 Pro | |
| AIDA64 / CPU SHA3 | |
| Average AMD Ryzen 7 6800H (2886 - 3634, n=8) | |
| Beelink GTR6 | |
| Beelink SER6 Pro | |
| Intel NUC 12 Pro Kit NUC12WSKi7 | |
| Intel NUC11PHKi7C | |
| Beelink SEi11 Pro | |
| AIDA64 / CPU Queen | |
| Average AMD Ryzen 7 6800H (75117 - 106322, n=8) | |
| Beelink GTR6 | |
| Beelink SER6 Pro | |
| Intel NUC 12 Pro Kit NUC12WSKi7 | |
| Intel NUC11PHKi7C | |
| Beelink SEi11 Pro | |
| AIDA64 / FPU SinJulia | |
| Average AMD Ryzen 7 6800H (11771 - 13120, n=8) | |
| Beelink GTR6 | |
| Beelink SER6 Pro | |
| Intel NUC 12 Pro Kit NUC12WSKi7 | |
| Intel NUC11PHKi7C | |
| Beelink SEi11 Pro | |
| AIDA64 / FPU Mandel | |
| Average AMD Ryzen 7 6800H (45287 - 58327, n=8) | |
| Beelink GTR6 | |
| Beelink SER6 Pro | |
| Intel NUC 12 Pro Kit NUC12WSKi7 | |
| Intel NUC11PHKi7C | |
| Beelink SEi11 Pro | |
| AIDA64 / CPU AES | |
| Beelink GTR6 | |
| Average AMD Ryzen 7 6800H (67816 - 137383, n=8) | |
| Beelink SER6 Pro | |
| Intel NUC 12 Pro Kit NUC12WSKi7 | |
| Intel NUC11PHKi7C | |
| Beelink SEi11 Pro | |
| AIDA64 / CPU ZLib | |
| Average AMD Ryzen 7 6800H (732 - 901, n=8) | |
| Beelink GTR6 | |
| Beelink SER6 Pro | |
| Intel NUC 12 Pro Kit NUC12WSKi7 | |
| Intel NUC11PHKi7C | |
| Beelink SEi11 Pro | |
| AIDA64 / FP64 Ray-Trace | |
| Average AMD Ryzen 7 6800H (6917 - 8980, n=8) | |
| Beelink GTR6 | |
| Beelink SER6 Pro | |
| Intel NUC 12 Pro Kit NUC12WSKi7 | |
| Intel NUC11PHKi7C | |
| Beelink SEi11 Pro | |
| AIDA64 / CPU PhotoWorxx | |
| Beelink GTR6 | |
| Beelink SER6 Pro | |
| Average AMD Ryzen 7 6800H (26496 - 30360, n=8) | |
| Intel NUC 12 Pro Kit NUC12WSKi7 | |
| Intel NUC11PHKi7C | |
| Beelink SEi11 Pro | |
系统性能
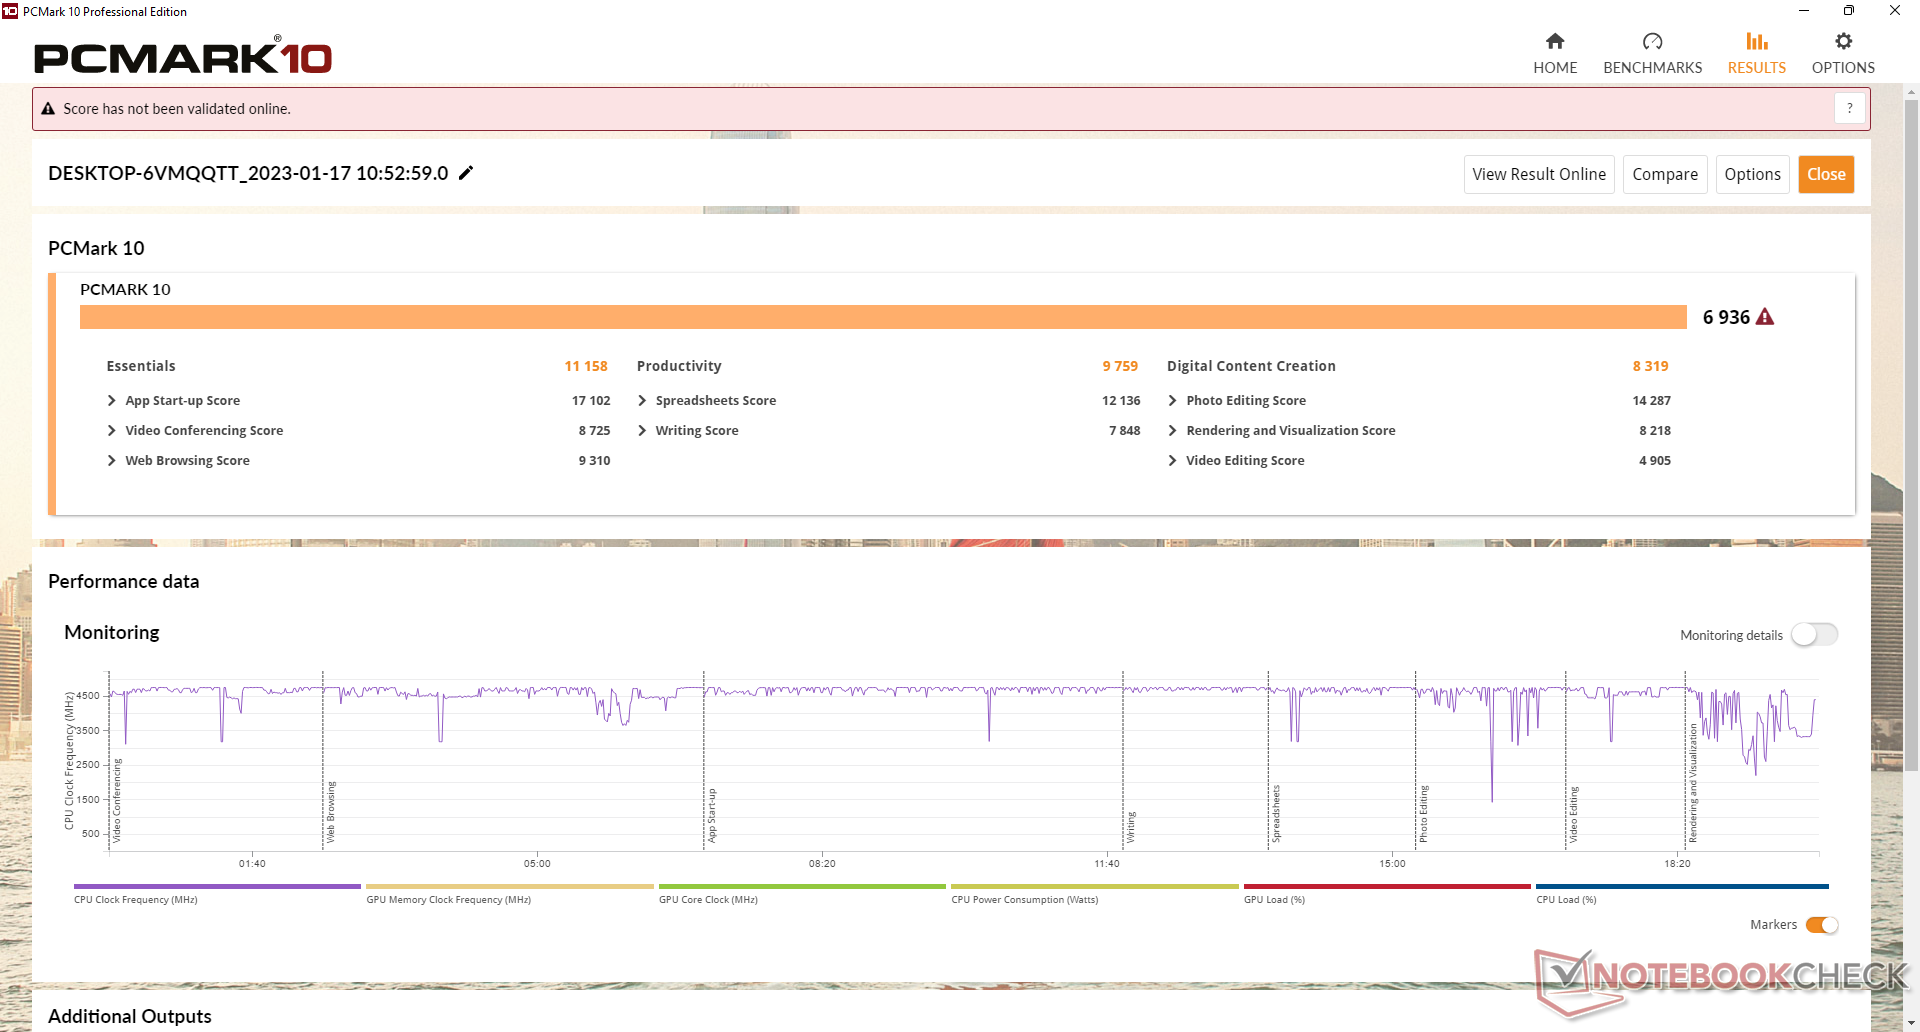
PCMark的结果是任何没有专用显卡的迷你电脑中最高的一些。这些高分归功于新的 Radeon 680M是对旧的集成显卡的一个重大飞跃 Radeon RX Vega系列或 Iris Xe系列.
CrossMark: Overall | Productivity | Creativity | Responsiveness
| PCMark 10 / Score | |
| Beelink GTR6 | |
| Beelink SER6 Pro | |
| Average AMD Ryzen 7 6800H, AMD Radeon 680M (6591 - 6936, n=4) | |
| Intel NUC11PHKi7C | |
| Intel NUC 12 Pro Kit NUC12WSKi7 | |
| Beelink SER Pro Ryzen 5 5600H | |
| Intel Hades Canyon NUC8i7HVK | |
| Beelink SEi11 Pro | |
| PCMark 10 / Essentials | |
| Beelink GTR6 | |
| Beelink SER6 Pro | |
| Intel NUC 12 Pro Kit NUC12WSKi7 | |
| Average AMD Ryzen 7 6800H, AMD Radeon 680M (10381 - 11158, n=4) | |
| Beelink SER Pro Ryzen 5 5600H | |
| Beelink SEi11 Pro | |
| Intel NUC11PHKi7C | |
| Intel Hades Canyon NUC8i7HVK | |
| PCMark 10 / Productivity | |
| Beelink GTR6 | |
| Beelink SER6 Pro | |
| Average AMD Ryzen 7 6800H, AMD Radeon 680M (9140 - 9759, n=4) | |
| Beelink SER Pro Ryzen 5 5600H | |
| Intel NUC11PHKi7C | |
| Intel Hades Canyon NUC8i7HVK | |
| Intel NUC 12 Pro Kit NUC12WSKi7 | |
| Beelink SEi11 Pro | |
| PCMark 10 / Digital Content Creation | |
| Beelink GTR6 | |
| Average AMD Ryzen 7 6800H, AMD Radeon 680M (8092 - 8485, n=4) | |
| Beelink SER6 Pro | |
| Intel NUC11PHKi7C | |
| Intel NUC 12 Pro Kit NUC12WSKi7 | |
| Beelink SER Pro Ryzen 5 5600H | |
| Intel Hades Canyon NUC8i7HVK | |
| Beelink SEi11 Pro | |
| CrossMark / Overall | |
| Beelink SER6 Pro | |
| Beelink GTR6 | |
| Intel NUC 12 Pro Kit NUC12WSKi7 | |
| Average AMD Ryzen 7 6800H, AMD Radeon 680M (1590 - 1704, n=3) | |
| Beelink SEi11 Pro | |
| Beelink SER Pro Ryzen 5 5600H | |
| CrossMark / Productivity | |
| Beelink GTR6 | |
| Beelink SER6 Pro | |
| Intel NUC 12 Pro Kit NUC12WSKi7 | |
| Average AMD Ryzen 7 6800H, AMD Radeon 680M (1566 - 1674, n=3) | |
| Beelink SEi11 Pro | |
| Beelink SER Pro Ryzen 5 5600H | |
| CrossMark / Creativity | |
| Intel NUC 12 Pro Kit NUC12WSKi7 | |
| Beelink SER6 Pro | |
| Average AMD Ryzen 7 6800H, AMD Radeon 680M (1696 - 1763, n=3) | |
| Beelink GTR6 | |
| Beelink SER Pro Ryzen 5 5600H | |
| Beelink SEi11 Pro | |
| CrossMark / Responsiveness | |
| Beelink GTR6 | |
| Beelink SER6 Pro | |
| Average AMD Ryzen 7 6800H, AMD Radeon 680M (1340 - 1625, n=3) | |
| Intel NUC 12 Pro Kit NUC12WSKi7 | |
| Beelink SEi11 Pro | |
| Beelink SER Pro Ryzen 5 5600H | |
| PCMark 10 Score | 6936 points | |
Help | ||
| AIDA64 / Memory Copy | |
| Beelink SER6 Pro | |
| Beelink GTR6 | |
| Average AMD Ryzen 7 6800H (48209 - 51186, n=8) | |
| Intel NUC 12 Pro Kit NUC12WSKi7 | |
| Beelink SEi11 Pro | |
| Intel NUC11PHKi7C | |
| AIDA64 / Memory Read | |
| Beelink GTR6 | |
| Beelink SER6 Pro | |
| Average AMD Ryzen 7 6800H (43828 - 51778, n=8) | |
| Intel NUC 12 Pro Kit NUC12WSKi7 | |
| Beelink SEi11 Pro | |
| Intel NUC11PHKi7C | |
| AIDA64 / Memory Write | |
| Beelink GTR6 | |
| Beelink SER6 Pro | |
| Average AMD Ryzen 7 6800H (51116 - 55307, n=8) | |
| Beelink SEi11 Pro | |
| Intel NUC 12 Pro Kit NUC12WSKi7 | |
| Intel NUC11PHKi7C | |
| AIDA64 / Memory Latency | |
| Intel NUC 12 Pro Kit NUC12WSKi7 | |
| Intel NUC11PHKi7C | |
| Average AMD Ryzen 7 6800H (83.1 - 104.1, n=8) | |
| Beelink SER6 Pro | |
| Beelink GTR6 | |
| Beelink SEi11 Pro | |
* ... smaller is better
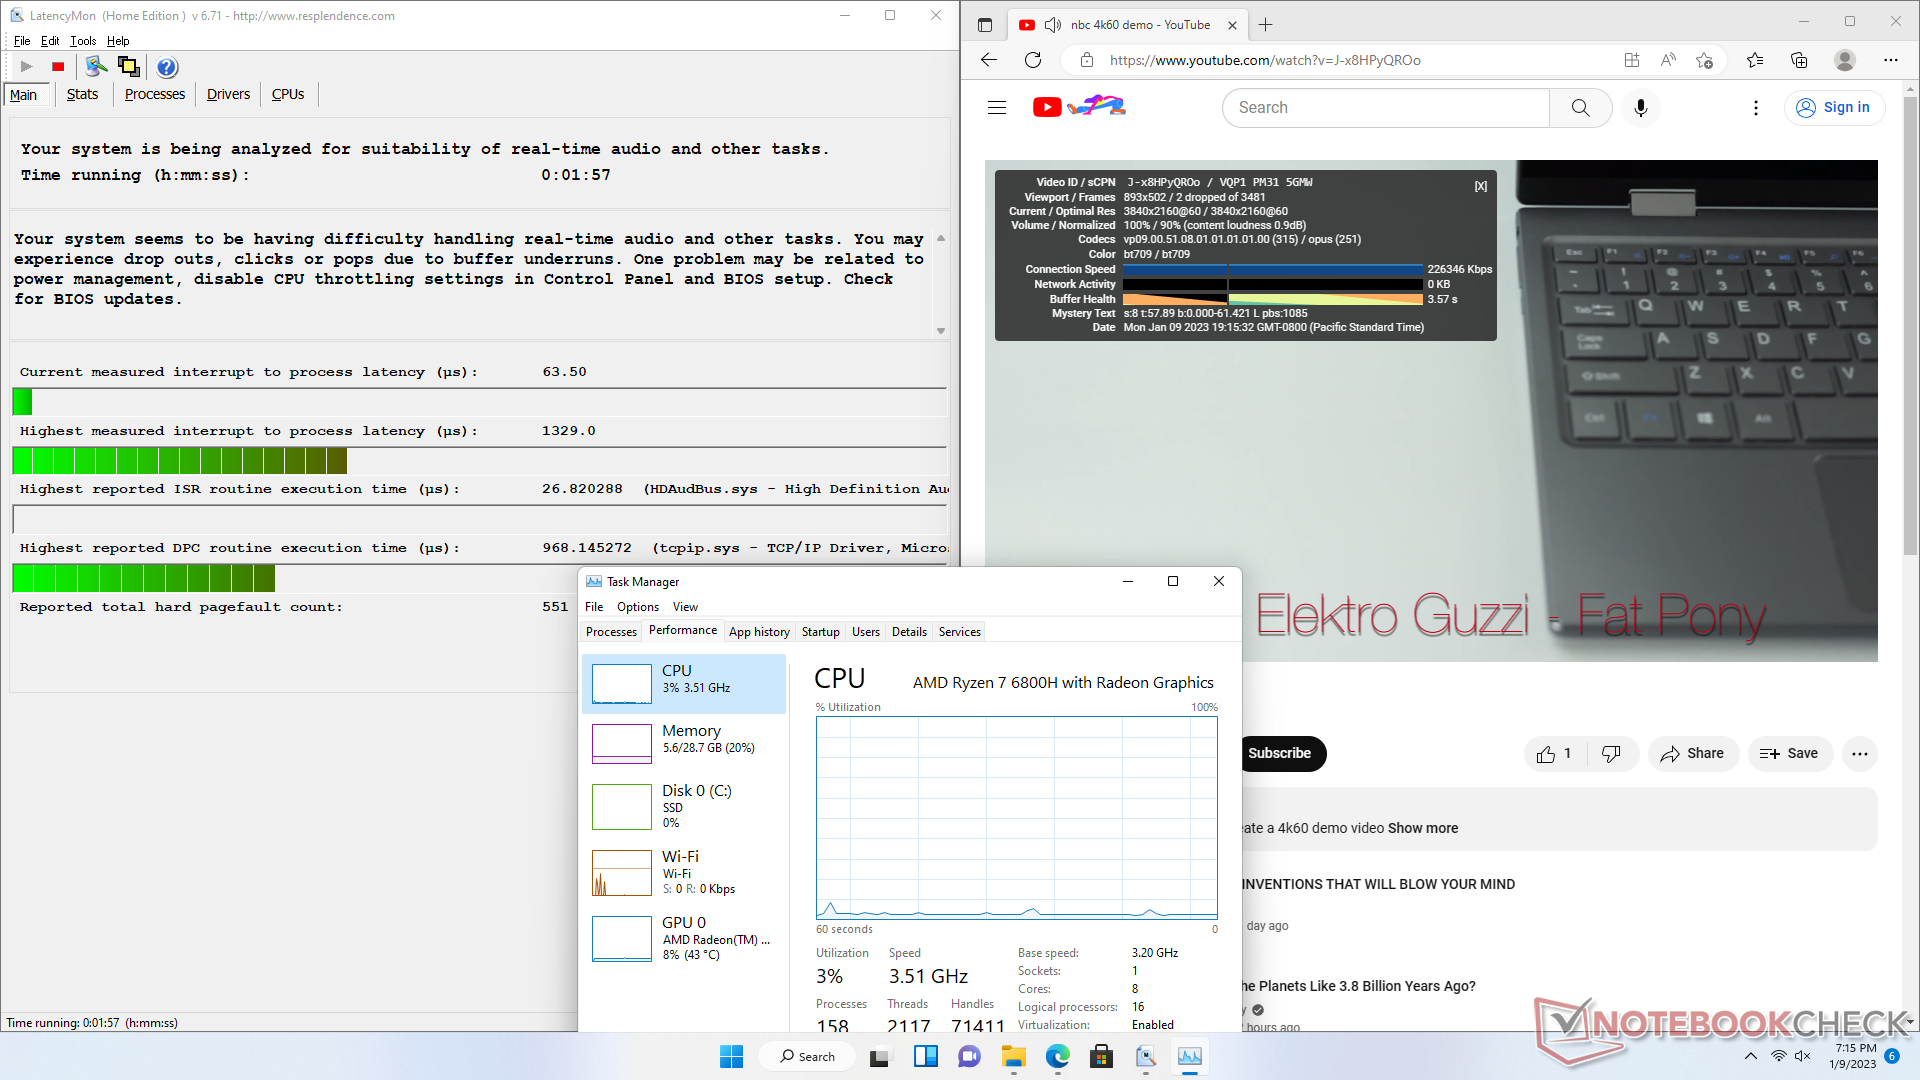
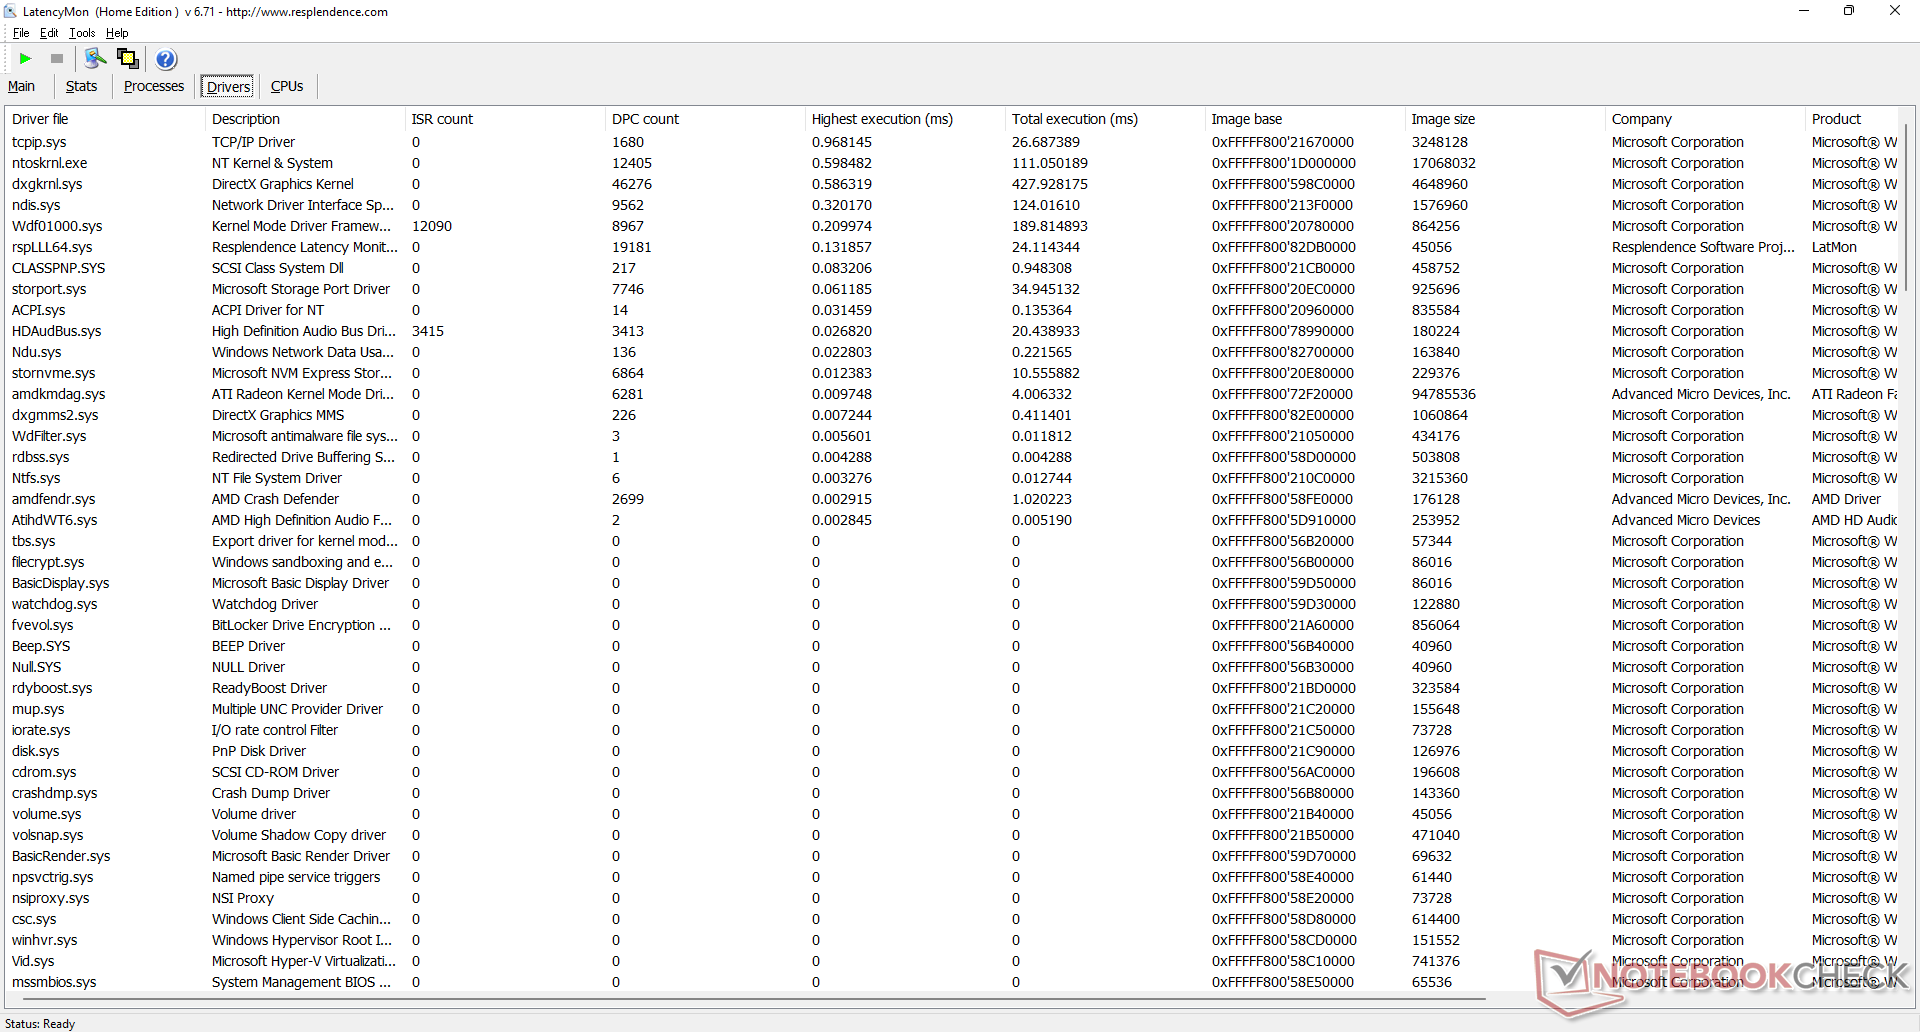
DPC延时
LatencyMon显示,在打开我们的主页的多个浏览器标签时存在DPC问题。在我们一分钟的测试视频中,4K视频在60FPS下的播放很流畅,只有两个丢帧。
| DPC Latencies / LatencyMon - interrupt to process latency (max), Web, Youtube, Prime95 | |
| Beelink SER6 Pro | |
| Intel NUC11PHKi7C | |
| Intel NUC 12 Pro Kit NUC12WSKi7 | |
| Beelink GTR6 | |
| Beelink SEi11 Pro | |
* ... smaller is better
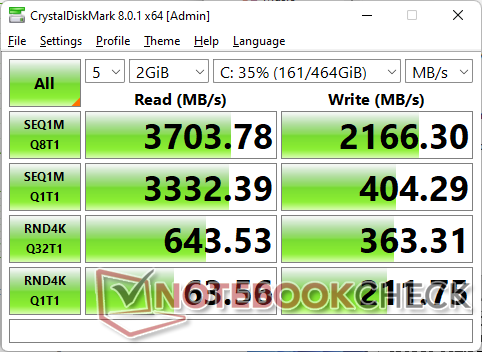
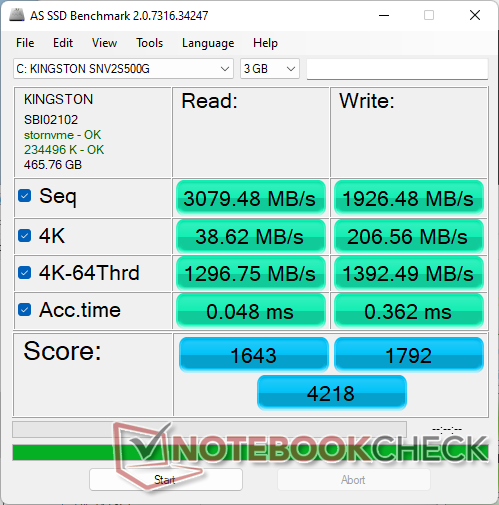
存储设备
金士顿 金士顿SNV2S我们单位的PCIe4 x4固态硬盘是一款中端NVMe硬盘,连续读取和速率分别约为3700 MB/s和2200 MB/s,而三星PM9A1等替代品的速率则为5000 MB/s或更高。该驱动器与2.5英寸SATA III插槽下方的内部金属板接触,用于散热。

| Drive Performance rating - Percent | |
| Beelink GTR6 | |
| Beelink SER6 Pro | |
| Intel Hades Canyon NUC8i7HVK -8! | |
| Intel NUC11PHKi7C | |
| Beelink SEi11 Pro | |
| Intel NUC 12 Pro Kit NUC12WSKi7 | |
| DiskSpd | |
| seq read | |
| Beelink GTR6 | |
| Beelink SER6 Pro | |
| Intel NUC11PHKi7C | |
| Intel NUC 12 Pro Kit NUC12WSKi7 | |
| Beelink SEi11 Pro | |
| seq write | |
| Beelink GTR6 | |
| Beelink SER6 Pro | |
| Intel NUC11PHKi7C | |
| Beelink SEi11 Pro | |
| Intel NUC 12 Pro Kit NUC12WSKi7 | |
| seq q8 t1 read | |
| Beelink GTR6 | |
| Beelink SER6 Pro | |
| Intel NUC11PHKi7C | |
| Beelink SEi11 Pro | |
| Intel NUC 12 Pro Kit NUC12WSKi7 | |
| seq q8 t1 write | |
| Beelink GTR6 | |
| Intel NUC11PHKi7C | |
| Beelink SER6 Pro | |
| Intel NUC 12 Pro Kit NUC12WSKi7 | |
| Beelink SEi11 Pro | |
| 4k q1 t1 read | |
| Beelink GTR6 | |
| Intel NUC 12 Pro Kit NUC12WSKi7 | |
| Beelink SEi11 Pro | |
| Beelink SER6 Pro | |
| Intel NUC11PHKi7C | |
| 4k q1 t1 write | |
| Beelink GTR6 | |
| Beelink SER6 Pro | |
| Intel NUC 12 Pro Kit NUC12WSKi7 | |
| Beelink SEi11 Pro | |
| Intel NUC11PHKi7C | |
| 4k q32 t16 read | |
| Beelink GTR6 | |
| Beelink SER6 Pro | |
| Intel NUC11PHKi7C | |
| Beelink SEi11 Pro | |
| Intel NUC 12 Pro Kit NUC12WSKi7 | |
| 4k q32 t16 write | |
| Beelink GTR6 | |
| Beelink SER6 Pro | |
| Beelink SEi11 Pro | |
| Intel NUC 12 Pro Kit NUC12WSKi7 | |
| Intel NUC11PHKi7C | |
* ... smaller is better
Disk Throttling: DiskSpd Read Loop, Queue Depth 8
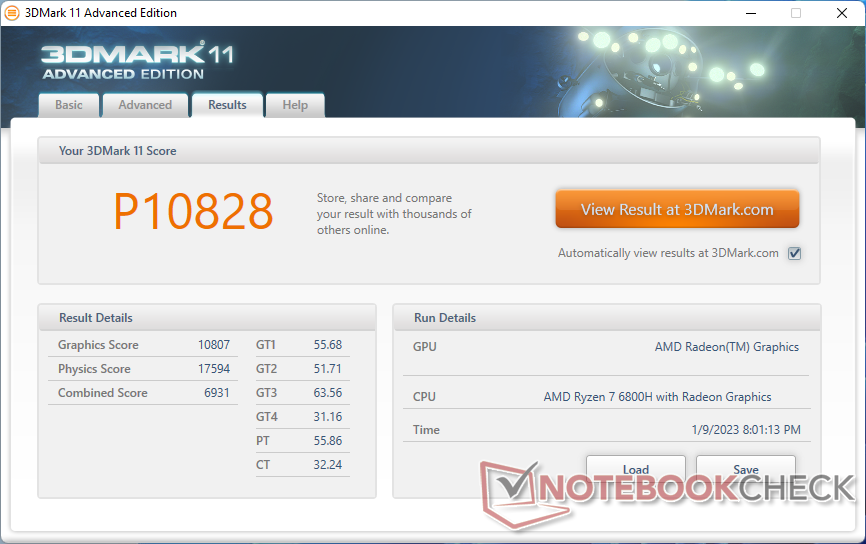
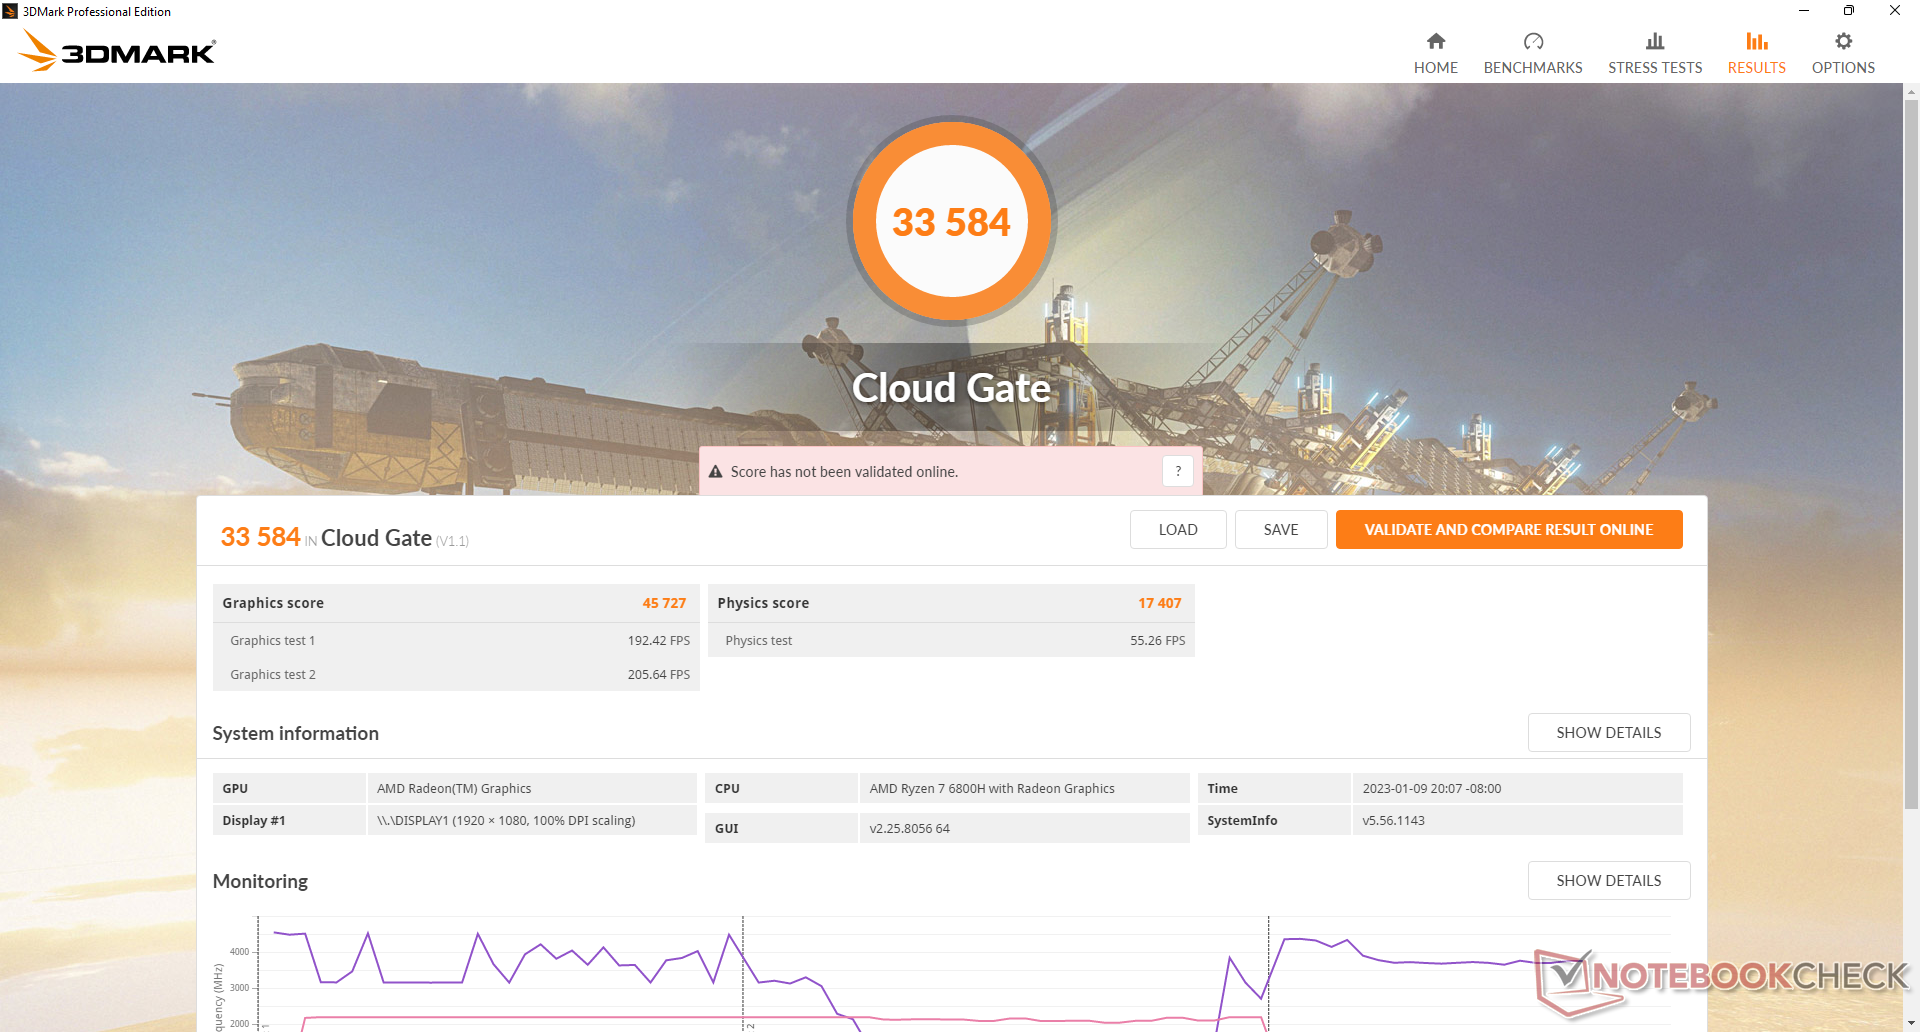
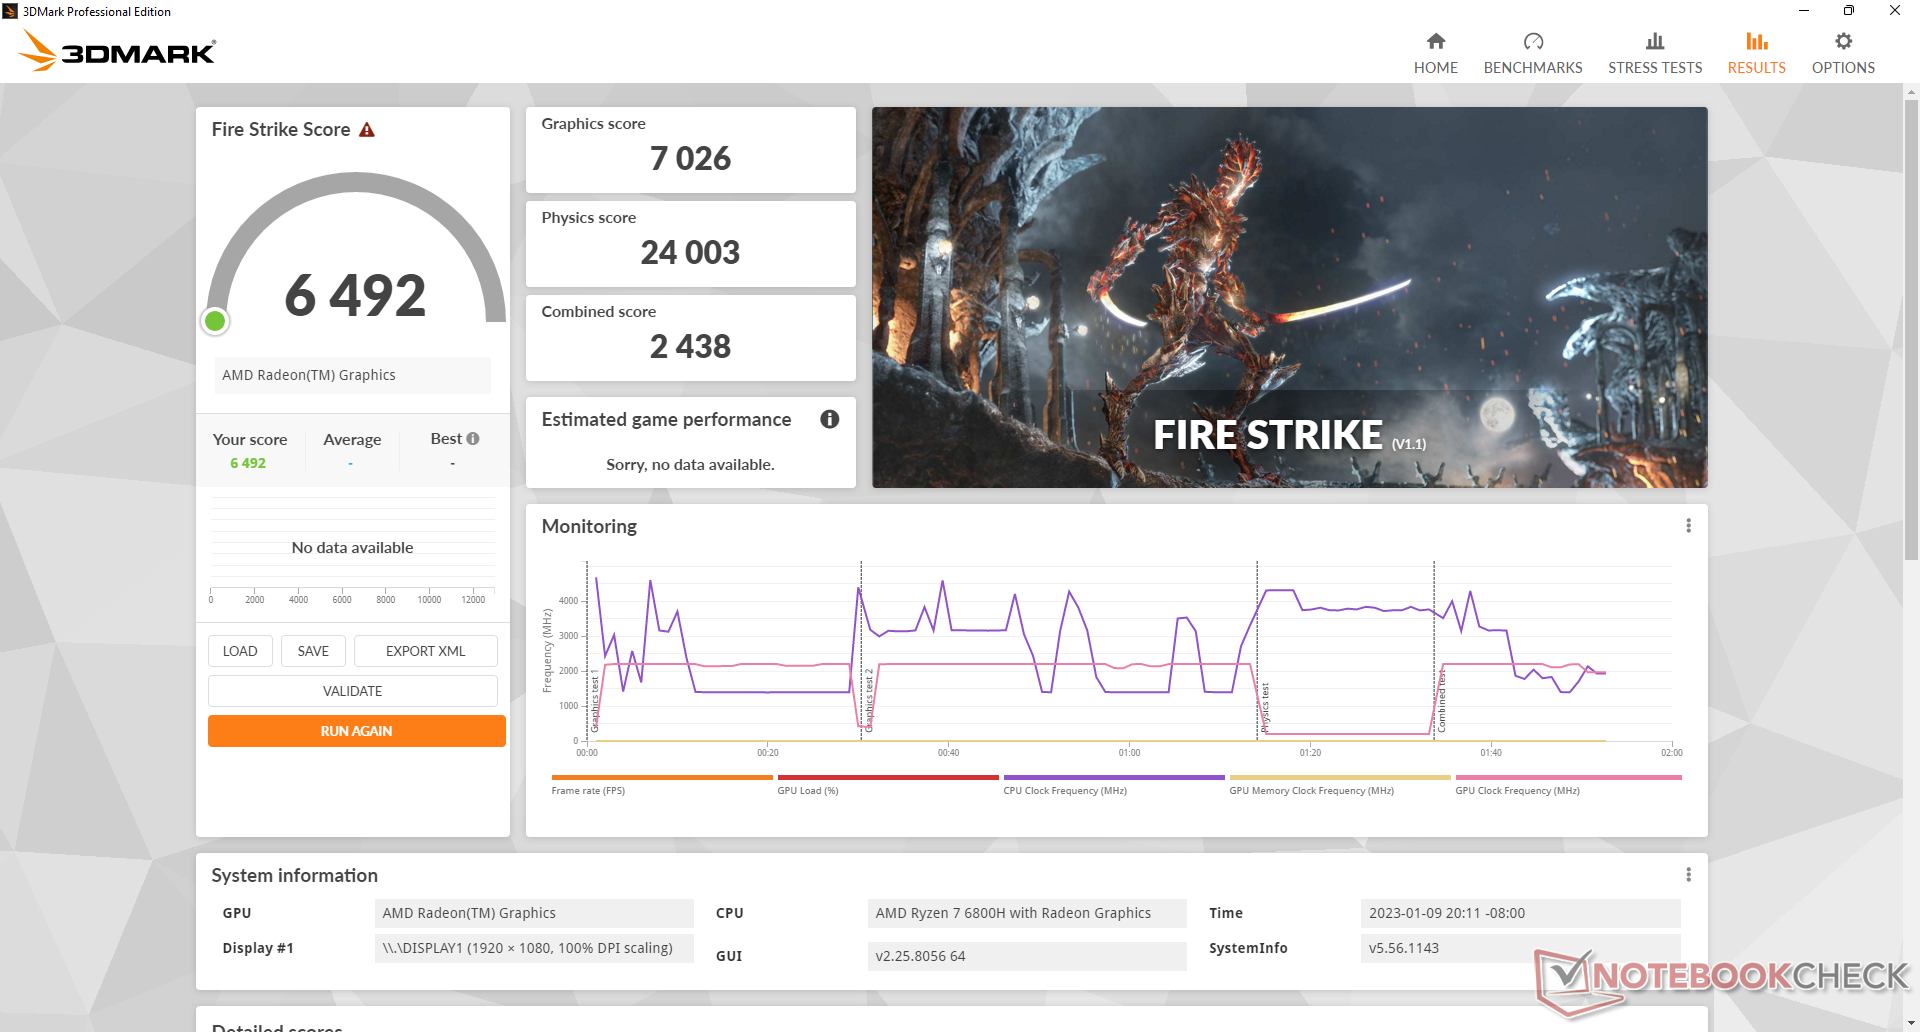
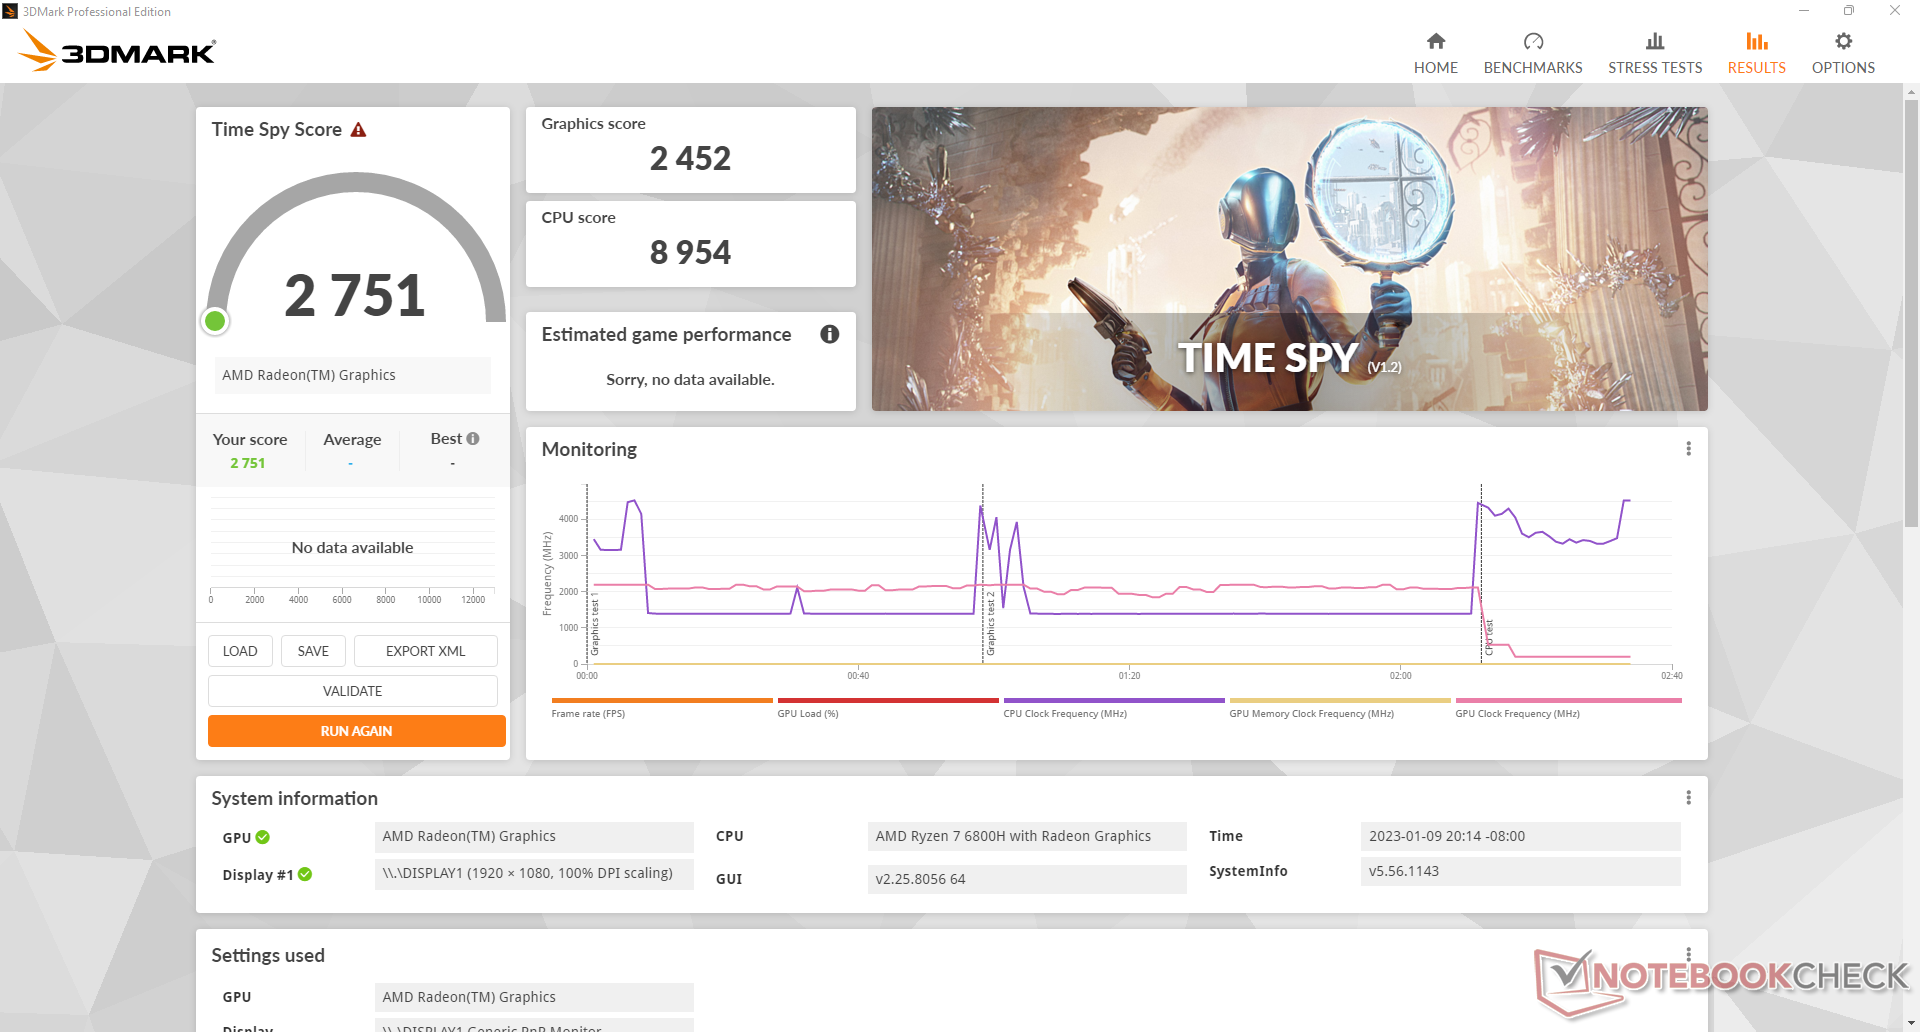
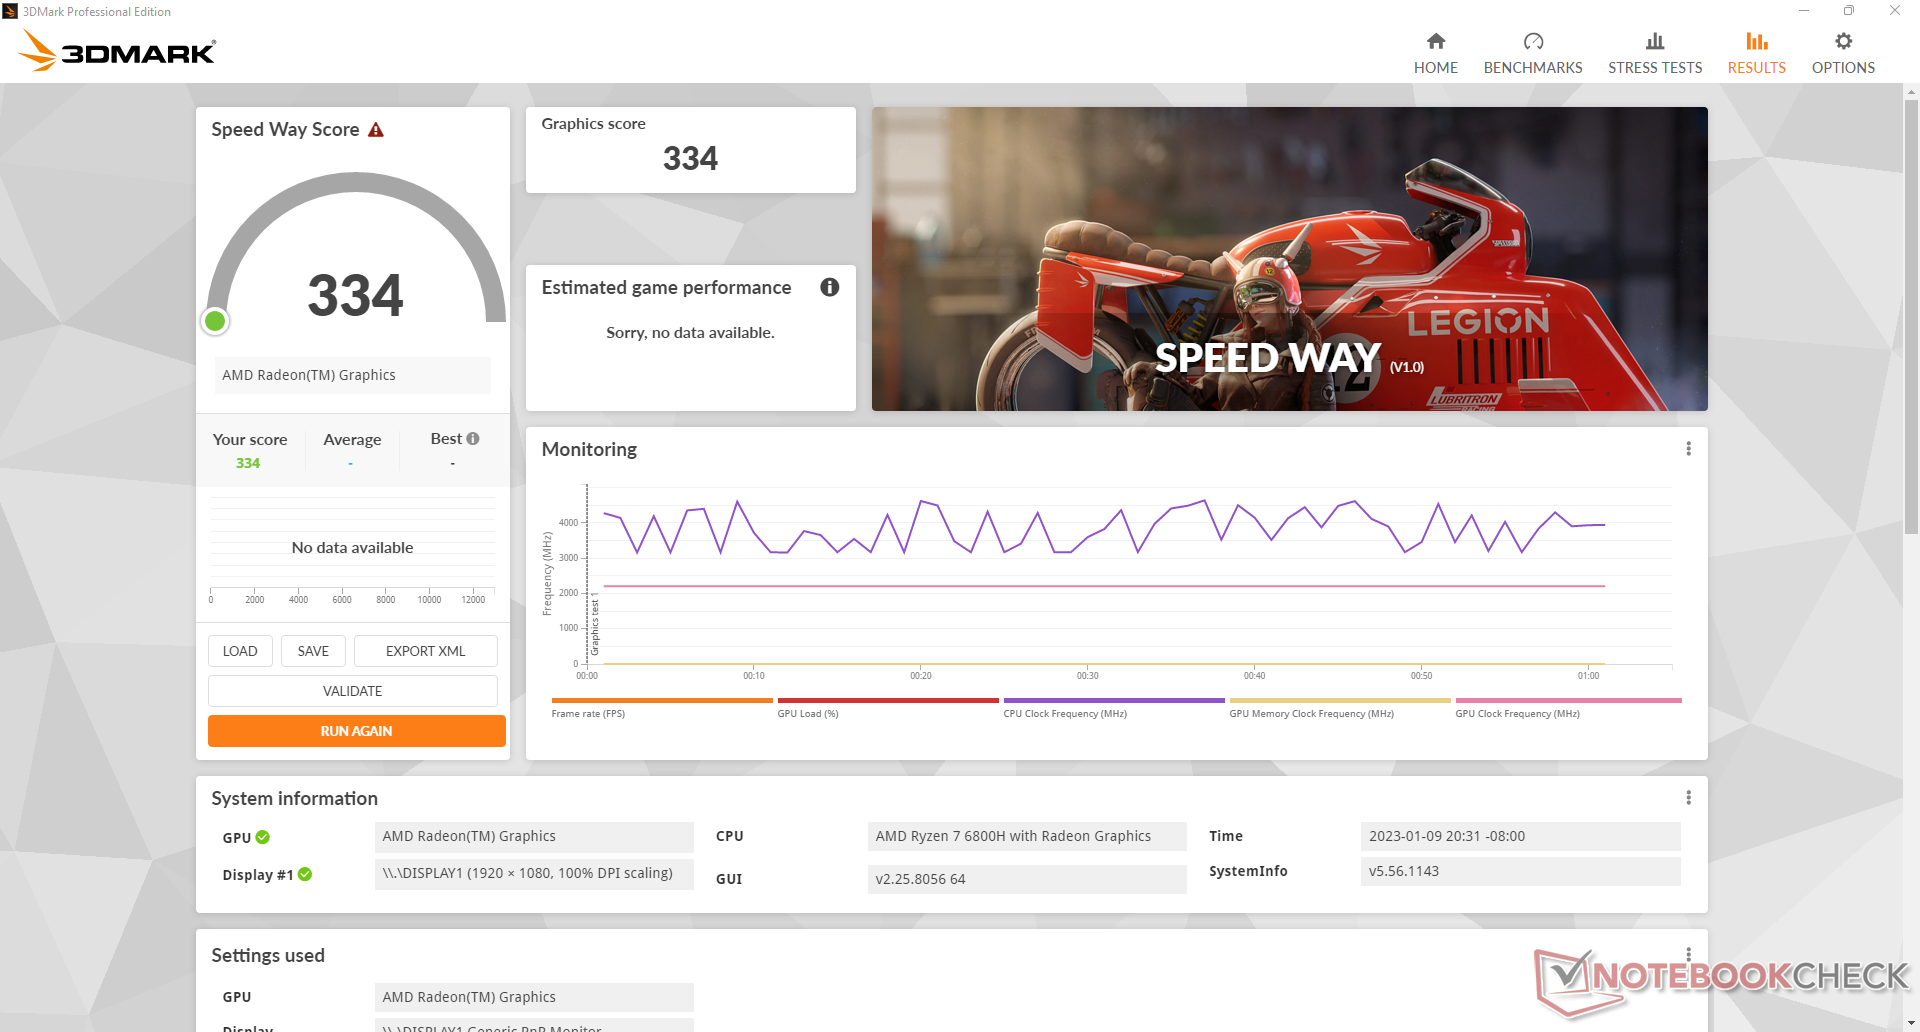
GPU性能
集成的 Radeon 680M与Ryzen 5 5600H或Ryzen 7 5800H上的上一代Radeon RX Vega 7或Vega 8相比,是一个重大的升级。原始性能提高了70%到100%,可以获得明显更好的游戏体验。这并不是说SER6 Pro是一台游戏机,因为它仍然比配备RTX 2060的笔记本电脑慢2倍以上。 GeForce 配备RTX 2060的笔记本电脑但它仍然有足够的能力在中低档设置下以1080p舒适地运行大多数游戏。
| 3DMark 11 - 1280x720 Performance GPU | |
| Minisforum Neptune Series HX90G | |
| Intel NUC11PHKi7C | |
| Intel Hades Canyon NUC8i7HVK | |
| Beelink SER6 Pro | |
| Beelink GTR6 | |
| Average AMD Radeon 680M (6858 - 11755, n=39) | |
| Intel NUC 12 Pro Kit NUC12WSKi7 | |
| Beelink SEi11 Pro | |
| Beelink SER Pro Ryzen 5 5600H | |
| Asus ZenBook Flip 14 UN5401QA-KN085W | |
| Minipc Union Ace Magician AMR5 | |
| Beelink SEi12 Core i5-1235U | |
| Trigkey S3 | |
| BMAX B5 Pro G7H8 | |
| Minipc Union NiPoGi CK10 - 10810U | |
| 3DMark 11 Performance | 10825 points | |
| 3DMark Cloud Gate Standard Score | 33584 points | |
| 3DMark Fire Strike Score | 6492 points | |
| 3DMark Time Spy Score | 2751 points | |
Help | ||
* ... smaller is better
| X-Plane 11.11 | |
| 1280x720 low (fps_test=1) | |
| Intel NUC11PHKi7C | |
| Beelink SER6 Pro | |
| Beelink GTR6 | |
| Intel NUC 12 Pro Kit NUC12WSKi7 | |
| Intel Hades Canyon NUC8i7HVK | |
| Minisforum Neptune Series HX90G | |
| Beelink SEi11 Pro | |
| Average AMD Radeon 680M (26.8 - 66.7, n=41) | |
| Beelink SER Pro Ryzen 5 5600H | |
| Beelink SEi12 Core i5-1235U | |
| Minipc Union NiPoGi CK10 - 10810U | |
| Trigkey S3 | |
| 1920x1080 med (fps_test=2) | |
| Intel NUC11PHKi7C | |
| Beelink SER6 Pro | |
| Intel Hades Canyon NUC8i7HVK | |
| Beelink GTR6 | |
| Minisforum Neptune Series HX90G | |
| Intel NUC 12 Pro Kit NUC12WSKi7 | |
| Average AMD Radeon 680M (21.1 - 53.1, n=41) | |
| Beelink SEi11 Pro | |
| Beelink SER Pro Ryzen 5 5600H | |
| Beelink SEi12 Core i5-1235U | |
| Minipc Union NiPoGi CK10 - 10810U | |
| Trigkey S3 | |
| 1920x1080 high (fps_test=3) | |
| Intel NUC11PHKi7C | |
| Minisforum Neptune Series HX90G | |
| Intel Hades Canyon NUC8i7HVK | |
| Beelink SER6 Pro | |
| Beelink GTR6 | |
| Intel NUC 12 Pro Kit NUC12WSKi7 | |
| Beelink SEi11 Pro | |
| Beelink SER Pro Ryzen 5 5600H | |
| Average AMD Radeon 680M (16.6 - 44.5, n=41) | |
| Beelink SEi12 Core i5-1235U | |
| Minipc Union NiPoGi CK10 - 10810U | |
| Trigkey S3 | |
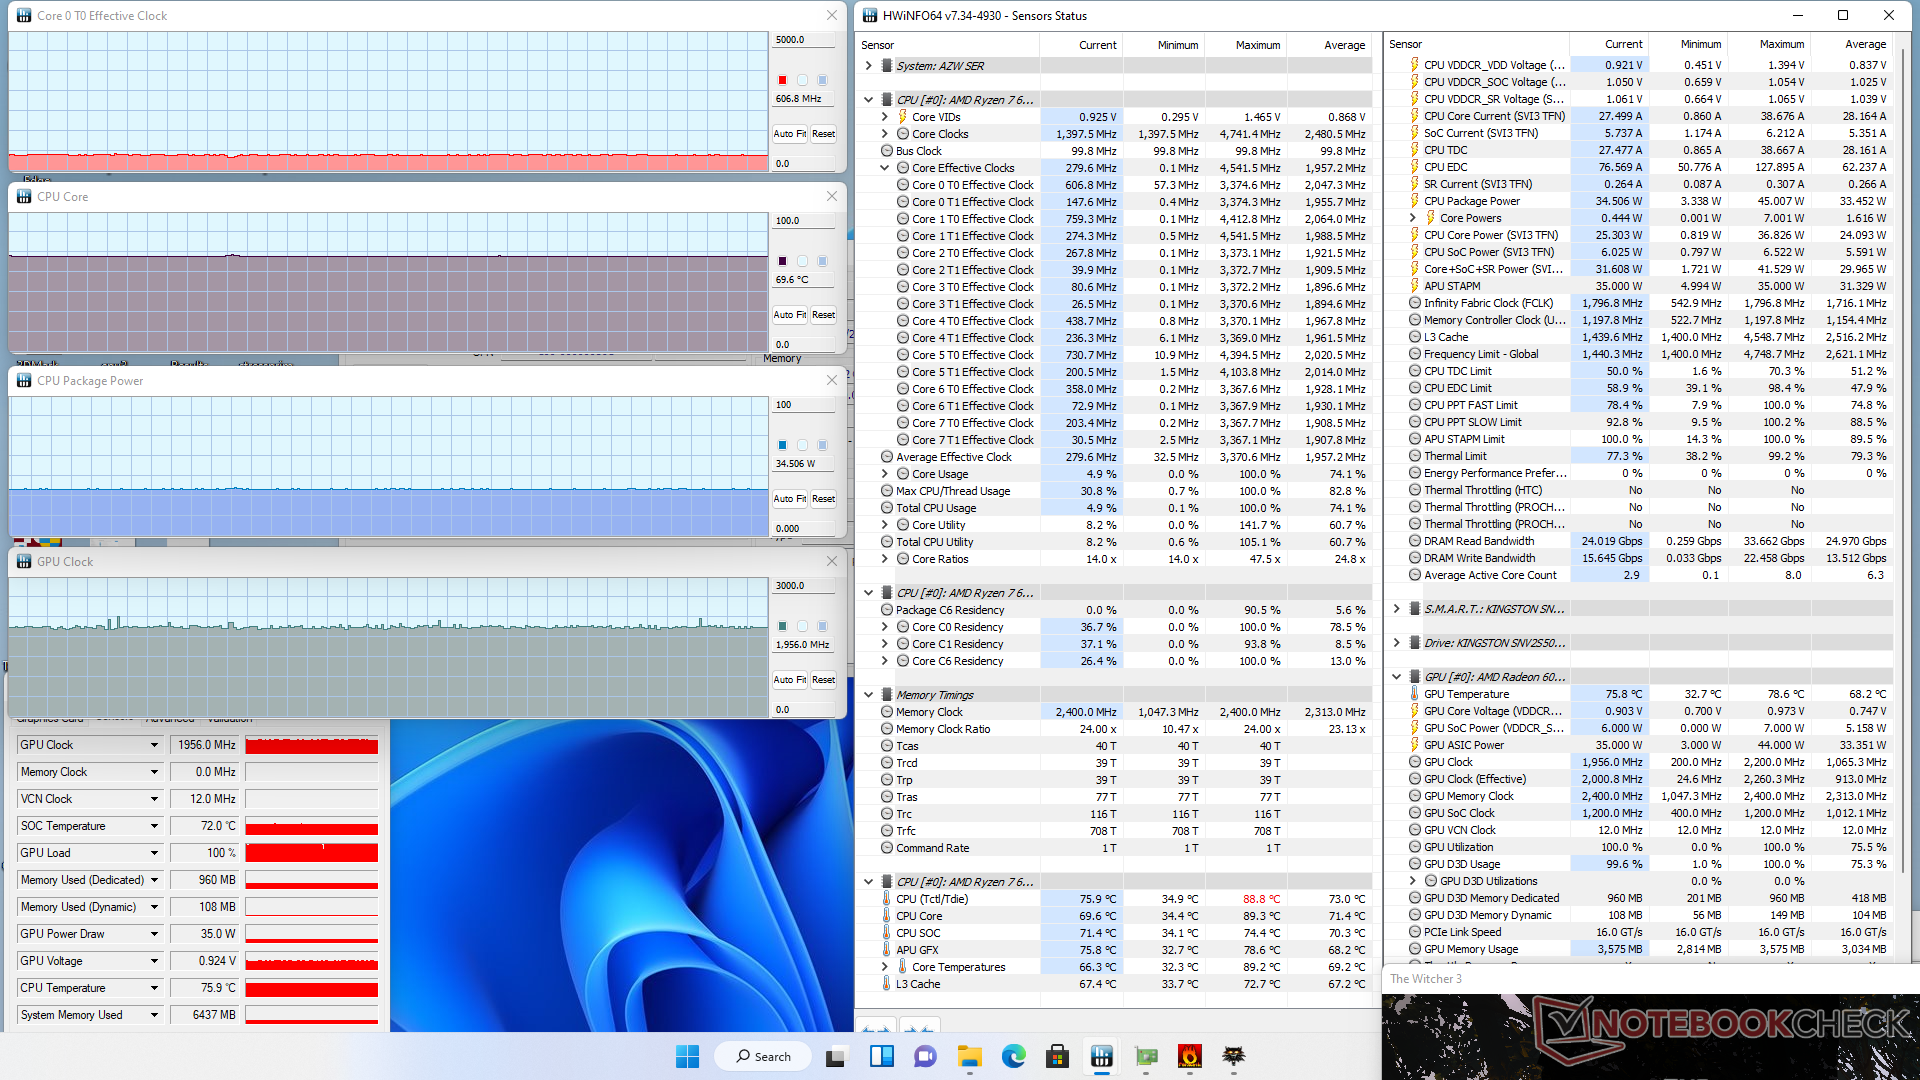
我们的设备会表现出维持帧率的问题。当空转时 Witcher 3时,帧率会周期性地从~80 FPS下降到~70 FPS,似乎没有任何理由。如下图所示,我们甚至经历了低至18FPS的下降。这种不稳定性表明后台活动被打断或后台程序管理不善。
Witcher 3 FPS Chart
| low | med. | high | ultra | |
|---|---|---|---|---|
| GTA V (2015) | 152.3 | 139.7 | 51.9 | 23.7 |
| The Witcher 3 (2015) | 138.1 | 85.1 | 43.3 | 27 |
| Dota 2 Reborn (2015) | 143.3 | 113.4 | 83.9 | 73.1 |
| Final Fantasy XV Benchmark (2018) | 68.1 | 34.7 | 24.6 | |
| X-Plane 11.11 (2018) | 66.4 | 52.9 | 43 | |
| Strange Brigade (2018) | 141.9 | 57.8 | 48.6 | 41.9 |
| Cyberpunk 2077 1.6 (2022) | 43.3 | 33.1 | 21.3 | 17.2 |
排放
系统噪音
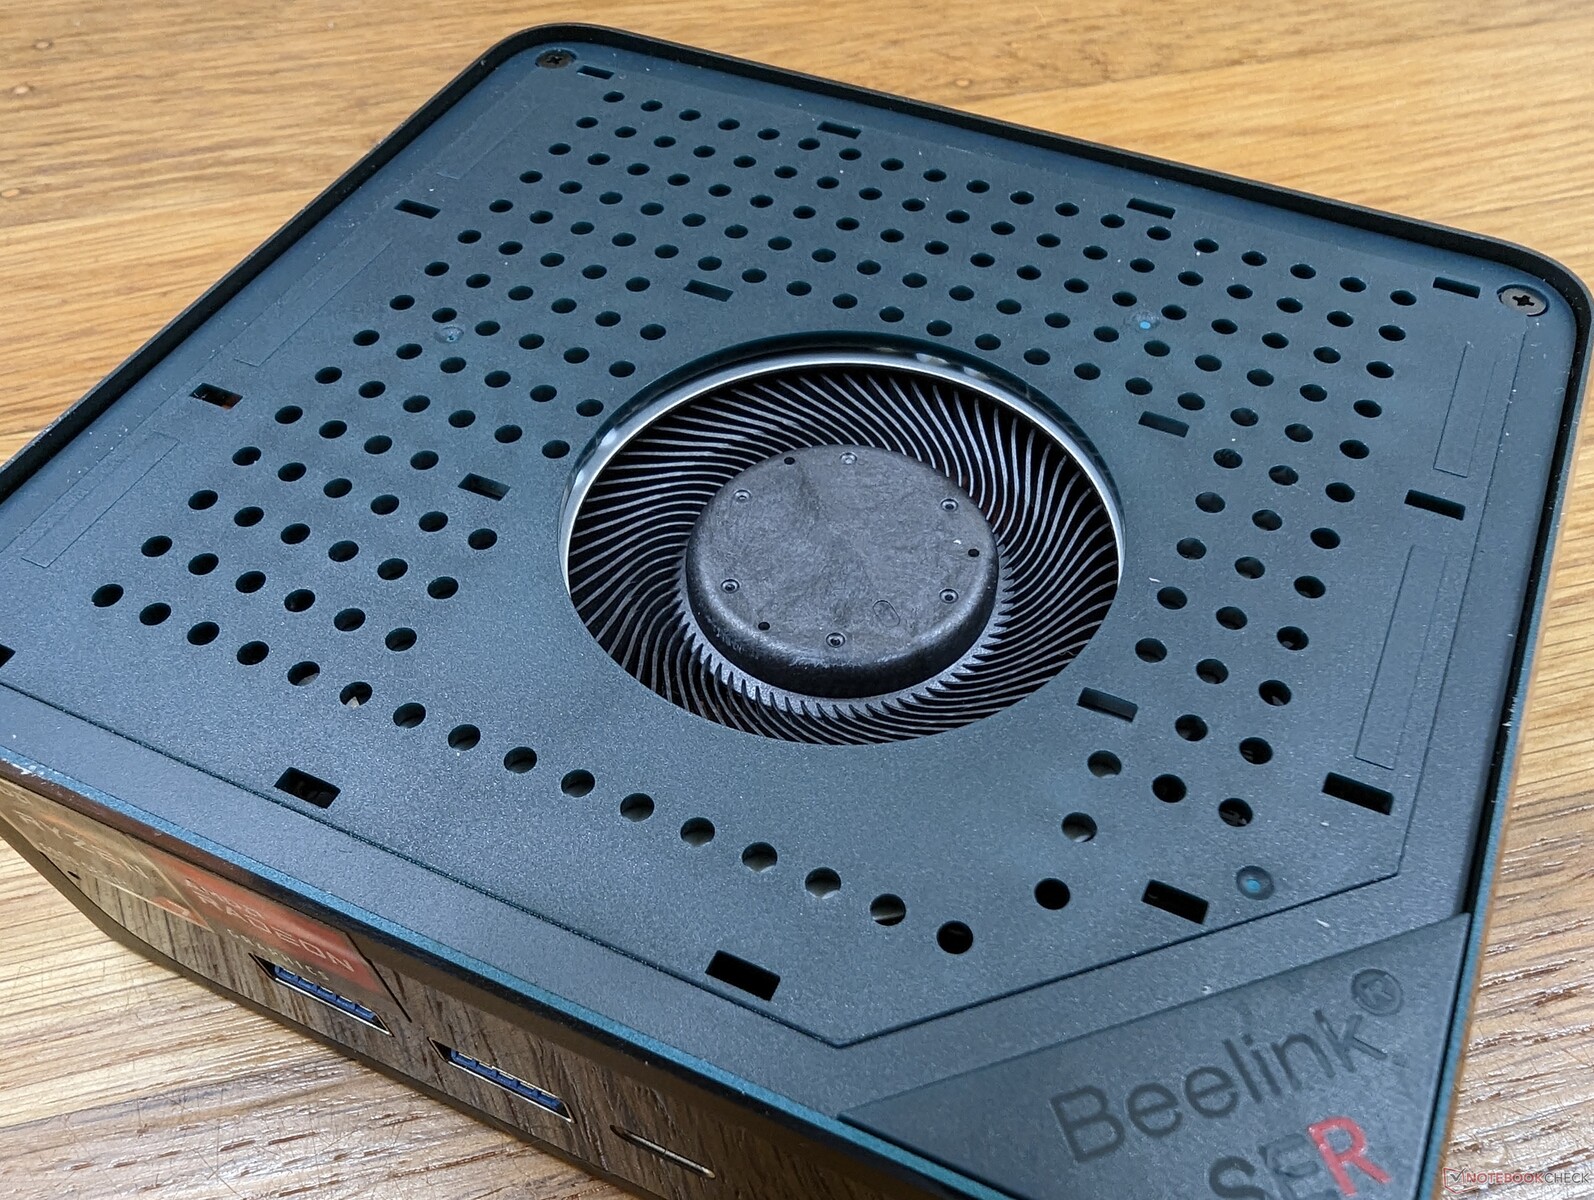
内部风扇对屏幕上的负载很敏感。例如,在浏览网页或视频流时,风扇噪音可能偶尔会在短时间内急剧上升到33 dB(A)。与大多数其他迷你PC相比,风扇噪音也会更快地达到最大约40 dB(A)。
我们在测试设备上遇到了一些轻微的电子噪音或线圈啸叫。因此,我们能够记录到24.1 dB(A)的噪音,而沉默的背景是22.8 dB(A),即使是在风扇闲置时。
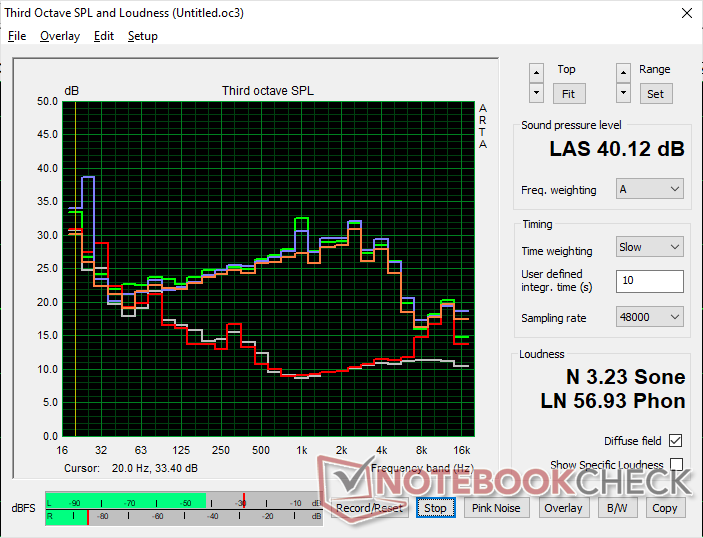
Noise level
| Idle |
| 24.1 / 24.1 / 33.8 dB(A) |
| Load |
| 40.1 / 40.1 dB(A) |
 | ||
30 dB silent 40 dB(A) audible 50 dB(A) loud |
||
min: | ||
| Beelink SER6 Pro Radeon 680M, R7 6800H, Kingston NV2 500GB SNV2S/500G | Beelink GTR6 Radeon 680M, R9 6900HX, Kingston KC3000 512G SKC3000S512G | Beelink SEi11 Pro Iris Xe G7 96EUs, i5-11320H, Kingston NV1 SNVS/500GCN | Intel NUC 12 Pro Kit NUC12WSKi7 Iris Xe G7 96EUs, i7-1260P, Transcend M.2 SSD 2200S TS512GMTE220S | Intel NUC11PHKi7C GeForce RTX 2060 Mobile, i7-1165G7, Samsung SSD 980 Pro 500GB MZ-V8P500BW | Intel Hades Canyon NUC8i7HVK Vega M GH, i7-8809G, Intel Optane 120 GB SSDPEK1W120GA | |
|---|---|---|---|---|---|---|
| Noise | -3% | 8% | -18% | -1% | -11% | |
| off / environment * (dB) | 22.8 | 23.2 -2% | 22.8 -0% | 30.4 -33% | 24.5 -7% | 28.7 -26% |
| Idle Minimum * (dB) | 24.1 | 23.6 2% | 24.7 -2% | 33.1 -37% | 25.3 -5% | 29 -20% |
| Idle Average * (dB) | 24.1 | 23.8 1% | 24.7 -2% | 33.1 -37% | 25.3 -5% | 29 -20% |
| Idle Maximum * (dB) | 33.8 | 36.2 -7% | 25.3 25% | 33.1 2% | 25.3 25% | 29 14% |
| Load Average * (dB) | 40.1 | 39.7 1% | 33.2 17% | 38.1 5% | 36.4 9% | 36 10% |
| Witcher 3 ultra * (dB) | 38.7 | 41 -6% | 34.5 11% | 39.7 -3% | 42 -9% | |
| Load Maximum * (dB) | 40.1 | 43 -7% | 37.8 6% | 43.6 -9% | 47.9 -19% | 49.4 -23% |
* ... smaller is better
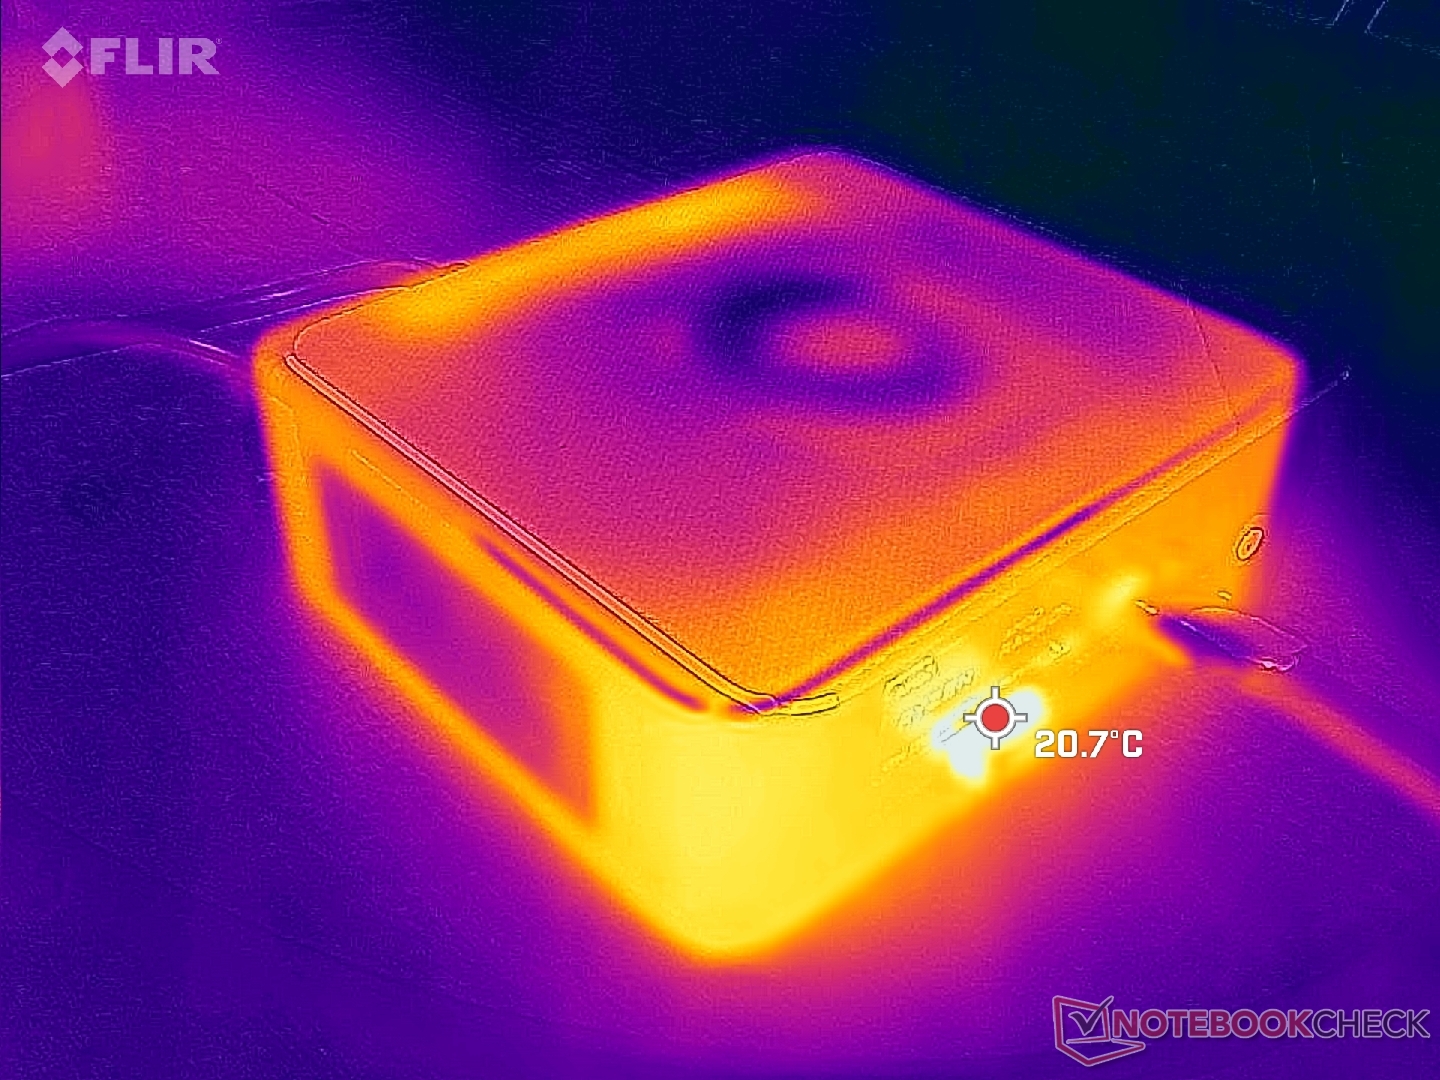
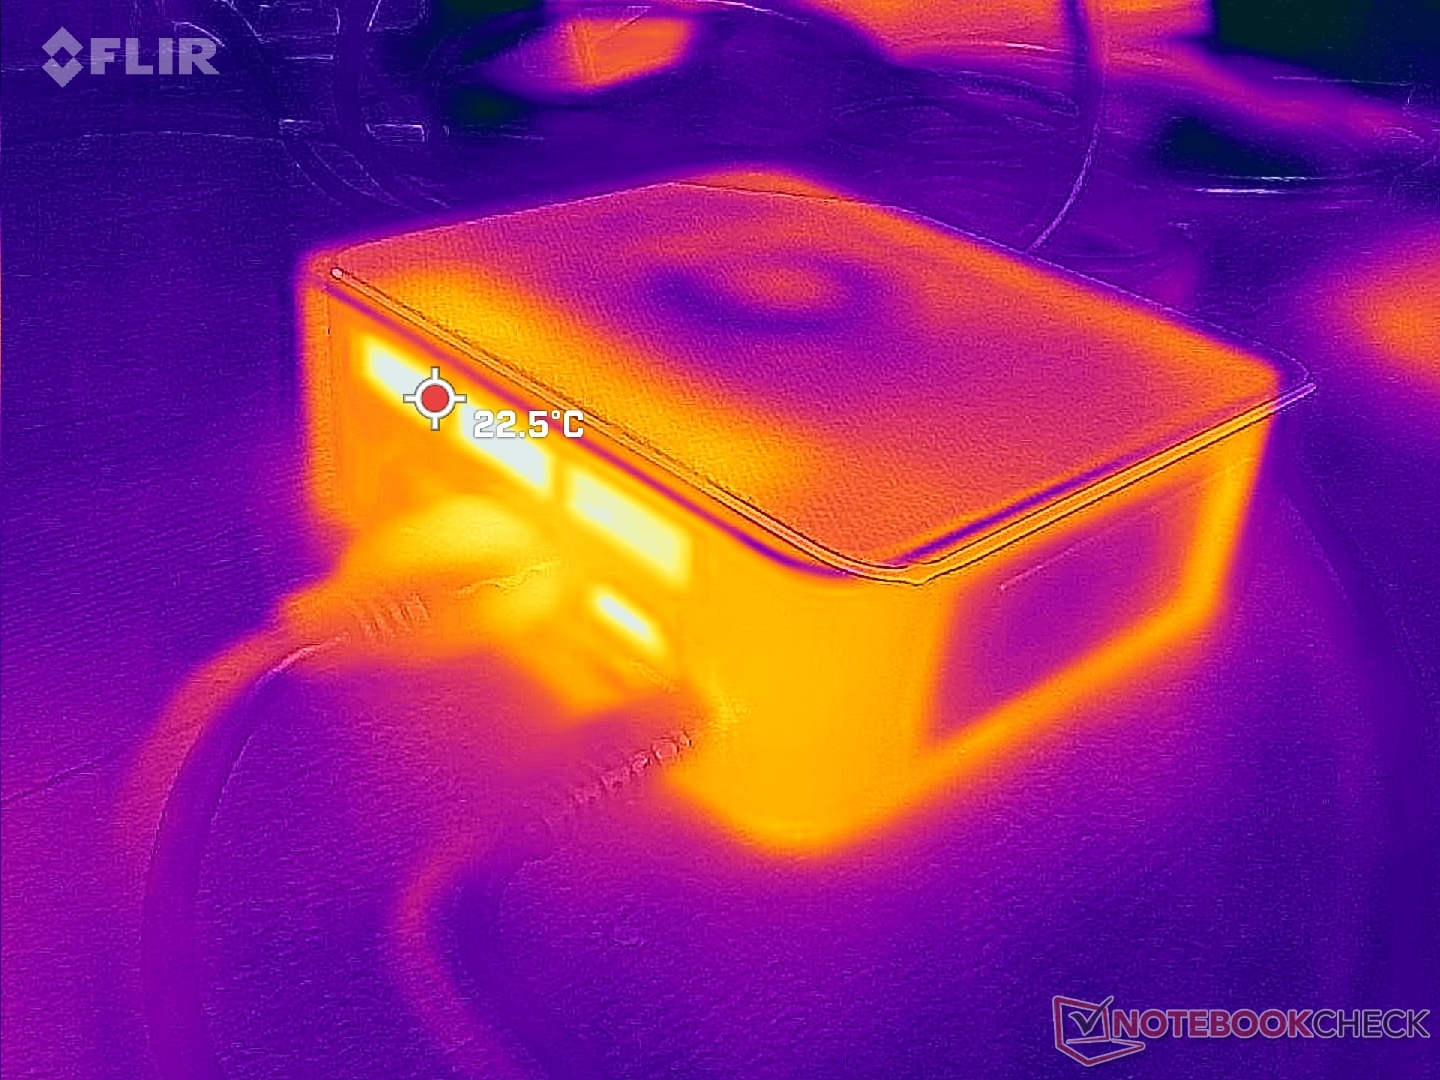
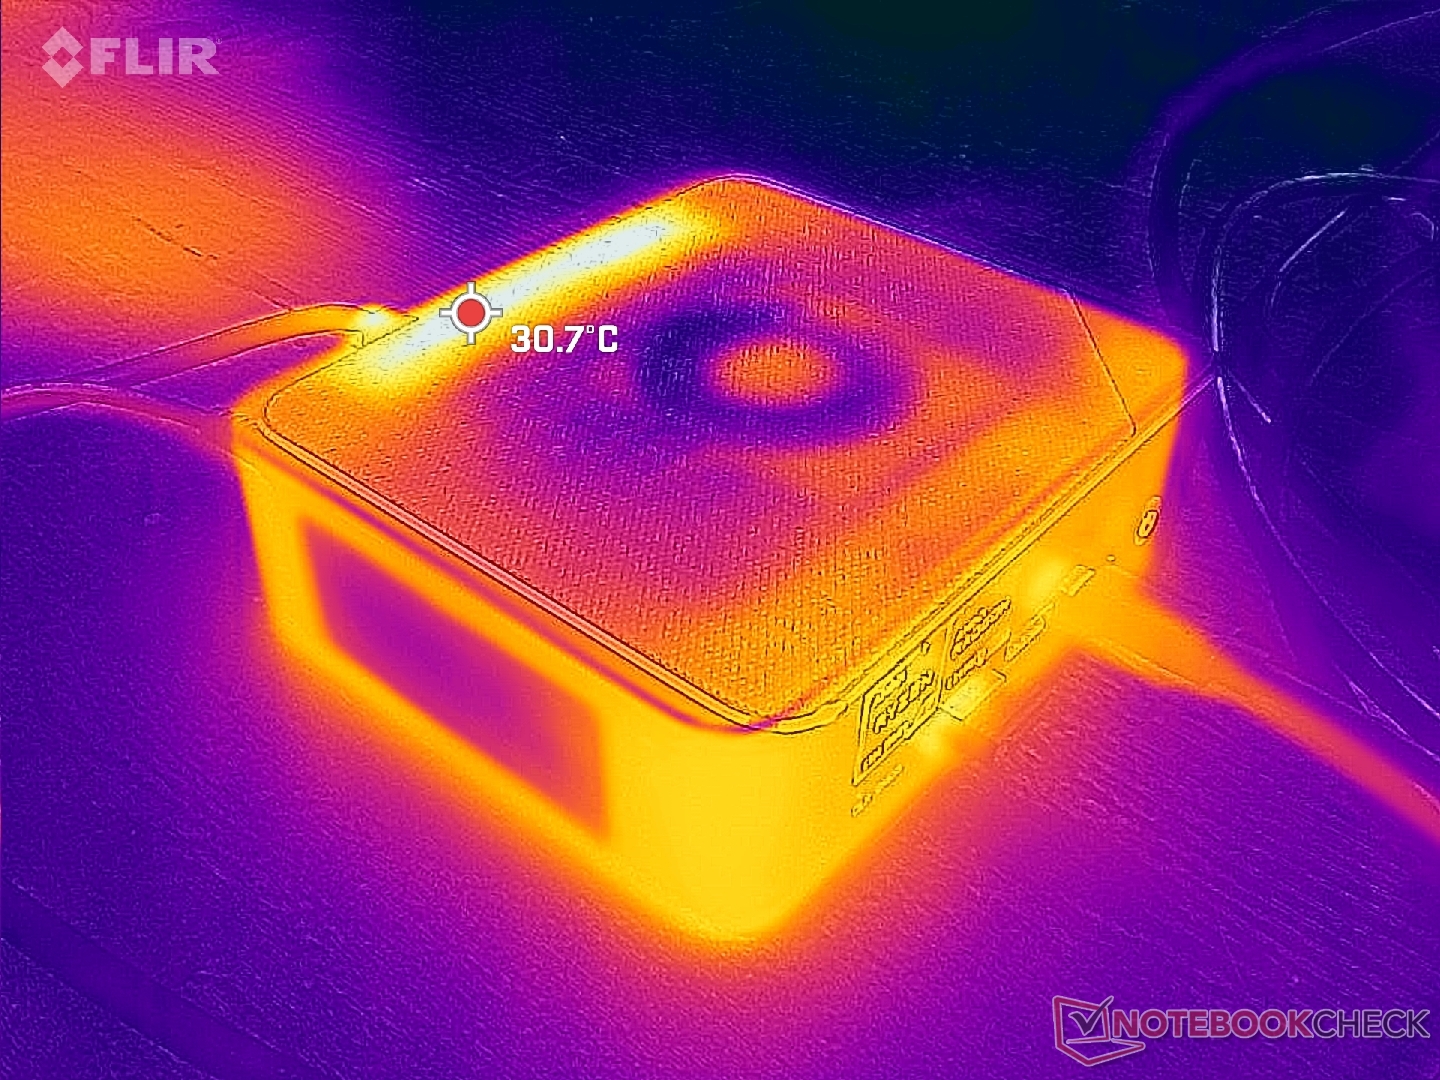
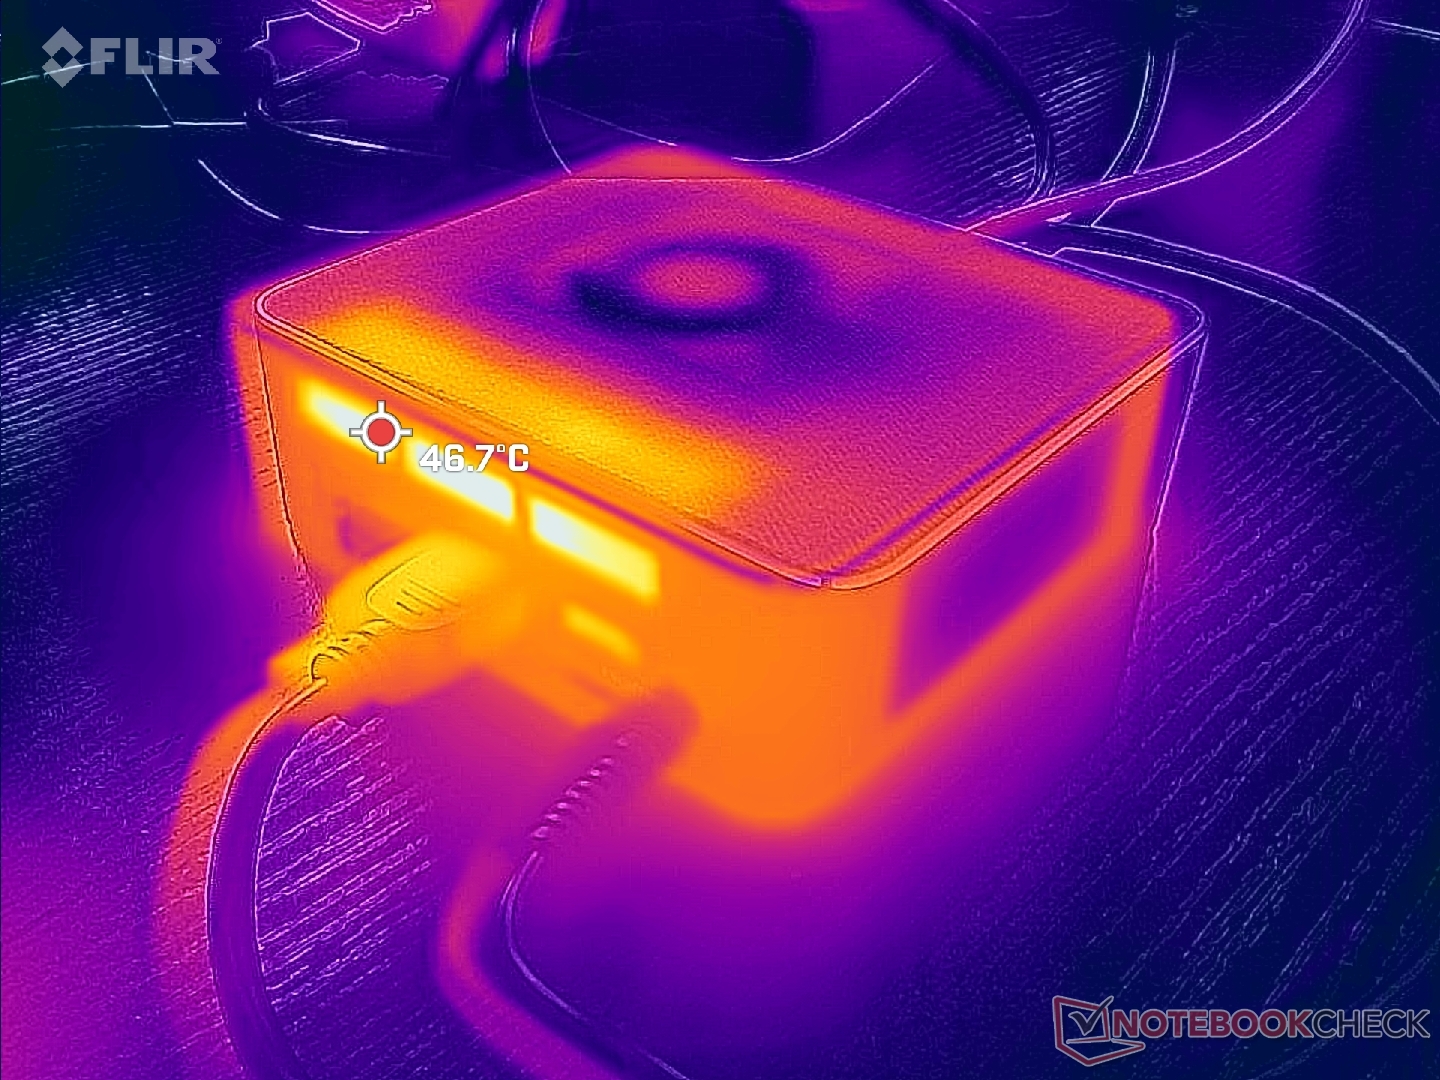
温度
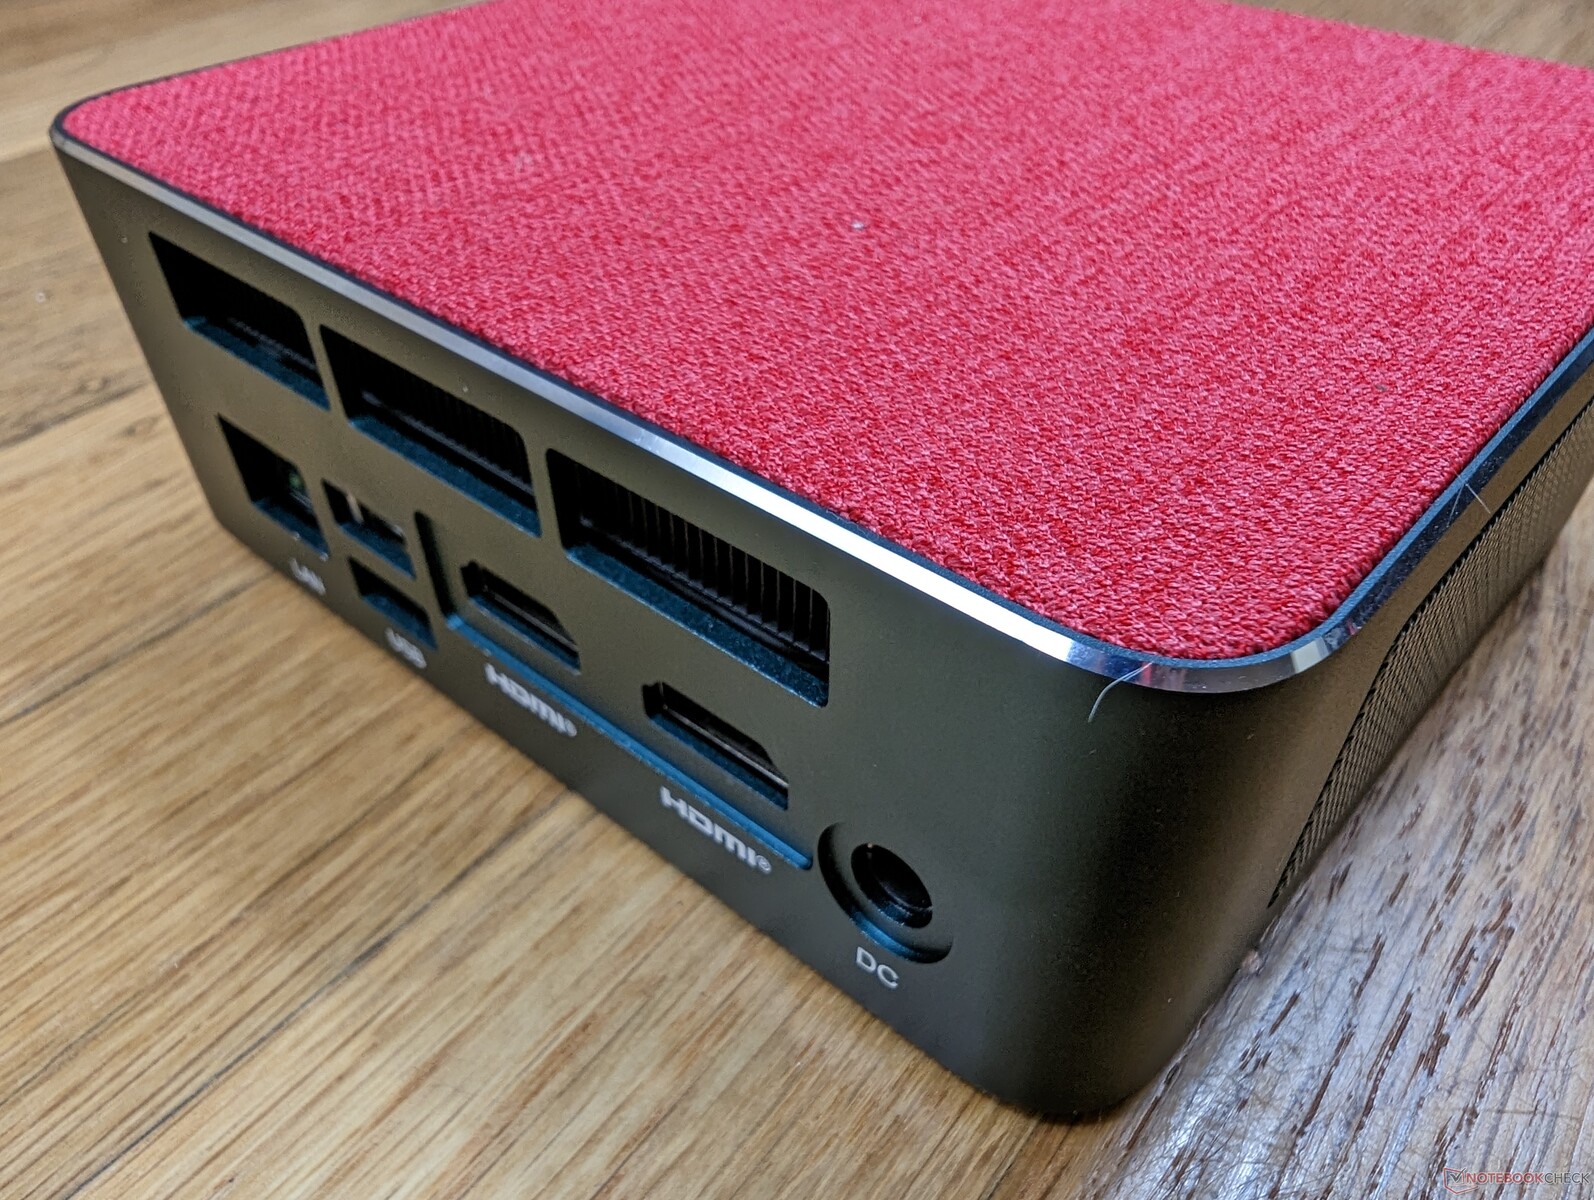
表面温度不是一个问题。与许多其他迷你PC不同,SER6 Pro采用了两个风扇,以提高冷却潜力。冷空气从侧面和顶部进入,而热空气从后面排出。因此,在迷你电脑顶部放置物品或将其垂直放置将阻碍一些空气流动。
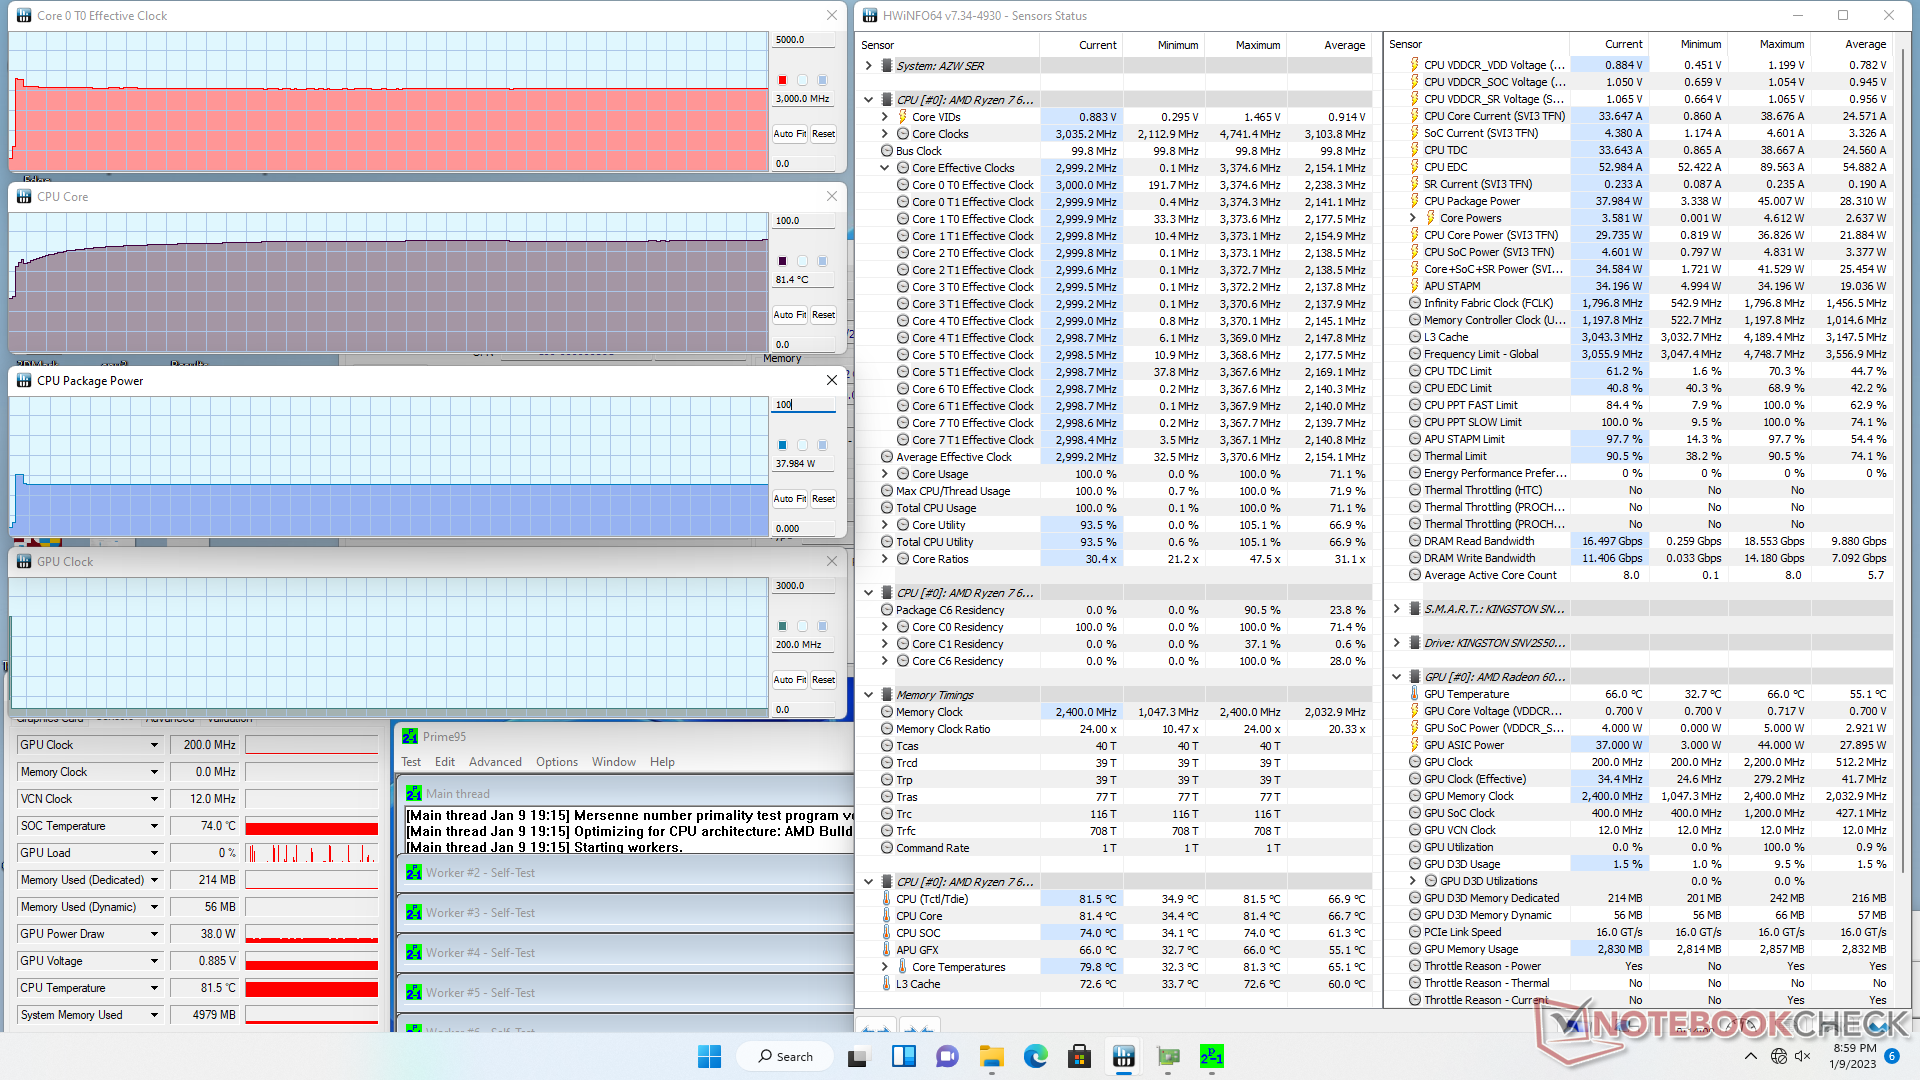
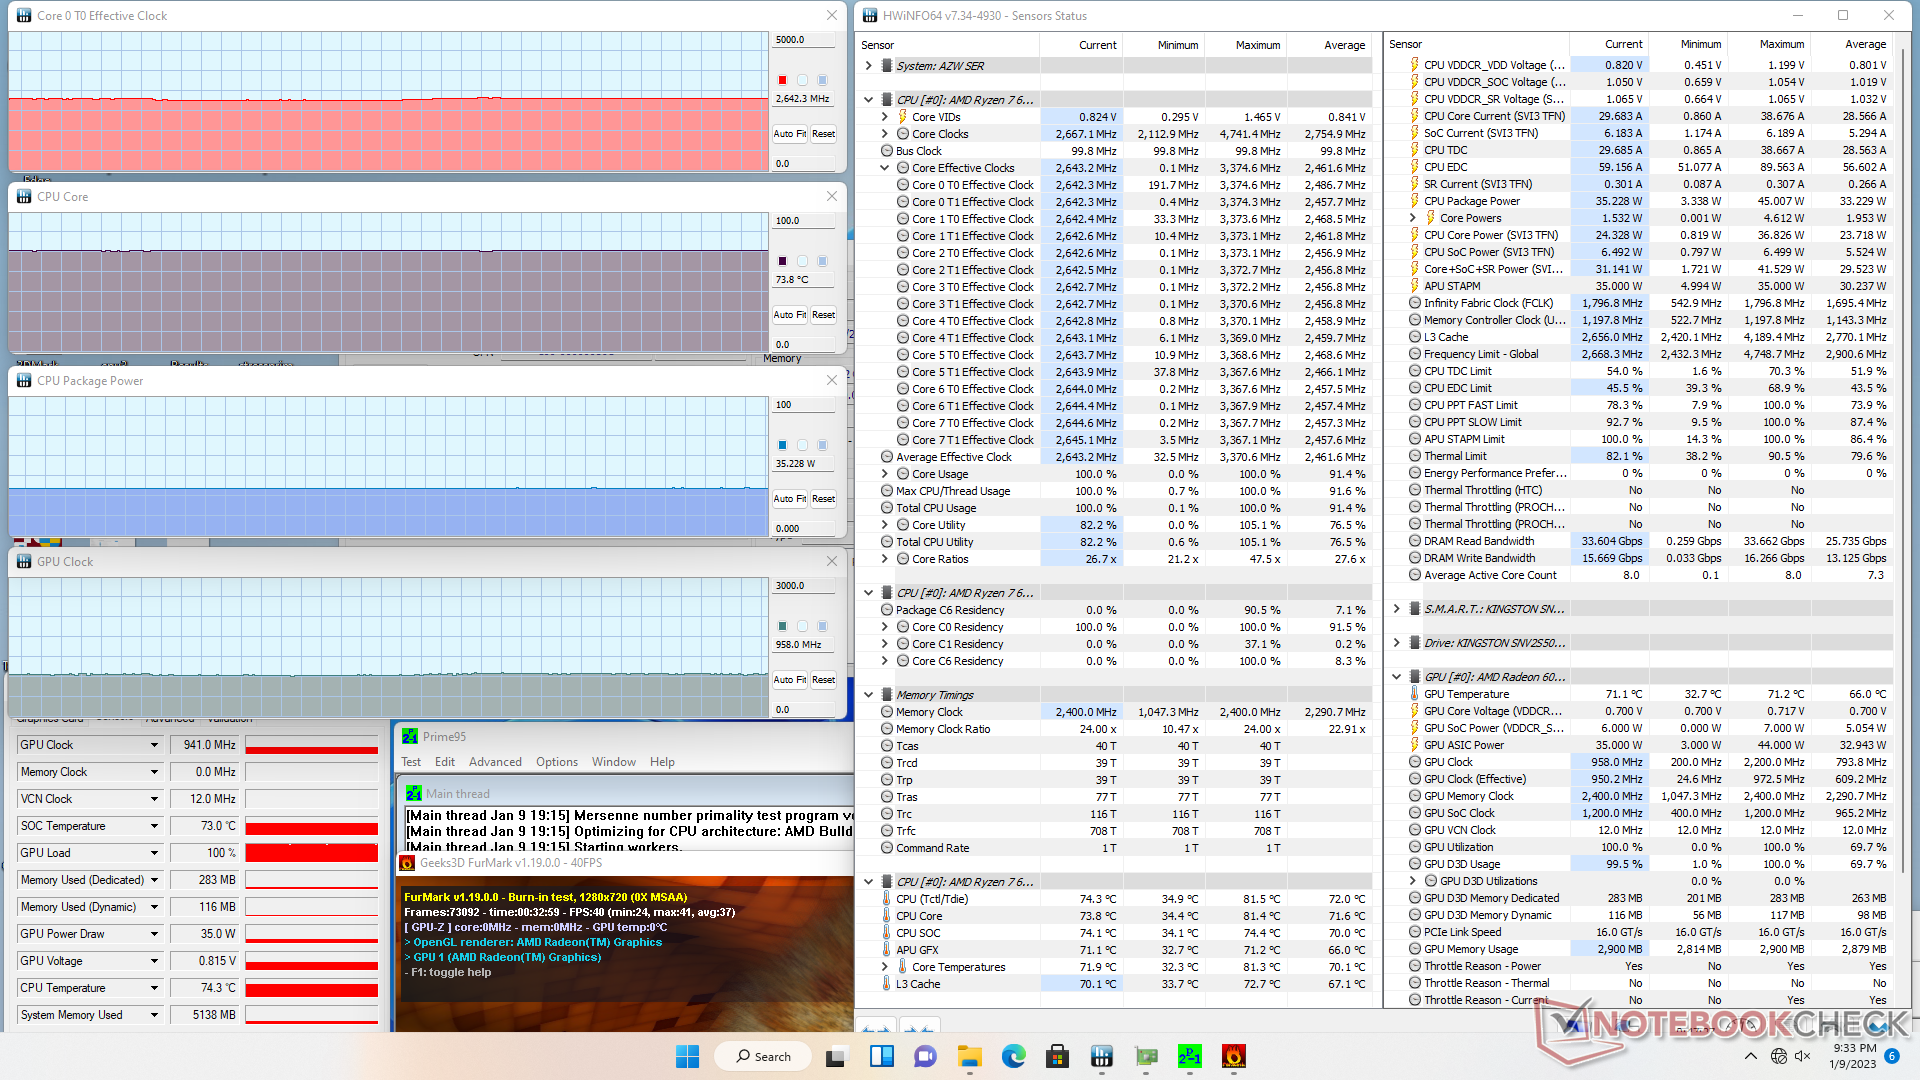
压力测试
当运行Prime95对CPU施加压力时,时钟频率和电路板功耗将分别提升到3.3 GHz和45 W,只持续了几秒钟。然后,CPU将迅速稳定在3GHz,38W和82C。在Beelink SEi11上重复这个相同的测试Beelink SEi11采用较慢的酷睿i5-11320H,将导致更高的核心温度为89℃。
当运行 Witcher 3代表典型的游戏负载时,GPU时钟速率和温度将分别稳定在1956 MHz和70 C,而SEi11则为83 C。SER6 Pro不仅速度更快,而且运行温度也更低。
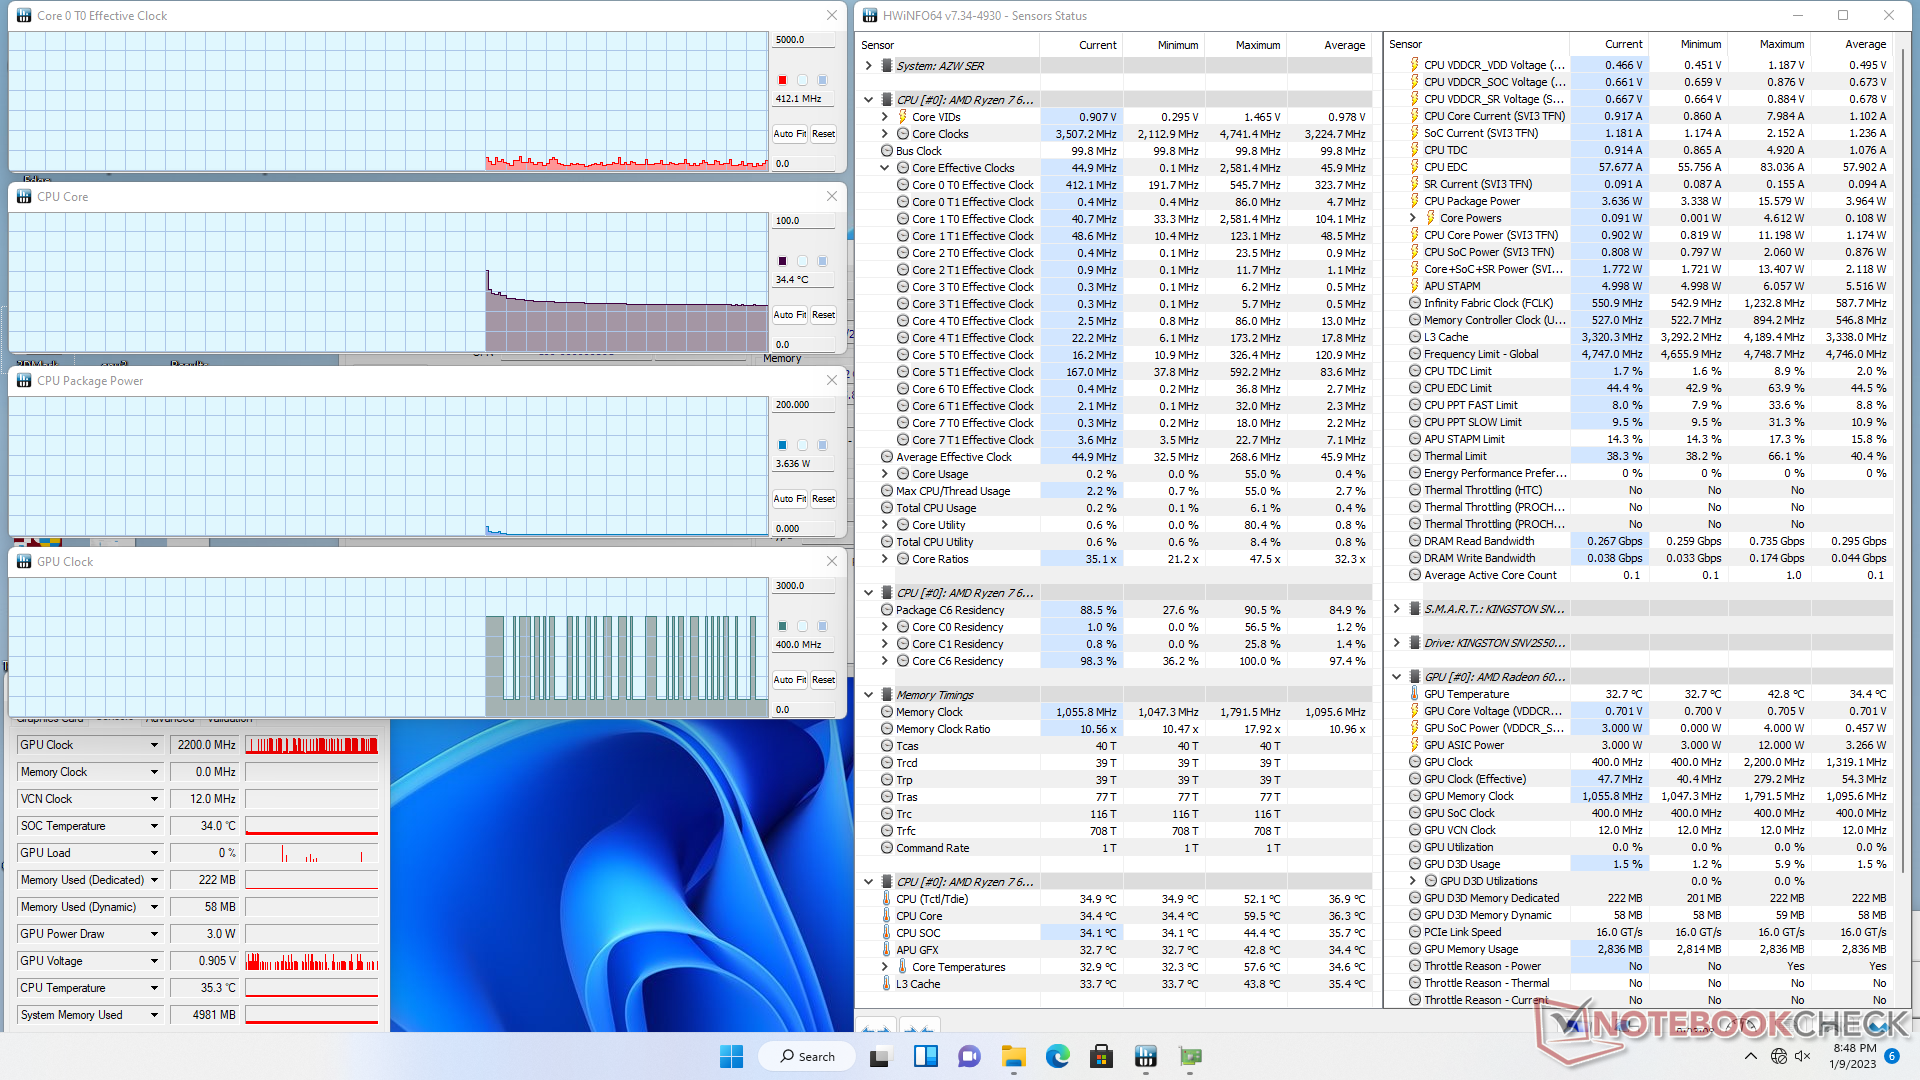
| CPU时钟(GHz) | GPU时钟(MHz) | CPU平均温度(°C) | |
| 系统空闲 | -- | -- | 34 |
| Prime95压力 | 3.0 | -- | 82 |
| Prime95 + FurMark 压力 | 2.7 | 941 | 74 |
| Witcher 3 应力 | ~0.6 | 1956 | 70 |
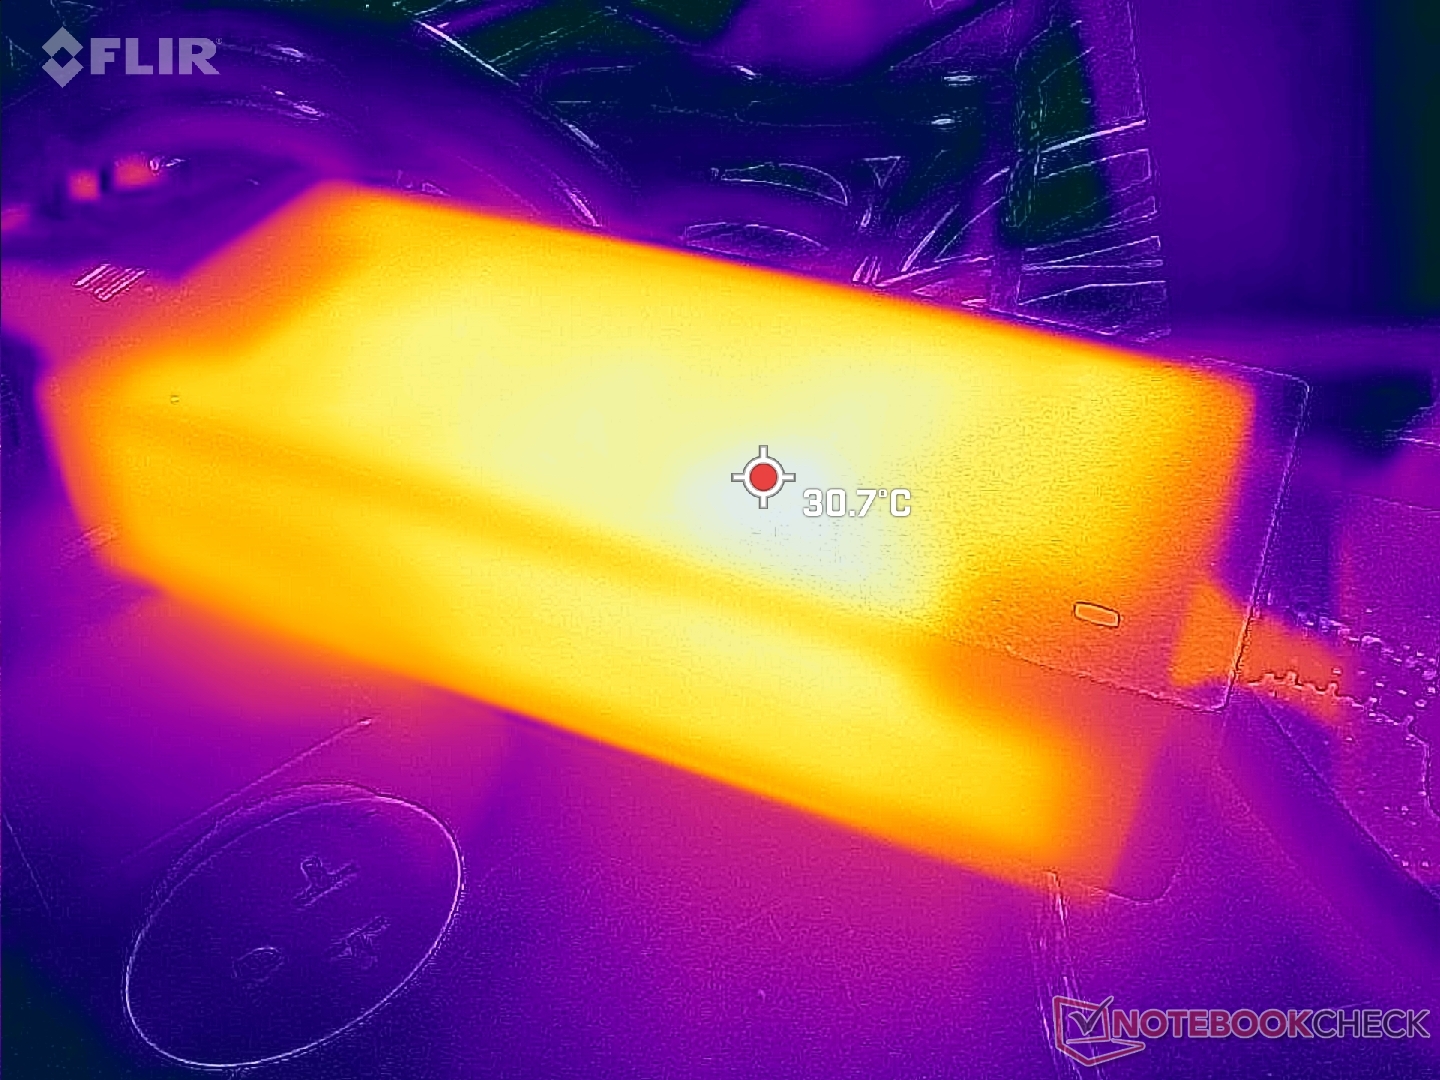
能源管理
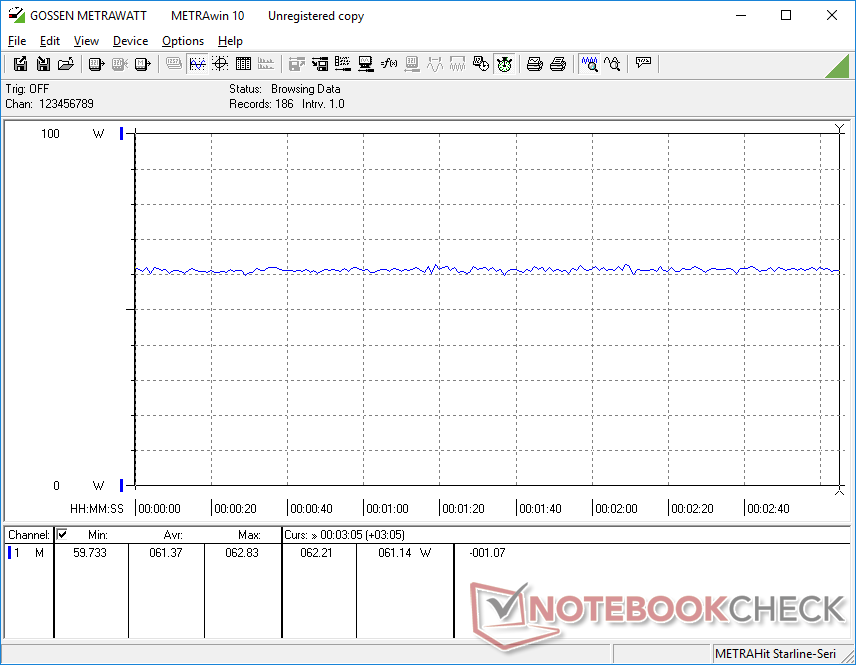
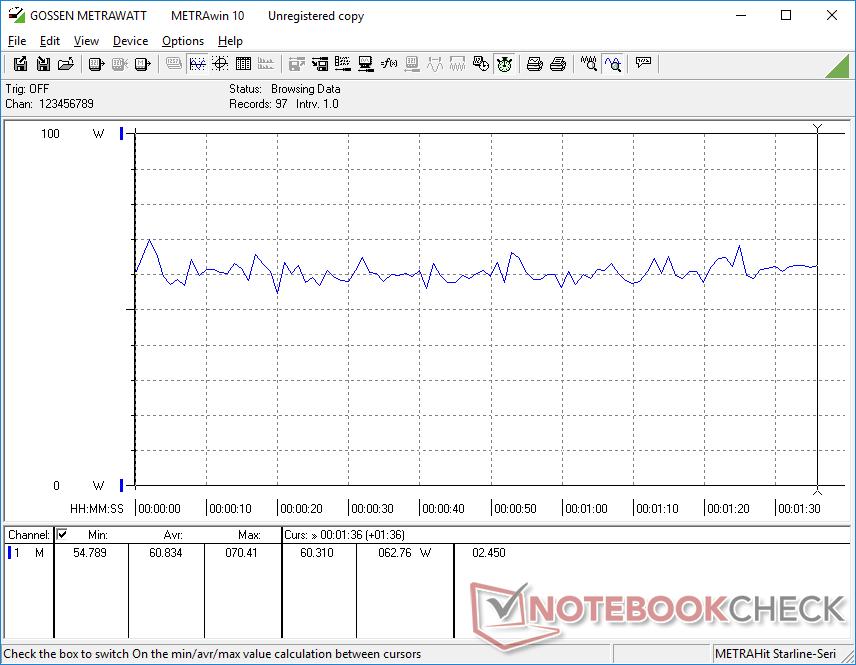
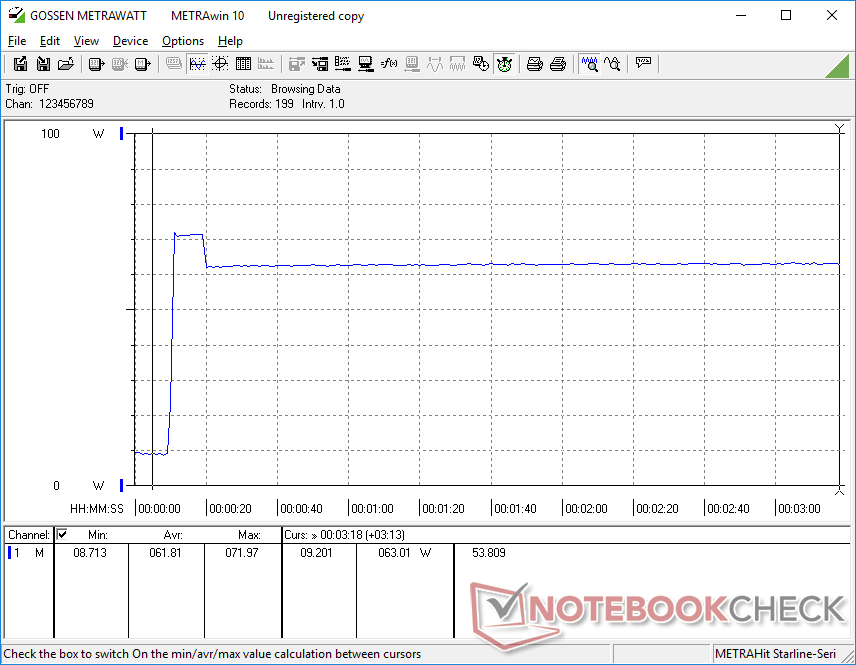
消耗功率
游戏时的功耗比运行在上一代的SER5 Pro高约33%。 Ryzen 5 5600H而且还略高于运行在英特尔第12代酷睿H系列CPU上的SEi11 Pro。然而,当考虑到我们的Radeon 680M可以提供高达2倍于Radeon RX Vega 7的性能时,更高的功耗当然是值得的。尽管升级了显卡,在桌面上空转仍会消耗与去年的型号一样多的电力。
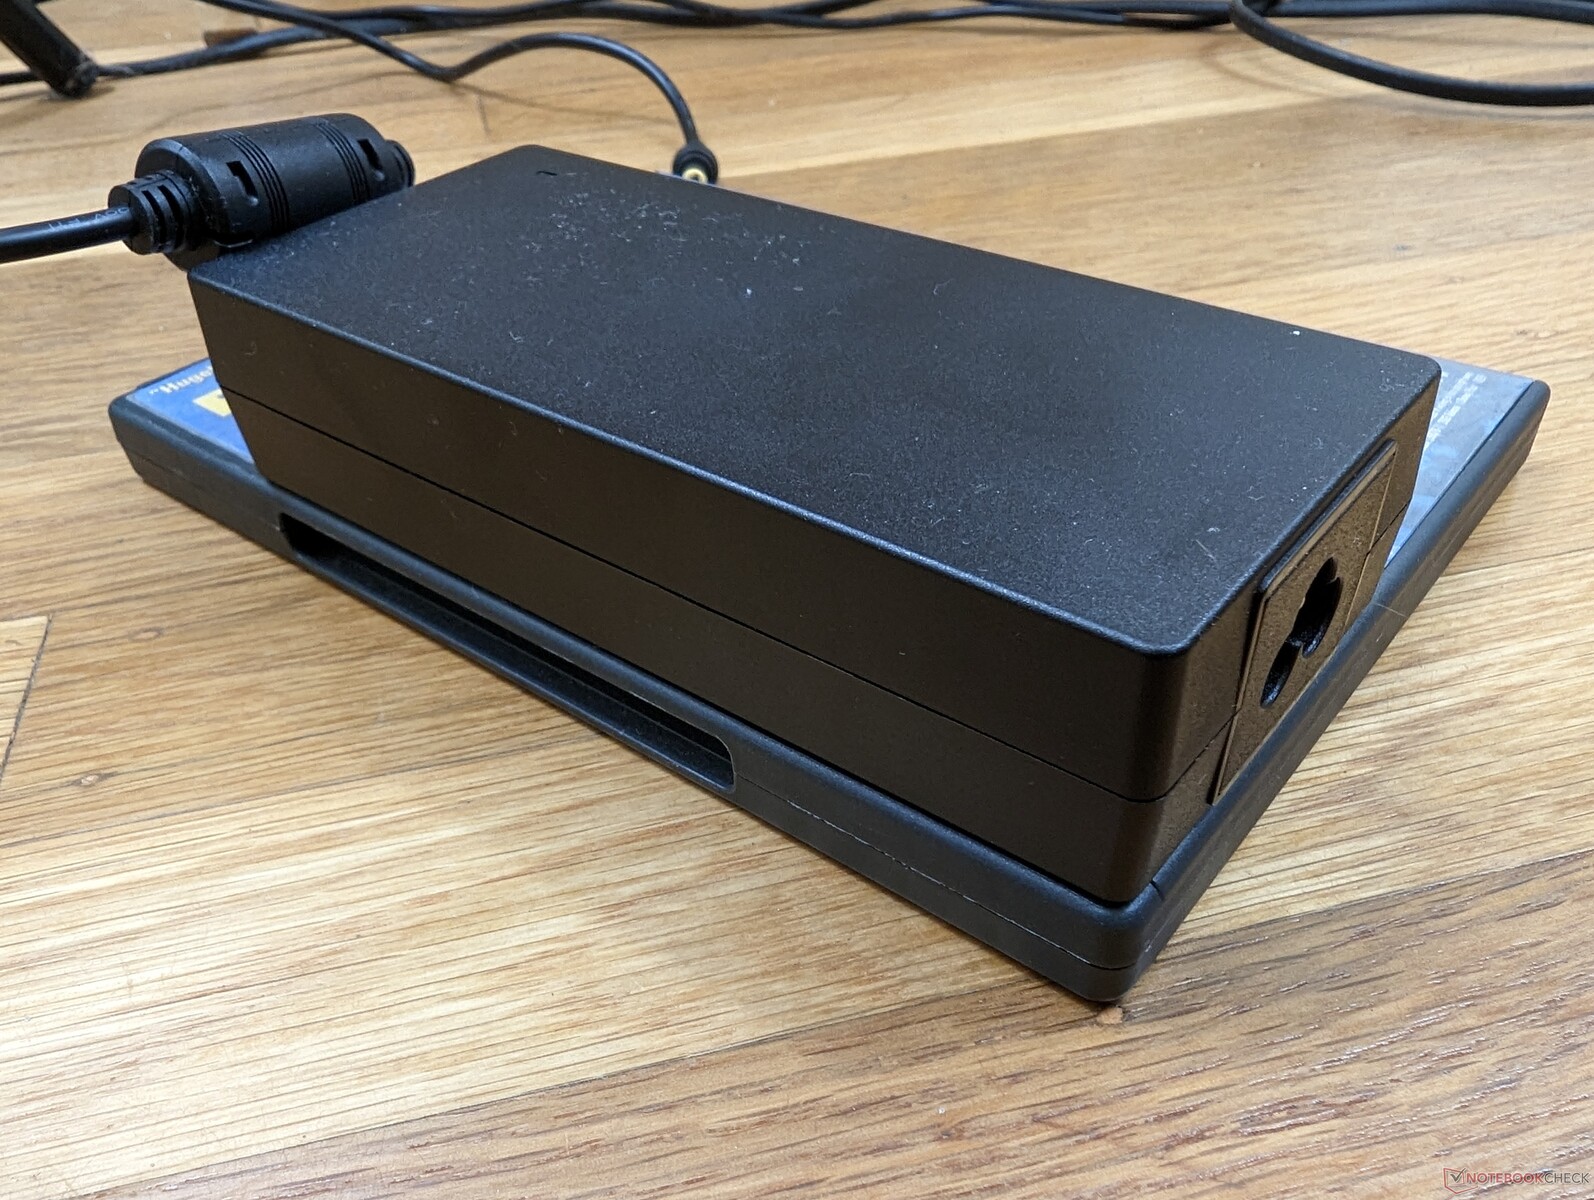
当CPU处于100%的利用率时,我们能够从120W的交流适配器上记录到72W的最大耗电量。高开销允许迷你电脑为某些USB-C设备供电或充电,代价是使用体积较大的交流适配器。

| Off / Standby | |
| Idle | |
| Load |
|
Key:
min: | |
| Beelink SER6 Pro R7 6800H, Radeon 680M, Kingston NV2 500GB SNV2S/500G, , x, | Beelink SER Pro Ryzen 5 5600H R5 5600H, Vega 7, Kingston NV1 SNVS/500GCN, , x, | Beelink SEi11 Pro i5-11320H, Iris Xe G7 96EUs, Kingston NV1 SNVS/500GCN, , x, | Intel NUC 12 Pro Kit NUC12WSKi7 i7-1260P, Iris Xe G7 96EUs, Transcend M.2 SSD 2200S TS512GMTE220S, , x, | Intel NUC11PHKi7C i7-1165G7, GeForce RTX 2060 Mobile, Samsung SSD 980 Pro 500GB MZ-V8P500BW, , x, | Intel Hades Canyon NUC8i7HVK i7-8809G, Vega M GH, Intel Optane 120 GB SSDPEK1W120GA, , x, | |
|---|---|---|---|---|---|---|
| Power Consumption | 19% | -3% | -35% | -93% | -91% | |
| Idle Minimum * (Watt) | 8.3 | 5.4 35% | 9.8 -18% | 12.1 -46% | 5.8 30% | 15.5 -87% |
| Idle Average * (Watt) | 8.4 | 8.2 2% | 10.3 -23% | 12.2 -45% | 5.9 30% | 16.2 -93% |
| Idle Maximum * (Watt) | 8.7 | 8.3 5% | 10.5 -21% | 12.3 -41% | 20.7 -138% | 16.5 -90% |
| Load Average * (Watt) | 60.8 | 49.3 19% | 54.2 11% | 64 -5% | 130.8 -115% | 83.4 -37% |
| Witcher 3 ultra * (Watt) | 61.4 | 46.1 25% | 53.1 14% | 154.4 -151% | 121.7 -98% | |
| Load Maximum * (Watt) | 72 | 50.2 30% | 59 18% | 98.8 -37% | 225.2 -213% | 173.5 -141% |
* ... smaller is better
Power Consumption Witcher 3 / Stresstest
Power Consumption external Monitor
Pros
Cons
结论--一个沉睡的打击
SER6 Pro与最近的GTR6 Pro有许多相同的优点和缺点。 GTR6.更具体地说,与其他采用集成显卡的迷你PC相比,性能特别强,但风扇噪音和功耗都比较大,而且分别略高。它的两个主要缺点并不影响买家将得到的令人难以置信的价值。32GB内存、500GB NVMe固态硬盘、Windows 11专业版,以及最快的集成显卡迷你电脑之一,所有这些只需650美元。
Beelink SER6 Pro在性能和价值方面都远远胜过同等价位的英特尔酷睿U系列NUC。
对于未来的修订,我们希望看到一个更小的交流适配器,以及只有一个大的内部风扇而不是两个小的。目前的交流适配器比迷你电脑本身还要重,而更大的风扇将导致更低的音调和更明显的风扇噪音。用户还应该注意游戏时潜在的帧率稳定性问题。除此以外,Beelink一直在用其 芯片 和 SER 系列迷你电脑在性能和价值方面都取得了骄人的成绩。
价格和可用性
亚马逊目前正在运送我们确切的SER6 Pro配置,价格为650美元。用户也可以,直接从制造商那里购买从制造商那里购买,价格为659美元。
Transparency
The selection of devices to be reviewed is made by our editorial team. The test sample was provided to the author as a loan by the manufacturer or retailer for the purpose of this review. The lender had no influence on this review, nor did the manufacturer receive a copy of this review before publication. There was no obligation to publish this review. As an independent media company, Notebookcheck is not subjected to the authority of manufacturers, retailers or publishers.
This is how Notebookcheck is testing
Every year, Notebookcheck independently reviews hundreds of laptops and smartphones using standardized procedures to ensure that all results are comparable. We have continuously developed our test methods for around 20 years and set industry standards in the process. In our test labs, high-quality measuring equipment is utilized by experienced technicians and editors. These tests involve a multi-stage validation process. Our complex rating system is based on hundreds of well-founded measurements and benchmarks, which maintains objectivity. Further information on our test methods can be found here.
Price comparison

