Beelink SEi12迷你电脑评论。超越英特尔NUC 11的表现

Beelink为预算和中档市场设计了大量的迷你电脑。虽然目前还没有配备专用GPU的型号,但其中许多型号已经预装了Windows 11、内存和存储,足以满足媒体中心、流媒体盒子或典型的日常浏览或办公任务的需要。
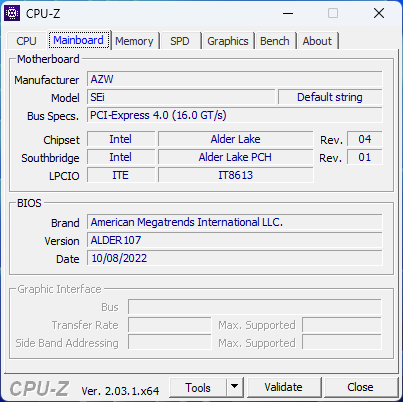
Beelink的最新迷你电脑是SEi12,它配备了第12代酷睿i5-1235U,而其他大多数廉价的替代品通常配备较旧或较慢的CPU,以保持低价。我们的评论单元可以在网上找到,价格仅为460美元。
SEi12的竞争者包括其他大多数采用U系列CPU的迷你电脑,如许多 英特尔NUC模型诸如BMAX B5 Pro或 王牌魔术师AMR5.
更多Beelink的评论。
潜在的竞争对手比较
Rating | Date | Model | Weight | Height | Size | Resolution | Price |
|---|---|---|---|---|---|---|---|
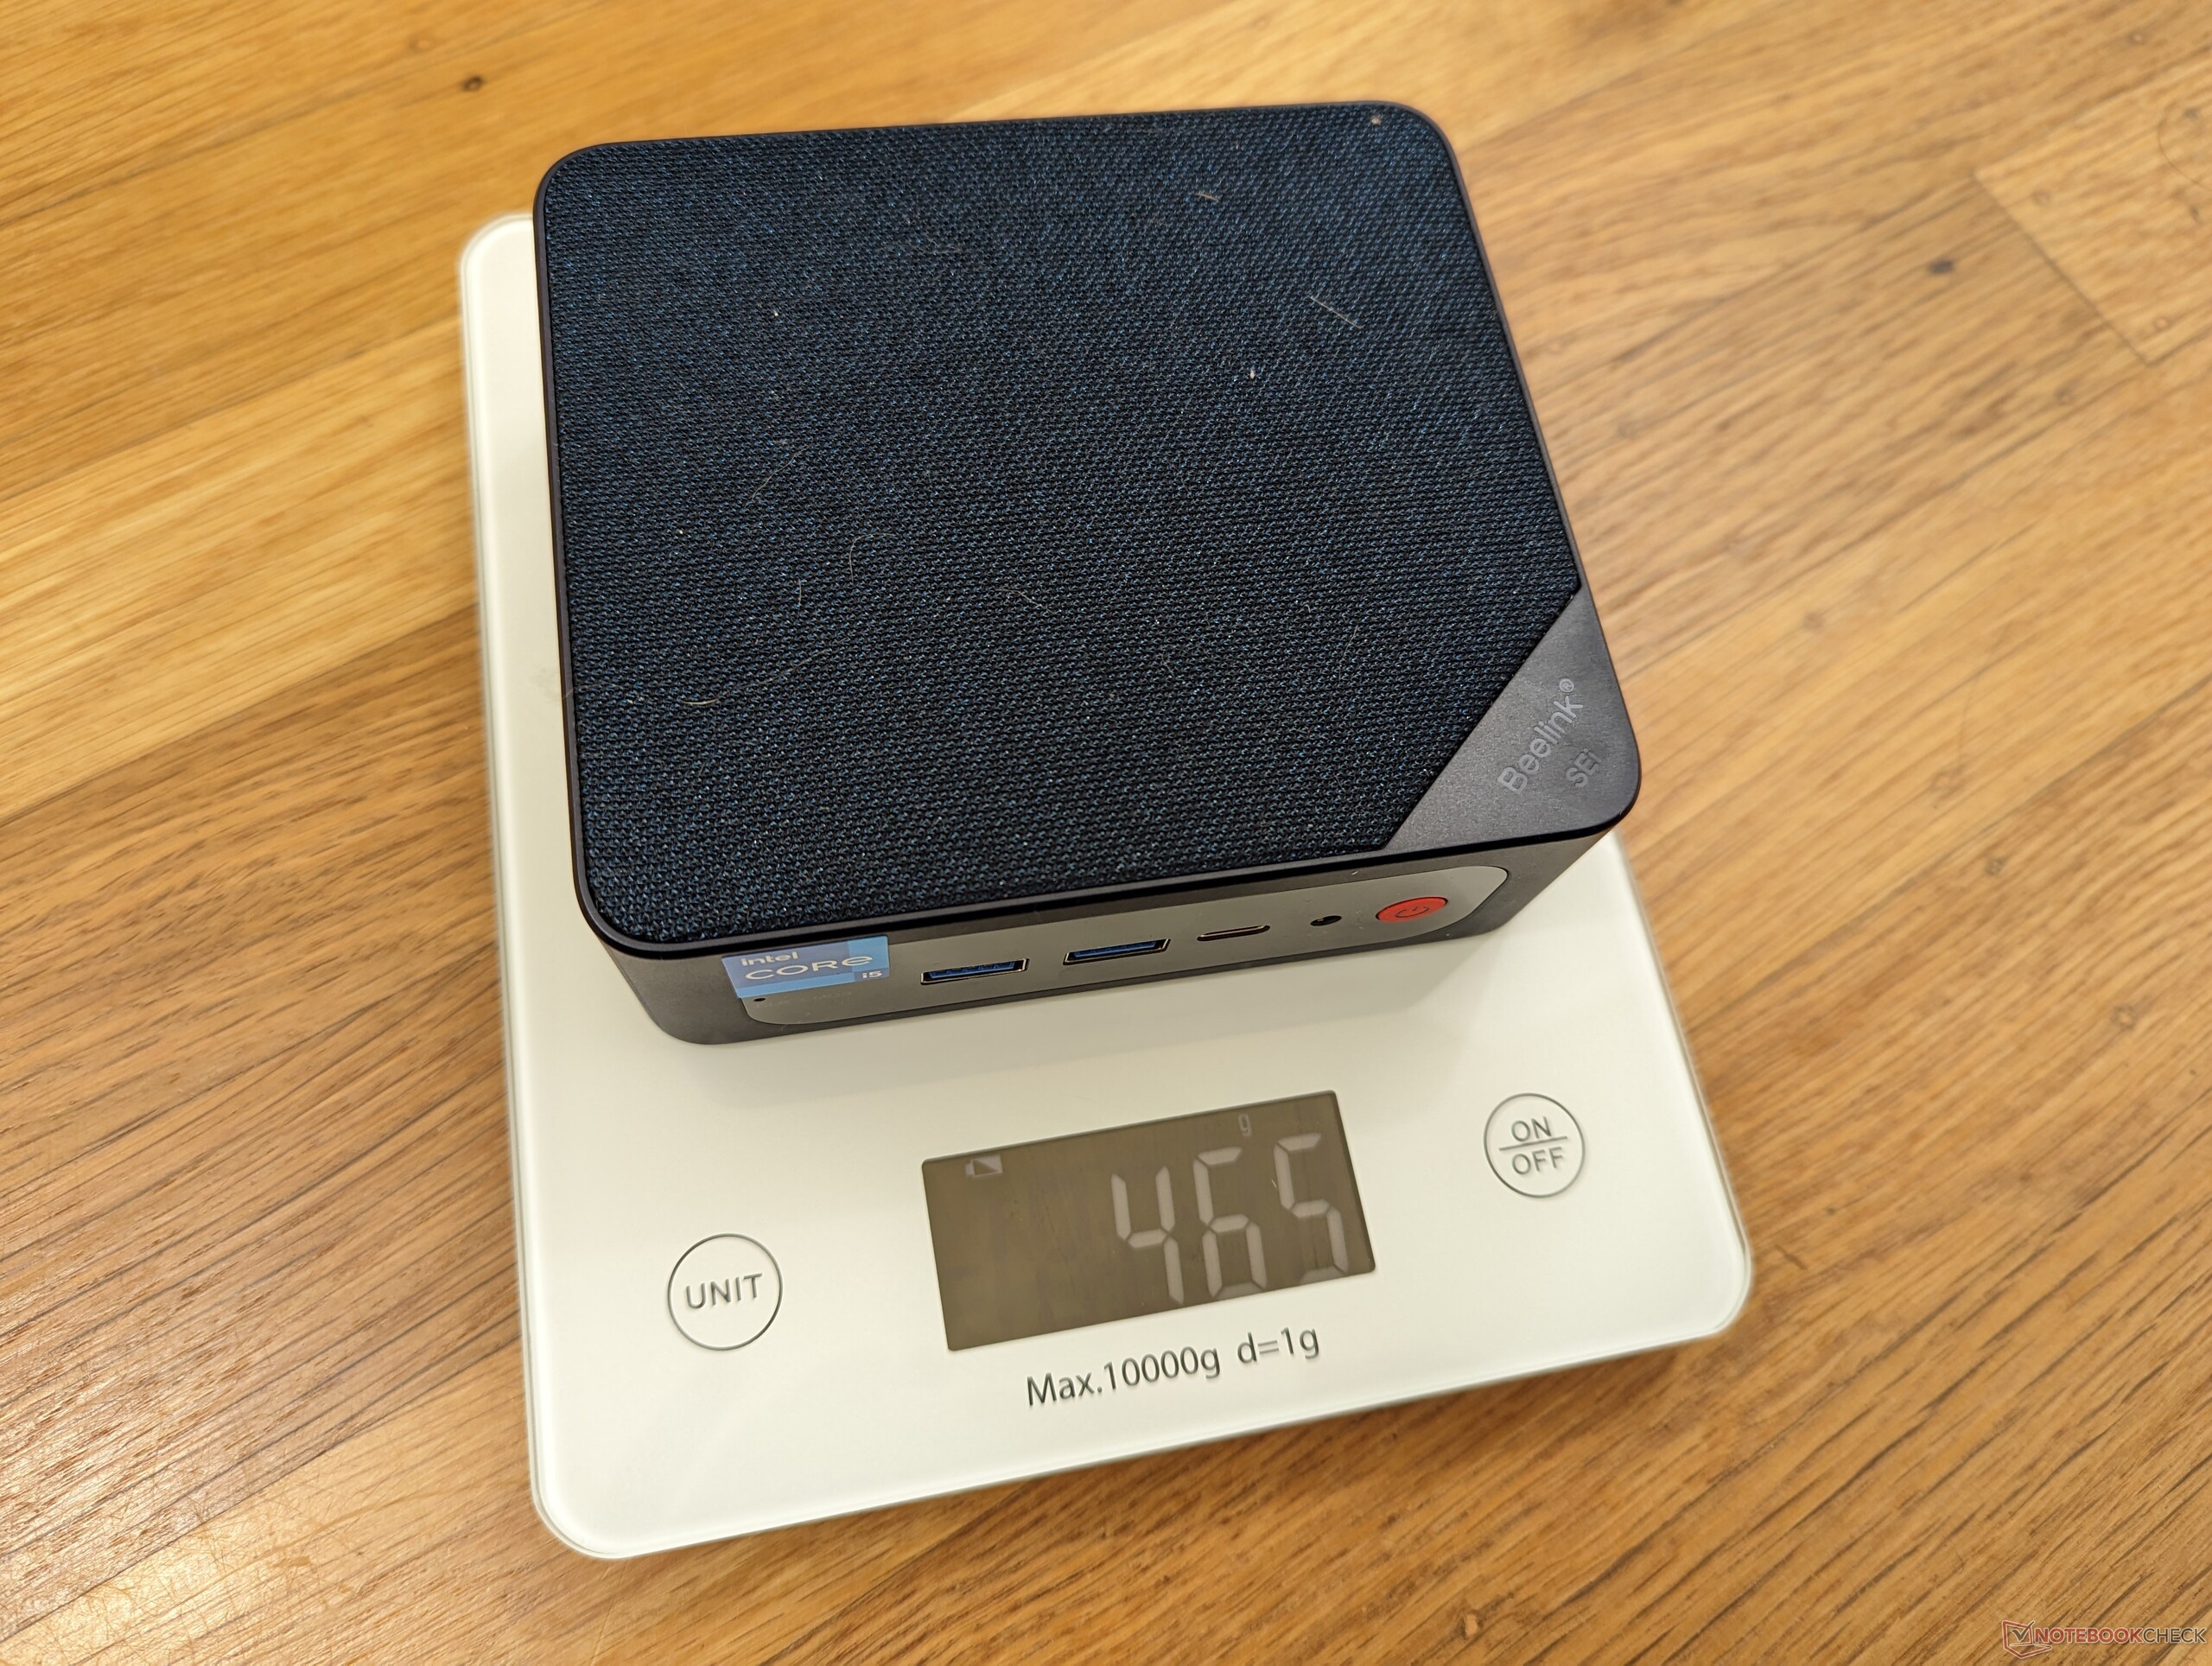
v (old) | 12 / 2022 | Beelink SEi12 Core i5-1235U i5-1235U, Iris Xe G7 80EUs | 465 g | 42 mm | x | ||
v (old) | 04 / 2022 | Beelink SEi8 i3-8109U, Iris Plus Graphics 655 | 346 g | 41 mm | x | ||
v (old) | 04 / 2022 | Beelink SER4 R7 4800U, Vega 8 | 494 g | 40 mm | x | ||
v (old) | Intel NUC11PAQi7 i7-1165G7, Iris Xe G7 96EUs | 647 g | 56 mm | x | |||
v (old) | 11 / 2022 | BMAX B5 Pro G7H8 i5-8260U, UHD Graphics 620 | 369 g | 43.2 mm | x | ||
v (old) | Intel Hades Canyon NUC8i7HVK i7-8809G, Vega M GH | 1.3 kg | 39 mm | x |
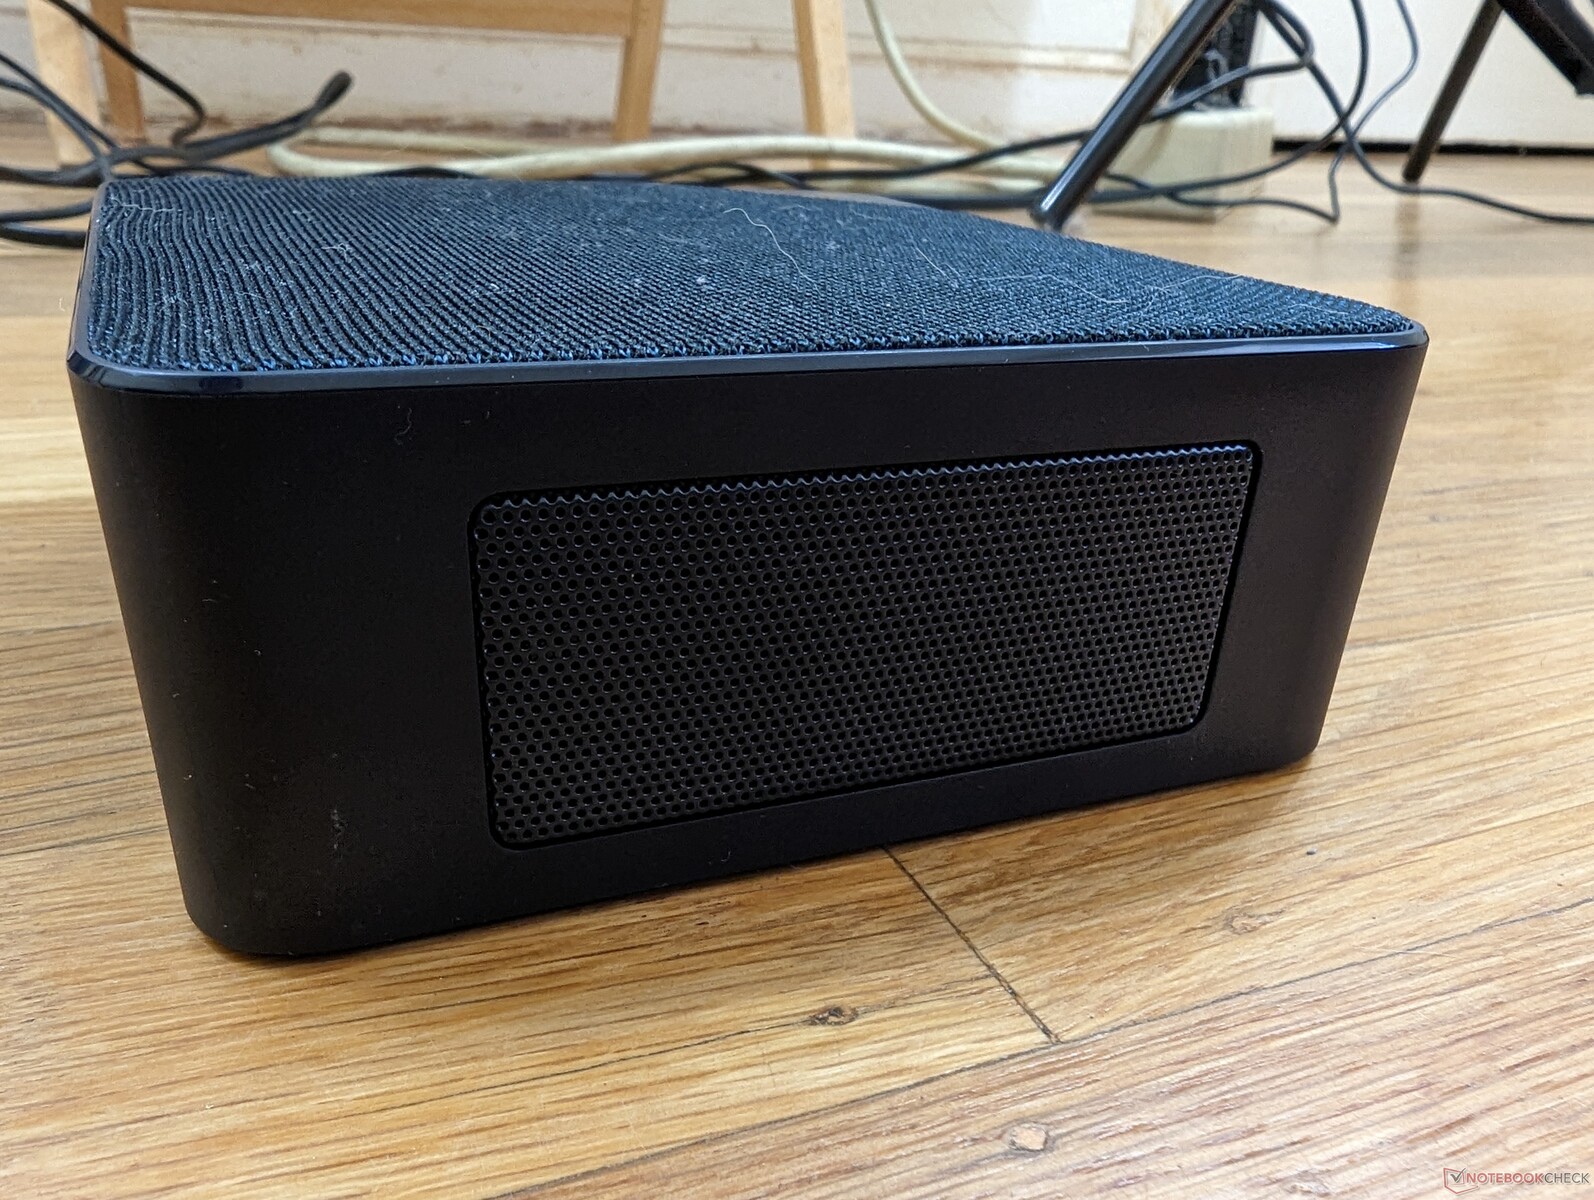
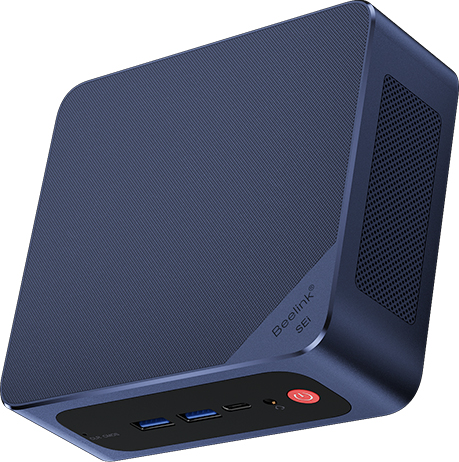
案例
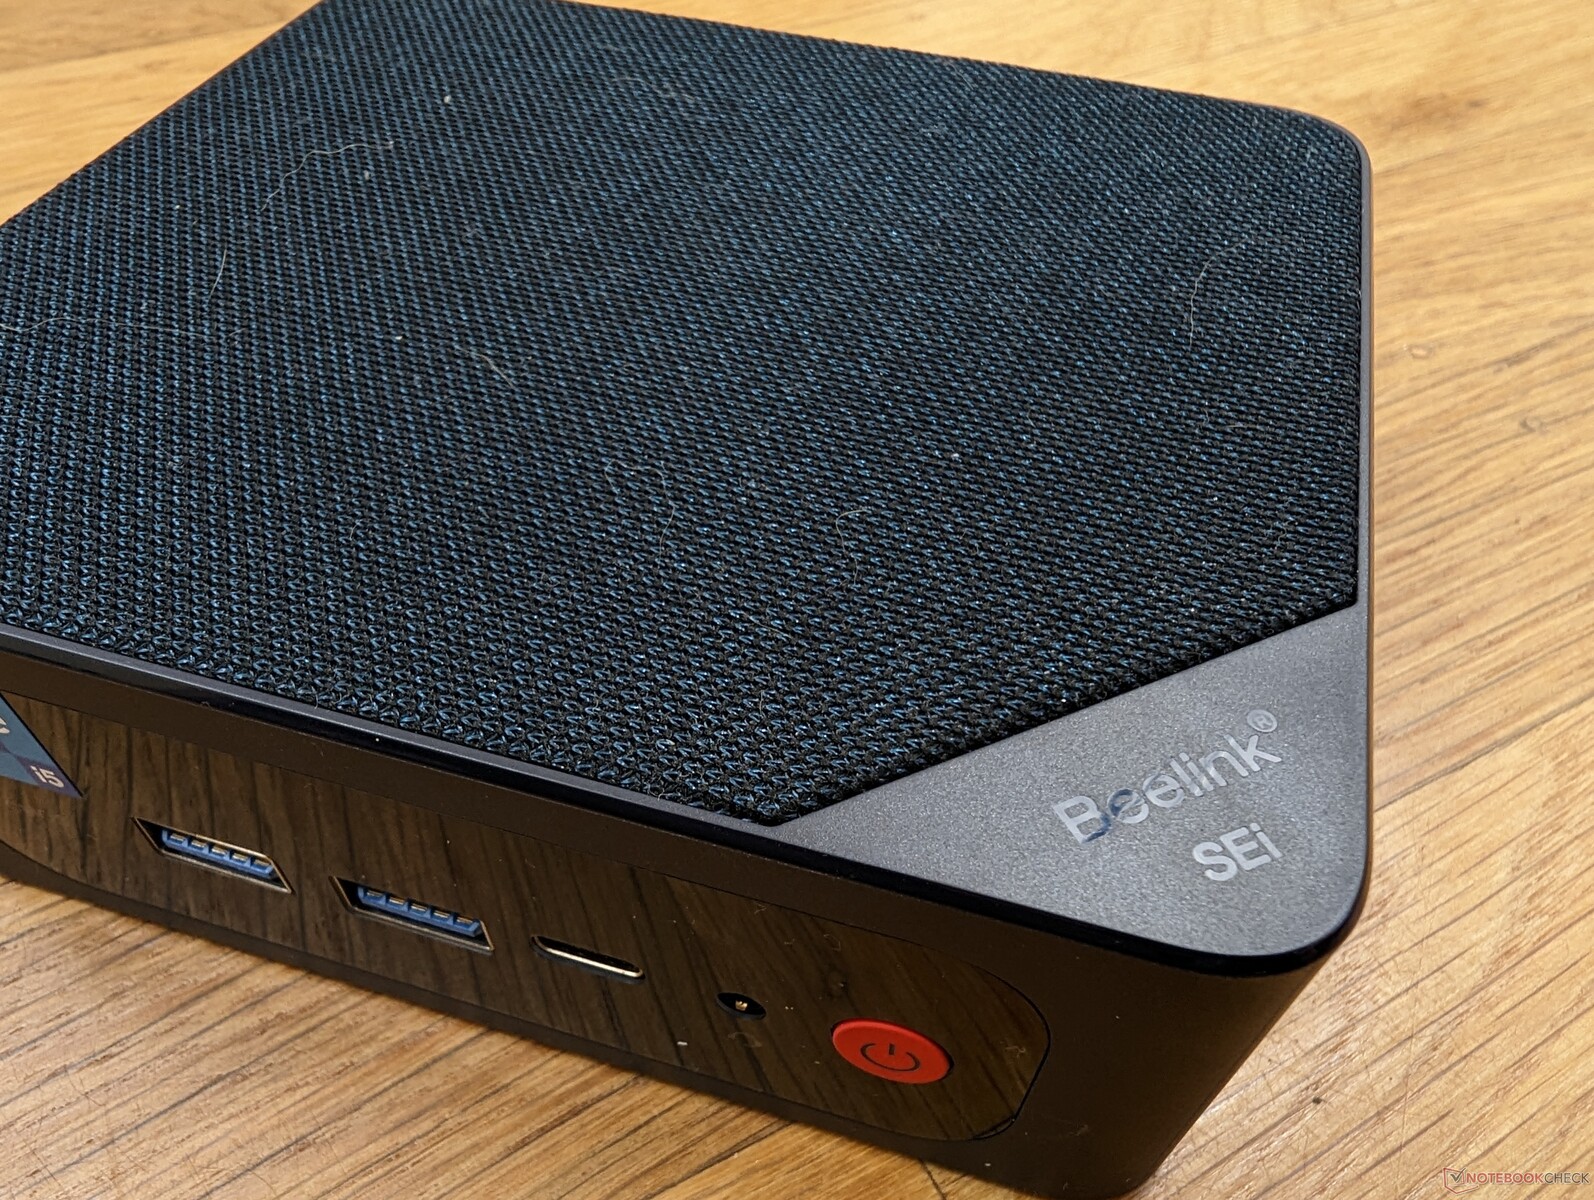
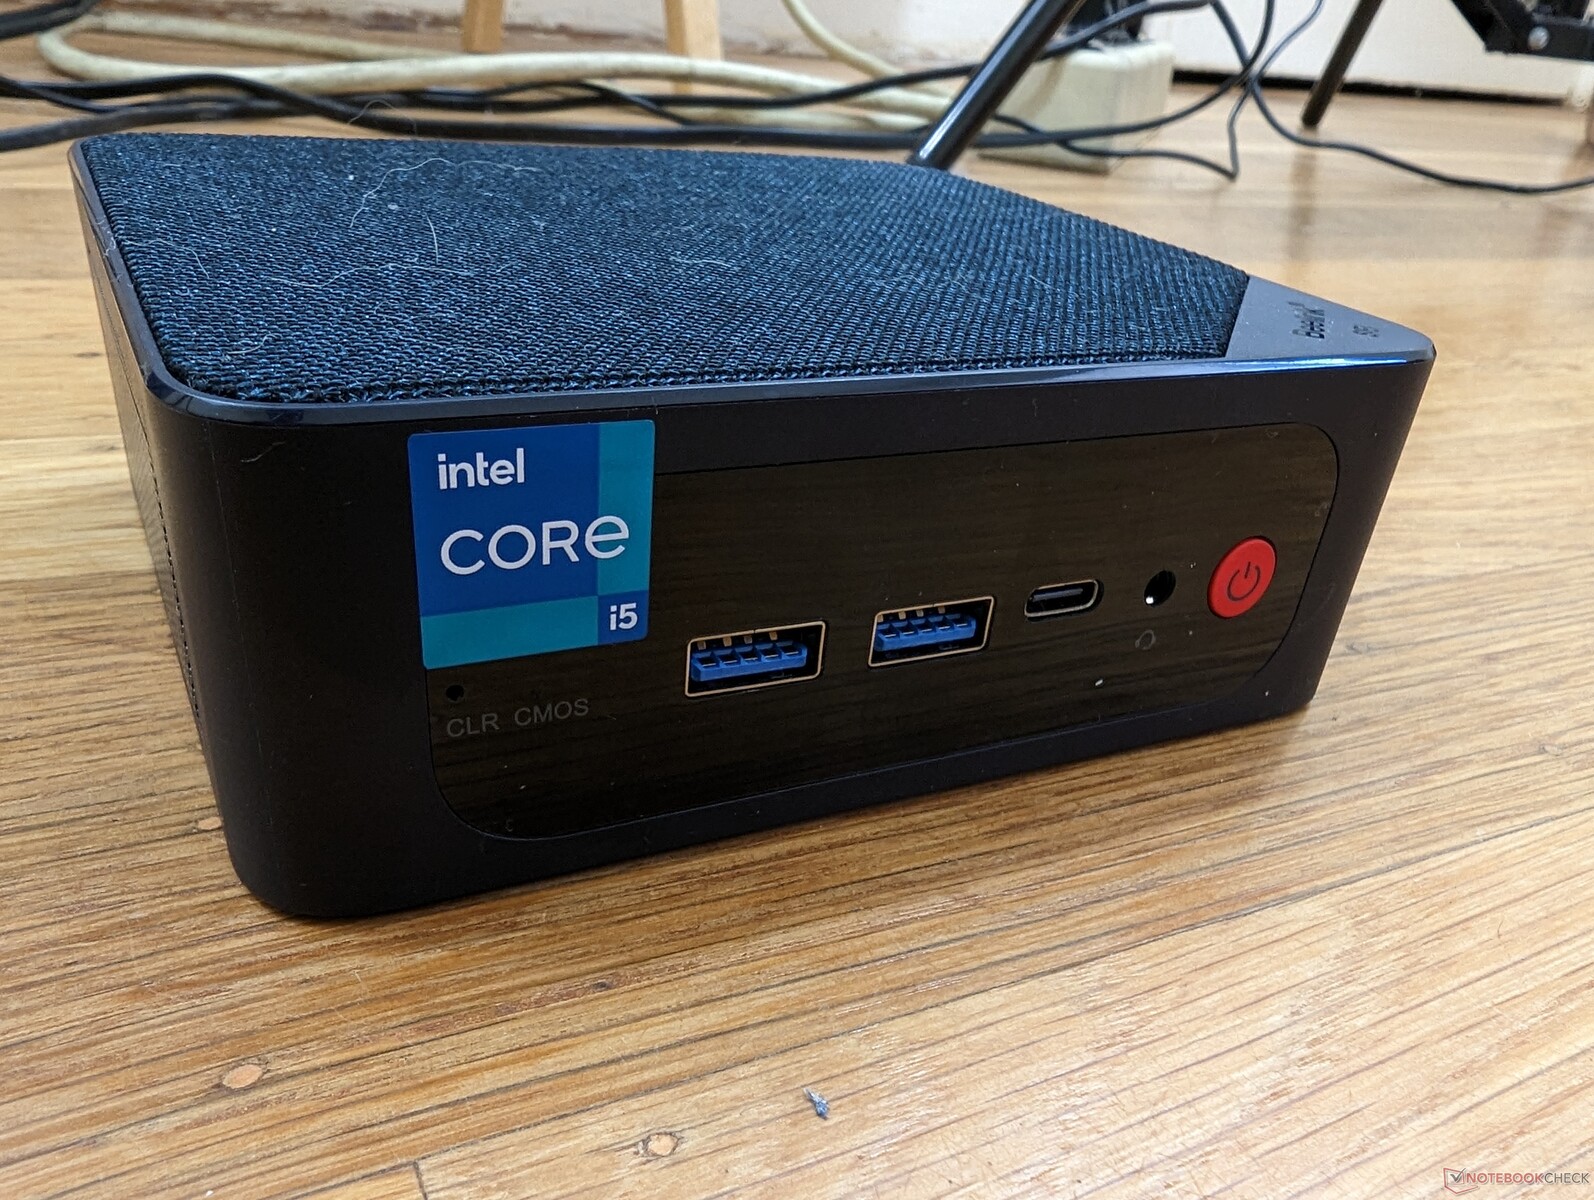
机箱只是比老款的略微厚一些,重一些。 SEi 11但有其他类似的金属材料和物理特征。SEi12最值得注意的视觉方面是其顶部表面的新羊毛或布材料,而旧的Beelink设计只是光滑的塑料或有孔的塑料网。这种布触摸起来很光滑,有一种奢华的感觉,但清洁起来可能比较困难,因为头发和灰尘更容易粘在上面。
连接性 - 没有Thunderbolt
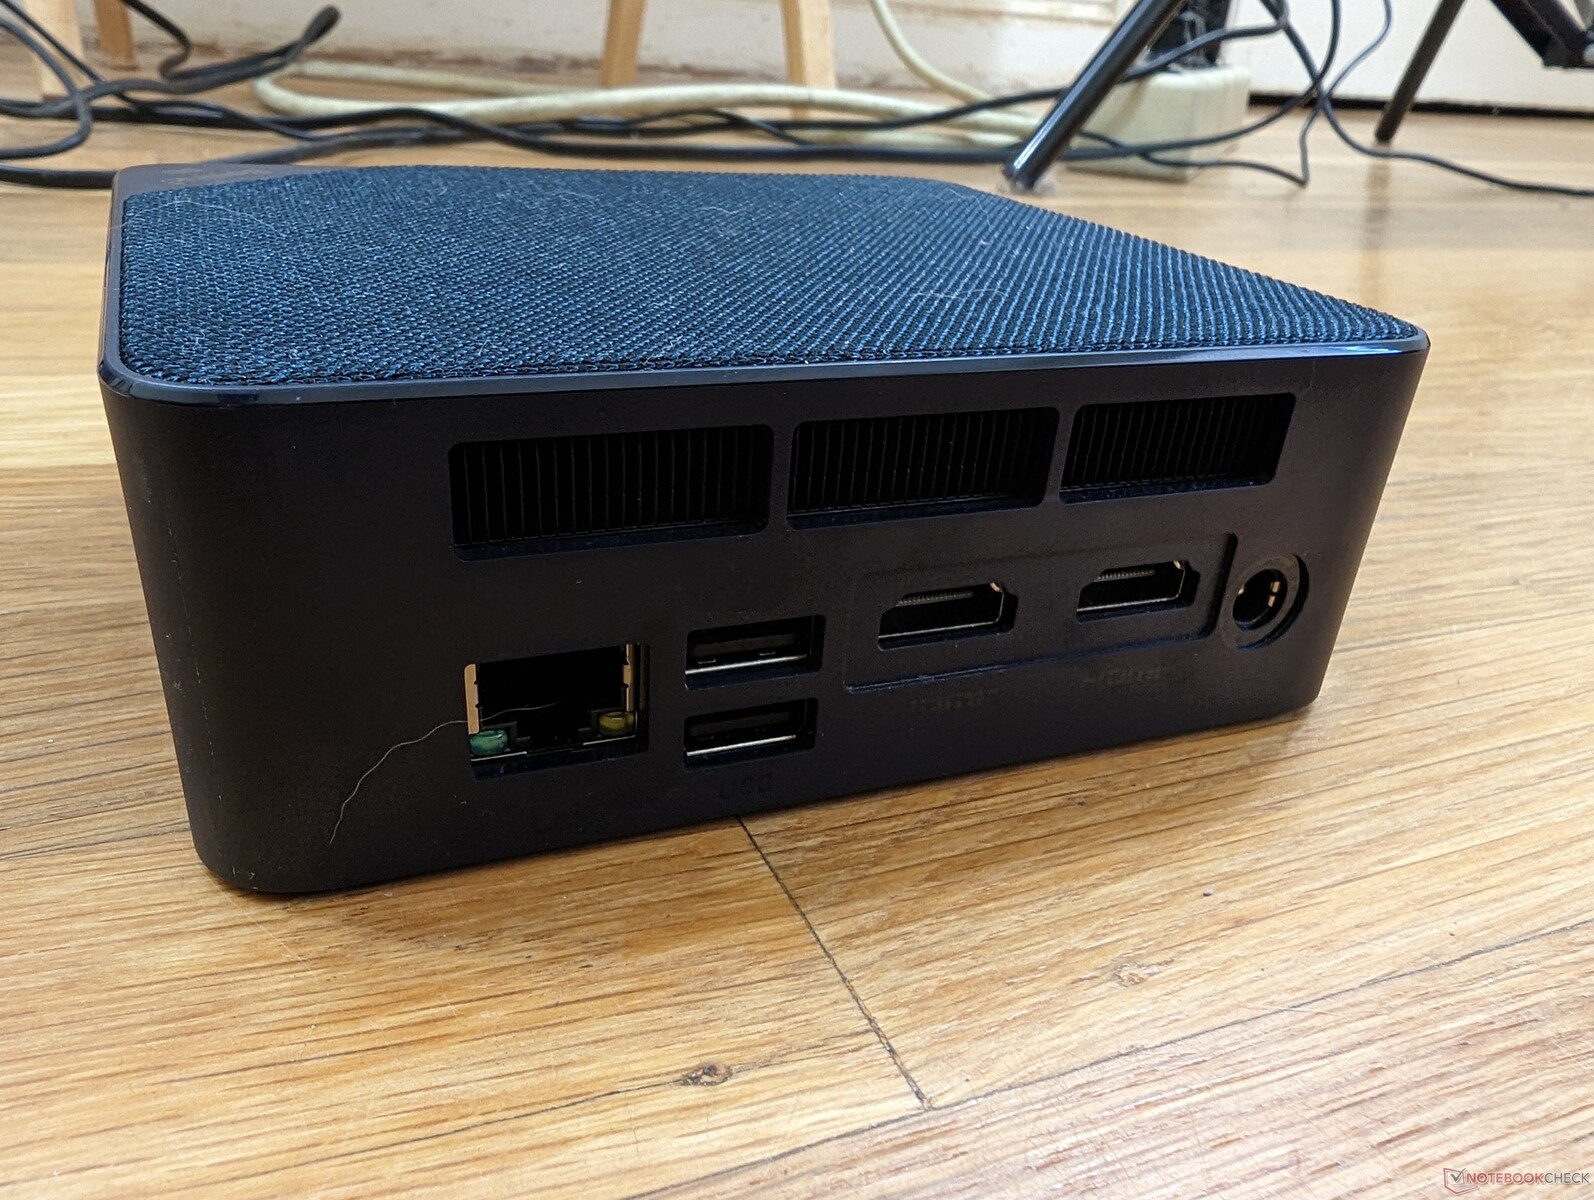
端口选项很好,有五个USB端口和两个HDMI端口可供选择。然而,我们无法从USB-C端口输出任何视频,这意味着DisplayPort-over-USB可能不被支持。该系统也不能由USB-C供电。
沟通
英特尔AX201是Wi-Fi 6和蓝牙5.2连接的标准配置。没有Wi-Fi 6E选项可能是为了降低成本,但如果用户愿意,可以安装自己的Wi-Fi 6E模块。尽管如此,传输速率还是既快又稳定。
| Networking | |
| iperf3 transmit AX12 | |
| Beelink SER4 | |
| Intel NUC11PAQi7 | |
| Intel Hades Canyon NUC8i7HVK | |
| Beelink SEi8 | |
| iperf3 receive AX12 | |
| Beelink SER4 | |
| Intel NUC11PAQi7 | |
| Intel Hades Canyon NUC8i7HVK | |
| Beelink SEi8 | |
| iperf3 receive AXE11000 | |
| Beelink SEi12 Core i5-1235U | |
| BMAX B5 Pro G7H8 | |
| iperf3 transmit AXE11000 | |
| Beelink SEi12 Core i5-1235U | |
| BMAX B5 Pro G7H8 | |
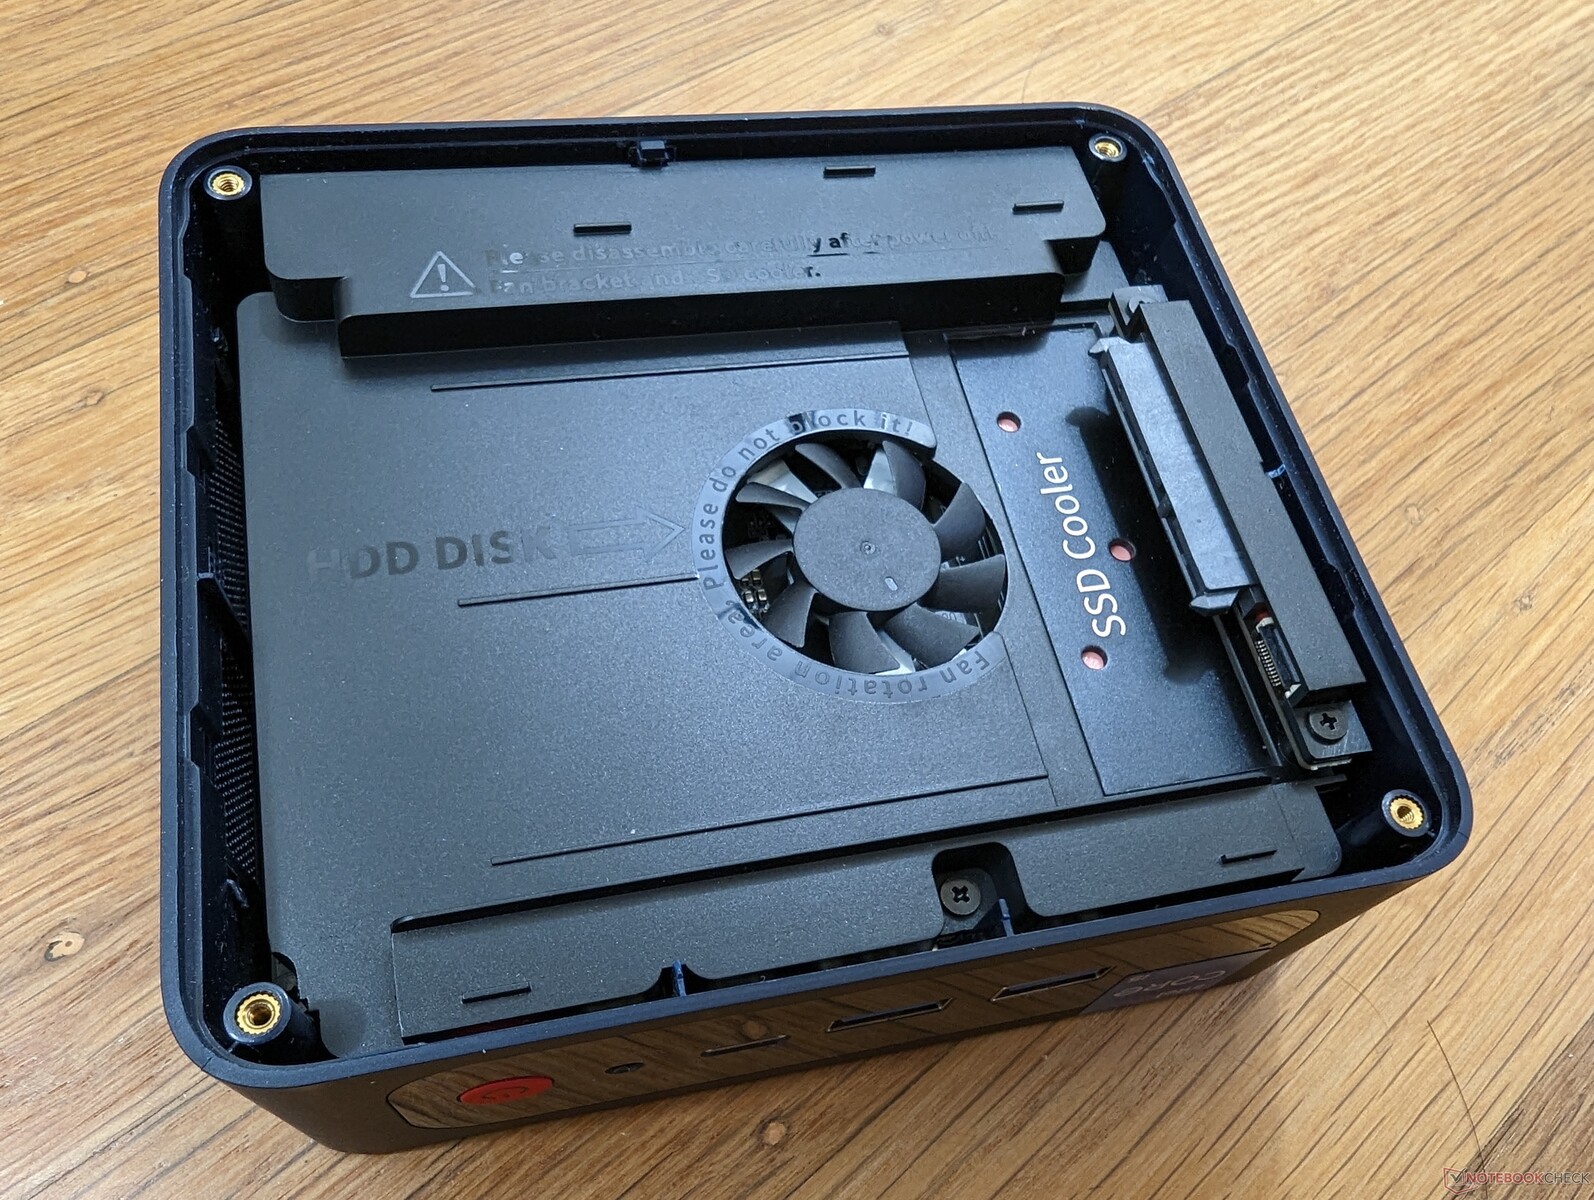
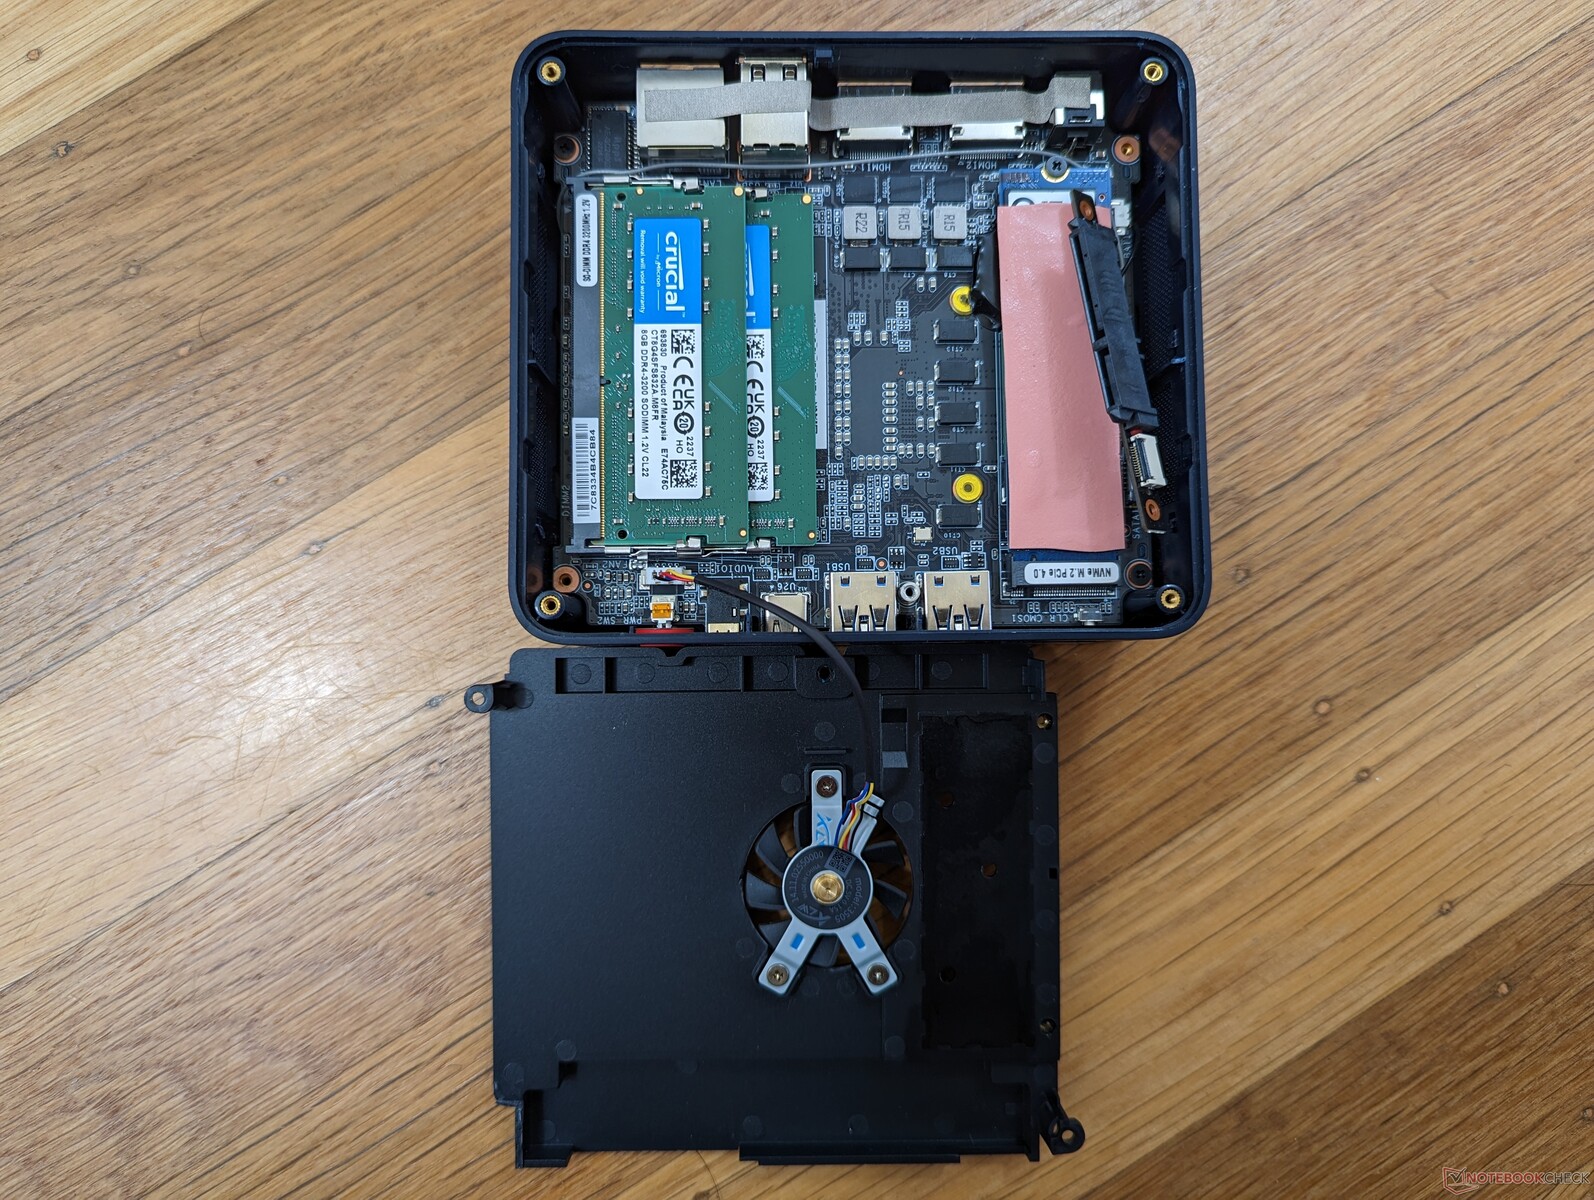
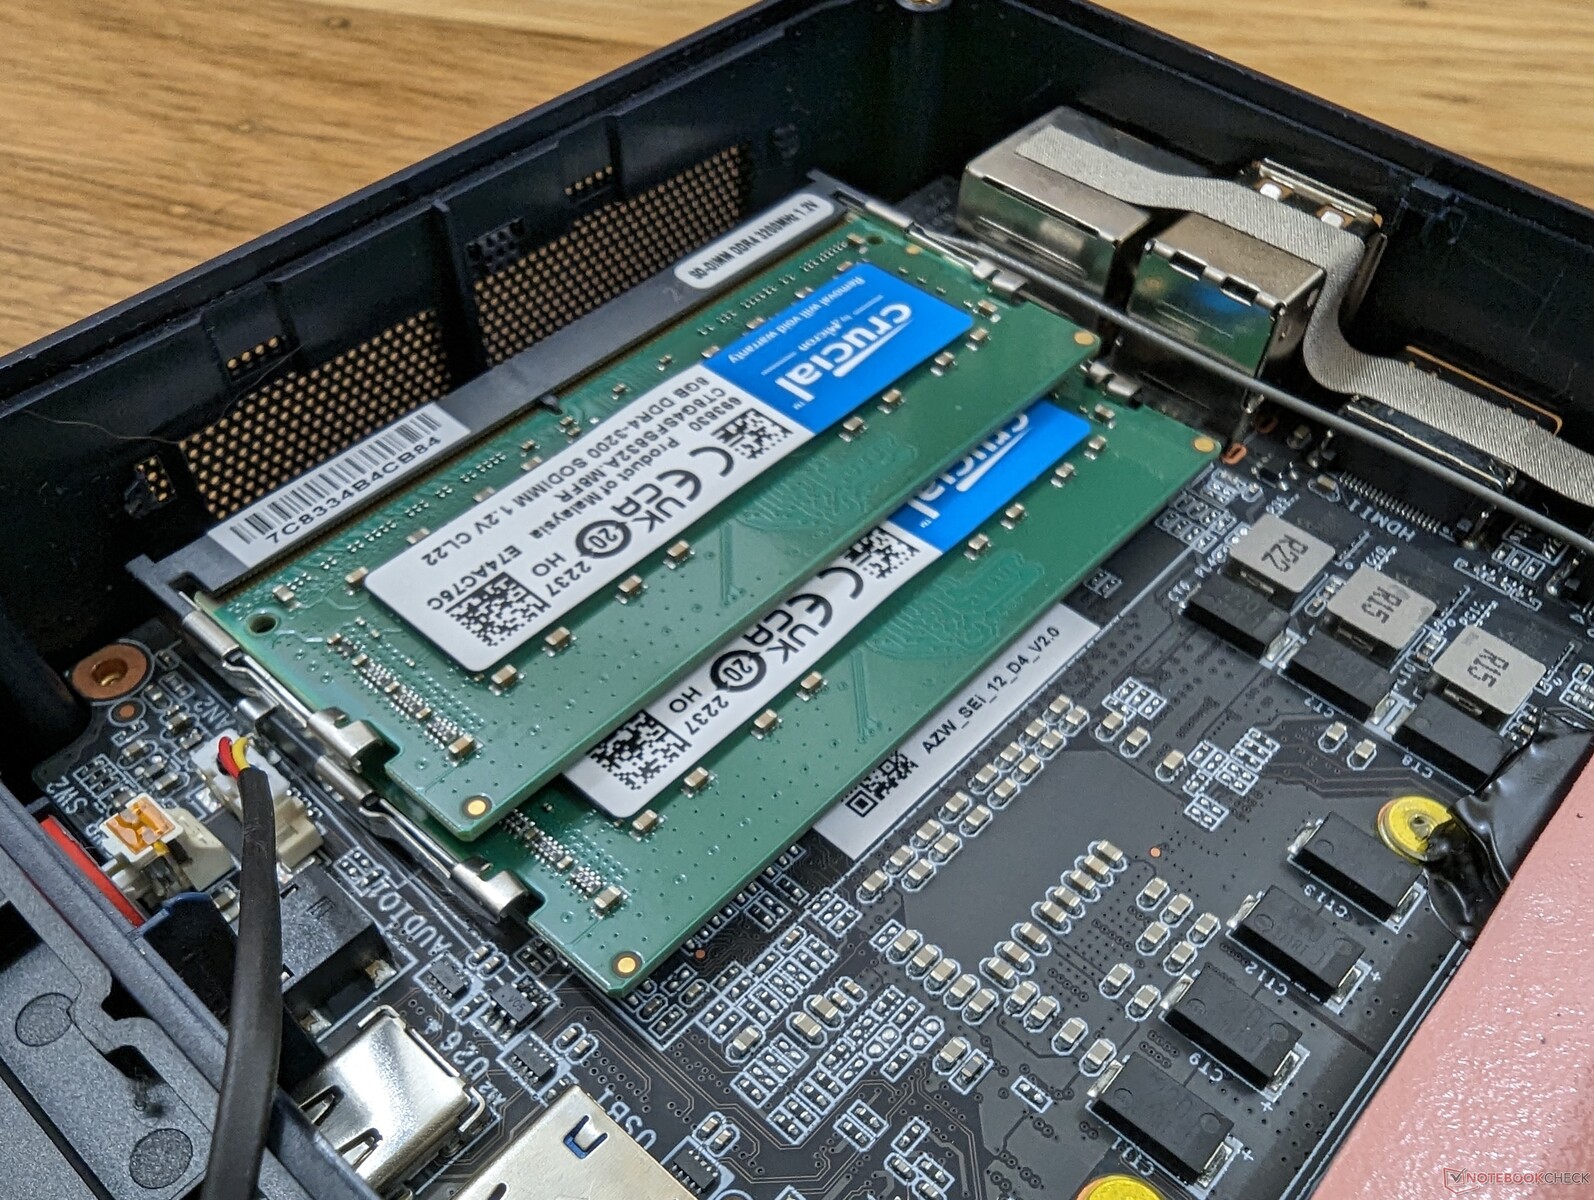
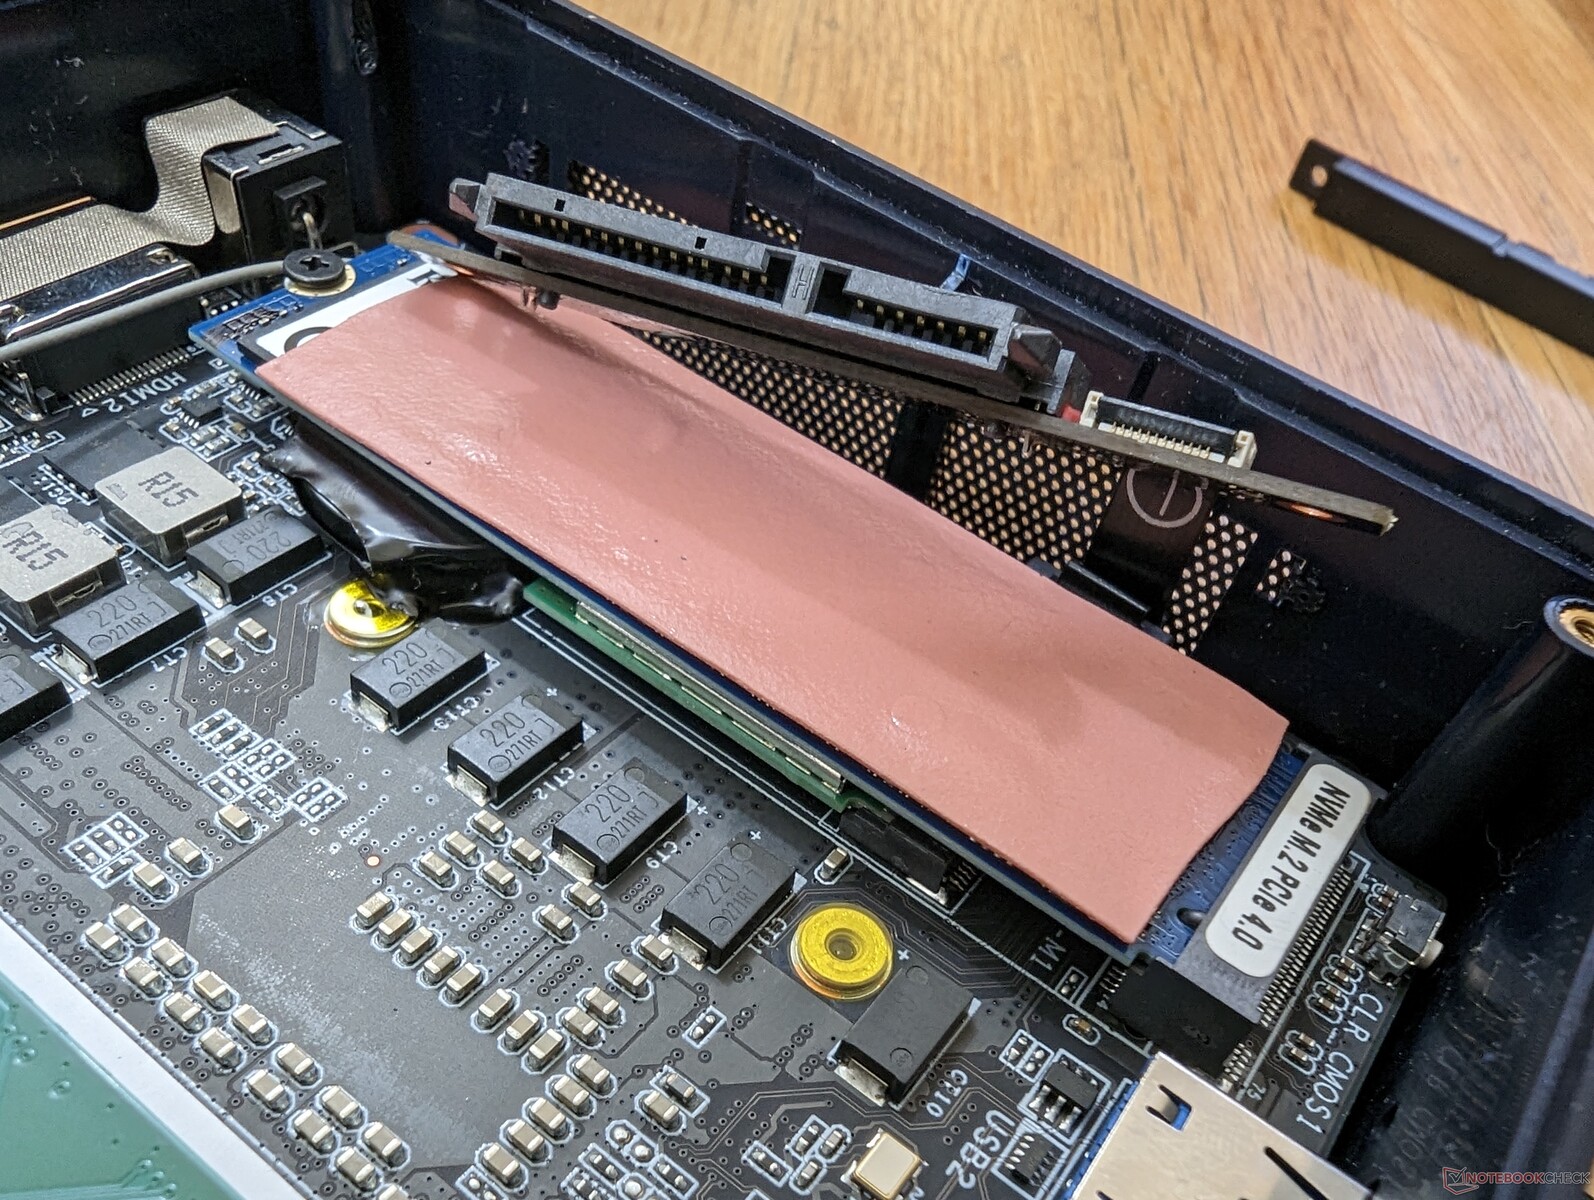
维护
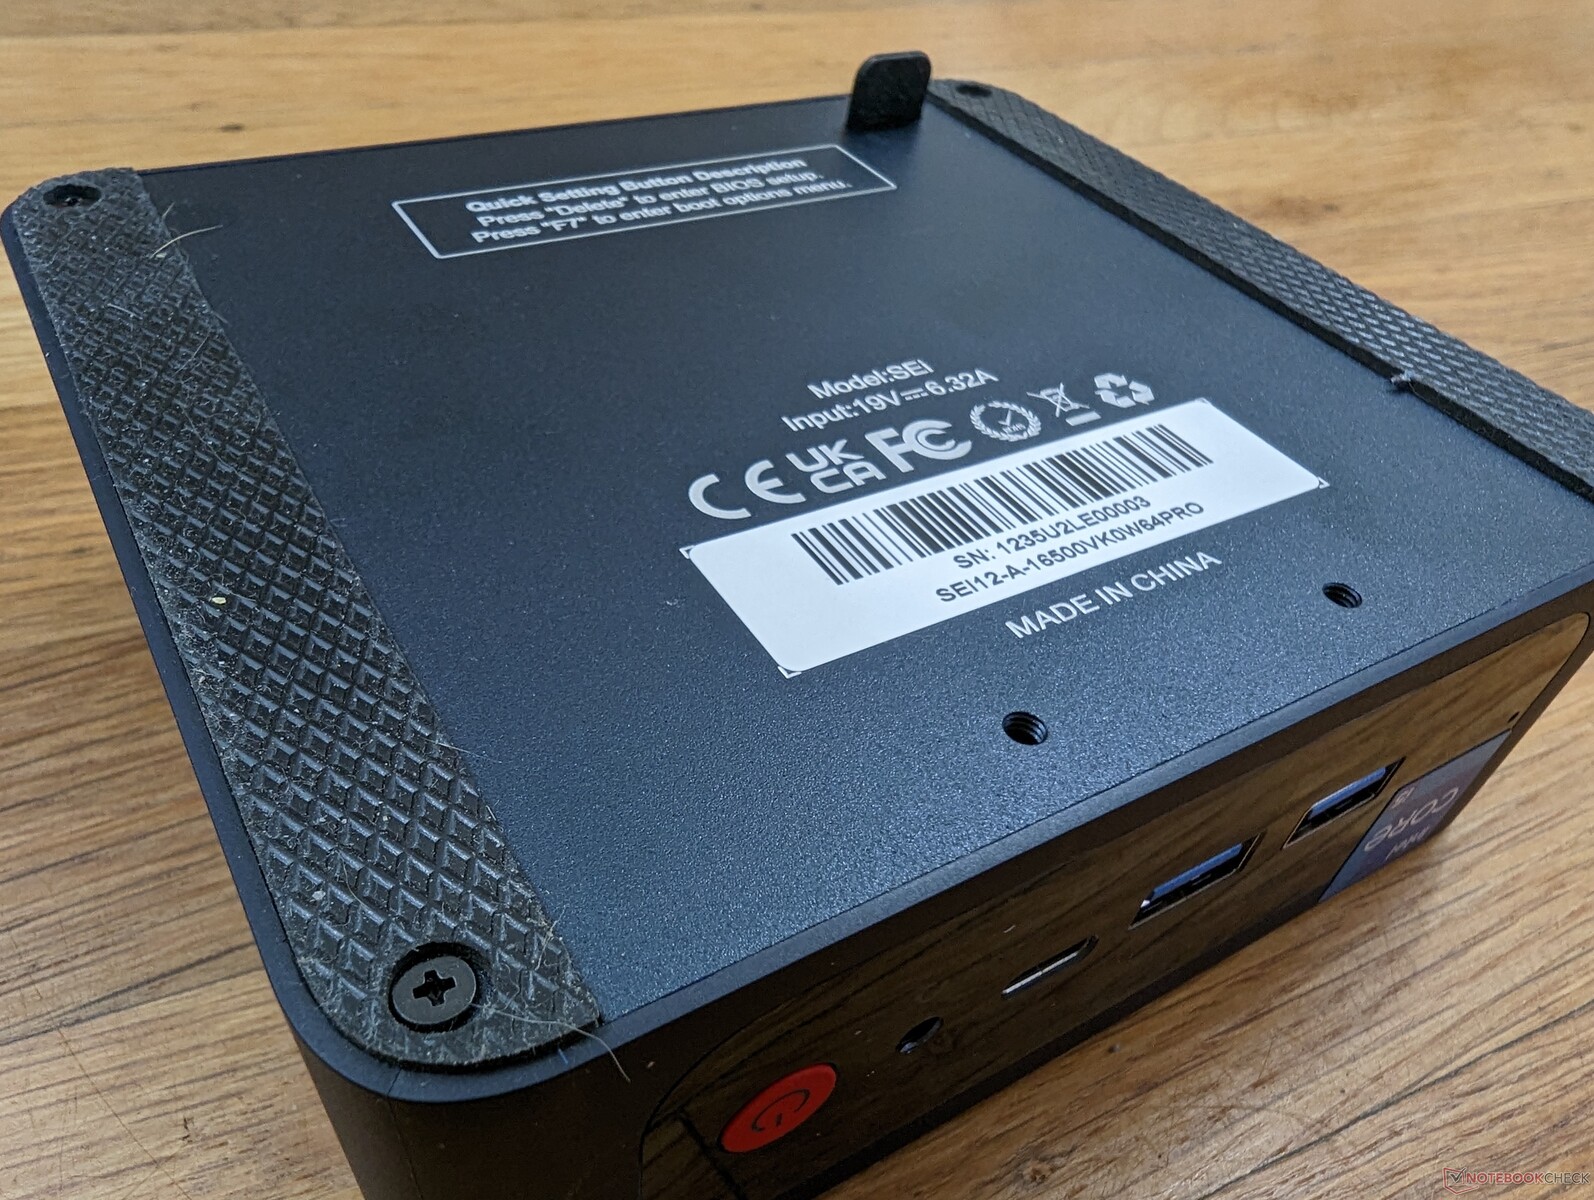
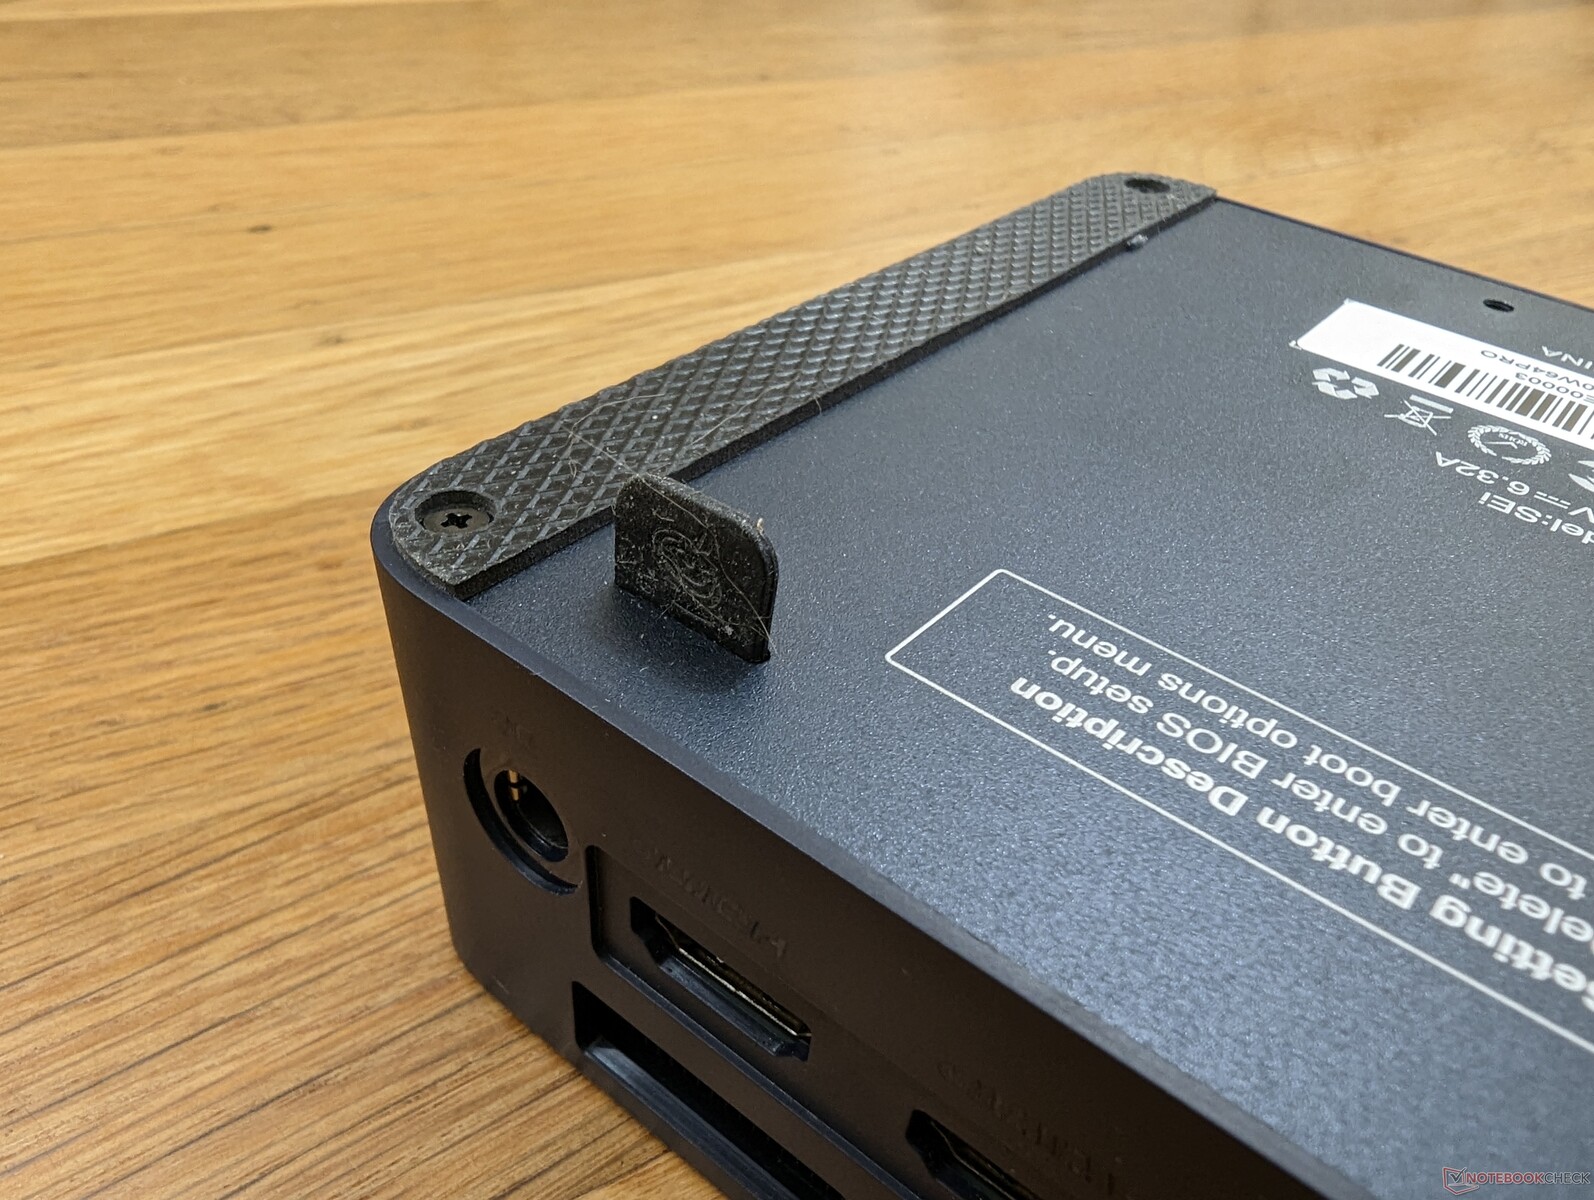
维修需要比其他大多数迷你电脑多做一些工作。如下面的图片所示,拆下底板就会露出其中一个风扇,然后必须将其拆下,露出内存、M.2 SSD和M.2 WLAN模块。值得庆幸的是,只需要一把普通的飞利浦螺丝刀就可以进行任何升级。
配件和保修
零售盒包括两条HDMI线、带螺丝的VESA支架、用户手册和AC适配器。制造商的有限保修期为一年,而如果购买英特尔NUC则为三年。
业绩
测试条件
在运行以下任何性能基准之前,我们将我们的设备设置为性能模式。制造商的任何迷你电脑都不包括预装的应用程序或 "控制中心 "类型的软件。
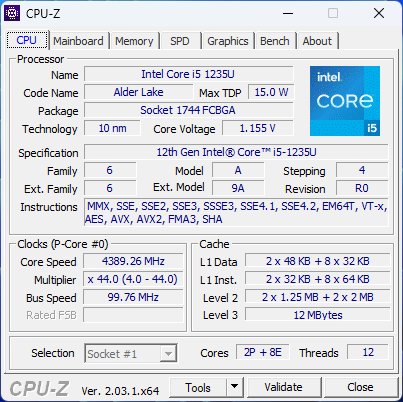
处理器
CPU的性能非常好,其结果是明显快于盖特威超薄14.1或VAIO FE 14.1的速度,两者都采用相同的12代 Core i5-1235UCPU。然而,Turbo Boost的可持续性肯定会更好,因为CineBench R15 xT的分数会随着时间的推移下降约14%,如下图所示。鉴于这是一款酷睿U系列的CPU,高Turbo Boost潜力是不可预期的。
整体多线程性能比第11代酷睿i7-1165G7快大约15%。 酷睿i7-1165G7在价格较高的NUC11中。
Cinebench R15 Multi Loop
Cinebench R23: Multi Core | Single Core
Cinebench R15: CPU Multi 64Bit | CPU Single 64Bit
Blender: v2.79 BMW27 CPU
7-Zip 18.03: 7z b 4 | 7z b 4 -mmt1
Geekbench 5.5: Multi-Core | Single-Core
HWBOT x265 Benchmark v2.2: 4k Preset
LibreOffice : 20 Documents To PDF
R Benchmark 2.5: Overall mean
| Cinebench R20 / CPU (Multi Core) | |
| Beelink SER4 | |
| Intel NUC Pro Chassis_i7_1265U | |
| HP Spectre x360 13.5 14t-ef000 | |
| Beelink SEi12 Core i5-1235U | |
| Average Intel Core i5-1235U (1783 - 3537, n=8) | |
| Intel NUC11PAQi7 | |
| Intel NUC Pro Chassis_i7_1185G7 | |
| Intel Hades Canyon NUC8i7HVK | |
| BMAX B5 Pro G7H8 | |
| Beelink SEi8 | |
| Cinebench R20 / CPU (Single Core) | |
| HP Spectre x360 13.5 14t-ef000 | |
| Intel NUC Pro Chassis_i7_1265U | |
| Beelink SEi12 Core i5-1235U | |
| Average Intel Core i5-1235U (566 - 651, n=8) | |
| Intel NUC11PAQi7 | |
| Intel NUC Pro Chassis_i7_1185G7 | |
| Beelink SER4 | |
| Intel Hades Canyon NUC8i7HVK | |
| BMAX B5 Pro G7H8 | |
| Beelink SEi8 | |
| Cinebench R23 / Multi Core | |
| Beelink SER4 | |
| Intel NUC Pro Chassis_i7_1265U | |
| HP Spectre x360 13.5 14t-ef000 | |
| Beelink SEi12 Core i5-1235U | |
| Intel NUC11PAQi7 | |
| Average Intel Core i5-1235U (2485 - 9208, n=8) | |
| Intel NUC Pro Chassis_i7_1185G7 | |
| BMAX B5 Pro G7H8 | |
| Beelink SEi8 | |
| Cinebench R23 / Single Core | |
| HP Spectre x360 13.5 14t-ef000 | |
| Intel NUC Pro Chassis_i7_1265U | |
| Beelink SEi12 Core i5-1235U | |
| Average Intel Core i5-1235U (1444 - 1698, n=8) | |
| Intel NUC Pro Chassis_i7_1185G7 | |
| Beelink SER4 | |
| Beelink SEi8 | |
| BMAX B5 Pro G7H8 | |
| Cinebench R15 / CPU Multi 64Bit | |
| Beelink SER4 | |
| Beelink SEi12 Core i5-1235U | |
| HP Spectre x360 13.5 14t-ef000 | |
| Intel NUC Pro Chassis_i7_1265U | |
| Average Intel Core i5-1235U (785 - 1587, n=8) | |
| Intel NUC11PAQi7 | |
| Intel Hades Canyon NUC8i7HVK | |
| Intel NUC Pro Chassis_i7_1185G7 | |
| BMAX B5 Pro G7H8 | |
| Beelink SEi8 | |
| Cinebench R15 / CPU Single 64Bit | |
| HP Spectre x360 13.5 14t-ef000 | |
| Intel NUC Pro Chassis_i7_1265U | |
| Beelink SEi12 Core i5-1235U | |
| Intel NUC11PAQi7 | |
| Intel NUC Pro Chassis_i7_1185G7 | |
| Average Intel Core i5-1235U (151.5 - 242, n=8) | |
| Beelink SER4 | |
| Intel Hades Canyon NUC8i7HVK | |
| BMAX B5 Pro G7H8 | |
| Beelink SEi8 | |
| Blender / v2.79 BMW27 CPU | |
| Beelink SEi8 | |
| BMAX B5 Pro G7H8 | |
| Intel NUC Pro Chassis_i7_1185G7 | |
| Intel Hades Canyon NUC8i7HVK | |
| Average Intel Core i5-1235U (366 - 662, n=8) | |
| Intel NUC11PAQi7 | |
| Beelink SEi12 Core i5-1235U | |
| HP Spectre x360 13.5 14t-ef000 | |
| Intel NUC Pro Chassis_i7_1265U | |
| Beelink SER4 | |
| 7-Zip 18.03 / 7z b 4 | |
| Beelink SER4 | |
| HP Spectre x360 13.5 14t-ef000 | |
| Intel NUC Pro Chassis_i7_1265U | |
| Beelink SEi12 Core i5-1235U | |
| Average Intel Core i5-1235U (20166 - 38643, n=8) | |
| Intel NUC11PAQi7 | |
| Intel NUC Pro Chassis_i7_1185G7 | |
| Intel Hades Canyon NUC8i7HVK | |
| BMAX B5 Pro G7H8 | |
| Beelink SEi8 | |
| 7-Zip 18.03 / 7z b 4 -mmt1 | |
| HP Spectre x360 13.5 14t-ef000 | |
| Intel NUC11PAQi7 | |
| Intel NUC Pro Chassis_i7_1265U | |
| Intel NUC Pro Chassis_i7_1185G7 | |
| Beelink SEi12 Core i5-1235U | |
| Average Intel Core i5-1235U (4371 - 5233, n=8) | |
| Beelink SER4 | |
| Intel Hades Canyon NUC8i7HVK | |
| BMAX B5 Pro G7H8 | |
| Beelink SEi8 | |
| Geekbench 5.5 / Multi-Core | |
| Intel NUC Pro Chassis_i7_1265U | |
| HP Spectre x360 13.5 14t-ef000 | |
| Beelink SEi12 Core i5-1235U | |
| Average Intel Core i5-1235U (5528 - 8571, n=10) | |
| Beelink SER4 | |
| Intel NUC Pro Chassis_i7_1185G7 | |
| Intel NUC11PAQi7 | |
| Beelink SEi8 | |
| BMAX B5 Pro G7H8 | |
| Geekbench 5.5 / Single-Core | |
| Intel NUC Pro Chassis_i7_1265U | |
| HP Spectre x360 13.5 14t-ef000 | |
| Beelink SEi12 Core i5-1235U | |
| Intel NUC11PAQi7 | |
| Average Intel Core i5-1235U (1426 - 1643, n=10) | |
| Intel NUC Pro Chassis_i7_1185G7 | |
| Beelink SER4 | |
| Beelink SEi8 | |
| BMAX B5 Pro G7H8 | |
| HWBOT x265 Benchmark v2.2 / 4k Preset | |
| Beelink SER4 | |
| HP Spectre x360 13.5 14t-ef000 | |
| Intel NUC Pro Chassis_i7_1265U | |
| Beelink SEi12 Core i5-1235U | |
| Intel NUC11PAQi7 | |
| Average Intel Core i5-1235U (4.99 - 9.43, n=8) | |
| Intel Hades Canyon NUC8i7HVK | |
| Intel NUC Pro Chassis_i7_1185G7 | |
| Beelink SEi8 | |
| BMAX B5 Pro G7H8 | |
| LibreOffice / 20 Documents To PDF | |
| BMAX B5 Pro G7H8 | |
| Beelink SEi8 | |
| Beelink SER4 | |
| Average Intel Core i5-1235U (42.4 - 65.5, n=8) | |
| Intel NUC Pro Chassis_i7_1265U | |
| Beelink SEi12 Core i5-1235U | |
| Intel NUC Pro Chassis_i7_1185G7 | |
| HP Spectre x360 13.5 14t-ef000 | |
| Intel NUC11PAQi7 | |
| R Benchmark 2.5 / Overall mean | |
| BMAX B5 Pro G7H8 | |
| Beelink SEi8 | |
| Intel NUC Pro Chassis_i7_1185G7 | |
| Beelink SER4 | |
| Intel NUC11PAQi7 | |
| Average Intel Core i5-1235U (0.4986 - 0.603, n=8) | |
| Beelink SEi12 Core i5-1235U | |
| Intel NUC Pro Chassis_i7_1265U | |
| HP Spectre x360 13.5 14t-ef000 | |
* ... smaller is better
AIDA64: FP32 Ray-Trace | FPU Julia | CPU SHA3 | CPU Queen | FPU SinJulia | FPU Mandel | CPU AES | CPU ZLib | FP64 Ray-Trace | CPU PhotoWorxx
| Performance rating | |
| Beelink SER4 | |
| HP Spectre x360 13.5 14t-ef000 | |
| Intel NUC Pro Chassis_i7_1265U | |
| Beelink SEi12 Core i5-1235U | |
| Intel NUC Pro Chassis_i7_1185G7 | |
| Average Intel Core i5-1235U | |
| BMAX B5 Pro G7H8 | |
| Beelink SEi8 | |
| AIDA64 / FP32 Ray-Trace | |
| Beelink SER4 | |
| HP Spectre x360 13.5 14t-ef000 | |
| Intel NUC Pro Chassis_i7_1185G7 | |
| Intel NUC Pro Chassis_i7_1265U | |
| Beelink SEi12 Core i5-1235U | |
| Average Intel Core i5-1235U (3078 - 7457, n=8) | |
| BMAX B5 Pro G7H8 | |
| Beelink SEi8 | |
| AIDA64 / FPU Julia | |
| Beelink SER4 | |
| HP Spectre x360 13.5 14t-ef000 | |
| Intel NUC Pro Chassis_i7_1265U | |
| Beelink SEi12 Core i5-1235U | |
| Intel NUC Pro Chassis_i7_1185G7 | |
| Average Intel Core i5-1235U (15838 - 37760, n=8) | |
| BMAX B5 Pro G7H8 | |
| Beelink SEi8 | |
| AIDA64 / CPU SHA3 | |
| HP Spectre x360 13.5 14t-ef000 | |
| Intel NUC Pro Chassis_i7_1185G7 | |
| Intel NUC Pro Chassis_i7_1265U | |
| Beelink SEi12 Core i5-1235U | |
| Beelink SER4 | |
| Average Intel Core i5-1235U (978 - 2072, n=8) | |
| BMAX B5 Pro G7H8 | |
| Beelink SEi8 | |
| AIDA64 / CPU Queen | |
| Beelink SER4 | |
| Intel NUC Pro Chassis_i7_1265U | |
| HP Spectre x360 13.5 14t-ef000 | |
| Beelink SEi12 Core i5-1235U | |
| Average Intel Core i5-1235U (45680 - 62404, n=8) | |
| Intel NUC Pro Chassis_i7_1185G7 | |
| BMAX B5 Pro G7H8 | |
| Beelink SEi8 | |
| AIDA64 / FPU SinJulia | |
| Beelink SER4 | |
| Intel NUC Pro Chassis_i7_1265U | |
| Beelink SEi12 Core i5-1235U | |
| Intel NUC Pro Chassis_i7_1185G7 | |
| HP Spectre x360 13.5 14t-ef000 | |
| BMAX B5 Pro G7H8 | |
| Average Intel Core i5-1235U (3099 - 4644, n=8) | |
| Beelink SEi8 | |
| AIDA64 / FPU Mandel | |
| Beelink SER4 | |
| HP Spectre x360 13.5 14t-ef000 | |
| Intel NUC Pro Chassis_i7_1265U | |
| Intel NUC Pro Chassis_i7_1185G7 | |
| Beelink SEi12 Core i5-1235U | |
| Average Intel Core i5-1235U (8046 - 18819, n=8) | |
| BMAX B5 Pro G7H8 | |
| Beelink SEi8 | |
| AIDA64 / CPU AES | |
| Intel NUC Pro Chassis_i7_1185G7 | |
| HP Spectre x360 13.5 14t-ef000 | |
| Beelink SEi12 Core i5-1235U | |
| Beelink SER4 | |
| Intel NUC Pro Chassis_i7_1265U | |
| Average Intel Core i5-1235U (23386 - 67140, n=8) | |
| BMAX B5 Pro G7H8 | |
| Beelink SEi8 | |
| AIDA64 / CPU ZLib | |
| Beelink SEi12 Core i5-1235U | |
| Beelink SER4 | |
| Intel NUC Pro Chassis_i7_1265U | |
| HP Spectre x360 13.5 14t-ef000 | |
| Average Intel Core i5-1235U (329 - 633, n=8) | |
| Intel NUC Pro Chassis_i7_1185G7 | |
| BMAX B5 Pro G7H8 | |
| Beelink SEi8 | |
| AIDA64 / FP64 Ray-Trace | |
| Beelink SER4 | |
| HP Spectre x360 13.5 14t-ef000 | |
| Intel NUC Pro Chassis_i7_1265U | |
| Intel NUC Pro Chassis_i7_1185G7 | |
| Beelink SEi12 Core i5-1235U | |
| Average Intel Core i5-1235U (1670 - 3928, n=8) | |
| BMAX B5 Pro G7H8 | |
| Beelink SEi8 | |
| AIDA64 / CPU PhotoWorxx | |
| Intel NUC Pro Chassis_i7_1265U | |
| HP Spectre x360 13.5 14t-ef000 | |
| Intel NUC Pro Chassis_i7_1185G7 | |
| Average Intel Core i5-1235U (15933 - 41909, n=8) | |
| Beelink SEi12 Core i5-1235U | |
| Beelink SER4 | |
| BMAX B5 Pro G7H8 | |
| Beelink SEi8 | |
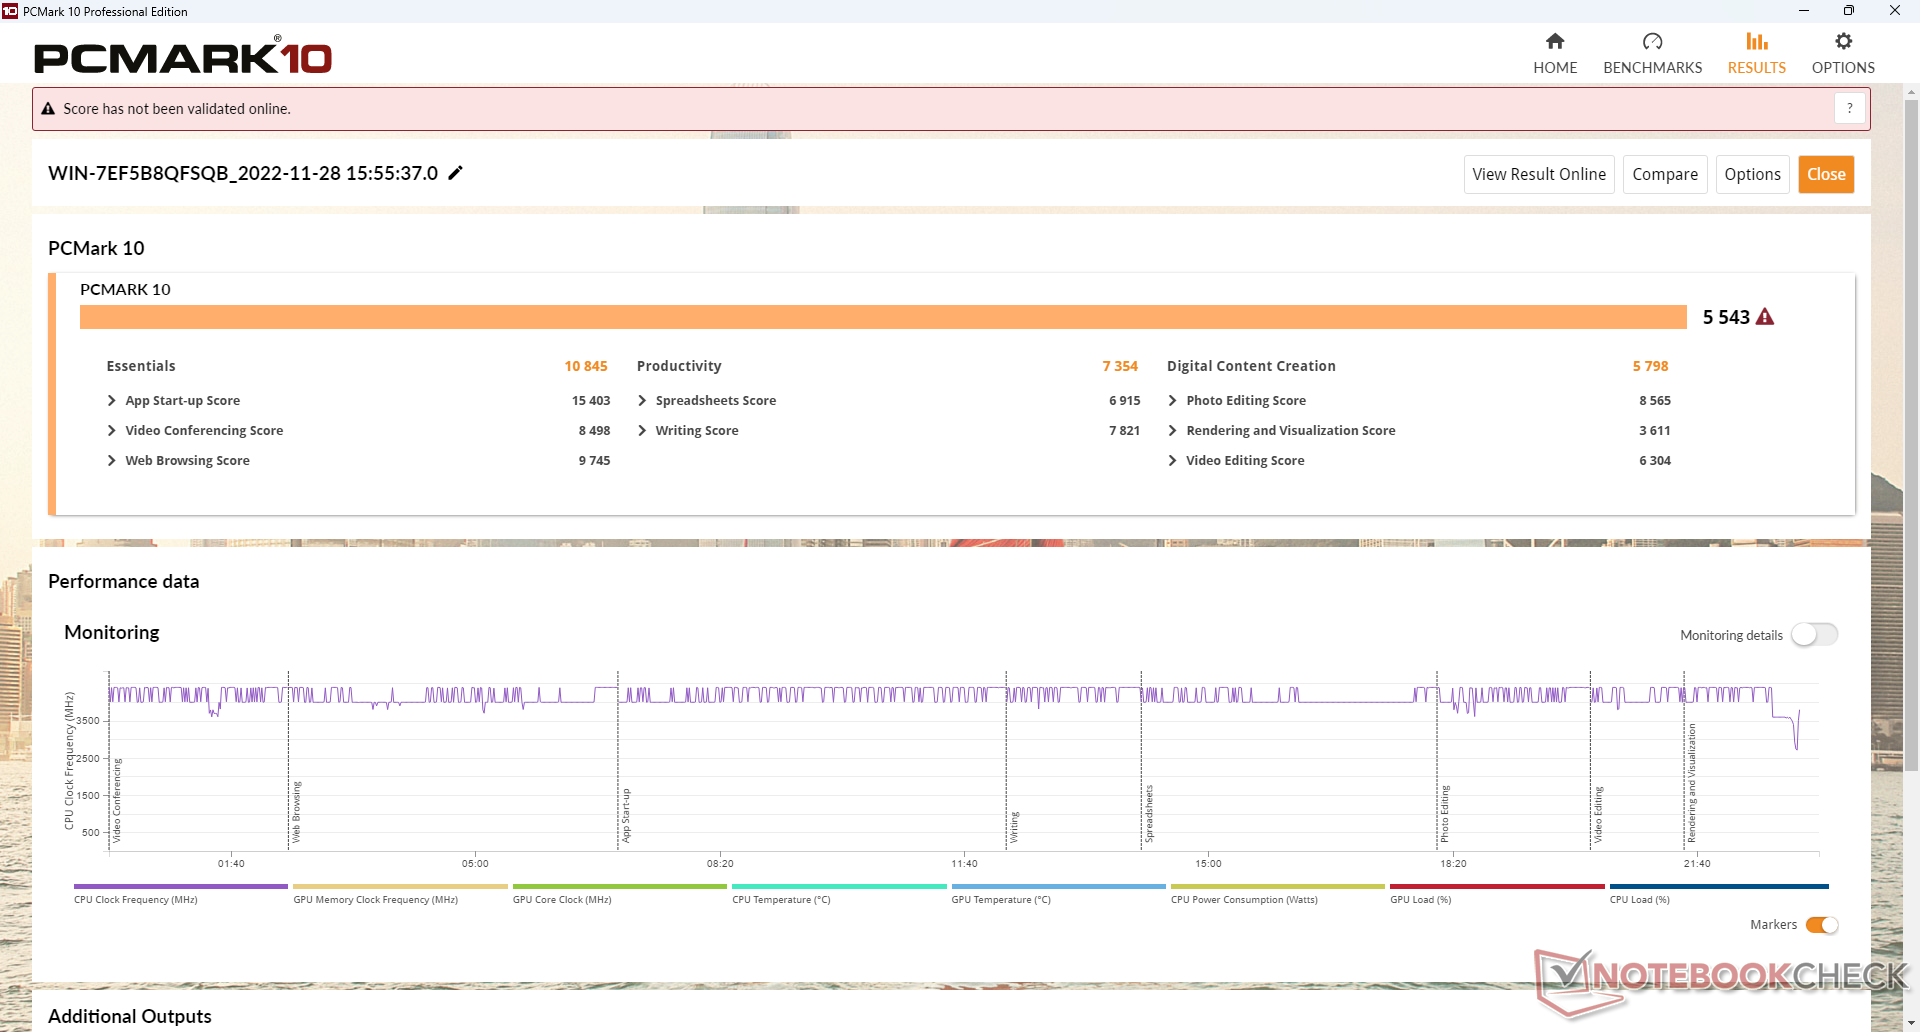
系统性能
PCMark的结果明显高于旧的贝岭SEi8它使用第八代i3-8109U和较慢的英特尔660p SSD。
CrossMark: Overall | Productivity | Creativity | Responsiveness
| PCMark 10 / Score | |
| Beelink SEi12 Core i5-1235U | |
| Intel Hades Canyon NUC8i7HVK | |
| Beelink SER4 | |
| Intel NUC11PAQi7 | |
| Average Intel Core i5-1235U, Intel Iris Xe Graphics G7 80EUs (4528 - 5543, n=8) | |
| BMAX B5 Pro G7H8 | |
| Beelink SEi8 | |
| PCMark 10 / Essentials | |
| Beelink SEi12 Core i5-1235U | |
| Intel NUC11PAQi7 | |
| Average Intel Core i5-1235U, Intel Iris Xe Graphics G7 80EUs (9143 - 11273, n=8) | |
| Beelink SER4 | |
| Intel Hades Canyon NUC8i7HVK | |
| BMAX B5 Pro G7H8 | |
| Beelink SEi8 | |
| PCMark 10 / Productivity | |
| Beelink SER4 | |
| Intel Hades Canyon NUC8i7HVK | |
| Beelink SEi12 Core i5-1235U | |
| Intel NUC11PAQi7 | |
| Average Intel Core i5-1235U, Intel Iris Xe Graphics G7 80EUs (6440 - 7354, n=8) | |
| BMAX B5 Pro G7H8 | |
| Beelink SEi8 | |
| PCMark 10 / Digital Content Creation | |
| Beelink SEi12 Core i5-1235U | |
| Intel Hades Canyon NUC8i7HVK | |
| Beelink SER4 | |
| Average Intel Core i5-1235U, Intel Iris Xe Graphics G7 80EUs (4220 - 5839, n=8) | |
| Intel NUC11PAQi7 | |
| BMAX B5 Pro G7H8 | |
| Beelink SEi8 | |
| CrossMark / Overall | |
| Beelink SEi12 Core i5-1235U | |
| Average Intel Core i5-1235U, Intel Iris Xe Graphics G7 80EUs (983 - 1644, n=8) | |
| BMAX B5 Pro G7H8 | |
| CrossMark / Productivity | |
| Beelink SEi12 Core i5-1235U | |
| Average Intel Core i5-1235U, Intel Iris Xe Graphics G7 80EUs (1026 - 1676, n=8) | |
| BMAX B5 Pro G7H8 | |
| CrossMark / Creativity | |
| Beelink SEi12 Core i5-1235U | |
| Average Intel Core i5-1235U, Intel Iris Xe Graphics G7 80EUs (1032 - 1618, n=8) | |
| BMAX B5 Pro G7H8 | |
| CrossMark / Responsiveness | |
| Beelink SEi12 Core i5-1235U | |
| Average Intel Core i5-1235U, Intel Iris Xe Graphics G7 80EUs (746 - 1867, n=8) | |
| BMAX B5 Pro G7H8 | |
| PCMark 10 Score | 5543 points | |
Help | ||
| AIDA64 / Memory Copy | |
| Average Intel Core i5-1235U (24653 - 61921, n=8) | |
| Beelink SEi12 Core i5-1235U | |
| Beelink SER4 | |
| Beelink SEi8 | |
| BMAX B5 Pro G7H8 | |
| AIDA64 / Memory Read | |
| Average Intel Core i5-1235U (24441 - 66108, n=8) | |
| Beelink SEi12 Core i5-1235U | |
| Beelink SER4 | |
| BMAX B5 Pro G7H8 | |
| Beelink SEi8 | |
| AIDA64 / Memory Write | |
| Average Intel Core i5-1235U (25156 - 75808, n=8) | |
| Beelink SEi12 Core i5-1235U | |
| Beelink SER4 | |
| BMAX B5 Pro G7H8 | |
| Beelink SEi8 | |
| AIDA64 / Memory Latency | |
| Beelink SER4 | |
| BMAX B5 Pro G7H8 | |
| Beelink SEi12 Core i5-1235U | |
| Average Intel Core i5-1235U (76.3 - 119, n=8) | |
| Beelink SEi8 | |
* ... smaller is better
DPC延时
LatencyMon显示,在打开我们主页的多个浏览器标签时没有DPC问题。在60FPS下的4K视频播放也很流畅,没有掉帧。
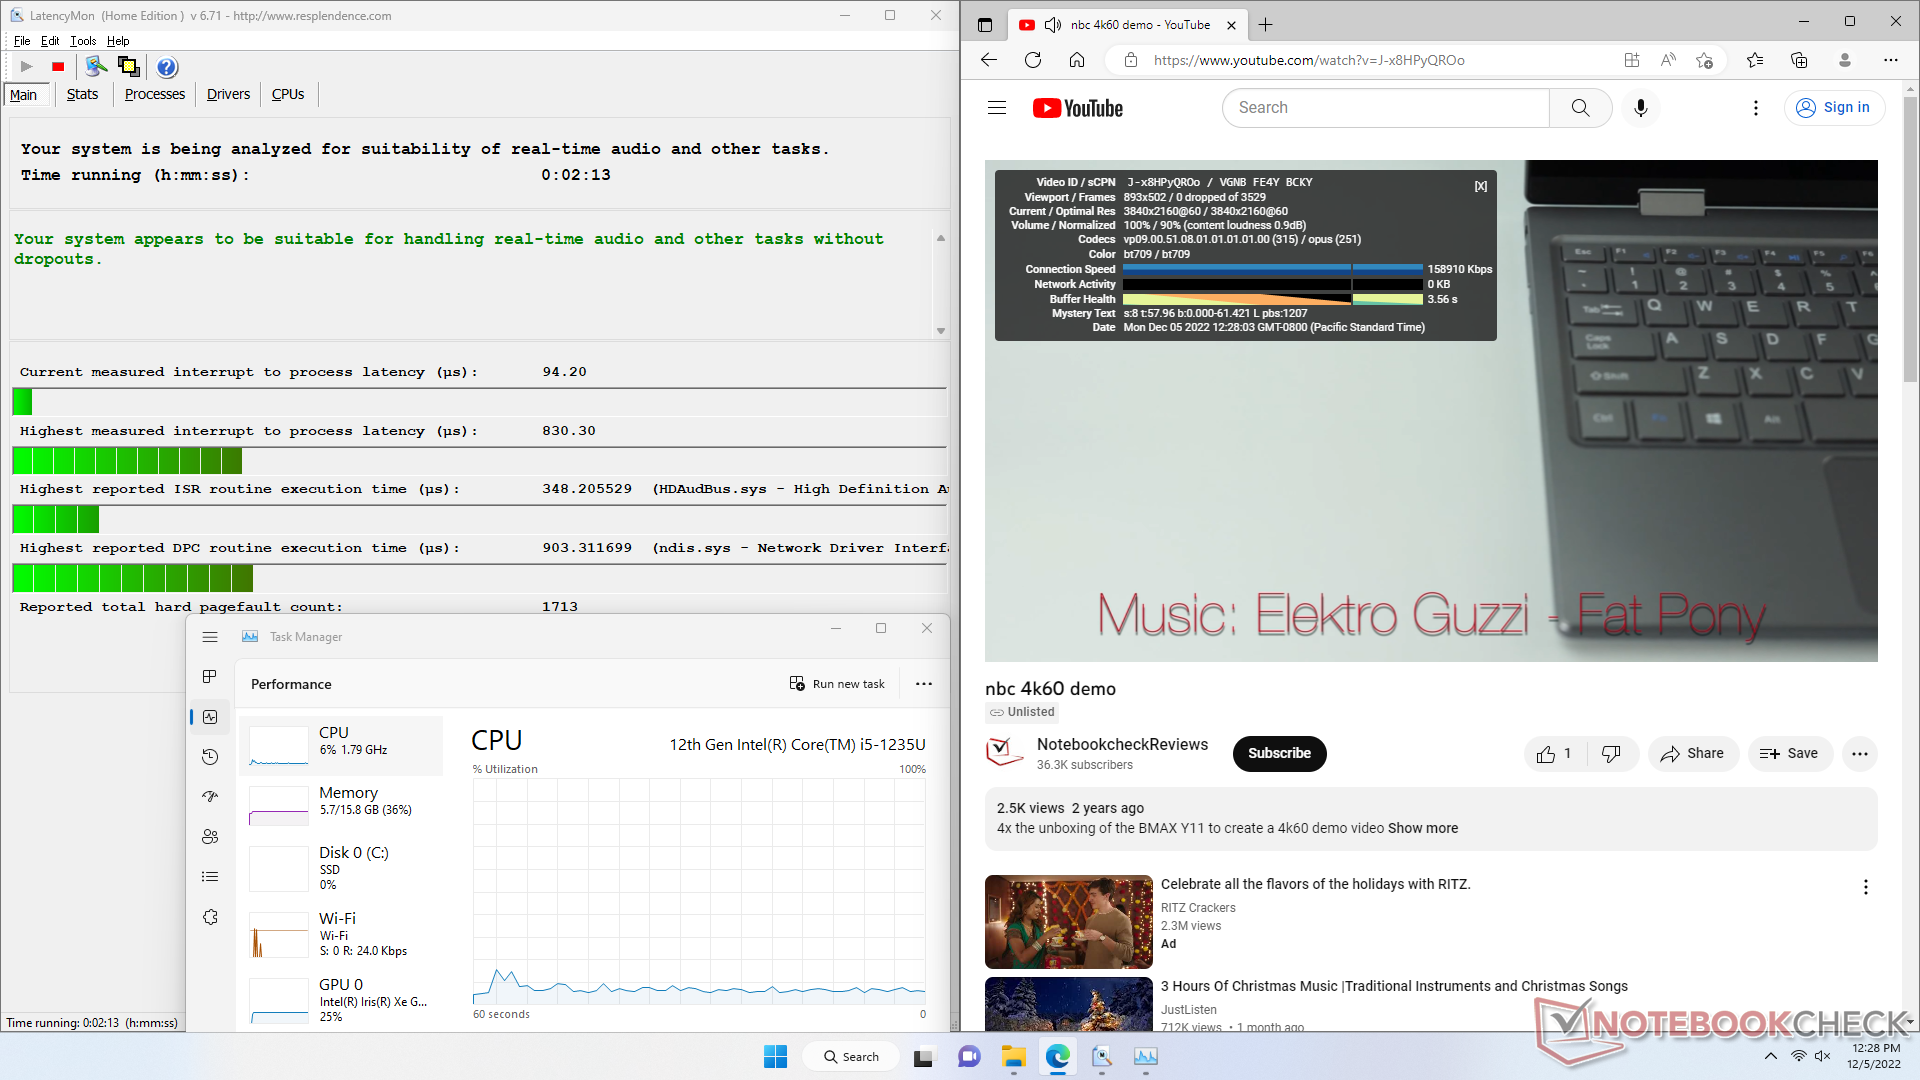
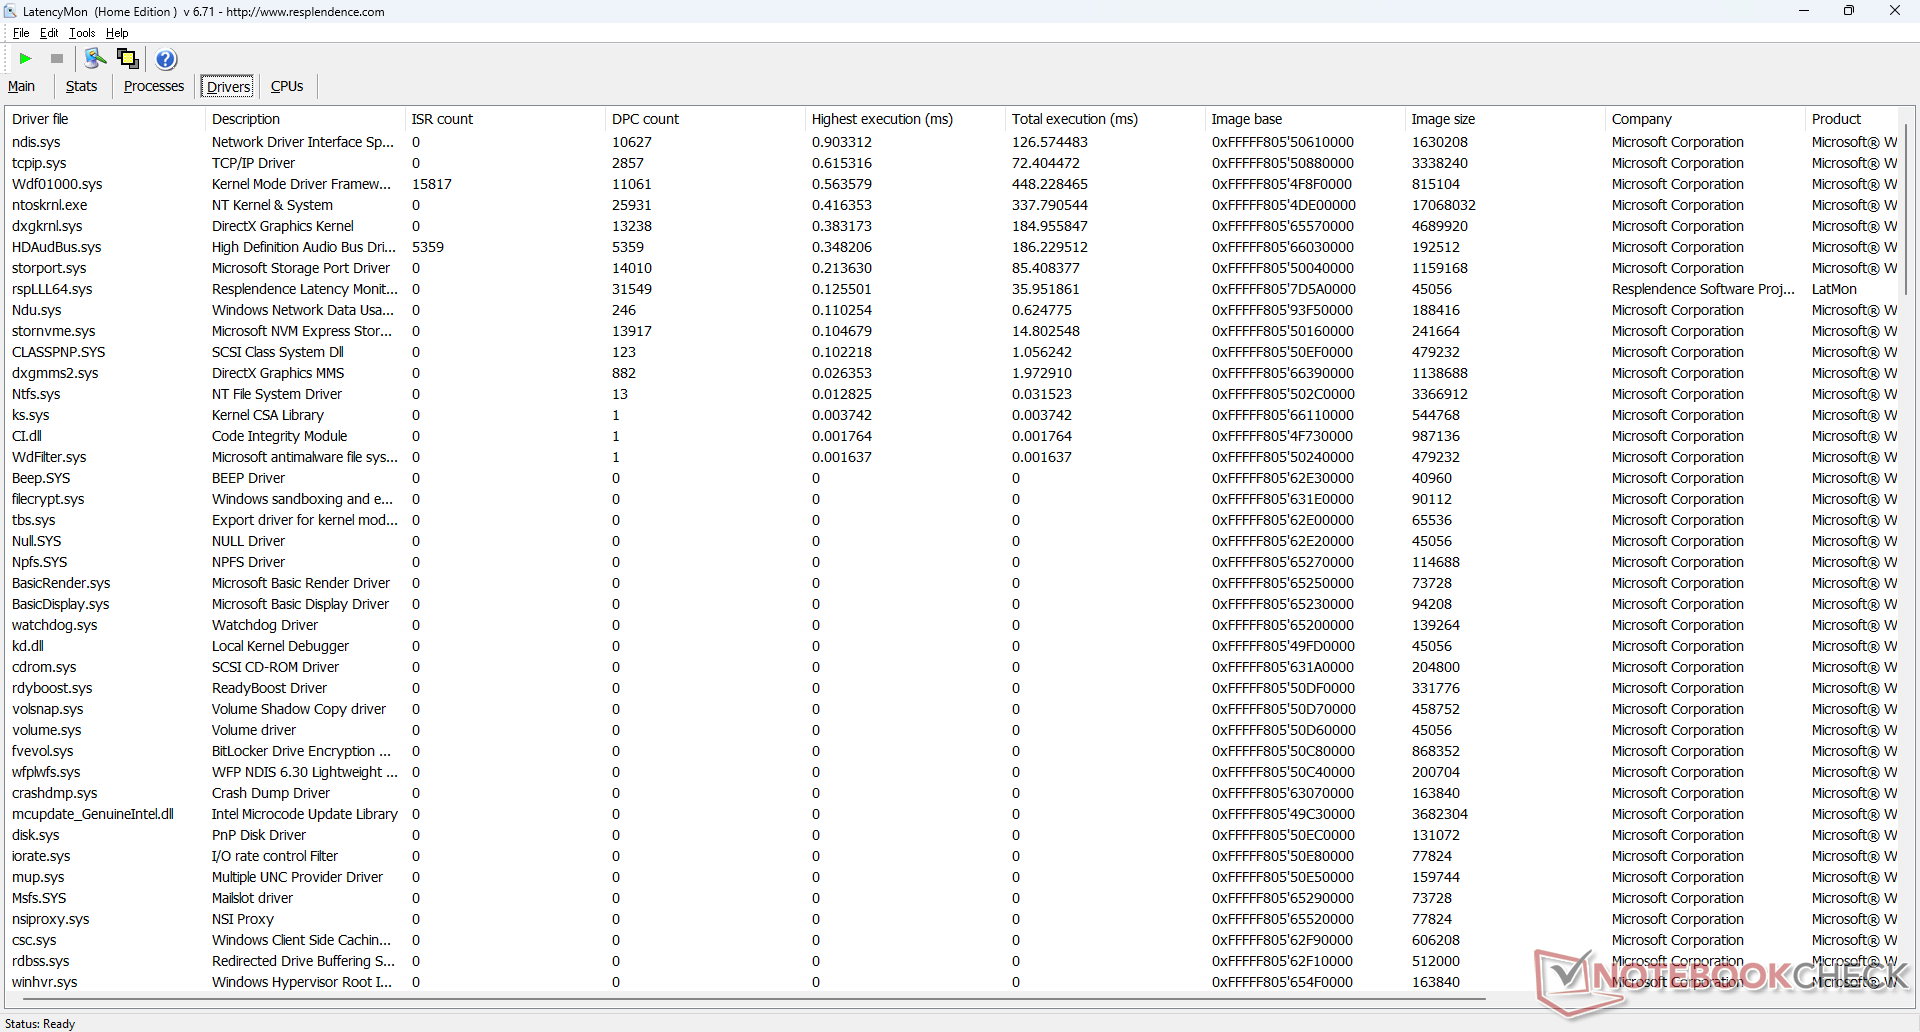
| DPC Latencies / LatencyMon - interrupt to process latency (max), Web, Youtube, Prime95 | |
| Beelink SEi12 Core i5-1235U | |
| Intel NUC11PAQi7 | |
| BMAX B5 Pro G7H8 | |
| Beelink SER4 | |
| Beelink SEi11 Pro | |
* ... smaller is better
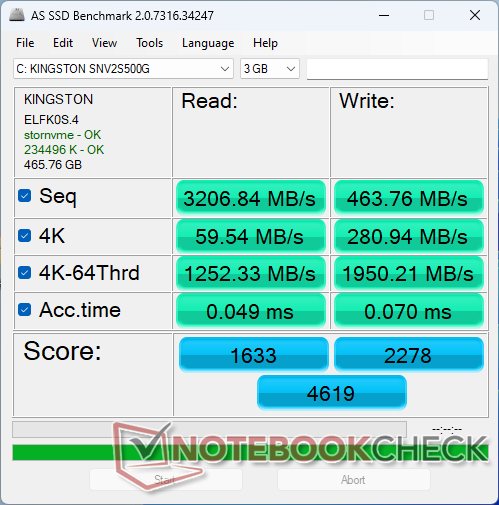
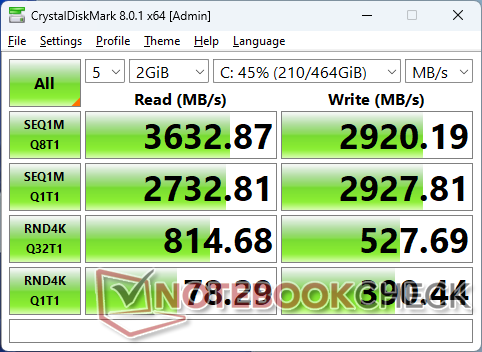
存储设备
该系统支持PCIe4 x4 NVMe固态硬盘,它甚至包括一个散热器以保持温度。尽管如此,该设备配备了一个较慢的 金士顿NV1PCIe3 x4 NVMe固态硬盘,作为一项节省成本的措施。当循环运行DiskSpd时,我们可以观察到传输率从3600MB/s的高点下降到1700MB/s的低点,这可能表明散热器的性能不佳。

| Drive Performance rating - Percent | |
| Intel NUC11PAQi7 | |
| Beelink SEi12 Core i5-1235U | |
| Intel Hades Canyon NUC8i7HVK -8! | |
| BMAX B5 Pro G7H8 | |
| Beelink SEi11 Pro | |
| Beelink SER4 | |
| DiskSpd | |
| seq read | |
| Intel NUC11PAQi7 | |
| Beelink SEi12 Core i5-1235U | |
| BMAX B5 Pro G7H8 | |
| Beelink SEi11 Pro | |
| Beelink SER4 | |
| seq write | |
| Intel NUC11PAQi7 | |
| Beelink SEi12 Core i5-1235U | |
| Beelink SEi11 Pro | |
| BMAX B5 Pro G7H8 | |
| Beelink SER4 | |
| seq q8 t1 read | |
| Intel NUC11PAQi7 | |
| Beelink SEi12 Core i5-1235U | |
| BMAX B5 Pro G7H8 | |
| Beelink SEi11 Pro | |
| Beelink SER4 | |
| seq q8 t1 write | |
| Intel NUC11PAQi7 | |
| Beelink SEi12 Core i5-1235U | |
| BMAX B5 Pro G7H8 | |
| Beelink SEi11 Pro | |
| Beelink SER4 | |
| 4k q1 t1 read | |
| Beelink SEi12 Core i5-1235U | |
| Beelink SER4 | |
| Intel NUC11PAQi7 | |
| Beelink SEi11 Pro | |
| BMAX B5 Pro G7H8 | |
| 4k q1 t1 write | |
| Beelink SEi12 Core i5-1235U | |
| Beelink SER4 | |
| Beelink SEi11 Pro | |
| BMAX B5 Pro G7H8 | |
| Intel NUC11PAQi7 | |
| 4k q32 t16 read | |
| Intel NUC11PAQi7 | |
| Beelink SEi12 Core i5-1235U | |
| BMAX B5 Pro G7H8 | |
| Beelink SEi11 Pro | |
| Beelink SER4 | |
| 4k q32 t16 write | |
| Intel NUC11PAQi7 | |
| Beelink SEi12 Core i5-1235U | |
| BMAX B5 Pro G7H8 | |
| Beelink SER4 | |
| Beelink SEi11 Pro | |
* ... smaller is better
Disk Throttling: DiskSpd Read Loop, Queue Depth 8
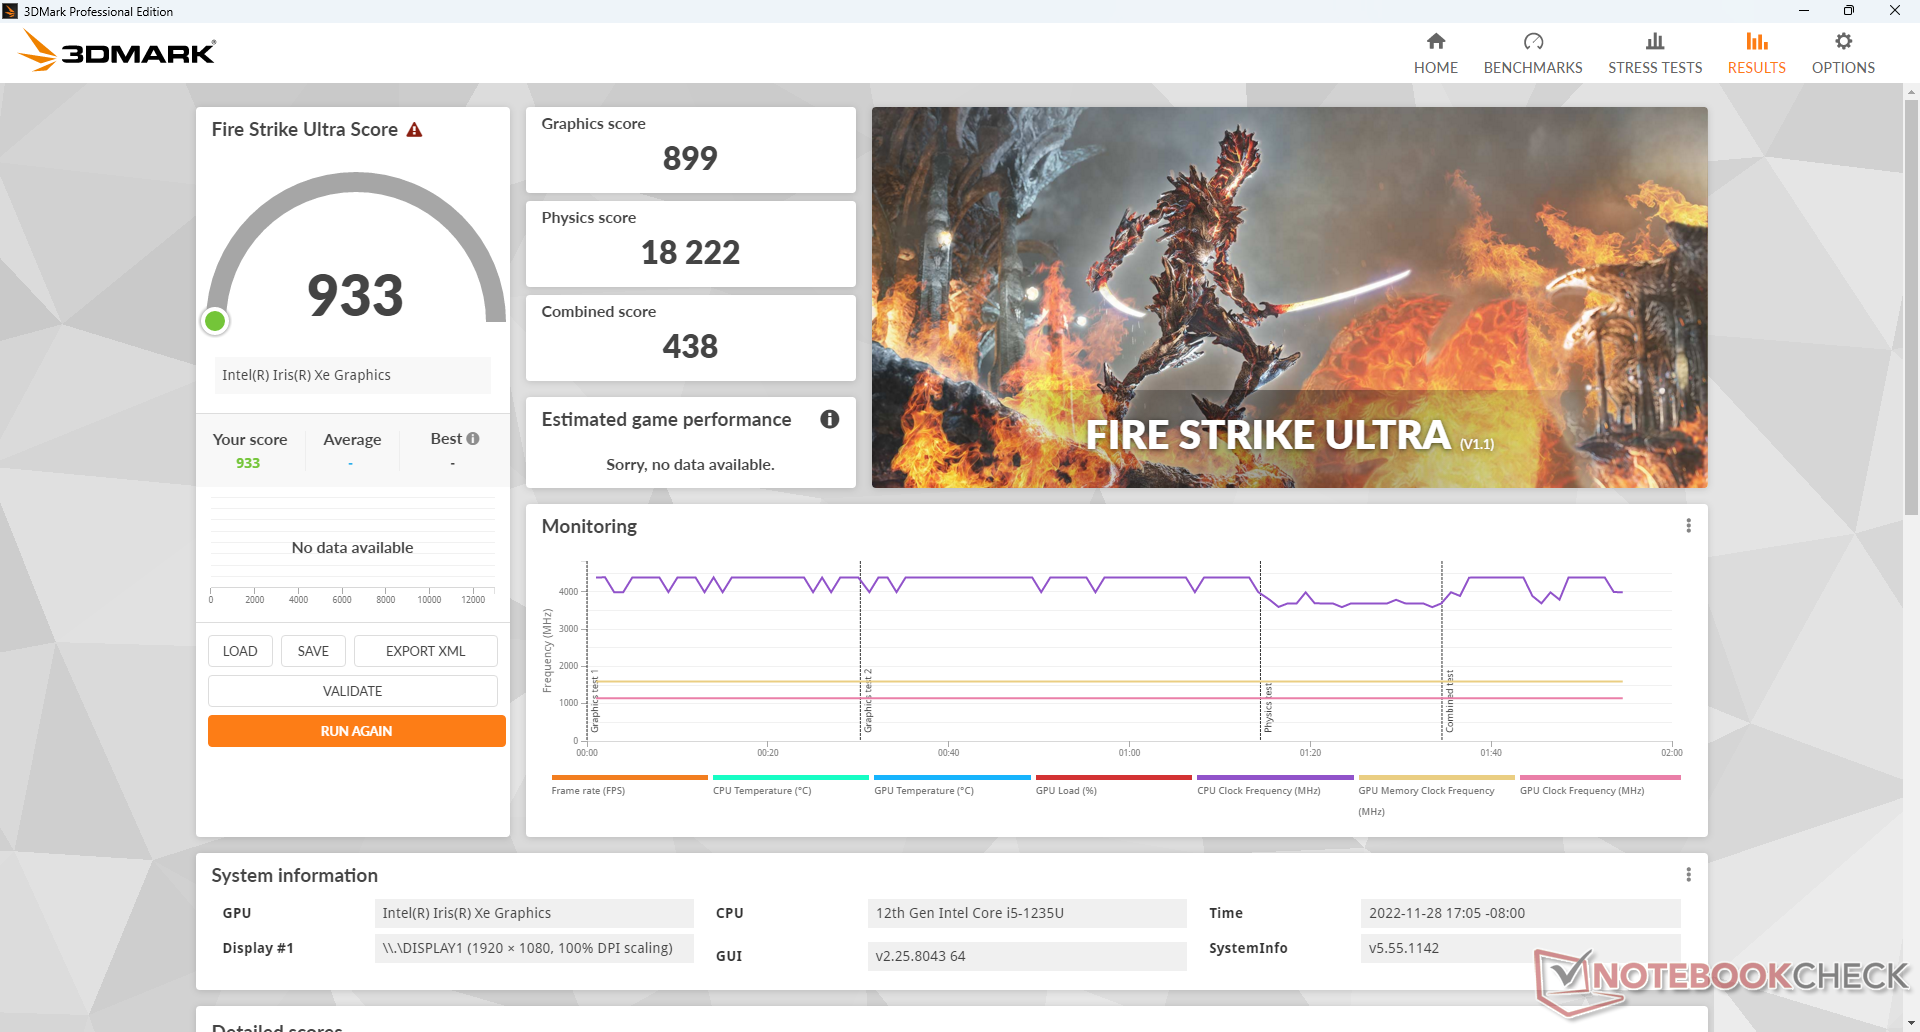
GPU性能
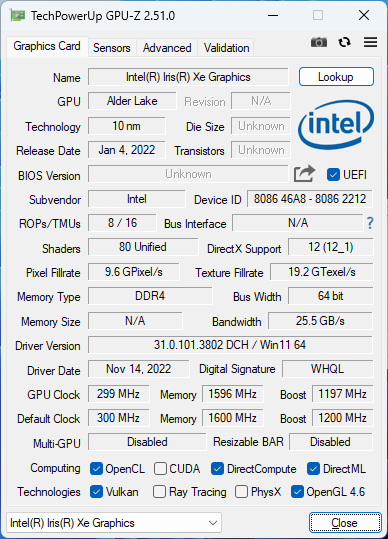
图形性能是我们所期望的,相对于其他具有相同集成度的PC而言。 Iris Xe G7 80 EUsGPU。请注意,如果配置了双通道内存而不是单通道内存,其他配备Iris Xe G7 96 EUs的PC可以快25%至40%。
| 3DMark | |
| 1920x1080 Fire Strike Graphics | |
| Intel Hades Canyon NUC8i7HVK | |
| Intel NUC 12 Pro Kit NUC12WSKi7 | |
| Beelink SEi12 Core i5-1235U | |
| Beelink SER4 | |
| Average Intel Iris Xe Graphics G7 80EUs (1560 - 5398, n=114) | |
| Intel NUC11PAQi7 | |
| Beelink SEi8 | |
| BMAX B5 Pro G7H8 | |
| 2560x1440 Time Spy Graphics | |
| Intel Hades Canyon NUC8i7HVK | |
| Intel NUC 12 Pro Kit NUC12WSKi7 | |
| Beelink SER4 | |
| Average Intel Iris Xe Graphics G7 80EUs (561 - 1576, n=111) | |
| Intel NUC11PAQi7 | |
| Beelink SEi12 Core i5-1235U | |
| Beelink SEi8 | |
| BMAX B5 Pro G7H8 | |
| 2560x1440 Time Spy Score | |
| Intel Hades Canyon NUC8i7HVK | |
| Intel NUC 12 Pro Kit NUC12WSKi7 | |
| Beelink SER4 | |
| Average Intel Iris Xe Graphics G7 80EUs (630 - 1791, n=111) | |
| Intel NUC11PAQi7 | |
| Beelink SEi12 Core i5-1235U | |
| Beelink SEi8 | |
| BMAX B5 Pro G7H8 | |
| 3DMark 11 - 1280x720 Performance GPU | |
| Intel Hades Canyon NUC8i7HVK | |
| Intel NUC 12 Pro Kit NUC12WSKi7 | |
| Beelink SER4 | |
| Intel NUC11PAQi7 | |
| Average Intel Iris Xe Graphics G7 80EUs (2246 - 6579, n=112) | |
| Beelink SEi12 Core i5-1235U | |
| Beelink SEi8 | |
| BMAX B5 Pro G7H8 | |
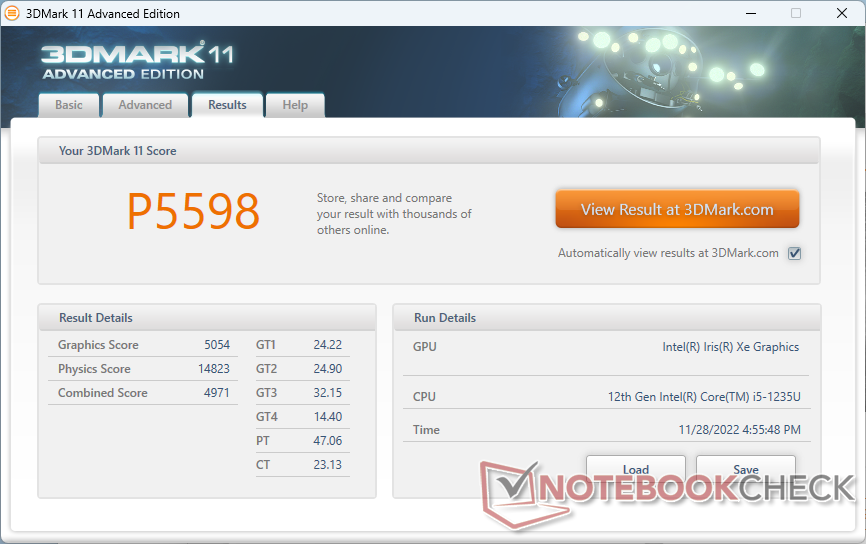
| 3DMark 11 Performance | 5598 points | |
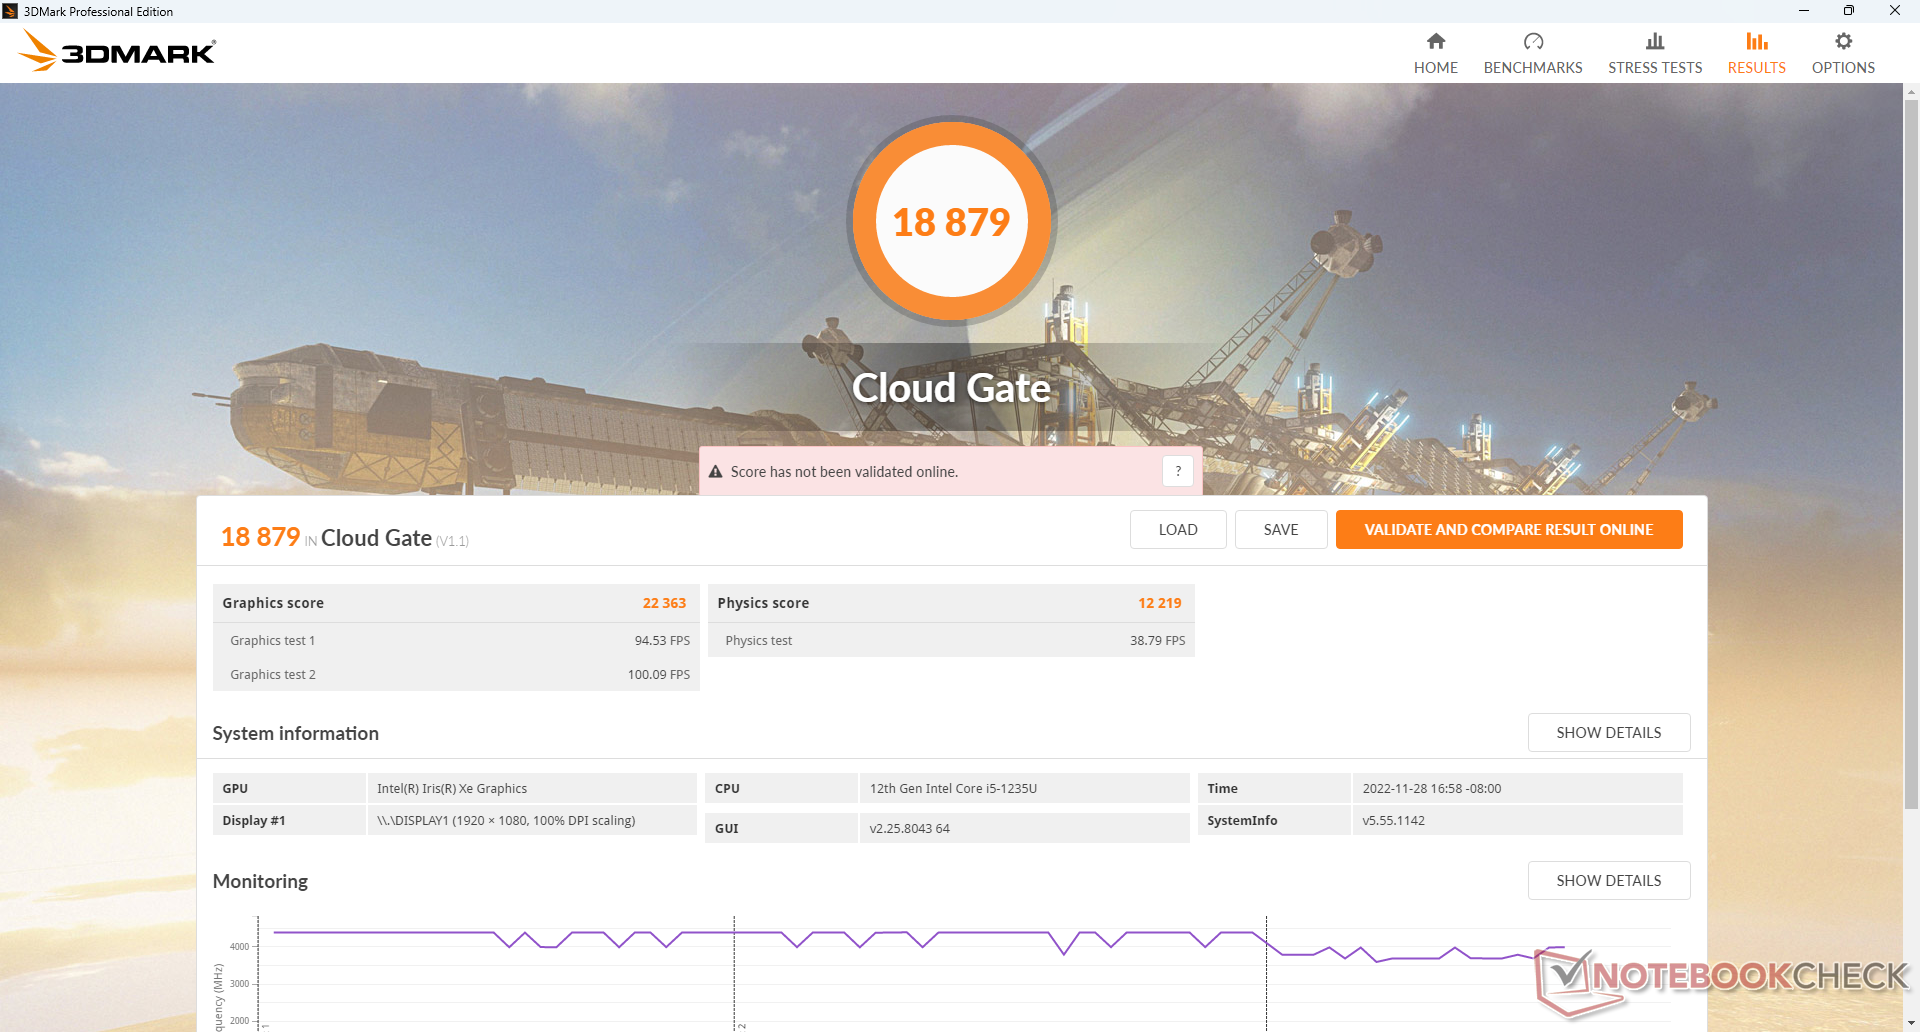
| 3DMark Cloud Gate Standard Score | 18879 points | |
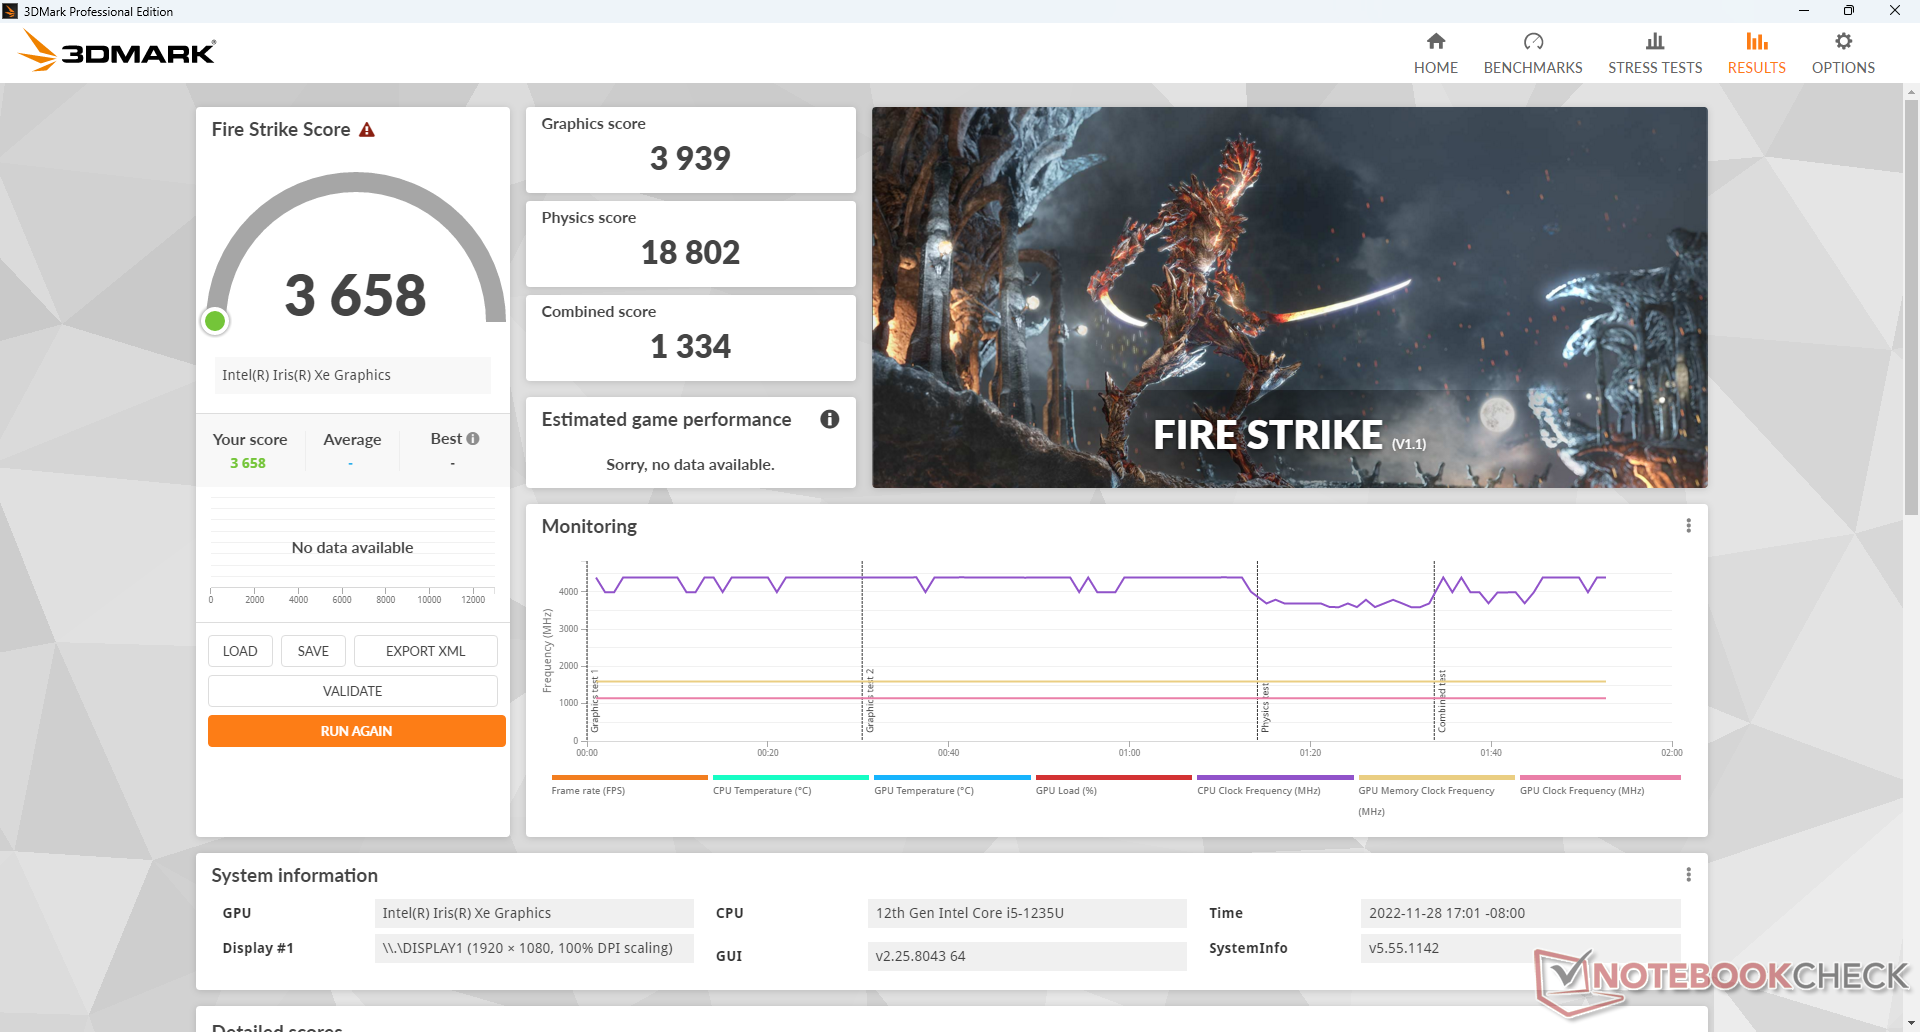
| 3DMark Fire Strike Score | 3658 points | |
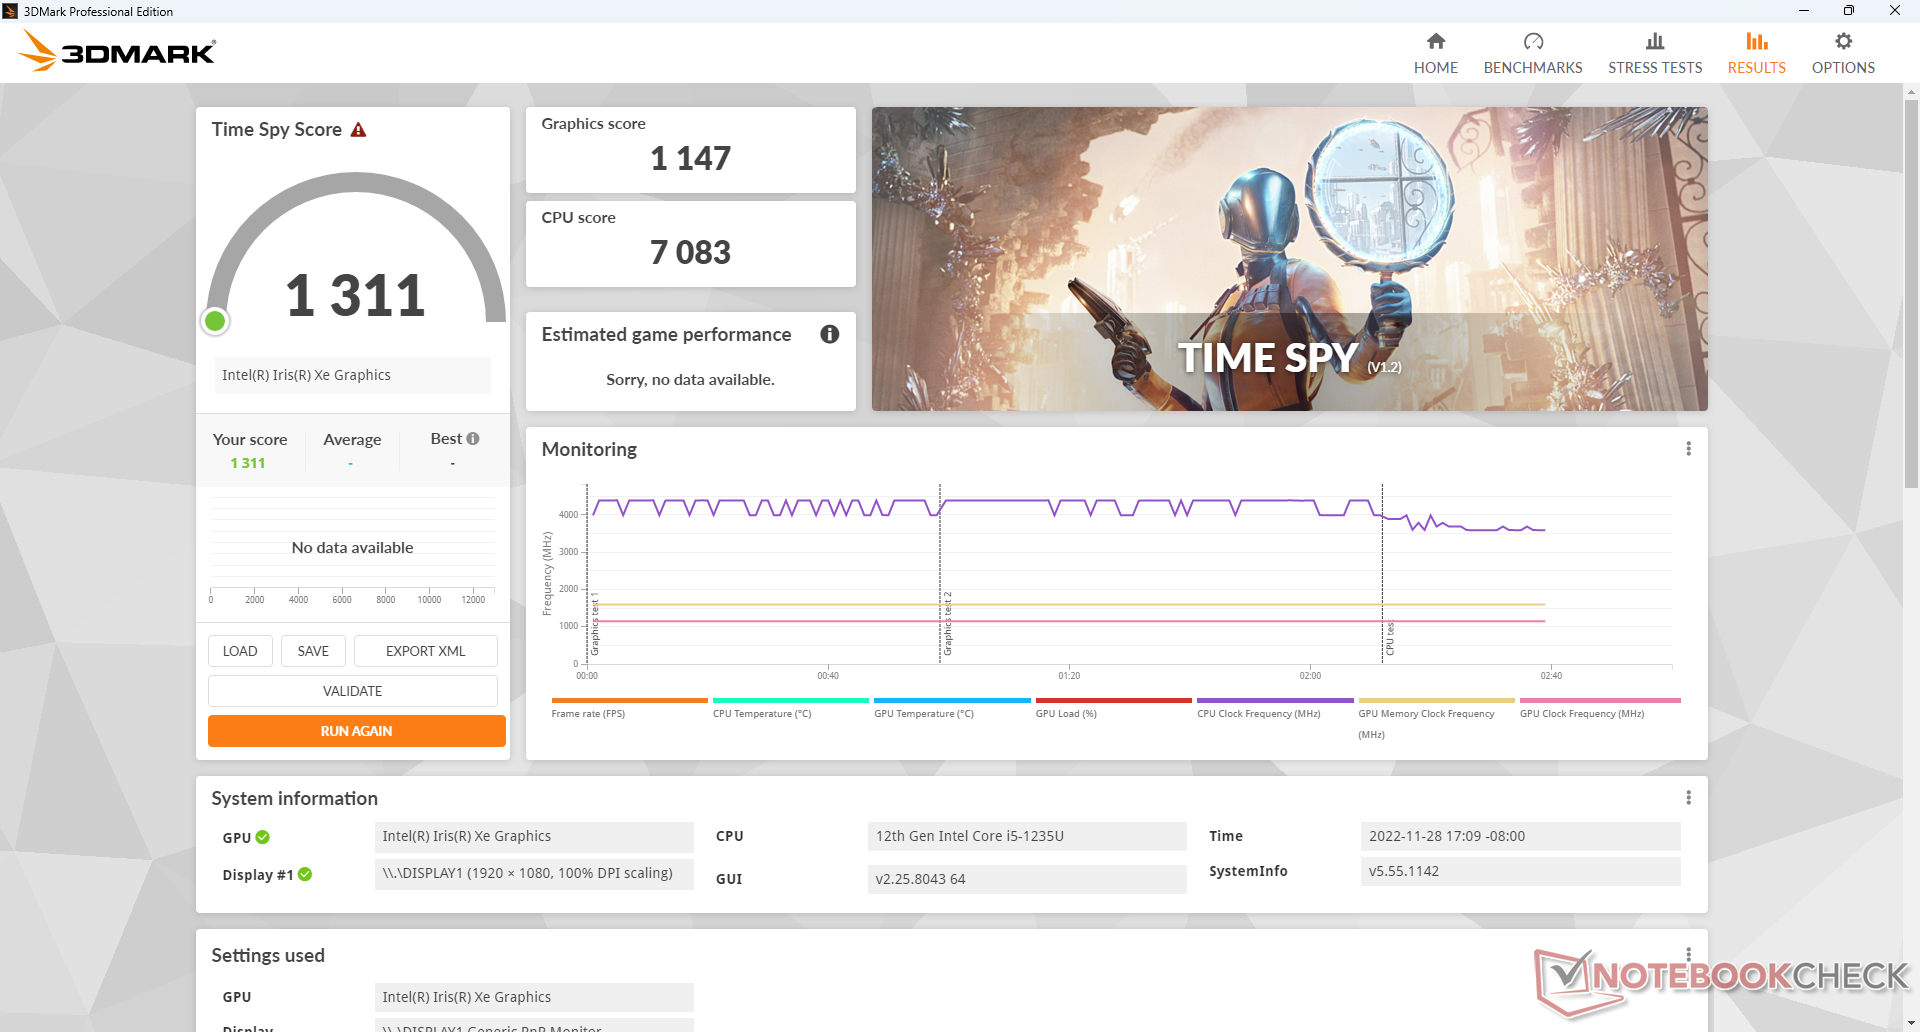
| 3DMark Time Spy Score | 1311 points | |
Help | ||
* ... smaller is better
| Performance rating - Percent | |
| Intel Hades Canyon NUC8i7HVK | |
| Beelink SEi11 Pro -1! | |
| Beelink SER4 | |
| Beelink SEi12 Core i5-1235U | |
| Intel NUC11PAQi7 | |
| BMAX B5 Pro G7H8 -5! | |
| The Witcher 3 - 1920x1080 Ultra Graphics & Postprocessing (HBAO+) | |
| Intel Hades Canyon NUC8i7HVK | |
| Beelink SER4 | |
| Beelink SEi11 Pro | |
| Beelink SEi12 Core i5-1235U | |
| Intel NUC11PAQi7 | |
| GTA V - 1920x1080 Highest AA:4xMSAA + FX AF:16x | |
| Intel Hades Canyon NUC8i7HVK | |
| Beelink SER4 | |
| Beelink SEi12 Core i5-1235U | |
| Intel NUC11PAQi7 | |
| Final Fantasy XV Benchmark - 1920x1080 High Quality | |
| Intel Hades Canyon NUC8i7HVK | |
| Beelink SEi11 Pro | |
| Beelink SER4 | |
| Beelink SEi12 Core i5-1235U | |
| Intel NUC11PAQi7 | |
| Strange Brigade - 1920x1080 ultra AA:ultra AF:16 | |
| Intel Hades Canyon NUC8i7HVK | |
| Beelink SER4 | |
| Beelink SEi11 Pro | |
| Beelink SEi12 Core i5-1235U | |
| Intel NUC11PAQi7 | |
| Dota 2 Reborn - 1920x1080 ultra (3/3) best looking | |
| Intel Hades Canyon NUC8i7HVK | |
| Beelink SER4 | |
| Beelink SEi11 Pro | |
| Beelink SEi12 Core i5-1235U | |
| Intel NUC11PAQi7 | |
| BMAX B5 Pro G7H8 | |
| X-Plane 11.11 - 1920x1080 high (fps_test=3) | |
| Intel Hades Canyon NUC8i7HVK | |
| Beelink SEi11 Pro | |
| Beelink SER4 | |
| Beelink SEi12 Core i5-1235U | |
| Intel NUC11PAQi7 | |
| Final Fantasy XV Benchmark | |
| 1280x720 Lite Quality | |
| Intel Hades Canyon NUC8i7HVK | |
| Intel NUC Pro Chassis_i7_1185G7 | |
| Intel NUC Pro Chassis_i7_1265U | |
| HP Spectre x360 13.5 14t-ef000 | |
| Beelink SER4 | |
| Beelink SEi12 Core i5-1235U | |
| Average Intel Iris Xe Graphics G7 80EUs (8.32 - 45.6, n=107) | |
| Intel NUC11PAQi7 | |
| Beelink SEi8 | |
| BMAX B5 Pro G7H8 | |
| 1920x1080 Standard Quality | |
| Intel Hades Canyon NUC8i7HVK | |
| Intel NUC Pro Chassis_i7_1265U | |
| Intel NUC Pro Chassis_i7_1185G7 | |
| HP Spectre x360 13.5 14t-ef000 | |
| Beelink SEi12 Core i5-1235U | |
| Beelink SER4 | |
| Average Intel Iris Xe Graphics G7 80EUs (4.47 - 25.4, n=100) | |
| Intel NUC11PAQi7 | |
| Beelink SEi8 | |
| 1920x1080 High Quality | |
| Intel NUC Pro Chassis_i7_1265U | |
| Intel Hades Canyon NUC8i7HVK | |
| Intel NUC Pro Chassis_i7_1185G7 | |
| HP Spectre x360 13.5 14t-ef000 | |
| Beelink SER4 | |
| Beelink SEi12 Core i5-1235U | |
| Average Intel Iris Xe Graphics G7 80EUs (4.01 - 22, n=92) | |
| Intel NUC11PAQi7 | |
| Beelink SEi8 | |
| Cyberpunk 2077 1.6 | |
| 1920x1080 Low Preset | |
| Intel Hades Canyon NUC8i7HVK | |
| HP Spectre x360 13.5 14t-ef000 | |
| Average Intel Iris Xe Graphics G7 80EUs (9.1 - 17.8, n=7) | |
| Beelink SEi12 Core i5-1235U | |
| 1920x1080 Medium Preset | |
| Intel Hades Canyon NUC8i7HVK | |
| HP Spectre x360 13.5 14t-ef000 | |
| Average Intel Iris Xe Graphics G7 80EUs (11.4 - 14.7, n=5) | |
| Beelink SEi12 Core i5-1235U | |
| 1920x1080 High Preset | |
| Intel Hades Canyon NUC8i7HVK | |
| HP Spectre x360 13.5 14t-ef000 | |
| Average Intel Iris Xe Graphics G7 80EUs (9 - 11.3, n=4) | |
| Beelink SEi12 Core i5-1235U | |
| 1920x1080 Ultra Preset | |
| Intel Hades Canyon NUC8i7HVK | |
| HP Spectre x360 13.5 14t-ef000 | |
| Average Intel Iris Xe Graphics G7 80EUs (7.4 - 9.71, n=4) | |
| Beelink SEi12 Core i5-1235U | |
| X-Plane 11.11 | |
| 1280x720 low (fps_test=1) | |
| Intel Hades Canyon NUC8i7HVK | |
| Beelink SEi12 Core i5-1235U | |
| Intel NUC Pro Chassis_i7_1265U | |
| Intel NUC11PAQi7 | |
| Beelink SER4 | |
| HP Spectre x360 13.5 14t-ef000 | |
| Intel NUC Pro Chassis_i7_1185G7 | |
| Average Intel Iris Xe Graphics G7 80EUs (9.12 - 74.4, n=111) | |
| Beelink SEi8 | |
| 1920x1080 med (fps_test=2) | |
| Intel Hades Canyon NUC8i7HVK | |
| HP Spectre x360 13.5 14t-ef000 | |
| Intel NUC Pro Chassis_i7_1265U | |
| Intel NUC Pro Chassis_i7_1185G7 | |
| Beelink SER4 | |
| Beelink SEi12 Core i5-1235U | |
| Intel NUC11PAQi7 | |
| Average Intel Iris Xe Graphics G7 80EUs (6.45 - 40.5, n=112) | |
| Beelink SEi8 | |
| 1920x1080 high (fps_test=3) | |
| Intel Hades Canyon NUC8i7HVK | |
| HP Spectre x360 13.5 14t-ef000 | |
| Intel NUC Pro Chassis_i7_1185G7 | |
| Intel NUC Pro Chassis_i7_1265U | |
| Beelink SER4 | |
| Beelink SEi12 Core i5-1235U | |
| Intel NUC11PAQi7 | |
| Average Intel Iris Xe Graphics G7 80EUs (5.55 - 36.3, n=110) | |
| Beelink SEi8 | |
Witcher 3 FPS Chart
| low | med. | high | ultra | |
|---|---|---|---|---|
| GTA V (2015) | 117.5 | 98.7 | 17.2 | 7.41 |
| The Witcher 3 (2015) | 77.7 | 48.7 | 26 | 12.2 |
| Dota 2 Reborn (2015) | 93.8 | 88.7 | 45.5 | 42.2 |
| Final Fantasy XV Benchmark (2018) | 35.7 | 19.3 | 13.5 | |
| X-Plane 11.11 (2018) | 48.4 | 32.8 | 29.5 | |
| Strange Brigade (2018) | 65.9 | 26.5 | 21.4 | 17.5 |
| Cyberpunk 2077 1.6 (2022) | 13.4 | 11.4 | 9 | 7.4 |
排放
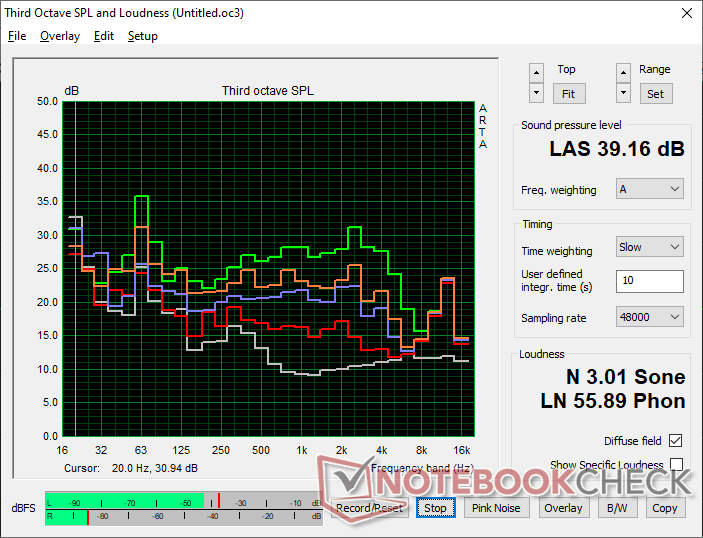
系统噪音
与Beelink的其他迷你电脑一样,SEi12的风扇噪音始终存在,接近28dB(A),而静音背景为23dB(A)。幸运的是,即使在引入更高的负载时,系统也不会变得让人分心。运行Witcher 3 或 3DMark 06 将导致与 SEi12 相似的风扇噪音水平。 英特尔NUC 11PAQ在类似条件下的风扇噪音水平。风扇噪音偶尔会达到39dB(A),尽管只是在短时间内,然后回落到30dB(A)的低范围。更强大的迷你电脑,如Beelink SER系列,甚至更响亮。
Noise level
| Idle |
| 27.8 / 27.8 / 27.8 dB(A) |
| Load |
| 32 / 39.2 dB(A) |
 | ||
30 dB silent 40 dB(A) audible 50 dB(A) loud |
||
min: | ||
| Beelink SEi12 Core i5-1235U Iris Xe G7 80EUs, i5-1235U, Kingston NV1 SNVS/500GCN | Beelink SEi8 Iris Plus Graphics 655, i3-8109U, Intel SSD 660p SSDPEKNW512G8 | Beelink SER4 Vega 8, R7 4800U, Intel SSD 660p SSDPEKNW512G8 | Intel NUC11PAQi7 Iris Xe G7 96EUs, i7-1165G7, Samsung SSD 980 Pro 500GB MZ-V8P500BW | BMAX B5 Pro G7H8 UHD Graphics 620, i5-8260U | Intel Hades Canyon NUC8i7HVK Vega M GH, i7-8809G, Intel Optane 120 GB SSDPEK1W120GA | |
|---|---|---|---|---|---|---|
| Noise | -4% | -14% | -4% | 10% | -14% | |
| off / environment * (dB) | 23.3 | 24.5 -5% | 23.4 -0% | 25.6 -10% | 23 1% | 28.7 -23% |
| Idle Minimum * (dB) | 27.8 | 26.5 5% | 33.2 -19% | 25.6 8% | 25.1 10% | 29 -4% |
| Idle Average * (dB) | 27.8 | 26.5 5% | 33.2 -19% | 25.6 8% | 25.1 10% | 29 -4% |
| Idle Maximum * (dB) | 27.8 | 31.1 -12% | 33.2 -19% | 25.6 8% | 25.1 10% | 29 -4% |
| Load Average * (dB) | 32 | 37.7 -18% | 38.6 -21% | 33.6 -5% | 28.6 11% | 36 -13% |
| Witcher 3 ultra * (dB) | 34.1 | 39.2 -15% | 33.6 1% | 30.1 12% | 42 -23% | |
| Load Maximum * (dB) | 39.2 | 37.5 4% | 40.8 -4% | 54.5 -39% | 34 13% | 49.4 -26% |
* ... smaller is better
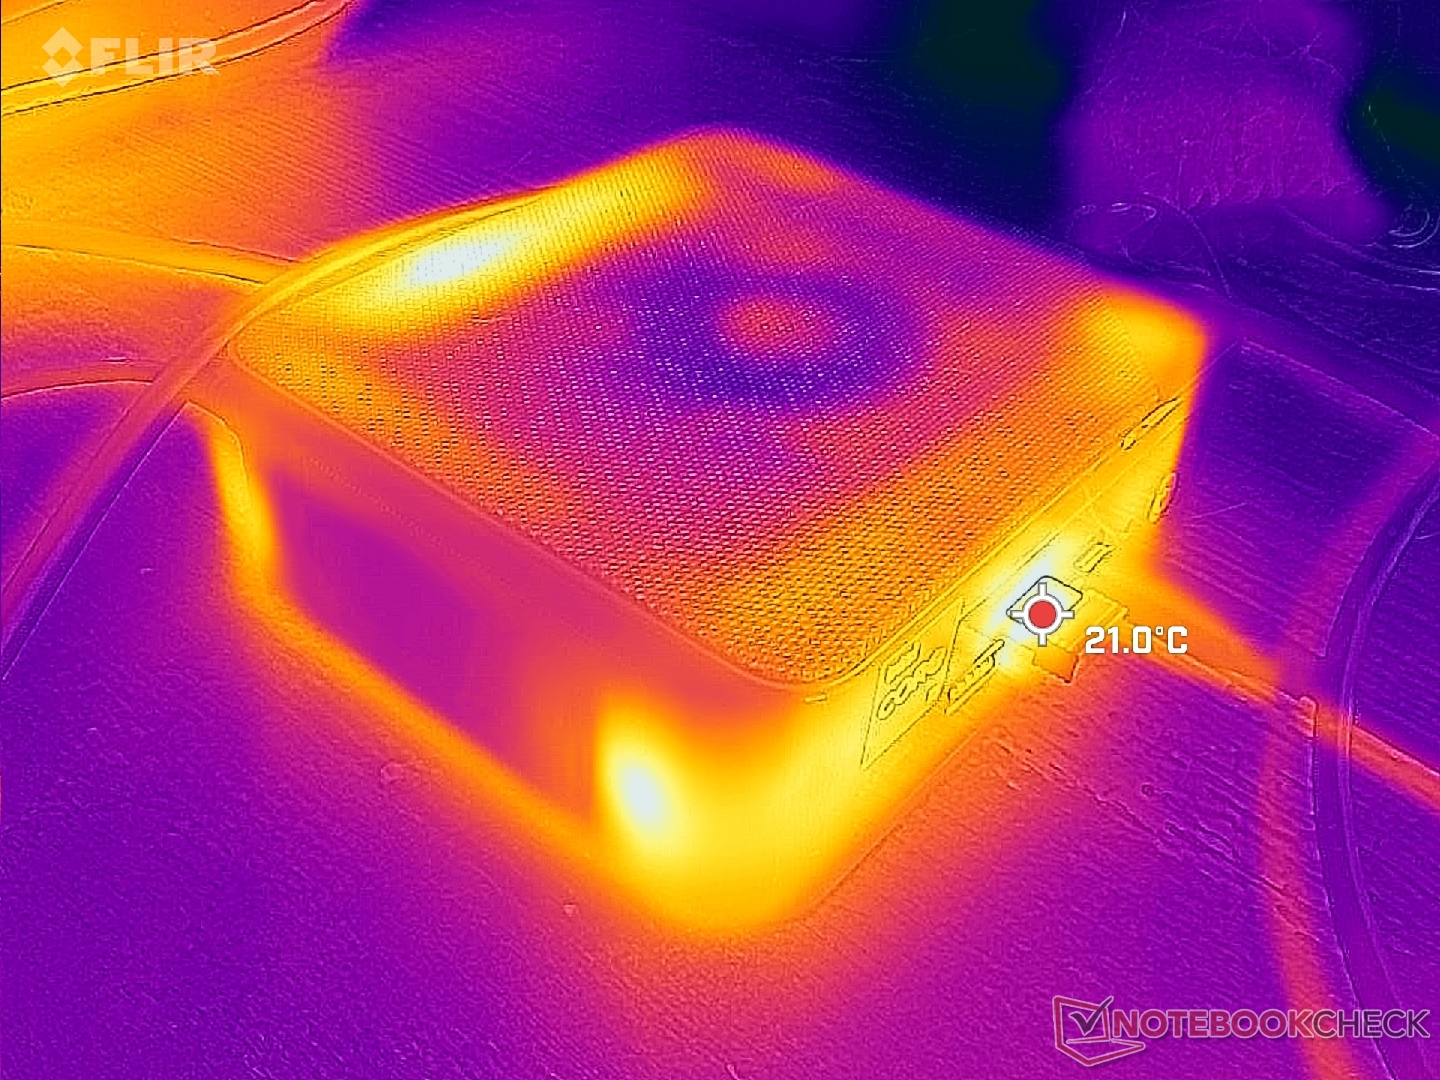
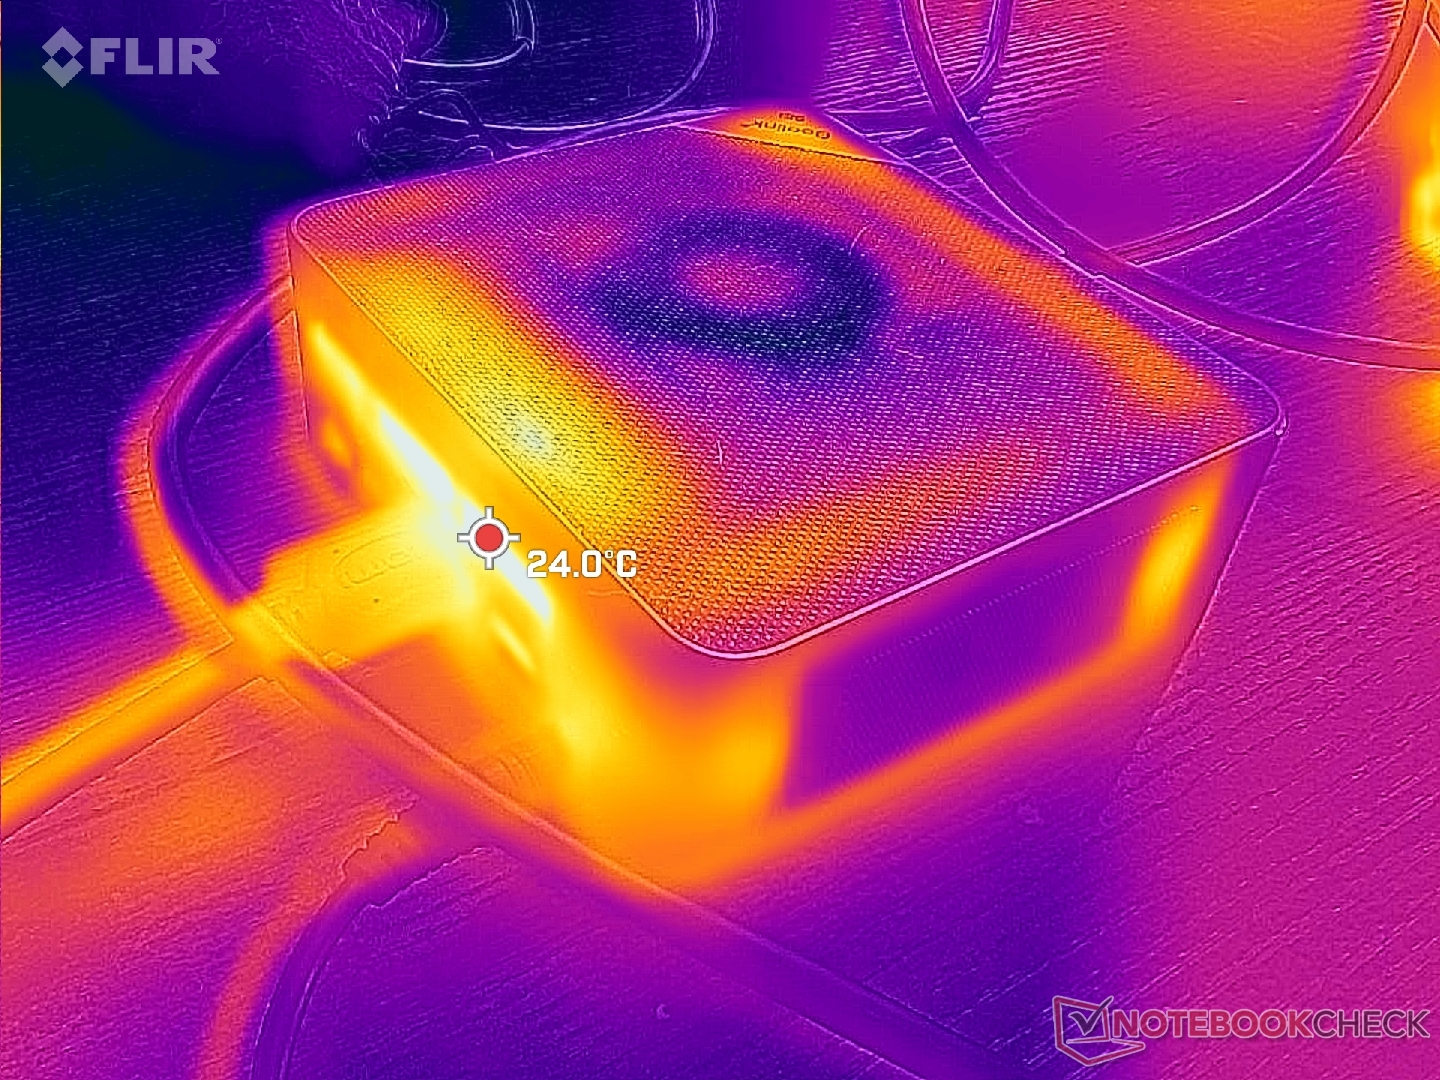
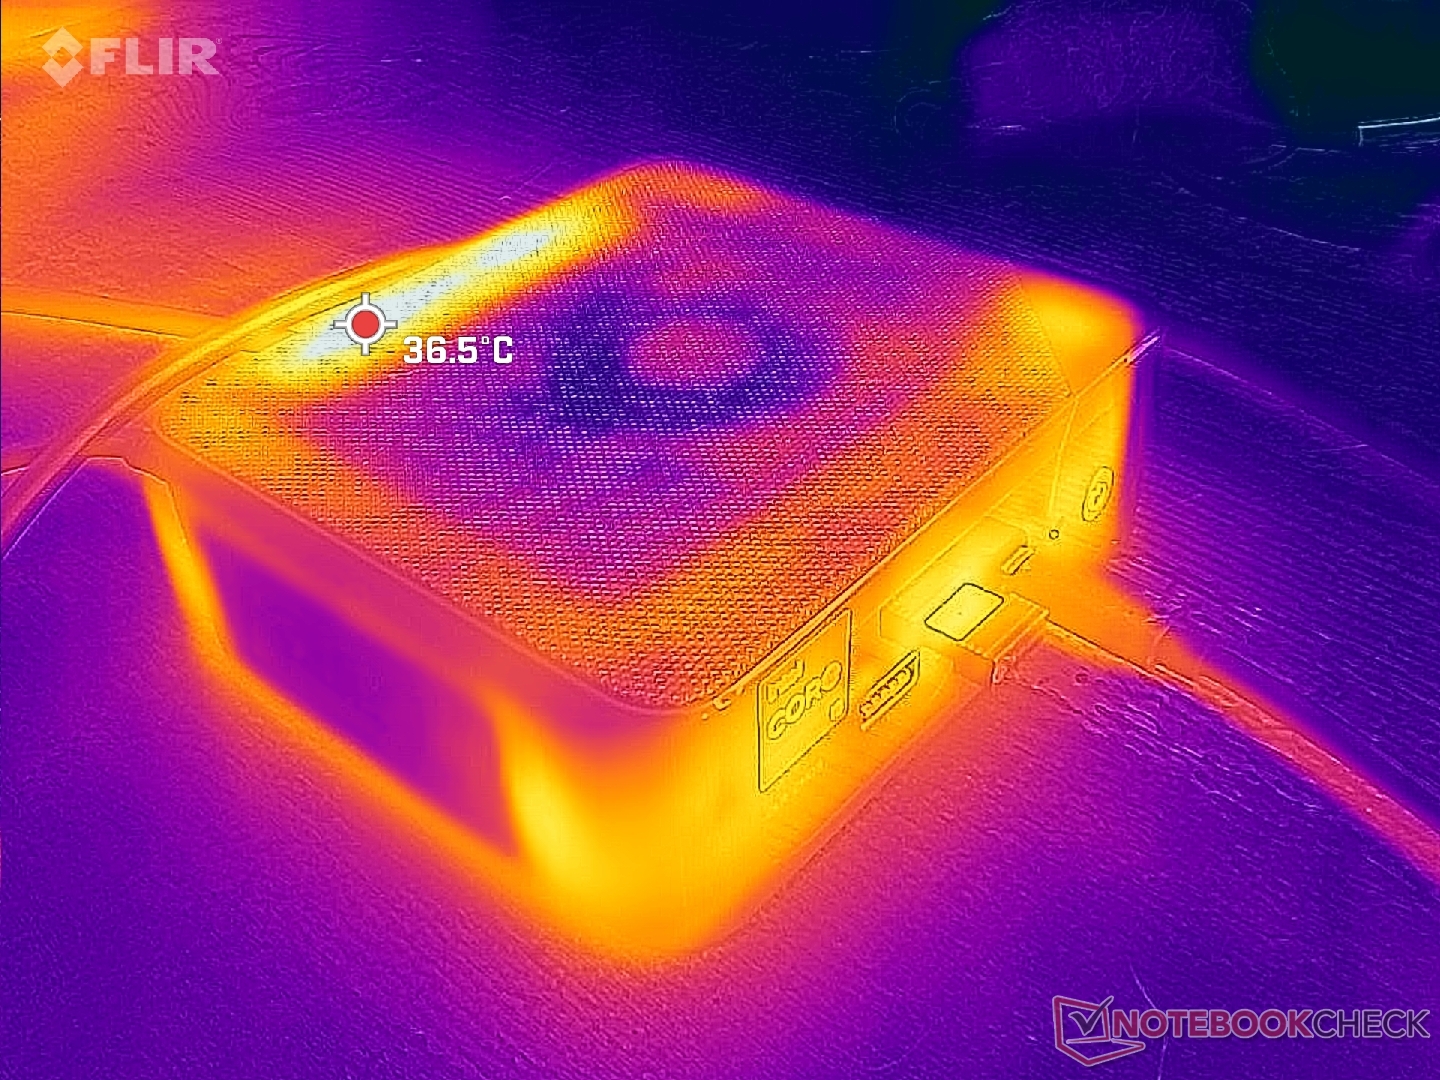
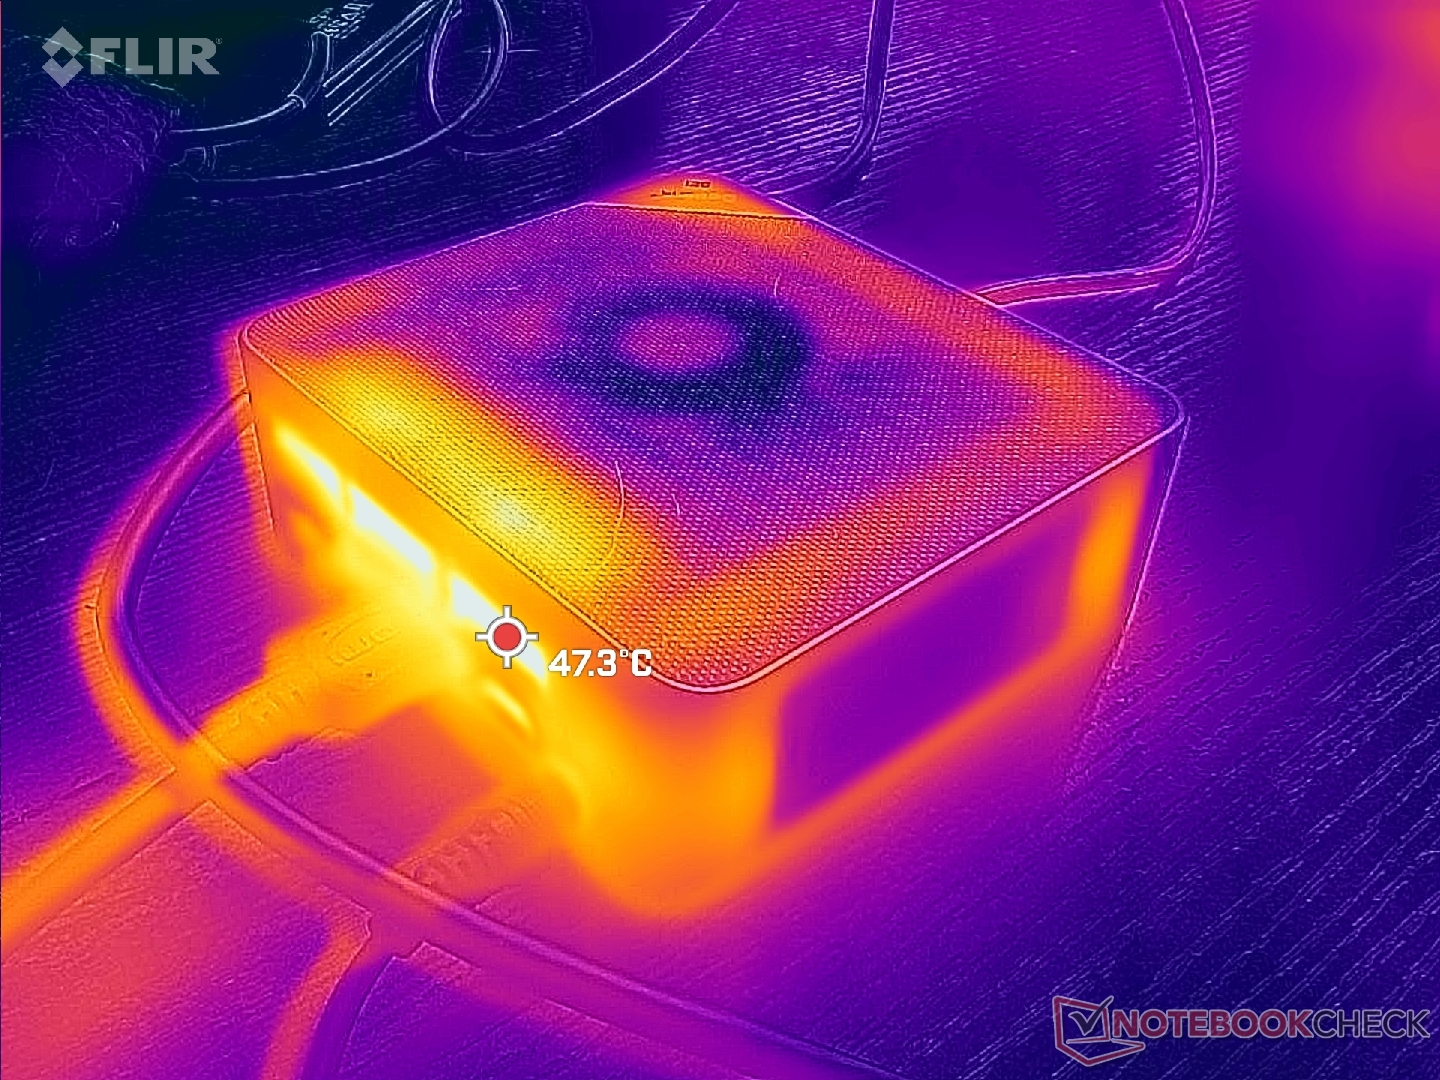
温度
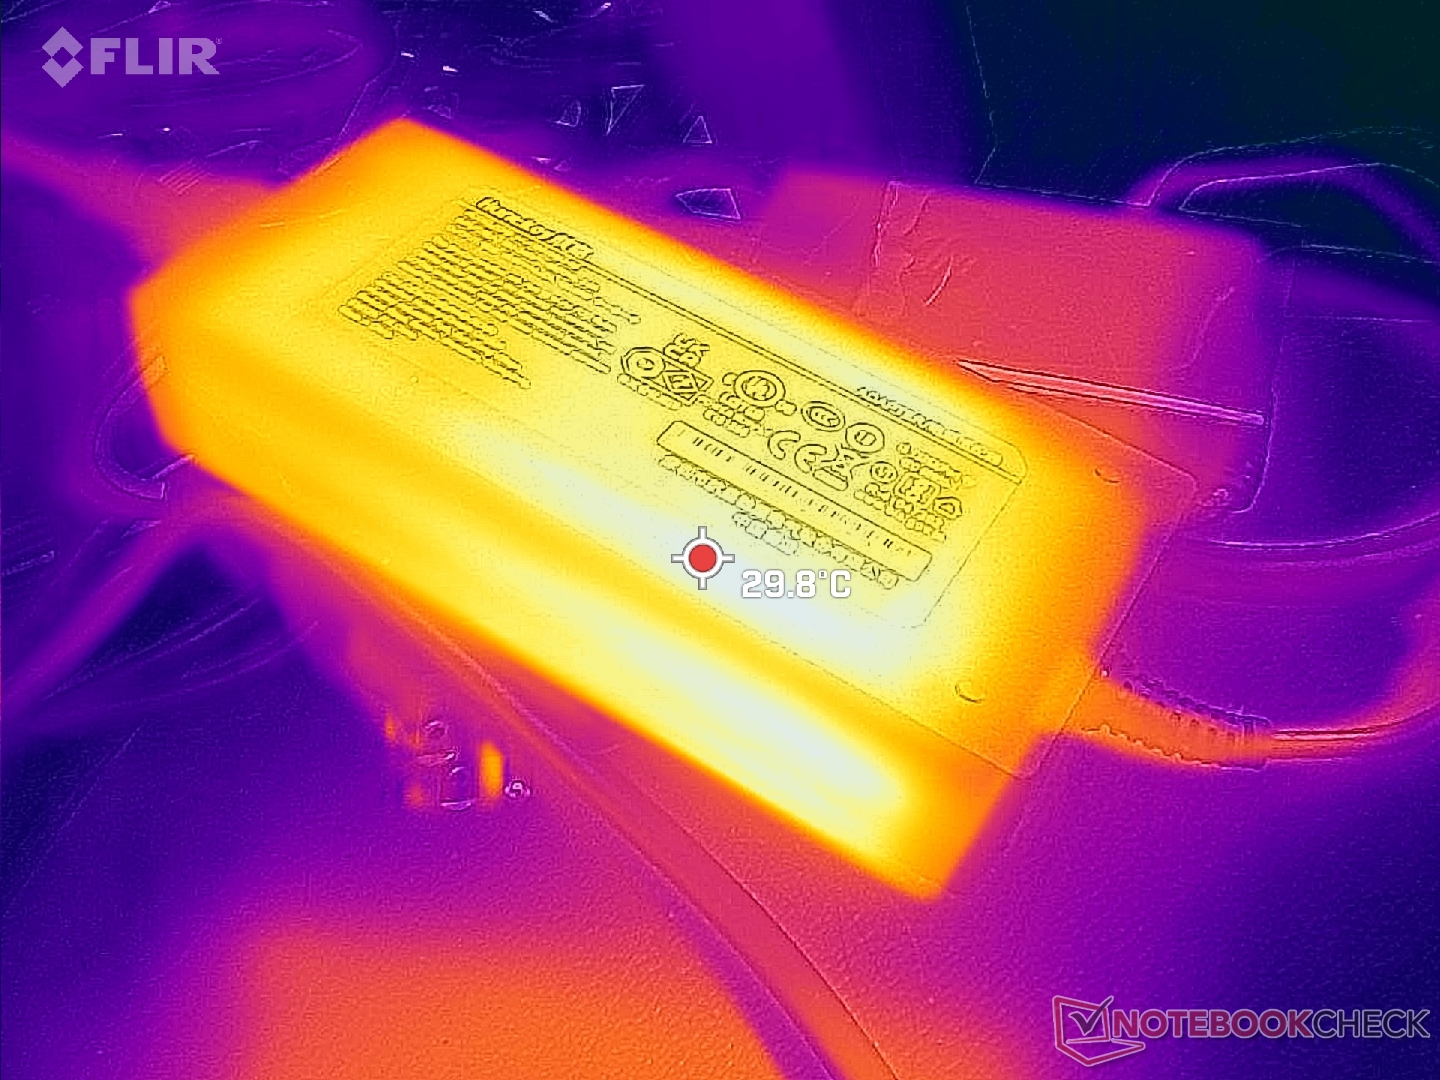
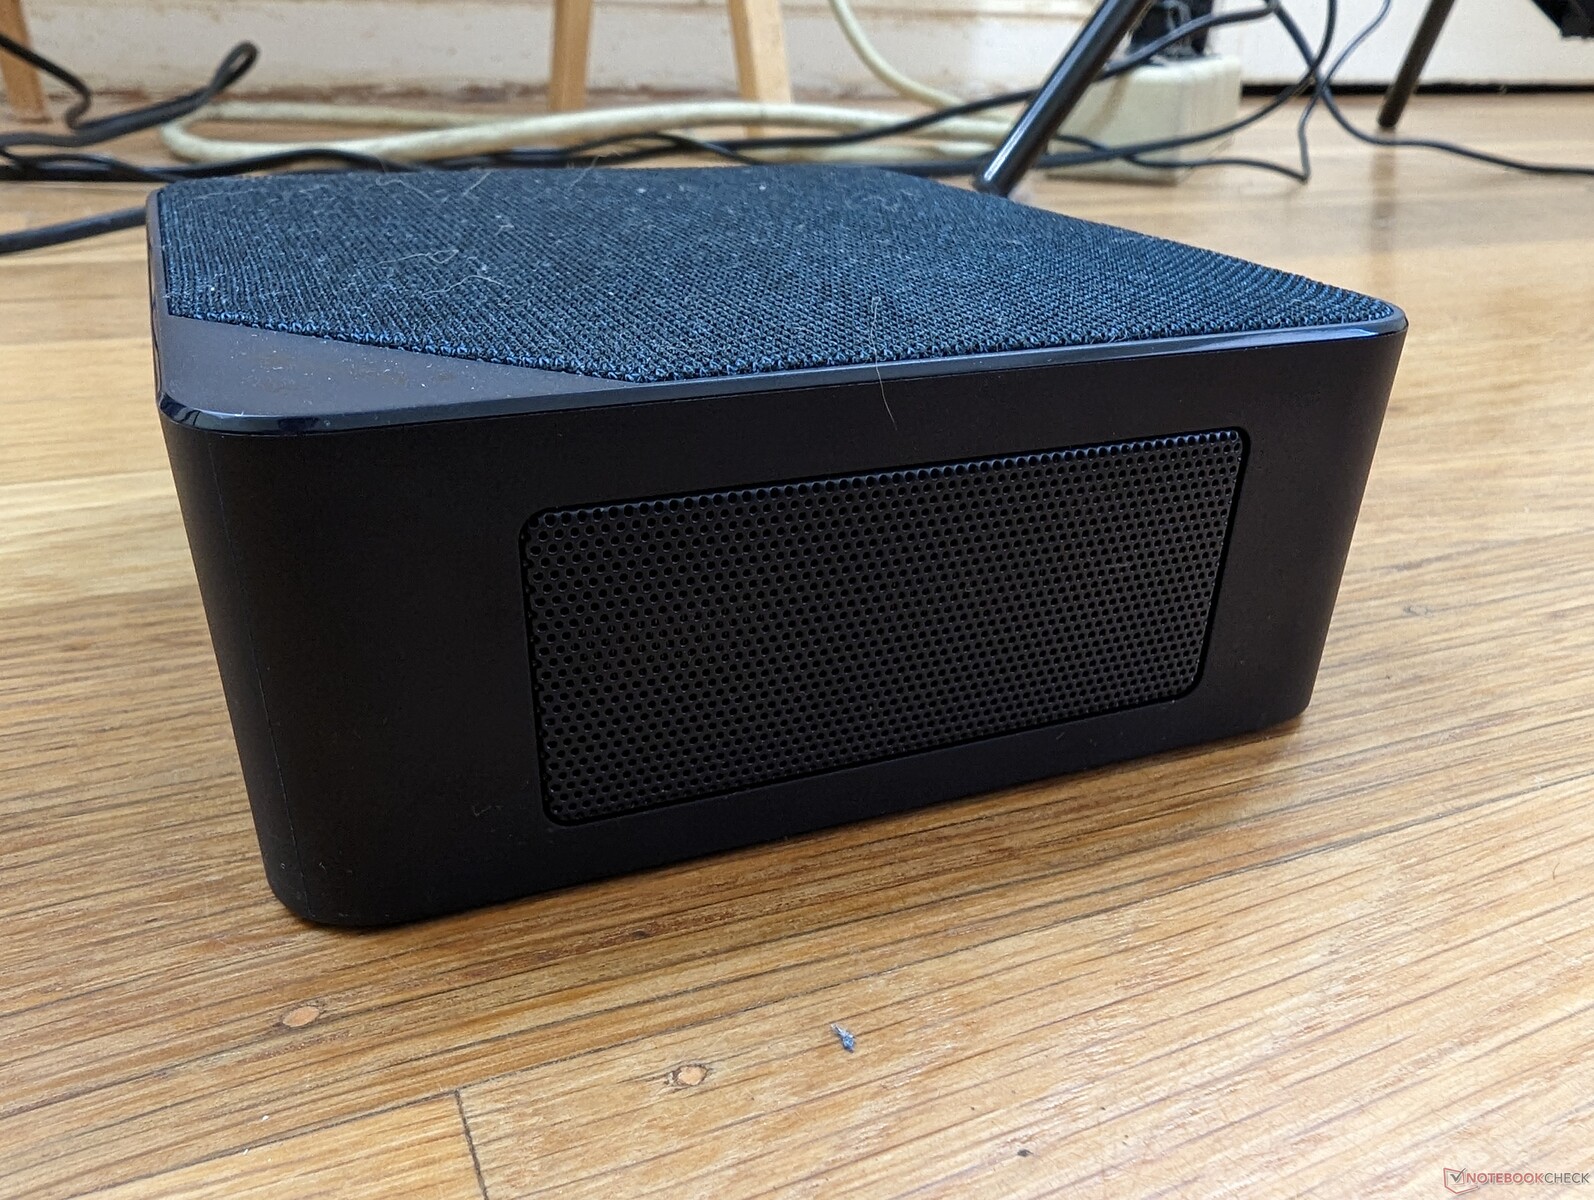
如下面的温度图所示,冷空气从侧面和顶部的网眼进入,而暖空气从后面排出。在运行高要求的应用时,后部的热点温度可高达47摄氏度。不建议在设备的顶部放置任何物品,否则会减少空气流动。
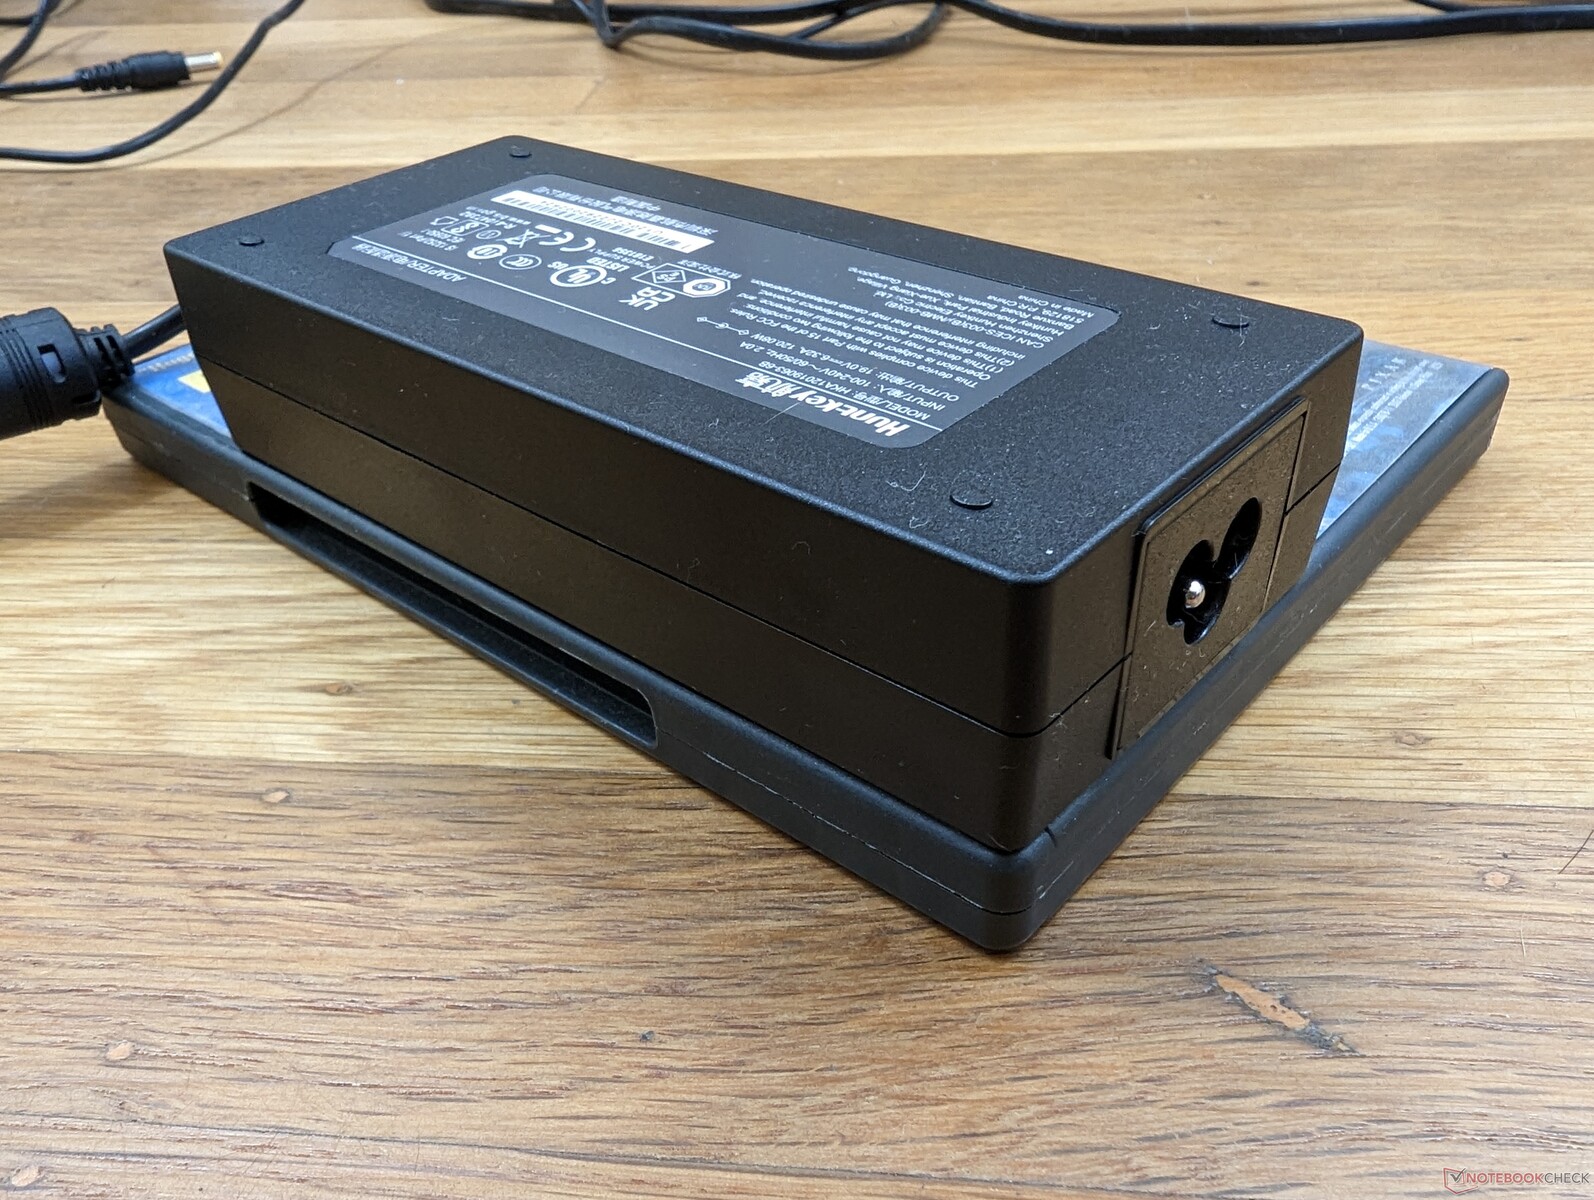
当长时间运行高要求的负载时,AC适配器的温度可以达到30 C。
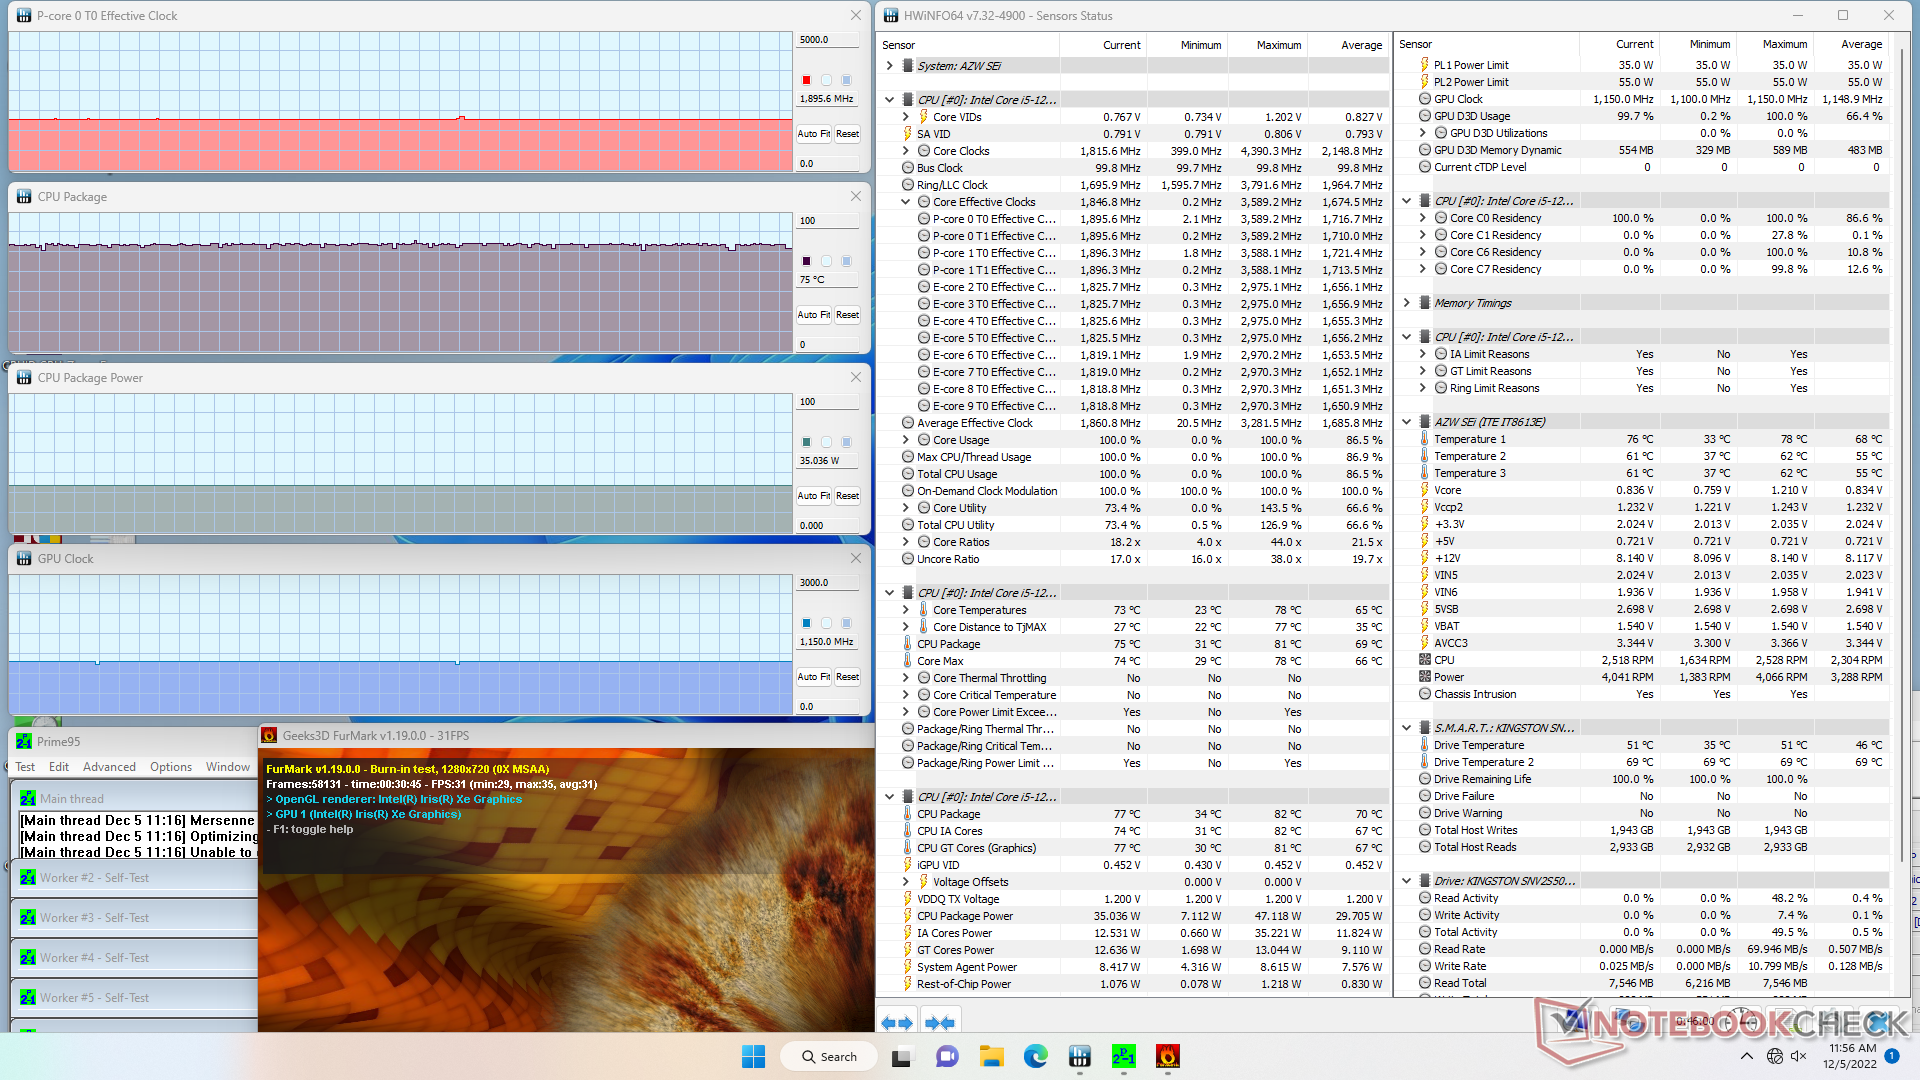
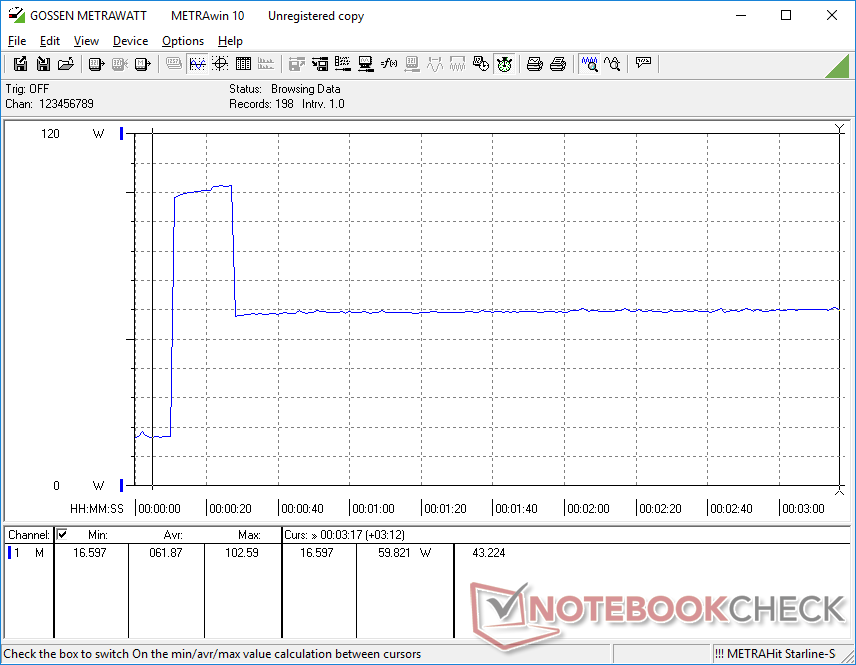
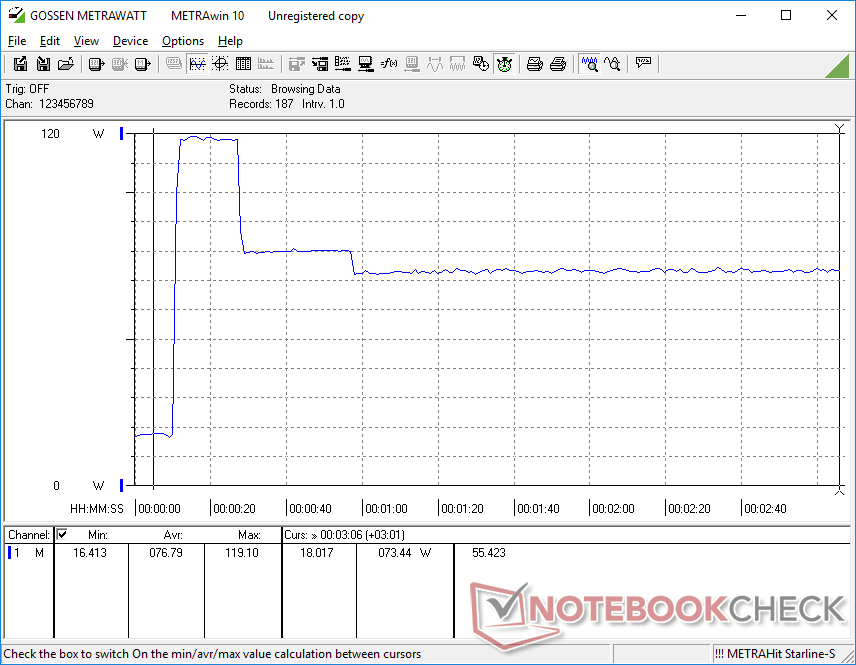
压力测试
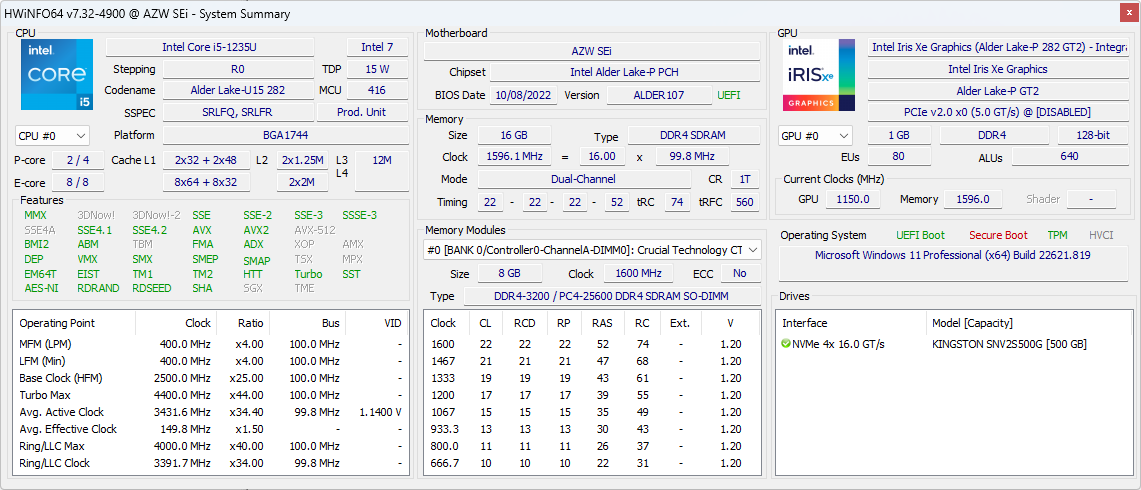
当使用Prime95时,CPU将提升到3.6 GHz,处理器功耗为47 W。然而,当核心温度达到76 C后仅几秒钟,时钟速率和功耗将分别下降到2.1 GHz和27 W,以保持67 C的较低核心温度。
运行时的GPU时钟速率和温度 Witcher 3将分别稳定在1150兆赫和68摄氏度,而在更昂贵的英特尔NUC11PAQi7上则是1300兆赫和57摄氏度。
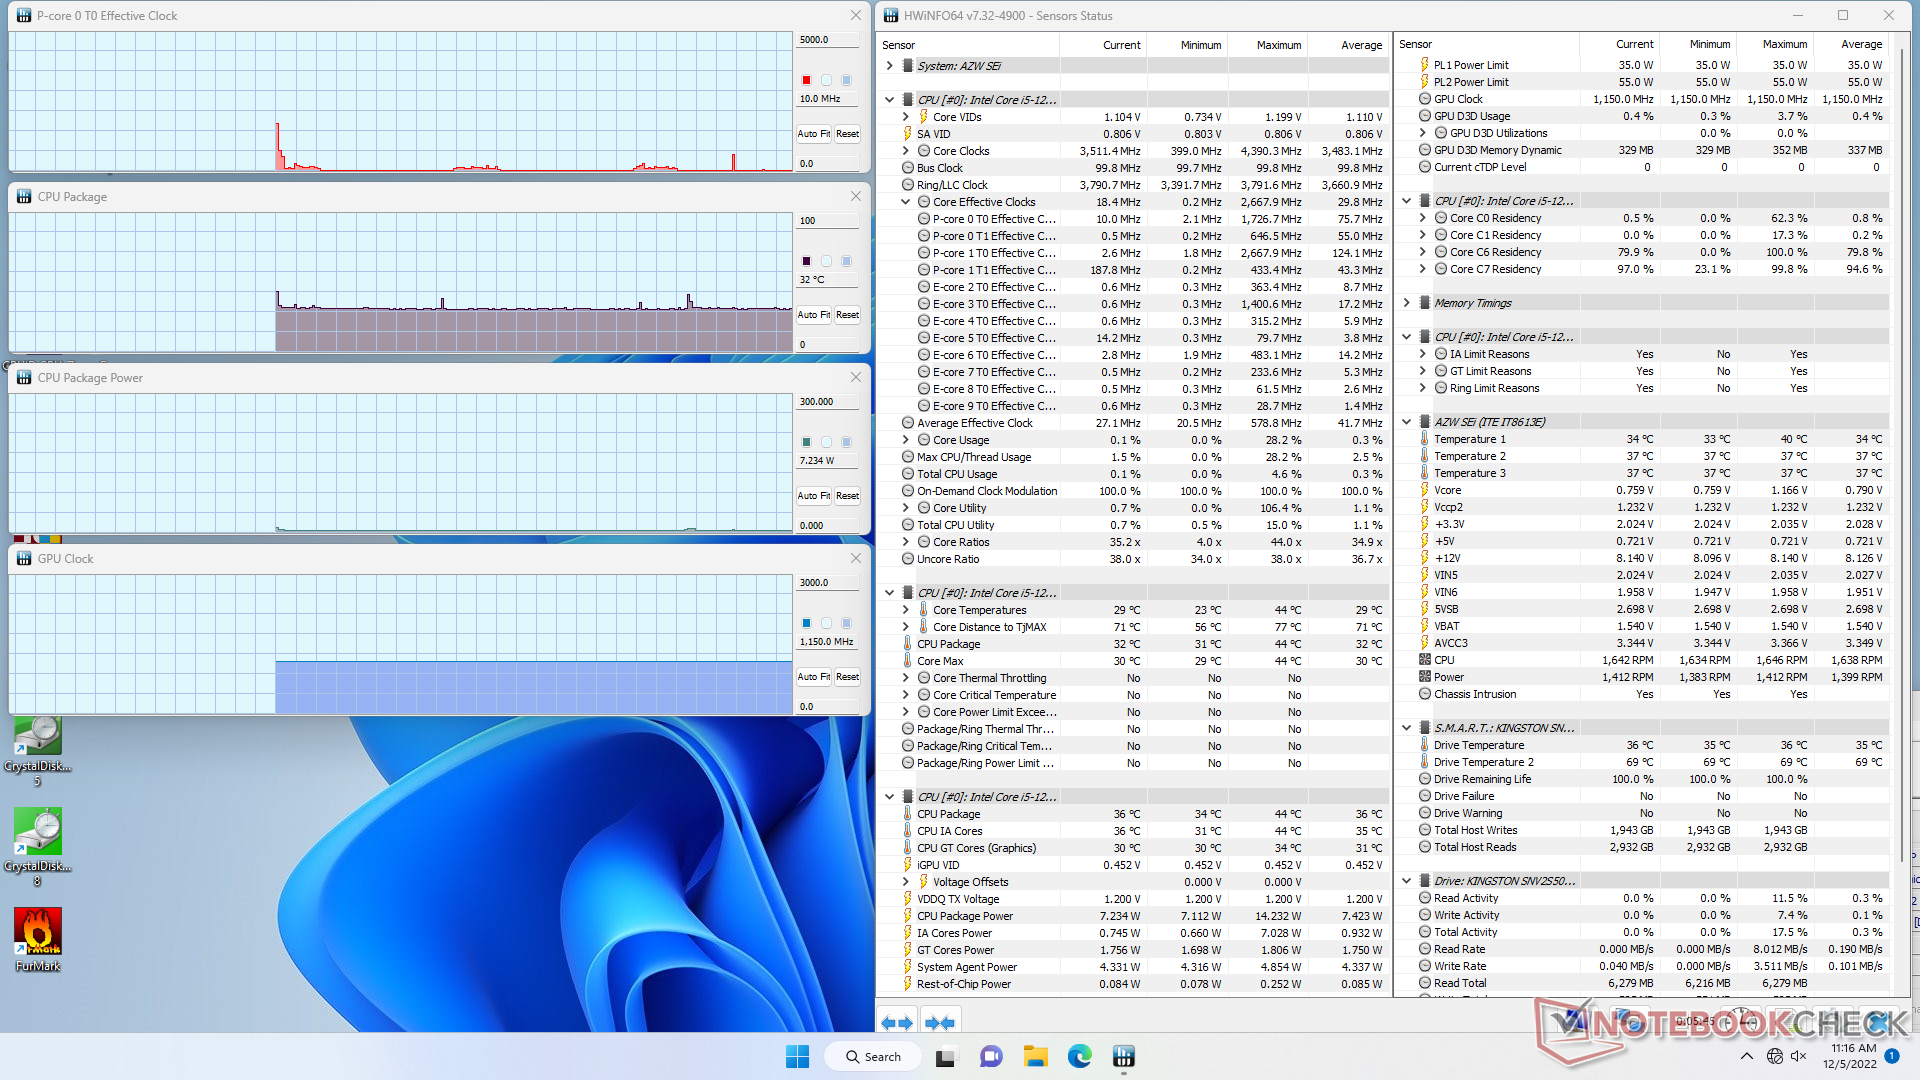
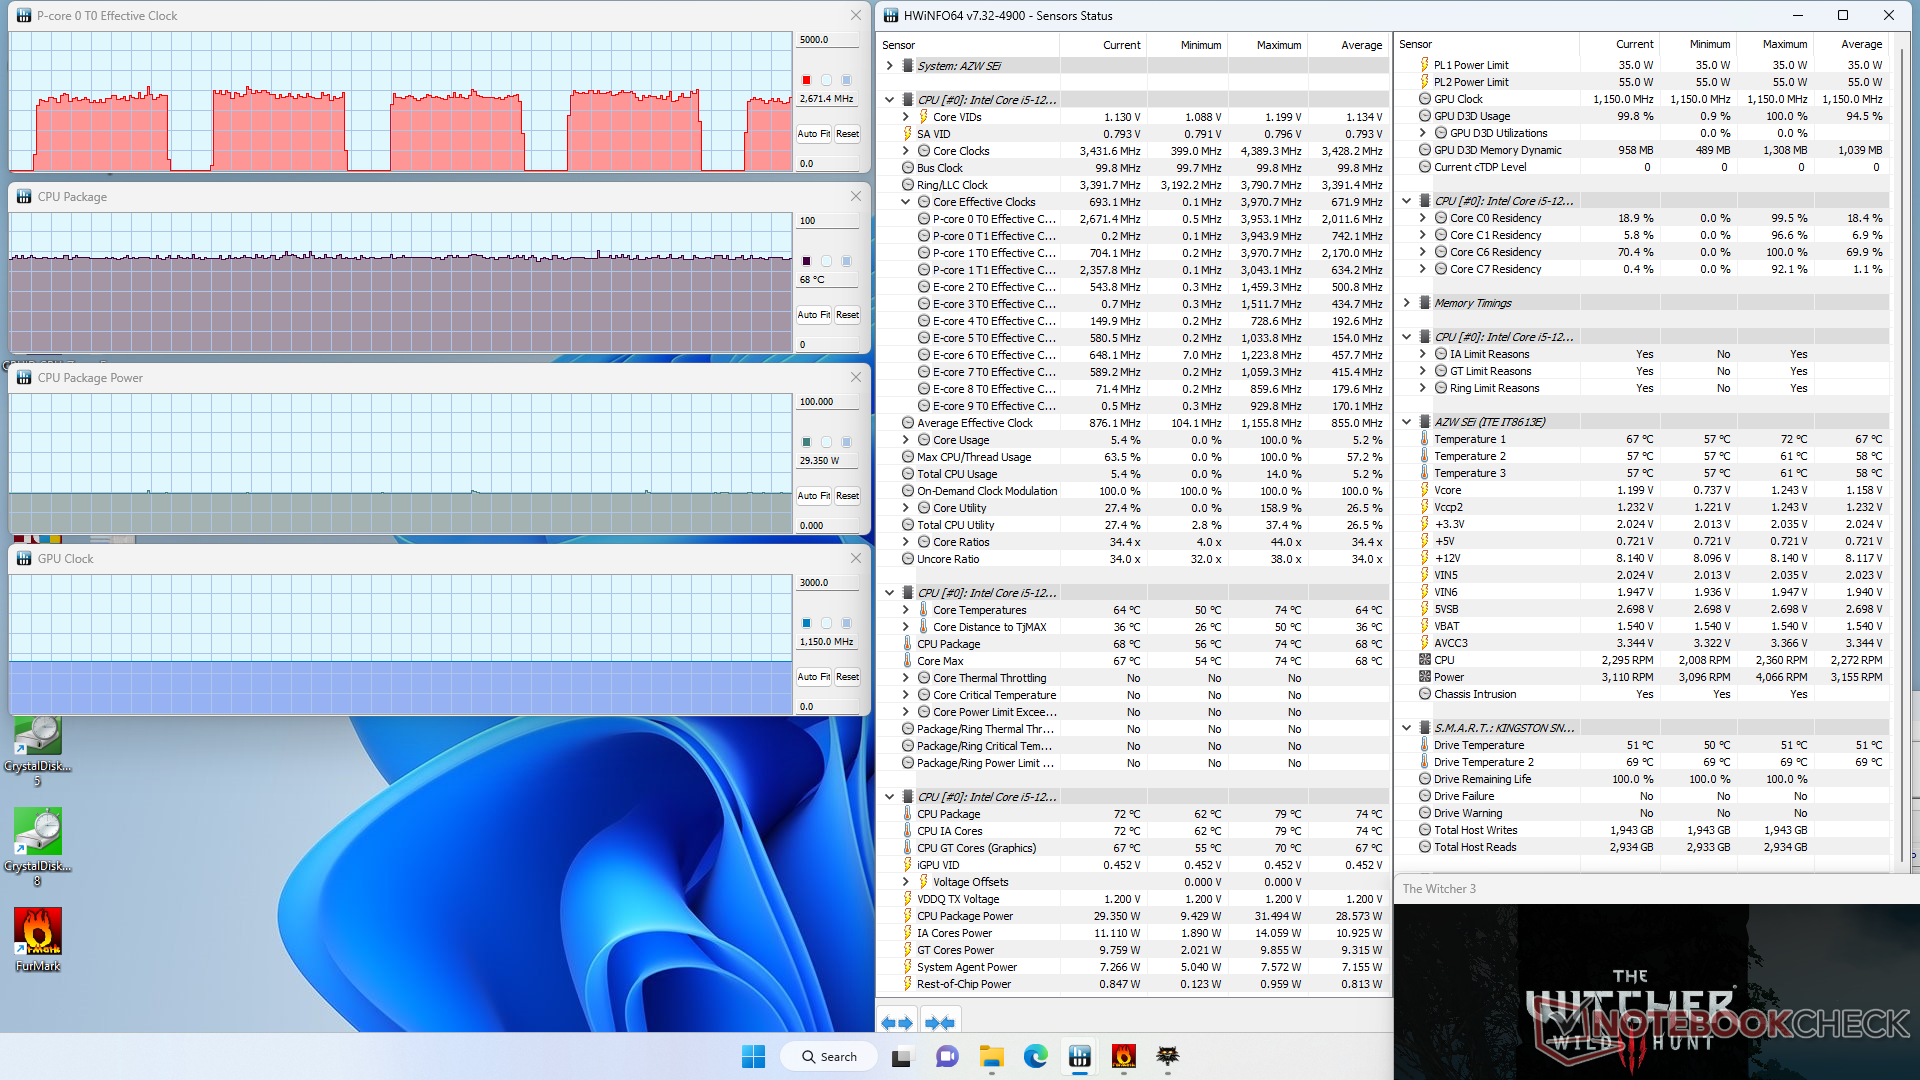
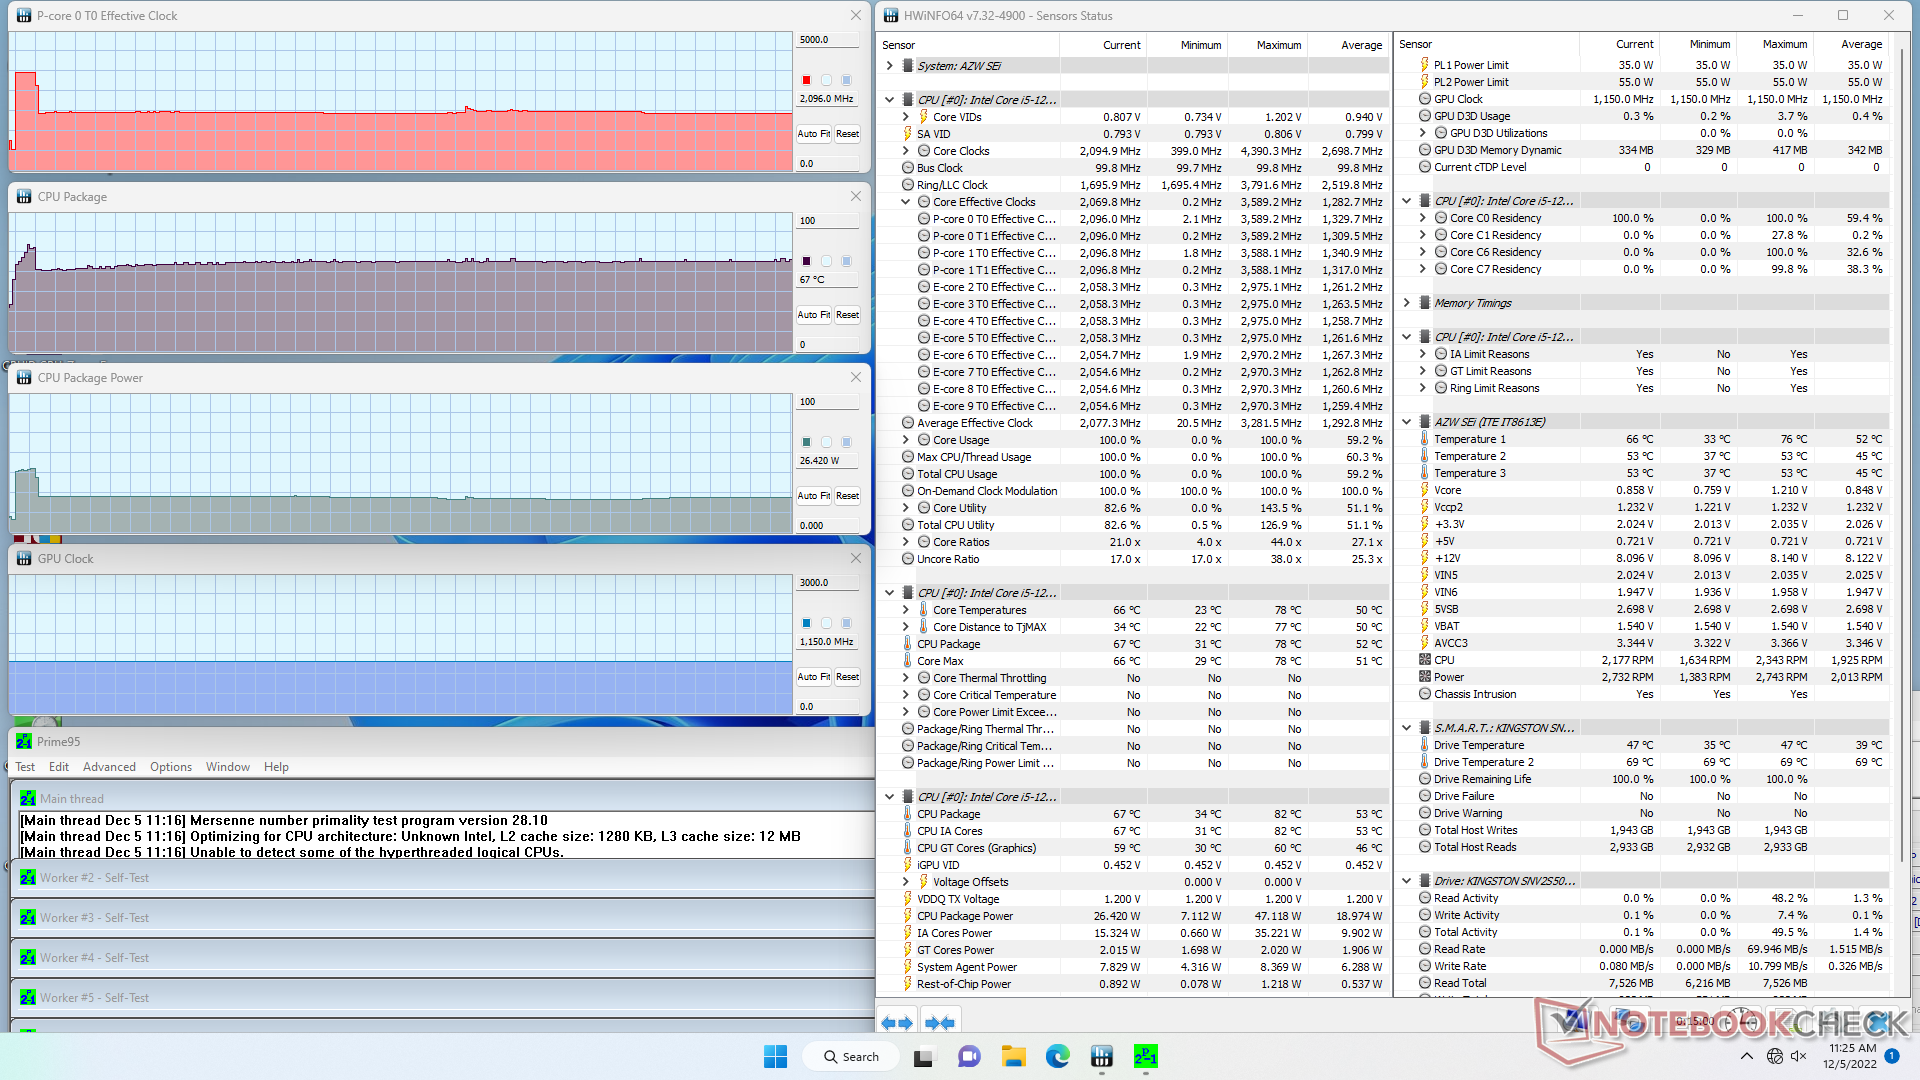
| CPU时钟(GHz) | GPU时钟(MHz) | CPU平均温度(°C) | |
| 系统空闲 | -- | -- | 32 |
| Prime95压力 | 2.1 | 1150 | 67 |
| Prime95 + FurMark压力 | 1.9 | 1150 | 75 |
| Witcher 3 应力 | ~2.6 | 1150 | 68 |
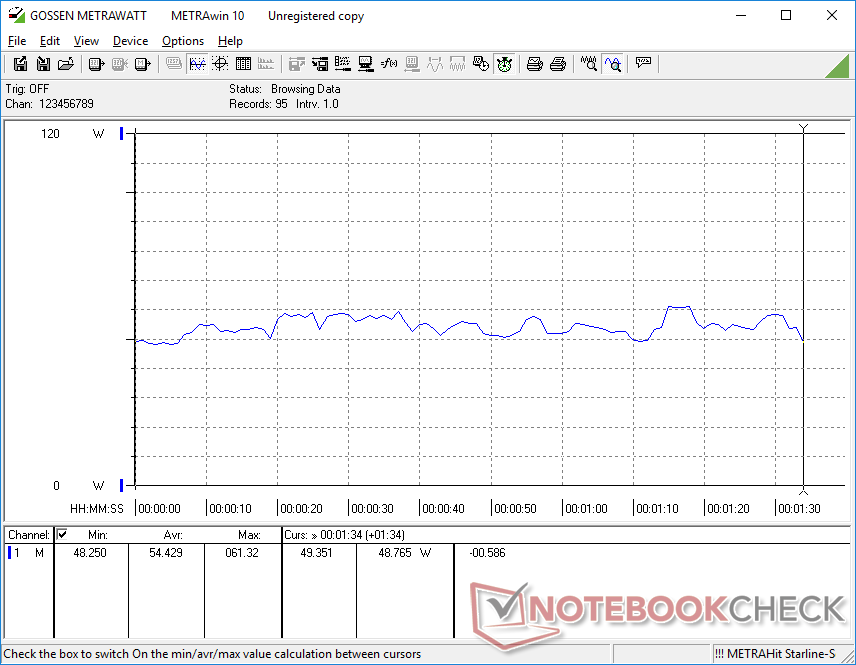
能源管理
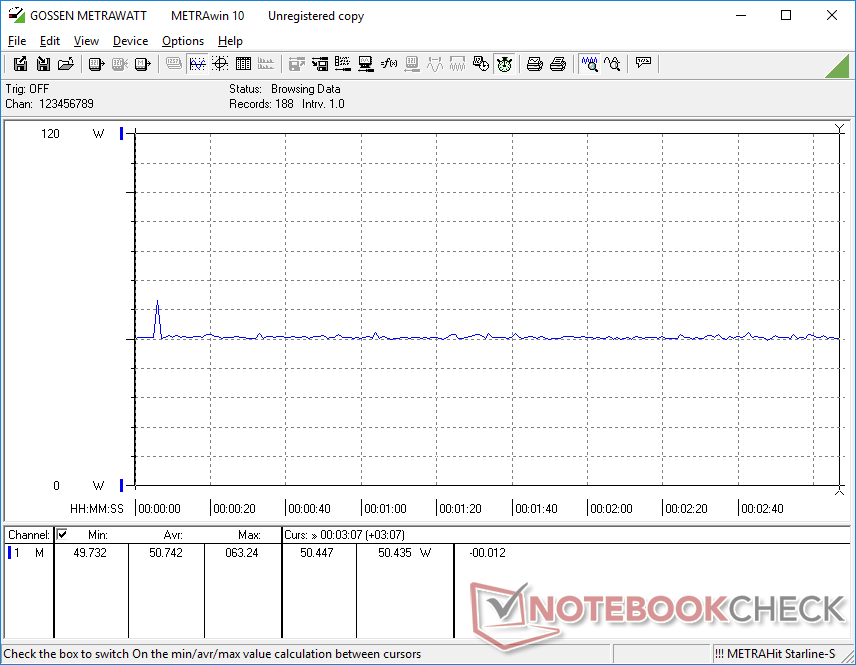
消耗功率
耗电量相对较高,这可能有助于解释比预期大的交流适配器。在桌面上空转消耗约17W,而其他U系列电源的迷你PC,如SER4,则消耗不到一半。 SER4 或英特尔NUC11。当运行像游戏这样的高要求负载时,消耗量平均约为50瓦,而NUC11的消耗量仅低于40瓦。
| Off / Standby | |
| Idle | |
| Load |
|
Key:
min: | |
| Beelink SEi12 Core i5-1235U i5-1235U, Iris Xe G7 80EUs, Kingston NV1 SNVS/500GCN, , x, | Beelink SEi8 i3-8109U, Iris Plus Graphics 655, Intel SSD 660p SSDPEKNW512G8, , x, | Beelink SER4 R7 4800U, Vega 8, Intel SSD 660p SSDPEKNW512G8, , x, | Intel NUC11PAQi7 i7-1165G7, Iris Xe G7 96EUs, Samsung SSD 980 Pro 500GB MZ-V8P500BW, , x, | BMAX B5 Pro G7H8 i5-8260U, UHD Graphics 620, , , x, | Intel Hades Canyon NUC8i7HVK i7-8809G, Vega M GH, Intel Optane 120 GB SSDPEK1W120GA, , x, | |
|---|---|---|---|---|---|---|
| Power Consumption | 49% | 59% | 49% | 49% | -38% | |
| Idle Minimum * (Watt) | 15.8 | 7.5 53% | 4.1 74% | 5.6 65% | 6 62% | 15.5 2% |
| Idle Average * (Watt) | 16.8 | 7.6 55% | 4.1 76% | 5.6 67% | 6.2 63% | 16.2 4% |
| Idle Maximum * (Watt) | 17 | 9.2 46% | 4.6 73% | 6 65% | 6.3 63% | 16.5 3% |
| Load Average * (Watt) | 54.4 | 41.1 24% | 35.6 35% | 31.4 42% | 42.8 21% | 83.4 -53% |
| Witcher 3 ultra * (Watt) | 50.7 | 35.6 30% | 39 23% | 35 31% | 121.7 -140% | |
| Load Maximum * (Watt) | 119.1 | 41.4 65% | 39.9 66% | 80.5 32% | 55.8 53% | 173.5 -46% |
* ... smaller is better
Power Consumption Witcher 3 / Stresstest
Power Consumption external Monitor
Pros
Cons
结论 - 低价但不影响性能
SEi12提供的性能水平与搭载Core U的英特尔NUC11相当,而且常常更好,而零售价却低得多。例如,配备酷睿i5-1135G7处理器、16GB内存和256GB固态硬盘的NUC11PAH目前的售价为550美元,而我们的SEi 12的存储量为两倍,售价仅为400美元。该模型不依赖慢得令人震惊的赛扬或Atom解决方案,以达到有吸引力的价格点,这仍然是Beelink许多迷你PC的关键卖点。
缺乏对Thunderbolt的支持是令人失望的,但这可能只会影响那些想用菊花链连接高分辨率显示器或连接eGPU的爱好者。值得一提的是,英特尔正在开始反击,最新的NUC12系列现在提供更快的Core P CPU。如果你对现代超极本的性能感到满意,那么SEi12中的酷睿i5-1235U仍然绰绰有余,当然比同价位的大多数迷你PC快得多。
价格和可用性
Beelink SEi12目前在亚马逊上以400美元的价格出售。从最初的480美元下降。另外,用户可以直接从制造商那里购买https://www.bee-link.com/catalog/product/buy?id=371460美元的价格。
Price comparison

