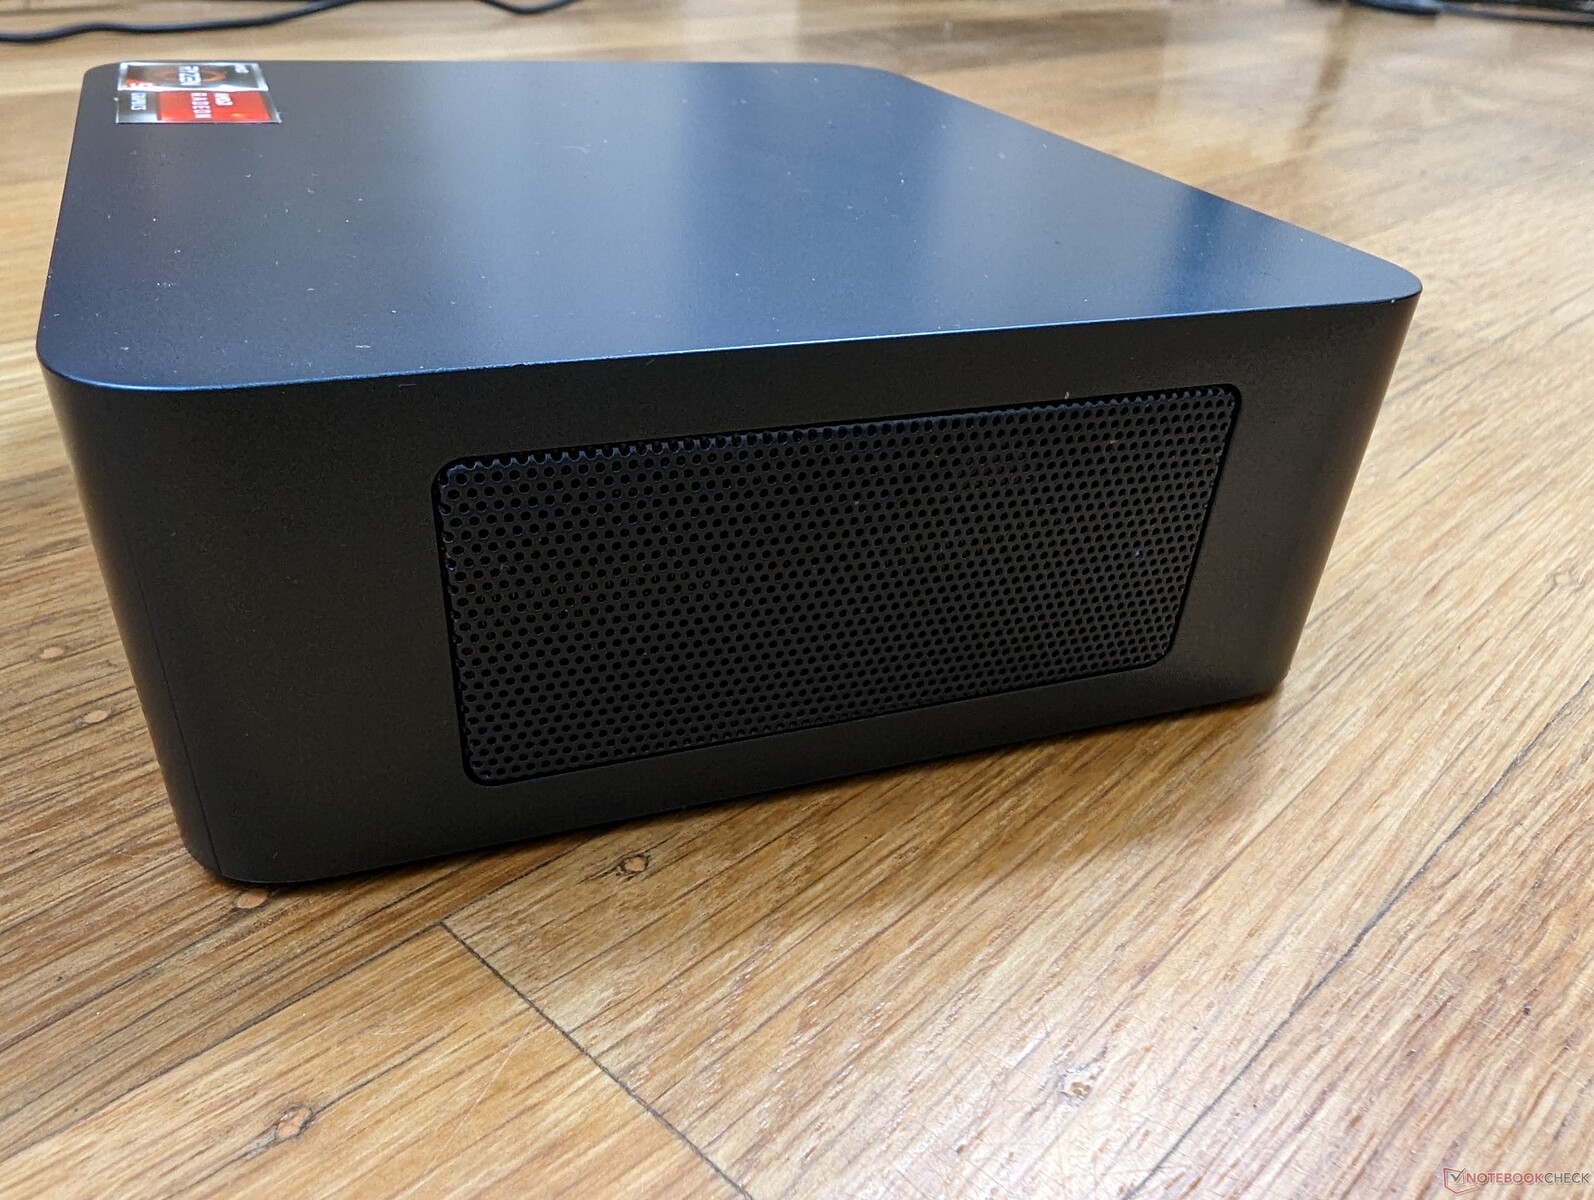
特瑞凯S3迷你电脑评测。以赛扬或凌动的价格获得类似酷睿i3的性能
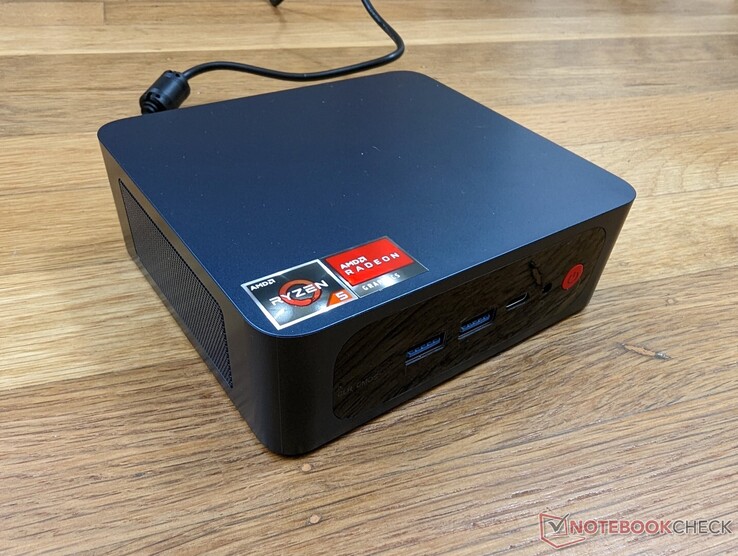
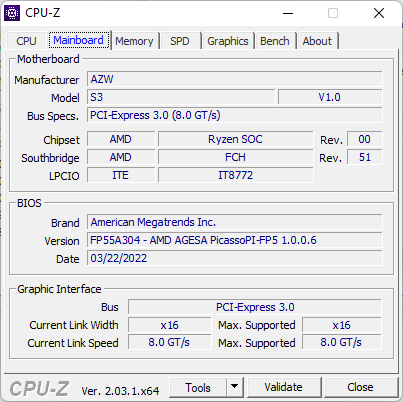
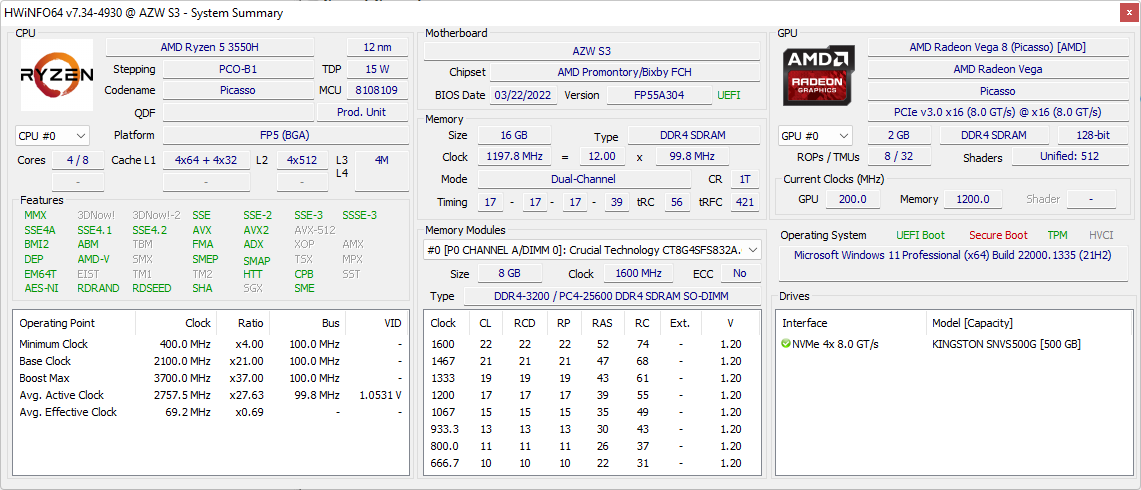
Trigkey专门生产运行在老式处理器上的廉价迷你电脑,以保持低价格。S3就是这样一款运行在三年前的 Ryzen 5 3550H零售价约为280美元。
这个领域的竞争者包括其他廉价迷你电脑,如 BMax B5 Pro, 贝林克U59,或 卓伟LarkBox.
潜在的竞争对手比较
Rating | Date | Model | Weight | Height | Size | Resolution | Price |
|---|---|---|---|---|---|---|---|
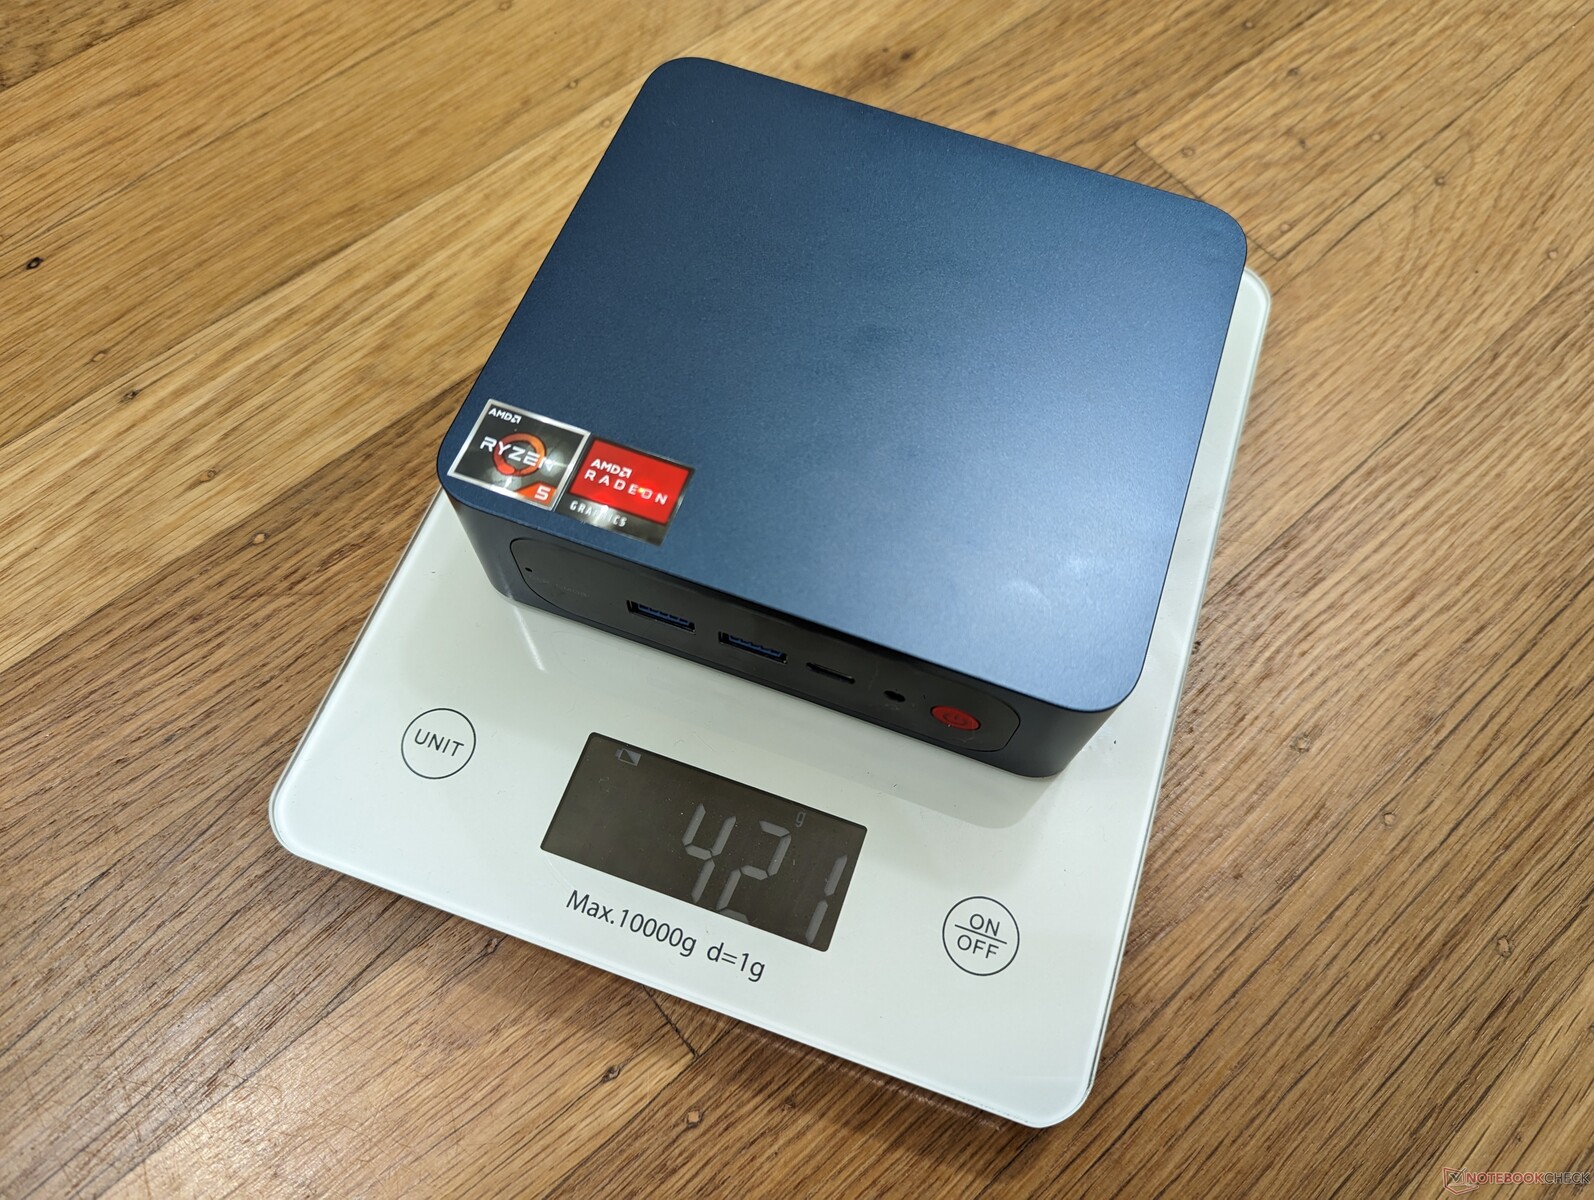
v (old) | 01 / 2023 | Trigkey S3 R5 3550H, Vega 8 | 419 g | 40.7 mm | x | ||
v (old) | 11 / 2022 | Intel NUC Pro Chassis_i7_1265U i7-1265U, Iris Xe G7 96EUs | 35 mm | x | |||
v (old) | Intel NUC11TNKi5 i5-1135G7, Iris Xe G7 80EUs | 504 g | 37 mm | x | |||
v (old) | 12 / 2022 | Beelink SEi12 Core i5-1235U i5-1235U, Iris Xe G7 80EUs | 465 g | 42 mm | x | ||
v (old) | 09 / 2022 | Beelink SEi11 Pro i5-11320H, Iris Xe G7 96EUs | 440 g | 40 mm | x | ||
v (old) | 10 / 2022 | Beelink SER Pro Ryzen 5 5600H R5 5600H, Vega 7 | 498 g | 42 mm | x |
连接性
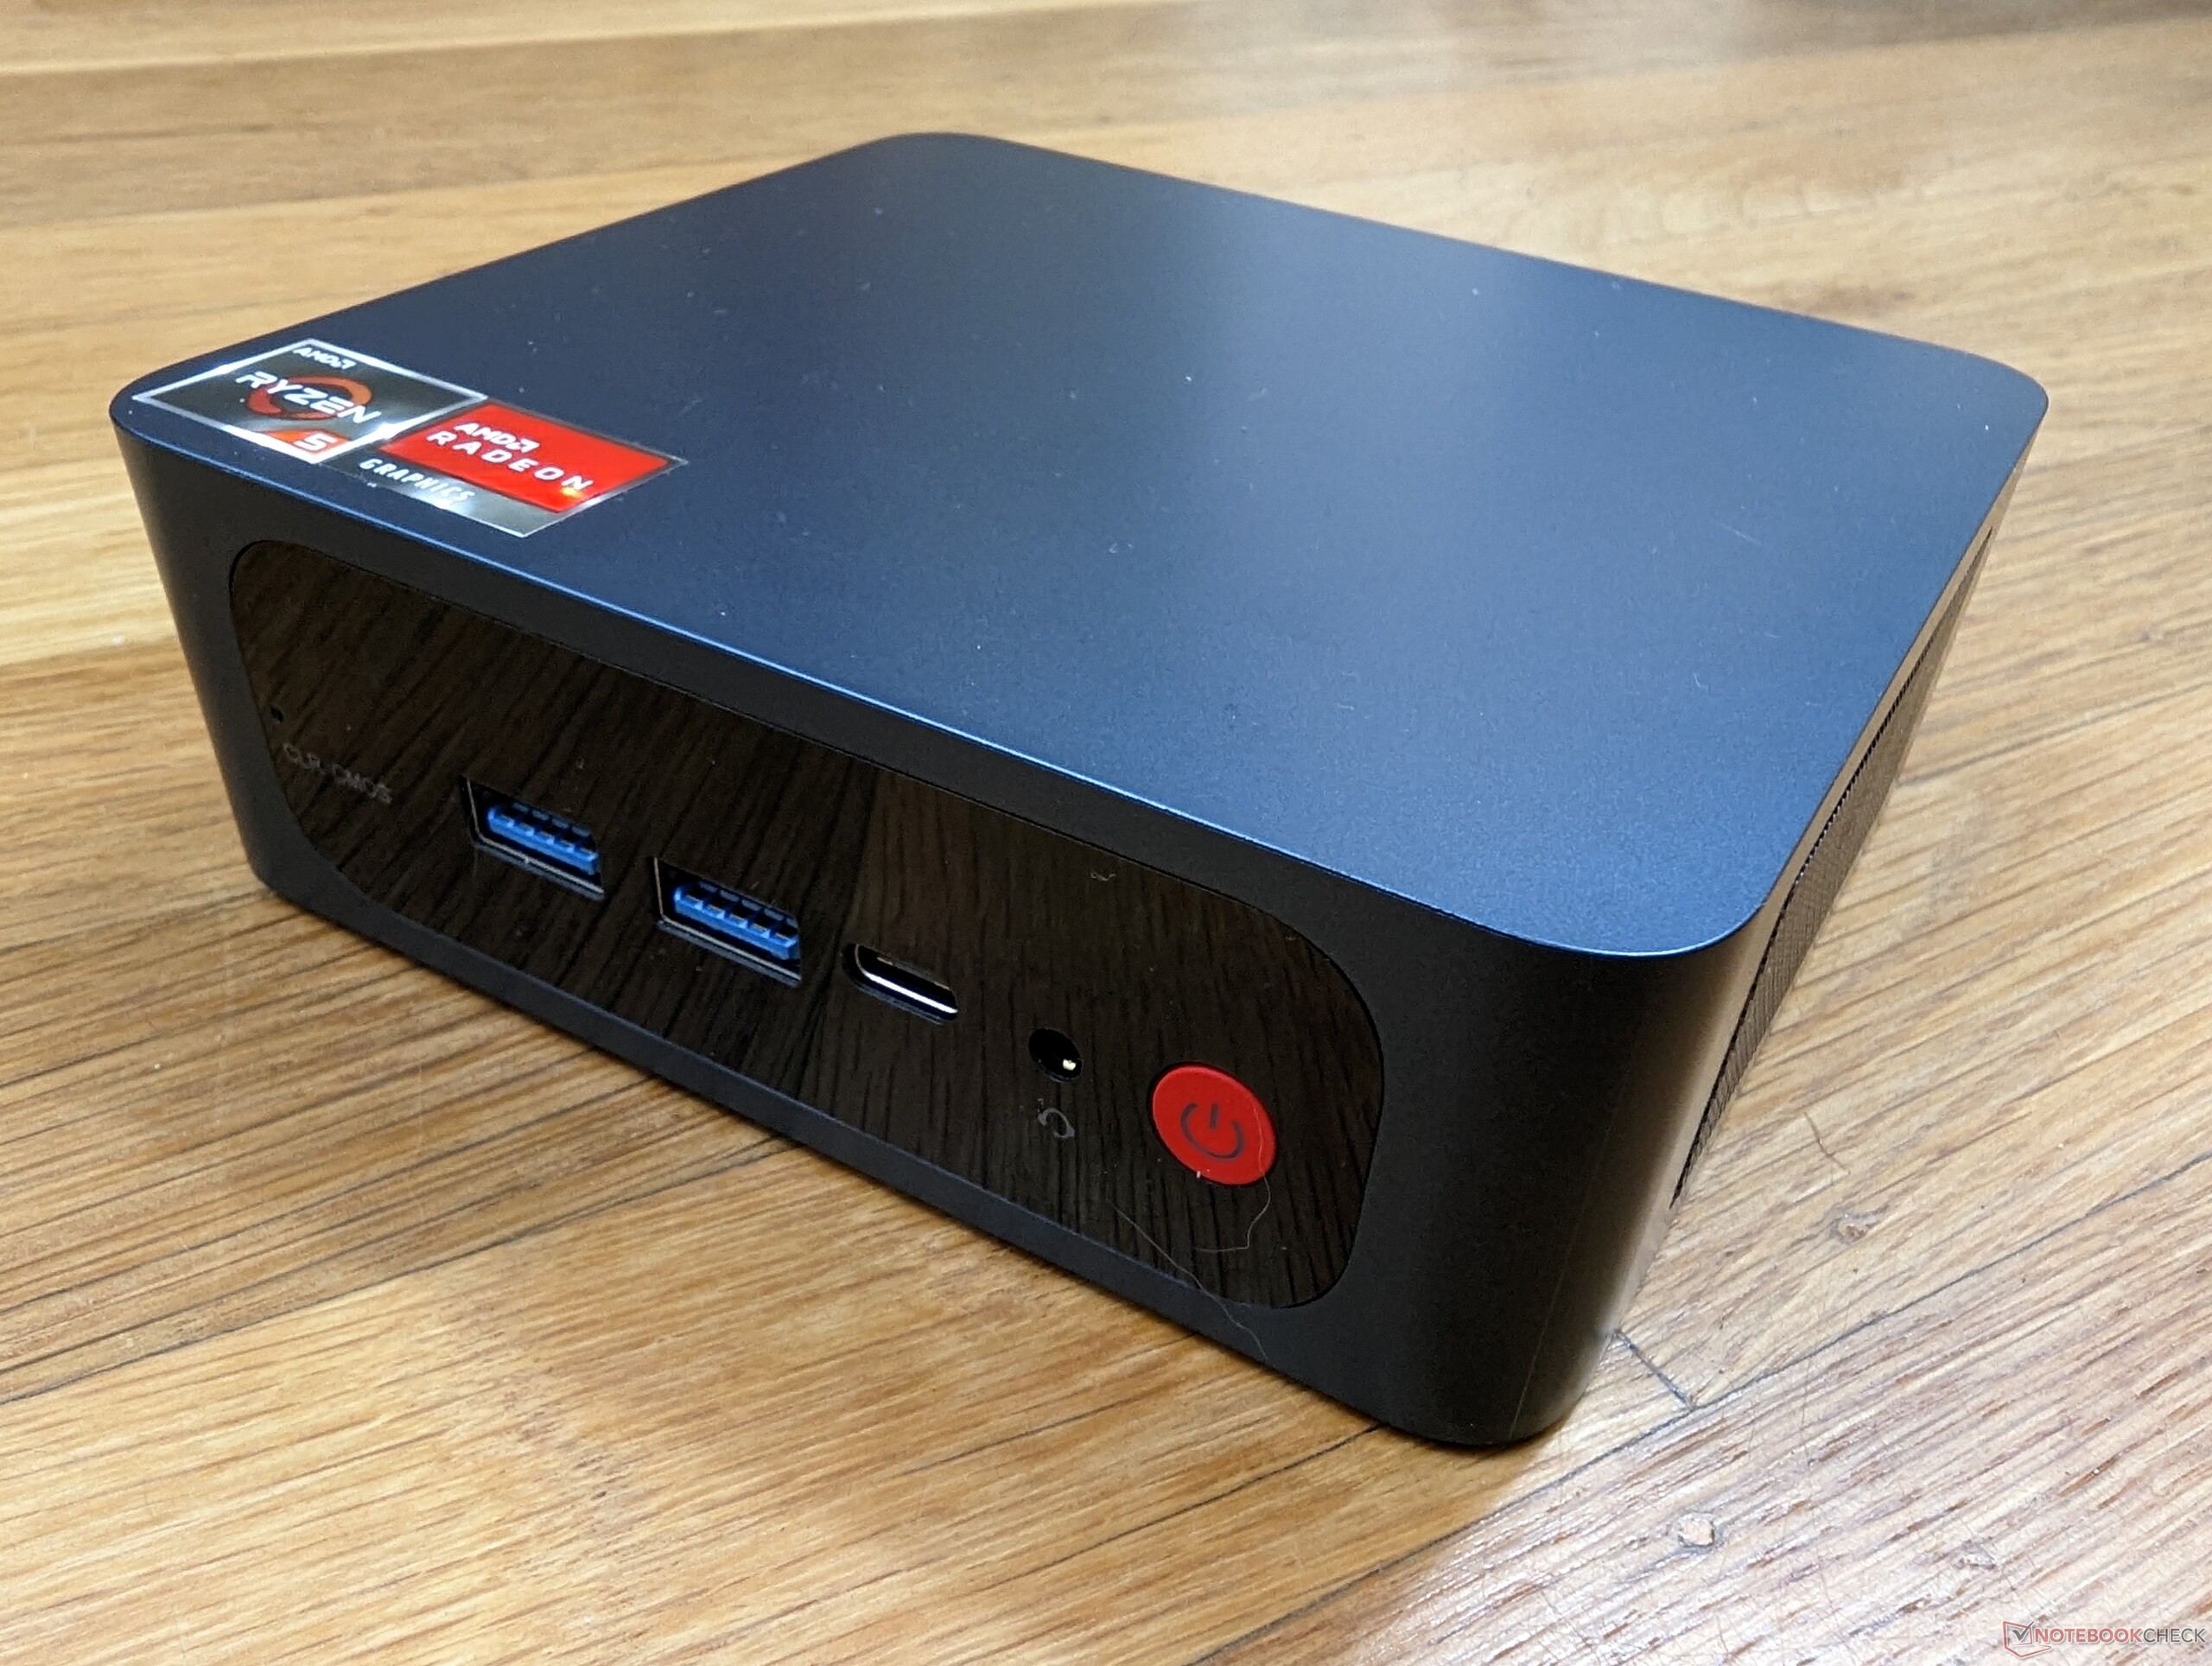
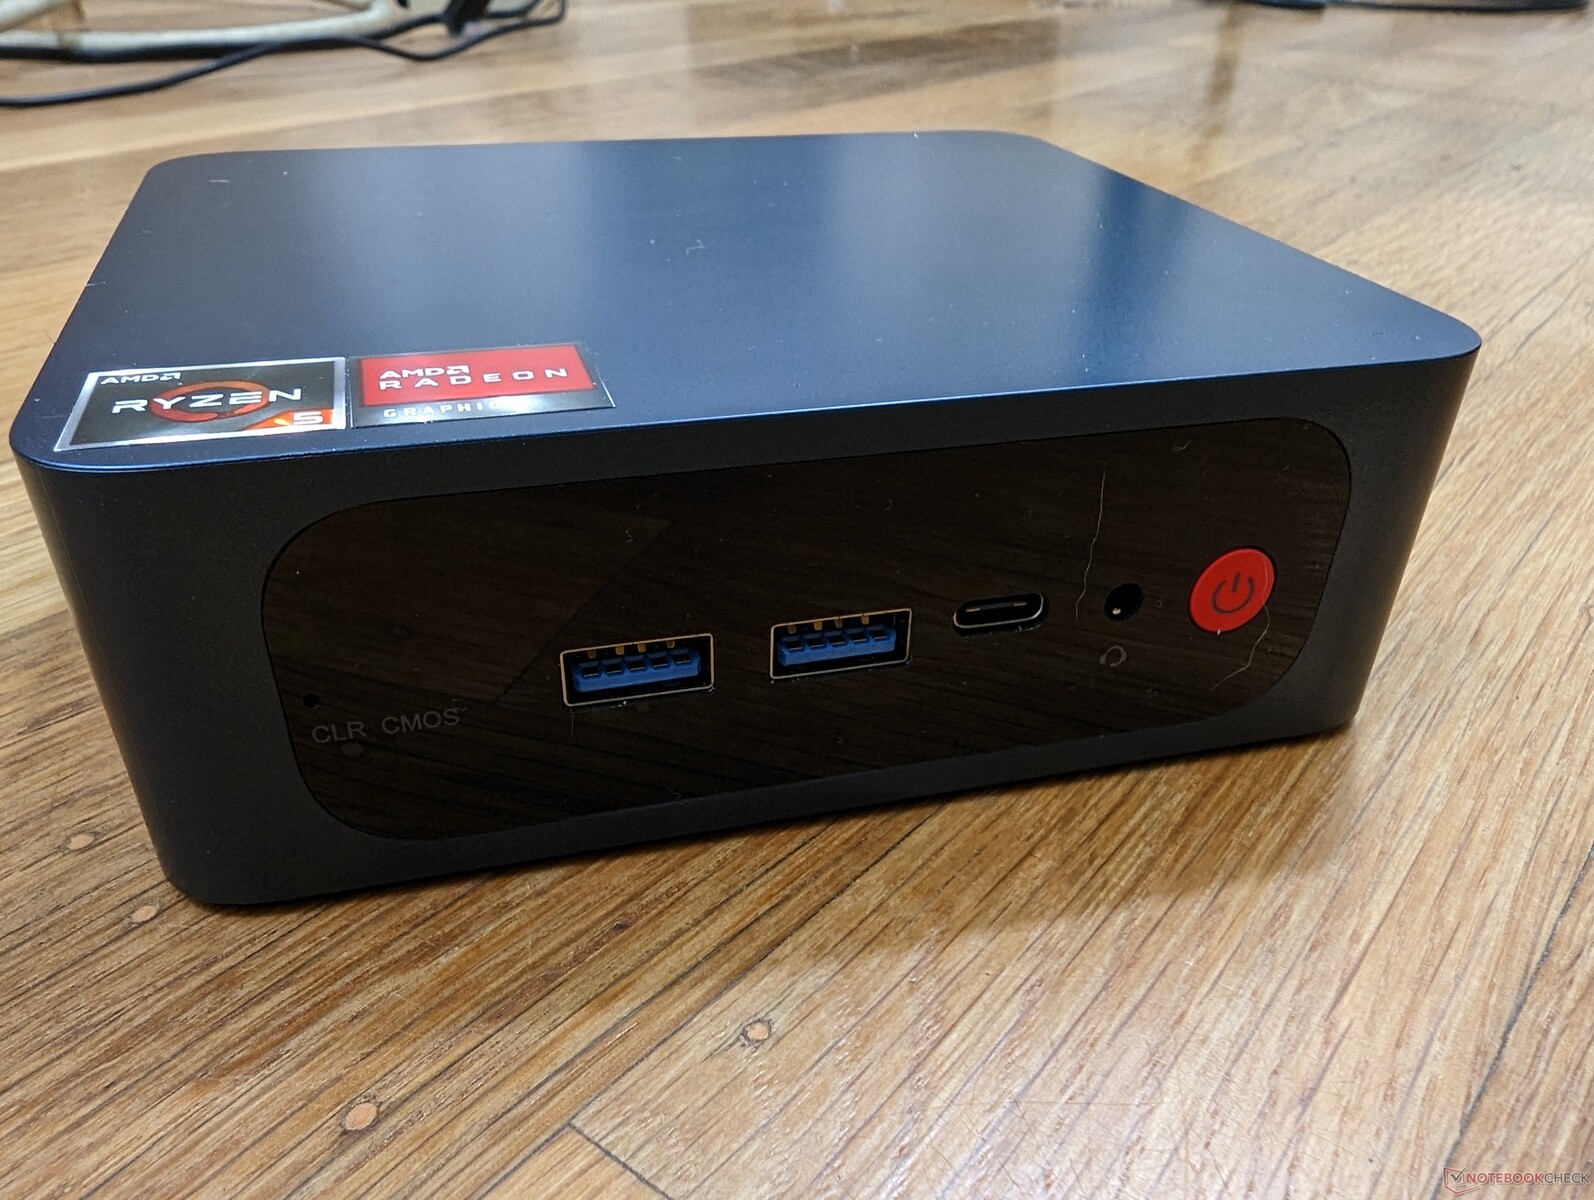
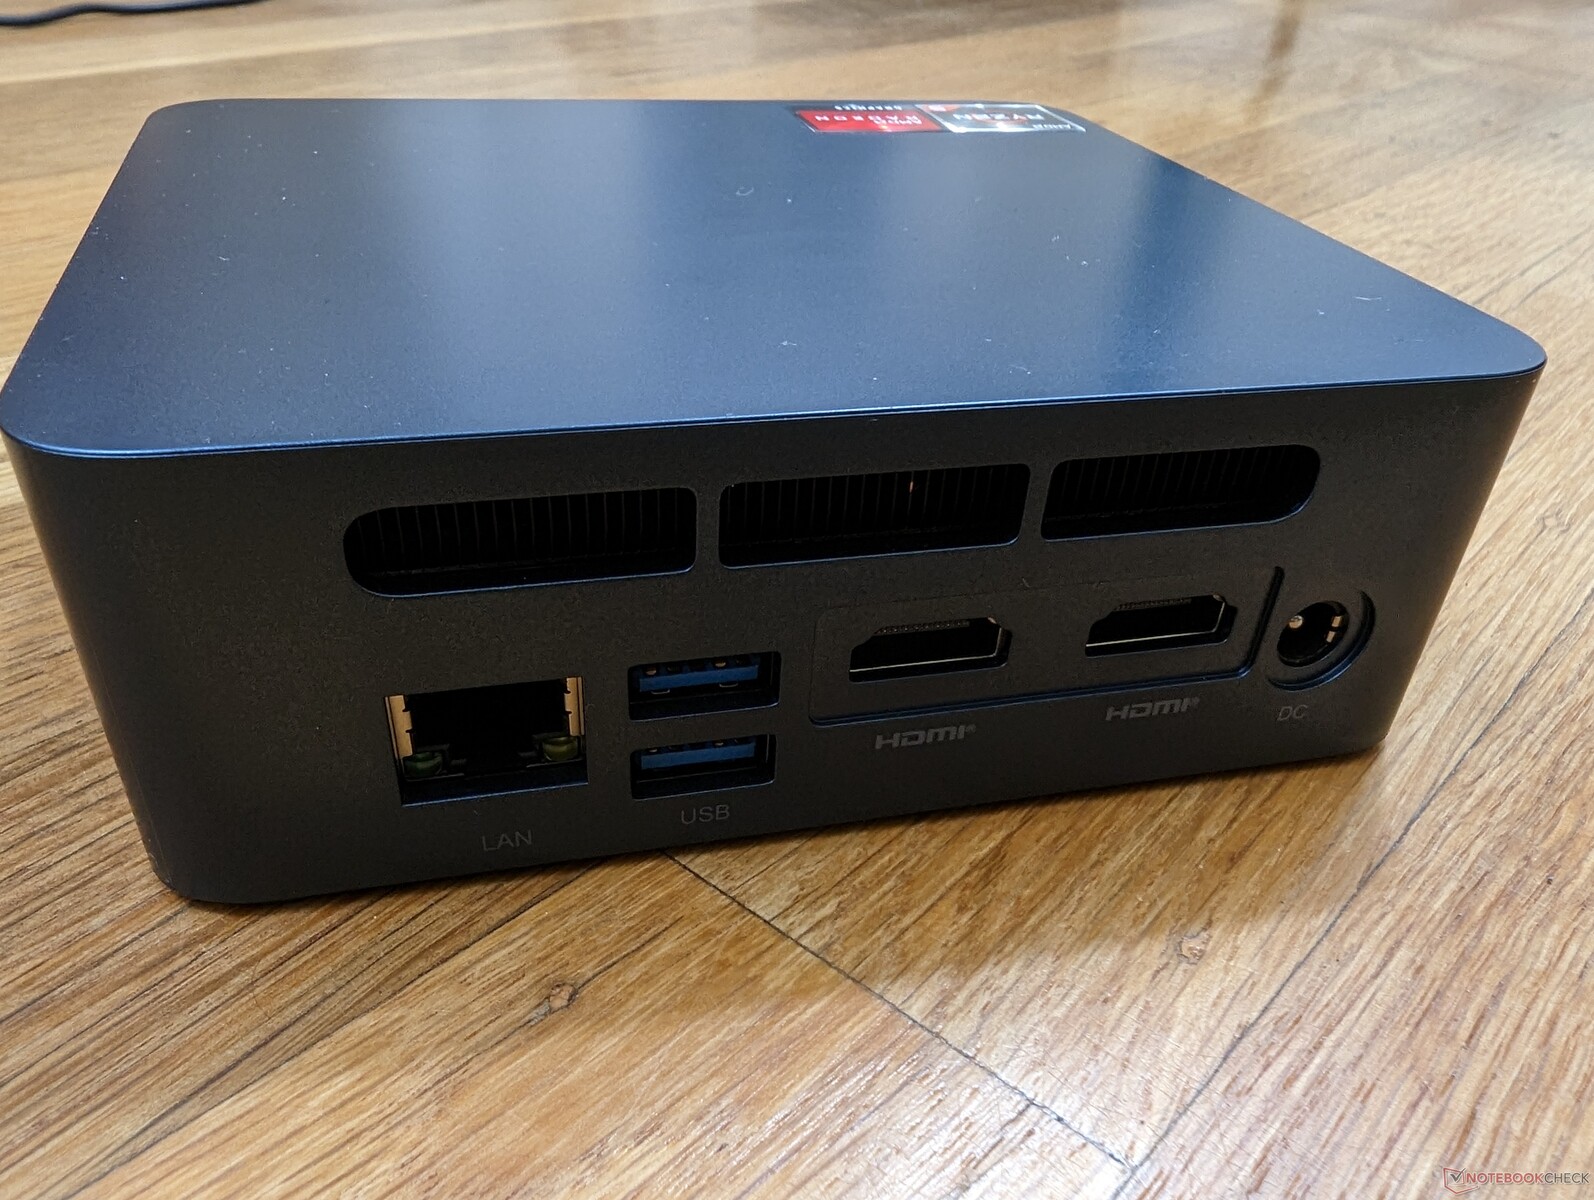
端口选择很多,但单一的USB-C端口似乎只用于数据或为外部设备充电。我们的外部USB-C显示器不能与Trigkey一起使用。
沟通
该系统配备了老式的1x1英特尔双频Wireless-AC 3165,其传输速率只是现代Wi-Fi 6和6E模块能力的一小部分。尽管如此,性能稳定,足以满足1080p流媒体和浏览的需要。
| Networking | |
| iperf3 transmit AX12 | |
| Intel NUC11TNKi5 | |
| iperf3 receive AX12 | |
| Intel NUC11TNKi5 | |
| iperf3 receive AXE11000 6GHz | |
| Intel NUC Pro Chassis_i7_1265U | |
| Beelink SER Pro Ryzen 5 5600H | |
| Beelink SEi11 Pro | |
| iperf3 receive AXE11000 | |
| Beelink SEi12 Core i5-1235U | |
| Trigkey S3 | |
| iperf3 transmit AXE11000 | |
| Beelink SEi12 Core i5-1235U | |
| Trigkey S3 | |
| iperf3 transmit AXE11000 6GHz | |
| Intel NUC Pro Chassis_i7_1265U | |
| Beelink SER Pro Ryzen 5 5600H | |
| Beelink SEi11 Pro | |
维护
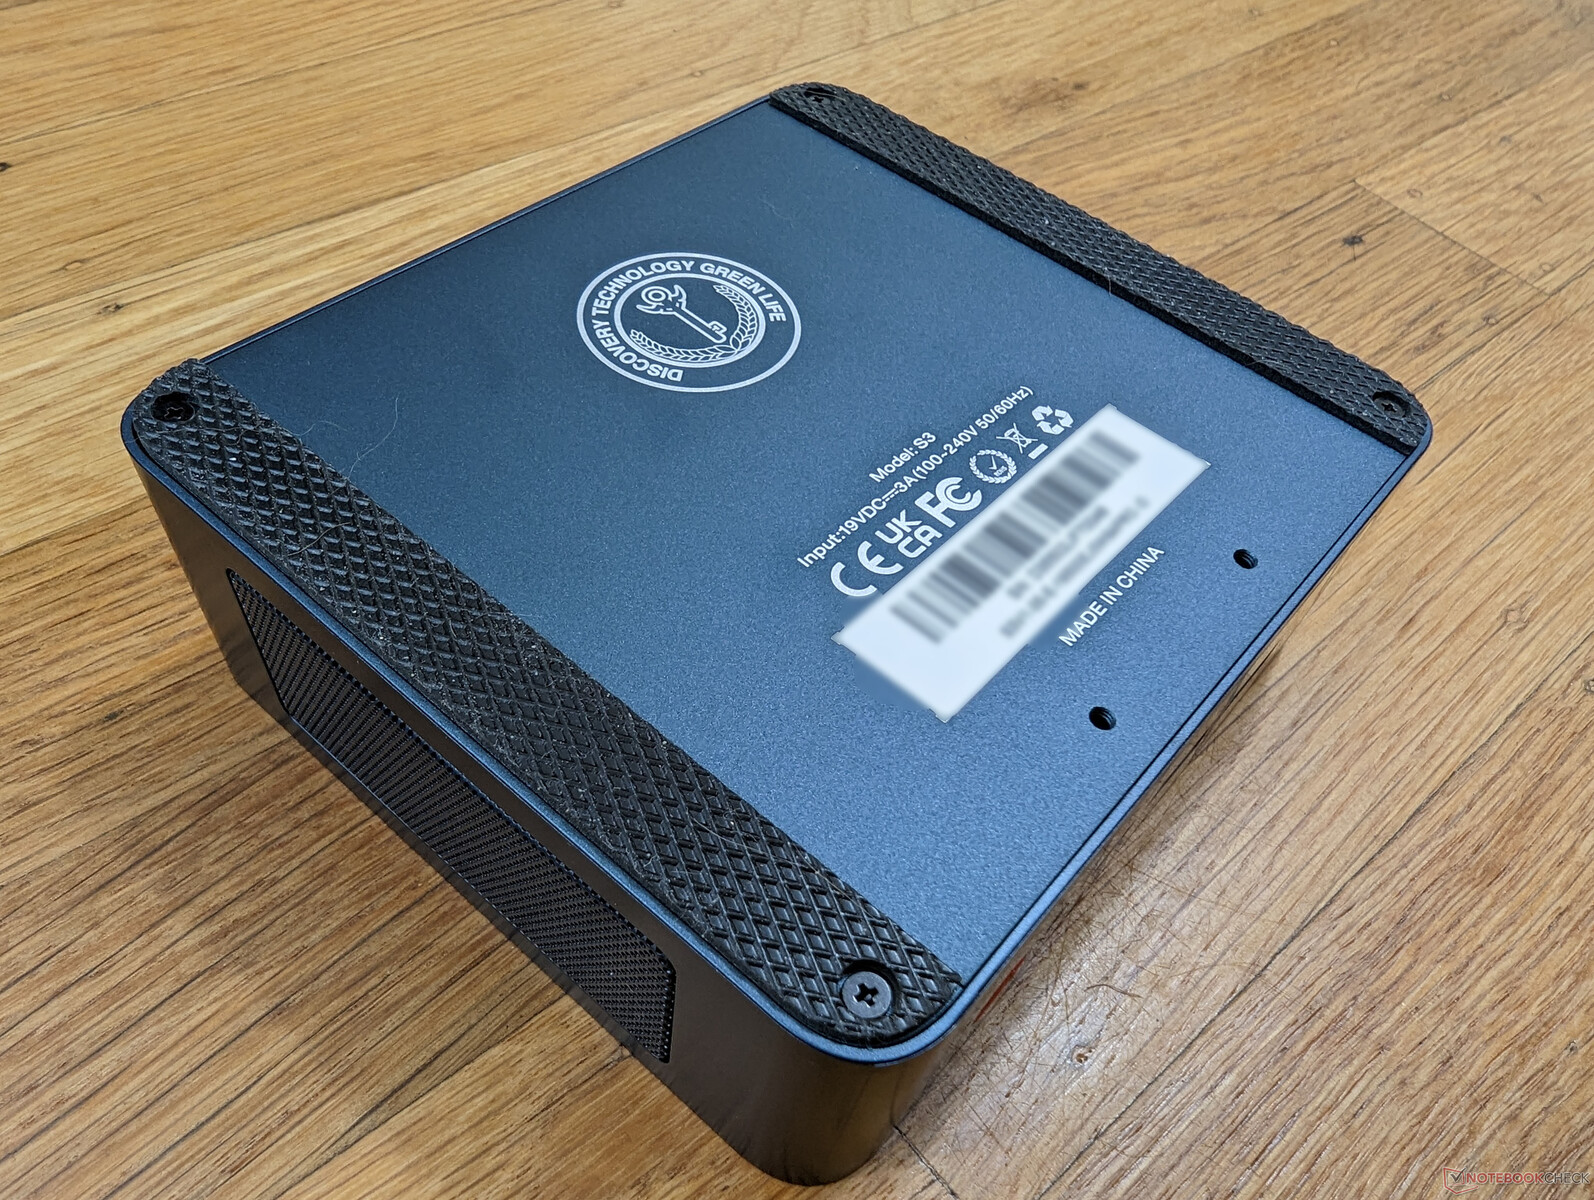
底部面板应该很容易脱落,但螺丝是软的,比大多数其他迷你PC更容易脱落。这种情况不幸发生在我们的设备上,因此我们建议业主在维修该设备时要非常小心。相比之下,英特尔NUC有拇指螺丝,可以更快地进行免工具维修。
配件和保修
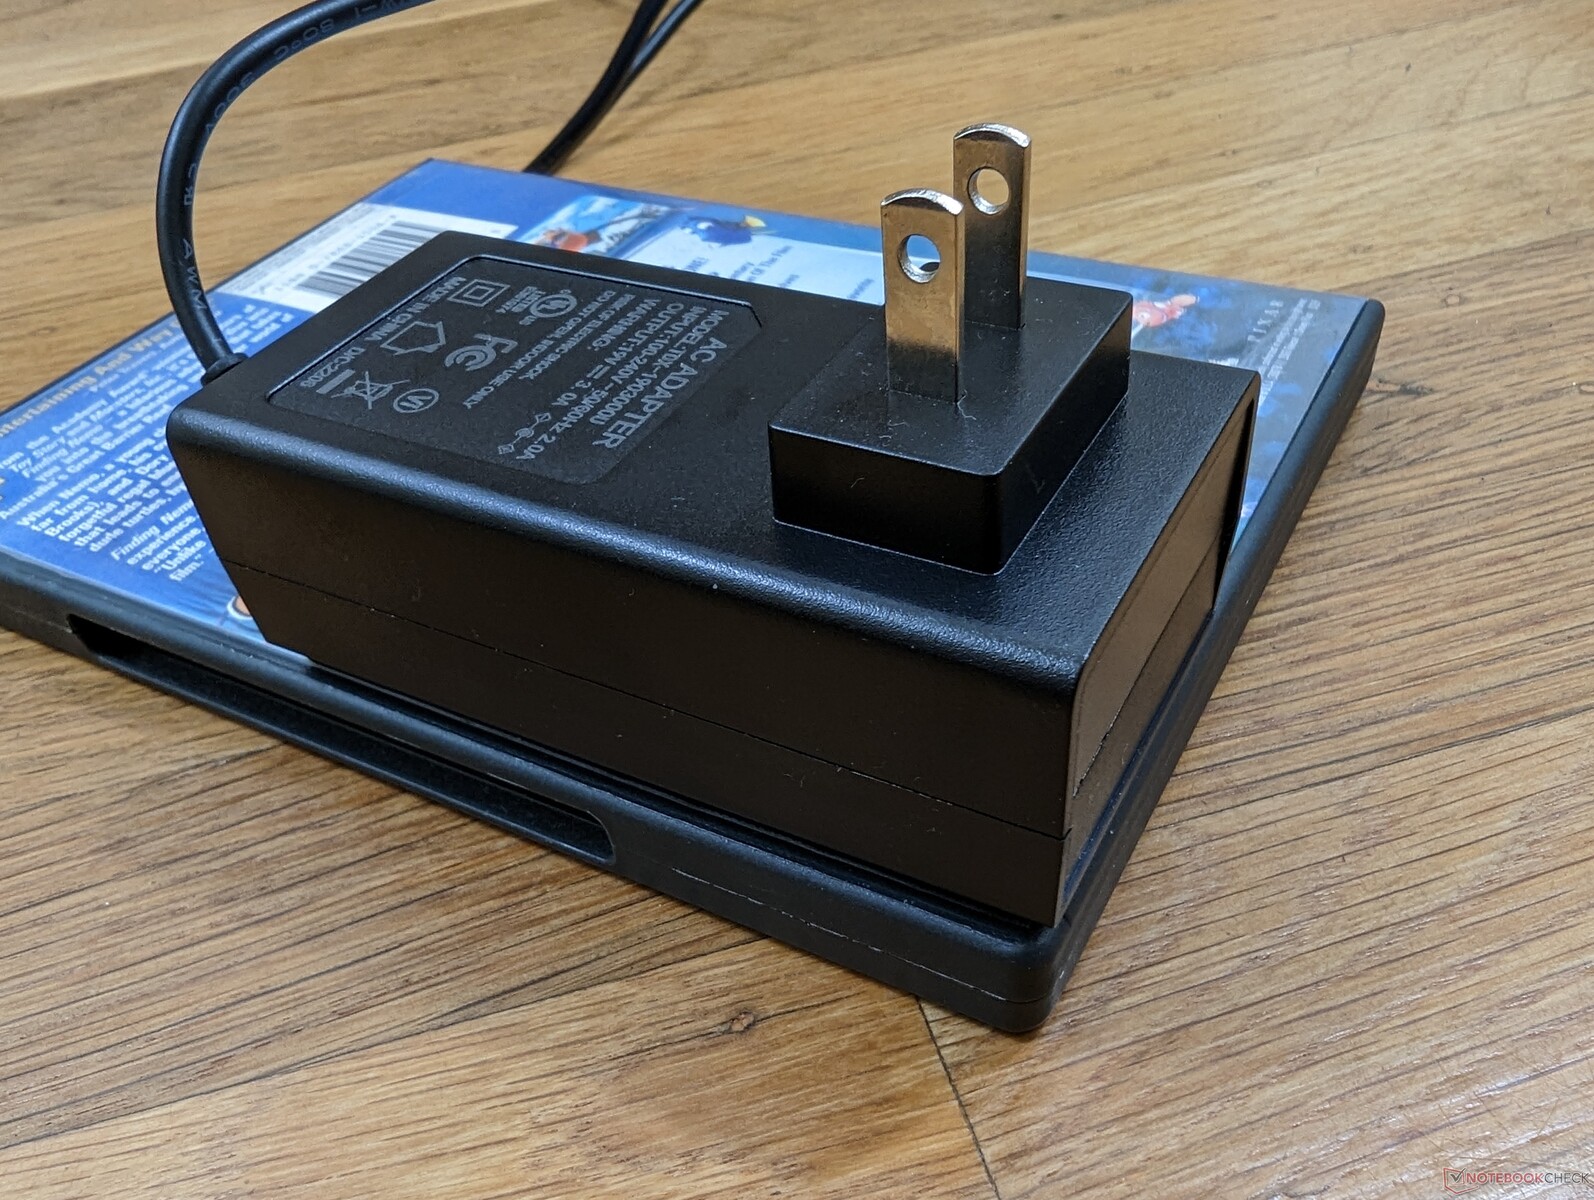
零售包装盒包括一个壁挂式支架、AC适配器、用户手册和两条HDMI线。通常的一年有限制造商保修期适用。
业绩
测试条件
在运行以下任何基准测试之前,我们将Windows设置为性能模式。该系统没有预装任何用于调整电源配置文件的 "控制中心 "类型的应用程序。
处理器
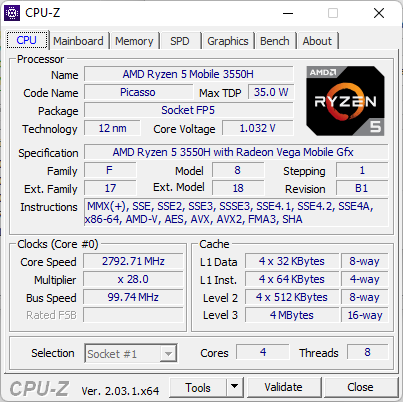
CPU的整体性能远远低于任何第11代或第12代英特尔酷睿i5或i7 U系列CPU,但仍明显快于目前市场上的任何赛扬或Atom解决方案。因此, Ryzen 5 3550H 在我们的Trigkey中更可与基于英特尔酷睿i3的PC或更老的 酷睿i5-8260U.太糟糕了,制造商没有选择使用 Ryzen 7 4800U而不是Zen 2 CPU,因为Zen+ H系列是一个巨大的升级。
Cinebench R15 Multi Loop
Cinebench R20: CPU (Multi Core) | CPU (Single Core)
Cinebench R23: Multi Core | Single Core
Cinebench R15: CPU Multi 64Bit | CPU Single 64Bit
Blender: v2.79 BMW27 CPU
7-Zip 18.03: 7z b 4 | 7z b 4 -mmt1
Geekbench 5.5: Multi-Core | Single-Core
HWBOT x265 Benchmark v2.2: 4k Preset
LibreOffice : 20 Documents To PDF
R Benchmark 2.5: Overall mean
| CPU Performance rating | |
| Beelink GTR6 | |
| Intel NUC 12 Pro Kit NUC12WSKi7 | |
| Intel NUC Pro Chassis_i7_1265U | |
| Beelink SEi12 Core i5-1235U | |
| Beelink SER Pro Ryzen 5 5600H | |
| Beelink SEi11 Pro | |
| Intel NUC Pro Chassis_i7_1185G7 | |
| Prime Computer PrimeBook Circular-i7-1165G7 | |
| Minipc Union NiPoGi CK10 - 10810U | |
| Beelink SER3 -2! | |
| Average AMD Ryzen 5 3550H | |
| Trigkey S3 | |
| MSI Cubi 5 10M -8! | |
| Beelink SEi8 | |
| BMAX B5 Pro G7H8 | |
| Beelink U59 N5105 | |
| Geekom MiniAir 11 Special Edition | |
| Chuwi LapBook Plus -6! | |
| Chuwi Hi10 Air -12! | |
| Cinebench R20 / CPU (Multi Core) | |
| Beelink GTR6 | |
| Intel NUC 12 Pro Kit NUC12WSKi7 | |
| Intel NUC Pro Chassis_i7_1265U | |
| Beelink SEi12 Core i5-1235U | |
| Beelink SER Pro Ryzen 5 5600H | |
| Beelink SEi11 Pro | |
| Prime Computer PrimeBook Circular-i7-1165G7 | |
| Intel NUC Pro Chassis_i7_1185G7 | |
| Average AMD Ryzen 5 3550H (1421 - 1728, n=8) | |
| Beelink SER3 | |
| Minipc Union NiPoGi CK10 - 10810U | |
| BMAX B5 Pro G7H8 | |
| Trigkey S3 | |
| Geekom MiniAir 11 Special Edition | |
| Beelink U59 N5105 | |
| Beelink SEi8 | |
| MSI Cubi 5 10M | |
| Chuwi LapBook Plus | |
| Cinebench R20 / CPU (Single Core) | |
| Intel NUC 12 Pro Kit NUC12WSKi7 | |
| Intel NUC Pro Chassis_i7_1265U | |
| Beelink GTR6 | |
| Beelink SEi12 Core i5-1235U | |
| Prime Computer PrimeBook Circular-i7-1165G7 | |
| Beelink SEi11 Pro | |
| Intel NUC Pro Chassis_i7_1185G7 | |
| Beelink SER Pro Ryzen 5 5600H | |
| Minipc Union NiPoGi CK10 - 10810U | |
| MSI Cubi 5 10M | |
| BMAX B5 Pro G7H8 | |
| Beelink SER3 | |
| Trigkey S3 | |
| Average AMD Ryzen 5 3550H (331 - 370, n=8) | |
| Beelink SEi8 | |
| Beelink U59 N5105 | |
| Geekom MiniAir 11 Special Edition | |
| Chuwi LapBook Plus | |
| Cinebench R23 / Multi Core | |
| Beelink GTR6 | |
| Intel NUC 12 Pro Kit NUC12WSKi7 | |
| Intel NUC Pro Chassis_i7_1265U | |
| Beelink SEi12 Core i5-1235U | |
| Beelink SER Pro Ryzen 5 5600H | |
| Beelink SEi11 Pro | |
| Prime Computer PrimeBook Circular-i7-1165G7 | |
| Intel NUC Pro Chassis_i7_1185G7 | |
| Average AMD Ryzen 5 3550H (3646 - 4213, n=2) | |
| Beelink SER3 | |
| Minipc Union NiPoGi CK10 - 10810U | |
| Trigkey S3 | |
| BMAX B5 Pro G7H8 | |
| Beelink U59 N5105 | |
| Geekom MiniAir 11 Special Edition | |
| Beelink SEi8 | |
| MSI Cubi 5 10M | |
| Cinebench R23 / Single Core | |
| Intel NUC 12 Pro Kit NUC12WSKi7 | |
| Intel NUC Pro Chassis_i7_1265U | |
| Beelink SEi12 Core i5-1235U | |
| Beelink GTR6 | |
| Prime Computer PrimeBook Circular-i7-1165G7 | |
| Beelink SEi11 Pro | |
| Intel NUC Pro Chassis_i7_1185G7 | |
| Beelink SER Pro Ryzen 5 5600H | |
| Minipc Union NiPoGi CK10 - 10810U | |
| MSI Cubi 5 10M | |
| Beelink SER3 | |
| Trigkey S3 | |
| Beelink SEi8 | |
| Average AMD Ryzen 5 3550H (850 - 922, n=2) | |
| BMAX B5 Pro G7H8 | |
| Beelink U59 N5105 | |
| Geekom MiniAir 11 Special Edition | |
| Geekbench 5.5 / Multi-Core | |
| Intel NUC 12 Pro Kit NUC12WSKi7 | |
| Beelink GTR6 | |
| Intel NUC Pro Chassis_i7_1265U | |
| Beelink SEi12 Core i5-1235U | |
| Beelink SER Pro Ryzen 5 5600H | |
| Intel NUC Pro Chassis_i7_1185G7 | |
| Beelink SEi11 Pro | |
| Prime Computer PrimeBook Circular-i7-1165G7 | |
| Minipc Union NiPoGi CK10 - 10810U | |
| Average AMD Ryzen 5 3550H (3162 - 3486, n=5) | |
| Trigkey S3 | |
| Beelink U59 N5105 | |
| Geekom MiniAir 11 Special Edition | |
| Beelink SEi8 | |
| BMAX B5 Pro G7H8 | |
| Geekbench 5.5 / Single-Core | |
| Intel NUC 12 Pro Kit NUC12WSKi7 | |
| Intel NUC Pro Chassis_i7_1265U | |
| Beelink GTR6 | |
| Beelink SEi12 Core i5-1235U | |
| Prime Computer PrimeBook Circular-i7-1165G7 | |
| Beelink SEi11 Pro | |
| Intel NUC Pro Chassis_i7_1185G7 | |
| Beelink SER Pro Ryzen 5 5600H | |
| Minipc Union NiPoGi CK10 - 10810U | |
| Trigkey S3 | |
| Average AMD Ryzen 5 3550H (880 - 907, n=5) | |
| Beelink SEi8 | |
| Geekom MiniAir 11 Special Edition | |
| Beelink U59 N5105 | |
| BMAX B5 Pro G7H8 | |
| HWBOT x265 Benchmark v2.2 / 4k Preset | |
| Beelink GTR6 | |
| Intel NUC 12 Pro Kit NUC12WSKi7 | |
| Beelink SER Pro Ryzen 5 5600H | |
| Intel NUC Pro Chassis_i7_1265U | |
| Beelink SEi12 Core i5-1235U | |
| Beelink SEi11 Pro | |
| Intel NUC Pro Chassis_i7_1185G7 | |
| Minipc Union NiPoGi CK10 - 10810U | |
| Prime Computer PrimeBook Circular-i7-1165G7 | |
| Beelink SER3 | |
| Average AMD Ryzen 5 3550H (3.7 - 4.43, n=5) | |
| Trigkey S3 | |
| Beelink SEi8 | |
| Geekom MiniAir 11 Special Edition | |
| Beelink U59 N5105 | |
| BMAX B5 Pro G7H8 | |
| Chuwi LapBook Plus | |
| LibreOffice / 20 Documents To PDF | |
| BMAX B5 Pro G7H8 | |
| Geekom MiniAir 11 Special Edition | |
| Beelink U59 N5105 | |
| Trigkey S3 | |
| Beelink SER3 | |
| Average AMD Ryzen 5 3550H (73.3 - 92.7, n=4) | |
| Beelink SEi8 | |
| Minipc Union NiPoGi CK10 - 10810U | |
| Beelink SER Pro Ryzen 5 5600H | |
| Prime Computer PrimeBook Circular-i7-1165G7 | |
| Beelink SEi11 Pro | |
| Intel NUC Pro Chassis_i7_1265U | |
| Beelink SEi12 Core i5-1235U | |
| Intel NUC Pro Chassis_i7_1185G7 | |
| Beelink GTR6 | |
| Intel NUC 12 Pro Kit NUC12WSKi7 | |
| R Benchmark 2.5 / Overall mean | |
| BMAX B5 Pro G7H8 | |
| Geekom MiniAir 11 Special Edition | |
| Beelink U59 N5105 | |
| Beelink SEi8 | |
| Average AMD Ryzen 5 3550H (0.732 - 0.752, n=4) | |
| Trigkey S3 | |
| Beelink SER3 | |
| Minipc Union NiPoGi CK10 - 10810U | |
| Prime Computer PrimeBook Circular-i7-1165G7 | |
| Intel NUC Pro Chassis_i7_1185G7 | |
| Beelink SEi11 Pro | |
| Beelink SER Pro Ryzen 5 5600H | |
| Beelink SEi12 Core i5-1235U | |
| Intel NUC Pro Chassis_i7_1265U | |
| Intel NUC 12 Pro Kit NUC12WSKi7 | |
| Beelink GTR6 | |
Cinebench R20: CPU (Multi Core) | CPU (Single Core)
Cinebench R23: Multi Core | Single Core
Cinebench R15: CPU Multi 64Bit | CPU Single 64Bit
Blender: v2.79 BMW27 CPU
7-Zip 18.03: 7z b 4 | 7z b 4 -mmt1
Geekbench 5.5: Multi-Core | Single-Core
HWBOT x265 Benchmark v2.2: 4k Preset
LibreOffice : 20 Documents To PDF
R Benchmark 2.5: Overall mean
* ... smaller is better
* ... smaller is better
AIDA64: FP32 Ray-Trace | FPU Julia | CPU SHA3 | CPU Queen | FPU SinJulia | FPU Mandel | CPU AES | CPU ZLib | FP64 Ray-Trace | CPU PhotoWorxx
| Performance rating | |
| Beelink SER Pro Ryzen 5 5600H | |
| Intel NUC Pro Chassis_i7_1265U | |
| Beelink SEi12 Core i5-1235U | |
| Beelink SEi11 Pro | |
| Intel NUC11TNKi5 | |
| Average AMD Ryzen 5 3550H | |
| Trigkey S3 | |
| AIDA64 / FP32 Ray-Trace | |
| Beelink SER Pro Ryzen 5 5600H | |
| Beelink SEi11 Pro | |
| Intel NUC Pro Chassis_i7_1265U | |
| Beelink SEi12 Core i5-1235U | |
| Intel NUC11TNKi5 | |
| Average AMD Ryzen 5 3550H (2996 - 3607, n=5) | |
| Trigkey S3 | |
| AIDA64 / FPU Julia | |
| Beelink SER Pro Ryzen 5 5600H | |
| Intel NUC Pro Chassis_i7_1265U | |
| Beelink SEi12 Core i5-1235U | |
| Beelink SEi11 Pro | |
| Intel NUC11TNKi5 | |
| Average AMD Ryzen 5 3550H (16278 - 18781, n=5) | |
| Trigkey S3 | |
| AIDA64 / CPU SHA3 | |
| Beelink SER Pro Ryzen 5 5600H | |
| Beelink SEi11 Pro | |
| Intel NUC Pro Chassis_i7_1265U | |
| Beelink SEi12 Core i5-1235U | |
| Intel NUC11TNKi5 | |
| Average AMD Ryzen 5 3550H (847 - 983, n=4) | |
| Trigkey S3 | |
| AIDA64 / CPU Queen | |
| Beelink SER Pro Ryzen 5 5600H | |
| Intel NUC Pro Chassis_i7_1265U | |
| Beelink SEi12 Core i5-1235U | |
| Beelink SEi11 Pro | |
| Intel NUC11TNKi5 | |
| Average AMD Ryzen 5 3550H (42017 - 48622, n=5) | |
| Trigkey S3 | |
| AIDA64 / FPU SinJulia | |
| Beelink SER Pro Ryzen 5 5600H | |
| Average AMD Ryzen 5 3550H (5386 - 6316, n=5) | |
| Trigkey S3 | |
| Intel NUC Pro Chassis_i7_1265U | |
| Beelink SEi11 Pro | |
| Beelink SEi12 Core i5-1235U | |
| Intel NUC11TNKi5 | |
| AIDA64 / FPU Mandel | |
| Beelink SER Pro Ryzen 5 5600H | |
| Intel NUC Pro Chassis_i7_1265U | |
| Beelink SEi11 Pro | |
| Intel NUC11TNKi5 | |
| Beelink SEi12 Core i5-1235U | |
| Average AMD Ryzen 5 3550H (8460 - 9767, n=5) | |
| Trigkey S3 | |
| AIDA64 / CPU AES | |
| Beelink SER Pro Ryzen 5 5600H | |
| Beelink SEi11 Pro | |
| Beelink SEi12 Core i5-1235U | |
| Intel NUC11TNKi5 | |
| Intel NUC Pro Chassis_i7_1265U | |
| Average AMD Ryzen 5 3550H (27486 - 32316, n=5) | |
| Trigkey S3 | |
| AIDA64 / CPU ZLib | |
| Beelink SEi12 Core i5-1235U | |
| Intel NUC Pro Chassis_i7_1265U | |
| Beelink SER Pro Ryzen 5 5600H | |
| Intel NUC11TNKi5 | |
| Beelink SEi11 Pro | |
| Average AMD Ryzen 5 3550H (299 - 352, n=5) | |
| Trigkey S3 | |
| AIDA64 / FP64 Ray-Trace | |
| Beelink SER Pro Ryzen 5 5600H | |
| Intel NUC Pro Chassis_i7_1265U | |
| Beelink SEi11 Pro | |
| Intel NUC11TNKi5 | |
| Beelink SEi12 Core i5-1235U | |
| Average AMD Ryzen 5 3550H (1584 - 1914, n=5) | |
| Trigkey S3 | |
| AIDA64 / CPU PhotoWorxx | |
| Intel NUC Pro Chassis_i7_1265U | |
| Beelink SEi12 Core i5-1235U | |
| Beelink SEi11 Pro | |
| Beelink SER Pro Ryzen 5 5600H | |
| Intel NUC11TNKi5 | |
| Trigkey S3 | |
| Average AMD Ryzen 5 3550H (14325 - 17838, n=5) | |
系统性能
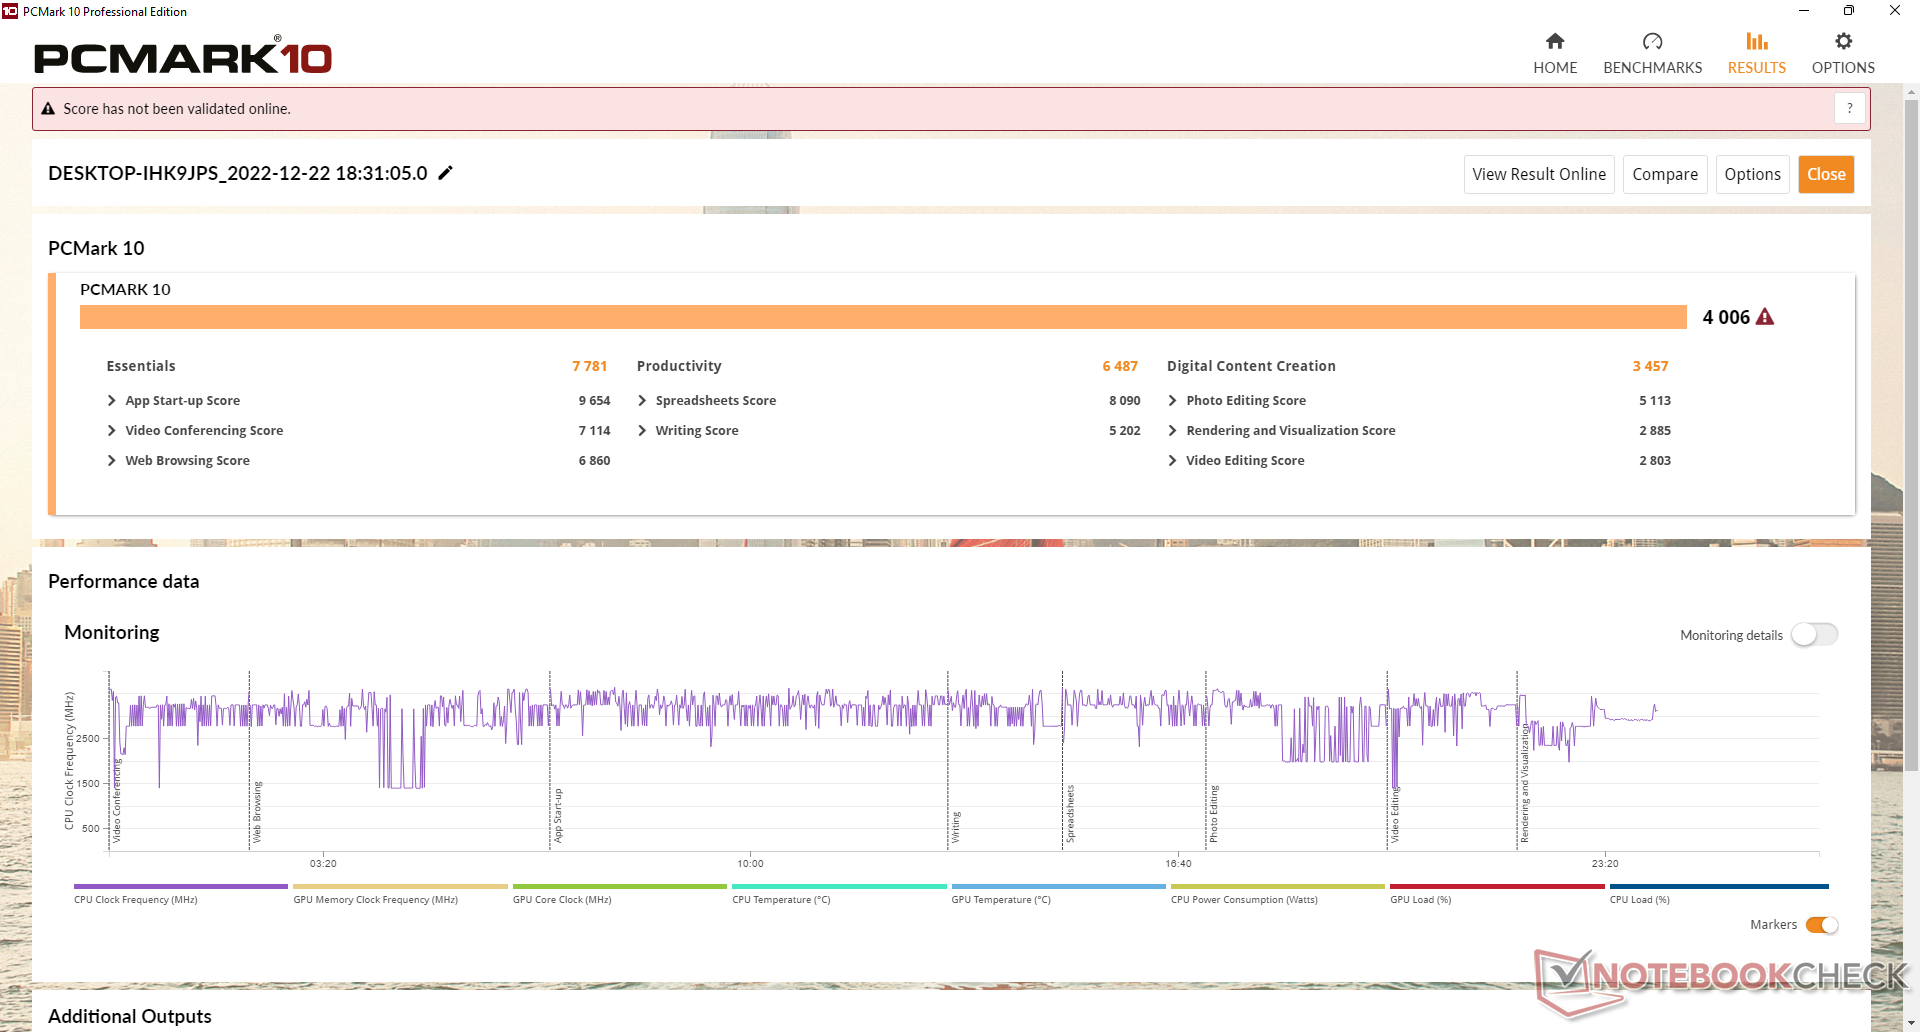
正如预期的那样,PCMark的结果介于采用赛扬或Atom CPU的较慢的迷你电脑和采用更现代的第11代或第12代英特尔CPU的较快的迷你电脑之间。
CrossMark: Overall | Productivity | Creativity | Responsiveness
| PCMark 10 / Score | |
| Beelink SER Pro Ryzen 5 5600H | |
| Beelink SEi12 Core i5-1235U | |
| Intel NUC Pro Chassis_i7_1265U | |
| Beelink SEi11 Pro | |
| Intel NUC11TNKi5 | |
| Average AMD Ryzen 5 3550H, AMD Radeon RX Vega 8 (Ryzen 2000/3000) (4006 - 4307, n=4) | |
| Trigkey S3 | |
| Beelink U59 N5105 | |
| Chuwi LapBook Plus | |
| PCMark 10 / Essentials | |
| Beelink SEi12 Core i5-1235U | |
| Beelink SER Pro Ryzen 5 5600H | |
| Beelink SEi11 Pro | |
| Intel NUC Pro Chassis_i7_1265U | |
| Intel NUC11TNKi5 | |
| Average AMD Ryzen 5 3550H, AMD Radeon RX Vega 8 (Ryzen 2000/3000) (7781 - 8579, n=4) | |
| Trigkey S3 | |
| Beelink U59 N5105 | |
| Chuwi LapBook Plus | |
| PCMark 10 / Productivity | |
| Beelink SER Pro Ryzen 5 5600H | |
| Beelink SEi12 Core i5-1235U | |
| Intel NUC Pro Chassis_i7_1265U | |
| Beelink SEi11 Pro | |
| Trigkey S3 | |
| Average AMD Ryzen 5 3550H, AMD Radeon RX Vega 8 (Ryzen 2000/3000) (5995 - 6487, n=4) | |
| Intel NUC11TNKi5 | |
| Beelink U59 N5105 | |
| Chuwi LapBook Plus | |
| PCMark 10 / Digital Content Creation | |
| Intel NUC Pro Chassis_i7_1265U | |
| Beelink SER Pro Ryzen 5 5600H | |
| Beelink SEi12 Core i5-1235U | |
| Beelink SEi11 Pro | |
| Intel NUC11TNKi5 | |
| Average AMD Ryzen 5 3550H, AMD Radeon RX Vega 8 (Ryzen 2000/3000) (3457 - 3947, n=4) | |
| Trigkey S3 | |
| Beelink U59 N5105 | |
| Chuwi LapBook Plus | |
| CrossMark / Overall | |
| Beelink SEi12 Core i5-1235U | |
| Intel NUC Pro Chassis_i7_1265U | |
| Beelink SEi11 Pro | |
| Beelink SER Pro Ryzen 5 5600H | |
| Trigkey S3 | |
| Average AMD Ryzen 5 3550H, AMD Radeon RX Vega 8 (Ryzen 2000/3000) (n=1) | |
| Beelink U59 N5105 | |
| CrossMark / Productivity | |
| Beelink SEi12 Core i5-1235U | |
| Intel NUC Pro Chassis_i7_1265U | |
| Beelink SEi11 Pro | |
| Beelink SER Pro Ryzen 5 5600H | |
| Trigkey S3 | |
| Average AMD Ryzen 5 3550H, AMD Radeon RX Vega 8 (Ryzen 2000/3000) (n=1) | |
| Beelink U59 N5105 | |
| CrossMark / Creativity | |
| Intel NUC Pro Chassis_i7_1265U | |
| Beelink SEi12 Core i5-1235U | |
| Beelink SER Pro Ryzen 5 5600H | |
| Beelink SEi11 Pro | |
| Trigkey S3 | |
| Average AMD Ryzen 5 3550H, AMD Radeon RX Vega 8 (Ryzen 2000/3000) (n=1) | |
| Beelink U59 N5105 | |
| CrossMark / Responsiveness | |
| Beelink SEi12 Core i5-1235U | |
| Beelink SEi11 Pro | |
| Intel NUC Pro Chassis_i7_1265U | |
| Beelink SER Pro Ryzen 5 5600H | |
| Trigkey S3 | |
| Average AMD Ryzen 5 3550H, AMD Radeon RX Vega 8 (Ryzen 2000/3000) (n=1) | |
| Beelink U59 N5105 | |
| PCMark 10 Score | 4006 points | |
Help | ||
| AIDA64 / Memory Copy | |
| Intel NUC Pro Chassis_i7_1265U | |
| Beelink SEi12 Core i5-1235U | |
| Beelink SER Pro Ryzen 5 5600H | |
| Beelink SEi11 Pro | |
| Trigkey S3 | |
| Average AMD Ryzen 5 3550H (28887 - 32188, n=5) | |
| Intel NUC11TNKi5 | |
| AIDA64 / Memory Read | |
| Intel NUC Pro Chassis_i7_1265U | |
| Beelink SER Pro Ryzen 5 5600H | |
| Beelink SEi12 Core i5-1235U | |
| Beelink SEi11 Pro | |
| Trigkey S3 | |
| Average AMD Ryzen 5 3550H (31862 - 35172, n=5) | |
| Intel NUC11TNKi5 | |
| AIDA64 / Memory Write | |
| Intel NUC Pro Chassis_i7_1265U | |
| Beelink SEi11 Pro | |
| Beelink SEi12 Core i5-1235U | |
| Beelink SER Pro Ryzen 5 5600H | |
| Trigkey S3 | |
| Average AMD Ryzen 5 3550H (32493 - 35847, n=5) | |
| Intel NUC11TNKi5 | |
| AIDA64 / Memory Latency | |
| Average AMD Ryzen 5 3550H (95 - 120, n=5) | |
| Intel NUC Pro Chassis_i7_1265U | |
| Trigkey S3 | |
| Beelink SEi12 Core i5-1235U | |
| Intel NUC11TNKi5 | |
| Beelink SEi11 Pro | |
| Beelink SER Pro Ryzen 5 5600H | |
* ... smaller is better
DPC延时
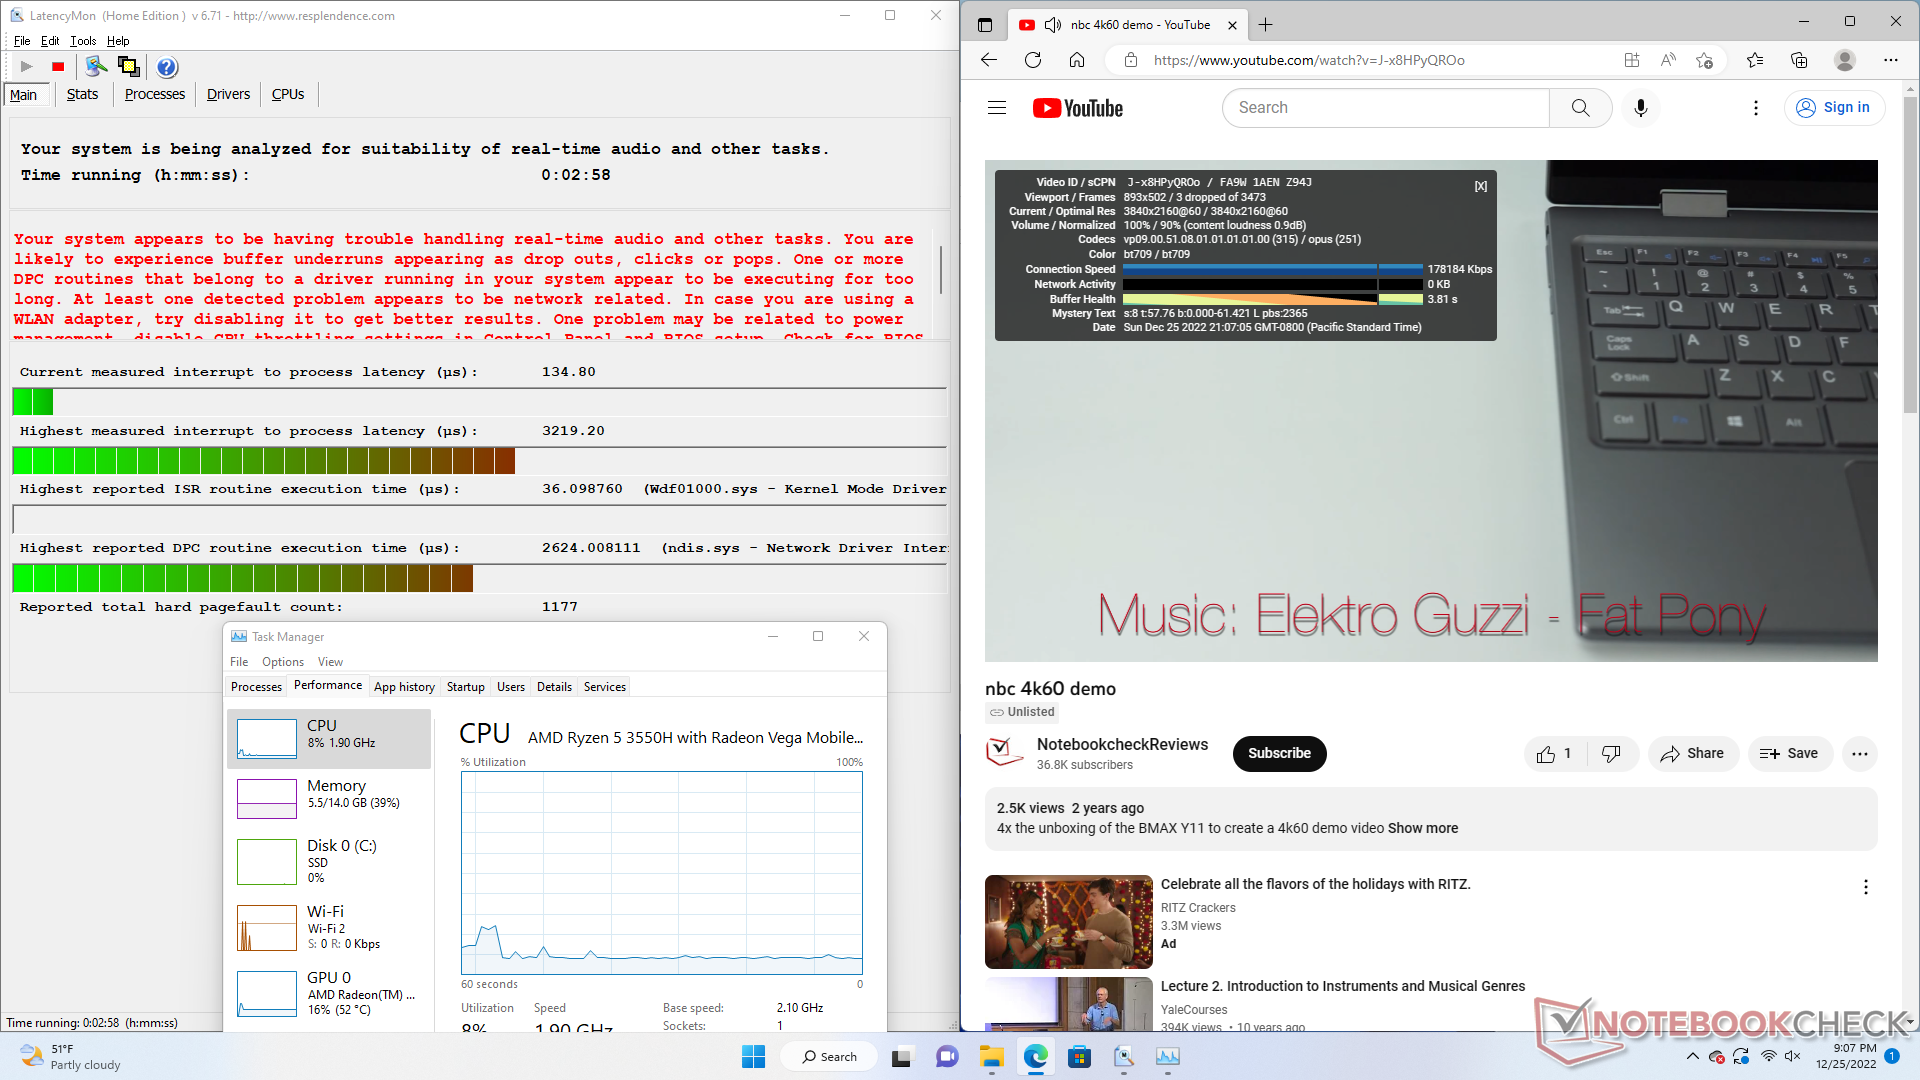
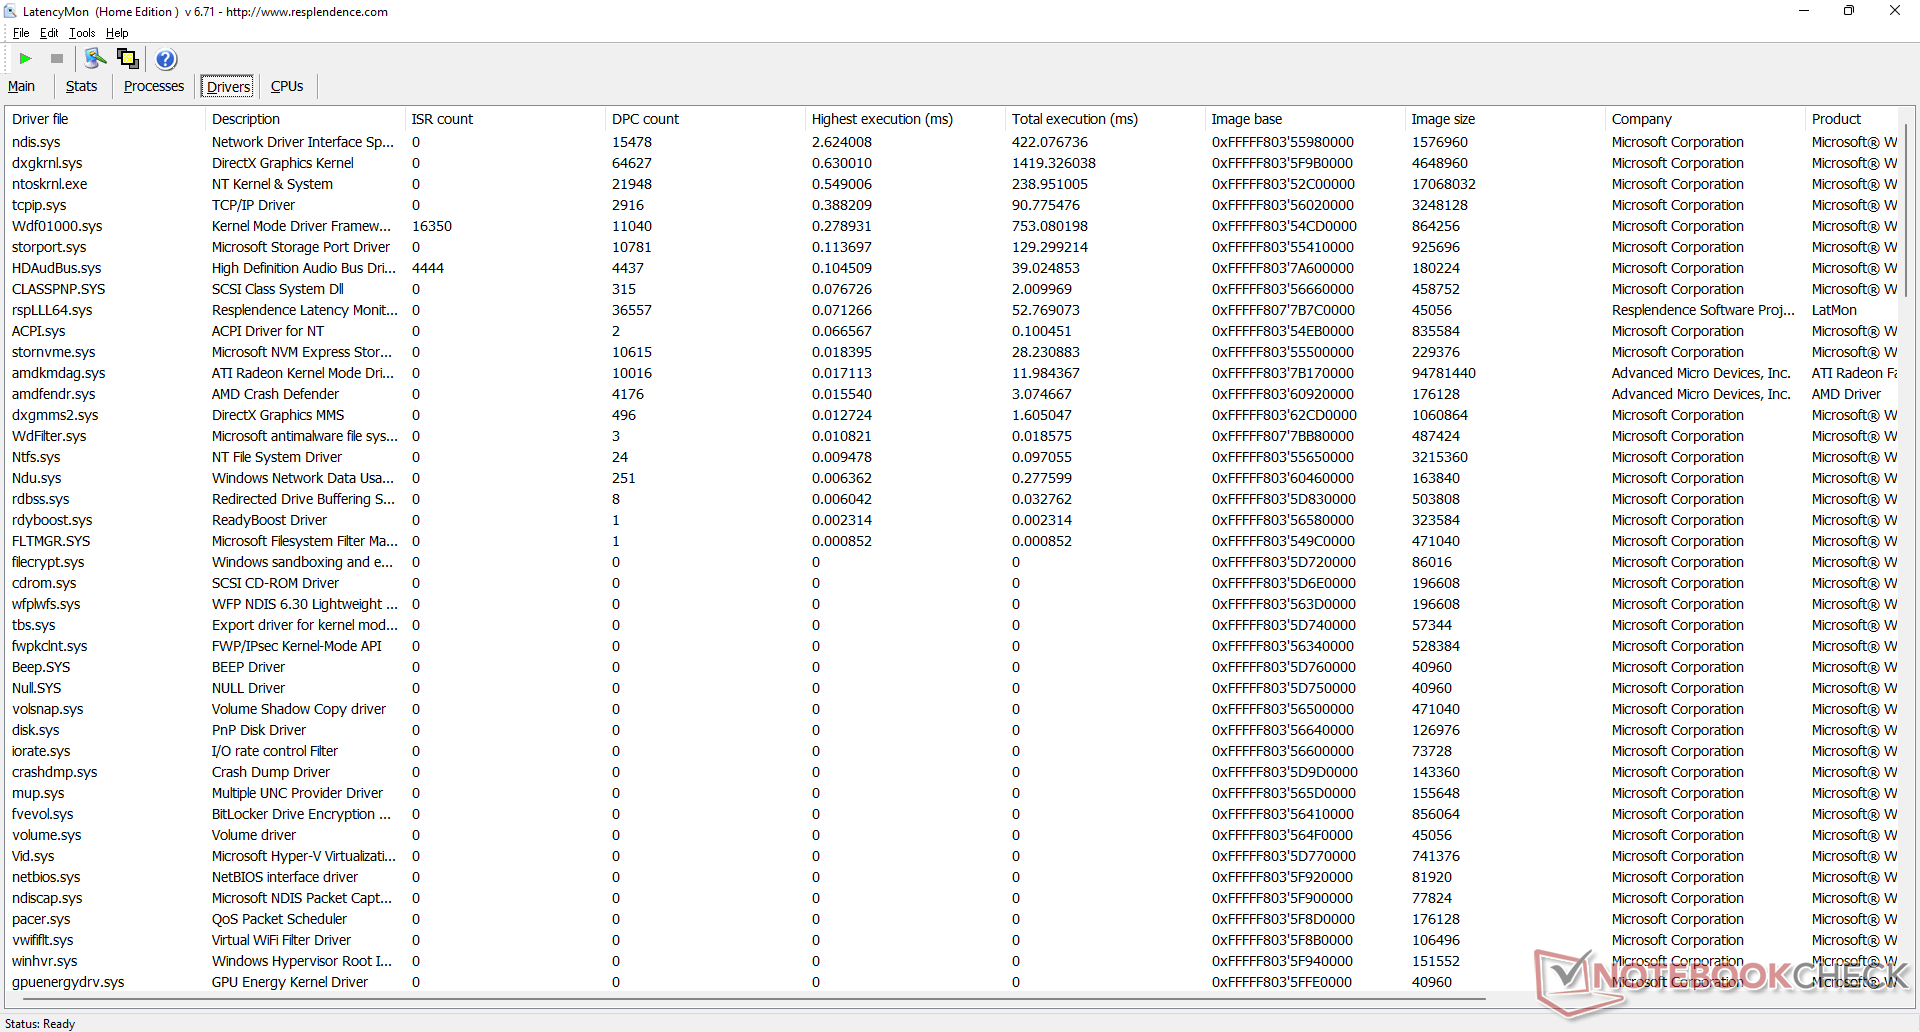
LatencyMon显示了在打开我们的主页的多个浏览器标签时的DPC问题。在60 FPS下的4K视频播放基本流畅,在我们长达1分钟的测试视频中只有3个丢帧。
| DPC Latencies / LatencyMon - interrupt to process latency (max), Web, Youtube, Prime95 | |
| Trigkey S3 | |
| Intel NUC Pro Chassis_i7_1265U | |
| Beelink SEi12 Core i5-1235U | |
| Beelink SER Pro Ryzen 5 5600H | |
| Intel NUC11TNKi5 | |
| Beelink SEi11 Pro | |
* ... smaller is better
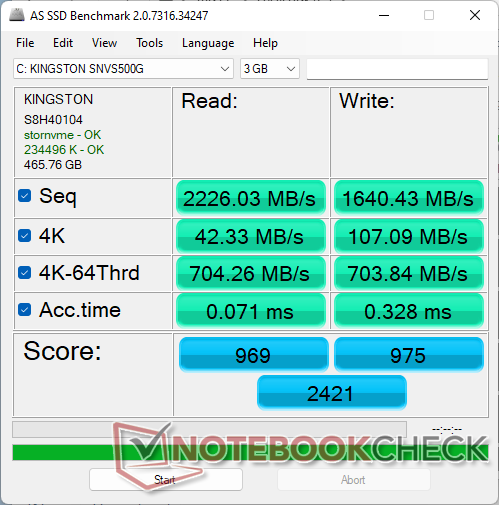
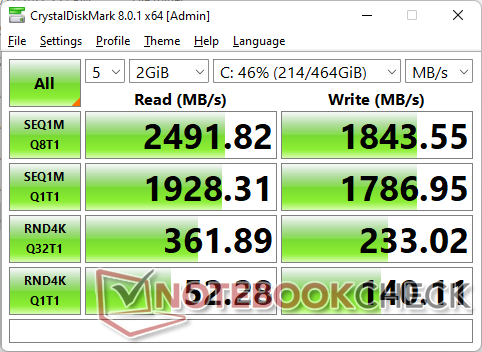
存储设备
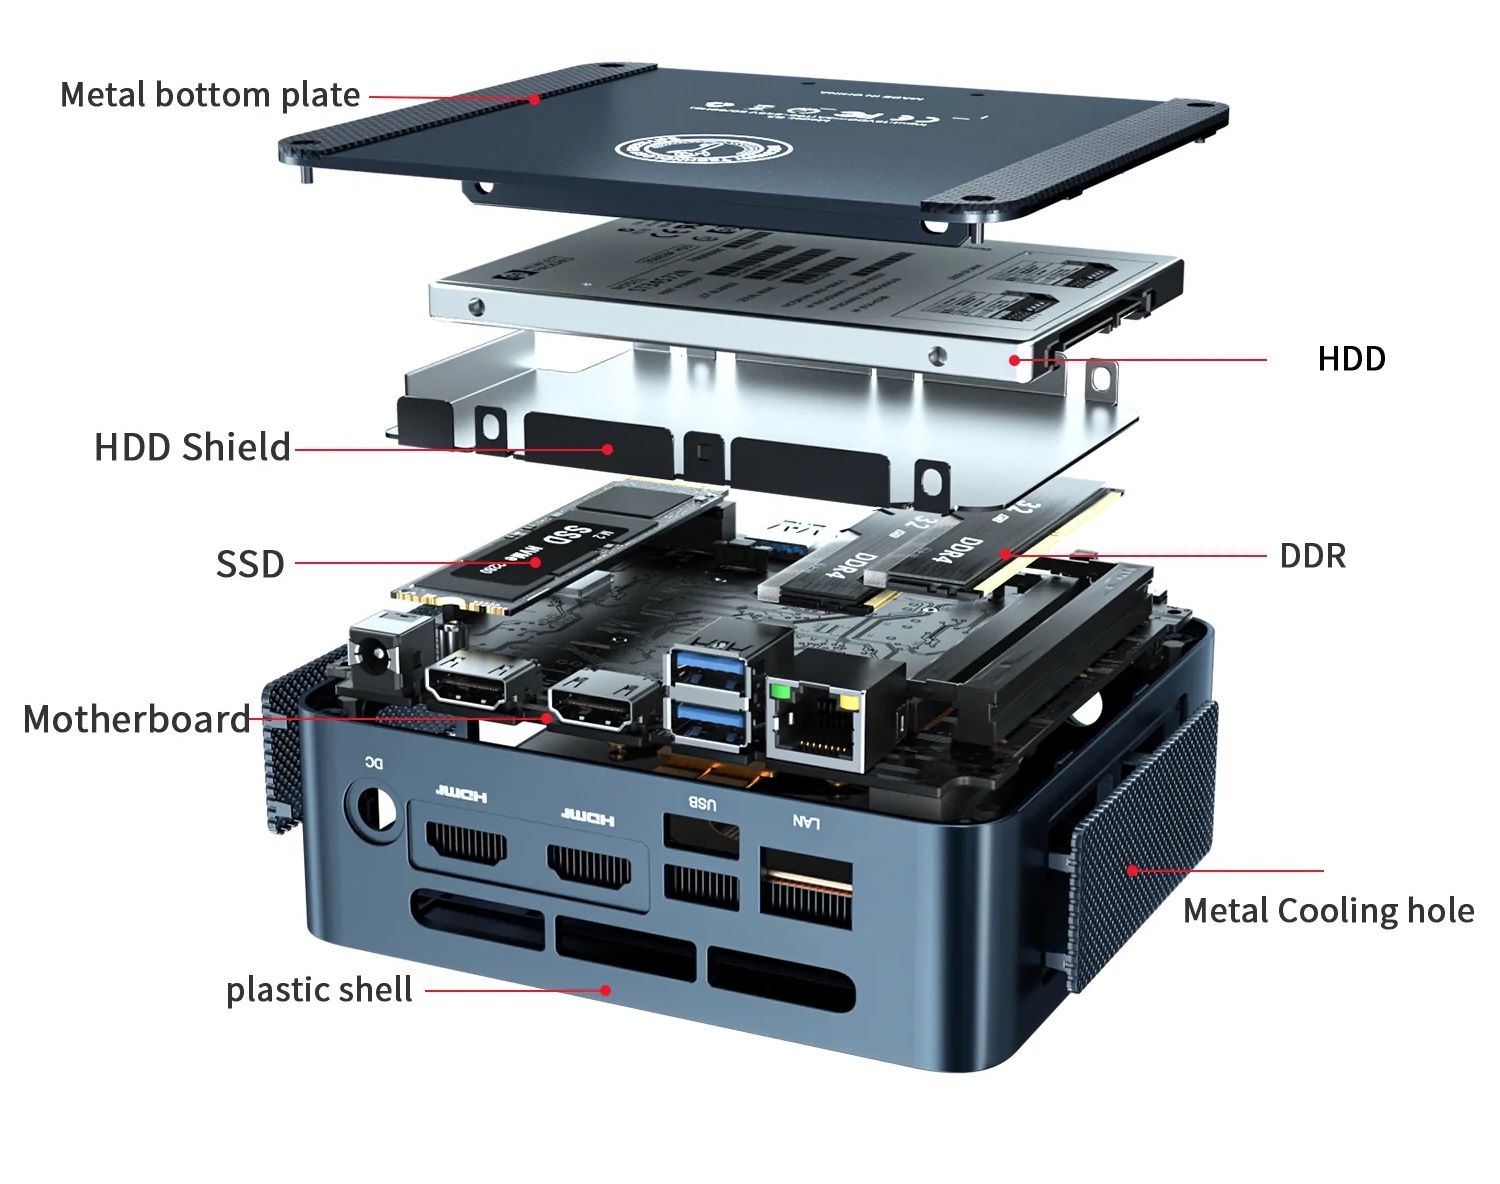
Trigkey使用相同的金士顿NV1 SNVS/500GCNM.2 2280 NVMe固态硬盘,这在许多Beelink迷你电脑上都可以找到,如 诸如SEi11 Pro或 SER Pro.这是一款经济型PCIe3 x4驱动器,最大持续传输率约为2500 MB/s。用户如果能打开底部面板,可以安装一个M.2固态硬盘和一个2.5英寸SATA III硬盘。

| Drive Performance rating - Percent | |
| Beelink SEi12 Core i5-1235U | |
| Intel NUC Pro Chassis_i7_1265U | |
| Beelink SEi11 Pro | |
| Beelink SER Pro Ryzen 5 5600H -11! | |
| Trigkey S3 | |
| Intel NUC11TNKi5 | |
* ... smaller is better
Disk Throttling: DiskSpd Read Loop, Queue Depth 8
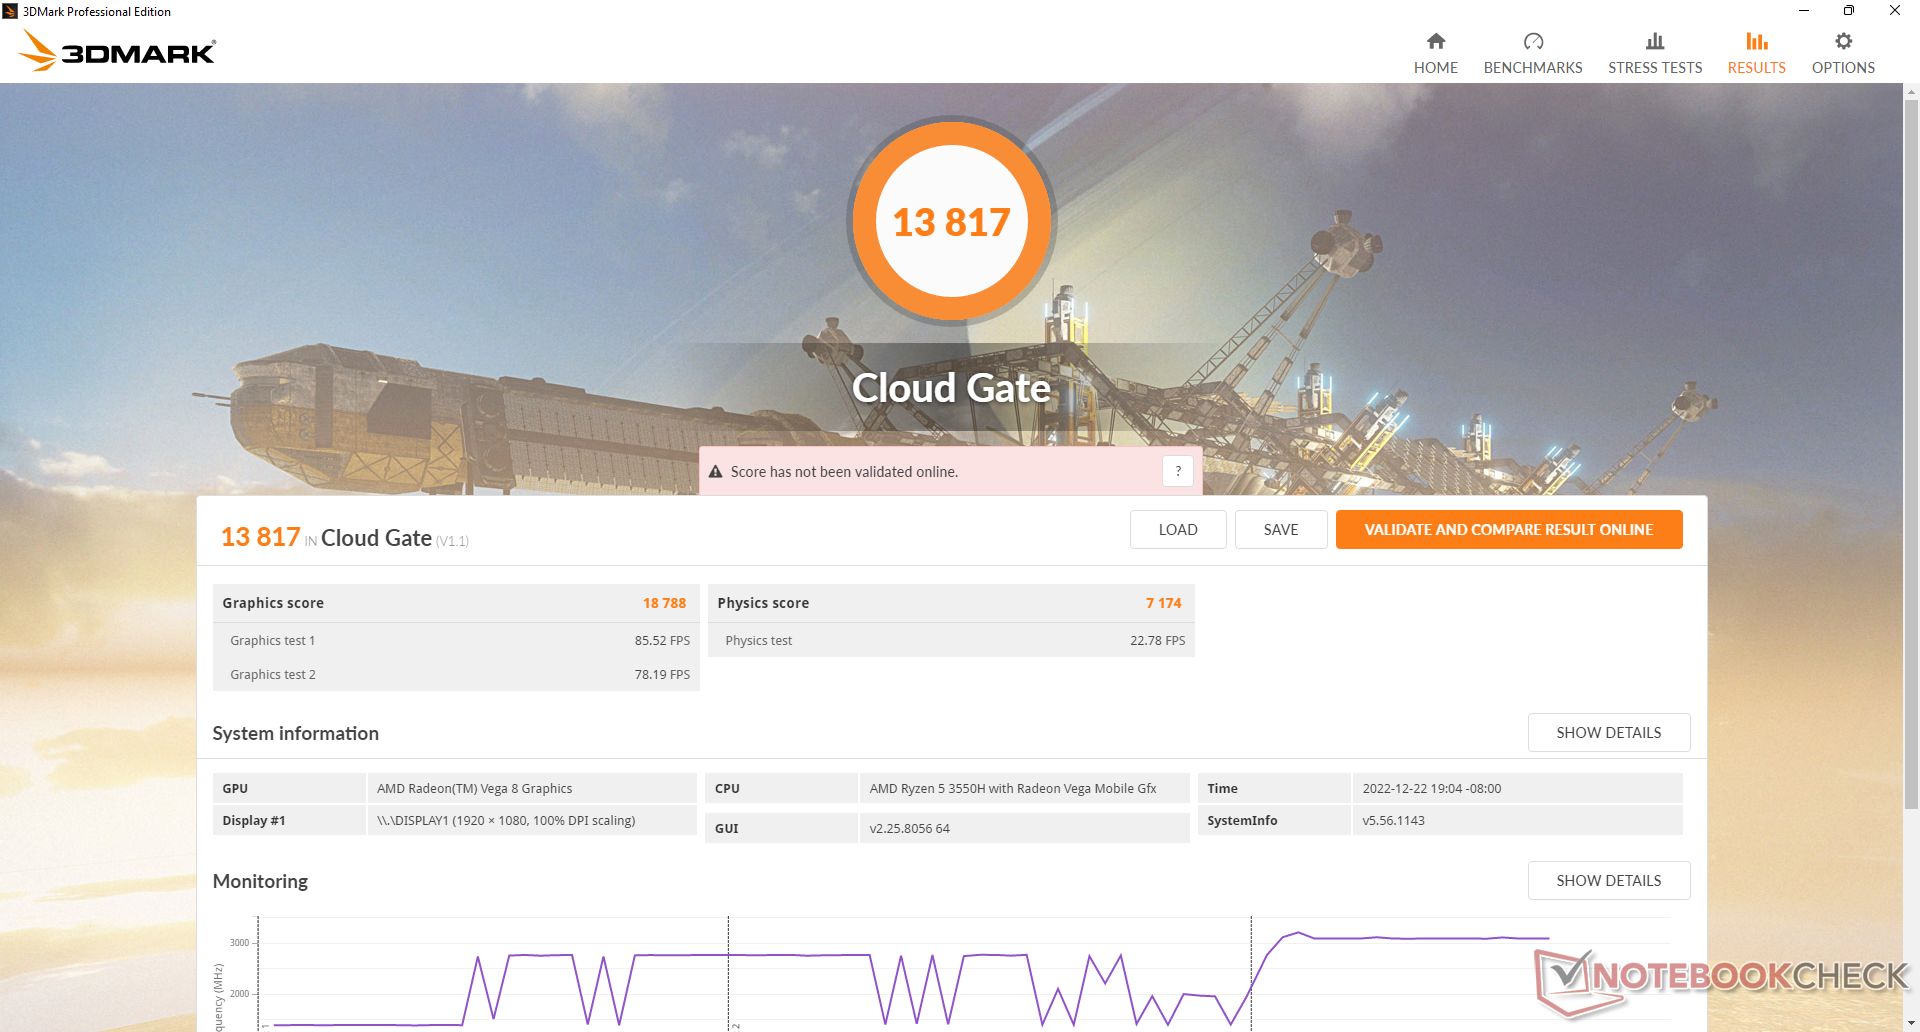
GPU性能
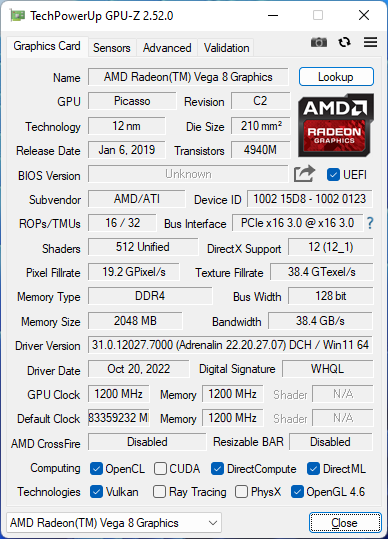
原始图形性能大约是620的2倍。 UHD Graphics 620通常在第十代或更早的英特尔CPU上发现。这不足以为大多数游戏提供动力,但在流媒体或在高分辨率显示器上运行时,每一点都有帮助。
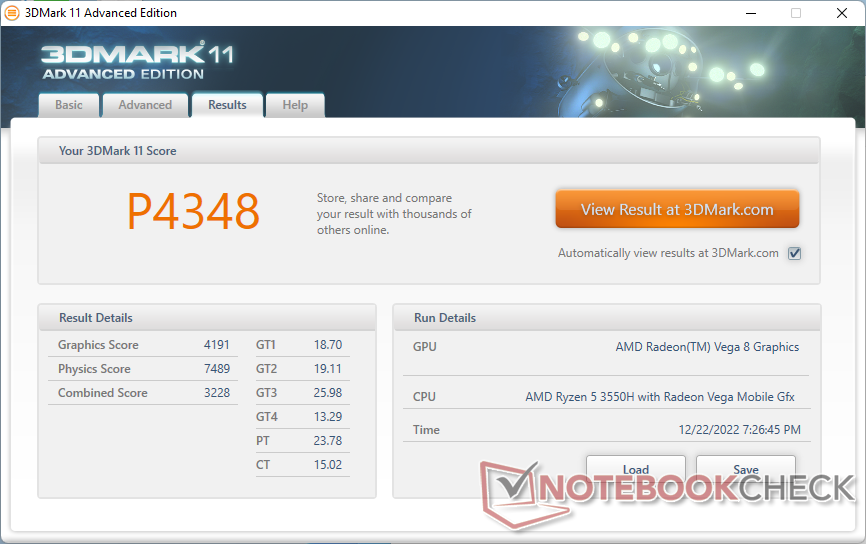
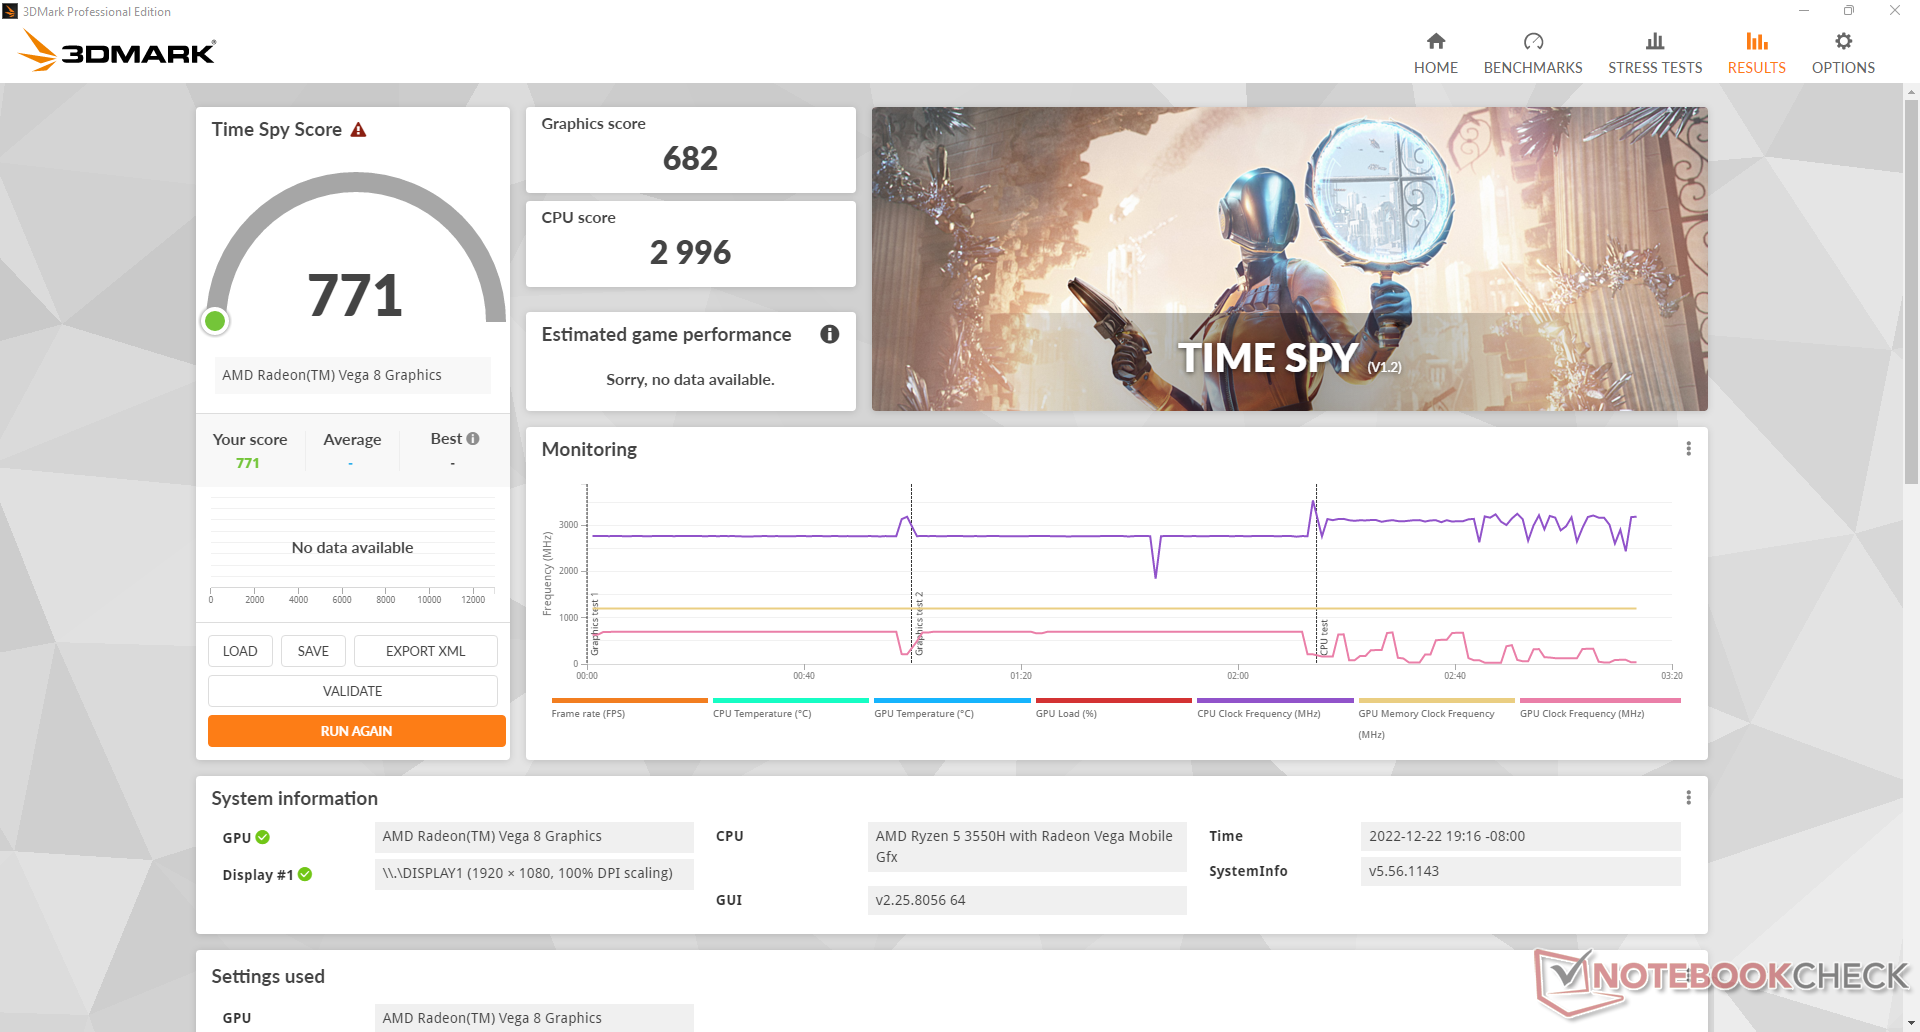
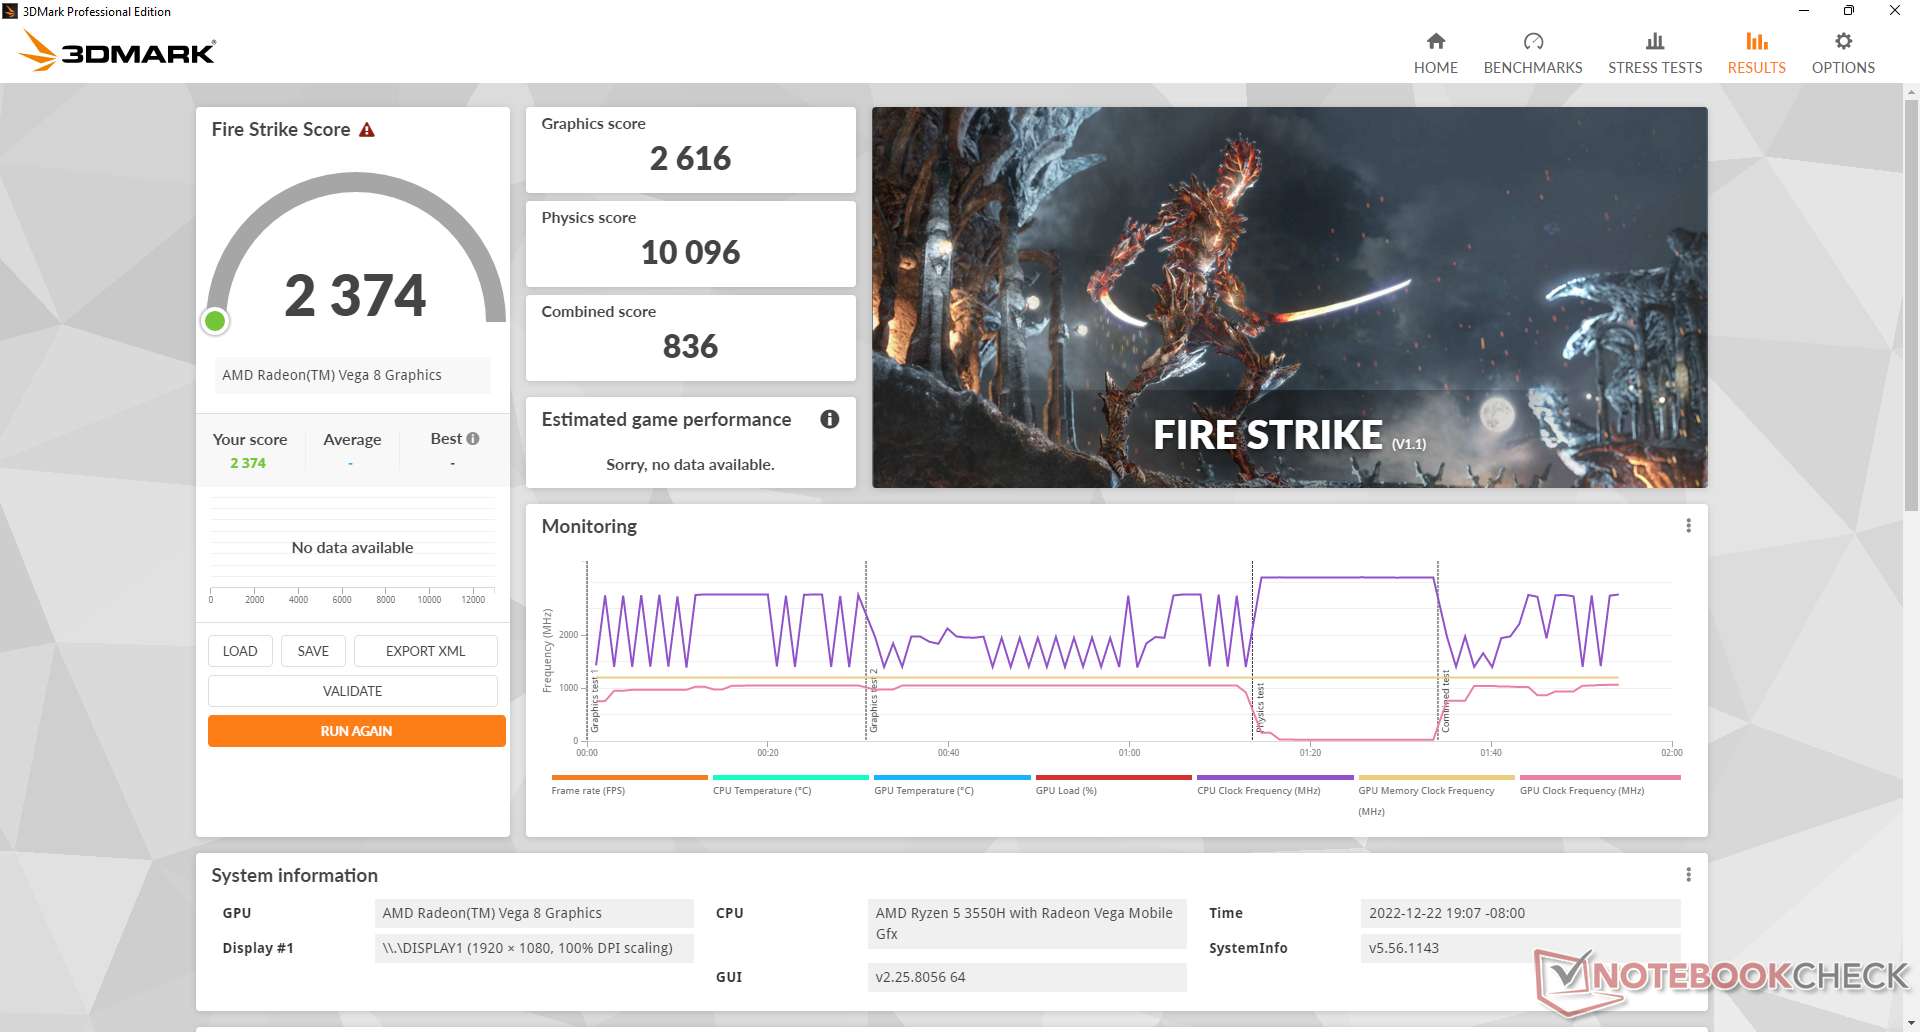
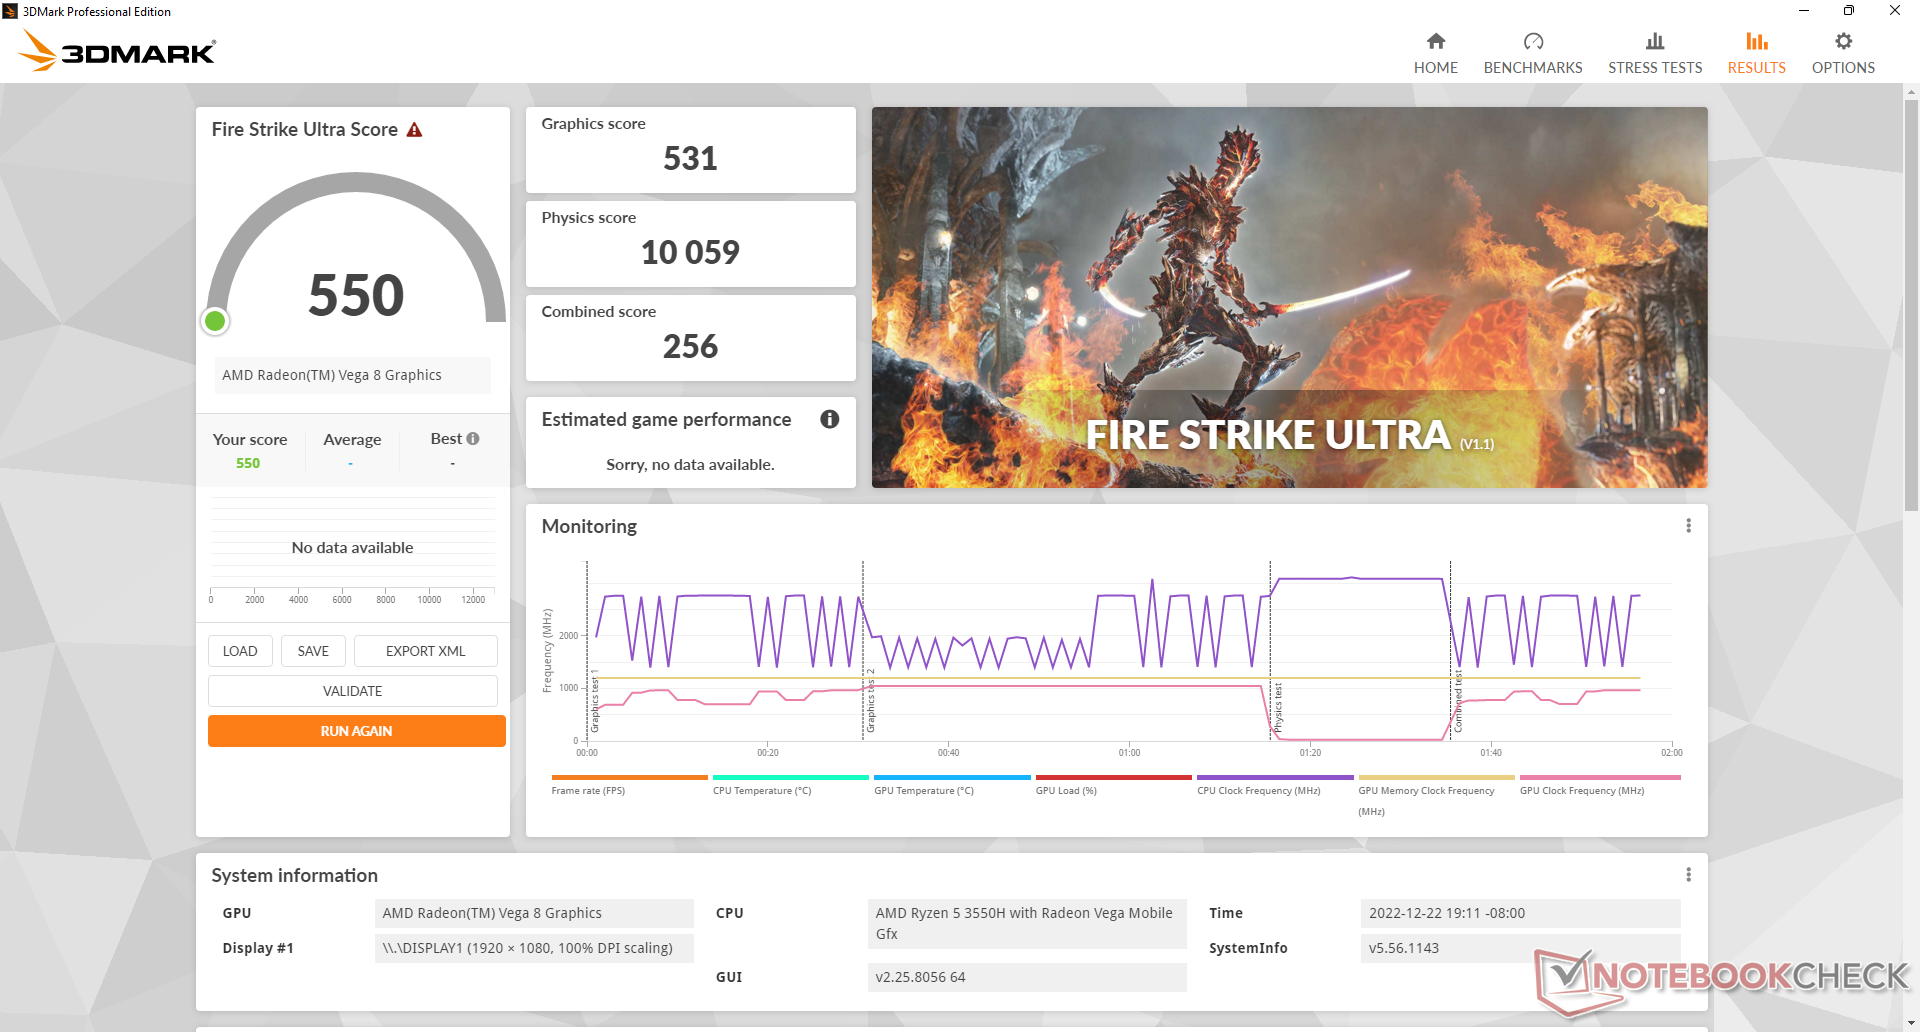
| 3DMark 11 Performance | 4348 points | |
| 3DMark Cloud Gate Standard Score | 13817 points | |
| 3DMark Fire Strike Score | 2374 points | |
| 3DMark Time Spy Score | 771 points | |
Help | ||
怠速时 Witcher 3显示帧率周期性地下降到30 FPS的短时期内,然后恢复。这种行为表明优化不力或中断背景活动,这有可能导致流式传输其他内容时丢帧。
Witcher 3 FPS Chart
| low | med. | high | ultra | |
|---|---|---|---|---|
| GTA V (2015) | 81.2 | 72.3 | 21.8 | 10.3 |
| The Witcher 3 (2015) | 50.7 | 33.8 | 18.3 | 10.1 |
| Dota 2 Reborn (2015) | 73 | 64.4 | 40.7 | 37.8 |
| Final Fantasy XV Benchmark (2018) | 27.2 | 13.8 | 9.68 | |
| X-Plane 11.11 (2018) | 11.5 | 10.5 | 9.58 | |
| Strange Brigade (2018) | 65.5 | 21.8 | 17.5 | 14.6 |
| Cyberpunk 2077 1.6 (2022) | 10.8 | 8.6 | 6.3 | 5 |
排放
系统噪音
风扇噪音出奇地安静,成为S3的一个强大的亮点。在运行高要求的负载时,我们只能达到最大的31分贝(A),而像Beelink SEi12或Beelink SER Pro这样更快的迷你电脑则为40分贝(A)或者更高。
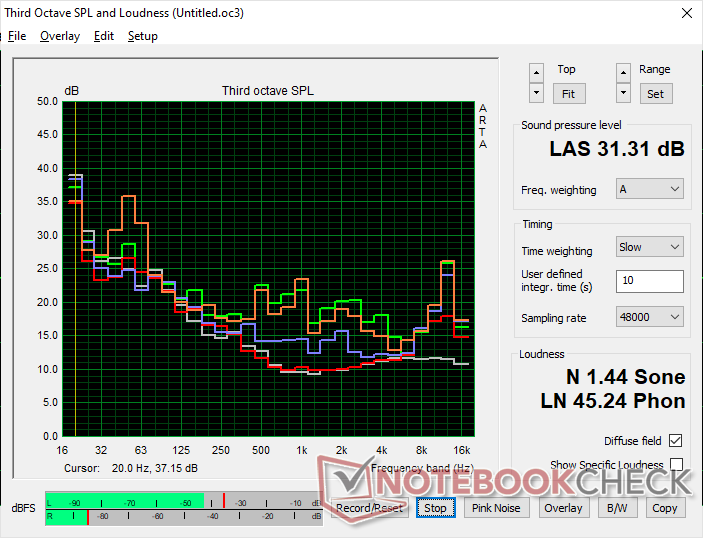
Noise level
| Idle |
| 24.5 / 24.5 / 24.5 dB(A) |
| Load |
| 27.1 / 31.3 dB(A) |
 | ||
30 dB silent 40 dB(A) audible 50 dB(A) loud |
||
min: | ||
| Trigkey S3 Vega 8, R5 3550H, Kingston NV1 SNVS/500GCN | Intel NUC Pro Chassis_i7_1265U Iris Xe G7 96EUs, i7-1265U, WDC PC SN720 SDAQNTW-512G | Intel NUC11TNKi5 Iris Xe G7 80EUs, i5-1135G7, Transcend M.2 SSD 430S TS512GMTS430S | Beelink SEi12 Core i5-1235U Iris Xe G7 80EUs, i5-1235U, Kingston NV1 SNVS/500GCN | Beelink SEi11 Pro Iris Xe G7 96EUs, i5-11320H, Kingston NV1 SNVS/500GCN | Beelink SER Pro Ryzen 5 5600H Vega 7, R5 5600H, Kingston NV1 SNVS/500GCN | |
|---|---|---|---|---|---|---|
| Noise | -36% | -36% | -13% | -9% | -10% | |
| off / environment * (dB) | 23.2 | 30.5 -31% | 24.8 -7% | 23.3 -0% | 22.8 2% | 22.8 2% |
| Idle Minimum * (dB) | 24.5 | 31.4 -28% | 35.6 -45% | 27.8 -13% | 24.7 -1% | 26.1 -7% |
| Idle Average * (dB) | 24.5 | 31.4 -28% | 35.6 -45% | 27.8 -13% | 24.7 -1% | 26.1 -7% |
| Idle Maximum * (dB) | 24.5 | 31.4 -28% | 35.6 -45% | 27.8 -13% | 25.3 -3% | 28.7 -17% |
| Load Average * (dB) | 27.1 | 43.8 -62% | 36.2 -34% | 32 -18% | 33.2 -23% | 32.3 -19% |
| Witcher 3 ultra * (dB) | 30.6 | 38 -24% | 34.1 -11% | 34.5 -13% | 32.8 -7% | |
| Load Maximum * (dB) | 31.3 | 44 -41% | 47.6 -52% | 39.2 -25% | 37.8 -21% | 36.4 -16% |
* ... smaller is better
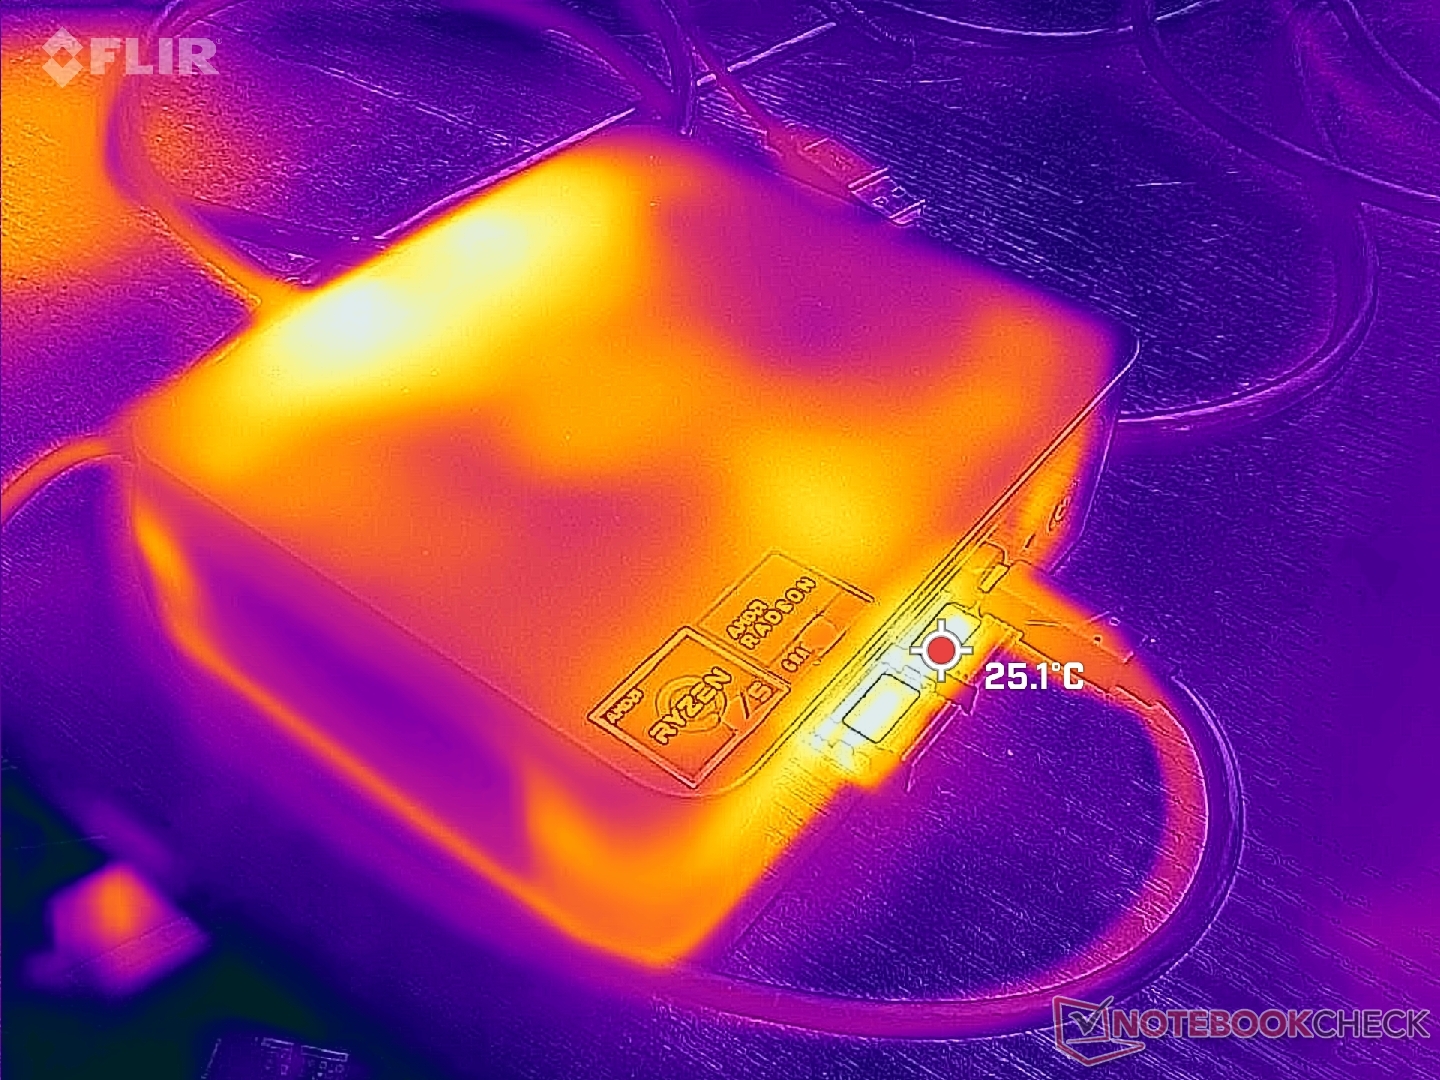
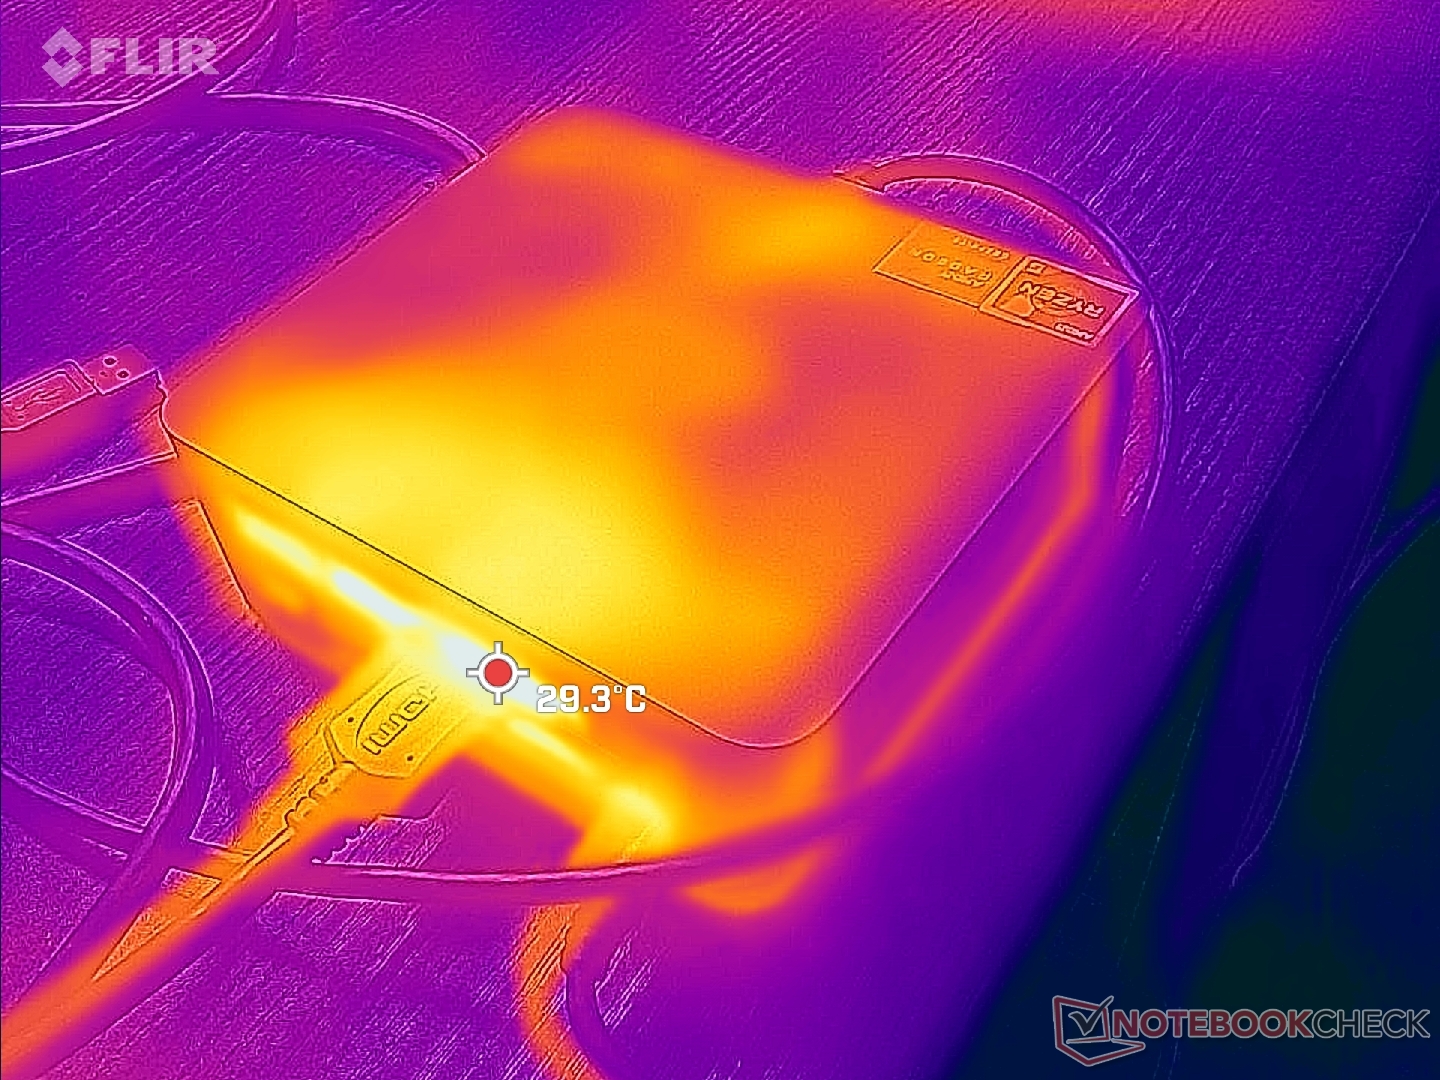
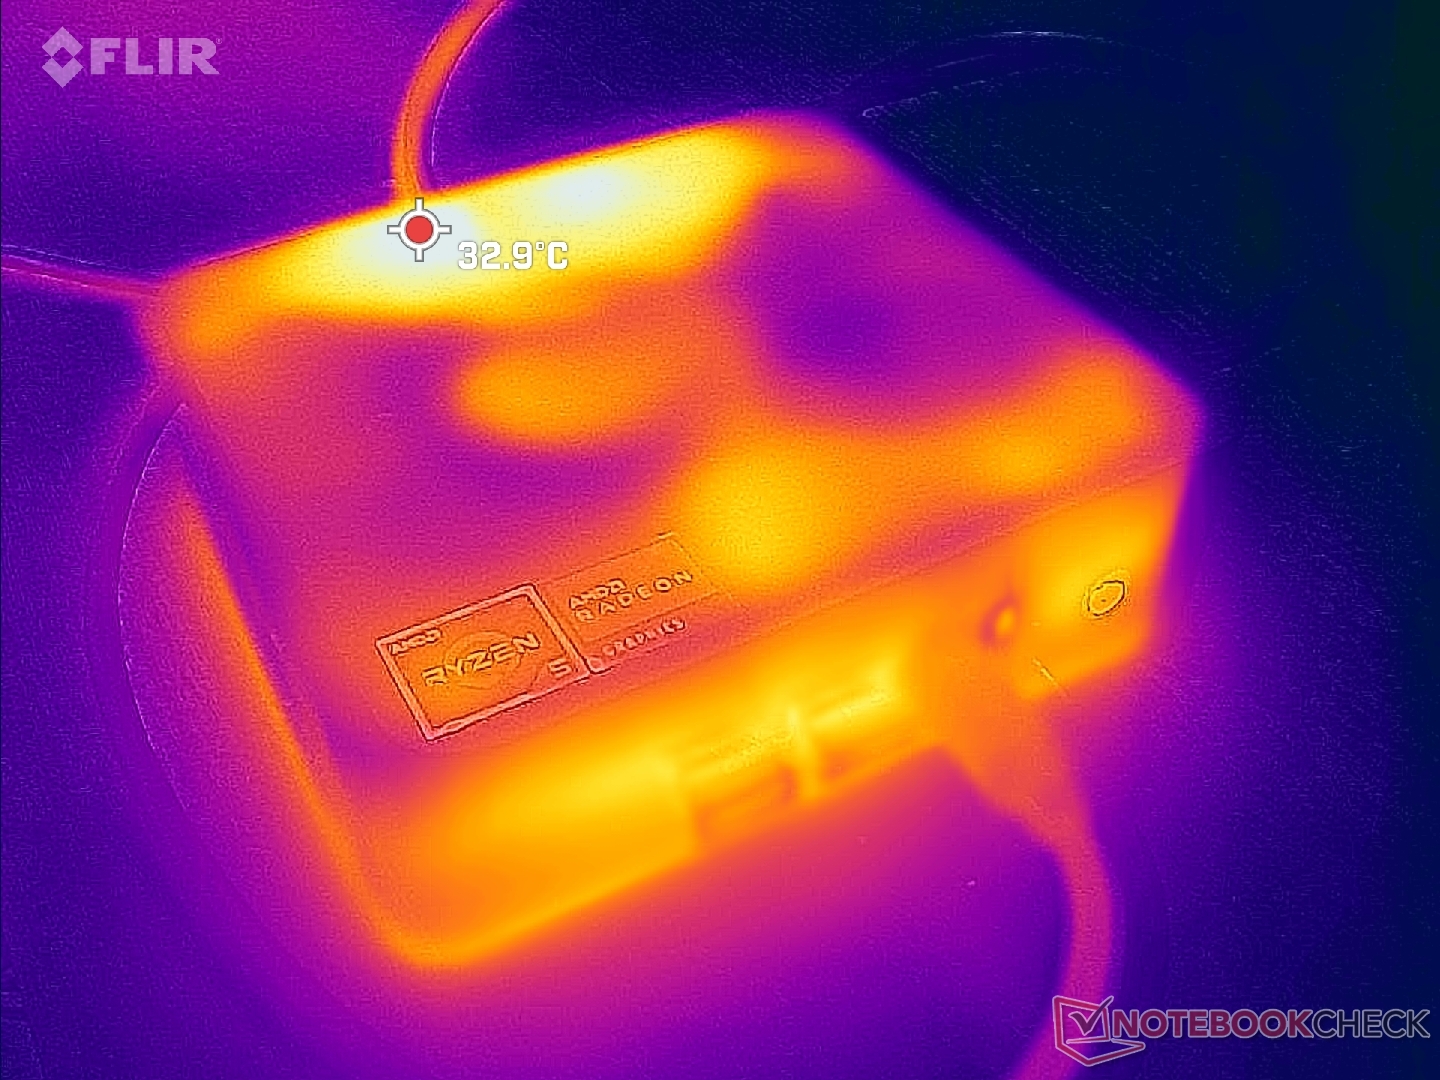
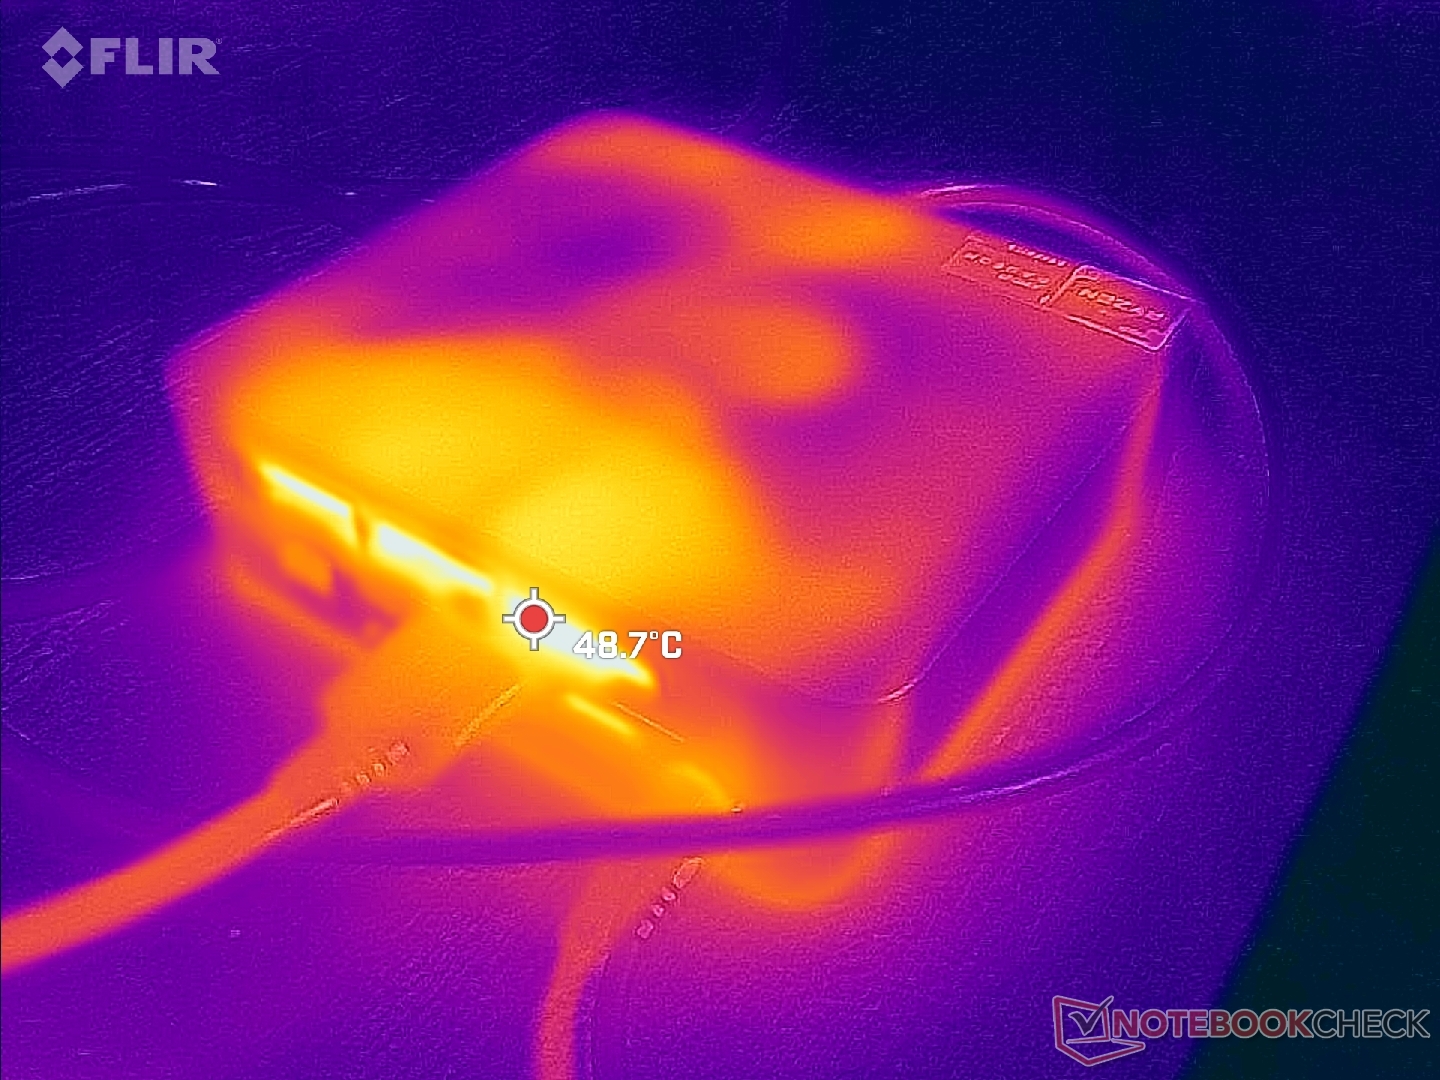
温度
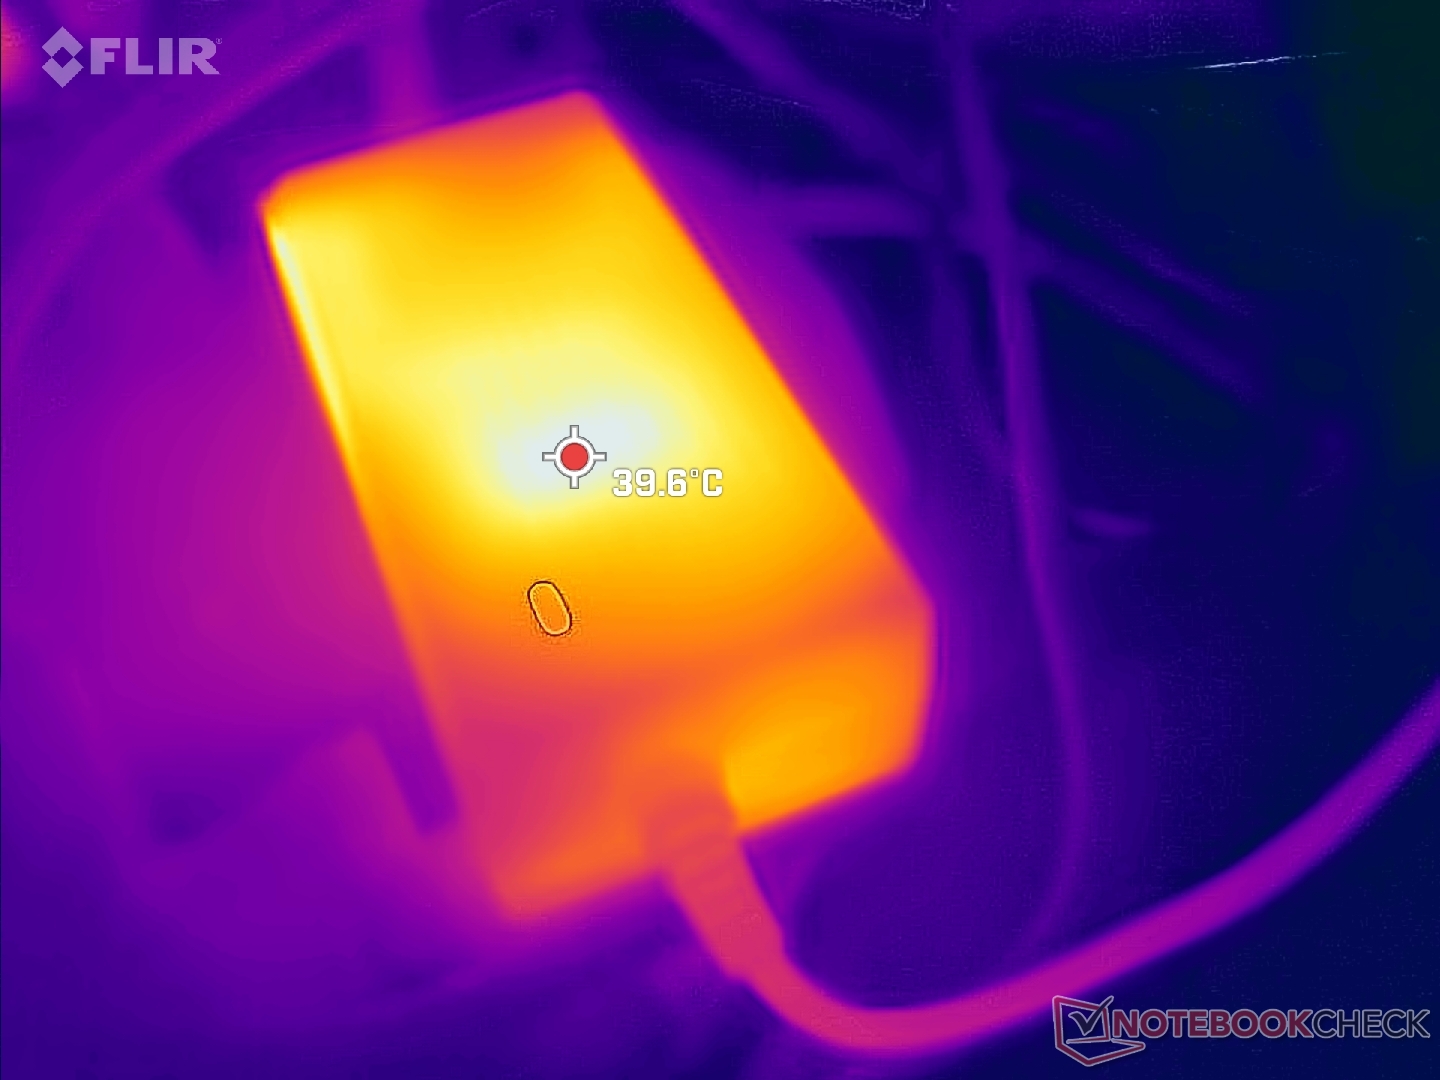
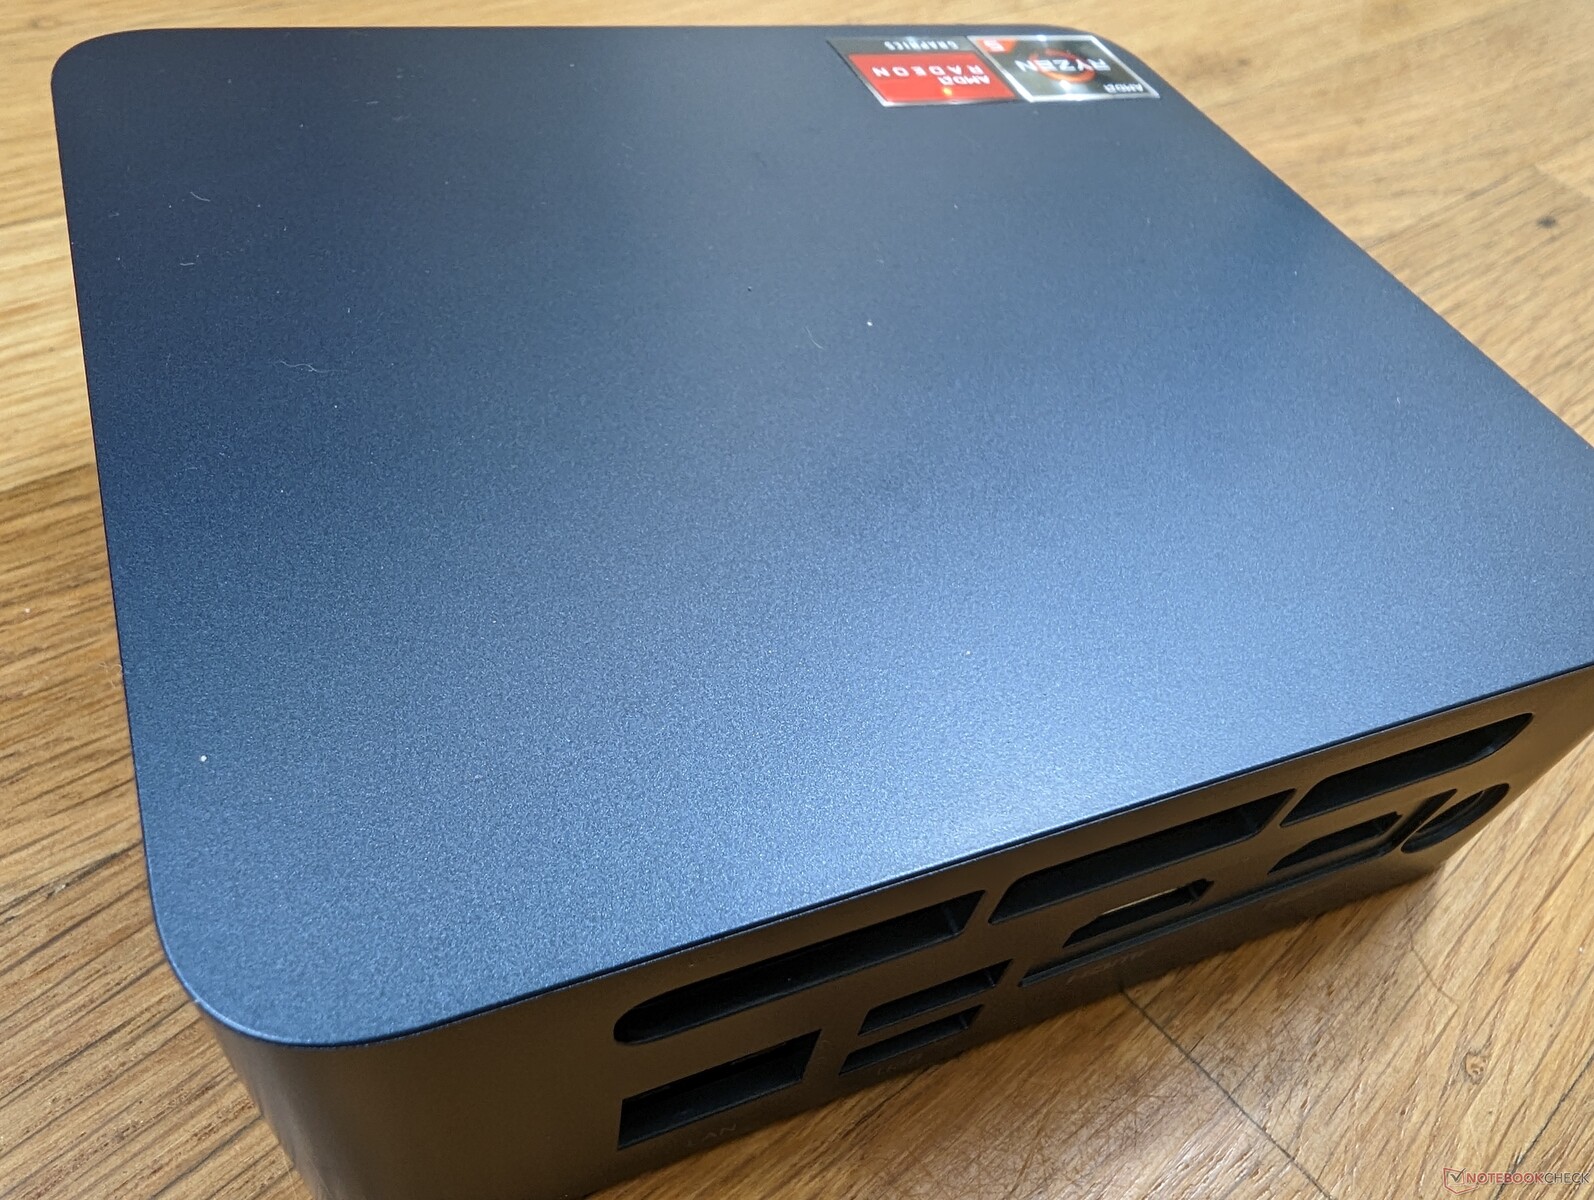
表面温度最热的地方是后部,热空气从那里流出。冷空气从侧面进入,而不是像Beelink SEi12那样从顶部进入,这意味着在迷你PC的顶部放置纸张等物品是安全的,不会妨碍气流。
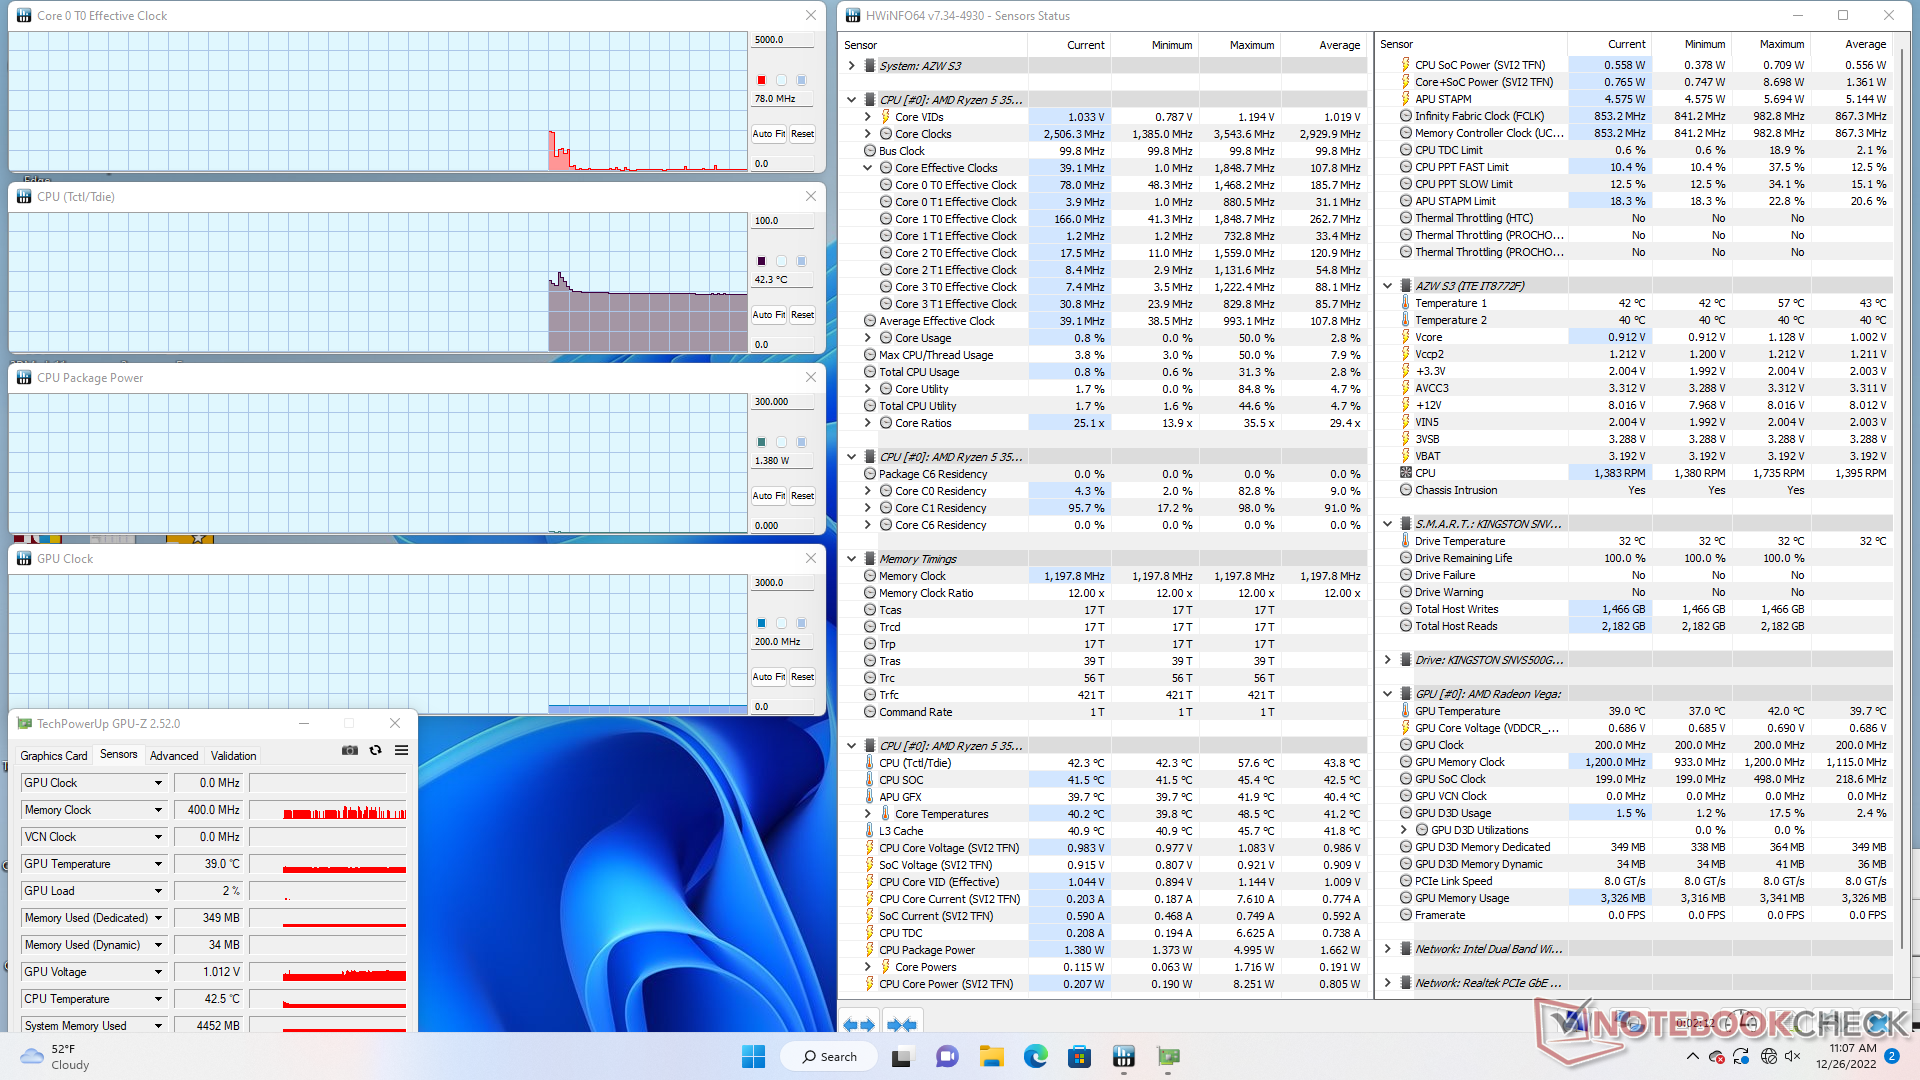
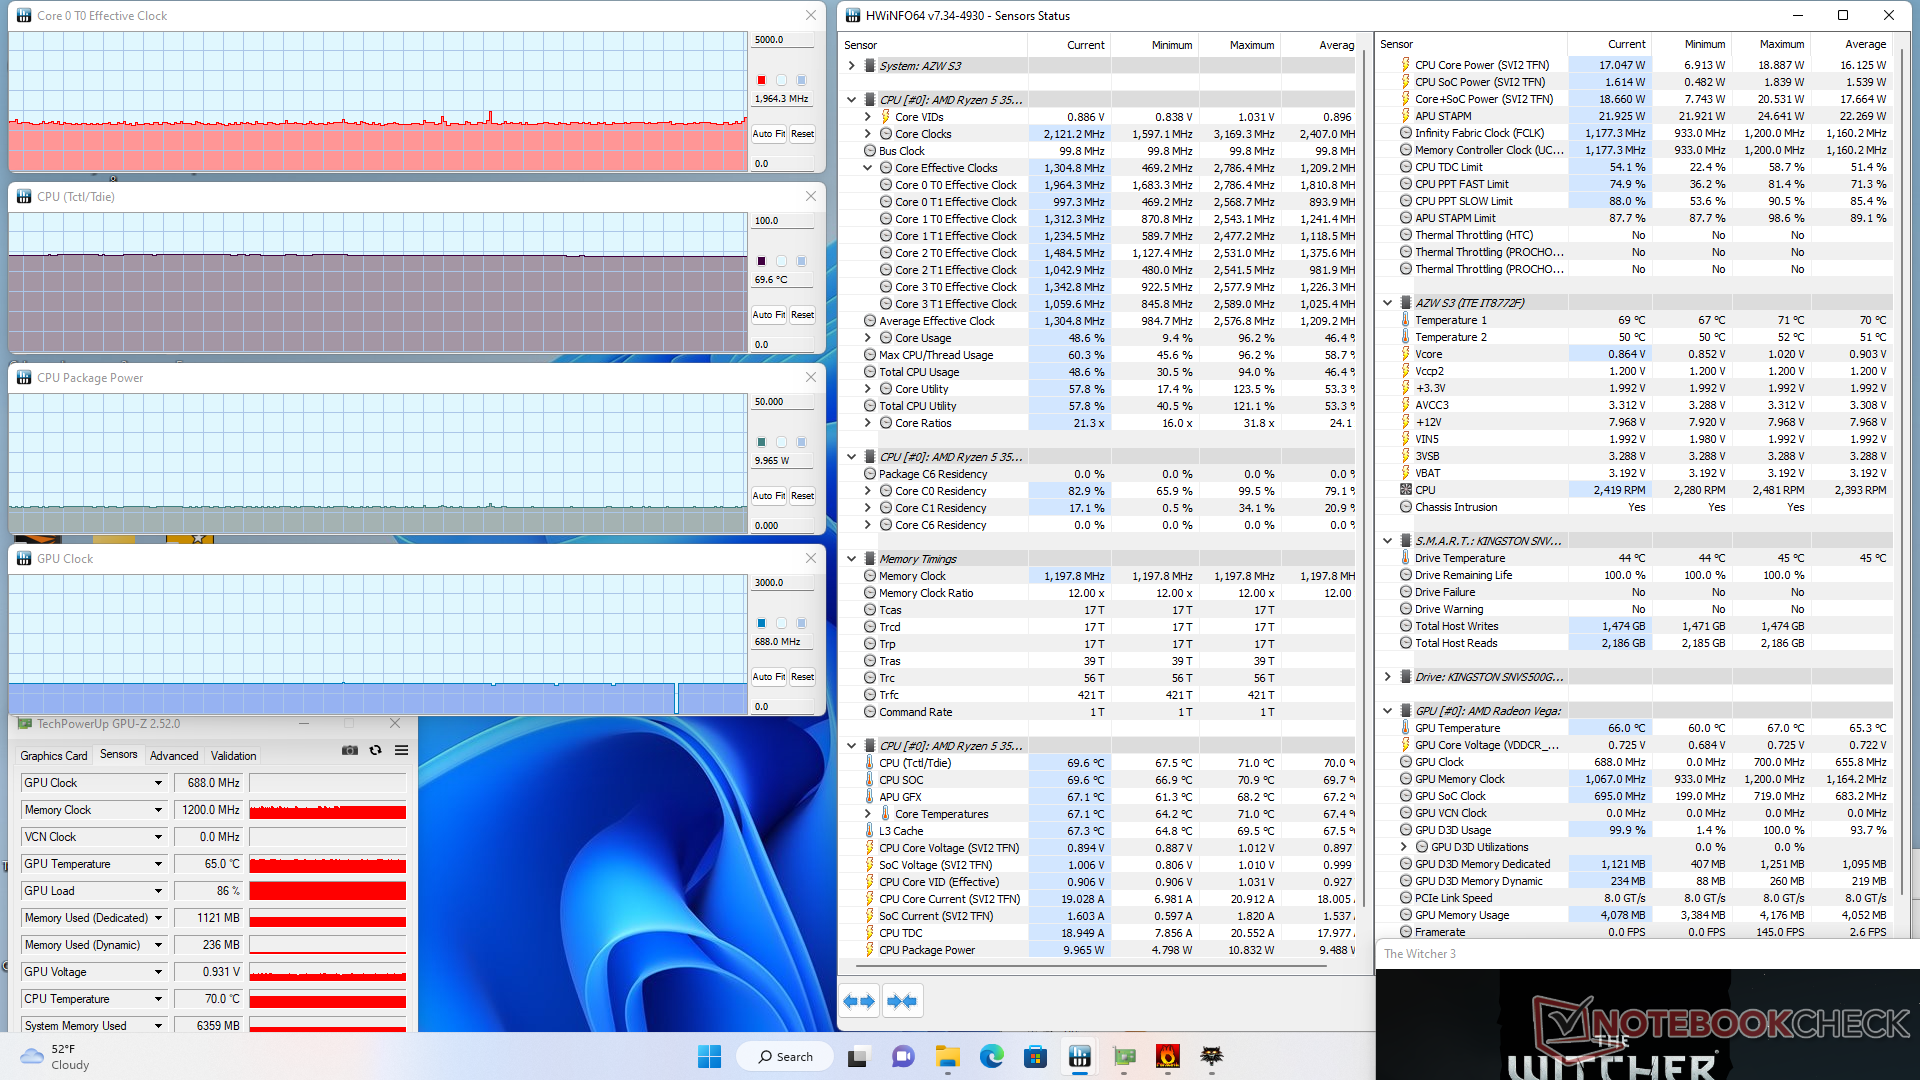
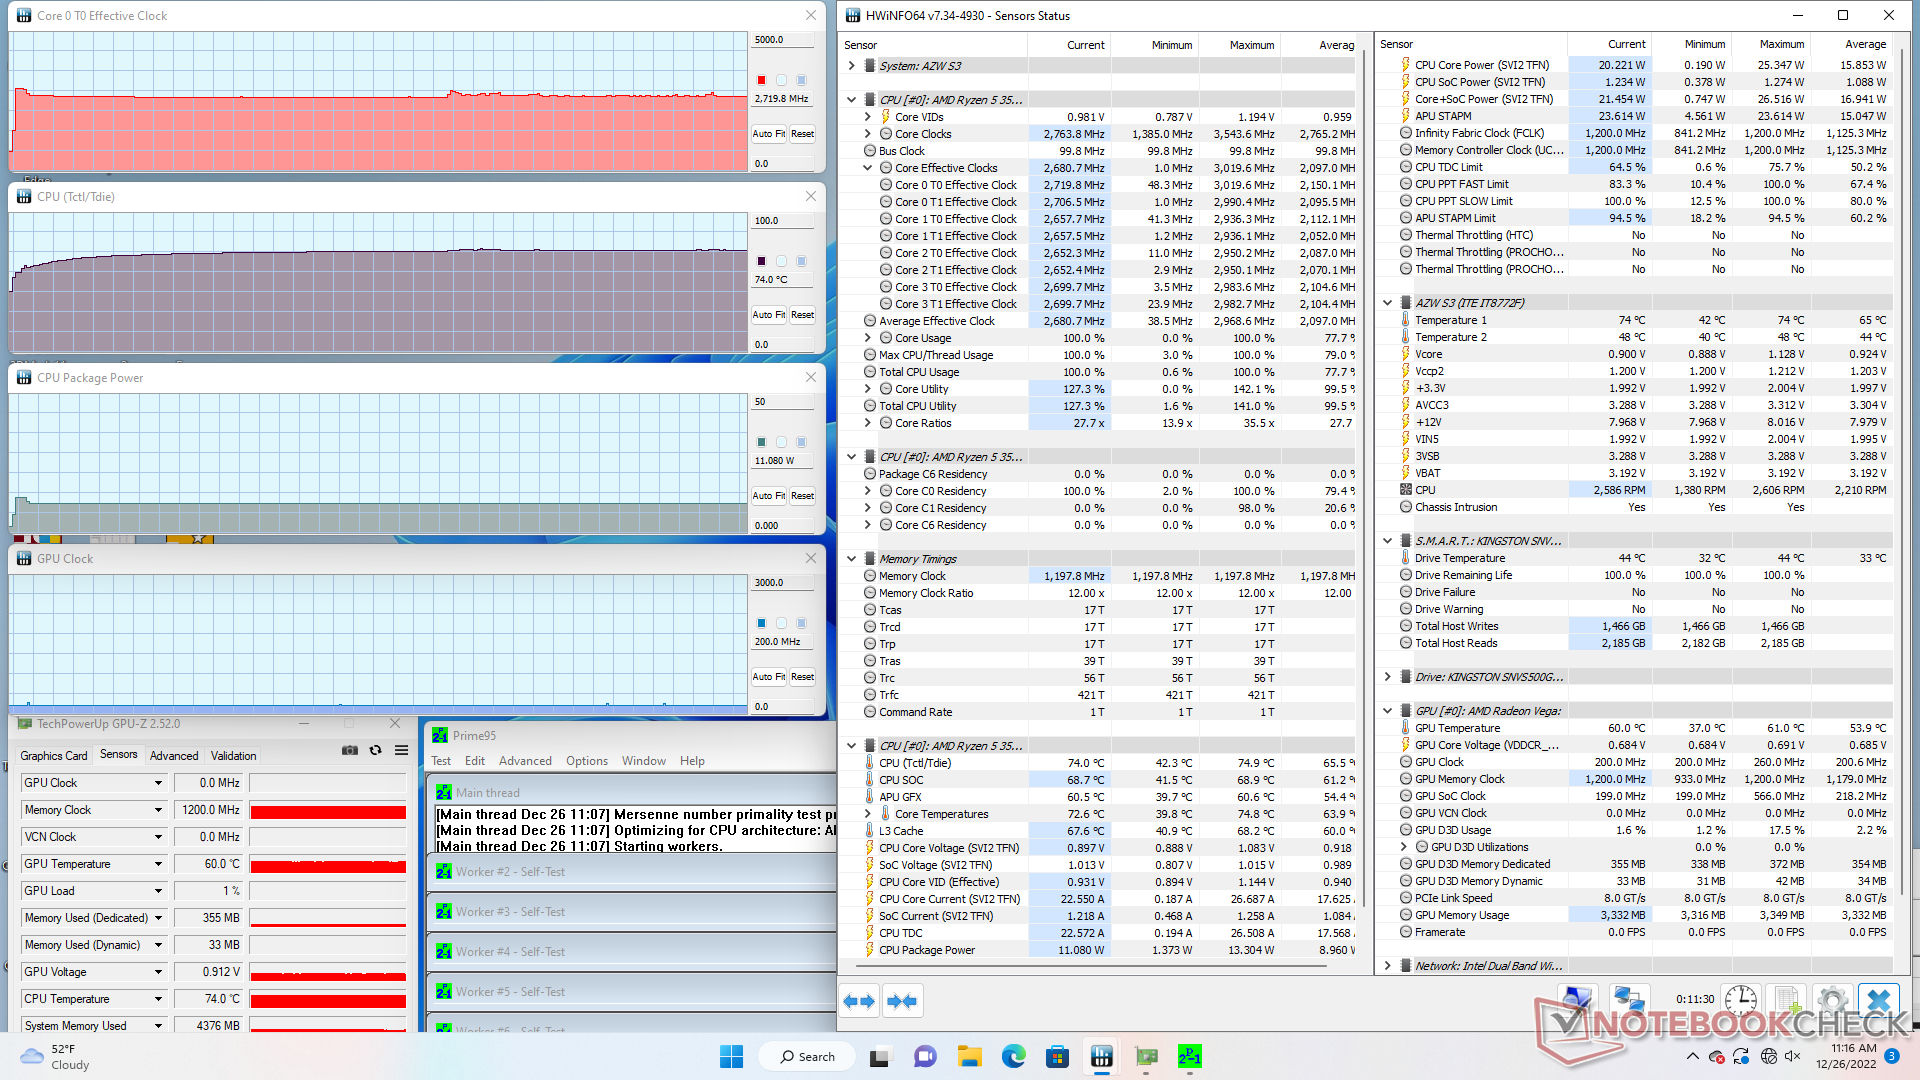
压力测试
当运行Prime95对CPU施加压力时,CPU的时钟频率和电路板的功耗将分别提升到3GHz和13W,然后在几秒钟后下降并稳定在2.7GHz、11W和74C。 Witcher 3这与 Beelink SEi12在类似的测试条件下相当,但仍然比在英特尔NUC11TNKi5 Pro.
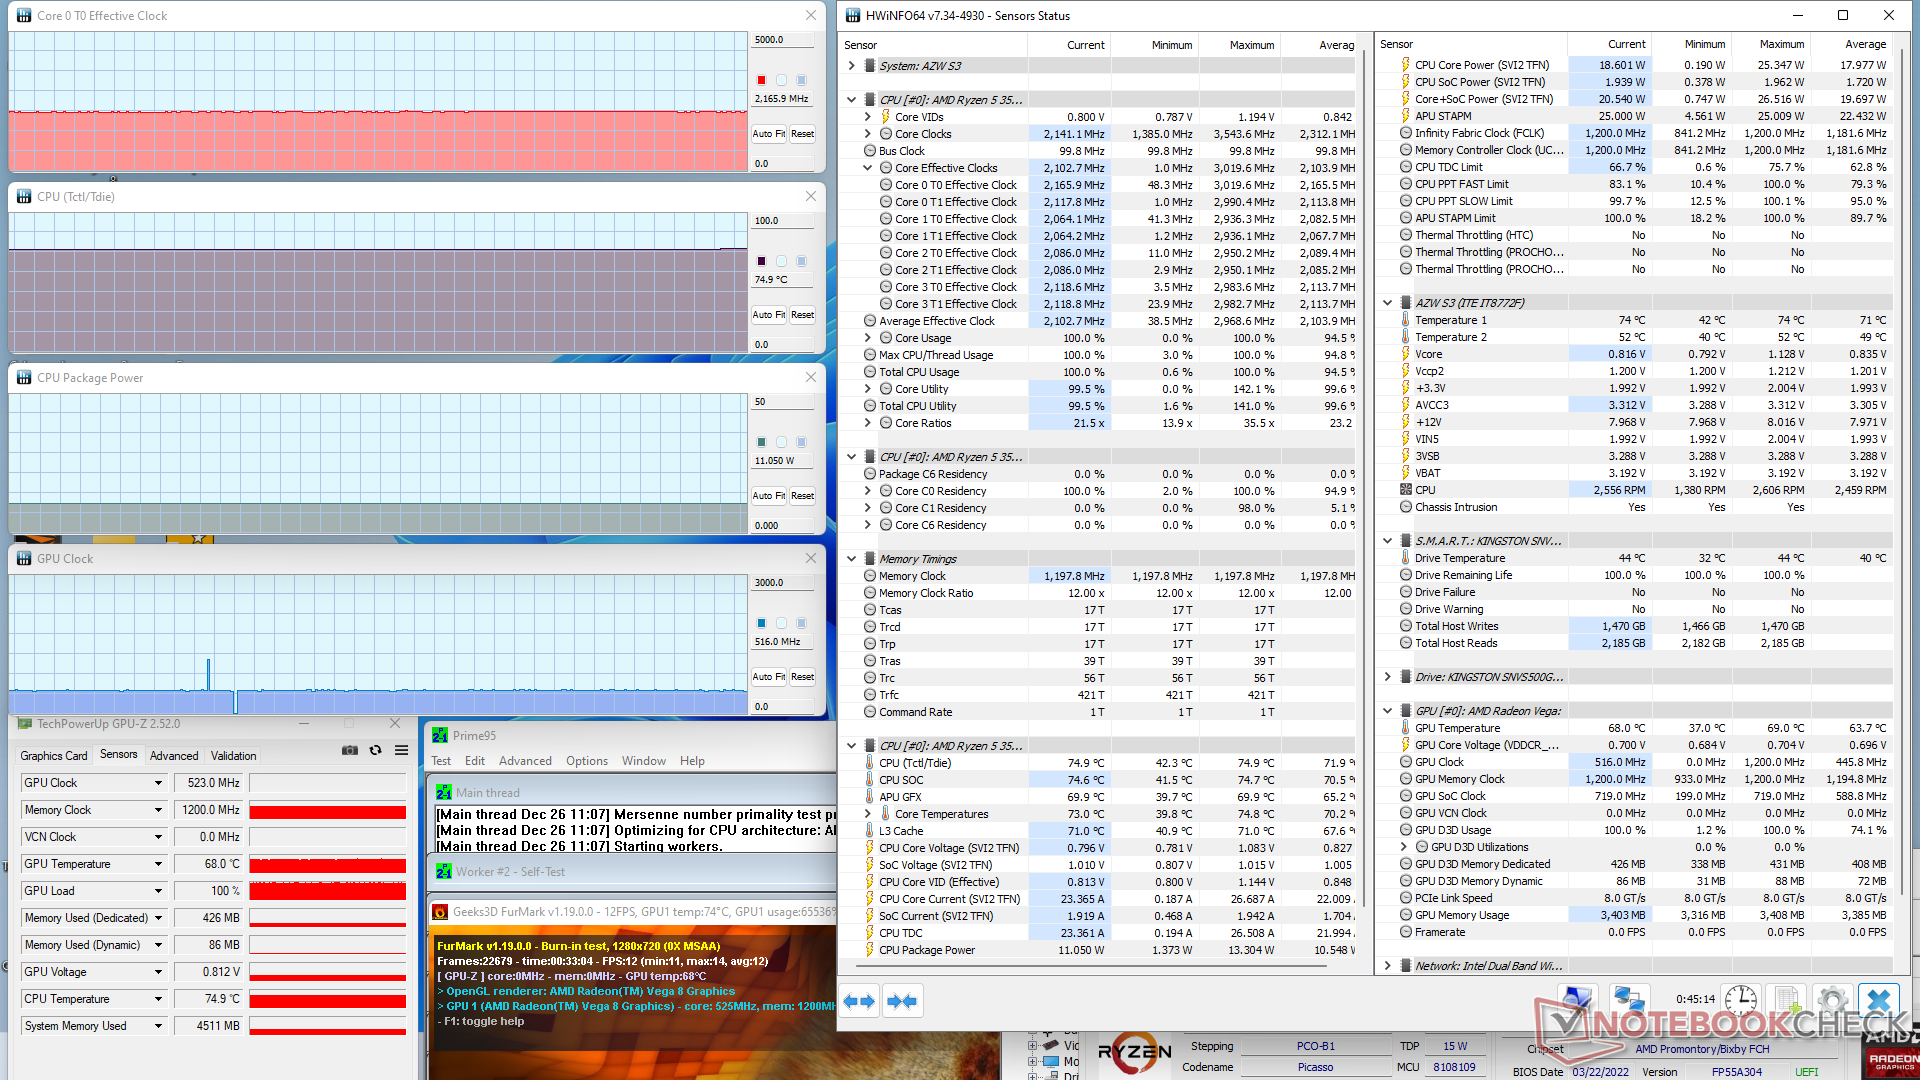
| CPU时钟(GHz) | GPU时钟(MHz) | CPU平均温度(°C) | |
| 系统空闲 | -- | -- | 42 |
| Prime95压力 | 2.7 | -- | 74 |
| Prime95 + FurMark 压力 | 2.2 | 523 | 75 |
| Witcher 3 应力 | 2.0 | 688 | 70 |
能源管理
消耗功率

空转功耗相对较高,高达22W,而英特尔NUC11或Beelink SEi12等搭载U系列的迷你电脑的功耗只有一半,考虑到S3搭载的是旧的H系列处理器,这并不意外。尽管集成的Radeon Vega 8的图形性能较慢,但在运行更高的负载(如游戏)时,情况会发生逆转。鉴于Zen+系列已经有几年的历史,总体上每瓦特的微薄性能并不令人惊讶。
| Off / Standby | |
| Idle | |
| Load |
|
Key:
min: | |
| Trigkey S3 R5 3550H, Vega 8, Kingston NV1 SNVS/500GCN, , x, | GMK NucBox 2 i5-8259U, Iris Plus Graphics 655, Netac S930E8/256GPN, , x, | Intel NUC11TNKi5 i5-1135G7, Iris Xe G7 80EUs, Transcend M.2 SSD 430S TS512GMTS430S, , x, | Beelink SEi12 Core i5-1235U i5-1235U, Iris Xe G7 80EUs, Kingston NV1 SNVS/500GCN, , x, | Beelink SEi11 Pro i5-11320H, Iris Xe G7 96EUs, Kingston NV1 SNVS/500GCN, , x, | Beelink SER Pro Ryzen 5 5600H R5 5600H, Vega 7, Kingston NV1 SNVS/500GCN, , x, | |
|---|---|---|---|---|---|---|
| Power Consumption | 32% | 2% | -35% | 3% | 21% | |
| Idle Minimum * (Watt) | 11.3 | 6.1 46% | 11.5 -2% | 15.8 -40% | 9.8 13% | 5.4 52% |
| Idle Average * (Watt) | 21.8 | 6.8 69% | 12.4 43% | 16.8 23% | 10.3 53% | 8.2 62% |
| Idle Maximum * (Watt) | 22.2 | 7.3 67% | 12.9 42% | 17 23% | 10.5 53% | 8.3 63% |
| Load Average * (Watt) | 39.7 | 46.3 -17% | 40.7 -3% | 54.4 -37% | 54.2 -37% | 49.3 -24% |
| Witcher 3 ultra * (Watt) | 37.5 | 43.9 -17% | 50.7 -35% | 53.1 -42% | 46.1 -23% | |
| Load Maximum * (Watt) | 48.9 | 50.7 -4% | 73.5 -50% | 119.1 -144% | 59 -21% | 50.2 -3% |
* ... smaller is better
Power Consumption Witcher 3 / Stresstest
Power Consumption external Monitor
Pros
Cons
结论 - 比赛扬或Atom替代品更快
当看到300美元以下的迷你电脑时,通常会选择 Intel Celeron或 原子驱动的因为这类处理器比通常的酷睿处理器更慢、更便宜。对于大多数基本的HTPC来说,快速的CPU并不是真正必要的,但是赛扬和Atom的CPU对于最小的多任务处理工作来说也是出了名的太慢。这就是Trigkey S3介入的地方,它的Ryzen 5 3550H CPU可以提供额外的性能动力,而不需要提高价格。
Trigkey S3以Atom或Celeron迷你PC的价格提供类似Core i3的性能。
主要的缺点是Ryzen 5 3550H是一个较老的CPU,因此在许多情况下,它需要比最新的U系列选项多一点的功率来运行。即便如此,值得庆幸的是,尽管耗电较高,但风扇的噪音并不响亮。
价格和可用性
Trigkey S3现在正在亚马逊上发货,价格为280美元。
Price comparison

