Beelink GTR6 Ryzen 9 6900HX迷你电脑评论。比大多数英特尔NUC更快

与由U系列处理器驱动的小型Beelink SEi或SER系列不同,GTR系列包括由更快的H系列处理器驱动的型号。GTR6直接继承了旧的GTR5,同时升级了CPU(从Zen 3 Ryzen 9 5900HX到Zen 3+ Ryzen 9 6900HX)和轻微的机箱重新设计。我们下面的基准测试将显示它是Beelink广泛的产品系列中最快的迷你电脑之一。
我们的审查单位是一个完全配置的GTR6,配备32GB内存和512GB NVMe固态硬盘,价格约为750美元。所有选项都配有相同的Ryzen 9 6900HX CPU和集成的Radeon 680M GPU。GTR6与英特尔NUC的集成显卡直接竞争。
更多Beelink评论。
潜在的竞争对手比较
Rating | Date | Model | Weight | Height | Size | Resolution | Price |
|---|---|---|---|---|---|---|---|
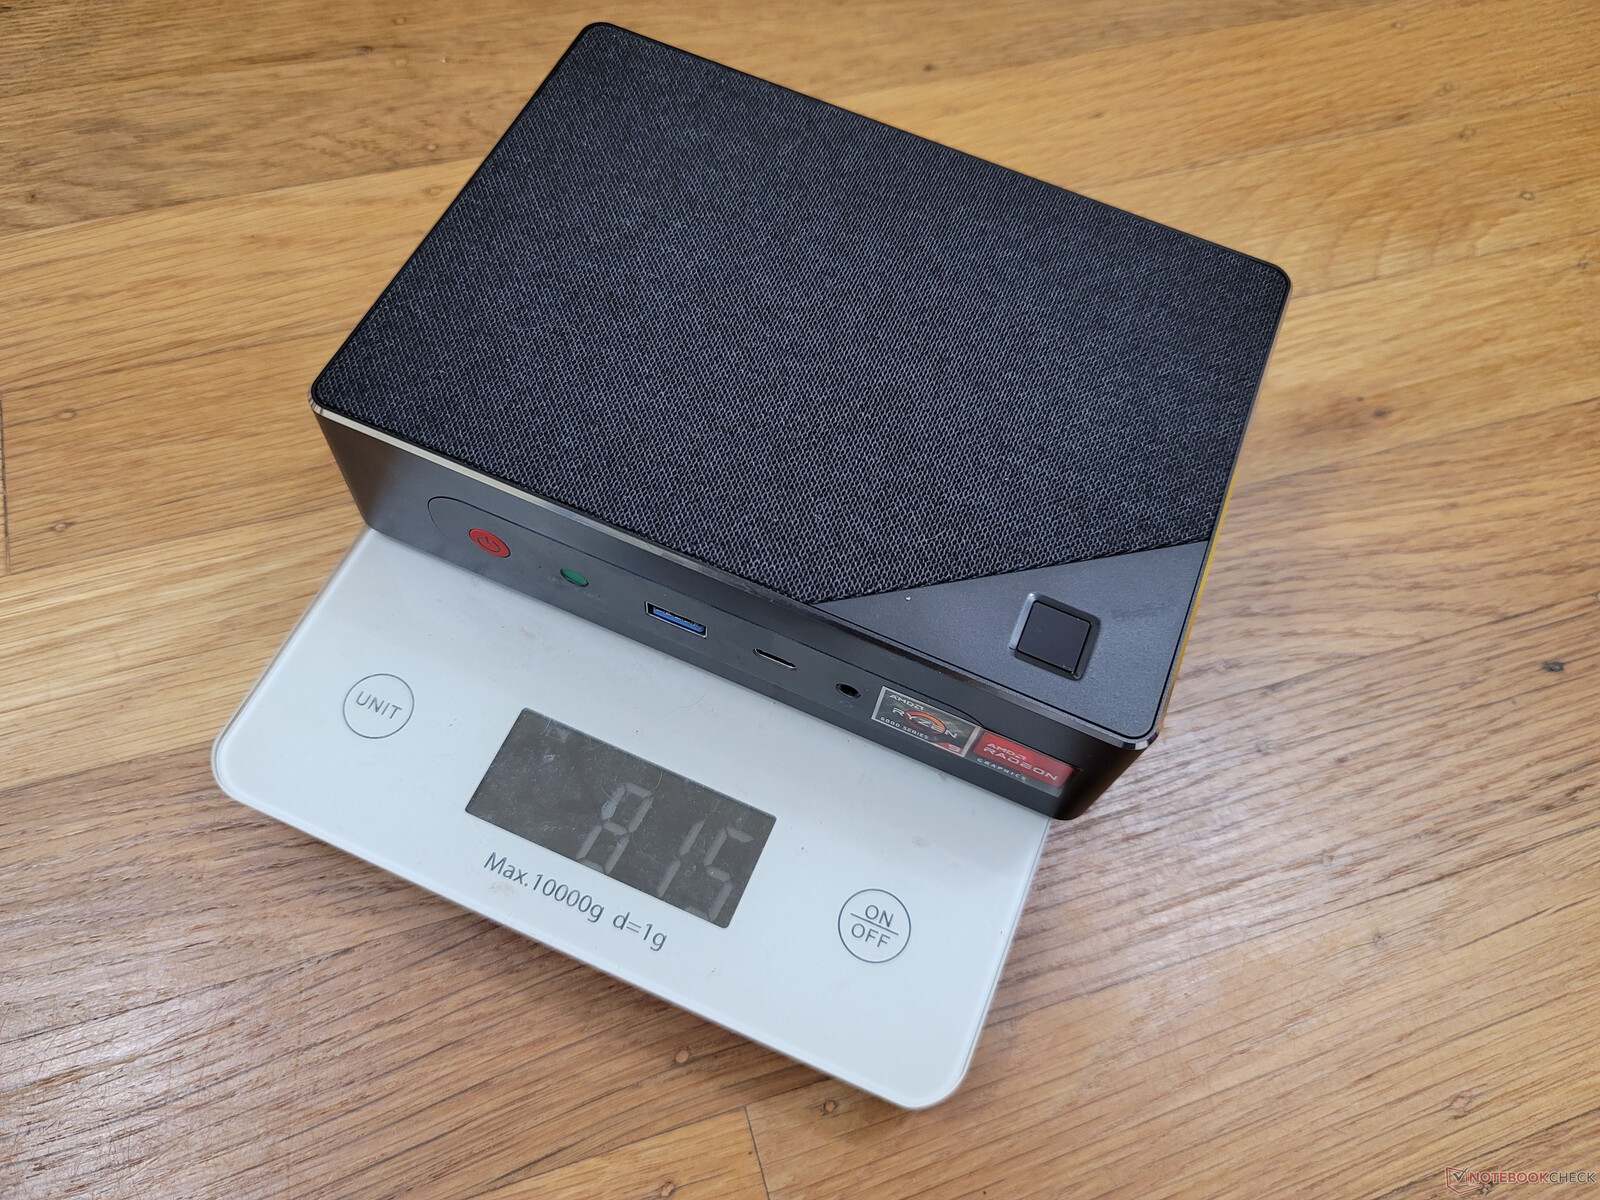
v (old) | 11 / 2022 | Beelink GTR6 R9 6900HX, Radeon 680M | 815 g | 43 mm | x | ||
v (old) | 09 / 2022 | Beelink SEi11 Pro i5-11320H, Iris Xe G7 96EUs | 440 g | 40 mm | x | ||
v (old) | 01 / 2022 | Beelink GTR5 R9 5900HX, Vega 8 | 686 g | 39 mm | x | ||
v (old) | Intel NUC11PHKi7C i7-1165G7, GeForce RTX 2060 Mobile | 1.4 kg | 42 mm | x | |||
v (old) | Intel NUC11TNKi5 i5-1135G7, Iris Xe G7 80EUs | 504 g | 37 mm | x | |||
v (old) | GMK NucBox 2 i5-8259U, Iris Plus Graphics 655 | 430 g | 50 mm | x |
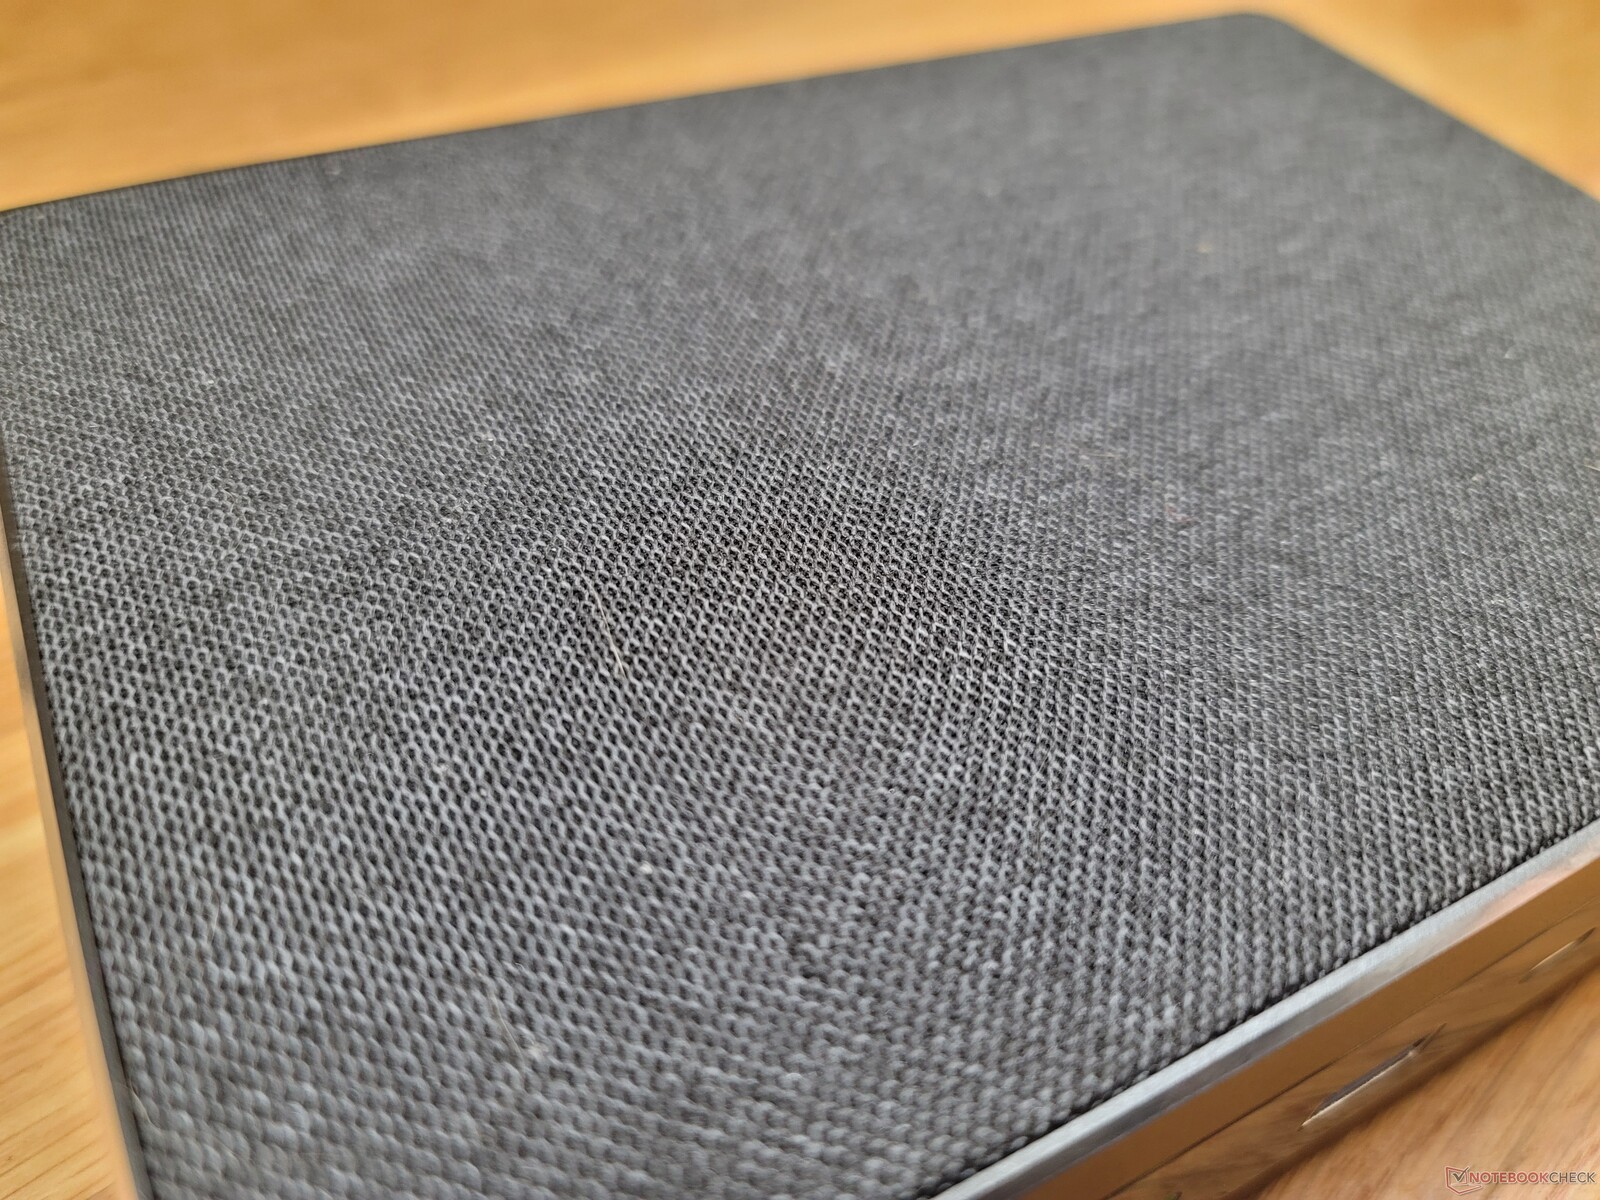
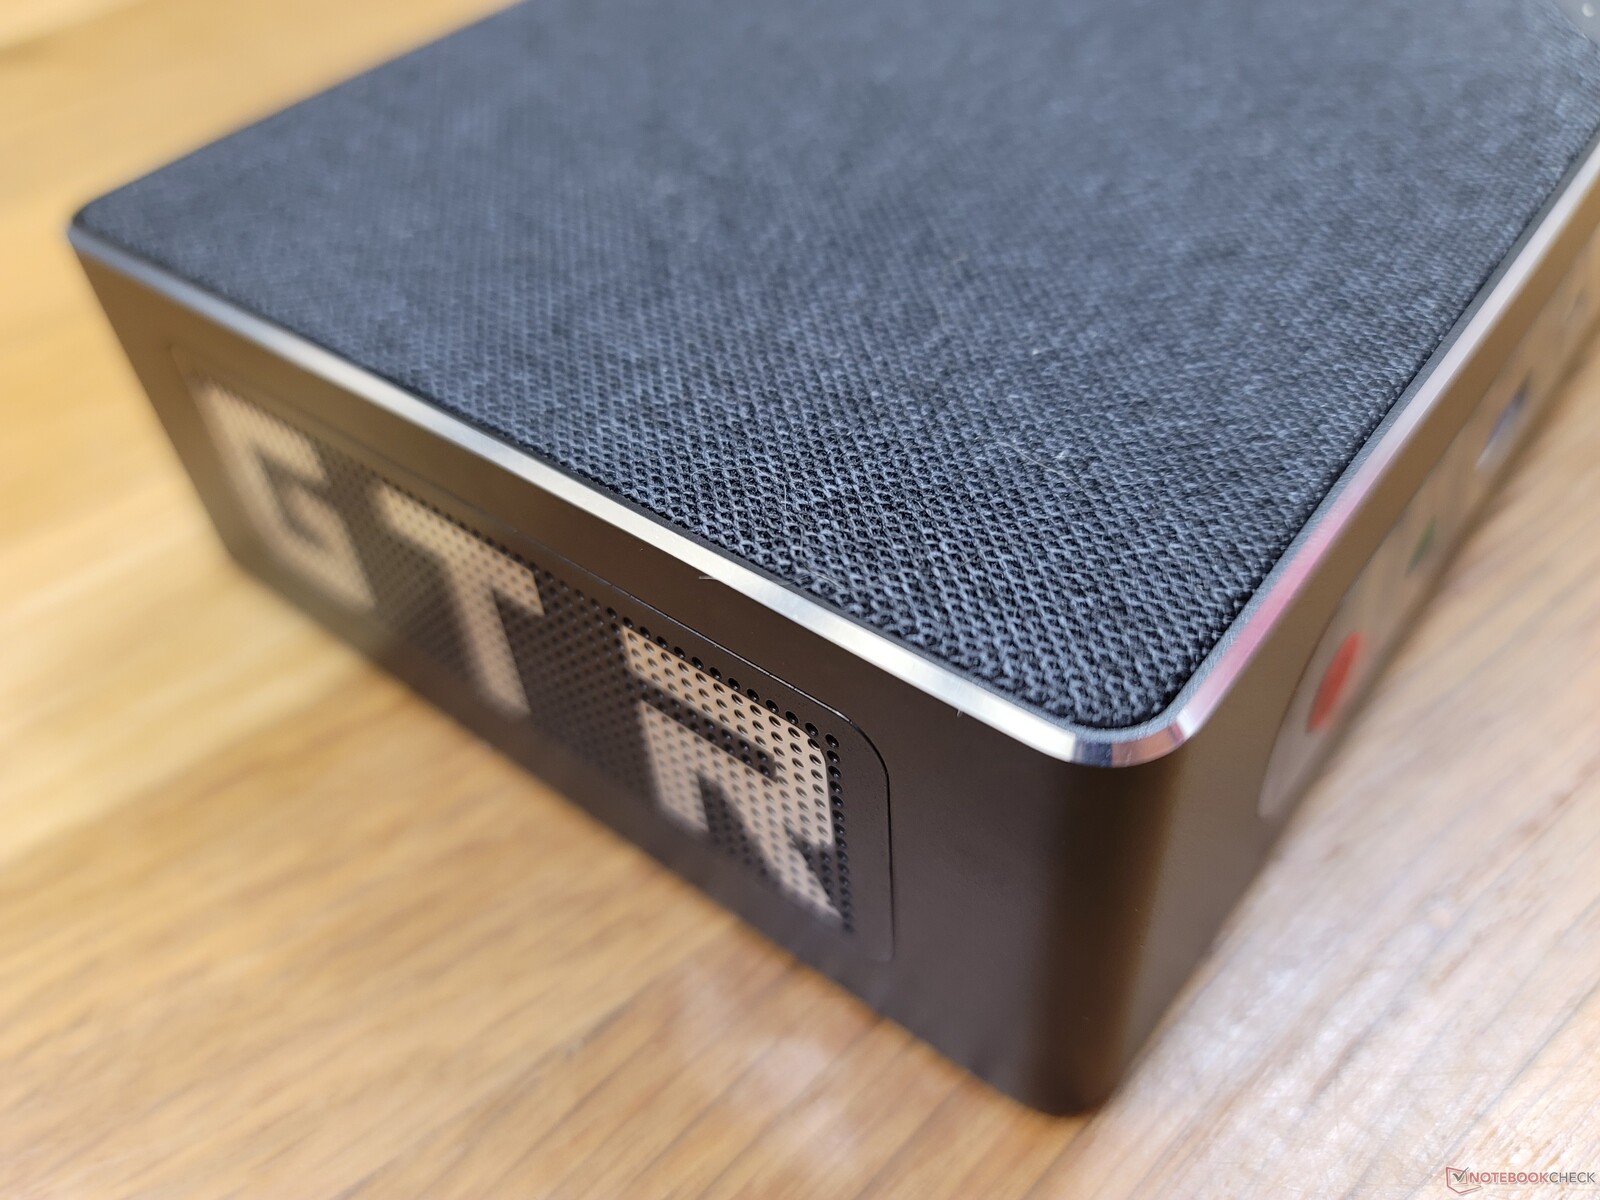
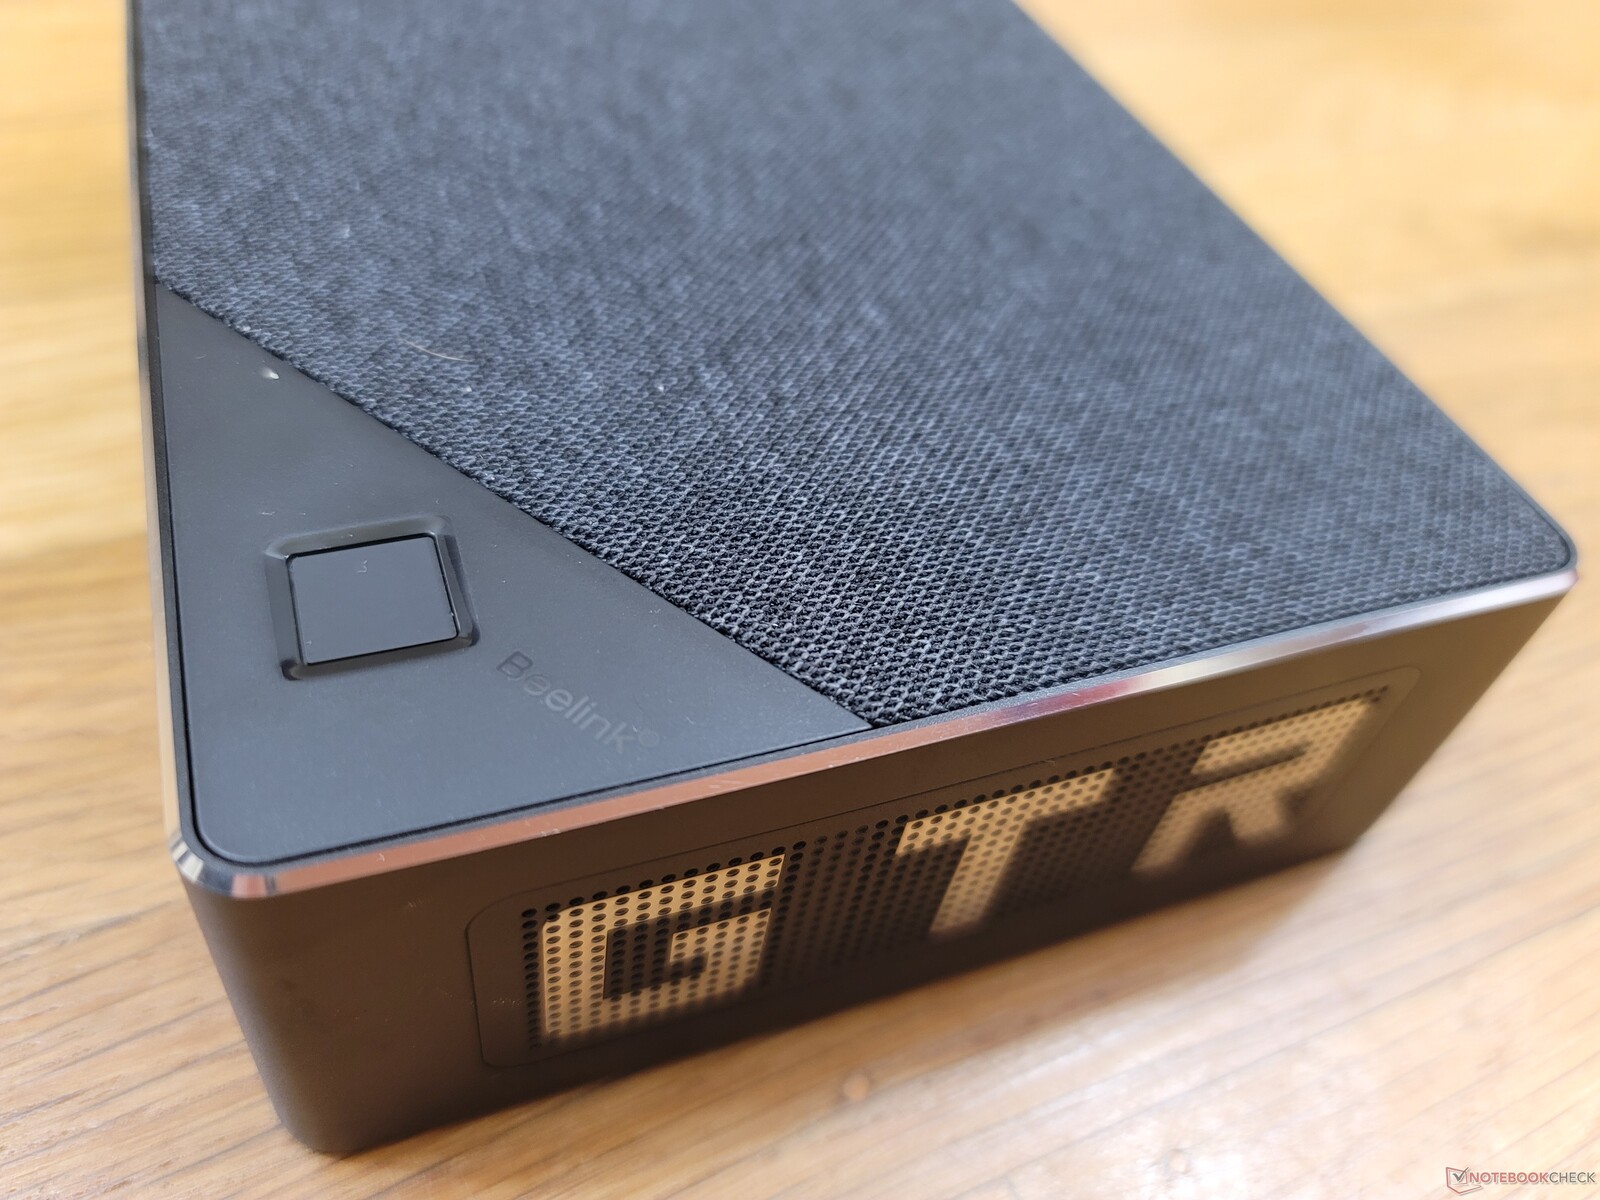
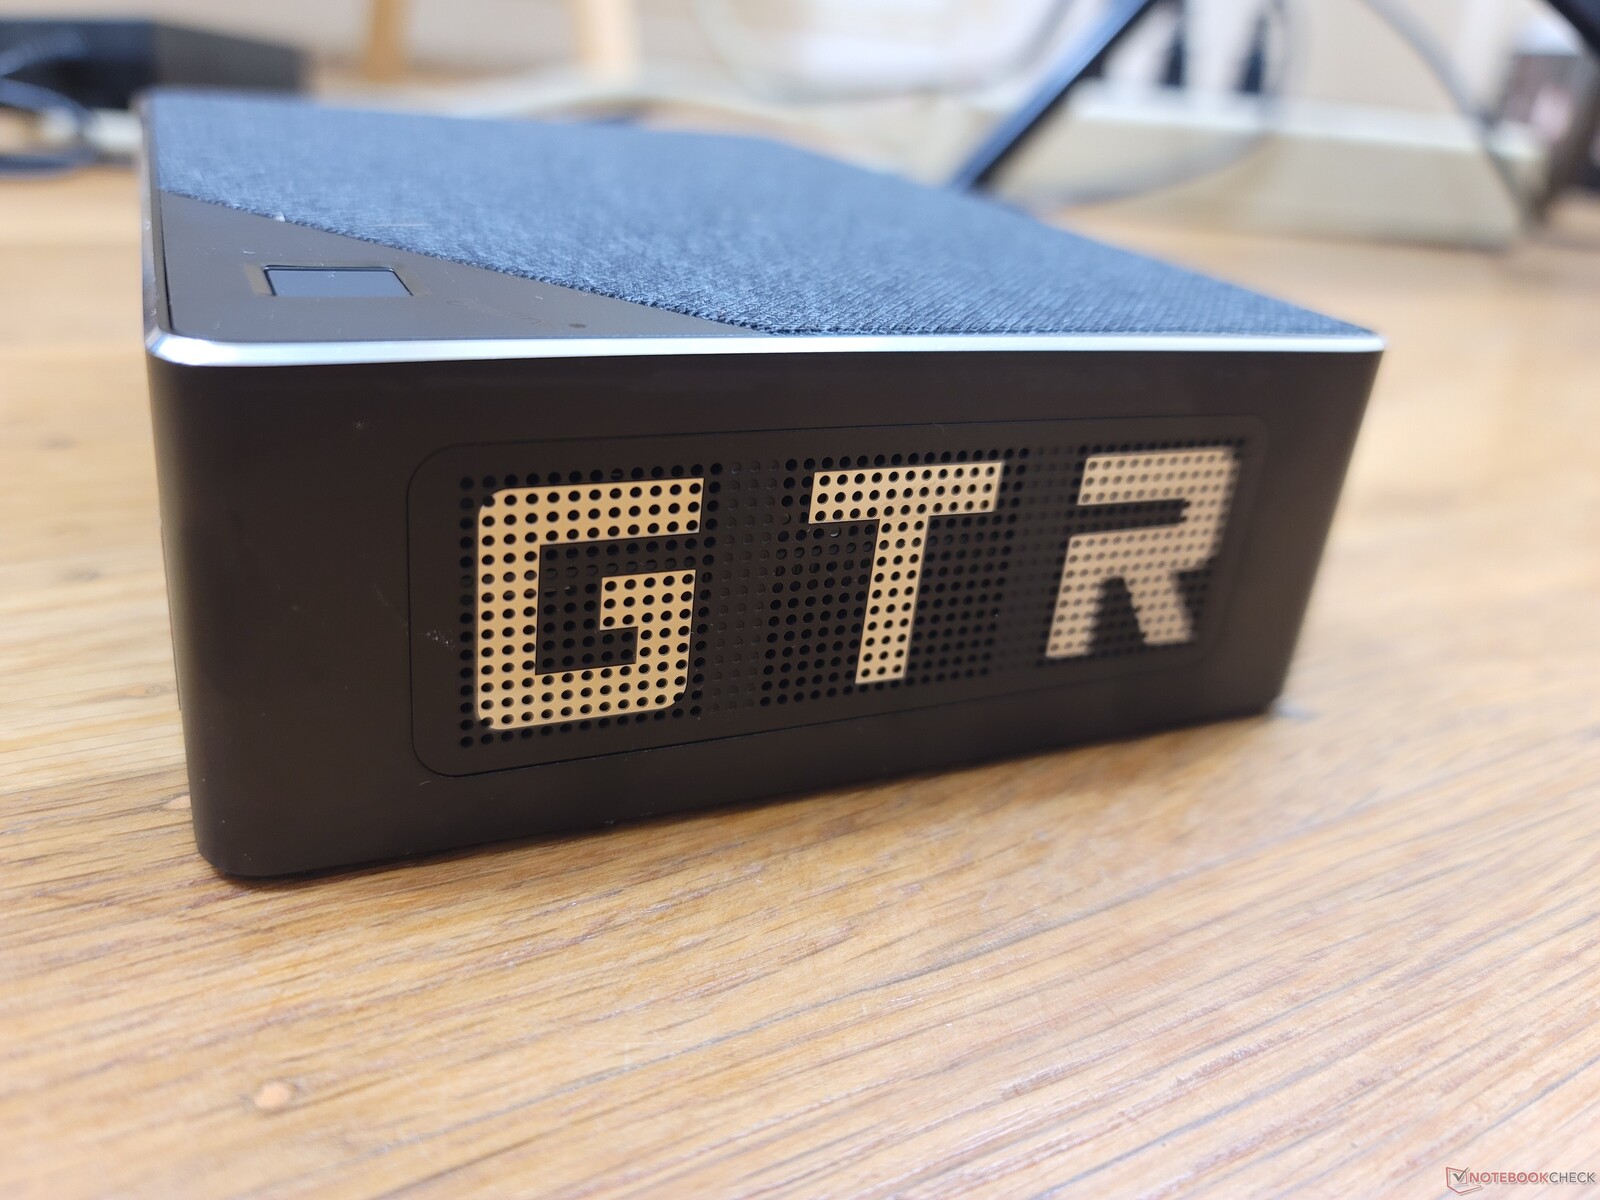
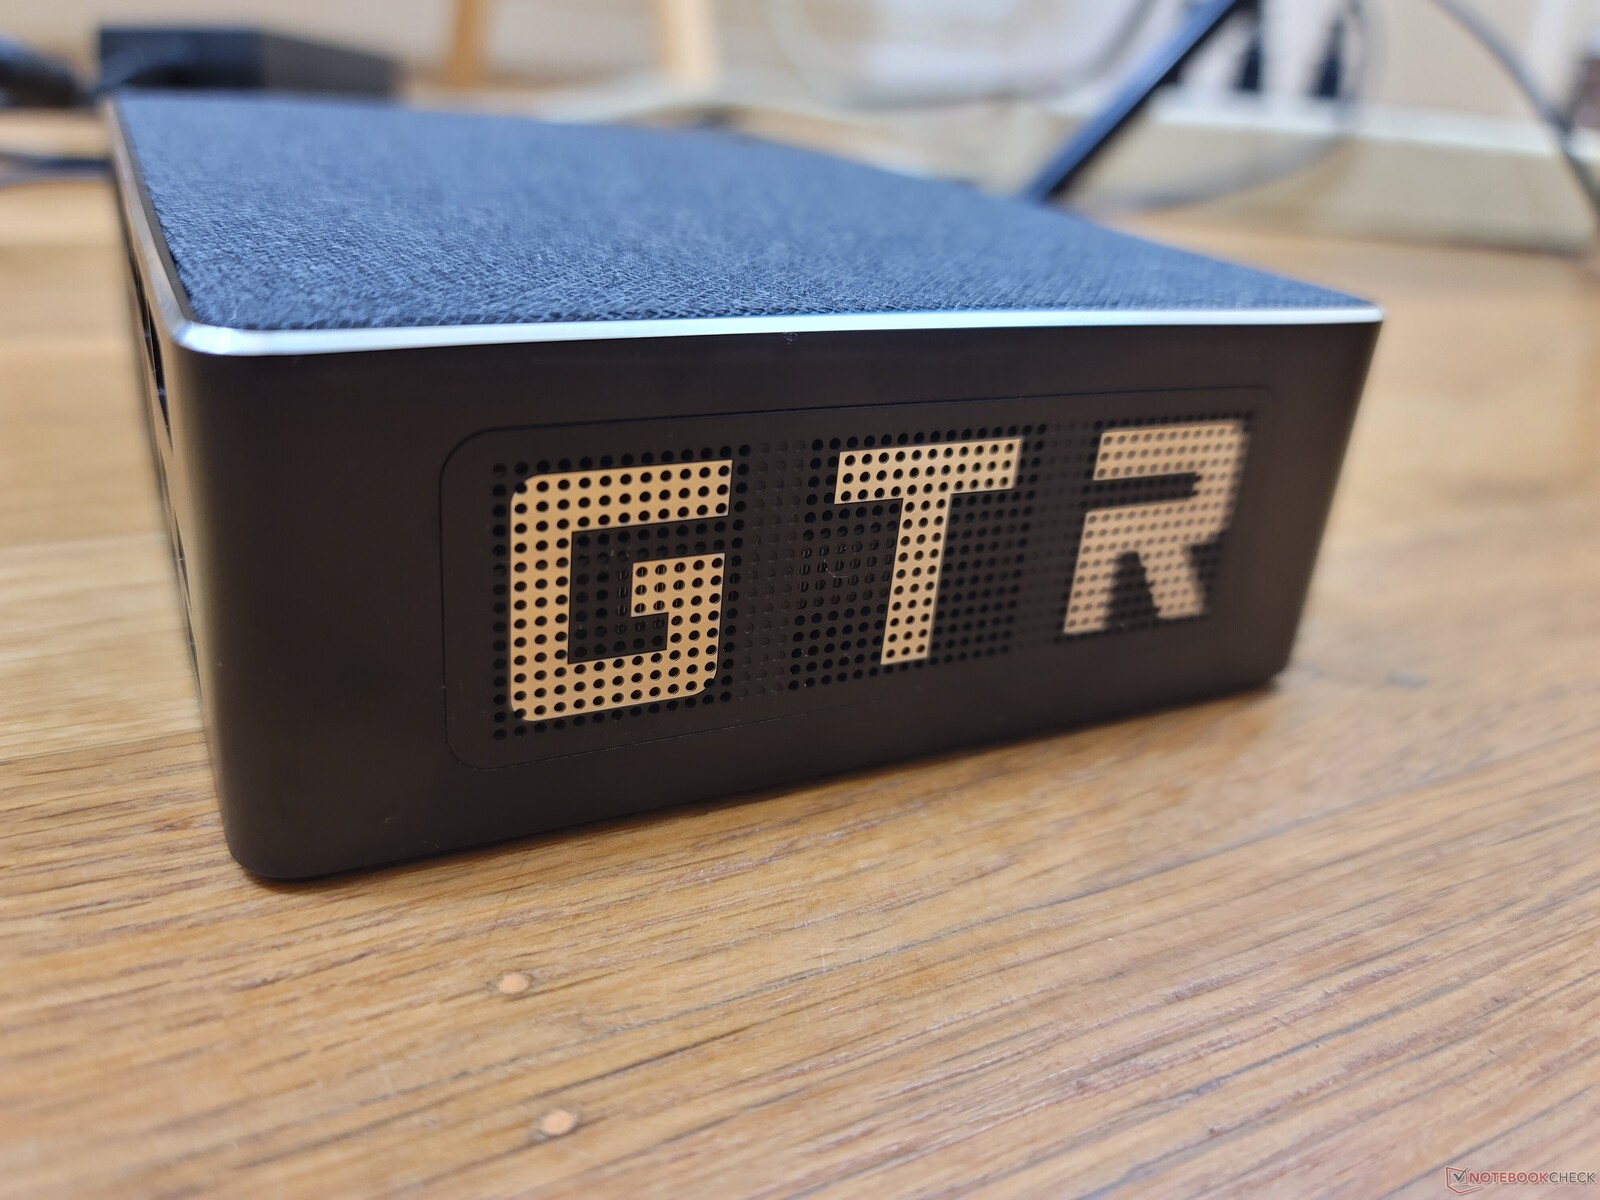
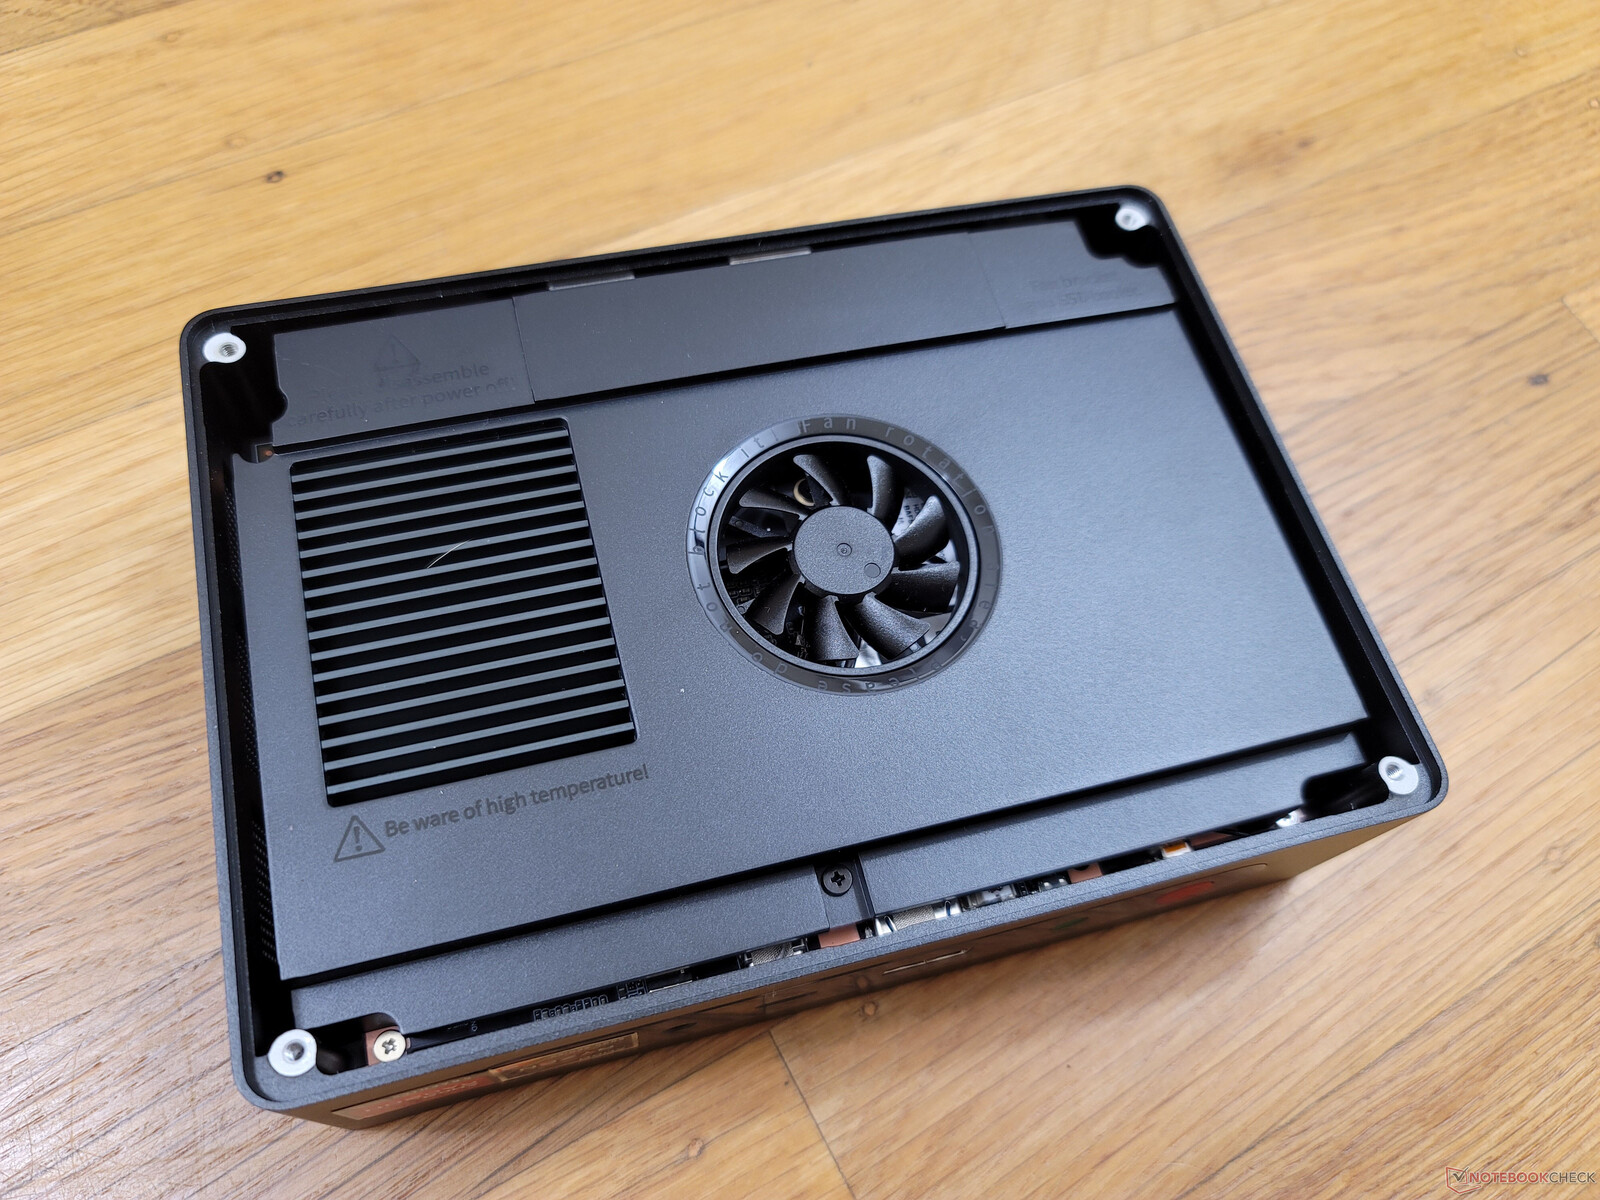
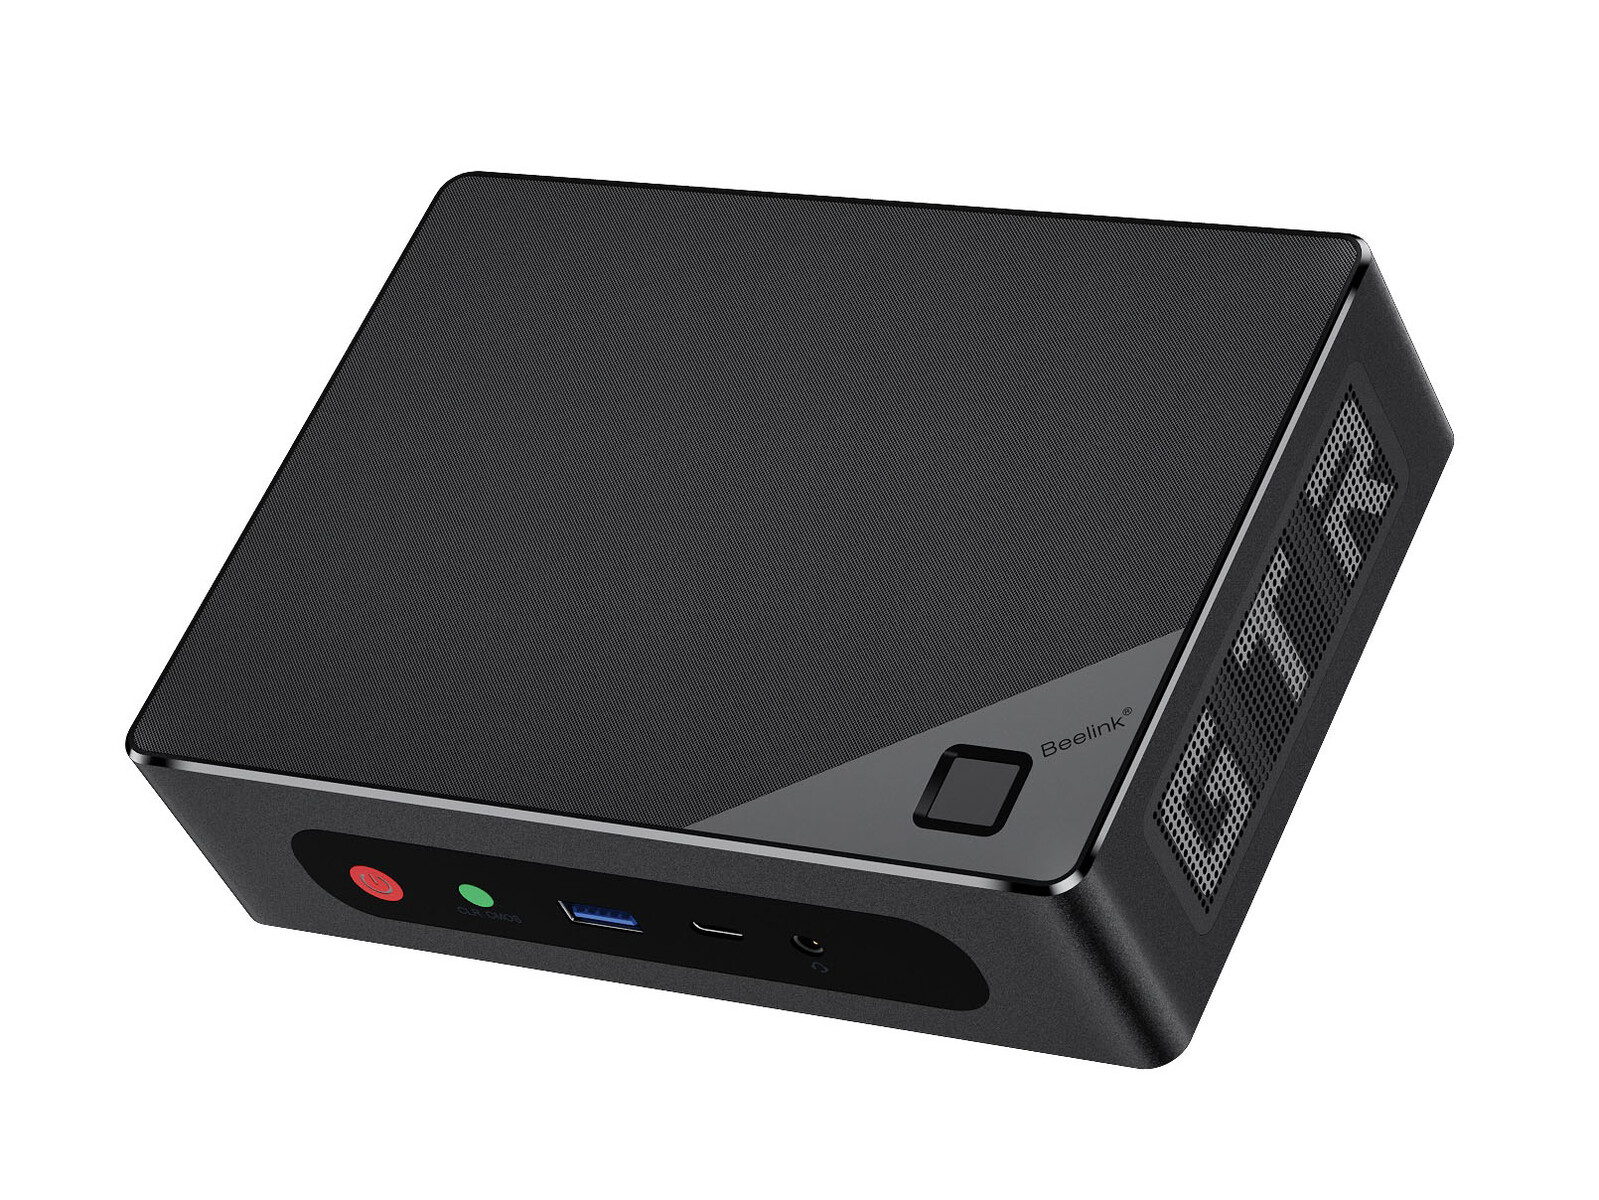
箱子 - 新的软网顶
这款机箱的金属侧面和顶部的透气软网让人感觉很坚固。特别是后者是Beelink的首创,因为该公司以前的迷你电脑都是以塑料或金属为顶层。可拆卸的网罩为整体设计增加了质量或奢华的元素。
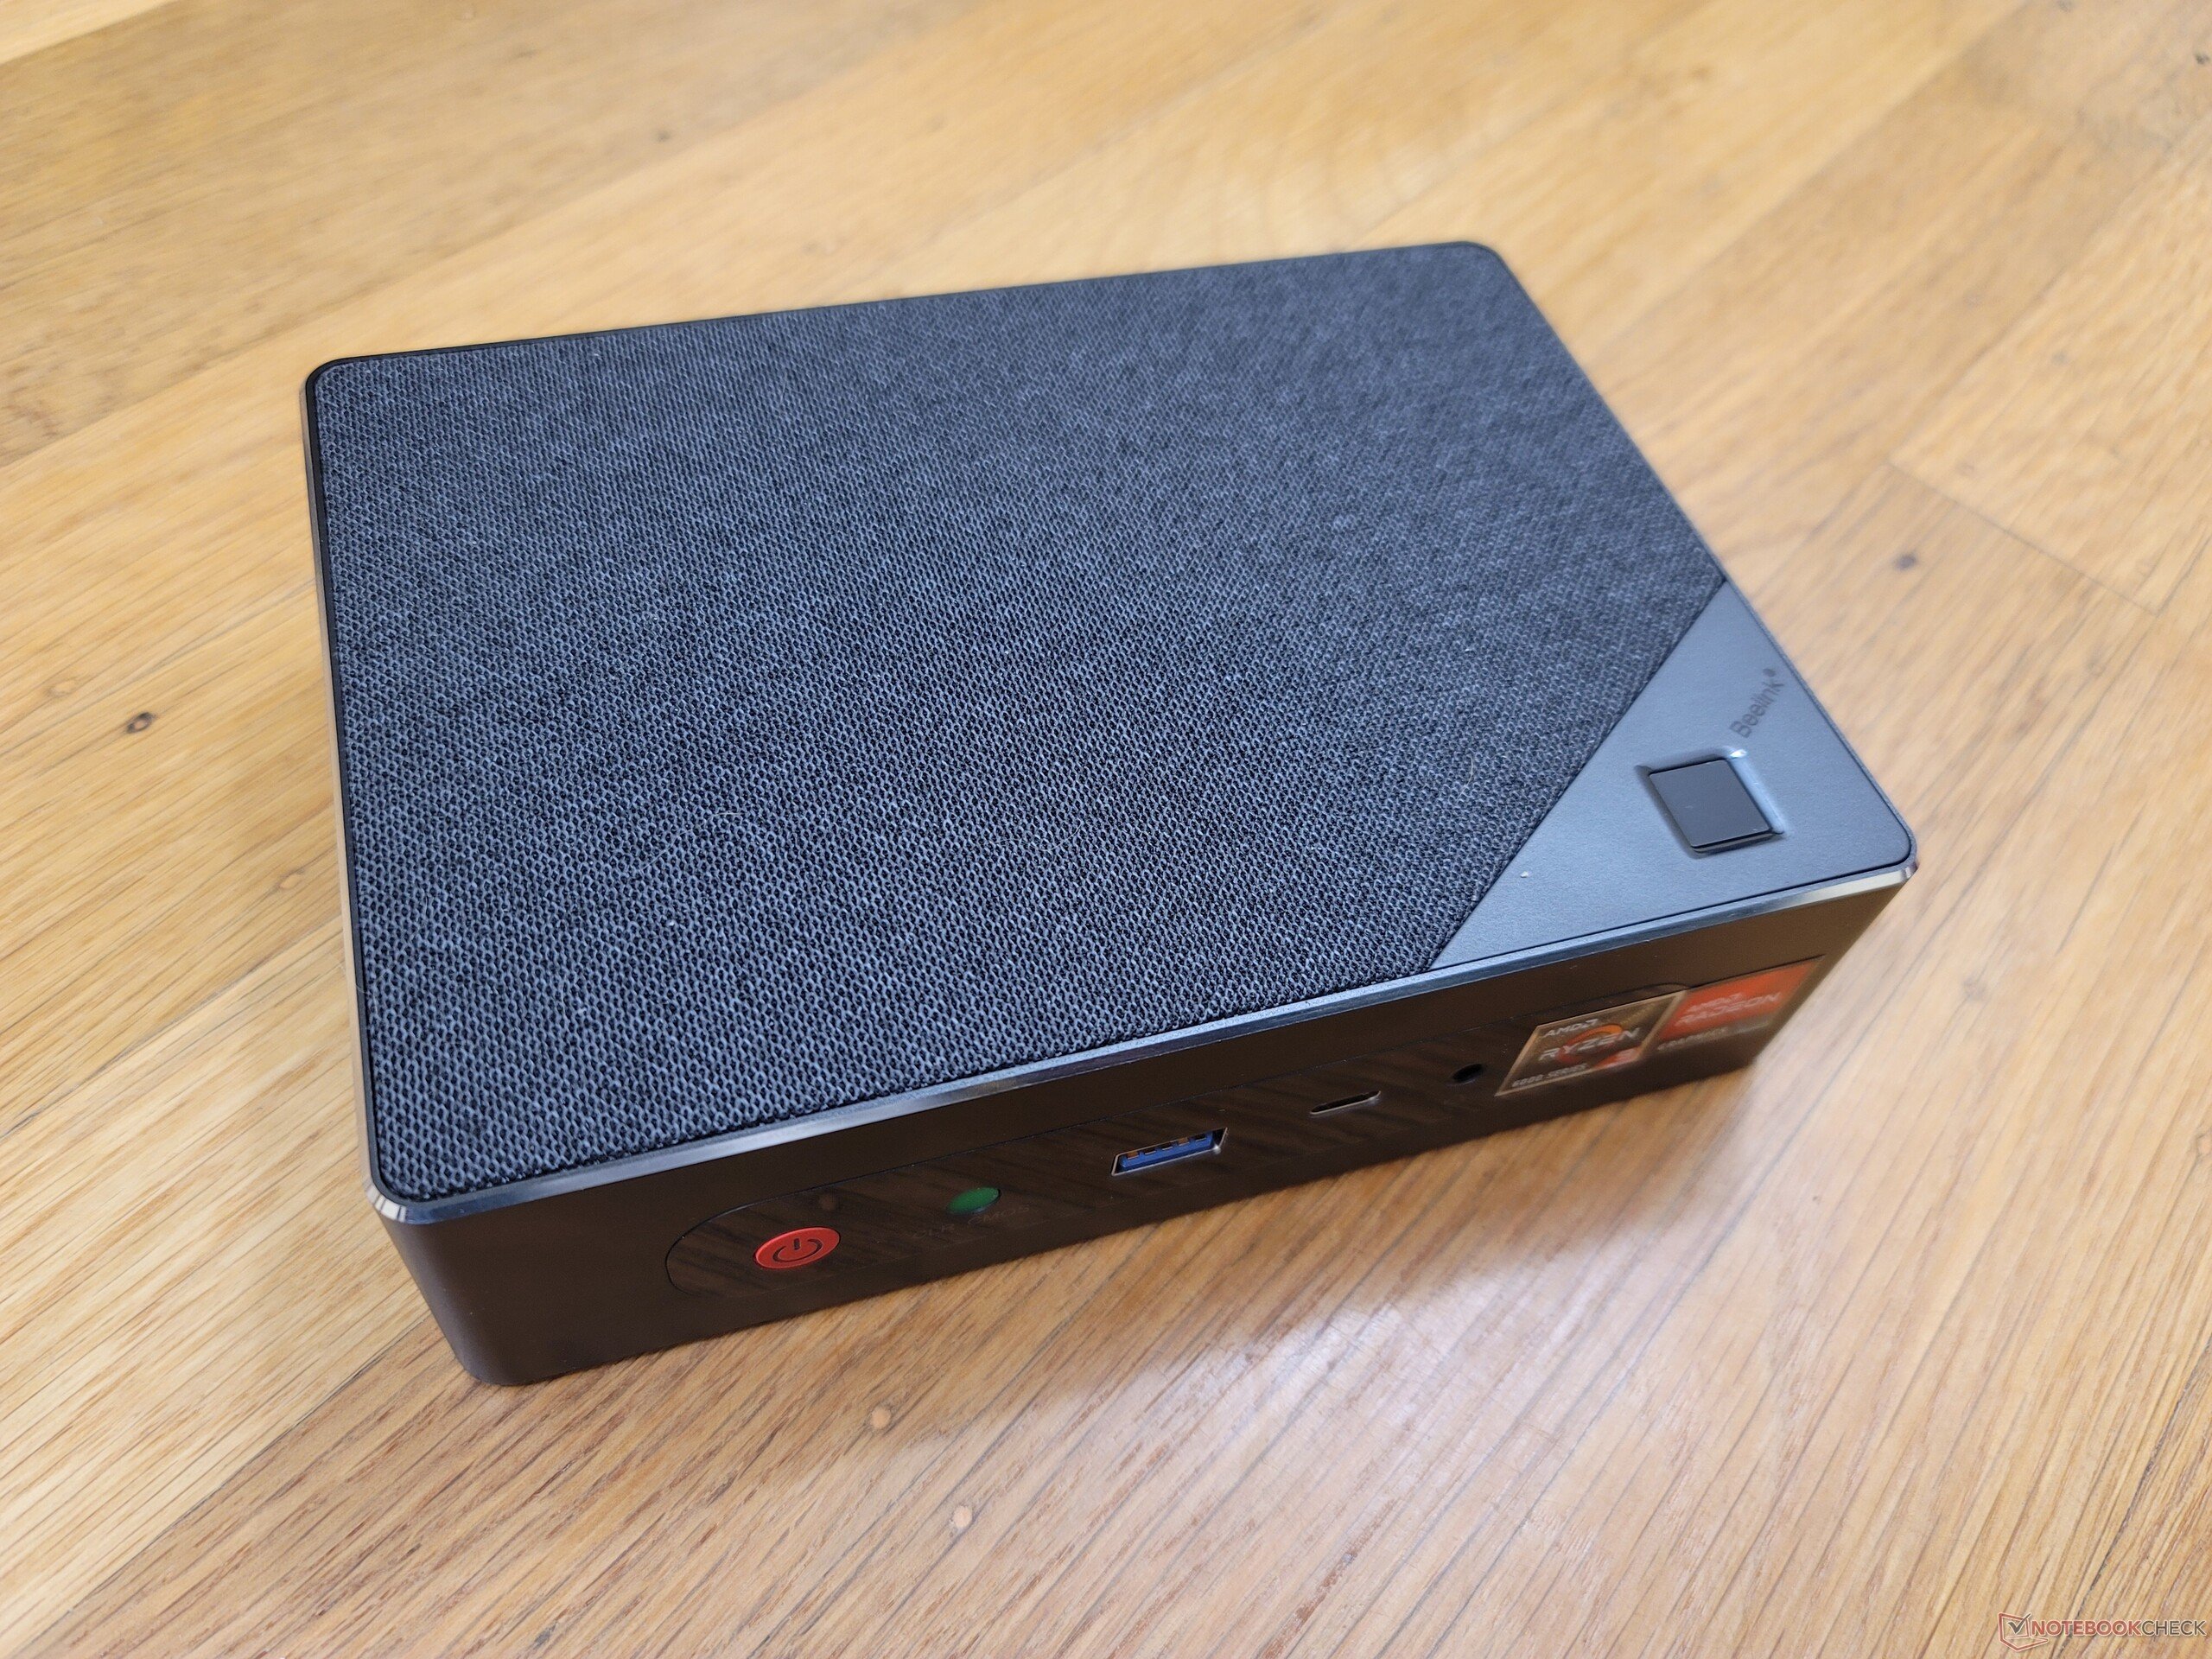
GTR6比GTR5和大多数英特尔NUC型号更厚、更重。较大的尺寸部分是由于与英特尔酷睿U系列相比,AMD HX处理器的要求更高。
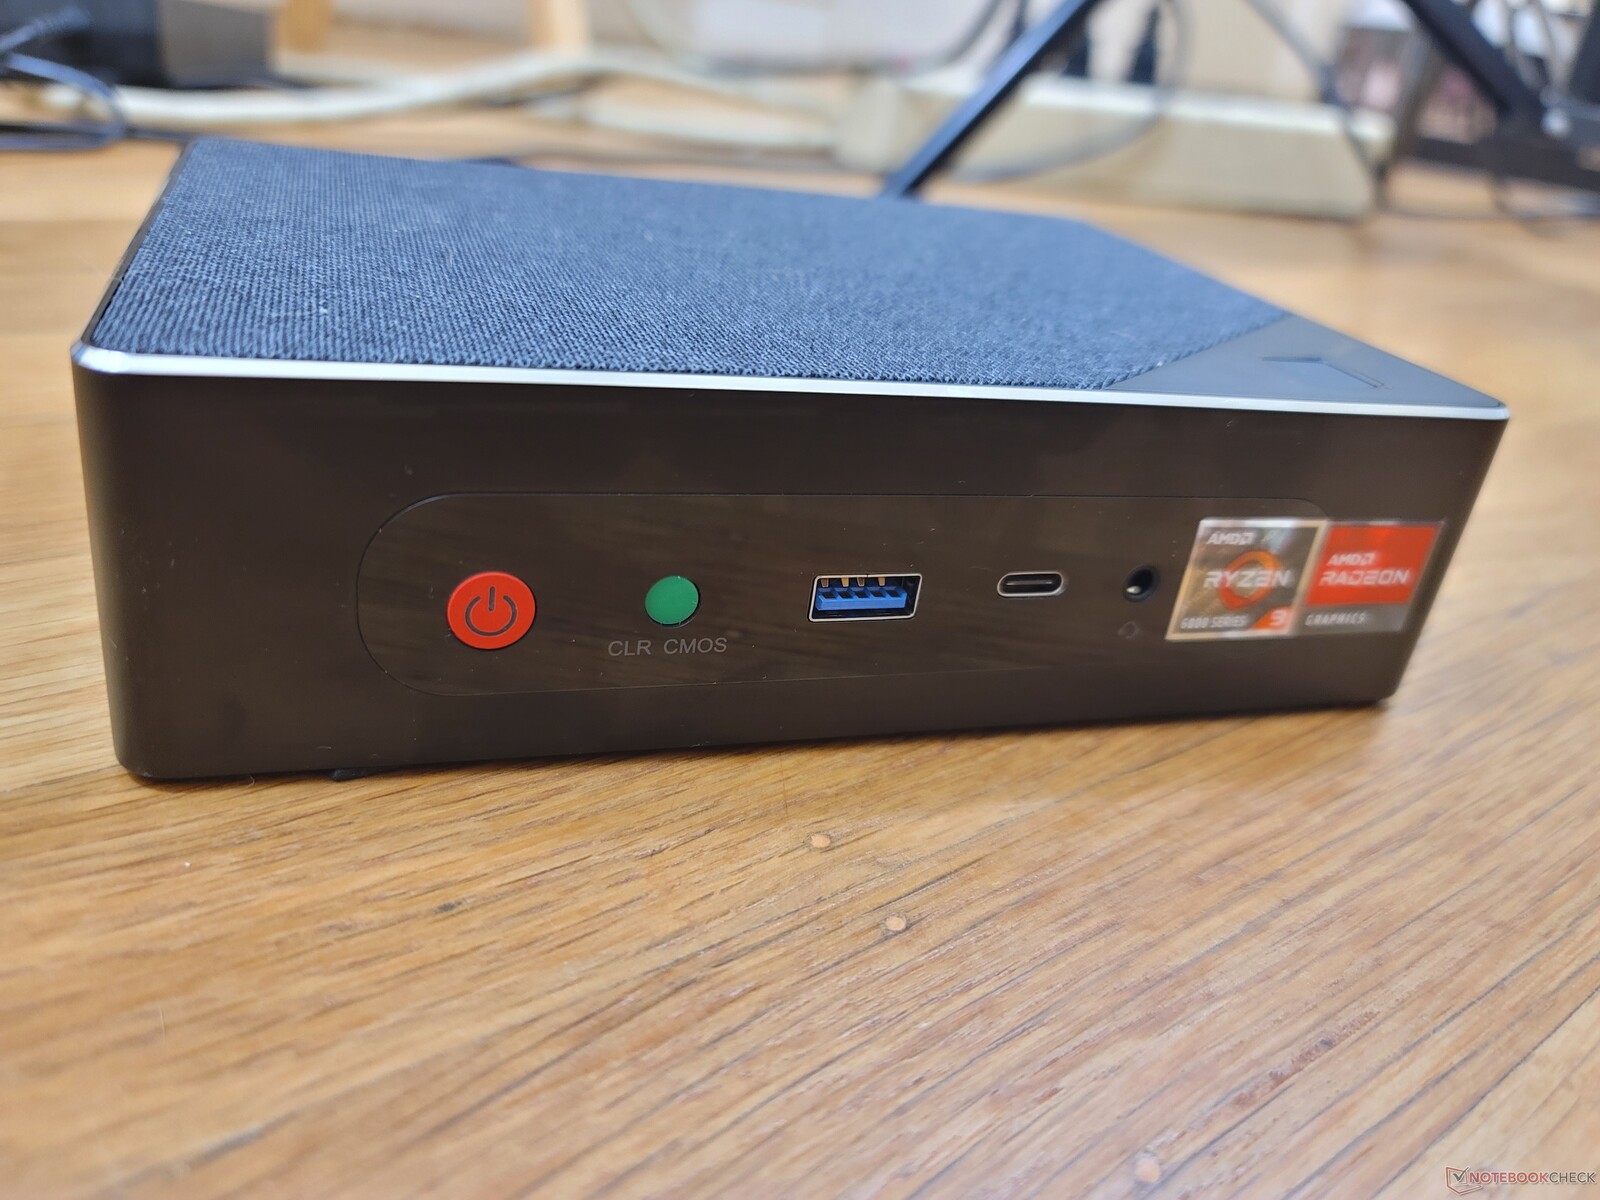
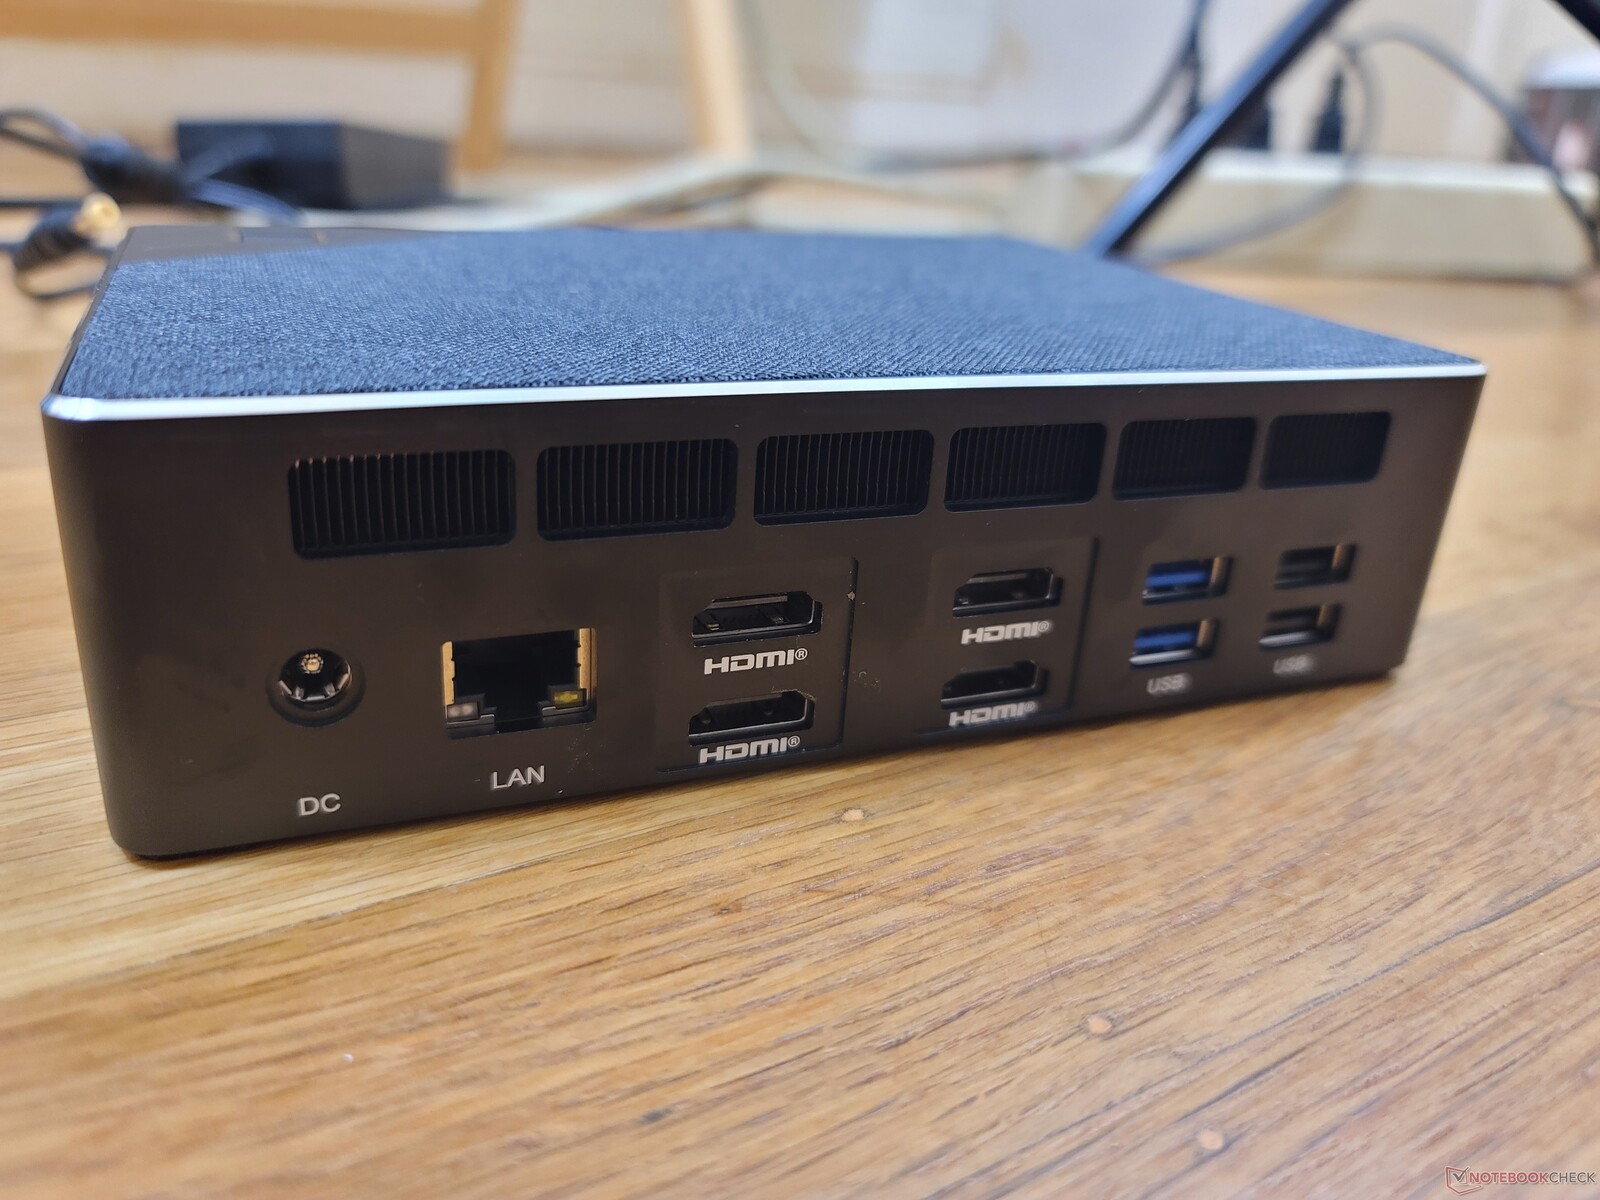
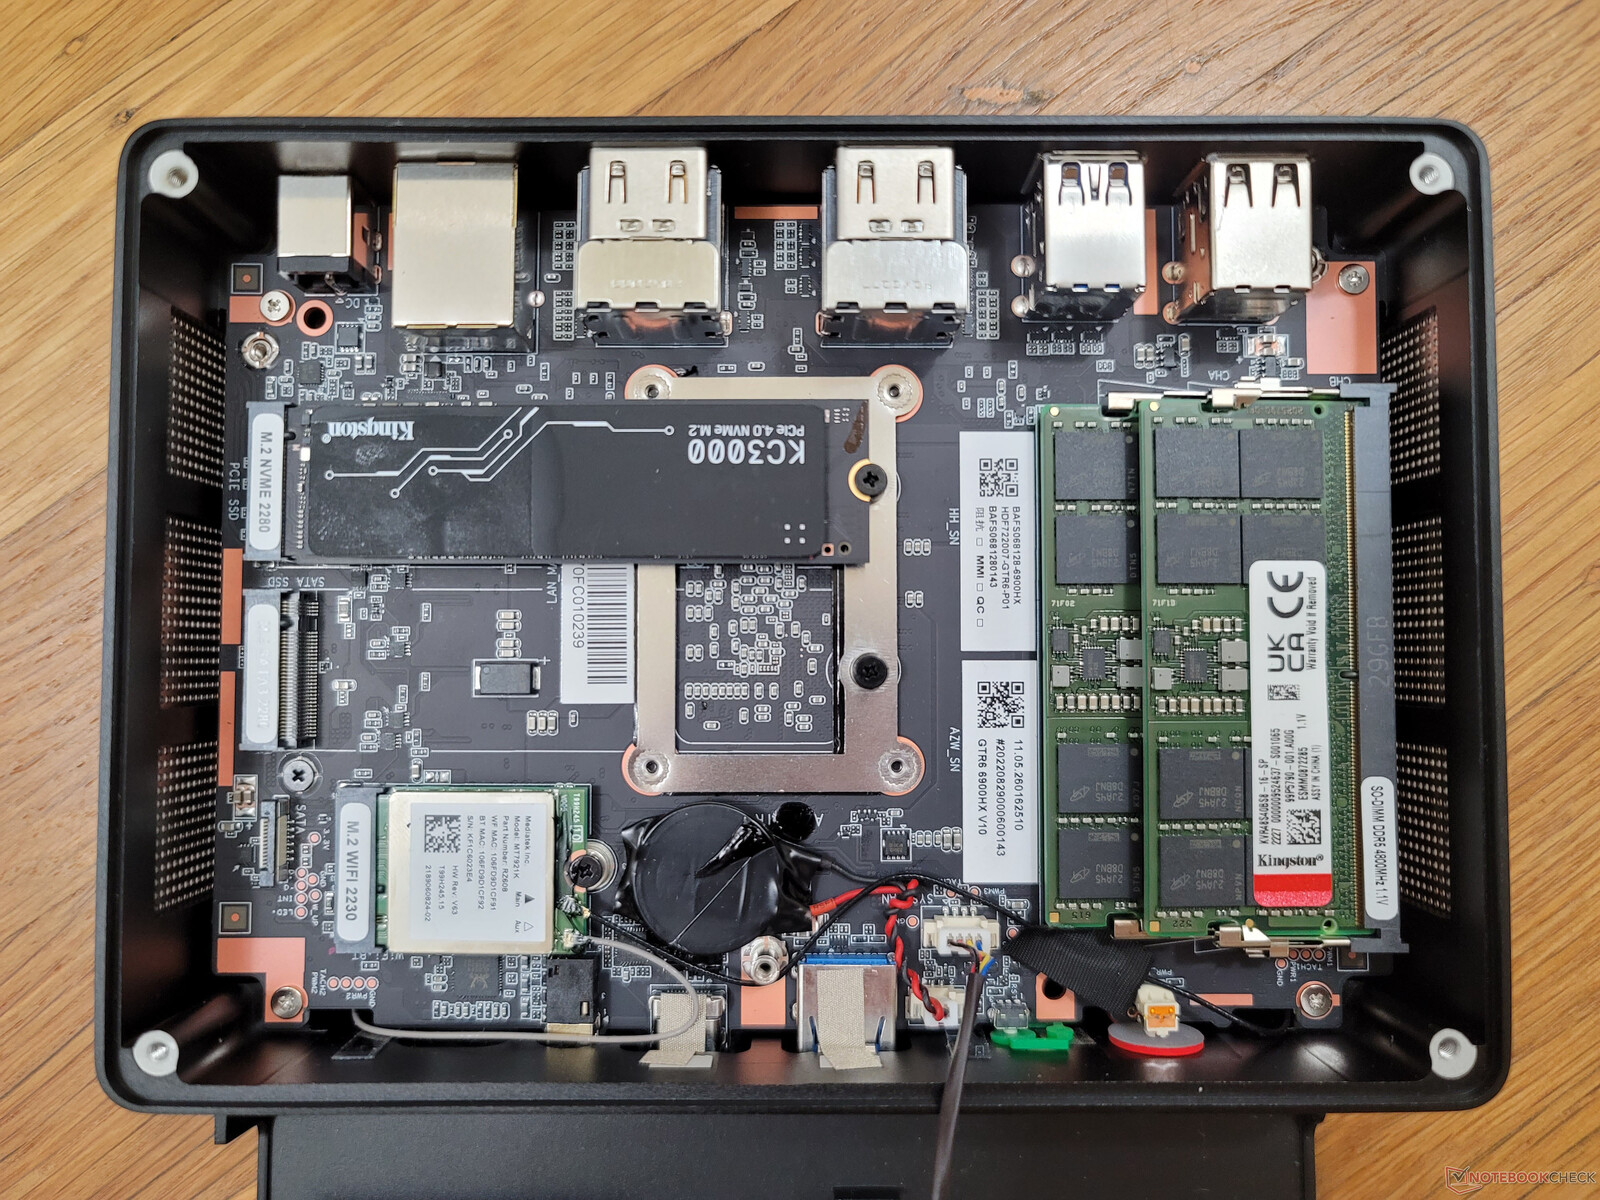
连接性 - 没有Thunderbolt
端口选项非常好,有四个独立的HDMI 2.1端口,支持高达8K显示器,频率为60 Hz。然而,只有一个USB-C端口,LAN端口只有1 Gbps,而现在许多NUC型号支持10 Gbps。
由于采用了AMD CPU,所以不支持Thunderbolt。
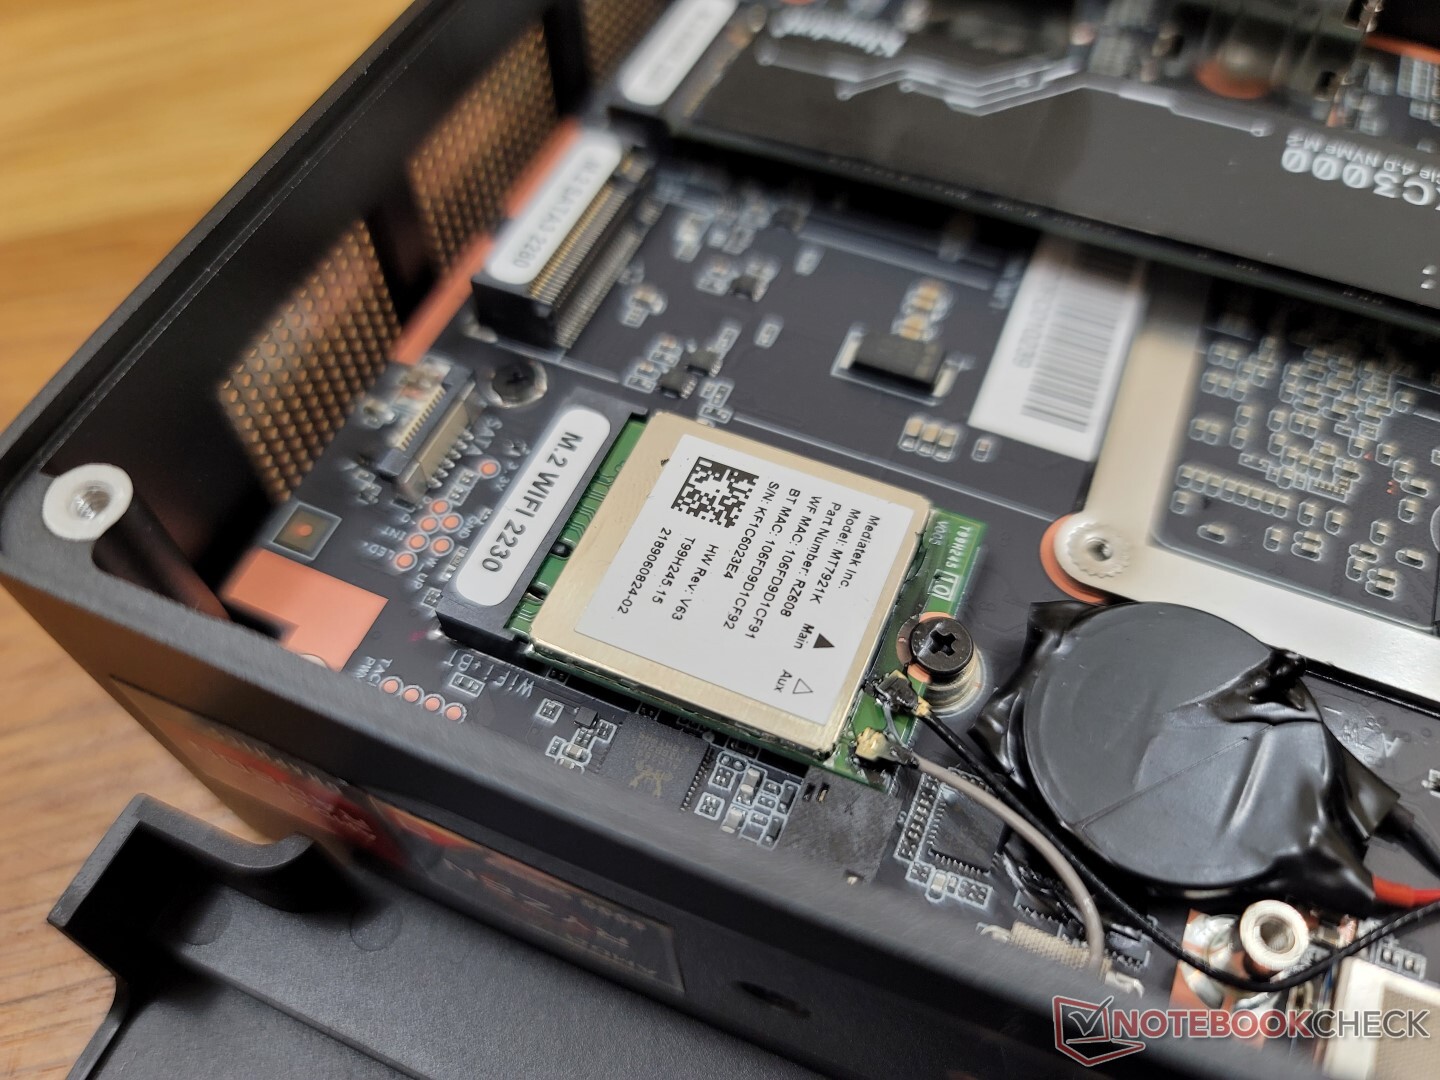
通信 - Wi-Fi 6E标准
联发科RZ608是Wi-Fi 6E和蓝牙5.2连接的标准配置。传输速率很稳定,尽管比大多数英特尔AX201/210解决方案要慢。
我们的测试设备上的RZ608检测我们的6GHz AXE11000网络的速度很慢,即使在写作时更新到最新的驱动程序。你可能需要等待几分钟,系统才能检测并连接到你的6GHz网络。
| Networking | |
| iperf3 transmit AX12 | |
| Intel NUC11TNKi5 | |
| Intel NUC11PHKi7C | |
| Beelink GTR5 | |
| GMK NucBox 2 | |
| iperf3 receive AX12 | |
| Intel NUC11TNKi5 | |
| Intel NUC11PHKi7C | |
| Beelink GTR5 | |
| GMK NucBox 2 | |
| iperf3 receive AXE11000 6GHz | |
| Beelink GTR6 | |
| Beelink SEi11 Pro | |
| iperf3 receive AXE11000 | |
| Beelink GTR6 | |
| iperf3 transmit AXE11000 | |
| Beelink GTR6 | |
| iperf3 transmit AXE11000 6GHz | |
| Beelink GTR6 | |
| Beelink SEi11 Pro | |
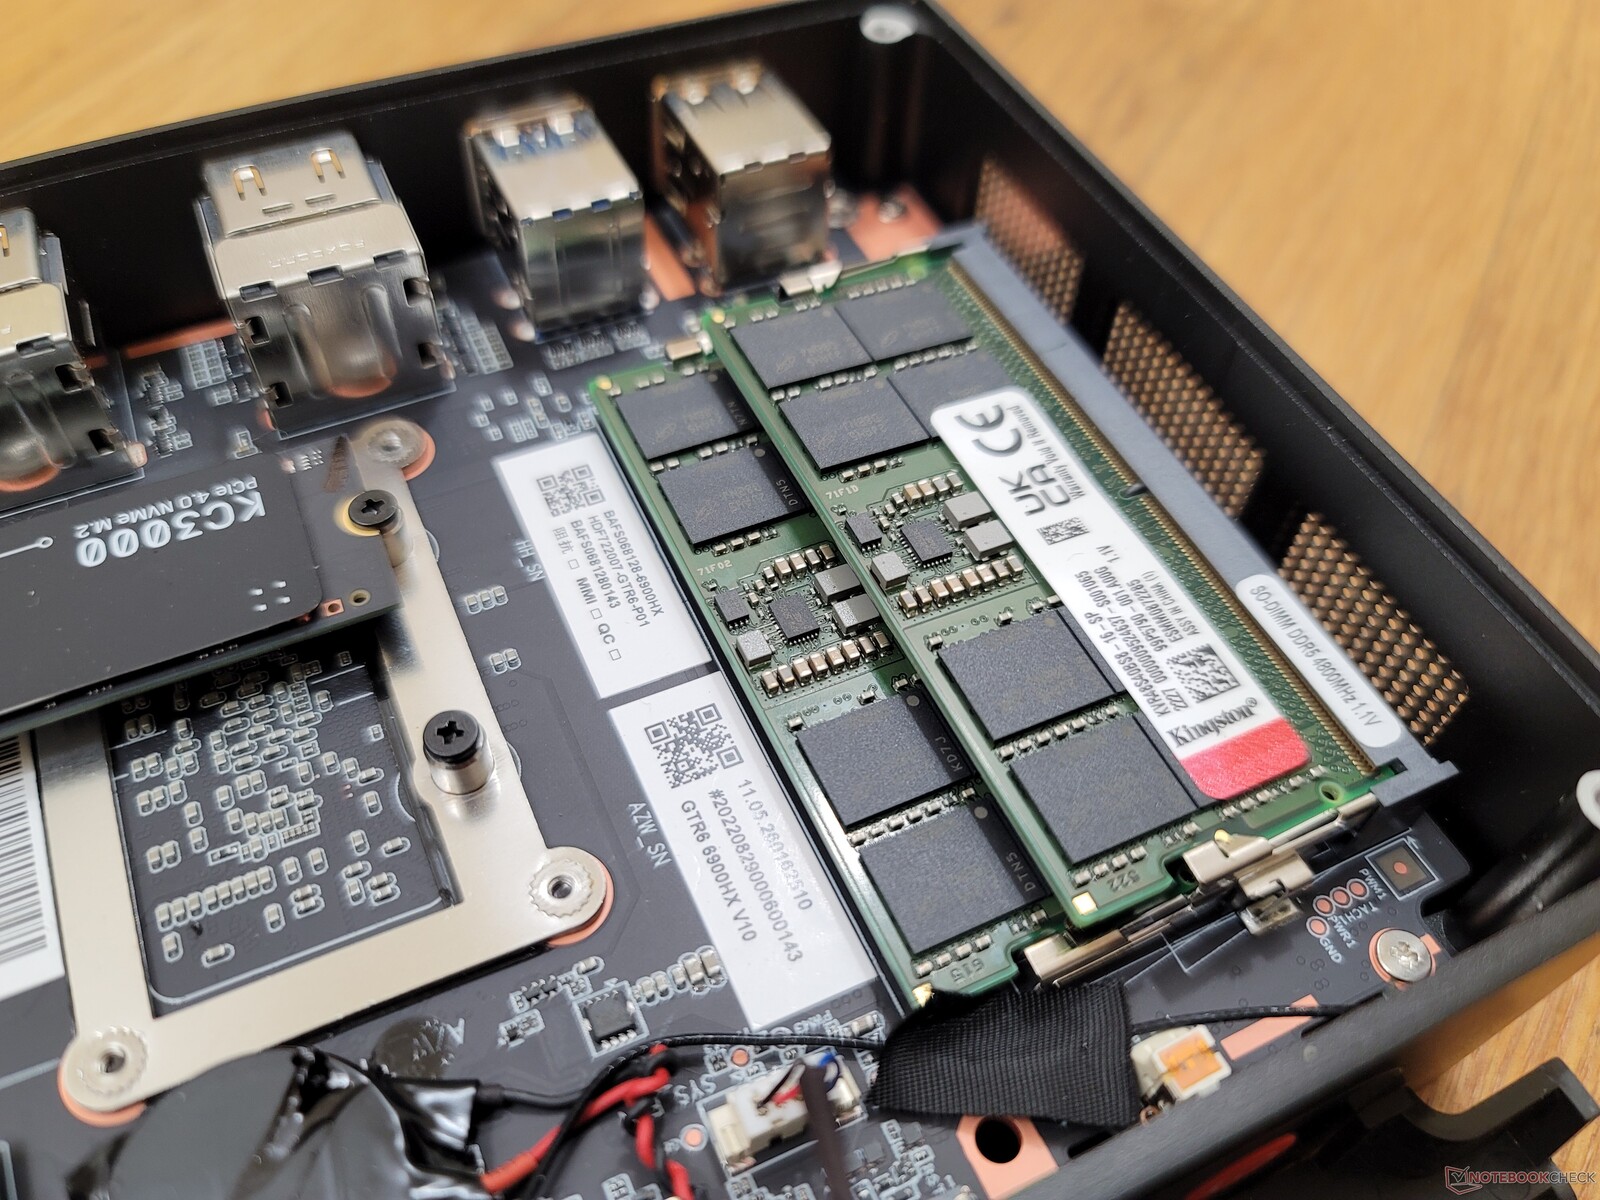
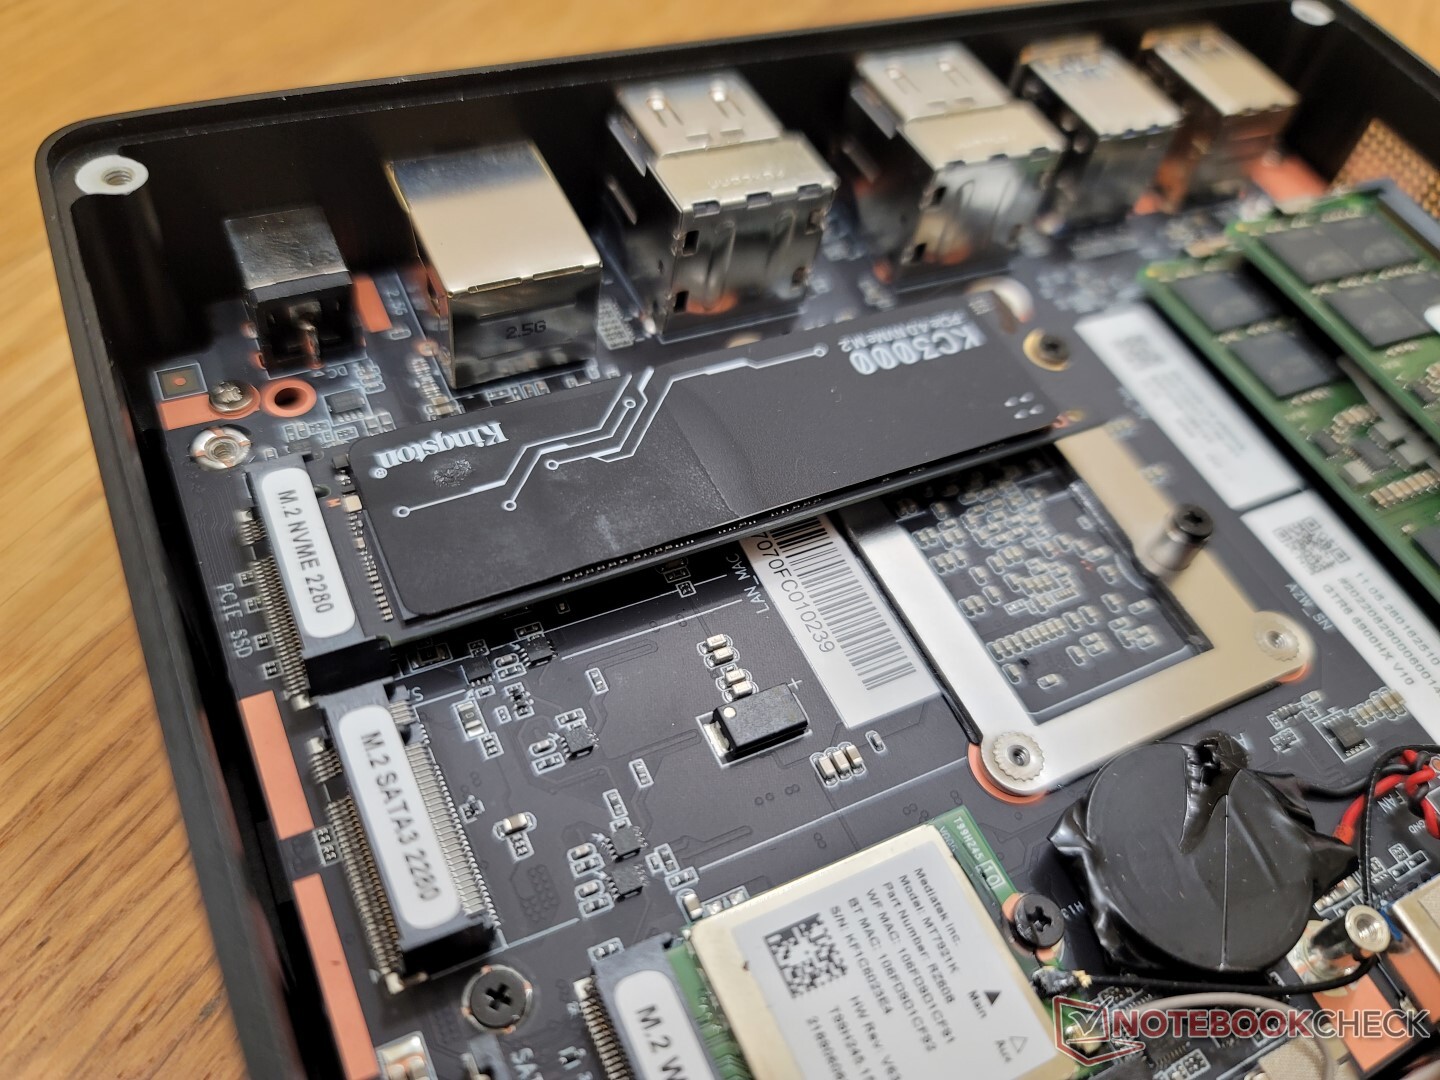
维护
底部面板仅由四颗飞利浦螺钉固定,便于维修。然而,另一块板子在下面,需要卸下另外四颗螺丝,如下图所示。
配件和保修
零售包装盒包括两条HDMI线,一个带额外螺丝的可拆卸VESA支架,用户手册,以及两个用于设备顶部的额外软触网罩。其中一个盖子是红色的,以补充基于AMD的硬件和修饰颜色。
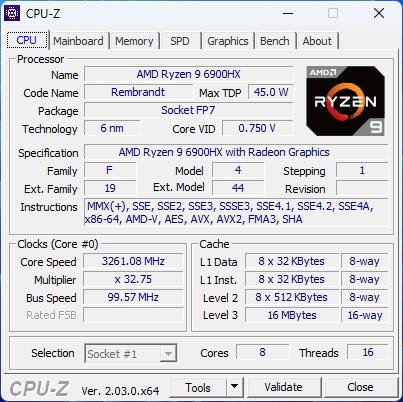
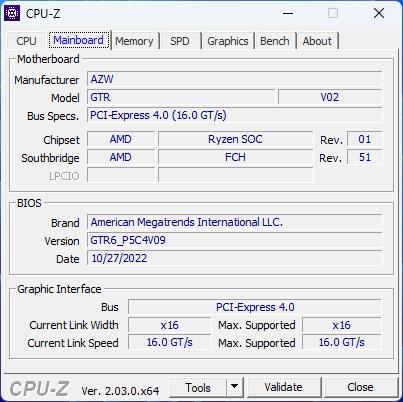
性能 - Zen 3+升级
测试条件
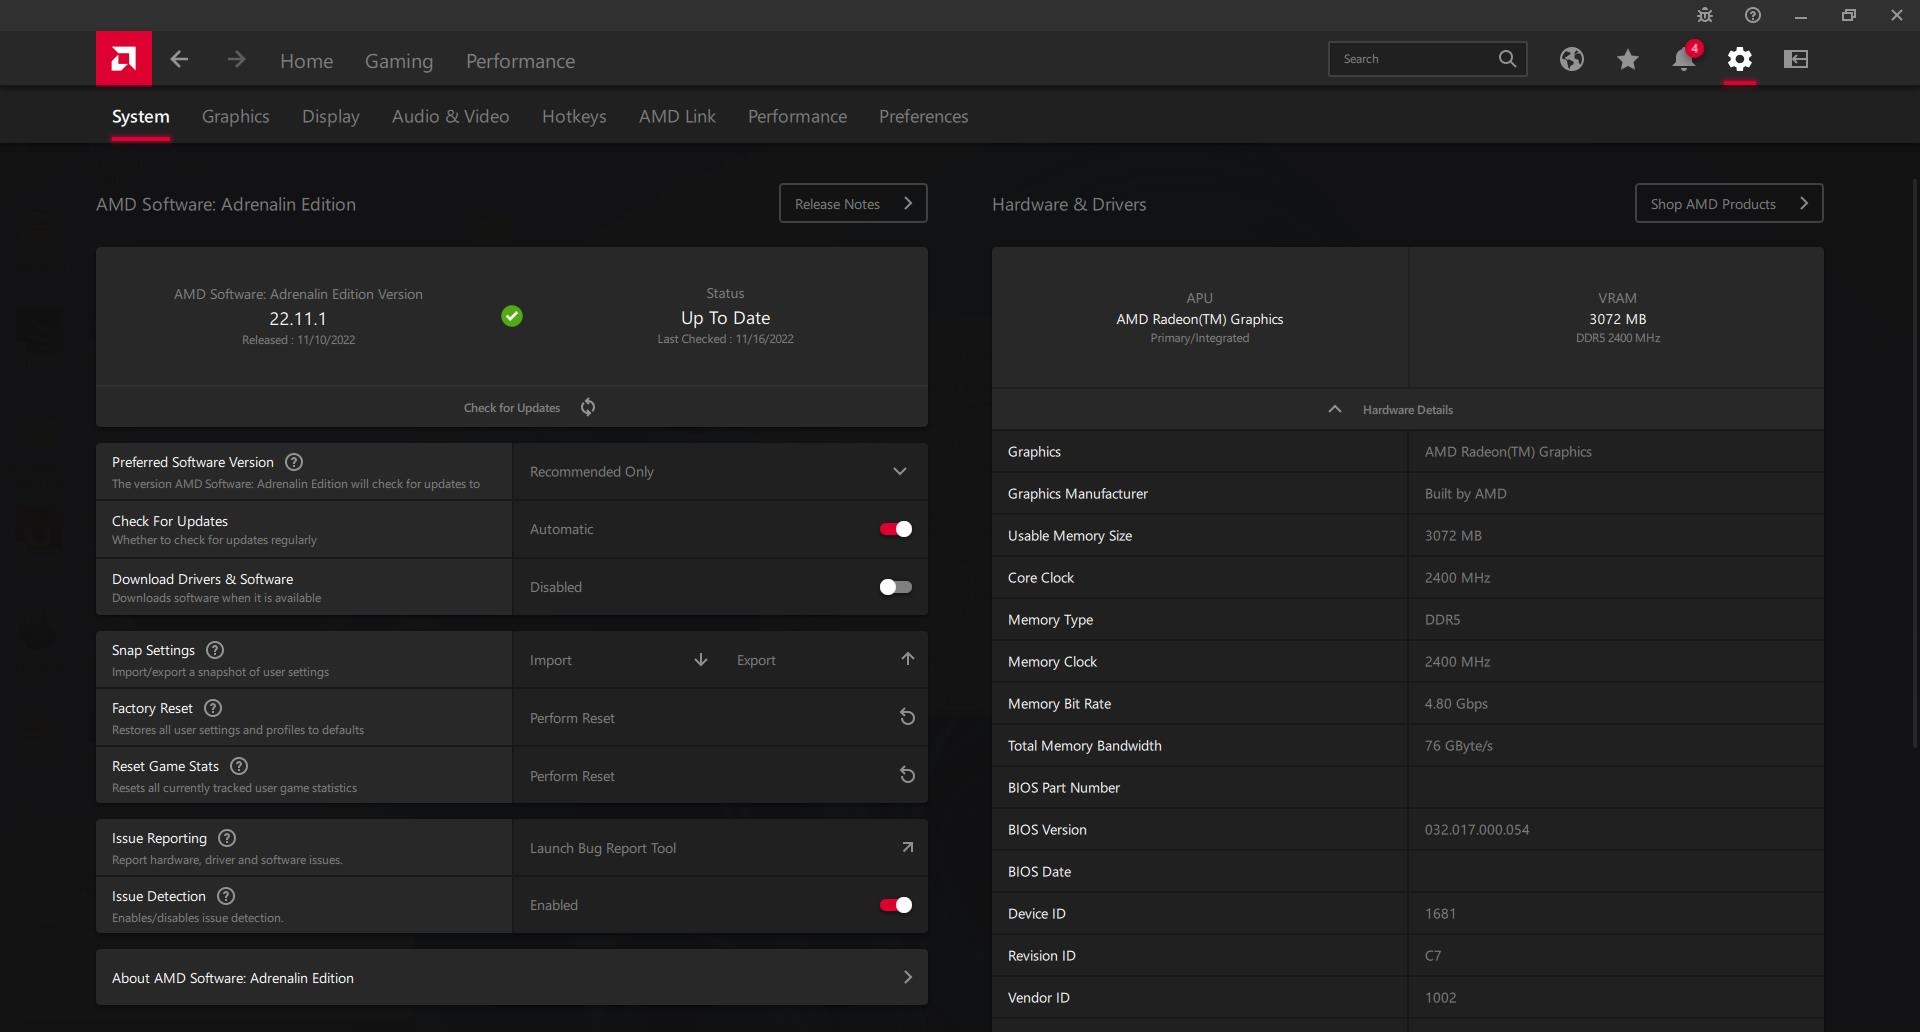
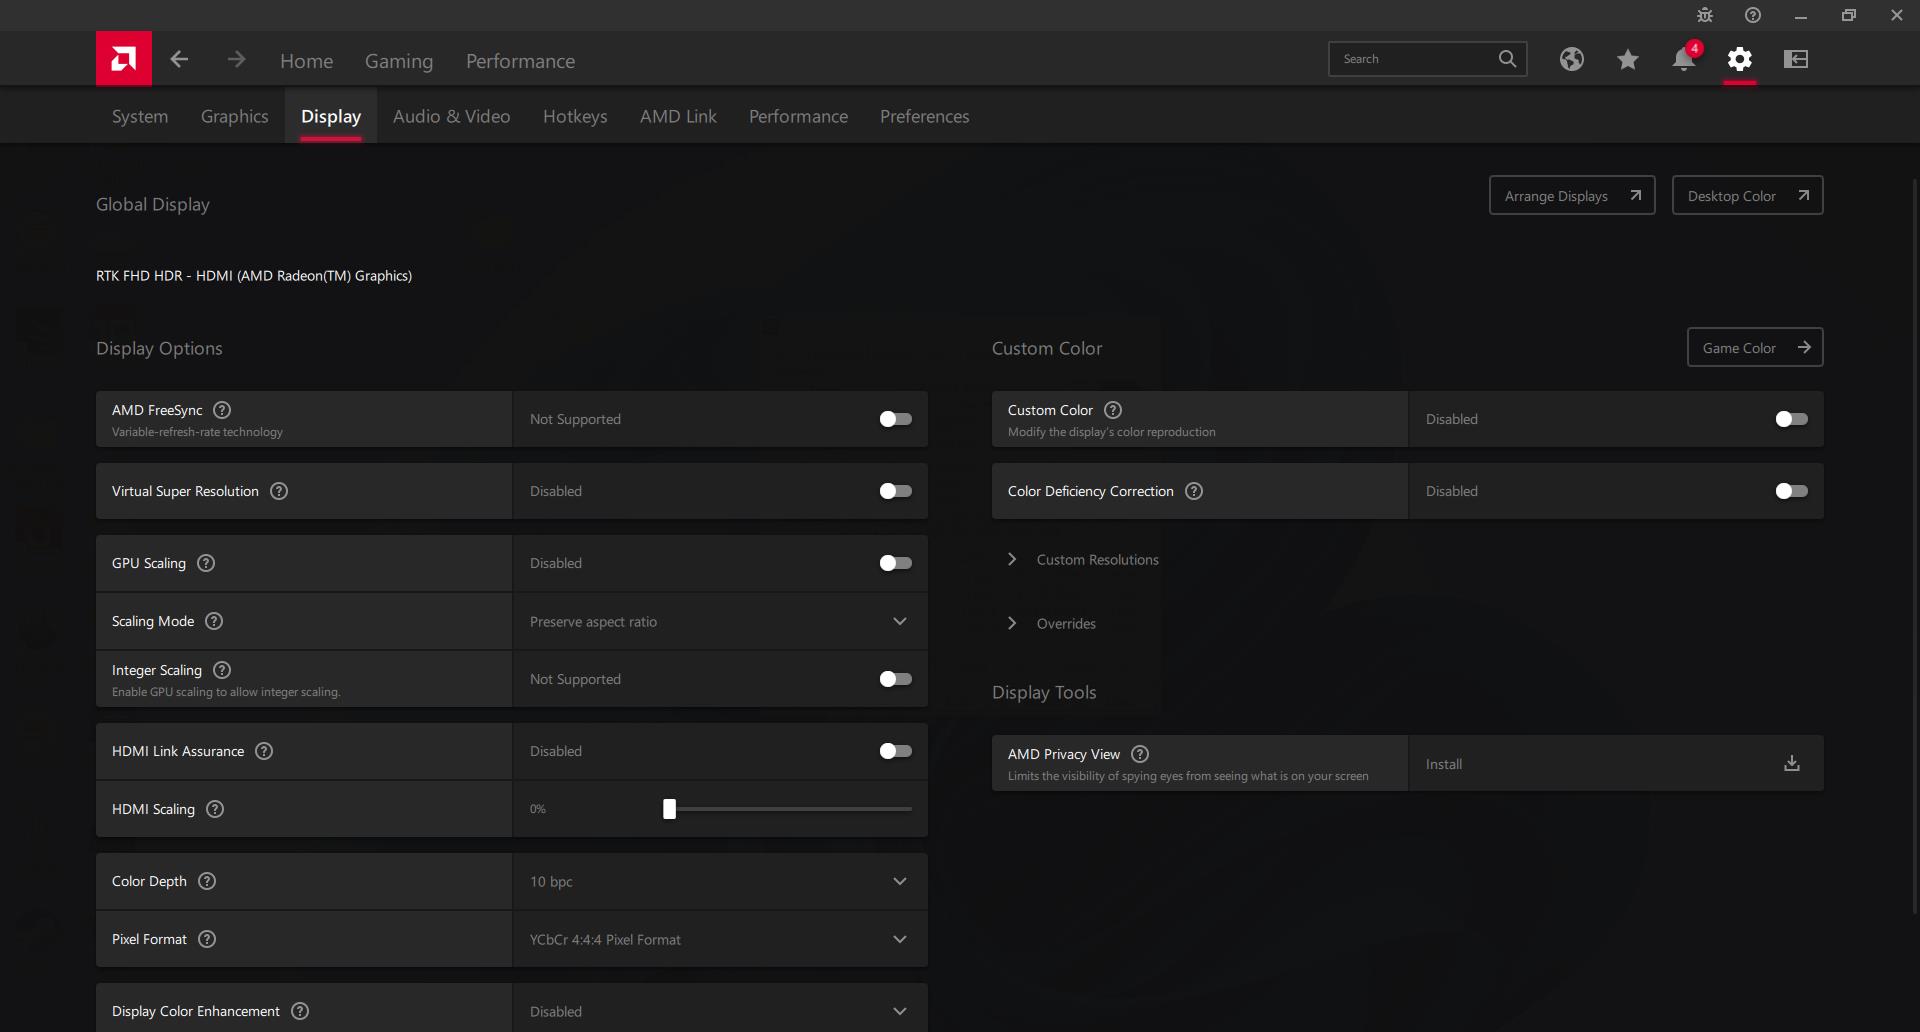
在运行以下任何基准测试之前,我们通过Windows将我们的设备设置为性能模式。Beelink不包括预装的应用程序,以获得干净的Windows 11 Pro体验。尽管如此,我们仍然建议安装AMD Radeon软件,以获得更多的设置,如下面的截图所示。
处理器
不幸的是,CPU的性能只是比Ryzen 9 5900HX高出一个小台阶。 Ryzen 9 5900HX充其量只是小幅提升。基准测试显示,Beelink GTR5的多线程性能与Ryzen 9 5900HX相同,只是单线程性能略快10%。平均多线程性能比采用相同的Ryzen 9 6900HX的笔记本电脑大约慢15%。 Ryzen 9 6900HX CPU如联想Legion S7 16。即便如此,尽管有轻微的性能挫折,GTR6仍然是这个尺寸中最快的迷你电脑之一。
Cinebench R15 Multi Loop
Cinebench R23: Multi Core | Single Core
Cinebench R15: CPU Multi 64Bit | CPU Single 64Bit
Blender: v2.79 BMW27 CPU
7-Zip 18.03: 7z b 4 | 7z b 4 -mmt1
Geekbench 5.5: Multi-Core | Single-Core
HWBOT x265 Benchmark v2.2: 4k Preset
LibreOffice : 20 Documents To PDF
R Benchmark 2.5: Overall mean
| Cinebench R20 / CPU (Multi Core) | |
| MSI GE67 HX 12UGS | |
| Schenker Vision 14 2022 RTX 3050 Ti | |
| Average AMD Ryzen 9 6900HX (3742 - 5813, n=19) | |
| Beelink GTR6 | |
| Beelink GTR5 | |
| Alienware m15 R4 RTX 3080 | |
| Lenovo Legion C7 15IMH05 82EH0030GE | |
| Beelink SEi11 Pro | |
| Intel NUC11TNKi5 | |
| Intel NUC11PHKi7C | |
| GMK NucBox 2 | |
| Cinebench R20 / CPU (Single Core) | |
| Schenker Vision 14 2022 RTX 3050 Ti | |
| MSI GE67 HX 12UGS | |
| Beelink GTR6 | |
| Average AMD Ryzen 9 6900HX (595 - 631, n=19) | |
| Intel NUC11PHKi7C | |
| Beelink GTR5 | |
| Beelink SEi11 Pro | |
| Intel NUC11TNKi5 | |
| Lenovo Legion C7 15IMH05 82EH0030GE | |
| Alienware m15 R4 RTX 3080 | |
| GMK NucBox 2 | |
| Cinebench R23 / Multi Core | |
| MSI GE67 HX 12UGS | |
| Schenker Vision 14 2022 RTX 3050 Ti | |
| Average AMD Ryzen 9 6900HX (9709 - 15100, n=19) | |
| Beelink GTR6 | |
| Beelink GTR5 | |
| Alienware m15 R4 RTX 3080 | |
| Lenovo Legion C7 15IMH05 82EH0030GE | |
| Intel NUC11PHKi7C | |
| Beelink SEi11 Pro | |
| Intel NUC11TNKi5 | |
| GMK NucBox 2 | |
| Cinebench R23 / Single Core | |
| MSI GE67 HX 12UGS | |
| Schenker Vision 14 2022 RTX 3050 Ti | |
| Beelink GTR6 | |
| Average AMD Ryzen 9 6900HX (1516 - 1616, n=19) | |
| Intel NUC11PHKi7C | |
| Beelink GTR5 | |
| Beelink SEi11 Pro | |
| Intel NUC11TNKi5 | |
| Lenovo Legion C7 15IMH05 82EH0030GE | |
| Alienware m15 R4 RTX 3080 | |
| GMK NucBox 2 | |
| Cinebench R15 / CPU Multi 64Bit | |
| MSI GE67 HX 12UGS | |
| Schenker Vision 14 2022 RTX 3050 Ti | |
| Average AMD Ryzen 9 6900HX (1588 - 2411, n=19) | |
| Beelink GTR6 | |
| Beelink GTR5 | |
| Alienware m15 R4 RTX 3080 | |
| Lenovo Legion C7 15IMH05 82EH0030GE | |
| Intel NUC11PHKi7C | |
| Beelink SEi11 Pro | |
| Intel NUC11TNKi5 | |
| GMK NucBox 2 | |
| Cinebench R15 / CPU Single 64Bit | |
| Schenker Vision 14 2022 RTX 3050 Ti | |
| MSI GE67 HX 12UGS | |
| Beelink GTR6 | |
| Average AMD Ryzen 9 6900HX (241 - 261, n=19) | |
| Beelink GTR5 | |
| Intel NUC11PHKi7C | |
| Beelink SEi11 Pro | |
| Lenovo Legion C7 15IMH05 82EH0030GE | |
| Intel NUC11TNKi5 | |
| Alienware m15 R4 RTX 3080 | |
| GMK NucBox 2 | |
| Blender / v2.79 BMW27 CPU | |
| GMK NucBox 2 | |
| Intel NUC11TNKi5 | |
| Intel NUC11PHKi7C | |
| Beelink SEi11 Pro | |
| Lenovo Legion C7 15IMH05 82EH0030GE | |
| Alienware m15 R4 RTX 3080 | |
| Beelink GTR5 | |
| Schenker Vision 14 2022 RTX 3050 Ti | |
| Beelink GTR6 | |
| Average AMD Ryzen 9 6900HX (212 - 357, n=21) | |
| MSI GE67 HX 12UGS | |
| 7-Zip 18.03 / 7z b 4 | |
| MSI GE67 HX 12UGS | |
| Average AMD Ryzen 9 6900HX (49526 - 65336, n=20) | |
| Beelink GTR6 | |
| Beelink GTR5 | |
| Schenker Vision 14 2022 RTX 3050 Ti | |
| Alienware m15 R4 RTX 3080 | |
| Lenovo Legion C7 15IMH05 82EH0030GE | |
| Beelink SEi11 Pro | |
| Intel NUC11PHKi7C | |
| Intel NUC11TNKi5 | |
| GMK NucBox 2 | |
| 7-Zip 18.03 / 7z b 4 -mmt1 | |
| Beelink GTR6 | |
| Schenker Vision 14 2022 RTX 3050 Ti | |
| Average AMD Ryzen 9 6900HX (5090 - 6070, n=20) | |
| Beelink GTR5 | |
| MSI GE67 HX 12UGS | |
| Lenovo Legion C7 15IMH05 82EH0030GE | |
| Alienware m15 R4 RTX 3080 | |
| Intel NUC11PHKi7C | |
| Beelink SEi11 Pro | |
| Intel NUC11TNKi5 | |
| GMK NucBox 2 | |
| Geekbench 5.5 / Multi-Core | |
| MSI GE67 HX 12UGS | |
| Schenker Vision 14 2022 RTX 3050 Ti | |
| Average AMD Ryzen 9 6900HX (8313 - 10490, n=21) | |
| Beelink GTR6 | |
| Lenovo Legion C7 15IMH05 82EH0030GE | |
| Beelink GTR5 | |
| Alienware m15 R4 RTX 3080 | |
| Intel NUC11PHKi7C | |
| Beelink SEi11 Pro | |
| Intel NUC11TNKi5 | |
| GMK NucBox 2 | |
| Geekbench 5.5 / Single-Core | |
| Schenker Vision 14 2022 RTX 3050 Ti | |
| MSI GE67 HX 12UGS | |
| Beelink GTR6 | |
| Average AMD Ryzen 9 6900HX (1523 - 1652, n=21) | |
| Beelink GTR5 | |
| Intel NUC11PHKi7C | |
| Beelink SEi11 Pro | |
| Intel NUC11TNKi5 | |
| Lenovo Legion C7 15IMH05 82EH0030GE | |
| Alienware m15 R4 RTX 3080 | |
| GMK NucBox 2 | |
| HWBOT x265 Benchmark v2.2 / 4k Preset | |
| MSI GE67 HX 12UGS | |
| Average AMD Ryzen 9 6900HX (12.6 - 18.7, n=20) | |
| Beelink GTR6 | |
| Beelink GTR5 | |
| Schenker Vision 14 2022 RTX 3050 Ti | |
| Alienware m15 R4 RTX 3080 | |
| Lenovo Legion C7 15IMH05 82EH0030GE | |
| Beelink SEi11 Pro | |
| Intel NUC11PHKi7C | |
| Intel NUC11TNKi5 | |
| GMK NucBox 2 | |
| LibreOffice / 20 Documents To PDF | |
| Alienware m15 R4 RTX 3080 | |
| GMK NucBox 2 | |
| Lenovo Legion C7 15IMH05 82EH0030GE | |
| Average AMD Ryzen 9 6900HX (44.8 - 81.7, n=20) | |
| Intel NUC11TNKi5 | |
| Beelink GTR5 | |
| Beelink SEi11 Pro | |
| Intel NUC11PHKi7C | |
| Beelink GTR6 | |
| Schenker Vision 14 2022 RTX 3050 Ti | |
| MSI GE67 HX 12UGS | |
| R Benchmark 2.5 / Overall mean | |
| GMK NucBox 2 | |
| Intel NUC11TNKi5 | |
| Alienware m15 R4 RTX 3080 | |
| Lenovo Legion C7 15IMH05 82EH0030GE | |
| Beelink SEi11 Pro | |
| Intel NUC11PHKi7C | |
| Average AMD Ryzen 9 6900HX (0.4627 - 0.4974, n=20) | |
| Beelink GTR5 | |
| Beelink GTR6 | |
| MSI GE67 HX 12UGS | |
| Schenker Vision 14 2022 RTX 3050 Ti | |
* ... smaller is better
AIDA64: FP32 Ray-Trace | FPU Julia | CPU SHA3 | CPU Queen | FPU SinJulia | FPU Mandel | CPU AES | CPU ZLib | FP64 Ray-Trace | CPU PhotoWorxx
| Performance rating | |
| Average AMD Ryzen 9 6900HX | |
| Beelink GTR6 | |
| Beelink GTR5 | |
| Intel NUC11PHKi7C | |
| Beelink SEi11 Pro | |
| Intel NUC11TNKi5 | |
| GMK NucBox 2 | |
| AIDA64 / FP32 Ray-Trace | |
| Average AMD Ryzen 9 6900HX (10950 - 17963, n=20) | |
| Beelink GTR5 | |
| Beelink GTR6 | |
| Intel NUC11PHKi7C | |
| Beelink SEi11 Pro | |
| Intel NUC11TNKi5 | |
| GMK NucBox 2 | |
| AIDA64 / FPU Julia | |
| Average AMD Ryzen 9 6900HX (71414 - 110797, n=20) | |
| Beelink GTR5 | |
| Beelink GTR6 | |
| Intel NUC11PHKi7C | |
| Beelink SEi11 Pro | |
| Intel NUC11TNKi5 | |
| GMK NucBox 2 | |
| AIDA64 / CPU SHA3 | |
| Average AMD Ryzen 9 6900HX (2471 - 3804, n=20) | |
| Beelink GTR6 | |
| Beelink GTR5 | |
| Intel NUC11PHKi7C | |
| Beelink SEi11 Pro | |
| Intel NUC11TNKi5 | |
| GMK NucBox 2 | |
| AIDA64 / CPU Queen | |
| Average AMD Ryzen 9 6900HX (84185 - 107544, n=20) | |
| Beelink GTR5 | |
| Beelink GTR6 | |
| Intel NUC11PHKi7C | |
| Beelink SEi11 Pro | |
| Intel NUC11TNKi5 | |
| GMK NucBox 2 | |
| AIDA64 / FPU SinJulia | |
| Average AMD Ryzen 9 6900HX (10970 - 13205, n=20) | |
| Beelink GTR5 | |
| Beelink GTR6 | |
| Intel NUC11PHKi7C | |
| Beelink SEi11 Pro | |
| Intel NUC11TNKi5 | |
| GMK NucBox 2 | |
| AIDA64 / FPU Mandel | |
| Average AMD Ryzen 9 6900HX (39164 - 61370, n=20) | |
| Beelink GTR5 | |
| Beelink GTR6 | |
| Intel NUC11PHKi7C | |
| Beelink SEi11 Pro | |
| Intel NUC11TNKi5 | |
| GMK NucBox 2 | |
| AIDA64 / CPU AES | |
| Beelink GTR6 | |
| Beelink GTR5 | |
| Average AMD Ryzen 9 6900HX (54613 - 142360, n=20) | |
| Intel NUC11PHKi7C | |
| Beelink SEi11 Pro | |
| Intel NUC11TNKi5 | |
| GMK NucBox 2 | |
| AIDA64 / CPU ZLib | |
| Average AMD Ryzen 9 6900HX (578 - 911, n=20) | |
| Beelink GTR5 | |
| Beelink GTR6 | |
| Intel NUC11PHKi7C | |
| Intel NUC11TNKi5 | |
| Beelink SEi11 Pro | |
| GMK NucBox 2 | |
| AIDA64 / FP64 Ray-Trace | |
| Average AMD Ryzen 9 6900HX (5798 - 9540, n=20) | |
| Beelink GTR5 | |
| Beelink GTR6 | |
| Intel NUC11PHKi7C | |
| Beelink SEi11 Pro | |
| Intel NUC11TNKi5 | |
| GMK NucBox 2 | |
| AIDA64 / CPU PhotoWorxx | |
| Beelink GTR6 | |
| Average AMD Ryzen 9 6900HX (26873 - 30604, n=20) | |
| Intel NUC11PHKi7C | |
| Beelink SEi11 Pro | |
| Beelink GTR5 | |
| Intel NUC11TNKi5 | |
| GMK NucBox 2 | |
系统性能
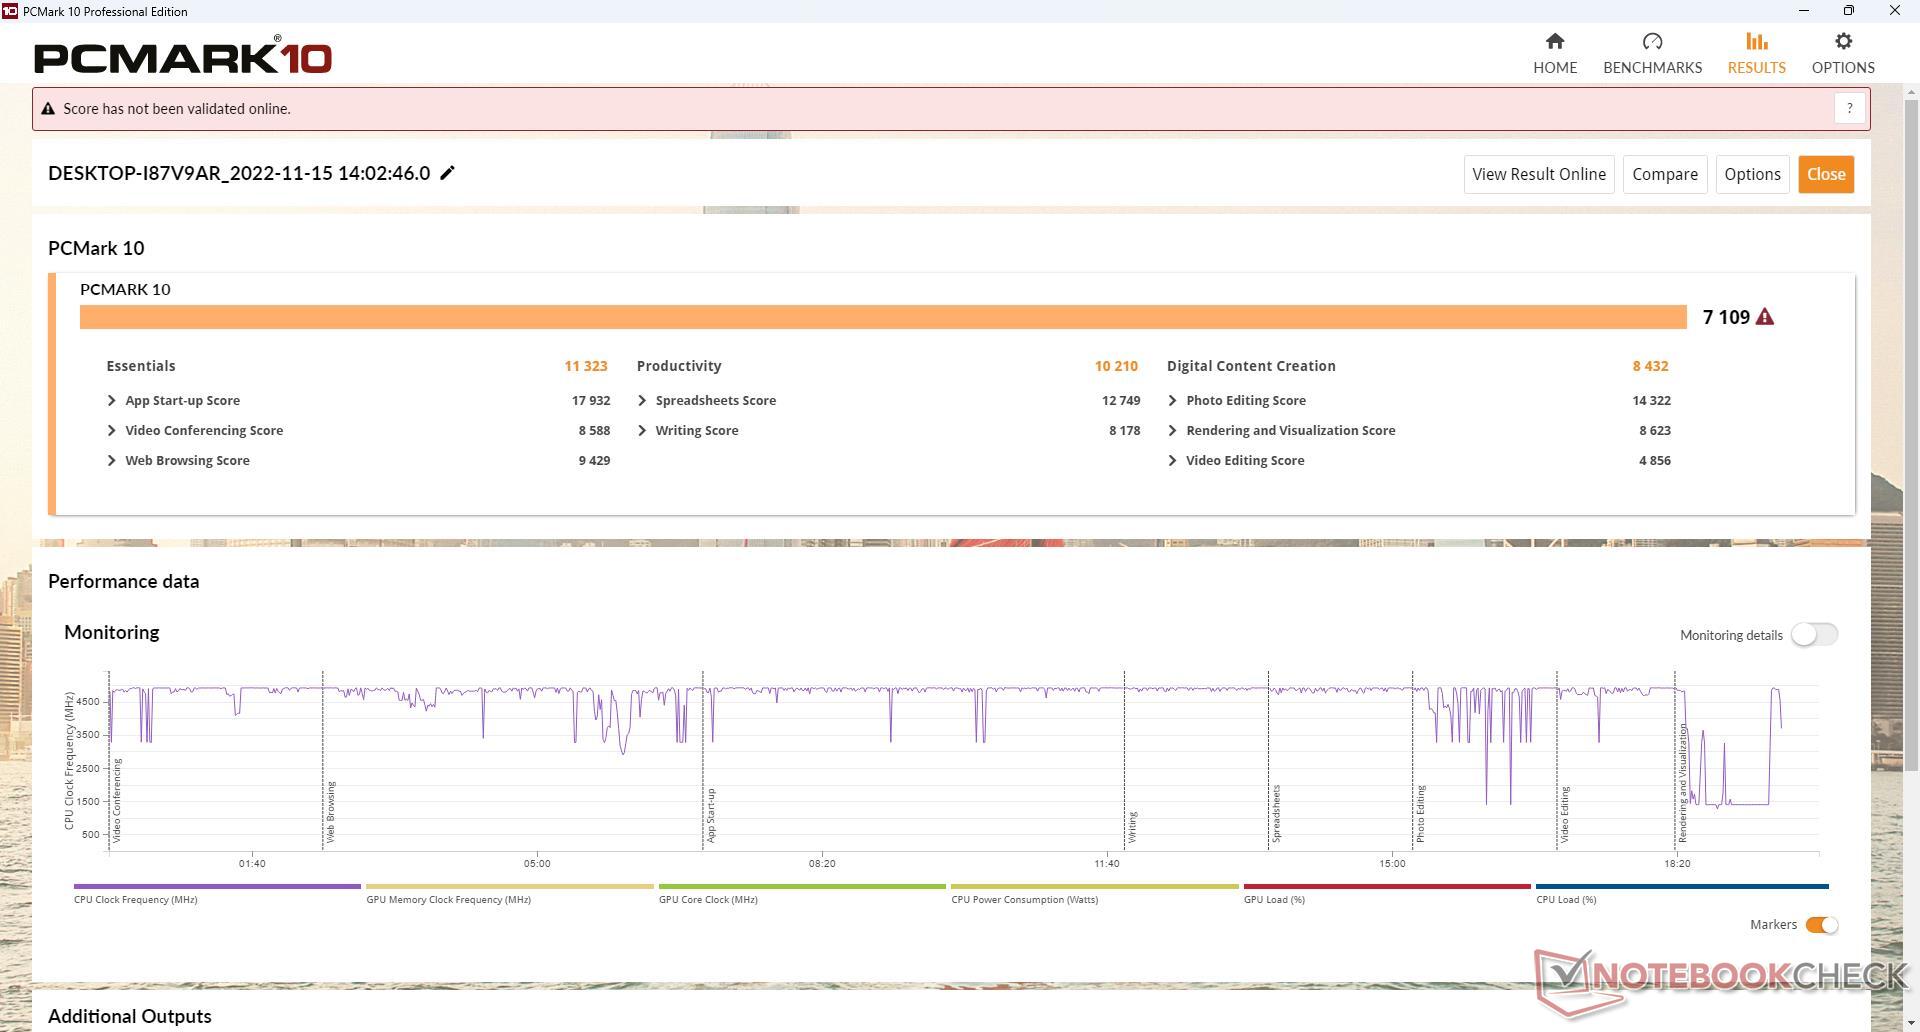
PCMark 10的结果一直高于去年的 GTR5 特别是在图形性能最重要的数字内容创作分测试中。
CrossMark: Overall | Productivity | Creativity | Responsiveness
| PCMark 10 / Score | |
| Beelink GTR6 | |
| Average AMD Ryzen 9 6900HX, AMD Radeon 680M (6251 - 7109, n=7) | |
| Beelink GTR5 | |
| Intel NUC11PHKi7C | |
| Beelink SEi11 Pro | |
| Intel NUC11TNKi5 | |
| GMK NucBox 2 | |
| PCMark 10 / Essentials | |
| Beelink GTR6 | |
| Beelink GTR5 | |
| Average AMD Ryzen 9 6900HX, AMD Radeon 680M (10029 - 11323, n=7) | |
| Beelink SEi11 Pro | |
| Intel NUC11PHKi7C | |
| Intel NUC11TNKi5 | |
| GMK NucBox 2 | |
| PCMark 10 / Productivity | |
| Beelink GTR6 | |
| Beelink GTR5 | |
| Average AMD Ryzen 9 6900HX, AMD Radeon 680M (9550 - 10210, n=7) | |
| Intel NUC11PHKi7C | |
| Beelink SEi11 Pro | |
| GMK NucBox 2 | |
| Intel NUC11TNKi5 | |
| PCMark 10 / Digital Content Creation | |
| Beelink GTR6 | |
| Average AMD Ryzen 9 6900HX, AMD Radeon 680M (6920 - 8703, n=7) | |
| Beelink GTR5 | |
| Intel NUC11PHKi7C | |
| Beelink SEi11 Pro | |
| Intel NUC11TNKi5 | |
| GMK NucBox 2 | |
| CrossMark / Overall | |
| Beelink GTR6 | |
| Average AMD Ryzen 9 6900HX, AMD Radeon 680M (1476 - 1731, n=7) | |
| Beelink GTR5 | |
| Beelink SEi11 Pro | |
| CrossMark / Productivity | |
| Beelink GTR6 | |
| Average AMD Ryzen 9 6900HX, AMD Radeon 680M (1451 - 1738, n=7) | |
| Beelink GTR5 | |
| Beelink SEi11 Pro | |
| CrossMark / Creativity | |
| Beelink GTR6 | |
| Average AMD Ryzen 9 6900HX, AMD Radeon 680M (1632 - 1745, n=7) | |
| Beelink GTR5 | |
| Beelink SEi11 Pro | |
| CrossMark / Responsiveness | |
| Beelink GTR6 | |
| Average AMD Ryzen 9 6900HX, AMD Radeon 680M (1060 - 1671, n=7) | |
| Beelink SEi11 Pro | |
| Beelink GTR5 | |
| PCMark 10 Score | 7109 points | |
Help | ||
| AIDA64 / Memory Copy | |
| Beelink GTR6 | |
| Average AMD Ryzen 9 6900HX (47938 - 53345, n=20) | |
| GMK NucBox 2 | |
| Beelink GTR5 | |
| Beelink SEi11 Pro | |
| Intel NUC11PHKi7C | |
| Intel NUC11TNKi5 | |
| AIDA64 / Memory Read | |
| Beelink GTR6 | |
| Average AMD Ryzen 9 6900HX (43892 - 53321, n=20) | |
| Beelink GTR5 | |
| Beelink SEi11 Pro | |
| Intel NUC11PHKi7C | |
| GMK NucBox 2 | |
| Intel NUC11TNKi5 | |
| AIDA64 / Memory Write | |
| Beelink GTR6 | |
| Average AMD Ryzen 9 6900HX (51085 - 57202, n=20) | |
| GMK NucBox 2 | |
| Beelink SEi11 Pro | |
| Beelink GTR5 | |
| Intel NUC11PHKi7C | |
| Intel NUC11TNKi5 | |
| AIDA64 / Memory Latency | |
| Intel NUC11PHKi7C | |
| Average AMD Ryzen 9 6900HX (80.7 - 120.6, n=20) | |
| Intel NUC11TNKi5 | |
| Beelink GTR6 | |
| Beelink SEi11 Pro | |
| Beelink GTR5 | |
| GMK NucBox 2 | |
* ... smaller is better
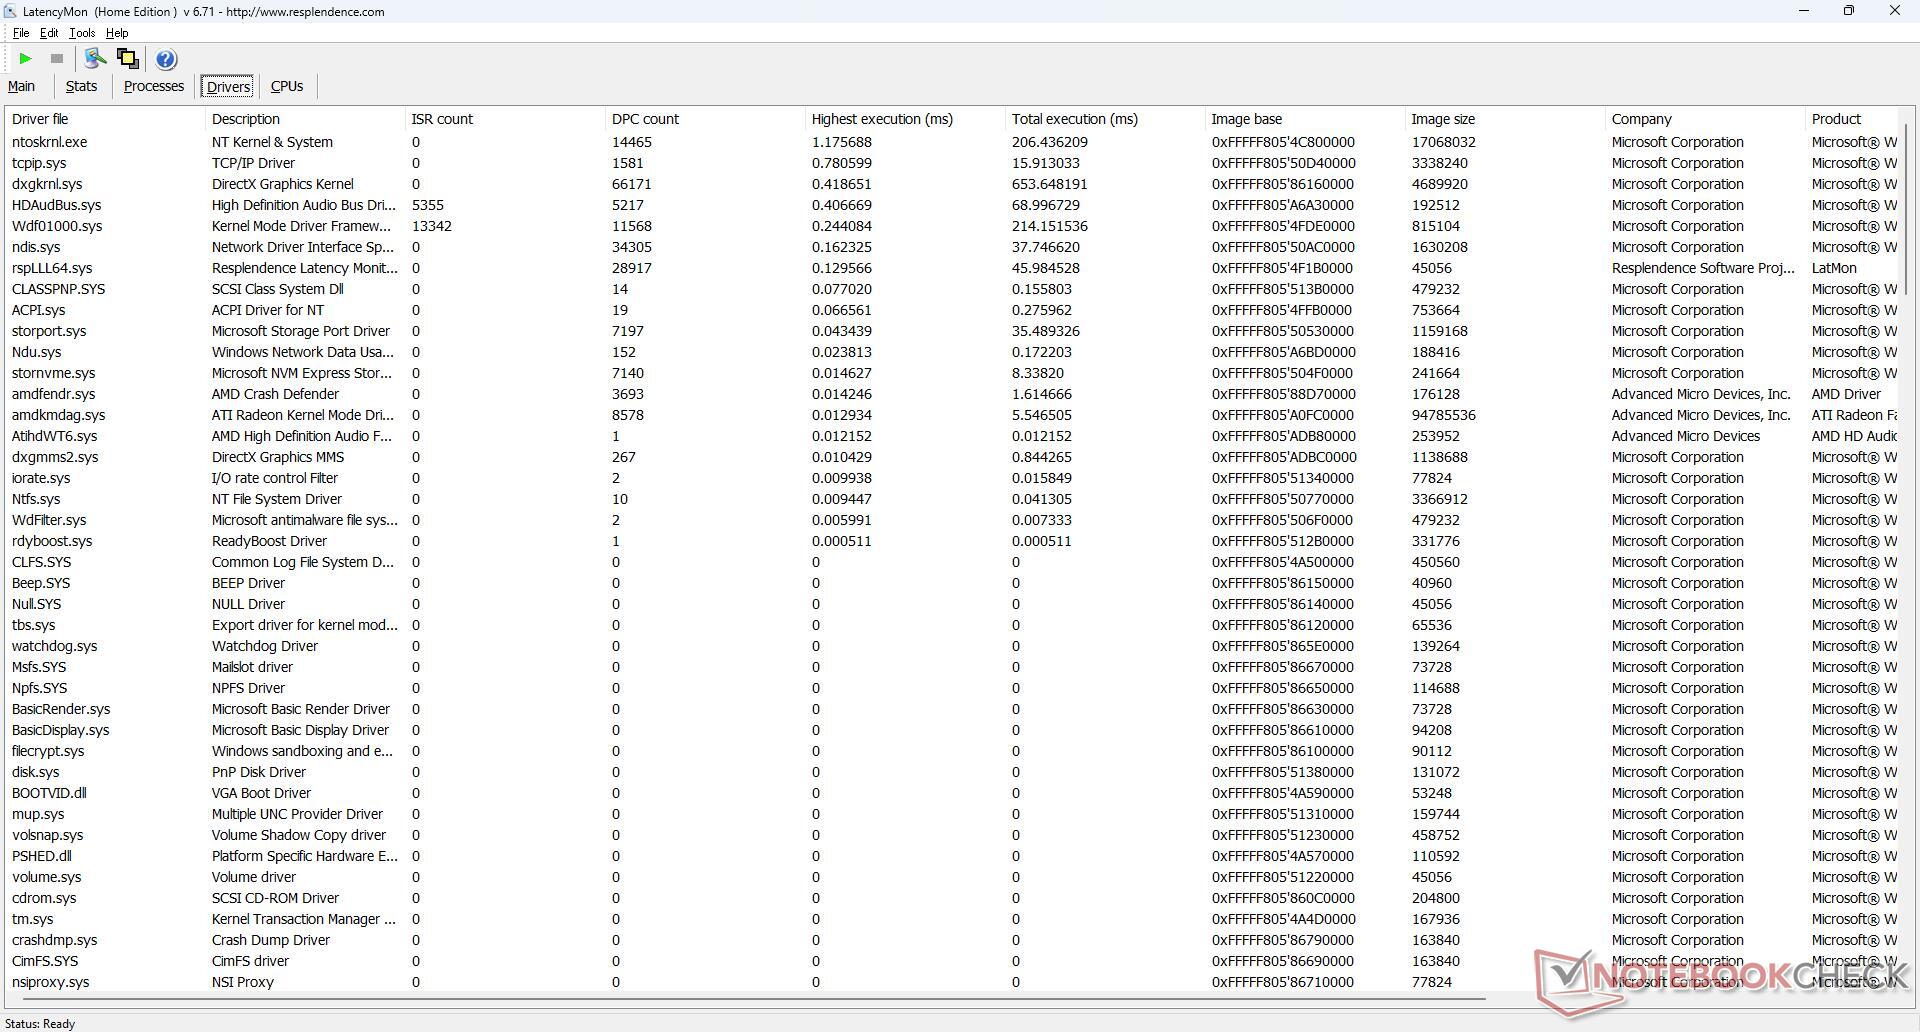
DPC延时
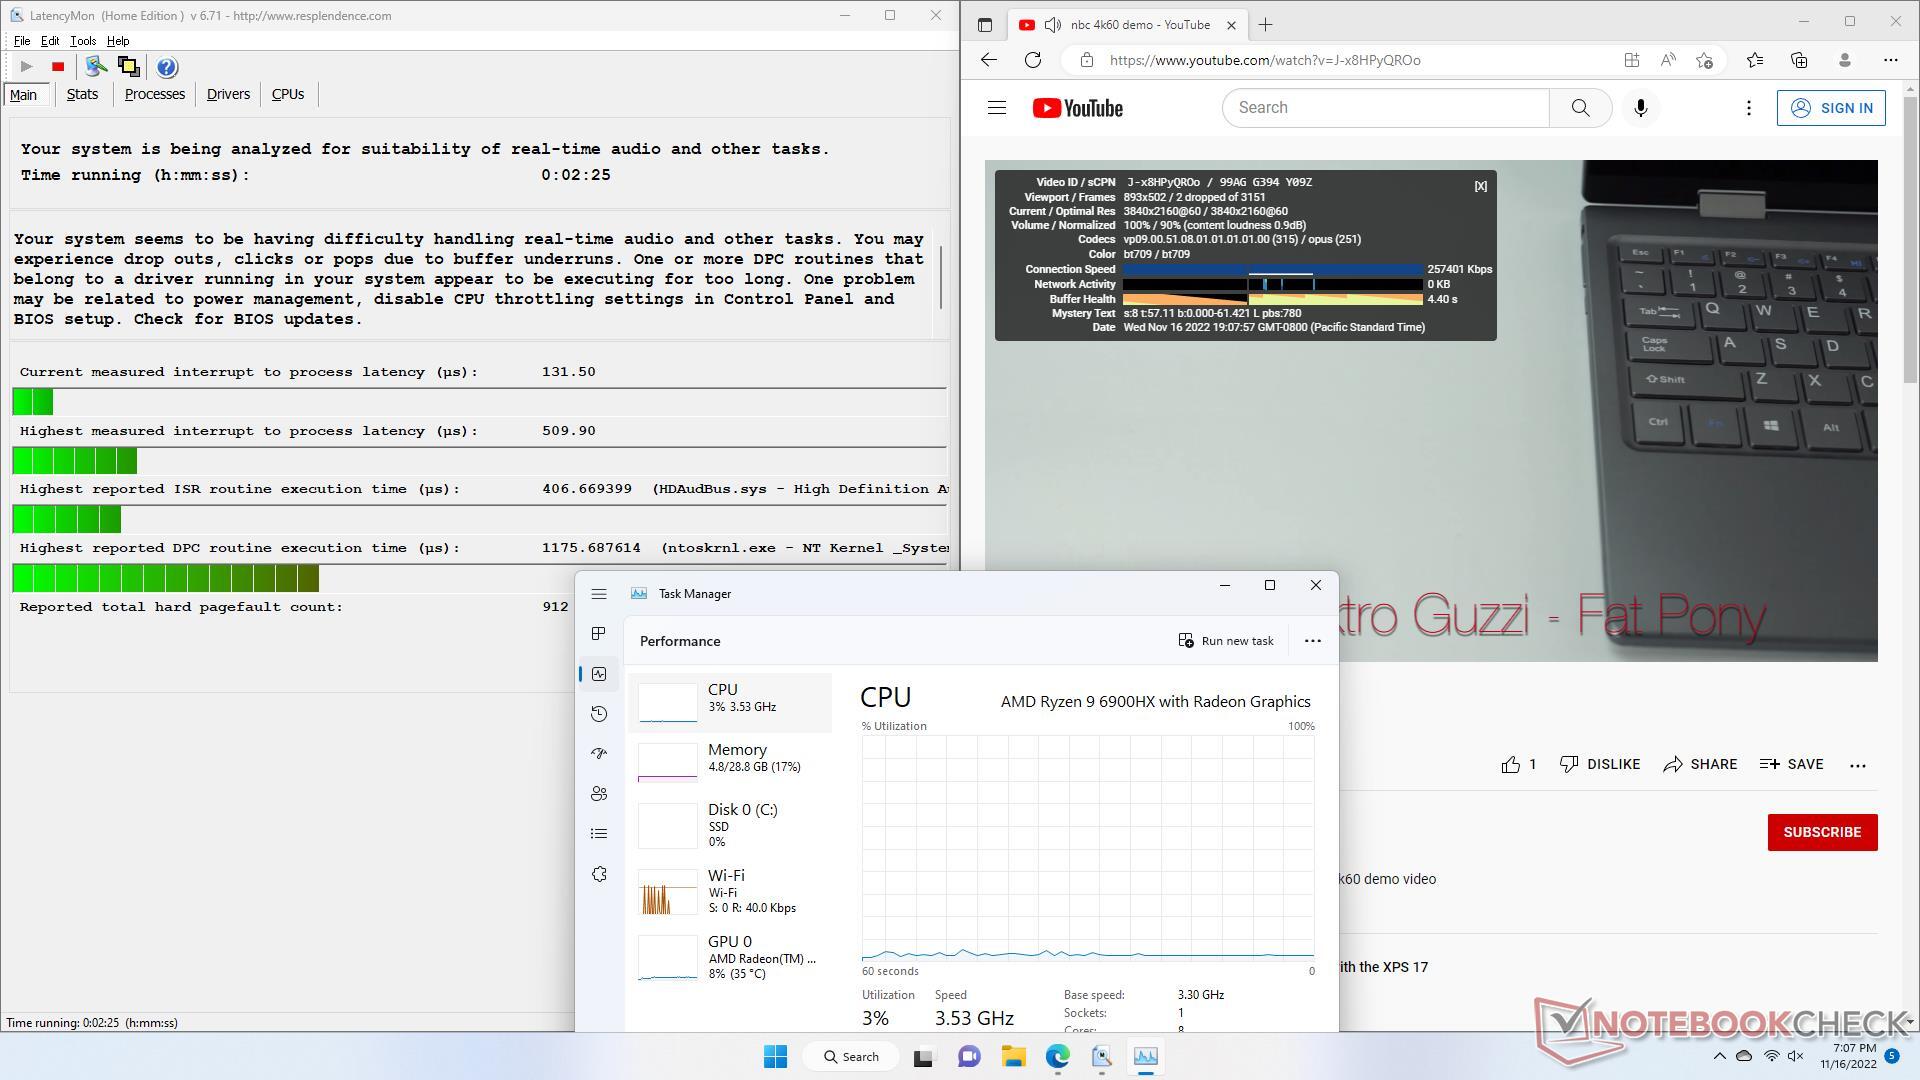
在我们的主页上打开多个浏览器标签时,存在轻微的DPC问题。在60FPS下的4K视频播放非常好,在我们长达1分钟的测试视频中只有2个丢帧。相对于采用较慢的U系列CPU的PC而言,处理器利用率非常低。
| DPC Latencies / LatencyMon - interrupt to process latency (max), Web, Youtube, Prime95 | |
| Intel NUC11PHKi7C | |
| GMK NucBox 2 | |
| Intel NUC11TNKi5 | |
| Beelink GTR6 | |
| Beelink SEi11 Pro | |
| Beelink GTR5 | |
* ... smaller is better
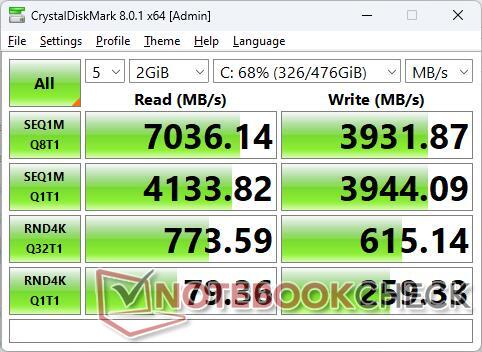
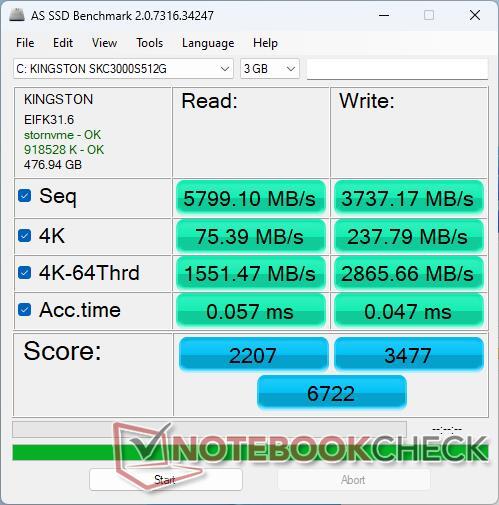
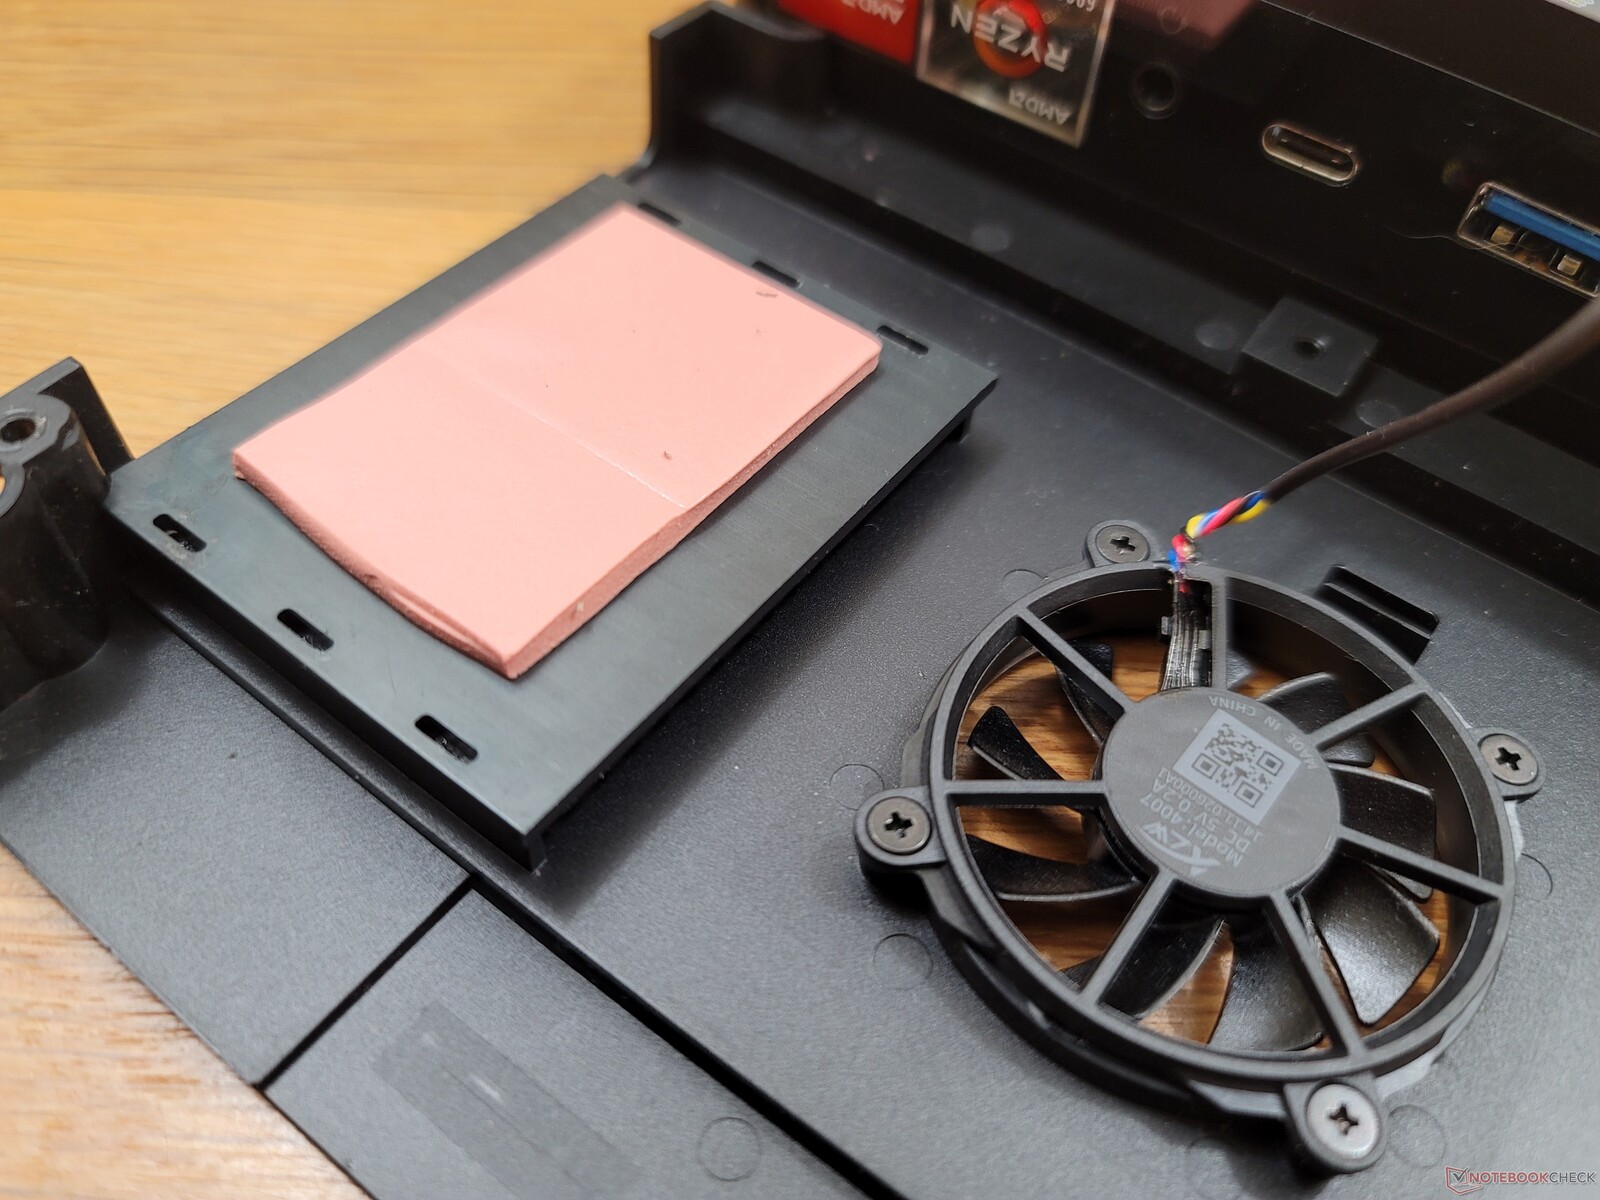
存储设备 - 包括SSD冷却
我们的设备配备了一个512GB的 金士顿KC3000PCIe4 x4 NVMe固态硬盘,连续读取和写入速率分别高达7000 MB/s和4000 MB/s。由于预装了专用的SSD散热器和热垫,该驱动器在长时间维持最大传输速率方面没有问题。

| Drive Performance rating - Percent | |
| Beelink GTR6 | |
| Intel NUC11PHKi7C | |
| Beelink SEi11 Pro | |
| Beelink GTR5 | |
| GMK NucBox 2 | |
| Intel NUC11TNKi5 | |
| DiskSpd | |
| seq read | |
| Beelink GTR6 | |
| Intel NUC11PHKi7C | |
| Beelink GTR5 | |
| Beelink SEi11 Pro | |
| GMK NucBox 2 | |
| Intel NUC11TNKi5 | |
| seq write | |
| Beelink GTR6 | |
| Intel NUC11PHKi7C | |
| Beelink GTR5 | |
| Beelink SEi11 Pro | |
| GMK NucBox 2 | |
| Intel NUC11TNKi5 | |
| seq q8 t1 read | |
| Beelink GTR6 | |
| Intel NUC11PHKi7C | |
| Beelink GTR5 | |
| Beelink SEi11 Pro | |
| GMK NucBox 2 | |
| Intel NUC11TNKi5 | |
| seq q8 t1 write | |
| Beelink GTR6 | |
| Intel NUC11PHKi7C | |
| Beelink GTR5 | |
| Beelink SEi11 Pro | |
| GMK NucBox 2 | |
| Intel NUC11TNKi5 | |
| 4k q1 t1 read | |
| Beelink GTR6 | |
| Beelink GTR5 | |
| Beelink SEi11 Pro | |
| Intel NUC11PHKi7C | |
| GMK NucBox 2 | |
| Intel NUC11TNKi5 | |
| 4k q1 t1 write | |
| Beelink GTR6 | |
| Beelink GTR5 | |
| Beelink SEi11 Pro | |
| GMK NucBox 2 | |
| Intel NUC11PHKi7C | |
| Intel NUC11TNKi5 | |
| 4k q32 t16 read | |
| Beelink GTR6 | |
| Intel NUC11PHKi7C | |
| Beelink GTR5 | |
| Beelink SEi11 Pro | |
| GMK NucBox 2 | |
| Intel NUC11TNKi5 | |
| 4k q32 t16 write | |
| Beelink GTR6 | |
| Beelink GTR5 | |
| GMK NucBox 2 | |
| Beelink SEi11 Pro | |
| Intel NUC11PHKi7C | |
| Intel NUC11TNKi5 | |
| AS SSD | |
| Score Total | |
| Beelink GTR6 | |
| Intel NUC11PHKi7C | |
| Beelink SEi11 Pro | |
| Beelink GTR5 | |
| GMK NucBox 2 | |
| Intel NUC11TNKi5 | |
| Score Read | |
| Beelink GTR6 | |
| Intel NUC11PHKi7C | |
| Beelink SEi11 Pro | |
| Beelink GTR5 | |
| GMK NucBox 2 | |
| Intel NUC11TNKi5 | |
| Score Write | |
| Beelink GTR6 | |
| Intel NUC11PHKi7C | |
| Beelink SEi11 Pro | |
| Beelink GTR5 | |
| GMK NucBox 2 | |
| Intel NUC11TNKi5 | |
| Seq Read | |
| Beelink GTR6 | |
| Intel NUC11PHKi7C | |
| Beelink GTR5 | |
| Beelink SEi11 Pro | |
| GMK NucBox 2 | |
| Intel NUC11TNKi5 | |
| Seq Write | |
| Beelink GTR6 | |
| Beelink SEi11 Pro | |
| Beelink GTR5 | |
| Intel NUC11PHKi7C | |
| GMK NucBox 2 | |
| Intel NUC11TNKi5 | |
| 4K Read | |
| Beelink GTR6 | |
| Beelink SEi11 Pro | |
| Beelink GTR5 | |
| GMK NucBox 2 | |
| Intel NUC11PHKi7C | |
| Intel NUC11TNKi5 | |
| 4K Write | |
| Beelink GTR6 | |
| Beelink SEi11 Pro | |
| Beelink GTR5 | |
| GMK NucBox 2 | |
| Intel NUC11PHKi7C | |
| Intel NUC11TNKi5 | |
| 4K-64 Read | |
| Beelink GTR6 | |
| Intel NUC11PHKi7C | |
| Beelink SEi11 Pro | |
| Beelink GTR5 | |
| GMK NucBox 2 | |
| Intel NUC11TNKi5 | |
| 4K-64 Write | |
| Beelink GTR6 | |
| Intel NUC11PHKi7C | |
| Beelink SEi11 Pro | |
| Beelink GTR5 | |
| GMK NucBox 2 | |
| Intel NUC11TNKi5 | |
| Access Time Read | |
| Intel NUC11TNKi5 | |
| Intel NUC11PHKi7C | |
| GMK NucBox 2 | |
| Beelink GTR6 | |
| Beelink GTR5 | |
| Beelink SEi11 Pro | |
| Access Time Write | |
| GMK NucBox 2 | |
| Beelink SEi11 Pro | |
| Beelink GTR5 | |
| Intel NUC11TNKi5 | |
| Intel NUC11PHKi7C | |
| Beelink GTR6 | |
* ... smaller is better
Disk Throttling: DiskSpd Read Loop, Queue Depth 8
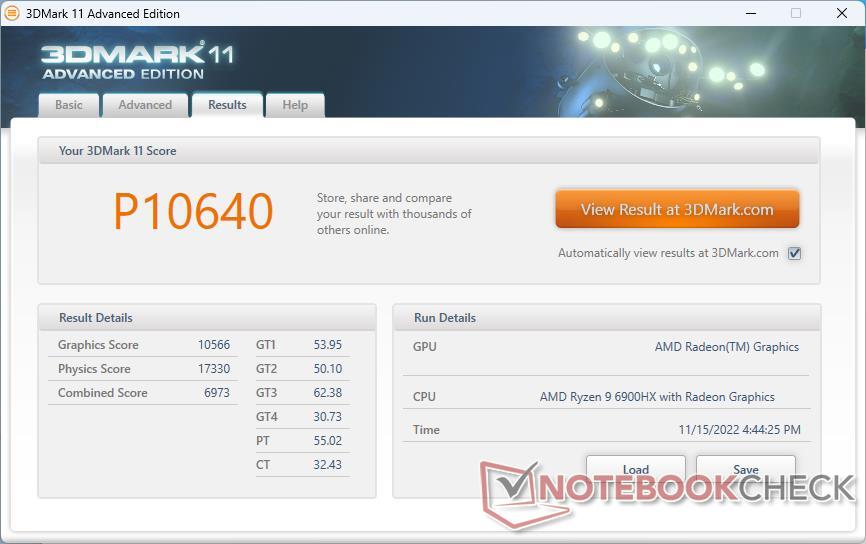
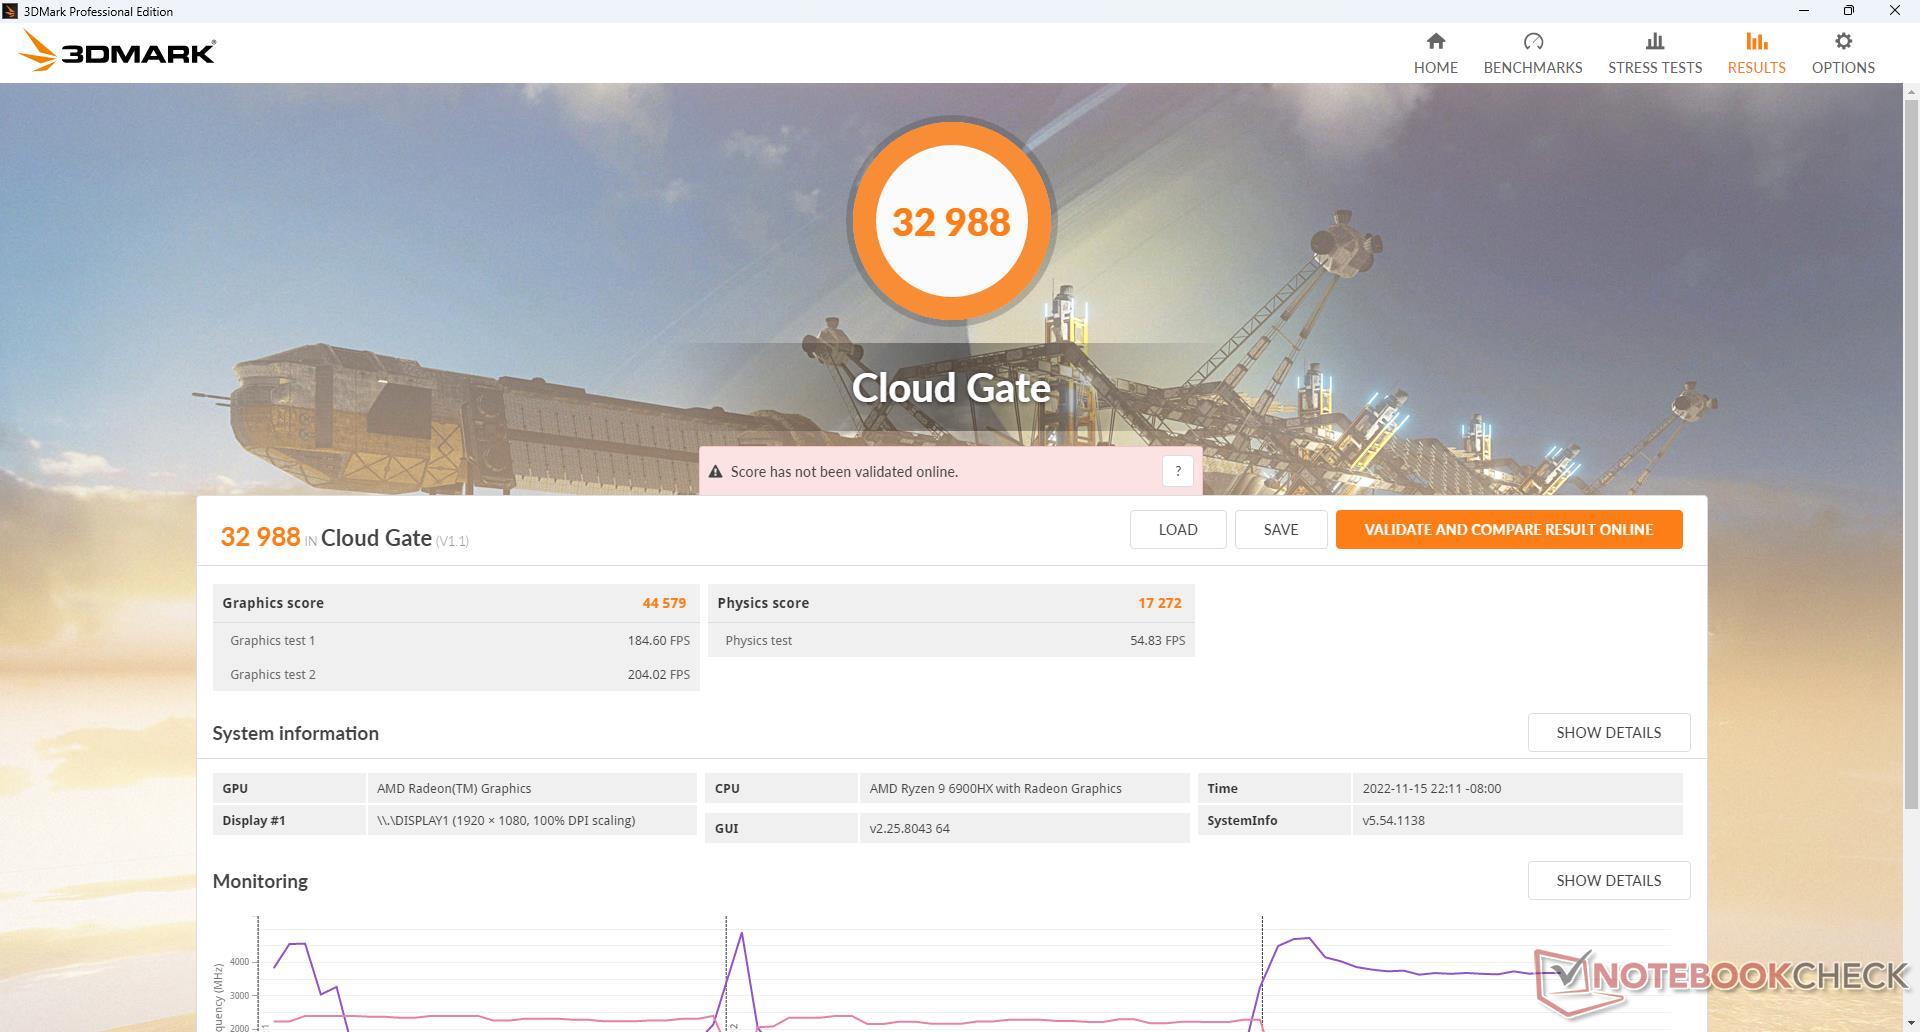
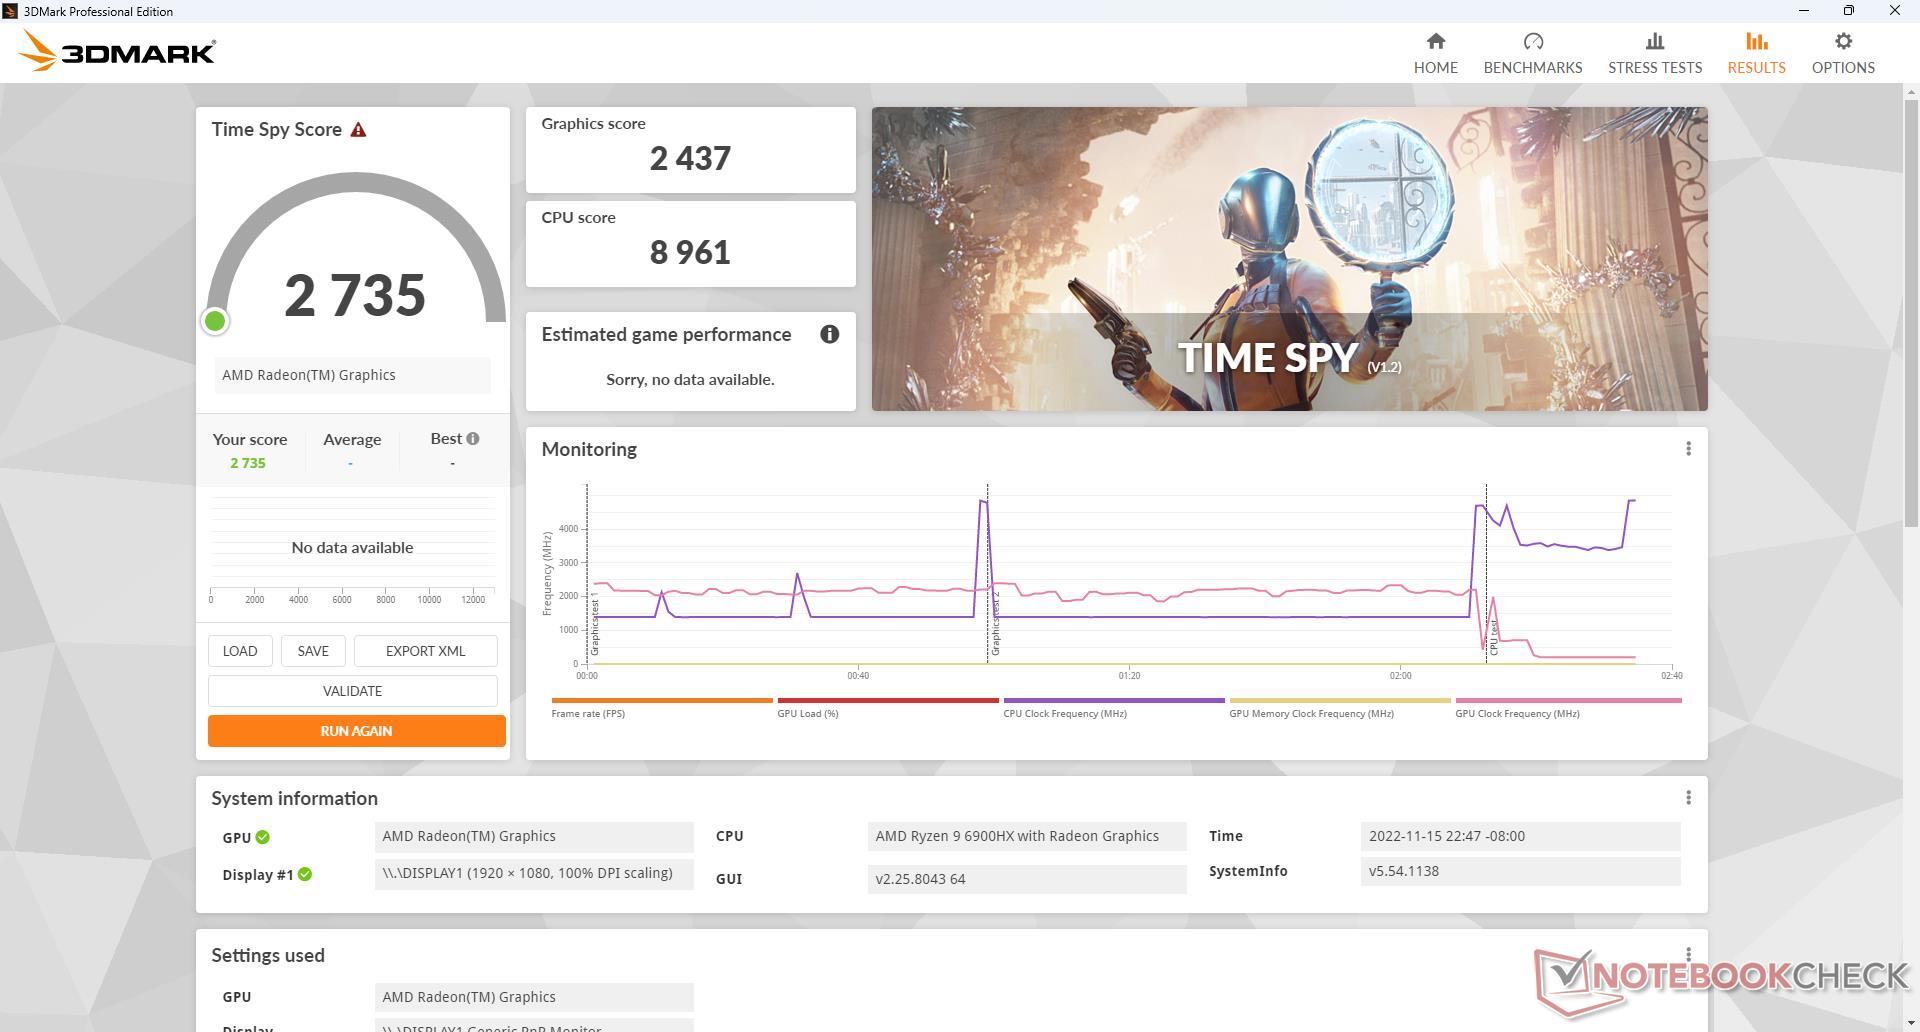
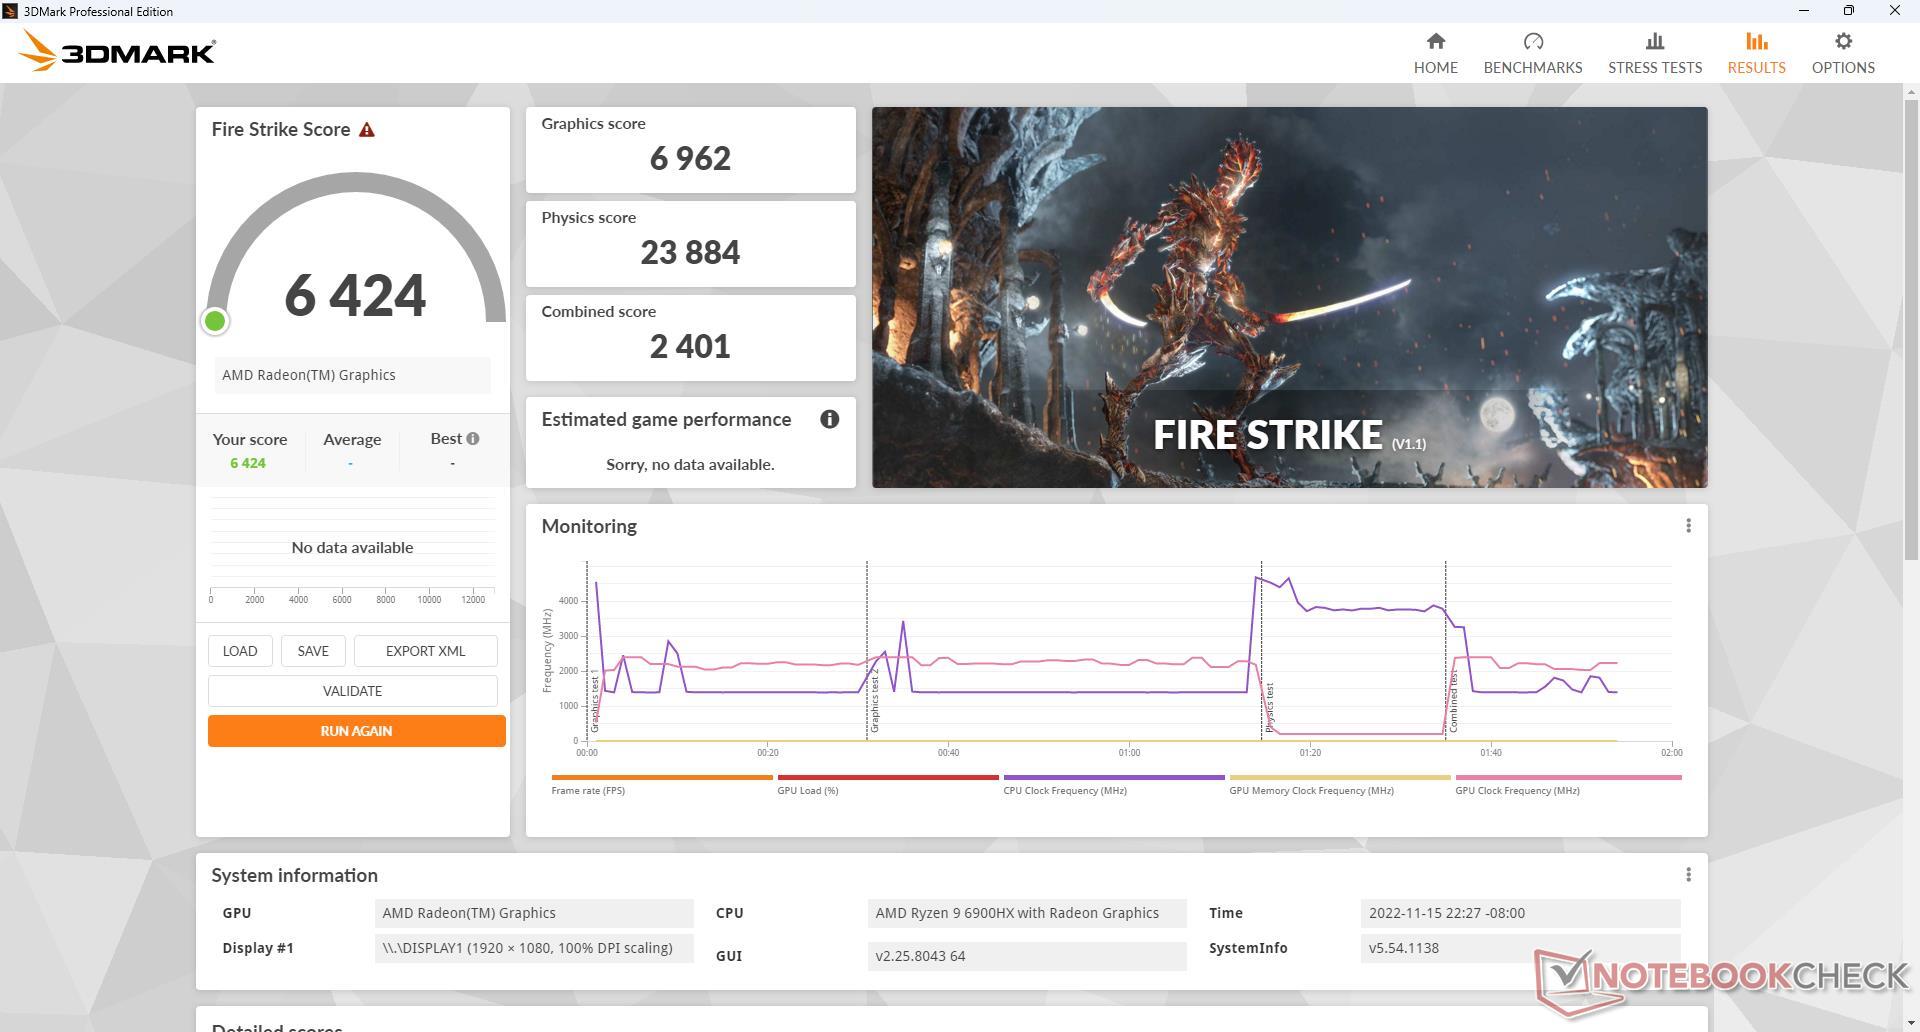
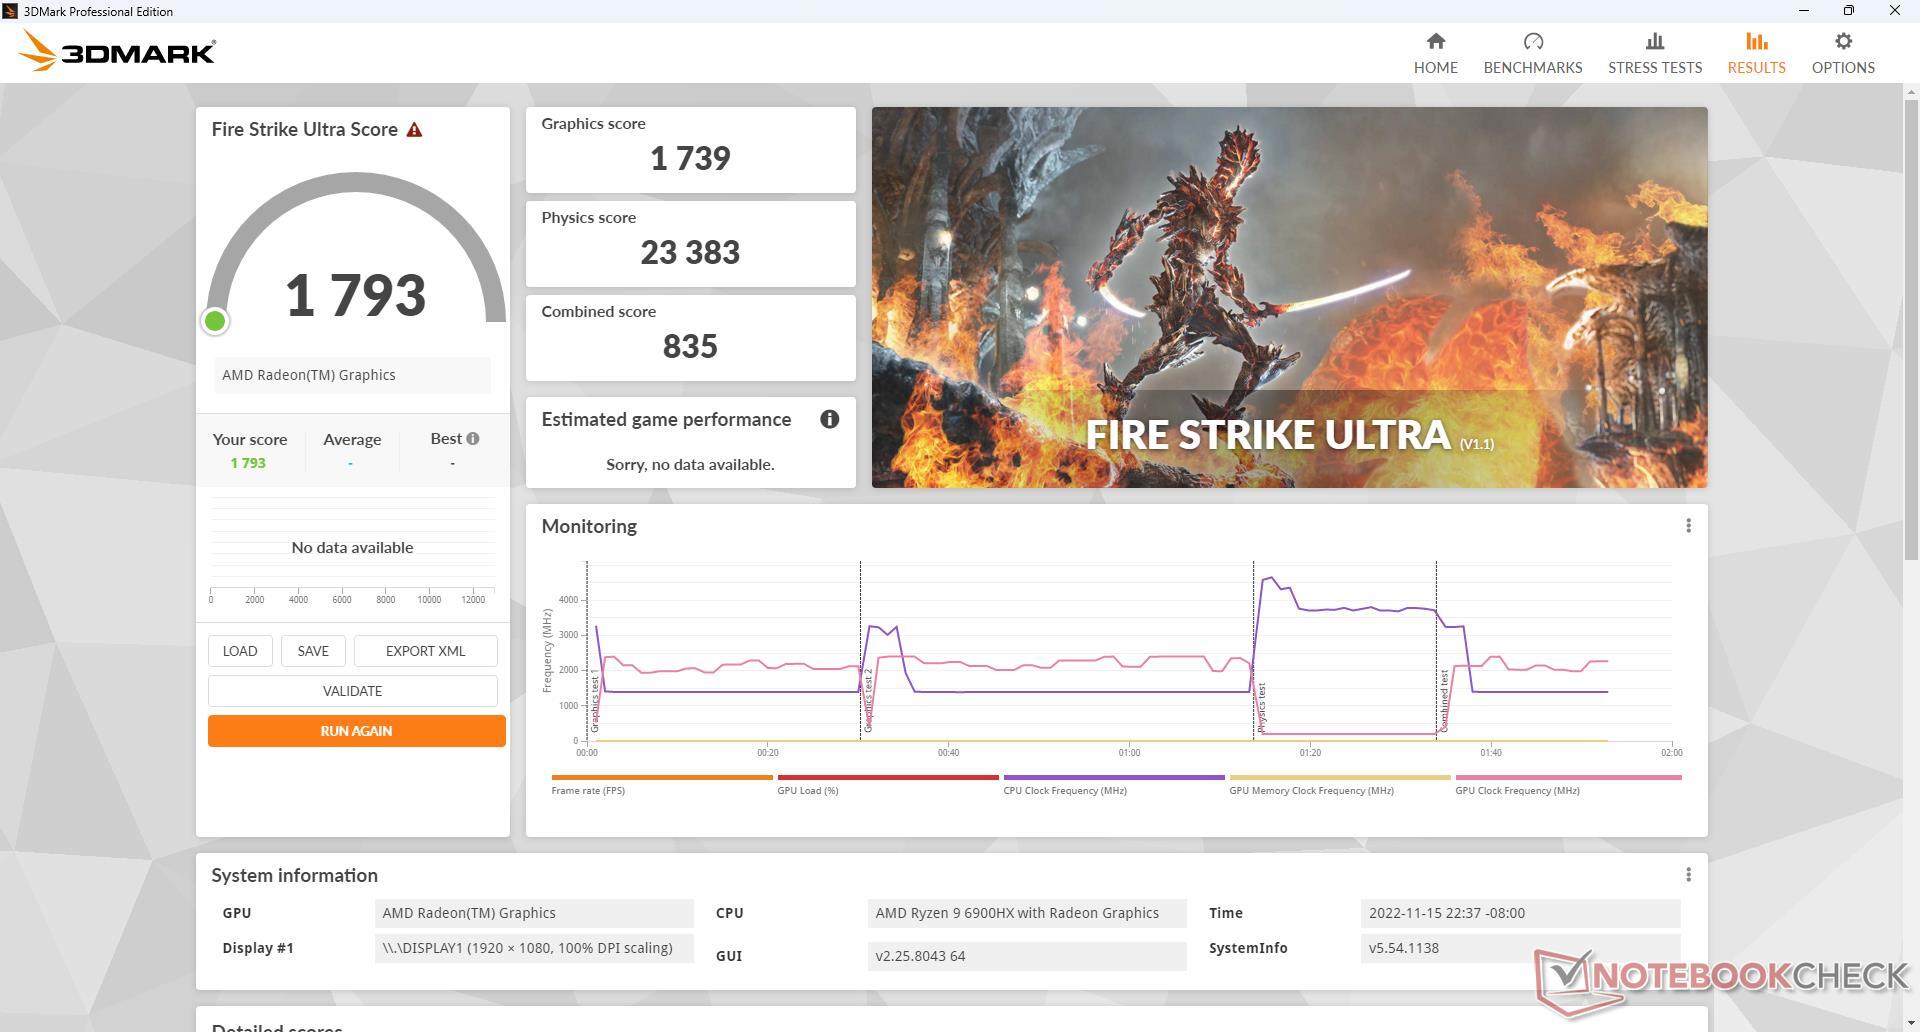
GPU性能 - 最快的集成图形
芯片 锐龙680M继续给人留下深刻印象,其结果是比即将推出的 Radeon RX Vega 8在上一代Ryzen 9 5900HX中。这使得新的集成AMD GPU远远领先于 任何英特尔Iris Xe 96 EUs解决方案50%或更多。专用的低端GPU,如GeForce GTX 1060或 GTX 1650仍然要快得多,但680M对于集成GPU来说还是令人印象深刻。大多数游戏都可以在1080p分辨率下以低到中的设置进行游戏,甚至包括赛博朋克2077。
| 3DMark | |
| 1920x1080 Fire Strike Graphics | |
| Intel NUC11PHKi7C | |
| Desktop PC Intel Xeon E5 2680v4 KFA2 GTX 1060 6GB | |
| KFA2 GeForce GTX 1650 EX One Click Plus | |
| Beelink GTR6 | |
| Average AMD Radeon 680M (3791 - 7706, n=41) | |
| Beelink SEi11 Pro | |
| Beelink GTR5 | |
| Intel NUC11TNKi5 | |
| GMK NucBox 2 | |
| 2560x1440 Time Spy Graphics | |
| Intel NUC11PHKi7C | |
| Desktop PC Intel Xeon E5 2680v4 KFA2 GTX 1060 6GB | |
| KFA2 GeForce GTX 1650 EX One Click Plus | |
| Beelink GTR6 | |
| Average AMD Radeon 680M (1359 - 2607, n=41) | |
| Beelink SEi11 Pro | |
| Beelink GTR5 | |
| Intel NUC11TNKi5 | |
| GMK NucBox 2 | |
| 2560x1440 Time Spy Score | |
| Intel NUC11PHKi7C | |
| Desktop PC Intel Xeon E5 2680v4 KFA2 GTX 1060 6GB | |
| KFA2 GeForce GTX 1650 EX One Click Plus | |
| Beelink GTR6 | |
| Average AMD Radeon 680M (1546 - 2914, n=41) | |
| Beelink GTR5 | |
| Beelink SEi11 Pro | |
| Intel NUC11TNKi5 | |
| GMK NucBox 2 | |
| 3DMark 11 - 1280x720 Performance GPU | |
| Intel NUC11PHKi7C | |
| Desktop PC Intel Xeon E5 2680v4 KFA2 GTX 1060 6GB | |
| KFA2 GeForce GTX 1650 EX One Click Plus | |
| Beelink GTR6 | |
| Average AMD Radeon 680M (6858 - 11755, n=39) | |
| Beelink GTR5 | |
| Beelink SEi11 Pro | |
| Intel NUC11TNKi5 | |
| GMK NucBox 2 | |
| 3DMark 11 Performance | 10640 points | |
| 3DMark Cloud Gate Standard Score | 32988 points | |
| 3DMark Fire Strike Score | 6424 points | |
| 3DMark Time Spy Score | 2735 points | |
Help | ||
| Blender | |
| v3.3 Classroom HIP/AMD | |
| Beelink GTR6 | |
| Average AMD Radeon 680M (270 - 555, n=34) | |
| v3.3 Classroom CPU | |
| Beelink SEi11 Pro | |
| Average AMD Radeon 680M (389 - 980, n=37) | |
| Beelink GTR6 | |
* ... smaller is better
| Performance rating - Percent | |
| Intel NUC11PHKi7C | |
| Beelink GTR6 | |
| Beelink GTR5 | |
| Beelink SEi11 Pro -1! | |
| Intel NUC11TNKi5 -3! | |
| GMK NucBox 2 -3! | |
| The Witcher 3 - 1920x1080 Ultra Graphics & Postprocessing (HBAO+) | |
| Intel NUC11PHKi7C | |
| Beelink GTR6 | |
| Beelink GTR5 | |
| Beelink SEi11 Pro | |
| GTA V - 1920x1080 Highest AA:4xMSAA + FX AF:16x | |
| Intel NUC11PHKi7C | |
| Beelink GTR6 | |
| Beelink GTR5 | |
| Final Fantasy XV Benchmark - 1920x1080 High Quality | |
| Intel NUC11PHKi7C | |
| Beelink GTR6 | |
| Beelink GTR5 | |
| Beelink SEi11 Pro | |
| Intel NUC11TNKi5 | |
| GMK NucBox 2 | |
| Strange Brigade - 1920x1080 ultra AA:ultra AF:16 | |
| Intel NUC11PHKi7C | |
| Beelink GTR6 | |
| Beelink GTR5 | |
| Beelink SEi11 Pro | |
| Dota 2 Reborn - 1920x1080 ultra (3/3) best looking | |
| Intel NUC11PHKi7C | |
| Beelink GTR6 | |
| Beelink GTR5 | |
| Beelink SEi11 Pro | |
| Intel NUC11TNKi5 | |
| GMK NucBox 2 | |
| X-Plane 11.11 - 1920x1080 high (fps_test=3) | |
| Intel NUC11PHKi7C | |
| Beelink GTR6 | |
| Beelink GTR5 | |
| Beelink SEi11 Pro | |
| Intel NUC11TNKi5 | |
| GMK NucBox 2 | |
| Final Fantasy XV Benchmark | |
| 1280x720 Lite Quality | |
| Intel NUC11PHKi7C | |
| Beelink GTR6 | |
| Average AMD Radeon 680M (34.4 - 74.7, n=39) | |
| Beelink GTR5 | |
| Beelink SEi11 Pro | |
| Intel NUC11TNKi5 | |
| GMK NucBox 2 | |
| 1920x1080 Standard Quality | |
| Intel NUC11PHKi7C | |
| Beelink GTR6 | |
| Average AMD Radeon 680M (18.3 - 36.9, n=40) | |
| Beelink GTR5 | |
| Beelink SEi11 Pro | |
| Intel NUC11TNKi5 | |
| GMK NucBox 2 | |
| 1920x1080 High Quality | |
| Intel NUC11PHKi7C | |
| Beelink GTR6 | |
| Average AMD Radeon 680M (12.9 - 26.2, n=40) | |
| Beelink GTR5 | |
| Beelink SEi11 Pro | |
| Intel NUC11TNKi5 | |
| GMK NucBox 2 | |
| The Witcher 3 | |
| 1024x768 Low Graphics & Postprocessing | |
| Intel NUC11PHKi7C | |
| Beelink GTR6 | |
| Average AMD Radeon 680M (67.4 - 150, n=31) | |
| Beelink SEi11 Pro | |
| Beelink GTR5 | |
| Intel NUC11TNKi5 | |
| 1366x768 Medium Graphics & Postprocessing | |
| Intel NUC11PHKi7C | |
| Beelink GTR6 | |
| Average AMD Radeon 680M (44.5 - 85.3, n=24) | |
| Beelink GTR5 | |
| Beelink SEi11 Pro | |
| 1920x1080 High Graphics & Postprocessing (Nvidia HairWorks Off) | |
| Intel NUC11PHKi7C | |
| Beelink GTR6 | |
| Average AMD Radeon 680M (22.3 - 48, n=33) | |
| Beelink SEi11 Pro | |
| Beelink GTR5 | |
| 1920x1080 Ultra Graphics & Postprocessing (HBAO+) | |
| Intel NUC11PHKi7C | |
| Beelink GTR6 | |
| Average AMD Radeon 680M (14.3 - 27.1, n=33) | |
| Beelink GTR5 | |
| Beelink SEi11 Pro | |
| GTA V | |
| 1024x768 Lowest Settings possible | |
| Intel NUC11PHKi7C | |
| Beelink GTR6 | |
| Beelink GTR5 | |
| Average AMD Radeon 680M (67.7 - 155.4, n=35) | |
| Beelink SEi11 Pro | |
| 1920x1080 Lowest Settings possible | |
| Intel NUC11PHKi7C | |
| Beelink GTR6 | |
| Average AMD Radeon 680M (56.9 - 115.8, n=27) | |
| Beelink GTR5 | |
| Beelink SEi11 Pro | |
| 1366x768 Normal/Off AF:4x | |
| Intel NUC11PHKi7C | |
| Beelink GTR6 | |
| Beelink GTR5 | |
| Average AMD Radeon 680M (60.7 - 143.9, n=32) | |
| Beelink SEi11 Pro | |
| 1920x1080 Normal/Off AF:4x | |
| Intel NUC11PHKi7C | |
| Beelink GTR6 | |
| Average AMD Radeon 680M (54.9 - 117.3, n=27) | |
| Beelink GTR5 | |
| Beelink SEi11 Pro | |
| 1920x1080 High/On (Advanced Graphics Off) AA:2xMSAA + FX AF:8x | |
| Intel NUC11PHKi7C | |
| Beelink GTR6 | |
| Average AMD Radeon 680M (25.9 - 99.1, n=37) | |
| Beelink GTR5 | |
| Beelink SEi11 Pro | |
| 1920x1080 Highest AA:4xMSAA + FX AF:16x | |
| Intel NUC11PHKi7C | |
| Beelink GTR6 | |
| Average AMD Radeon 680M (11.3 - 25.3, n=37) | |
| Beelink GTR5 | |
| Dota 2 Reborn | |
| 1280x720 min (0/3) fastest | |
| Beelink GTR6 | |
| Intel NUC11PHKi7C | |
| Beelink GTR5 | |
| Beelink SEi11 Pro | |
| Average AMD Radeon 680M (34.4 - 146.2, n=41) | |
| GMK NucBox 2 | |
| Intel NUC11TNKi5 | |
| 1366x768 med (1/3) | |
| Intel NUC11PHKi7C | |
| Beelink GTR6 | |
| Beelink GTR5 | |
| Average AMD Radeon 680M (33.3 - 121.4, n=41) | |
| Beelink SEi11 Pro | |
| GMK NucBox 2 | |
| Intel NUC11TNKi5 | |
| 1920x1080 high (2/3) | |
| Intel NUC11PHKi7C | |
| Beelink GTR6 | |
| Average AMD Radeon 680M (33.2 - 89.1, n=41) | |
| Beelink GTR5 | |
| Beelink SEi11 Pro | |
| Intel NUC11TNKi5 | |
| GMK NucBox 2 | |
| 1920x1080 ultra (3/3) best looking | |
| Intel NUC11PHKi7C | |
| Beelink GTR6 | |
| Average AMD Radeon 680M (33.2 - 84.9, n=41) | |
| Beelink GTR5 | |
| Beelink SEi11 Pro | |
| Intel NUC11TNKi5 | |
| GMK NucBox 2 | |
| Cyberpunk 2077 1.6 | |
| 1280x720 Low Preset | |
| Beelink GTR6 | |
| Average AMD Radeon 680M (46.1 - 77.6, n=14) | |
| 1920x1080 Low Preset | |
| Beelink GTR6 | |
| Average AMD Radeon 680M (26 - 50.6, n=15) | |
| Beelink SEi11 Pro | |
| 1920x1080 Medium Preset | |
| Beelink GTR6 | |
| Average AMD Radeon 680M (20.1 - 41.8, n=15) | |
| Beelink SEi11 Pro | |
| 1920x1080 High Preset | |
| Beelink GTR6 | |
| Average AMD Radeon 680M (16.3 - 33.6, n=15) | |
| Beelink SEi11 Pro | |
| 1920x1080 Ultra Preset | |
| Beelink GTR6 | |
| Average AMD Radeon 680M (14 - 23.8, n=15) | |
| Beelink SEi11 Pro | |
| X-Plane 11.11 | |
| 1280x720 low (fps_test=1) | |
| Intel NUC11PHKi7C | |
| Beelink GTR6 | |
| Beelink GTR5 | |
| Beelink SEi11 Pro | |
| Average AMD Radeon 680M (26.8 - 66.7, n=41) | |
| Intel NUC11TNKi5 | |
| GMK NucBox 2 | |
| 1920x1080 med (fps_test=2) | |
| Intel NUC11PHKi7C | |
| Beelink GTR6 | |
| Beelink GTR5 | |
| Average AMD Radeon 680M (21.1 - 53.1, n=41) | |
| Beelink SEi11 Pro | |
| Intel NUC11TNKi5 | |
| GMK NucBox 2 | |
| 1920x1080 high (fps_test=3) | |
| Intel NUC11PHKi7C | |
| Beelink GTR6 | |
| Beelink GTR5 | |
| Beelink SEi11 Pro | |
| Average AMD Radeon 680M (16.6 - 44.5, n=41) | |
| Intel NUC11TNKi5 | |
| GMK NucBox 2 | |
| Strange Brigade | |
| 1280x720 lowest AF:1 | |
| Intel NUC11PHKi7C | |
| Beelink GTR6 | |
| Average AMD Radeon 680M (72.9 - 167.5, n=38) | |
| Beelink GTR5 | |
| Beelink SEi11 Pro | |
| 1920x1080 medium AA:medium AF:4 | |
| Intel NUC11PHKi7C | |
| Beelink GTR6 | |
| Average AMD Radeon 680M (30 - 63, n=38) | |
| Beelink GTR5 | |
| Beelink SEi11 Pro | |
| 1920x1080 high AA:high AF:8 | |
| Intel NUC11PHKi7C | |
| Beelink GTR6 | |
| Average AMD Radeon 680M (25.3 - 53.1, n=38) | |
| Beelink GTR5 | |
| Beelink SEi11 Pro | |
| 1920x1080 ultra AA:ultra AF:16 | |
| Intel NUC11PHKi7C | |
| Beelink GTR6 | |
| Average AMD Radeon 680M (22 - 46, n=38) | |
| Beelink GTR5 | |
| Beelink SEi11 Pro | |
Witcher 3 FPS Chart
| low | med. | high | ultra | |
|---|---|---|---|---|
| GTA V (2015) | 152.6 | 138 | 51.8 | 23.7 |
| The Witcher 3 (2015) | 139.2 | 84 | 46 | 27.1 |
| Dota 2 Reborn (2015) | 141.9 | 112.7 | 80.9 | 71.4 |
| Final Fantasy XV Benchmark (2018) | 68.5 | 34.9 | 24.5 | |
| X-Plane 11.11 (2018) | 64.8 | 52.6 | 41.8 | |
| Strange Brigade (2018) | 142.4 | 57.4 | 48.5 | 41.6 |
| Cyberpunk 2077 1.6 (2022) | 43 | 33 | 22.3 | 17.5 |
排放
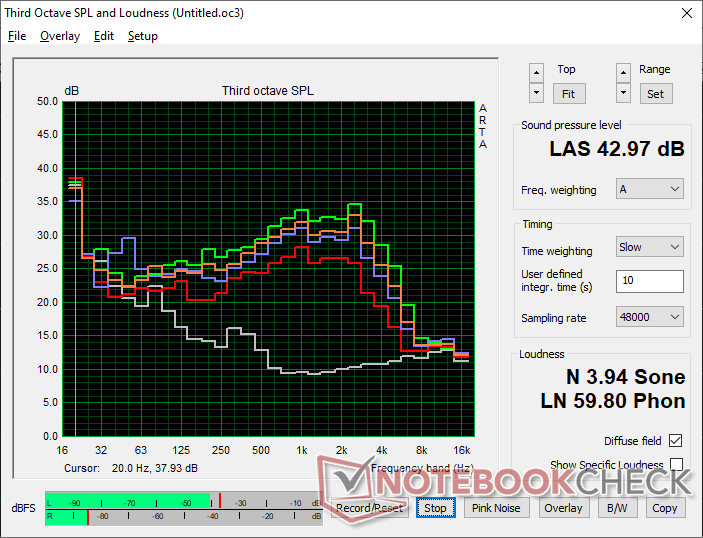
系统噪音
风扇噪音也许是最需要制造商注意的。GTR6在23 dB(A)到高达36 dB(A)之间不断跳动,即使在没有屏幕活动时也是如此。如果只是简单的网络浏览或视频流,风扇噪音的变化是明显的,而且令人分心。大多数其他迷你电脑的风扇控制和转速行为都比GTR6优越。
在游戏时,风扇噪音会稳定在40dB(A)的范围内,这至少可以与许多超极本和类似测试条件下的老款GTR5相媲美。只是太糟糕的是,在低到中度负荷时,风扇的脉冲如此频繁。
Noise level
| Idle |
| 23.6 / 23.8 / 36.2 dB(A) |
| Load |
| 39.7 / 43 dB(A) |
 | ||
30 dB silent 40 dB(A) audible 50 dB(A) loud |
||
min: | ||
| Beelink GTR6 Radeon 680M, R9 6900HX, Kingston KC3000 512G SKC3000S512G | Beelink SEi11 Pro Iris Xe G7 96EUs, i5-11320H, Kingston NV1 SNVS/500GCN | Beelink GTR5 Vega 8, R9 5900HX, Kingston NV1 SNVS/500GCN | Intel NUC11PHKi7C GeForce RTX 2060 Mobile, i7-1165G7, Samsung SSD 980 Pro 500GB MZ-V8P500BW | Intel NUC11TNKi5 Iris Xe G7 80EUs, i5-1135G7, Transcend M.2 SSD 430S TS512GMTS430S | GMK NucBox 2 Iris Plus Graphics 655, i5-8259U, Netac S930E8/256GPN | |
|---|---|---|---|---|---|---|
| Noise | 10% | -14% | 2% | -14% | 5% | |
| off / environment * (dB) | 23.2 | 22.8 2% | 23.1 -0% | 24.5 -6% | 24.8 -7% | 25.6 -10% |
| Idle Minimum * (dB) | 23.6 | 24.7 -5% | 34.2 -45% | 25.3 -7% | 35.6 -51% | 25.7 -9% |
| Idle Average * (dB) | 23.8 | 24.7 -4% | 34.2 -44% | 25.3 -6% | 35.6 -50% | 25.7 -8% |
| Idle Maximum * (dB) | 36.2 | 25.3 30% | 34.2 6% | 25.3 30% | 35.6 2% | 25.7 29% |
| Load Average * (dB) | 39.7 | 33.2 16% | 44.6 -12% | 36.4 8% | 36.2 9% | 35.3 11% |
| Witcher 3 ultra * (dB) | 41 | 34.5 16% | 41.4 -1% | 39.7 3% | 38 7% | |
| Load Maximum * (dB) | 43 | 37.8 12% | 45.1 -5% | 47.9 -11% | 47.6 -11% | 35.1 18% |
* ... smaller is better
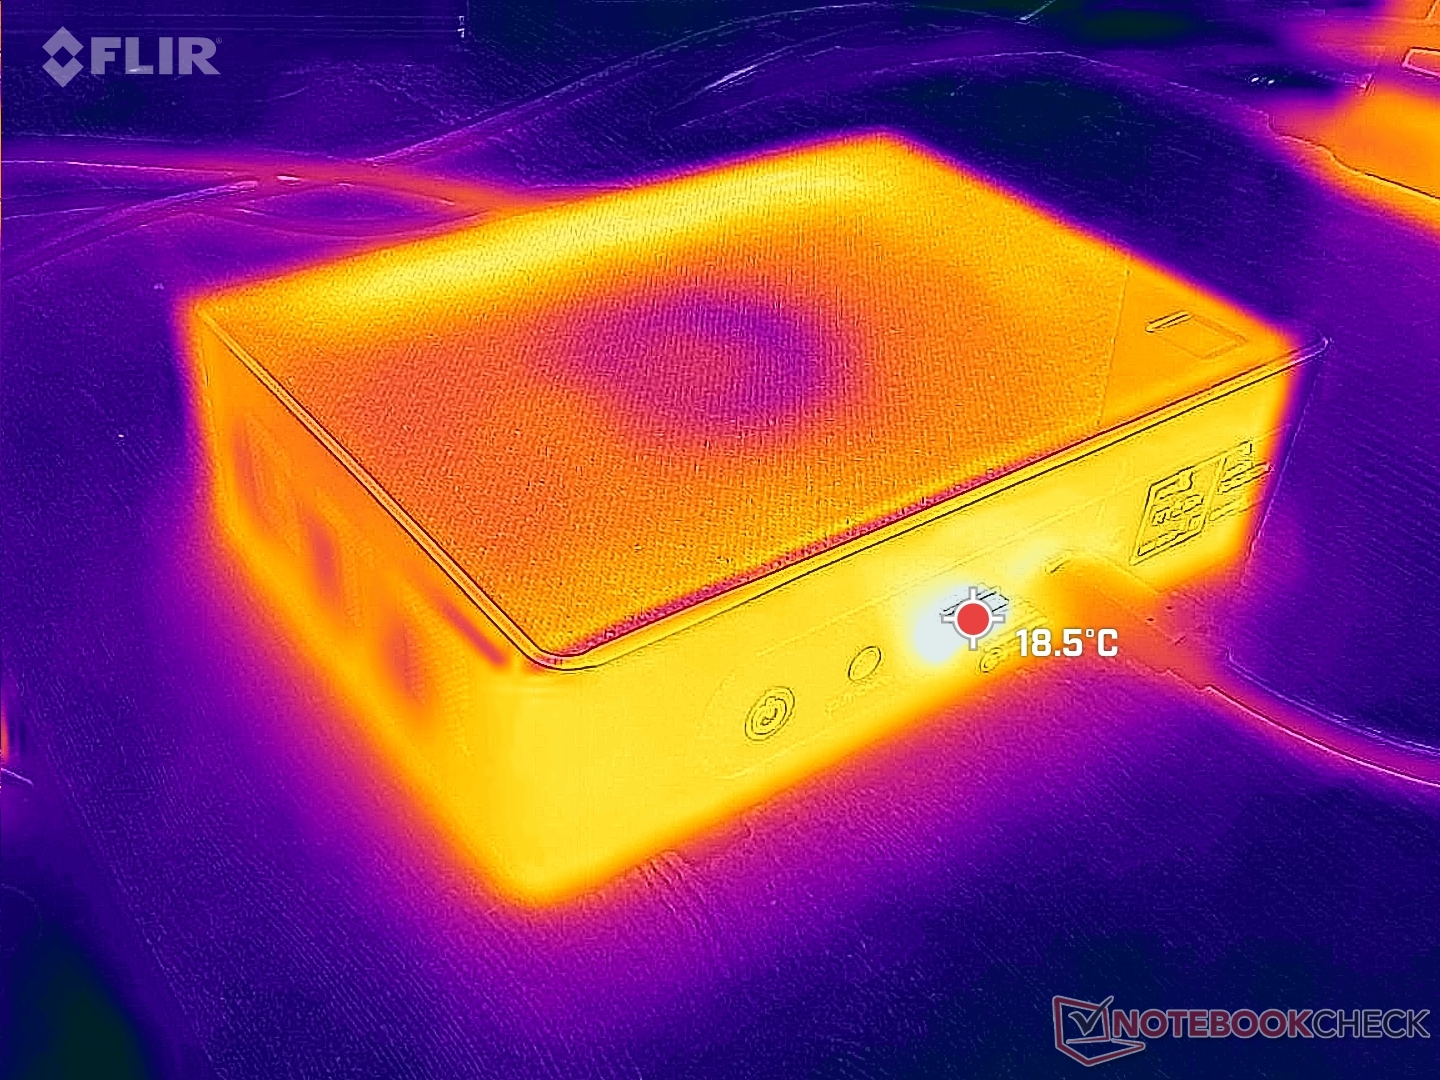
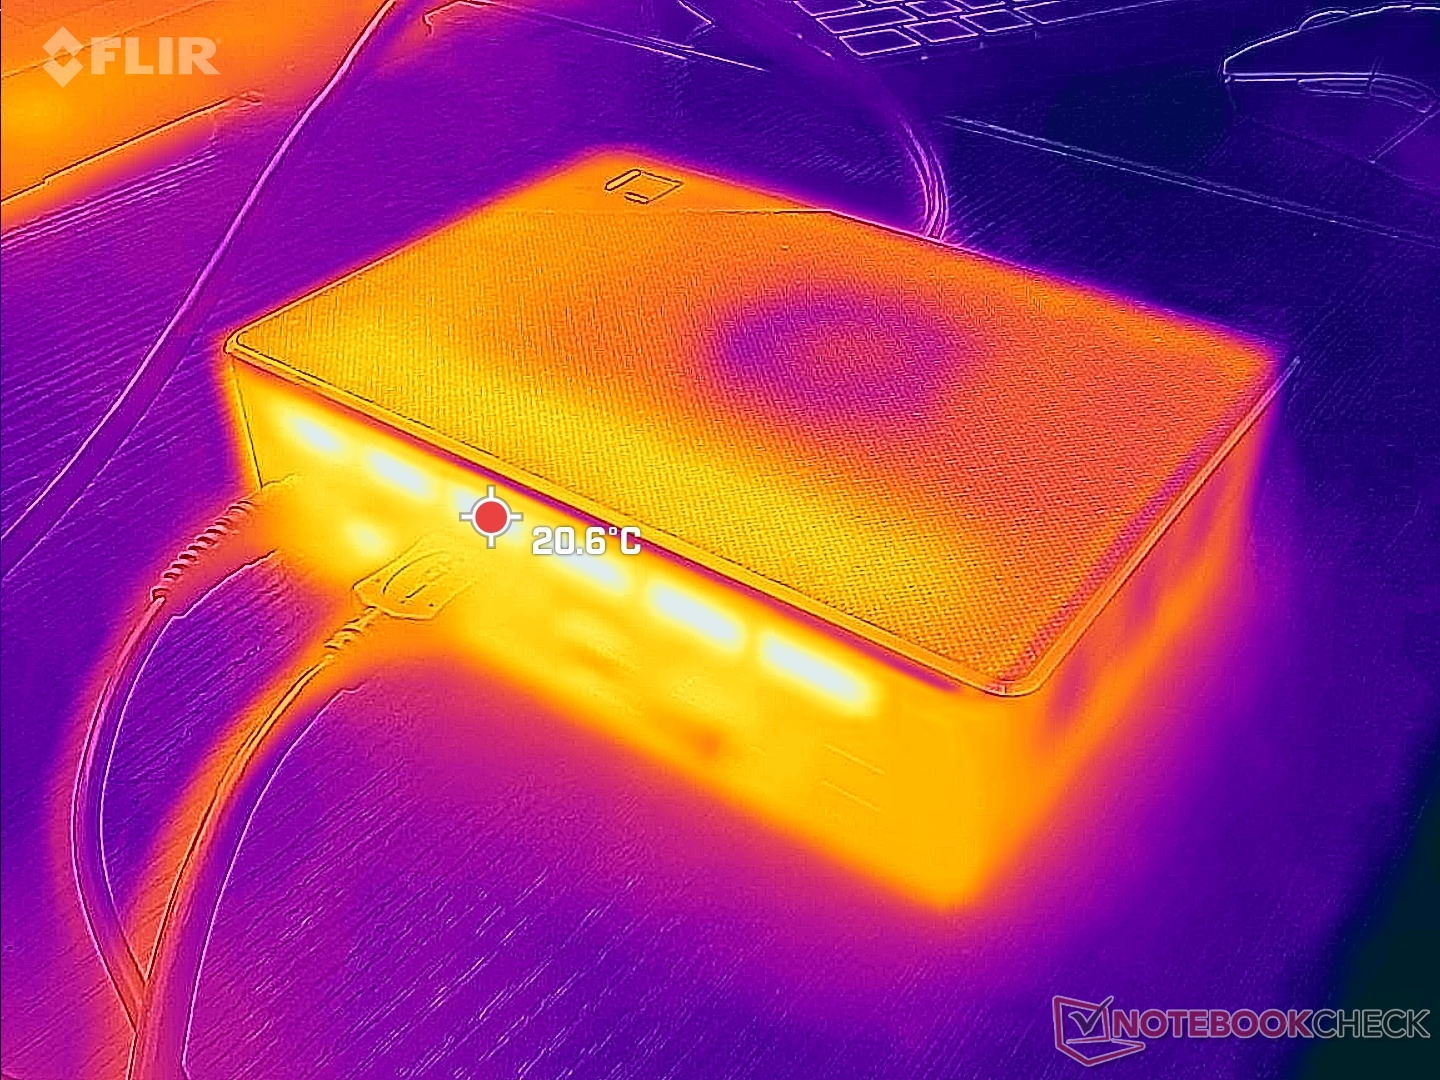
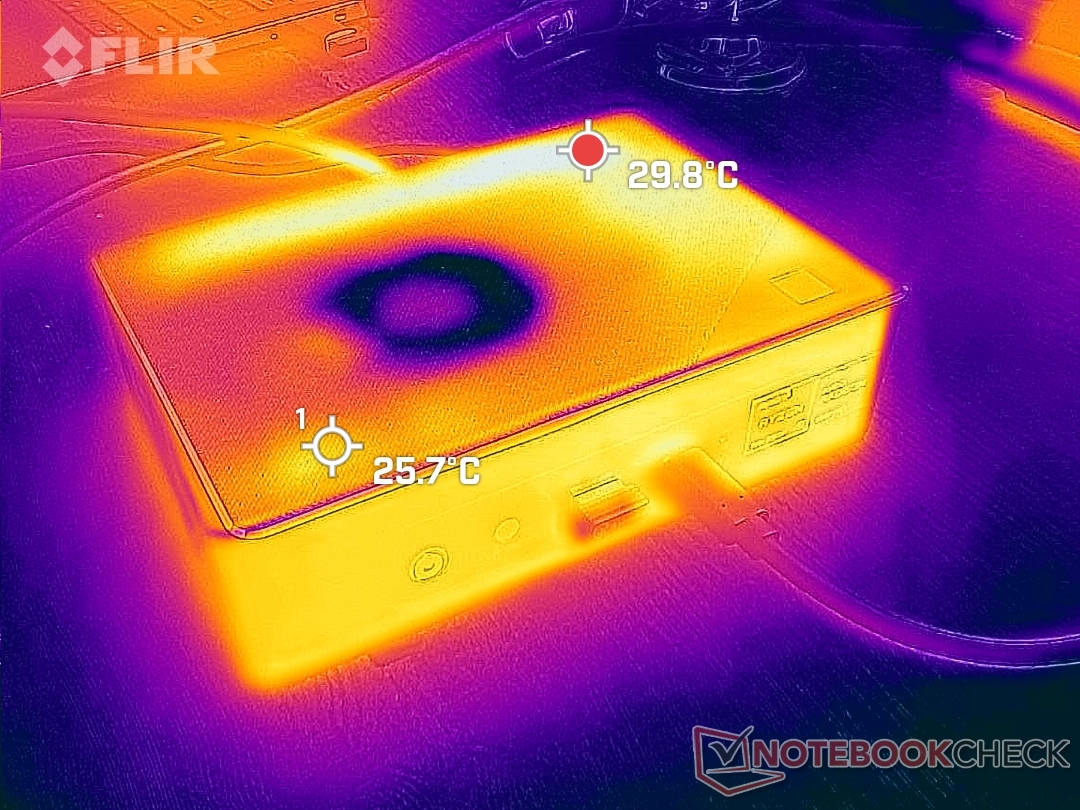
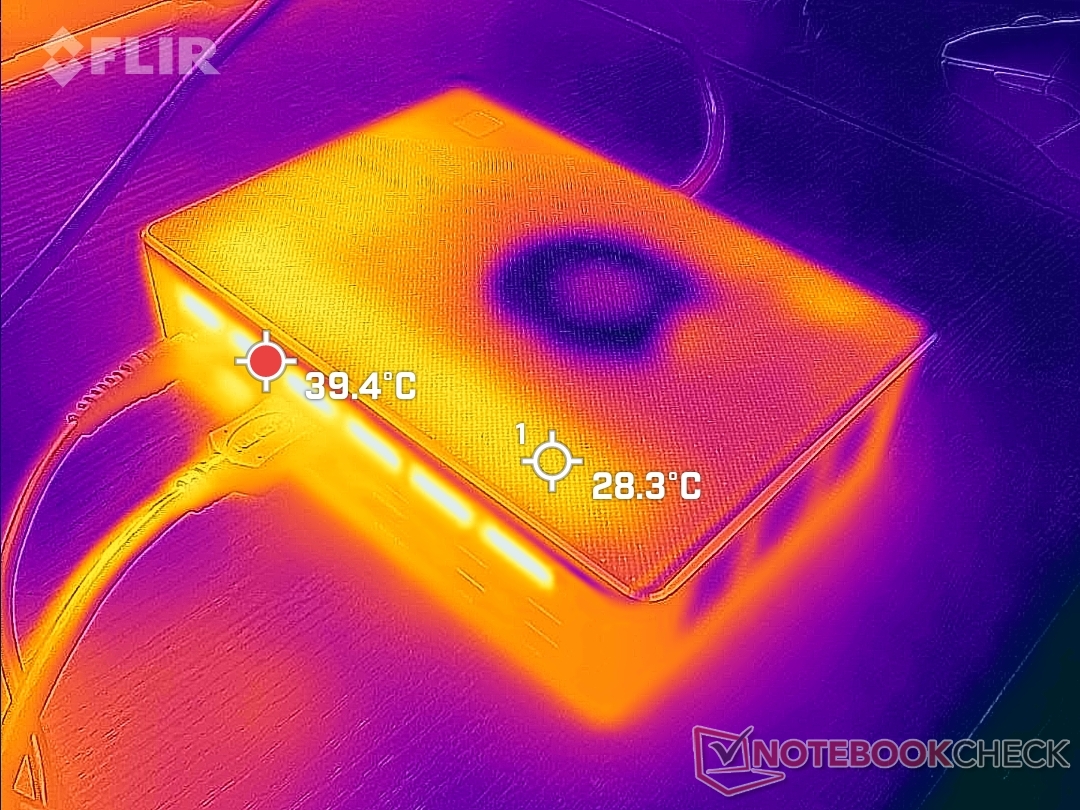
温度
表面温度不是问题,因为它的温度绝不会让人感到不舒服。然而,请记住,冷空气是从顶部进入的,因此不建议在设备顶部放置任何书籍或物品。请确保在设备后面留有足够的空间,因为废热从这里流出。
压力测试
当使用Prime95时,CPU会在几秒钟内提升到3.4GHz和45W,然后稳定在3.1GHz、38W和66C。由于制造商在默认设置时似乎设置了一个保守的温度上限,所以肯定有最终用户超频的空间。
GPU时钟频率和温度将分别稳定在1977MHz和相当凉爽的56C,当运行时 Witcher 3以代表典型的游戏负载。
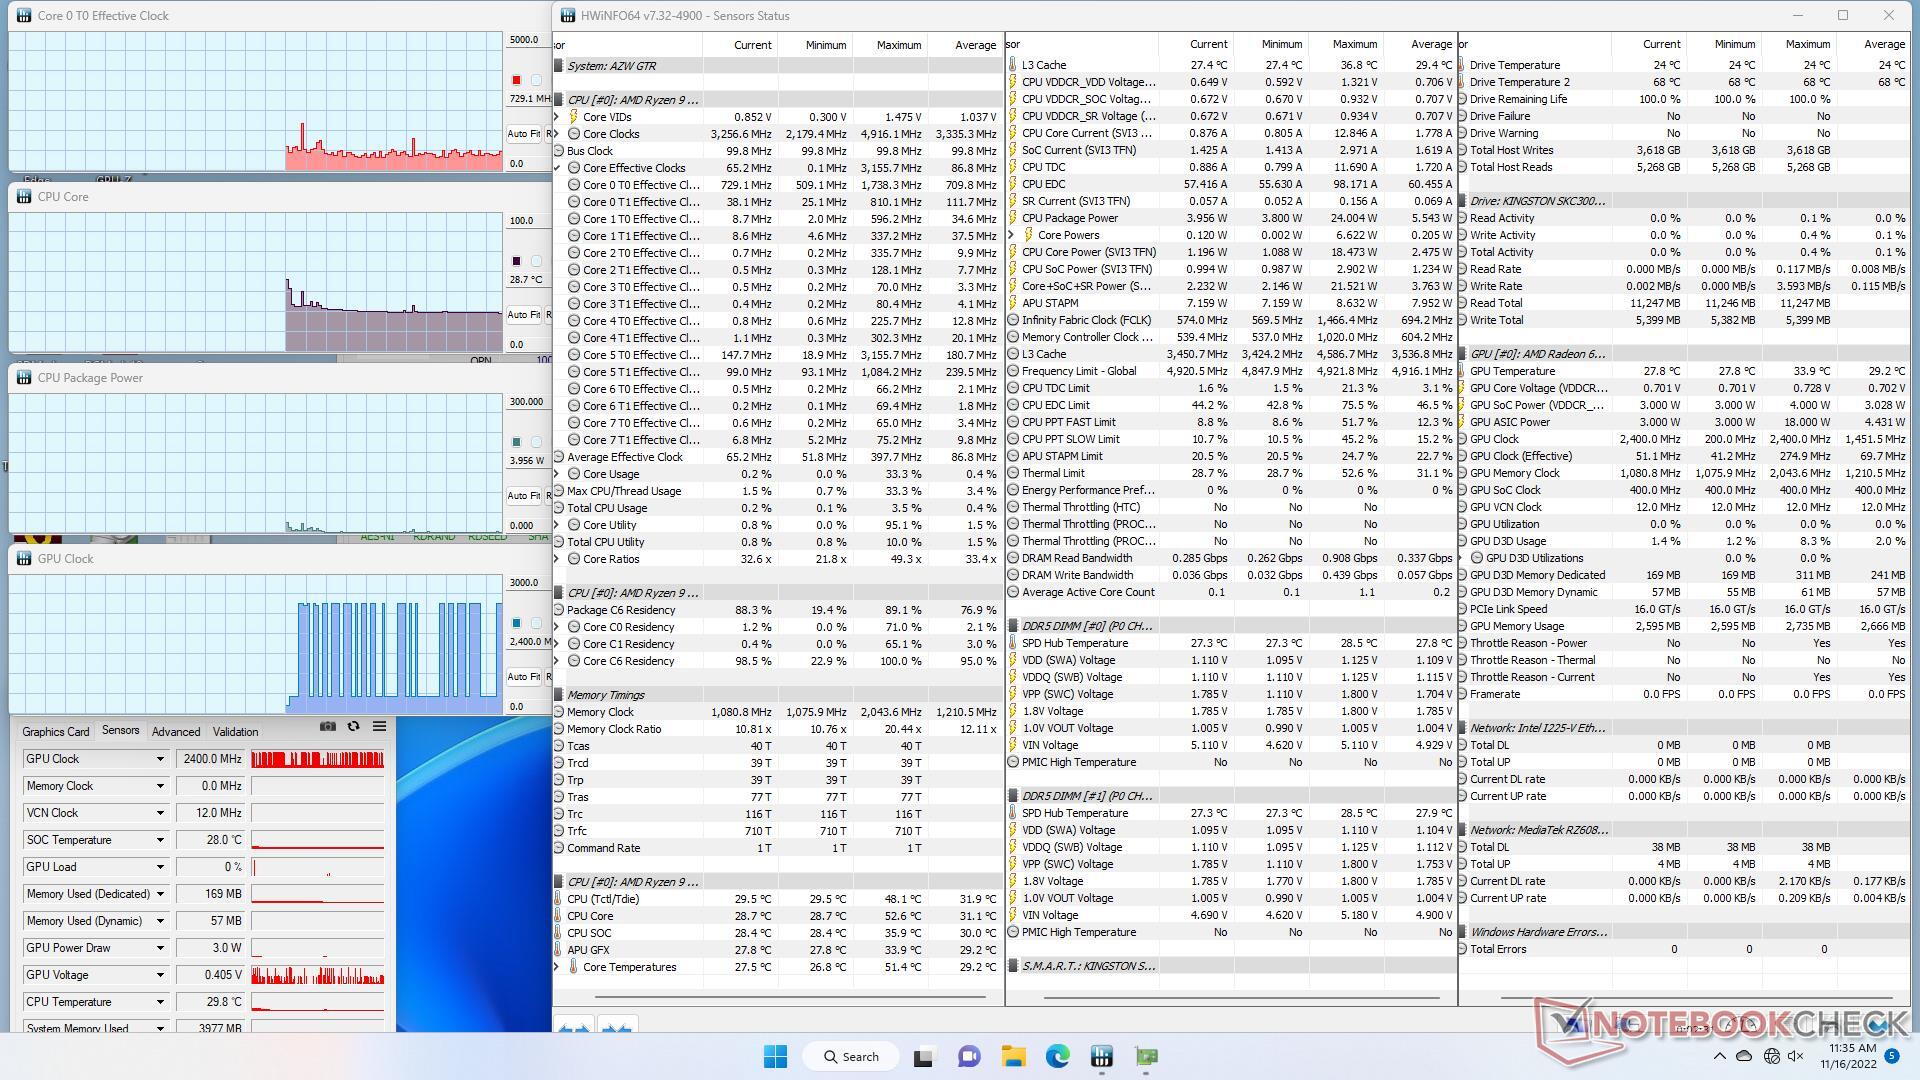
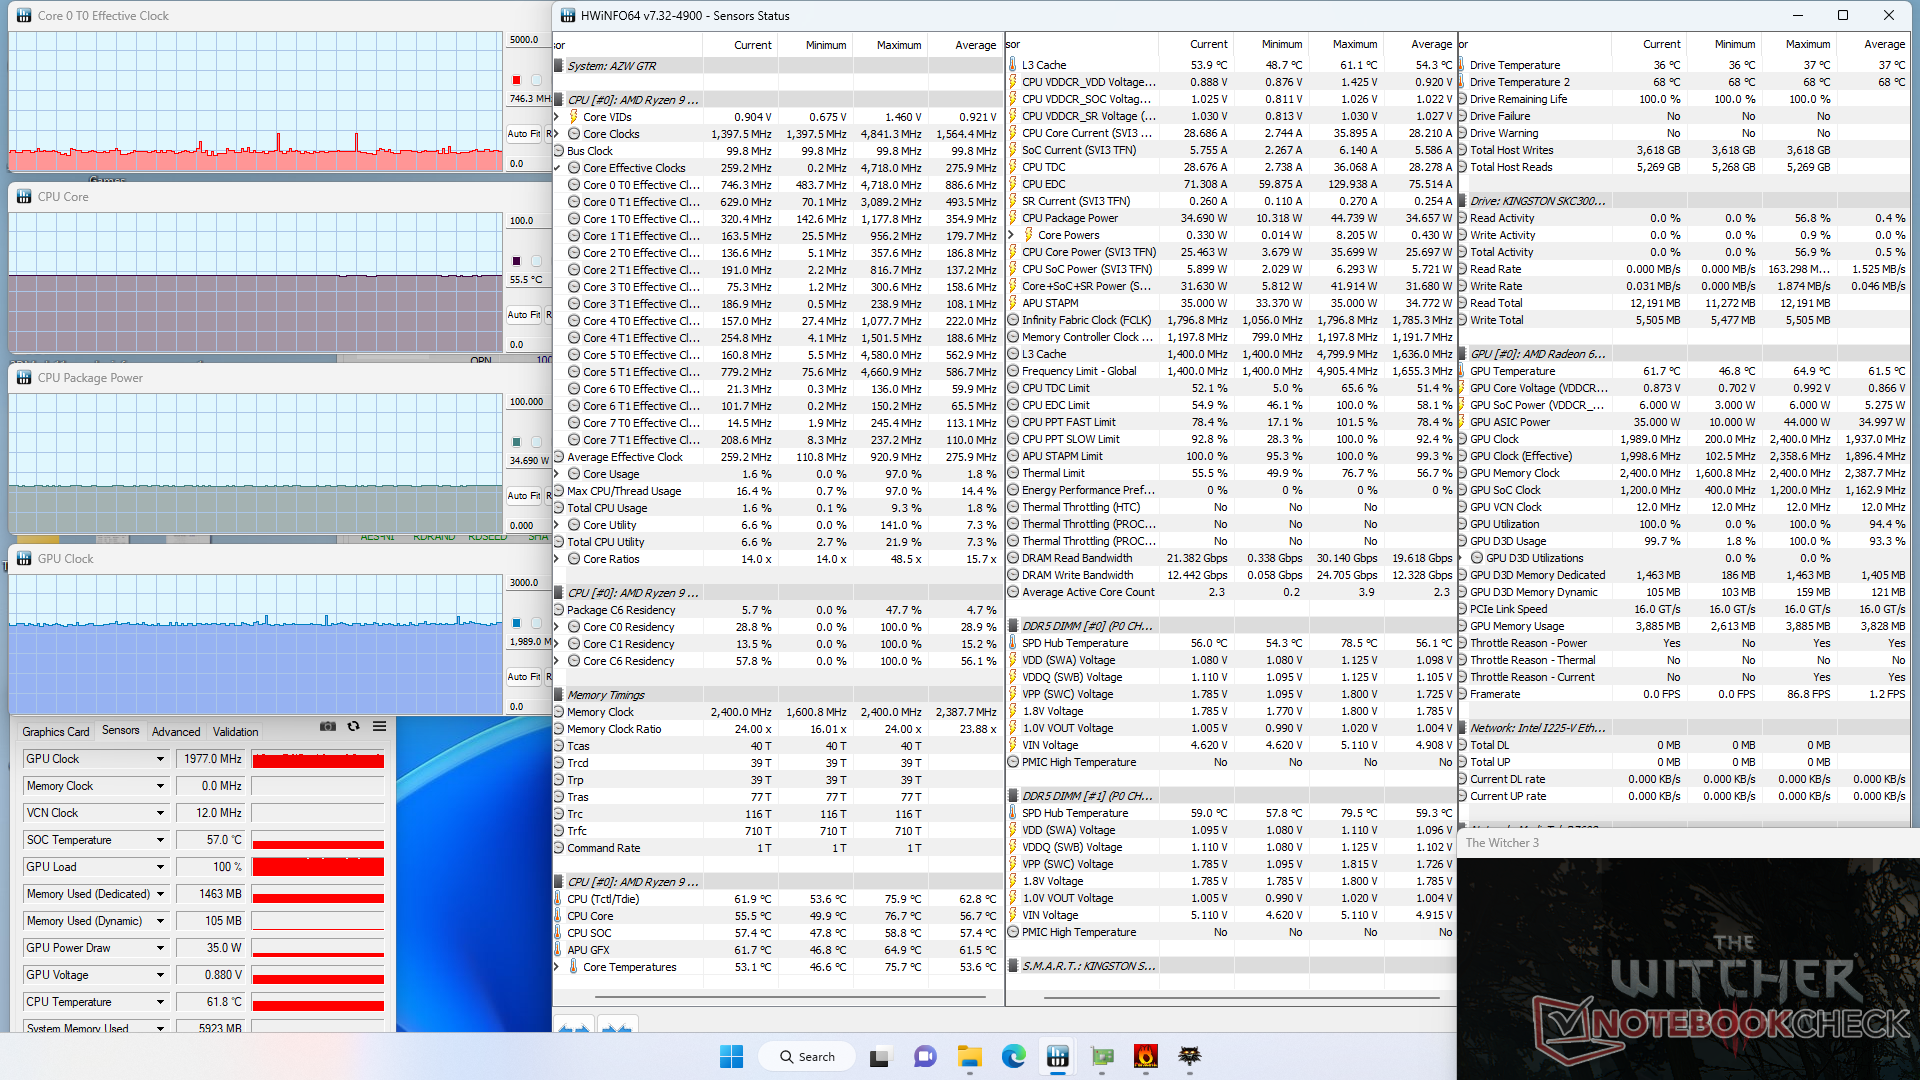
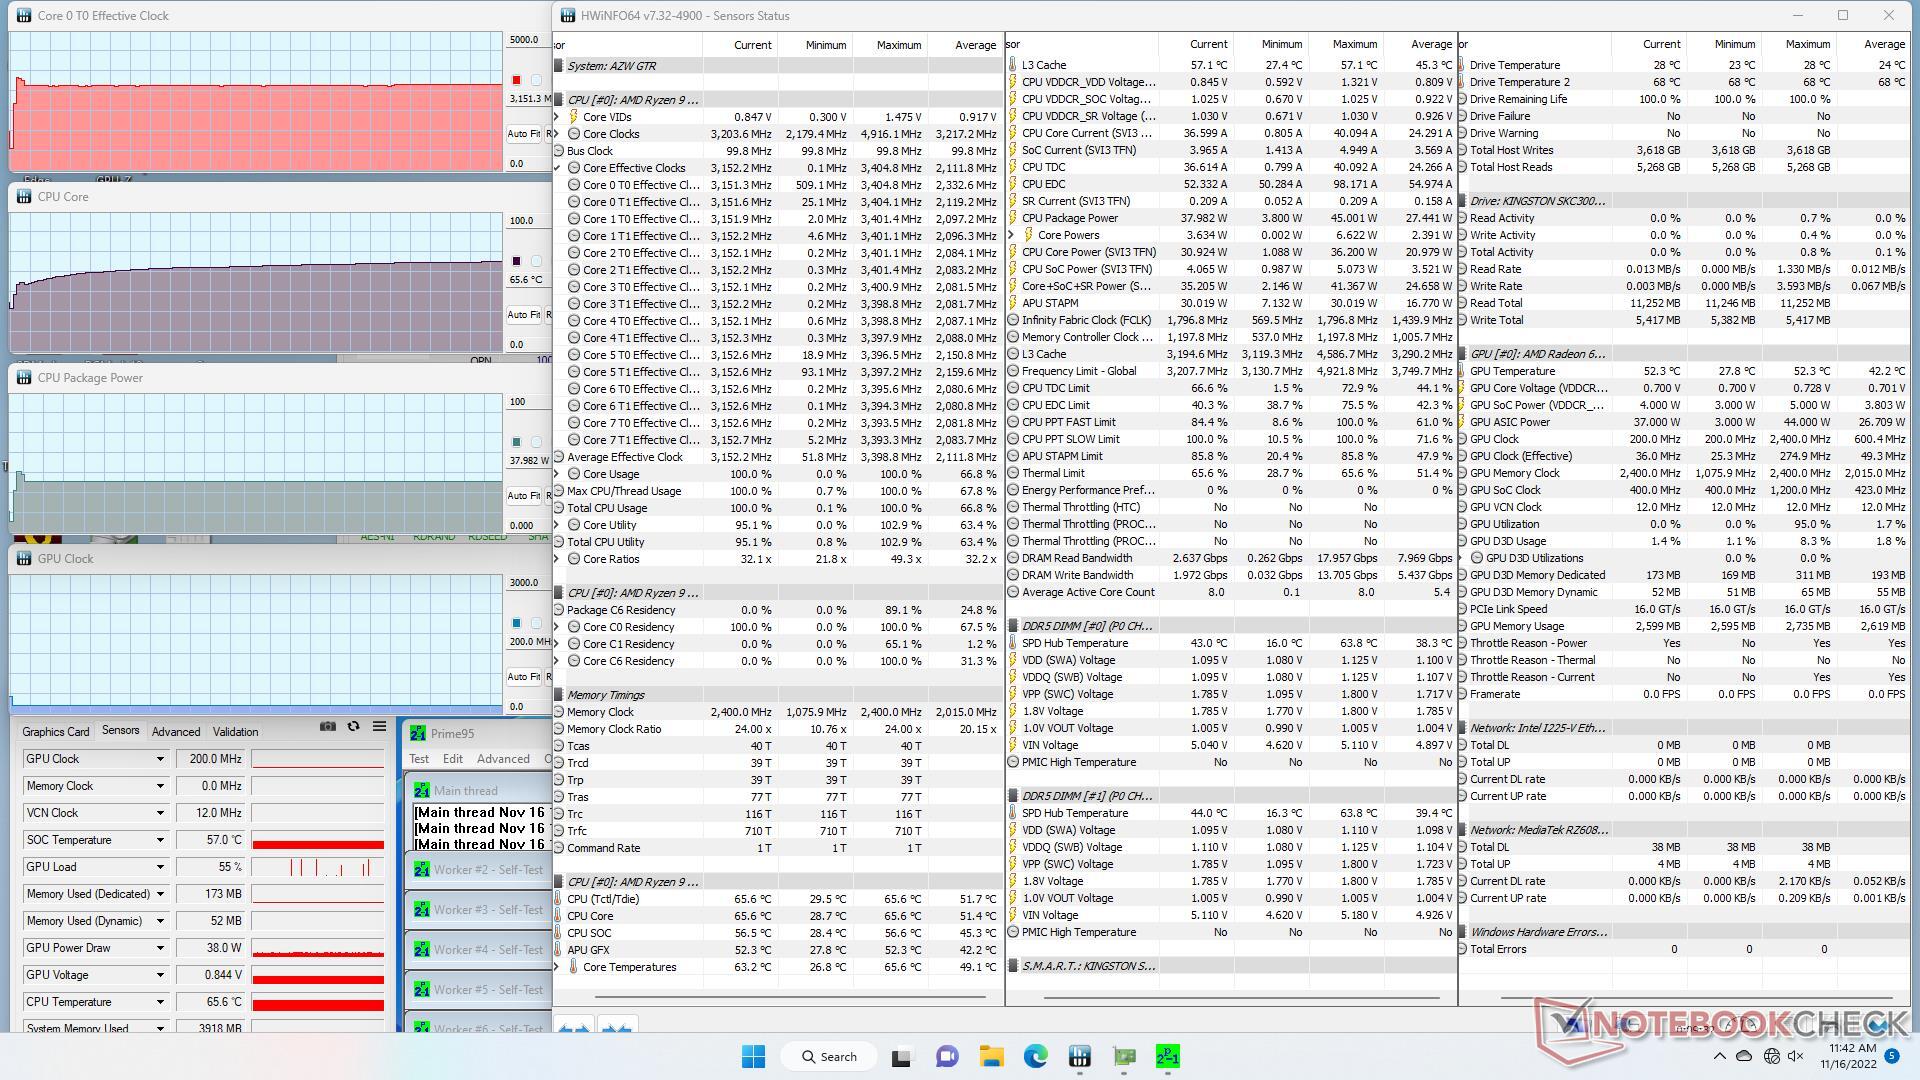
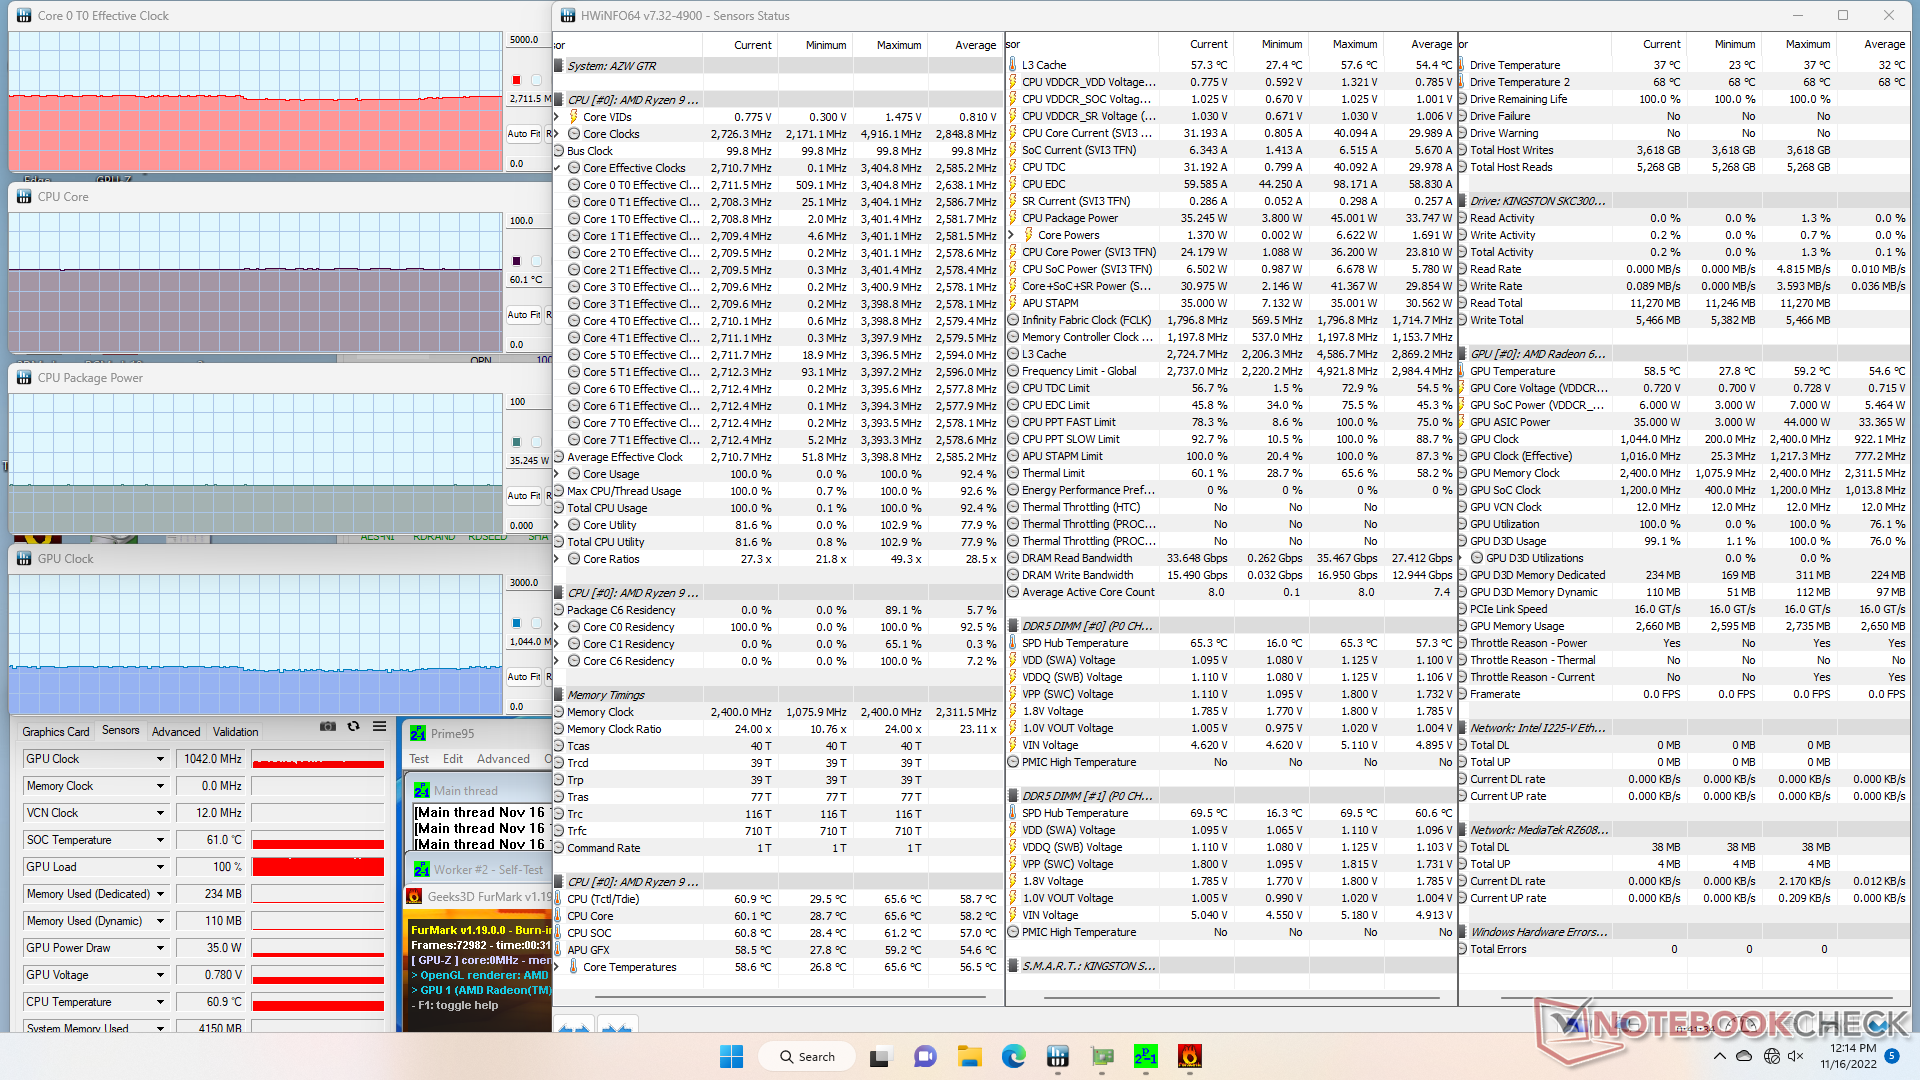
| CPU时钟(GHz) | GPU时钟(MHz) | CPU平均温度(°C) | |
| 系统空闲 | -- | -- | 28 |
| Prime95压力 | 3.2 | -- | 66 |
| Prime95 + FurMark 压力 | 2.7 | 1042 | 60 |
| Witcher 3 应力 | ~0.8 | 1977 | 56 |
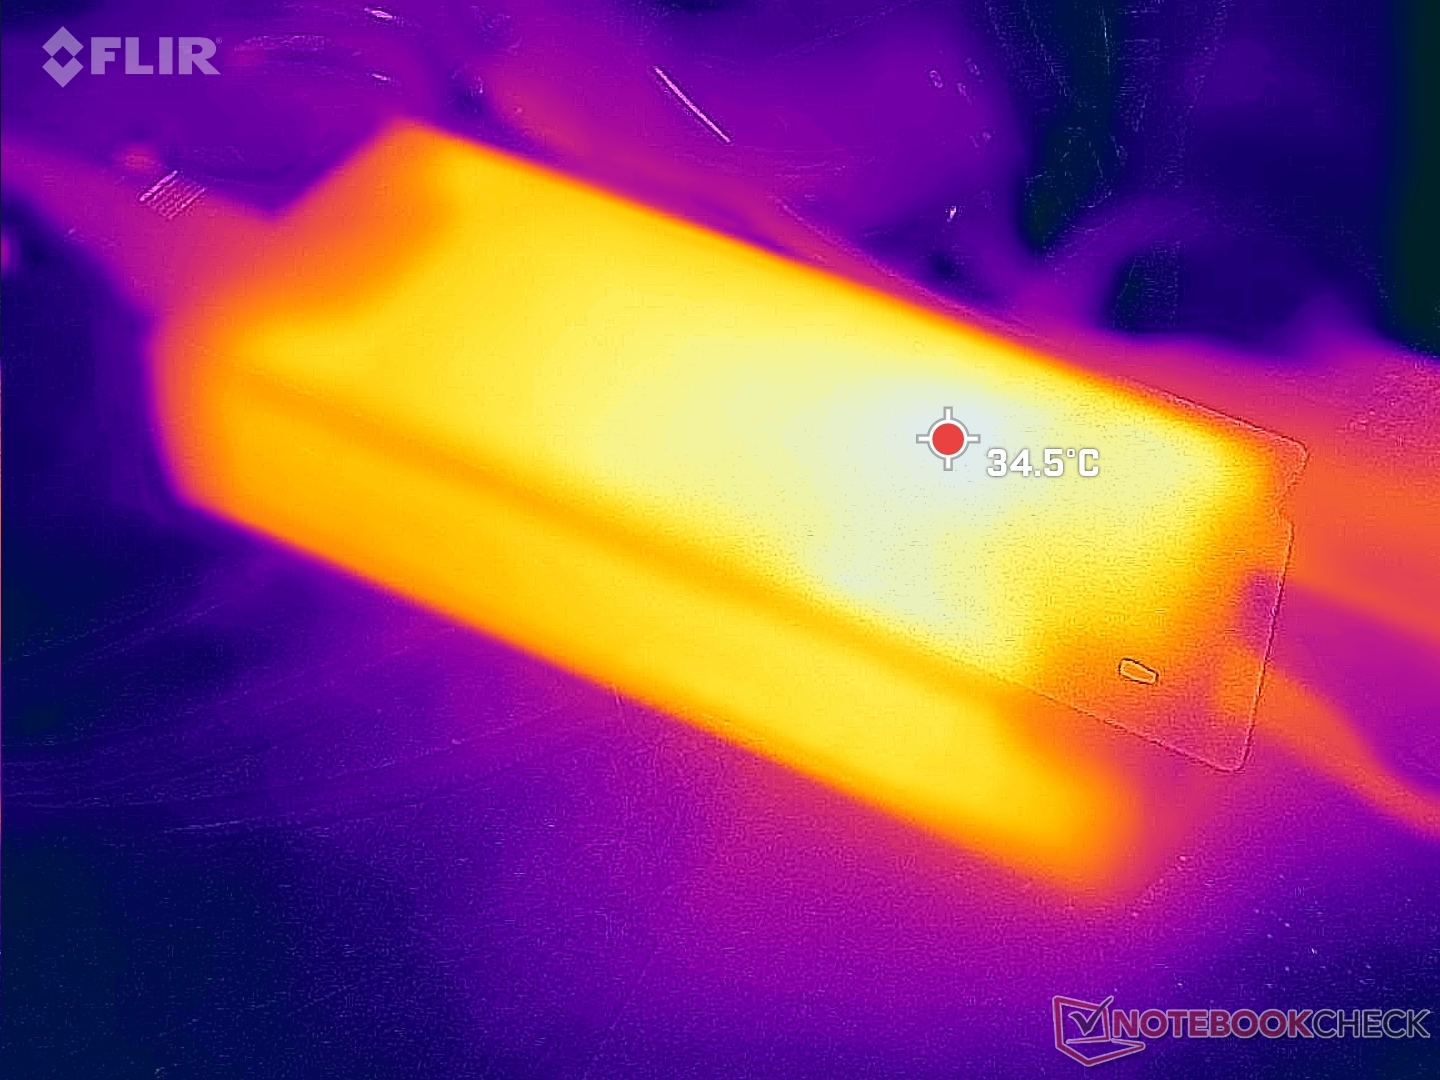
能源管理
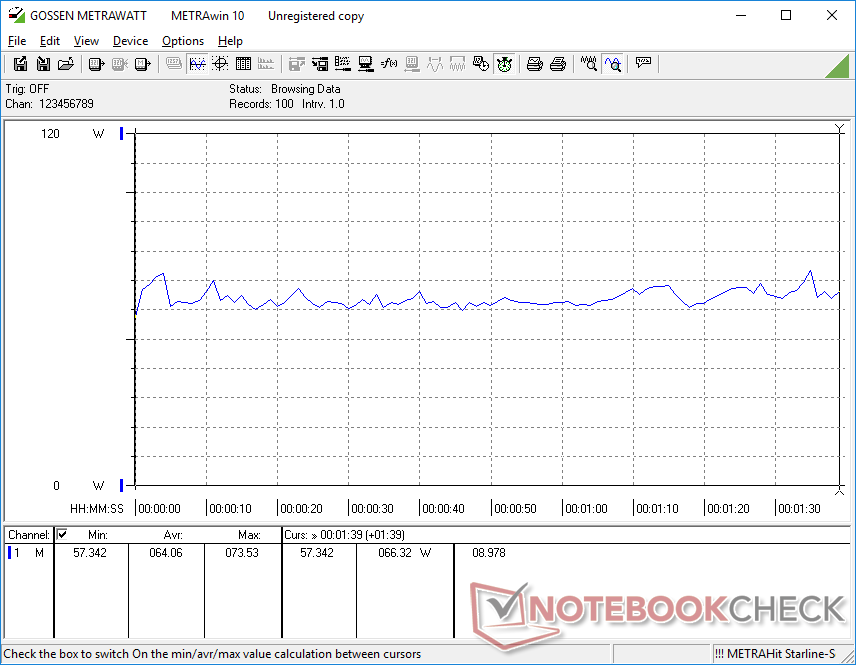
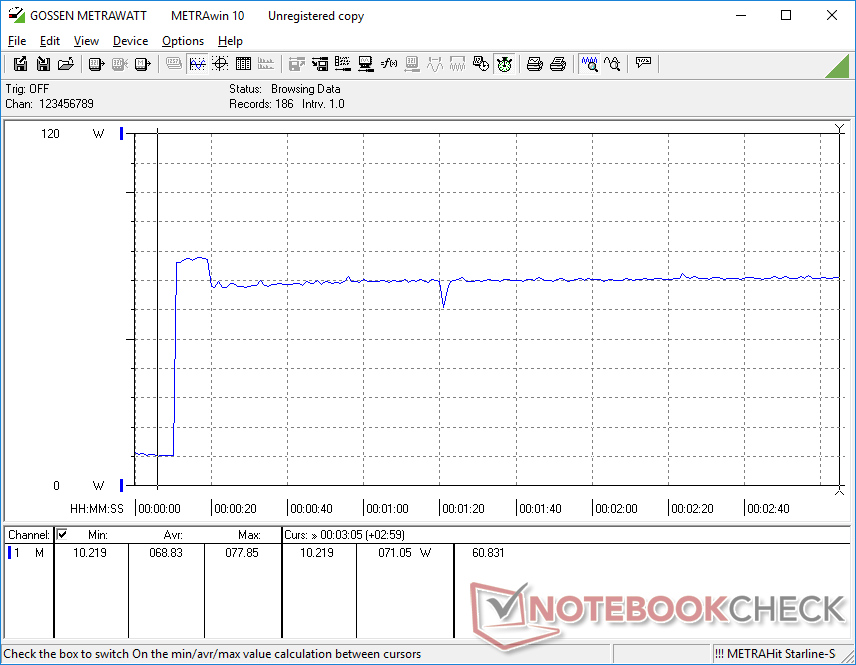
消耗功率
总体消耗几乎与我们在GTR5上记录的相同。 GTR5 尽管图形性能增加了60%。换句话说,GTR6能够在相同的电源包络下提供比前代产品快得多的图形性能,每瓦性能高得多。然而,功耗仍然比大多数采用英特尔酷睿U CPU和Iris Xe 96 EU的笔记本电脑和迷你PC高得多,这也解释了为什么GTR6的物理尺寸相对于许多英特尔NUC更大。
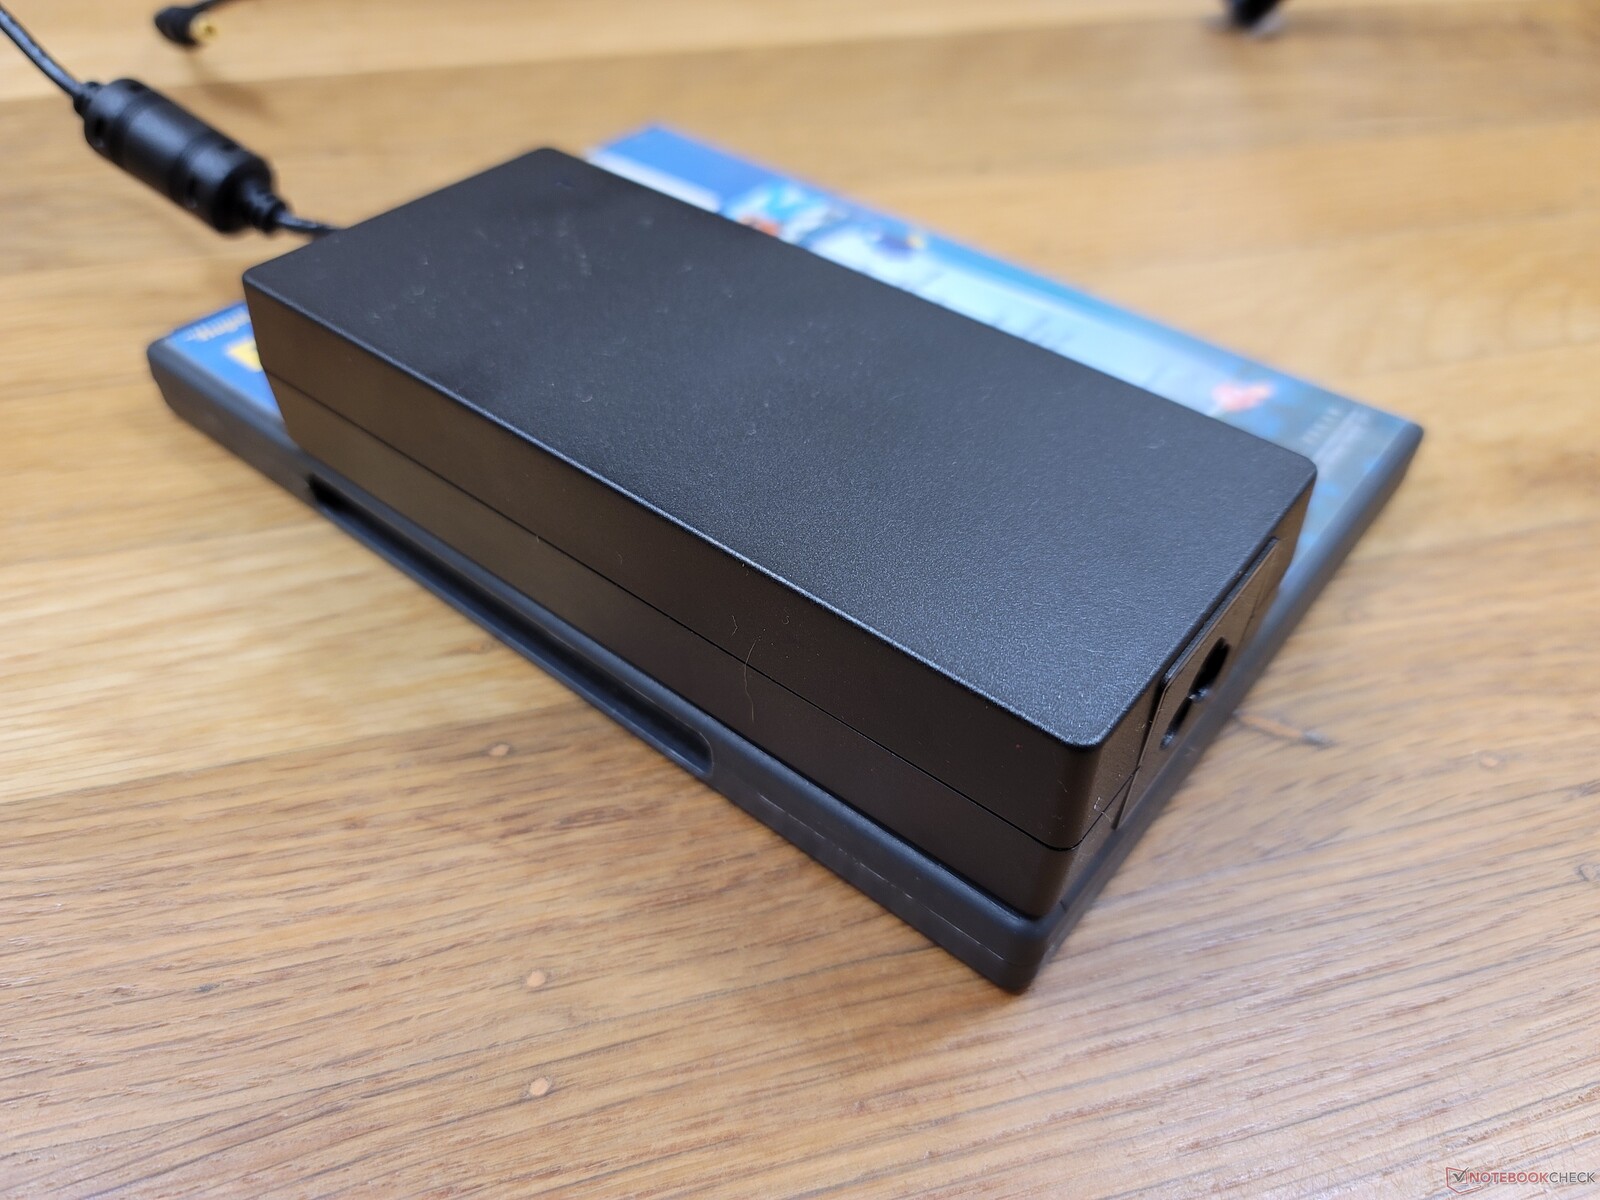
当CPU处于100%的利用率时,我们能够从中型(约14.4 x 6.3 x 3厘米)的120 W交流适配器中记录到81 W的临时最大消耗。


| Off / Standby | |
| Idle | |
| Load |
|
Key:
min: | |
| Beelink GTR6 R9 6900HX, Radeon 680M, Kingston KC3000 512G SKC3000S512G, , x, | Beelink SEi11 Pro i5-11320H, Iris Xe G7 96EUs, Kingston NV1 SNVS/500GCN, , x, | Beelink GTR5 R9 5900HX, Vega 8, Kingston NV1 SNVS/500GCN, , x, | Intel NUC11PHKi7C i7-1165G7, GeForce RTX 2060 Mobile, Samsung SSD 980 Pro 500GB MZ-V8P500BW, , x, | Intel NUC11TNKi5 i5-1135G7, Iris Xe G7 80EUs, Transcend M.2 SSD 430S TS512GMTS430S, , x, | GMK NucBox 2 i5-8259U, Iris Plus Graphics 655, Netac S930E8/256GPN, , x, | |
|---|---|---|---|---|---|---|
| Power Consumption | 6% | 8% | -73% | -3% | 29% | |
| Idle Minimum * (Watt) | 7.6 | 9.8 -29% | 6.2 18% | 5.8 24% | 11.5 -51% | 6.1 20% |
| Idle Average * (Watt) | 9.9 | 10.3 -4% | 8.9 10% | 5.9 40% | 12.4 -25% | 6.8 31% |
| Idle Maximum * (Watt) | 10.6 | 10.5 1% | 9 15% | 20.7 -95% | 12.9 -22% | 7.3 31% |
| Load Average * (Watt) | 64 | 54.2 15% | 66.8 -4% | 130.8 -104% | 40.7 36% | 46.3 28% |
| Witcher 3 ultra * (Watt) | 69 | 53.1 23% | 62.6 9% | 154.4 -124% | 43.9 36% | |
| Load Maximum * (Watt) | 80.4 | 59 27% | 81.6 -1% | 225.2 -180% | 73.5 9% | 50.7 37% |
* ... smaller is better
Power Consumption Witcher 3 / Stresstest
Power Consumption external Monitor
Pros
Cons
结论 - 所有关于GPU的信息
选择Beelink GTR6的主要优势在于 GTR5 的主要优势是其显著改善的集成图形。否则,Zen 3+ Ryzen 9 6900HX的处理器性能仅比Zen 3 Ryzen 9 5900HX略快。如果你打算主要向你的迷你电脑传输内容,偶尔进行适度的多任务处理,那么GTR5有足够的能力满足你的目的。如果你计划在本地运行游戏或其他GPU密集型任务,那么GTR6可能值得投资。
价格是另一个需要考虑的主要因素。以750美元的价格,GTR6配备了内存、固态硬盘、正版Windows 11 Pro,以及比大多数英特尔NUC选项(甚至包括最新的12代NUC Pro模型)更快的CPU和集成GPU。.Beelink甚至提供了一个没有内存或存储的裸机SKU,价格仅为540美元。
AMD Radeon 680M GPU是Beelink GTR6的亮点。相对于相同的750美元价格范围内的英特尔NUC的竞争者来说,每美元的性能很高。
风扇噪音也许是我们对GTR6最大的抱怨,因为当系统空转或运行要求不高的负载时,它似乎毫无理由地跳动。否则,GTR6的每美元性能和功能集都非常有竞争力。
价格和可用性
Beelink GTR6现在已经在亚马逊上以我们的确切配置发货。 售价999美元,如果直接从制造商处购买,则只需749美元。.
Price comparison

