英特尔酷睿i5-8260U首次亮相。BMAX B5 Pro G7H8迷你电脑评测
与Chuwi一样,Max专门生产廉价的笔记本电脑、显示器和迷你电脑,通常比大型和更知名的制造商的最基本SKU便宜数百美元。他们的秘诀是使用老一代的CPU,可以大大降低设备的成本。
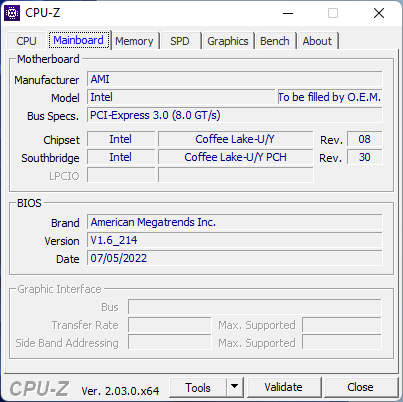
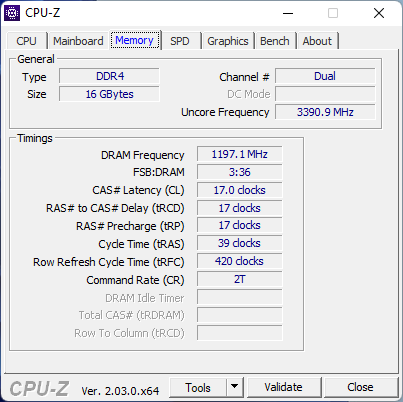
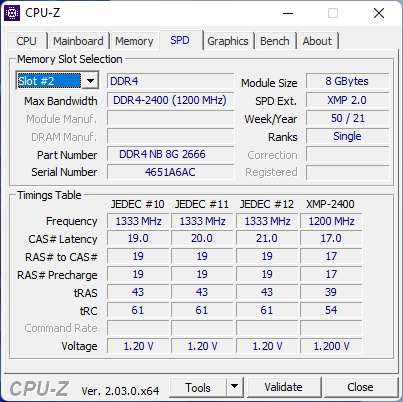
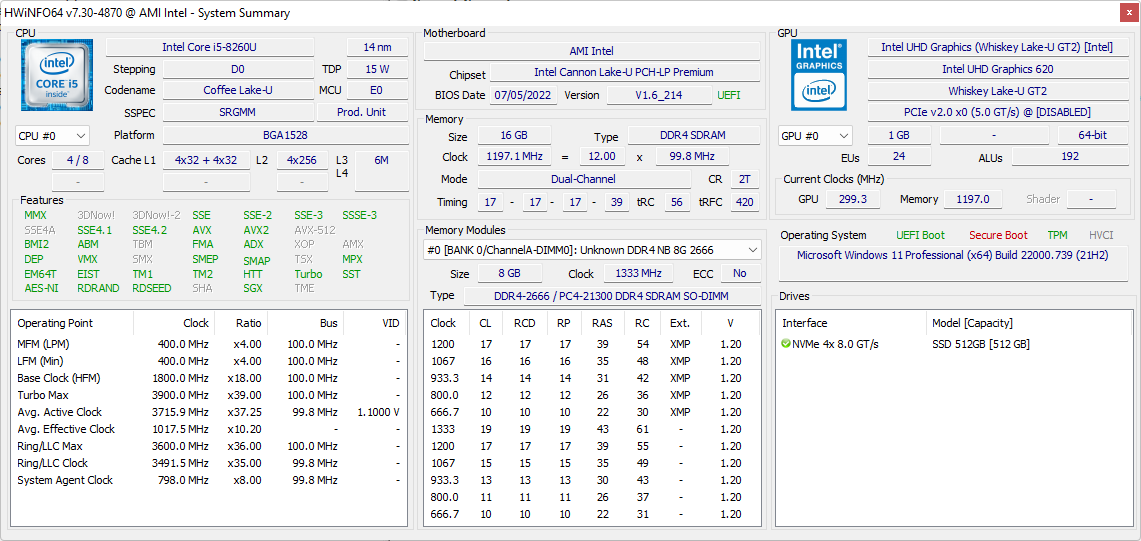
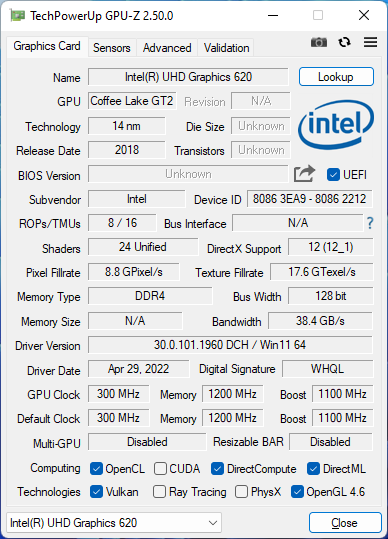
BMax B5 Pro是该制造商最新推出的迷你PC,目标是预算较紧的HTPC用户。值得注意的是,它采用了较老的第8代英特尔酷睿U系列CPU,而最新的迷你电脑则采用了第12代选项。我们的具体配置是不常见的Coffee Lake Core i5-8260U CPU,配备16GB内存,512GB NVMe SSD,并预装Windows 11,在撰写本文时仅售280美元。B5 Pro与其他廉价的迷你电脑直接竞争,如Beelink SEi8 或GMK NucBox 2 。
更多BMax评论。
潜在的竞争对手比较
Rating | Date | Model | Weight | Height | Size | Resolution | Price |
|---|---|---|---|---|---|---|---|
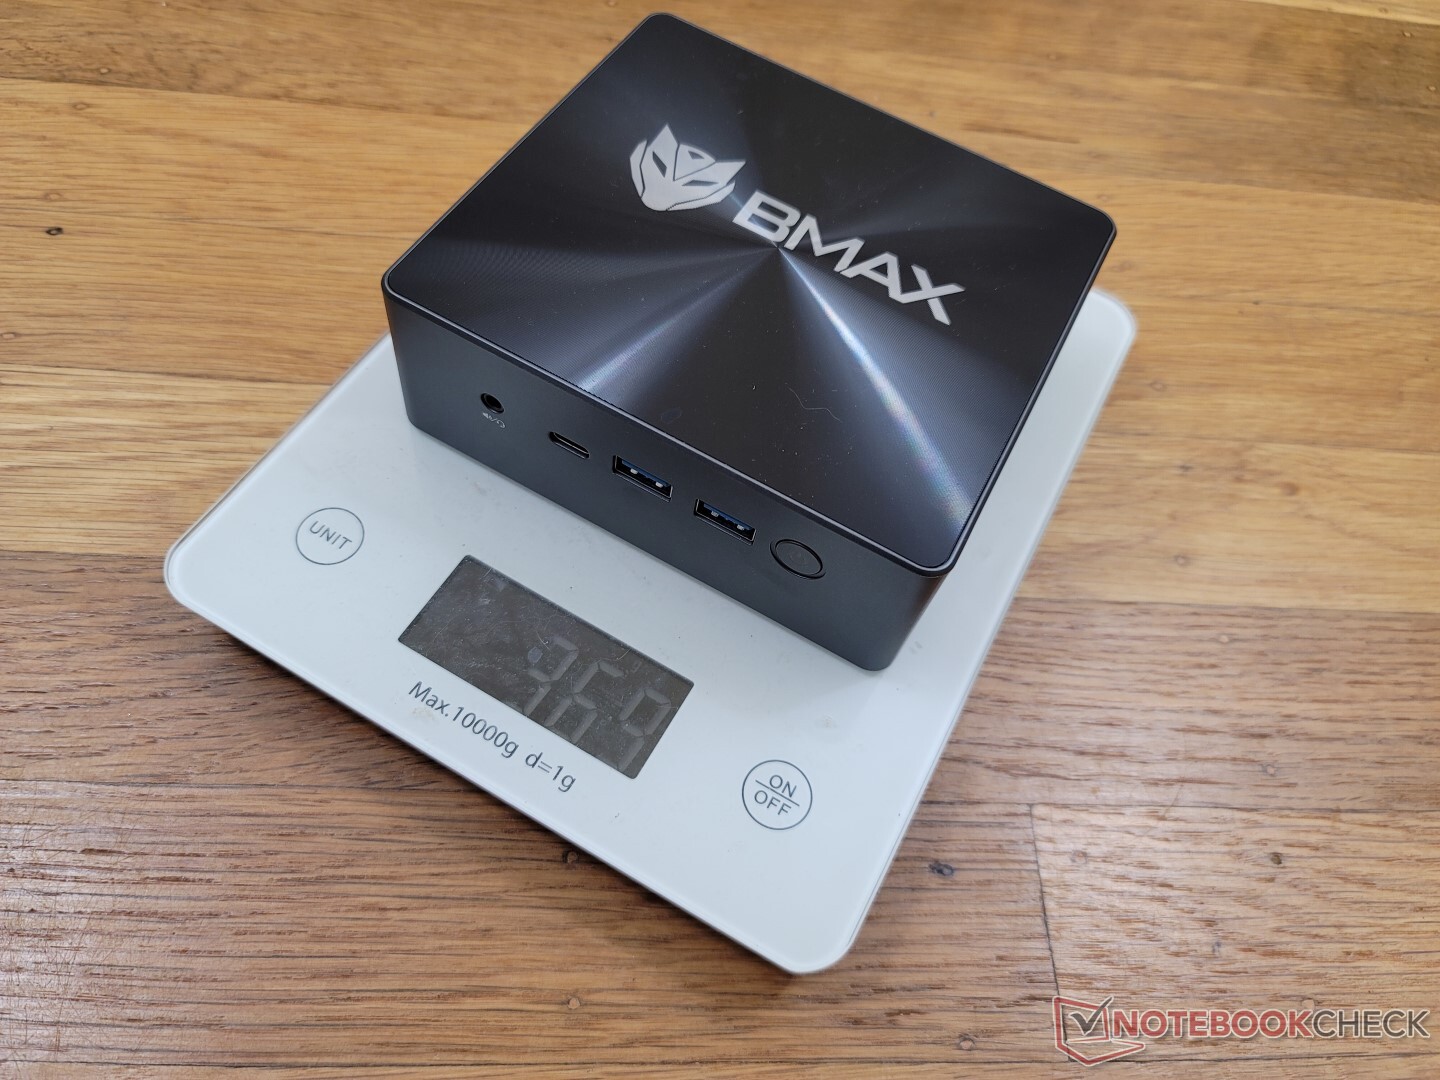
v (old) | 11 / 2022 | BMAX B5 Pro G7H8 i5-8260U, UHD Graphics 620 | 369 g | 43.2 mm | x | ||
v (old) | 09 / 2022 | Beelink SEi11 Pro i5-11320H, Iris Xe G7 96EUs | 440 g | 40 mm | x | ||
v (old) | 09 / 2022 | Beelink U59 N5105 Celeron N5105, UHD Graphics (Jasper Lake 24 EU) | 320 g | 42 mm | x | ||
v (old) | 04 / 2022 | Beelink SEi8 i3-8109U, Iris Plus Graphics 655 | 346 g | 41 mm | x | ||
v (old) | 10 / 2022 | Beelink SER Pro Ryzen 5 5600H R5 5600H, Vega 7 | 498 g | 42 mm | x | ||
v (old) | Intel NUC11TNKi5 i5-1135G7, Iris Xe G7 80EUs | 504 g | 37 mm | x |
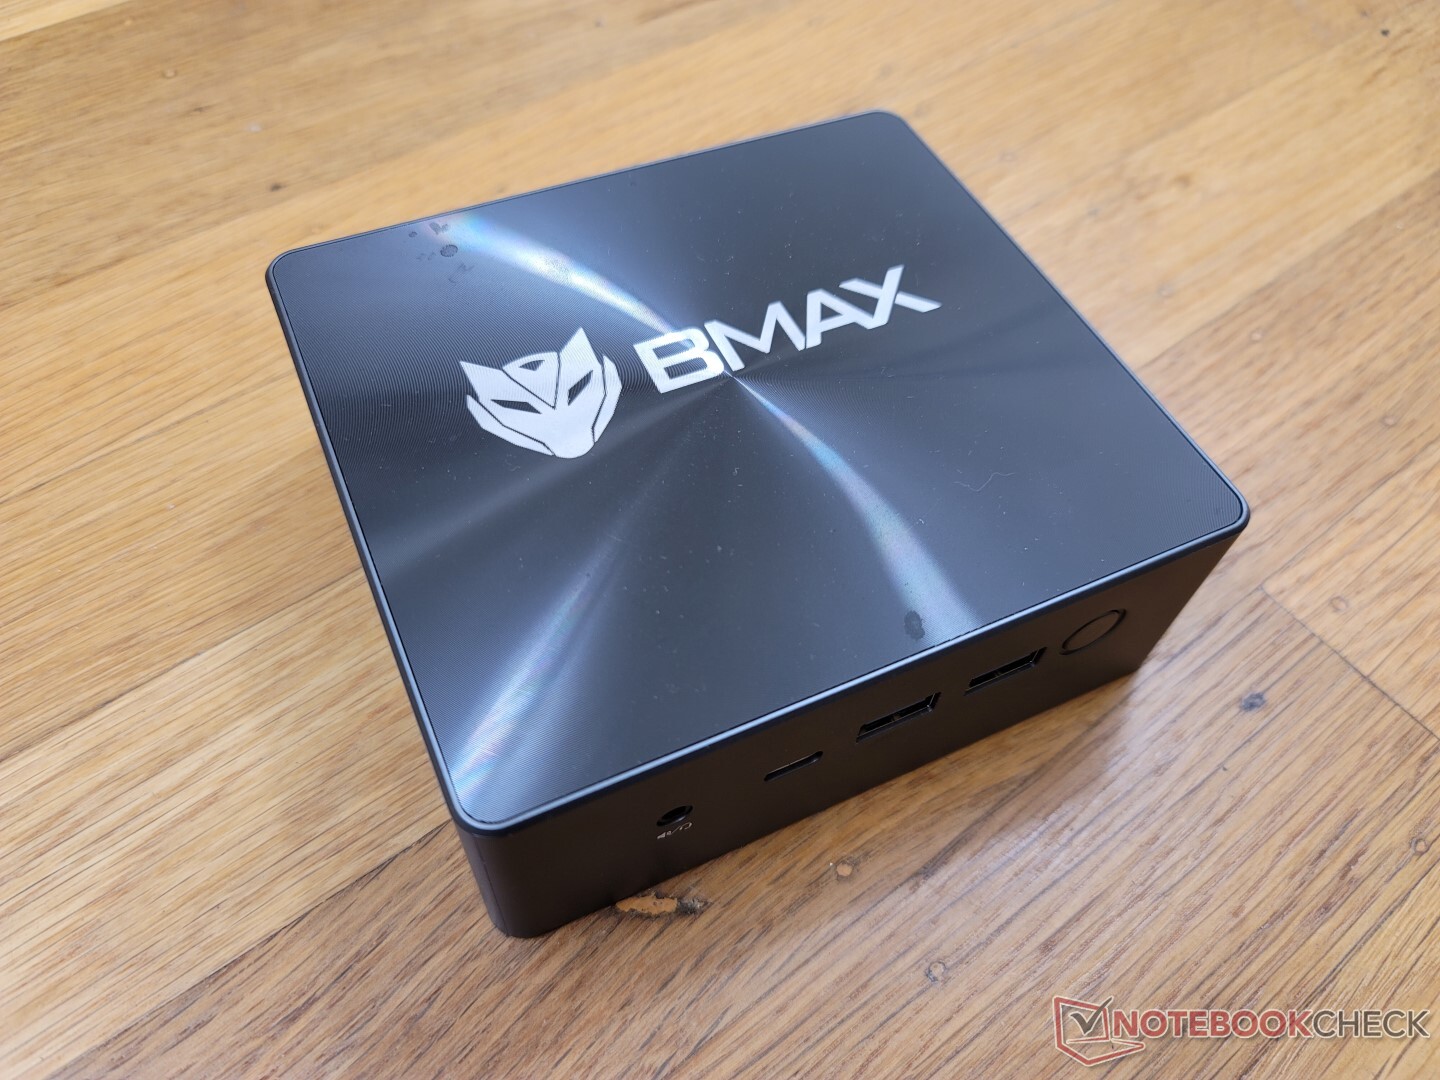
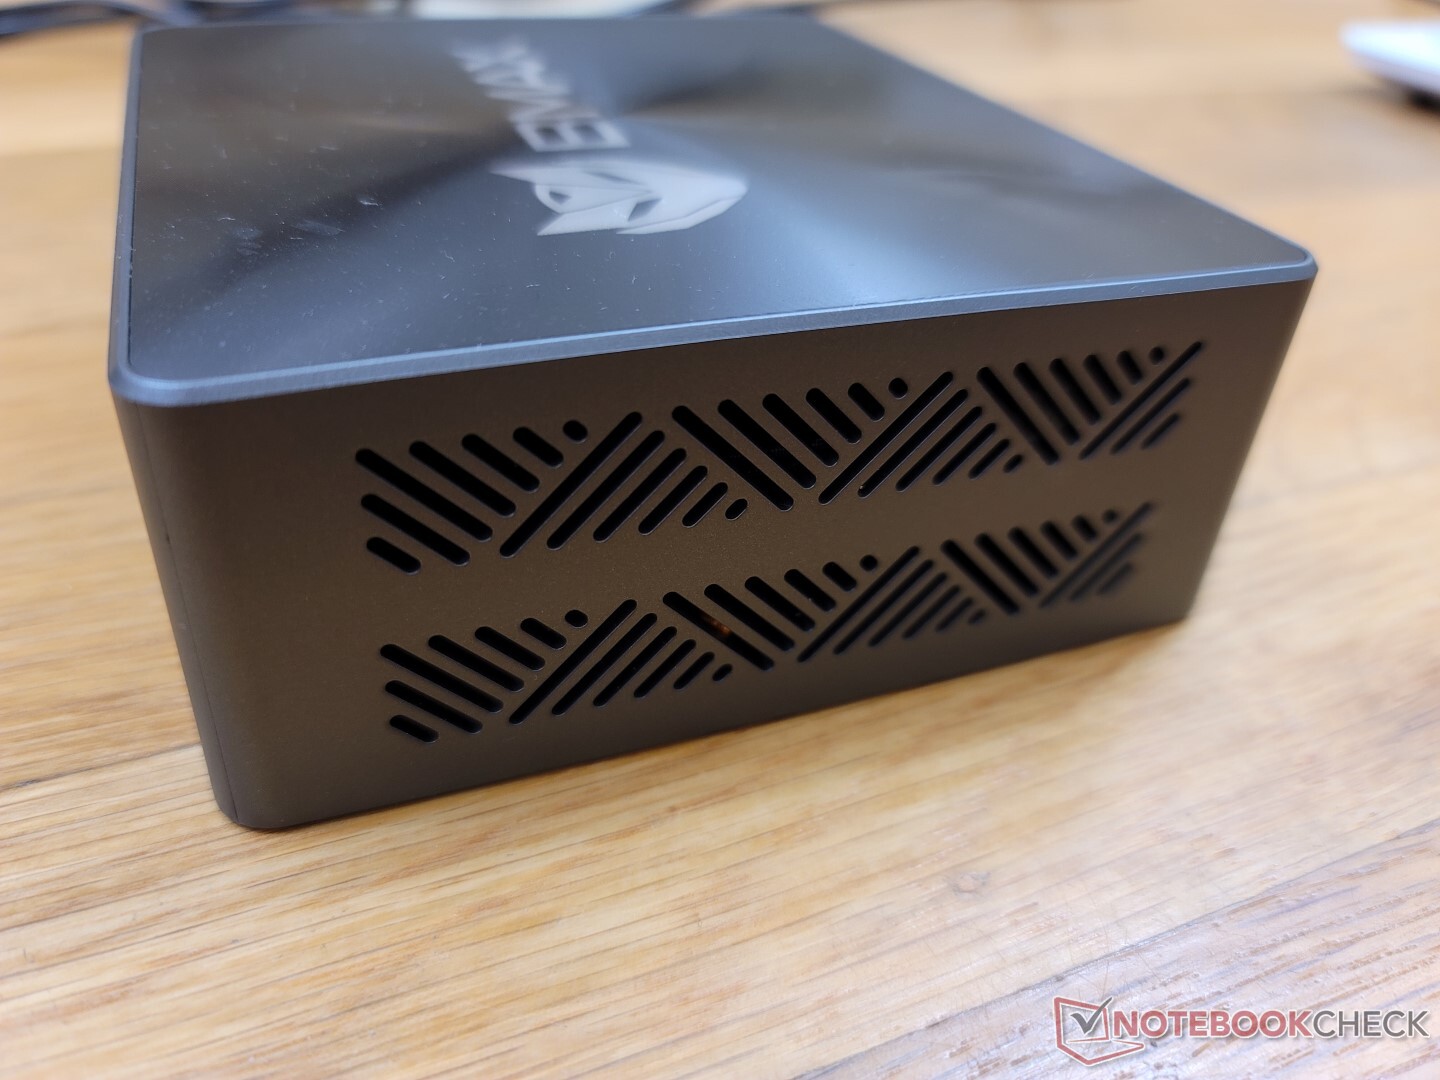
案例 - 没有什么不寻常的地方
这款机箱的厚度略高于 英特尔NUC11TNKi5与Beelink SEi8几乎相同。边缘和底部的刚性很强,因为这些地方是金属,而顶部是便宜的塑料,更容易翘曲。它仍然是一个强大的设计,没有明显的缺陷,即使它不像英特尔NUC那样重。
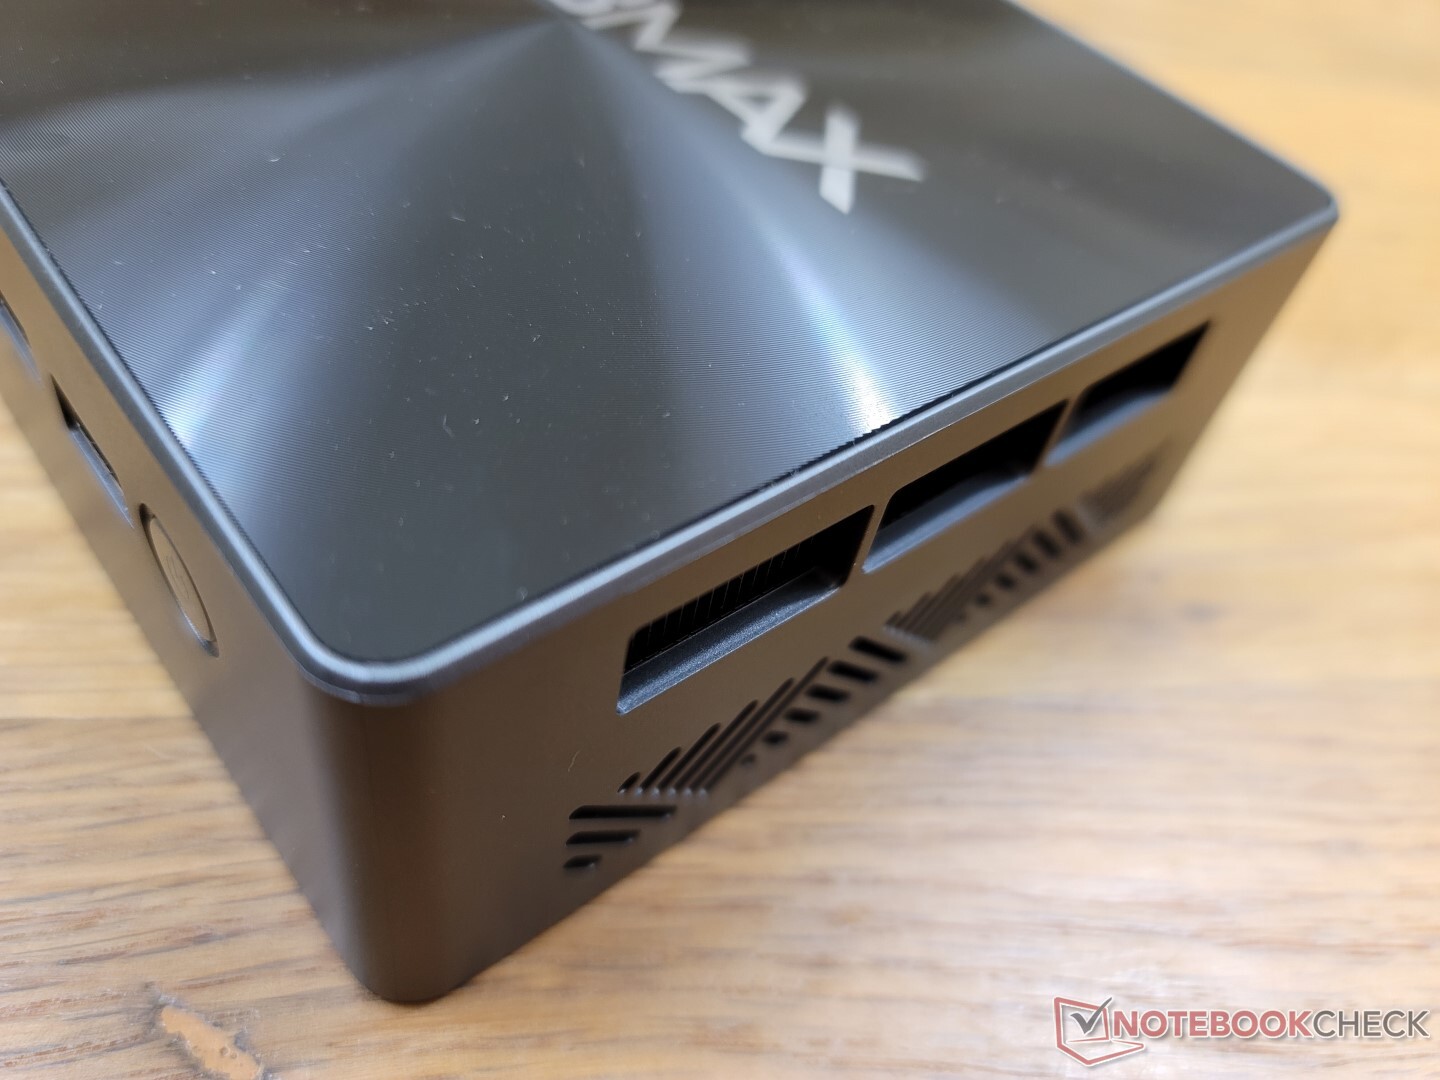
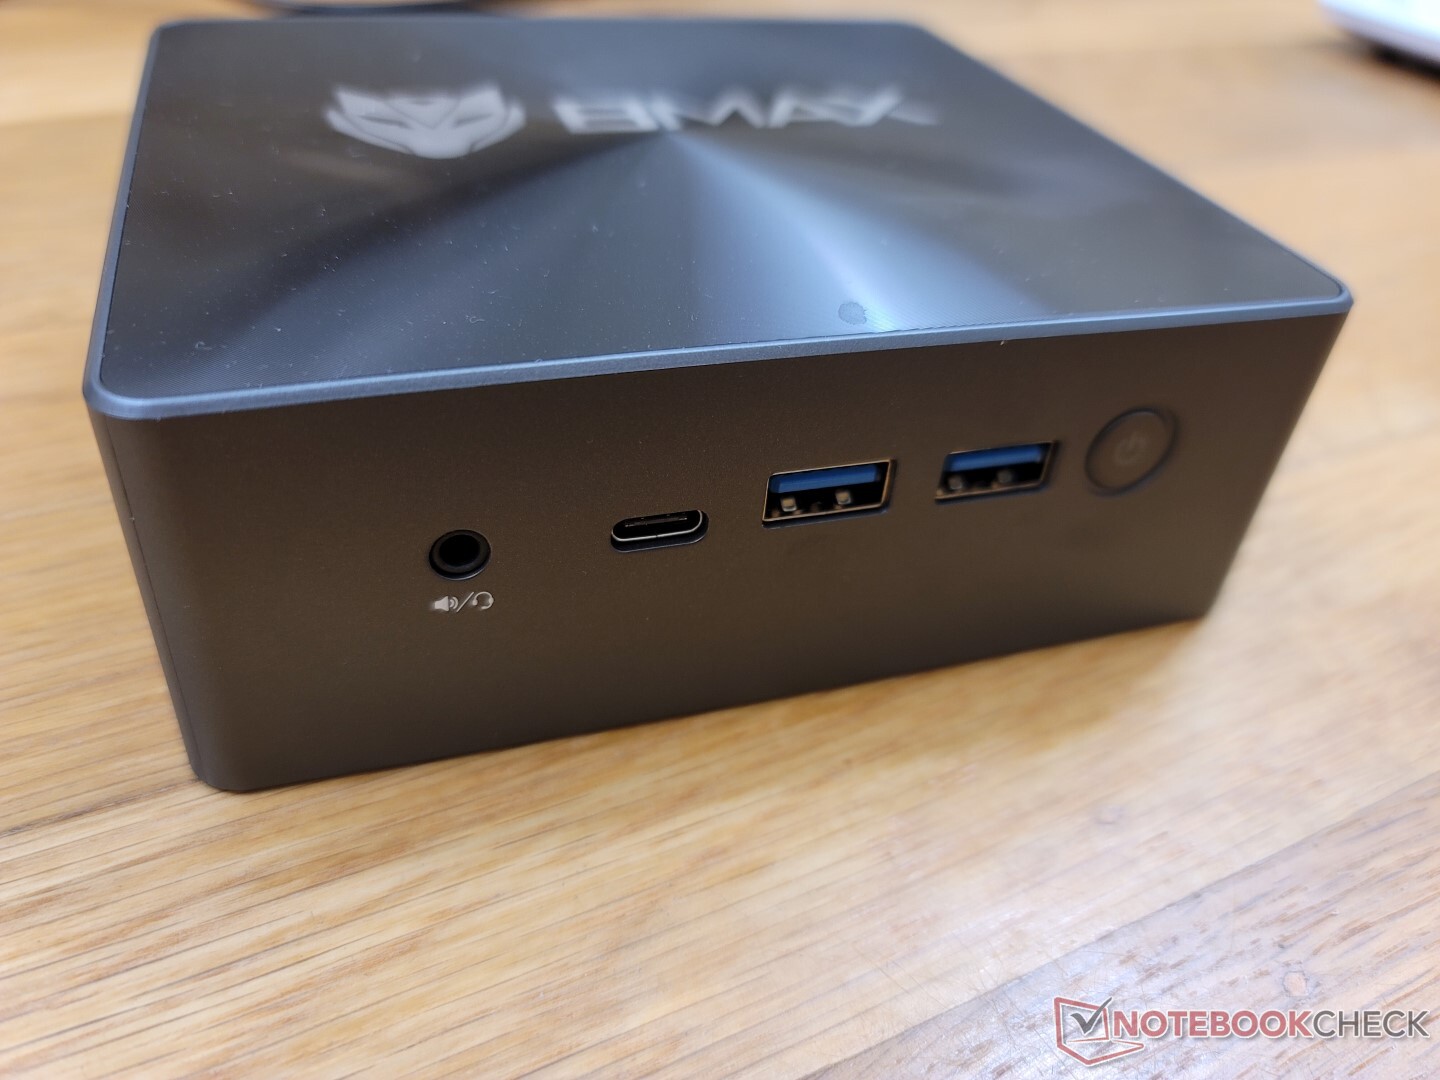
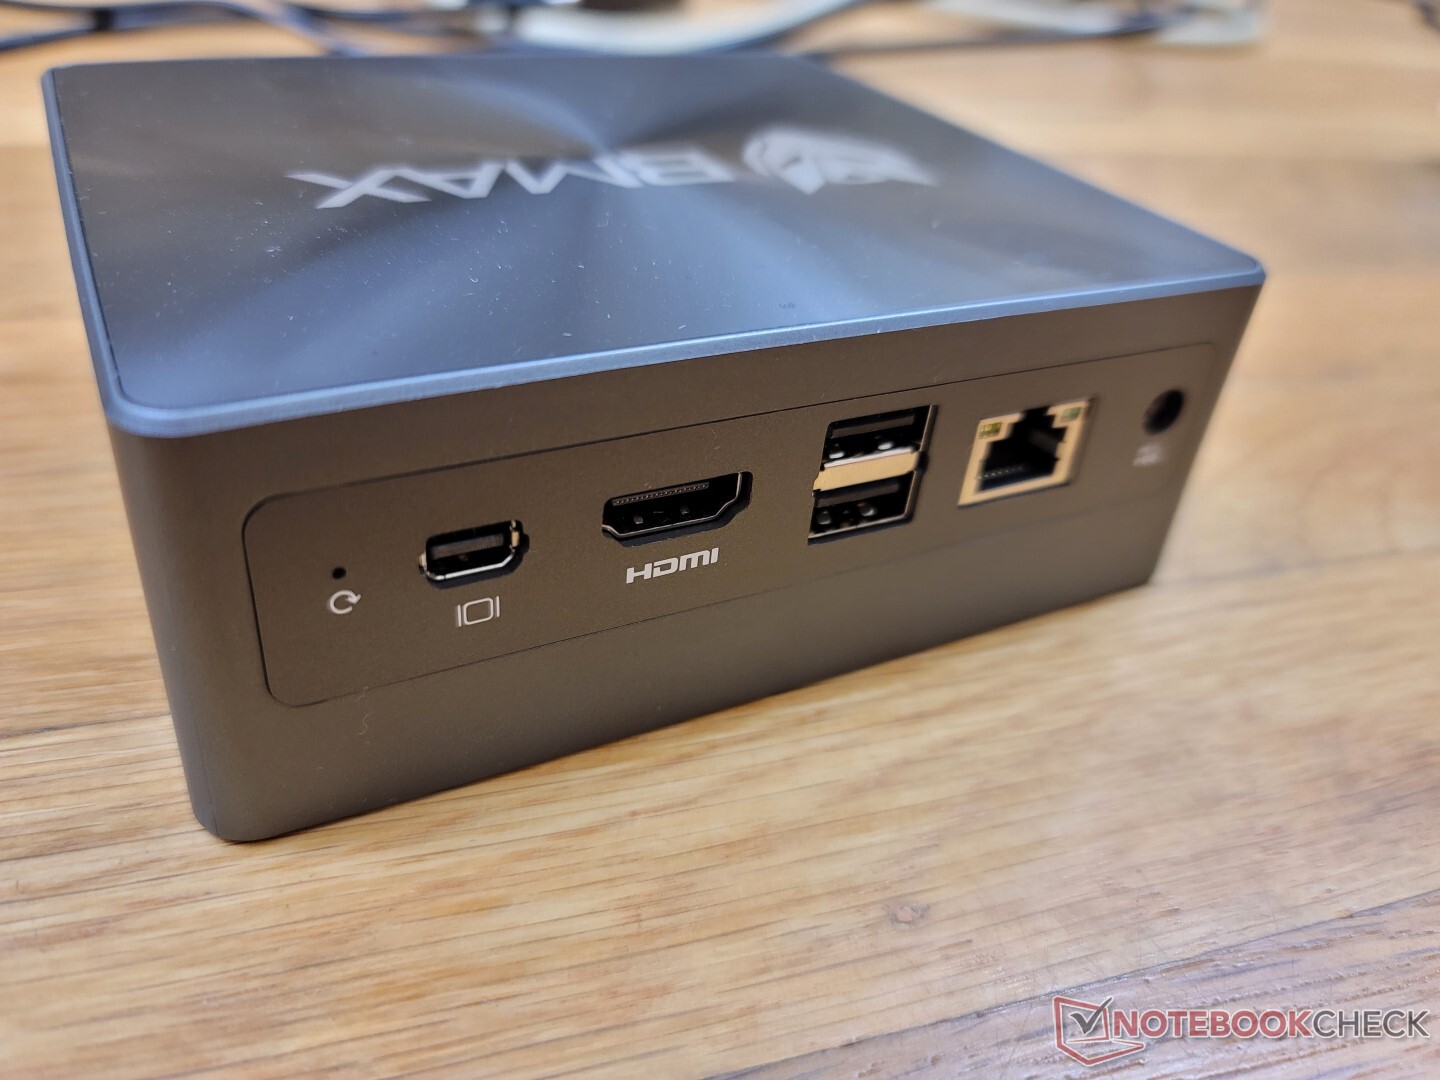
连接性 - 不支持Thunderbolt
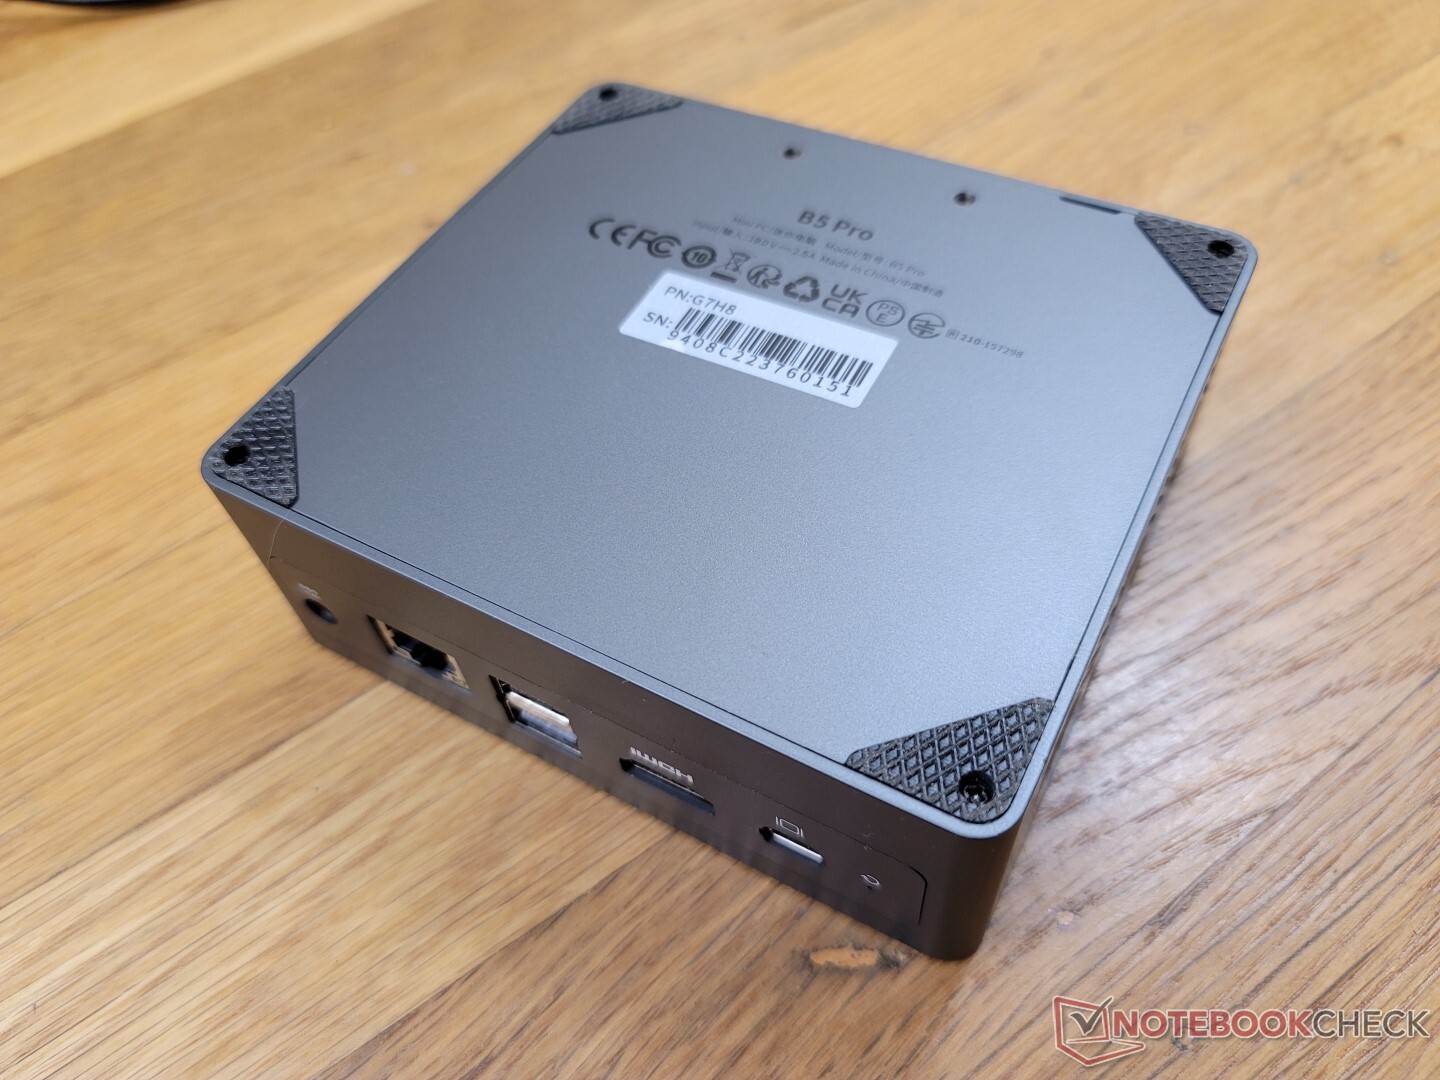
B5 Pro上最引人注目的端口是迷你DisplayPort,因为这个价格范围内的大多数其他迷你PC根本没有迷你DisplayPort。通过HDMI不支持60赫兹的4K显示器。
前面的USB-C端口支持外部显示器,但它不支持Power-in或Thunderbolt。
沟通
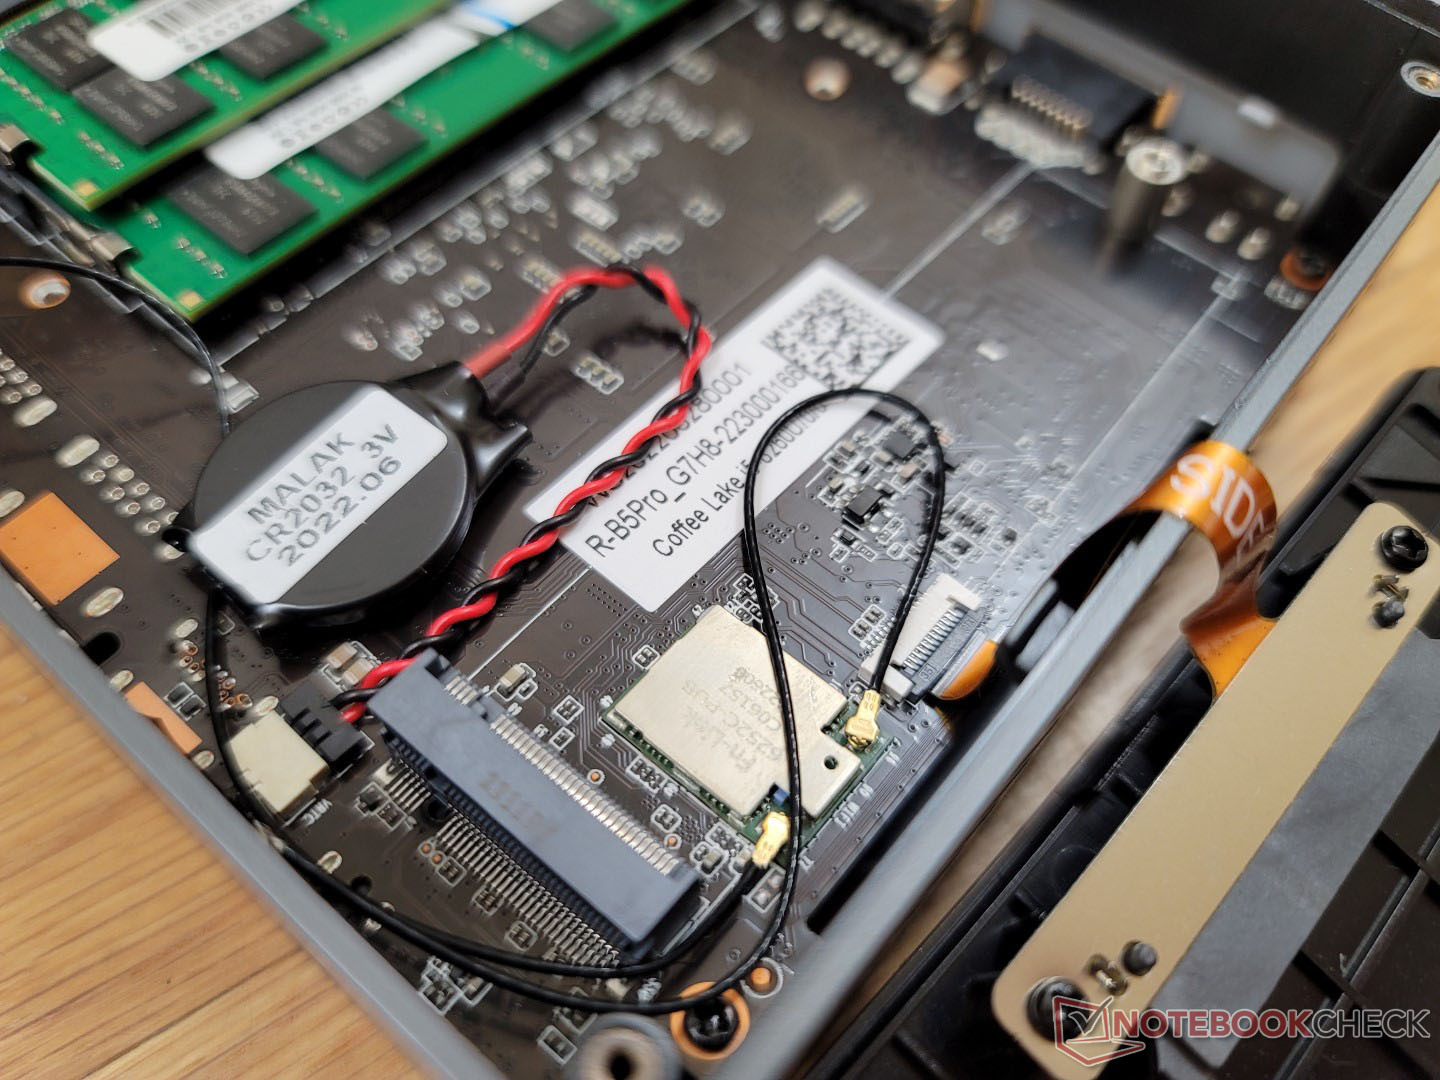
RealTek RTL8852BE是Wi-Fi 6和蓝牙5.2连接的标准配置。没有Wi-Fi 6E支持可能是为了节省成本。传输速率很稳定,没有任何问题,即使它们不如更常见的英特尔AX200/201系列那么快。
| Networking | |
| iperf3 transmit AX12 | |
| Intel NUC11TNKi5 | |
| Beelink SEi8 | |
| iperf3 receive AX12 | |
| Intel NUC11TNKi5 | |
| Beelink SEi8 | |
| iperf3 receive AXE11000 6GHz | |
| Beelink SER Pro Ryzen 5 5600H | |
| Beelink SEi11 Pro | |
| iperf3 receive AXE11000 | |
| BMAX B5 Pro G7H8 | |
| Beelink U59 N5105 | |
| iperf3 transmit AXE11000 6GHz | |
| Beelink SER Pro Ryzen 5 5600H | |
| Beelink SEi11 Pro | |
| iperf3 transmit AXE11000 | |
| BMAX B5 Pro G7H8 | |
| Beelink U59 N5105 | |
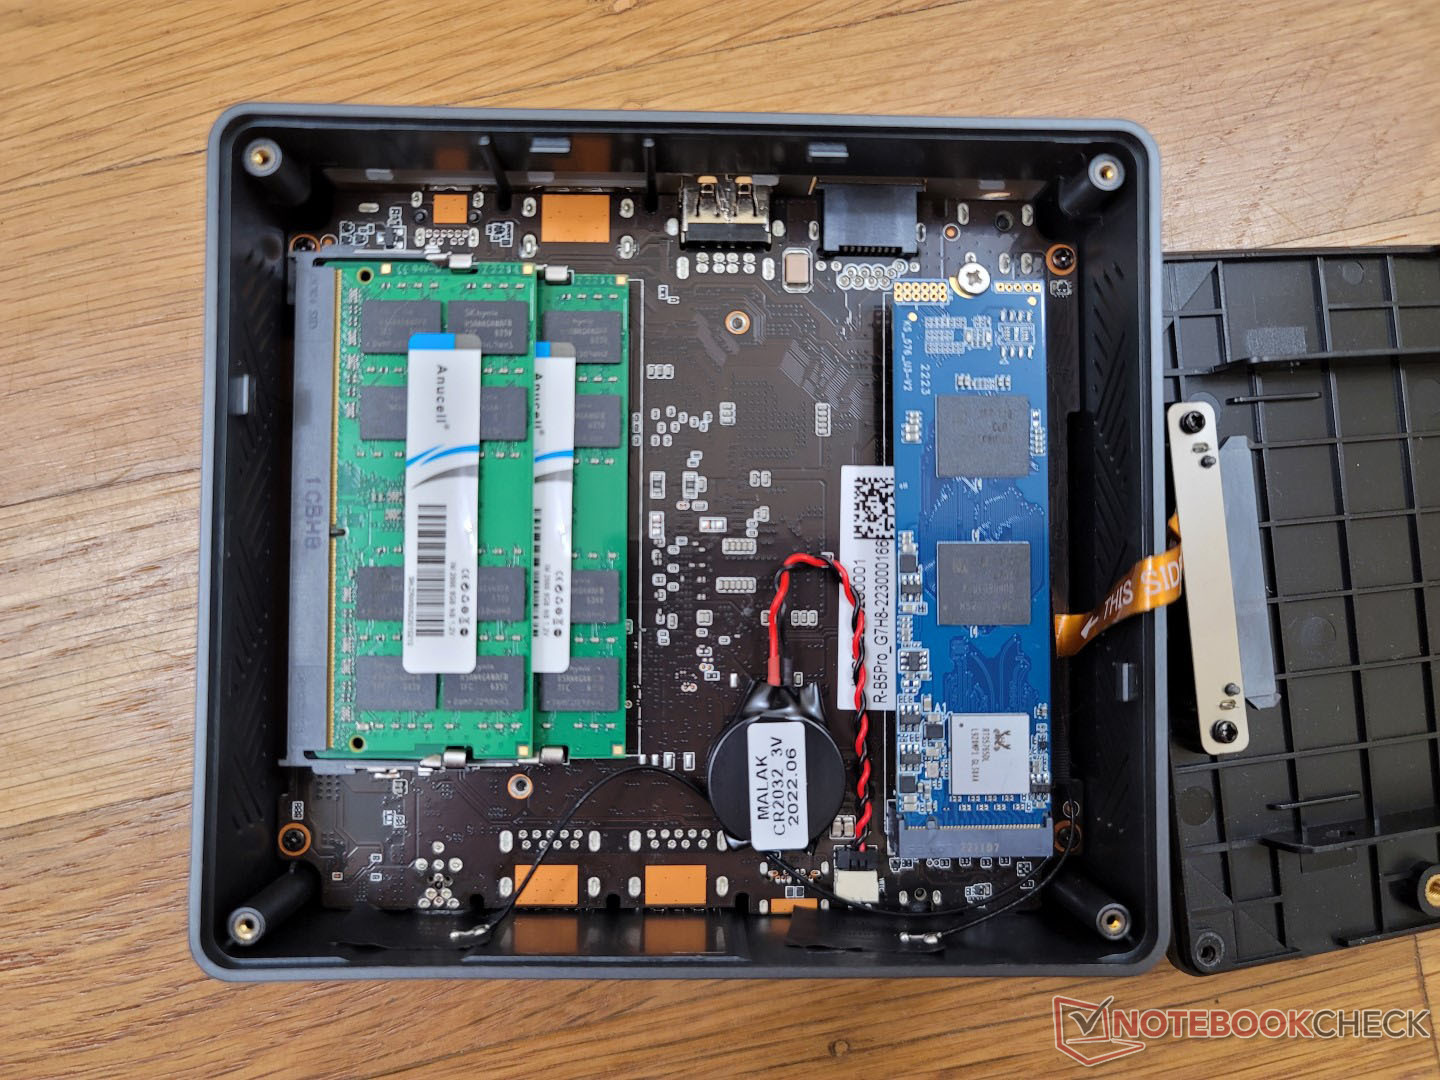
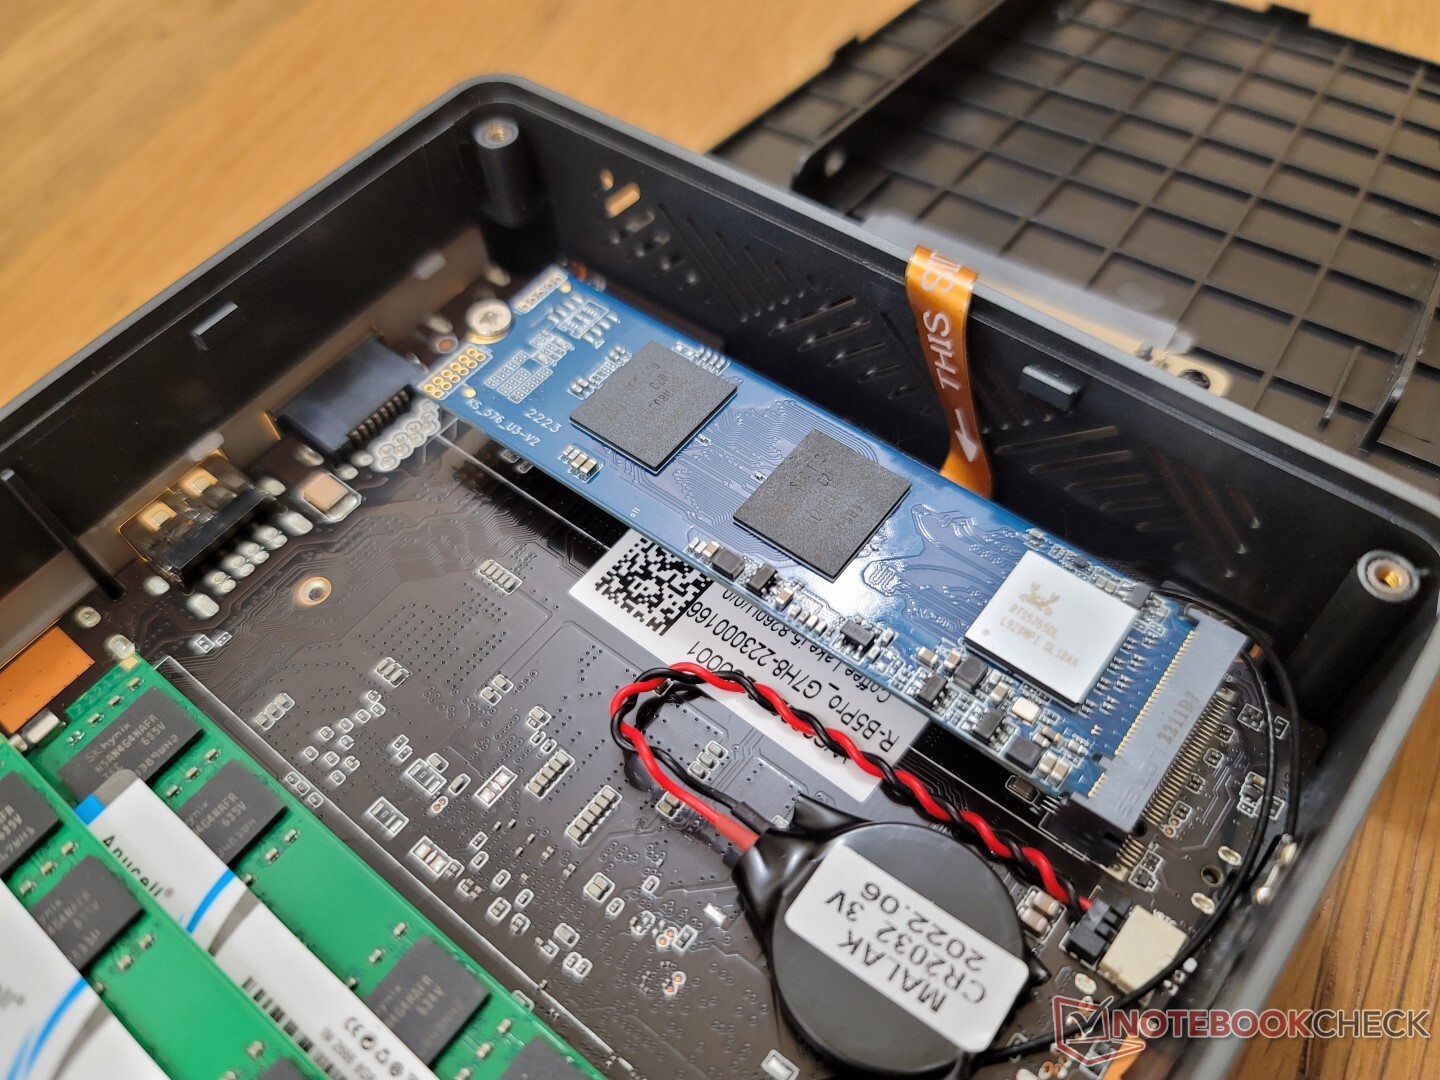
维护
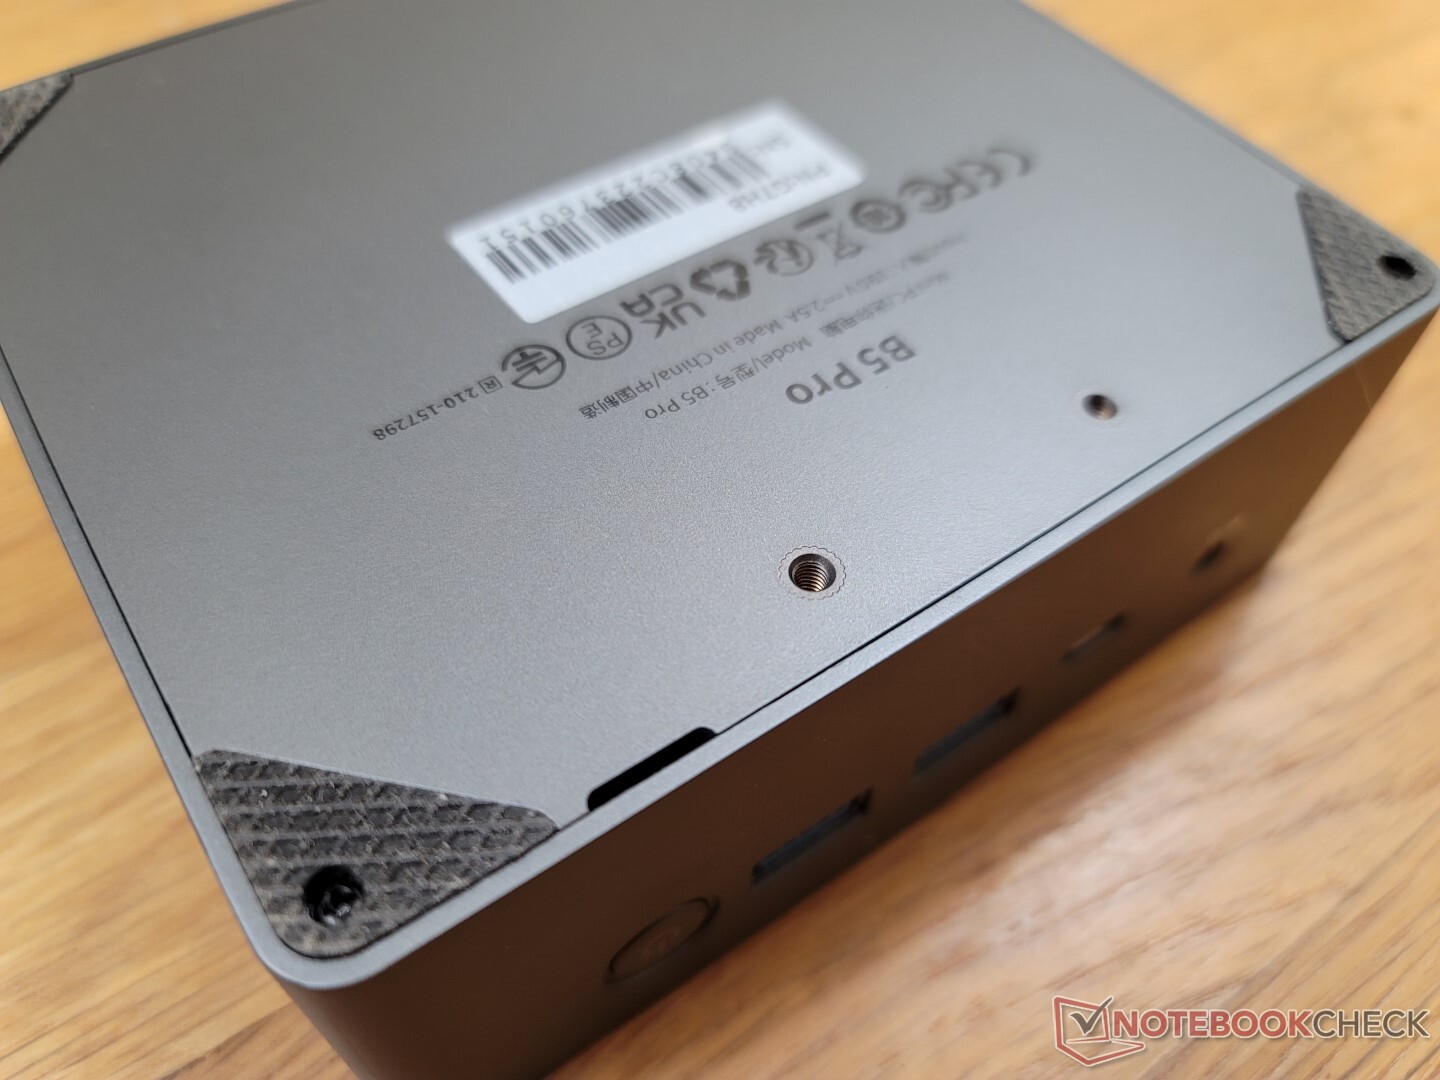
底板由四个飞利浦螺钉固定,便于维修。然而,与Beelink SEi8不同的是,BMax的底板沿边缘有一个小缝隙,便于抓取和拆卸。
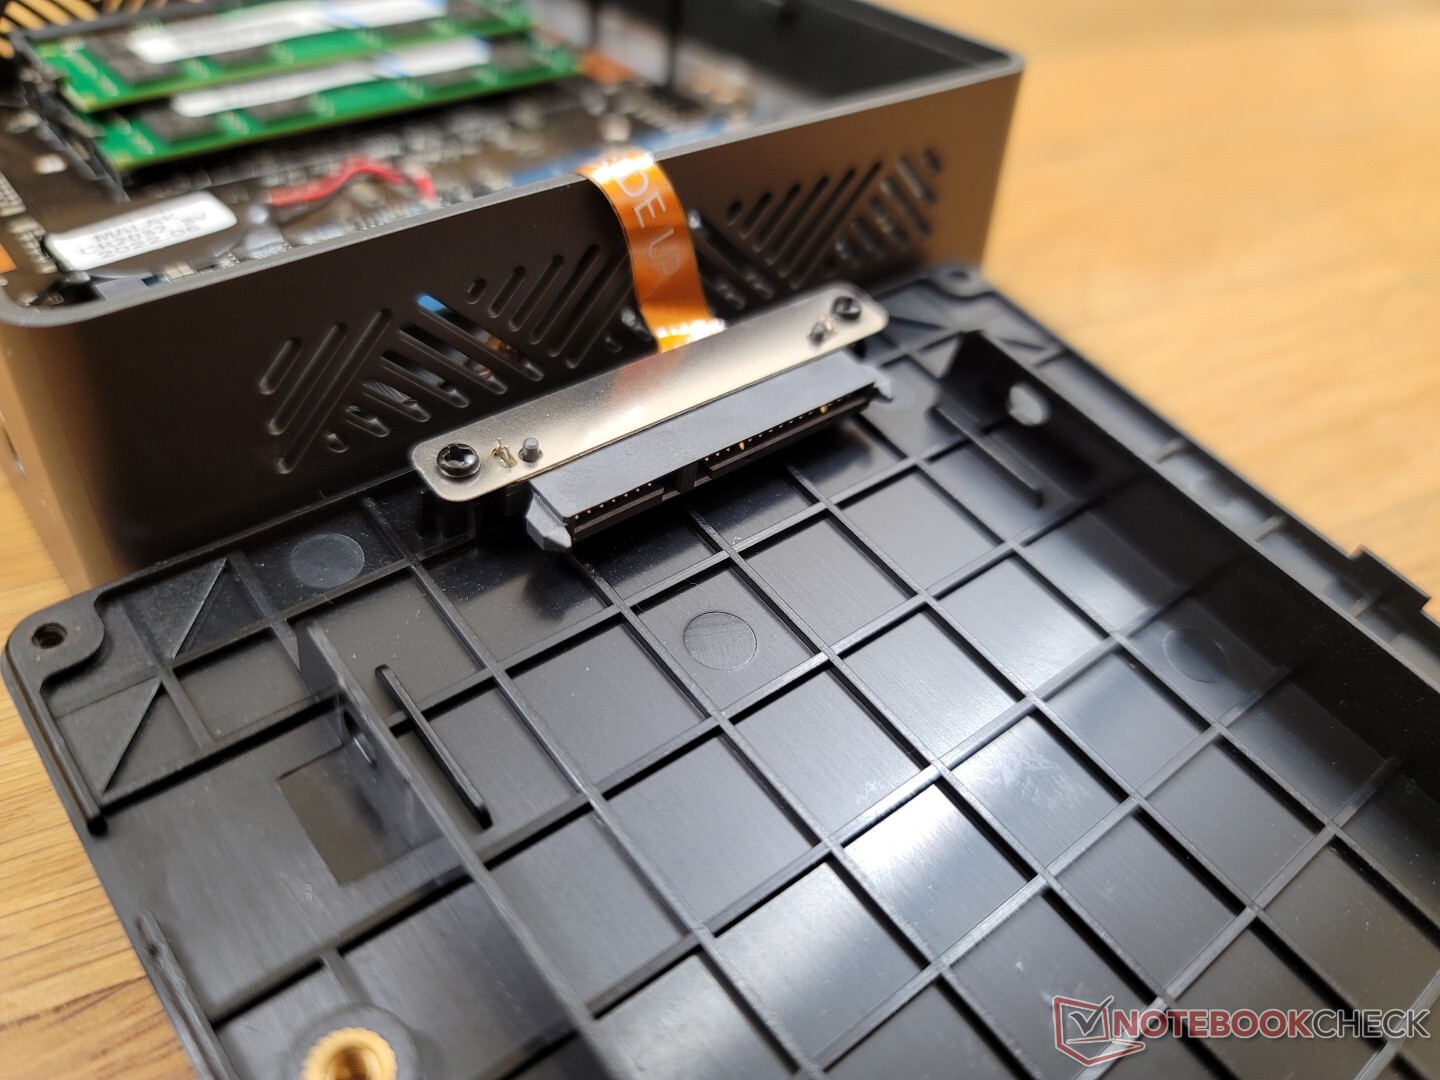
用户可以在里面安装最多两个DDR4 SODIMM模块和最多两个存储驱动器。
配件和保修
零售包装盒包括一条HDMI线和带螺丝的可移动VESA安装支架,以及AC适配器。如果在美国购买,则适用标准的一年有限保修。
性能--第8代与第12代

测试条件
在运行以下任何基准测试之前,我们通过Windows将我们的设备设置为性能模式,以获得尽可能高的分数。为了获得干净的Windows用户体验,制造商没有预装任何应用程序。
处理器
原始的CPU性能一般与第十代的 酷睿i7-1065G7或酷睿i5-8259U.尽管比第11代 酷睿i5-1135G7缓慢了50%,但它的速度仍足以满足普通的多媒体目的,如网页浏览、视频流和中等程度的多任务处理。
第12代 酷睿i5-1235U比我们的酷睿i5-8260U领先几代,分别提供大约60%和80%的单线程和多线程性能。
性能的可持续性还算不错。在循环运行CineBench R15 xT时,性能会随着时间的推移而下降约11%。
Cinebench R15 Multi Loop
Cinebench R23: Multi Core | Single Core
Cinebench R15: CPU Multi 64Bit | CPU Single 64Bit
Blender: v2.79 BMW27 CPU
7-Zip 18.03: 7z b 4 | 7z b 4 -mmt1
Geekbench 5.5: Multi-Core | Single-Core
HWBOT x265 Benchmark v2.2: 4k Preset
LibreOffice : 20 Documents To PDF
R Benchmark 2.5: Overall mean
| Cinebench R20 / CPU (Multi Core) | |
| Beelink SER Pro Ryzen 5 5600H | |
| Beelink SEi11 Pro | |
| Asus Vivobook 15 K513EQ | |
| Intel NUC11TNKi5 | |
| BMAX B5 Pro G7H8 | |
| Geekom Mini IT8-GM08i5T | |
| Infinix INBook X2 | |
| Fujitsu Lifebook U939 i5 | |
| Beelink U59 N5105 | |
| Beelink SEi8 | |
| Cinebench R20 / CPU (Single Core) | |
| Asus Vivobook 15 K513EQ | |
| Beelink SEi11 Pro | |
| Beelink SER Pro Ryzen 5 5600H | |
| Intel NUC11TNKi5 | |
| Infinix INBook X2 | |
| BMAX B5 Pro G7H8 | |
| Fujitsu Lifebook U939 i5 | |
| Geekom Mini IT8-GM08i5T | |
| Beelink SEi8 | |
| Beelink U59 N5105 | |
| Cinebench R23 / Multi Core | |
| Beelink SER Pro Ryzen 5 5600H | |
| Beelink SEi11 Pro | |
| Asus Vivobook 15 K513EQ | |
| Intel NUC11TNKi5 | |
| Geekom Mini IT8-GM08i5T | |
| Infinix INBook X2 | |
| BMAX B5 Pro G7H8 | |
| Beelink U59 N5105 | |
| Beelink SEi8 | |
| Cinebench R23 / Single Core | |
| Asus Vivobook 15 K513EQ | |
| Beelink SEi11 Pro | |
| Intel NUC11TNKi5 | |
| Beelink SER Pro Ryzen 5 5600H | |
| Infinix INBook X2 | |
| Beelink SEi8 | |
| BMAX B5 Pro G7H8 | |
| Beelink U59 N5105 | |
| Cinebench R15 / CPU Multi 64Bit | |
| Beelink SER Pro Ryzen 5 5600H | |
| Asus Vivobook 15 K513EQ | |
| Beelink SEi11 Pro | |
| Intel NUC11TNKi5 | |
| BMAX B5 Pro G7H8 | |
| Geekom Mini IT8-GM08i5T | |
| Infinix INBook X2 | |
| Fujitsu Lifebook U939 i5 | |
| Beelink U59 N5105 | |
| Beelink SEi8 | |
| Cinebench R15 / CPU Single 64Bit | |
| Asus Vivobook 15 K513EQ | |
| Beelink SER Pro Ryzen 5 5600H | |
| Beelink SEi11 Pro | |
| Intel NUC11TNKi5 | |
| Fujitsu Lifebook U939 i5 | |
| BMAX B5 Pro G7H8 | |
| Infinix INBook X2 | |
| Geekom Mini IT8-GM08i5T | |
| Beelink SEi8 | |
| Beelink U59 N5105 | |
| Blender / v2.79 BMW27 CPU | |
| Beelink U59 N5105 | |
| Beelink SEi8 | |
| Fujitsu Lifebook U939 i5 | |
| Infinix INBook X2 | |
| BMAX B5 Pro G7H8 | |
| Geekom Mini IT8-GM08i5T | |
| Intel NUC11TNKi5 | |
| Asus Vivobook 15 K513EQ | |
| Beelink SEi11 Pro | |
| Beelink SER Pro Ryzen 5 5600H | |
| 7-Zip 18.03 / 7z b 4 | |
| Beelink SER Pro Ryzen 5 5600H | |
| Geekom Mini IT8-GM08i5T | |
| Asus Vivobook 15 K513EQ | |
| Beelink SEi11 Pro | |
| Intel NUC11TNKi5 | |
| BMAX B5 Pro G7H8 | |
| Infinix INBook X2 | |
| Fujitsu Lifebook U939 i5 | |
| Beelink U59 N5105 | |
| Beelink SEi8 | |
| 7-Zip 18.03 / 7z b 4 -mmt1 | |
| Beelink SER Pro Ryzen 5 5600H | |
| Asus Vivobook 15 K513EQ | |
| Beelink SEi11 Pro | |
| Intel NUC11TNKi5 | |
| BMAX B5 Pro G7H8 | |
| Fujitsu Lifebook U939 i5 | |
| Geekom Mini IT8-GM08i5T | |
| Beelink SEi8 | |
| Infinix INBook X2 | |
| Beelink U59 N5105 | |
| Geekbench 5.5 / Multi-Core | |
| Beelink SER Pro Ryzen 5 5600H | |
| Beelink SEi11 Pro | |
| Intel NUC11TNKi5 | |
| Geekom Mini IT8-GM08i5T | |
| Fujitsu Lifebook U939 i5 | |
| Infinix INBook X2 | |
| Beelink U59 N5105 | |
| Beelink SEi8 | |
| BMAX B5 Pro G7H8 | |
| Geekbench 5.5 / Single-Core | |
| Beelink SEi11 Pro | |
| Beelink SER Pro Ryzen 5 5600H | |
| Intel NUC11TNKi5 | |
| Infinix INBook X2 | |
| Fujitsu Lifebook U939 i5 | |
| Geekom Mini IT8-GM08i5T | |
| Beelink SEi8 | |
| Beelink U59 N5105 | |
| BMAX B5 Pro G7H8 | |
| HWBOT x265 Benchmark v2.2 / 4k Preset | |
| Beelink SER Pro Ryzen 5 5600H | |
| Beelink SEi11 Pro | |
| Asus Vivobook 15 K513EQ | |
| Intel NUC11TNKi5 | |
| Geekom Mini IT8-GM08i5T | |
| Infinix INBook X2 | |
| Fujitsu Lifebook U939 i5 | |
| Beelink SEi8 | |
| Beelink U59 N5105 | |
| BMAX B5 Pro G7H8 | |
| LibreOffice / 20 Documents To PDF | |
| BMAX B5 Pro G7H8 | |
| Beelink U59 N5105 | |
| Beelink SEi8 | |
| Geekom Mini IT8-GM08i5T | |
| Infinix INBook X2 | |
| Fujitsu Lifebook U939 i5 | |
| Beelink SER Pro Ryzen 5 5600H | |
| Intel NUC11TNKi5 | |
| Beelink SEi11 Pro | |
| Asus Vivobook 15 K513EQ | |
| R Benchmark 2.5 / Overall mean | |
| BMAX B5 Pro G7H8 | |
| Beelink U59 N5105 | |
| Beelink SEi8 | |
| Geekom Mini IT8-GM08i5T | |
| Infinix INBook X2 | |
| Fujitsu Lifebook U939 i5 | |
| Intel NUC11TNKi5 | |
| Beelink SEi11 Pro | |
| Asus Vivobook 15 K513EQ | |
| Beelink SER Pro Ryzen 5 5600H | |
* ... smaller is better
AIDA64: FP32 Ray-Trace | FPU Julia | CPU SHA3 | CPU Queen | FPU SinJulia | FPU Mandel | CPU AES | CPU ZLib | FP64 Ray-Trace | CPU PhotoWorxx
| Performance rating | |
| Beelink SER Pro Ryzen 5 5600H | |
| Beelink SEi11 Pro | |
| Intel NUC11TNKi5 | |
| BMAX B5 Pro G7H8 | |
| Beelink SEi8 | |
| Beelink U59 N5105 | |
| AIDA64 / FP32 Ray-Trace | |
| Beelink SER Pro Ryzen 5 5600H | |
| Beelink SEi11 Pro | |
| Intel NUC11TNKi5 | |
| BMAX B5 Pro G7H8 | |
| Beelink SEi8 | |
| Beelink U59 N5105 | |
| AIDA64 / FPU Julia | |
| Beelink SER Pro Ryzen 5 5600H | |
| Beelink SEi11 Pro | |
| Intel NUC11TNKi5 | |
| BMAX B5 Pro G7H8 | |
| Beelink SEi8 | |
| Beelink U59 N5105 | |
| AIDA64 / CPU SHA3 | |
| Beelink SER Pro Ryzen 5 5600H | |
| Beelink SEi11 Pro | |
| Intel NUC11TNKi5 | |
| BMAX B5 Pro G7H8 | |
| Beelink SEi8 | |
| Beelink U59 N5105 | |
| AIDA64 / CPU Queen | |
| Beelink SER Pro Ryzen 5 5600H | |
| Beelink SEi11 Pro | |
| Intel NUC11TNKi5 | |
| BMAX B5 Pro G7H8 | |
| Beelink SEi8 | |
| Beelink U59 N5105 | |
| AIDA64 / FPU SinJulia | |
| Beelink SER Pro Ryzen 5 5600H | |
| Beelink SEi11 Pro | |
| Intel NUC11TNKi5 | |
| BMAX B5 Pro G7H8 | |
| Beelink SEi8 | |
| Beelink U59 N5105 | |
| AIDA64 / FPU Mandel | |
| Beelink SER Pro Ryzen 5 5600H | |
| Beelink SEi11 Pro | |
| Intel NUC11TNKi5 | |
| BMAX B5 Pro G7H8 | |
| Beelink SEi8 | |
| Beelink U59 N5105 | |
| AIDA64 / CPU AES | |
| Beelink SER Pro Ryzen 5 5600H | |
| Beelink SEi11 Pro | |
| Intel NUC11TNKi5 | |
| Beelink U59 N5105 | |
| BMAX B5 Pro G7H8 | |
| Beelink SEi8 | |
| AIDA64 / CPU ZLib | |
| Beelink SER Pro Ryzen 5 5600H | |
| Intel NUC11TNKi5 | |
| Beelink SEi11 Pro | |
| BMAX B5 Pro G7H8 | |
| Beelink U59 N5105 | |
| Beelink SEi8 | |
| AIDA64 / FP64 Ray-Trace | |
| Beelink SER Pro Ryzen 5 5600H | |
| Beelink SEi11 Pro | |
| Intel NUC11TNKi5 | |
| BMAX B5 Pro G7H8 | |
| Beelink SEi8 | |
| Beelink U59 N5105 | |
| AIDA64 / CPU PhotoWorxx | |
| Beelink SEi11 Pro | |
| Beelink SER Pro Ryzen 5 5600H | |
| BMAX B5 Pro G7H8 | |
| Intel NUC11TNKi5 | |
| Beelink SEi8 | |
| Beelink U59 N5105 | |
系统性能
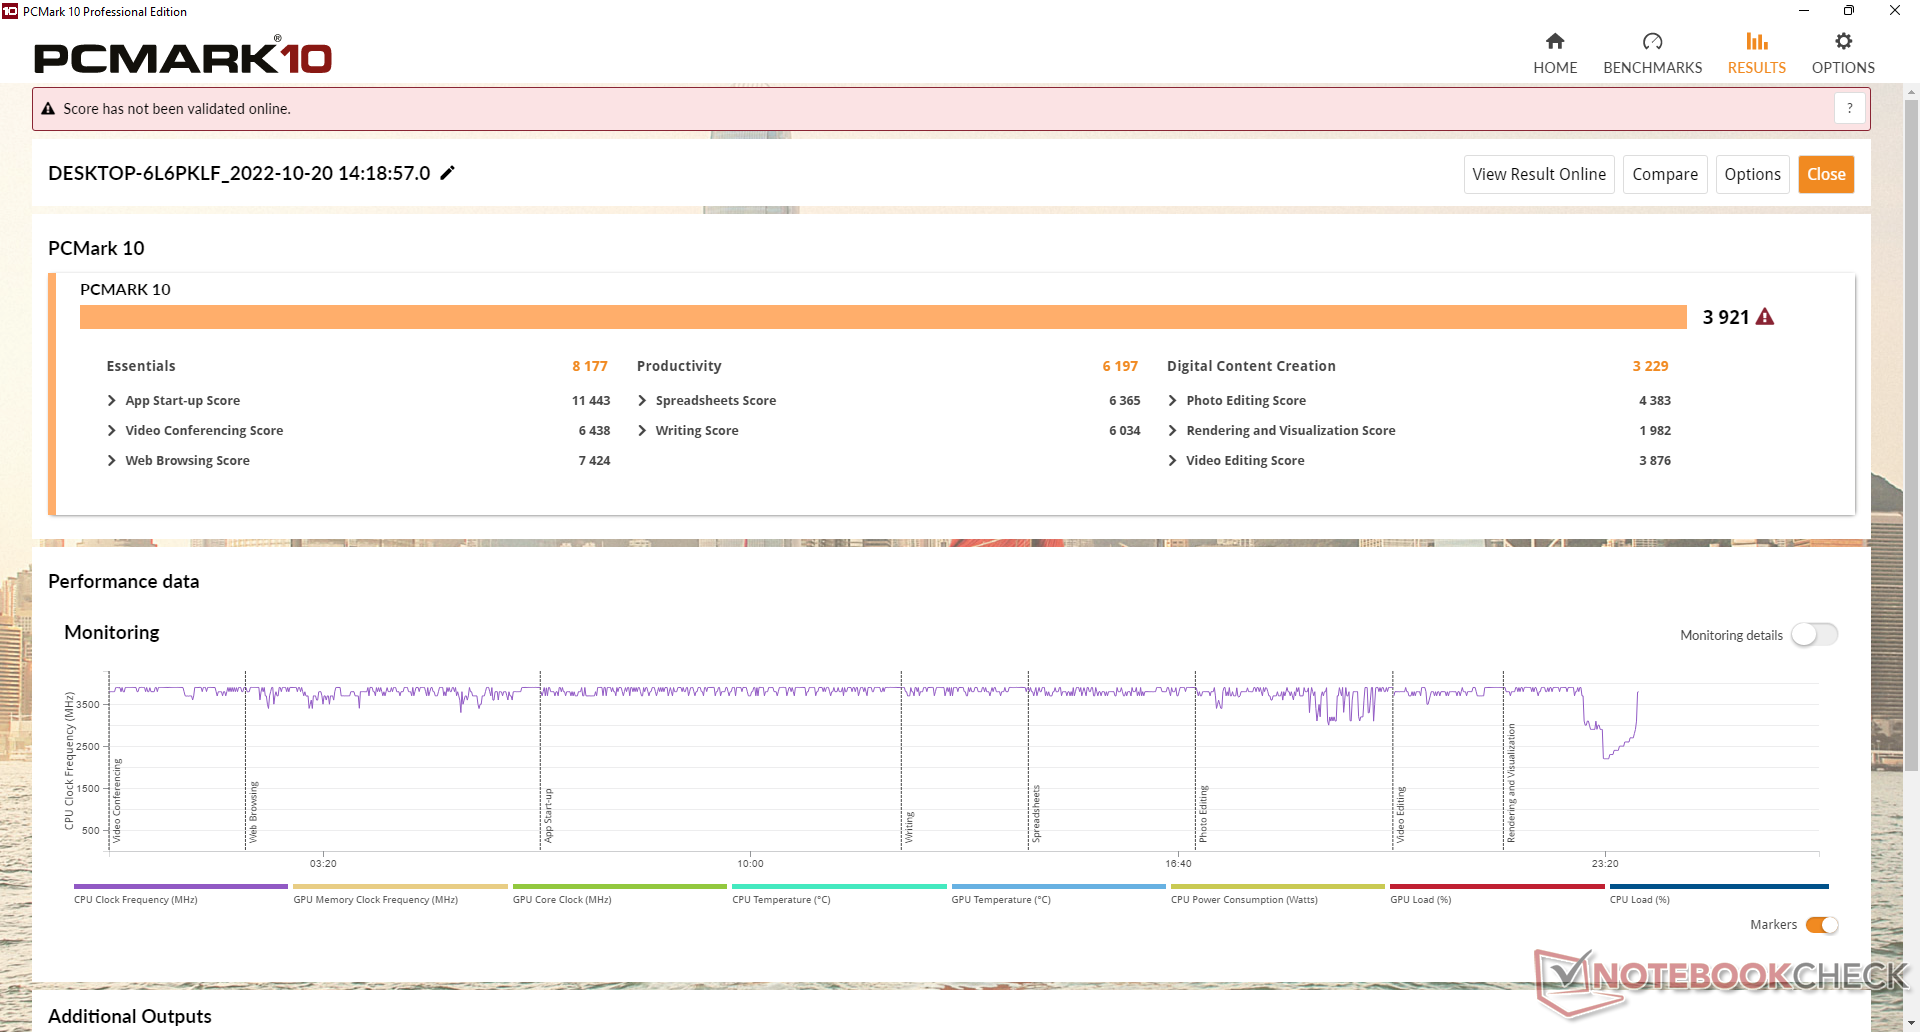
PCMark 10的结果与Beelink SEi8相当,后者也使用较旧的第八代酷睿CPU。采用较新的第11代CPU的迷你电脑,如英特尔NUC11TNKi5,能够提供明显更高的数字内容创作分数,因为它们的集成GPU速度更快。
CrossMark: Overall | Productivity | Creativity | Responsiveness
| PCMark 10 / Score | |
| Beelink SER Pro Ryzen 5 5600H | |
| Beelink SEi11 Pro | |
| Intel NUC11TNKi5 | |
| BMAX B5 Pro G7H8 | |
| Beelink SEi8 | |
| Beelink U59 N5105 | |
| PCMark 10 / Essentials | |
| Beelink SER Pro Ryzen 5 5600H | |
| Beelink SEi11 Pro | |
| Intel NUC11TNKi5 | |
| BMAX B5 Pro G7H8 | |
| Beelink SEi8 | |
| Beelink U59 N5105 | |
| PCMark 10 / Productivity | |
| Beelink SER Pro Ryzen 5 5600H | |
| Beelink SEi11 Pro | |
| BMAX B5 Pro G7H8 | |
| Intel NUC11TNKi5 | |
| Beelink SEi8 | |
| Beelink U59 N5105 | |
| PCMark 10 / Digital Content Creation | |
| Beelink SER Pro Ryzen 5 5600H | |
| Beelink SEi11 Pro | |
| Intel NUC11TNKi5 | |
| BMAX B5 Pro G7H8 | |
| Beelink SEi8 | |
| Beelink U59 N5105 | |
| CrossMark / Overall | |
| Beelink SEi11 Pro | |
| Beelink SER Pro Ryzen 5 5600H | |
| BMAX B5 Pro G7H8 | |
| Beelink U59 N5105 | |
| CrossMark / Productivity | |
| Beelink SEi11 Pro | |
| Beelink SER Pro Ryzen 5 5600H | |
| BMAX B5 Pro G7H8 | |
| Beelink U59 N5105 | |
| CrossMark / Creativity | |
| Beelink SER Pro Ryzen 5 5600H | |
| Beelink SEi11 Pro | |
| BMAX B5 Pro G7H8 | |
| Beelink U59 N5105 | |
| CrossMark / Responsiveness | |
| Beelink SEi11 Pro | |
| Beelink SER Pro Ryzen 5 5600H | |
| BMAX B5 Pro G7H8 | |
| Beelink U59 N5105 | |
| PCMark 10 Score | 3921 points | |
Help | ||
| AIDA64 / Memory Copy | |
| Beelink SER Pro Ryzen 5 5600H | |
| Beelink SEi11 Pro | |
| Beelink SEi8 | |
| BMAX B5 Pro G7H8 | |
| Beelink U59 N5105 | |
| Intel NUC11TNKi5 | |
| AIDA64 / Memory Read | |
| Beelink SER Pro Ryzen 5 5600H | |
| Beelink SEi11 Pro | |
| BMAX B5 Pro G7H8 | |
| Beelink SEi8 | |
| Intel NUC11TNKi5 | |
| Beelink U59 N5105 | |
| AIDA64 / Memory Write | |
| Beelink SEi11 Pro | |
| Beelink SER Pro Ryzen 5 5600H | |
| BMAX B5 Pro G7H8 | |
| Beelink U59 N5105 | |
| Intel NUC11TNKi5 | |
| Beelink SEi8 | |
| AIDA64 / Memory Latency | |
| BMAX B5 Pro G7H8 | |
| Intel NUC11TNKi5 | |
| Beelink SEi11 Pro | |
| Beelink SER Pro Ryzen 5 5600H | |
| Beelink U59 N5105 | |
| Beelink SEi8 | |
* ... smaller is better
DPC延时
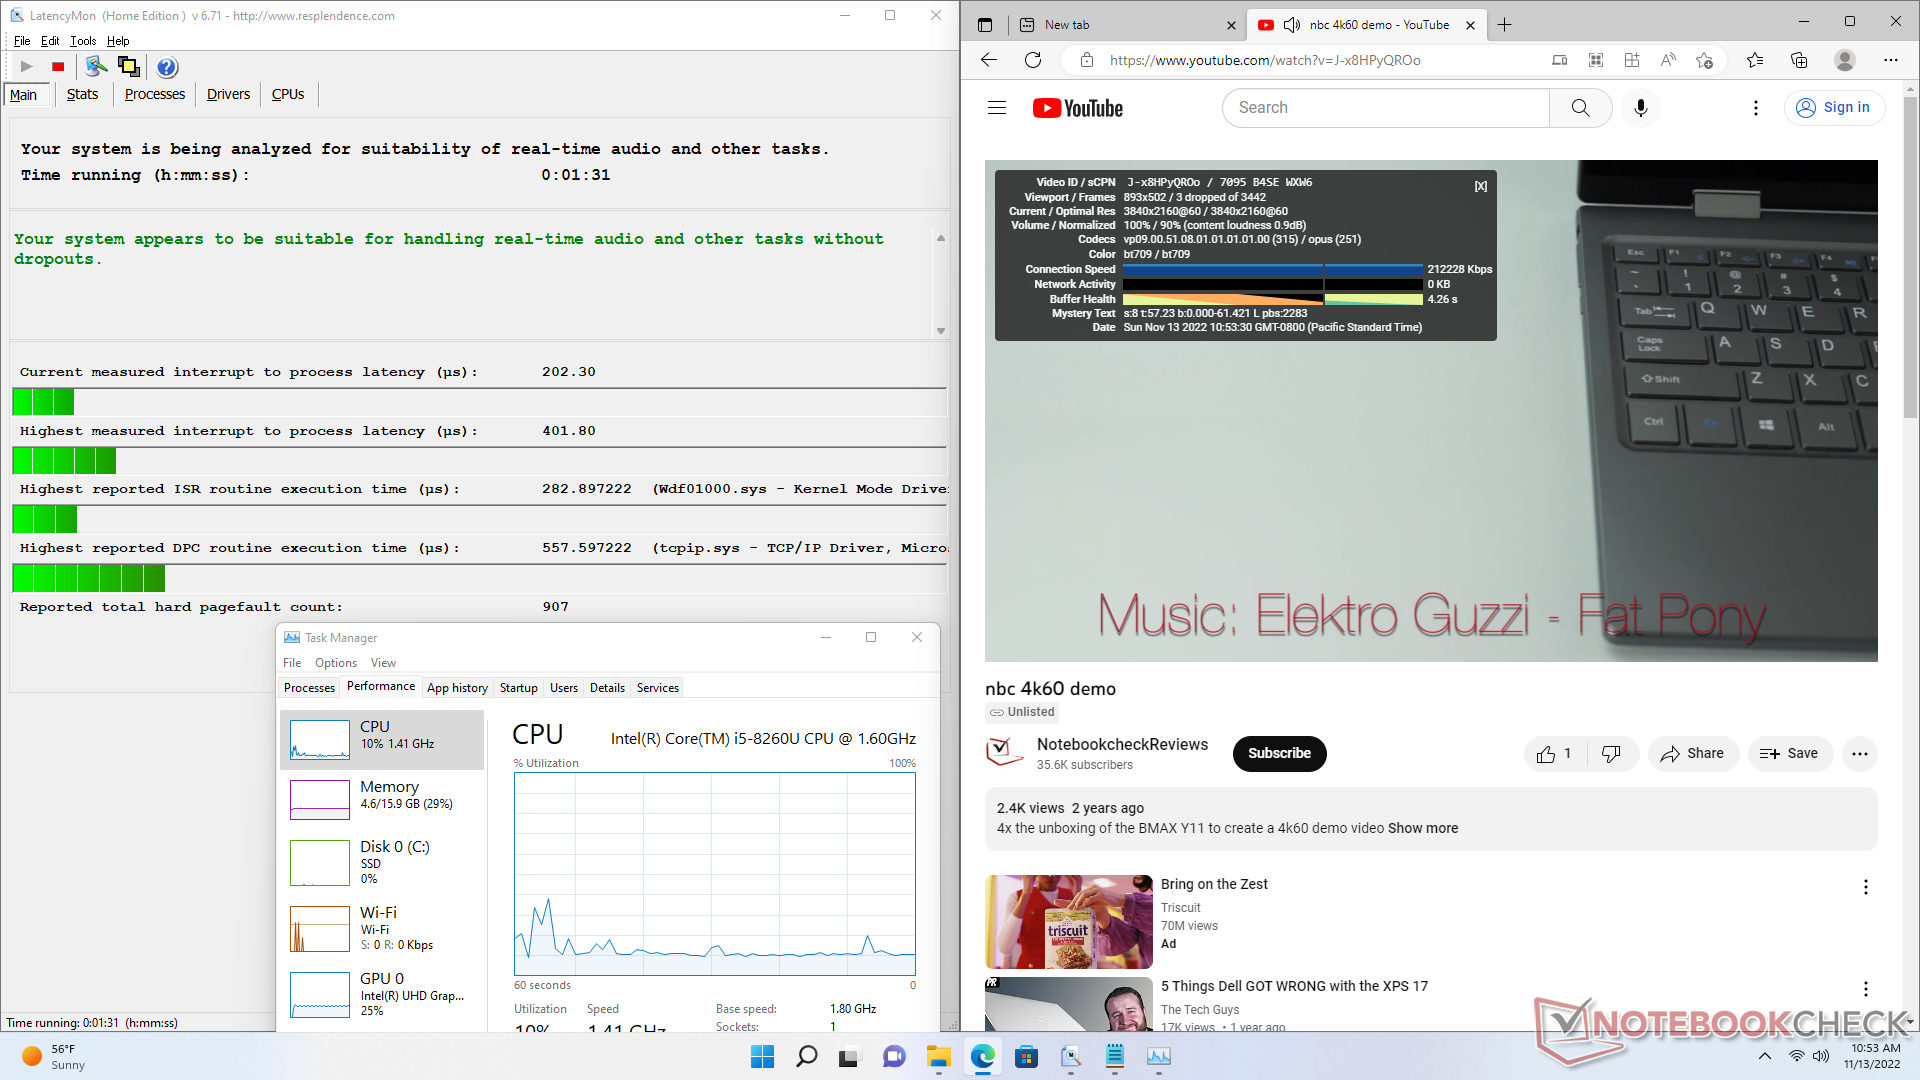
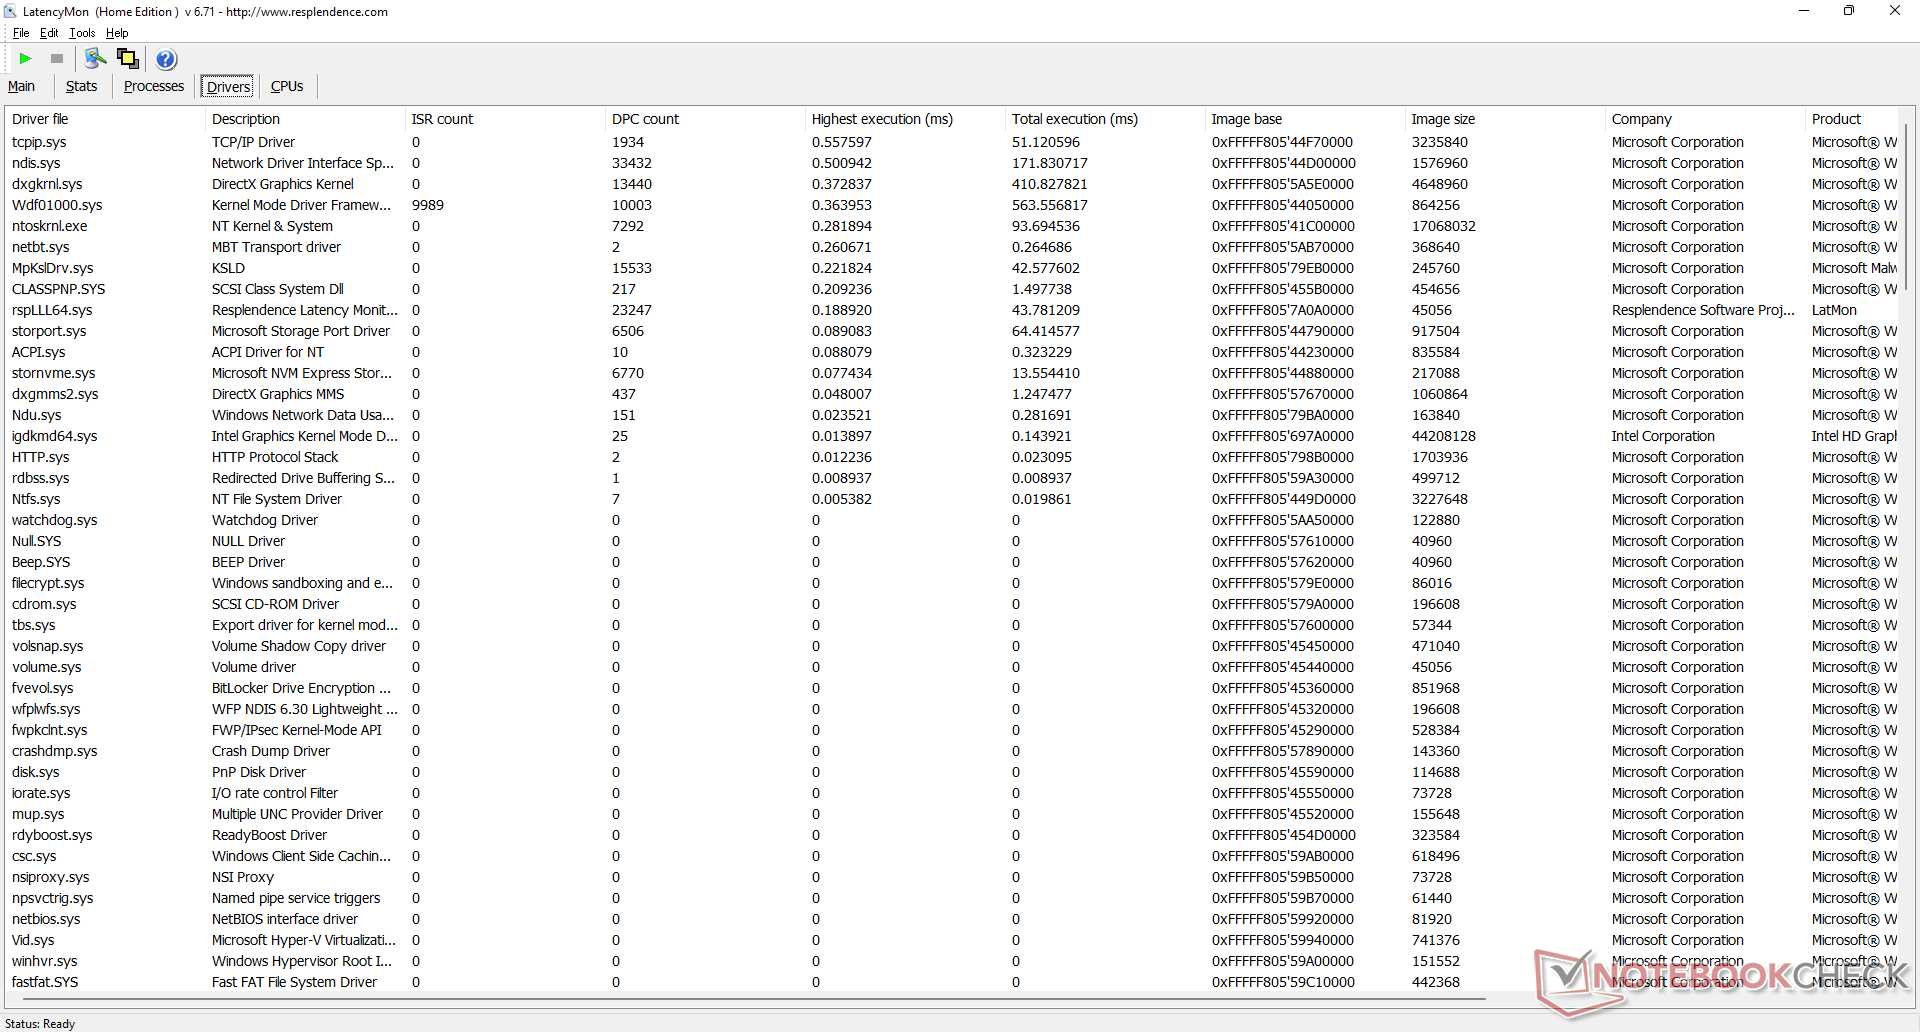
LatencyMon显示,在浏览网页时没有重大的DPC问题。在60 FPS下的4K视频播放也很出色,在我们长达1分钟的播放测试中只有3个丢帧。
| DPC Latencies / LatencyMon - interrupt to process latency (max), Web, Youtube, Prime95 | |
| Beelink SEi8 | |
| Beelink U59 N5105 | |
| Beelink SER Pro Ryzen 5 5600H | |
| Intel NUC11TNKi5 | |
| BMAX B5 Pro G7H8 | |
| Beelink SEi11 Pro | |
* ... smaller is better
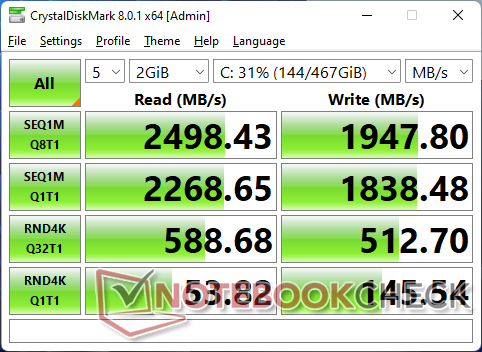
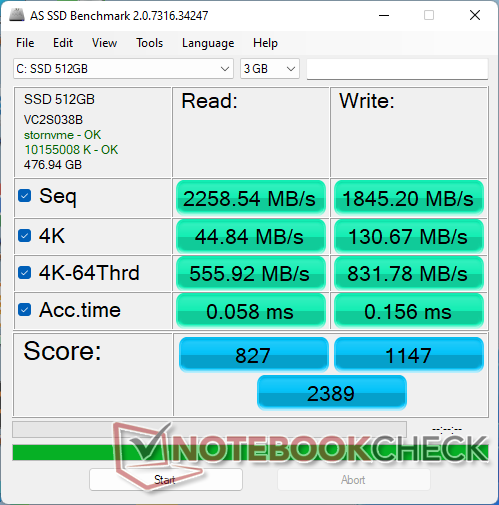
存储设备 - 多达两个驱动器
B5 Pro使用了一个普通的M.2 PCIe3 x4固态硬盘,配备了一个 RealTek RTS5763DL控制器以节省成本。然而,性能并不理想,因为当硬盘受到压力时,读取率会从最初的2400MB/s的高点下降到1700MB/s。

| Drive Performance rating - Percent | |
| Beelink SER Pro Ryzen 5 5600H -11! | |
| BMAX B5 Pro G7H8 | |
| Beelink SEi11 Pro | |
| Beelink SEi8 | |
| Beelink U59 N5105 | |
| Intel NUC11TNKi5 | |
| DiskSpd | |
| seq read | |
| BMAX B5 Pro G7H8 | |
| Beelink SER Pro Ryzen 5 5600H | |
| Beelink SEi11 Pro | |
| Beelink SEi8 | |
| Intel NUC11TNKi5 | |
| Beelink U59 N5105 | |
| seq write | |
| Beelink SER Pro Ryzen 5 5600H | |
| Beelink SEi11 Pro | |
| BMAX B5 Pro G7H8 | |
| Beelink SEi8 | |
| Intel NUC11TNKi5 | |
| Beelink U59 N5105 | |
| seq q8 t1 read | |
| Beelink SER Pro Ryzen 5 5600H | |
| BMAX B5 Pro G7H8 | |
| Beelink SEi11 Pro | |
| Beelink SEi8 | |
| Intel NUC11TNKi5 | |
| Beelink U59 N5105 | |
| seq q8 t1 write | |
| BMAX B5 Pro G7H8 | |
| Beelink SER Pro Ryzen 5 5600H | |
| Beelink SEi11 Pro | |
| Beelink SEi8 | |
| Intel NUC11TNKi5 | |
| Beelink U59 N5105 | |
| 4k q1 t1 read | |
| Beelink SEi8 | |
| Beelink SEi11 Pro | |
| BMAX B5 Pro G7H8 | |
| Beelink SER Pro Ryzen 5 5600H | |
| Beelink U59 N5105 | |
| Intel NUC11TNKi5 | |
| 4k q1 t1 write | |
| Beelink SEi11 Pro | |
| Beelink SER Pro Ryzen 5 5600H | |
| Beelink SEi8 | |
| BMAX B5 Pro G7H8 | |
| Beelink U59 N5105 | |
| Intel NUC11TNKi5 | |
| 4k q32 t16 read | |
| BMAX B5 Pro G7H8 | |
| Beelink SER Pro Ryzen 5 5600H | |
| Beelink SEi11 Pro | |
| Beelink SEi8 | |
| Intel NUC11TNKi5 | |
| Beelink U59 N5105 | |
| 4k q32 t16 write | |
| BMAX B5 Pro G7H8 | |
| Beelink SER Pro Ryzen 5 5600H | |
| Beelink SEi11 Pro | |
| Beelink SEi8 | |
| Intel NUC11TNKi5 | |
| Beelink U59 N5105 | |
| AS SSD | |
| Score Total | |
| Beelink SEi11 Pro | |
| BMAX B5 Pro G7H8 | |
| Beelink SEi8 | |
| Intel NUC11TNKi5 | |
| Beelink U59 N5105 | |
| Score Read | |
| Beelink SEi11 Pro | |
| BMAX B5 Pro G7H8 | |
| Beelink SEi8 | |
| Intel NUC11TNKi5 | |
| Beelink U59 N5105 | |
| Score Write | |
| Beelink SEi11 Pro | |
| BMAX B5 Pro G7H8 | |
| Beelink SEi8 | |
| Intel NUC11TNKi5 | |
| Beelink U59 N5105 | |
| Seq Read | |
| BMAX B5 Pro G7H8 | |
| Beelink SEi11 Pro | |
| Beelink SEi8 | |
| Intel NUC11TNKi5 | |
| Beelink U59 N5105 | |
| Seq Write | |
| BMAX B5 Pro G7H8 | |
| Beelink SEi11 Pro | |
| Beelink SEi8 | |
| Intel NUC11TNKi5 | |
| Beelink U59 N5105 | |
| 4K Read | |
| Beelink SEi8 | |
| BMAX B5 Pro G7H8 | |
| Beelink SEi11 Pro | |
| Intel NUC11TNKi5 | |
| Beelink U59 N5105 | |
| 4K Write | |
| Beelink SEi11 Pro | |
| BMAX B5 Pro G7H8 | |
| Beelink SEi8 | |
| Beelink U59 N5105 | |
| Intel NUC11TNKi5 | |
| 4K-64 Read | |
| Beelink SEi11 Pro | |
| BMAX B5 Pro G7H8 | |
| Beelink SEi8 | |
| Intel NUC11TNKi5 | |
| Beelink U59 N5105 | |
| 4K-64 Write | |
| Beelink SEi11 Pro | |
| BMAX B5 Pro G7H8 | |
| Beelink SEi8 | |
| Intel NUC11TNKi5 | |
| Beelink U59 N5105 | |
| Access Time Read | |
| Intel NUC11TNKi5 | |
| Beelink SEi8 | |
| Beelink U59 N5105 | |
| BMAX B5 Pro G7H8 | |
| Beelink SEi11 Pro | |
| Access Time Write | |
| Beelink SEi11 Pro | |
| Intel NUC11TNKi5 | |
| Beelink U59 N5105 | |
| BMAX B5 Pro G7H8 | |
| Beelink SEi8 | |
* ... smaller is better
Disk Throttling: DiskSpd Read Loop, Queue Depth 8
GPU性能
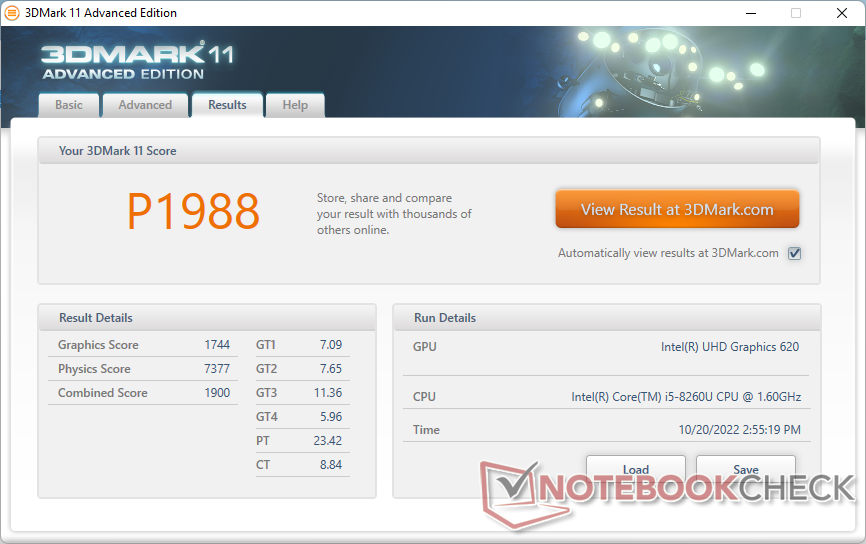
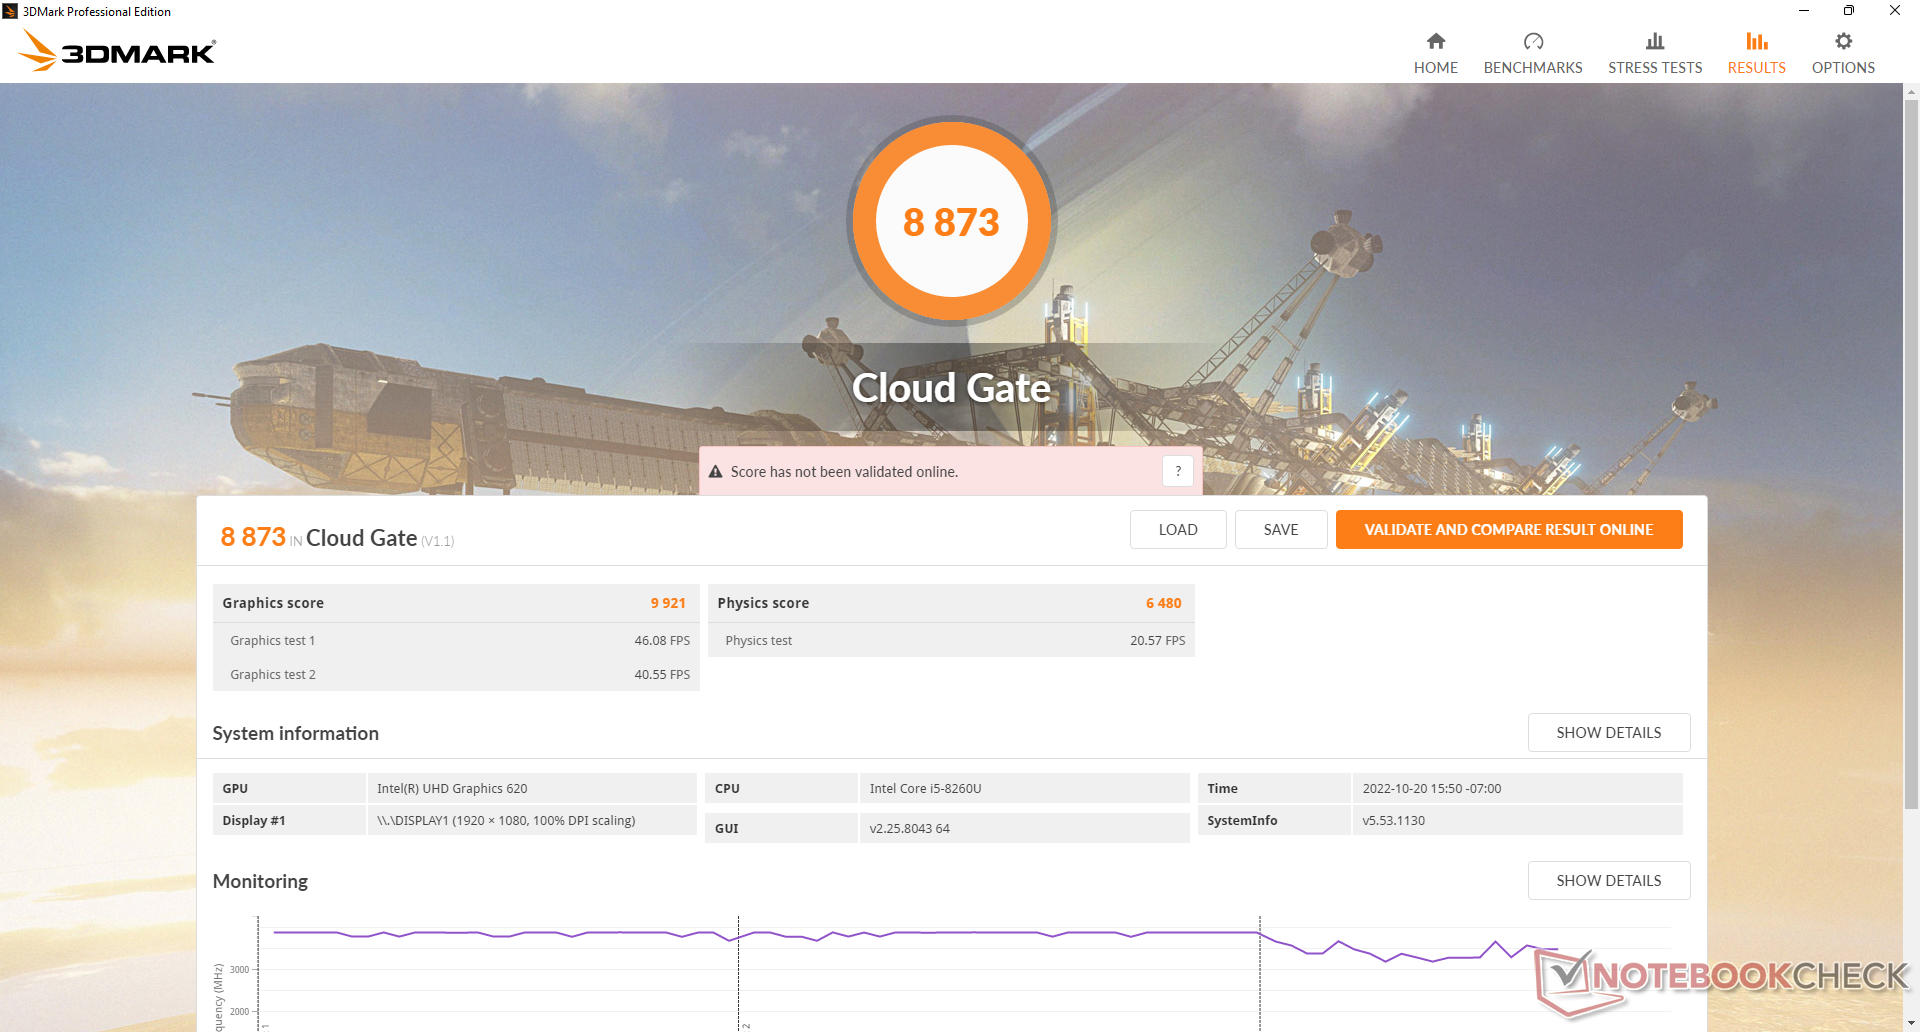
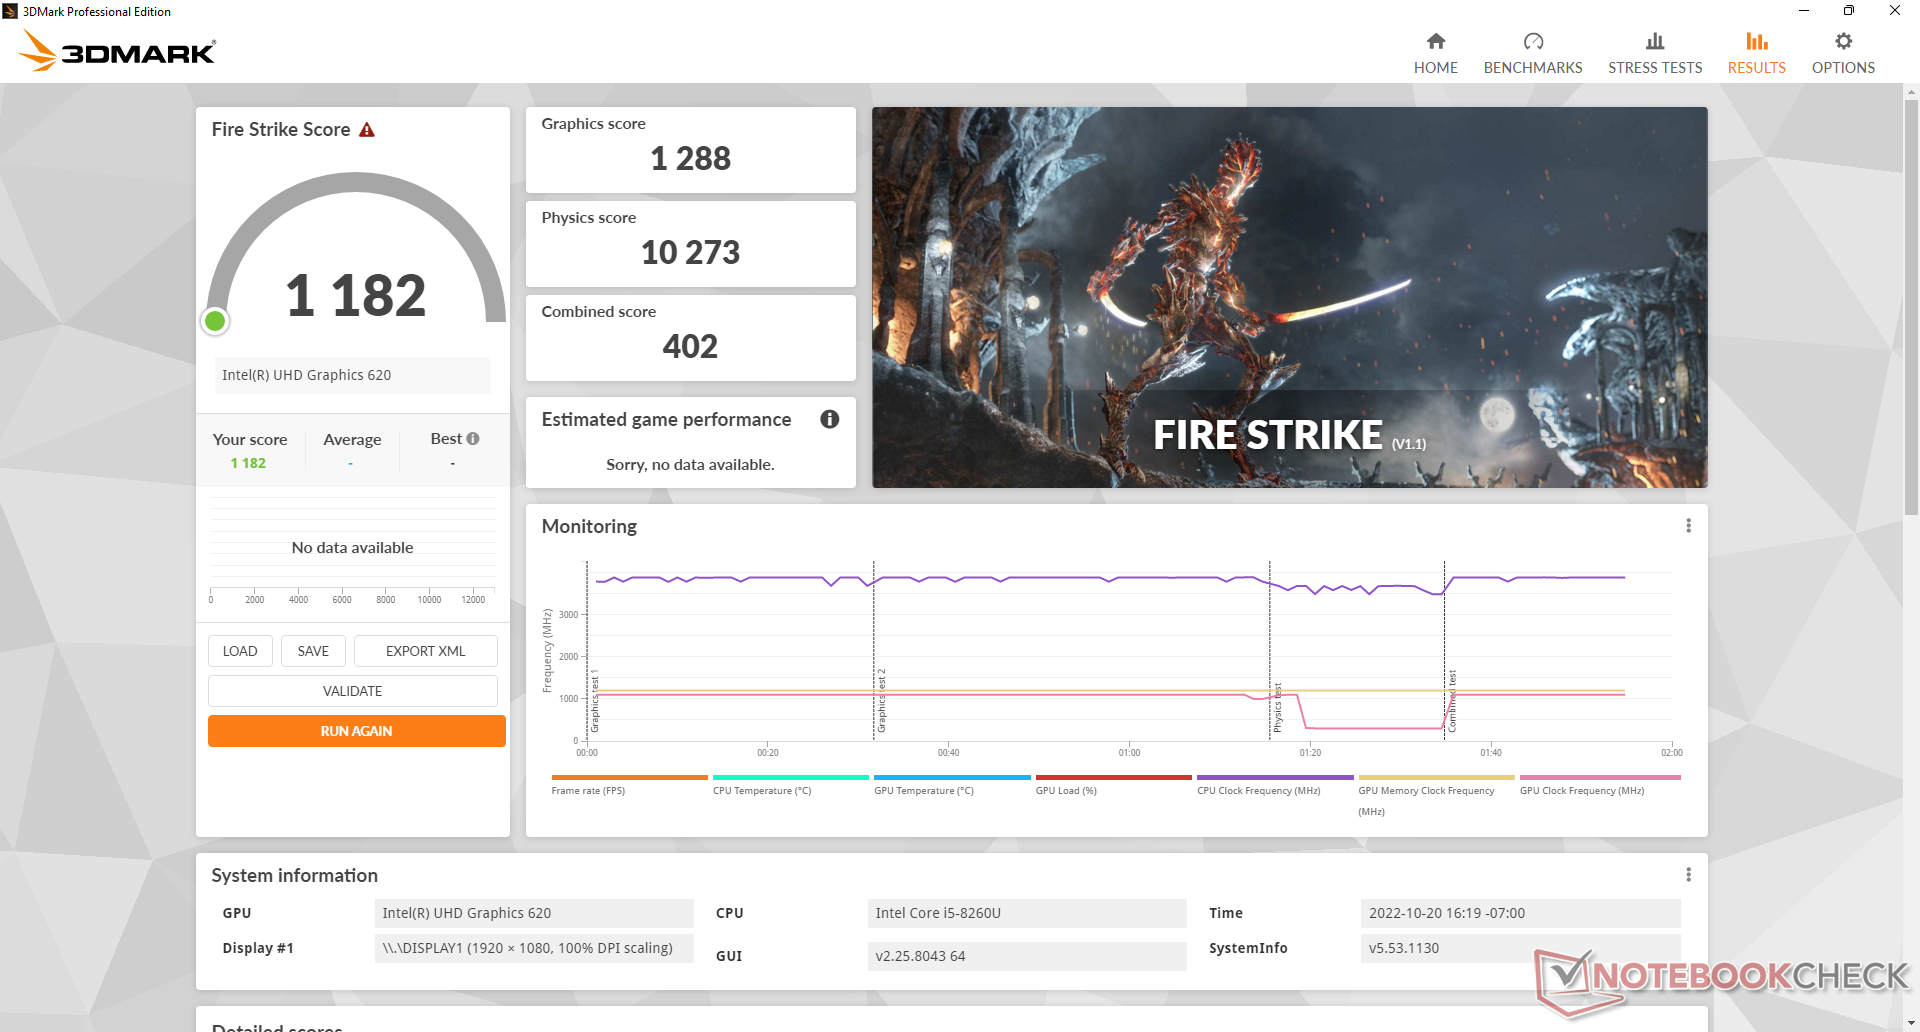
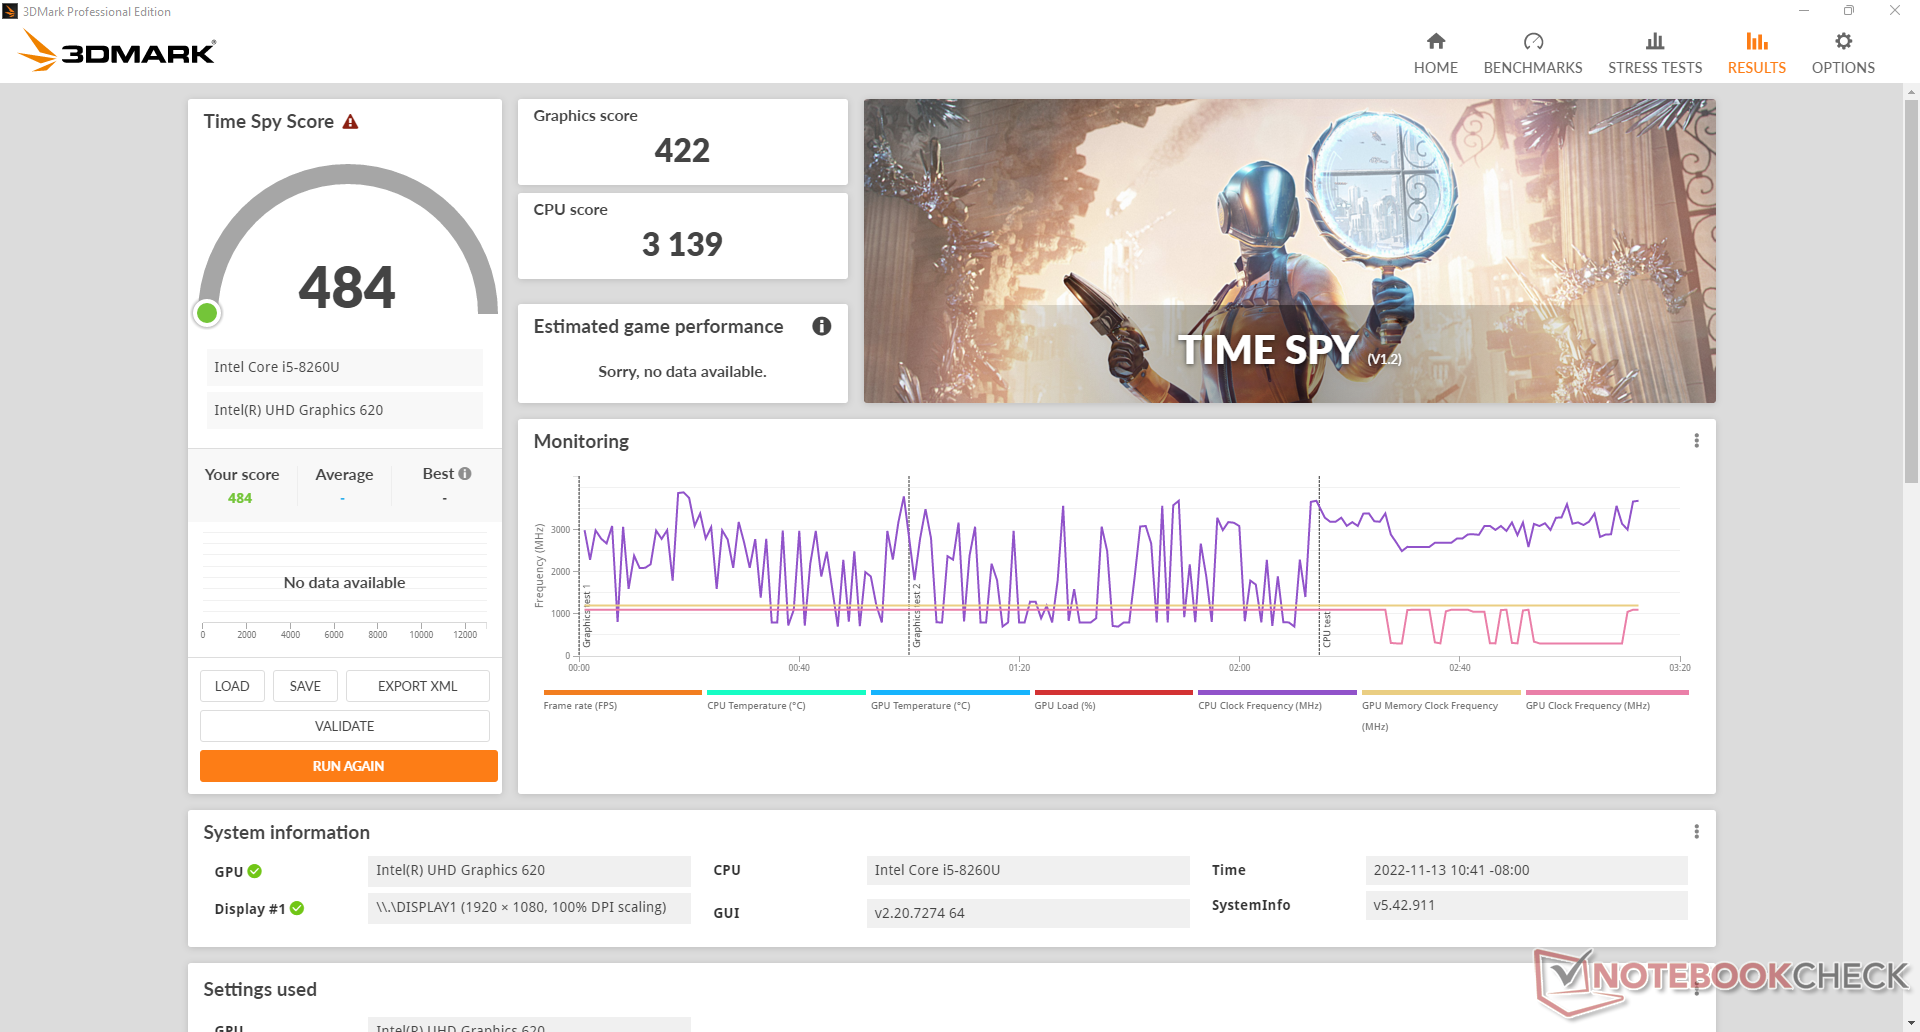
按照今天的标准,图形性能很差。这款 Iris Xe 80 EUs例如,许多现代酷睿i5 U系列CPU中的Iris Xe 80 EU提供了2倍到2.5倍的性能,比我们老化的 UHD Graphics 620.大多数游戏都无法播放,有些甚至根本无法启动,包括X-Plane。
| 3DMark | |
| 1920x1080 Fire Strike Graphics | |
| Beelink SEi11 Pro | |
| Asus Vivobook 15 K513EQ | |
| Beelink SER Pro Ryzen 5 5600H | |
| Intel NUC11TNKi5 | |
| Infinix INBook X2 | |
| Geekom Mini IT8-GM08i5T | |
| Beelink SEi8 | |
| BMAX B5 Pro G7H8 | |
| Beelink U59 N5105 | |
| 2560x1440 Time Spy Graphics | |
| Beelink SEi11 Pro | |
| Asus Vivobook 15 K513EQ | |
| Beelink SER Pro Ryzen 5 5600H | |
| Intel NUC11TNKi5 | |
| Infinix INBook X2 | |
| Geekom Mini IT8-GM08i5T | |
| Beelink SEi8 | |
| BMAX B5 Pro G7H8 | |
| Beelink U59 N5105 | |
| 2560x1440 Time Spy Score | |
| Beelink SEi11 Pro | |
| Asus Vivobook 15 K513EQ | |
| Beelink SER Pro Ryzen 5 5600H | |
| Intel NUC11TNKi5 | |
| Infinix INBook X2 | |
| Geekom Mini IT8-GM08i5T | |
| Beelink SEi8 | |
| BMAX B5 Pro G7H8 | |
| Beelink U59 N5105 | |
| 3DMark 11 - 1280x720 Performance GPU | |
| Beelink SEi11 Pro | |
| Asus Vivobook 15 K513EQ | |
| Beelink SER Pro Ryzen 5 5600H | |
| Intel NUC11TNKi5 | |
| Infinix INBook X2 | |
| Geekom Mini IT8-GM08i5T | |
| Beelink SEi8 | |
| BMAX B5 Pro G7H8 | |
| Fujitsu Lifebook U939 i5 | |
| Beelink U59 N5105 | |
| 3DMark 11 Performance | 1988 points | |
| 3DMark Cloud Gate Standard Score | 8873 points | |
| 3DMark Fire Strike Score | 1182 points | |
| 3DMark Time Spy Score | 484 points | |
Help | ||
| Blender - v3.3 Classroom CPU (sort by value) | |
| BMAX B5 Pro G7H8 | |
| Beelink SEi11 Pro | |
| Beelink U59 N5105 | |
| Beelink SER Pro Ryzen 5 5600H | |
* ... smaller is better
| Performance rating - Percent | |
| Asus Vivobook 15 K513EQ | |
| Beelink SER Pro Ryzen 5 5600H | |
| Beelink SEi11 Pro -1! | |
| Intel NUC11TNKi5 -3! | |
| Infinix INBook X2 -2! | |
| Beelink SEi8 -3! | |
| Fujitsu Lifebook U939 i5 -4! | |
| Beelink U59 N5105 -3! | |
| BMAX B5 Pro G7H8 -5! | |
| The Witcher 3 - 1920x1080 Ultra Graphics & Postprocessing (HBAO+) | |
| Asus Vivobook 15 K513EQ | |
| Beelink SER Pro Ryzen 5 5600H | |
| Beelink SEi11 Pro | |
| Infinix INBook X2 | |
| Beelink U59 N5105 | |
| GTA V - 1920x1080 Highest AA:4xMSAA + FX AF:16x | |
| Asus Vivobook 15 K513EQ | |
| Beelink SER Pro Ryzen 5 5600H | |
| Final Fantasy XV Benchmark - 1920x1080 High Quality | |
| Beelink SEi11 Pro | |
| Asus Vivobook 15 K513EQ | |
| Beelink SER Pro Ryzen 5 5600H | |
| Intel NUC11TNKi5 | |
| Infinix INBook X2 | |
| Beelink SEi8 | |
| Strange Brigade - 1920x1080 ultra AA:ultra AF:16 | |
| Beelink SER Pro Ryzen 5 5600H | |
| Beelink SEi11 Pro | |
| Asus Vivobook 15 K513EQ | |
| Dota 2 Reborn - 1920x1080 ultra (3/3) best looking | |
| Asus Vivobook 15 K513EQ | |
| Beelink SER Pro Ryzen 5 5600H | |
| Beelink SEi11 Pro | |
| Intel NUC11TNKi5 | |
| Infinix INBook X2 | |
| Beelink SEi8 | |
| Fujitsu Lifebook U939 i5 | |
| Beelink U59 N5105 | |
| BMAX B5 Pro G7H8 | |
| X-Plane 11.11 - 1920x1080 high (fps_test=3) | |
| Asus Vivobook 15 K513EQ | |
| Beelink SEi11 Pro | |
| Beelink SER Pro Ryzen 5 5600H | |
| Intel NUC11TNKi5 | |
| Infinix INBook X2 | |
| Fujitsu Lifebook U939 i5 | |
| Beelink SEi8 | |
| Beelink U59 N5105 | |
| The Witcher 3 | |
| 1024x768 Low Graphics & Postprocessing | |
| Beelink SEi11 Pro | |
| Asus Vivobook 15 K513EQ | |
| Beelink SER Pro Ryzen 5 5600H | |
| Intel NUC11TNKi5 | |
| Infinix INBook X2 | |
| BMAX B5 Pro G7H8 | |
| Beelink U59 N5105 | |
| Fujitsu Lifebook U939 i5 | |
| 1366x768 Medium Graphics & Postprocessing | |
| Beelink SEi11 Pro | |
| Beelink SER Pro Ryzen 5 5600H | |
| Asus Vivobook 15 K513EQ | |
| Infinix INBook X2 | |
| Beelink U59 N5105 | |
| BMAX B5 Pro G7H8 | |
| 1920x1080 High Graphics & Postprocessing (Nvidia HairWorks Off) | |
| Asus Vivobook 15 K513EQ | |
| Beelink SEi11 Pro | |
| Beelink SER Pro Ryzen 5 5600H | |
| Infinix INBook X2 | |
| Beelink U59 N5105 | |
| BMAX B5 Pro G7H8 | |
| Final Fantasy XV Benchmark - 1280x720 Lite Quality | |
| Asus Vivobook 15 K513EQ | |
| Beelink SER Pro Ryzen 5 5600H | |
| Beelink SEi11 Pro | |
| Intel NUC11TNKi5 | |
| Infinix INBook X2 | |
| Geekom Mini IT8-GM08i5T | |
| Beelink SEi8 | |
| Beelink U59 N5105 | |
| BMAX B5 Pro G7H8 | |
| Dota 2 Reborn | |
| 1280x720 min (0/3) fastest | |
| Beelink SER Pro Ryzen 5 5600H | |
| Asus Vivobook 15 K513EQ | |
| Beelink SEi11 Pro | |
| Beelink SEi8 | |
| Infinix INBook X2 | |
| Intel NUC11TNKi5 | |
| Beelink U59 N5105 | |
| Fujitsu Lifebook U939 i5 | |
| BMAX B5 Pro G7H8 | |
| 1366x768 med (1/3) | |
| Asus Vivobook 15 K513EQ | |
| Beelink SER Pro Ryzen 5 5600H | |
| Beelink SEi11 Pro | |
| Infinix INBook X2 | |
| Intel NUC11TNKi5 | |
| Fujitsu Lifebook U939 i5 | |
| Beelink SEi8 | |
| Beelink U59 N5105 | |
| BMAX B5 Pro G7H8 | |
| 1920x1080 high (2/3) | |
| Asus Vivobook 15 K513EQ | |
| Beelink SER Pro Ryzen 5 5600H | |
| Beelink SEi11 Pro | |
| Intel NUC11TNKi5 | |
| Infinix INBook X2 | |
| Beelink SEi8 | |
| Fujitsu Lifebook U939 i5 | |
| Beelink U59 N5105 | |
| BMAX B5 Pro G7H8 | |
| 1920x1080 ultra (3/3) best looking | |
| Asus Vivobook 15 K513EQ | |
| Beelink SER Pro Ryzen 5 5600H | |
| Beelink SEi11 Pro | |
| Intel NUC11TNKi5 | |
| Infinix INBook X2 | |
| Beelink SEi8 | |
| Fujitsu Lifebook U939 i5 | |
| Beelink U59 N5105 | |
| BMAX B5 Pro G7H8 | |
Witcher 3 FPS Chart
| low | med. | high | ultra | |
|---|---|---|---|---|
| The Witcher 3 (2015) | 23.8 | 13.5 | 7.3 | |
| Dota 2 Reborn (2015) | 42.4 | 8.6 | 5.6 | 5.6 |
| Final Fantasy XV Benchmark (2018) | 5.61 |
排放
系统噪音 - 一点都不响
即使在不运行任何应用程序的情况下,内部风扇几乎总是以大约25 dB(A)的速度活动,而静音背景为23 dB(A)。幸运的是,这个低的范围足够安静,在大多数情况下都不会被注意到。运行更高的负载,如游戏,会引起30至34 dB(A)的风扇噪音,这仍然是非常安静的,特别是在HTPC环境中。
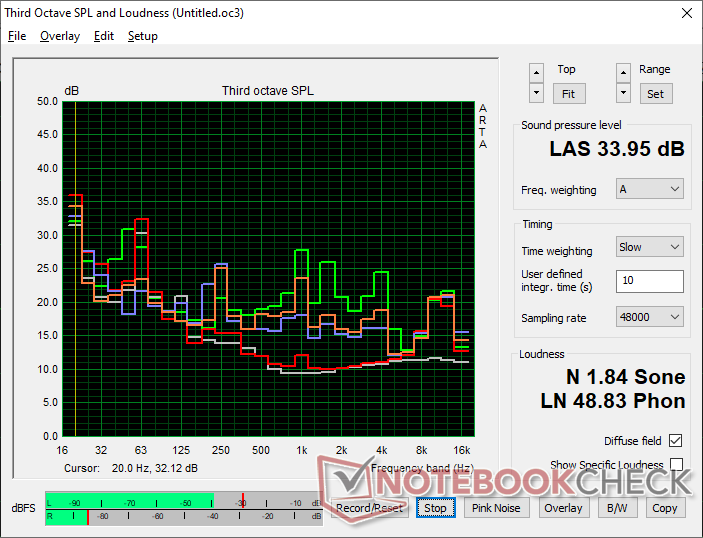
Noise level
| Idle |
| 25.1 / 25.1 / 25.1 dB(A) |
| Load |
| 28.6 / 34 dB(A) |
 | ||
30 dB silent 40 dB(A) audible 50 dB(A) loud |
||
min: | ||
| BMAX B5 Pro G7H8 UHD Graphics 620, i5-8260U | Beelink SEi11 Pro Iris Xe G7 96EUs, i5-11320H, Kingston NV1 SNVS/500GCN | Beelink U59 N5105 UHD Graphics (Jasper Lake 24 EU), Celeron N5105, Silicon Motion AZW 512G NV428 | Beelink SEi8 Iris Plus Graphics 655, i3-8109U, Intel SSD 660p SSDPEKNW512G8 | Beelink SER Pro Ryzen 5 5600H Vega 7, R5 5600H, Kingston NV1 SNVS/500GCN | Intel NUC11TNKi5 Iris Xe G7 80EUs, i5-1135G7, Transcend M.2 SSD 430S TS512GMTS430S | |
|---|---|---|---|---|---|---|
| Noise | -5% | 14% | -14% | -7% | -32% | |
| off / environment * (dB) | 23 | 22.8 1% | 21.5 7% | 24.5 -7% | 22.8 1% | 24.8 -8% |
| Idle Minimum * (dB) | 25.1 | 24.7 2% | 22.1 12% | 26.5 -6% | 26.1 -4% | 35.6 -42% |
| Idle Average * (dB) | 25.1 | 24.7 2% | 22.1 12% | 26.5 -6% | 26.1 -4% | 35.6 -42% |
| Idle Maximum * (dB) | 25.1 | 25.3 -1% | 22.1 12% | 31.1 -24% | 28.7 -14% | 35.6 -42% |
| Load Average * (dB) | 28.6 | 33.2 -16% | 23.9 16% | 37.7 -32% | 32.3 -13% | 36.2 -27% |
| Witcher 3 ultra * (dB) | 30.1 | 34.5 -15% | 24.4 19% | 32.8 -9% | 38 -26% | |
| Load Maximum * (dB) | 34 | 37.8 -11% | 26.8 21% | 37.5 -10% | 36.4 -7% | 47.6 -40% |
* ... smaller is better
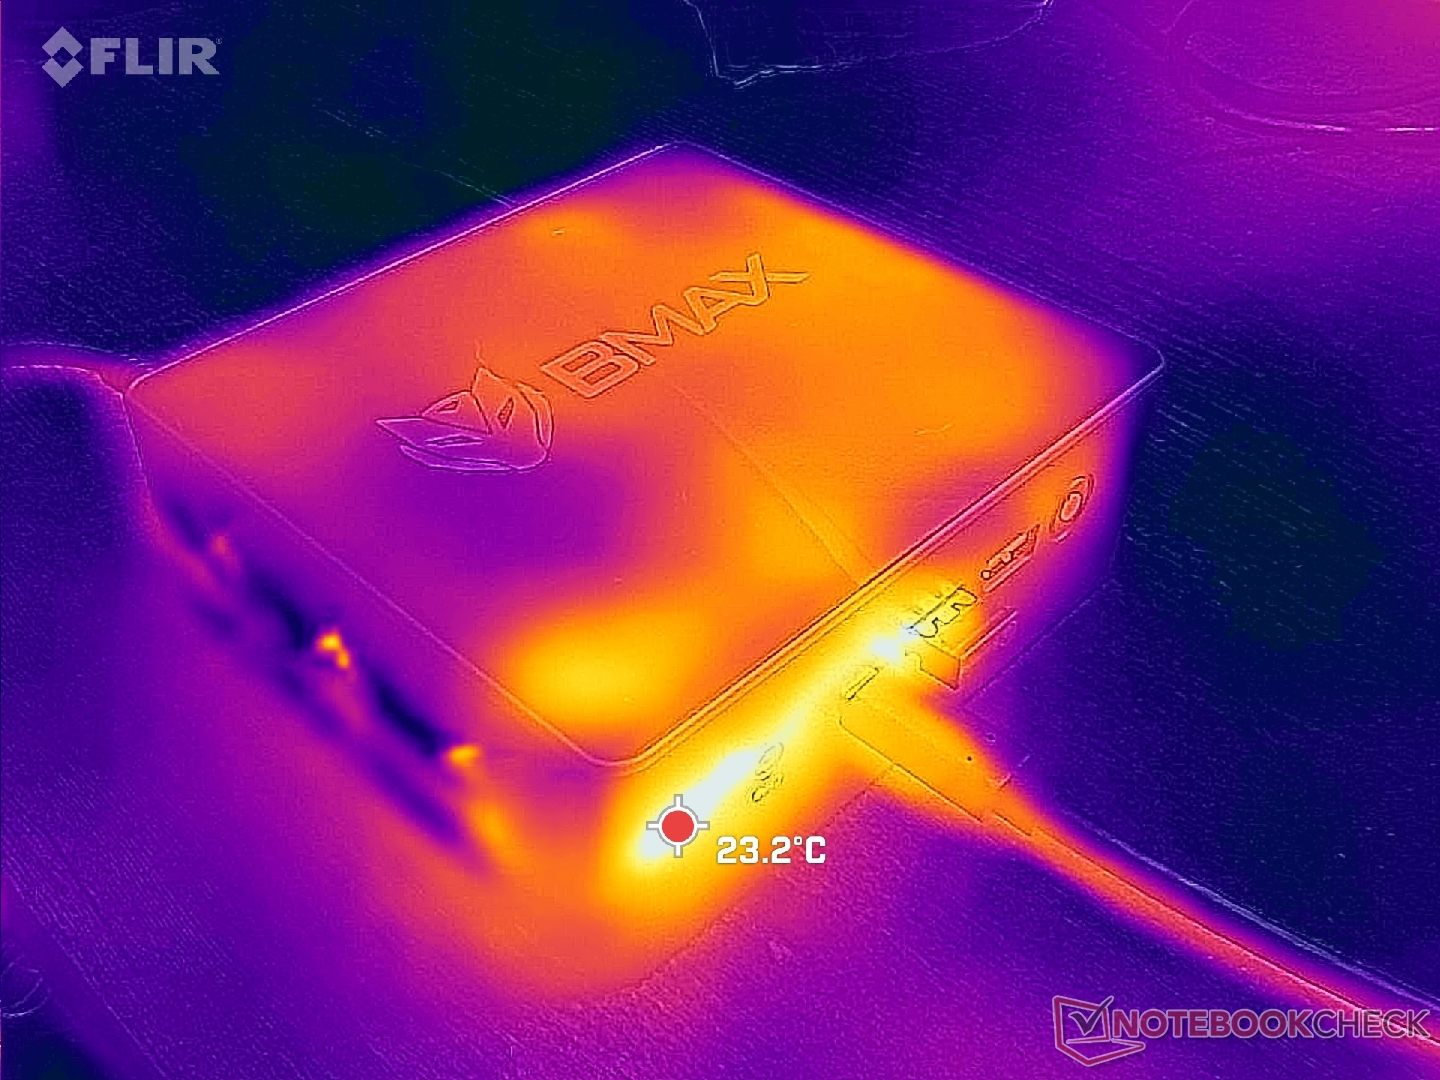
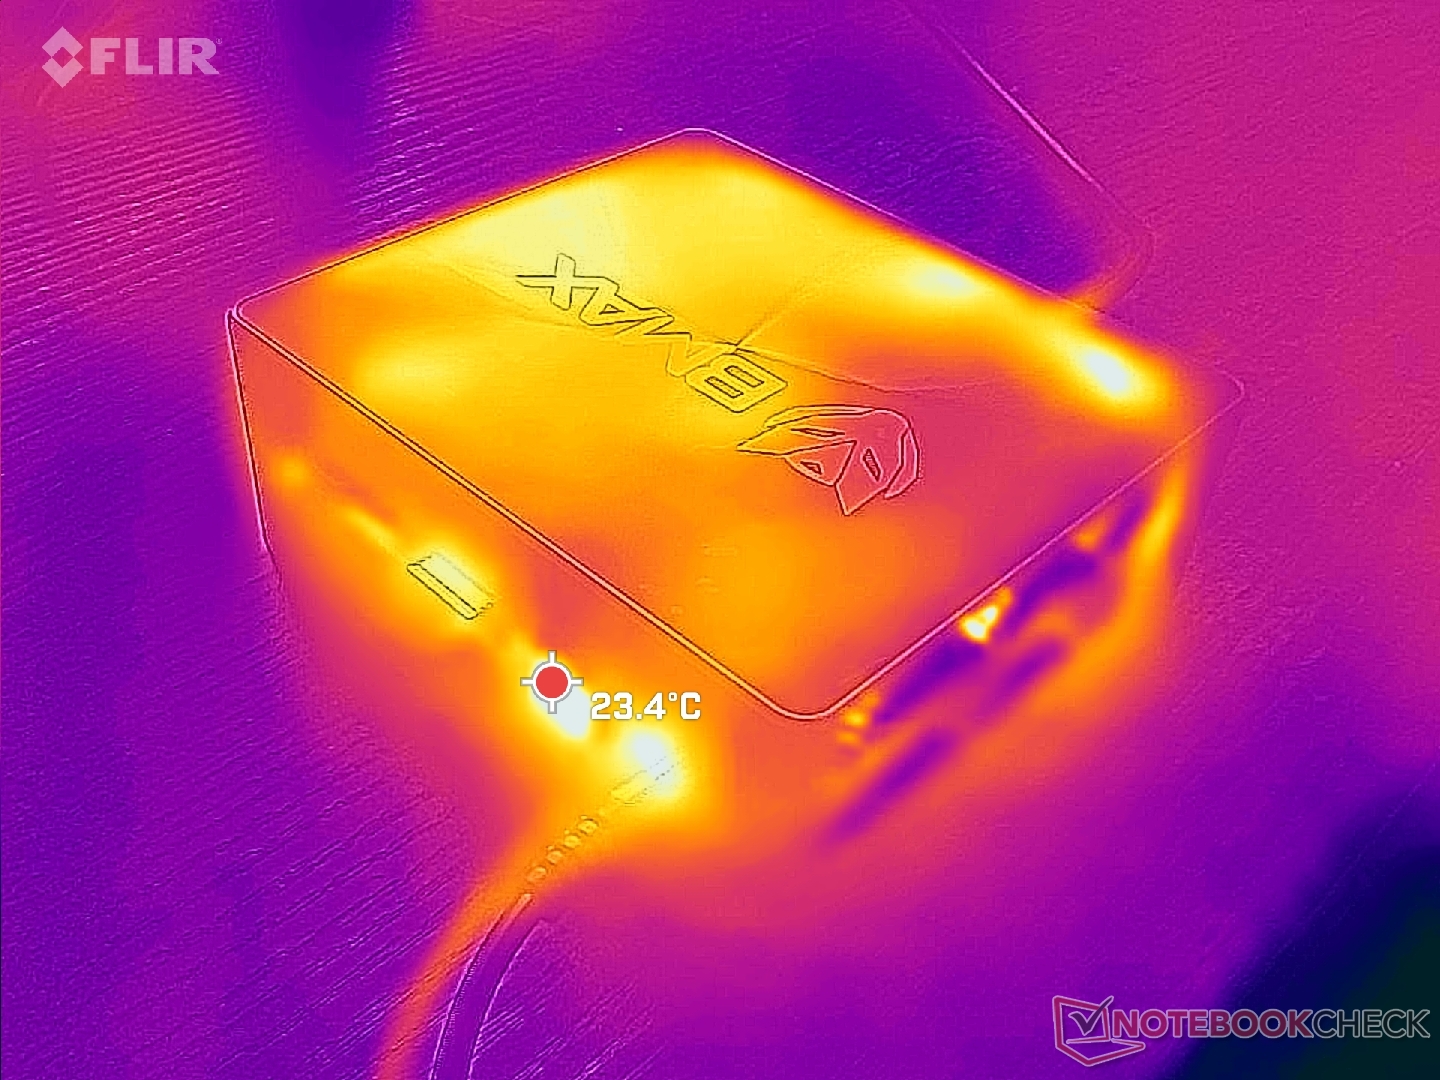
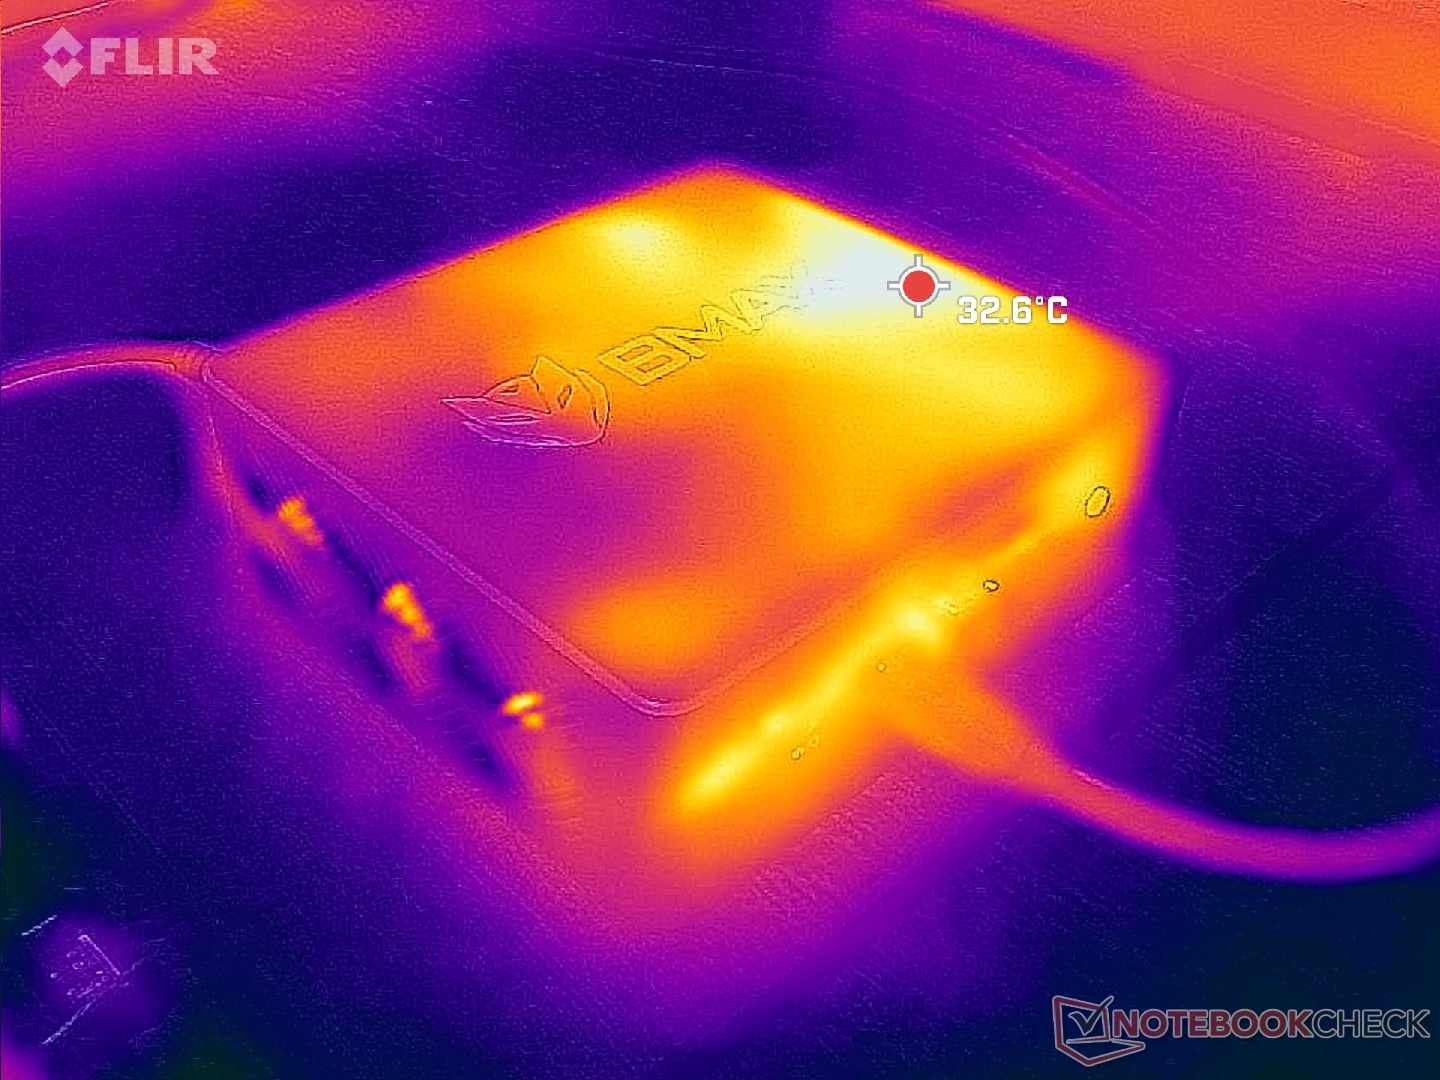
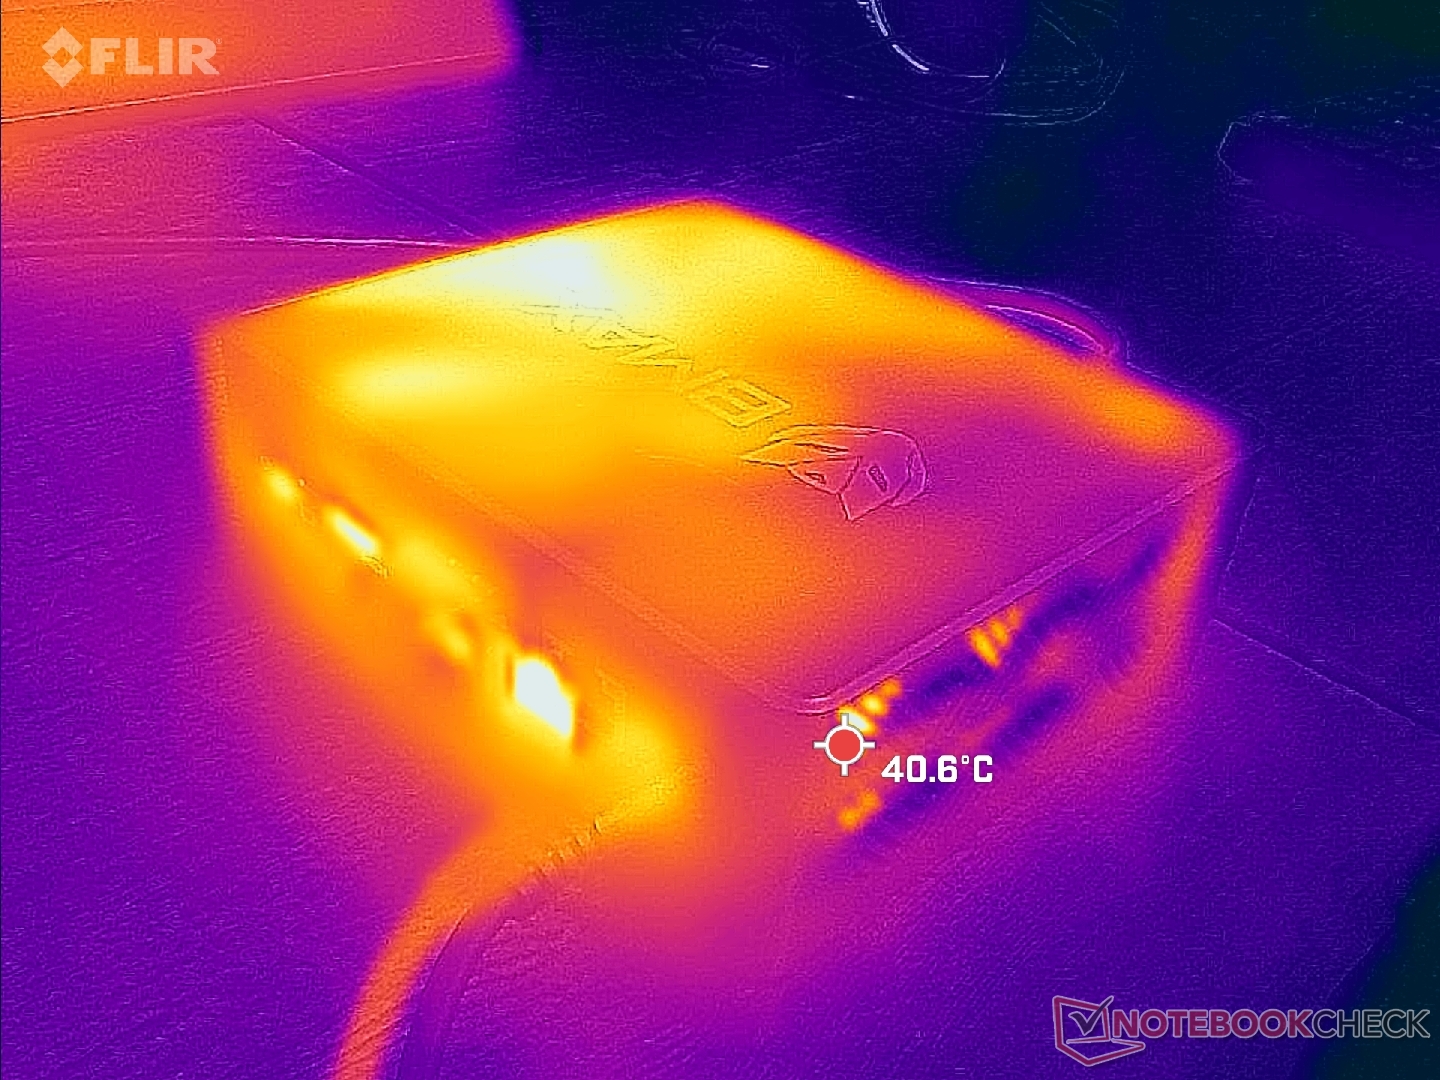
温度
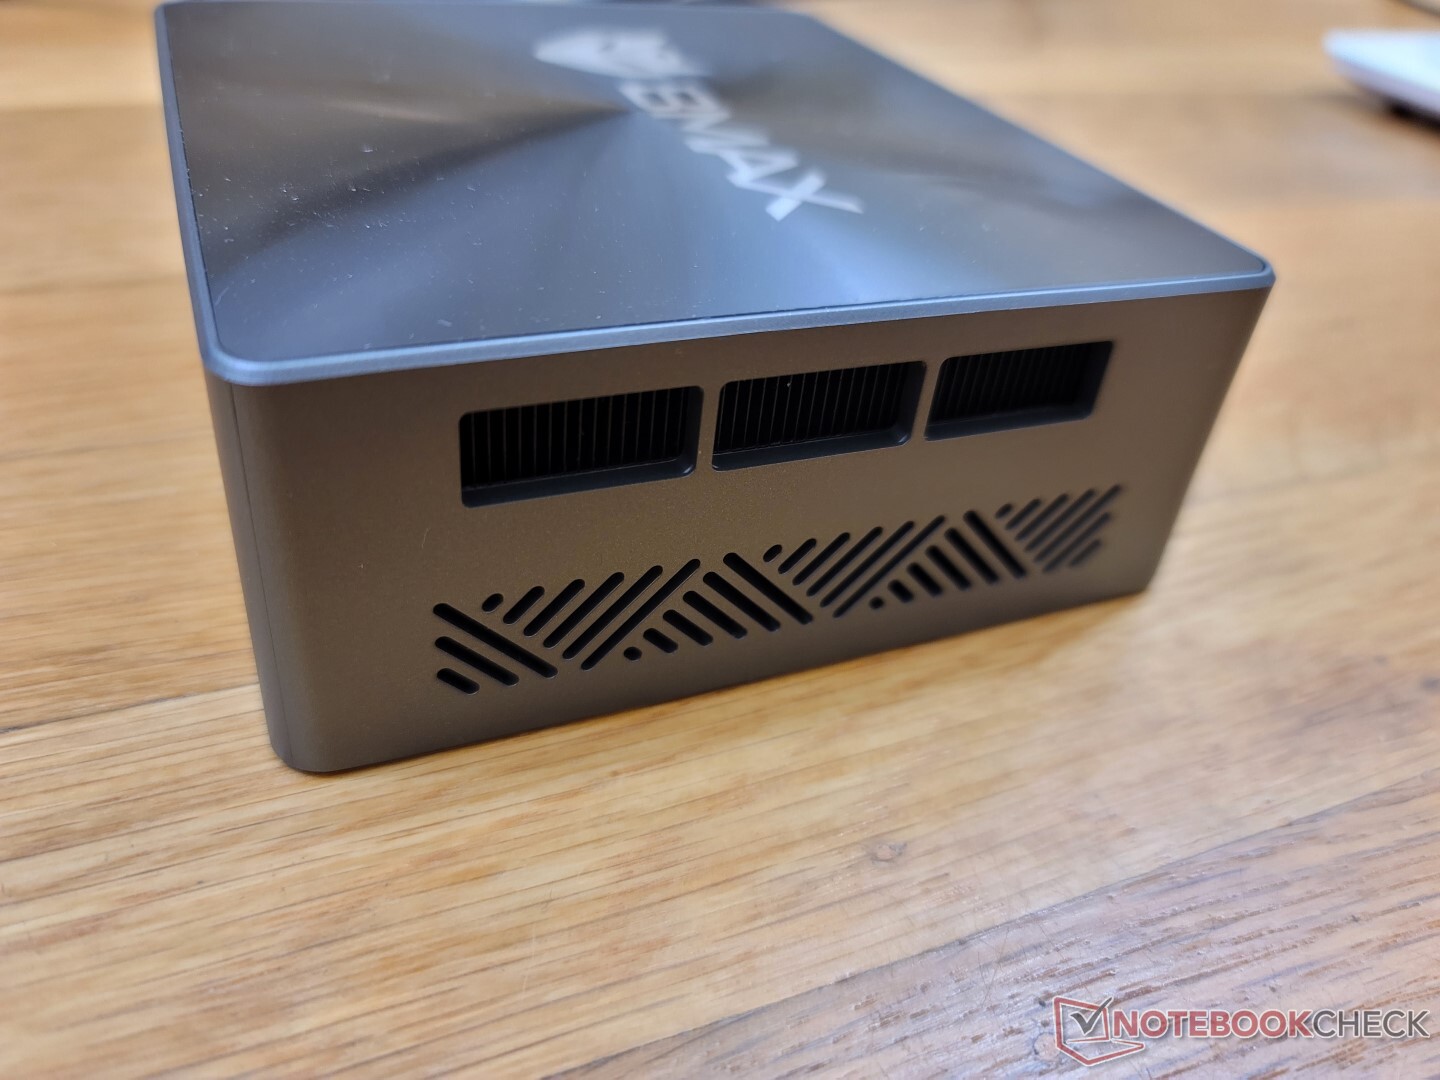
表面温度永远不会让人感到不舒服。例如,在高处理压力下,顶部的热点只达到33℃左右。热量从机箱的右侧排出,而不像英特尔NUC那样热量从后面排出。
物品可以安全地放在设备顶部,因为那里没有通风格栅。
压力测试
当在Prime95下受压时,CPU将提升到2.8 GHz和28 W,持续约20秒或直到核心温度达到76 C。 在Beelink SEi8将导致更快的核心时钟和更高的温度,分别为2.8GHz和80C。因此,B5 Pro的Turbo Boost潜力是有限的,这与我们在上述CineBench压力测试中观察到的情况一致。
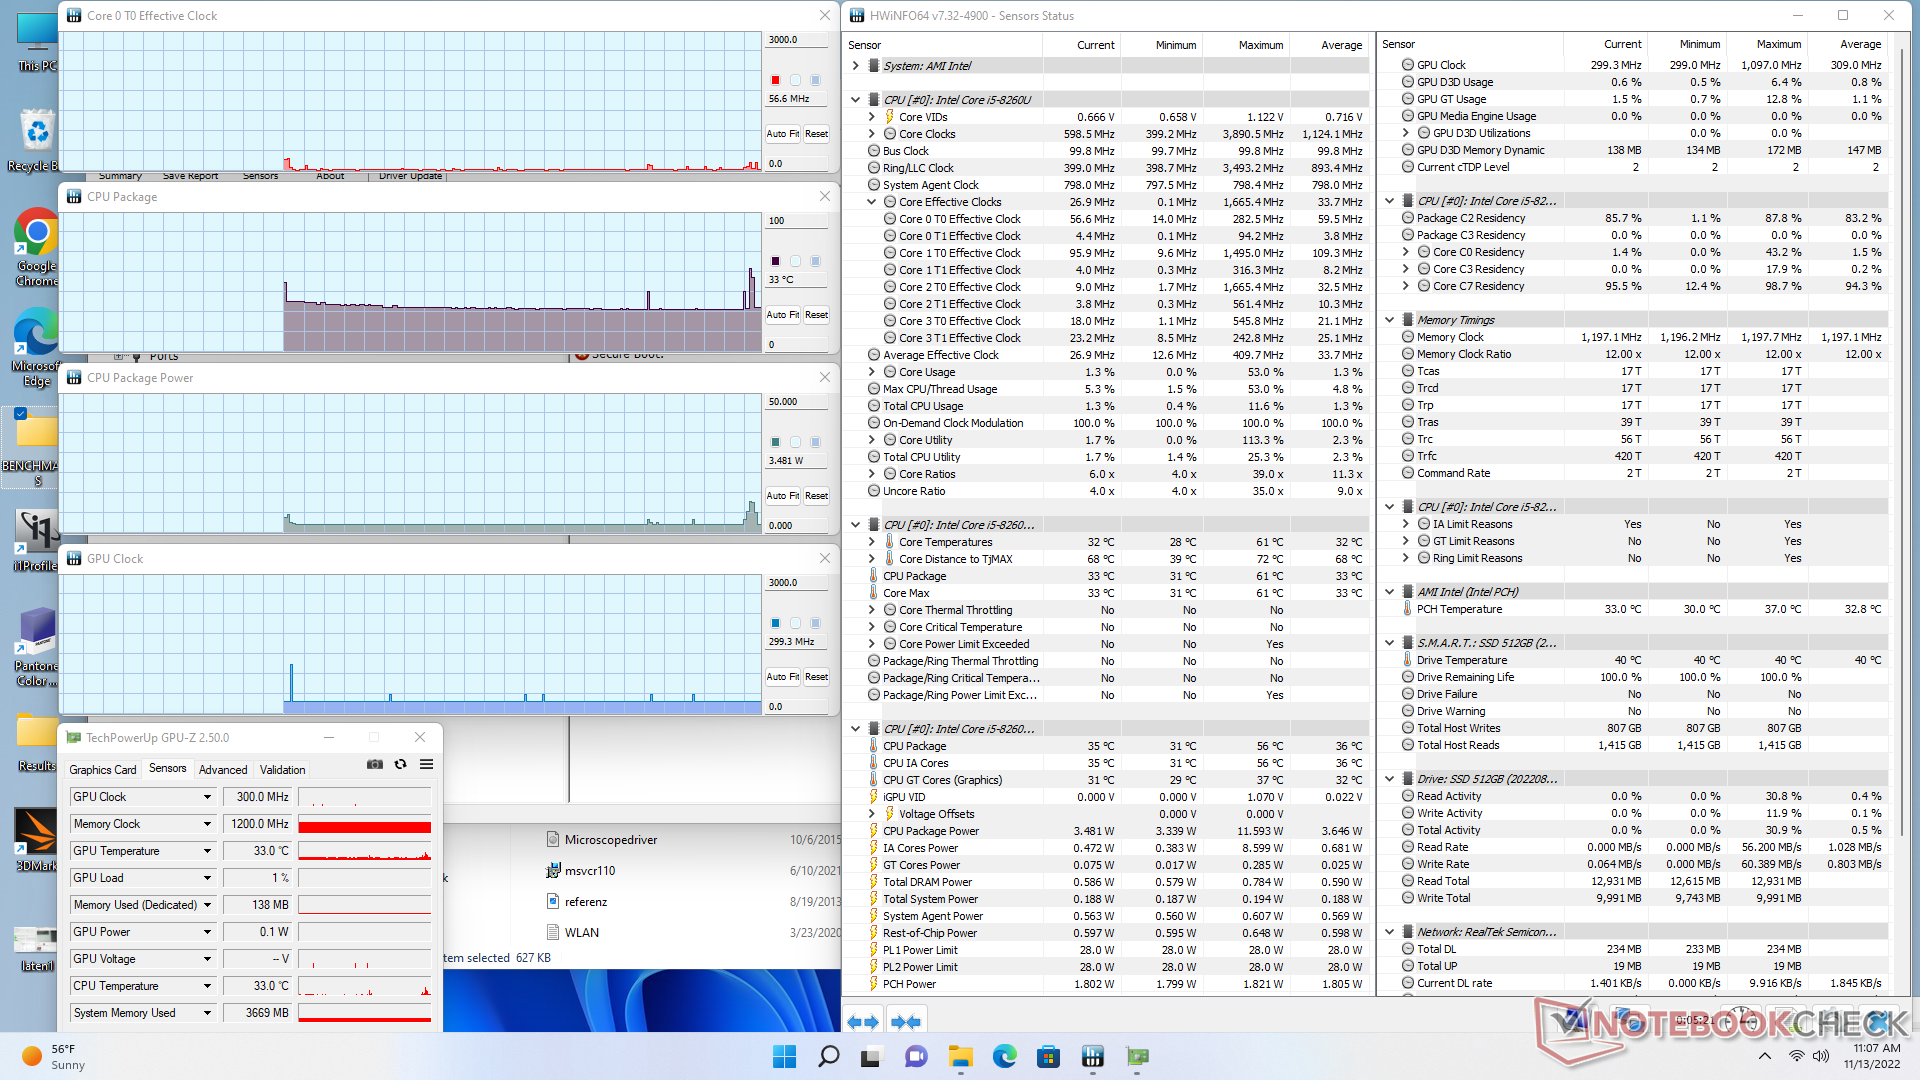
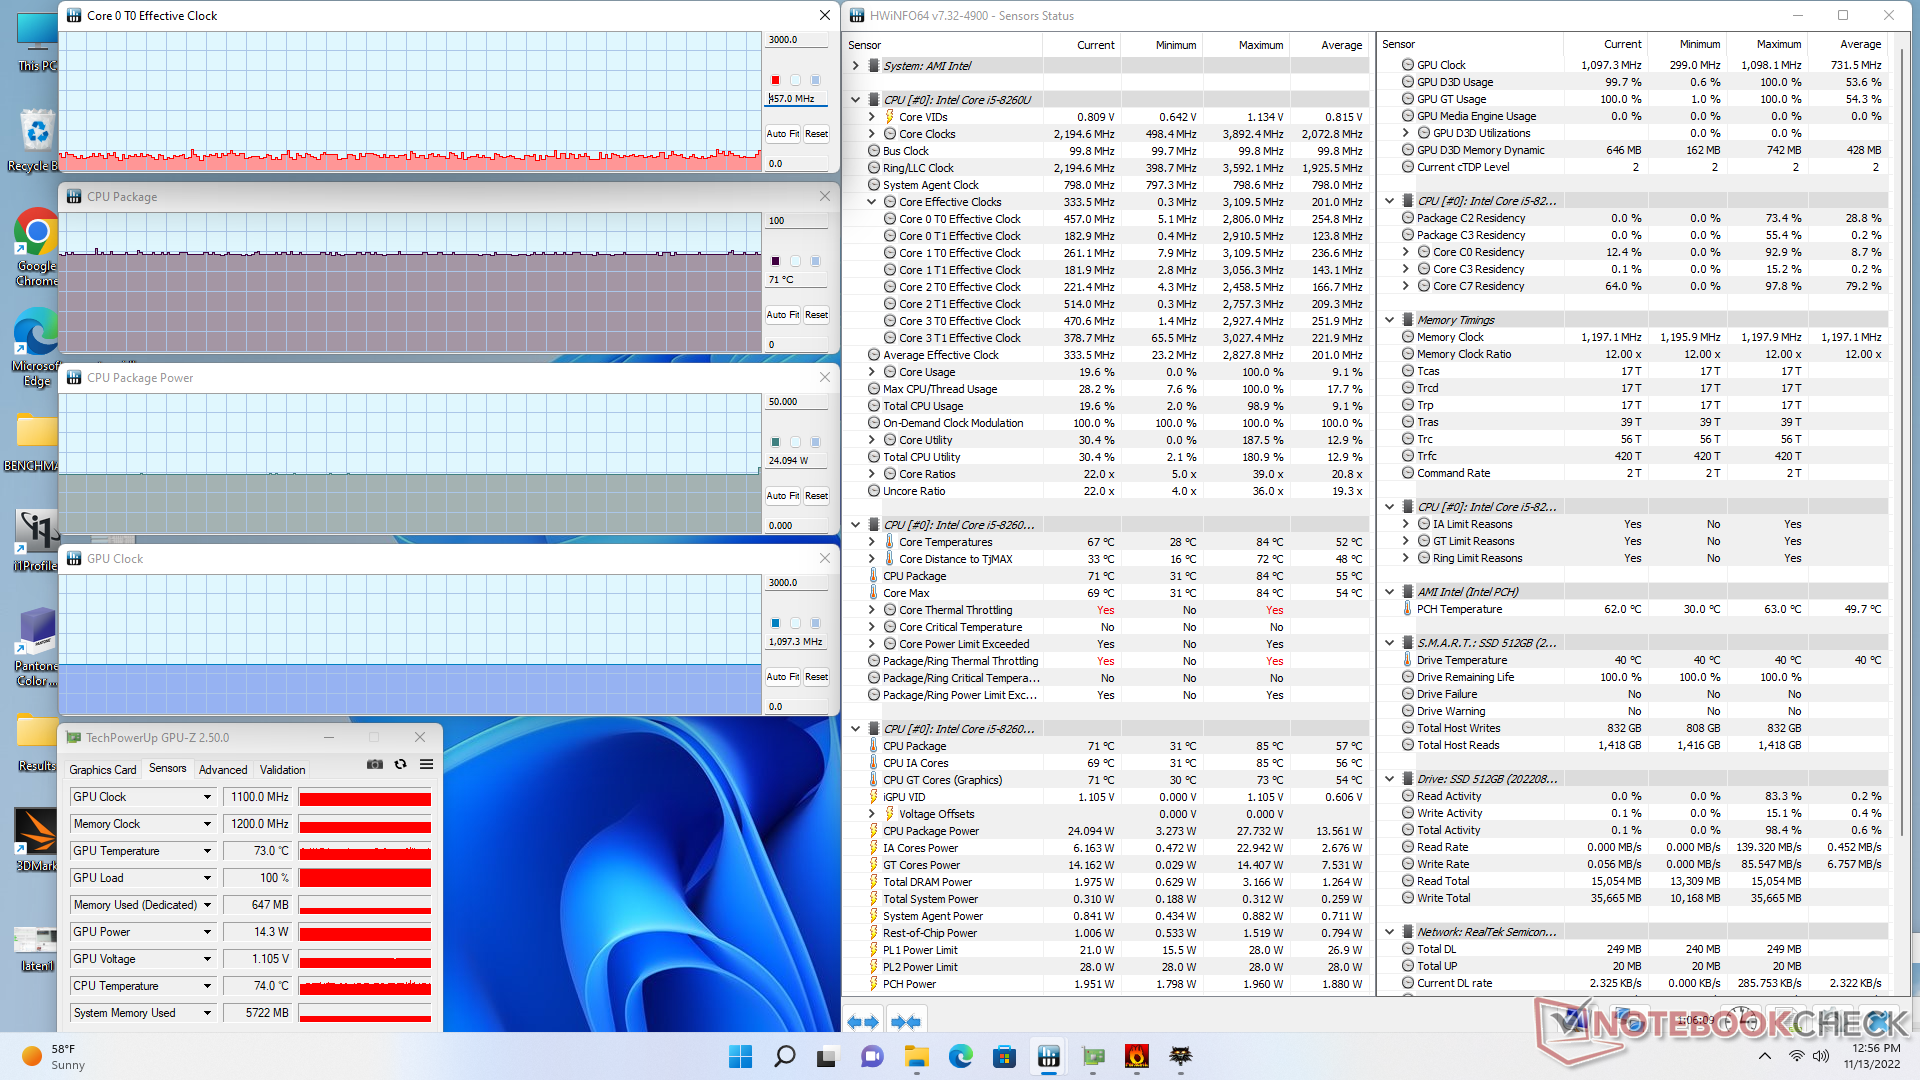
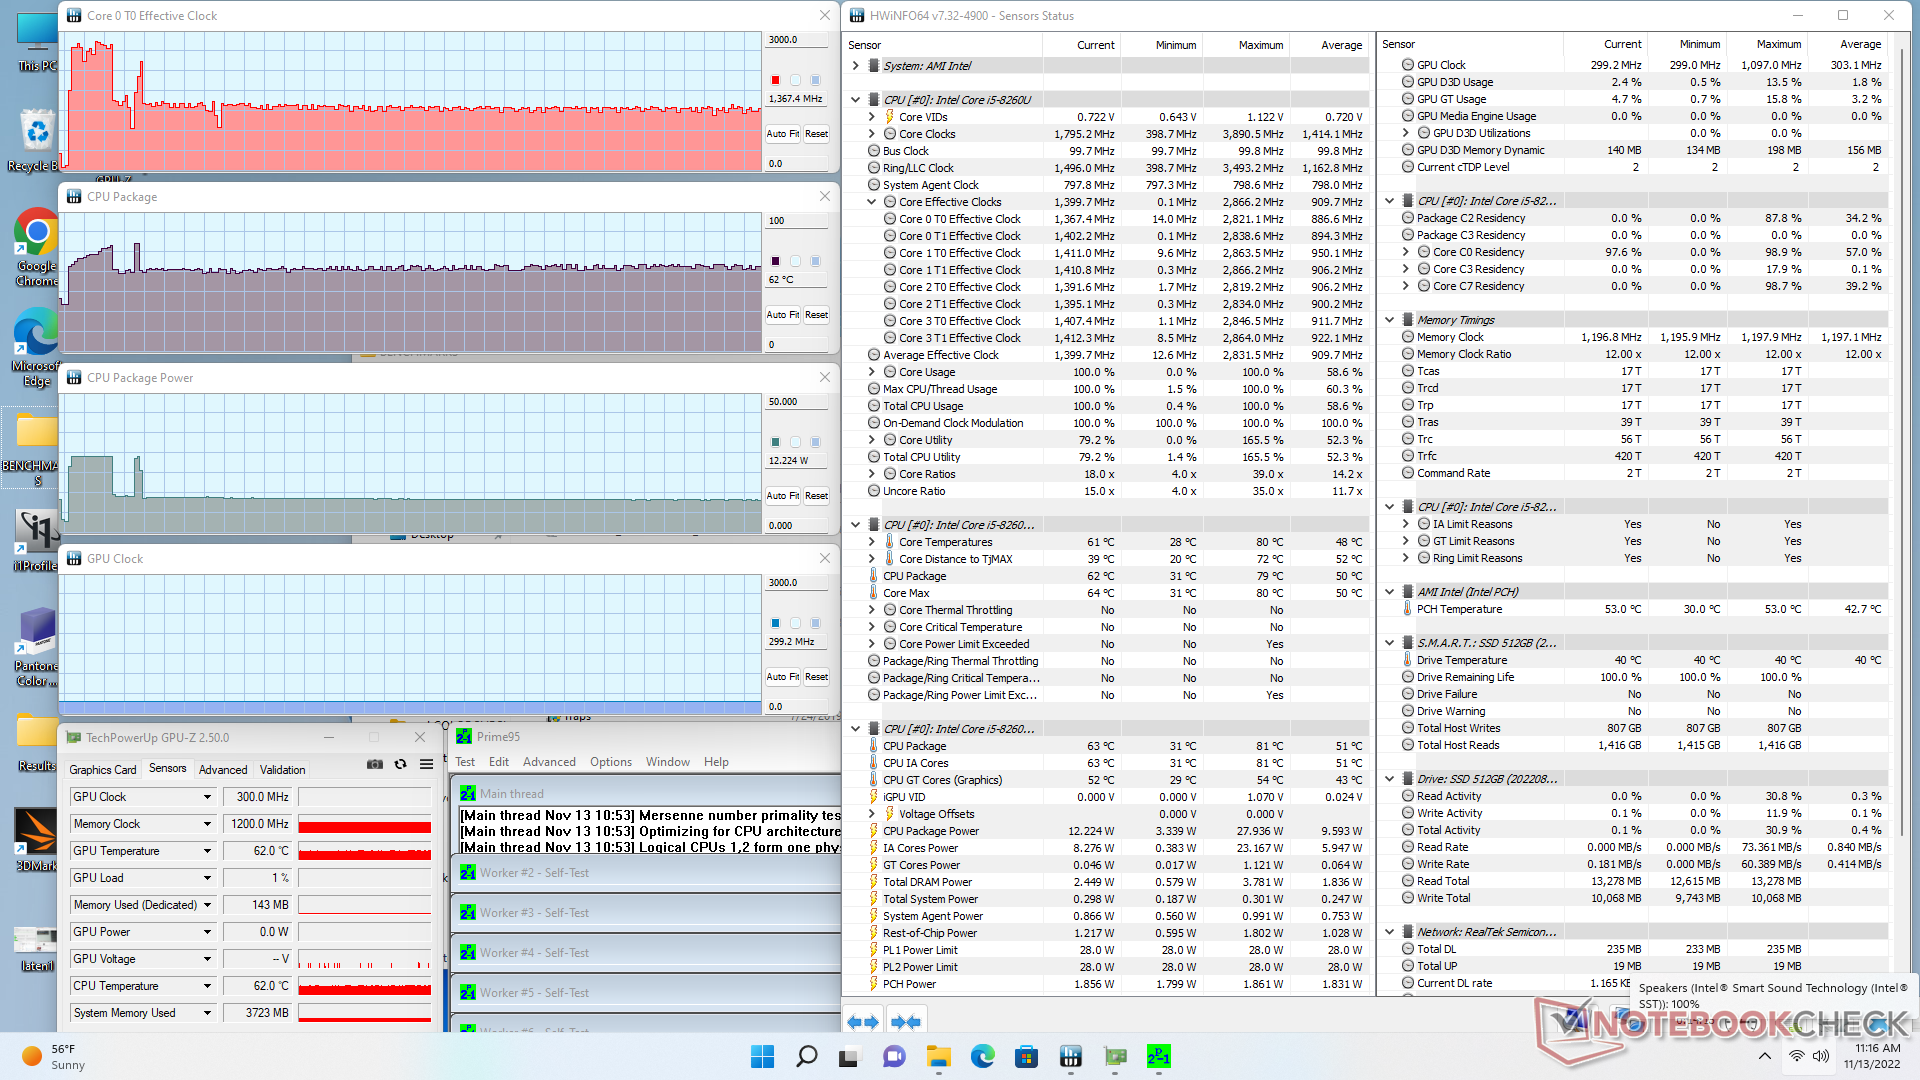
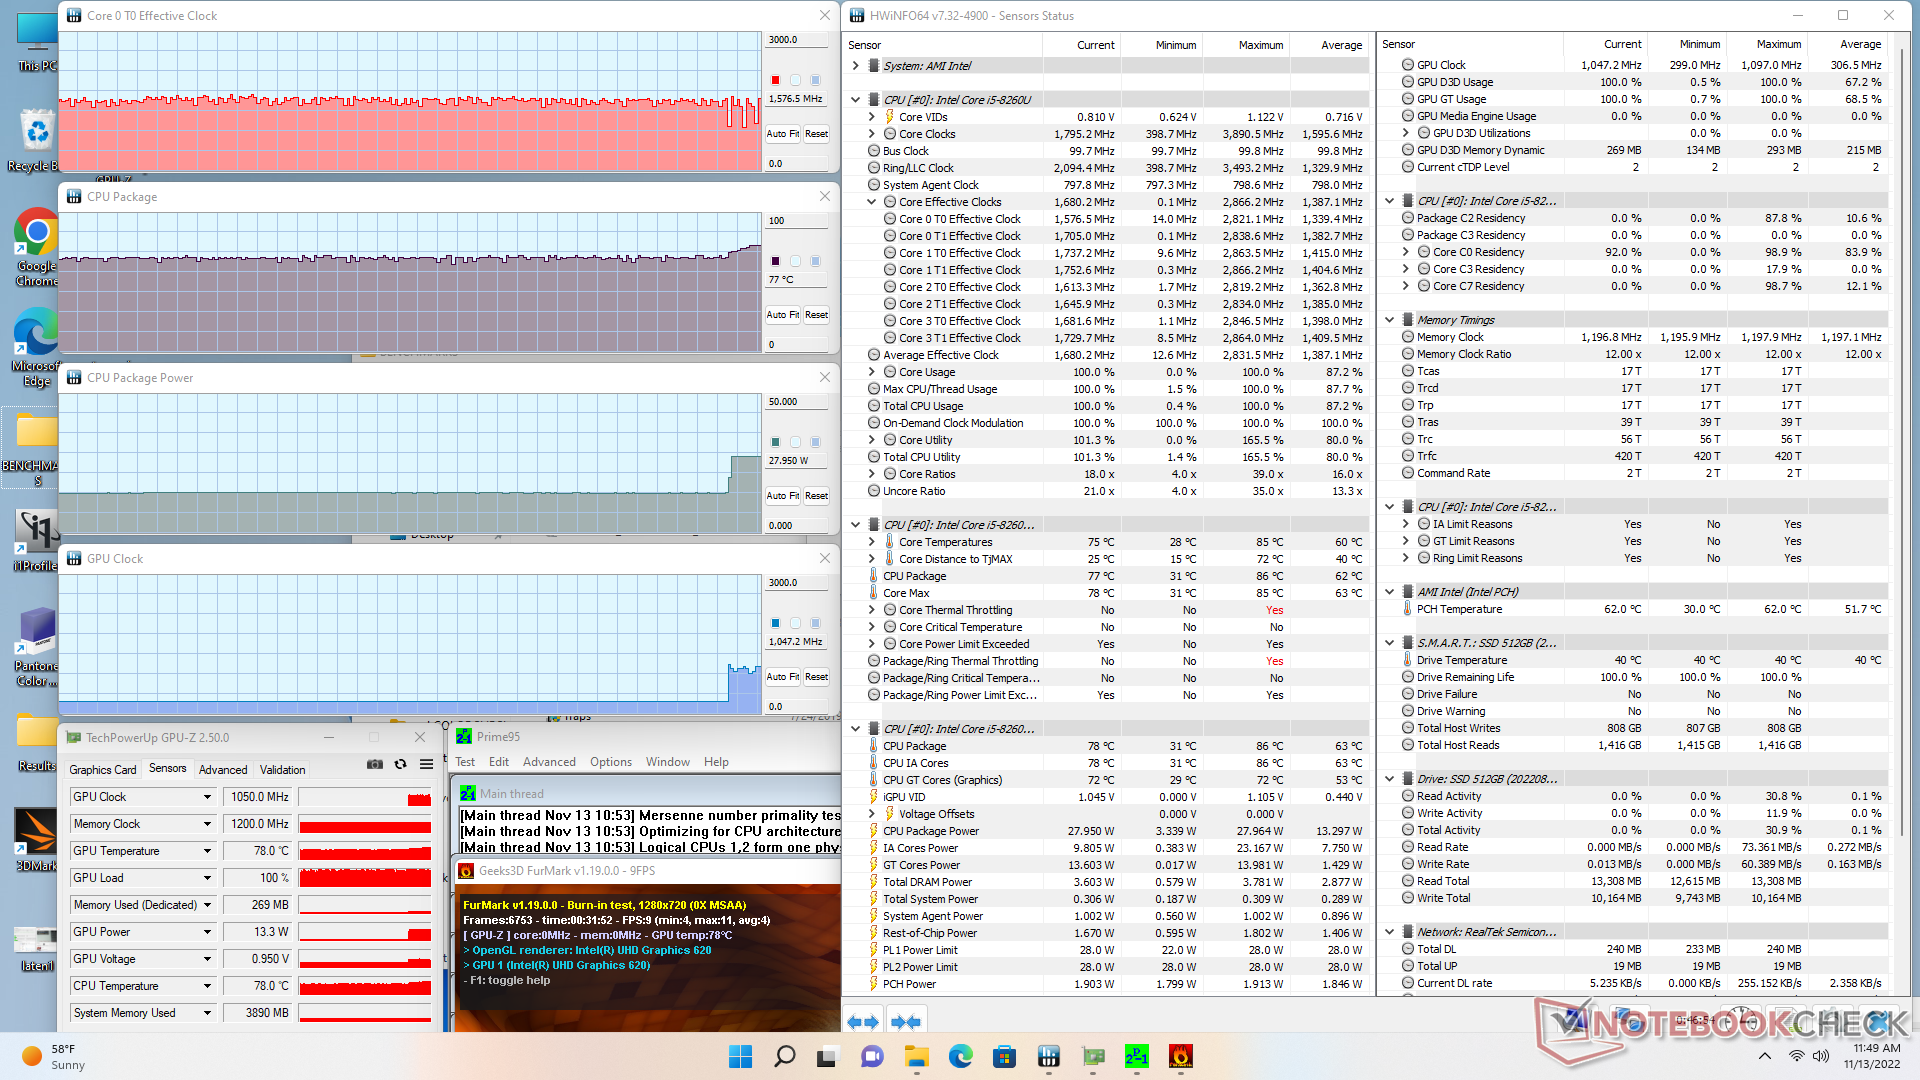
| CPU时钟(GHz) | GPU时钟(MHz) | CPU平均温度(°C) | |
| 系统空闲 | -- | -- | 33 |
| Prime95压力 | 1.3 | -- | 62 |
| Prime95 + FurMark 压力 | 1.6 | 300 | 67 |
| Witcher 3 应力 | ~400 | 1100 | 71 |
能源管理
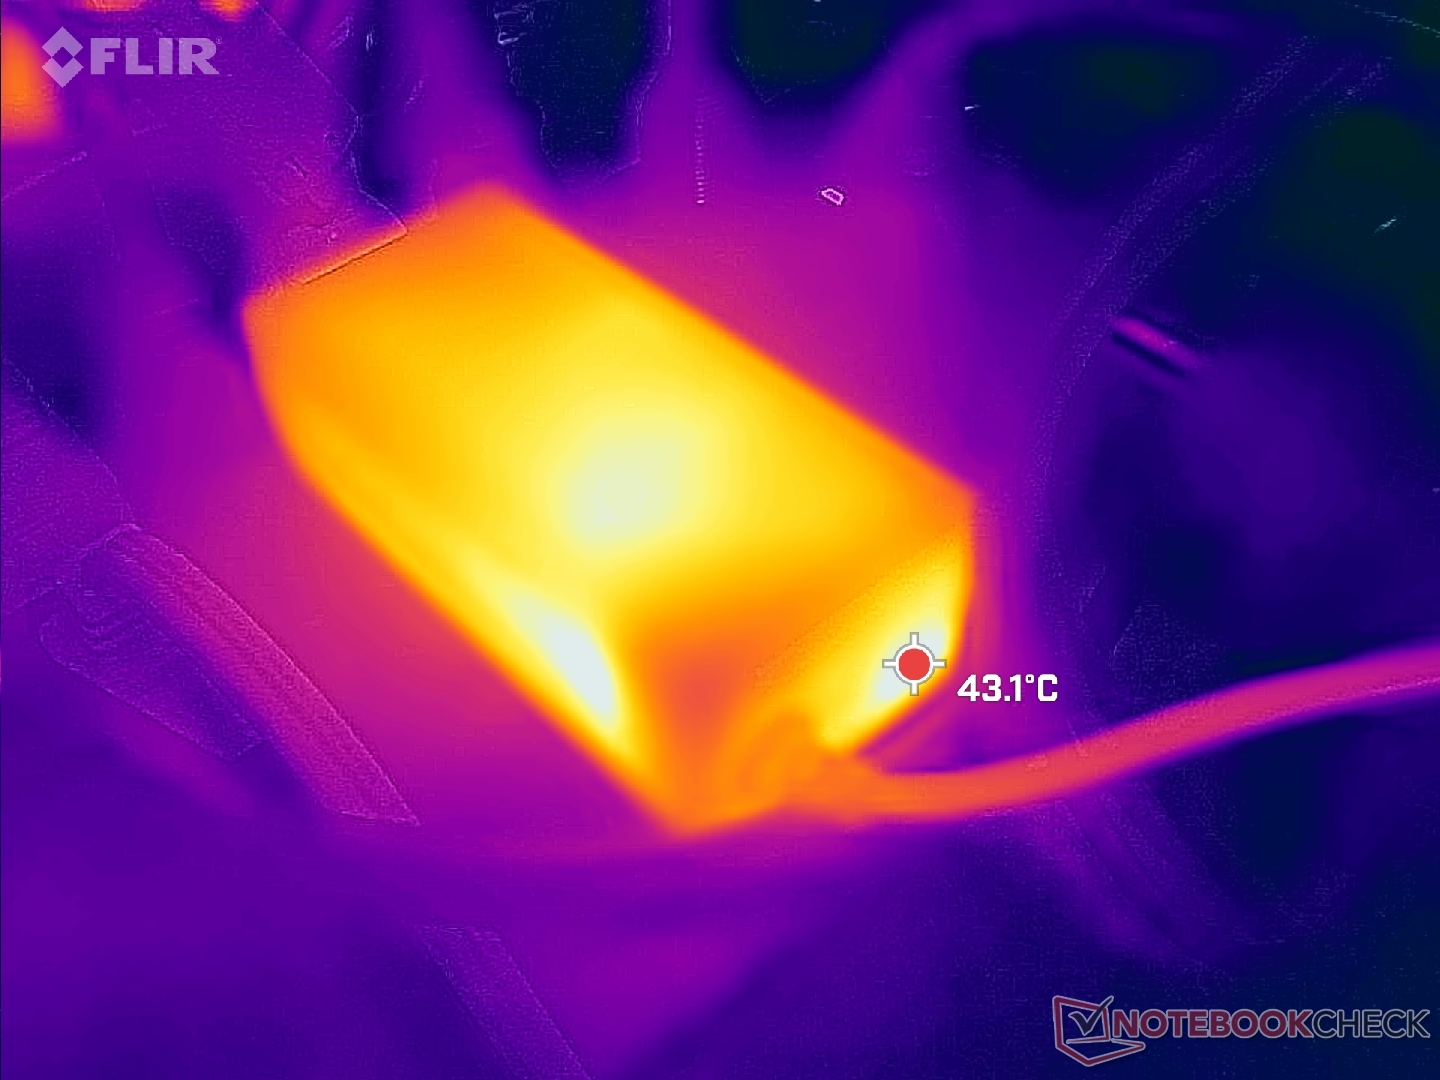
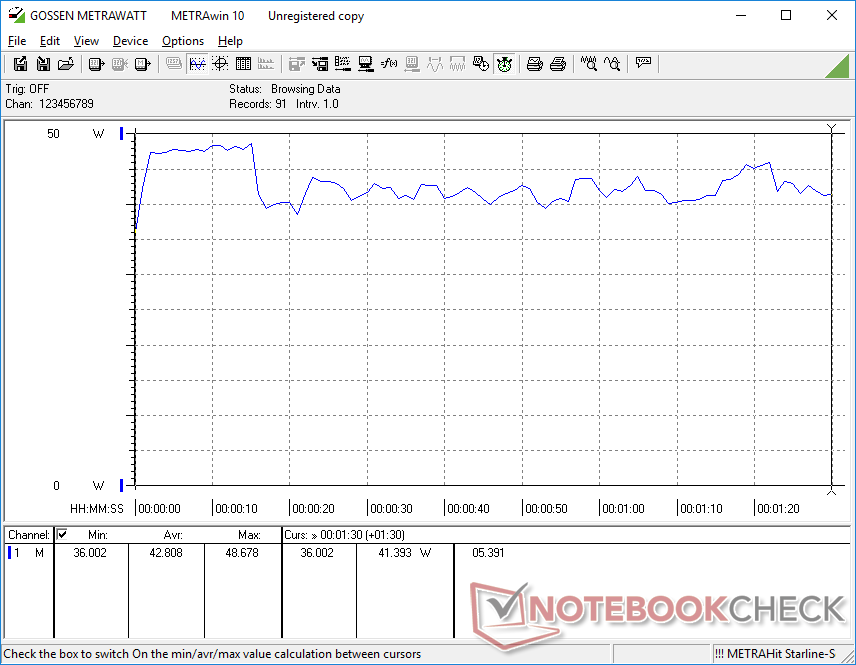
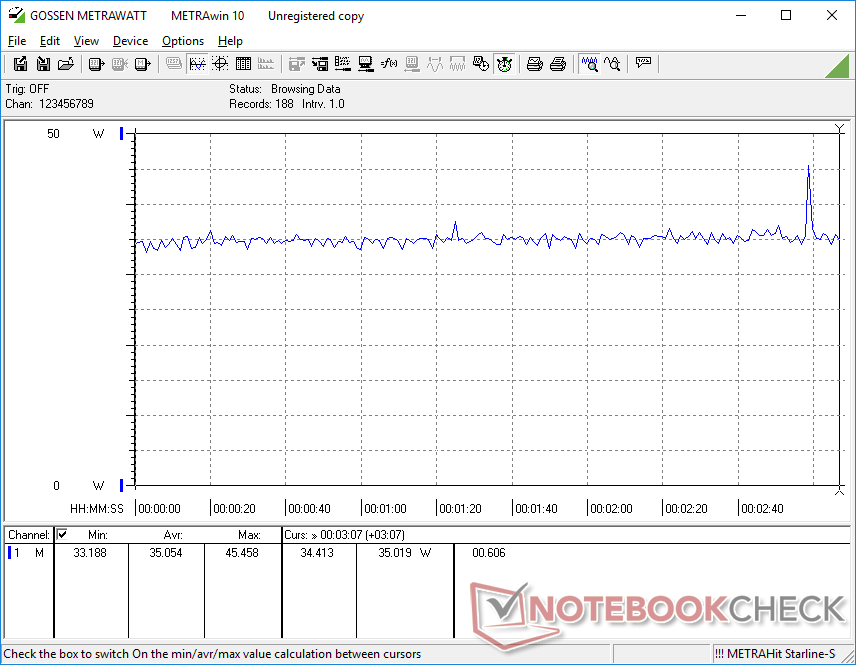
耗电量 - 非常低的要求
总体消耗量低于许多采用较新CPU的迷你电脑,如英特尔NUC11TNKi5及其第11代酷睿i5-1135G7。然而,每瓦性能明显倾向于后者。虽然用户可以通过BMax节省几瓦,但采用上述NUC等新一代CPU的迷你PC可以提供2倍以上的图形性能或50%的CPU性能。
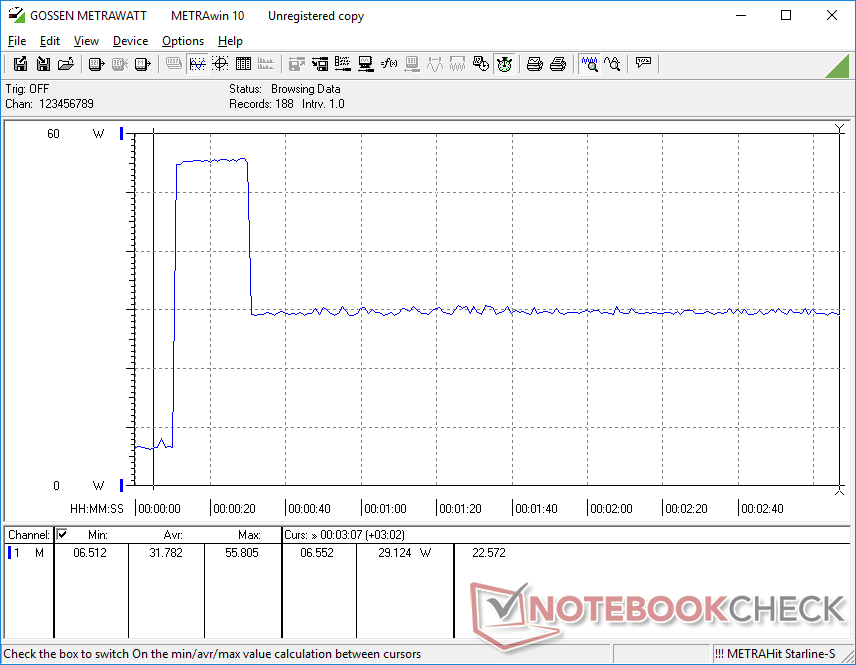
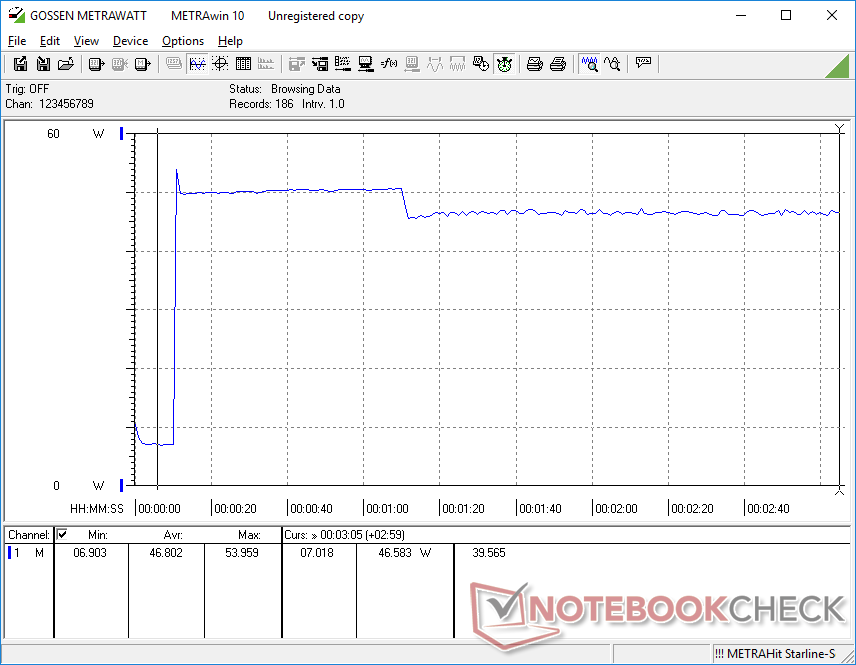
当CPU处于100%的利用率时,我们能够从小型(约9.8 x 4.3 x 3.7厘米)的48瓦交流适配器中记录到55.9瓦的最大耗电量。正如我们下面的图表所示,这一比率只是暂时的。
| Off / Standby | |
| Idle | |
| Load |
|
Key:
min: | |
| BMAX B5 Pro G7H8 i5-8260U, UHD Graphics 620, , , x, | Beelink SEi11 Pro i5-11320H, Iris Xe G7 96EUs, Kingston NV1 SNVS/500GCN, , x, | Beelink U59 N5105 Celeron N5105, UHD Graphics (Jasper Lake 24 EU), Silicon Motion AZW 512G NV428, , x, | Beelink SEi8 i3-8109U, Iris Plus Graphics 655, Intel SSD 660p SSDPEKNW512G8, , x, | Beelink SER Pro Ryzen 5 5600H R5 5600H, Vega 7, Kingston NV1 SNVS/500GCN, , x, | Intel NUC11TNKi5 i5-1135G7, Iris Xe G7 80EUs, Transcend M.2 SSD 430S TS512GMTS430S, , x, | |
|---|---|---|---|---|---|---|
| Power Consumption | -47% | 2% | -13% | -15% | -58% | |
| Idle Minimum * (Watt) | 6 | 9.8 -63% | 6.7 -12% | 7.5 -25% | 5.4 10% | 11.5 -92% |
| Idle Average * (Watt) | 6.2 | 10.3 -66% | 8.1 -31% | 7.6 -23% | 8.2 -32% | 12.4 -100% |
| Idle Maximum * (Watt) | 6.3 | 10.5 -67% | 11.6 -84% | 9.2 -46% | 8.3 -32% | 12.9 -105% |
| Load Average * (Watt) | 42.8 | 54.2 -27% | 23.9 44% | 41.1 4% | 49.3 -15% | 40.7 5% |
| Witcher 3 ultra * (Watt) | 35 | 53.1 -52% | 19.1 45% | 46.1 -32% | 43.9 -25% | |
| Load Maximum * (Watt) | 55.8 | 59 -6% | 28.8 48% | 41.4 26% | 50.2 10% | 73.5 -32% |
* ... smaller is better
Power Consumption Witcher 3 / Stresstest
Power Consumption external Monitor
Pros
Cons
结论 - 对于基本的HTPC目的来说,是一个廉价的选择。
如果你想最大限度地提高你的成本效益,那么BMax B5 Pro应该是你名单上的佼佼者。它提供了一个宽敞的512GB NVMe固态硬盘,第二个固态硬盘的空间,16GB可移动内存,已经安装的正版Windows 11 Pro,安静的风扇噪音,以及一个可与第十代 酷睿i7-1065G7所有这些价格都低于300美元。酷睿i5-8260U比目前任何酷睿i3、赛扬、Atom或Ryzen 3的替代品都要好,在这个价格范围内都很常见。
BMax B5 Pro是一个完整的软件包,价格几乎是裸机英特尔NUC的一半,不需要满足于低级别的赛扬或Atom处理器。
该模型的主要缺点是其薄弱的图形性能,这真的不应该是一个问题,因为没有人应该为游戏目的购买B5 Pro。图形性能仍然足以应付舒适的4K60流媒体。
我们希望看到更多的USB-C端口,支持USB-C Power Delivery,以及一个HDMI 2.0端口或更好的版本。
价格和可用性
亚马逊 目前,我们确切的BMax B5 Pro配置的发货价格为380美元,或在发布时应用优惠券代码后的280美元。
Price comparison

