赛扬N5105碧玉湖首次亮相。Beelink U59迷你电脑评测
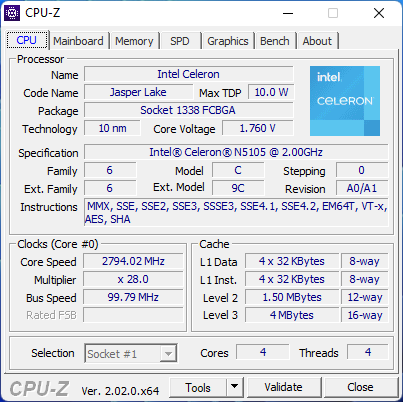
Beelink更新了其最便宜的迷你电脑之一,采用更快的Jasper Lake英特尔赛扬N5105 CPU,以取代之前的赛扬N5095。 U59型号.虽然机箱几乎和以前一样,但有几个重要的区别,我们将在下面的评论中指出。
Beelink U59与其他廉价的迷你电脑竞争,如 Zotac Nano系列, GMK NucBox系列或 卓伟GBox.
更多Beelink评论。
潜在的竞争对手比较
Rating | Date | Model | Weight | Height | Size | Resolution | Price |
|---|---|---|---|---|---|---|---|
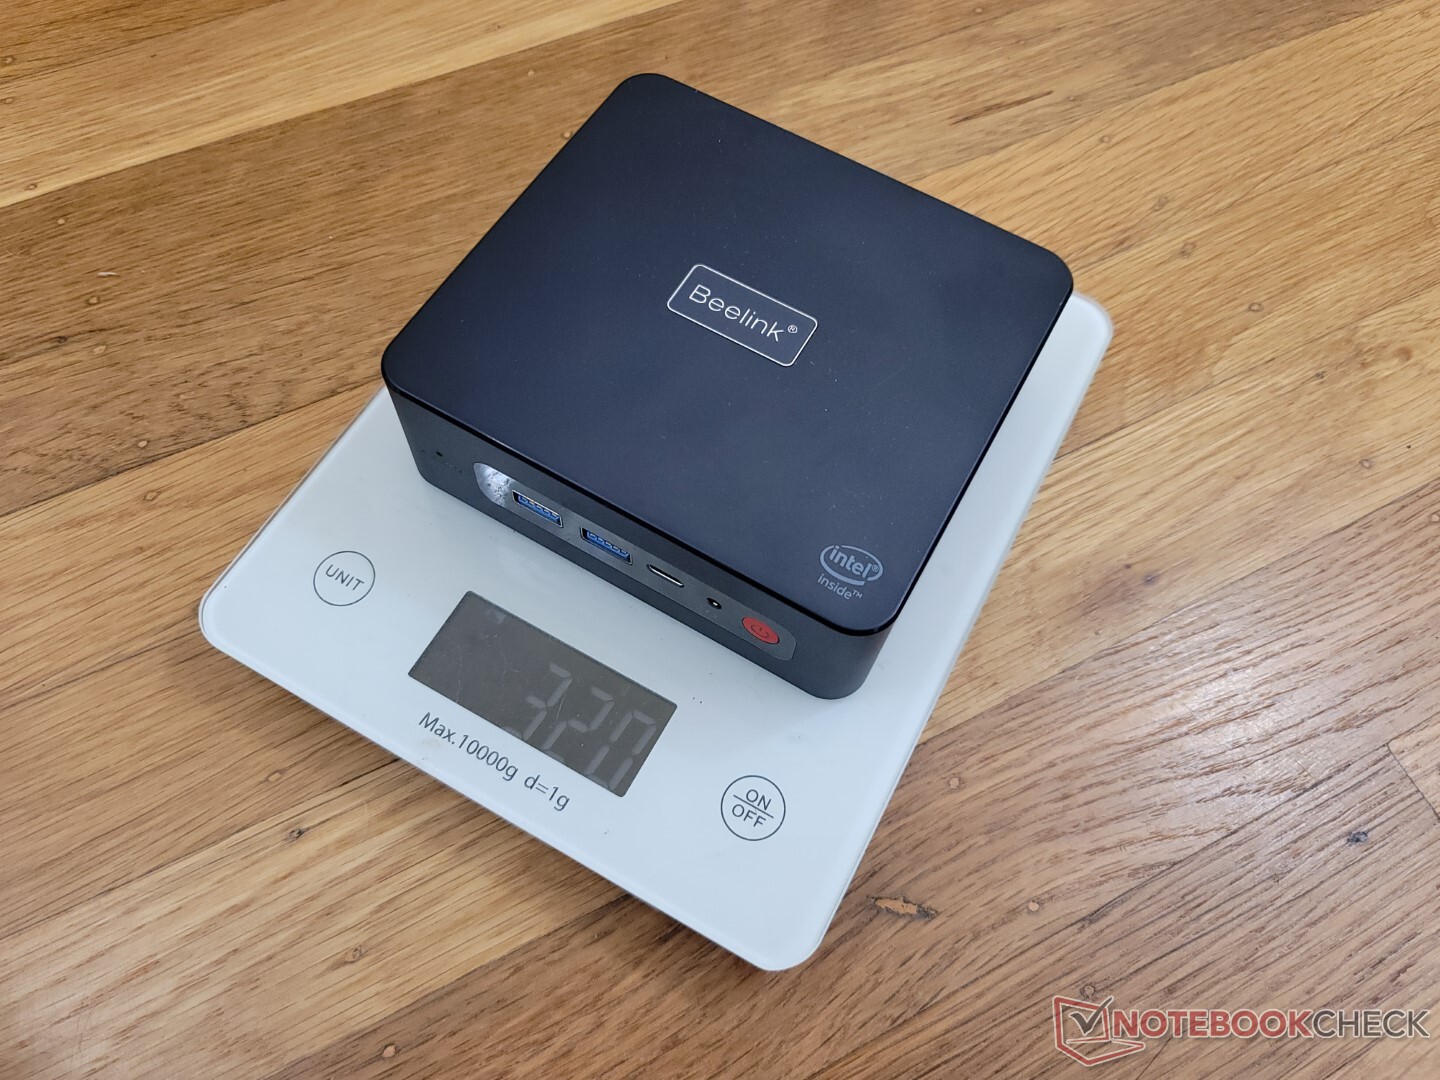
v (old) | 09 / 2022 | Beelink U59 N5105 Celeron N5105, UHD Graphics (Jasper Lake 24 EU) | 320 g | 42 mm | x | ||
v (old) | 06 / 2022 | Beelink U59 Mini-S Celeron N5095, UHD Graphics (Jasper Lake 16 EU) | 279 g | 41 mm | x | ||
v (old) | 04 / 2022 | Beelink SER4 R7 4800U, Vega 8 | 494 g | 40 mm | x | ||
v (old) | 11 / 2021 | Beelink SER3 R7 3750H, Vega 10 | 492 g | 40 mm | x | ||
v (old) | Intel NUC11TNKi5 i5-1135G7, Iris Xe G7 80EUs | 504 g | 37 mm | x | |||
v (old) | 07 / 2022 | Zotac ZBOX PI336 pico Celeron N6211, UHD Graphics (Elkhart Lake 16 EU) | 293 g | 20.7 mm | x |
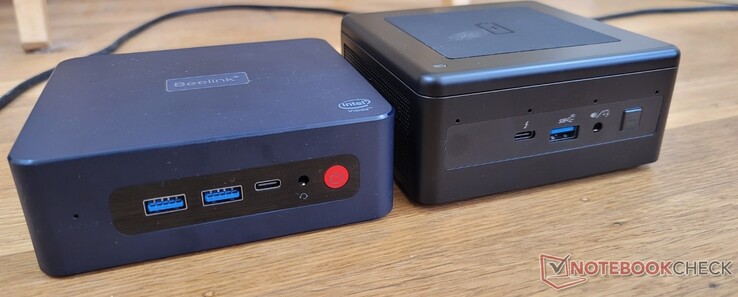
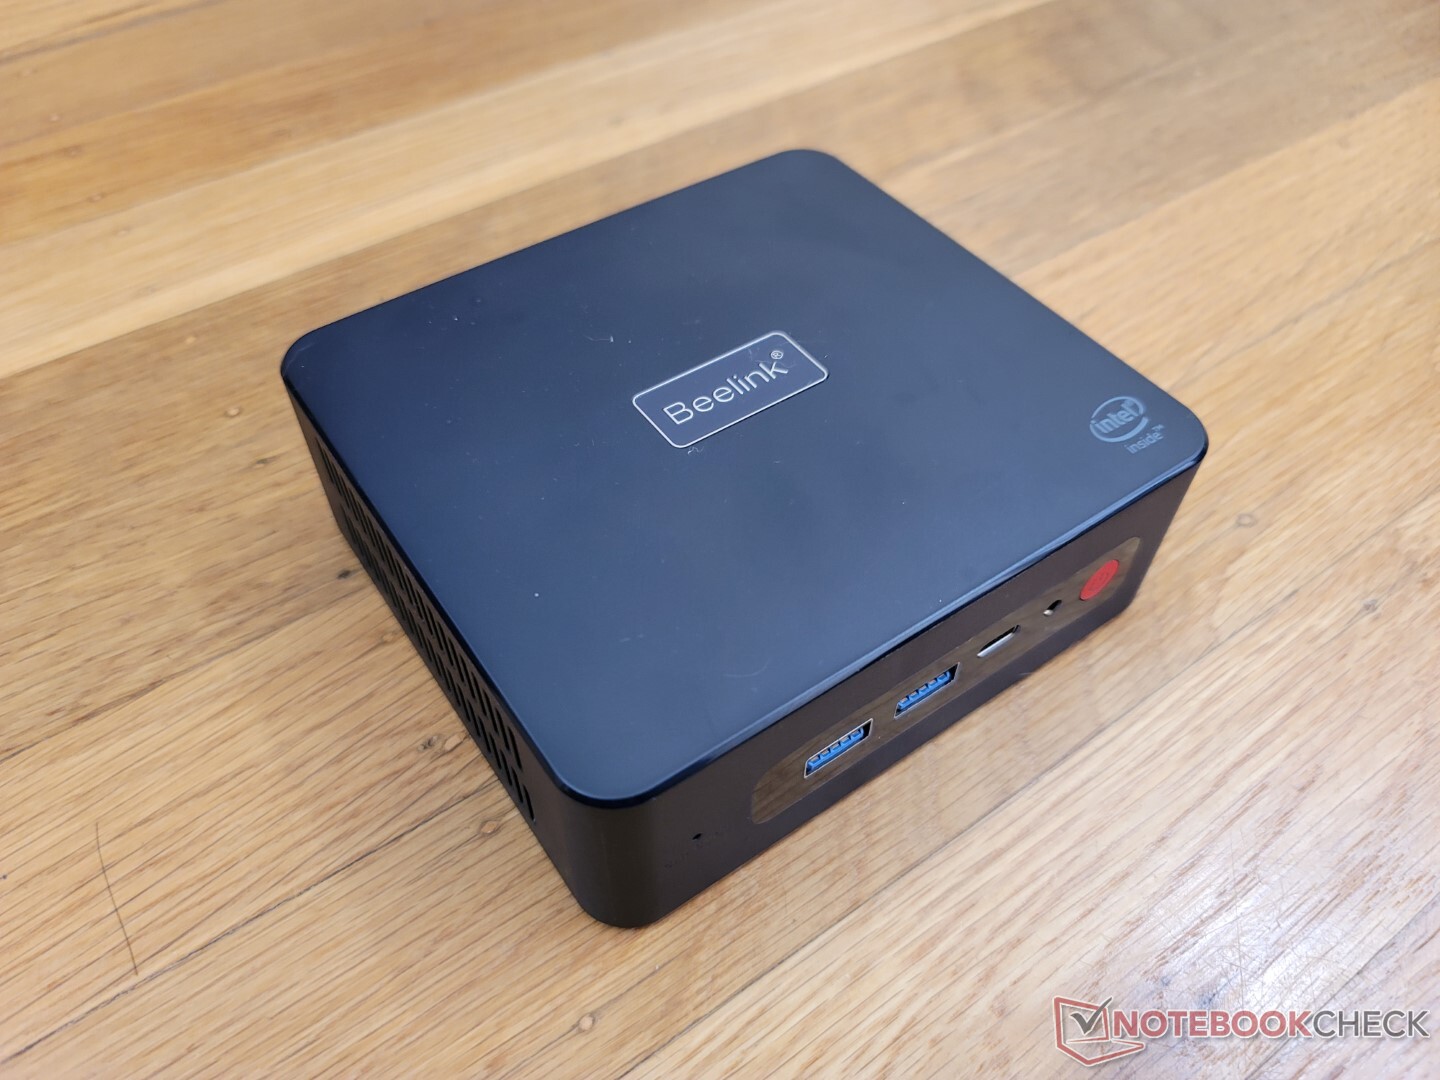
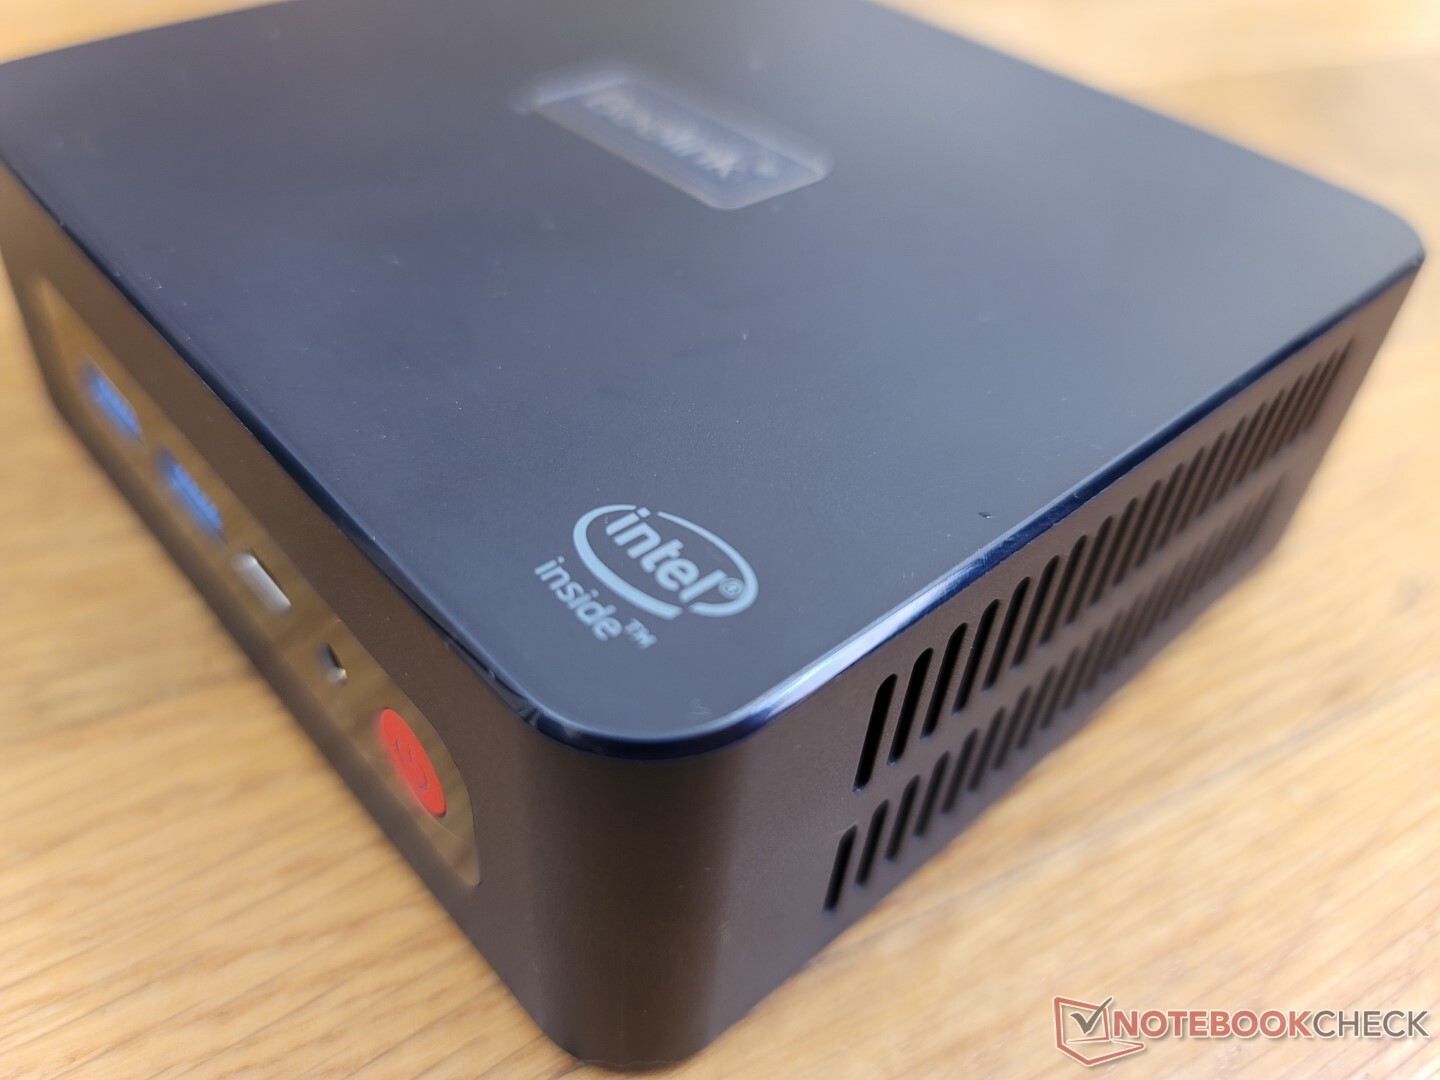
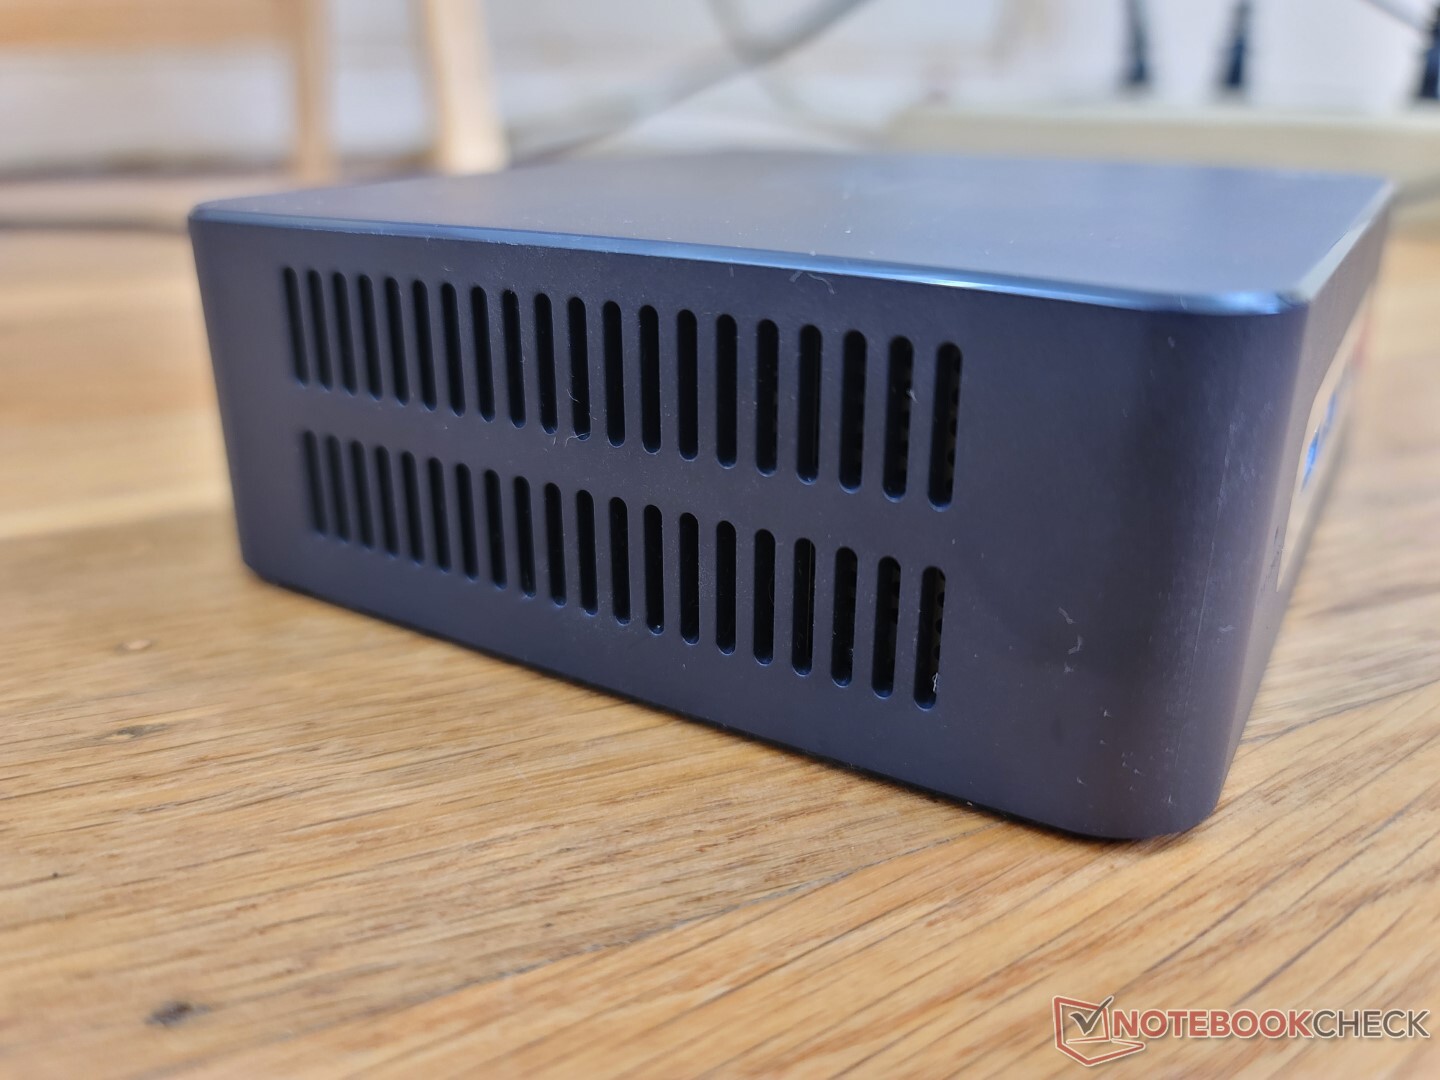
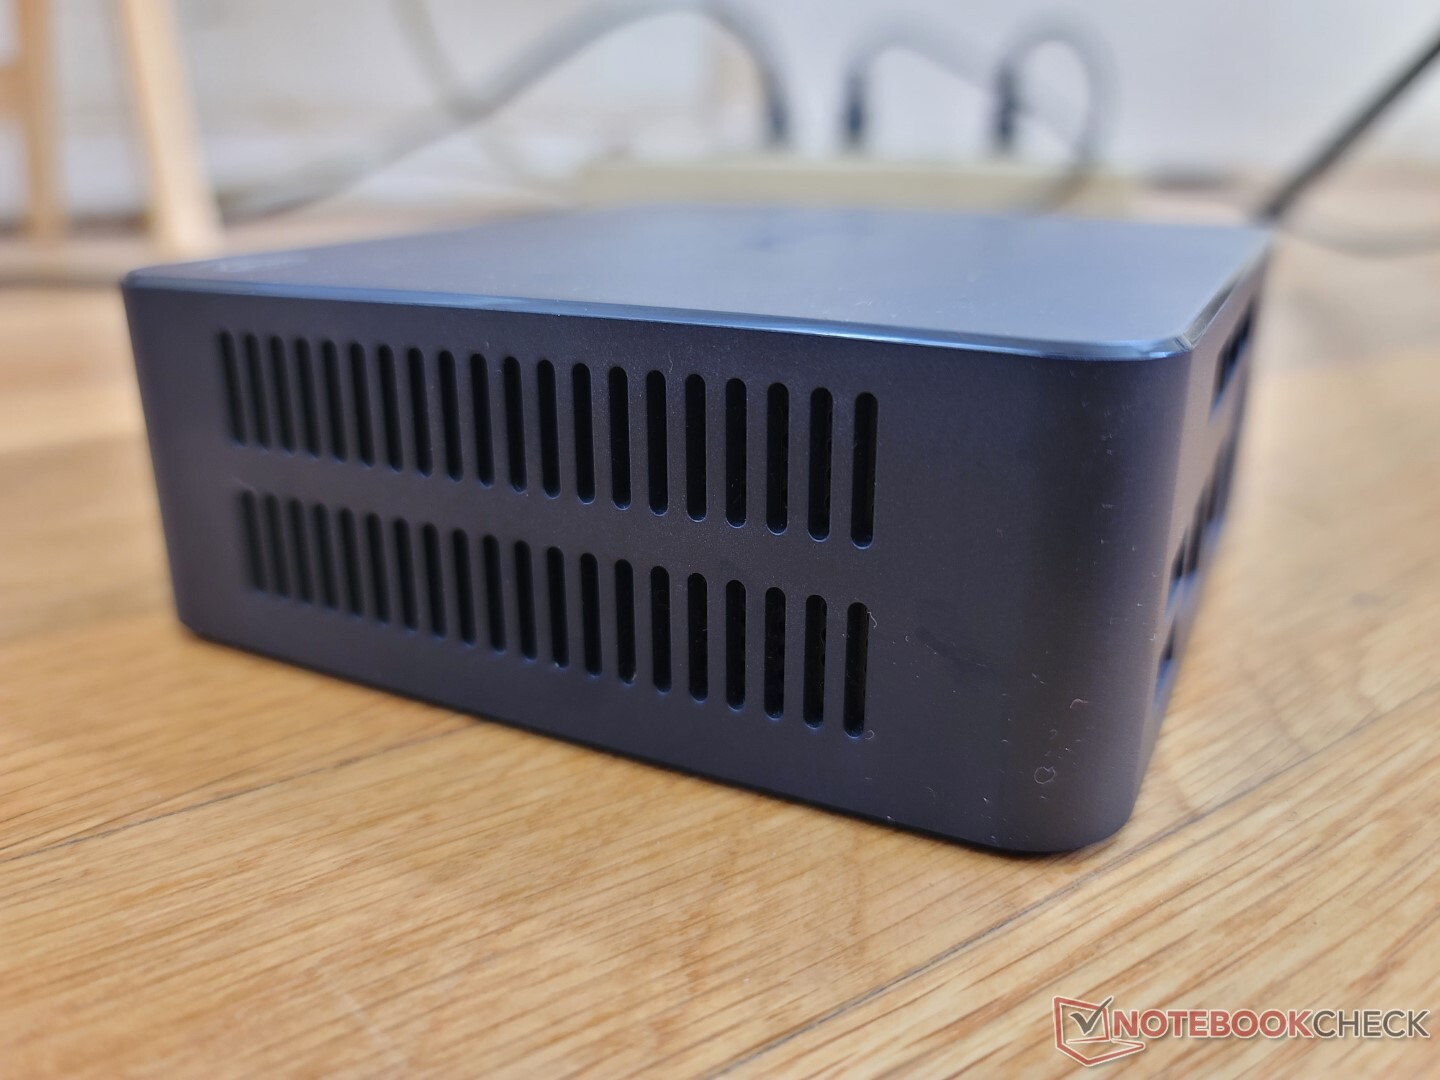
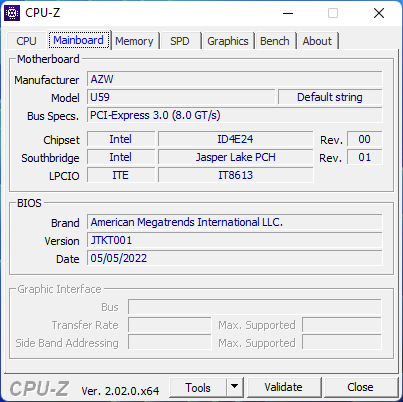
案例
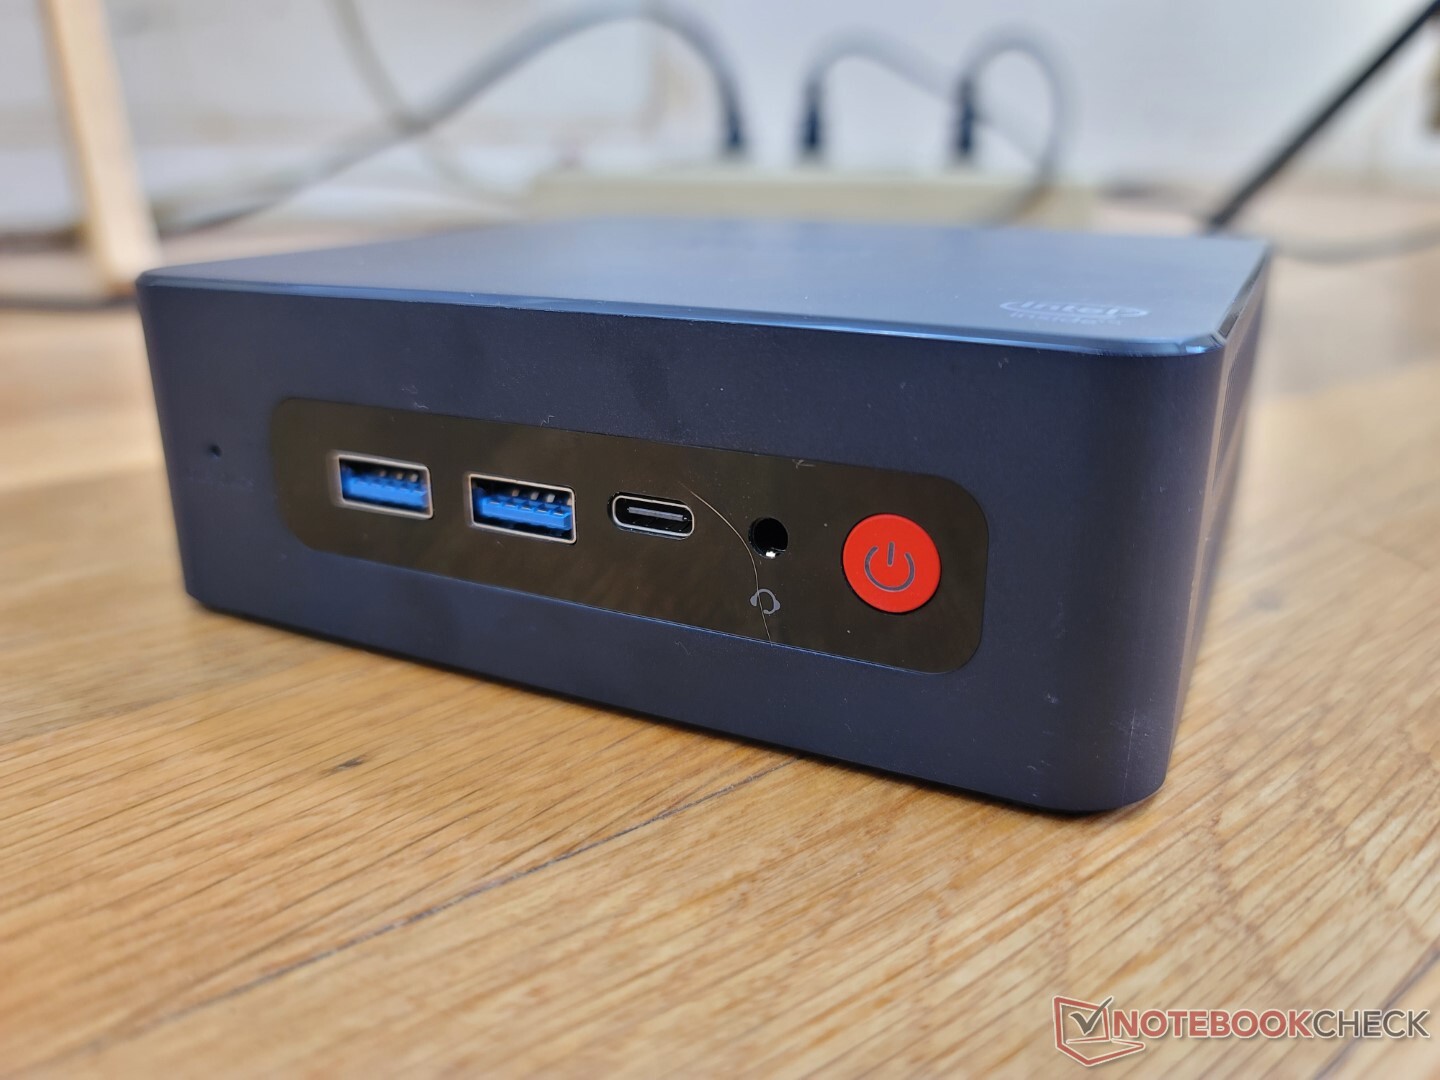
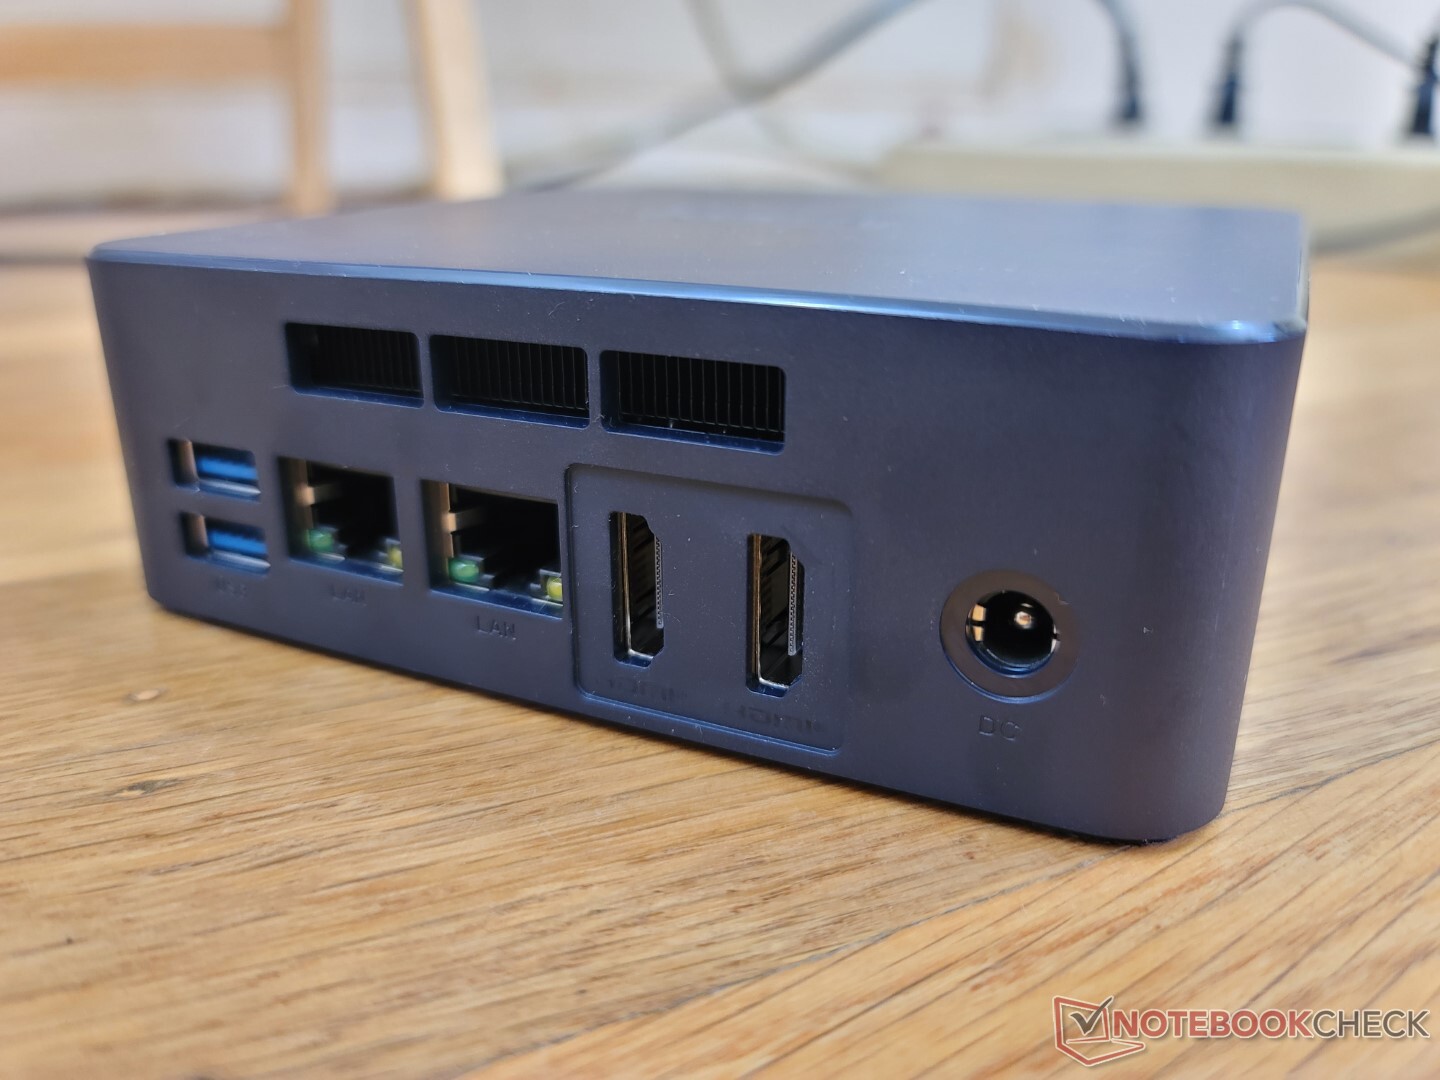
连接性
端口选项大多与原来的U59相同,包括USB-C端口和缺乏Kensington锁。然而,对于这个较新的模型,制造商已经集成了第二个RJ-45端口,总共有两个。请注意,这里的USB-C端口支持DisplayPort,但不支持Power Delivery,因此该系统要依靠其专有的AC适配器供电。
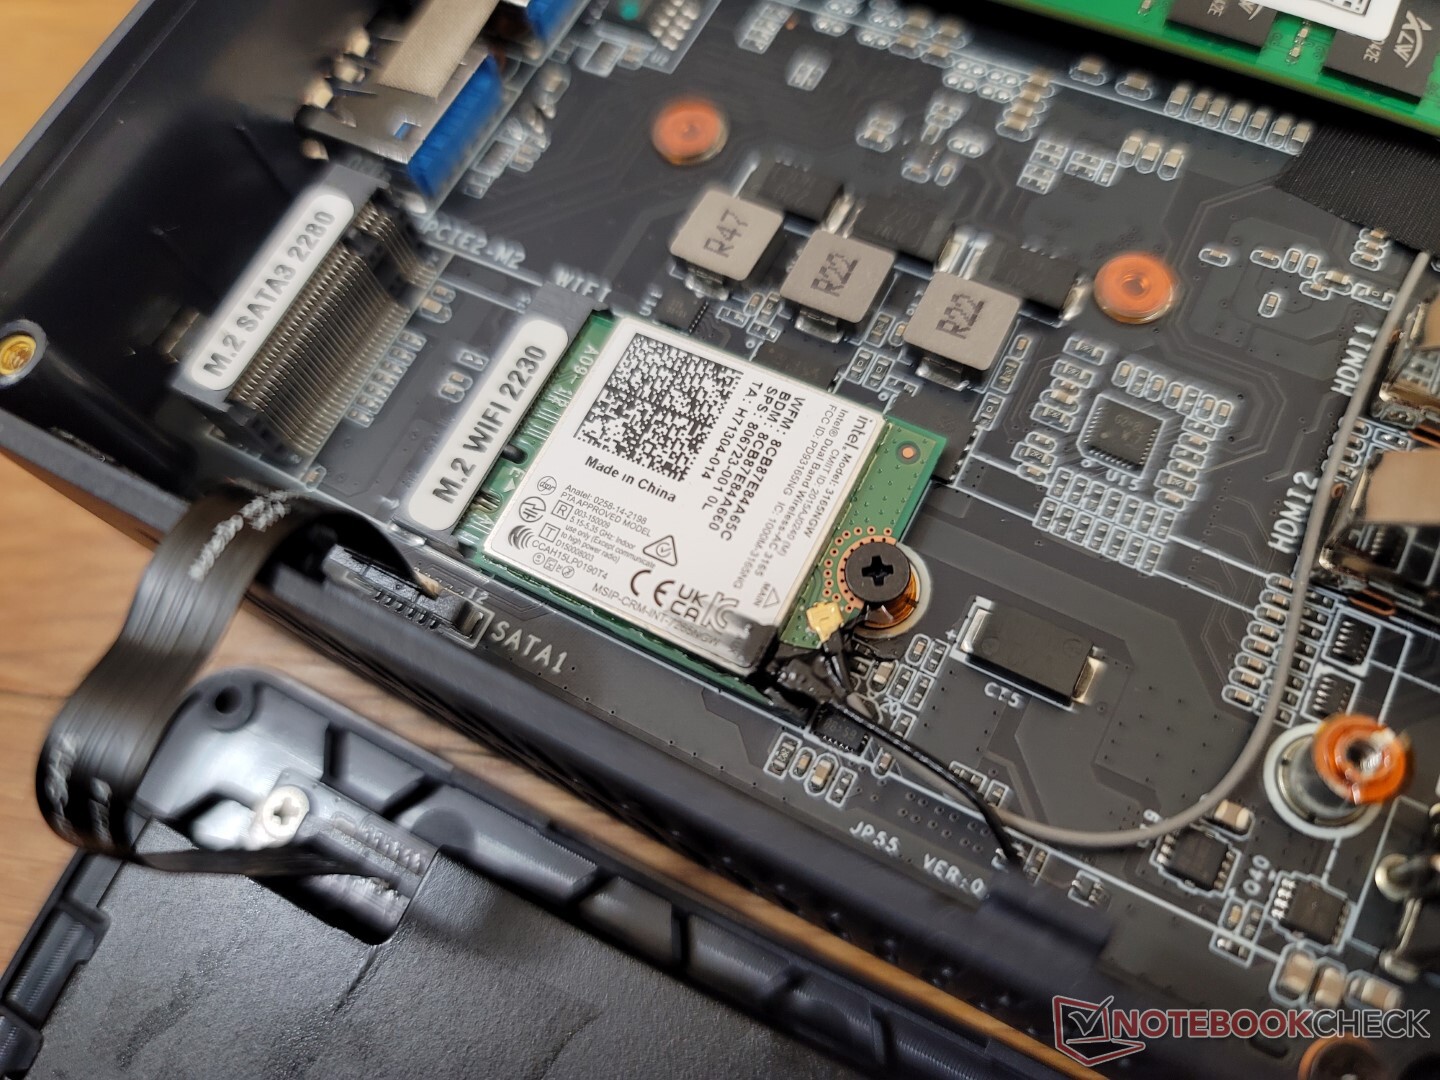
沟通
与U59迷你S版不同,英特尔3165无线网络模块是可拆卸的。虽然速度很慢,但我们在传输4K内容时没有遇到连接问题。
| Networking | |
| iperf3 transmit AX12 | |
| Intel NUC11TNKi5 | |
| Beelink SER4 | |
| Beelink SER3 | |
| iperf3 receive AX12 | |
| Intel NUC11TNKi5 | |
| Beelink SER4 | |
| Beelink SER3 | |
| iperf3 receive AXE11000 | |
| Beelink U59 N5105 | |
| Beelink U59 Mini-S | |
| iperf3 transmit AXE11000 | |
| Beelink U59 N5105 | |
| Beelink U59 Mini-S | |
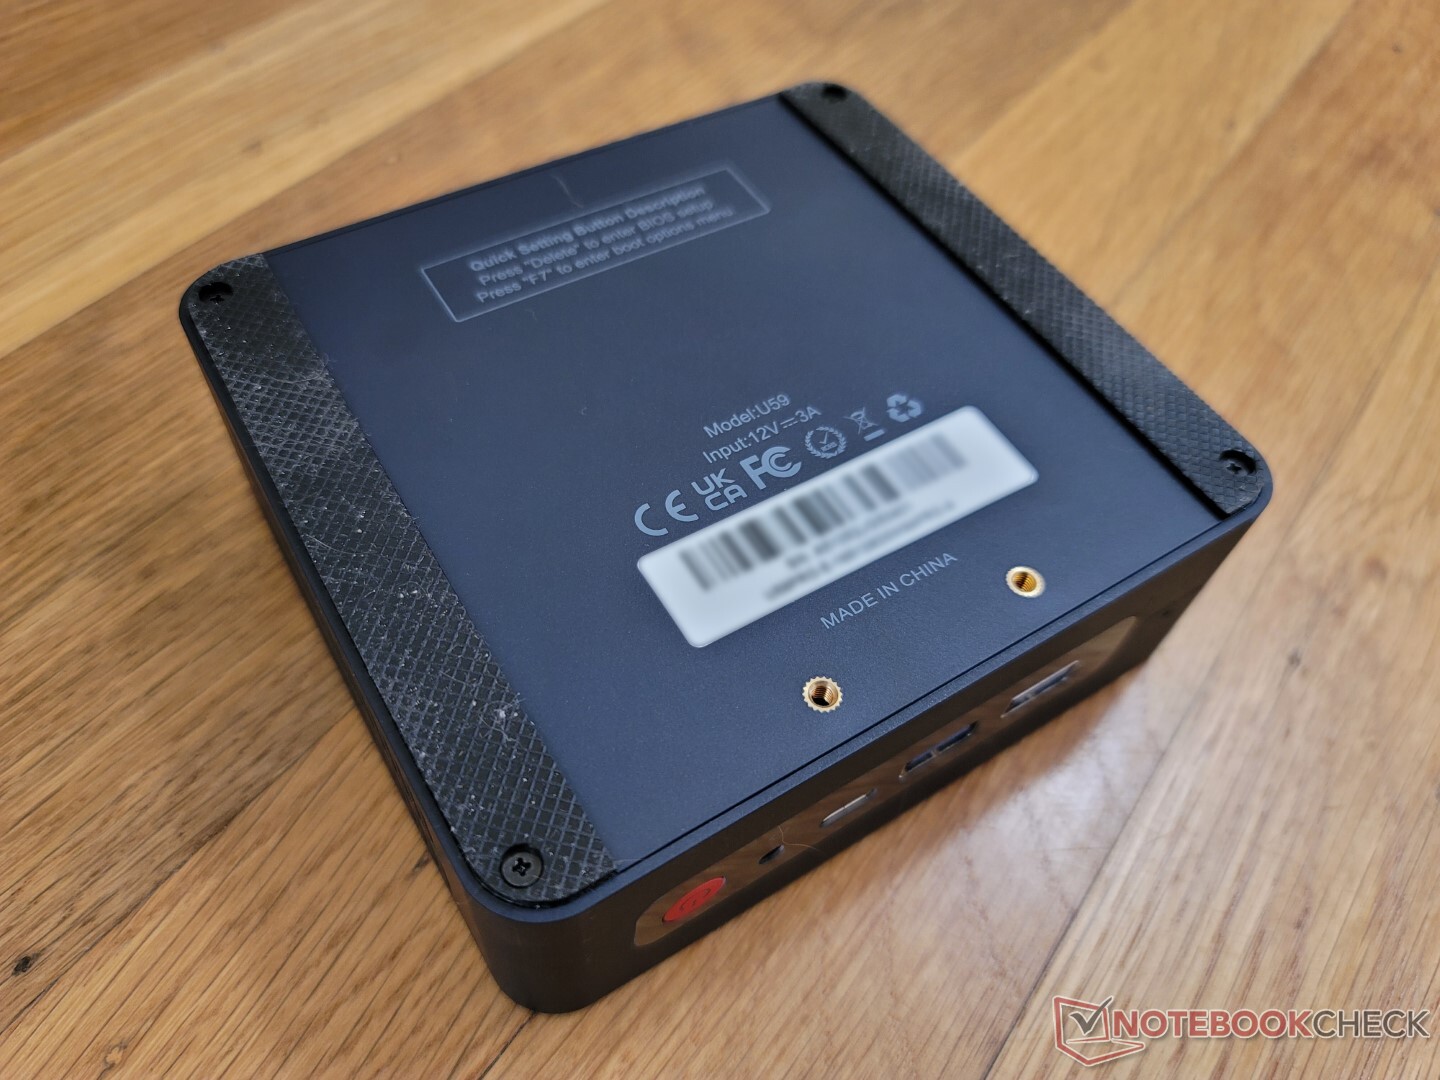
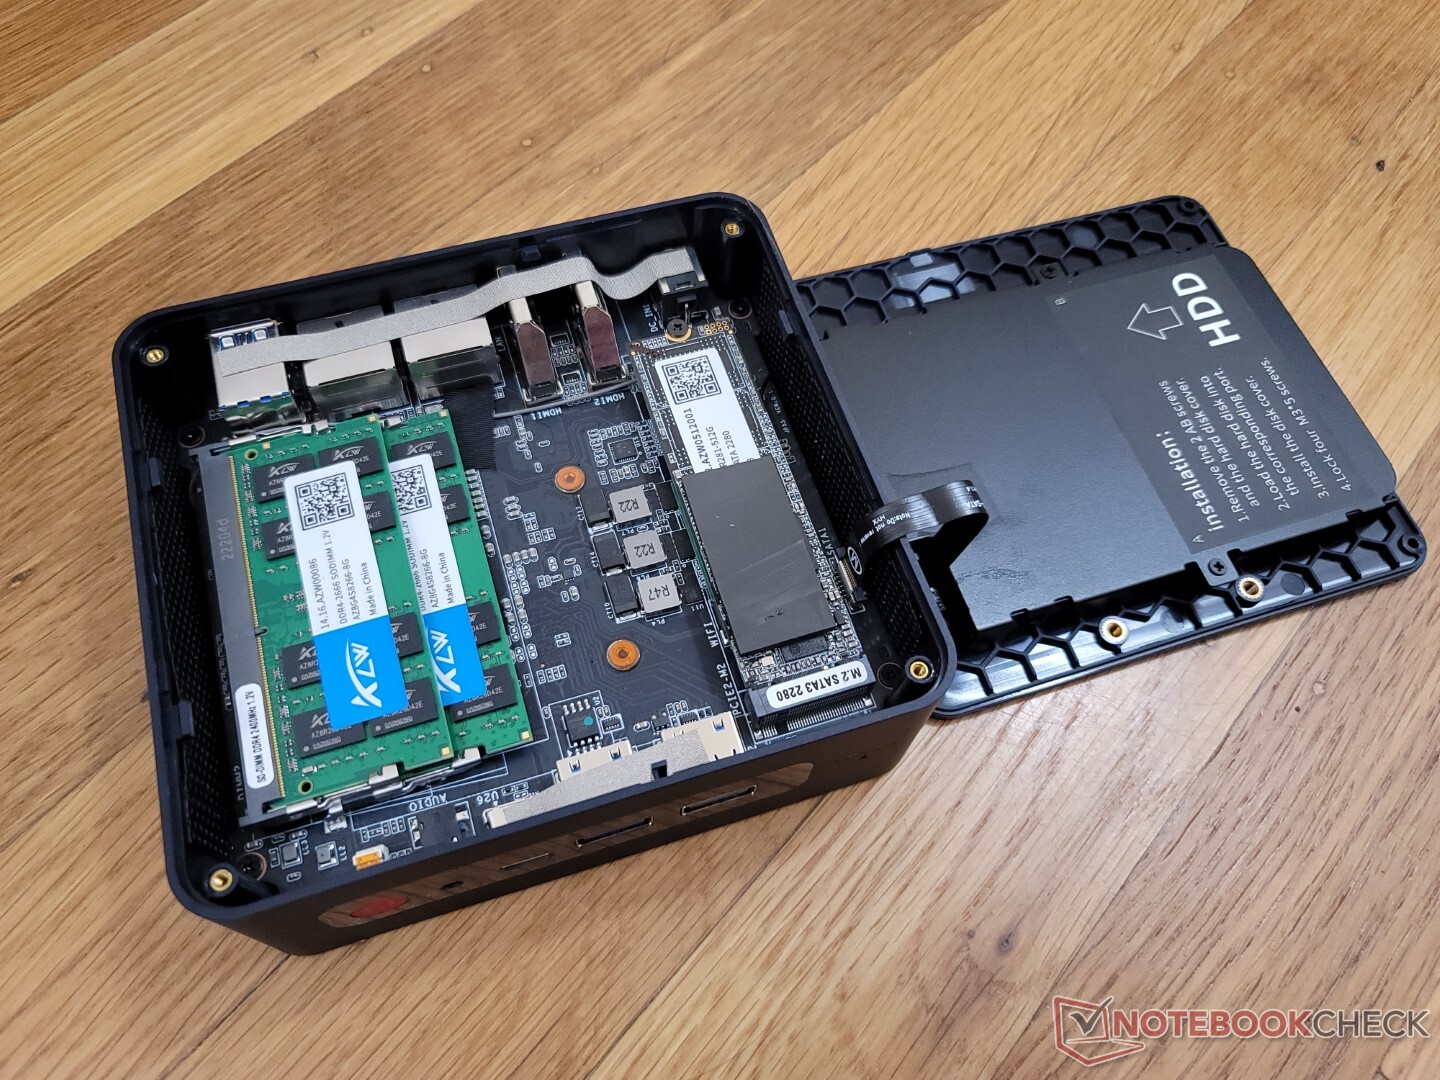
维护
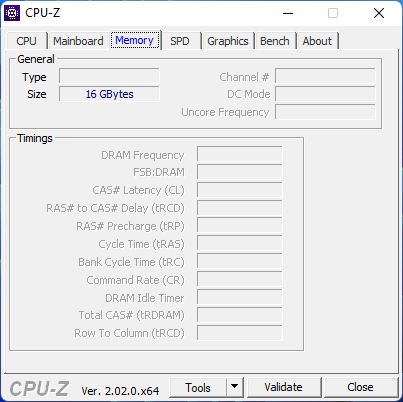
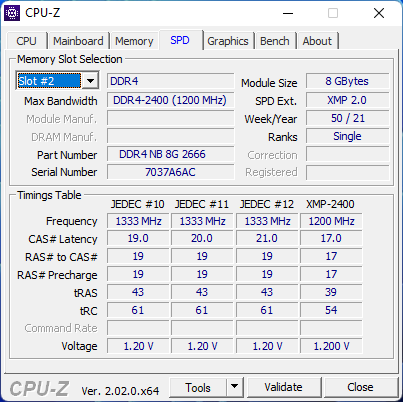
底部面板只需用一把飞利浦螺丝刀就可以拆下,揭开2个存储插槽(M.2 SATA 2280 + 2.5英寸SATA III),2个SODIMM插槽,以及可拆卸的M.2 WLAN模块。相比之下,U59 Mini-S的单一SODIMM插槽仅限于单通道内存。
配件和保修
盒子里包括两条HDMI线、AC适配器、文件和一个用于VESA安装的适配器支架。
如果从美国购买,则适用标准的一年有限保修。
业绩
测试条件
在运行以下任何基准测试之前,我们通过Windows将我们的测试装置设置为性能模式。没有制造商特定的程序或BIOS功能与迷你PC的性能有关。
处理器
原始的CPU性能只比N5095快一丝。 N5095 在单线程和多线程操作中都只比N5095快一点。性能差异是如此之小,以至于两者可能是同一个处理器。
Cinebench R15 Multi Loop
Cinebench R23: Multi Core | Single Core
Cinebench R15: CPU Multi 64Bit | CPU Single 64Bit
Blender: v2.79 BMW27 CPU
7-Zip 18.03: 7z b 4 | 7z b 4 -mmt1
Geekbench 5.5: Multi-Core | Single-Core
HWBOT x265 Benchmark v2.2: 4k Preset
LibreOffice : 20 Documents To PDF
R Benchmark 2.5: Overall mean
| Cinebench R20 / CPU (Multi Core) | |
| Beelink SER4 | |
| Intel NUC11TNKi5 | |
| Beelink SER3 | |
| Lenovo IdeaPad 3 15ITL05 81X80074GE | |
| Beelink U59 N5105 | |
| Average Intel Celeron N5105 (n=1) | |
| Teclast TBOLT F15 Pro | |
| Beelink U59 Mini-S | |
| Beelink SEi8 | |
| HP 17-by2437ng | |
| Zotac ZBOX PI336 pico | |
| Cinebench R20 / CPU (Single Core) | |
| Lenovo IdeaPad 3 15ITL05 81X80074GE | |
| Intel NUC11TNKi5 | |
| Beelink SER4 | |
| Teclast TBOLT F15 Pro | |
| HP 17-by2437ng | |
| Beelink SER3 | |
| Beelink SEi8 | |
| Beelink U59 N5105 | |
| Average Intel Celeron N5105 (n=1) | |
| Beelink U59 Mini-S | |
| Zotac ZBOX PI336 pico | |
| Cinebench R23 / Multi Core | |
| Beelink SER4 | |
| Intel NUC11TNKi5 | |
| Beelink SER3 | |
| Lenovo IdeaPad 3 15ITL05 81X80074GE | |
| Beelink U59 N5105 | |
| Average Intel Celeron N5105 (n=1) | |
| Beelink U59 Mini-S | |
| Teclast TBOLT F15 Pro | |
| Beelink SEi8 | |
| Zotac ZBOX PI336 pico | |
| Cinebench R23 / Single Core | |
| Intel NUC11TNKi5 | |
| Lenovo IdeaPad 3 15ITL05 81X80074GE | |
| Beelink SER4 | |
| Teclast TBOLT F15 Pro | |
| Beelink SER3 | |
| Beelink SEi8 | |
| Beelink U59 N5105 | |
| Average Intel Celeron N5105 (n=1) | |
| Beelink U59 Mini-S | |
| Zotac ZBOX PI336 pico | |
| Cinebench R15 / CPU Multi 64Bit | |
| Beelink SER4 | |
| Intel NUC11TNKi5 | |
| Beelink SER3 | |
| Lenovo IdeaPad 3 15ITL05 81X80074GE | |
| Beelink U59 N5105 | |
| Average Intel Celeron N5105 (n=1) | |
| Beelink U59 Mini-S | |
| Teclast TBOLT F15 Pro | |
| Beelink SEi8 | |
| HP 17-by2437ng | |
| Zotac ZBOX PI336 pico | |
| Cinebench R15 / CPU Single 64Bit | |
| Intel NUC11TNKi5 | |
| Beelink SER4 | |
| HP 17-by2437ng | |
| Teclast TBOLT F15 Pro | |
| Beelink SER3 | |
| Lenovo IdeaPad 3 15ITL05 81X80074GE | |
| Beelink SEi8 | |
| Beelink U59 N5105 | |
| Average Intel Celeron N5105 (n=1) | |
| Beelink U59 Mini-S | |
| Zotac ZBOX PI336 pico | |
| Blender / v2.79 BMW27 CPU | |
| Zotac ZBOX PI336 pico | |
| Beelink U59 Mini-S | |
| Beelink U59 N5105 | |
| Average Intel Celeron N5105 (n=1) | |
| Teclast TBOLT F15 Pro | |
| HP 17-by2437ng | |
| Beelink SEi8 | |
| Lenovo IdeaPad 3 15ITL05 81X80074GE | |
| Beelink SER3 | |
| Intel NUC11TNKi5 | |
| Beelink SER4 | |
| 7-Zip 18.03 / 7z b 4 | |
| Beelink SER4 | |
| Intel NUC11TNKi5 | |
| Beelink SER3 | |
| Lenovo IdeaPad 3 15ITL05 81X80074GE | |
| Beelink U59 N5105 | |
| Average Intel Celeron N5105 (n=1) | |
| Beelink U59 Mini-S | |
| HP 17-by2437ng | |
| Teclast TBOLT F15 Pro | |
| Beelink SEi8 | |
| Zotac ZBOX PI336 pico | |
| 7-Zip 18.03 / 7z b 4 -mmt1 | |
| Intel NUC11TNKi5 | |
| Lenovo IdeaPad 3 15ITL05 81X80074GE | |
| Beelink SER4 | |
| HP 17-by2437ng | |
| Teclast TBOLT F15 Pro | |
| Beelink SER3 | |
| Beelink SEi8 | |
| Beelink U59 Mini-S | |
| Beelink U59 N5105 | |
| Average Intel Celeron N5105 (n=1) | |
| Zotac ZBOX PI336 pico | |
| Geekbench 5.5 / Multi-Core | |
| Beelink SER4 | |
| Intel NUC11TNKi5 | |
| Lenovo IdeaPad 3 15ITL05 81X80074GE | |
| Teclast TBOLT F15 Pro | |
| Beelink U59 N5105 | |
| Average Intel Celeron N5105 (n=1) | |
| HP 17-by2437ng | |
| Beelink U59 Mini-S | |
| Beelink SEi8 | |
| Zotac ZBOX PI336 pico | |
| Geekbench 5.5 / Single-Core | |
| Intel NUC11TNKi5 | |
| Lenovo IdeaPad 3 15ITL05 81X80074GE | |
| Beelink SER4 | |
| Teclast TBOLT F15 Pro | |
| HP 17-by2437ng | |
| Beelink SEi8 | |
| Beelink U59 N5105 | |
| Average Intel Celeron N5105 (n=1) | |
| Beelink U59 Mini-S | |
| Zotac ZBOX PI336 pico | |
| HWBOT x265 Benchmark v2.2 / 4k Preset | |
| Beelink SER4 | |
| Intel NUC11TNKi5 | |
| Beelink SER3 | |
| Lenovo IdeaPad 3 15ITL05 81X80074GE | |
| Beelink SEi8 | |
| HP 17-by2437ng | |
| Teclast TBOLT F15 Pro | |
| Beelink U59 N5105 | |
| Average Intel Celeron N5105 (n=1) | |
| Beelink U59 Mini-S | |
| Zotac ZBOX PI336 pico | |
| LibreOffice / 20 Documents To PDF | |
| Zotac ZBOX PI336 pico | |
| Beelink U59 Mini-S | |
| Beelink U59 N5105 | |
| Average Intel Celeron N5105 (n=1) | |
| Beelink SER3 | |
| Teclast TBOLT F15 Pro | |
| Beelink SEi8 | |
| HP 17-by2437ng | |
| Beelink SER4 | |
| Intel NUC11TNKi5 | |
| Lenovo IdeaPad 3 15ITL05 81X80074GE | |
| R Benchmark 2.5 / Overall mean | |
| Zotac ZBOX PI336 pico | |
| Beelink U59 Mini-S | |
| Beelink U59 N5105 | |
| Average Intel Celeron N5105 (n=1) | |
| Beelink SEi8 | |
| Teclast TBOLT F15 Pro | |
| HP 17-by2437ng | |
| Beelink SER3 | |
| Lenovo IdeaPad 3 15ITL05 81X80074GE | |
| Intel NUC11TNKi5 | |
| Beelink SER4 | |
* ... smaller is better
AIDA64: FP32 Ray-Trace | FPU Julia | CPU SHA3 | CPU Queen | FPU SinJulia | FPU Mandel | CPU AES | CPU ZLib | FP64 Ray-Trace | CPU PhotoWorxx
| Performance rating | |
| Beelink SER4 | |
| Intel NUC11TNKi5 | |
| Beelink SER3 | |
| Beelink U59 N5105 | |
| Beelink U59 Mini-S | |
| Zotac ZBOX PI336 pico | |
| AIDA64 / FP32 Ray-Trace | |
| Beelink SER4 | |
| Intel NUC11TNKi5 | |
| Beelink SER3 | |
| Beelink U59 Mini-S | |
| Beelink U59 N5105 | |
| Zotac ZBOX PI336 pico | |
| AIDA64 / FPU Julia | |
| Beelink SER4 | |
| Intel NUC11TNKi5 | |
| Beelink SER3 | |
| Beelink U59 N5105 | |
| Beelink U59 Mini-S | |
| Zotac ZBOX PI336 pico | |
| AIDA64 / CPU SHA3 | |
| Intel NUC11TNKi5 | |
| Beelink SER4 | |
| Beelink SER3 | |
| Beelink U59 N5105 | |
| Beelink U59 Mini-S | |
| Zotac ZBOX PI336 pico | |
| AIDA64 / CPU Queen | |
| Beelink SER4 | |
| Intel NUC11TNKi5 | |
| Beelink SER3 | |
| Beelink U59 N5105 | |
| Beelink U59 Mini-S | |
| Zotac ZBOX PI336 pico | |
| AIDA64 / FPU SinJulia | |
| Beelink SER4 | |
| Beelink SER3 | |
| Intel NUC11TNKi5 | |
| Beelink U59 Mini-S | |
| Beelink U59 N5105 | |
| Zotac ZBOX PI336 pico | |
| AIDA64 / FPU Mandel | |
| Beelink SER4 | |
| Intel NUC11TNKi5 | |
| Beelink SER3 | |
| Beelink U59 N5105 | |
| Beelink U59 Mini-S | |
| Zotac ZBOX PI336 pico | |
| AIDA64 / CPU AES | |
| Intel NUC11TNKi5 | |
| Beelink SER4 | |
| Beelink SER3 | |
| Beelink U59 N5105 | |
| Beelink U59 Mini-S | |
| Zotac ZBOX PI336 pico | |
| AIDA64 / CPU ZLib | |
| Beelink SER4 | |
| Intel NUC11TNKi5 | |
| Beelink SER3 | |
| Beelink U59 N5105 | |
| Beelink U59 Mini-S | |
| Zotac ZBOX PI336 pico | |
| AIDA64 / FP64 Ray-Trace | |
| Beelink SER4 | |
| Intel NUC11TNKi5 | |
| Beelink SER3 | |
| Beelink U59 N5105 | |
| Beelink U59 Mini-S | |
| Zotac ZBOX PI336 pico | |
| AIDA64 / CPU PhotoWorxx | |
| Beelink SER4 | |
| Intel NUC11TNKi5 | |
| Beelink U59 N5105 | |
| Beelink SER3 | |
| Beelink U59 Mini-S | |
| Zotac ZBOX PI336 pico | |
系统性能
CrossMark: Overall | Productivity | Creativity | Responsiveness
| PCMark 10 / Score | |
| Beelink SER4 | |
| Intel NUC11TNKi5 | |
| Beelink SER3 | |
| Beelink U59 N5105 | |
| Average Intel Celeron N5105, Intel UHD Graphics (Jasper Lake 24 EU) (n=1) | |
| Beelink U59 Mini-S | |
| PCMark 10 / Essentials | |
| Beelink SER4 | |
| Intel NUC11TNKi5 | |
| Beelink SER3 | |
| Beelink U59 N5105 | |
| Average Intel Celeron N5105, Intel UHD Graphics (Jasper Lake 24 EU) (n=1) | |
| Beelink U59 Mini-S | |
| PCMark 10 / Productivity | |
| Beelink SER4 | |
| Intel NUC11TNKi5 | |
| Beelink SER3 | |
| Beelink U59 N5105 | |
| Average Intel Celeron N5105, Intel UHD Graphics (Jasper Lake 24 EU) (n=1) | |
| Beelink U59 Mini-S | |
| PCMark 10 / Digital Content Creation | |
| Beelink SER4 | |
| Intel NUC11TNKi5 | |
| Beelink SER3 | |
| Beelink U59 N5105 | |
| Average Intel Celeron N5105, Intel UHD Graphics (Jasper Lake 24 EU) (n=1) | |
| Beelink U59 Mini-S | |
| CrossMark / Overall | |
| Beelink U59 N5105 | |
| Average Intel Celeron N5105, Intel UHD Graphics (Jasper Lake 24 EU) (n=1) | |
| Beelink U59 Mini-S | |
| CrossMark / Productivity | |
| Beelink U59 N5105 | |
| Average Intel Celeron N5105, Intel UHD Graphics (Jasper Lake 24 EU) (n=1) | |
| Beelink U59 Mini-S | |
| CrossMark / Creativity | |
| Beelink U59 N5105 | |
| Average Intel Celeron N5105, Intel UHD Graphics (Jasper Lake 24 EU) (n=1) | |
| Beelink U59 Mini-S | |
| CrossMark / Responsiveness | |
| Beelink U59 N5105 | |
| Average Intel Celeron N5105, Intel UHD Graphics (Jasper Lake 24 EU) (n=1) | |
| Beelink U59 Mini-S | |
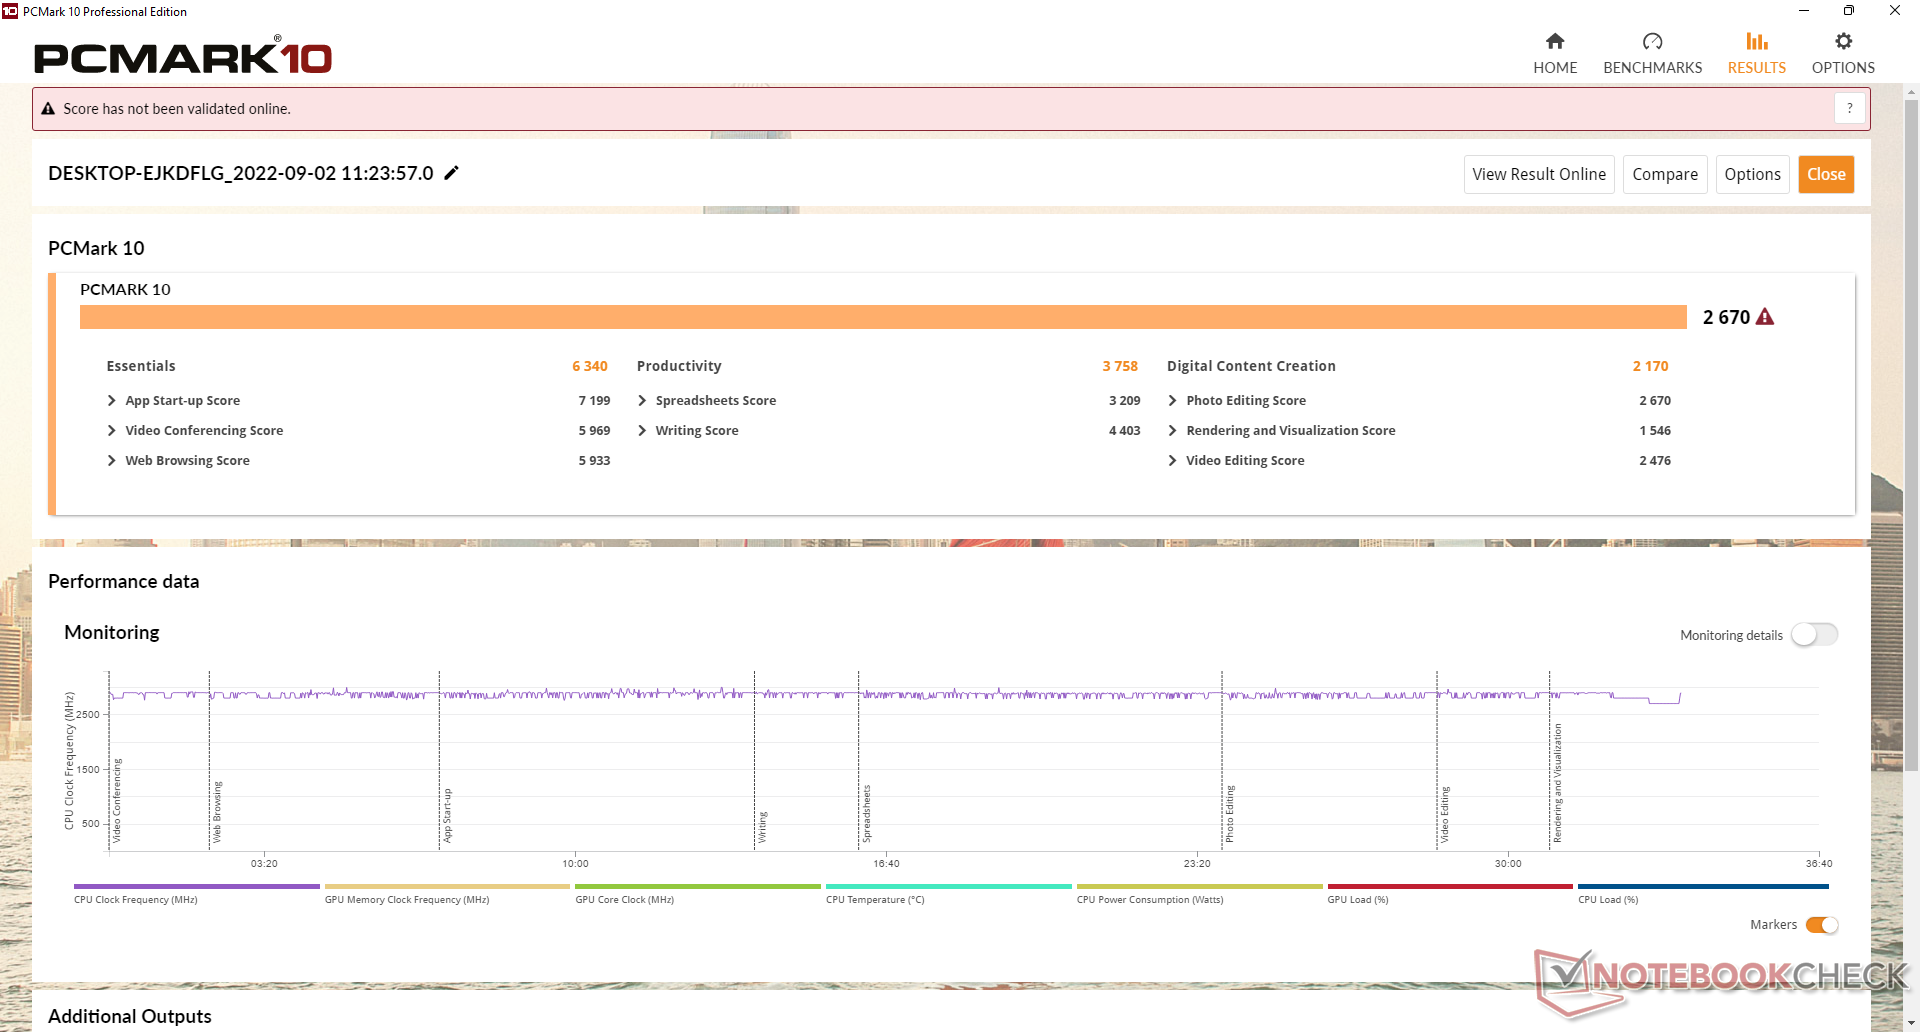
| PCMark 10 Score | 2670 points | |
Help | ||
| AIDA64 / Memory Copy | |
| Beelink SER4 | |
| Beelink U59 N5105 | |
| Intel NUC11TNKi5 | |
| Beelink U59 Mini-S | |
| Beelink SER3 | |
| Zotac ZBOX PI336 pico | |
| AIDA64 / Memory Read | |
| Beelink SER4 | |
| Intel NUC11TNKi5 | |
| Beelink SER3 | |
| Beelink U59 N5105 | |
| Beelink U59 Mini-S | |
| Zotac ZBOX PI336 pico | |
| AIDA64 / Memory Write | |
| Beelink SER4 | |
| Beelink U59 N5105 | |
| Intel NUC11TNKi5 | |
| Beelink U59 Mini-S | |
| Beelink SER3 | |
| Zotac ZBOX PI336 pico | |
| AIDA64 / Memory Latency | |
| Beelink SER3 | |
| Beelink SER4 | |
| Intel NUC11TNKi5 | |
| Zotac ZBOX PI336 pico | |
| Beelink U59 N5105 | |
| Beelink U59 Mini-S | |
* ... smaller is better
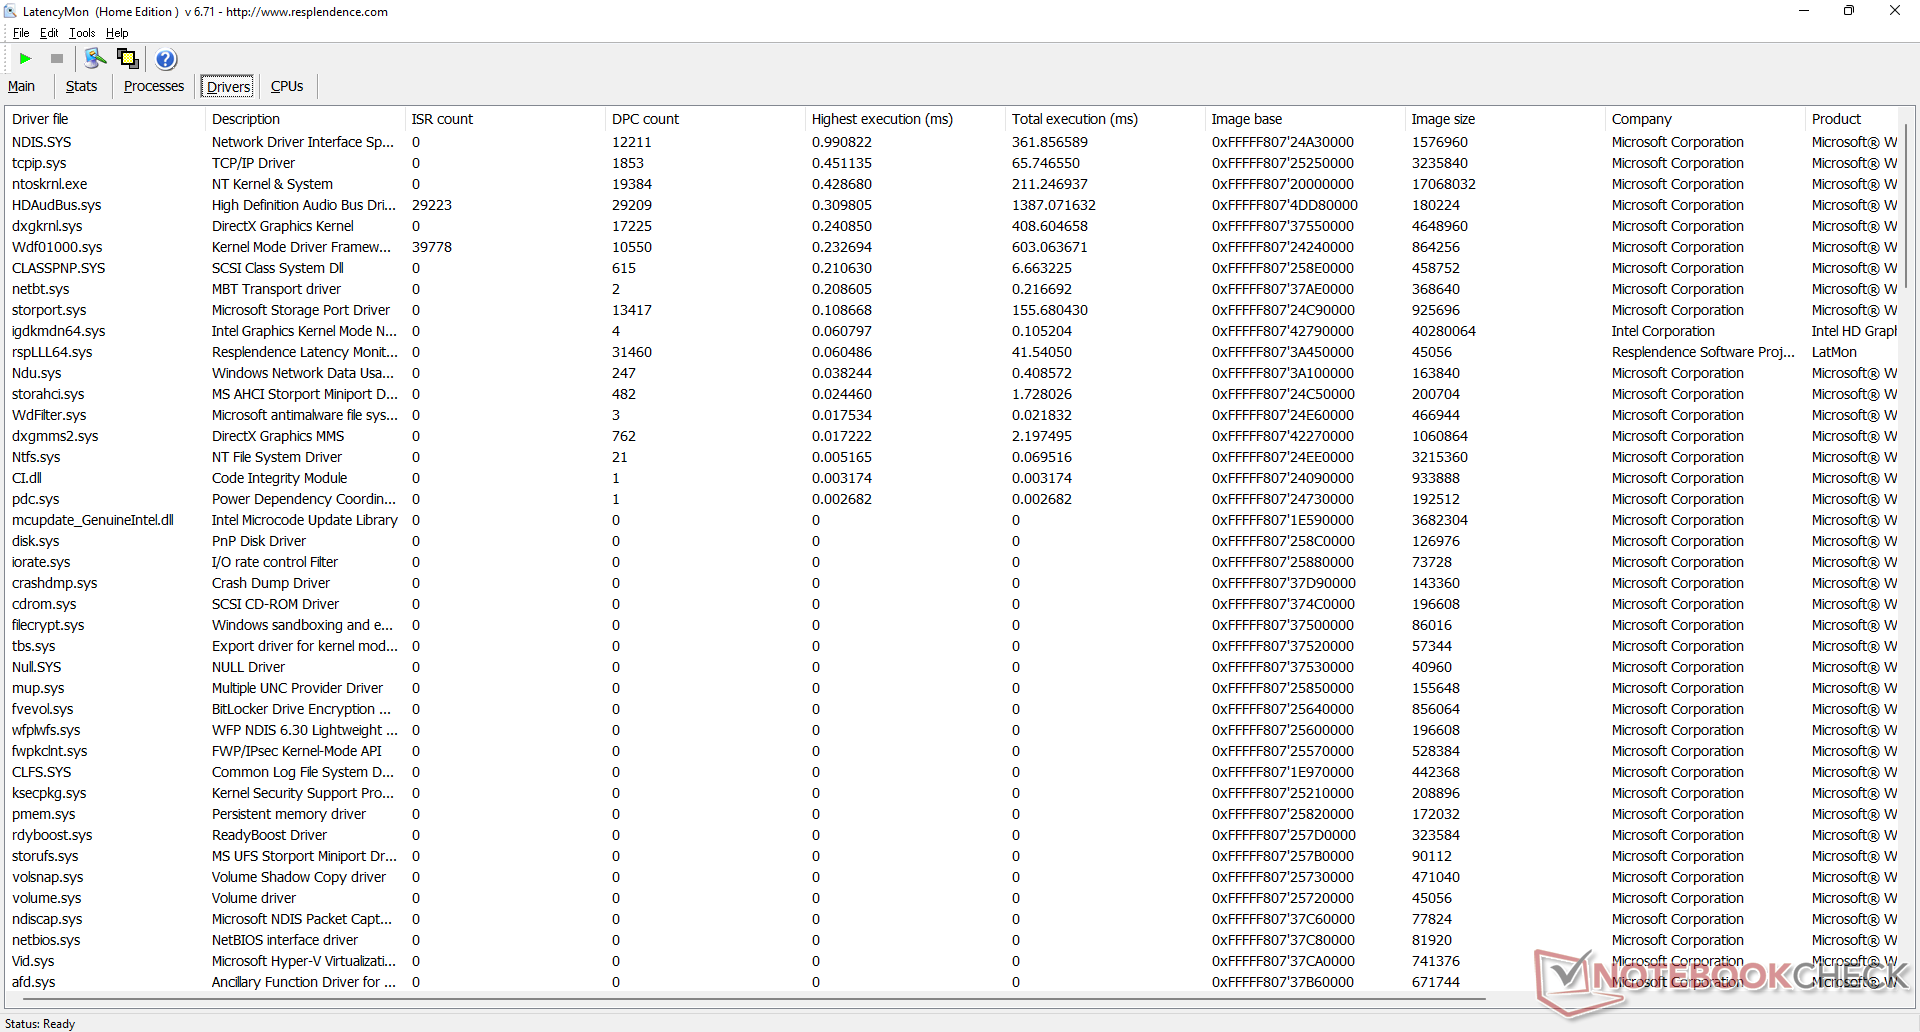
DPC延时
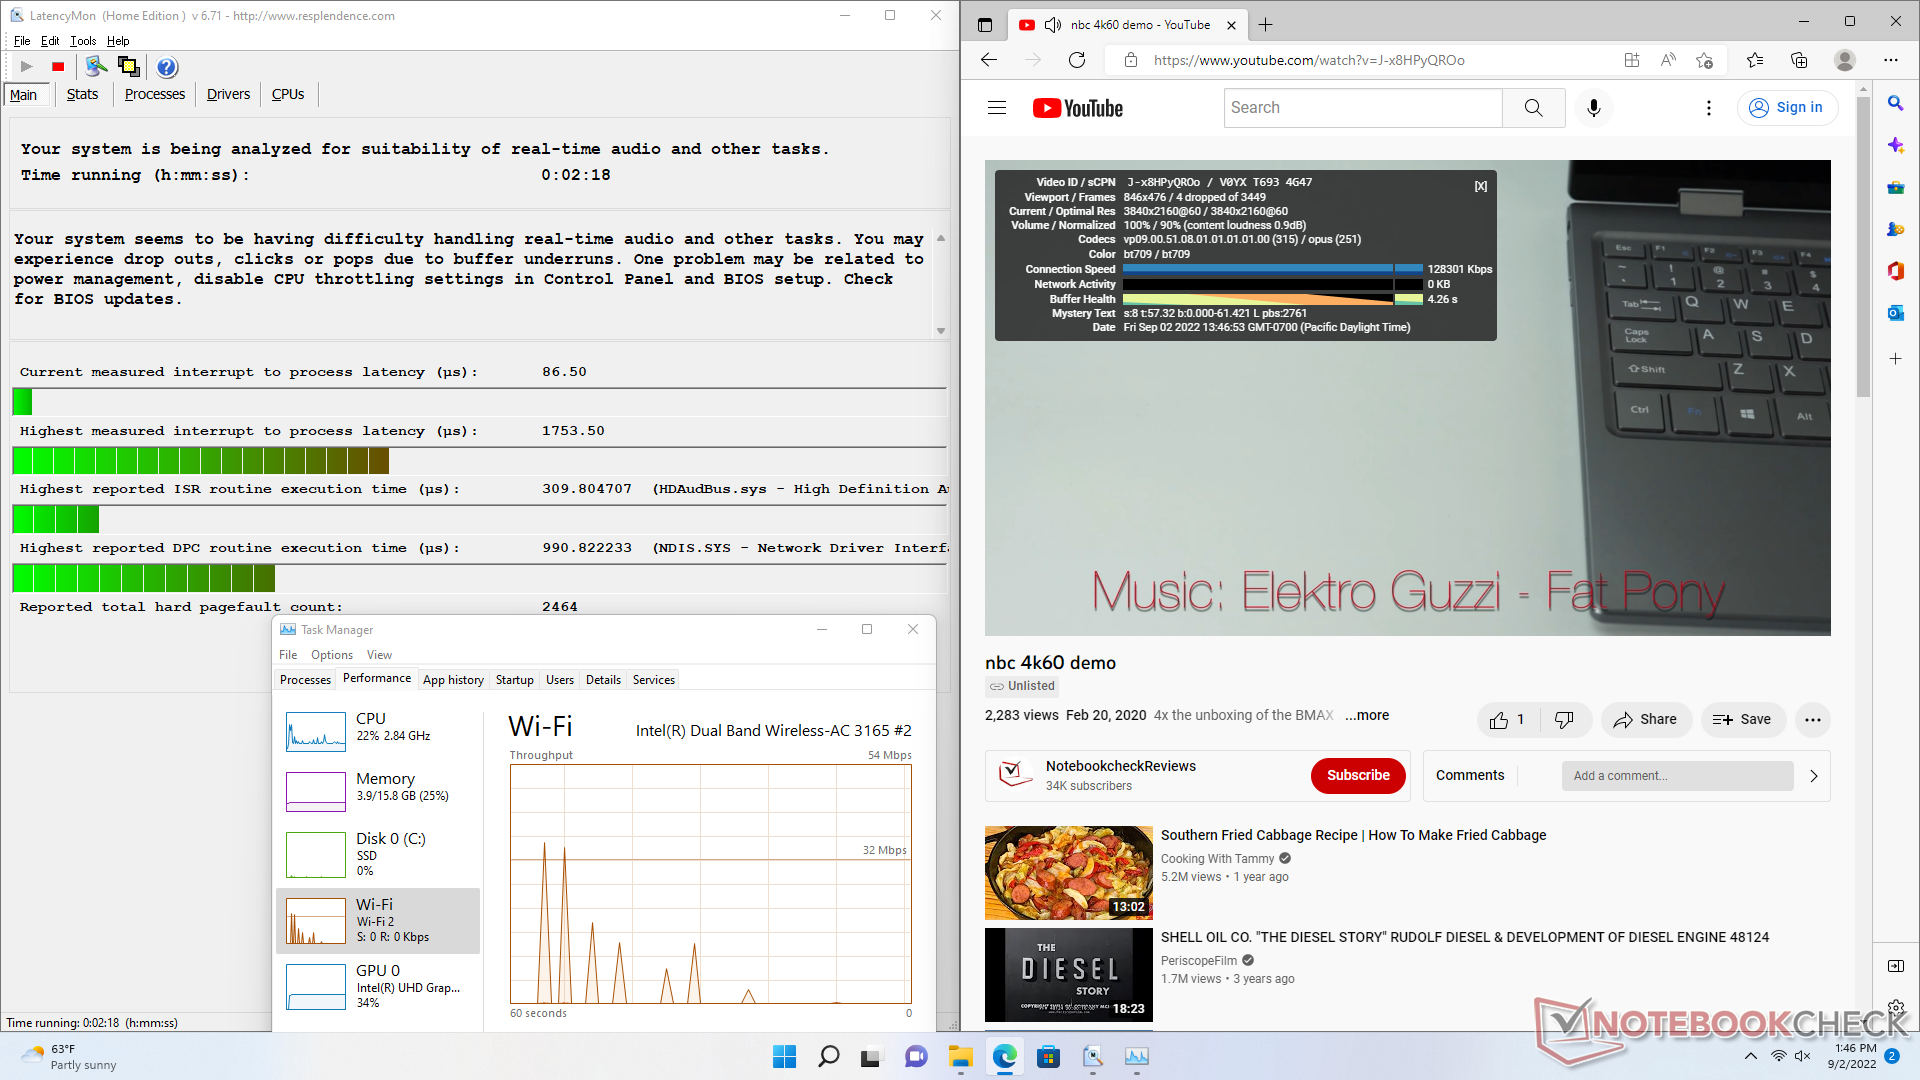
LatencyMon揭示了在打开我们主页的多个浏览器标签时的DPC问题。在我们长达1分钟的测试视频中,以60 FPS播放4K视频几乎完美,只有4个丢帧。
| DPC Latencies / LatencyMon - interrupt to process latency (max), Web, Youtube, Prime95 | |
| Beelink U59 N5105 | |
| Beelink U59 Mini-S | |
| Zotac ZBOX PI336 pico | |
| Beelink SER3 | |
| Intel NUC11TNKi5 | |
| Beelink SER4 | |
* ... smaller is better
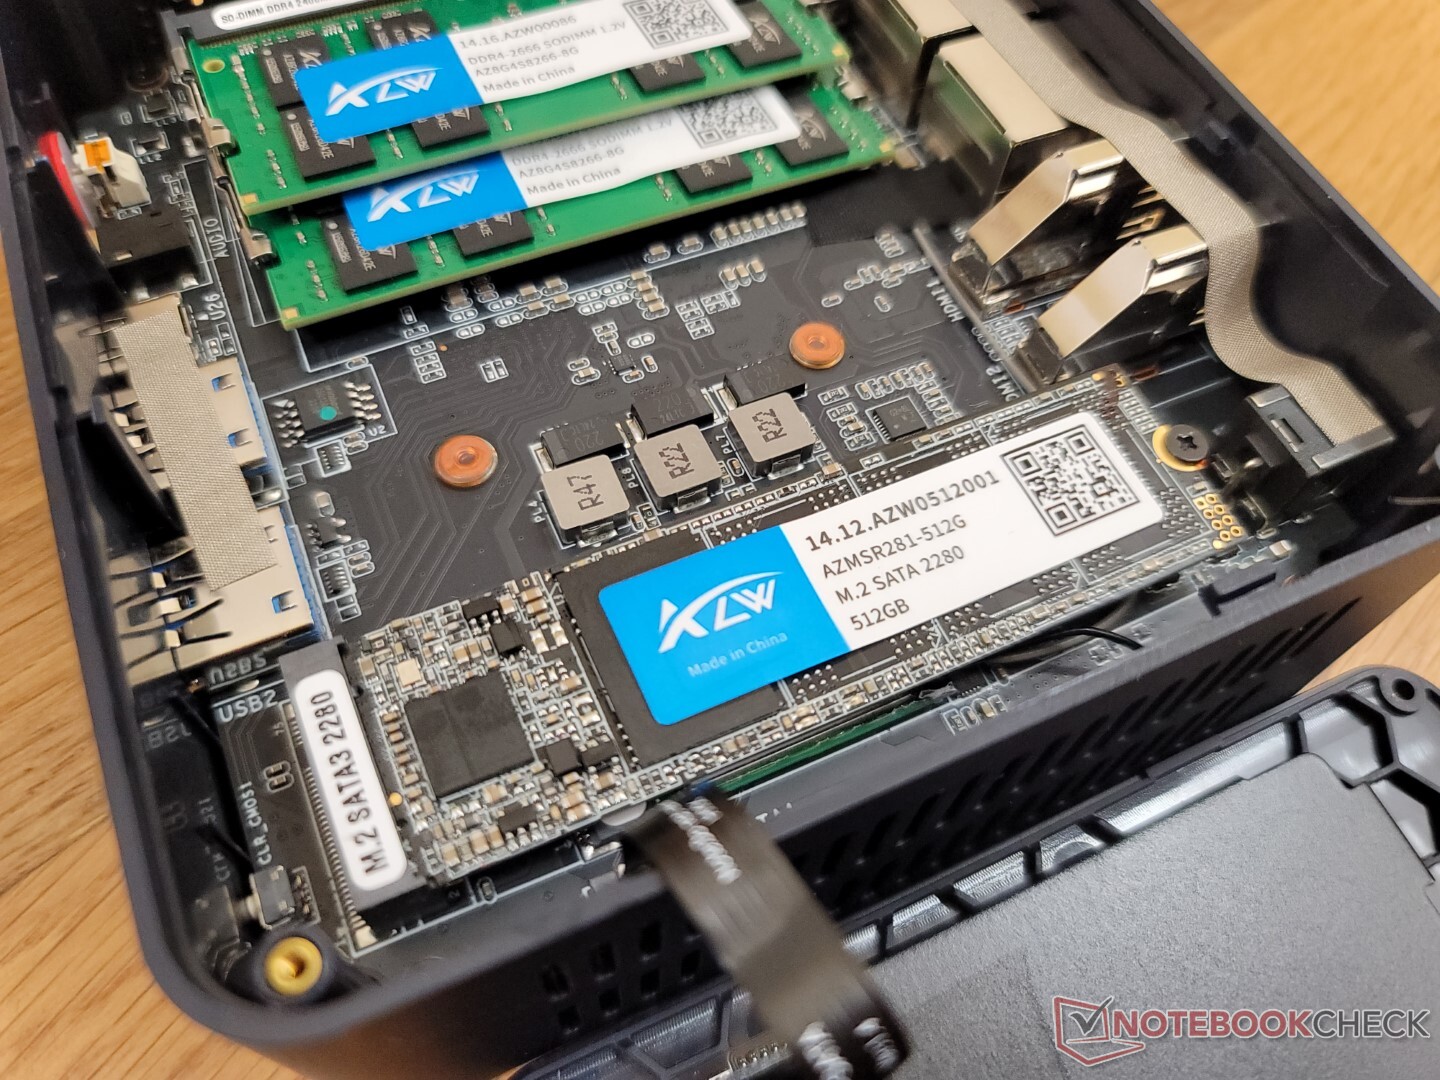
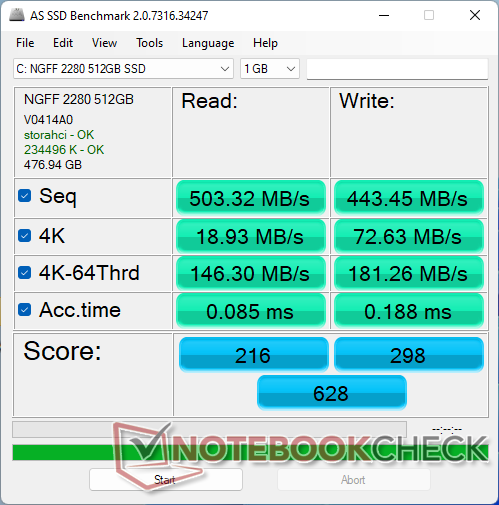
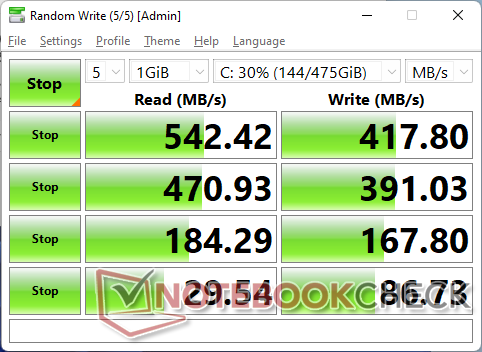
存储设备
该模型配备了一个M.2 SATA III驱动器,而不是NVMe可能是为了节省成本。然而,考虑到CPU,一个SATA III驱动器是可以接受的。该硅动AZW驱动器在我们的测试单元中会返回到400MB/s以上的连续读取和写入速率。
在U59这样的经济型迷你电脑上,还包括一个用于固态硬盘的小型散热垫,这让人感到惊讶。这块垫子位于固态硬盘和连接到顶部底板的2.5英寸SATA III金属外壳之间。

| Drive Performance rating - Percent | |
| Beelink SER3 | |
| Beelink SER4 | |
| Intel NUC11TNKi5 | |
| Beelink U59 N5105 | |
| Beelink U59 Mini-S | |
| Zotac ZBOX PI336 pico | |
| DiskSpd | |
| seq read | |
| Beelink SER4 | |
| Beelink SER3 | |
| Intel NUC11TNKi5 | |
| Beelink U59 N5105 | |
| Beelink U59 Mini-S | |
| Zotac ZBOX PI336 pico | |
| seq write | |
| Beelink SER3 | |
| Beelink SER4 | |
| Intel NUC11TNKi5 | |
| Beelink U59 N5105 | |
| Beelink U59 Mini-S | |
| Zotac ZBOX PI336 pico | |
| seq q8 t1 read | |
| Beelink SER3 | |
| Beelink SER4 | |
| Intel NUC11TNKi5 | |
| Beelink U59 N5105 | |
| Beelink U59 Mini-S | |
| Zotac ZBOX PI336 pico | |
| seq q8 t1 write | |
| Beelink SER3 | |
| Beelink SER4 | |
| Intel NUC11TNKi5 | |
| Beelink U59 Mini-S | |
| Beelink U59 N5105 | |
| Zotac ZBOX PI336 pico | |
| 4k q1 t1 read | |
| Beelink SER4 | |
| Beelink SER3 | |
| Beelink U59 N5105 | |
| Intel NUC11TNKi5 | |
| Beelink U59 Mini-S | |
| Zotac ZBOX PI336 pico | |
| 4k q1 t1 write | |
| Beelink SER4 | |
| Beelink SER3 | |
| Beelink U59 N5105 | |
| Beelink U59 Mini-S | |
| Intel NUC11TNKi5 | |
| Zotac ZBOX PI336 pico | |
| 4k q32 t16 read | |
| Beelink SER3 | |
| Beelink SER4 | |
| Intel NUC11TNKi5 | |
| Beelink U59 N5105 | |
| Beelink U59 Mini-S | |
| Zotac ZBOX PI336 pico | |
| 4k q32 t16 write | |
| Beelink SER4 | |
| Beelink SER3 | |
| Intel NUC11TNKi5 | |
| Beelink U59 N5105 | |
| Beelink U59 Mini-S | |
| Zotac ZBOX PI336 pico | |
* ... smaller is better
Disk Throttling: DiskSpd Read Loop, Queue Depth 8
GPU性能
| 3DMark | |
| 1920x1080 Fire Strike Graphics | |
| Beelink SER4 | |
| Intel NUC11TNKi5 | |
| Lenovo IdeaPad 3 15ITL05 81X80074GE | |
| Beelink SER3 | |
| Beelink SEi8 | |
| Teclast TBOLT F15 Pro | |
| Beelink U59 N5105 | |
| Average Intel UHD Graphics (Jasper Lake 24 EU) (n=1) | |
| HP 17-by2437ng | |
| Beelink U59 Mini-S | |
| Zotac ZBOX PI336 pico | |
| 2560x1440 Time Spy Graphics | |
| Beelink SER4 | |
| Intel NUC11TNKi5 | |
| Lenovo IdeaPad 3 15ITL05 81X80074GE | |
| Beelink SER3 | |
| Beelink SEi8 | |
| Teclast TBOLT F15 Pro | |
| HP 17-by2437ng | |
| Beelink U59 N5105 | |
| Average Intel UHD Graphics (Jasper Lake 24 EU) (n=1) | |
| Beelink U59 Mini-S | |
| 2560x1440 Time Spy Score | |
| Beelink SER4 | |
| Intel NUC11TNKi5 | |
| Lenovo IdeaPad 3 15ITL05 81X80074GE | |
| Beelink SER3 | |
| Beelink SEi8 | |
| Teclast TBOLT F15 Pro | |
| HP 17-by2437ng | |
| Beelink U59 N5105 | |
| Average Intel UHD Graphics (Jasper Lake 24 EU) (n=1) | |
| Beelink U59 Mini-S | |
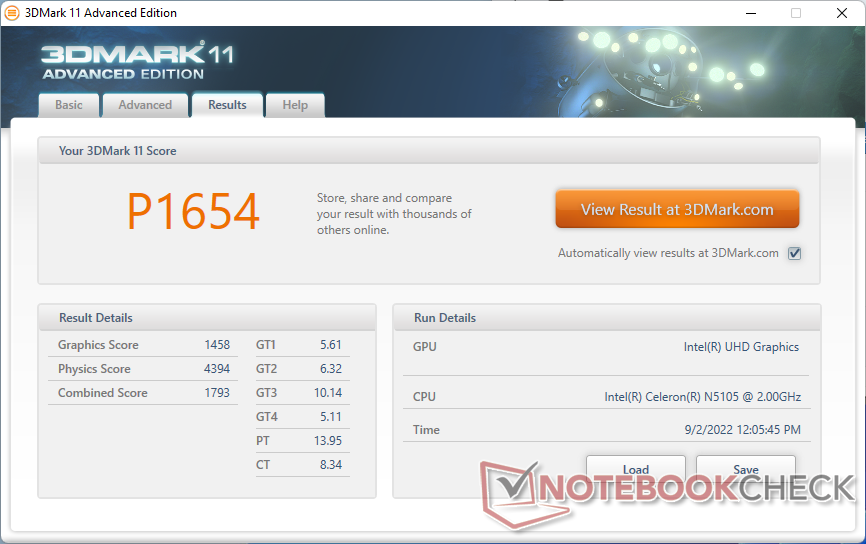
| 3DMark 11 - 1280x720 Performance GPU | |
| Beelink SER4 | |
| Intel NUC11TNKi5 | |
| Lenovo IdeaPad 3 15ITL05 81X80074GE | |
| Beelink SER3 | |
| Beelink SEi8 | |
| Teclast TBOLT F15 Pro | |
| HP 17-by2437ng | |
| Beelink U59 N5105 | |
| Average Intel UHD Graphics (Jasper Lake 24 EU) (n=1) | |
| Beelink U59 Mini-S | |
| Zotac ZBOX PI336 pico | |
| 3DMark 11 Performance | 1654 points | |
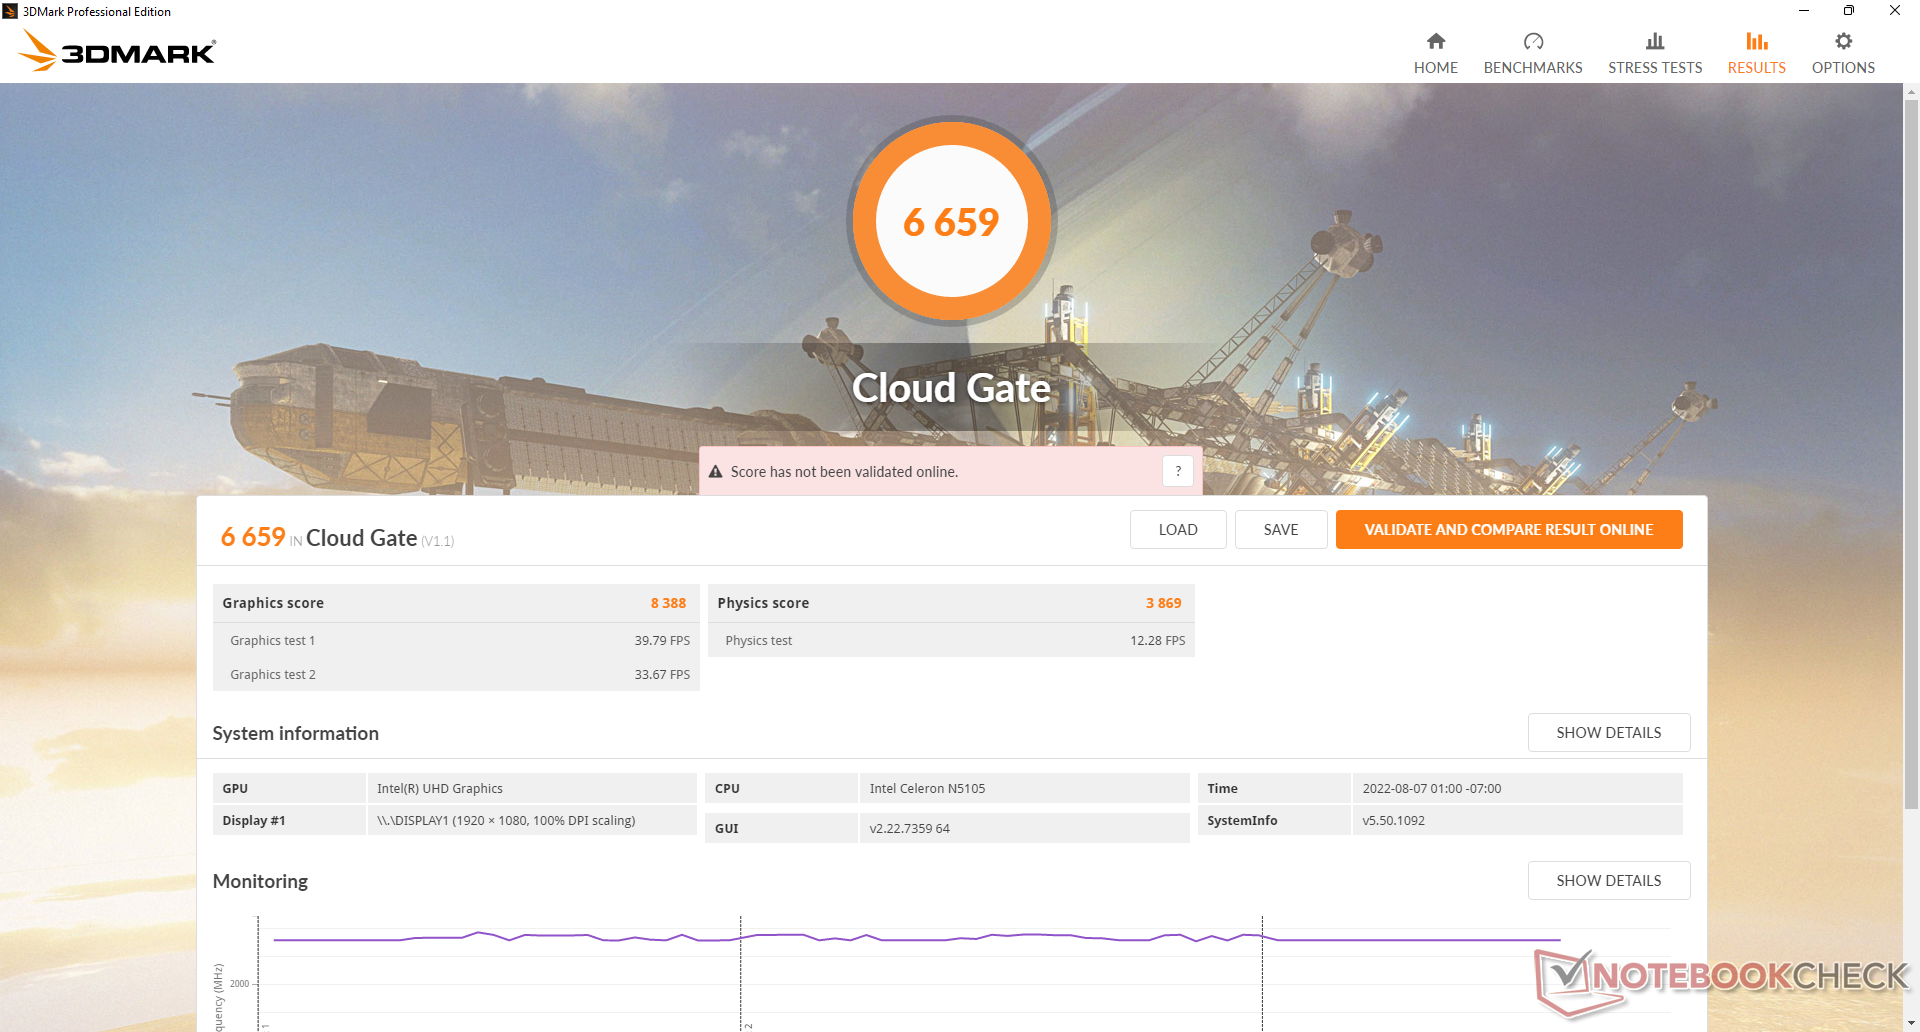
| 3DMark Cloud Gate Standard Score | 6659 points | |
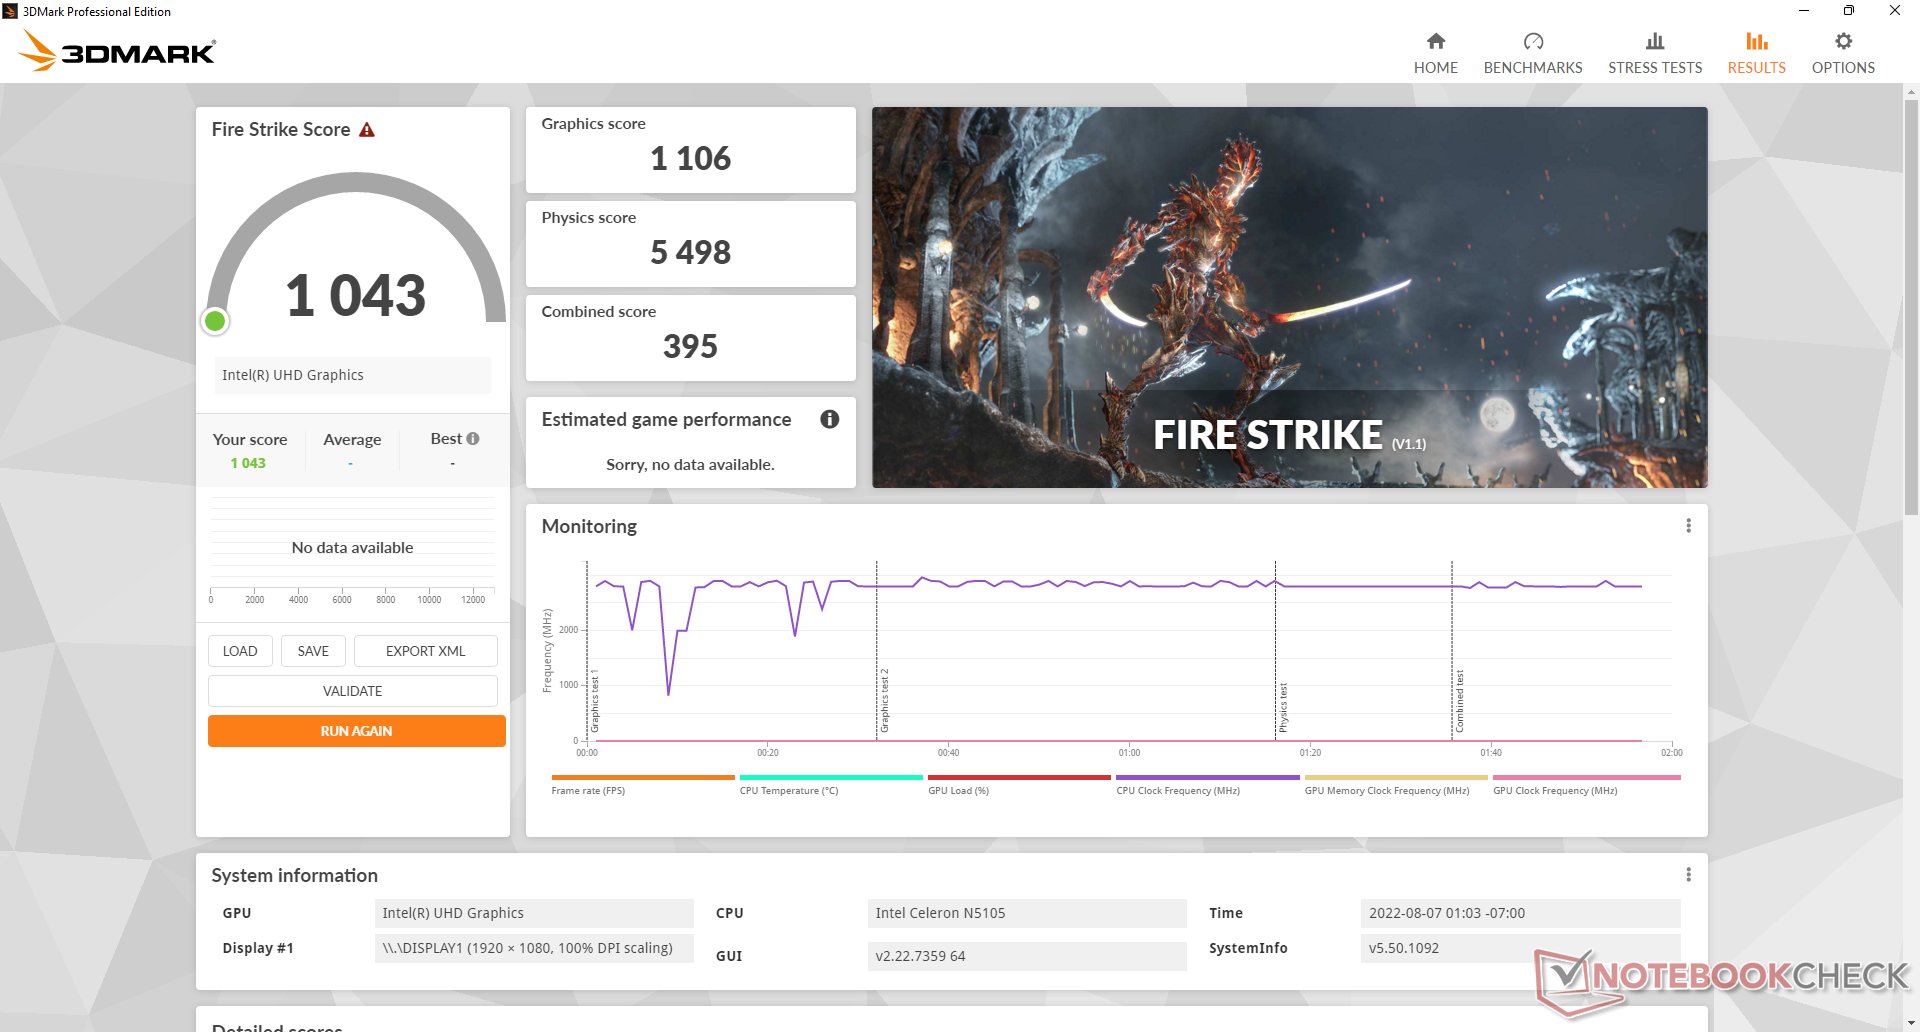
| 3DMark Fire Strike Score | 1043 points | |
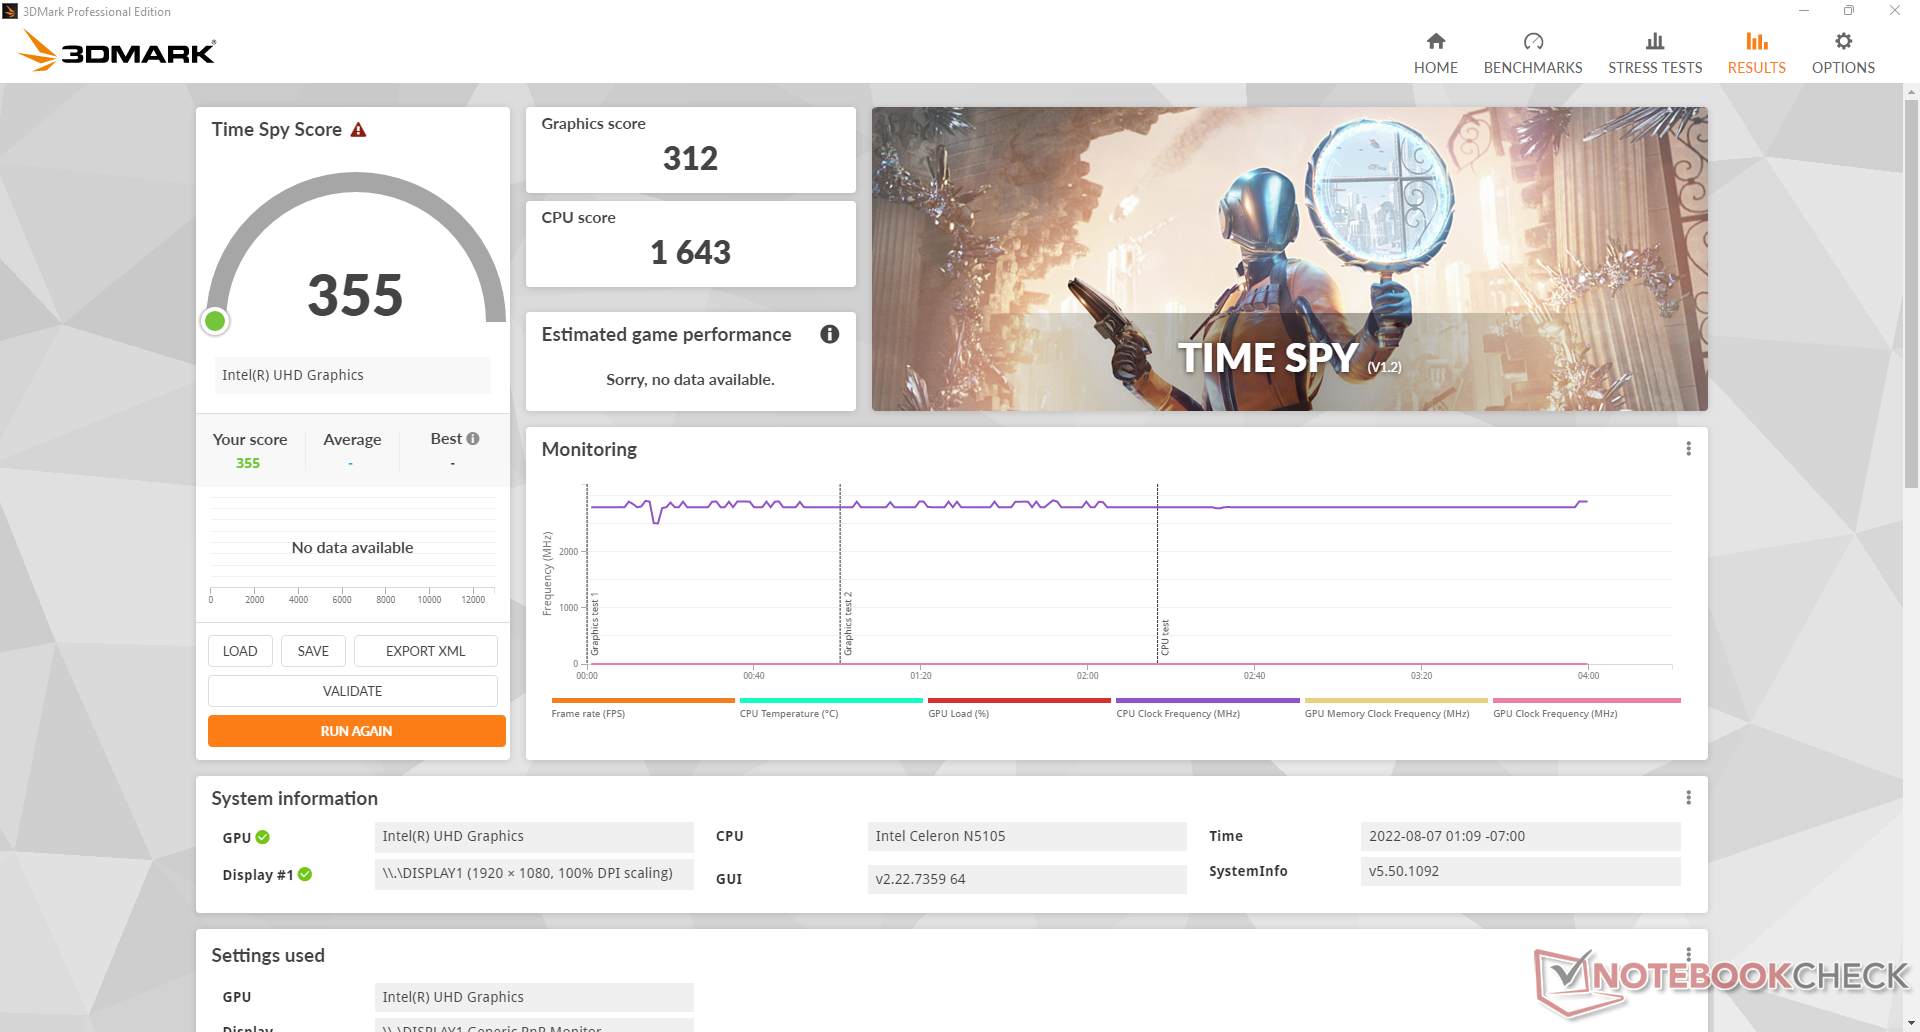
| 3DMark Time Spy Score | 355 points | |
Help | ||
| The Witcher 3 | |
| 1024x768 Low Graphics & Postprocessing | |
| Beelink SER4 | |
| Intel NUC11TNKi5 | |
| Lenovo IdeaPad 3 15ITL05 81X80074GE | |
| Beelink SER3 | |
| Teclast TBOLT F15 Pro | |
| Beelink U59 N5105 | |
| Average Intel UHD Graphics (Jasper Lake 24 EU) (n=1) | |
| 1366x768 Medium Graphics & Postprocessing | |
| Beelink SER4 | |
| Lenovo IdeaPad 3 15ITL05 81X80074GE | |
| Beelink SER3 | |
| Teclast TBOLT F15 Pro | |
| Beelink U59 N5105 | |
| Average Intel UHD Graphics (Jasper Lake 24 EU) (n=1) | |
| 1920x1080 High Graphics & Postprocessing (Nvidia HairWorks Off) | |
| Beelink SER4 | |
| Lenovo IdeaPad 3 15ITL05 81X80074GE | |
| Beelink SER3 | |
| Teclast TBOLT F15 Pro | |
| Beelink U59 N5105 | |
| Average Intel UHD Graphics (Jasper Lake 24 EU) (n=1) | |
| 1920x1080 Ultra Graphics & Postprocessing (HBAO+) | |
| Beelink SER4 | |
| Lenovo IdeaPad 3 15ITL05 81X80074GE | |
| Beelink SER3 | |
| Beelink U59 N5105 | |
| Average Intel UHD Graphics (Jasper Lake 24 EU) (n=1) | |
| X-Plane 11.11 | |
| 1280x720 low (fps_test=1) | |
| Beelink SER4 | |
| Lenovo IdeaPad 3 15ITL05 81X80074GE | |
| Intel NUC11TNKi5 | |
| Teclast TBOLT F15 Pro | |
| Beelink SER3 | |
| Beelink SEi8 | |
| Beelink U59 N5105 | |
| Average Intel UHD Graphics (Jasper Lake 24 EU) (n=1) | |
| Beelink U59 Mini-S | |
| Zotac ZBOX PI336 pico | |
| 1920x1080 med (fps_test=2) | |
| Beelink SER4 | |
| Intel NUC11TNKi5 | |
| Lenovo IdeaPad 3 15ITL05 81X80074GE | |
| Beelink SER3 | |
| Beelink SEi8 | |
| Teclast TBOLT F15 Pro | |
| Beelink U59 N5105 | |
| Average Intel UHD Graphics (Jasper Lake 24 EU) (n=1) | |
| Beelink U59 Mini-S | |
| Zotac ZBOX PI336 pico | |
| 1920x1080 high (fps_test=3) | |
| Beelink SER4 | |
| Intel NUC11TNKi5 | |
| Lenovo IdeaPad 3 15ITL05 81X80074GE | |
| Beelink SER3 | |
| Teclast TBOLT F15 Pro | |
| Beelink SEi8 | |
| Beelink U59 N5105 | |
| Average Intel UHD Graphics (Jasper Lake 24 EU) (n=1) | |
| Beelink U59 Mini-S | |
| Zotac ZBOX PI336 pico | |
| Final Fantasy XV Benchmark - 1280x720 Lite Quality | |
| Beelink SER4 | |
| Intel NUC11TNKi5 | |
| Lenovo IdeaPad 3 15ITL05 81X80074GE | |
| Beelink SER3 | |
| Beelink SEi8 | |
| Teclast TBOLT F15 Pro | |
| Beelink U59 N5105 | |
| Average Intel UHD Graphics (Jasper Lake 24 EU) (n=1) | |
| Beelink U59 Mini-S | |
| Zotac ZBOX PI336 pico | |
| low | med. | high | ultra | |
|---|---|---|---|---|
| The Witcher 3 (2015) | 21.6 | 14.4 | 7.8 | 3.9 |
| Dota 2 Reborn (2015) | 73.8 | 24.1 | 16.8 | 15.5 |
| Final Fantasy XV Benchmark (2018) | 13.7 | |||
| X-Plane 11.11 (2018) | 20.8 | 13.3 | 12.3 |
排放
系统噪音
即使设置为性能模式,无论负载如何,风扇噪音都很安静。在21.5 dB(A)的无声背景下,我们只能记录到最大的不到27 dB(A),而去年的U59是34 dB(A)。如果不选择像Zotac ZBOX PI336这样的无风扇机型,这是最安静的迷你PC之一。
我们的测试装置会表现出轻微的电子噪音或线圈啸叫,这有助于解释我们的空转噪音为22.1 dB(A)。
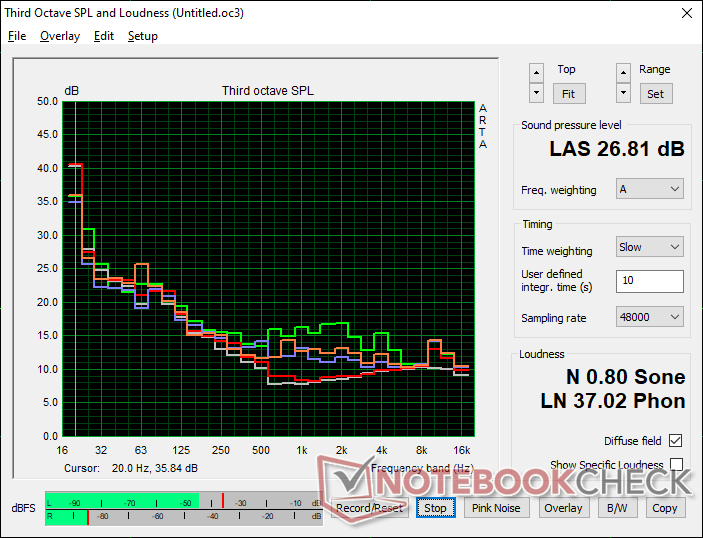
Noise level
| Idle |
| 22.1 / 22.1 / 22.1 dB(A) |
| Load |
| 23.9 / 26.8 dB(A) |
 | ||
30 dB silent 40 dB(A) audible 50 dB(A) loud |
||
min: | ||
| Beelink U59 N5105 UHD Graphics (Jasper Lake 24 EU), Celeron N5105, Silicon Motion AZW 512G NV428 | Beelink U59 Mini-S UHD Graphics (Jasper Lake 16 EU), Celeron N5095, Silicon Motion AZW 256G M.228 220426 C SATA 3 | Beelink SER4 Vega 8, R7 4800U, Intel SSD 660p SSDPEKNW512G8 | Beelink SER3 Vega 10, R7 3750H, GSemi AZW GSDFN512TS3F1OGCX | Intel NUC11TNKi5 Iris Xe G7 80EUs, i5-1135G7, Transcend M.2 SSD 430S TS512GMTS430S | Zotac ZBOX PI336 pico UHD Graphics (Elkhart Lake 16 EU), Celeron N6211, SanDisk DF4128 | |
|---|---|---|---|---|---|---|
| Noise | -12% | -48% | -31% | -55% | ||
| off / environment * (dB) | 21.5 | 23.3 -8% | 23.4 -9% | 23.4 -9% | 24.8 -15% | |
| Idle Minimum * (dB) | 22.1 | 24.2 -10% | 33.2 -50% | 23.4 -6% | 35.6 -61% | |
| Idle Average * (dB) | 22.1 | 24.2 -10% | 33.2 -50% | 23.4 -6% | 35.6 -61% | |
| Idle Maximum * (dB) | 22.1 | 24.2 -10% | 33.2 -50% | 29.4 -33% | 35.6 -61% | |
| Load Average * (dB) | 23.9 | 25.1 -5% | 38.6 -62% | 35.2 -47% | 36.2 -51% | |
| Witcher 3 ultra * (dB) | 24.4 | 39.2 -61% | 37.2 -52% | 38 -56% | ||
| Load Maximum * (dB) | 26.8 | 33.9 -26% | 40.8 -52% | 43.3 -62% | 47.6 -78% |
* ... smaller is better
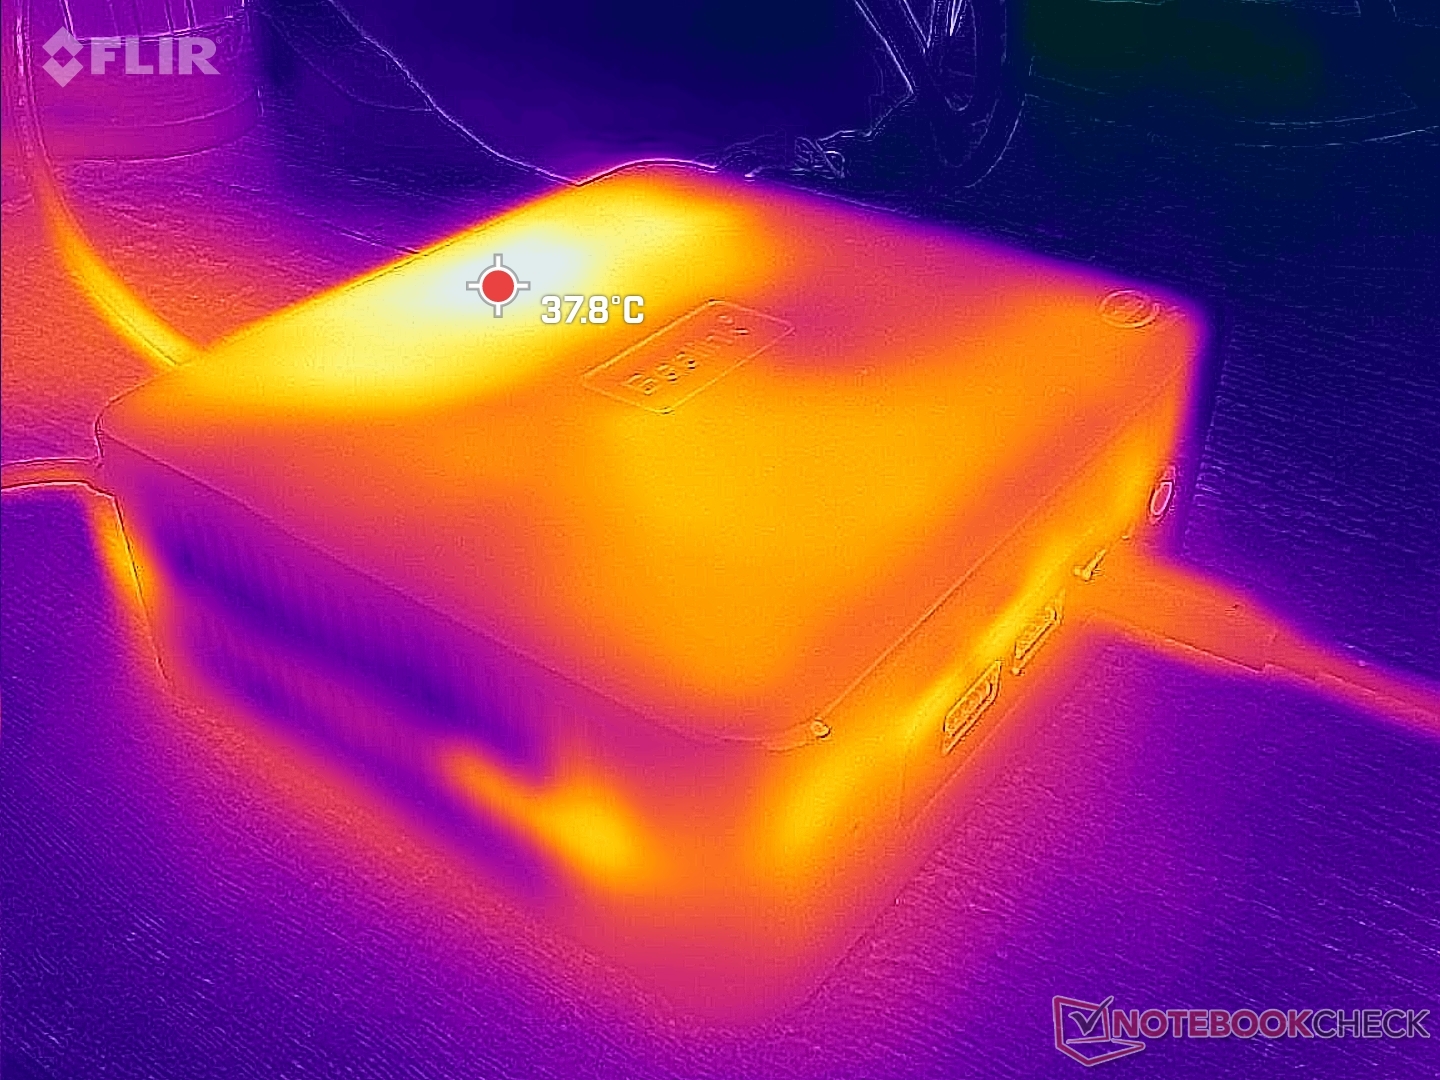
温度
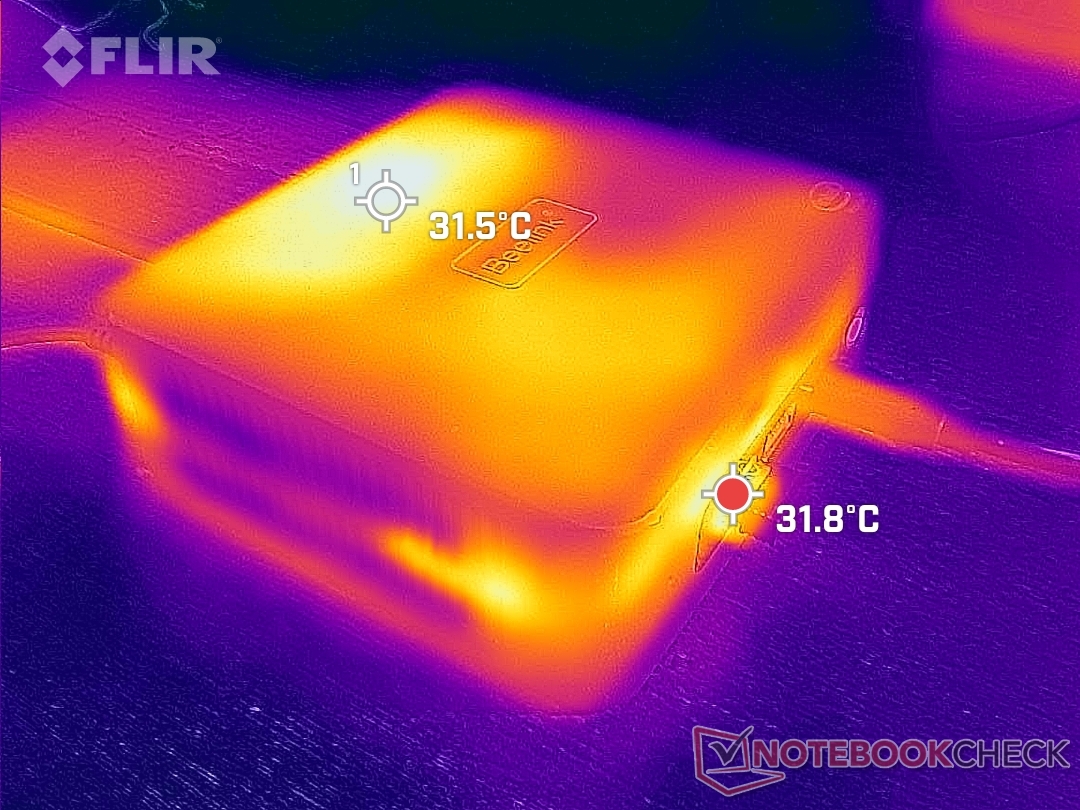
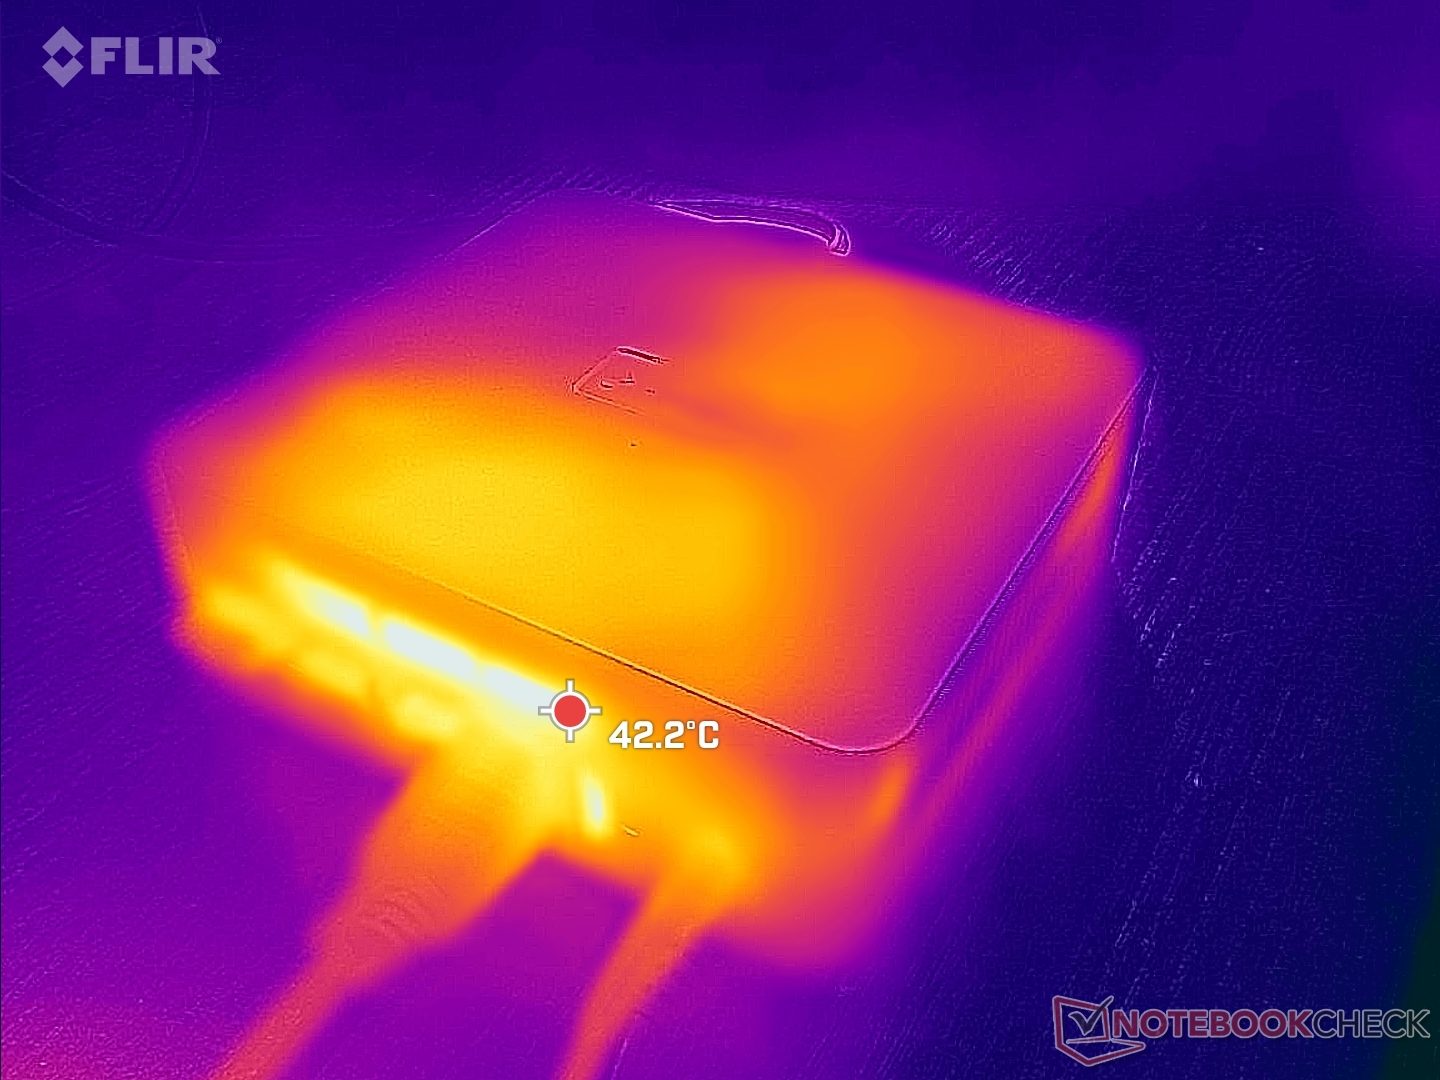
即使在桌面上空转时,表面温度也很高,因为风扇是如此慵懒。在不运行任何应用程序的情况下,设备的顶部可以达到32摄氏度,而在长时间运行压力大的应用程序时,则高达38摄氏度。热点在机箱的后部,离后部的通风栅栏最近。
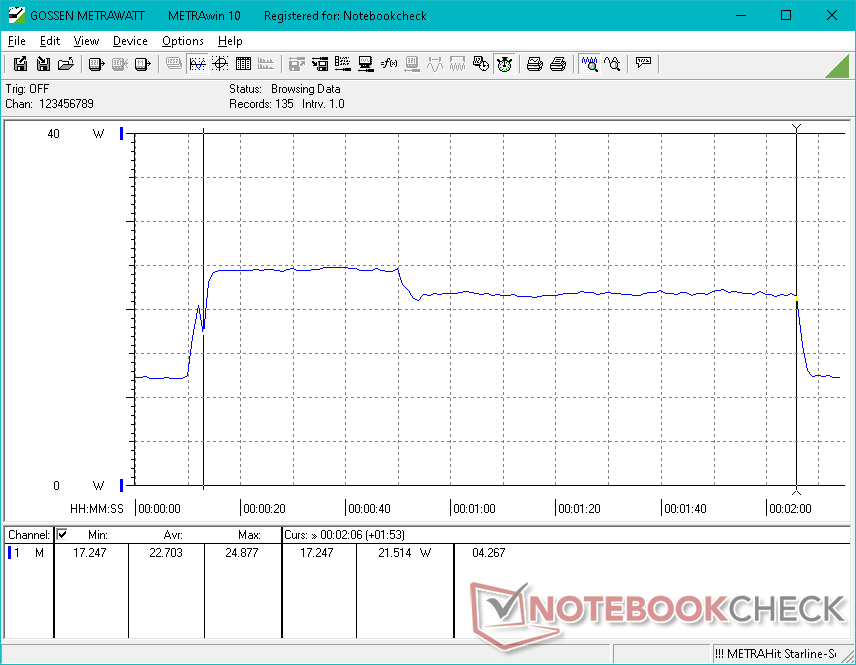
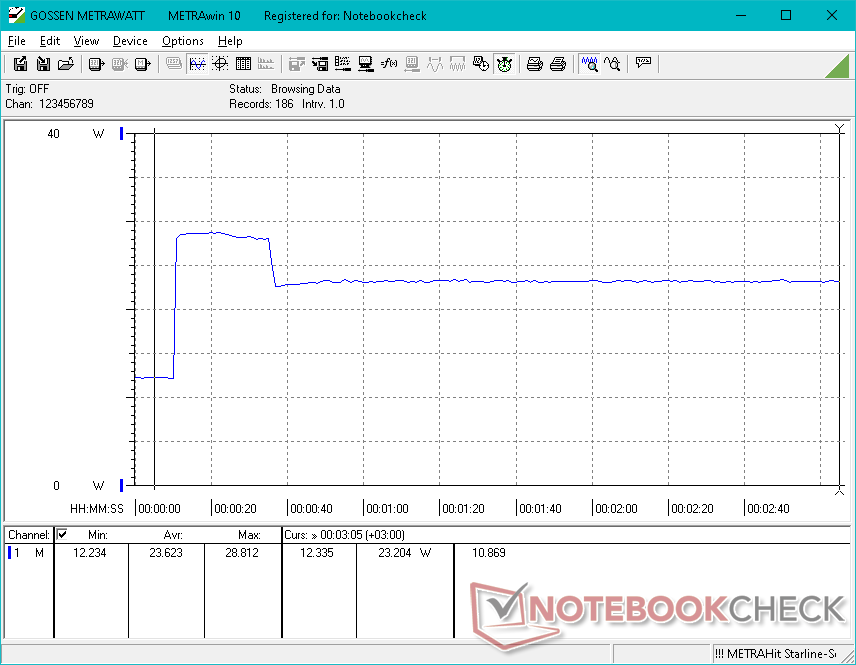
压力测试
在启动Prime95压力时,CPU的时钟频率、温度和电路板功耗将分别飙升至2.8 GHz、86 C和20 W。然而,在20秒左右之后,时钟频率和电路板功耗将分别下降到2.4 GHz和15 W,以保持76 C的较低的核心温度,如下图所示。这实际上比我们在去年的U59上记录的更老的N5095的速度和温度分别慢了200MHz和9C。
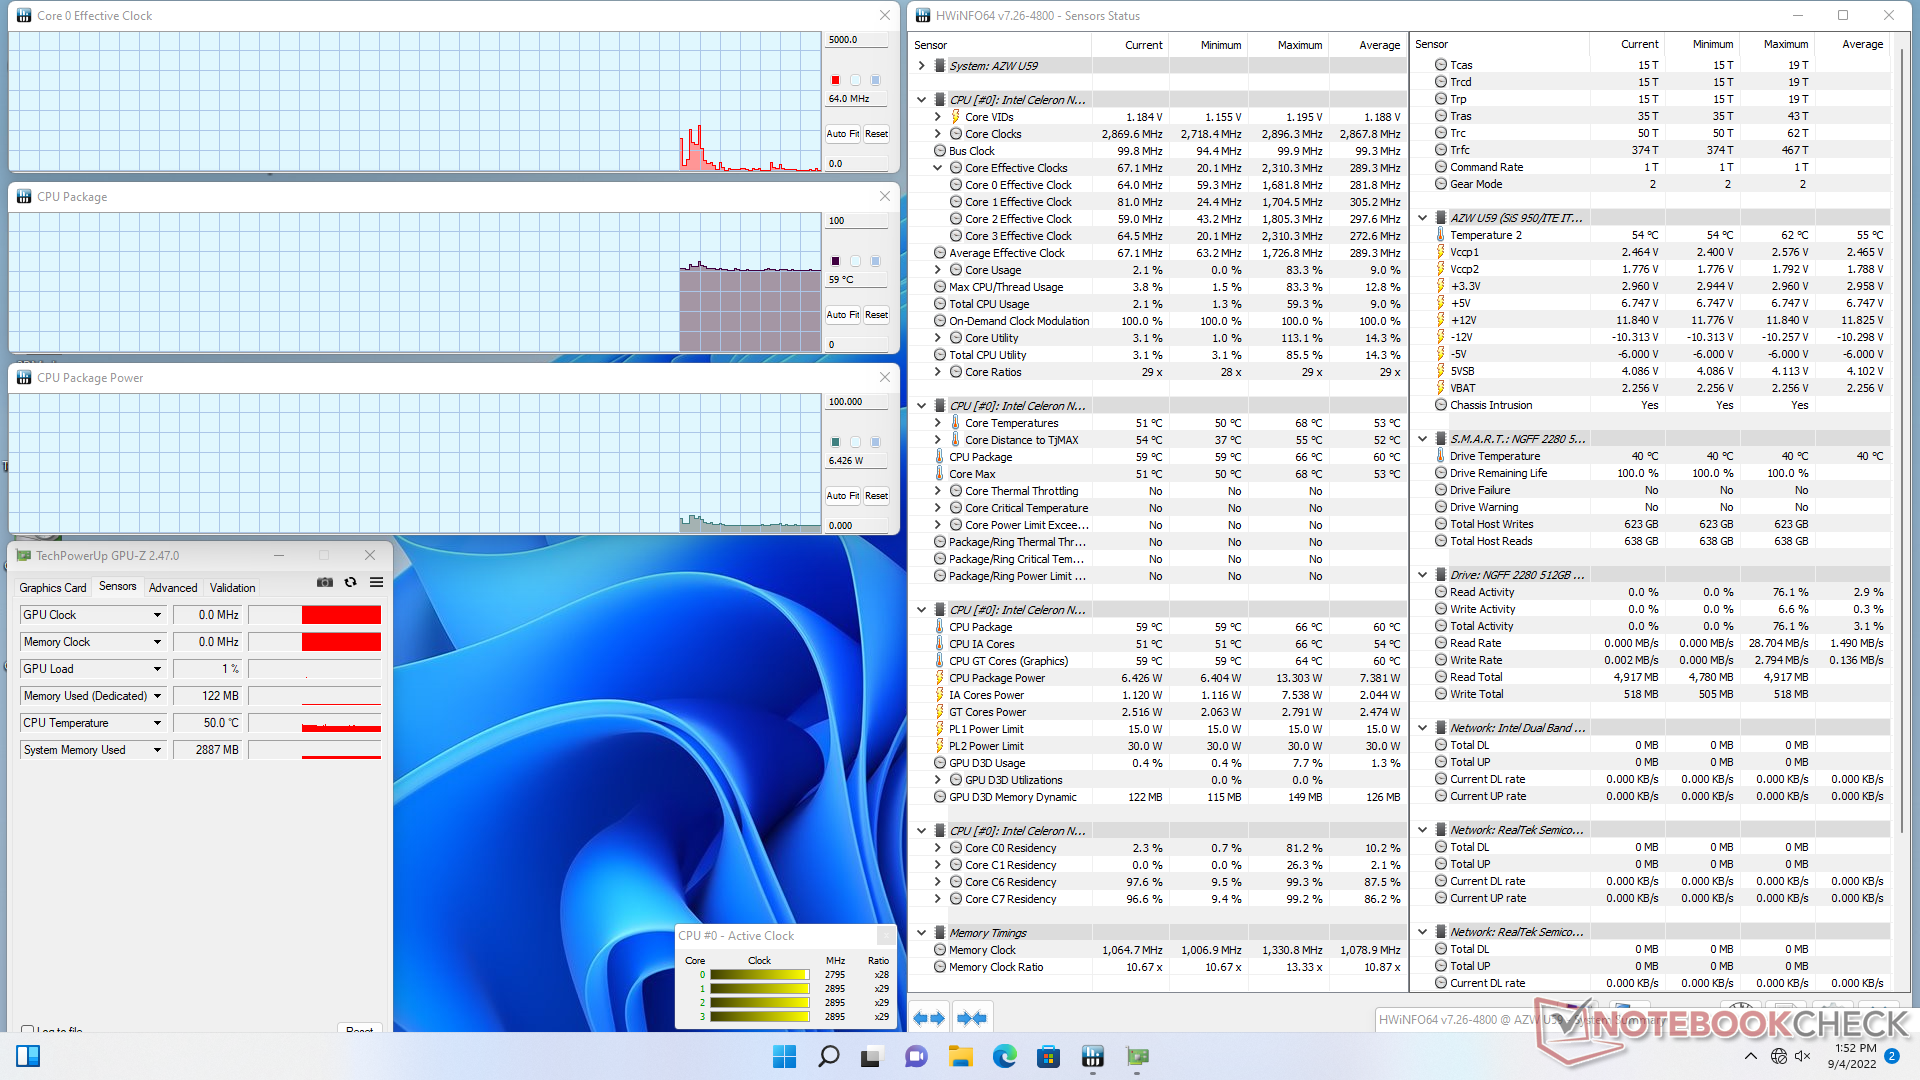
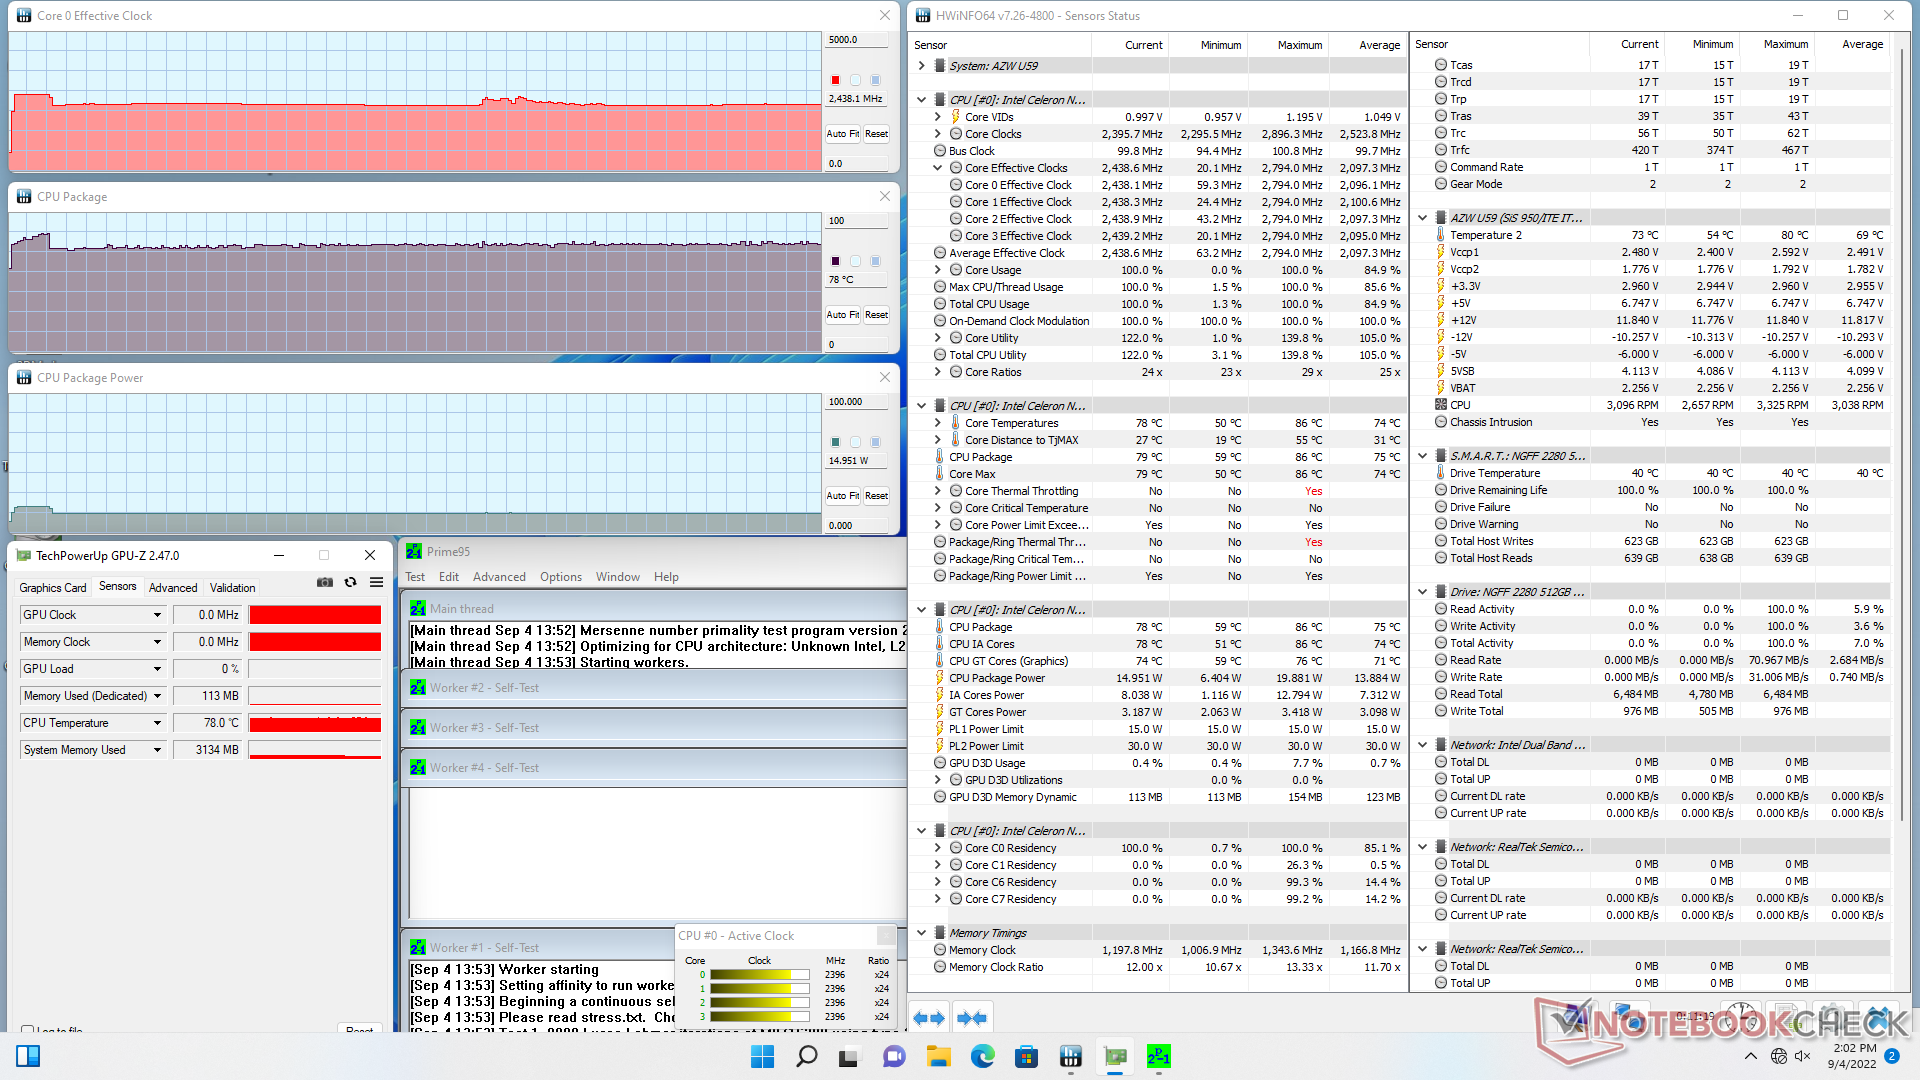
| CPU时钟(GHz) | GPU时钟(MHz) | CPU平均温度(°C) | |
| 系统空闲 | -- | -- | 59 |
| Prime95压力 | 2.4 | -- | 78 |
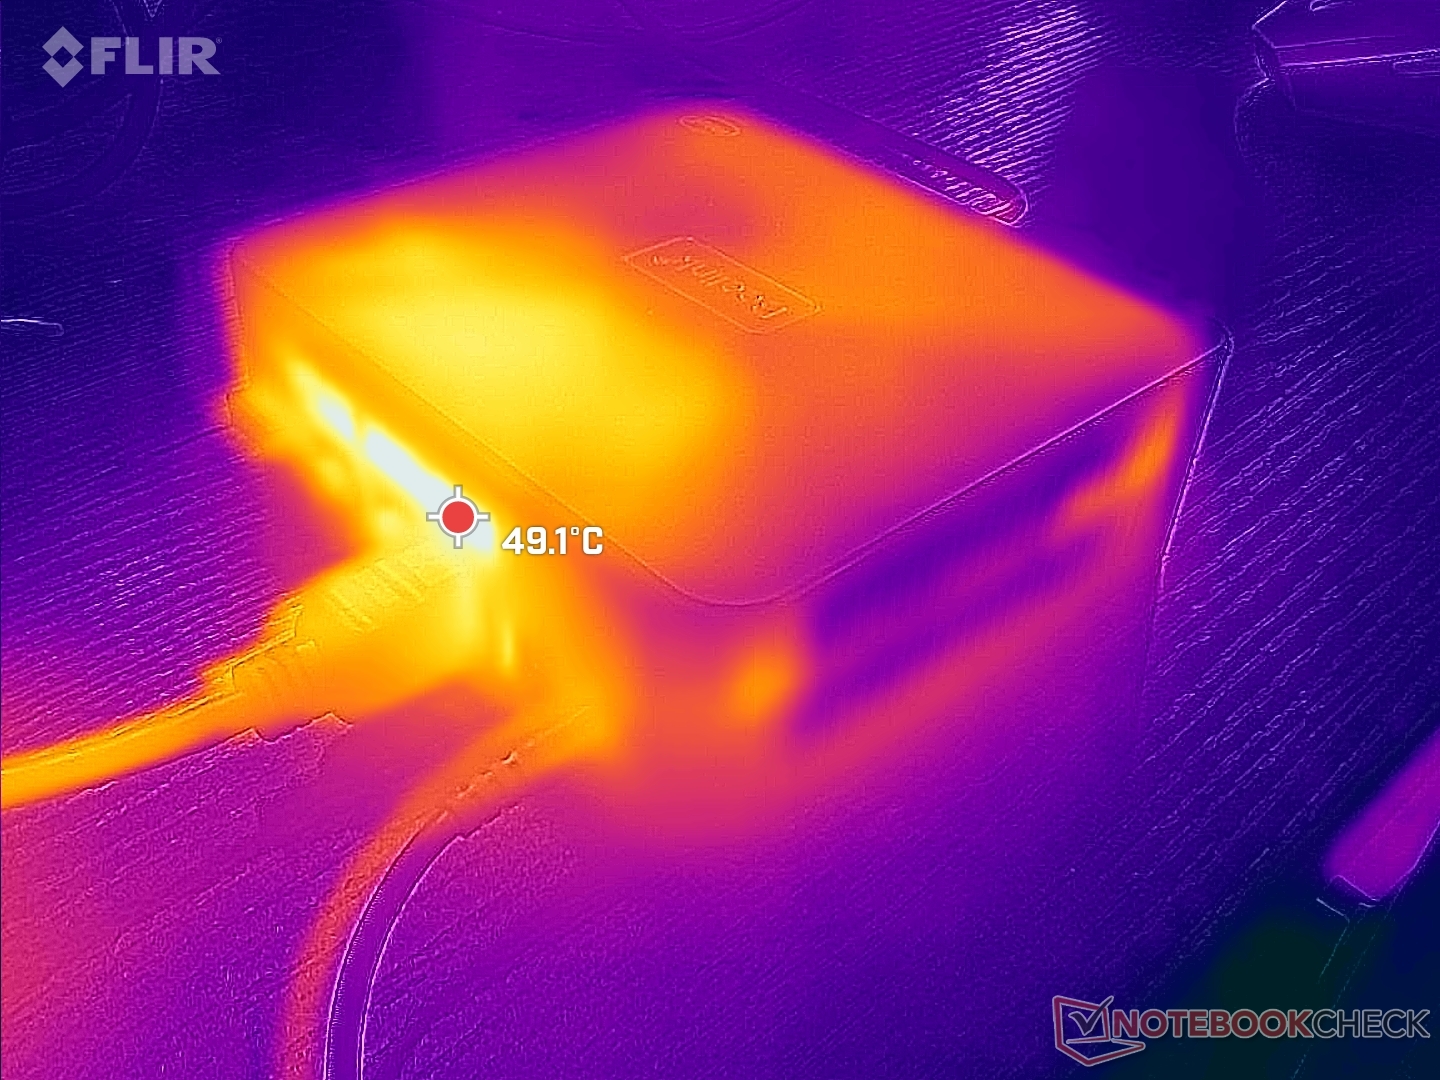
能源管理
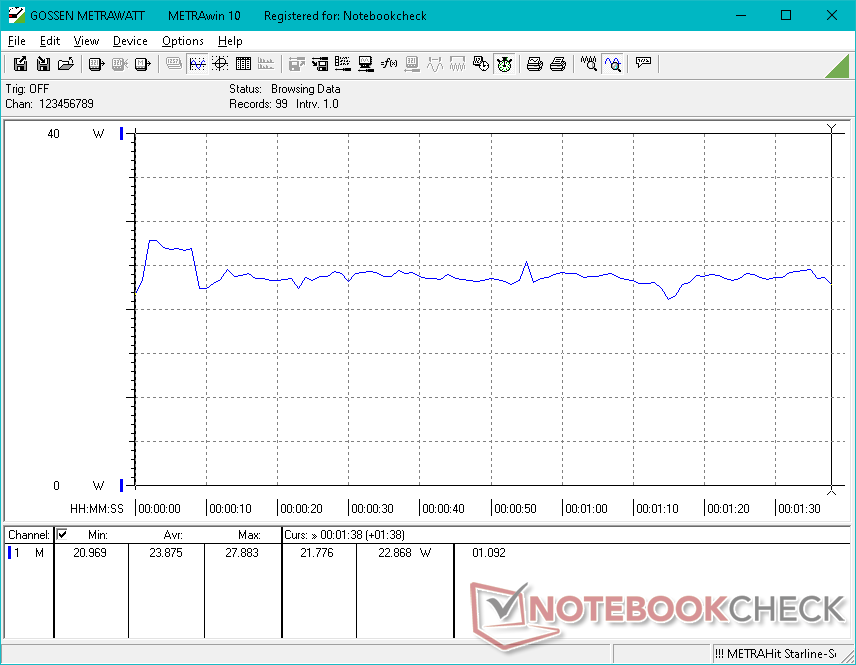
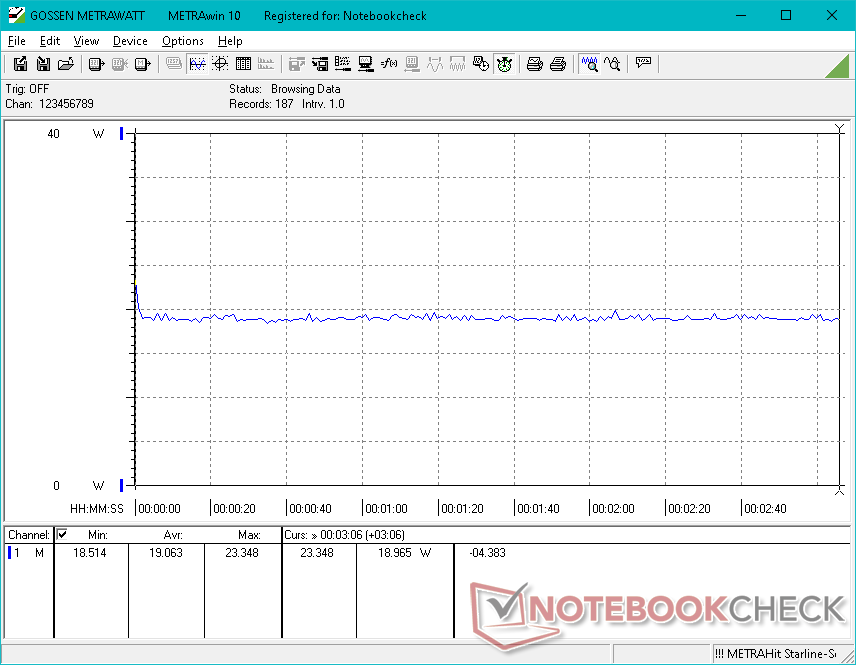
消耗功率
该系统只是比去年使用旧赛扬N5095的U59的要求略高。然而,上述GPU的提升是值得多花几瓦的。总体消耗量仍然比采用Core U或Ryzen U CPU的迷你电脑低得多,如 英特尔NUC11或Beelink SER4。
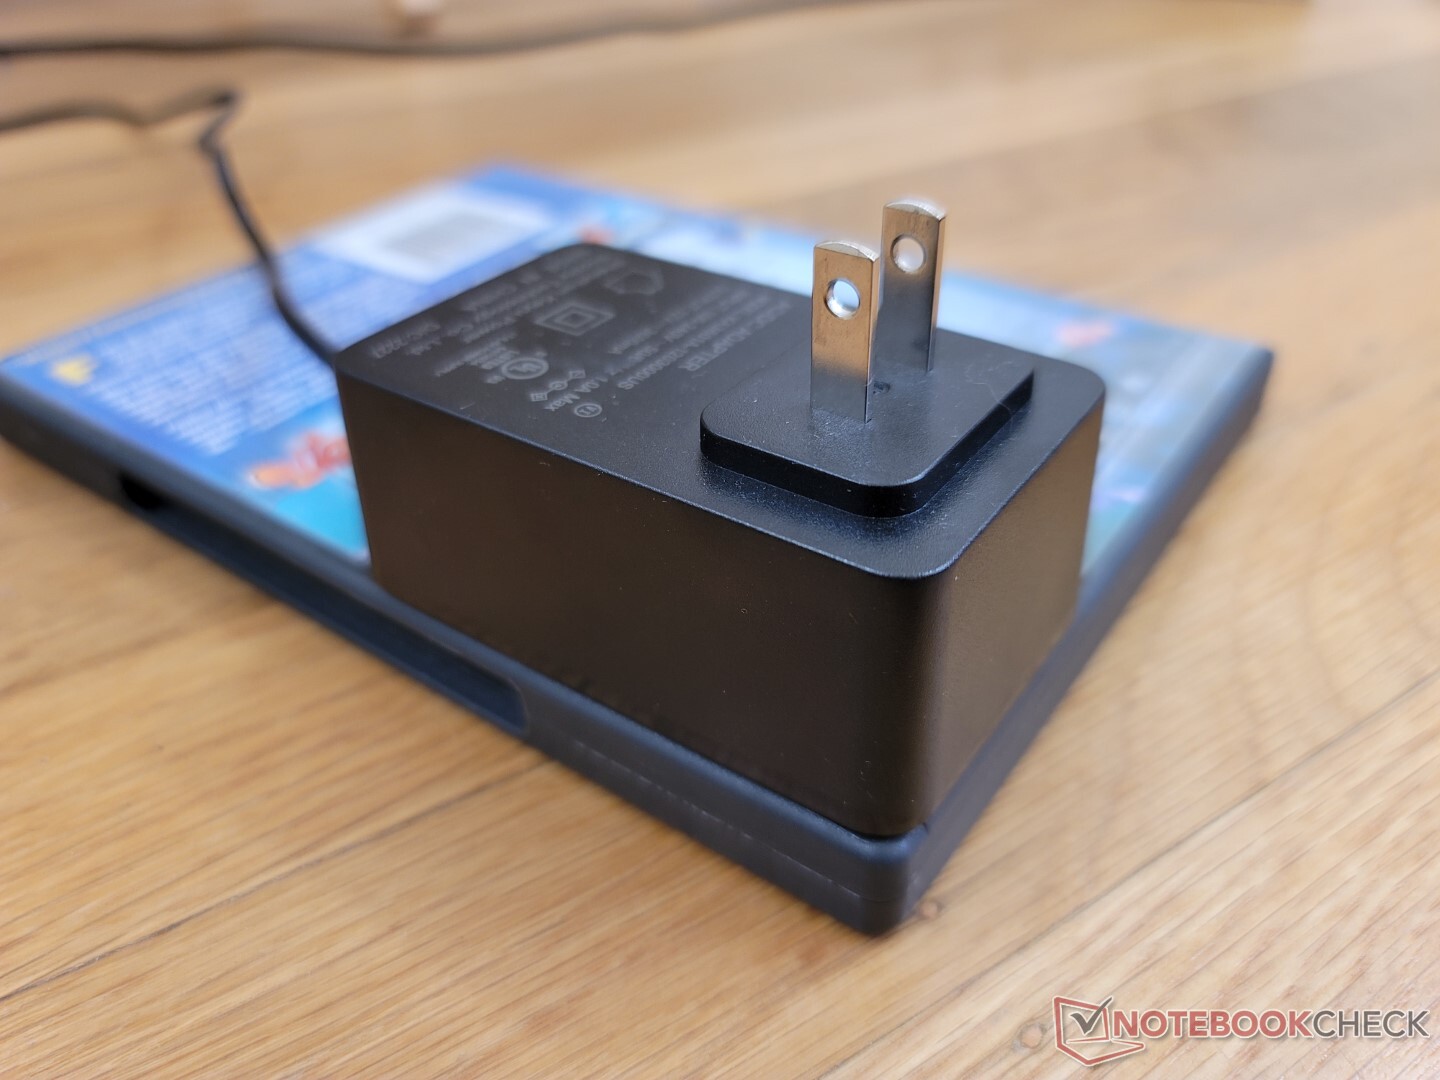
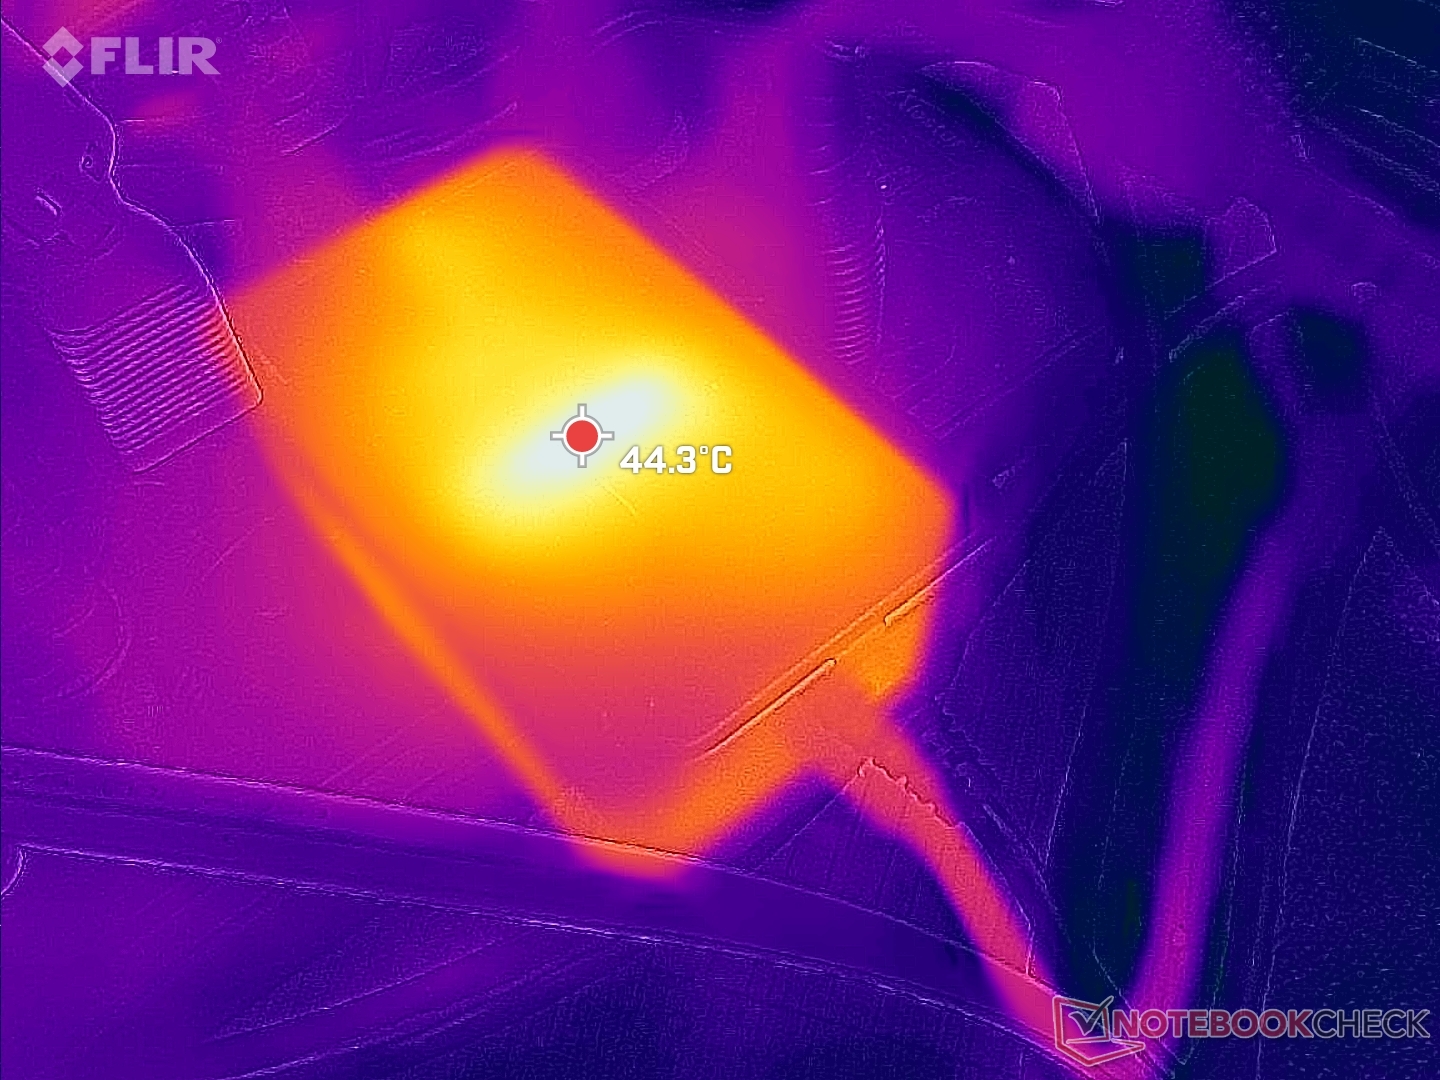
在运行Prime95压力时,我们能够从小型(约7.8 x 4.6 x 3.2厘米)的36瓦交流适配器中记录到29瓦的临时最大消耗。
| Off / Standby | |
| Idle | |
| Load |
|
Key:
min: | |
| Beelink U59 N5105 Celeron N5105, UHD Graphics (Jasper Lake 24 EU), Silicon Motion AZW 512G NV428, , x, | Beelink U59 Mini-S Celeron N5095, UHD Graphics (Jasper Lake 16 EU), Silicon Motion AZW 256G M.228 220426 C SATA 3, , x, | Beelink SER4 R7 4800U, Vega 8, Intel SSD 660p SSDPEKNW512G8, , x, | Beelink SER3 R7 3750H, Vega 10, GSemi AZW GSDFN512TS3F1OGCX, , x, | Intel NUC11TNKi5 i5-1135G7, Iris Xe G7 80EUs, Transcend M.2 SSD 430S TS512GMTS430S, , x, | Zotac ZBOX PI336 pico Celeron N6211, UHD Graphics (Elkhart Lake 16 EU), SanDisk DF4128, , x, | |
|---|---|---|---|---|---|---|
| Power Consumption | 15% | -4% | -27% | -82% | 42% | |
| Idle Minimum * (Watt) | 6.7 | 7 -4% | 4.1 39% | 7 -4% | 11.5 -72% | 5.4 19% |
| Idle Average * (Watt) | 8.1 | 7 14% | 4.1 49% | 9.1 -12% | 12.4 -53% | 5.5 32% |
| Idle Maximum * (Watt) | 11.6 | 7.6 34% | 4.6 60% | 9.7 16% | 12.9 -11% | 6.2 47% |
| Load Average * (Watt) | 23.9 | 18.3 23% | 35.6 -49% | 29.5 -23% | 40.7 -70% | 11.3 53% |
| Witcher 3 ultra * (Watt) | 19.1 | 35.6 -86% | 32.5 -70% | 43.9 -130% | ||
| Load Maximum * (Watt) | 28.8 | 27.1 6% | 39.9 -39% | 48.7 -69% | 73.5 -155% | 11.8 59% |
* ... smaller is better
Power Consumption Witcher 3 / Stresstest
Power Consumption external Monitor
Pros
Cons
结论 - 相同的CPU,更快的GPU
如果你要追求处理速度,那么几乎没有理由选择 赛扬N5105而不是 N5095.N5105可能运行起来稍微有点冷,但它在单线程或多线程性能方面没有任何明显的提高。它的优势在于集成GPU,比N5095的集成GPU快得多。
不幸的是,N5105的GPU仍然很慢,因此在同时运行超过一两个应用程序时,Windows UI体验仍然很滞后。在这种情况下,U59 N5105的流媒体功能与U59 N5095上的基本相同。建议尽可能找到带有双通道内存的SKU,以最大限度地提高集成GPU的性能。
至于迷你电脑本身,考虑到其极低的售价,U59有相当多的功能。配置中预装了Windows 11和非常宽敞的512GB固态硬盘,以及16GB内存,价格仅为200美元左右,而英特尔NUC在没有任何内存或存储的情况下,价格很容易超过2倍。如果你想做的只是基本的1080p流媒体或浏览,那么这台U59就能充分完成任务。然而,对于更繁重的多任务处理和更多的开销,你会想投资于配备更快的Core或Ryzen CPU的迷你电脑,如Bellink SEI或SER系列。
Price comparison

