Beelink SER5 Pro 5600H迷你电脑评论。NUC 11的速度与AMD Ryzen
")
与Zotac及其声名狼藉的ZBox迷你电脑一样,Beelink也希望通过每隔几个月推出配备越来越快的处理器的新机型来实现。Beelink SER4在今年早些时候推出了Zen 2 Ryzen 7 4800U处理器,但现在SER5已经进入市场,配备了更快的Zen 3 Ryzen 5600H所有这些都是在保持价格远低于500美元的情况下。
这个领域的竞争者包括其他没有独立显卡的迷你PC或HTPC,如 王牌魔术师TK11, Geekom MiniAir 11, Zotac ZBox PI336, 以及大多数 英特尔NUC模型.
更多Beelink评论。
潜在的竞争对手比较
Rating | Date | Model | Weight | Height | Size | Resolution | Price |
|---|---|---|---|---|---|---|---|
v (old) | 10 / 2022 | Beelink SER Pro Ryzen 5 5600H R5 5600H, Vega 7 | 498 g | 42 mm | x | ||
v (old) | 09 / 2022 | Beelink SEi11 Pro i5-11320H, Iris Xe G7 96EUs | 440 g | 40 mm | x | ||
v (old) | 01 / 2022 | Beelink GTR5 R9 5900HX, Vega 8 | 686 g | 39 mm | x | ||
v (old) | Intel NUC11TNKi5 i5-1135G7, Iris Xe G7 80EUs | 504 g | 37 mm | x | |||
v (old) | Intel NUC10i7FNH i7-10710U, UHD Graphics 620 | 697 g | 51 mm | 0.00" | 0x0 | ||
v (old) | 07 / 2022 | Zotac ZBOX PI336 pico Celeron N6211, UHD Graphics (Elkhart Lake 16 EU) | 293 g | 20.7 mm | x |
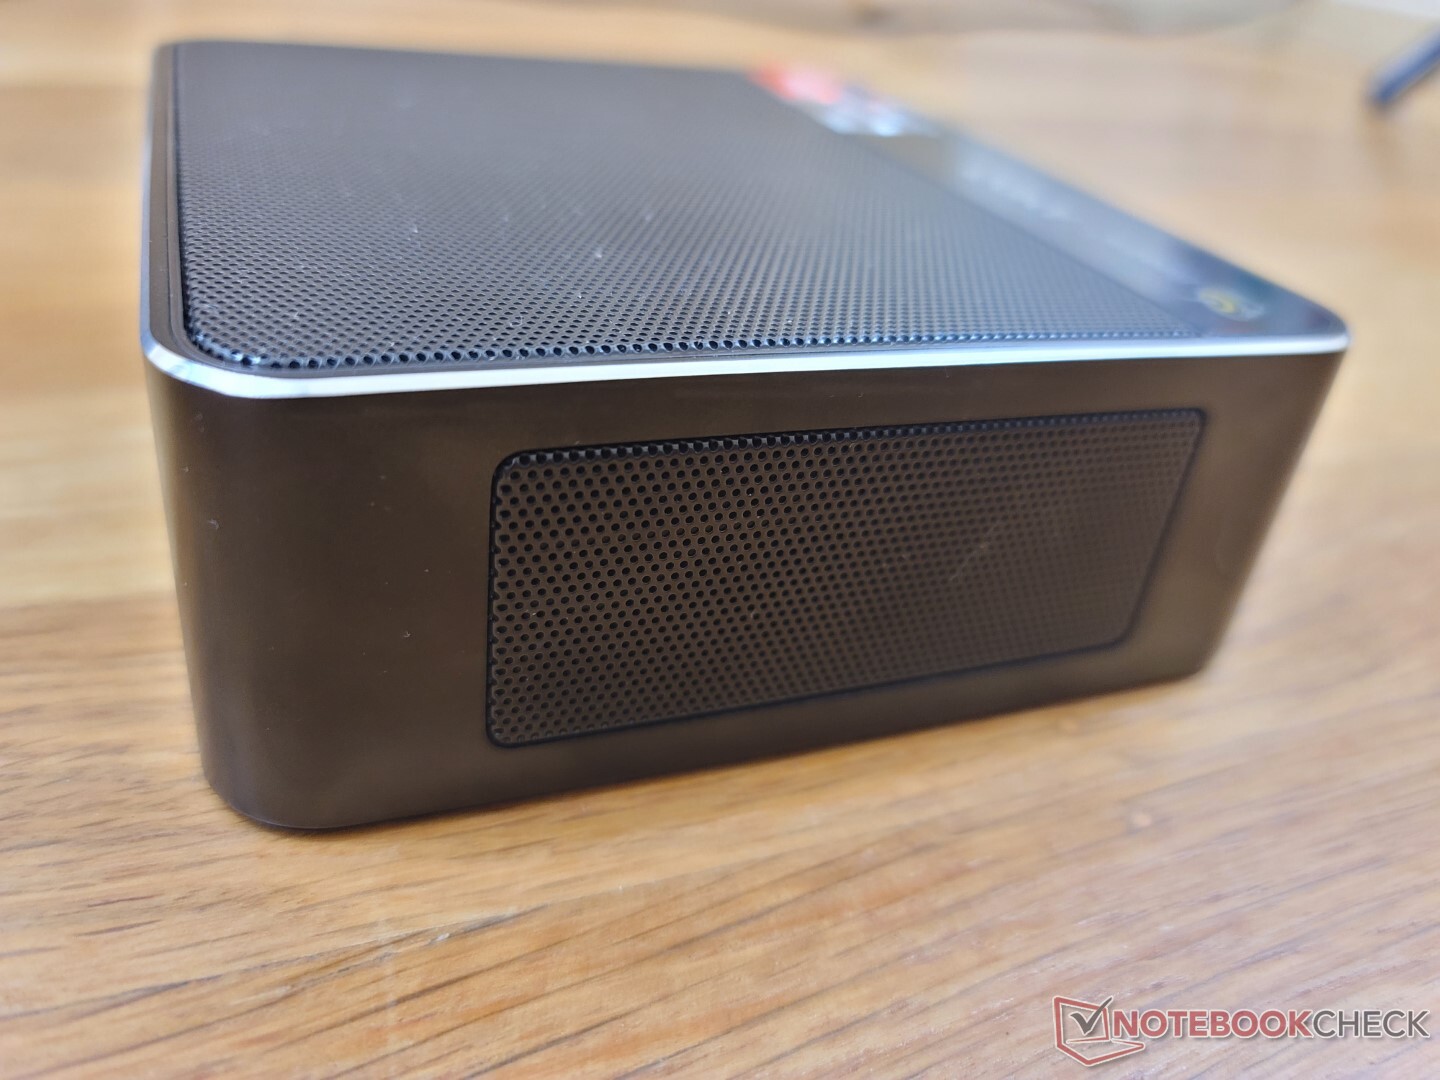
案例
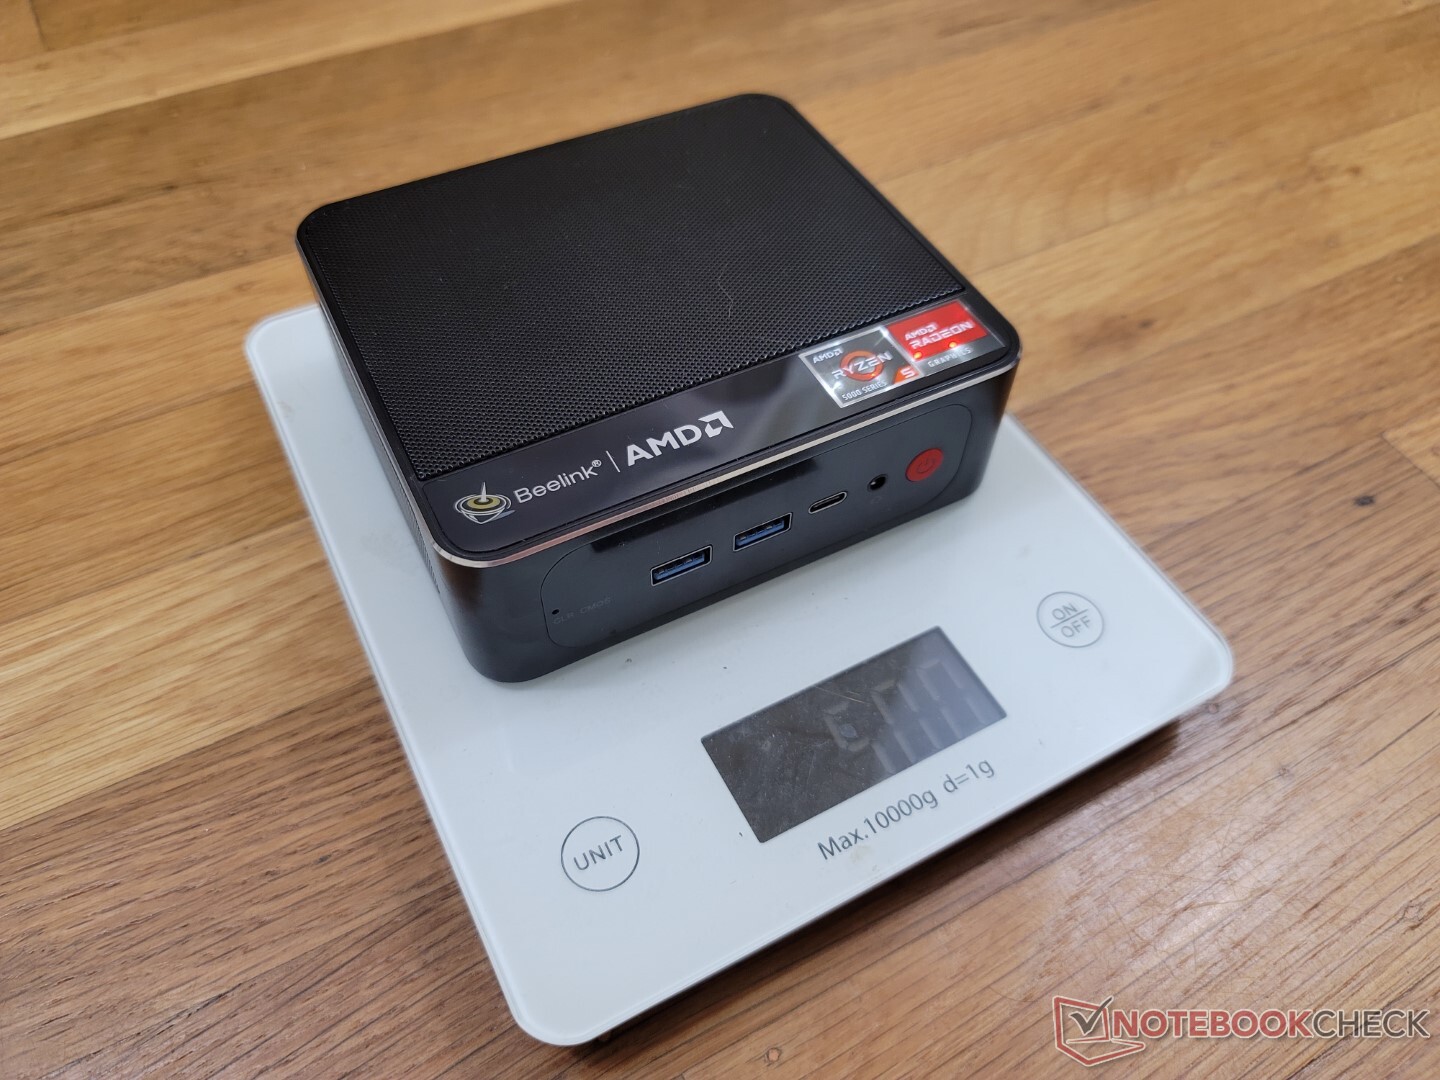
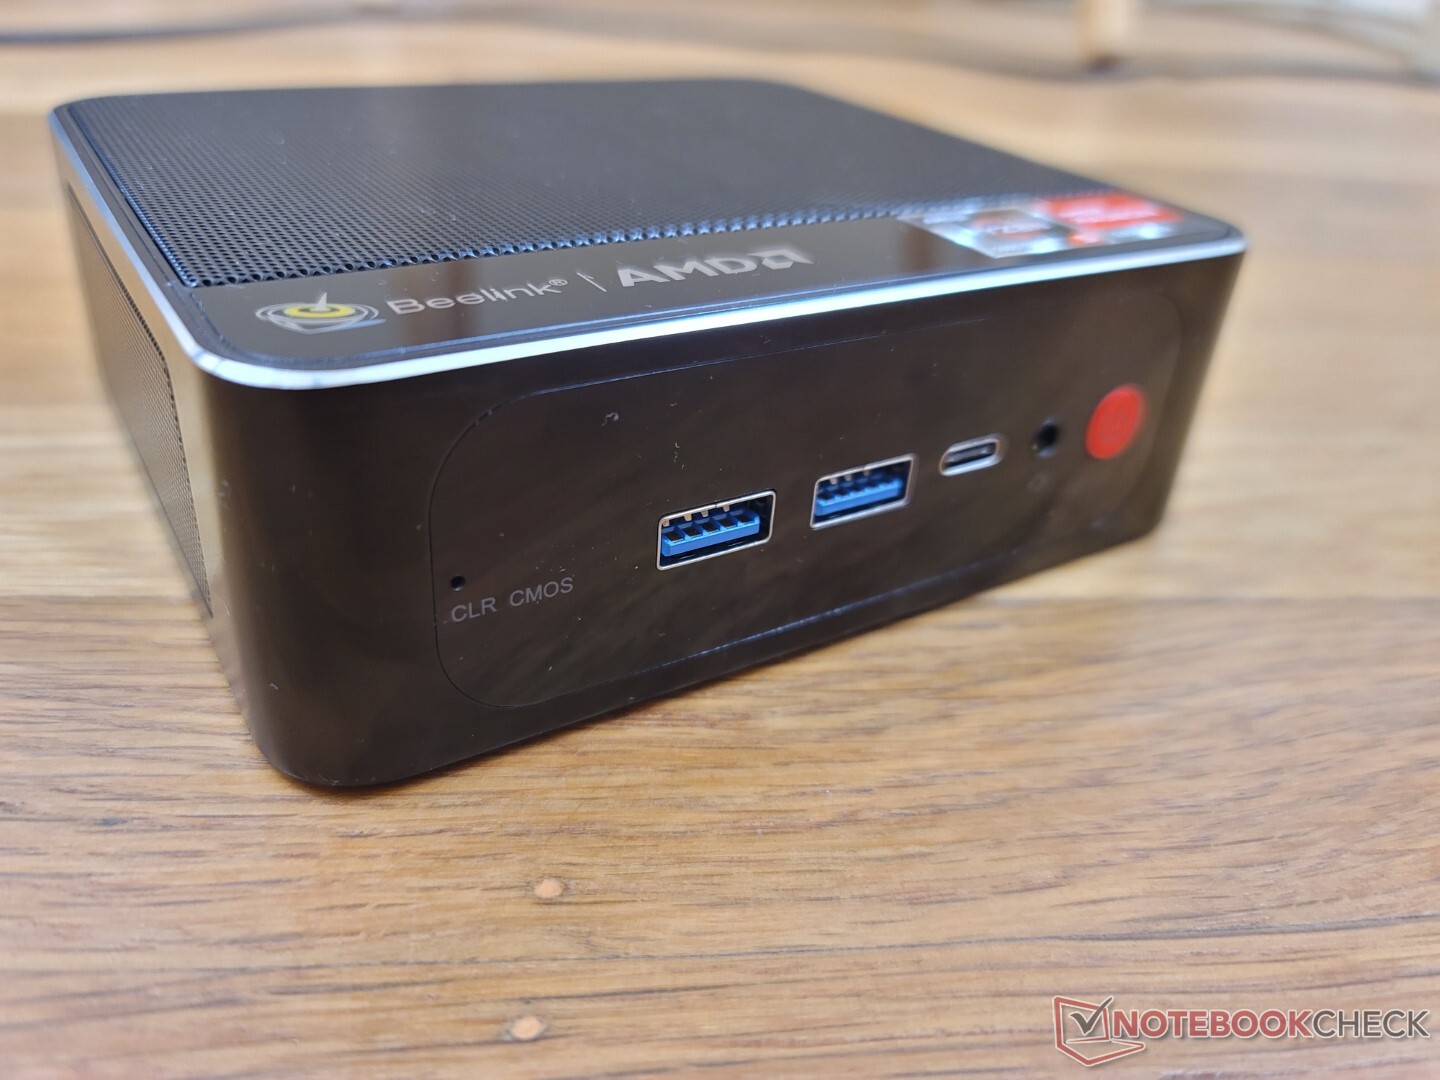
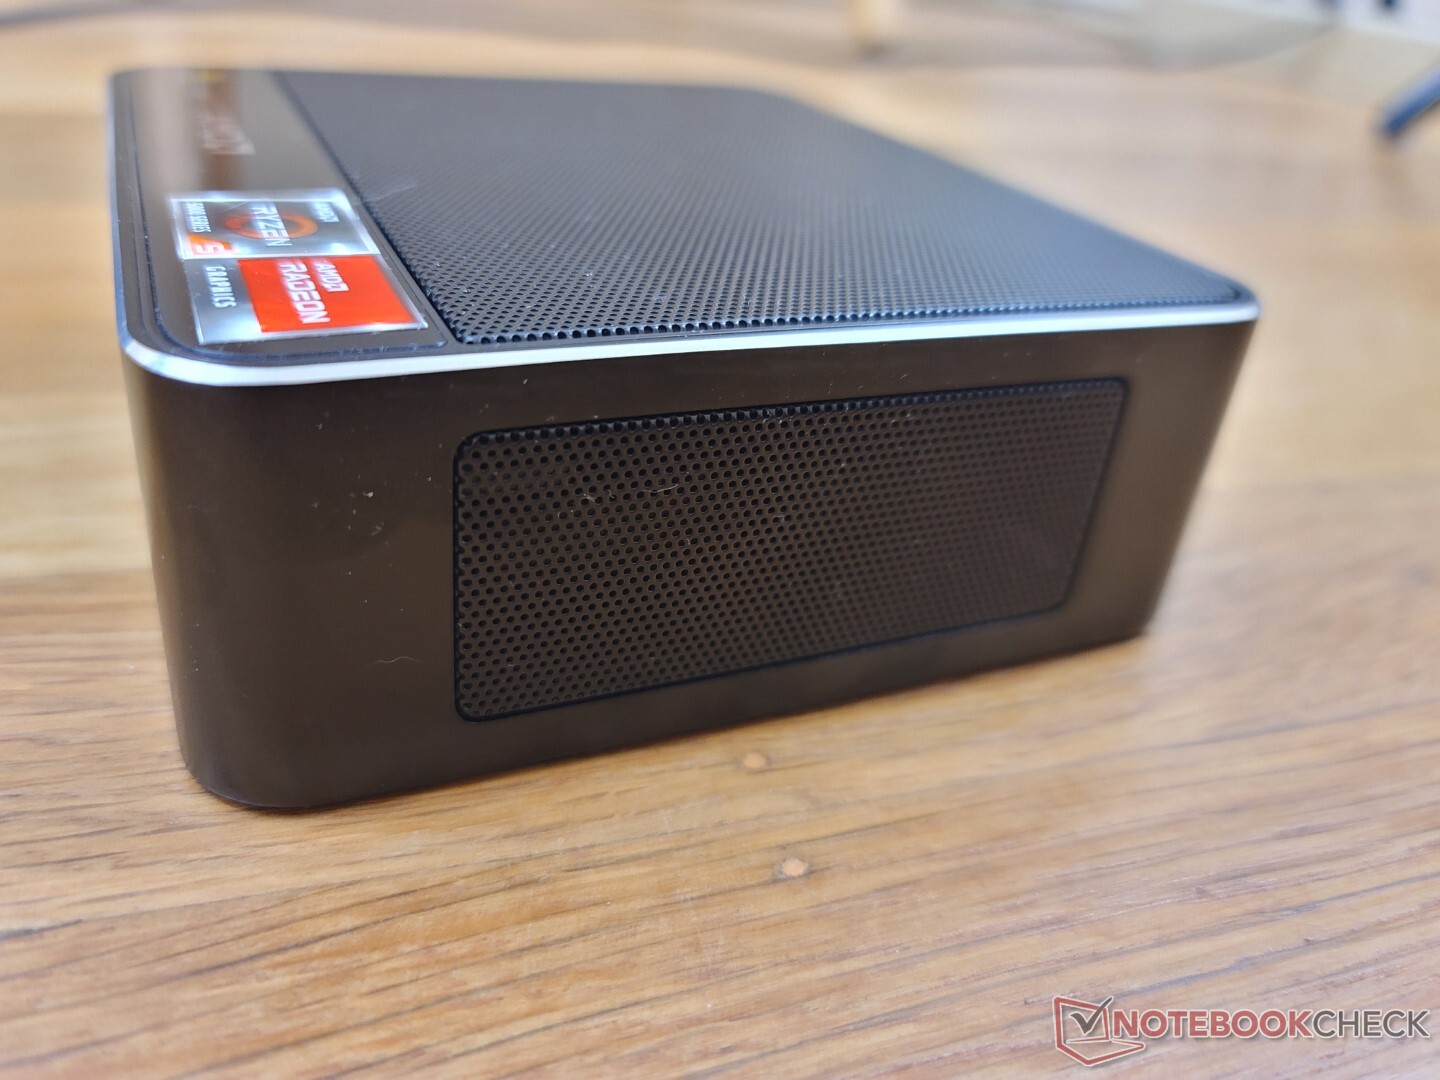
SER4和SER5都采用了相同的机箱骨架,尽管表面的标记和颜色略有不同。在SER5上,侧面的通风格栅是黑色而不是红色。
就尺寸而言,SER5仅比Intel NUC 11TNK 稍厚。然而,它也同样重,约半公斤。
连接性
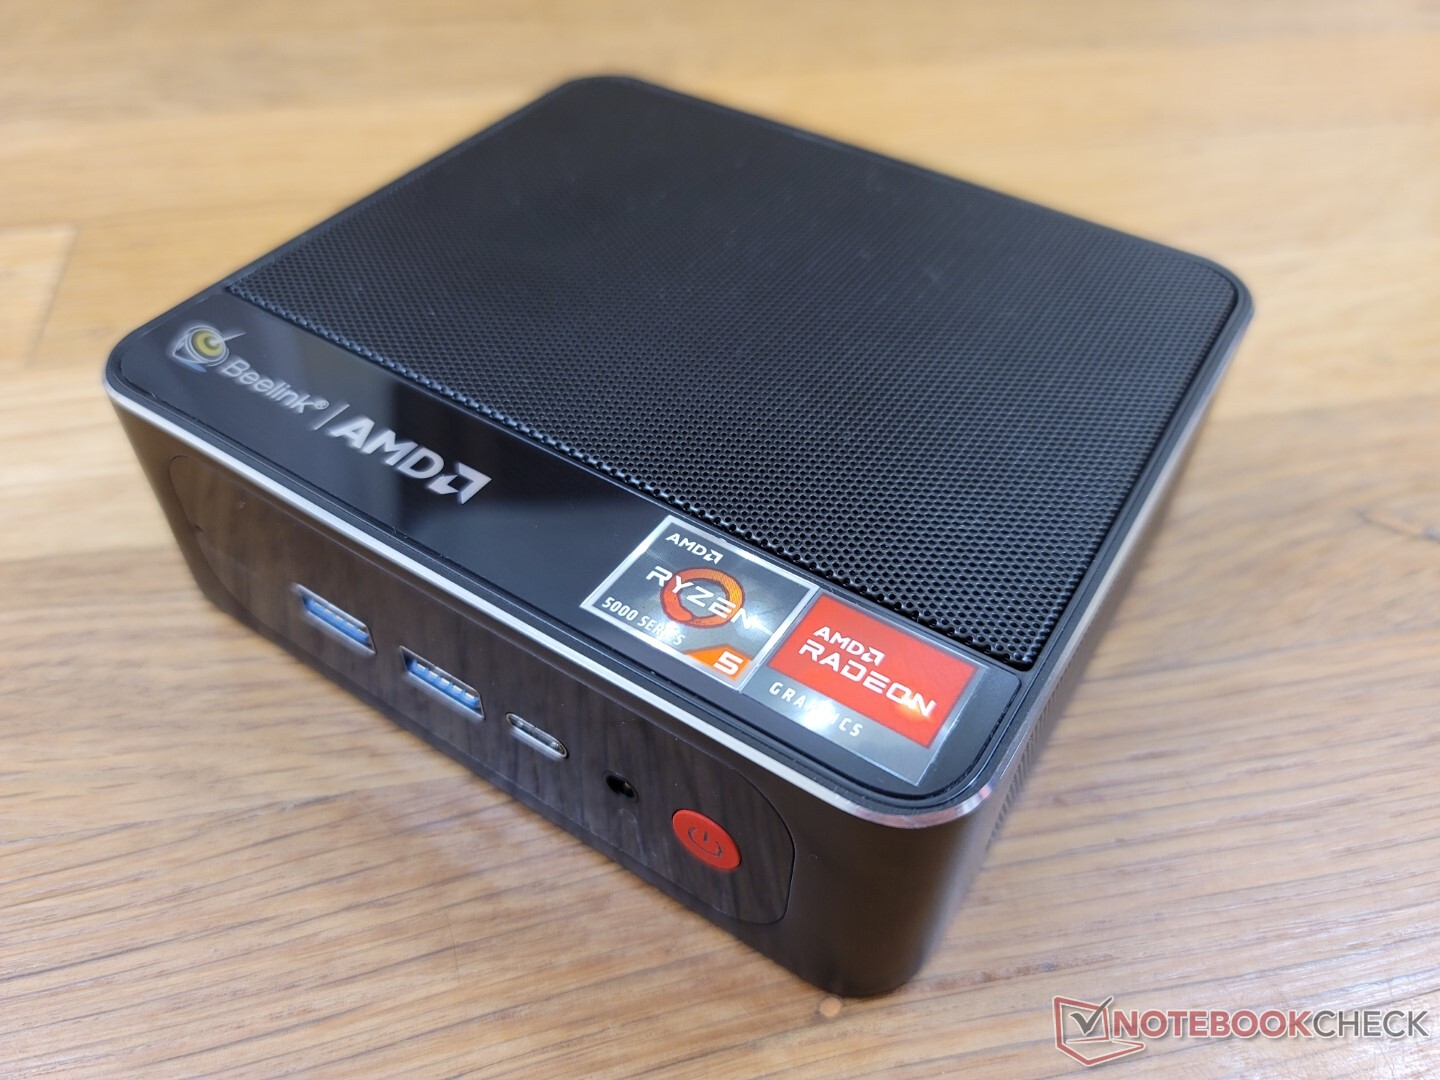
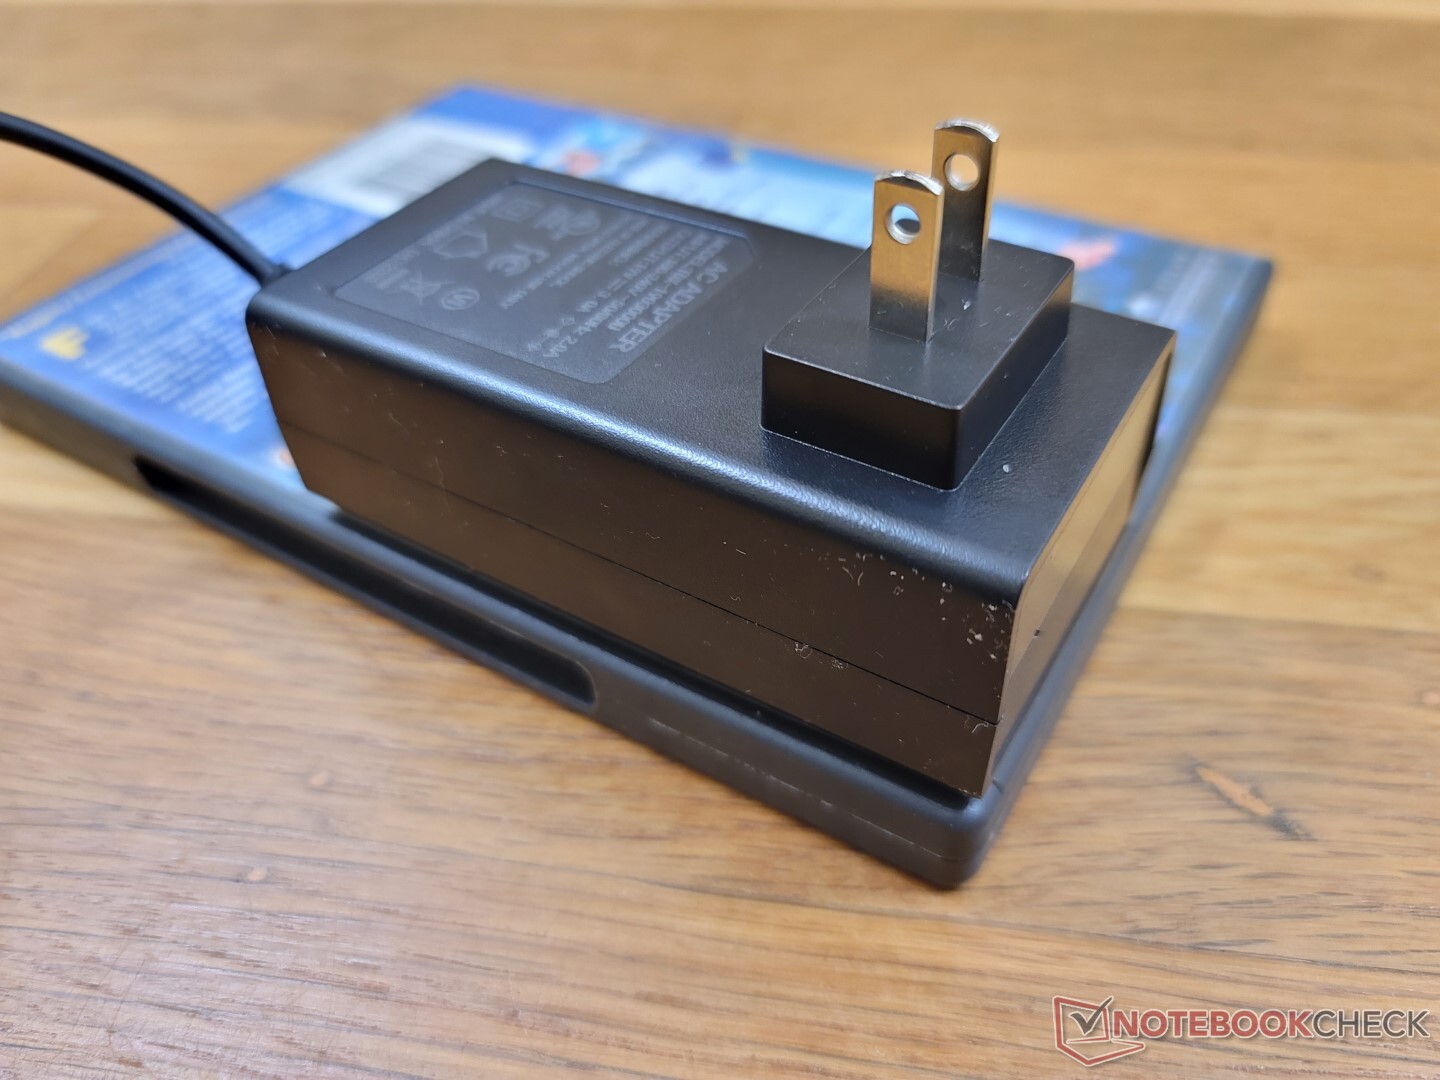
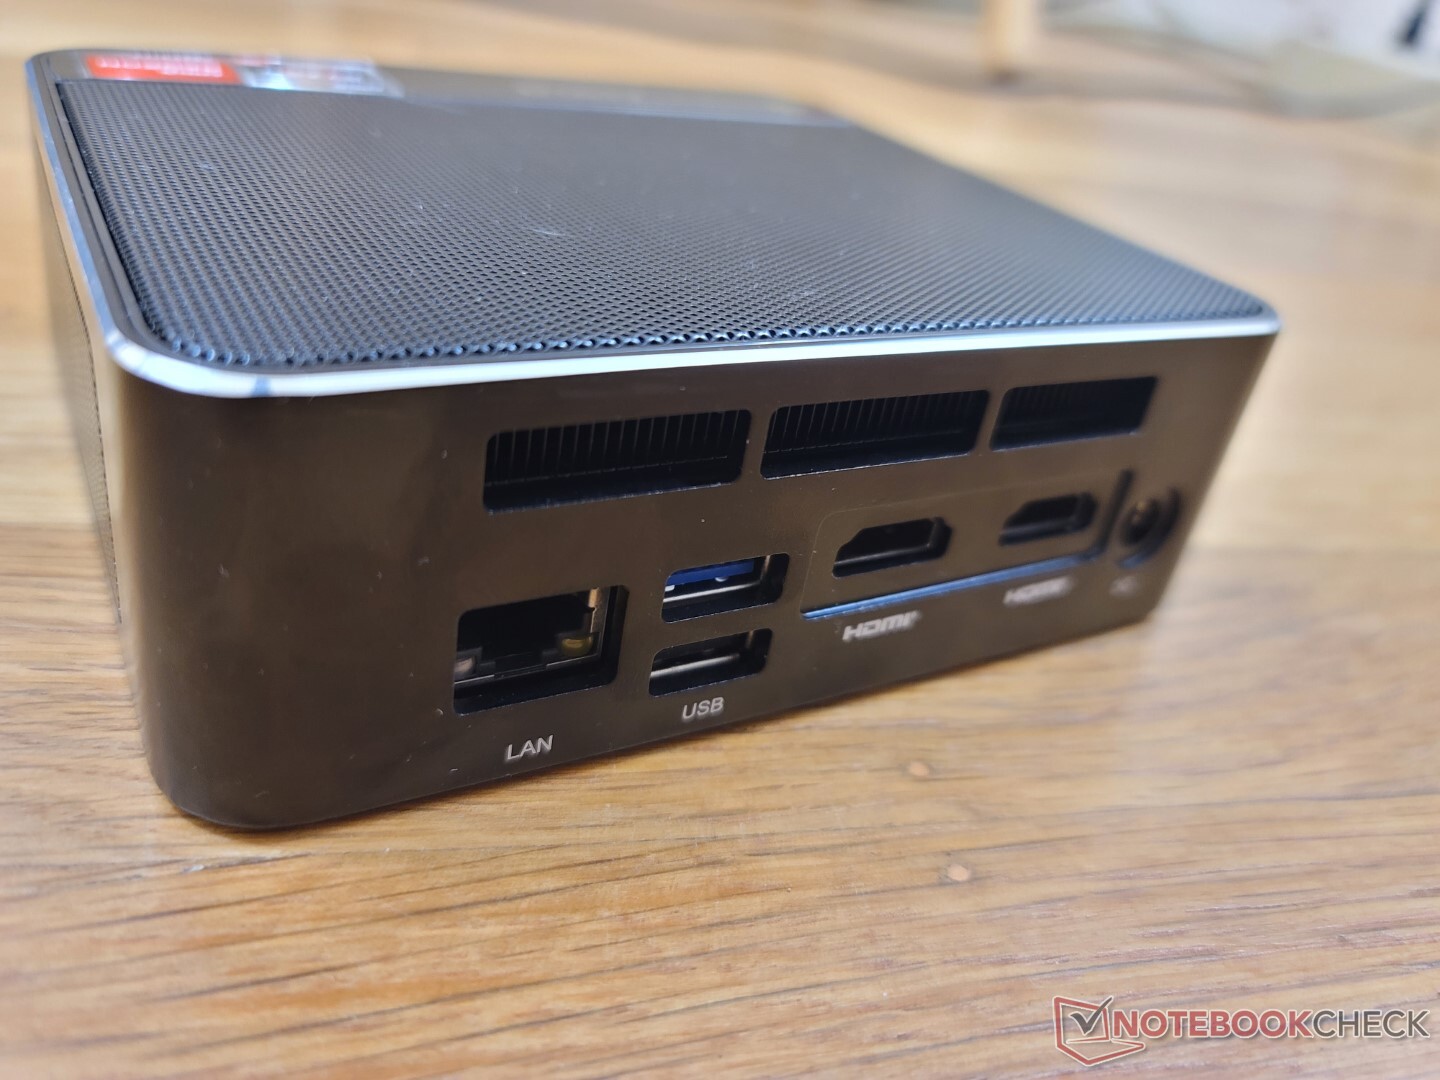
端口选项与SER4上的相同。令人失望的是,Beelink仍然没有转向USB-C交流适配器,因为SER5依靠一个专有的交流桶适配器来代替。前面的单个USB-C端口支持DisplayPort 1.4,但不支持PD-in。
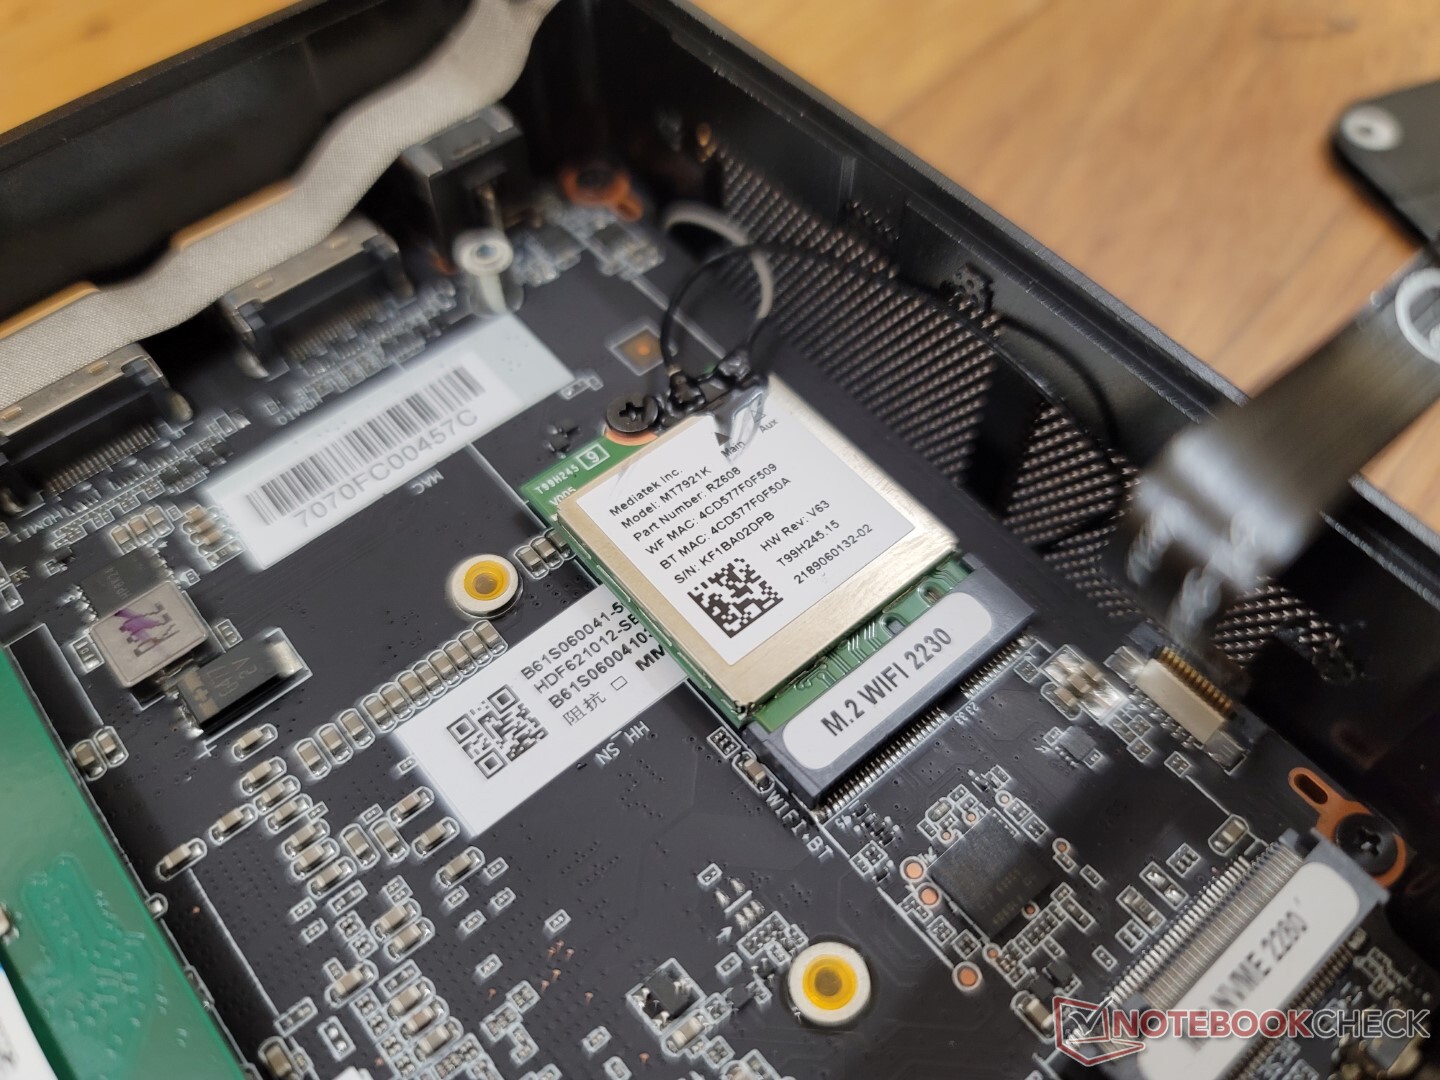
沟通
联发科RZ608是支持Wi-Fi 6E的标准配置,就像在Beelink SEi11 Pro上一样。 贝加莱SEi11 Pro.然而,与常见的英特尔AX200/210系列相比,性能仍有欠缺,如下图所示。
| Networking | |
| iperf3 transmit AX12 | |
| Intel NUC11TNKi5 | |
| Beelink GTR5 | |
| iperf3 receive AX12 | |
| Intel NUC11TNKi5 | |
| Beelink GTR5 | |
| iperf3 receive AXE11000 6GHz | |
| Zotac ZBOX PI336 pico | |
| Beelink SER Pro Ryzen 5 5600H | |
| Beelink SEi11 Pro | |
| iperf3 transmit AXE11000 6GHz | |
| Zotac ZBOX PI336 pico | |
| Beelink SER Pro Ryzen 5 5600H | |
| Beelink SEi11 Pro | |
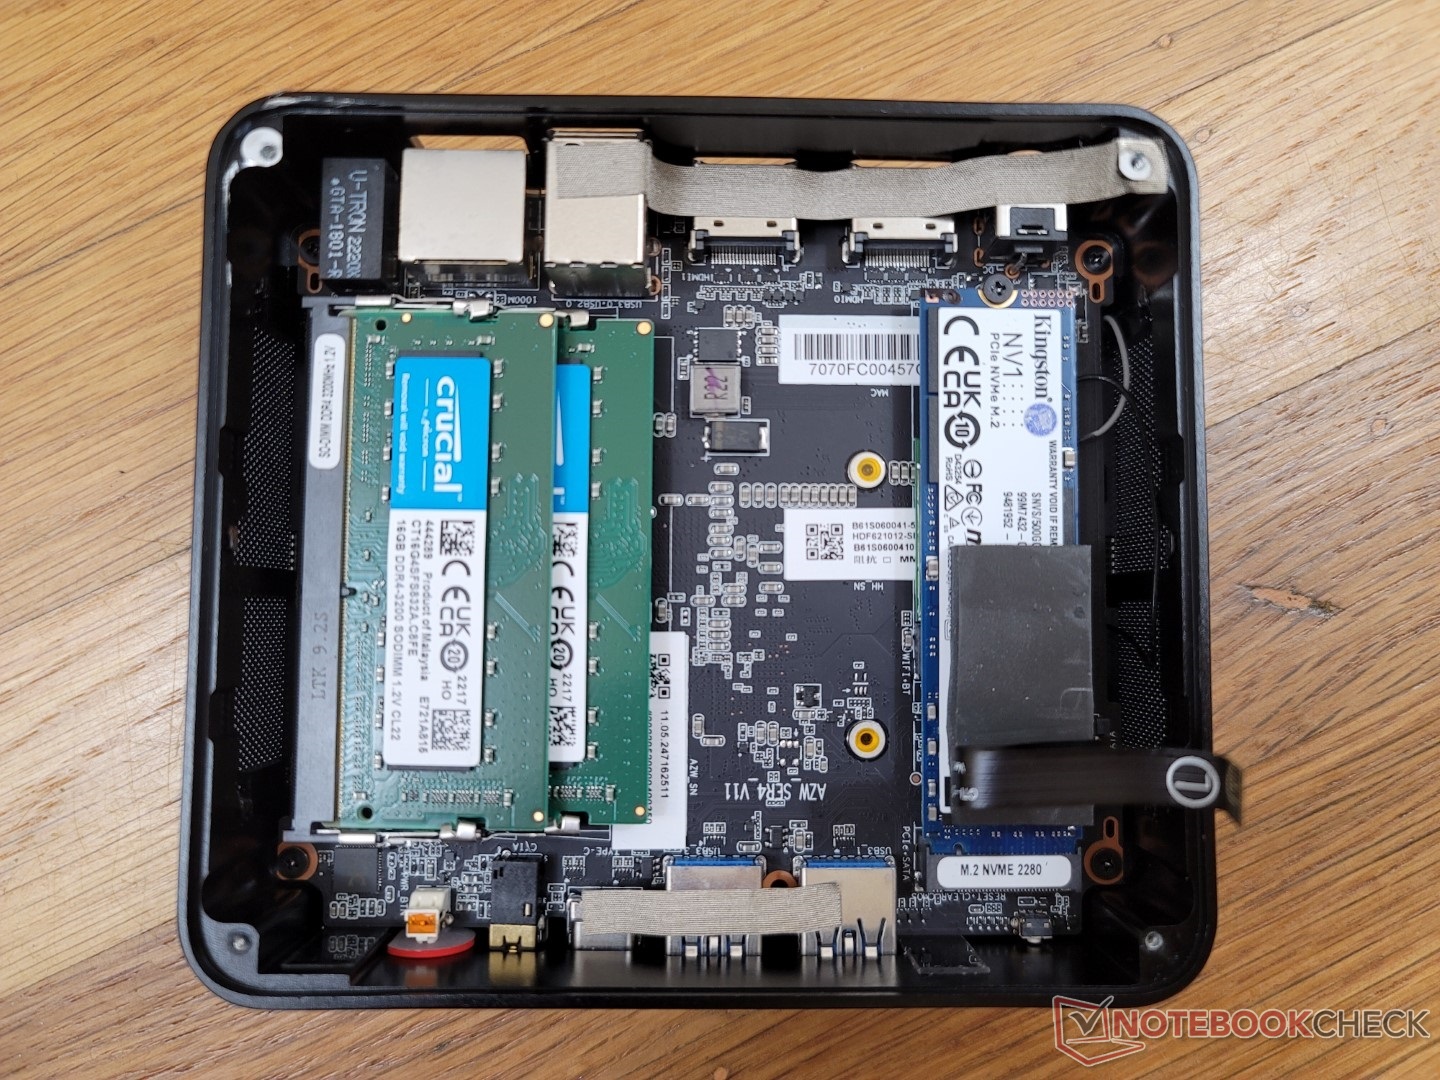
维护
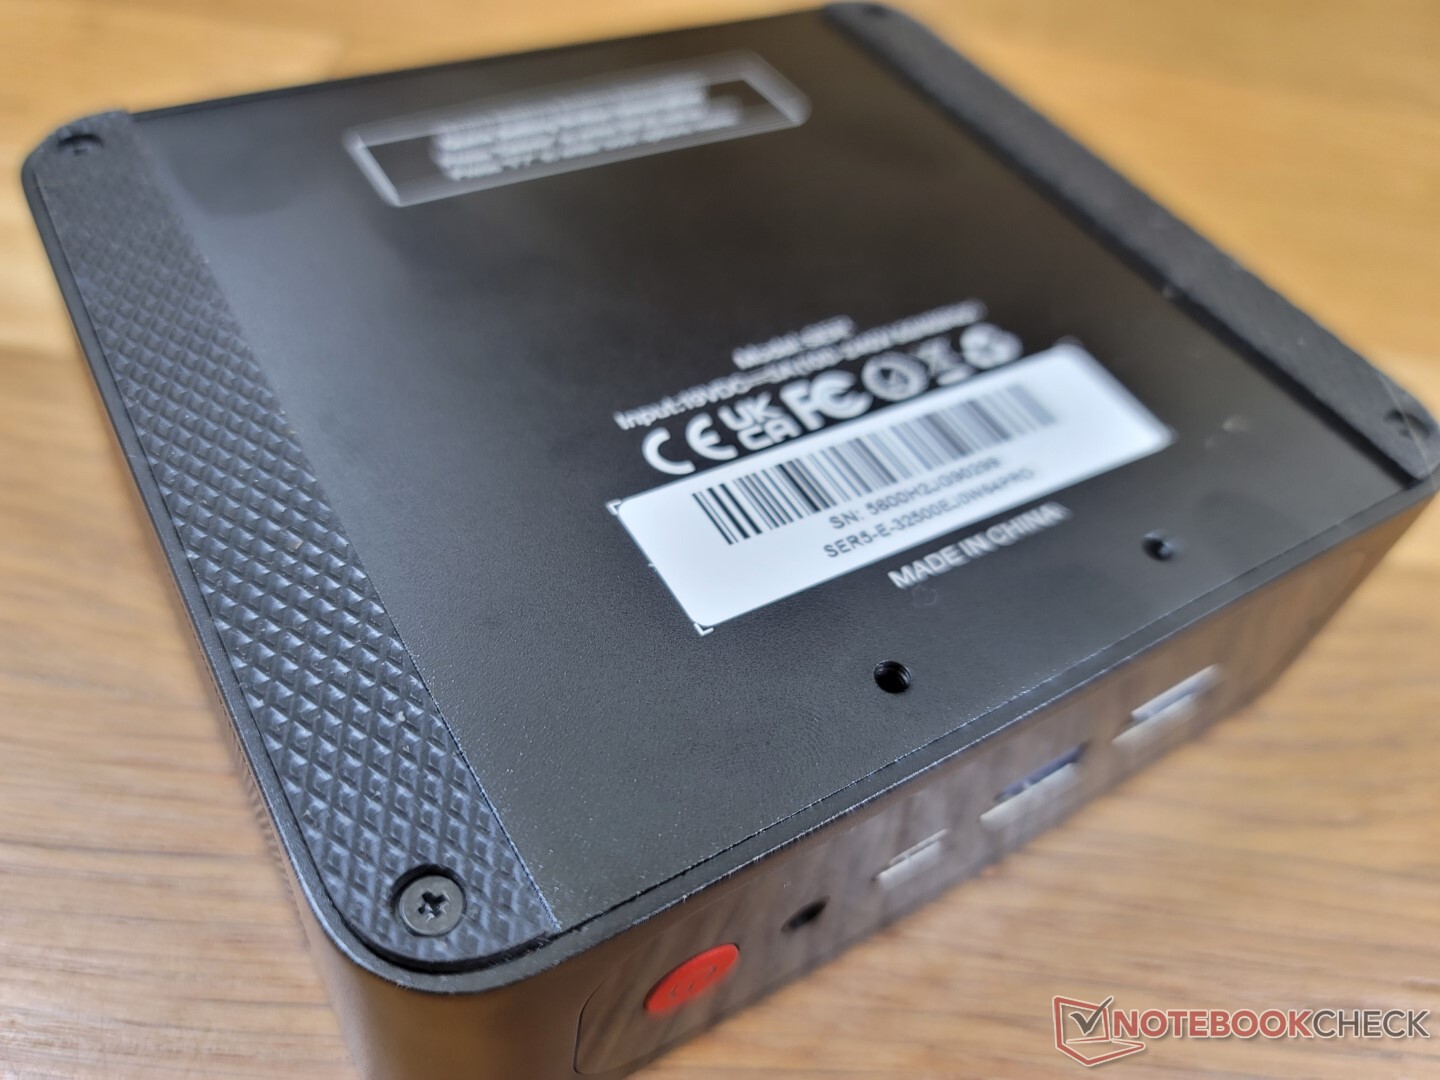
底部面板由四个飞利浦螺钉固定。这些螺丝比英特尔NUC上的手拧螺丝小得多,需要用螺丝刀来拆卸。请记住,这些螺丝也很软,如果不小心的话,很容易被剥落。
配件和保修
零售包装盒包括一个可拆卸的VESA安装支架、额外的螺丝、用户手册、两条HDMI线和AC适配器。
如果在美国购买,则适用标准的一年有限制造商保修。
业绩
测试条件
在运行以下任何基准测试之前,我们通过Windows将我们的设备设置为性能模式。
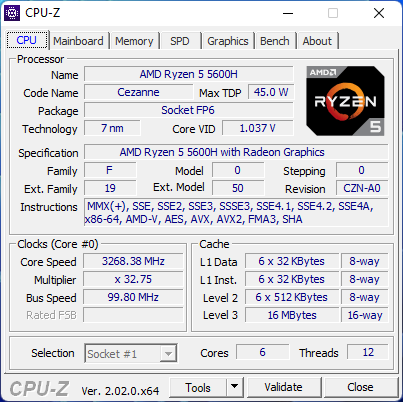
处理器
多线程性能比我们数据库中配备相同设备的平均PC慢约15%。 Ryzen 5 5600HCPU。即便如此,总体性能仍然比普通的 酷睿i7-1165G7在许多超极本和英特尔NUC上发现的那样。
Cinebench R15 Multi Loop
Cinebench R23: Multi Core | Single Core
Cinebench R15: CPU Multi 64Bit | CPU Single 64Bit
Blender: v2.79 BMW27 CPU
7-Zip 18.03: 7z b 4 | 7z b 4 -mmt1
Geekbench 5.5: Multi-Core | Single-Core
HWBOT x265 Benchmark v2.2: 4k Preset
LibreOffice : 20 Documents To PDF
R Benchmark 2.5: Overall mean
| Cinebench R20 / CPU (Multi Core) | |
| HP Envy 16 h0112nr | |
| Schenker XMG Apex 15 NH57E PS | |
| Honor MagicBook 14 2022 | |
| Beelink GTR5 | |
| Average AMD Ryzen 5 5600H (3074 - 4059, n=16) | |
| Beelink SER4 | |
| Beelink SER Pro Ryzen 5 5600H | |
| Intel NUC10i7FNH | |
| Beelink SEi11 Pro | |
| Framework Laptop 13.5 | |
| Intel NUC11TNKi5 | |
| Zotac ZBOX PI336 pico | |
| Cinebench R20 / CPU (Single Core) | |
| HP Envy 16 h0112nr | |
| Honor MagicBook 14 2022 | |
| Framework Laptop 13.5 | |
| Beelink GTR5 | |
| Beelink SEi11 Pro | |
| Schenker XMG Apex 15 NH57E PS | |
| Average AMD Ryzen 5 5600H (527 - 538, n=15) | |
| Beelink SER Pro Ryzen 5 5600H | |
| Intel NUC11TNKi5 | |
| Beelink SER4 | |
| Intel NUC10i7FNH | |
| Zotac ZBOX PI336 pico | |
| Cinebench R23 / Multi Core | |
| HP Envy 16 h0112nr | |
| Schenker XMG Apex 15 NH57E PS | |
| Honor MagicBook 14 2022 | |
| Beelink GTR5 | |
| Average AMD Ryzen 5 5600H (7945 - 10416, n=13) | |
| Beelink SER4 | |
| Beelink SER Pro Ryzen 5 5600H | |
| Beelink SEi11 Pro | |
| Framework Laptop 13.5 | |
| Intel NUC11TNKi5 | |
| Zotac ZBOX PI336 pico | |
| Cinebench R23 / Single Core | |
| HP Envy 16 h0112nr | |
| Honor MagicBook 14 2022 | |
| Framework Laptop 13.5 | |
| Beelink GTR5 | |
| Beelink SEi11 Pro | |
| Schenker XMG Apex 15 NH57E PS | |
| Intel NUC11TNKi5 | |
| Beelink SER Pro Ryzen 5 5600H | |
| Average AMD Ryzen 5 5600H (1316 - 1381, n=13) | |
| Beelink SER4 | |
| Zotac ZBOX PI336 pico | |
| Cinebench R15 / CPU Multi 64Bit | |
| HP Envy 16 h0112nr | |
| Honor MagicBook 14 2022 | |
| Honor MagicBook 14 2022 | |
| Schenker XMG Apex 15 NH57E PS | |
| Beelink GTR5 | |
| Average AMD Ryzen 5 5600H (1319 - 1723, n=16) | |
| Beelink SER4 | |
| Beelink SER Pro Ryzen 5 5600H | |
| Intel NUC10i7FNH | |
| Beelink SEi11 Pro | |
| Framework Laptop 13.5 | |
| Intel NUC11TNKi5 | |
| Zotac ZBOX PI336 pico | |
| Cinebench R15 / CPU Single 64Bit | |
| HP Envy 16 h0112nr | |
| Beelink GTR5 | |
| Honor MagicBook 14 2022 | |
| Schenker XMG Apex 15 NH57E PS | |
| Framework Laptop 13.5 | |
| Average AMD Ryzen 5 5600H (218 - 225, n=14) | |
| Beelink SER Pro Ryzen 5 5600H | |
| Beelink SEi11 Pro | |
| Intel NUC11TNKi5 | |
| Intel NUC10i7FNH | |
| Beelink SER4 | |
| Zotac ZBOX PI336 pico | |
| Blender / v2.79 BMW27 CPU | |
| Zotac ZBOX PI336 pico | |
| Intel NUC11TNKi5 | |
| Framework Laptop 13.5 | |
| Beelink SEi11 Pro | |
| Intel NUC10i7FNH | |
| Beelink SER Pro Ryzen 5 5600H | |
| Beelink SER4 | |
| Average AMD Ryzen 5 5600H (300 - 384, n=14) | |
| Honor MagicBook 14 2022 | |
| Beelink GTR5 | |
| HP Envy 16 h0112nr | |
| Schenker XMG Apex 15 NH57E PS | |
| 7-Zip 18.03 / 7z b 4 | |
| Schenker XMG Apex 15 NH57E PS | |
| Beelink GTR5 | |
| HP Envy 16 h0112nr | |
| Honor MagicBook 14 2022 | |
| Average AMD Ryzen 5 5600H (36315 - 46562, n=14) | |
| Beelink SER4 | |
| Beelink SER Pro Ryzen 5 5600H | |
| Intel NUC10i7FNH | |
| Beelink SEi11 Pro | |
| Framework Laptop 13.5 | |
| Intel NUC11TNKi5 | |
| Zotac ZBOX PI336 pico | |
| 7-Zip 18.03 / 7z b 4 -mmt1 | |
| Beelink GTR5 | |
| HP Envy 16 h0112nr | |
| Schenker XMG Apex 15 NH57E PS | |
| Framework Laptop 13.5 | |
| Beelink SER Pro Ryzen 5 5600H | |
| Average AMD Ryzen 5 5600H (5213 - 5446, n=14) | |
| Honor MagicBook 14 2022 | |
| Beelink SEi11 Pro | |
| Intel NUC11TNKi5 | |
| Intel NUC10i7FNH | |
| Beelink SER4 | |
| Zotac ZBOX PI336 pico | |
| Geekbench 5.5 / Multi-Core | |
| HP Envy 16 h0112nr | |
| Honor MagicBook 14 2022 | |
| Schenker XMG Apex 15 NH57E PS | |
| Beelink GTR5 | |
| Average AMD Ryzen 5 5600H (4990 - 7253, n=14) | |
| Beelink SER4 | |
| Beelink SER Pro Ryzen 5 5600H | |
| Intel NUC10i7FNH | |
| Beelink SEi11 Pro | |
| Intel NUC11TNKi5 | |
| Zotac ZBOX PI336 pico | |
| Geekbench 5.5 / Single-Core | |
| HP Envy 16 h0112nr | |
| Honor MagicBook 14 2022 | |
| Beelink GTR5 | |
| Beelink SEi11 Pro | |
| Schenker XMG Apex 15 NH57E PS | |
| Beelink SER Pro Ryzen 5 5600H | |
| Average AMD Ryzen 5 5600H (1365 - 1445, n=14) | |
| Intel NUC11TNKi5 | |
| Intel NUC10i7FNH | |
| Beelink SER4 | |
| Zotac ZBOX PI336 pico | |
| HWBOT x265 Benchmark v2.2 / 4k Preset | |
| Schenker XMG Apex 15 NH57E PS | |
| HP Envy 16 h0112nr | |
| Beelink GTR5 | |
| Honor MagicBook 14 2022 | |
| Average AMD Ryzen 5 5600H (9.92 - 13.3, n=14) | |
| Beelink SER Pro Ryzen 5 5600H | |
| Beelink SER4 | |
| Intel NUC10i7FNH | |
| Beelink SEi11 Pro | |
| Framework Laptop 13.5 | |
| Intel NUC11TNKi5 | |
| Zotac ZBOX PI336 pico | |
| LibreOffice / 20 Documents To PDF | |
| Zotac ZBOX PI336 pico | |
| Beelink SER4 | |
| Average AMD Ryzen 5 5600H (52.2 - 81.5, n=14) | |
| Schenker XMG Apex 15 NH57E PS | |
| Beelink SER Pro Ryzen 5 5600H | |
| Intel NUC11TNKi5 | |
| Beelink GTR5 | |
| Beelink SEi11 Pro | |
| HP Envy 16 h0112nr | |
| Framework Laptop 13.5 | |
| Honor MagicBook 14 2022 | |
| R Benchmark 2.5 / Overall mean | |
| Zotac ZBOX PI336 pico | |
| Intel NUC10i7FNH | |
| Intel NUC11TNKi5 | |
| Beelink SEi11 Pro | |
| Beelink SER4 | |
| Framework Laptop 13.5 | |
| Average AMD Ryzen 5 5600H (0.526 - 0.596, n=14) | |
| Beelink SER Pro Ryzen 5 5600H | |
| Schenker XMG Apex 15 NH57E PS | |
| Honor MagicBook 14 2022 | |
| Beelink GTR5 | |
| HP Envy 16 h0112nr | |
* ... smaller is better
AIDA64: FP32 Ray-Trace | FPU Julia | CPU SHA3 | CPU Queen | FPU SinJulia | FPU Mandel | CPU AES | CPU ZLib | FP64 Ray-Trace | CPU PhotoWorxx
| Performance rating | |
| Beelink GTR5 | |
| Beelink SER Pro Ryzen 5 5600H | |
| Beelink SEi11 Pro | |
| Intel NUC11TNKi5 | |
| Zotac ZBOX PI336 pico | |
| AIDA64 / FP32 Ray-Trace | |
| Beelink GTR5 | |
| Beelink SER Pro Ryzen 5 5600H | |
| Beelink SEi11 Pro | |
| Intel NUC11TNKi5 | |
| Zotac ZBOX PI336 pico | |
| AIDA64 / FPU Julia | |
| Beelink GTR5 | |
| Beelink SER Pro Ryzen 5 5600H | |
| Beelink SEi11 Pro | |
| Intel NUC11TNKi5 | |
| Zotac ZBOX PI336 pico | |
| AIDA64 / CPU SHA3 | |
| Beelink GTR5 | |
| Beelink SER Pro Ryzen 5 5600H | |
| Beelink SEi11 Pro | |
| Intel NUC11TNKi5 | |
| Zotac ZBOX PI336 pico | |
| AIDA64 / CPU Queen | |
| Beelink GTR5 | |
| Beelink SER Pro Ryzen 5 5600H | |
| Beelink SEi11 Pro | |
| Intel NUC11TNKi5 | |
| Zotac ZBOX PI336 pico | |
| AIDA64 / FPU SinJulia | |
| Beelink GTR5 | |
| Beelink SER Pro Ryzen 5 5600H | |
| Beelink SEi11 Pro | |
| Intel NUC11TNKi5 | |
| Zotac ZBOX PI336 pico | |
| AIDA64 / FPU Mandel | |
| Beelink GTR5 | |
| Beelink SER Pro Ryzen 5 5600H | |
| Beelink SEi11 Pro | |
| Intel NUC11TNKi5 | |
| Zotac ZBOX PI336 pico | |
| AIDA64 / CPU AES | |
| Beelink GTR5 | |
| Beelink SER Pro Ryzen 5 5600H | |
| Beelink SEi11 Pro | |
| Intel NUC11TNKi5 | |
| Zotac ZBOX PI336 pico | |
| AIDA64 / CPU ZLib | |
| Beelink GTR5 | |
| Beelink SER Pro Ryzen 5 5600H | |
| Intel NUC11TNKi5 | |
| Beelink SEi11 Pro | |
| Zotac ZBOX PI336 pico | |
| AIDA64 / FP64 Ray-Trace | |
| Beelink GTR5 | |
| Beelink SER Pro Ryzen 5 5600H | |
| Beelink SEi11 Pro | |
| Intel NUC11TNKi5 | |
| Zotac ZBOX PI336 pico | |
| AIDA64 / CPU PhotoWorxx | |
| Beelink SEi11 Pro | |
| Beelink GTR5 | |
| Beelink SER Pro Ryzen 5 5600H | |
| Intel NUC11TNKi5 | |
| Zotac ZBOX PI336 pico | |
系统性能
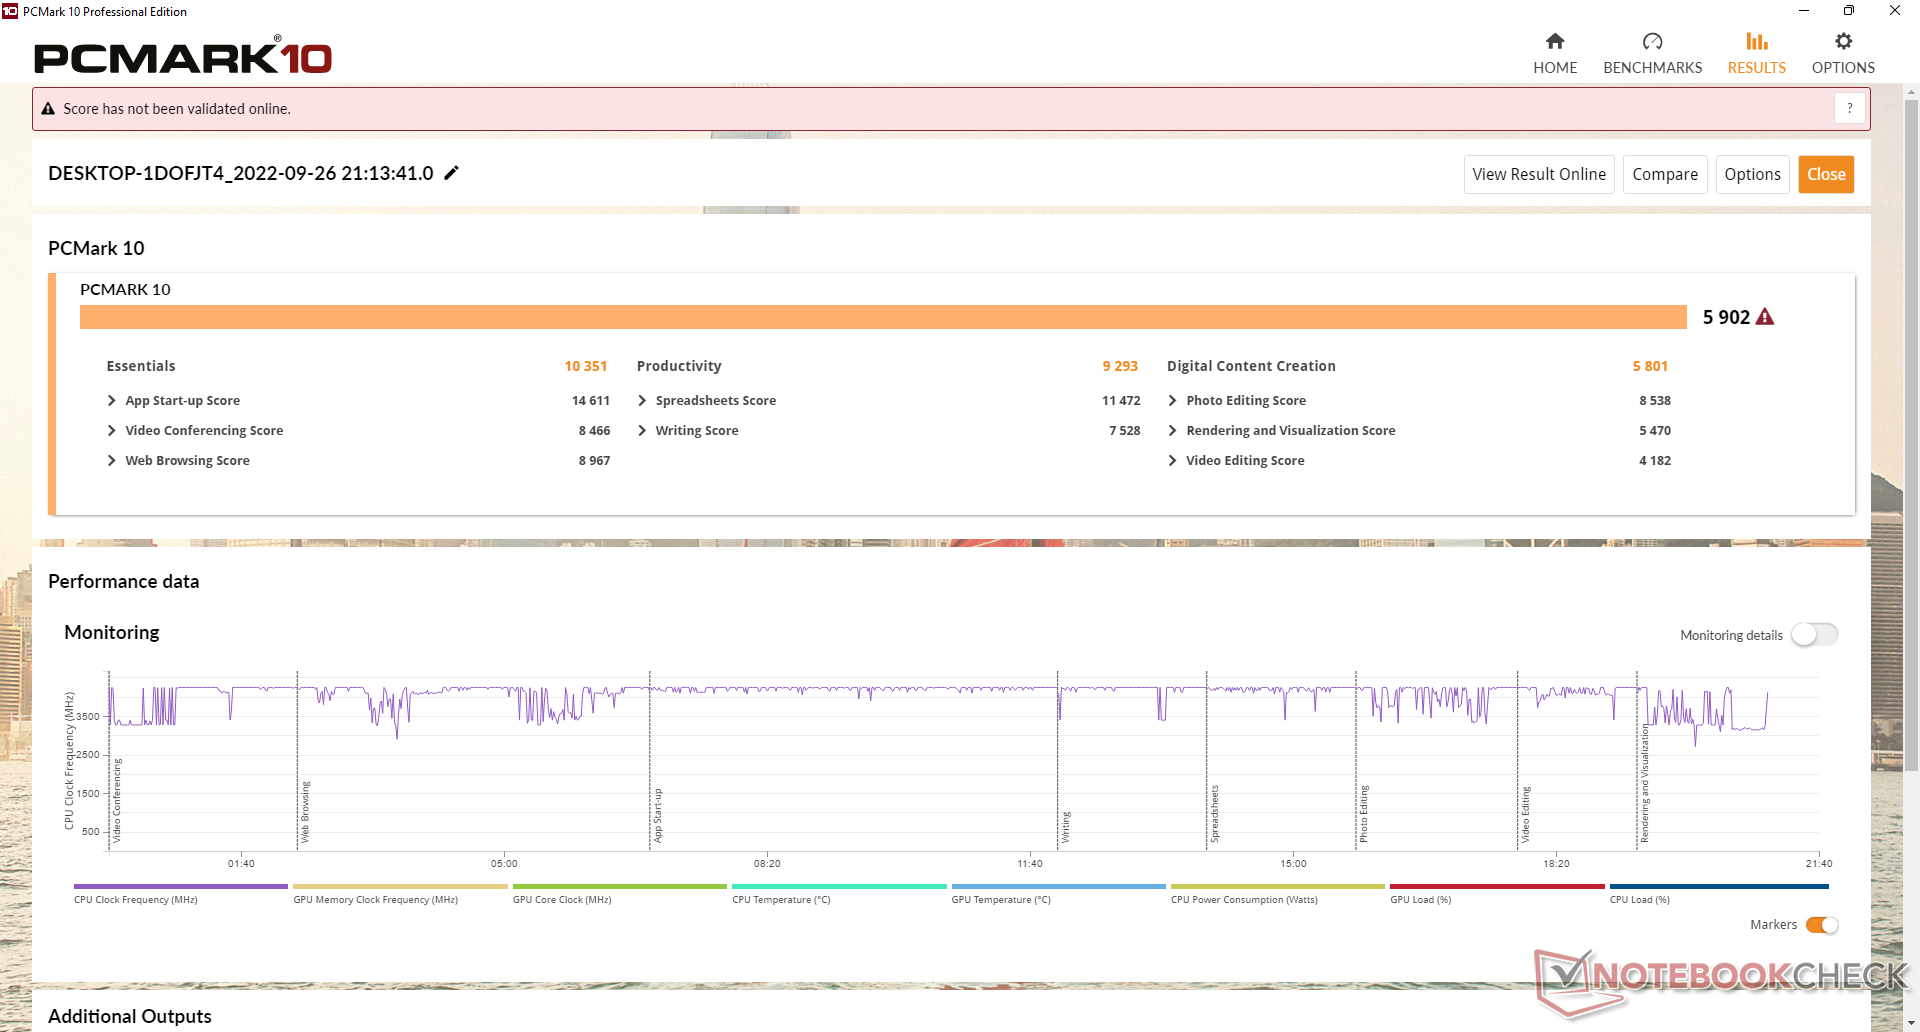
与其他Ryzen 5 5600H笔记本电脑或迷你电脑相比,PCMark 10的结果是我们所期望的,但在数字内容创作分测试中,GPU性能最为重要。这是因为许多采用这种相同处理器的笔记本电脑通常会配备更快的独立显卡。
CrossMark: Overall | Productivity | Creativity | Responsiveness
| PCMark 10 / Score | |
| Beelink GTR5 | |
| Average AMD Ryzen 5 5600H (5309 - 7091, n=14) | |
| Beelink SER Pro Ryzen 5 5600H | |
| Beelink SEi11 Pro | |
| Intel NUC11TNKi5 | |
| Intel NUC10i7FNH | |
| PCMark 10 / Essentials | |
| Beelink GTR5 | |
| Beelink SER Pro Ryzen 5 5600H | |
| Beelink SEi11 Pro | |
| Average AMD Ryzen 5 5600H (9326 - 10506, n=14) | |
| Intel NUC10i7FNH | |
| Intel NUC11TNKi5 | |
| PCMark 10 / Productivity | |
| Beelink GTR5 | |
| Beelink SER Pro Ryzen 5 5600H | |
| Average AMD Ryzen 5 5600H (7975 - 9642, n=14) | |
| Beelink SEi11 Pro | |
| Intel NUC10i7FNH | |
| Intel NUC11TNKi5 | |
| PCMark 10 / Digital Content Creation | |
| Average AMD Ryzen 5 5600H (4921 - 9907, n=14) | |
| Beelink GTR5 | |
| Beelink SER Pro Ryzen 5 5600H | |
| Beelink SEi11 Pro | |
| Intel NUC11TNKi5 | |
| Intel NUC10i7FNH | |
| CrossMark / Overall | |
| Beelink GTR5 | |
| Beelink SEi11 Pro | |
| Beelink SER Pro Ryzen 5 5600H | |
| Average AMD Ryzen 5 5600H (1157 - 1353, n=7) | |
| CrossMark / Productivity | |
| Beelink GTR5 | |
| Beelink SEi11 Pro | |
| Beelink SER Pro Ryzen 5 5600H | |
| Average AMD Ryzen 5 5600H (1217 - 1384, n=7) | |
| CrossMark / Creativity | |
| Beelink GTR5 | |
| Average AMD Ryzen 5 5600H (1184 - 1377, n=7) | |
| Beelink SER Pro Ryzen 5 5600H | |
| Beelink SEi11 Pro | |
| CrossMark / Responsiveness | |
| Beelink SEi11 Pro | |
| Beelink GTR5 | |
| Beelink SER Pro Ryzen 5 5600H | |
| Average AMD Ryzen 5 5600H (926 - 1225, n=7) | |
| PCMark 10 Score | 5902 points | |
Help | ||
| AIDA64 / Memory Copy | |
| Beelink GTR5 | |
| Beelink SER Pro Ryzen 5 5600H | |
| Beelink SEi11 Pro | |
| Average AMD Ryzen 5 5600H (20549 - 42141, n=14) | |
| Intel NUC11TNKi5 | |
| Zotac ZBOX PI336 pico | |
| AIDA64 / Memory Read | |
| Beelink SER Pro Ryzen 5 5600H | |
| Beelink GTR5 | |
| Beelink SEi11 Pro | |
| Average AMD Ryzen 5 5600H (22917 - 47595, n=14) | |
| Intel NUC11TNKi5 | |
| Zotac ZBOX PI336 pico | |
| AIDA64 / Memory Write | |
| Beelink SEi11 Pro | |
| Beelink SER Pro Ryzen 5 5600H | |
| Beelink GTR5 | |
| Average AMD Ryzen 5 5600H (20226 - 44872, n=14) | |
| Intel NUC11TNKi5 | |
| Zotac ZBOX PI336 pico | |
| AIDA64 / Memory Latency | |
| Intel NUC11TNKi5 | |
| Beelink SEi11 Pro | |
| Beelink SER Pro Ryzen 5 5600H | |
| Beelink GTR5 | |
| Average AMD Ryzen 5 5600H (75 - 89.1, n=14) | |
| Zotac ZBOX PI336 pico | |
* ... smaller is better
DPC延时
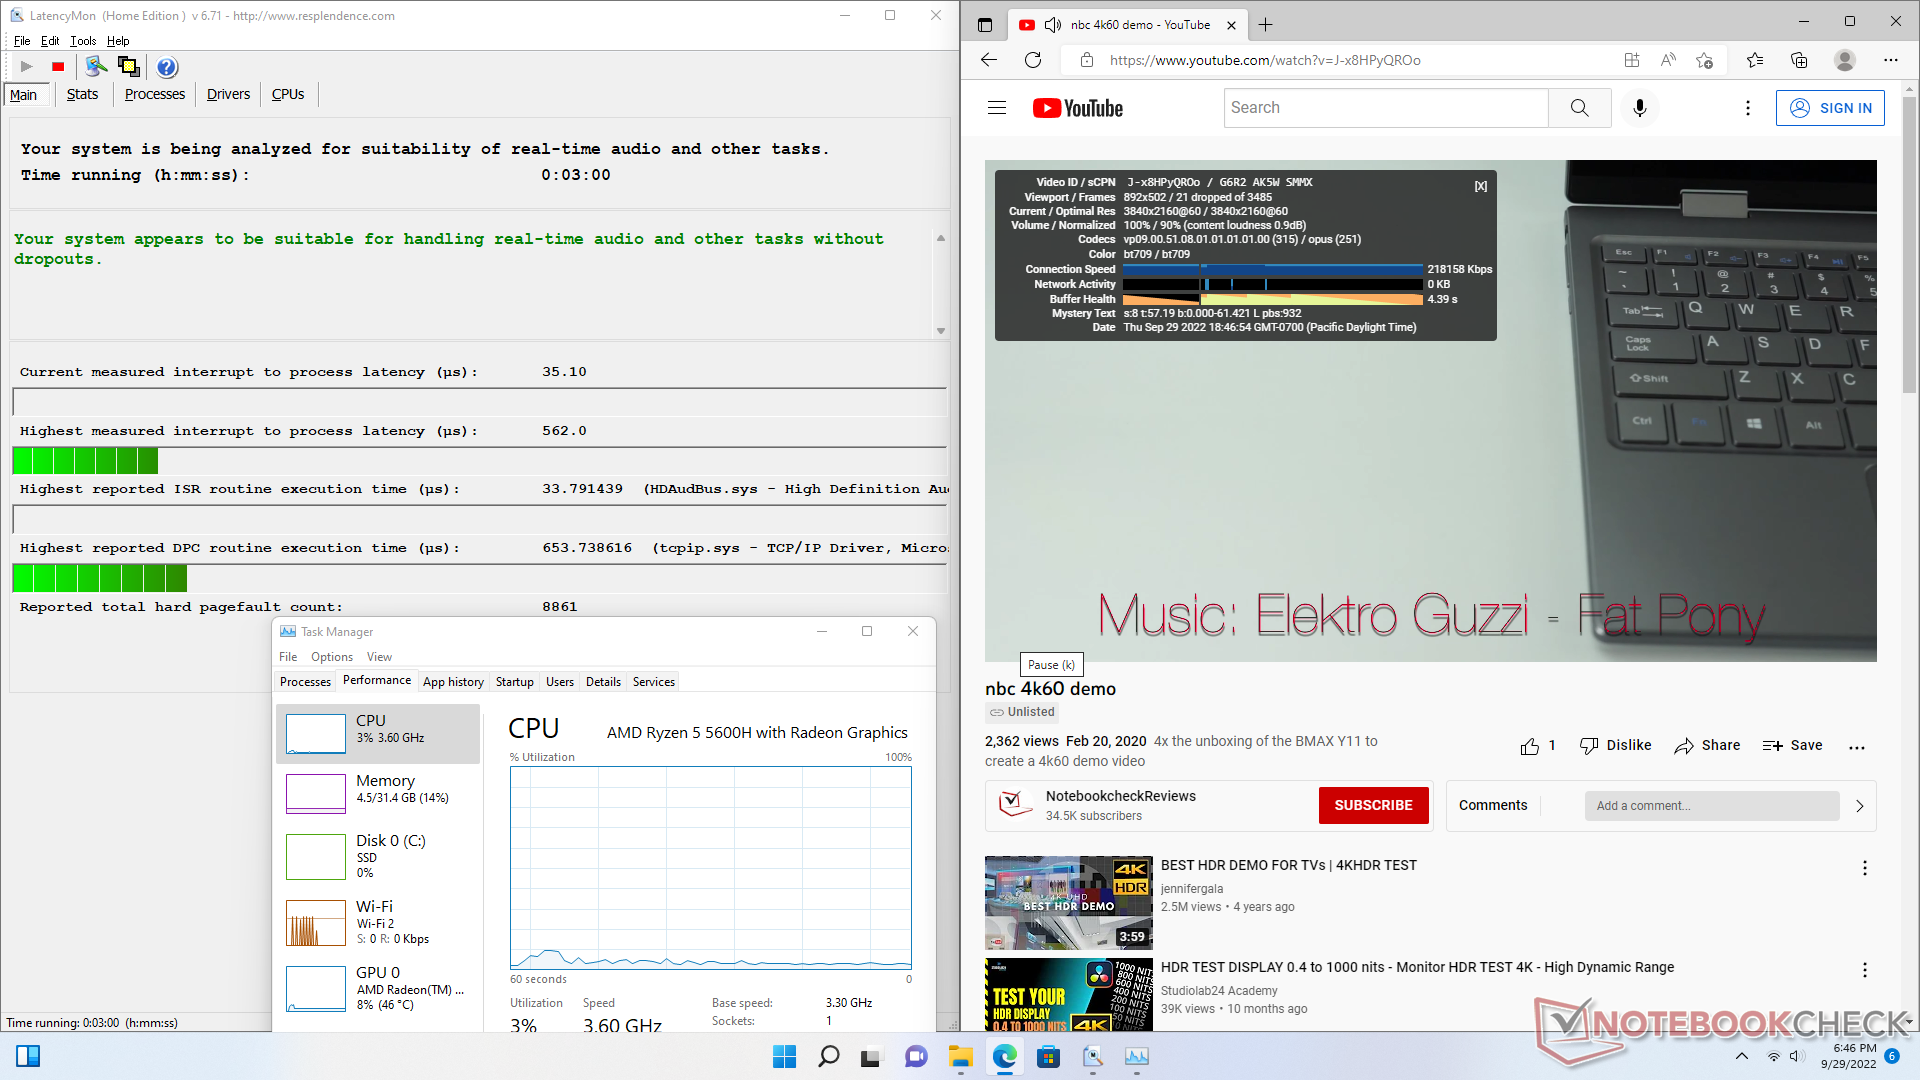
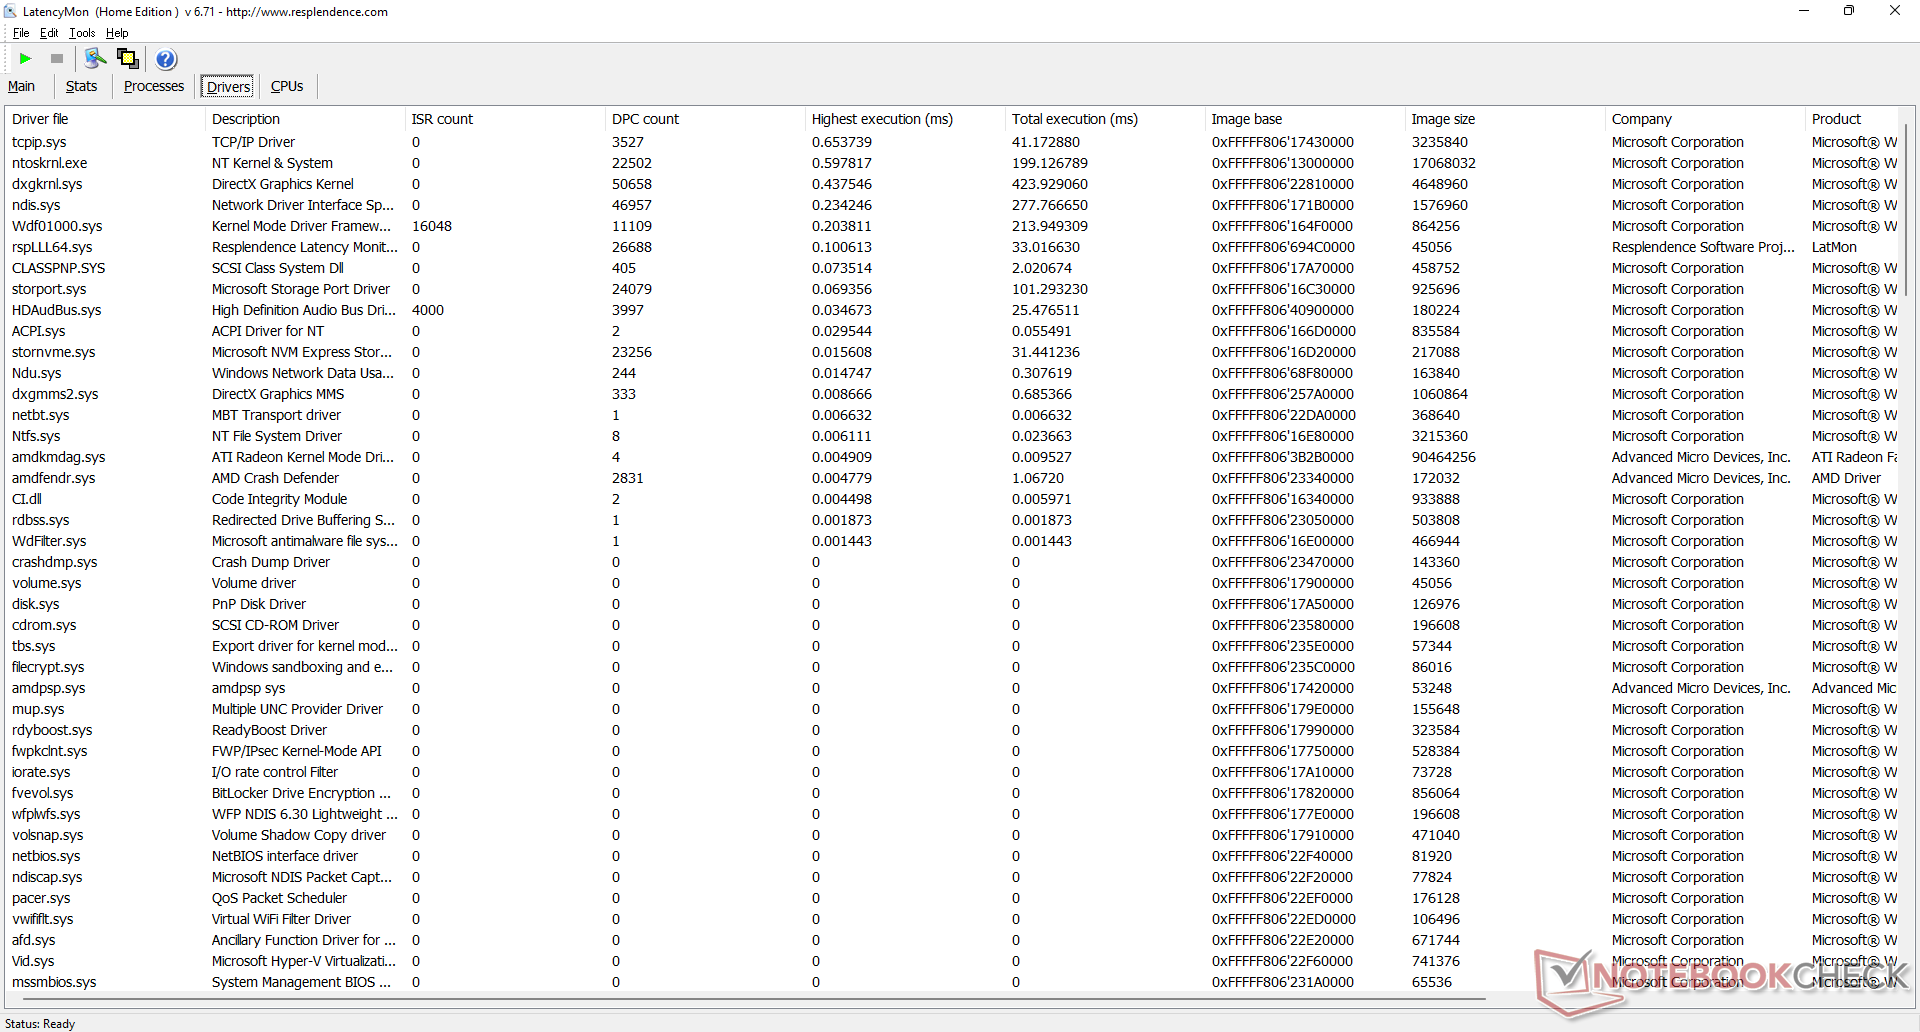
LatencyMon显示,在我们的主页上打开多个浏览器标签时,没有重大的DPC问题。不幸的是,在60 FPS下的4K视频播放并不完美,在我们长达1分钟的视频中出现了21个丢帧。
| DPC Latencies / LatencyMon - interrupt to process latency (max), Web, Youtube, Prime95 | |
| Zotac ZBOX PI336 pico | |
| Beelink SER Pro Ryzen 5 5600H | |
| Intel NUC11TNKi5 | |
| Beelink SEi11 Pro | |
| Beelink GTR5 | |
* ... smaller is better
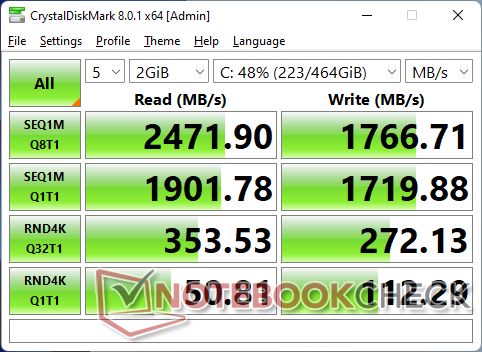
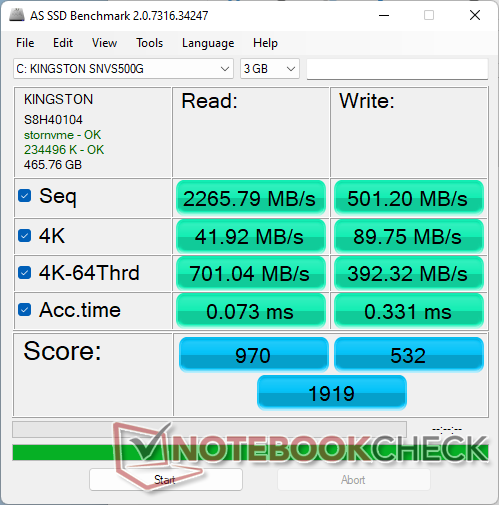
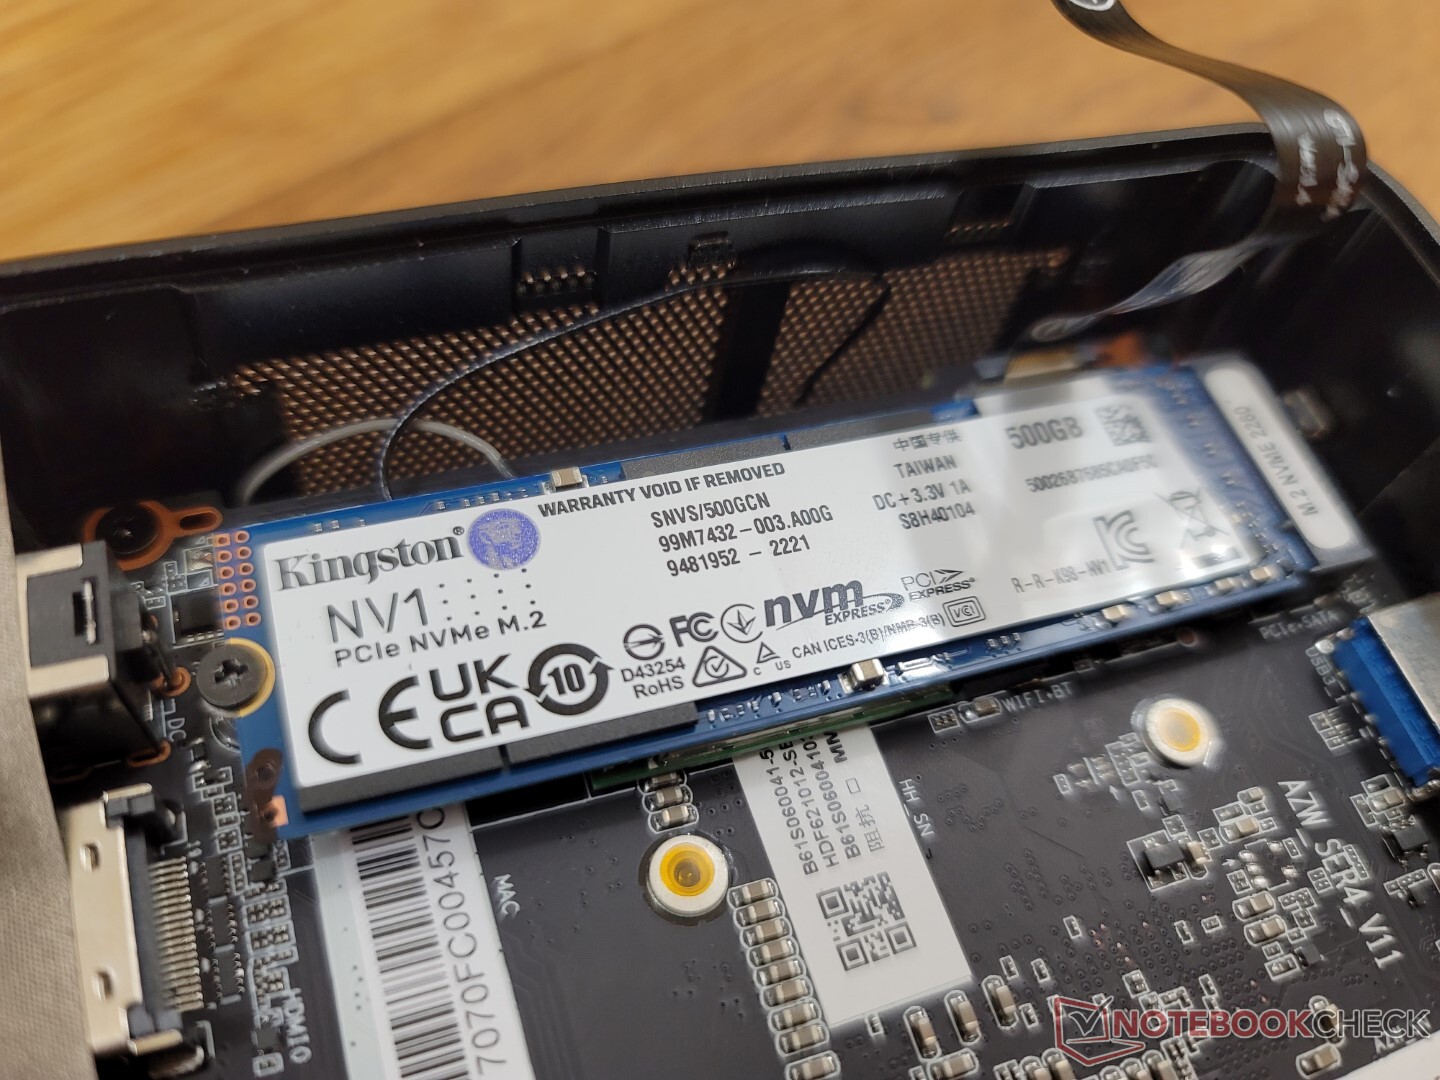
存储设备
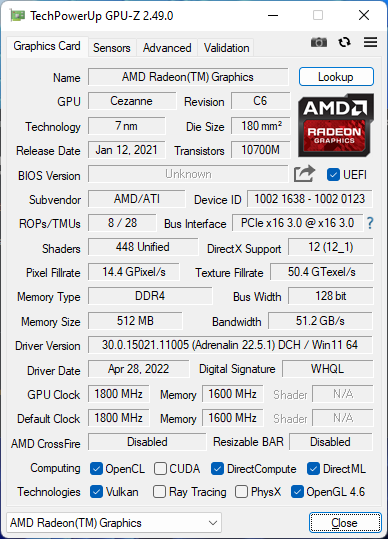
NVMe速度被限制在PCIe3 x4,而大多数较新的英特尔NUC型号完全支持PCIe4 x4。然而,对于大多数用户来说,PCIe3是绰绰有余的,所以这里的切角并不明显。我们的中档500GB 金士顿NV1固态硬盘能够维持其最大~2500MB/s的读取速率,而没有任何散热问题。

| Drive Performance rating - Percent | |
| Beelink SER Pro Ryzen 5 5600H -11! | |
| Beelink GTR5 | |
| Beelink SEi11 Pro | |
| Intel NUC10i7FNH | |
| Intel NUC11TNKi5 | |
| Zotac ZBOX PI336 pico | |
* ... smaller is better
Disk Throttling: DiskSpd Read Loop, Queue Depth 8
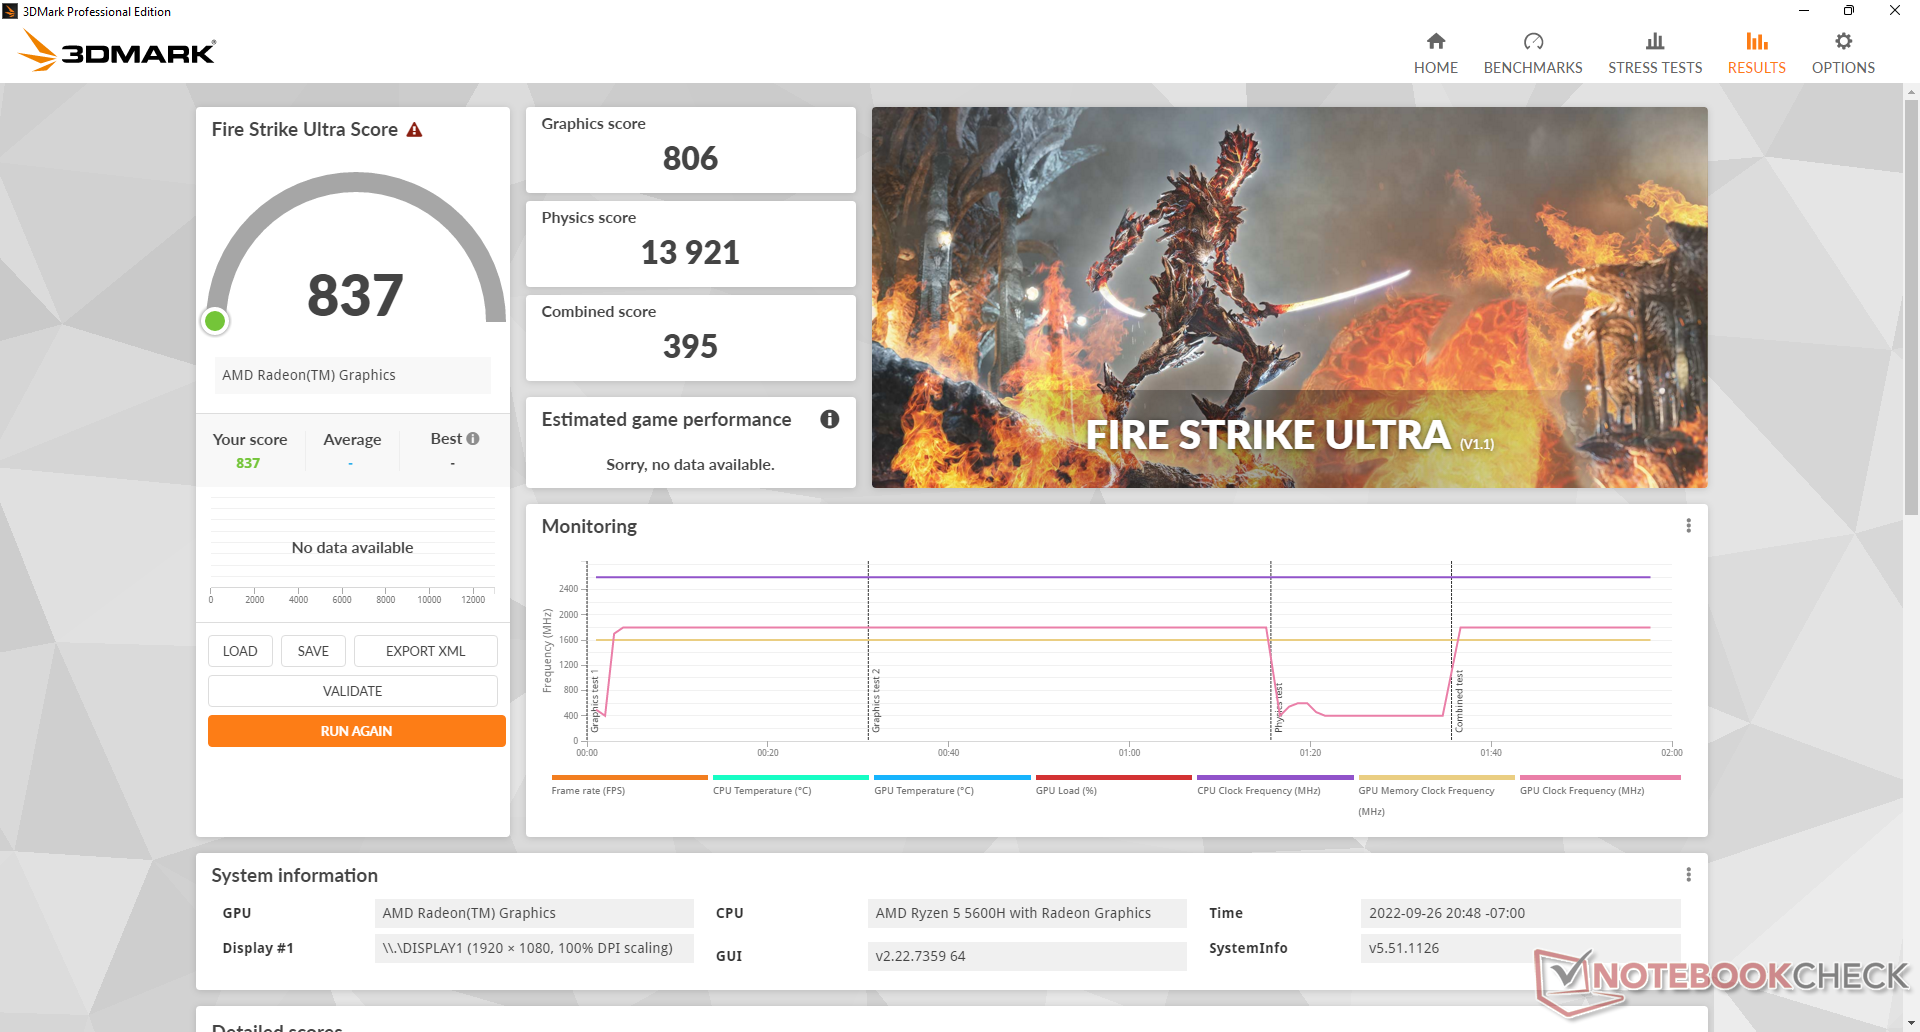
GPU性能
图形性能比其他大多数具有相同集成度的笔记本电脑或迷你PC快得多。 Radeon RX Vega 7GPU要快30%到35%,因为此类产品通常将GPU与较慢的Ryzen U系列CPU或单通道内存搭配使用。Ryzen 5 5600H对GPU的瓶颈较小,帧率因此而受益。然而,它仍然不是游戏机。
这款 Iris Xe 96 EUs通常在大多数第11代酷睿i7英特尔笔记本电脑或迷你PC上发现的Iris Xe 96 EUs仍然快10%到15%。
| 3DMark | |
| 1920x1080 Fire Strike Graphics | |
| Intel NUC11PHKi7C | |
| Honor MagicBook 14 2022 | |
| Lenovo Yoga 7-14ARB G7 | |
| Beelink SEi11 Pro | |
| Beelink GTR5 | |
| Beelink SER Pro Ryzen 5 5600H | |
| Beelink SER4 | |
| Average AMD Radeon RX Vega 7 (1772 - 4037, n=66) | |
| Intel NUC11TNKi5 | |
| Intel NUC10i7FNH | |
| Zotac ZBOX PI336 pico | |
| 2560x1440 Time Spy Graphics | |
| Intel NUC11PHKi7C | |
| Honor MagicBook 14 2022 | |
| Lenovo Yoga 7-14ARB G7 | |
| Beelink SEi11 Pro | |
| Beelink GTR5 | |
| Beelink SER Pro Ryzen 5 5600H | |
| Beelink SER4 | |
| Intel NUC11TNKi5 | |
| Average AMD Radeon RX Vega 7 (496 - 1249, n=61) | |
| Intel NUC10i7FNH | |
| 2560x1440 Time Spy Score | |
| Intel NUC11PHKi7C | |
| Honor MagicBook 14 2022 | |
| Lenovo Yoga 7-14ARB G7 | |
| Beelink GTR5 | |
| Beelink SEi11 Pro | |
| Beelink SER4 | |
| Beelink SER Pro Ryzen 5 5600H | |
| Intel NUC11TNKi5 | |
| Average AMD Radeon RX Vega 7 (570 - 1420, n=62) | |
| Intel NUC10i7FNH | |
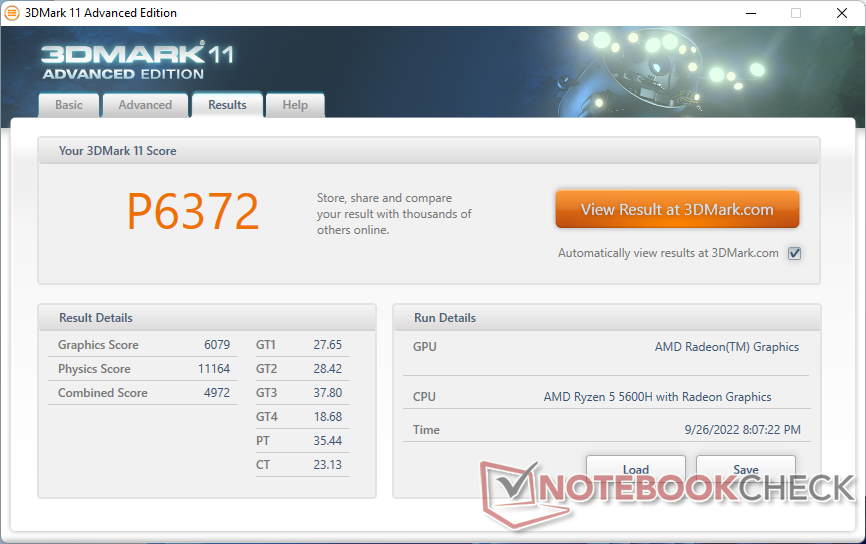
| 3DMark 11 - 1280x720 Performance GPU | |
| Intel NUC11PHKi7C | |
| Honor MagicBook 14 2022 | |
| Lenovo Yoga 7-14ARB G7 | |
| Beelink GTR5 | |
| Beelink SEi11 Pro | |
| Beelink SER Pro Ryzen 5 5600H | |
| Beelink SER4 | |
| Intel NUC11TNKi5 | |
| Average AMD Radeon RX Vega 7 (3353 - 6249, n=62) | |
| Intel NUC10i7FNH | |
| Zotac ZBOX PI336 pico | |
| 3DMark 11 Performance | 6372 points | |
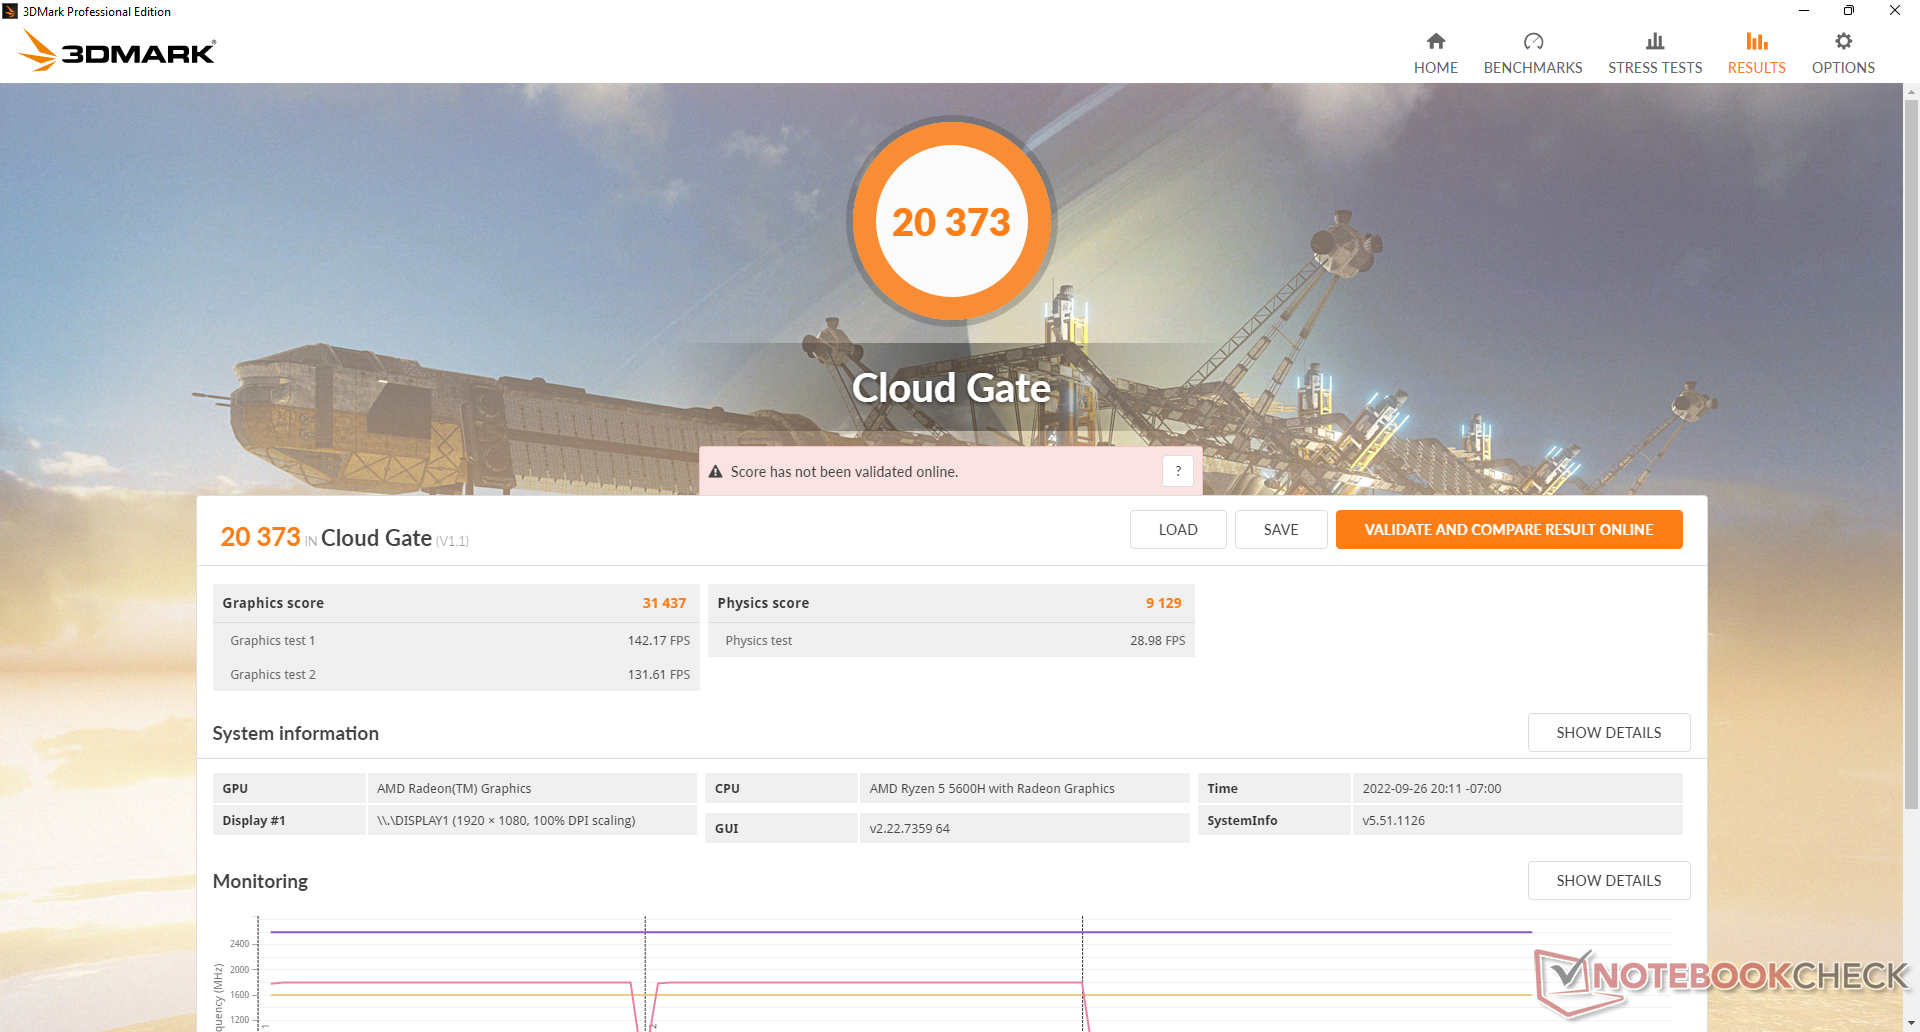
| 3DMark Cloud Gate Standard Score | 20373 points | |
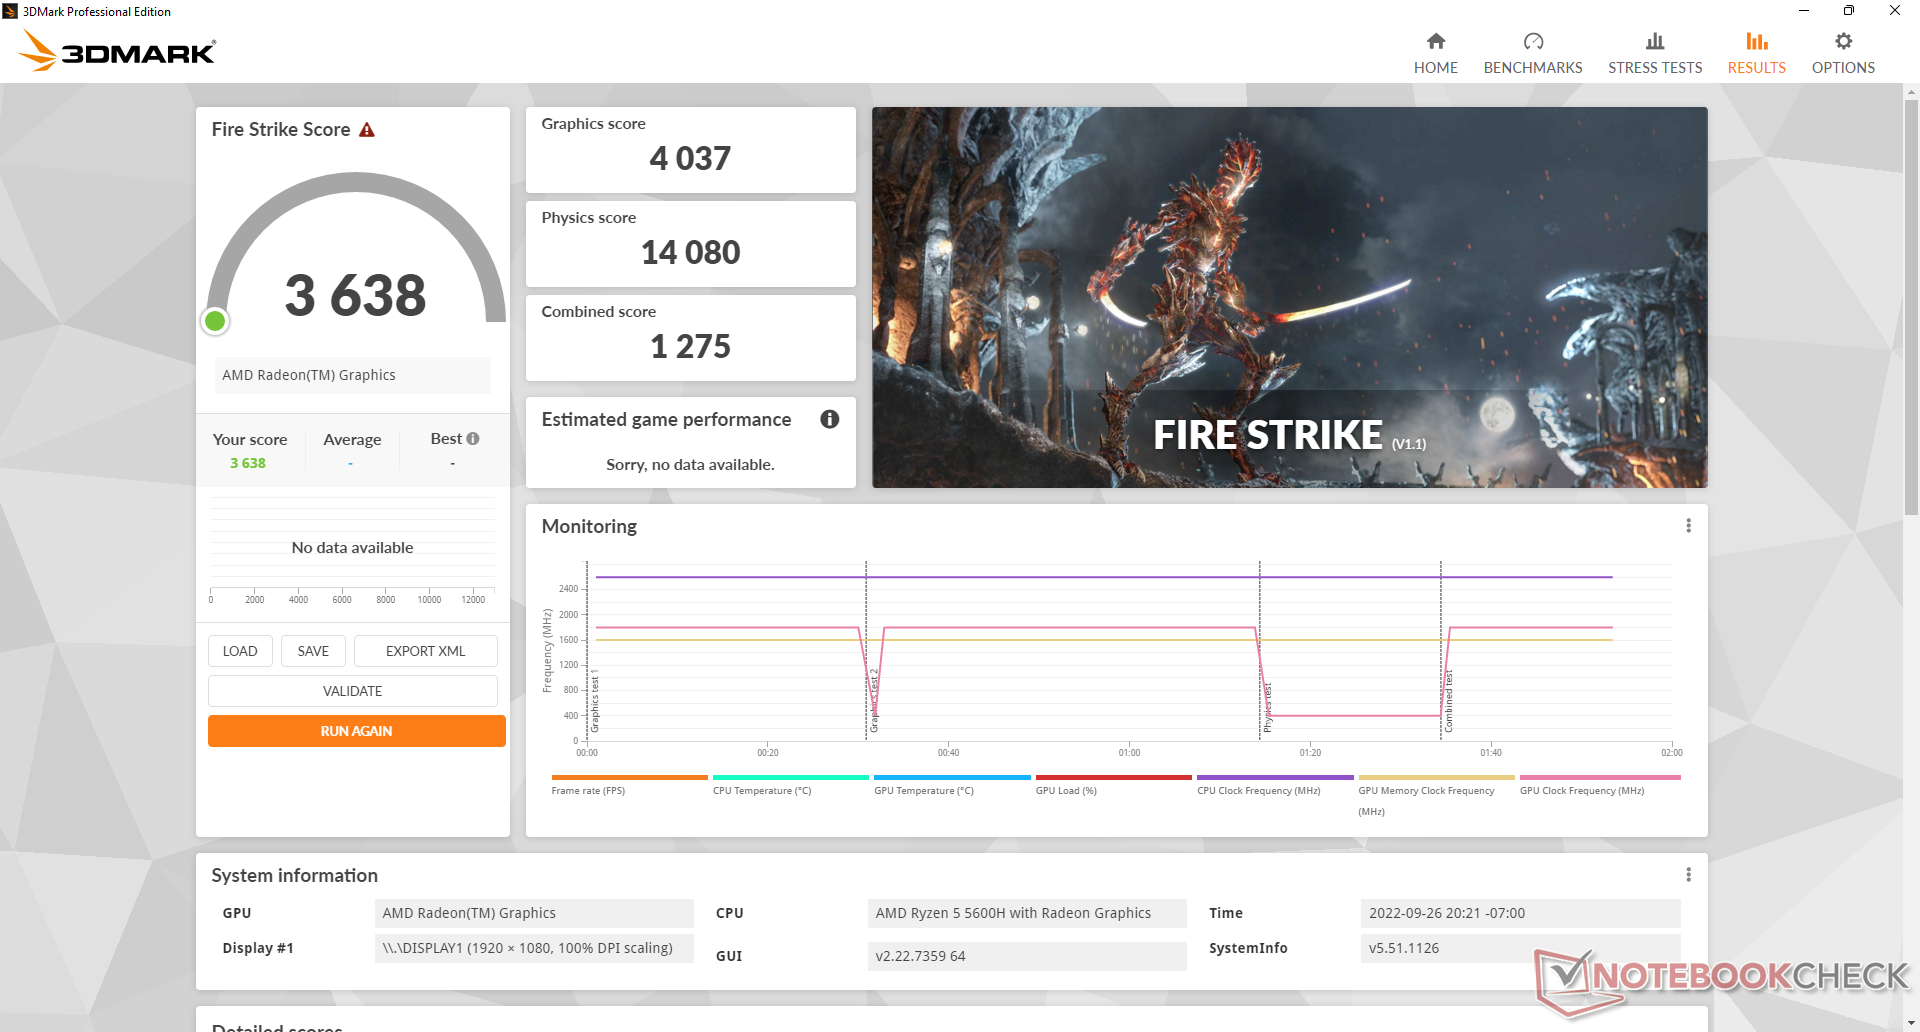
| 3DMark Fire Strike Score | 3638 points | |
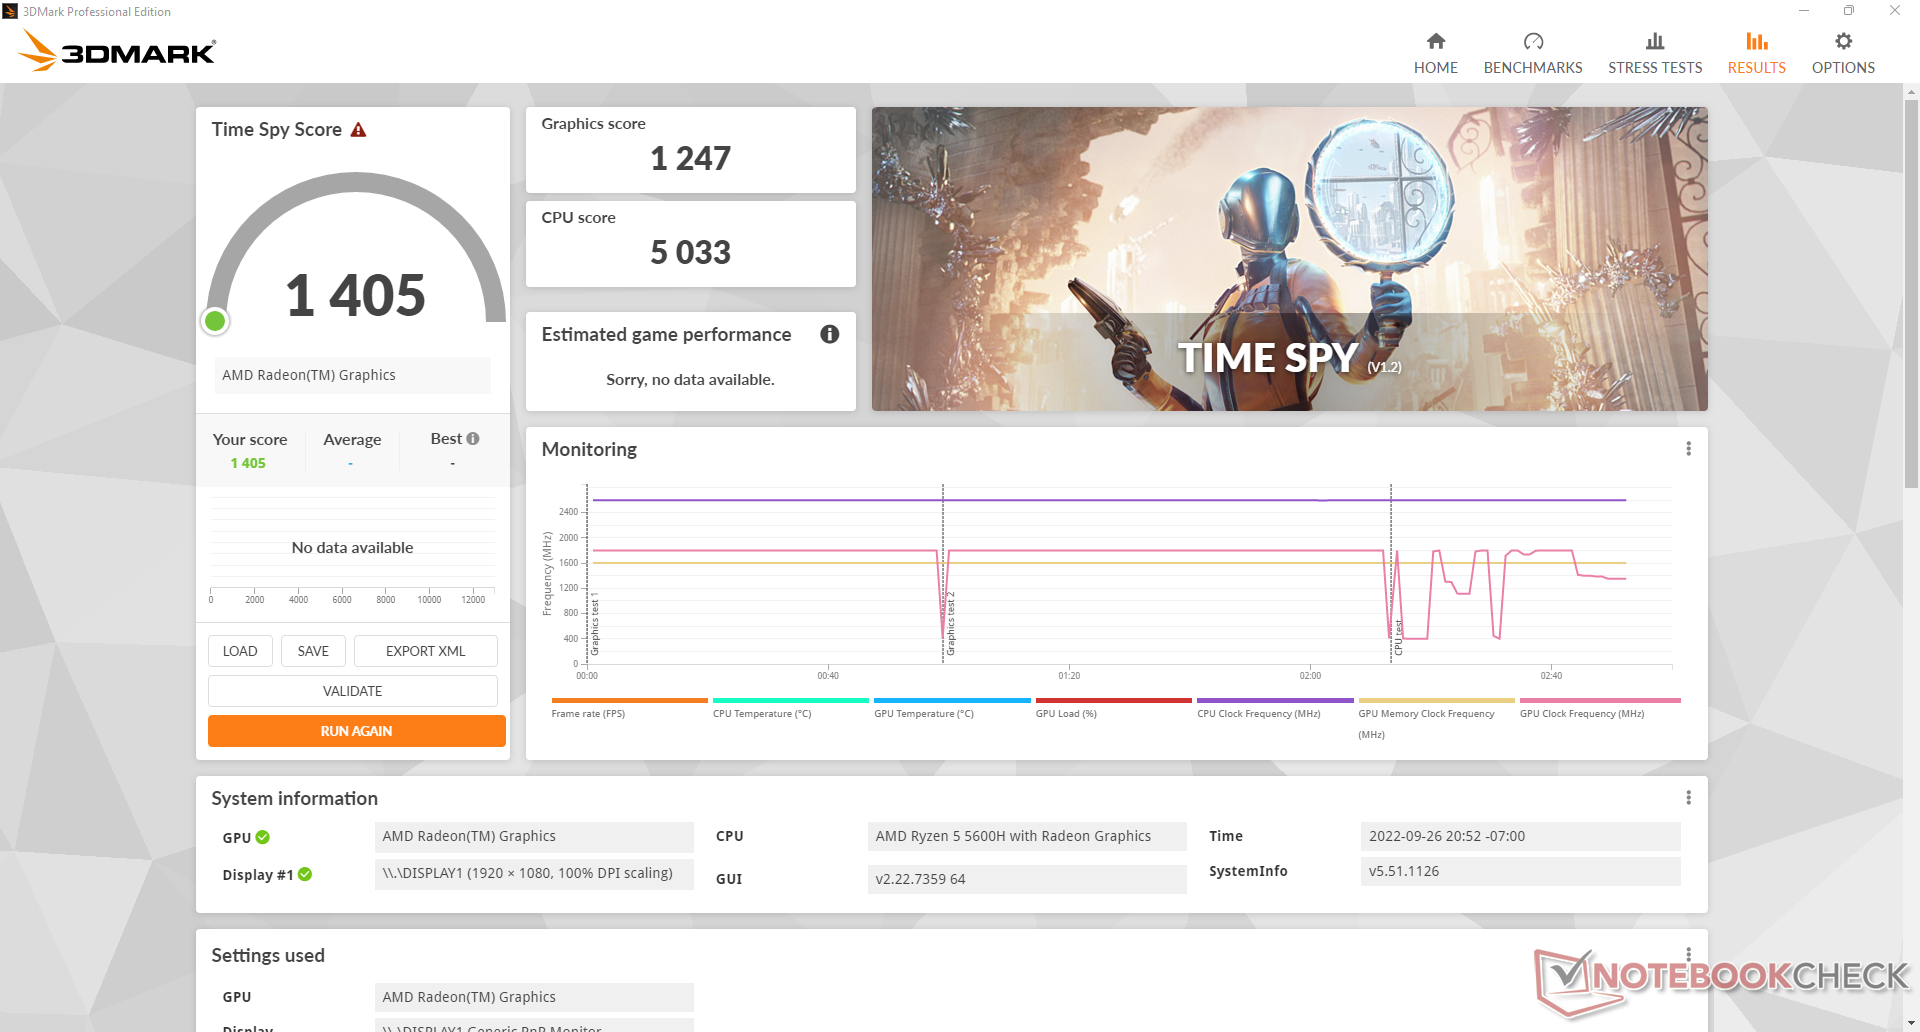
| 3DMark Time Spy Score | 1405 points | |
Help | ||
| Blender - v3.3 Classroom CPU | |
| Beelink SER Pro Ryzen 5 5600H | |
| Average of class Mini PC (132 - 4571, n=83, last 2 years) | |
* ... smaller is better
| The Witcher 3 | |
| 1024x768 Low Graphics & Postprocessing | |
| Intel NUC11PHKi7C | |
| Honor MagicBook 14 2022 | |
| Lenovo Yoga 7-14ARB G7 | |
| Beelink SEi11 Pro | |
| Beelink GTR5 | |
| Beelink SER Pro Ryzen 5 5600H | |
| Beelink SER4 | |
| Intel NUC11TNKi5 | |
| Average AMD Radeon RX Vega 7 (25.5 - 105.8, n=53) | |
| 1366x768 Medium Graphics & Postprocessing | |
| Intel NUC11PHKi7C | |
| Honor MagicBook 14 2022 | |
| Lenovo Yoga 7-14ARB G7 | |
| Beelink GTR5 | |
| Beelink SEi11 Pro | |
| Beelink SER Pro Ryzen 5 5600H | |
| Beelink SER4 | |
| Average AMD Radeon RX Vega 7 (9.74 - 81.3, n=39) | |
| 1920x1080 High Graphics & Postprocessing (Nvidia HairWorks Off) | |
| Intel NUC11PHKi7C | |
| Honor MagicBook 14 2022 | |
| Lenovo Yoga 7-14ARB G7 | |
| Beelink SEi11 Pro | |
| Beelink GTR5 | |
| Beelink SER Pro Ryzen 5 5600H | |
| Beelink SER4 | |
| Average AMD Radeon RX Vega 7 (8.96 - 26.2, n=52) | |
| 1920x1080 Ultra Graphics & Postprocessing (HBAO+) | |
| Intel NUC11PHKi7C | |
| Honor MagicBook 14 2022 | |
| Lenovo Yoga 7-14ARB G7 | |
| Beelink GTR5 | |
| Beelink SER Pro Ryzen 5 5600H | |
| Beelink SER4 | |
| Beelink SEi11 Pro | |
| Average AMD Radeon RX Vega 7 (6.5 - 15.8, n=44) | |
| X-Plane 11.11 | |
| 1280x720 low (fps_test=1) | |
| Honor MagicBook 14 2022 | |
| Intel NUC11PHKi7C | |
| Beelink GTR5 | |
| Beelink SEi11 Pro | |
| Lenovo Yoga 7-14ARB G7 | |
| Beelink SER Pro Ryzen 5 5600H | |
| Beelink SER4 | |
| Average AMD Radeon RX Vega 7 (24.7 - 53.4, n=60) | |
| Intel NUC11TNKi5 | |
| Intel NUC10i7FNH | |
| Zotac ZBOX PI336 pico | |
| 1920x1080 med (fps_test=2) | |
| Honor MagicBook 14 2022 | |
| Intel NUC11PHKi7C | |
| Beelink GTR5 | |
| Lenovo Yoga 7-14ARB G7 | |
| Beelink SEi11 Pro | |
| Beelink SER Pro Ryzen 5 5600H | |
| Beelink SER4 | |
| Average AMD Radeon RX Vega 7 (19.3 - 40.3, n=60) | |
| Intel NUC11TNKi5 | |
| Intel NUC10i7FNH | |
| Zotac ZBOX PI336 pico | |
| 1920x1080 high (fps_test=3) | |
| Honor MagicBook 14 2022 | |
| Intel NUC11PHKi7C | |
| Beelink GTR5 | |
| Beelink SEi11 Pro | |
| Lenovo Yoga 7-14ARB G7 | |
| Beelink SER Pro Ryzen 5 5600H | |
| Beelink SER4 | |
| Intel NUC11TNKi5 | |
| Average AMD Radeon RX Vega 7 (17.4 - 35.7, n=60) | |
| Intel NUC10i7FNH | |
| Zotac ZBOX PI336 pico | |
| Final Fantasy XV Benchmark | |
| 1280x720 Lite Quality | |
| Intel NUC11PHKi7C | |
| Honor MagicBook 14 2022 | |
| Lenovo Yoga 7-14ARB G7 | |
| Beelink GTR5 | |
| Beelink SER Pro Ryzen 5 5600H | |
| Beelink SEi11 Pro | |
| Beelink SER4 | |
| Average AMD Radeon RX Vega 7 (17.1 - 41.1, n=44) | |
| Intel NUC11TNKi5 | |
| Zotac ZBOX PI336 pico | |
| 1920x1080 Standard Quality | |
| Intel NUC11PHKi7C | |
| Honor MagicBook 14 2022 | |
| Lenovo Yoga 7-14ARB G7 | |
| Beelink GTR5 | |
| Beelink SEi11 Pro | |
| Beelink SER Pro Ryzen 5 5600H | |
| Beelink SER4 | |
| Average AMD Radeon RX Vega 7 (8.9 - 20.3, n=44) | |
| Intel NUC11TNKi5 | |
| Zotac ZBOX PI336 pico | |
| 1920x1080 High Quality | |
| Intel NUC11PHKi7C | |
| Honor MagicBook 14 2022 | |
| Lenovo Yoga 7-14ARB G7 | |
| Beelink GTR5 | |
| Beelink SEi11 Pro | |
| Beelink SER Pro Ryzen 5 5600H | |
| Beelink SER4 | |
| Intel NUC11TNKi5 | |
| Average AMD Radeon RX Vega 7 (5.85 - 14.3, n=41) | |
| Strange Brigade | |
| 1280x720 lowest AF:1 | |
| Intel NUC11PHKi7C | |
| Honor MagicBook 14 2022 | |
| Lenovo Yoga 7-14ARB G7 | |
| Beelink GTR5 | |
| Beelink SER Pro Ryzen 5 5600H | |
| Beelink SER4 | |
| Beelink SEi11 Pro | |
| Average AMD Radeon RX Vega 7 (19.4 - 95.3, n=43) | |
| Zotac ZBOX PI336 pico | |
| 1920x1080 medium AA:medium AF:4 | |
| Intel NUC11PHKi7C | |
| Honor MagicBook 14 2022 | |
| Lenovo Yoga 7-14ARB G7 | |
| Beelink GTR5 | |
| Beelink SER Pro Ryzen 5 5600H | |
| Beelink SEi11 Pro | |
| Beelink SER4 | |
| Average AMD Radeon RX Vega 7 (13.4 - 36.1, n=43) | |
| 1920x1080 high AA:high AF:8 | |
| Intel NUC11PHKi7C | |
| Honor MagicBook 14 2022 | |
| Lenovo Yoga 7-14ARB G7 | |
| Beelink GTR5 | |
| Beelink SER Pro Ryzen 5 5600H | |
| Beelink SER4 | |
| Beelink SEi11 Pro | |
| Average AMD Radeon RX Vega 7 (11.5 - 30.1, n=43) | |
| 1920x1080 ultra AA:ultra AF:16 | |
| Intel NUC11PHKi7C | |
| Honor MagicBook 14 2022 | |
| Lenovo Yoga 7-14ARB G7 | |
| Beelink GTR5 | |
| Beelink SER Pro Ryzen 5 5600H | |
| Beelink SER4 | |
| Beelink SEi11 Pro | |
| Average AMD Radeon RX Vega 7 (9.9 - 25.5, n=41) | |
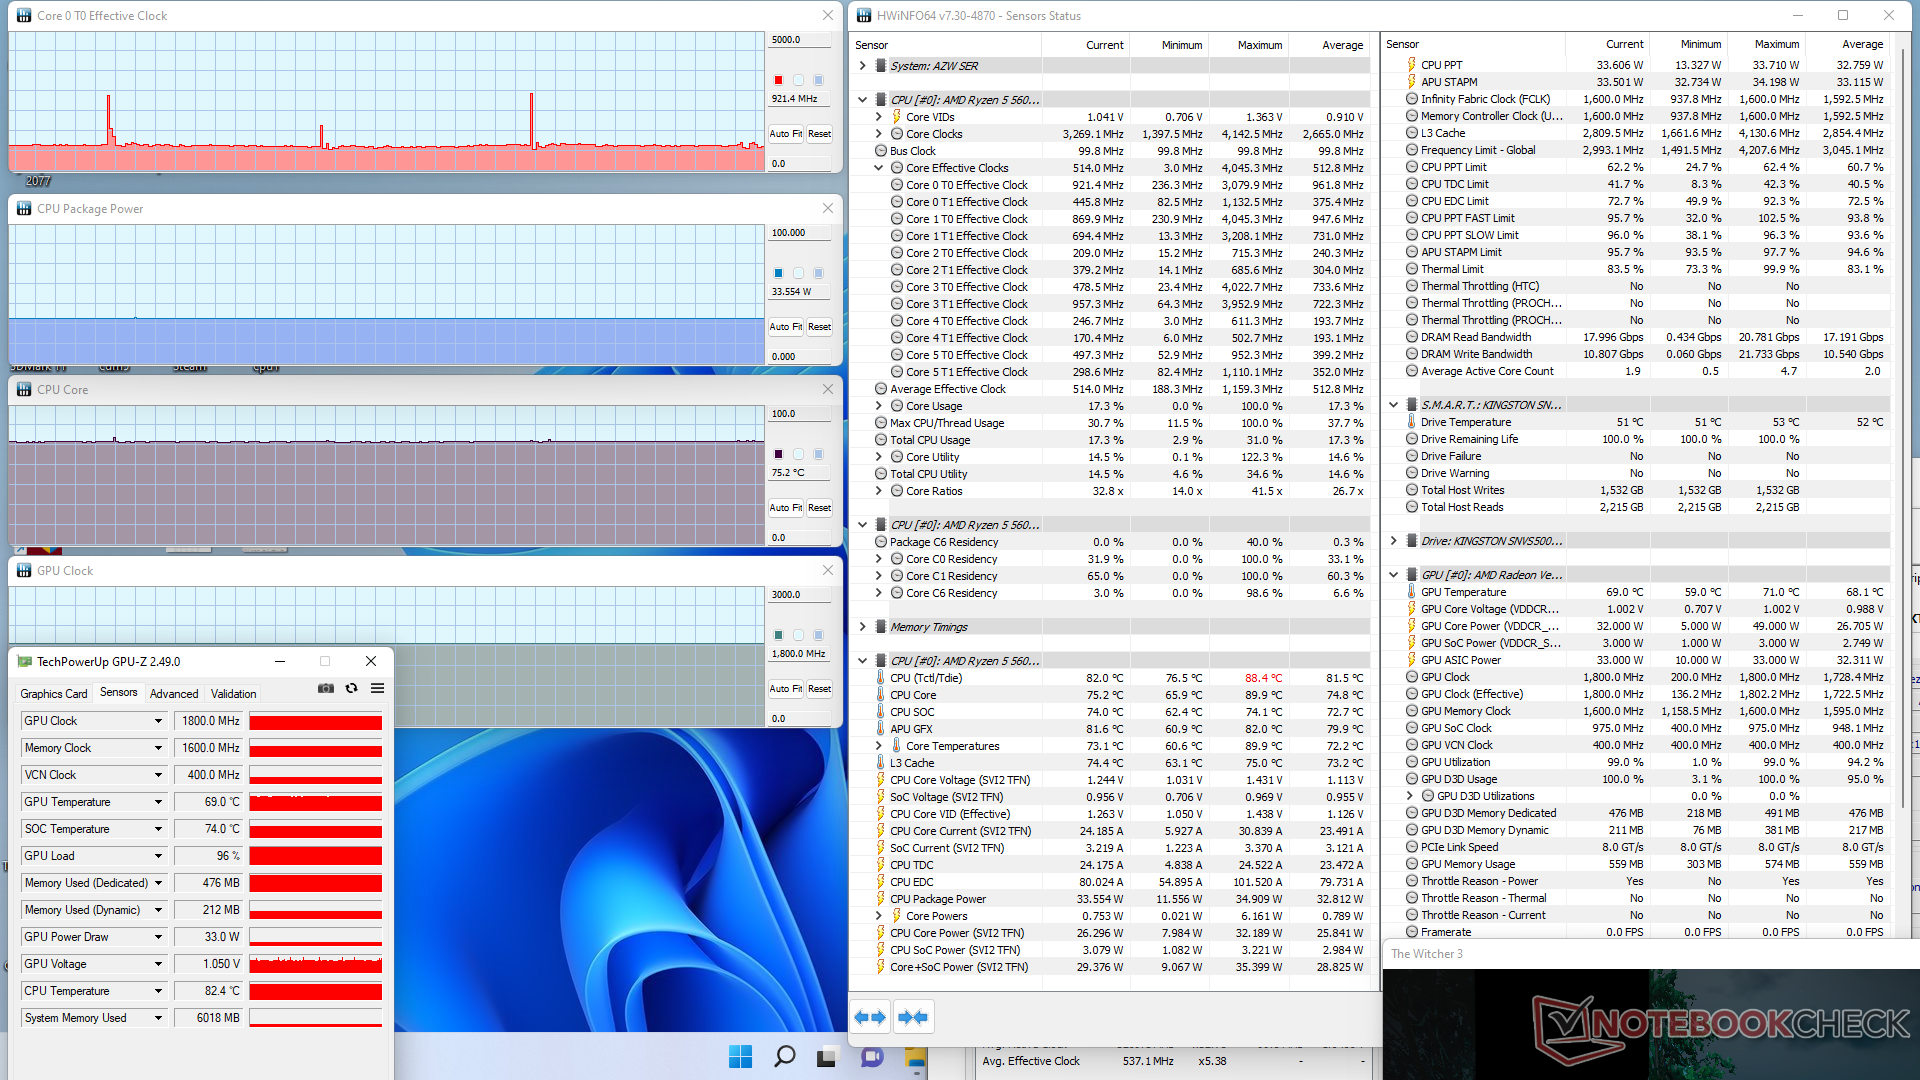
不幸的是,帧率并不像我们希望的那样稳定。当闲置在 Witcher 3时,帧率有时会下降到60FPS,甚至19FPS,似乎没有任何理由,如下图所示。对背景活动的处理不当可能是造成帧率中断的原因。
Witcher 3 FPS Chart
| low | med. | high | ultra | |
|---|---|---|---|---|
| GTA V (2015) | 132.9 | 117.6 | 32.2 | 14.5 |
| The Witcher 3 (2015) | 79.2 | 48.7 | 25.1 | 15.8 |
| Dota 2 Reborn (2015) | 137.5 | 103.1 | 59.3 | 56.3 |
| Final Fantasy XV Benchmark (2018) | 41.1 | 20.3 | 14.3 | |
| X-Plane 11.11 (2018) | 53.4 | 40.3 | 35.7 | |
| Strange Brigade (2018) | 95.3 | 36 | 30.1 | 25.5 |
| Cyberpunk 2077 1.6 (2022) | 20.9 | 16.2 | 11.4 |
排放
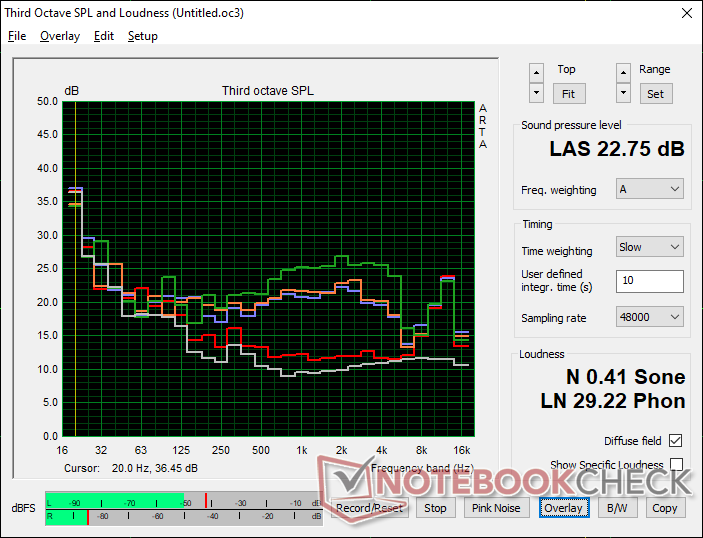
系统噪音
我们的测试装置受到了电子噪音或线圈啸叫的影响。因此,我们能够记录到26.1 dB(A)的噪音,而沉默的背景是22.8 dB(A),即使是在没有运行应用程序的情况下在桌面上空转。在网络浏览或视频流等典型负载期间,风扇噪音将在28.7 dB(A)范围内徘徊,这比NUC11TNK更安静。
在运行游戏等更高要求的负载时,风扇噪音在32至37 dB(A)之间,这又比NUC11TNK和更快的NUC11TNK更安静。 贝加莱GTR5.相对于你得到的性能,这是一台安静的迷你电脑。
Noise level
| Idle |
| 26.1 / 26.1 / 28.7 dB(A) |
| Load |
| 32.3 / 36.4 dB(A) |
 | ||
30 dB silent 40 dB(A) audible 50 dB(A) loud |
||
min: | ||
| Beelink SER Pro Ryzen 5 5600H Vega 7, R5 5600H, Kingston NV1 SNVS/500GCN | Beelink SEi11 Pro Iris Xe G7 96EUs, i5-11320H, Kingston NV1 SNVS/500GCN | Beelink GTR5 Vega 8, R9 5900HX, Kingston NV1 SNVS/500GCN | Intel NUC11TNKi5 Iris Xe G7 80EUs, i5-1135G7, Transcend M.2 SSD 430S TS512GMTS430S | Beelink SEi8 Iris Plus Graphics 655, i3-8109U, Intel SSD 660p SSDPEKNW512G8 | Beelink SER4 Vega 8, R7 4800U, Intel SSD 660p SSDPEKNW512G8 | |
|---|---|---|---|---|---|---|
| Noise | 1% | -24% | -23% | -7% | -18% | |
| off / environment * (dB) | 22.8 | 22.8 -0% | 23.1 -1% | 24.8 -9% | 24.5 -7% | 23.4 -3% |
| Idle Minimum * (dB) | 26.1 | 24.7 5% | 34.2 -31% | 35.6 -36% | 26.5 -2% | 33.2 -27% |
| Idle Average * (dB) | 26.1 | 24.7 5% | 34.2 -31% | 35.6 -36% | 26.5 -2% | 33.2 -27% |
| Idle Maximum * (dB) | 28.7 | 25.3 12% | 34.2 -19% | 35.6 -24% | 31.1 -8% | 33.2 -16% |
| Load Average * (dB) | 32.3 | 33.2 -3% | 44.6 -38% | 36.2 -12% | 37.7 -17% | 38.6 -20% |
| Witcher 3 ultra * (dB) | 32.8 | 34.5 -5% | 41.4 -26% | 38 -16% | 39.2 -20% | |
| Load Maximum * (dB) | 36.4 | 37.8 -4% | 45.1 -24% | 47.6 -31% | 37.5 -3% | 40.8 -12% |
* ... smaller is better
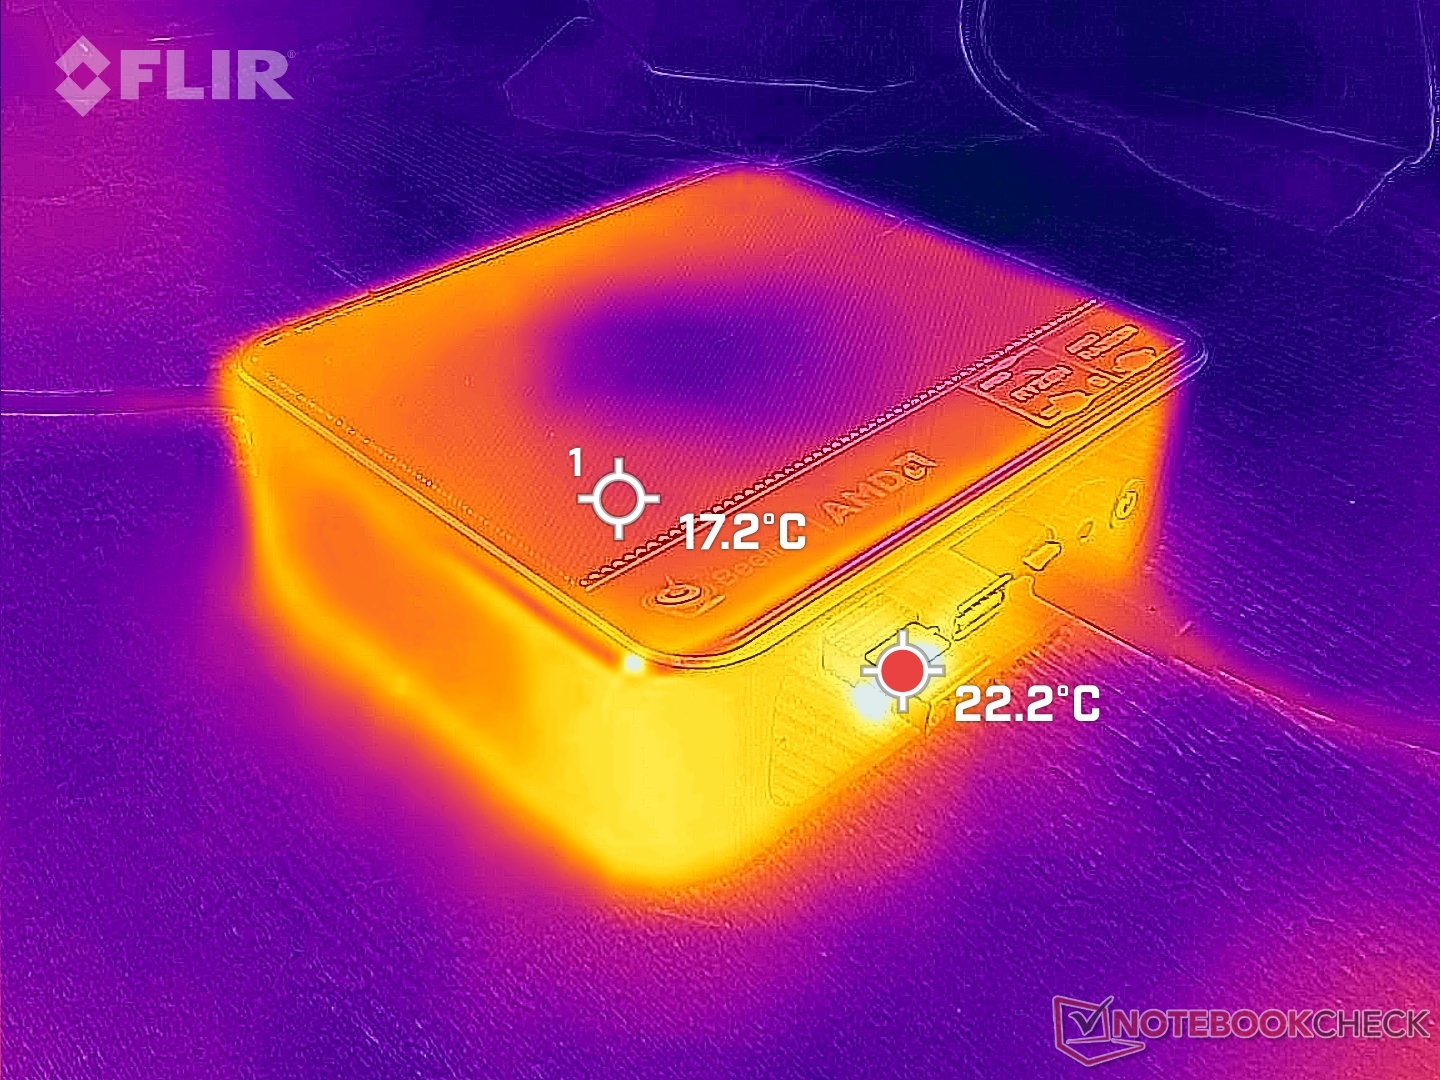
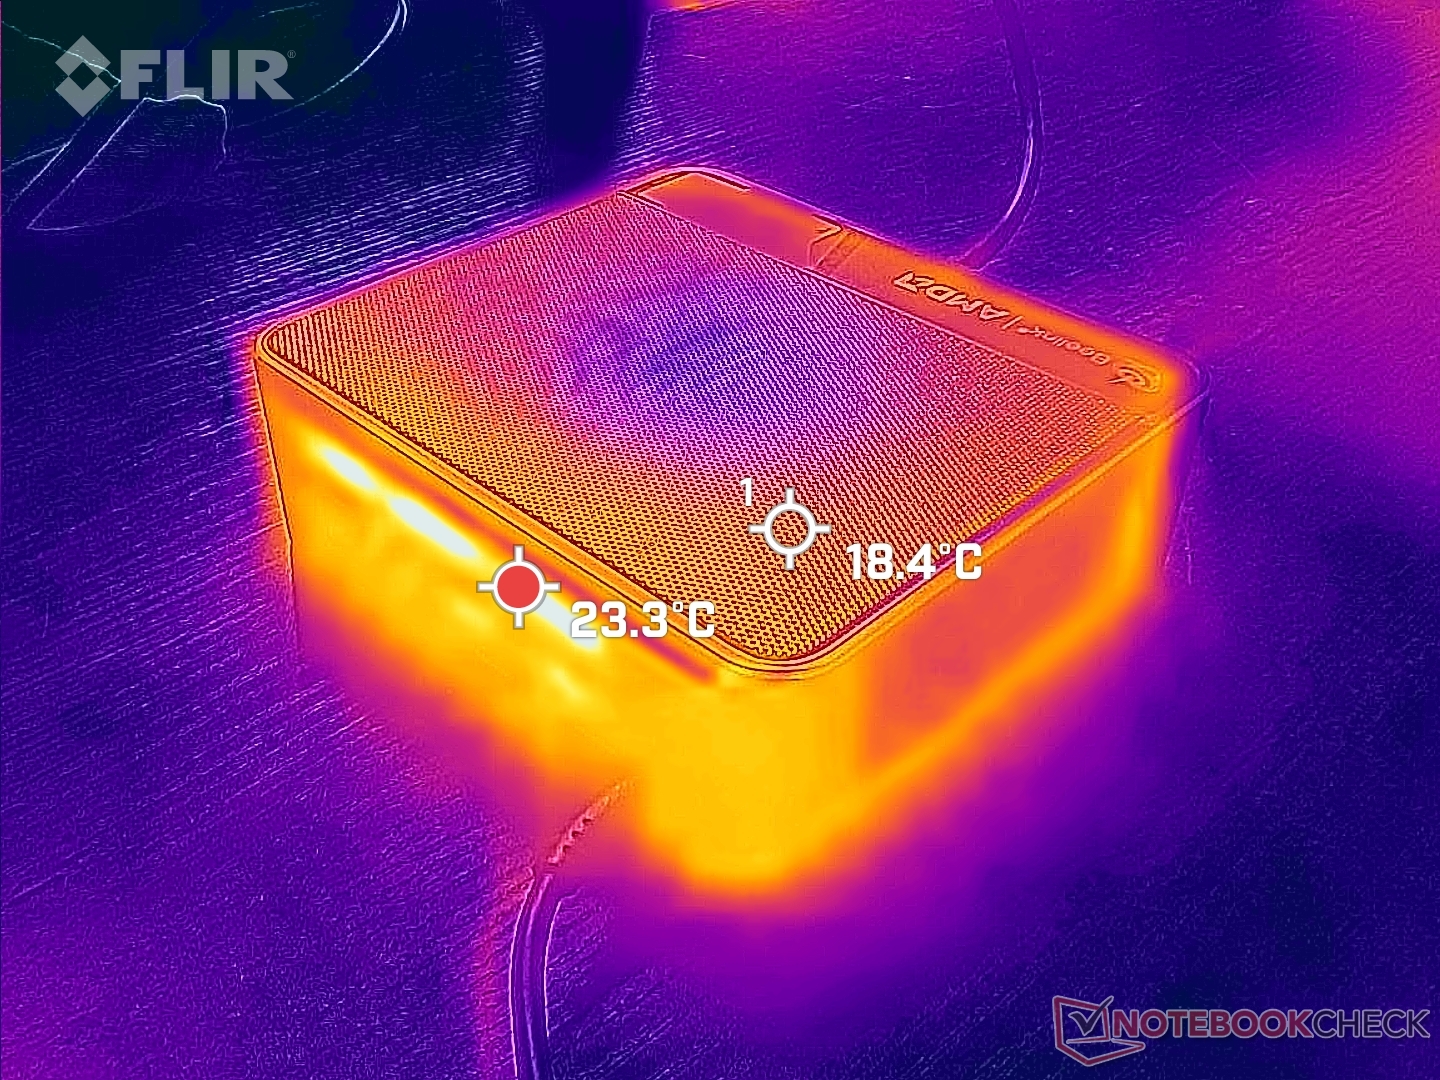
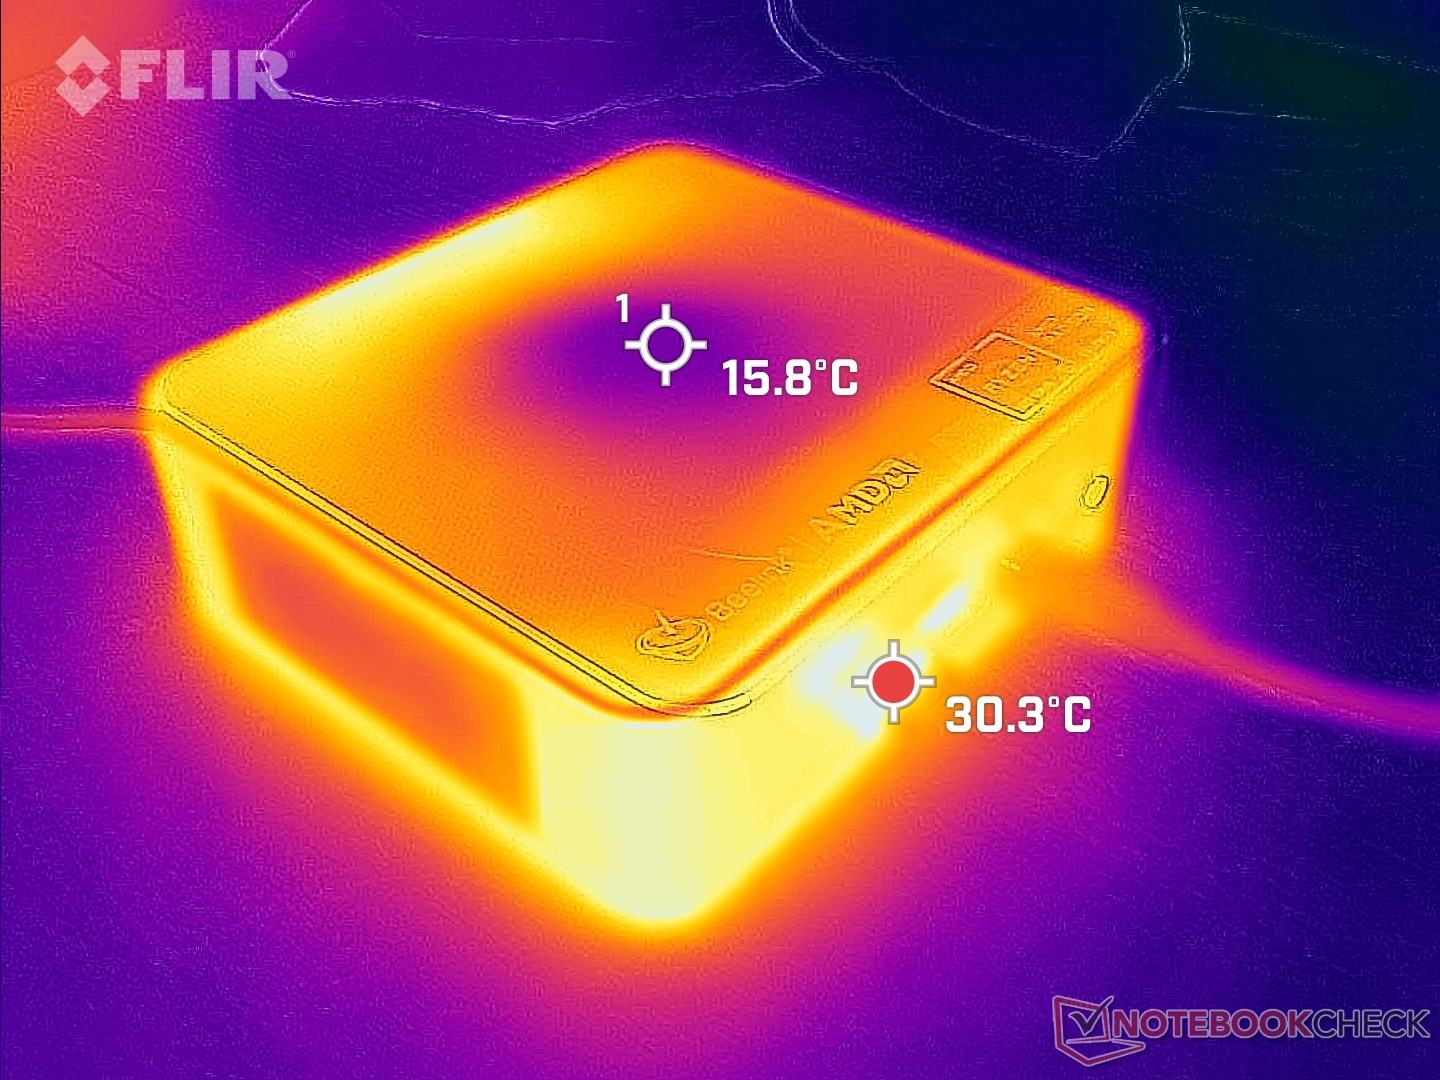
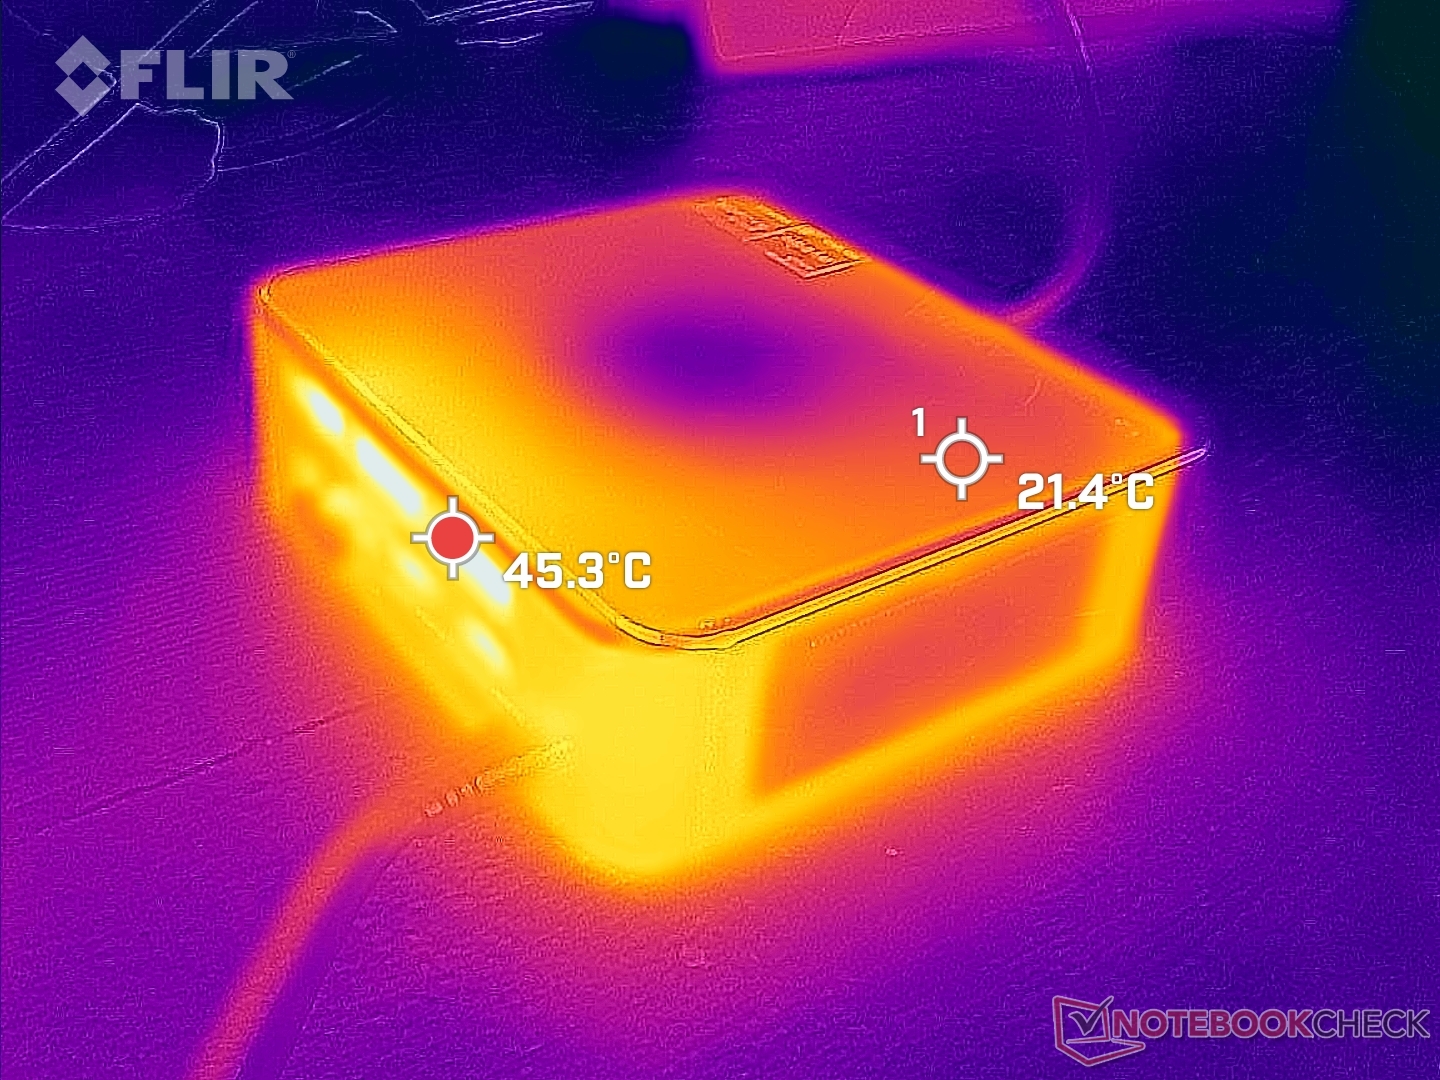
温度
冷空气从顶部进入,废热从后面排出。你要保持顶部没有任何书籍、纸张或其他障碍物,以获得最佳冷却效果。
压力测试
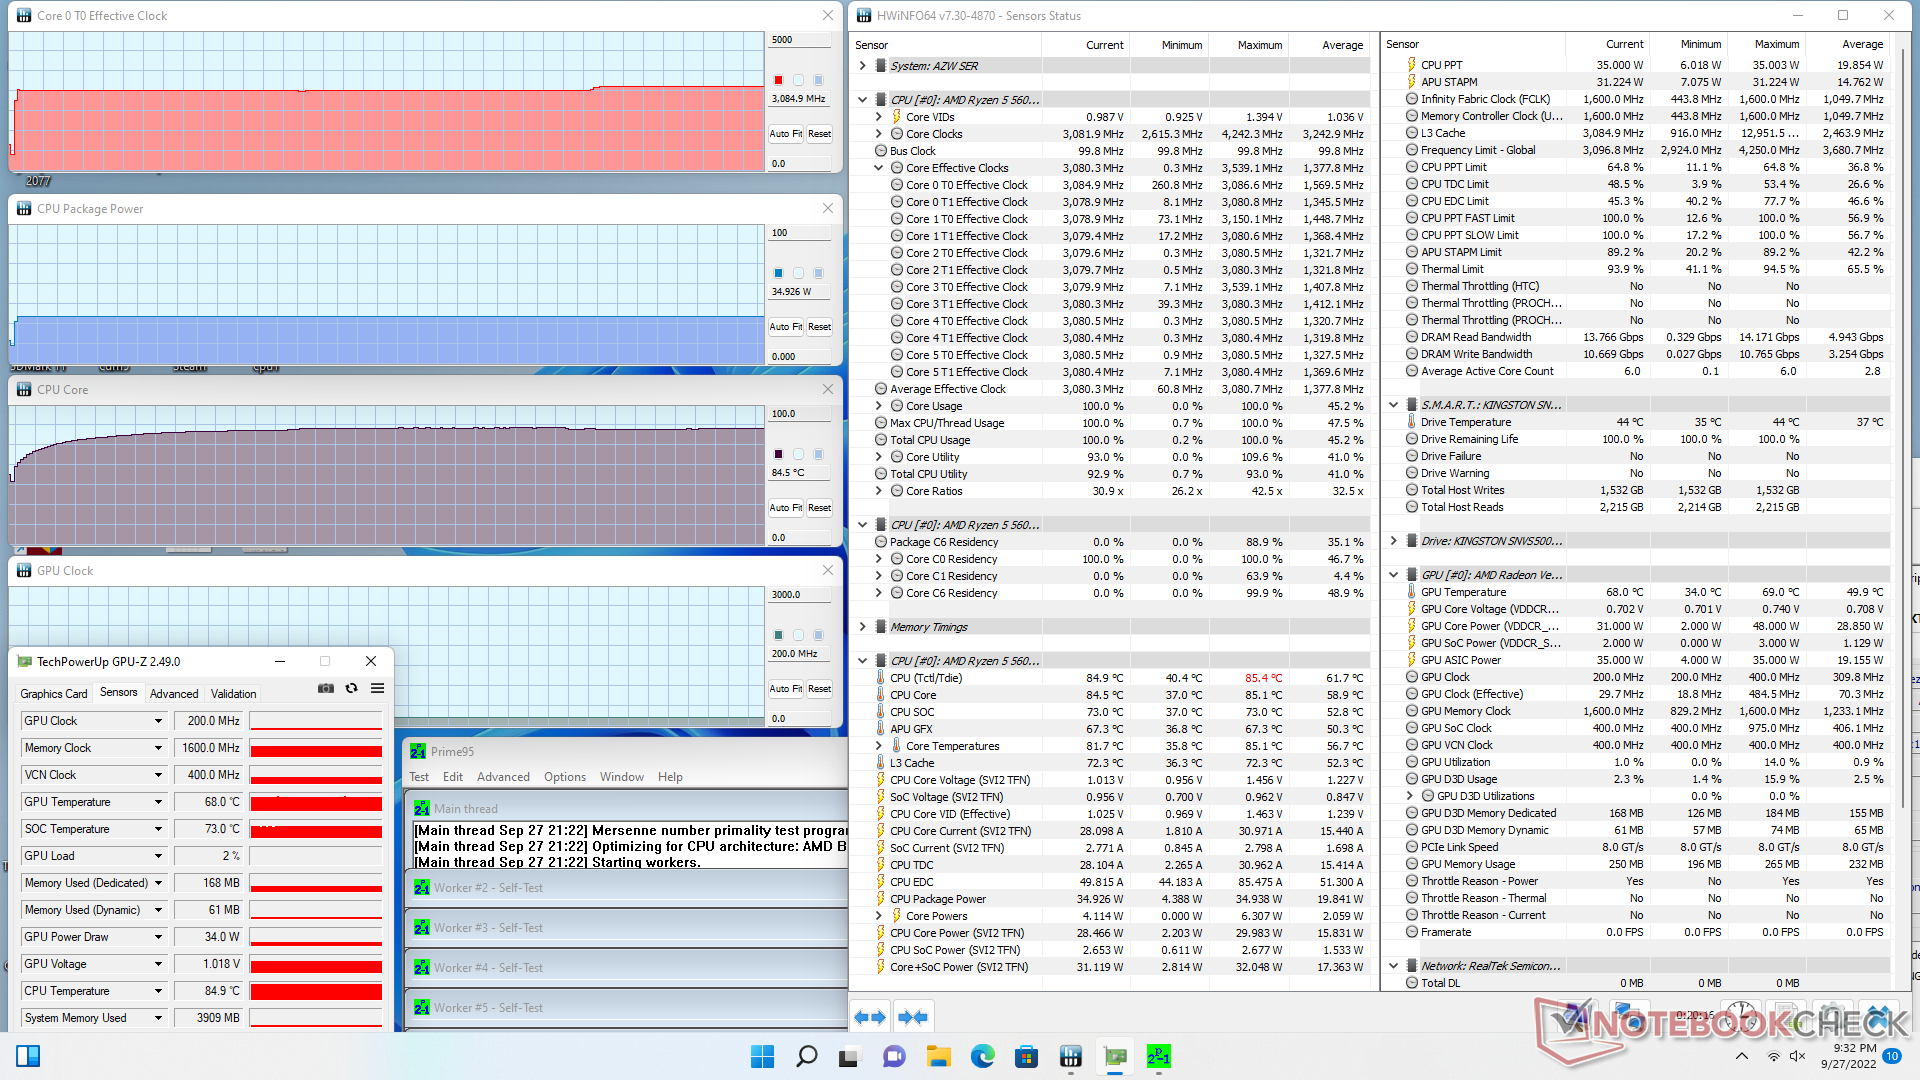
在启动Prime95时,CPU时钟速率和电路板功耗将分别稳定在3.0 GHz和35 W。35 W是Ryzen 5 5600H的低端,因此在SER5上没有看到更高的TDP目标,这有点令人失望。核心温度已经相当高,达到85摄氏度,这可能解释了35瓦的低评级。
运行 Witcher 3将导致75℃的核心温度,而英特尔NUC11PAQ的核心温度为57℃。 英特尔NUC11PAQ.在大多数情况下,Beelink系统的运行温度比英特尔的要高一些。
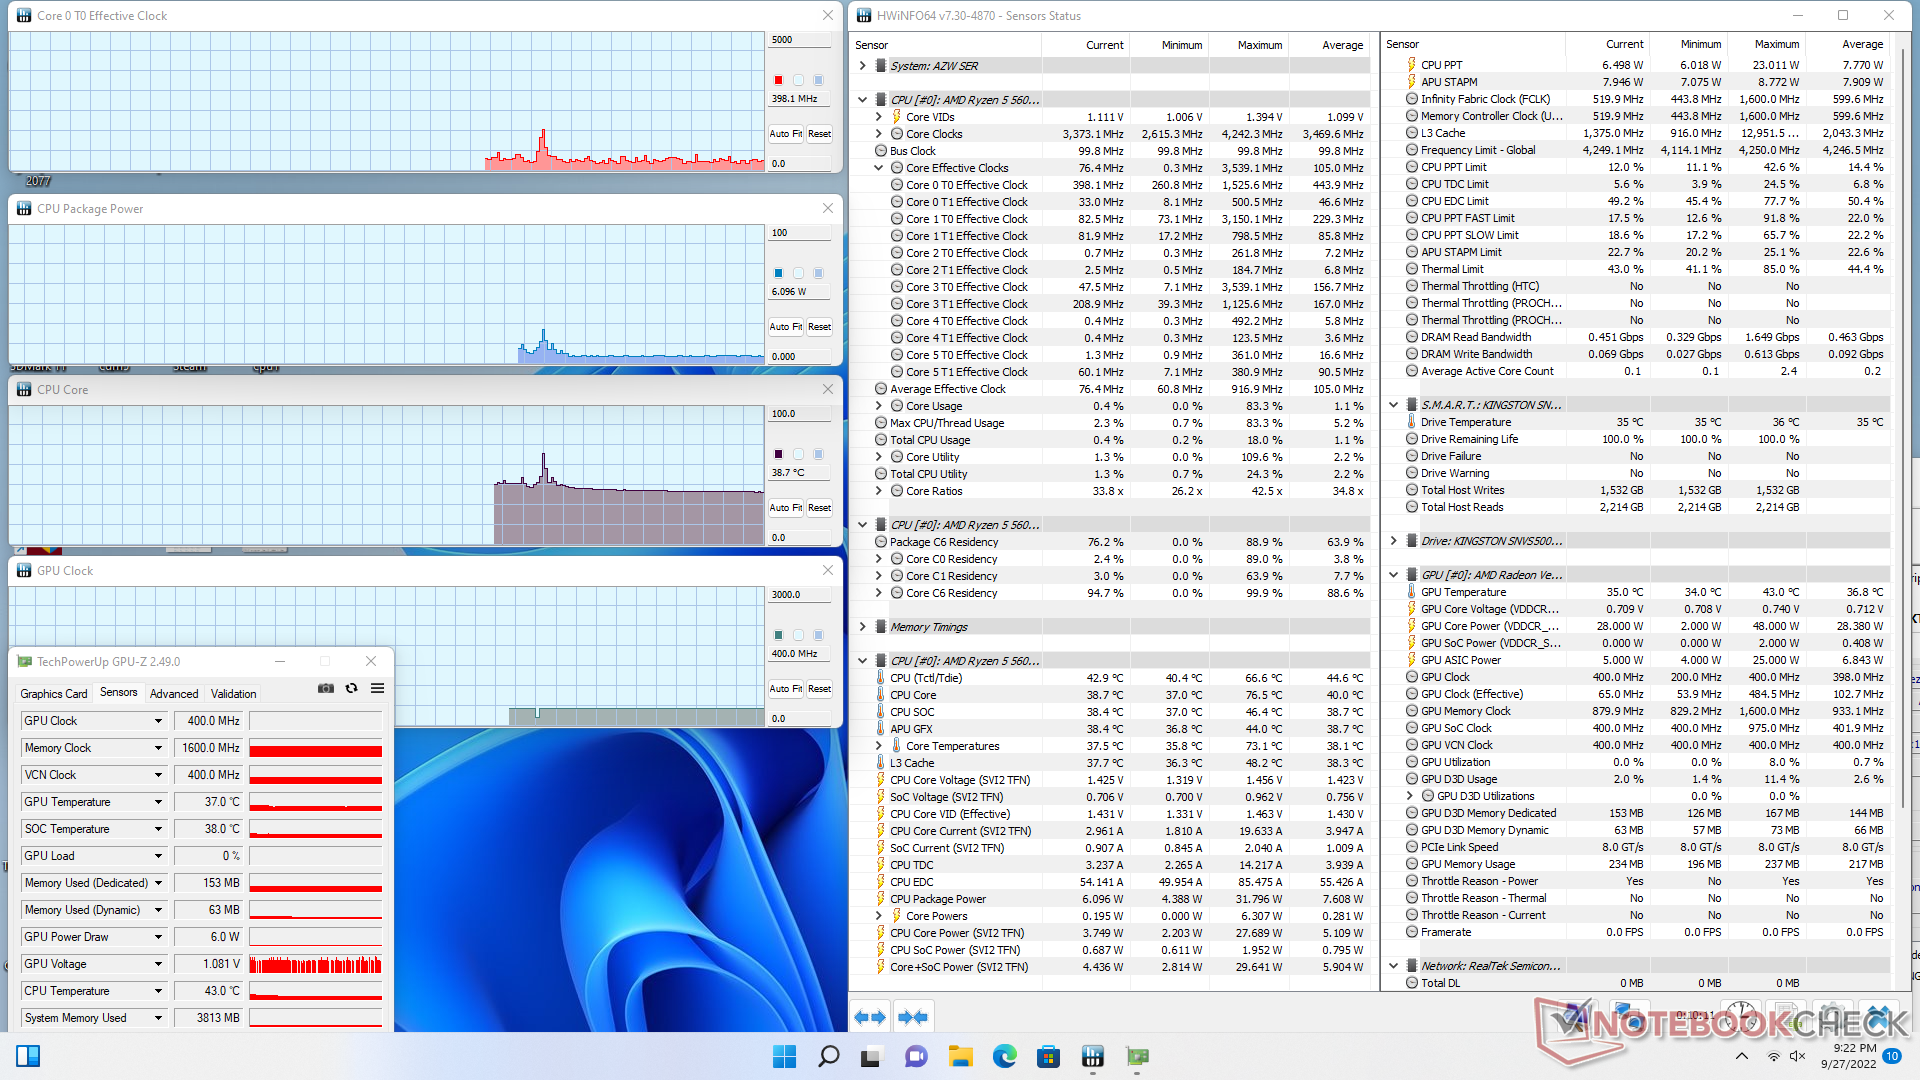
| CPU时钟(GHz) | GPU时钟(MHz) | CPU平均温度(°C) | |
| 系统空闲 | -- | -- | 39 |
| Prime95压力 | 3.0 | -- | 85 |
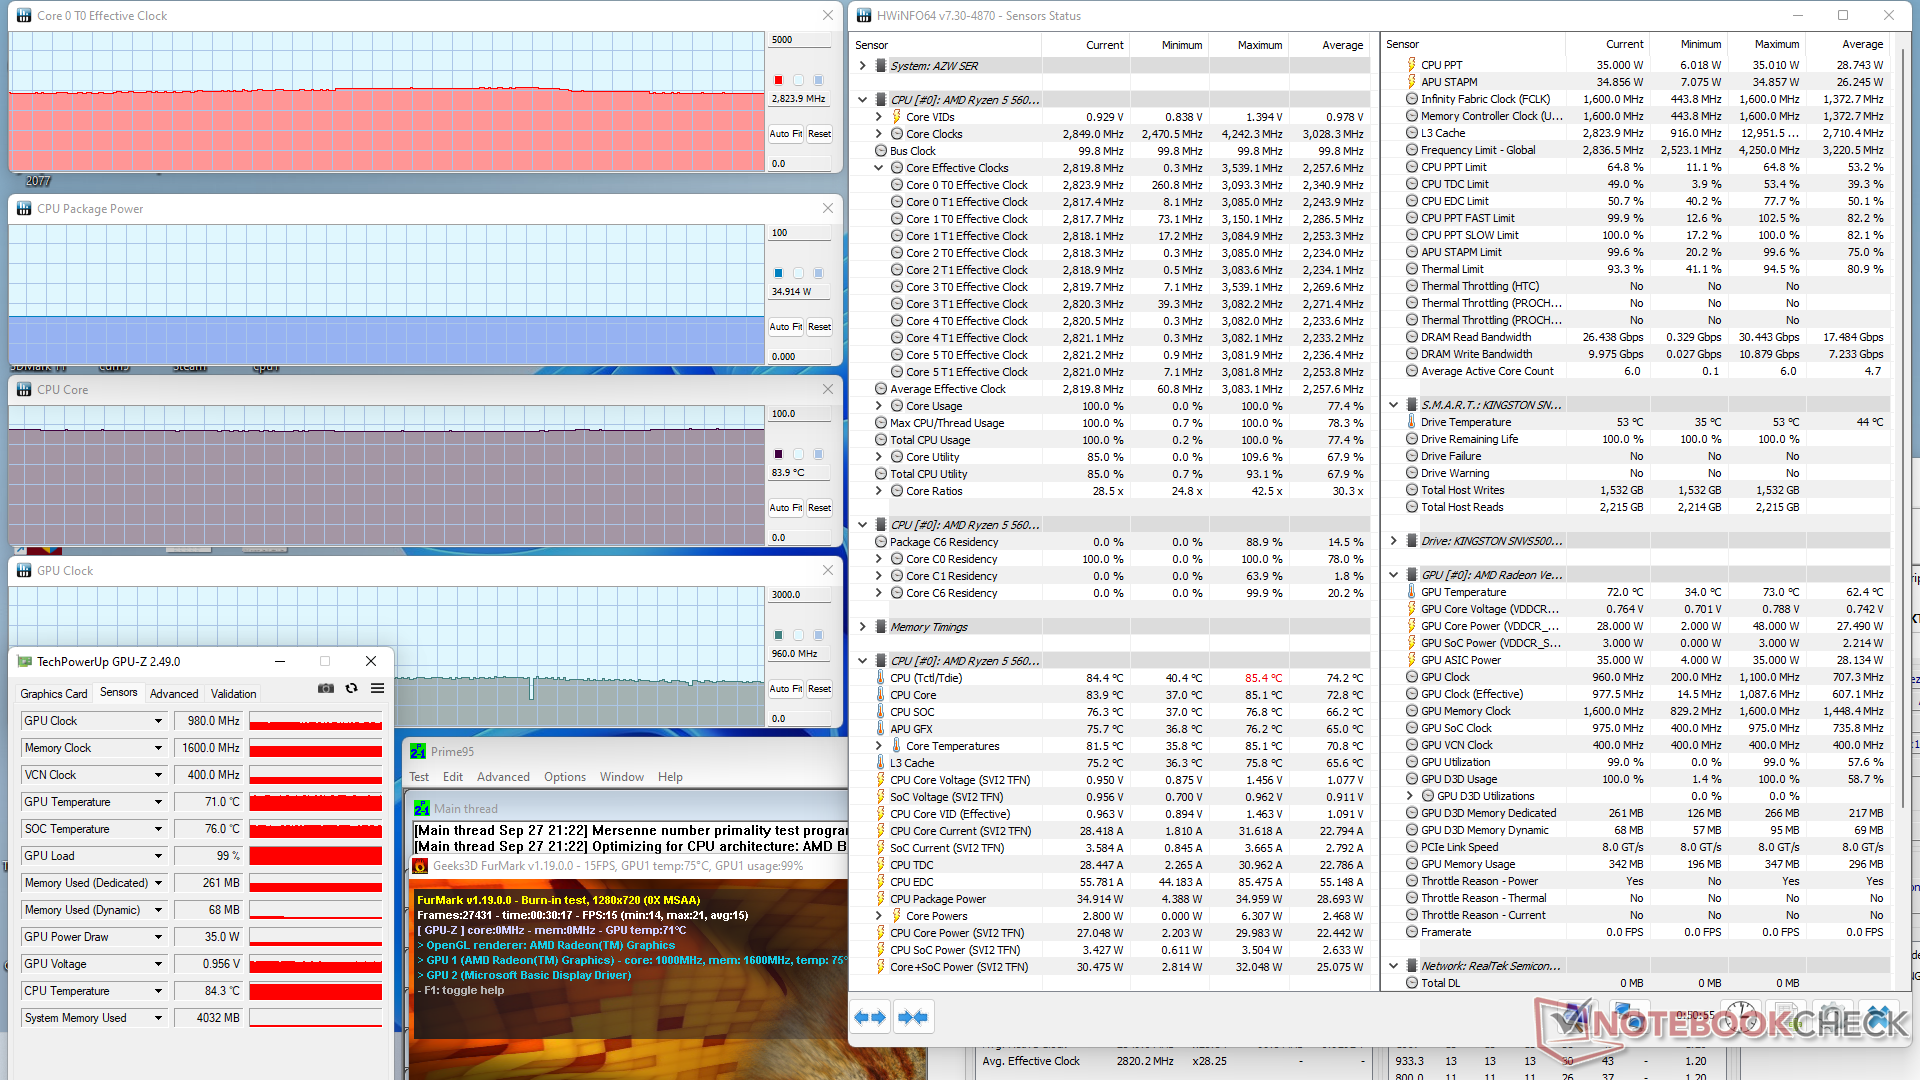
| Prime95 + FurMark压力 | 2.8 | 980 | 84 |
| Witcher 3 应力 | ~0.9 | 1800 | 75 |
能源管理
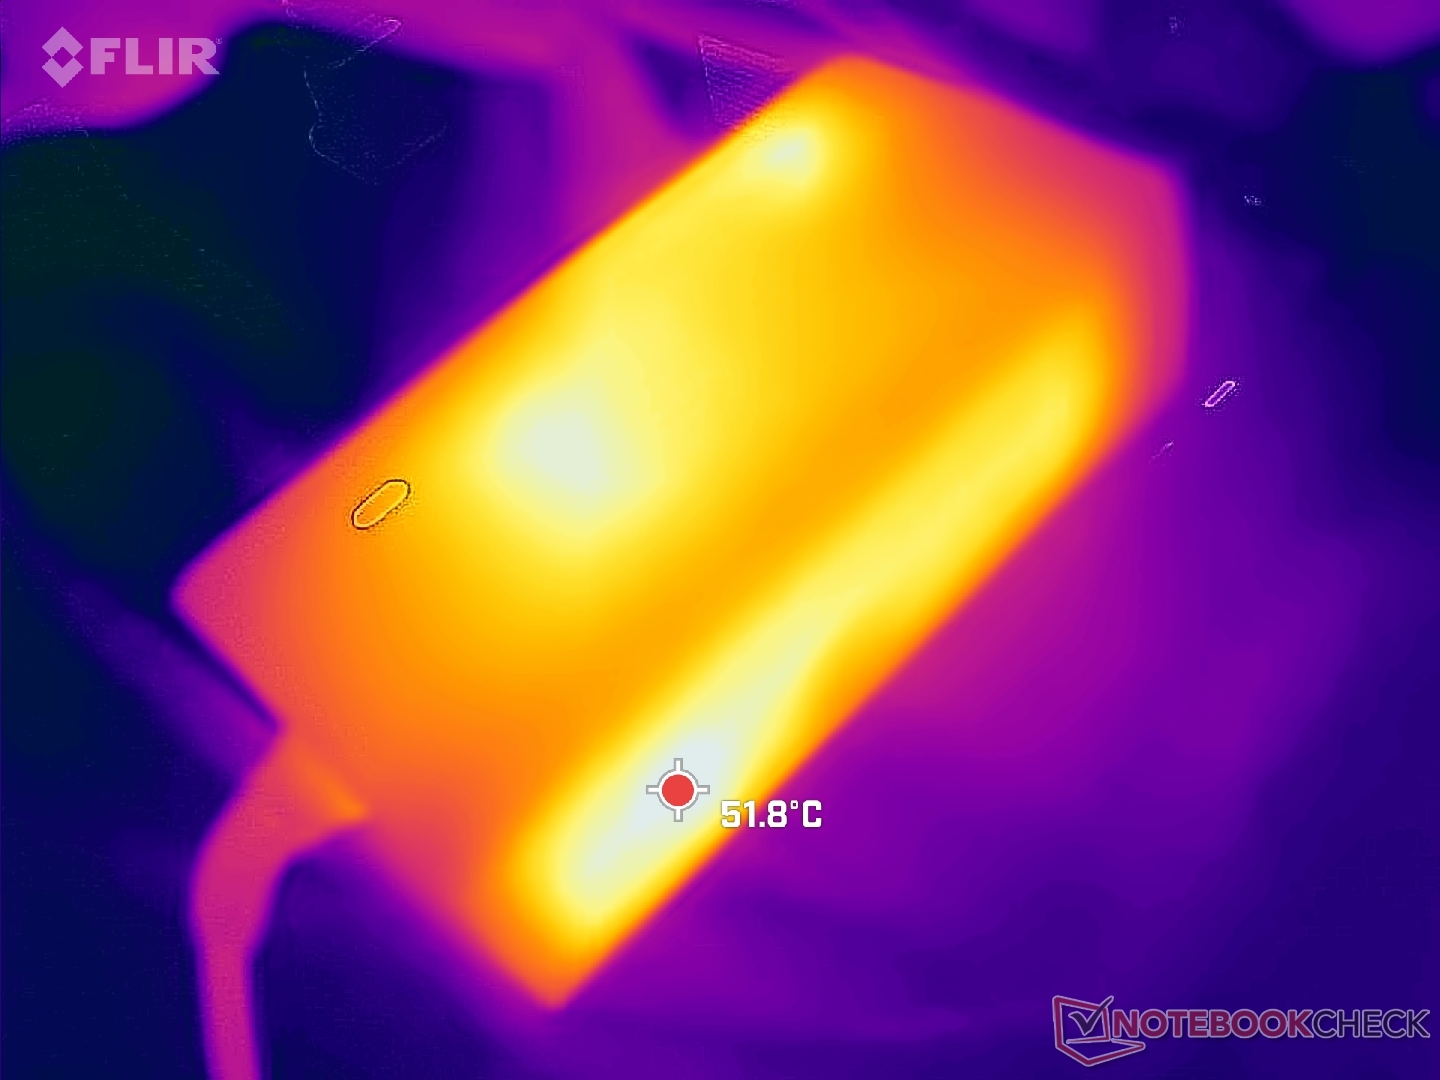
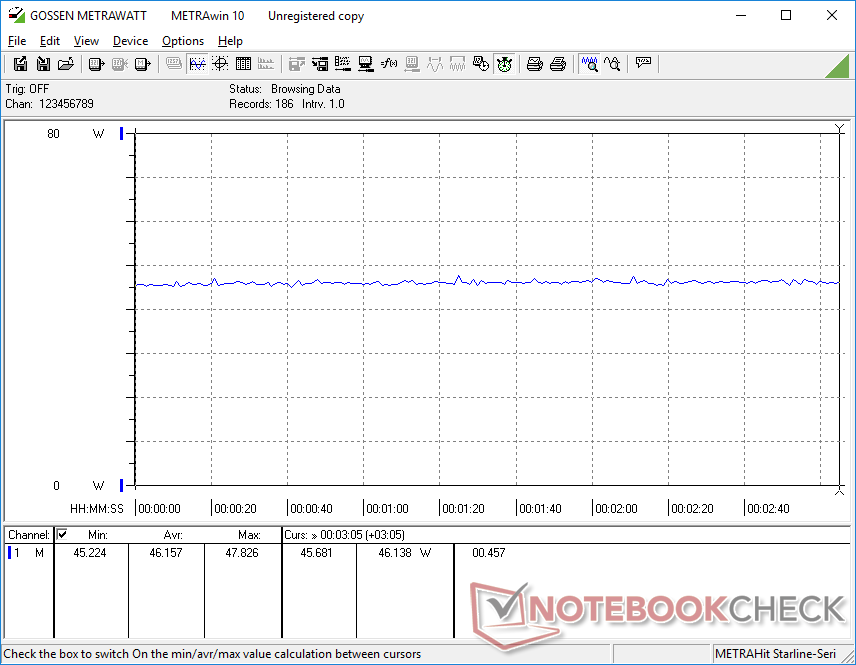
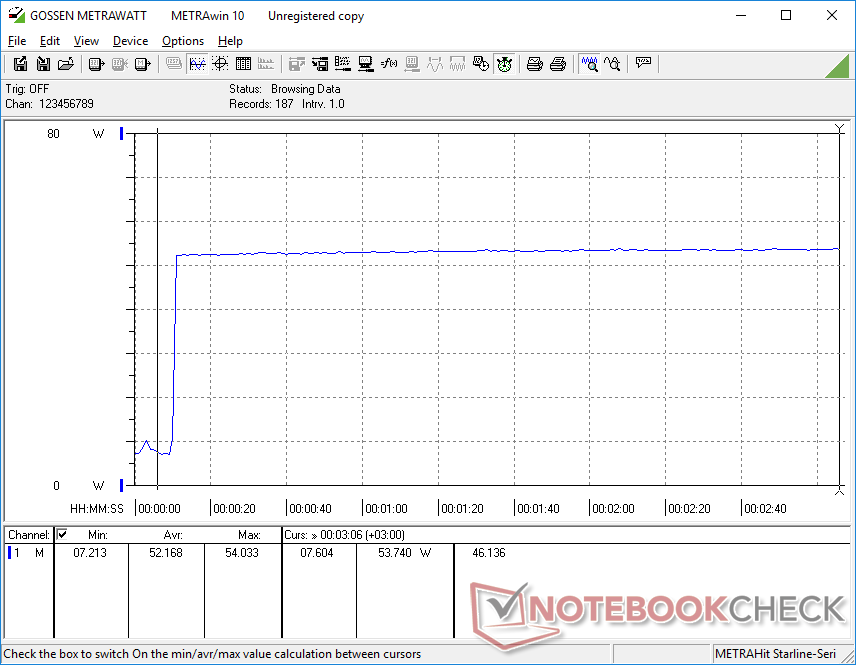
消耗功率
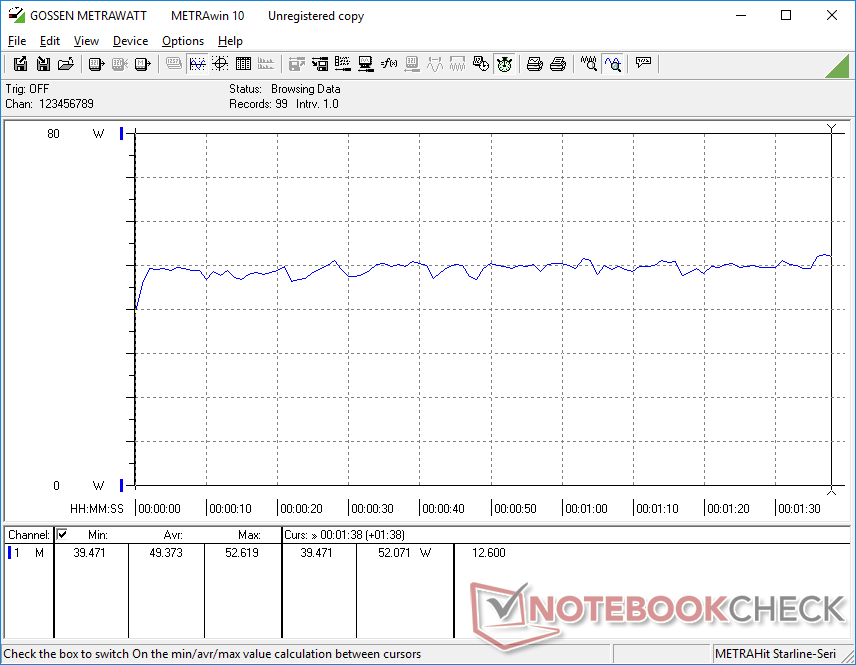
由于我们的Ryzen H系列CPU的目标是相对较高的TDP水平,因此功耗通常高于运行在Ryzen U系列或Core U系列CPU上的机型。使用英特尔NUC11的 酷睿i5-1135G7例如,游戏时需要40至44瓦,而我们的Beelink则需要46至50瓦。Ryzen 5 5600H的每瓦性能仍然更好,特别是在多线程CPU性能方面。
我们能够从中小型(约10 x 4.9 x 3.3厘米)57瓦的壁挂式交流适配器记录到CPU处于100%利用率时的最大功耗为50.2瓦。我们怀疑,如果连接了多个USB设备或外部USB-C显示器,这个数值会更高。

| Off / Standby | |
| Idle | |
| Load |
|
Key:
min: | |
| Beelink SER Pro Ryzen 5 5600H R5 5600H, Vega 7, Kingston NV1 SNVS/500GCN, , x, | Beelink SEi11 Pro i5-11320H, Iris Xe G7 96EUs, Kingston NV1 SNVS/500GCN, , x, | Beelink GTR5 R9 5900HX, Vega 8, Kingston NV1 SNVS/500GCN, , x, | Intel NUC11TNKi5 i5-1135G7, Iris Xe G7 80EUs, Transcend M.2 SSD 430S TS512GMTS430S, , x, | Beelink SEi8 i3-8109U, Iris Plus Graphics 655, Intel SSD 660p SSDPEKNW512G8, , x, | Beelink SER4 R7 4800U, Vega 8, Intel SSD 660p SSDPEKNW512G8, , x, | |
|---|---|---|---|---|---|---|
| Power Consumption | -30% | -28% | -41% | -2% | 32% | |
| Idle Minimum * (Watt) | 5.4 | 9.8 -81% | 6.2 -15% | 11.5 -113% | 7.5 -39% | 4.1 24% |
| Idle Average * (Watt) | 8.2 | 10.3 -26% | 8.9 -9% | 12.4 -51% | 7.6 7% | 4.1 50% |
| Idle Maximum * (Watt) | 8.3 | 10.5 -27% | 9 -8% | 12.9 -55% | 9.2 -11% | 4.6 45% |
| Load Average * (Watt) | 49.3 | 54.2 -10% | 66.8 -35% | 40.7 17% | 41.1 17% | 35.6 28% |
| Witcher 3 ultra * (Watt) | 46.1 | 53.1 -15% | 62.6 -36% | 43.9 5% | 35.6 23% | |
| Load Maximum * (Watt) | 50.2 | 59 -18% | 81.6 -63% | 73.5 -46% | 41.4 18% | 39.9 21% |
* ... smaller is better
Power Consumption Witcher 3 / Stresstest
Power Consumption external Monitor
Pros
Cons
结论--英特尔NUC11的另一个优秀替代品
Beelink SER5 Pro的价格约为450美元,满载16GB内存、500GB存储空间和Windows 11 Pro的授权拷贝。相比之下,配备相同存储和内存容量的英特尔NUC11PAHi7目前售价近900美元。SER5甚至能够提供比英特尔更快的处理器性能和许多相同的可升级选项,包括SODIMM和双存储。如果你想节省几百美元,那么Beelink应该在你的考虑清单上占据重要位置。
Beelink SER5 Pro比性能相似的英特尔NUC便宜数百美元。企业可能仍然喜欢NUC的可靠性,但大多数家庭用户将想考虑更实惠的Beelink。
有一些边角料,但对核心用户体验的影响都不大。与英特尔NUC相比,SER5 Pro缺乏Thunderbolt、防盗锁、PCIe4 SSD支持、三年制造商保修和更强大的机箱骨架。如果这些功能对你来说很重要的话,NUC仍然是更好的投资,但在其他方面的价格节省是相当大的。
价格和可用性
Beelink SER5现在在亚马逊。售价略低于400美元。
Price comparison

