惠普Victus 16游戏笔记本电脑回顾。时尚外壳下的强大硬件
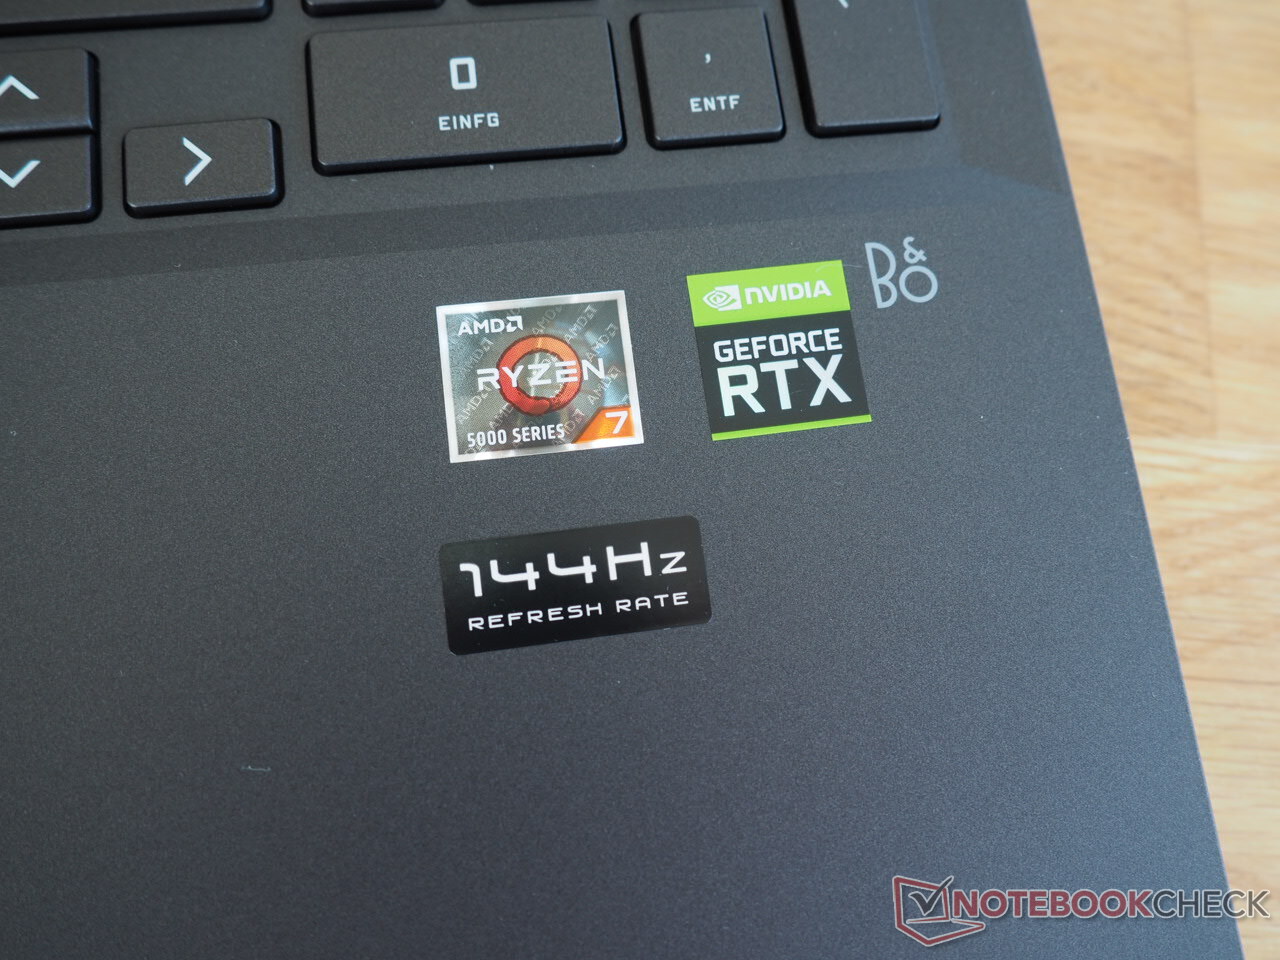
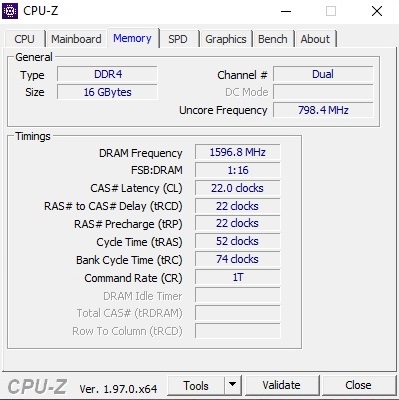
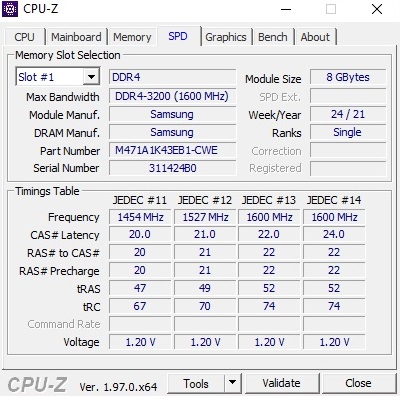
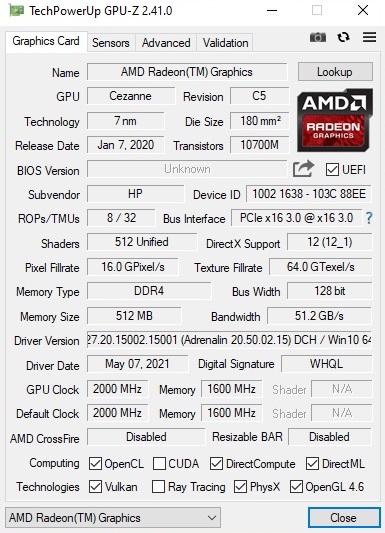
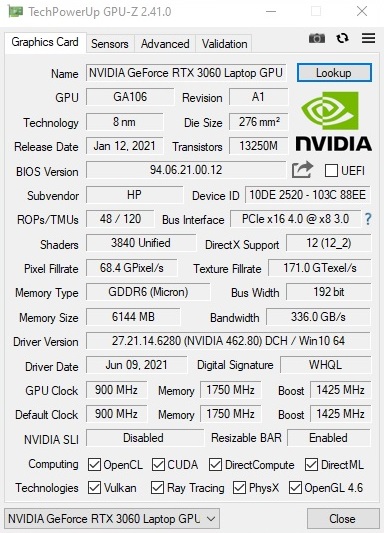
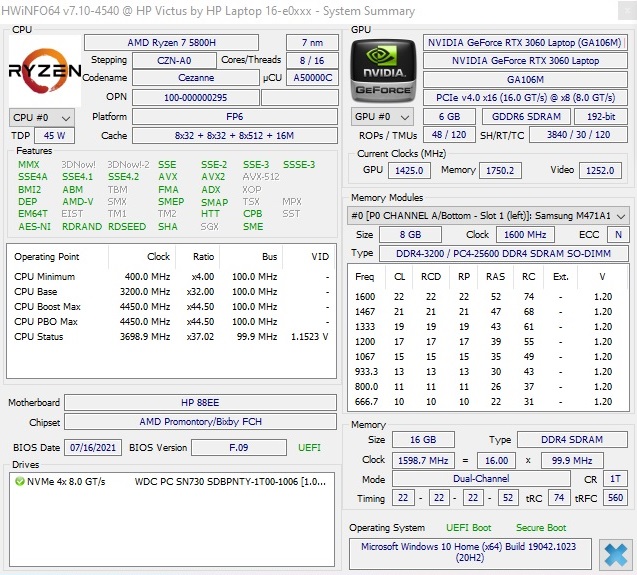
全新的HP Victus 16有各种设备配置。我们的测试设备,标签为e0179ng,售价近1400欧元(约1641美元),包含一个强大的 GeForce RTX 3060与6GB的GDDR6-VRAM和一个非常强大的 Ryzen 7 5800H.它们伴随着双通道模式的16GB内存(2x 8GB DDR4-3.200)和一个大的、1TB NVMe SSD。显示屏是一个基于IPS的16.1英寸哑光面板,分辨率为1920 x 1080像素,支持FreeSync。Windows 10 Home 64位被预装为操作系统。
胜利者16-e0179ng的竞争对手包括其他配备GeForce RTX 3060的游戏笔记本电脑,如 联想Legion 5 15ACH,的竞争者包括其他带有RTX 3060的游戏笔记本,如联想 5 15ACH, Alienware m15 R5,以及 华硕TUF F15 FX506HM.这些竞争对手也被列为我们下面图表中的对比设备。
Possible Competitors in Comparison
Rating | Date | Model | Weight | Height | Size | Resolution | Price |
|---|---|---|---|---|---|---|---|
| 84.3 % v7 (old) | 10 / 2021 | HP Victus 16-e0179ng R7 5800H, GeForce RTX 3060 Laptop GPU | 2.5 kg | 23.5 mm | 16.10" | 1920x1080 | |
| 83.4 % v7 (old) | 09 / 2021 | Lenovo Legion 5 15ACH-82JU00C6GE-FL R7 5800H, GeForce RTX 3060 Laptop GPU | 2.5 kg | 26 mm | 15.60" | 1920x1080 | |
| 84.7 % v7 (old) | 08 / 2025 | Alienware m15 R5 Ryzen Edition R7 5800H, GeForce RTX 3060 Laptop GPU | 2.5 kg | 22.85 mm | 15.60" | 1920x1080 | |
| 85.9 % v7 (old) | 10 / 2021 | Asus TUF Gaming F15 FX506HM i7-11800H, GeForce RTX 3060 Laptop GPU | 2.3 kg | 24.9 mm | 15.60" | 1920x1080 |
案例
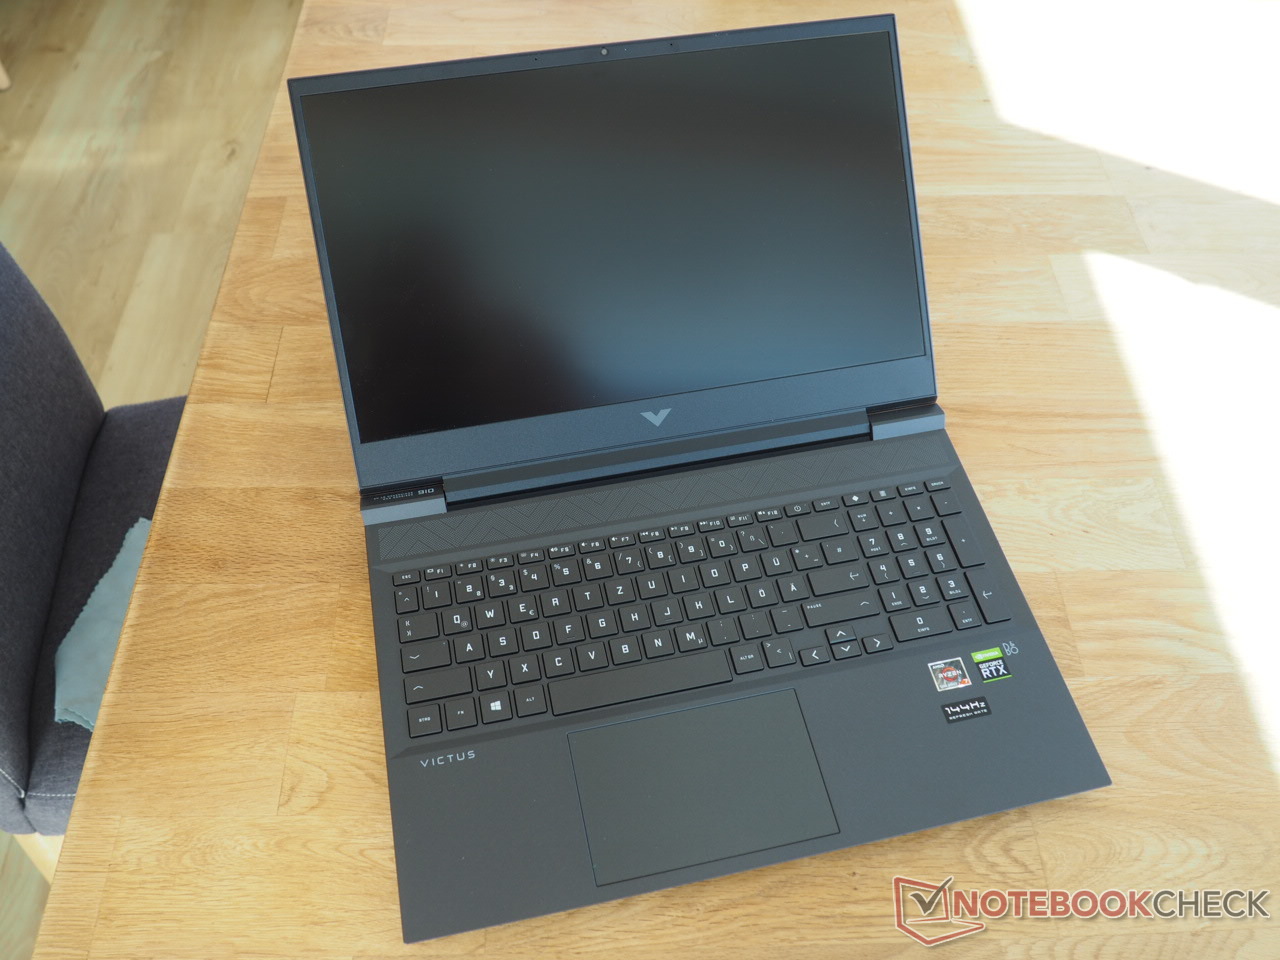
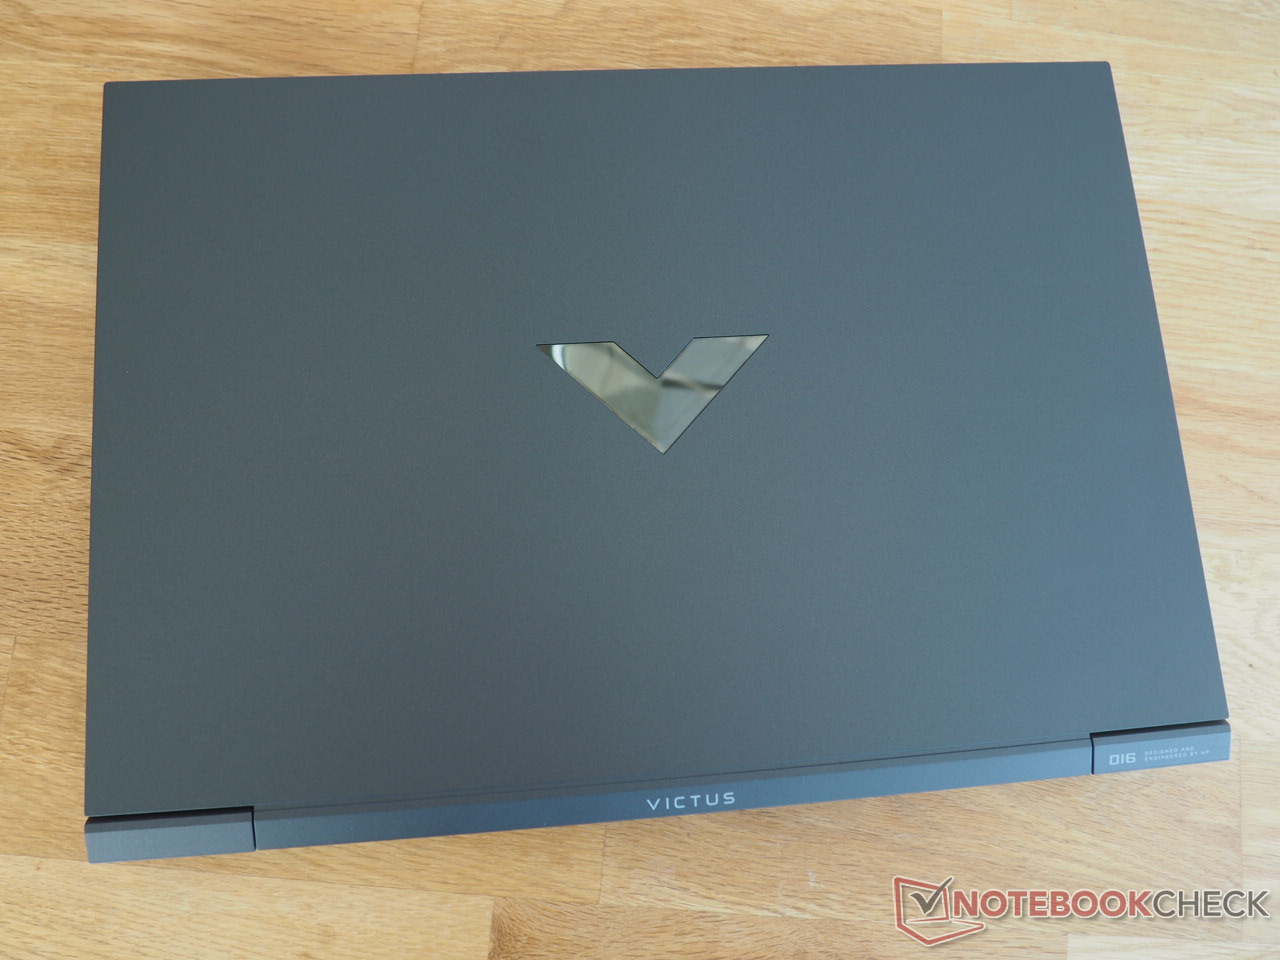
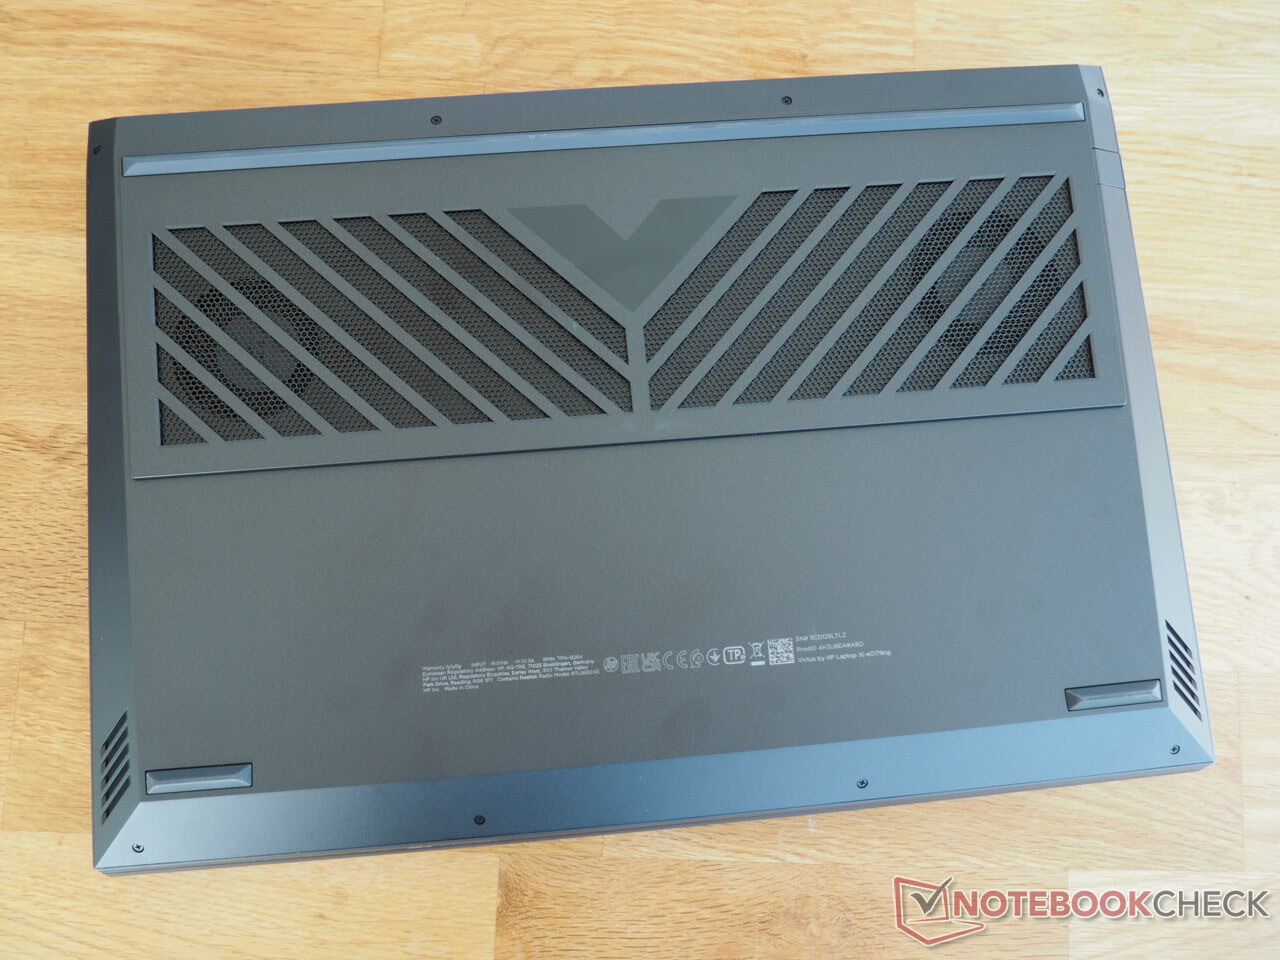
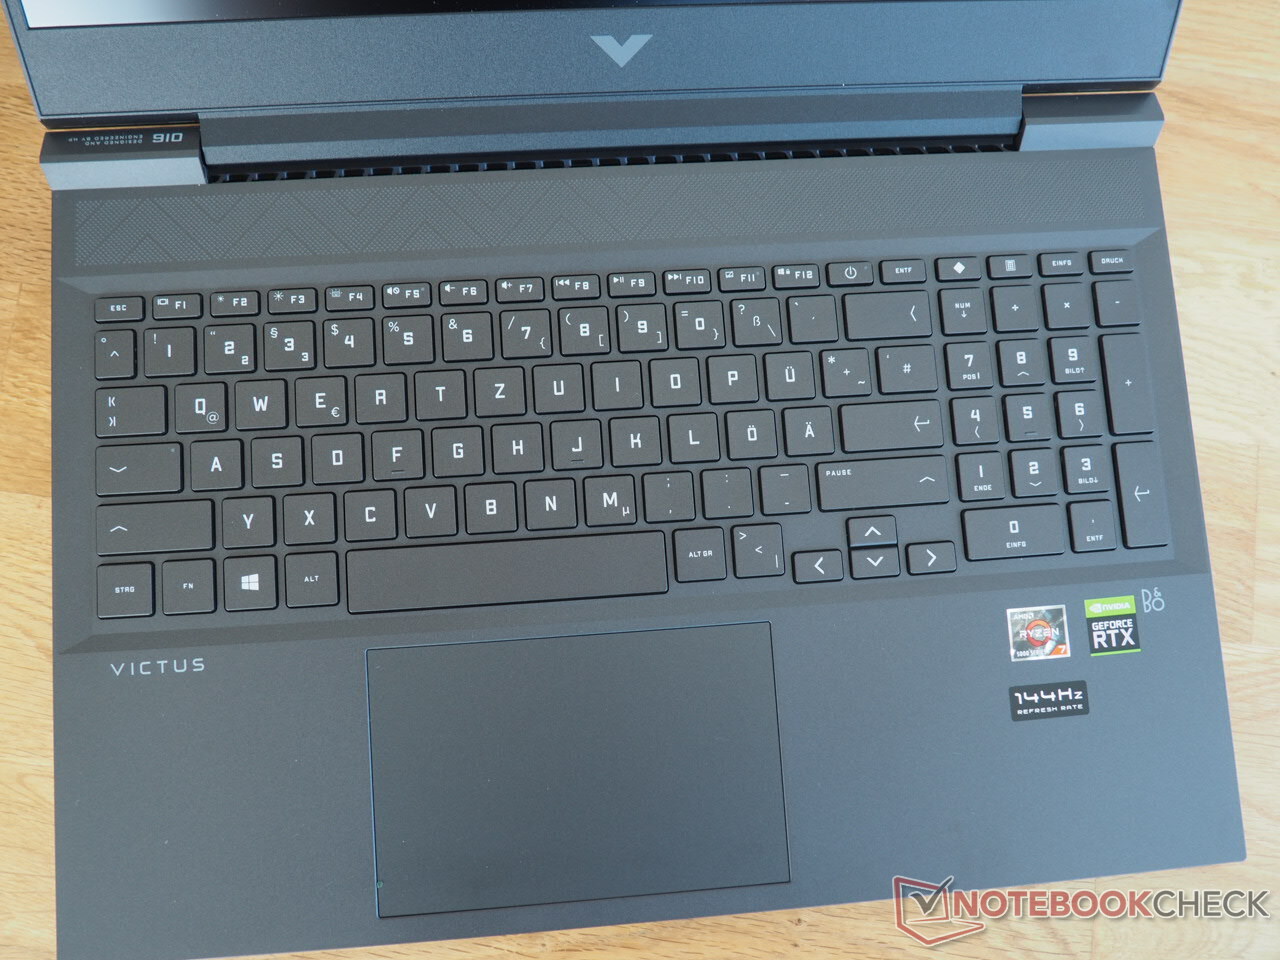
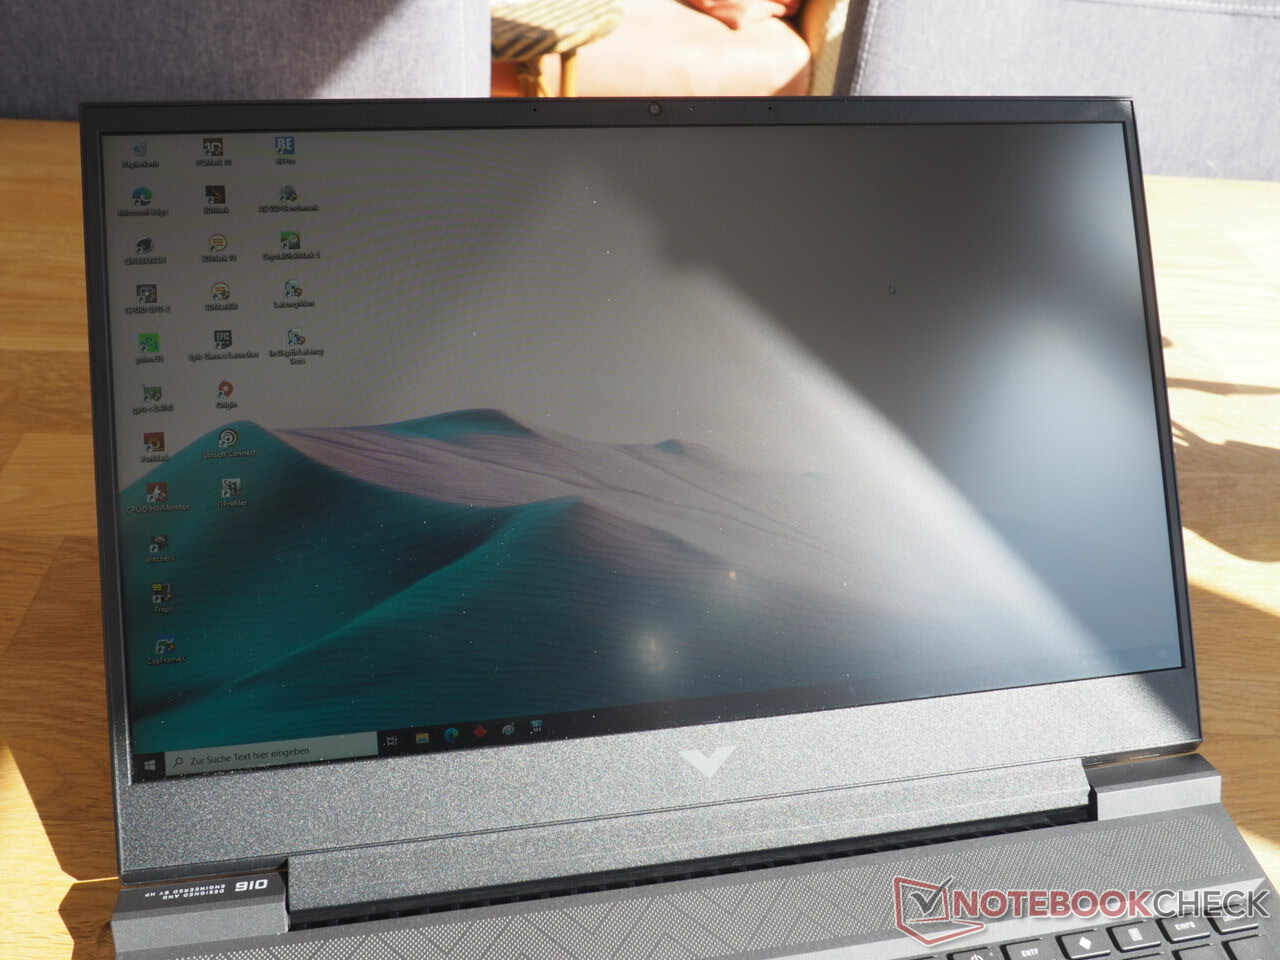
惠普笔记本电脑以其独特的设计而闻名。Victus 16在这里也不例外,在视觉上与竞争对手有许多不同之处。除了显示屏盖子上的V字(不幸的是,它非常容易沾染指纹),机箱底部的风扇通风口的漂亮设计也提供了一个个性化的外观。尽管有众多的设计元素,这款机箱看起来并不过分俏皮,仍然相当低调,这主要是由于采用了深色的颜色。
在建造质量方面,Victus 16给人留下了一些混合的感觉。例如,塑料表面,在某些地方(盖板和触摸板区域)容易产生咔哒声,可以更加坚固。铰链也不完美。首先,当我们打开显示屏盖子时,底座也会随之轻微移动, ,其次,表面的振动也会导致显示屏的晃动超过常规的晃动。另一方面,做工方面几乎没有任何抱怨的理由。 我们测试设备的几乎所有外壳元素都显示出干净的过渡。然而,由于边缘设计,一些角落仍然感觉相当尖锐,所以它们在使用笔记本电脑时可能会引起一些不适。
在2.5公斤(约5.5磅),Victus 16的重量与竞争对手相似。只有华硕TUF F15要轻一些,为2.3公斤(约5磅)。在高度方面,2.35厘米(约0.93英寸)的 16英寸笔记本电脑给人以纤细的印象,位于更纤细的Alienware m15 R5和更厚的联想Legion 5之间。
装备
连接方式
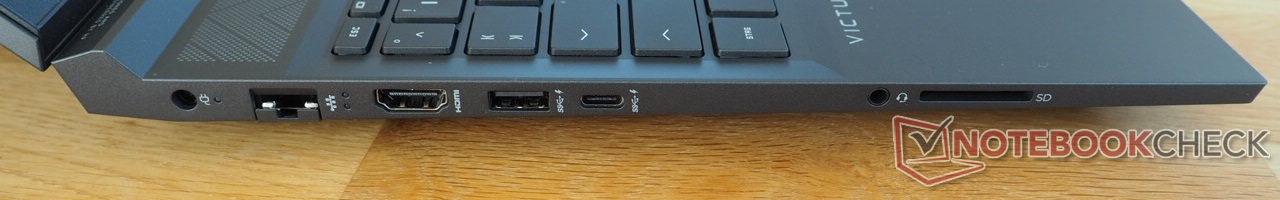
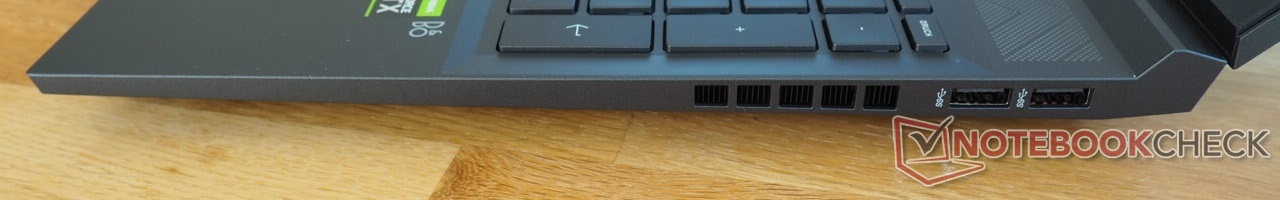
连接设备已经不是很新潮了。由于AMD的原因,这款笔记本电脑不得不放弃Thunderbolt。然而,四个可用的USB端口(3x Type-A,1x Type-C)只支持3.2 Gen1,这相当于旧的3.0标准,是一个不必要的限制。至少Type-C端口能够进行DisplayPort输出,因此,与HDMI 2.1端口和内置显示器一起,你可以运行多达三个显示器。连接由一个RJ45端口、一个音频端口(耳机/麦克风组合端口)和一个读卡器完成。
由于大部分连接都放在两边的后半部分,所以很容易使用外部鼠标,特别是对于右手用户。
SD卡阅读器
读卡器(SD/SDHC/SDXC)的性能一般。在连续读取和传输照片时,勉强达到80MB/s,低于游戏笔记本电脑的平均水平。但至少Victus 16有一个读卡器,而所有的竞争对手在这方面都失败了。
| SD Card Reader | |
| average JPG Copy Test (av. of 3 runs) | |
| Average of class Gaming (20.9 - 210, n=54, last 2 years) | |
| HP Victus 16-e0179ng (AV PRO microSD 128 GB V60) | |
| maximum AS SSD Seq Read Test (1GB) | |
| Average of class Gaming (25.5 - 261, n=51, last 2 years) | |
| HP Victus 16-e0179ng (AV PRO microSD 128 GB V60) | |
沟通
来自Realtek的通信模块处理无线通信。虽然RTL8852AE在技术方面处于相当当前的水平(Wi-Fi 6),但在我们使用Netgear Nighthawk AX12路由器进行的范围测试中(1米距离),测量结果并不真正令人信服。例如,在接收数据方面,Victus 16排在最后一位。
网络摄像头
正如我们习惯于从大多数笔记本电脑上看到的那样,网络摄像头的质量是有限的。除了颜色的准确性外,图像的清晰度也令人失望。


辅料
盒子里包含的只是一份快速入门指南和一个漂亮的200瓦的电源。
维护
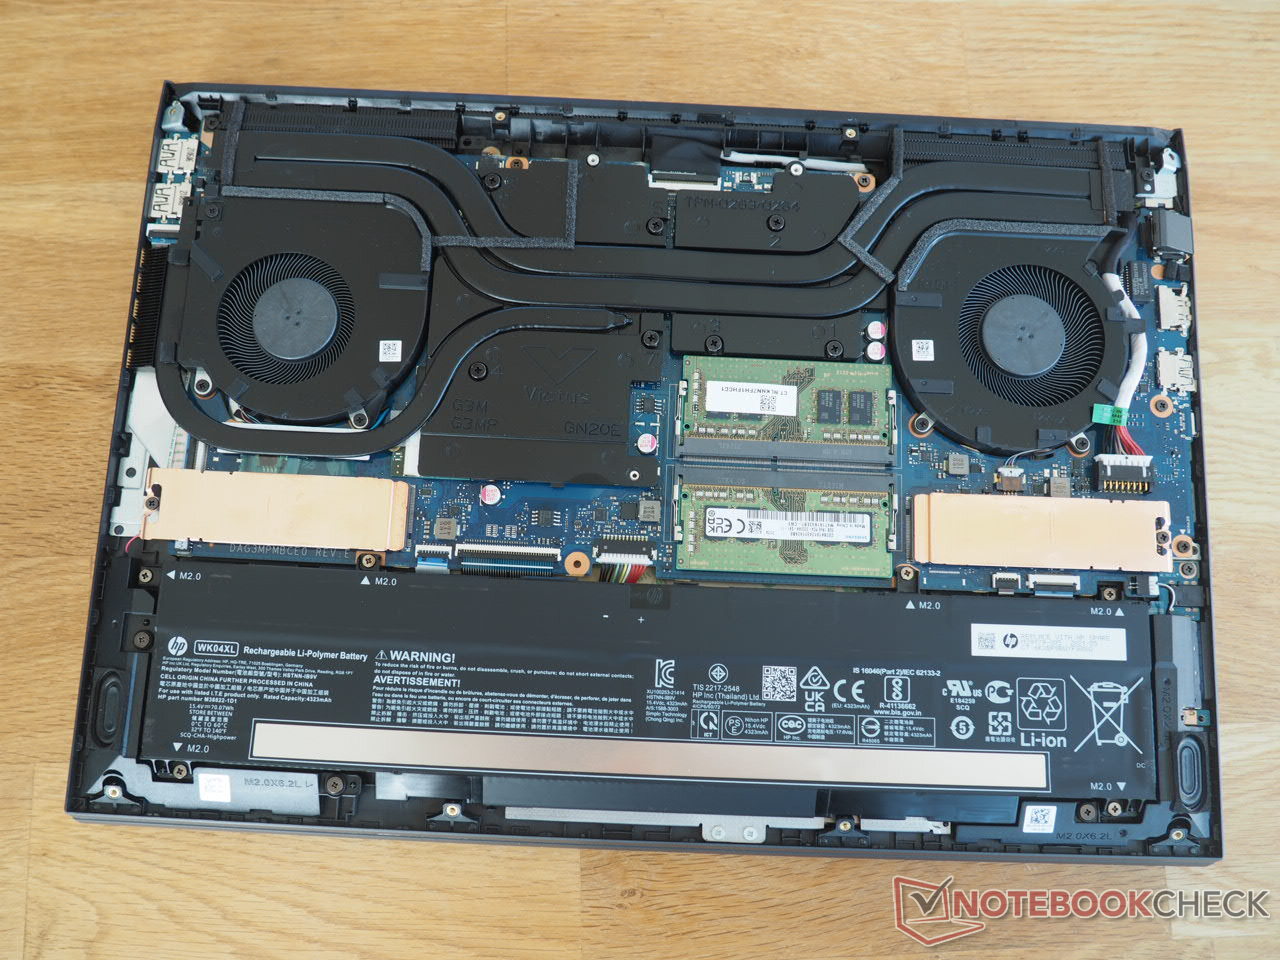
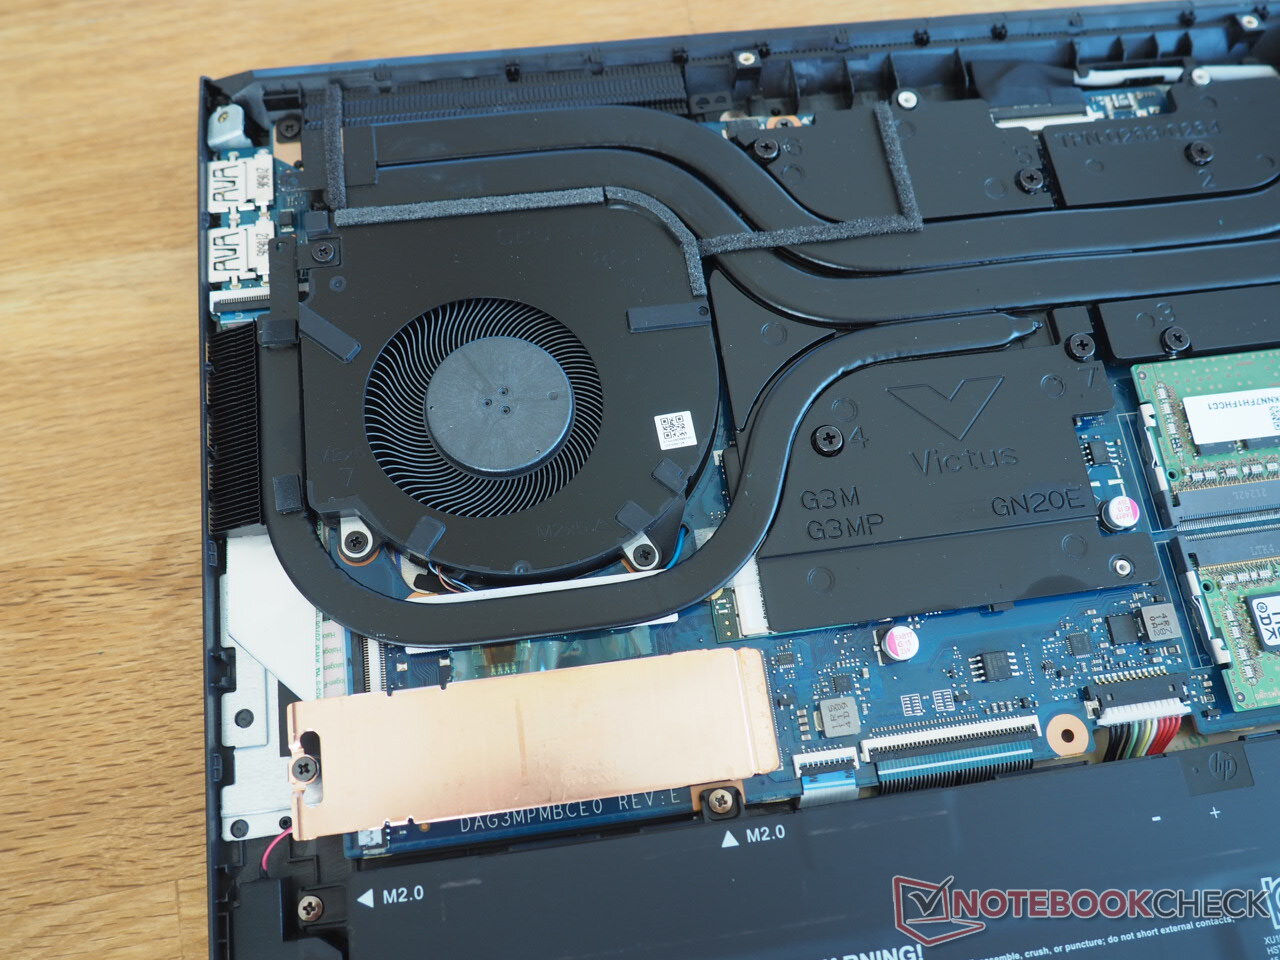
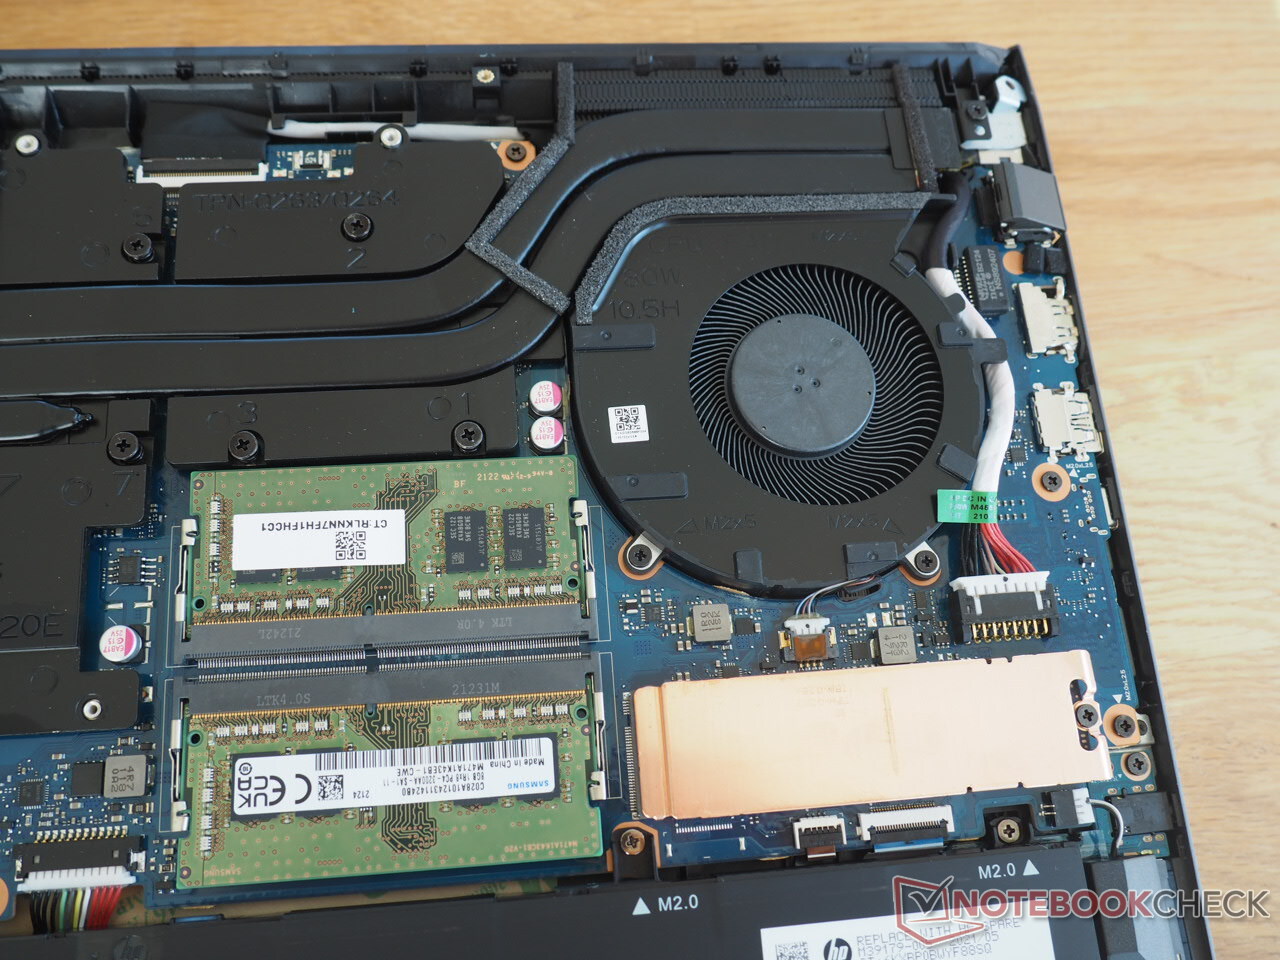
你不仅需要一个小的螺丝刀来拧小的飞利浦螺丝,才能接触到内部,而且你还需要很好地结合细腻的触感和力量。箱子的底部是紧固的,特别是在后面。在你最终成功打开机箱后,迎接你的是一个干净的展示。掌托下面的空间完全被电池占据了。后面是两个内存插槽和两个M.2插槽(每个都有一个冷却元件)。冷却系统由两个风扇、几个热管和相对较大的金属表面组成。
输入设备
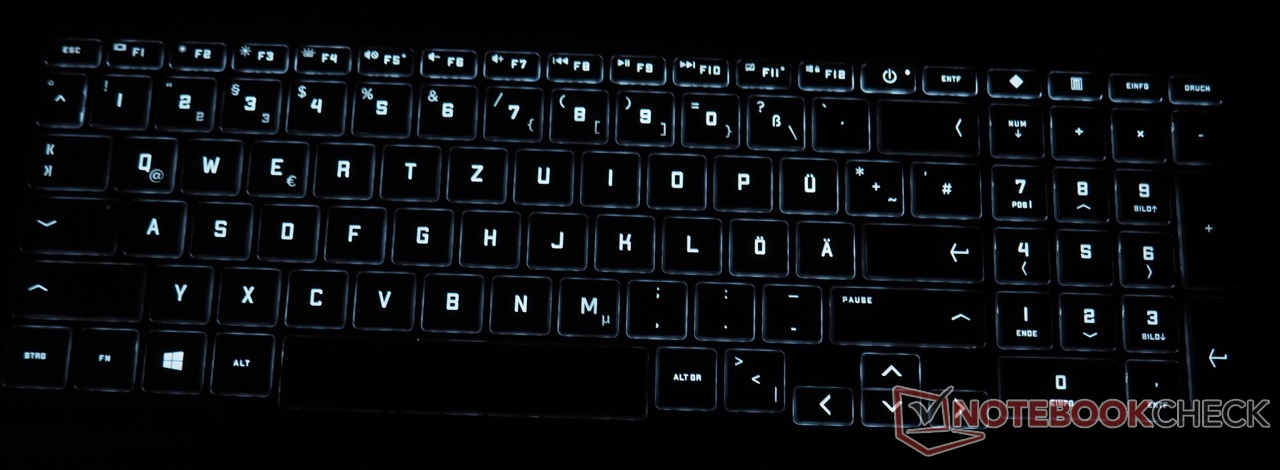
键盘
Victus 16使用了一个略微非传统的键盘布局。电源键的位置和插入键、删除键以及><|键的位置一样不寻常(见图)。德国用户还必须适应单行的回车键。还有更多的负分是,那些微不足道的方向键几乎不适合用于游戏。另一方面,16英寸笔记本电脑提供了一个完整的数字块。我们会将打字体验评价为 "良好"(压力点、行程等),尽管按键的形状有一个真正的优势。
触摸板
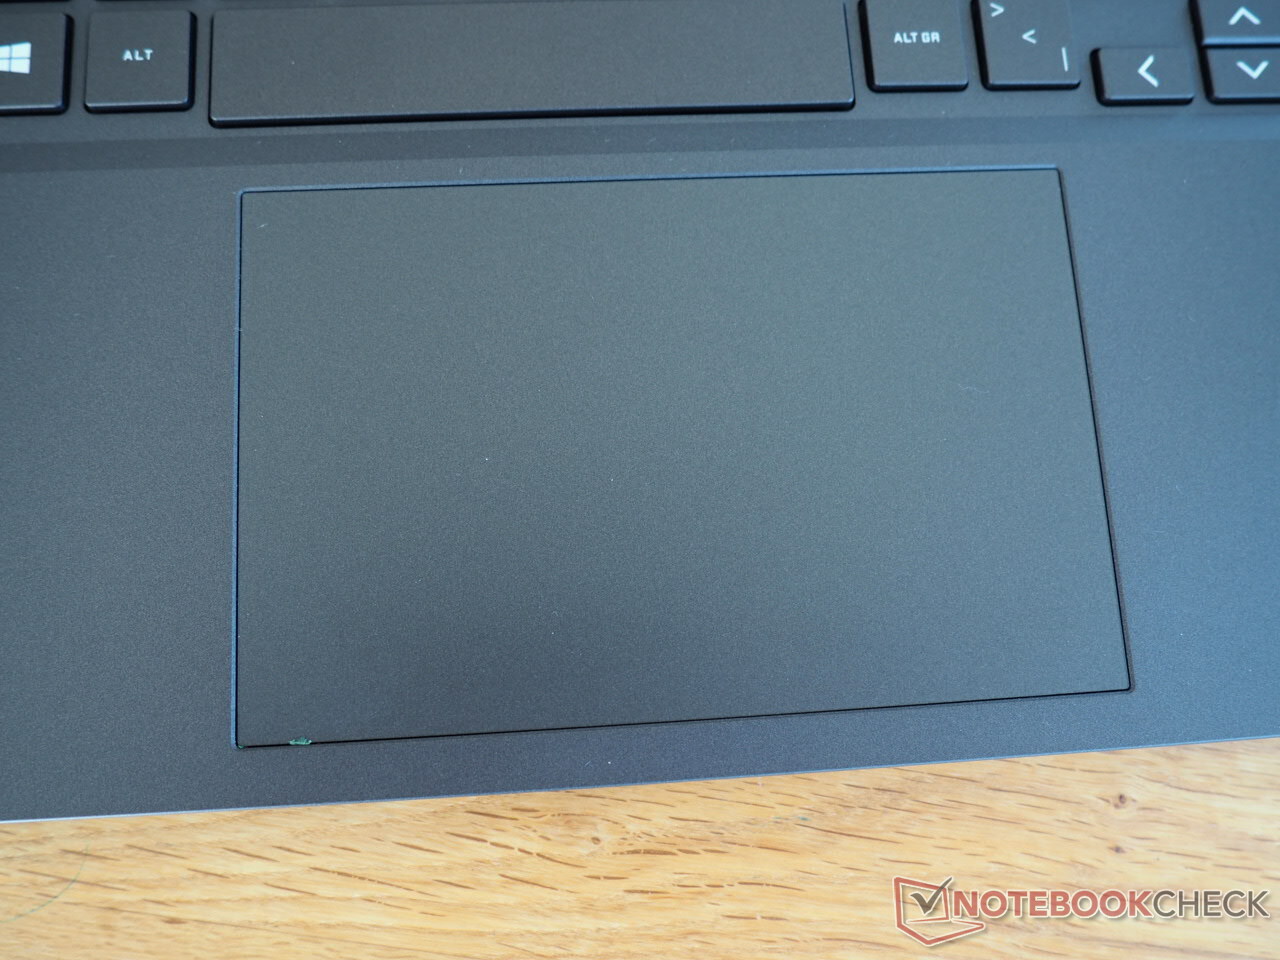
除了稳定性不理想外,触摸板的性能很好。它的宽度为12.5厘米(约4.9英寸),深度为8厘米(约3.1英寸),是令人愉快的大。尽管表面感觉比许多竞争者的光滑程度稍差,但所有的鼠标动作都很容易成功。手势支持,如用两个手指缩放和滚动,也能可靠地工作。一个小问题:底部边缘的左右点击会产生轻微的咔哒声,这让人对笔记本电脑的质量印象大打折扣。
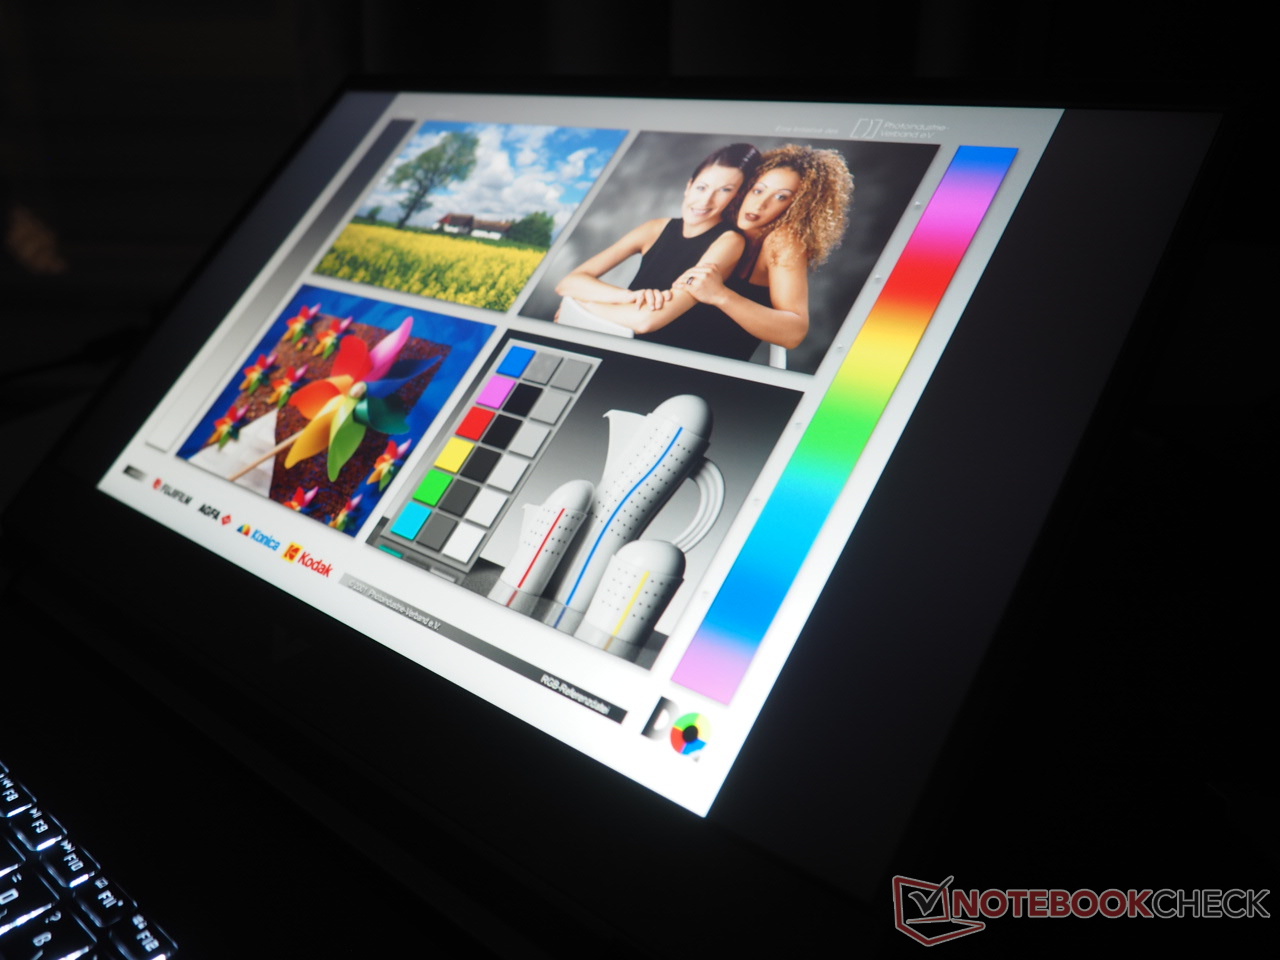
显示
虽然一些竞争对手提供了平庸的显示器(其中第一个是华硕TUF F15),但Victus 16-e0179ng的144-Hz面板几乎在每个方面都有成绩。
| |||||||||||||||||||||||||
Brightness Distribution: 88 %
Center on Battery: 361 cd/m²
Contrast: 1203:1 (Black: 0.3 cd/m²)
ΔE ColorChecker Calman: 2.44 | ∀{0.5-29.43 Ø4.72}
calibrated: 1.26
ΔE Greyscale Calman: 4.6 | ∀{0.09-98 Ø4.97}
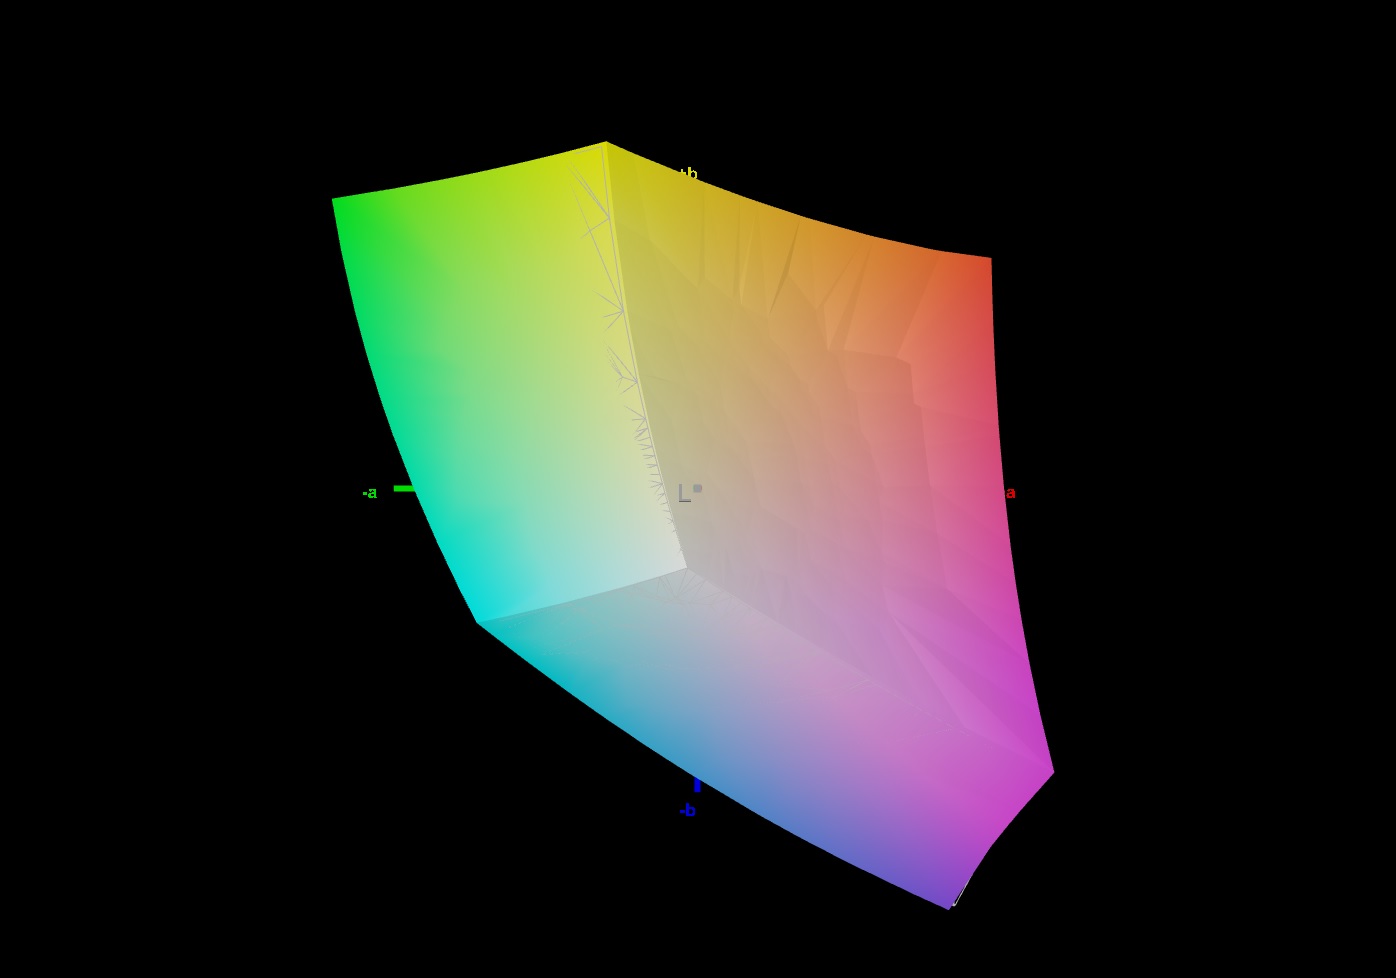
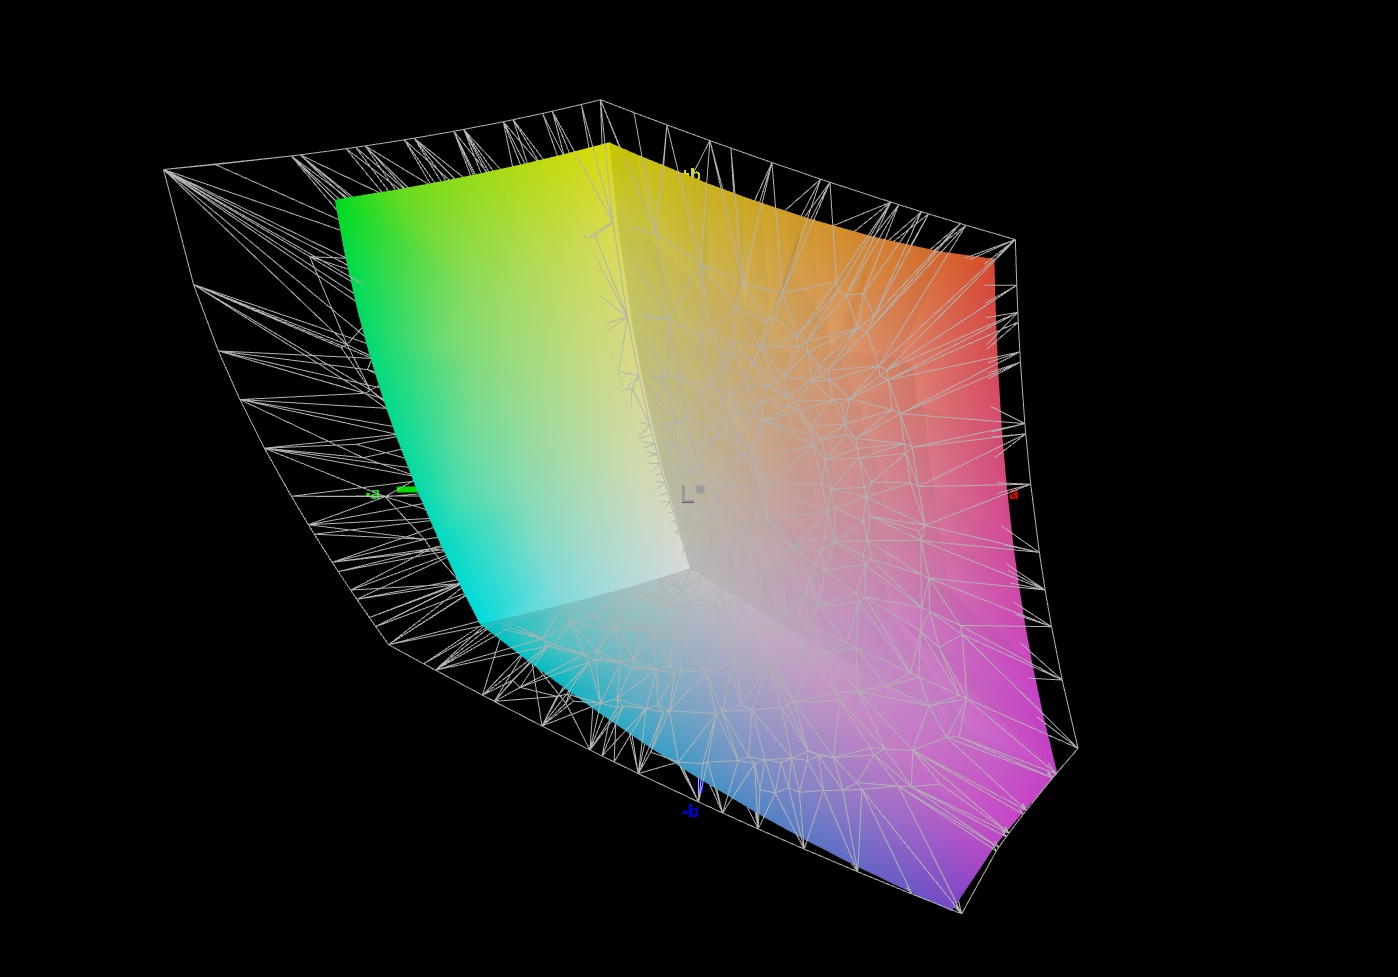
73.5% AdobeRGB 1998 (Argyll 3D)
100% sRGB (Argyll 3D)
72.6% Display P3 (Argyll 3D)
Gamma: 2.268
CCT: 6609 K
| HP Victus 16-e0179ng BOE09BE, IPS, 1920x1080, 16.1" | Lenovo Legion 5 15ACH-82JU00C6GE-FL B156HAN12.H, , 1920x1080, 15.6" | Alienware m15 R5 Ryzen Edition B156HAN, IPS, 1920x1080, 15.6" | Asus TUF Gaming F15 FX506HM Chi Mei N156HRA-EA1, IPS, 1920x1080, 15.6" | |
|---|---|---|---|---|
| Display | -7% | -40% | ||
| Display P3 Coverage (%) | 72.6 | 65.4 -10% | 41.9 -42% | |
| sRGB Coverage (%) | 100 | 96.3 -4% | 62.9 -37% | |
| AdobeRGB 1998 Coverage (%) | 73.5 | 67.5 -8% | 43.3 -41% | |
| Response Times | -3% | 50% | -123% | |
| Response Time Grey 50% / Grey 80% * (ms) | 9.6 ? | 13.6 ? -42% | 4 ? 58% | 28.4 ? -196% |
| Response Time Black / White * (ms) | 14.4 ? | 9.2 ? 36% | 8.4 ? 42% | 21.6 ? -50% |
| PWM Frequency (Hz) | ||||
| Screen | -14% | 3% | -59% | |
| Brightness middle (cd/m²) | 361 | 350 -3% | 329 -9% | 268.3 -26% |
| Brightness (cd/m²) | 341 | 350 3% | 321 -6% | 257 -25% |
| Brightness Distribution (%) | 88 | 96 9% | 92 5% | 84 -5% |
| Black Level * (cd/m²) | 0.3 | 0.3 -0% | 0.27 10% | 0.34 -13% |
| Contrast (:1) | 1203 | 1167 -3% | 1219 1% | 789 -34% |
| Colorchecker dE 2000 * | 2.44 | 3.9 -60% | 2.78 -14% | 5.05 -107% |
| Colorchecker dE 2000 max. * | 6.37 | 8.2 -29% | 4.88 23% | 15.43 -142% |
| Colorchecker dE 2000 calibrated * | 1.26 | 1.6 -27% | 1.63 -29% | 3.21 -155% |
| Greyscale dE 2000 * | 4.6 | 5.5 -20% | 2.5 46% | 5.5 -20% |
| Gamma | 2.268 97% | 2.15 102% | 2.106 104% | 2.35 94% |
| CCT | 6609 98% | 7414 88% | 6201 105% | 7392 88% |
| Color Space (Percent of AdobeRGB 1998) (%) | 76 | |||
| Color Space (Percent of sRGB) (%) | 99 | |||
| Total Average (Program / Settings) | -8% /
-11% | 27% /
12% | -74% /
-64% |
* ... smaller is better
这要从色彩空间的覆盖率说起,它测量的是100%的sRGB和近74%的AdobeRGB。这对一台游戏笔记本电脑来说是相当多的。响应时间约为10毫秒,也是不错的。
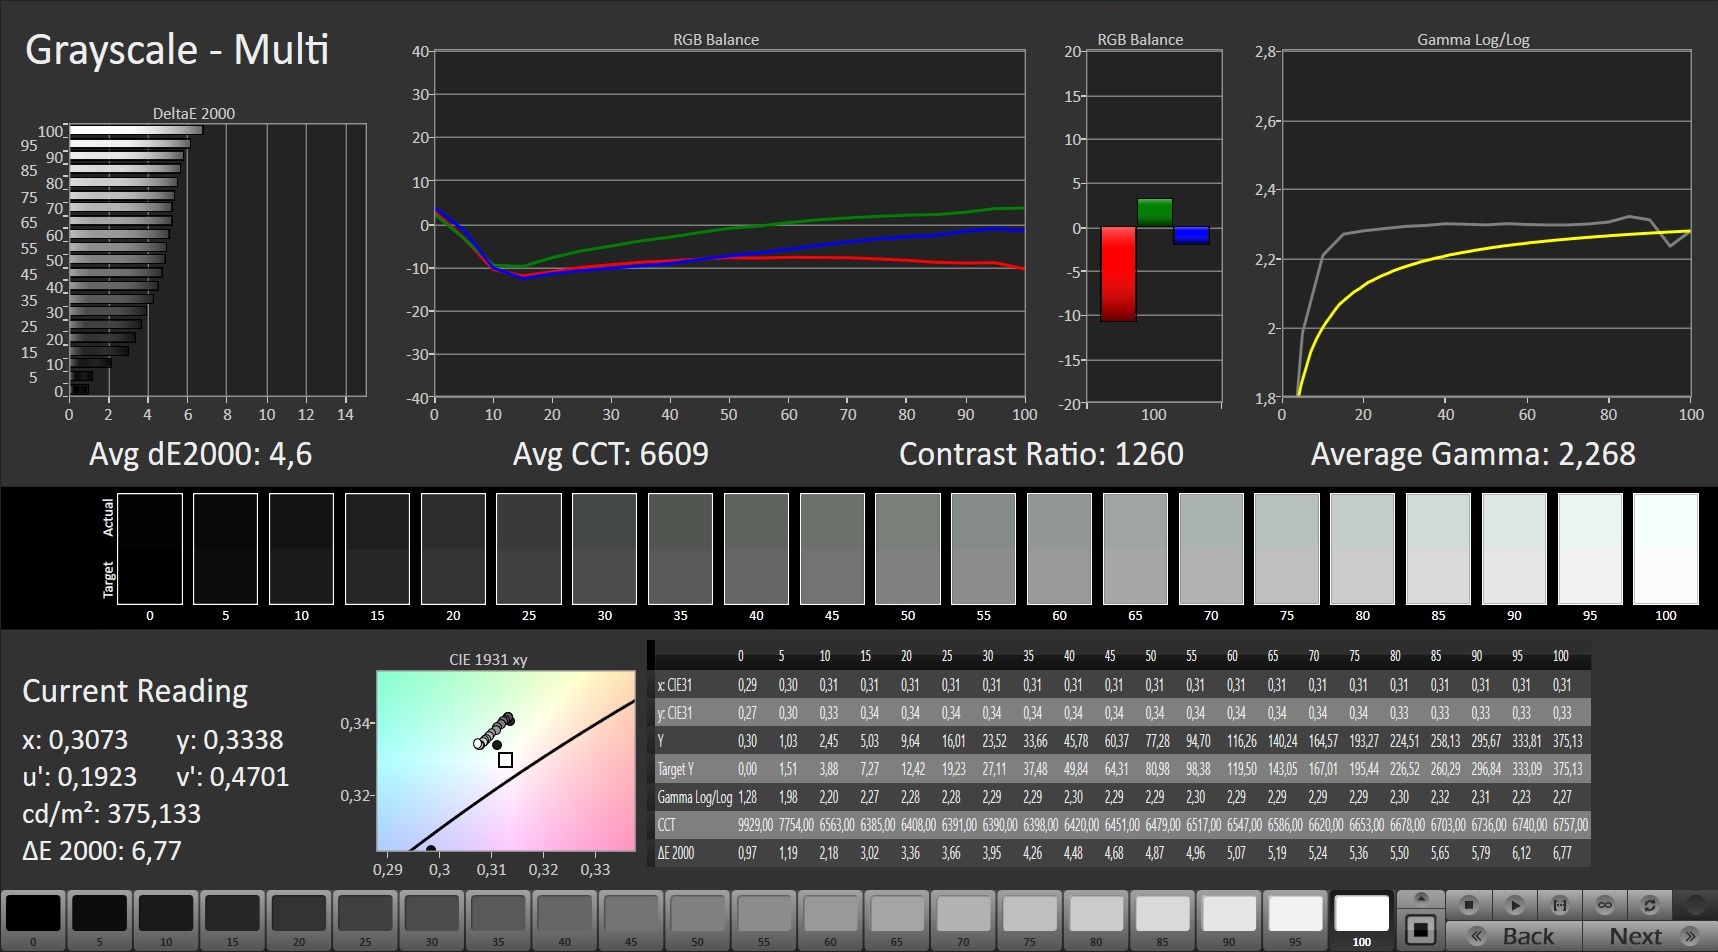
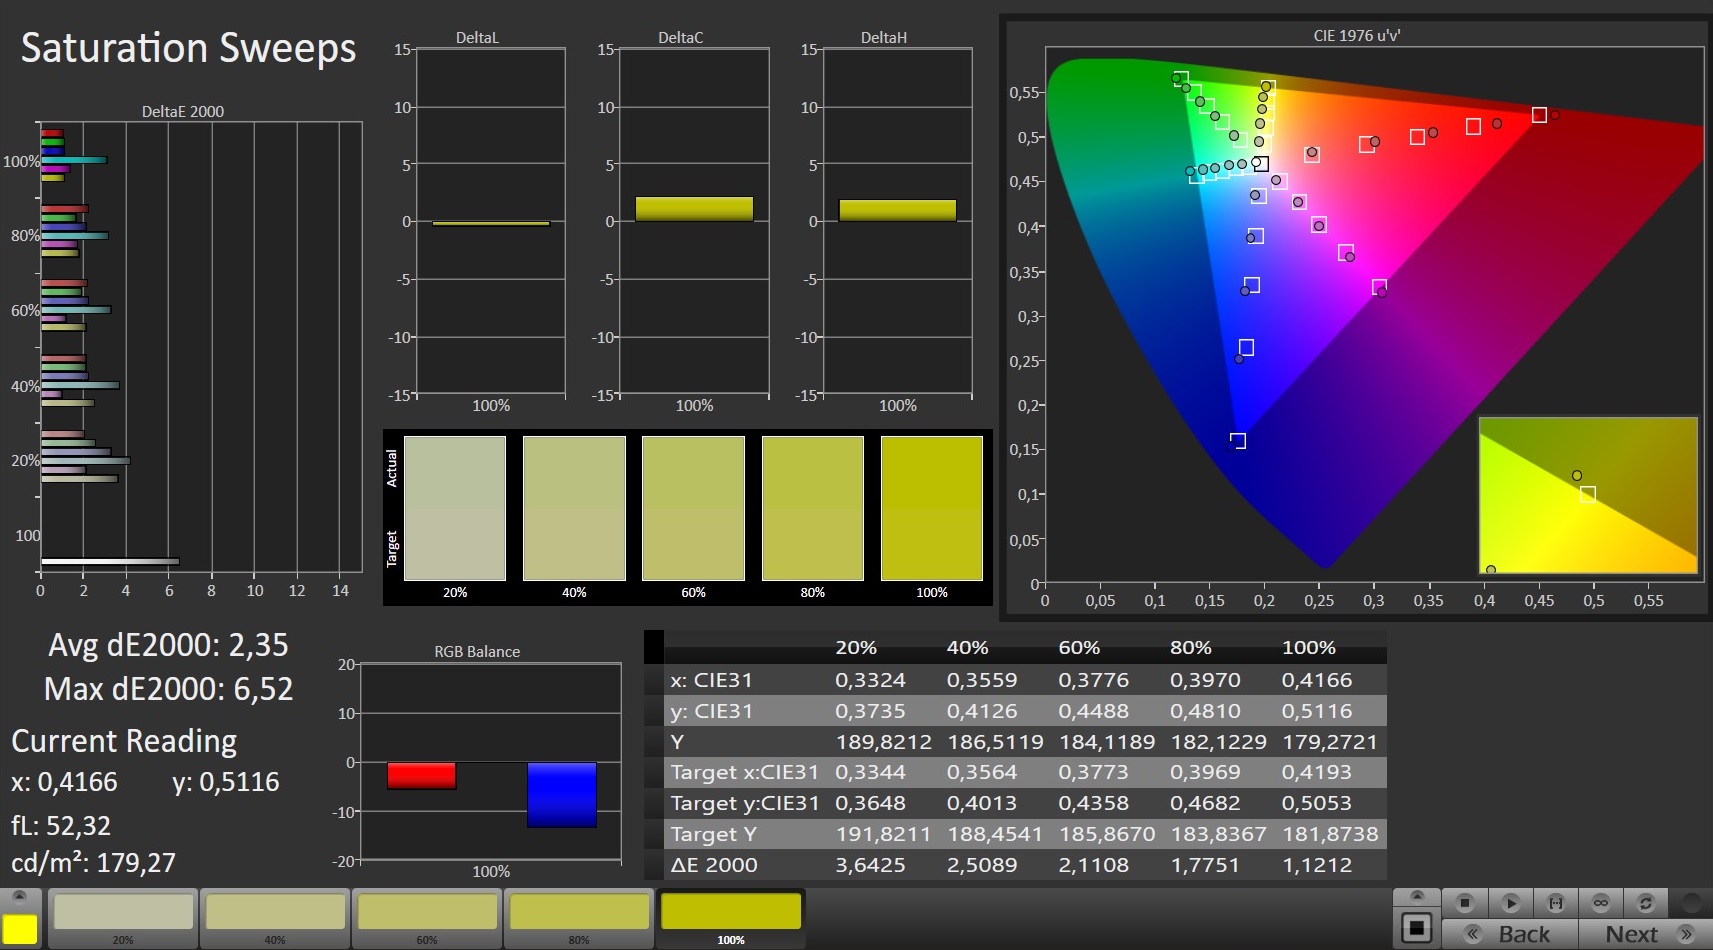
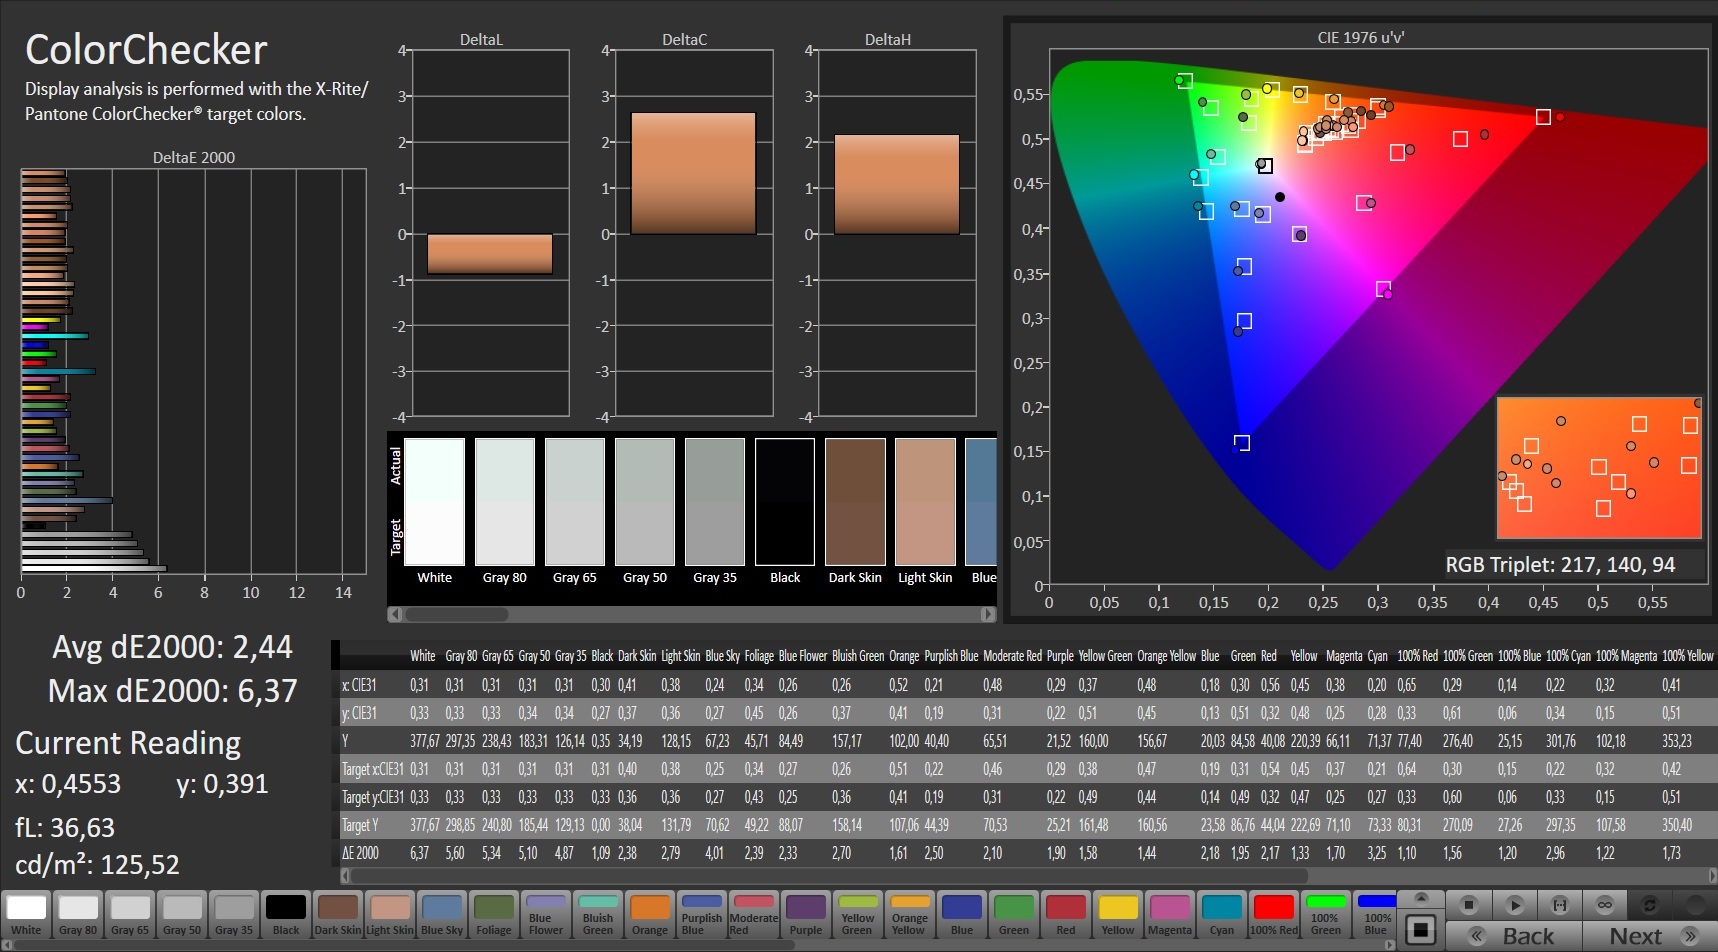
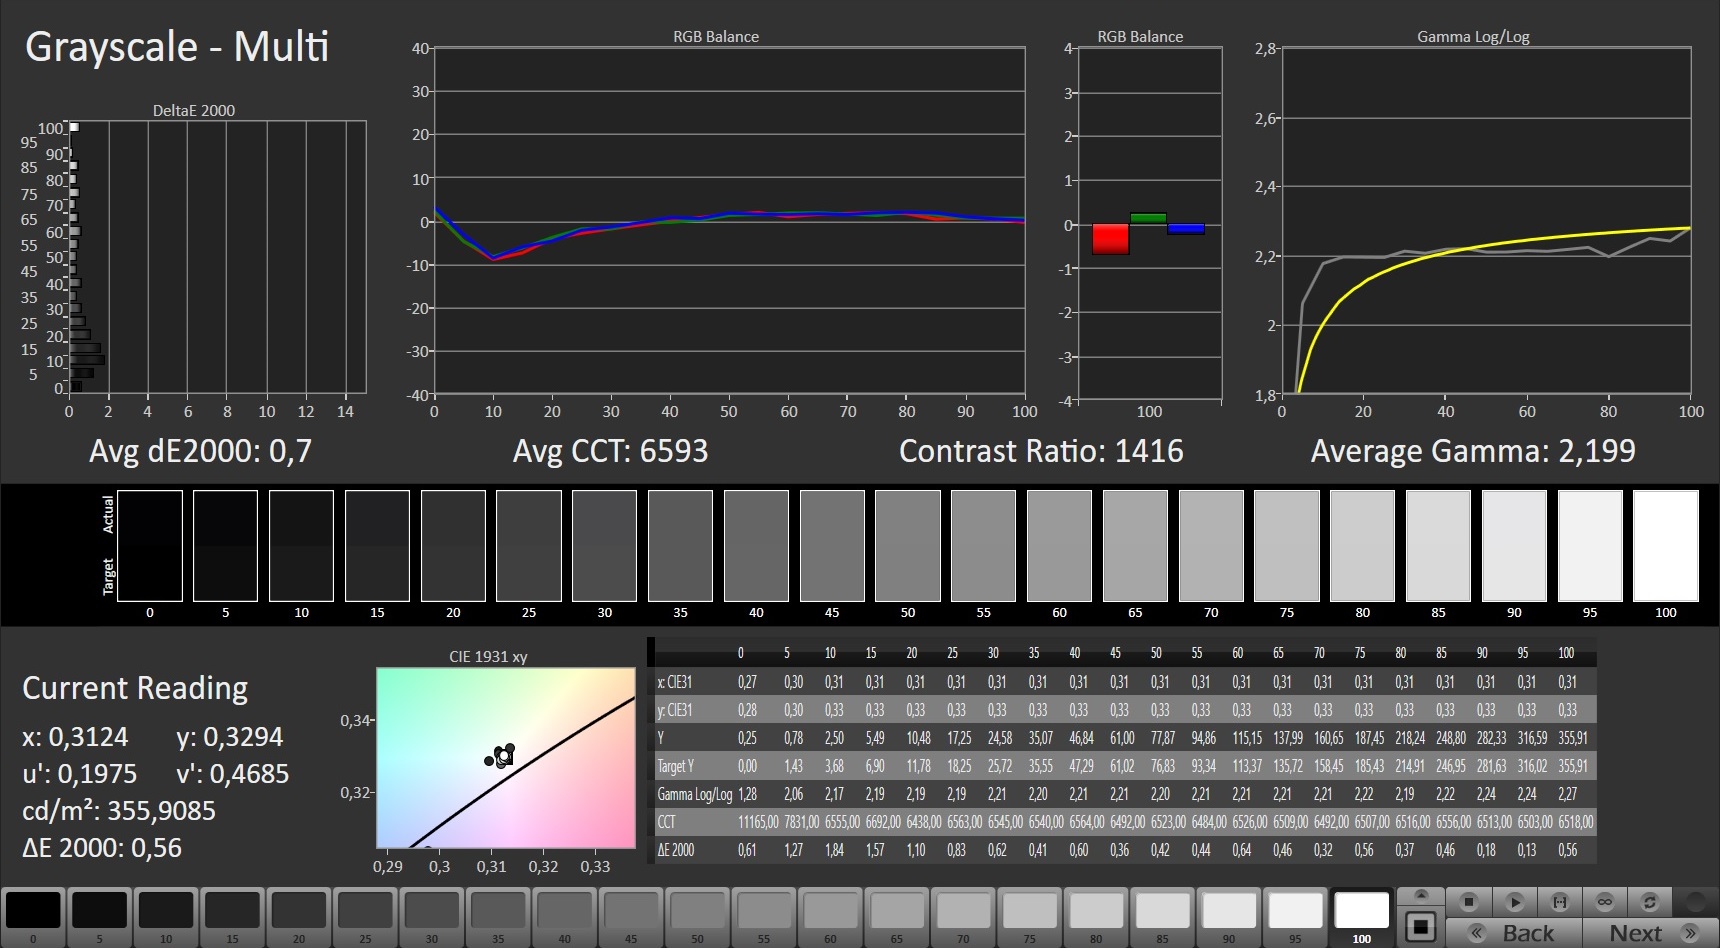
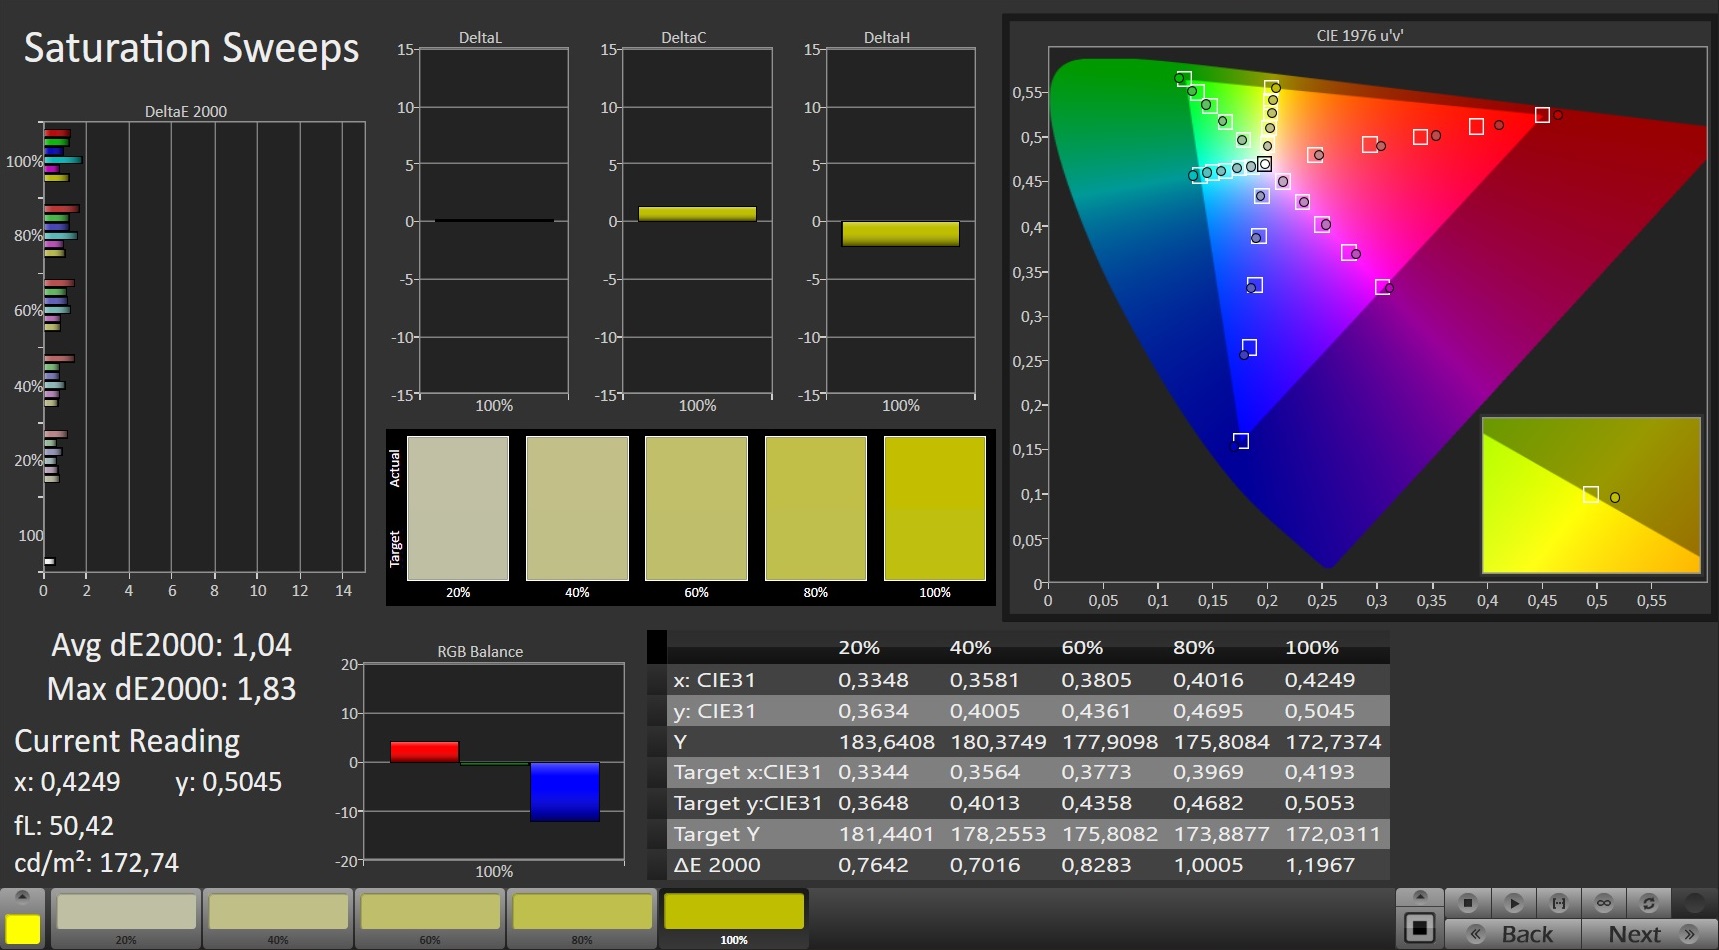
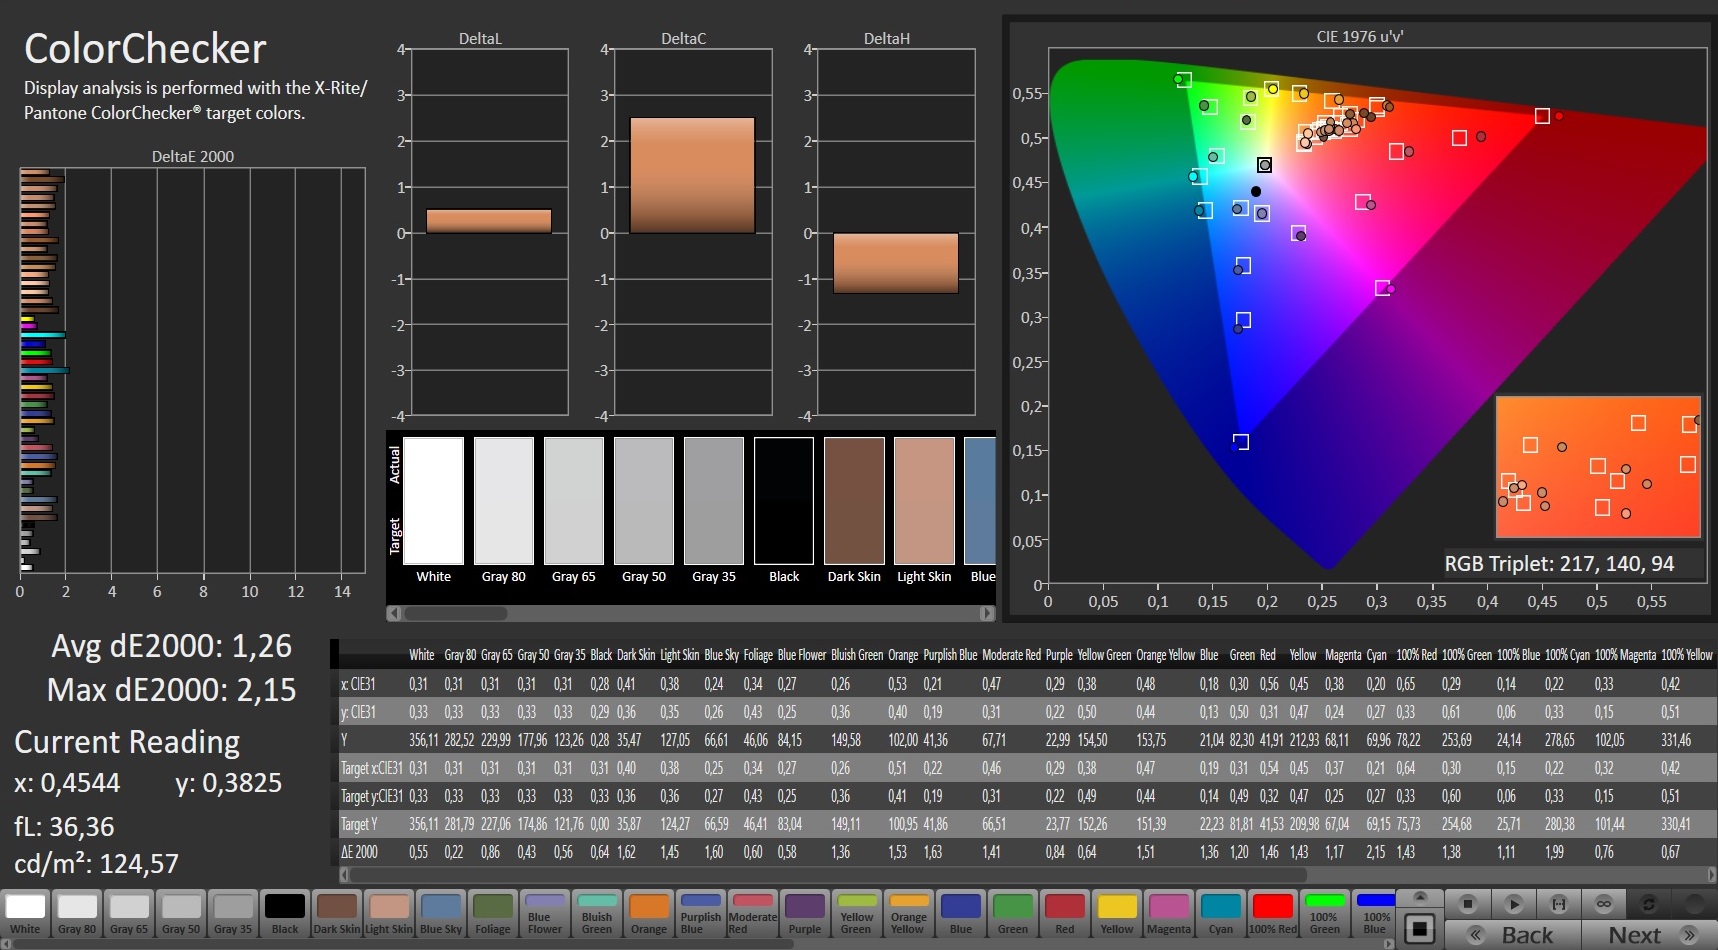
16英寸的屏幕在其他测量中也留下了令人信服的印象。相对较低的黑值(0.3cd/m²)和可接受的亮度(平均341cd/m²)导致了约1200:1的对比度。再加上交付状态下相对较好的色彩再现,这确保了鲜艳而有区别的显示图像。
另一个积极的观点是,在我们的测试装置中,我们没有看到任何由于PWM或 任何类似的原因导致的显示闪烁。
Display Response Times
| ↔ Response Time Black to White | ||
|---|---|---|
| 14.4 ms ... rise ↗ and fall ↘ combined | ↗ 8.4 ms rise | 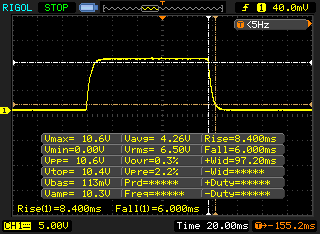 |
| ↘ 6 ms fall | ||
| The screen shows good response rates in our tests, but may be too slow for competitive gamers. In comparison, all tested devices range from 0.1 (minimum) to 240 (maximum) ms. » 35 % of all devices are better. This means that the measured response time is better than the average of all tested devices (19.8 ms). | ||
| ↔ Response Time 50% Grey to 80% Grey | ||
| 9.6 ms ... rise ↗ and fall ↘ combined | ↗ 5.2 ms rise | 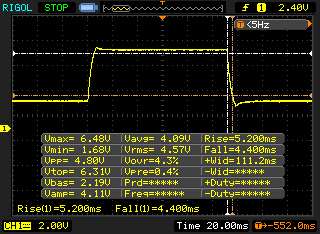 |
| ↘ 4.4 ms fall | ||
| The screen shows fast response rates in our tests and should be suited for gaming. In comparison, all tested devices range from 0.165 (minimum) to 636 (maximum) ms. » 23 % of all devices are better. This means that the measured response time is better than the average of all tested devices (31 ms). | ||
Screen Flickering / PWM (Pulse-Width Modulation)
| Screen flickering / PWM not detected | 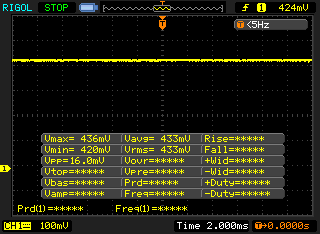 | ||
In comparison: 52 % of all tested devices do not use PWM to dim the display. If PWM was detected, an average of 7772 (minimum: 5 - maximum: 343500) Hz was measured. | |||
测试条件
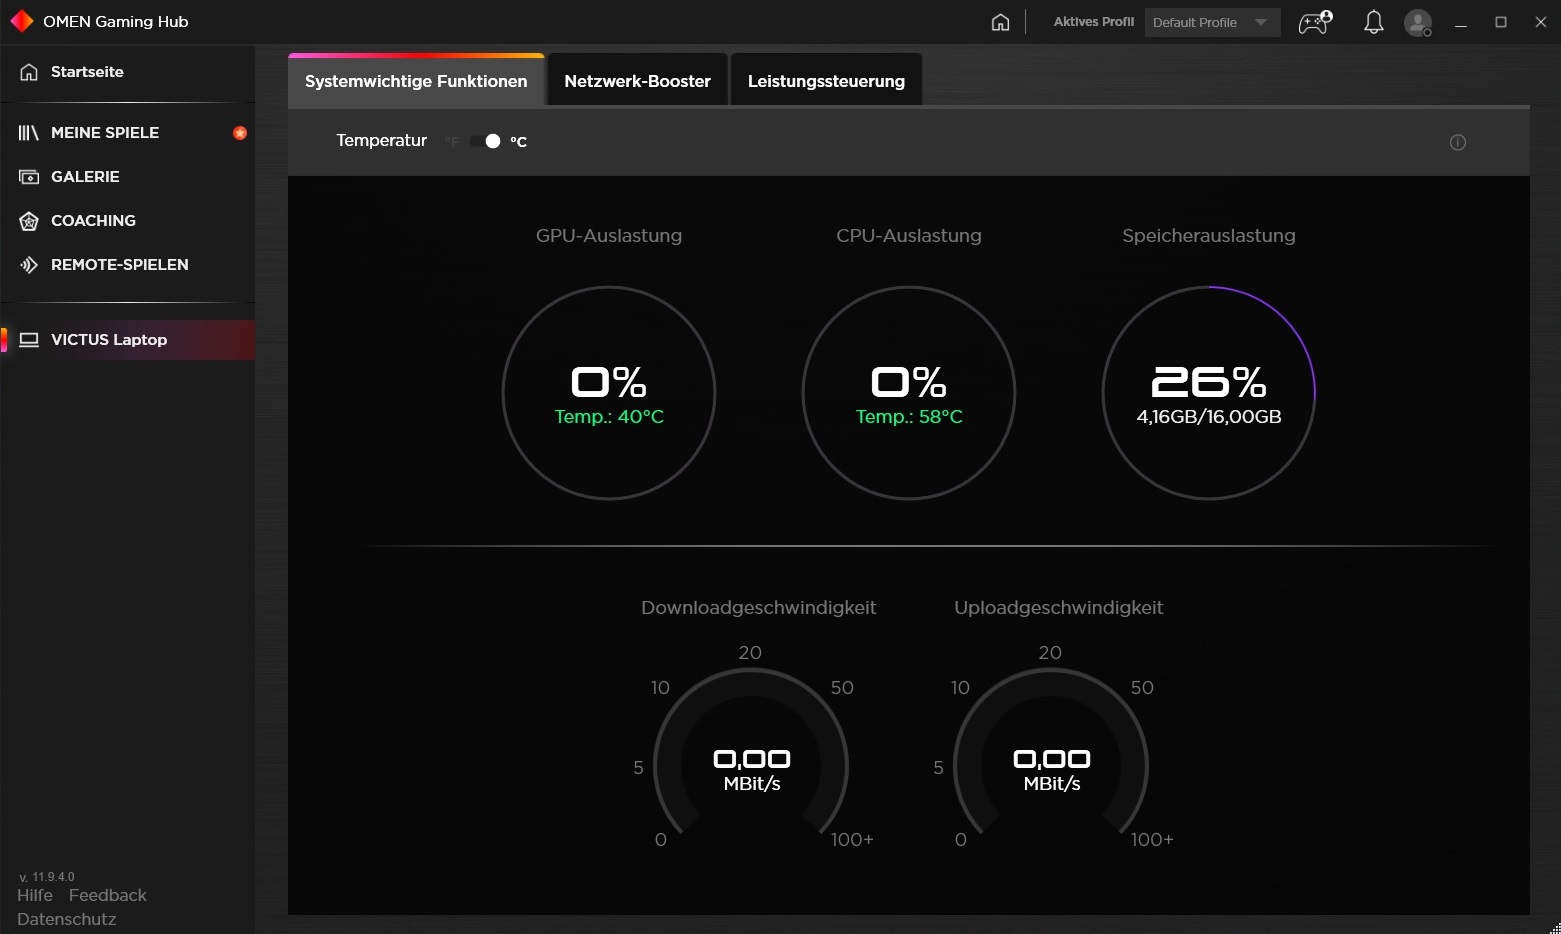
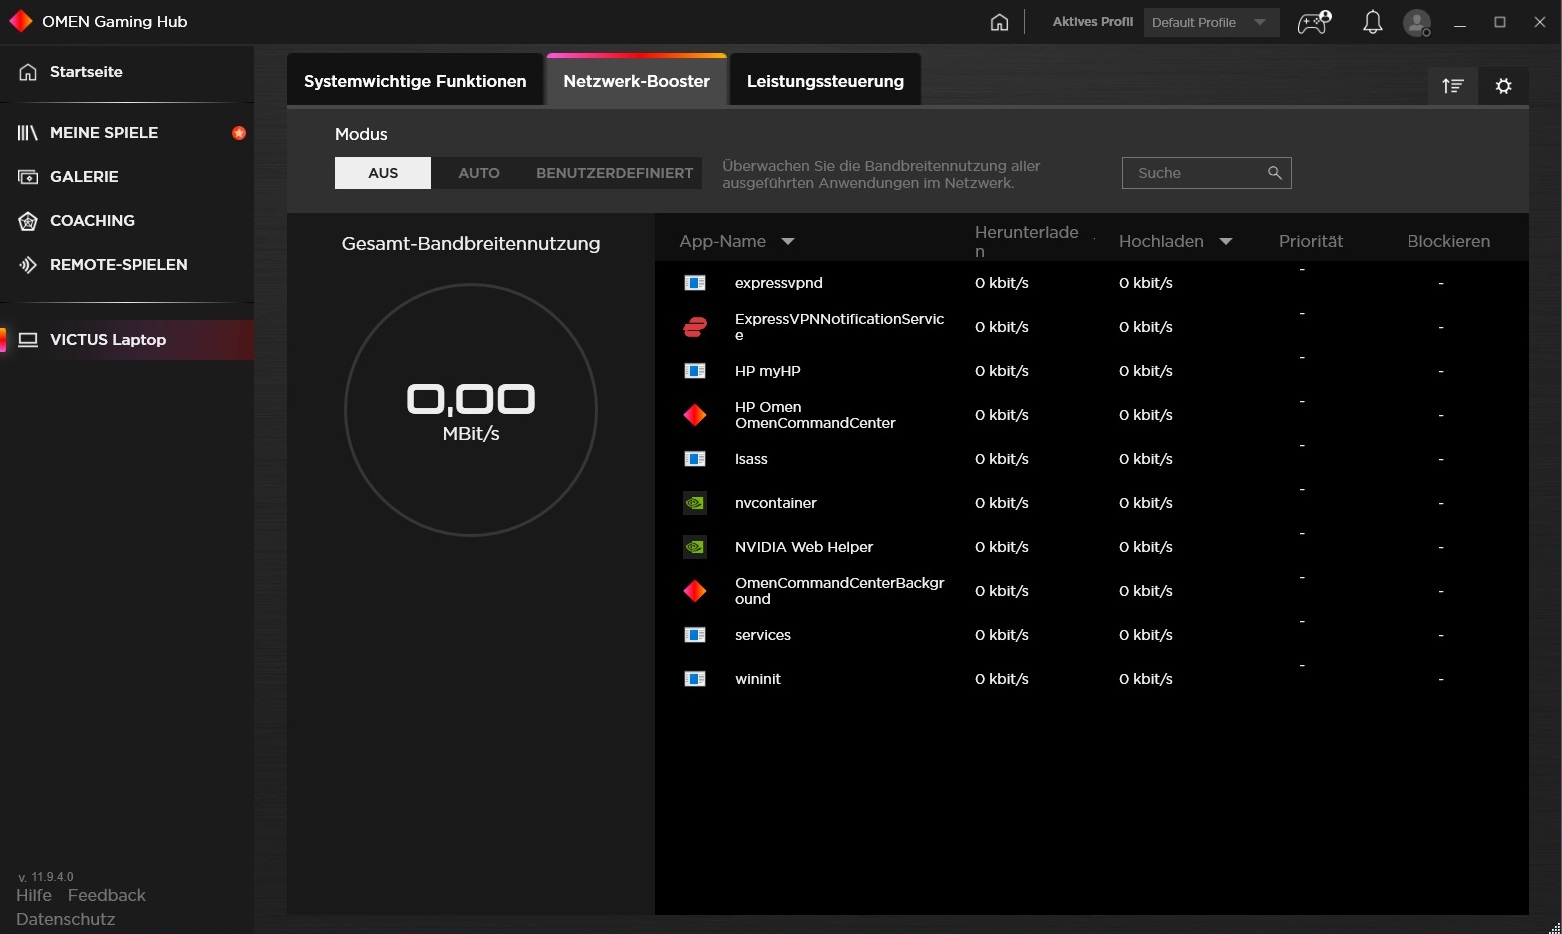
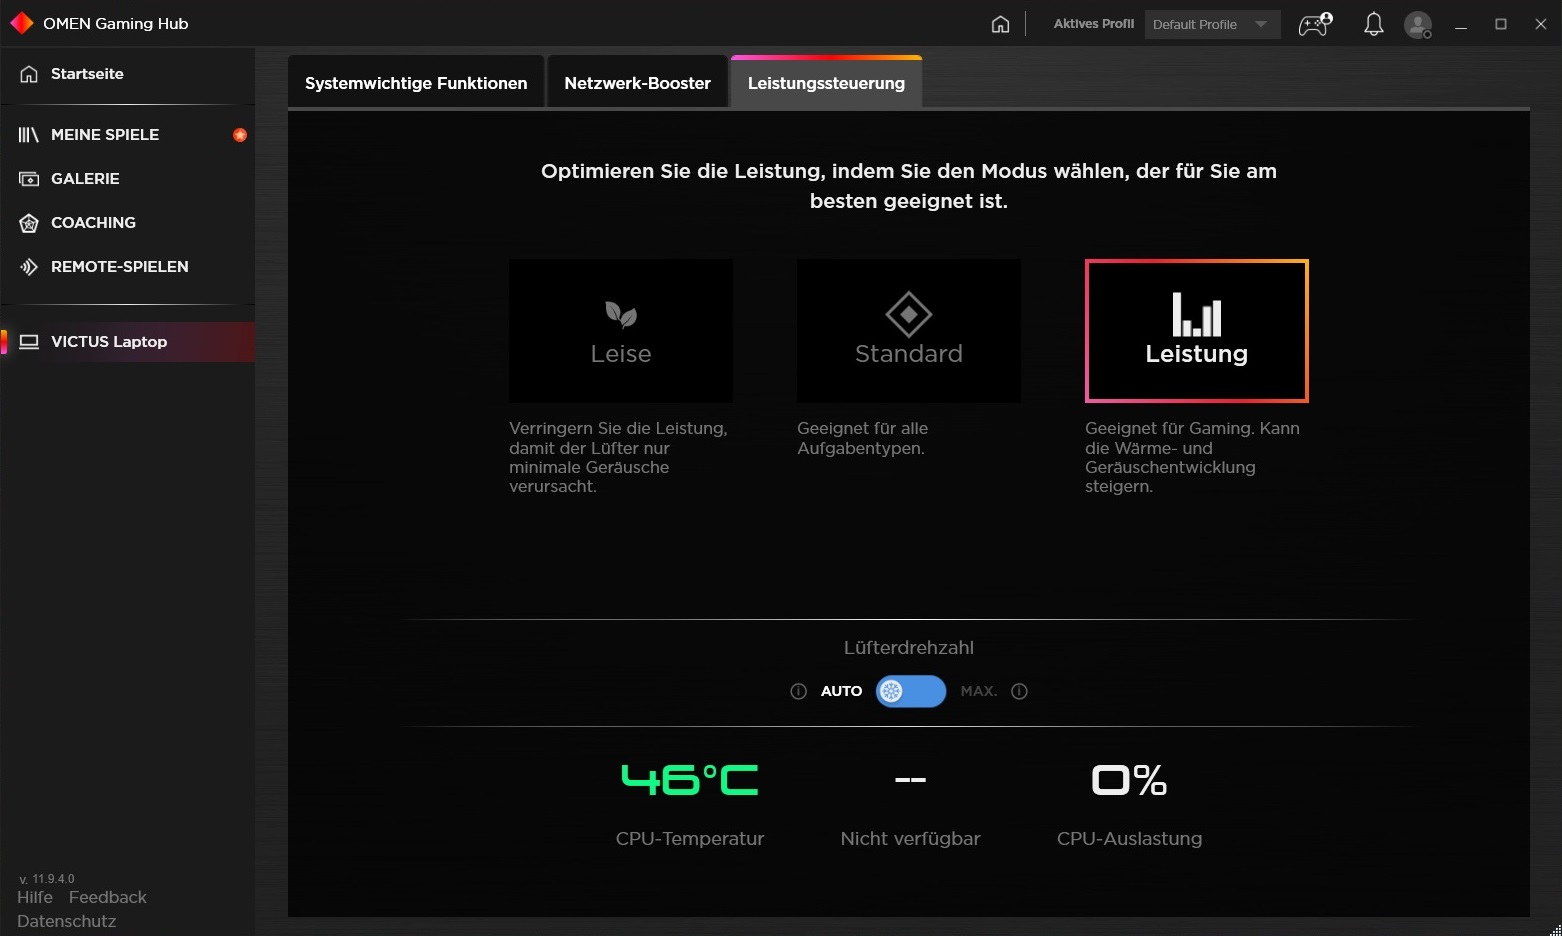
那些喜欢微调性能的人应该对Omen Gaming Hub感到高兴。Victus Laptop "菜单提供了系统监控(温度、负载......)、网络助推器和性能控制等选项卡。在后者中,我们选择了带有自动风扇速度的 "性能 "模式进行测量。
业绩
考虑到GeForce RTX 3060,Victus 16-e0179ng应该在较低的高端范围内解决,尽管6GB的VRAM在这一点上已经不是最先进的了。16GB的内存和1TB的固态硬盘应该能满足大多数买家的需求,并在未来几年内足够使用。AMD的八核处理器也是如此。
处理器
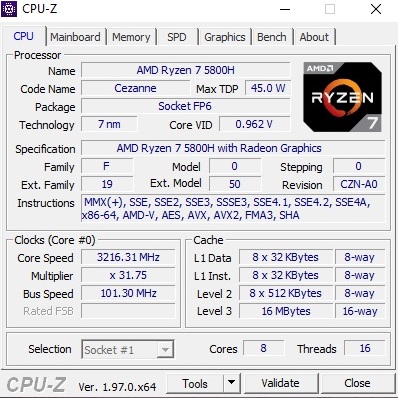
淘宝网笔记本上的Ryzen 7 5800H被认为是笔记本电脑领域的绝对顶级。这个基于7纳米的八核模型包含16MB L3缓存,并能够通过SMT在16个线程上并行工作,不必躲在英特尔竞争对手的后面。事实上,情况恰恰相反。
正如我们的Cinebench R15循环所示,5800H的性能达到了酷睿i7-11800H的水平,后者也被指定为45瓦TDP。然而,较新的基准测试,如Cinebench R23显示,Victus 16中的处理器无法发挥其全部潜力。在其他设备中,AMD的CPU所取得的性能要高出不同的百分点。5800H的基本时钟速度也是3.2GHz。在负载情况下,由于自动涡轮增压,最高可达到4.4 GHz。
Cinebench R15 Multi Constant Load Test
* ... smaller is better
系统性能
在PCMark 10系统测试中,Victus最终排名倒数第二。然而,这些差异相对较小,在实际操作中应该很难察觉。从主观上看,操作系统的响应速度与我们对当前游戏笔记本电脑的期望一样快。
| PCMark 10 / Score | |
| Average of class Gaming (5828 - 11574, n=96, last 2 years) | |
| Asus TUF Gaming F15 FX506HM | |
| Average AMD Ryzen 7 5800H, NVIDIA GeForce RTX 3060 Laptop GPU (6465 - 6855, n=6) | |
| Lenovo Legion 5 15ACH-82JU00C6GE-FL | |
| HP Victus 16-e0179ng | |
| Alienware m15 R5 Ryzen Edition | |
| PCMark 10 / Essentials | |
| Average of class Gaming (8810 - 12600, n=100, last 2 years) | |
| Asus TUF Gaming F15 FX506HM | |
| Lenovo Legion 5 15ACH-82JU00C6GE-FL | |
| Average AMD Ryzen 7 5800H, NVIDIA GeForce RTX 3060 Laptop GPU (9589 - 10414, n=6) | |
| HP Victus 16-e0179ng | |
| Alienware m15 R5 Ryzen Edition | |
| PCMark 10 / Productivity | |
| Average of class Gaming (6845 - 21327, n=98, last 2 years) | |
| Lenovo Legion 5 15ACH-82JU00C6GE-FL | |
| Average AMD Ryzen 7 5800H, NVIDIA GeForce RTX 3060 Laptop GPU (8798 - 9728, n=6) | |
| HP Victus 16-e0179ng | |
| Alienware m15 R5 Ryzen Edition | |
| Asus TUF Gaming F15 FX506HM | |
| PCMark 10 / Digital Content Creation | |
| Average of class Gaming (7602 - 19657, n=98, last 2 years) | |
| Asus TUF Gaming F15 FX506HM | |
| Average AMD Ryzen 7 5800H, NVIDIA GeForce RTX 3060 Laptop GPU (7884 - 9497, n=6) | |
| HP Victus 16-e0179ng | |
| Alienware m15 R5 Ryzen Edition | |
| Lenovo Legion 5 15ACH-82JU00C6GE-FL | |
| PCMark 10 Score | 6567 points | |
Help | ||
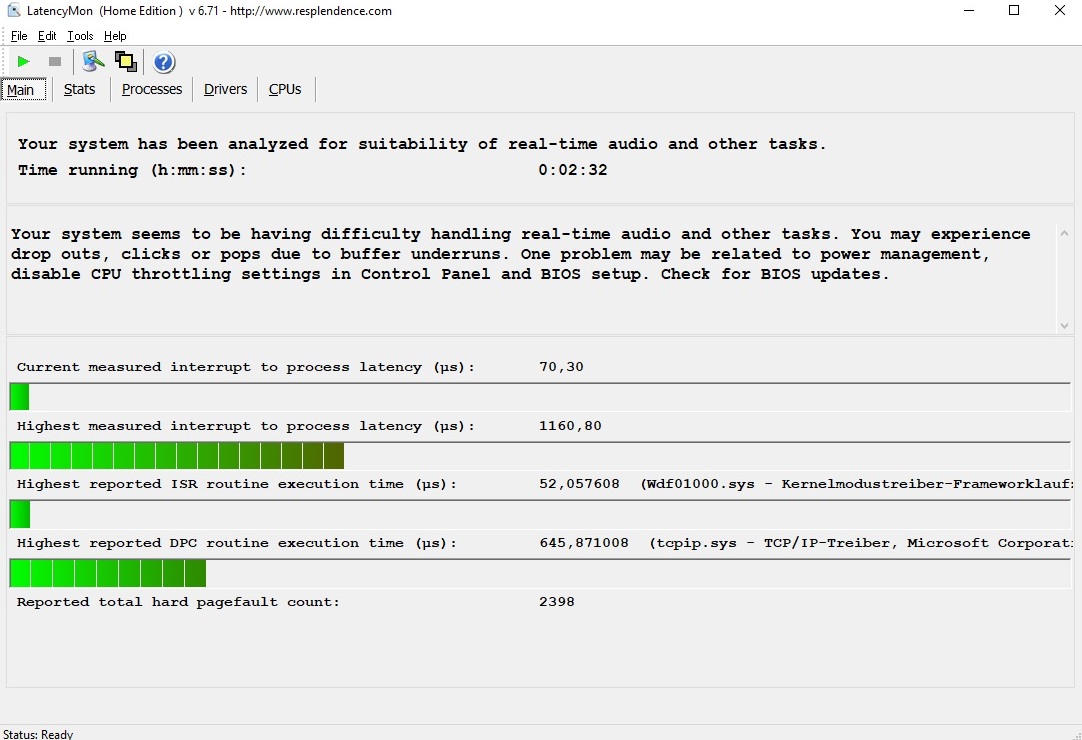
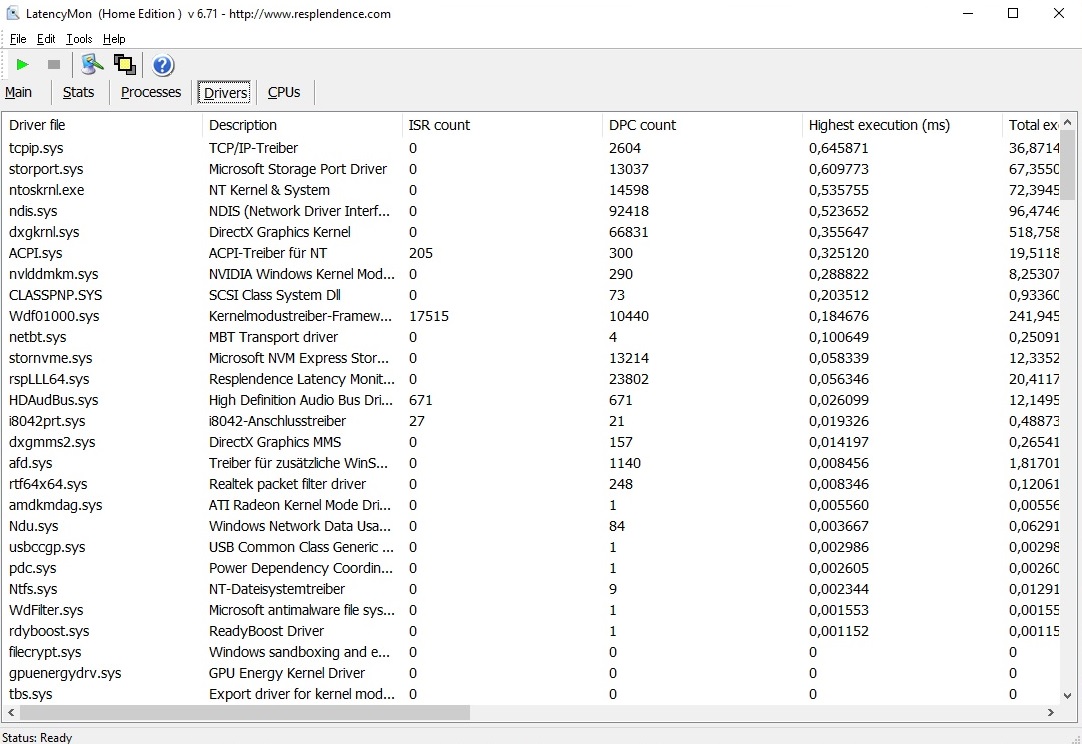
DPC延迟
在延迟方面还有一些优化的空间。LatencyMon工具报告说,Victus 16在交付状态下对音频和/或视频内容的实时处理有一些问题。不过,大多数用户应该不会注意到这个问题。
| DPC Latencies / LatencyMon - interrupt to process latency (max), Web, Youtube, Prime95 | |
| Asus TUF Gaming F15 FX506HM | |
| HP Victus 16-e0179ng | |
| Lenovo Legion 5 15ACH-82JU00C6GE-FL | |
| Alienware m15 R5 Ryzen Edition | |
* ... smaller is better
存储解决方案
作为存储解决方案,惠普在我们的测试装置中使用了西部数据的NVMe驱动器。西部数据PC SN730的1TB版本超越了大多数使用美光、东芝或SK海力士固态硬盘的竞争对手的固态硬盘,特别是在AS固态硬盘的基准中。同样非常有用的是,那些想要扩展存储的人可以在引擎盖下找到一个空的M.2插槽。
| HP Victus 16-e0179ng WDC PC SN730 SDBPNTY-1T00 | Lenovo Legion 5 15ACH-82JU00C6GE-FL Micron 2300 512GB MTFDHBA512TDV | Alienware m15 R5 Ryzen Edition Toshiba KBG40ZNS512G NVMe | Asus TUF Gaming F15 FX506HM SK Hynix HFM001TD3JX013N | |
|---|---|---|---|---|
| CrystalDiskMark 5.2 / 6 | 4% | -22% | 3% | |
| Write 4K (MB/s) | 157.3 | 124.6 -21% | 116.9 -26% | 168.1 7% |
| Read 4K (MB/s) | 49 | 54.2 11% | 44.56 -9% | 65.1 33% |
| Write Seq (MB/s) | 2983 | 2706 -9% | 1552 -48% | 2124 -29% |
| Read Seq (MB/s) | 2247 | 2298 2% | 1682 -25% | 2204 -2% |
| Write 4K Q32T1 (MB/s) | 395 | 499.7 27% | 497.8 26% | 455.3 15% |
| Read 4K Q32T1 (MB/s) | 557 | 570 2% | 436.8 -22% | 465.6 -16% |
| Write Seq Q32T1 (MB/s) | 3094 | 2999 -3% | 1461 -53% | 2911 -6% |
| Read Seq Q32T1 (MB/s) | 2871 | 3461 21% | 2364 -18% | 3519 23% |
| AS SSD | -27% | -80% | -13% | |
| Seq Read (MB/s) | 2383 | 2960 24% | 2082 -13% | 2873 21% |
| Seq Write (MB/s) | 2466 | 2586 5% | 825 -67% | 1619 -34% |
| 4K Read (MB/s) | 44.14 | 46.84 6% | 42.41 -4% | 57.5 30% |
| 4K Write (MB/s) | 117.5 | 96.1 -18% | 98.3 -16% | 149.6 27% |
| 4K-64 Read (MB/s) | 1734 | 854 -51% | 1255 -28% | 1252 -28% |
| 4K-64 Write (MB/s) | 2088 | 2015 -3% | 738 -65% | 2196 5% |
| Access Time Read * (ms) | 0.049 | 0.048 2% | 0.109 -122% | 0.04 18% |
| Access Time Write * (ms) | 0.032 | 0.094 -194% | 0.17 -431% | 0.082 -156% |
| Score Read (Points) | 2017 | 1197 -41% | 1506 -25% | 1597 -21% |
| Score Write (Points) | 2452 | 2370 -3% | 918 -63% | 2508 2% |
| Score Total (Points) | 5503 | 4170 -24% | 3136 -43% | 4869 -12% |
| Total Average (Program / Settings) | -12% /
-14% | -51% /
-55% | -5% /
-6% |
* ... smaller is better

Constant Performance Reading: DiskSpd Read Loop, Queue Depth 8
图形卡
与之相反的是 GeForce RTX 3050(Ti),由于其微薄的视频存储只有4GB,并没有提供任何特别的保证和对未来的感觉。 GeForce RTX 3060对于注重价格的游戏玩家来说是一个不错的选择。Nvidia安培一代的DirectX 12型号至少有6GB的GDDR6 VRAM,目前还是足够的。
然而,与CPU性能类似,与竞争对手相比,Victus 16的GPU性能也大多低于平均值。这并不奇怪,因为惠普只为RTX 3060配置了95瓦的TGP(包括动态提升)。理论上,高达130瓦是可能的,例如联想用Legion 5显示。在合成图形基准测试和游戏运行中,那台笔记本电脑往往比惠普的设备领先10%以上。
| 3DMark 11 Performance | 22166 points | |
| 3DMark Cloud Gate Standard Score | 45994 points | |
| 3DMark Fire Strike Score | 17711 points | |
| 3DMark Time Spy Score | 7680 points | |
Help | ||
游戏性能
| The Witcher 3 | |
| 1920x1080 High Graphics & Postprocessing (Nvidia HairWorks Off) | |
| Average of class Gaming (181 - 341, n=3, last 2 years) | |
| Average NVIDIA GeForce RTX 3060 Laptop GPU (81 - 186.8, n=41) | |
| Asus TUF Gaming F15 FX506HM | |
| Alienware m15 R5 Ryzen Edition | |
| HP Victus 16-e0179ng | |
| 1920x1080 Ultra Graphics & Postprocessing (HBAO+) | |
| Average of class Gaming (95 - 240, n=8, last 2 years) | |
| Average NVIDIA GeForce RTX 3060 Laptop GPU (58.2 - 91.5, n=48) | |
| Alienware m15 R5 Ryzen Edition | |
| Asus TUF Gaming F15 FX506HM | |
| HP Victus 16-e0179ng | |
除了一些较小的FPS波动外,用" "进行的恒定负载测试。的测试。Witcher 3"显示没有任何异常。
The Witcher 3 FPS Chart
| low | med. | high | ultra | |
|---|---|---|---|---|
| GTA V (2015) | 150 | 86.6 | ||
| The Witcher 3 (2015) | 135 | 70.9 | ||
| Dota 2 Reborn (2015) | 149 | 134 | 128 | 121 |
| Final Fantasy XV Benchmark (2018) | 74.9 | |||
| X-Plane 11.11 (2018) | 98.9 | 87.2 | 72.8 | |
| Far Cry 5 (2018) | 109 | 102 | ||
| Strange Brigade (2018) | 146 | 128 | ||
| Hunt Showdown (2020) | 93.3 | |||
| Doom Eternal (2020) | 149 | 145 | ||
| Crysis Remastered (2020) | 60.7 | 43.4 | ||
| Mafia Definitive Edition (2020) | 86.1 | |||
| Star Wars Squadrons (2020) | 178 | 166 | ||
| FIFA 21 (2020) | 194 | 185 | ||
| Outriders (2021) | 100 | 85.3 | ||
| Resident Evil Village (2021) | 129 | 113 | ||
| Mass Effect Legendary Edition (2021) | 109 | |||
| Monster Hunter Stories 2 (2021) | 143 | |||
| Deathloop (2021) | 72.3 | 63.5 |
排放
噪声排放
在空闲运行期间,16英寸笔记本电脑在噪音水平方面取得了良好的数据。在很长一段时间内,风扇保持关闭,这导致了完全无声的操作。然而,在负载情况下,和平与安静就会结束。44-52 dB(A)代表了一个明显的噪音水平,对一些用户来说可能会感到很烦人,建议使用耳机。在"TheWitcher 3"期间,Victus 16的噪音几乎达到50 dB(A),比Alienware m15 R5和华硕TUF F15更明显,但仍比联想Legion 5的噪音小。
Noise level
| Idle |
| 24 / 25 / 34 dB(A) |
| Load |
| 44 / 52 dB(A) |
 | ||
30 dB silent 40 dB(A) audible 50 dB(A) loud |
||
min: | ||
| HP Victus 16-e0179ng R7 5800H, GeForce RTX 3060 Laptop GPU | Lenovo Legion 5 15ACH-82JU00C6GE-FL R7 5800H, GeForce RTX 3060 Laptop GPU | Alienware m15 R5 Ryzen Edition R7 5800H, GeForce RTX 3060 Laptop GPU | Asus TUF Gaming F15 FX506HM i7-11800H, GeForce RTX 3060 Laptop GPU | Average of class Gaming | |
|---|---|---|---|---|---|
| Noise | -8% | 1% | 10% | -1% | |
| off / environment * (dB) | 24 | 24.2 -1% | 24 -0% | 24.8 -3% | 24.1 ? -0% |
| Idle Minimum * (dB) | 24 | 29 -21% | 24 -0% | 24.6 -3% | 25.9 ? -8% |
| Idle Average * (dB) | 25 | 29 -16% | 25 -0% | 24.9 -0% | 27.4 ? -10% |
| Idle Maximum * (dB) | 34 | 29 15% | 35 -3% | 24.9 27% | 29.9 ? 12% |
| Load Average * (dB) | 44 | 53.5 -22% | 44 -0% | 27.1 38% | 43 ? 2% |
| Witcher 3 ultra * (dB) | 50 | 53.5 -7% | 48 4% | 46.4 7% | |
| Load Maximum * (dB) | 52 | 53.5 -3% | 50 4% | 49 6% | 54.1 ? -4% |
* ... smaller is better
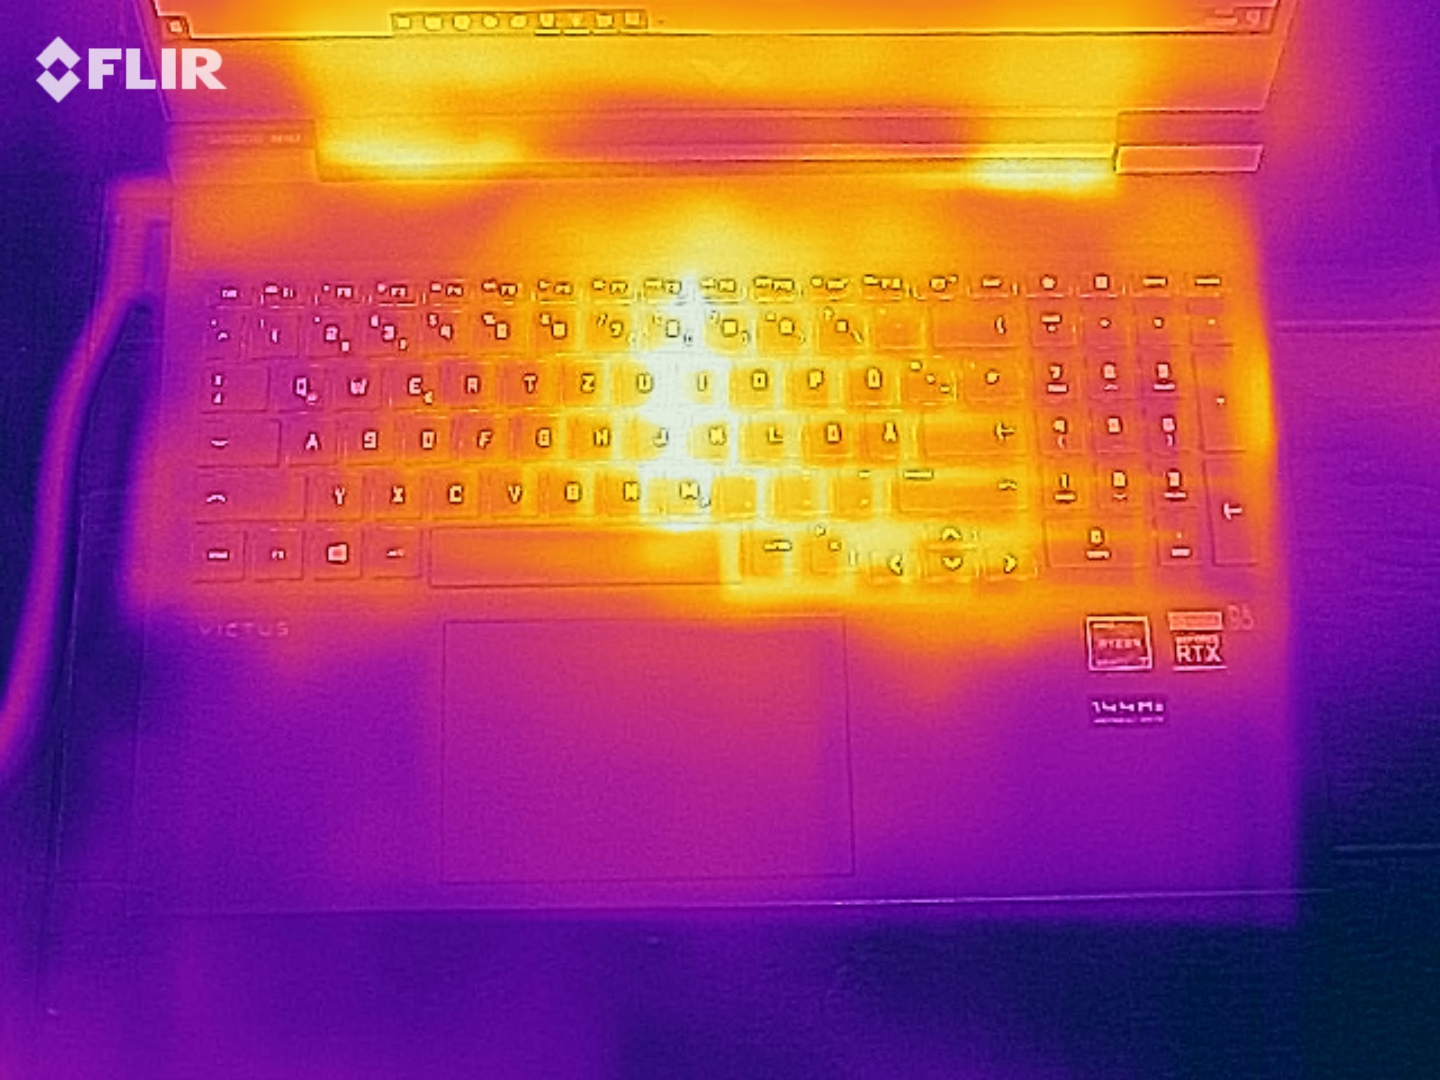
温度
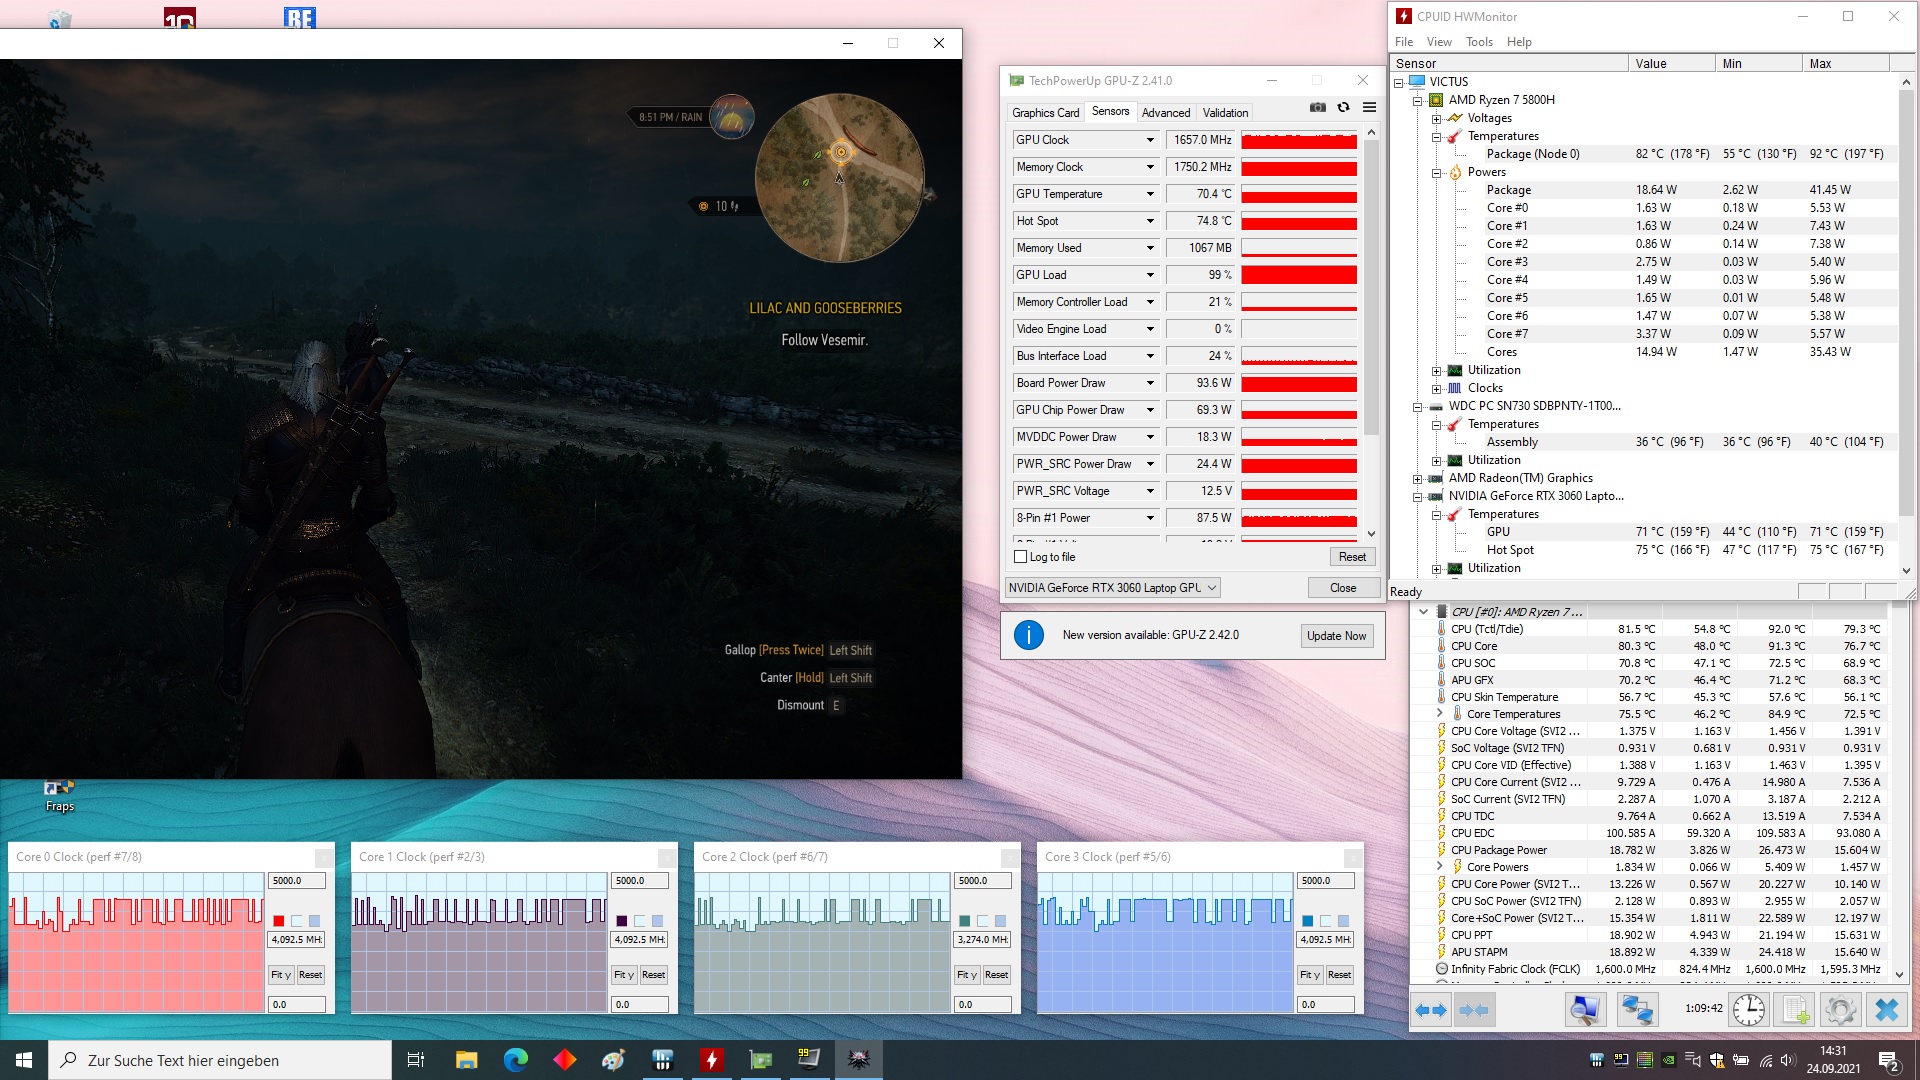
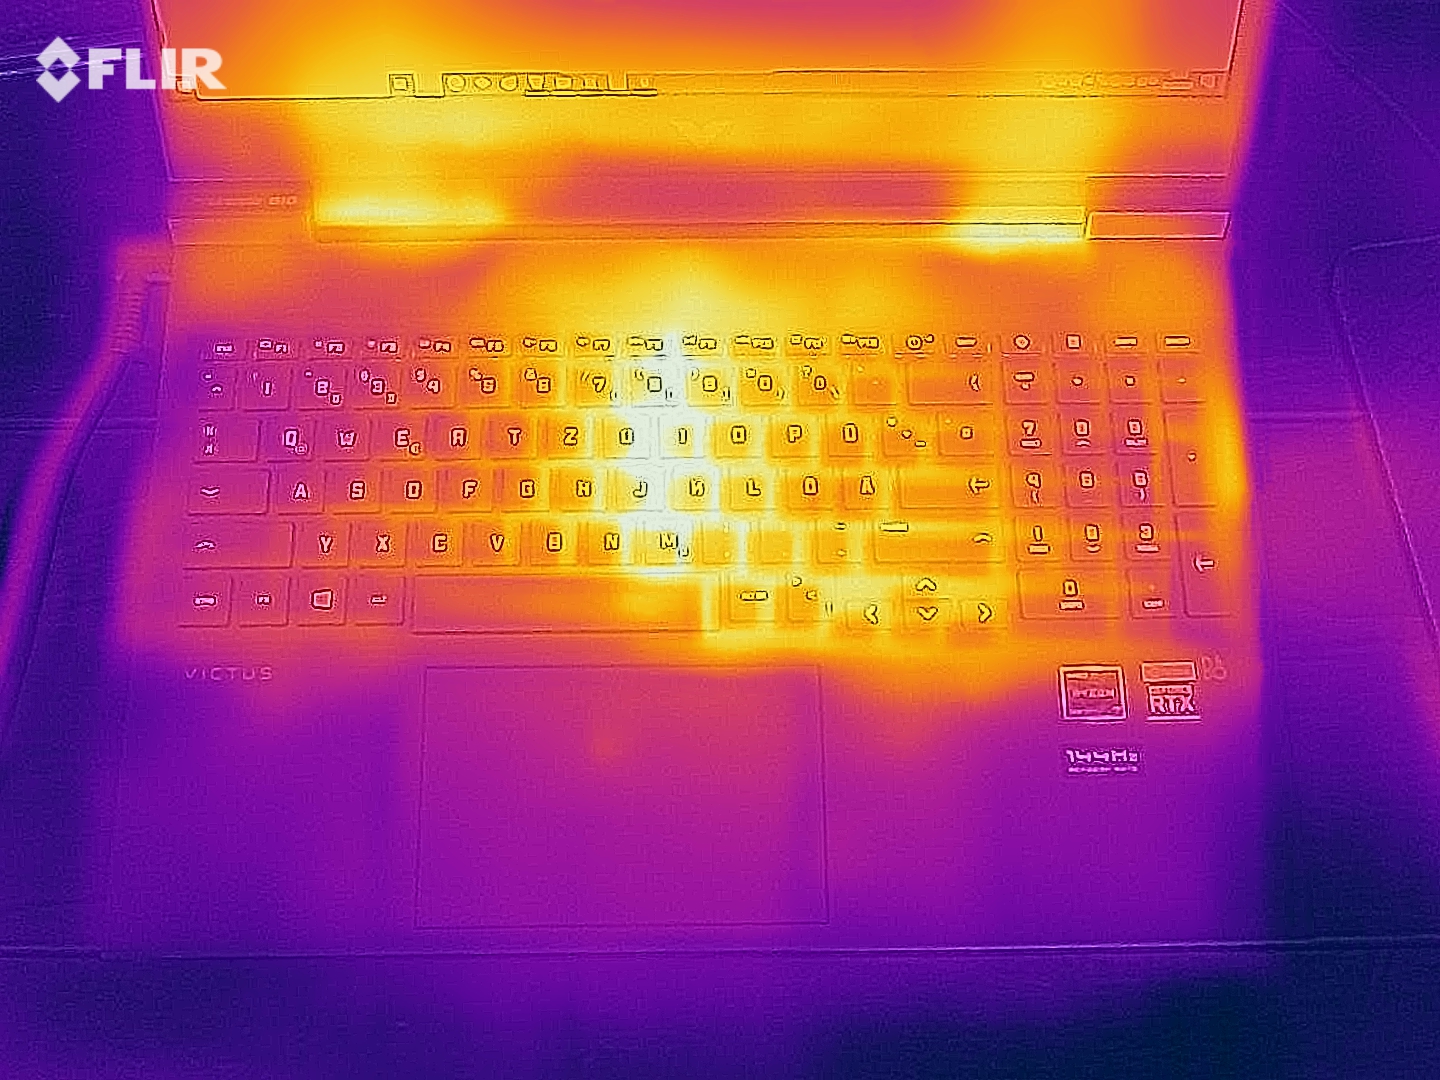
在空闲运行时,温度的发展已经变得相当高。根据我们的测量,底座顶部的中央区域和背面的温度达到40°C(104°F)以上。在3D操作过程中,机箱的温度甚至超过了50°C(122°F),这说明在游戏过程中把设备放在腿上是不可取的。不过,掌托始终保持着合理的温度。
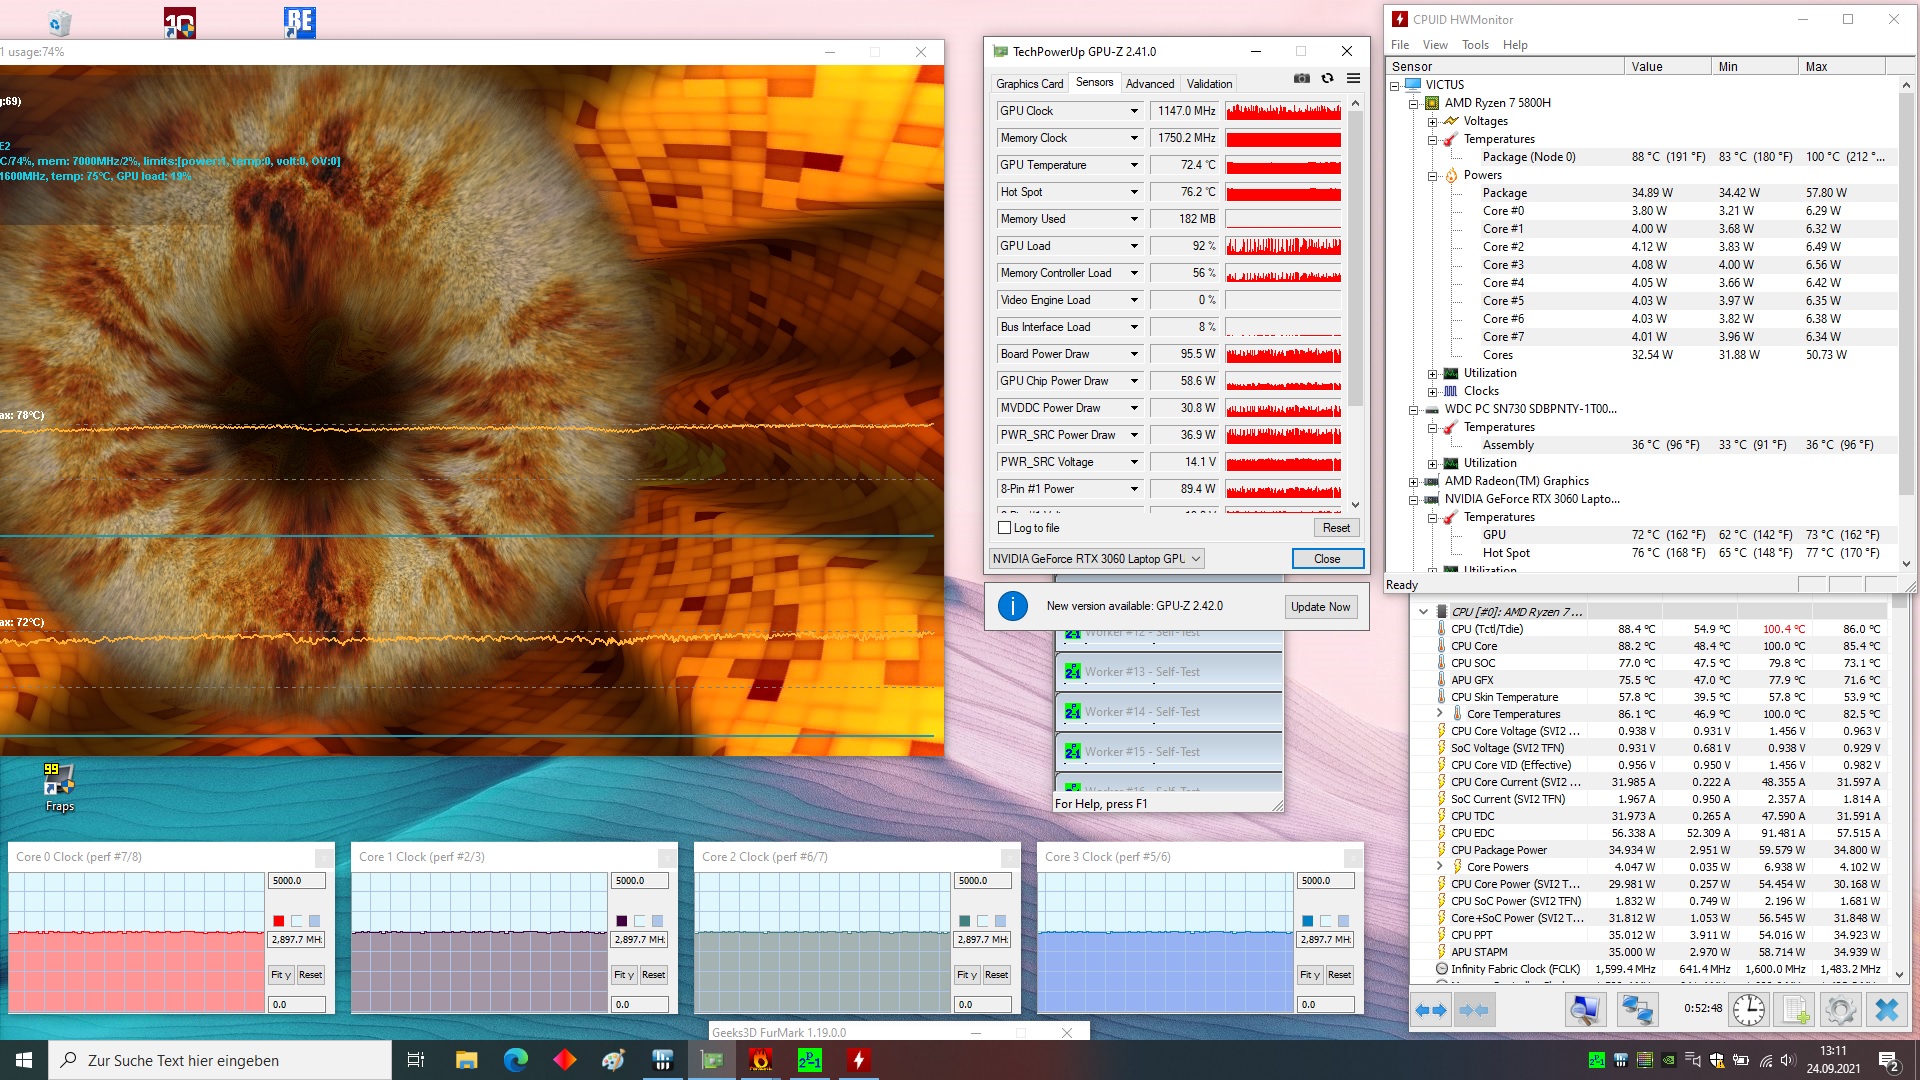
组件也出了不少汗。CPU和GPU分别在82和70℃(180和158°F)完成了60分钟的Witcher 3 测试。在压力测试(FurMark + Prime95)中,Ryzen 7 5800H的温度更高,接近90°C(194°F)。另一方面,GeForce RTX 3060的温度几乎没有增加。
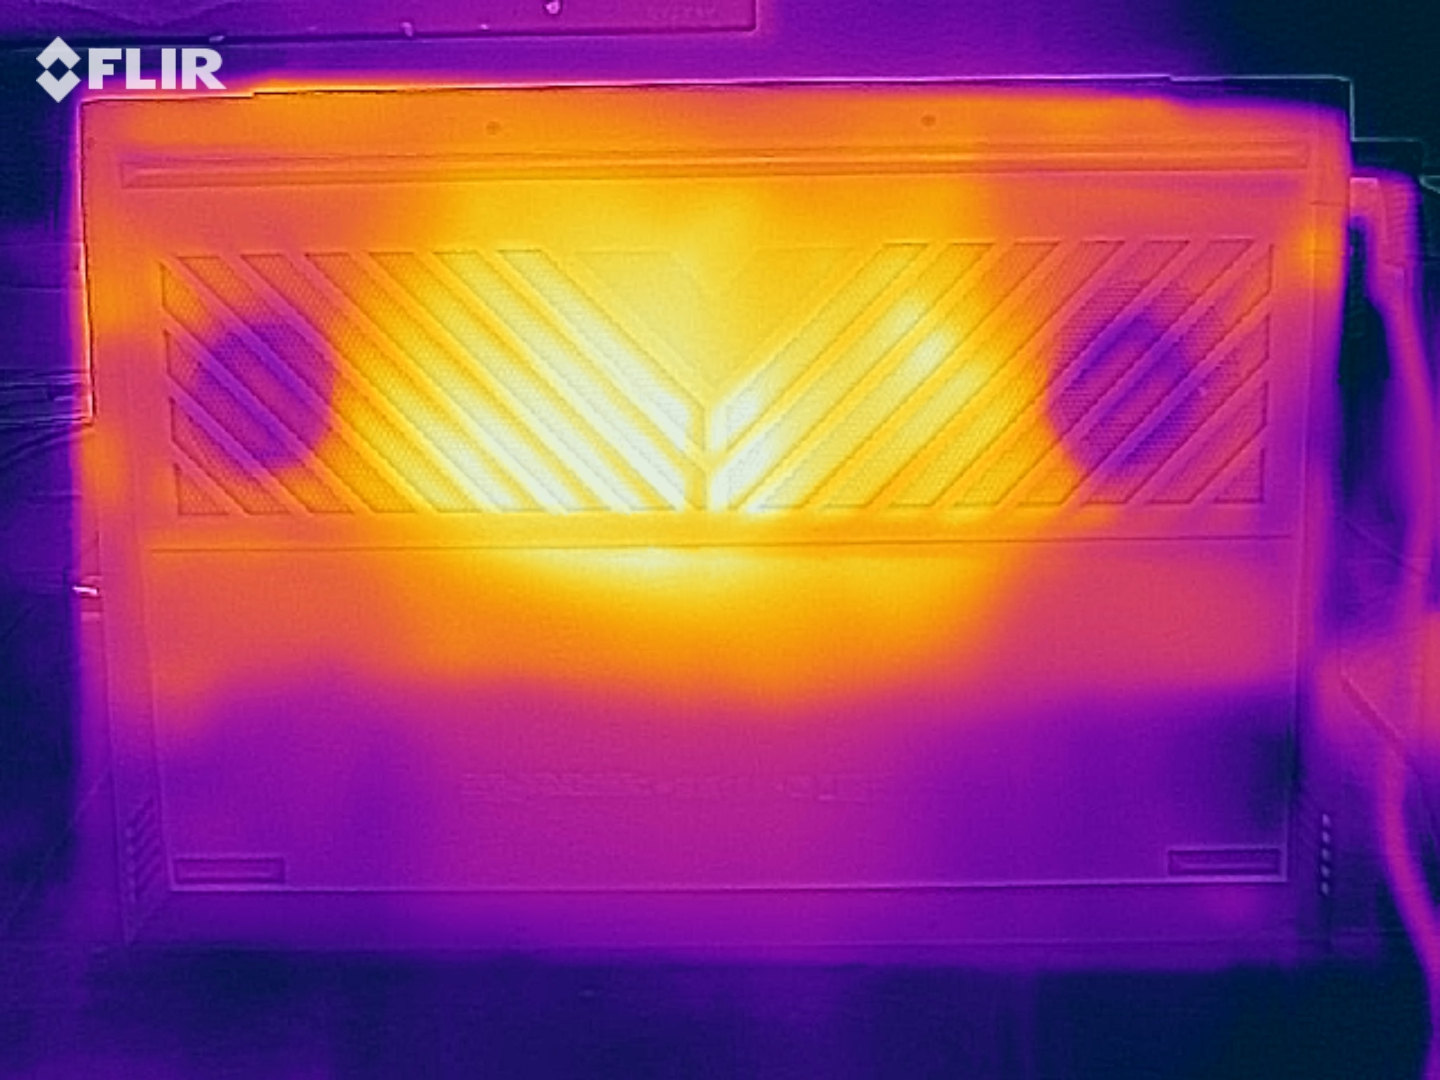
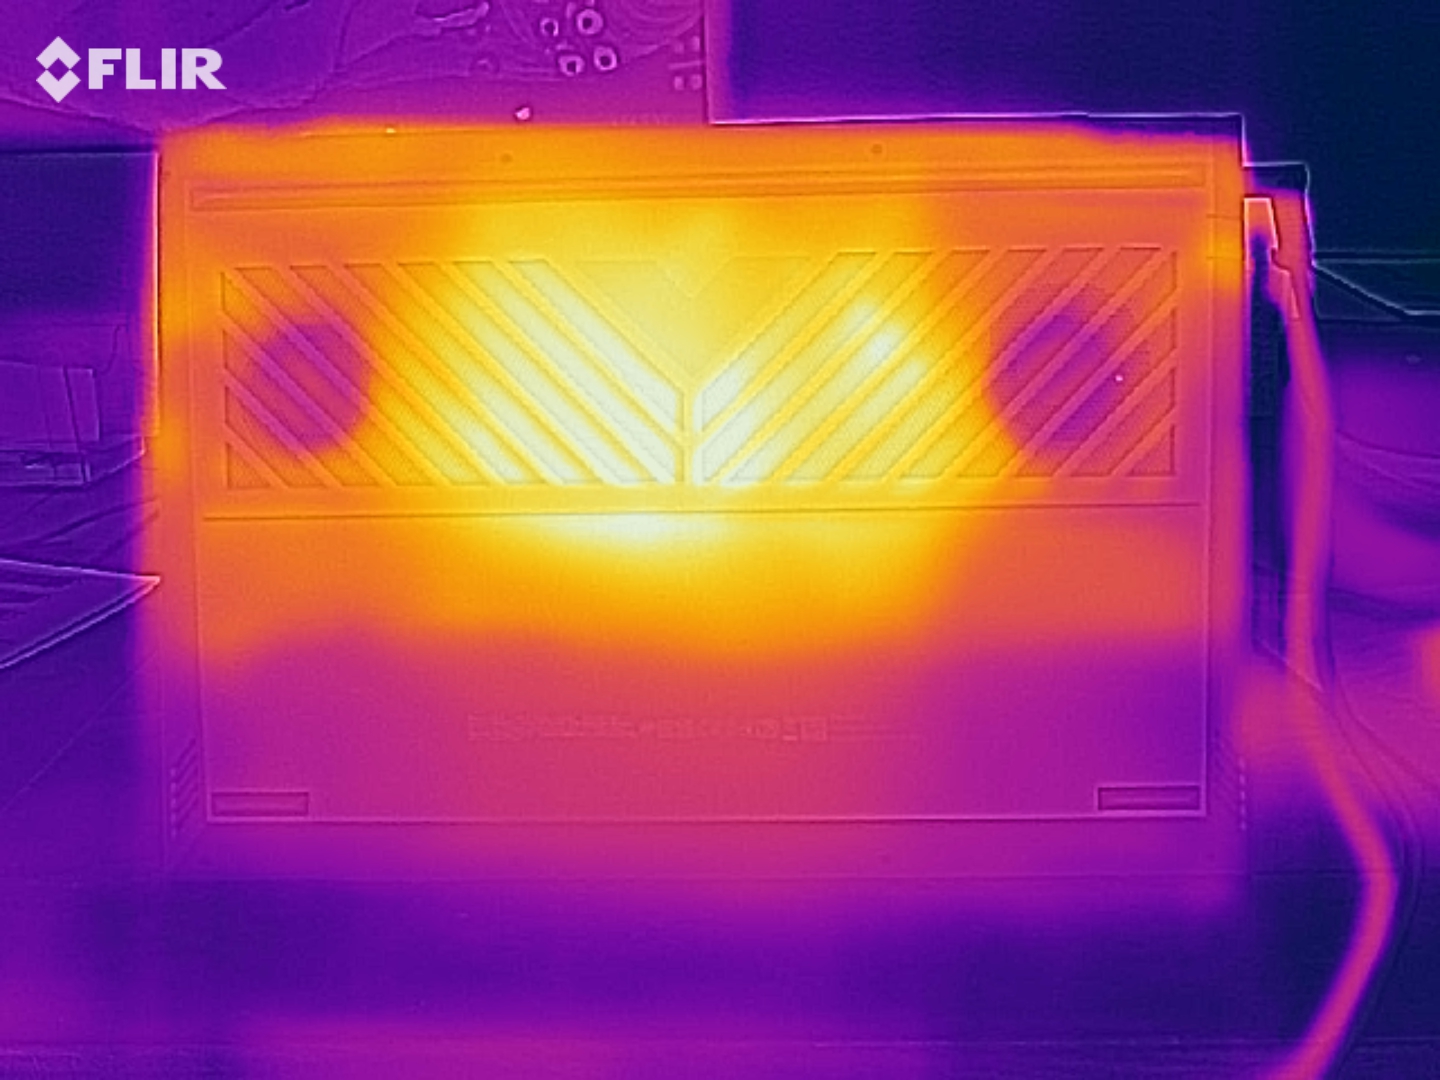
(-) The maximum temperature on the upper side is 51 °C / 124 F, compared to the average of 40.4 °C / 105 F, ranging from 21.2 to 68.8 °C for the class Gaming.
(-) The bottom heats up to a maximum of 52 °C / 126 F, compared to the average of 43.2 °C / 110 F
(±) In idle usage, the average temperature for the upper side is 34.7 °C / 94 F, compared to the device average of 33.9 °C / 93 F.
(-) Playing The Witcher 3, the average temperature for the upper side is 40.1 °C / 104 F, compared to the device average of 33.9 °C / 93 F.
(±) The palmrests and touchpad can get very hot to the touch with a maximum of 39 °C / 102.2 F.
(-) The average temperature of the palmrest area of similar devices was 28.8 °C / 83.8 F (-10.2 °C / -18.4 F).
| HP Victus 16-e0179ng R7 5800H, GeForce RTX 3060 Laptop GPU | Lenovo Legion 5 15ACH-82JU00C6GE-FL R7 5800H, GeForce RTX 3060 Laptop GPU | Alienware m15 R5 Ryzen Edition R7 5800H, GeForce RTX 3060 Laptop GPU | Asus TUF Gaming F15 FX506HM i7-11800H, GeForce RTX 3060 Laptop GPU | Average of class Gaming | |
|---|---|---|---|---|---|
| Heat | 25% | 1% | 25% | 17% | |
| Maximum Upper Side * (°C) | 51 | 42.6 16% | 62 -22% | 46.4 9% | 45.2 ? 11% |
| Maximum Bottom * (°C) | 52 | 52.2 -0% | 61 -17% | 45.4 13% | 48.1 ? 7% |
| Idle Upper Side * (°C) | 46 | 24.9 46% | 36 22% | 26 43% | 31.1 ? 32% |
| Idle Bottom * (°C) | 41 | 25.3 38% | 33 20% | 27.4 33% | 34.2 ? 17% |
* ... smaller is better
演讲者
我们的音频分析证明,Victus 16的声音在该领域中属于中等水平。根据目前的测量,所有竞争设备中,40%的设备提供了更好的声音,54%的设备提供了更差的声音,6%的设备具有可比性。像往常一样,尤其是低音缺乏。例如,华硕TUF F15的竞争对手在这里领先。
HP Victus 16-e0179ng audio analysis
(±) | speaker loudness is average but good (78 dB)
Bass 100 - 315 Hz
(-) | nearly no bass - on average 20.4% lower than median
(±) | linearity of bass is average (13.6% delta to prev. frequency)
Mids 400 - 2000 Hz
(+) | balanced mids - only 0.9% away from median
(+) | mids are linear (2.4% delta to prev. frequency)
Highs 2 - 16 kHz
(±) | higher highs - on average 5.5% higher than median
(+) | highs are linear (5.1% delta to prev. frequency)
Overall 100 - 16.000 Hz
(±) | linearity of overall sound is average (17.5% difference to median)
Compared to same class
» 49% of all tested devices in this class were better, 12% similar, 40% worse
» The best had a delta of 6%, average was 18%, worst was 132%
Compared to all devices tested
» 34% of all tested devices were better, 8% similar, 58% worse
» The best had a delta of 4%, average was 24%, worst was 134%
Asus TUF Gaming F15 FX506HM audio analysis
(±) | speaker loudness is average but good (77.1 dB)
Bass 100 - 315 Hz
(±) | reduced bass - on average 13.8% lower than median
(±) | linearity of bass is average (7.9% delta to prev. frequency)
Mids 400 - 2000 Hz
(+) | balanced mids - only 2.9% away from median
(+) | mids are linear (5.9% delta to prev. frequency)
Highs 2 - 16 kHz
(+) | balanced highs - only 1.8% away from median
(+) | highs are linear (2.7% delta to prev. frequency)
Overall 100 - 16.000 Hz
(+) | overall sound is linear (13.1% difference to median)
Compared to same class
» 18% of all tested devices in this class were better, 4% similar, 78% worse
» The best had a delta of 6%, average was 18%, worst was 132%
Compared to all devices tested
» 13% of all tested devices were better, 3% similar, 84% worse
» The best had a delta of 4%, average was 24%, worst was 134%
电源管理
消耗功率
大多数时候,耗电量低于竞争对手。怠速运行时5至20瓦,负载时108至189瓦,表明电池寿命良好。
| Off / Standby | |
| Idle | |
| Load |
|
Key:
min: | |
| HP Victus 16-e0179ng R7 5800H, GeForce RTX 3060 Laptop GPU | Lenovo Legion 5 15ACH-82JU00C6GE-FL R7 5800H, GeForce RTX 3060 Laptop GPU | Alienware m15 R5 Ryzen Edition R7 5800H, GeForce RTX 3060 Laptop GPU | Asus TUF Gaming F15 FX506HM i7-11800H, GeForce RTX 3060 Laptop GPU | Average of class Gaming | |
|---|---|---|---|---|---|
| Power Consumption | -12% | -40% | -19% | -61% | |
| Idle Minimum * (Watt) | 5 | 7.3 -46% | 11 -120% | 9.5 -90% | 13.1 ? -162% |
| Idle Average * (Watt) | 10 | 10.5 -5% | 14 -40% | 12.1 -21% | 18.8 ? -88% |
| Idle Maximum * (Watt) | 20 | 15.7 22% | 25 -25% | 22.5 -13% | 24.4 ? -22% |
| Load Average * (Watt) | 108 | 108 -0% | 123 -14% | 99.5 8% | 108.5 ? -0% |
| Witcher 3 ultra * (Watt) | 145 | 175 -21% | 176 -21% | 157 -8% | |
| Load Maximum * (Watt) | 189 | 228 -21% | 226 -20% | 173.5 8% | 254 ? -34% |
* ... smaller is better
Power Consumption The Witcher 3
电池寿命
70Wh,惠普为Victus 16配备的电池容量既不大也不特别小。然而,竞争对手仍然达到了略高的80至90Wh的容量。由于适度的功耗和集成图形切换,在要求不高的任务中,这台16英寸笔记本电脑在远离充电器的情况下可以持续相当长的时间。在亮度降低到大约150cd/m²的情况下,近6个小时的网上冲浪,只有TUF F15的表现最好。华硕的竞争对手在这项测试中持续了近8小时。
| HP Victus 16-e0179ng R7 5800H, GeForce RTX 3060 Laptop GPU, 70 Wh | Lenovo Legion 5 15ACH-82JU00C6GE-FL R7 5800H, GeForce RTX 3060 Laptop GPU, 80 Wh | Alienware m15 R5 Ryzen Edition R7 5800H, GeForce RTX 3060 Laptop GPU, 86 Wh | Asus TUF Gaming F15 FX506HM i7-11800H, GeForce RTX 3060 Laptop GPU, 90 Wh | Average of class Gaming | |
|---|---|---|---|---|---|
| Battery runtime | 10% | 9% | 39% | 11% | |
| Reader / Idle (h) | 8.5 | 14.7 73% | 11 29% | 8.71 ? 2% | |
| WiFi v1.3 (h) | 5.9 | 4.8 -19% | 5.1 -14% | 7.9 34% | 6.98 ? 18% |
| Load (h) | 1.3 | 1.8 38% | 0.9 -31% | 2 54% | 1.47 ? 13% |
| H.264 (h) | 4.3 | 8.8 | 8.26 ? | ||
| Witcher 3 ultra (h) | 1.6 |
Pros
Cons
判决书
如果你不考虑略高的噪音水平和3D操作中相当高的温度,惠普Victus 16-e0179ng是一个相对成功和平衡的游戏笔记本电脑。
这款16英寸笔记本电脑不仅提供了有趣的外壳设计,还提供了良好的输入设备和令人信服的144-Hz显示屏。结合了Ryzen 7 5800H和 GeForce RTX 3060还可以在高到最大的细节水平上流畅地运行当前所有的游戏--至少在原生全高清分辨率下是这样。
大多数买家也应该对提供的电池寿命感到满意。惠普可以在连接方面做一些改进。至少有一个USB 3.2 Gen2端口对Victus 16来说是好事。总的来说,这款16英寸笔记本电脑与价格相近的RTX 3060竞争对手处于同一水平。
那些在1000至1500欧元(约1172-1759美元)的价格范围内寻找强大的游戏笔记本电脑的人,几乎可以毫不犹豫地选择这个。
HP Victus 16-e0179ng
- 09/28/2021 v7 (old)
Florian Glaser
Price comparison

