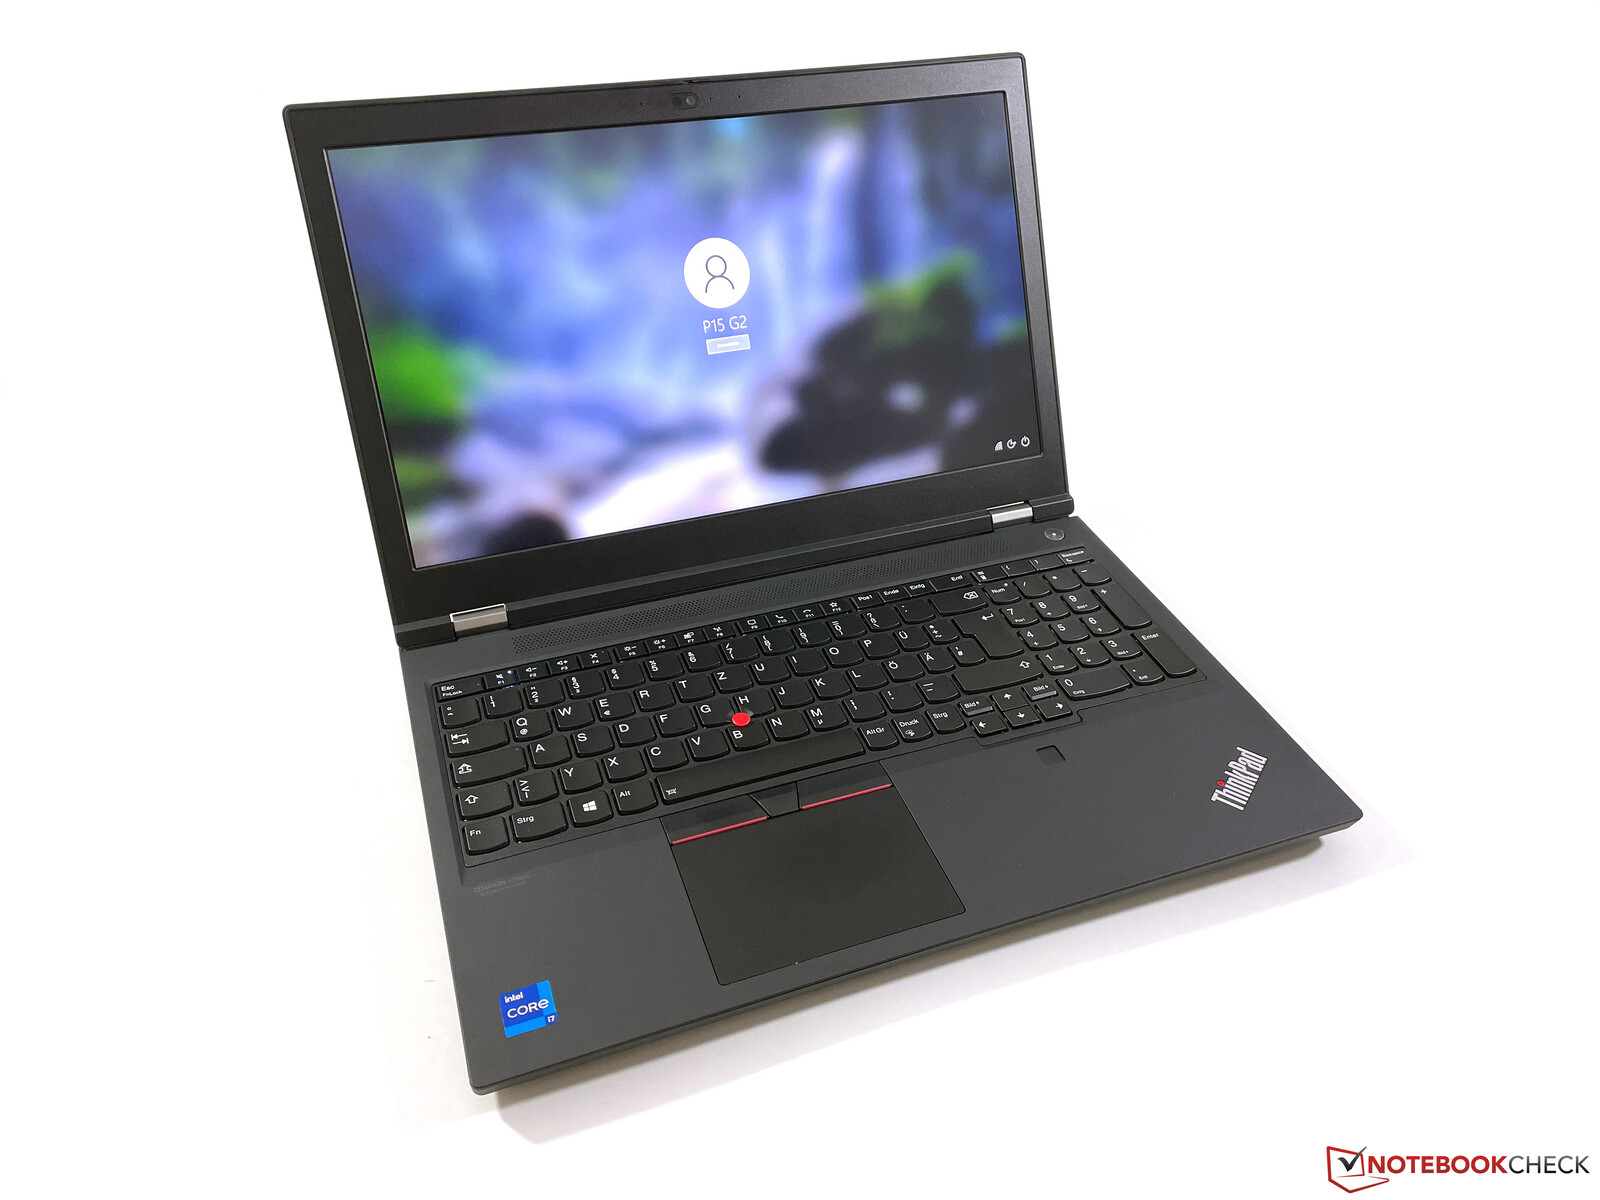
联想ThinkPad P15第二代笔记本电脑评测。配备新GPU的传统工作站
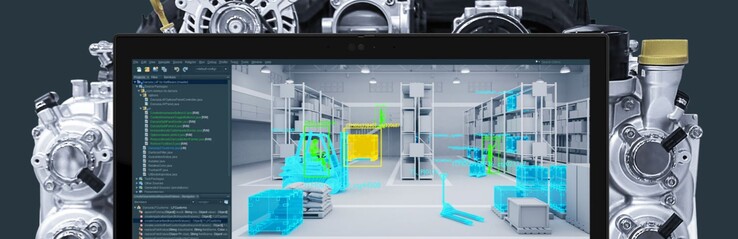
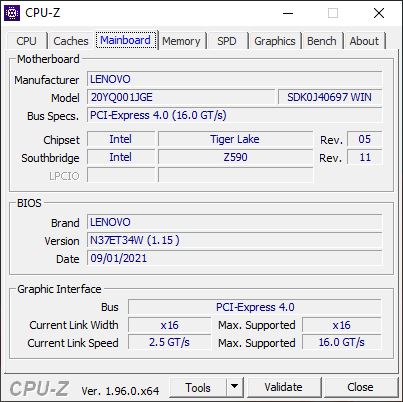
通过ThinkPad P15,联想继续提供传统的移动工作站,其中高性能和良好的维护选项继续发挥重要作用,而不是实现最薄的设计。联想在第一代ThinkPad P15上使用了全新的外壳,现在第二代也采用了这种外壳,没有任何改动。处理器已经更新为英特尔最新的45瓦CPU(Tiger Lake H45 Core i5、i7、i9或Xeon),显卡也已经更新为Nvidia的新RTX A GPU(Quadro GPU的继任者)。
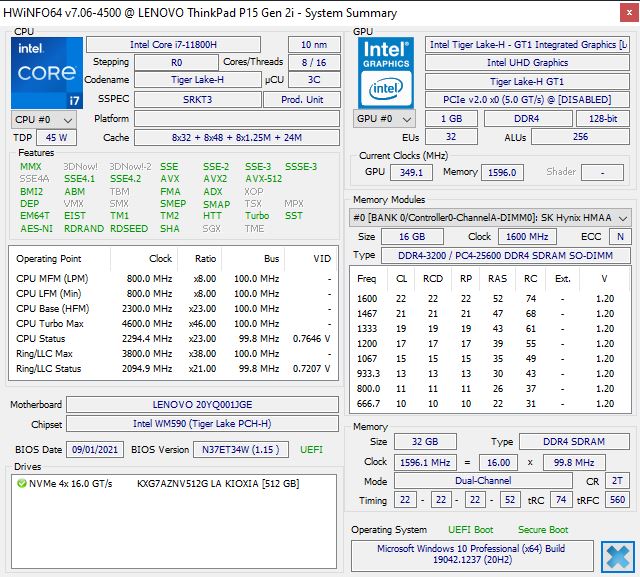
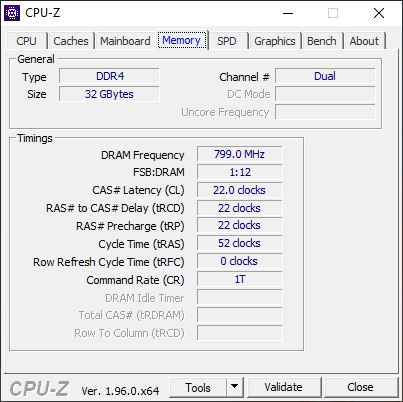
我们的测试设备型号为20YQ001JGE,价格为2850欧元(约合人民币3304元)(如果是相应的Campus型号,则为2500欧元(约合人民币2898元)),它是一个中端配置,配备了Core i7-11800H ,32GB内存,512GB PCIe SSD,新RTX A3000 ,以及亮度为500 cd/m²的1080p显示屏。不需要ISV认证的用户应该看看相同构造的ThinkPad T15g Gen 2 ,它由消费者GeForce GPU驱动。
Possible contenders in comparison
Rating | Date | Model | Weight | Height | Size | Resolution | Price |
|---|---|---|---|---|---|---|---|
| 87.2 % v7 (old) | 10 / 2021 | Lenovo ThinkPad P15 G2-20YQ001JGE i7-11800H, RTX A3000 Laptop GPU | 2.9 kg | 31.5 mm | 15.60" | 1920x1080 | |
| 87.8 % v7 (old) | 08 / 2021 | HP ZBook Studio 15 G8 i9-11950H, GeForce RTX 3070 Laptop GPU | 1.9 kg | 18 mm | 15.60" | 3840x2160 | |
| 90.2 % v7 (old) | 06 / 2021 | HP ZBook Fury 15 G7 W-10885M, Quadro RTX 5000 Max-Q | 2.4 kg | 25.9 mm | 15.60" | 3840x2160 | |
| 87.8 % v7 (old) | 12 / 2020 | Dell Precision 7550 W-10885M, Quadro RTX 5000 Max-Q | 2.8 kg | 27.36 mm | 15.60" | 3840x2160 | |
| 83.4 % v7 (old) | 02 / 2021 | MSI WS66 10TMT-207US i9-10980HK, Quadro RTX 5000 Max-Q | 2.3 kg | 19.8 mm | 15.60" | 1920x1080 | |
| 85.6 % v7 (old) | Lenovo ThinkPad P15 Gen1-20ST000DGE i7-10750H, Quadro T1000 (Laptop) | 2.7 kg | 31.45 mm | 15.60" | 1920x1080 |
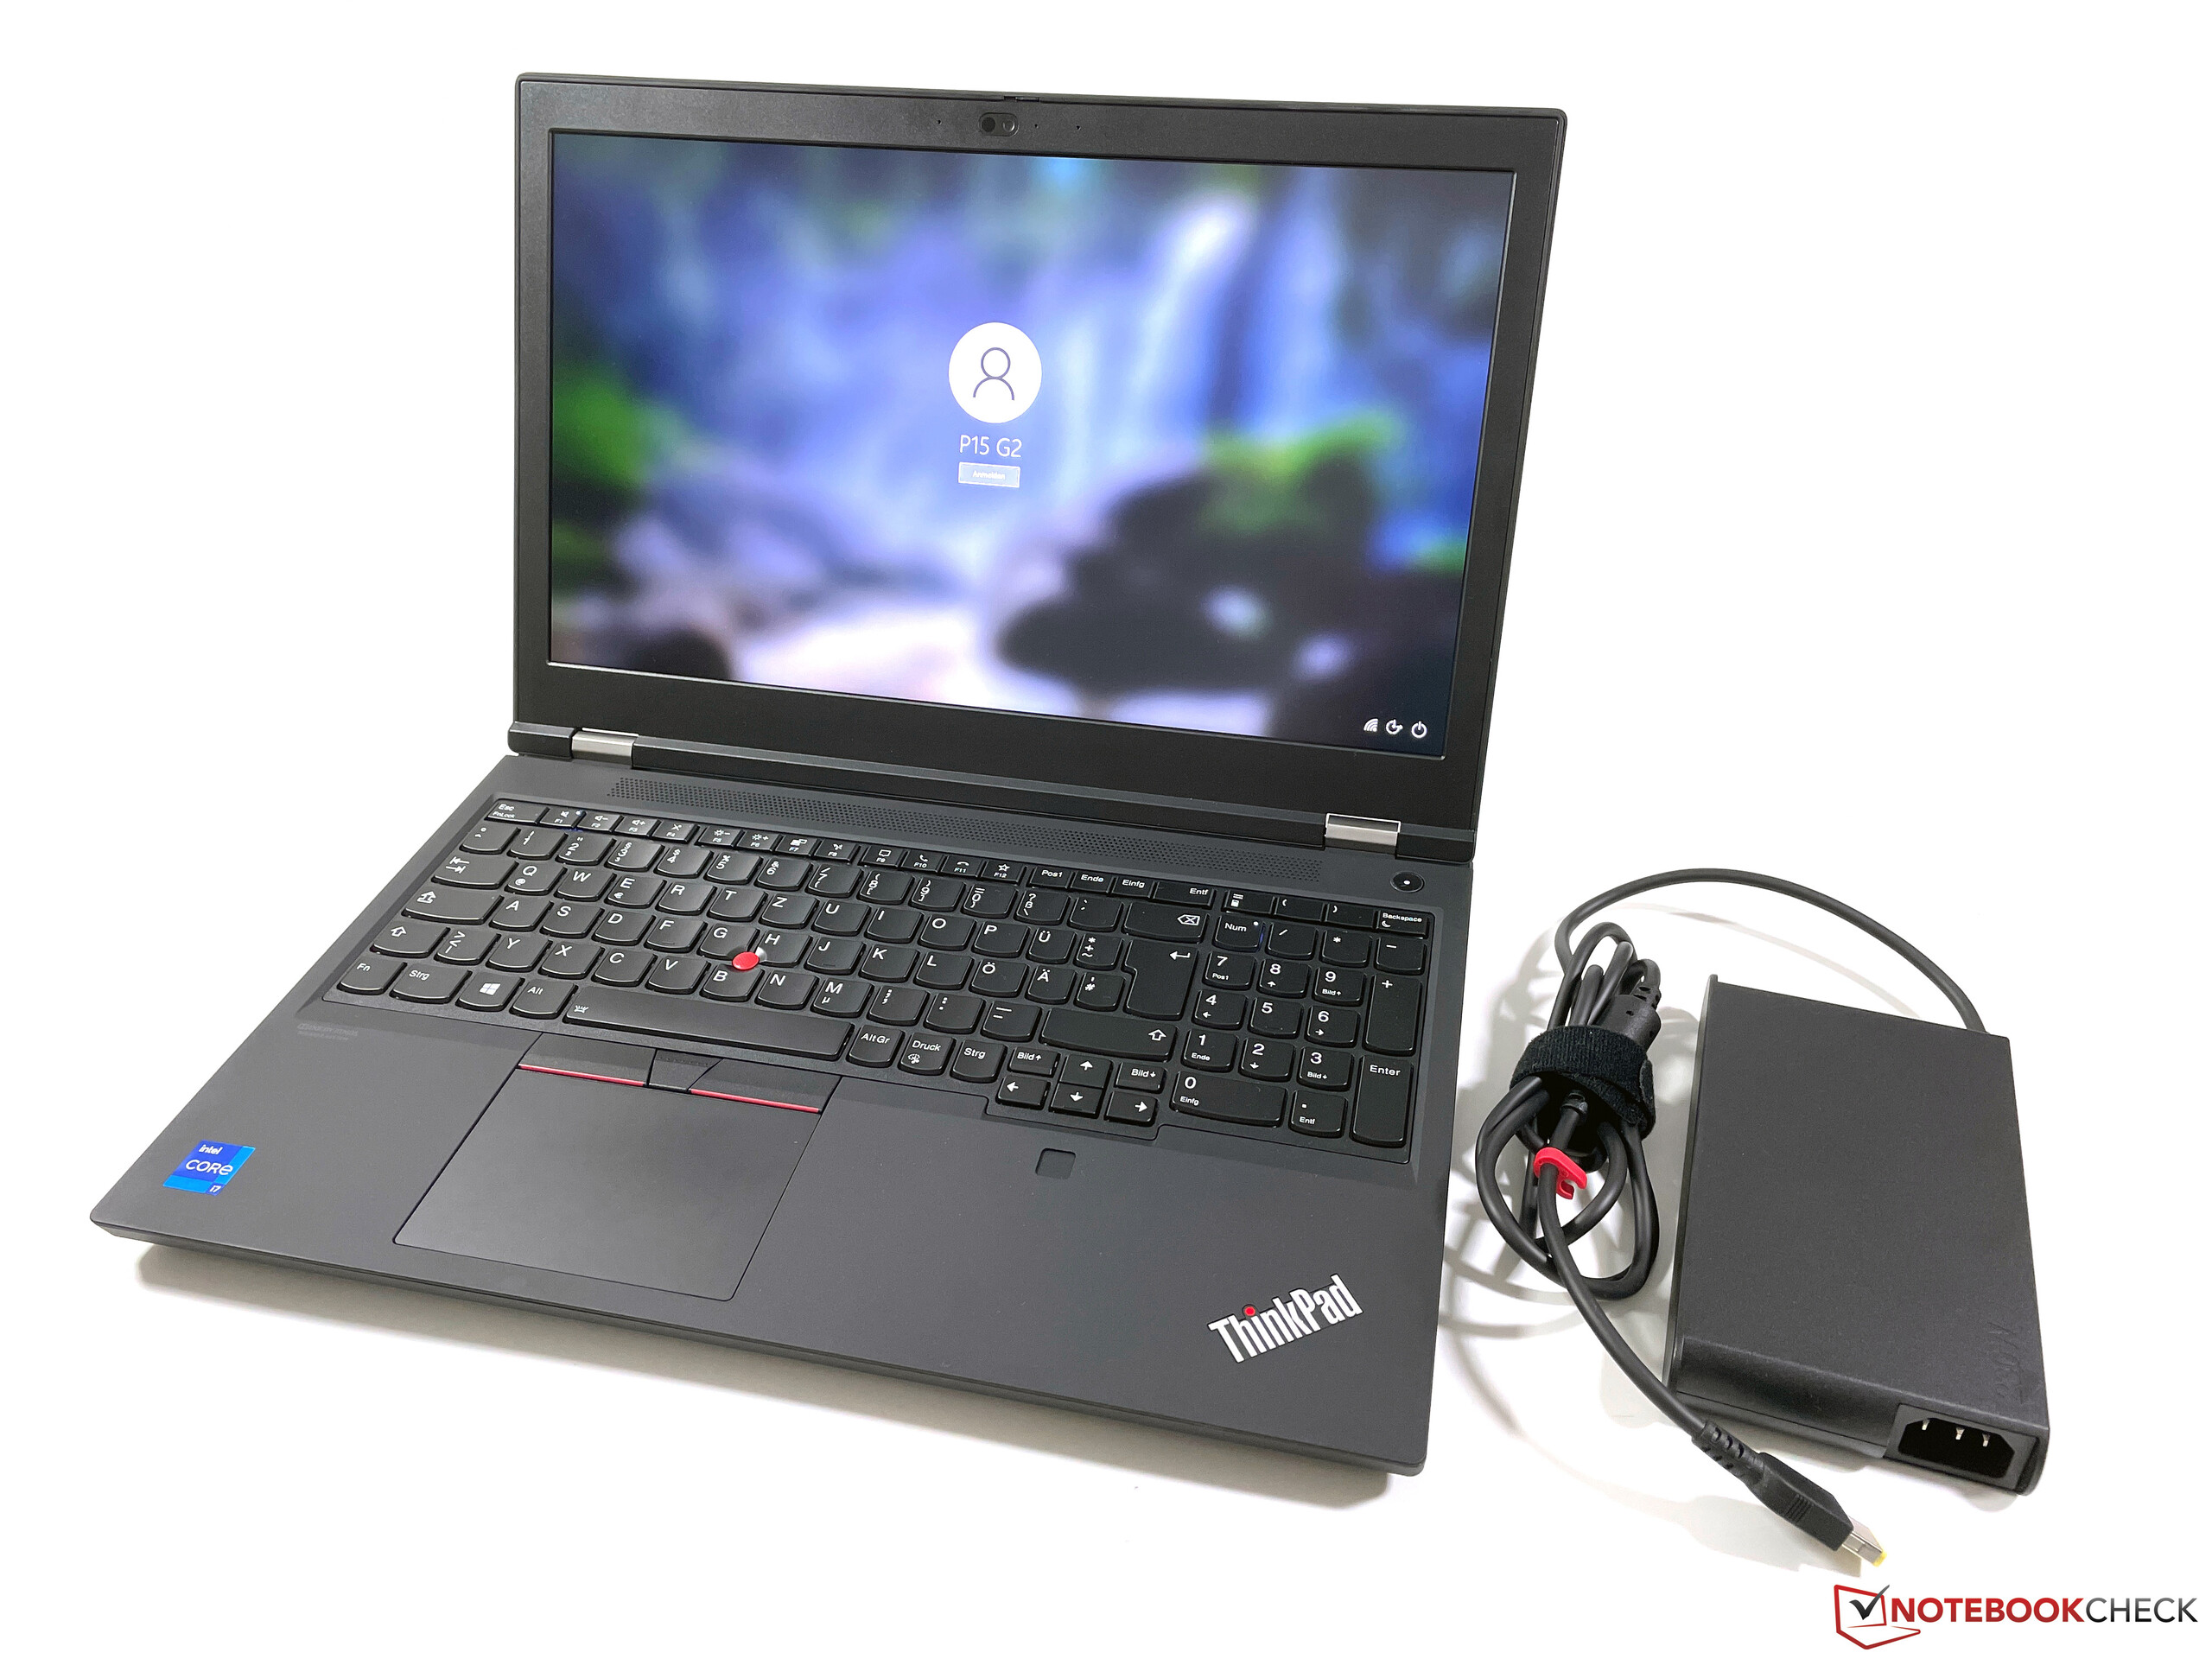
外壳 - 传统ThinkPad
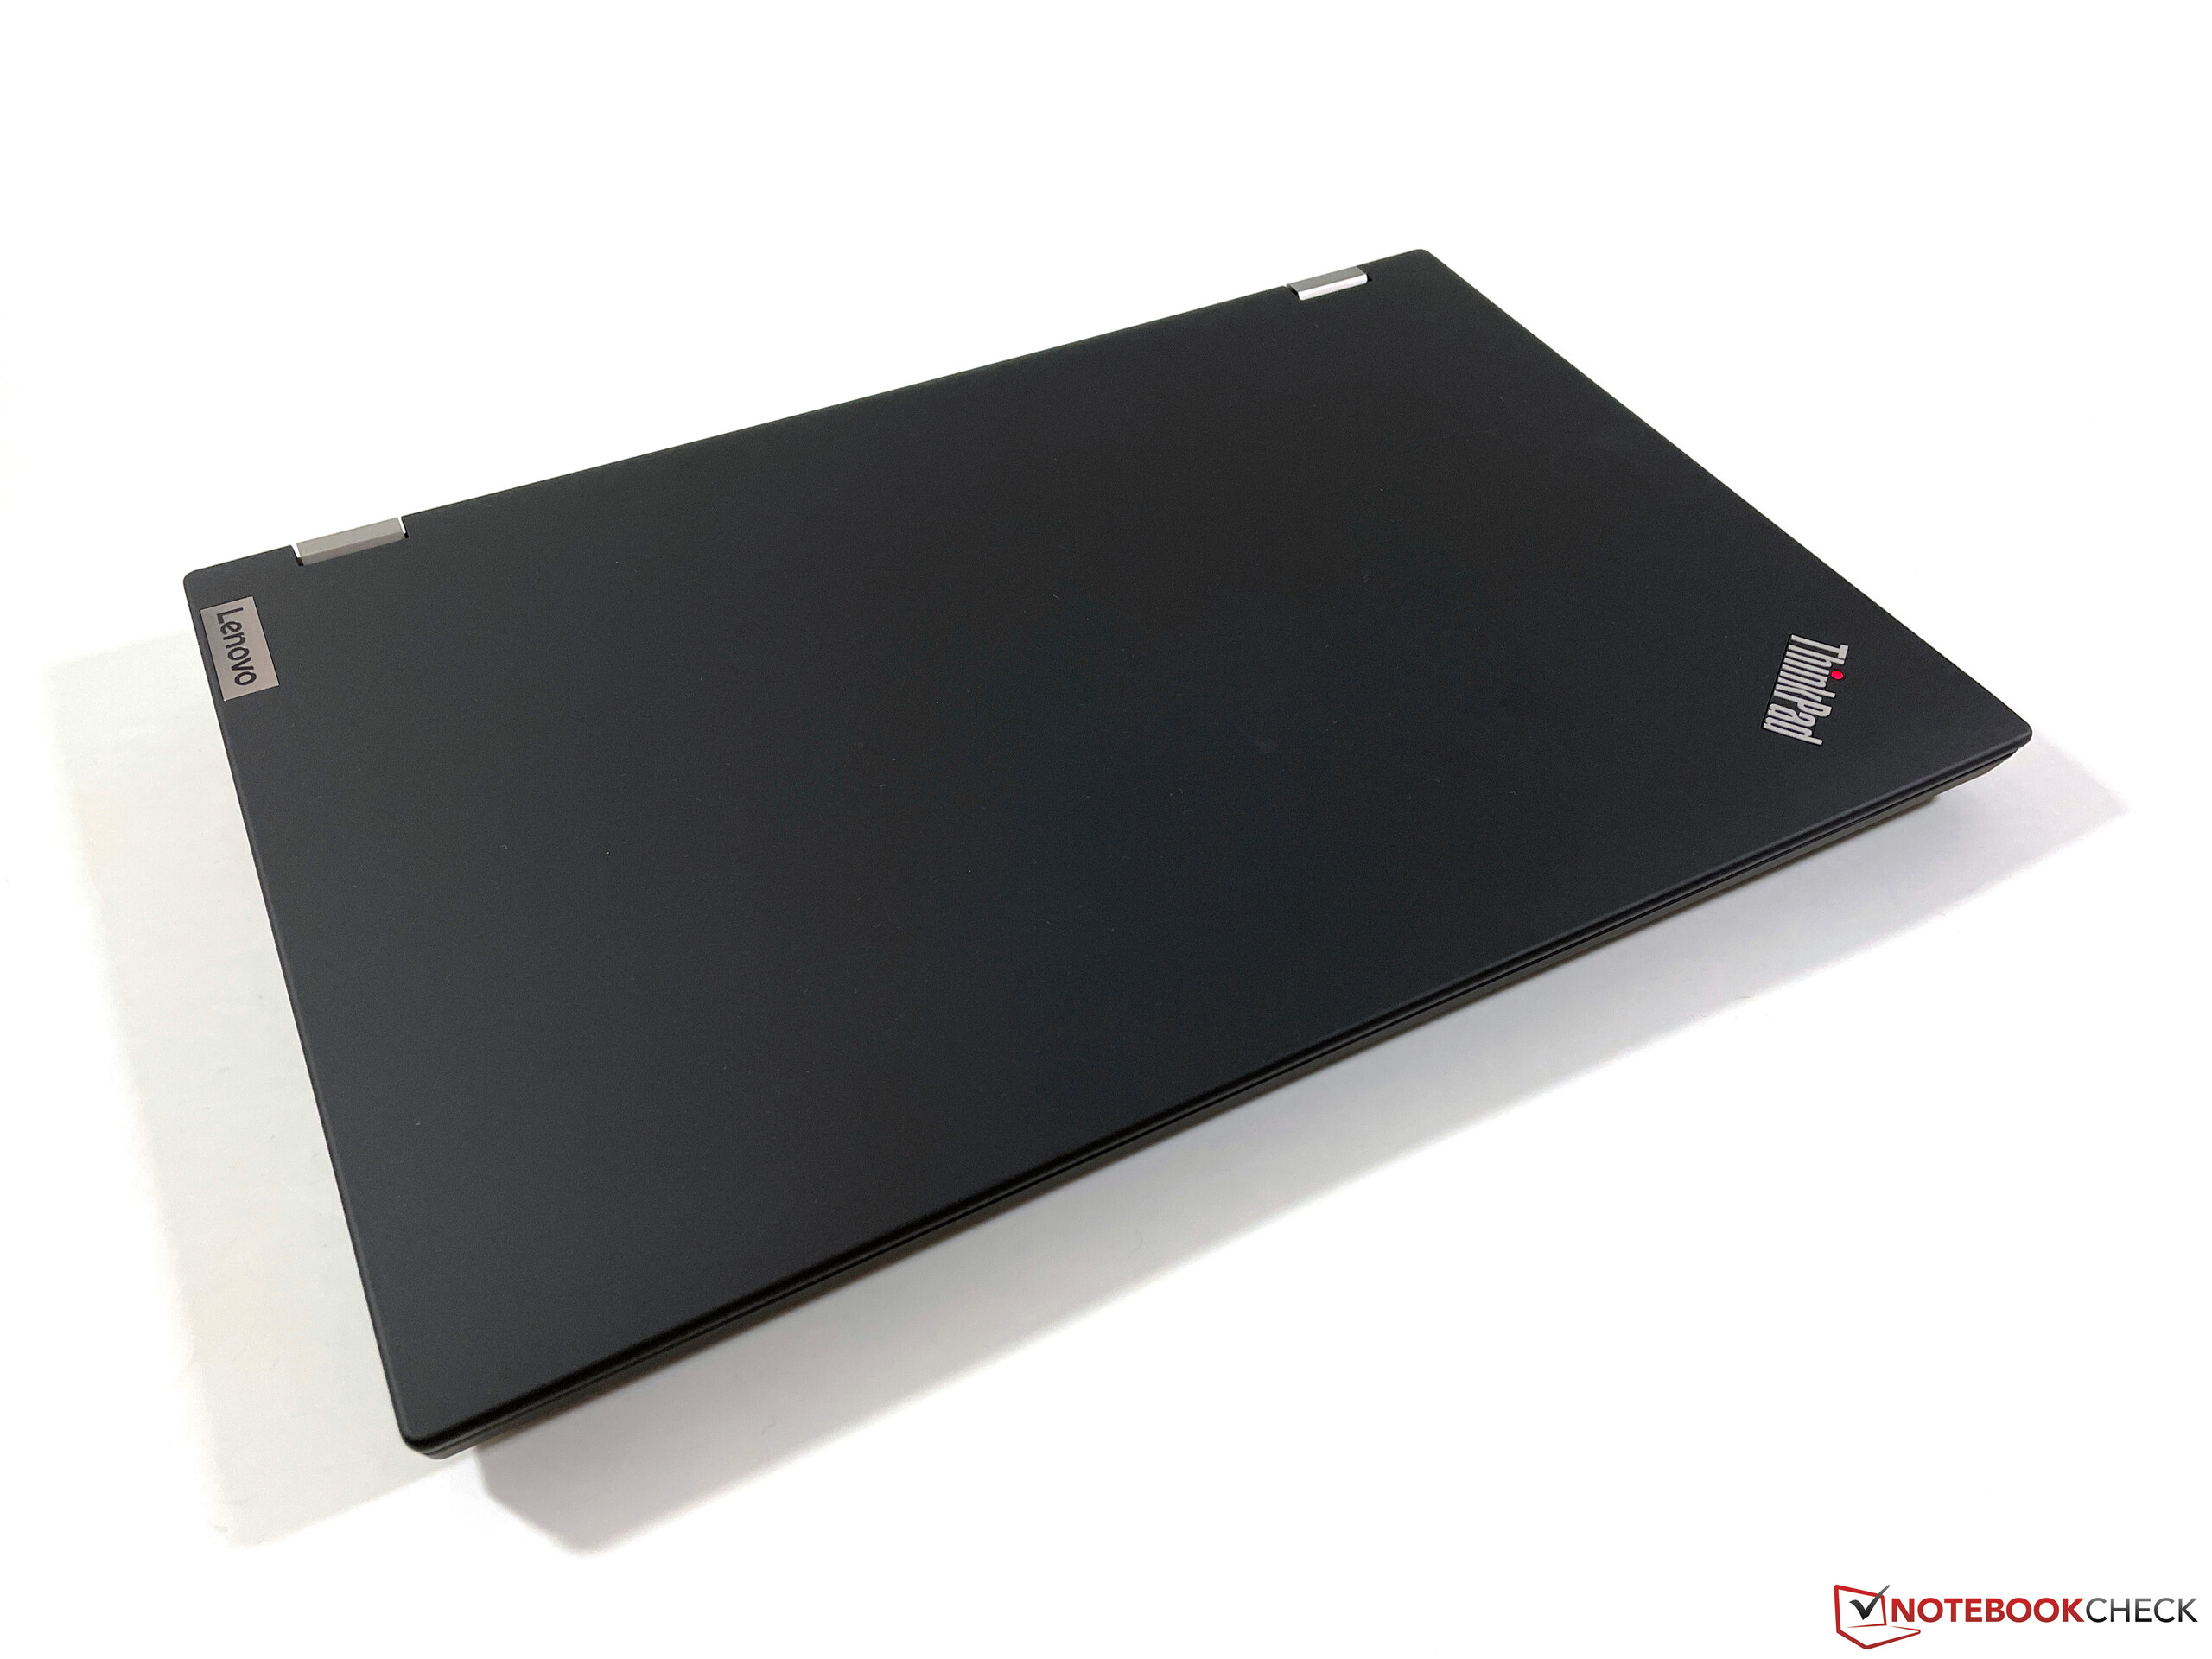
P15第二代仍然可以被立即识别为经典的ThinkPad,这对一些用户来说可能很无聊,但它至少是功能性的。外观几乎完全由塑料制成,虽然触感相当好(不太粗糙),但也相当容易沾染灰尘。从主观上讲,在戴尔或惠普的竞争中,质量印象肯定更高。
在设计方面,P15第二代看起来也一点都不现代。第一次打开盖子时,你可能会对巨大的显示屏边框感到惊讶。从设计的角度来看,这很容易成为一台2015年的笔记本电脑。这里当然可以安装一个使用16:10长宽比的16英寸显示屏。虽然重点在于移动工作站的性能,但在其设计方面肯定仍有改进的余地。
由塑料和玻璃纤维制成的结构的稳定性,以及由熟悉的镁质防滚架在底座单元上的加固,仍然非常好。几乎不可能凹陷底座单元,甚至精力充沛的打字也完全没有问题。只有键盘的左下方像前辈 ,但后面会有更多的介绍。智能卡读卡器上方的塑料也有一点弹性。两个铰链排列整齐(最大打开角度为180度),但在非常狭窄的角度下,它们不再能够支撑屏幕。另一方面,盖子本身非常坚固,即使我们在局部施加压力,显示屏也没有显示任何问题。
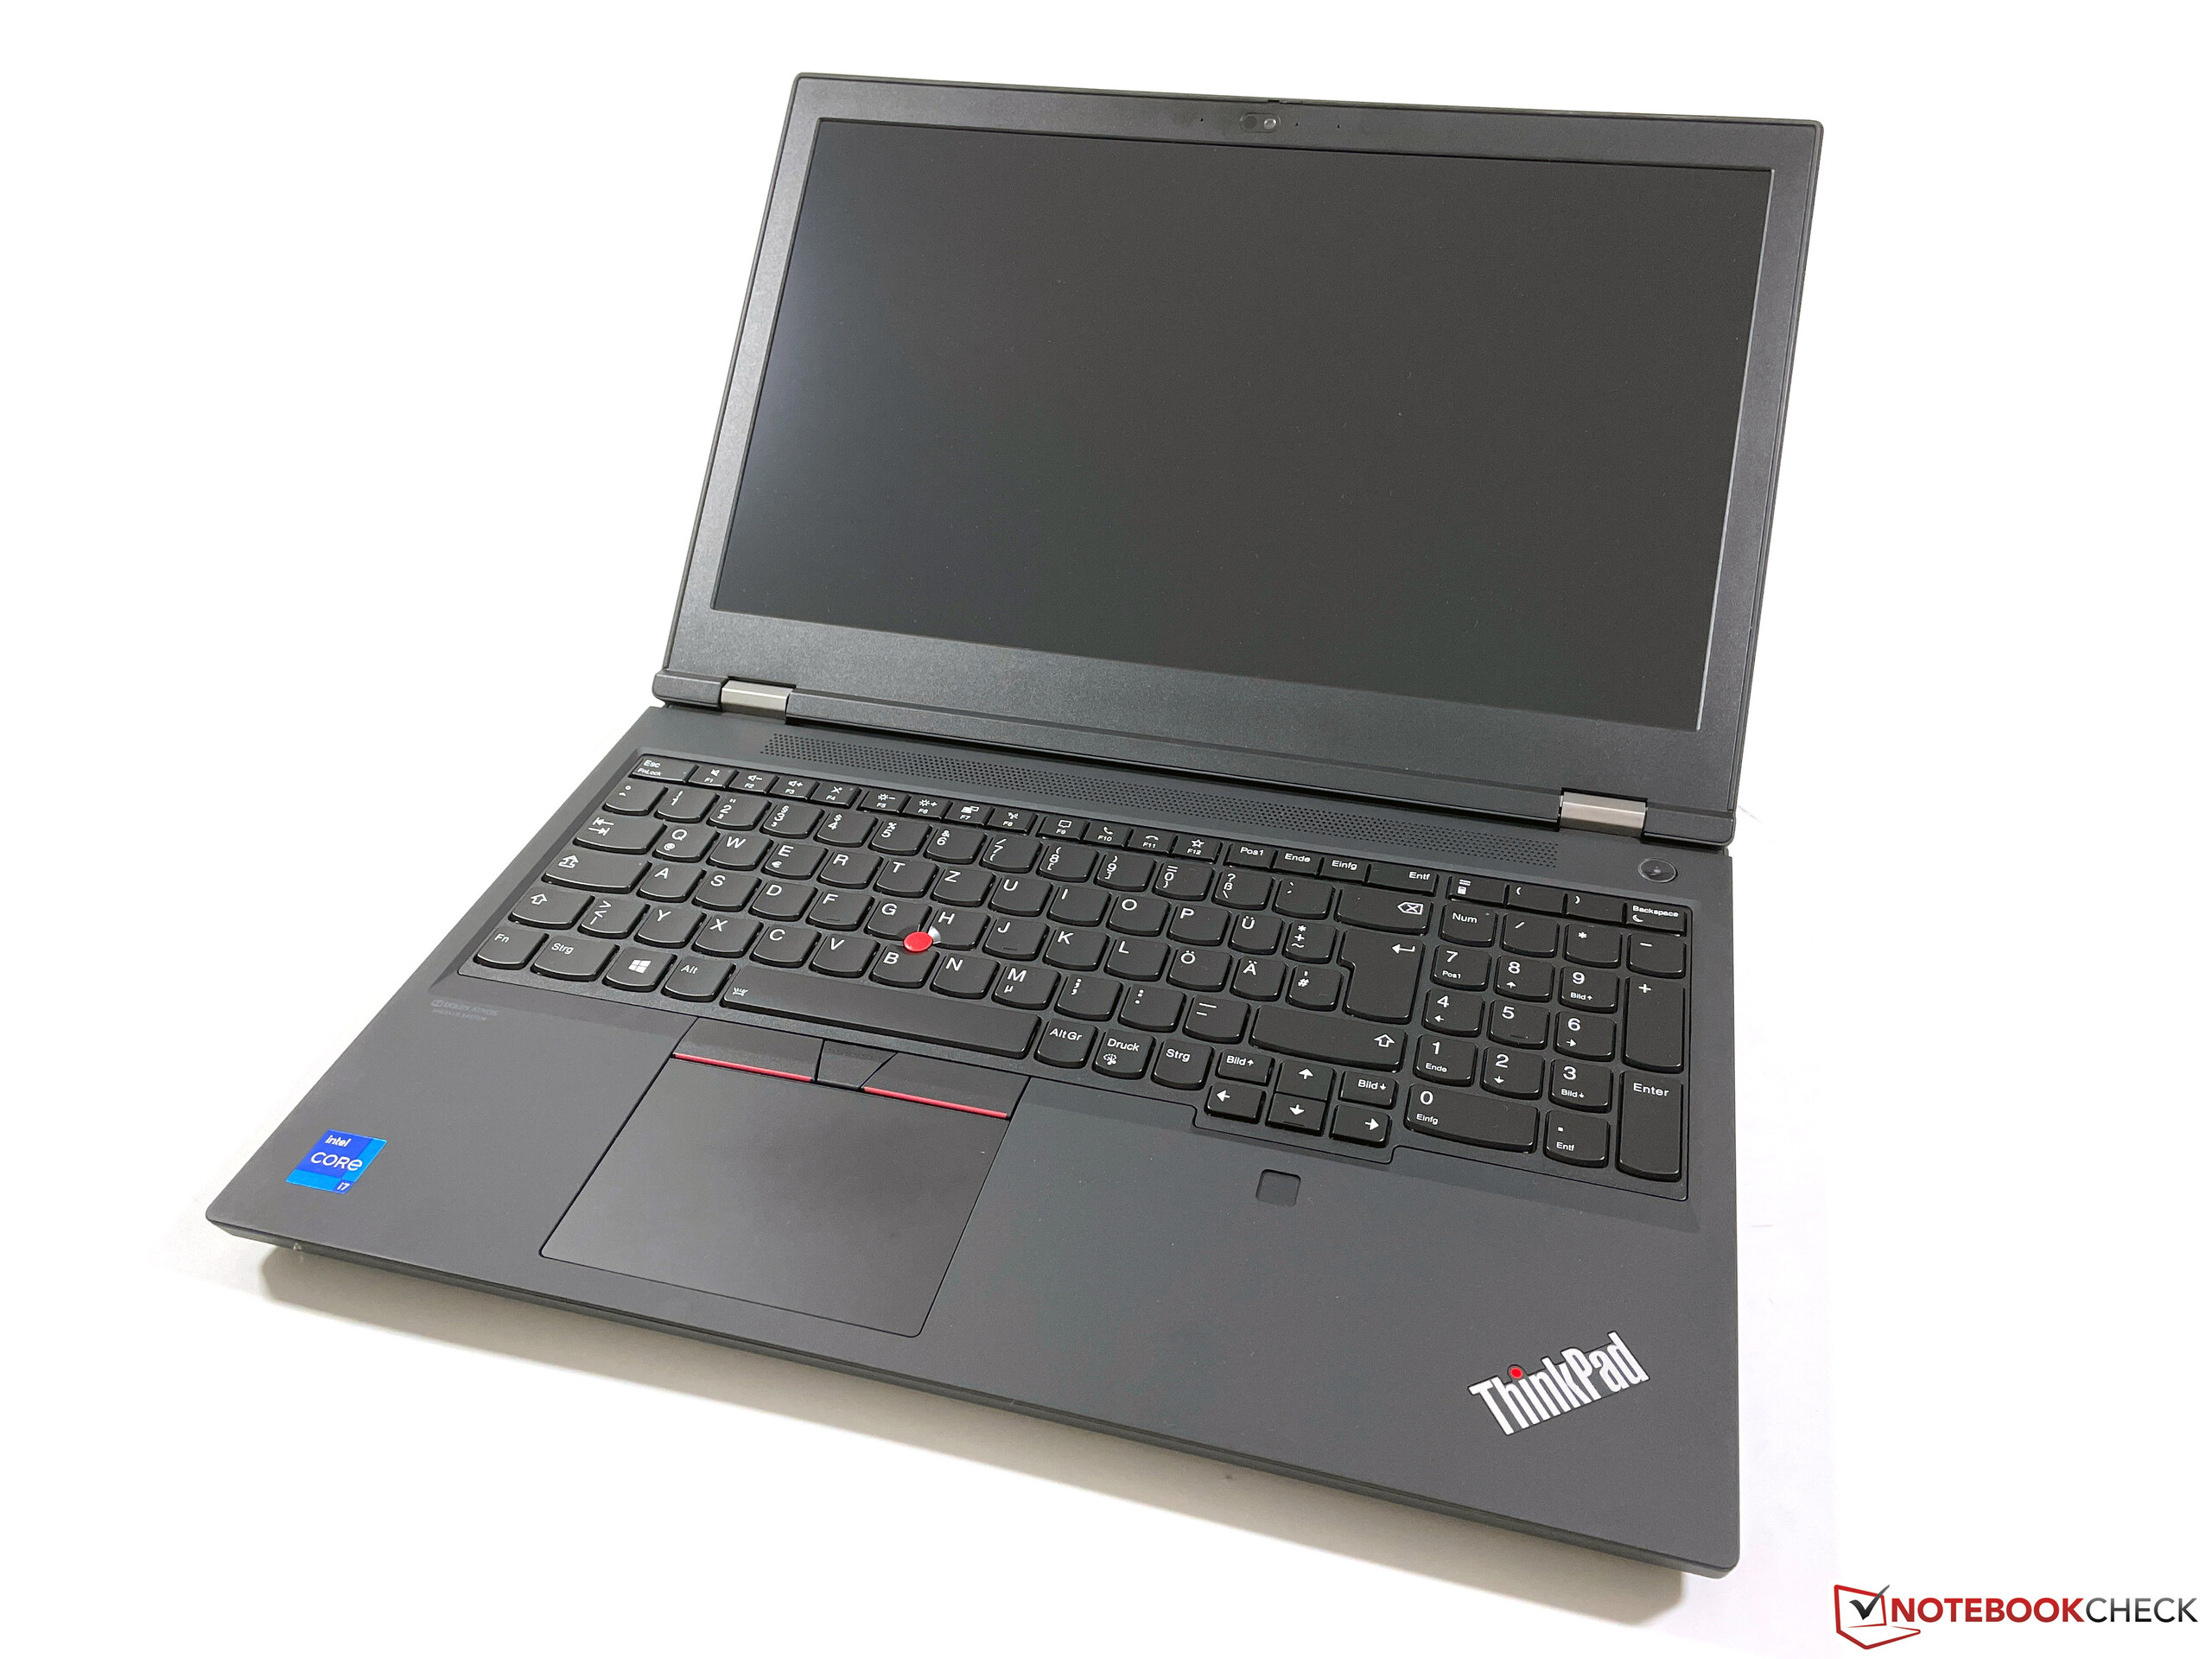
当把ThinkPad P15 Gen 2的尺寸与其他设备进行比较时,你很快就会发现它相当笨重,因为它不仅是最重的,也是我们比较组中最大的设备。除了近2.9公斤的重量外,在运输该设备时,你还应该考虑到约900克的电源适配器。
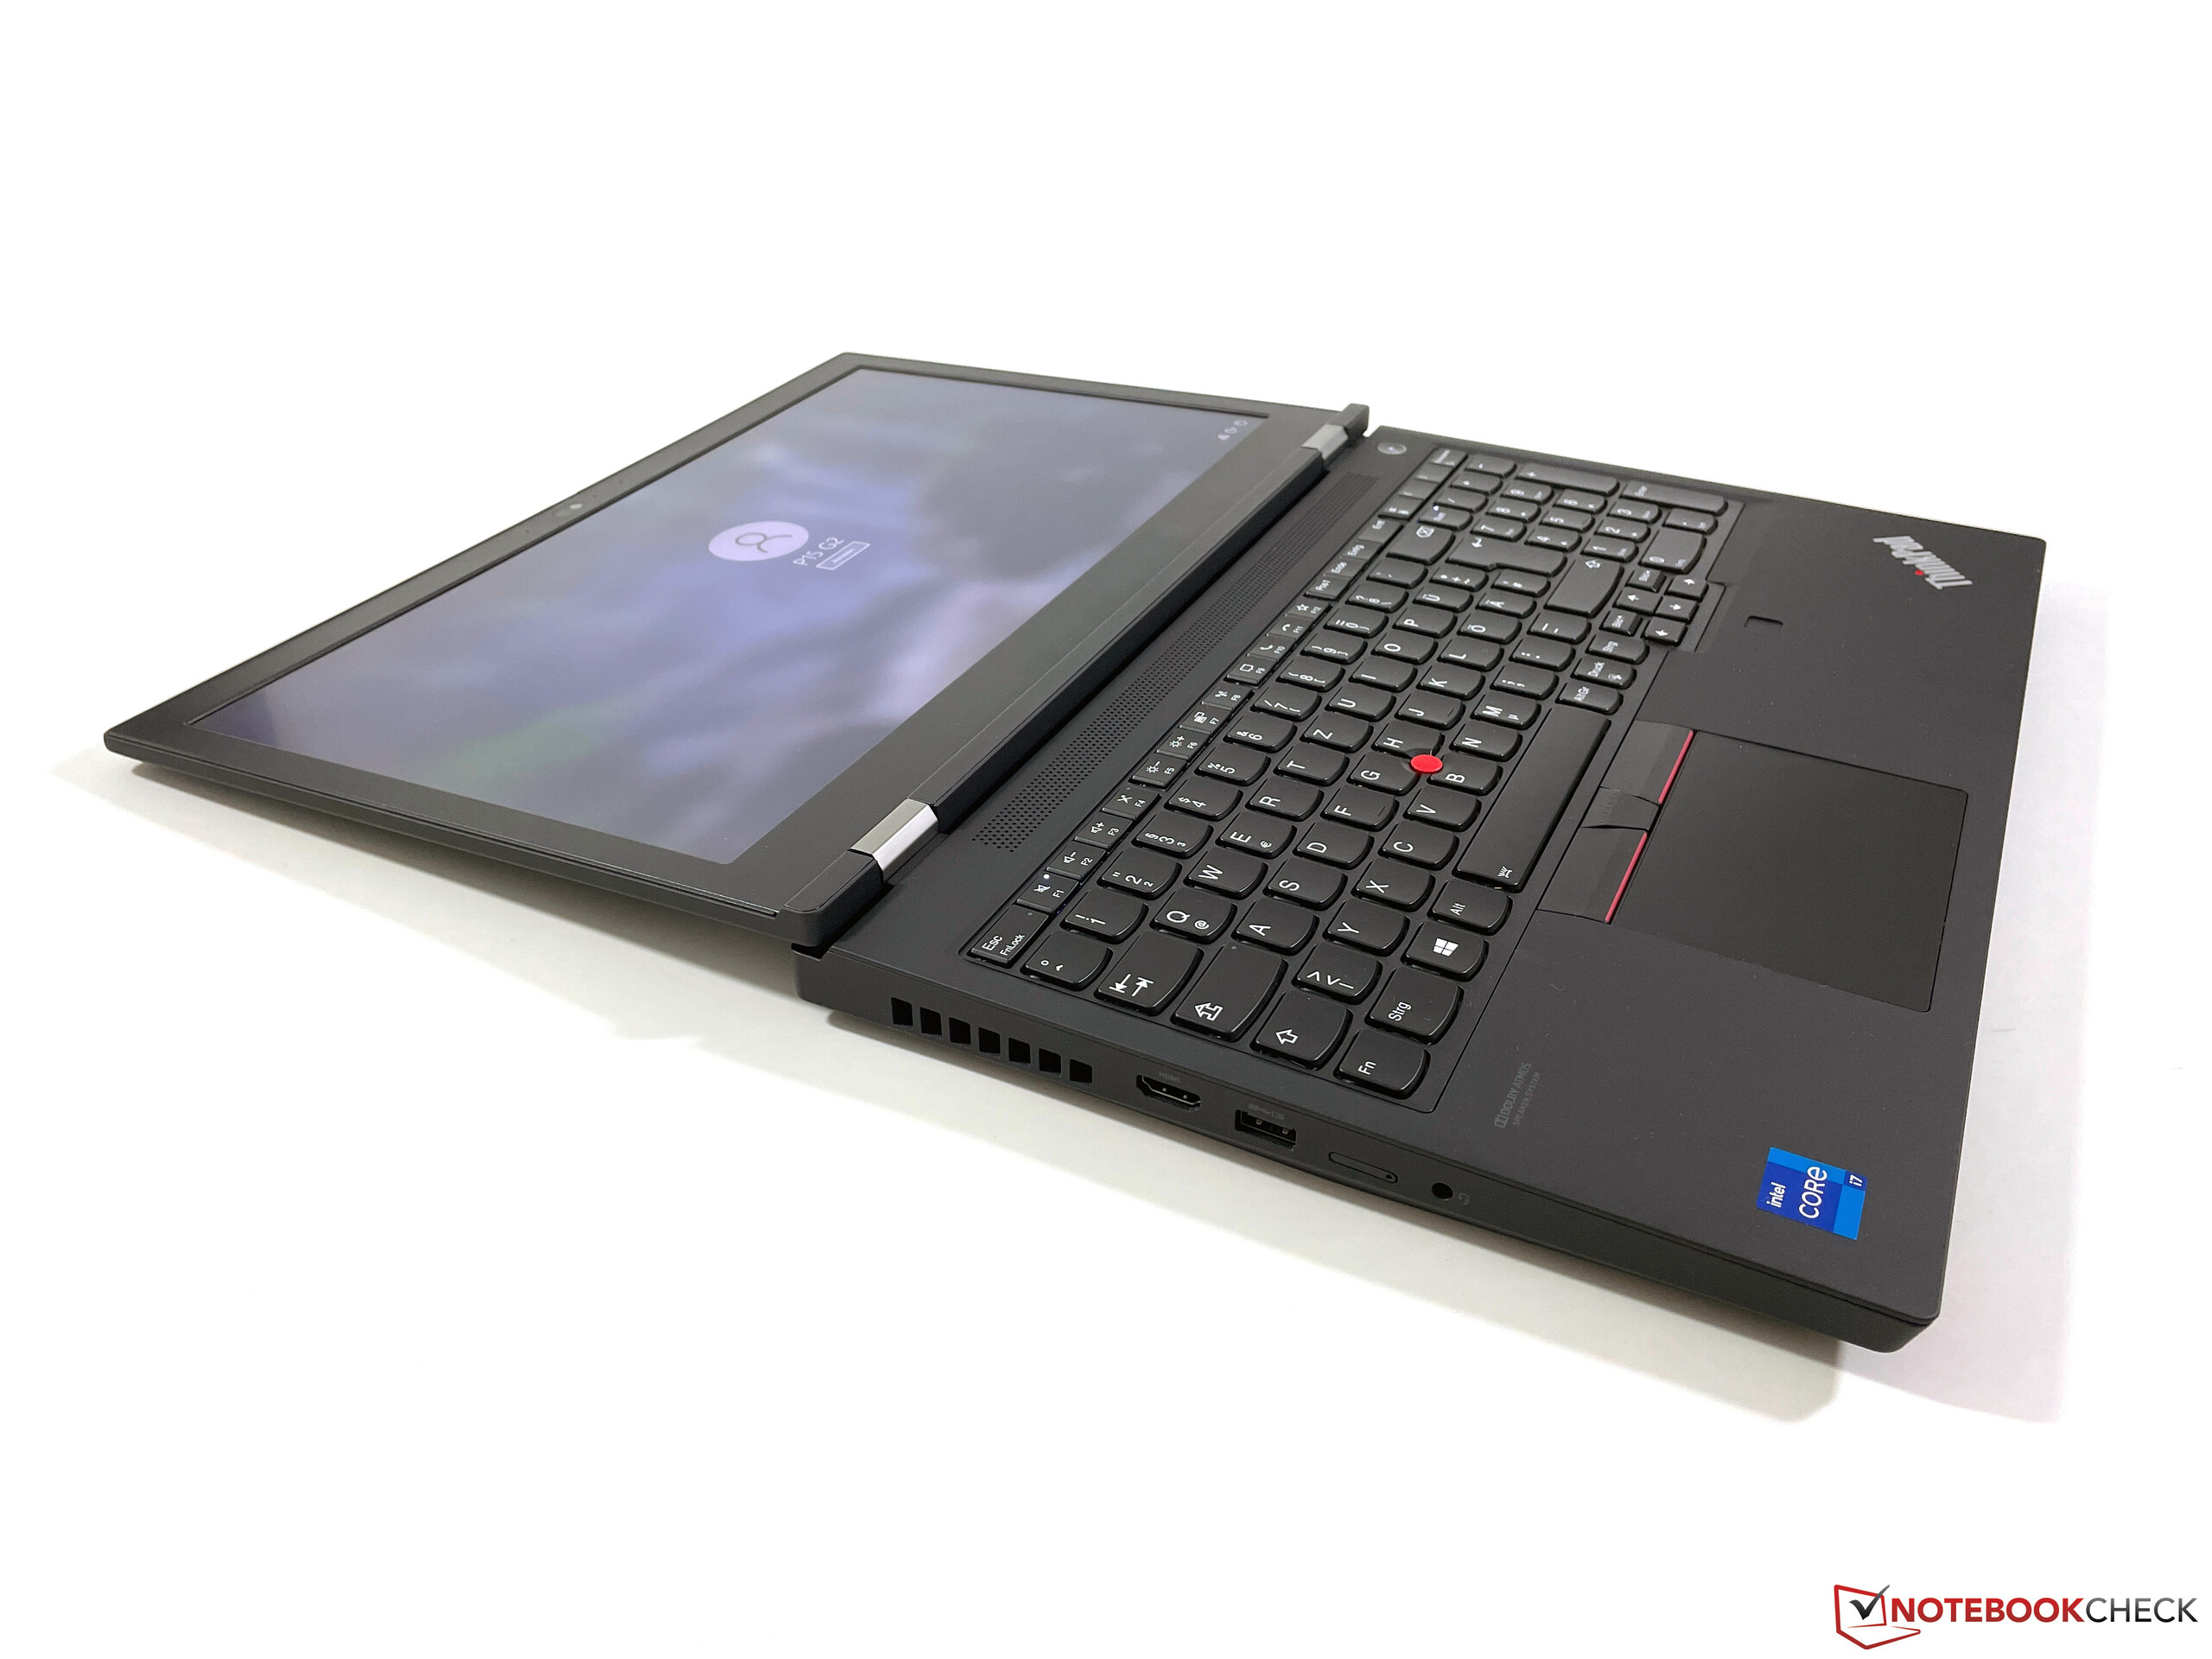
连接性 - 带有Thunderbolt 4的P15
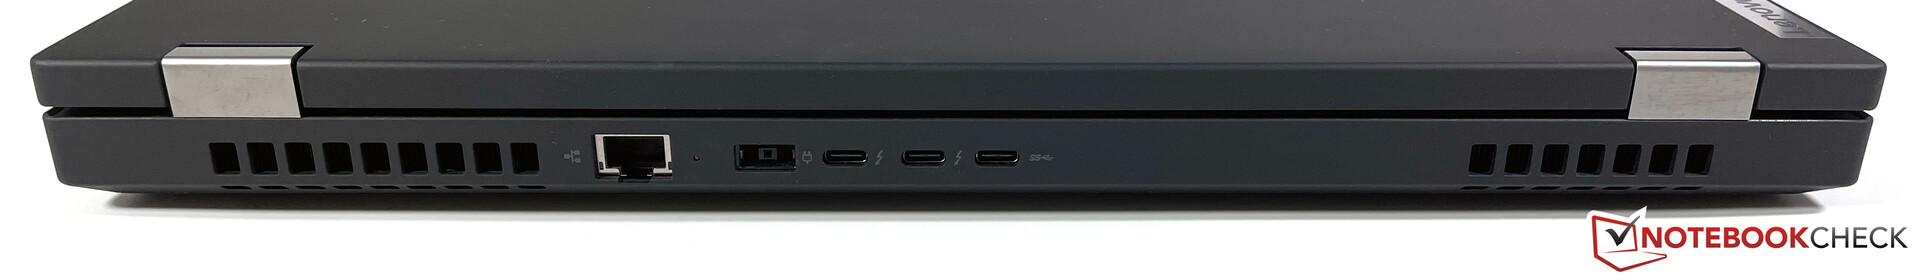
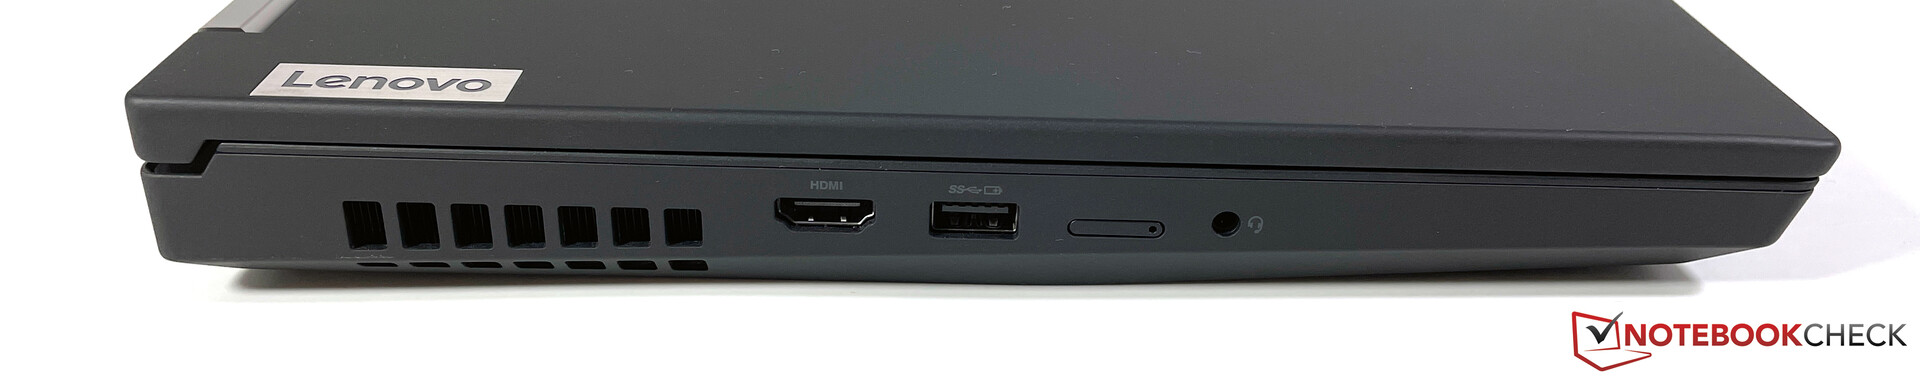
P15第二代再次提供了大量的端口。背面的端口布局发生了轻微变化,但原则上非常相似。然而,由于新的组件,我们现在有更快的Thunderbolt 4端口以及HDMI 2.1输出。总的来说,布局很好,但我们希望至少有一个USB-C端口放在侧面。
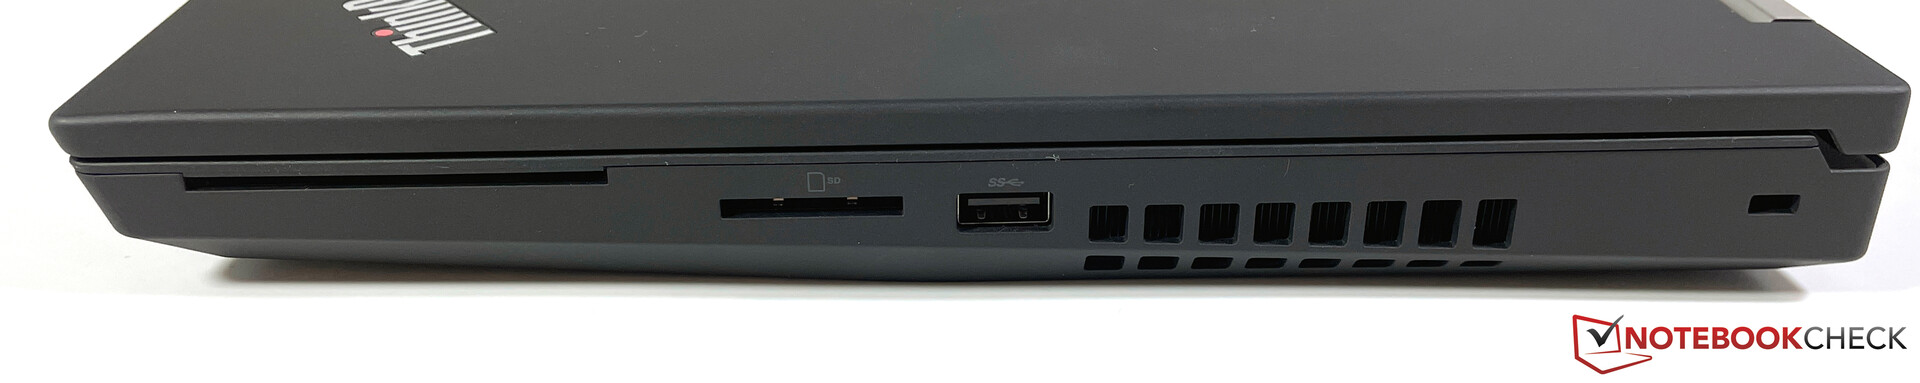
SD卡阅读器
P15 G2仍然配备了一个非常快的SD卡读卡器。我们用参考卡(AV Pro V60)测得的传输速率超过200MB/s。
| SD Card Reader | |
| average JPG Copy Test (av. of 3 runs) | |
| MSI WS66 10TMT-207US (Toshiba Exceria Pro SDXC 64 GB UHS-II) | |
| Lenovo ThinkPad P15 G2-20YQ001JGE (AV Pro V60) | |
| Dell Precision 7550 (Toshiba Exceria Pro SDXC 64 GB UHS-II) | |
| HP ZBook Fury 15 G7 (Toshiba Exceria Pro SDXC 64 GB UHS-II) | |
| Average of class Workstation (49.6 - 681, n=14, last 2 years) | |
| Lenovo ThinkPad P15 Gen1-20ST000DGE (Toshiba Exceria Pro SDXC 64 GB UHS-II) | |
| HP ZBook Studio 15 G8 (AV Pro V60) | |
| maximum AS SSD Seq Read Test (1GB) | |
| Average of class Workstation (87.6 - 1455, n=14, last 2 years) | |
| MSI WS66 10TMT-207US (Toshiba Exceria Pro SDXC 64 GB UHS-II) | |
| Lenovo ThinkPad P15 G2-20YQ001JGE (AV Pro V60) | |
| HP ZBook Fury 15 G7 (Toshiba Exceria Pro SDXC 64 GB UHS-II) | |
| Dell Precision 7550 (Toshiba Exceria Pro SDXC 64 GB UHS-II) | |
| Lenovo ThinkPad P15 Gen1-20ST000DGE (Toshiba Exceria Pro SDXC 64 GB UHS-II) | |
| HP ZBook Studio 15 G8 (AV Pro V60) | |
沟通
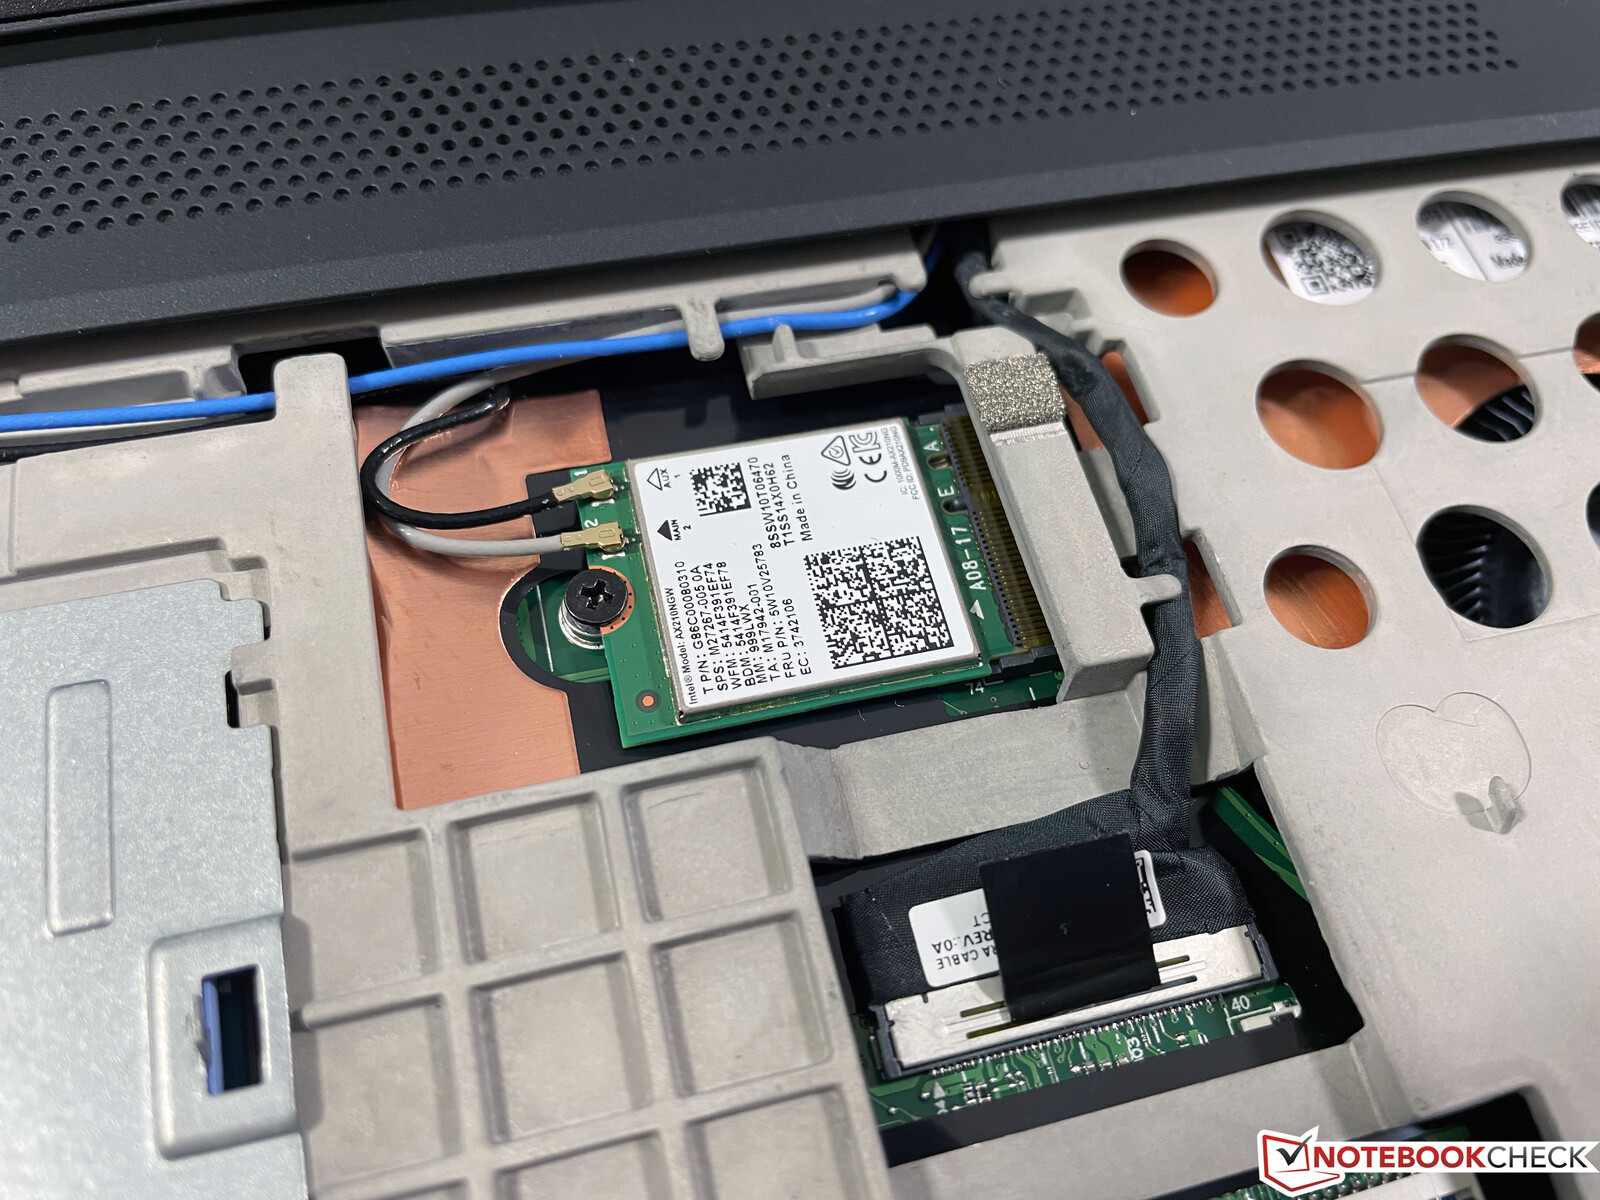
除了更快的有线网络连接(2.5Gb/s),联想还为P15 Gen 2配备了英特尔最新的Wi-Fi模块(AX210),支持现代Wi-Fi 6E标准以及蓝牙5.2。在我们用Netgear Nighthawk RAX120路由器进行的标准化测试中,传输速率非常好,我们在实践中没有遇到任何问题。已经安装了WWAN模块所需的天线,但还不支持5G模块。
| Networking | |
| iperf3 transmit AX12 | |
| MSI WS66 10TMT-207US | |
| HP ZBook Studio 15 G8 | |
| Lenovo ThinkPad P15 G2-20YQ001JGE | |
| Lenovo ThinkPad P15 Gen1-20ST000DGE | |
| Average Intel Wi-Fi 6E AX210 (675 - 1602, n=27) | |
| Dell Precision 7550 | |
| HP ZBook Fury 15 G7 | |
| iperf3 receive AX12 | |
| Lenovo ThinkPad P15 G2-20YQ001JGE | |
| HP ZBook Studio 15 G8 | |
| Lenovo ThinkPad P15 Gen1-20ST000DGE | |
| Dell Precision 7550 | |
| Average Intel Wi-Fi 6E AX210 (914 - 1716, n=27) | |
| MSI WS66 10TMT-207US | |
| HP ZBook Fury 15 G7 | |
网络摄像头
联想继续使用熟悉的720p网络摄像头,即使在良好的照明条件下也不能产生良好的图像。至少有一个机械快门和一个通过Windows Hello进行面部识别的红外传感器。


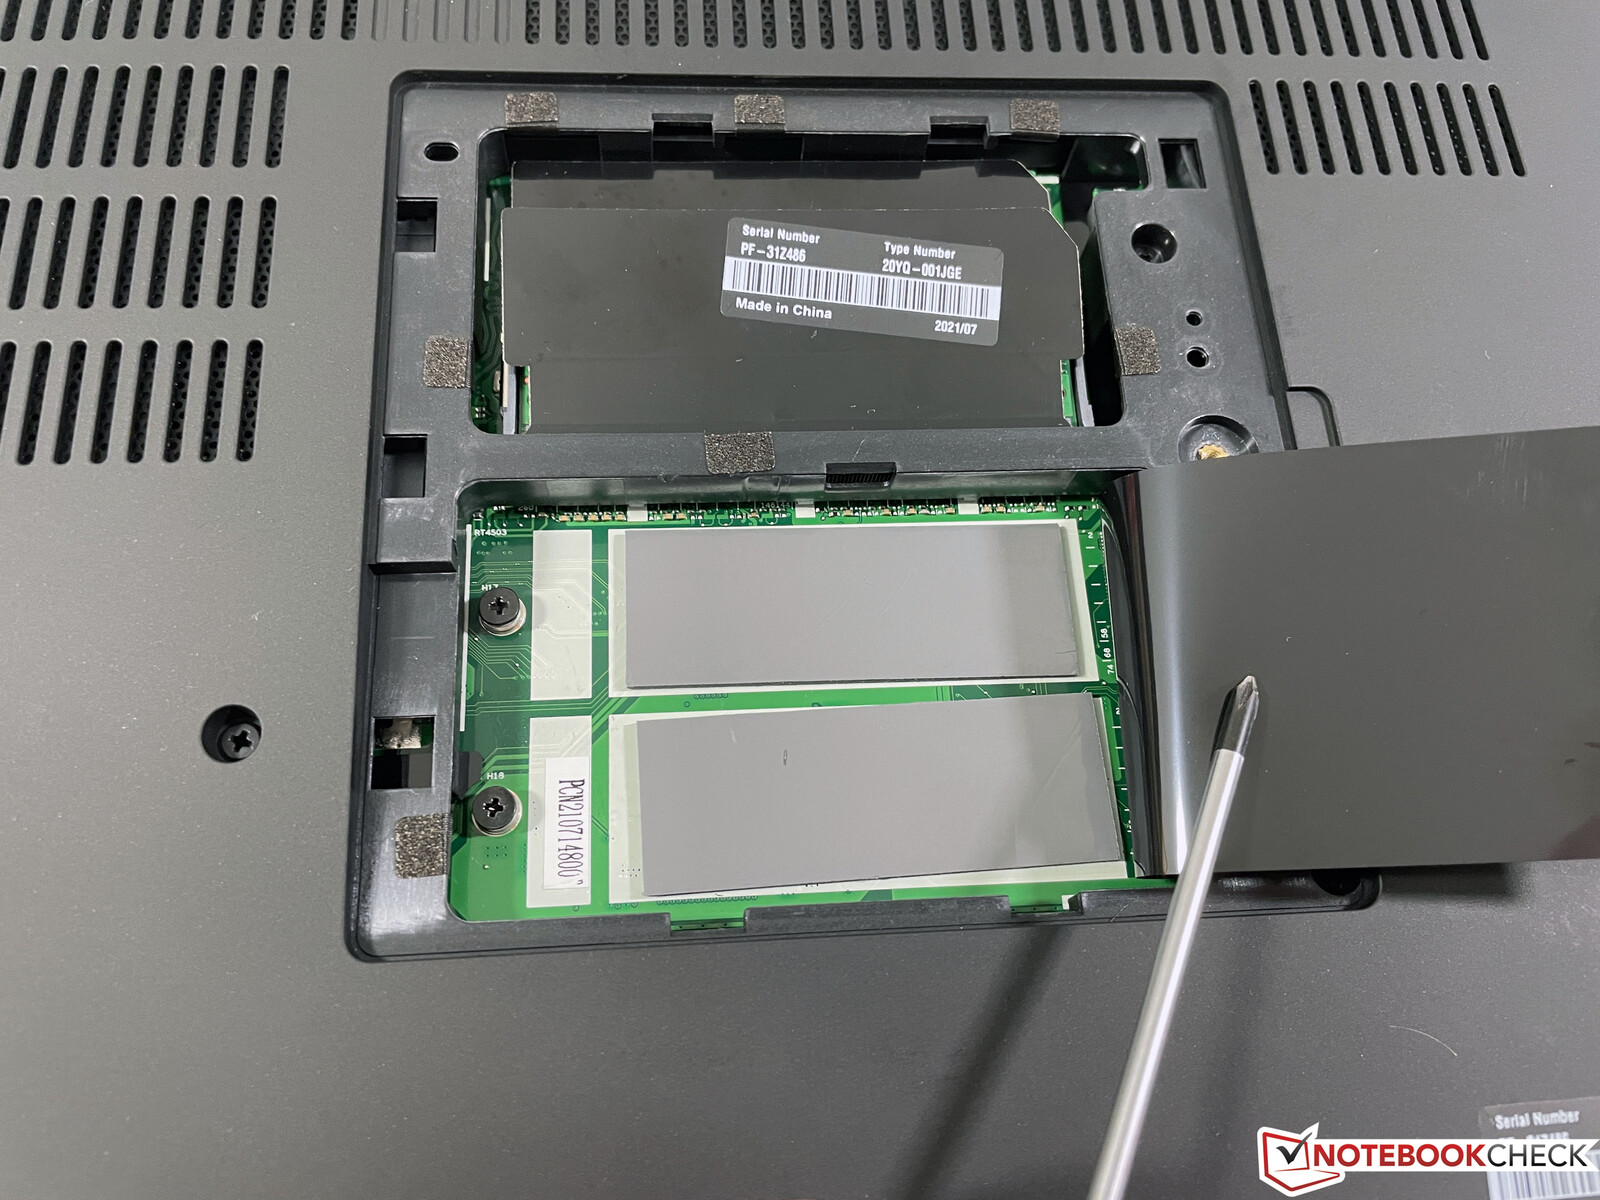
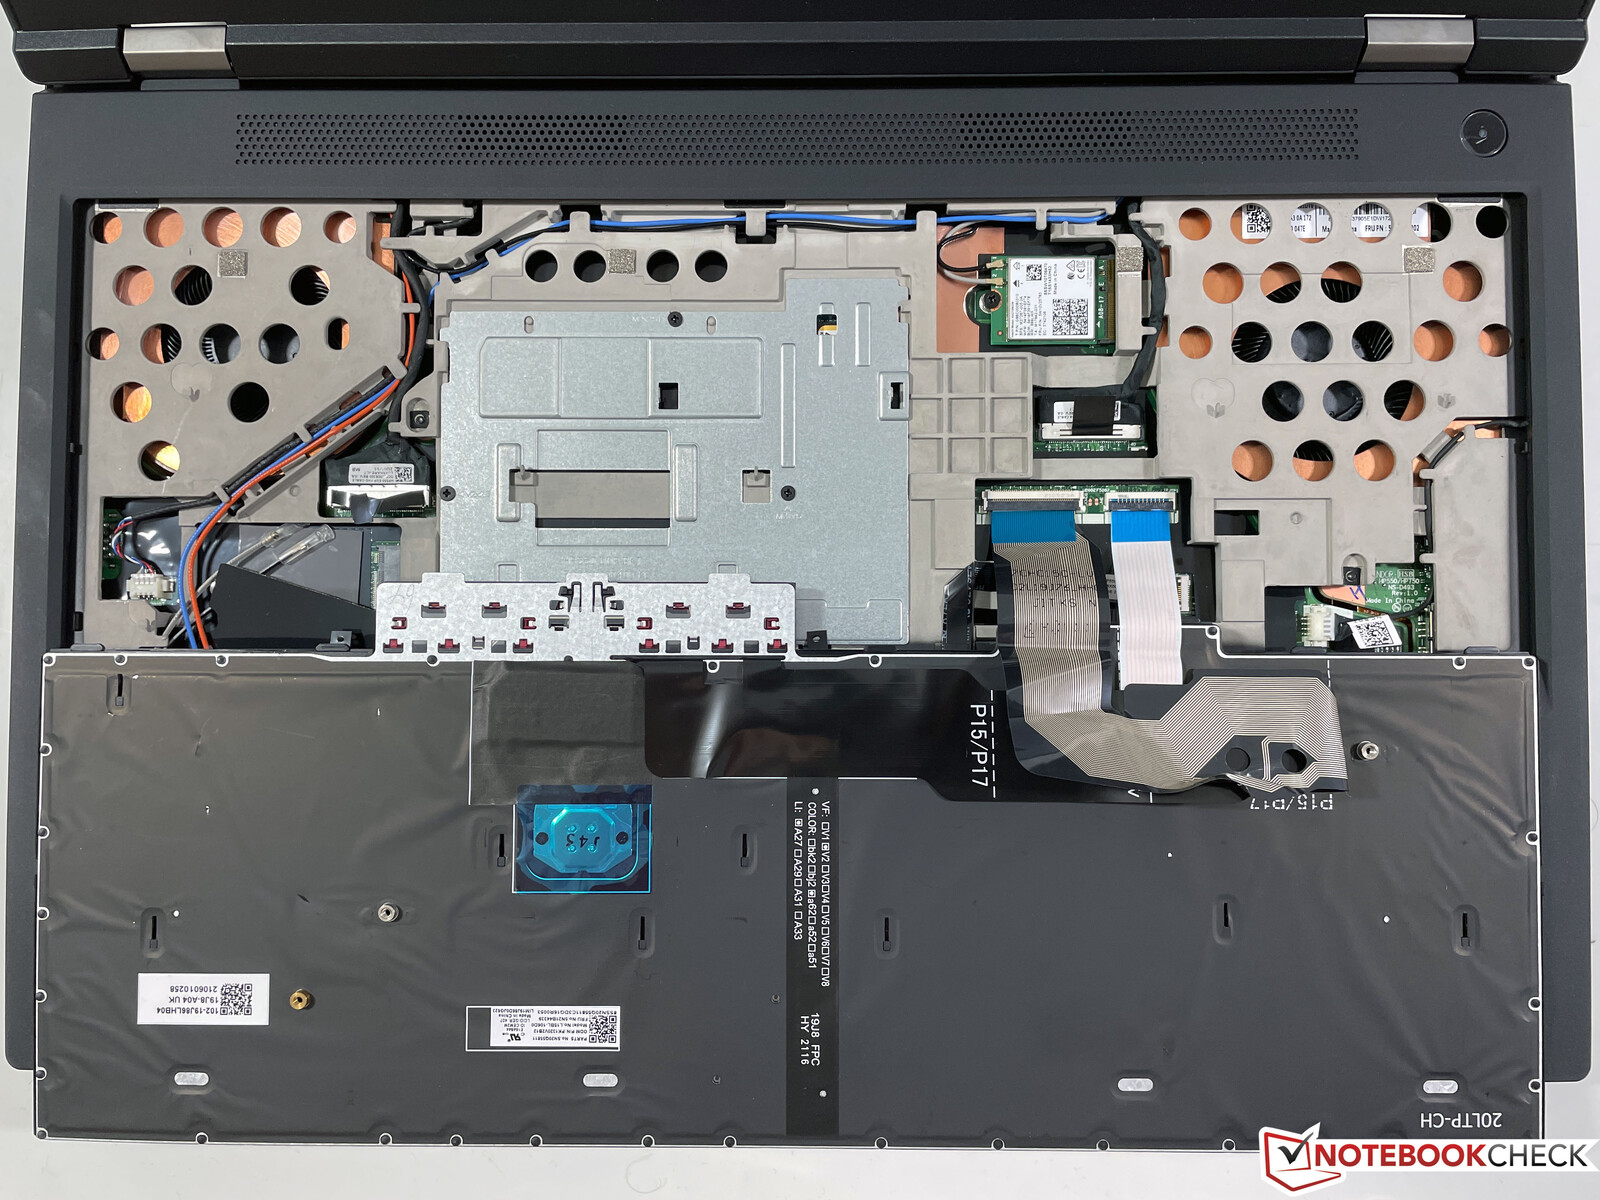
维护
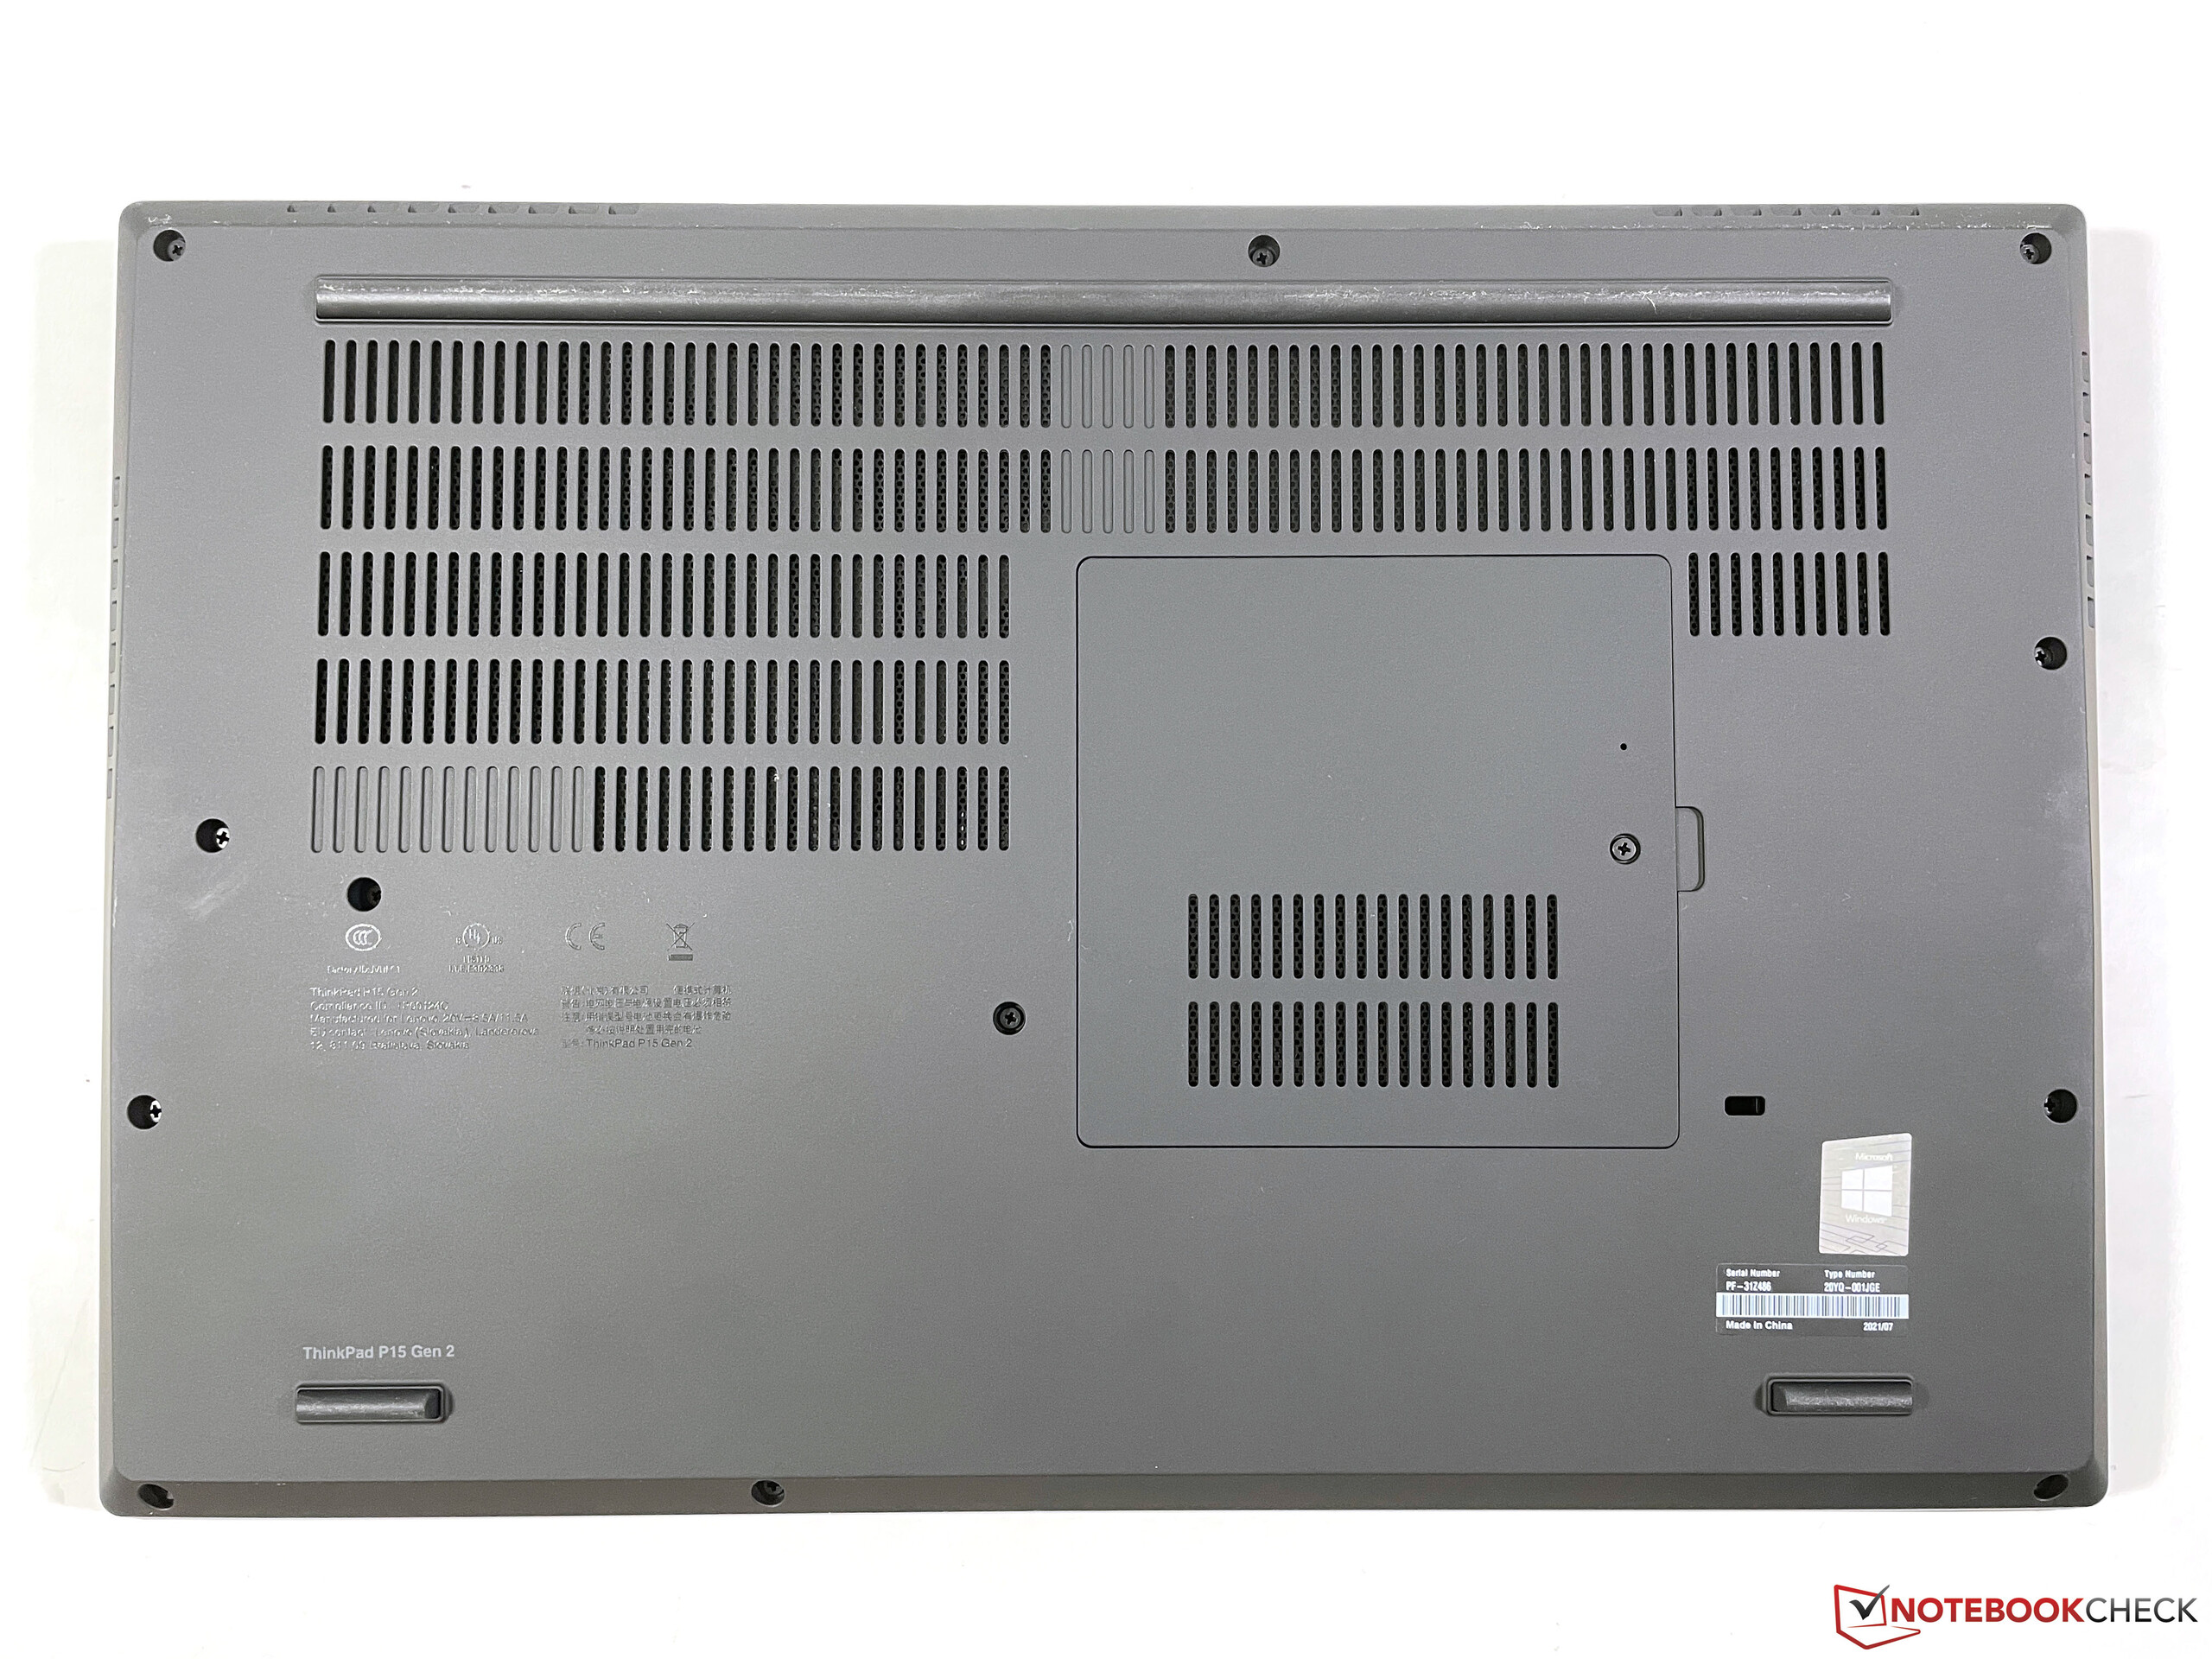
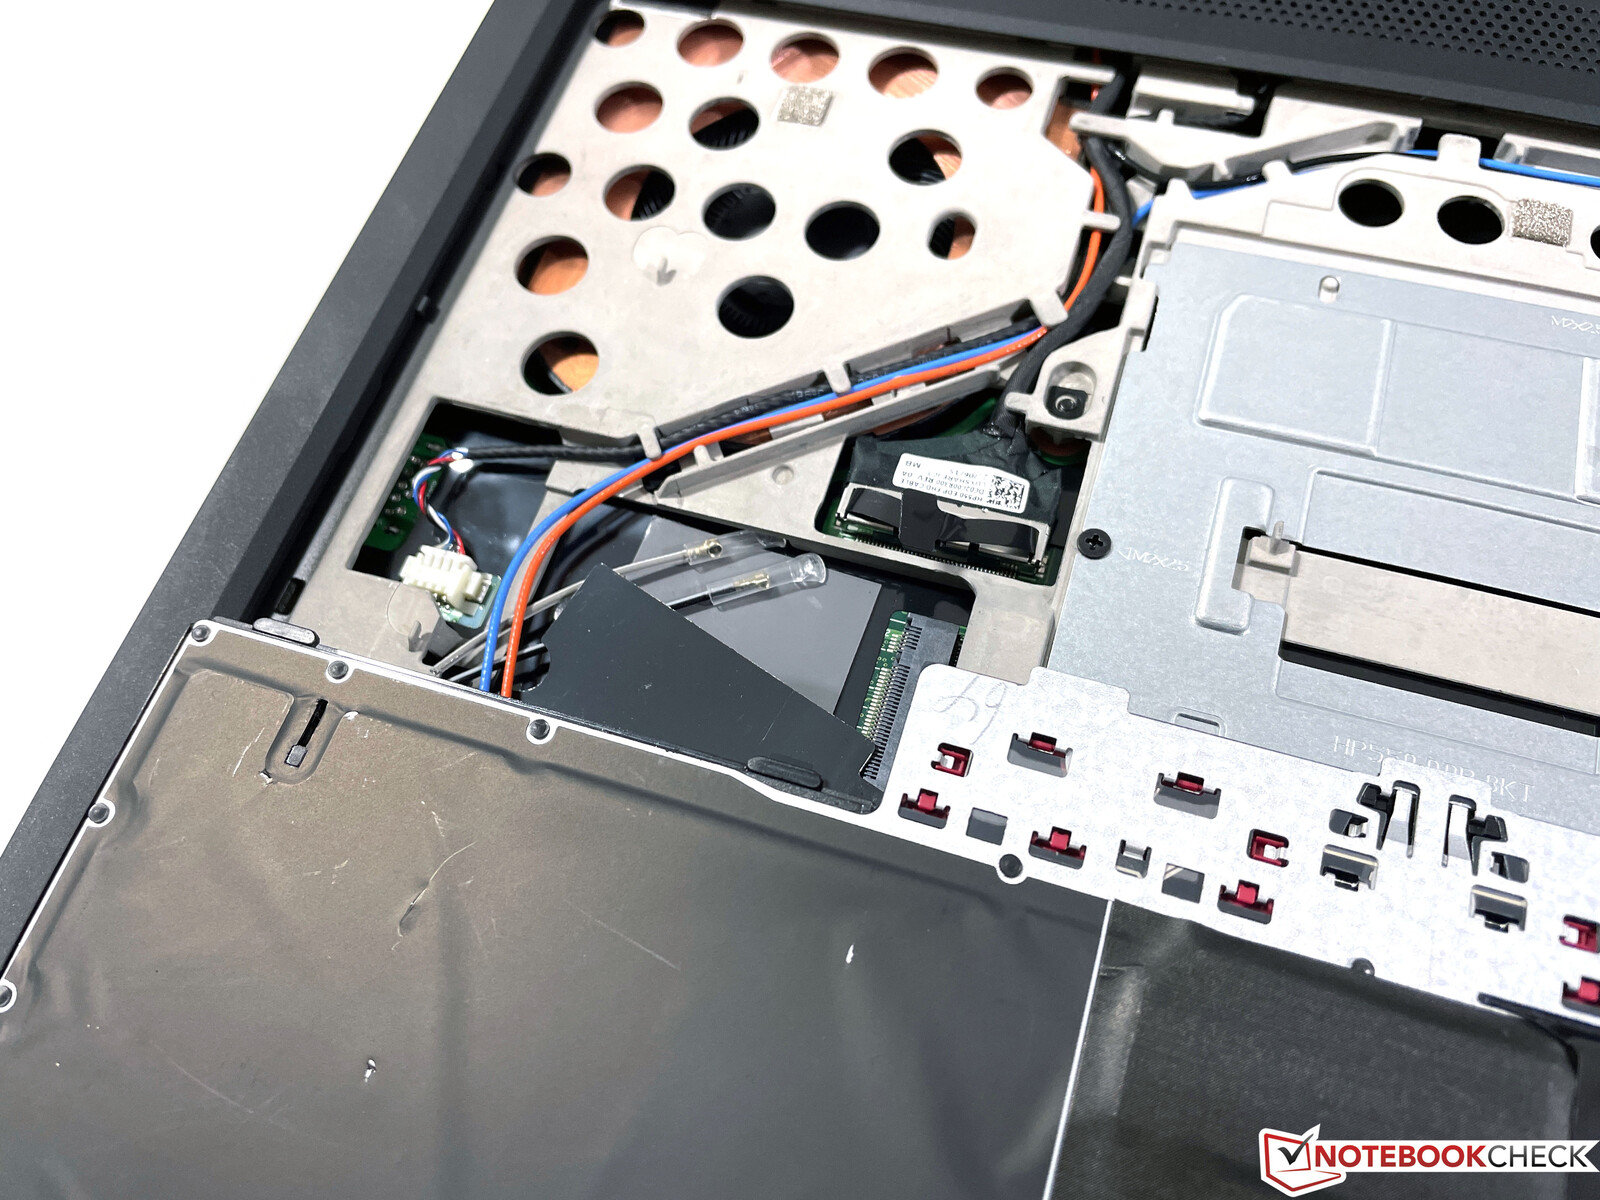
底部有一个维护舱口,可以让你快速到达四个内存插槽中的两个和三个M.2-2280插槽中的两个。不过,为了访问其余的组件,你必须拆下键盘,考虑到这里还有其他的盖子,这并不是一件小事。为了访问风扇,需要拆除整个底盖。总而言之,维护选项非常好,尽管了解你在做什么很重要。
担保
ThinkPad P15第二代默认提供三年的保修,包括现场服务。你可以选择延长保修范围以及保修期,但需要额外收费。
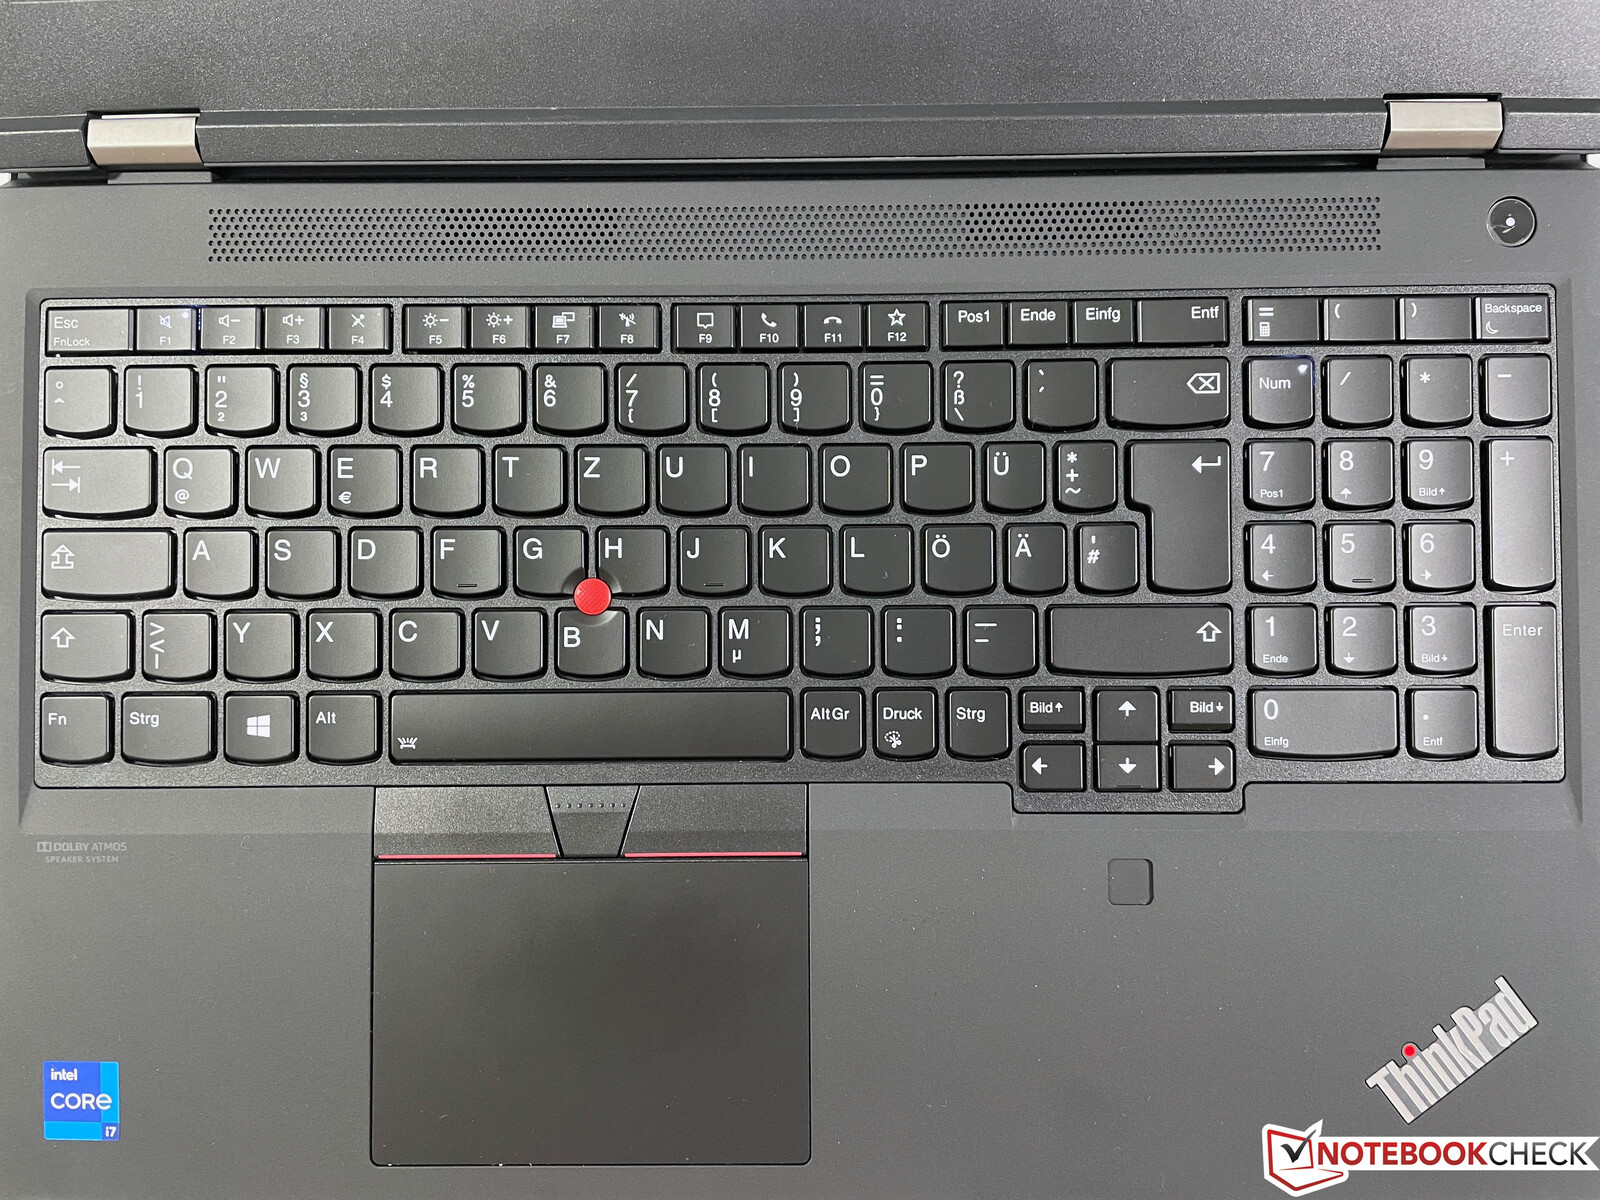
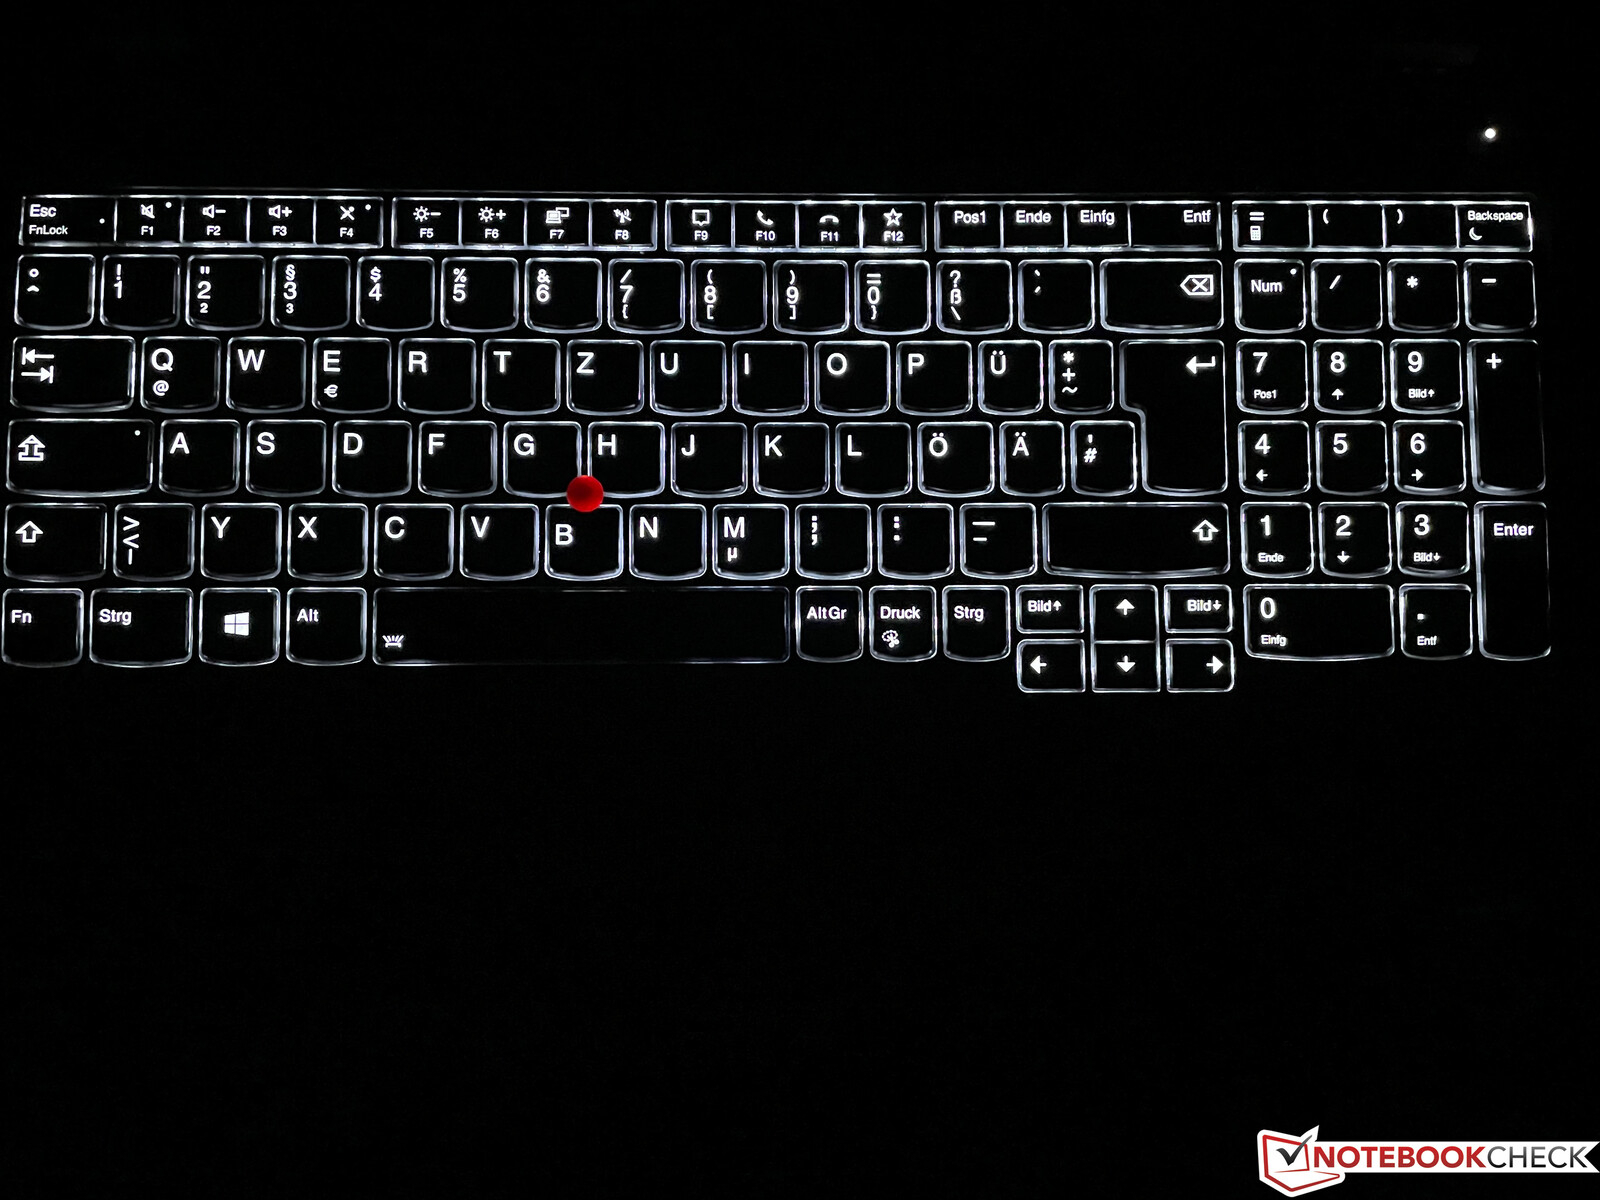
输入设备--P15再次发出咔咔的声音
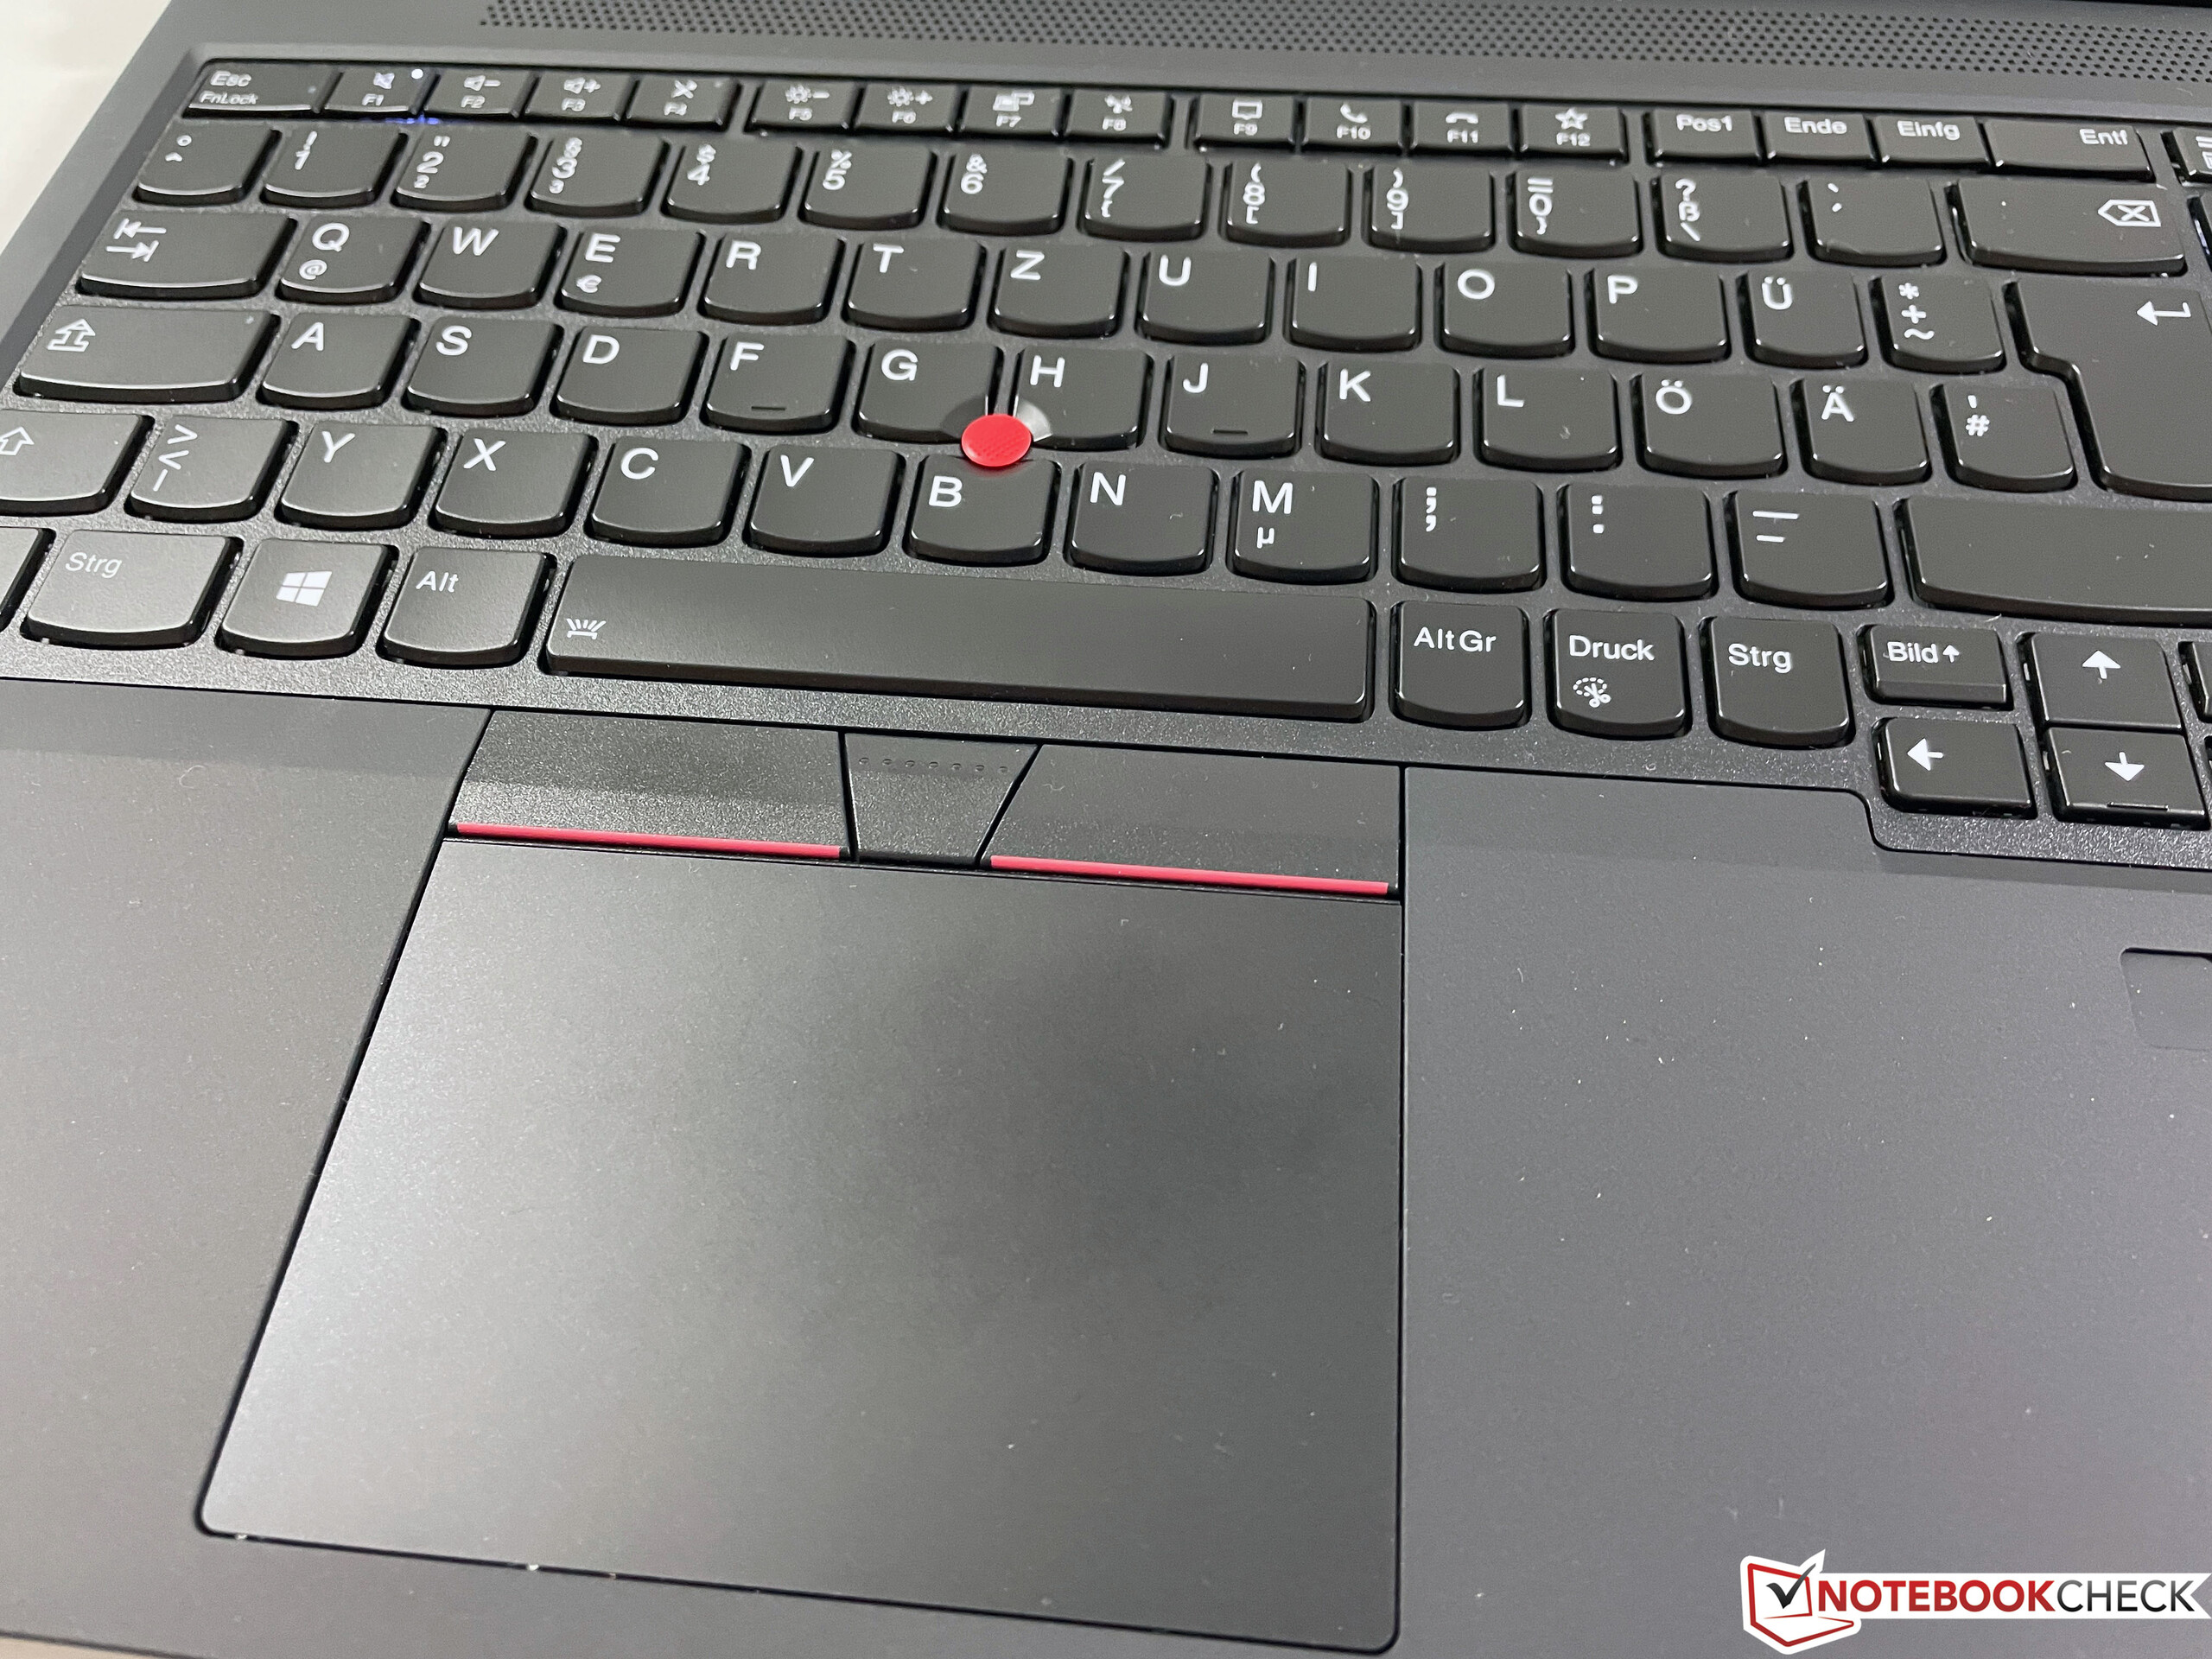
与前代产品相比,输入设备也没有变化。用户仍然得到同样宽松的键程(1.8毫米),因此是移动领域最好的键盘之一。此外,制造商没有让基本单元的额外空间被浪费,而是安装了一个完整的数字键盘。两段式白色键盘背光允许在较暗的环境中舒适地打字。然而,有一个弱点。就像的前身
,左下角的按键有轻微的响声,这对感知的质量有一点影响。ClickPad略微向左偏移,位于TrackPoint下方的中心位置。专门的按键已经被适当地安装,它们产生了消音和高质量的点击声。点击板本身也没有响声,两个输入选项总体上工作顺利。
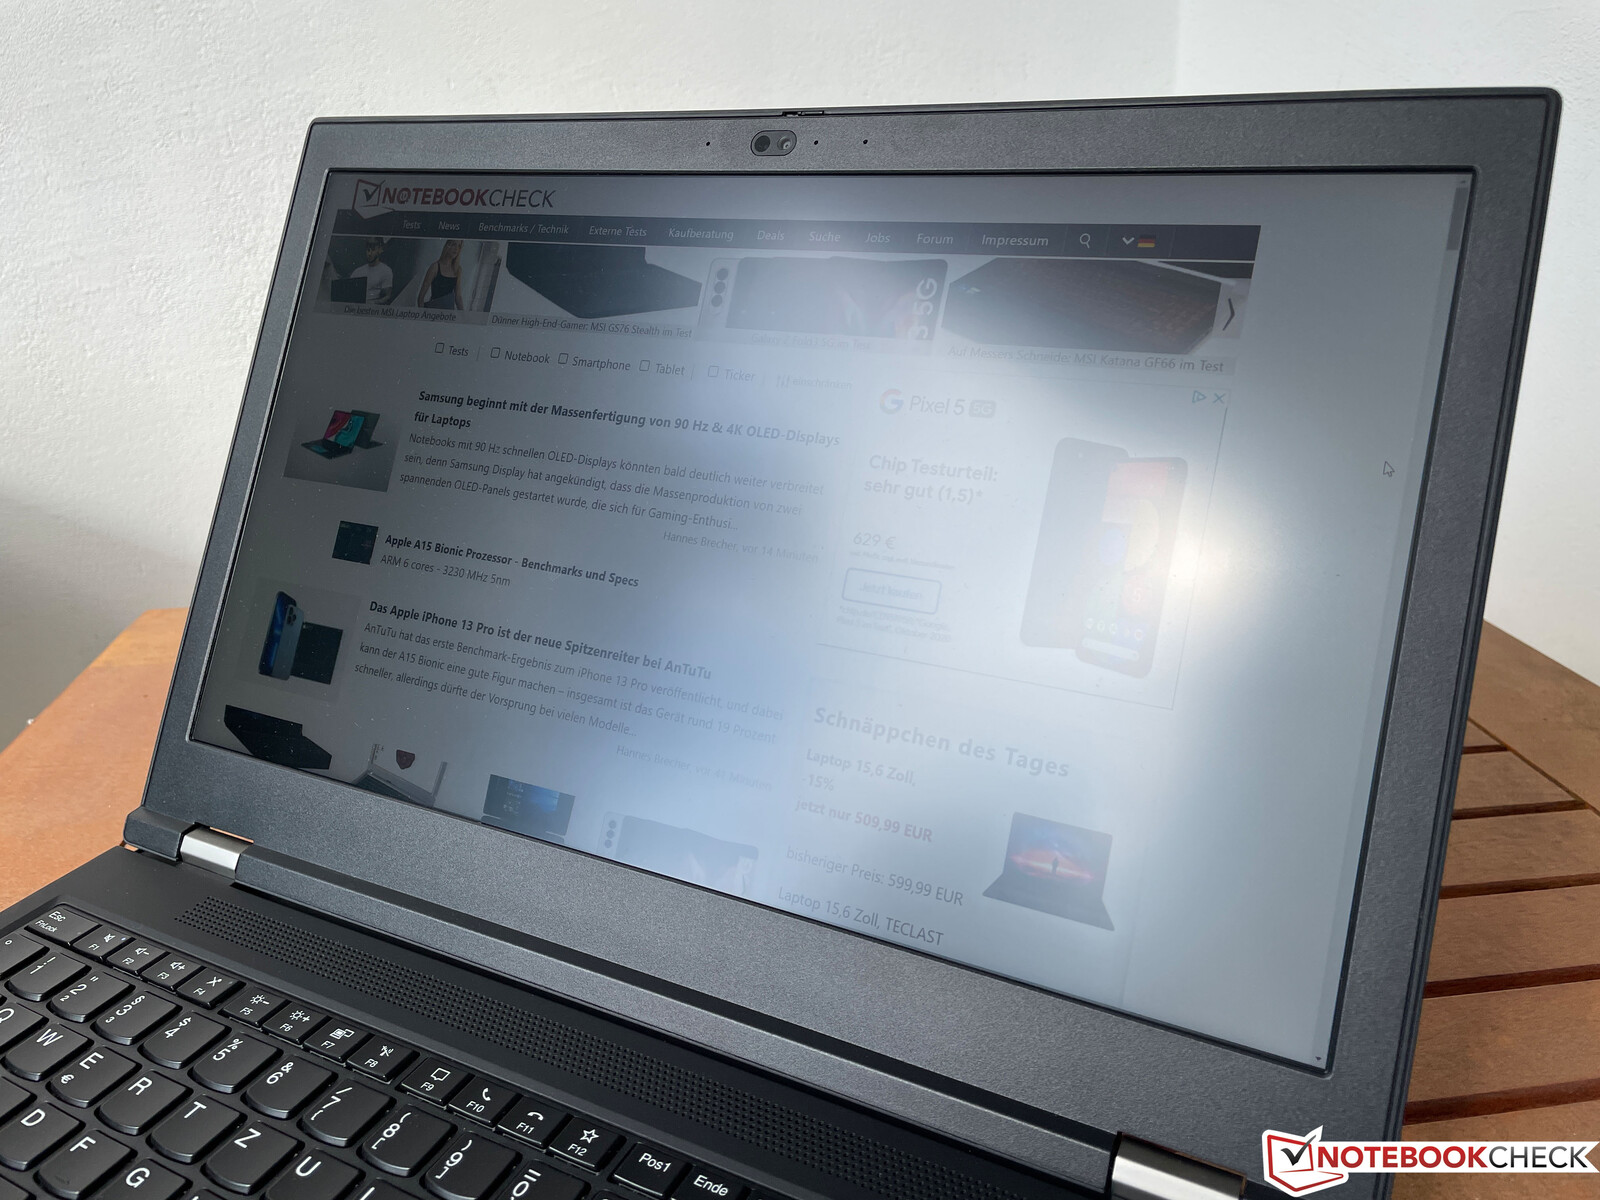
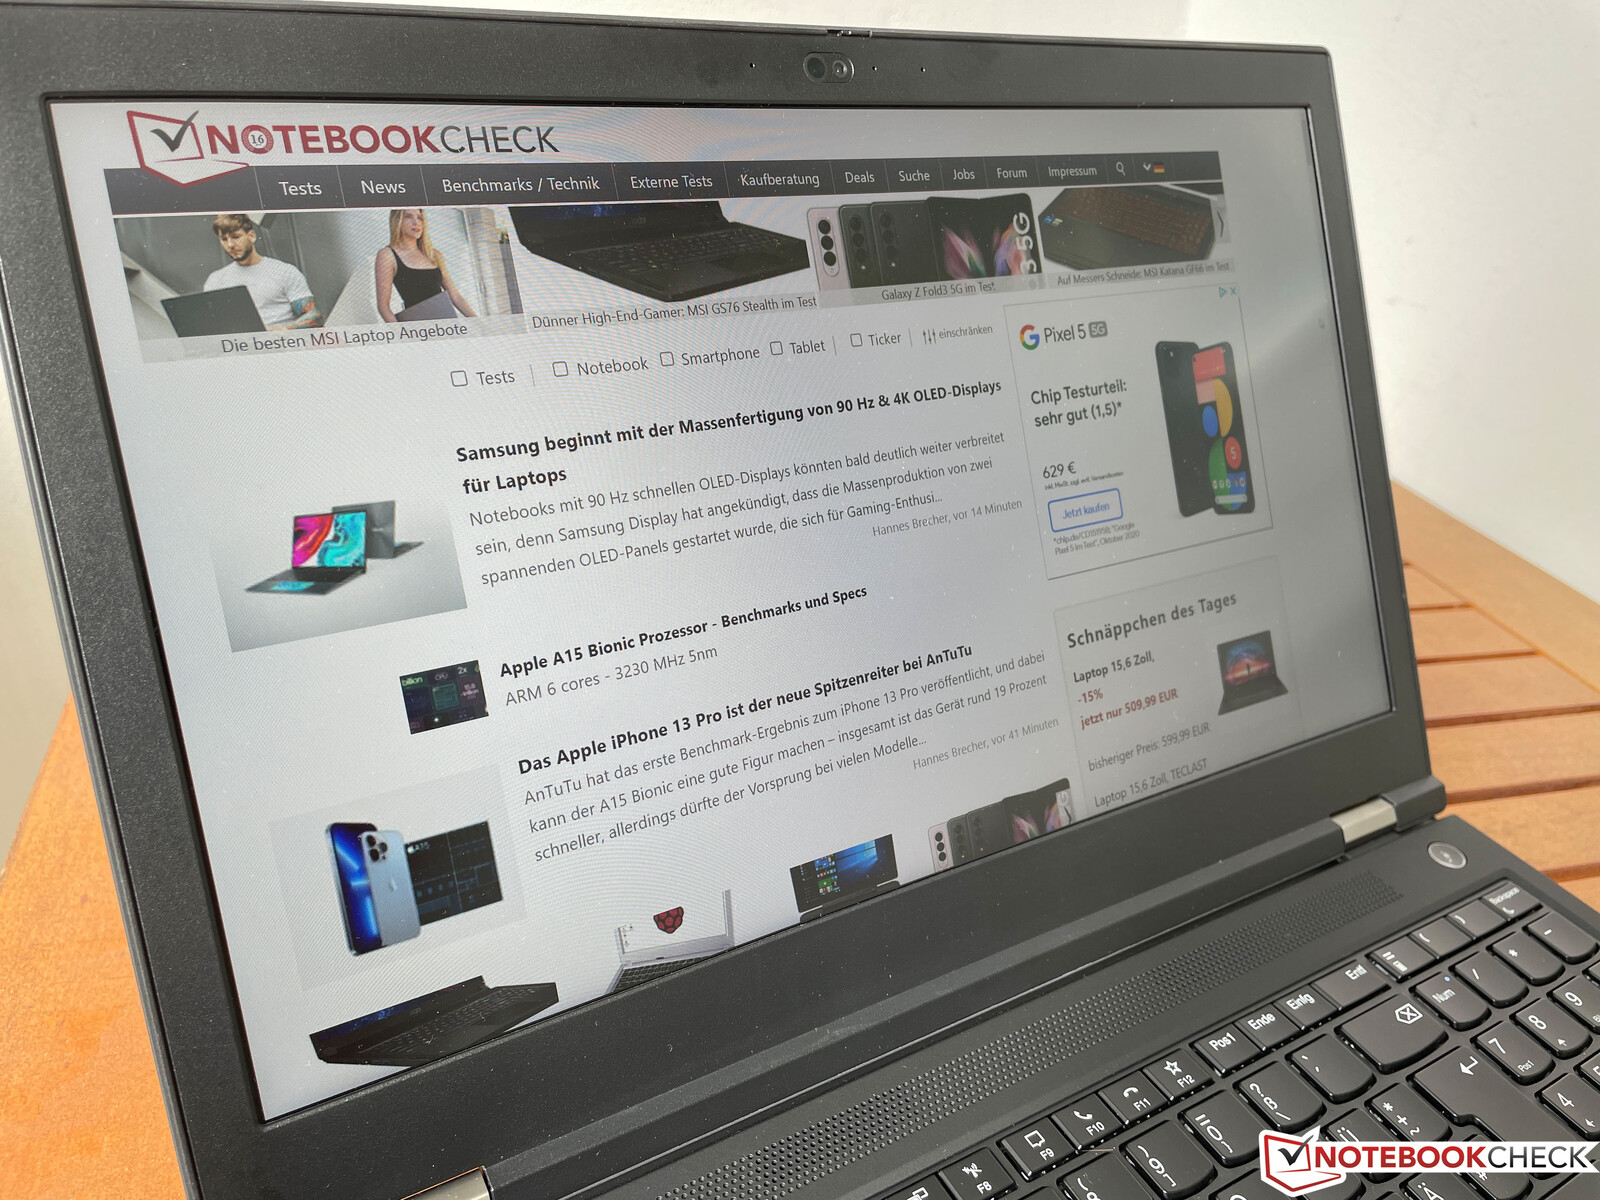
显示器 - 1080p HDR 500

我们的测试设备配备了可选的1080p面板,其亮度为500cd/m²。此外,还有两个4K显示屏(IPS或OLED)可供选择。和以前一样,所有显示屏都具有16:9的长宽比。我们的测试设备的主观图像印象非常好,因为尽管有磨砂表面,但明亮的表面看起来没有颗粒感。此外,响应时间也很好,这意味着没有看到令人烦恼的重影现象。
500尼特面板的整体表现也比我们在前身P15 Gen 1 中审查的标准300尼特对应产品好得多。这款显示器刚刚错过了宣传的亮度,大约为490cd/m²,但黑色水平略高。尽管如此,对比度仍然很好,超过1,200:1。
| |||||||||||||||||||||||||
Brightness Distribution: 95 %
Center on Battery: 499 cd/m²
Contrast: 1277:1 (Black: 0.39 cd/m²)
ΔE ColorChecker Calman: 2.1 | ∀{0.5-29.43 Ø4.71}
calibrated: 0.8
ΔE Greyscale Calman: 3.4 | ∀{0.09-98 Ø4.96}
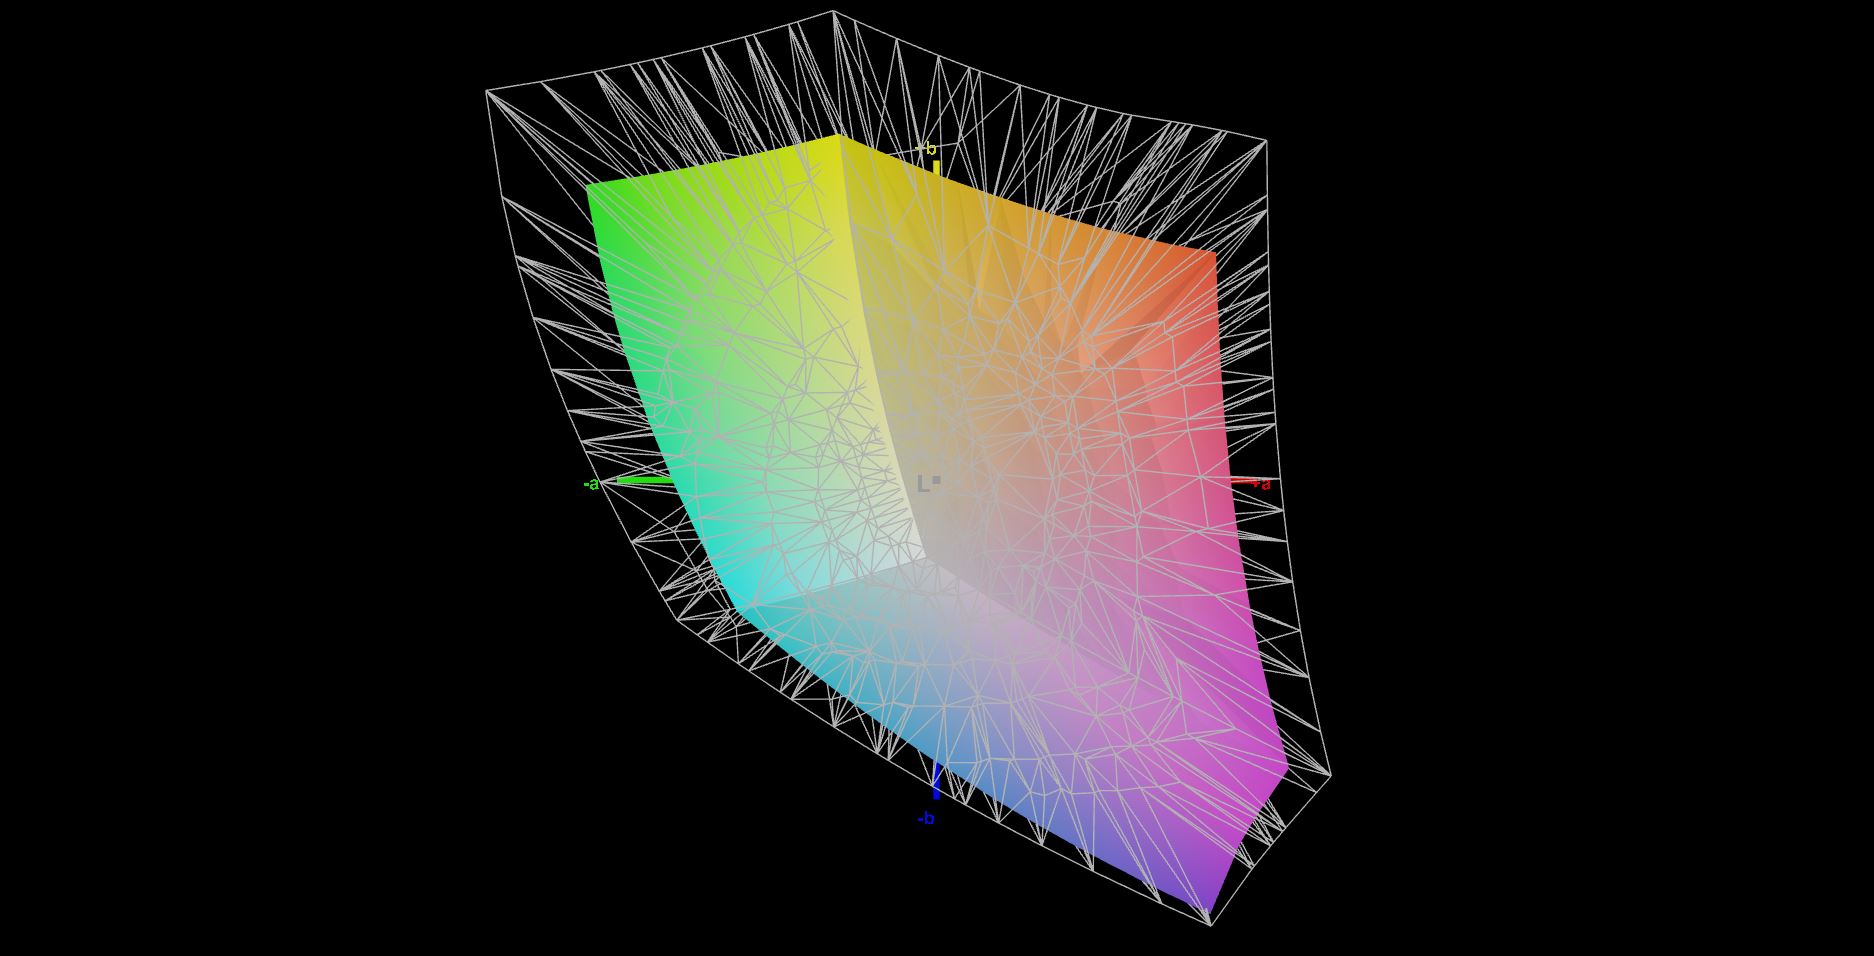
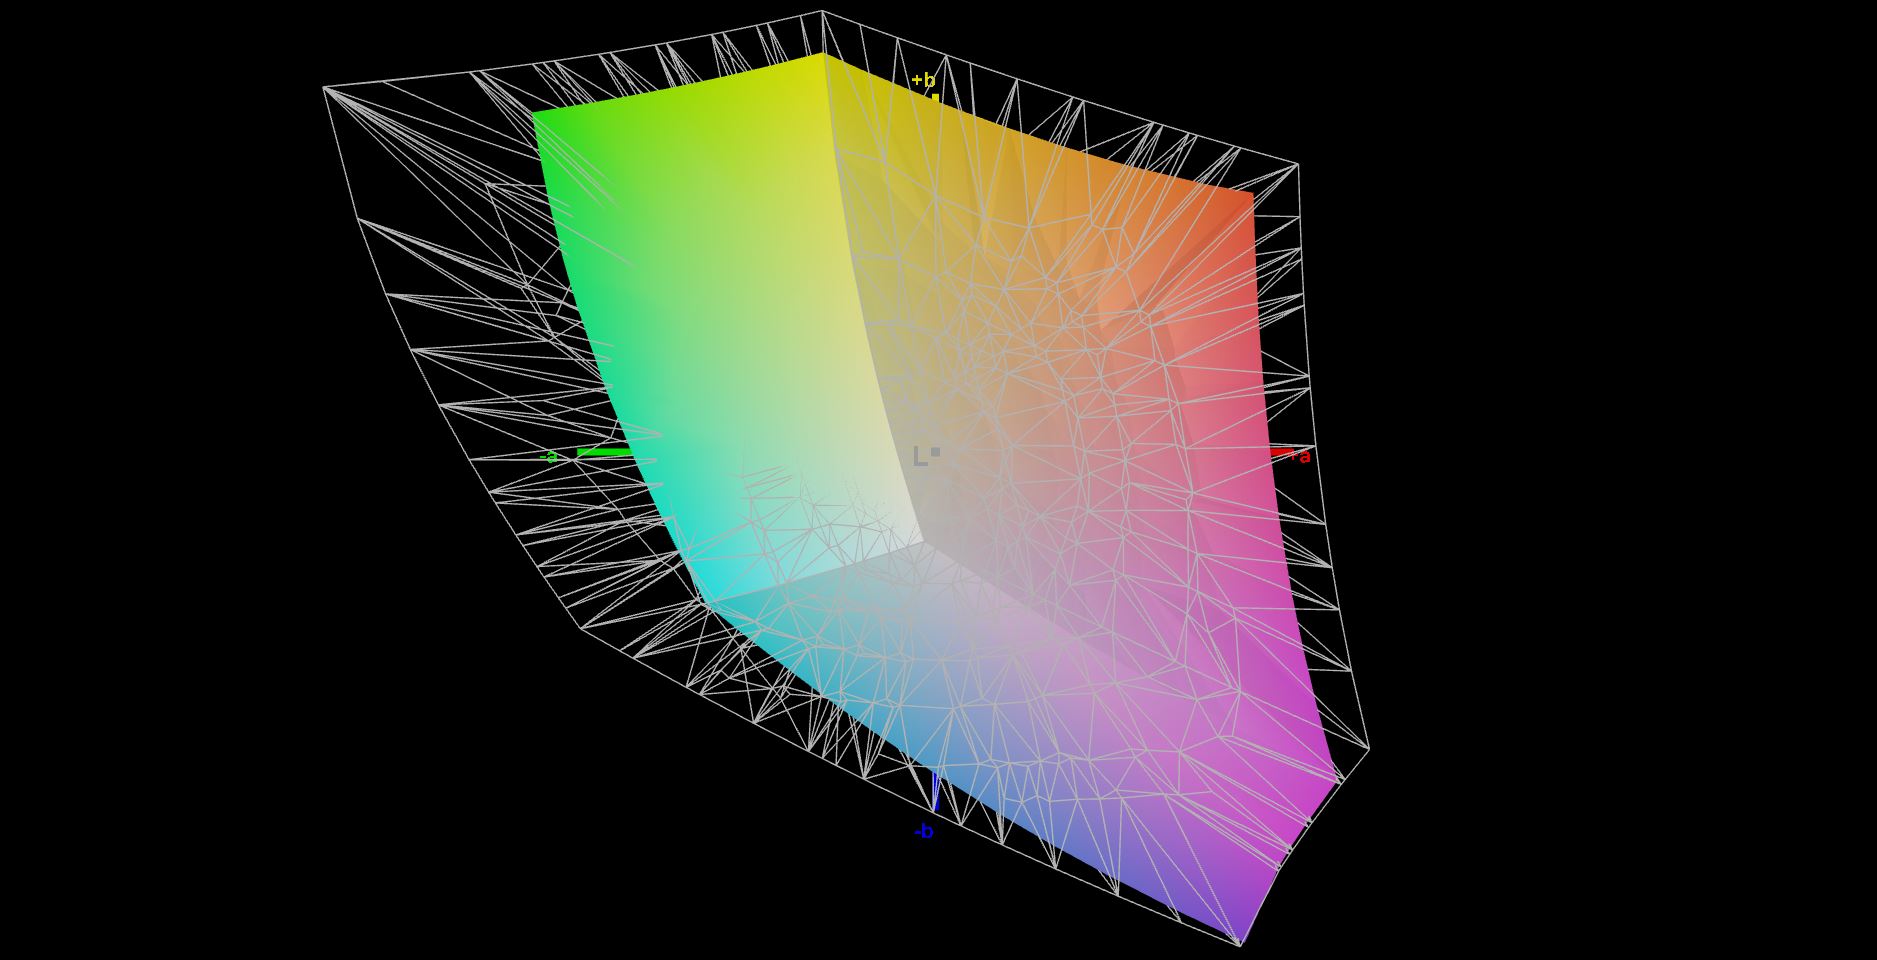
70.6% AdobeRGB 1998 (Argyll 3D)
99.8% sRGB (Argyll 3D)
68.6% Display P3 (Argyll 3D)
Gamma: 2.32
CCT: 7162 K
| Lenovo ThinkPad P15 G2-20YQ001JGE N156HCE_GN1, IPS, 1920x1080, 15.6" | HP ZBook Studio 15 G8 SDC4145, OLED, 3840x2160, 15.6" | HP ZBook Fury 15 G7 LG Philips LGD0661, IPS, 3840x2160, 15.6" | Dell Precision 7550 AU Optronics B156ZAN, IPS, 3840x2160, 15.6" | MSI WS66 10TMT-207US AU Optronics B156HAB03.0, IPS, 1920x1080, 15.6" | Lenovo ThinkPad P15 Gen1-20ST000DGE N156HCE-EN1, a-Si IPS LED, 1920x1080, 15.6" | |
|---|---|---|---|---|---|---|
| Display | 27% | 20% | 19% | -10% | -5% | |
| Display P3 Coverage (%) | 68.6 | 99.9 46% | 95.6 39% | 82.1 20% | 62.8 -8% | 66.6 -3% |
| sRGB Coverage (%) | 99.8 | 100 0% | 99.8 0% | 99.6 0% | 86.9 -13% | 92.3 -8% |
| AdobeRGB 1998 Coverage (%) | 70.6 | 95.3 35% | 84.5 20% | 96.8 37% | 63.6 -10% | 67.1 -5% |
| Response Times | 90% | -87% | -75% | -50% | -58% | |
| Response Time Grey 50% / Grey 80% * (ms) | 37.6 ? | 2.4 ? 94% | 56 ? -49% | 51.2 ? -36% | 44.8 ? -19% | 41.2 ? -10% |
| Response Time Black / White * (ms) | 16 ? | 2.4 ? 85% | 36 ? -125% | 34 ? -113% | 28.8 ? -80% | 32.8 ? -105% |
| PWM Frequency (Hz) | 26040 ? | 240.4 ? | 24270 | |||
| Screen | -71% | -40% | -69% | -73% | -75% | |
| Brightness middle (cd/m²) | 498 | 379.6 -24% | 672.8 35% | 473.5 -5% | 374.5 -25% | 338 -32% |
| Brightness (cd/m²) | 490 | 380 -22% | 674 38% | 461 -6% | 363 -26% | 304 -38% |
| Brightness Distribution (%) | 95 | 95 0% | 89 -6% | 90 -5% | 91 -4% | 81 -15% |
| Black Level * (cd/m²) | 0.39 | 0.5 -28% | 0.55 -41% | 0.42 -8% | 0.45 -15% | |
| Contrast (:1) | 1277 | 1346 5% | 861 -33% | 892 -30% | 751 -41% | |
| Colorchecker dE 2000 * | 2.1 | 5.15 -145% | 3.48 -66% | 4.8 -129% | 4.05 -93% | 5.5 -162% |
| Colorchecker dE 2000 max. * | 5.6 | 7.79 -39% | 9.44 -69% | 8.73 -56% | 8.17 -46% | 11.5 -105% |
| Colorchecker dE 2000 calibrated * | 0.8 | 3.1 -288% | 3.03 -279% | 3.08 -285% | 4.36 -445% | 1.9 -137% |
| Greyscale dE 2000 * | 3.4 | 2.6 24% | 3.1 9% | 5.6 -65% | 2.6 24% | 7.8 -129% |
| Gamma | 2.32 95% | 1.99 111% | 2.04 108% | 2.34 94% | 2.21 100% | 2.24 98% |
| CCT | 7162 91% | 6166 105% | 6380 102% | 7549 86% | 7027 93% | 6764 96% |
| Color Space (Percent of AdobeRGB 1998) (%) | 75.2 | 86.4 | 56.4 | 60 | ||
| Color Space (Percent of sRGB) (%) | 100 | 99.7 | 86.3 | 92.1 | ||
| Total Average (Program / Settings) | 15% /
-20% | -36% /
-34% | -42% /
-51% | -44% /
-56% | -46% /
-58% |
* ... smaller is better
工厂校准是体面的,但我们可以看到灰度有轻微的蓝色色调,而且色温也有点太冷。这种 "技巧 "经常被用来提高亮度。经过我们的校准(CalMAN和X-Rite i1 Pro 2),亮度略有下降(~475 cd/m²),但不再有颜色色调的回报。
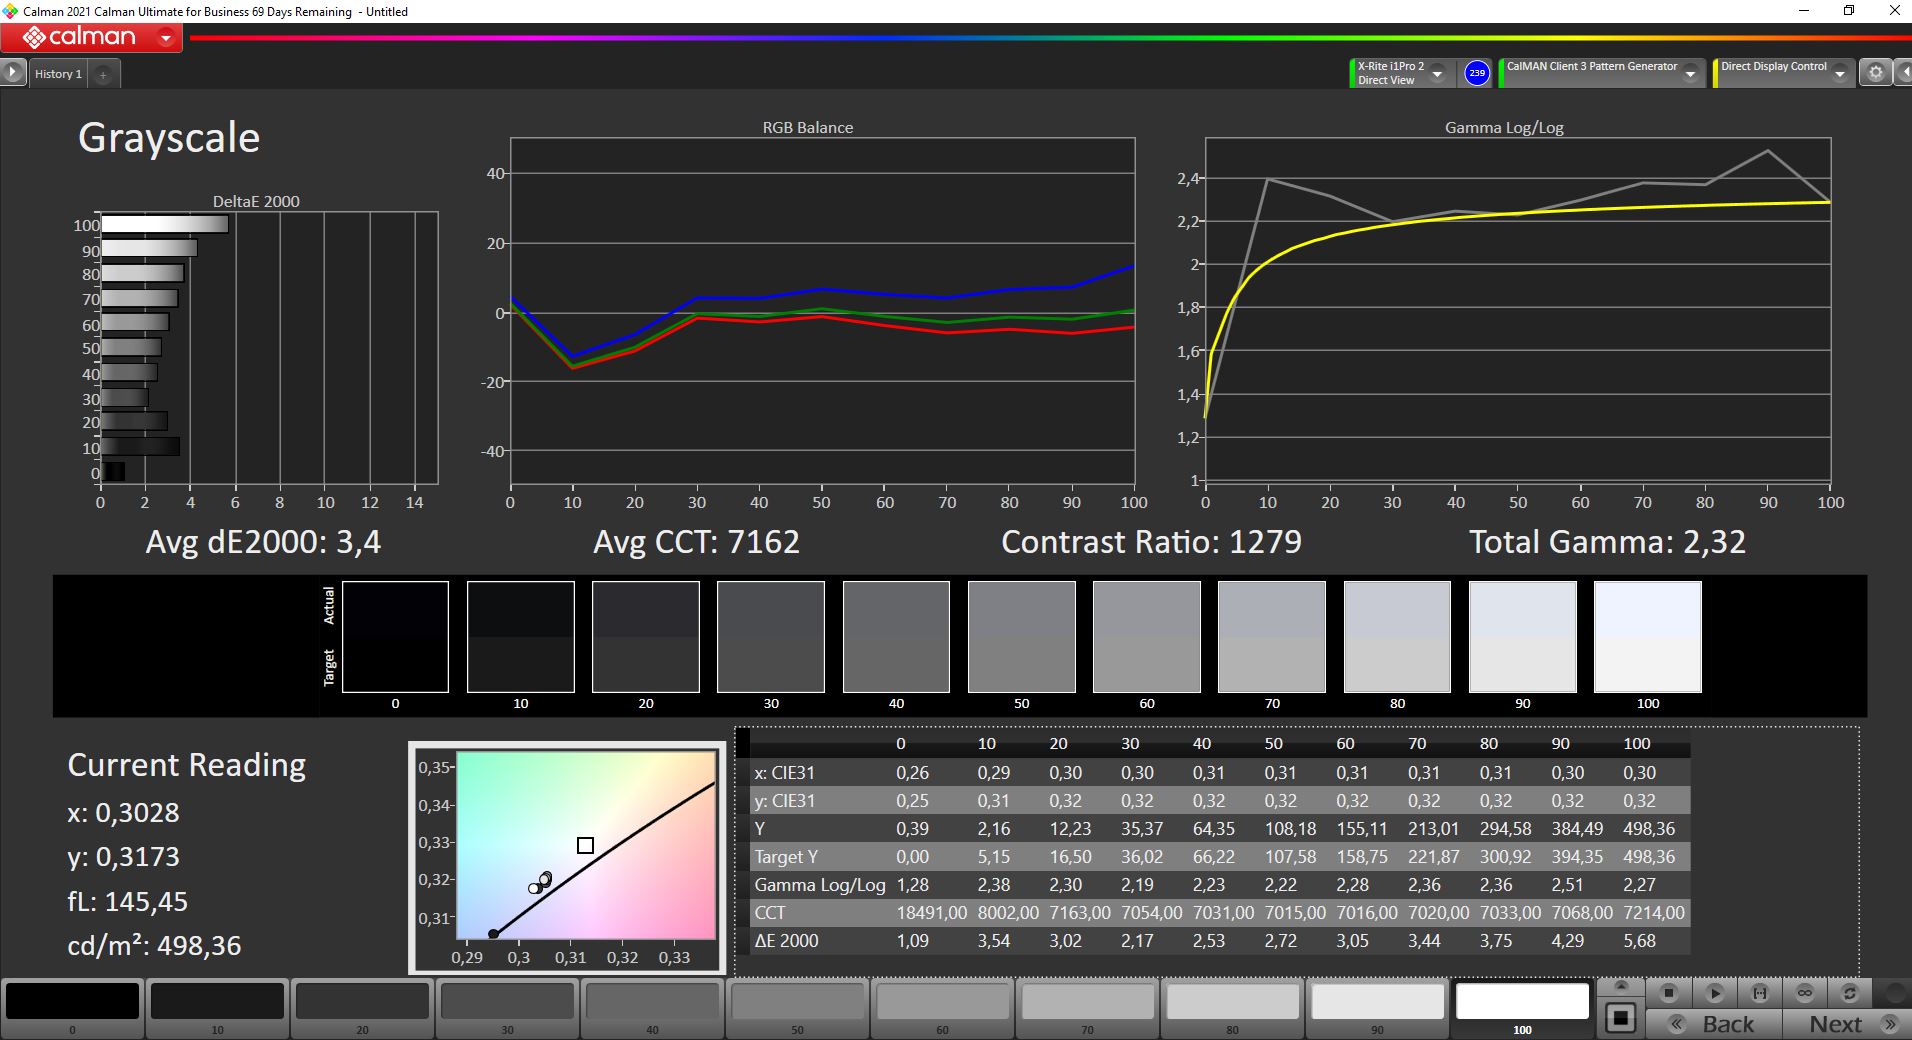
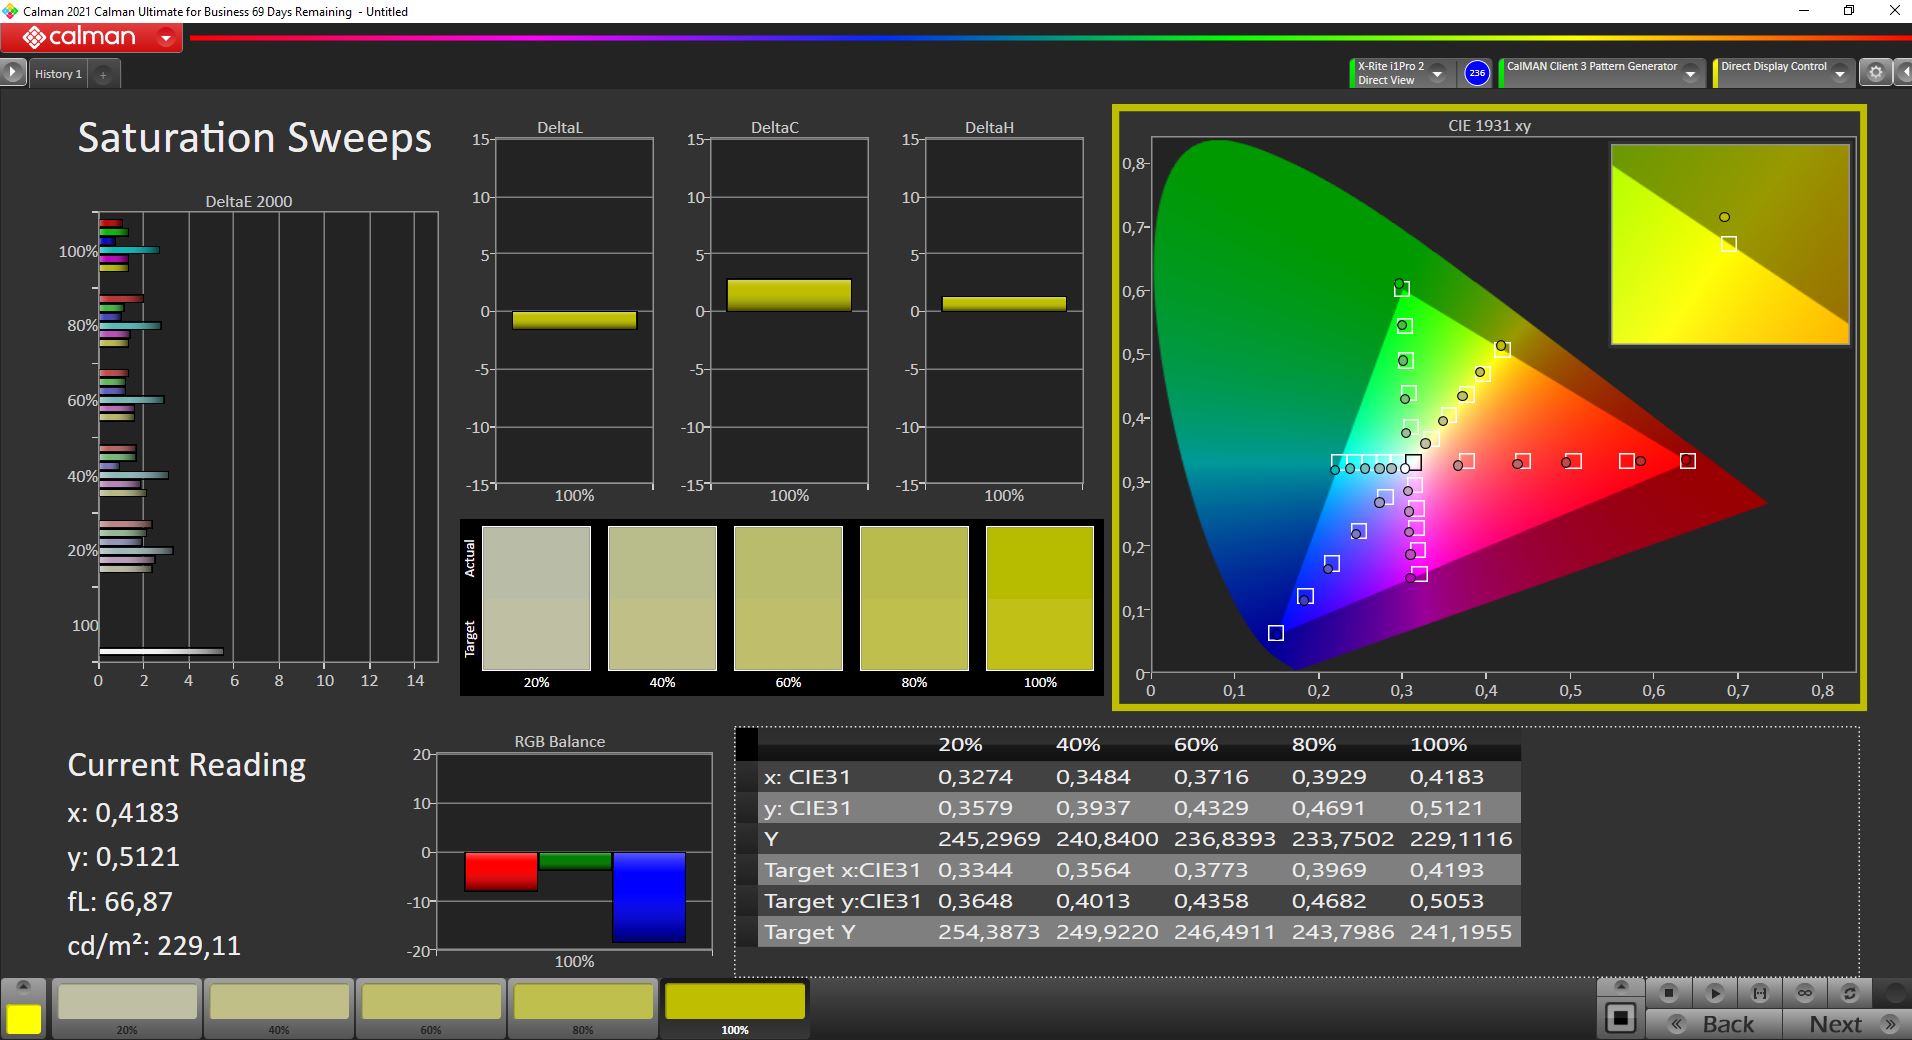
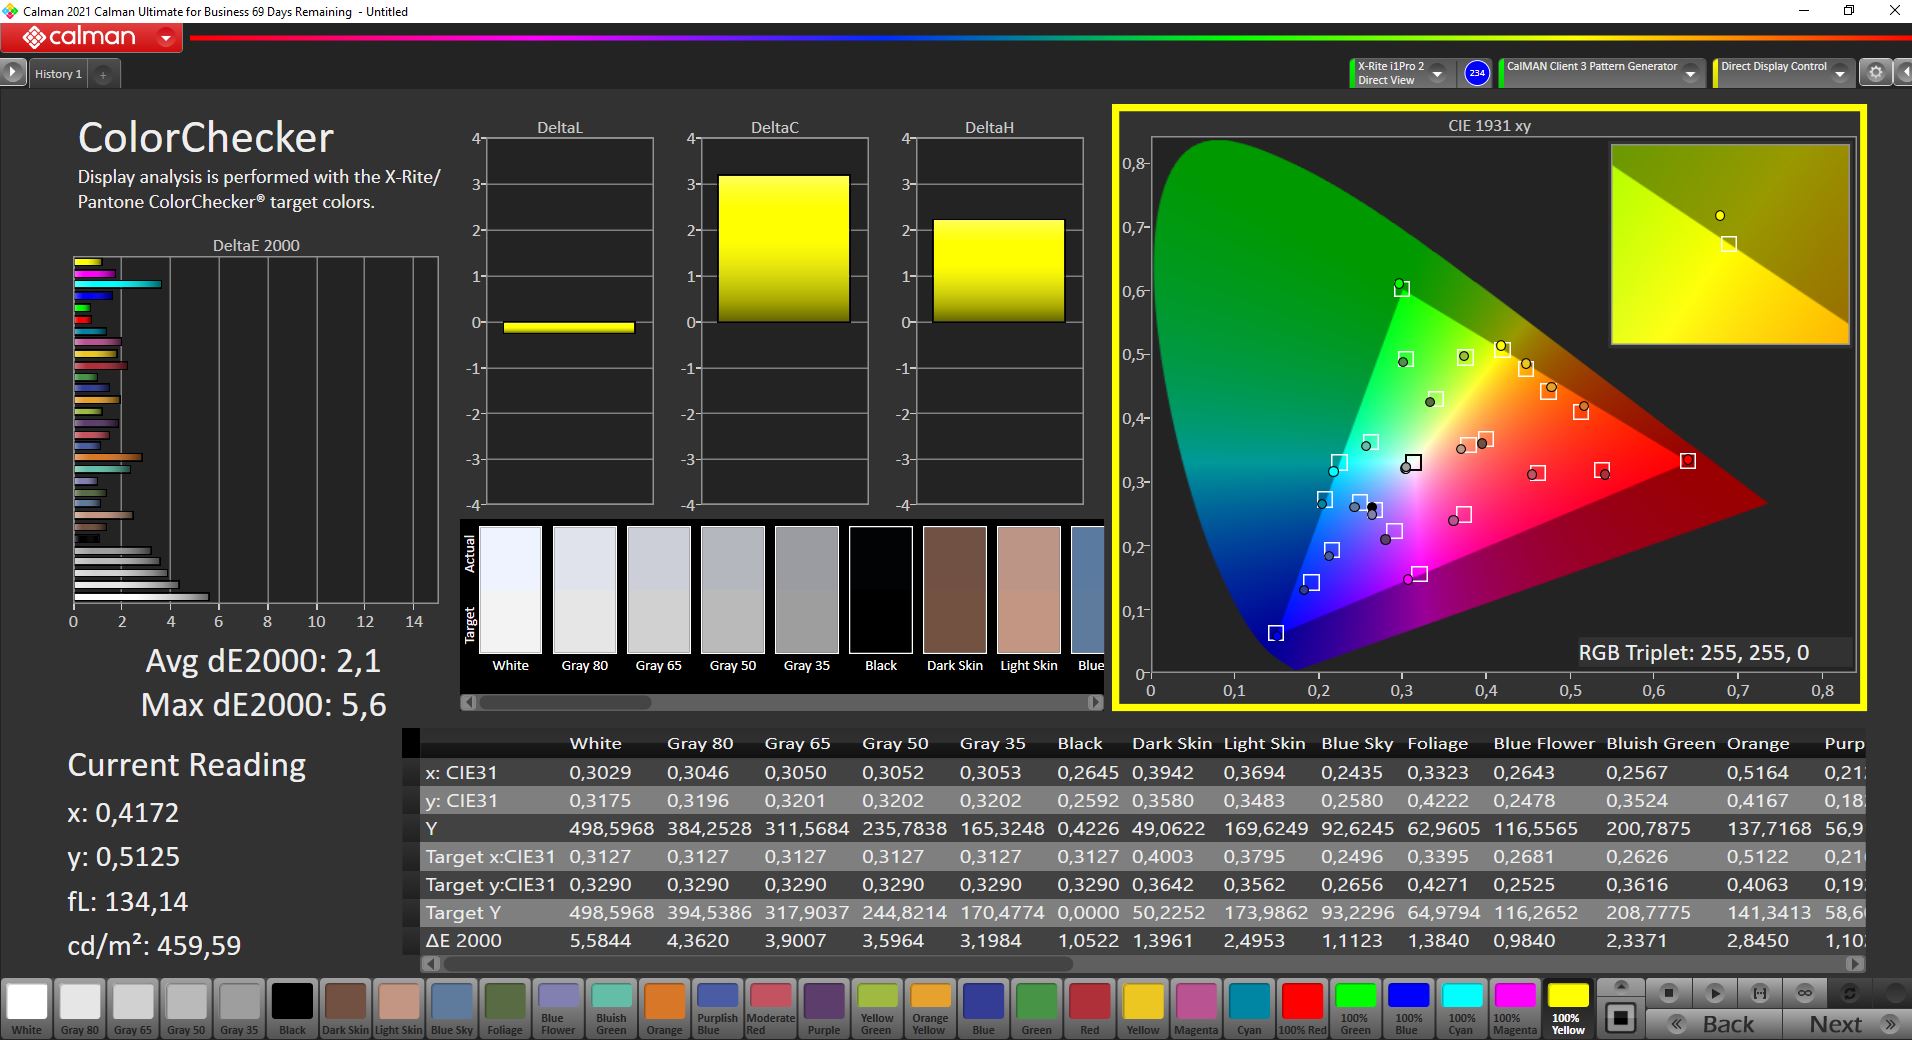
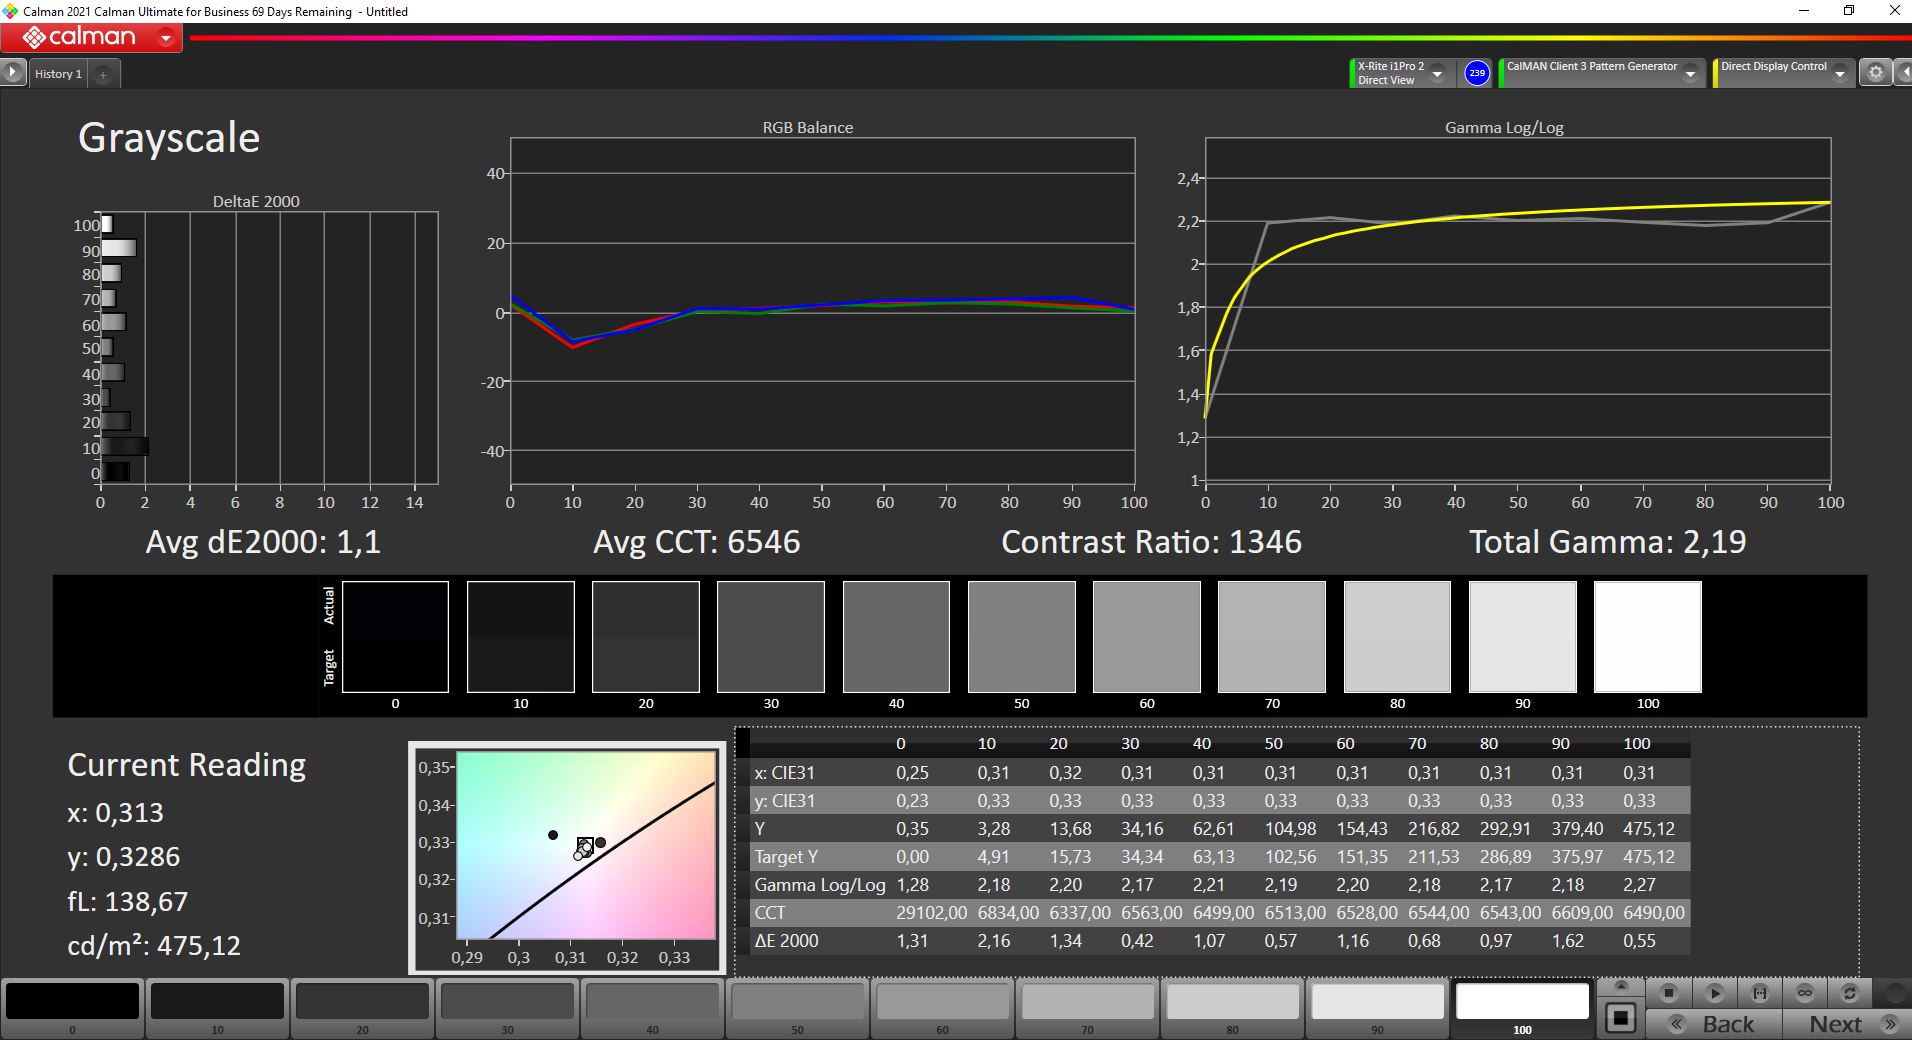
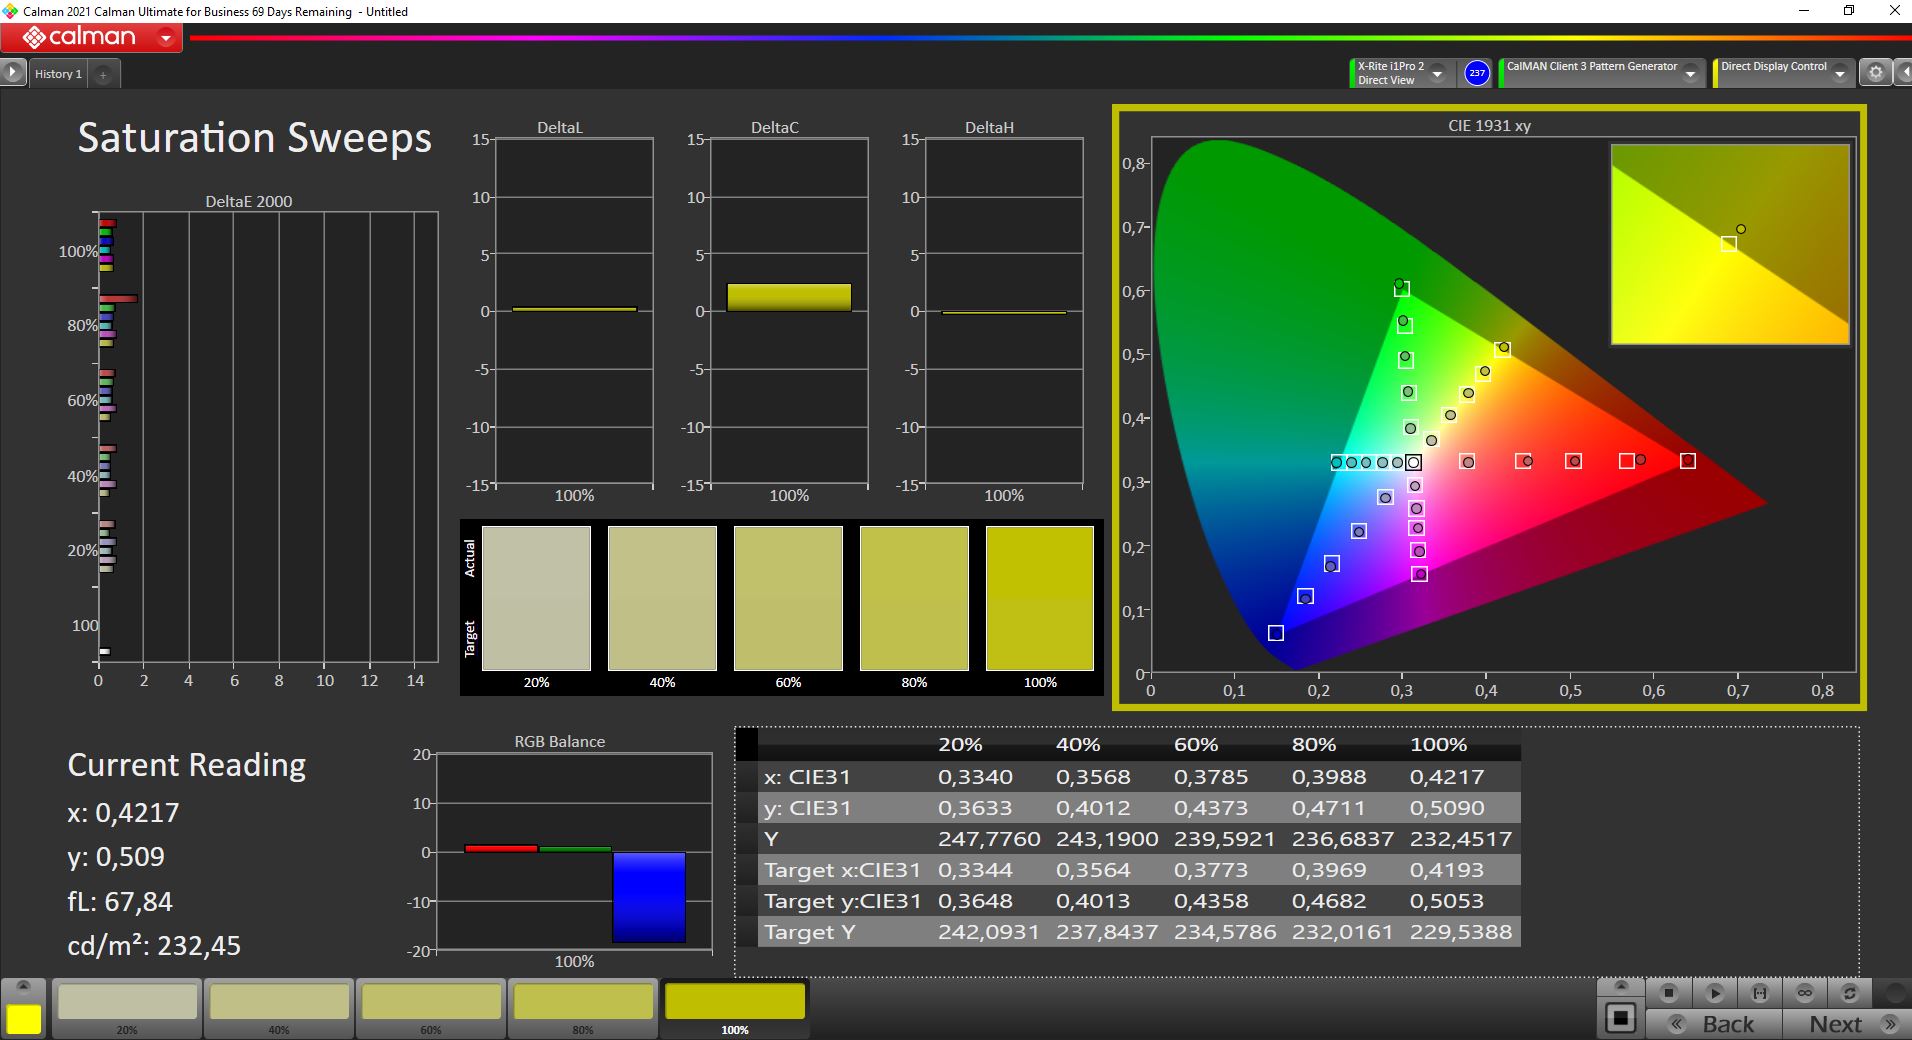
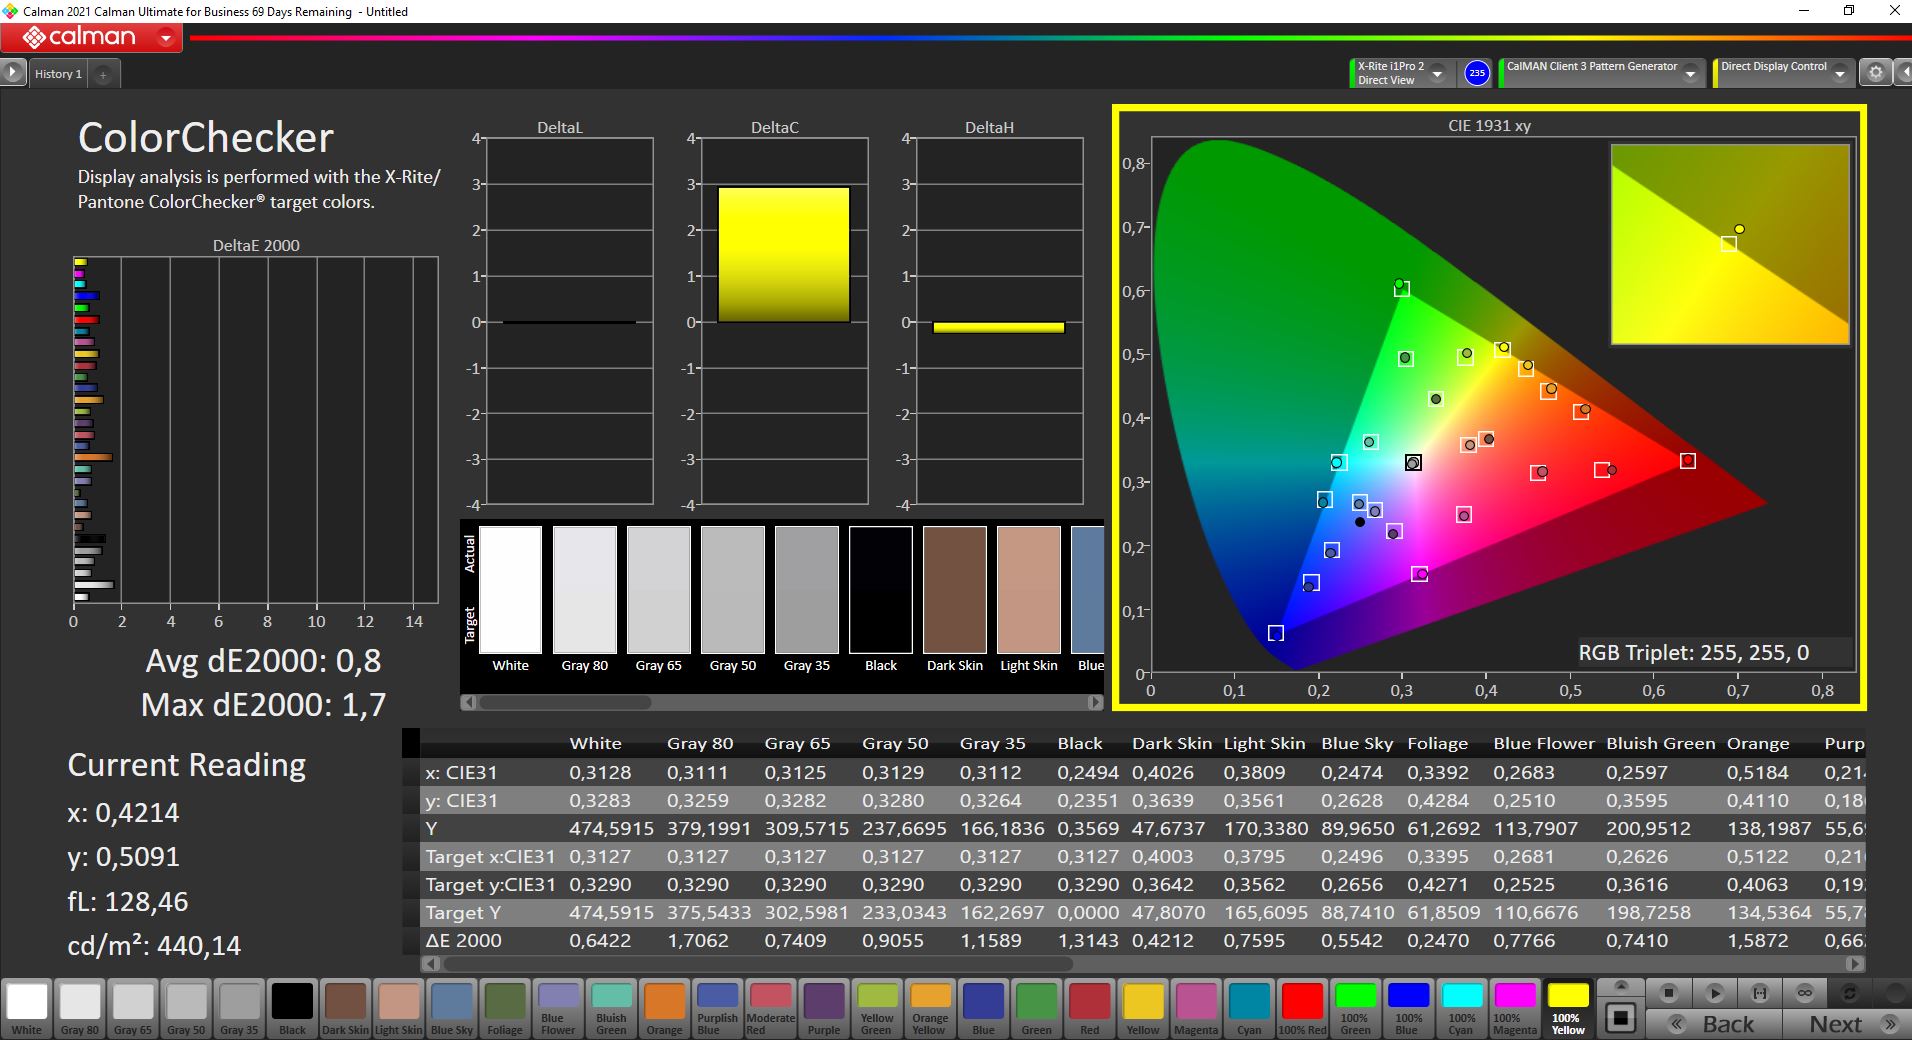
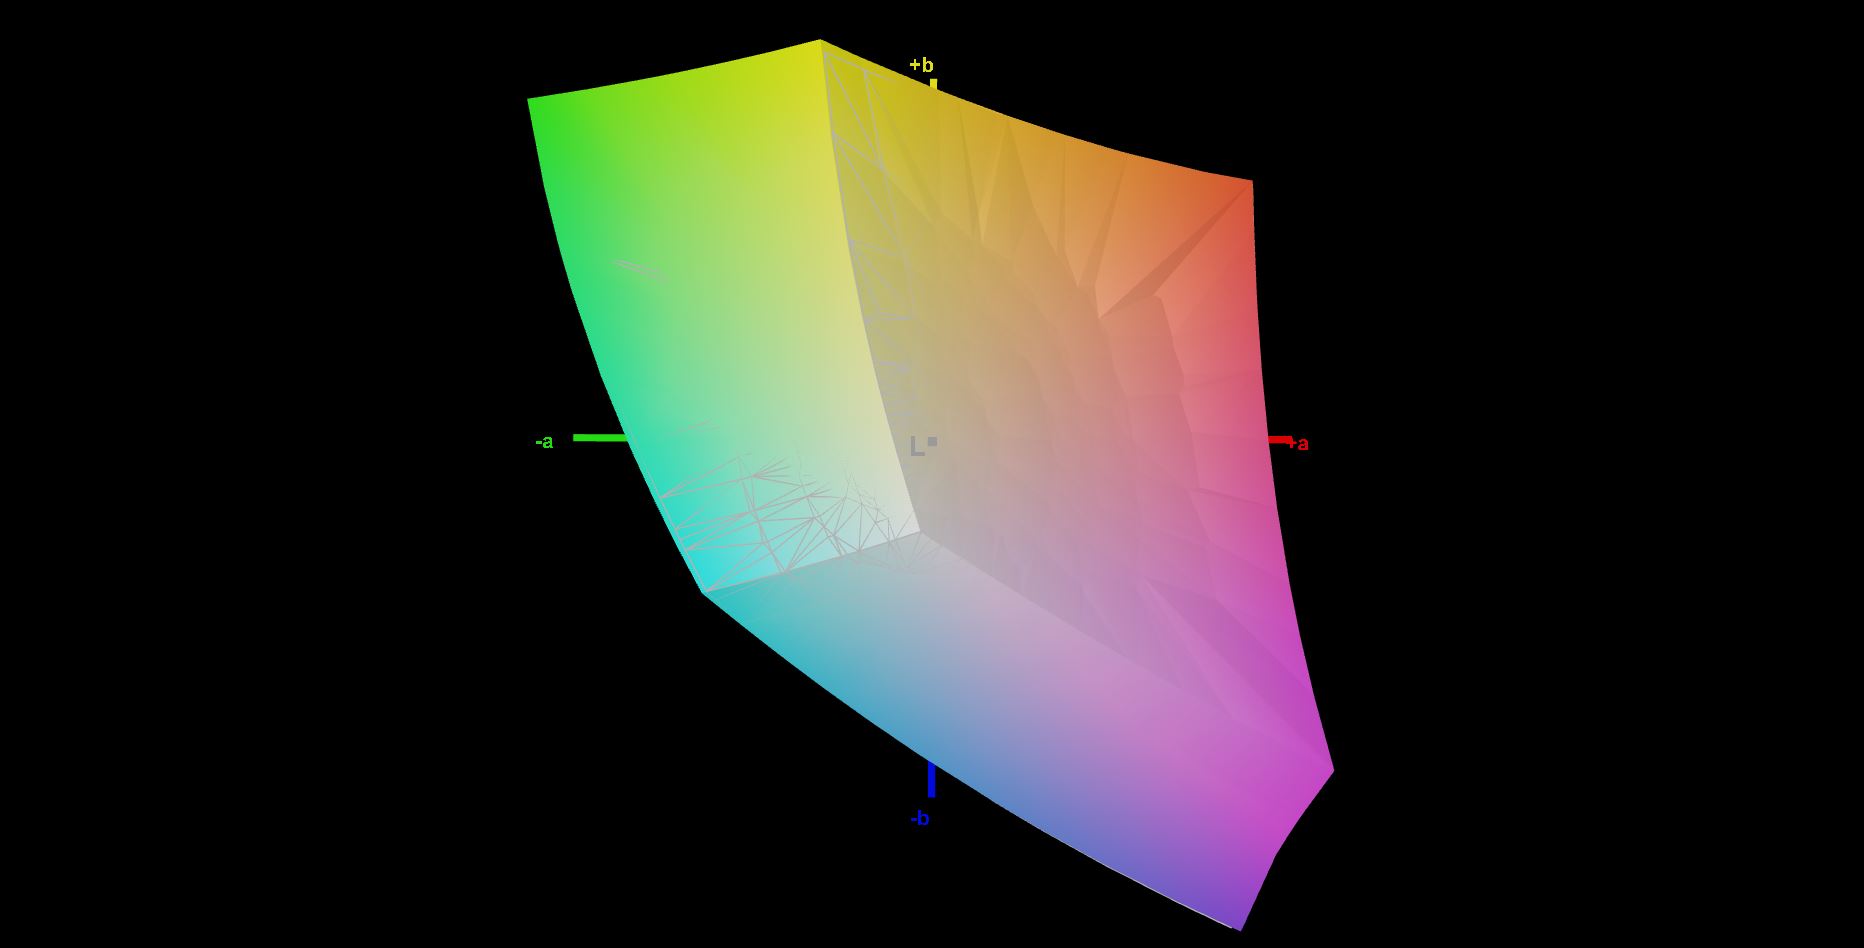
1080p面板完全覆盖了小的sRGB色彩空间,由于色彩偏差小,这款显示器适合在这个色彩空间中编辑图片/视频,而且色彩准确。需要更大色彩空间的用户将不可避免地要选择两个4K显示器中的一个,然后覆盖DCI-P3(OLED)或AdobeRGB(IPS)色彩空间。
Display Response Times
| ↔ Response Time Black to White | ||
|---|---|---|
| 16 ms ... rise ↗ and fall ↘ combined | ↗ 6 ms rise | 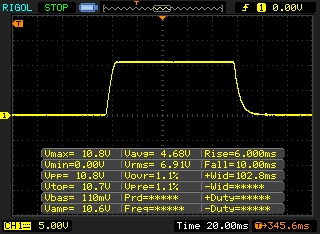 |
| ↘ 10 ms fall | ||
| The screen shows good response rates in our tests, but may be too slow for competitive gamers. In comparison, all tested devices range from 0.1 (minimum) to 240 (maximum) ms. » 37 % of all devices are better. This means that the measured response time is better than the average of all tested devices (19.8 ms). | ||
| ↔ Response Time 50% Grey to 80% Grey | ||
| 37.6 ms ... rise ↗ and fall ↘ combined | ↗ 18 ms rise | 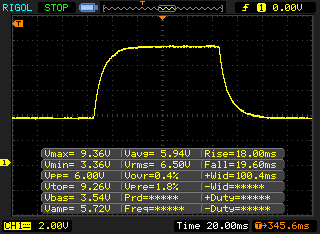 |
| ↘ 19.6 ms fall | ||
| The screen shows slow response rates in our tests and will be unsatisfactory for gamers. In comparison, all tested devices range from 0.165 (minimum) to 636 (maximum) ms. » 55 % of all devices are better. This means that the measured response time is worse than the average of all tested devices (30.9 ms). | ||
Screen Flickering / PWM (Pulse-Width Modulation)
| Screen flickering / PWM detected | 26040 Hz | ≤ 50 % brightness setting | 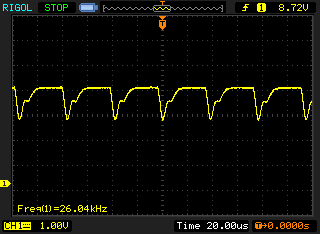 |
| ≤ 118 cd/m² brightness | |||
The display backlight flickers at 26040 Hz (worst case, e.g., utilizing PWM) Flickering detected at a brightness setting of 50 % (118 cd/m²) and below. There should be no flickering or PWM above this brightness setting. The frequency of 26040 Hz is quite high, so most users sensitive to PWM should not notice any flickering. Flickering occurs at relatively low brightness settings, so extended use at this brightness setting or lower can cause eyestrain. In comparison: 52 % of all tested devices do not use PWM to dim the display. If PWM was detected, an average of 7744 (minimum: 5 - maximum: 343500) Hz was measured. | |||
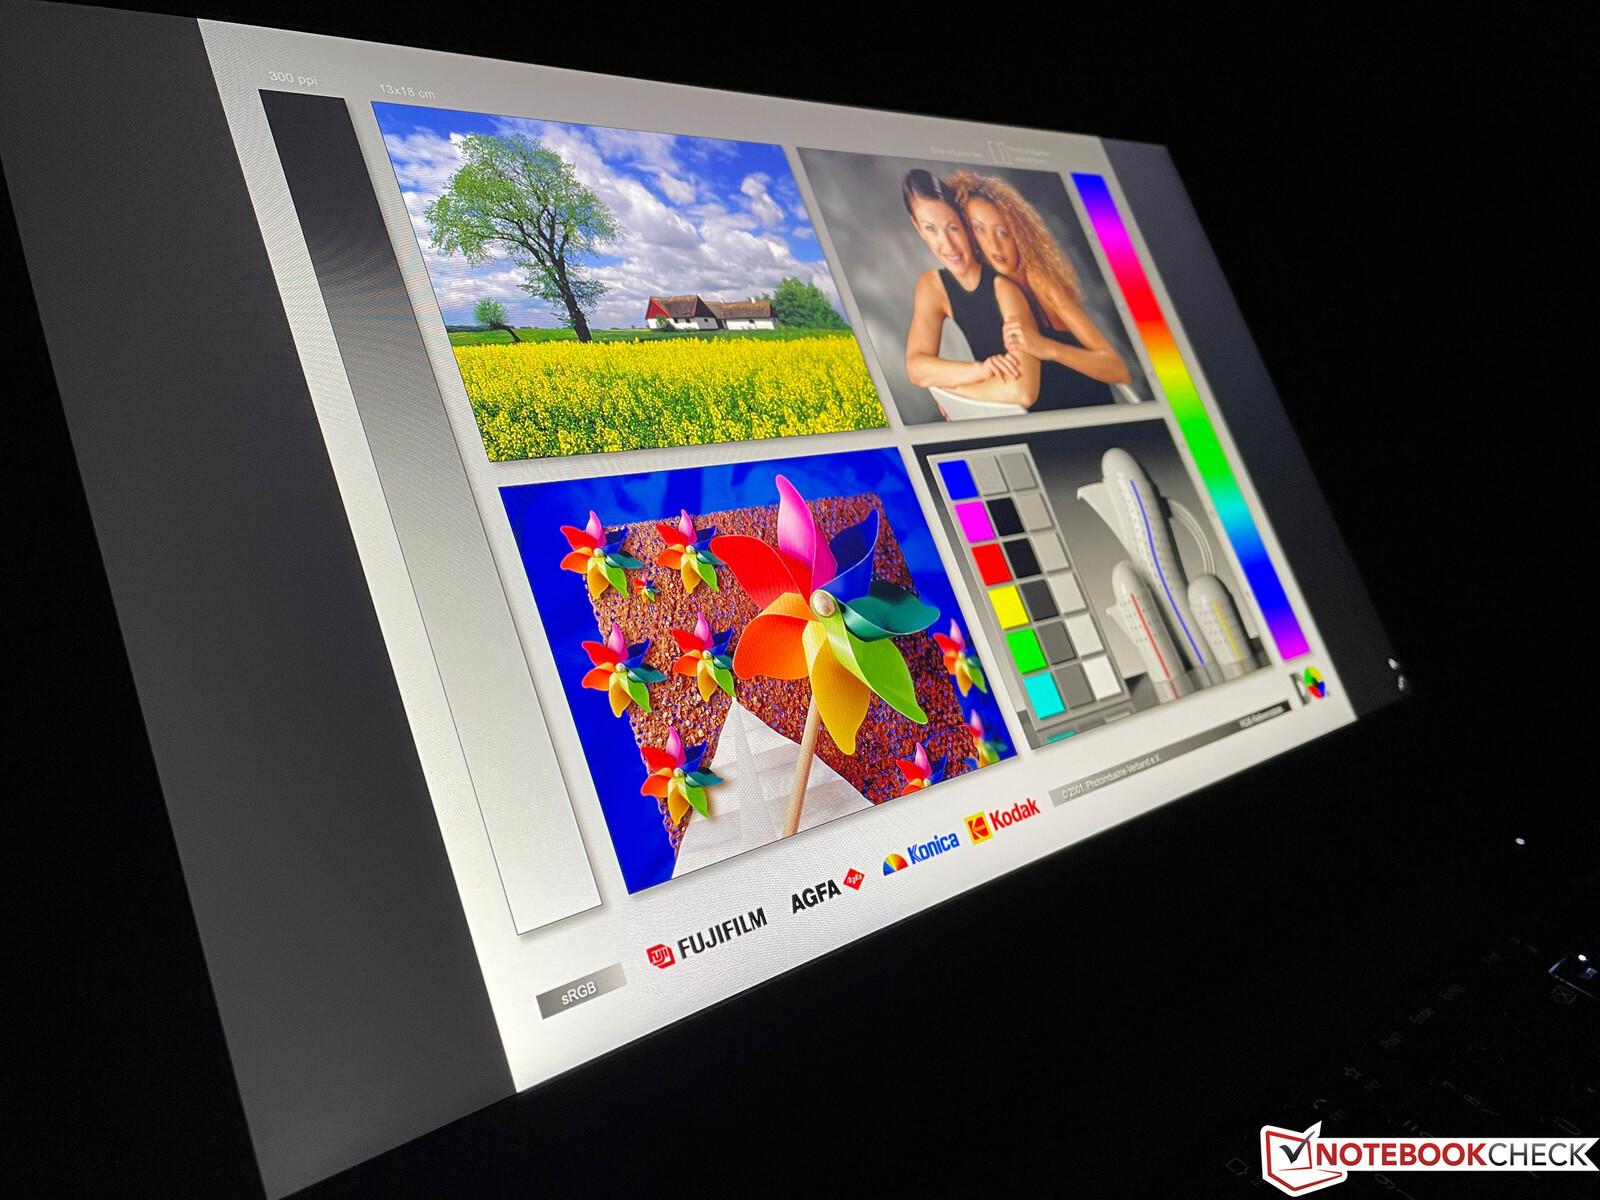
由于其尺寸和重量,P15 Gen 2当然不是完美的旅行伴侣,但由于其哑光和明亮的面板,你可以在户外相当舒适地工作。IPS面板的可视角度稳定性也非常好。
性能 -Tiger Lake H45和Nvidia RTX
除了英特尔最新的45瓦CPU (Tiger Lake H),联想还使用了Nvidia新的专业RTX GPU作为选项;AMD的CPU或显卡都不提供。联想没有提供自己的性能模式,并将控制措施整合到正常的Windows性能滑块中(左键点击任务栏中的电池图标)。我们还是会去了解具体的配置,但总的来说,联想现在赋予了显卡更多的重要性,把处理器的TDP值降低了一些。
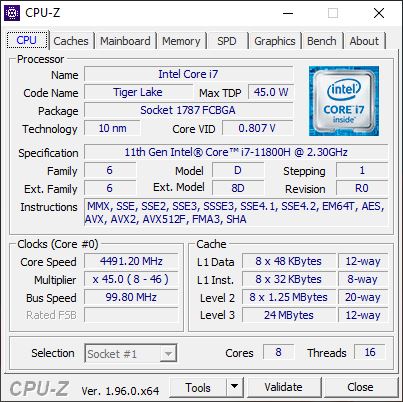
处理器 - 酷睿i7-11800H
尽管如此,ThinkPad P15第二代可以将自己定位在我们的比较组的顶端,因为超薄的ZBook Studio 15 G8,这是迄今为止我们测试的唯一一款采用最新CPU的产品。在电池供电的情况下,CPU的性能保持一致。进一步的CPU基准测试可在我们的数据库 。
Cinebench R15 Multi endurance test
Cinebench R20: CPU (Multi Core) | CPU (Single Core)
Cinebench R15: CPU Multi 64Bit | CPU Single 64Bit
Blender: v2.79 BMW27 CPU
7-Zip 18.03: 7z b 4 | 7z b 4 -mmt1
Geekbench 5.5: Multi-Core | Single-Core
HWBOT x265 Benchmark v2.2: 4k Preset
LibreOffice : 20 Documents To PDF
R Benchmark 2.5: Overall mean
| Cinebench R23 / Multi Core | |
| Average of class Workstation (14621 - 38520, n=23, last 2 years) | |
| HP ZBook Studio 15 G8 | |
| Average Intel Core i7-11800H (6508 - 14088, n=48) | |
| Lenovo ThinkPad P15 G2-20YQ001JGE | |
| Lenovo ThinkPad P15 Gen1-20ST000DGE | |
| HP ZBook Fury 15 G7 | |
| Cinebench R23 / Single Core | |
| Average of class Workstation (1712 - 2228, n=23, last 2 years) | |
| HP ZBook Studio 15 G8 | |
| Lenovo ThinkPad P15 G2-20YQ001JGE | |
| Average Intel Core i7-11800H (1386 - 1522, n=45) | |
| HP ZBook Fury 15 G7 | |
| Lenovo ThinkPad P15 Gen1-20ST000DGE | |
| Cinebench R20 / CPU (Multi Core) | |
| Average of class Workstation (5760 - 15043, n=23, last 2 years) | |
| HP ZBook Studio 15 G8 | |
| Average Intel Core i7-11800H (2498 - 5408, n=50) | |
| Lenovo ThinkPad P15 G2-20YQ001JGE | |
| MSI WS66 10TMT-207US | |
| Dell Precision 7550 | |
| HP ZBook Fury 15 G7 | |
| HP ZBook Fury 15 G7 | |
| Lenovo ThinkPad P15 Gen1-20ST000DGE | |
| Cinebench R20 / CPU (Single Core) | |
| Average of class Workstation (671 - 857, n=23, last 2 years) | |
| HP ZBook Studio 15 G8 | |
| Lenovo ThinkPad P15 G2-20YQ001JGE | |
| Average Intel Core i7-11800H (520 - 586, n=47) | |
| HP ZBook Fury 15 G7 | |
| HP ZBook Fury 15 G7 | |
| MSI WS66 10TMT-207US | |
| Lenovo ThinkPad P15 Gen1-20ST000DGE | |
| Dell Precision 7550 | |
| Cinebench R15 / CPU Multi 64Bit | |
| Average of class Workstation (2489 - 5810, n=23, last 2 years) | |
| Average Intel Core i7-11800H (1342 - 2173, n=50) | |
| Lenovo ThinkPad P15 G2-20YQ001JGE | |
| HP ZBook Studio 15 G8 | |
| MSI WS66 10TMT-207US | |
| Dell Precision 7550 | |
| HP ZBook Fury 15 G7 | |
| HP ZBook Fury 15 G7 | |
| Lenovo ThinkPad P15 Gen1-20ST000DGE | |
| Cinebench R15 / CPU Single 64Bit | |
| Average of class Workstation (191.4 - 328, n=23, last 2 years) | |
| HP ZBook Studio 15 G8 | |
| Lenovo ThinkPad P15 G2-20YQ001JGE | |
| Average Intel Core i7-11800H (201 - 231, n=46) | |
| HP ZBook Fury 15 G7 | |
| HP ZBook Fury 15 G7 | |
| MSI WS66 10TMT-207US | |
| Dell Precision 7550 | |
| Lenovo ThinkPad P15 Gen1-20ST000DGE | |
| Blender / v2.79 BMW27 CPU | |
| HP ZBook Fury 15 G7 | |
| Lenovo ThinkPad P15 Gen1-20ST000DGE | |
| Dell Precision 7550 | |
| Average Intel Core i7-11800H (217 - 454, n=46) | |
| MSI WS66 10TMT-207US | |
| Lenovo ThinkPad P15 G2-20YQ001JGE | |
| HP ZBook Studio 15 G8 | |
| Average of class Workstation (91 - 222, n=23, last 2 years) | |
| 7-Zip 18.03 / 7z b 4 | |
| Average of class Workstation (60489 - 116969, n=23, last 2 years) | |
| HP ZBook Studio 15 G8 | |
| Lenovo ThinkPad P15 G2-20YQ001JGE | |
| MSI WS66 10TMT-207US | |
| Average Intel Core i7-11800H (33718 - 56758, n=46) | |
| Dell Precision 7550 | |
| Lenovo ThinkPad P15 Gen1-20ST000DGE | |
| HP ZBook Fury 15 G7 | |
| 7-Zip 18.03 / 7z b 4 -mmt1 | |
| Average of class Workstation (5126 - 6960, n=23, last 2 years) | |
| HP ZBook Studio 15 G8 | |
| HP ZBook Fury 15 G7 | |
| Dell Precision 7550 | |
| Average Intel Core i7-11800H (5138 - 5732, n=46) | |
| Lenovo ThinkPad P15 G2-20YQ001JGE | |
| MSI WS66 10TMT-207US | |
| Lenovo ThinkPad P15 Gen1-20ST000DGE | |
| Geekbench 5.5 / Multi-Core | |
| Average of class Workstation (11542 - 25554, n=23, last 2 years) | |
| Lenovo ThinkPad P15 G2-20YQ001JGE | |
| Average Intel Core i7-11800H (4655 - 9851, n=40) | |
| Dell Precision 7550 | |
| MSI WS66 10TMT-207US | |
| HP ZBook Studio 15 G8 | |
| HP ZBook Fury 15 G7 | |
| Lenovo ThinkPad P15 Gen1-20ST000DGE | |
| Geekbench 5.5 / Single-Core | |
| Average of class Workstation (1783 - 2183, n=23, last 2 years) | |
| HP ZBook Studio 15 G8 | |
| Lenovo ThinkPad P15 G2-20YQ001JGE | |
| Average Intel Core i7-11800H (1429 - 1625, n=40) | |
| MSI WS66 10TMT-207US | |
| HP ZBook Fury 15 G7 | |
| Dell Precision 7550 | |
| Lenovo ThinkPad P15 Gen1-20ST000DGE | |
| HWBOT x265 Benchmark v2.2 / 4k Preset | |
| Average of class Workstation (17.8 - 40.5, n=23, last 2 years) | |
| HP ZBook Studio 15 G8 | |
| Lenovo ThinkPad P15 G2-20YQ001JGE | |
| Average Intel Core i7-11800H (7.38 - 17.4, n=46) | |
| Dell Precision 7550 | |
| MSI WS66 10TMT-207US | |
| Lenovo ThinkPad P15 Gen1-20ST000DGE | |
| HP ZBook Fury 15 G7 | |
| LibreOffice / 20 Documents To PDF | |
| HP ZBook Fury 15 G7 | |
| Lenovo ThinkPad P15 Gen1-20ST000DGE | |
| HP ZBook Studio 15 G8 | |
| Lenovo ThinkPad P15 G2-20YQ001JGE | |
| Average of class Workstation (37.1 - 74.7, n=23, last 2 years) | |
| Dell Precision 7550 | |
| Average Intel Core i7-11800H (38.6 - 59.9, n=45) | |
| MSI WS66 10TMT-207US | |
| R Benchmark 2.5 / Overall mean | |
| Lenovo ThinkPad P15 Gen1-20ST000DGE | |
| MSI WS66 10TMT-207US | |
| Dell Precision 7550 | |
| Lenovo ThinkPad P15 G2-20YQ001JGE | |
| Average Intel Core i7-11800H (0.548 - 0.615, n=46) | |
| HP ZBook Fury 15 G7 | |
| HP ZBook Studio 15 G8 | |
| Average of class Workstation (0.3825 - 0.603, n=23, last 2 years) | |
* ... smaller is better
系统性能
系统性能非常好,这一点在我们对性能的主观印象以及基准测试中都得到了证实。P15 Gen 2得益于快速的PCIe 4.0固态硬盘和强大的显卡,而且没有任何瓶颈。在实践中,所有的命令都能立即执行,而且在切换图形(Optimus)时也没有任何限制。
| PCMark 10 / Score | |
| Average of class Workstation (6563 - 10409, n=19, last 2 years) | |
| HP ZBook Studio 15 G8 | |
| Lenovo ThinkPad P15 G2-20YQ001JGE | |
| Average Intel Core i7-11800H, NVIDIA RTX A3000 Laptop GPU (n=1) | |
| Dell Precision 7550 | |
| MSI WS66 10TMT-207US | |
| HP ZBook Fury 15 G7 | |
| Lenovo ThinkPad P15 Gen1-20ST000DGE | |
| PCMark 10 / Essentials | |
| MSI WS66 10TMT-207US | |
| Average of class Workstation (9622 - 11157, n=19, last 2 years) | |
| Lenovo ThinkPad P15 G2-20YQ001JGE | |
| Average Intel Core i7-11800H, NVIDIA RTX A3000 Laptop GPU (n=1) | |
| HP ZBook Studio 15 G8 | |
| Lenovo ThinkPad P15 Gen1-20ST000DGE | |
| Dell Precision 7550 | |
| HP ZBook Fury 15 G7 | |
| PCMark 10 / Productivity | |
| Average of class Workstation (8789 - 20616, n=19, last 2 years) | |
| MSI WS66 10TMT-207US | |
| HP ZBook Studio 15 G8 | |
| Lenovo ThinkPad P15 G2-20YQ001JGE | |
| Average Intel Core i7-11800H, NVIDIA RTX A3000 Laptop GPU (n=1) | |
| Lenovo ThinkPad P15 Gen1-20ST000DGE | |
| Dell Precision 7550 | |
| HP ZBook Fury 15 G7 | |
| PCMark 10 / Digital Content Creation | |
| Average of class Workstation (8108 - 15631, n=19, last 2 years) | |
| HP ZBook Studio 15 G8 | |
| Lenovo ThinkPad P15 G2-20YQ001JGE | |
| Average Intel Core i7-11800H, NVIDIA RTX A3000 Laptop GPU (n=1) | |
| Dell Precision 7550 | |
| HP ZBook Fury 15 G7 | |
| Lenovo ThinkPad P15 Gen1-20ST000DGE | |
| MSI WS66 10TMT-207US | |
| PCMark 10 Score | 6564 points | |
Help | ||
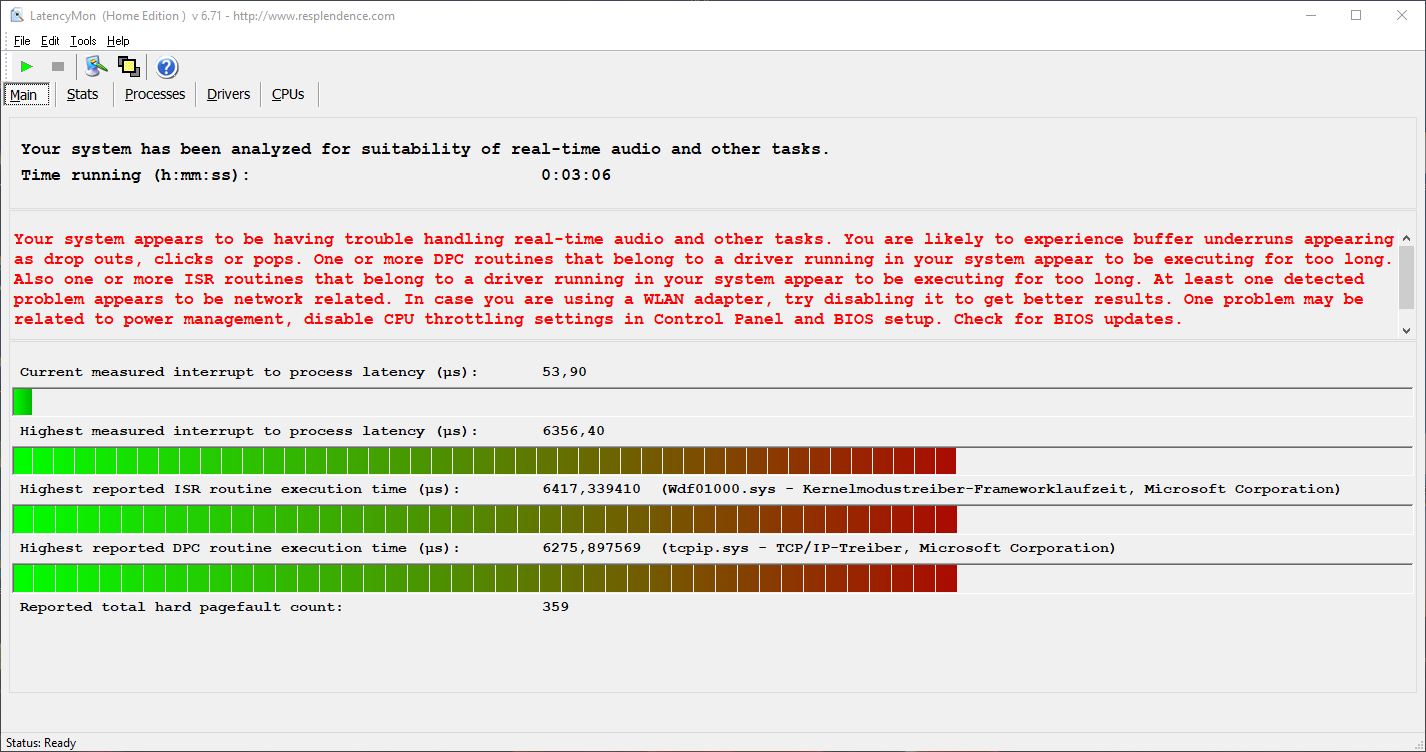
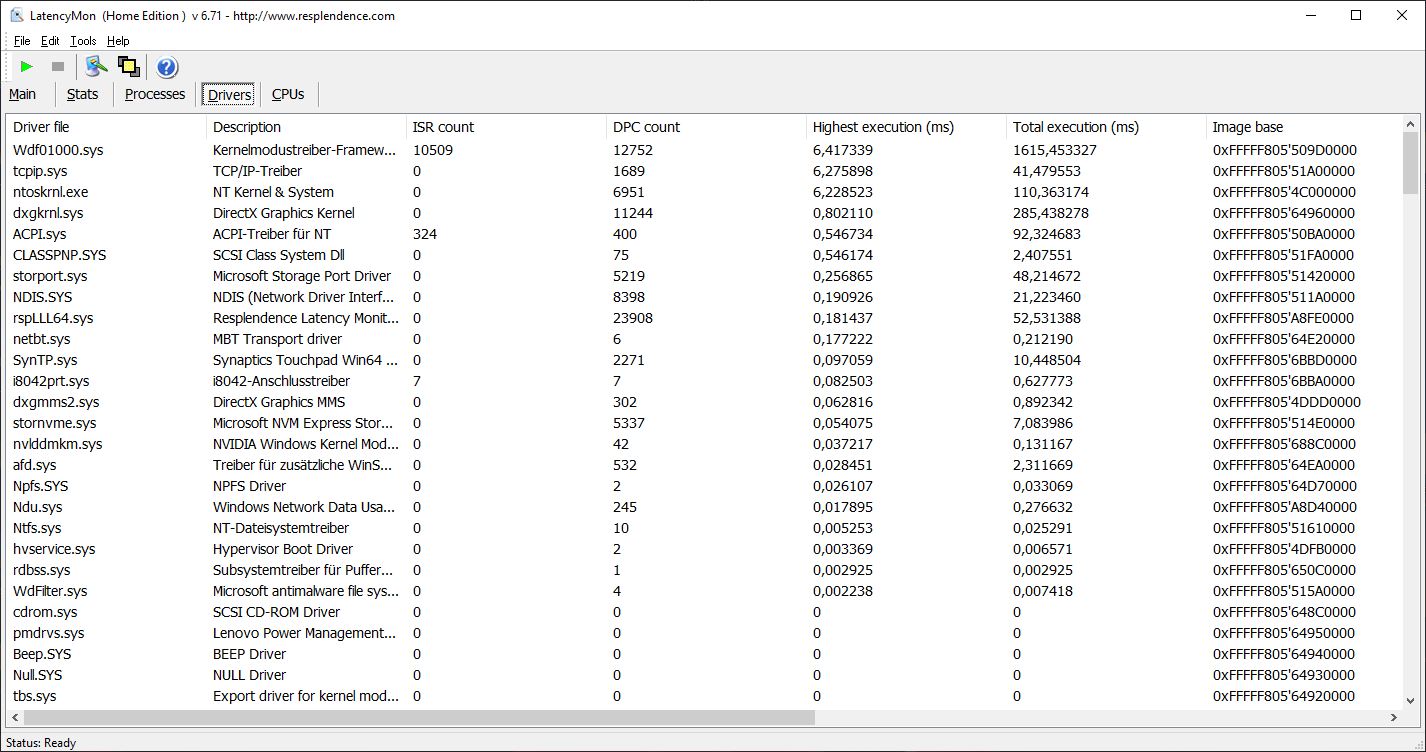
DPC延迟
在目前的BIOS版本下,ThinkPad P15 Gen 2在我们的标准化延迟测试中显示出明显的问题。有趣的是,P15 Gen 1的前身,在这里表现得非常好,所以我们怀疑有一个驱动问题,希望能够迅速解决。
| DPC Latencies / LatencyMon - interrupt to process latency (max), Web, Youtube, Prime95 | |
| Dell Precision 7550 | |
| Lenovo ThinkPad P15 G2-20YQ001JGE | |
| MSI WS66 10TMT-207US | |
| HP ZBook Fury 15 G7 | |
| HP ZBook Studio 15 G8 | |
| Lenovo ThinkPad P15 Gen1-20ST000DGE | |
* ... smaller is better
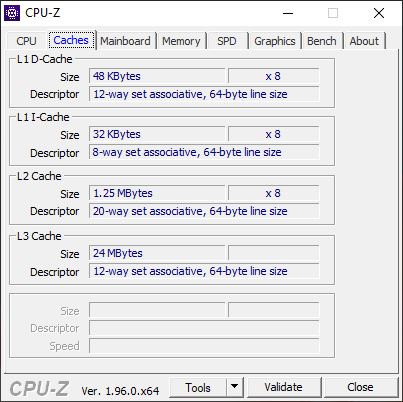
储存
P15 Gen 2总共可以容纳三个M.2-2280 SSD。快速的PCIe 4.0插槽,在我们的测试设备中已经被相应的快速驱动器(Kioxia XG7)占据,位于键盘下方。底部维护舱口下的两个插槽支持稍慢的PCIe 3.0 x4标准。
我们的测试设备配备了一块512GB的PCIe 4.0固态硬盘,可以达到非常高的传输速率,超过5GB/s。在初始启动后,仍有422GB可用。其他固态硬盘的基准测试可以在这里找到Laptop SSD & HDD Benchmarks 。
| Lenovo ThinkPad P15 G2-20YQ001JGE Kioxia XG7 KXG7AZNV512G | HP ZBook Studio 15 G8 Samsung PM981a MZVLB2T0HALB | HP ZBook Fury 15 G7 Samsung PM981a MZVLB1T0HBLR | Dell Precision 7550 SK Hynix PC601A NVMe 1TB | MSI WS66 10TMT-207US WDC PC SN730 SDBPNTY-1T00 | Lenovo ThinkPad P15 Gen1-20ST000DGE Toshiba XG6 KXG6AZNV512G | Average Kioxia XG7 KXG7AZNV512G | |
|---|---|---|---|---|---|---|---|
| CrystalDiskMark 5.2 / 6 | -21% | -19% | -27% | -10% | -17% | 0% | |
| Write 4K (MB/s) | 141.1 | 110.5 -22% | 114.1 -19% | 121 -14% | 185.8 32% | 129.5 -8% | 141.1 ? 0% |
| Read 4K (MB/s) | 58.8 | 51.8 -12% | 57.2 -3% | 42.16 -28% | 47.21 -20% | 49.54 -16% | 58.8 ? 0% |
| Write Seq (MB/s) | 3320 | 2071 -38% | 2580 -22% | 2150 -35% | 2874 -13% | 2379 -28% | 3320 ? 0% |
| Read Seq (MB/s) | 2994 | 2505 -16% | 2527 -16% | 1755 -41% | 1786 -40% | 1989 -34% | 2994 ? 0% |
| Write 4K Q32T1 (MB/s) | 626 | 429.8 -31% | 480.2 -23% | 395.3 -37% | 466.8 -25% | 663 6% | 626 ? 0% |
| Read 4K Q32T1 (MB/s) | 401.8 | 418.3 4% | 387.6 -4% | 381.8 -5% | 563 40% | 425.2 6% | 402 ? 0% |
| Write Seq Q32T1 (MB/s) | 3742 | 3060 -18% | 2996 -20% | 2730 -27% | 3091 -17% | 2960 -21% | 3742 ? 0% |
| Read Seq Q32T1 (MB/s) | 5097 | 3539 -31% | 2853 -44% | 3468 -32% | 3395 -33% | 3182 -38% | 5097 ? 0% |
| AS SSD | -20% | -34% | -40% | -3% | -25% | -9% | |
| Seq Read (MB/s) | 5105 | 2953 -42% | 2127 -58% | 2028 -60% | 2321 -55% | 2747 -46% | 4551 ? -11% |
| Seq Write (MB/s) | 1815 | 1691 -7% | 1296 -29% | 1193 -34% | 2620 44% | 1192 -34% | 1432 ? -21% |
| 4K Read (MB/s) | 47.46 | 43.98 -7% | 54.8 15% | 42.31 -11% | 48.57 2% | 46.49 -2% | 46.2 ? -3% |
| 4K Write (MB/s) | 137.3 | 105.4 -23% | 110.8 -19% | 105.5 -23% | 165.1 20% | 131.9 -4% | 126.3 ? -8% |
| 4K-64 Read (MB/s) | 2112 | 1065 -50% | 1420 -33% | 1128 -47% | 1712 -19% | 1431 -32% | 2136 ? 1% |
| 4K-64 Write (MB/s) | 1702 | 1957 15% | 2012 18% | 1537 -10% | 2174 28% | 1437 -16% | 1700 ? 0% |
| Access Time Read * (ms) | 0.065 | 0.04 38% | 0.046 29% | 0.069 -6% | 0.057 12% | 0.102 -57% | 0.1105 ? -70% |
| Access Time Write * (ms) | 0.03 | 0.105 -250% | 0.099 -230% | 0.106 -253% | 0.068 -127% | 0.031 -3% | 0.033 ? -10% |
| Score Read (Points) | 2670 | 1404 -47% | 1687 -37% | 1373 -49% | 1993 -25% | 1752 -34% | 2638 ? -1% |
| Score Write (Points) | 2021 | 2232 10% | 2253 11% | 1762 -13% | 2601 29% | 1688 -16% | 1970 ? -3% |
| Score Total (Points) | 5885 | 4297 -27% | 4770 -19% | 3801 -35% | 5630 -4% | 4261 -28% | 5793 ? -2% |
| Copy ISO MB/s (MB/s) | 2054 | 2474 20% | 2779 35% | 1768 -14% | 2589 26% | 2054 ? 0% | |
| Copy Program MB/s (MB/s) | 714 | 1074 50% | 123.3 -83% | 627 -12% | 791 11% | 714 ? 0% | |
| Copy Game MB/s (MB/s) | 1431 | 1929 35% | 440.8 -69% | 1477 3% | 1625 14% | 1431 ? 0% | |
| Total Average (Program / Settings) | -21% /
-20% | -27% /
-28% | -34% /
-36% | -7% /
-5% | -21% /
-21% | -5% /
-6% |
* ... smaller is better

Continuous load read: DiskSpd Read Loop, Queue Depth 8
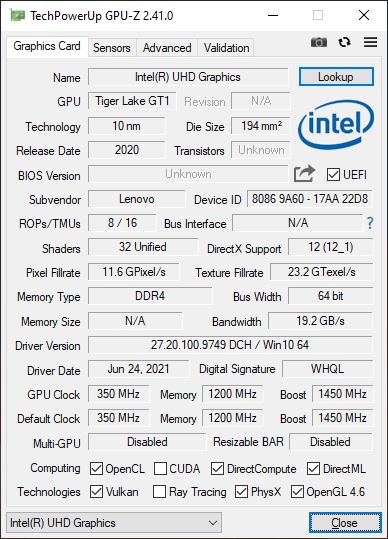
显卡 - Nvidia RTX A3000
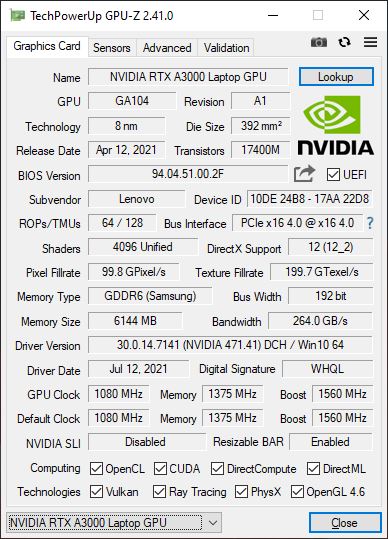
新的Nvidia RTX A3000,基于GA104芯片,比消费版的GeForce RTX 3060
,提供了256个CUDA核心。在P15 Gen 2中,GPU以110瓦的TGP运行,这使其成为最快的型号之一(最大可能为130瓦)。然而,与消费级GPU最大的不同是,特殊的驱动程序与软件认证一起,确保了相应的应用程序顺利运行。在正常的DirectX基准测试中(如3DMark),一切都取决于GPU的性能。在某些时候,RTX A3000几乎与RTX 3070,也领先于旧的高端Quadro RTX 5000 Max-Q GPU,但例如,一个拥有130瓦的快速RTX 3060(如在Legion 5),仍然领先几个百分点。另一方面,旧的RTX 3000的性能明显超过了(+50%)。
在专业的SPECviewperf基准测试中,新的RTX A3000也表现得非常好,根据不同的场景,它可以再次超过旧的Quadro RTX 5000 Max-Q。
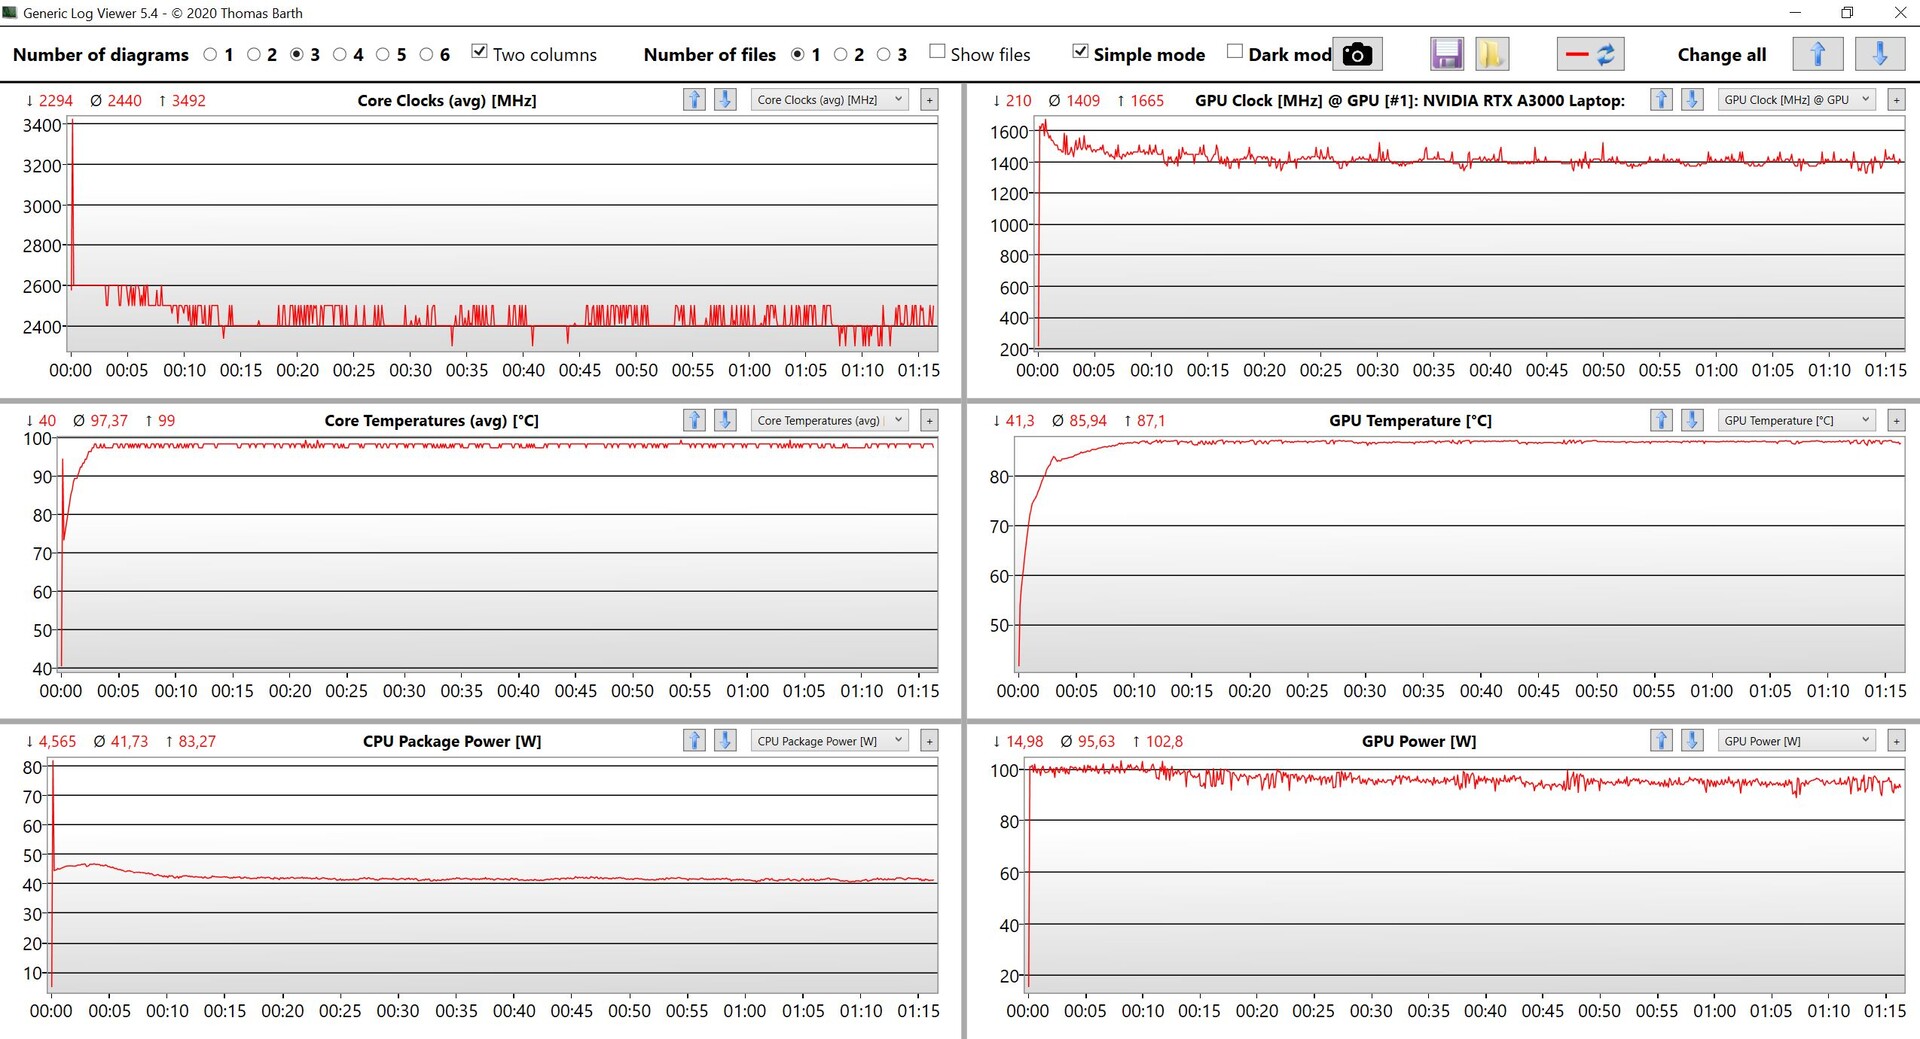
即使在连续的负载下,GPU的性能也保持稳定,但你必须应对电池电量上约25%的赤字,因为GPU的功耗在这里被限制在50瓦。与其他显卡的进一步比较可在我们的GPU基准测试文章中找到。
| 3DMark 11 - 1280x720 Performance GPU | |
| Average of class Workstation (12535 - 69594, n=23, last 2 years) | |
| Lenovo Legion 5 15ACH-82JU00C6GE-FL | |
| HP ZBook Studio 15 G8 | |
| Lenovo ThinkPad P15 G2-20YQ001JGE | |
| MSI WS66 10TMT-207US | |
| Lenovo ThinkPad P73-20QR0030GE | |
| HP ZBook Fury 15 G7 | |
| Dell Precision 7550 | |
| Average NVIDIA RTX A3000 Laptop GPU (23699 - 27523, n=3) | |
| Lenovo ThinkPad P73-20QR002DGE | |
| HP ZBook Studio G7 | |
| Lenovo ThinkPad P15 Gen1-20ST000DGE | |
| 3DMark | |
| 1920x1080 Fire Strike Graphics | |
| Average of class Workstation (8293 - 52560, n=23, last 2 years) | |
| Lenovo Legion 5 15ACH-82JU00C6GE-FL | |
| HP ZBook Studio 15 G8 | |
| Lenovo ThinkPad P15 G2-20YQ001JGE | |
| MSI WS66 10TMT-207US | |
| Lenovo ThinkPad P73-20QR0030GE | |
| HP ZBook Fury 15 G7 | |
| Dell Precision 7550 | |
| Average NVIDIA RTX A3000 Laptop GPU (17034 - 20417, n=3) | |
| Lenovo ThinkPad P73-20QR002DGE | |
| HP ZBook Studio G7 | |
| Lenovo ThinkPad P15 Gen1-20ST000DGE | |
| 2560x1440 Time Spy Graphics | |
| Average of class Workstation (2725 - 24806, n=23, last 2 years) | |
| Lenovo Legion 5 15ACH-82JU00C6GE-FL | |
| HP ZBook Studio 15 G8 | |
| Lenovo ThinkPad P73-20QR0030GE | |
| MSI WS66 10TMT-207US | |
| Lenovo ThinkPad P15 G2-20YQ001JGE | |
| HP ZBook Fury 15 G7 | |
| Dell Precision 7550 | |
| Average NVIDIA RTX A3000 Laptop GPU (6530 - 7536, n=3) | |
| Lenovo ThinkPad P73-20QR002DGE | |
| HP ZBook Studio G7 | |
| Lenovo ThinkPad P15 Gen1-20ST000DGE | |
| 3DMark Vantage P Result | 71308 points | |
| 3DMark 11 Performance | 23888 points | |
| 3DMark Fire Strike Score | 18291 points | |
| 3DMark Time Spy Score | 7779 points | |
Help | ||
游戏性能
使用专业的GPU驱动程序进行游戏也是没有问题的,我们在基准测试中没有遇到任何障碍。总的来说,游戏性能非常好,即使是现代游戏,在最高设置下也能以原生1080p分辨率运行。更多的游戏基准测试可在这里Computer Games on Laptop Graphics Cards 。
The Witcher 3 FPS diagram
| low | med. | high | ultra | |
|---|---|---|---|---|
| GTA V (2015) | 180 | 174 | 158 | 90.1 |
| The Witcher 3 (2015) | 335 | 222 | 152 | 69.8 |
| Dota 2 Reborn (2015) | 164 | 148 | 142 | 132 |
| Final Fantasy XV Benchmark (2018) | 160 | 101 | 75.1 | |
| X-Plane 11.11 (2018) | 124 | 105 | 85.1 | |
| Far Cry 5 (2018) | 115 | 111 | 103 | |
| Strange Brigade (2018) | 365 | 183 | 151 | 114 |
| Far Cry New Dawn (2019) | 127 | 103 | 98 | 87 |
| Borderlands 3 (2019) | 129 | 115 | 87 | 69 |
| Gears Tactics (2020) | 306 | 173 | 123 | 87 |
| F1 2020 (2020) | 264 | 164 | 151 | 114 |
| Death Stranding (2020) | 159 | 133 | 124 | 120 |
| Horizon Zero Dawn (2020) | 139 | 104 | 94 | 83 |
| Watch Dogs Legion (2020) | 98 | 93 | 86 | 39 |
| Dirt 5 (2020) | 183 | 111 | 89 | 72 |
| Assassin´s Creed Valhalla (2020) | 110 | 79 | 68 | 51 |
| Immortals Fenyx Rising (2020) | 133 | 90 | 82 | 77 |
| Cyberpunk 2077 1.0 (2020) | 110 | 71 | 60 | 51 |
| Hitman 3 (2021) | 227 | 146 | 129 | 118 |
| F1 2021 (2021) | 266 | 172 | 154 | 82.9 |
排放--P15的工作强度很大
噪声排放
在做要求不高的活动时,P15 Gen 2中的两个风扇通常是完全关闭的,你也不会被电子噪音或线圈啸叫所困扰。然而,只要你把设备放在更多的负载下,风扇就会迅速启动,也会达到超过45分贝(A)的水平。在游戏和专用CPU或GPU负载下,噪音通常在45至47 dB(A)之间,但在综合负载或要求非常高的游戏中,最高可以迅速达到54.9 dB(A)。这使得新的P15第二代非常响亮,甚至比前辈 ,诚然,在测试中只配备了较弱的Quadro T1000 GPU。
Noise level
| Idle |
| 24.3 / 24.3 / 28.6 dB(A) |
| Load |
| 47.5 / 54.9 dB(A) |
 | ||
30 dB silent 40 dB(A) audible 50 dB(A) loud |
||
min: | ||
| Lenovo ThinkPad P15 G2-20YQ001JGE RTX A3000 Laptop GPU, i7-11800H, Kioxia XG7 KXG7AZNV512G | HP ZBook Studio 15 G8 GeForce RTX 3070 Laptop GPU, i9-11950H, Samsung PM981a MZVLB2T0HALB | HP ZBook Fury 15 G7 Quadro RTX 5000 Max-Q, W-10885M, Samsung PM981a MZVLB1T0HBLR | Dell Precision 7550 Quadro RTX 5000 Max-Q, W-10885M, SK Hynix PC601A NVMe 1TB | MSI WS66 10TMT-207US Quadro RTX 5000 Max-Q, i9-10980HK, WDC PC SN730 SDBPNTY-1T00 | Lenovo ThinkPad P15 Gen1-20ST000DGE Quadro T1000 (Laptop), i7-10750H, Toshiba XG6 KXG6AZNV512G | |
|---|---|---|---|---|---|---|
| Noise | 5% | 5% | -2% | -13% | 6% | |
| off / environment * (dB) | 24.3 | 23.5 3% | 26.4 -9% | 25.8 -6% | 26 -7% | 24.9 -2% |
| Idle Minimum * (dB) | 24.3 | 25.3 -4% | 26.4 -9% | 25.8 -6% | 32 -32% | 24.9 -2% |
| Idle Average * (dB) | 24.3 | 25.3 -4% | 26.4 -9% | 25.8 -6% | 32 -32% | 24.9 -2% |
| Idle Maximum * (dB) | 28.6 | 25.3 12% | 26.4 8% | 25.9 9% | 32 -12% | 28.8 -1% |
| Load Average * (dB) | 47.5 | 41.2 13% | 31.7 33% | 51.2 -8% | 42 12% | 37.7 21% |
| Load Maximum * (dB) | 54.9 | 49.4 10% | 47 14% | 51.9 5% | 59.7 -9% | 44.6 19% |
| Witcher 3 ultra * (dB) | 49.4 | 47 | 51.9 | 47.4 | 37.7 |
* ... smaller is better
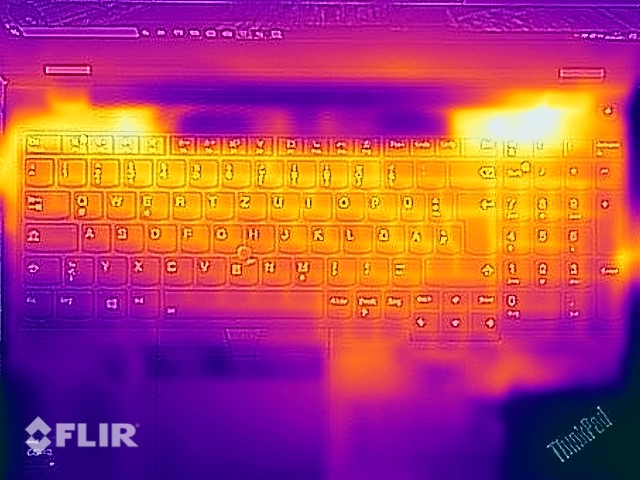
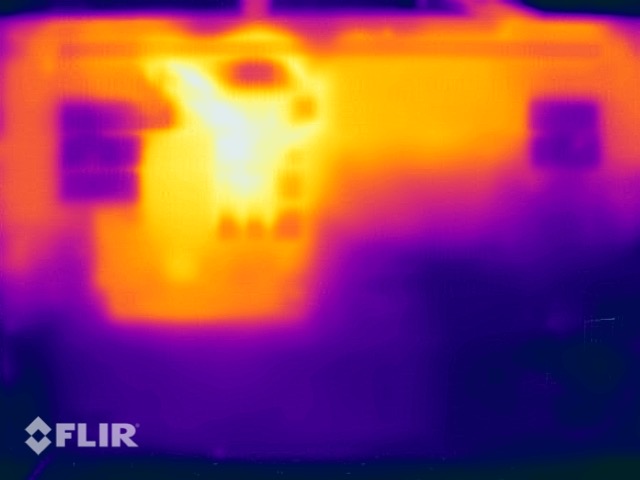
温度
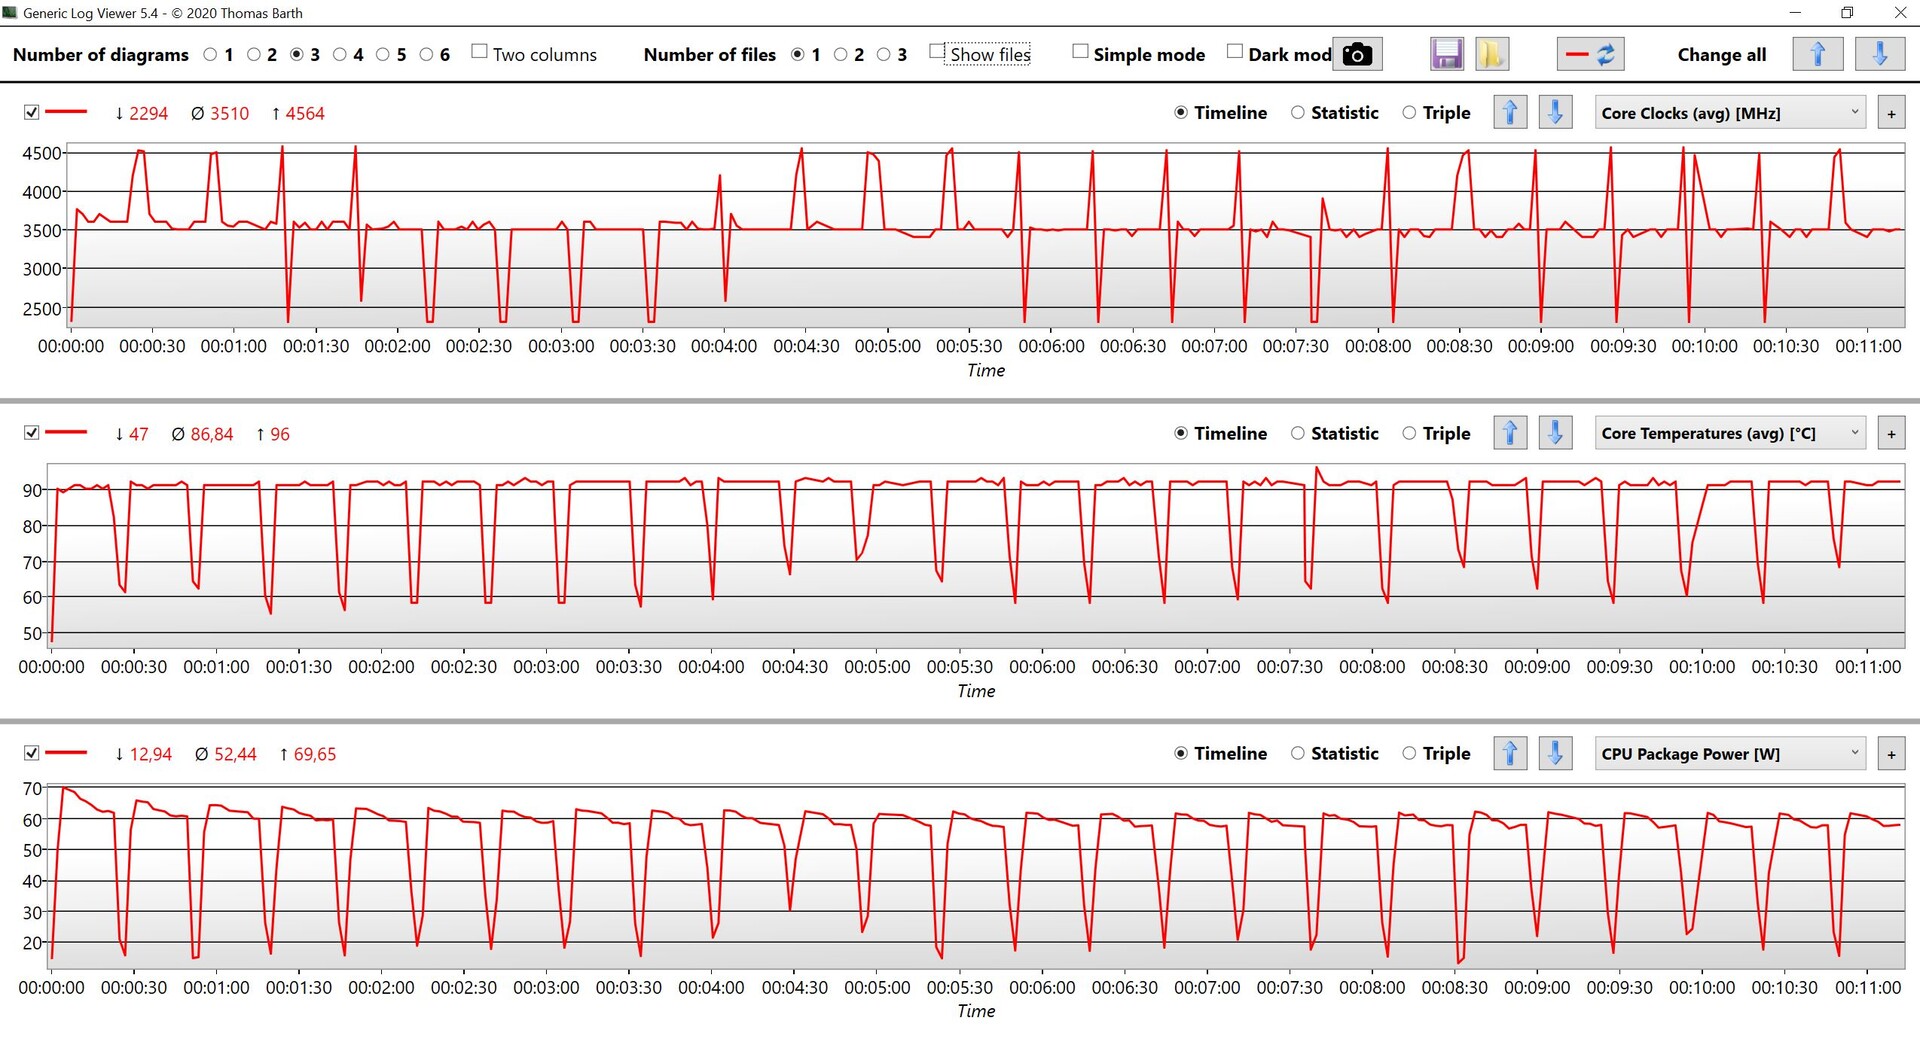
尽管噪音水平很高,但P15 Gen 2在非常高的机箱温度下挣扎,而且在负载时绝对不应该放在腿上。我们在高负荷的情况下,在底部的几个点上测量到超过50℃(约122°F),在一个测量点上甚至超过60℃(约140°F)。底座的顶部也明显发热,但只在两个上角,这就是为什么打字时没有问题。
我们对压力测试的结果感到有点失望。虽然GPU性能几乎保持稳定,但CPU甚至不能在标称的45瓦特下工作。人们在这里不得不怀疑联想对P15第二代的冷却做了什么,因为有更薄(而且明显更便宜)的游戏笔记本,如内部的Legion 5 15,有更好的冷却(压力测试中CPU为45瓦,GPU为115瓦),甚至更低的温度。此外,令人怀疑的是,由于更强大的组件(尤其是GPU),P15 Gen 2的冷却不会进一步过度消耗。
(-) The maximum temperature on the upper side is 49.7 °C / 121 F, compared to the average of 38.2 °C / 101 F, ranging from 22.2 to 69.8 °C for the class Workstation.
(-) The bottom heats up to a maximum of 63.2 °C / 146 F, compared to the average of 41.1 °C / 106 F
(+) In idle usage, the average temperature for the upper side is 26.3 °C / 79 F, compared to the device average of 32 °C / 90 F.
(±) Playing The Witcher 3, the average temperature for the upper side is 37.9 °C / 100 F, compared to the device average of 32 °C / 90 F.
(+) The palmrests and touchpad are reaching skin temperature as a maximum (35.1 °C / 95.2 F) and are therefore not hot.
(-) The average temperature of the palmrest area of similar devices was 27.8 °C / 82 F (-7.3 °C / -13.2 F).
Lenovo ThinkPad P15 G2-20YQ001JGE audio analysis
(±) | speaker loudness is average but good (78 dB)
Bass 100 - 315 Hz
(-) | nearly no bass - on average 15.5% lower than median
(±) | linearity of bass is average (9.6% delta to prev. frequency)
Mids 400 - 2000 Hz
(±) | higher mids - on average 7.5% higher than median
(+) | mids are linear (6.6% delta to prev. frequency)
Highs 2 - 16 kHz
(+) | balanced highs - only 2.4% away from median
(+) | highs are linear (5.8% delta to prev. frequency)
Overall 100 - 16.000 Hz
(±) | linearity of overall sound is average (20.6% difference to median)
Compared to same class
» 74% of all tested devices in this class were better, 6% similar, 21% worse
» The best had a delta of 7%, average was 17%, worst was 35%
Compared to all devices tested
» 55% of all tested devices were better, 8% similar, 37% worse
» The best had a delta of 4%, average was 23%, worst was 134%
HP ZBook Fury 15 G7 audio analysis
(±) | speaker loudness is average but good (80.1 dB)
Bass 100 - 315 Hz
(±) | reduced bass - on average 8% lower than median
(±) | linearity of bass is average (9.5% delta to prev. frequency)
Mids 400 - 2000 Hz
(+) | balanced mids - only 3.3% away from median
(+) | mids are linear (4.8% delta to prev. frequency)
Highs 2 - 16 kHz
(+) | balanced highs - only 2.2% away from median
(+) | highs are linear (3.5% delta to prev. frequency)
Overall 100 - 16.000 Hz
(+) | overall sound is linear (10.1% difference to median)
Compared to same class
» 6% of all tested devices in this class were better, 4% similar, 90% worse
» The best had a delta of 7%, average was 17%, worst was 35%
Compared to all devices tested
» 5% of all tested devices were better, 2% similar, 94% worse
» The best had a delta of 4%, average was 23%, worst was 134%
Dell Precision 7550 audio analysis
(+) | speakers can play relatively loud (83.6 dB)
Bass 100 - 315 Hz
(±) | reduced bass - on average 11.5% lower than median
(±) | linearity of bass is average (11.6% delta to prev. frequency)
Mids 400 - 2000 Hz
(±) | higher mids - on average 5.7% higher than median
(+) | mids are linear (4.5% delta to prev. frequency)
Highs 2 - 16 kHz
(+) | balanced highs - only 3.2% away from median
(+) | highs are linear (5.4% delta to prev. frequency)
Overall 100 - 16.000 Hz
(+) | overall sound is linear (12.6% difference to median)
Compared to same class
» 21% of all tested devices in this class were better, 4% similar, 75% worse
» The best had a delta of 7%, average was 17%, worst was 35%
Compared to all devices tested
» 11% of all tested devices were better, 3% similar, 86% worse
» The best had a delta of 4%, average was 23%, worst was 134%
能源管理--ThinkPad具有良好的耐力
能源消耗
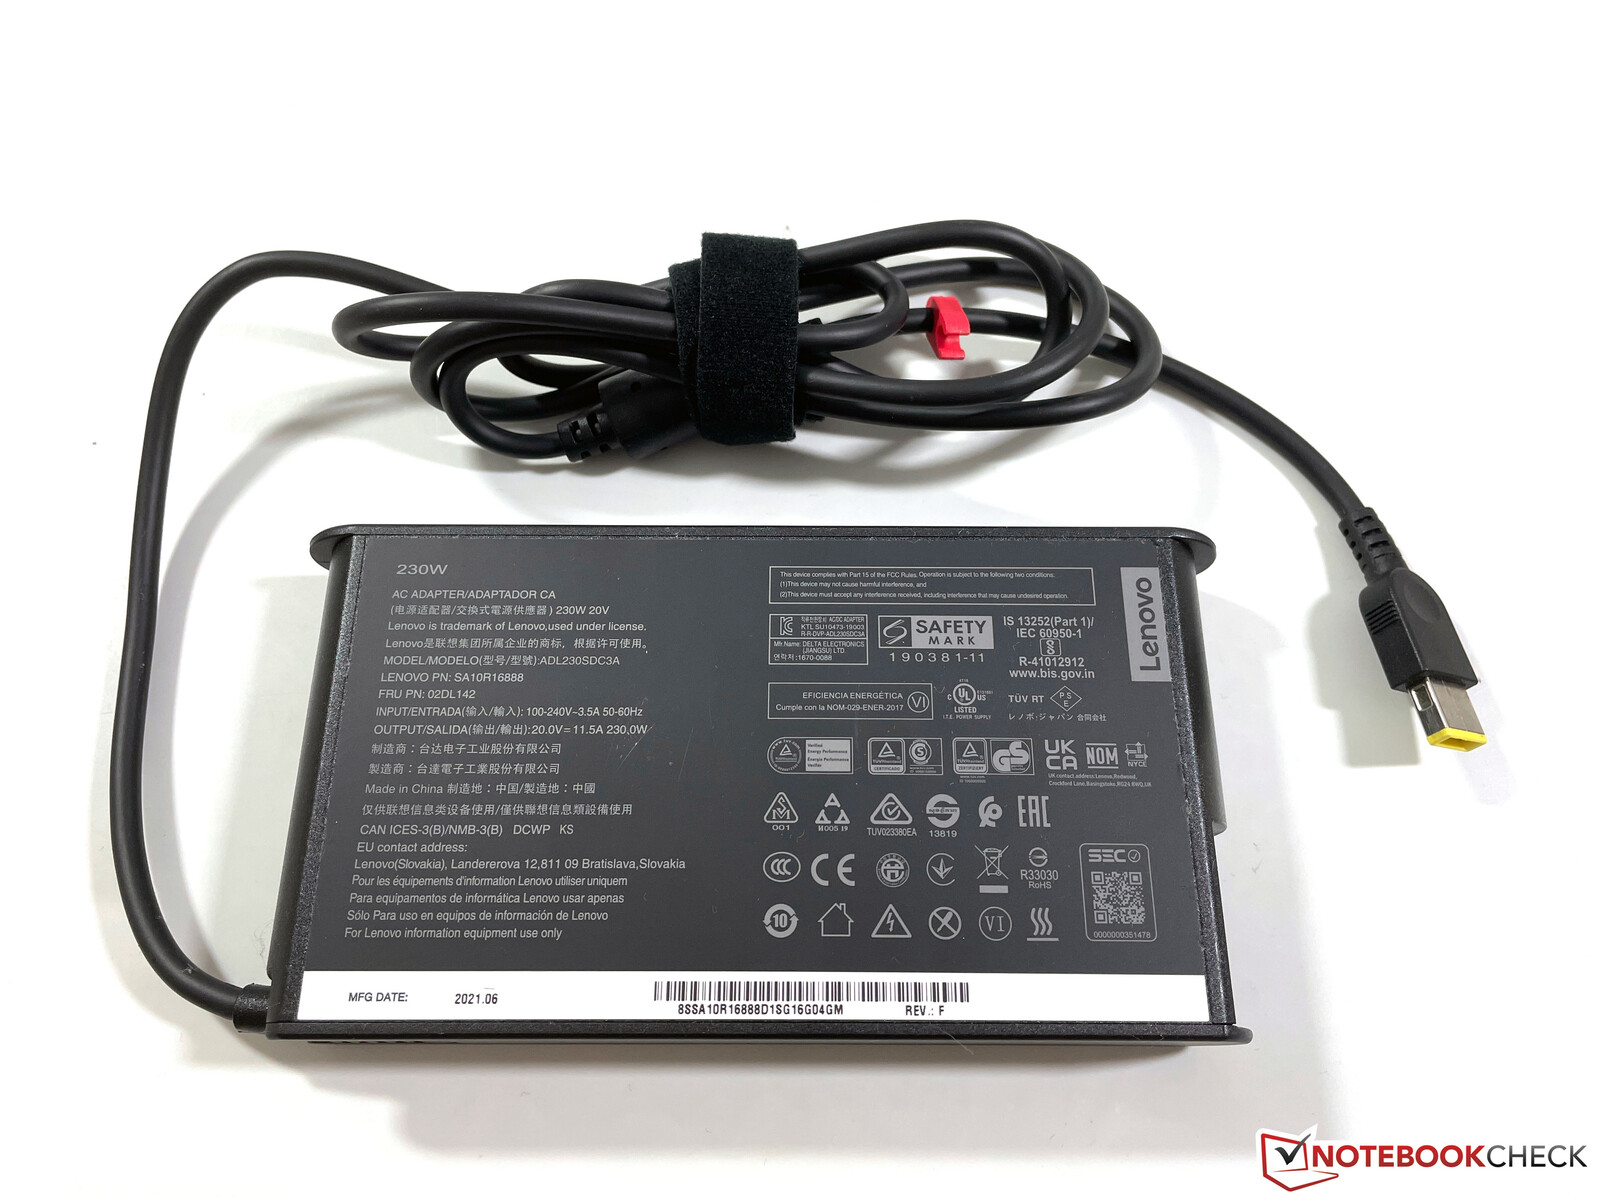
联想能够减少一些空闲消耗,而且明亮的500cd/m²面板似乎也没有对消耗率产生巨大影响。负载下没有任何意外,附带的230瓦电源适配器绝对足够,甚至还有足够的余量在负载下为电池充电。
| Off / Standby | |
| Idle | |
| Load |
|
Key:
min: | |
| Lenovo ThinkPad P15 G2-20YQ001JGE i7-11800H, RTX A3000 Laptop GPU, Kioxia XG7 KXG7AZNV512G, IPS, 1920x1080, 15.6" | HP ZBook Studio 15 G8 i9-11950H, GeForce RTX 3070 Laptop GPU, Samsung PM981a MZVLB2T0HALB, OLED, 3840x2160, 15.6" | HP ZBook Fury 15 G7 W-10885M, Quadro RTX 5000 Max-Q, Samsung PM981a MZVLB1T0HBLR, IPS, 3840x2160, 15.6" | Dell Precision 7550 W-10885M, Quadro RTX 5000 Max-Q, SK Hynix PC601A NVMe 1TB, IPS, 3840x2160, 15.6" | MSI WS66 10TMT-207US i9-10980HK, Quadro RTX 5000 Max-Q, WDC PC SN730 SDBPNTY-1T00, IPS, 1920x1080, 15.6" | Lenovo ThinkPad P15 Gen1-20ST000DGE i7-10750H, Quadro T1000 (Laptop), Toshiba XG6 KXG6AZNV512G, a-Si IPS LED, 1920x1080, 15.6" | Average NVIDIA RTX A3000 Laptop GPU | Average of class Workstation | |
|---|---|---|---|---|---|---|---|---|
| Power Consumption | -51% | -16% | -38% | -78% | -2% | -21% | -22% | |
| Idle Minimum * (Watt) | 6.3 | 11 -75% | 4.6 27% | 8.2 -30% | 13.8 -119% | 8.4 -33% | 8.23 ? -31% | 9.11 ? -45% |
| Idle Average * (Watt) | 10.7 | 18.8 -76% | 13.6 -27% | 16.8 -57% | 18.4 -72% | 12.3 -15% | 14.6 ? -36% | 13.8 ? -29% |
| Idle Maximum * (Watt) | 11.6 | 31.7 -173% | 21.5 -85% | 24.4 -110% | 41.5 -258% | 14.2 -22% | 15.3 ? -32% | 17.9 ? -54% |
| Load Average * (Watt) | 99.3 | 105.2 -6% | 113.1 -14% | 131 -32% | 110.5 -11% | 96 3% | 109.3 ? -10% | 96 ? 3% |
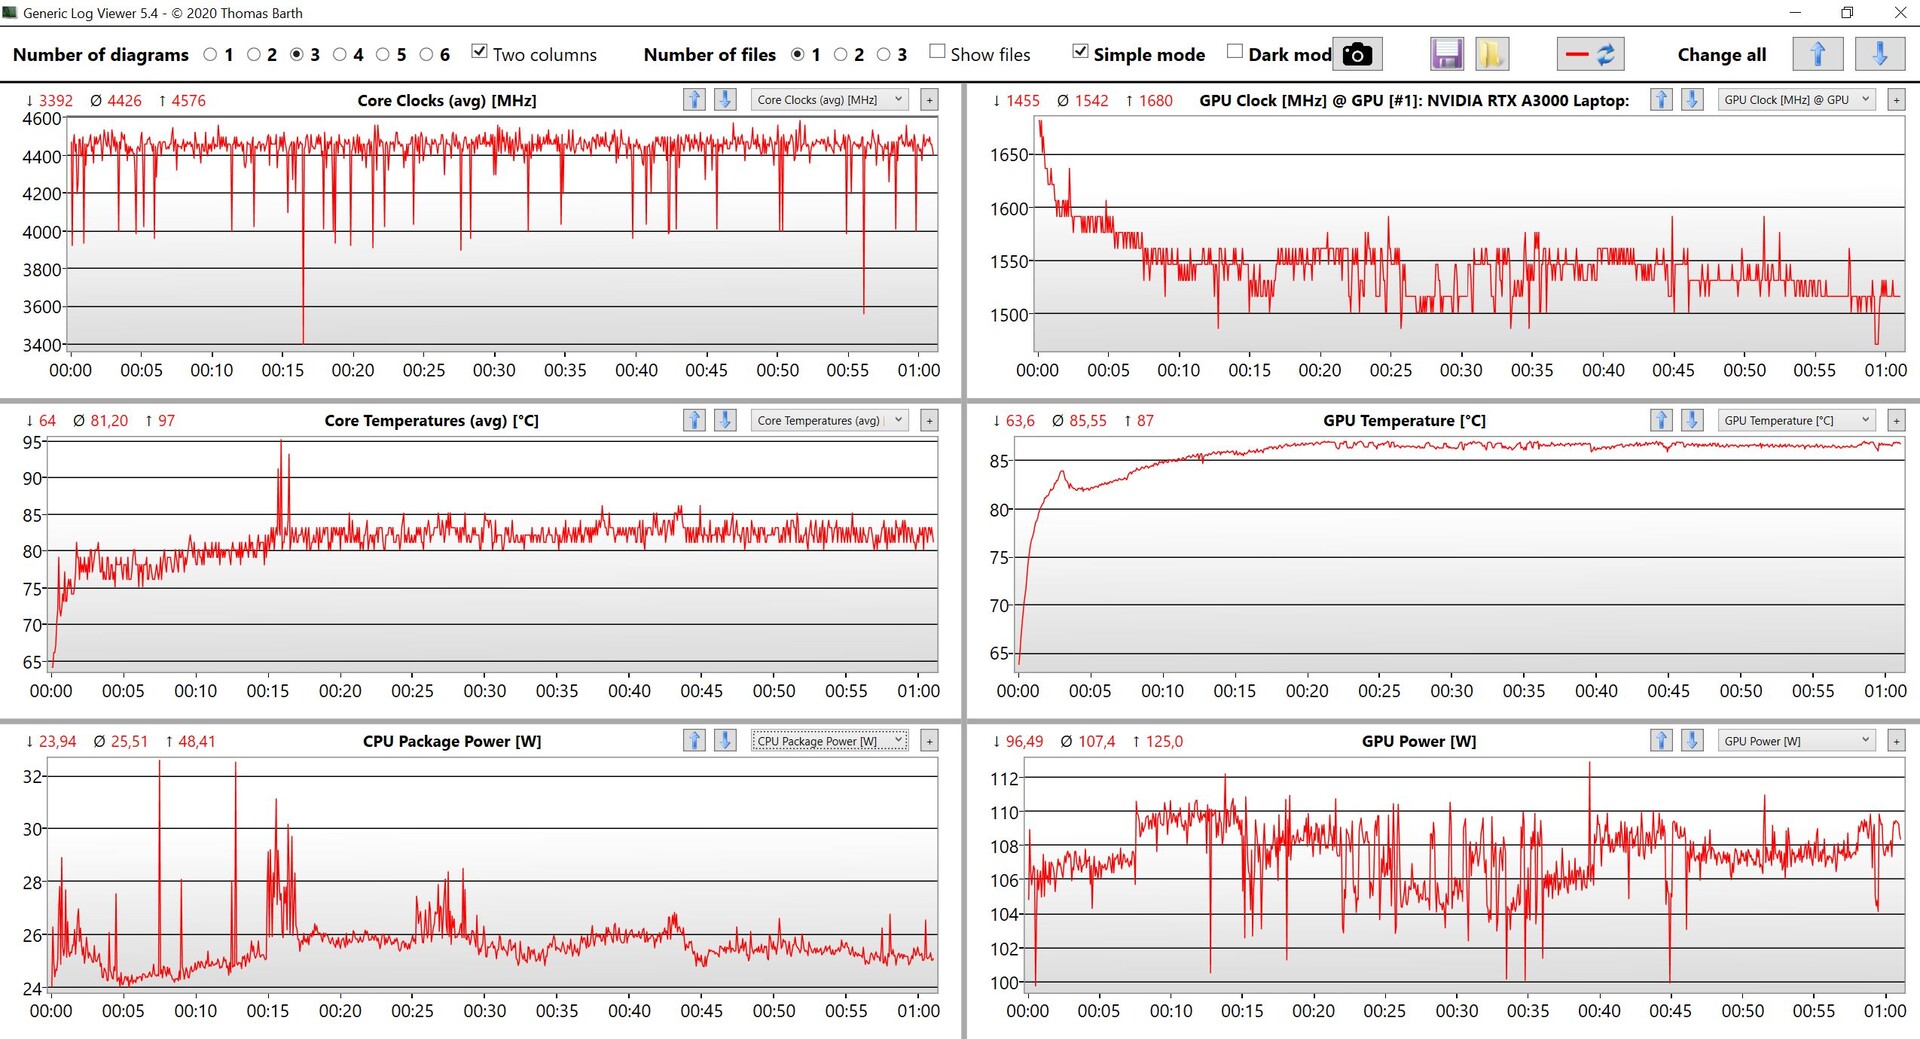
| Witcher 3 ultra * (Watt) | 154 | 148 4% | 157.5 -2% | 156.6 -2% | 151.6 2% | 95 38% | ||
| Load Maximum * (Watt) | 210 | 171.8 18% | 199 5% | 201.8 4% | 227.1 -8% | 168.8 20% | 196.5 ? 6% | 180.3 ? 14% |
* ... smaller is better
Energy consumption during The Witcher 3 / stress test
电池寿命
有了94Wh的大电池,在我们的Wi-Fi和视频测试中,实际运行时间可能达到10小时左右(均为150cd/m²)。在Wi-Fi测试中,当我们将显示器的亮度设置为最大时,电池寿命就会减少到6.5小时以下。另一方面,笔记本电脑的电池在负载下大约80分钟后就会失效。当设备开机时,需要110分钟才能完全充电,但大约26分钟后,50%的容量又可以使用。
| Lenovo ThinkPad P15 G2-20YQ001JGE i7-11800H, RTX A3000 Laptop GPU, 94 Wh | HP ZBook Studio 15 G8 i9-11950H, GeForce RTX 3070 Laptop GPU, 83 Wh | HP ZBook Fury 15 G7 W-10885M, Quadro RTX 5000 Max-Q, 94 Wh | Dell Precision 7550 W-10885M, Quadro RTX 5000 Max-Q, 95 Wh | MSI WS66 10TMT-207US i9-10980HK, Quadro RTX 5000 Max-Q, 99.99 Wh | Average of class Workstation | |
|---|---|---|---|---|---|---|
| Battery runtime | 1% | -7% | -17% | -15% | -1% | |
| H.264 (h) | 10 | 10.1 ? 1% | ||||
| WiFi v1.3 (h) | 9.9 | 6.2 -37% | 8.6 -13% | 8.9 -10% | 7.8 -21% | 8.55 ? -14% |
| Load (h) | 1.3 | 1.8 38% | 1.3 0% | 1 -23% | 1.2 -8% | 1.441 ? 11% |
Pros
Cons
结论 - P15第二代显示出其冷却系统的特别弱点

传统上,移动工作站提供最高的性能,并且易于维护。作为回报,用户乐意忍受更大、更厚的机箱。然而,这已不再完全适用。是的,目前ThinkPad P15第二代的维护方案非常好,但昂贵的工作站尤其在性能和冷却方面受到影响。你不可避免地要问自己,为什么现在还需要这么厚的机箱,因为性能(包括CPU和GPU)以及温度有时比现代游戏笔记本或甚至更薄的移动工作站还要差。对于CPU,我们也希望能有更多的动态管理(在只有CPU的负载下有更高的TDP)。
ThinkPad P15第二代非常令人失望,它在高温和负载下的风扇噪音方面很挣扎。然而,新的RTX A3000提供了良好的性能,与旧的Quadro GPU相比有了明显的提升。
总的来说,P15第二代的概念到现在似乎有点过时了,部分原因是巨大的屏幕边框。制造商可以很容易地在这里安装一个16英寸显示屏(16:10),就像在新的 ThinkPad P1第四代比如说。
P15 Gen 2提供了一系列令人满意的端口、维护选项和输入设备,明亮的1080p显示屏也做得很好,但我们希望看到更好的冷却系统。然而,特别是由于在图形和专业应用方面的高性能,P15 Gen 2仍然得到了一个好的分数。我们已经迫不及待地想看看戴尔、惠普和微星的新工作站型号将如何表现。
价格和可用性
在撰写本文时,你可以在联想的网上商店找到多种配置的ThinkPad P15第二代的多种配置,在联想的网上商店。目前有,有两个配备RTX A300 GPU的版本。:一个是配备酷睿i7-11800H处理器、64GB内存、1TB PCIe固态硬盘和HDR 400Dolby Vision600-nit UHD(3840x2160)IPS显示屏(4799美元),第二个是仅在CPU方面有差异的酷睿i9-11950H,内存只有32GB(5109.00美元)。
如果你能接受较低的图形性能,还有其他型号来满足你的需求价格从2,949美元左右开始。
Lenovo ThinkPad P15 G2-20YQ001JGE
- 09/29/2021 v7 (old)
Andreas Osthoff
Price comparison

