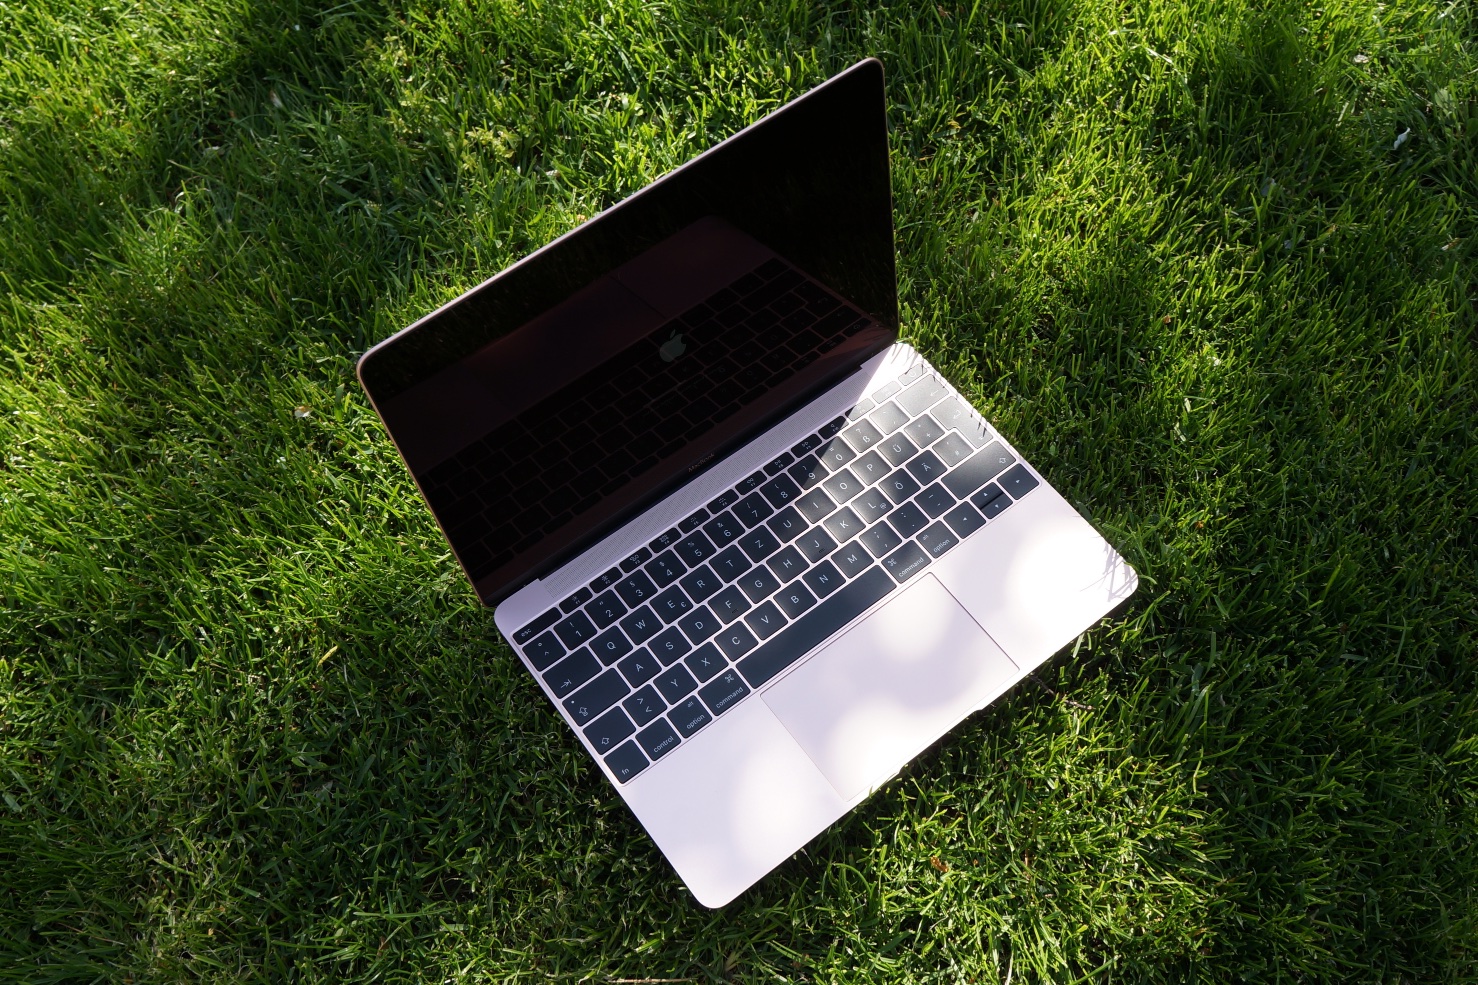
Apple MacBook 12 (Early 2016) 1.1 GHz 笔记本电脑简短评测
Apple MacBook 12 (Early 2016) 1.1 GHz (MacBook 12 (Early 2016) Series)
Processor
Intel Core m3-6Y30 2c/4t 2 x 1.1 GHz, Skylake
Graphics adapter
Intel HD Graphics 515
Memory
8 GB
, DDR3L-1866 板载
Display
12.00 inch 16:10, 2304 x 1440 pixel 226 PPI, APPA027, IPS, glossy: yes
Mainboard
Intel Skylake-Y Premium PCH
Storage
Apple SSD AP0256, 256 GB
, NVMe, 231 GB free
Weight
927 g, Power Supply: 171 g
Price
1449 Euro
Links
Note: The manufacturer may use components from different suppliers including display panels, drives or memory sticks with similar specifications.
| Networking | |
| iperf Server (receive) TCP 1 m | |
| Apple MacBook Pro Retina 13 inch 2013-10 | |
| Apple MacBook 12 (Early 2016) 1.1 GHz | |
| MSI GE72 965M Ti | |
| MSI CX61 2QC 2970M MS-16GD | |
| iperf Client (transmit) TCP 1 m | |
| Apple MacBook Pro Retina 13 inch 2013-10 (Hinum) | |
| Apple MacBook 12 (Early 2016) 1.1 GHz | |
| MSI GE72 965M Ti | |
| MSI CX61 2QC 2970M MS-16GD | |
| |||||||||||||||||||||||||
APPA027 tested with X-Rite i1Pro 2
Maximum: 387 cd/m² (Nits) Average: 358 cd/m² Minimum: 6.5 cd/m²Brightness Distribution: 88 %
Center on Battery: 387 cd/m²
Contrast: 823:1 (Black: 0.47 cd/m²)
ΔE ColorChecker Calman: 1.6 | ∀{0.5-29.43 Ø4.71}
ΔE Greyscale Calman: 1 | ∀{0.09-98 Ø4.96}
97.8% sRGB (Calman 2D)
82.2% sRGB (Argyll 1.6.3 3D)
61.6% AdobeRGB 1998 (Argyll 1.6.3 3D)
68% AdobeRGB 1998 (Argyll 3D)
95.4% sRGB (Argyll 3D)
66.8% Display P3 (Argyll 3D)
Gamma: 2.26
CCT: 6680 K
| Apple MacBook 12 (Early 2016) 1.1 GHz HD Graphics 515, 6Y30, Apple SSD AP0256 | Apple iPad Pro 12.9 A9X / PowerVR GT7xxx, A9X, Apple 128 GB (iPad Pro 12.9 NVMe) | Apple MacBook Air 13 inch 2015-03 HD Graphics 6000, 5650U, Apple SSD SD0256F | Apple MacBook Air 11 inch 2015-03 HD Graphics 6000, 5250U, Apple SSD SM0128F | Apple MacBook 12 (Early 2015) 1.1 GHz HD Graphics 5300, 5Y31, Apple SSD AP0256 | |
|---|---|---|---|---|---|
| Display | 19% | -39% | -38% | 1% | |
| Display P3 Coverage (%) | 66.8 | 91.2 37% | 40.1 -40% | 40.56 -39% | 67.6 1% |
| sRGB Coverage (%) | 95.4 | 98.1 3% | 59.8 -37% | 60.6 -36% | 95.6 0% |
| AdobeRGB 1998 Coverage (%) | 68 | 79.3 17% | 41.51 -39% | 41.95 -38% | 68.7 1% |
| Response Times | |||||
| Response Time Grey 50% / Grey 80% * (ms) | 41.2 ? | ||||
| Response Time Black / White * (ms) | 30.4 ? | ||||
| PWM Frequency (Hz) | |||||
| Screen | -7% | -57% | -44% | 1% | |
| Brightness middle (cd/m²) | 387 | 399 3% | 329 -15% | 368 -5% | 345 -11% |
| Brightness (cd/m²) | 358 | 393 10% | 310 -13% | 349 -3% | 325 -9% |
| Brightness Distribution (%) | 88 | 92 5% | 82 -7% | 90 2% | 90 2% |
| Black Level * (cd/m²) | 0.47 | 0.22 53% | 0.405 14% | 0.493 -5% | 0.324 31% |
| Contrast (:1) | 823 | 1814 120% | 812 -1% | 746 -9% | 1065 29% |
| Colorchecker dE 2000 * | 1.6 | 2.96 -85% | 3.96 -147% | 3.29 -106% | 1.62 -1% |
| Colorchecker dE 2000 max. * | 4 | 7.51 -88% | 5.22 -31% | 2.51 37% | |
| Greyscale dE 2000 * | 1 | 3 -200% | 3.51 -251% | 3.06 -206% | 1.88 -88% |
| Gamma | 2.26 97% | 2.21 100% | 3.83 57% | 2.68 82% | 2.55 86% |
| CCT | 6680 97% | 7049 92% | 6711 97% | 6397 102% | 6411 101% |
| Color Space (Percent of AdobeRGB 1998) (%) | 61.6 | 71.15 16% | 38.4 -38% | 38.8 -37% | 61.8 0% |
| Color Space (Percent of sRGB) (%) | 82.2 | 97.87 19% | 59.8 -27% | 95.5 16% | |
| Total Average (Program / Settings) | 6% /
-0% | -48% /
-53% | -41% /
-43% | 1% /
1% |
* ... smaller is better
Display Response Times
ℹ
Display response times show how fast the screen is able to change from one color to the next. Slow response times can lead to afterimages and can cause moving objects to appear blurry (ghosting). Gamers of fast-paced 3D titles should pay special attention to fast response times.| ↔ Response Time Black to White | ||
|---|---|---|
| 30.4 ms ... rise ↗ and fall ↘ combined | ↗ 6.8 ms rise | 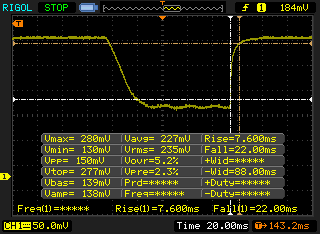 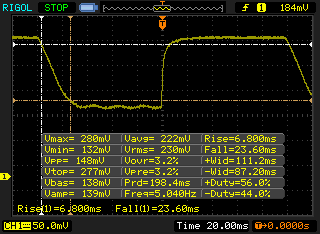 |
| ↘ 23.6 ms fall | ||
| The screen shows slow response rates in our tests and will be unsatisfactory for gamers. In comparison, all tested devices range from 0.1 (minimum) to 240 (maximum) ms. » 82 % of all devices are better. This means that the measured response time is worse than the average of all tested devices (19.8 ms). | ||
| ↔ Response Time 50% Grey to 80% Grey | ||
| 41.2 ms ... rise ↗ and fall ↘ combined | ↗ 15.6 ms rise | 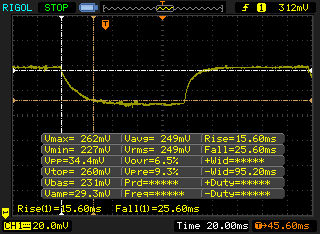 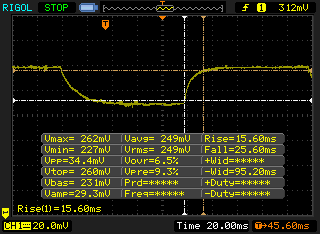 |
| ↘ 25.6 ms fall | ||
| The screen shows slow response rates in our tests and will be unsatisfactory for gamers. In comparison, all tested devices range from 0.165 (minimum) to 636 (maximum) ms. » 66 % of all devices are better. This means that the measured response time is worse than the average of all tested devices (31 ms). | ||
Screen Flickering / PWM (Pulse-Width Modulation)
ℹ
To dim the screen, some notebooks will simply cycle the backlight on and off in rapid succession - a method called Pulse Width Modulation (PWM) . This cycling frequency should ideally be undetectable to the human eye. If said frequency is too low, users with sensitive eyes may experience strain or headaches or even notice the flickering altogether.| Screen flickering / PWM not detected | 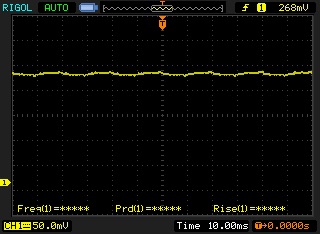 | ||
In comparison: 52 % of all tested devices do not use PWM to dim the display. If PWM was detected, an average of 7754 (minimum: 5 - maximum: 343500) Hz was measured. | |||
| PCMark 8 Home Score Accelerated v2 | 2550 points | |
| PCMark 8 Work Score Accelerated v2 | 3550 points | |
Help | ||

Apple SSD AP0256
Sequential Read:
754 MB/s
Sequential Write:
638 MB/s
512K Read:
616 MB/s
512K Write:
678 MB/s
4K Read:
14.6 MB/s
4K Write:
20.5 MB/s
4K QD32 Read:
464 MB/s
4K QD32 Write:
315 MB/s
| 3DMark 11 - 1280x720 Performance GPU | |
| Apple MacBook Air 13 inch 2015-03 | |
| Microsoft Surface Pro 4, Core m3 | |
| Apple MacBook 12 (Early 2016) 1.1 GHz | |
| Dell XPS 12 9250 4K | |
| HP Spectre x2 12-a003ng K3D42EA | |
| Dell Latitude 13 7370 | |
| Apple MacBook 12 (Early 2015) 1.1 GHz | |
| 3DMark | |
| 1920x1080 Fire Strike Graphics | |
| Apple MacBook Air 13 inch 2015-03 | |
| Microsoft Surface Pro 4, Core m3 | |
| Apple MacBook 12 (Early 2016) 1.1 GHz | |
| HP Spectre x2 12-a003ng K3D42EA | |
| Apple MacBook 12 (Early 2015) 1.1 GHz | |
| Dell XPS 12 9250 4K | |
| Dell Latitude 13 7370 | |
| 1280x720 Cloud Gate Standard Graphics | |
| Apple MacBook Air 13 inch 2015-03 | |
| Microsoft Surface Pro 4, Core m3 | |
| HP Spectre x2 12-a003ng K3D42EA | |
| Apple MacBook 12 (Early 2016) 1.1 GHz | |
| Apple MacBook 12 (Early 2015) 1.1 GHz | |
| Dell Latitude 13 7370 | |
| Dell XPS 12 9250 4K | |
| 3DMark 2001SE Standard | 20345 points | |
| 3DMark 03 Standard | 18019 points | |
| 3DMark 05 Standard | 9173 points | |
| 3DMark 06 Standard Score | 6921 points | |
| 3DMark Vantage P Result | 4672 points | |
| 3DMark 11 Performance | 1277 points | |
| 3DMark Cloud Gate Standard Score | 4446 points | |
| 3DMark Fire Strike Score | 682 points | |
Help | ||
| low | med. | high | ultra | |
|---|---|---|---|---|
| The Witcher 3 (2015) | 7.4 | |||
| World of Warships (2015) | 32.1 | 30.2 | 16.4 | 11.7 |
| FIFA 16 (2015) | 42 severe graphical problems (unplayable slow) | |||
| Fallout 4 (2015) | 0 severe graphical problems (unplayable) | |||
| Need for Speed 2016 (2016) | 6.1 |
(±) The average temperature for the upper side under maximal load is 33 °C / 91 F, compared to the average of 30.8 °C / 87 F for the devices in the class Subnotebook.
(+) The maximum temperature on the upper side is 39 °C / 102 F, compared to the average of 35.9 °C / 97 F, ranging from 21.4 to 59 °C for the class Subnotebook.
(±) The bottom heats up to a maximum of 44 °C / 111 F, compared to the average of 39.2 °C / 103 F
(+) In idle usage, the average temperature for the upper side is 28.4 °C / 83 F, compared to the device average of 30.8 °C / 87 F.
(+) The palmrests and touchpad are cooler than skin temperature with a maximum of 30 °C / 86 F and are therefore cool to the touch.
(±) The average temperature of the palmrest area of similar devices was 28.2 °C / 82.8 F (-1.8 °C / -3.2 F).
Power Consumption
| Off / Standby | |
| Idle | |
| Load |
|
Key:
min: | |
| Battery Runtime - WiFi Websurfing | |
| Apple iPad Pro 12.9 | |
| Apple MacBook Air 13 inch 2015-03 | |
| Apple MacBook Pro Retina 13 inch 2015-03 | |
| Apple MacBook Air 11 inch 2015-03 | |
| Apple MacBook 12 (Early 2016) 1.1 GHz | |
| Apple MacBook 12 (Early 2015) 1.1 GHz | |
Pros
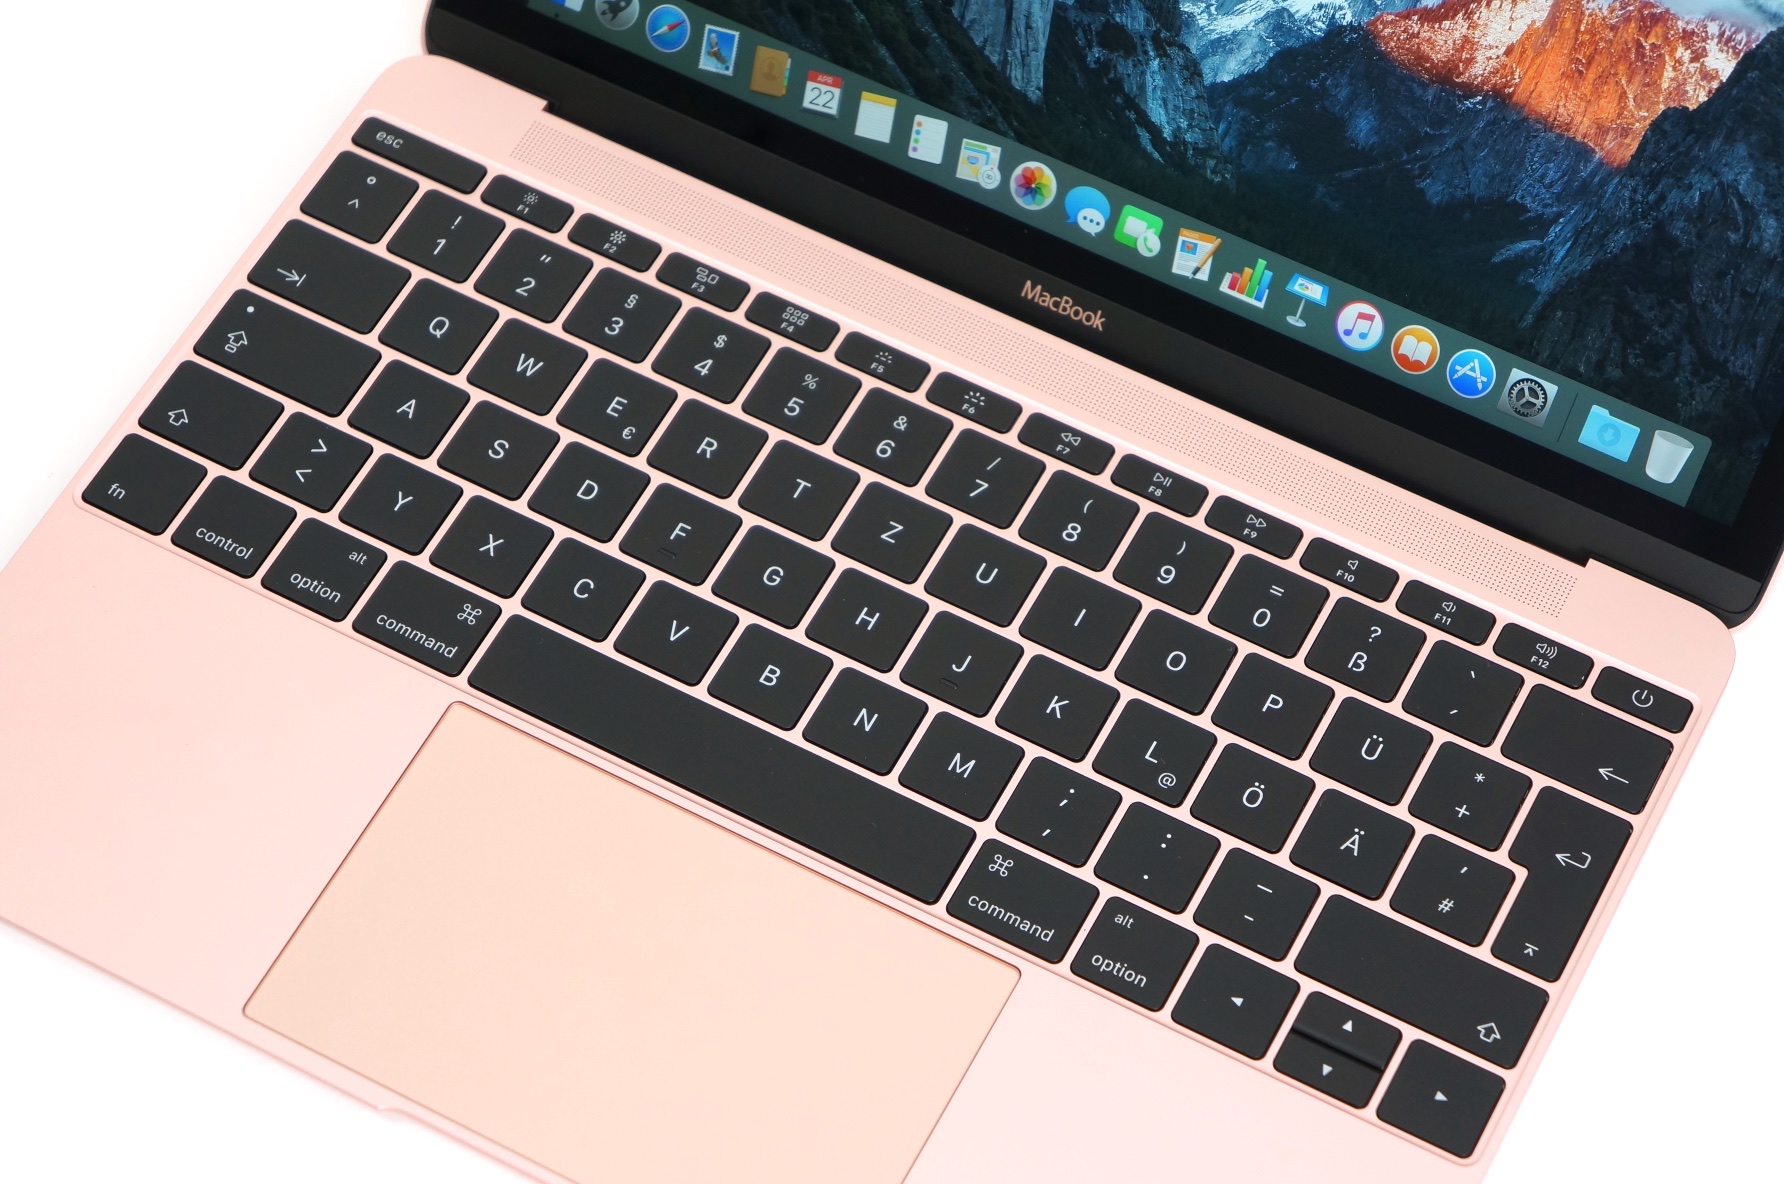
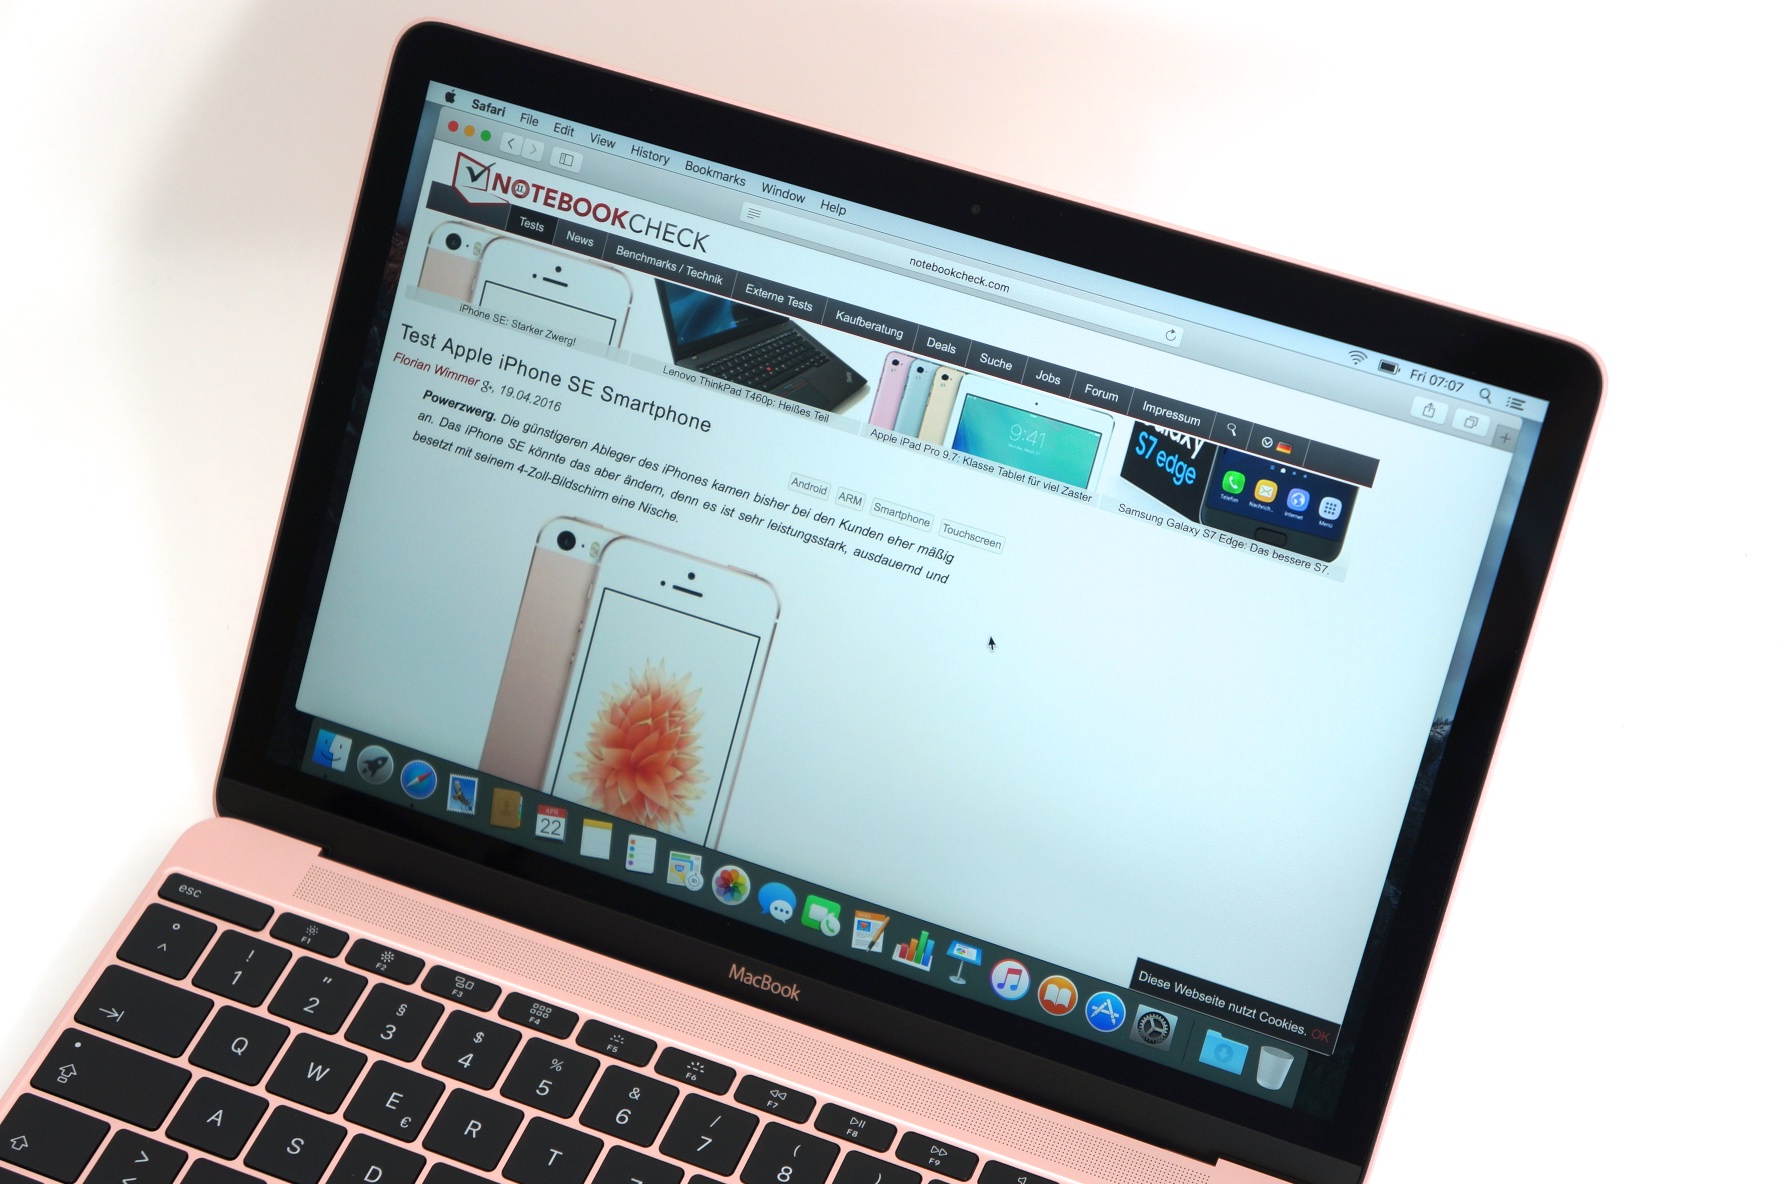
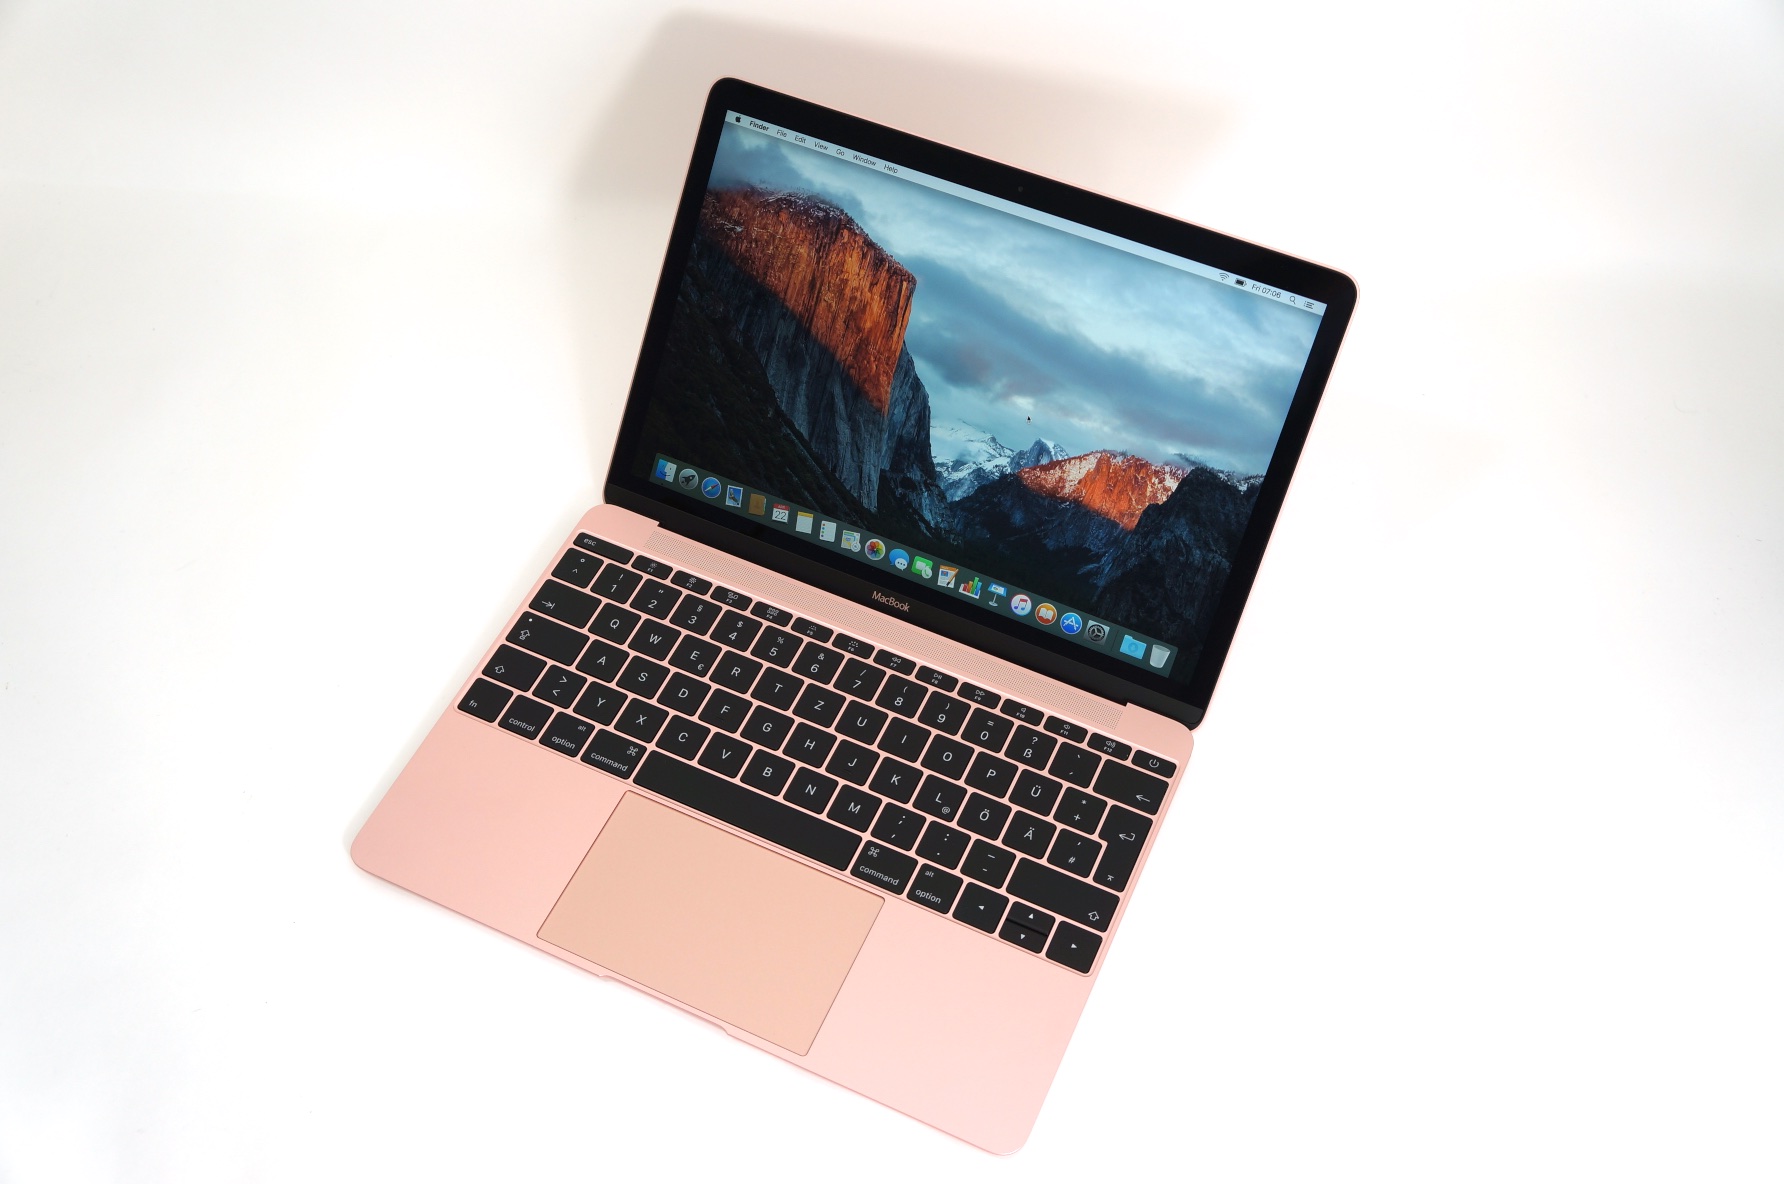
+ 出色的Retina屏幕
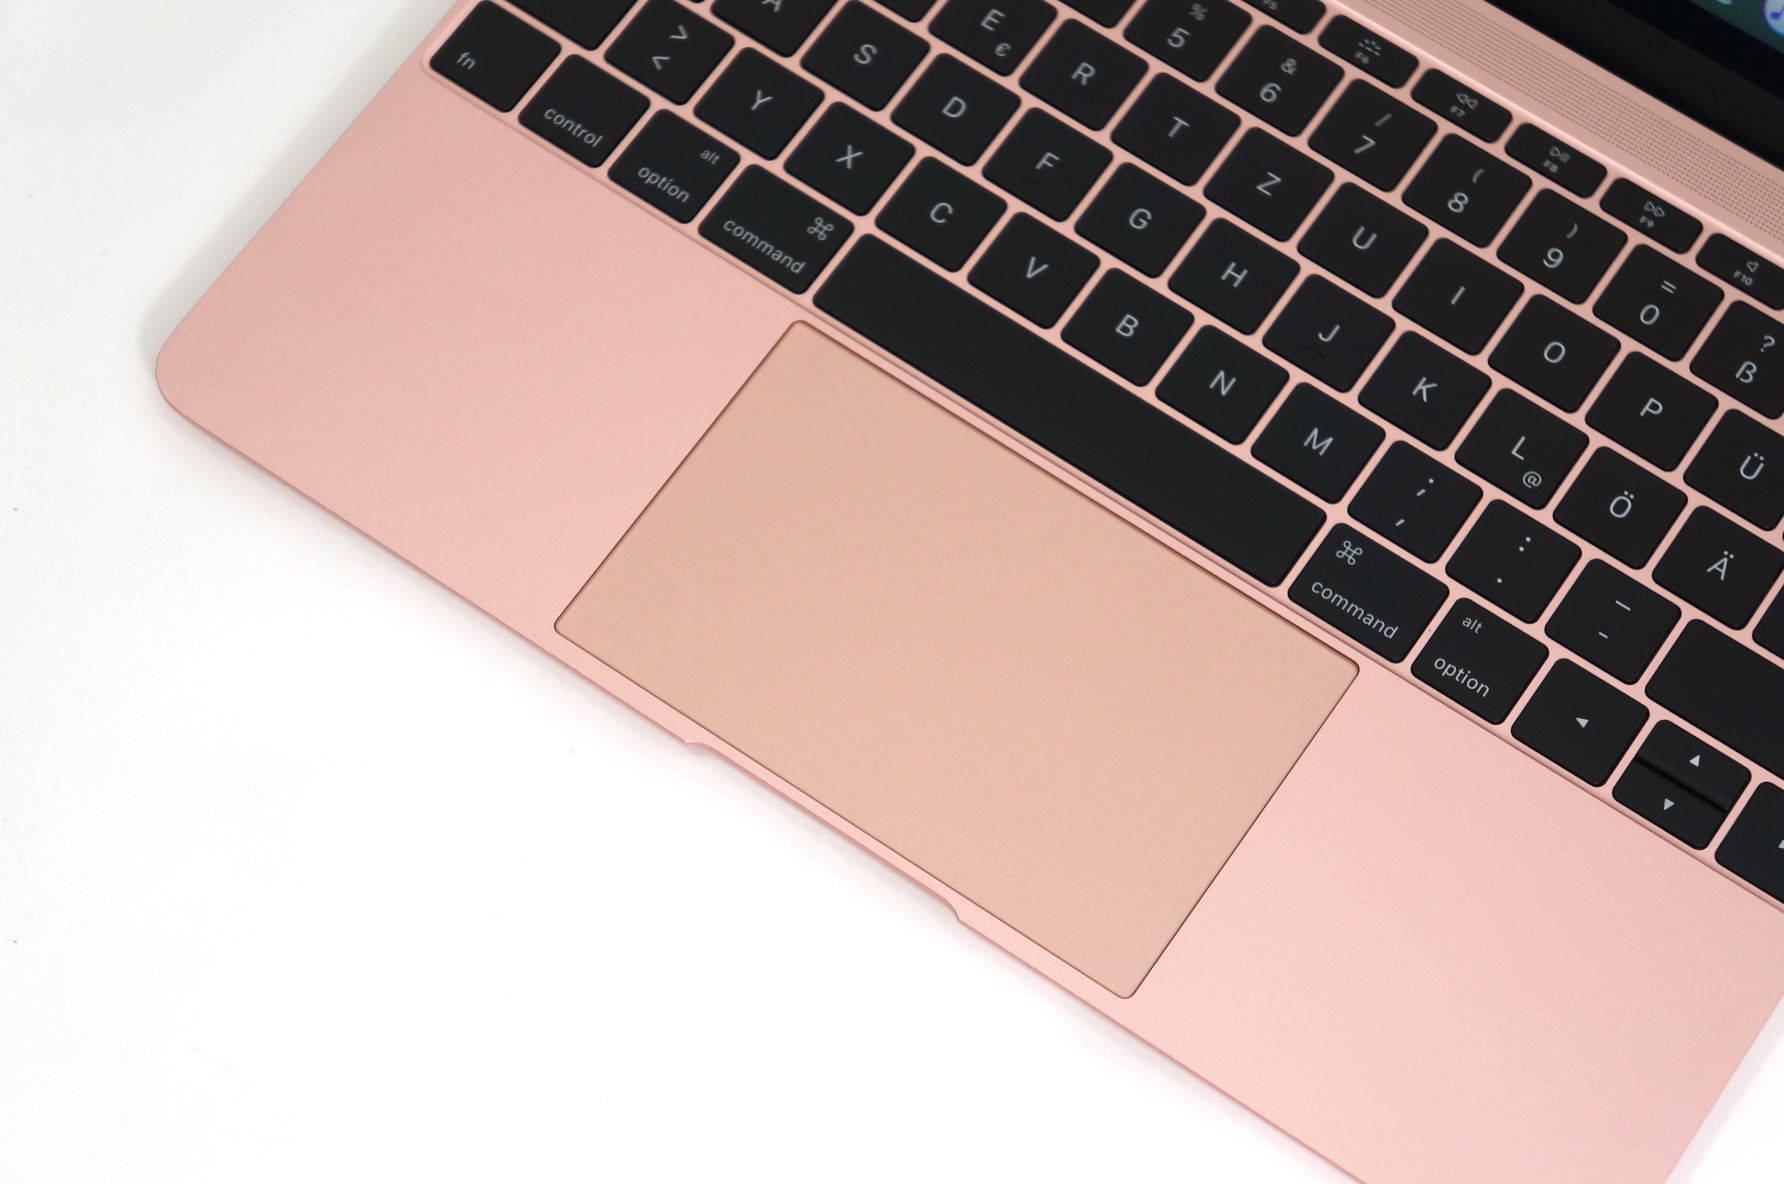
+ 准确的Force Touch触控板
+ 高品质扬声器
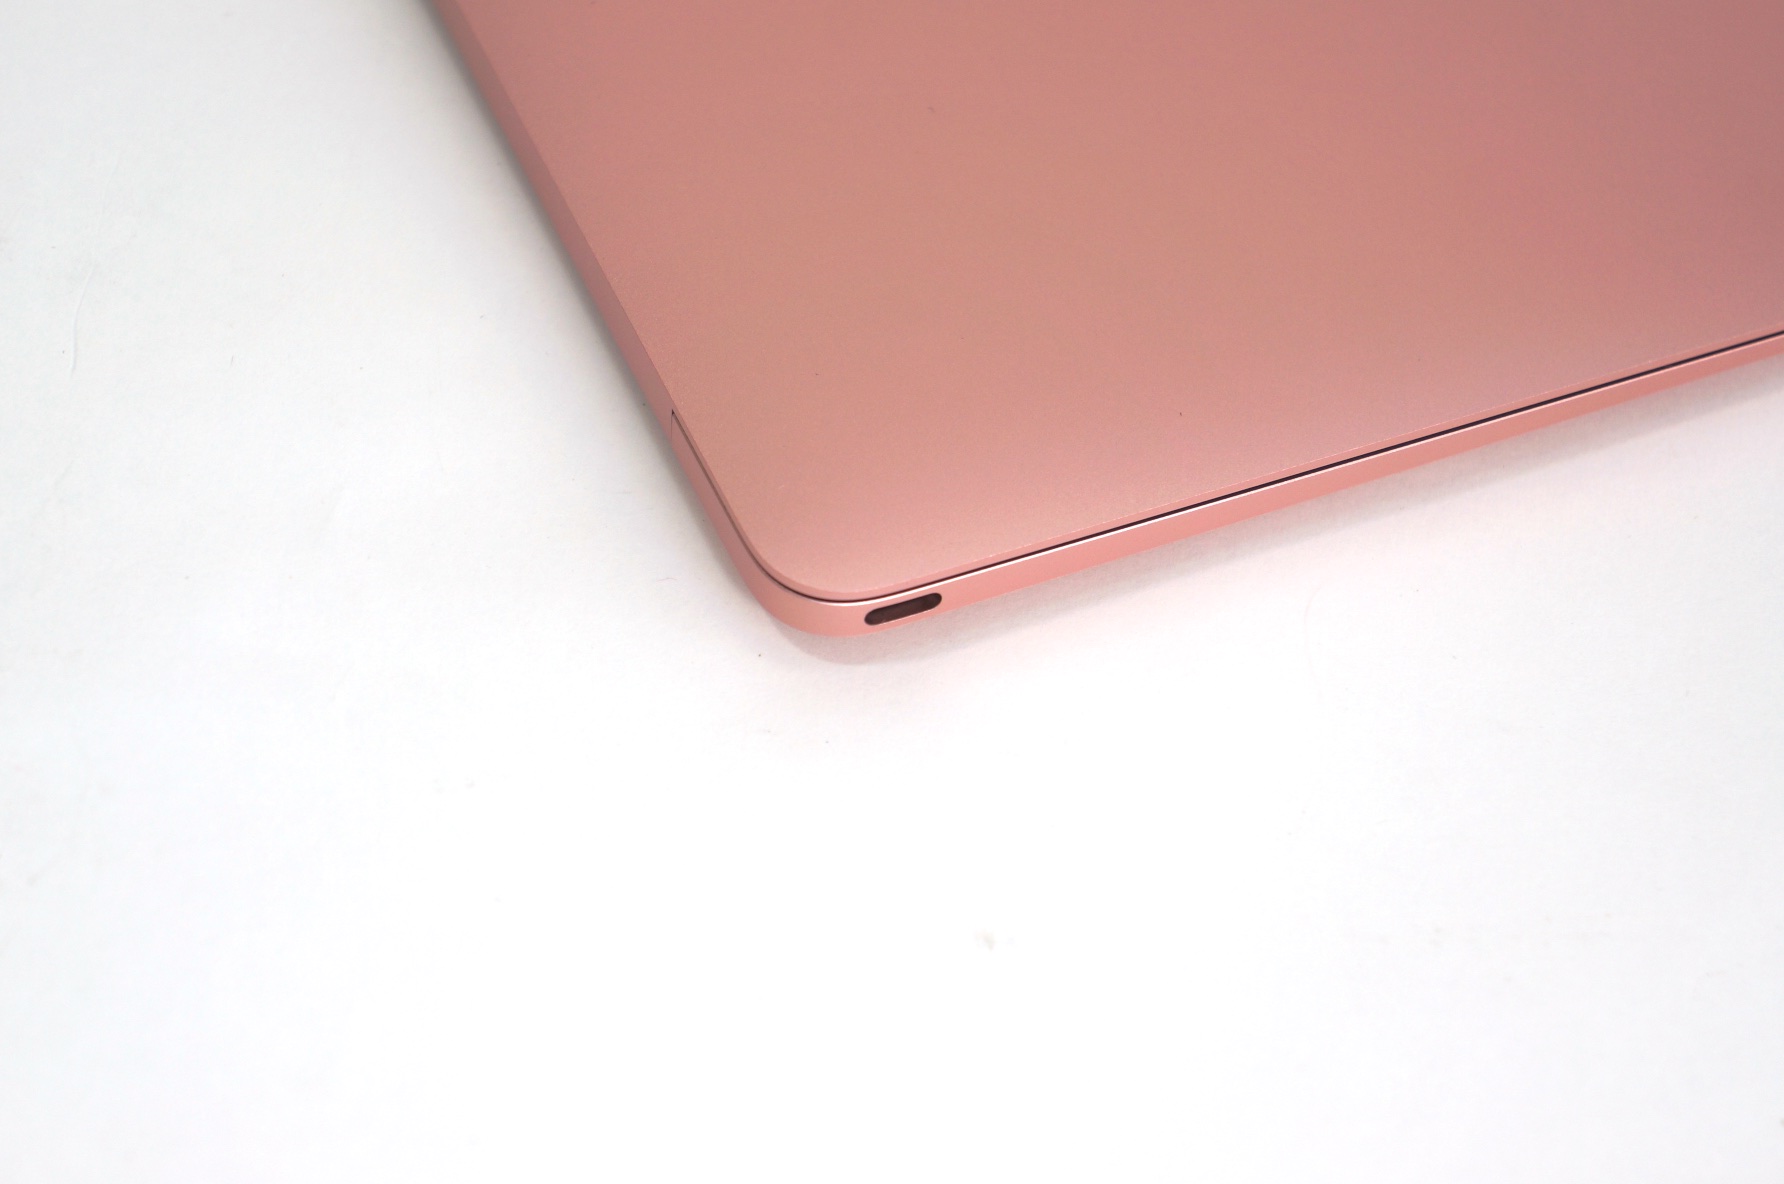
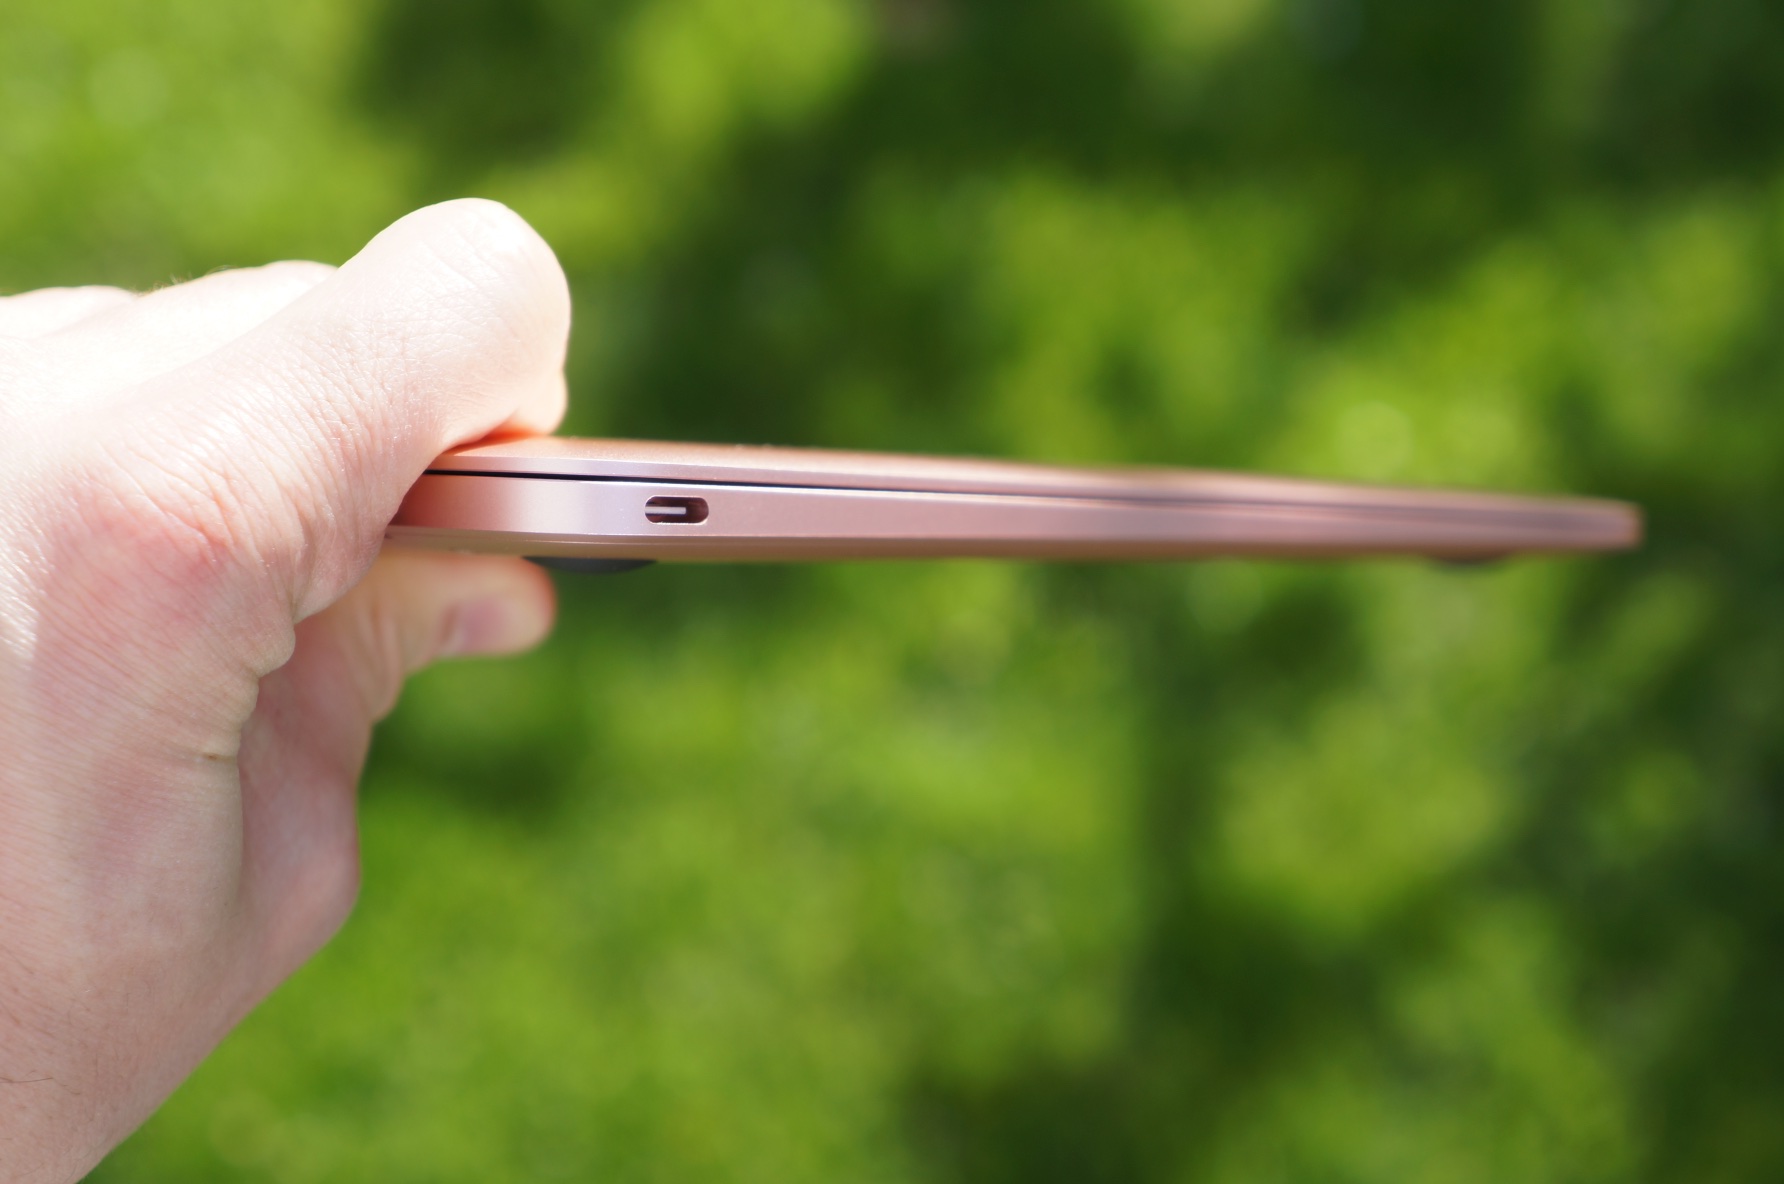
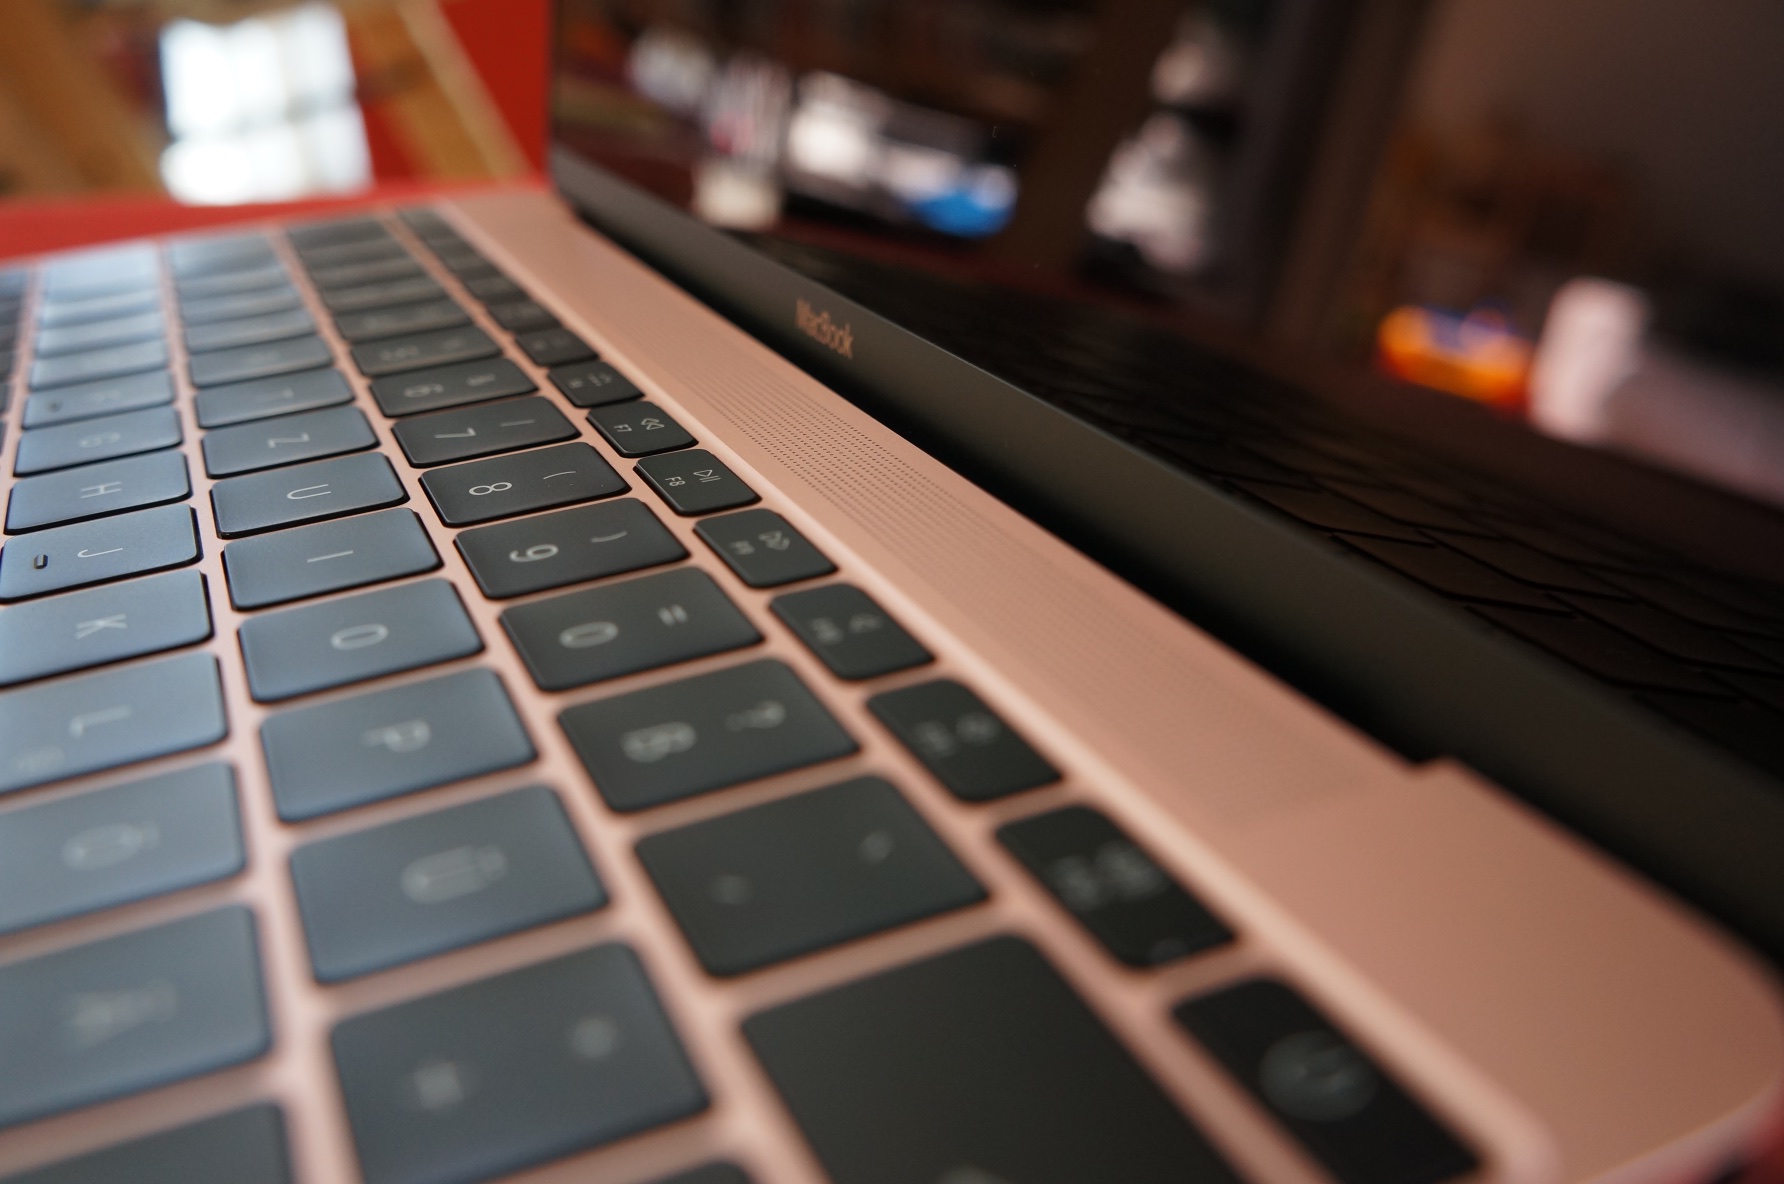
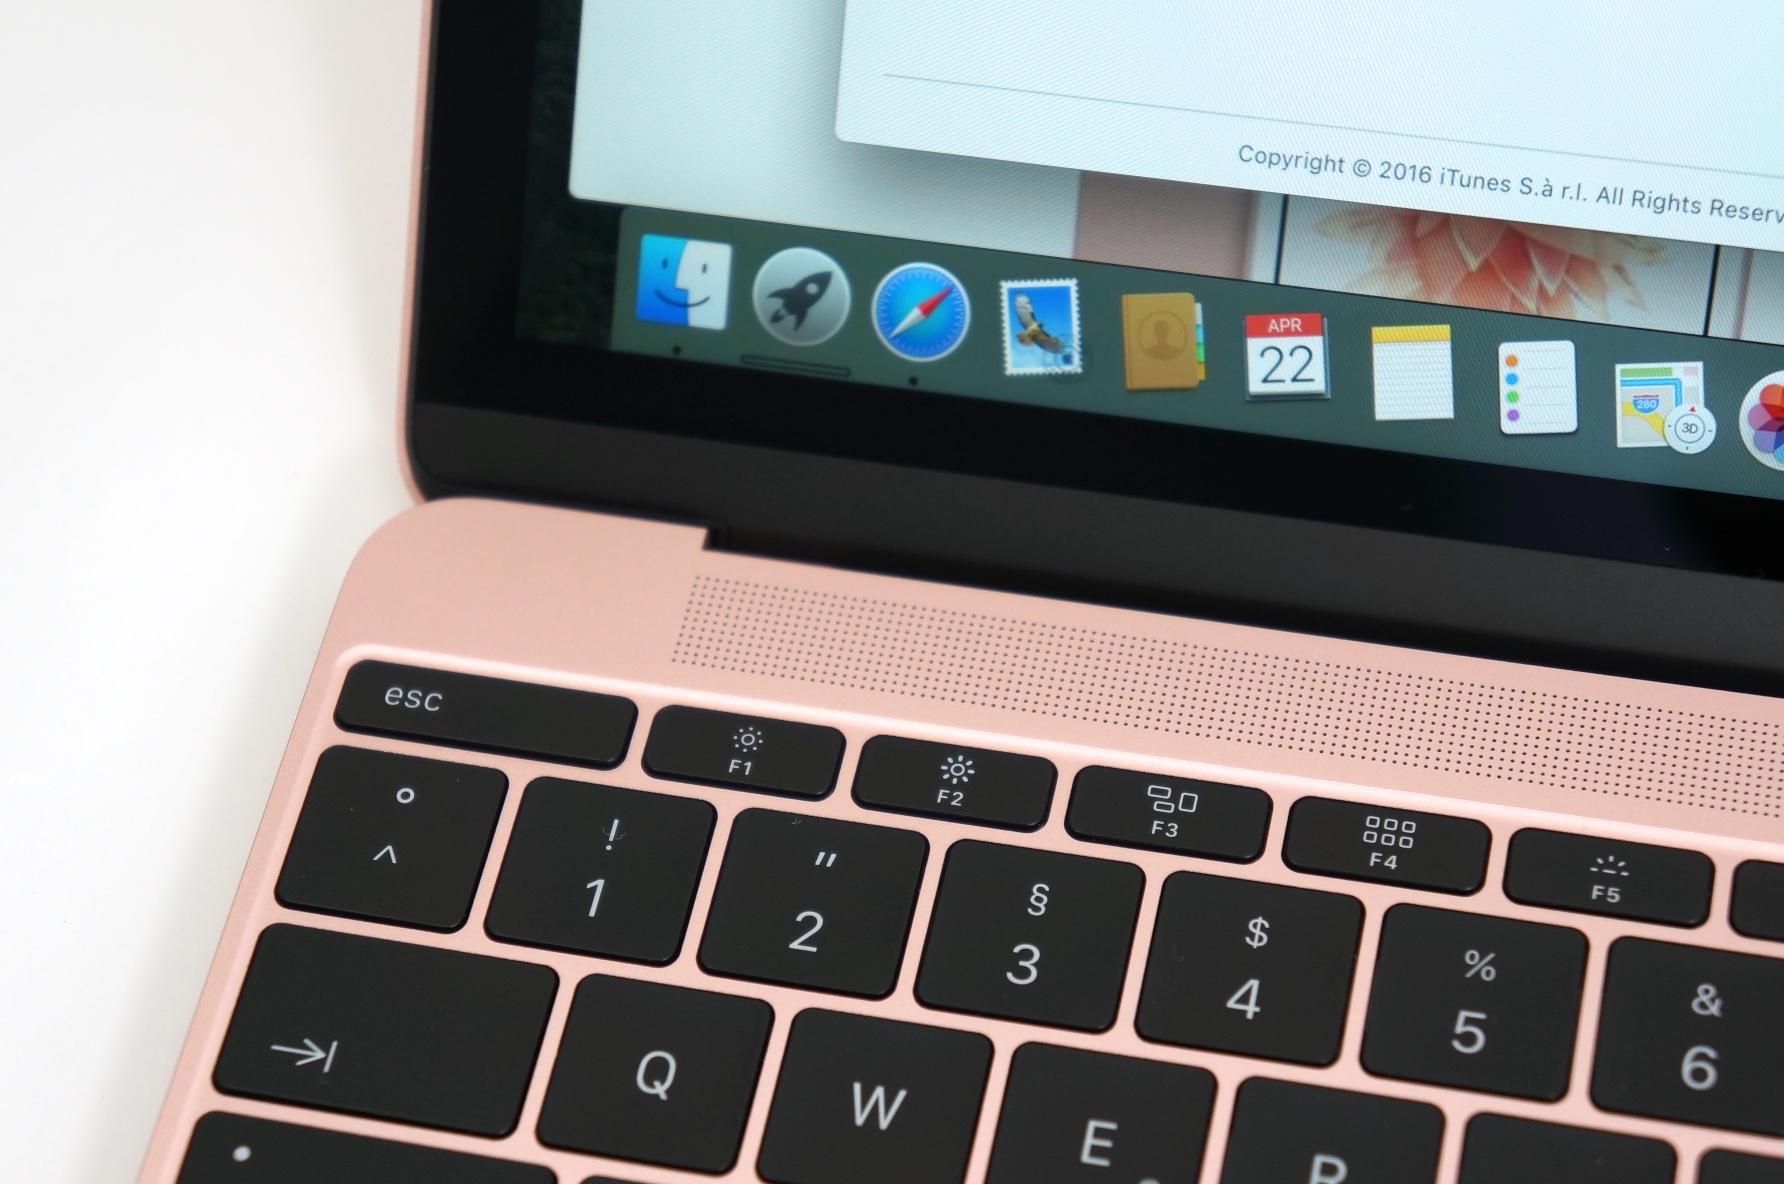
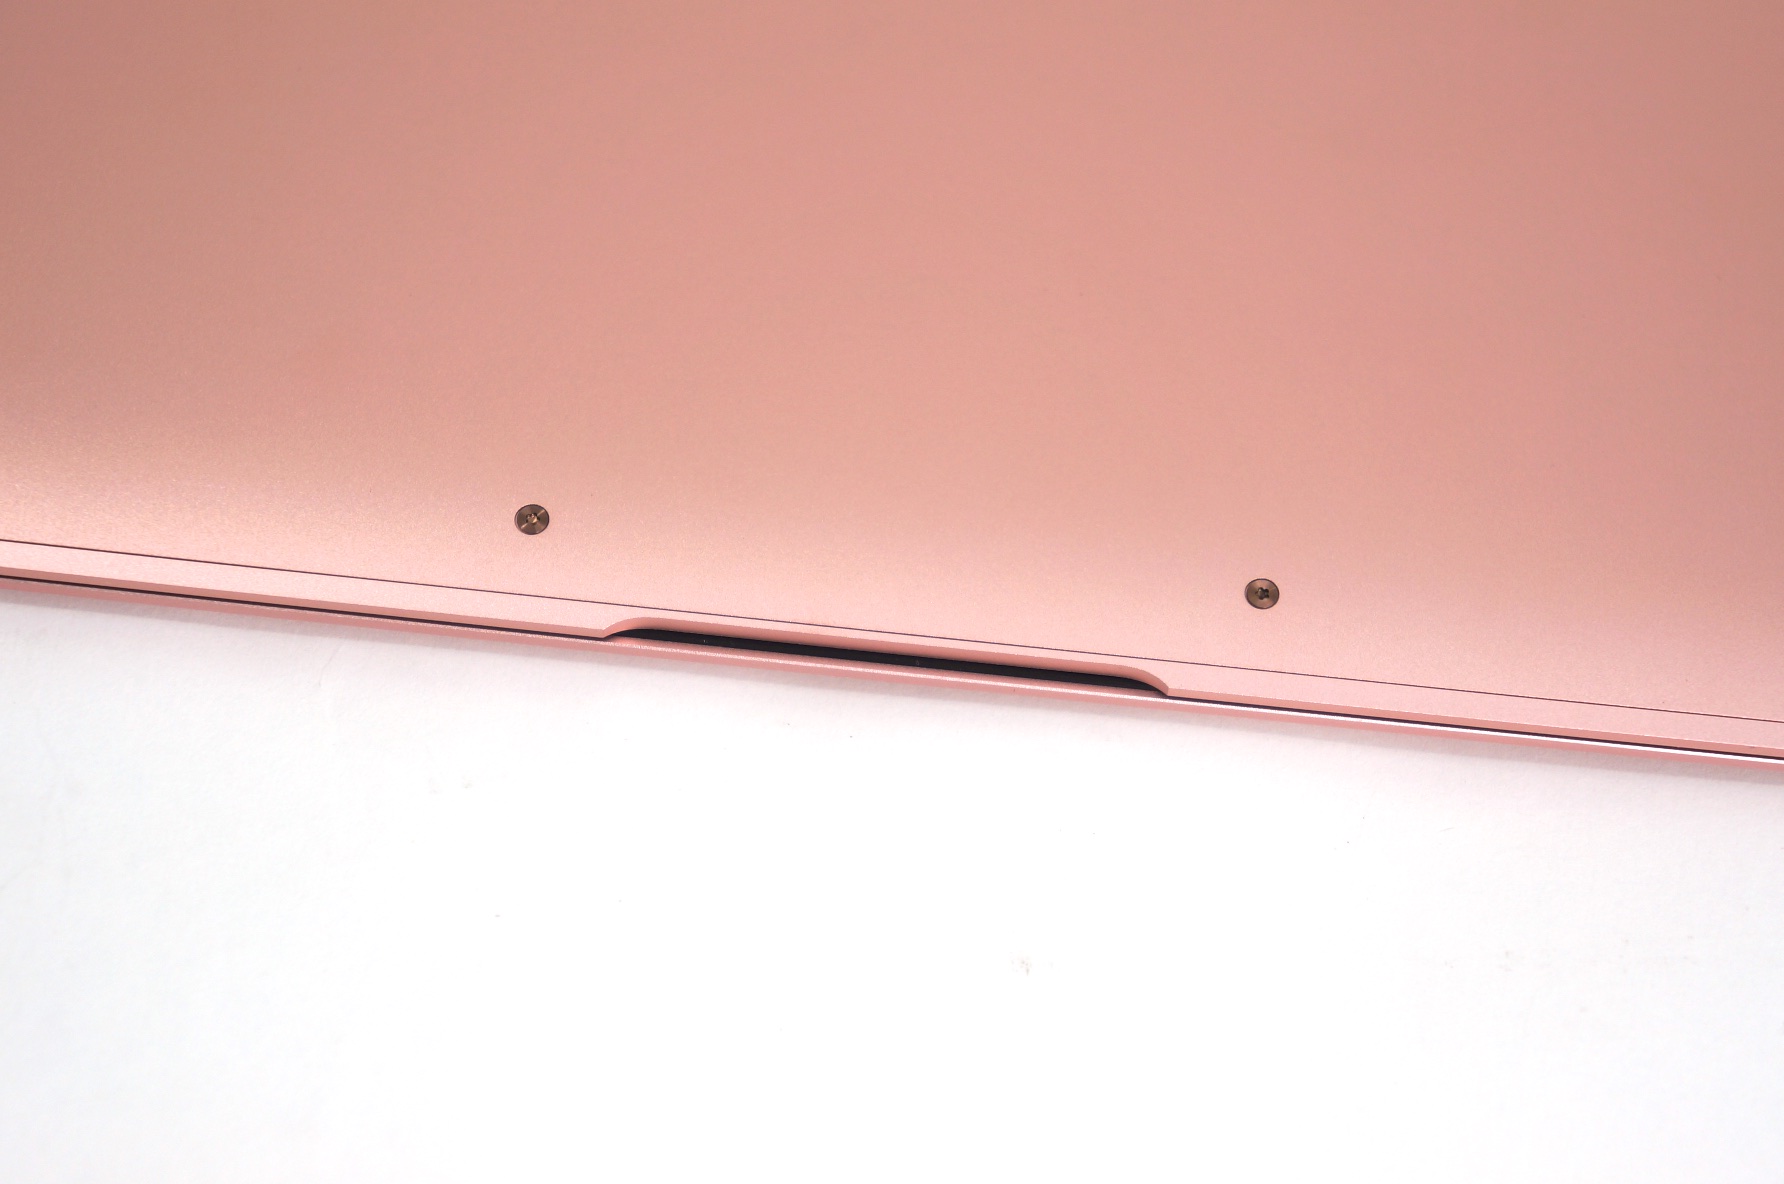
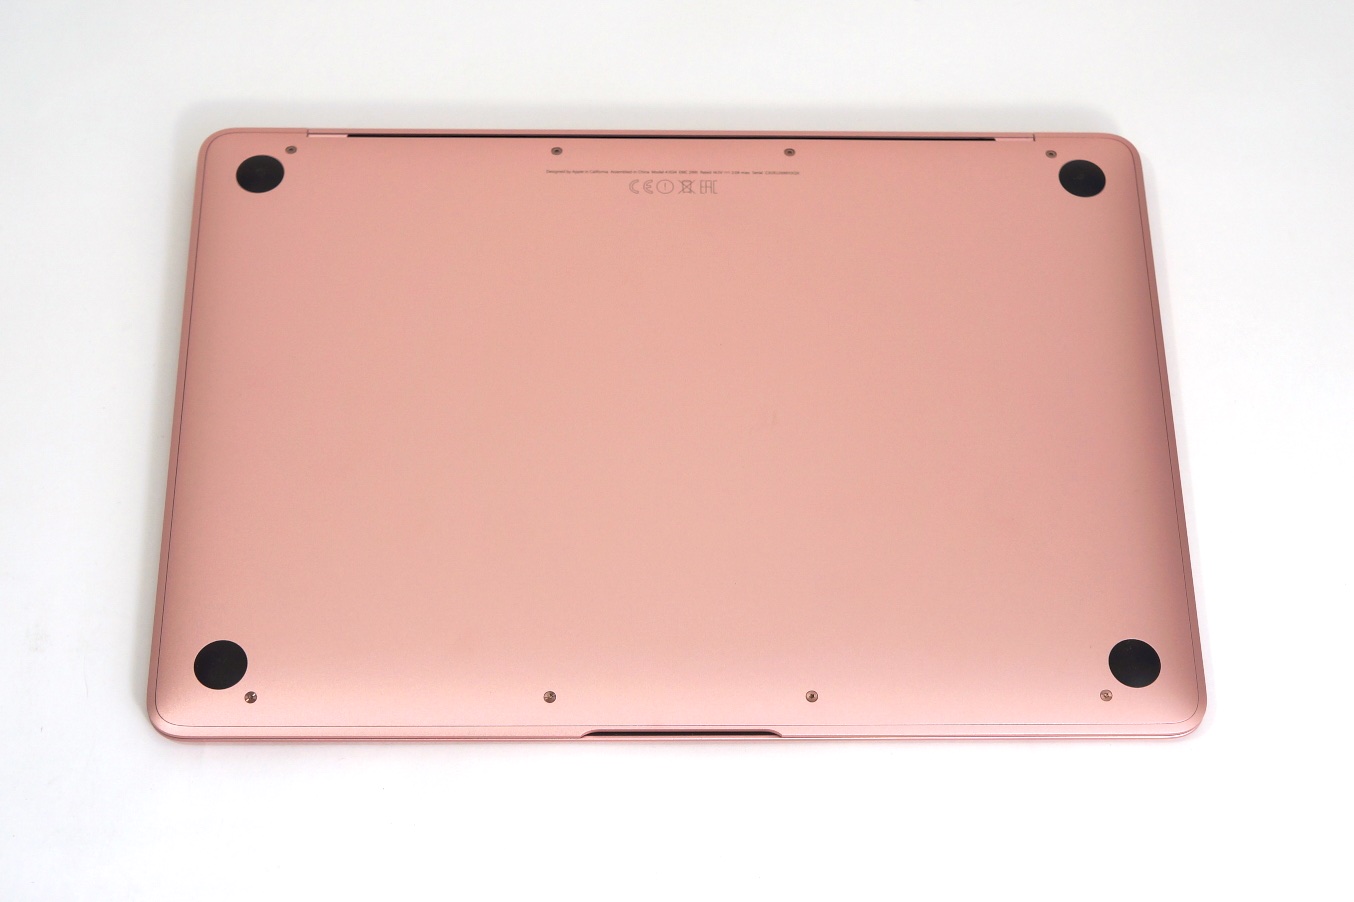
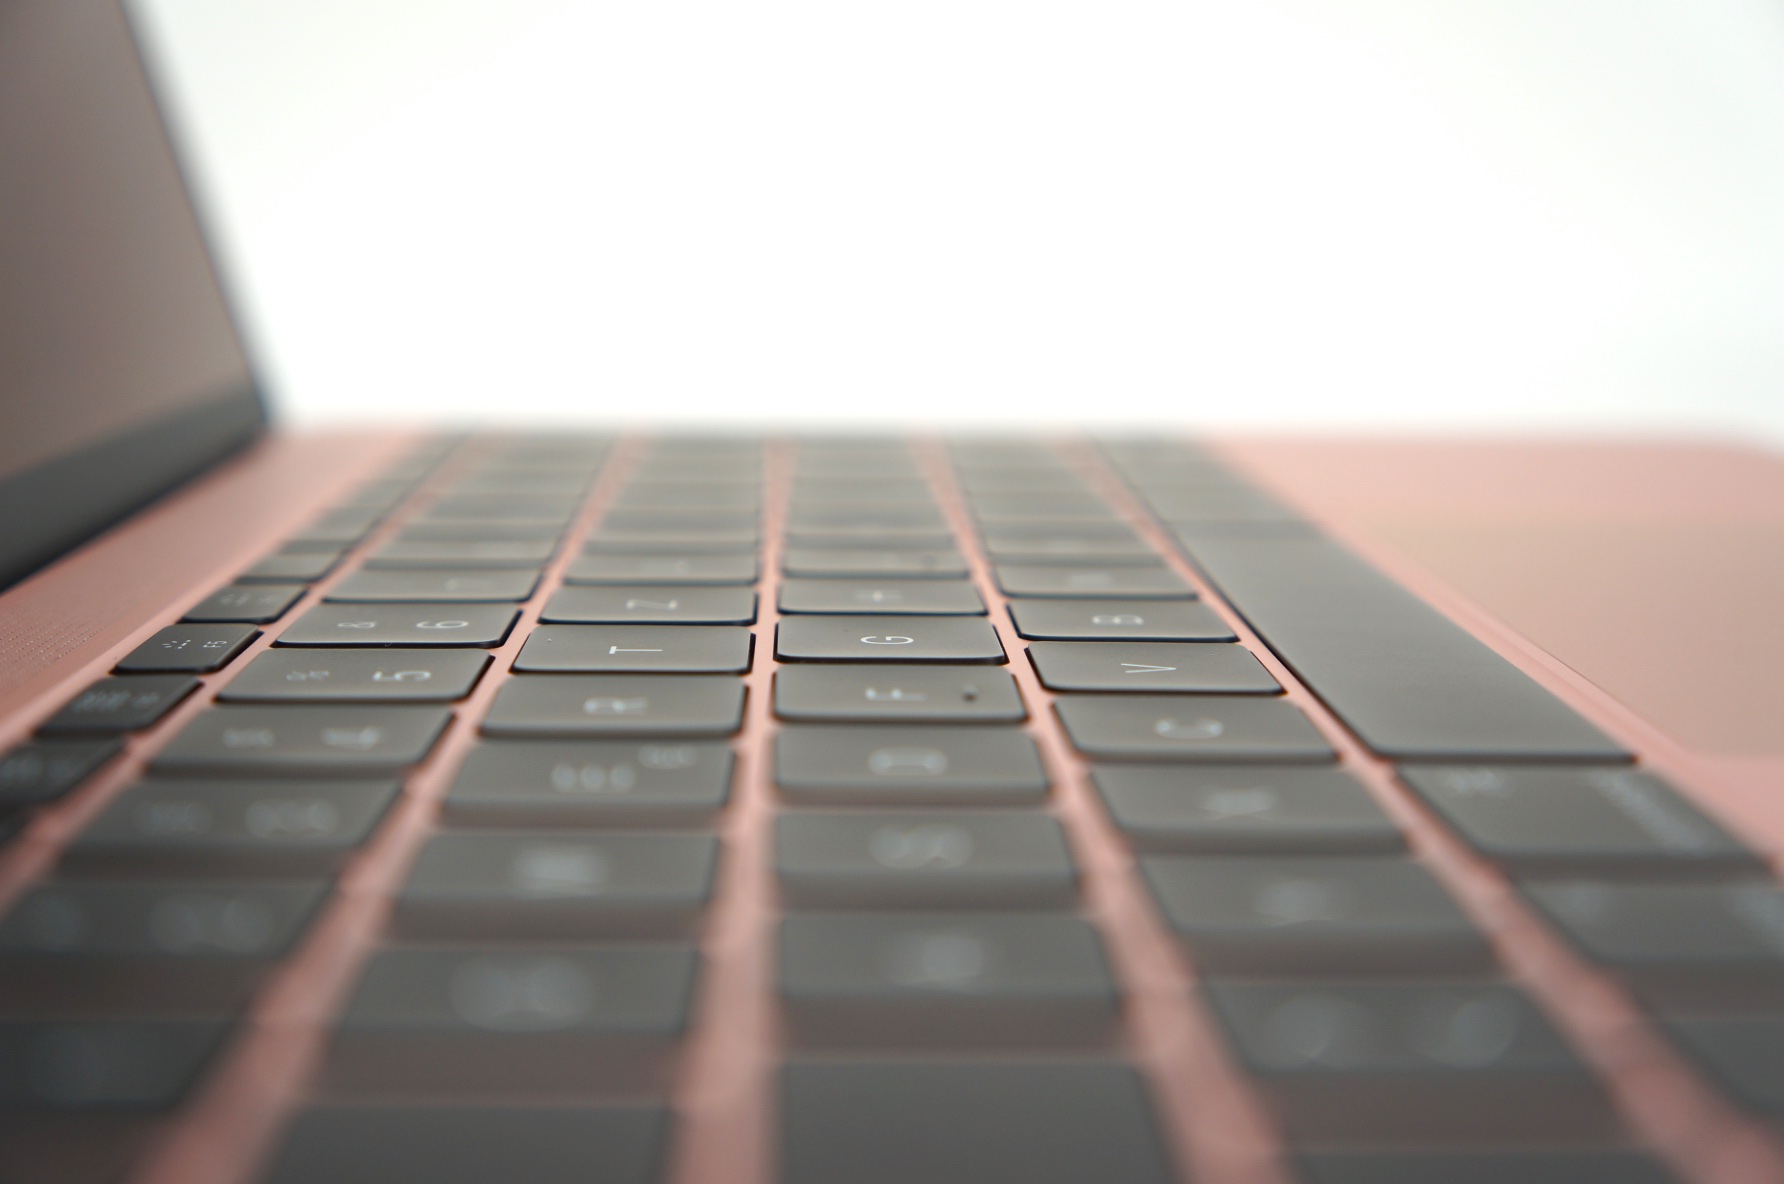
+ 高端铝合金机身
+ 被动散热,安静而不会过热
Cons
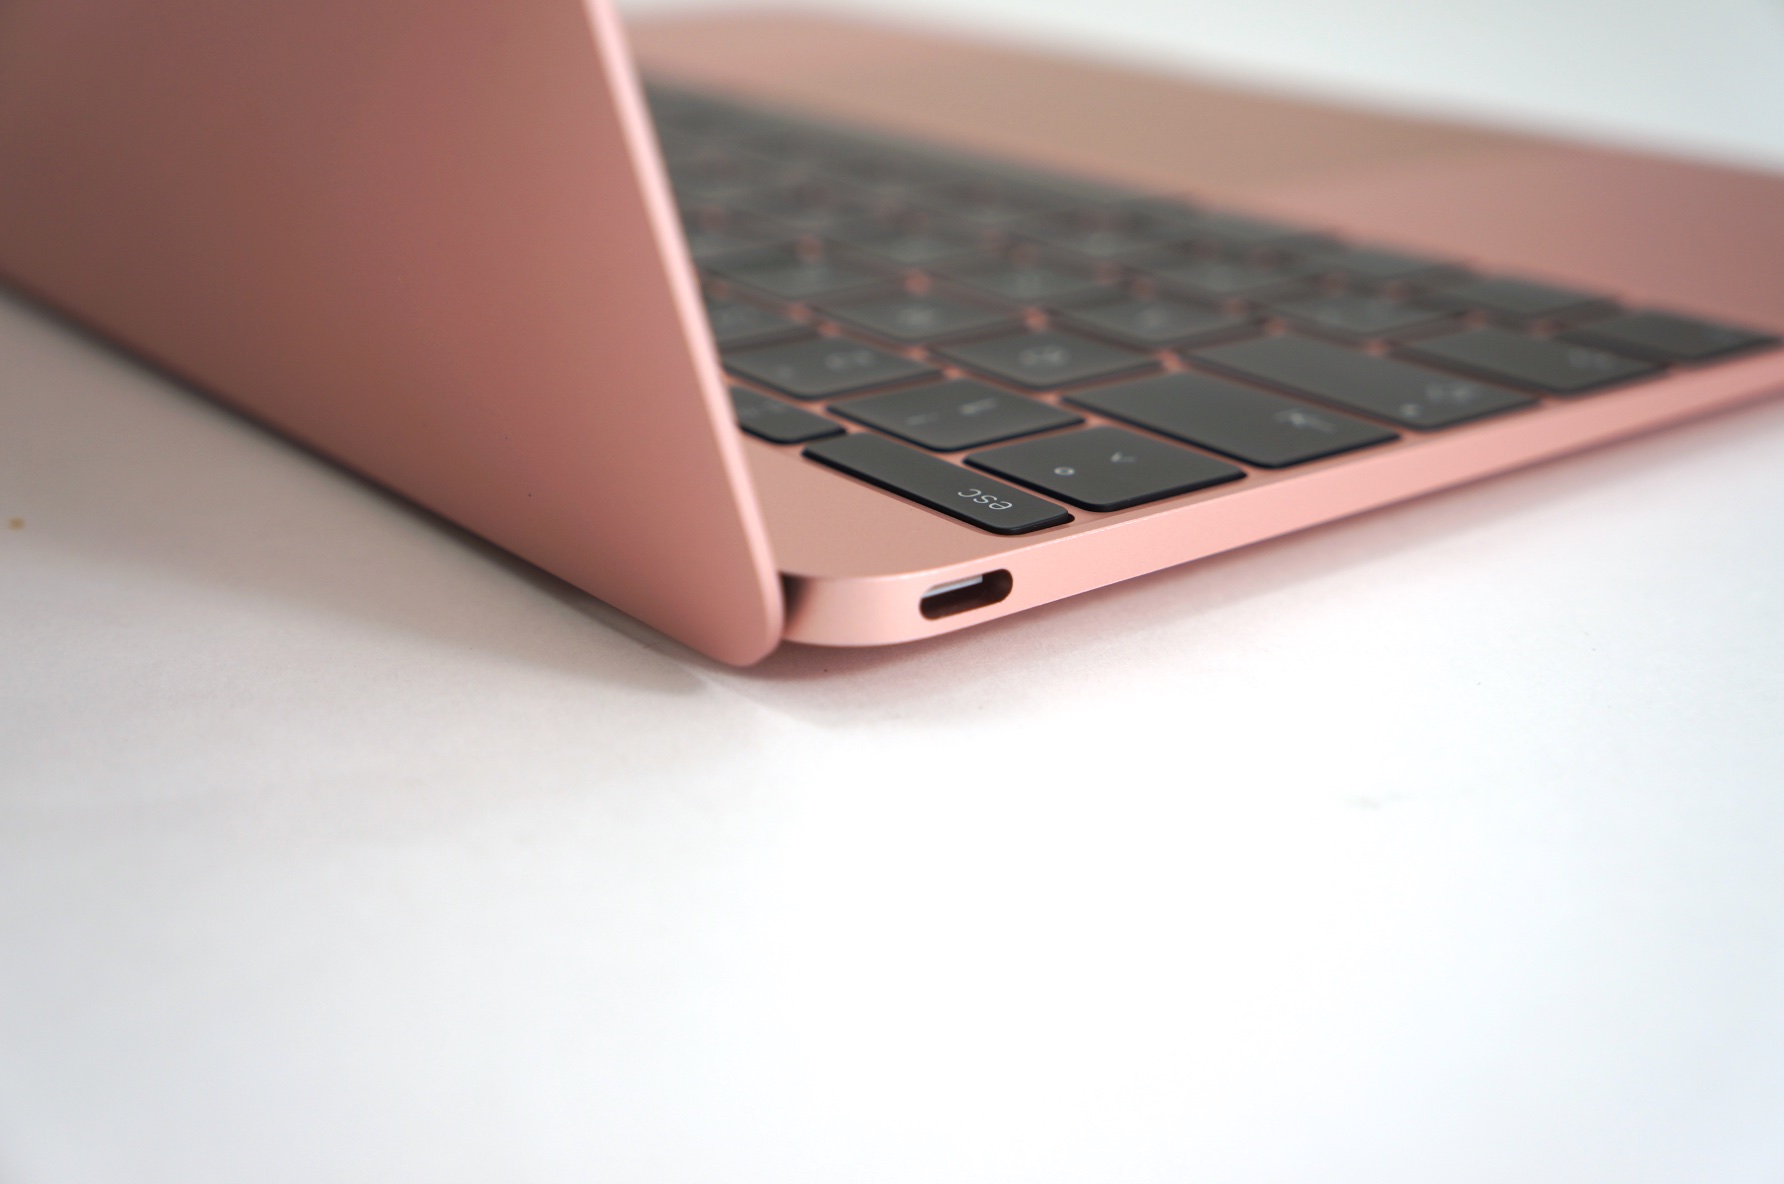
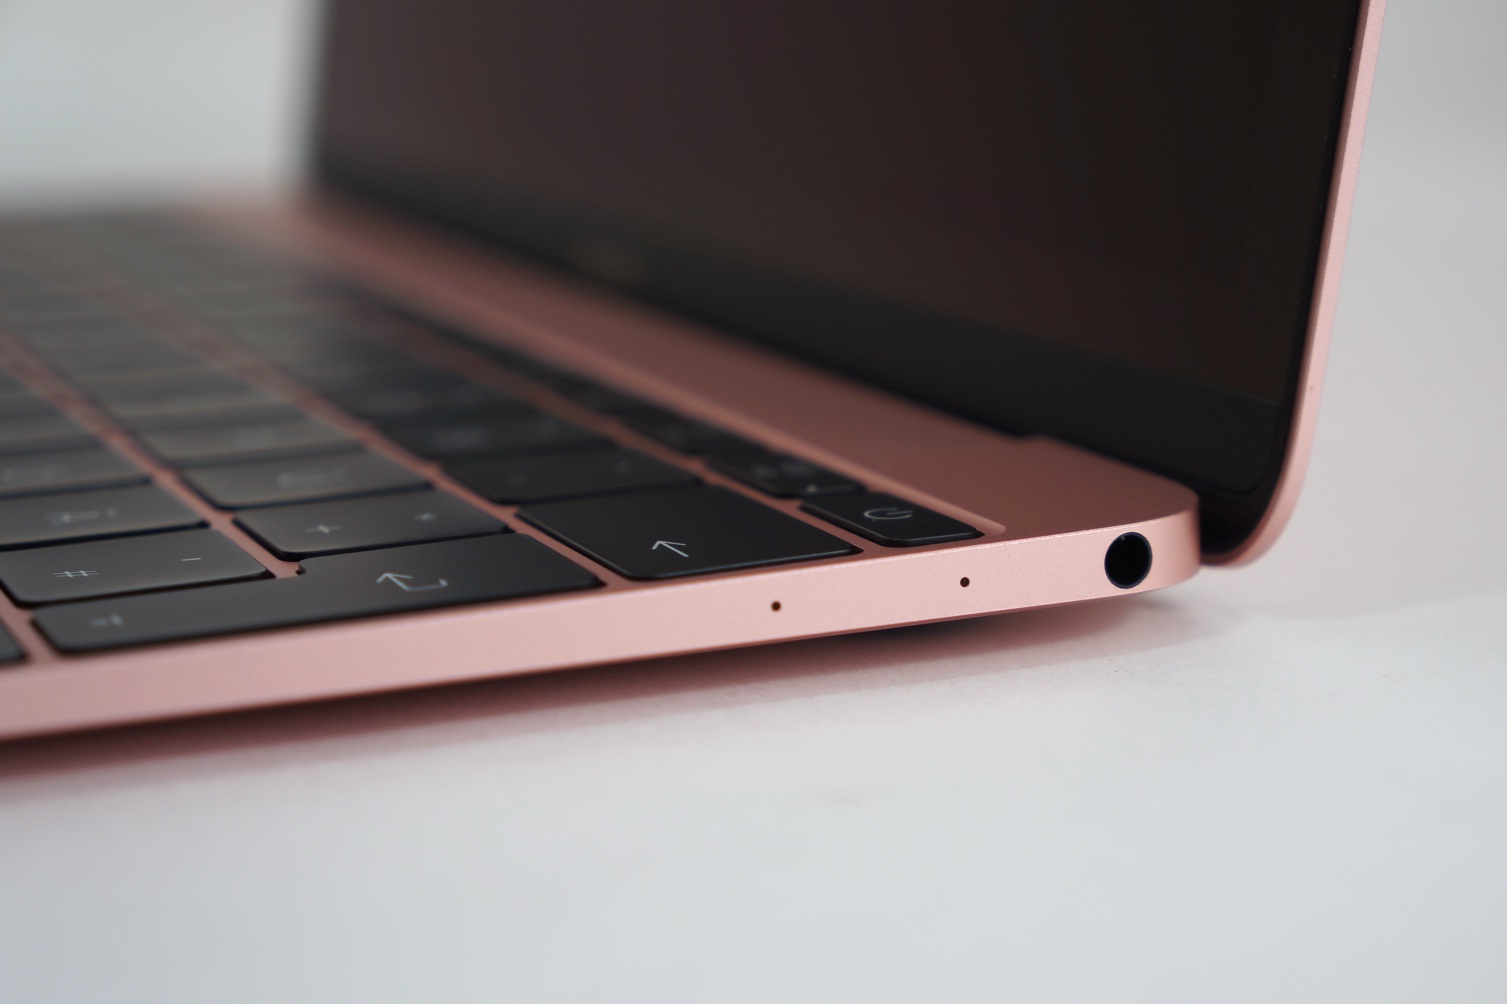
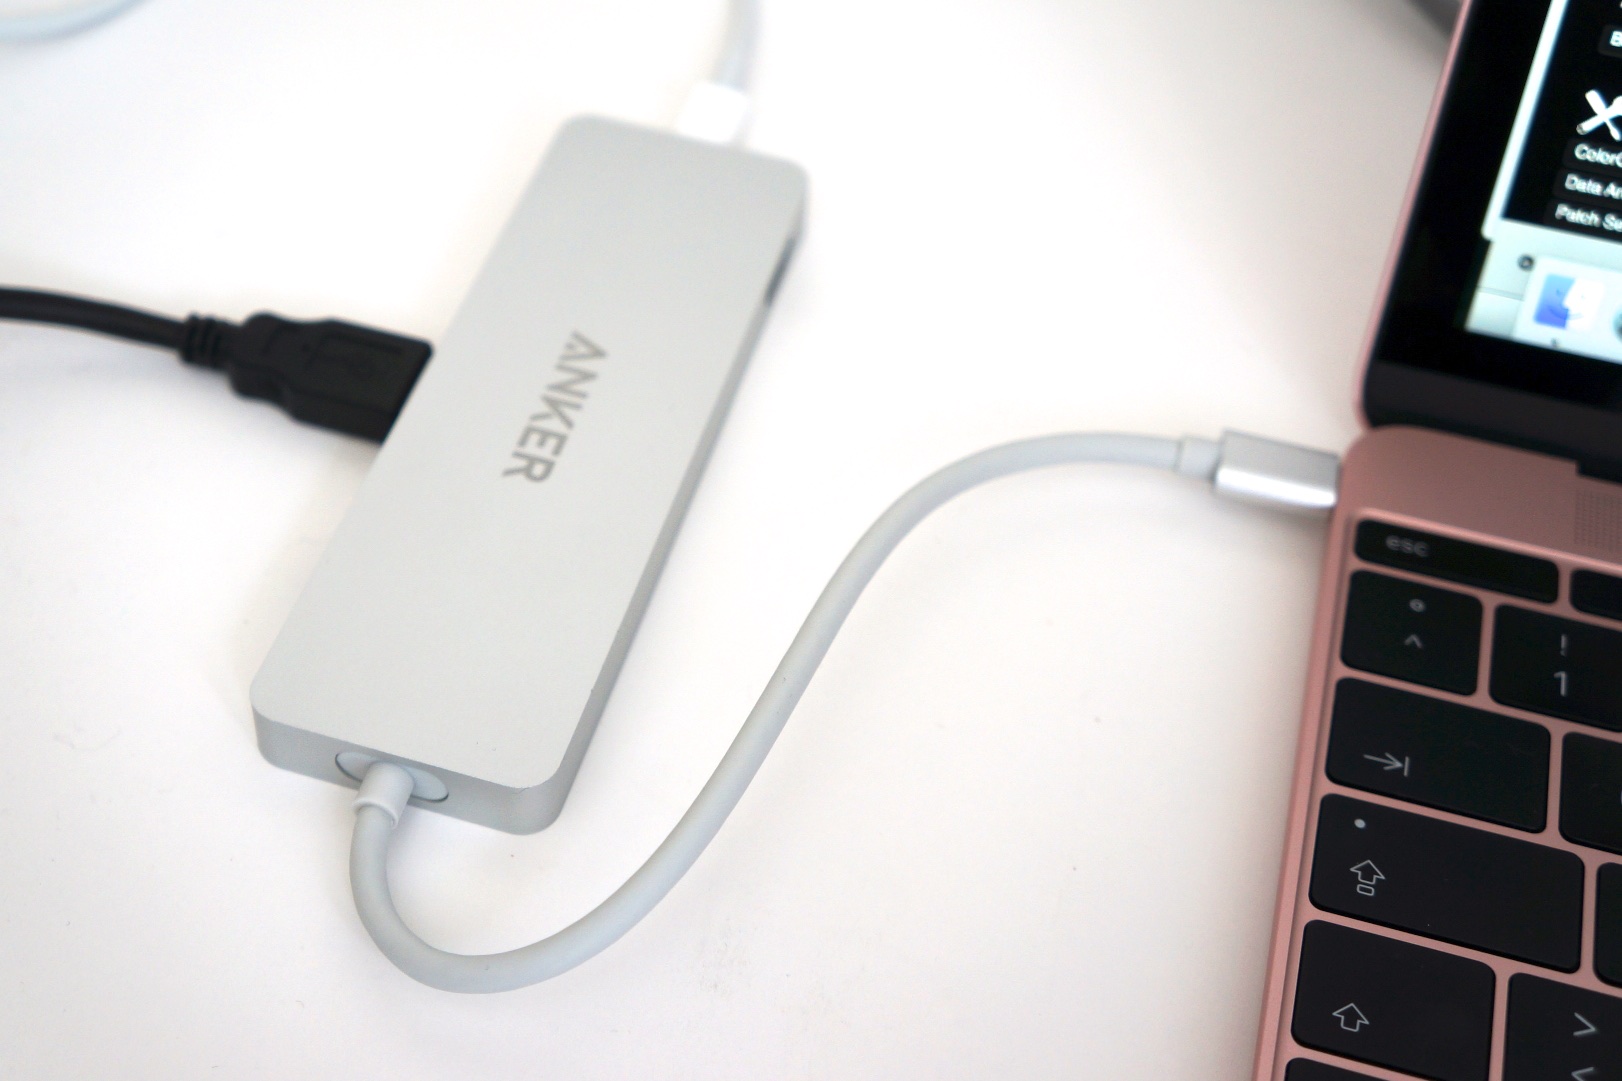
- 仅一个集成接口会限制实用性
- 键盘键程较短容易造成误操作
- 无LED充电指示灯
- 可维护升级空间差(iFixit打分1/10)
- 单核性能相比2015机型更低
12寸MacBook曾是也依然是一台出彩的设备。轻盈,绚丽的屏幕和高品质机身都是它的亮点。不过,相比2015机型它并没有什么太大改变。略微改进的图形性能和略长的电池续航都很难成为更换的理由。由于较弱的单核性能,Skylake m3处理器在一些测试中甚至比前代机型更慢(和日常使用)。不过,这台无风扇亚笔记本的性能足够大部分用途的需要。Turbo加速可以在数分钟的时间内保持在2 GHz左右。
小巧,轻盈,有限。如果你可以接受它有限的功能,MacBook 12将是一台出色的设备。
这台MacBook唯一的USB-C接口同时用作充电接口。因此,你可能会需要昂贵复杂的转接器。另外,入门级型号1449欧元(约10738人民币)的售价并不便宜。我们认为相比13寸Air增加100欧元(约741人民币)投资十分值得考虑,特别是它的屏幕远胜Air。
注:本文是基于完整评测的缩减版本,阅读完整的英文评测,请点击这里。
Apple MacBook 12 (Early 2016) 1.1 GHz
- 04/27/2016 v5.1 (old)
Klaus Hinum, J. Simon Leitner
Subnotebook - Weighted Average