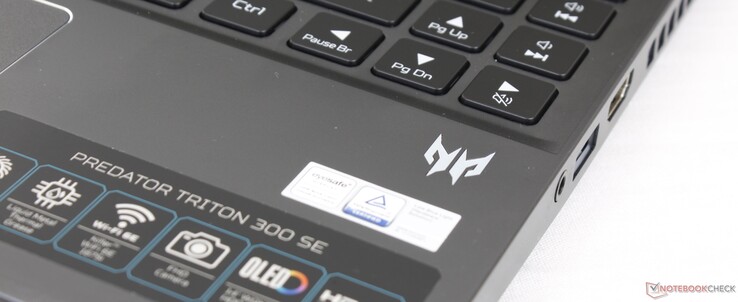
宏碁掠夺者Triton 300 SE PT314评论。14英寸笔记本电脑的液态金属散热
自从我们上次审查捕食者Triton 300以来,已经有两年时间了。 上次回顾捕食者Triton 300.这个最新的模型,称为捕食者Triton 300 SE,采用了较新的12代酷睿H系列CPU和Nvidia Ampere RTX GPU,同时采用了较小的14英寸机箱设计。因此,它与市场上一些最小的游戏笔记本电脑竞争,包括 Razer Blade 14, 华硕Zephyrus G14,以及 Alienware x14.
我们的评测单位是一个更高端的SKU,配备酷睿i9-12900H处理器和90赫兹1800p OLED显示屏,价格约为1950美元。另一个配置是酷睿i7-12700H处理器,165赫兹1200p IPS显示屏,以及一半的内存和存储空间,价格便宜数百美元。目前,所有选项都配有相同的95WGeForce RTX 3060 GPU。
有一个更大的16英寸版本,与捕食者Triton 300 SE的名字相同,但有不同的型号(PT316对PT314)。
更多宏碁评论。
潜在的竞争对手比较
Rating | Date | Model | Weight | Height | Size | Resolution | Price |
|---|---|---|---|---|---|---|---|
| 86 % v7 (old) | 11 / 2022 | Acer Predator Triton 300 SE i9-12900H, GeForce RTX 3060 Laptop GPU | 1.7 kg | 19.8 mm | 14.00" | 2880x1800 | |
| 86.4 % v7 (old) | 10 / 2022 | Asus ROG Zephyrus G14 GA402RJ R7 6800HS, Radeon RX 6700S | 1.7 kg | 19.5 mm | 14.00" | 2560x1600 | |
| 89.4 % v7 (old) | 05 / 2022 | Razer Blade 14 Ryzen 9 6900HX R9 6900HX, GeForce RTX 3070 Ti Laptop GPU | 1.8 kg | 16.8 mm | 14.00" | 2560x1440 | |
| 86.7 % v7 (old) | 03 / 2022 | Alienware x14 i7 RTX 3060 i7-12700H, GeForce RTX 3060 Laptop GPU | 1.8 kg | 14.5 mm | 14.00" | 1920x1080 | |
| 87.2 % v7 (old) | 09 / 2022 | Dell Inspiron 14 Plus 7420 i7-12700H, GeForce RTX 3050 4GB Laptop GPU | 1.7 kg | 18.87 mm | 14.00" | 2240x1400 | |
| 87.7 % v7 (old) | 01 / 2022 | Schenker Vision 14 i7-11370H, GeForce RTX 3050 Ti Laptop GPU | 1.1 kg | 15.6 mm | 14.00" | 2880x1800 |
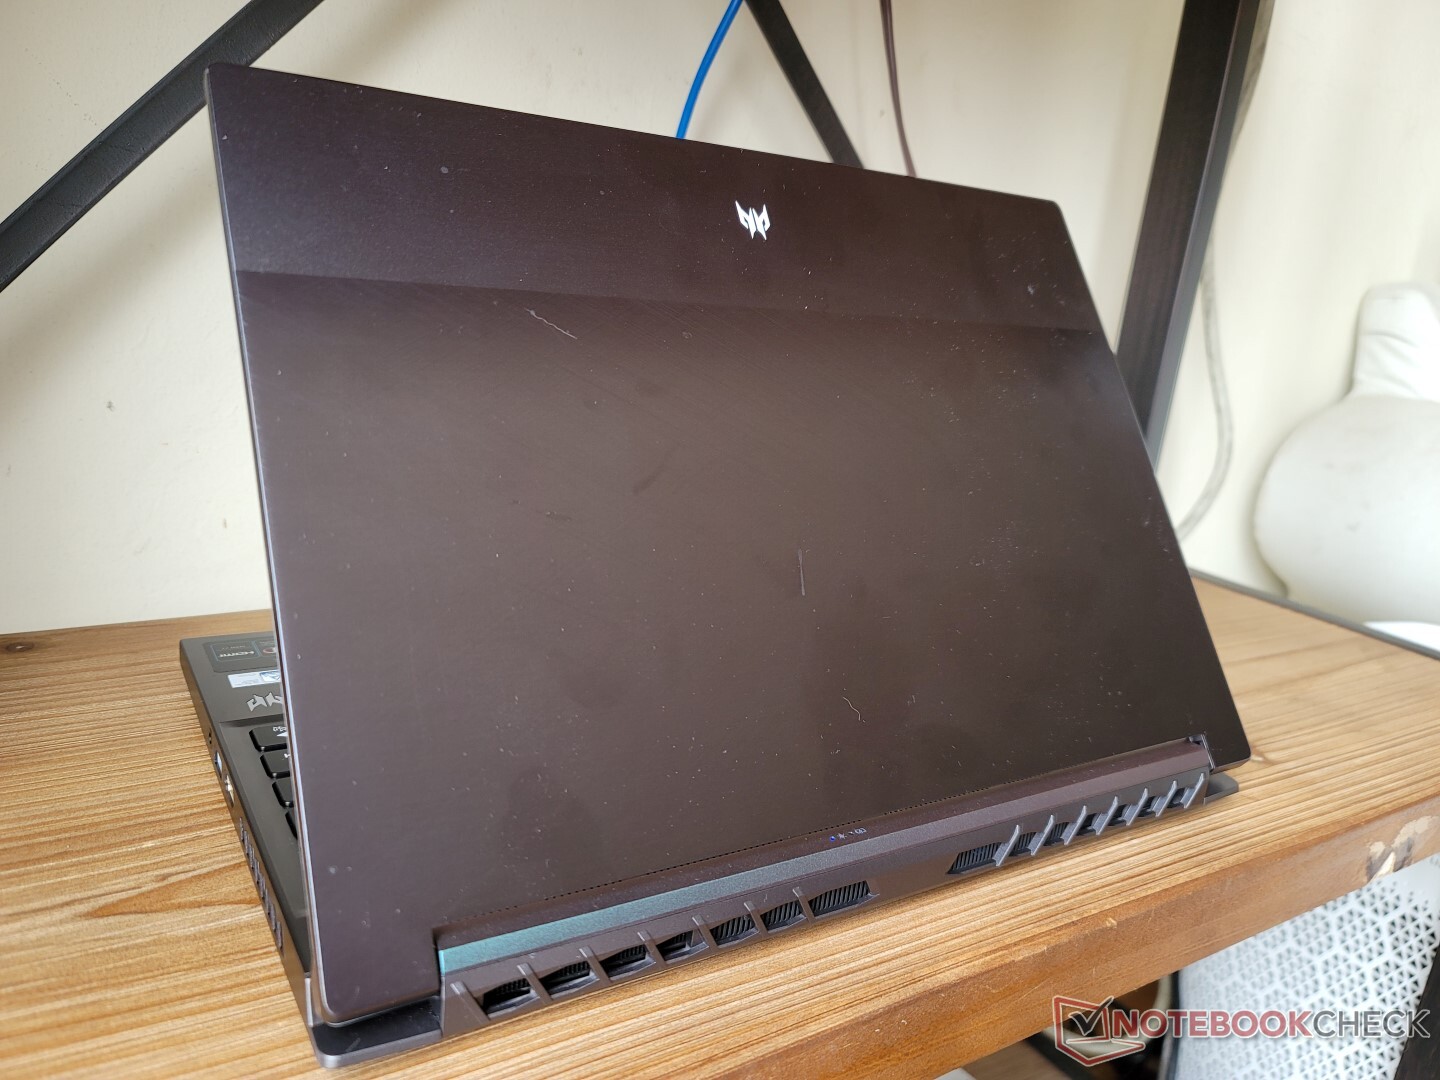
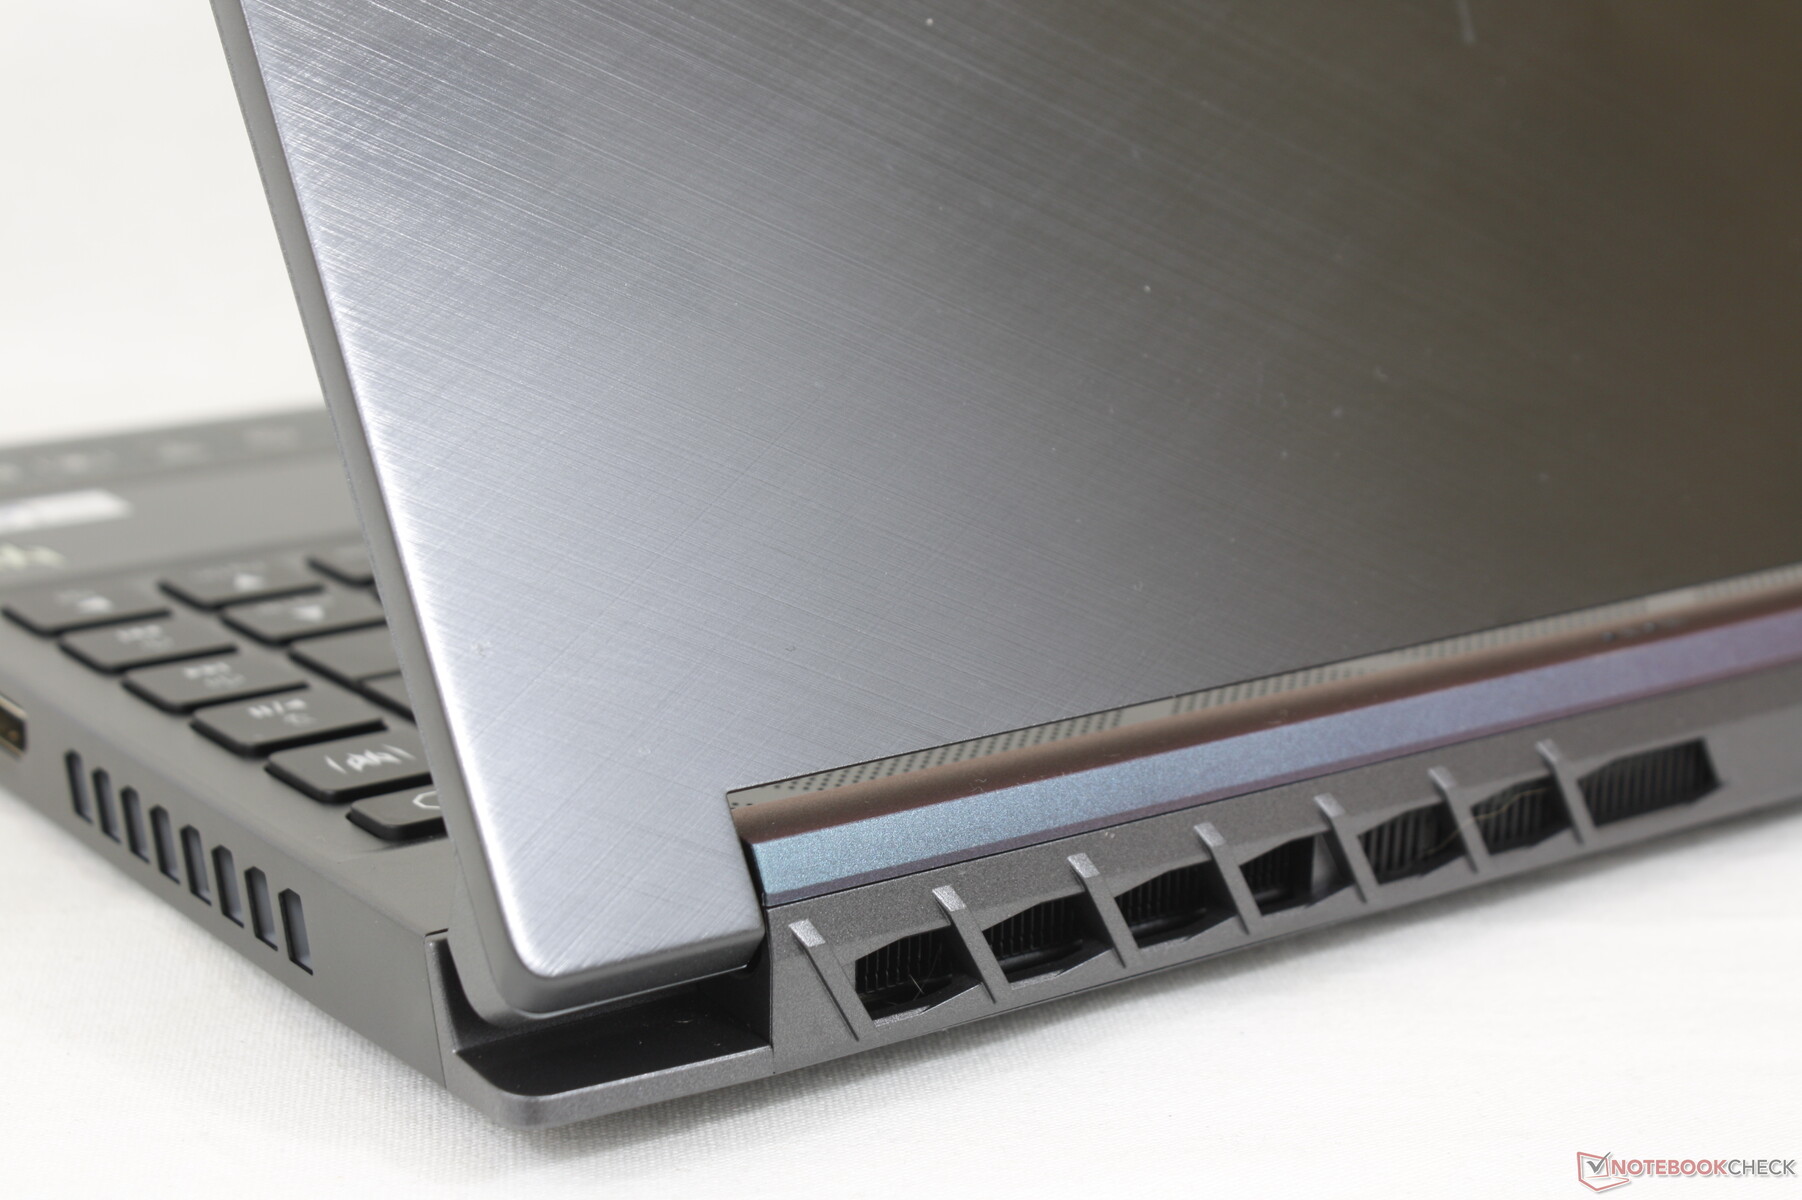
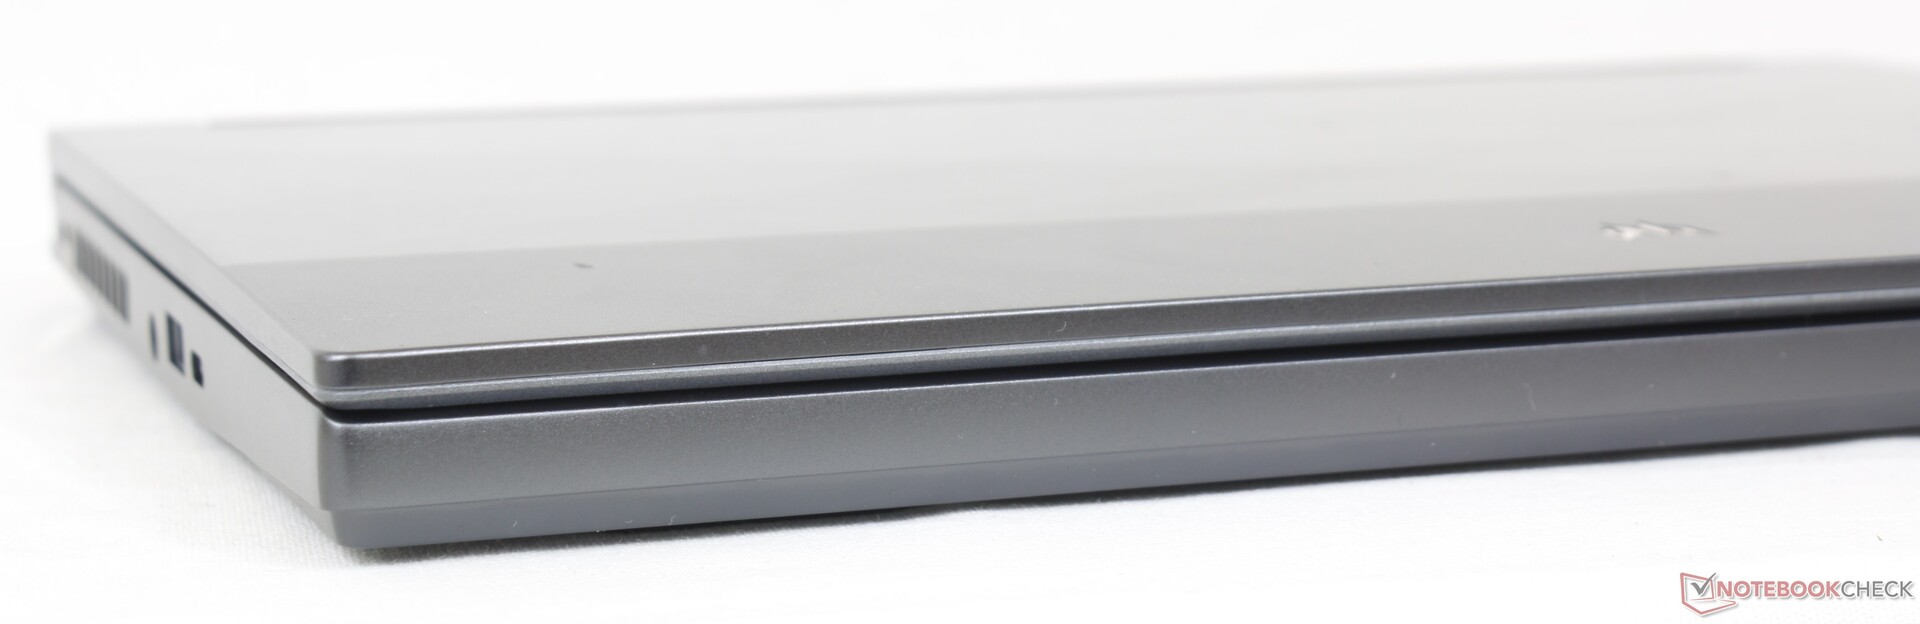
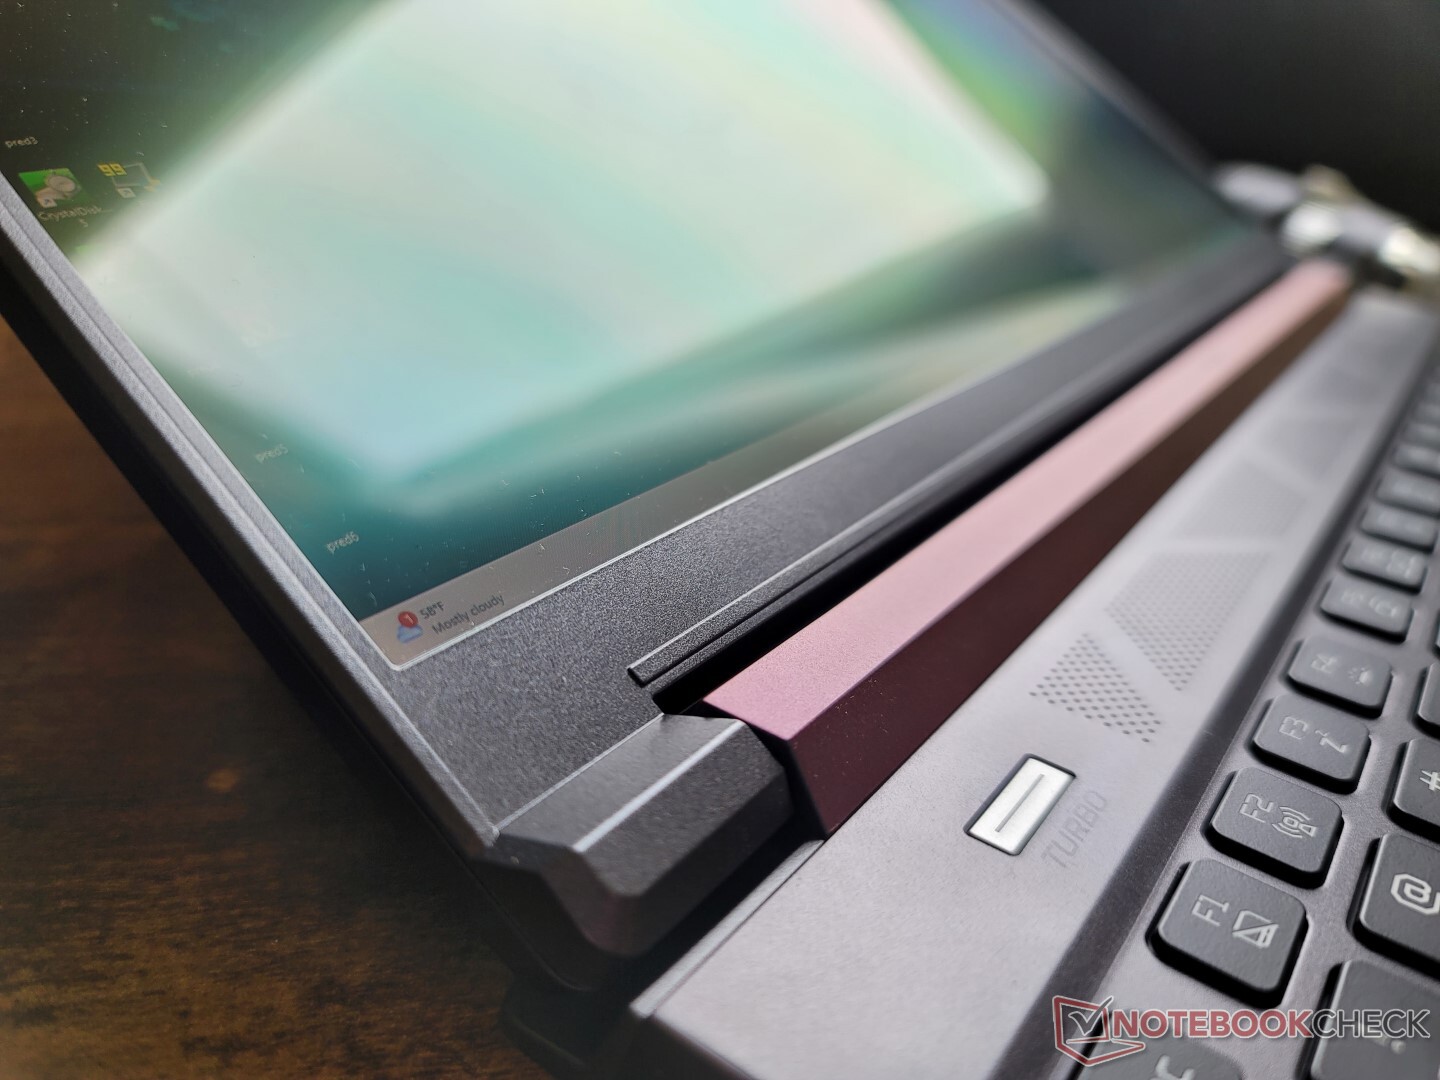
外壳 - 与Zephyrus G14尺寸相似
金属底座很结实,只有极少的扭曲或翘曲的迹象,当沿着键盘中心或角落施加压力时没有吱吱作响。它不像Razer Blade 14那样坚硬,但它肯定也不会感到廉价。
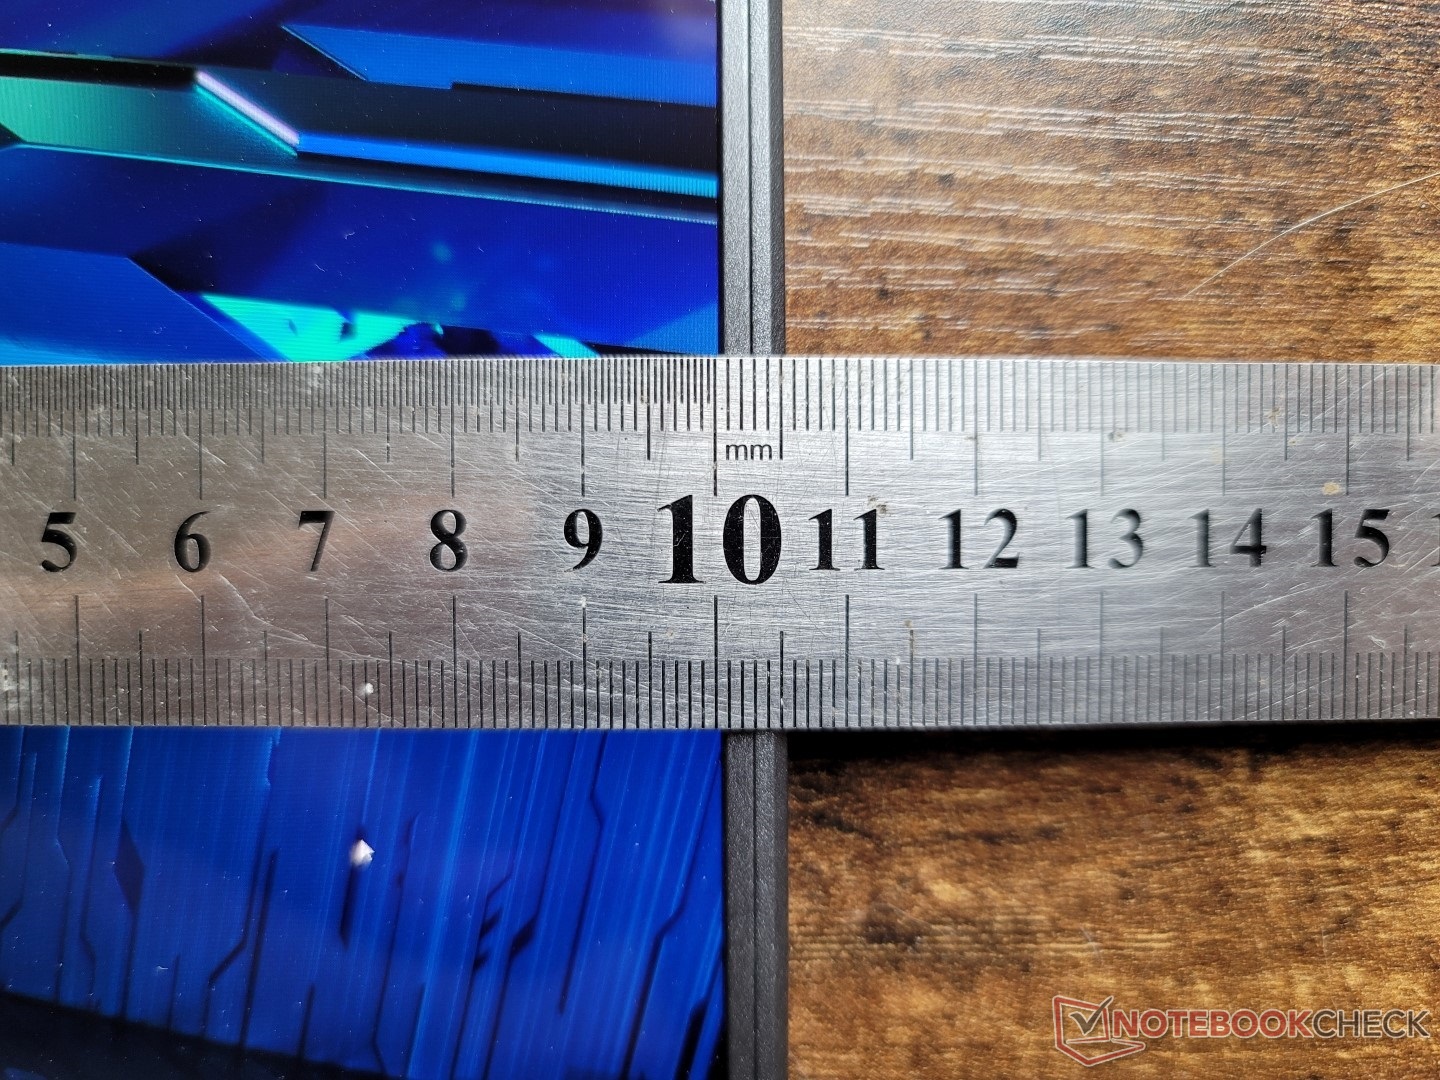
机箱最薄弱的地方是它的显示屏。虽然这在大多数笔记本电脑上很常见,但宏碁的显示屏特别薄,明显比Zephyrus G14或Blade 14的显示屏更容易翘起。我们很欣赏显示屏几乎可以完全打开180度,这与上述华硕或雷蛇机型不同,但宏碁的铰链感觉更弱,相比之下,有一种摇摆不定的趋势。
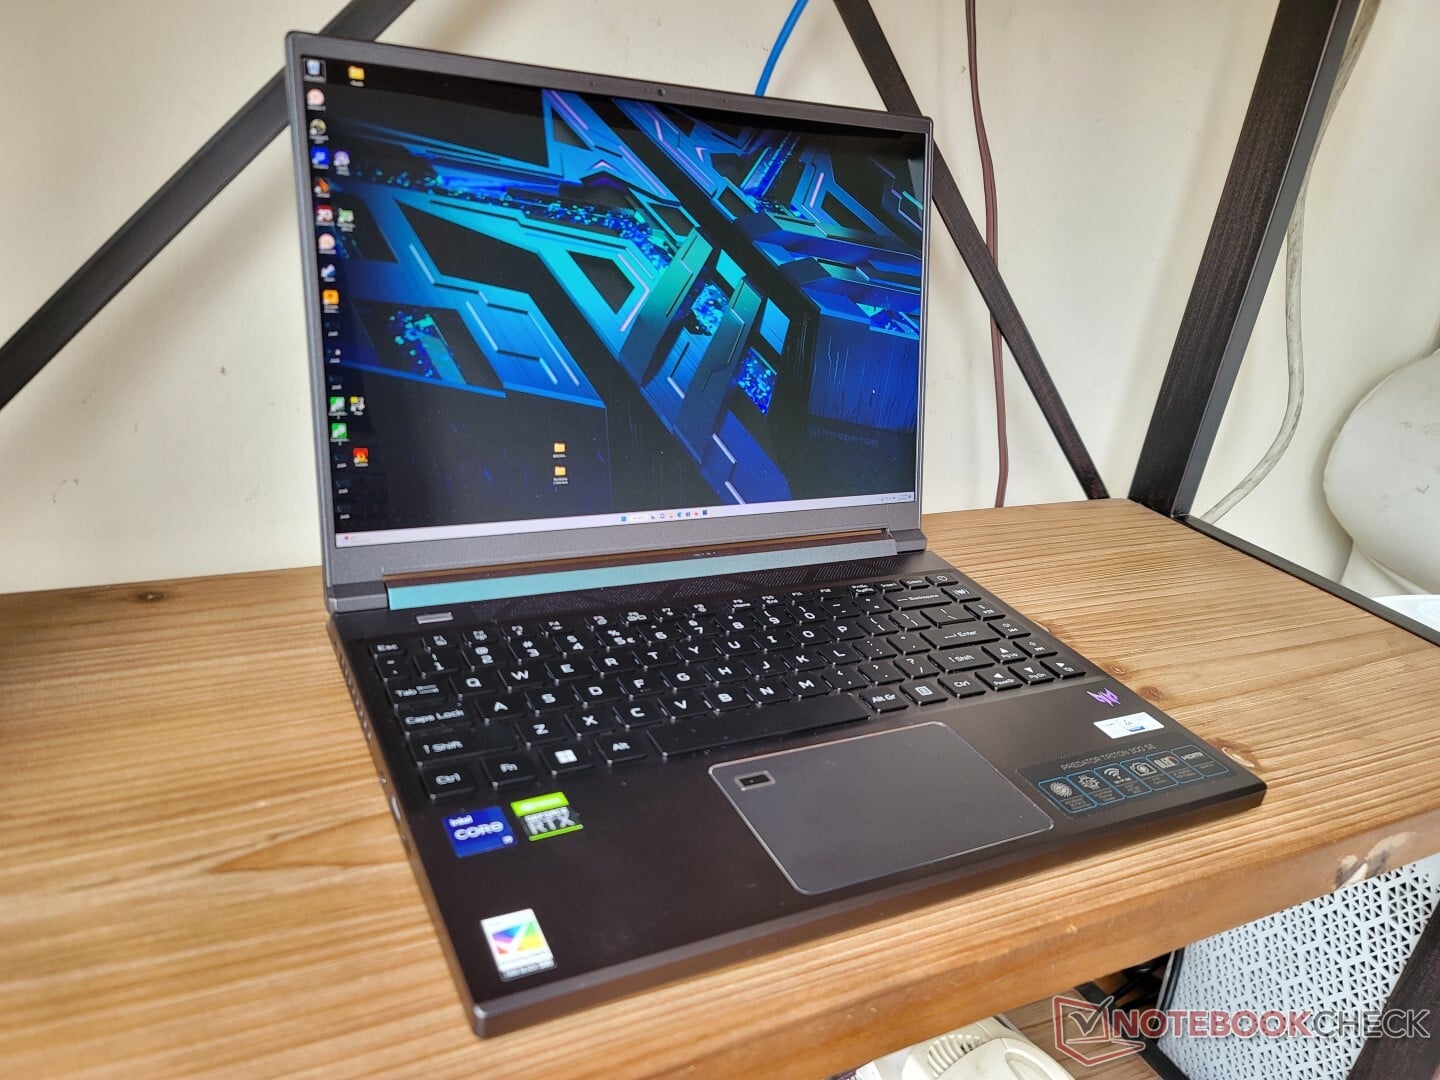
巧合的是,重量和尺寸都与华硕Zephyrus G14几乎相同。刀锋14和Alienware x14都明显更薄,但它们有更大的脚印作为补偿。大多数普通的14英寸超极本,如斯肯克视觉14 可以大大减轻半公斤以上的重量,但没有性能上的优势。
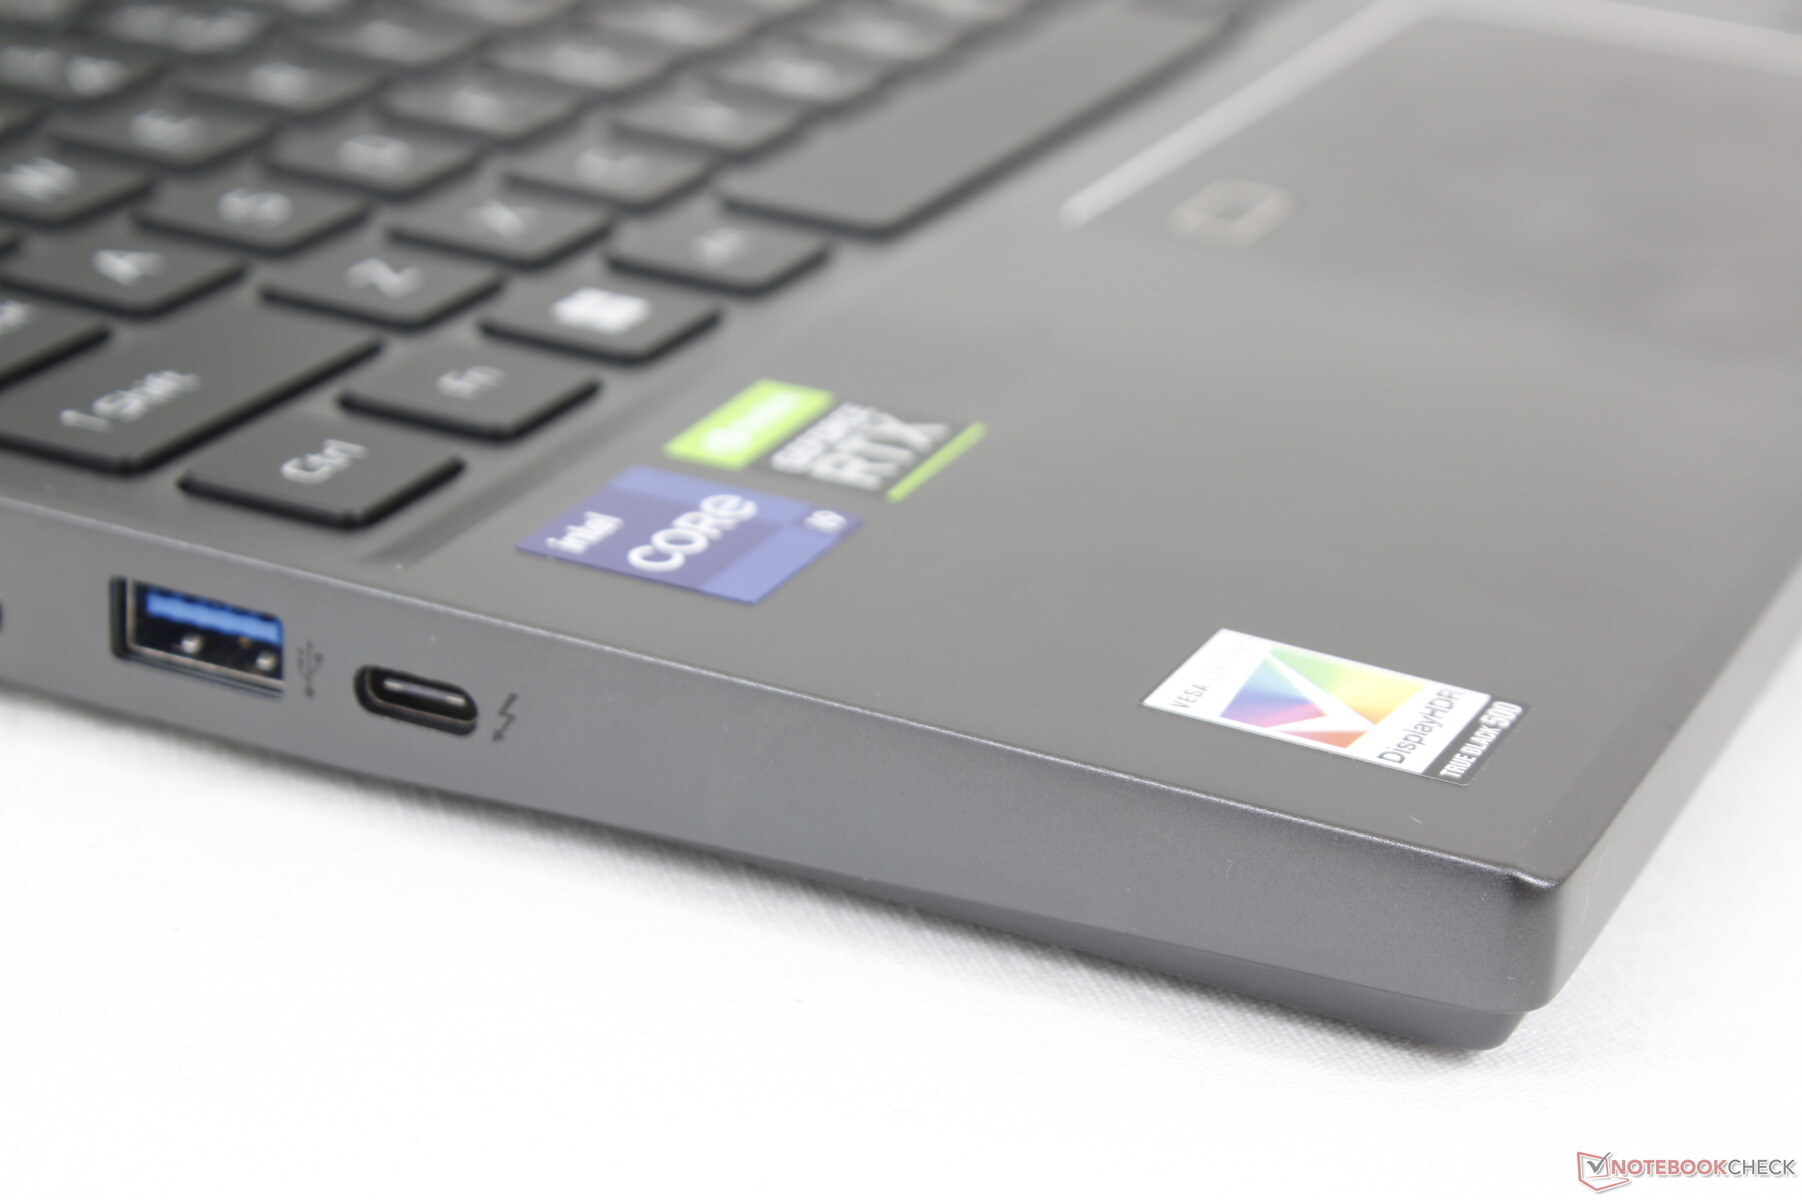
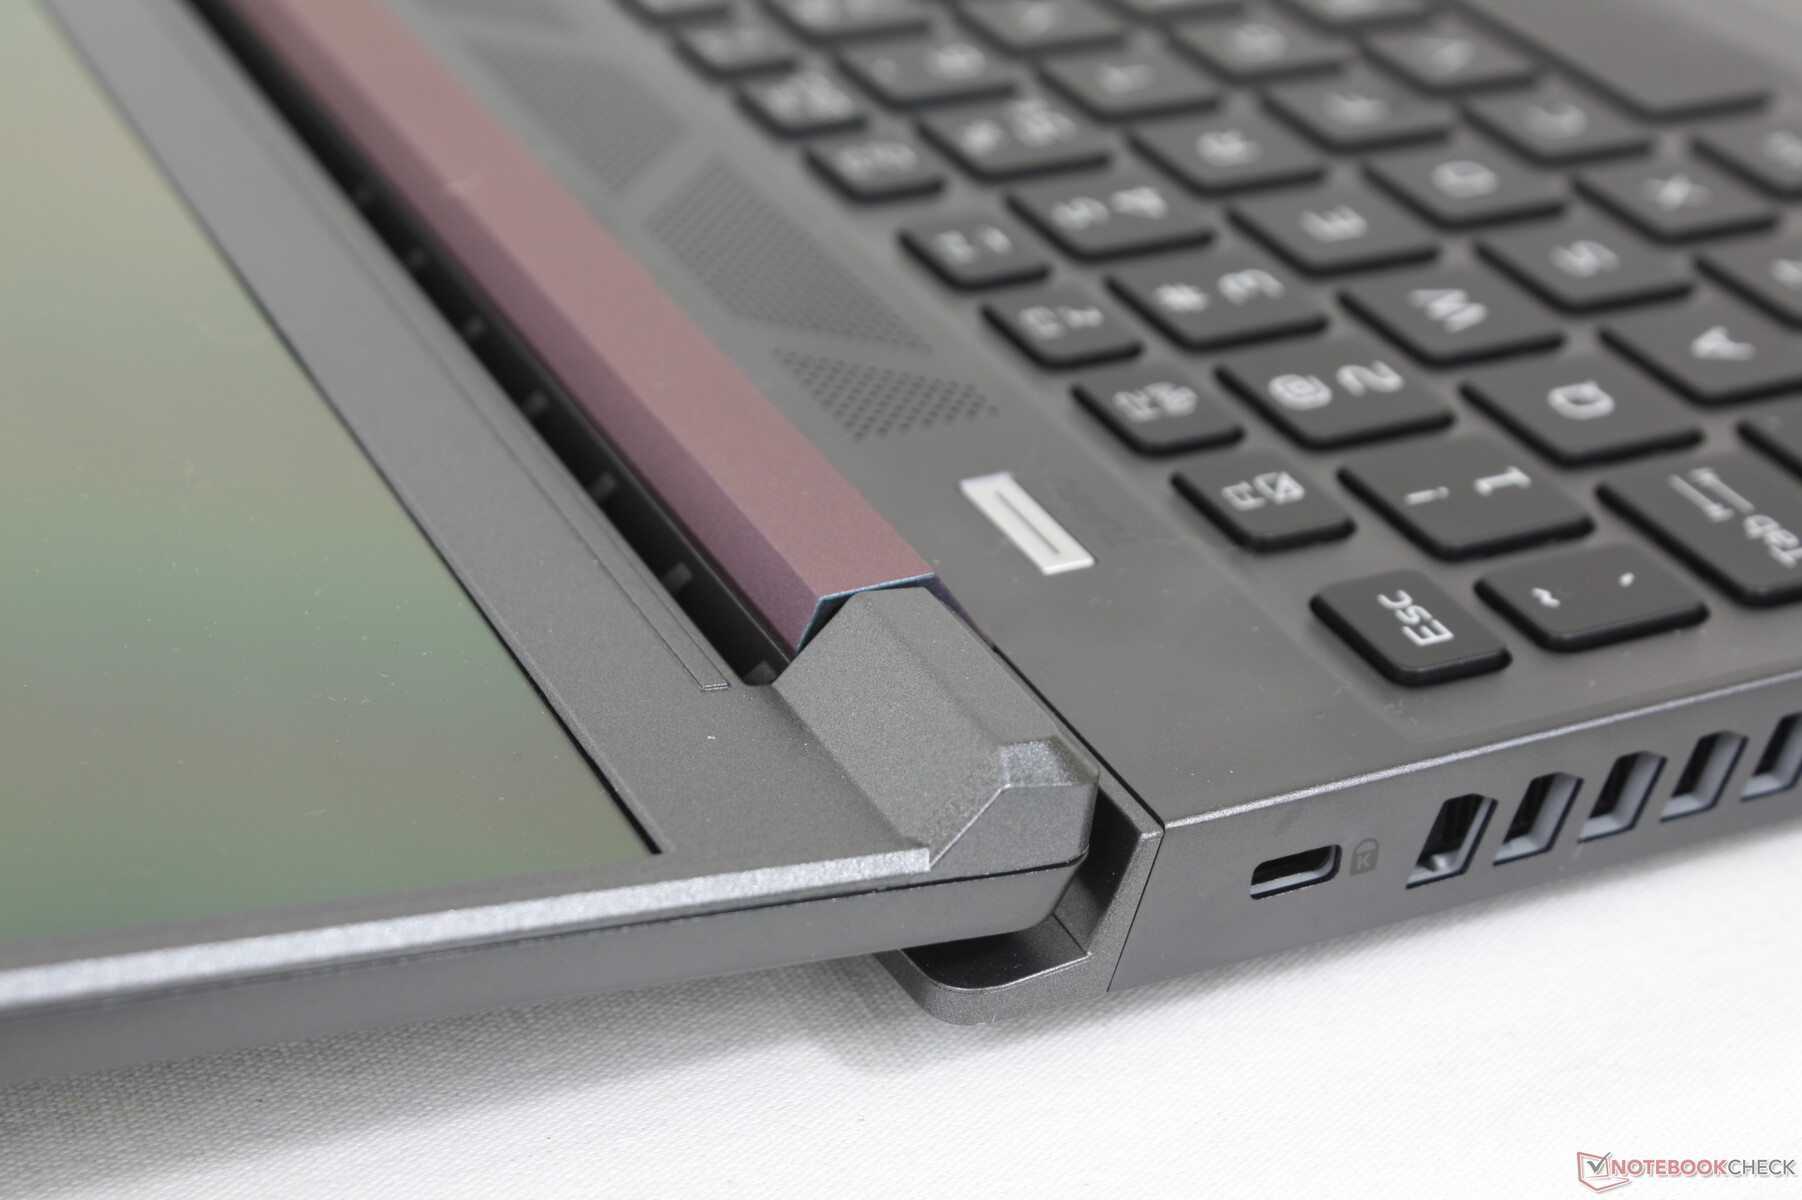
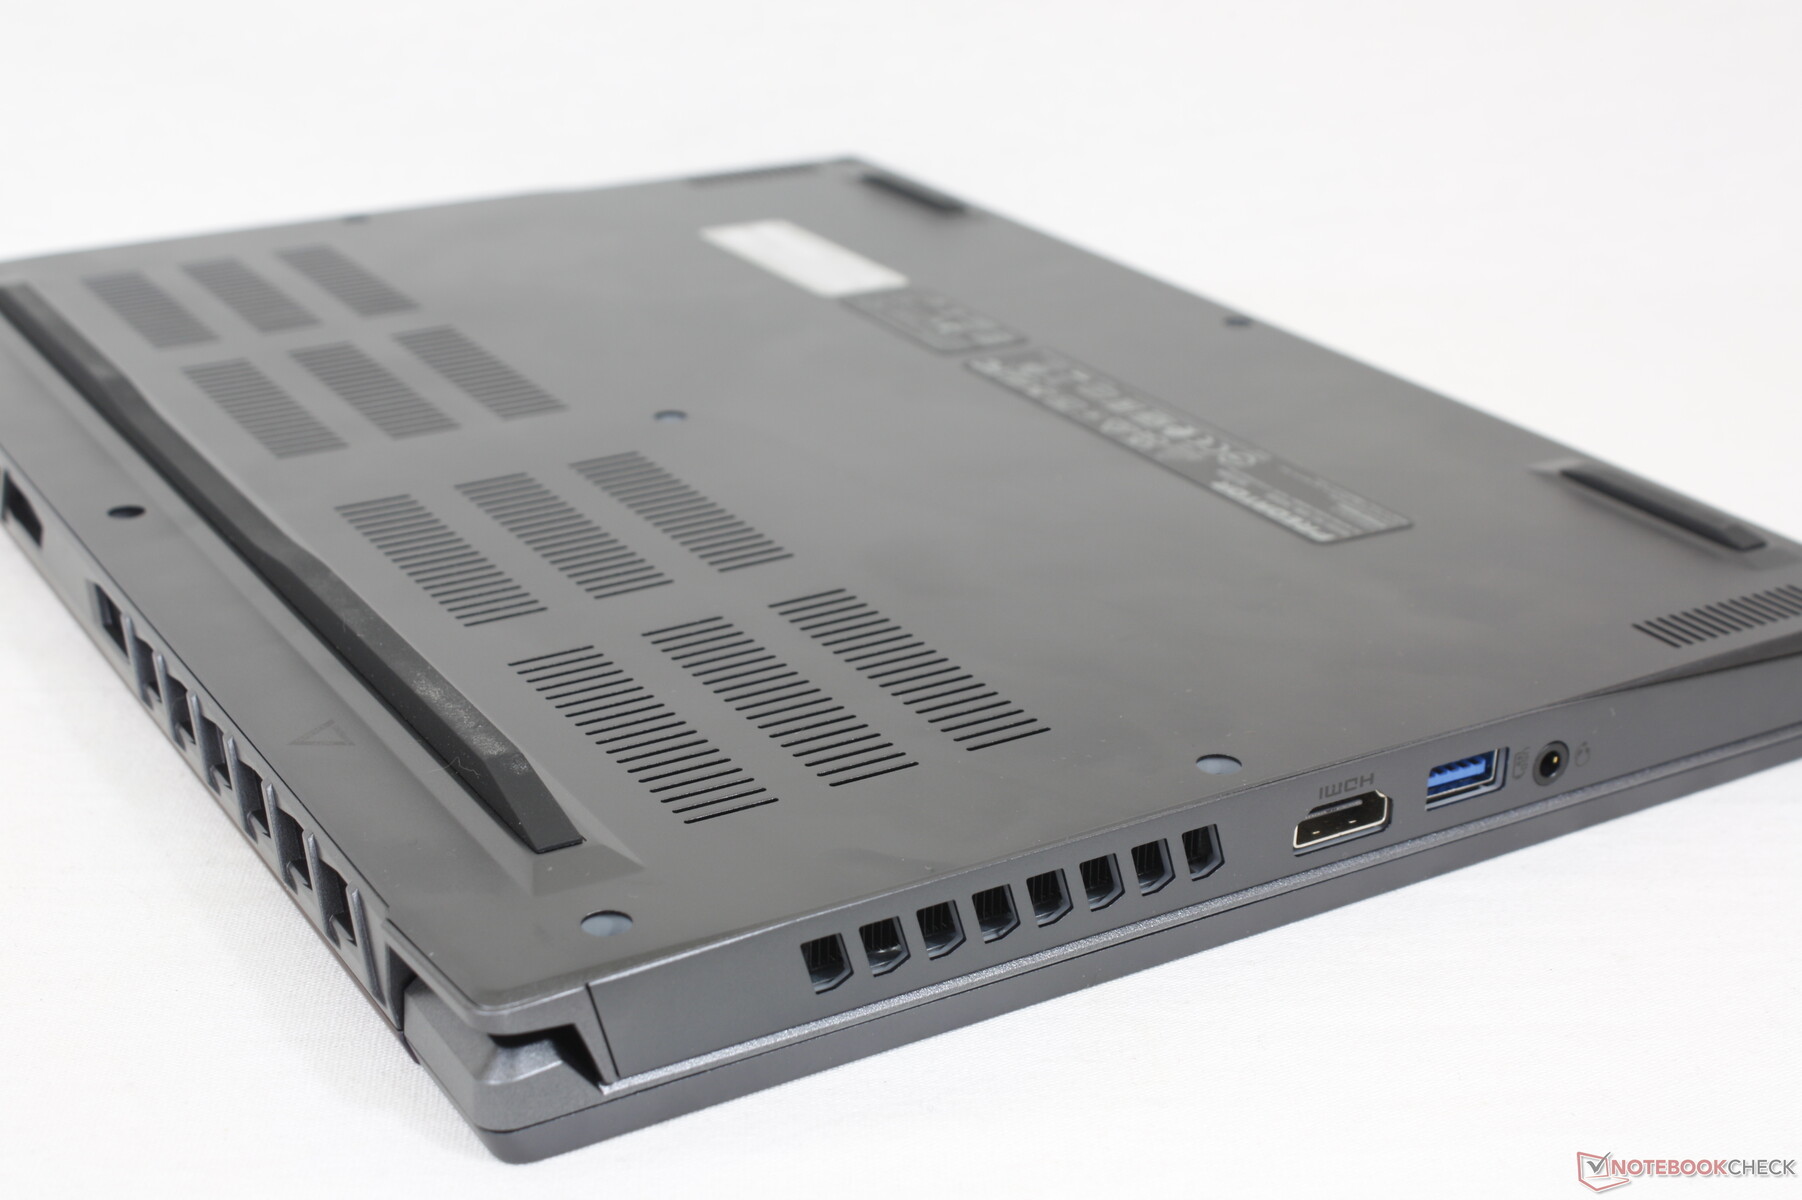
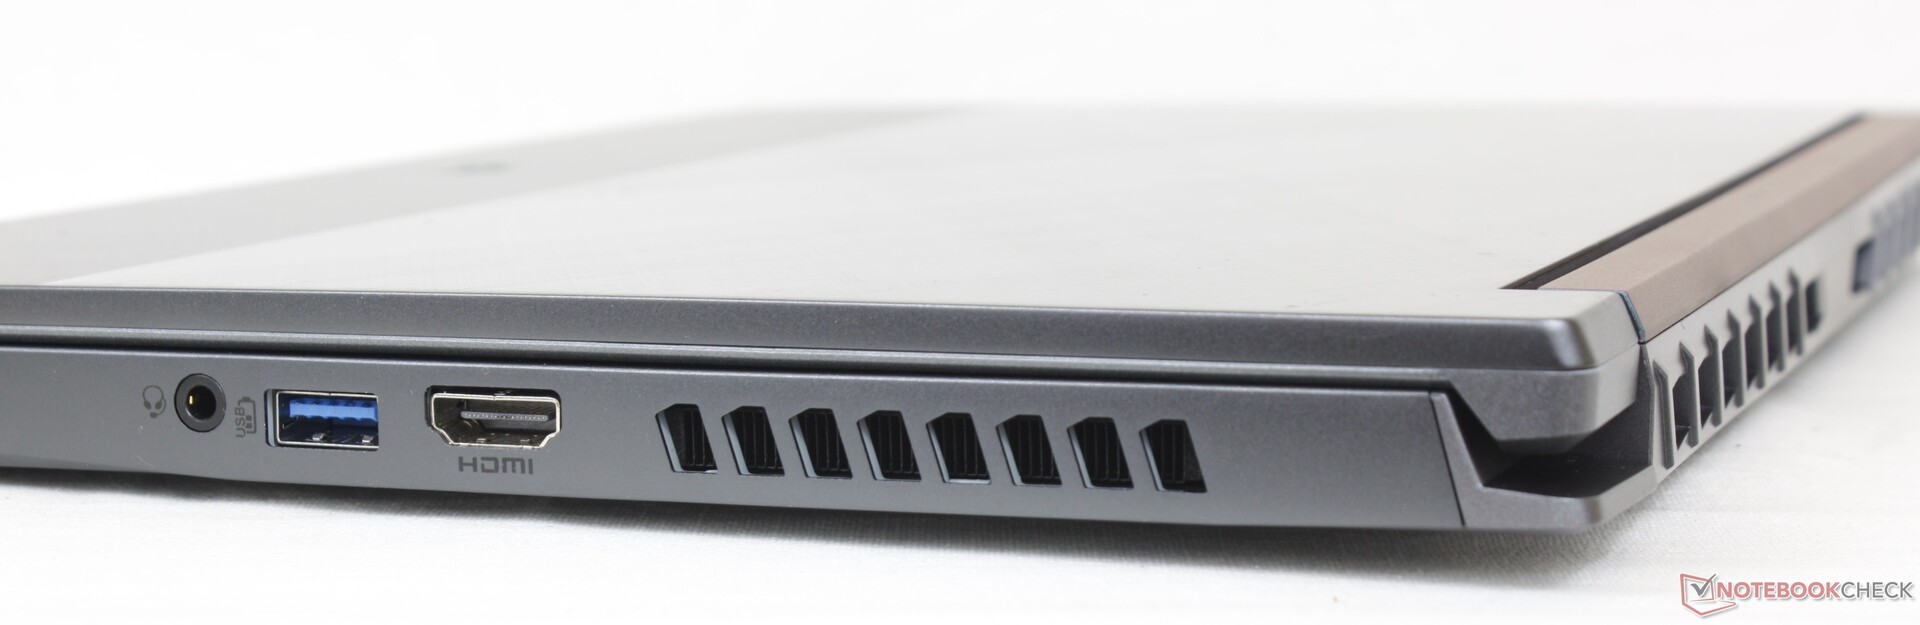
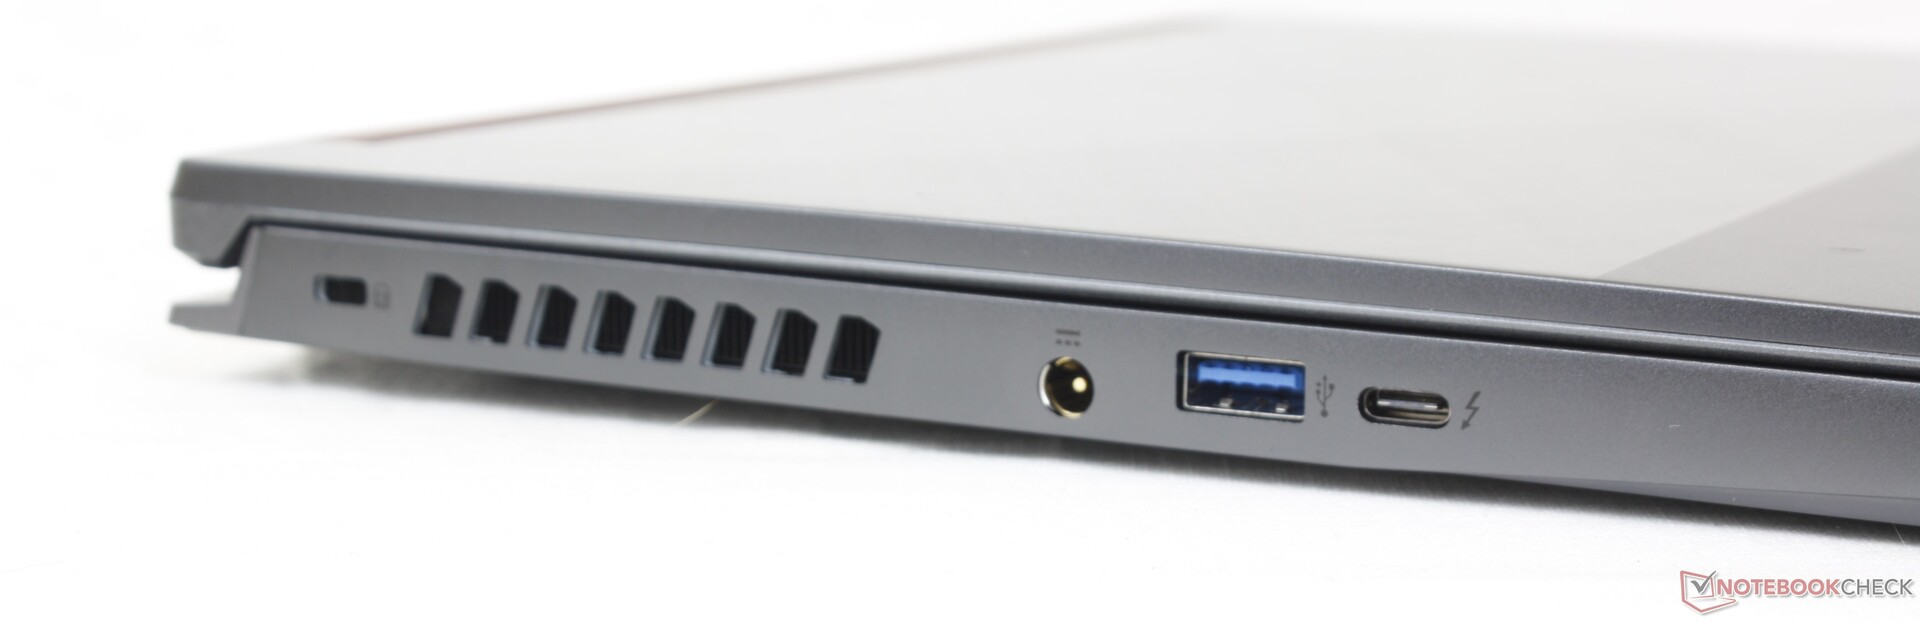
连接性 - 支持Thunderbolt 4
与华硕Zephyrus G14或Razer Blade 14相比,端口的选择更为有限,因为每种选择都比我们的宏碁多集成了一个USB-C端口。端口的定位也有些不利,因为端口被紧紧地挤在一起,而且相对靠近前缘。很明显,机箱周围的大型通风格栅占用了端口的宝贵空间。
沟通
英特尔AX1675i是Wi-Fi 6E和蓝牙5.2连接的标准配置。当与我们的6GHz网络配对时,我们经历了快速和稳定的传输率。
| Networking | |
| iperf3 transmit AX12 | |
| Alienware x14 i7 RTX 3060 | |
| Schenker Vision 14 | |
| Razer Blade 14 Ryzen 9 6900HX | |
| iperf3 receive AX12 | |
| Schenker Vision 14 | |
| Razer Blade 14 Ryzen 9 6900HX | |
| Alienware x14 i7 RTX 3060 | |
| iperf3 receive AXE11000 6GHz | |
| Acer Predator Triton 300 SE | |
| Dell Inspiron 14 Plus 7420 | |
| iperf3 receive AXE11000 | |
| Asus ROG Zephyrus G14 GA402RJ | |
| iperf3 transmit AXE11000 6GHz | |
| Acer Predator Triton 300 SE | |
| Dell Inspiron 14 Plus 7420 | |
网络摄像头
一个200万像素的摄像头是标准配置,可与许多中档超极本相媲美。没有红外传感器,甚至没有隐私快门。


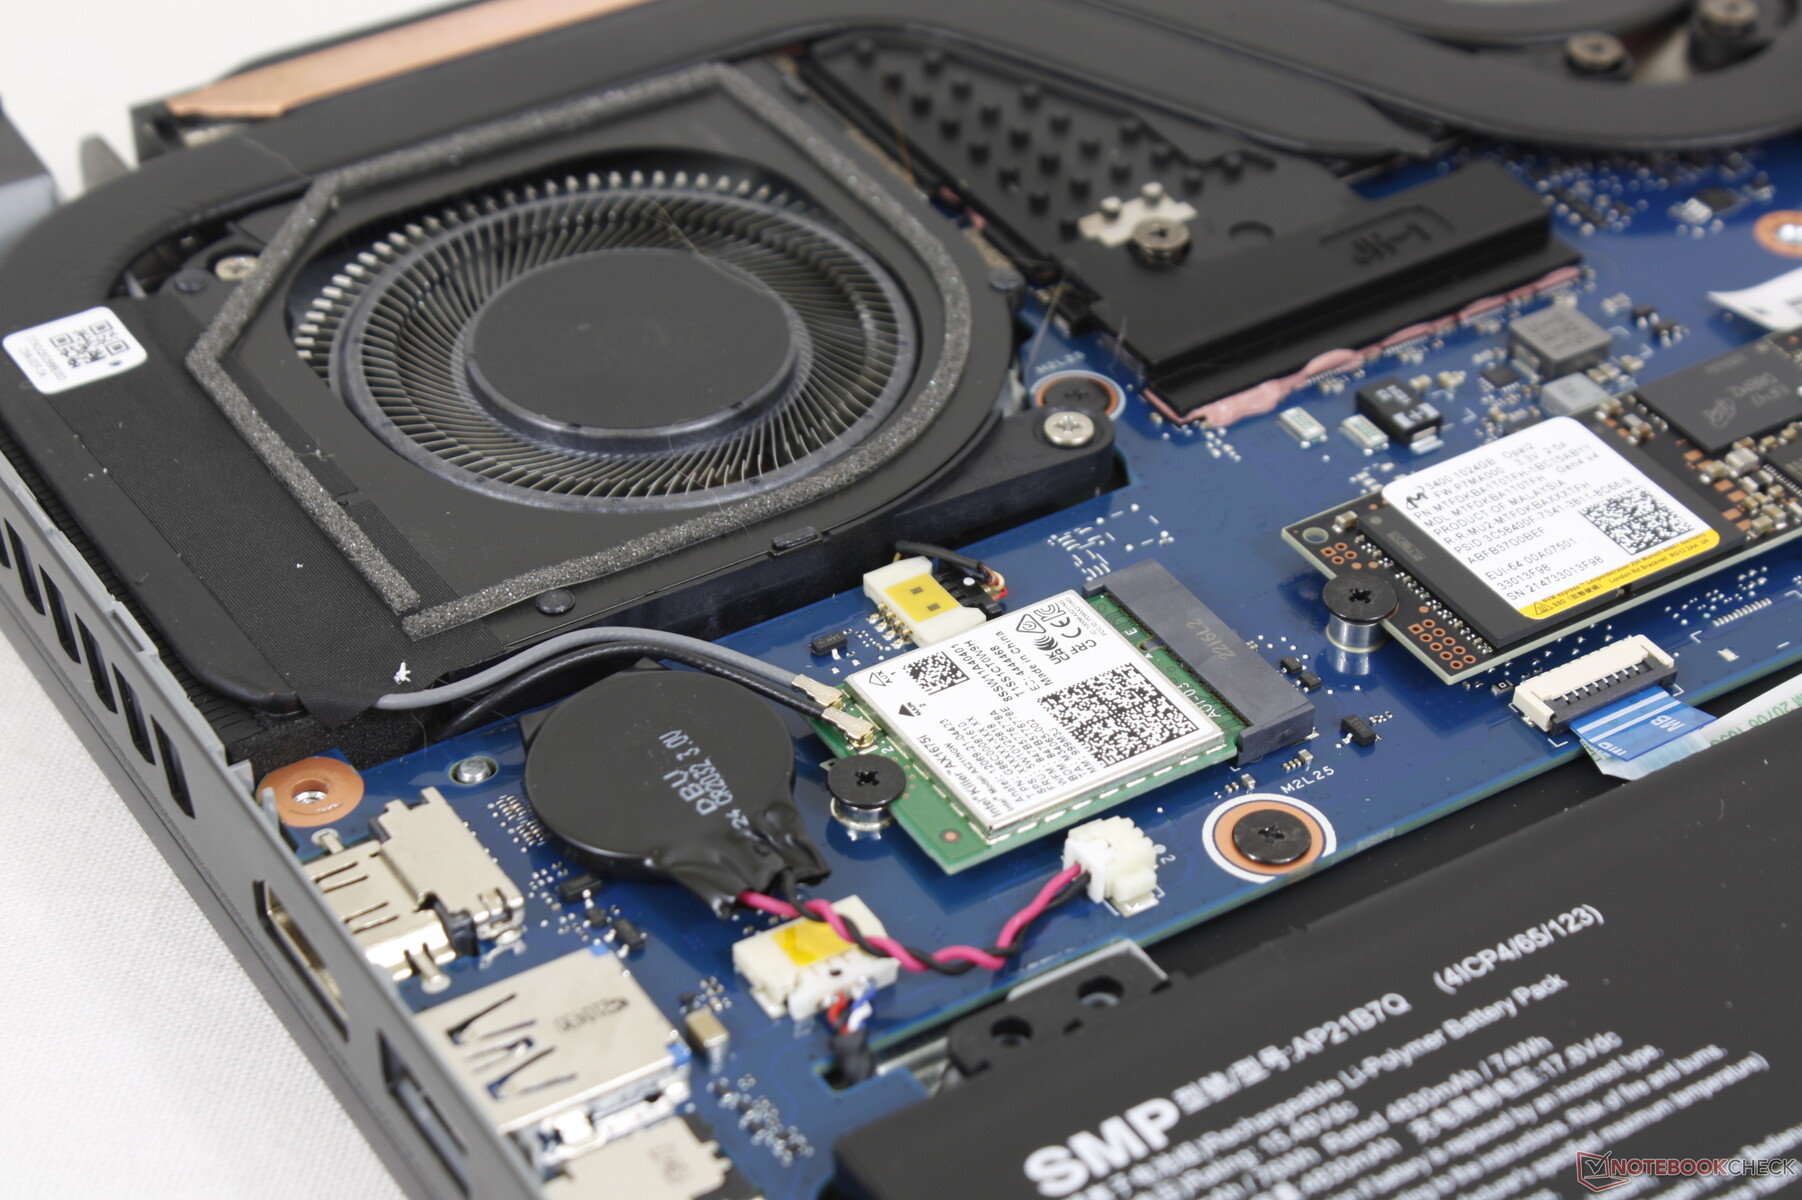
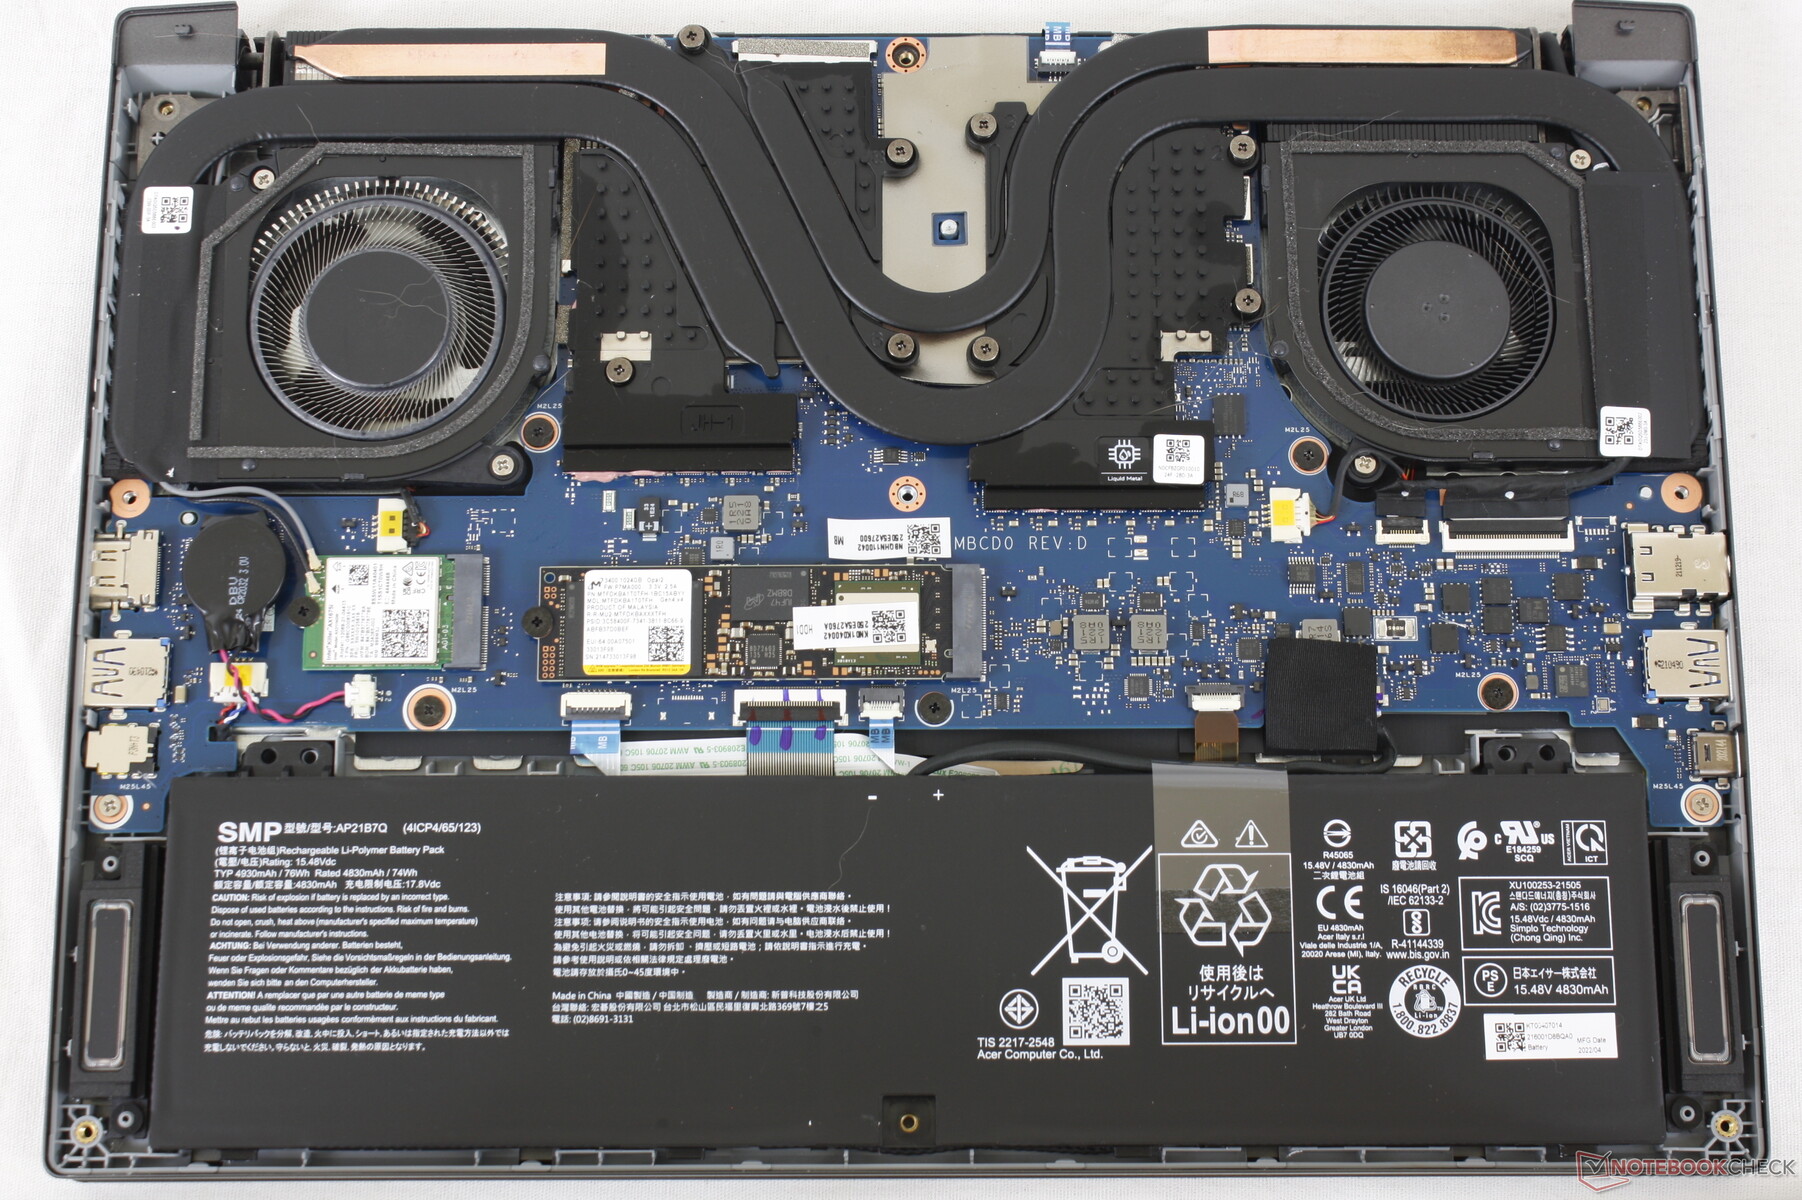
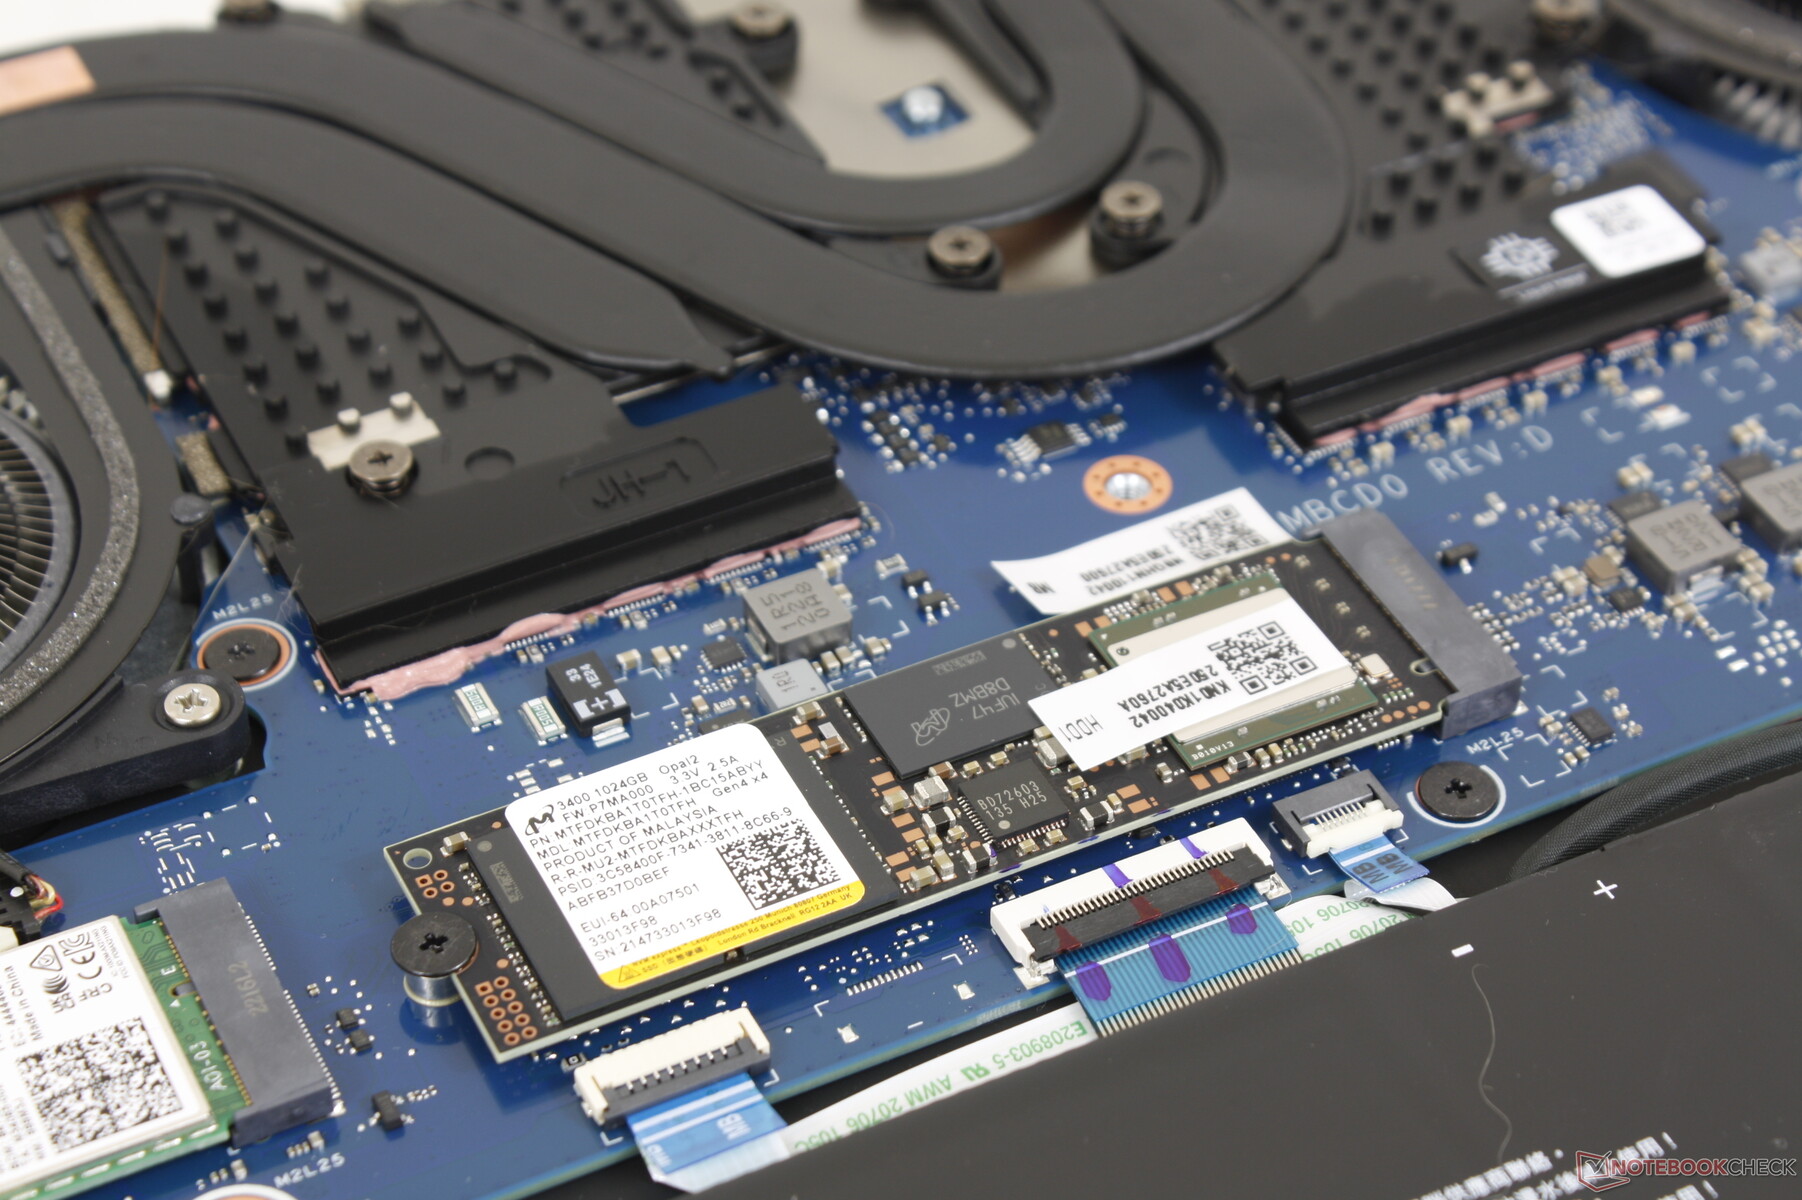
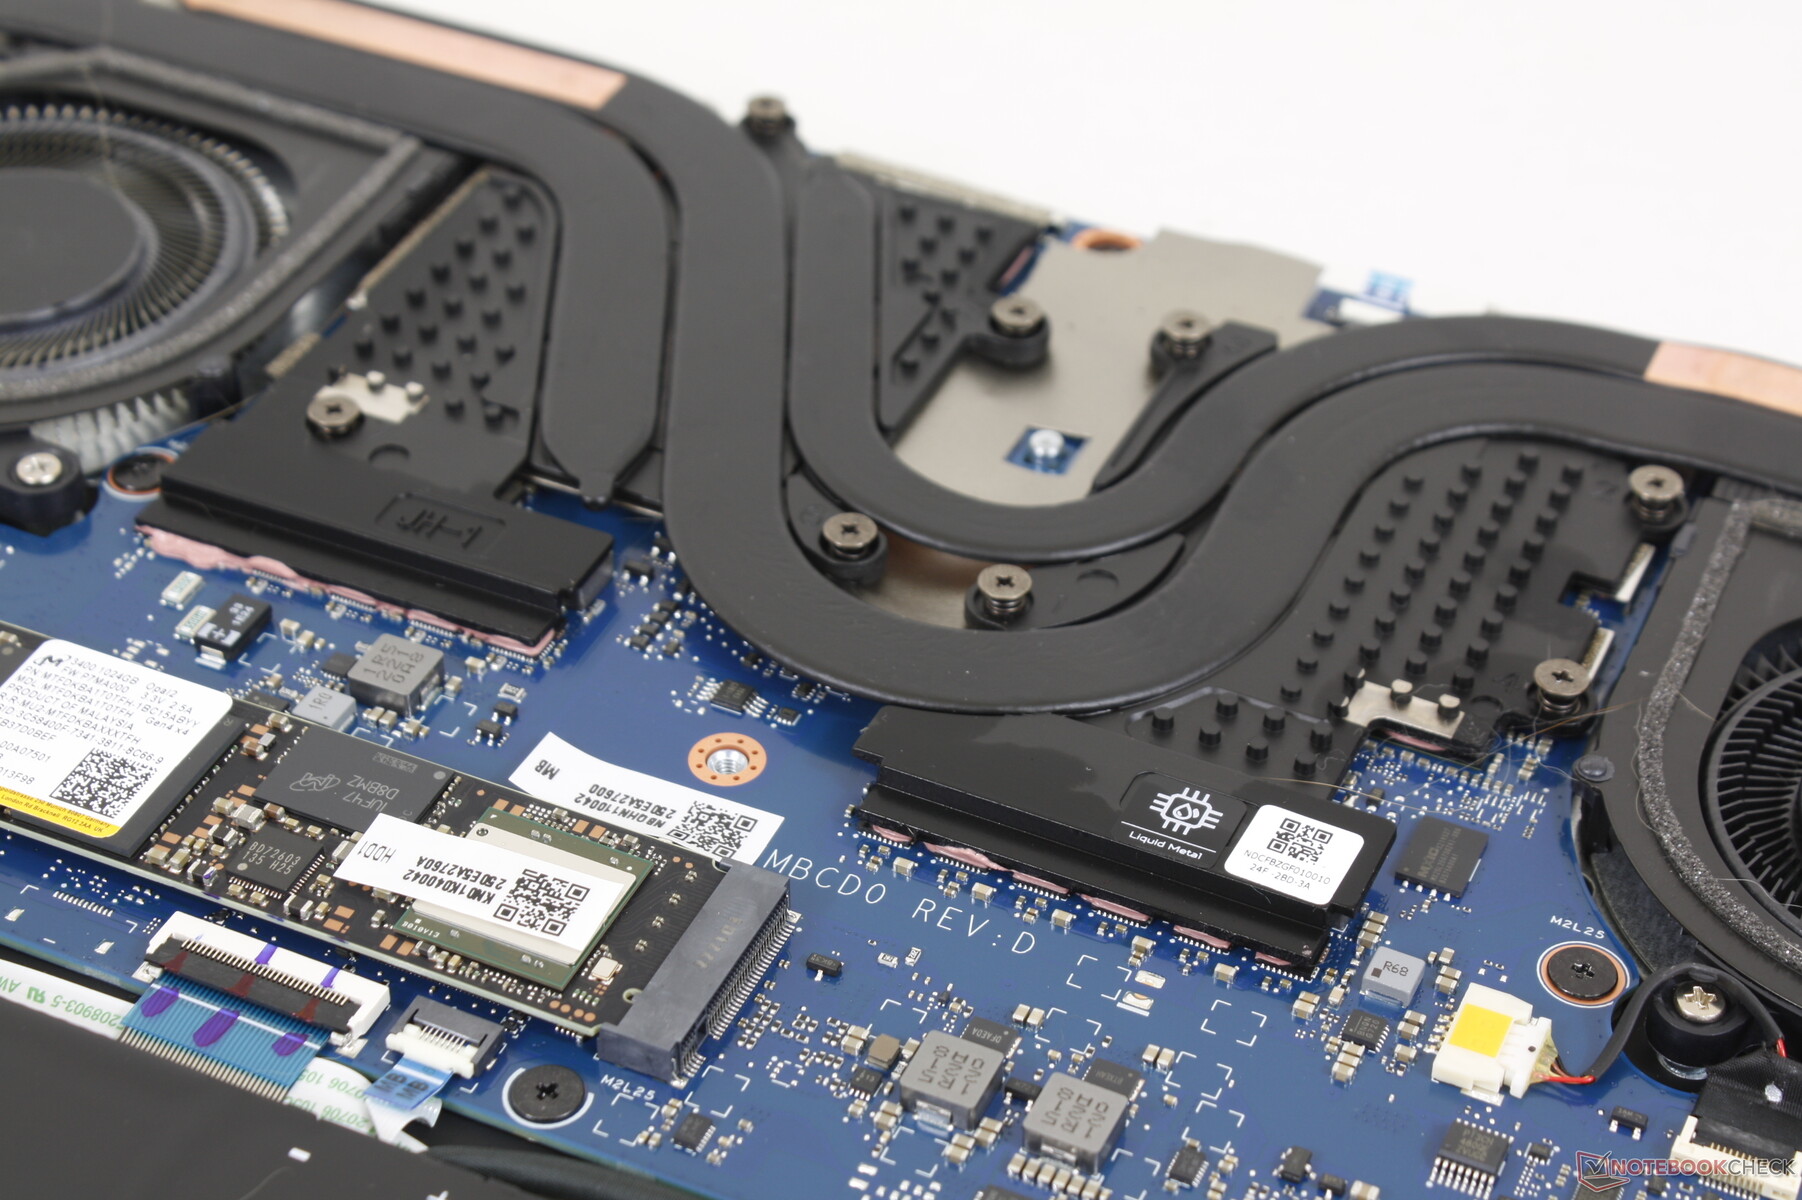
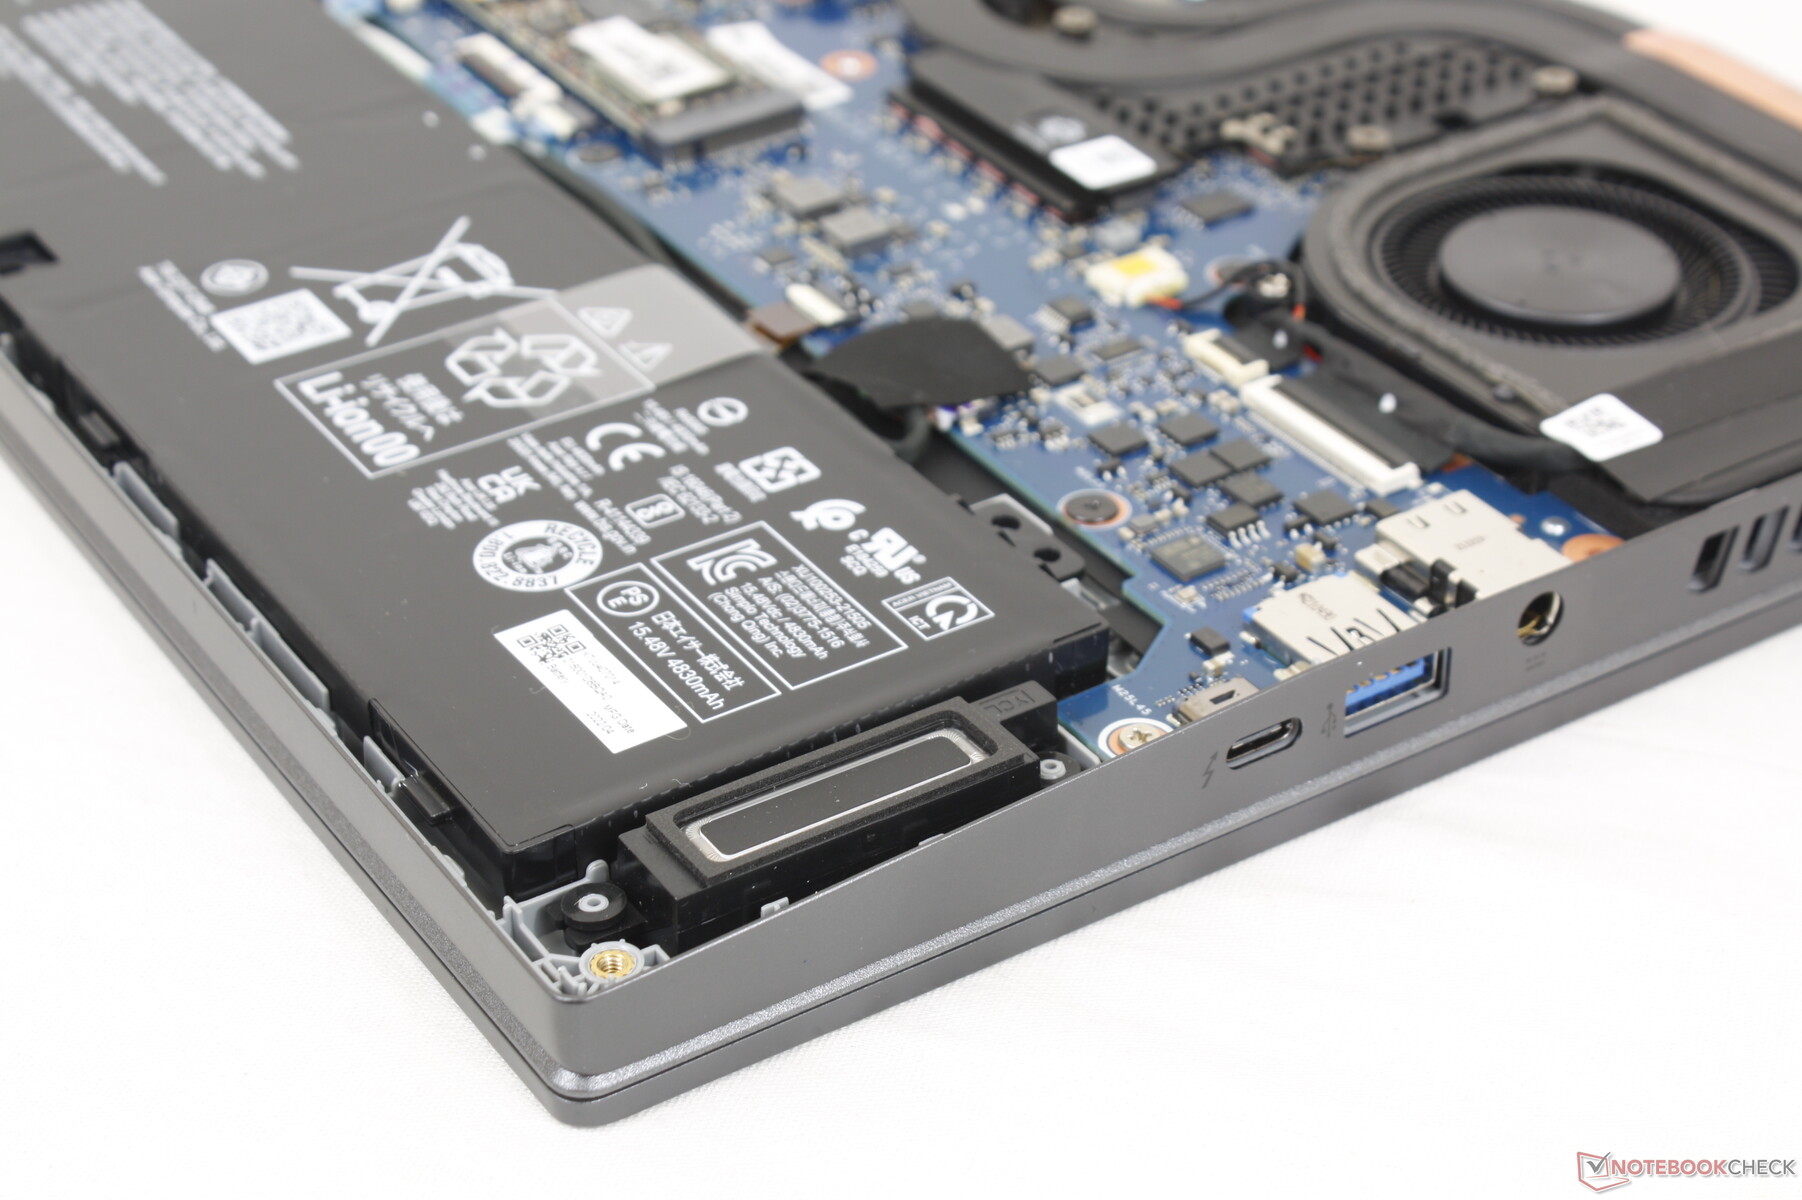
维护
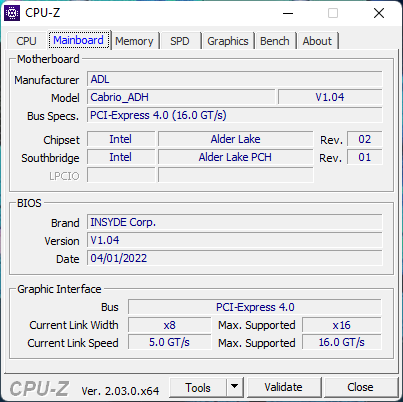
底部面板由9颗T6 Torx螺钉固定,相对来说比较容易维修。用户只能升级SSD、WLAN模块和电池。与上一代机型不同,内存模块是焊接的。
配件和保修
零售盒中除了交流电适配器和文件外,还包括一个方便的手提箱。其他制造商很少包括手提箱而不收取额外费用。如果在美国购买,通常有一年的制造商有限保修期。
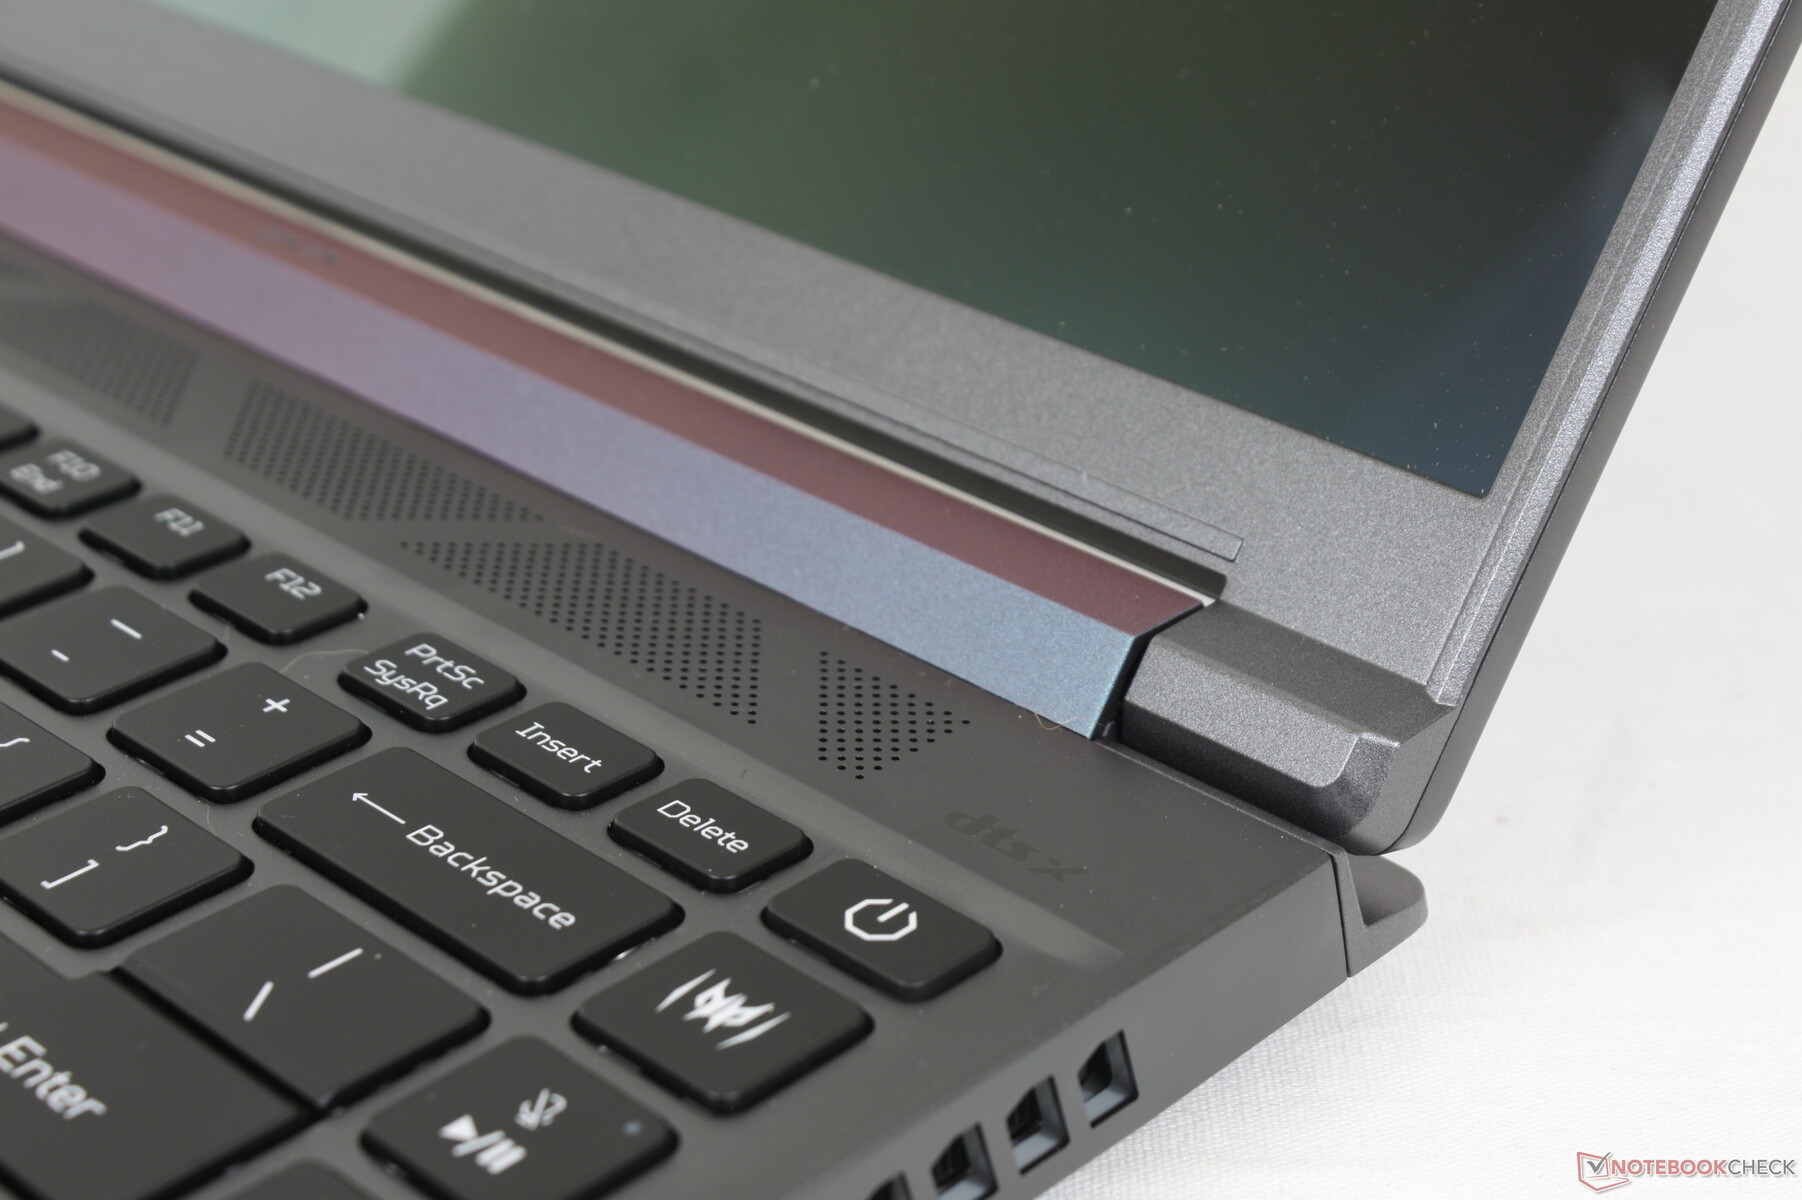
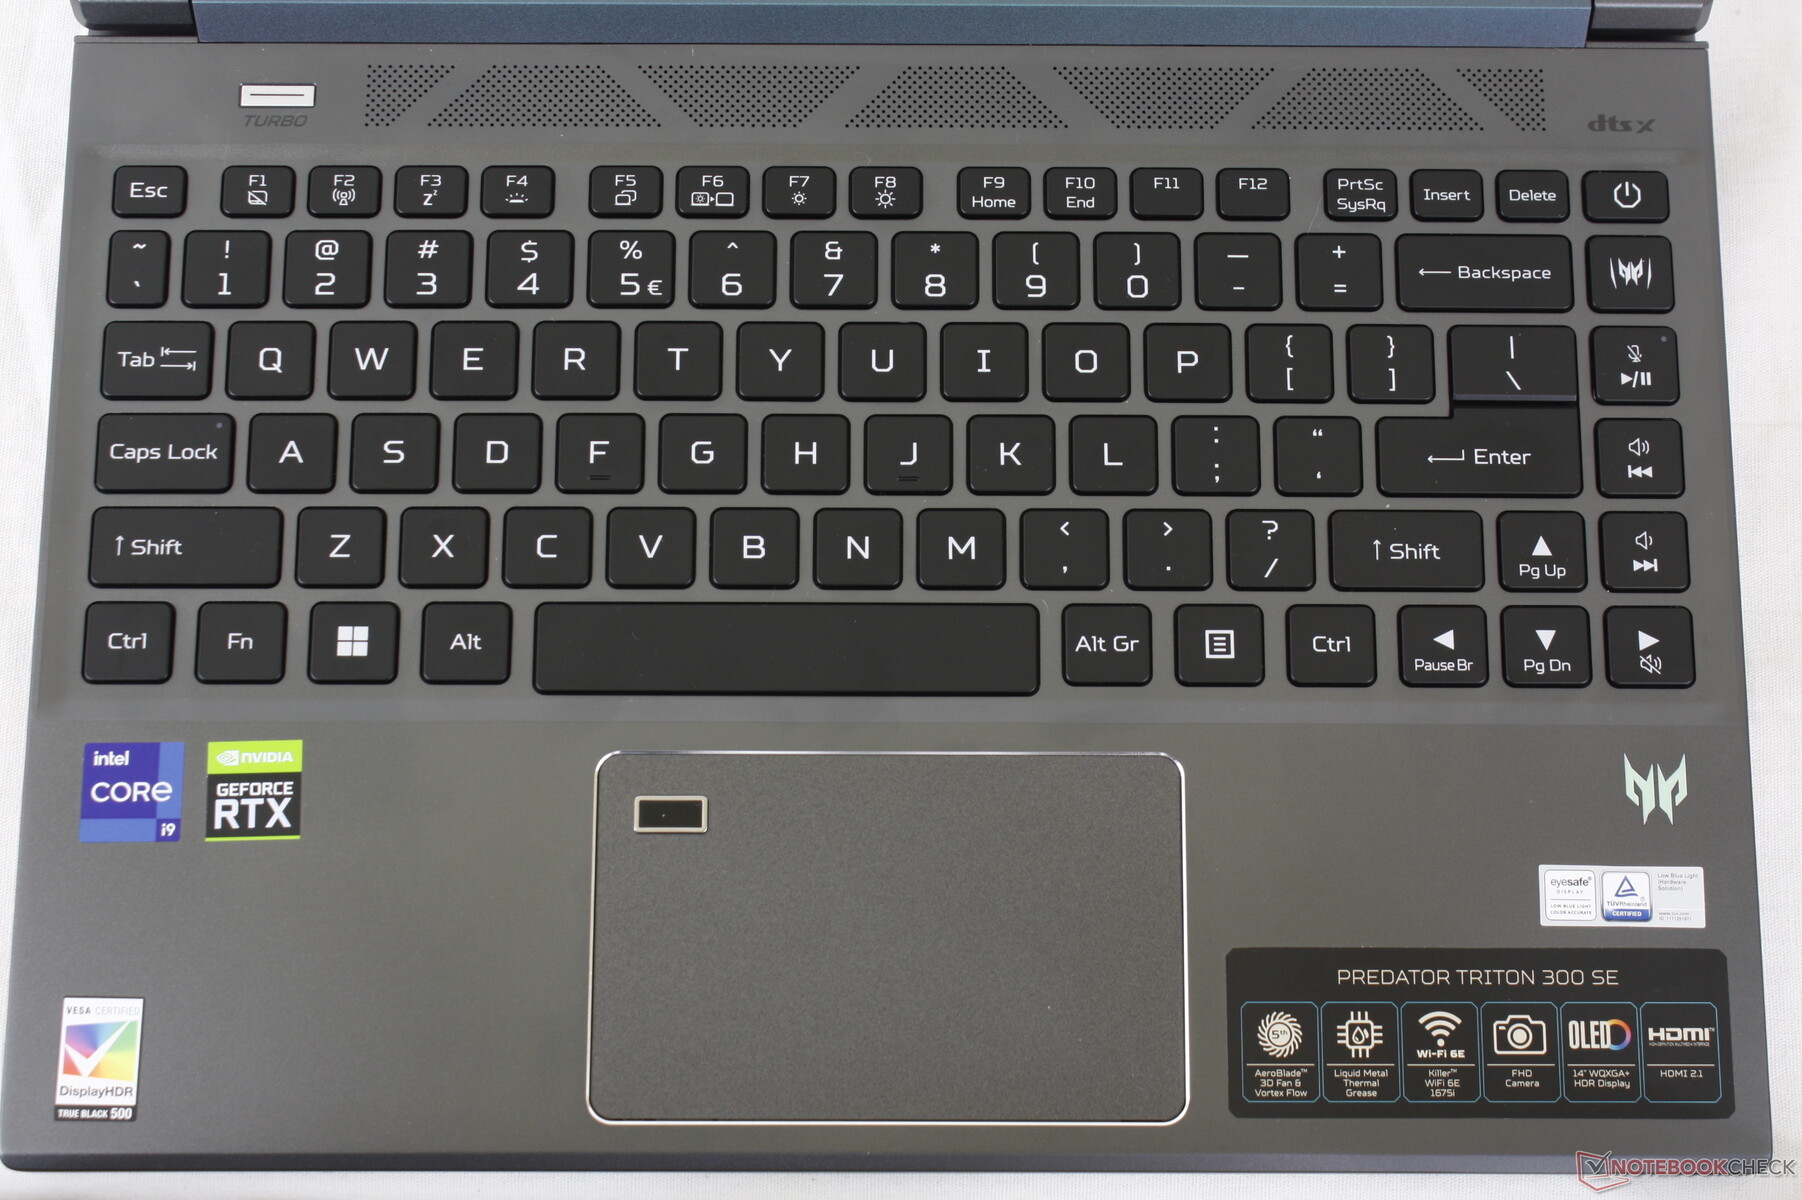
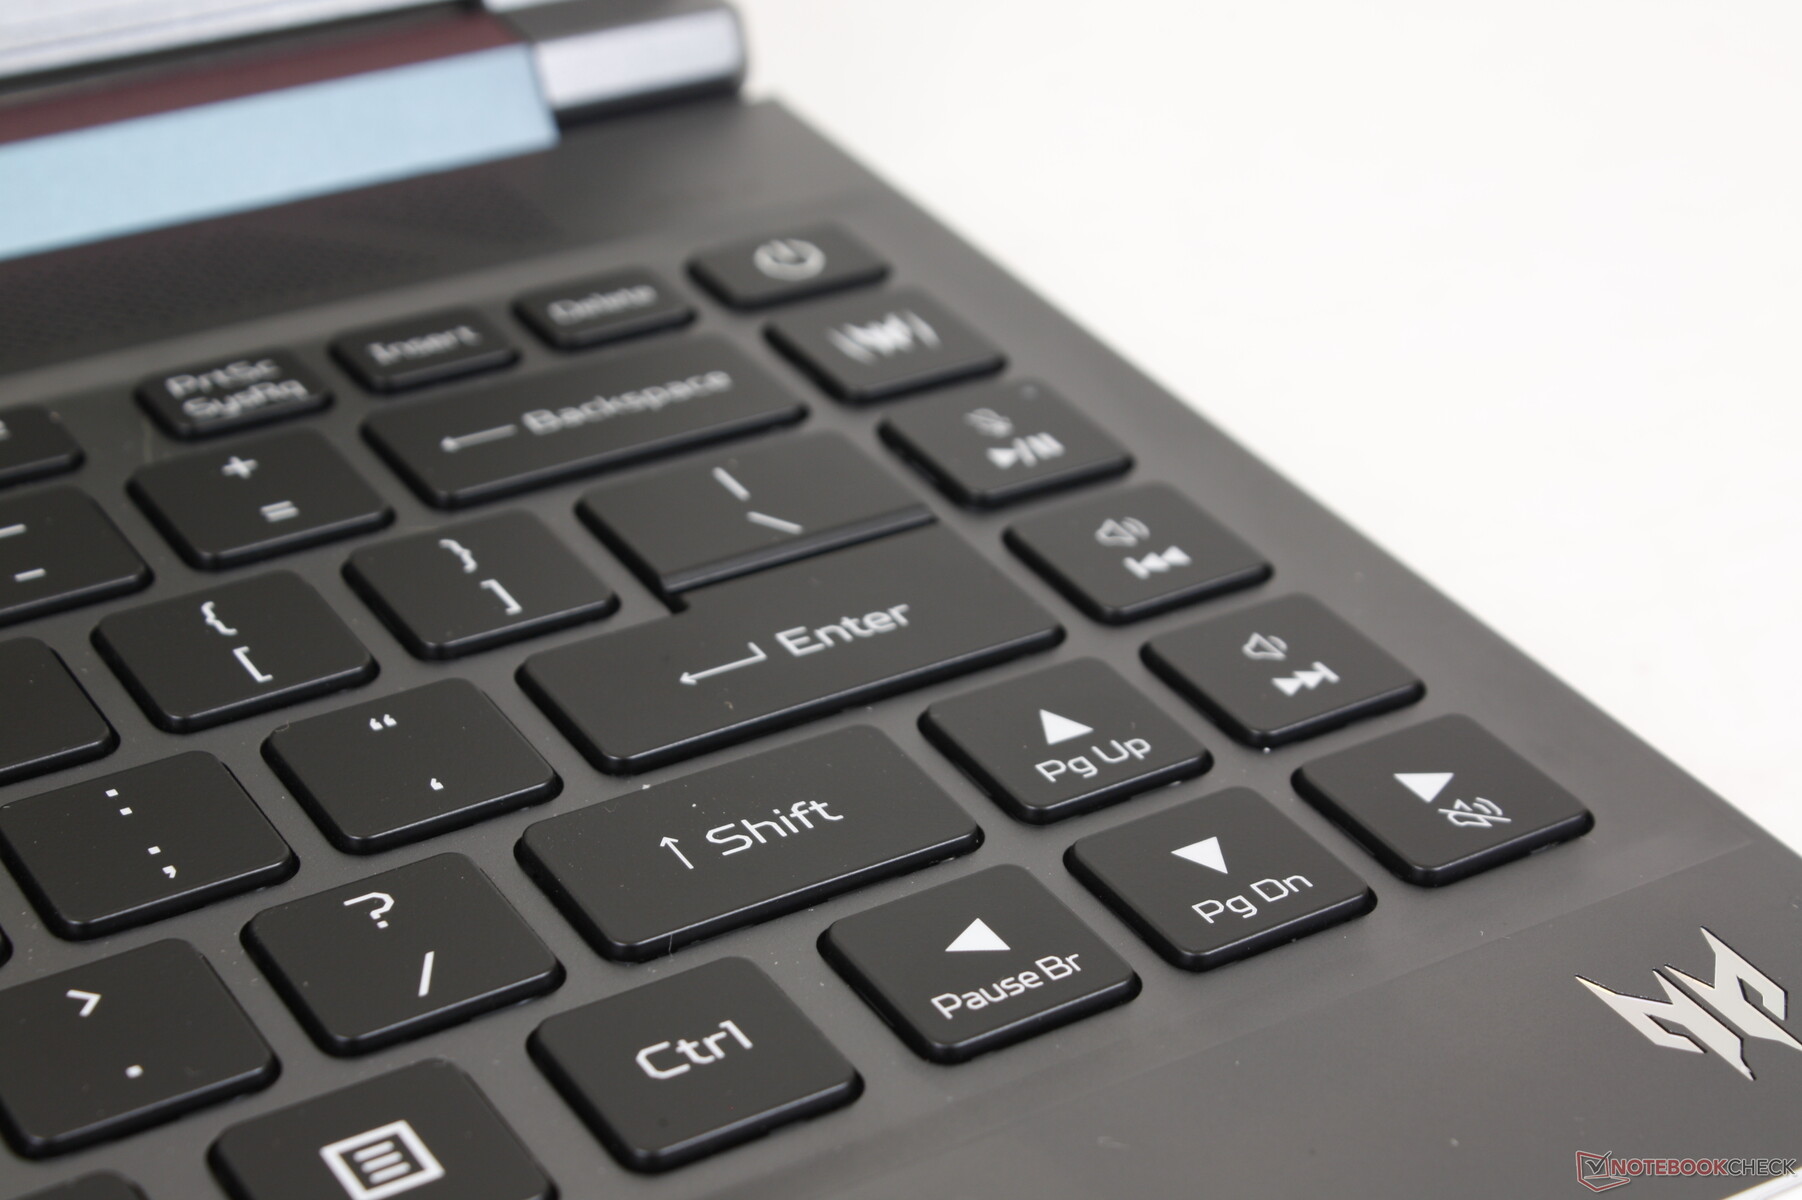
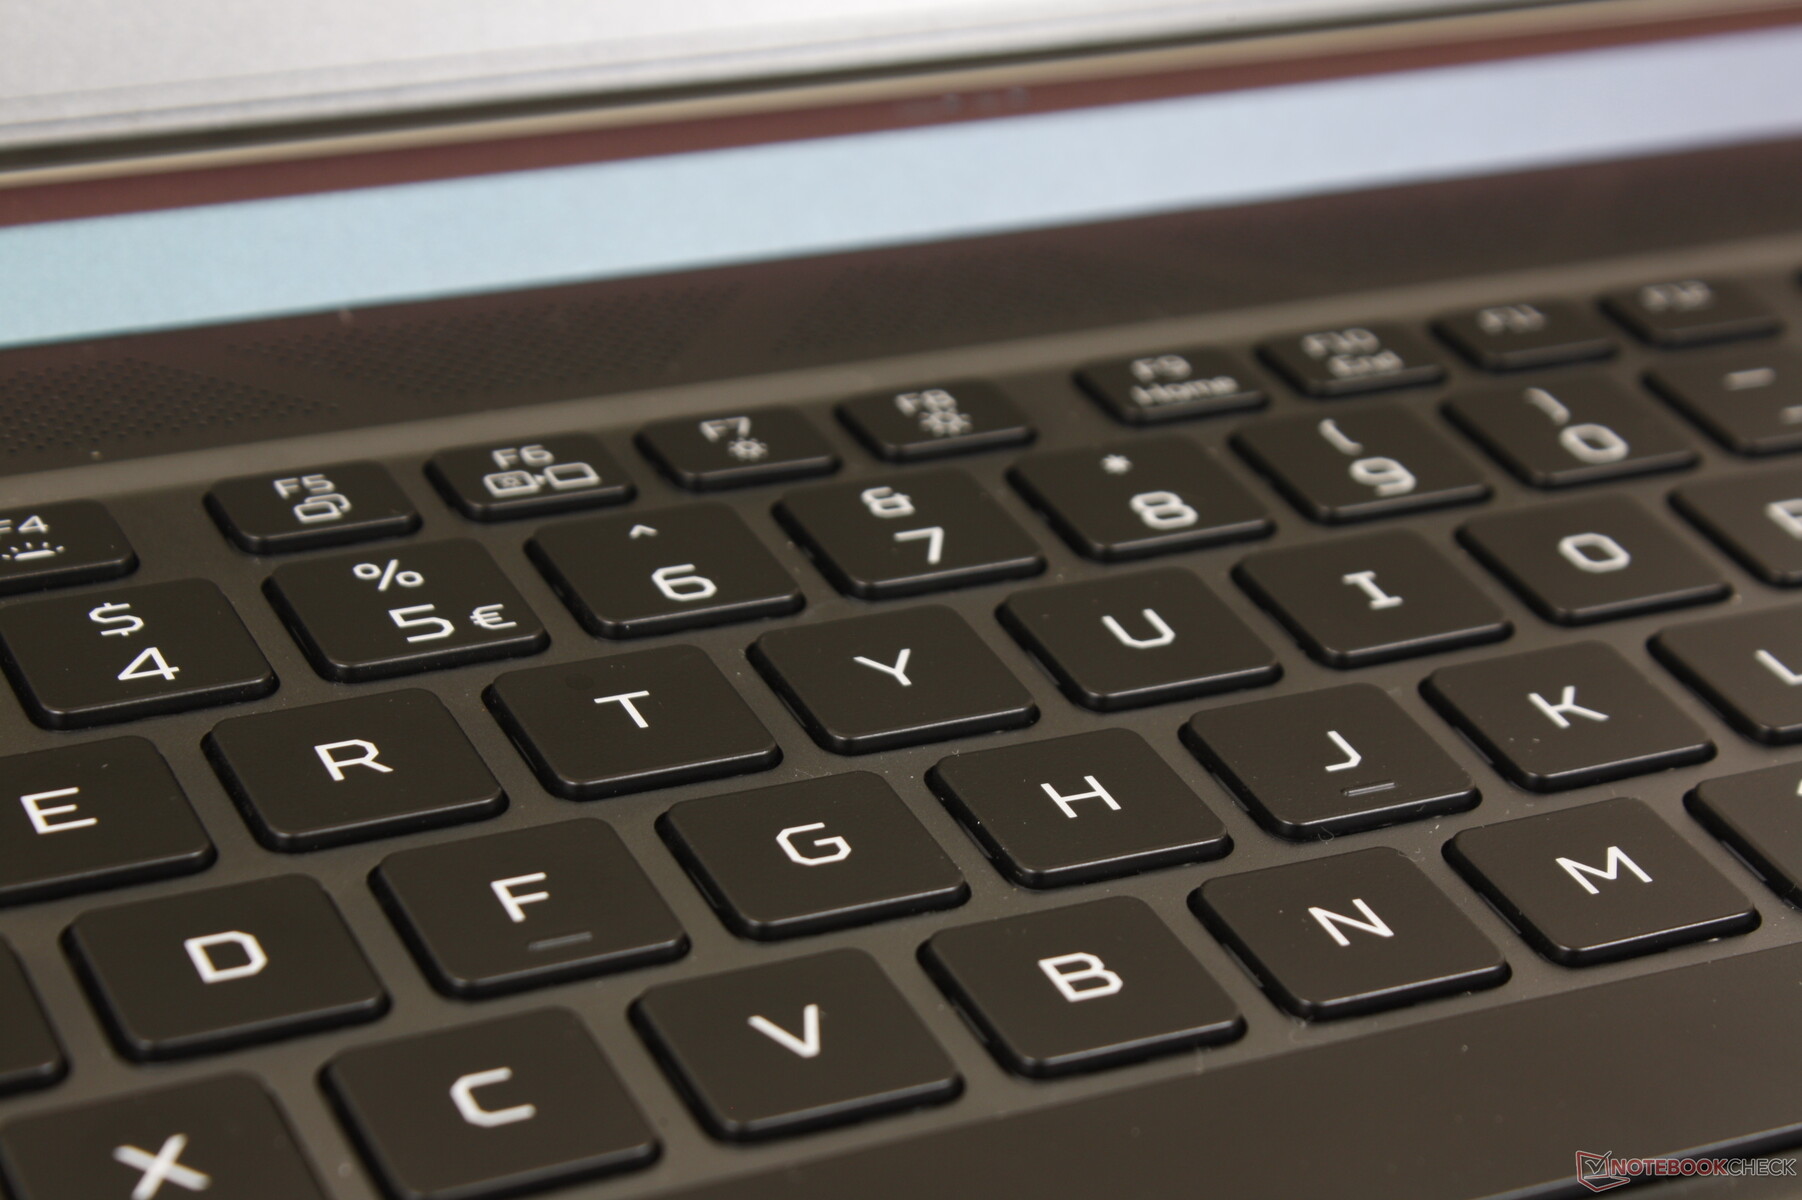
输入设备 - 软键和静音键
键盘
键的行程较浅,反馈相对较弱,类似于Blade 14和许多廉价的Utlrabook上的键,如 华硕VivoBook S14.如果你以前在超极本上打过字,那么你会知道在这里会有什么期待。反馈可能相对安静,但它不像以商务为中心的ThinkPad或EliteBook上的按键那样锐利和坚定。
三区RGB背光是标准配置,而Blade 14包括每键RGB照明。所有按键和符号都有背光。
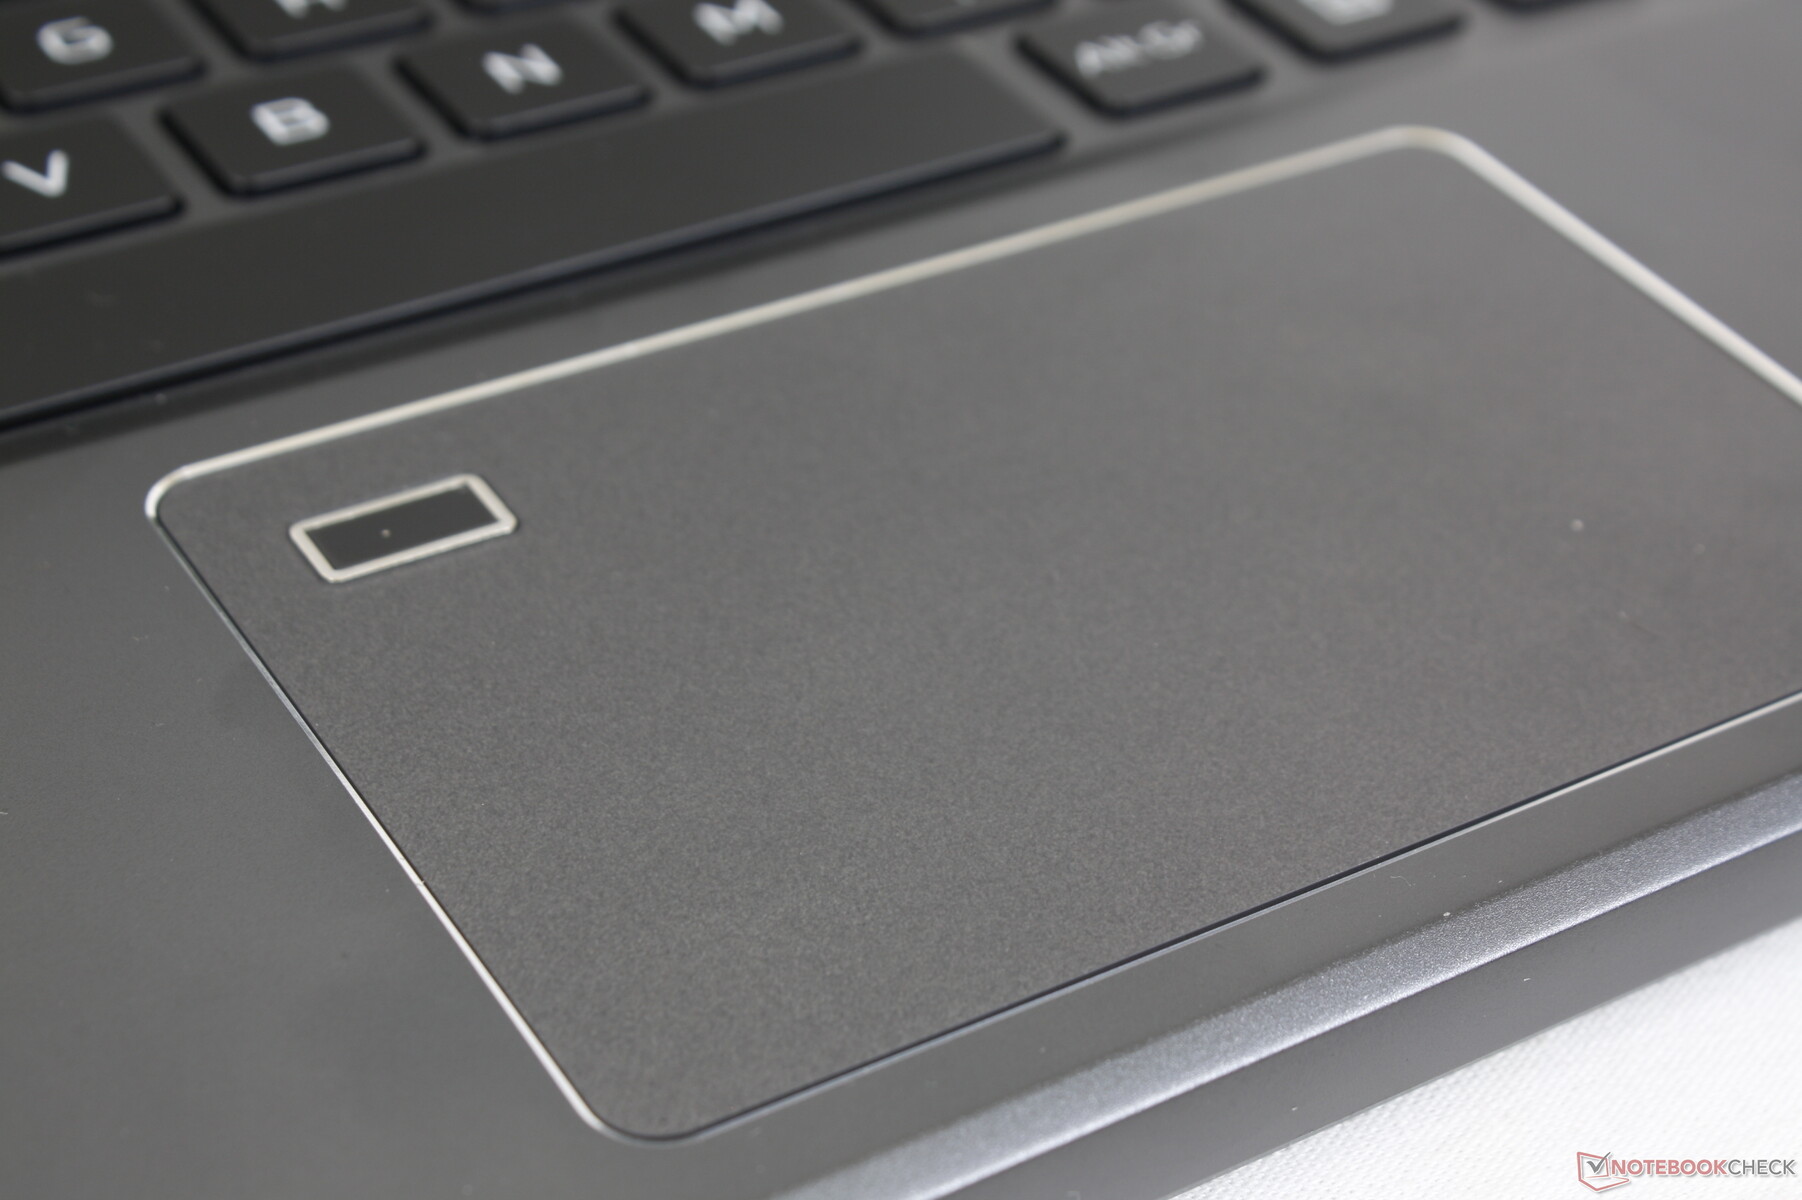
触摸板
点击板略大于Zephyrus G14的点击板。 Zephyrus G14(10.5 x 6.5 cm vs. 10.5 x 6 cm)。然而,位于角落的指纹识别器减少了光标控制或多点触摸输入的有效空间,因此点击板会感觉更小。其他大多数笔记本电脑已经将指纹识别器迁移到更方便的地方,如电源按钮或键盘,而不是。在这方面,Predator Triton 300 SE会让人觉得是一个旧的机箱设计。
点击点击板时的反馈很软,而且很浅,给人的印象很弱。只要有可能,你肯定会想使用USB鼠标。
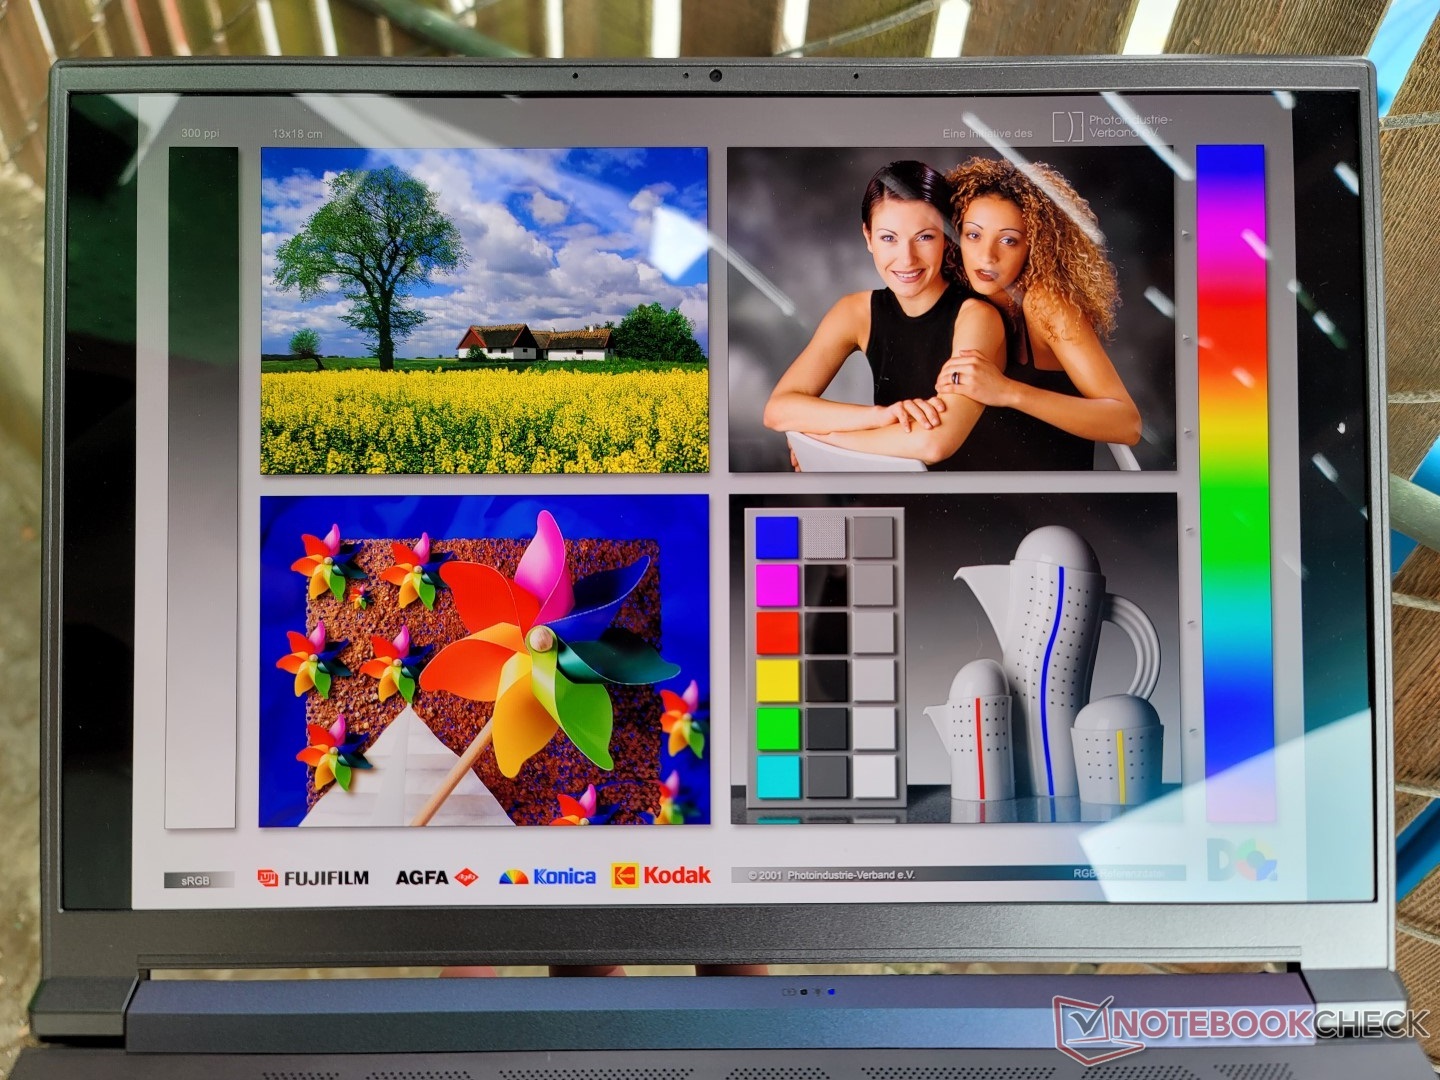
显示器 - OLED和IPS选项
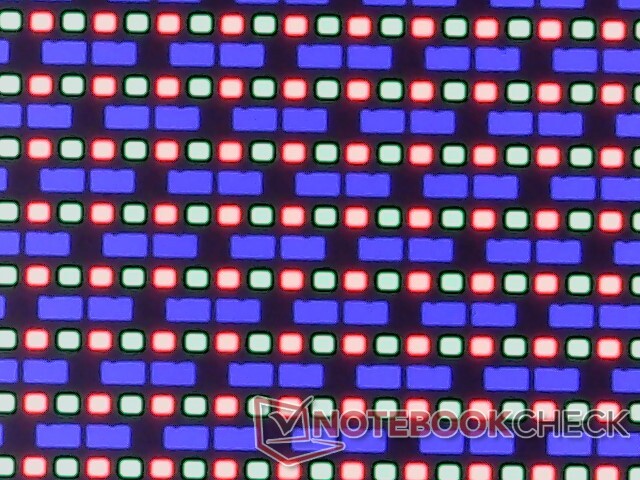
掠夺者Triton 300 SE是少数同时提供全DCI-P3色彩和相对较快的90 Hz刷新率的OLED游戏笔记本电脑之一。某些IPS替代品可以有更快的刷新率,如刀锋14上的面板。 刀锋14的面板,但它们通常只承诺sRGB覆盖率。
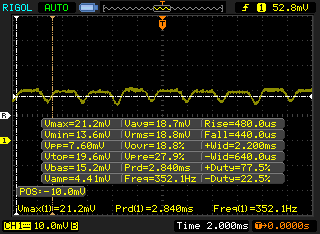
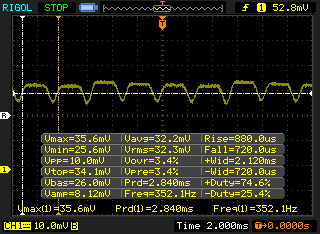
缺乏自适应同步支持是14英寸Predator Triton 300 SE的一个明显缺点。虽然重影可能几乎不存在,但与IPS相比,OLED面板肯定有自己的一套缺点。例如,大约352赫兹的闪烁频率,在所有的亮度水平上仍然存在,与我们在其他14英寸OLED笔记本电脑上记录的情况类似,如 华硕VivoBook 14.
宏碁提供了一个分辨率较低的1200p IPS SKU,支持MUX和更快的165 Hz刷新率。如果全P3色彩覆盖对你的任务不重要,那么IPS替代品可能值得考虑,特别是对游戏而言。
| |||||||||||||||||||||||||
Brightness Distribution: 99 %
Center on Battery: 414.3 cd/m²
Contrast: ∞:1 (Black: 0 cd/m²)
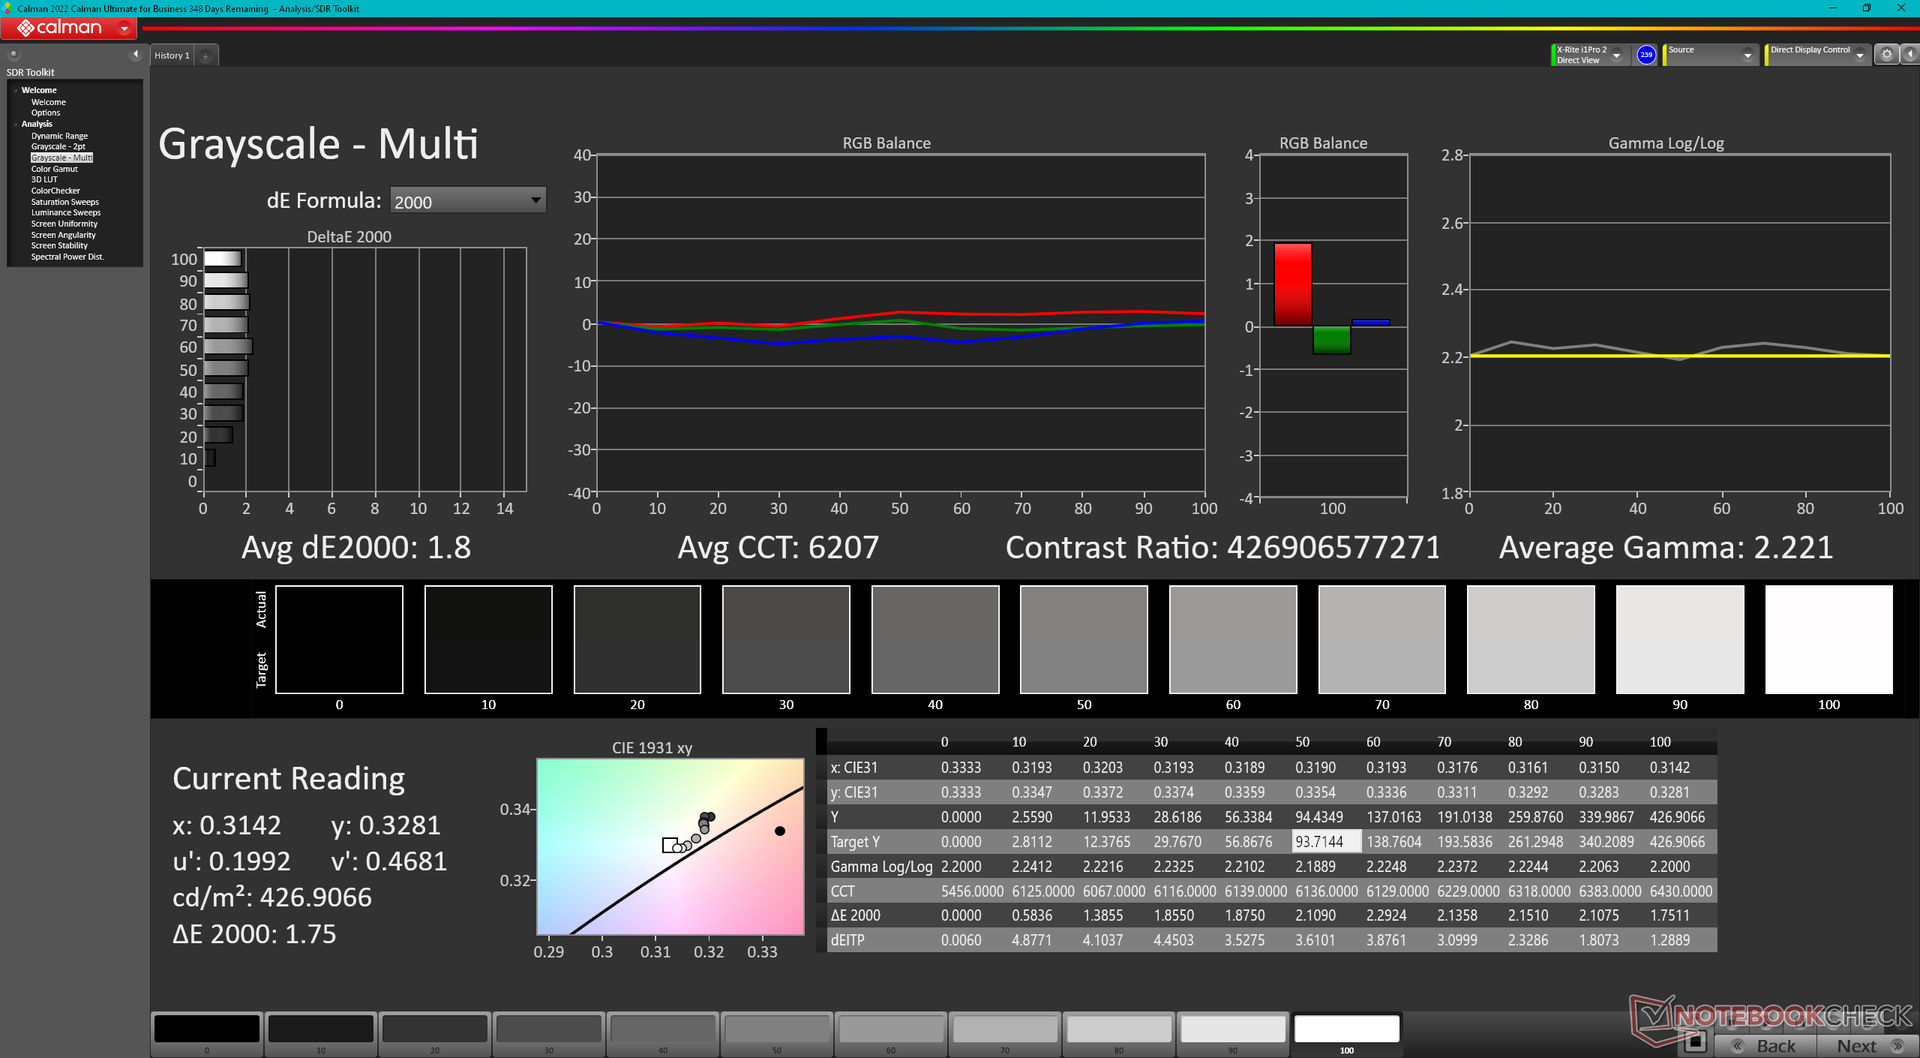
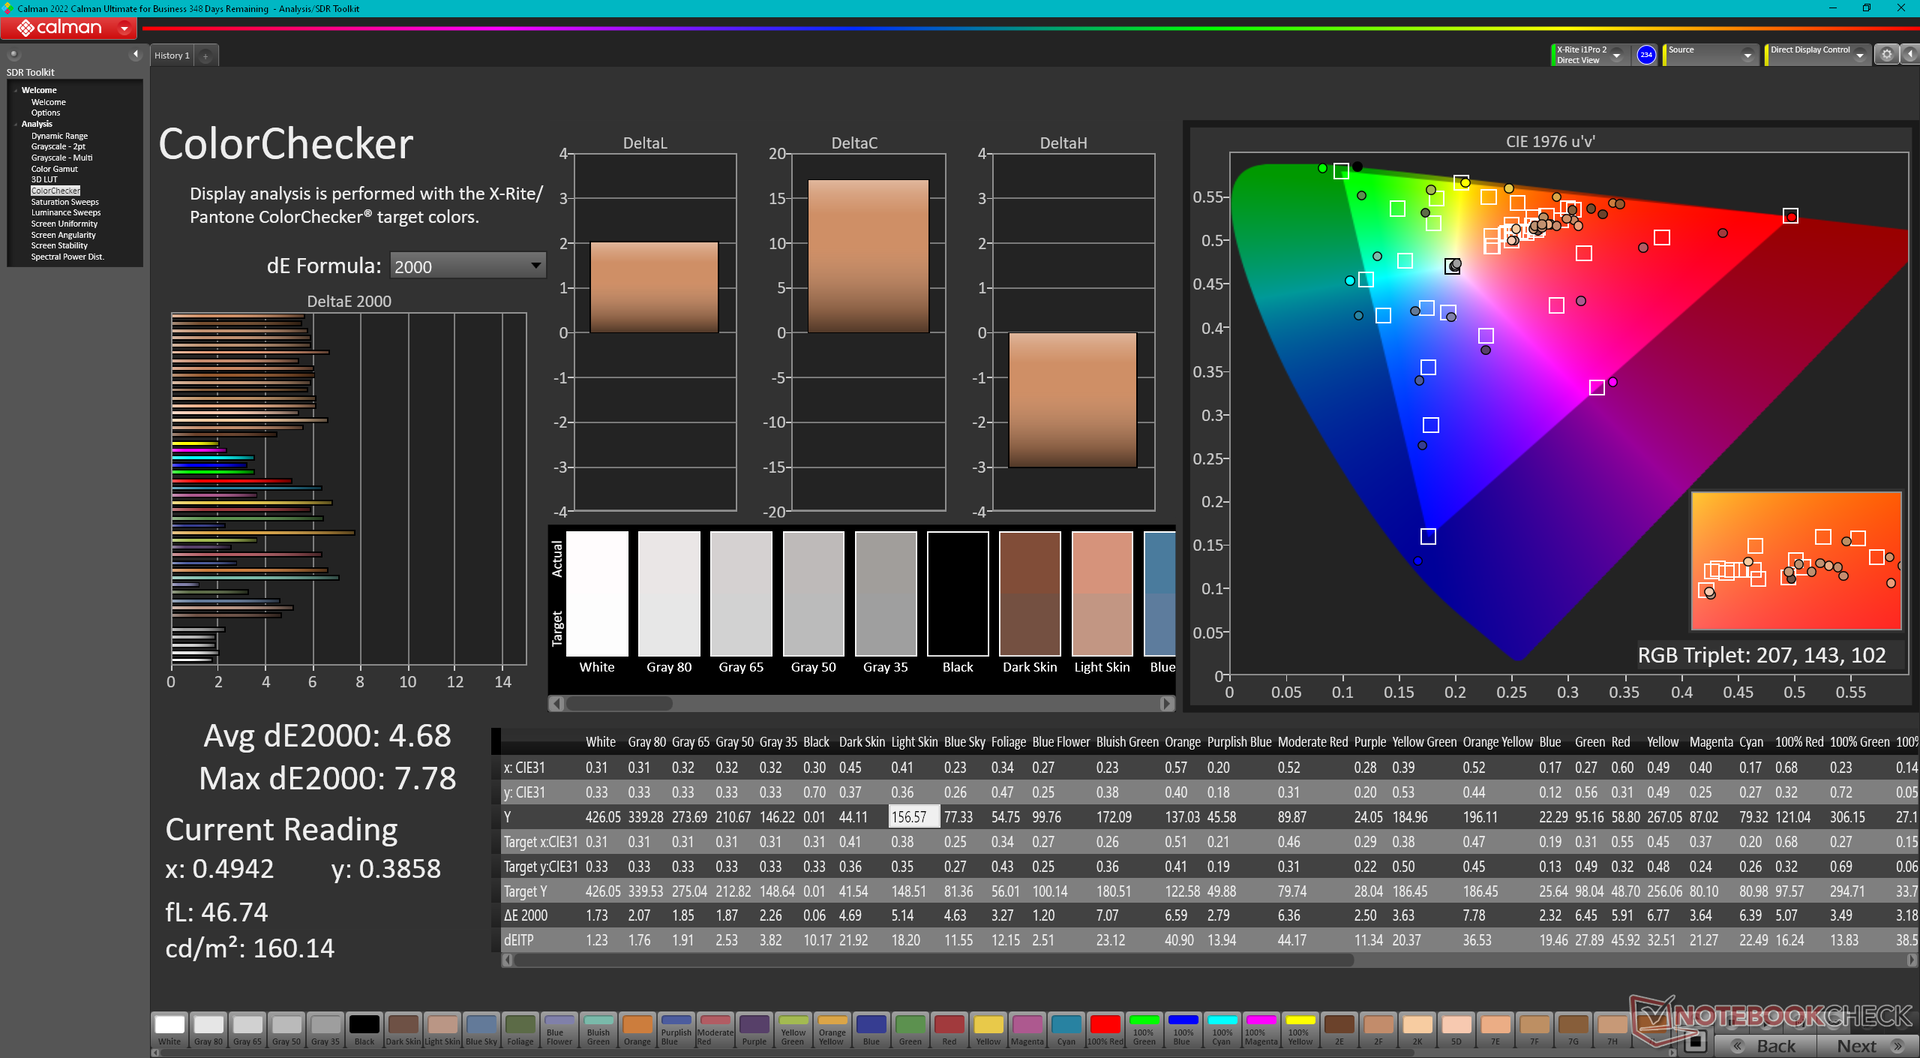
ΔE ColorChecker Calman: 4.68 | ∀{0.5-29.43 Ø4.71}
ΔE Greyscale Calman: 1.8 | ∀{0.09-98 Ø4.96}
99% AdobeRGB 1998 (Argyll 3D)
100% sRGB (Argyll 3D)
99.9% Display P3 (Argyll 3D)
Gamma: 2.22
CCT: 6207 K
| Acer Predator Triton 300 SE Samsung ATNA40YK07-0, OLED, 2880x1800, 14" | Asus ROG Zephyrus G14 GA402RJ BOEhydis NE140QDM-NX1, IPS, 2560x1600, 14" | Razer Blade 14 Ryzen 9 6900HX TL140BDXP02-0, IPS, 2560x1440, 14" | Alienware x14 i7 RTX 3060 SHP154D, IPS, 1920x1080, 14" | Dell Inspiron 14 Plus 7420 InfoVision 140NWHE, IPS, 2240x1400, 14" | Schenker Vision 14 MNE007ZA1, IPS, 2880x1800, 14" | |
|---|---|---|---|---|---|---|
| Display | -5% | -5% | -4% | -21% | -17% | |
| Display P3 Coverage (%) | 99.9 | 97.6 -2% | 97.2 -3% | 99.6 0% | 68.8 -31% | 74.3 -26% |
| sRGB Coverage (%) | 100 | 99.9 0% | 99.9 0% | 100 0% | 99.3 -1% | 97.6 -2% |
| AdobeRGB 1998 Coverage (%) | 99 | 85.6 -14% | 85.7 -13% | 87.6 -12% | 69.5 -30% | 75.7 -24% |
| Response Times | -426% | -1077% | -533% | -1944% | -2062% | |
| Response Time Grey 50% / Grey 80% * (ms) | 1.36 ? | 8.3 ? -510% | 16.8 ? -1135% | 9.6 ? -606% | 32.8 ? -2312% | 40.4 ? -2871% |
| Response Time Black / White * (ms) | 1.36 ? | 6 ? -341% | 15.2 ? -1018% | 7.6 ? -459% | 22.8 ? -1576% | 18.4 ? -1253% |
| PWM Frequency (Hz) | 367.6 ? | 26191 ? | ||||
| Screen | 5% | 13% | -24% | -12% | 5% | |
| Brightness middle (cd/m²) | 414.3 | 500 21% | 354 -15% | 434 5% | 331.1 -20% | 407 -2% |
| Brightness (cd/m²) | 416 | 470 13% | 328 -21% | 411 -1% | 326 -22% | 407 -2% |
| Brightness Distribution (%) | 99 | 85 -14% | 86 -13% | 89 -10% | 85 -14% | 94 -5% |
| Black Level * (cd/m²) | 0.42 | 0.37 | 0.25 | 0.29 | 0.25 | |
| Colorchecker dE 2000 * | 4.68 | 2.45 48% | 1.66 65% | 3 36% | 2.23 52% | 2.6 44% |
| Colorchecker dE 2000 max. * | 7.78 | 5.34 31% | 3.83 51% | 7.1 9% | 5.44 30% | 4.4 43% |
| Greyscale dE 2000 * | 1.8 | 3.1 -72% | 1.6 11% | 5.1 -183% | 3.6 -100% | 2.7 -50% |
| Gamma | 2.22 99% | 2.213 99% | 2.23 99% | 2.19 100% | 2.21 100% | 2.18 101% |
| CCT | 6207 105% | 7251 90% | 6542 99% | 6204 105% | 6022 108% | 6316 103% |
| Contrast (:1) | 1190 | 957 | 1736 | 1142 | 1628 | |
| Colorchecker dE 2000 calibrated * | 1.2 | 0.7 | 0.63 | 2 | ||
| Total Average (Program / Settings) | -142% /
-76% | -356% /
-190% | -187% /
-111% | -659% /
-366% | -691% /
-377% |
* ... smaller is better
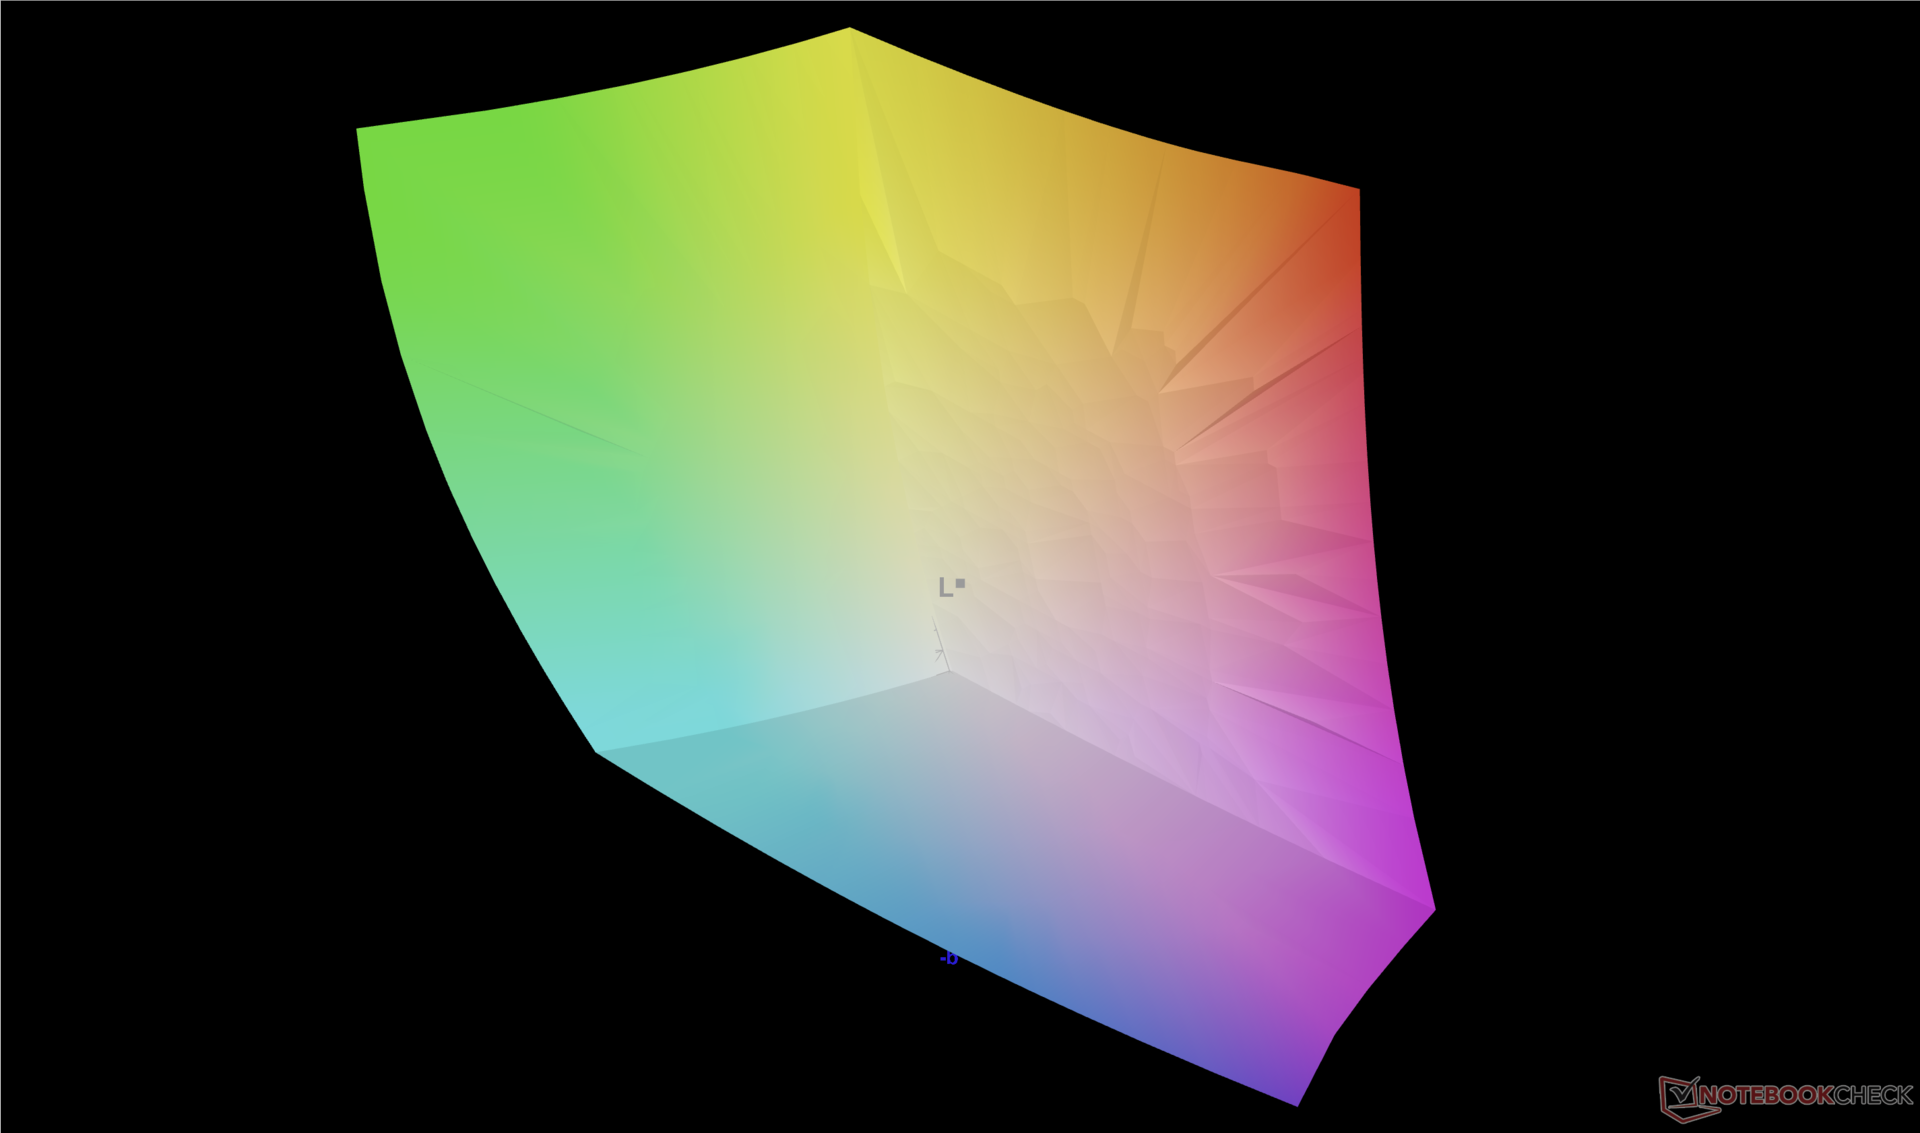
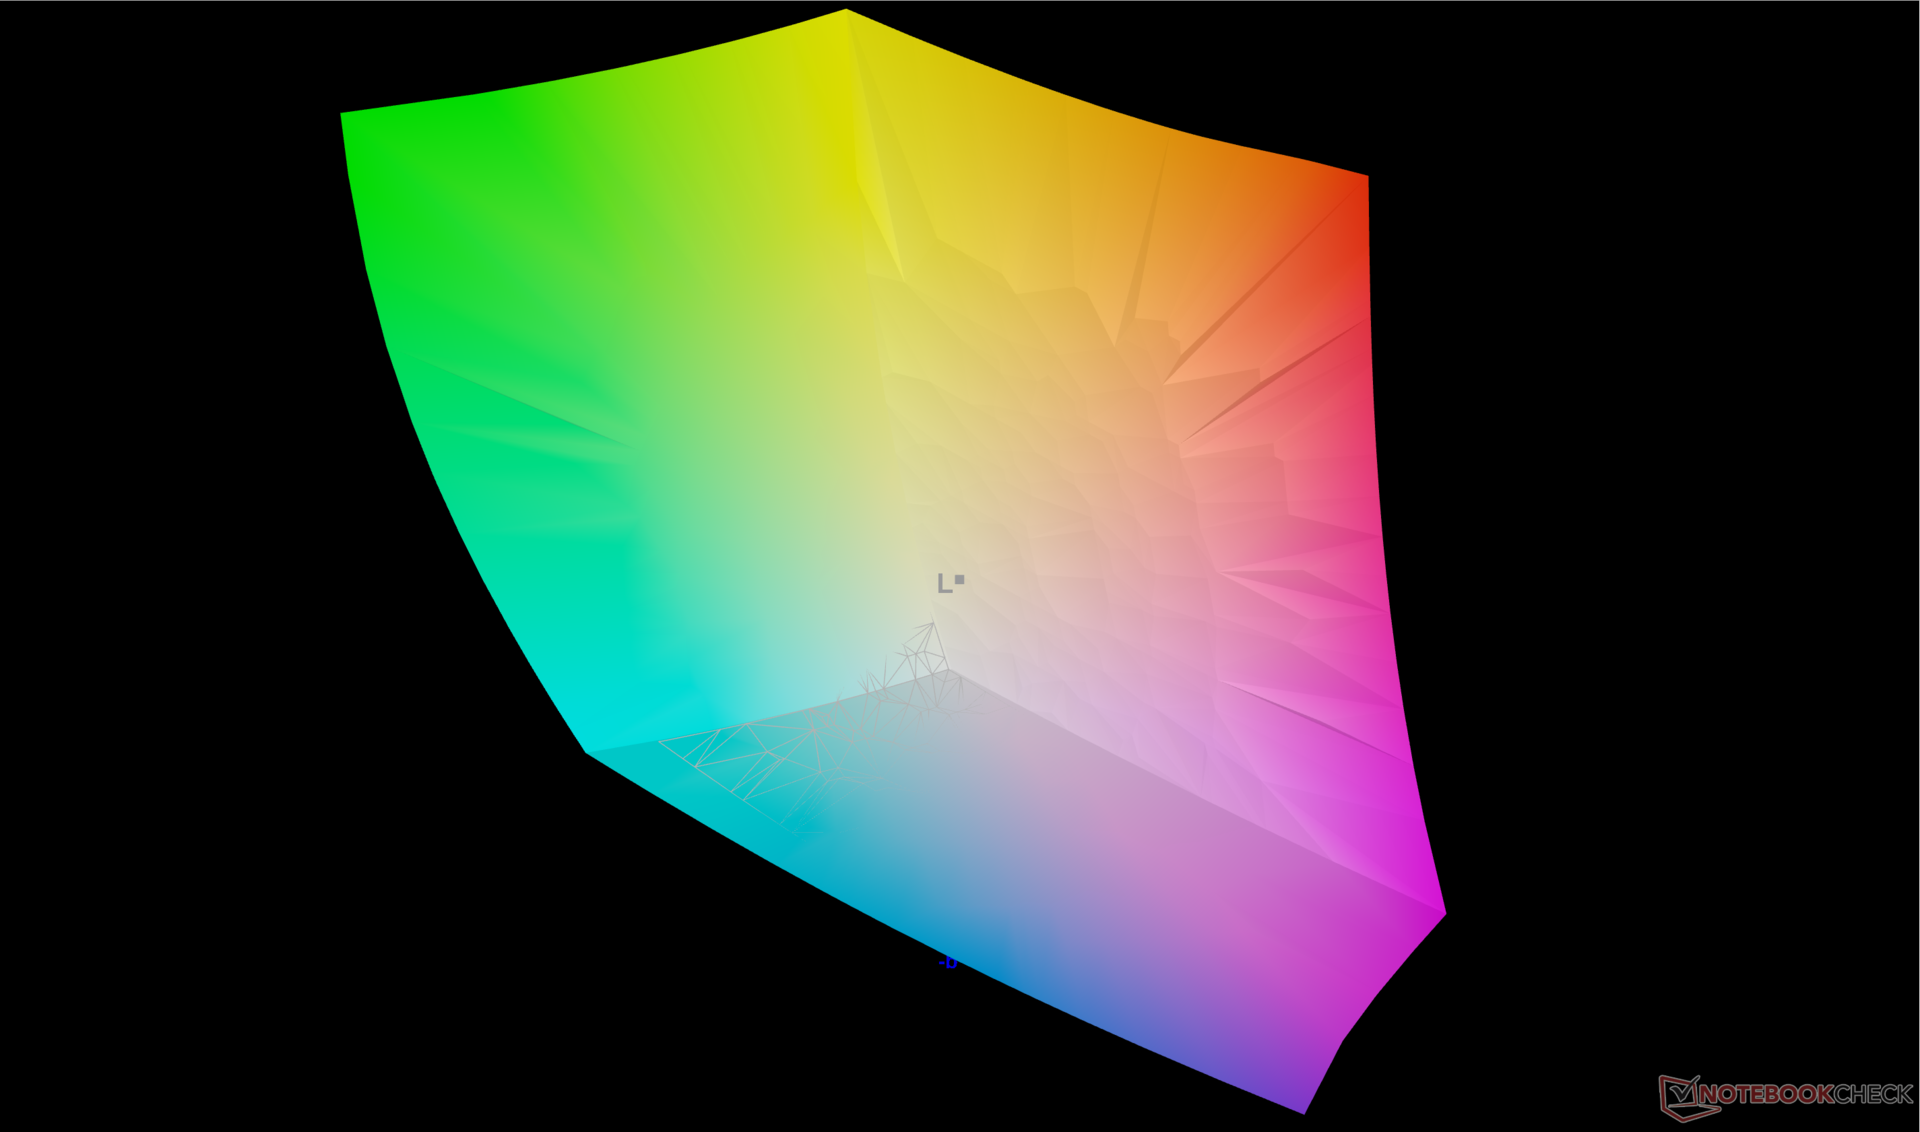
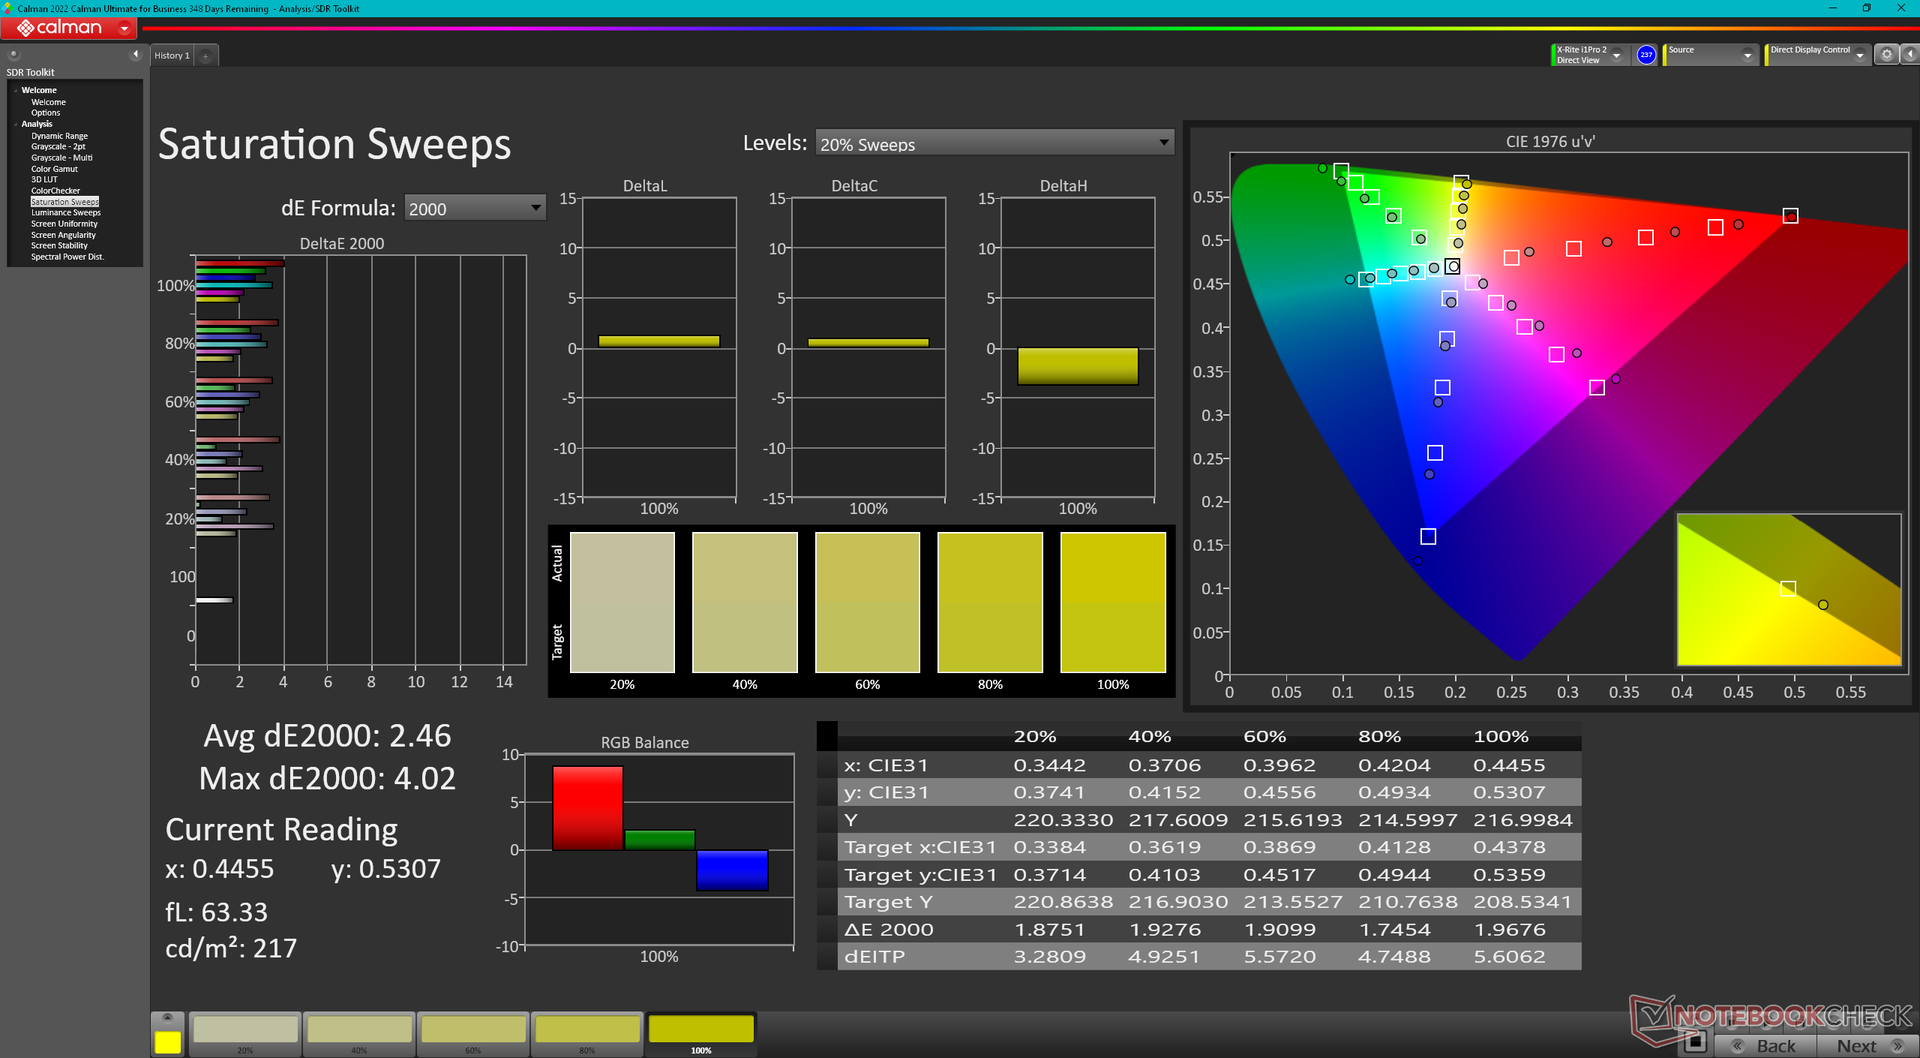
该面板根据P3标准进行了适当的校准,平均灰度和彩色deltaE值分别只有1.8和4.68。
Display Response Times
| ↔ Response Time Black to White | ||
|---|---|---|
| 1.36 ms ... rise ↗ and fall ↘ combined | ↗ 0.52 ms rise | 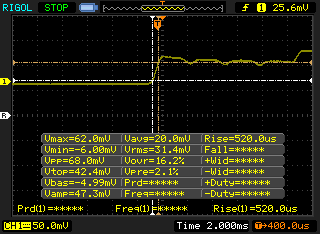 |
| ↘ 0.84 ms fall | ||
| The screen shows very fast response rates in our tests and should be very well suited for fast-paced gaming. In comparison, all tested devices range from 0.1 (minimum) to 240 (maximum) ms. » 8 % of all devices are better. This means that the measured response time is better than the average of all tested devices (19.8 ms). | ||
| ↔ Response Time 50% Grey to 80% Grey | ||
| 1.36 ms ... rise ↗ and fall ↘ combined | ↗ 0.68 ms rise | 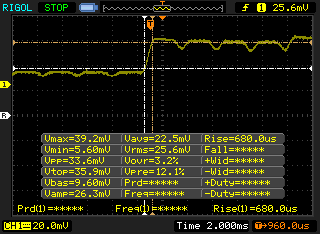 |
| ↘ 0.68 ms fall | ||
| The screen shows very fast response rates in our tests and should be very well suited for fast-paced gaming. In comparison, all tested devices range from 0.165 (minimum) to 636 (maximum) ms. » 6 % of all devices are better. This means that the measured response time is better than the average of all tested devices (31 ms). | ||
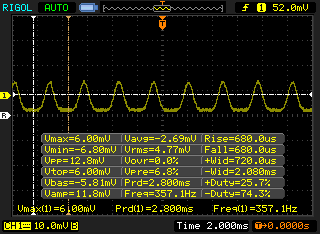
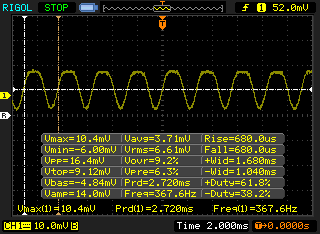
Screen Flickering / PWM (Pulse-Width Modulation)
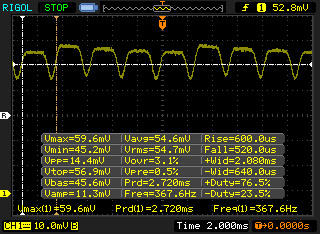
| Screen flickering / PWM detected | 367.6 Hz | ≤ 100 % brightness setting |  |
The display backlight flickers at 367.6 Hz (worst case, e.g., utilizing PWM) Flickering detected at a brightness setting of 100 % and below. There should be no flickering or PWM above this brightness setting. The frequency of 367.6 Hz is relatively high, so most users sensitive to PWM should not notice any flickering. However, there are reports that some users are still sensitive to PWM at 500 Hz and above, so be aware. In comparison: 52 % of all tested devices do not use PWM to dim the display. If PWM was detected, an average of 7757 (minimum: 5 - maximum: 343500) Hz was measured. | |||
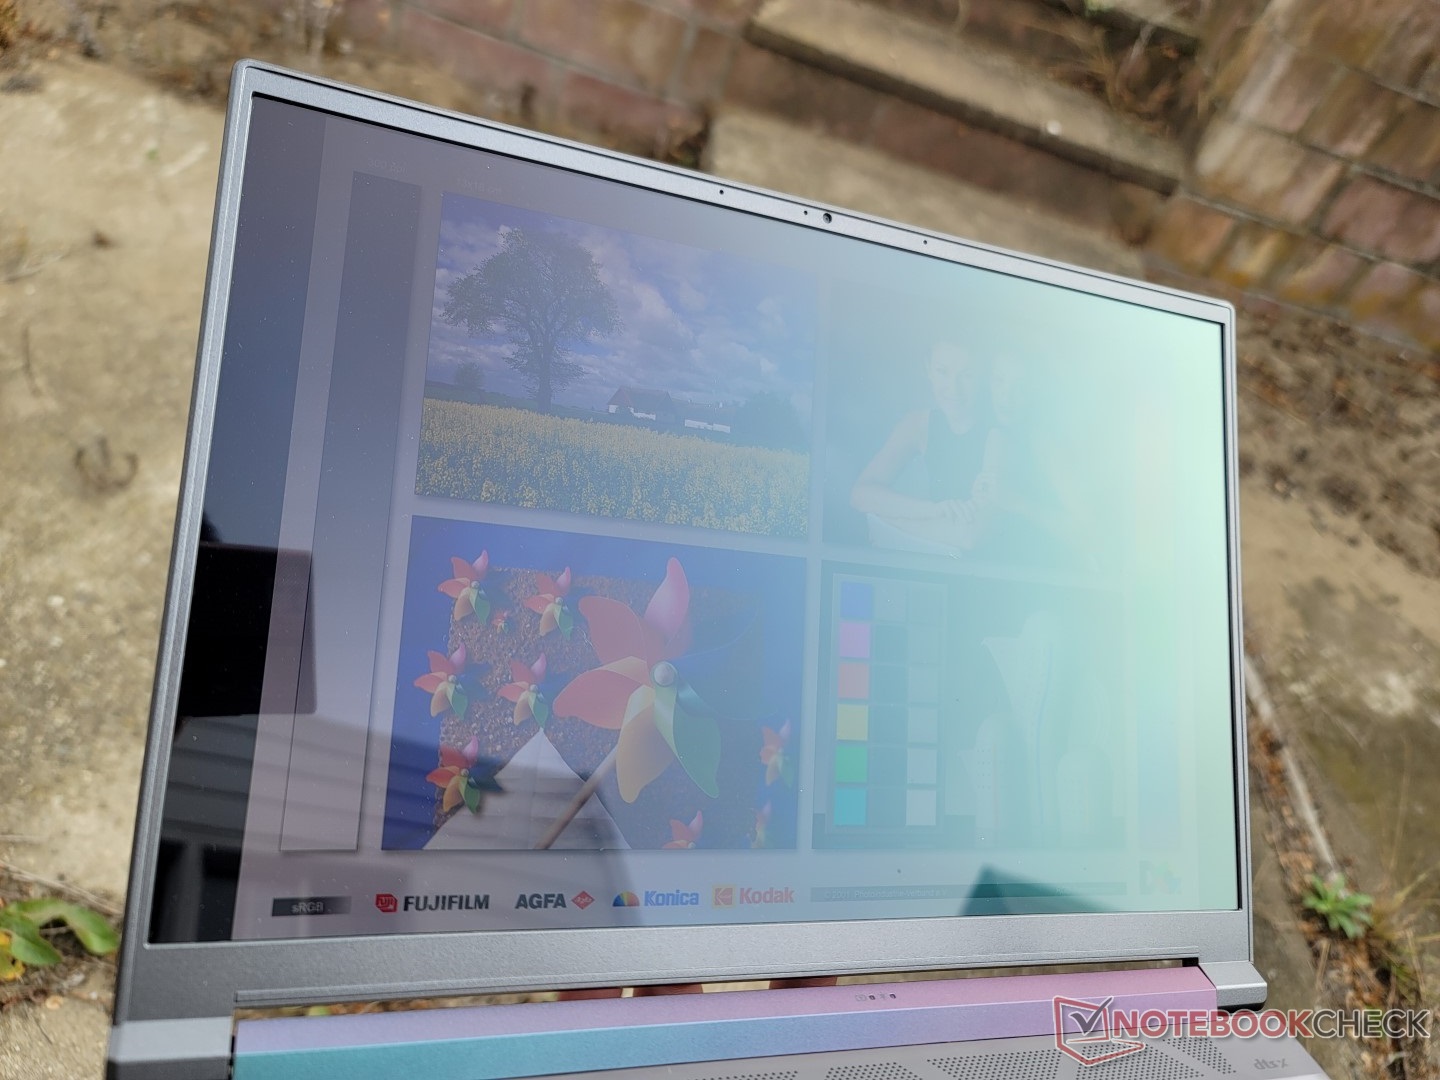
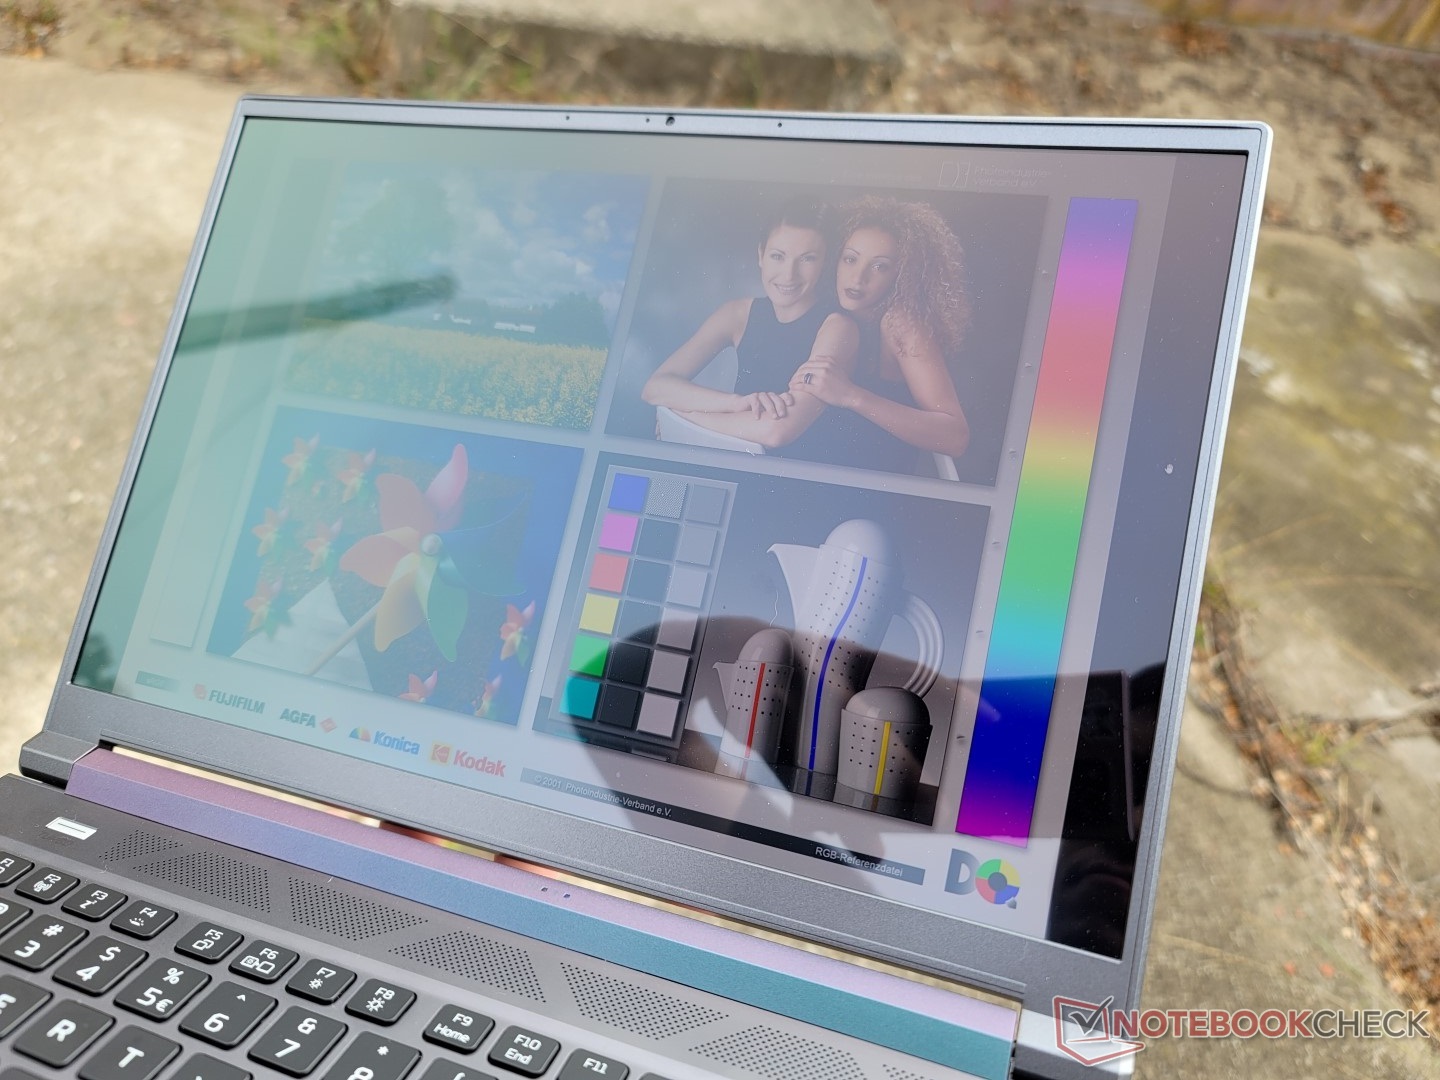
由于光面OLED面板的深黑色水平和颜色,如果在阴凉处,户外能见度还算不错。尽管如此,在大多数情况下,眩光仍然是不可避免的。Zephyrus G14的哑光显示屏的亮度约为100尼特,更容易阅读。
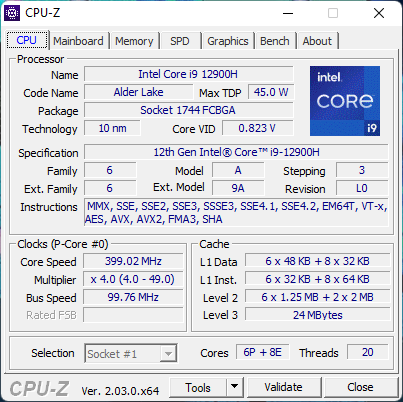
性能 - 第12代酷睿i9
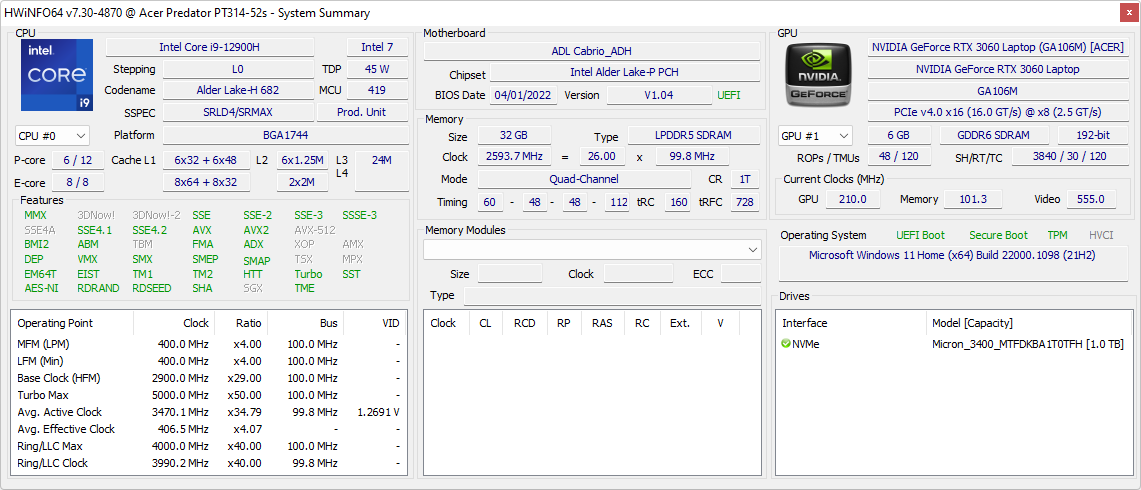
测试条件
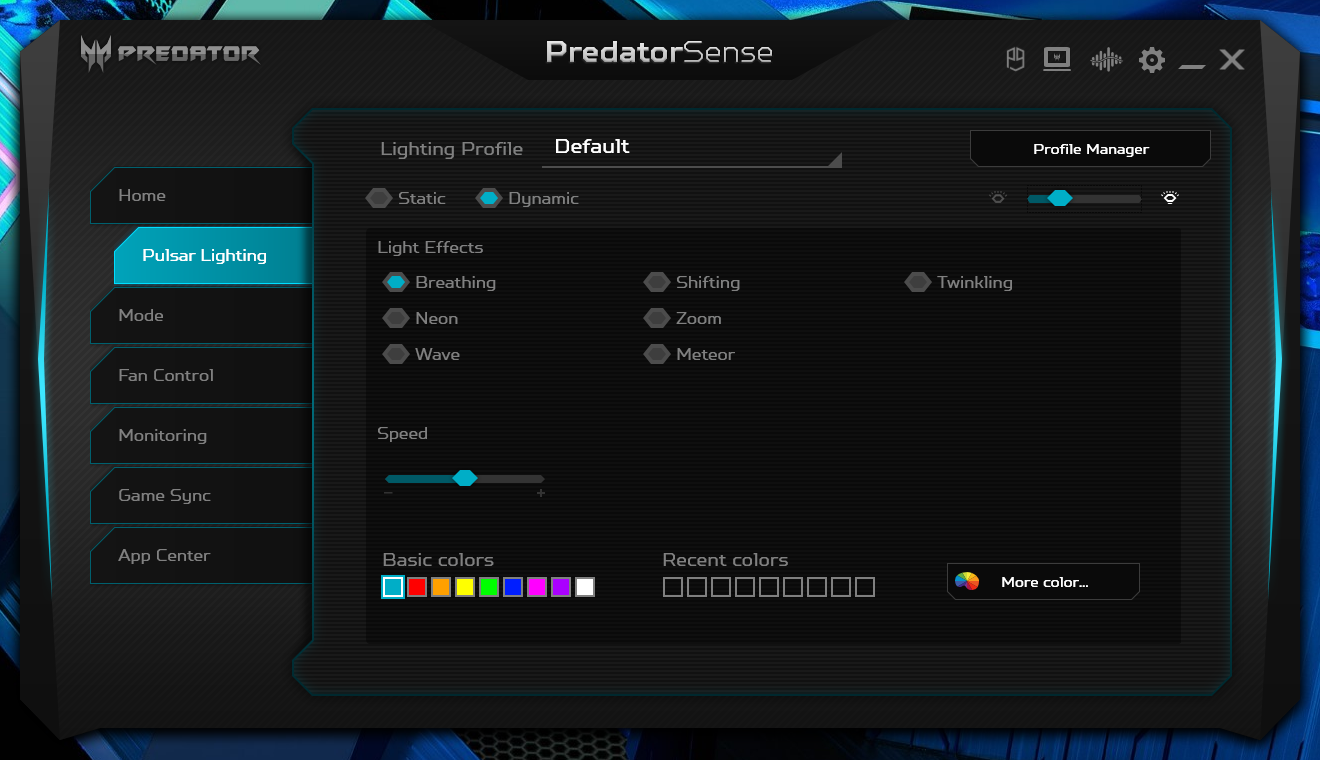
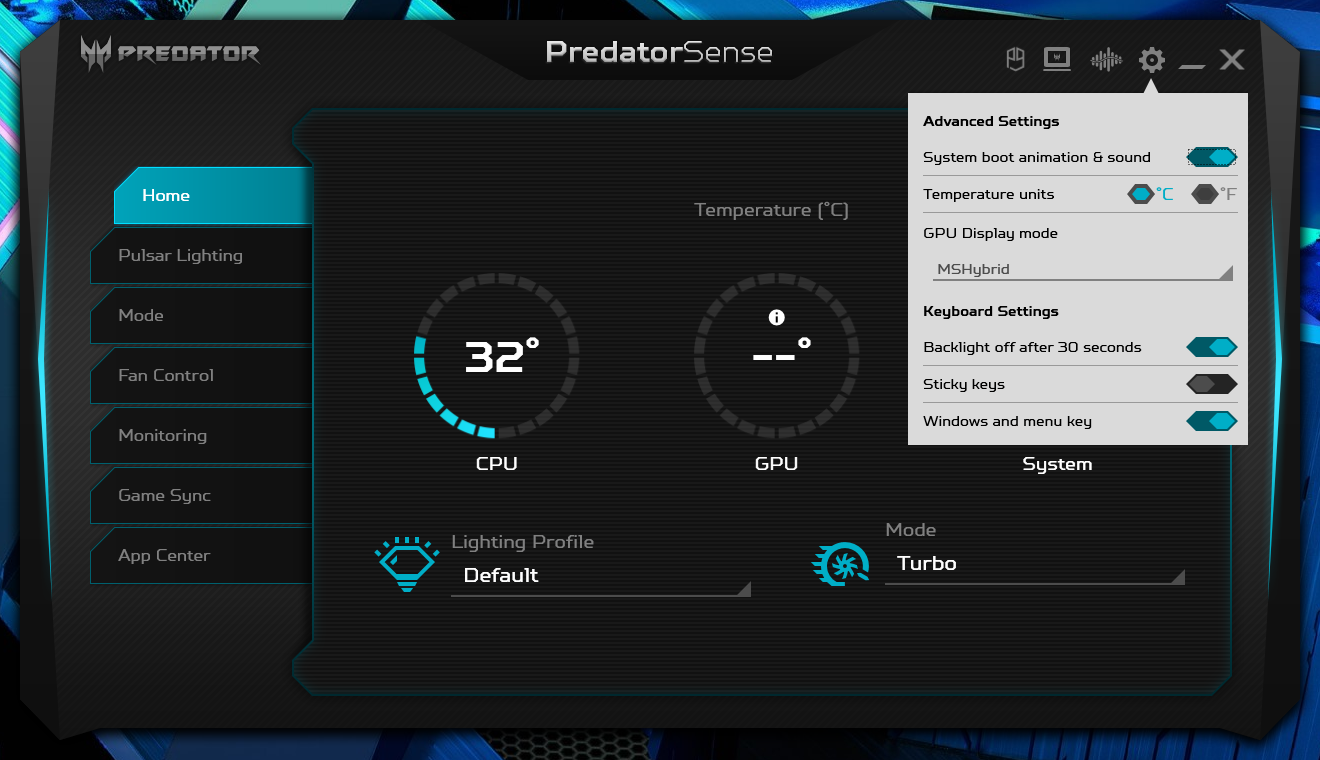
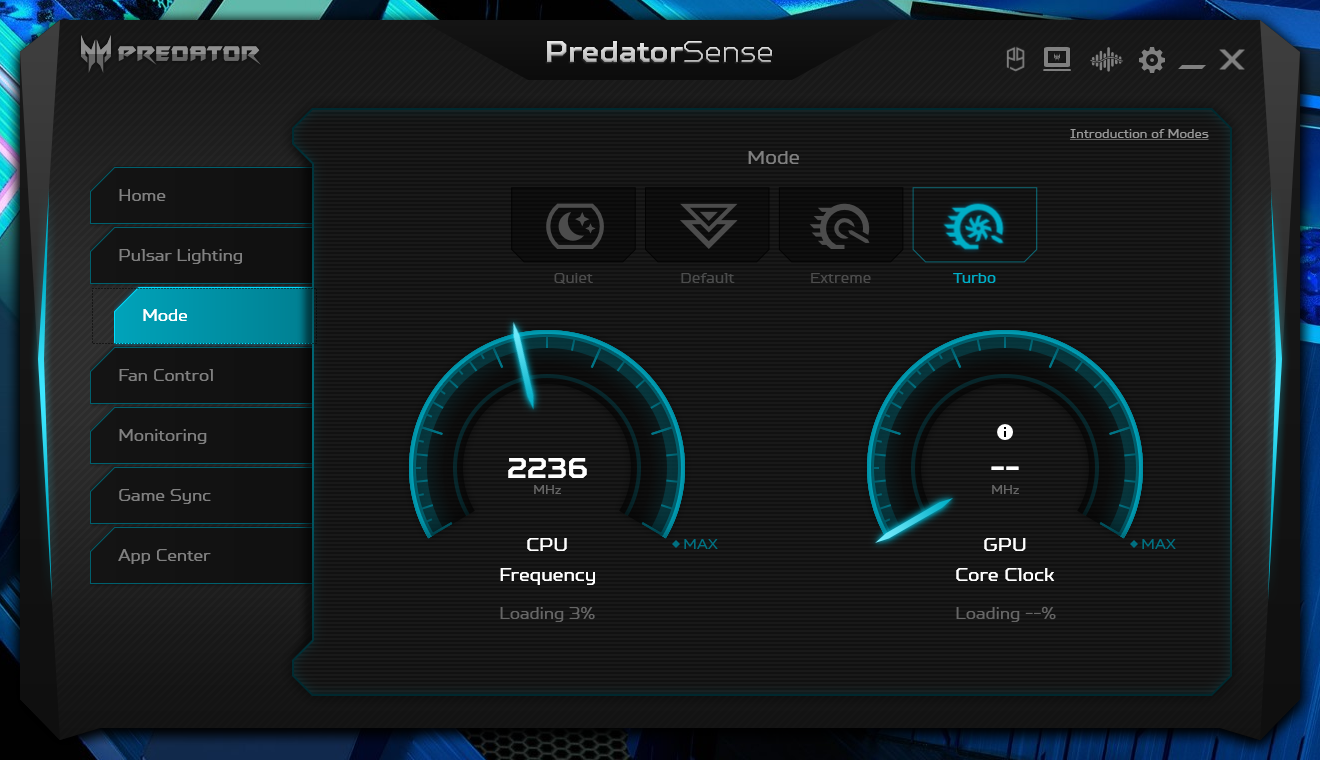
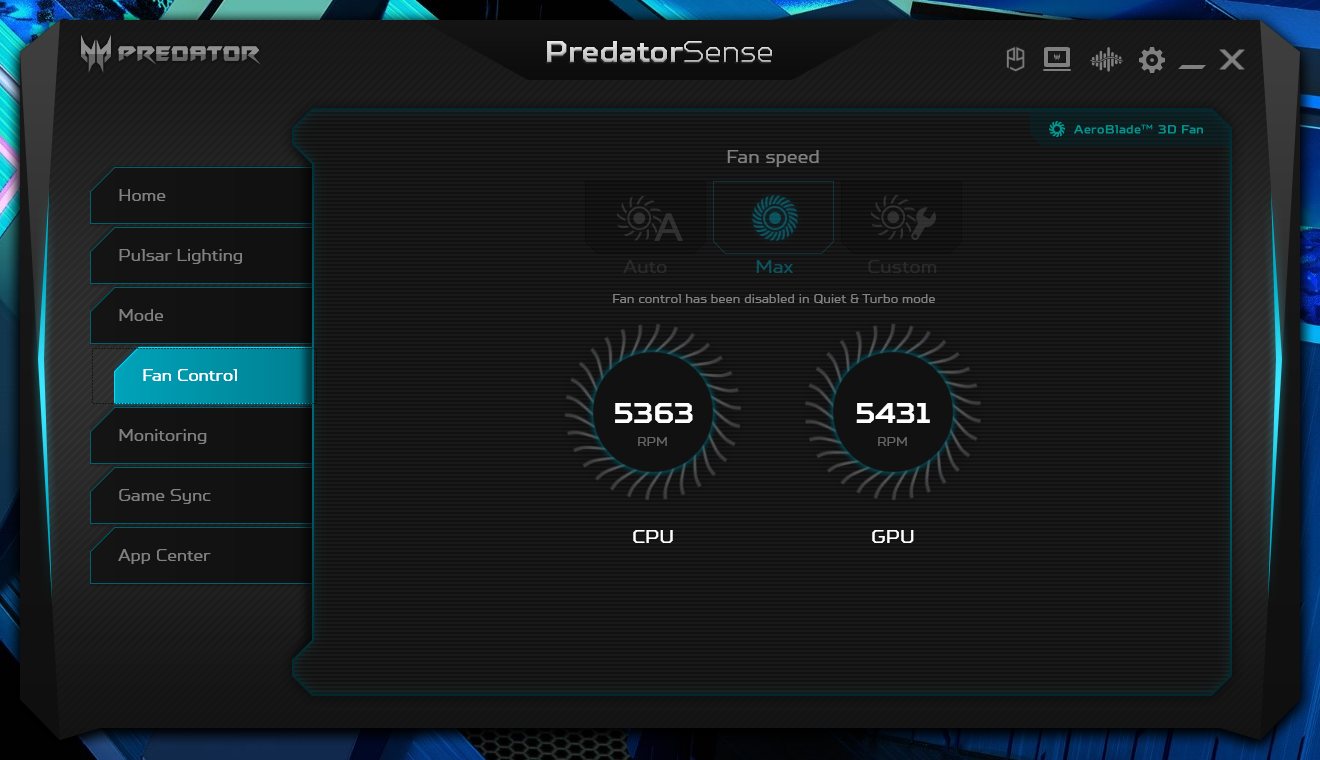
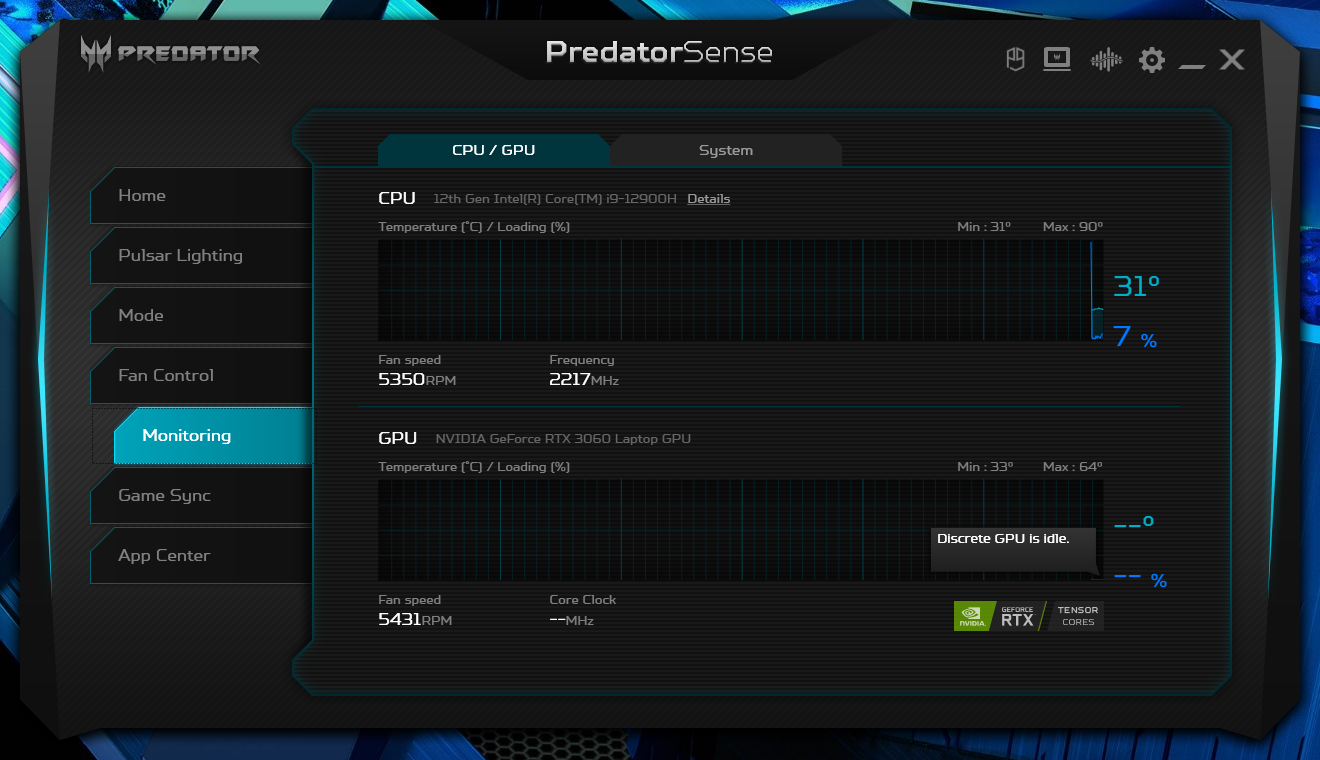
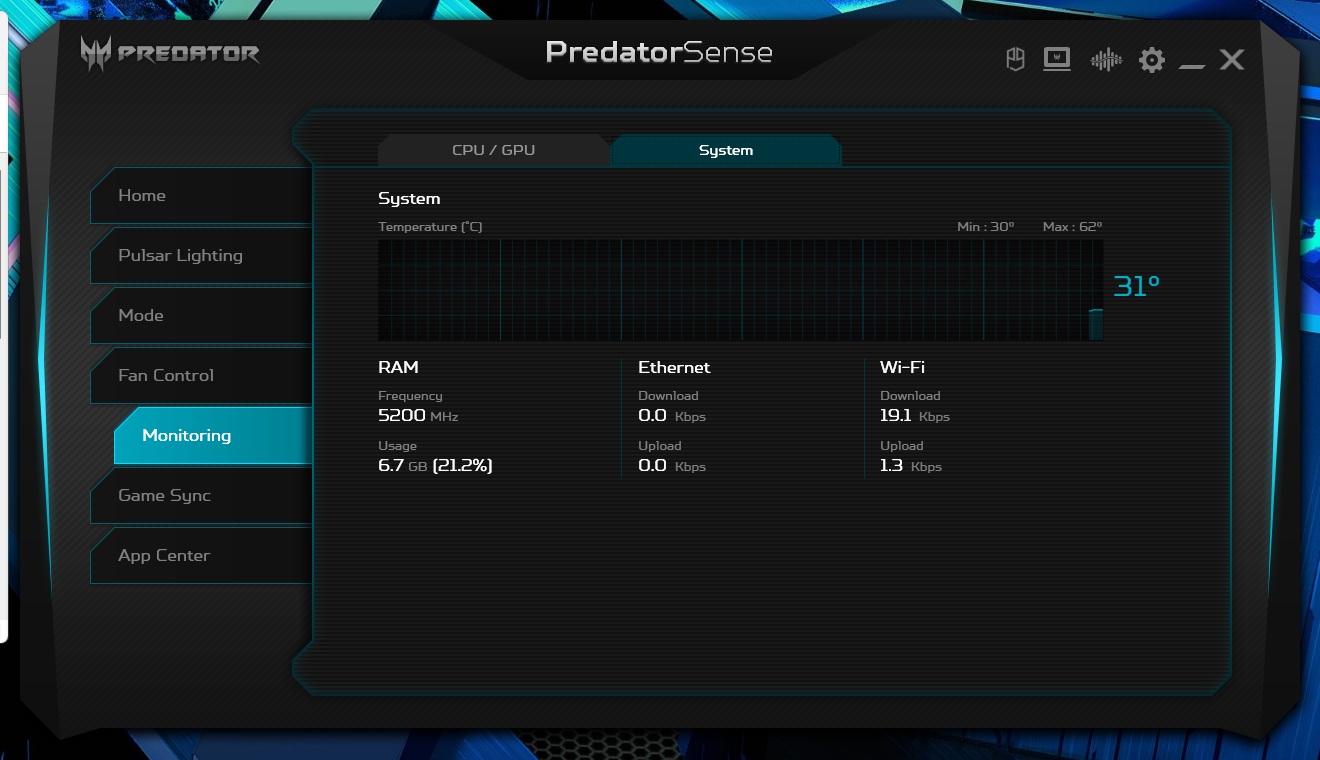
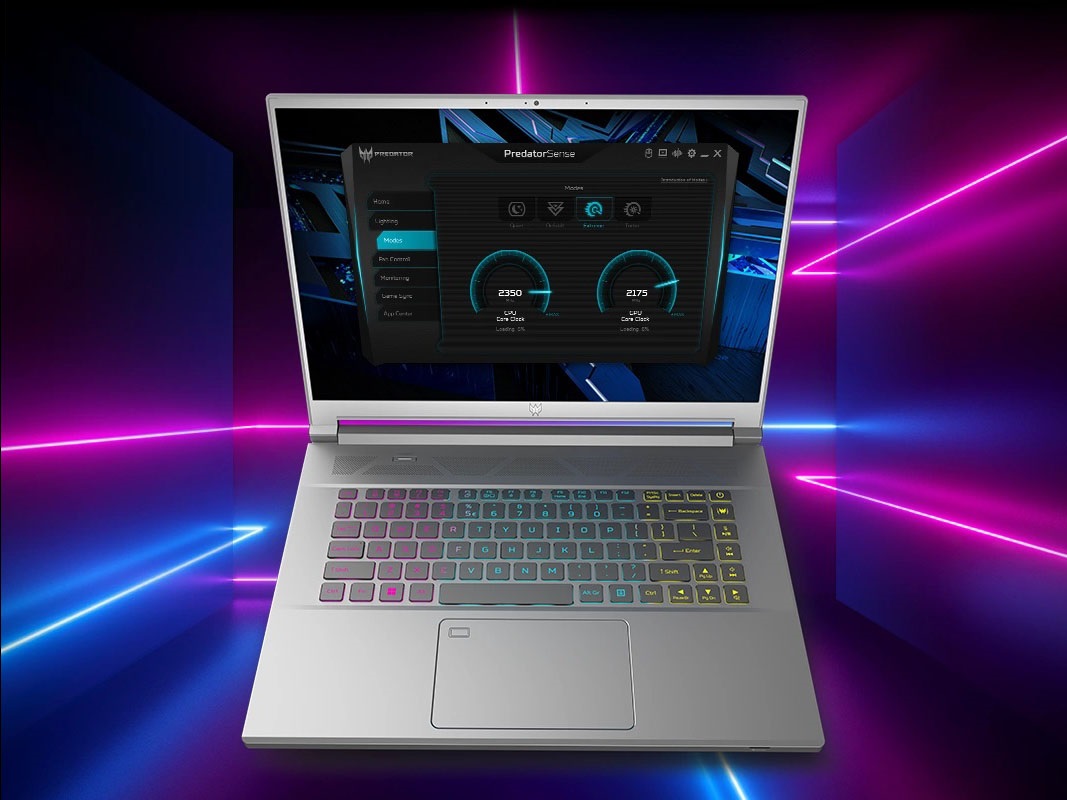
在运行以下任何基准测试之前,我们通过Windows将我们的设备设置为 "最佳性能 "模式,并通过预装的PredatorSense软件设置为 "涡轮 "模式。建议用户熟悉PredatorSense,因为它是调整键盘背光、风扇、启动设置等的主要控制中心,如下面的截图所示。
不幸的是,正如宏碁所确认的,MUX只适用于非OLED SKU。试图通过PredatorSense切换出MSHybrid模式会使我们的设备崩溃。
处理器
CPU性能是任何14英寸游戏笔记本电脑中最快的之一。对于任何明显更快,你将不得不考虑更大的模型,如 微星GE77与酷睿i9-12900HX.即便如此, 酷睿i9-12900H在我们的14英寸Acer中无法长时间维持非常高的Turbo Boost时钟速率,正如我们下面的压力测试部分所显示的那样。
降级到 酷睿i7-12700H根据我们使用Alienware x14的时间,SKU可能只会带来1%到2%的性能损失。潜在的买家可能会通过这种方式节省几百美元,并获得与更昂贵的酷睿i9-12900H基本相同的处理器性能。
Cinebench R15 Multi Loop
Cinebench R23: Multi Core | Single Core
Cinebench R15: CPU Multi 64Bit | CPU Single 64Bit
Blender: v2.79 BMW27 CPU
7-Zip 18.03: 7z b 4 | 7z b 4 -mmt1
Geekbench 5.5: Multi-Core | Single-Core
HWBOT x265 Benchmark v2.2: 4k Preset
LibreOffice : 20 Documents To PDF
R Benchmark 2.5: Overall mean
| Cinebench R20 / CPU (Multi Core) | |
| MSI Raider GE77 HX 12UHS | |
| Acer Predator Triton 300 SE | |
| Alienware x14 i7 RTX 3060 | |
| Average Intel Core i9-12900H (2681 - 7471, n=28) | |
| Lenovo IdeaPad Gaming 3 15IAH7 | |
| Razer Blade 14 Ryzen 9 6900HX | |
| Acer Nitro 5 AN515-46-R1A1 | |
| Razer Blade 14 Ryzen 9 RTX 3070 | |
| Asus ROG Zephyrus G14 GA402RJ | |
| Asus ZenBook 14X UM5401QA-KN162 | |
| Lenovo Legion 5 Pro 16 ARH7H-82RG0047GE | |
| Schenker Vision 14 | |
| Cinebench R20 / CPU (Single Core) | |
| MSI Raider GE77 HX 12UHS | |
| Acer Predator Triton 300 SE | |
| Average Intel Core i9-12900H (624 - 738, n=28) | |
| Alienware x14 i7 RTX 3060 | |
| Lenovo IdeaPad Gaming 3 15IAH7 | |
| Acer Nitro 5 AN515-46-R1A1 | |
| Razer Blade 14 Ryzen 9 6900HX | |
| Schenker Vision 14 | |
| Lenovo Legion 5 Pro 16 ARH7H-82RG0047GE | |
| Asus ROG Zephyrus G14 GA402RJ | |
| Asus ZenBook 14X UM5401QA-KN162 | |
| Razer Blade 14 Ryzen 9 RTX 3070 | |
| Cinebench R23 / Multi Core | |
| MSI Raider GE77 HX 12UHS | |
| Acer Predator Triton 300 SE | |
| Alienware x14 i7 RTX 3060 | |
| Average Intel Core i9-12900H (7359 - 19648, n=28) | |
| Lenovo IdeaPad Gaming 3 15IAH7 | |
| Razer Blade 14 Ryzen 9 6900HX | |
| Acer Nitro 5 AN515-46-R1A1 | |
| Razer Blade 14 Ryzen 9 RTX 3070 | |
| Asus ROG Zephyrus G14 GA402RJ | |
| Asus ZenBook 14X UM5401QA-KN162 | |
| Lenovo Legion 5 Pro 16 ARH7H-82RG0047GE | |
| Schenker Vision 14 | |
| Cinebench R23 / Single Core | |
| Acer Predator Triton 300 SE | |
| MSI Raider GE77 HX 12UHS | |
| Average Intel Core i9-12900H (1634 - 1930, n=28) | |
| Alienware x14 i7 RTX 3060 | |
| Lenovo IdeaPad Gaming 3 15IAH7 | |
| Acer Nitro 5 AN515-46-R1A1 | |
| Razer Blade 14 Ryzen 9 6900HX | |
| Schenker Vision 14 | |
| Lenovo Legion 5 Pro 16 ARH7H-82RG0047GE | |
| Asus ROG Zephyrus G14 GA402RJ | |
| Asus ZenBook 14X UM5401QA-KN162 | |
| Razer Blade 14 Ryzen 9 RTX 3070 | |
| Cinebench R15 / CPU Multi 64Bit | |
| MSI Raider GE77 HX 12UHS | |
| Alienware x14 i7 RTX 3060 | |
| Average Intel Core i9-12900H (1395 - 3077, n=28) | |
| Acer Predator Triton 300 SE | |
| Razer Blade 14 Ryzen 9 6900HX | |
| Lenovo IdeaPad Gaming 3 15IAH7 | |
| Acer Nitro 5 AN515-46-R1A1 | |
| Razer Blade 14 Ryzen 9 RTX 3070 | |
| Asus ROG Zephyrus G14 GA402RJ | |
| Asus ZenBook 14X UM5401QA-KN162 | |
| Lenovo Legion 5 Pro 16 ARH7H-82RG0047GE | |
| Schenker Vision 14 | |
| Schenker Vision 14 | |
| Cinebench R15 / CPU Single 64Bit | |
| MSI Raider GE77 HX 12UHS | |
| Acer Predator Triton 300 SE | |
| Average Intel Core i9-12900H (235 - 277, n=29) | |
| Alienware x14 i7 RTX 3060 | |
| Acer Nitro 5 AN515-46-R1A1 | |
| Lenovo IdeaPad Gaming 3 15IAH7 | |
| Razer Blade 14 Ryzen 9 6900HX | |
| Lenovo Legion 5 Pro 16 ARH7H-82RG0047GE | |
| Asus ROG Zephyrus G14 GA402RJ | |
| Schenker Vision 14 | |
| Asus ZenBook 14X UM5401QA-KN162 | |
| Razer Blade 14 Ryzen 9 RTX 3070 | |
| Blender / v2.79 BMW27 CPU | |
| Schenker Vision 14 | |
| Lenovo Legion 5 Pro 16 ARH7H-82RG0047GE | |
| Asus ZenBook 14X UM5401QA-KN162 | |
| Asus ROG Zephyrus G14 GA402RJ | |
| Razer Blade 14 Ryzen 9 RTX 3070 | |
| Acer Nitro 5 AN515-46-R1A1 | |
| Average Intel Core i9-12900H (160 - 451, n=28) | |
| Alienware x14 i7 RTX 3060 | |
| Lenovo IdeaPad Gaming 3 15IAH7 | |
| Razer Blade 14 Ryzen 9 6900HX | |
| Acer Predator Triton 300 SE | |
| MSI Raider GE77 HX 12UHS | |
| 7-Zip 18.03 / 7z b 4 | |
| MSI Raider GE77 HX 12UHS | |
| Alienware x14 i7 RTX 3060 | |
| Acer Predator Triton 300 SE | |
| Razer Blade 14 Ryzen 9 6900HX | |
| Acer Nitro 5 AN515-46-R1A1 | |
| Average Intel Core i9-12900H (34684 - 76677, n=28) | |
| Asus ROG Zephyrus G14 GA402RJ | |
| Asus ZenBook 14X UM5401QA-KN162 | |
| Razer Blade 14 Ryzen 9 RTX 3070 | |
| Lenovo Legion 5 Pro 16 ARH7H-82RG0047GE | |
| Lenovo IdeaPad Gaming 3 15IAH7 | |
| Schenker Vision 14 | |
| 7-Zip 18.03 / 7z b 4 -mmt1 | |
| MSI Raider GE77 HX 12UHS | |
| Average Intel Core i9-12900H (5302 - 6289, n=28) | |
| Razer Blade 14 Ryzen 9 6900HX | |
| Acer Nitro 5 AN515-46-R1A1 | |
| Alienware x14 i7 RTX 3060 | |
| Acer Predator Triton 300 SE | |
| Lenovo Legion 5 Pro 16 ARH7H-82RG0047GE | |
| Schenker Vision 14 | |
| Asus ROG Zephyrus G14 GA402RJ | |
| Lenovo IdeaPad Gaming 3 15IAH7 | |
| Asus ZenBook 14X UM5401QA-KN162 | |
| Razer Blade 14 Ryzen 9 RTX 3070 | |
| Geekbench 5.5 / Multi-Core | |
| MSI Raider GE77 HX 12UHS | |
| Alienware x14 i7 RTX 3060 | |
| Acer Predator Triton 300 SE | |
| Average Intel Core i9-12900H (8519 - 14376, n=31) | |
| Razer Blade 14 Ryzen 9 6900HX | |
| Acer Nitro 5 AN515-46-R1A1 | |
| Asus ROG Zephyrus G14 GA402RJ | |
| Asus ZenBook 14X UM5401QA-KN162 | |
| Lenovo IdeaPad Gaming 3 15IAH7 | |
| Lenovo Legion 5 Pro 16 ARH7H-82RG0047GE | |
| Schenker Vision 14 | |
| Geekbench 5.5 / Single-Core | |
| MSI Raider GE77 HX 12UHS | |
| Acer Predator Triton 300 SE | |
| Average Intel Core i9-12900H (1631 - 1897, n=31) | |
| Alienware x14 i7 RTX 3060 | |
| Lenovo IdeaPad Gaming 3 15IAH7 | |
| Schenker Vision 14 | |
| Razer Blade 14 Ryzen 9 6900HX | |
| Acer Nitro 5 AN515-46-R1A1 | |
| Asus ROG Zephyrus G14 GA402RJ | |
| Lenovo Legion 5 Pro 16 ARH7H-82RG0047GE | |
| Asus ZenBook 14X UM5401QA-KN162 | |
| HWBOT x265 Benchmark v2.2 / 4k Preset | |
| MSI Raider GE77 HX 12UHS | |
| Acer Predator Triton 300 SE | |
| Razer Blade 14 Ryzen 9 6900HX | |
| Alienware x14 i7 RTX 3060 | |
| Average Intel Core i9-12900H (8.05 - 22.5, n=28) | |
| Acer Nitro 5 AN515-46-R1A1 | |
| Lenovo IdeaPad Gaming 3 15IAH7 | |
| Razer Blade 14 Ryzen 9 RTX 3070 | |
| Asus ROG Zephyrus G14 GA402RJ | |
| Lenovo Legion 5 Pro 16 ARH7H-82RG0047GE | |
| Asus ZenBook 14X UM5401QA-KN162 | |
| Schenker Vision 14 | |
| LibreOffice / 20 Documents To PDF | |
| Lenovo Legion 5 Pro 16 ARH7H-82RG0047GE | |
| Razer Blade 14 Ryzen 9 RTX 3070 | |
| Asus ROG Zephyrus G14 GA402RJ | |
| Asus ZenBook 14X UM5401QA-KN162 | |
| Acer Nitro 5 AN515-46-R1A1 | |
| Razer Blade 14 Ryzen 9 6900HX | |
| Lenovo IdeaPad Gaming 3 15IAH7 | |
| Schenker Vision 14 | |
| MSI Raider GE77 HX 12UHS | |
| Average Intel Core i9-12900H (36.8 - 59.8, n=28) | |
| Acer Predator Triton 300 SE | |
| Alienware x14 i7 RTX 3060 | |
| R Benchmark 2.5 / Overall mean | |
| Razer Blade 14 Ryzen 9 RTX 3070 | |
| Schenker Vision 14 | |
| Asus ZenBook 14X UM5401QA-KN162 | |
| Asus ROG Zephyrus G14 GA402RJ | |
| Lenovo IdeaPad Gaming 3 15IAH7 | |
| Lenovo Legion 5 Pro 16 ARH7H-82RG0047GE | |
| Acer Nitro 5 AN515-46-R1A1 | |
| Razer Blade 14 Ryzen 9 6900HX | |
| Alienware x14 i7 RTX 3060 | |
| Average Intel Core i9-12900H (0.4218 - 0.506, n=28) | |
| Acer Predator Triton 300 SE | |
| MSI Raider GE77 HX 12UHS | |
* ... smaller is better
AIDA64: FP32 Ray-Trace | FPU Julia | CPU SHA3 | CPU Queen | FPU SinJulia | FPU Mandel | CPU AES | CPU ZLib | FP64 Ray-Trace | CPU PhotoWorxx
| Performance rating | |
| Razer Blade 14 Ryzen 9 6900HX | |
| Acer Predator Triton 300 SE | |
| Asus ROG Zephyrus G14 GA402RJ | |
| Average Intel Core i9-12900H | |
| Dell Inspiron 14 Plus 7420 | |
| Alienware x14 i7 RTX 3060 | |
| Schenker Vision 14 | |
| AIDA64 / FP32 Ray-Trace | |
| Razer Blade 14 Ryzen 9 6900HX | |
| Acer Predator Triton 300 SE | |
| Asus ROG Zephyrus G14 GA402RJ | |
| Dell Inspiron 14 Plus 7420 | |
| Average Intel Core i9-12900H (4074 - 18289, n=29) | |
| Schenker Vision 14 | |
| Alienware x14 i7 RTX 3060 | |
| AIDA64 / FPU Julia | |
| Razer Blade 14 Ryzen 9 6900HX | |
| Asus ROG Zephyrus G14 GA402RJ | |
| Acer Predator Triton 300 SE | |
| Dell Inspiron 14 Plus 7420 | |
| Average Intel Core i9-12900H (22307 - 93236, n=29) | |
| Alienware x14 i7 RTX 3060 | |
| Schenker Vision 14 | |
| AIDA64 / CPU SHA3 | |
| Acer Predator Triton 300 SE | |
| Razer Blade 14 Ryzen 9 6900HX | |
| Average Intel Core i9-12900H (1378 - 4215, n=29) | |
| Asus ROG Zephyrus G14 GA402RJ | |
| Alienware x14 i7 RTX 3060 | |
| Dell Inspiron 14 Plus 7420 | |
| Schenker Vision 14 | |
| AIDA64 / CPU Queen | |
| Acer Predator Triton 300 SE | |
| Razer Blade 14 Ryzen 9 6900HX | |
| Asus ROG Zephyrus G14 GA402RJ | |
| Average Intel Core i9-12900H (78172 - 111241, n=28) | |
| Alienware x14 i7 RTX 3060 | |
| Dell Inspiron 14 Plus 7420 | |
| Schenker Vision 14 | |
| AIDA64 / FPU SinJulia | |
| Razer Blade 14 Ryzen 9 6900HX | |
| Asus ROG Zephyrus G14 GA402RJ | |
| Acer Predator Triton 300 SE | |
| Alienware x14 i7 RTX 3060 | |
| Average Intel Core i9-12900H (5709 - 10410, n=29) | |
| Dell Inspiron 14 Plus 7420 | |
| Schenker Vision 14 | |
| AIDA64 / FPU Mandel | |
| Razer Blade 14 Ryzen 9 6900HX | |
| Asus ROG Zephyrus G14 GA402RJ | |
| Acer Predator Triton 300 SE | |
| Dell Inspiron 14 Plus 7420 | |
| Average Intel Core i9-12900H (11257 - 45581, n=29) | |
| Alienware x14 i7 RTX 3060 | |
| Schenker Vision 14 | |
| AIDA64 / CPU AES | |
| Razer Blade 14 Ryzen 9 6900HX | |
| Acer Predator Triton 300 SE | |
| Asus ROG Zephyrus G14 GA402RJ | |
| Alienware x14 i7 RTX 3060 | |
| Average Intel Core i9-12900H (31935 - 151546, n=29) | |
| Schenker Vision 14 | |
| Dell Inspiron 14 Plus 7420 | |
| AIDA64 / CPU ZLib | |
| Acer Predator Triton 300 SE | |
| Alienware x14 i7 RTX 3060 | |
| Dell Inspiron 14 Plus 7420 | |
| Average Intel Core i9-12900H (449 - 1193, n=29) | |
| Razer Blade 14 Ryzen 9 6900HX | |
| Asus ROG Zephyrus G14 GA402RJ | |
| Schenker Vision 14 | |
| AIDA64 / FP64 Ray-Trace | |
| Razer Blade 14 Ryzen 9 6900HX | |
| Acer Predator Triton 300 SE | |
| Asus ROG Zephyrus G14 GA402RJ | |
| Dell Inspiron 14 Plus 7420 | |
| Average Intel Core i9-12900H (2235 - 10511, n=29) | |
| Alienware x14 i7 RTX 3060 | |
| Schenker Vision 14 | |
| AIDA64 / CPU PhotoWorxx | |
| Acer Predator Triton 300 SE | |
| Alienware x14 i7 RTX 3060 | |
| Average Intel Core i9-12900H (20960 - 48269, n=30) | |
| Dell Inspiron 14 Plus 7420 | |
| Razer Blade 14 Ryzen 9 6900HX | |
| Schenker Vision 14 | |
| Asus ROG Zephyrus G14 GA402RJ | |
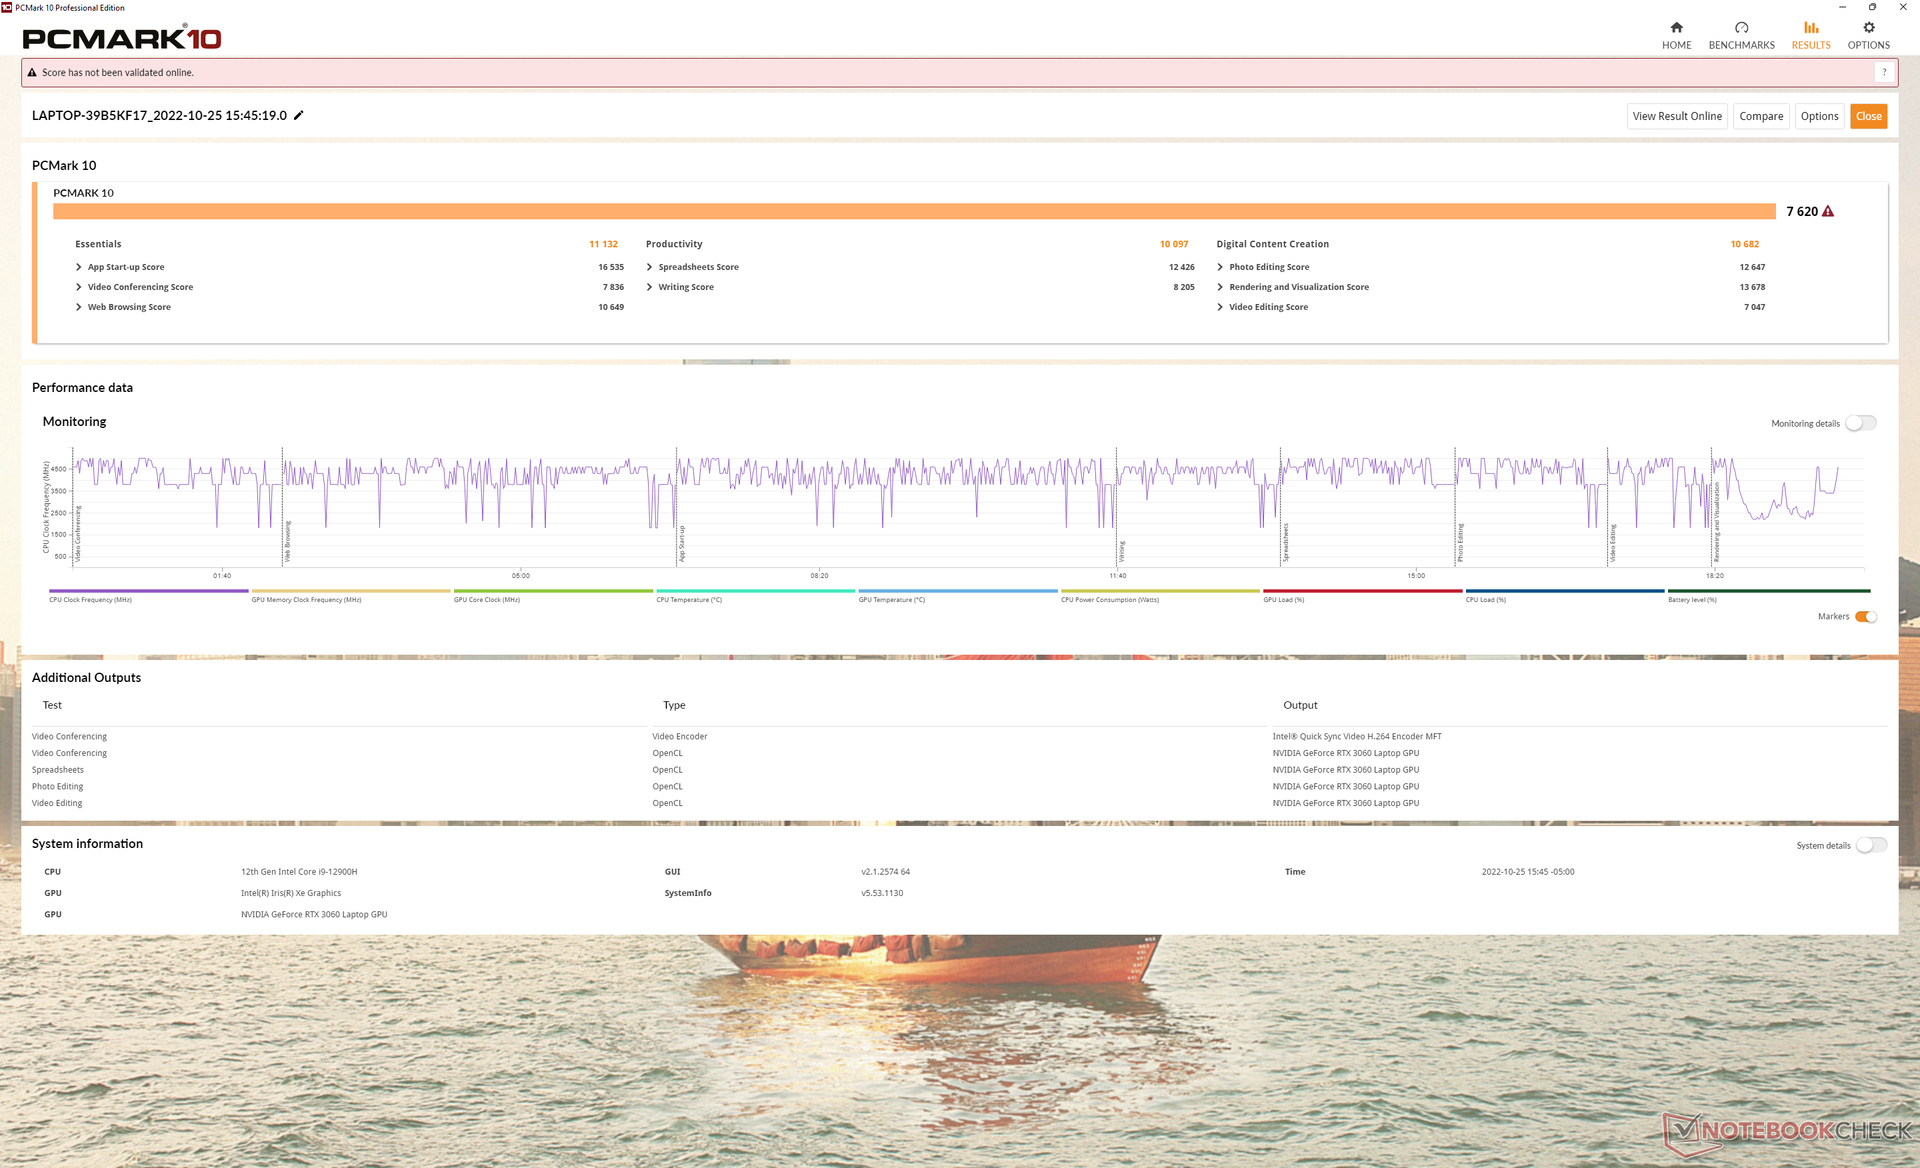
系统性能
PCMark结果比2020年的Predator Triton 300快了近50%,因为旧型号的数字内容创作得分异常低。相对于其他采用最新的Zen 3+或12代酷睿H CPU的游戏笔记本,现在的分数应该是这样的,如戴尔G16.
CrossMark: Overall | Productivity | Creativity | Responsiveness
| PCMark 10 / Score | |
| Acer Predator Triton 300 SE | |
| Asus ROG Zephyrus G14 GA402RJ | |
| Razer Blade 14 Ryzen 9 6900HX | |
| Alienware x14 i7 RTX 3060 | |
| Dell Inspiron 14 Plus 7420 | |
| Schenker Vision 14 | |
| Acer Predator Triton 300 PT315-52-79LP | |
| PCMark 10 / Essentials | |
| Acer Predator Triton 300 SE | |
| Razer Blade 14 Ryzen 9 6900HX | |
| Alienware x14 i7 RTX 3060 | |
| Dell Inspiron 14 Plus 7420 | |
| Asus ROG Zephyrus G14 GA402RJ | |
| Acer Predator Triton 300 PT315-52-79LP | |
| Schenker Vision 14 | |
| PCMark 10 / Productivity | |
| Acer Predator Triton 300 SE | |
| Alienware x14 i7 RTX 3060 | |
| Asus ROG Zephyrus G14 GA402RJ | |
| Razer Blade 14 Ryzen 9 6900HX | |
| Dell Inspiron 14 Plus 7420 | |
| Schenker Vision 14 | |
| Acer Predator Triton 300 PT315-52-79LP | |
| PCMark 10 / Digital Content Creation | |
| Asus ROG Zephyrus G14 GA402RJ | |
| Razer Blade 14 Ryzen 9 6900HX | |
| Acer Predator Triton 300 SE | |
| Alienware x14 i7 RTX 3060 | |
| Dell Inspiron 14 Plus 7420 | |
| Schenker Vision 14 | |
| Acer Predator Triton 300 PT315-52-79LP | |
| CrossMark / Overall | |
| Acer Predator Triton 300 SE | |
| Alienware x14 i7 RTX 3060 | |
| Dell Inspiron 14 Plus 7420 | |
| Schenker Vision 14 | |
| CrossMark / Productivity | |
| Acer Predator Triton 300 SE | |
| Alienware x14 i7 RTX 3060 | |
| Dell Inspiron 14 Plus 7420 | |
| Schenker Vision 14 | |
| CrossMark / Creativity | |
| Acer Predator Triton 300 SE | |
| Alienware x14 i7 RTX 3060 | |
| Dell Inspiron 14 Plus 7420 | |
| Schenker Vision 14 | |
| CrossMark / Responsiveness | |
| Acer Predator Triton 300 SE | |
| Alienware x14 i7 RTX 3060 | |
| Schenker Vision 14 | |
| Dell Inspiron 14 Plus 7420 | |
| PCMark 10 Score | 7620 points | |
Help | ||
| AIDA64 / Memory Copy | |
| Alienware x14 i7 RTX 3060 | |
| Acer Predator Triton 300 SE | |
| Average Intel Core i9-12900H (34438 - 74264, n=29) | |
| Dell Inspiron 14 Plus 7420 | |
| Razer Blade 14 Ryzen 9 6900HX | |
| Asus ROG Zephyrus G14 GA402RJ | |
| Schenker Vision 14 | |
| AIDA64 / Memory Read | |
| Alienware x14 i7 RTX 3060 | |
| Acer Predator Triton 300 SE | |
| Dell Inspiron 14 Plus 7420 | |
| Average Intel Core i9-12900H (36365 - 74642, n=29) | |
| Razer Blade 14 Ryzen 9 6900HX | |
| Asus ROG Zephyrus G14 GA402RJ | |
| Schenker Vision 14 | |
| AIDA64 / Memory Write | |
| Alienware x14 i7 RTX 3060 | |
| Acer Predator Triton 300 SE | |
| Average Intel Core i9-12900H (32276 - 67858, n=29) | |
| Dell Inspiron 14 Plus 7420 | |
| Asus ROG Zephyrus G14 GA402RJ | |
| Razer Blade 14 Ryzen 9 6900HX | |
| Schenker Vision 14 | |
| AIDA64 / Memory Latency | |
| Dell Inspiron 14 Plus 7420 | |
| Alienware x14 i7 RTX 3060 | |
| Acer Predator Triton 300 SE | |
| Asus ROG Zephyrus G14 GA402RJ | |
| Average Intel Core i9-12900H (74.7 - 118.1, n=28) | |
| Razer Blade 14 Ryzen 9 6900HX | |
| Schenker Vision 14 | |
* ... smaller is better
DPC延时
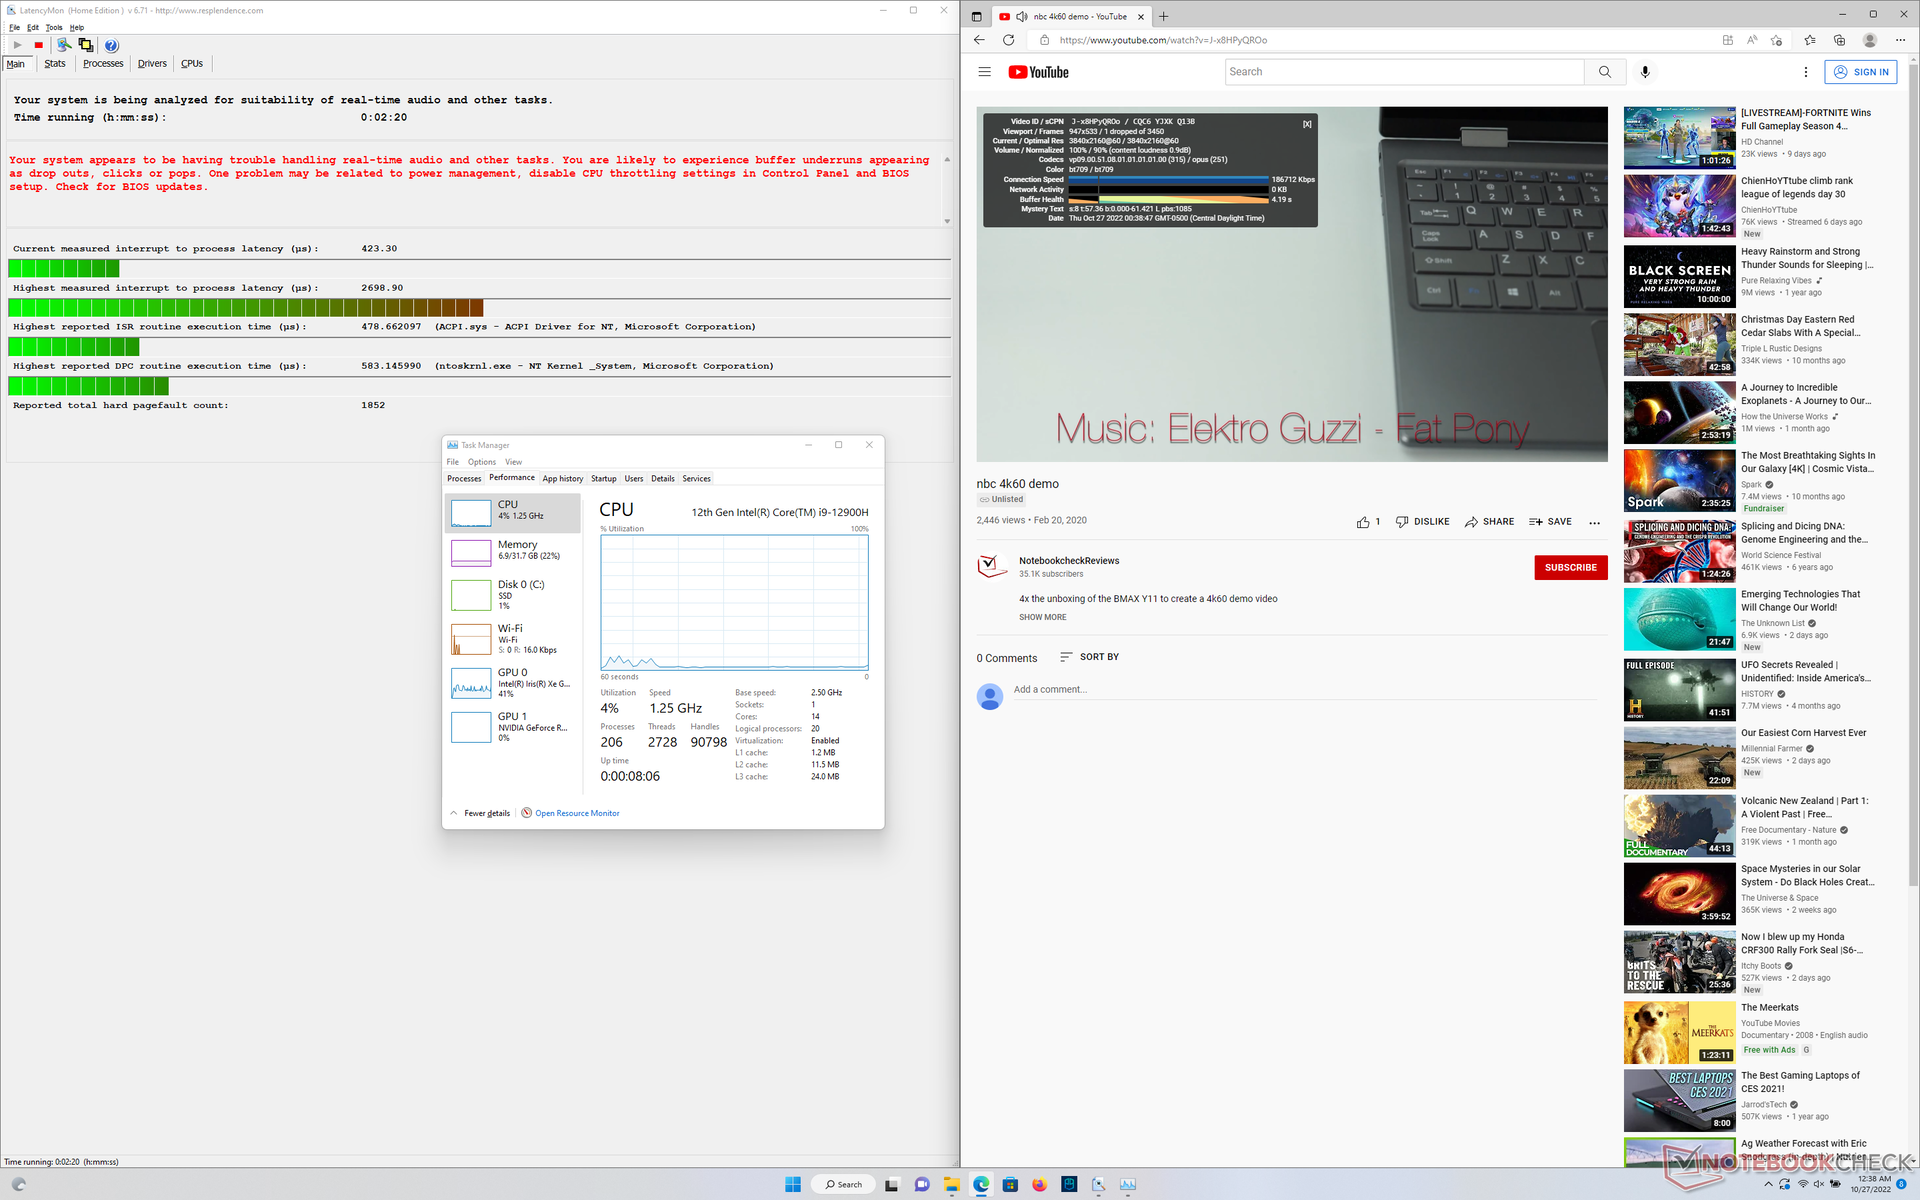
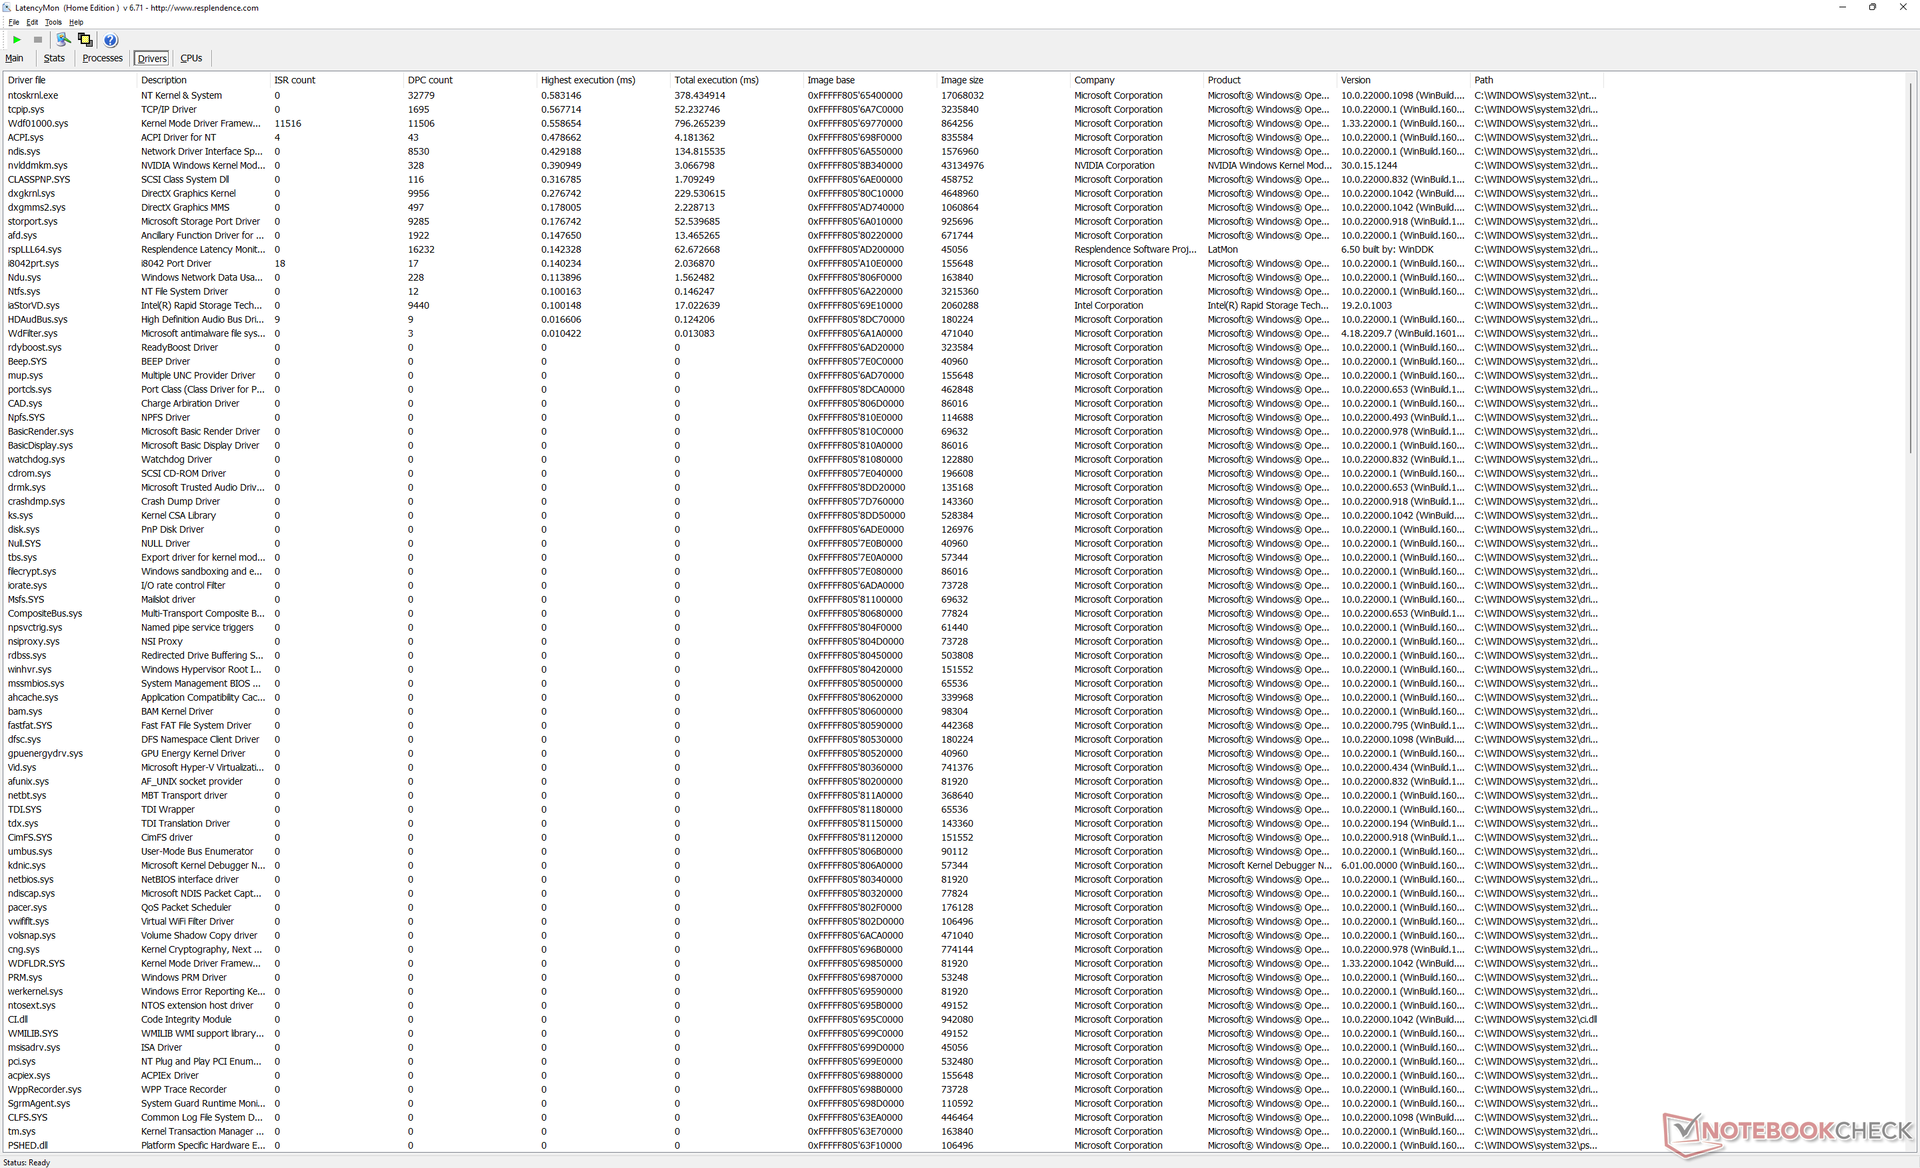
LatencyMon显示了在打开我们主页的多个浏览器标签时的DPC问题。的 2020年掠夺者Triton 300 也会有类似的DPC问题,所以看到这个问题没有得到解决,有点令人失望。除此之外,在播放4K60视频时,没有出现重大的跳帧。
| DPC Latencies / LatencyMon - interrupt to process latency (max), Web, Youtube, Prime95 | |
| Acer Predator Triton 300 SE | |
| Razer Blade 14 Ryzen 9 6900HX | |
| Alienware x14 i7 RTX 3060 | |
| Asus ROG Zephyrus G14 GA402RJ | |
| Schenker Vision 14 | |
| Dell Inspiron 14 Plus 7420 | |
* ... smaller is better
存储设备--不包括散热片
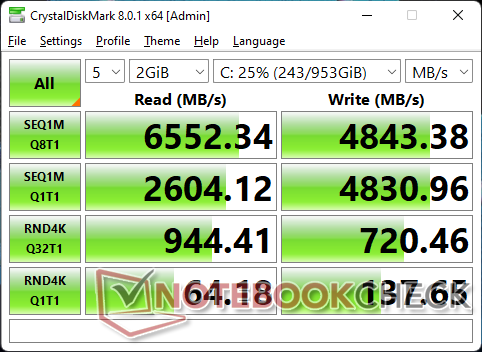
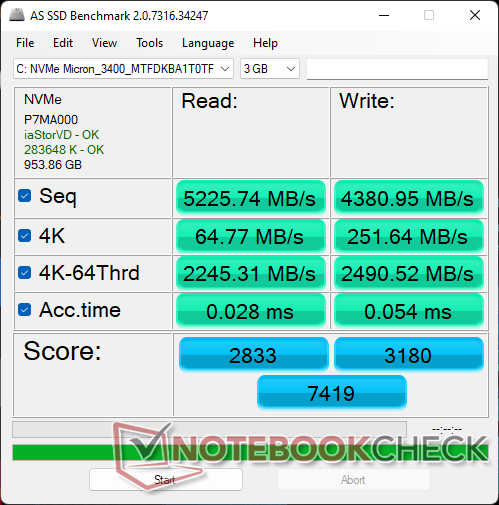
我们的测试装置配备了一个 1TB美光3400PCIe4 NVMe固态硬盘,连续读取和写入速度分别高达6600MB/s和5000MB/s。不幸的是,该驱动器无法长时间保持如此快的速度,可能是由于缺乏散热片。我们下面的DiskSpd循环结果显示,在测试开始时,读取速度高达6500MB/s,然后随着时间的推移,下降到1700MB/s甚至400MB/s。竞争者如 Razer Blade 14这样的竞争对手在维持更快的SSD传输率方面要好得多。

| Drive Performance rating - Percent | |
| Razer Blade 14 Ryzen 9 6900HX | |
| Schenker Vision 14 | |
| Acer Predator Triton 300 SE -11! | |
| Alienware x14 i7 RTX 3060 | |
| Asus ROG Zephyrus G14 GA402RJ | |
| Dell Inspiron 14 Plus 7420 | |
* ... smaller is better
Disk Throttling: DiskSpd Read Loop, Queue Depth 8
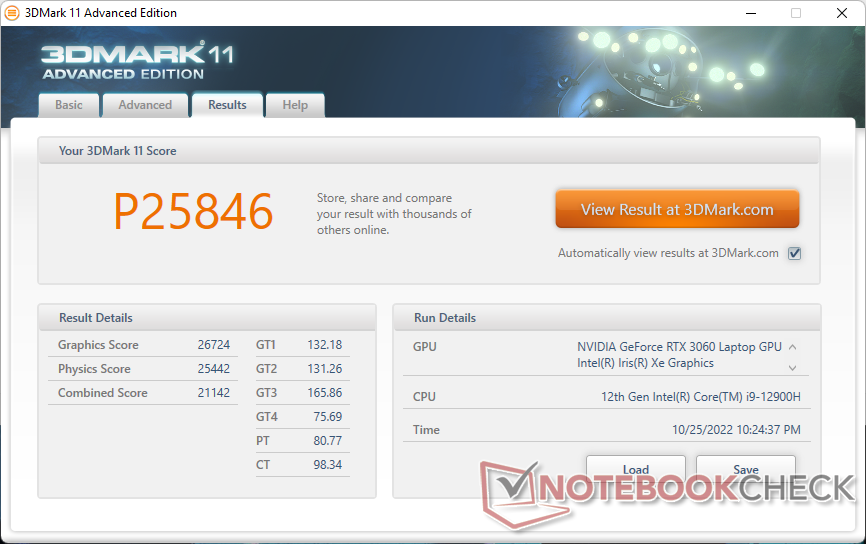
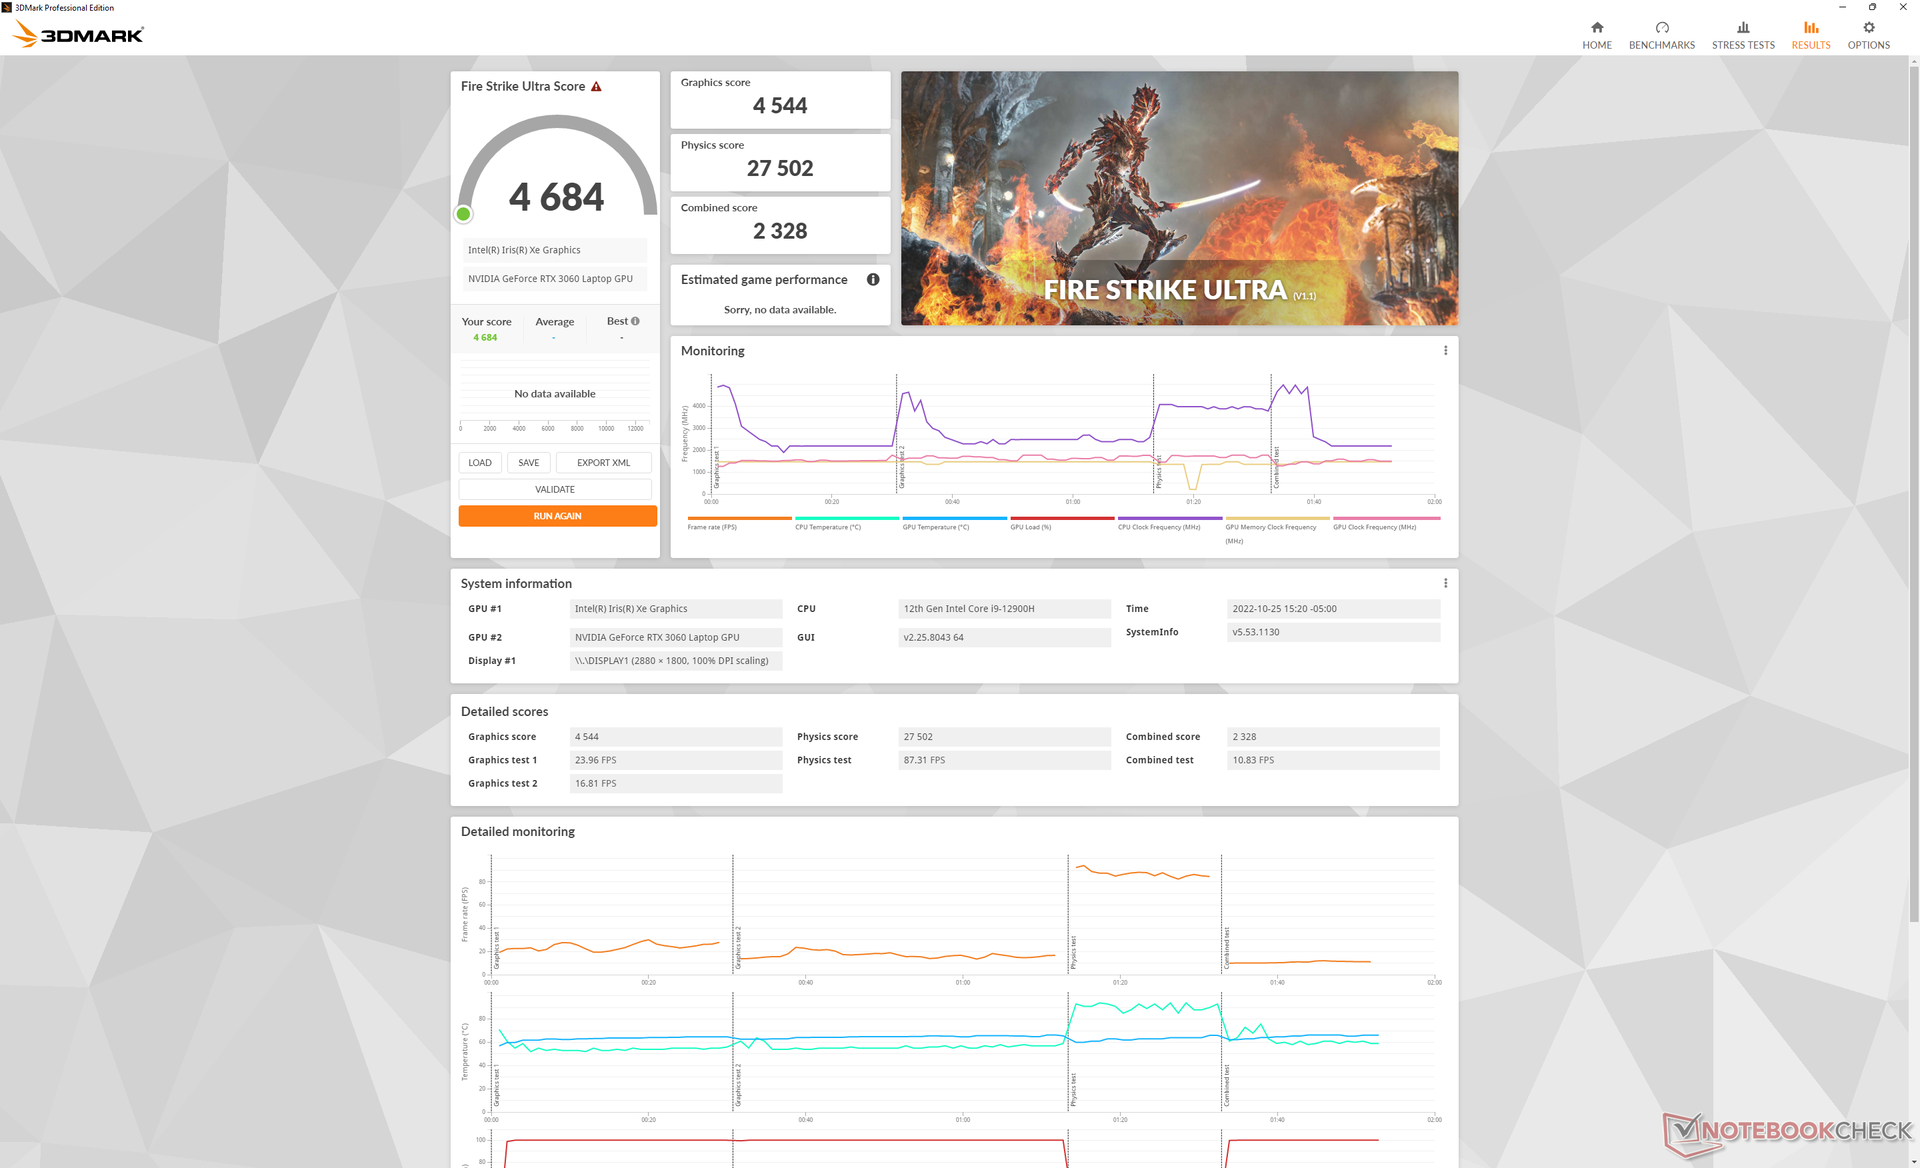
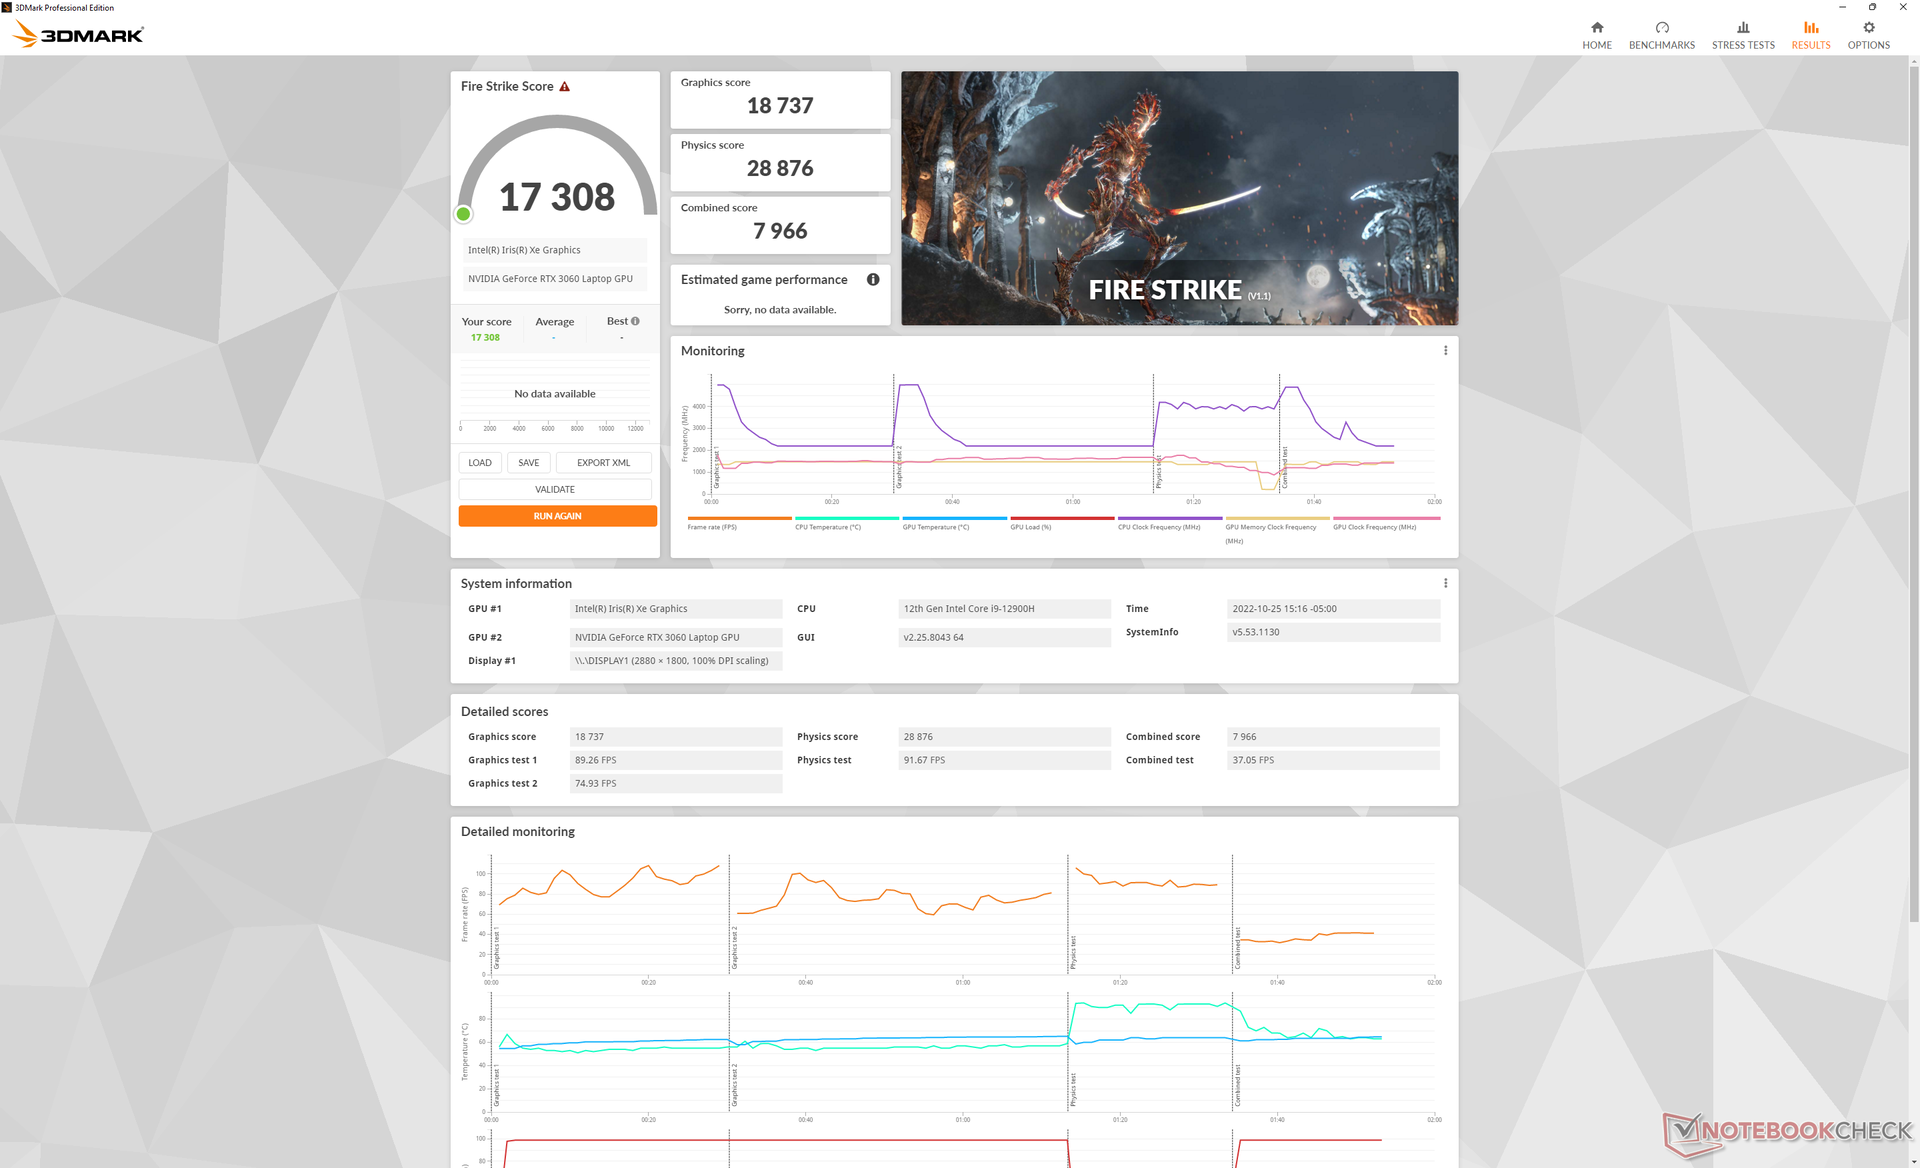
GPU性能 - 95 W TGP
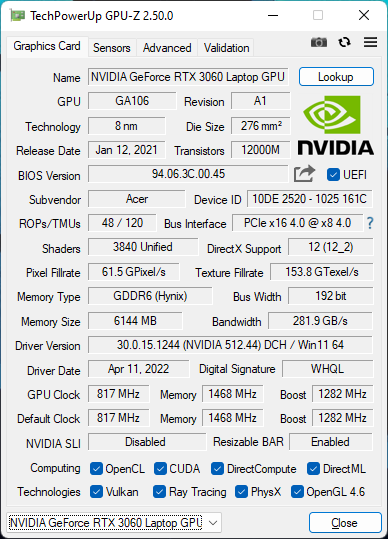
图形性能在我们数据库中配备相同的笔记本电脑的1到2个百分点之内。 GeForce RTX 3060GPU,即使在Turbo模式下运行。如果关闭Turbo模式,性能将下降约5%至6%,比平均水平要慢。因此,用户如果想在游戏时最大限度地发挥笔记本电脑的作用,就必须在最大声的设置下运行Predator Triton 300 SE。
总体性能仍然比旧的 RTX 2060中的 2020年掠夺者Triton 300约25%至30%。除了像《赛博朋克2077》这样要求最高的游戏,大多数游戏在1080p的最大设置下都很稳定。在原生的1800p分辨率下,性能开始下降,不幸的是,这里没有G-Sync支持来缓解不均匀的帧节奏。我们发现中高设置下的1800p是这台机器的甜蜜点。

| 3DMark | |
| 1920x1080 Fire Strike Graphics | |
| Razer Blade 14 Ryzen 9 6900HX | |
| Asus ROG Zephyrus G14 GA402RJ | |
| Lenovo Legion 7 15IMH05-81YT001VGE | |
| Average NVIDIA GeForce RTX 3060 Laptop GPU (16354 - 23109, n=49) | |
| Acer Predator Triton 300 SE | |
| Asus ROG Zephyrus M15 GU502LU-BI7N4 | |
| Acer Predator Triton 300 PT315-52-79LP | |
| Dell Inspiron 14 Plus 7420 | |
| Schenker Vision 14 | |
| 2560x1440 Time Spy Graphics | |
| Razer Blade 14 Ryzen 9 6900HX | |
| Lenovo Legion 7 15IMH05-81YT001VGE | |
| Asus ROG Zephyrus G14 GA402RJ | |
| Average NVIDIA GeForce RTX 3060 Laptop GPU (6285 - 9235, n=49) | |
| Acer Predator Triton 300 SE | |
| Asus ROG Zephyrus M15 GU502LU-BI7N4 | |
| Acer Predator Triton 300 PT315-52-79LP | |
| Schenker Vision 14 | |
| Dell Inspiron 14 Plus 7420 | |
| 2560x1440 Time Spy Score | |
| Razer Blade 14 Ryzen 9 6900HX | |
| Lenovo Legion 7 15IMH05-81YT001VGE | |
| Asus ROG Zephyrus G14 GA402RJ | |
| Acer Predator Triton 300 SE | |
| Average NVIDIA GeForce RTX 3060 Laptop GPU (6473 - 9677, n=50) | |
| Asus ROG Zephyrus M15 GU502LU-BI7N4 | |
| Acer Predator Triton 300 PT315-52-79LP | |
| Dell Inspiron 14 Plus 7420 | |
| Schenker Vision 14 | |
| 3DMark 11 - 1280x720 Performance GPU | |
| Razer Blade 14 Ryzen 9 6900HX | |
| Asus ROG Zephyrus G14 GA402RJ | |
| Lenovo Legion 7 15IMH05-81YT001VGE | |
| Average NVIDIA GeForce RTX 3060 Laptop GPU (13799 - 30772, n=43) | |
| Acer Predator Triton 300 SE | |
| Asus ROG Zephyrus M15 GU502LU-BI7N4 | |
| Acer Predator Triton 300 PT315-52-79LP | |
| Schenker Vision 14 | |
| Dell Inspiron 14 Plus 7420 | |
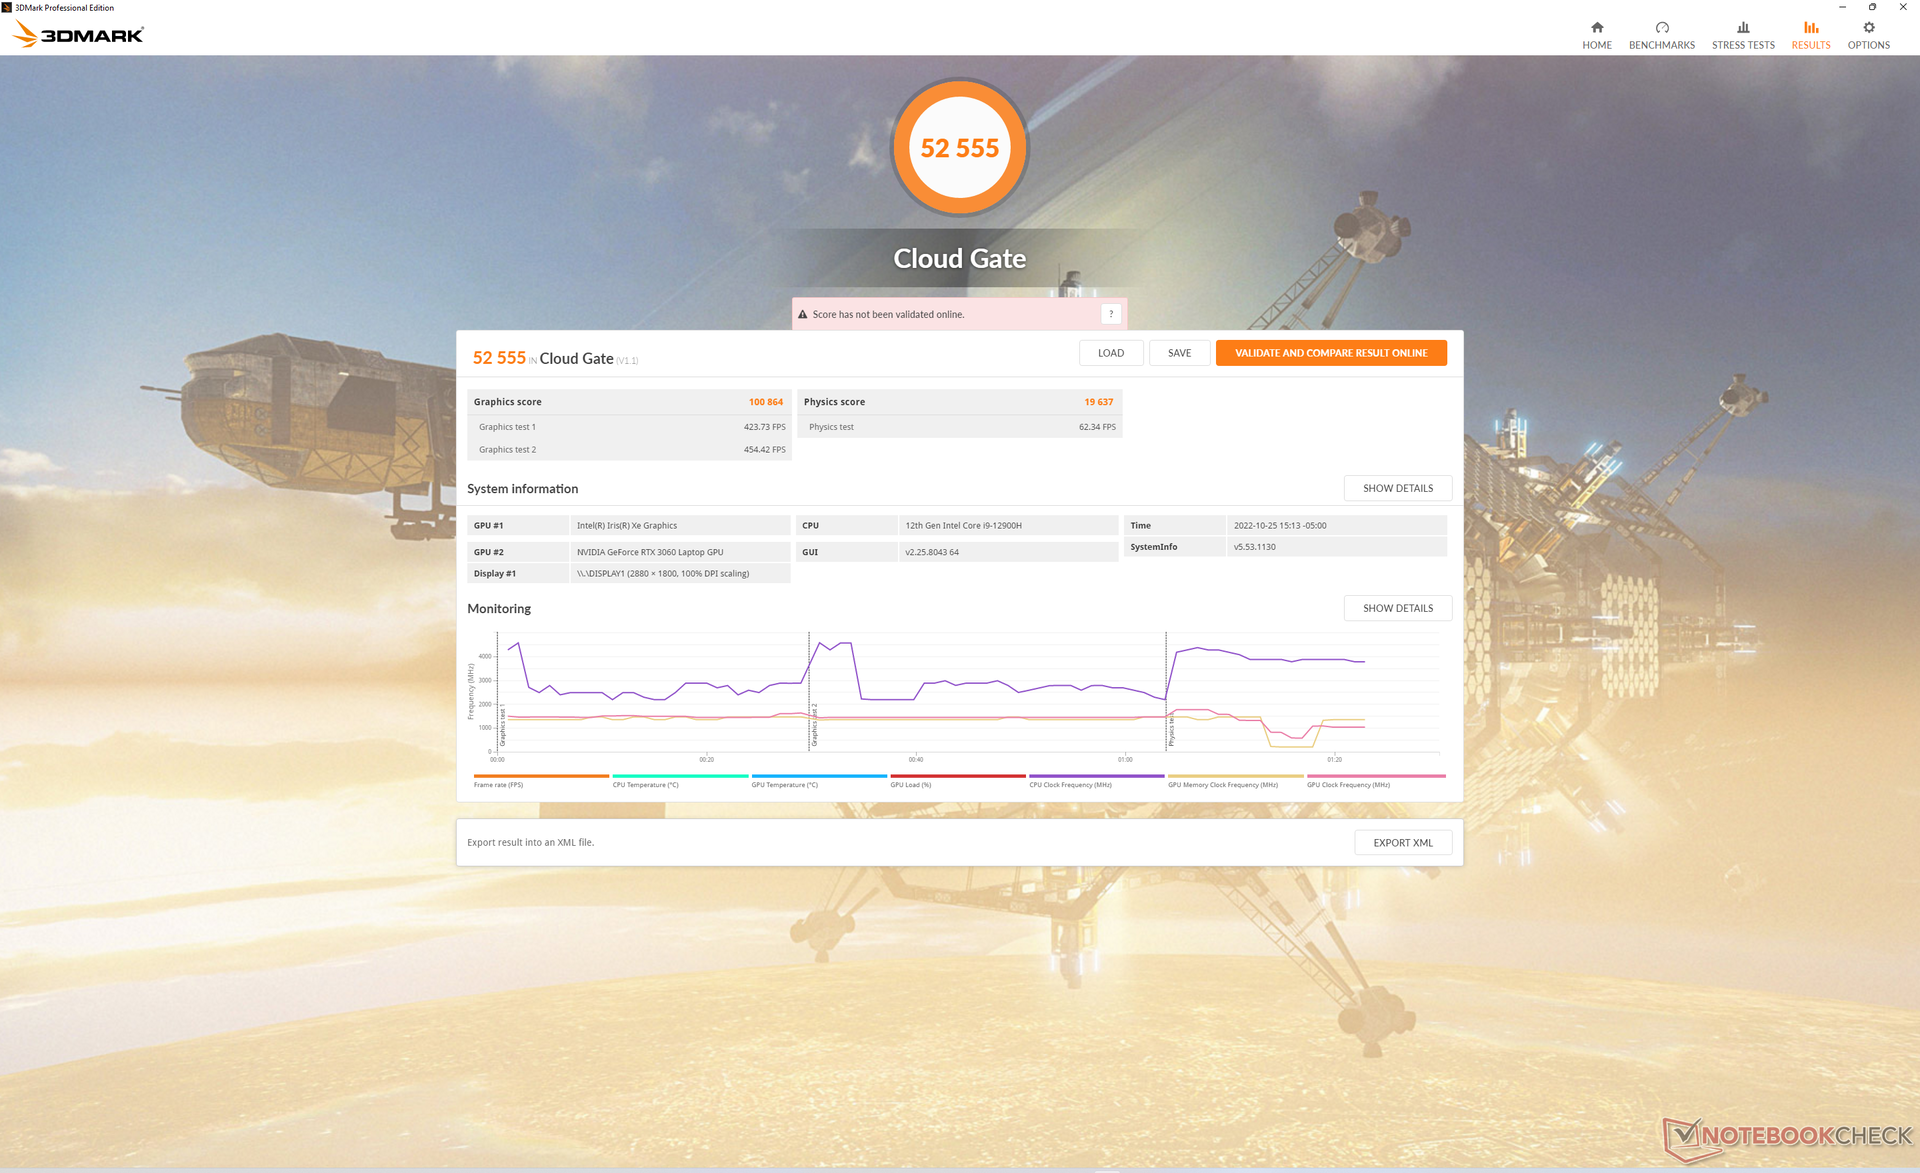
| 3DMark 11 Performance | 25846 points | |
| 3DMark Cloud Gate Standard Score | 52555 points | |
| 3DMark Fire Strike Score | 19053 points | |
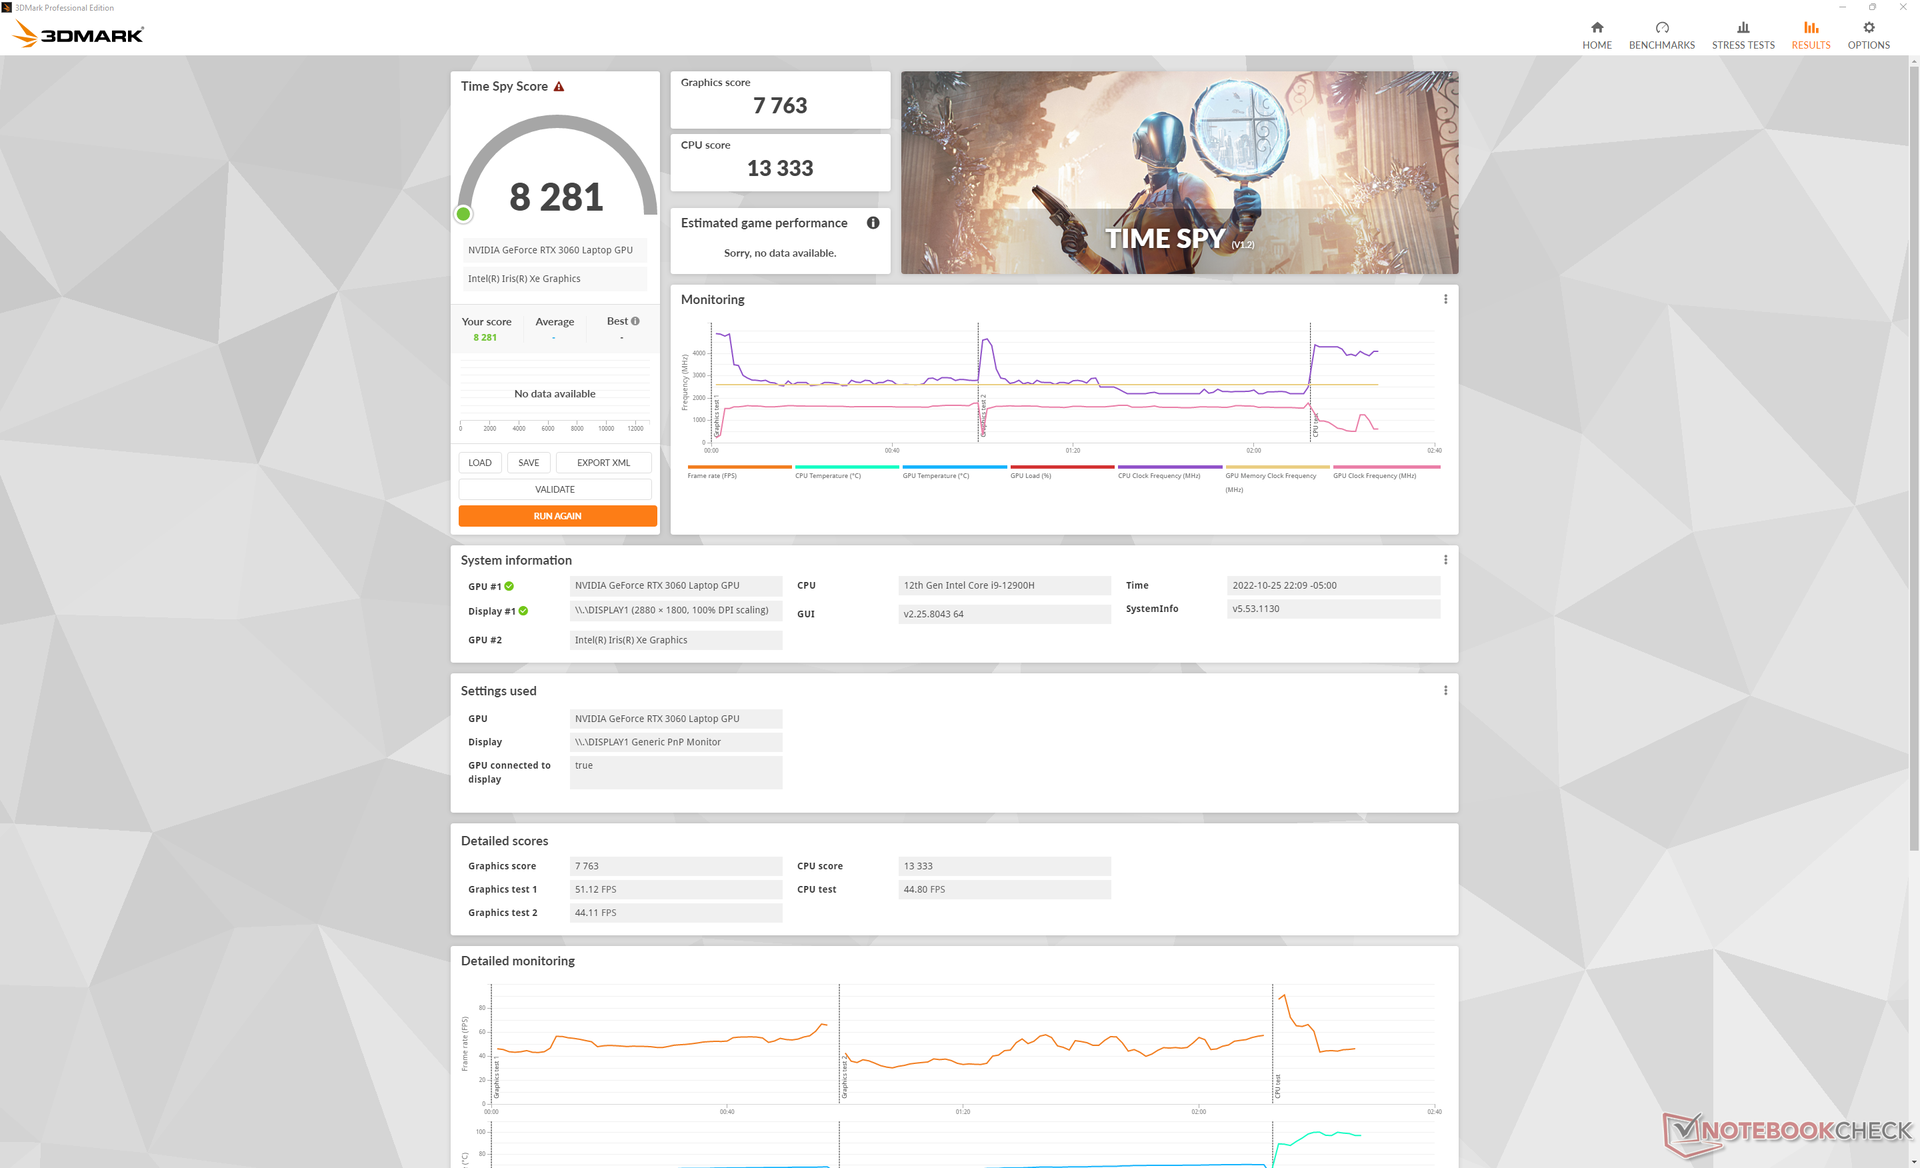
| 3DMark Time Spy Score | 8281 points | |
Help | ||
* ... smaller is better
Witcher 3 FPS Chart
| low | med. | high | ultra | QHD | |
|---|---|---|---|---|---|
| GTA V (2015) | 185.9 | 181.8 | 172.3 | 99.6 | 75.2 |
| The Witcher 3 (2015) | 341.1 | 230 | 145.6 | 75 | |
| Dota 2 Reborn (2015) | 185 | 169.2 | 162.1 | 153.6 | |
| Final Fantasy XV Benchmark (2018) | 176.4 | 105.1 | 79.1 | 60.5 | |
| X-Plane 11.11 (2018) | 141.8 | 126.1 | 101 | ||
| Strange Brigade (2018) | 389 | 196.7 | 157.8 | 138.6 | 100.8 |
| Cyberpunk 2077 1.6 (2022) | 109.8 | 71.9 | 70.4 | 57.7 | 36 |
排放物 - 游戏时声音很大
系统噪音
PredatorSense风扇模式包括安静、默认和涡轮。如果设置为 "默认 "或更高,风扇就会频繁跳动,因此建议在浏览网页或传输视频时将系统设置为 "安静"。否则,在运行要求不高的负载时,风扇噪音可高达34 dB(A),而静音背景为24 dB(A)。
在默认和涡轮模式设置之间,风扇噪音有很大的差别。在默认模式下运行Witcher 3 ,风扇噪音最高为47分贝(A),而在涡轮模式下则为60分贝(A)。如下表所示,60分贝(A)的噪音明显高于其他大多数笔记本电脑,无论其大小如何。如前所述,要充分利用95W的TGP GPU,启用Turbo模式是必须的。尽管如此,用户可能想考虑在默认模式下进行游戏,以获得更安静的风扇噪音,即使这将导致5%至6%的性能下降。
Noise level
| Idle |
| 23.8 / 23.8 / 30.6 dB(A) |
| Load |
| 44.2 / 60 dB(A) |
 | ||
30 dB silent 40 dB(A) audible 50 dB(A) loud |
||
min: | ||
| Acer Predator Triton 300 SE GeForce RTX 3060 Laptop GPU, i9-12900H, Micron 3400 1TB MTFDKBA1T0TFH | Asus ROG Zephyrus G14 GA402RJ Radeon RX 6700S, R7 6800HS, Micron 2450 1TB MTFDKBA1T0TFK | Razer Blade 14 Ryzen 9 6900HX GeForce RTX 3070 Ti Laptop GPU, R9 6900HX, Samsung PM9A1 MZVL21T0HCLR | Alienware x14 i7 RTX 3060 GeForce RTX 3060 Laptop GPU, i7-12700H, WDC PC SN810 1TB | Dell Inspiron 14 Plus 7420 GeForce RTX 3050 4GB Laptop GPU, i7-12700H, SK Hynix BC711 512GB HFM512GD3GX013N | Schenker Vision 14 GeForce RTX 3050 Ti Laptop GPU, i7-11370H, Samsung SSD 980 Pro 1TB MZ-V8P1T0BW | |
|---|---|---|---|---|---|---|
| Noise | 5% | 16% | 4% | 8% | 8% | |
| off / environment * (dB) | 23.8 | 25 -5% | 23.3 2% | 24.7 -4% | 23.2 3% | 24.3 -2% |
| Idle Minimum * (dB) | 23.8 | 25 -5% | 23.3 2% | 24.7 -4% | 23.2 3% | 24.3 -2% |
| Idle Average * (dB) | 23.8 | 26 -9% | 23.3 2% | 24.7 -4% | 23.2 3% | 24.3 -2% |
| Idle Maximum * (dB) | 30.6 | 29 5% | 23.3 24% | 30.9 -1% | 23.2 24% | 25.9 15% |
| Load Average * (dB) | 44.2 | 45 -2% | 34.7 21% | 40 10% | 47.5 -7% | 43.3 2% |
| Witcher 3 ultra * (dB) | 60.1 | 43 28% | 42.1 30% | 51.5 14% | 51.7 14% | 44.6 26% |
| Load Maximum * (dB) | 60 | 45 25% | 42.1 30% | 51.5 14% | 51.7 14% | 49.5 17% |
* ... smaller is better
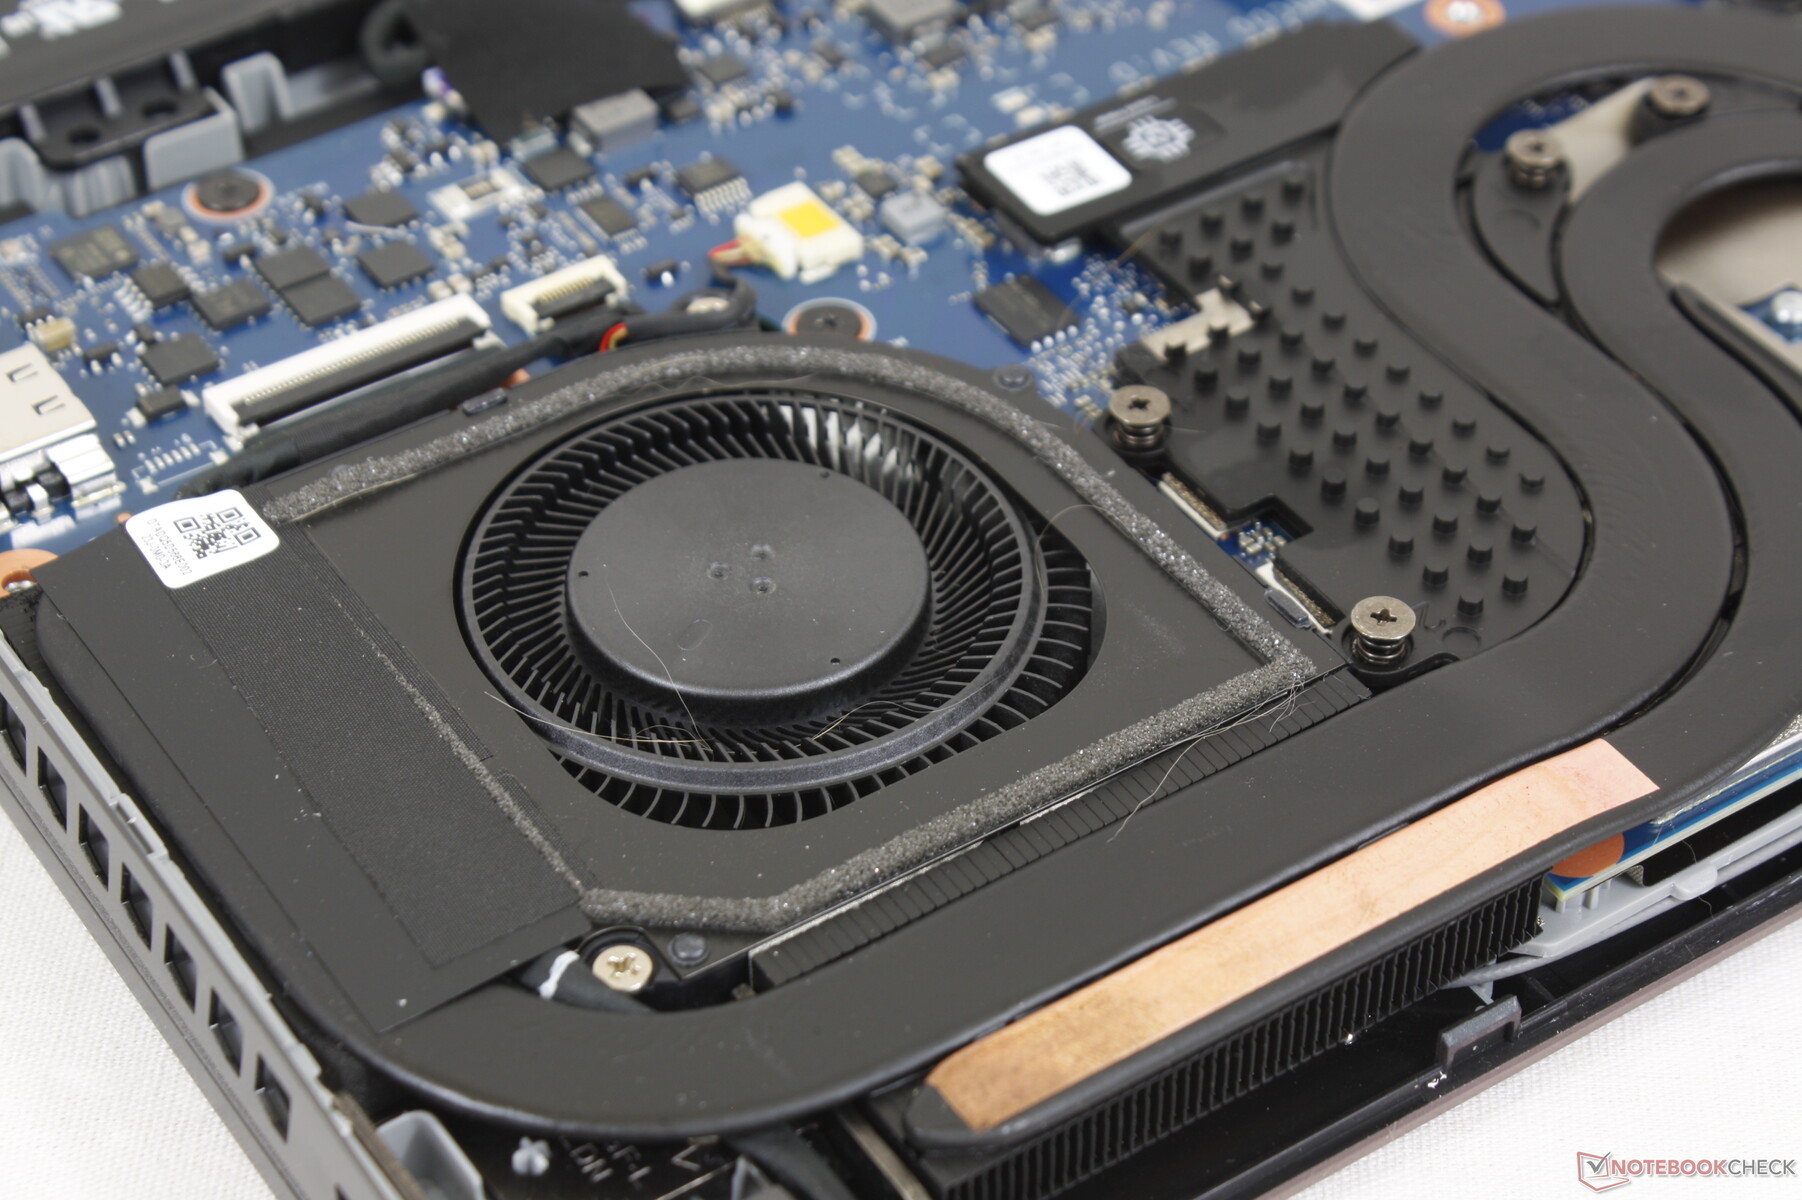
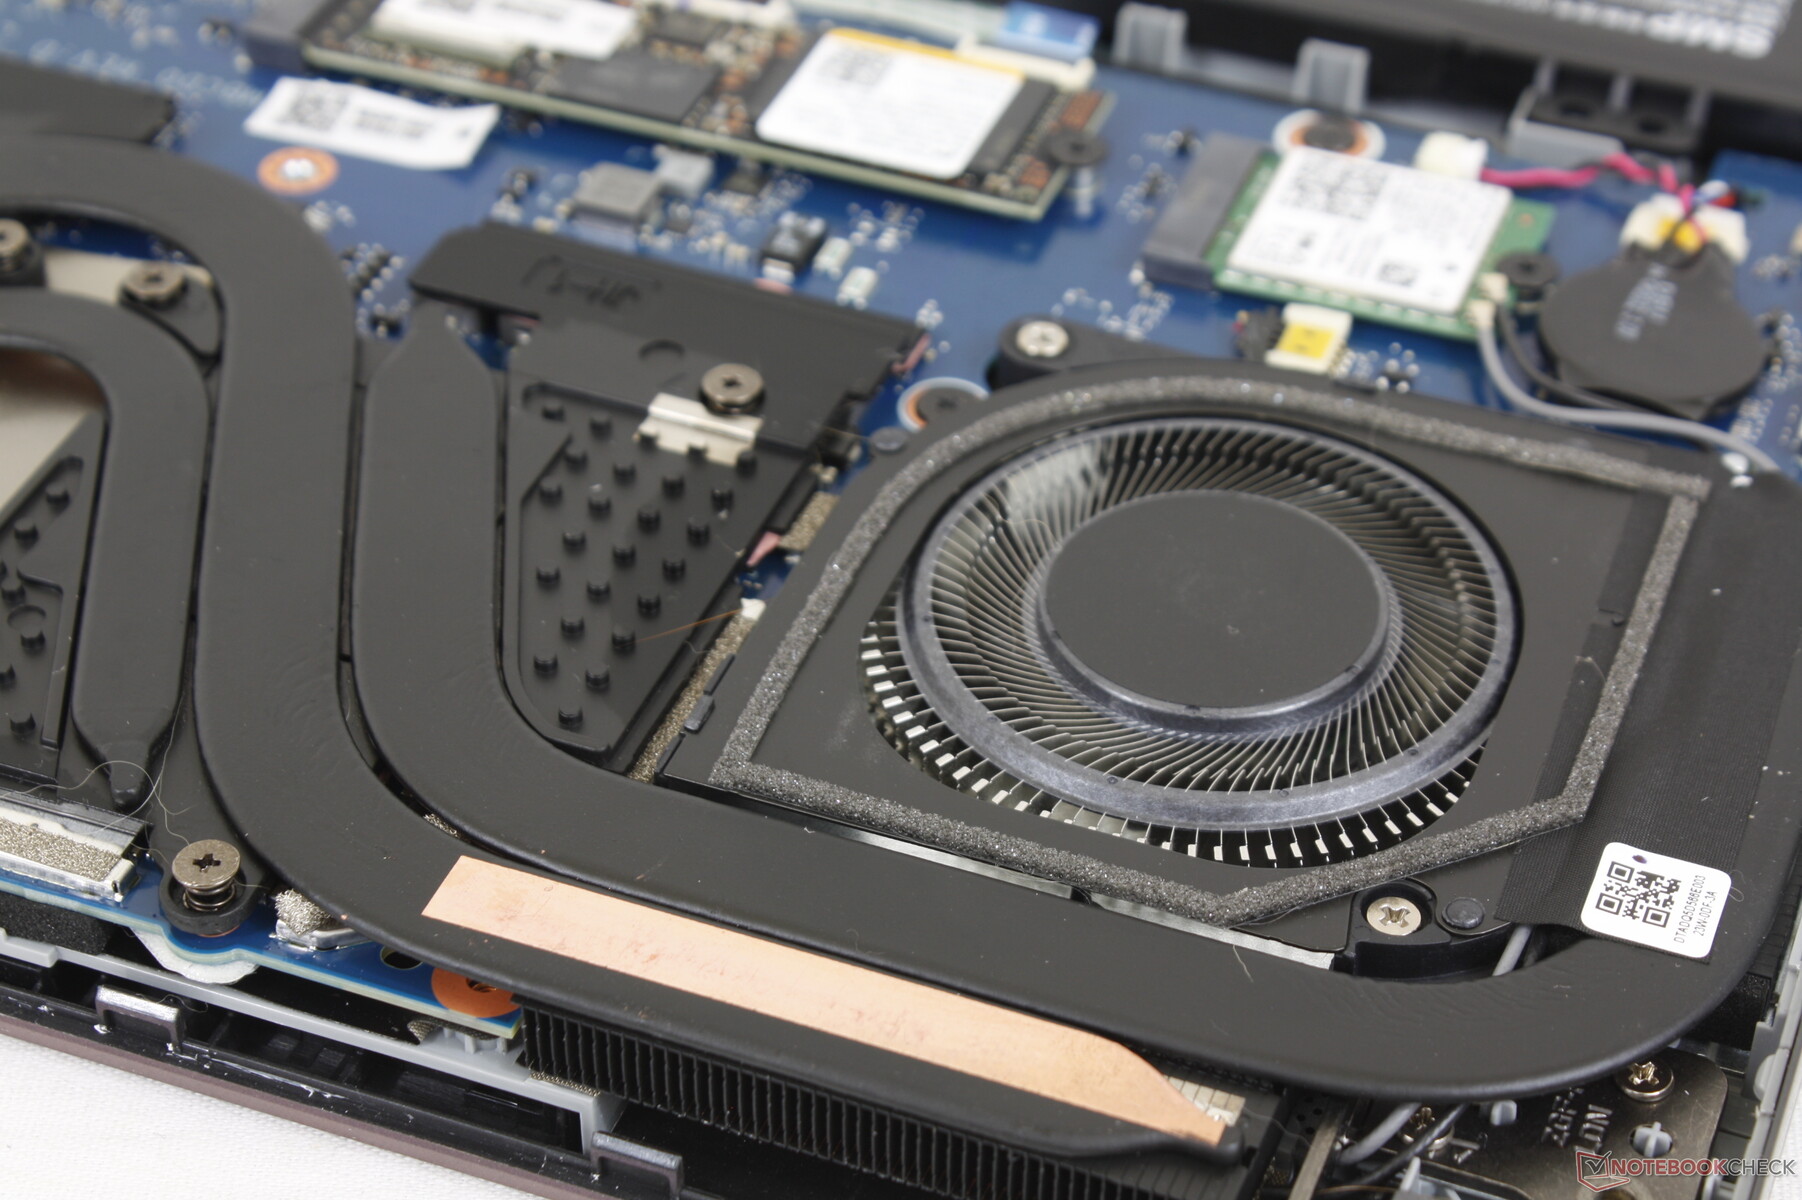
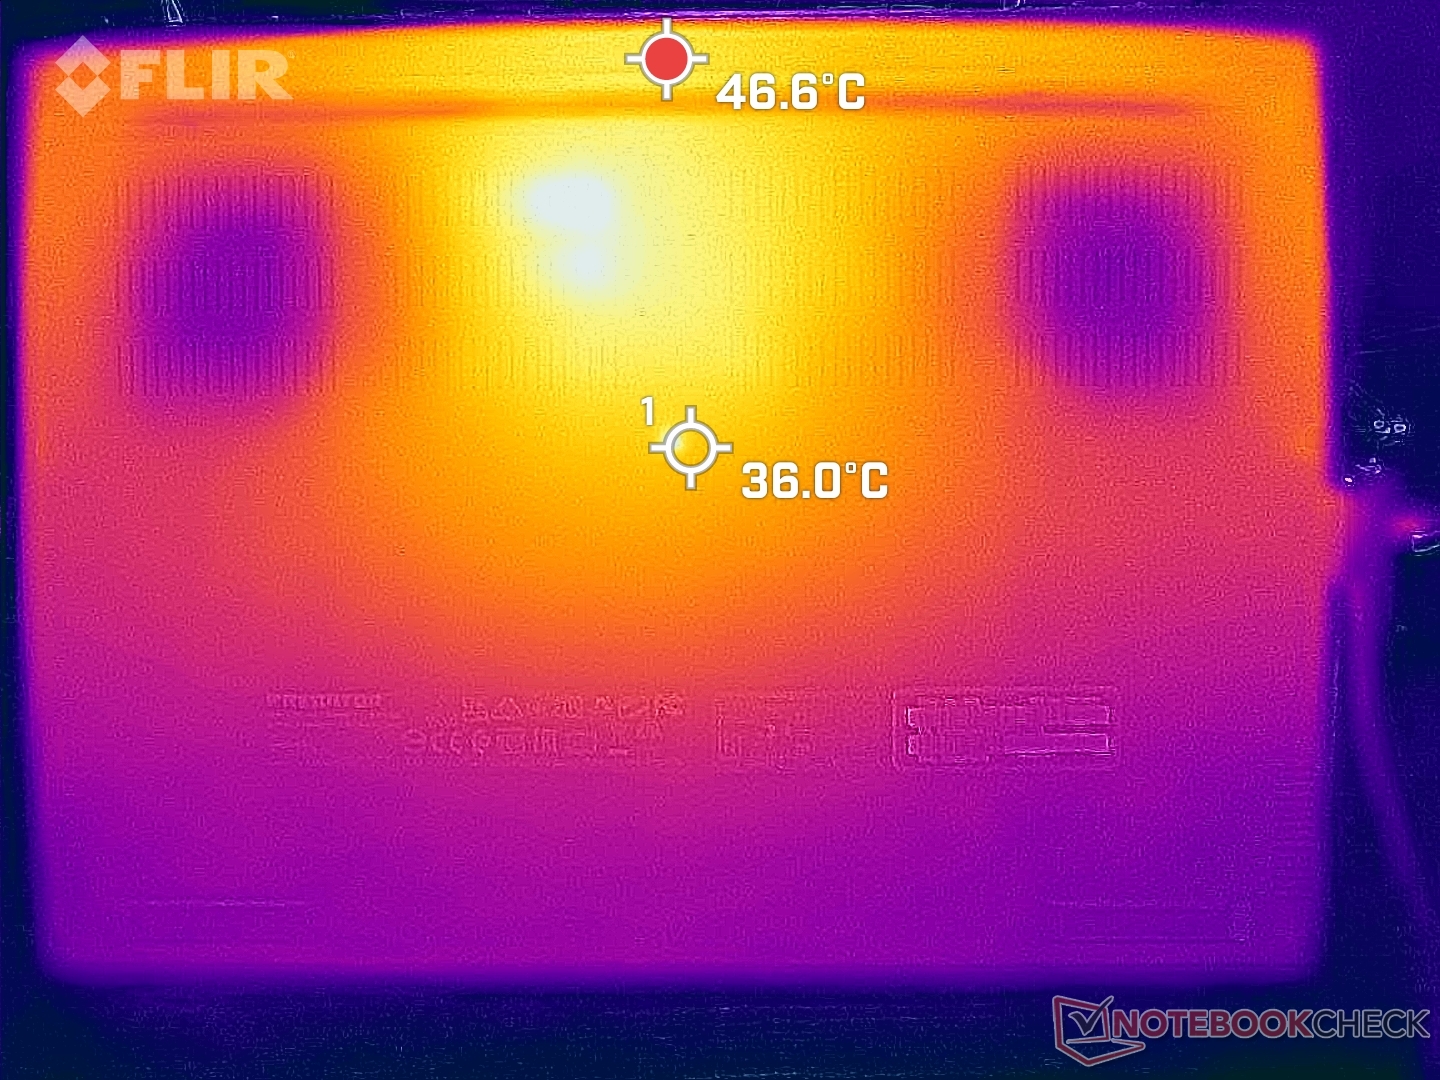
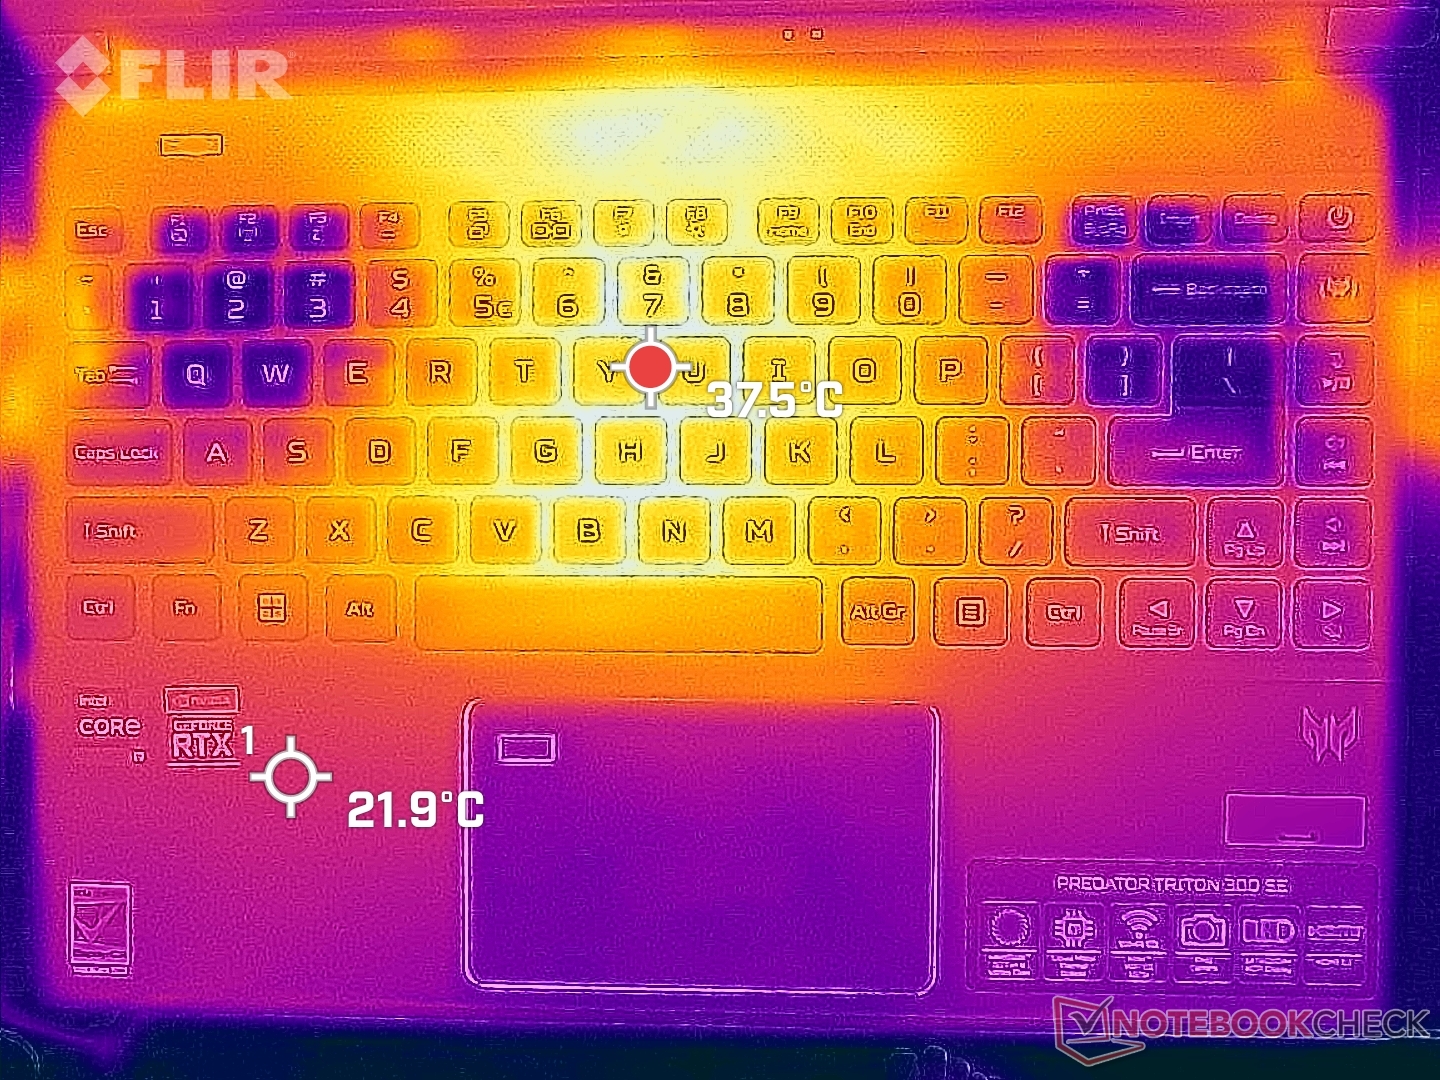
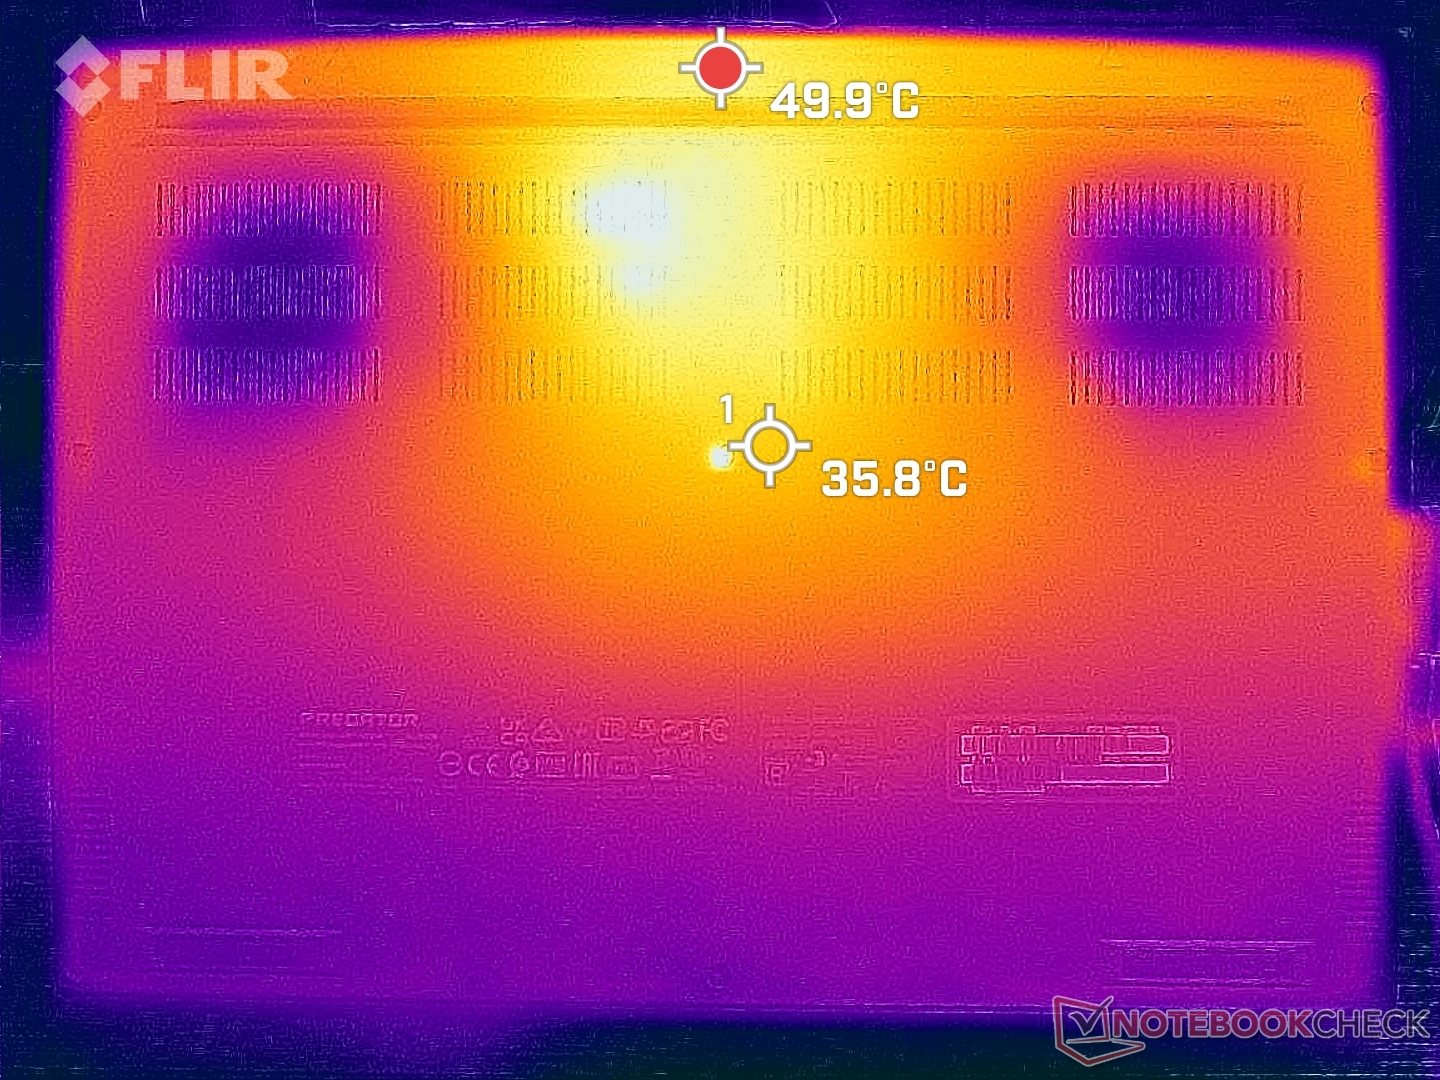
温度
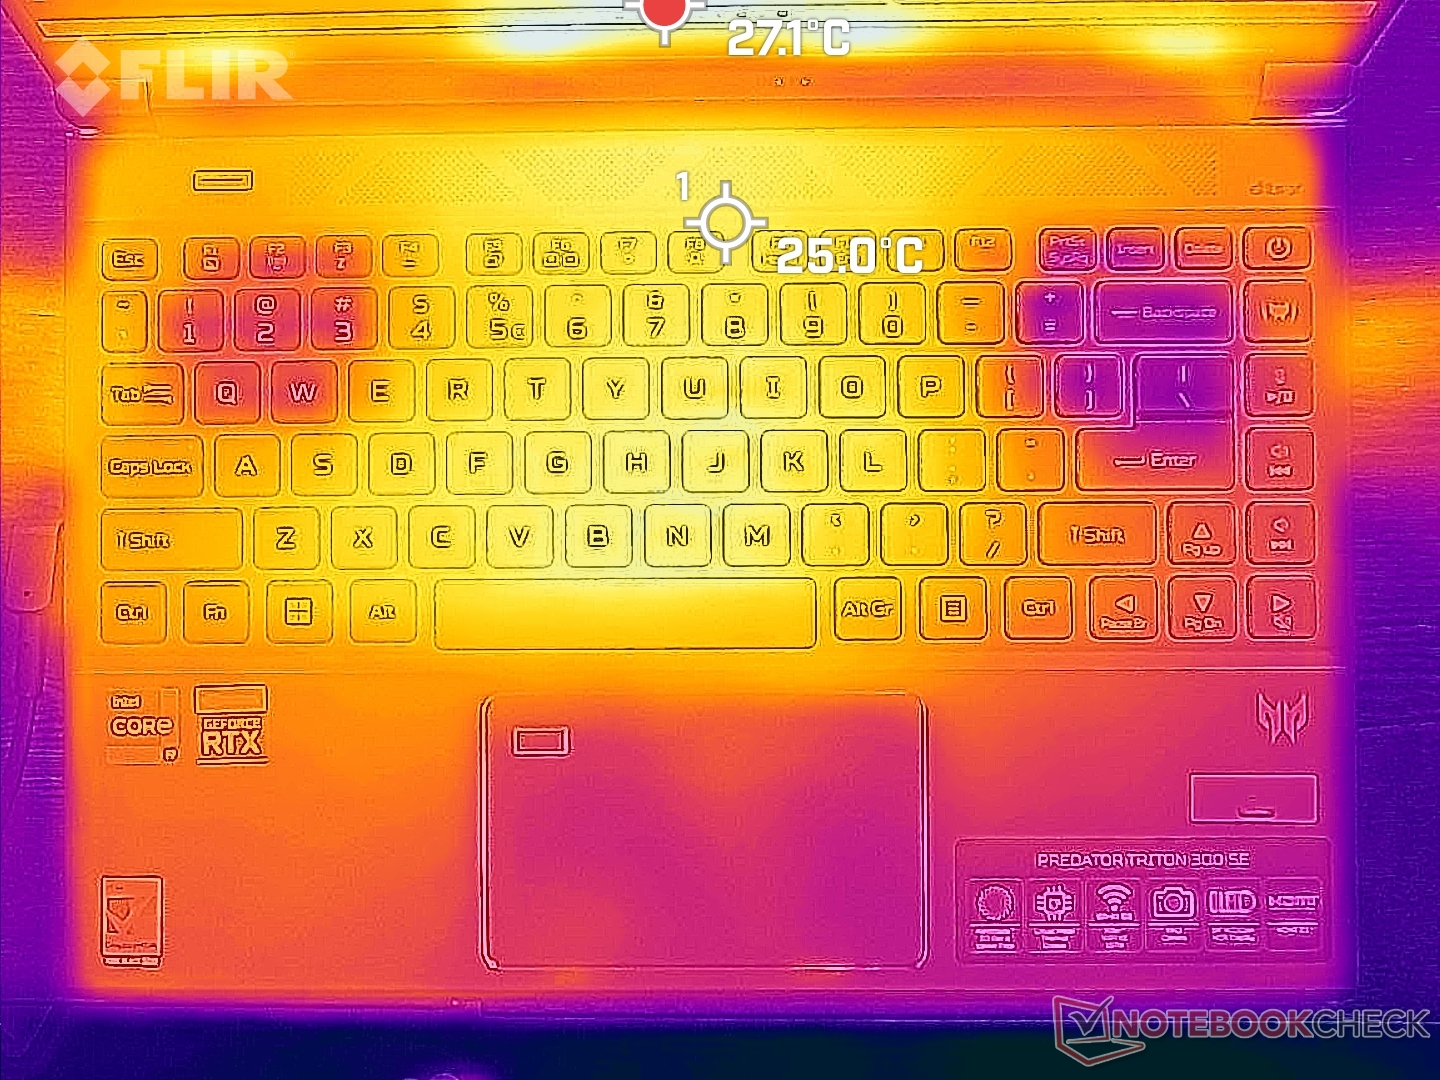
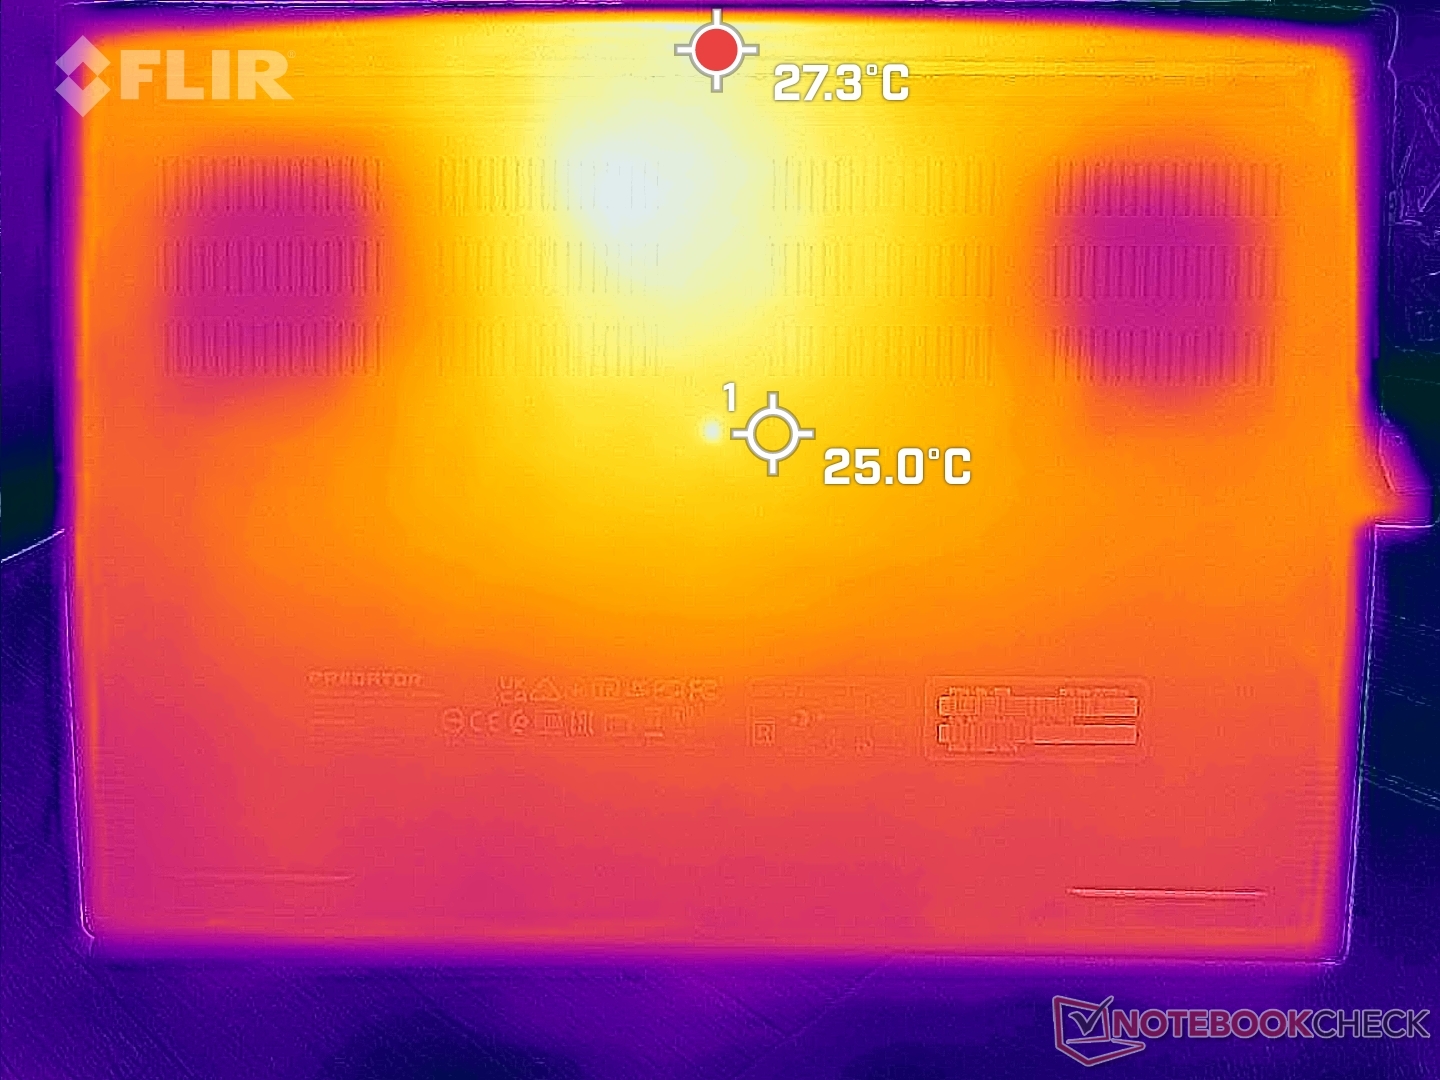
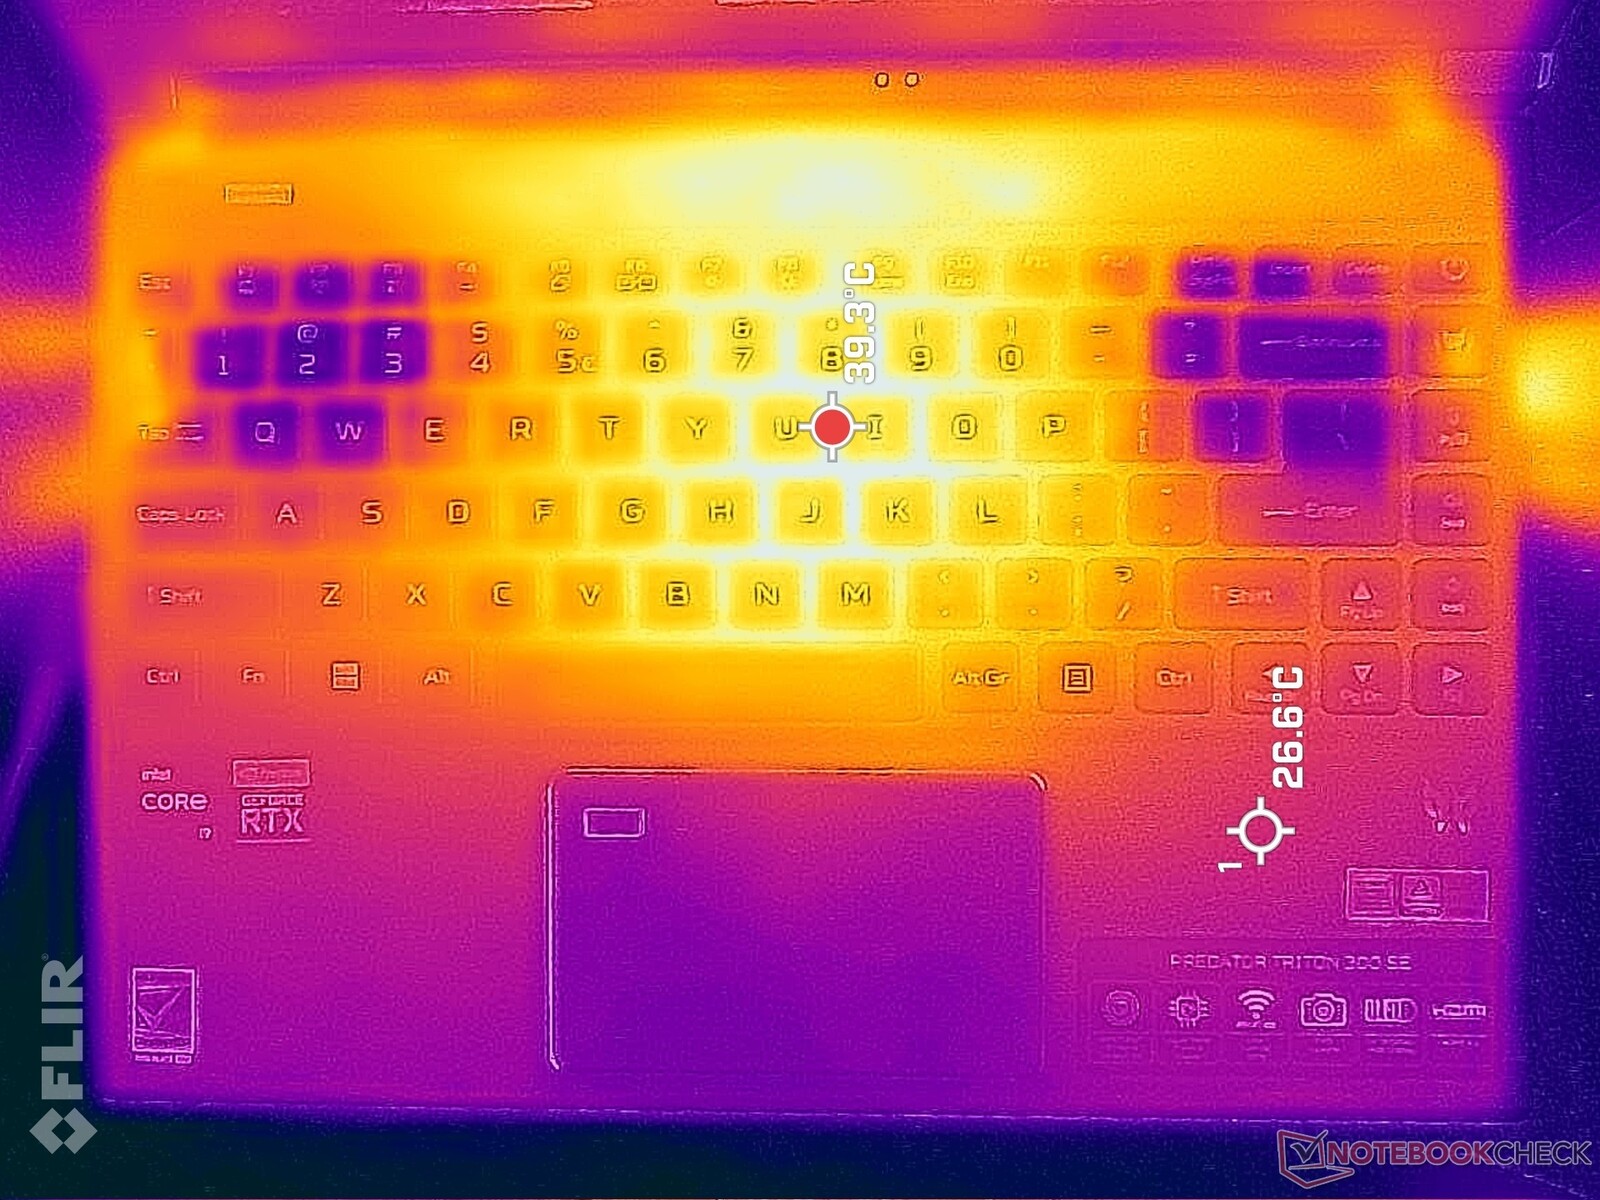
如下面的热图所示,机箱顶部和底部的热点可以分别达到43℃和46℃,朝向机箱的后部。整体表面温度明显比我们在Zephyrus G14或Alienware x14上记录的温度要低。 Alienware x14在类似的条件下,热点可以很容易地达到50℃以上。
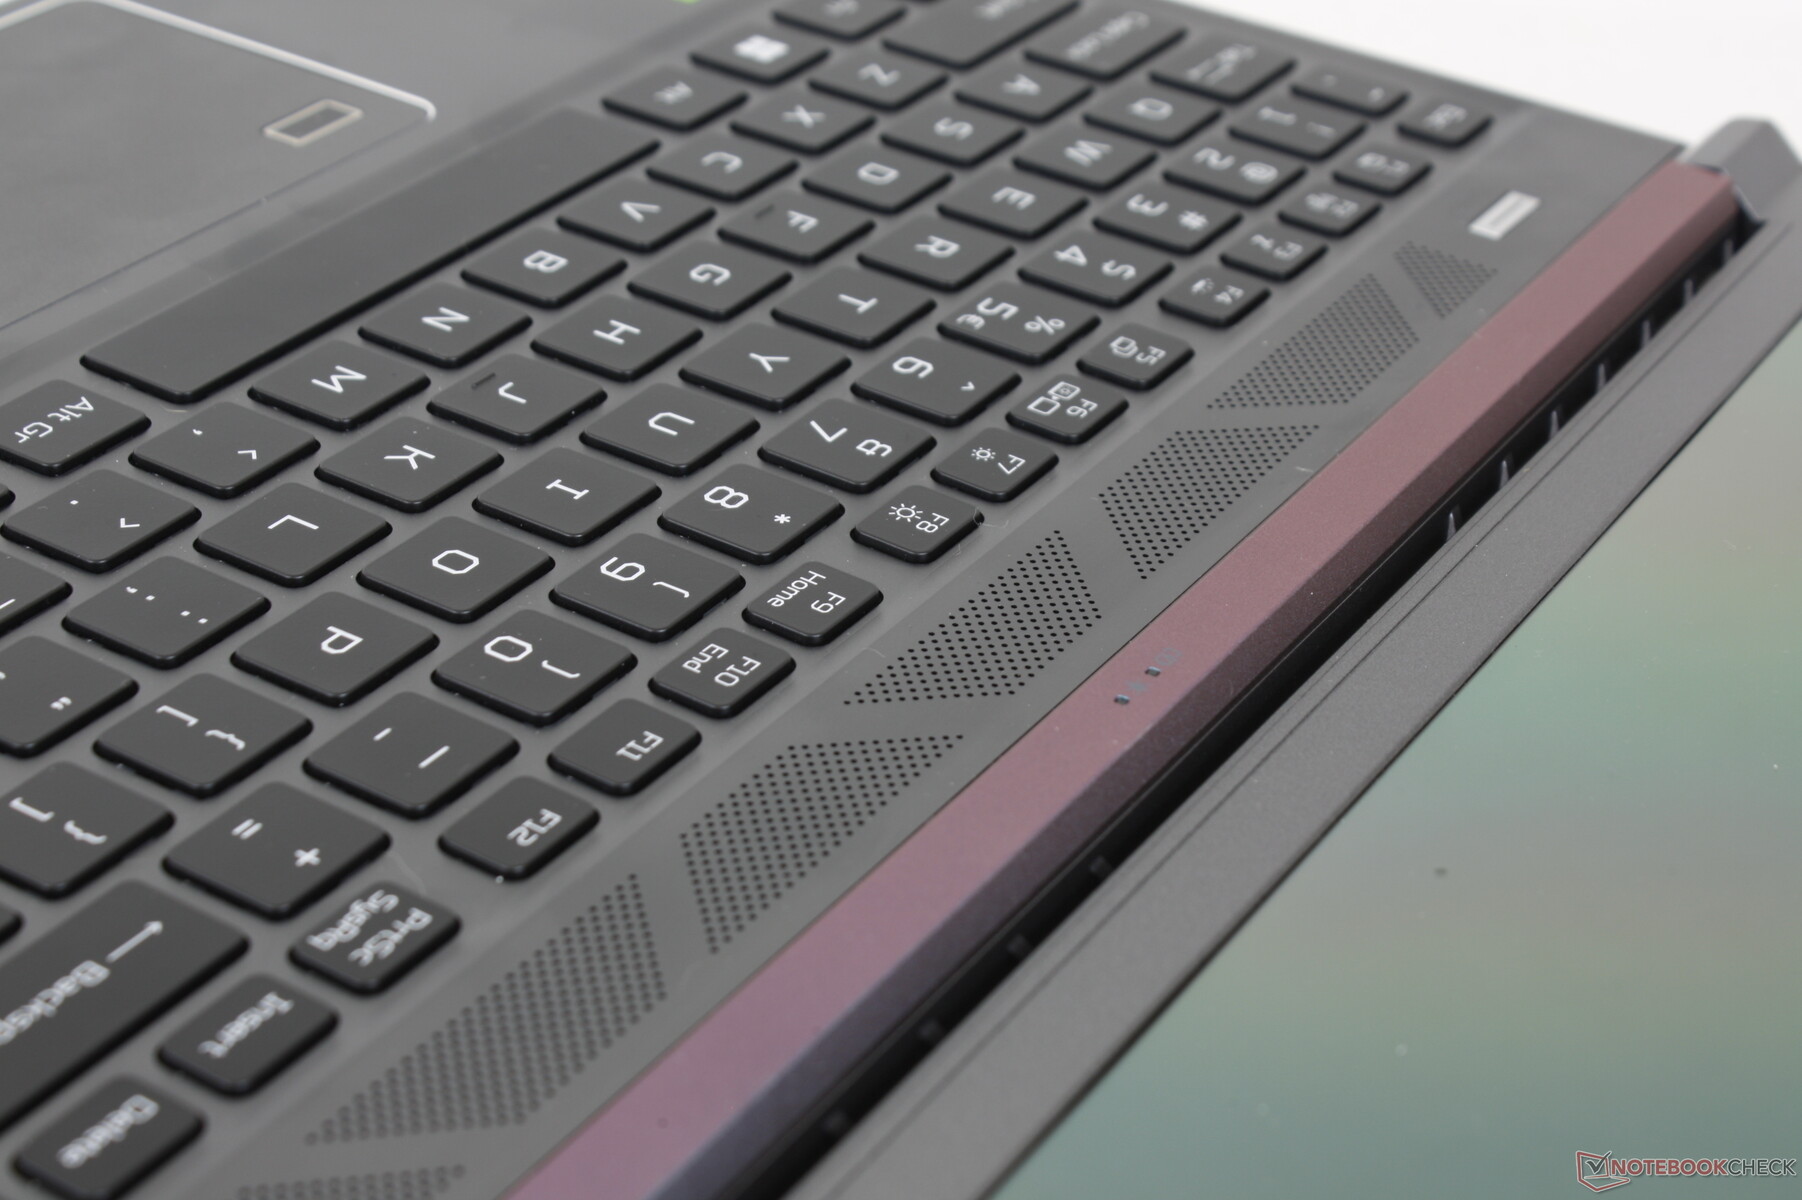
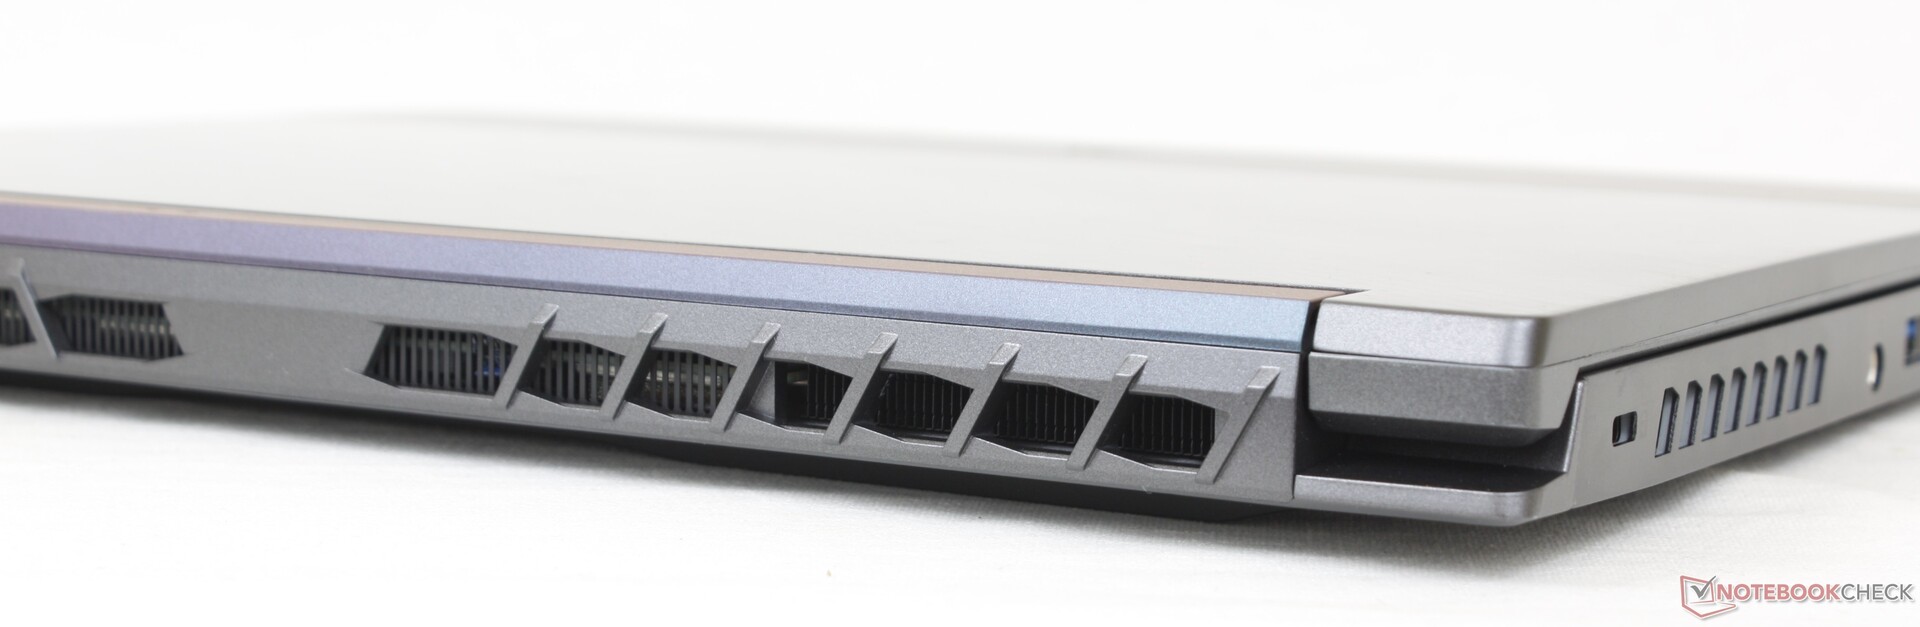
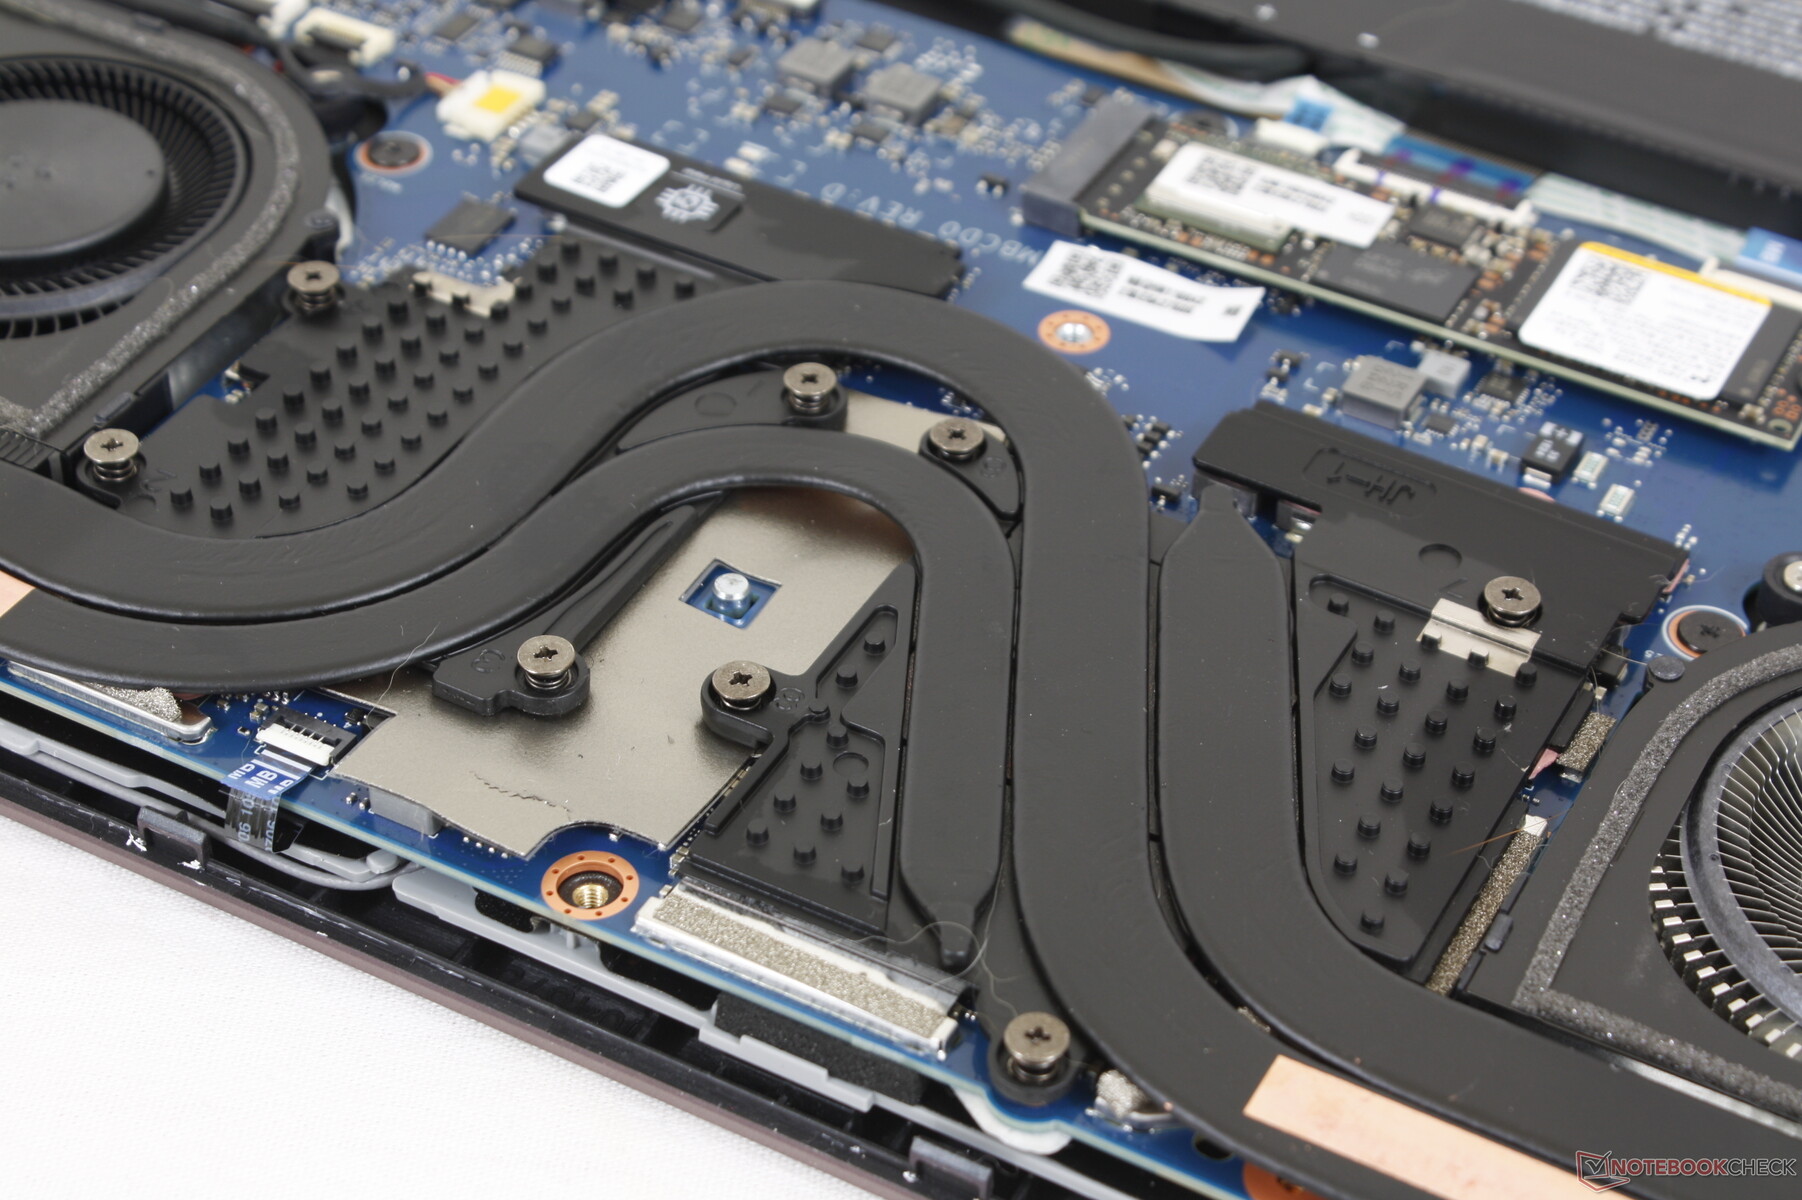
机箱几乎有一半的面积用于通风,包括键盘的边缘、后面、底部和侧面。请确保不要意外地挡住任何通风格栅,以保持最佳冷却效果。
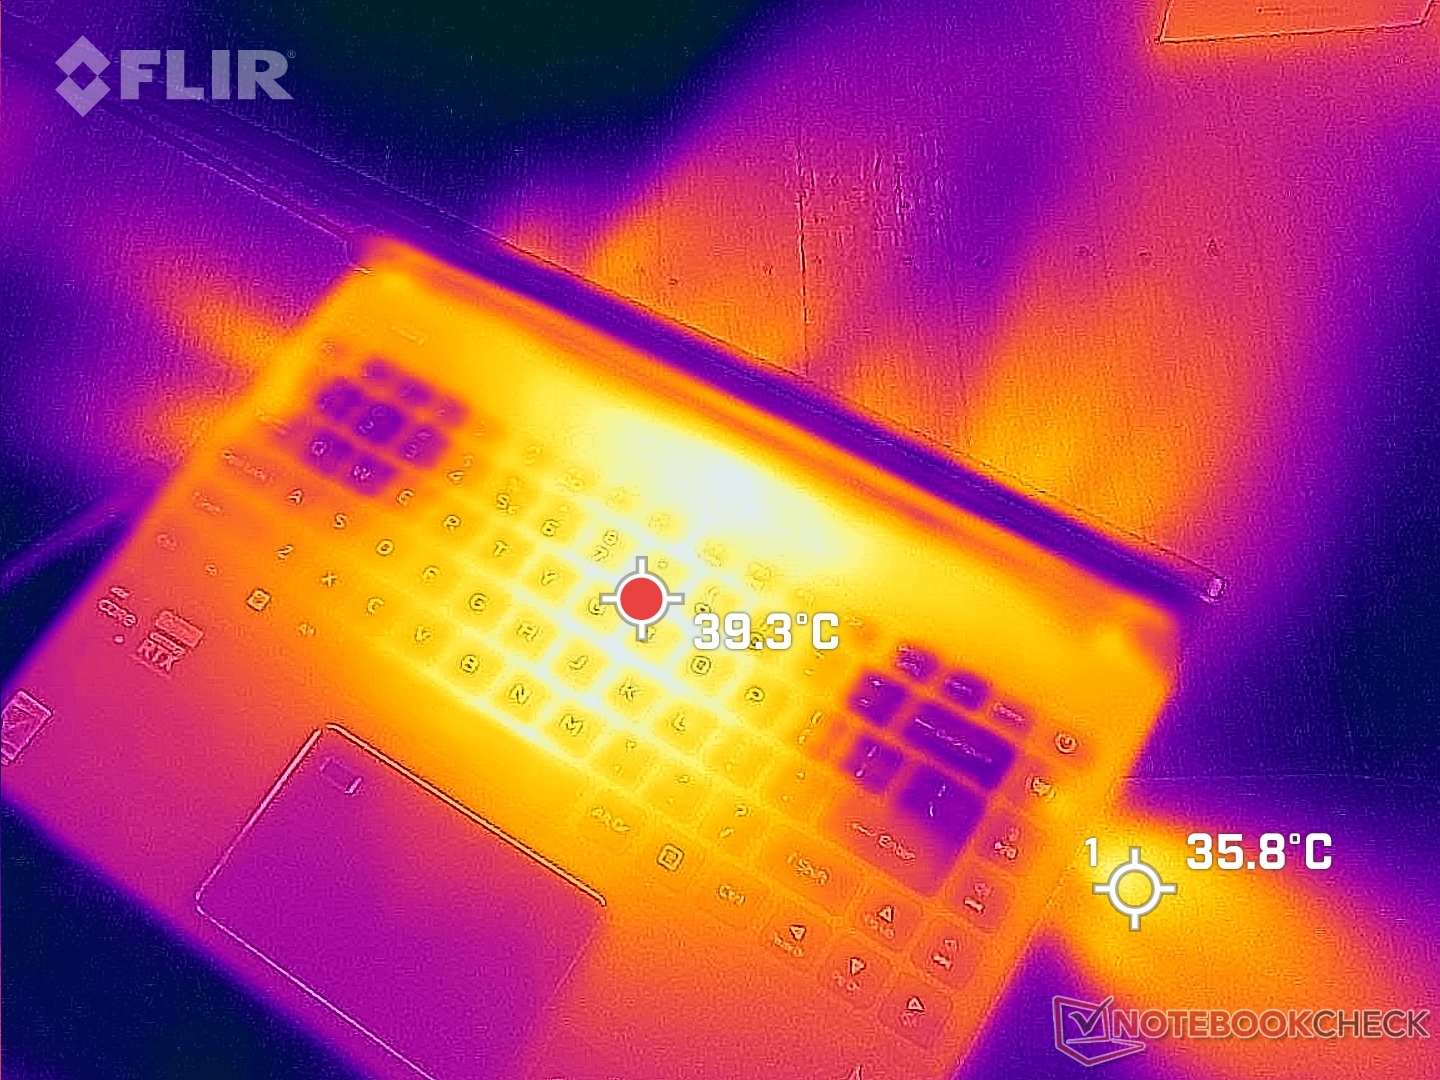
(±) The maximum temperature on the upper side is 43 °C / 109 F, compared to the average of 40.4 °C / 105 F, ranging from 21.2 to 68.8 °C for the class Gaming.
(-) The bottom heats up to a maximum of 46.4 °C / 116 F, compared to the average of 43.2 °C / 110 F
(+) In idle usage, the average temperature for the upper side is 26 °C / 79 F, compared to the device average of 33.9 °C / 93 F.
(±) Playing The Witcher 3, the average temperature for the upper side is 37.1 °C / 99 F, compared to the device average of 33.9 °C / 93 F.
(+) The palmrests and touchpad are reaching skin temperature as a maximum (32 °C / 89.6 F) and are therefore not hot.
(-) The average temperature of the palmrest area of similar devices was 28.8 °C / 83.8 F (-3.2 °C / -5.8 F).
| Acer Predator Triton 300 SE Intel Core i9-12900H, NVIDIA GeForce RTX 3060 Laptop GPU | Asus ROG Zephyrus G14 GA402RJ AMD Ryzen 7 6800HS, AMD Radeon RX 6700S | Razer Blade 14 Ryzen 9 6900HX AMD Ryzen 9 6900HX, NVIDIA GeForce RTX 3070 Ti Laptop GPU | Alienware x14 i7 RTX 3060 Intel Core i7-12700H, NVIDIA GeForce RTX 3060 Laptop GPU | Dell Inspiron 14 Plus 7420 Intel Core i7-12700H, NVIDIA GeForce RTX 3050 4GB Laptop GPU | Schenker Vision 14 Intel Core i7-11370H, NVIDIA GeForce RTX 3050 Ti Laptop GPU | |
|---|---|---|---|---|---|---|
| Heat | -24% | -13% | -1% | 8% | -12% | |
| Maximum Upper Side * (°C) | 43 | 53 -23% | 40.6 6% | 51.3 -19% | 40 7% | 49.7 -16% |
| Maximum Bottom * (°C) | 46.4 | 54 -16% | 42.6 8% | 44.4 4% | 36.4 22% | 56 -21% |
| Idle Upper Side * (°C) | 28.2 | 34 -21% | 38 -35% | 27.2 4% | 27 4% | 28.8 -2% |
| Idle Bottom * (°C) | 28.4 | 38 -34% | 37 -30% | 26.6 6% | 29.2 -3% | 30.6 -8% |
* ... smaller is better
压力测试
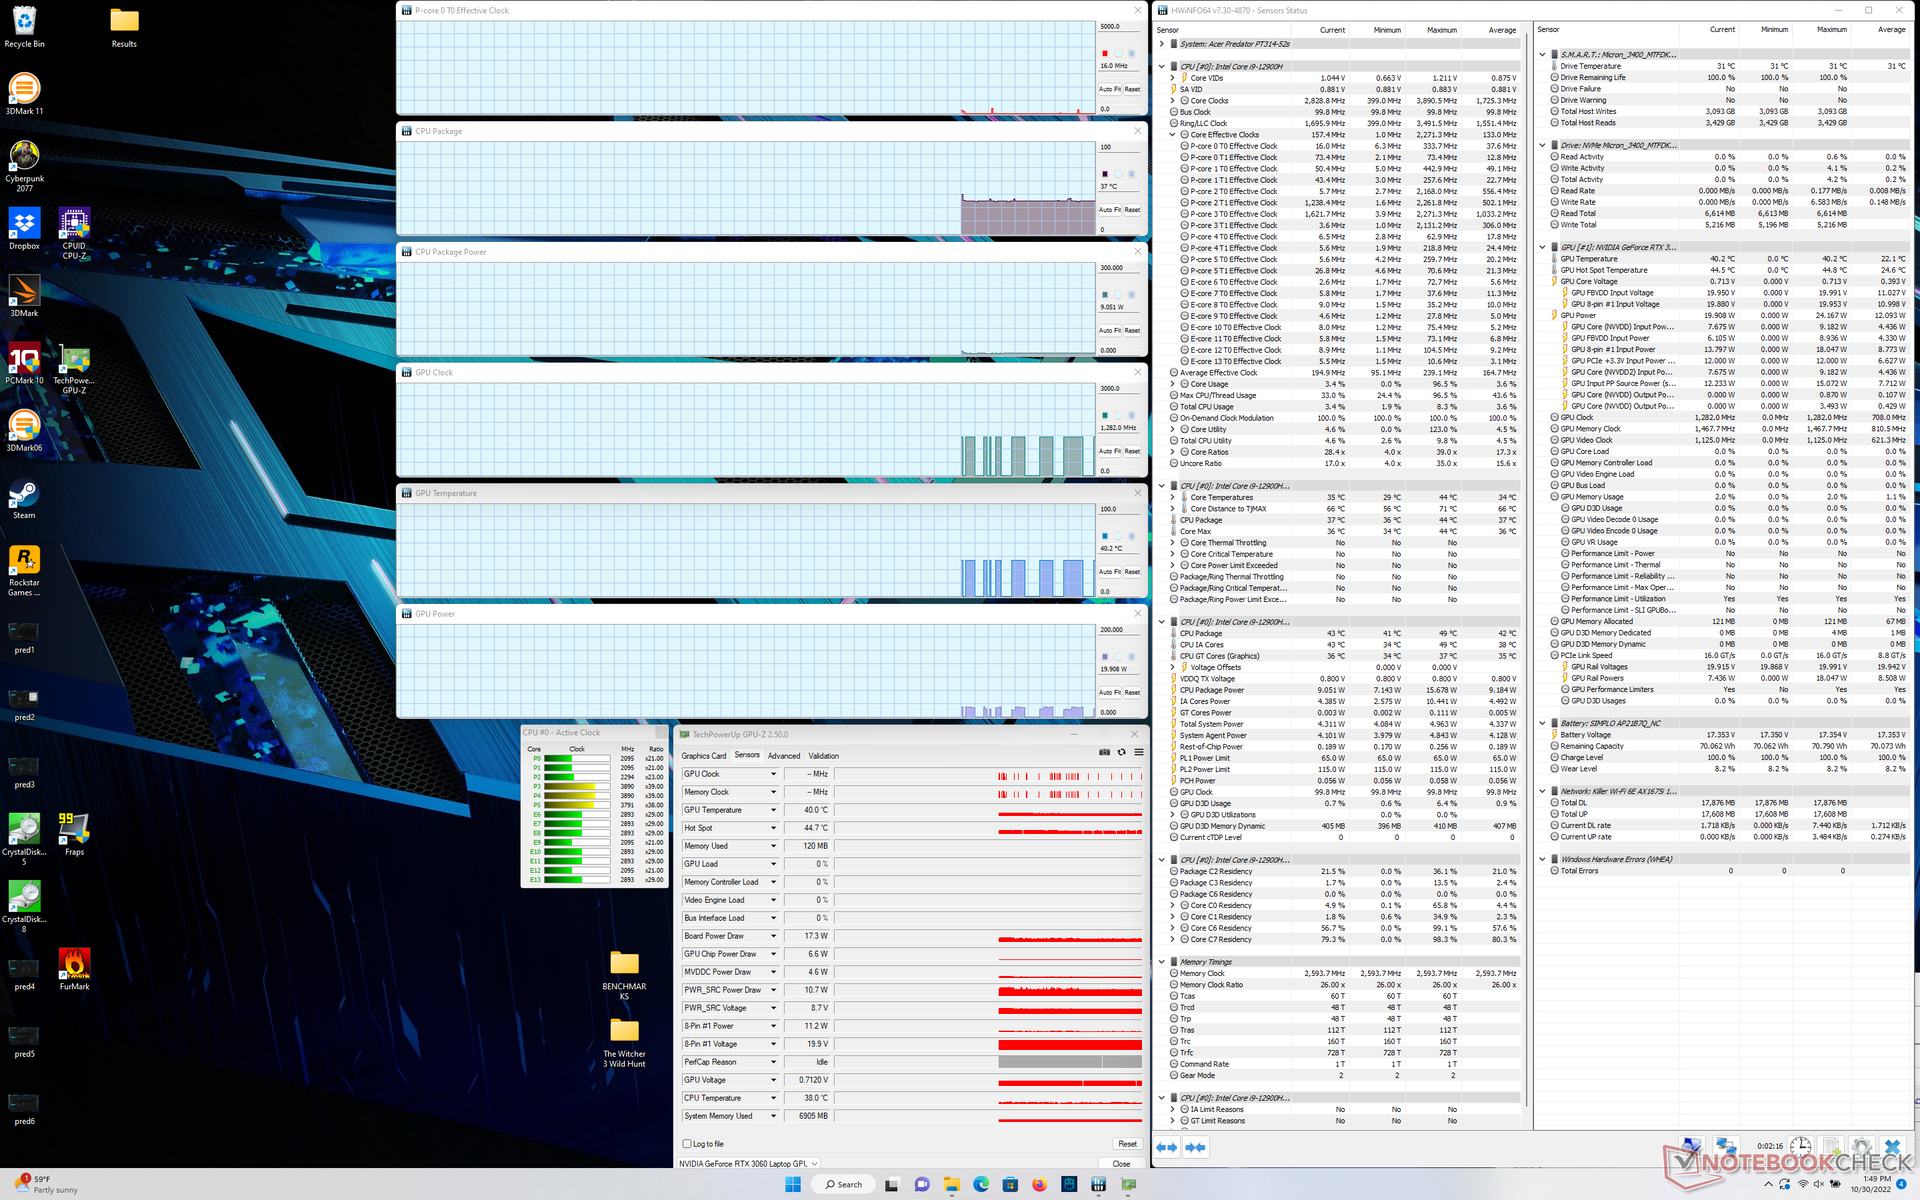
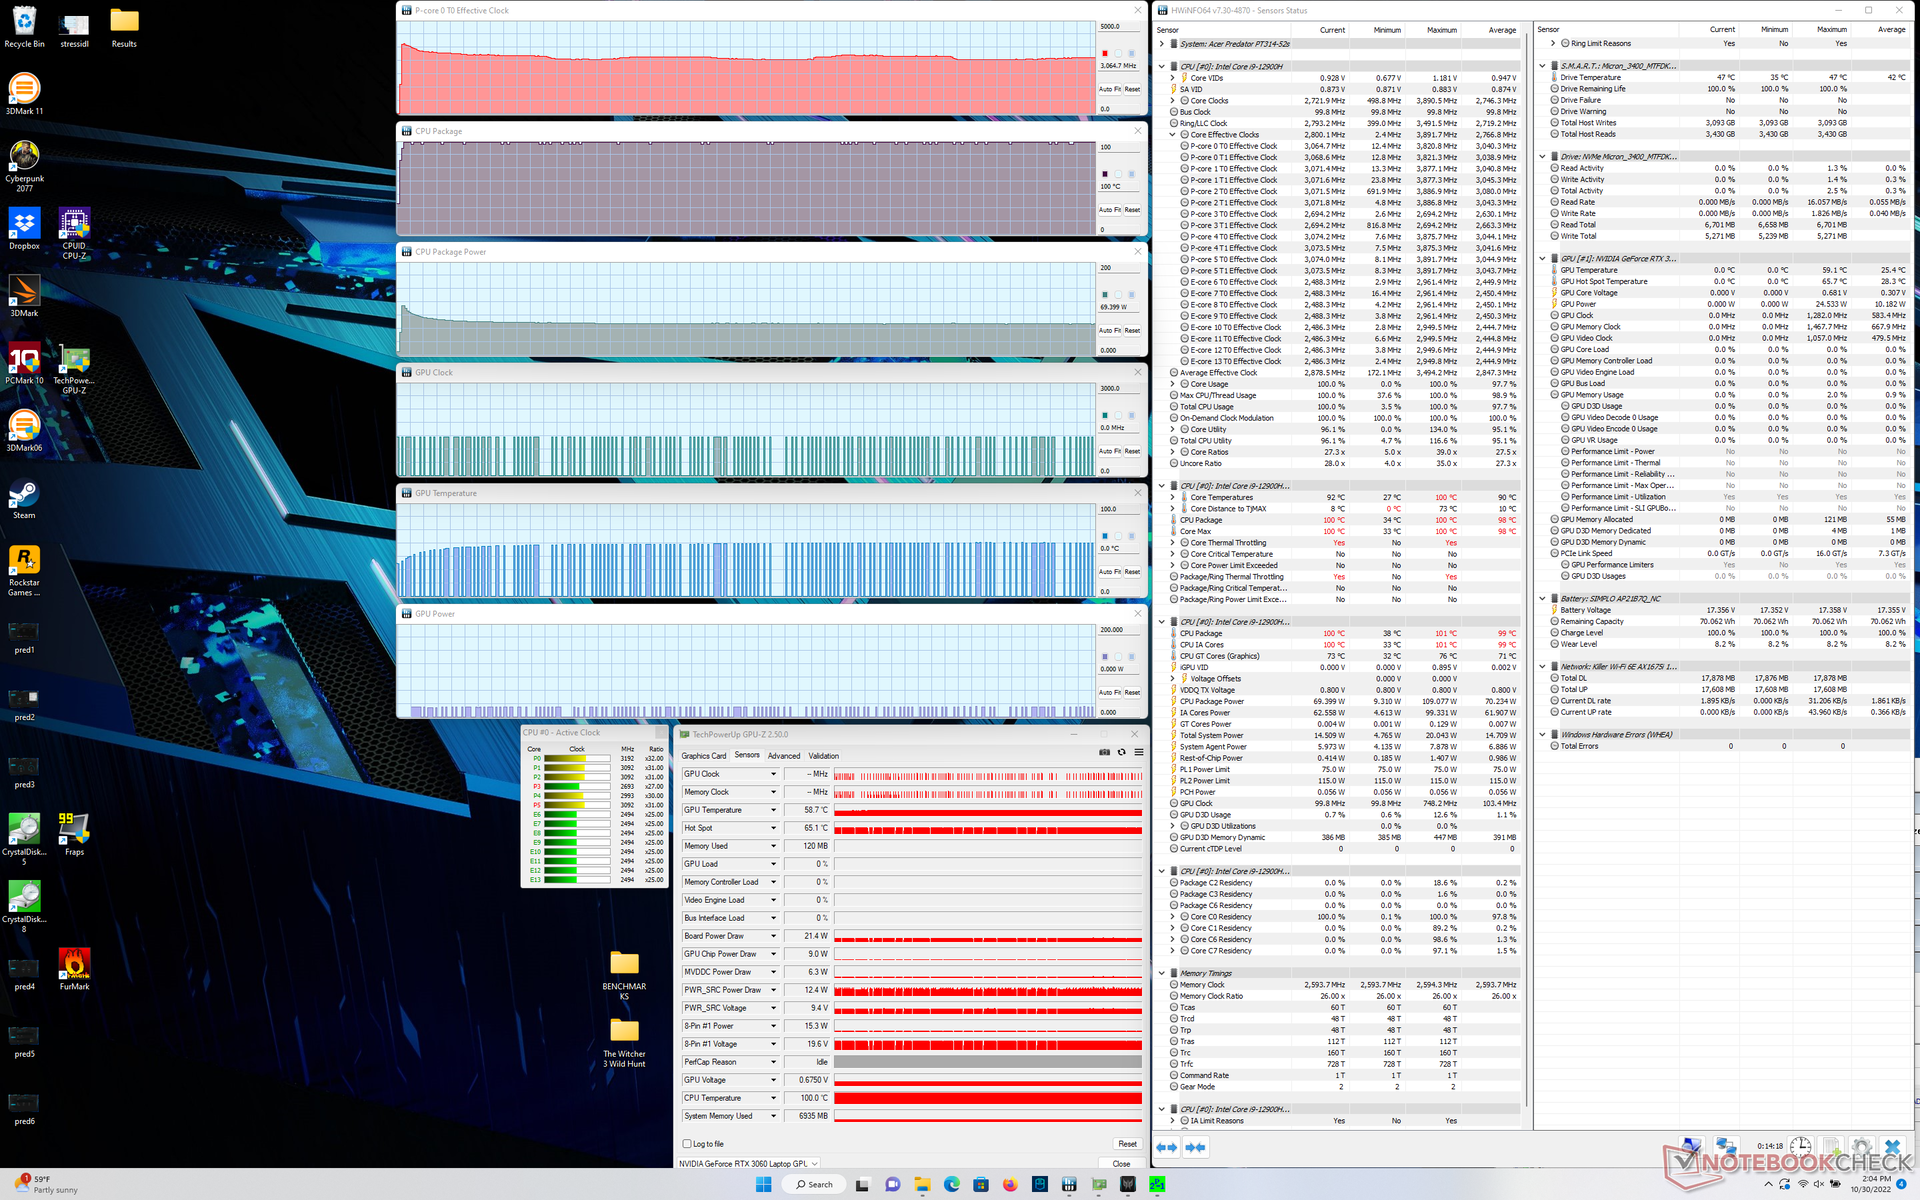
在启动Prime95压力时,CPU的时钟频率、温度和电路板功耗将分别飙升至3.7 GHz、100 C和108 W。然而,仅仅几秒钟之后,时钟频率和功耗就开始下降,然后分别稳定在3.0 GHz和69 W,同时保持100 C的核心温度。很少有笔记本电脑的CPU能稳定在90 C以上的温度范围,因此在宏碁上看到这种情况是有点令人震惊。例如,戴尔Precision 5470,采用同样的Core i9-12900H CPU,在类似条件下,会稳定在2.4 GHz和80 C。很明显,宏碁的系统正在将酷睿i9 CPU推向冷却解决方案所能允许的最大限度。
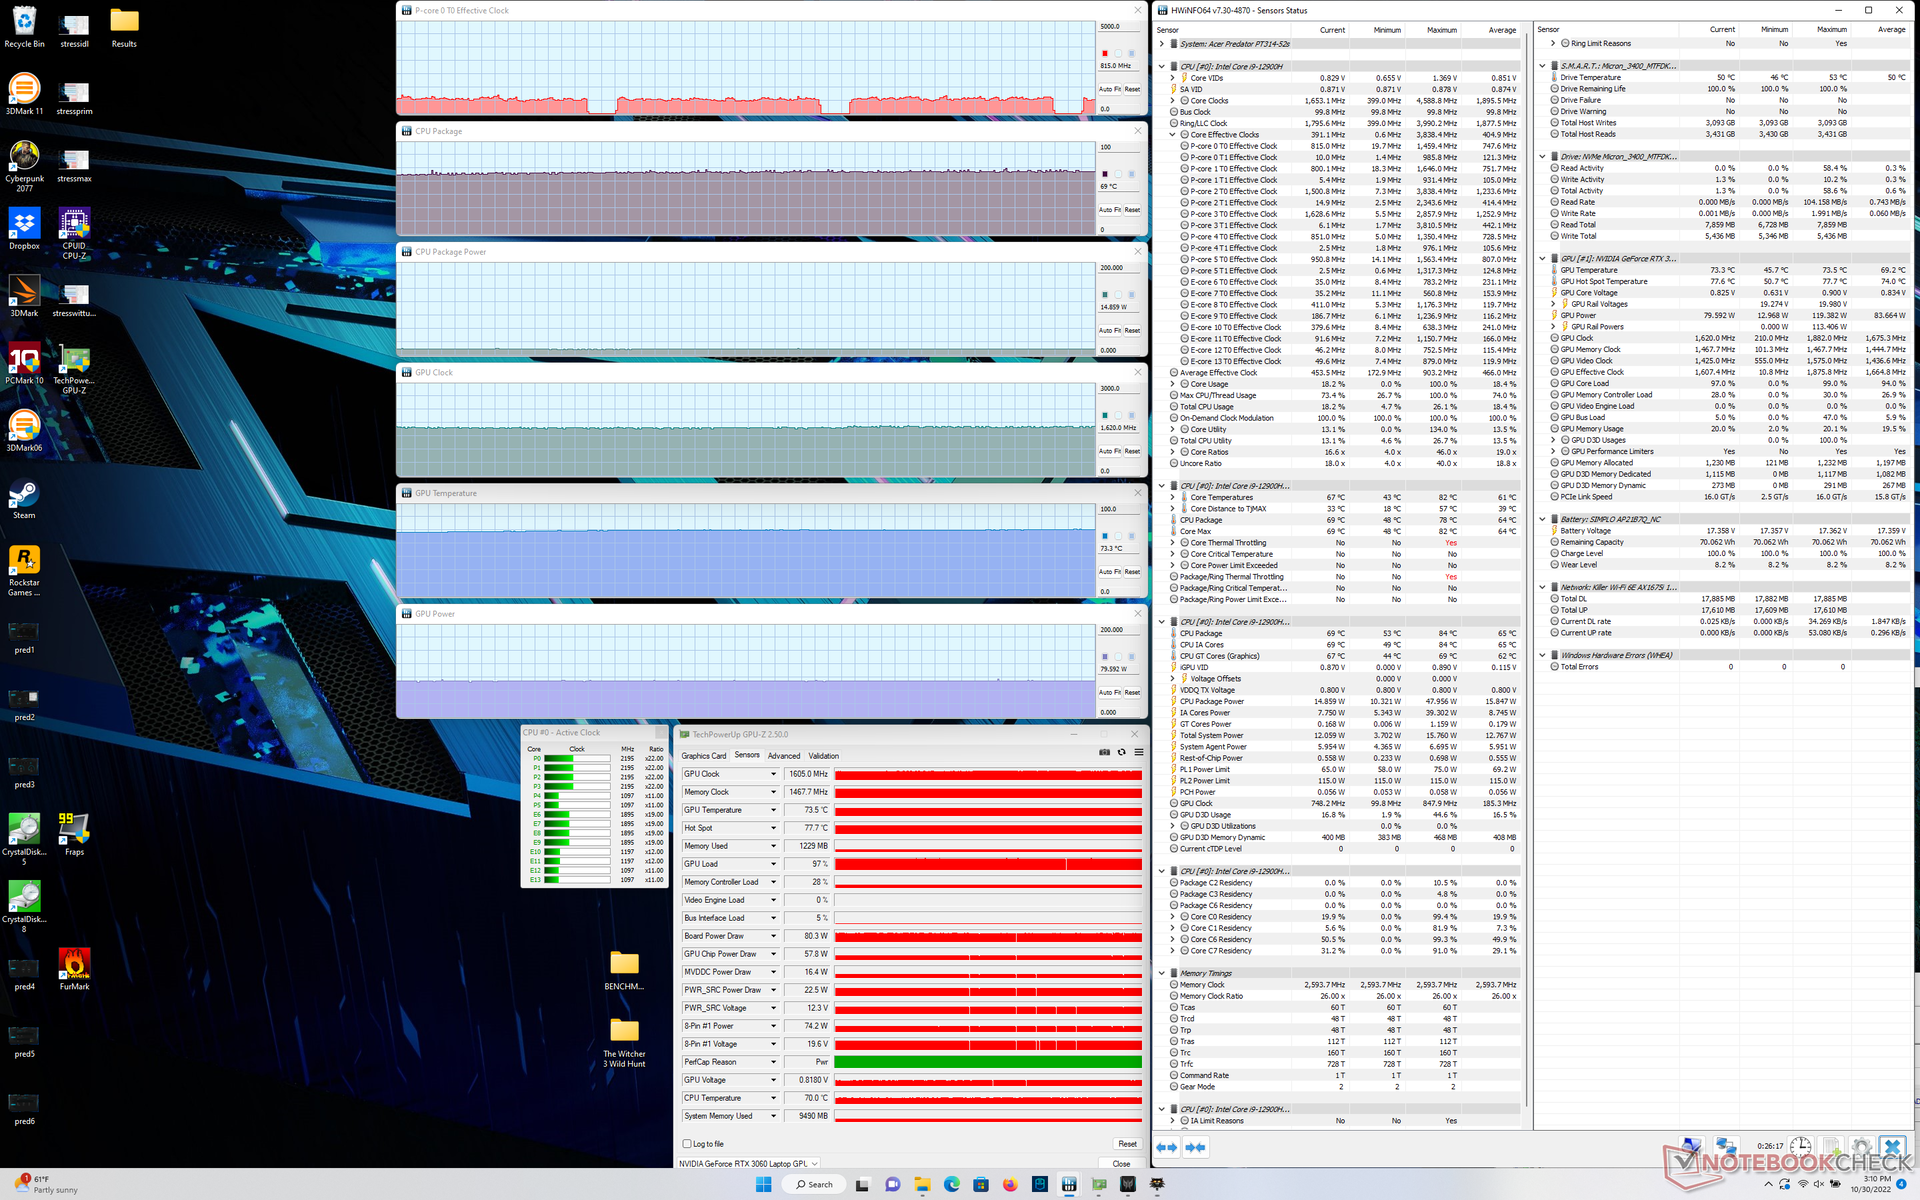
运行 Witcher 3 如果禁用Turbo模式,时钟频率和主板功耗将分别下降到1605 MHz和80 W,而温度将略微上升到73 C,因为风扇的上限较低。因此,如果用户希望充分利用95W的TGP GPU,必须启用Turbo模式。
用电池供电运行限制了性能,特别是由于Turbo模式需要主电源。在电池上进行的Fire Strike 测试将返回物理和图形分数,分别为14166和11131分,而在主电源上则为31176和20405分。
| CPU时钟(GHz) | GPU时钟(MHz) | CPU平均温度(°C) | GPU平均温度(°C) | |
| 系统空闲 | -- | -- | 37 | 40 |
| Prime95压力 | 3.0 - 3.1 | -- | 100 | 59 |
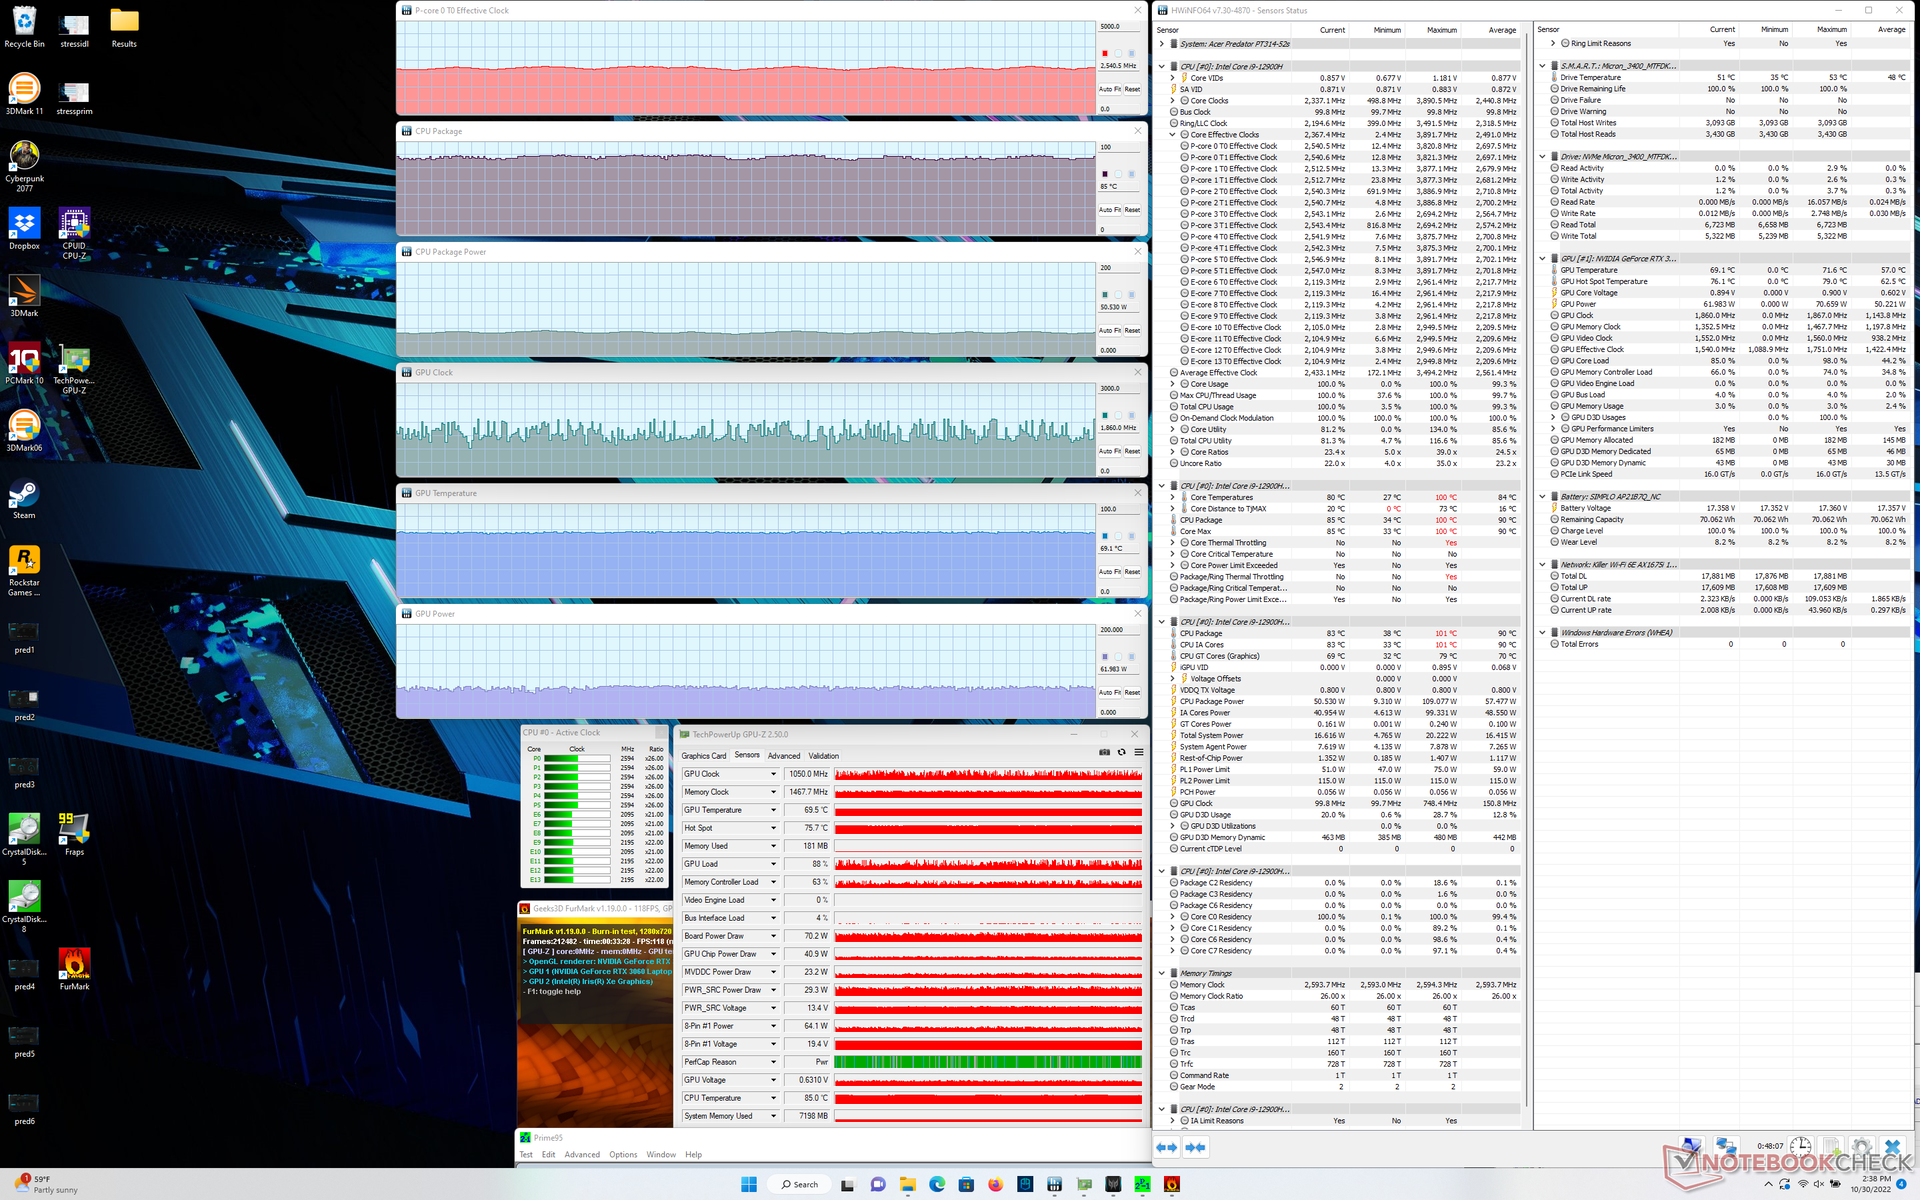
| Prime95 + FurMark 压力 | 2.5 | ~1050 | 85 | 69 |
| Witcher 3 应力(涡轮关闭) | ~0.8 | 1605 | 69 | 73 |
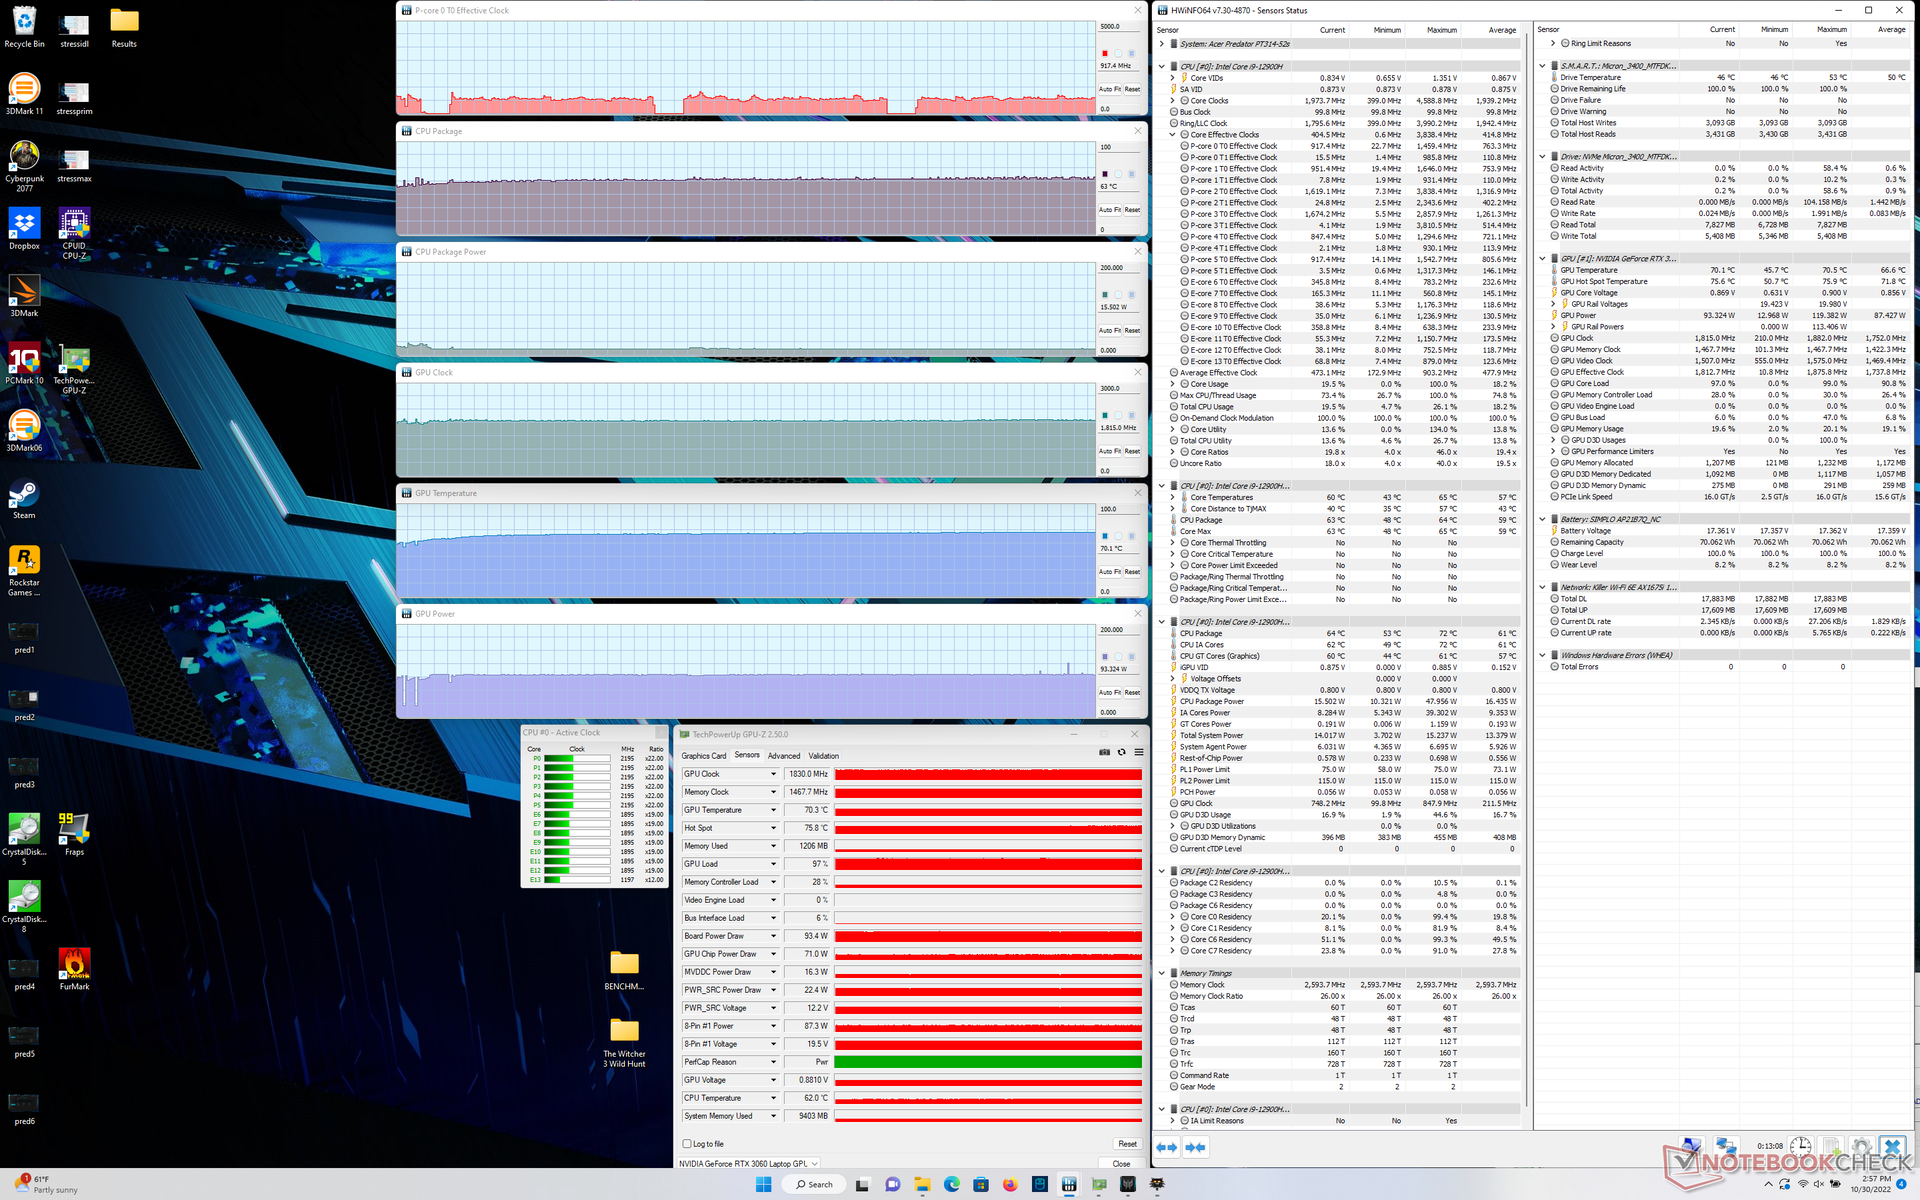
| Witcher 3 应力(涡轮开启) | ~0.8 | 1830 | 63 | 70 |
发言人
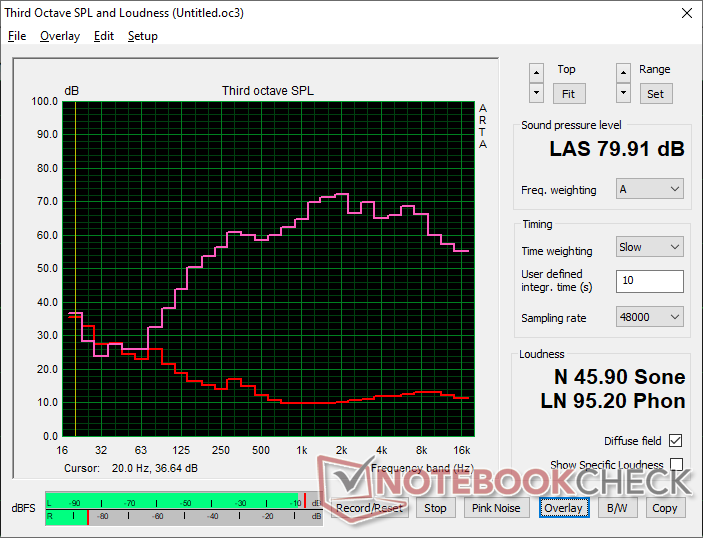
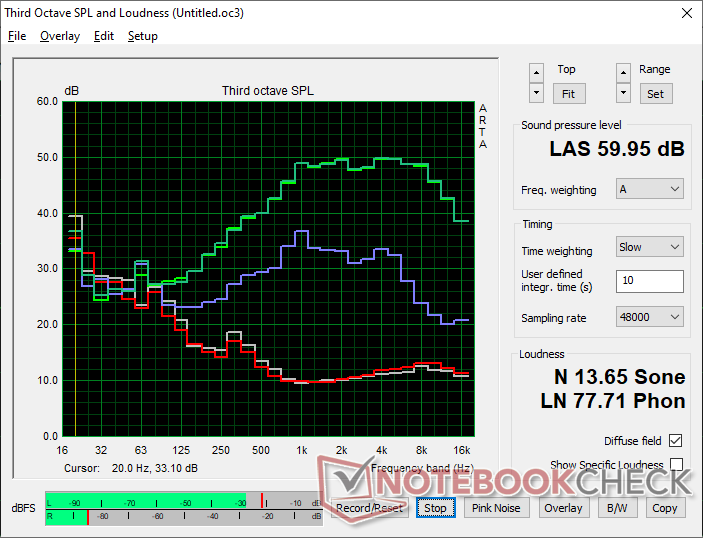
Acer Predator Triton 300 SE audio analysis
(±) | speaker loudness is average but good (79.9 dB)
Bass 100 - 315 Hz
(±) | reduced bass - on average 10.3% lower than median
(±) | linearity of bass is average (9.7% delta to prev. frequency)
Mids 400 - 2000 Hz
(±) | higher mids - on average 5% higher than median
(+) | mids are linear (4% delta to prev. frequency)
Highs 2 - 16 kHz
(±) | higher highs - on average 5.5% higher than median
(±) | linearity of highs is average (7.6% delta to prev. frequency)
Overall 100 - 16.000 Hz
(±) | linearity of overall sound is average (15.1% difference to median)
Compared to same class
» 32% of all tested devices in this class were better, 6% similar, 62% worse
» The best had a delta of 6%, average was 18%, worst was 132%
Compared to all devices tested
» 21% of all tested devices were better, 4% similar, 75% worse
» The best had a delta of 4%, average was 23%, worst was 134%
Apple MacBook Pro 16 2021 M1 Pro audio analysis
(+) | speakers can play relatively loud (84.7 dB)
Bass 100 - 315 Hz
(+) | good bass - only 3.8% away from median
(+) | bass is linear (5.2% delta to prev. frequency)
Mids 400 - 2000 Hz
(+) | balanced mids - only 1.3% away from median
(+) | mids are linear (2.1% delta to prev. frequency)
Highs 2 - 16 kHz
(+) | balanced highs - only 1.9% away from median
(+) | highs are linear (2.7% delta to prev. frequency)
Overall 100 - 16.000 Hz
(+) | overall sound is linear (4.6% difference to median)
Compared to same class
» 0% of all tested devices in this class were better, 0% similar, 100% worse
» The best had a delta of 5%, average was 17%, worst was 45%
Compared to all devices tested
» 0% of all tested devices were better, 0% similar, 100% worse
» The best had a delta of 4%, average was 23%, worst was 134%
能源管理
耗电量--比上一代机型更高效
总体消耗量与 消耗量与Alienware x14相当。它配备了类似的CPU和GPU选项。在桌面上的省电模式和最低亮度设置下的空转仅消耗8W,而最高性能模式和亮度设置将消耗约18W。请注意,功耗和因此的电池寿命对屏幕颜色很敏感,这与IPS面板不同,正如我们的OLED功耗测量所示 这里.
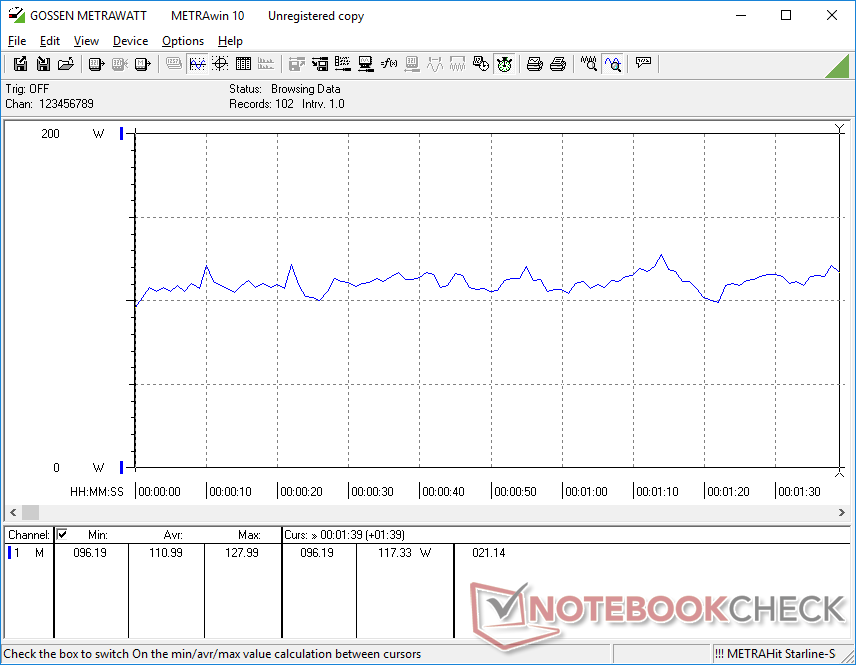
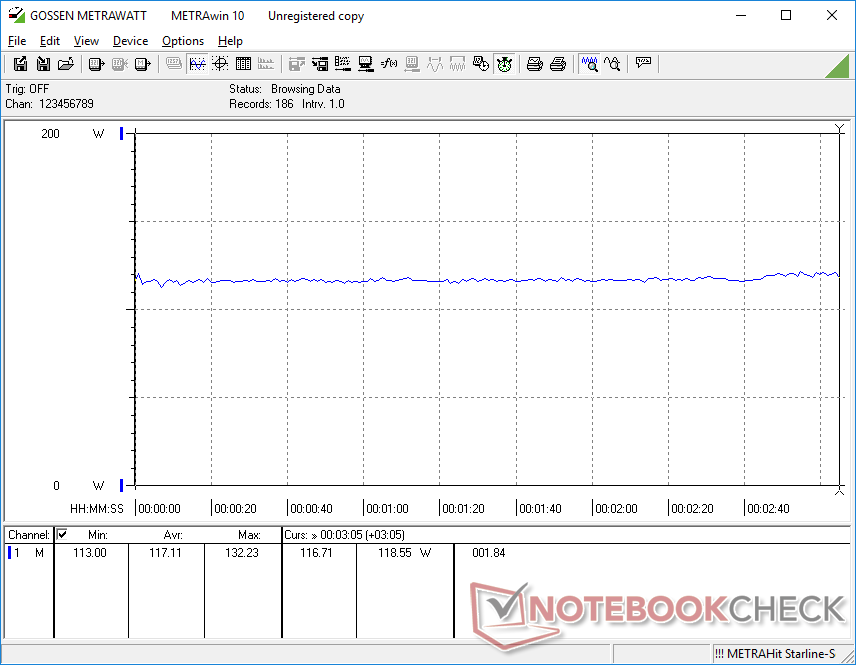
运行 Witcher 3代表游戏负载,消耗的功率比2020 Predator Triton 300上的功率少约14%。 2020 Predator Triton 300同时提供高达30%的图形性能,每瓦性能显著提高。然而,第12代CPU现在比以前更耗电了。
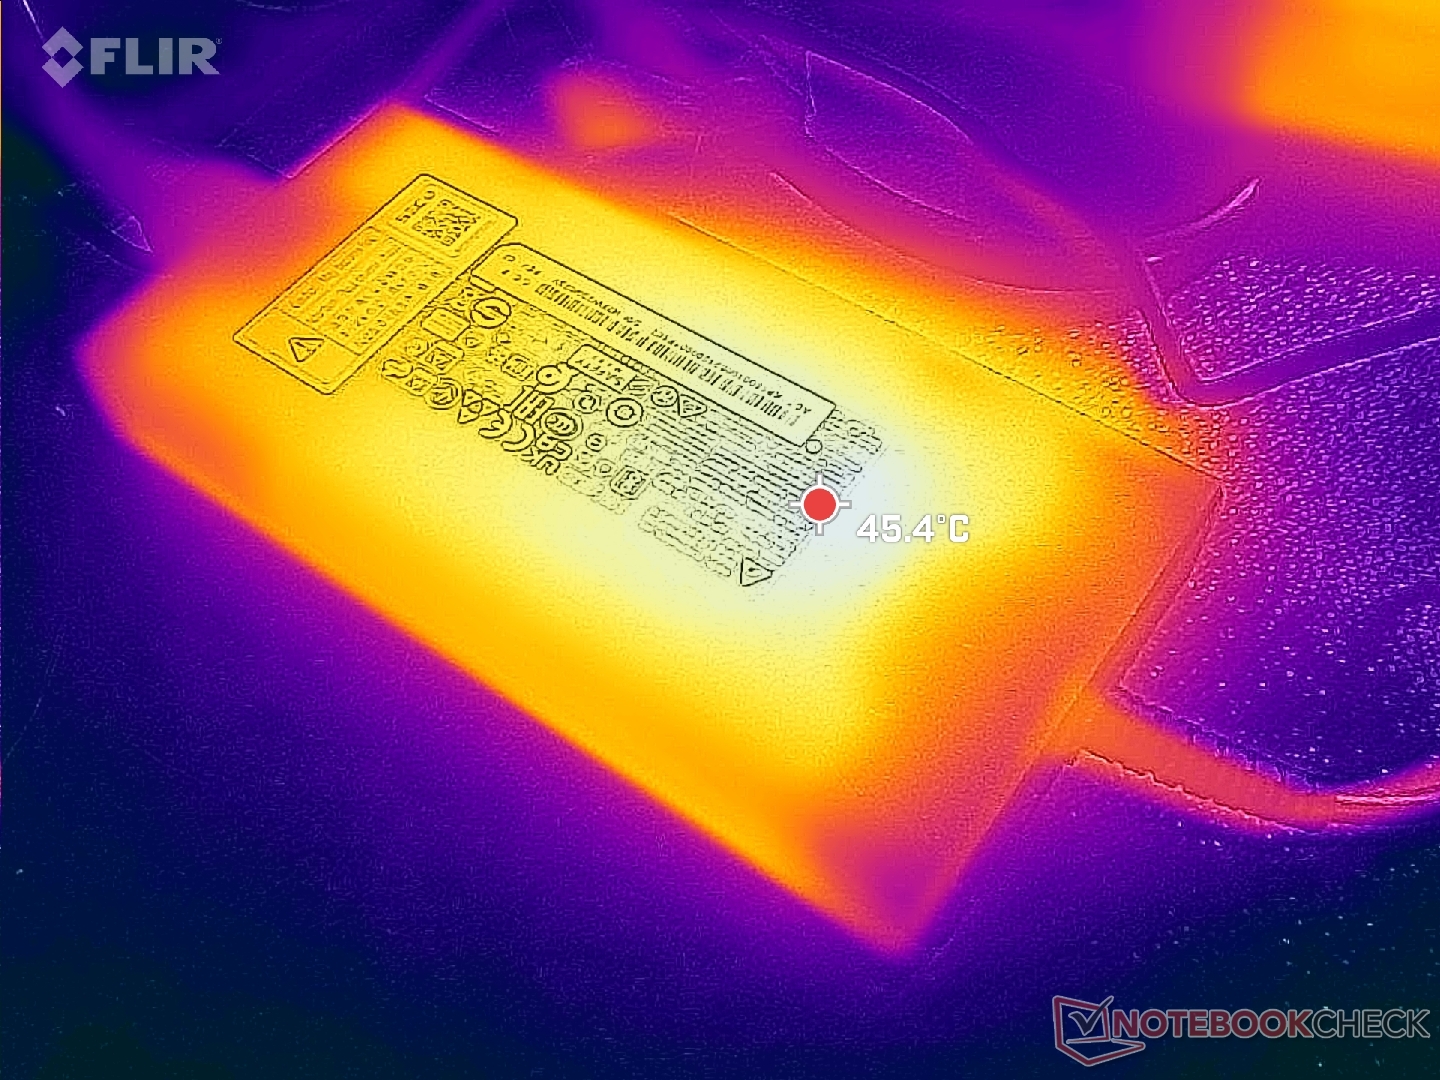
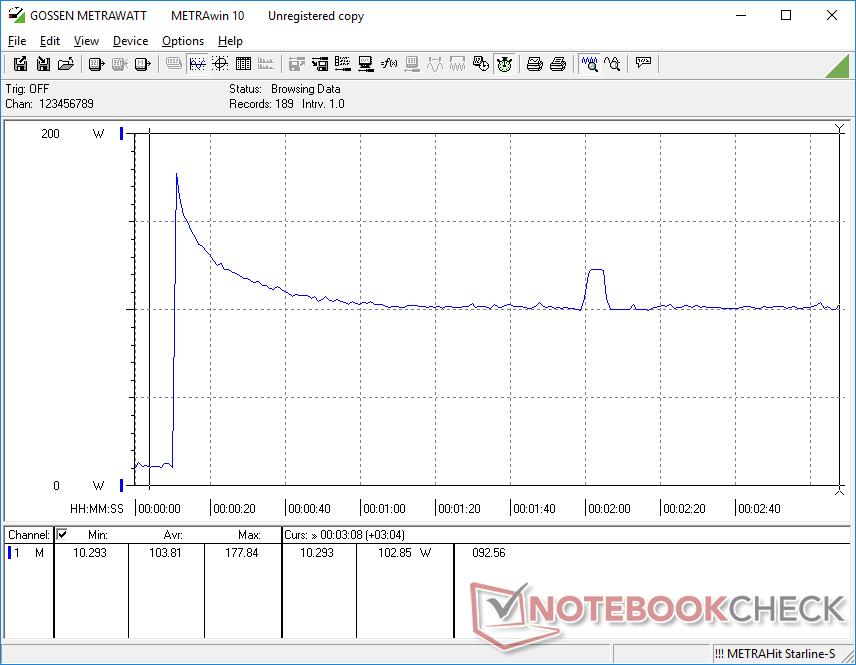
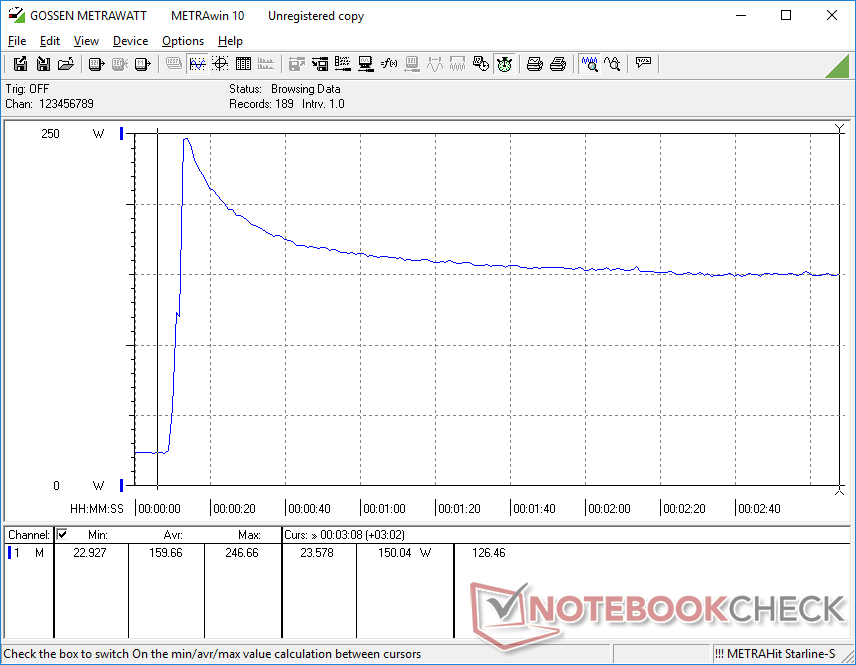
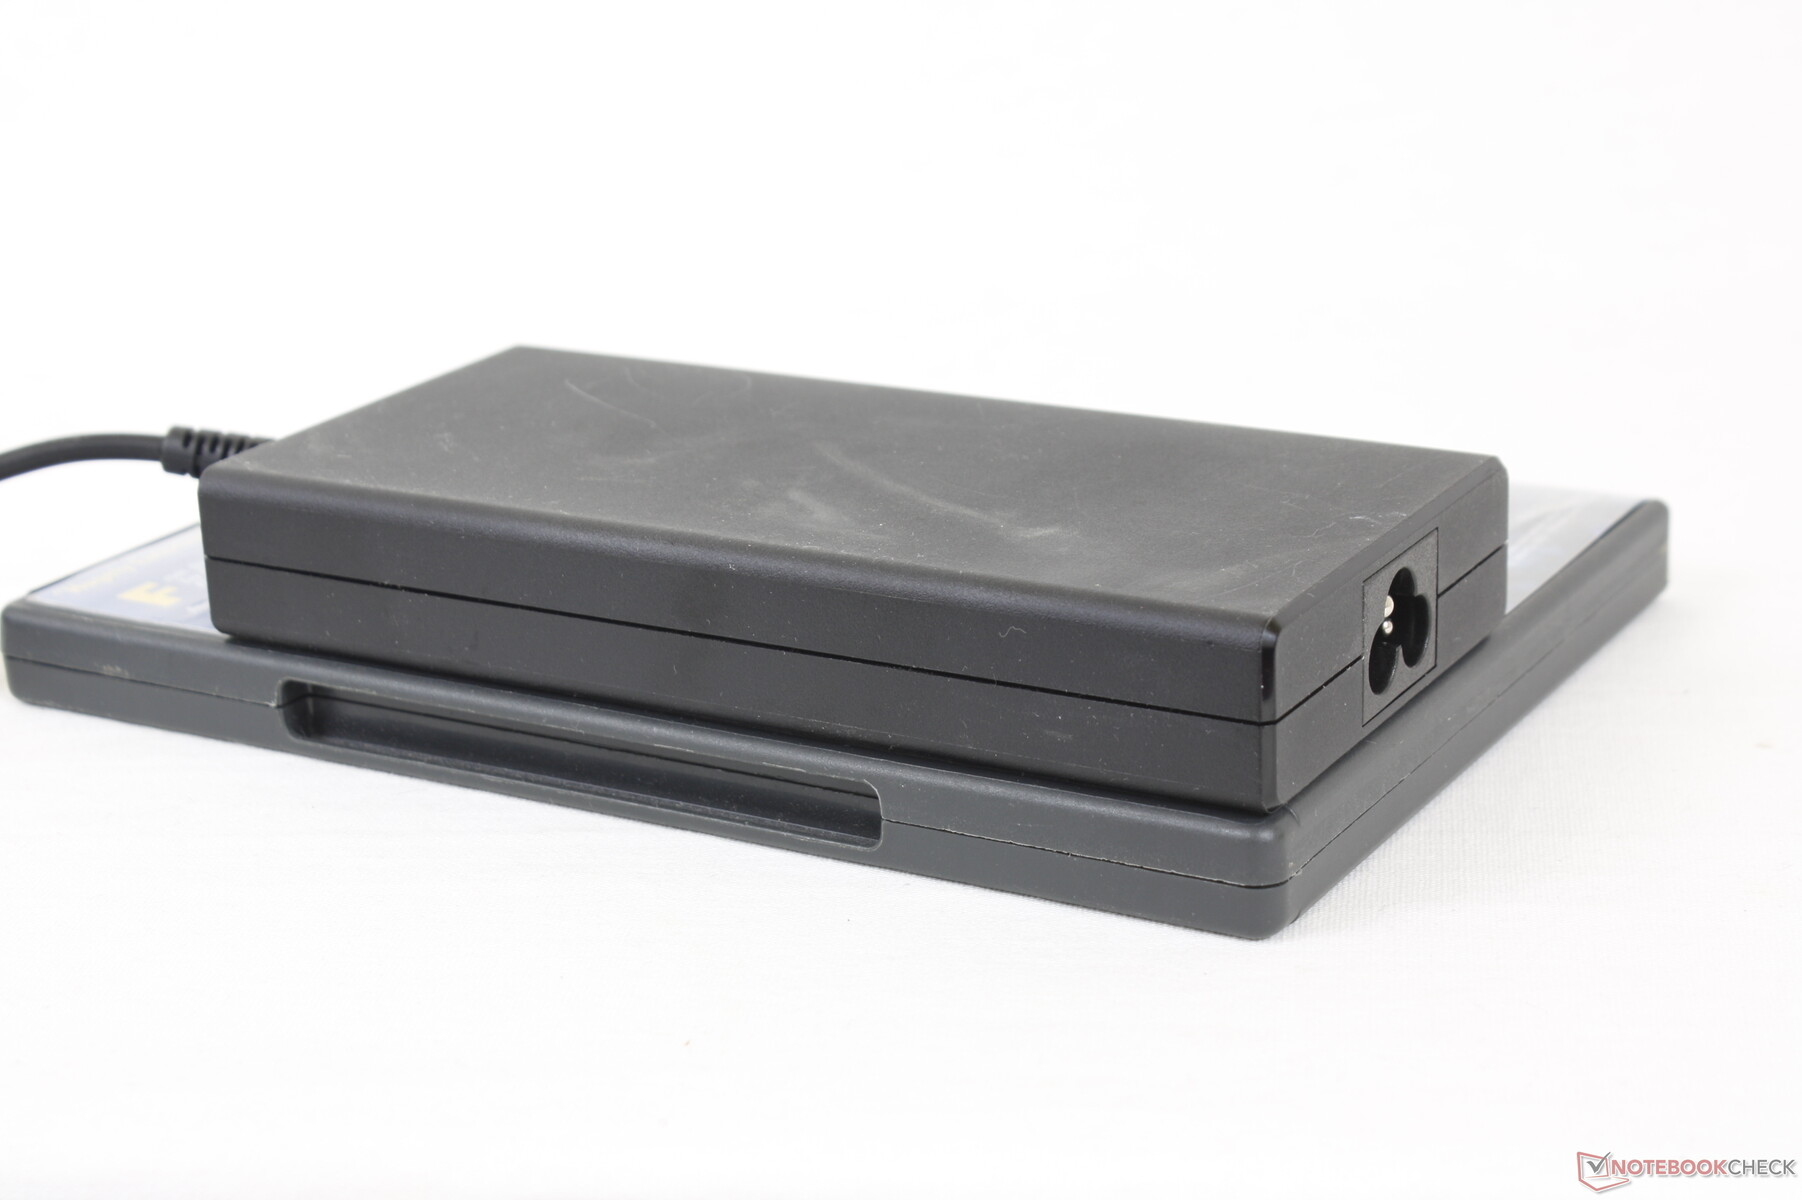
当CPU和GPU各自处于100%的利用率时,我们能够从中等大小(约15.1 x 7.2 x 2.3厘米)的200瓦交流适配器中记录到246瓦的临时最大功耗。由于散热问题,这一比率将迅速下降并稳定在150瓦的较安全水平,如我们下面的图表所示。该系统在游戏时仍能以合理的速度充电。
| Off / Standby | |
| Idle | |
| Load |
|
Key:
min: | |
| Acer Predator Triton 300 SE i9-12900H, GeForce RTX 3060 Laptop GPU, Micron 3400 1TB MTFDKBA1T0TFH, OLED, 2880x1800, 14" | Asus ROG Zephyrus G14 GA402RJ R7 6800HS, Radeon RX 6700S, Micron 2450 1TB MTFDKBA1T0TFK, IPS, 2560x1600, 14" | Razer Blade 14 Ryzen 9 6900HX R9 6900HX, GeForce RTX 3070 Ti Laptop GPU, Samsung PM9A1 MZVL21T0HCLR, IPS, 2560x1440, 14" | Alienware x14 i7 RTX 3060 i7-12700H, GeForce RTX 3060 Laptop GPU, WDC PC SN810 1TB, IPS, 1920x1080, 14" | Schenker Vision 14 i7-11370H, GeForce RTX 3050 Ti Laptop GPU, Samsung SSD 980 Pro 1TB MZ-V8P1T0BW, IPS, 2880x1800, 14" | Acer Predator Triton 300 PT315-52-79LP i7-10750H, GeForce RTX 2060 Mobile, WDC PC SN730 SDBQNTY-1T00, IPS, 1920x1080, 15.6" | |
|---|---|---|---|---|---|---|
| Power Consumption | -24% | -34% | 15% | 22% | 12% | |
| Idle Minimum * (Watt) | 7.6 | 12 -58% | 10.2 -34% | 7.9 -4% | 6.7 12% | 4 47% |
| Idle Average * (Watt) | 12.3 | 18 -46% | 26 -111% | 11.1 10% | 12.6 -2% | 10 19% |
| Idle Maximum * (Watt) | 17.6 | 26 -48% | 26.7 -52% | 11.8 33% | 15.4 12% | 19 -8% |
| Load Average * (Watt) | 111 | 88 21% | 89.3 20% | 107.4 3% | 85.7 23% | 96 14% |
| Witcher 3 ultra * (Watt) | 117.1 | 157.7 -35% | 158.7 -36% | 111 5% | 83 29% | 136 -16% |
| Load Maximum * (Watt) | 245.8 | 194 21% | 227.5 7% | 140.4 43% | 110.9 55% | 214 13% |
* ... smaller is better
Power Consumption Witcher 3 / Stresstest
Power Consumption external Monitor
电池寿命--对于尺寸和功率来说还不错
在平衡电源配置文件上,实际的WLAN浏览时间平均为6小时多一点。尽管如此,大多数其他14英寸笔记本电脑可以持续更长的时间,包括华硕ROG Zephyrus G14或Razer Blade 14,各多出几个小时。更耗电的英特尔CPU和OLED面板可能是造成整体电池寿命缩短的原因。
从空电到满电的充电时间相对较慢,为2小时。此外,该系统不能通过USB-C充电。
| Acer Predator Triton 300 SE i9-12900H, GeForce RTX 3060 Laptop GPU, 76 Wh | Asus ROG Zephyrus G14 GA402RJ R7 6800HS, Radeon RX 6700S, 76 Wh | Razer Blade 14 Ryzen 9 6900HX R9 6900HX, GeForce RTX 3070 Ti Laptop GPU, 62 Wh | Alienware x14 i7 RTX 3060 i7-12700H, GeForce RTX 3060 Laptop GPU, 80 Wh | Dell Inspiron 14 Plus 7420 i7-12700H, GeForce RTX 3050 4GB Laptop GPU, 64 Wh | Schenker Vision 14 i7-11370H, GeForce RTX 3050 Ti Laptop GPU, 53 Wh | |
|---|---|---|---|---|---|---|
| Battery runtime | 65% | 42% | 3% | 11% | -2% | |
| Reader / Idle (h) | 8.1 | 12.2 51% | 11.9 47% | |||
| WiFi v1.3 (h) | 6.2 | 10.2 65% | 9.5 53% | 8.9 44% | 7.2 16% | 5.5 -11% |
| Load (h) | 1.3 | 1.6 23% | 0.8 -38% | 0.9 -31% | 1.4 8% | |
| H.264 (h) | 9.4 | 6.8 | ||||
| Witcher 3 ultra (h) | 0.8 |
Pros
Cons
评语--好,但还不够好
14英寸的Predator Triton 300 SE面临着激烈的竞争,对手是 华硕Zephyrus G14, Razer Blade 14, 和 Alienware x14.当与Zephyrus G14相比,华硕笔记本电脑是 经常在销售在提供相同水平的图形性能和几乎相同的重量和尺寸的情况下,以较低的价格出售数百美元。与刀锋14相比,雷蛇的笔记本电脑可以说更时尚,其设计更薄,每键RGB照明。最后,Alienware x14集成了更坚实的键盘按键和更薄的外形。所有这些机器的固态硬盘性能也比宏碁的好。
宏碁掠夺者Triton 300 SE是一个特别强大的游戏笔记本电脑,无论大小。然而,当涉及到风扇噪音和固态硬盘性能时,其他14英寸游戏笔记本电脑已经打败了它。
在运行游戏时,宏碁系统的噪音也比上面提到的三个替代品大。我们知道,无论如何,Turbo模式都会很吵,但它比竞争对手吵得多的事实给系统带来了影响。必须启用Turbo模式才能充分发挥宏碁的GPU的作用。
有一些值得称道的品质,如16:10的90赫兹OLED面板,快速的Core i9 CPU,以及对Thunderbolt 4的支持,这些都是Razer Blade 14和大多数华硕Zephyrus G14型号所不具备的。事实上,掠夺者Triton 300 SE是目前14英寸类别中唯一的16:10游戏笔记本电脑之一。不过,如果这种独特的功能不是优先考虑的,那么Zephyrus G14、Blade 14或Alienware x14都值得考虑。
价格和可用性
Acer Predator Triton 300 SE
- 11/02/2022 v7 (old)
Allen Ngo
Price comparison

