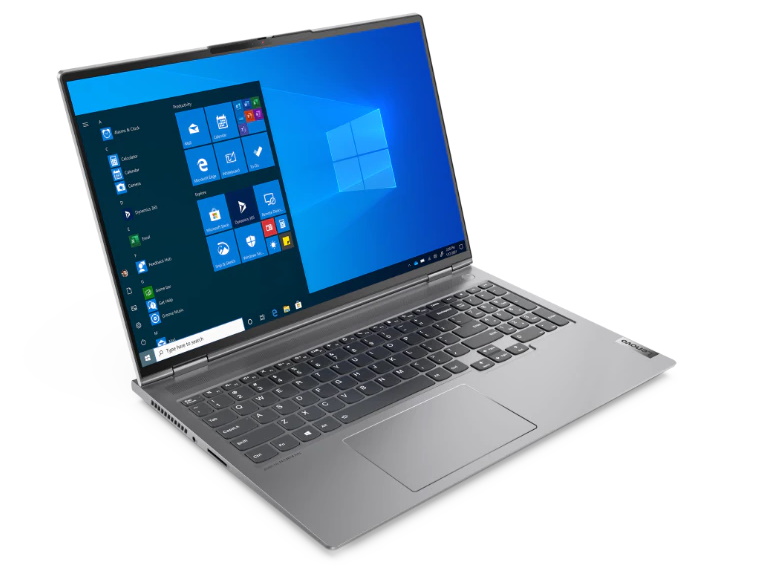
联想ThinkBook 16p的笔记本电脑评测。如果你准备好接受一些妥协,那就是众望所归了
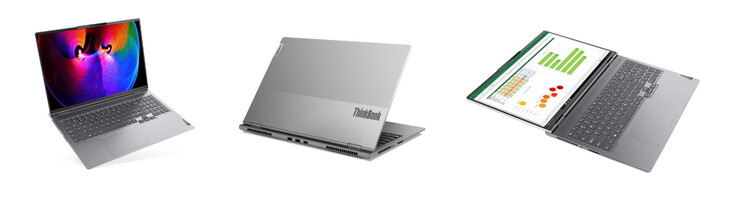
认为ThinkBook 15p还是有点太老套的用户现在可能想看看新的ThinkBook 16p。它是16:10而不是16:9,它有高屏占比而不是慷慨的边框,它还配备了潜在的强大显卡以及强大的处理器。联想将越来越流行的16英寸显示屏之一挤进15英寸的机箱,并增加了垂直像素数。而不是NVIDIAGeForce GTX 1650 Ti Max-Q ,而是NVIDIAGeForce RTX 3060笔记本GPU,上面还有一个强大的AMD Ryzen 9 5900HX。这给ThinkBook带来了巨大的性能提升,推动它进入游戏领域。
这款 "强大的创意工具"(联想)的竞争对手包括游戏和多媒体笔记本电脑,如戴尔Inspiron 16 Plus 7610,配有RTX 3050 ,以及Razer Blade 15 Base Model ,还包括专用游戏设备,如 Alienware m15 R5 或 Schenker XMG Core 15 。我们还使用虚拟的前身,联想ThinkBook 15p ,进行比较。
Possible contenders in comparison
Rating | Date | Model | Weight | Height | Size | Resolution | Price |
|---|---|---|---|---|---|---|---|
| 87 % v7 (old) | 09 / 2021 | Lenovo ThinkBook 16p G2 ACH R9 5900HX, GeForce RTX 3060 Laptop GPU | 2 kg | 19.5 mm | 16.00" | 2560x1600 | |
| 86.4 % v7 (old) | Lenovo ThinkBook 15p Gen1 4K i7-10750H, GeForce GTX 1650 Ti Max-Q | 2 kg | 19.9 mm | 15.60" | 3840x2160 | ||
| 86.7 % v7 (old) | 10 / 2021 | Dell Inspiron 16 Plus 7610 i7-11800H, GeForce RTX 3050 4GB Laptop GPU | 2 kg | 18.99 mm | 16.00" | 3072x1920 | |
| 85.5 % v7 (old) | 04 / 2021 | Razer Blade 15 Base Edition 2021, i7-10750H RTX 3060 i7-10750H, GeForce RTX 3060 Laptop GPU | 2.1 kg | 19.9 mm | 15.60" | 1920x1080 | |
| 84.7 % v7 (old) | 08 / 2025 | Alienware m15 R5 Ryzen Edition R7 5800H, GeForce RTX 3060 Laptop GPU | 2.5 kg | 22.85 mm | 15.60" | 1920x1080 | |
| 84.9 % v7 (old) | Schenker XMG Core 15 Ampere R7 4800H, GeForce RTX 3060 Laptop GPU | 2 kg | 22.9 mm | 15.60" | 2560x1440 |
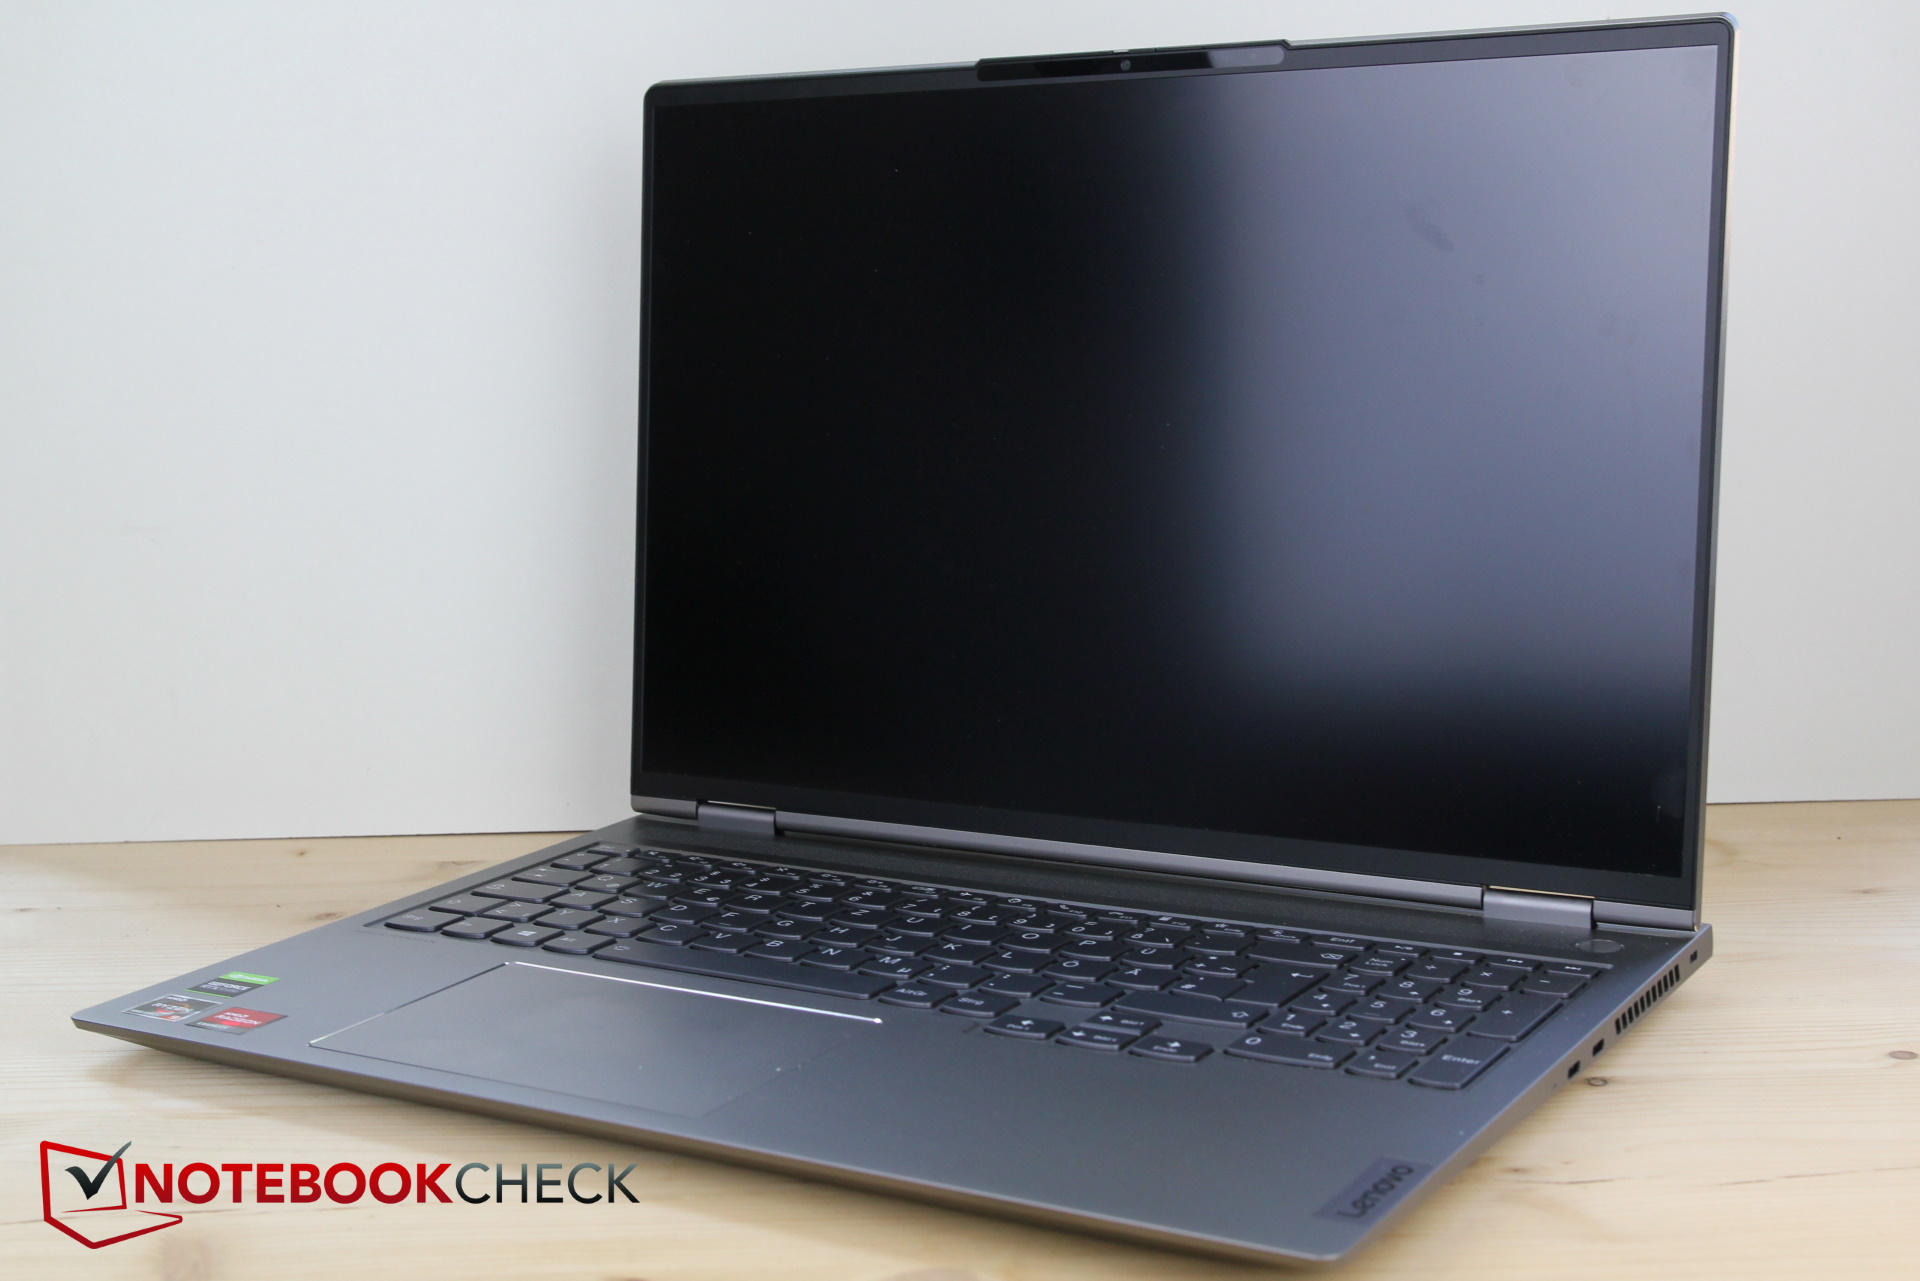
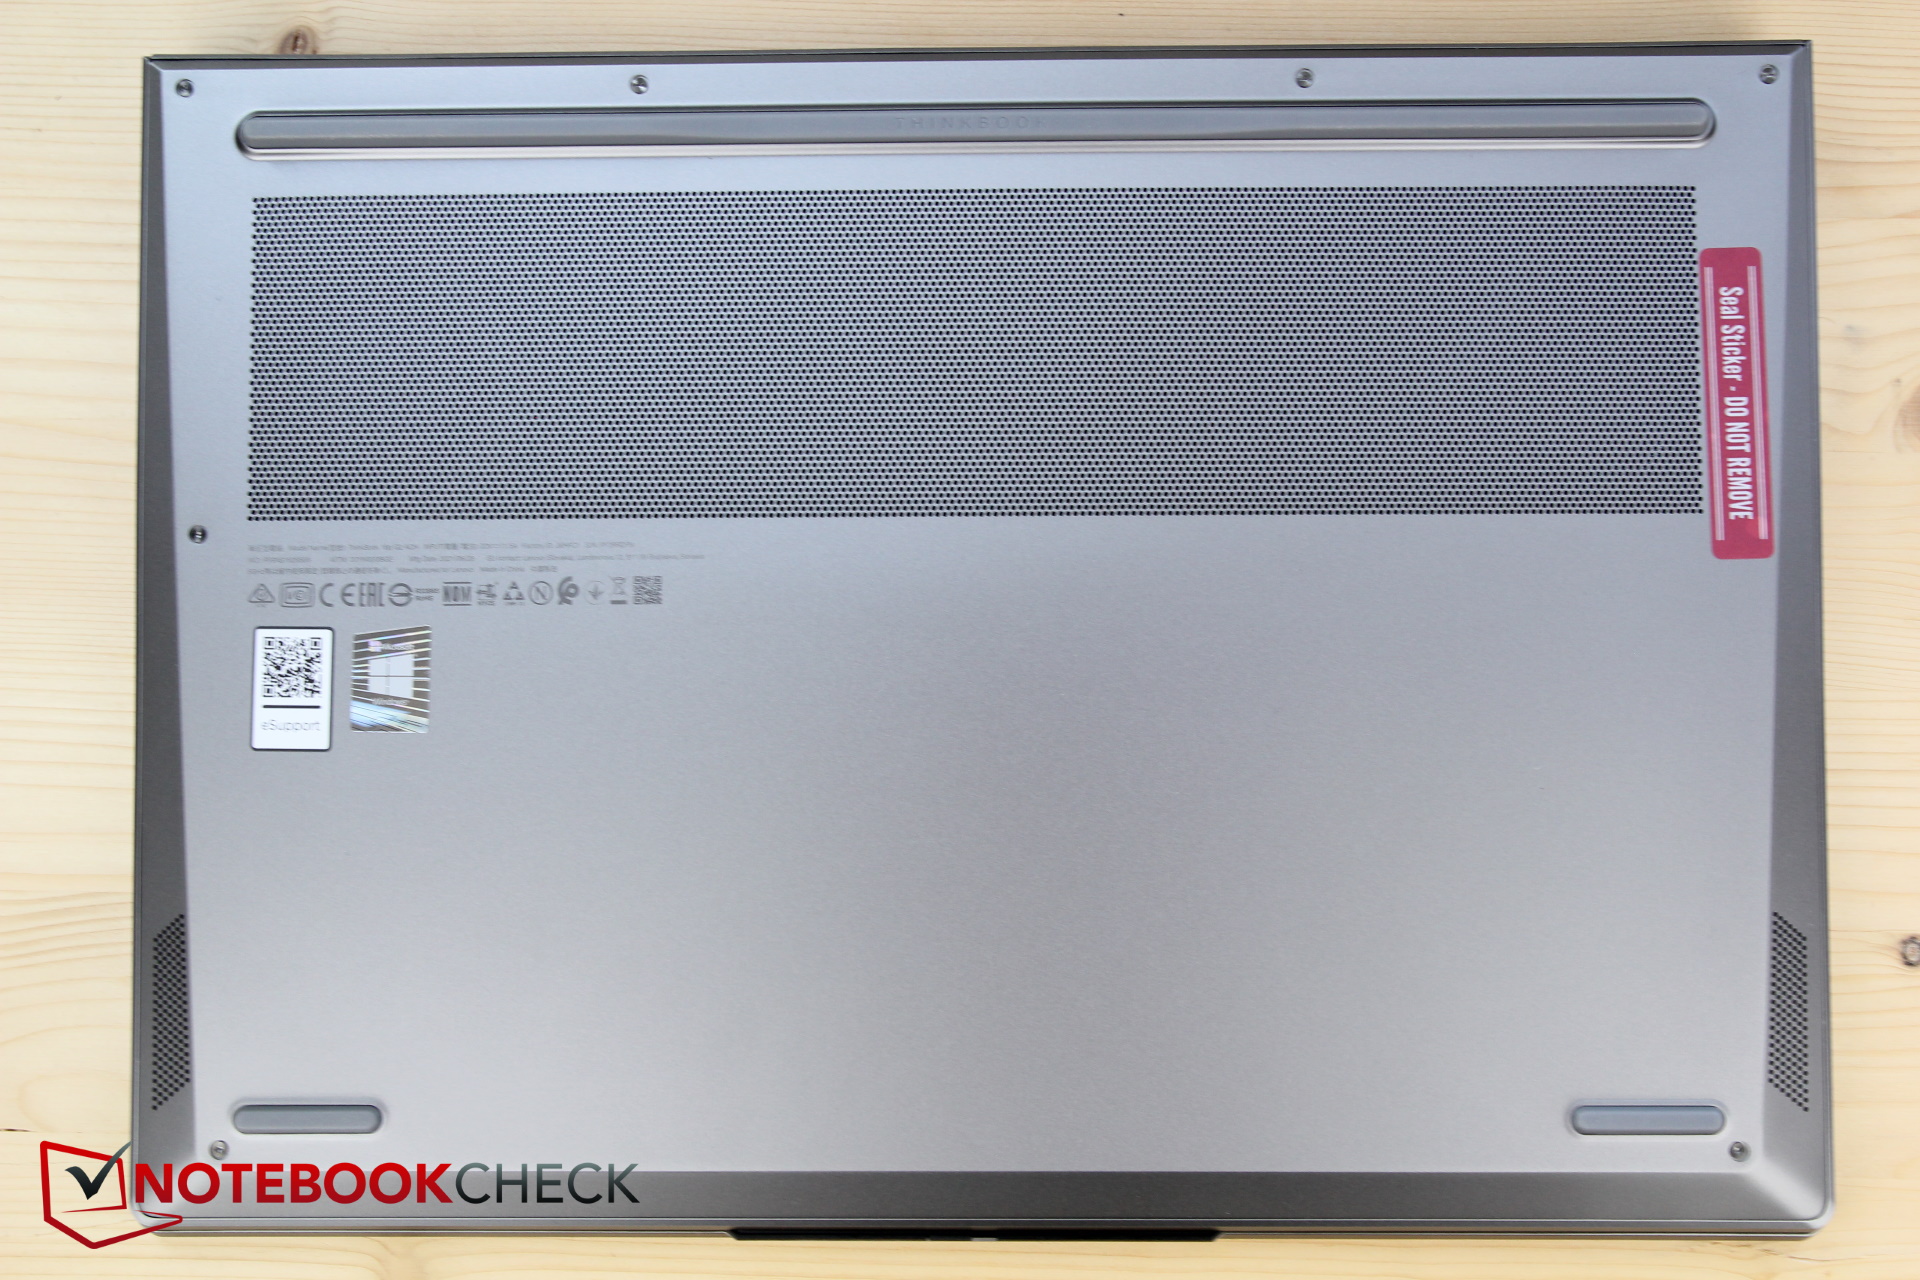
外壳 - 有缝隙的金属一体机身
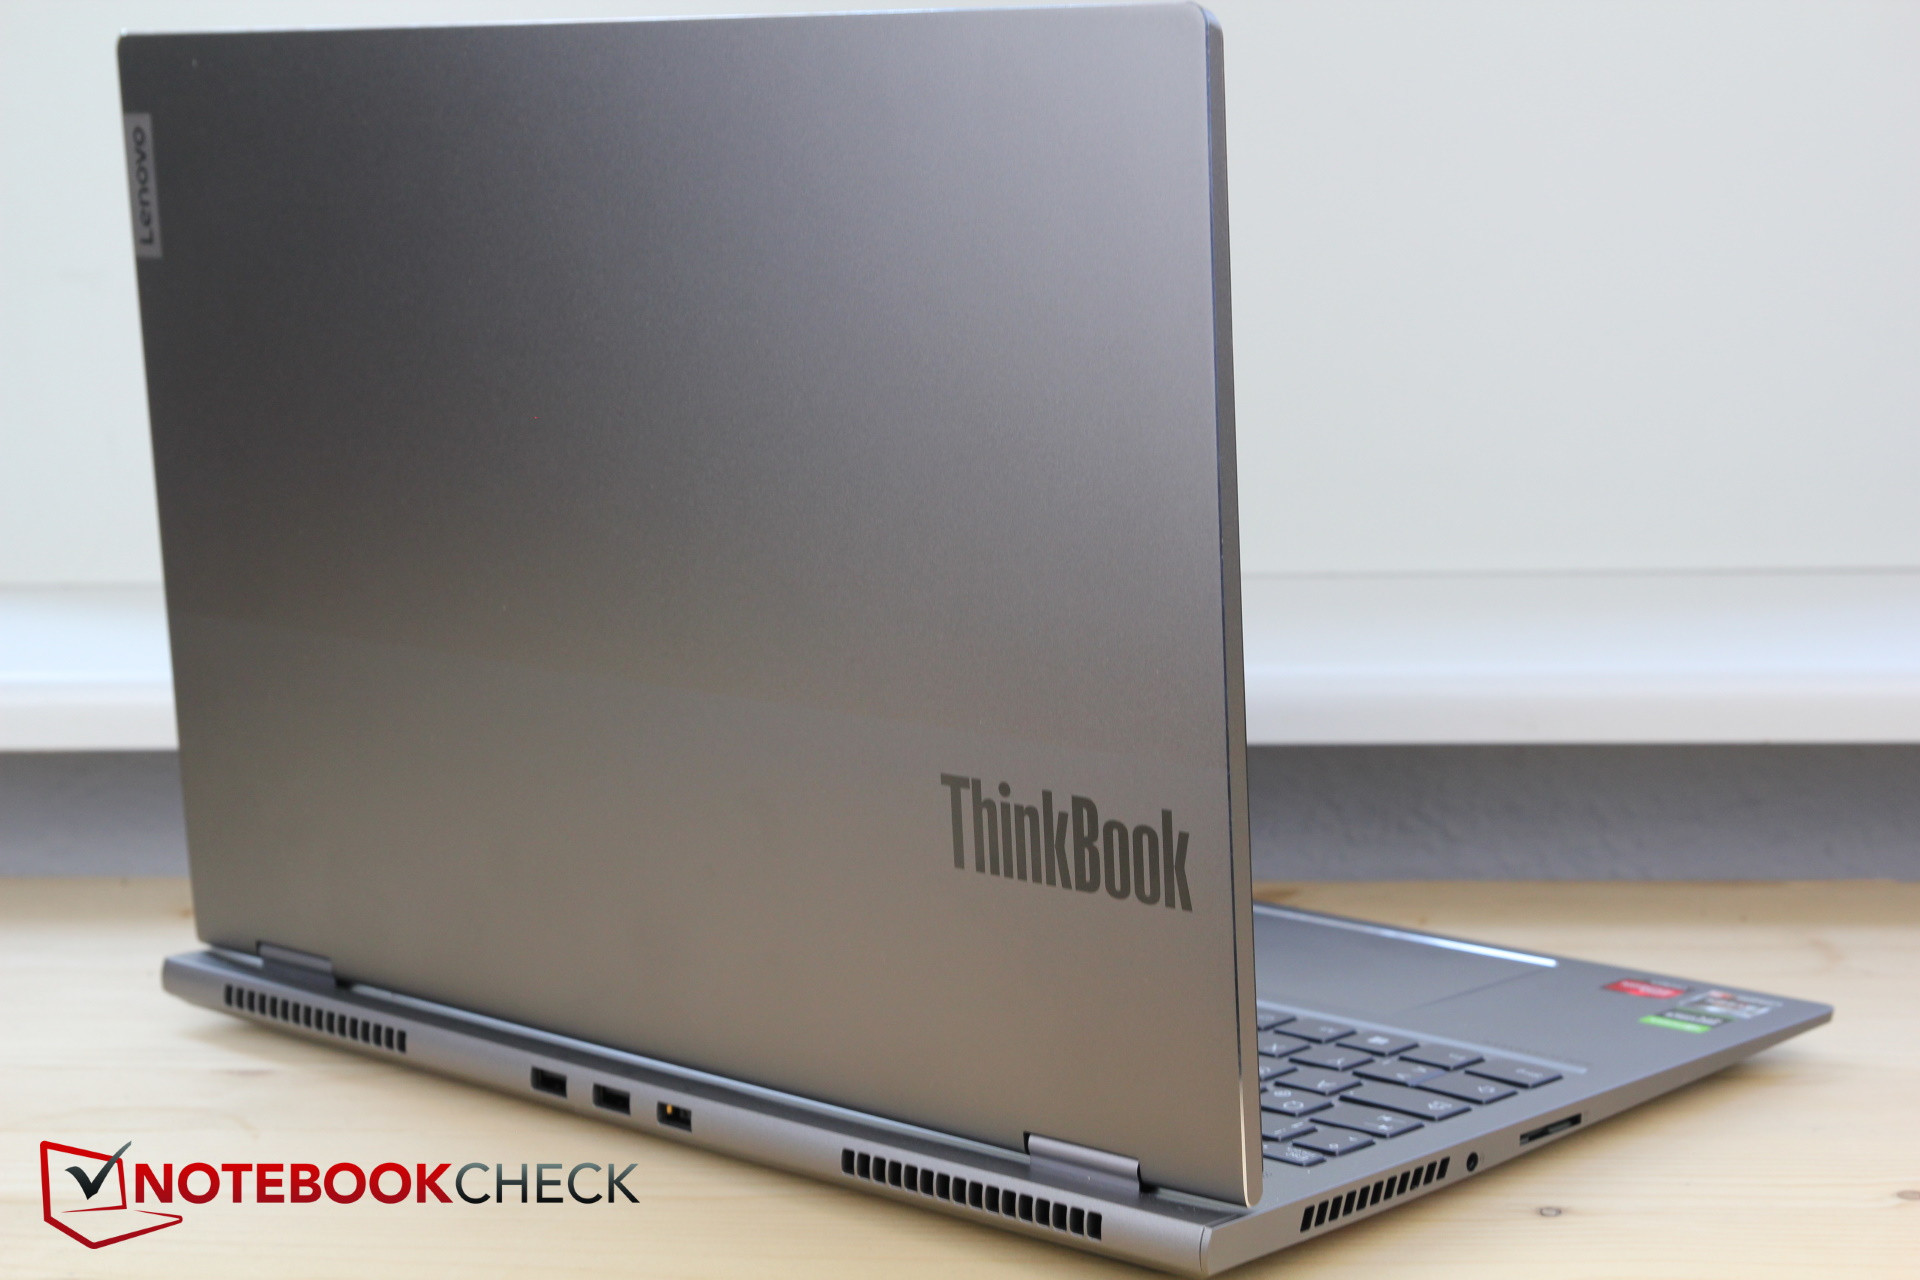
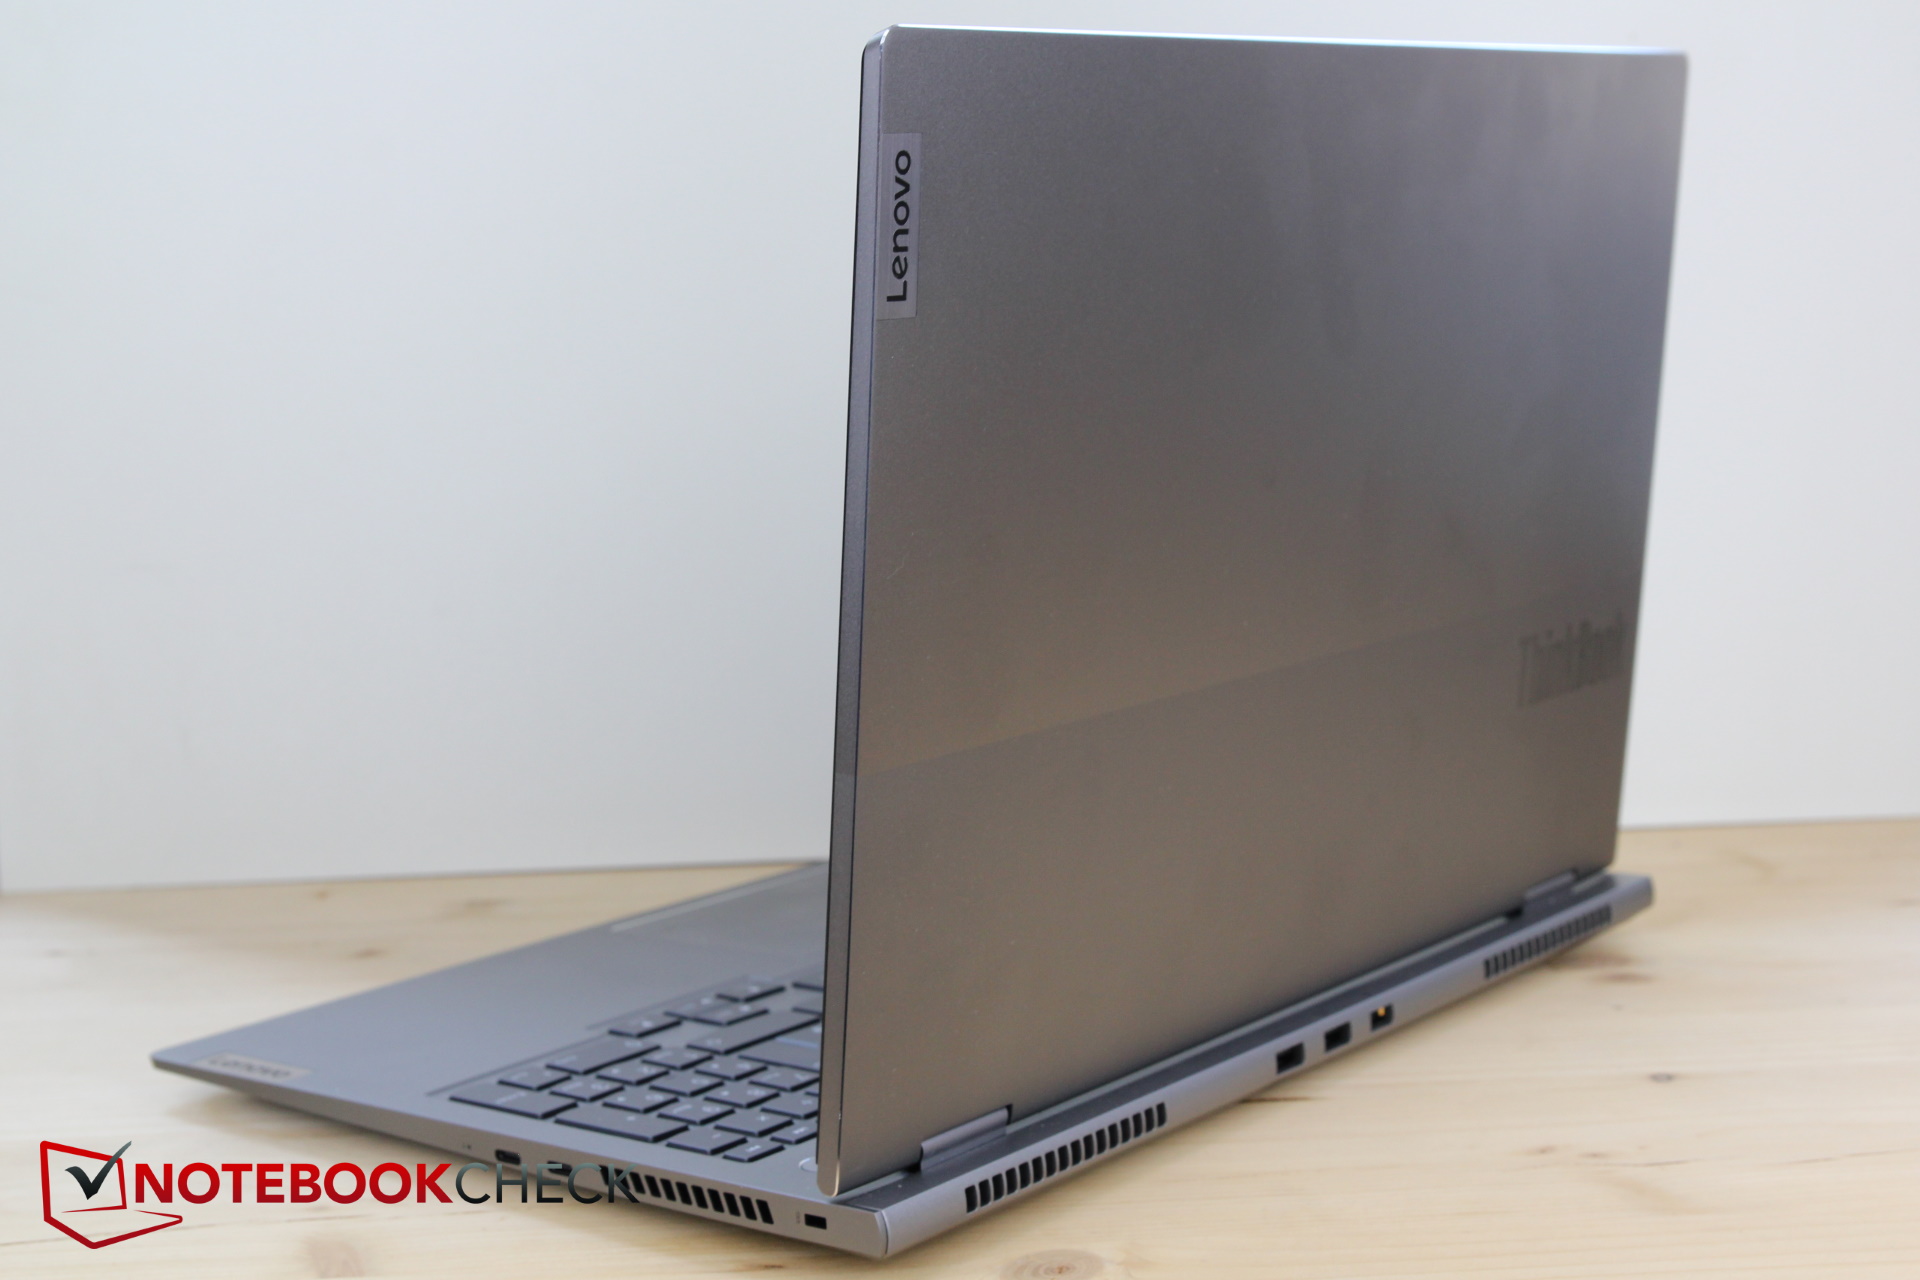
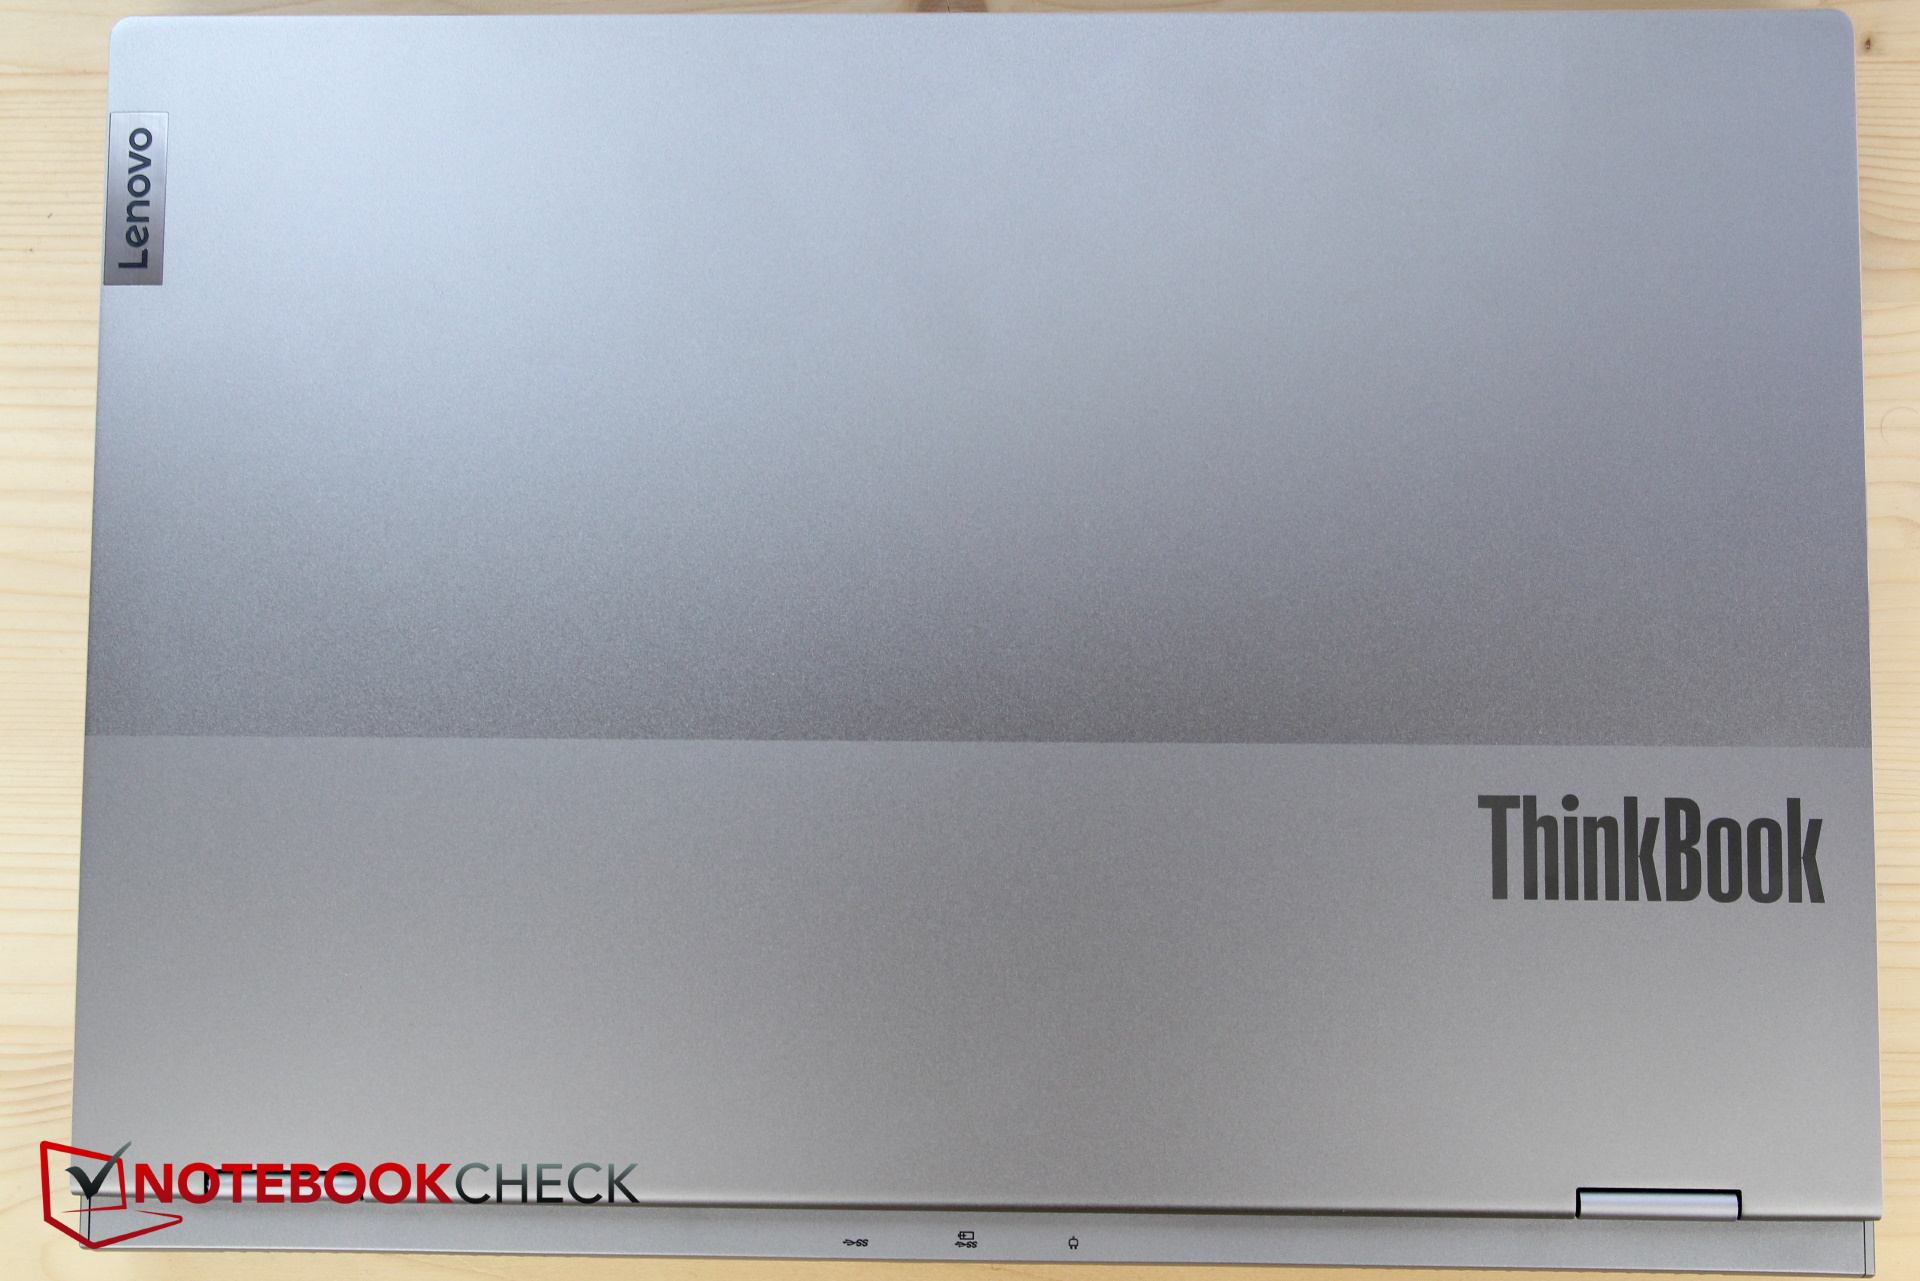
外壳与联想ThinkBook 15p的外壳没有什么不同。它几乎完全由铝制成,这使得显示屏和键盘底座尤其是相对坚固。银灰色的金属外壳在底座上有联想的标志,在盖子上也有ThinkBook的标志作为装饰。
两个铰链对显示屏有很好的抓握作用,但笔记本电脑仍然可以用一只手轻松打开。底部至少有一处出现了不均匀的缝隙,但除此之外,制造质量似乎处于良好水平,我们几乎没有注意到任何吱吱作响的声音。
新鲜空气从底部吸入,废热则分别通过左边和右边的两个通风槽向后面和侧面散去。
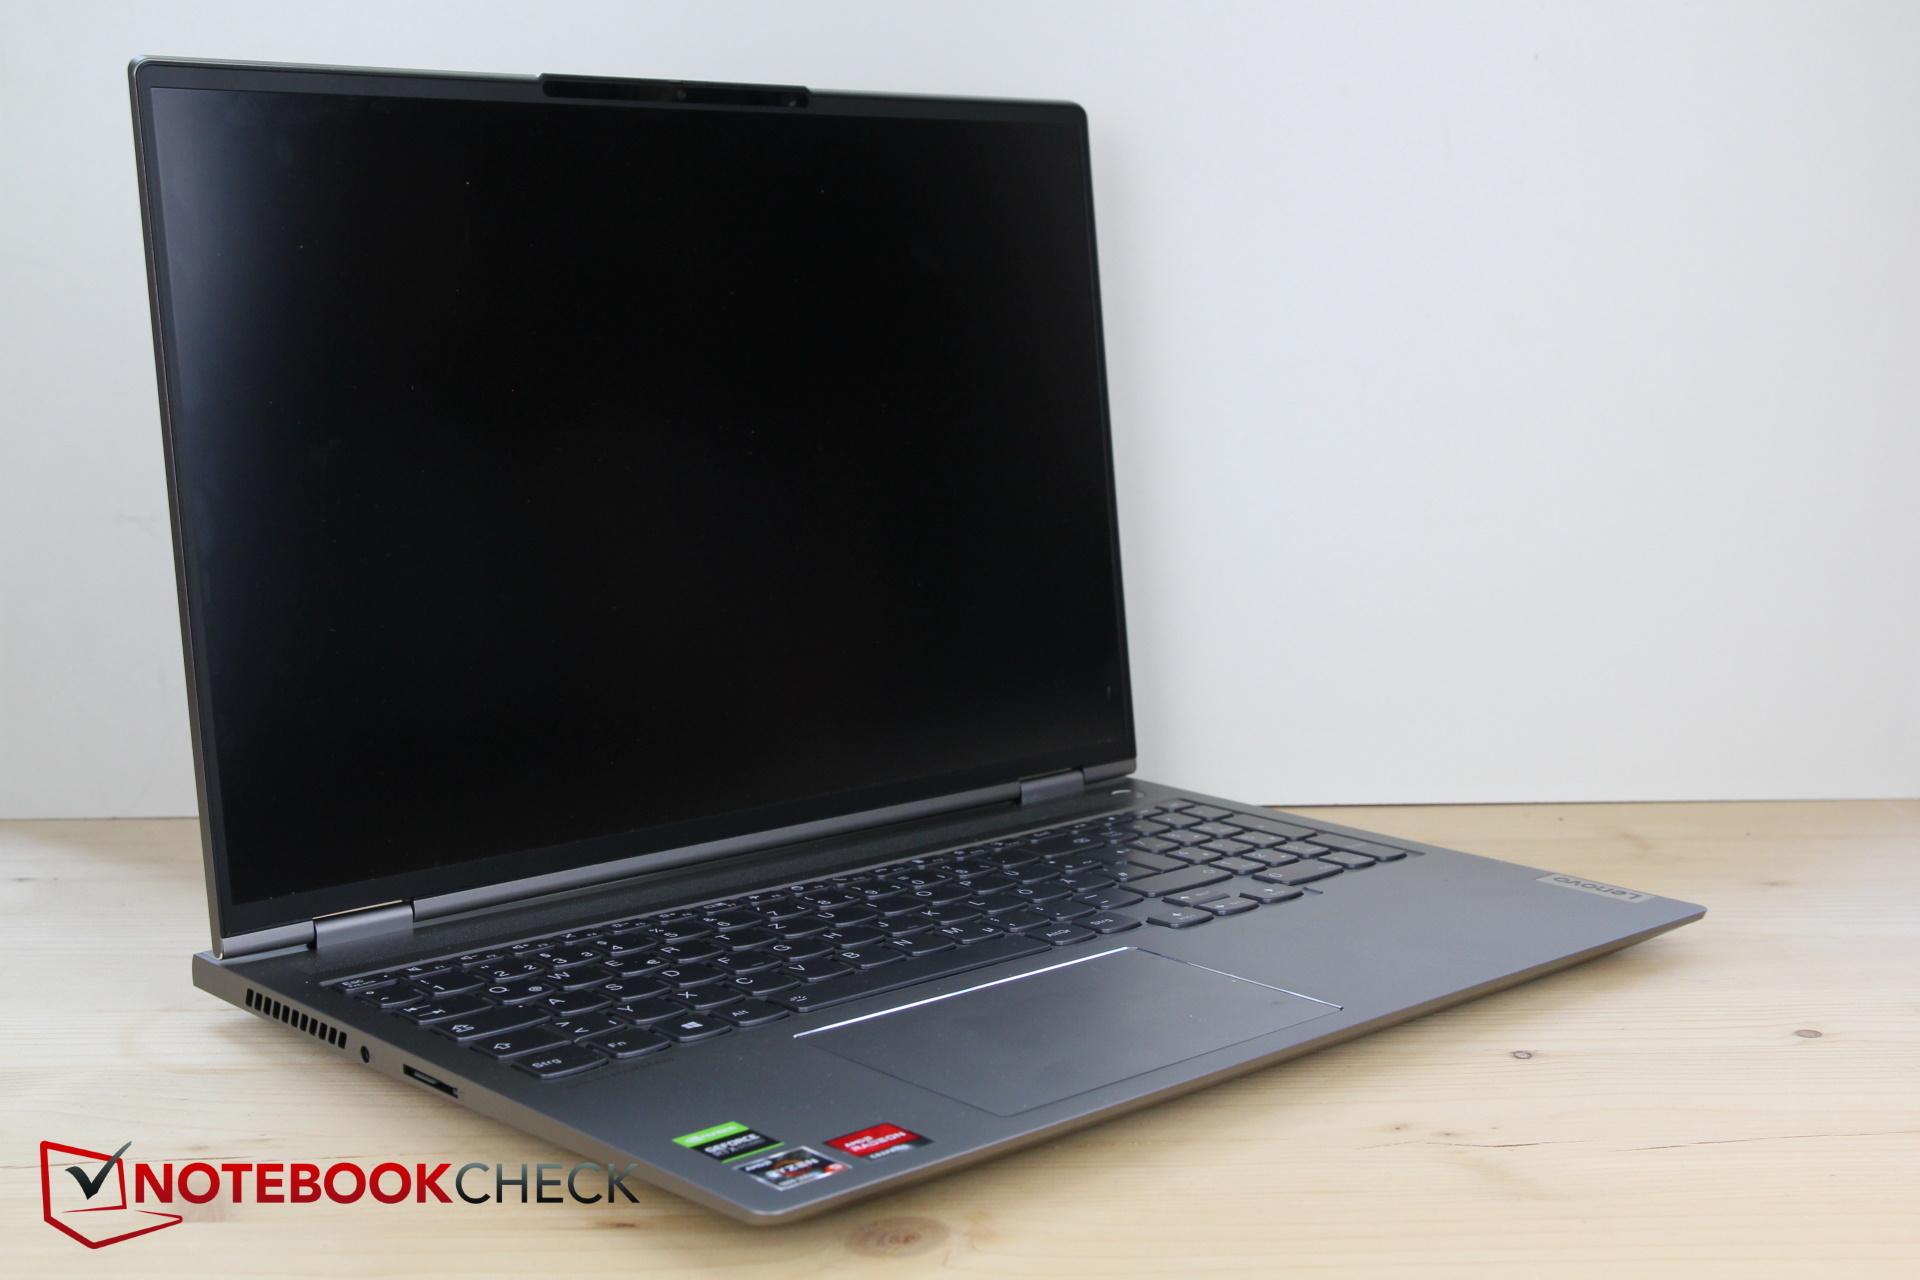
戴尔Inspiron 16 Plus 7610,比ThinkBook薄了半毫米,但总体上在尺寸和重量方面非常相似。否则,ThinkBook的2公斤重量很难使其与竞争对手区分开来;只有Alienware比它重了近500克。尽管ThinkBook 16p采用了16:10长宽比的显示屏,但它几乎没有比15英寸的竞争对手大多少,其中只有一些机型的深度要小几毫米。
Connectivity - Super spartan ThinkBook 16p
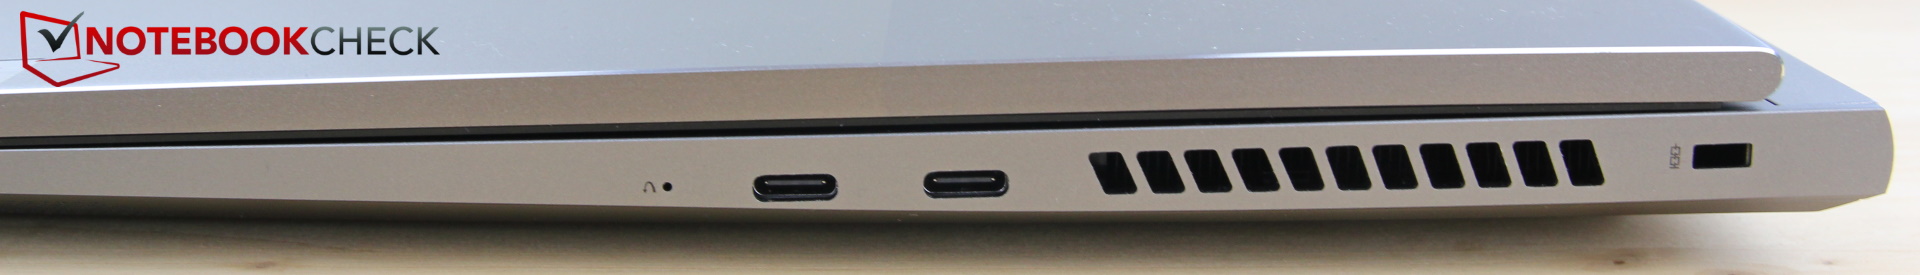
我们已经批评了ThinkBook 15p的连接性,而16p也没有做得更好。没有专门的HDMI或DisplayPort输入,这意味着你必须使用一个适配器,用于支持DisplayPort 1.4的两个USB-C连接中的一个,而联想并不包括这个适配器。因此,在连接外部显示器之前,你必须购买一个适配器或集线器。由于使用AMD平台,Thunderbolt也不见了。
此外,还缺少一个LAN端口;缺少高速有线网络连接对于一个 "高性能创作工具 "来说是否合适,值得怀疑。至少有一个完整的SD读卡器,这已经不是一个必然的事情了。总的来说,只有四个USB端口和一个耳机端口,这不算什么
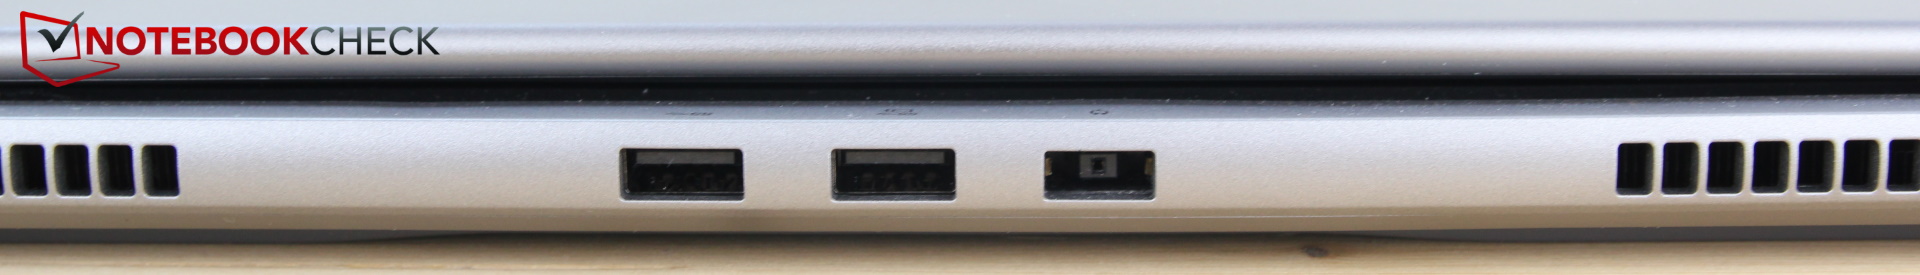
USB-C端口在右侧。由于适配器甚至带长线的集线器在这里使用几乎是不可避免的,它们的位置可能不是很理想。两个USB-A端口与电源一起位于背面。我们发现,每次我们想插入一个简单的USB-A棒时,都要把手伸到显示器后面,这有点令人讨厌。阅读器和耳机接口位于左侧。
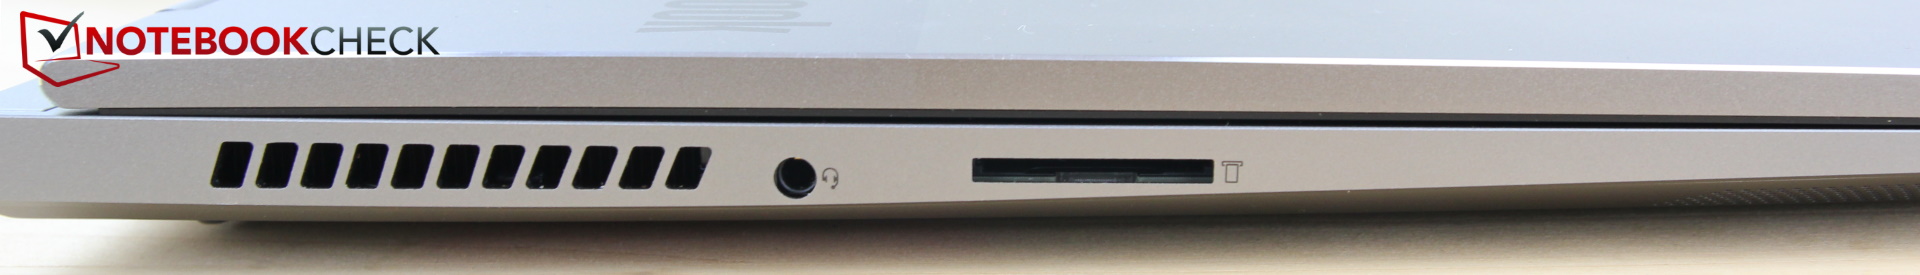
SD卡阅读器
SD卡可以在没有锁定机制的情况下被推入,大约一半的卡突出在插槽外。与前代产品相比,读卡器的速度向前迈进了一步,现在属于同类产品的平均水平。从我们的128GB AV PRO V60 microSD参考存储卡中复制1GB的图像到桌面上大约需要13秒。
| SD Card Reader | |
| average JPG Copy Test (av. of 3 runs) | |
| Average of class Multimedia (23 - 531, n=43, last 2 years) | |
| Schenker XMG Core 15 Ampere (Toshiba Exceria Pro SDXC 64 GB UHS-II) | |
| Lenovo ThinkBook 16p G2 ACH | |
| Lenovo ThinkBook 15p Gen1 4K (AV Pro V60) | |
| Dell Inspiron 16 Plus 7610 (AV PRO microSD 128 GB V60) | |
| maximum AS SSD Seq Read Test (1GB) | |
| Average of class Multimedia (27.9 - 1455, n=42, last 2 years) | |
| Schenker XMG Core 15 Ampere (Toshiba Exceria Pro SDXC 64 GB UHS-II) | |
| Lenovo ThinkBook 16p G2 ACH | |
| Lenovo ThinkBook 15p Gen1 4K (AV Pro V60) | |
| Dell Inspiron 16 Plus 7610 (AV PRO microSD 128 GB V60) | |
沟通
由于缺乏局域网适配器和端口,只有Wi-Fi和蓝牙5等无线通信选项可用。在我们的测量中,英特尔AX200 WLAN模块的表现有些低于平均水平。
| Networking | |
| iperf3 transmit AX12 | |
| Razer Blade 15 Base Edition 2021, i7-10750H RTX 3060 | |
| Schenker XMG Core 15 Ampere | |
| Lenovo ThinkBook 15p Gen1 4K | |
| Alienware m15 R5 Ryzen Edition | |
| Average Intel Wi-Fi 6 AX200 (447 - 1645, n=127) | |
| Dell Inspiron 16 Plus 7610 | |
| Lenovo ThinkBook 16p G2 ACH | |
| iperf3 receive AX12 | |
| Razer Blade 15 Base Edition 2021, i7-10750H RTX 3060 | |
| Schenker XMG Core 15 Ampere | |
| Lenovo ThinkBook 15p Gen1 4K | |
| Alienware m15 R5 Ryzen Edition | |
| Dell Inspiron 16 Plus 7610 | |
| Average Intel Wi-Fi 6 AX200 (523 - 1684, n=128) | |
| Lenovo ThinkBook 16p G2 ACH | |
网络摄像头
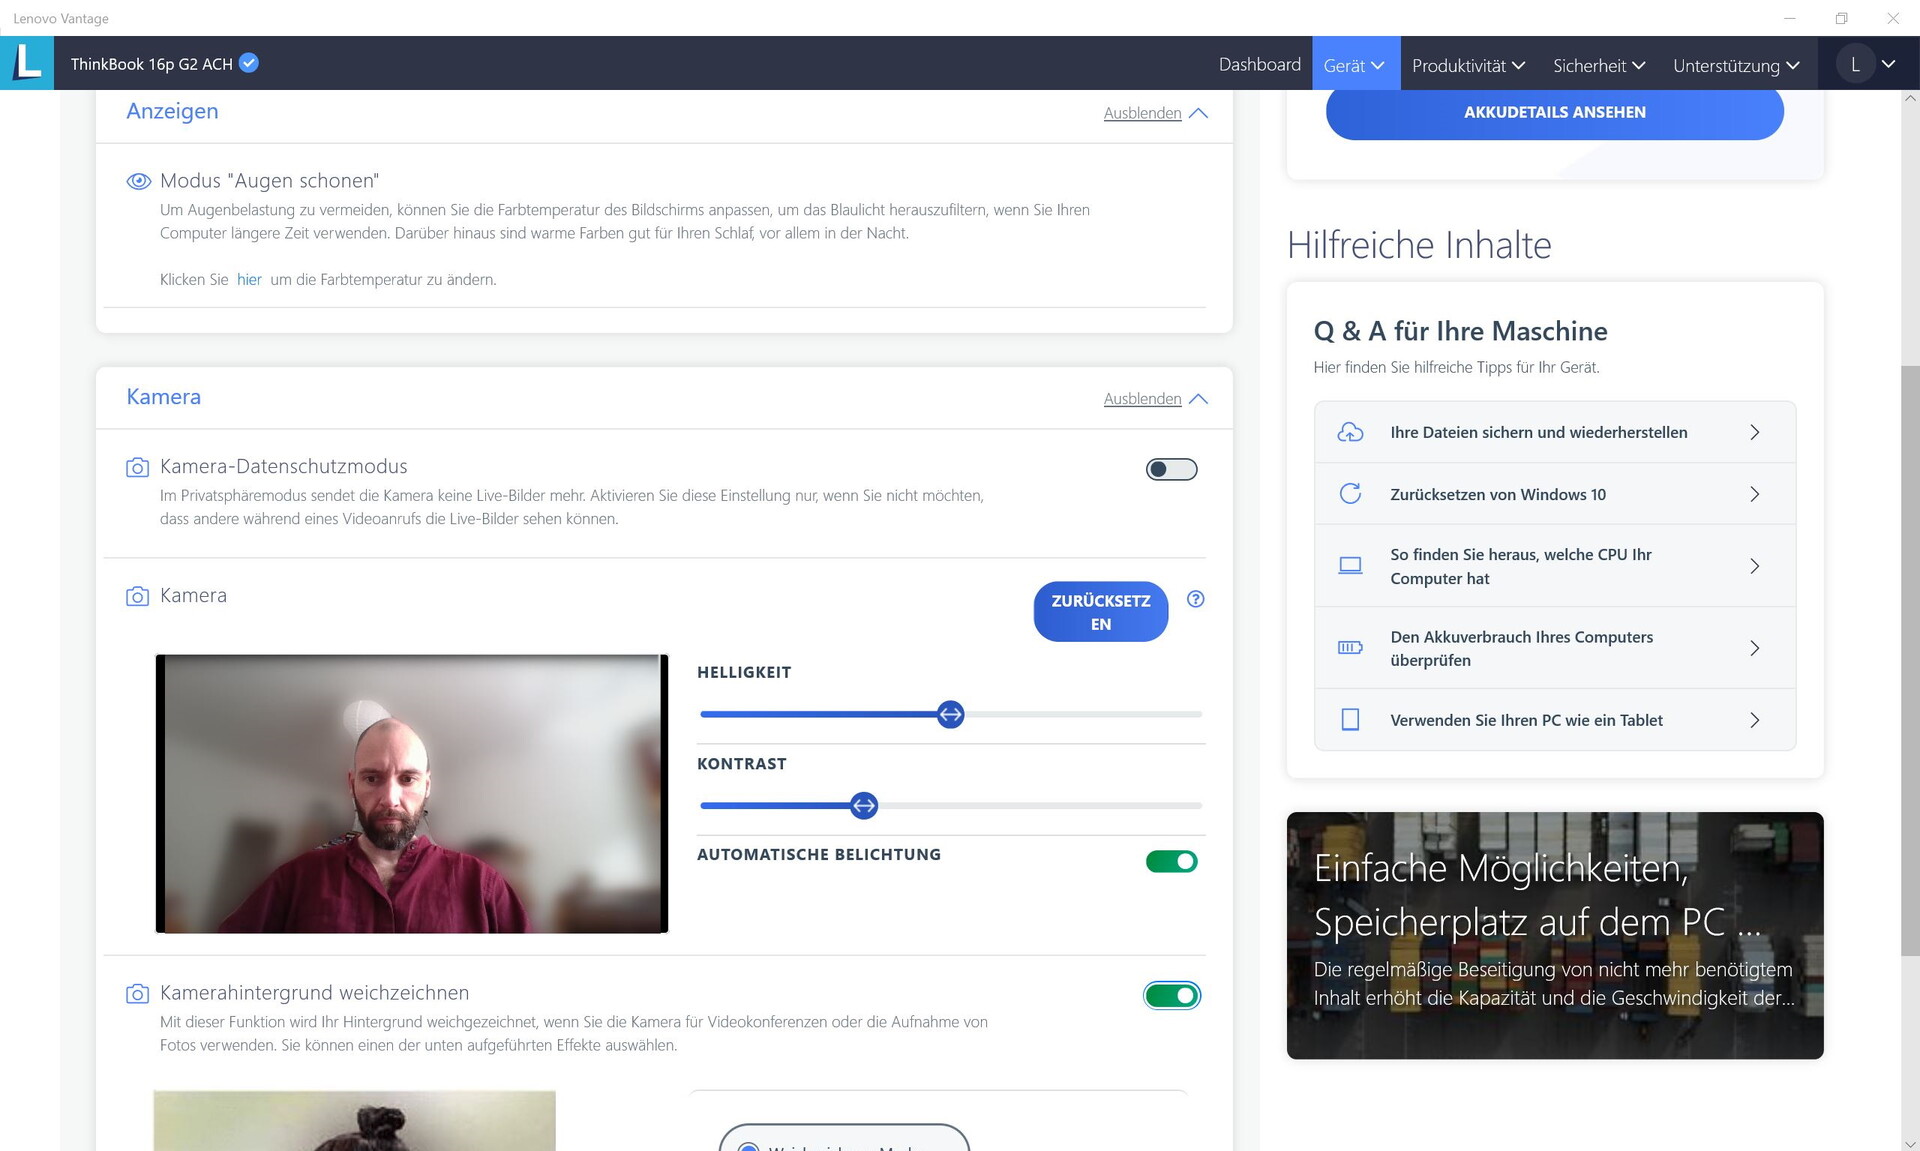
你会认为这里的效果很好,因为联想用全高清模式取代了通常的标准720p摄像头。然而,内置模块并不是一个真正的卖点,因为颜色偏差相当大,尽管是全高清分辨率,但图像看起来有颗粒感和冲淡感。另一方面,有一个手动快门是一个积极的事情,它可以防止相机拍摄未经授权的照片。
用于将人与背景分离的人工智能控制不断失败。


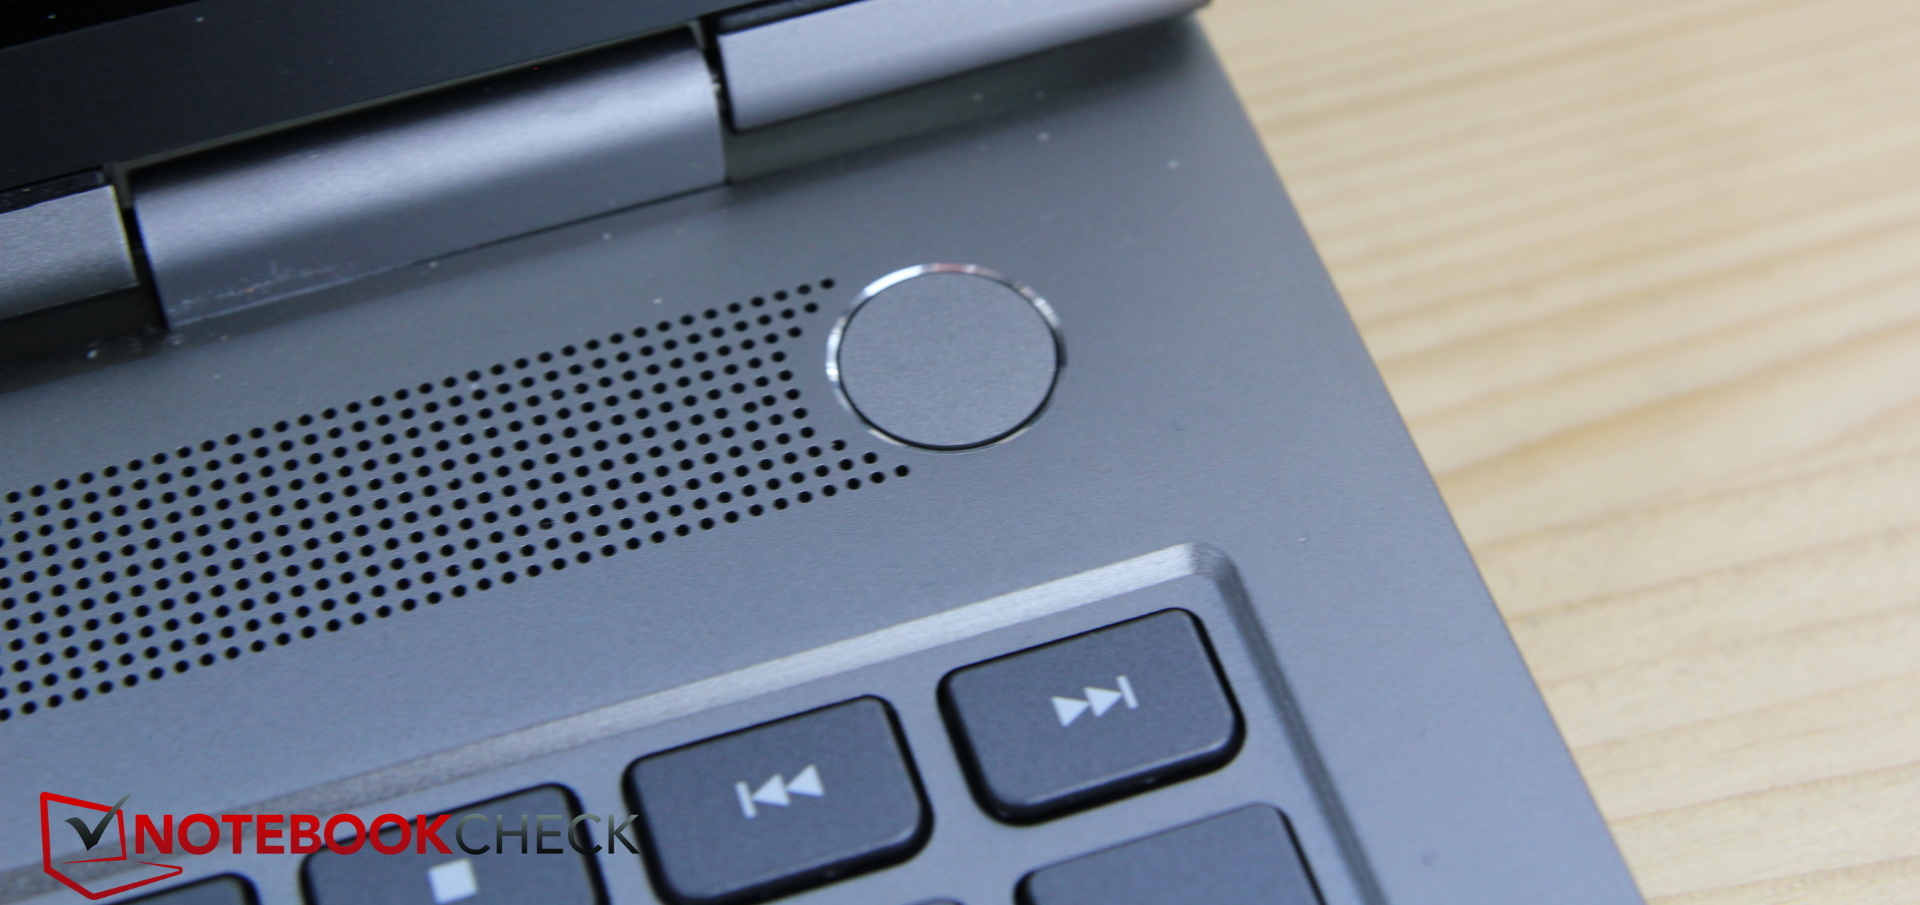
安全问题
ThinkBook 16p有一个Kensington插槽,TPM 2.0,以及一个集成在电源按钮上的指纹传感器。
辅料
联想没有包括任何配件;如果包括一个用于LAN和/或HDMI或DisplayPort的USB-C适配器就更理想了。
维护
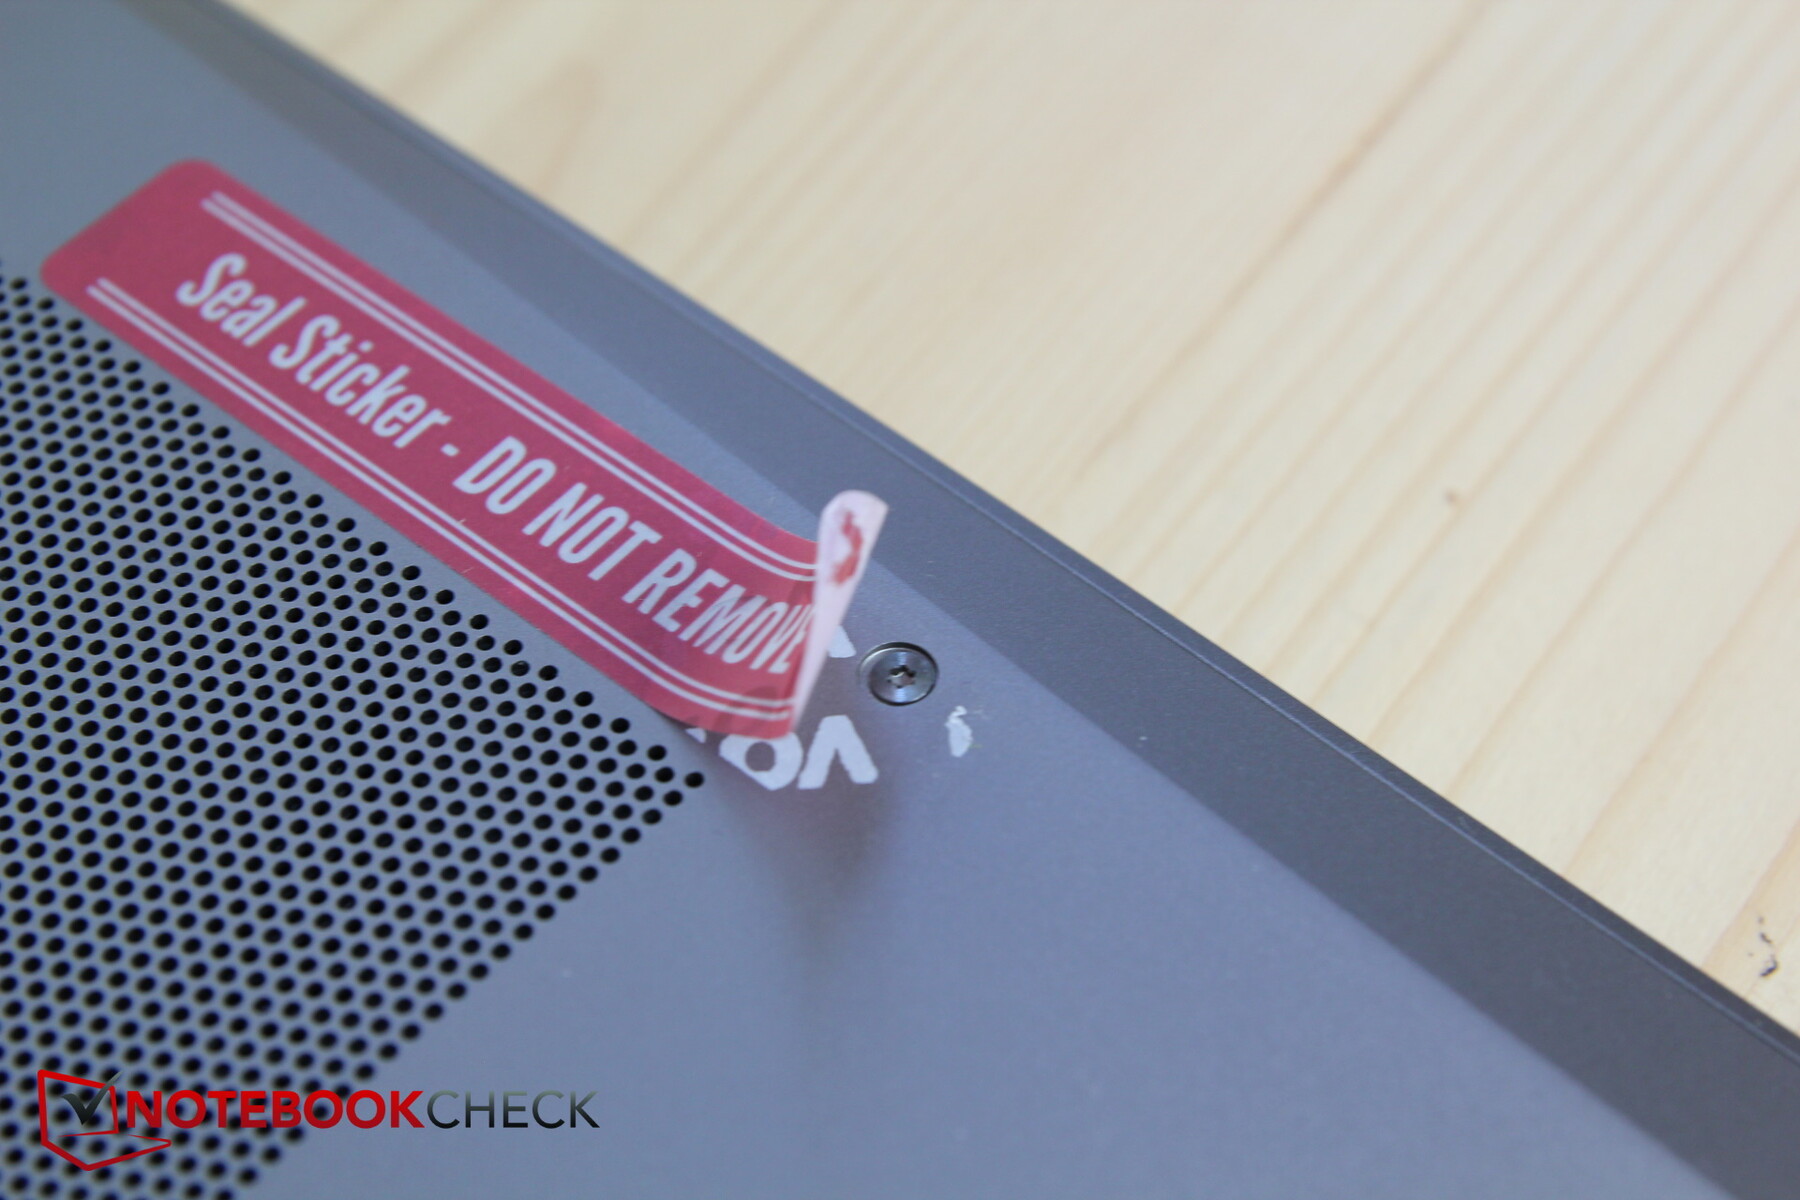
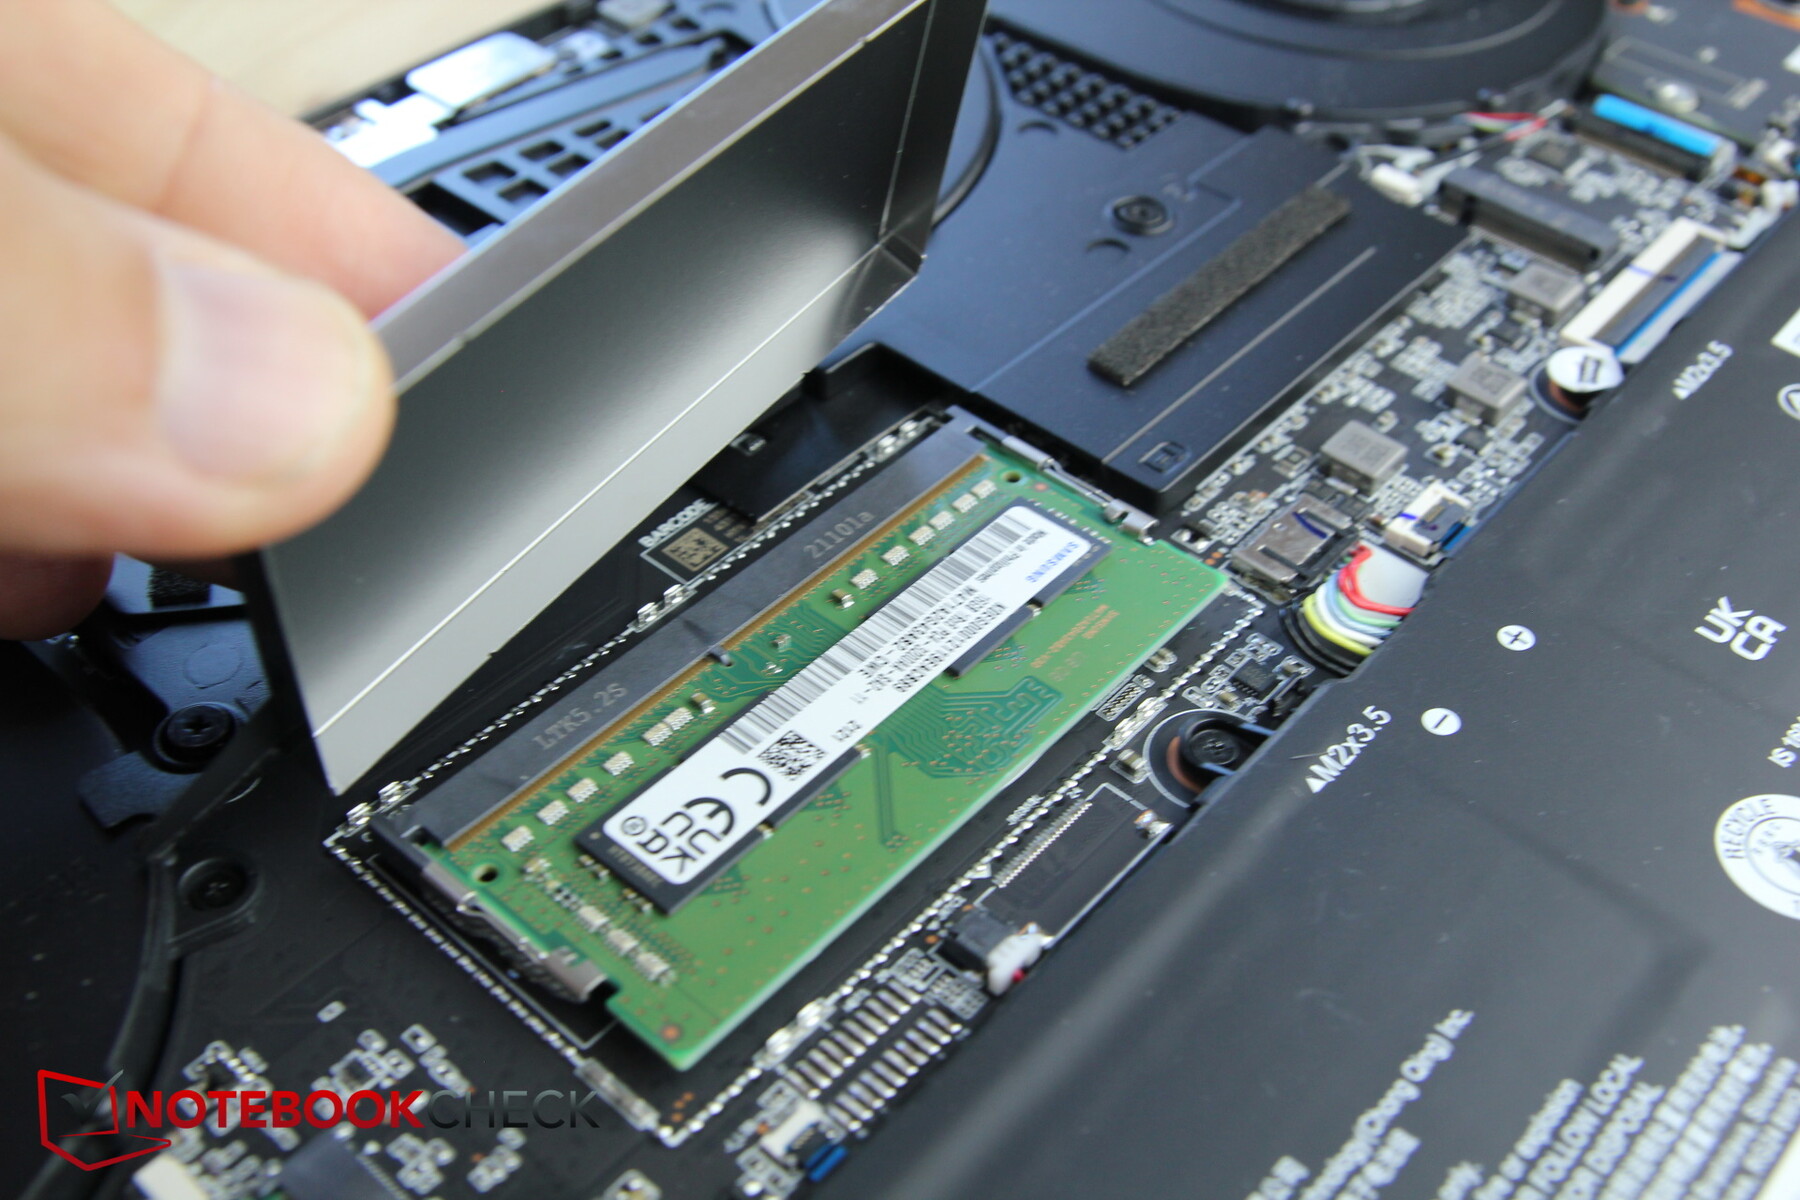
用户很难维护,因为工厂的红色密封贴纸掩盖了位于底部的8个Torx螺丝中的一个。移除它可能会导致保修失效。没有维护舱口来弥补这一点。此外,16GB的内存是焊接的,而另一个内存插槽的内容可以被替换。
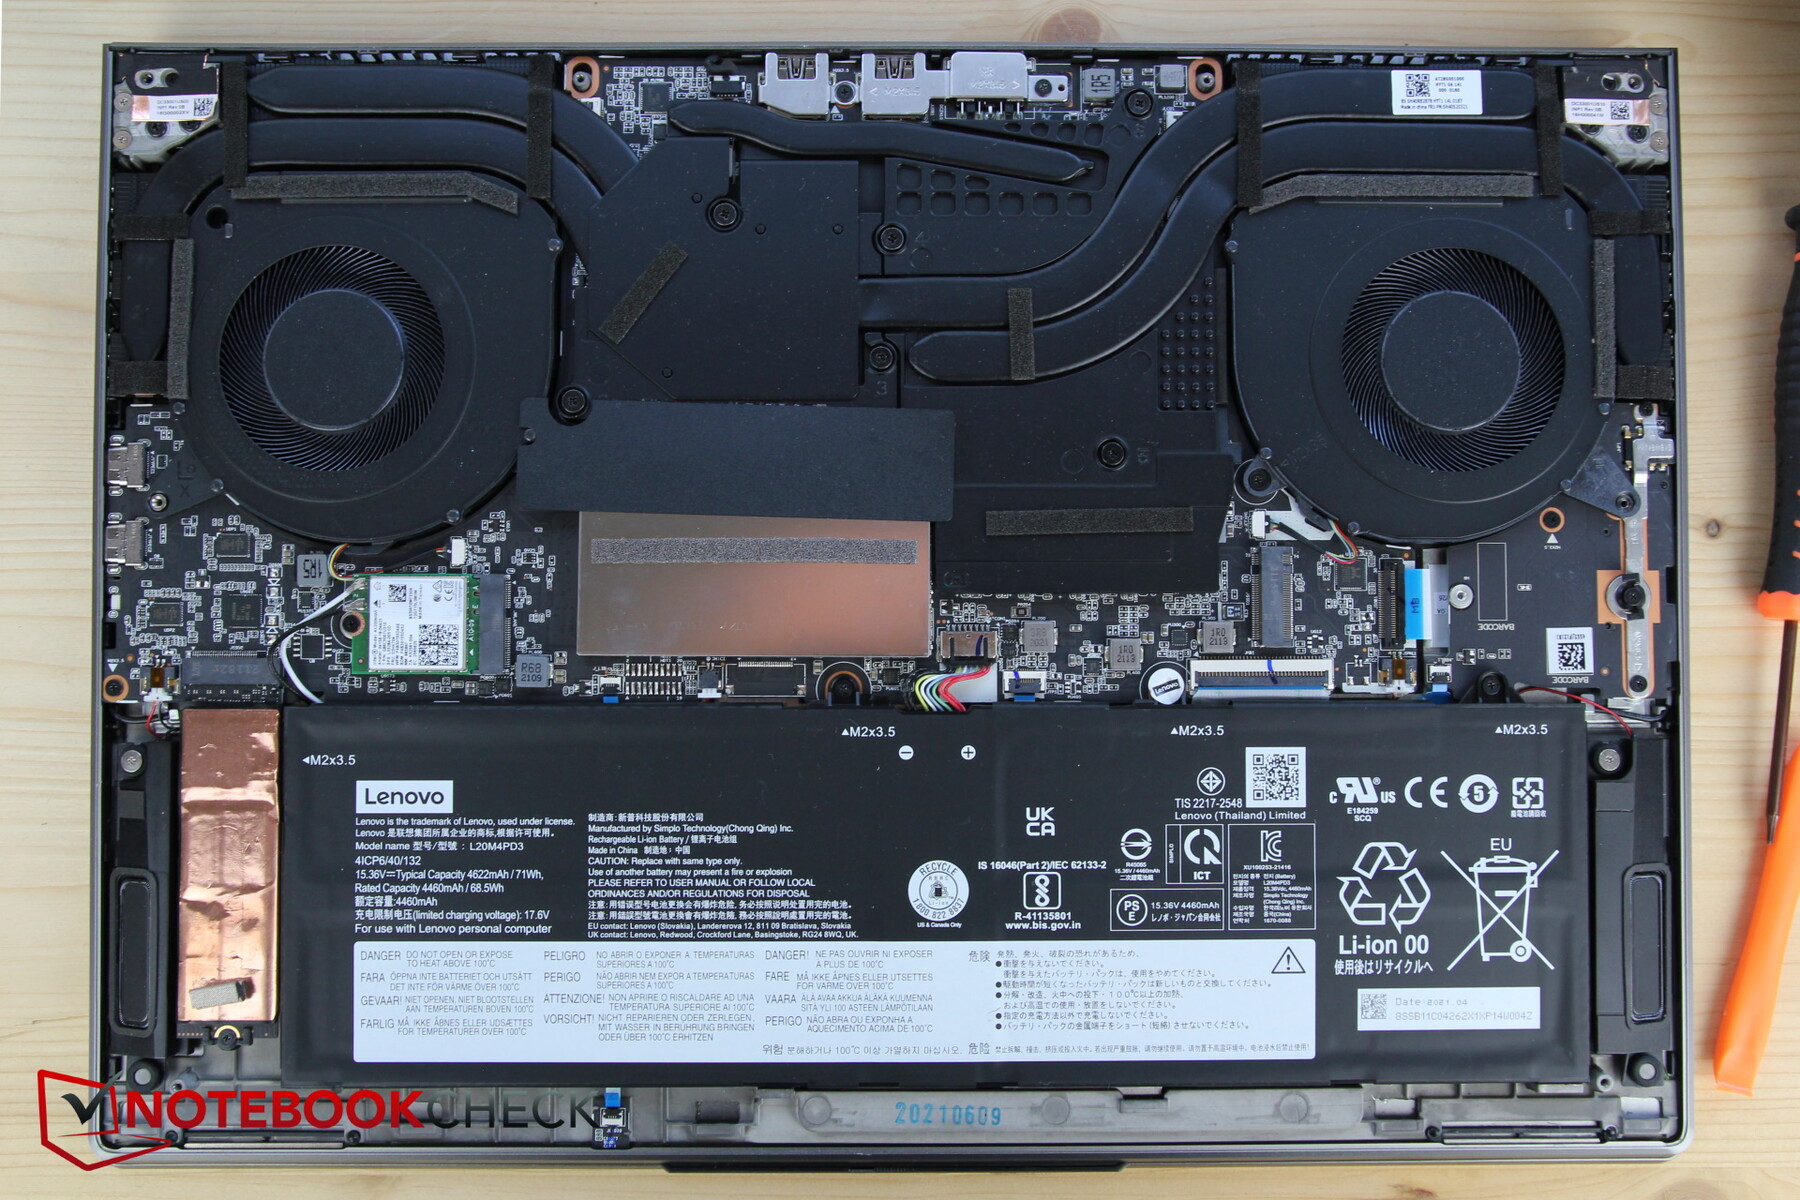
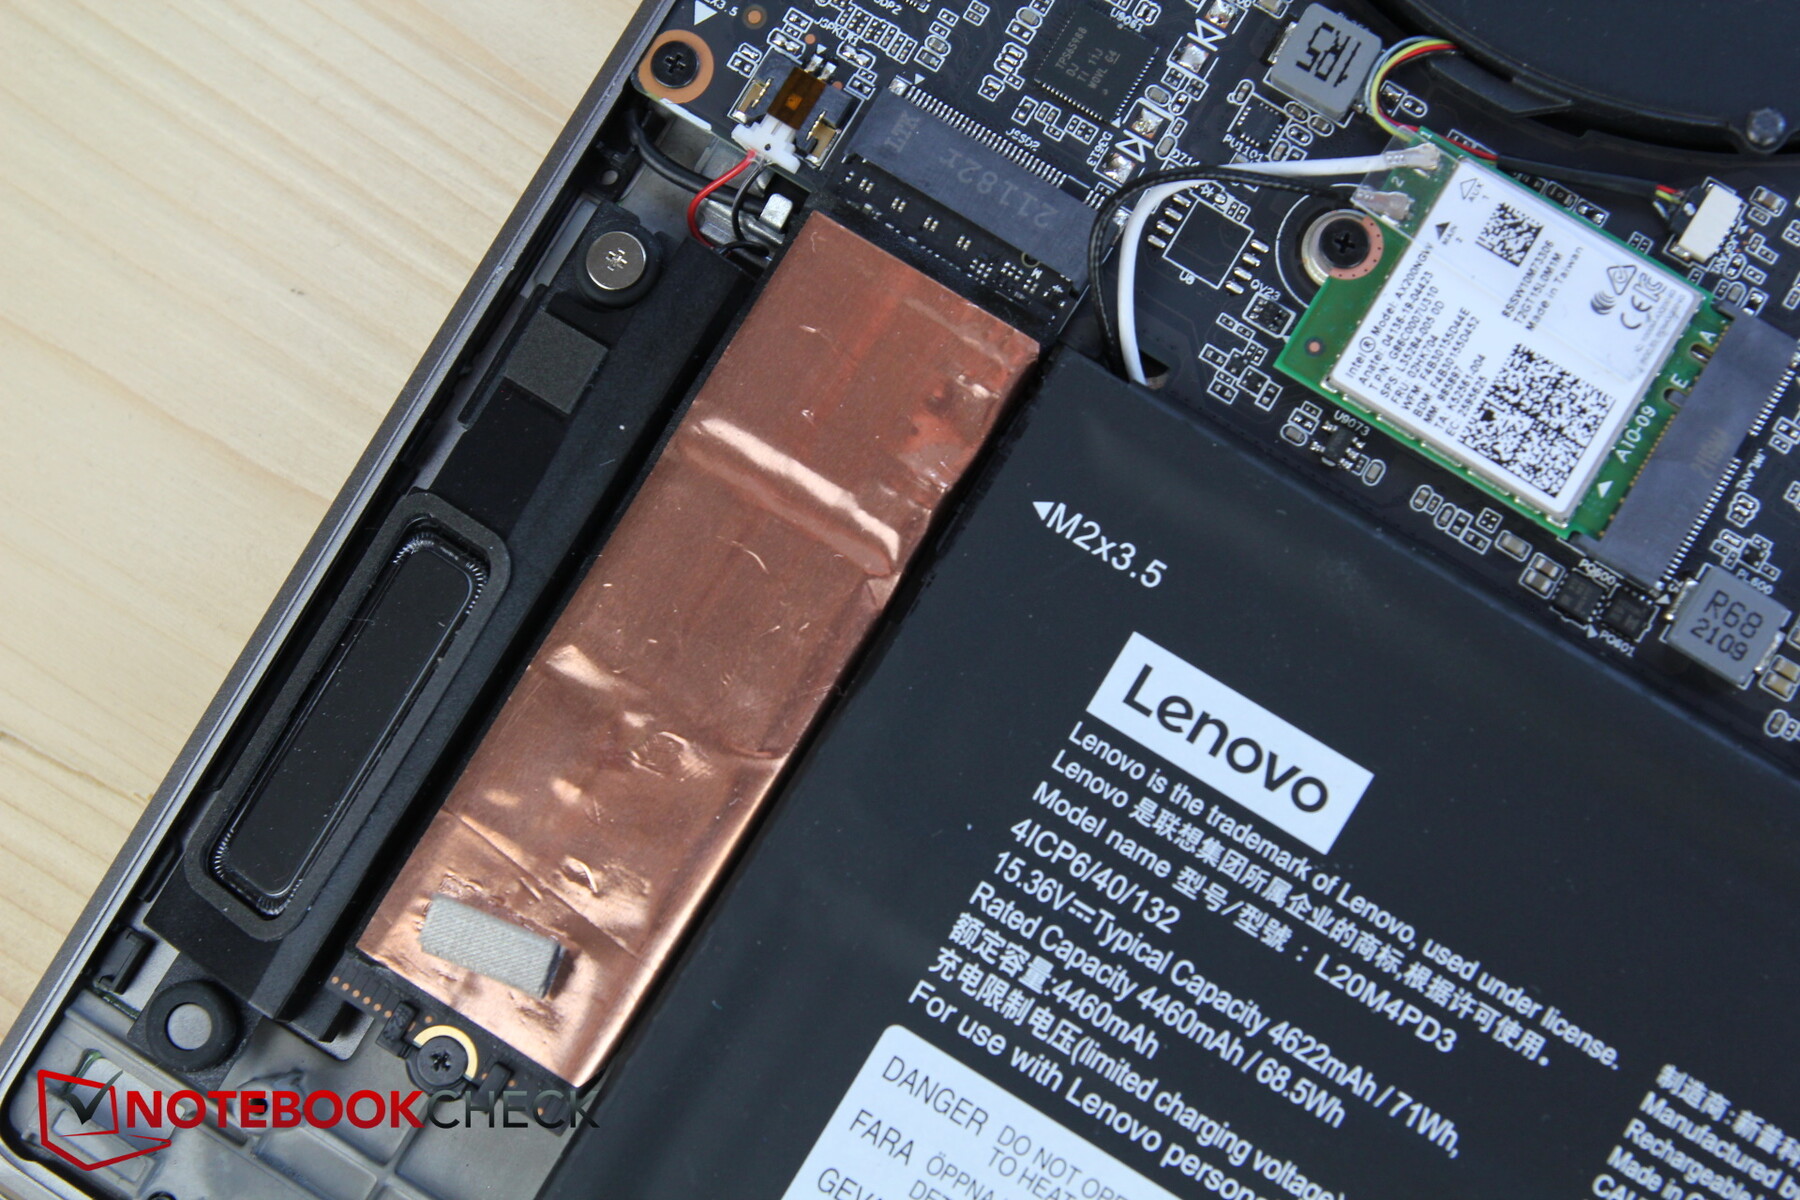
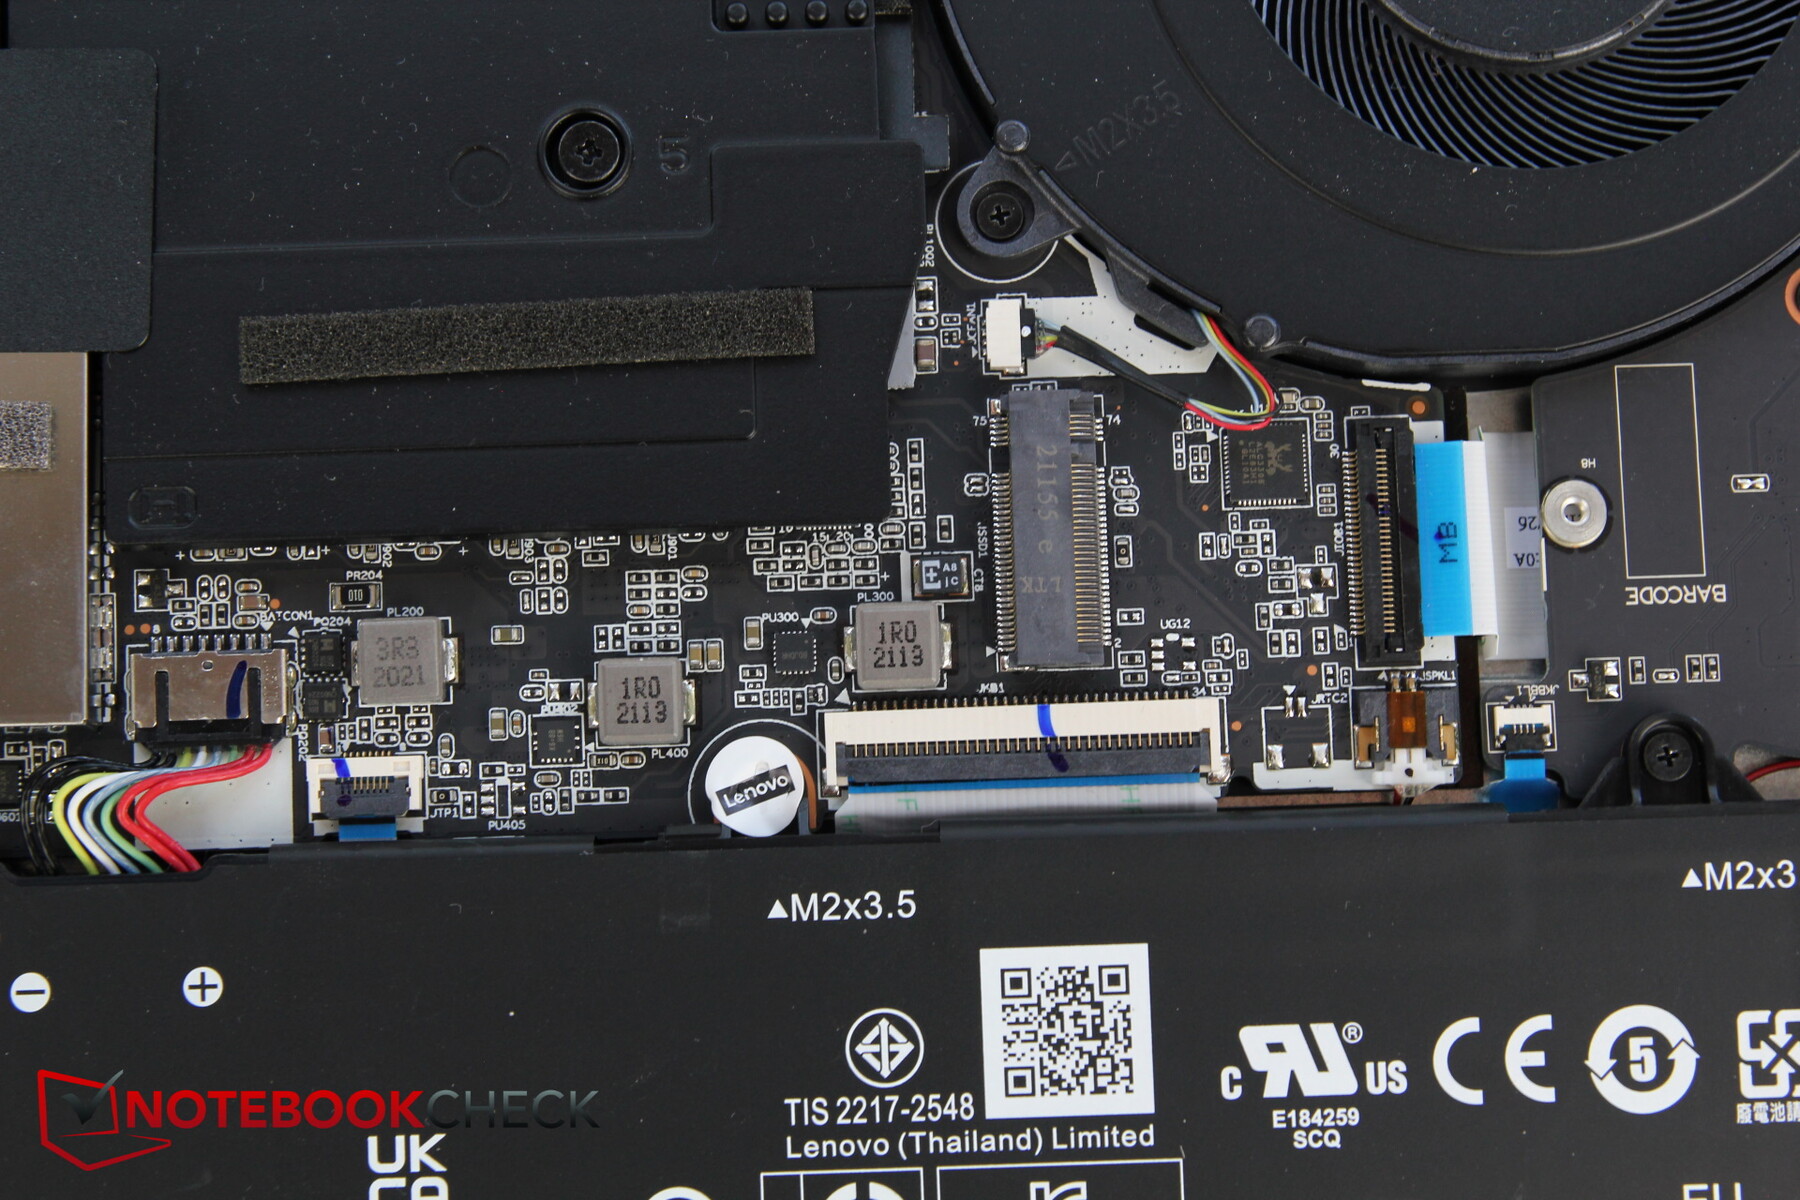
松开螺丝后,底盖仍然非常牢固地坐在那里,必须用合适的工具将其撬开。之后,你可以接触到风扇、WLAN模块、RAM插槽和SSD。然而,后两者也被隐藏在保护罩后面,这些保护罩通常覆盖着塑料或金属板。例如,在固态硬盘的顶部有一个塑料条,上面有一个铜条用来散热。总的来说,由于盖子太多,组件不是很容易接触。
似乎还有一个固态硬盘插槽("SSD1"),但其位置被其他一些塑料层阻挡或覆盖。
担保
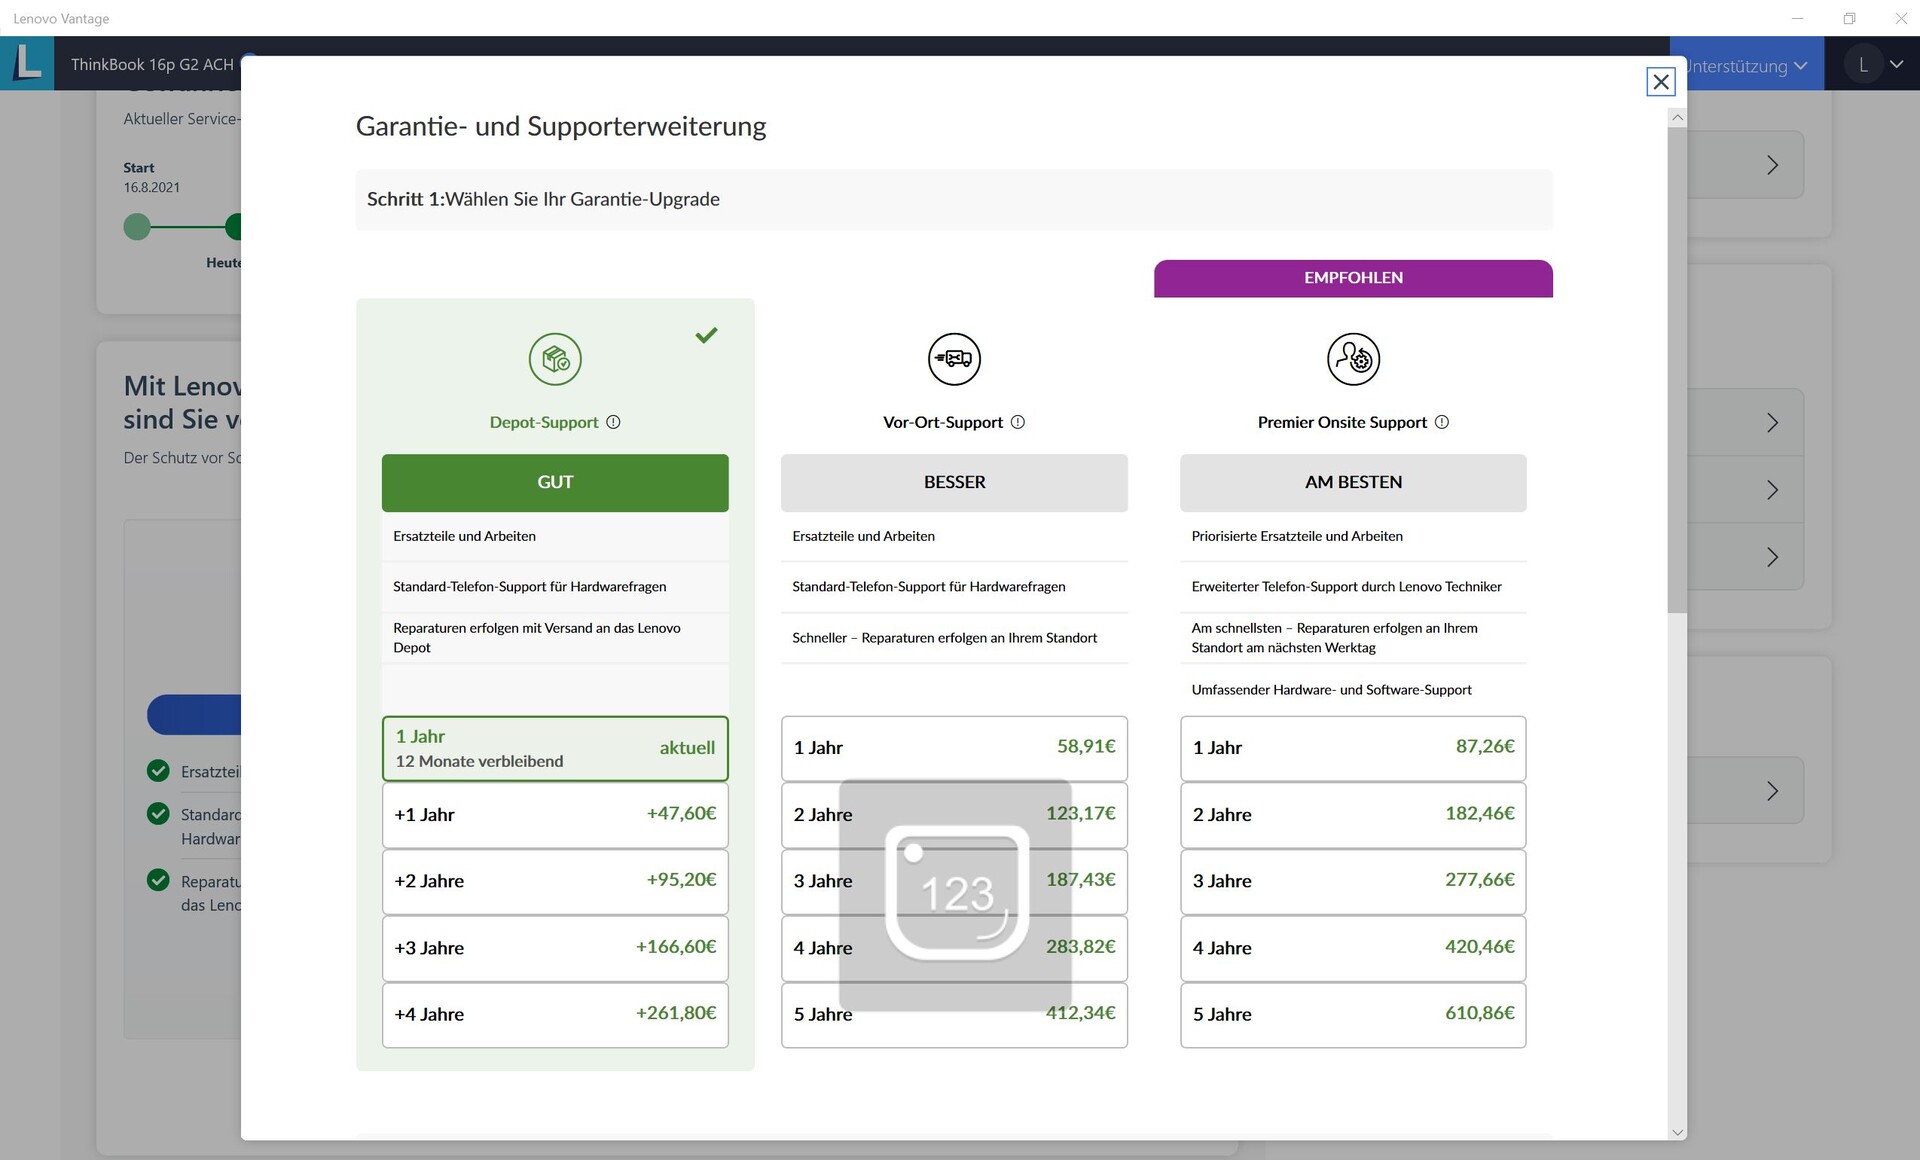
联想只提供12个月的保修。制造商对保修期内的延期或现场服务收取额外费用。众多选项显示在右边的屏幕截图中。
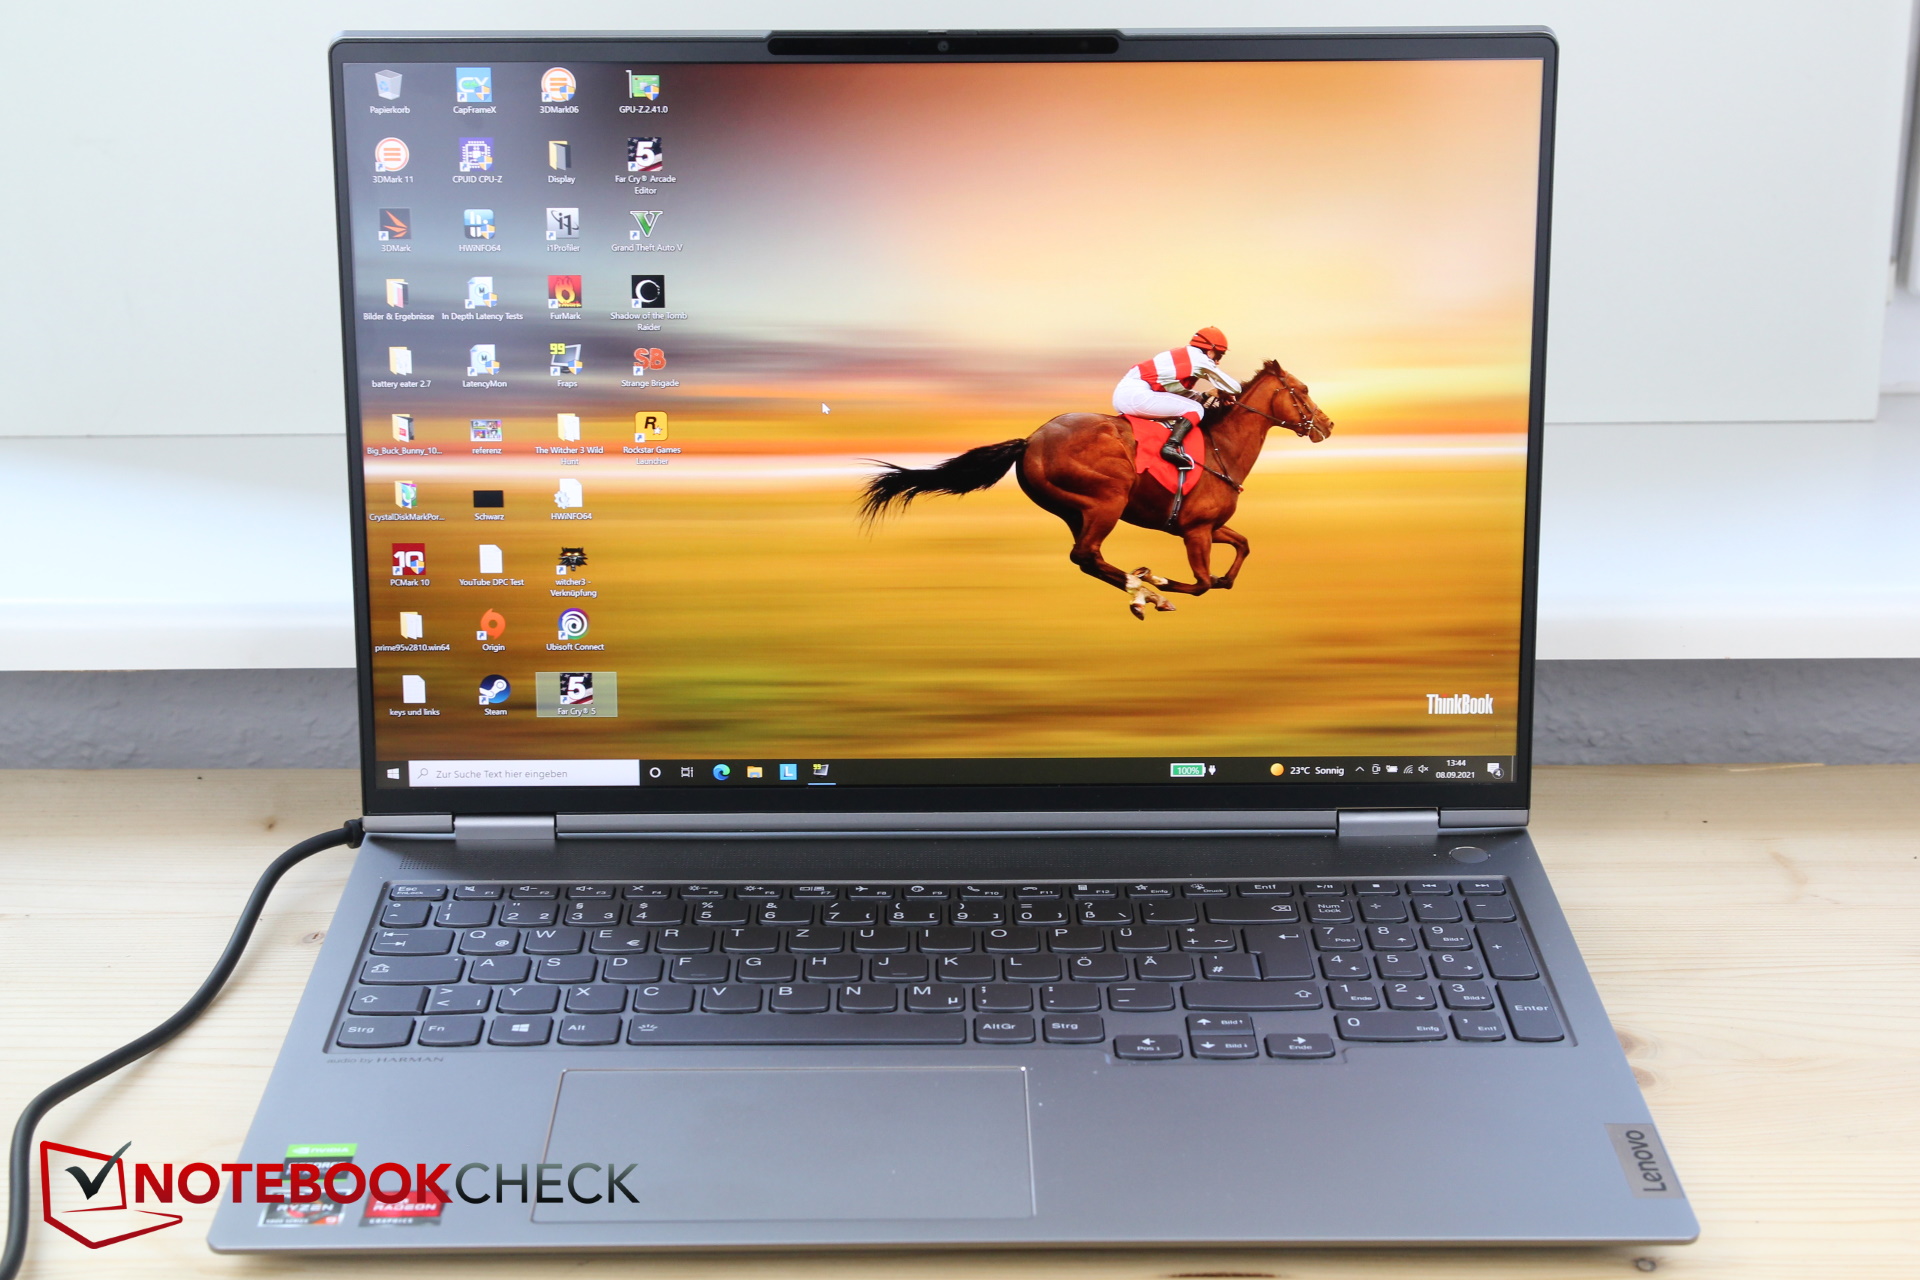
输入设备 - 没有ThinkPad,但还可以
键盘
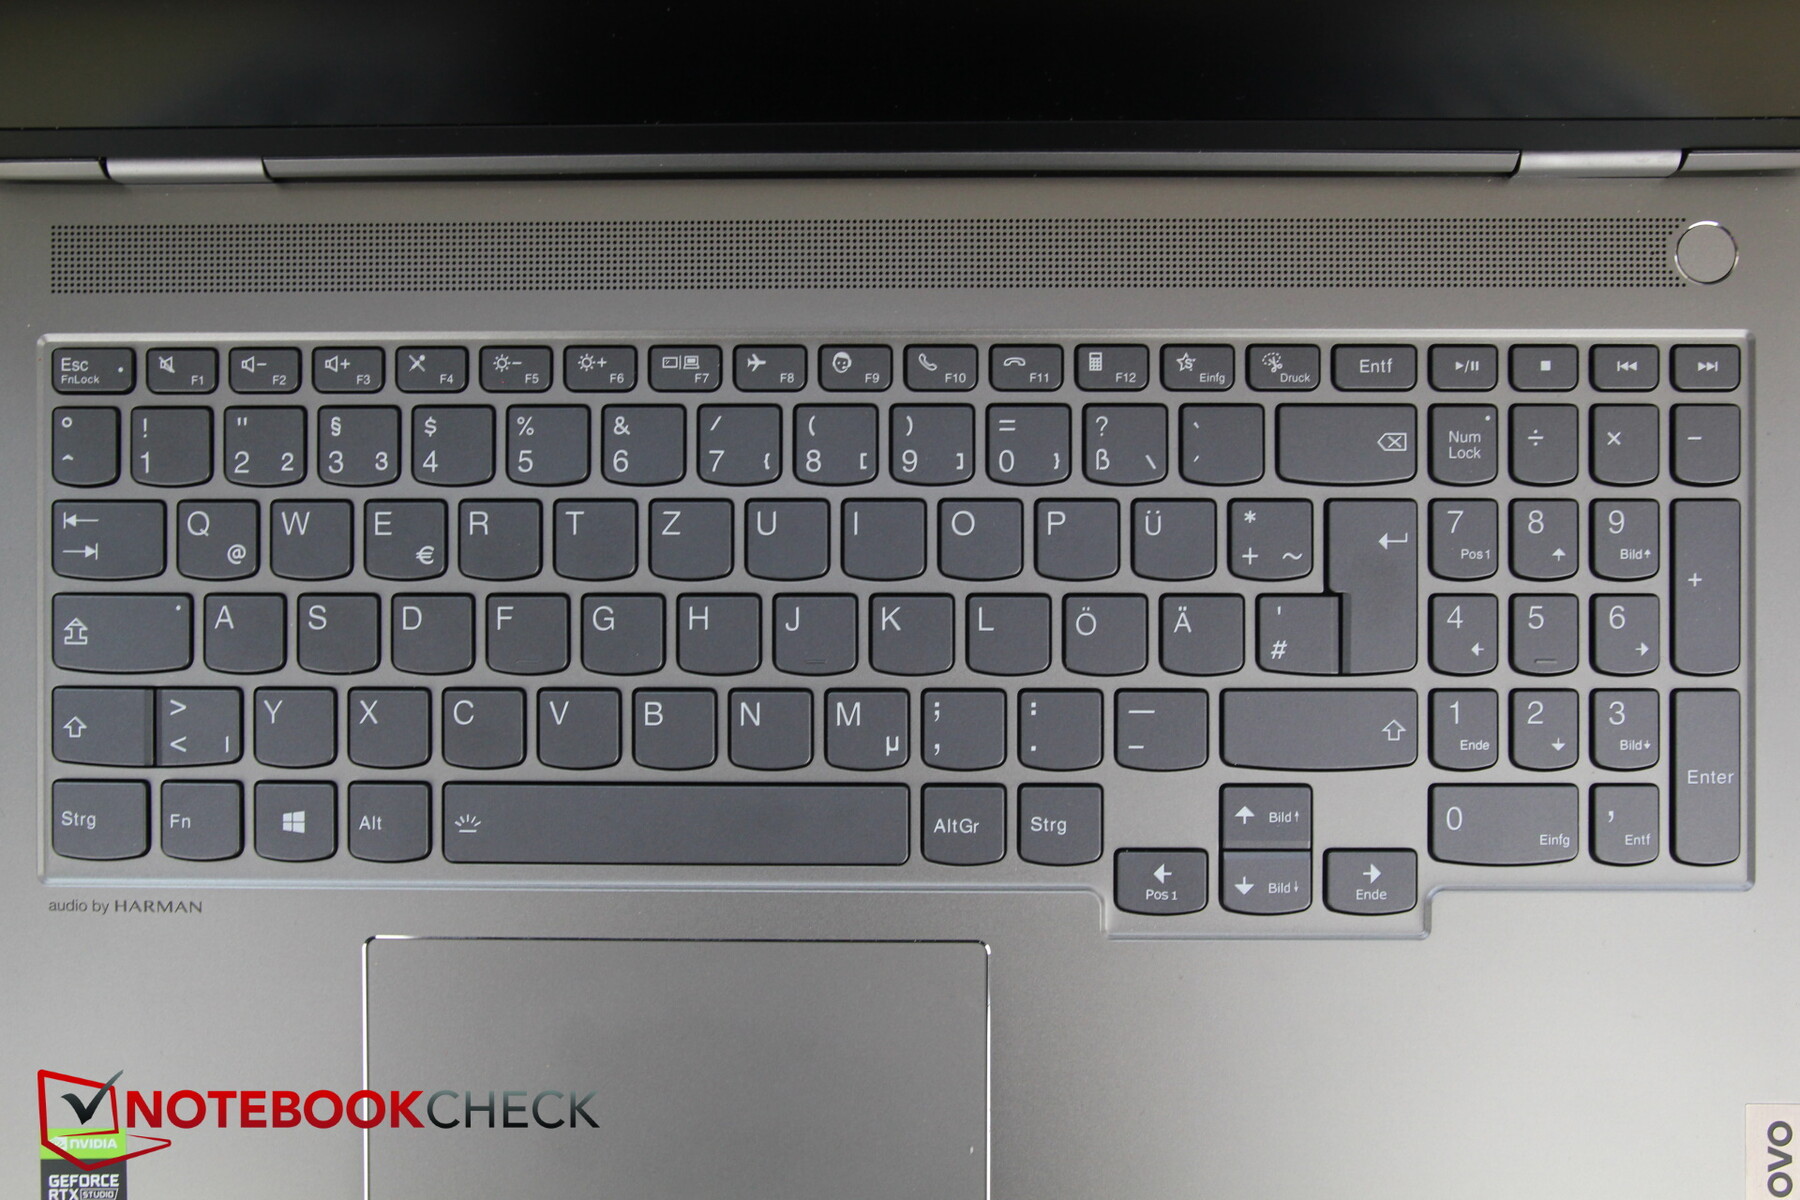
键的布局与15p略有不同。在方向键的区域,键盘底座现在有一个朝向底部的突起,所以方向键现在是正常大小,也更好地与邻近的按键分开。
这些键的大小约为1.5厘米,底部呈圆形,给人留下了不杂乱的印象。除了通常的特殊功能外,还有一个按钮可以自动打开联想支持网站。
行程相对较短,但仍然刚刚够用,而且反馈有点软。不过,打字速度相当快,打字噪音也适中。
在环境光线较差的情况下,两段式的白色背光很好用。
触摸板
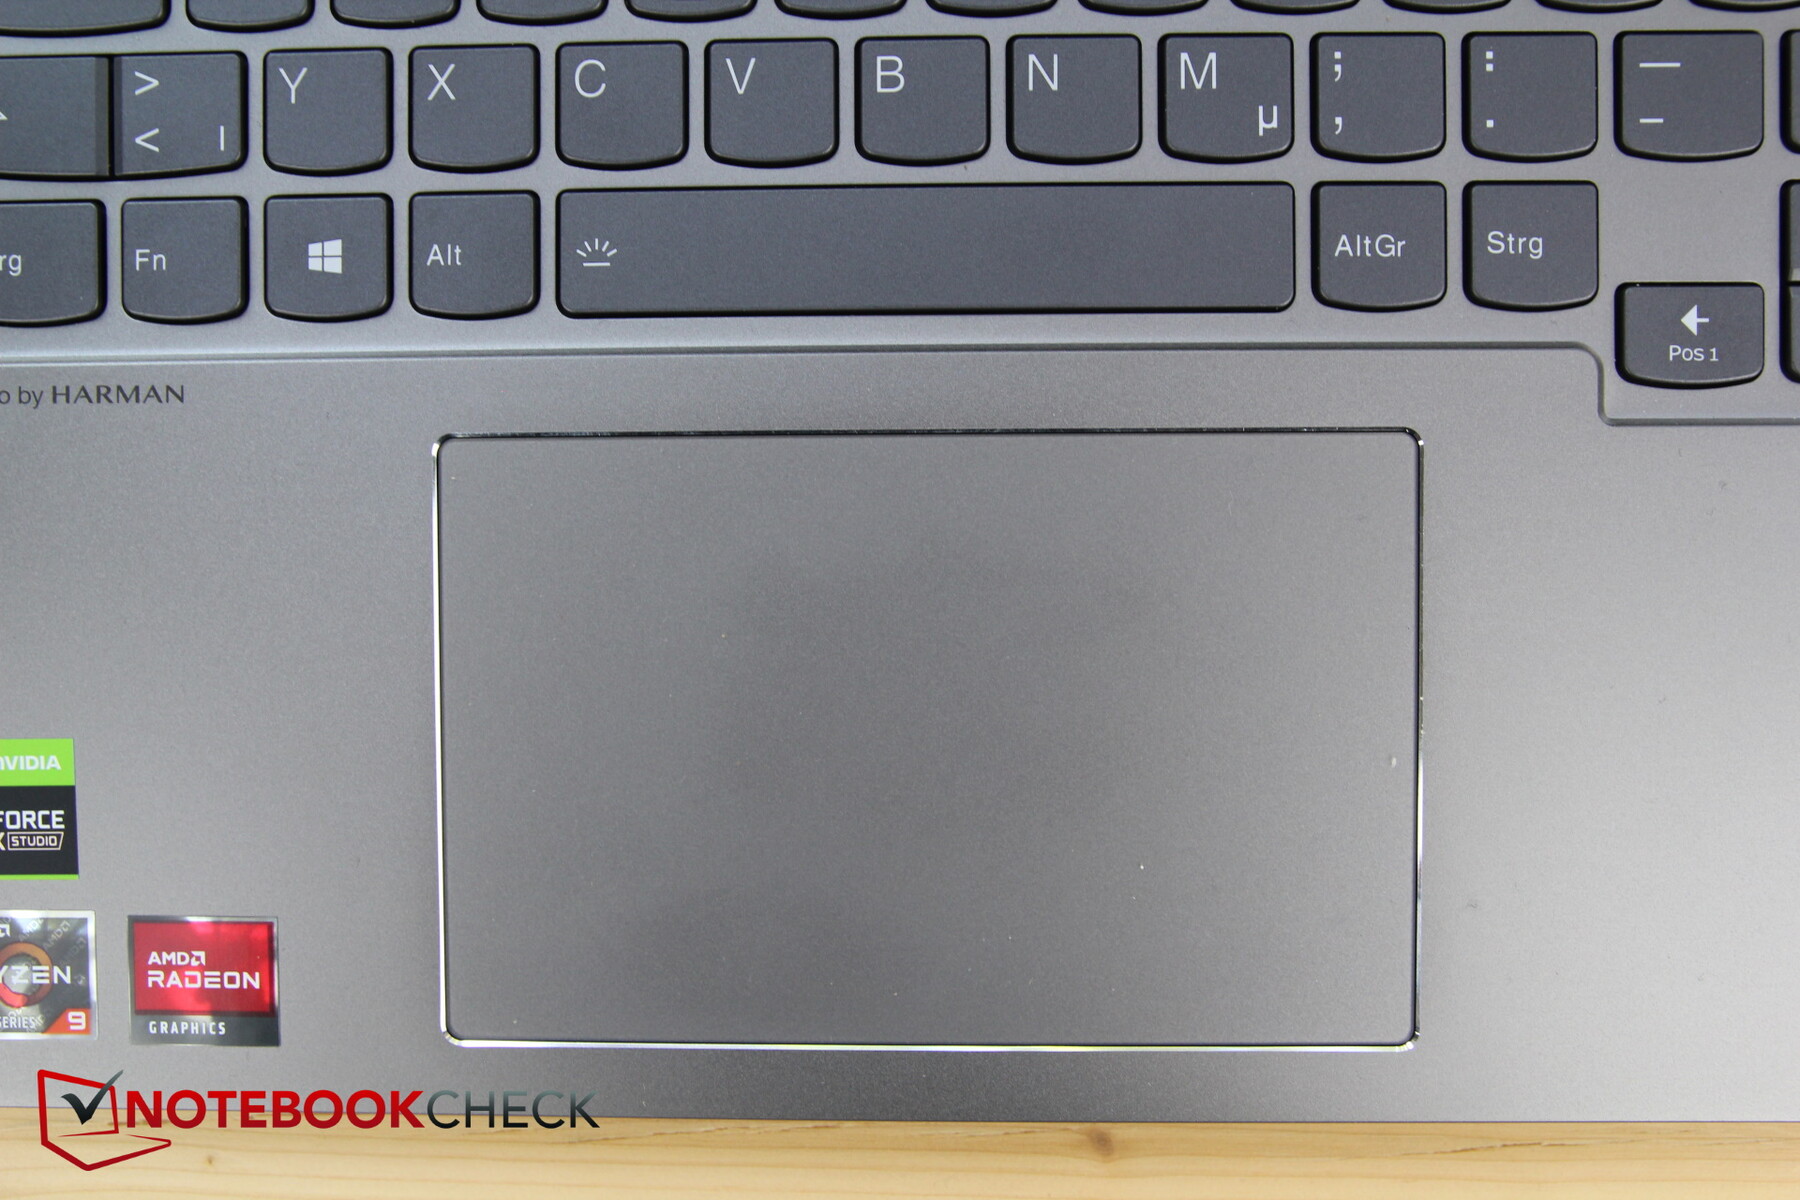
触摸板的尺寸约为12 x 7.5厘米,因此具有良好的尺寸。即使在缓慢的运动中,滑行能力仍然非常好,只有外角有缺陷。
没有专用的鼠标按钮;集成在触摸板表面的按钮可以可靠地触发,而且点击的声音也是合格的。
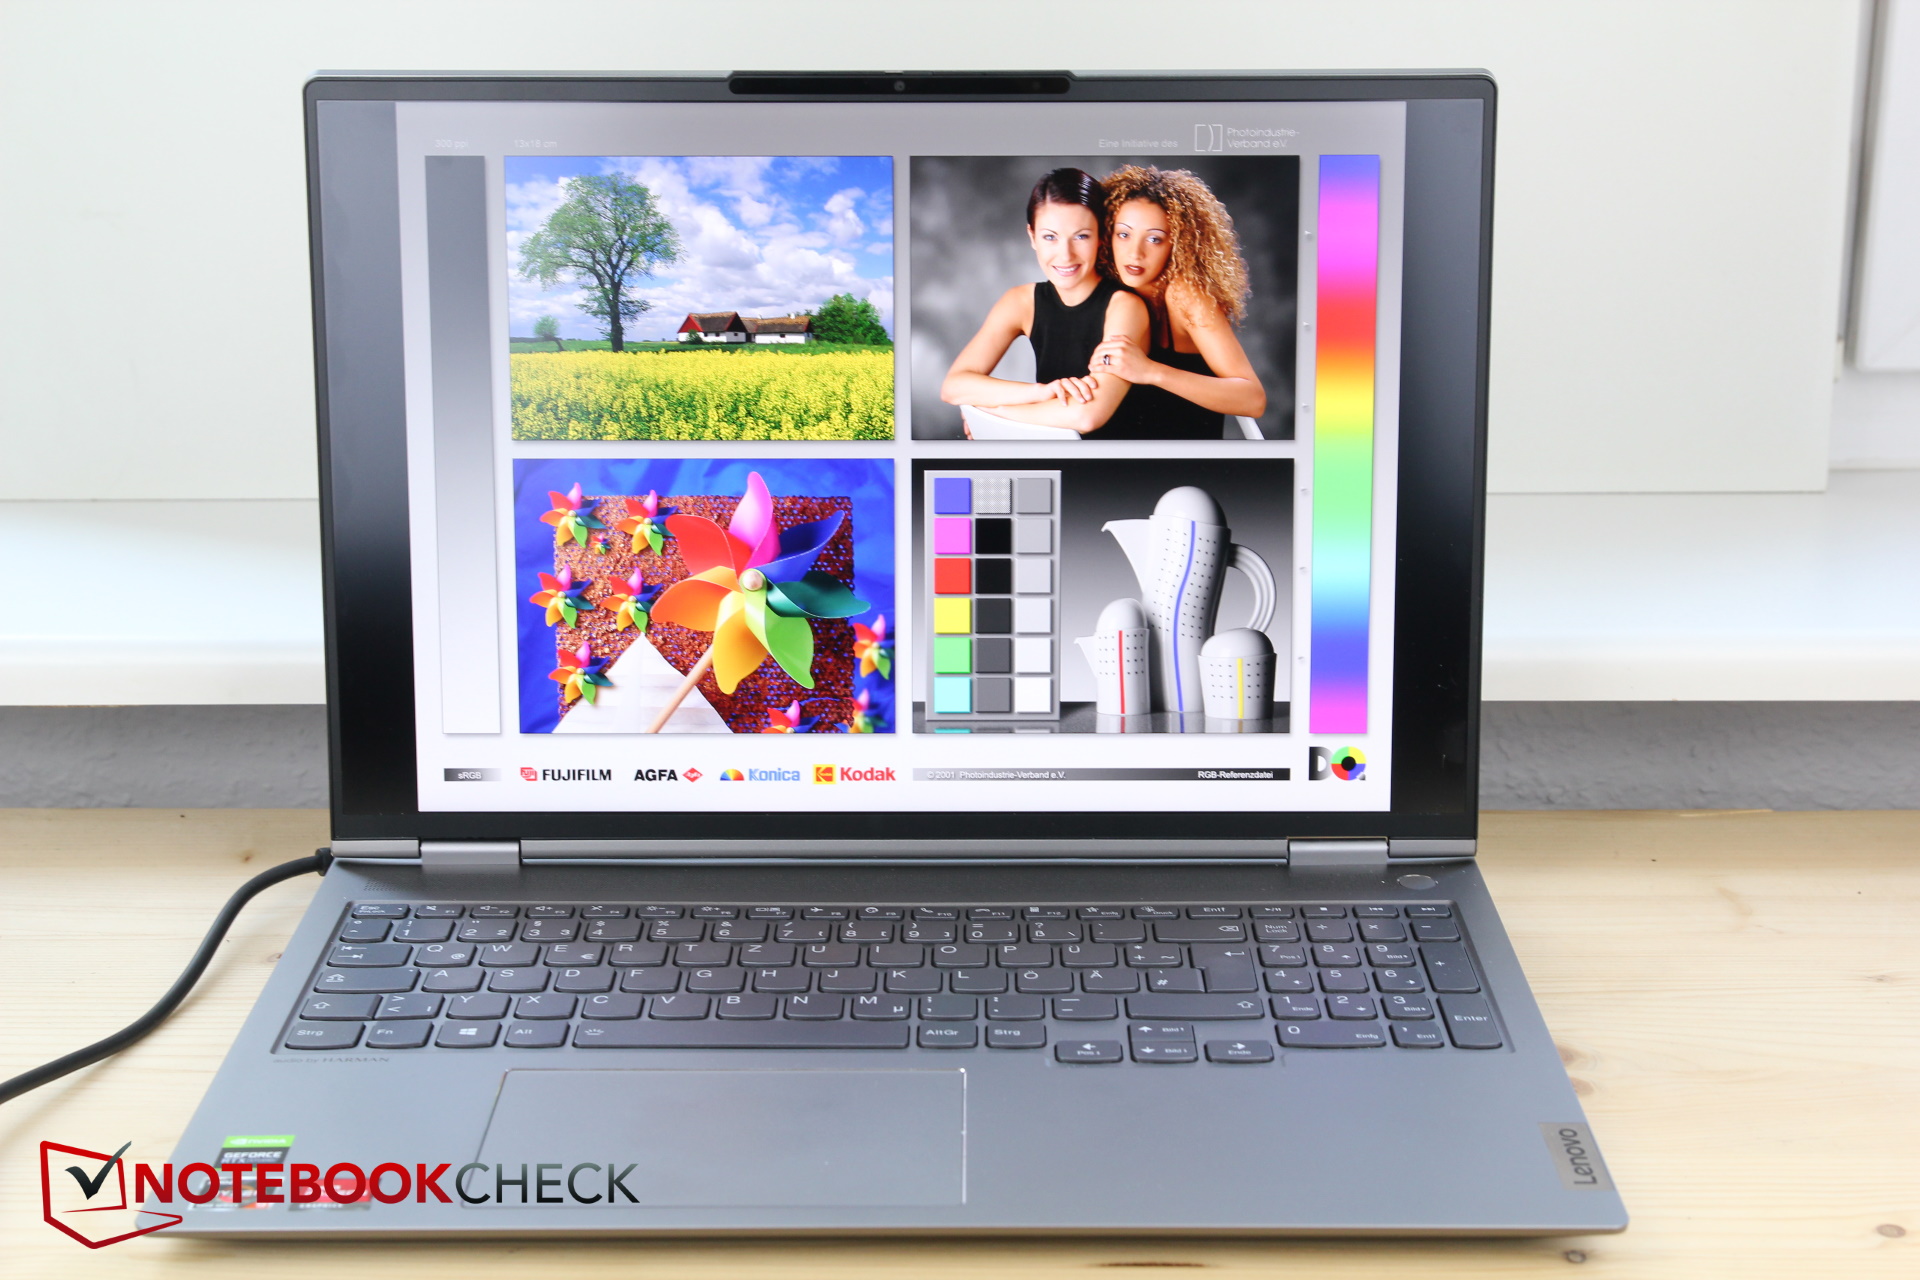
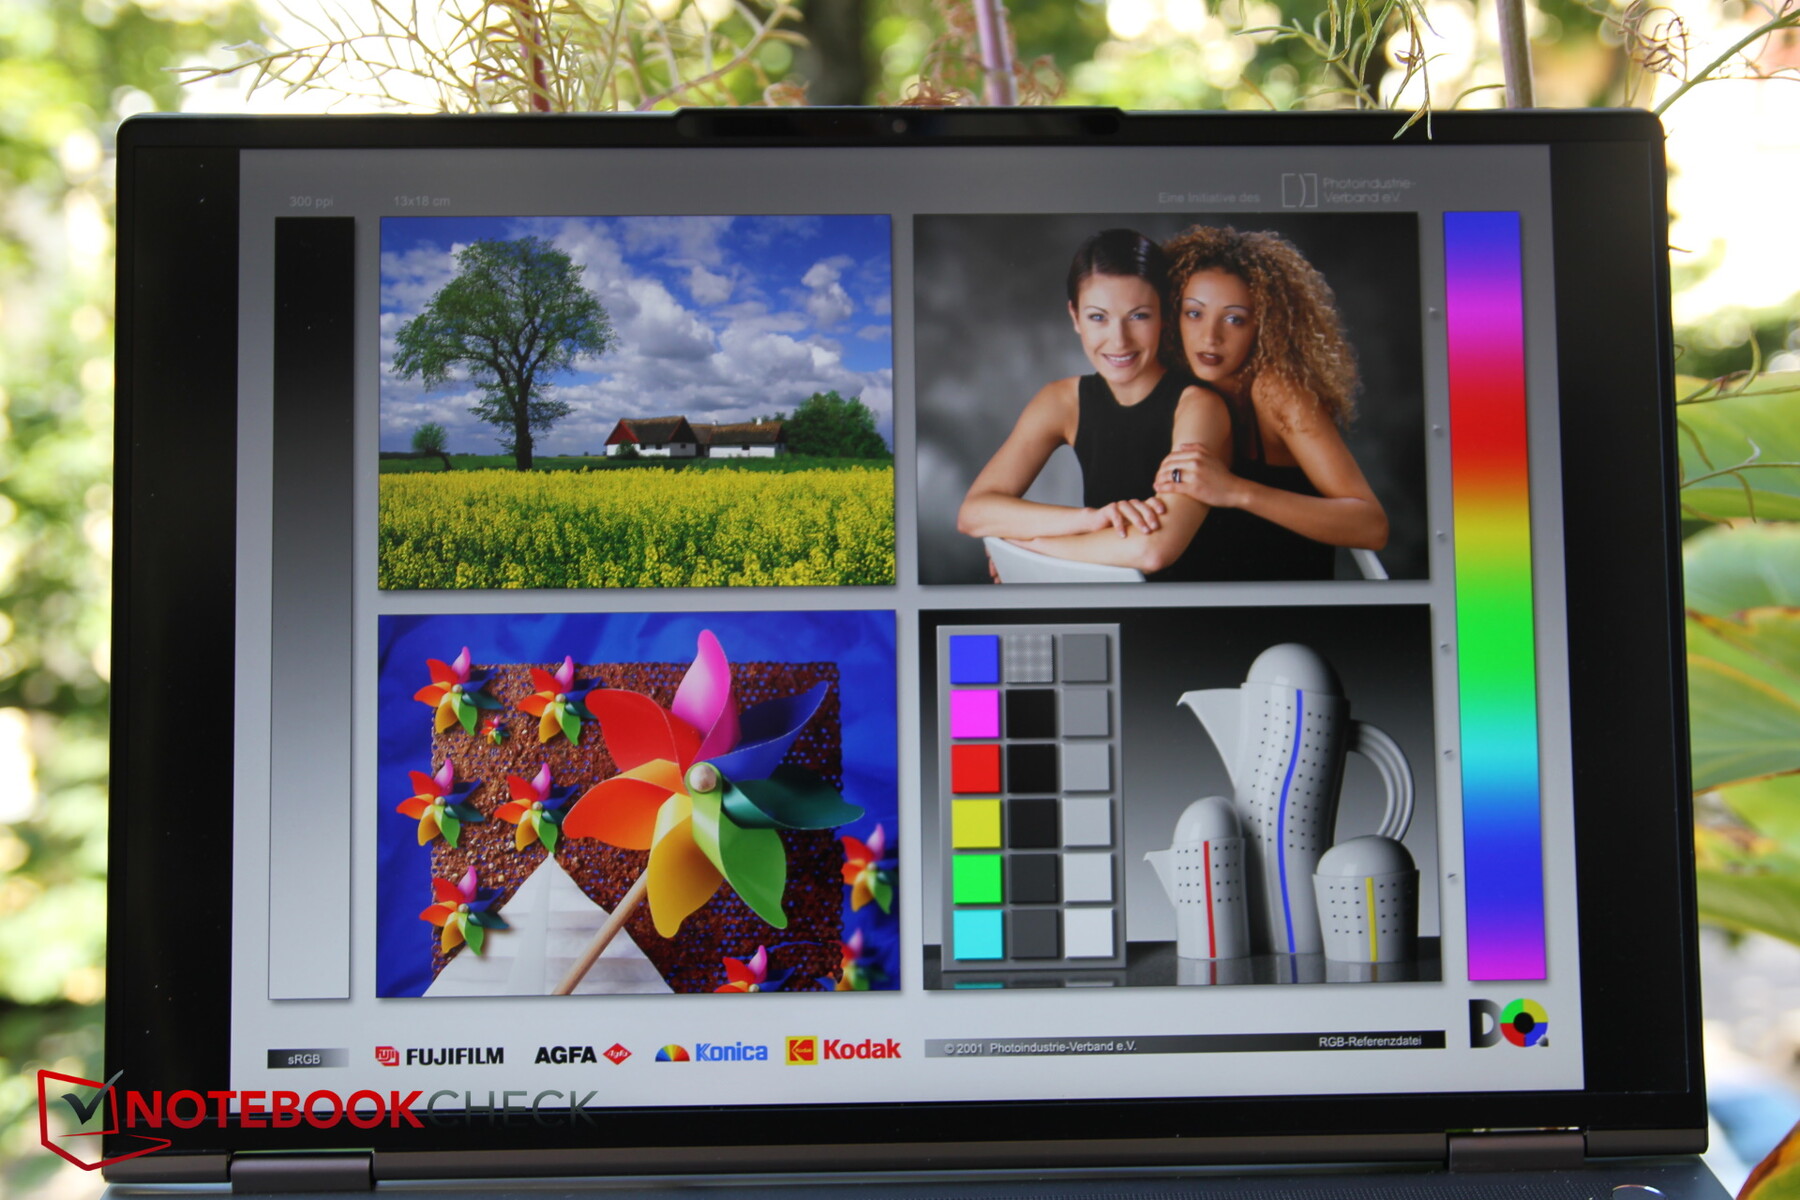
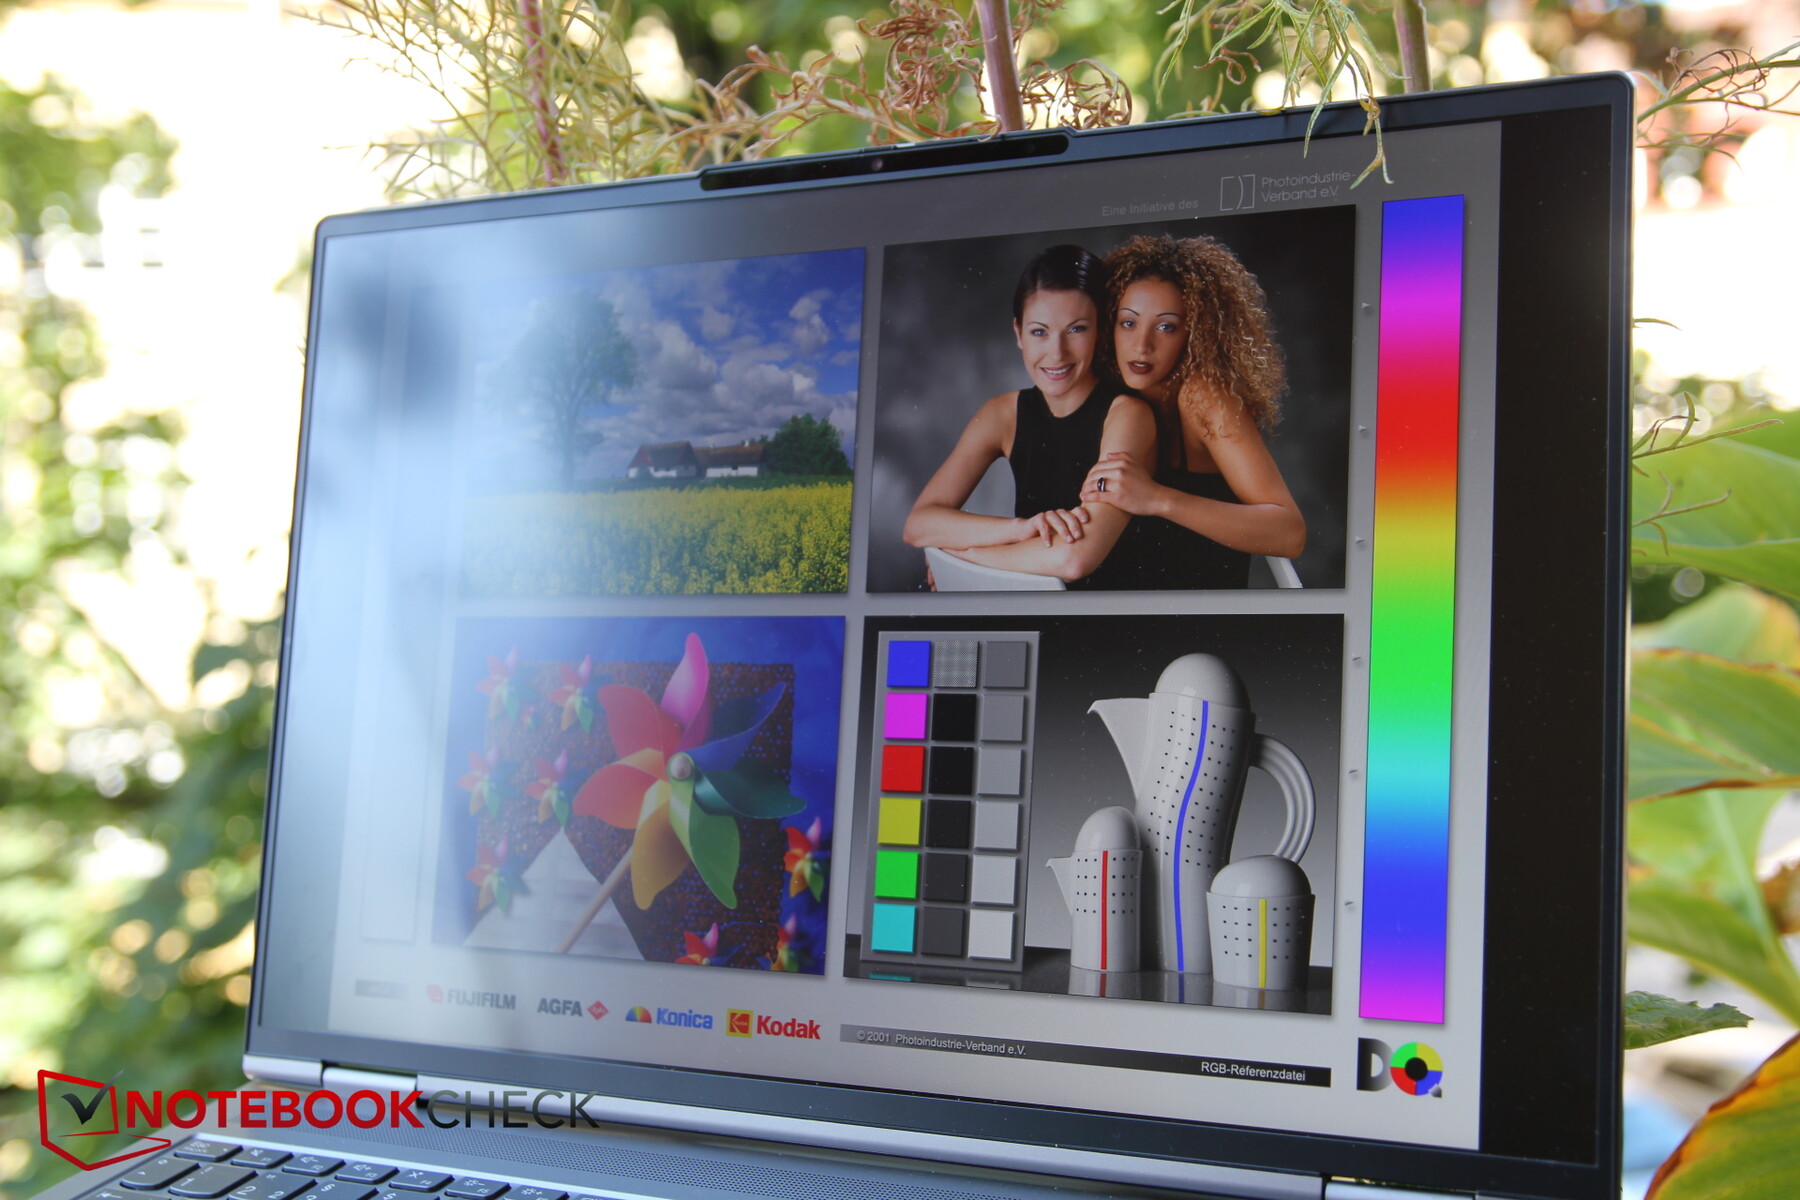
显示 - 16:10,但只有60赫兹


IPS显示屏是ThinkBook 16p的亮点之一。它的分辨率为2560x1600像素,所以它的长宽比为16:10,但它只提供60赫兹的刷新率--这让人明白ThinkBook并不是为了成为一台专门的游戏笔记本电脑,因为现在他们的显示屏通常提供更高的刷新率。
近400尼特的亮度是不错的,但亮度分布可以更好。特别是右下角的发光度大大降低了。
没有使用PWM。响应时间令人失望,至少从游戏标准来看是如此。
| |||||||||||||||||||||||||
Brightness Distribution: 83 %
Center on Battery: 438 cd/m²
Contrast: 998:1 (Black: 0.44 cd/m²)
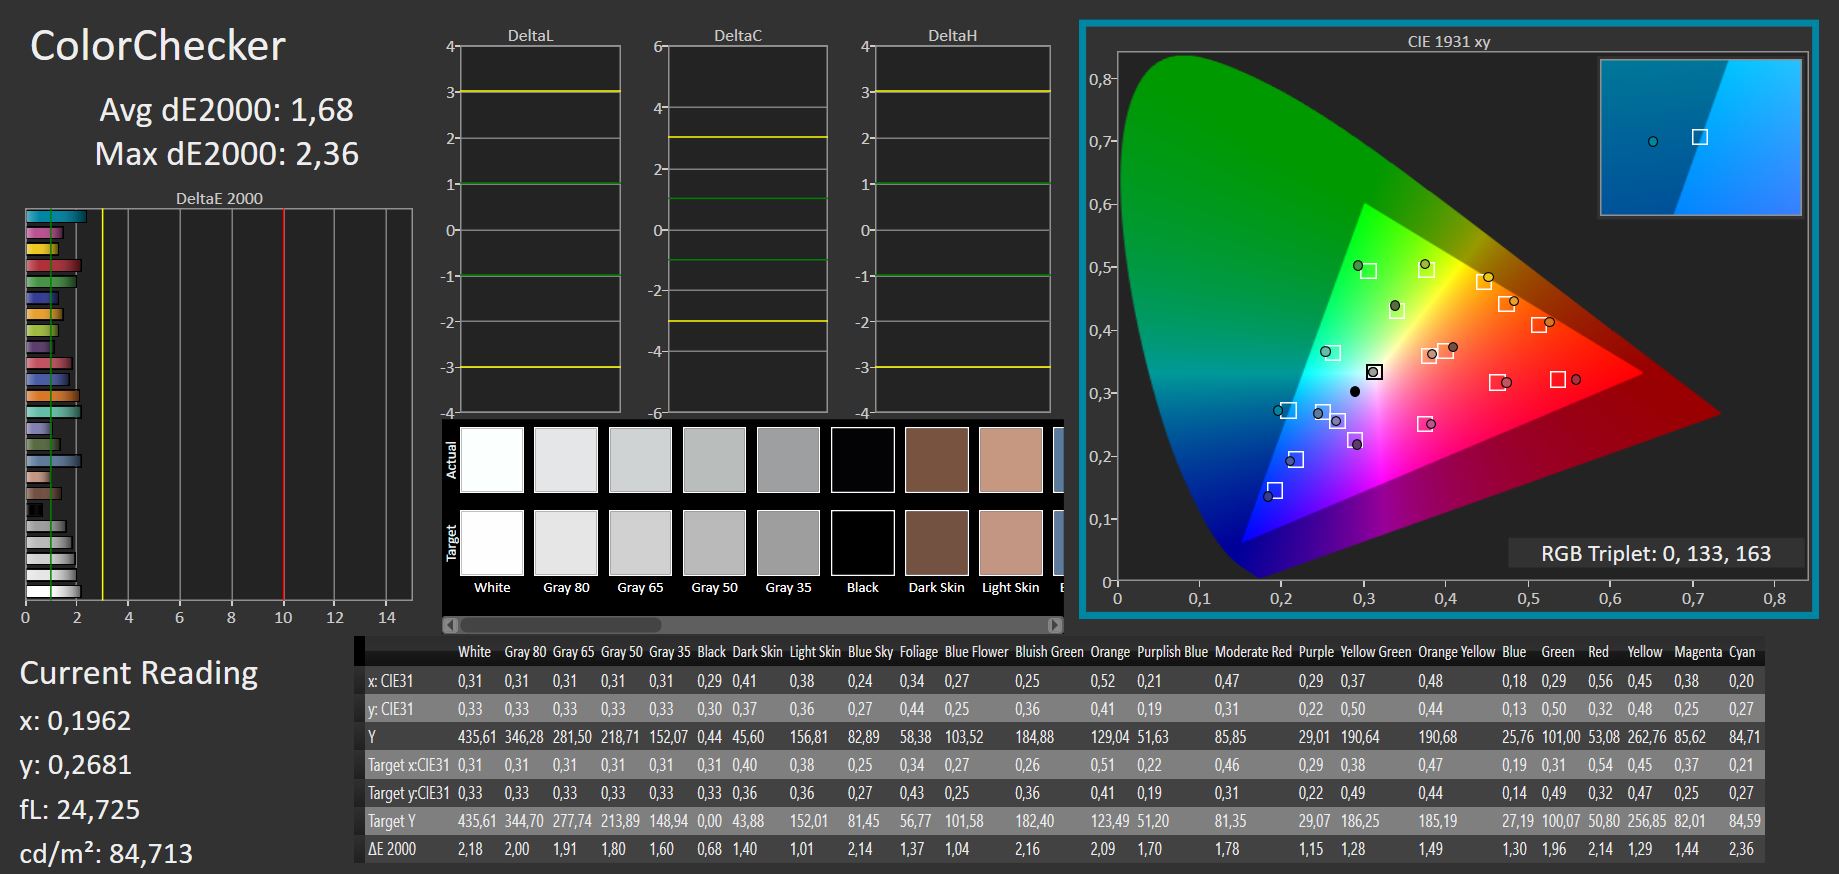
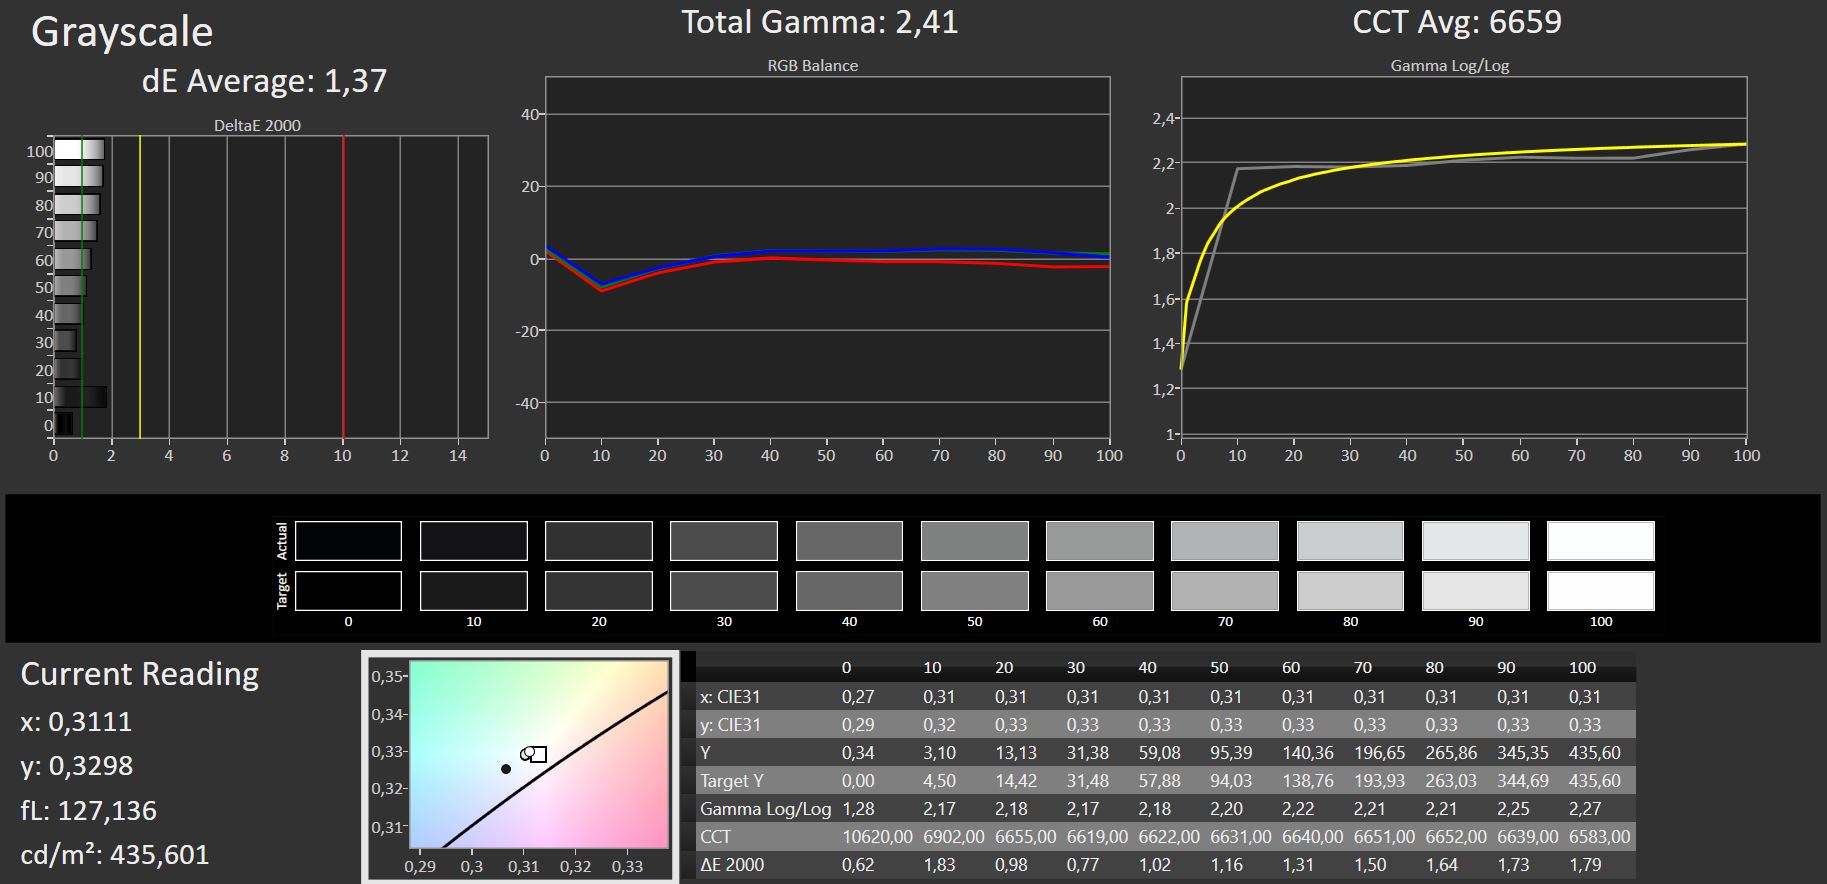
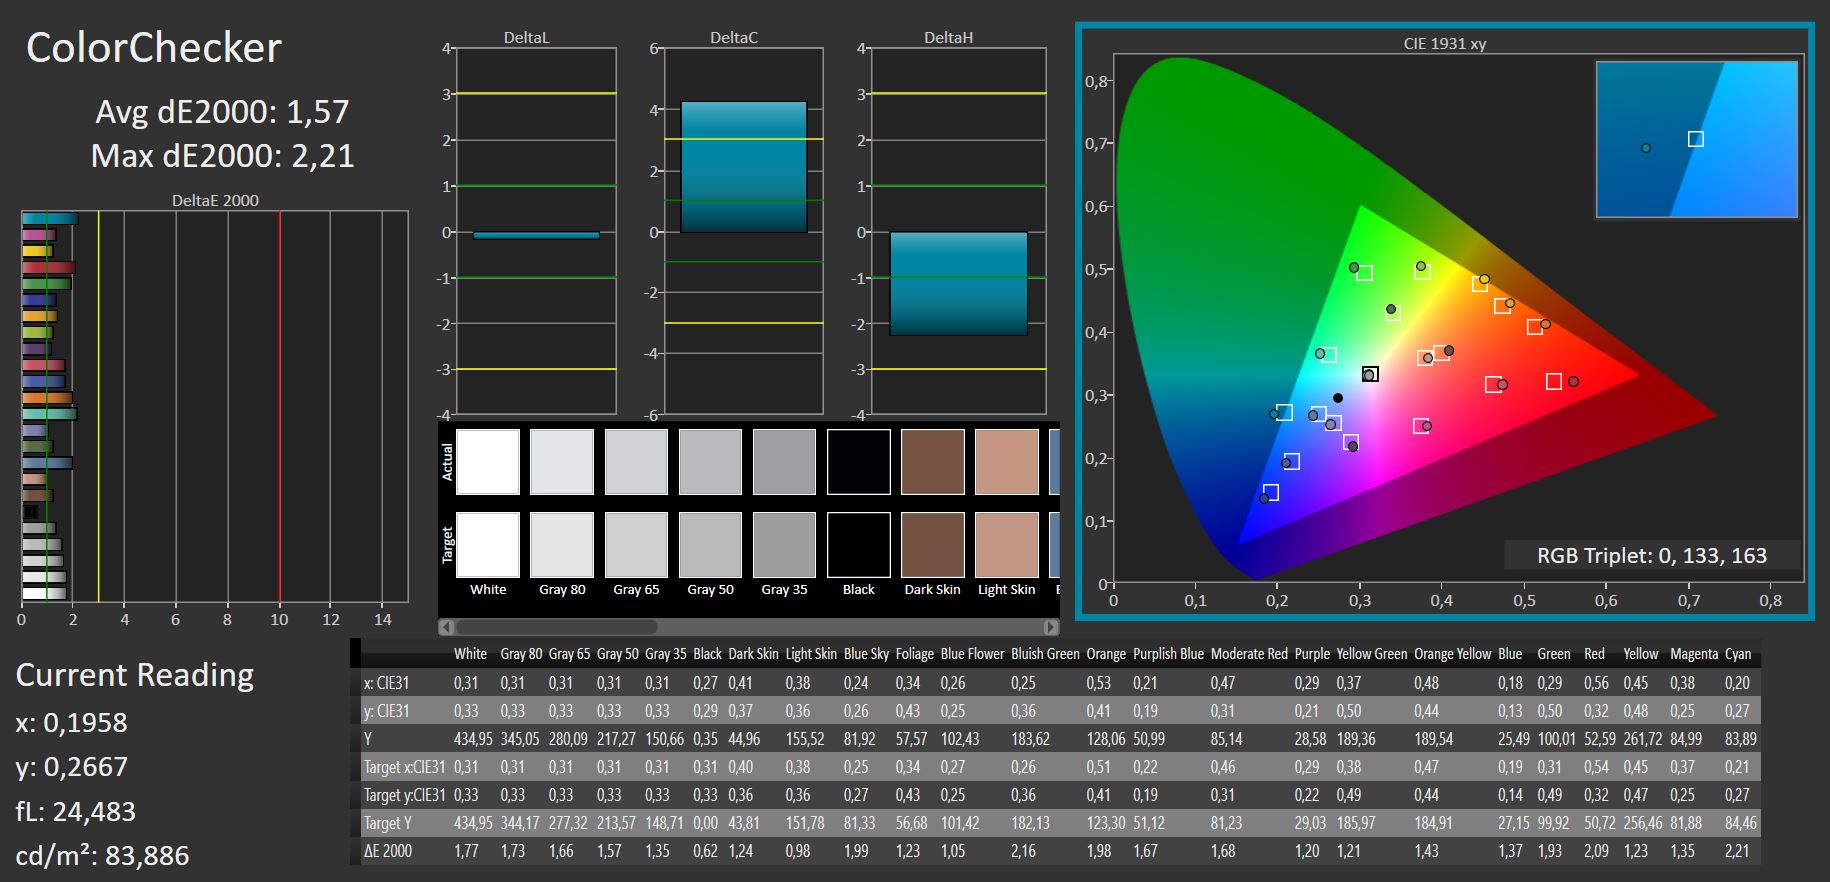
ΔE ColorChecker Calman: 1.68 | ∀{0.5-29.43 Ø4.73}
calibrated: 1.57
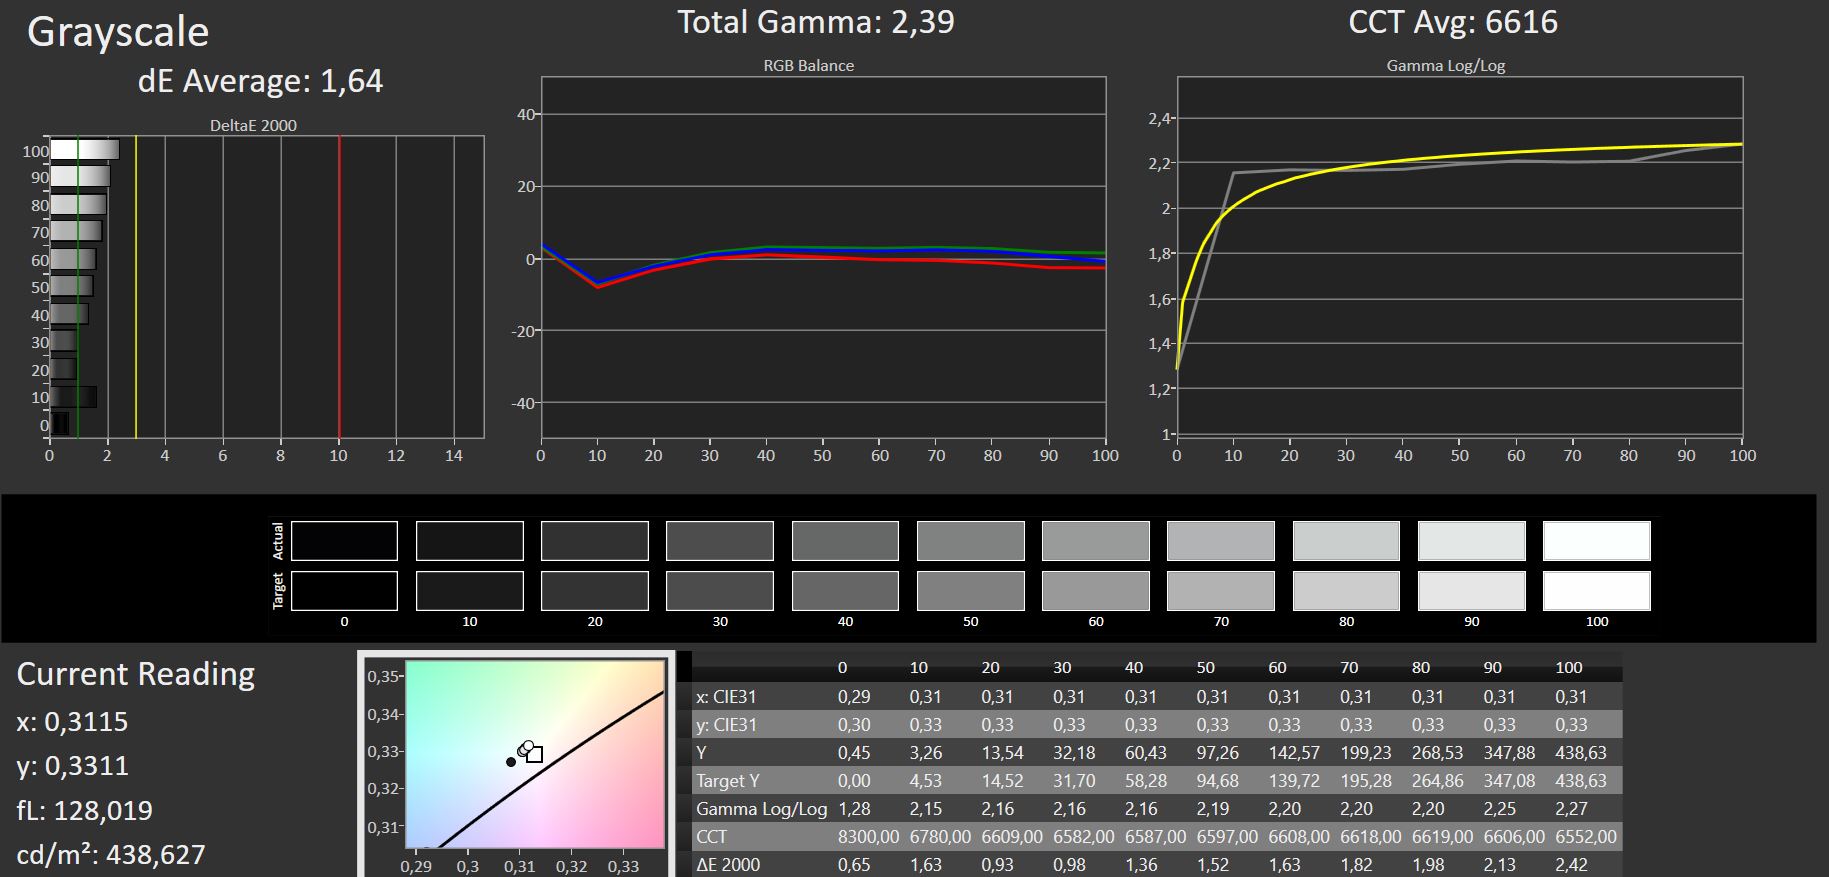
ΔE Greyscale Calman: 1.64 | ∀{0.09-98 Ø4.97}
77.4% AdobeRGB 1998 (Argyll 3D)
100% sRGB (Argyll 3D)
76.4% Display P3 (Argyll 3D)
Gamma: 2.39
CCT: 6616 K
| Lenovo ThinkBook 16p G2 ACH Lenovo LEN8A95 (AUO B160QAN02.M), IPS, 2560x1600, 16" | Lenovo ThinkBook 15p Gen1 4K CSOT T3 MNF601EA-1, IPS, 3840x2160, 15.6" | Dell Inspiron 16 Plus 7610 AU Optronics B160QAN, IPS, 3072x1920, 16" | Razer Blade 15 Base Edition 2021, i7-10750H RTX 3060 BOE NV156FHM-N4K, IPS, 1920x1080, 15.6" | Alienware m15 R5 Ryzen Edition B156HAN, IPS, 1920x1080, 15.6" | Schenker XMG Core 15 Ampere BOE CQ NE156QHM-NY2, IPS, 2560x1440, 15.6" | |
|---|---|---|---|---|---|---|
| Display | 13% | -2% | -13% | -6% | ||
| Display P3 Coverage (%) | 76.4 | 87.4 14% | 74.1 -3% | 64.3 -16% | 69.8 -9% | |
| sRGB Coverage (%) | 100 | 99.6 0% | 99.4 -1% | 91.8 -8% | 98.8 -1% | |
| AdobeRGB 1998 Coverage (%) | 77.4 | 96.9 25% | 75.8 -2% | 65.5 -15% | 70.7 -9% | |
| Response Times | -44% | -81% | 58% | 69% | 48% | |
| Response Time Grey 50% / Grey 80% * (ms) | 36 | 44.8 ? -24% | 49.2 ? -37% | 8.8 ? 76% | 4 ? 89% | 14.8 ? 59% |
| Response Time Black / White * (ms) | 16.4 | 26.8 ? -63% | 36.8 ? -124% | 10 ? 39% | 8.4 ? 49% | 10.4 ? 37% |
| PWM Frequency (Hz) | 1000 ? | |||||
| Screen | 17% | -21% | -66% | -22% | 4% | |
| Brightness middle (cd/m²) | 439 | 599 36% | 296.8 -32% | 317.2 -28% | 329 -25% | 347 -21% |
| Brightness (cd/m²) | 397 | 599 51% | 292 -26% | 306 -23% | 321 -19% | 328 -17% |
| Brightness Distribution (%) | 83 | 91 10% | 87 5% | 89 7% | 92 11% | 89 7% |
| Black Level * (cd/m²) | 0.44 | 0.37 16% | 0.21 52% | 0.31 30% | 0.27 39% | 0.27 39% |
| Contrast (:1) | 998 | 1619 62% | 1413 42% | 1023 3% | 1219 22% | 1285 29% |
| Colorchecker dE 2000 * | 1.68 | 1.4 17% | 2.56 -52% | 4.37 -160% | 2.78 -65% | 1.66 1% |
| Colorchecker dE 2000 max. * | 2.36 | 2.9 -23% | 4.76 -102% | 6.62 -181% | 4.88 -107% | 3.03 -28% |
| Colorchecker dE 2000 calibrated * | 1.57 | 1.86 -18% | 2.67 -70% | 1.63 -4% | 1.23 22% | |
| Greyscale dE 2000 * | 1.64 | 2.2 -34% | 2.6 -59% | 4.5 -174% | 2.5 -52% | 1.6 2% |
| Gamma | 2.39 92% | 2.14 103% | 2.07 106% | 2.4 92% | 2.106 104% | 2.278 97% |
| CCT | 6616 98% | 6842 95% | 6628 98% | 7418 88% | 6201 105% | 6430 101% |
| Color Space (Percent of AdobeRGB 1998) (%) | 83.6 | 59.2 | 76 | 71 | ||
| Color Space (Percent of sRGB) (%) | 99.5 | 91.4 | 99 | 94 | ||
| Total Average (Program / Settings) | -5% /
7% | -35% /
-26% | -7% /
-37% | 24% /
-6% | 15% /
8% |
* ... smaller is better
对比度和黑度可以改进,但显示器开箱后已经配置好了,相应的色彩偏差也很低。一个新的校准几乎没有带来任何改进。
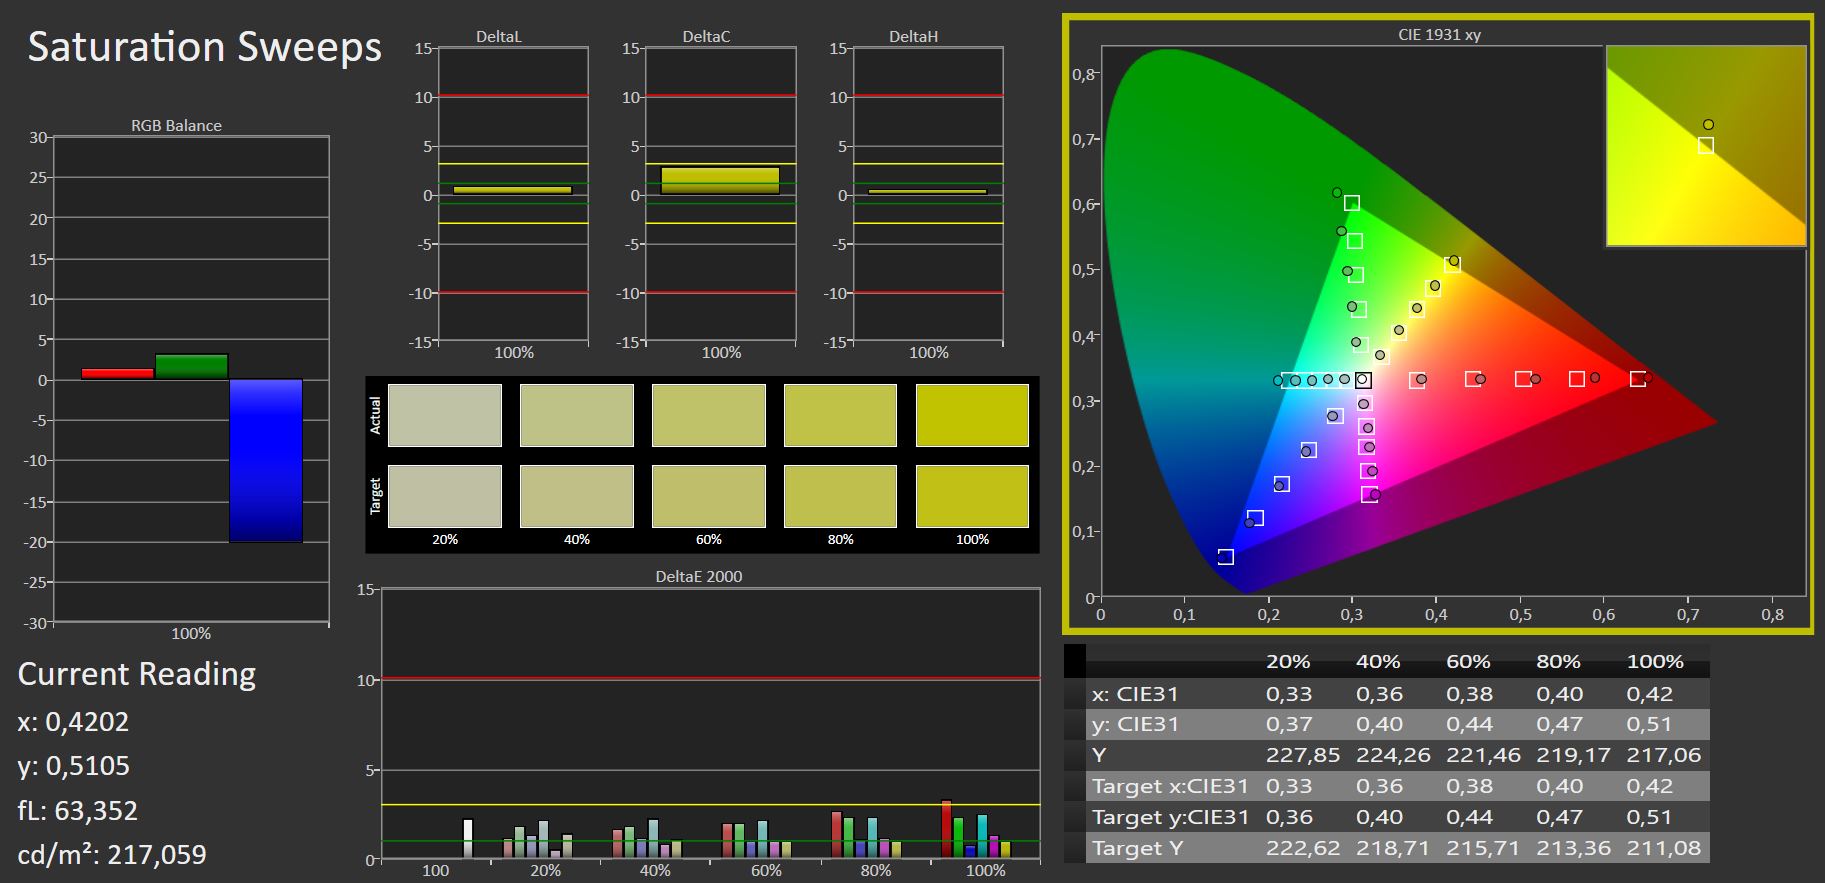
联想宣传该显示器具有完整的sRGB覆盖率,这在我们的测量中得到了证实。AdobeRGB和Display P3的覆盖率仍分别为77%左右。ThinkBook 15p的4K显示屏在这里要好得多,它甚至几乎完全覆盖了AdobeRGB色彩空间。因此,对于创作者来说,这里有一个小小的缺陷,因为由于16:10的长宽比,没有提供可选的4K显示屏。

哑光表面可靠地消除了大多数反射,良好的最大亮度确保ThinkBook即使在户外也能很好地使用。
Display Response Times
| ↔ Response Time Black to White | ||
|---|---|---|
| 16.4 ms ... rise ↗ and fall ↘ combined | ↗ ms rise | 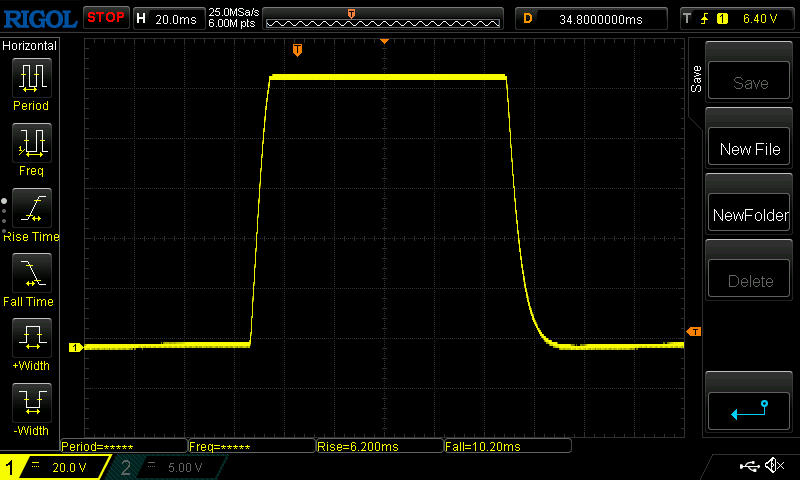 |
| ↘ ms fall | ||
| The screen shows good response rates in our tests, but may be too slow for competitive gamers. In comparison, all tested devices range from 0.1 (minimum) to 240 (maximum) ms. » 38 % of all devices are better. This means that the measured response time is better than the average of all tested devices (19.9 ms). | ||
| ↔ Response Time 50% Grey to 80% Grey | ||
| 36 ms ... rise ↗ and fall ↘ combined | ↗ ms rise | 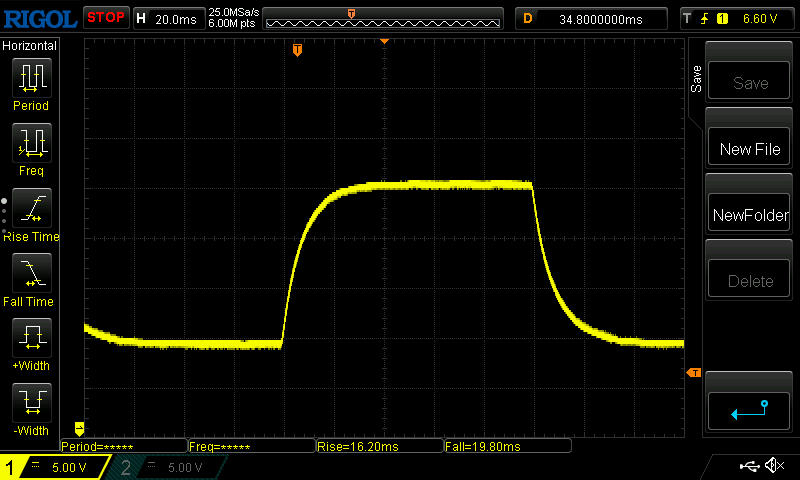 |
| ↘ ms fall | ||
| The screen shows slow response rates in our tests and will be unsatisfactory for gamers. In comparison, all tested devices range from 0.165 (minimum) to 636 (maximum) ms. » 50 % of all devices are better. This means that the measured response time is worse than the average of all tested devices (31.1 ms). | ||
Screen Flickering / PWM (Pulse-Width Modulation)
| Screen flickering / PWM not detected | 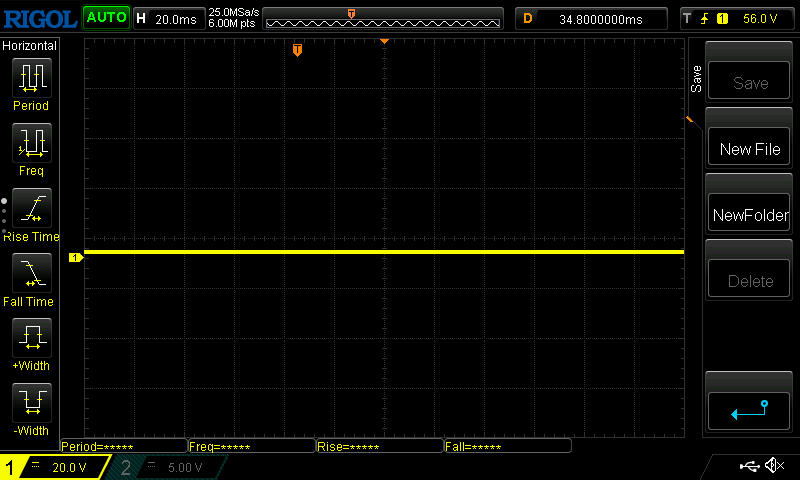 | ||
In comparison: 52 % of all tested devices do not use PWM to dim the display. If PWM was detected, an average of 7798 (minimum: 5 - maximum: 343500) Hz was measured. | |||
在带有HDMI端口的USB集线器的帮助下,与外部显示器的连接工作很顺利。
作为IPS面板的典型代表,该显示器具有相对稳定的视角。然而,你会注意到,当你从狭窄的角度看它时,"光彩 "消失了,画面变得有点暗淡,但这在之后几乎没有恶化。

性能--Ryzen顶级,RTX减慢
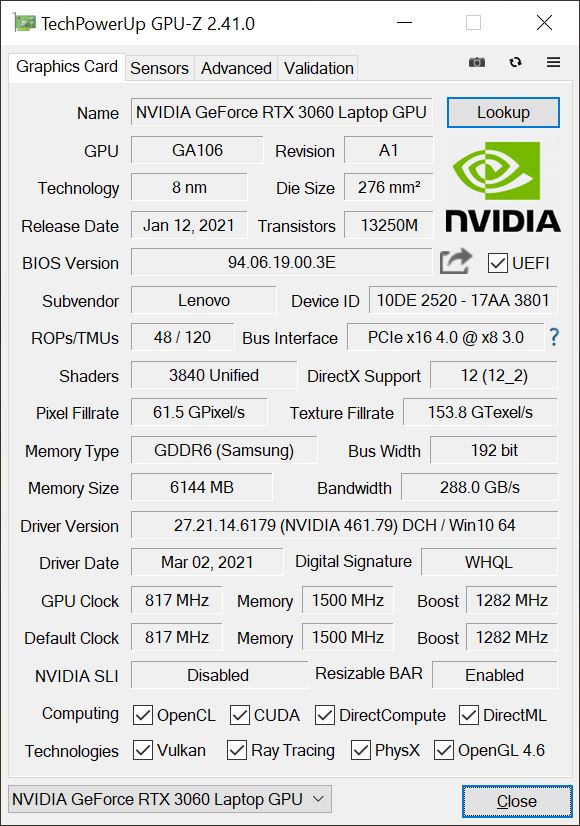
凭借其NVIDIAGeForce RTX 3060笔记本GPU ,32GB内存和AMD Ryzen 9 5900HX处理器,ThinkBook对于一台商务笔记本来说太强大了,这就是为什么联想试图特别吸引创作者。除了刷新率低和显示器的响应时间不太有利外,也可以推荐这款笔记本电脑作为游戏设备,因为应该可以获得所需的性能。
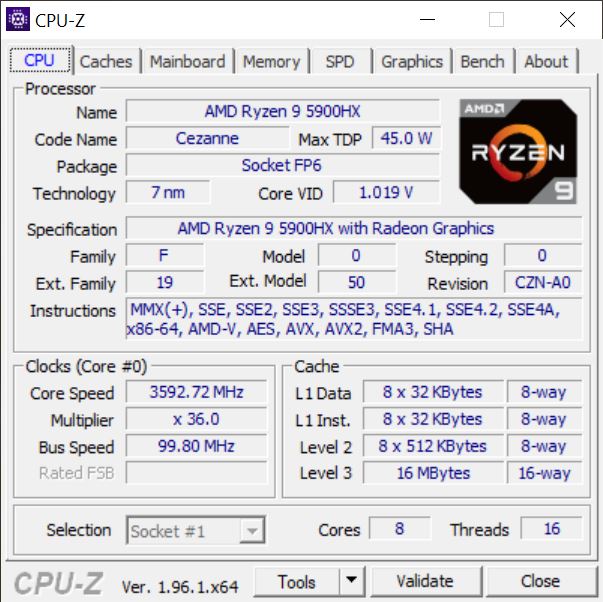

处理器
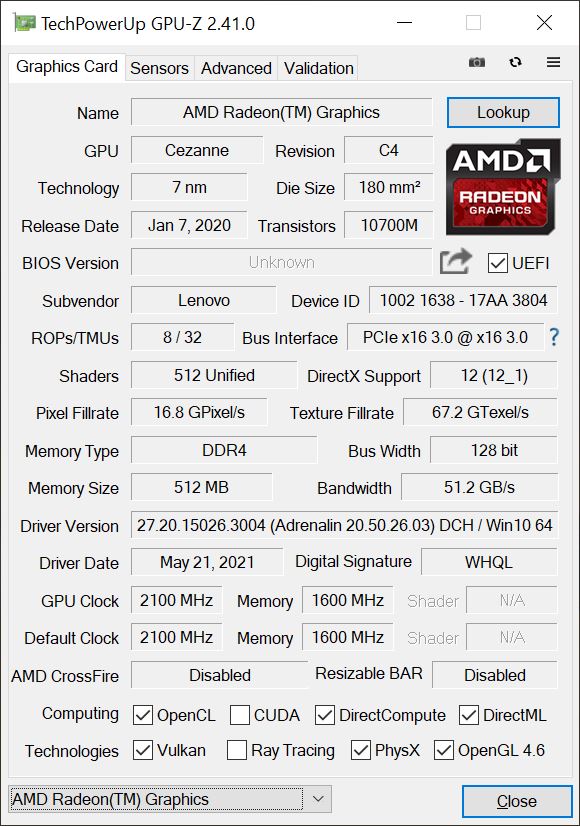
AMD Ryzen 9 5900HX是一个拥有八个核心的强大CPU,在Turbo模式下,时钟速度高达4.6GHz;此外,它可以同时处理总共16个线程。此外,Radeon RX Vega 8GPU被集成到该处理器中。
在我们的Cinebench R15耐力测试中观察到的性能非常稳定,在最初几次运行后没有出现其他常见的下降。Ryzen处理器的性能显然超过了英特尔酷睿i7-11800H ,它也有八个核心。虽然它们在单线程运行中不相上下,但在多线程测试中,AMD的CPU领先约20%!正如预期的那样,ThinkBook的CPU甚至比Alienware游戏笔记本中的AMD Ryzen 7 5800H。
在电池供电的情况下,Cinebench R15得分下降到1444分,这相当于性能下降了约33%!
Cinebench R15 Multi endurance test
Cinebench R20: CPU (Single Core) | CPU (Multi Core)
Cinebench R15: CPU Single 64Bit | CPU Multi 64Bit
Blender: v2.79 BMW27 CPU
7-Zip 18.03: 7z b 4 -mmt1 | 7z b 4
Geekbench 5.5: Single-Core | Multi-Core
HWBOT x265 Benchmark v2.2: 4k Preset
LibreOffice : 20 Documents To PDF
R Benchmark 2.5: Overall mean
| Cinebench R23 / Single Core | |
| Average of class Multimedia (1128 - 2459, n=73, last 2 years) | |
| Dell Inspiron 16 Plus 7610 | |
| Lenovo ThinkBook 16p G2 ACH | |
| Average AMD Ryzen 9 5900HX (1218 - 1499, n=29) | |
| Alienware m15 R5 Ryzen Edition | |
| Schenker XMG Core 15 Ampere | |
| Razer Blade 15 Base Edition 2021, i7-10750H RTX 3060 | |
| Lenovo ThinkBook 15p Gen1 4K | |
| Cinebench R23 / Multi Core | |
| Average of class Multimedia (4861 - 33362, n=81, last 2 years) | |
| Lenovo ThinkBook 16p G2 ACH | |
| Average AMD Ryzen 9 5900HX (6622 - 14363, n=30) | |
| Alienware m15 R5 Ryzen Edition | |
| Schenker XMG Core 15 Ampere | |
| Dell Inspiron 16 Plus 7610 | |
| Lenovo ThinkBook 15p Gen1 4K | |
| Razer Blade 15 Base Edition 2021, i7-10750H RTX 3060 | |
| Cinebench R20 / CPU (Single Core) | |
| Average of class Multimedia (425 - 853, n=64, last 2 years) | |
| Dell Inspiron 16 Plus 7610 | |
| Lenovo ThinkBook 16p G2 ACH | |
| Average AMD Ryzen 9 5900HX (471 - 584, n=29) | |
| Alienware m15 R5 Ryzen Edition | |
| Schenker XMG Core 15 Ampere | |
| Razer Blade 15 Base Edition 2021, i7-10750H RTX 3060 | |
| Lenovo ThinkBook 15p Gen1 4K | |
| Cinebench R20 / CPU (Multi Core) | |
| Average of class Multimedia (1887 - 12912, n=64, last 2 years) | |
| Lenovo ThinkBook 16p G2 ACH | |
| Average AMD Ryzen 9 5900HX (2242 - 5476, n=30) | |
| Alienware m15 R5 Ryzen Edition | |
| Schenker XMG Core 15 Ampere | |
| Dell Inspiron 16 Plus 7610 | |
| Lenovo ThinkBook 15p Gen1 4K | |
| Razer Blade 15 Base Edition 2021, i7-10750H RTX 3060 | |
| Cinebench R15 / CPU Single 64Bit | |
| Average of class Multimedia (184.8 - 326, n=66, last 2 years) | |
| Lenovo ThinkBook 16p G2 ACH | |
| Average AMD Ryzen 9 5900HX (197 - 243, n=25) | |
| Alienware m15 R5 Ryzen Edition | |
| Dell Inspiron 16 Plus 7610 | |
| Razer Blade 15 Base Edition 2021, i7-10750H RTX 3060 | |
| Lenovo ThinkBook 15p Gen1 4K | |
| Schenker XMG Core 15 Ampere | |
| Cinebench R15 / CPU Multi 64Bit | |
| Average of class Multimedia (856 - 5224, n=68, last 2 years) | |
| Lenovo ThinkBook 16p G2 ACH | |
| Average AMD Ryzen 9 5900HX (1076 - 2267, n=29) | |
| Alienware m15 R5 Ryzen Edition | |
| Schenker XMG Core 15 Ampere | |
| Dell Inspiron 16 Plus 7610 | |
| Lenovo ThinkBook 15p Gen1 4K | |
| Razer Blade 15 Base Edition 2021, i7-10750H RTX 3060 | |
| Blender / v2.79 BMW27 CPU | |
| Razer Blade 15 Base Edition 2021, i7-10750H RTX 3060 | |
| Lenovo ThinkBook 15p Gen1 4K | |
| Dell Inspiron 16 Plus 7610 | |
| Alienware m15 R5 Ryzen Edition | |
| Schenker XMG Core 15 Ampere | |
| Average AMD Ryzen 9 5900HX (219 - 442, n=29) | |
| Average of class Multimedia (100 - 557, n=65, last 2 years) | |
| Lenovo ThinkBook 16p G2 ACH | |
| 7-Zip 18.03 / 7z b 4 -mmt1 | |
| Average of class Multimedia (3666 - 7545, n=63, last 2 years) | |
| Lenovo ThinkBook 16p G2 ACH | |
| Average AMD Ryzen 9 5900HX (4791 - 5905, n=29) | |
| Alienware m15 R5 Ryzen Edition | |
| Dell Inspiron 16 Plus 7610 | |
| Razer Blade 15 Base Edition 2021, i7-10750H RTX 3060 | |
| Lenovo ThinkBook 15p Gen1 4K | |
| Schenker XMG Core 15 Ampere | |
| 7-Zip 18.03 / 7z b 4 | |
| Lenovo ThinkBook 16p G2 ACH | |
| Average of class Multimedia (29095 - 130368, n=62, last 2 years) | |
| Average AMD Ryzen 9 5900HX (36011 - 62503, n=29) | |
| Alienware m15 R5 Ryzen Edition | |
| Schenker XMG Core 15 Ampere | |
| Dell Inspiron 16 Plus 7610 | |
| Lenovo ThinkBook 15p Gen1 4K | |
| Razer Blade 15 Base Edition 2021, i7-10750H RTX 3060 | |
| Geekbench 5.5 / Single-Core | |
| Average of class Multimedia (805 - 2974, n=62, last 2 years) | |
| Lenovo ThinkBook 16p G2 ACH | |
| Average AMD Ryzen 9 5900HX (1271 - 1574, n=27) | |
| Alienware m15 R5 Ryzen Edition | |
| Razer Blade 15 Base Edition 2021, i7-10750H RTX 3060 | |
| Lenovo ThinkBook 15p Gen1 4K | |
| Schenker XMG Core 15 Ampere | |
| Geekbench 5.5 / Multi-Core | |
| Average of class Multimedia (4652 - 20422, n=62, last 2 years) | |
| Lenovo ThinkBook 16p G2 ACH | |
| Average AMD Ryzen 9 5900HX (5057 - 9294, n=27) | |
| Schenker XMG Core 15 Ampere | |
| Alienware m15 R5 Ryzen Edition | |
| Lenovo ThinkBook 15p Gen1 4K | |
| Razer Blade 15 Base Edition 2021, i7-10750H RTX 3060 | |
| HWBOT x265 Benchmark v2.2 / 4k Preset | |
| Average of class Multimedia (5.26 - 36.1, n=63, last 2 years) | |
| Lenovo ThinkBook 16p G2 ACH | |
| Average AMD Ryzen 9 5900HX (8.26 - 17.1, n=29) | |
| Alienware m15 R5 Ryzen Edition | |
| Schenker XMG Core 15 Ampere | |
| Dell Inspiron 16 Plus 7610 | |
| Lenovo ThinkBook 15p Gen1 4K | |
| Razer Blade 15 Base Edition 2021, i7-10750H RTX 3060 | |
| LibreOffice / 20 Documents To PDF | |
| Schenker XMG Core 15 Ampere | |
| Alienware m15 R5 Ryzen Edition | |
| Lenovo ThinkBook 15p Gen1 4K | |
| Lenovo ThinkBook 16p G2 ACH | |
| Average AMD Ryzen 9 5900HX (44.1 - 87.4, n=29) | |
| Average of class Multimedia (23.9 - 146.7, n=64, last 2 years) | |
| Razer Blade 15 Base Edition 2021, i7-10750H RTX 3060 | |
| Dell Inspiron 16 Plus 7610 | |
| R Benchmark 2.5 / Overall mean | |
| Razer Blade 15 Base Edition 2021, i7-10750H RTX 3060 | |
| Lenovo ThinkBook 15p Gen1 4K | |
| Schenker XMG Core 15 Ampere | |
| Dell Inspiron 16 Plus 7610 | |
| Alienware m15 R5 Ryzen Edition | |
| Average AMD Ryzen 9 5900HX (0.48 - 0.599, n=29) | |
| Lenovo ThinkBook 16p G2 ACH | |
| Average of class Multimedia (0.3604 - 0.947, n=63, last 2 years) | |
* ... smaller is better
系统性能
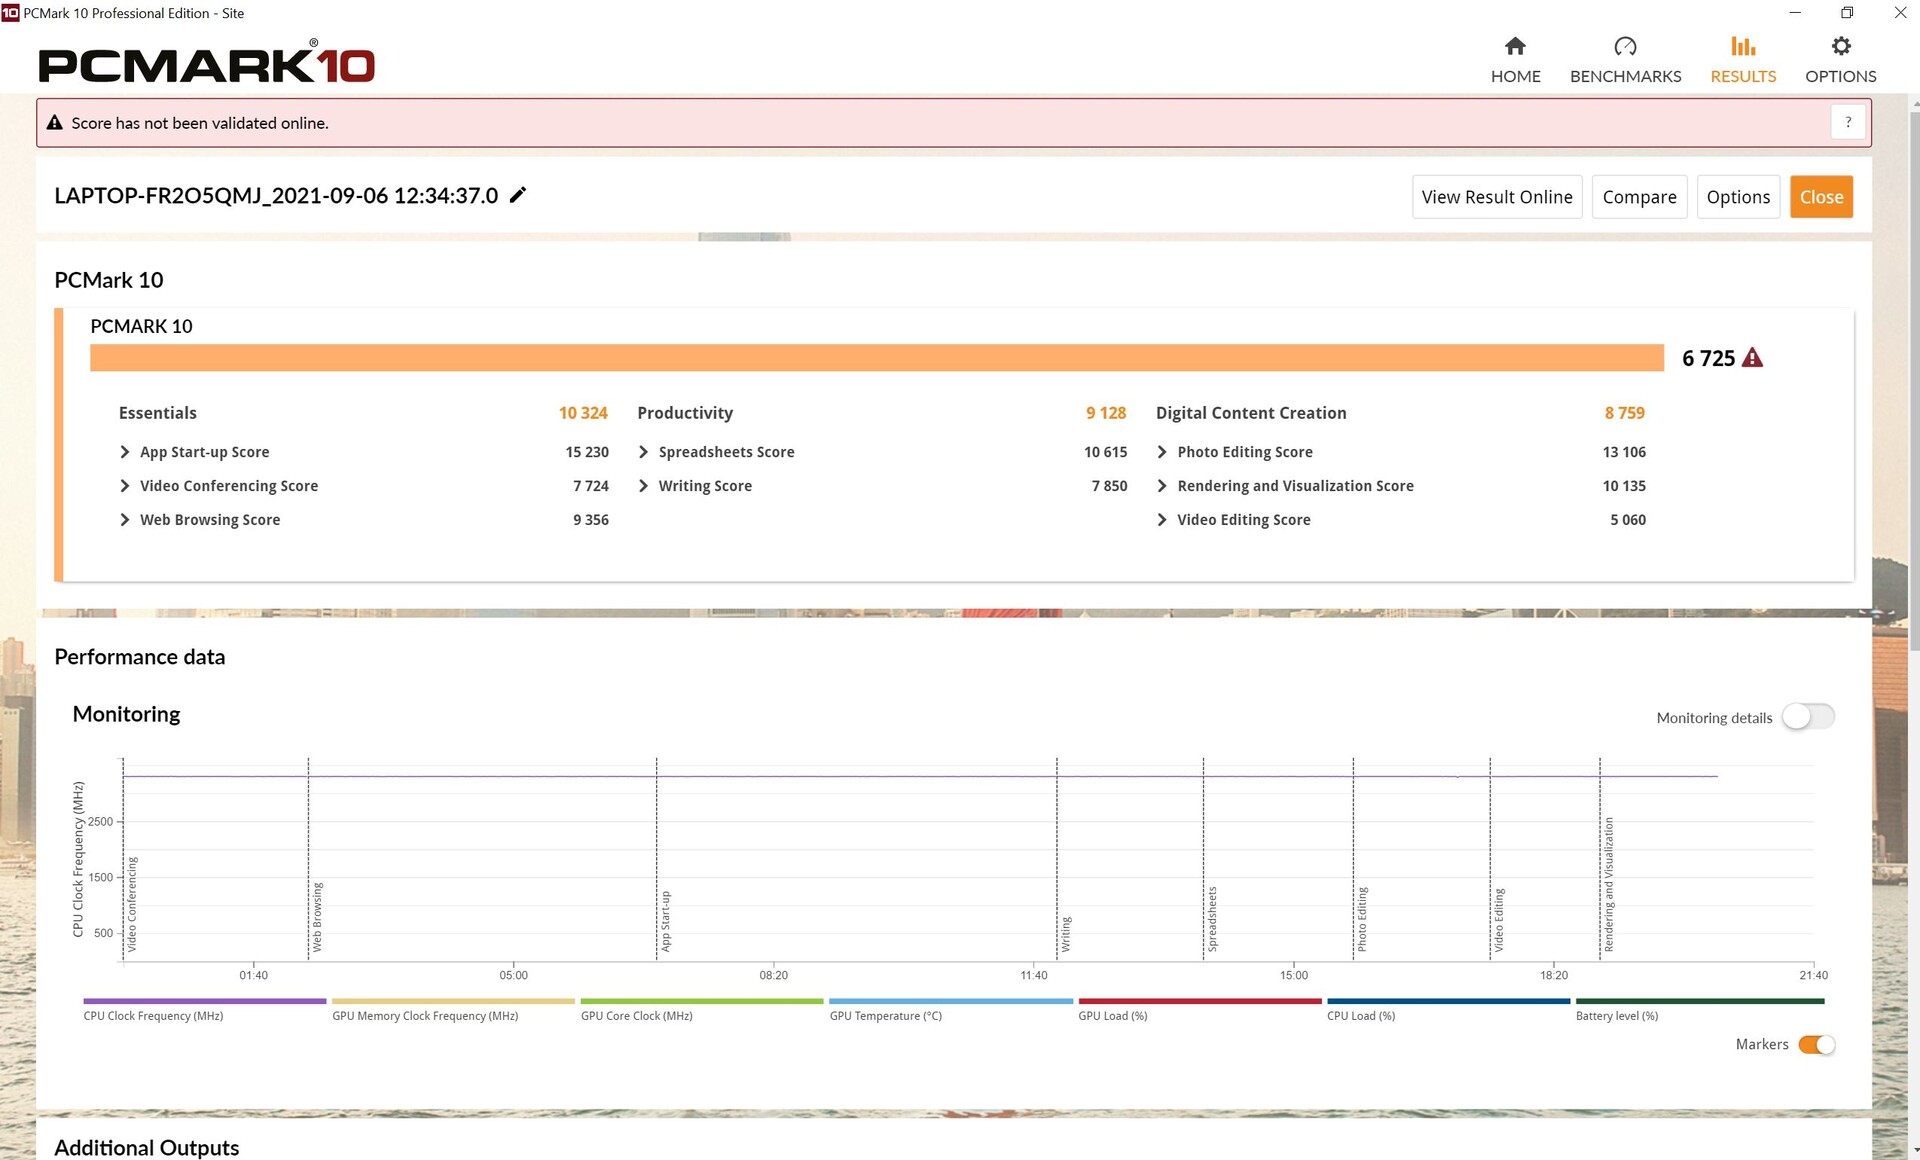
在PCMark 10中,16p在所有分项测试中都取得了领先,与采用Comet Lake的15p的差异尤其明显。其他竞争者通常比我们的测试模型落后几个百分点。
| PCMark 10 / Score | |
| Average of class Multimedia (4325 - 10386, n=58, last 2 years) | |
| Lenovo ThinkBook 16p G2 ACH | |
| Average AMD Ryzen 9 5900HX, NVIDIA GeForce RTX 3060 Laptop GPU (6505 - 6725, n=2) | |
| Alienware m15 R5 Ryzen Edition | |
| Razer Blade 15 Base Edition 2021, i7-10750H RTX 3060 | |
| Dell Inspiron 16 Plus 7610 | |
| Schenker XMG Core 15 Ampere | |
| Lenovo ThinkBook 15p Gen1 4K | |
| PCMark 10 / Essentials | |
| Average of class Multimedia (8025 - 11664, n=57, last 2 years) | |
| Lenovo ThinkBook 16p G2 ACH | |
| Razer Blade 15 Base Edition 2021, i7-10750H RTX 3060 | |
| Average AMD Ryzen 9 5900HX, NVIDIA GeForce RTX 3060 Laptop GPU (9827 - 10324, n=2) | |
| Dell Inspiron 16 Plus 7610 | |
| Alienware m15 R5 Ryzen Edition | |
| Schenker XMG Core 15 Ampere | |
| Lenovo ThinkBook 15p Gen1 4K | |
| PCMark 10 / Productivity | |
| Average of class Multimedia (7323 - 18233, n=57, last 2 years) | |
| Lenovo ThinkBook 16p G2 ACH | |
| Average AMD Ryzen 9 5900HX, NVIDIA GeForce RTX 3060 Laptop GPU (8803 - 9128, n=2) | |
| Alienware m15 R5 Ryzen Edition | |
| Dell Inspiron 16 Plus 7610 | |
| Razer Blade 15 Base Edition 2021, i7-10750H RTX 3060 | |
| Schenker XMG Core 15 Ampere | |
| Lenovo ThinkBook 15p Gen1 4K | |
| PCMark 10 / Digital Content Creation | |
| Average of class Multimedia (3651 - 16240, n=57, last 2 years) | |
| Lenovo ThinkBook 16p G2 ACH | |
| Average AMD Ryzen 9 5900HX, NVIDIA GeForce RTX 3060 Laptop GPU (8634 - 8759, n=2) | |
| Alienware m15 R5 Ryzen Edition | |
| Schenker XMG Core 15 Ampere | |
| Razer Blade 15 Base Edition 2021, i7-10750H RTX 3060 | |
| Dell Inspiron 16 Plus 7610 | |
| Lenovo ThinkBook 15p Gen1 4K | |
| PCMark 10 Score | 6725 points | |
Help | ||
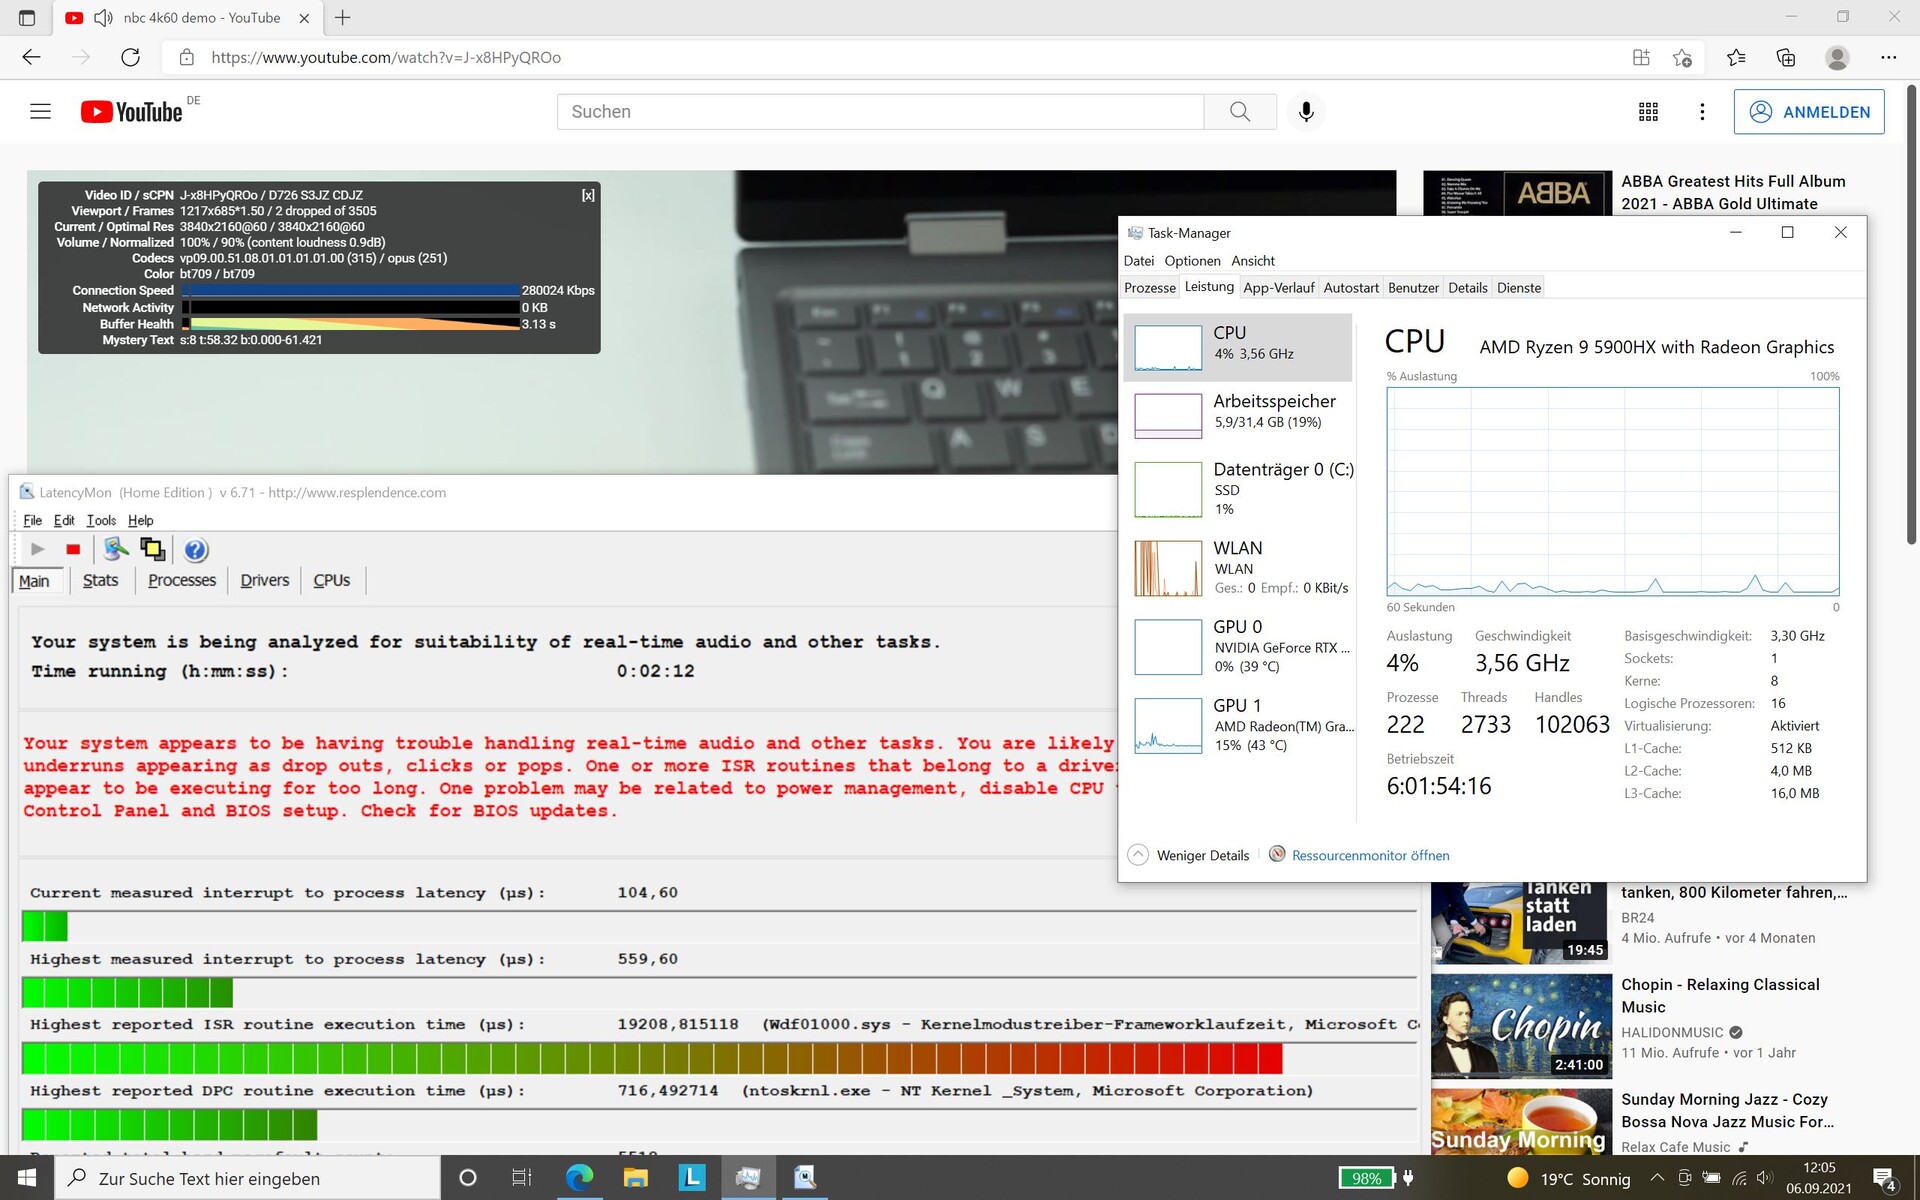
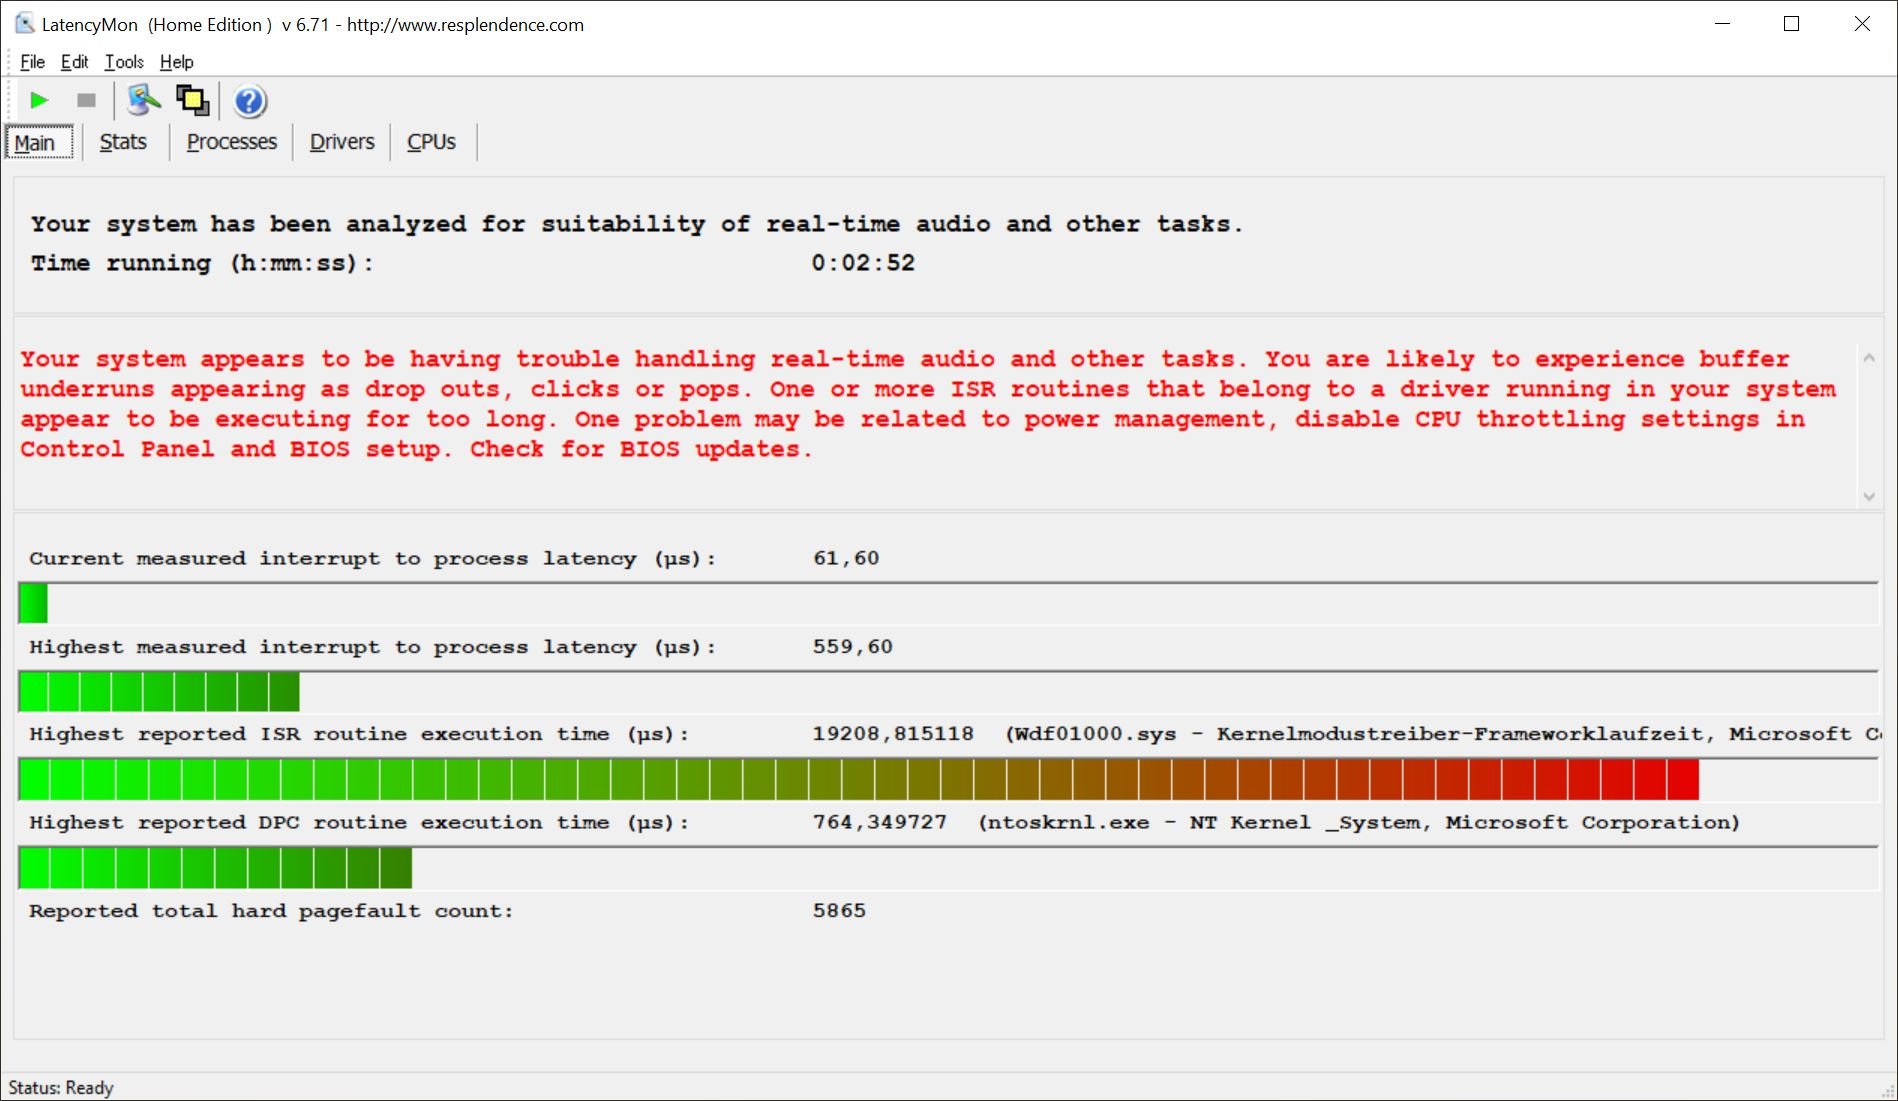
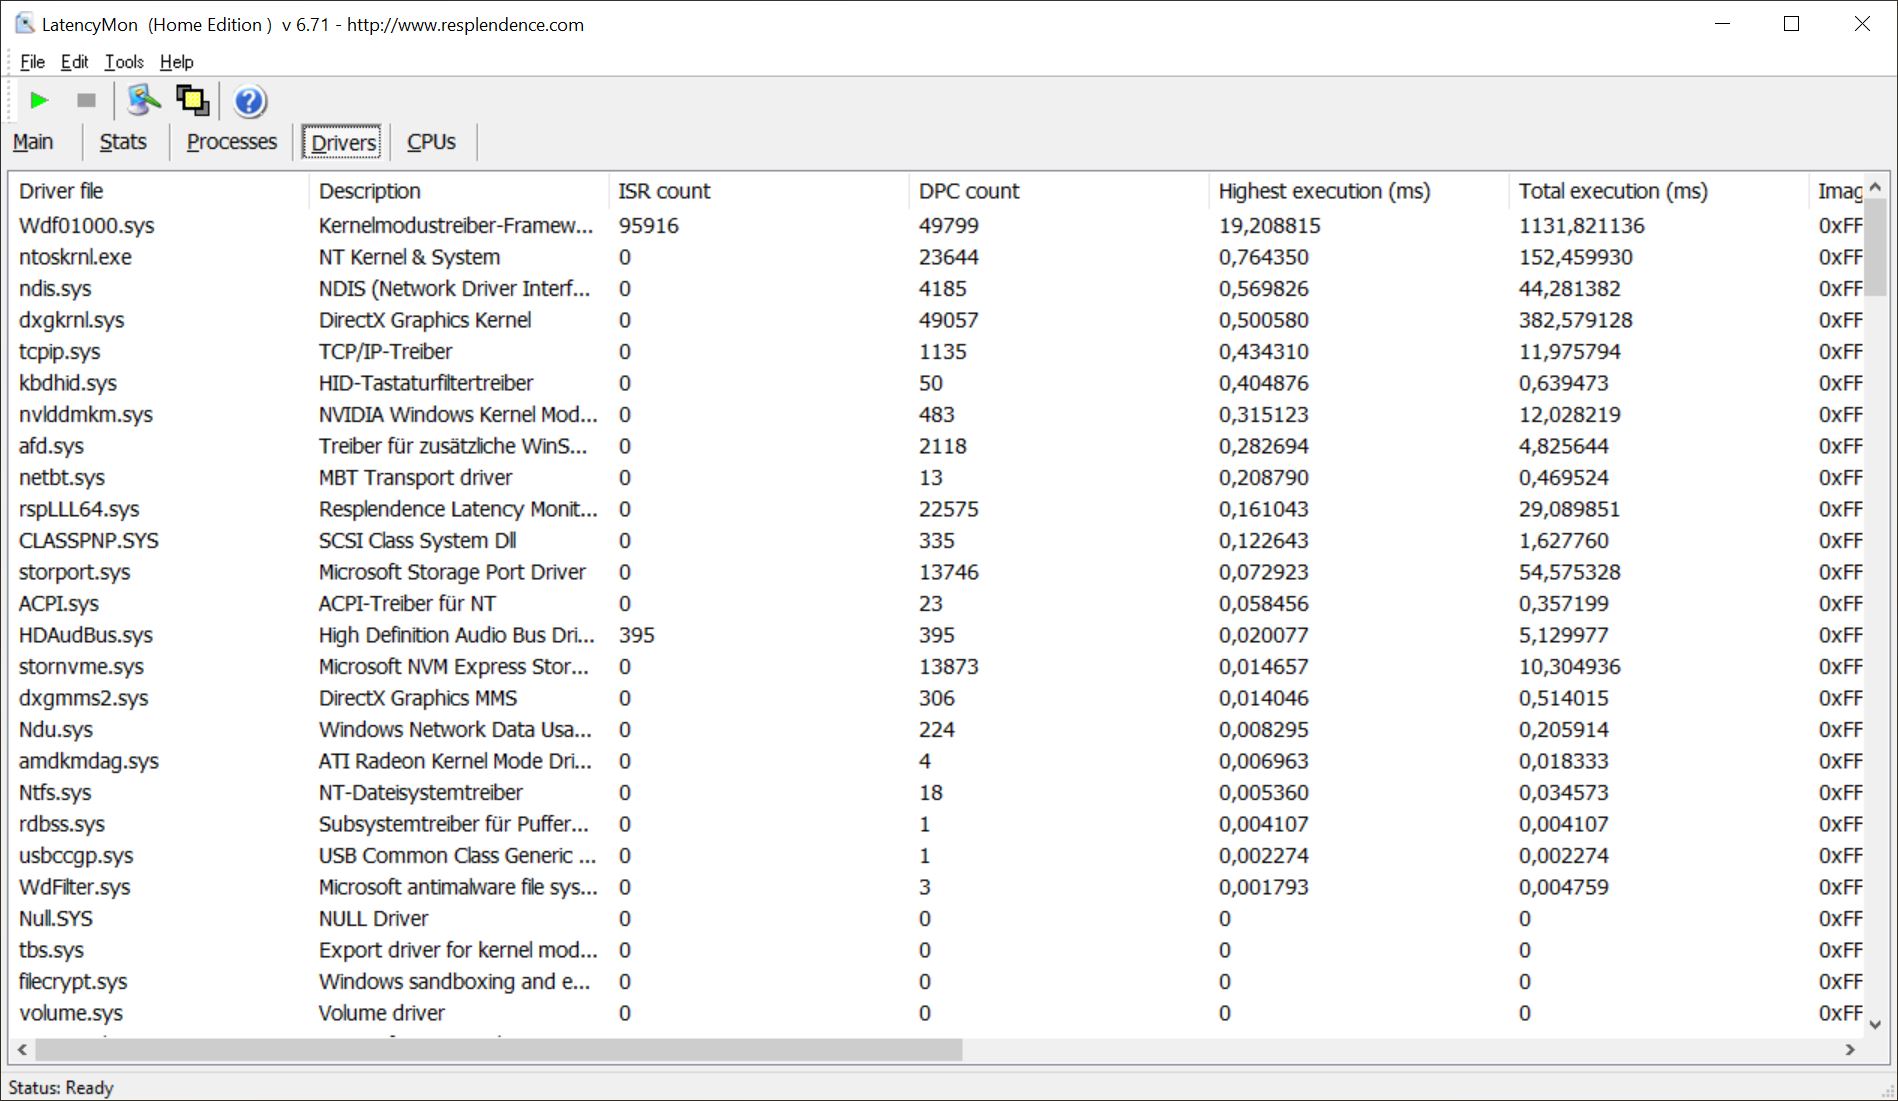
DPC延迟
ThinkBook在处理多个浏览器标签时没有任何问题,但在播放我们在YouTube上的4K/60帧测试视频时确实很吃力,它再现了两个丢帧。LatencyMon工具还显示,实时音频播放也有问题。再一次,罪魁祸首是内核模式驱动框架运行时间。
| DPC Latencies / LatencyMon - interrupt to process latency (max), Web, Youtube, Prime95 | |
| Dell Inspiron 16 Plus 7610 | |
| Lenovo ThinkBook 15p Gen1 4K | |
| Razer Blade 15 Base Edition 2021, i7-10750H RTX 3060 | |
| Lenovo ThinkBook 16p G2 ACH | |
| Schenker XMG Core 15 Ampere | |
| Alienware m15 R5 Ryzen Edition | |
* ... smaller is better
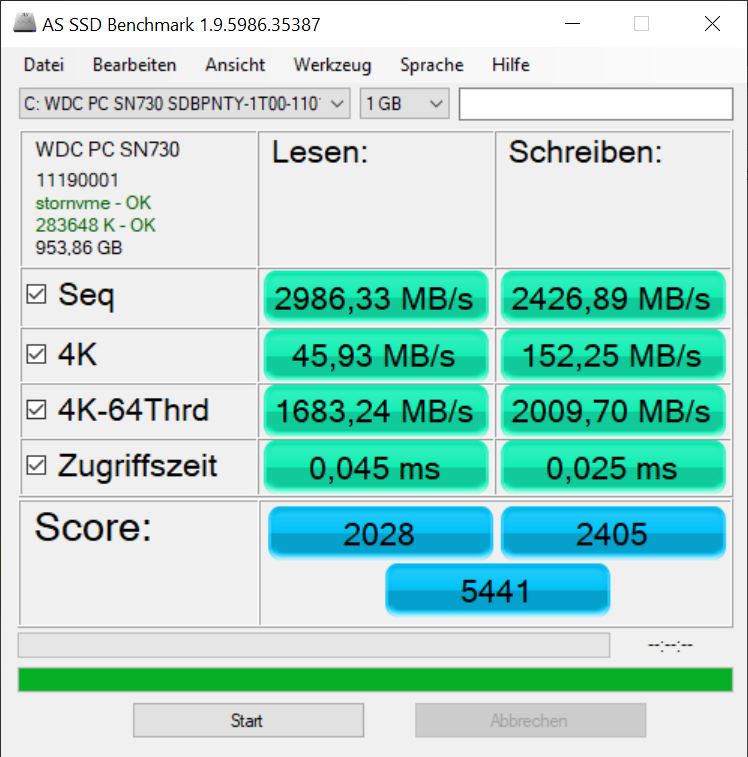
储存
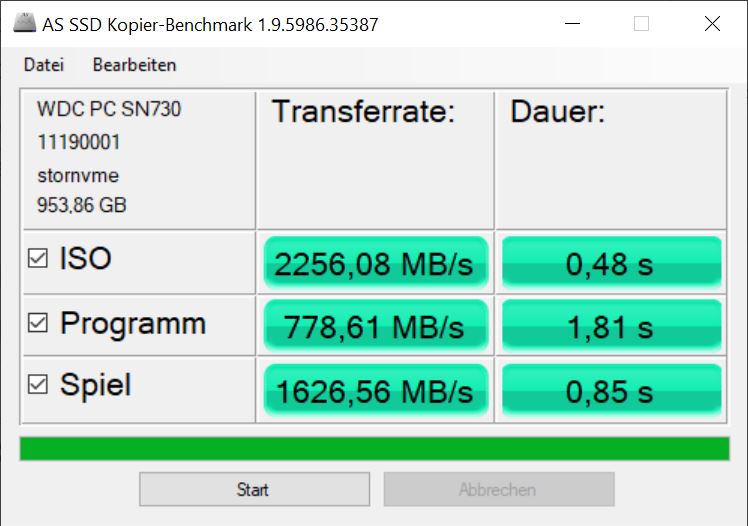
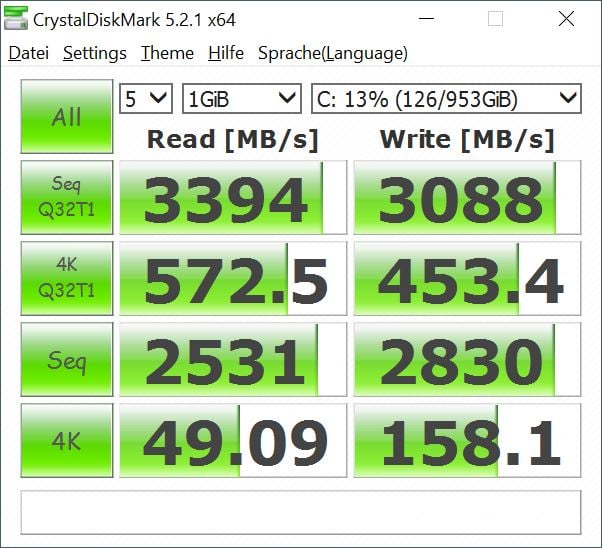
联想安装了西数的1TB NVMe固态硬盘,在我们的 SSD/HDD基准测试文章中排名第28位 。内置的SSD甚至比ThinkBook 15p的同型号产品快10%左右。大多数竞争者的性能都可以被超越,而只有在 绅宝XMG Core 15中的固态硬盘略微快一些。
| Lenovo ThinkBook 16p G2 ACH WDC PC SN730 SDBPNTY-1T00 | Lenovo ThinkBook 15p Gen1 4K WDC PC SN730 SDBPNTY-1T00 | Dell Inspiron 16 Plus 7610 Kingston OM3PDP3512B | Razer Blade 15 Base Edition 2021, i7-10750H RTX 3060 Samsung SSD PM981a MZVLB512HBJQ | Alienware m15 R5 Ryzen Edition Toshiba KBG40ZNS512G NVMe | Schenker XMG Core 15 Ampere Samsung SSD 970 EVO Plus 1TB | Average WDC PC SN730 SDBPNTY-1T00 | |
|---|---|---|---|---|---|---|---|
| CrystalDiskMark 5.2 / 6 | -9% | -23% | -10% | -26% | 2% | -10% | |
| Write 4K (MB/s) | 158.1 | 150.8 -5% | 176.8 12% | 123.8 -22% | 116.9 -26% | 139.1 -12% | 139.9 ? -12% |
| Read 4K (MB/s) | 49.09 | 43.01 -12% | 52.3 7% | 45.53 -7% | 44.56 -9% | 47.59 -3% | 44.5 ? -9% |
| Write Seq (MB/s) | 2830 | 2846 1% | 1170 -59% | 2132 -25% | 1552 -45% | 2917 3% | 2346 ? -17% |
| Read Seq (MB/s) | 2531 | 2366 -7% | 1557 -38% | 2067 -18% | 1682 -34% | 2586 2% | 2102 ? -17% |
| Write 4K Q32T1 (MB/s) | 453.4 | 450 -1% | 471.5 4% | 462.9 2% | 497.8 10% | 511 13% | 442 ? -3% |
| Read 4K Q32T1 (MB/s) | 573 | 295.5 -48% | 437.9 -24% | 553 -3% | 436.8 -24% | 571 0% | 460 ? -20% |
| Write Seq Q32T1 (MB/s) | 3088 | 3079 0% | 1214 -61% | 2955 -4% | 1461 -53% | 3263 6% | 3049 ? -1% |
| Read Seq Q32T1 (MB/s) | 3394 | 3433 1% | 2549 -25% | 3246 -4% | 2364 -30% | 3567 5% | 3285 ? -3% |
| AS SSD | -15% | -43% | -35% | -83% | 4% | -27% | |
| Seq Read (MB/s) | 2986 | 2852 -4% | 2077 -30% | 2401 -20% | 2082 -30% | 2829 -5% | 2606 ? -13% |
| Seq Write (MB/s) | 2426 | 2344 -3% | 778 -68% | 2087 -14% | 825 -66% | 2646 9% | 1935 ? -20% |
| 4K Read (MB/s) | 45.93 | 37.3 -19% | 49.6 8% | 49.58 8% | 42.41 -8% | 54.8 19% | 42.9 ? -7% |
| 4K Write (MB/s) | 152.3 | 79.6 -48% | 236.1 55% | 98.8 -35% | 98.3 -35% | 179.1 18% | 129.1 ? -15% |
| 4K-64 Read (MB/s) | 1683 | 1500 -11% | 801 -52% | 1601 -5% | 1255 -25% | 1734 3% | 1361 ? -19% |
| 4K-64 Write (MB/s) | 2010 | 2055 2% | 942 -53% | 1862 -7% | 738 -63% | 2396 19% | 1920 ? -4% |
| Access Time Read * (ms) | 0.045 | 0.053 -18% | 0.06 -33% | 0.06 -33% | 0.109 -142% | 0.033 27% | 0.0689 ? -53% |
| Access Time Write * (ms) | 0.025 | 0.033 -32% | 0.073 -192% | 0.11 -340% | 0.17 -580% | 0.021 16% | 0.06215 ? -149% |
| Score Read (Points) | 2028 | 1822 -10% | 1059 -48% | 1890 -7% | 1506 -26% | 2072 2% | 1664 ? -18% |
| Score Write (Points) | 2405 | 2369 -1% | 1256 -48% | 2170 -10% | 918 -62% | 2839 18% | 2242 ? -7% |
| Score Total (Points) | 5441 | 5095 -6% | 2804 -48% | 5015 -8% | 3136 -42% | 5965 10% | 4726 ? -13% |
| Copy ISO MB/s (MB/s) | 2256 | 2071 -8% | 1028 -54% | 2206 -2% | 1391 -38% | 2119 -6% | 2041 ? -10% |
| Copy Program MB/s (MB/s) | 779 | 605 -22% | 794 2% | 694 -11% | 645 -17% | 406.1 -48% | 552 ? -29% |
| Copy Game MB/s (MB/s) | 1627 | 1131 -30% | 987 -39% | 1555 -4% | 1101 -32% | 1086 -33% | 1183 ? -27% |
| Total Average (Program / Settings) | -12% /
-13% | -33% /
-36% | -23% /
-26% | -55% /
-63% | 3% /
3% | -19% /
-21% |
* ... smaller is better

Continuous load read: DiskSpd Read Loop, Queue Depth 8
图形卡
根据配置的不同,ThinkBook 16p要么配备集成在CPU中的Radeon RX Vega 8,要么配备更强大的NVIDIAGeForce RTX 3060笔记本GPU 。不幸的是,联想在其产品页面上没有说明RTX 3060所使用的TGP--当涉及到如此重要的性能值时,对于一个制造商来说是不可能的事。
在其他地方,TGP被说成是75瓦。这个值在RTX 3060中可能在60到115瓦之间,所以在我们的测试模型中相当低。因此,在3DMark测试中,它的表现略低于我们数据库中的平均RTX 3060。游戏竞争者在这里更强大,但戴尔Inspiron 16 Plus 7610,配备RTX 3050,通常比我们的ThinkBook再落后20%到30%。
在电池供电的情况下,GPU的性能下降得非常厉害。在3DMark 11中,我们只测得6900个GPU点数,而不是最初的24689点,这意味着下降了70%以上
| 3DMark 11 - 1280x720 Performance GPU | |
| Schenker XMG Core 15 Ampere | |
| Alienware m15 R5 Ryzen Edition | |
| Average NVIDIA GeForce RTX 3060 Laptop GPU (13799 - 30772, n=43) | |
| Razer Blade 15 Base Edition 2021, i7-10750H RTX 3060 | |
| Lenovo ThinkBook 16p G2 ACH | |
| Average of class Multimedia (3765 - 60002, n=62, last 2 years) | |
| Dell Inspiron 16 Plus 7610 | |
| Lenovo ThinkBook 15p Gen1 4K | |
| 3DMark 11 Performance | 21986 points | |
| 3DMark Cloud Gate Standard Score | 42348 points | |
| 3DMark Fire Strike Score | 16883 points | |
| 3DMark Time Spy Score | 7634 points | |
Help | ||
游戏性能
在游戏中,应该注意的是,在标准的16:9分辨率下使用16:10的长宽比,如全高清,会导致图像被拉伸,游戏中的所有人物和物体也随之被拉伸。
3DMark测试的结果在《Witcher 3 》中得到了证实:分辨率和细节水平越高,与游戏竞争对手的差距就越大。总的来说,RTX 3060的表现仅略低于预期水平,但竞争对手的游戏笔记本通常表现得更好。
此外,原生分辨率高于全高清,这给GPU带来很大压力。尽管如此,16p在以原生分辨率玩《Witcher 3》时能达到约53帧;在以原生分辨率和Ultra设置玩《Far Cry 5》时也达到67帧。在《古墓丽影》中,可以达到58 fps。
即使在一个小时的过程中,在《Witcher 3》中观察到的帧率也是相当稳定的,只是略微下降。
The Witcher 3 FPS diagram
| low | med. | high | ultra | |
|---|---|---|---|---|
| GTA V (2015) | 178 | 149 | 87.3 | |
| The Witcher 3 (2015) | 313 | 132 | 73 | |
| Dota 2 Reborn (2015) | 152 | 146 | 129 | 121 |
| X-Plane 11.11 (2018) | 103 | 88.6 | 74 | |
| Far Cry 5 (2018) | 114 | 98 | 95 | 90 |
| Strange Brigade (2018) | 292 | 169 | 142 | 125 |
| Shadow of the Tomb Raider (2018) | 137 | 107 | 101 | 91 |
排放--不显眼的联想ThinkBook
噪声排放
ThinkBook 16p的噪音发展达到了预期水平。好的一点是,系统在空闲时通常不会启动风扇,因此很安静。在负载情况下,它仍然比拥有更强大GPU的游戏竞争对手更安静;戴尔Inspiron,尽管它的GPU较弱,但运行起来并不安静。
风扇本身对我们来说有点太高调了,但烦人的因素仍然在限制范围内。
Noise level
| Idle |
| 23 / 23 / 23 dB(A) |
| Load |
| 35.66 / 48.13 dB(A) |
 | ||
30 dB silent 40 dB(A) audible 50 dB(A) loud |
||
min: | ||
| Lenovo ThinkBook 16p G2 ACH GeForce RTX 3060 Laptop GPU, R9 5900HX, WDC PC SN730 SDBPNTY-1T00 | Lenovo ThinkBook 15p Gen1 4K GeForce GTX 1650 Ti Max-Q, i7-10750H, WDC PC SN730 SDBPNTY-1T00 | Dell Inspiron 16 Plus 7610 GeForce RTX 3050 4GB Laptop GPU, i7-11800H, Kingston OM3PDP3512B | Razer Blade 15 Base Edition 2021, i7-10750H RTX 3060 GeForce RTX 3060 Laptop GPU, i7-10750H, Samsung SSD PM981a MZVLB512HBJQ | Alienware m15 R5 Ryzen Edition GeForce RTX 3060 Laptop GPU, R7 5800H, Toshiba KBG40ZNS512G NVMe | Schenker XMG Core 15 Ampere GeForce RTX 3060 Laptop GPU, R7 4800H, Samsung SSD 970 EVO Plus 1TB | |
|---|---|---|---|---|---|---|
| Noise | -12% | -9% | -8% | -14% | -14% | |
| off / environment * (dB) | 23 | 28.7 -25% | 24.4 -6% | 25.3 -10% | 24 -4% | 24 -4% |
| Idle Minimum * (dB) | 23 | 28.7 -25% | 24.4 -6% | 25.4 -10% | 24 -4% | 26 -13% |
| Idle Average * (dB) | 23 | 28.7 -25% | 24.4 -6% | 25.4 -10% | 25 -9% | 28 -22% |
| Idle Maximum * (dB) | 23 | 28.7 -25% | 24.4 -6% | 25.4 -10% | 35 -52% | 30 -30% |
| Load Average * (dB) | 35.66 | 34.8 2% | 48.3 -35% | 42.5 -19% | 44 -23% | 42 -18% |
| Witcher 3 ultra * (dB) | 48.7 | 43.6 10% | 48.9 -0% | 42 14% | 48 1% | 50 -3% |
| Load Maximum * (dB) | 48.13 | 45.6 5% | 48.9 -2% | 52.2 -8% | 50 -4% | 52 -8% |
* ... smaller is better
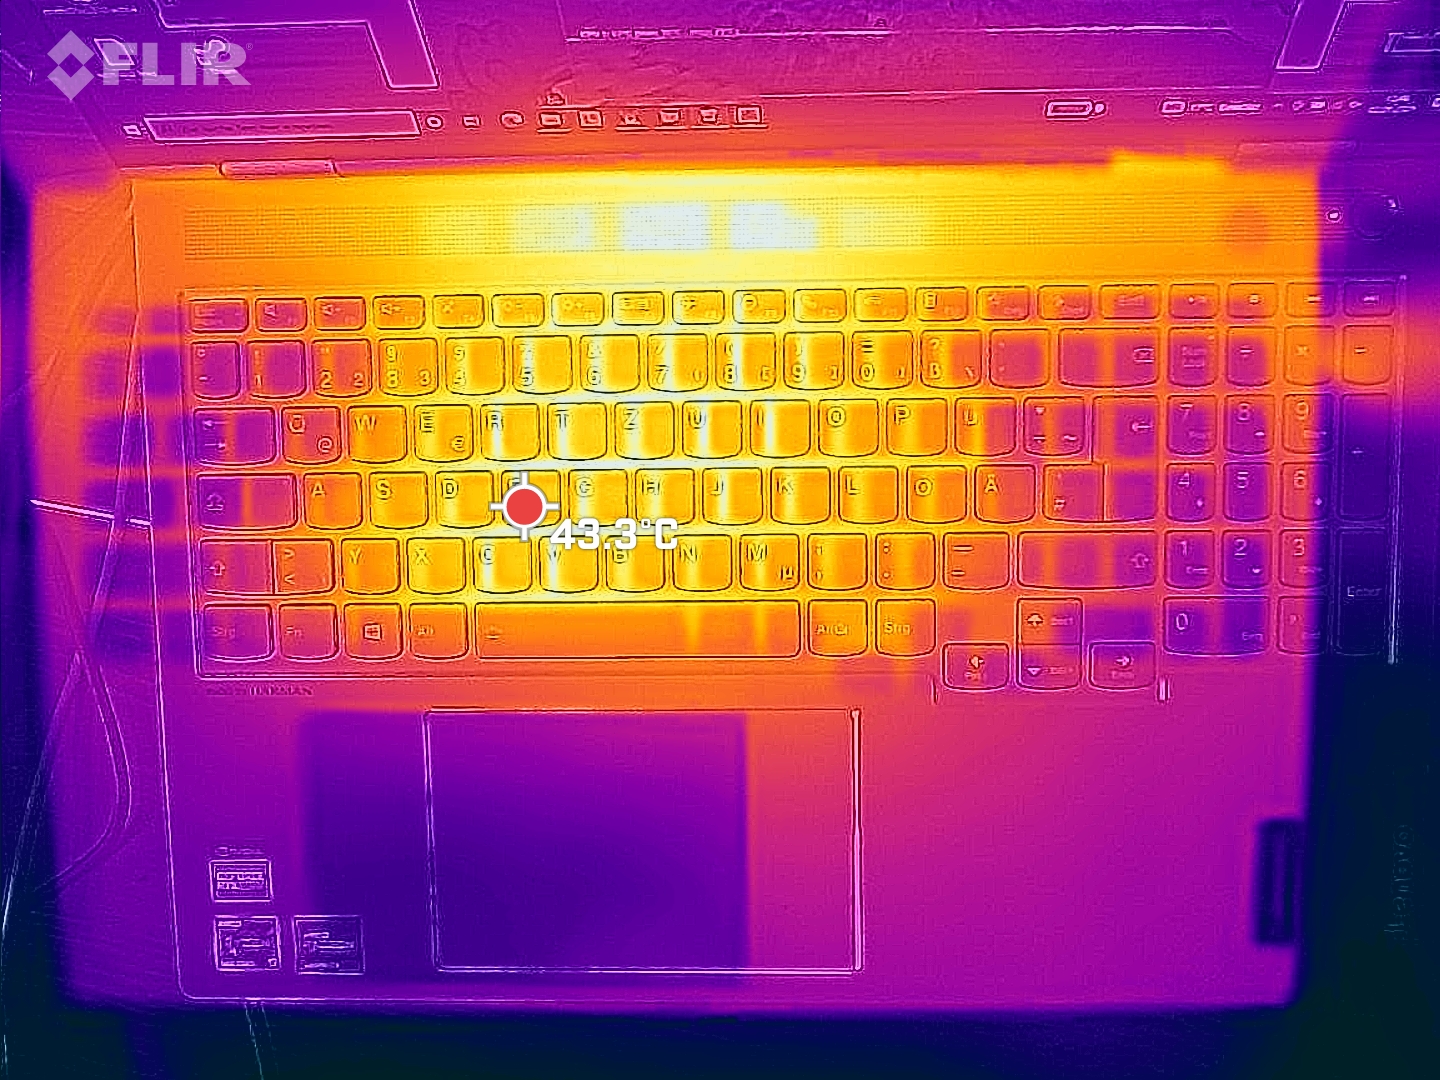
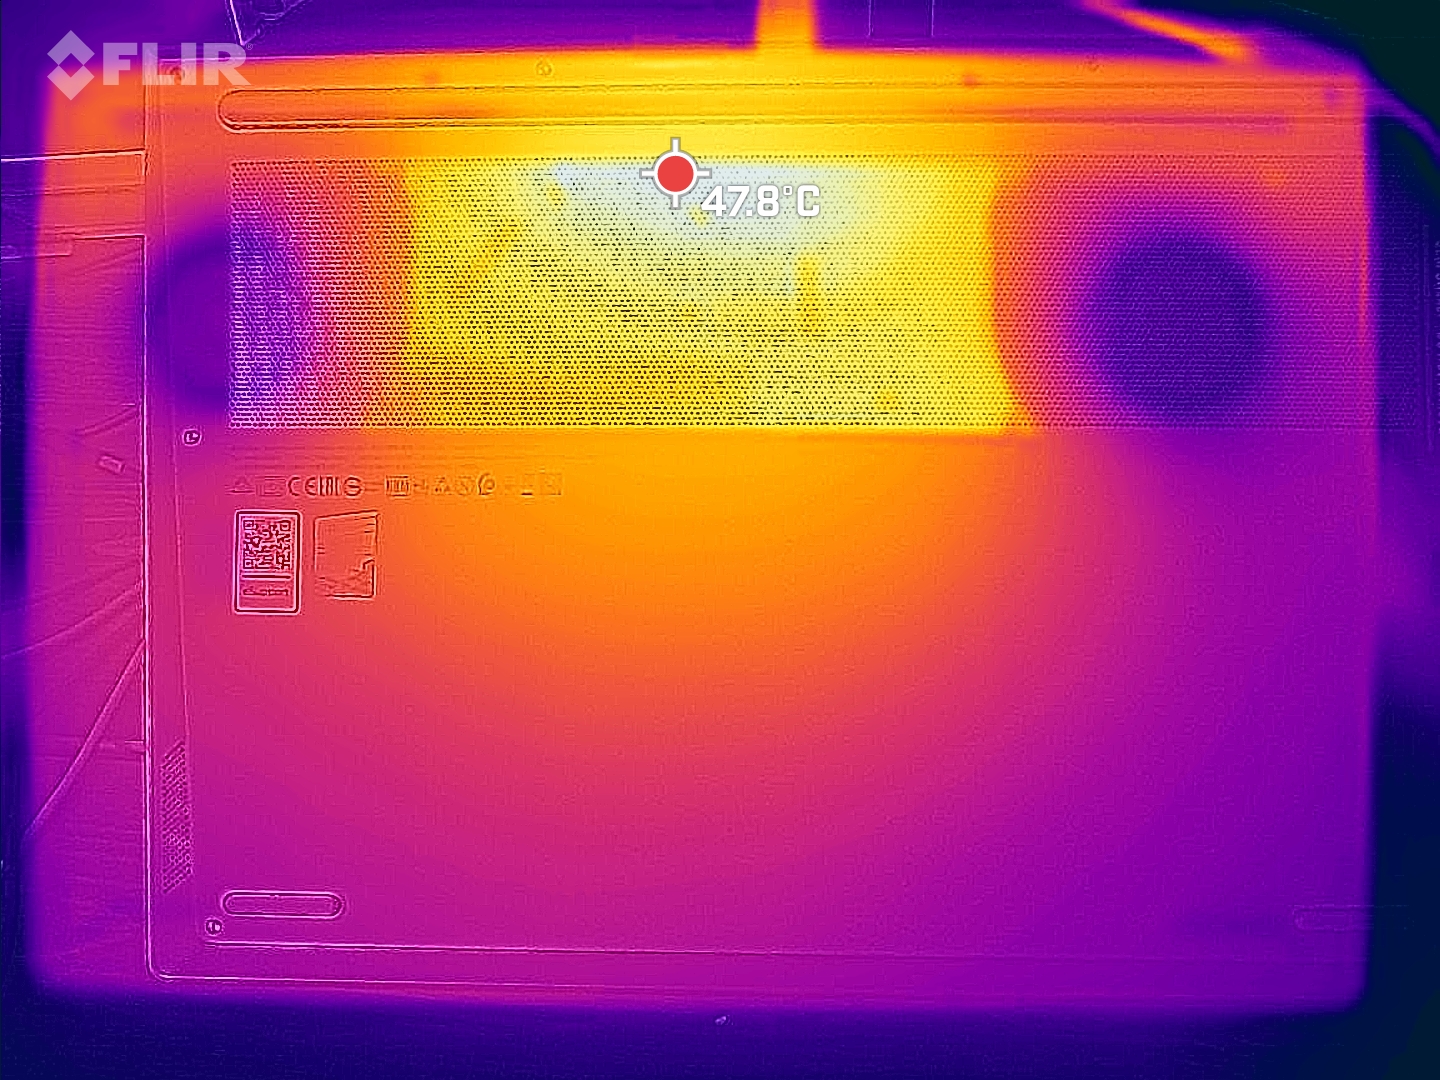
温度
显示屏中间有一些热点,在压力测试或我们的TheWitcher 3测试中,温度可以达到50 °C(约122 °F)(顶部)到53 °C(约127 °F)(底部)。掌托区的温度相对较低,刚刚超过30°C(约86°F),但WASD键的温度可以达到45°C(约113°F)。Razer Blade在负载下仍然略微凉爽,而Alienware则明显变热;除此之外,竞争对手在此方面的表现非常接近。
(-) The maximum temperature on the upper side is 50 °C / 122 F, compared to the average of 36.8 °C / 98 F, ranging from 21 to 71 °C for the class Multimedia.
(-) The bottom heats up to a maximum of 53 °C / 127 F, compared to the average of 39.1 °C / 102 F
(+) In idle usage, the average temperature for the upper side is 28.1 °C / 83 F, compared to the device average of 31.3 °C / 88 F.
(-) Playing The Witcher 3, the average temperature for the upper side is 40.6 °C / 105 F, compared to the device average of 31.3 °C / 88 F.
(+) The palmrests and touchpad are reaching skin temperature as a maximum (34 °C / 93.2 F) and are therefore not hot.
(-) The average temperature of the palmrest area of similar devices was 28.7 °C / 83.7 F (-5.3 °C / -9.5 F).
| Lenovo ThinkBook 16p G2 ACH GeForce RTX 3060 Laptop GPU, R9 5900HX, WDC PC SN730 SDBPNTY-1T00 | Lenovo ThinkBook 15p Gen1 4K GeForce GTX 1650 Ti Max-Q, i7-10750H, WDC PC SN730 SDBPNTY-1T00 | Dell Inspiron 16 Plus 7610 GeForce RTX 3050 4GB Laptop GPU, i7-11800H, Kingston OM3PDP3512B | Razer Blade 15 Base Edition 2021, i7-10750H RTX 3060 GeForce RTX 3060 Laptop GPU, i7-10750H, Samsung SSD PM981a MZVLB512HBJQ | Alienware m15 R5 Ryzen Edition GeForce RTX 3060 Laptop GPU, R7 5800H, Toshiba KBG40ZNS512G NVMe | Schenker XMG Core 15 Ampere GeForce RTX 3060 Laptop GPU, R7 4800H, Samsung SSD 970 EVO Plus 1TB | |
|---|---|---|---|---|---|---|
| Heat | 19% | -7% | -6% | -18% | 3% | |
| Maximum Upper Side * (°C) | 50 | 41.2 18% | 46.4 7% | 45.2 10% | 62 -24% | 48 4% |
| Maximum Bottom * (°C) | 53 | 47 11% | 54.8 -3% | 48 9% | 61 -15% | 50 6% |
| Idle Upper Side * (°C) | 29 | 22.6 22% | 31.4 -8% | 34.4 -19% | 36 -24% | 28 3% |
| Idle Bottom * (°C) | 30 | 23.1 23% | 36.6 -22% | 37.2 -24% | 33 -10% | 31 -3% |
* ... smaller is better
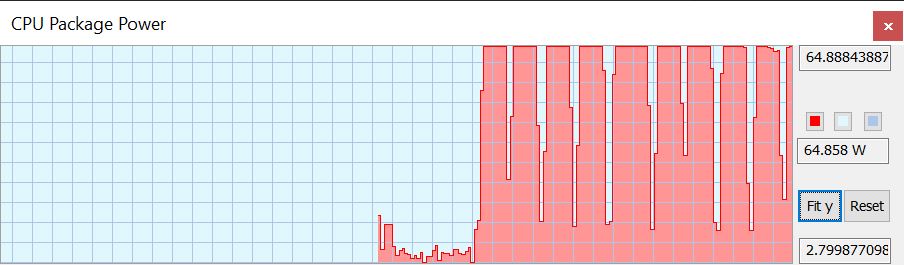
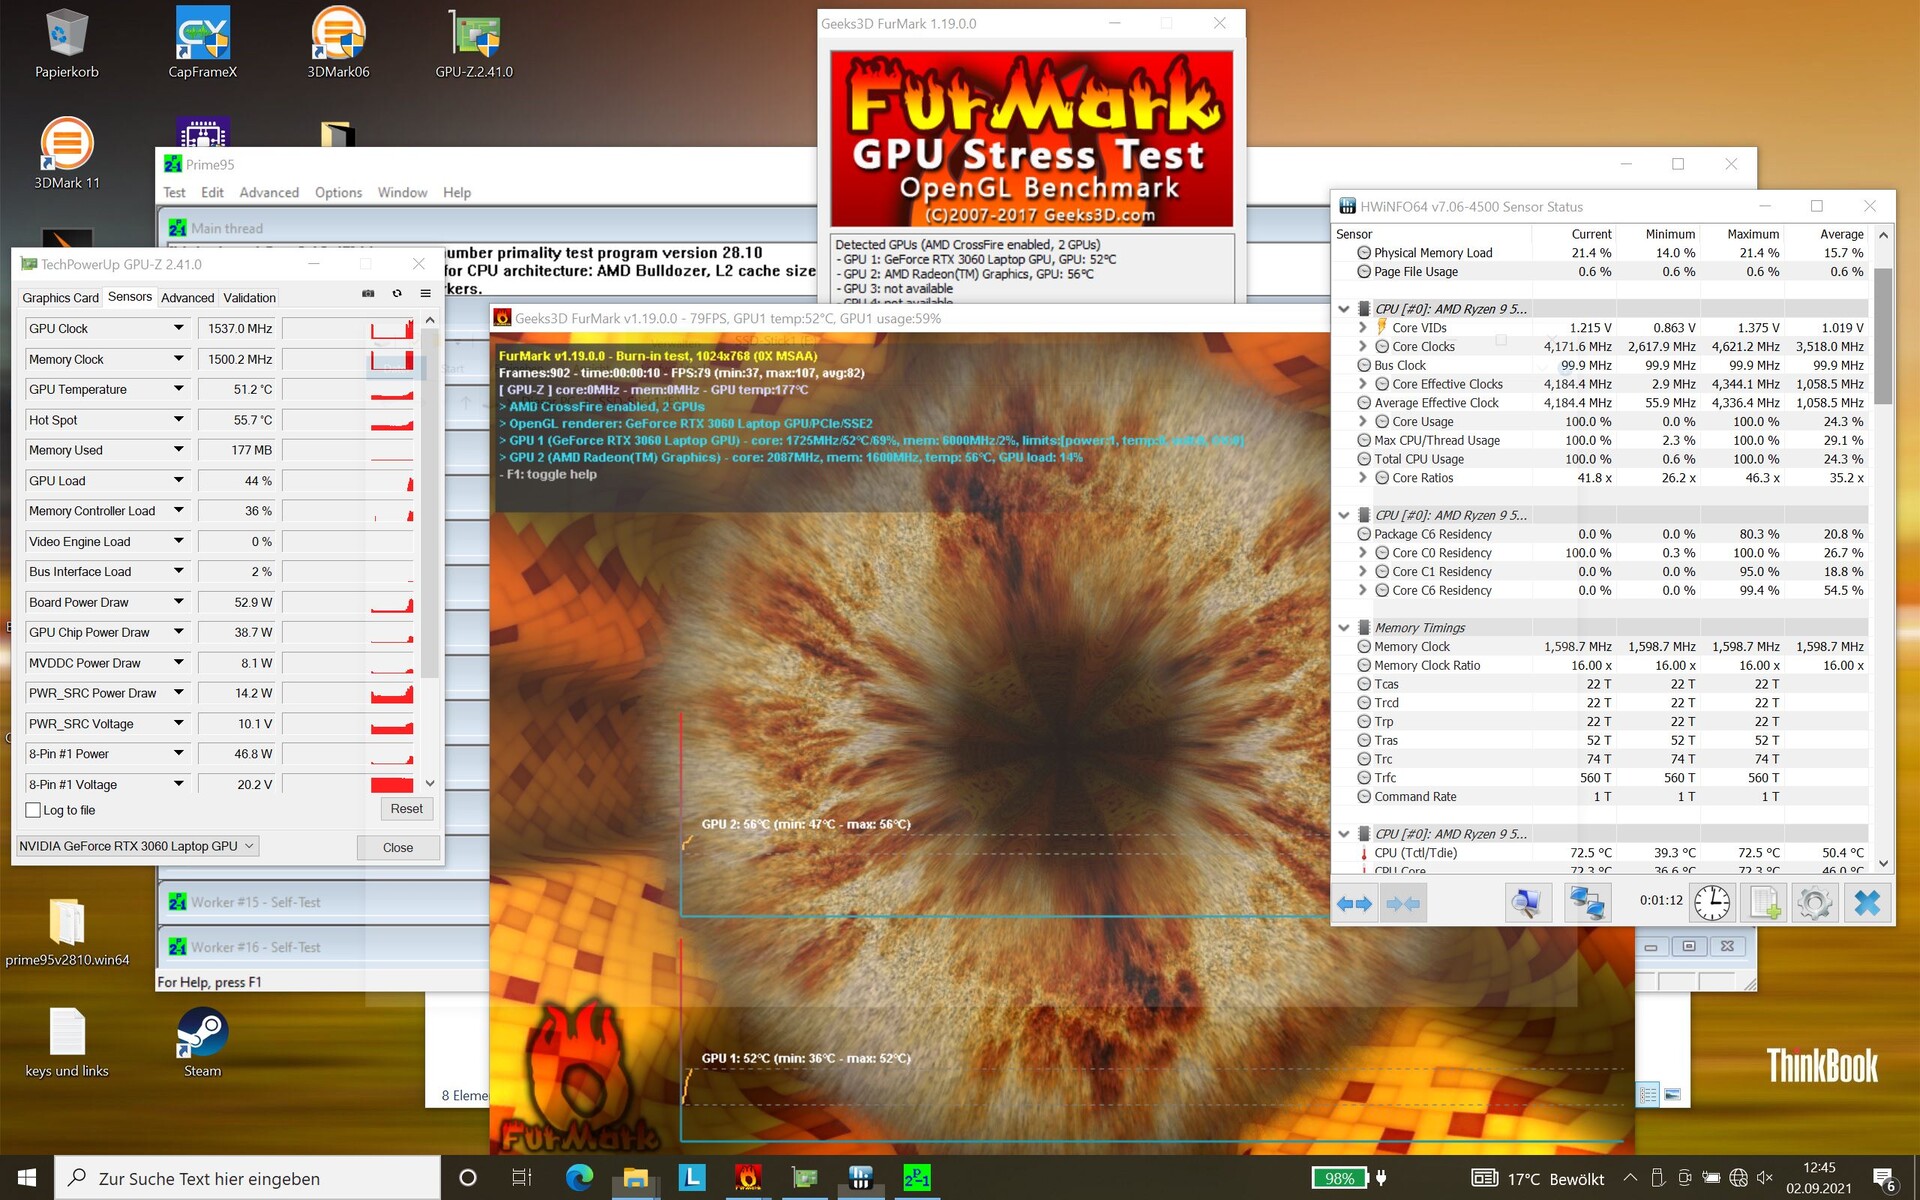
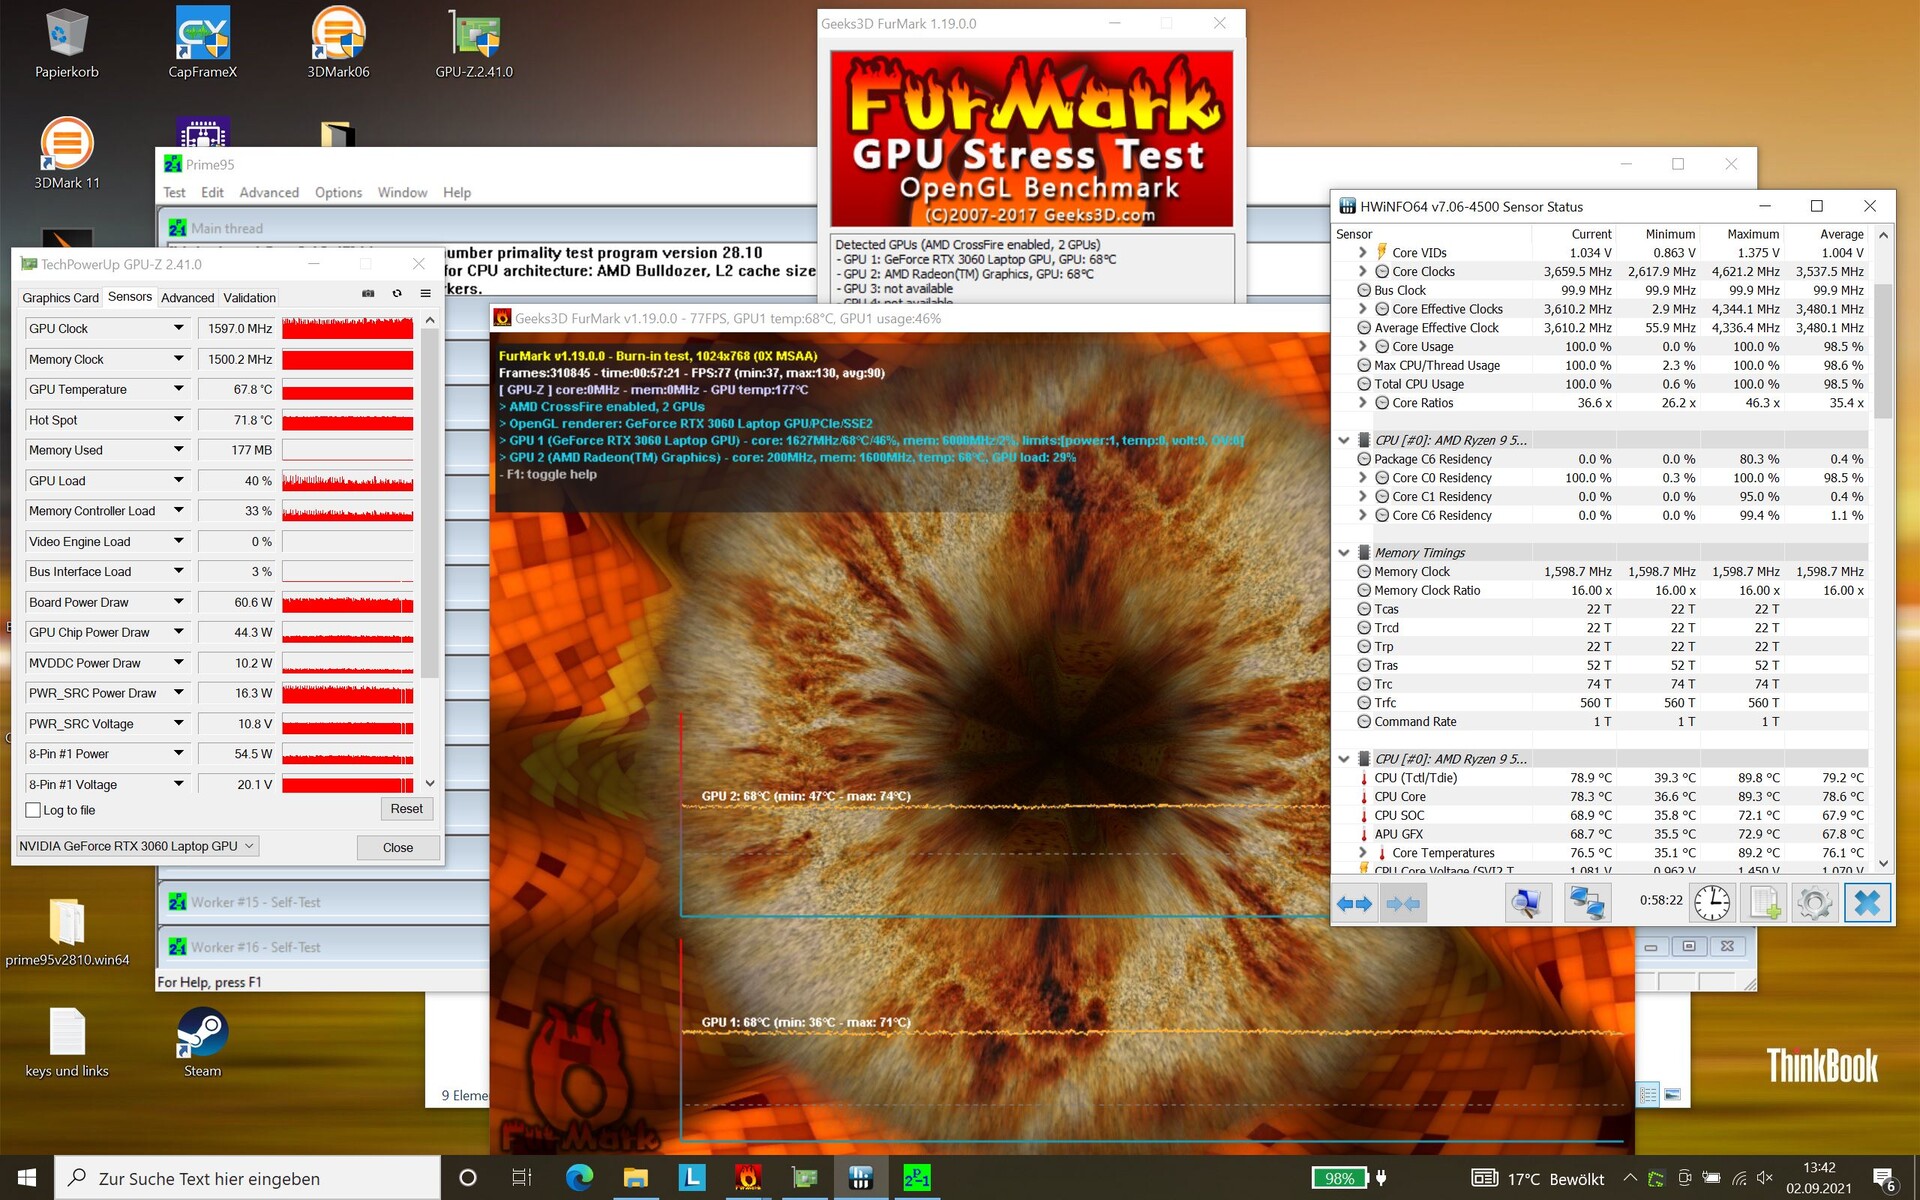
CPU核心以大约4.2GHz的频率开始压力测试。在接下来的一个小时里,时钟速率下降,最终在3.4和4GHz左右波动。核心温度始终保持在90℃(约194°F)以下。
在整个测试过程中,GPU时钟速率在1.3和1.8GHz之间波动。同时,显卡发热到75°C(约167°F),这个数值不是一个问题。3DMark 11的新运行显示,硬件从压力中迅速恢复过来,没有观察到明显的性能损失。
发言人
扬声器以平衡的方式再现了中音和高音,但低音的再现充其量是平庸的,这也是经常发生的情况。此外,扬声器的音量还可以再大一些。对于外部音频设备,在模拟端口方面,只有耳机和麦克风的组合连接可用。
Lenovo ThinkBook 16p G2 ACH audio analysis
(±) | speaker loudness is average but good (74.8 dB)
Bass 100 - 315 Hz
(±) | reduced bass - on average 14.7% lower than median
(±) | linearity of bass is average (11.1% delta to prev. frequency)
Mids 400 - 2000 Hz
(+) | balanced mids - only 4.2% away from median
(+) | mids are linear (5.5% delta to prev. frequency)
Highs 2 - 16 kHz
(+) | balanced highs - only 2.7% away from median
(+) | highs are linear (6.6% delta to prev. frequency)
Overall 100 - 16.000 Hz
(+) | overall sound is linear (14.9% difference to median)
Compared to same class
» 35% of all tested devices in this class were better, 5% similar, 60% worse
» The best had a delta of 5%, average was 17%, worst was 45%
Compared to all devices tested
» 20% of all tested devices were better, 4% similar, 76% worse
» The best had a delta of 4%, average was 24%, worst was 134%
Dell Inspiron 16 Plus 7610 audio analysis
(±) | speaker loudness is average but good (75.3 dB)
Bass 100 - 315 Hz
(±) | reduced bass - on average 14.4% lower than median
(±) | linearity of bass is average (8.4% delta to prev. frequency)
Mids 400 - 2000 Hz
(±) | higher mids - on average 5.6% higher than median
(±) | linearity of mids is average (7.9% delta to prev. frequency)
Highs 2 - 16 kHz
(+) | balanced highs - only 3.9% away from median
(±) | linearity of highs is average (7.2% delta to prev. frequency)
Overall 100 - 16.000 Hz
(±) | linearity of overall sound is average (19.3% difference to median)
Compared to same class
» 62% of all tested devices in this class were better, 8% similar, 30% worse
» The best had a delta of 5%, average was 17%, worst was 45%
Compared to all devices tested
» 47% of all tested devices were better, 8% similar, 46% worse
» The best had a delta of 4%, average was 24%, worst was 134%
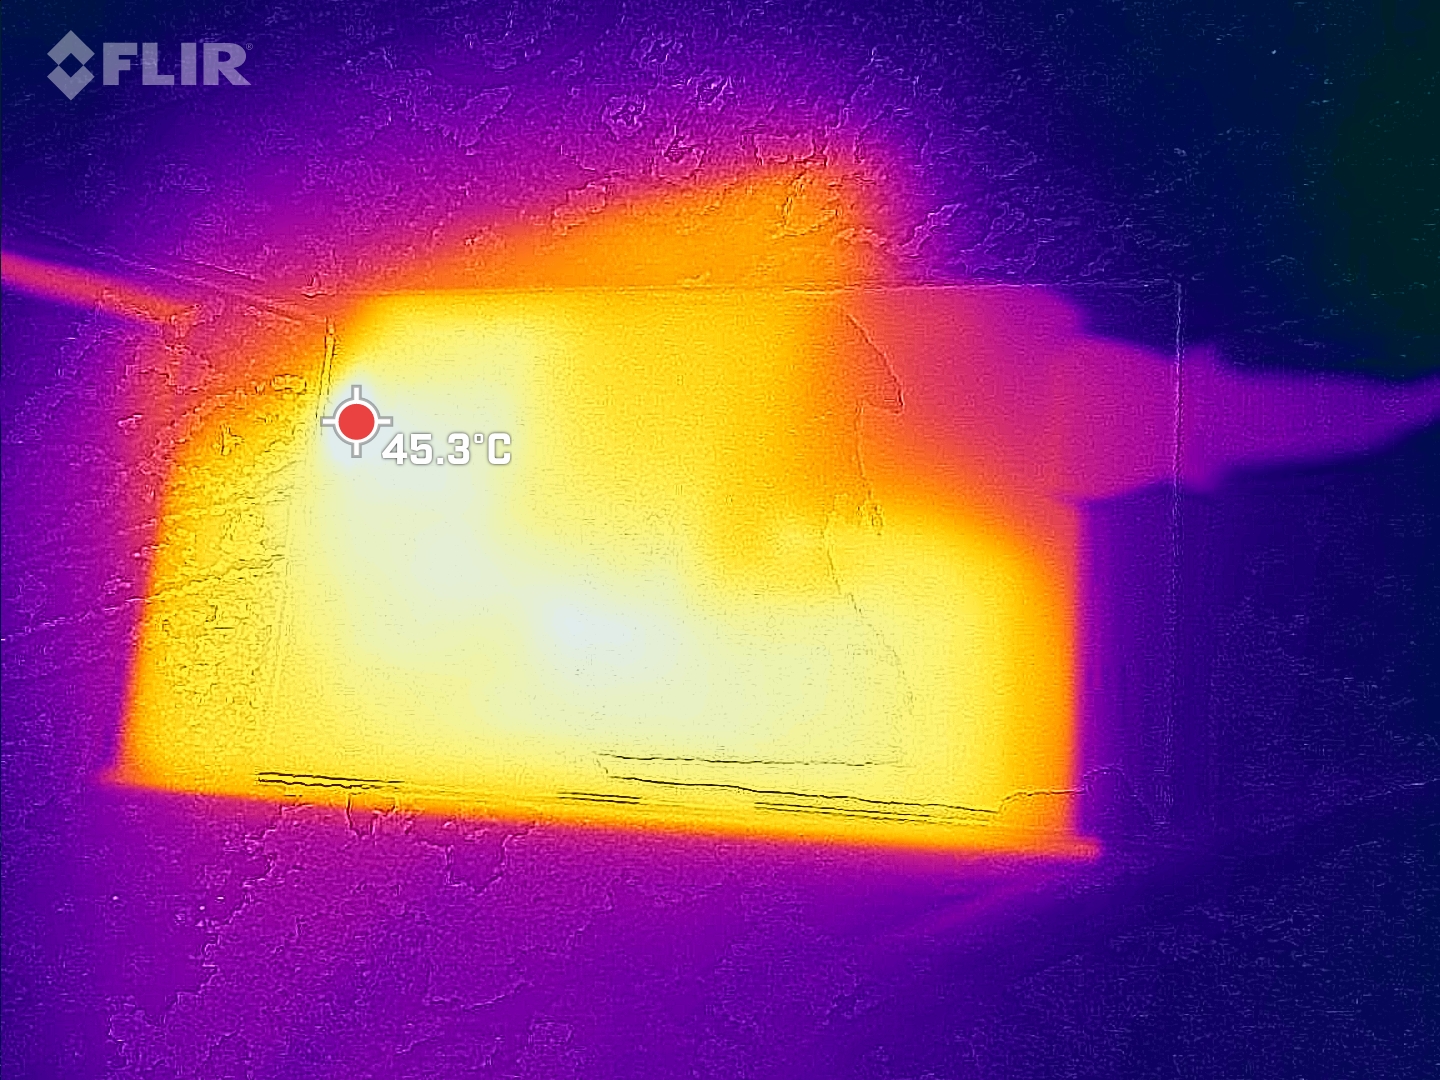
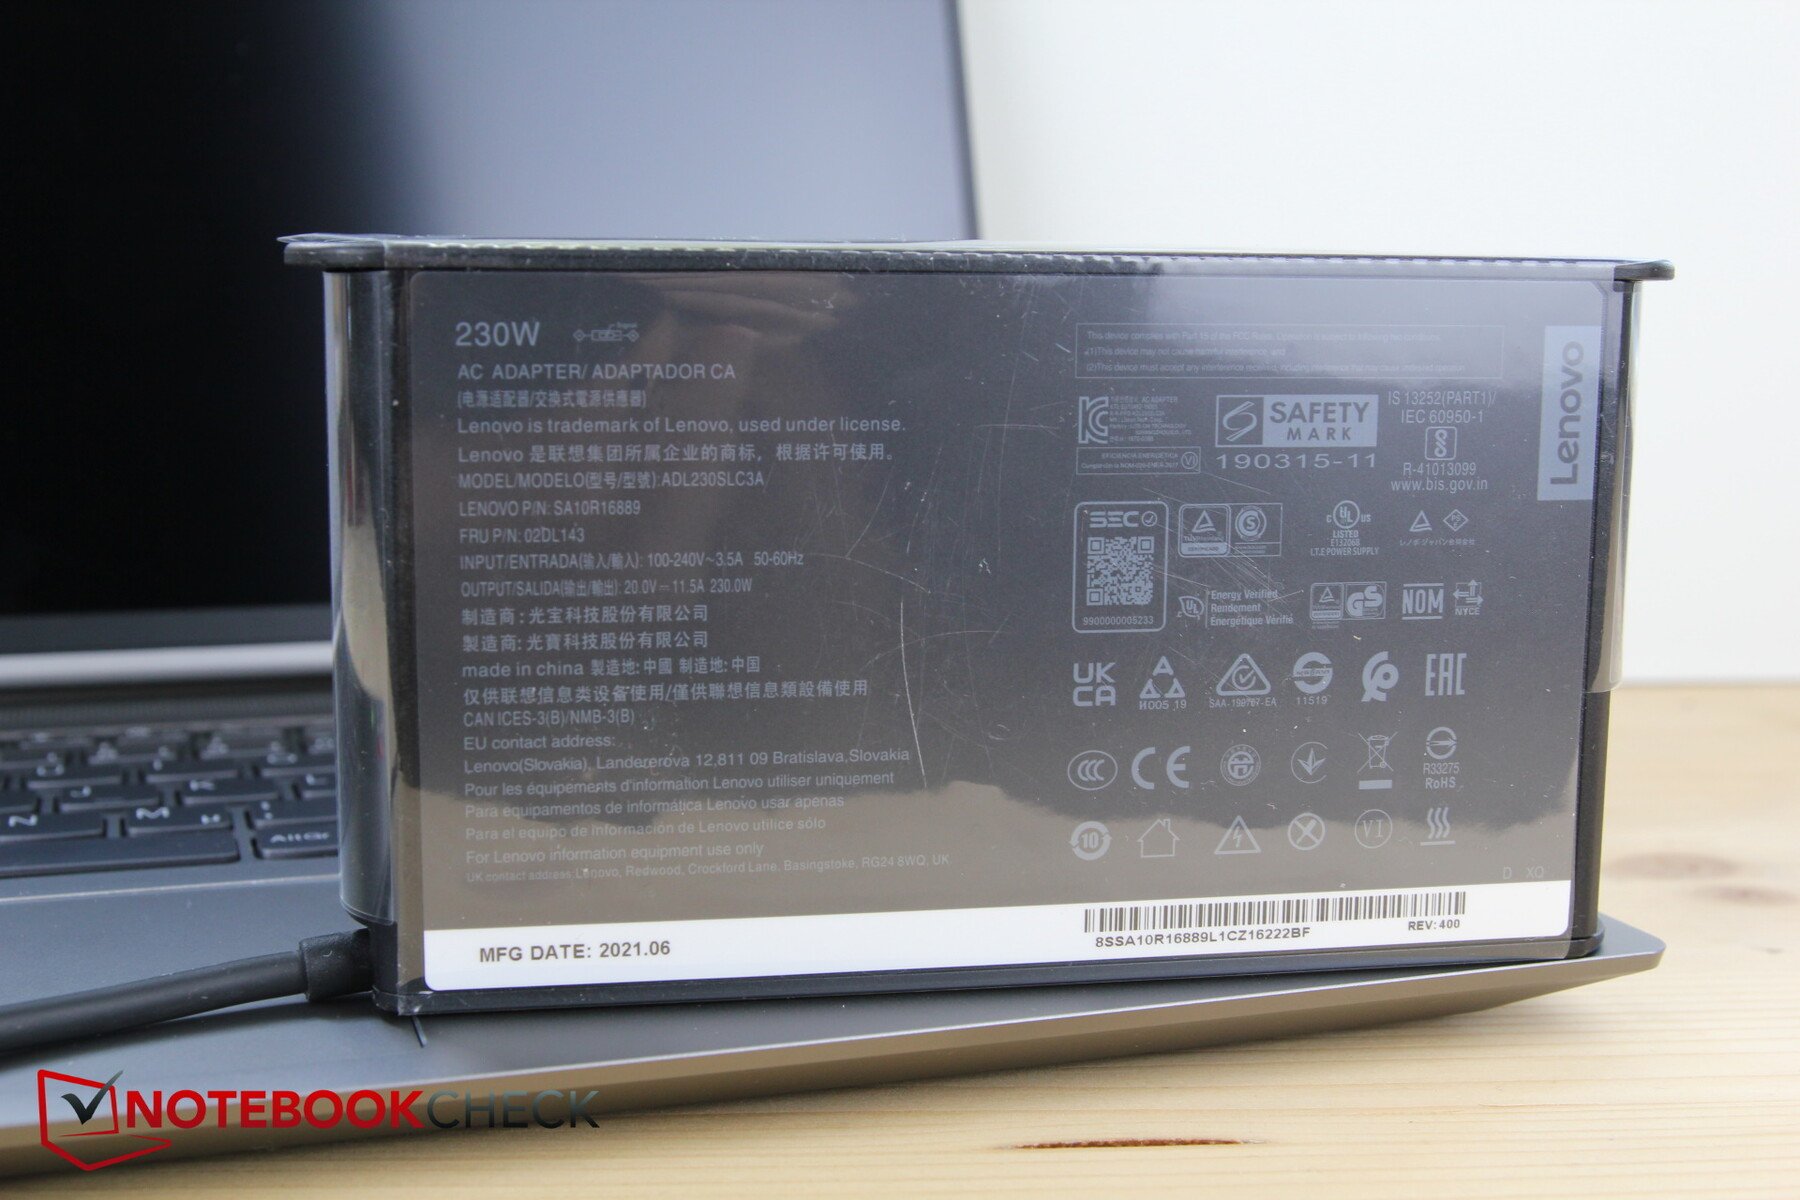
能源管理 - 合理的消耗,良好的电池寿命
能源消耗
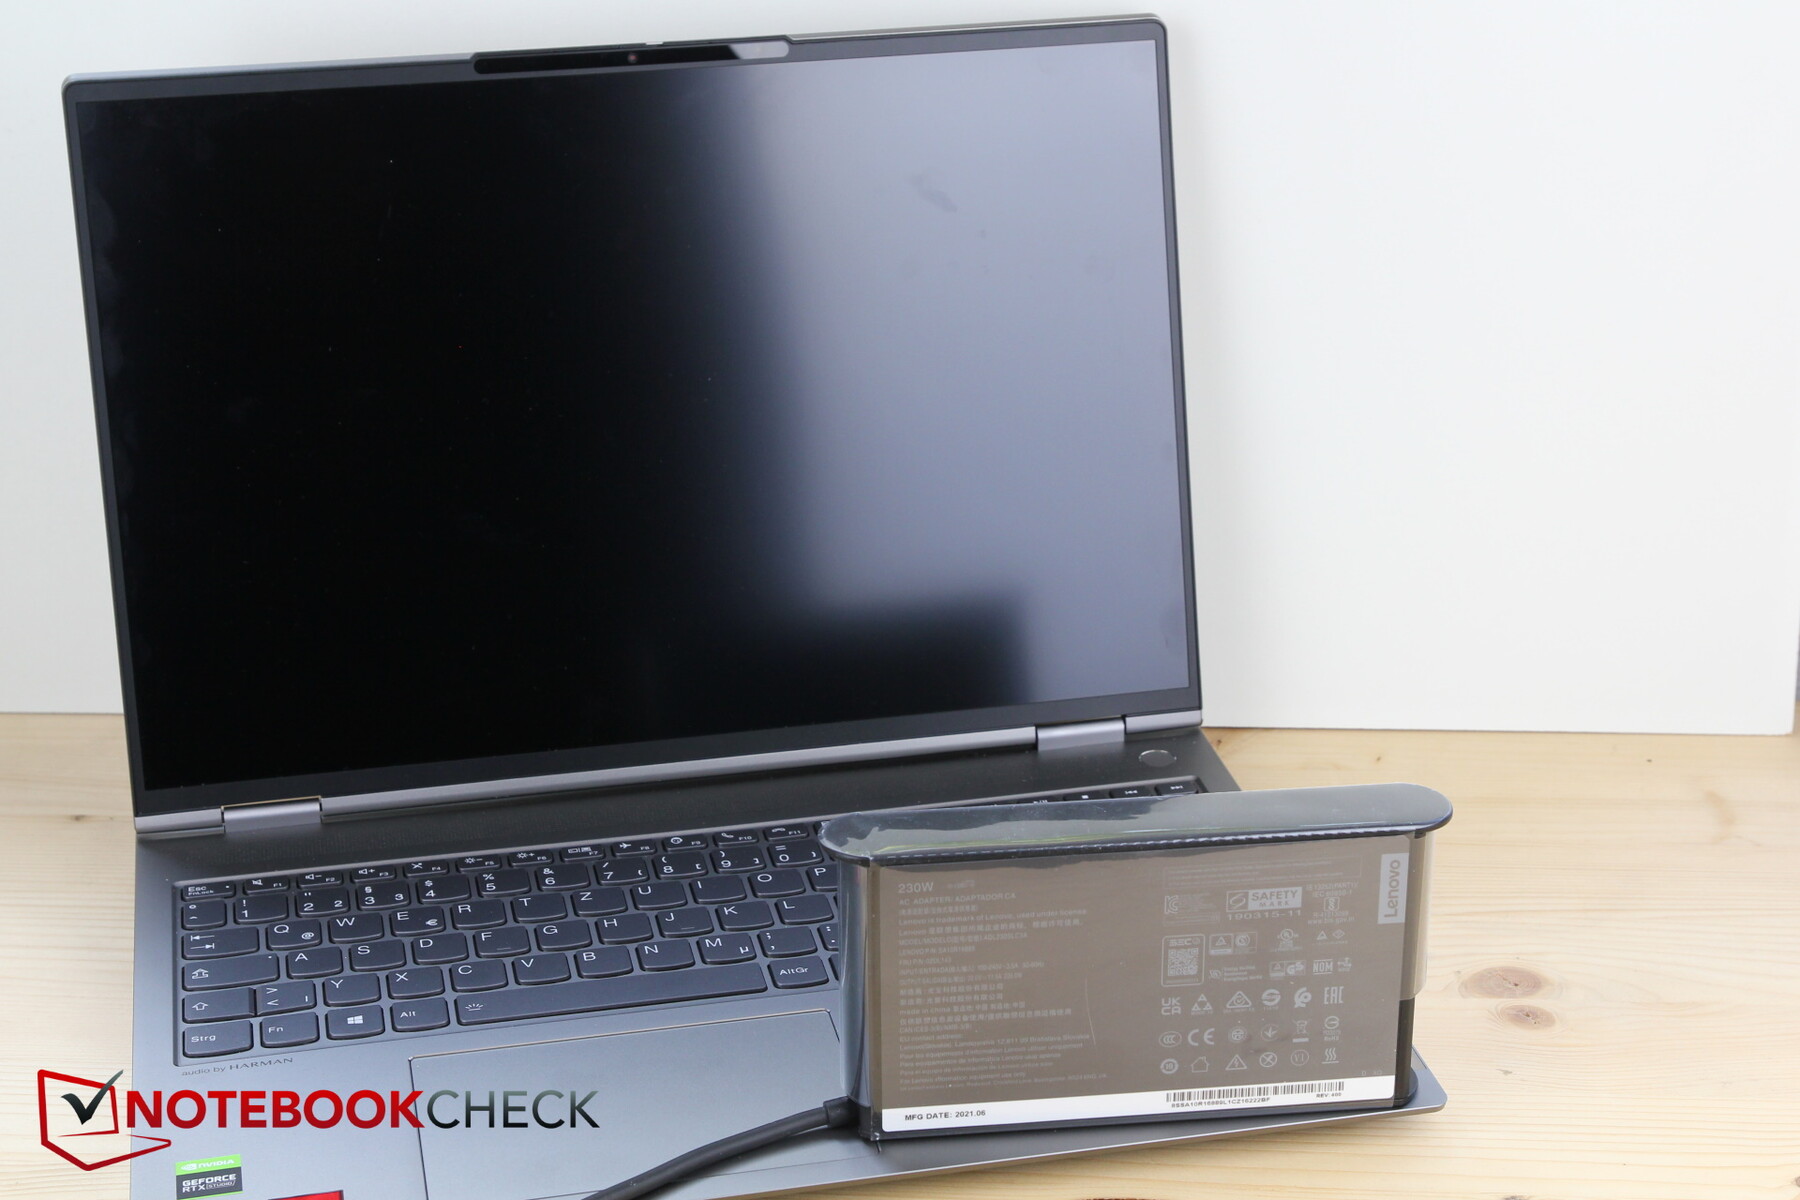
在消耗方面,这款笔记本电脑在配备RTX 3050的Inspiron和游戏机型之间排名。在空闲使用时,该系统的消耗量比竞争对手略高。在负载情况下,显卡的低TGP降低了最大消耗,暂时达到142瓦的最大值。电源适配器提供230瓦的功率,所以远远没有面临任何问题。
| Off / Standby | |
| Idle | |
| Load |
|
Key:
min: | |
| Lenovo ThinkBook 16p G2 ACH R9 5900HX, GeForce RTX 3060 Laptop GPU, WDC PC SN730 SDBPNTY-1T00, IPS, 2560x1600, 16" | Lenovo ThinkBook 15p Gen1 4K i7-10750H, GeForce GTX 1650 Ti Max-Q, WDC PC SN730 SDBPNTY-1T00, IPS, 3840x2160, 15.6" | Dell Inspiron 16 Plus 7610 i7-11800H, GeForce RTX 3050 4GB Laptop GPU, Kingston OM3PDP3512B, IPS, 3072x1920, 16" | Razer Blade 15 Base Edition 2021, i7-10750H RTX 3060 i7-10750H, GeForce RTX 3060 Laptop GPU, Samsung SSD PM981a MZVLB512HBJQ, IPS, 1920x1080, 15.6" | Alienware m15 R5 Ryzen Edition R7 5800H, GeForce RTX 3060 Laptop GPU, Toshiba KBG40ZNS512G NVMe, IPS, 1920x1080, 15.6" | Schenker XMG Core 15 Ampere R7 4800H, GeForce RTX 3060 Laptop GPU, Samsung SSD 970 EVO Plus 1TB, IPS, 2560x1440, 15.6" | Average NVIDIA GeForce RTX 3060 Laptop GPU | Average of class Multimedia | |
|---|---|---|---|---|---|---|---|---|
| Power Consumption | 22% | 15% | -19% | -25% | -18% | -12% | 35% | |
| Idle Minimum * (Watt) | 13.2 | 4.3 67% | 7.7 42% | 11.7 11% | 11 17% | 11 17% | 10.4 ? 21% | 5.71 ? 57% |
| Idle Average * (Watt) | 17 | 10.8 36% | 10.7 37% | 16 6% | 14 18% | 14 18% | 14.5 ? 15% | 10.1 ? 41% |
| Idle Maximum * (Watt) | 18.6 | 13.2 29% | 16.8 10% | 29.3 -58% | 25 -34% | 20 -8% | 21.4 ? -15% | 12.4 ? 33% |
| Load Average * (Watt) | 88.8 | 103.2 -16% | 100.39 -13% | 95.6 -8% | 123 -39% | 94 -6% | 109.3 ? -23% | 65 ? 27% |
| Witcher 3 ultra * (Watt) | 123 123 | 94 24% | 108 12% | 141.3 -15% | 176 -43% | 167 -36% | ||
| Load Maximum * (Watt) | 132 | 140.2 -6% | 129 2% | 197 -49% | 226 -71% | 251 -90% | 206 ? -56% | 112.2 ? 15% |
* ... smaller is better
Energy consumption during The Witcher 3 / Stress test
电池寿命
联想使用71Wh的电池。这比15p中的56Wh电池大得多,但戴尔Inspiron和Alienware的电池是86Wh。前者在Wi-Fi测试中多持续了约一个小时,但Alienware尽管电池较大,但持续时间却少了3小时。对于这种配置的笔记本电脑来说,8:30小时的浏览和约7小时的观看视频是很好的速率。
| Lenovo ThinkBook 16p G2 ACH R9 5900HX, GeForce RTX 3060 Laptop GPU, 71 Wh | Lenovo ThinkBook 15p Gen1 4K i7-10750H, GeForce GTX 1650 Ti Max-Q, 57 Wh | Dell Inspiron 16 Plus 7610 i7-11800H, GeForce RTX 3050 4GB Laptop GPU, 86 Wh | Razer Blade 15 Base Edition 2021, i7-10750H RTX 3060 i7-10750H, GeForce RTX 3060 Laptop GPU, 65 Wh | Alienware m15 R5 Ryzen Edition R7 5800H, GeForce RTX 3060 Laptop GPU, 86 Wh | Schenker XMG Core 15 Ampere R7 4800H, GeForce RTX 3060 Laptop GPU, 62 Wh | Average of class Multimedia | |
|---|---|---|---|---|---|---|---|
| Battery runtime | 1% | 41% | -35% | -23% | -29% | 53% | |
| H.264 (h) | 7 | 7.3 4% | 8.8 26% | 6 -14% | 16.4 ? 134% | ||
| WiFi v1.3 (h) | 8.5 | 9.8 15% | 9.9 16% | 4.8 -44% | 5.1 -40% | 5.8 -32% | 12 ? 41% |
| Load (h) | 2 | 1.7 -15% | 3.3 65% | 1.5 -25% | 0.9 -55% | 1.2 -40% | 1.675 ? -16% |
| Reader / Idle (h) | 20.5 | 7.8 | 14.7 | 7.8 | 25.2 ? | ||
| Witcher 3 ultra (h) | 1.6 |
Pros
Cons
评语--不是游戏笔记本电脑,这很好
你是否喜欢ThinkBook 16p完全取决于你自己的要求和期望。如果你因为RTX 3060而期待一台面向性能的游戏笔记本,你可能会感到失望。尽管ThinkBook拥有强大的硬件,但它并不打算成为一台游戏笔记本电脑,而是成为面向性能的商业用户甚至创作者的工作主力。你也可以在ThinkBook上玩游戏,没有任何问题,但有更好的游戏笔记本可以从RTX 3060中获得更多的性能,而且可以提供更高的刷新率。
作为回报,ThinkBook也规避了游戏笔记本的各种弊端。由于RTX 3060的速度有所减慢,它的电池寿命很好,而且不会出现令人讨厌的噪音或发热。创作者可能肯定会喜欢16:10的显示屏,尽管如果有额外的4K选项就更好了。
然而,这台工作母机不得不为其缺乏端口而受到批评。由于缺乏端口,通过局域网快速上网只能使用适配器,而外部显示器也只能使用适配器或集线器连接;这一方面限制了移动性,另一方面也使额外的购买成为必要--毕竟,联想在盒子里不包括任何适配器。不过,ThinkBook 16p几乎必须配备一个集线器。
正确地说,ThinkBook 16p并不是作为游戏笔记本销售的,而是作为商务笔记本或创意专业人士的强大笔记本。其强大的硬件使其可用性相当普遍,但你必须接受两方面的妥协。
价格和可用性
在写这篇文章的时候,我们对联想ThinkBook 16p的确切测试配置似乎并不存在。目前,你可以找到一个版本的 AMD Ryzen 7 5800H,RTX 3060,16GB内存和1TB SSD,在制造商的网上商店售价2319美元。另外,你也可以等待其他配置,在Amazon或newegg,例如。
Lenovo ThinkBook 16p G2 ACH
- 09/10/2021 v7 (old)
Christian Hintze
Price comparison

