华硕Zenbook 14X OLED预生产单元回顾。这是很有冲击力的颜色!

华硕已将亮度作为2021年的首要任务。其许多笔记本电脑系列现在将默认配备OLED显示屏。这将OLED技术和3K/4K分辨率带入较低的价格范围。中端客户将开始认真考虑购买OLED面板,现在与没有OLED的设备的差异不再是500欧元(约581美元),而是只有200至300欧元(约232美元至约349美元)。
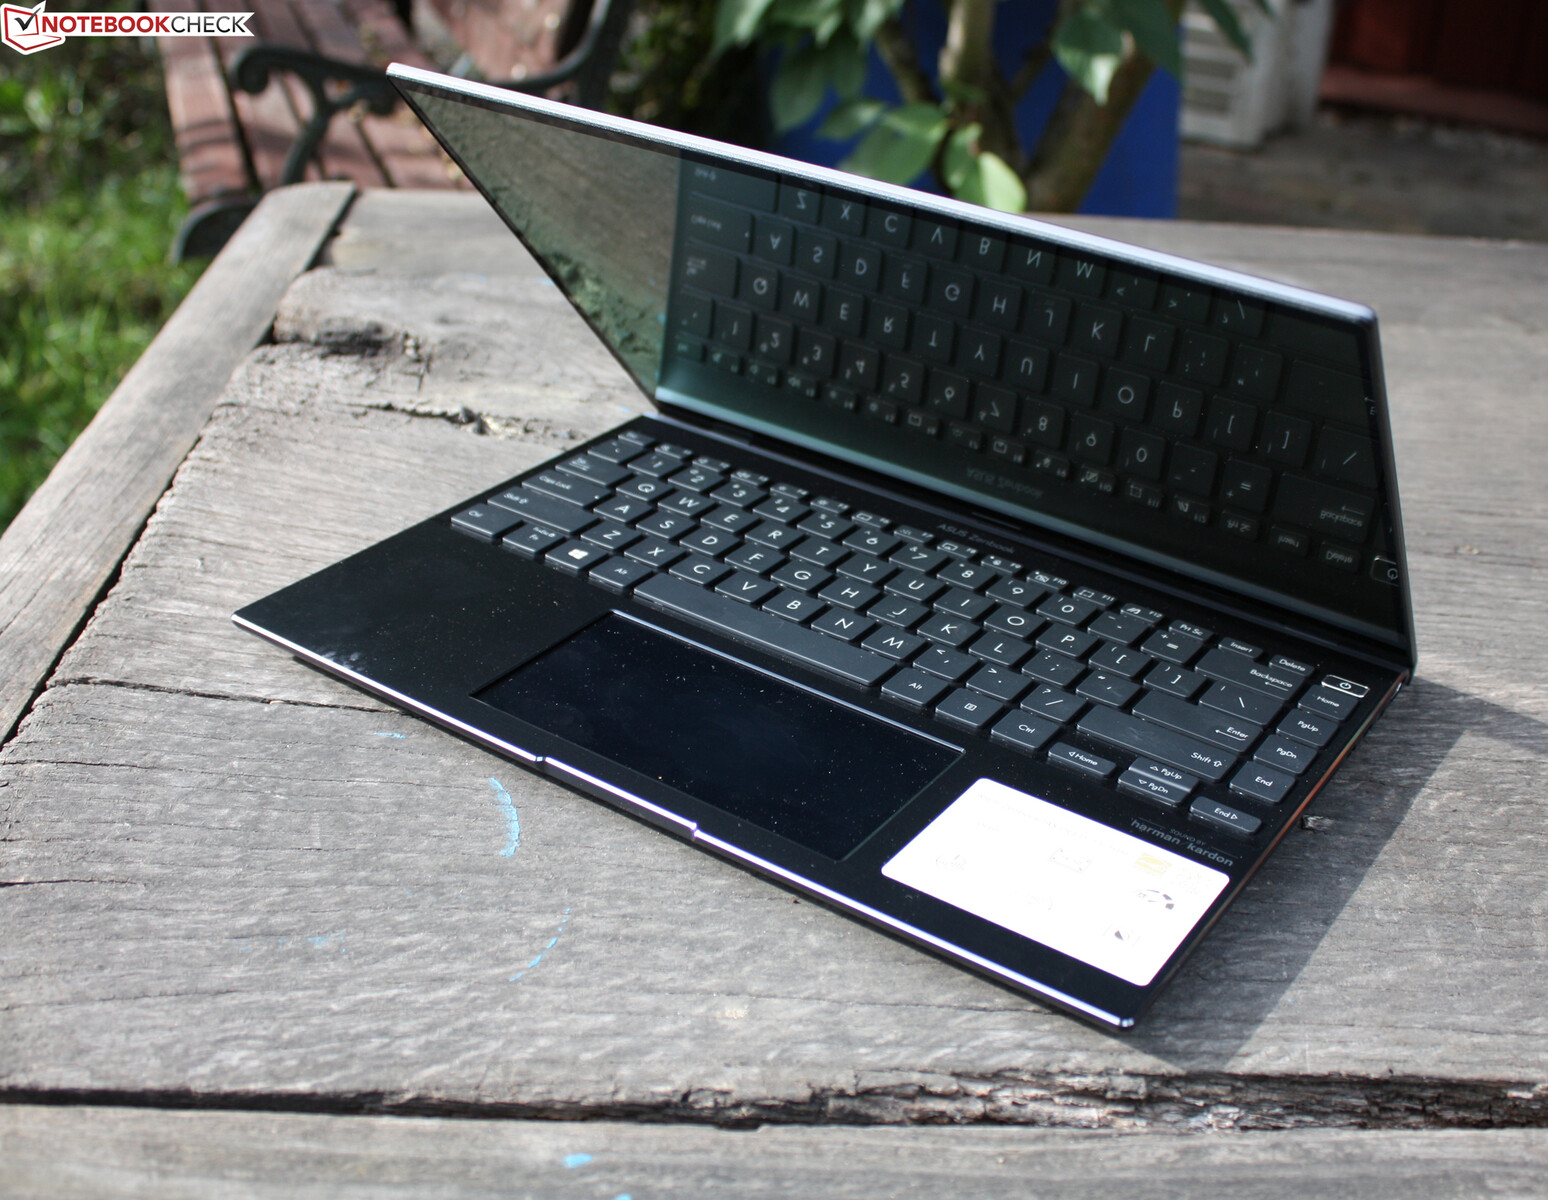
也就是说,华硕的Zenbook 14X并没有提供中档的硬件和做工。机箱具有高于平均水平的坚固性和质量。包括ScreenPad(ClickPad=第二块显示屏)在内的输入设备都是一流的,使用Core i7和GeForce MX450的性能在次笔记本联盟中几乎是顶级的。
然而,竞争对手也不甘示弱,提供了一个强大的对手,例如戴尔XPS 13 9310 OLED 。唯一的区别是没有DGPU吗?我们对Zenbook 14X只有赞美之词,还是有一些批评之处?请在我们的评论中找出答案。
Possible contenders in comparison
Rating | Date | Model | Weight | Height | Size | Resolution | Price |
|---|---|---|---|---|---|---|---|
v (old) | 10 / 2021 | Asus Zenbook 14X UX5400E i7-1165G7, GeForce MX450 | 1.4 kg | 16.9 mm | 14.00" | 2880x1800 | |
| 88.3 % v7 (old) | 06 / 2021 | Dell XPS 13 9310 OLED i7-1185G7, Iris Xe G7 96EUs | 1.2 kg | 14.8 mm | 13.40" | 3456x2160 | |
v (old) | 09 / 2021 | Asus ZenBook 13 OLED UM325UA R7 5700U, Vega 8 | 1.1 kg | 14.8 mm | 13.30" | 1920x1080 | |
| 86.5 % v7 (old) | 02 / 2021 | HP Envy 14-eb0010nr i5-1135G7, GeForce GTX 1650 Ti Max-Q | 1.6 kg | 17.9 mm | 14.00" | 1920x1200 | |
| 85.3 % v7 (old) | HP Envy 13-ba1475ng i7-1165G7, GeForce MX450 | 1.3 kg | 17 mm | 13.30" | 1920x1080 | ||
| 84.1 % v7 (old) | 02 / 2021 | Asus Zenbook 14 UX435EG i7-1165G7, GeForce MX450 | 1.3 kg | 16.9 mm | 14.00" | 1920x1080 | |
| 84.2 % v7 (old) | 04 / 2021 | Lenovo IdeaPad Slim 9i 14ITL5 i7-1165G7, Iris Xe G7 96EUs | 1.3 kg | 14.6 mm | 14.00" | 3840x2160 | |
| 82.2 % v7 (old) | MSI Modern 14 B11SB-085 i7-1165G7, GeForce MX450 | 1.3 kg | 16.9 mm | 14.00" | 1920x1080 |
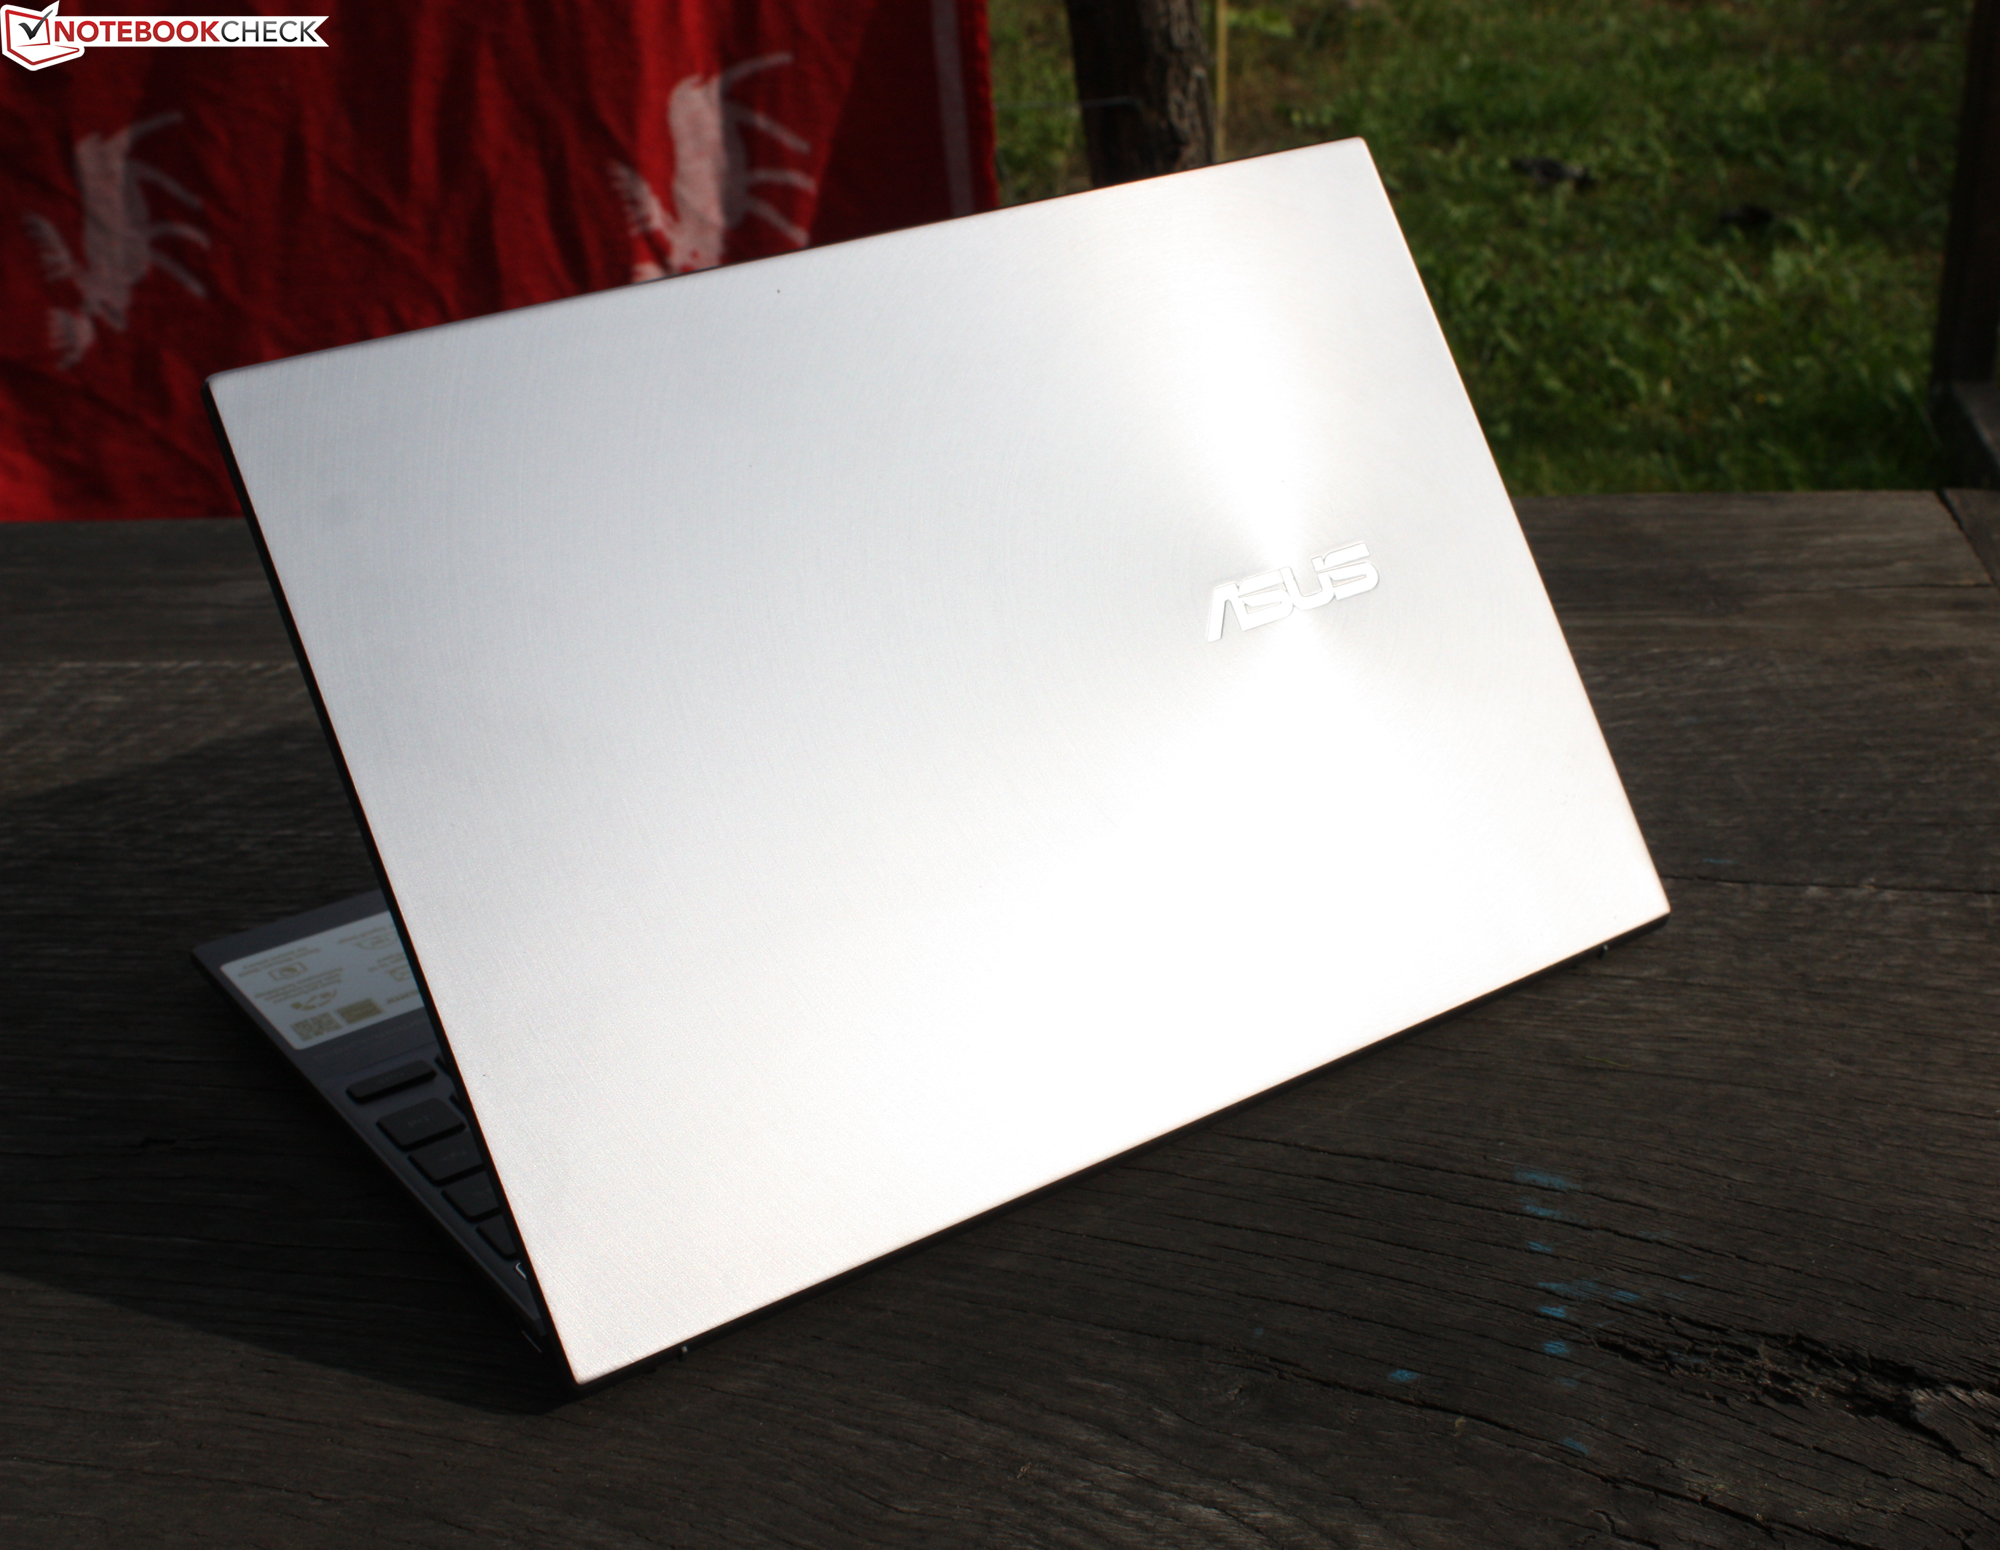
外壳 - 高品质的笔记本电脑
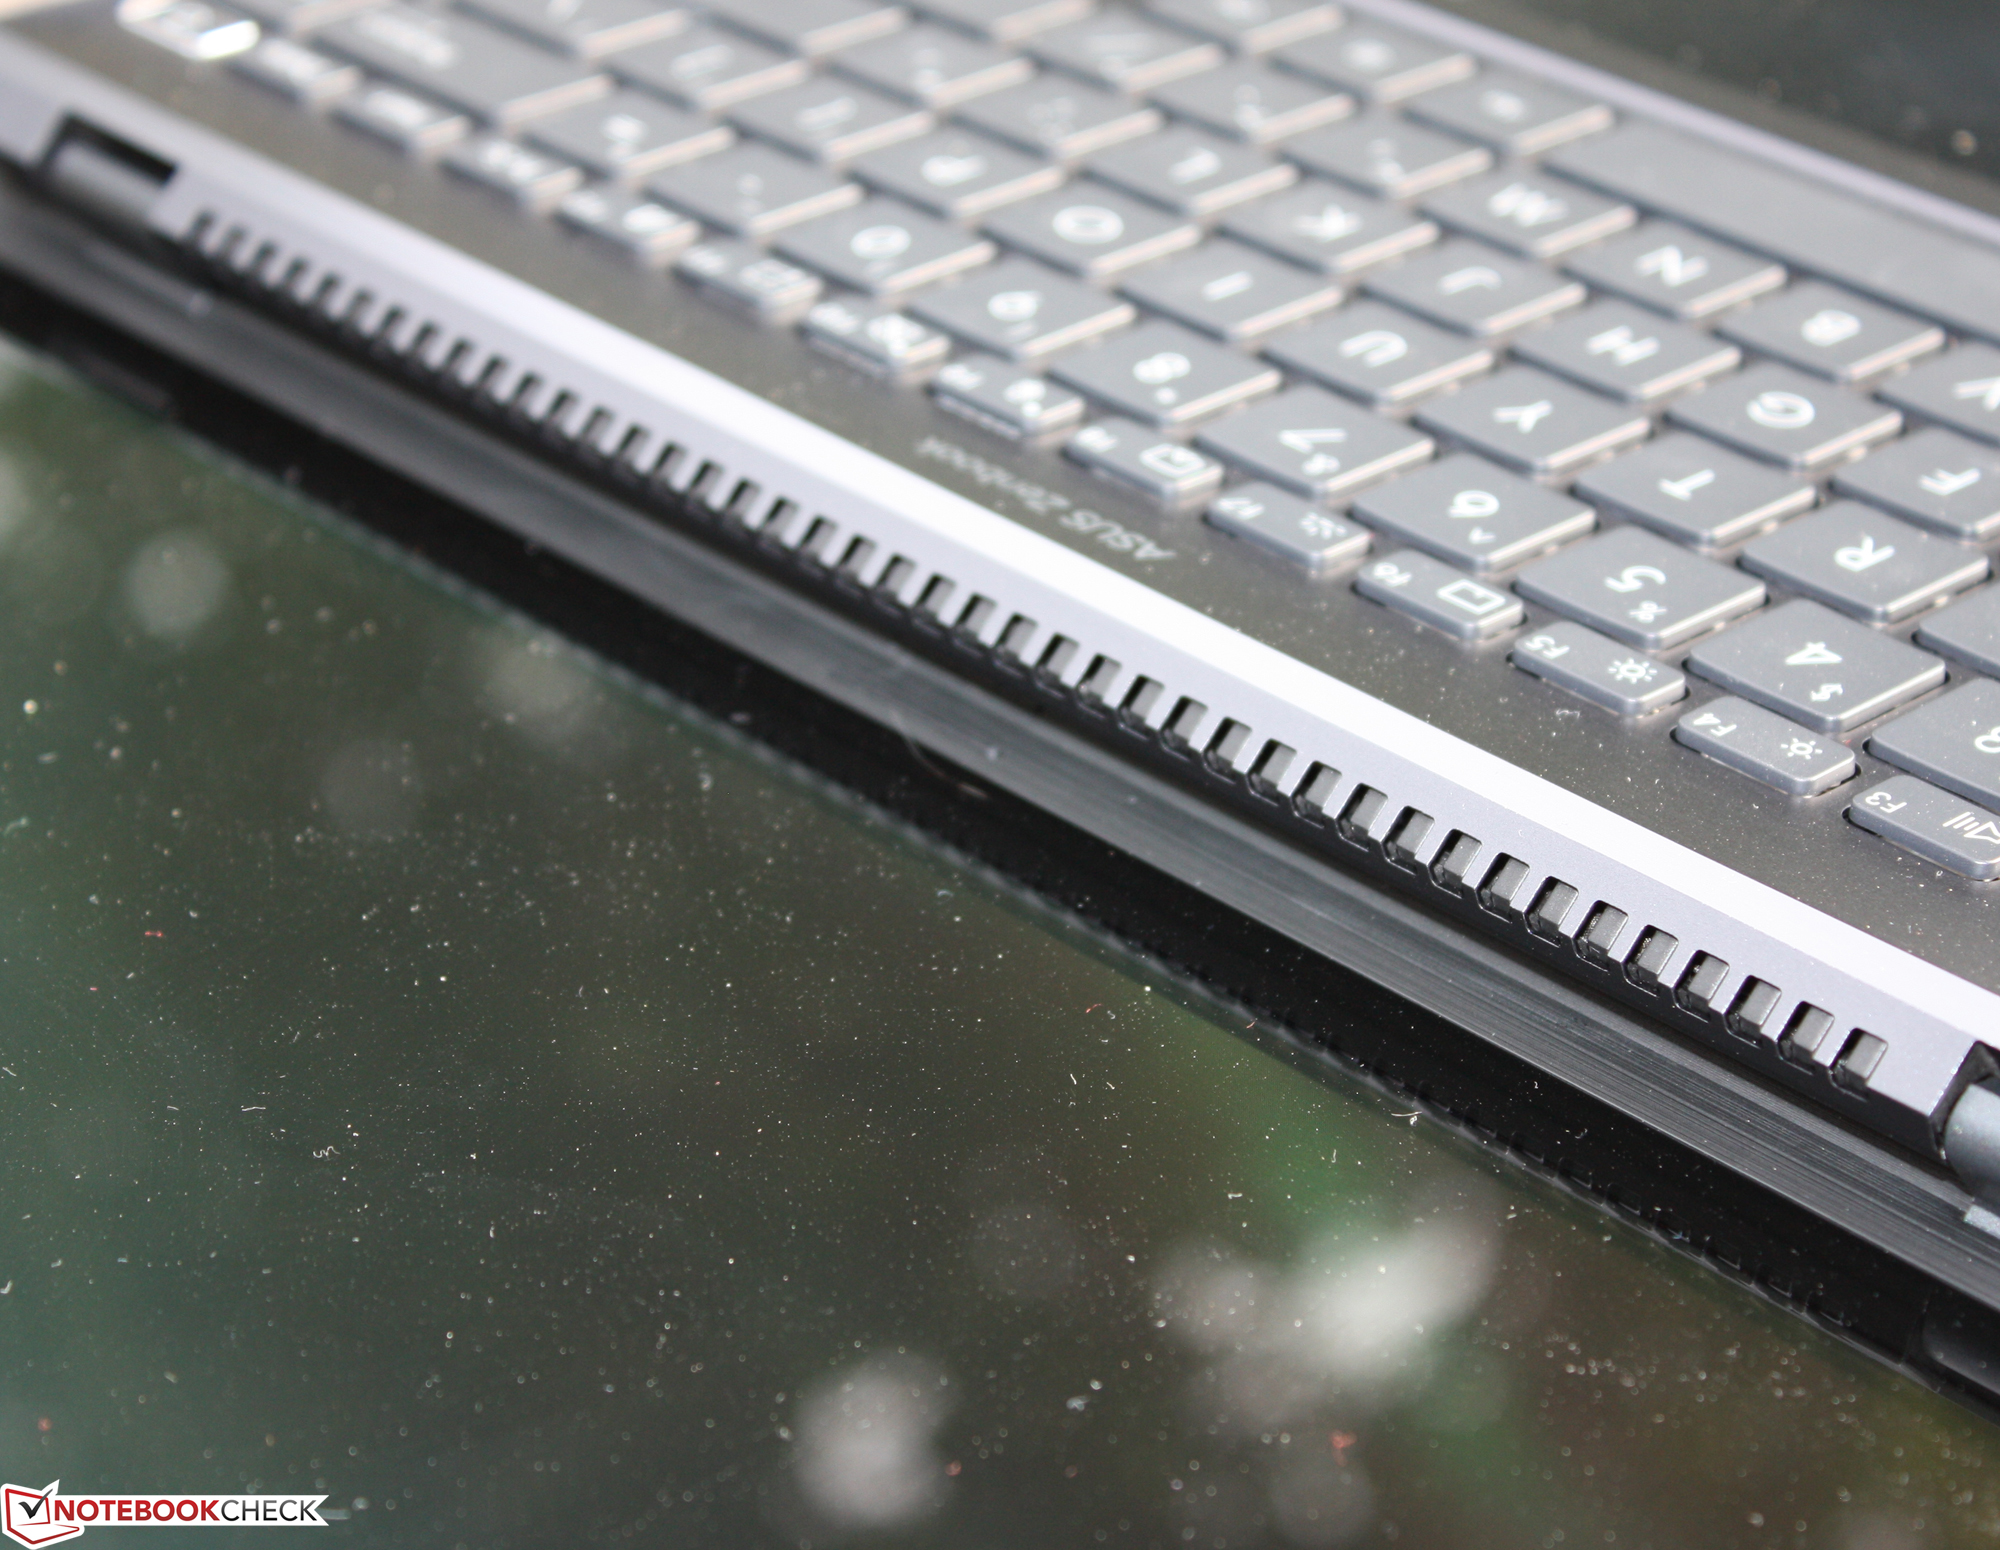
仅仅是机箱就已经相当令人印象深刻了。华硕并没有追求最轻的机箱,但作为回报,它实现了一个特别抗扭的机箱。当施加正常的力量时,盖子不能被压入!这是很罕见的--即使是在最高质量的笔记本中。这是非常罕见的--即使是在最高质量的副笔记本中。盖子的铝背与集成的显示面板(非触摸)形成了一个似乎坚不可摧的单元。
严格的质量也延伸到了铰链。关闭的位置通过磁力固定在底座上,然后用一根手指就可以打开盖子。在这之后,铰链提供了一个牢固的抓地力,在携带或举起设备时,一切都能保持原位。
完全由铝制成的底座也不例外。它只能在某些地方从下面压进去一点。键盘在任何时候都不会弯曲,而底座本身也完全牢固。
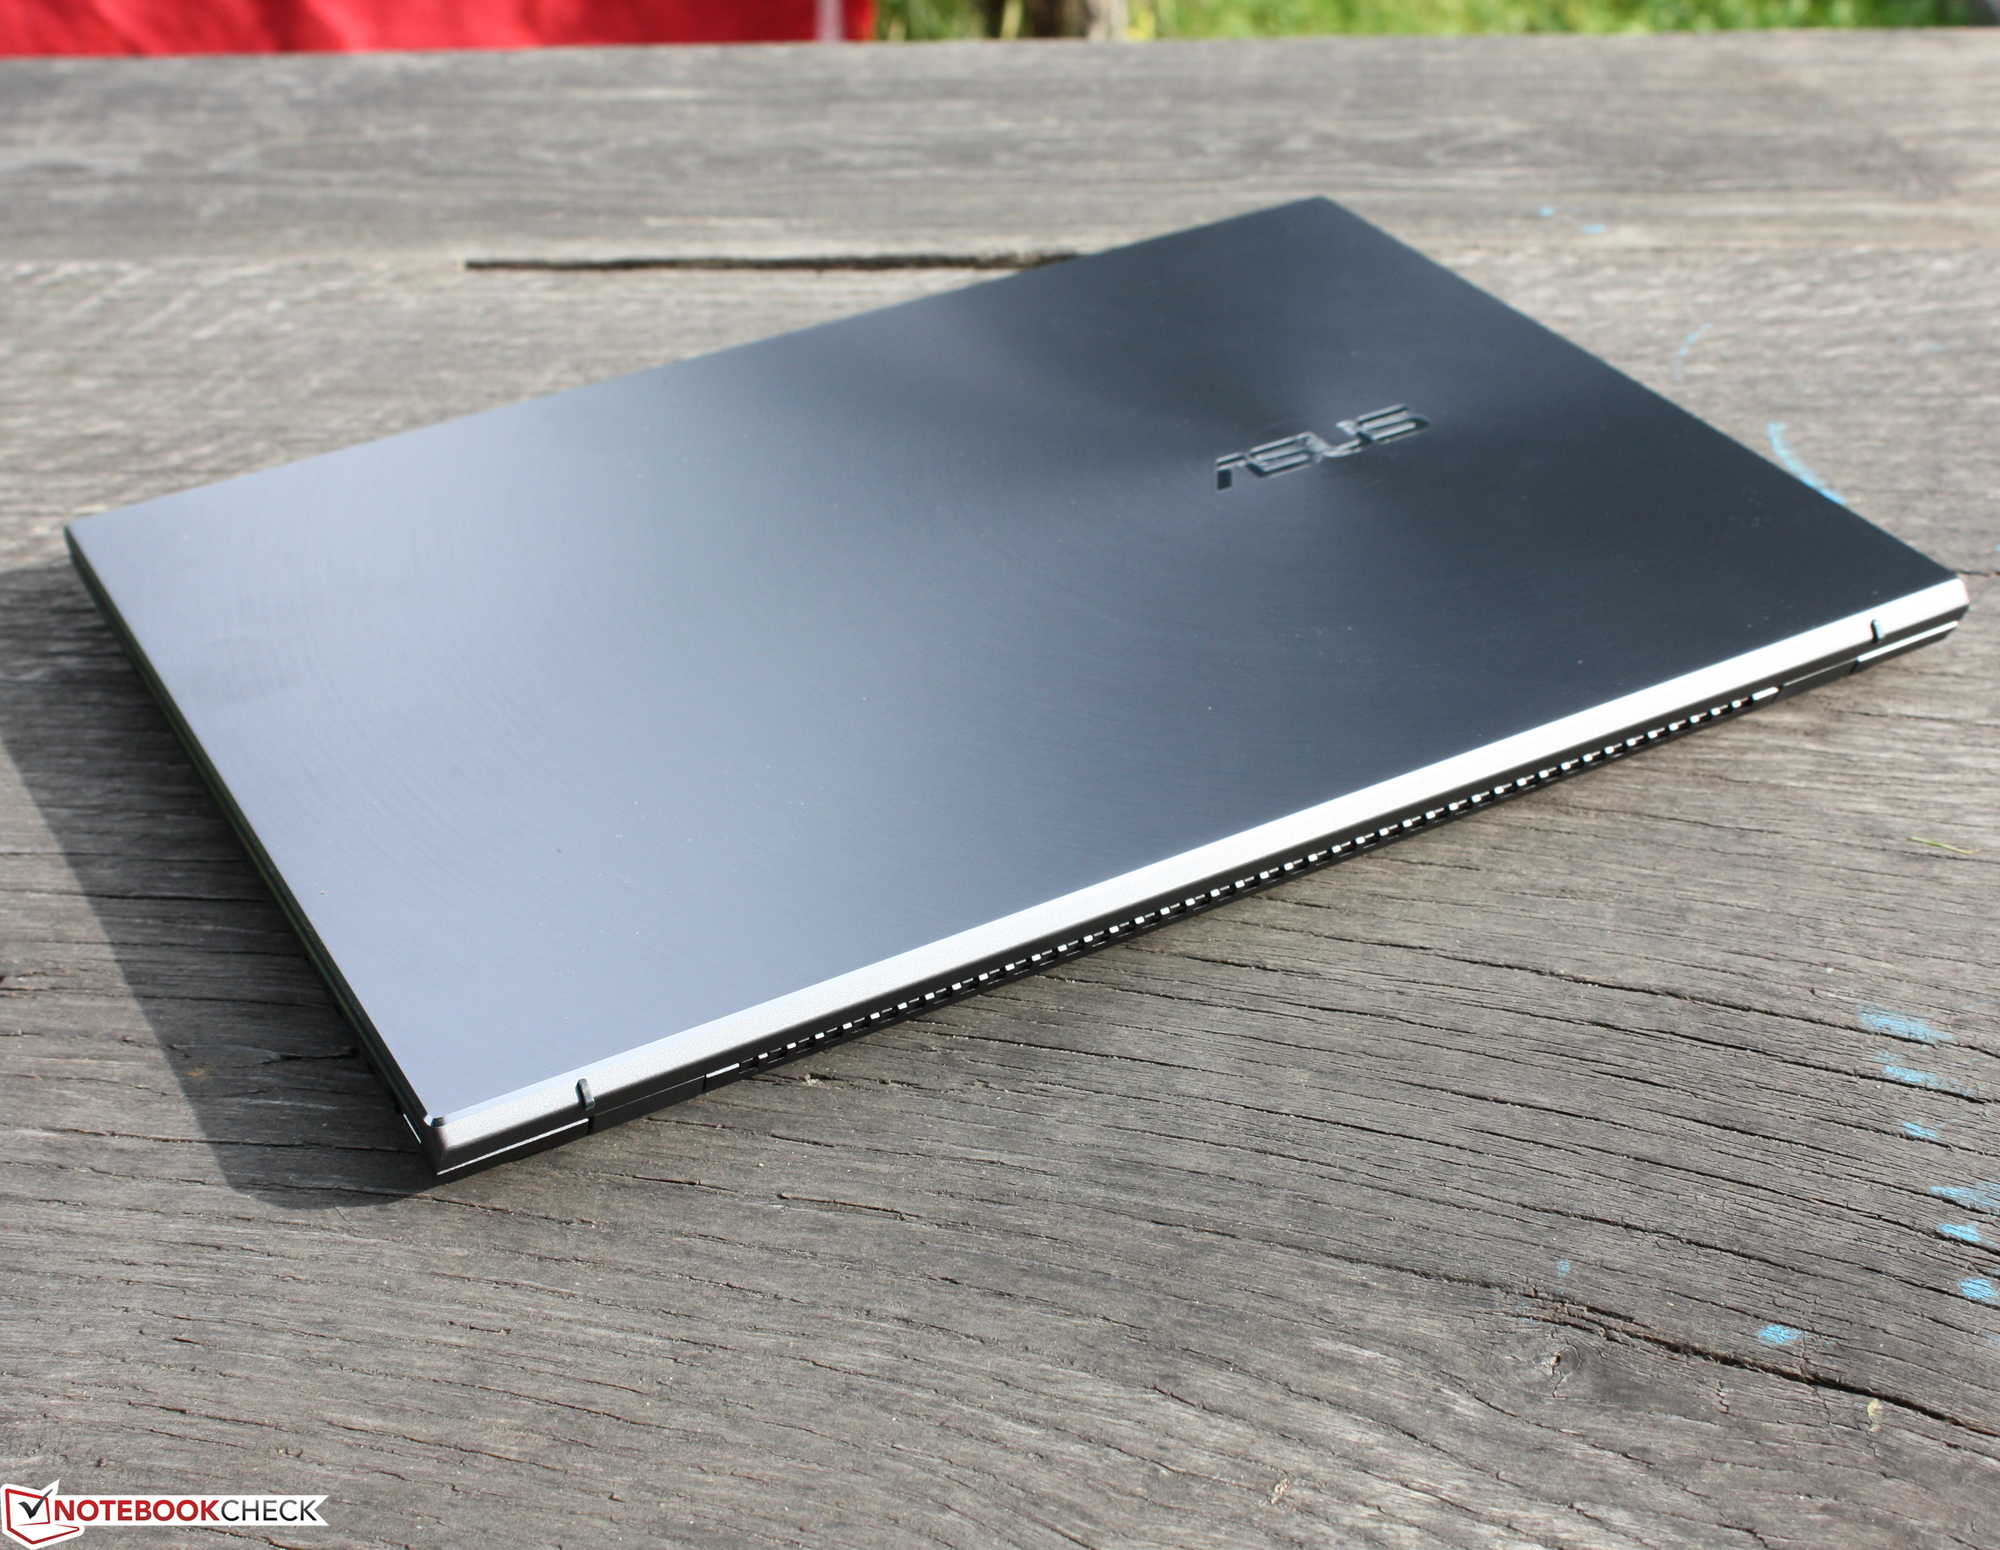

Zenbook的重量为1.4公斤,是较重的机型之一。只有HP Envy 14-eb0010nr,超过了1.6公斤。与较轻的14英寸和13英寸设备的平均值相比,差距为100克。然而,你会得到一个更坚固的底盘作为回报。在我们的比较中,最薄的型号是戴尔XPS 13 9310 OLED,14.8毫米,只有1.2公斤。
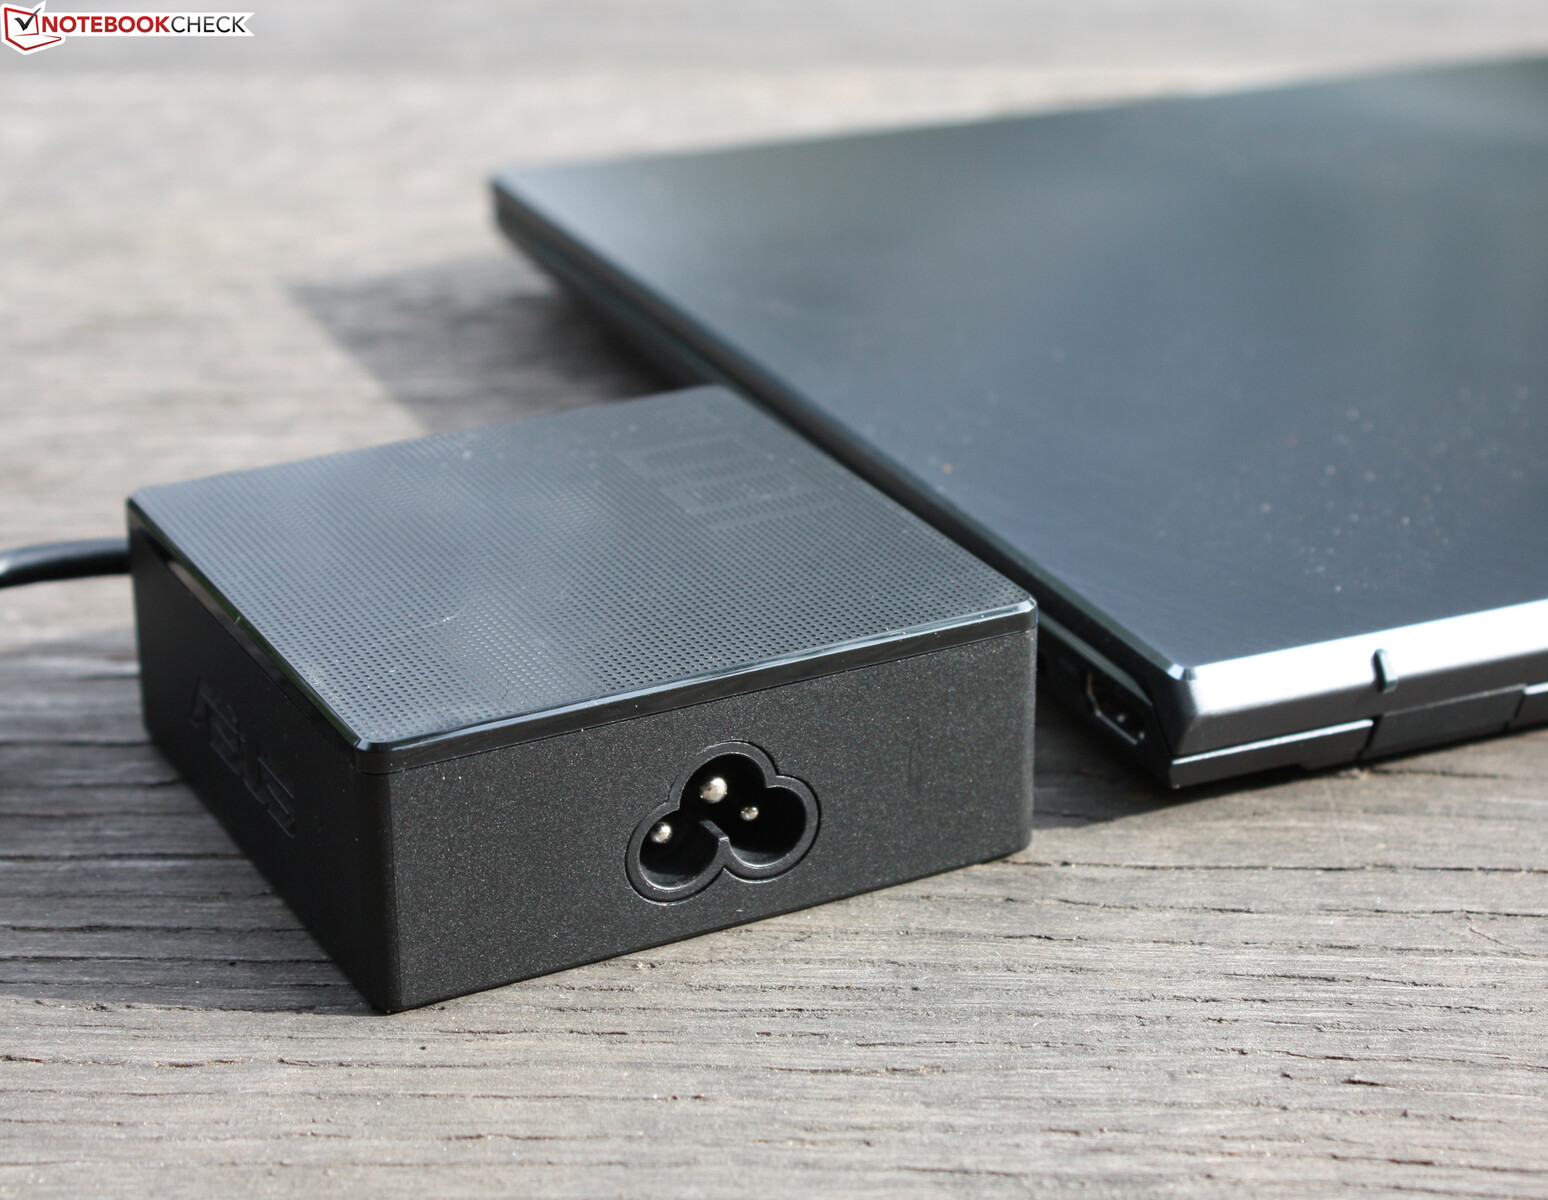
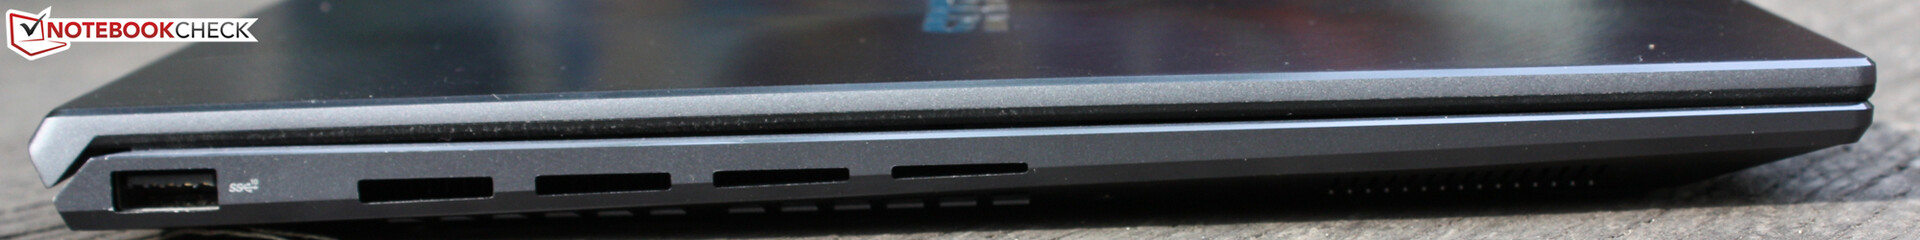
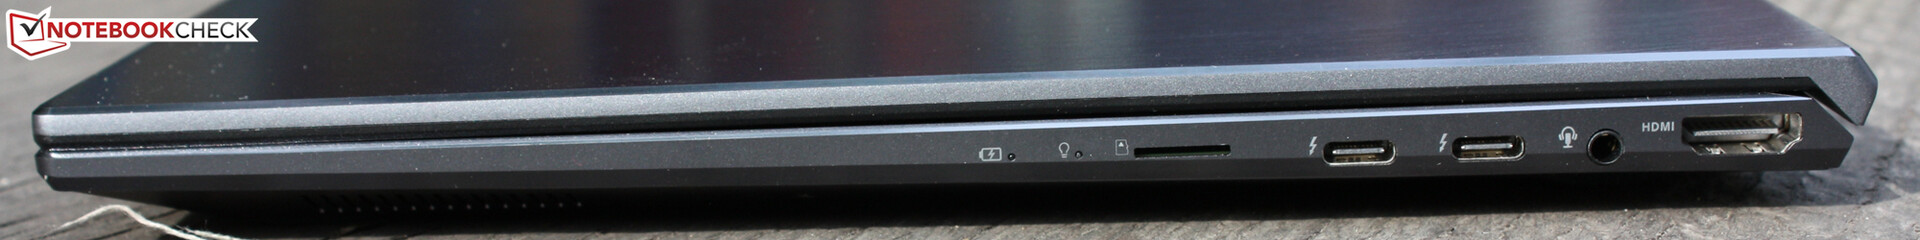
连接性 - 带有Thunderbolt 4的华硕设备
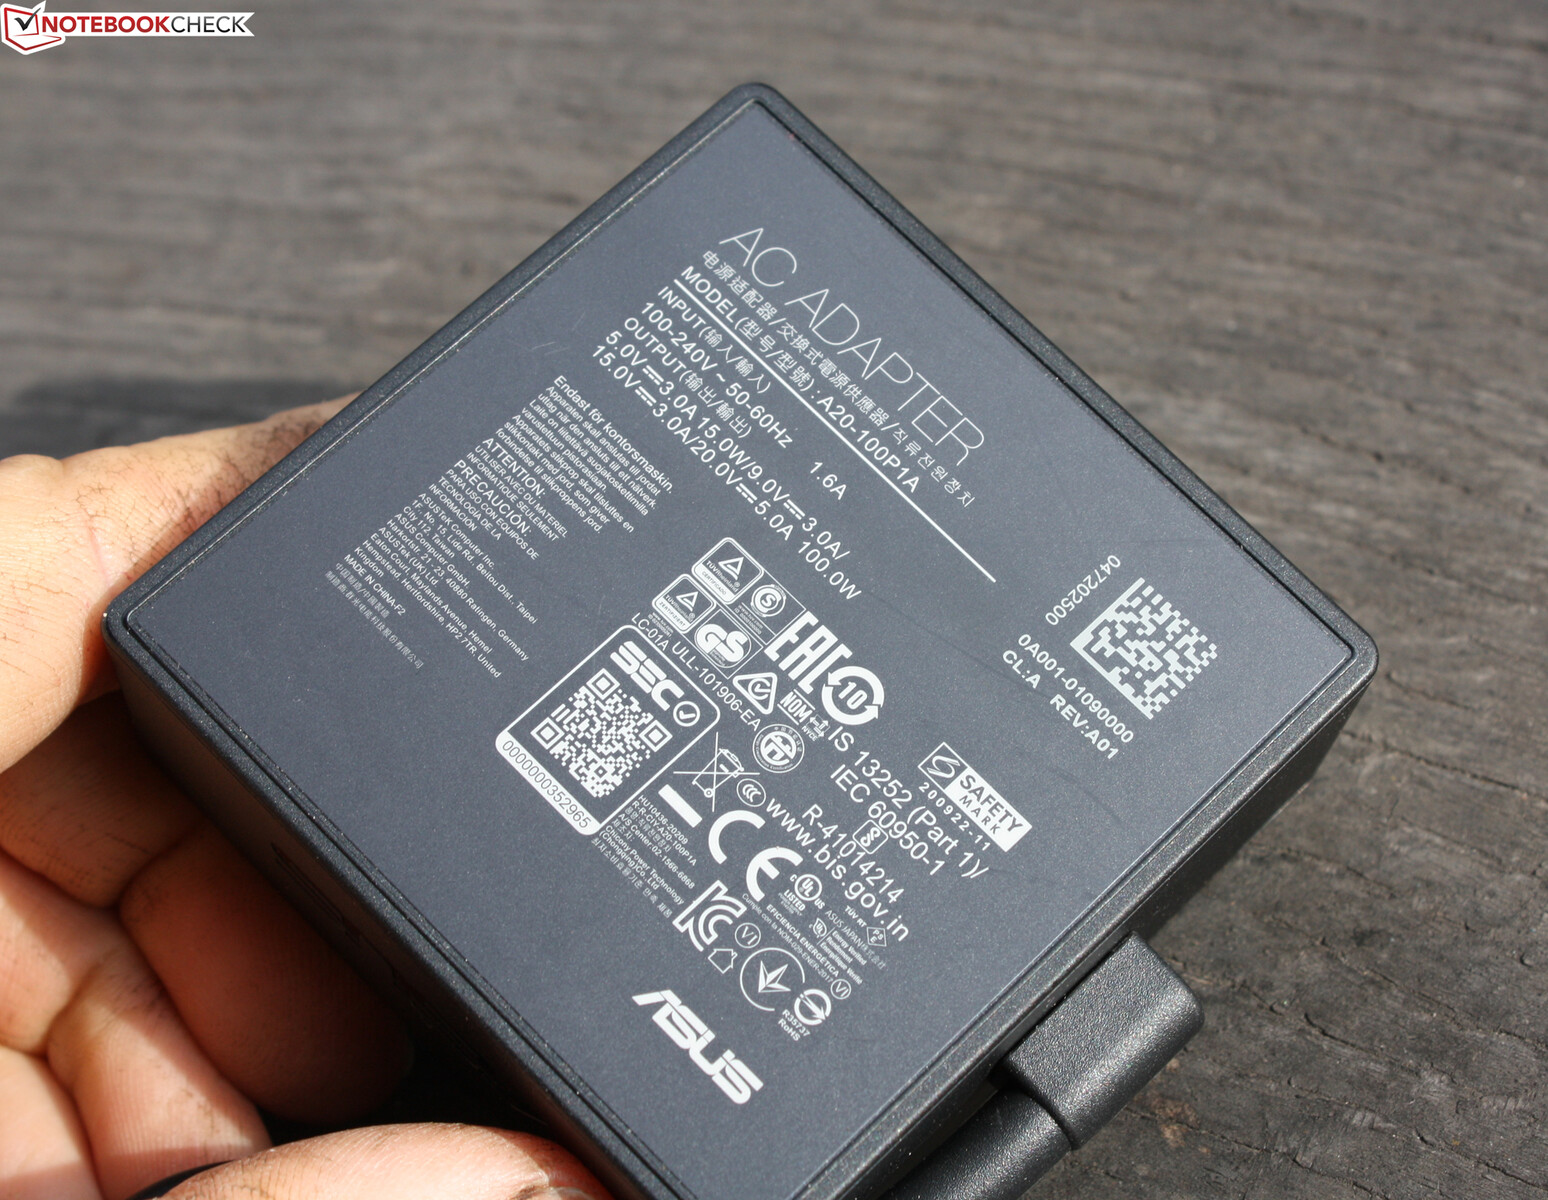
华硕提供了两个Type-C Thunderbolt 4端口。它们可以输出图像信号(DisplayPort),也可以用来连接电源适配器(100瓦)。包括HDMI,可以连接三个显示器。然而,在实践中,如果同时使用Type-C充电器,它将被限制为两个。
SD卡阅读器
和它的同类产品一样,这个微型SD读卡器的表现一般,但不是很好。我们用128GB的AV PRO V60 microSD进行测试。
| SD Card Reader | |
| average JPG Copy Test (av. of 3 runs) | |
| Dell XPS 13 9310 OLED (AV PRO microSD 128 GB V60) | |
| Asus Zenbook 14 UX435EG (Toshiba Exceria Pro M501 microSDXC 64GB) | |
| HP Envy 13-ba1475ng (AV Pro V60) | |
| Average of class Subnotebook (23.7 - 188, n=9, last 2 years) | |
| HP Envy 14-eb0010nr (Toshiba Exceria Pro M501 microSDXC 32GB) | |
| Asus Zenbook 14X UX5400E (AV Pro SD microSD 128 GB V60) | |
| MSI Modern 14 B11SB-085 (Toshiba Exceria Pro M501 microSDXC 64GB) | |
| maximum AS SSD Seq Read Test (1GB) | |
| Dell XPS 13 9310 OLED (AV PRO microSD 128 GB V60) | |
| Average of class Subnotebook (24.9 - 195, n=8, last 2 years) | |
| Asus Zenbook 14 UX435EG (Toshiba Exceria Pro M501 microSDXC 64GB) | |
| HP Envy 13-ba1475ng (AV Pro V60) | |
| HP Envy 14-eb0010nr (Toshiba Exceria Pro M501 microSDXC 32GB) | |
| Asus Zenbook 14X UX5400E (AV Pro SD microSD 128 GB V60) | |
| MSI Modern 14 B11SB-085 (Toshiba Exceria Pro M501 microSDXC 64GB) | |
沟通
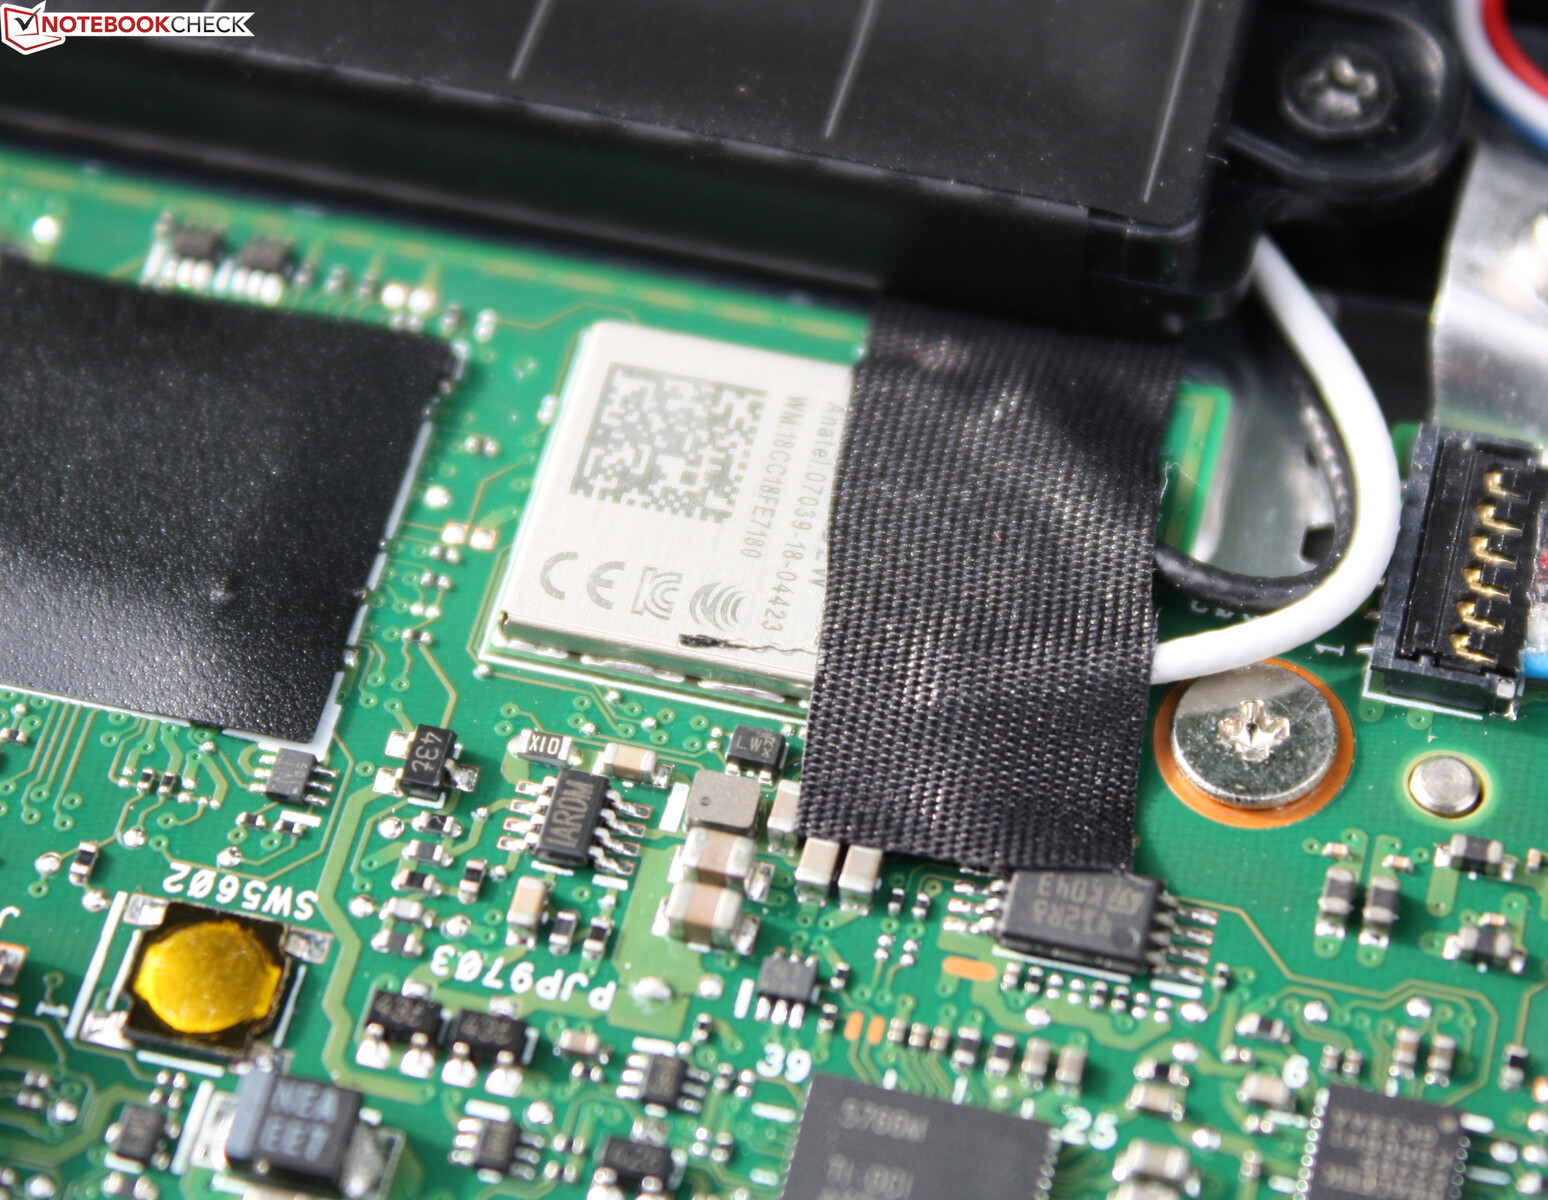
英特尔AX201 Wi-Fi芯片集成在设备中,所以它不能被替换。在我们的测试中,传输速率多次明显低于平均水平,所以它们并不代表AX201通常的能力。我们将此归因于我们的预生产样品中的次优驱动配置,并期望在生产模型中获得更好的结果。
| Networking | |
| iperf3 transmit AX12 | |
| HP Envy 13-ba1475ng | |
| Asus Zenbook 14 UX435EG | |
| Lenovo IdeaPad Slim 9i 14ITL5 | |
| MSI Modern 14 B11SB-085 | |
| HP Envy 14-eb0010nr | |
| Average Intel Wi-Fi 6 AX201 (49.8 - 1775, n=324) | |
| Asus Zenbook 14X UX5400E | |
| Dell XPS 13 9310 OLED | |
| iperf3 receive AX12 | |
| HP Envy 13-ba1475ng | |
| Lenovo IdeaPad Slim 9i 14ITL5 | |
| Asus Zenbook 14 UX435EG | |
| Dell XPS 13 9310 OLED | |
| HP Envy 14-eb0010nr | |
| MSI Modern 14 B11SB-085 | |
| Average Intel Wi-Fi 6 AX201 (136 - 1743, n=324) | |
| Asus Zenbook 14X UX5400E | |
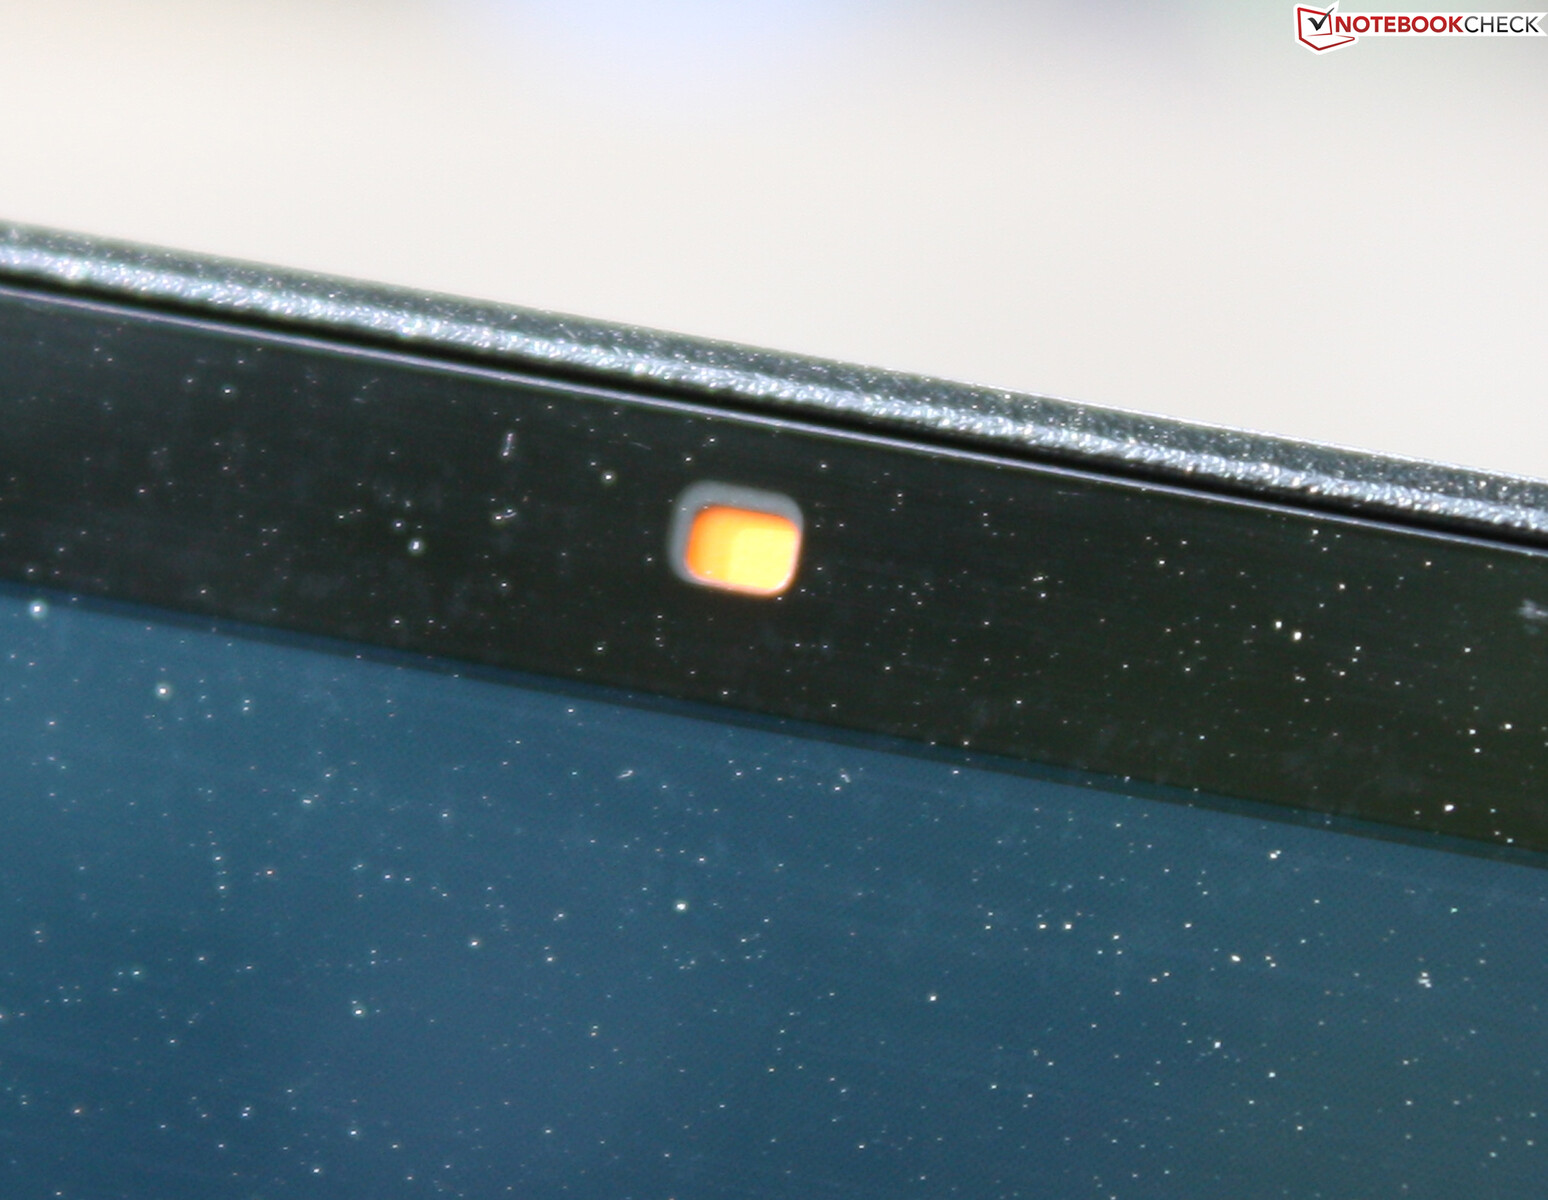
网络摄像头
我们评测样品中的网络摄像头没有反应,电子快门(摄像头前面的橙色快门)对相应的Fn键没有反应。我们推测这是个生产前的错误。
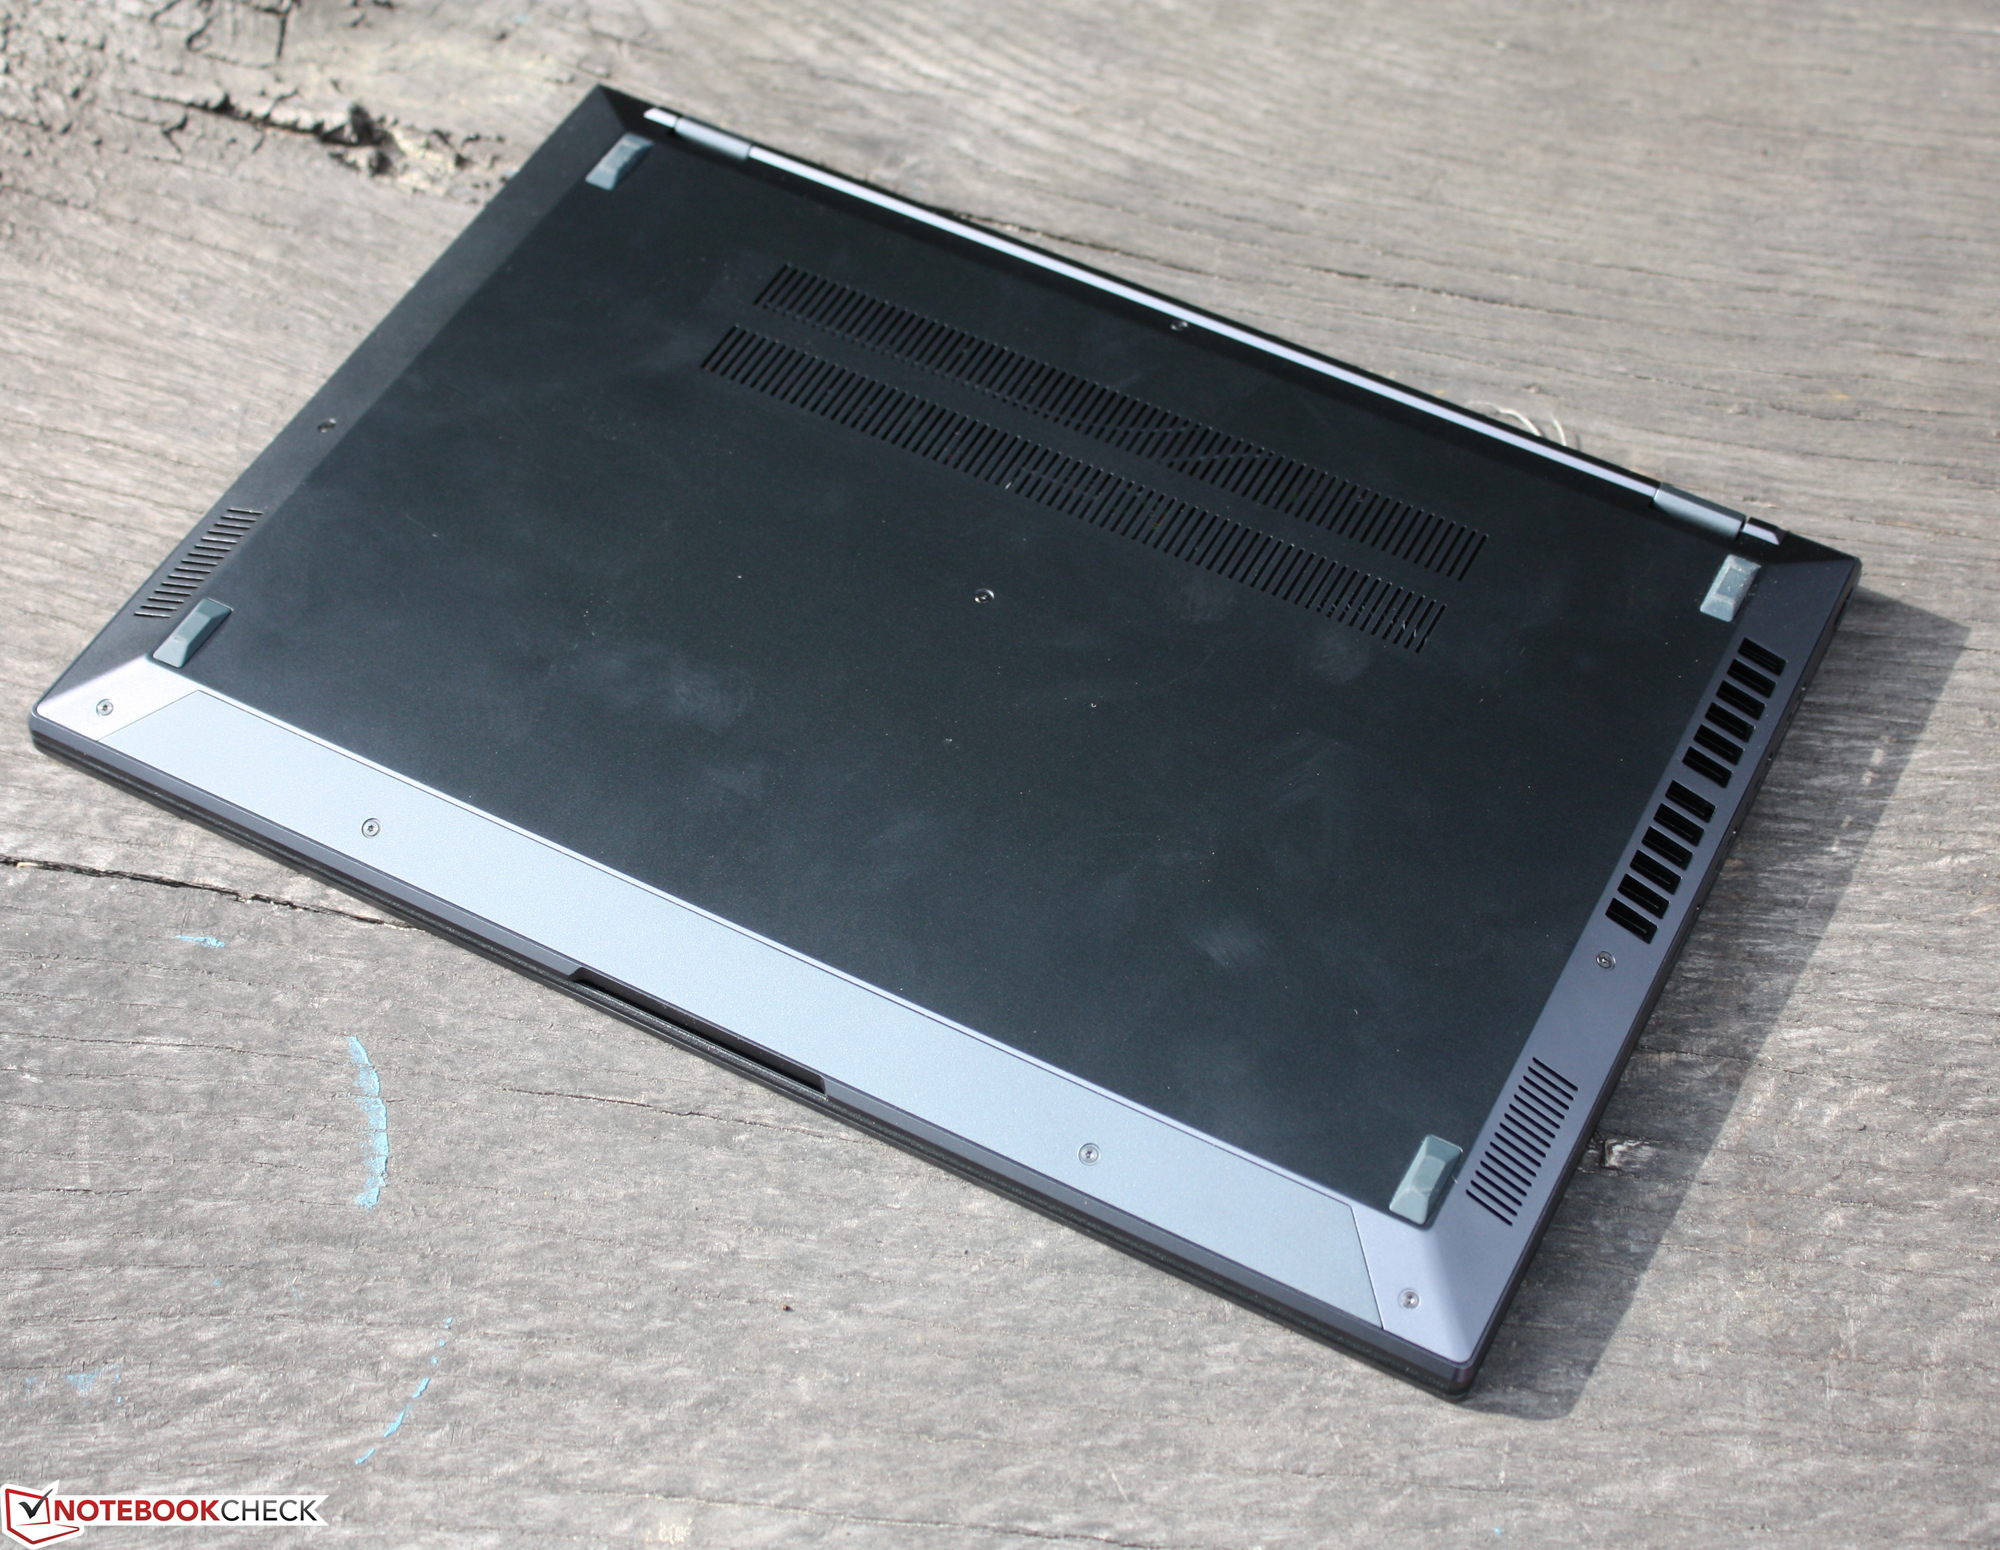
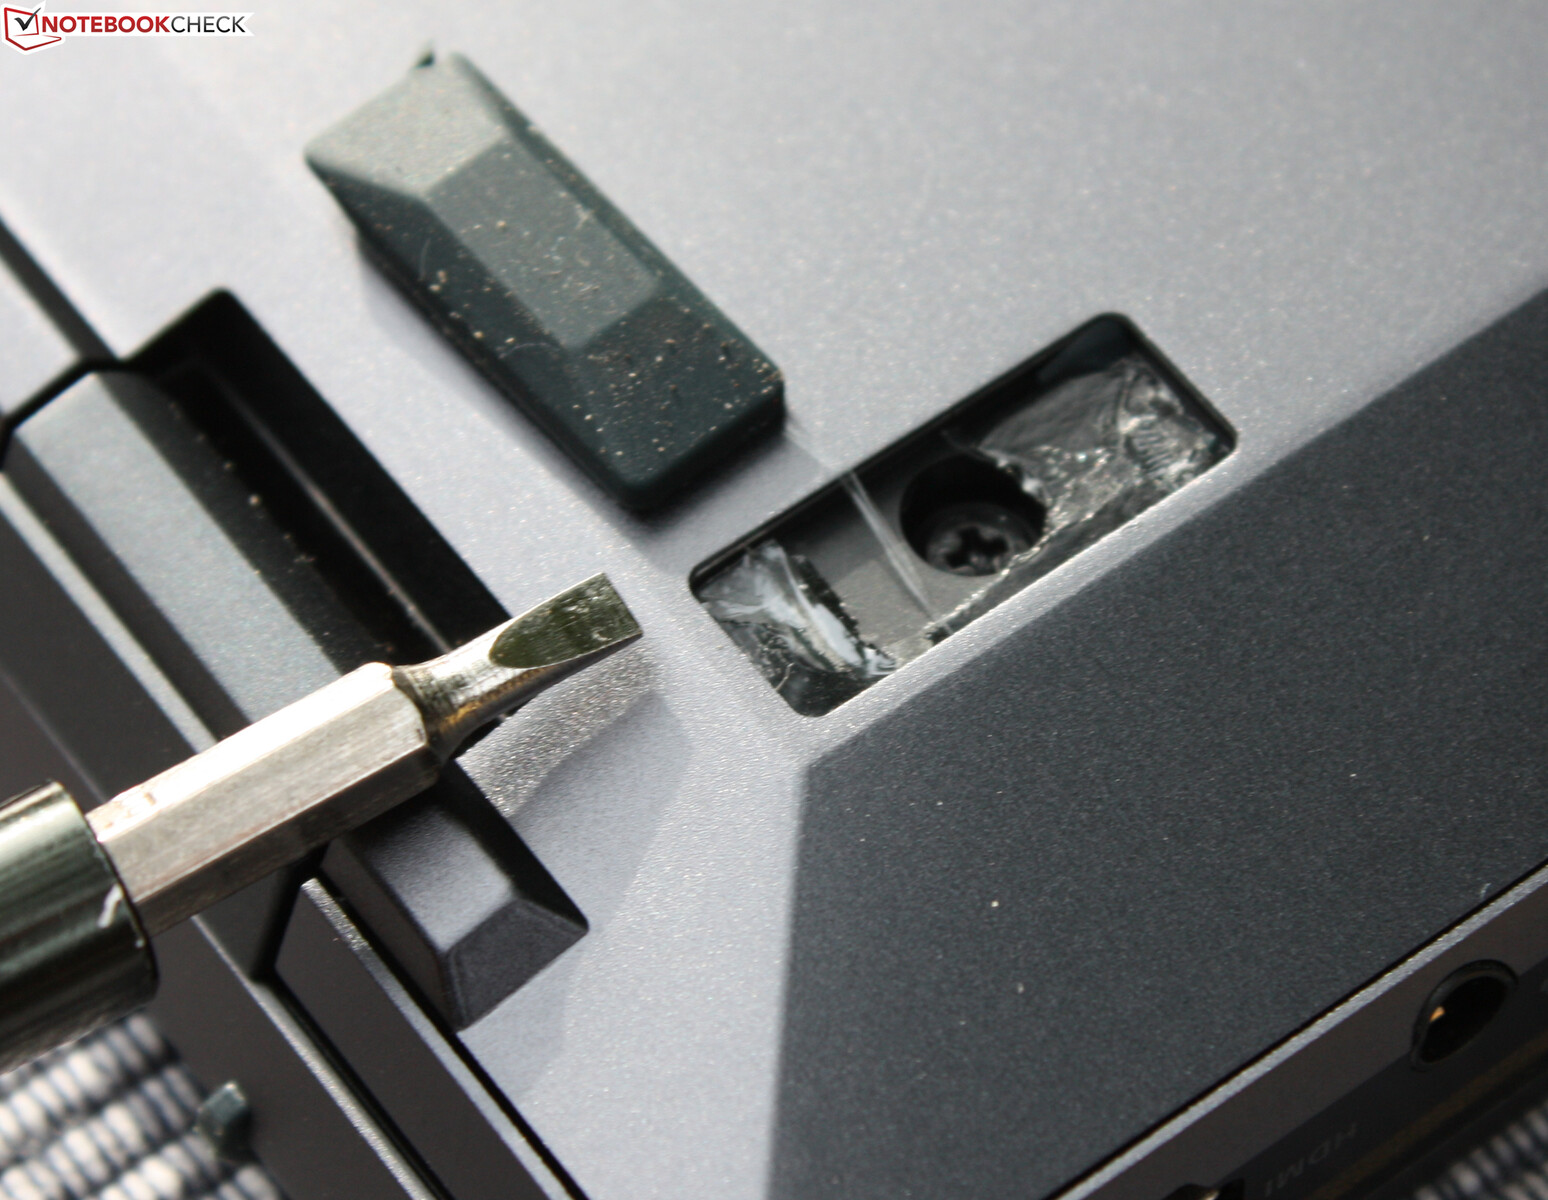
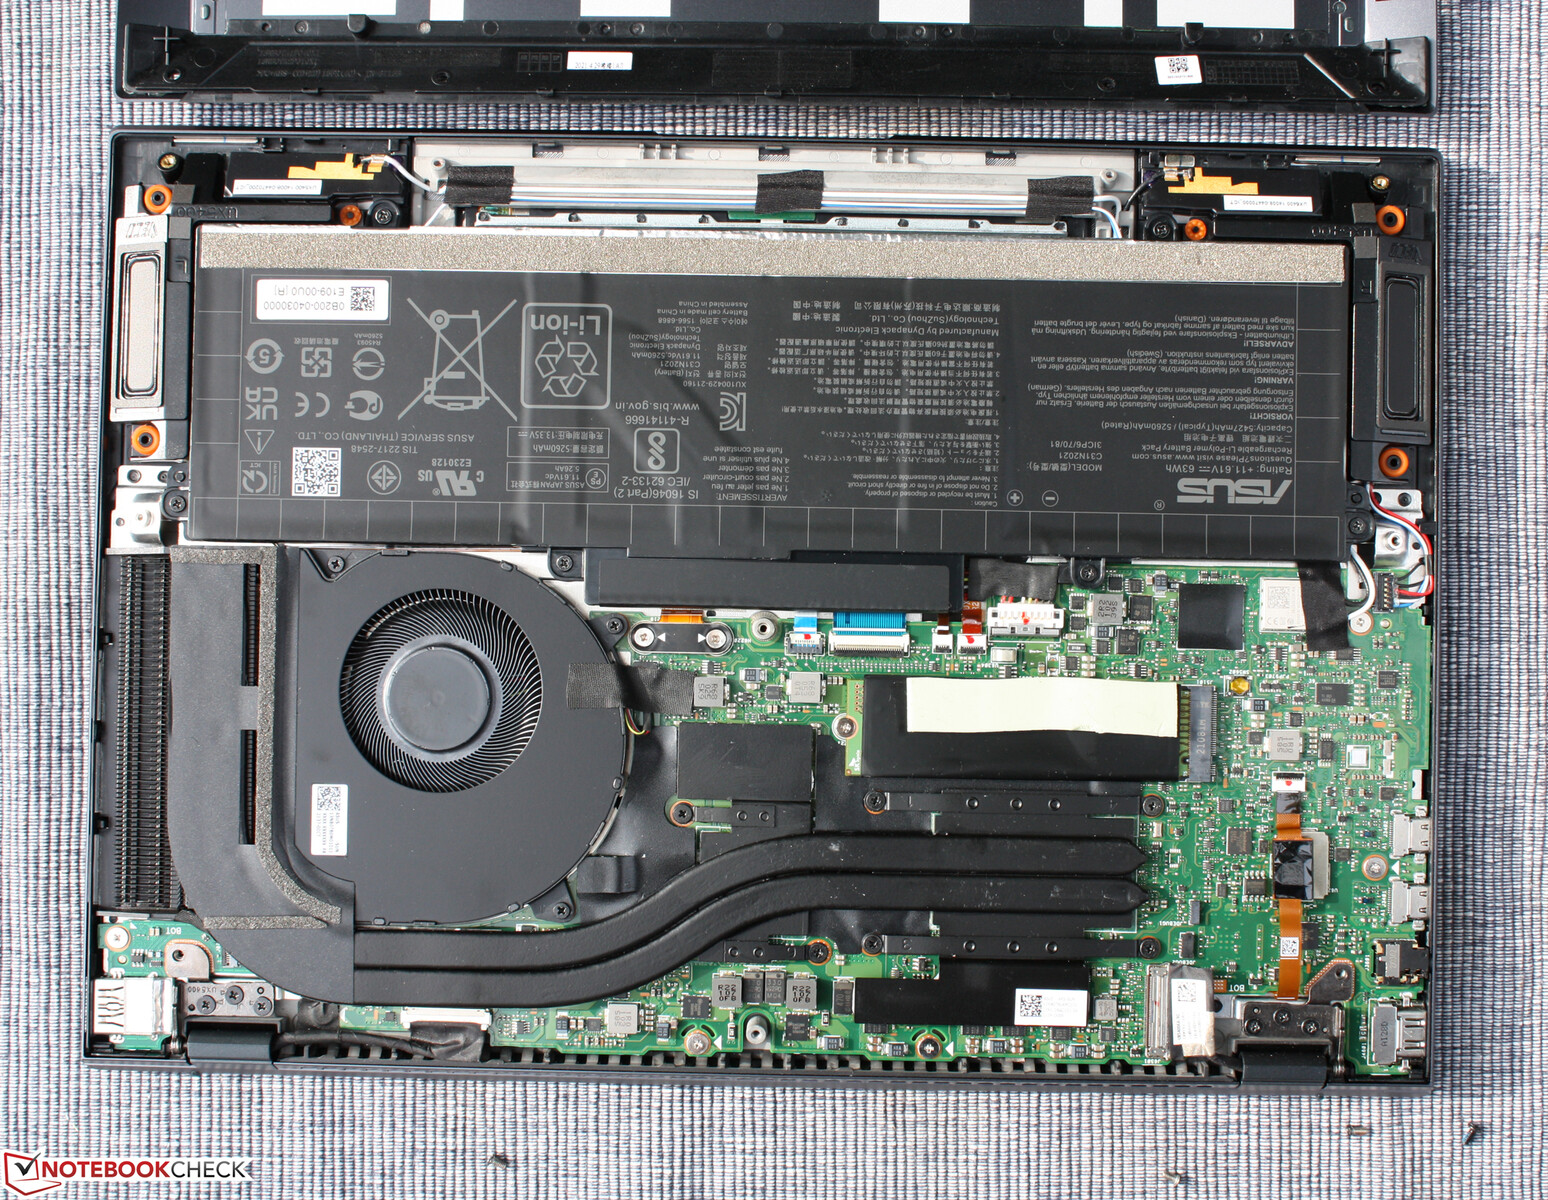
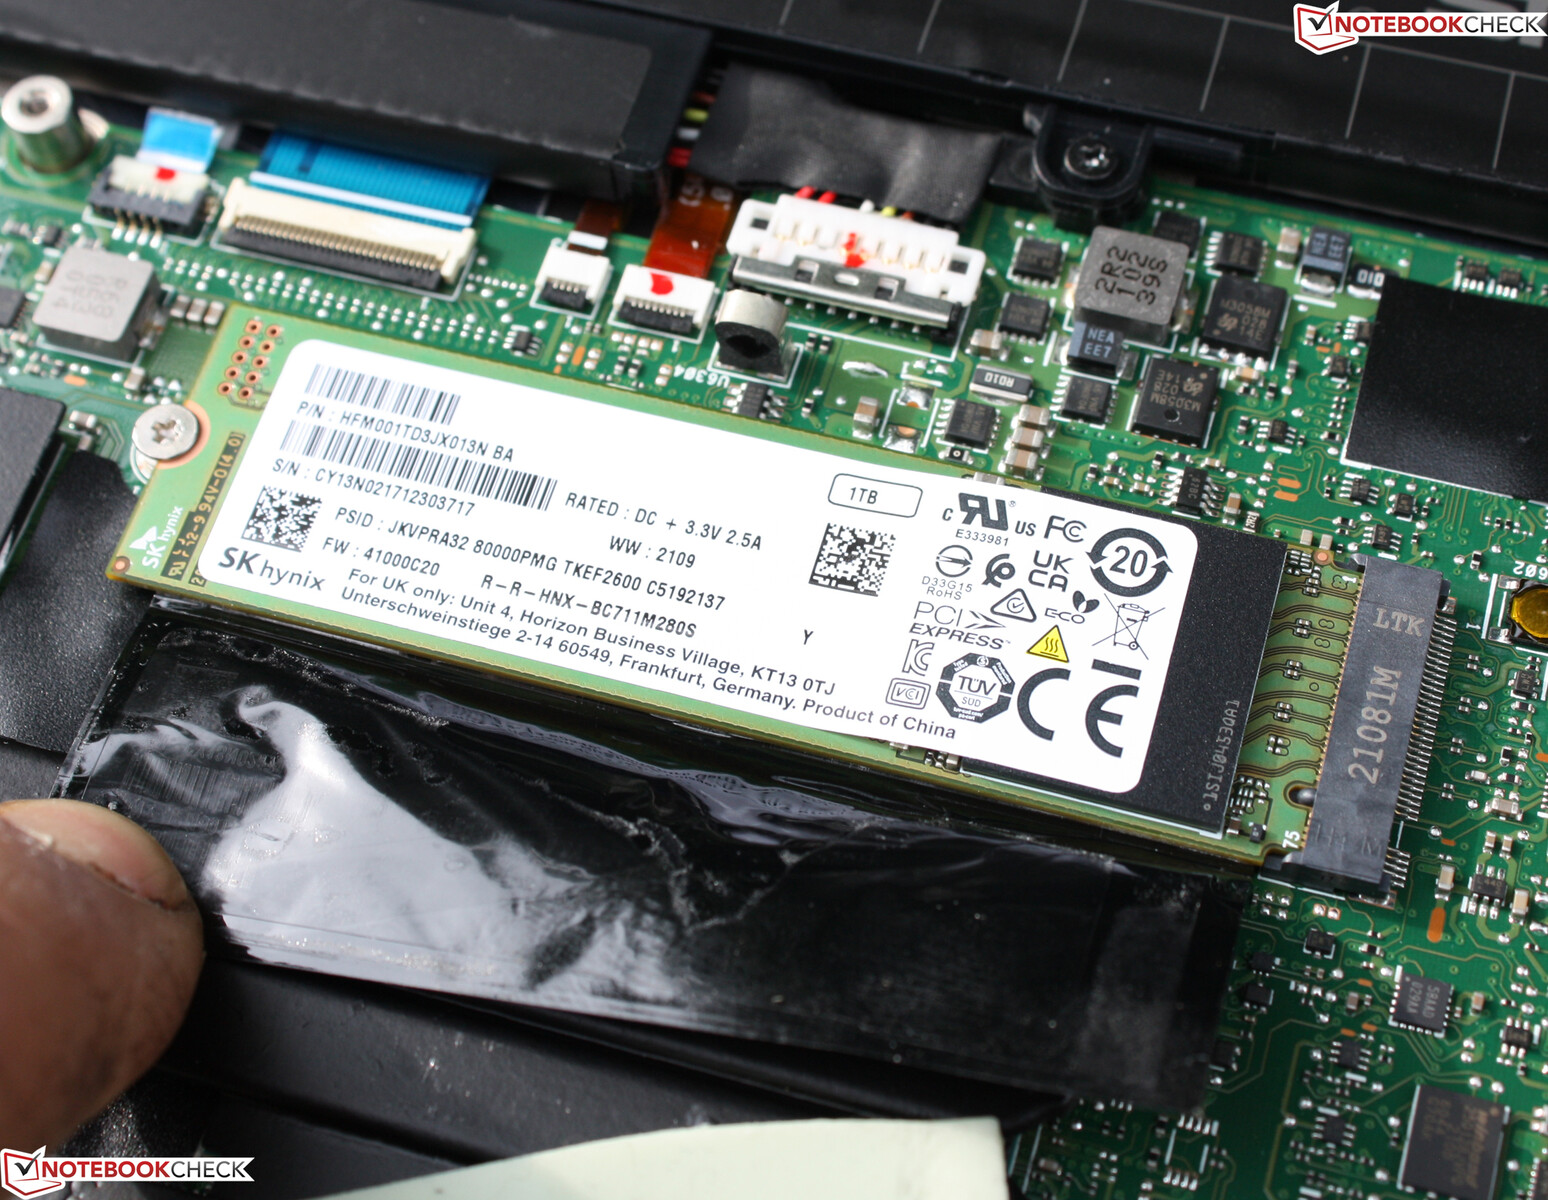
维护
打开Zenbook的过程很复杂,因为有隐藏在橡胶脚下的螺丝。之后,盖子可以很容易地被掀开。然而,这里没有什么可维护的,因为Wi-Fi模块和RAM都是焊接的(没有插座)。
安全问题
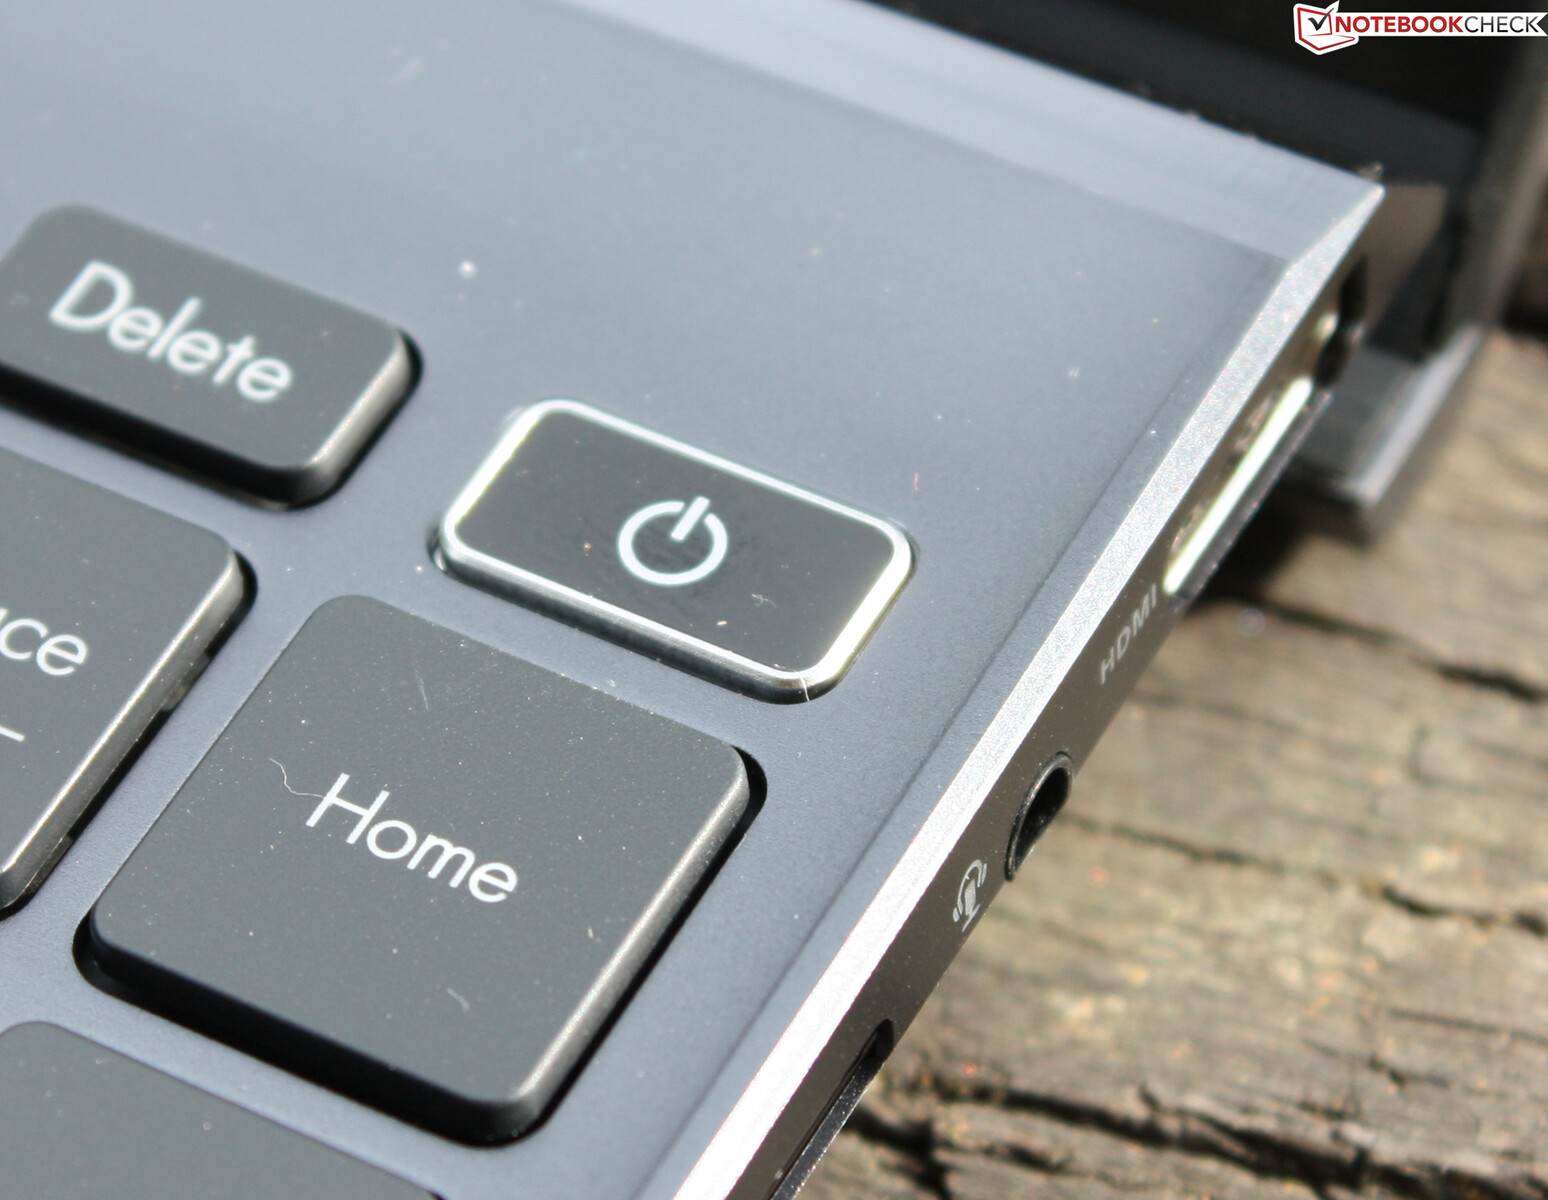
电源键上有一个指纹传感器,非常不显眼:你可以通过物理传感器快速登录,而且没有为单独的指纹识别模块浪费空间。主板上的TPM(可信平台模块)固件已经成为标准,是Windows 11的基本要求。在某些方面,这个加密处理器的行为就像一张永久安装的智能卡,但它与本地计算机而不是用户捆绑在一起。
担保
Zenbook 14X在德国的商店里还没有上市。华硕在德国通常提供两年的提货和退货保证。
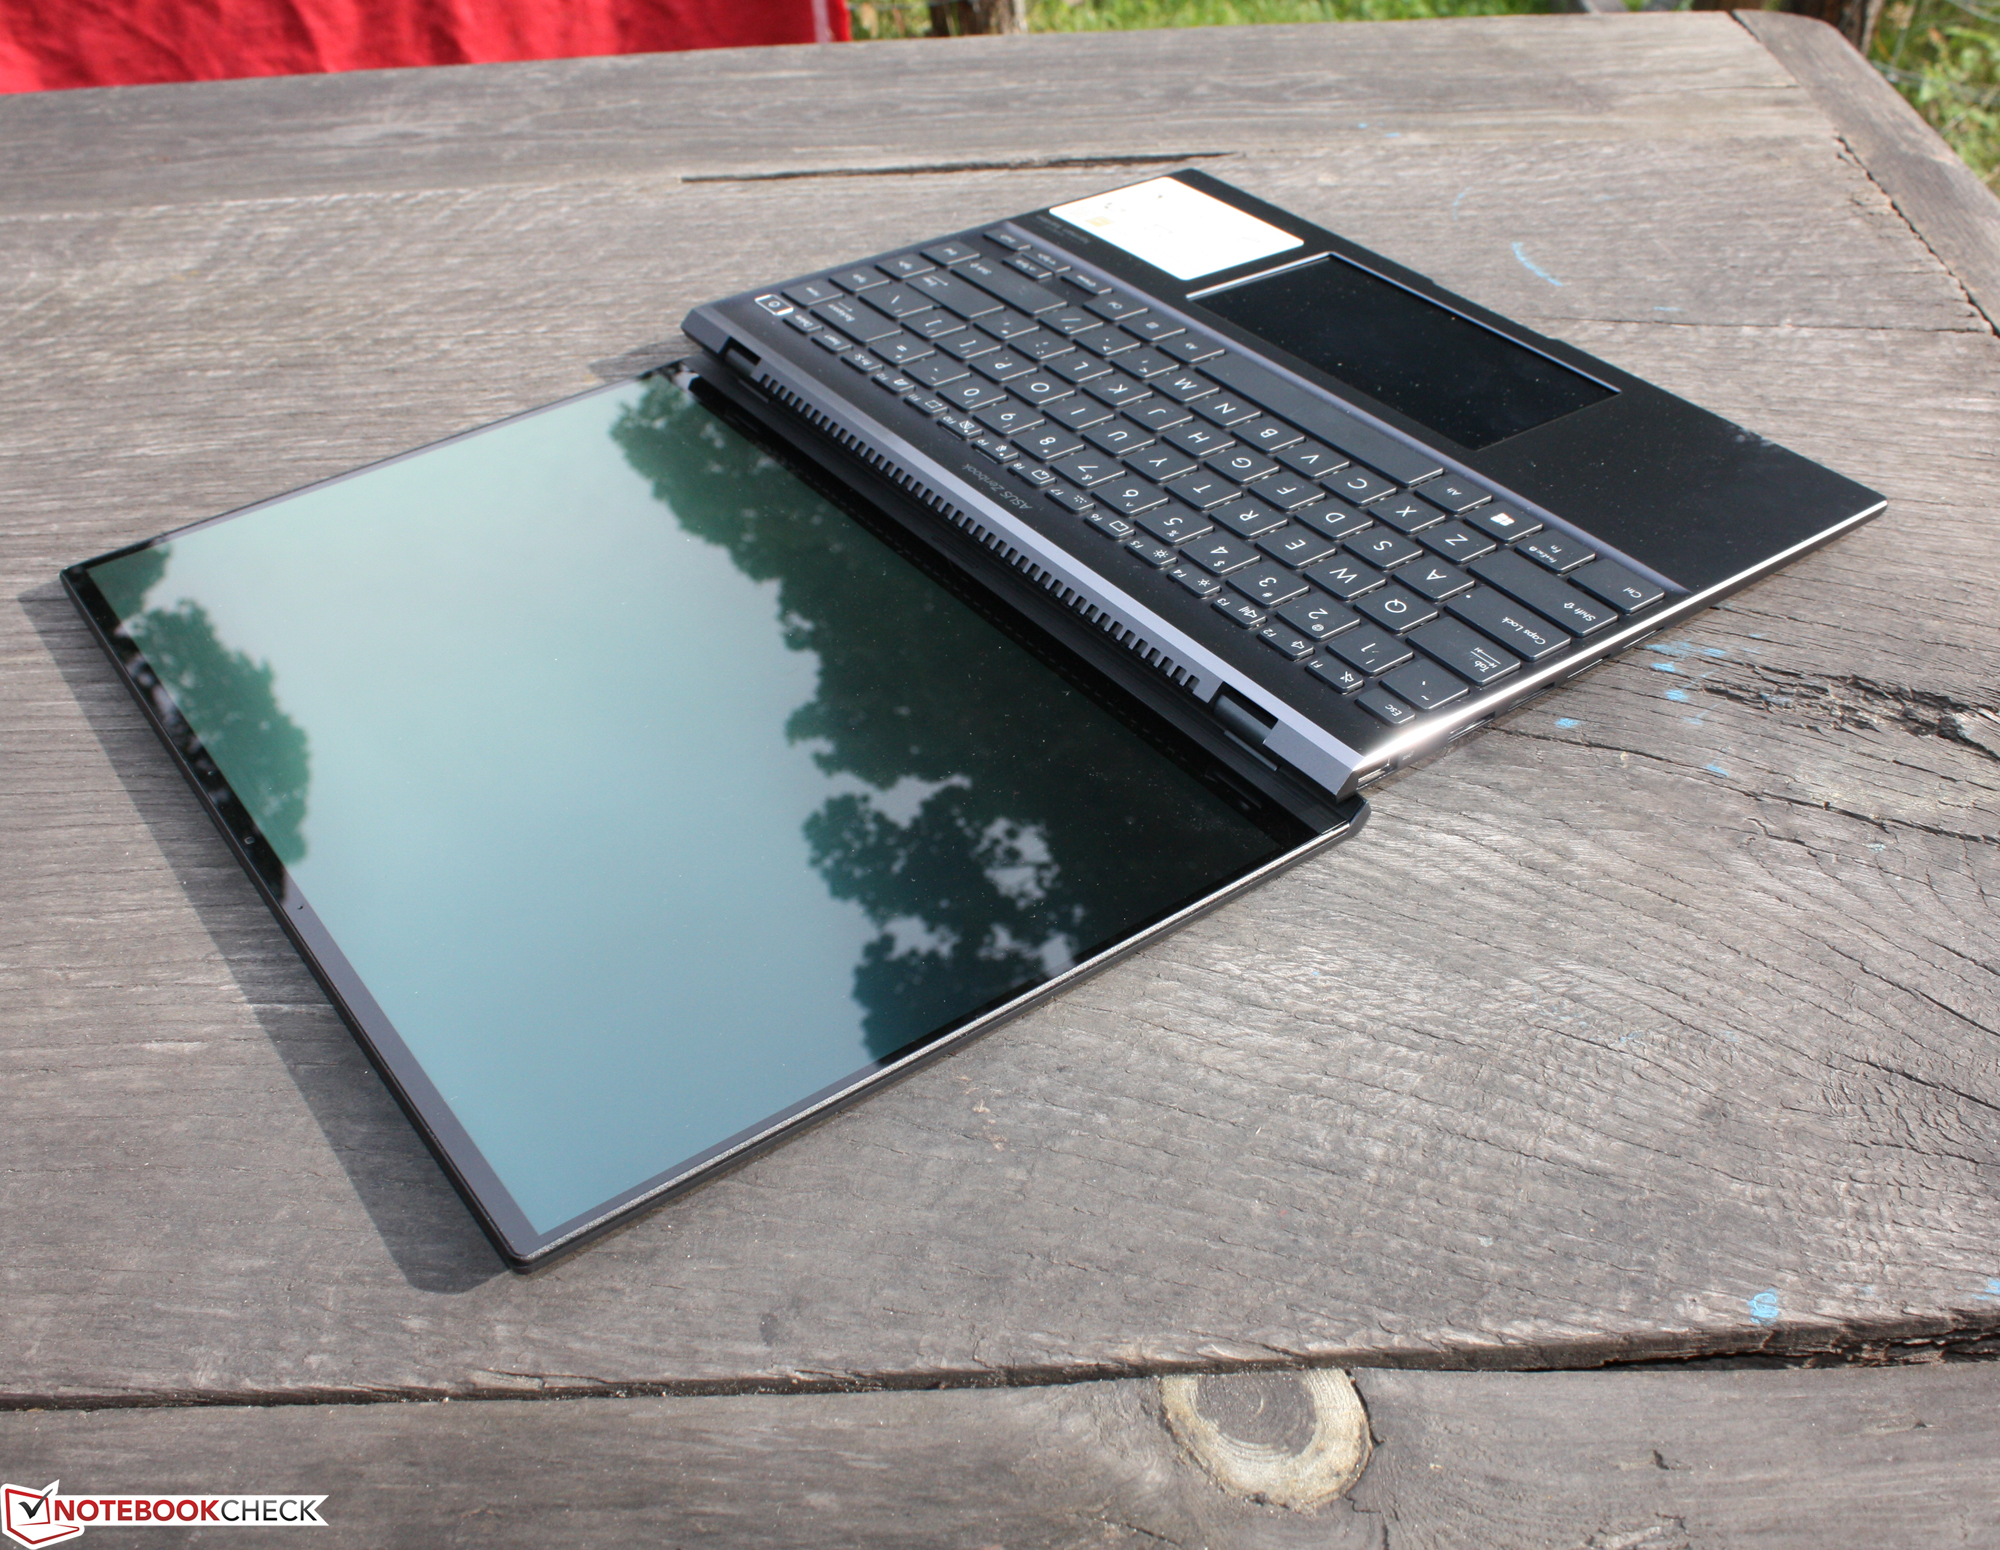
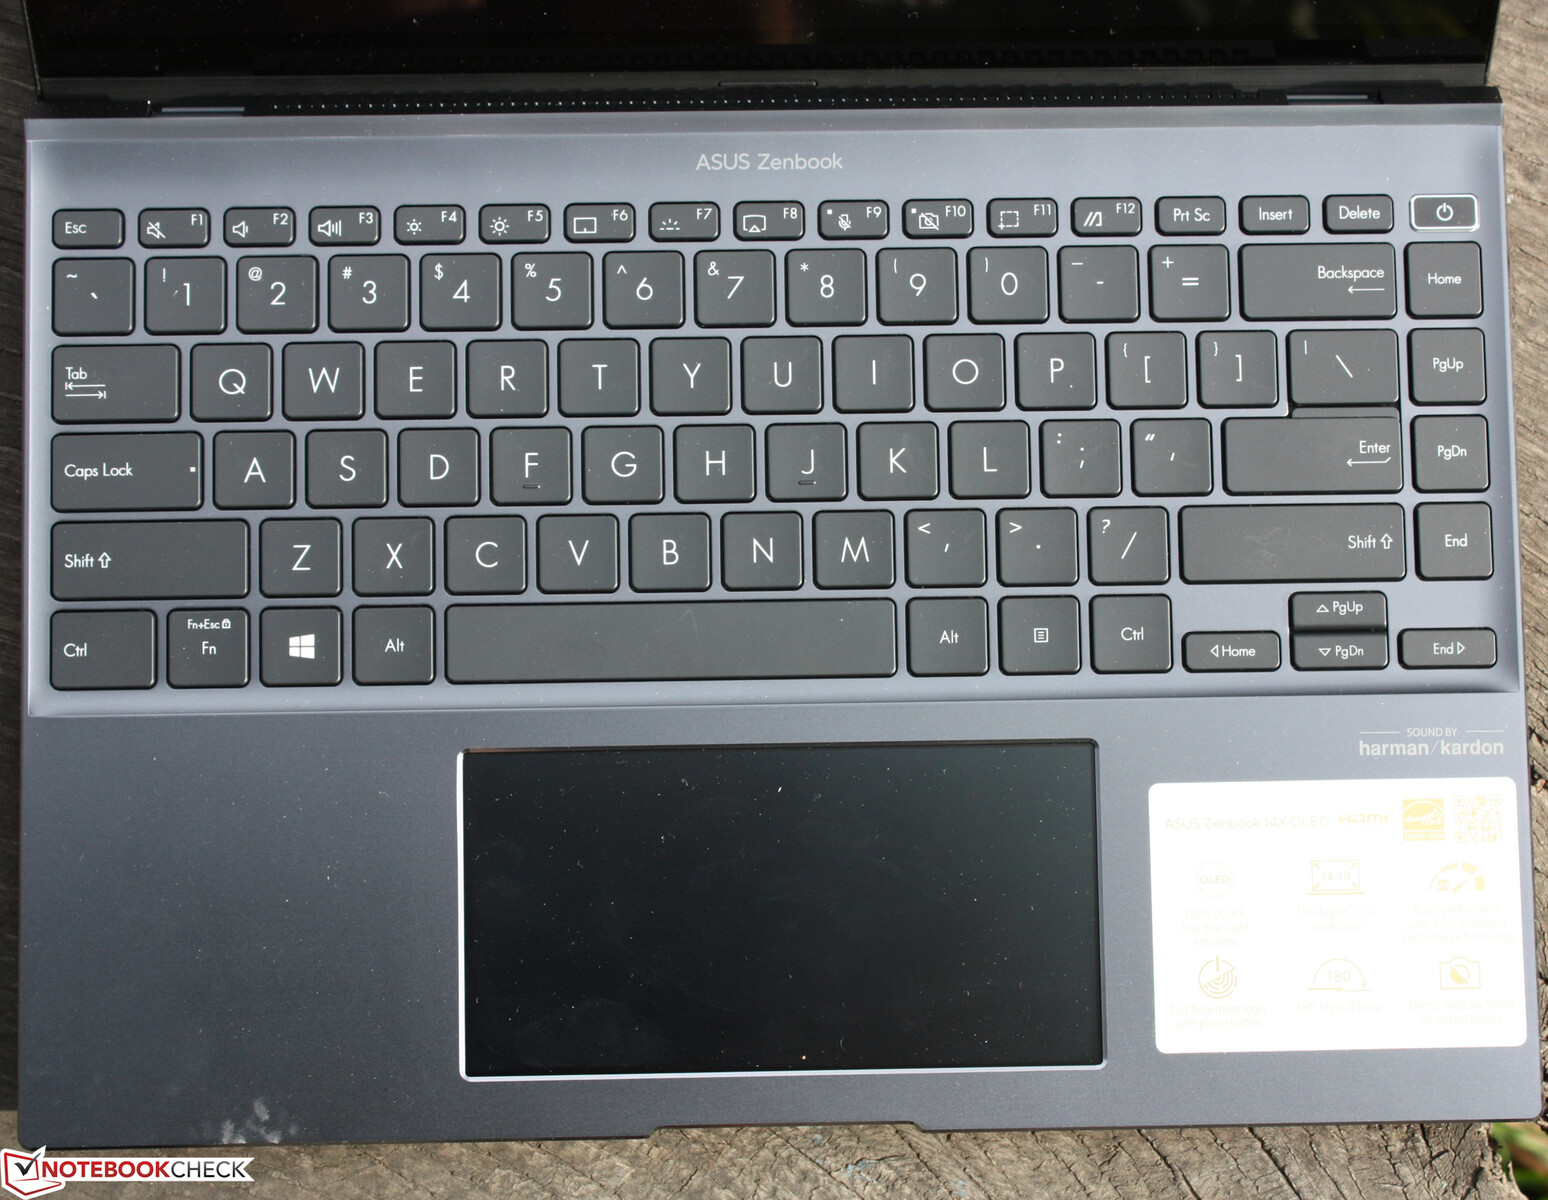
输入设备 - 生产性的双显示器
哑光的防滑键有一个明显的压力点,行程适中,键程牢固。打字时几乎无声。由于采用了三段式白色背光,在较暗的环境中工作是可能的。
总的来说,宽大的键盘上有大的Shift、Ctrl和方向键,使用户能够快速打字。按笔记本电脑的标准,按键之间的间距相当大(2.5毫米)。键盘的稳固底座是一个非常积极的方面。在任何时候都不会有任何弯曲。
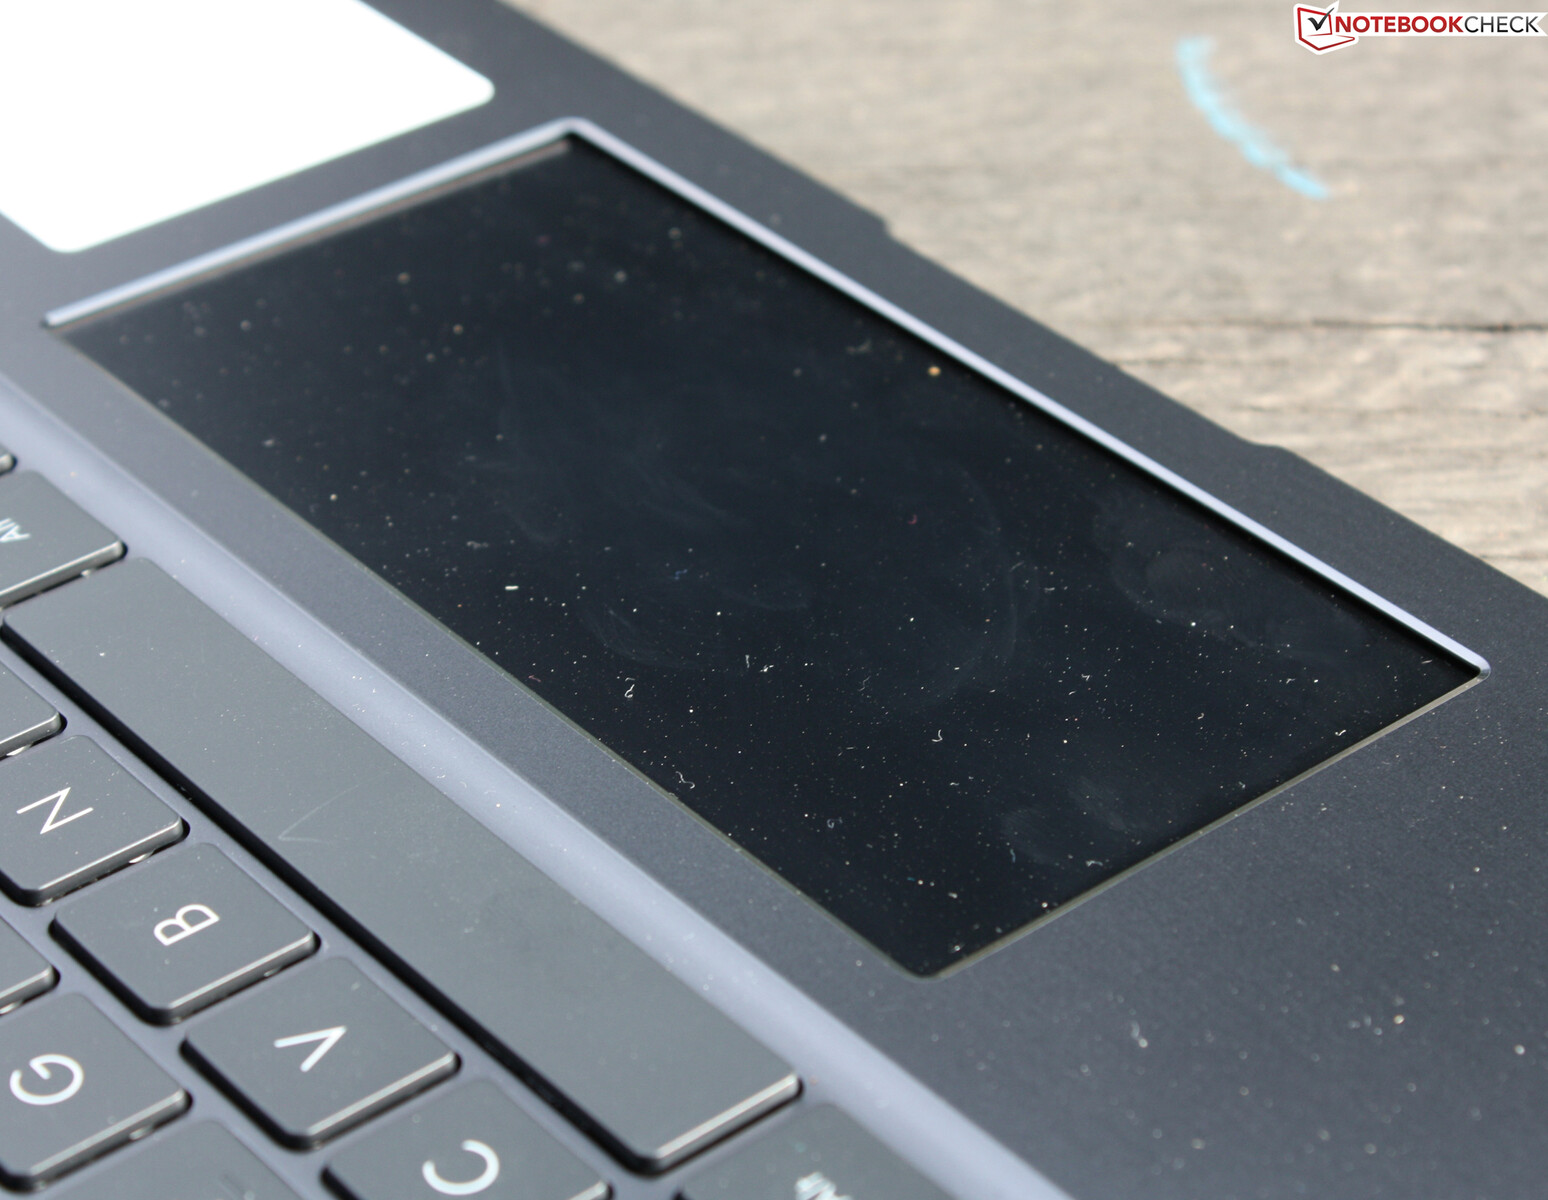
触摸板
ClickPad对边缘很敏感,并提供一个短的行程。它的操作有一种沉闷的、安静的噪音。哑光表面相当光滑,但不滑溜。它为手指的滑动提供了一个舒适的表面。我们发现短行程不令人满意,但这是个人品味的问题。
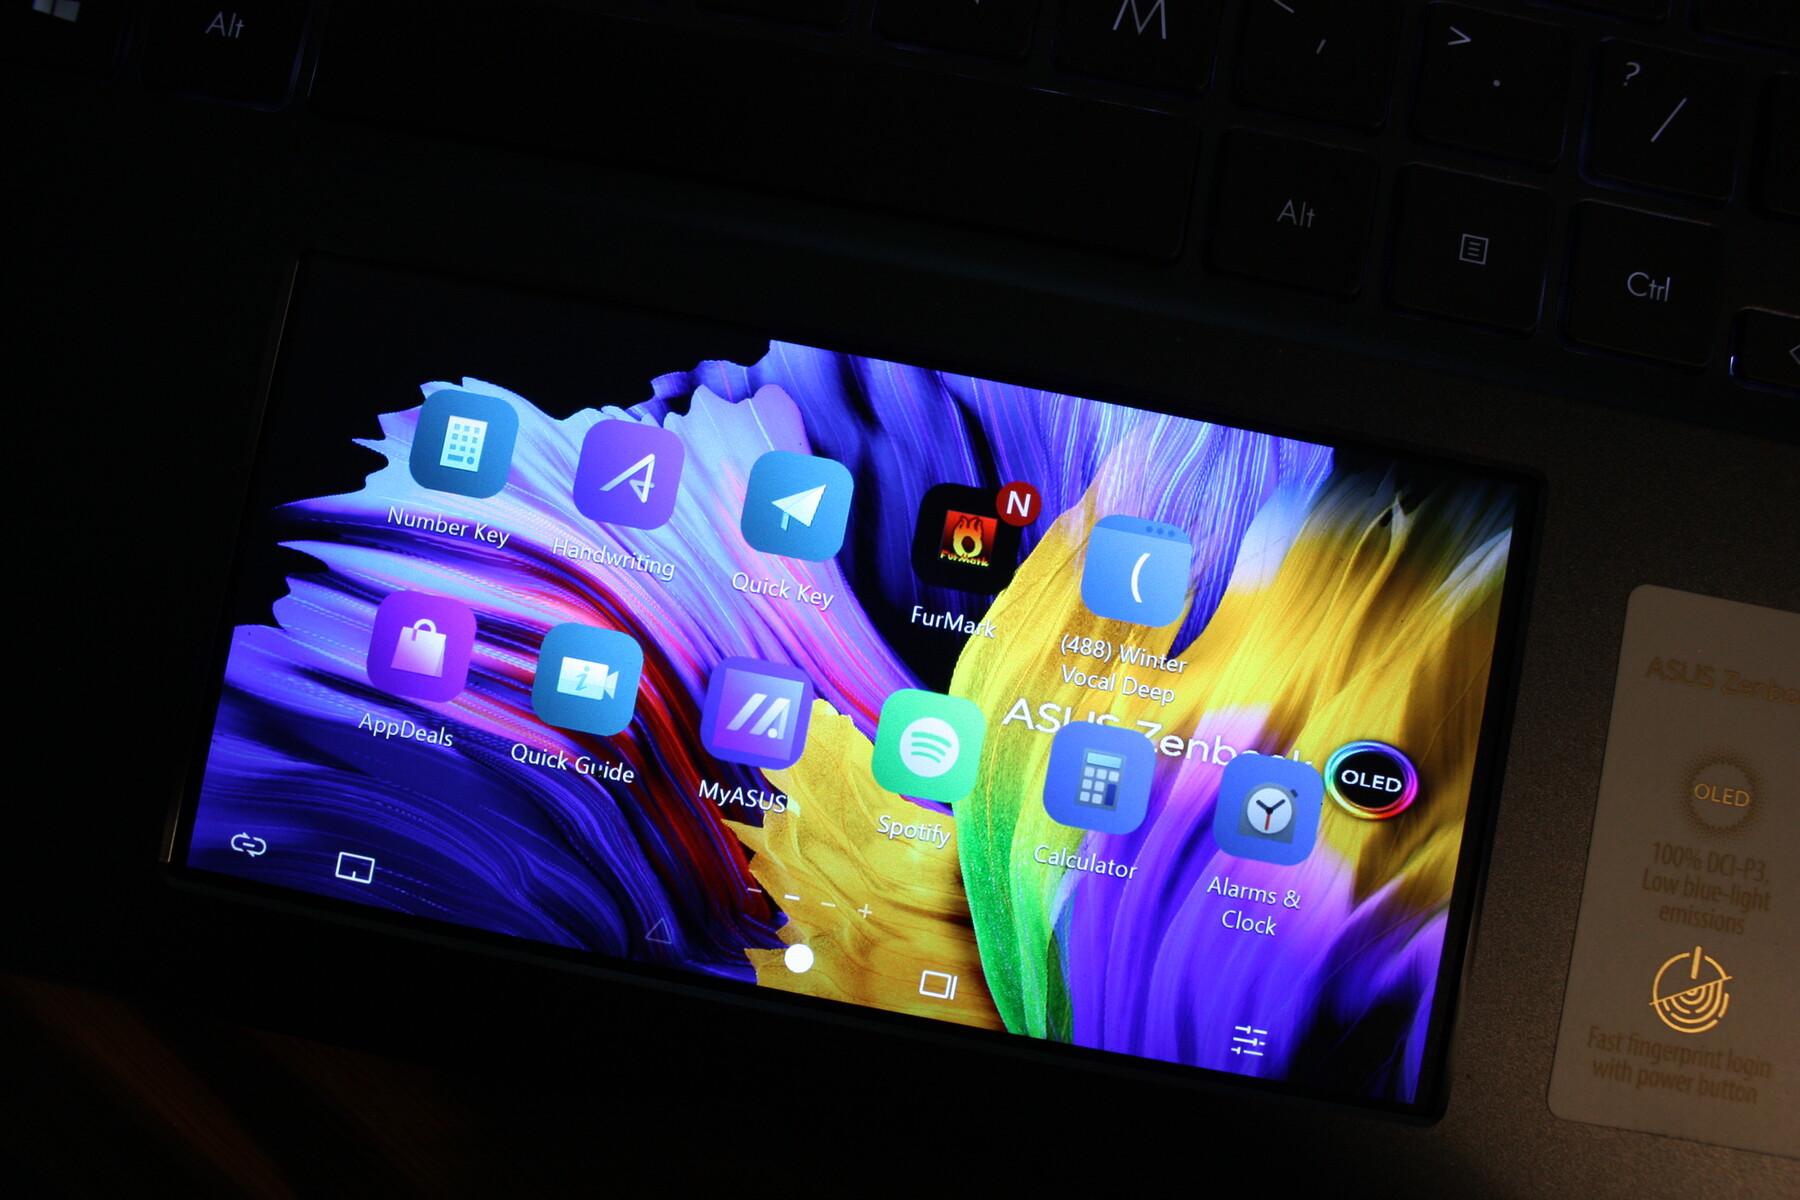
当需要时,垫子可以变成一个显示屏。垫子功能可以通过覆盖物即时使用,或者通过停用显示功能(Fn+F6)来长时间使用。
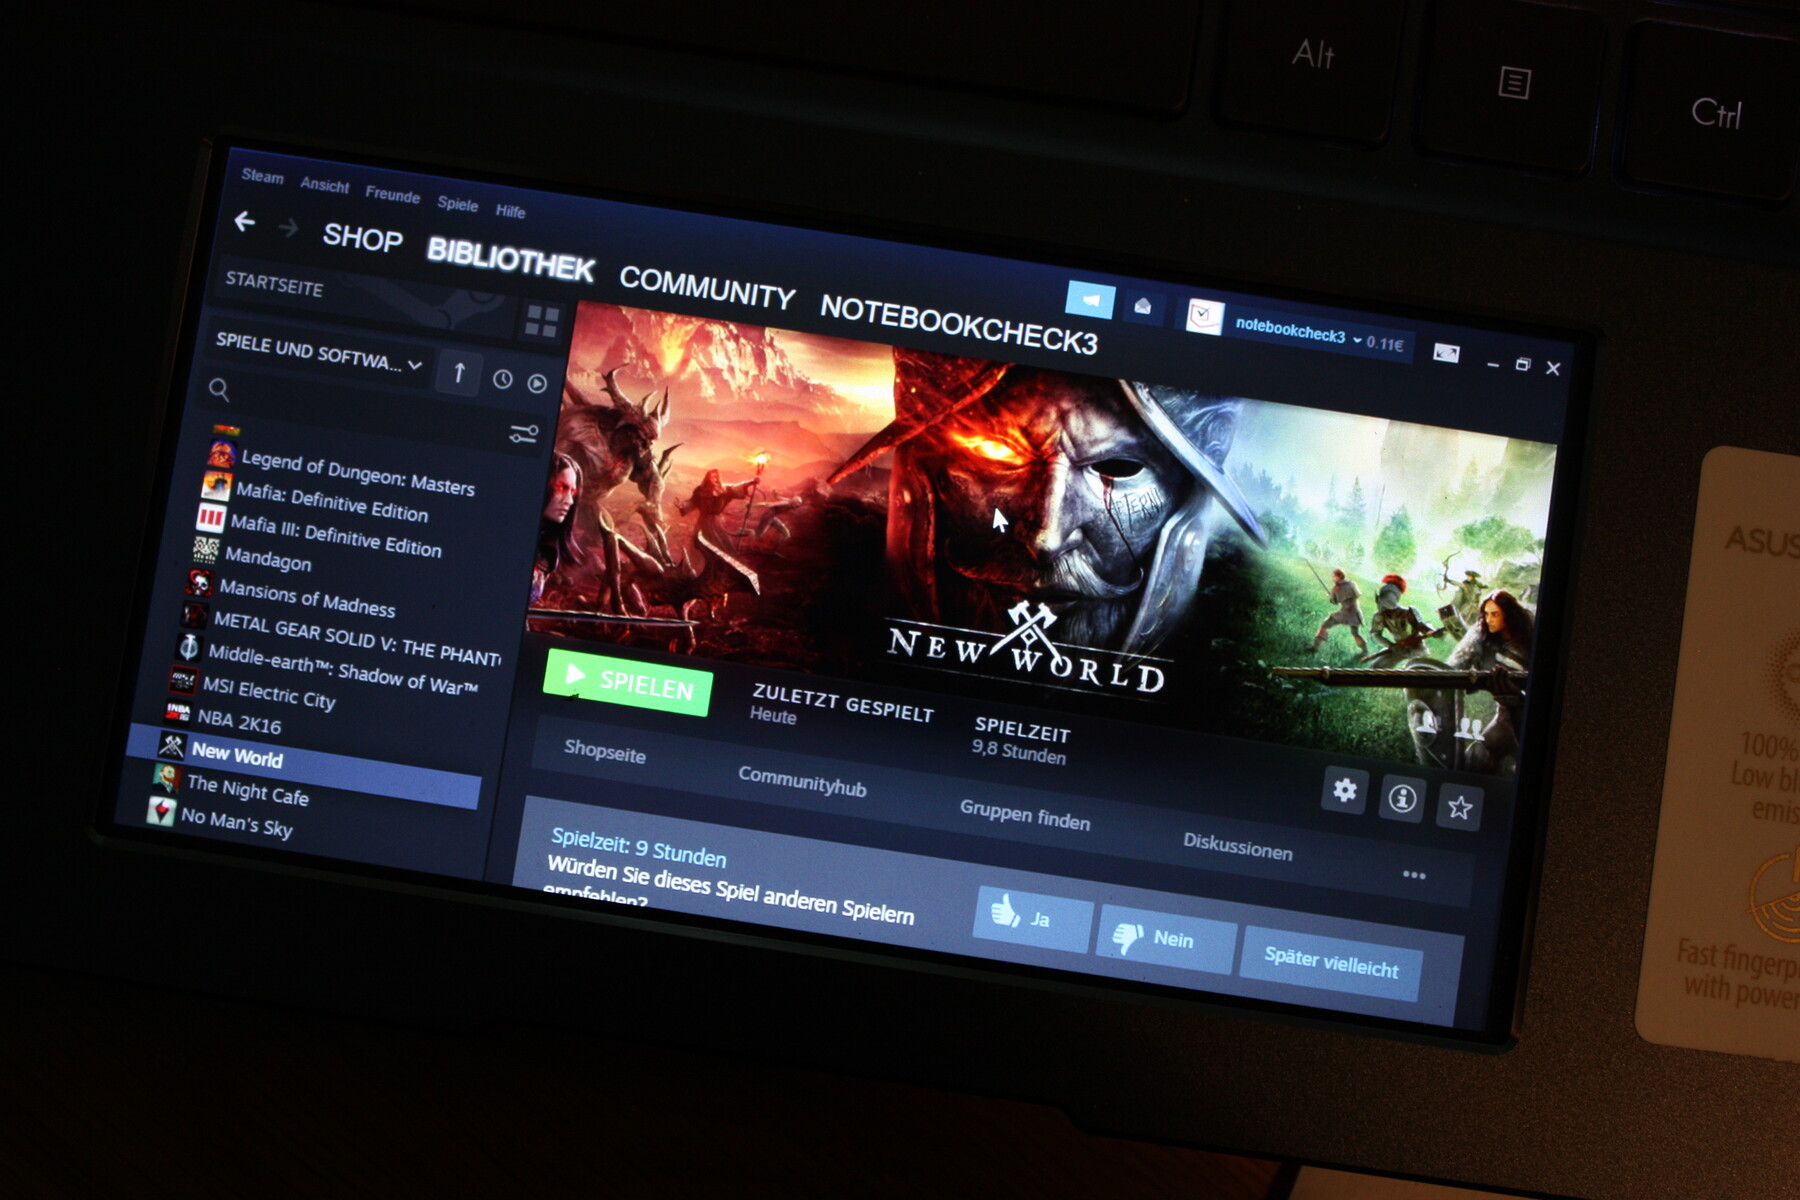
ScreenPad 2.0是哑光的,分辨率为全高清+(2160x1080)。这是一块IPS面板。在Windows中,副显示屏作为一个扩展桌面运行,就像任何HDMI连接的显示器一样。你可以将窗口拖入其中,例如Steam应用、编辑器或Photoshop的工具。
数字签名在ScreenPad上进行,因为OLED面板毕竟是非触摸的。华硕在ScreenPad上预装了组。每个组都可以用在小显示屏上有用的应用程序来填充。例如,手写、数字键盘、应用商店、计算器或Spotify。
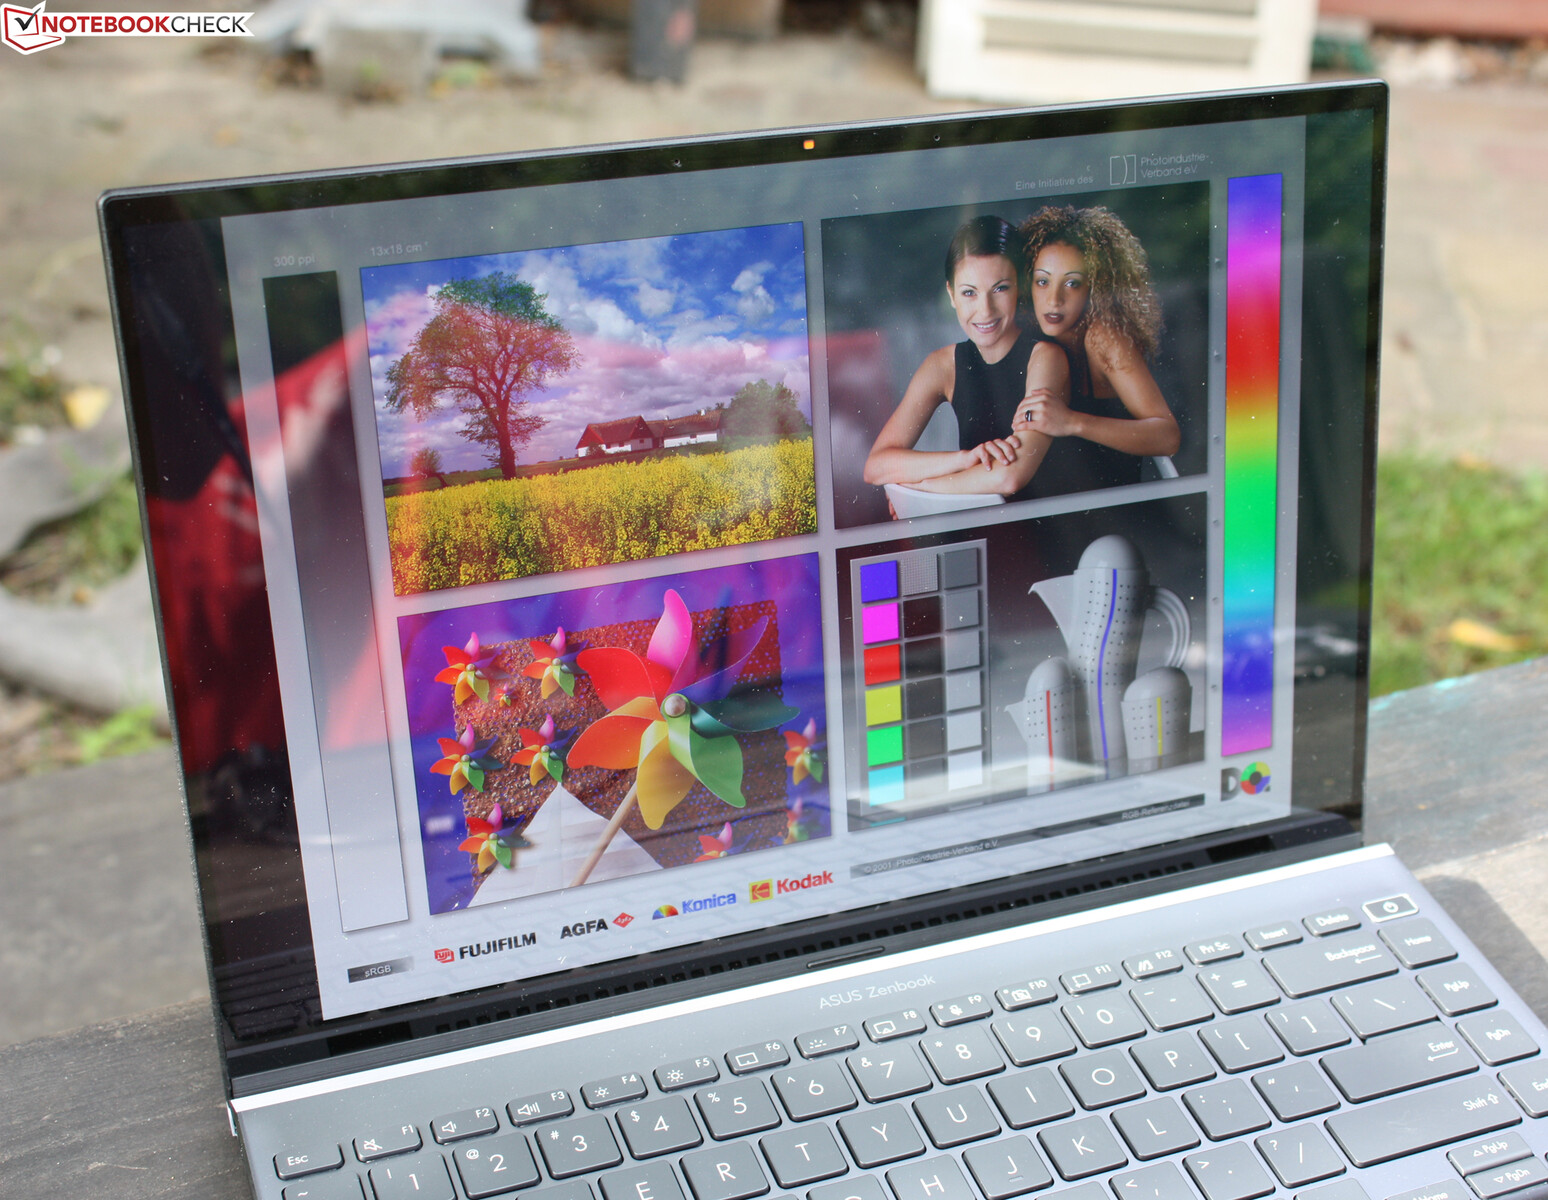
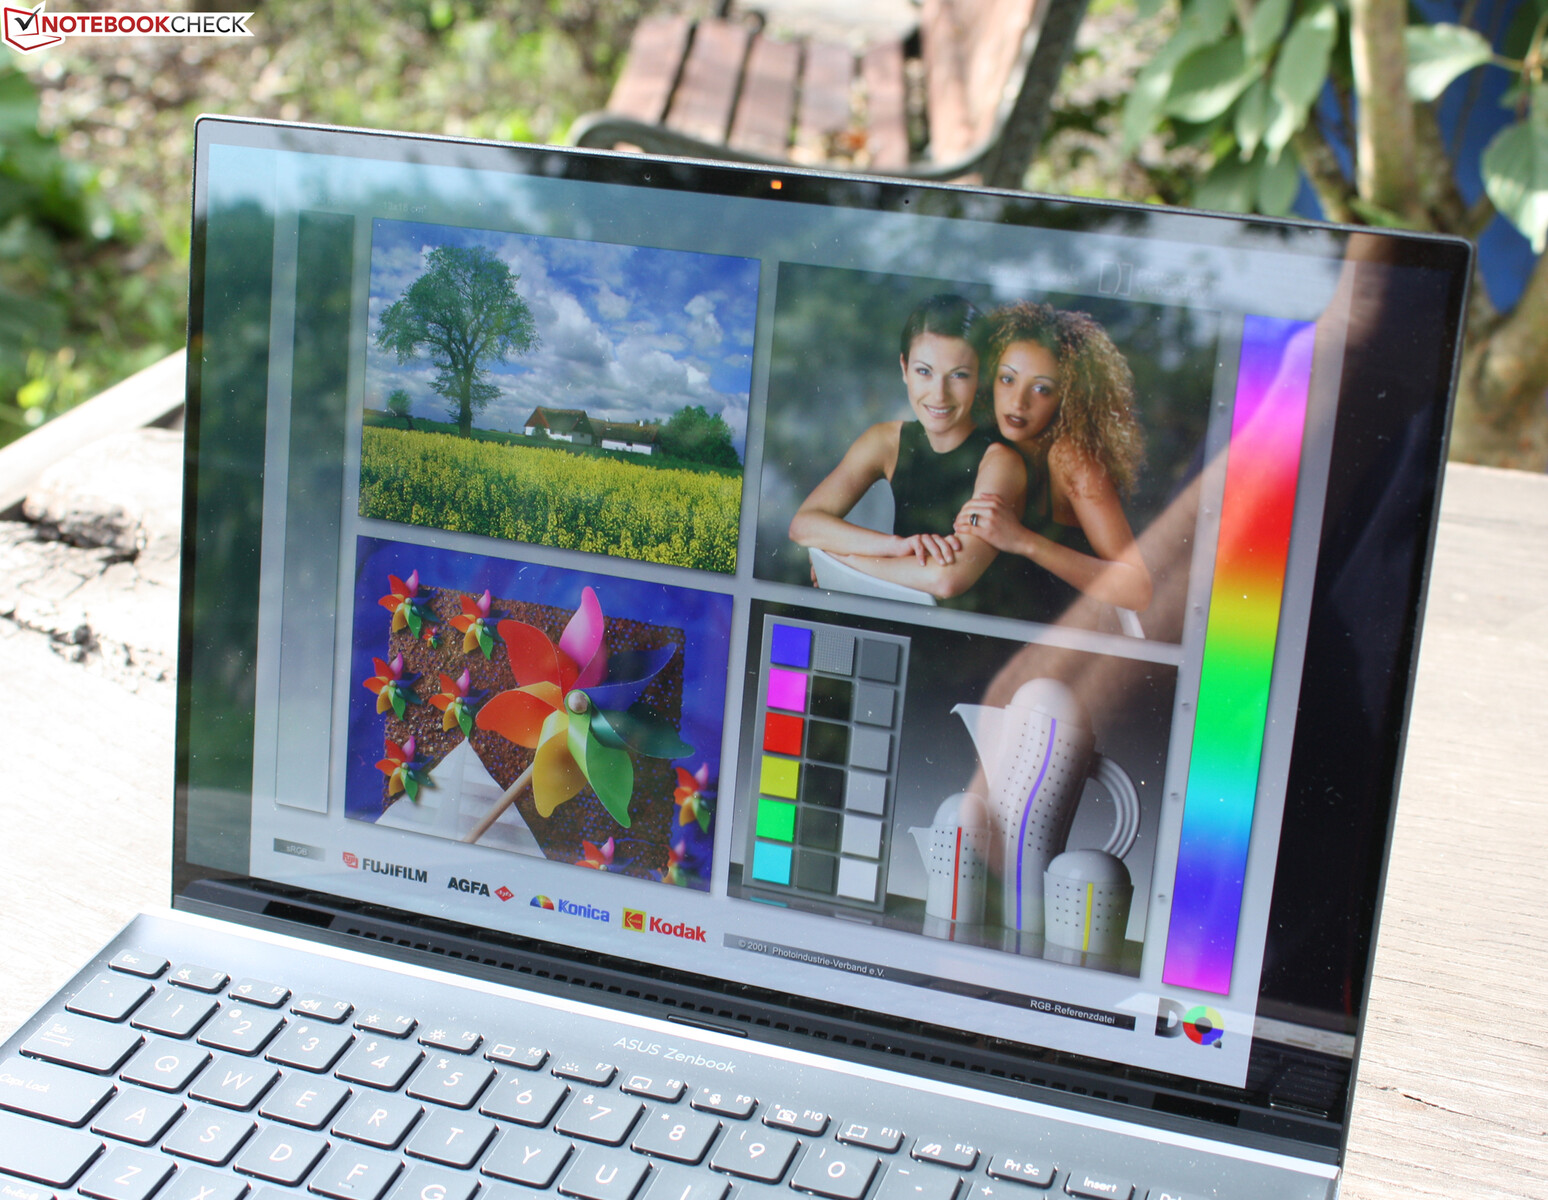
显示
购买Zenbook 14X的主要理由是其14英寸OLED面板。三星提供了一个WQXGA+面板,像素为2880x1800(16:10)。刷新率为90赫兹,响应时间为0.2毫秒,这个充满活力的显示屏胜过任何IPS型号。
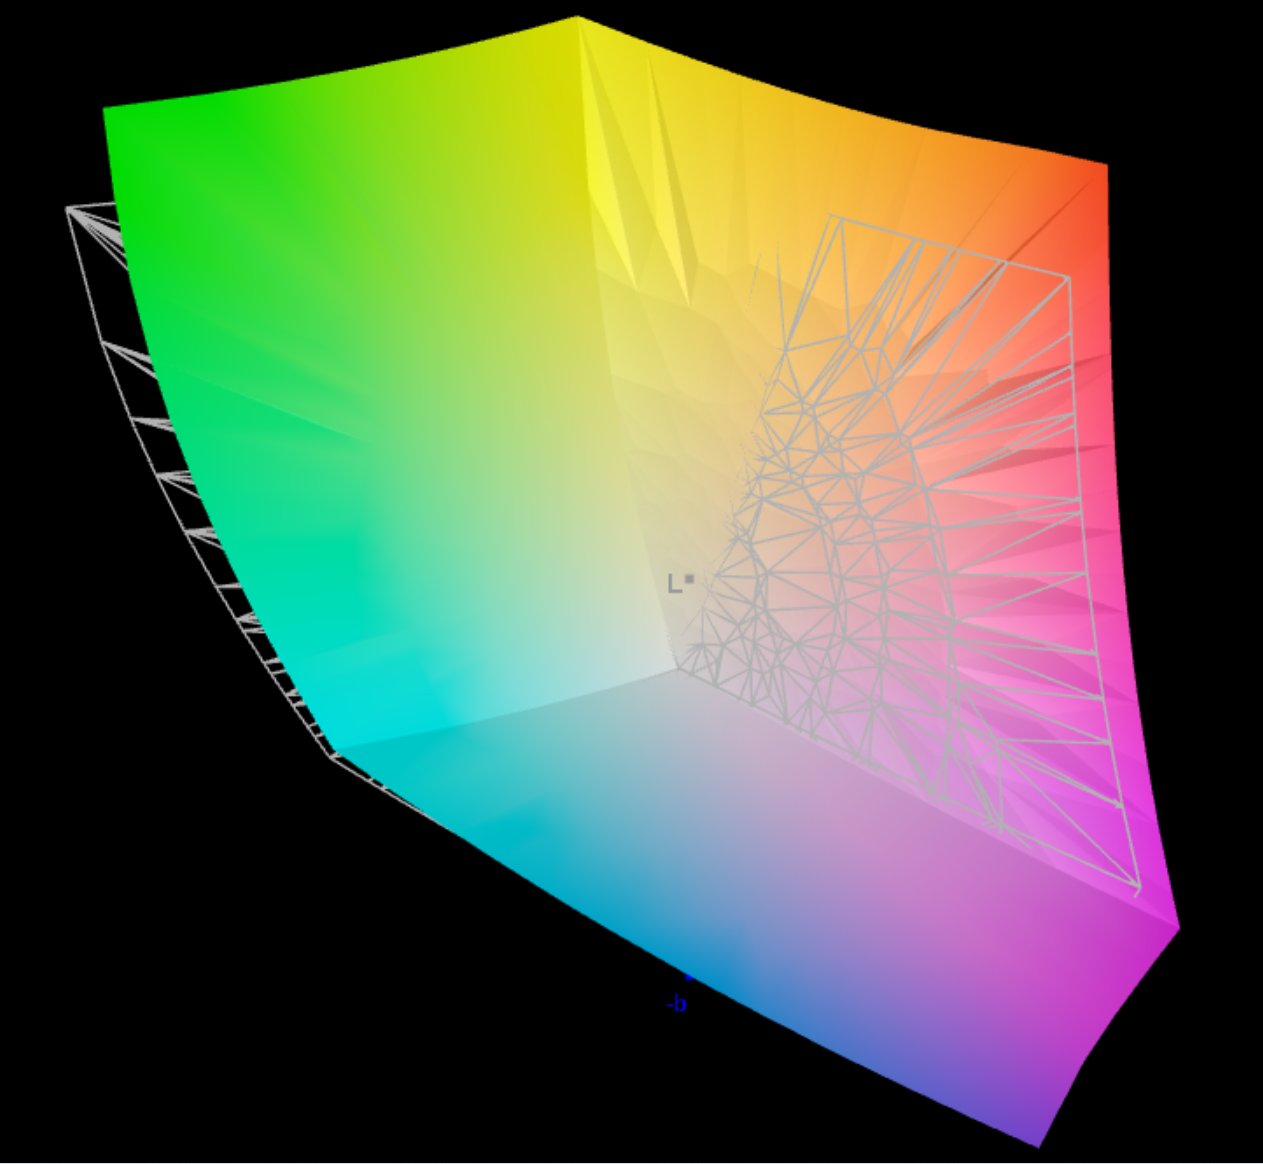
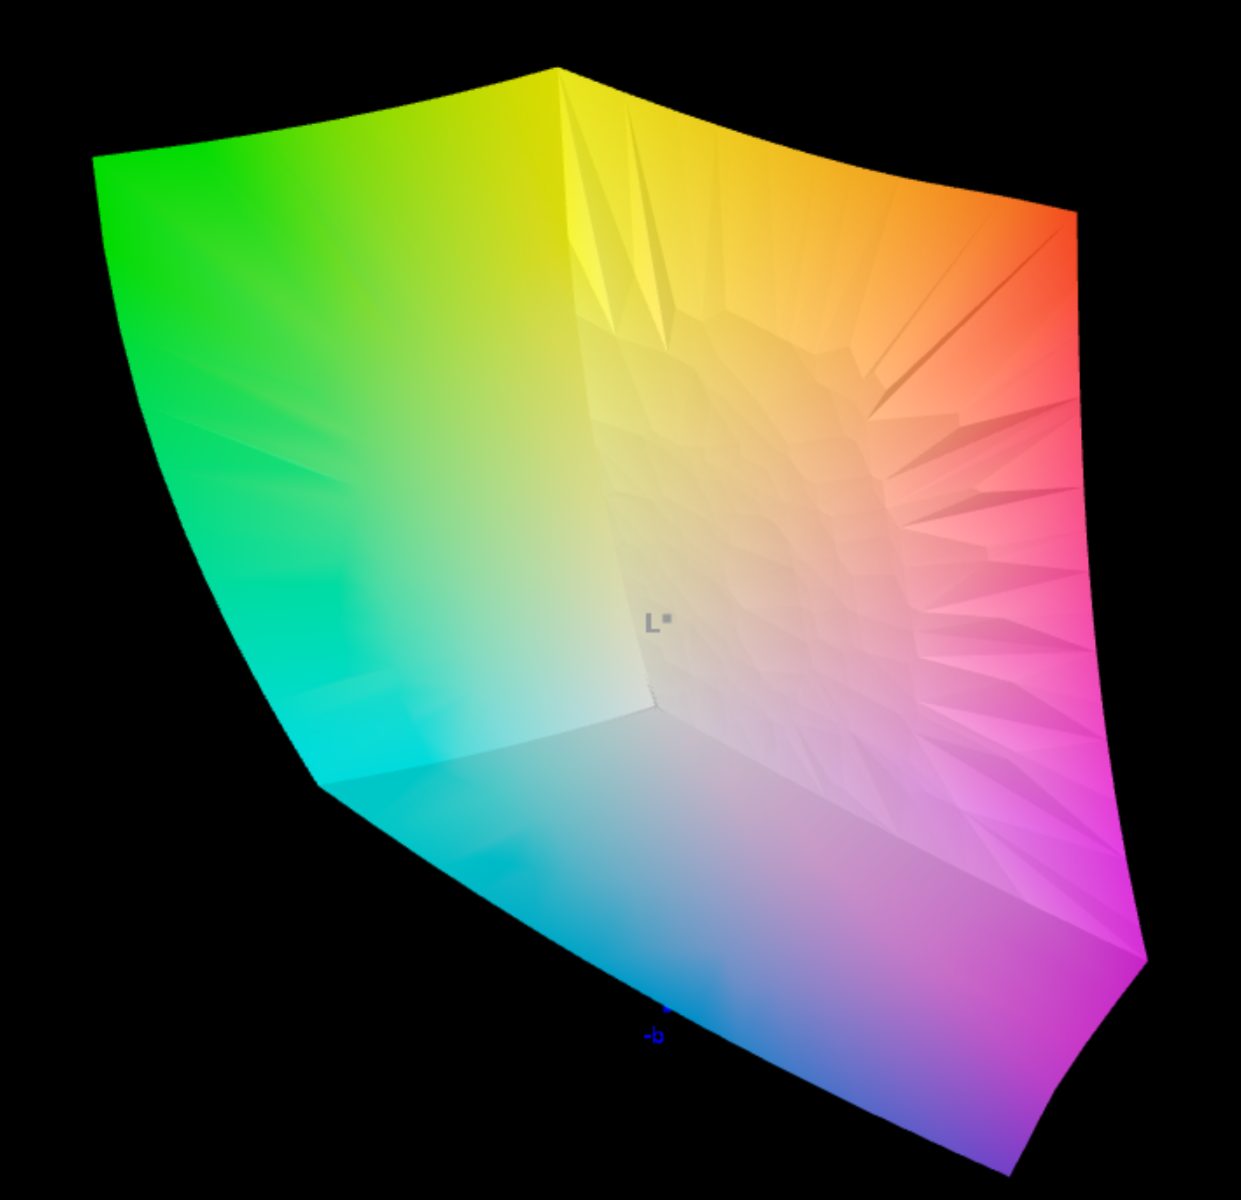
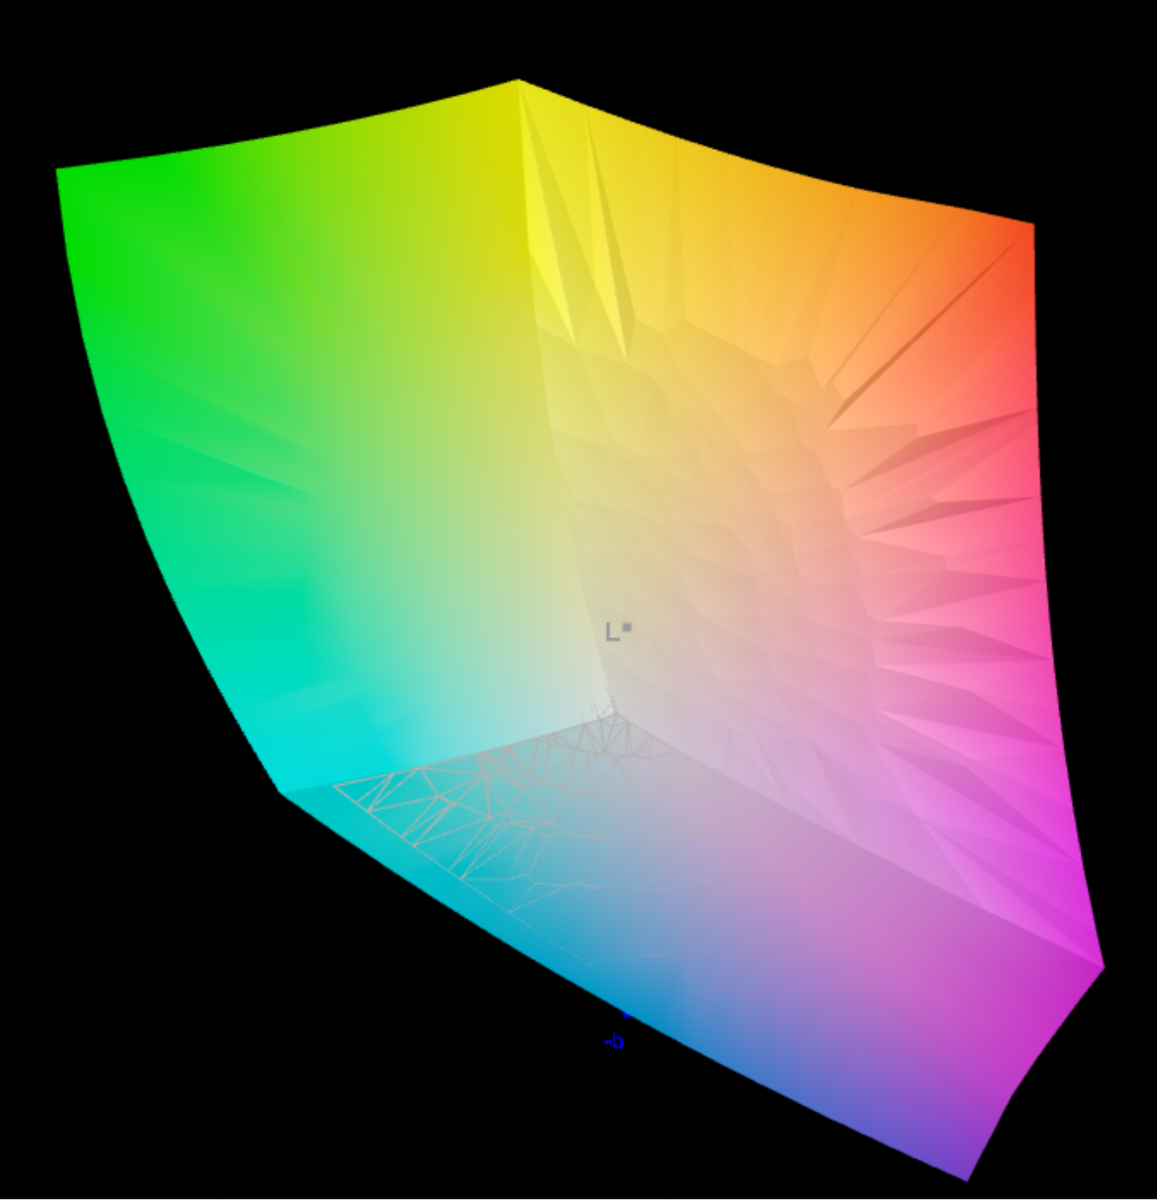
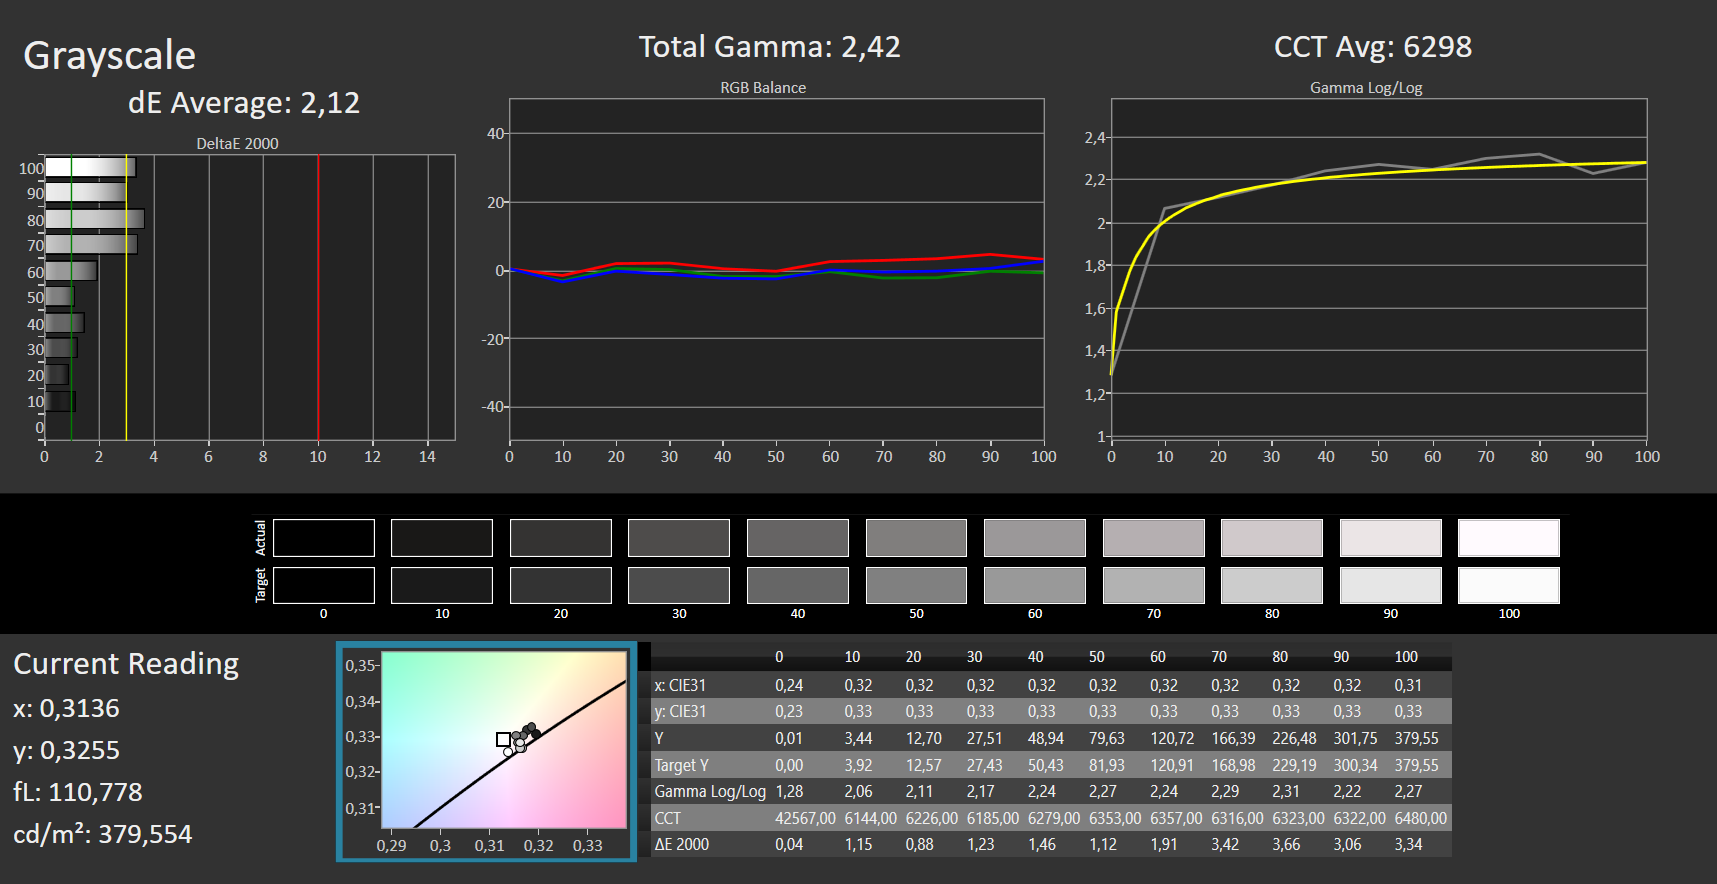
它还承诺100%的DCI-P3色域,我们可以通过测量证实这一点。华硕表示,亮度达到500尼特;我们平均测量了381cd/m²,最大为401cd/m²。尼特和cd/m²是1:1转换的,这意味着我们无法测量制造商宣传的亮度。亮度的分布是均匀的。
无论如何,高亮度对OLED显示器是有害的,所以它们不应该被长期使用。关于烧毁的问题,华硕用一个不能被禁用的OLED屏保来回应。它在15分钟后激活,对保护面板很重要。根据制造商的说法,用户可以在被告知相关风险(警告信息)后禁用屏保。这应该可以通过个人的MyAsus设置(需要账户)。我们在Windows 10的显示设置中没有找到关闭屏幕保护程序的选项。
屏占比为92%,这是一个非常窄的边框,围绕着大量的显示屏。三星的面板利用直流调光来降低亮度。
华硕在Zenbook 14X的阵容中有三种面板选择:与我们的评测单元一样的WQXGA+(2880x1800)非触摸版本,同样的面板但有触摸功能,以及4K触摸(3840x2400)选项。诸如HDR真黑600、100% DCI-P3和92%的屏占比等规格在所有变体中都是相同的。
| |||||||||||||||||||||||||
Brightness Distribution: 93 %
Center on Battery: 379 cd/m²
Contrast: 3790:1 (Black: 0.1 cd/m²)
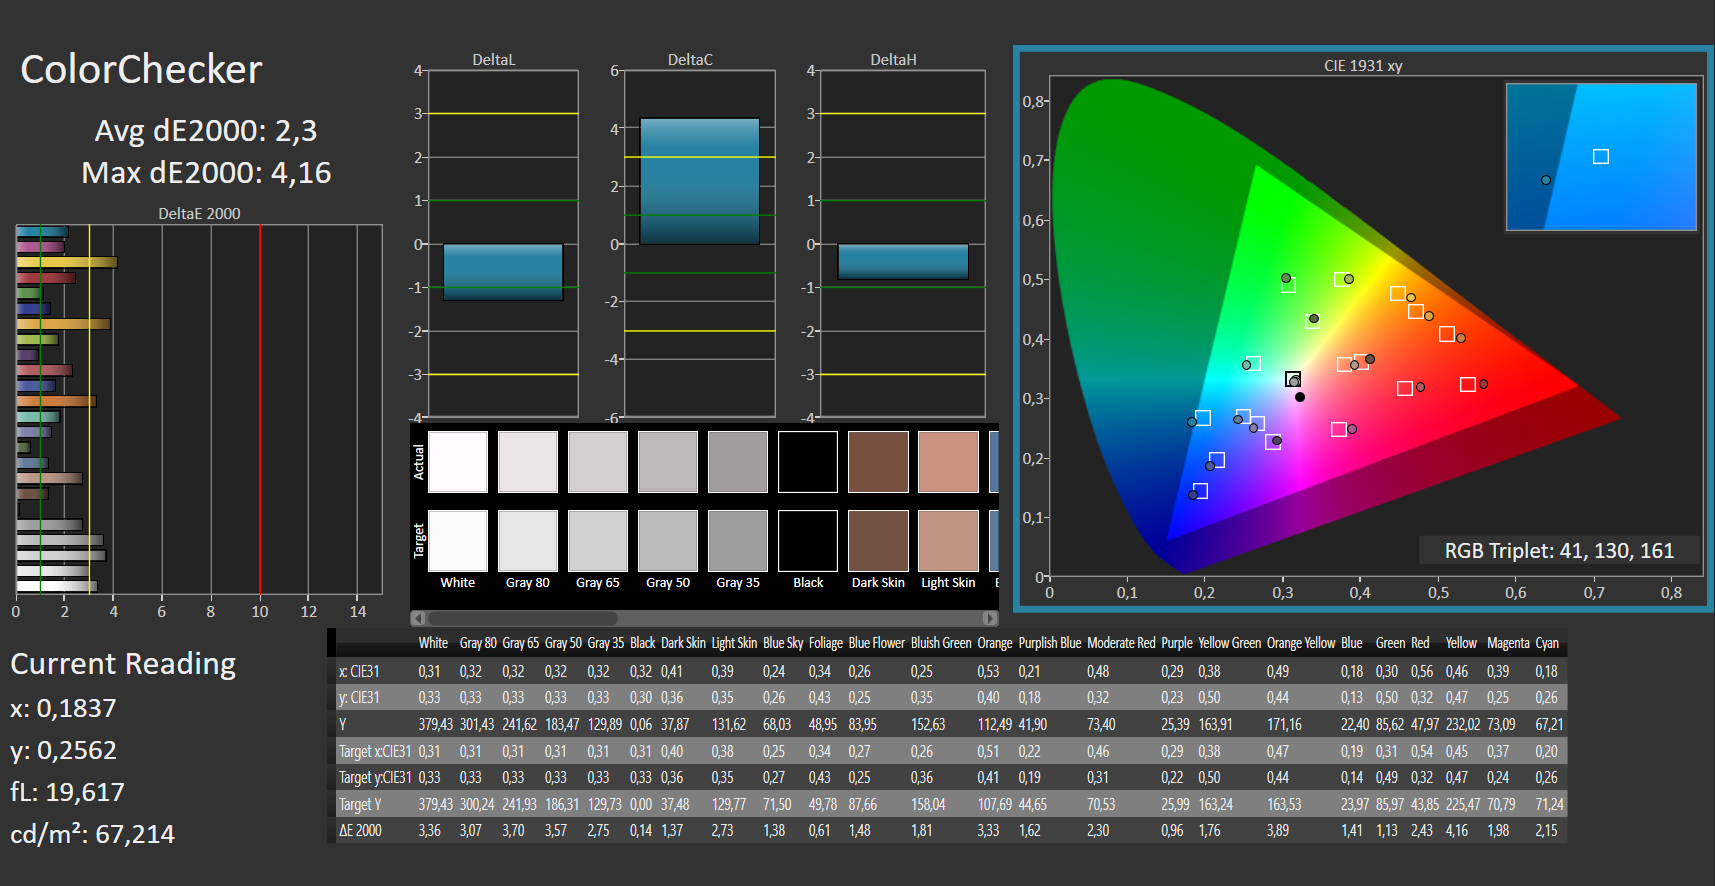
ΔE ColorChecker Calman: 2.3 | ∀{0.5-29.43 Ø4.73}
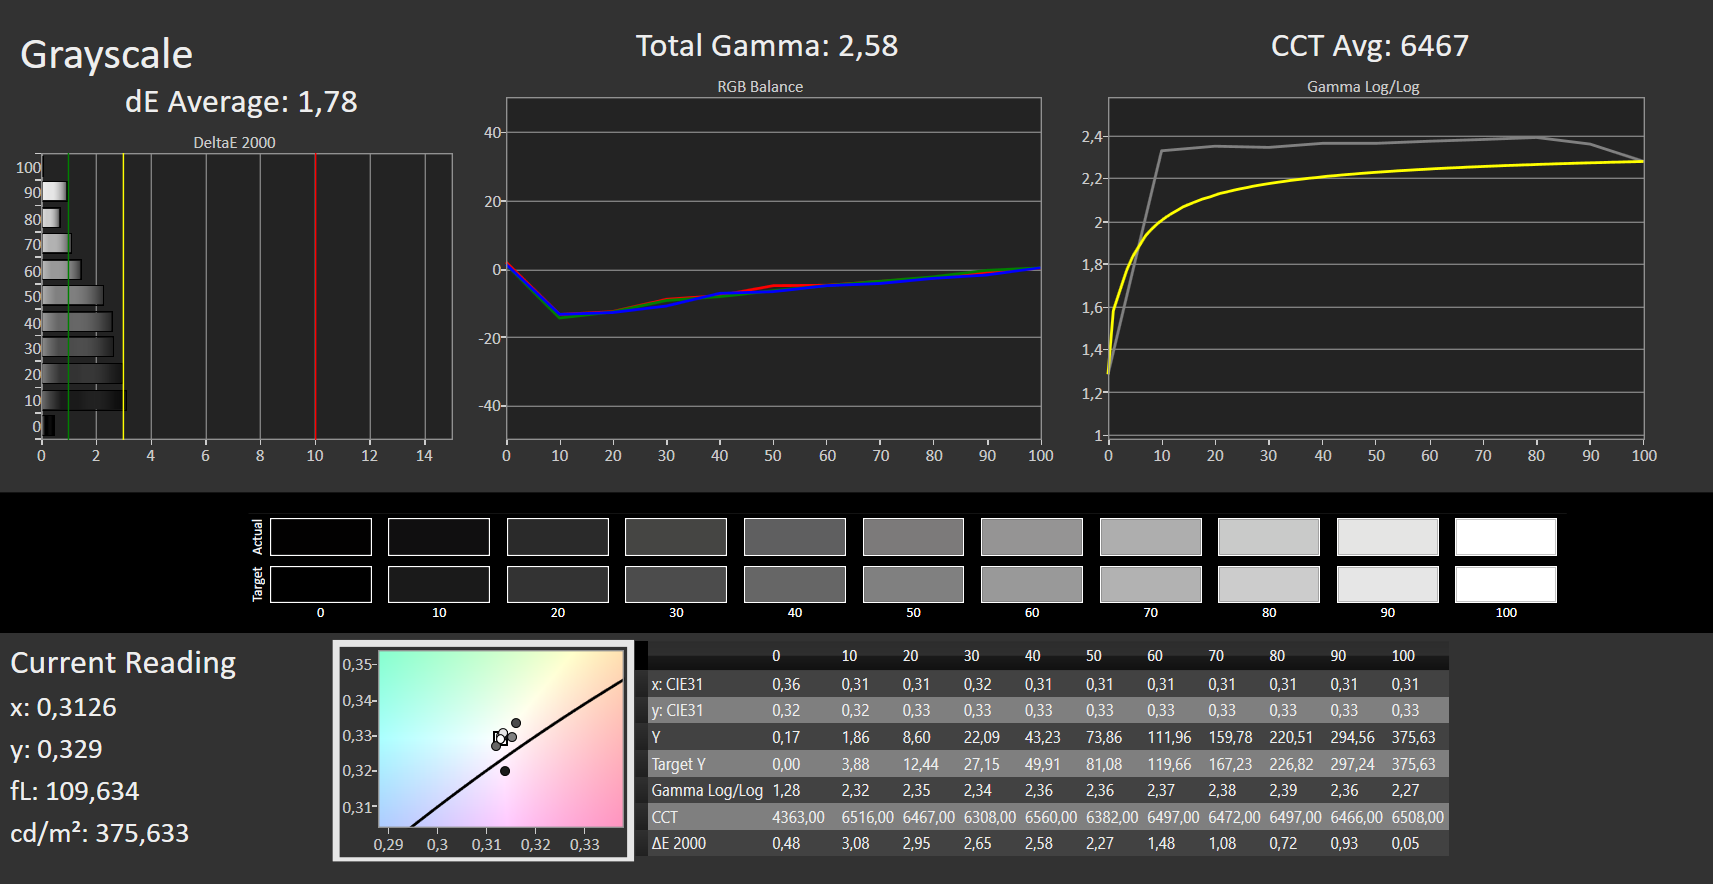
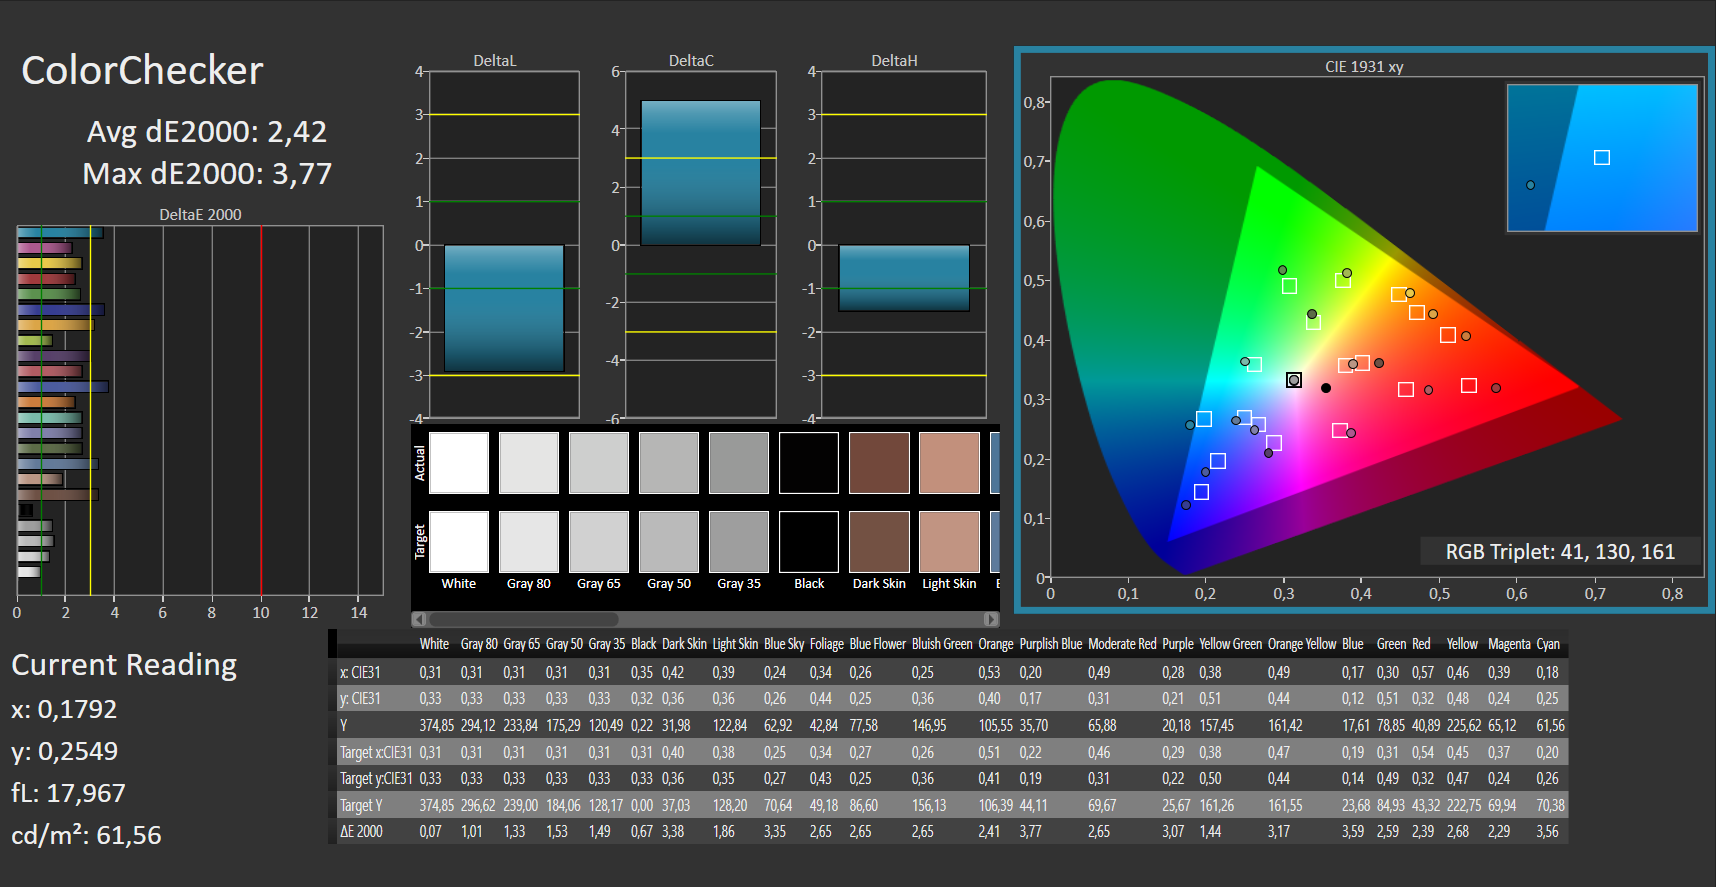
calibrated: 2.42
ΔE Greyscale Calman: 2.12 | ∀{0.09-98 Ø4.97}
96% AdobeRGB 1998 (Argyll 3D)
100% sRGB (Argyll 3D)
100% Display P3 (Argyll 3D)
Gamma: 2.42
| Asus Zenbook 14X UX5400E Samsung SDC4154, OLED, 2880x1800, 14" | Dell XPS 13 9310 OLED Samsung 134XK01, OLED, 3456x2160, 13.4" | Asus Zenbook 14 UX435EG Au Optronics B140HAN03.2, IPS, 1920x1080, 14" | MSI Modern 14 B11SB-085 BOE CQ NV140FHM-N4V, IPS, 1920x1080, 14" | HP Envy 14-eb0010nr AU Optronics AUOF392, IPS, 1920x1200, 14" | Lenovo IdeaPad Slim 9i 14ITL5 B140ZAN01.7, IPS, 3840x2160, 14" | |
|---|---|---|---|---|---|---|
| Display | 1% | -28% | -53% | -14% | -10% | |
| Display P3 Coverage (%) | 100 | 99.7 0% | 60.9 -39% | 39.9 -60% | 77.1 -23% | 87.4 -13% |
| sRGB Coverage (%) | 100 | 100 0% | 90.4 -10% | 58.8 -41% | 99.8 0% | 99.9 0% |
| AdobeRGB 1998 Coverage (%) | 96 | 97.7 2% | 62.3 -35% | 41.2 -57% | 76.7 -20% | 81.1 -16% |
| Response Times | -10% | -1575% | -925% | -2580% | -2040% | |
| Response Time Grey 50% / Grey 80% * (ms) | 2 ? | 2.2 ? -10% | 39 ? -1850% | 25 ? -1150% | 61.2 ? -2960% | 48.4 ? -2320% |
| Response Time Black / White * (ms) | 2 ? | 2.2 ? -10% | 28 ? -1300% | 16 ? -700% | 46 ? -2200% | 37.2 ? -1760% |
| PWM Frequency (Hz) | 240.4 ? | 92 ? | ||||
| Screen | -32% | -84% | -61% | -25% | -66% | |
| Brightness middle (cd/m²) | 379 | 384 1% | 323 -15% | 347 -8% | 412 9% | 475.8 26% |
| Brightness (cd/m²) | 381 | 387 2% | 313 -18% | 311 -18% | 392 3% | 463 22% |
| Brightness Distribution (%) | 93 | 97 4% | 80 -14% | 81 -13% | 81 -13% | 89 -4% |
| Black Level * (cd/m²) | 0.1 | 0.36 -260% | 0.12 -20% | 0.32 -220% | 0.44 -340% | |
| Contrast (:1) | 3790 | 897 -76% | 2892 -24% | 1288 -66% | 1081 -71% | |
| Colorchecker dE 2000 * | 2.3 | 4.56 -98% | 4.86 -111% | 5.05 -120% | 1.88 18% | 3.81 -66% |
| Colorchecker dE 2000 max. * | 4.16 | 7.27 -75% | 7.52 -81% | 16.98 -308% | 3.06 26% | 6.96 -67% |
| Colorchecker dE 2000 calibrated * | 2.42 | 4.52 -87% | 3.64 -50% | 1.96 19% | 2.55 -5% | |
| Greyscale dE 2000 * | 2.12 | 1.5 29% | 4.83 -128% | 1.63 23% | 2.2 -4% | 4.1 -93% |
| Gamma | 2.42 91% | 2.26 97% | 2.64 83% | 2.3 96% | 2.1 105% | 2.14 103% |
| CCT | 6219 105% | 7405 88% | 6666 98% | 6650 98% | 6564 99% | |
| Color Space (Percent of AdobeRGB 1998) (%) | 87.1 | 57.5 | 38 | 68.7 | 72.4 | |
| Color Space (Percent of sRGB) (%) | 100 | 90.3 | 58 | 99.8 | 99.9 | |
| Total Average (Program / Settings) | -14% /
-20% | -562% /
-285% | -346% /
-192% | -873% /
-388% | -705% /
-336% |
* ... smaller is better
正如人们所期望的那样,OLED显示屏具有出色的对比度(3,790:1);黑色很深,颜色很鲜艳。作为典型的OLED,其响应时间也很好。用于降低亮度的PWM在50%及以下的亮度水平上设置,使显示器以362Hz的频率闪烁。敏感的用户可能会受此影响,尽管我们在实践中很少将亮度调整到50%以下。在日光下的正常办公室使用中,我们在60-70%的水平上操作。
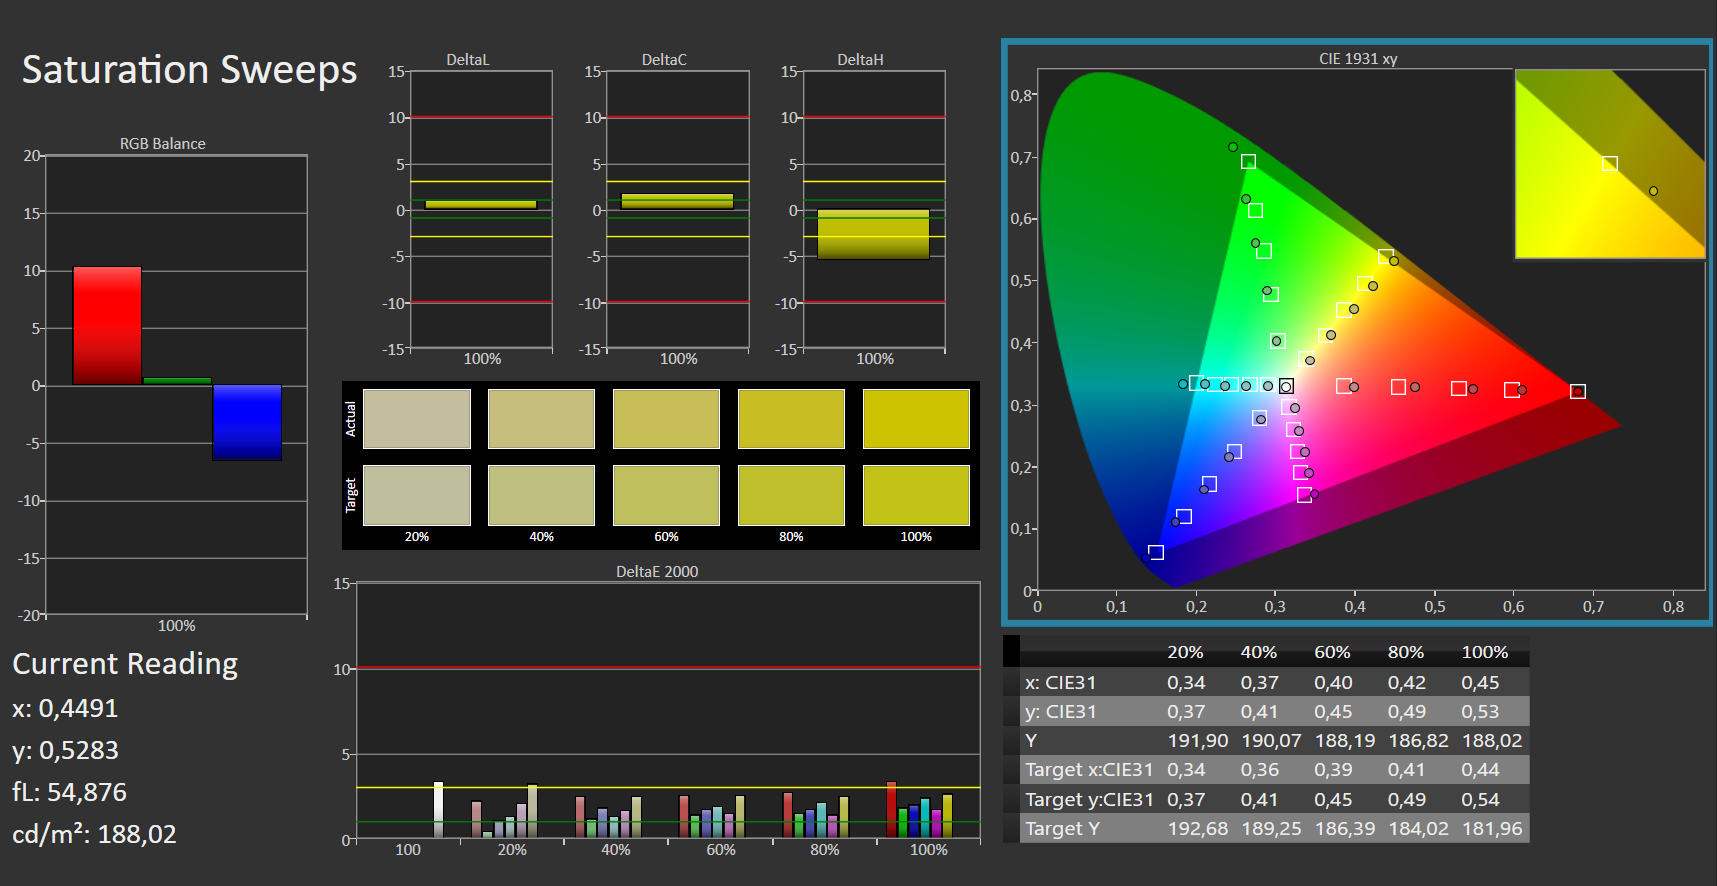
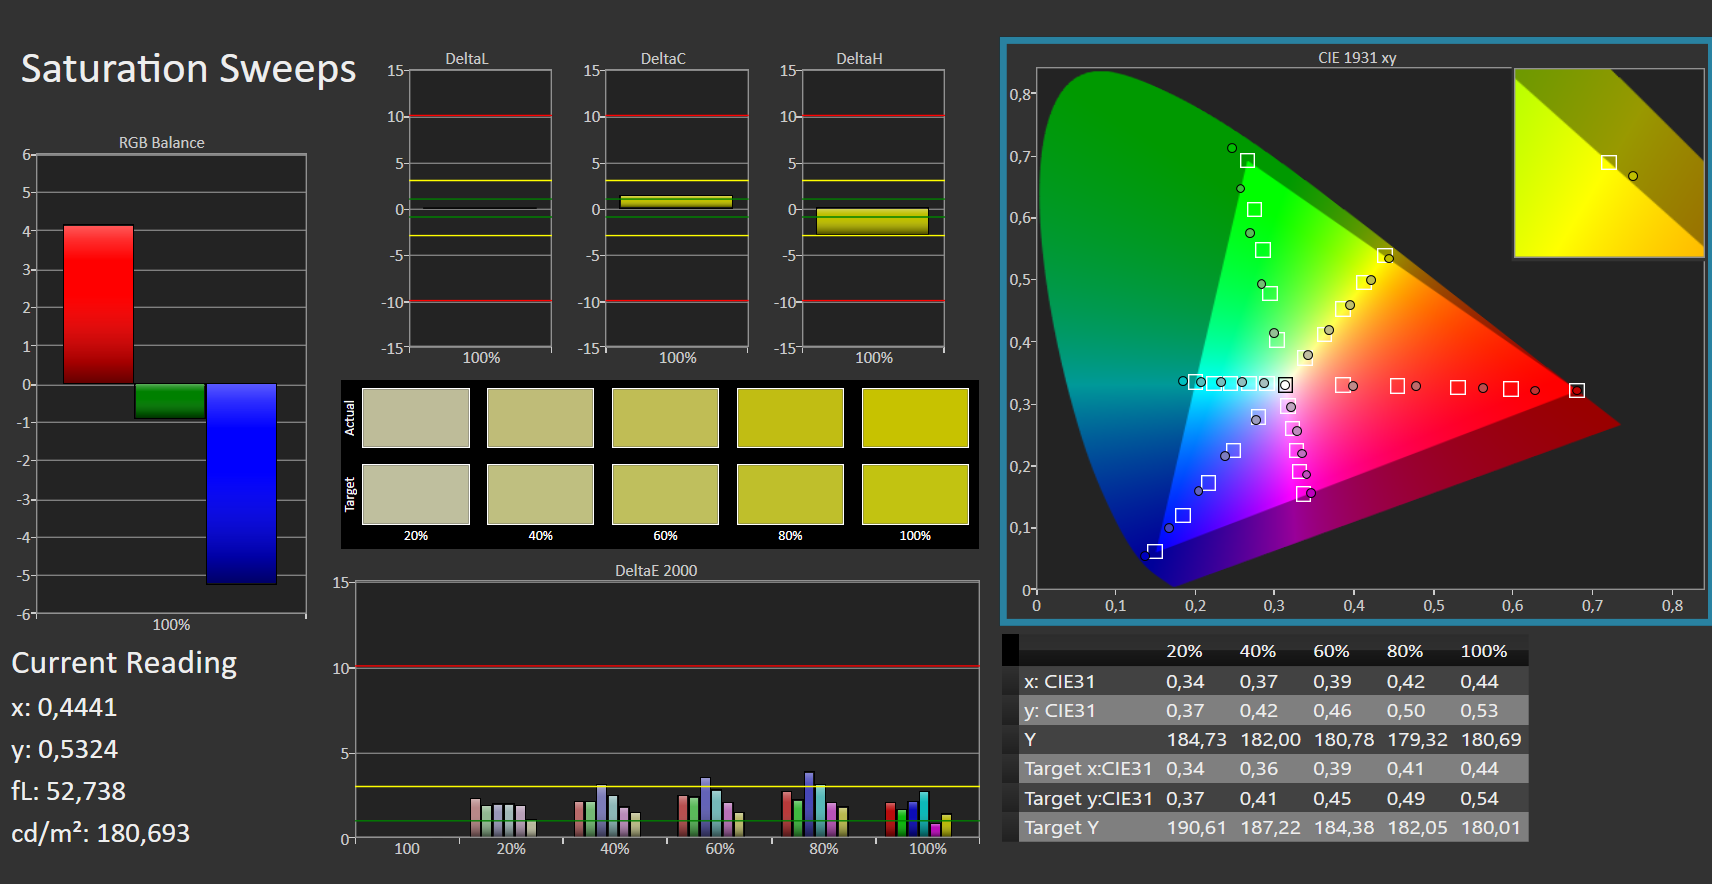
我们测量了校准前的灰度和彩色DeltaE值,分别为2.4和2.3,这是非常好的数值,因为它们低于3.0。校准改善了灰度(1.8),但色彩变得更糟(2.4)。简而言之:你可以跳过校准,因为出厂时校准的面板不能被改善。
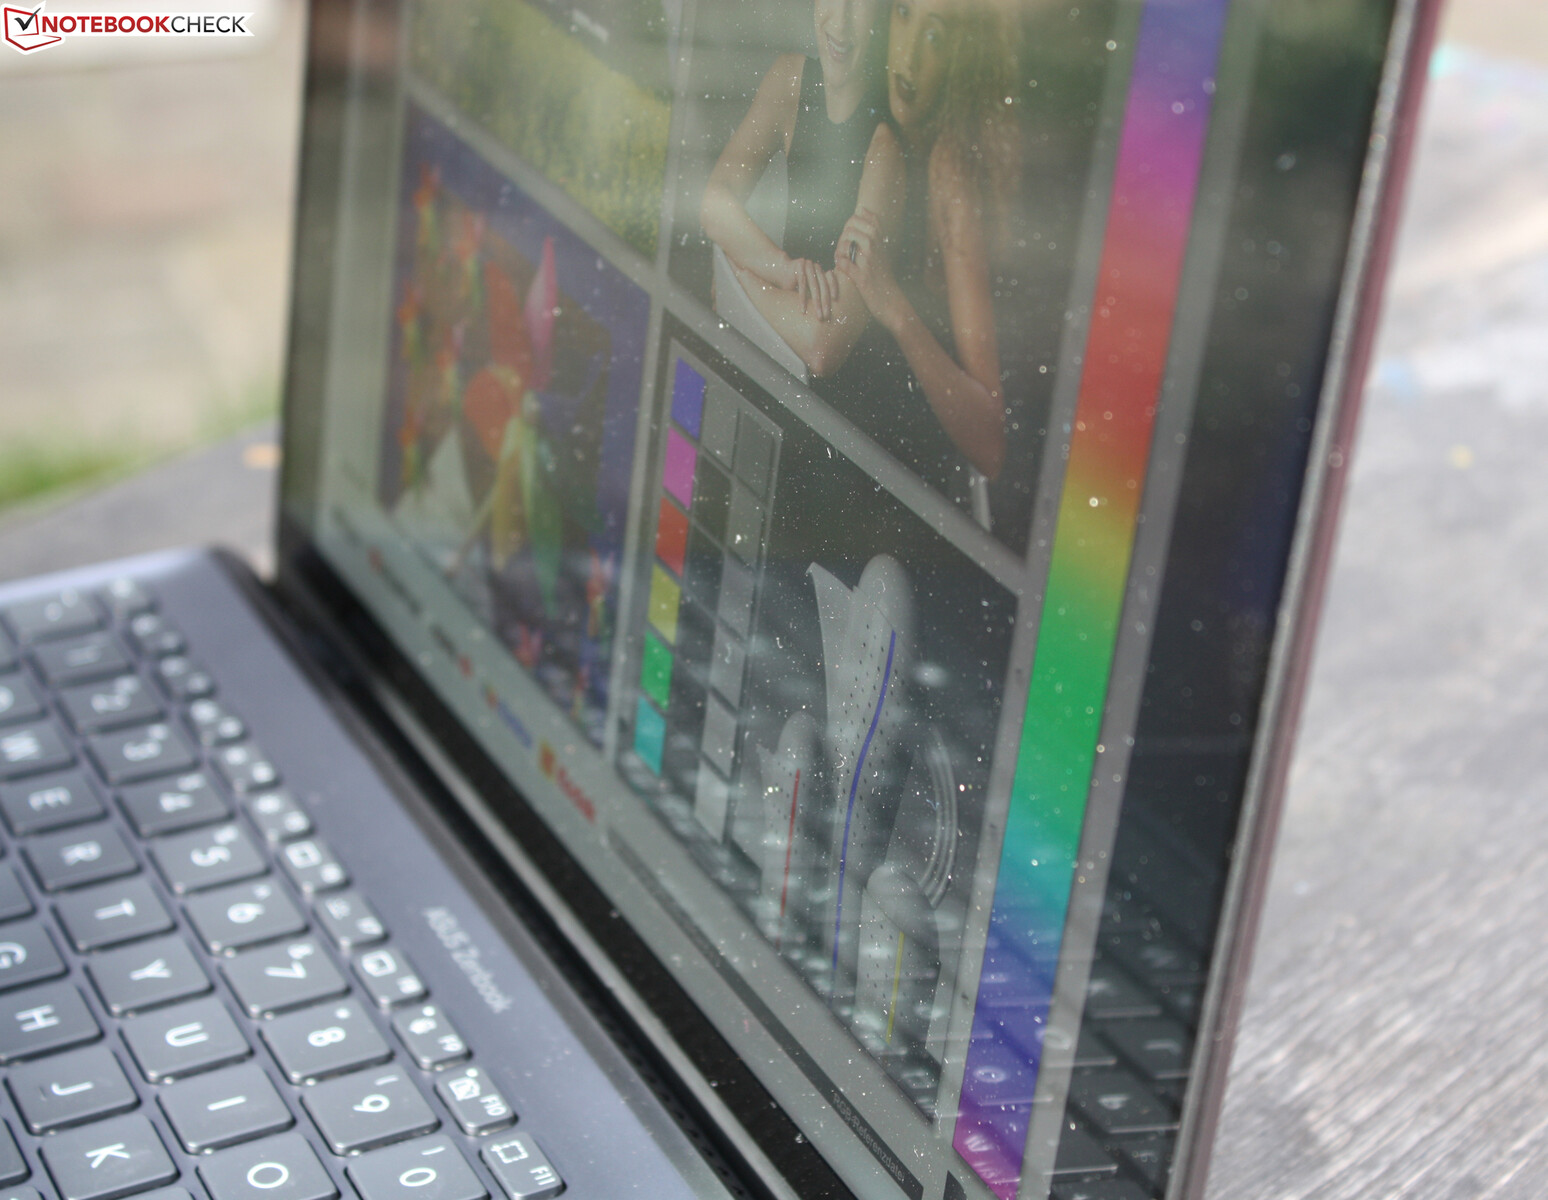
光滑的表面(非触摸)在户外受到反射的影响,而高亮度在这里没有什么帮助。该面板可以在阴暗的地方很好地使用,部分原因是在电池供电的情况下亮度不会降低(显示屏中心的亮度为379 cd/m²)。
Display Response Times
| ↔ Response Time Black to White | ||
|---|---|---|
| 2 ms ... rise ↗ and fall ↘ combined | ↗ 1 ms rise |  |
| ↘ 1 ms fall | ||
| The screen shows very fast response rates in our tests and should be very well suited for fast-paced gaming. In comparison, all tested devices range from 0.1 (minimum) to 240 (maximum) ms. » 11 % of all devices are better. This means that the measured response time is better than the average of all tested devices (19.9 ms). | ||
| ↔ Response Time 50% Grey to 80% Grey | ||
| 2 ms ... rise ↗ and fall ↘ combined | ↗ 1 ms rise |  |
| ↘ 1 ms fall | ||
| The screen shows very fast response rates in our tests and should be very well suited for fast-paced gaming. In comparison, all tested devices range from 0.165 (minimum) to 636 (maximum) ms. » 10 % of all devices are better. This means that the measured response time is better than the average of all tested devices (31.1 ms). | ||
Screen Flickering / PWM (Pulse-Width Modulation)
| Screen flickering / PWM not detected | ≤ 50 % brightness setting |  | |
In comparison: 52 % of all tested devices do not use PWM to dim the display. If PWM was detected, an average of 7794 (minimum: 5 - maximum: 343500) Hz was measured. | |||
毫无疑问,OLED面板提供了最好的可视角度。即使从平坦的角度看,颜色仍然稳定,亮度也不会失去强度。
性能 - 有瓶颈的MX450
华硕选择了Tiger Lake 28瓦的英特尔酷睿i7-1165G7(2.8GHz),集成英特尔Iris Xe G7显卡(12代)。后者由Nvidia英特尔酷睿i7-1165G7 补充,可以禁用(Optimus)。对价格敏感的买家来说,将有一个配备i5-1135G7(2.4 GHz)的变体,这也将与MX450 。目标群体包括专业用户,他们正在寻找一款令人尊敬的、具有高端显示屏和全面性能的便携式笔记本电脑,用于工作和娱乐。
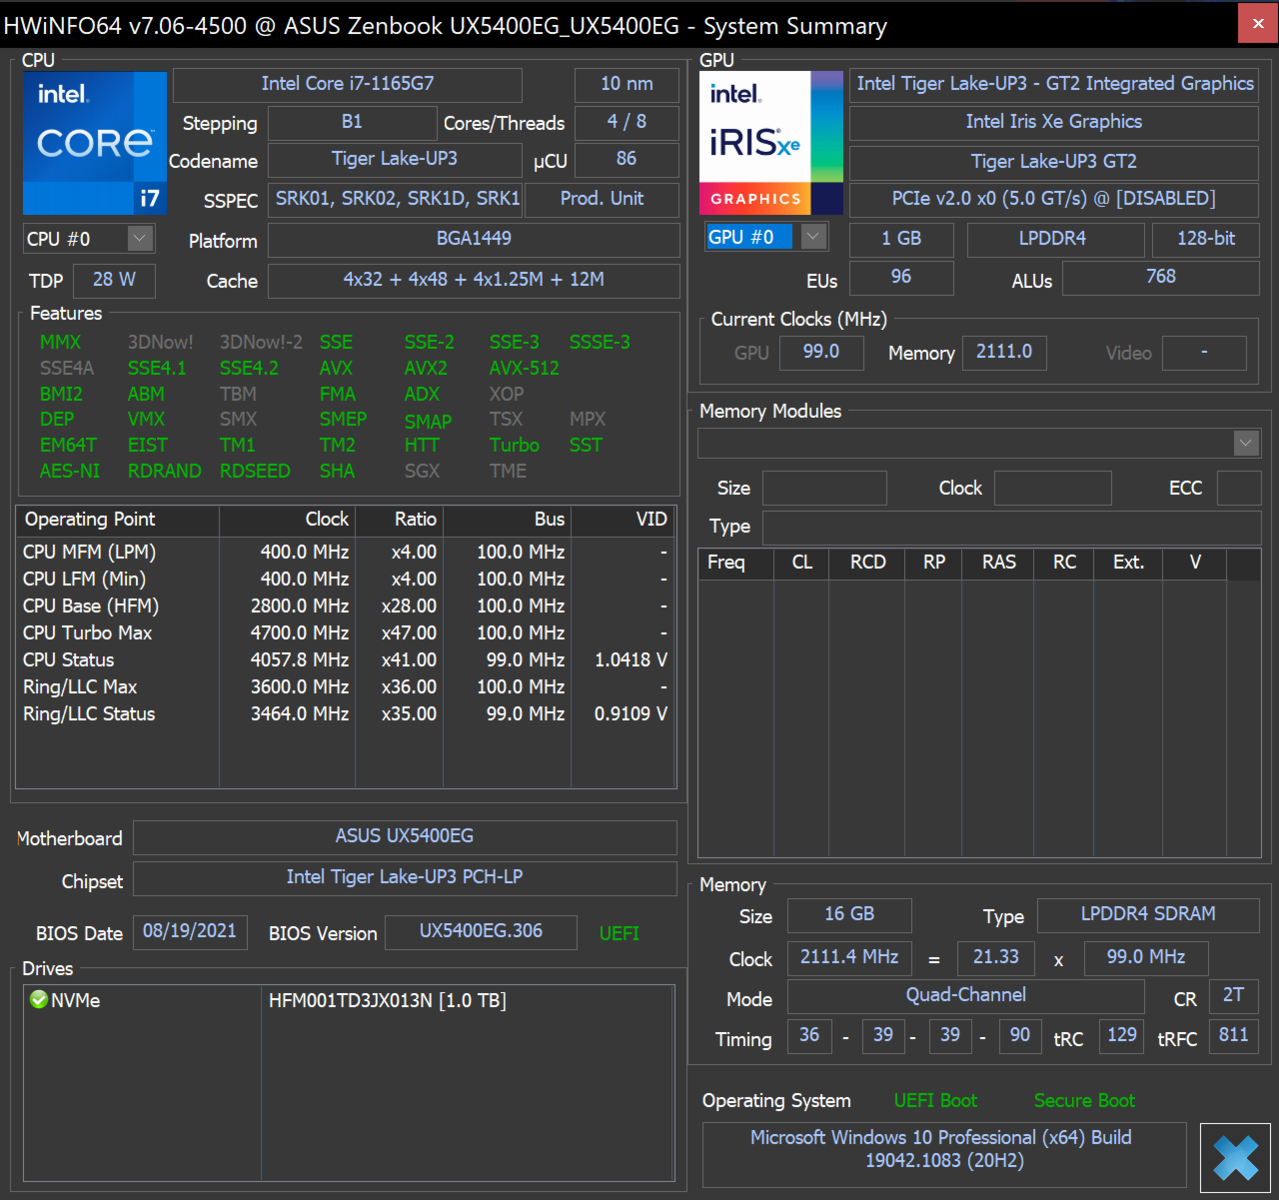
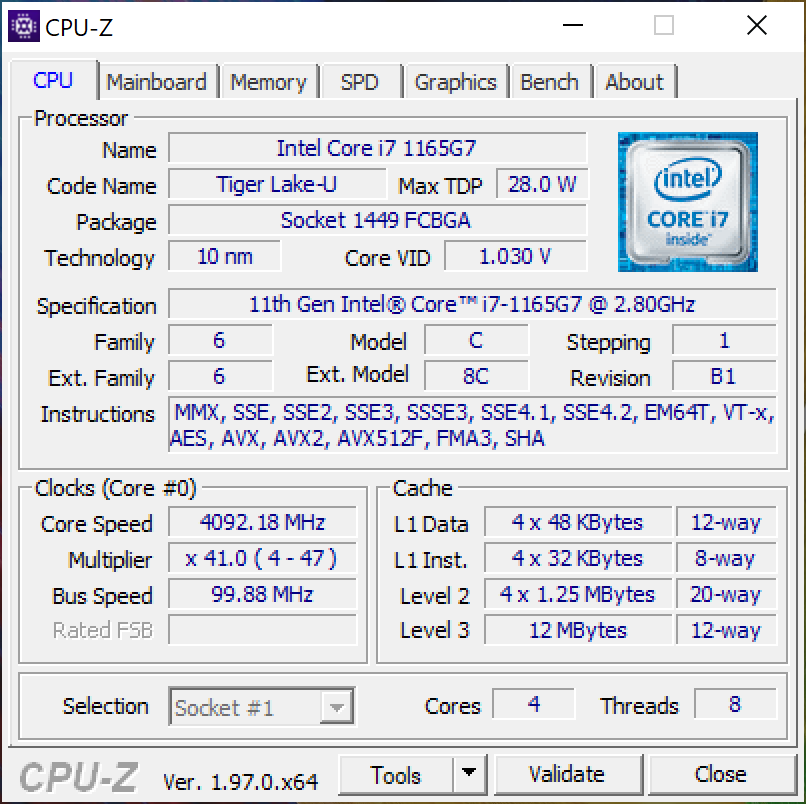
处理器
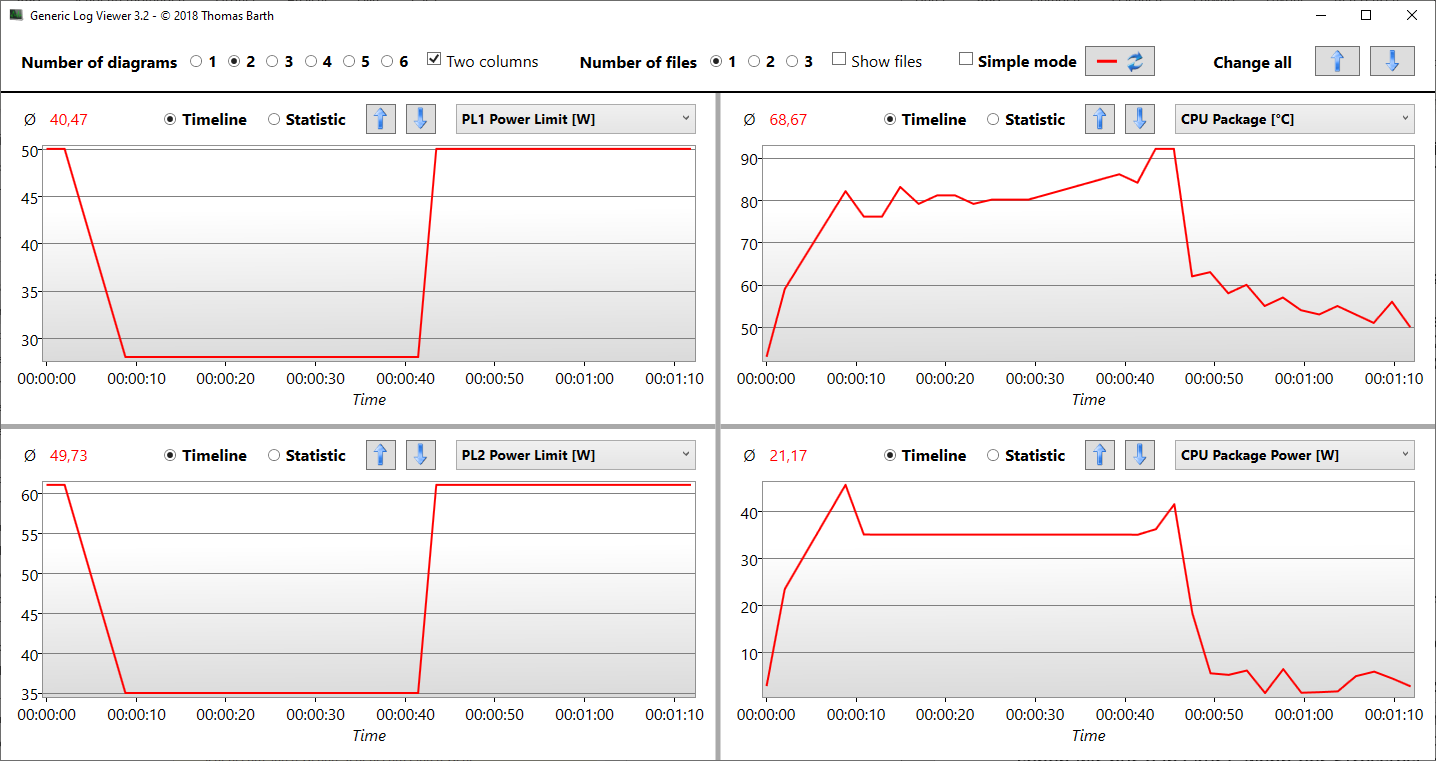
Core i7-1165G7(2.8 GHz)的PL1为50瓦,PL2(短期)为61瓦。实际上,处理器只在61瓦的情况下运行了几秒钟,当Cinebench R15运行一次(100%的CPU负载)时,PL2值短暂地触及60瓦的大关。PL1值也只在短时间内维持在50瓦,在五秒钟内下降到28瓦。CPU包的平均消耗量为35瓦,开始时的峰值高达45瓦。
这种情况在电池供电时发生了变化,PL1/PL2值根本没有被使用;CPU包的功耗短暂地刮到了20瓦的大关,然后以7瓦的速度持续运行。其结果是。在R15测试中,没有达到951分,而只有284分(30%)。
该循环显示,Zenbook 14X的Turbo稳定性不理想,这与其他i7-1165G7设备基本一致。正如我们经常看到的那样,Ryzen 7 5700U在这方面发挥的作用完全不同,但它的Turbo在第一次运行后也会减弱。
在所有Cinebench测试中,i7-1165G7在多核情况下落后于Ryzen 7 5700U,差距很大(-24%)。在单核模式下情况正好相反,i7以很大的优势领先(+17%)。总而言之,与具有相同芯片组的其他型号相比,该SoC的性能略高于平均水平。
Cinebench R15 Multi endurance test
Cinebench R20: CPU (Multi Core) | CPU (Single Core)
Cinebench R15: CPU Multi 64Bit | CPU Single 64Bit
Blender: v2.79 BMW27 CPU
7-Zip 18.03: 7z b 4 | 7z b 4 -mmt1
Geekbench 5.5: Multi-Core | Single-Core
HWBOT x265 Benchmark v2.2: 4k Preset
LibreOffice : 20 Documents To PDF
R Benchmark 2.5: Overall mean
| Cinebench R23 / Multi Core | |
| Average of class Subnotebook (1555 - 21812, n=60, last 2 years) | |
| Asus ZenBook 13 OLED UM325UA | |
| HP Envy 14-eb0010nr | |
| Asus Zenbook 14X UX5400E | |
| MSI Modern 14 B11SB-085 | |
| Lenovo IdeaPad Slim 9i 14ITL5 | |
| Average Intel Core i7-1165G7 (2525 - 6862, n=64) | |
| Dell XPS 13 9310 OLED | |
| HP Envy 13-ba1475ng | |
| Asus Zenbook 14 UX435EG | |
| Cinebench R23 / Single Core | |
| Average of class Subnotebook (358 - 2213, n=61, last 2 years) | |
| Lenovo IdeaPad Slim 9i 14ITL5 | |
| MSI Modern 14 B11SB-085 | |
| Asus Zenbook 14X UX5400E | |
| Dell XPS 13 9310 OLED | |
| Average Intel Core i7-1165G7 (1110 - 1539, n=59) | |
| HP Envy 13-ba1475ng | |
| HP Envy 14-eb0010nr | |
| Asus ZenBook 13 OLED UM325UA | |
| Cinebench R20 / CPU (Multi Core) | |
| Average of class Subnotebook (579 - 8541, n=57, last 2 years) | |
| Asus ZenBook 13 OLED UM325UA | |
| Asus Zenbook 14X UX5400E | |
| HP Envy 14-eb0010nr | |
| MSI Modern 14 B11SB-085 | |
| Average Intel Core i7-1165G7 (1060 - 2657, n=81) | |
| Dell XPS 13 9310 OLED | |
| HP Envy 13-ba1475ng | |
| Lenovo IdeaPad Slim 9i 14ITL5 | |
| Asus Zenbook 14 UX435EG | |
| Cinebench R20 / CPU (Single Core) | |
| Average of class Subnotebook (128 - 832, n=57, last 2 years) | |
| MSI Modern 14 B11SB-085 | |
| Asus Zenbook 14X UX5400E | |
| Dell XPS 13 9310 OLED | |
| Average Intel Core i7-1165G7 (442 - 589, n=81) | |
| Asus Zenbook 14 UX435EG | |
| HP Envy 13-ba1475ng | |
| Lenovo IdeaPad Slim 9i 14ITL5 | |
| HP Envy 14-eb0010nr | |
| Asus ZenBook 13 OLED UM325UA | |
| Cinebench R15 / CPU Multi 64Bit | |
| Average of class Subnotebook (327 - 3345, n=57, last 2 years) | |
| Asus ZenBook 13 OLED UM325UA | |
| Asus Zenbook 14X UX5400E | |
| HP Envy 14-eb0010nr | |
| MSI Modern 14 B11SB-085 | |
| Average Intel Core i7-1165G7 (553 - 1027, n=86) | |
| Lenovo IdeaPad Slim 9i 14ITL5 | |
| Dell XPS 13 9310 OLED | |
| Asus Zenbook 14 UX435EG | |
| HP Envy 13-ba1475ng | |
| Cinebench R15 / CPU Single 64Bit | |
| Average of class Subnotebook (72.4 - 322, n=57, last 2 years) | |
| Dell XPS 13 9310 OLED | |
| Average Intel Core i7-1165G7 (115 - 230, n=78) | |
| Asus Zenbook 14 UX435EG | |
| HP Envy 13-ba1475ng | |
| Lenovo IdeaPad Slim 9i 14ITL5 | |
| MSI Modern 14 B11SB-085 | |
| HP Envy 14-eb0010nr | |
| Asus Zenbook 14X UX5400E | |
| Asus ZenBook 13 OLED UM325UA | |
| Blender / v2.79 BMW27 CPU | |
| Asus Zenbook 14 UX435EG | |
| HP Envy 13-ba1475ng | |
| Dell XPS 13 9310 OLED | |
| Average Intel Core i7-1165G7 (468 - 1138, n=80) | |
| Lenovo IdeaPad Slim 9i 14ITL5 | |
| MSI Modern 14 B11SB-085 | |
| Asus Zenbook 14X UX5400E | |
| HP Envy 14-eb0010nr | |
| Asus ZenBook 13 OLED UM325UA | |
| Average of class Subnotebook (159 - 2271, n=58, last 2 years) | |
| 7-Zip 18.03 / 7z b 4 | |
| Average of class Subnotebook (11668 - 77867, n=57, last 2 years) | |
| Asus ZenBook 13 OLED UM325UA | |
| Lenovo IdeaPad Slim 9i 14ITL5 | |
| HP Envy 14-eb0010nr | |
| MSI Modern 14 B11SB-085 | |
| Average Intel Core i7-1165G7 (15347 - 27405, n=80) | |
| Asus Zenbook 14X UX5400E | |
| Asus Zenbook 14 UX435EG | |
| Dell XPS 13 9310 OLED | |
| HP Envy 13-ba1475ng | |
| 7-Zip 18.03 / 7z b 4 -mmt1 | |
| Average of class Subnotebook (2643 - 6699, n=59, last 2 years) | |
| Lenovo IdeaPad Slim 9i 14ITL5 | |
| MSI Modern 14 B11SB-085 | |
| Asus Zenbook 14 UX435EG | |
| Average Intel Core i7-1165G7 (4478 - 5507, n=80) | |
| HP Envy 13-ba1475ng | |
| HP Envy 14-eb0010nr | |
| Asus Zenbook 14X UX5400E | |
| Asus ZenBook 13 OLED UM325UA | |
| Dell XPS 13 9310 OLED | |
| Geekbench 5.5 / Multi-Core | |
| Average of class Subnotebook (2557 - 17218, n=48, last 2 years) | |
| Asus ZenBook 13 OLED UM325UA | |
| Dell XPS 13 9310 OLED | |
| Lenovo IdeaPad Slim 9i 14ITL5 | |
| Asus Zenbook 14X UX5400E | |
| Asus Zenbook 14 UX435EG | |
| Average Intel Core i7-1165G7 (3078 - 5926, n=77) | |
| HP Envy 13-ba1475ng | |
| HP Envy 14-eb0010nr | |
| MSI Modern 14 B11SB-085 | |
| Geekbench 5.5 / Single-Core | |
| Average of class Subnotebook (726 - 2224, n=48, last 2 years) | |
| Lenovo IdeaPad Slim 9i 14ITL5 | |
| Dell XPS 13 9310 OLED | |
| Asus Zenbook 14 UX435EG | |
| Average Intel Core i7-1165G7 (1302 - 1595, n=77) | |
| MSI Modern 14 B11SB-085 | |
| Asus Zenbook 14X UX5400E | |
| HP Envy 13-ba1475ng | |
| HP Envy 14-eb0010nr | |
| Asus ZenBook 13 OLED UM325UA | |
| HWBOT x265 Benchmark v2.2 / 4k Preset | |
| Average of class Subnotebook (0.97 - 25.1, n=57, last 2 years) | |
| Asus ZenBook 13 OLED UM325UA | |
| HP Envy 14-eb0010nr | |
| Asus Zenbook 14X UX5400E | |
| Lenovo IdeaPad Slim 9i 14ITL5 | |
| MSI Modern 14 B11SB-085 | |
| Dell XPS 13 9310 OLED | |
| Average Intel Core i7-1165G7 (1.39 - 8.47, n=80) | |
| HP Envy 13-ba1475ng | |
| Asus Zenbook 14 UX435EG | |
| LibreOffice / 20 Documents To PDF | |
| Asus ZenBook 13 OLED UM325UA | |
| Average of class Subnotebook (39.9 - 220, n=56, last 2 years) | |
| HP Envy 13-ba1475ng | |
| Asus Zenbook 14 UX435EG | |
| MSI Modern 14 B11SB-085 | |
| Asus Zenbook 14X UX5400E | |
| HP Envy 14-eb0010nr | |
| Lenovo IdeaPad Slim 9i 14ITL5 | |
| Average Intel Core i7-1165G7 (21.5 - 88.1, n=78) | |
| Dell XPS 13 9310 OLED | |
| R Benchmark 2.5 / Overall mean | |
| HP Envy 14-eb0010nr | |
| Asus Zenbook 14X UX5400E | |
| HP Envy 13-ba1475ng | |
| Asus ZenBook 13 OLED UM325UA | |
| Dell XPS 13 9310 OLED | |
| Average Intel Core i7-1165G7 (0.552 - 1.002, n=80) | |
| MSI Modern 14 B11SB-085 | |
| Asus Zenbook 14 UX435EG | |
| Lenovo IdeaPad Slim 9i 14ITL5 | |
| Average of class Subnotebook (0.4024 - 1.456, n=58, last 2 years) | |
* ... smaller is better
系统性能
根据PCMark 10,Zenbook 14X在应用性能方面处于领先地位,特别是在生产力方面。该基准测试在这里利用了超快的SK Hynix固态硬盘的优势。
| PCMark 10 / Score | |
| Average of class Subnotebook (4920 - 9939, n=44, last 2 years) | |
| HP Envy 14-eb0010nr | |
| Average Intel Core i7-1165G7, NVIDIA GeForce MX450 (4823 - 5814, n=9) | |
| Asus Zenbook 14X UX5400E | |
| Dell XPS 13 9310 OLED | |
| HP Envy 13-ba1475ng | |
| Asus Zenbook 14 UX435EG | |
| Lenovo IdeaPad Slim 9i 14ITL5 | |
| MSI Modern 14 B11SB-085 | |
| PCMark 10 / Essentials | |
| Dell XPS 13 9310 OLED | |
| Average of class Subnotebook (8552 - 11646, n=44, last 2 years) | |
| Lenovo IdeaPad Slim 9i 14ITL5 | |
| Average Intel Core i7-1165G7, NVIDIA GeForce MX450 (8088 - 9955, n=9) | |
| Asus Zenbook 14 UX435EG | |
| HP Envy 13-ba1475ng | |
| HP Envy 14-eb0010nr | |
| Asus Zenbook 14X UX5400E | |
| MSI Modern 14 B11SB-085 | |
| PCMark 10 / Productivity | |
| Average of class Subnotebook (5435 - 16606, n=44, last 2 years) | |
| Asus Zenbook 14X UX5400E | |
| Average Intel Core i7-1165G7, NVIDIA GeForce MX450 (7826 - 9292, n=9) | |
| Asus Zenbook 14 UX435EG | |
| HP Envy 14-eb0010nr | |
| HP Envy 13-ba1475ng | |
| MSI Modern 14 B11SB-085 | |
| Dell XPS 13 9310 OLED | |
| Lenovo IdeaPad Slim 9i 14ITL5 | |
| PCMark 10 / Digital Content Creation | |
| Average of class Subnotebook (5722 - 13779, n=44, last 2 years) | |
| HP Envy 14-eb0010nr | |
| Dell XPS 13 9310 OLED | |
| Average Intel Core i7-1165G7, NVIDIA GeForce MX450 (4812 - 5878, n=9) | |
| Asus Zenbook 14X UX5400E | |
| Lenovo IdeaPad Slim 9i 14ITL5 | |
| HP Envy 13-ba1475ng | |
| Asus Zenbook 14 UX435EG | |
| MSI Modern 14 B11SB-085 | |
| PCMark 10 Score | 5234 points | |
Help | ||
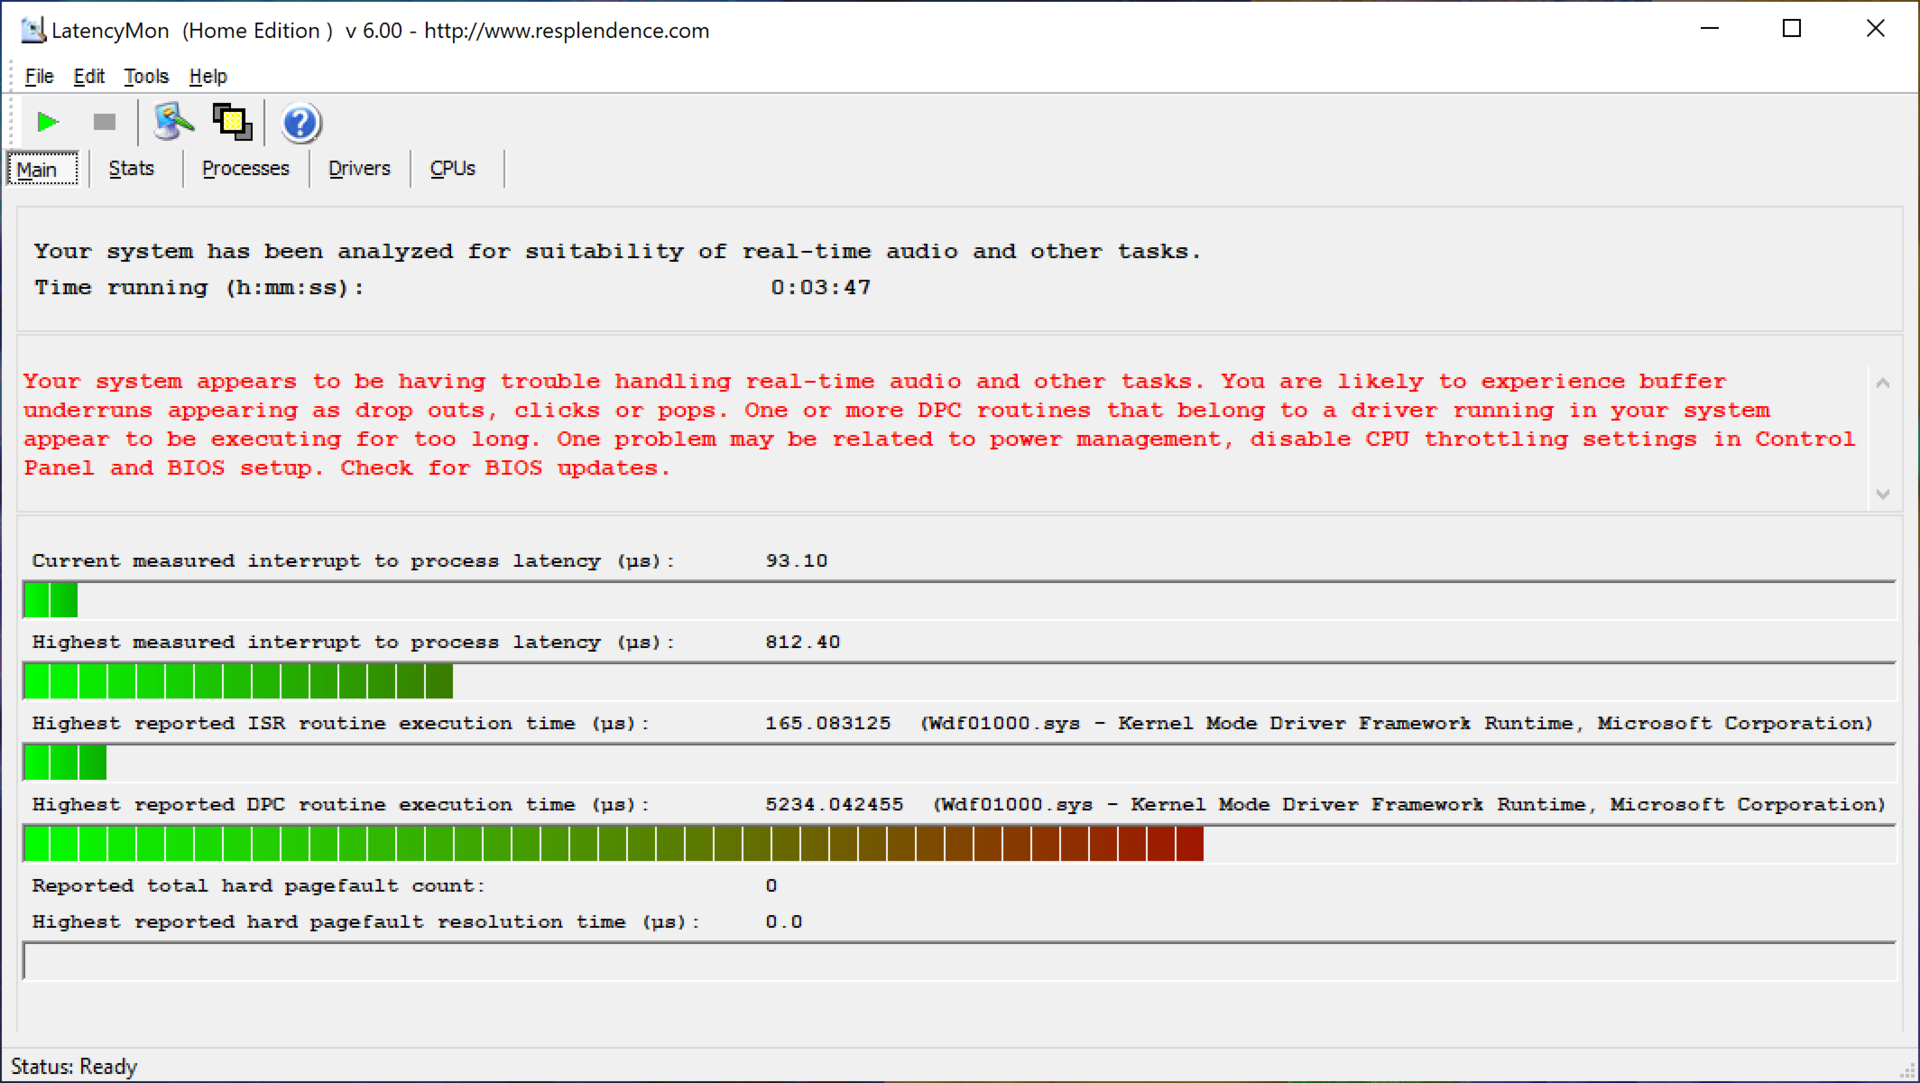
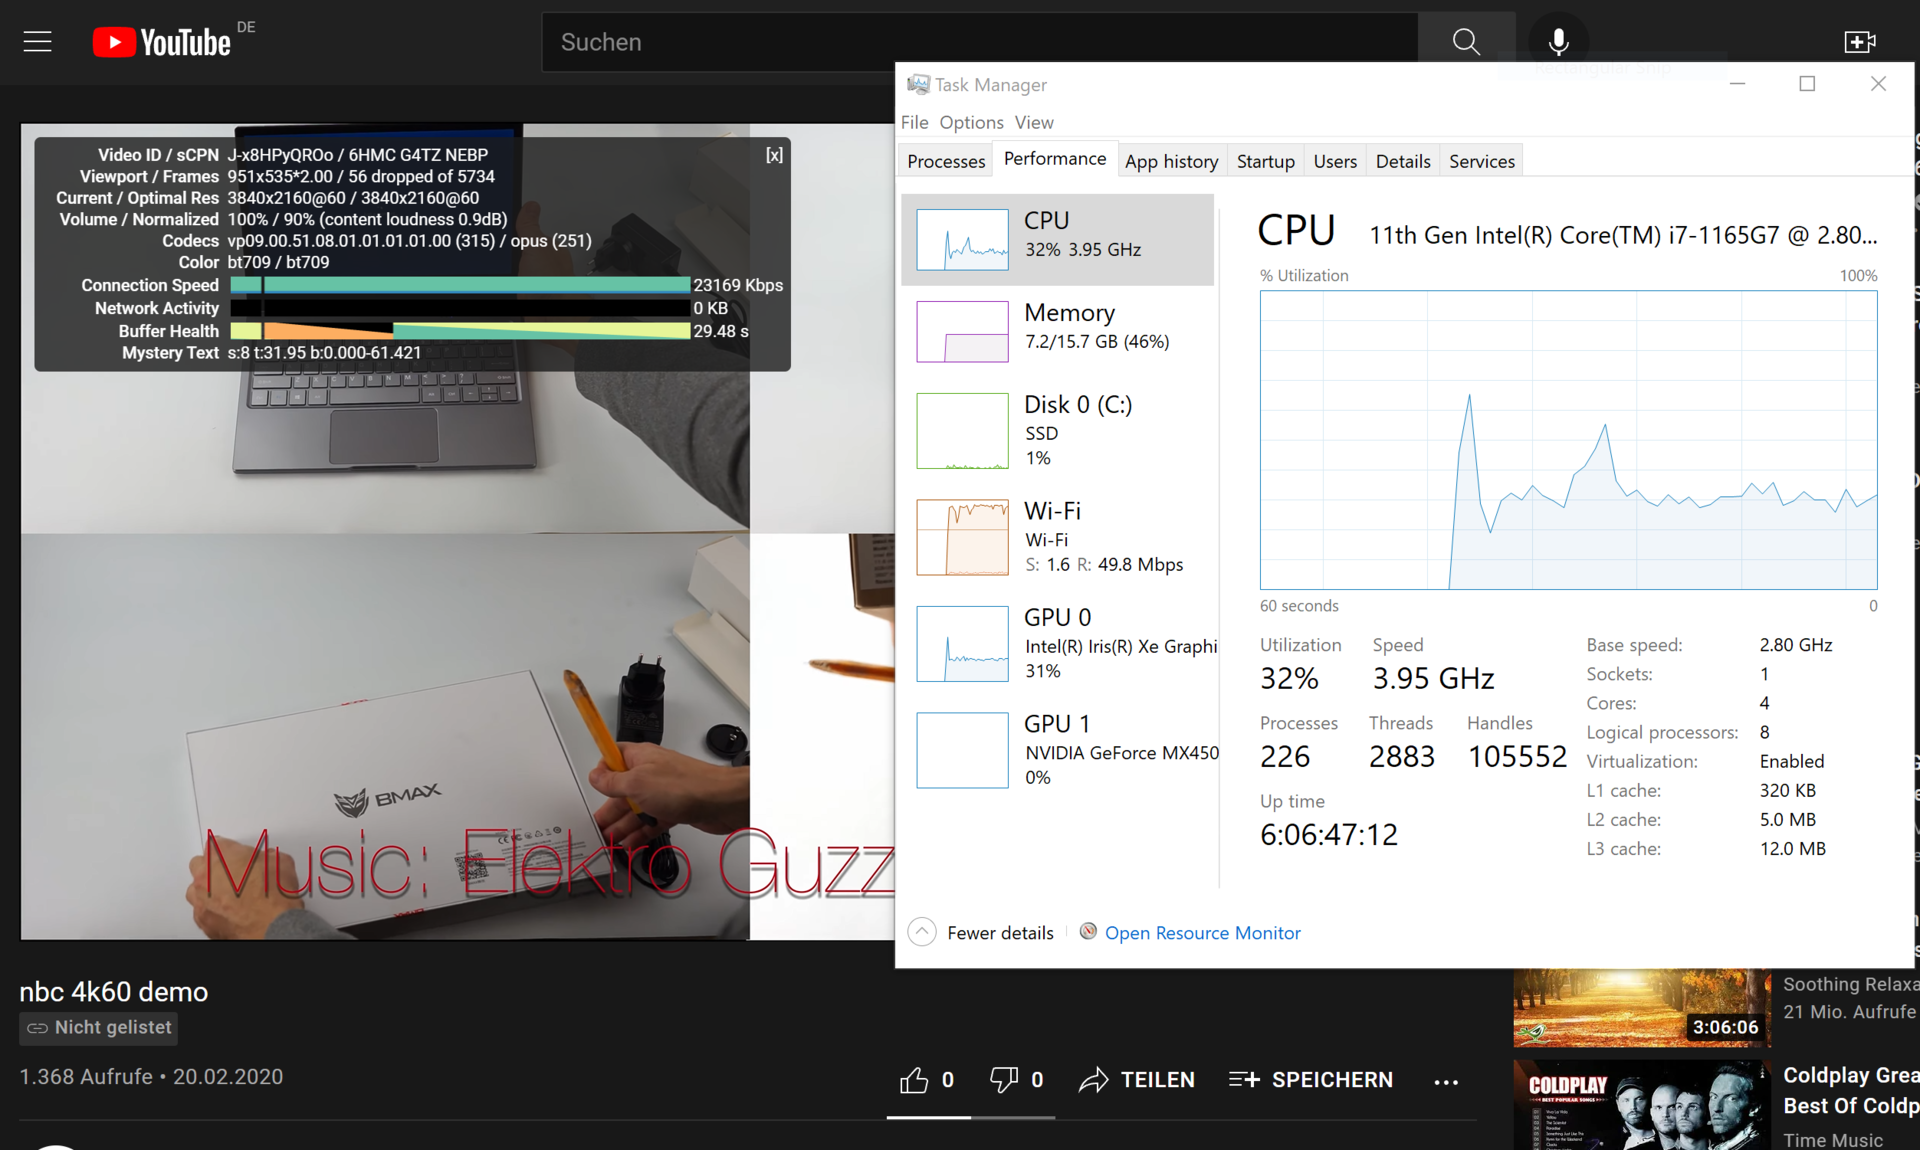
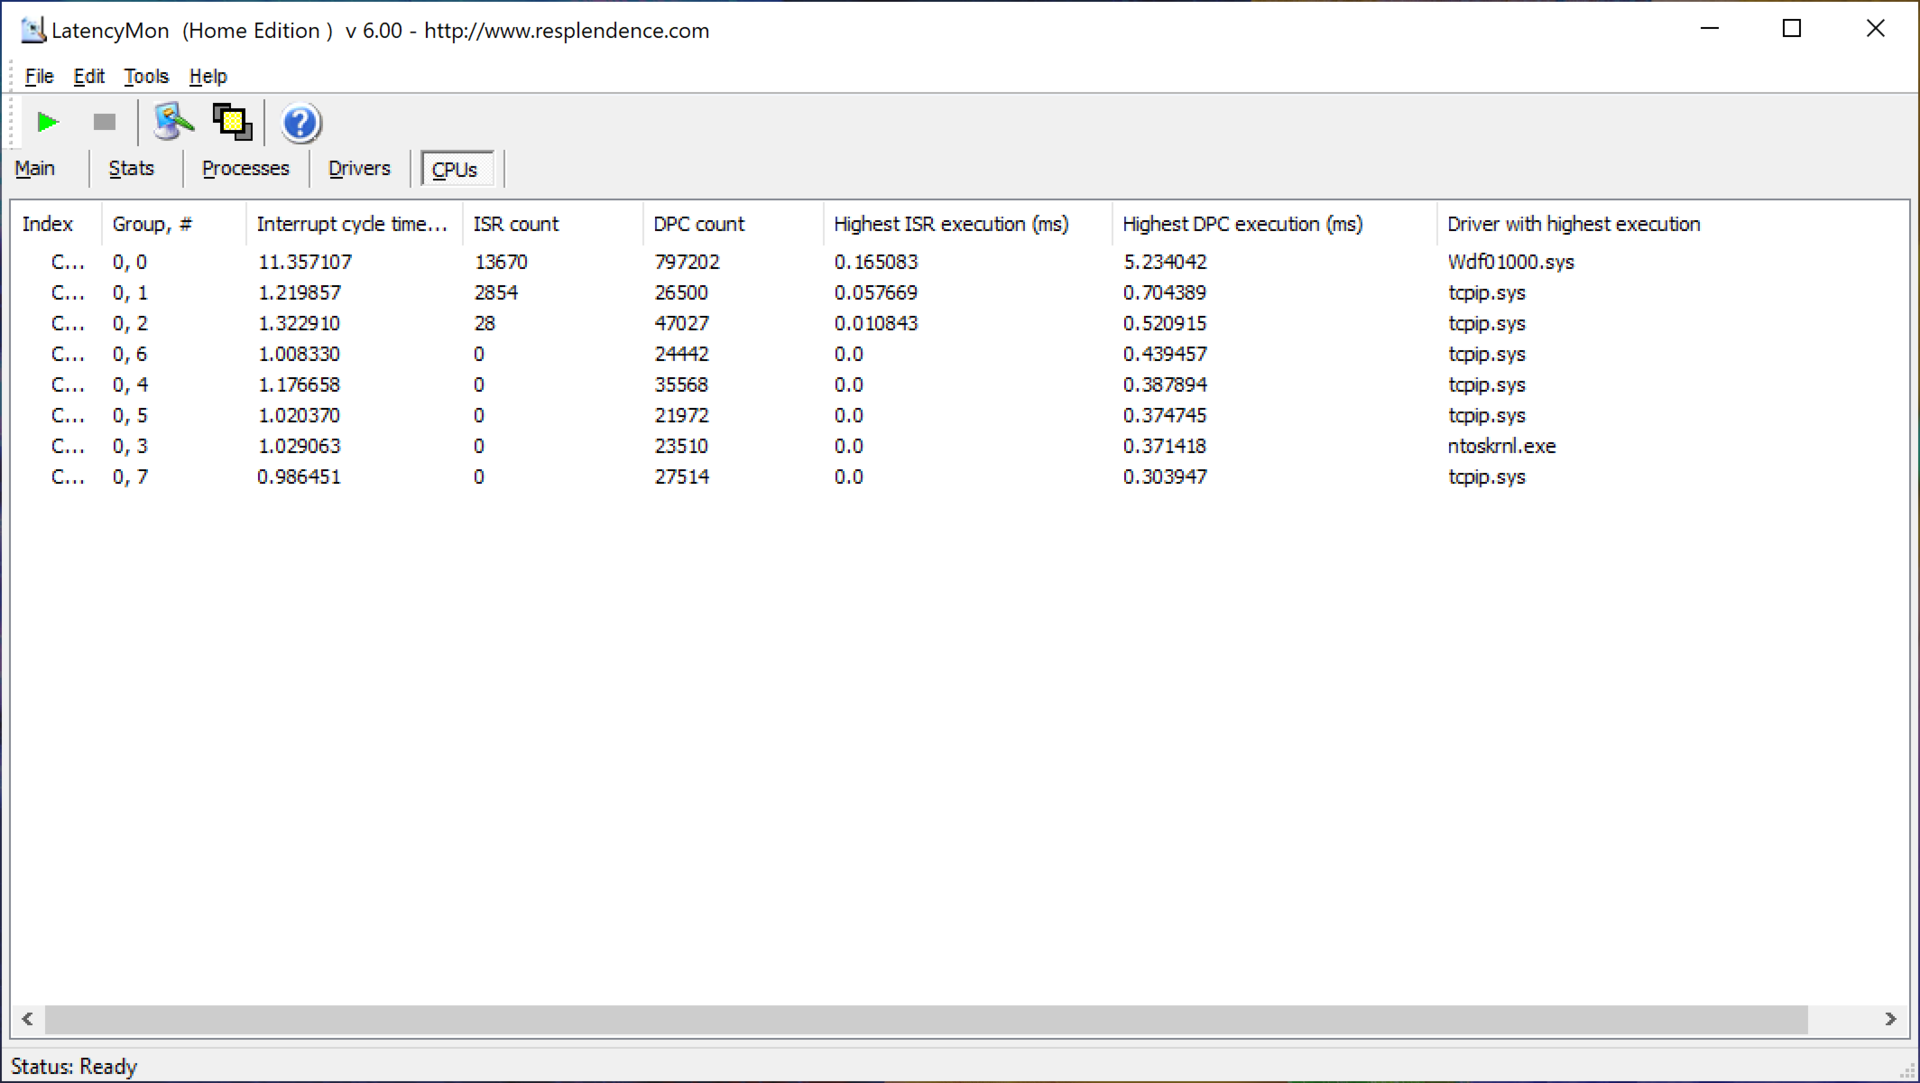
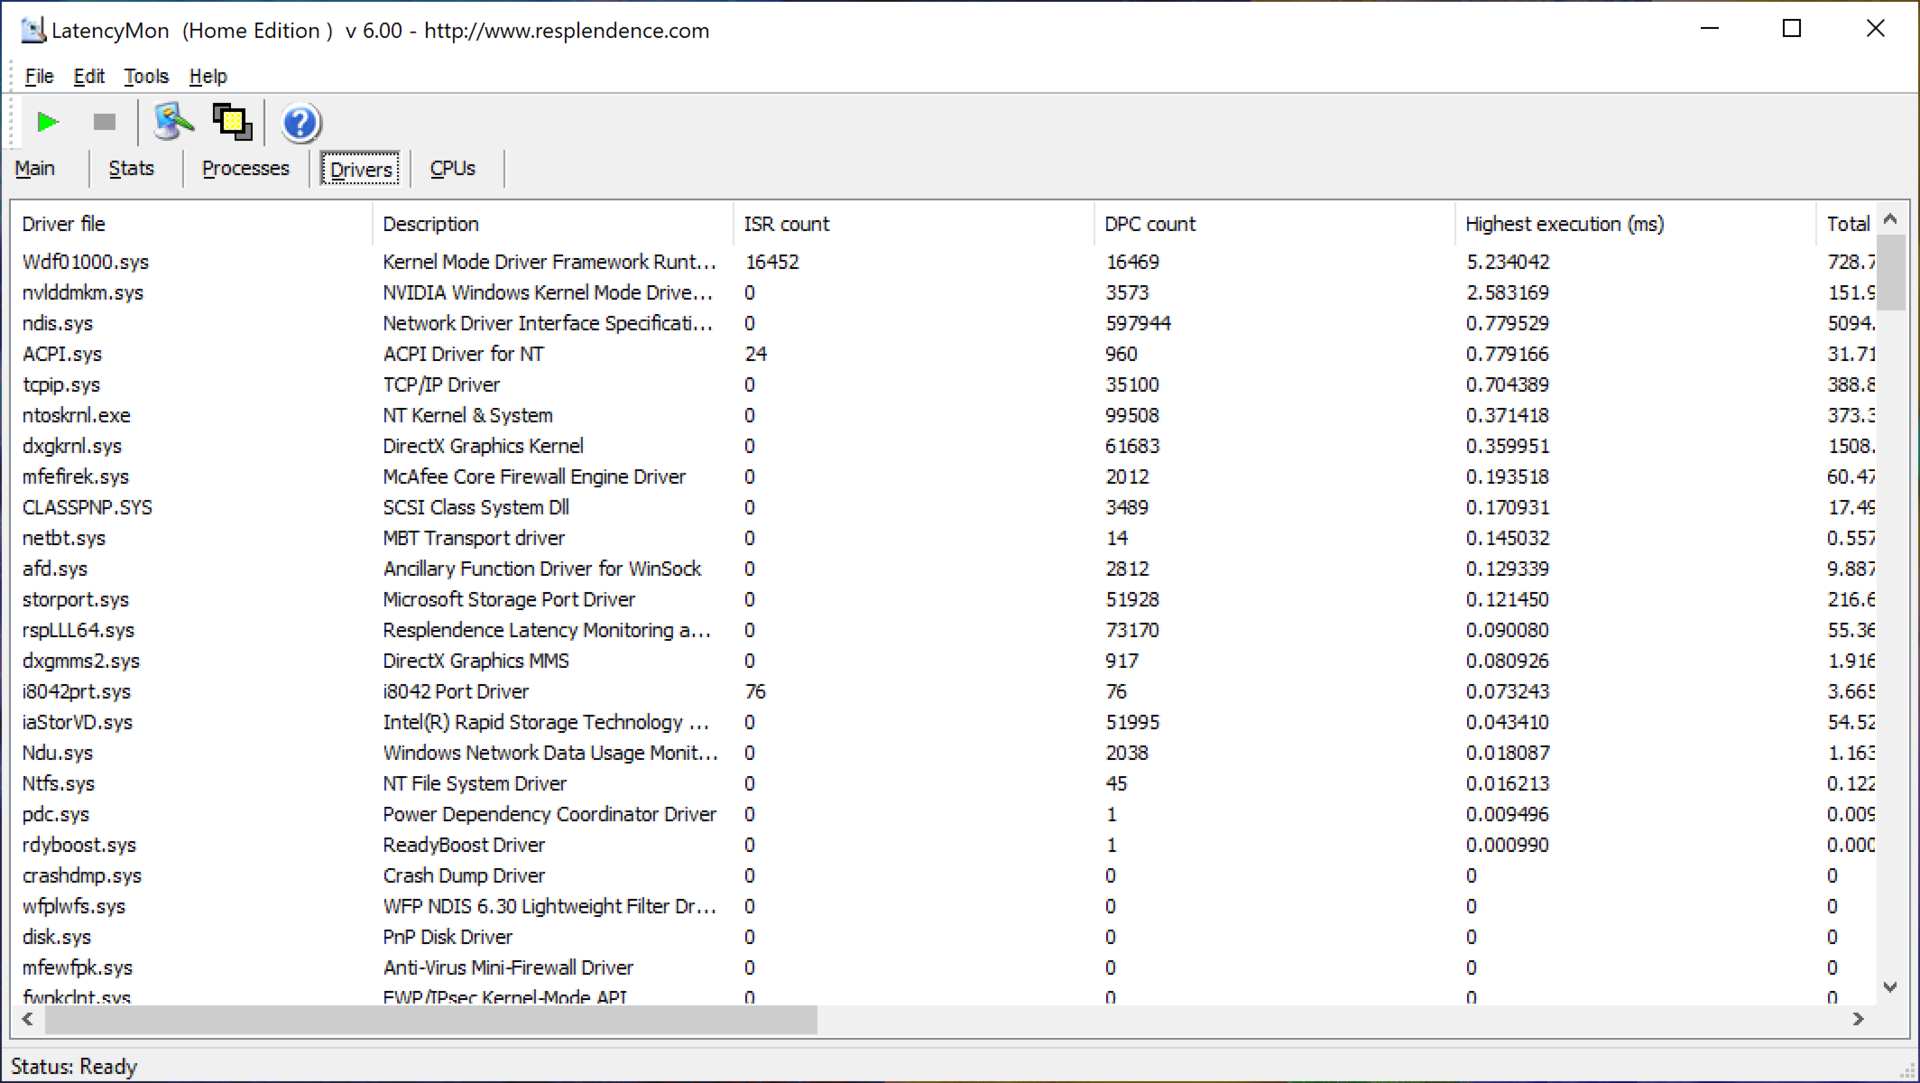
DPC延迟
在我们的标准化延迟测试中(网页浏览、YouTube 4K播放、CPU负载),Zenbook出现了延迟升高的问题。这是由内核模式的驱动程序造成的。现有的驱动配置不适合实时音频应用。在视频播放过程中,有56个丢帧。
| DPC Latencies / LatencyMon - interrupt to process latency (max), Web, Youtube, Prime95 | |
| HP Envy 14-eb0010nr | |
| Dell XPS 13 9310 OLED | |
| Lenovo IdeaPad Slim 9i 14ITL5 | |
| MSI Modern 14 B11SB-085 | |
| HP Envy 13-ba1475ng | |
| Asus Zenbook 14X UX5400E | |
| Asus Zenbook 14 UX435EG | |
* ... smaller is better
储存
1TB的SK海力士并没有让人失望,因为它在我们的比较中几乎超过了所有竞争者。只有Zenbook 14 UX435EG中的三星PM981a快了大约25%。在实践中,无论如何,这些差异是无法感知的;你只能通过测量来识别它们。开箱后大约有870GB的容量。
| Asus Zenbook 14X UX5400E SK Hynix HFM001TD3JX013N | Dell XPS 13 9310 OLED Toshiba XG6 KXG60ZNV512G | Asus Zenbook 14 UX435EG Samsung PM981a MZVLB1T0HBLR | MSI Modern 14 B11SB-085 Kingston OM8PCP3512F-AB | HP Envy 13-ba1475ng Intel SSD 660p SSDPEKNW512G8 | Lenovo IdeaPad Slim 9i 14ITL5 WDC PC SN730 SDBPNTY-512G | Average SK Hynix HFM001TD3JX013N | |
|---|---|---|---|---|---|---|---|
| CrystalDiskMark 5.2 / 6 | -20% | 20% | -19% | -33% | -11% | -2% | |
| Write 4K (MB/s) | 121.6 | 156.8 29% | 211.8 74% | 236.2 94% | 133.5 10% | 131.5 8% | 155.8 ? 28% |
| Read 4K (MB/s) | 57.9 | 39.66 -32% | 50.1 -13% | 47.53 -18% | 39.66 -32% | 36.83 -36% | 57 ? -2% |
| Write Seq (MB/s) | 18545 | 854 -95% | 2938 -84% | 974 -95% | 907 -95% | 1614 -91% | 3943 ? -79% |
| Read Seq (MB/s) | 2085 | 2167 4% | 2639 27% | 1043 -50% | 1481 -29% | 2030 -3% | 2180 ? 5% |
| Write 4K Q32T1 (MB/s) | 414 | 441.1 7% | 656 58% | 603 46% | 446.2 8% | 516 25% | 452 ? 9% |
| Read 4K Q32T1 (MB/s) | 401 | 395.5 -1% | 723 80% | 299.3 -25% | 335.1 -16% | 419.7 5% | 447 ? 11% |
| Write Seq Q32T1 (MB/s) | 2790 | 858 -69% | 3022 8% | 974 -65% | 975 -65% | 2705 -3% | 2859 ? 2% |
| Read Seq Q32T1 (MB/s) | 3219 | 3258 1% | 3561 11% | 1983 -38% | 1874 -42% | 3390 5% | 3515 ? 9% |
| AS SSD | -15% | 29% | -40% | -50% | -22% | 7% | |
| Seq Read (MB/s) | 2637 | 2694 2% | 2861 8% | 1610 -39% | 1608 -39% | 2068 -22% | 2839 ? 8% |
| Seq Write (MB/s) | 1243 | 1407 13% | 2837 128% | 931 -25% | 659 -47% | 1414 14% | 1917 ? 54% |
| 4K Read (MB/s) | 54.7 | 54.4 -1% | 60.3 10% | 36.18 -34% | 51.3 -6% | 46.99 -14% | 53 ? -3% |
| 4K Write (MB/s) | 128.4 | 195.8 52% | 164.2 28% | 170.5 33% | 151.8 18% | 211.9 65% | 127.3 ? -1% |
| 4K-64 Read (MB/s) | 1011 | 1092 8% | 1598 58% | 457.3 -55% | 322.1 -68% | 1027 2% | 1369 ? 35% |
| 4K-64 Write (MB/s) | 1432 | 1269 -11% | 1572 10% | 914 -36% | 800 -44% | 978 -32% | 1939 ? 35% |
| Access Time Read * (ms) | 0.031 | 0.064 -106% | 0.046 -48% | 0.092 -197% | 0.077 -148% | 0.057 -84% | 0.0468 ? -51% |
| Access Time Write * (ms) | 0.028 | 0.062 -121% | 0.021 25% | 0.019 32% | 0.046 -64% | 0.066 -136% | 0.0532 ? -90% |
| Score Read (Points) | 1330 | 1416 6% | 1945 46% | 655 -51% | 534 -60% | 1281 -4% | 1706 ? 28% |
| Score Write (Points) | 1685 | 1606 -5% | 2020 20% | 1178 -30% | 1018 -40% | 1331 -21% | 2258 ? 34% |
| Score Total (Points) | 3637 | 3692 2% | 4966 37% | 2144 -41% | 1797 -51% | 3243 -11% | 4797 ? 32% |
| Copy ISO MB/s (MB/s) | 1782 | 2414 | 1277 | 961 | 1891 | 1908 ? | |
| Copy Program MB/s (MB/s) | 1023 | 575 | 438.4 | 753 | 604 | 665 ? | |
| Copy Game MB/s (MB/s) | 1148 | 1408 | 977 | 896 | 1422 | 1349 ? | |
| Total Average (Program / Settings) | -18% /
-17% | 25% /
25% | -30% /
-31% | -42% /
-43% | -17% /
-18% | 3% /
3% |
* ... smaller is better

Continuous load read: DiskSpd Read Loop, Queue Depth 8
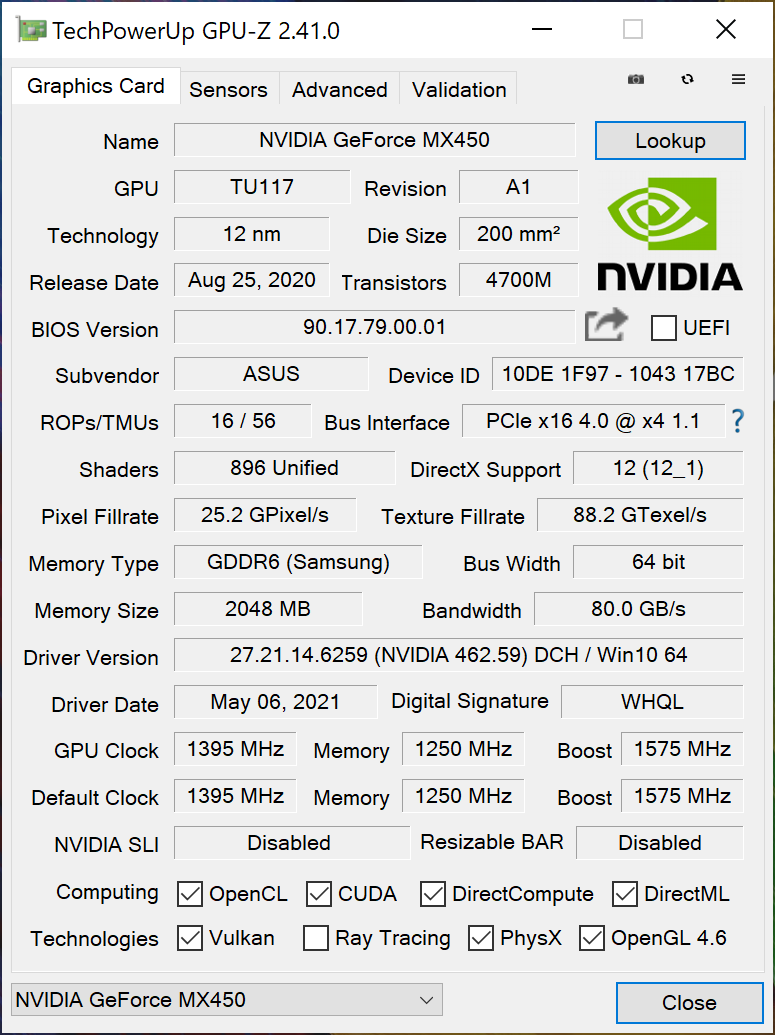
图形卡
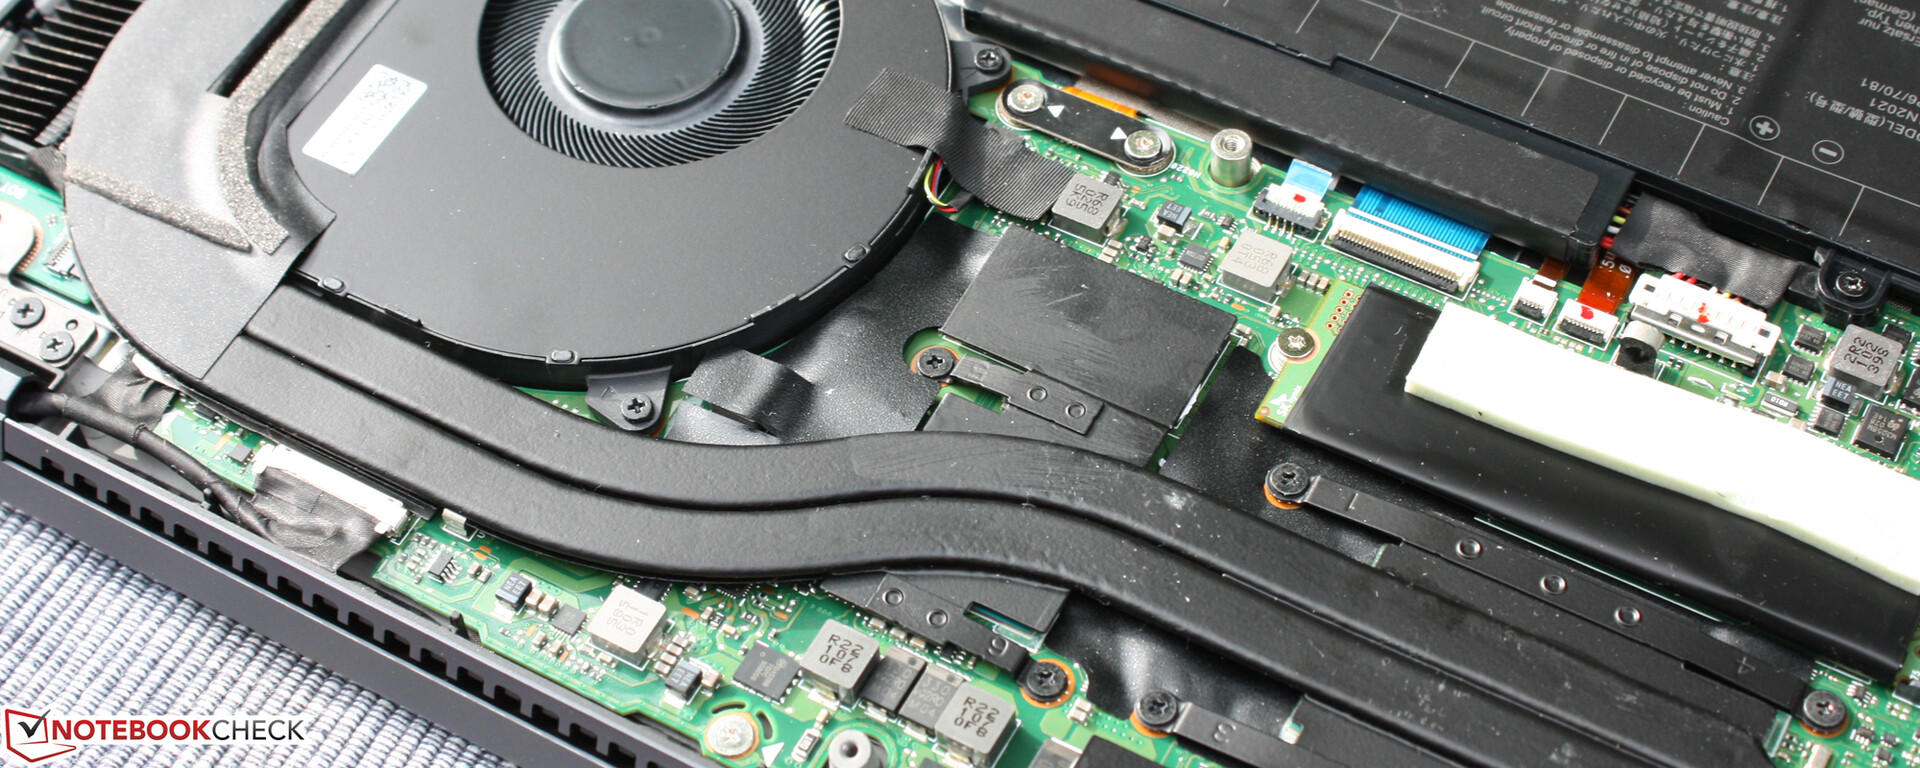
MX450安装的(图灵TU117M)是第二个最强大的变体,即N18S-G5,它提供了一个64位的连接和1,395至1,575 MHz以及GDDR6。它的运行功率高达25瓦。尽管如此,制造商避免使用第二个风扇。
- N18S-G5-B:GBD-128封装,1,395-1,575 MHz,GDDR6 5,001 MHz,28.5 W
- N18S-G5:GB2E-64封装,1,395-1,575MHz,GDDR6 5,001MHz,25W
- N18S-G5:GB2E-64封装,1,395-1,575MHz,GDDR5 3,501MHz,25W
- N18S-LP:GB2E-64封装,720-930 MHz,GDDR6 5,001 MHz,12 W
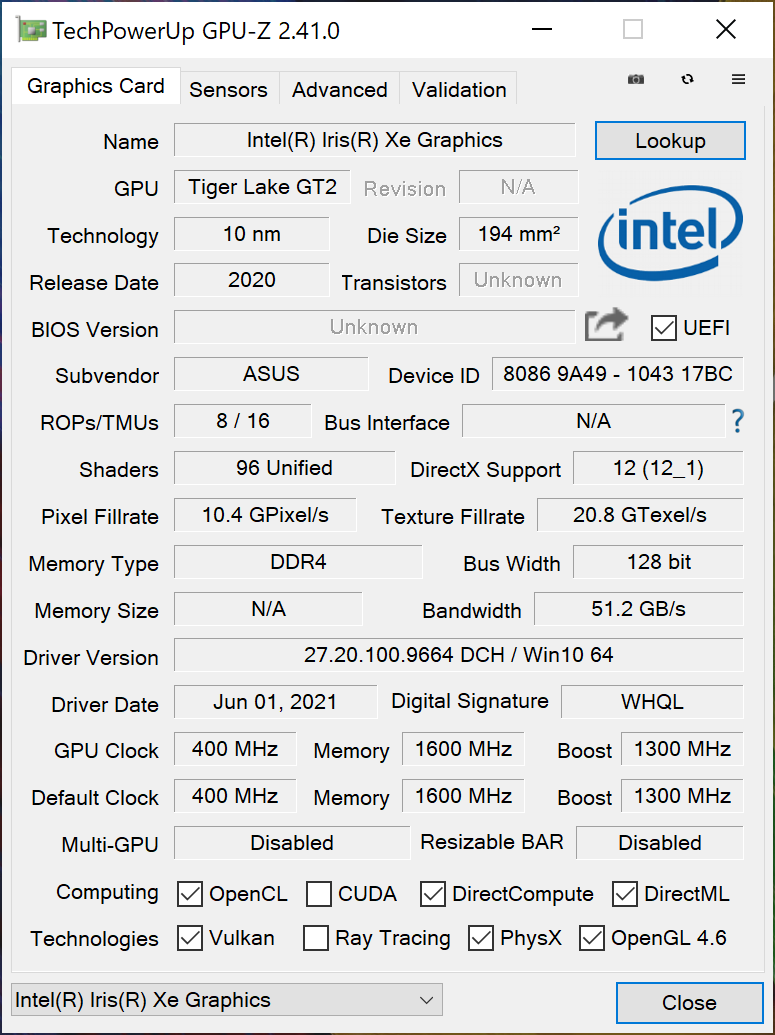
除了GeForce MX450GPU,你还可以得到集成的英特尔Iris Xe 96EUs图形。MX450在合成基准测试中名列前茅,它与Iris Xe Graphics G7 96EUs相当,或者在某些情况下比它高出近10%。MX450,比Vega 8(ZenBook 13 OLED UM325UA)高出约40-50%。
| 3DMark | |
| 1920x1080 Fire Strike Graphics | |
| HP Envy 14-eb0010nr | |
| Average of class Subnotebook (832 - 16347, n=56, last 2 years) | |
| Lenovo IdeaPad Slim 9i 14ITL5 | |
| Asus Zenbook 14X UX5400E | |
| Dell XPS 13 9310 OLED | |
| Average NVIDIA GeForce MX450 (4336 - 5753, n=17) | |
| MSI Modern 14 B11SB-085 | |
| HP Envy 13-ba1475ng | |
| Asus Zenbook 14 UX435EG | |
| Asus ZenBook 13 OLED UM325UA | |
| 2560x1440 Time Spy Graphics | |
| Average of class Subnotebook (804 - 6288, n=55, last 2 years) | |
| HP Envy 14-eb0010nr | |
| MSI Modern 14 B11SB-085 | |
| Average NVIDIA GeForce MX450 (1086 - 2300, n=16) | |
| Asus Zenbook 14X UX5400E | |
| Asus Zenbook 14 UX435EG | |
| Lenovo IdeaPad Slim 9i 14ITL5 | |
| Dell XPS 13 9310 OLED | |
| Asus ZenBook 13 OLED UM325UA | |
| 3DMark Fire Strike Score | 4892 points | |
| 3DMark Time Spy Score | 1810 points | |
Help | ||
游戏性能
在真正的游戏基准测试中,MX450表现适中。在《TheWitcher 3Ultra》中,该dGPU的表现低于平均水平。微星Modern 14 B11SB-085 和配备相同dGPU的惠普Envy 13-ba1475ng领先约20%,甚至Iris Xe Graphics G7 96EUs有时也会快一点(戴尔XPS 13 9310 OLED )。
MX450在《Far Cry 5》、《Strange Brigade》和《New World》中运行得更好,它甚至比Iris Xe Graphics G7 96EUs高出50%(Strange Brigade)。我们缺乏在《远征5》中的对比率,但MX450,在这里的表现比它自己的平均水平要好。最近的《新世界》在全高清分辨率和中等细节的情况下还只是可以玩32FPS,但你不能切换到3K。
| The Witcher 3 - 1920x1080 High Graphics & Postprocessing (Nvidia HairWorks Off) | |
| HP Envy 14-eb0010nr | |
| Average of class Subnotebook (25.6 - 64, n=13, last 2 years) | |
| HP Envy 13-ba1475ng | |
| Average NVIDIA GeForce MX450 (21 - 46, n=16) | |
| MSI Modern 14 B11SB-085 | |
| Lenovo IdeaPad Slim 9i 14ITL5 | |
| Dell XPS 13 9310 OLED | |
| Asus Zenbook 14 UX435EG | |
| Asus Zenbook 14X UX5400E | |
| Far Cry 5 - 1920x1080 Medium Preset AA:T | |
| Average of class Subnotebook (21 - 59, n=24, last 2 years) | |
| Asus Zenbook 14X UX5400E | |
| Average NVIDIA GeForce MX450 (24 - 41, n=7) | |
| Asus Zenbook 14 UX435EG | |
| Strange Brigade - 1920x1080 high AA:high AF:8 | |
| HP Envy 14-eb0010nr | |
| Average of class Subnotebook (22.8 - 114.9, n=50, last 2 years) | |
| Asus Zenbook 14X UX5400E | |
| Average NVIDIA GeForce MX450 (19.2 - 46.7, n=12) | |
| MSI Modern 14 B11SB-085 | |
| Dell XPS 13 9310 OLED | |
| New World - 1920x1080 Medium Video Quality | |
| Asus Zenbook 14X UX5400E | |
| Average NVIDIA GeForce MX450 (25.9 - 32, n=2) | |
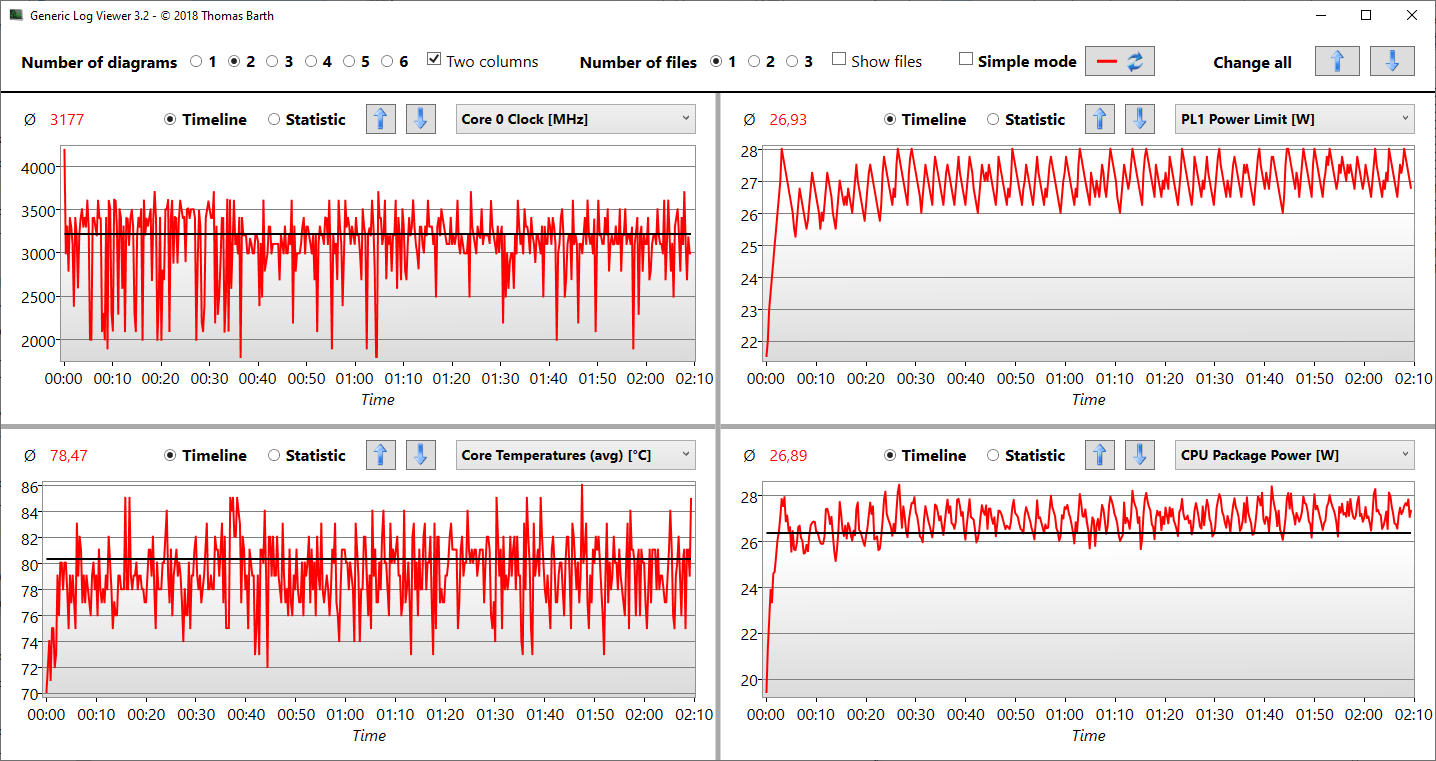
我们在超级设置(全高清)下看了《Witcher 3》。FPS从18FPS一直跳到26FPS,间隔时间相等,在每个水平上停留了将近2分钟。视频时钟速率和温度在同一周期内同步上升。温度管理显然允许dGPU在温度低于65℃(约149°F)一定时间内从1300MHz跳到1575MHz。而GPU温度的快速上升又导致时钟速率分两阶段下降(1,450,1,250 MHz)。单个风扇和没有分离的热管的热能似乎没有达到最佳工作状态,因为我们很少观察到时钟速度如此突然的增加和减少。
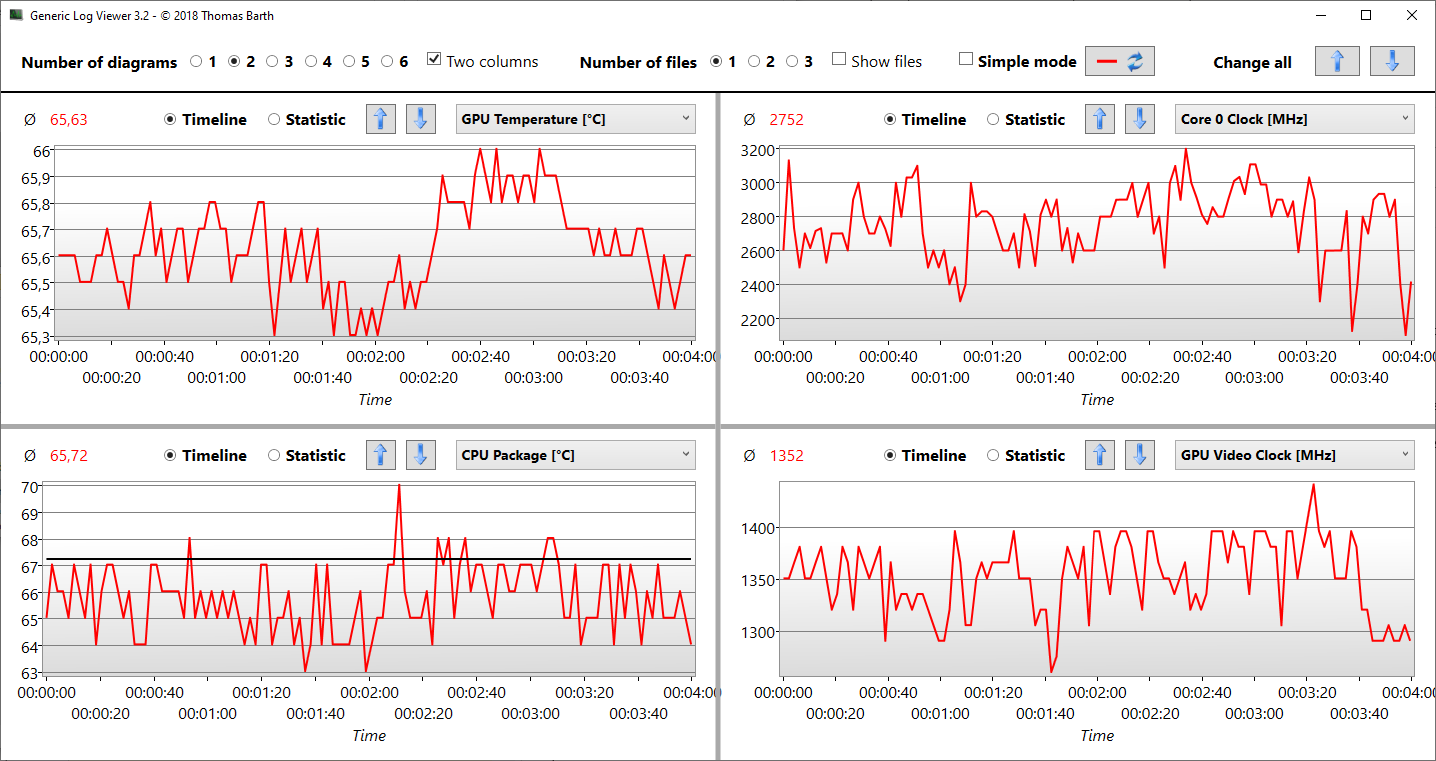
这似乎是一个孤立的案例,因为在新世界(中,全高清)中,热能和视频时钟速率没有显示任何异常的变化。见Logviewer。
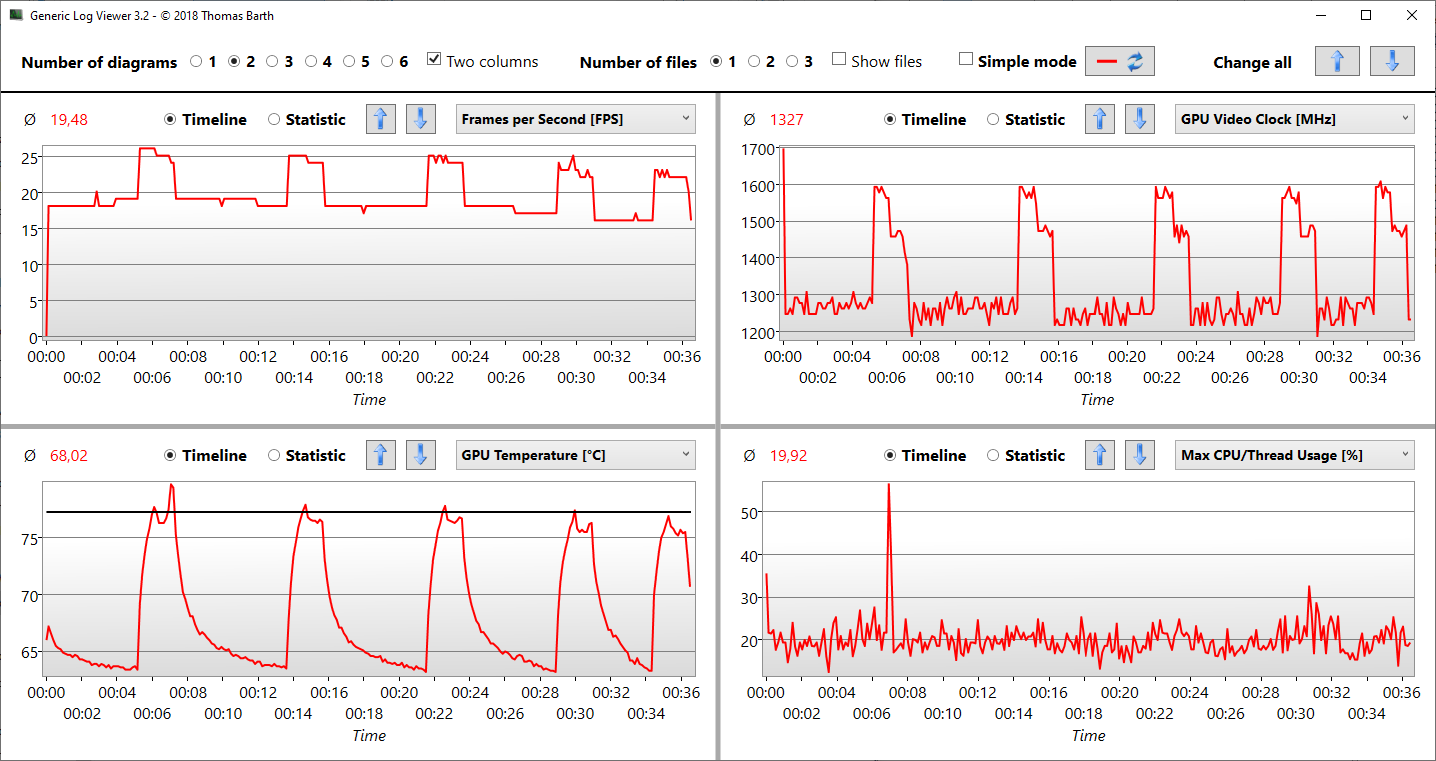
The Witcher 3 FPS diagram
| low | med. | high | ultra | QHD | 4K | |
|---|---|---|---|---|---|---|
| GTA V (2015) | 53 | 23.4 | 11 | |||
| The Witcher 3 (2015) | 28.1 | 22.9 | ||||
| Dota 2 Reborn (2015) | 36.1 | 35.5 | 35.4 | 34.9 | 33.3 | |
| X-Plane 11.11 (2018) | 62.7 | 51.3 | 41.4 | 40.1 | ||
| Far Cry 5 (2018) | 36 | 30 | 27 | 19 | ||
| Strange Brigade (2018) | 44.8 | 36 | ||||
| New World (2021) | 41.6 | 32 | 20.1 | 12.5 | 8.7 |
排放 - 安静的华硕Zenbook
噪声排放
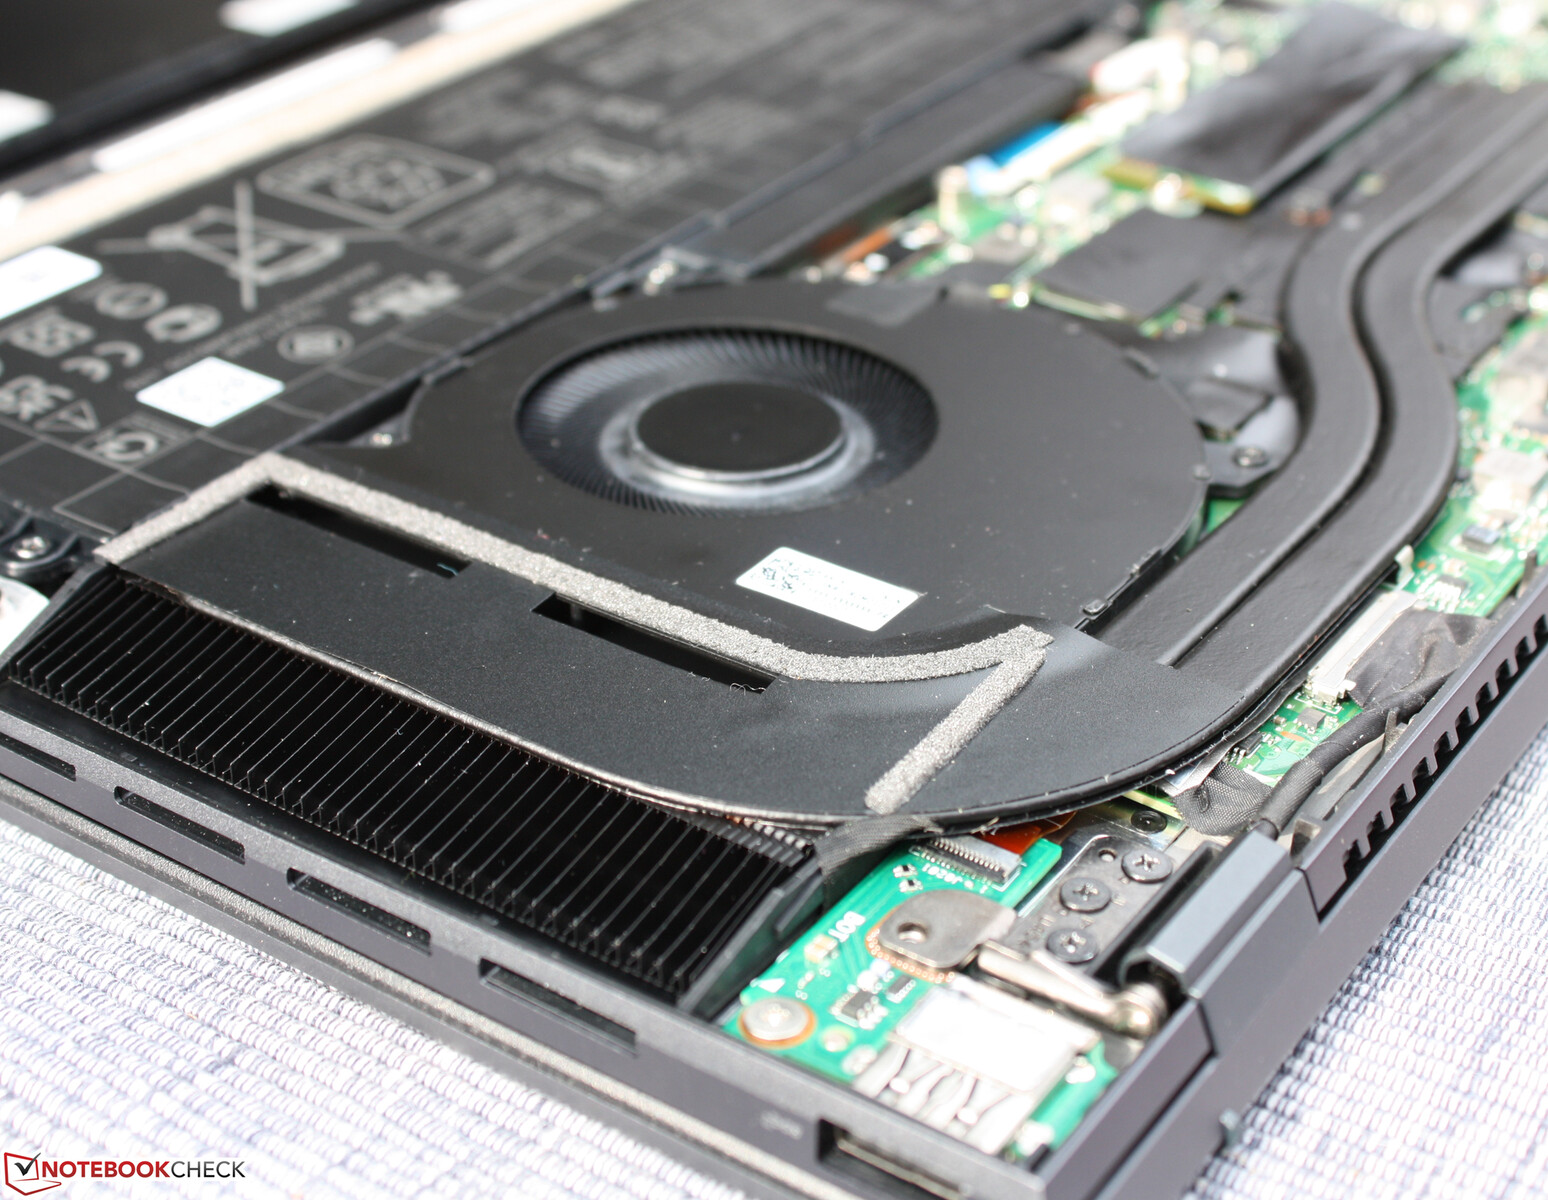
风扇的噪音相当好:在空闲使用时你不会注意到任何东西,但风扇仍有部分活动,尽管你只有把耳朵靠近设备时才能听到它。我们测量了负载下的38和37 dB(A),对于带有dGPU的笔记本电脑来说,这是一个非常低的比率。负载中指的是 Witcher 3,在全高清和超级设置下运行。我们可以看到,dGPU的散热性能达到了极限,这不仅导致了GPU时钟速率的波动,而且还导致了风扇速度的变化。37 dB(A)是这里的最大值。在用Prime95和FurMark进行的压力测试中,达到了38dB(A)。风扇的噪音是无害的;风扇的速度不知不觉地加快,然后又缓缓地降低了。
Noise level
| Idle |
| 26 / 26 / 26.3 dB(A) |
| Load |
| 37.1 / 38 dB(A) |
 | ||
30 dB silent 40 dB(A) audible 50 dB(A) loud |
||
min: | ||
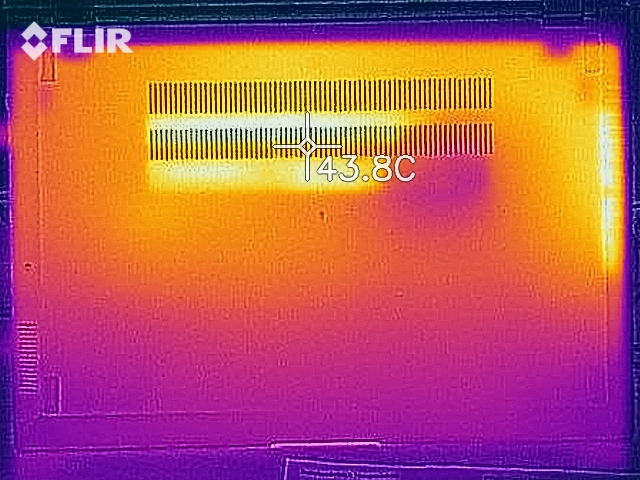
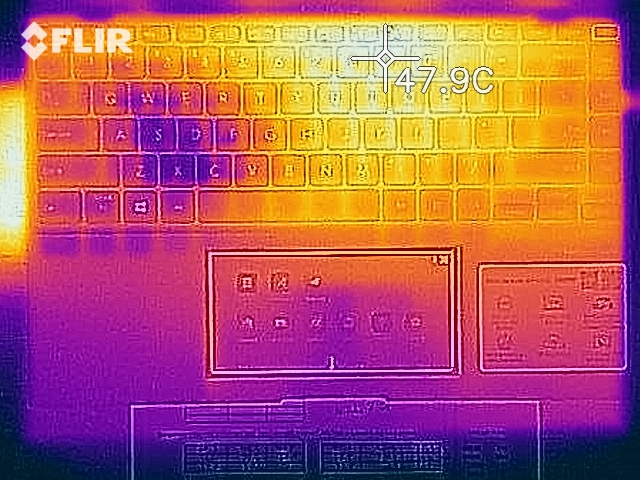
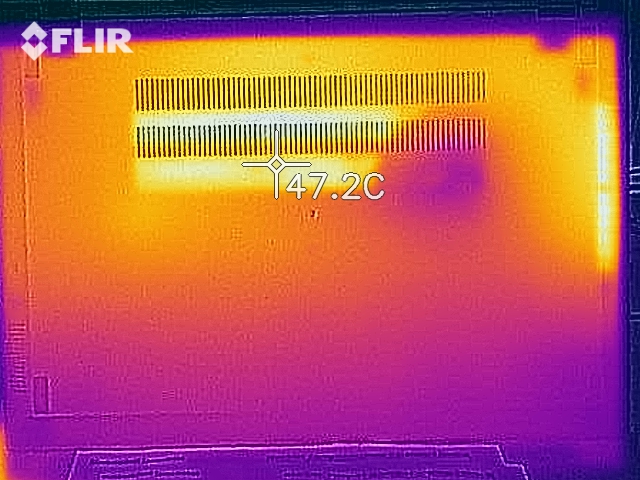
温度
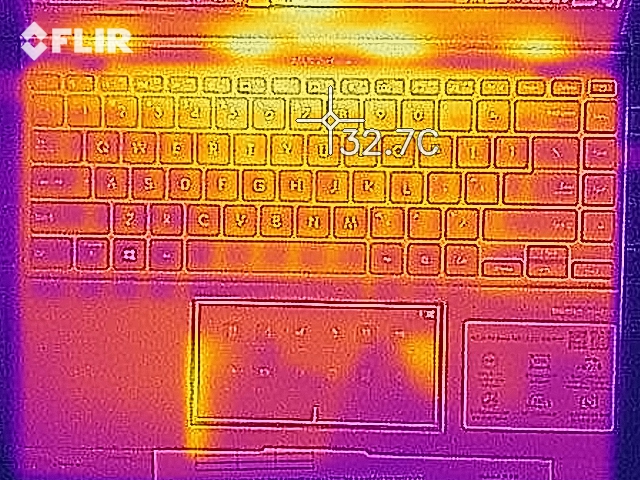
在办公室的情况下,我们在桌子上有一个设备,在任何时候都最多是温热的。出风口在左侧,进风口在铰链之间。
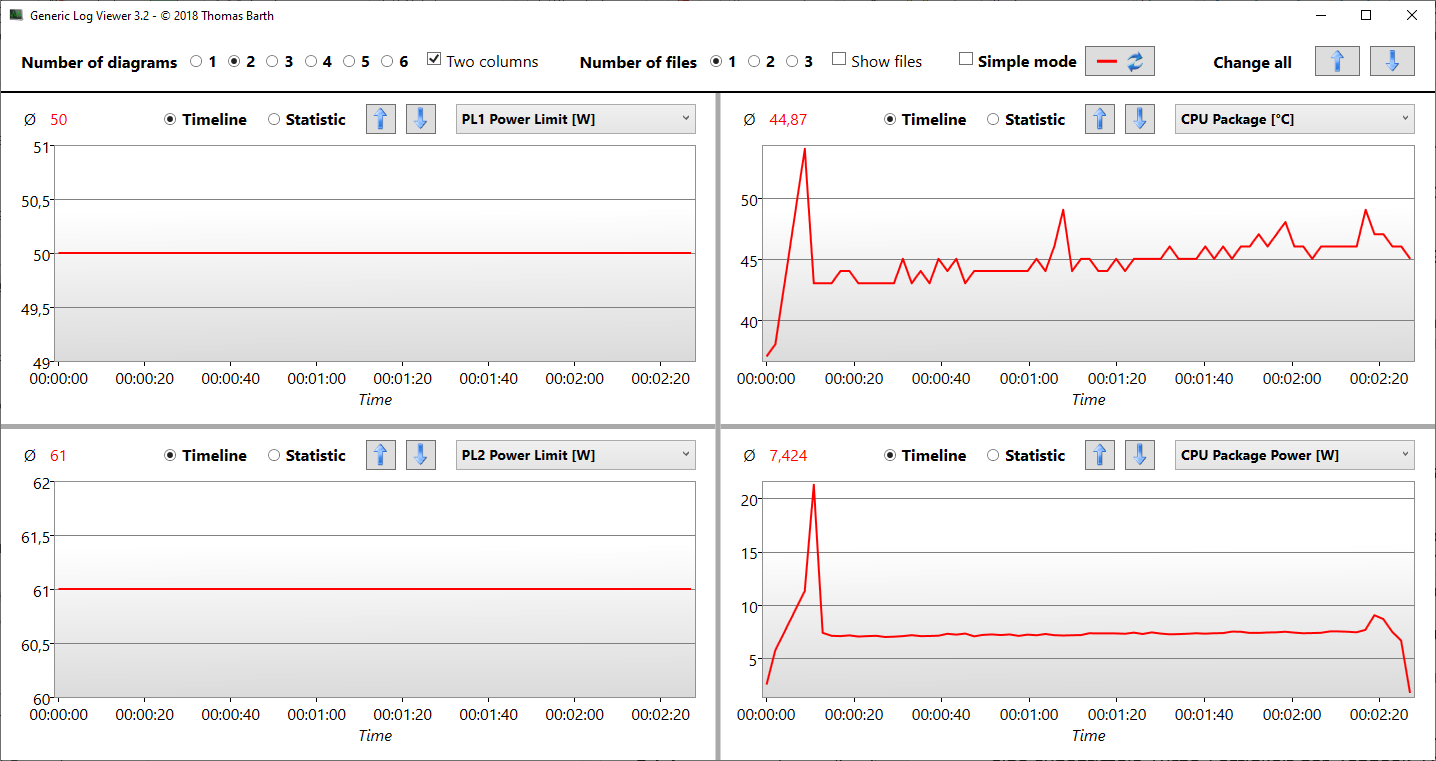
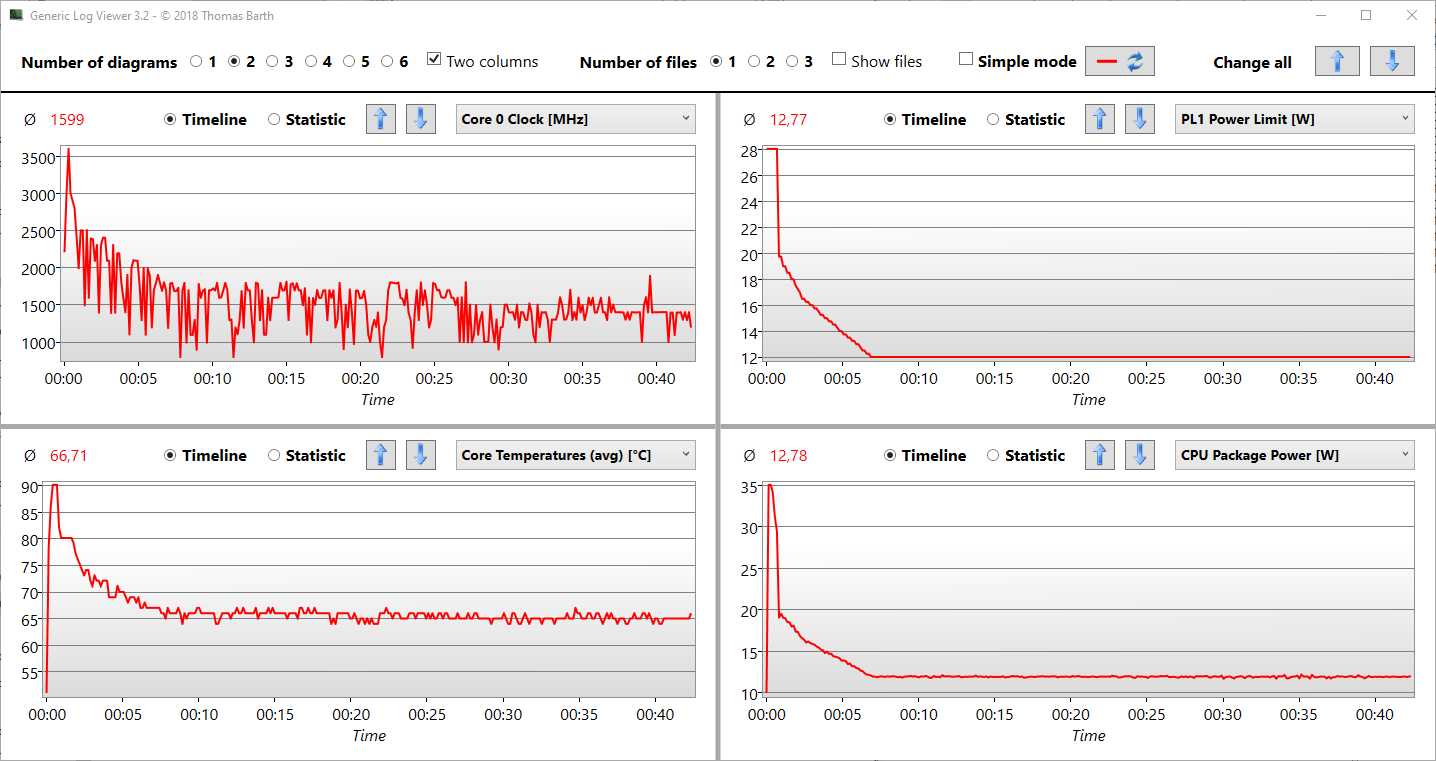
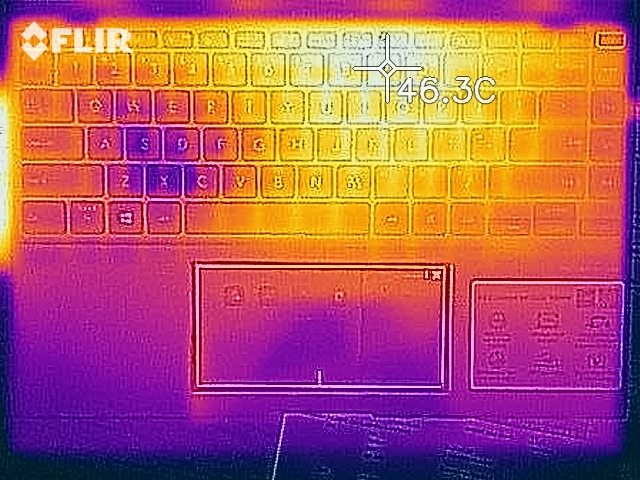
我们用Prime95和FurMark进行的压力测试考察了系统如何在一段时间内处理最大负荷。表面温度在这里仍然上升(顶部为48 °C(~118 °F)),核心温度在90 °C(~194 °F)的峰值后稳定在65 °C(~149 °F)。在这种情况下,7分钟后的封装功率只有12瓦,5瓦只能维持几秒钟。在压力测试后没有立即出现性能下降。
我们只用Prime95进行了同样的分析,并注意到Zenbook几乎没有那么挣扎。刚好低于27°C(~81°F)的封装功率保持不变(也是PL1)。在这次测试中,从未达到90℃(约194°F),SoC在78℃(约172°F)左右波动。
(±) The maximum temperature on the upper side is 42.4 °C / 108 F, compared to the average of 35.9 °C / 97 F, ranging from 21.4 to 59 °C for the class Subnotebook.
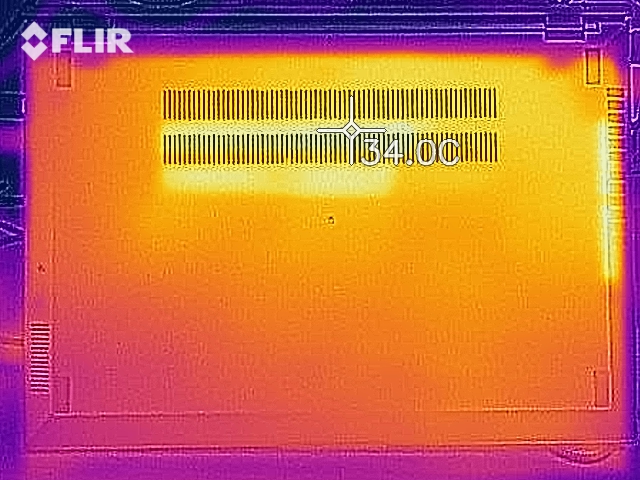
(-) The bottom heats up to a maximum of 47.7 °C / 118 F, compared to the average of 39.2 °C / 103 F
(+) In idle usage, the average temperature for the upper side is 29.3 °C / 85 F, compared to the device average of 30.8 °C / 87 F.
(±) Playing The Witcher 3, the average temperature for the upper side is 35.8 °C / 96 F, compared to the device average of 30.8 °C / 87 F.
(+) The palmrests and touchpad are reaching skin temperature as a maximum (33 °C / 91.4 F) and are therefore not hot.
(-) The average temperature of the palmrest area of similar devices was 28.2 °C / 82.8 F (-4.8 °C / -8.6 F).
发言人
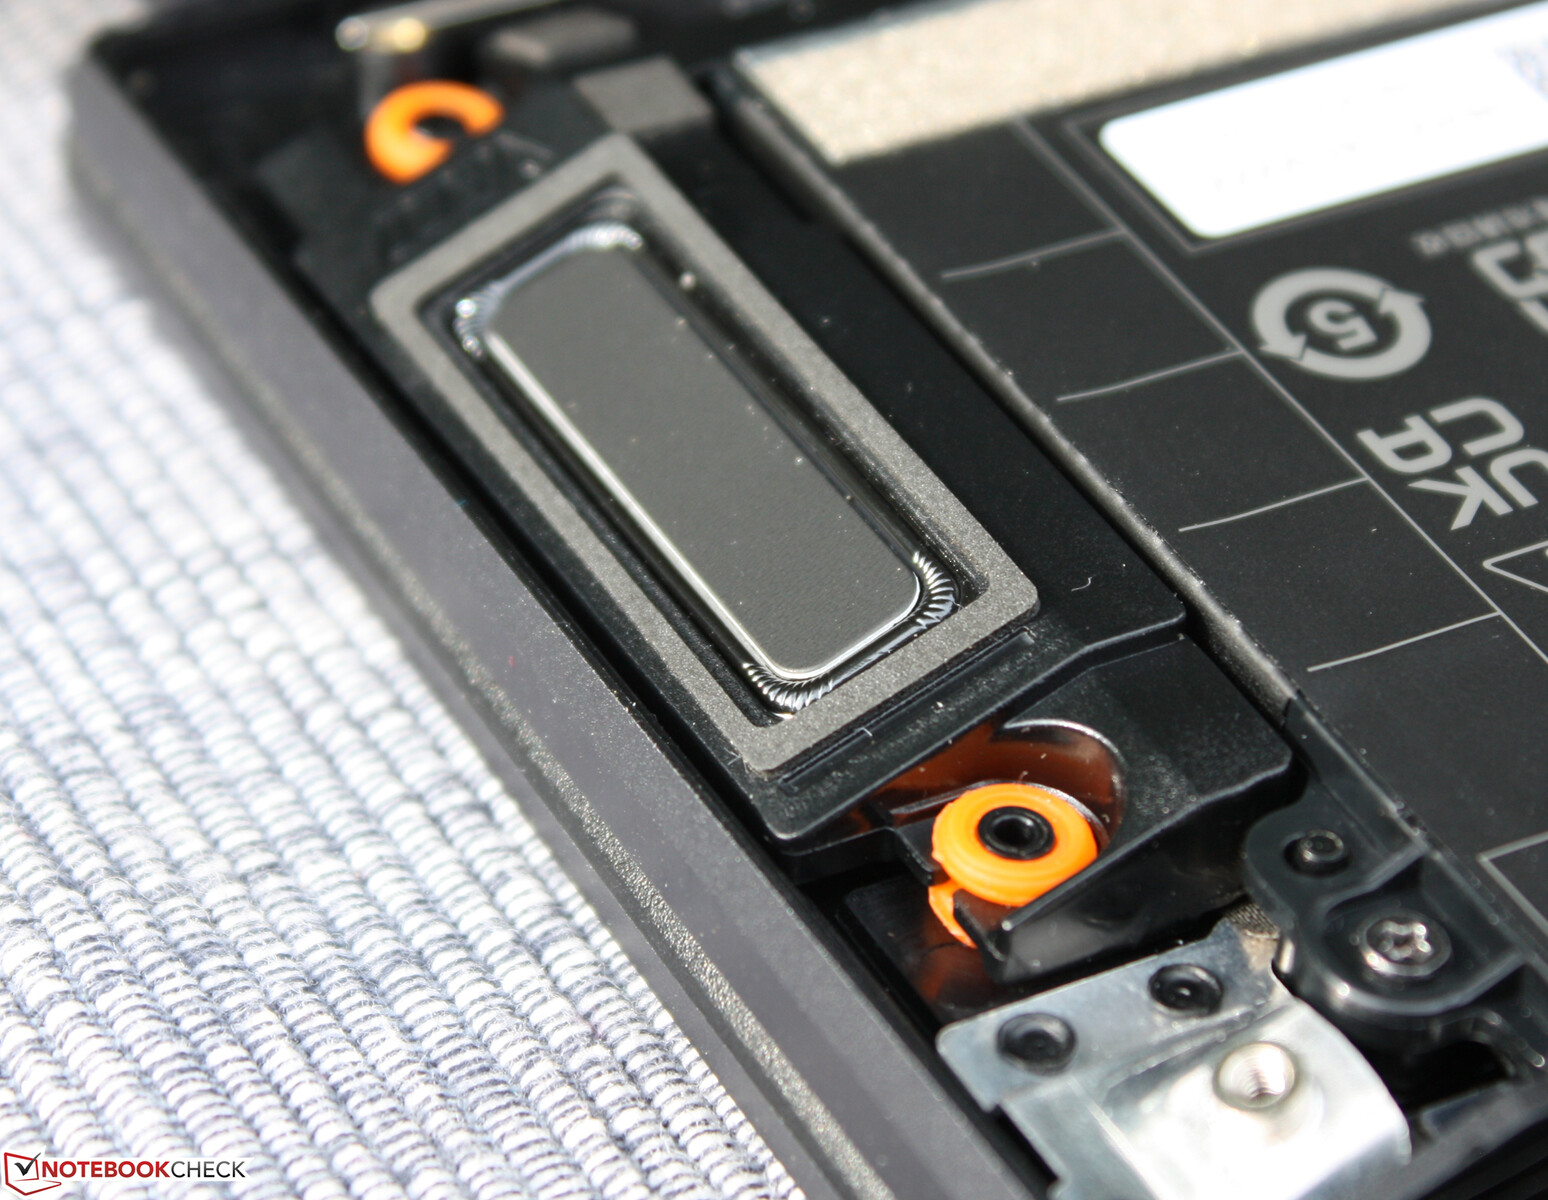
像这样的扬声器是很罕见的!Zenbook提供了音量,一定程度的深度和低音,并以平衡的方式再现了高音。小型扬声器位于掌托下的左右两侧,利用表面作为反射器。在这方面,当设备放在坚硬的桌子上时,声音要比放在柔软的地毯上好。
双阵列麦克风可以无噪音地拾取声音,是视频通话和会议的理想选择。
Asus Zenbook 14X UX5400E audio analysis
(±) | speaker loudness is average but good (76.7 dB)
Bass 100 - 315 Hz
(±) | reduced bass - on average 14.5% lower than median
(±) | linearity of bass is average (11.6% delta to prev. frequency)
Mids 400 - 2000 Hz
(+) | balanced mids - only 2.5% away from median
(+) | mids are linear (4.6% delta to prev. frequency)
Highs 2 - 16 kHz
(+) | balanced highs - only 2.3% away from median
(+) | highs are linear (3.6% delta to prev. frequency)
Overall 100 - 16.000 Hz
(+) | overall sound is linear (10.4% difference to median)
Compared to same class
» 8% of all tested devices in this class were better, 3% similar, 89% worse
» The best had a delta of 5%, average was 18%, worst was 53%
Compared to all devices tested
» 5% of all tested devices were better, 1% similar, 93% worse
» The best had a delta of 4%, average was 24%, worst was 134%
Dell XPS 13 9310 OLED audio analysis
(±) | speaker loudness is average but good (81.3 dB)
Bass 100 - 315 Hz
(±) | reduced bass - on average 11.6% lower than median
(±) | linearity of bass is average (12.1% delta to prev. frequency)
Mids 400 - 2000 Hz
(±) | higher mids - on average 5.1% higher than median
(+) | mids are linear (3.3% delta to prev. frequency)
Highs 2 - 16 kHz
(+) | balanced highs - only 2.6% away from median
(+) | highs are linear (3.3% delta to prev. frequency)
Overall 100 - 16.000 Hz
(+) | overall sound is linear (13.4% difference to median)
Compared to same class
» 22% of all tested devices in this class were better, 5% similar, 72% worse
» The best had a delta of 5%, average was 18%, worst was 53%
Compared to all devices tested
» 14% of all tested devices were better, 4% similar, 83% worse
» The best had a delta of 4%, average was 24%, worst was 134%
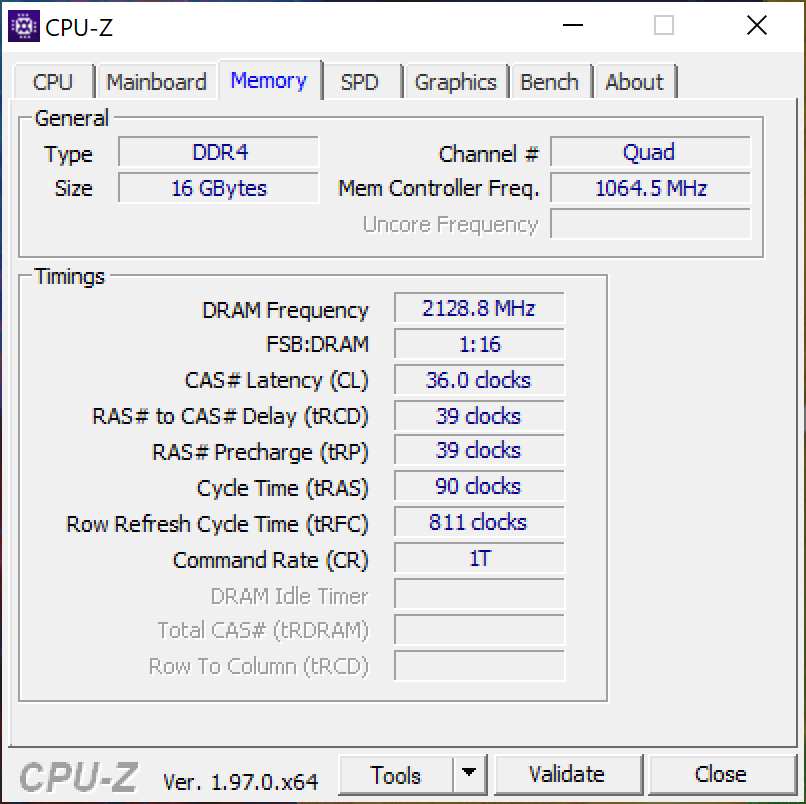
能源管理
能源消耗
这一定是由于OLED技术的缘故。闲置功耗为7.2瓦,比相同尺寸的IPS显示屏的竞争对手多出40-50%。戴尔XPS 13 9310 OLED也有这个小问题。当涉及到平均闲置消耗(10.4瓦)和最大闲置消耗(11瓦)时,这种情况仍然存在,尽管后者与竞争对手相比似乎并不那么高。
对碳足迹来说是不幸的。OLED屏幕保护程序,在正常情况下不能被禁用,导致空闲使用时不必要的高功耗9-12瓦,而这是在亮度为150cd/m³(-3级)且没有键盘背光的情况下实现的
Witcher 3Ultra代表了MX450
的最大游戏负荷,我们测得其为53瓦。这是一个平均值;由于GPU时钟速度的节流,这里的功耗在45瓦和73瓦之间波动。在压力测试中,100瓦的电源适配器确实不得不在最大负荷下努力工作;它在开始时必须提供96瓦。正如压力测试所显示的,在这种情况下,由于节流,功耗也明显降低,即大约两分钟后为60瓦。
| Off / Standby | |
| Idle | |
| Load |
|
Key:
min: | |
| Asus Zenbook 14X UX5400E i7-1165G7, GeForce MX450, SK Hynix HFM001TD3JX013N, OLED, 2880x1800, 14" | Dell XPS 13 9310 OLED i7-1185G7, Iris Xe G7 96EUs, Toshiba XG6 KXG60ZNV512G, OLED, 3456x2160, 13.4" | Asus Zenbook 14 UX435EG i7-1165G7, GeForce MX450, Samsung PM981a MZVLB1T0HBLR, IPS, 1920x1080, 14" | MSI Modern 14 B11SB-085 i7-1165G7, GeForce MX450, Kingston OM8PCP3512F-AB, IPS, 1920x1080, 14" | HP Envy 14-eb0010nr i5-1135G7, GeForce GTX 1650 Ti Max-Q, Samsung SSD PM981a MZVLB256HBHQ, IPS, 1920x1200, 14" | Lenovo IdeaPad Slim 9i 14ITL5 i7-1165G7, Iris Xe G7 96EUs, WDC PC SN730 SDBPNTY-512G, IPS, 3840x2160, 14" | Average NVIDIA GeForce MX450 | Average of class Subnotebook | |
|---|---|---|---|---|---|---|---|---|
| Power Consumption | 27% | 22% | 13% | -29% | 20% | 15% | 35% | |
| Idle Minimum * (Watt) | 7.2 | 5.7 21% | 3.4 53% | 3 58% | 4.2 42% | 4.5 37% | 4.91 ? 32% | 3.82 ? 47% |
| Idle Average * (Watt) | 10.4 | 6 42% | 7.6 27% | 6.3 39% | 18.3 -76% | 10.5 -1% | 8.36 ? 20% | 6.61 ? 36% |
| Idle Maximum * (Watt) | 11 | 12.3 -12% | 14.2 -29% | 10.3 6% | 19.2 -75% | 10.6 4% | 11.1 ? -1% | 7.99 ? 27% |
| Load Average * (Watt) | 61.7 | 44.4 28% | 56 9% | 66 -7% | 72.9 -18% | 44.2 28% | 58.4 ? 5% | 41.9 ? 32% |
| Witcher 3 ultra * (Watt) | 53.6 | 36.5 32% | 41 24% | 66.6 -24% | 61.5 -15% | 45.8 15% | ||
| Load Maximum * (Watt) | 96 | 47.8 50% | 50.4 47% | 90.6 6% | 127.8 -33% | 61.9 36% | 76.2 ? 21% | 64.1 ? 33% |
* ... smaller is better
Energy consumption during The Witcher 3 / stress test
电池寿命
Zenbook 14X的电池寿命并不长。Wi-Fi测试只持续了5:21小时,即使我们手动关闭了屏幕保护程序。如果在浏览器测试中使用屏保,运行时间就会低得多,只有2:22小时。Zenbook不得不使用63Wh,但这是通常的配置,即使在竞争对手中也是如此。
| Asus Zenbook 14X UX5400E i7-1165G7, GeForce MX450, 63 Wh | Asus Zenbook 14 UX435EG i7-1165G7, GeForce MX450, 63 Wh | MSI Modern 14 B11SB-085 i7-1165G7, GeForce MX450, 52.4 Wh | HP Envy 14-eb0010nr i5-1135G7, GeForce GTX 1650 Ti Max-Q, 63.3 Wh | Lenovo IdeaPad Slim 9i 14ITL5 i7-1165G7, Iris Xe G7 96EUs, 63.5 Wh | Average of class Subnotebook | |
|---|---|---|---|---|---|---|
| Battery runtime | 4% | 61% | 35% | 63% | 68% | |
| Reader / Idle (h) | 34 | 18.5 -46% | 27.7 -19% | 40.1 18% | 28.6 ? -16% | |
| WiFi v1.3 (h) | 5.4 | 8.5 57% | 8.7 61% | 10.8 100% | 11 104% | 14 ? 159% |
| Load (h) | 1.2 | 1.2 0% | 1.5 25% | 2 67% | 1.946 ? 62% | |
| H.264 (h) | 10.1 | 15.6 ? |
Pros
Cons
结论 - 鲜艳的色彩,蹒跚的表现
通过Zenbook 14X,华硕在其产品系列中拥有了一款次笔记本,在大多数情况下,使用起来非常愉快。首先,有生动明亮的OLED面板,3K分辨率,轻松准确地再现了常见的色彩空间。
但Zenbook在做工、输入设备和端口方面也处于领先地位,有2个Thunderbolt 4连接和ScreenPad 2.0。使用Zenbook 14X简直是一种享受,因为它是一个坚实的、非常好的副笔记本。
虽然我们可以在大多数领域完全赞扬它,但电池寿命、功耗和性能发展值得一些批评。
对于现代高端次笔记本来说,刚刚超过5小时的电池运行时间低于平均水平。强制性的OLED屏幕保护程序导致空闲使用时的高耗电量为9-12瓦。单个风扇需要同时冷却MX450和英特尔i7,这使得图形性能在一些游戏中出现波动,并且不允许处理器在持续负载下处于最佳状态。我们渴望看到生产型产品在这里是否会有更好的表现。
价格和可用性
在撰写本文时,华硕Zenbook 14X UX5400E似乎还没有在美国上市。我们回顾了一个带有英文键盘的预生产单位。因此,很难与竞争对手进行价格比较。
可以不使用dGPU的性能但想要OLED显示屏的用户应该仔细看看戴尔XPS 13 9310 OLED 。电池寿命和PWM是那里的批评点。接下来是华硕ZenBook 13 OLED UM325UA,我们还没有评测。从技术上讲,它有望成为一个非常有趣和相对实惠的设备,其Ryzen 5000和全高清OLED显示屏(约1500欧元(约1746美元))。
如果OLED技术不是那么重要,高性能的14英寸机,如华硕Zenbook 14 UX435EG(MX450) 或惠普Envy 14-eb0010nr( GTX 1650 Ti Max-Q) 都值得考虑,其中Envy 14的IPS显示屏更好。然而,潜在的买家应该仔细看看这些机型,因为除了OLED技术之外,还有其他原因导致它们的评级比审查中的华硕Zenbook 14X UX5400E低5-6%。
Price comparison

