微软Surface Pro 6(2018)(i7,512 GB,16GB)评测
| SD Card Reader | |
| average JPG Copy Test (av. of 3 runs) | |
| Microsoft Surface Book 2 (Toshiba Exceria Pro SDXC 64 GB UHS-II) | |
| Dell Latitude 5290 2-in-1 (Toshiba Exceria Pro M501 UHS-II) | |
| Microsoft Surface Pro 6, Core i7, 512 GB (Toshiba Exceria Pro M501 microSDXC 64GB) | |
| Microsoft Surface Go MHN-00003 (Toshiba Exceria Pro M501) | |
| Average of class Convertible (28.1 - 197, n=23, last 2 years) | |
| maximum AS SSD Seq Read Test (1GB) | |
| Microsoft Surface Book 2 (Toshiba Exceria Pro SDXC 64 GB UHS-II) | |
| Dell Latitude 5290 2-in-1 (Toshiba Exceria Pro M501 UHS-II) | |
| Average of class Convertible (28.9 - 254, n=22, last 2 years) | |
| Microsoft Surface Pro 6, Core i7, 512 GB (Toshiba Exceria Pro M501 microSDXC 64GB) | |
| Microsoft Surface Go MHN-00003 (Toshiba Exceria Pro M501) | |
| Networking | |
| iperf3 transmit AX12 | |
| Samsung Galaxy Book 12 SM-W728 | |
| Microsoft Surface Pro (2017) i5 | |
| HP Elite x2 1013 G3-2TT14EA | |
| Huawei Matebook E | |
| Microsoft Surface Pro 6, Core i7, 512 GB | |
| Microsoft Surface Pro 6, Core i5, 128 GB | |
| Lenovo ThinkPad X1 Tablet G3-20KJ001NGE | |
| Microsoft Surface Book 2 | |
| Microsoft Surface Go MHN-00003 | |
| Dell Latitude 5290 2-in-1 | |
| Lenovo Miix 520-12IKB 20M3000LGE | |
| iperf3 receive AX12 | |
| Dell Latitude 5290 2-in-1 | |
| Lenovo ThinkPad X1 Tablet G3-20KJ001NGE | |
| Samsung Galaxy Book 12 SM-W728 | |
| Microsoft Surface Pro 6, Core i7, 512 GB | |
| Microsoft Surface Go MHN-00003 | |
| Microsoft Surface Pro (2017) i5 | |
| Microsoft Surface Pro 6, Core i5, 128 GB | |
| Microsoft Surface Book 2 | |
| Huawei Matebook E | |
| HP Elite x2 1013 G3-2TT14EA | |
| Lenovo Miix 520-12IKB 20M3000LGE | |
| |||||||||||||||||||||||||
Brightness Distribution: 91 %
Center on Battery: 484 cd/m²
Contrast: 1467:1 (Black: 0.33 cd/m²)
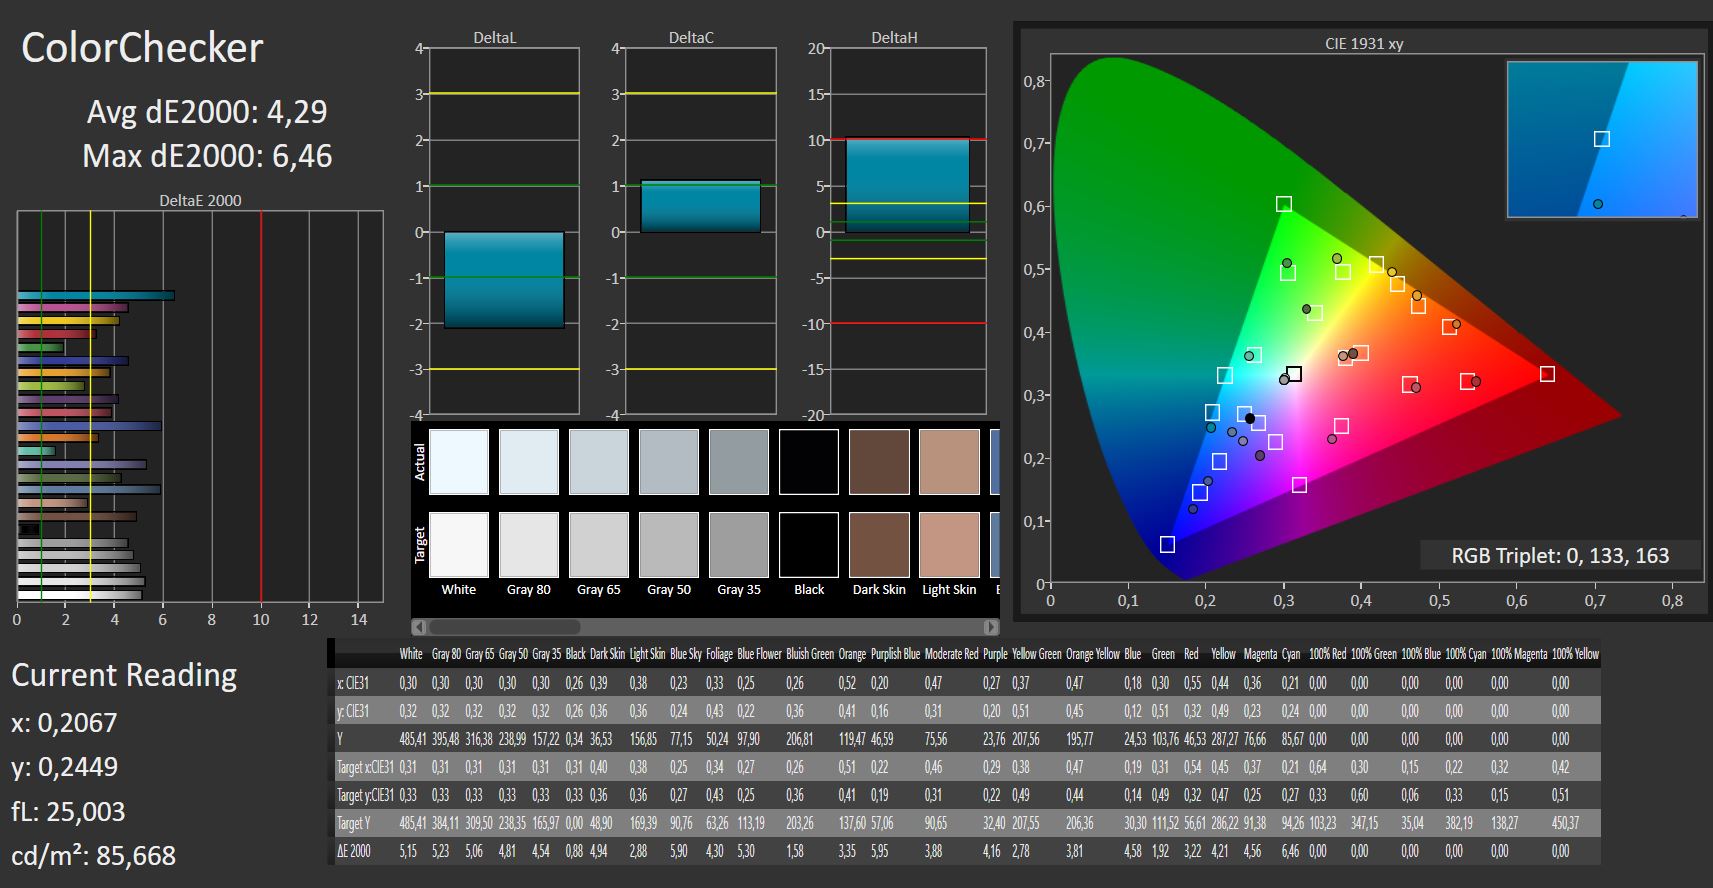
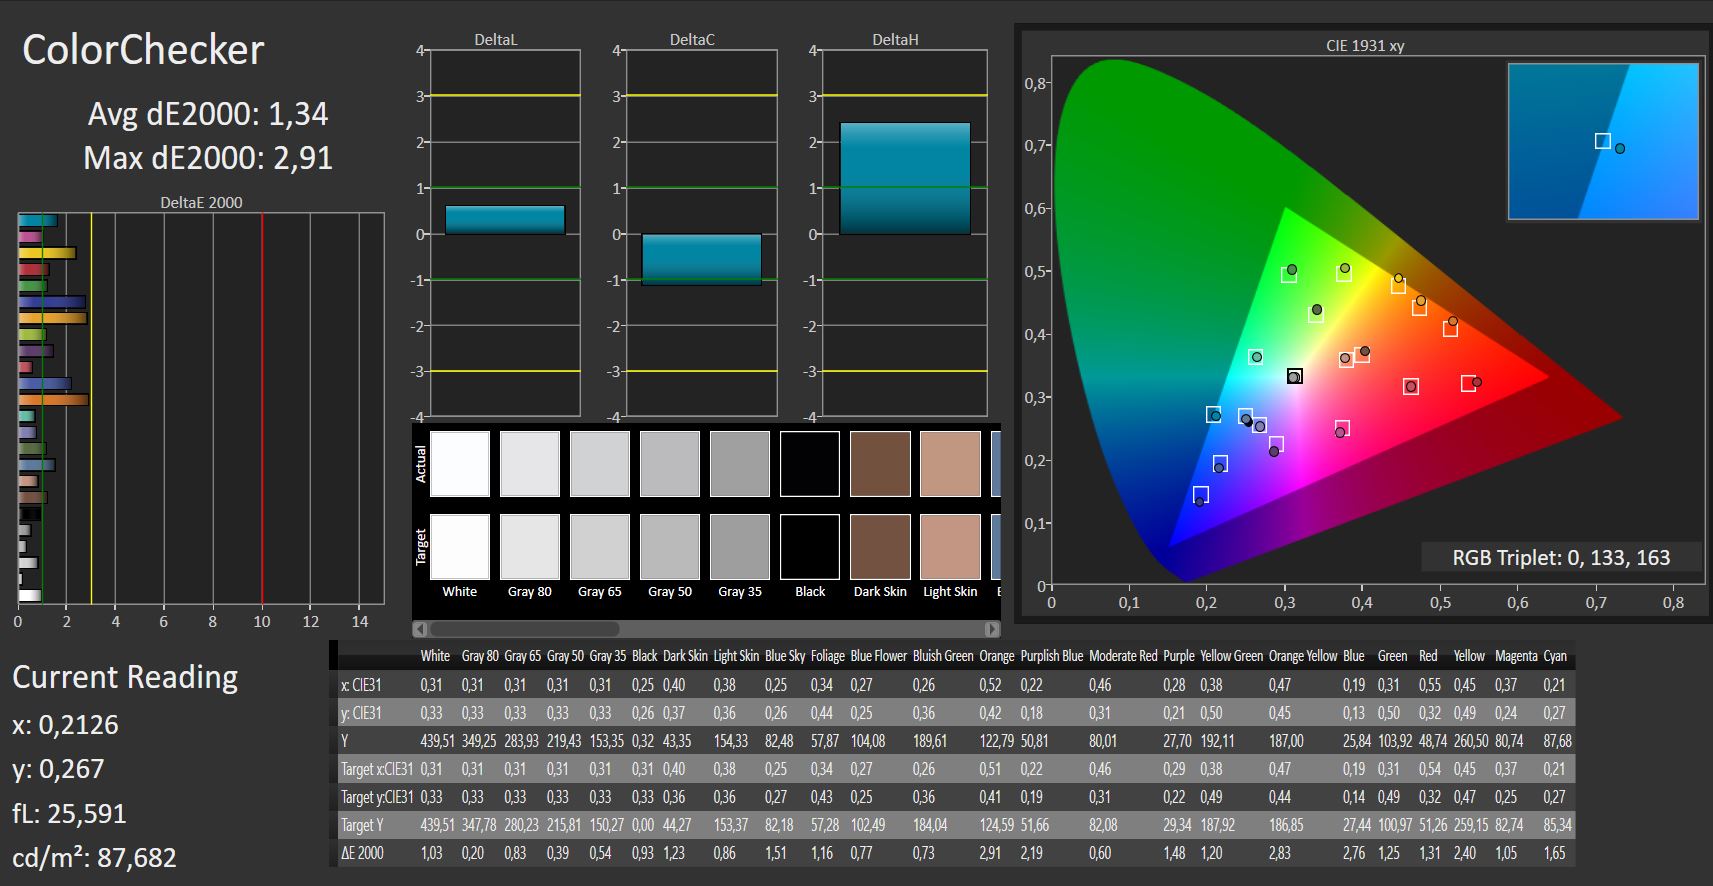
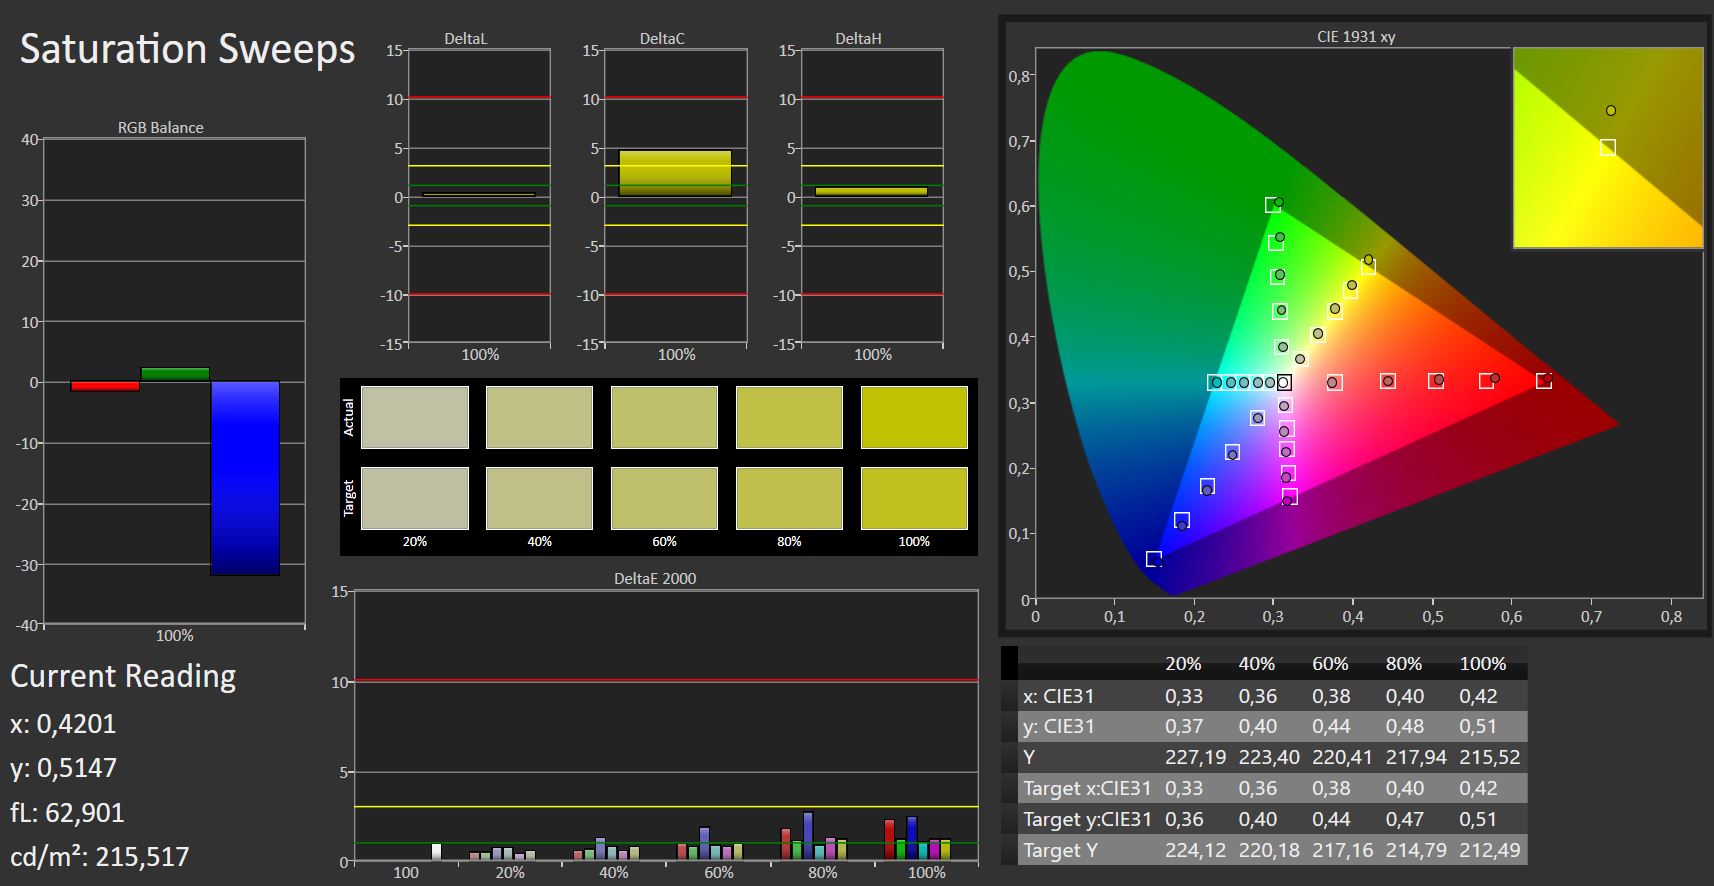
ΔE ColorChecker Calman: 4.29 | ∀{0.5-29.43 Ø4.73}
calibrated: 1.34
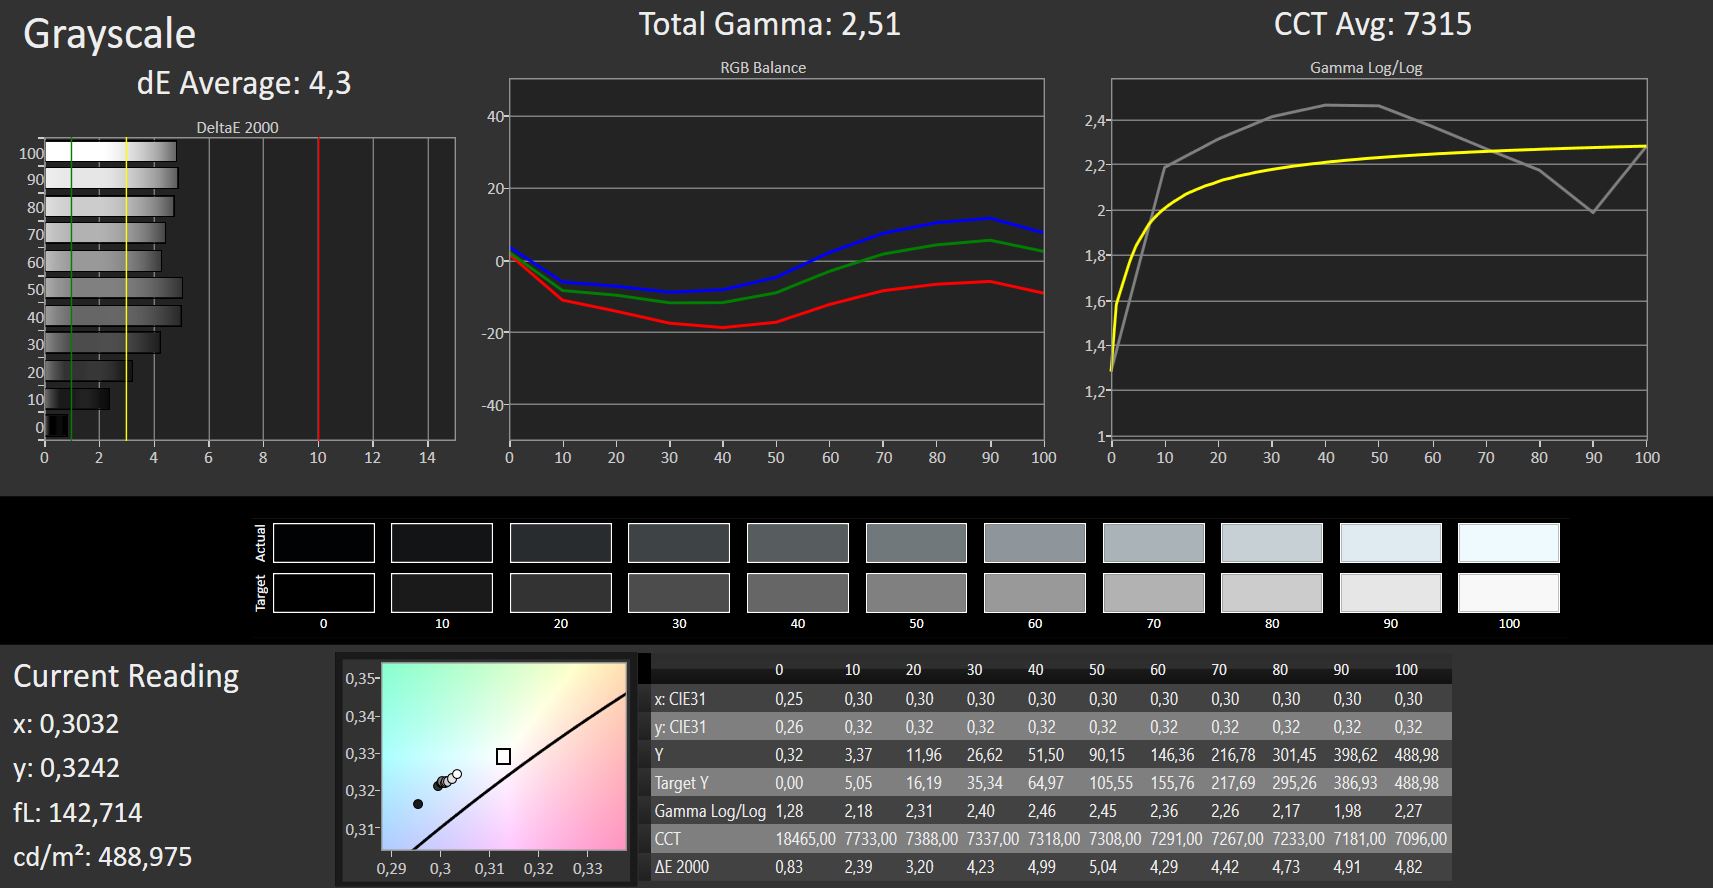
ΔE Greyscale Calman: 4.3 | ∀{0.09-98 Ø4.97}
95% sRGB (Argyll 1.6.3 3D)
62% AdobeRGB 1998 (Argyll 1.6.3 3D)
67.9% AdobeRGB 1998 (Argyll 3D)
95.5% sRGB (Argyll 3D)
67.1% Display P3 (Argyll 3D)
Gamma: 2.51
CCT: 7315 K
| Microsoft Surface Pro 6, Core i7, 512 GB LGPhilips LP123WQ112604, , 2736x1824, 12.3" | Microsoft Surface Pro (2017) i5 LG Display LP123WQ112604, , 2736x1824, 12.3" | Dell Latitude 5290 2-in-1 SHP1479, , 1920x1280, 12.3" | HP Elite x2 1013 G3-2TT14EA AU Optronics AUO101A, , 3000x2000, 13" | Lenovo ThinkPad X1 Tablet G3-20KJ001NGE LP130QP1-SPA1, , 3000x2000, 13" | Samsung Galaxy Book 12 SM-W728 Samsung SDCA029, , 2160x1440, 12" | Microsoft Surface Book 2 Panasonic MEI96A2 , , 3000x2000, 13.5" | Microsoft Surface Go MHN-00003 Sharp SHP14A6, , 1800x1200, 10" | Huawei Matebook E Chi Mei CMN7801, , 2160x1440, 12" | Lenovo Miix 520-12IKB 20M3000LGE Unbekannt, , 1920x1200, 12.2" | |
|---|---|---|---|---|---|---|---|---|---|---|
| Display | 2% | 4% | 1% | 3% | 11% | 1% | 0% | 17% | -2% | |
| Display P3 Coverage (%) | 67.1 | 67.6 1% | 70.5 5% | 67.5 1% | 68.1 1% 67.8 1% | 77.3 15% | 67.9 1% | 66.5 -1% | 84.9 27% | 66.1 -1% |
| sRGB Coverage (%) | 95.5 | 99 4% | 98.6 3% | 96.7 1% | 99.4 4% 99.1 4% | 92.8 -3% | 95.7 0% | 97.5 2% | 99.8 5% | 91.6 -4% |
| AdobeRGB 1998 Coverage (%) | 67.9 | 69.1 2% | 71.5 5% | 68.2 0% | 69.9 3% 69.3 2% | 83.1 22% | 69.4 2% | 67.5 -1% | 79.9 18% | 66.7 -2% |
| Response Times | -7% | -38% | -7% | -40% | 56% | -22% | -2% | 26% | 12% | |
| Response Time Grey 50% / Grey 80% * (ms) | 43 ? | 42 ? 2% | 56.8 ? -32% | 47 ? -9% | 47.2 ? -10% | 4 ? 91% | 52.8 ? -23% | 44 ? -2% | 26 ? 40% | 36 ? 16% |
| Response Time Black / White * (ms) | 25 ? | 29 ? -16% | 36 ? -44% | 26 ? -4% | 42.4 ? -70% | 20 ? 20% | 30 ? -20% | 25.6 ? -2% | 22 ? 12% | 23 ? 8% |
| PWM Frequency (Hz) | 22000 ? | 21000 | 1852 ? | 250 ? | 1020 ? | 200 ? | ||||
| Screen | 4% | -10% | -12% | 3% | 84% | 18% | 18% | -9% | -31% | |
| Brightness middle (cd/m²) | 484 | 417 -14% | 548 13% | 452 -7% | 474 -2% | 376 -22% | 385 -20% | 456 -6% | 439 -9% | 384 -21% |
| Brightness (cd/m²) | 473 | 401 -15% | 545 15% | 412 -13% | 418 -12% | 378 -20% | 372 -21% | 426 -10% | 428 -10% | 355 -25% |
| Brightness Distribution (%) | 91 | 88 -3% | 86 -5% | 85 -7% | 76 -16% | 91 0% | 89 -2% | 88 -3% | 92 1% | 80 -12% |
| Black Level * (cd/m²) | 0.33 | 0.29 12% | 0.51 -55% | 0.48 -45% | 0.33 -0% | 0.03 91% | 0.21 36% | 0.31 6% | 0.35 -6% | 0.56 -70% |
| Contrast (:1) | 1467 | 1438 -2% | 1075 -27% | 942 -36% | 1436 -2% | 12533 754% | 1833 25% | 1471 0% | 1254 -15% | 686 -53% |
| Colorchecker dE 2000 * | 4.29 | 3.63 15% | 3.65 15% | 4.05 6% | 3.2 25% | 4.1 4% | 1.6 63% | 1.3 70% | 5.17 -21% | 4.58 -7% |
| Colorchecker dE 2000 max. * | 6.46 | 6.74 -4% | 7.15 -11% | 6.64 -3% | 6.1 6% | 6.45 -0% | 4.5 30% | 3 54% | 7.68 -19% | 11.63 -80% |
| Colorchecker dE 2000 calibrated * | 1.34 | 1.81 -35% | 1.56 -16% | 0.9 33% | 1.1 18% | |||||
| Greyscale dE 2000 * | 4.3 | 2.18 49% | 5.5 -28% | 4.87 -13% | 4.5 -5% | 3.64 15% | 1.5 65% | 1.4 67% | 5.69 -32% | 5.63 -31% |
| Gamma | 2.51 88% | 3.09 71% | 2.154 102% | 2.71 81% | 2.07 106% | 2.58 85% | 2.22 99% | 2.24 98% | 2.42 91% | 2.45 90% |
| CCT | 7315 89% | 6767 96% | 7052 92% | 7160 91% | 5881 111% | 7113 91% | 6502 100% | 6687 97% | 7999 81% | 7571 86% |
| Color Space (Percent of AdobeRGB 1998) (%) | 62 | 63 2% | 65.2 5% | 62 0% | 64 3% | 74 19% | 64 3% | 62.3 0% | 71 15% | 60 -3% |
| Color Space (Percent of sRGB) (%) | 95 | 99 4% | 99.1 4% | 97 2% | 99.4 5% | 93 -2% | 95.9 1% | 96.8 2% | 100 5% | 92 -3% |
| Total Average (Program / Settings) | -0% /
2% | -15% /
-11% | -6% /
-9% | -11% /
-2% | 50% /
66% | -1% /
9% | 5% /
12% | 11% /
1% | -7% /
-19% |
* ... smaller is better
Display Response Times
| ↔ Response Time Black to White | ||
|---|---|---|
| 25 ms ... rise ↗ and fall ↘ combined | ↗ 13 ms rise | 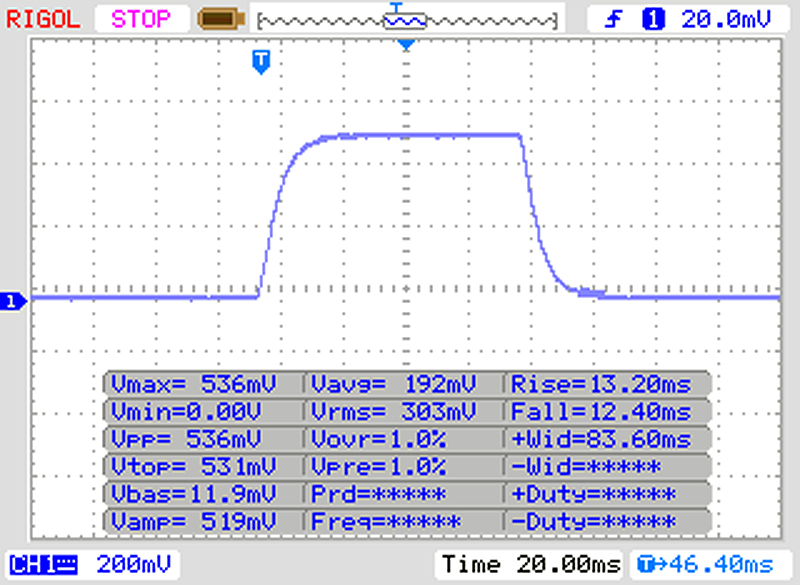 |
| ↘ 12 ms fall | ||
| The screen shows relatively slow response rates in our tests and may be too slow for gamers. In comparison, all tested devices range from 0.1 (minimum) to 240 (maximum) ms. » 59 % of all devices are better. This means that the measured response time is worse than the average of all tested devices (19.9 ms). | ||
| ↔ Response Time 50% Grey to 80% Grey | ||
| 43 ms ... rise ↗ and fall ↘ combined | ↗ 21 ms rise | 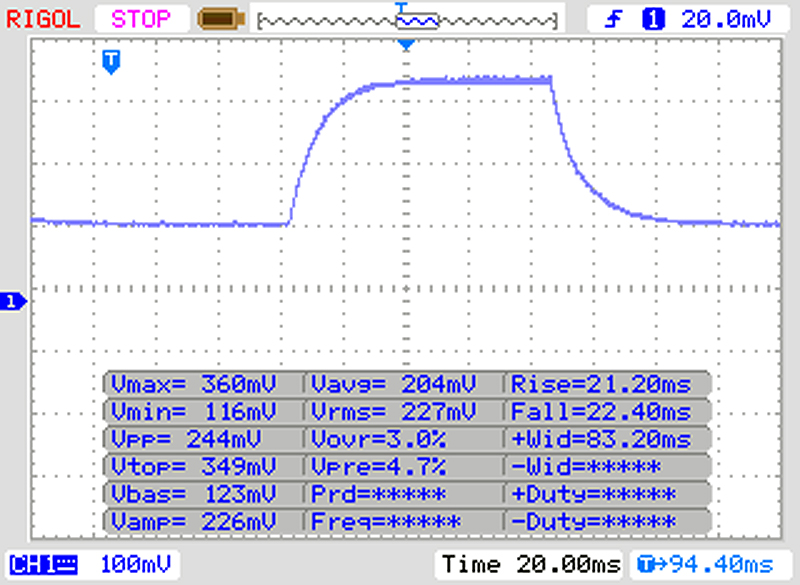 |
| ↘ 22 ms fall | ||
| The screen shows slow response rates in our tests and will be unsatisfactory for gamers. In comparison, all tested devices range from 0.165 (minimum) to 636 (maximum) ms. » 71 % of all devices are better. This means that the measured response time is worse than the average of all tested devices (31.1 ms). | ||
Screen Flickering / PWM (Pulse-Width Modulation)
| Screen flickering / PWM detected | 22000 Hz | ≤ 50 % brightness setting | 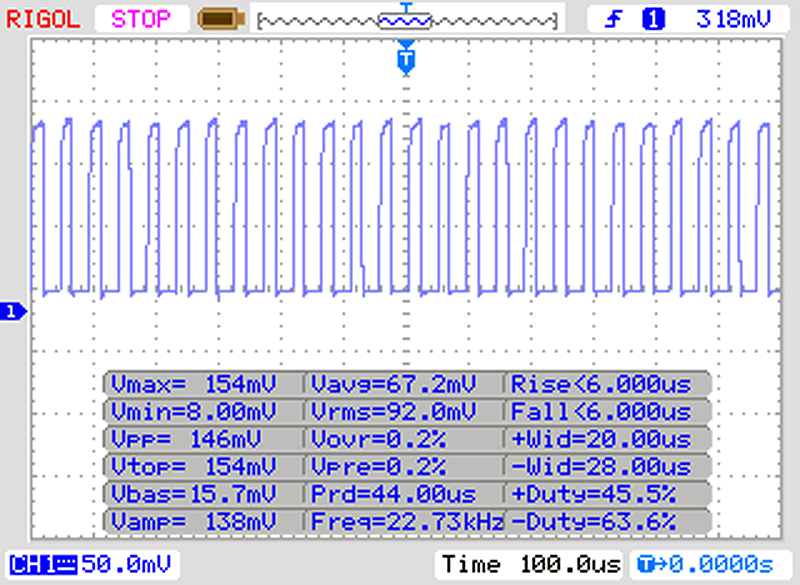 |
The display backlight flickers at 22000 Hz (worst case, e.g., utilizing PWM) Flickering detected at a brightness setting of 50 % and below. There should be no flickering or PWM above this brightness setting. The frequency of 22000 Hz is quite high, so most users sensitive to PWM should not notice any flickering. In comparison: 52 % of all tested devices do not use PWM to dim the display. If PWM was detected, an average of 7791 (minimum: 5 - maximum: 343500) Hz was measured. | |||
| PCMark 8 Home Score Accelerated v2 | 3281 points | |
| PCMark 8 Creative Score Accelerated v2 | 4454 points | |
| PCMark 8 Work Score Accelerated v2 | 4262 points | |
| PCMark 10 Score | 3448 points | |
Help | ||
| Microsoft Surface Pro 6, Core i7, 512 GB Toshiba KBG30ZPZ512G | Microsoft Surface Pro (2017) i7 Samsung PM971 KUS040202M | Microsoft Surface Pro 6, Core i5, 128 GB Toshiba KBG30ZPZ128G | HP Elite x2 1013 G3-2TT14EA Samsung PM961 MZVLW256HEHP | Samsung Galaxy Book 12 SM-W728 Samsung SSD PM871a MZNLN256HMHQ | Microsoft Surface Book 2 Samsung PM961 MZVLW256HEHP | Microsoft Surface Go MHN-00003 64 GB eMMC Flash | Huawei Matebook E SanDisk SD8SN8U256G1027 | Lenovo Miix 520-12IKB 20M3000LGE Samsung SSD PM961 1TB M.2 PCIe 3.0 x4 NVMe (MZVLW1T0) | Average Toshiba KBG30ZPZ512G | |
|---|---|---|---|---|---|---|---|---|---|---|
| CrystalDiskMark 3.0 | 40% | -43% | 49% | -11% | 30% | -73% | -21% | 50% | 0% | |
| Read Seq (MB/s) | 651 | 1308 101% | 748 15% | 1786 174% | 511 -22% | 1370 110% | 259.6 -60% | 506 -22% | 883 36% | 651 ? 0% |
| Write Seq (MB/s) | 792 | 961 21% | 127.6 -84% | 1209 53% | 473.7 -40% | 341.2 -57% | 122.4 -85% | 461 -42% | 932 18% | 792 ? 0% |
| Read 512 (MB/s) | 388.2 | 227.5 -41% | 385.3 -1% | 717 85% | 443.7 14% | 654 68% | 190.6 -51% | 341.9 -12% | 586 51% | 388 ? 0% |
| Write 512 (MB/s) | 575 | 792 38% | 115.8 -80% | 798 39% | 395.4 -31% | 337.9 -41% | 107.1 -81% | 294.7 -49% | 627 9% | 575 ? 0% |
| Read 4k (MB/s) | 43.75 | 53.6 23% | 29.93 -32% | 49.66 14% | 40.46 -8% | 43.64 0% | 19.06 -56% | 32.46 -26% | 54.8 25% | 43.8 ? 0% |
| Write 4k (MB/s) | 97.2 | 136.3 40% | 39.77 -59% | 104.2 7% | 91.9 -5% | 148.5 53% | 24.27 -75% | 65.3 -33% | 139.3 43% | 97.2 ? 0% |
| Read 4k QD32 (MB/s) | 241.2 | 485.6 101% | 192.7 -20% | 286 19% | 289.1 20% | 465.5 93% | 34.45 -86% | 381.8 58% | 607 152% | 241 ? 0% |
| Write 4k QD32 (MB/s) | 304.9 | 421.5 38% | 45.38 -85% | 298.4 -2% | 260.7 -14% | 337.1 11% | 33.64 -89% | 184.4 -40% | 498.5 63% | 305 ? 0% |

| 3DMark 11 Performance | 2202 points | |
| 3DMark Cloud Gate Standard Score | 9052 points | |
Help | ||
| Civilization 6 - 1024x768 Minimum Preset | |
| Microsoft Surface Pro 6, Core i7, 512 GB | |
| Microsoft Surface Pro 6, Core i5, 128 GB | |
| Average Intel UHD Graphics 620 (27.8 - 54.4, n=13) | |
| Farming Simulator 17 - 1366x768 Medium Preset | |
| Microsoft Surface Pro (2017) i7 | |
| Microsoft Surface Pro 6, Core i7, 512 GB | |
| Average Intel UHD Graphics 620 (8 - 67.9, n=12) | |
| Microsoft Surface Pro 6, Core i5, 128 GB | |
| Samsung Galaxy Book 12 SM-W728 | |
| Dirt 4 - 1280x720 Ultra Low Preset | |
| Microsoft Surface Pro 6, Core i7, 512 GB | |
| Average Intel UHD Graphics 620 (46.6 - 50, n=2) | |
| Playerunknown's Battlegrounds (PUBG) - 1280x720 Very Low Preset | |
| Microsoft Surface Pro 6, Core i7, 512 GB | |
| Average Intel UHD Graphics 620 (18 - 21.9, n=2) | |
| Middle-earth: Shadow of War - 1280x720 Lowest Preset | |
| Microsoft Surface Pro 6, Core i7, 512 GB | |
| Average Intel UHD Graphics 620 (18 - 23, n=3) | |
| Microsoft Surface Pro 6, Core i5, 128 GB | |
| F1 2018 - 1280x720 Ultra Low Preset | |
| Microsoft Surface Pro 6, Core i5, 128 GB | |
| Average Intel UHD Graphics 620 (31 - 35.8, n=5) | |
| Microsoft Surface Pro 6, Core i7, 512 GB | |
| Shadow of the Tomb Raider - 1280x720 Lowest Preset | |
| Average of class Convertible (24 - 180, n=2, last 2 years) | |
| Microsoft Surface Pro 6, Core i5, 128 GB | |
| Microsoft Surface Pro 6, Core i7, 512 GB | |
| Average Intel UHD Graphics 620 (12 - 21.7, n=13) | |
| low | med. | high | ultra | QHD | |
|---|---|---|---|---|---|
| BioShock Infinite (2013) | 78.1 | 40.9 | 33.7 | 10.2 | |
| Thief (2014) | 26.5 | 13.3 | 12.1 | ||
| Rise of the Tomb Raider (2016) | 21.7 | 14 | 7.5 | ||
| Civilization 6 (2016) | 45.3 | 16.9 | |||
| Farming Simulator 17 (2016) | 80.5 | 56.9 | 23.9 | ||
| Dirt 4 (2017) | 50 | 13.6 | 11.2 | ||
| Playerunknown's Battlegrounds (PUBG) (2017) | 21.9 | 12 | 9.5 | ||
| Middle-earth: Shadow of War (2017) | 23 | 12 | |||
| F1 2018 (2018) | 32 | 15 | 12 | ||
| Shadow of the Tomb Raider (2018) | 16 | 6 |
Noise level
| Idle |
| 30.3 / 30.3 / 30.3 dB(A) |
| Load |
| 33.5 / 33.5 dB(A) |
 | ||
30 dB silent 40 dB(A) audible 50 dB(A) loud |
||
min: | ||
(±) The maximum temperature on the upper side is 40.4 °C / 105 F, compared to the average of 35.4 °C / 96 F, ranging from 19.6 to 60 °C for the class Convertible.
(±) The bottom heats up to a maximum of 43.8 °C / 111 F, compared to the average of 36.9 °C / 98 F
(+) In idle usage, the average temperature for the upper side is 30.3 °C / 87 F, compared to the device average of 30.3 °C / 87 F.
(±) The palmrests and touchpad can get very hot to the touch with a maximum of 39 °C / 102.2 F.
(-) The average temperature of the palmrest area of similar devices was 28 °C / 82.4 F (-11 °C / -19.8 F).
Microsoft Surface Pro 6, Core i7, 512 GB audio analysis
(-) | not very loud speakers (69.1 dB)
Bass 100 - 315 Hz
(±) | reduced bass - on average 11.4% lower than median
(±) | linearity of bass is average (10.6% delta to prev. frequency)
Mids 400 - 2000 Hz
(+) | balanced mids - only 4.3% away from median
(±) | linearity of mids is average (10.4% delta to prev. frequency)
Highs 2 - 16 kHz
(±) | higher highs - on average 5.7% higher than median
(±) | linearity of highs is average (8.1% delta to prev. frequency)
Overall 100 - 16.000 Hz
(±) | linearity of overall sound is average (21.4% difference to median)
Compared to same class
» 57% of all tested devices in this class were better, 12% similar, 32% worse
» The best had a delta of 6%, average was 20%, worst was 57%
Compared to all devices tested
» 60% of all tested devices were better, 7% similar, 33% worse
» The best had a delta of 4%, average was 24%, worst was 134%
HP Elite x2 1013 G3-2TT14EA audio analysis
(±) | speaker loudness is average but good (74.4 dB)
Bass 100 - 315 Hz
(-) | nearly no bass - on average 15.1% lower than median
(±) | linearity of bass is average (10.9% delta to prev. frequency)
Mids 400 - 2000 Hz
(±) | higher mids - on average 7.9% higher than median
(±) | linearity of mids is average (11.3% delta to prev. frequency)
Highs 2 - 16 kHz
(±) | higher highs - on average 5.2% higher than median
(+) | highs are linear (6.8% delta to prev. frequency)
Overall 100 - 16.000 Hz
(±) | linearity of overall sound is average (20.8% difference to median)
Compared to same class
» 55% of all tested devices in this class were better, 10% similar, 35% worse
» The best had a delta of 6%, average was 20%, worst was 57%
Compared to all devices tested
» 56% of all tested devices were better, 8% similar, 36% worse
» The best had a delta of 4%, average was 24%, worst was 134%
| Off / Standby | |
| Idle | |
| Load |
|
Key:
min: | |
| Microsoft Surface Pro 6, Core i7, 512 GB i7-8650U, UHD Graphics 620, Toshiba KBG30ZPZ512G, IPS, 2736x1824, 12.3" | Microsoft Surface Pro (2017) i7 i7-7660U, Iris Plus Graphics 640, Samsung PM971 KUS040202M, IPS, 2736x1824, 12.3" | Microsoft Surface Pro 6, Core i5, 128 GB i5-8250U, UHD Graphics 620, Toshiba KBG30ZPZ128G, IPS, 2736x1834, 12.3" | Microsoft Surface Pro (2017) i5 i5-7300U, HD Graphics 620, Samsung PM971 KUS030202M, IPS, 2736x1824, 12.3" | Dell Latitude 5290 2-in-1 i5-8350U, UHD Graphics 620, Toshiba XG5 KXG50ZNV256G, IPS, 1920x1280, 12.3" | HP Elite x2 1013 G3-2TT14EA i5-8350U, UHD Graphics 620, Samsung PM961 MZVLW256HEHP, IPS, 3000x2000, 13" | Samsung Galaxy Book 12 SM-W728 i5-7200U, HD Graphics 620, Samsung SSD PM871a MZNLN256HMHQ, Super AMOLED, 2160x1440, 12" | Microsoft Surface Book 2 i7-8650U, GeForce GTX 1050 Mobile, Samsung PM961 MZVLW256HEHP, IPS, 3000x2000, 13.5" | Microsoft Surface Go MHN-00003 Pentium 4415Y, UHD Graphics 615, 64 GB eMMC Flash, IPS, 1800x1200, 10" | Huawei Matebook E i5-7Y54, HD Graphics 615, SanDisk SD8SN8U256G1027, IPS, 2160x1440, 12" | Lenovo Miix 520-12IKB 20M3000LGE i5-8550U, UHD Graphics 620, Samsung SSD PM961 1TB M.2 PCIe 3.0 x4 NVMe (MZVLW1T0), IPS, 1920x1200, 12.2" | Average Intel UHD Graphics 620 | Average of class Convertible | |
|---|---|---|---|---|---|---|---|---|---|---|---|---|---|
| Power Consumption | -19% | 1% | 13% | 1% | -12% | 0% | -82% | 33% | 14% | 5% | -4% | -22% | |
| Idle Minimum * (Watt) | 3.2 | 4.2 -31% | 4.3 -34% | 3.6 -13% | 3 6% | 4.9 -53% | 3.9 -22% | 4.7 -47% | 2.88 10% | 3.9 -22% | 3.9 -22% | 3.81 ? -19% | 4.24 ? -33% |
| Idle Average * (Watt) | 8.7 | 10.1 -16% | 8.7 -0% | 8.1 7% | 7.2 17% | 8.9 -2% | 9 -3% | 10.6 -22% | 4.8 45% | 8.8 -1% | 8.2 6% | 6.94 ? 20% | 7.03 ? 19% |
| Idle Maximum * (Watt) | 10.4 | 14 -35% | 9.4 10% | 8.7 16% | 10 4% | 11 -6% | 11.9 -14% | 12.3 -18% | 7.5 28% | 8.9 14% | 8.4 19% | 8.75 ? 16% | 8.61 ? 17% |
| Load Average * (Watt) | 29.2 | 37.4 -28% | 24.5 16% | 25.5 13% | 37.1 -27% | 32 -10% | 27.3 7% | 81 -177% | 16.9 42% | 20 32% | 25.2 14% | 35 ? -20% | 43.9 ? -50% |
| Load Maximum * (Watt) | 40.8 | 34 17% | 36 12% | 23.5 42% | 38.2 6% | 36 12% | 27.9 32% | 100.3 -146% | 23.8 42% | 21.8 47% | 37 9% | 47.5 ? -16% | 67.2 ? -65% |
| Witcher 3 ultra * (Watt) | 38.1 | 97 |
* ... smaller is better
| Microsoft Surface Pro 6, Core i7, 512 GB i7-8650U, UHD Graphics 620, 45 Wh | Microsoft Surface Pro (2017) i7 i7-7660U, Iris Plus Graphics 640, 45 Wh | Microsoft Surface Pro 6, Core i5, 128 GB i5-8250U, UHD Graphics 620, 45 Wh | Microsoft Surface Pro (2017) i5 i5-7300U, HD Graphics 620, 45 Wh | Dell Latitude 5290 2-in-1 i5-8350U, UHD Graphics 620, 42 Wh | HP Elite x2 1013 G3-2TT14EA i5-8350U, UHD Graphics 620, 50 Wh | Samsung Galaxy Book 12 SM-W728 i5-7200U, HD Graphics 620, 39 Wh | Microsoft Surface Book 2 i7-8650U, GeForce GTX 1050 Mobile, 75 Wh | Microsoft Surface Go MHN-00003 Pentium 4415Y, UHD Graphics 615, 28 Wh | Huawei Matebook E i5-7Y54, HD Graphics 615, 33.7 Wh | Lenovo Miix 520-12IKB 20M3000LGE i5-8550U, UHD Graphics 620, 38 Wh | Average of class Convertible | |
|---|---|---|---|---|---|---|---|---|---|---|---|---|
| Battery runtime | -9% | -1% | 23% | -39% | -11% | -5% | 37% | -2% | -20% | -34% | 25% | |
| Reader / Idle (h) | 18.1 | 17.8 -2% | 17.6 -3% | 13 -28% | 17.2 -5% | 24.5 35% | 12.9 -29% | 27.7 ? 53% | ||||
| WiFi v1.3 (h) | 8.5 | 8.2 -4% | 9.1 7% | 12.4 46% | 5 -41% | 7.7 -9% | 11.1 31% | 7.5 -12% | 6.8 -20% | 5.6 -34% | 12.1 ? 42% | |
| Load (h) | 2.2 | 1.9 -14% | 2 -9% | 2.8 27% | 1.4 -36% | 2.3 5% | 3.2 45% | 3 36% | 1.779 ? -19% | |||
| H.264 (h) | 10.2 | 6.5 | 6.8 | 15.6 | 6.4 | 15.3 ? | ||||||
| Witcher 3 ultra (h) | 1.9 | 3.8 |
Pros
Cons
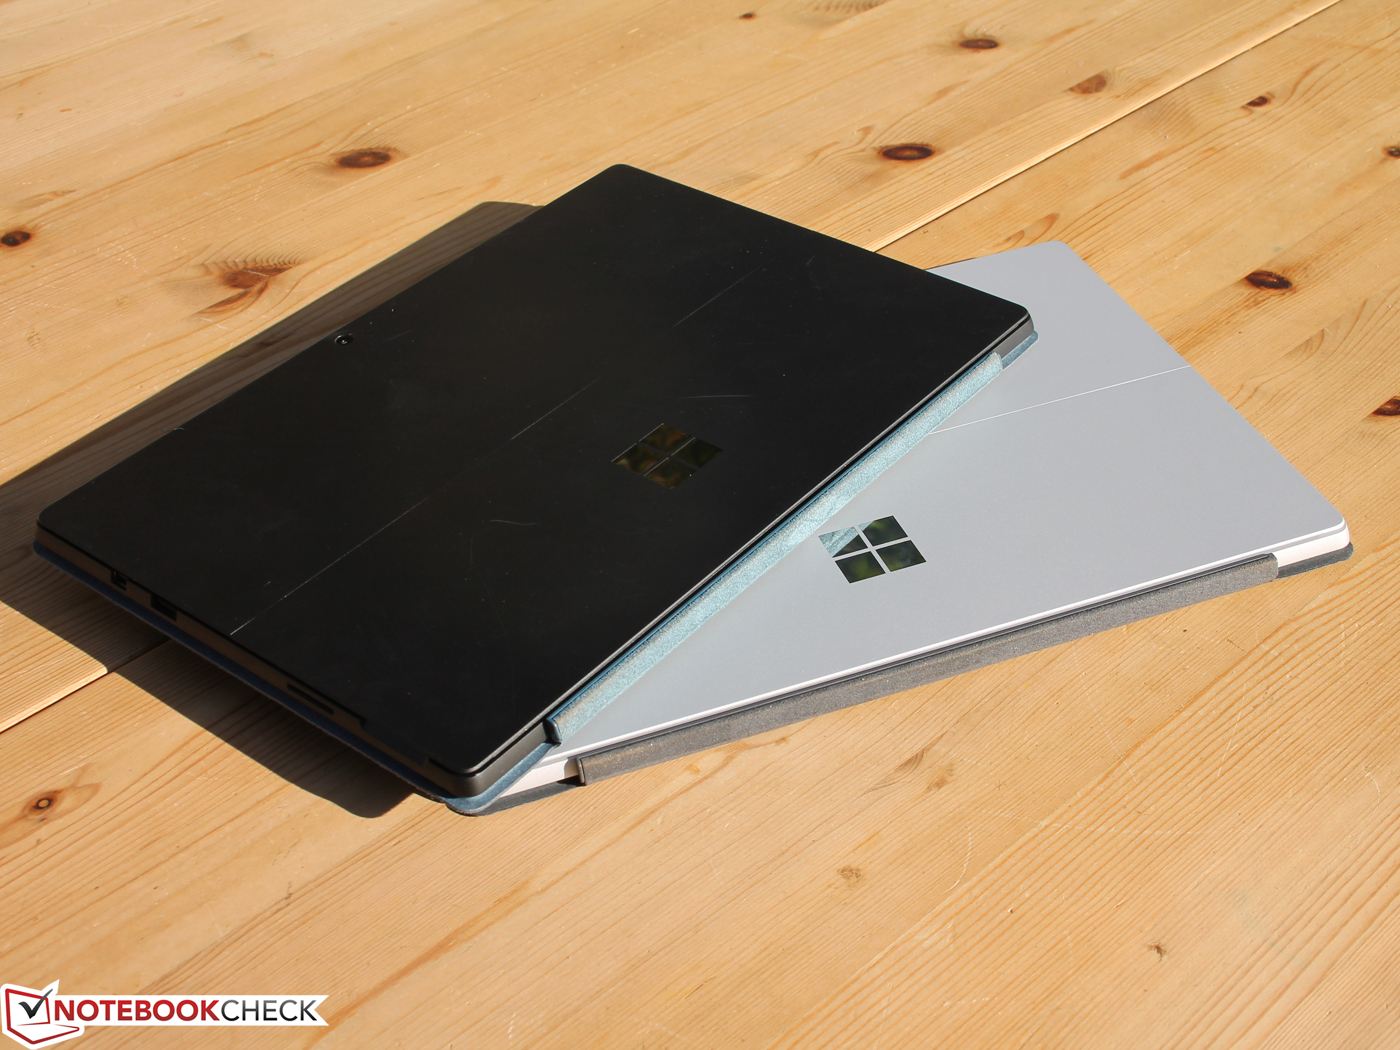
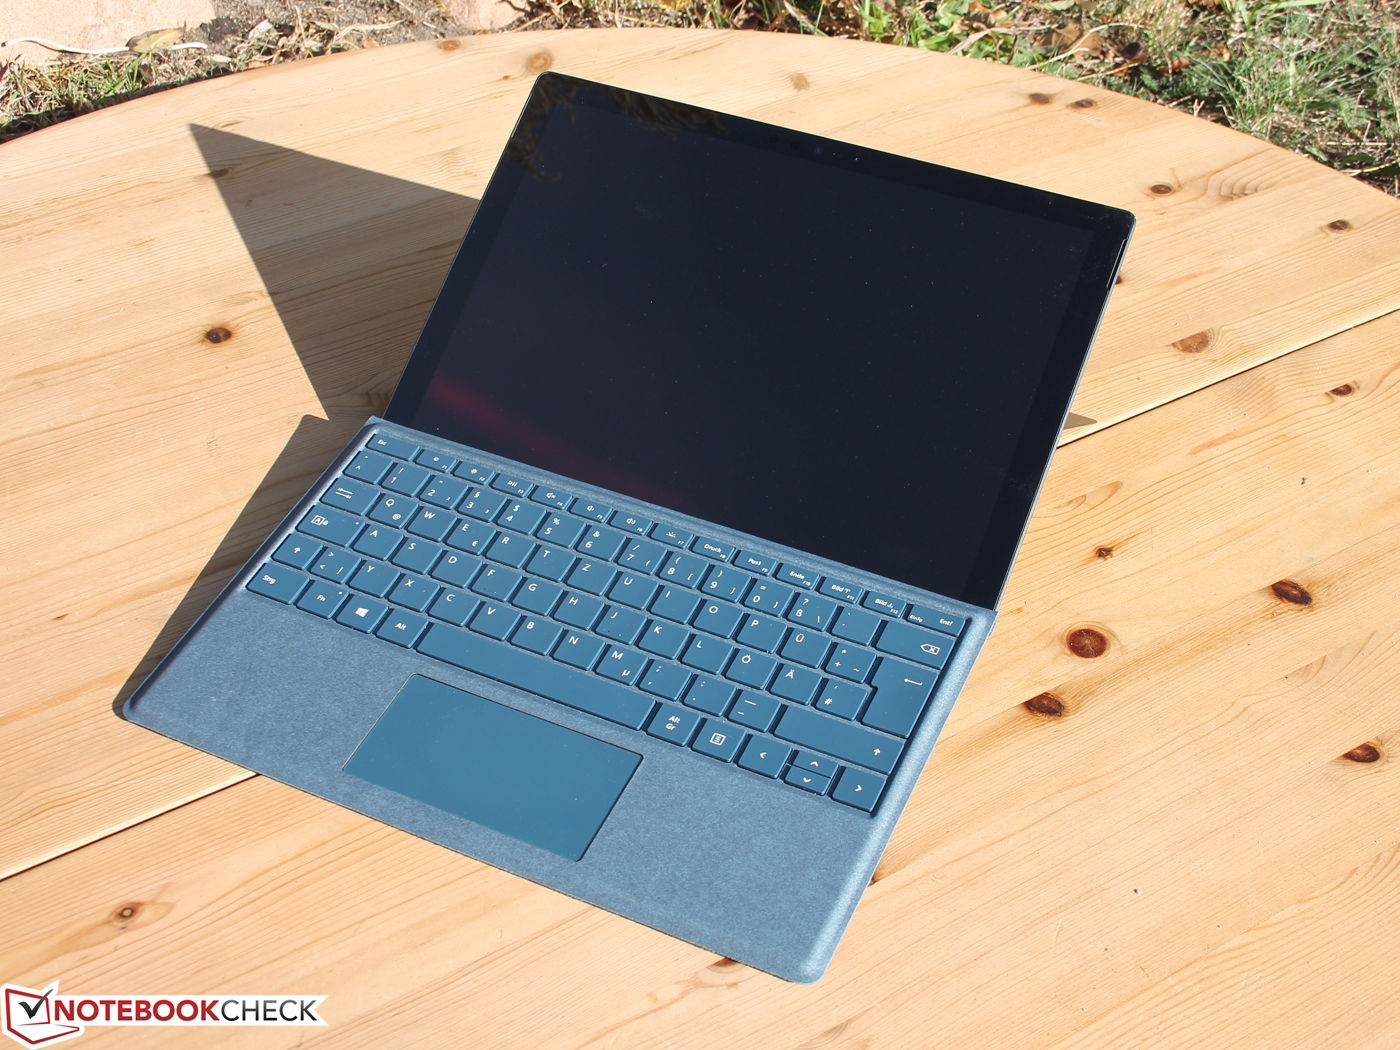
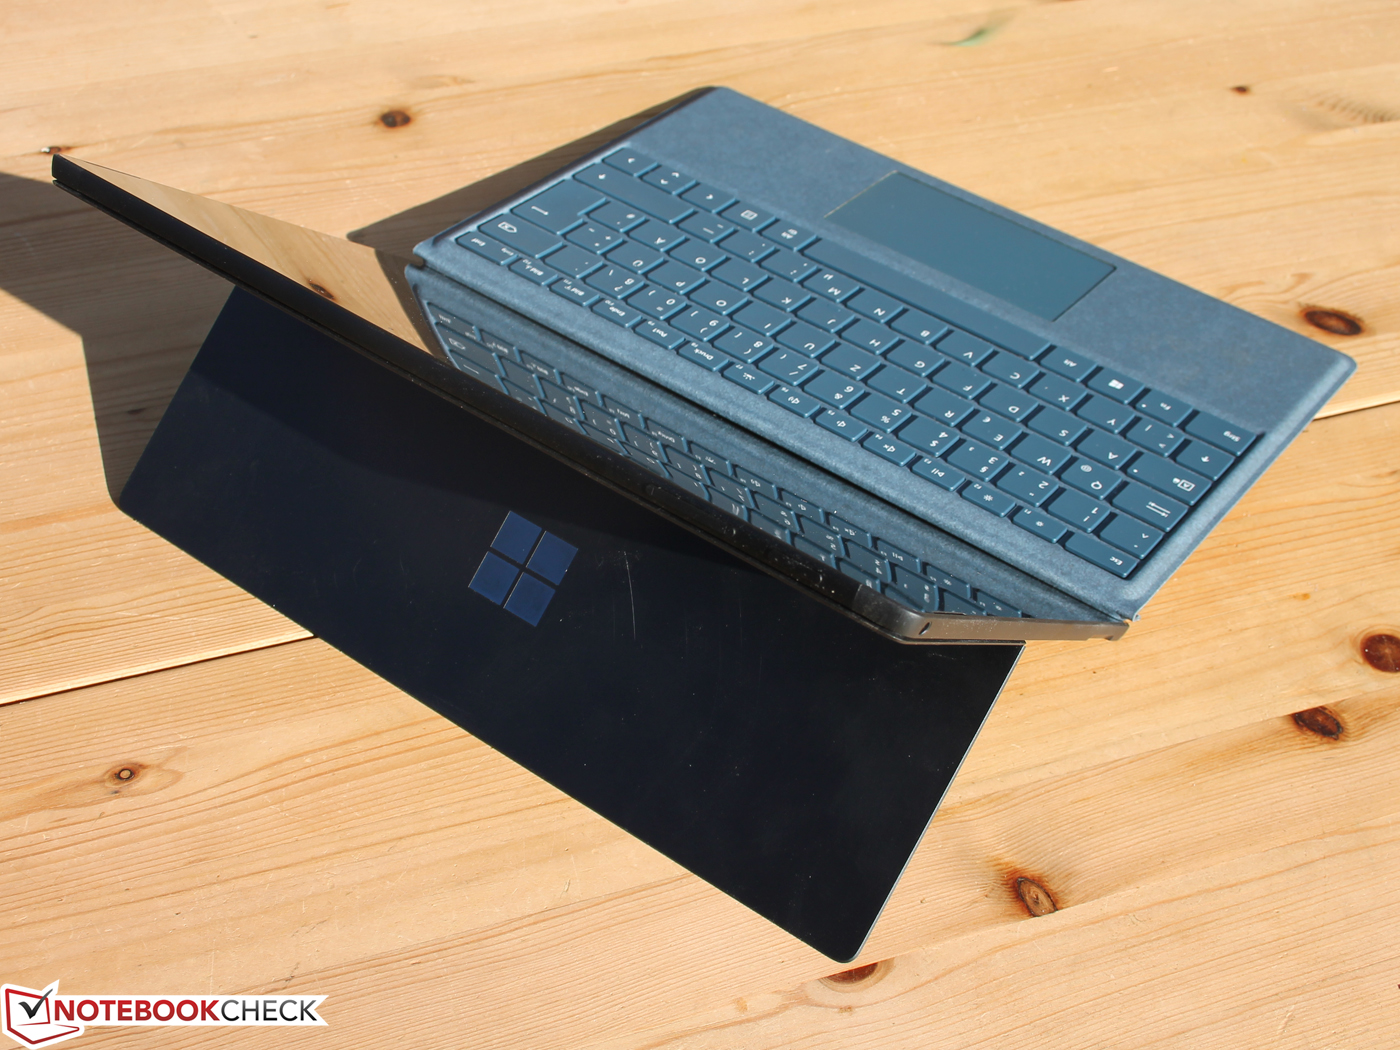
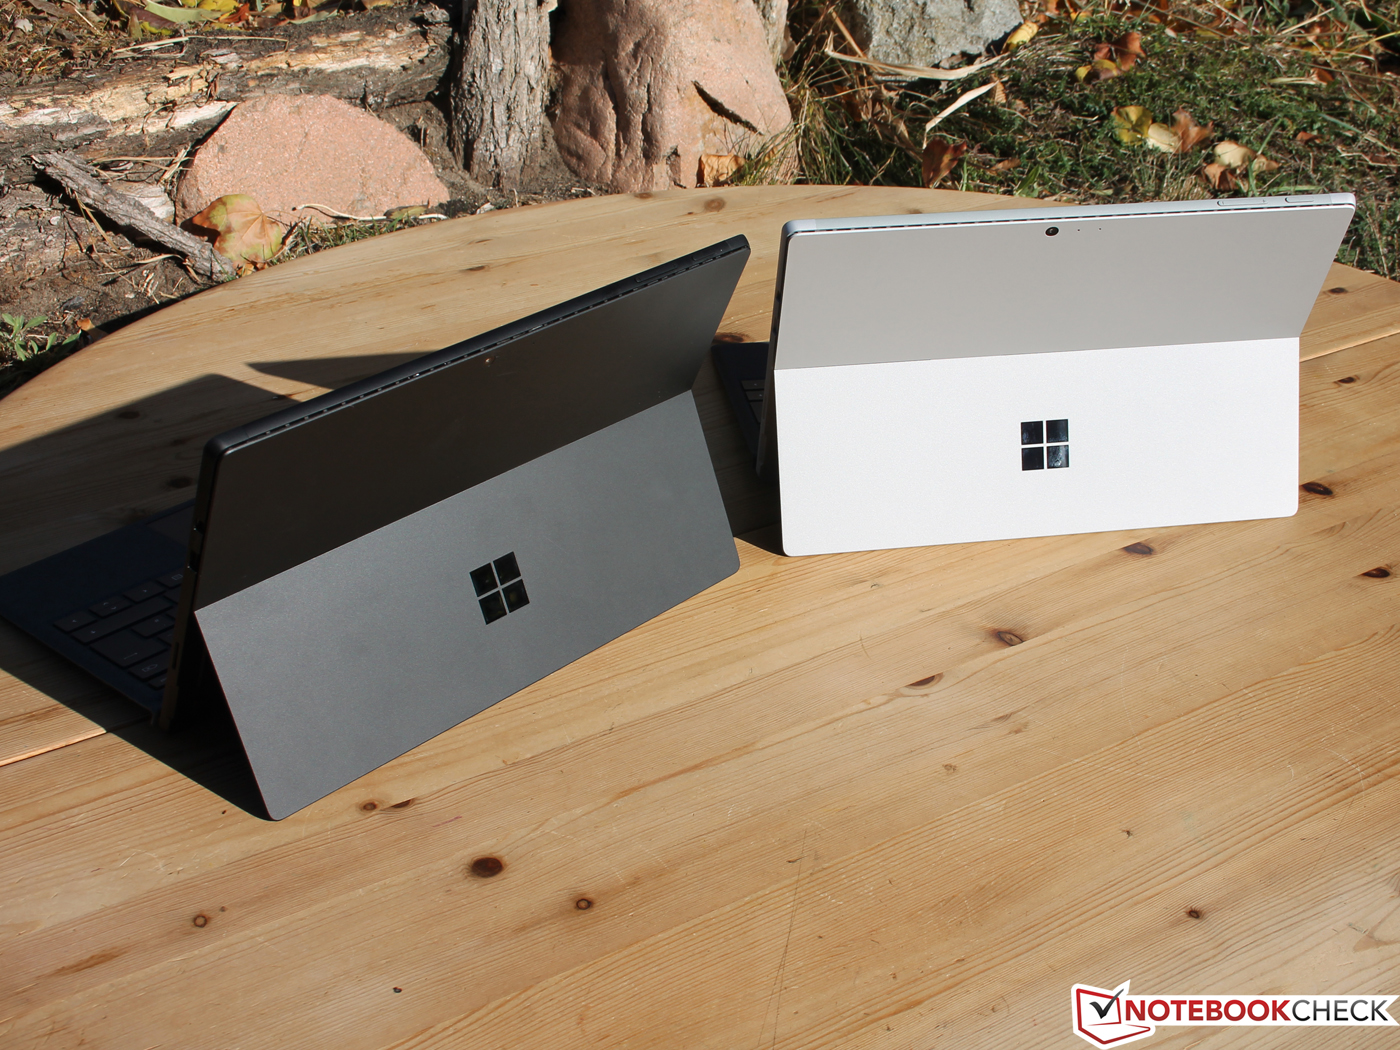
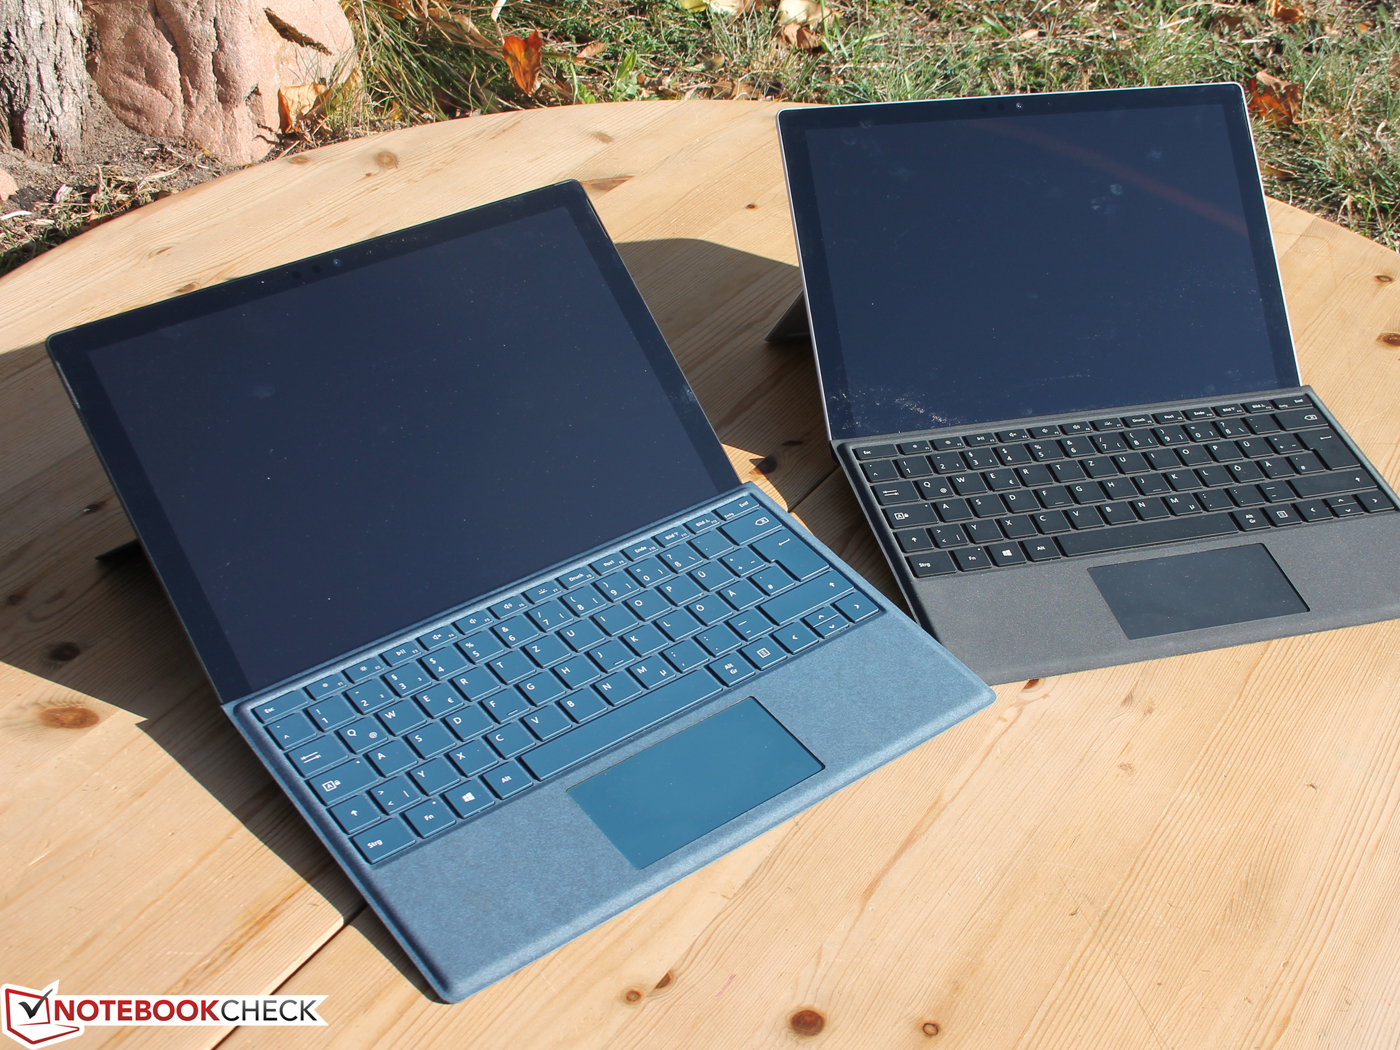
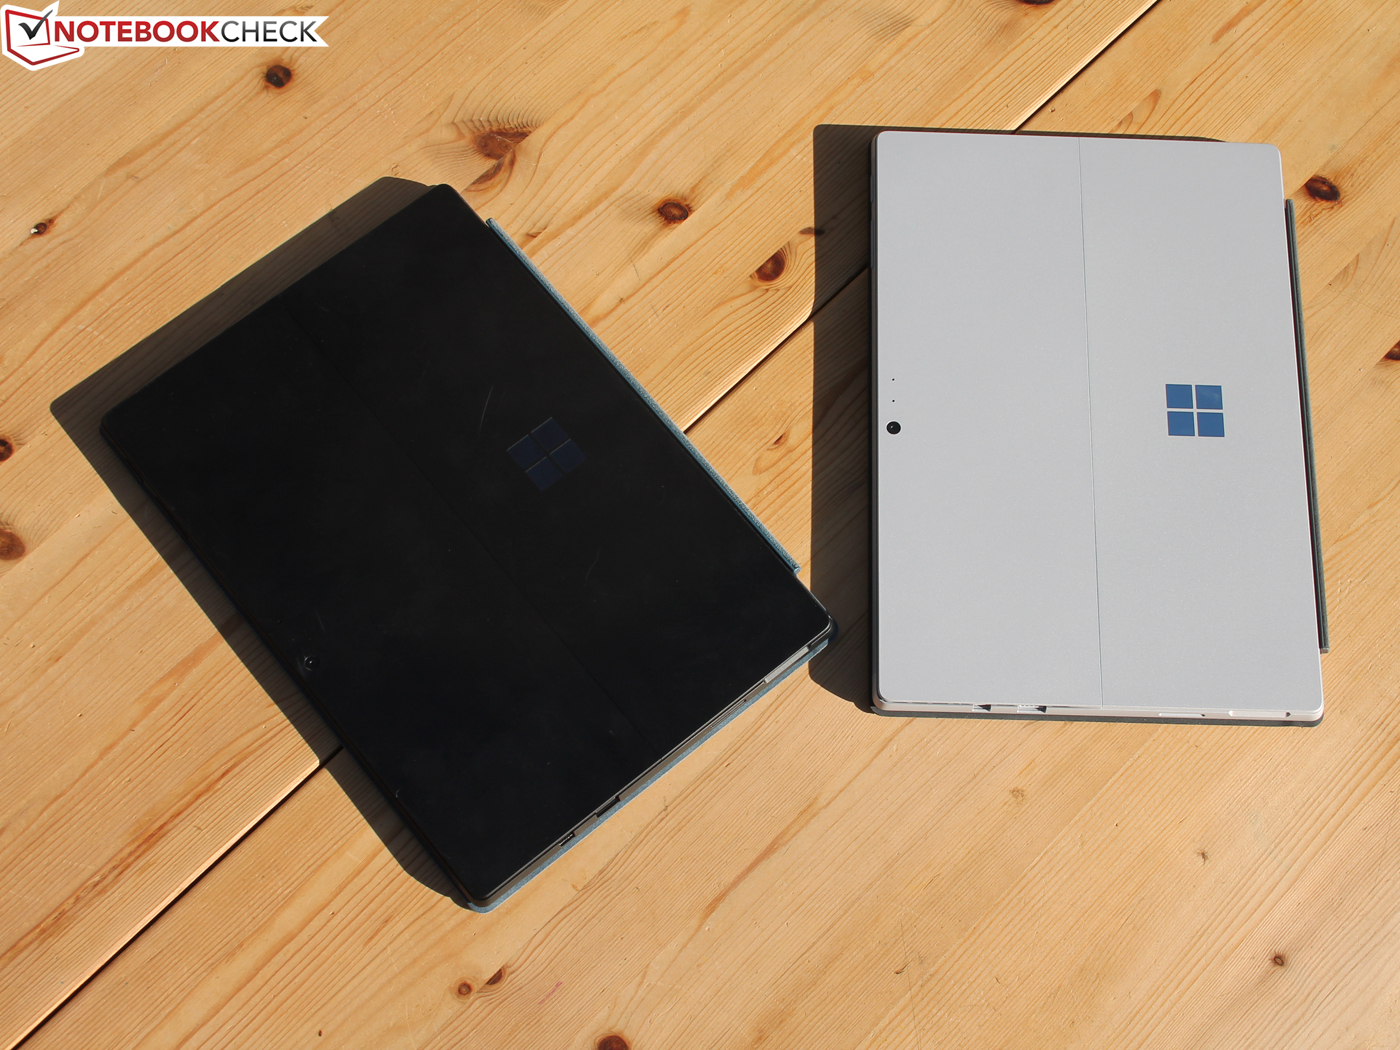
旧瓶装新酒?除了多出一个黑色外观选项,Surface Pro 6看起来与它的上一代几乎相同。这还是一台纤薄,高品质且坚固耐用的平板电脑,它易于持握,786克的质量也相对很轻。
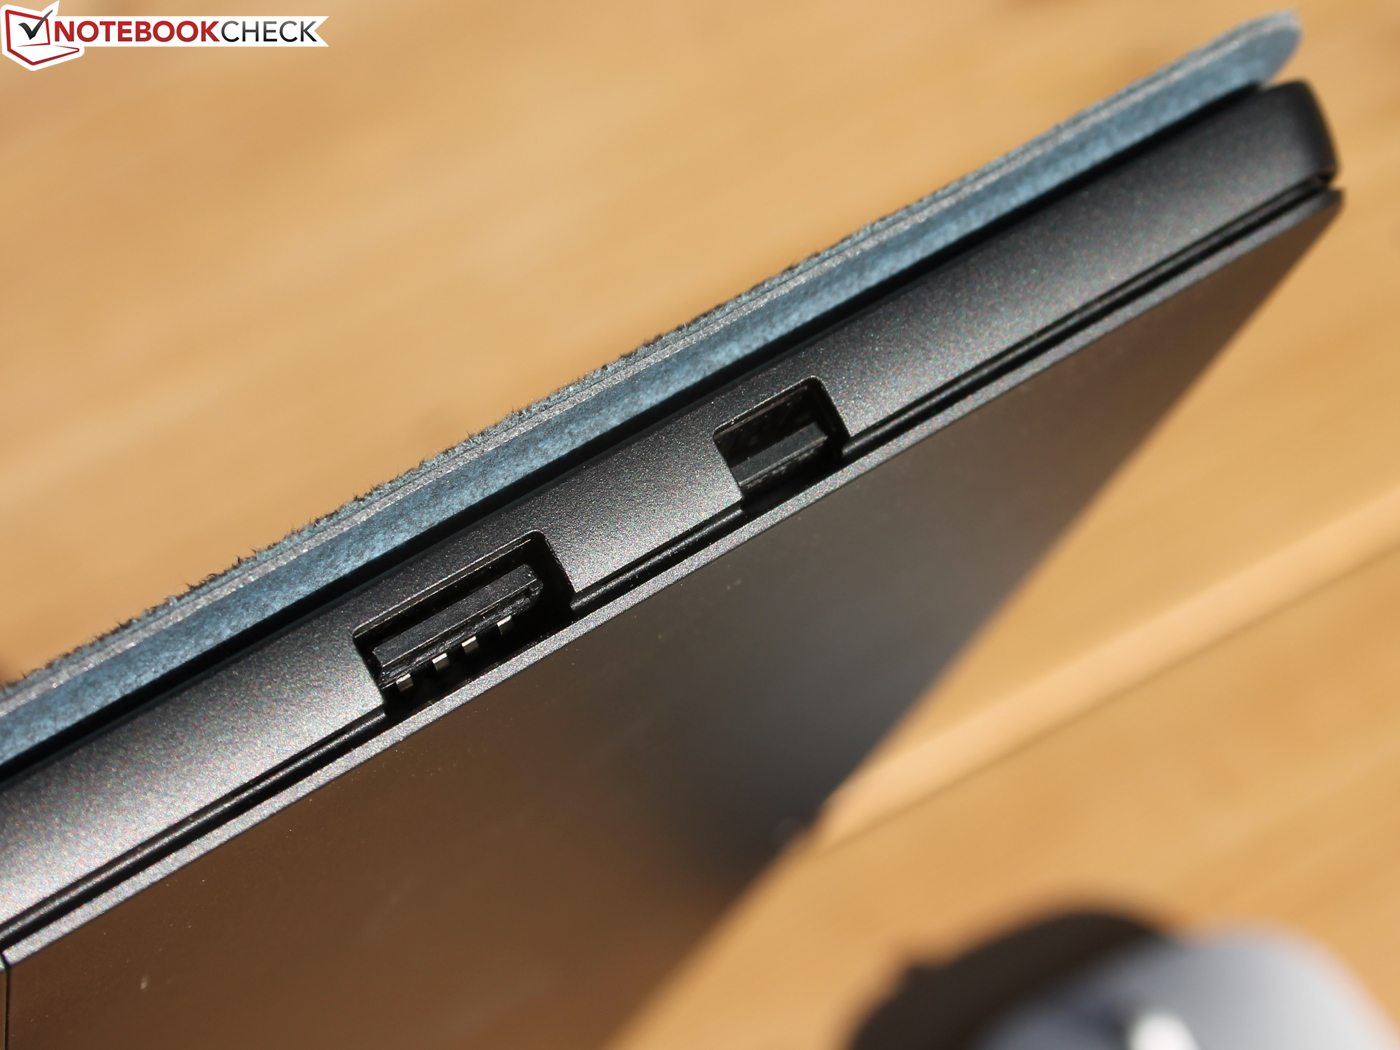
坏消息是,微软对于接口选择依然很吝啬。Surface Pro 6仍然只有一个Mini DP接口,一个USB Type-A接口,一个microSD卡读卡器和耳机接口,USB Type-C依然缺失。令人更加失望的是,它的竞品们在两年前就拥有了USB Type-C或雷电3接口。我们始终无法理解微软为什么不去采用这个新标准。
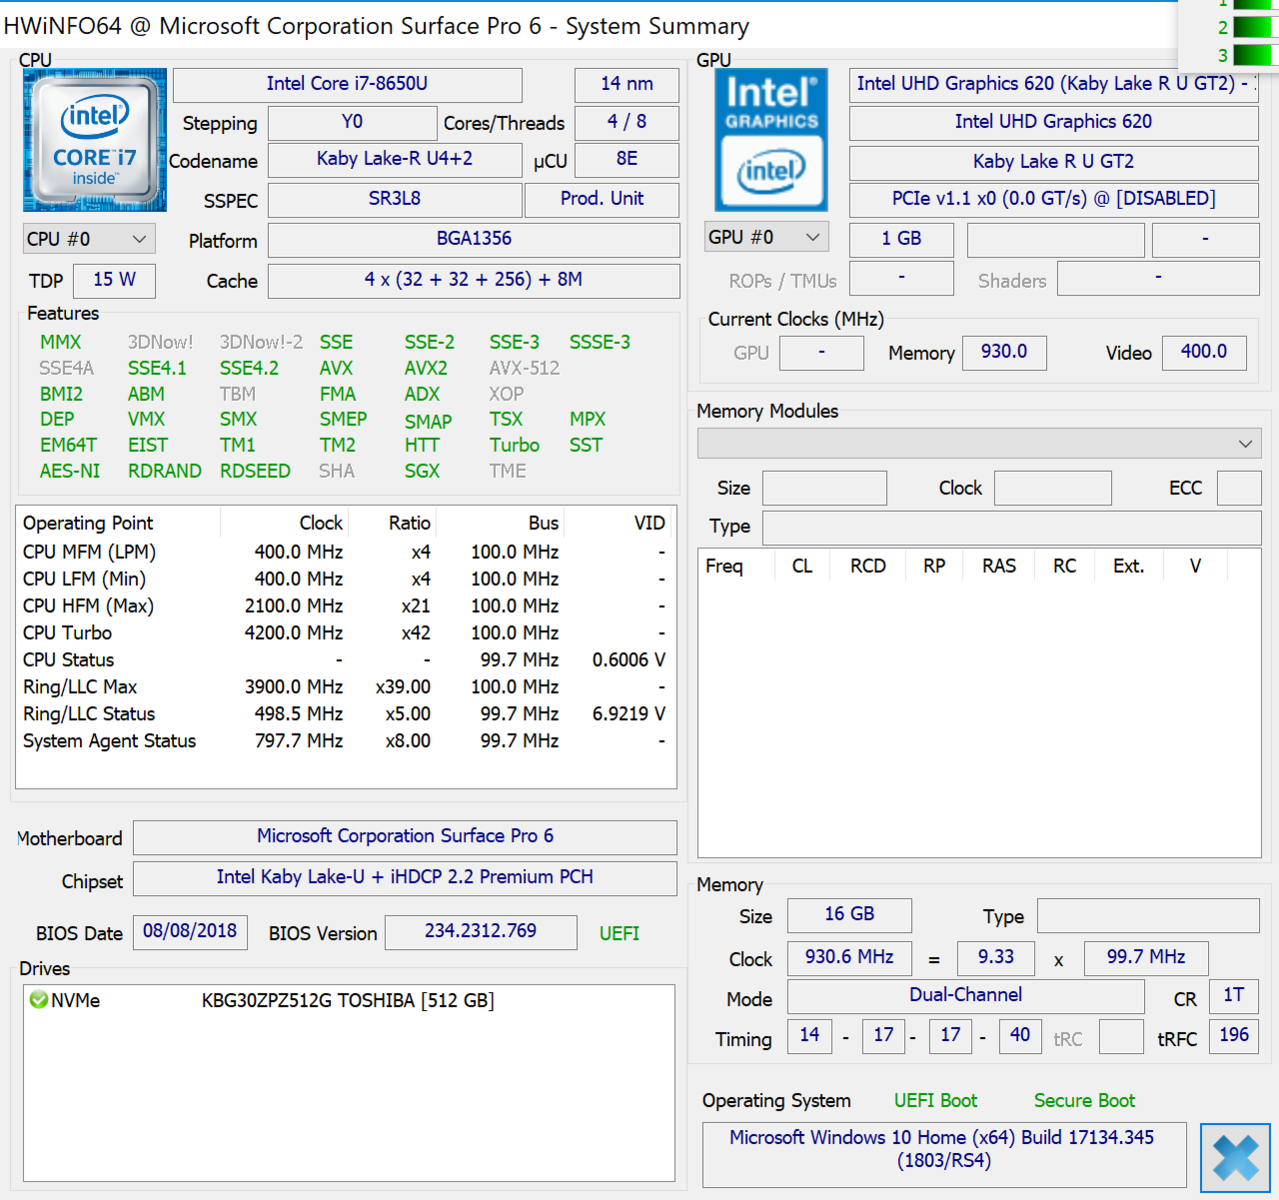
i7型号虽然小巧,但性能却超过了许多更大的笔记本电脑。值得注意的是,Surface Pro 6在我们的Cinebench R15循环跑分测试中比Surface Book 2得分更高,即使Surface Book 2的性能已经很强。除此之外,我们还发现i7版的降频明显少于i5版,主要原因应该是后者未配备风扇。
然而,续航就没那么令人印象深刻了,我们测试的设备有着与上一代差不多的续航表现。i7 Surface Pro 6依然能够满足全天的使用,而且在我们的Wi-Fi续航测试中,没有别的竞品可以达到8到9小时的水平。
“Surface Pro 6终于兑现了微软对于打造一台性能媲美笔记本电脑的平板的诺言。不过设计仍然和上一代差不多,USB Type-C的缺失更让人感到沮丧。”
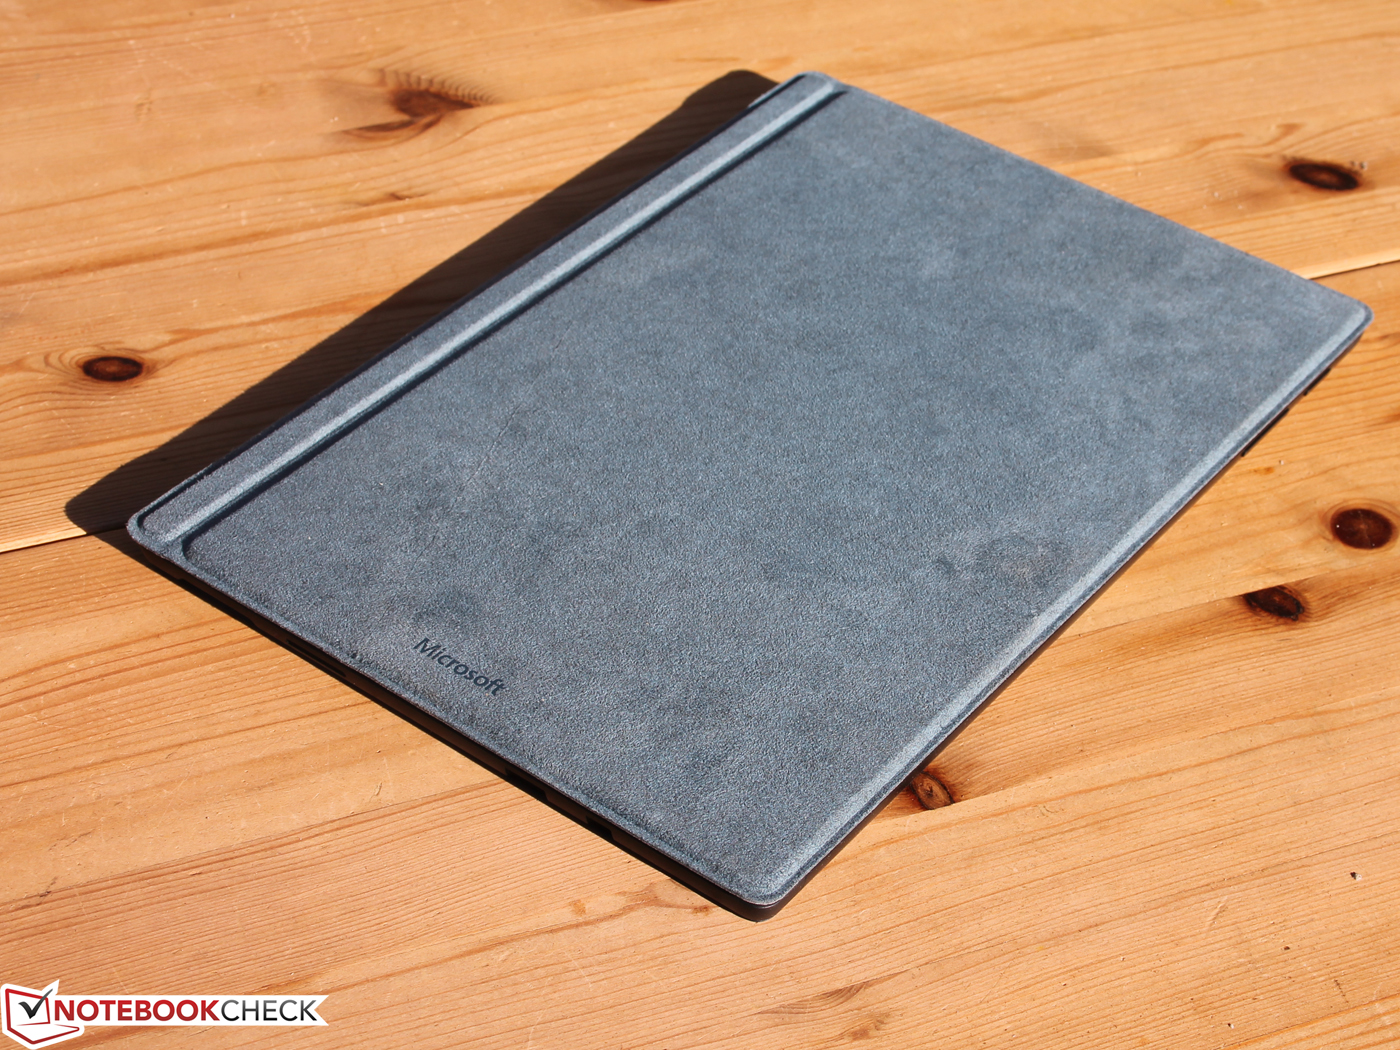
微软仍然用着去年的键盘盖和手写笔,这意味着老配件也可以在Surface Pro 6上使用。除此之外,我们必须赞扬大幅升级的摄像头。屏幕依然够亮,能满足户外使用,同时还拥有着完整的sRGB色域覆盖。
我们测试的设备官方售价为14887元,且不带键盘,这个价格对于一台平板电脑来说非常昂贵。不过如果和我们十佳二合一平板榜单里的其他设备比较,价格也没有那么高。三星Galaxy Book 12要便宜许多,在我们的测试中也得到了88分的高分,但它用的还是老旧的i5-7200U处理器。
我们正在测试它的一款竞品:联想ThinkPad X1 Tablet 3代,这台电脑售价和Surface Pro 6相当,但是有手写笔,两个雷电3,更高分辨率的屏幕和LTE模块,屏幕比例为3:2,但在重量上多出了180克。理论上来说ThinkPad X1 Tablet会更强,我们的测评将在不久后证明是否的确如此。
Microsoft Surface Pro 6, Core i7, 512 GB
- 02/17/2020 v7 (old)
Sebastian Jentsch
Price comparison

